

Análise do Lenovo IdeaPad Pro 5 16IMH G9: 90 W GeForce RTX 4050 quase tão bom quanto o RTX 4060

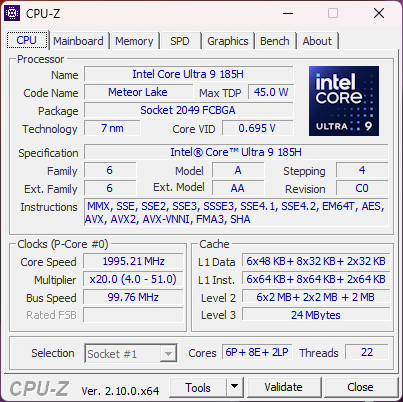
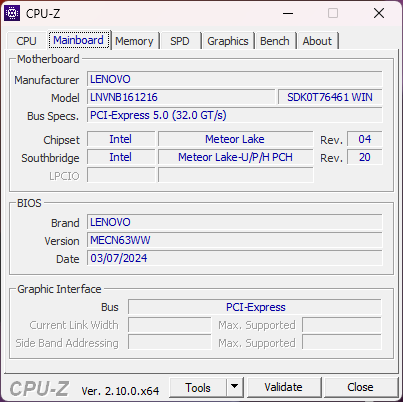
Depois de analisar recentemente o IdeaPad Pro 5 16IMH iGPU e IPS, agora estamos prontos para verificar a configuração dGPU e OLED mais cara. Nossa unidade de teste específica vem equipada com opções de ponta, incluindo o Meteor Lake Core Ultra 9 185H por US$ 1.500 no varejo. Ele também é um dos poucos notebooks multimídia ultrafinos com um GeForce RTX 4050 de 90 W, já que a maioria dos outros notebooks da categoria normalmente tem como alvo tetos de TGP mais baixos.
O IdeaPad Pro 5 16 G9 é diferente do carro-chefe Yoga Pro 9i 16 G9. Este último, por exemplo, oferece opções de mini-LED e RTX 4070 que não estão disponíveis no IdeaPad.
As alternativas ao IdeaPad Pro 5 16IMH incluem outros notebooks multimídia de 16 polegadas de médio e alto padrão, como o Dell Inspiron 16 7640 2 em 1, Asus Zenbook S16, Samsung Galaxy Book4 Ultraou a Série HP Envy. Recomendamos que o senhor confira nossa análise existente sobre o iGPU IdeaPad Pro 5 16IMH G9 para saber mais sobre as características físicas do modelo. Uma versão menor de 14 polegadas desse modelo também está disponível, chamada de IdeaPad Pro 5 14 G9.
Mais análises da Lenovo:
Possíveis concorrentes em comparação
Avaliação | Versão | Data | Modelo | Peso | Altura | Size | Resolução | Preço |
|---|---|---|---|---|---|---|---|---|
| 84.7 % | v8 | 09/2024 | Lenovo IdeaPad Pro 5 16IMH G9 RTX 4050 Ultra 9 185H, NVIDIA GeForce RTX 4050 Laptop GPU | 2 kg | 18.95 mm | 16.00" | 2048x1280 | |
| 87.9 % v7 (old) | v7 (old) | 05/2024 | Lenovo IdeaPad Pro 5 16IMH G9 Ultra 7 155H, Arc 8-Core | 1.9 kg | 17.5 mm | 16.00" | 2560x1600 | |
| 82.1 % | v8 | 07/2024 | Dell Inspiron 16 7640 2-in-1 Ultra 7 155H, Arc 8-Core | 2.1 kg | 18.99 mm | 16.00" | 2560x1600 | |
| 84.7 % | v8 | 07/2024 | Asus Zenbook S 16 UM5606-RK333W Ryzen AI 9 HX 370, Radeon 890M | 1.5 kg | 12.9 mm | 16.00" | 2880x1800 | |
| 87.2 % v7 (old) | v7 (old) | 05/2024 | HP Envy x360 2-in-1 16-ad0097nr R7 8840HS, Radeon 780M | 1.8 kg | 18.3 mm | 16.00" | 2880x1800 | |
| 90.4 % v7 (old) | v7 (old) | 03/2024 | Samsung Galaxy Book4 Ultra Ultra 7 155H, NVIDIA GeForce RTX 4050 Laptop GPU | 1.8 kg | 17 mm | 16.00" | 2880x1800 |
Observação: Atualizamos recentemente nosso sistema de classificação e os resultados da versão 8 não são comparáveis aos resultados da versão 7. Mais informações estão disponíveis aqui .
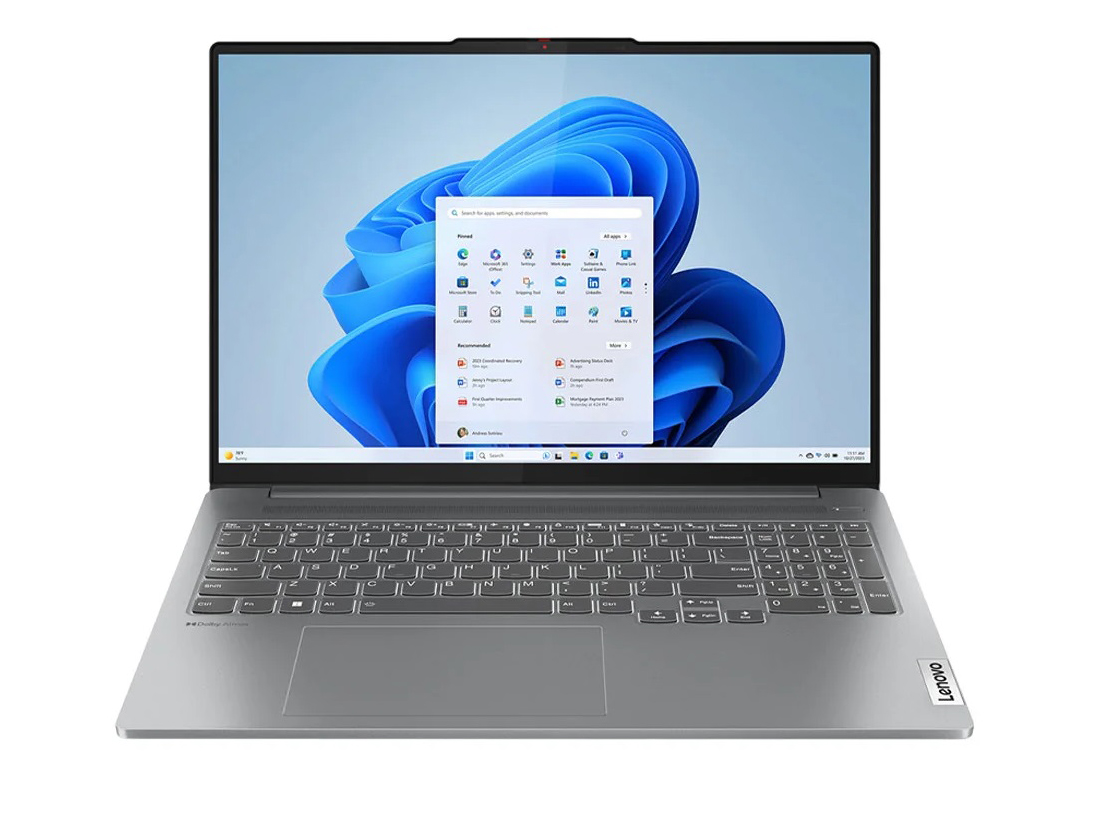
Caso
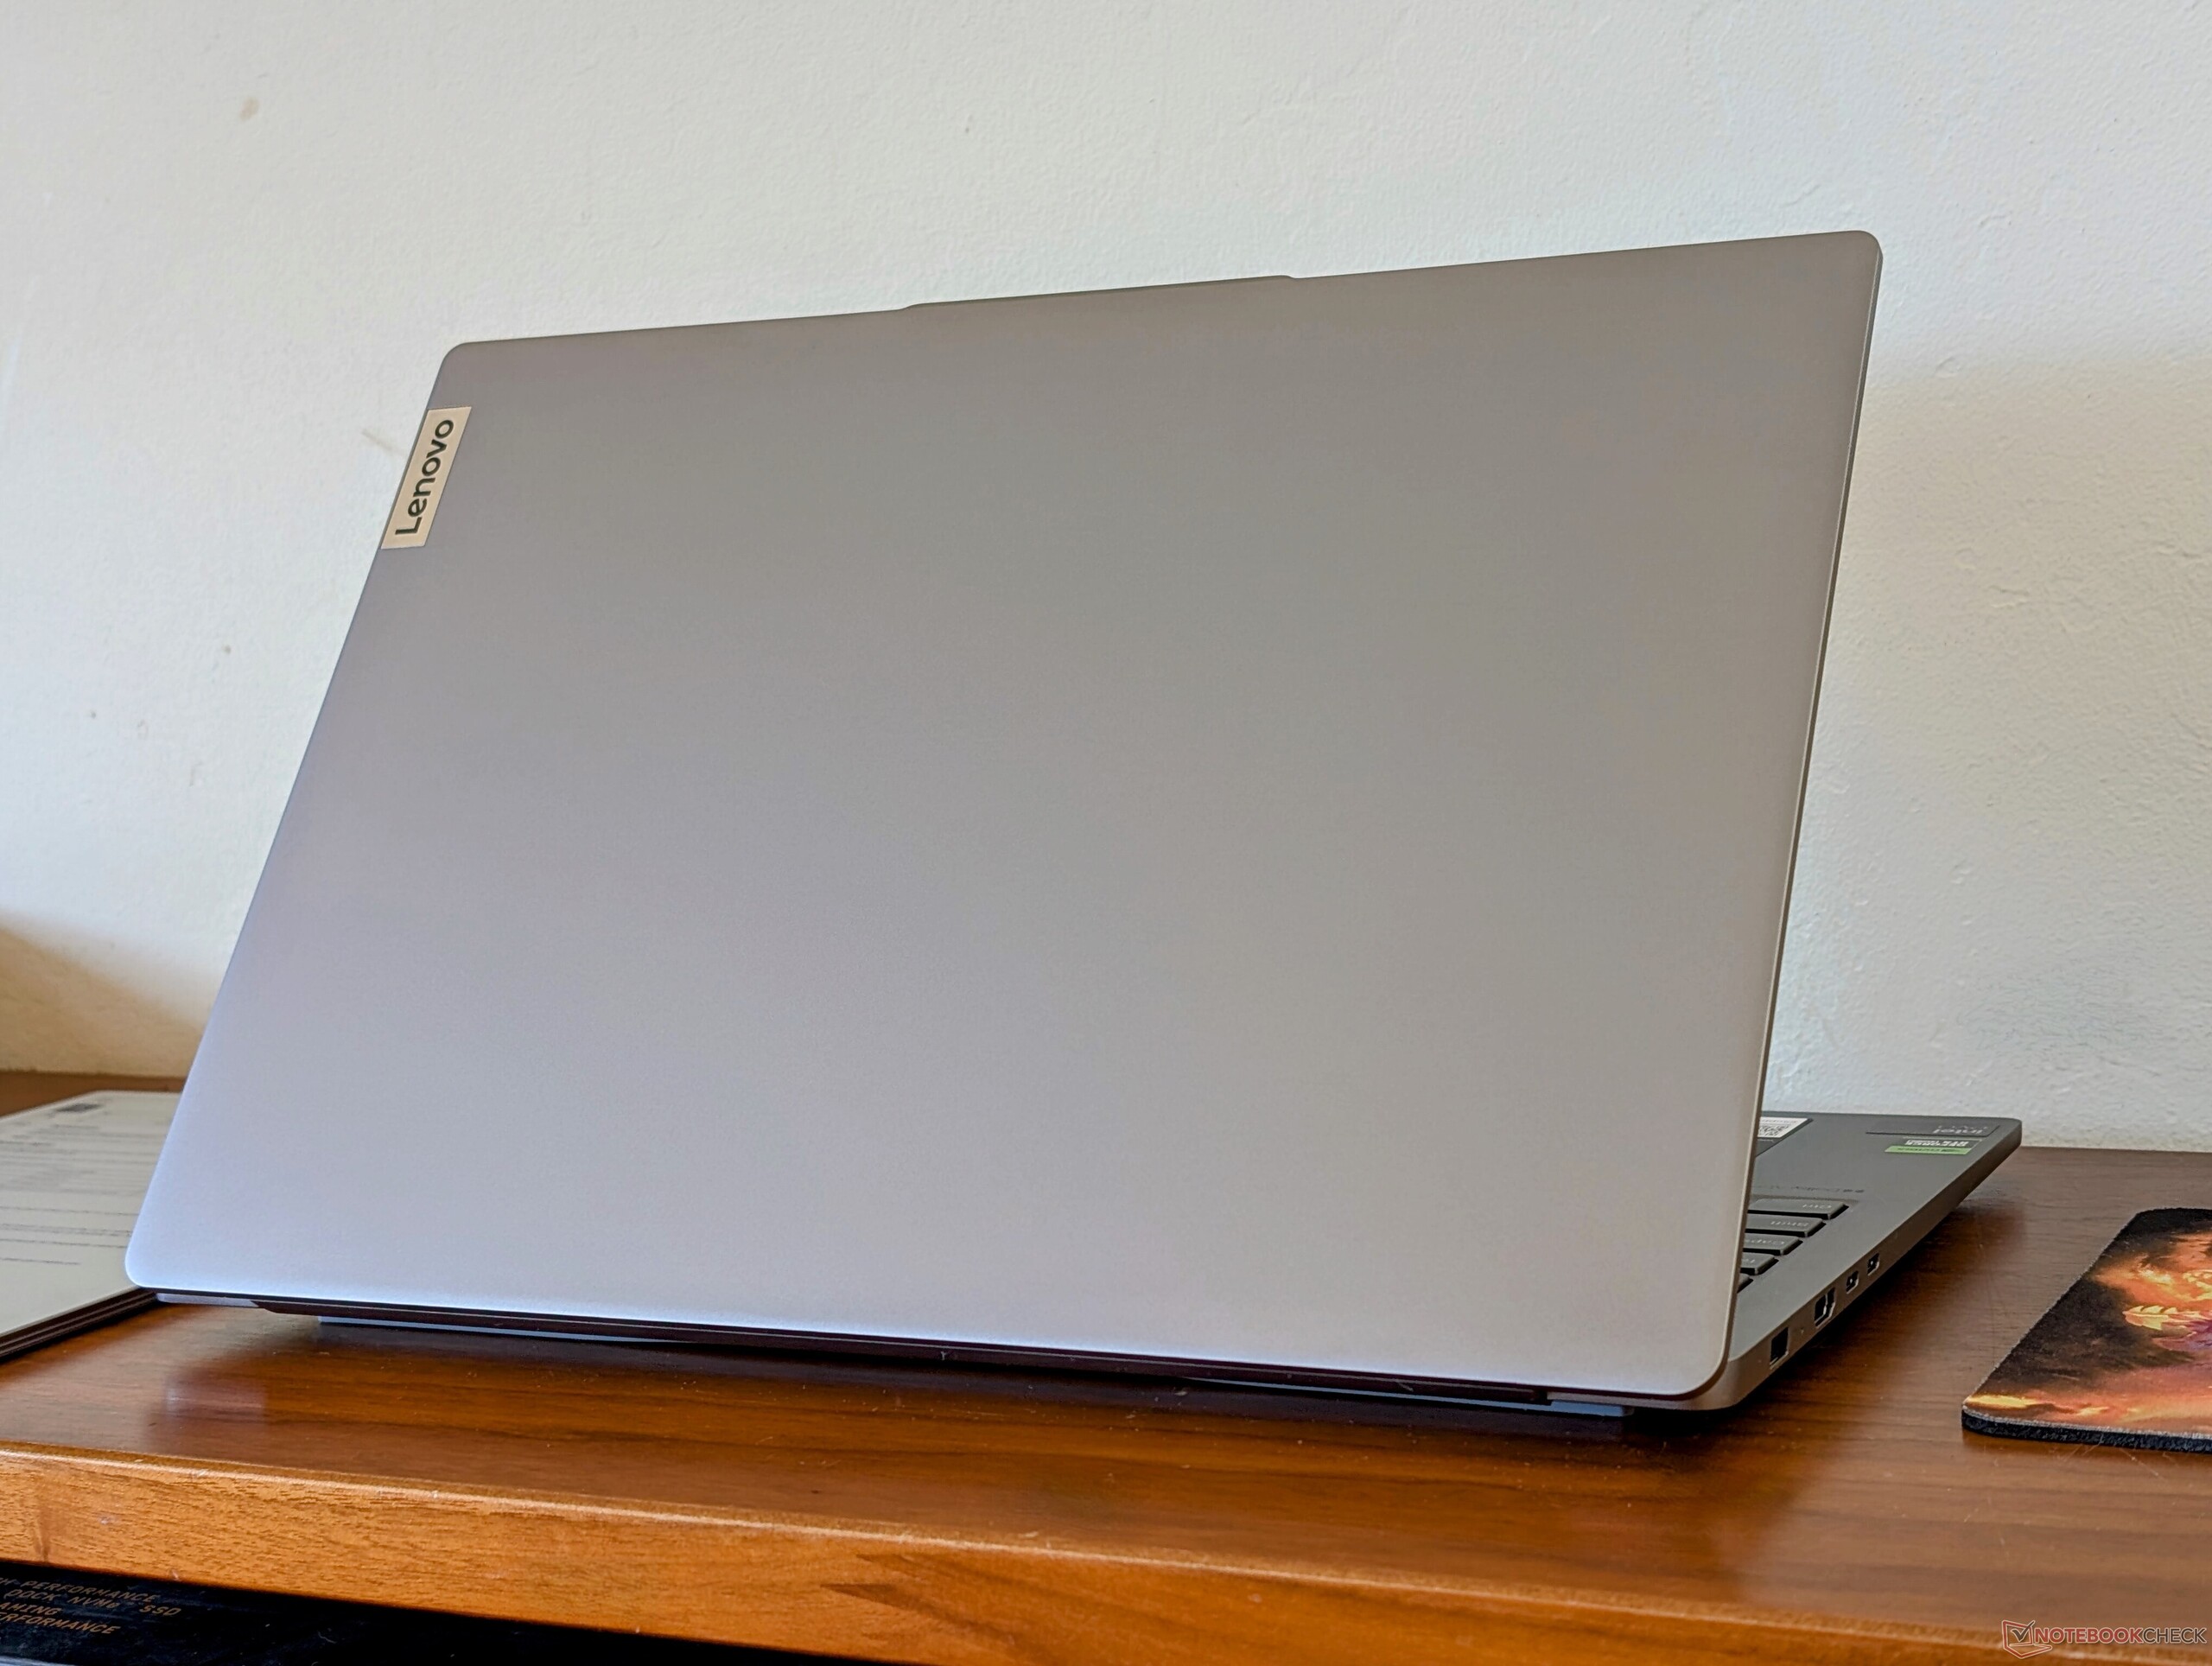
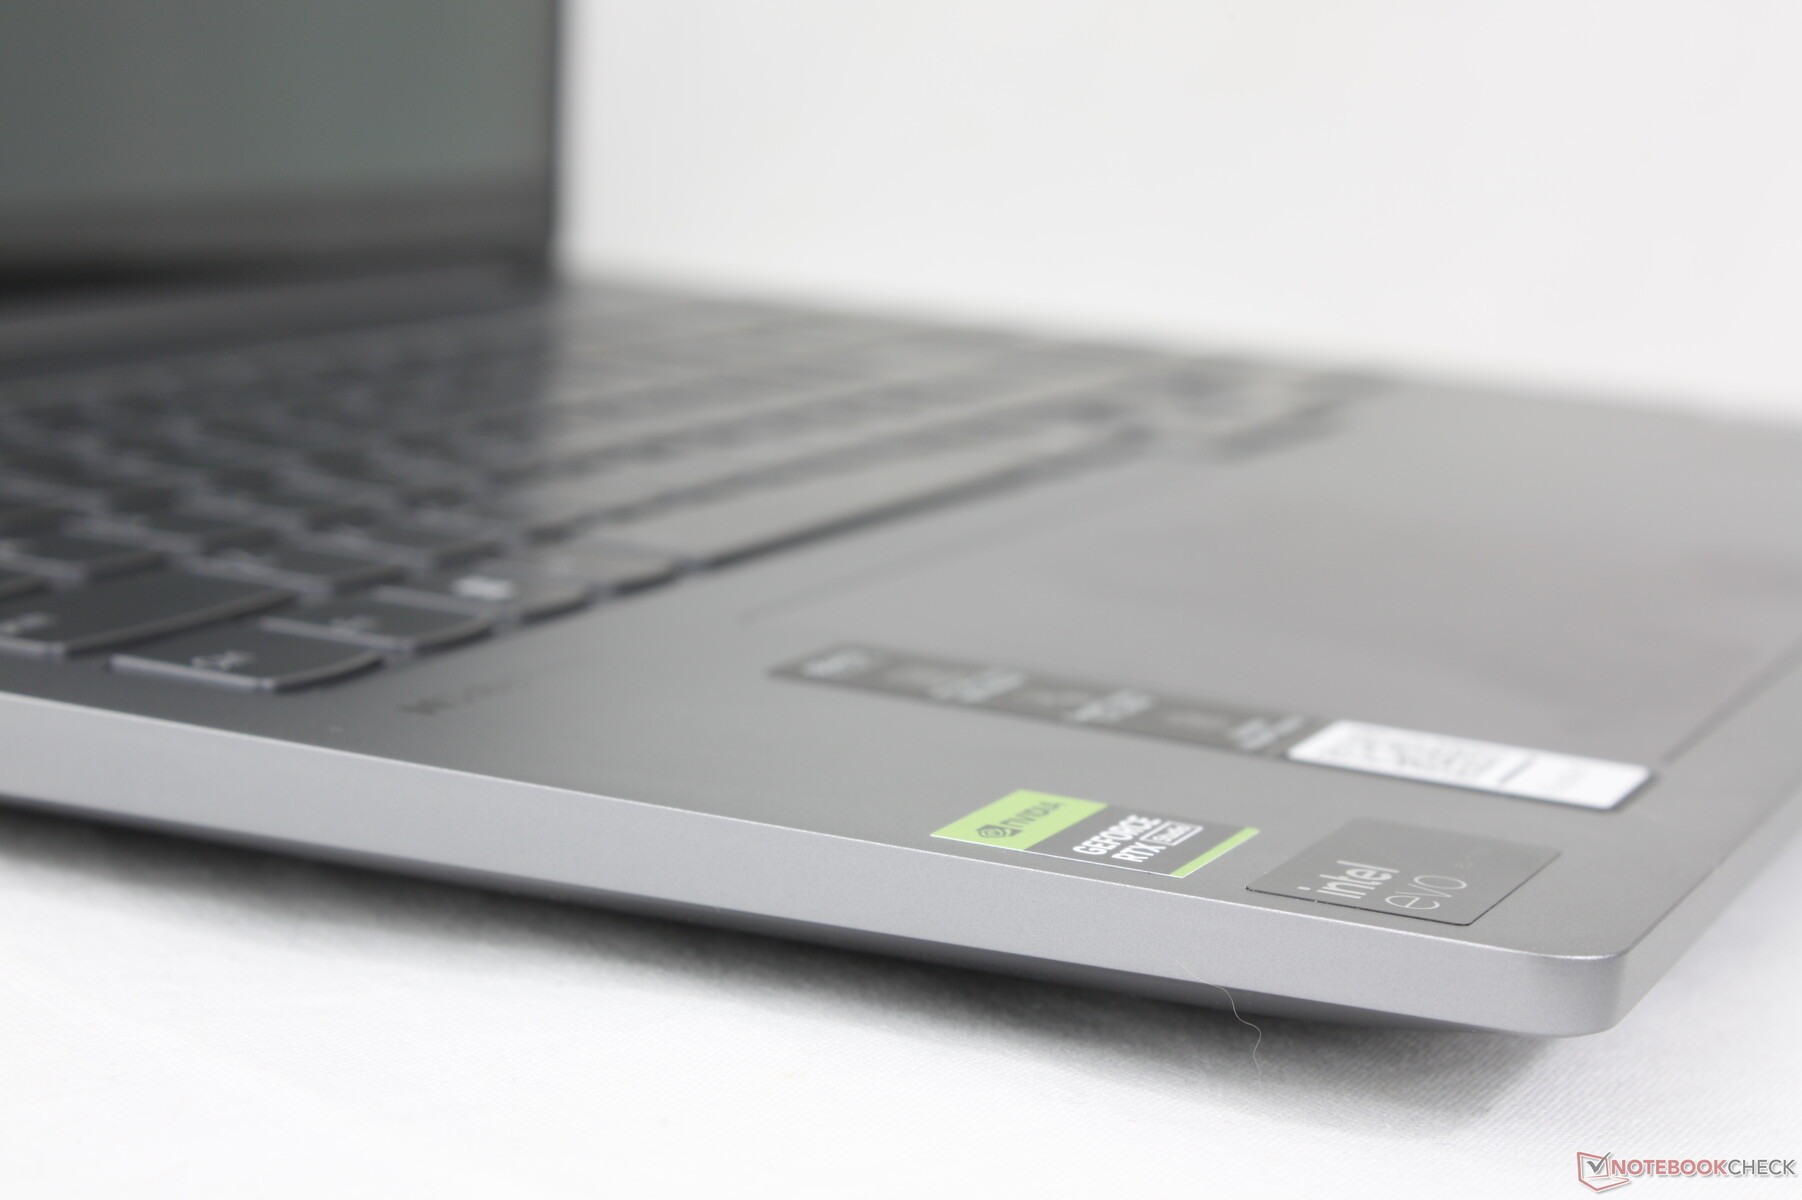
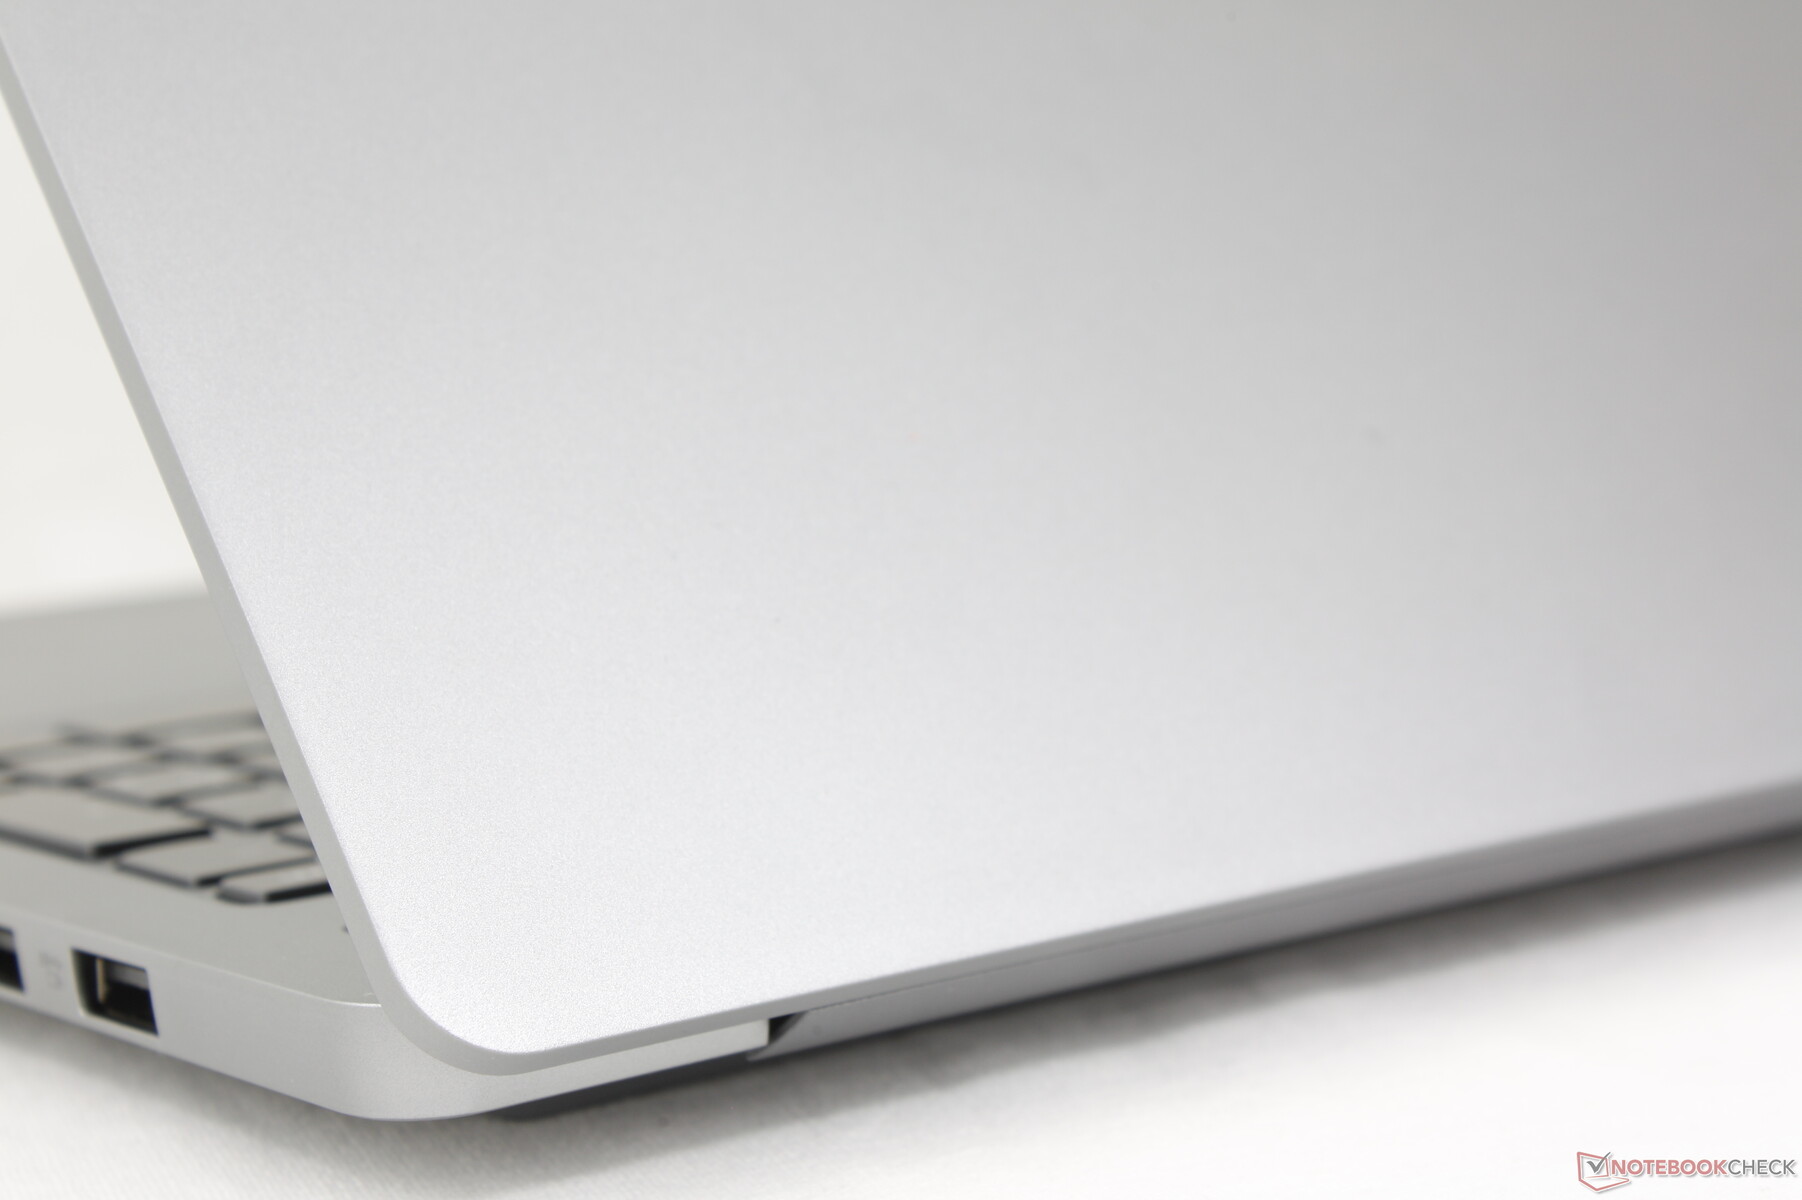
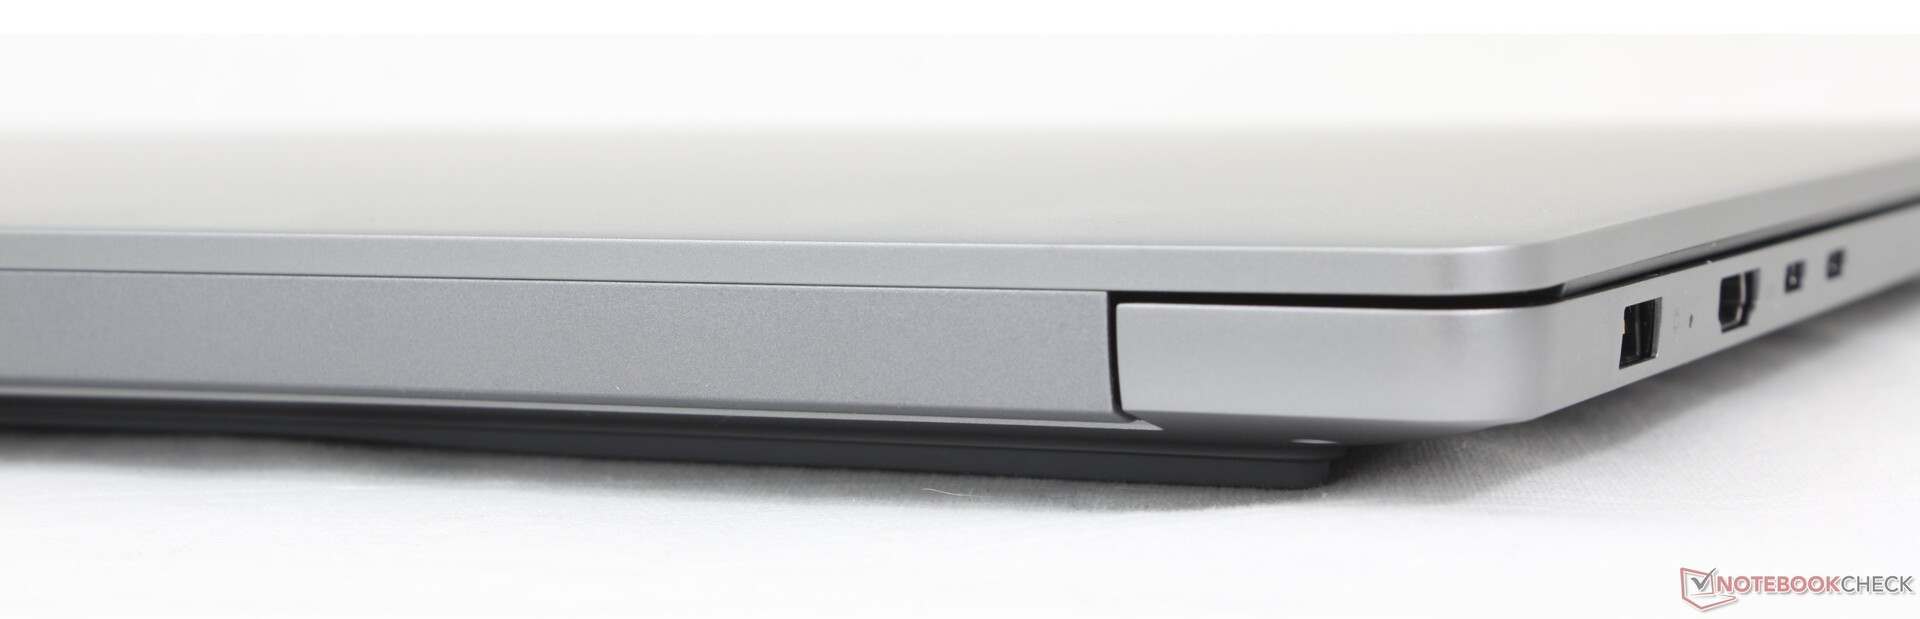
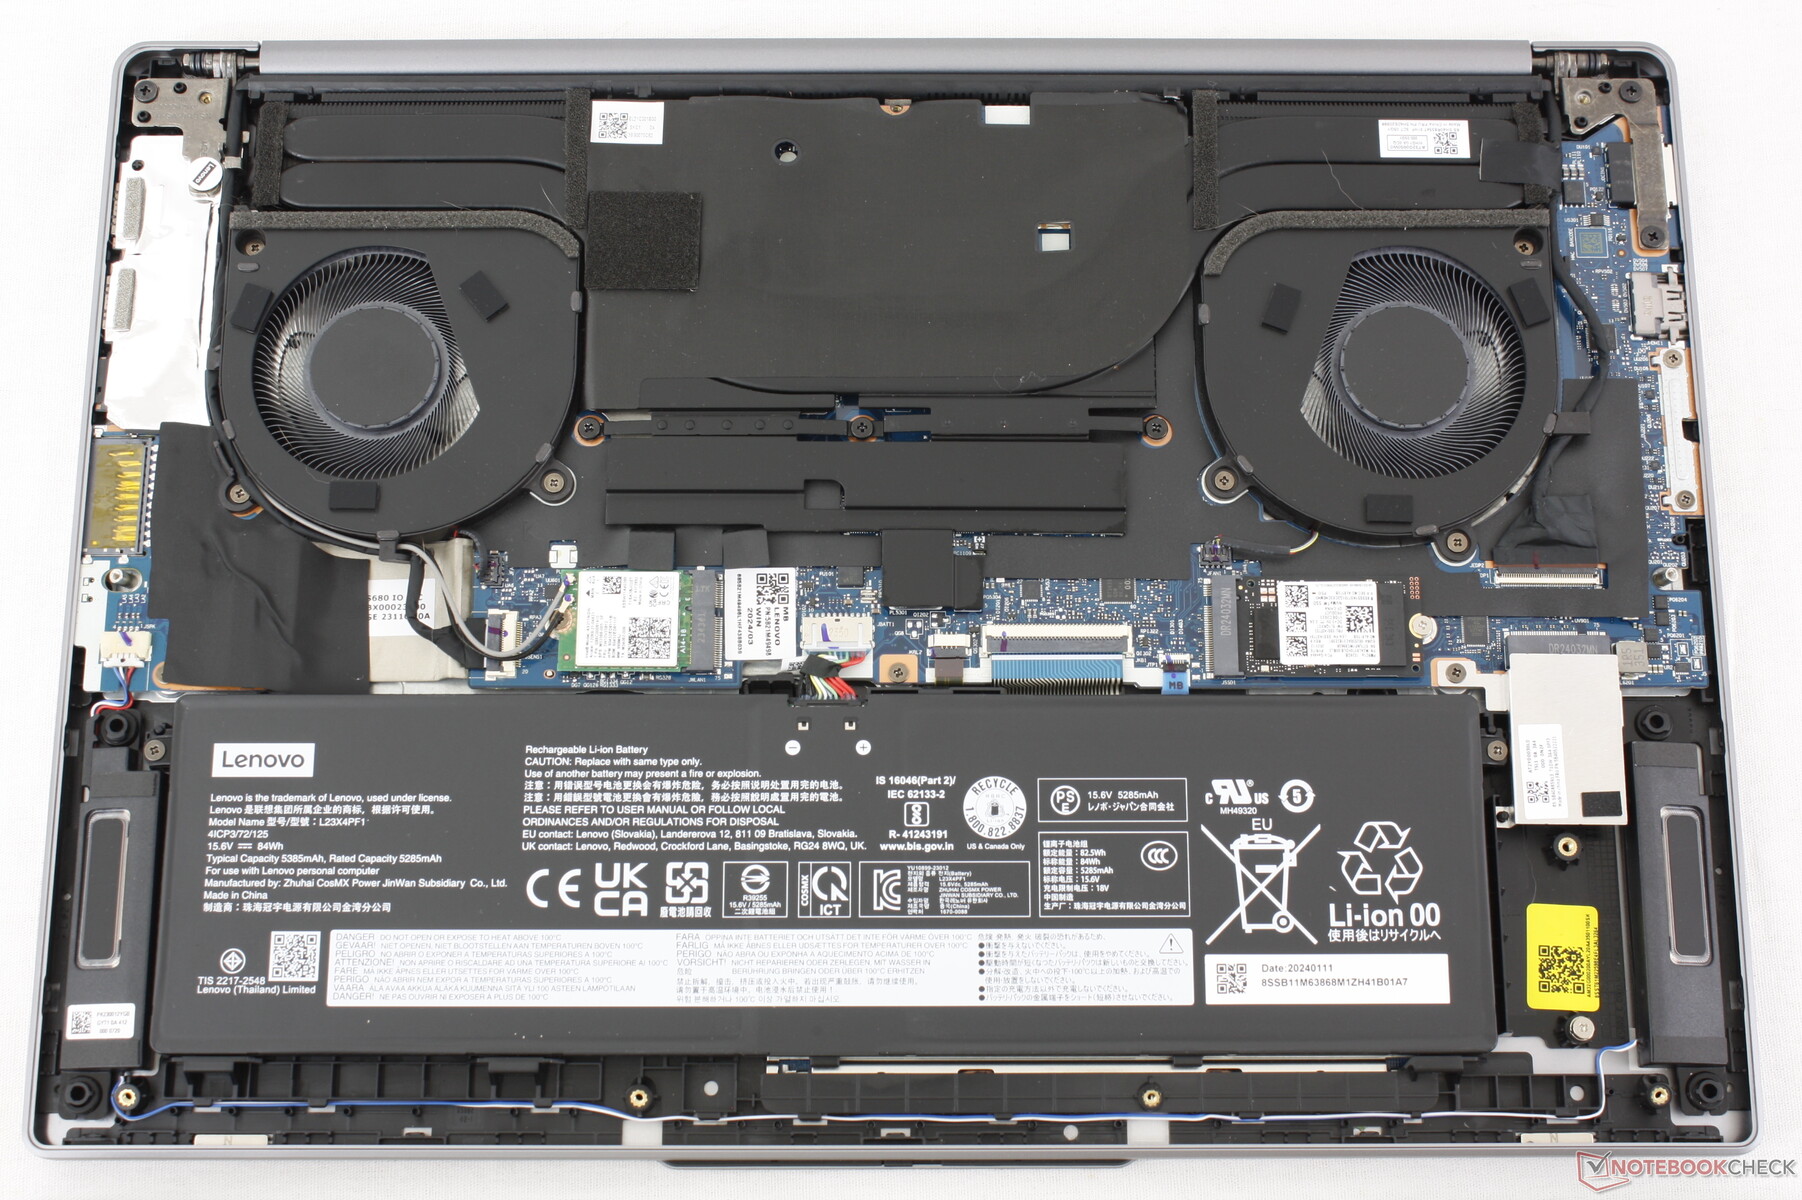
O chassi incorpora uma porta de adaptador CA dedicada ao longo da borda esquerda, que funciona como uma maneira fácil de distinguir visualmente entre as configurações de iGPU e dGPU. A GPU e o painel OLED adicionam cerca de 100 g ao peso total e, portanto, nossa unidade não é muito mais pesada do que a opção básica de iGPU. As dimensões, o design e os materiais permanecem inalterados.

Conectividade
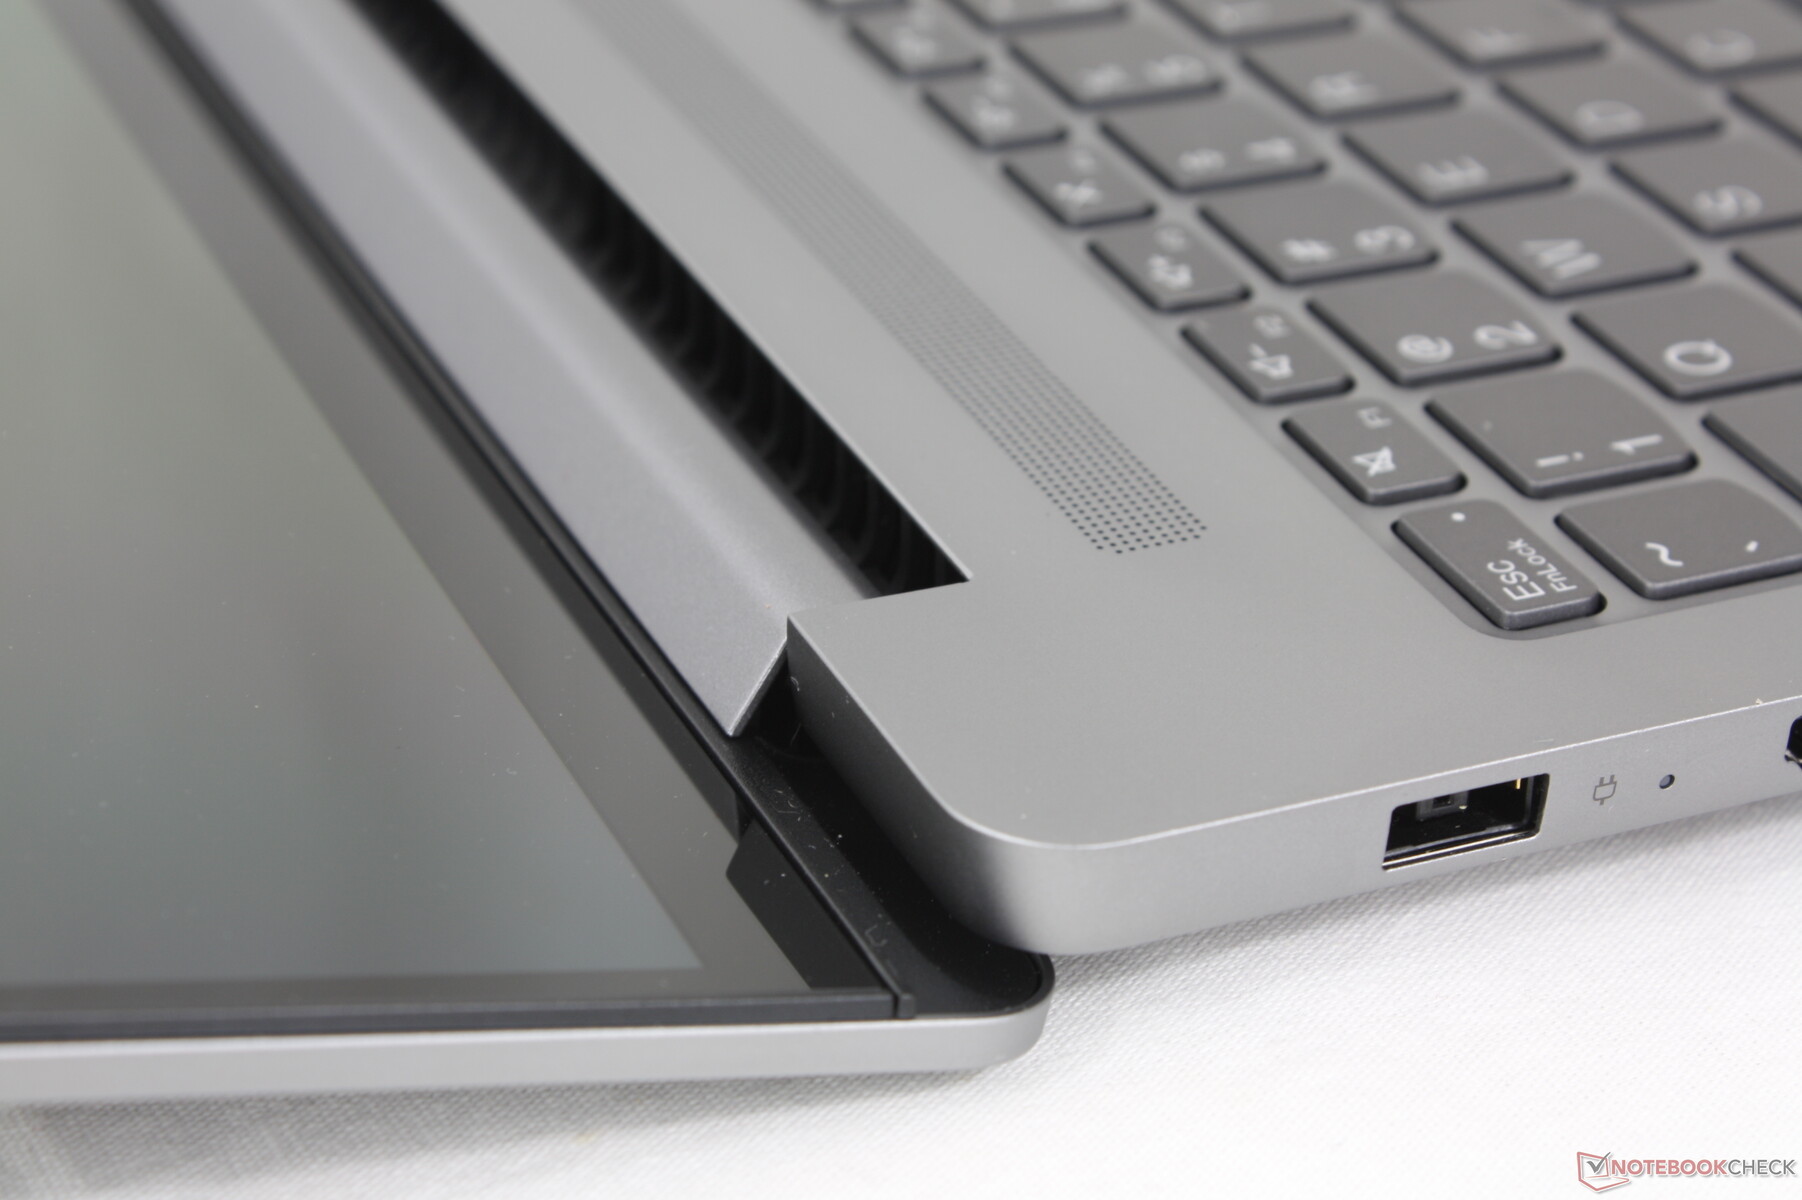
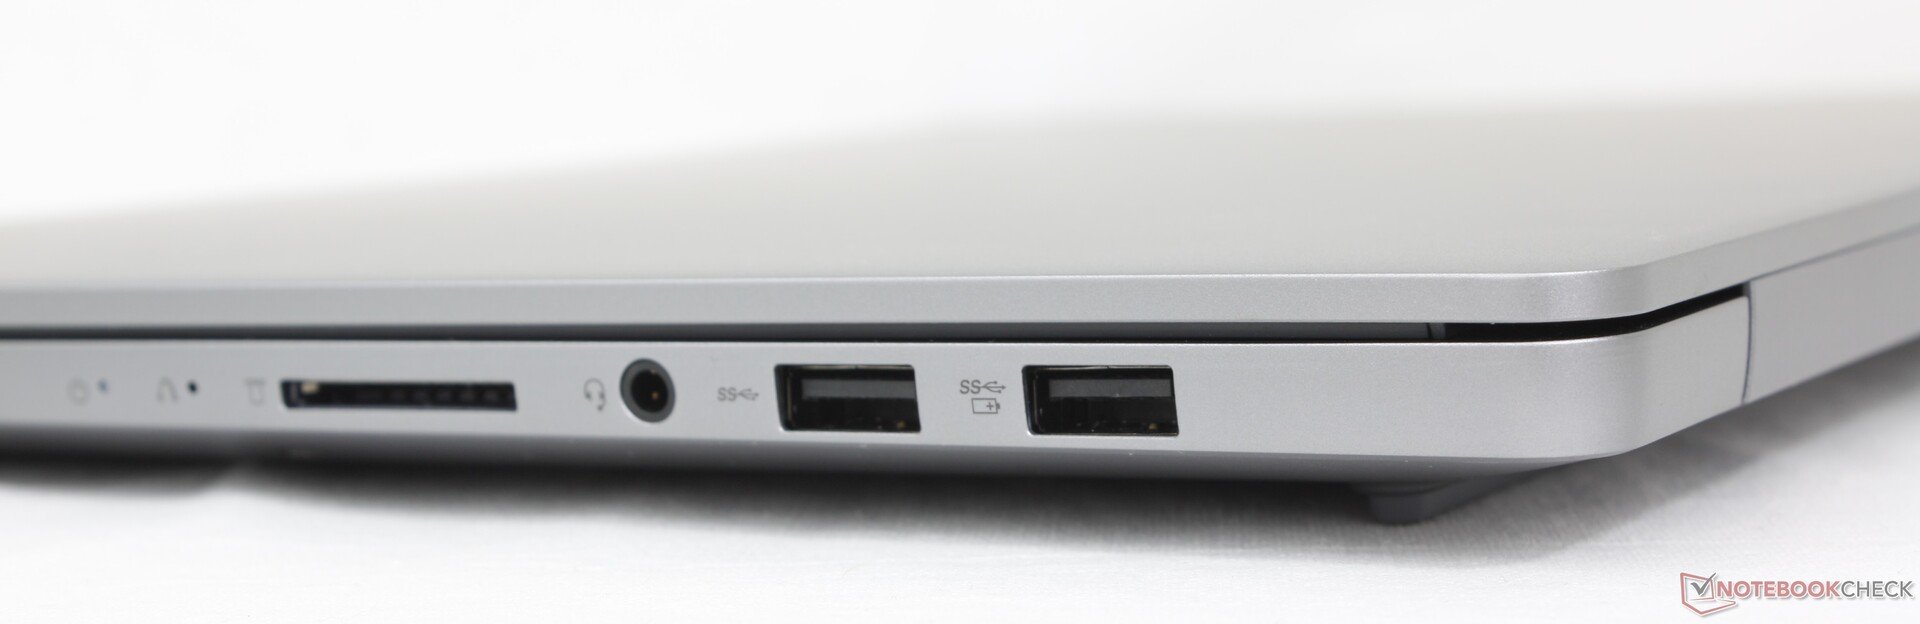
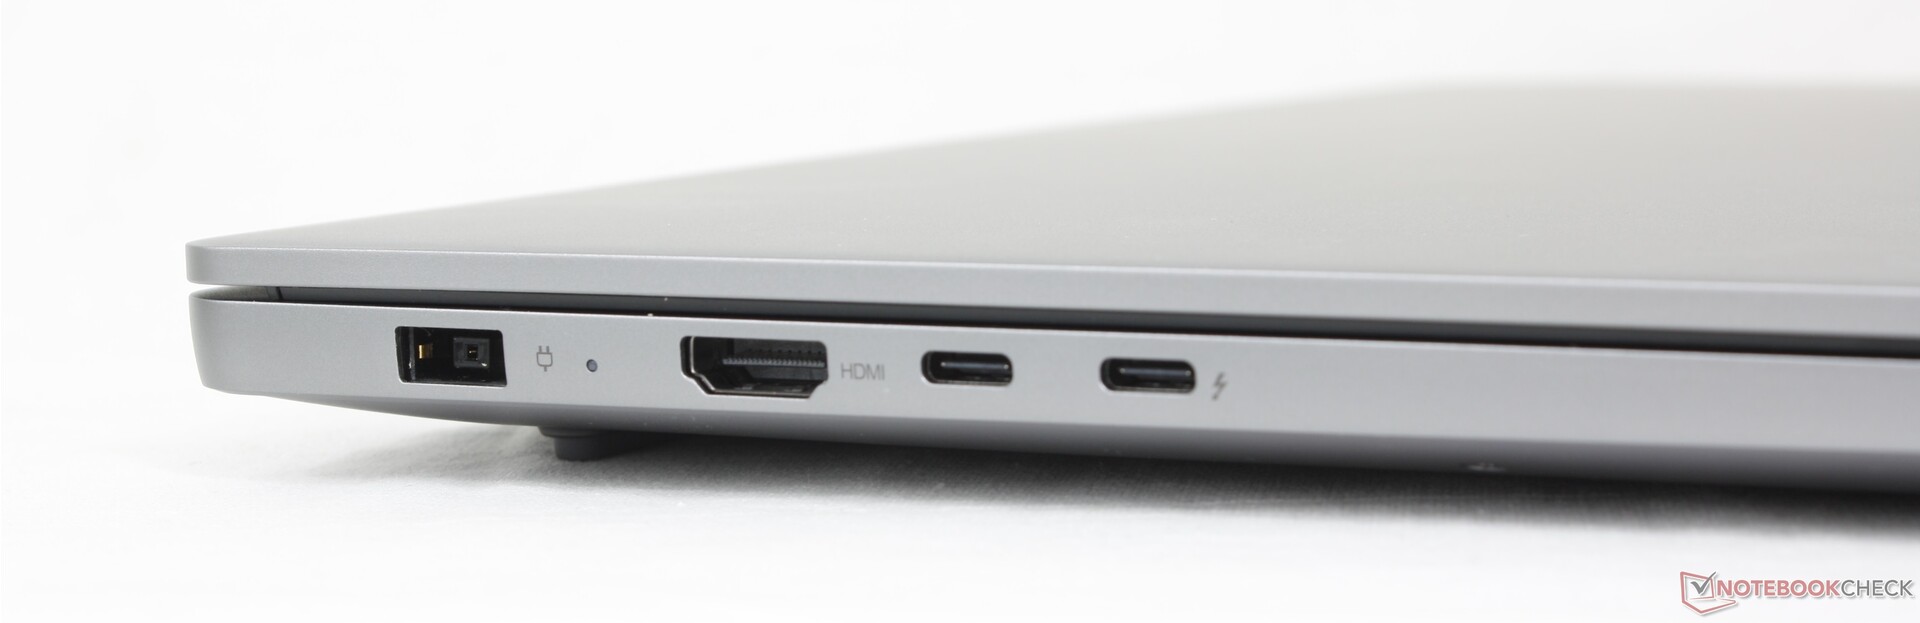
Nossa configuração de dGPU suporta tanto o carregamento universal por USB-C quanto o carregamento por adaptador CA proprietário, ao contrário da configuração de iGPU, que suporta apenas o primeiro. O adaptador CA barril é necessário para alimentar a CPU Core Ultra H e os gráficos Nvidia discretos de 90 W sem recorrer a um teto TGP inferior de 50 W, que é a abordagem que a Samsung está adotando com seu Galaxy Book4 Ultra.
As opções de portas são idênticas às do Inspiron 16 7640 2 em 1 e oferecem mais do que o Samsung.
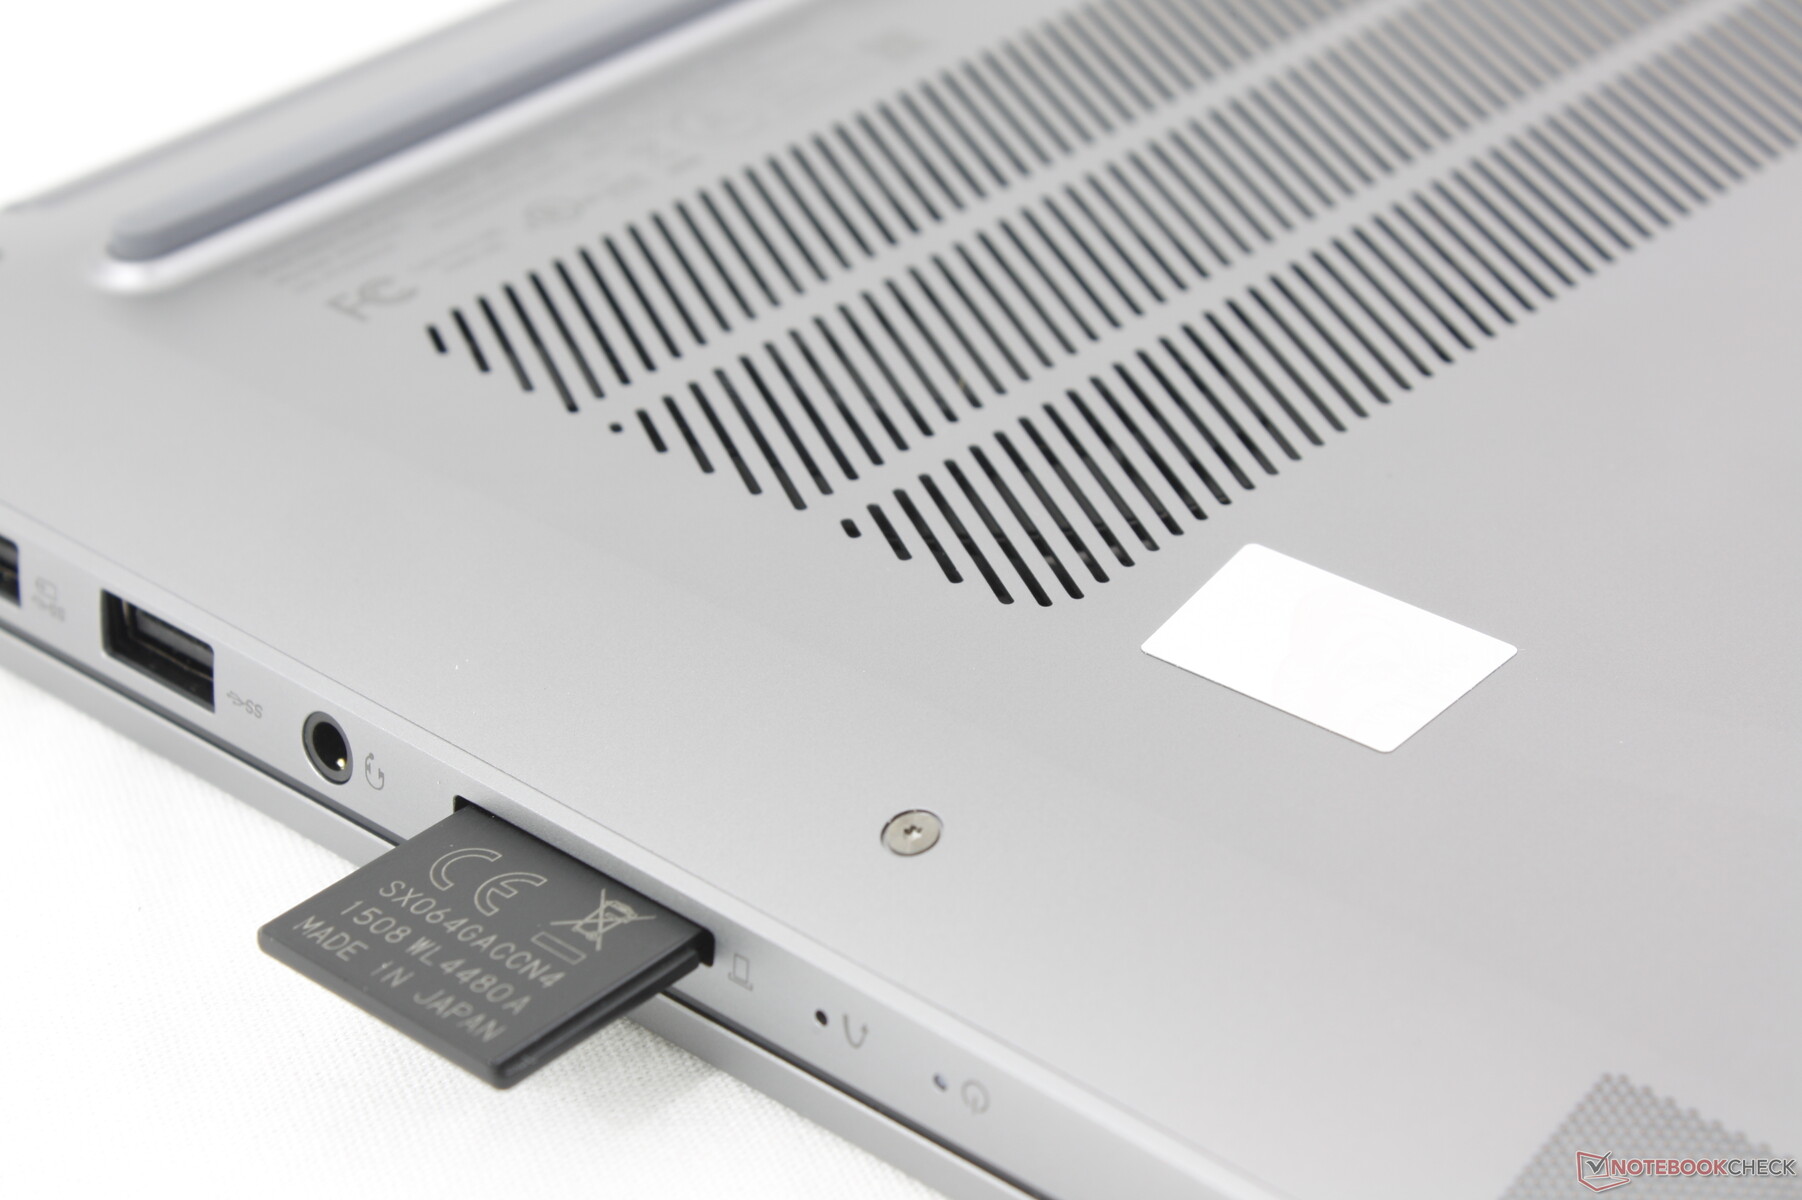
Leitor de cartão SD
| SD Card Reader | |
| average JPG Copy Test (av. of 3 runs) | |
| Asus Zenbook S 16 UM5606-RK333W (Angelbird AV Pro V60) | |
| Samsung Galaxy Book4 Ultra (Angelbird AV Pro V60) | |
| Lenovo IdeaPad Pro 5 16IMH G9 RTX 4050 (Toshiba Exceria Pro SDXC 64 GB UHS-II) | |
| Lenovo IdeaPad Pro 5 16IMH G9 (Angelbird AV Pro V60) | |
| Dell Inspiron 16 7640 2-in-1 (Toshiba Exceria Pro SDXC 64 GB UHS-II) | |
| maximum AS SSD Seq Read Test (1GB) | |
| Asus Zenbook S 16 UM5606-RK333W (Angelbird AV Pro V60) | |
| Lenovo IdeaPad Pro 5 16IMH G9 (Angelbird AV Pro V60) | |
| Samsung Galaxy Book4 Ultra (Angelbird AV Pro V60) | |
| Lenovo IdeaPad Pro 5 16IMH G9 RTX 4050 (Toshiba Exceria Pro SDXC 64 GB UHS-II) | |
| Dell Inspiron 16 7640 2-in-1 (Toshiba Exceria Pro SDXC 64 GB UHS-II) | |
Comunicação
O Intel AX211 vem com suporte padrão para Wi-Fi 6E e Bluetooth 5.3. As taxas de transferência são estáveis, acima de 1 Gbps, quando emparelhadas com nosso roteador de teste AXE11000.
Webcam
A webcam de 2 MP vem de fábrica com IR e um obturador físico para privacidade.


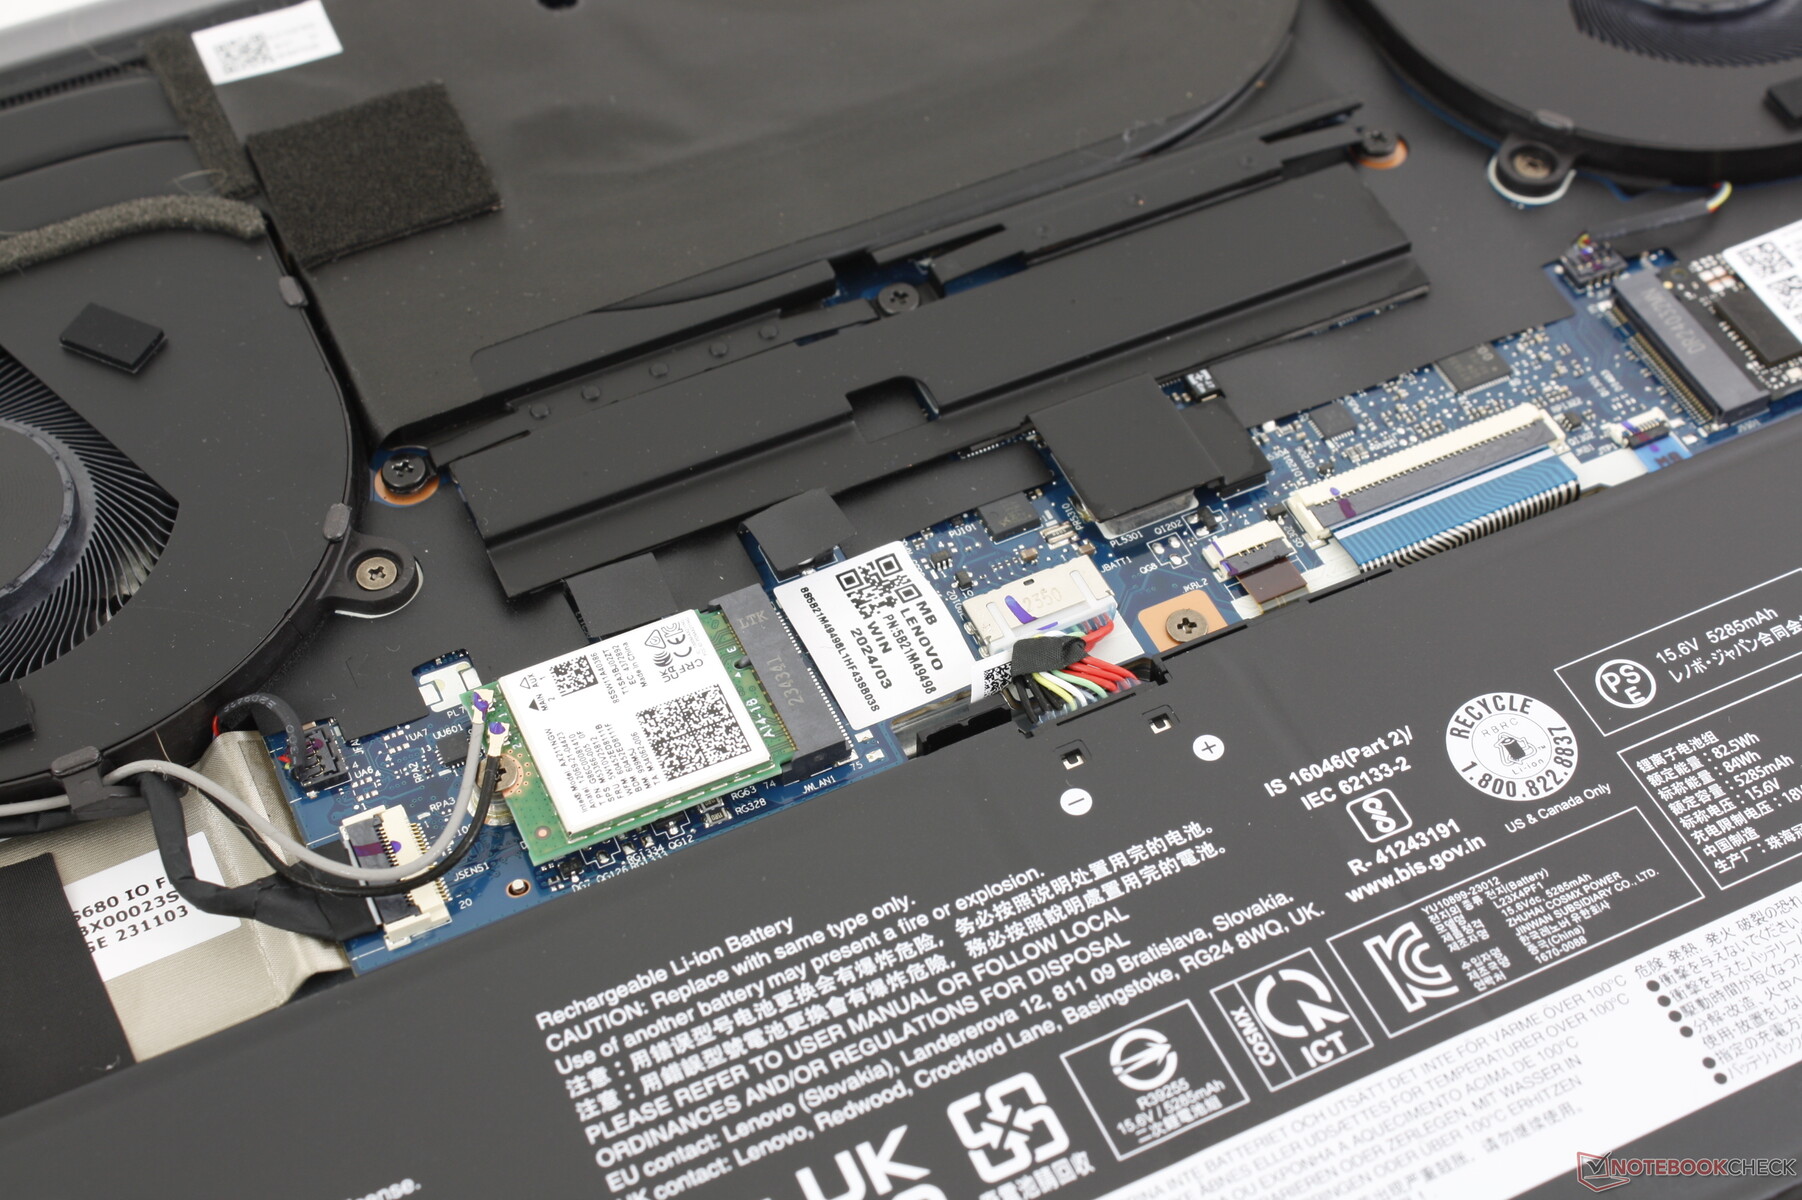
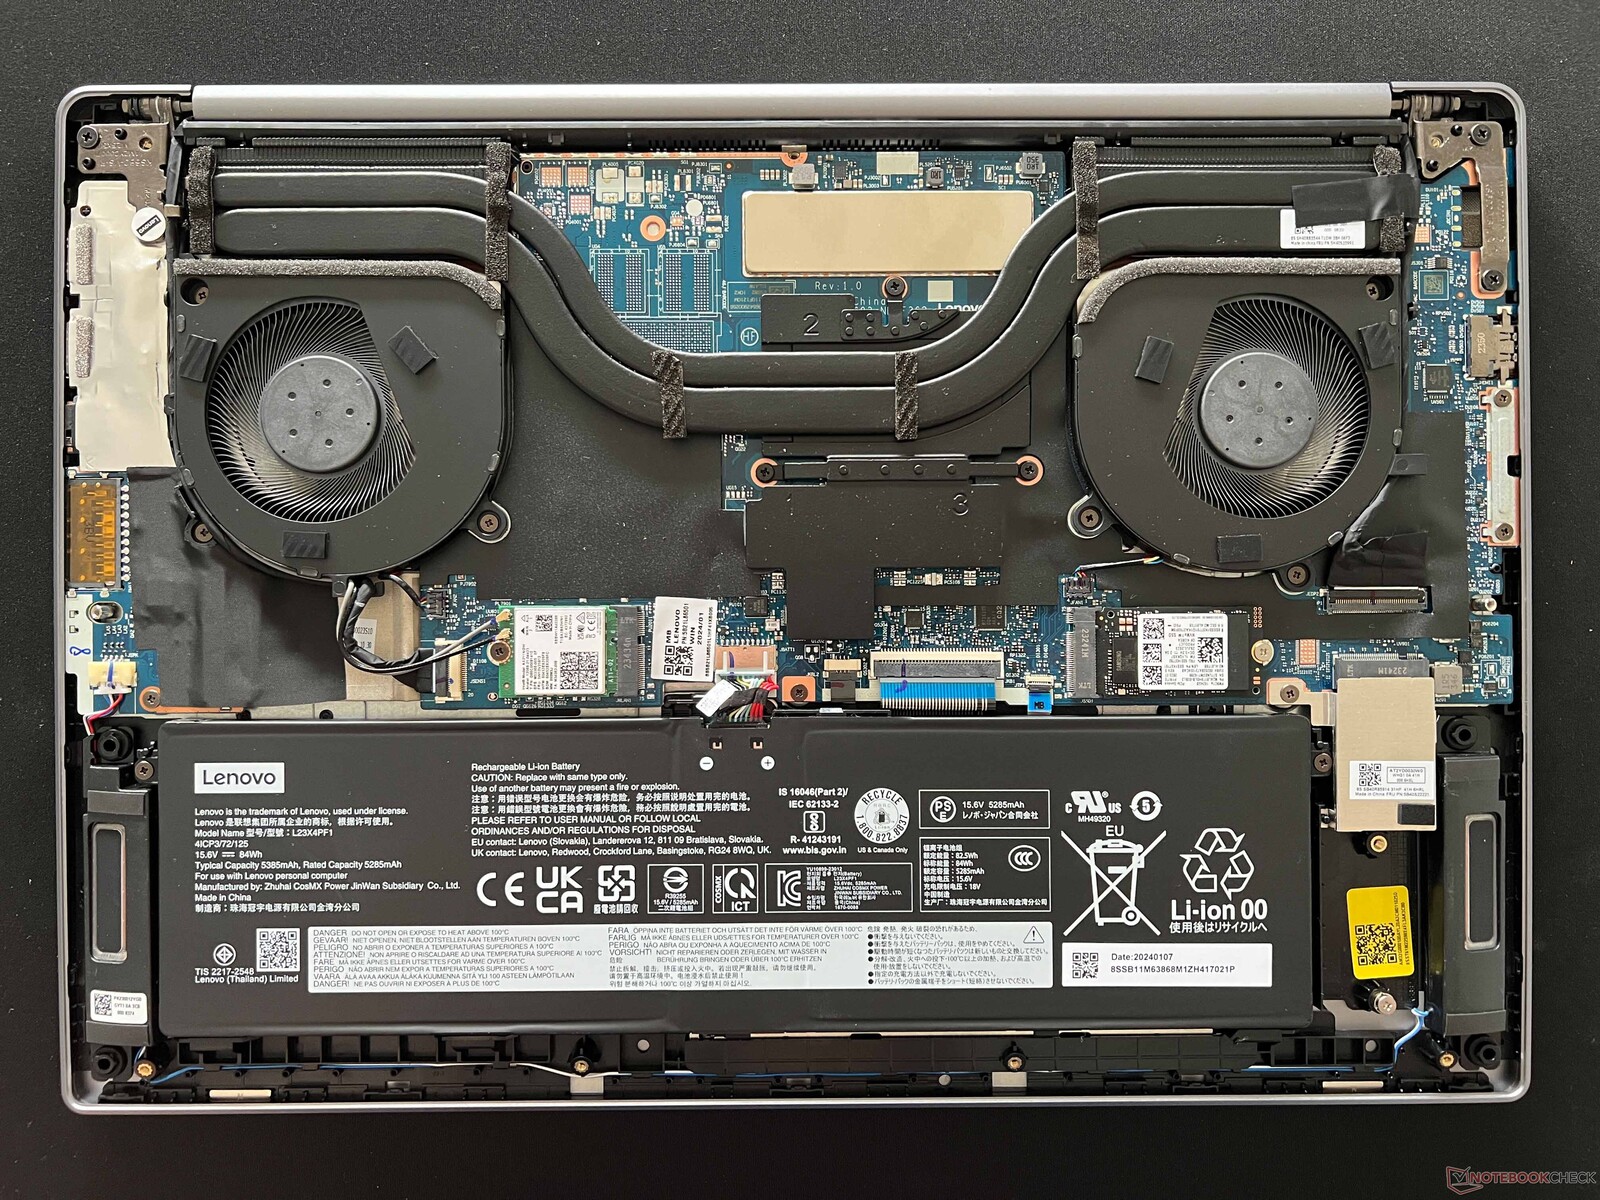
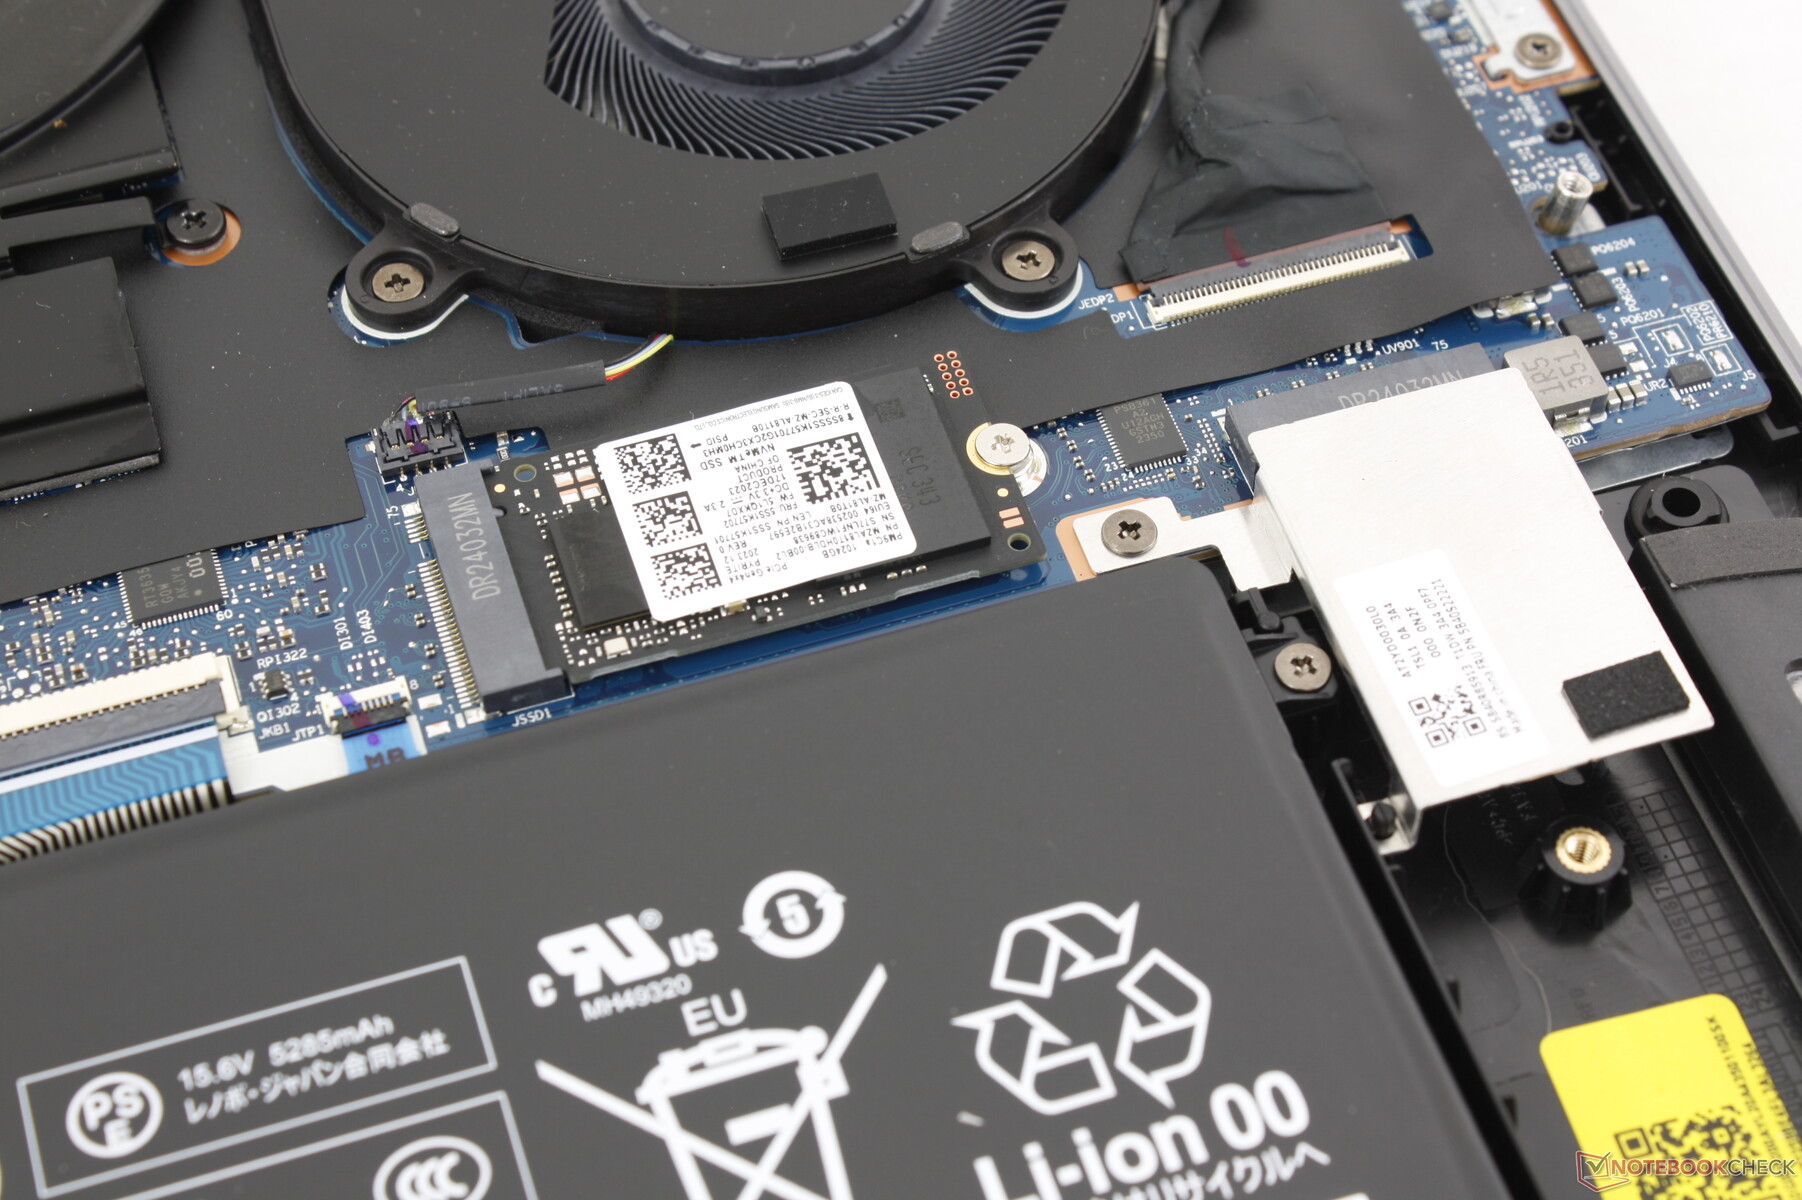
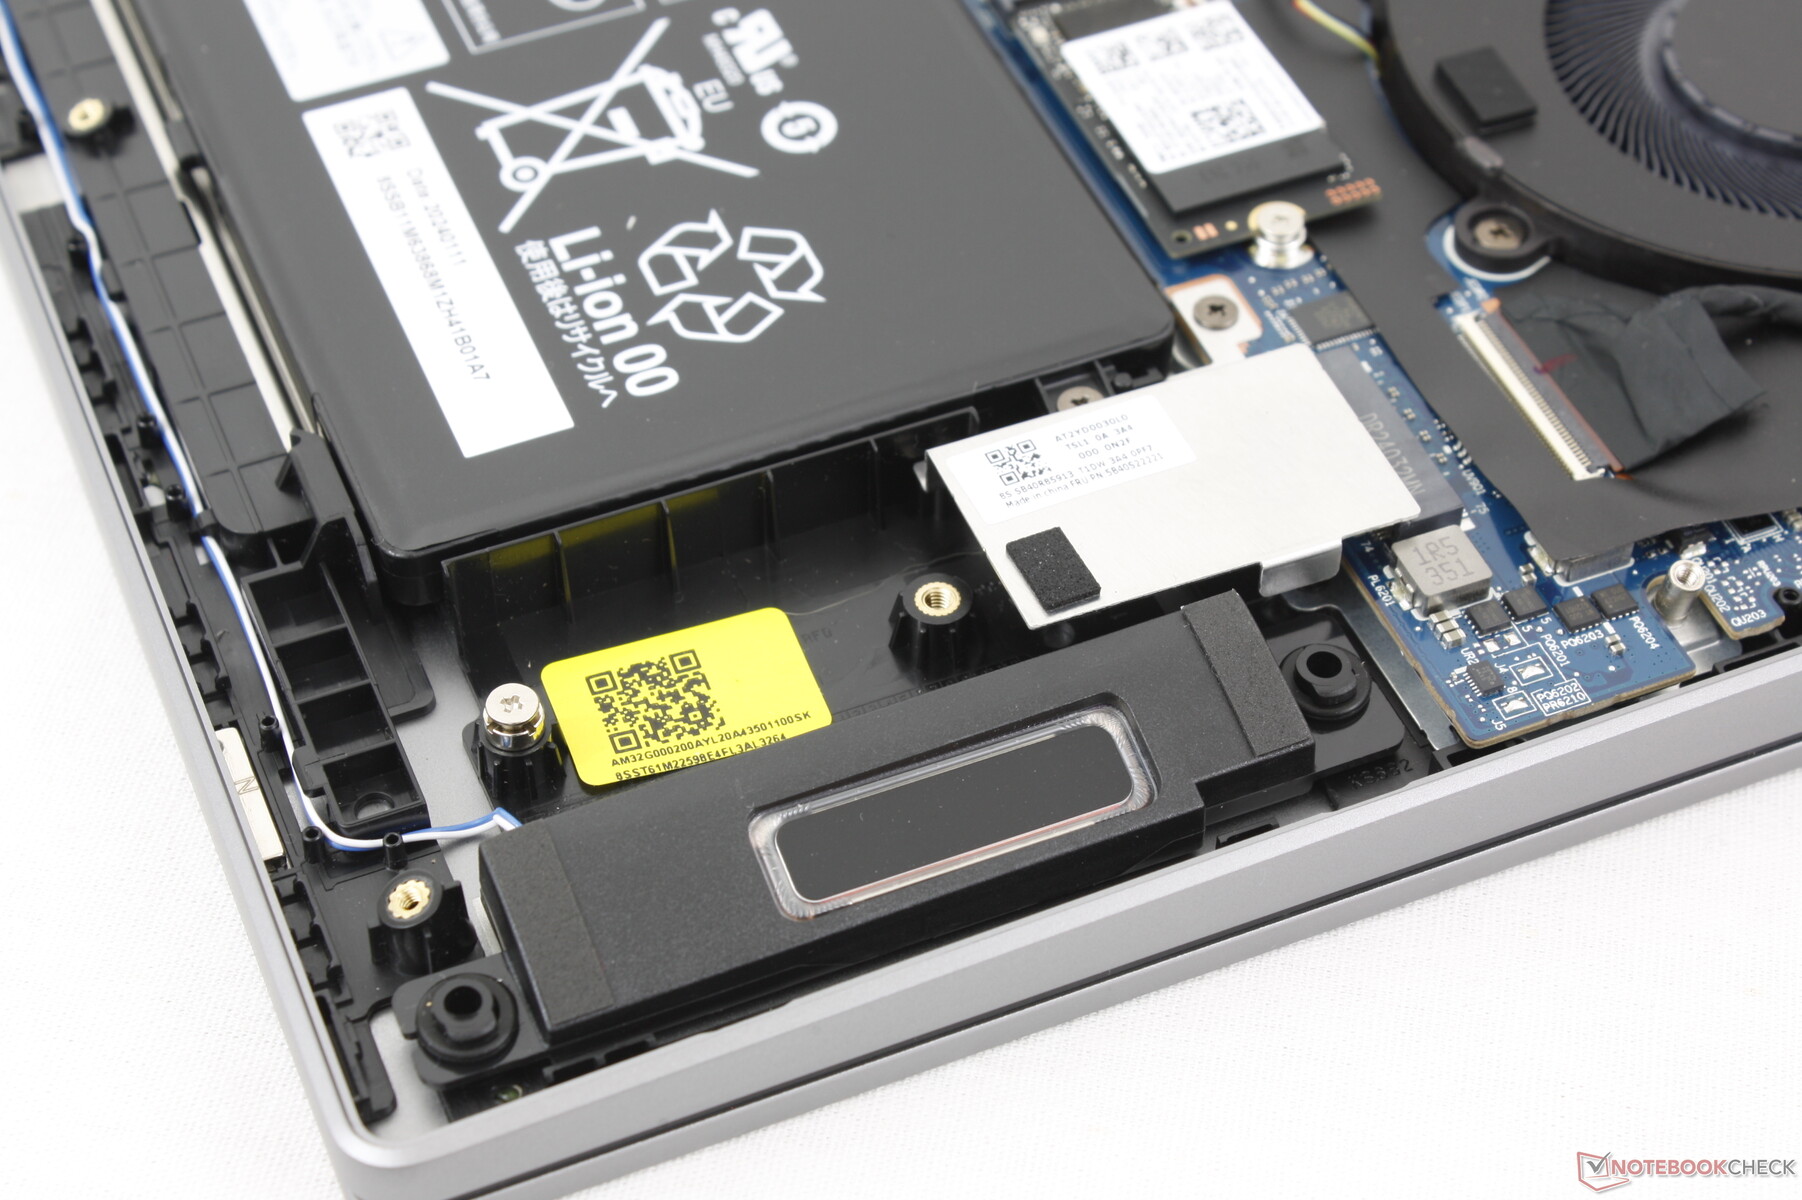
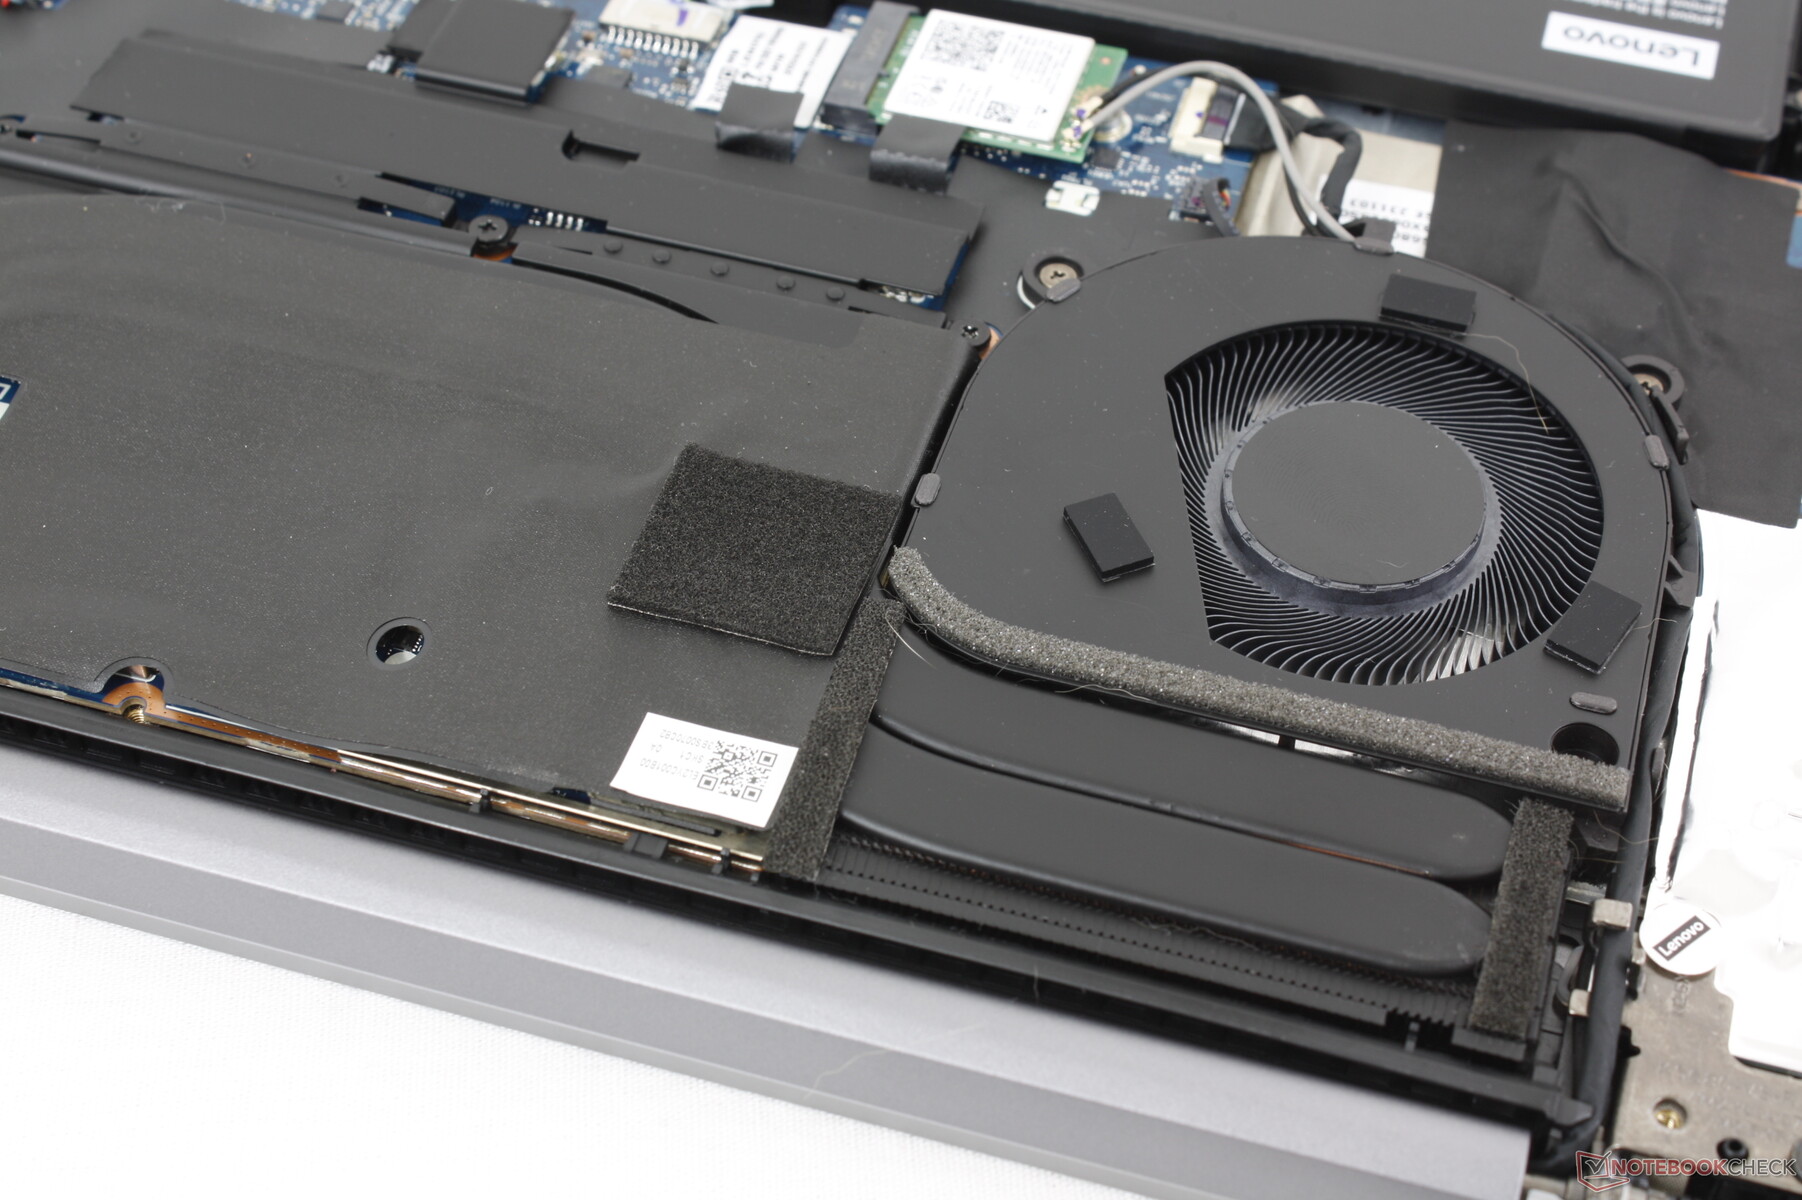
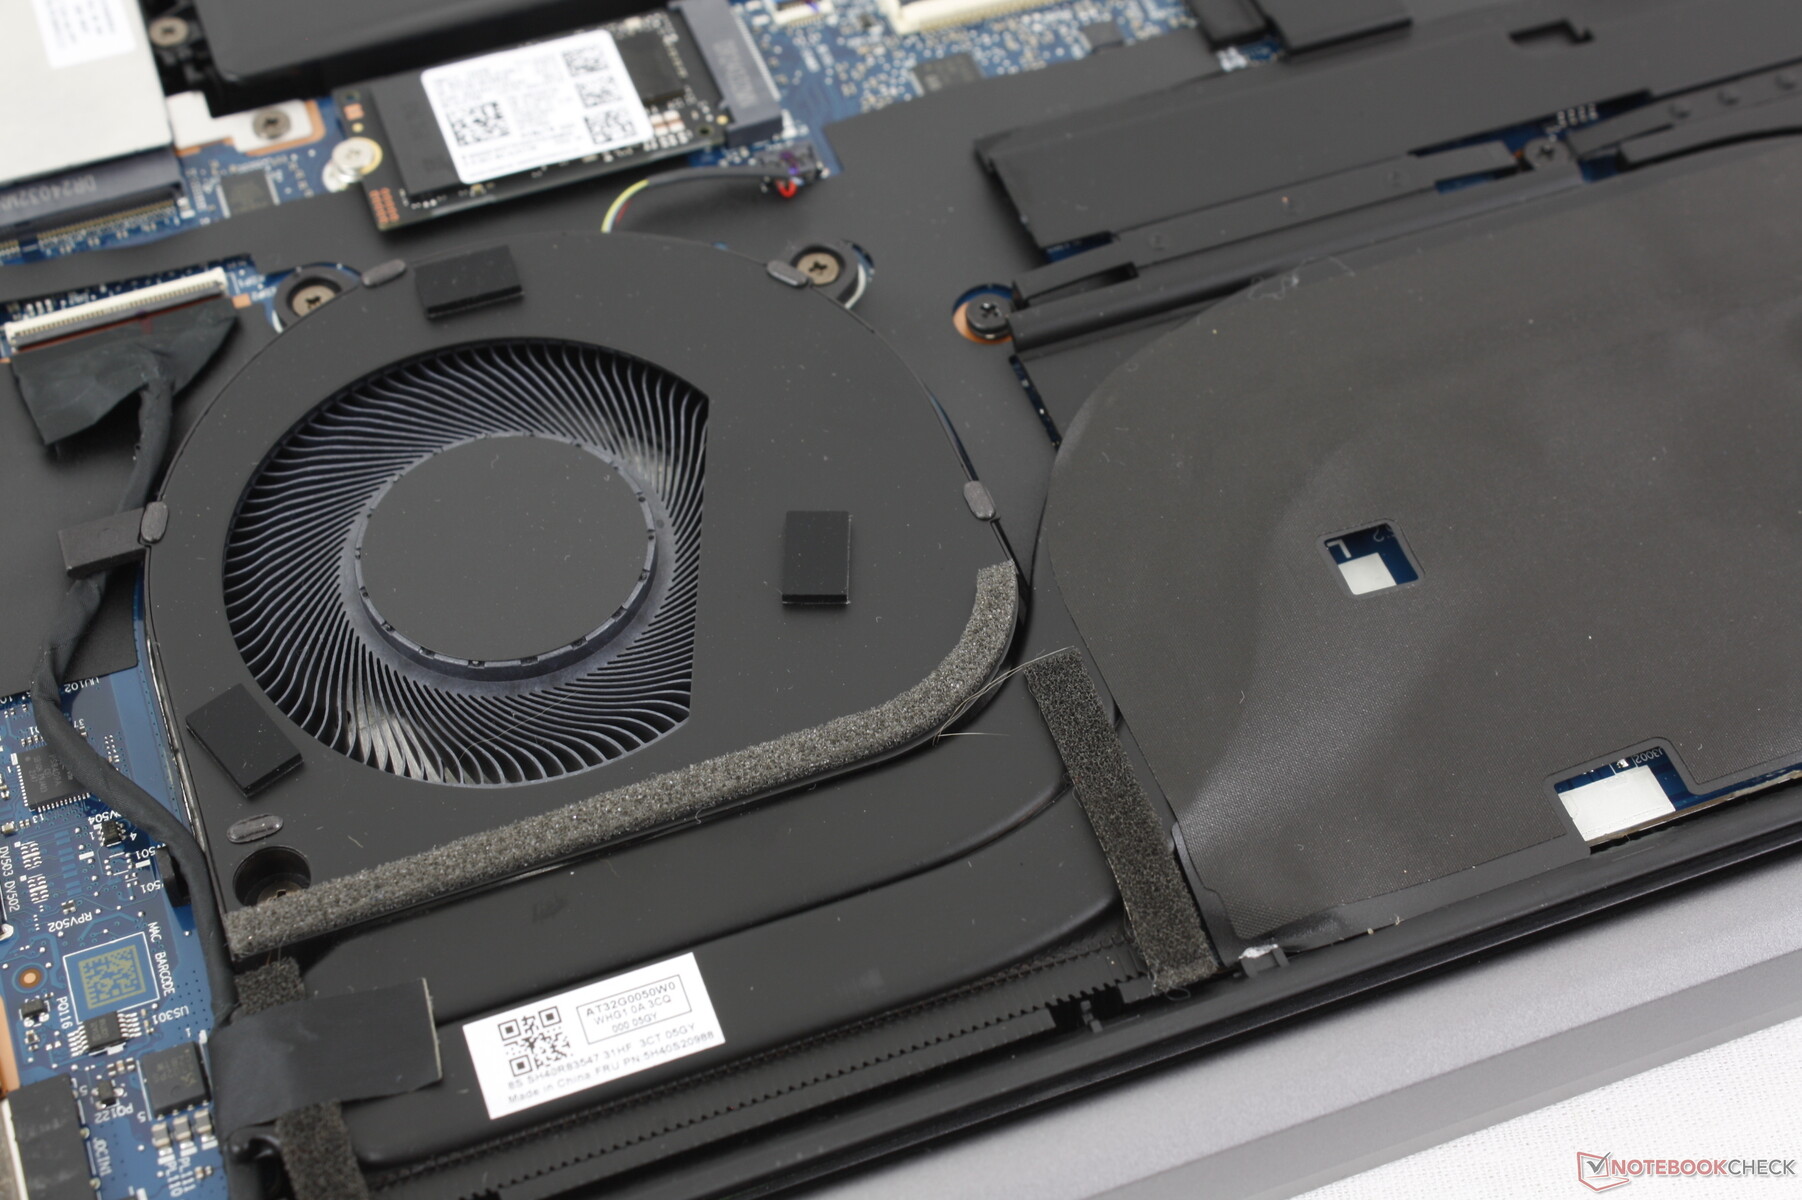
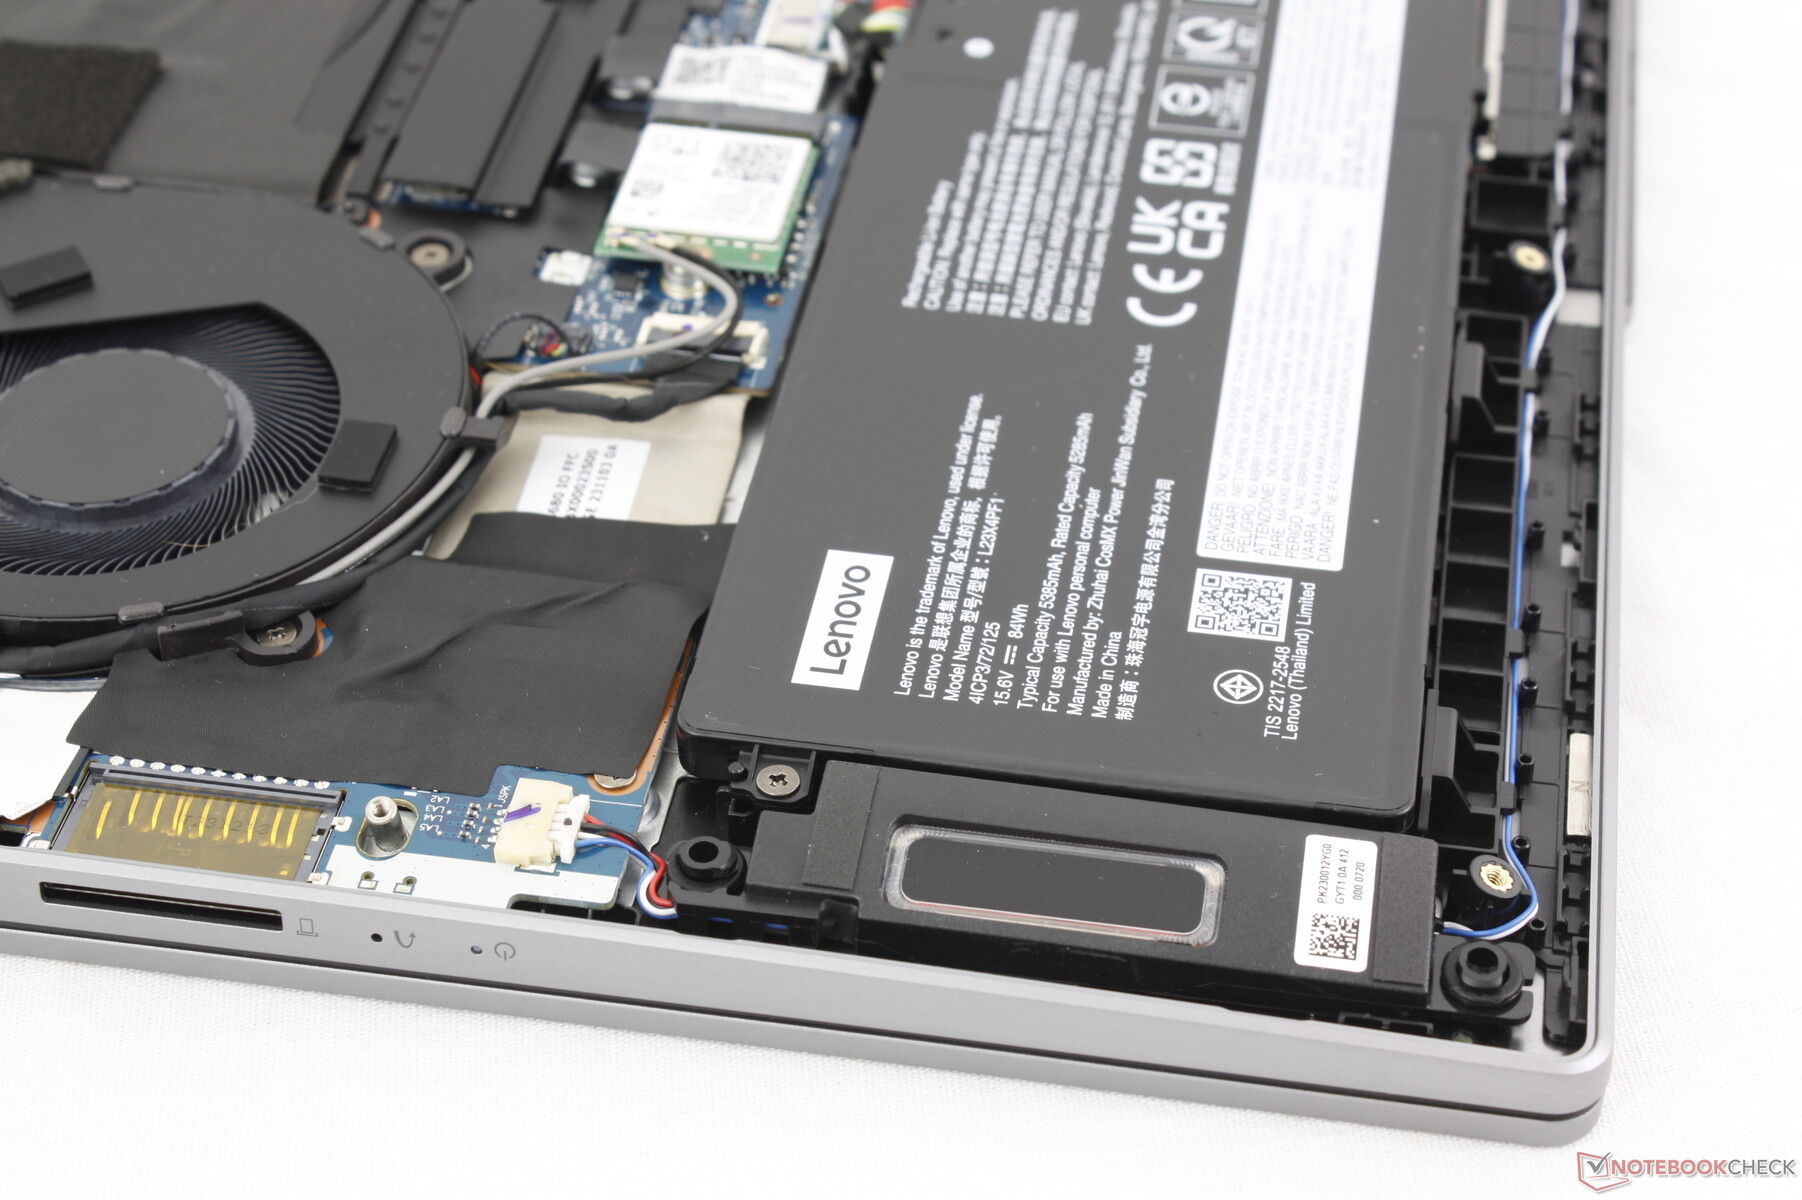
Manutenção
O painel inferior é fixado por nove parafusos Torx para facilitar a manutenção. A solução de resfriamento permanece inalterada em relação à versão iGPU, apesar do hardware mais exigente, o que significa que podemos esperar ruídos mais altos e temperaturas mais elevadas, em média.
Sustentabilidade
A tampa inferior é composta de 50% de alumínio reciclado, enquanto os plásticos da embalagem são compostos de 90% de fontes oceânicas. Também apreciamos o fato de que os guias de reparo oficiais https://pcsupport.lenovo.com/us/en/products/laptops-and-netbooks/5-series/ideapad-pro-5-16imh9/83d4/83d4001hus/document-userguide para o modelo estão disponíveis diretamente da Lenovo como downloads gratuitos.
Acessórios e garantia
Não há extras na caixa de varejo além do adaptador CA e da documentação. A garantia limitada usual de um ano se aplica se o produto for comprado nos EUA.
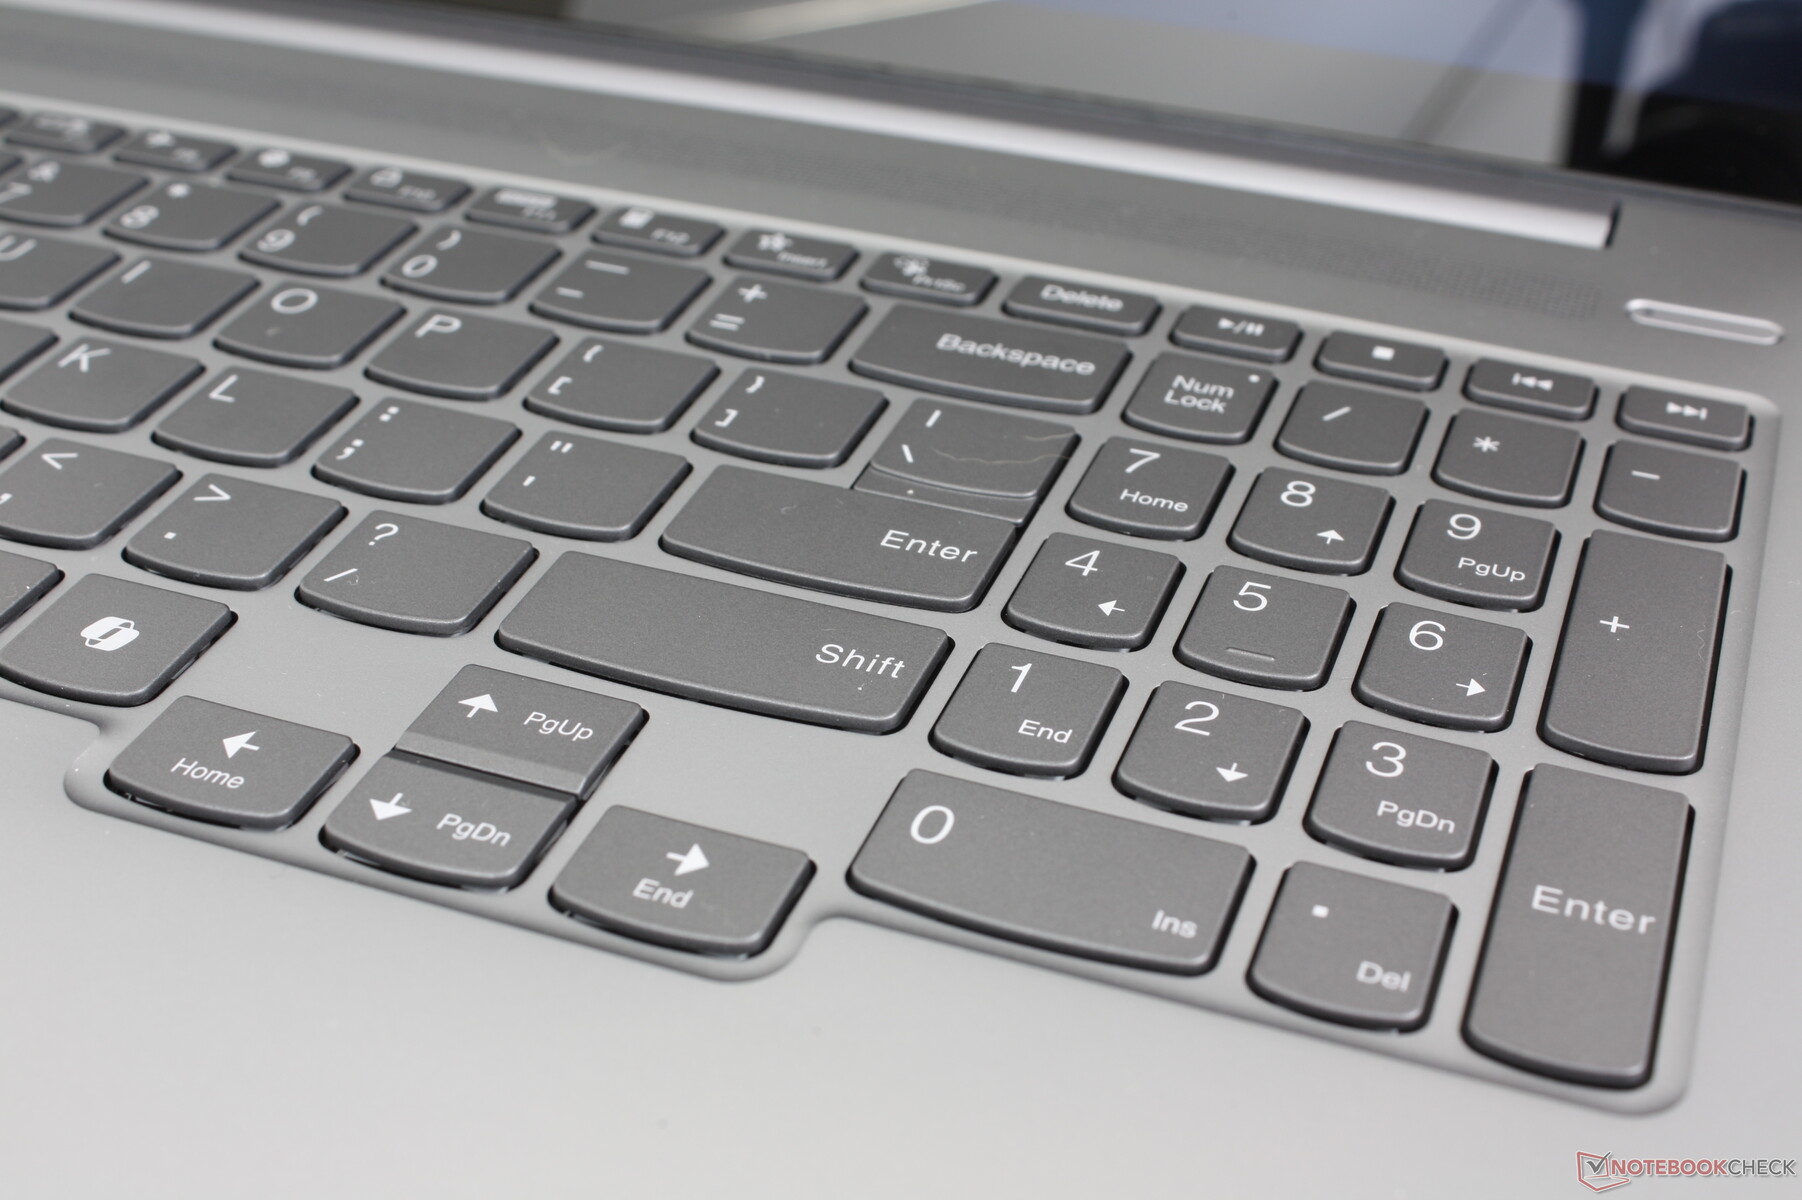
Dispositivos de entrada
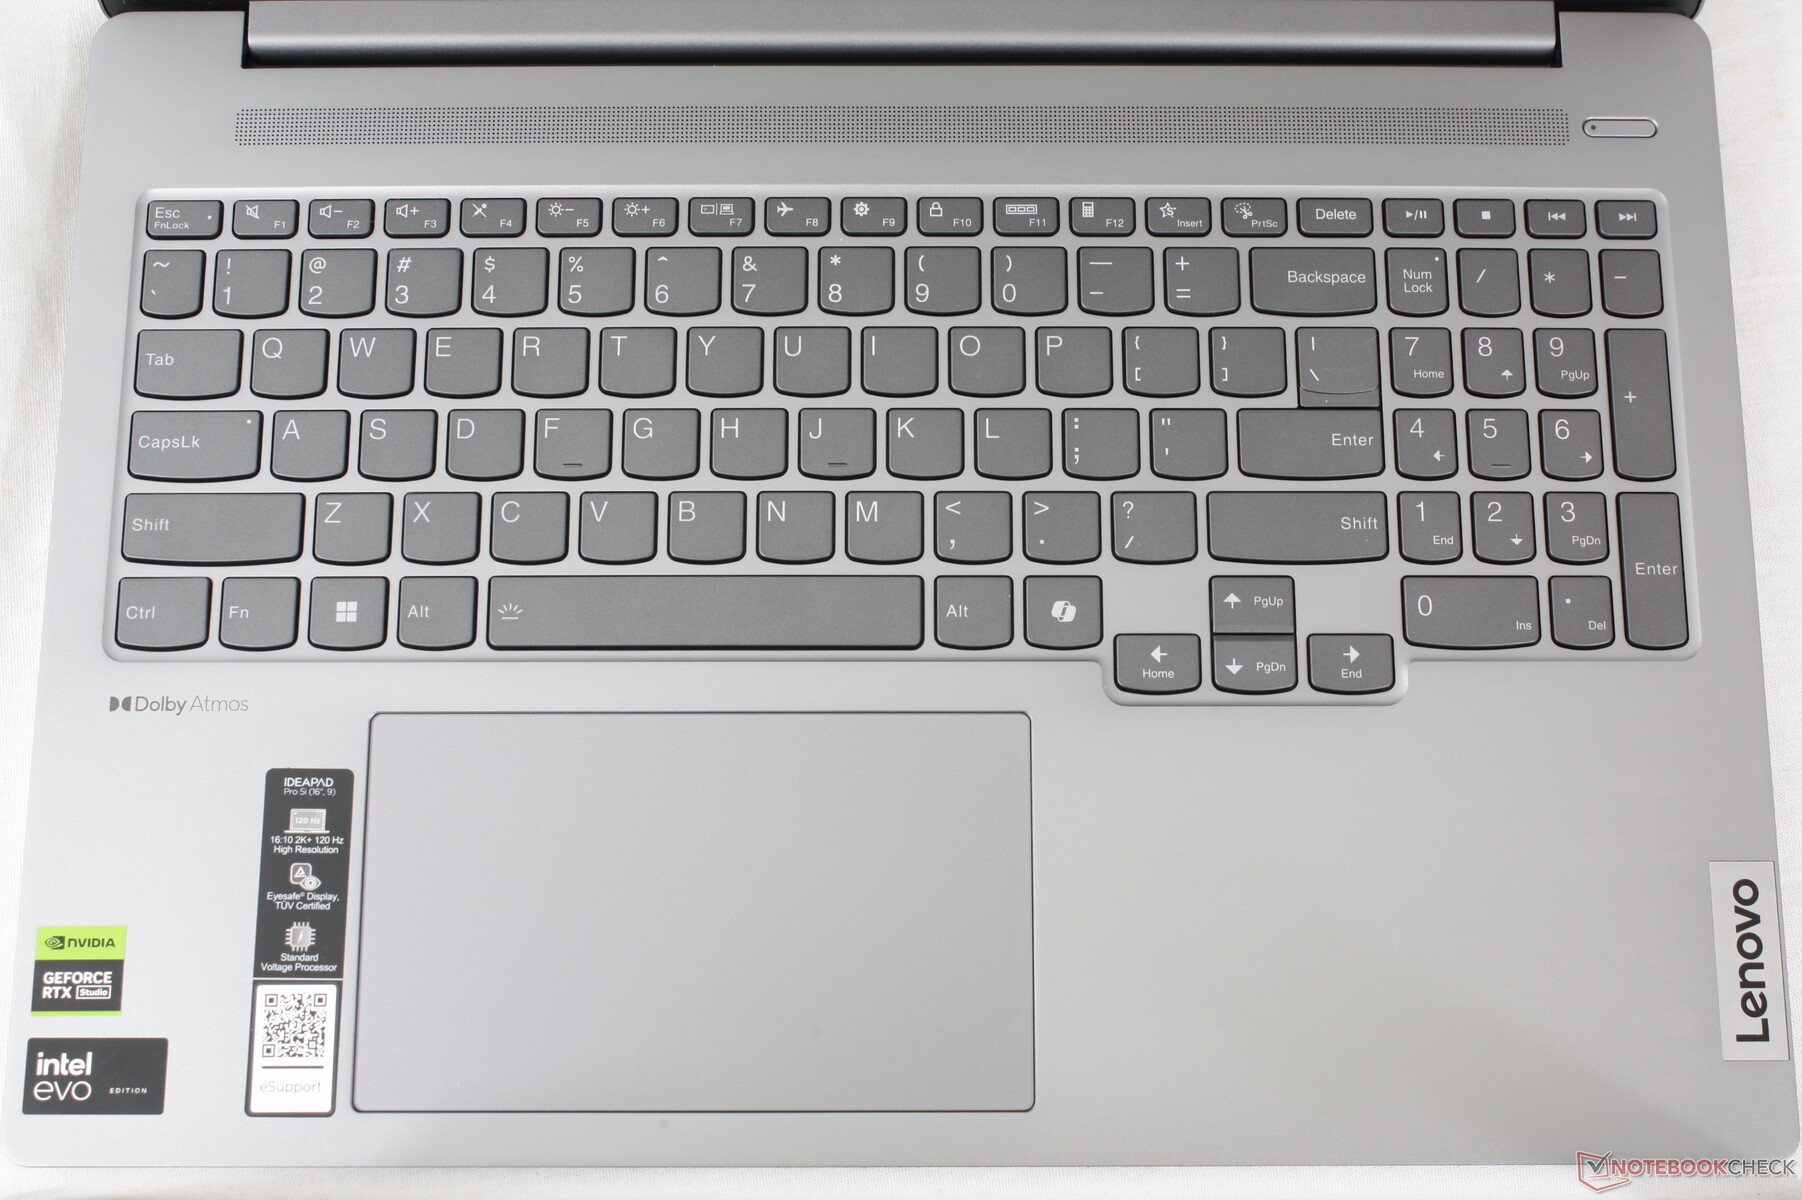
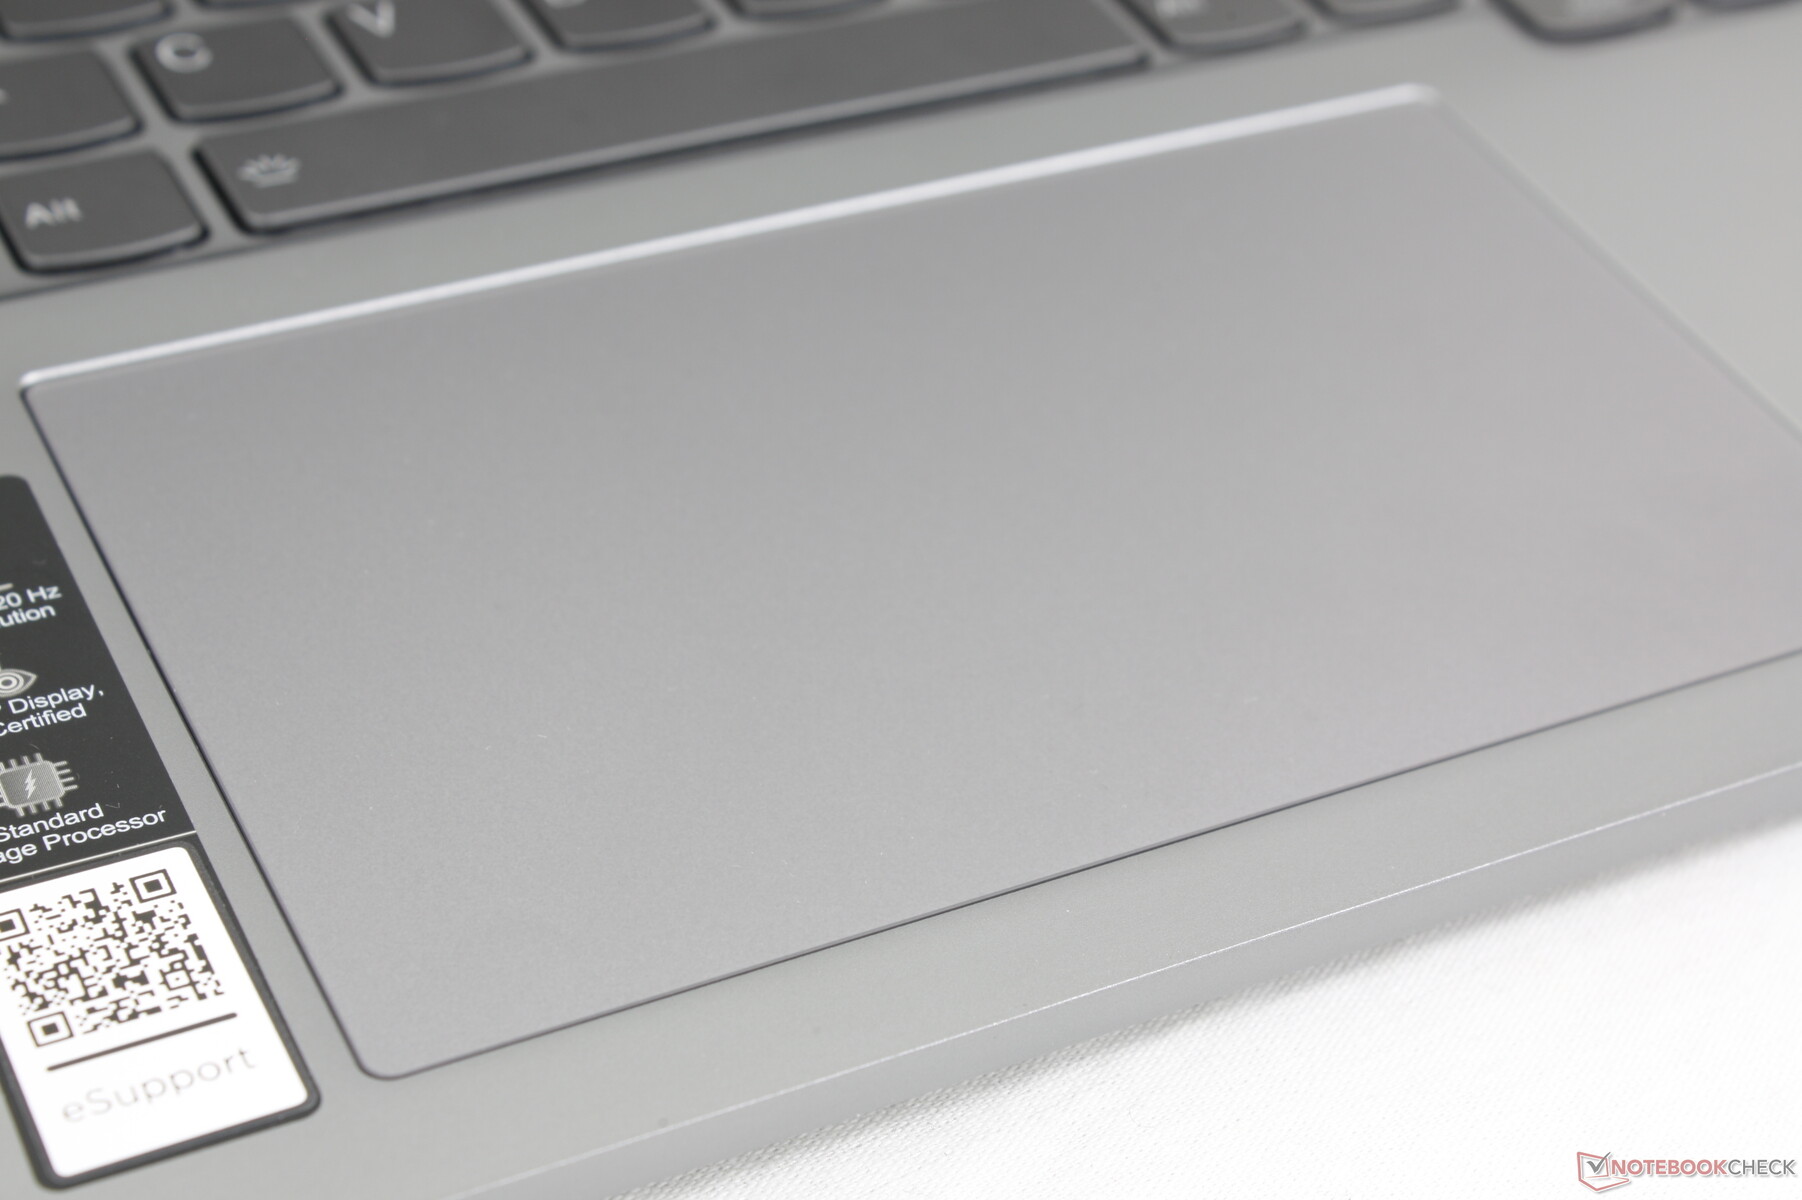
Teclado e touchpad
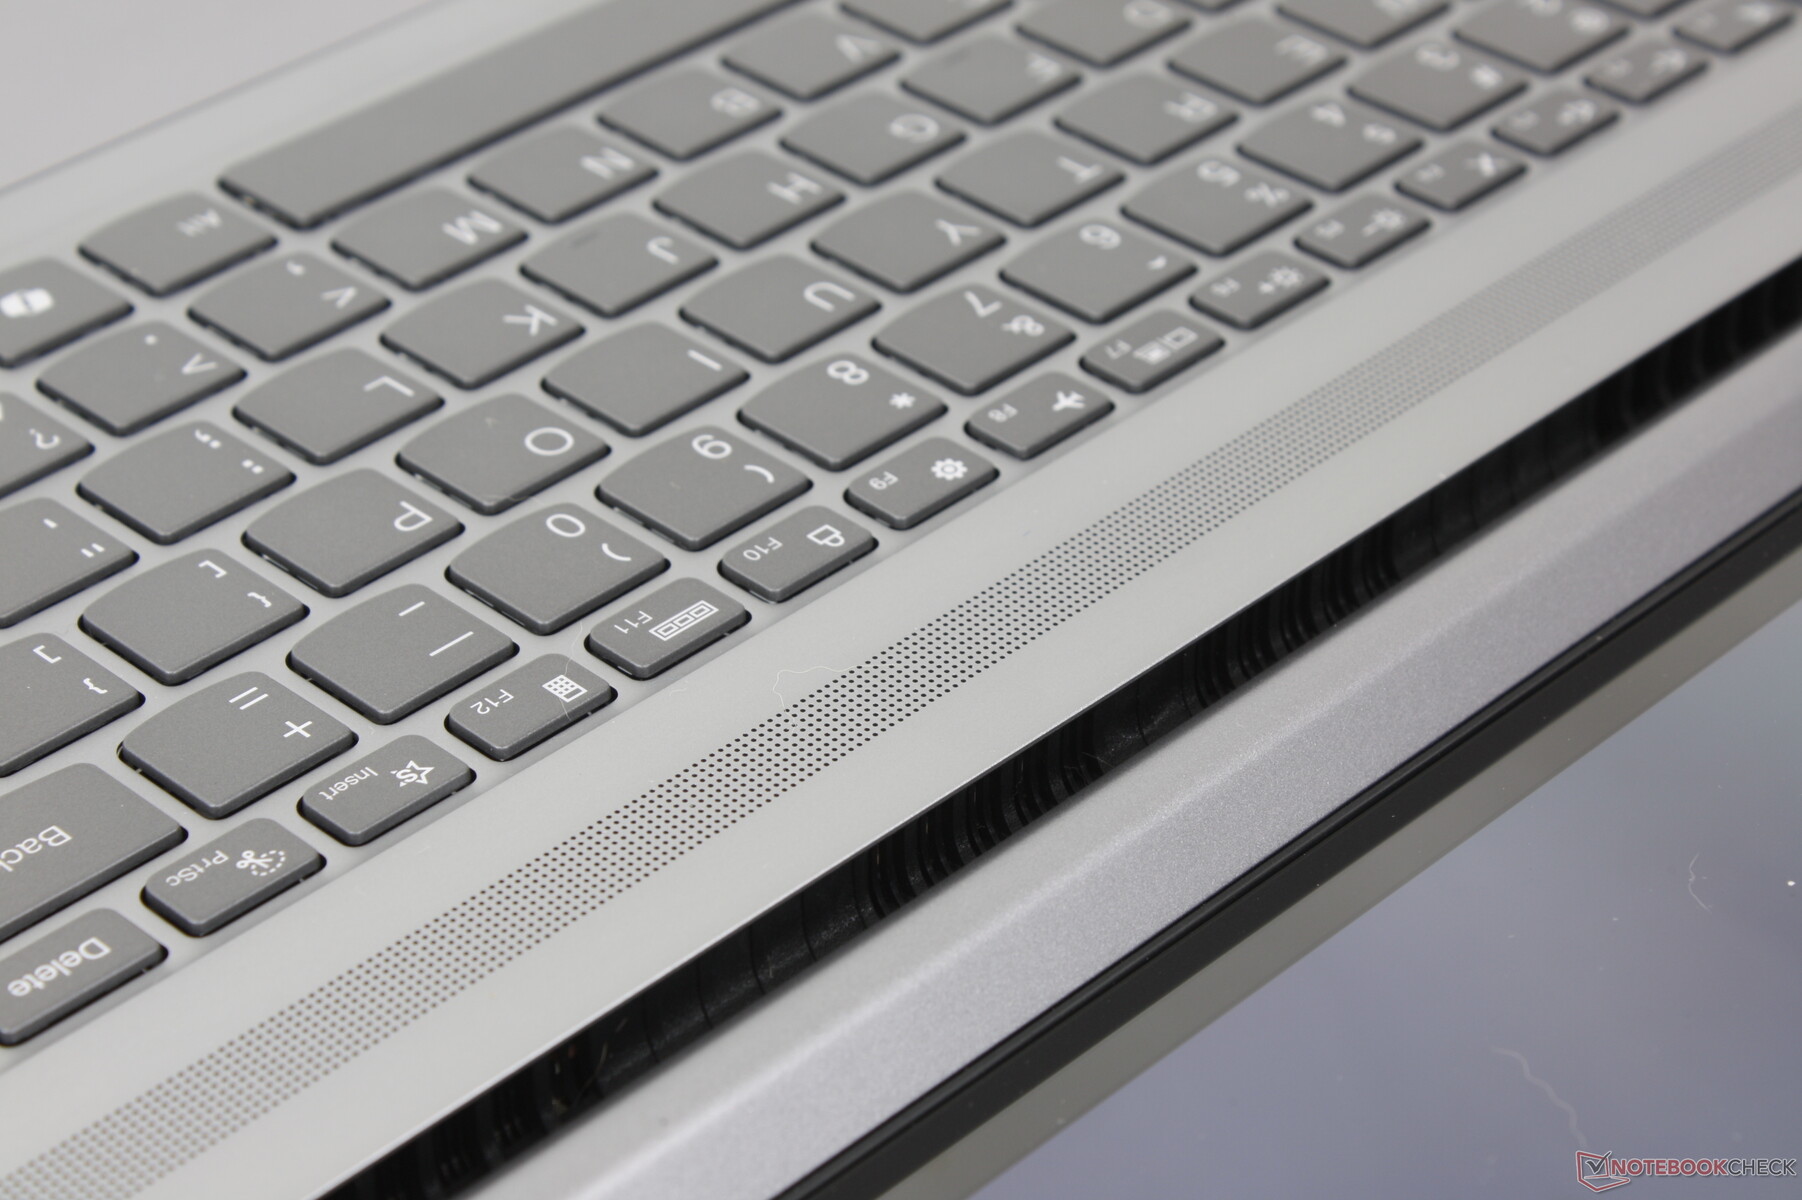
Os teclados dos modelos IdeaPad são mais rasos e com feedback mais fraco do que os teclados dos modelos ThinkPad. Embora seja útil, a experiência de digitação é certamente um degrau abaixo do melhor da Lenovo, que se aproxima de sistemas mais baratos, mesmo na configuração superior de US$ 1.500.

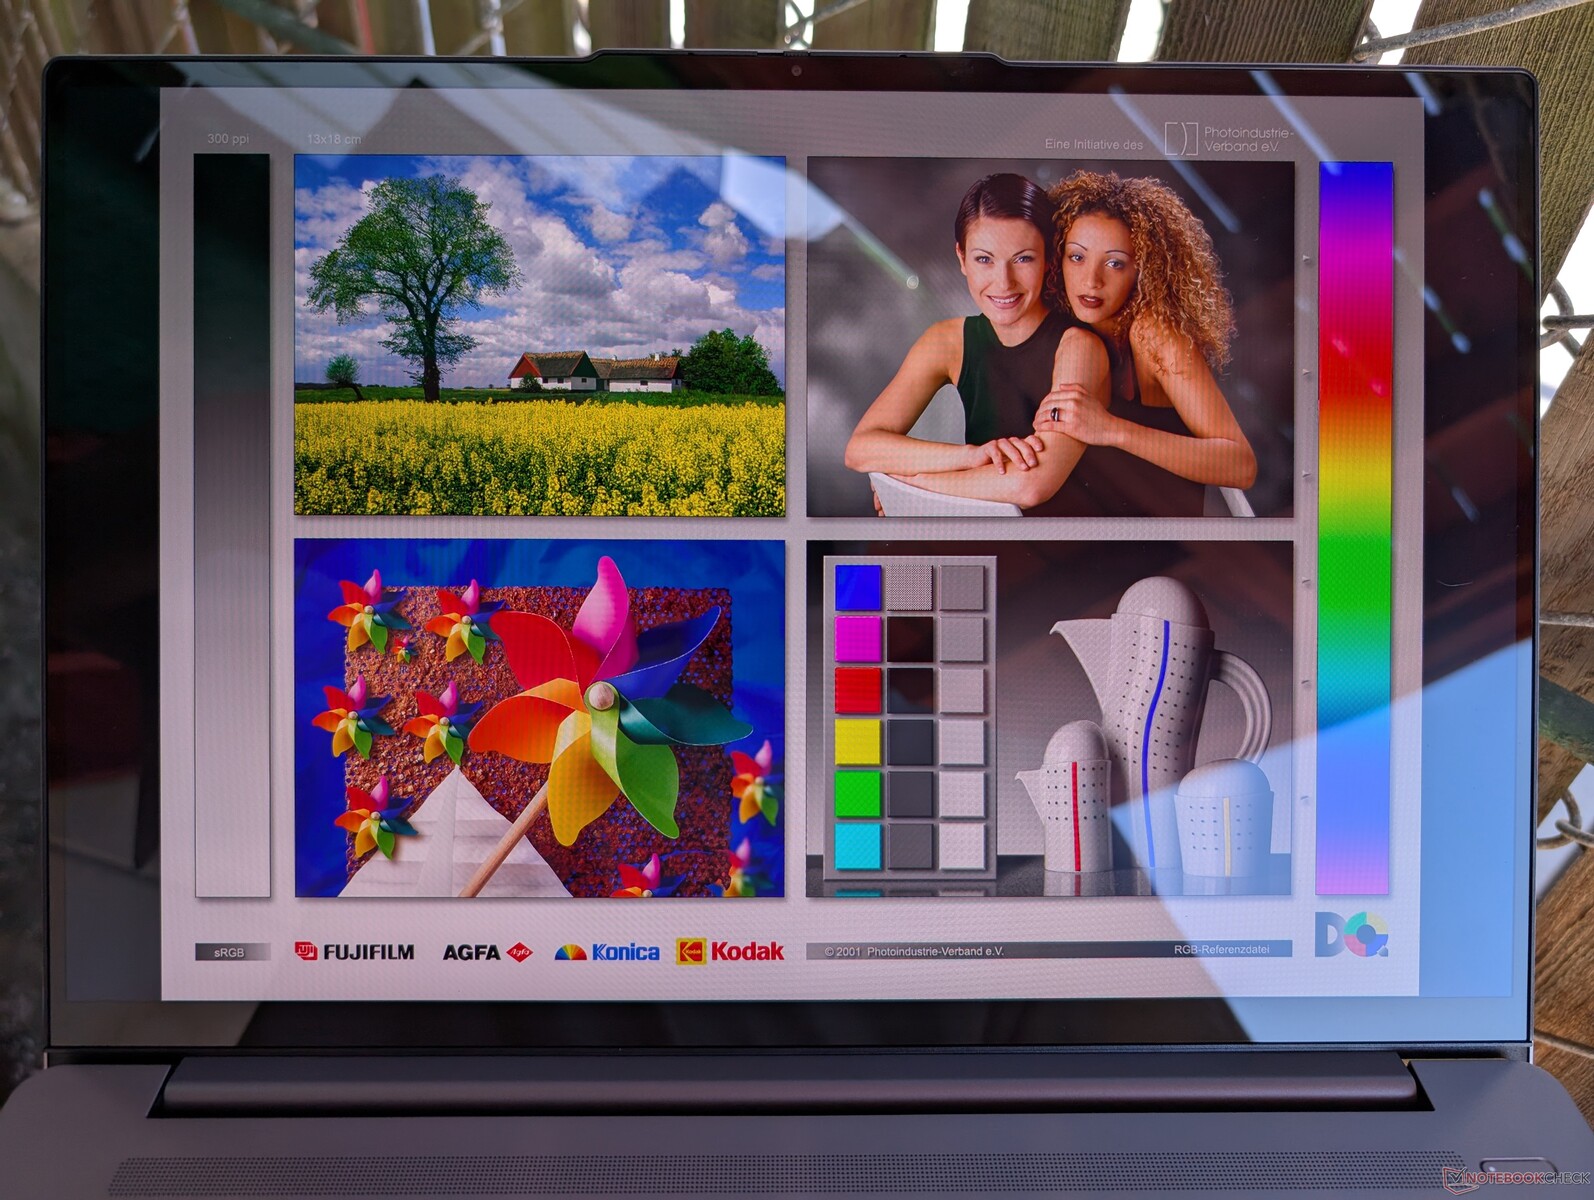
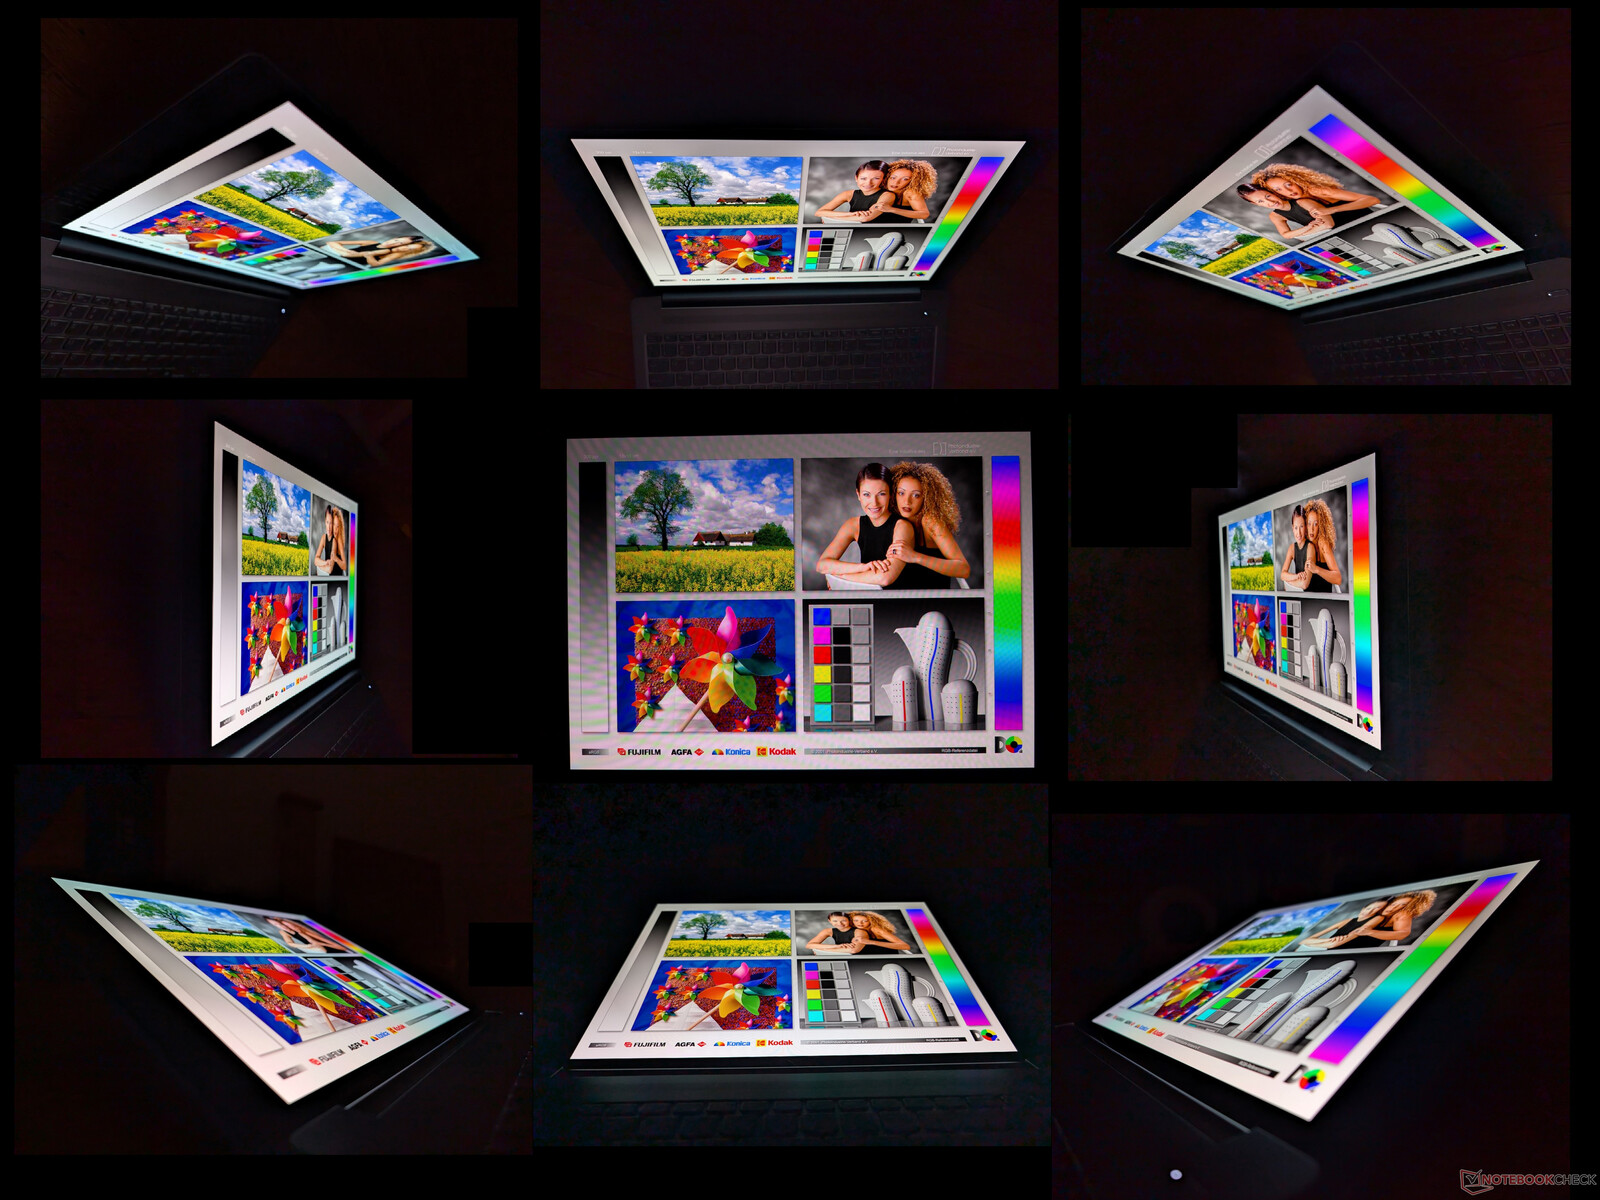
Tela - do IPS ao OLED
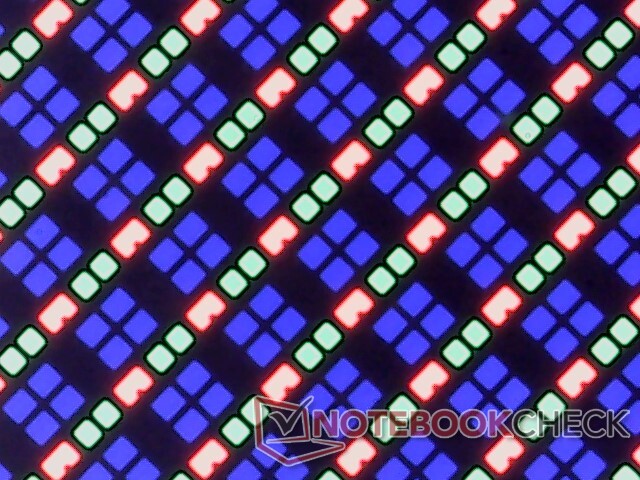
Há duas opções de exibição disponíveis, como segue:
- 2560 x 1600, IPS, 120 Hz, sem toque
- 2048 x 1280, OLED, 120 Hz, sensível ao toque
Diferentemente da maioria dos outros notebooks, a opção OLED aqui não é necessariamente melhor do que a opção IPS, pois troca uma resolução nativa mais alta por cores mais profundas e melhor suporte a HDR. Se as suas cargas de trabalho consistem principalmente em planilhas ou multitarefas em janelas, o painel IPS de resolução mais alta pode ser mais produtivo. Para tarefas como reprodução ou edição de vídeo, as cores mais profundas e o contraste mais escuro do OLED podem melhorar a experiência.
A resolução de 1280p é, no entanto, inferior à de outros notebooks de 16 polegadas, como o Asus Zenbook S 16envy x360 2-in-1 16, ou Galaxy Book4 Ultra, todos com painéis OLED de 1800p. É provável que isso seja intencional, como forma de incentivar os compradores a considerar a série mais sofisticada do Série Yoga Pro 9 16 G9 mas, ainda assim, torna o IdeaPad Pro 5 16 G9 um pouco menos atraente em comparação com seus concorrentes imediatos.

| |||||||||||||||||||||||||
iluminação: 98 %
iluminação com acumulador: 367.6 cd/m²
Contraste: ∞:1 (Preto: 0 cd/m²)
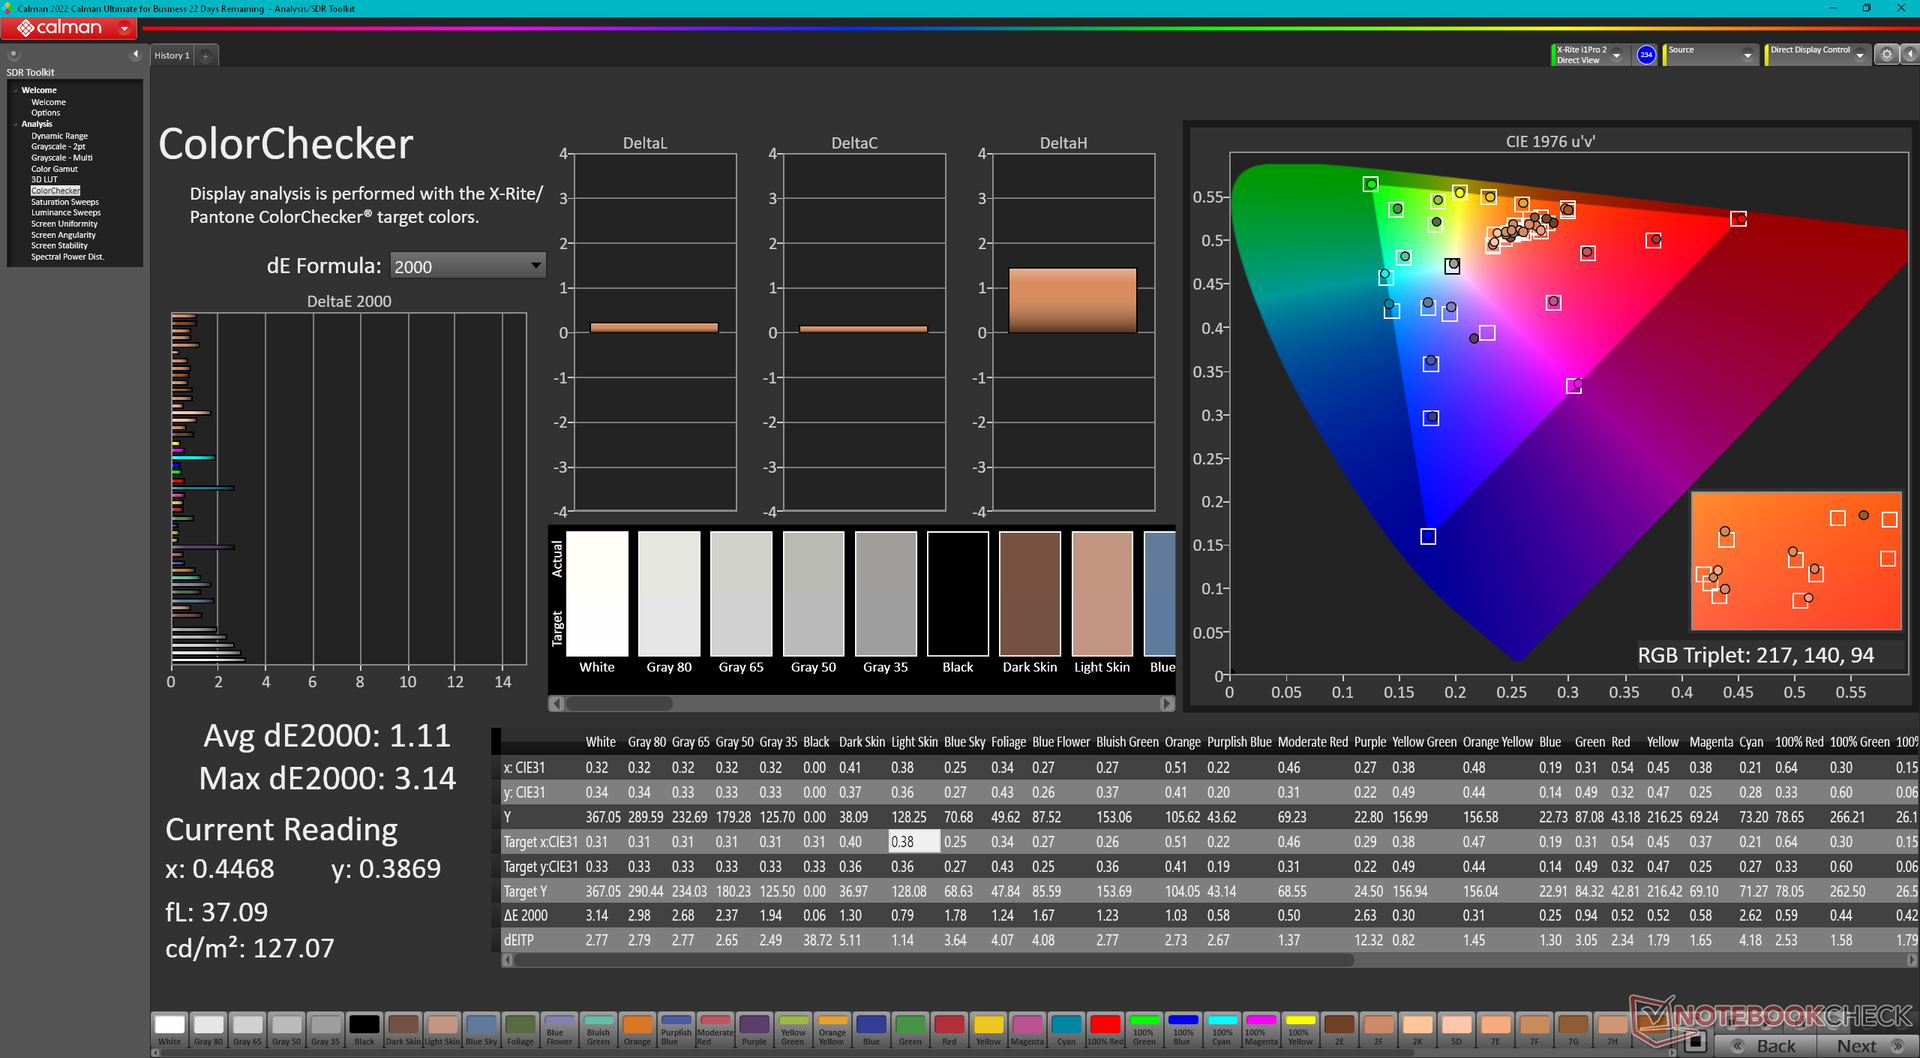
ΔE Color 4.31 | 0.5-29.43 Ø4.87, calibrated: 1.11
ΔE Greyscale 1.7 | 0.5-98 Ø5.1
97.8% AdobeRGB 1998 (Argyll 2.2.0 3D)
100% sRGB (Argyll 2.2.0 3D)
99.7% Display P3 (Argyll 2.2.0 3D)
Gamma: 2.2
| Lenovo IdeaPad Pro 5 16IMH G9 RTX 4050 LEN1602K, OLED, 2048x1280, 16", 120 Hz | Lenovo IdeaPad Pro 5 16IMH G9 NE160QDM-NY2, IPS, 2560x1600, 16", 120 Hz | Dell Inspiron 16 7640 2-in-1 AU Optronics B160QAT, Mini-LED, 2560x1600, 16", 90 Hz | Asus Zenbook S 16 UM5606-RK333W ATNA60CL10-0, OLED, 2880x1800, 16", 120 Hz | HP Envy x360 2-in-1 16-ad0097nr Samsung SDC41A6, OLED, 2880x1800, 16", 120 Hz | Samsung Galaxy Book4 Ultra ATNA60CL07-0, OLED, 2880x1800, 16", 120 Hz | |
|---|---|---|---|---|---|---|
| Display | -25% | -2% | -1% | -0% | -4% | |
| Display P3 Coverage | 99.7 | 63.3 -37% | 99.4 0% | 99.9 0% | 99.6 0% | 98.6 -1% |
| sRGB Coverage | 100 | 95.2 -5% | 100 0% | 100 0% | 100 0% | 99.9 0% |
| AdobeRGB 1998 Coverage | 97.8 | 65.3 -33% | 92.5 -5% | 95.6 -2% | 96.5 -1% | 88.5 -10% |
| Response Times | -1708% | -2489% | 46% | 26% | 13% | |
| Response Time Grey 50% / Grey 80% * | 0.58 ? | 15 ? -2486% | 15.4 ? -2555% | 0.56 ? 3% | 0.8 ? -38% | 0.54 ? 7% |
| Response Time Black / White * | 1 ? | 10.3 ? -930% | 60.6 ? -5960% | 0.65 ? 35% | 0.89 ? 11% | 0.69 ? 31% |
| PWM Frequency | 240 ? | 2753.7 ? 1047% | 480 100% | 491.8 ? 105% | 240 ? 0% | |
| Screen | -14% | -21% | 43% | 10% | 20% | |
| Brightness middle | 367.6 | 368 0% | 413 12% | 407 11% | 399.4 9% | 390 6% |
| Brightness | 371 | 368 -1% | 409 10% | 405 9% | 405 9% | 393 6% |
| Brightness Distribution | 98 | 91 -7% | 97 -1% | 97 -1% | 98 0% | 98 0% |
| Black Level * | 0.31 | 0.14 | 0.02 | |||
| Colorchecker dE 2000 * | 4.31 | 2.4 44% | 3.48 19% | 0.6 86% | 4.05 6% | 1.4 68% |
| Colorchecker dE 2000 max. * | 6.85 | 6.5 5% | 6.97 -2% | 1.2 82% | 6.69 2% | 2.7 61% |
| Colorchecker dE 2000 calibrated * | 1.11 | 0.8 28% | 1.02 8% | |||
| Greyscale dE 2000 * | 1.7 | 4.5 -165% | 4.5 -165% | 0.5 71% | 1.1 35% | 2.1 -24% |
| Gamma | 2.2 100% | 2.21 100% | 2.15 102% | 2.2 100% | 2.27 97% | 2.27 97% |
| CCT | 6272 104% | 6324 103% | 6446 101% | 6453 101% | 6419 101% | 6431 101% |
| Contrast | 1187 | 2950 | 20350 | |||
| Média Total (Programa/Configurações) | -582% /
-299% | -837% /
-633% | 29% /
33% | 12% /
11% | 10% /
12% |
* ... menor é melhor
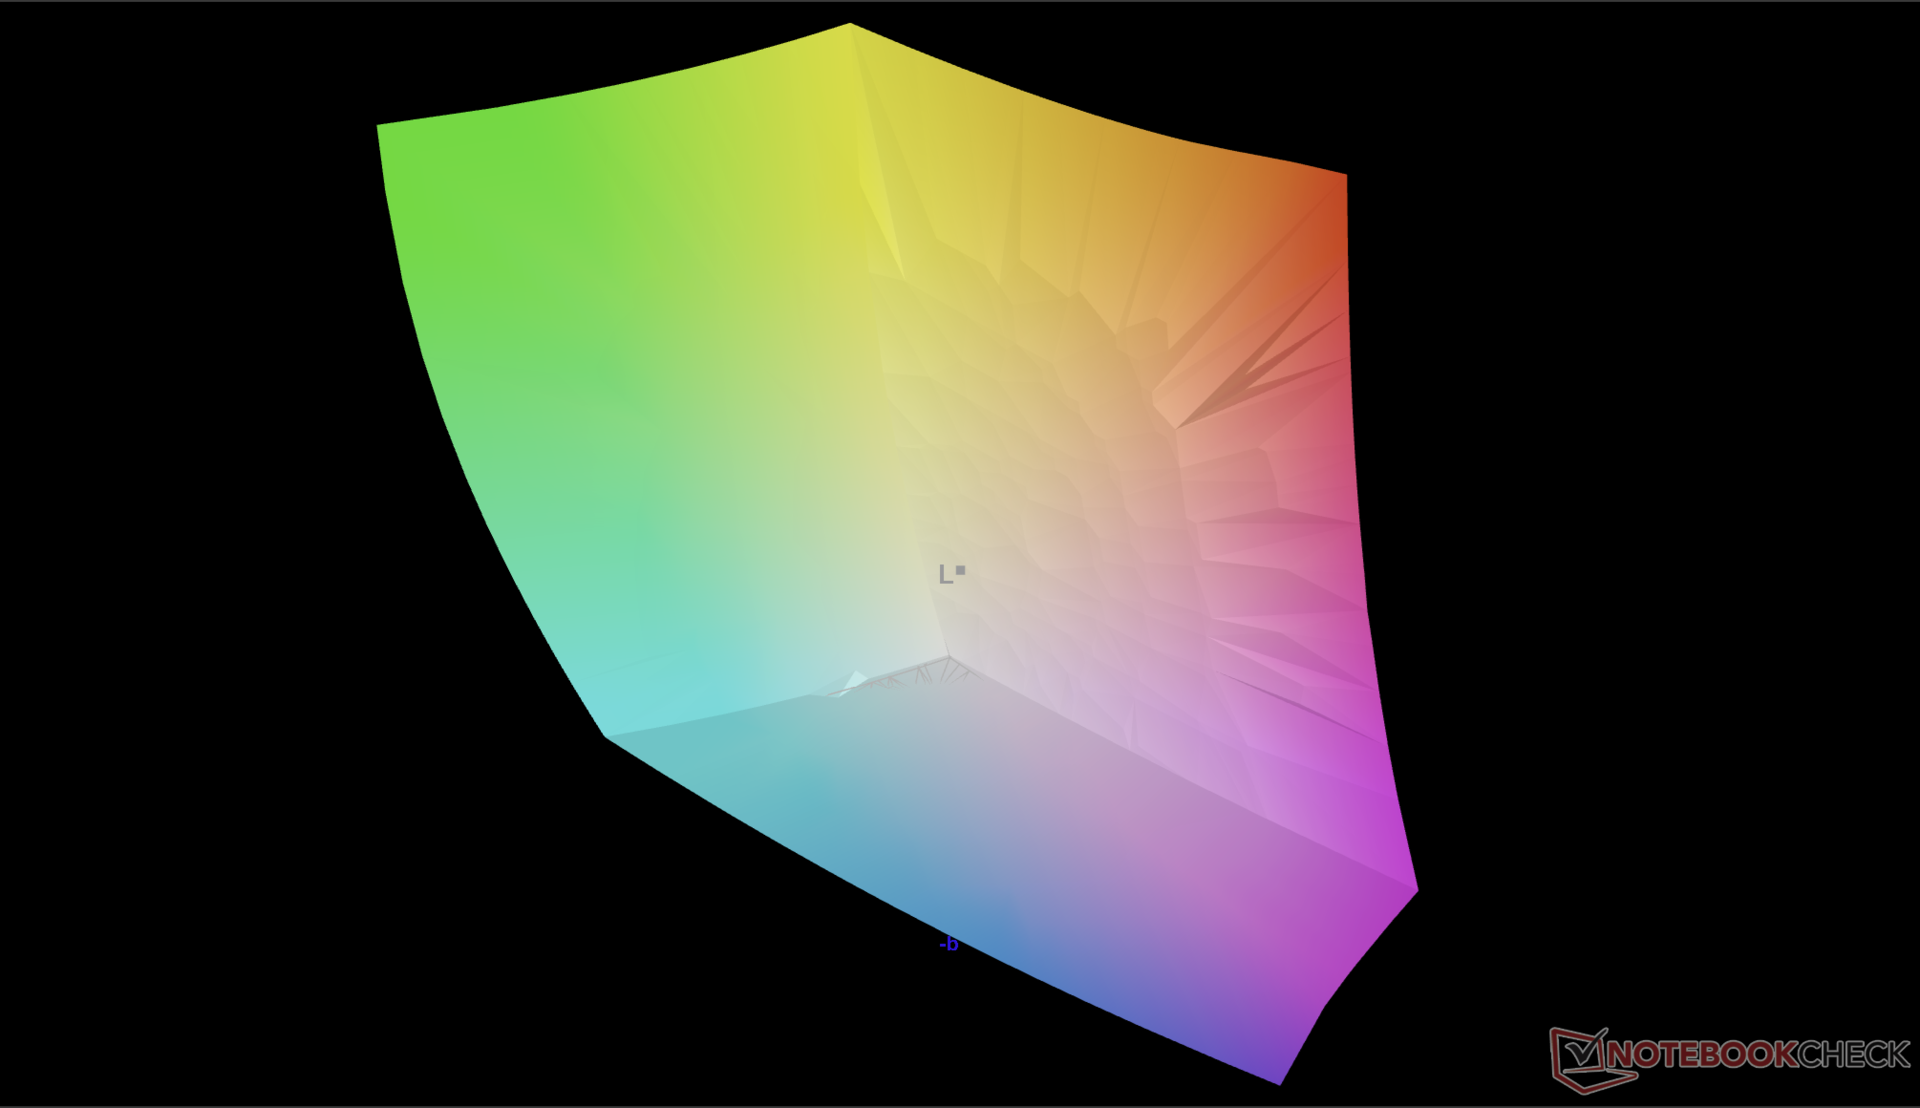

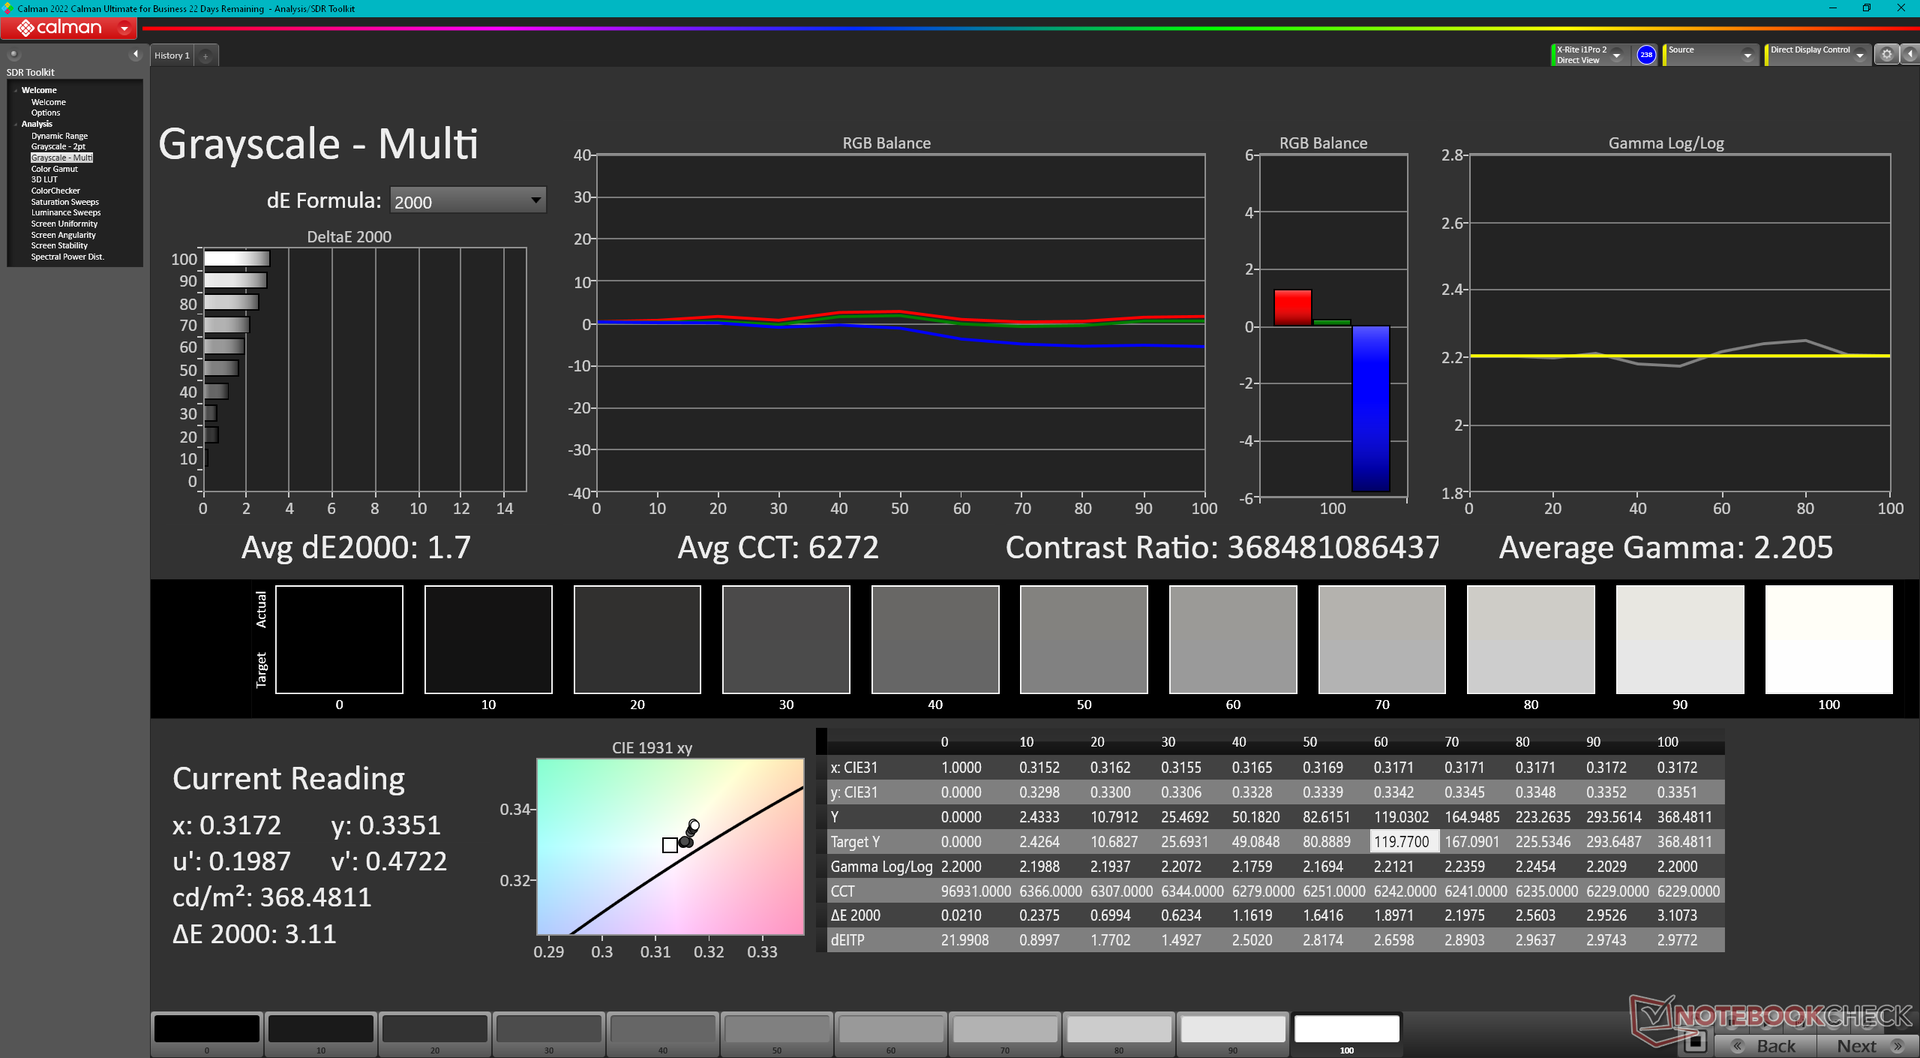
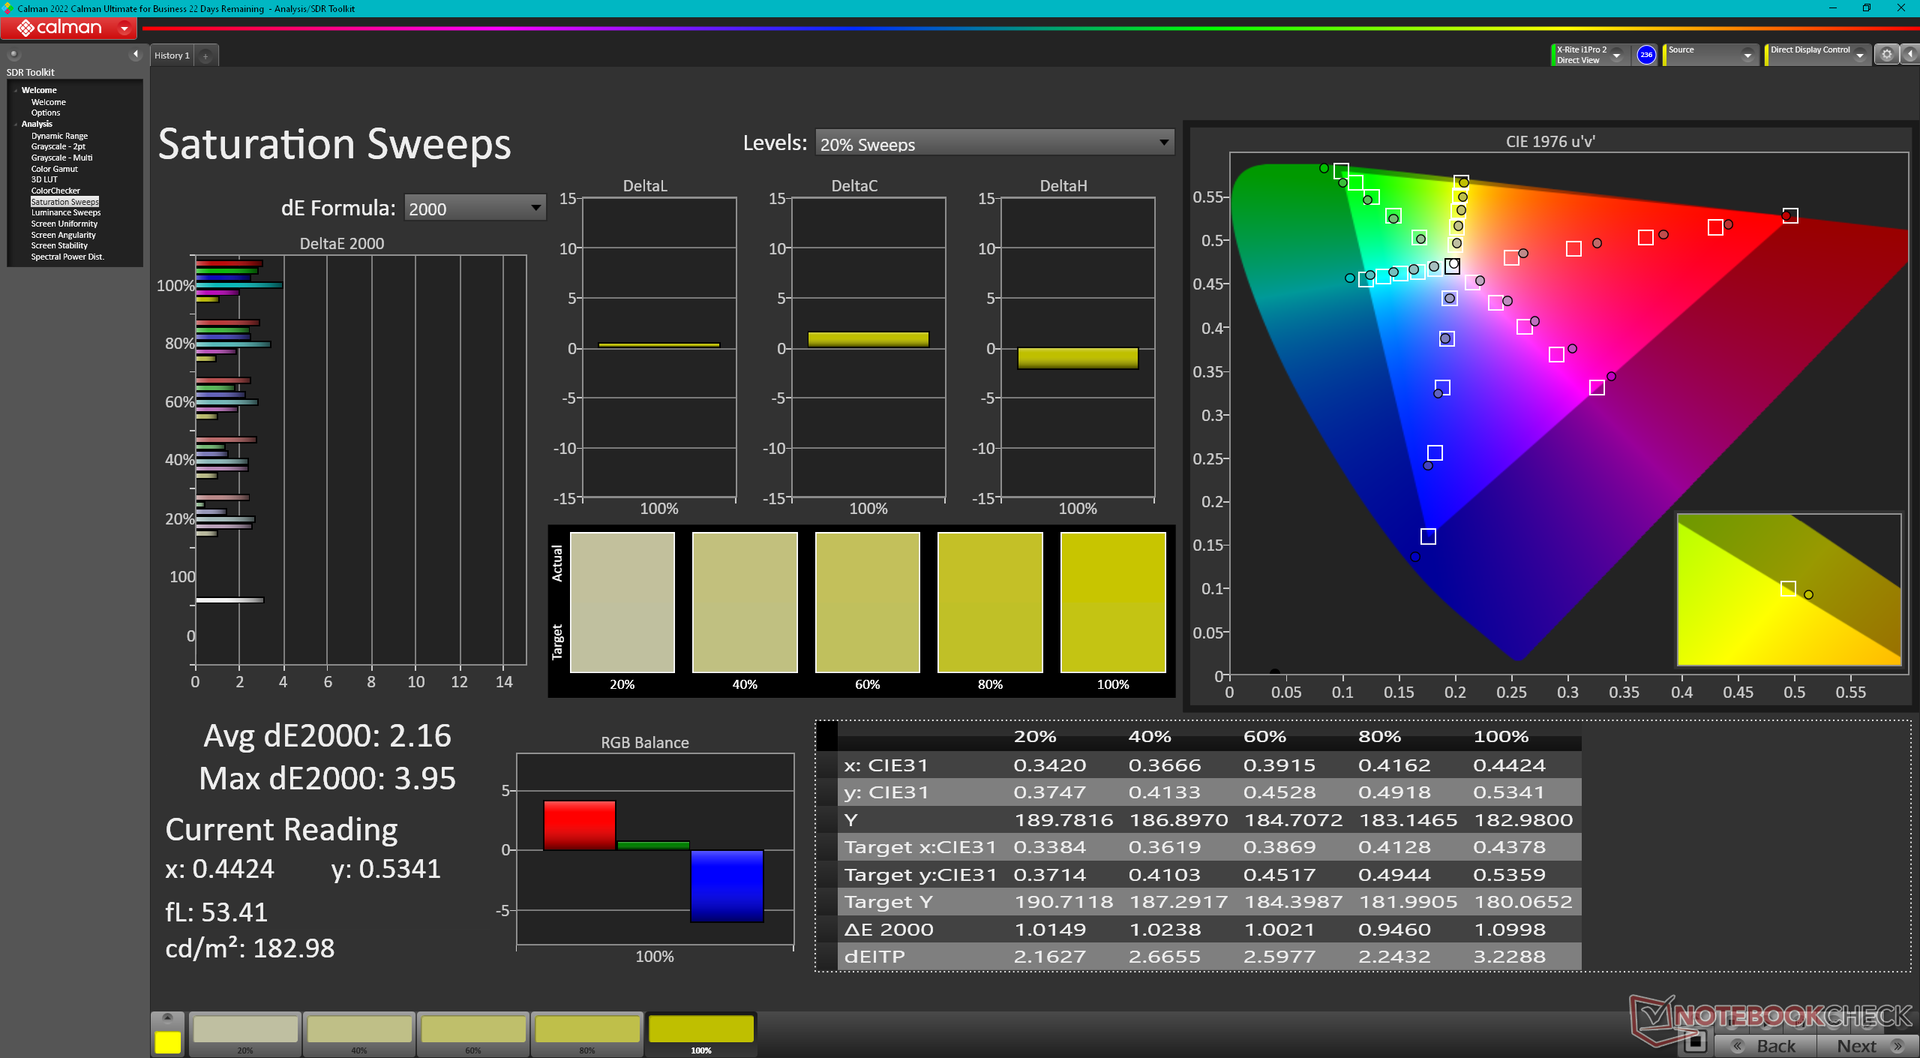
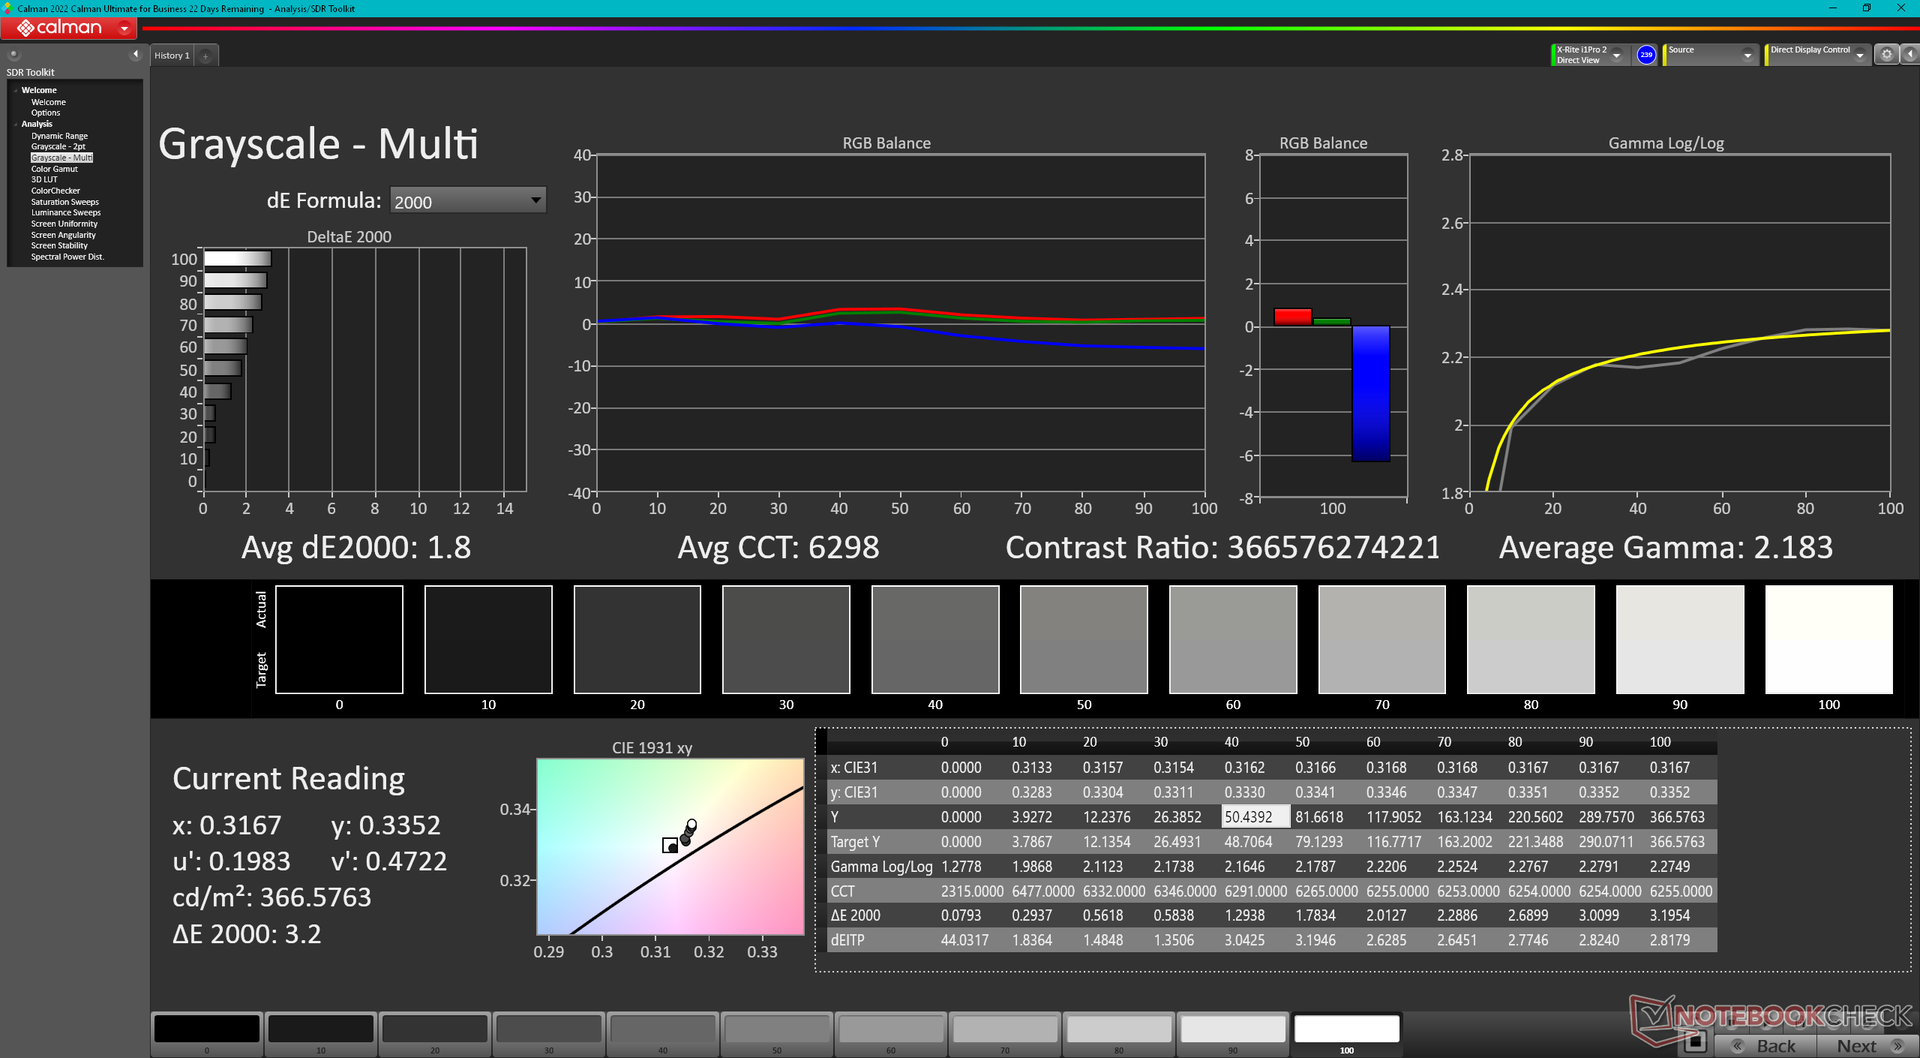
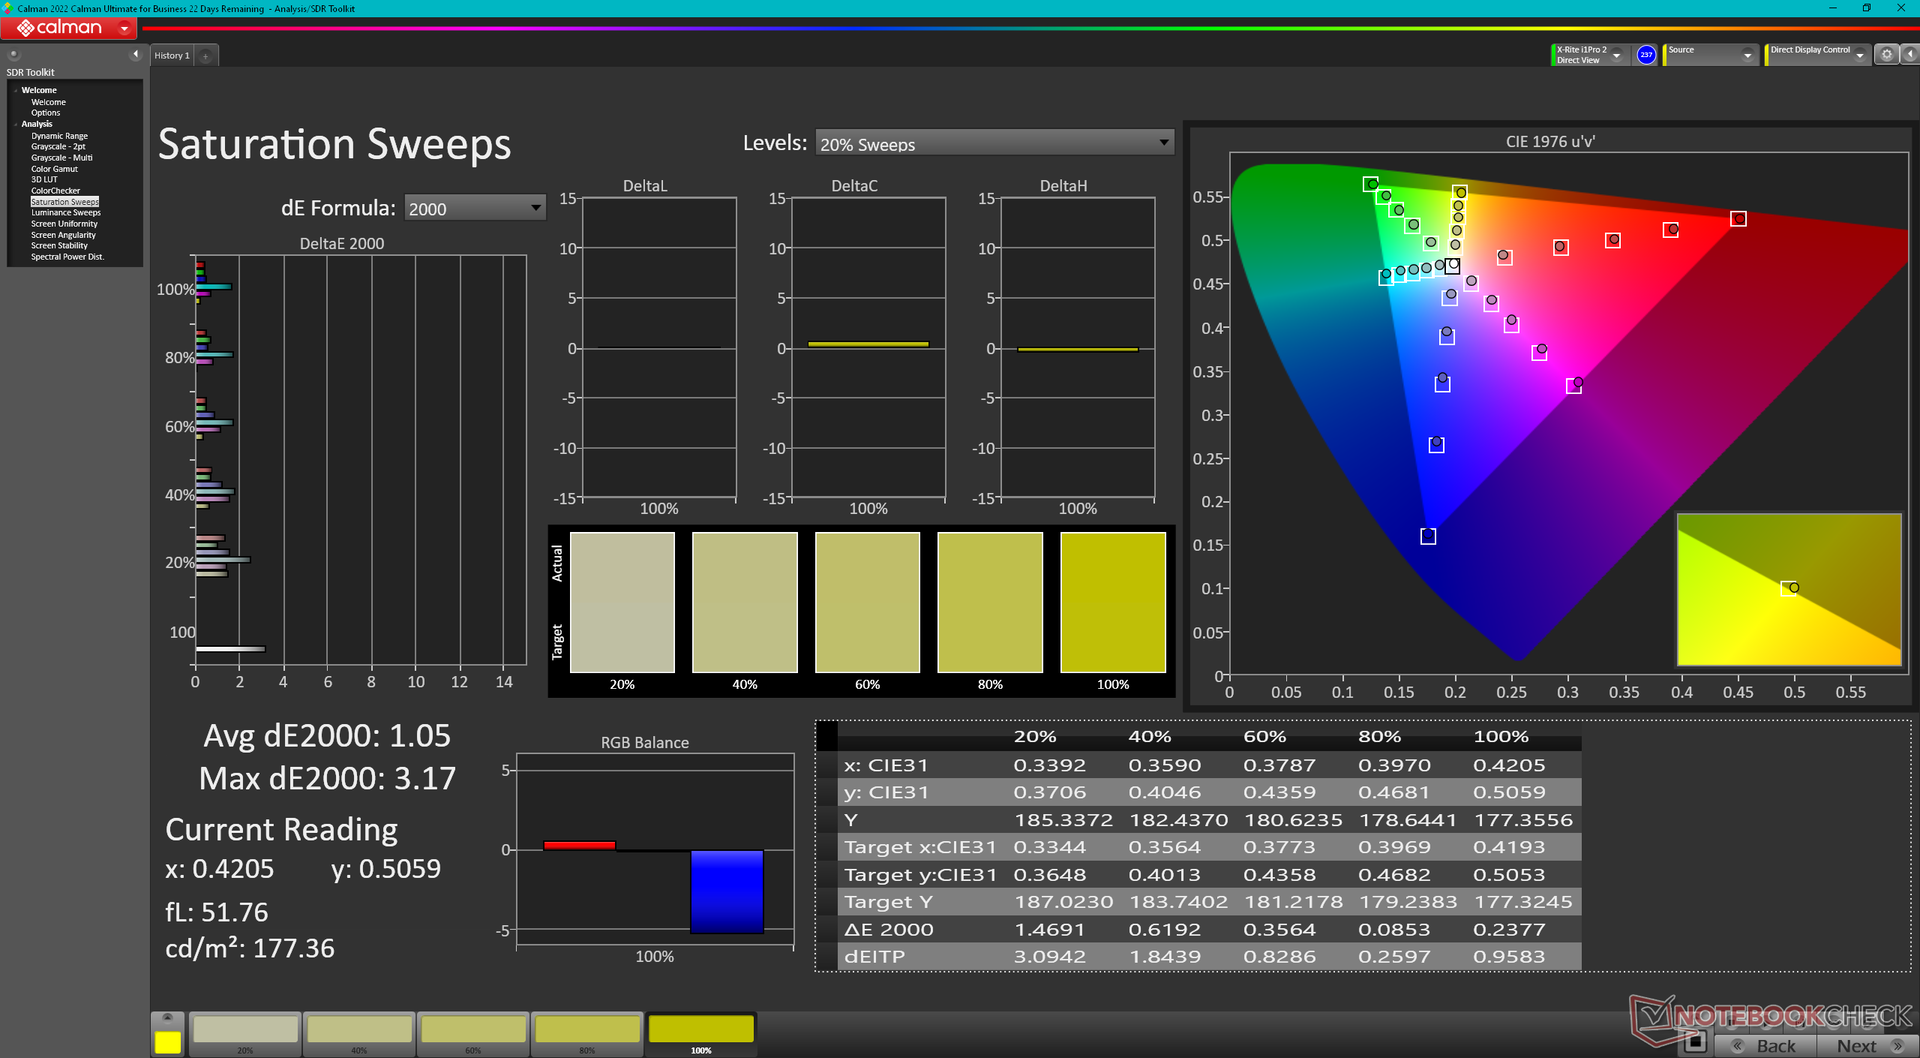
Embora não tenha sido calibrado na fábrica, o monitor é razoavelmente preciso em relação ao padrão P3, com valores médios de deltaE de escala de cinza e cor de 1,7 e 4,31, respectivamente.

Exibir tempos de resposta
| ↔ Tempo de resposta preto para branco | ||
|---|---|---|
| 1 ms ... ascensão ↗ e queda ↘ combinadas | ↗ 0.56 ms ascensão | 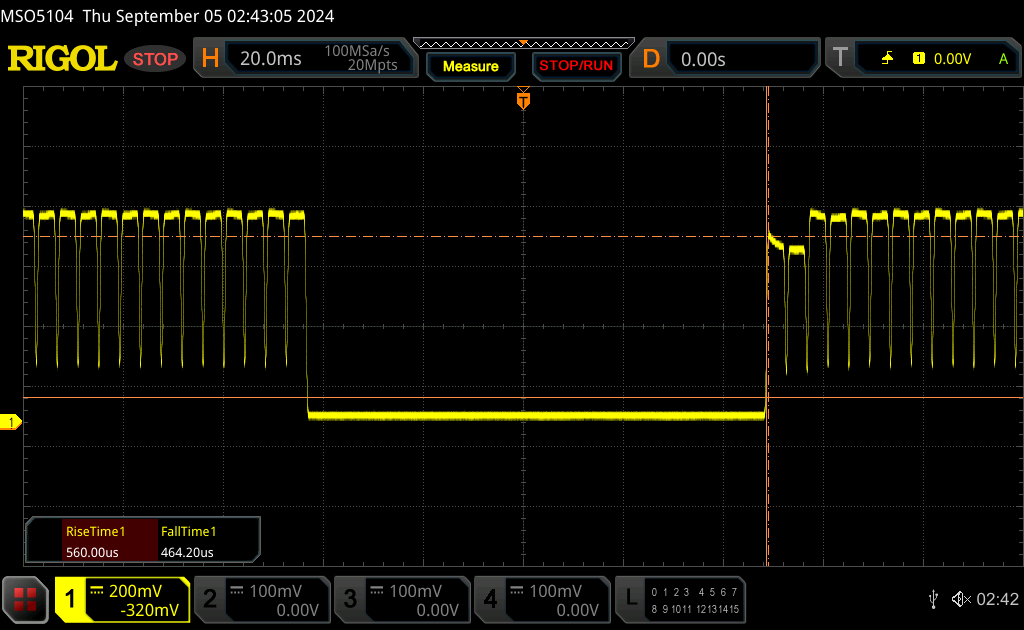 |
| ↘ 0.44 ms queda | ||
| A tela mostra taxas de resposta muito rápidas em nossos testes e deve ser muito adequada para jogos em ritmo acelerado. Em comparação, todos os dispositivos testados variam de 0.1 (mínimo) a 240 (máximo) ms. » 2 % de todos os dispositivos são melhores. Isso significa que o tempo de resposta medido é melhor que a média de todos os dispositivos testados (20.8 ms). | ||
| ↔ Tempo de resposta 50% cinza a 80% cinza | ||
| 0.58 ms ... ascensão ↗ e queda ↘ combinadas | ↗ 0.28 ms ascensão | 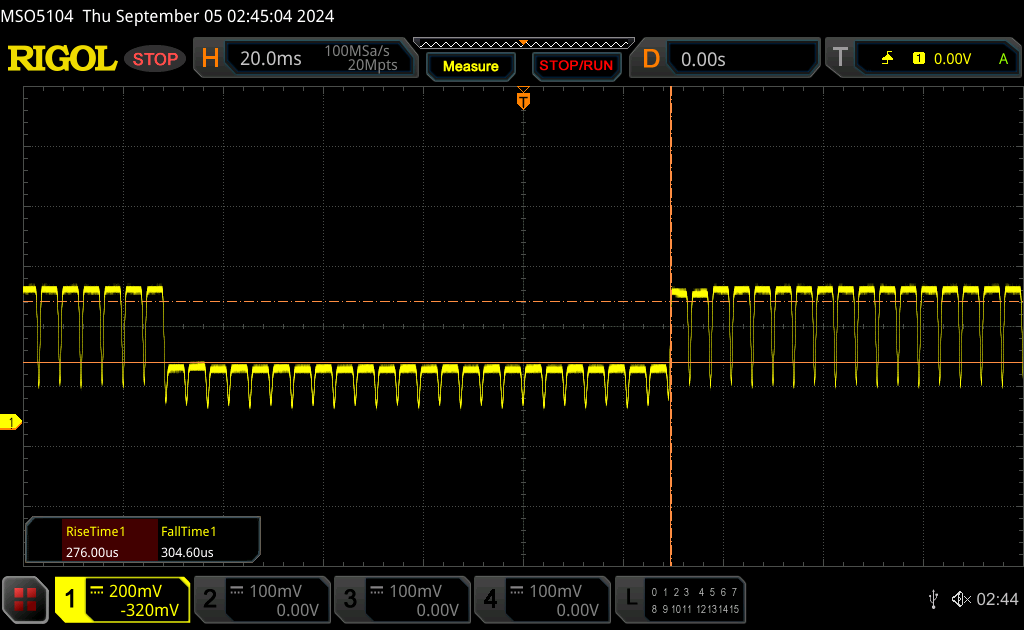 |
| ↘ 0.3 ms queda | ||
| A tela mostra taxas de resposta muito rápidas em nossos testes e deve ser muito adequada para jogos em ritmo acelerado. Em comparação, todos os dispositivos testados variam de 0.165 (mínimo) a 636 (máximo) ms. » 1 % de todos os dispositivos são melhores. Isso significa que o tempo de resposta medido é melhor que a média de todos os dispositivos testados (32.5 ms). | ||
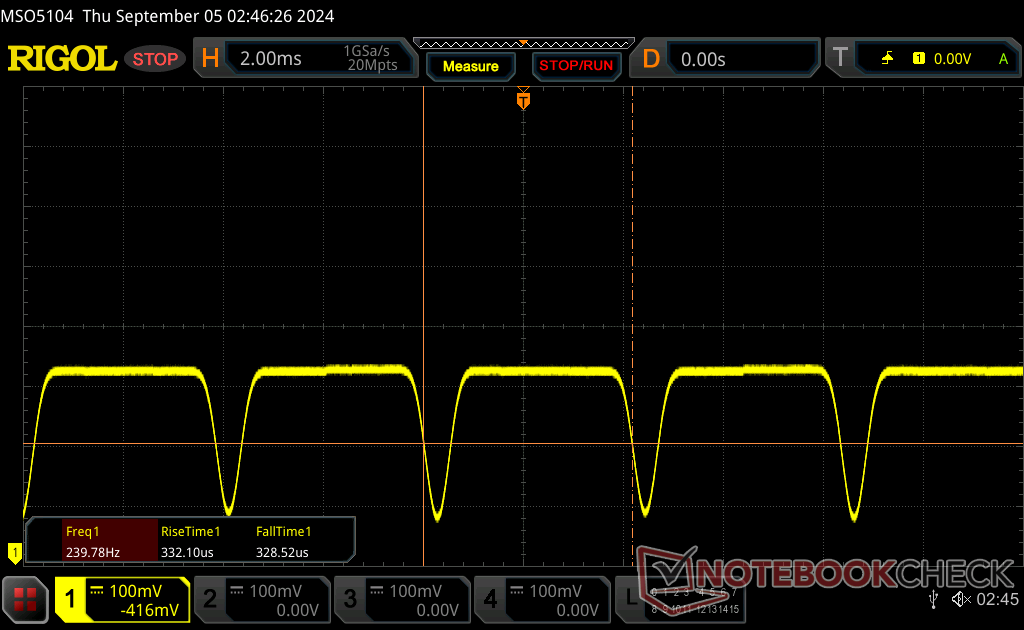
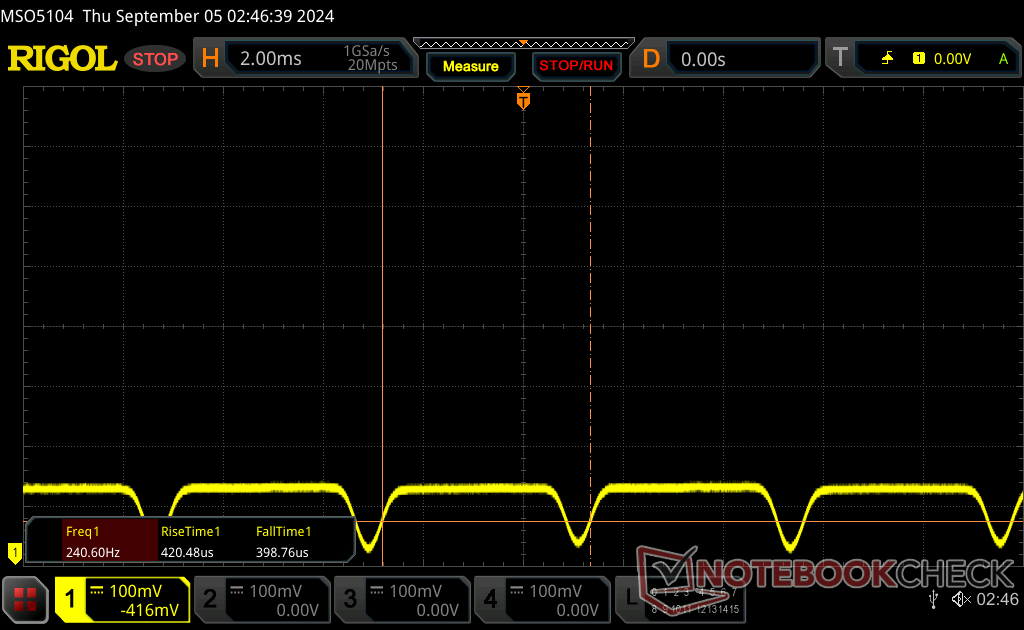
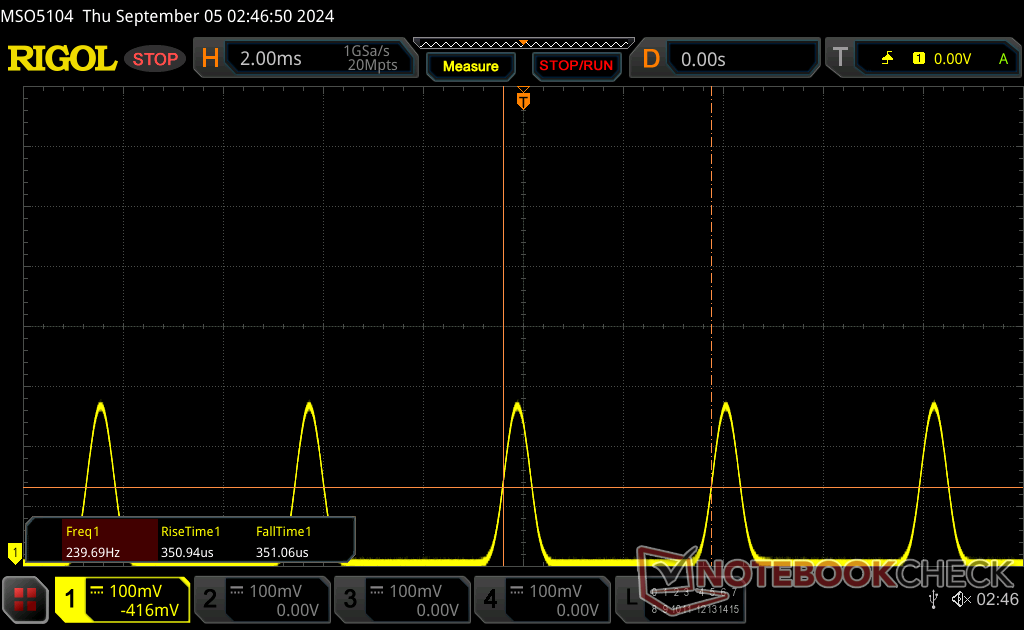
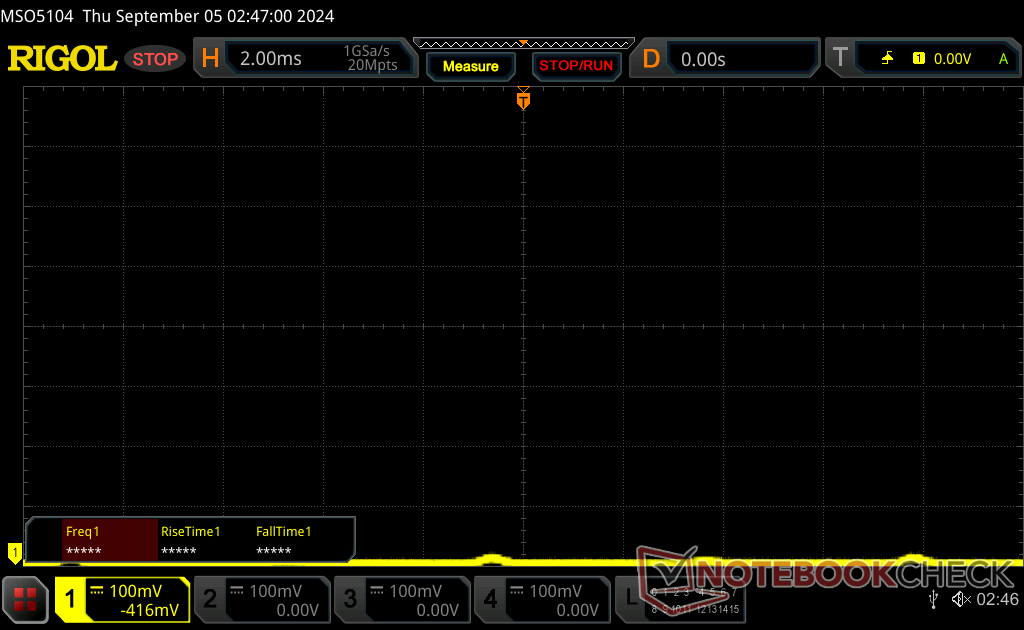
Cintilação da tela / PWM (modulação por largura de pulso)
| Tela tremeluzindo/PWM detectado | 240 Hz Amplitude: 38 % | ≤ 100 % configuração de brilho |  |
A luz de fundo da tela pisca em 240 Hz (pior caso, por exemplo, utilizando PWM) Cintilação detectada em uma configuração de brilho de 100 % e abaixo. Não deve haver cintilação ou PWM acima desta configuração de brilho. A frequência de 240 Hz é relativamente baixa, portanto, usuários sensíveis provavelmente notarão cintilação e sentirão fadiga ocular na configuração de brilho indicada e abaixo. [pwm_comparison] Em comparação: 53 % de todos os dispositivos testados não usam PWM para escurecer a tela. Se PWM foi detectado, uma média de 8516 (mínimo: 5 - máximo: 343500) Hz foi medida. | |||
Uma frequência de modulação de largura de pulso de 240 Hz é detectável e consistente em todos os níveis de brilho.
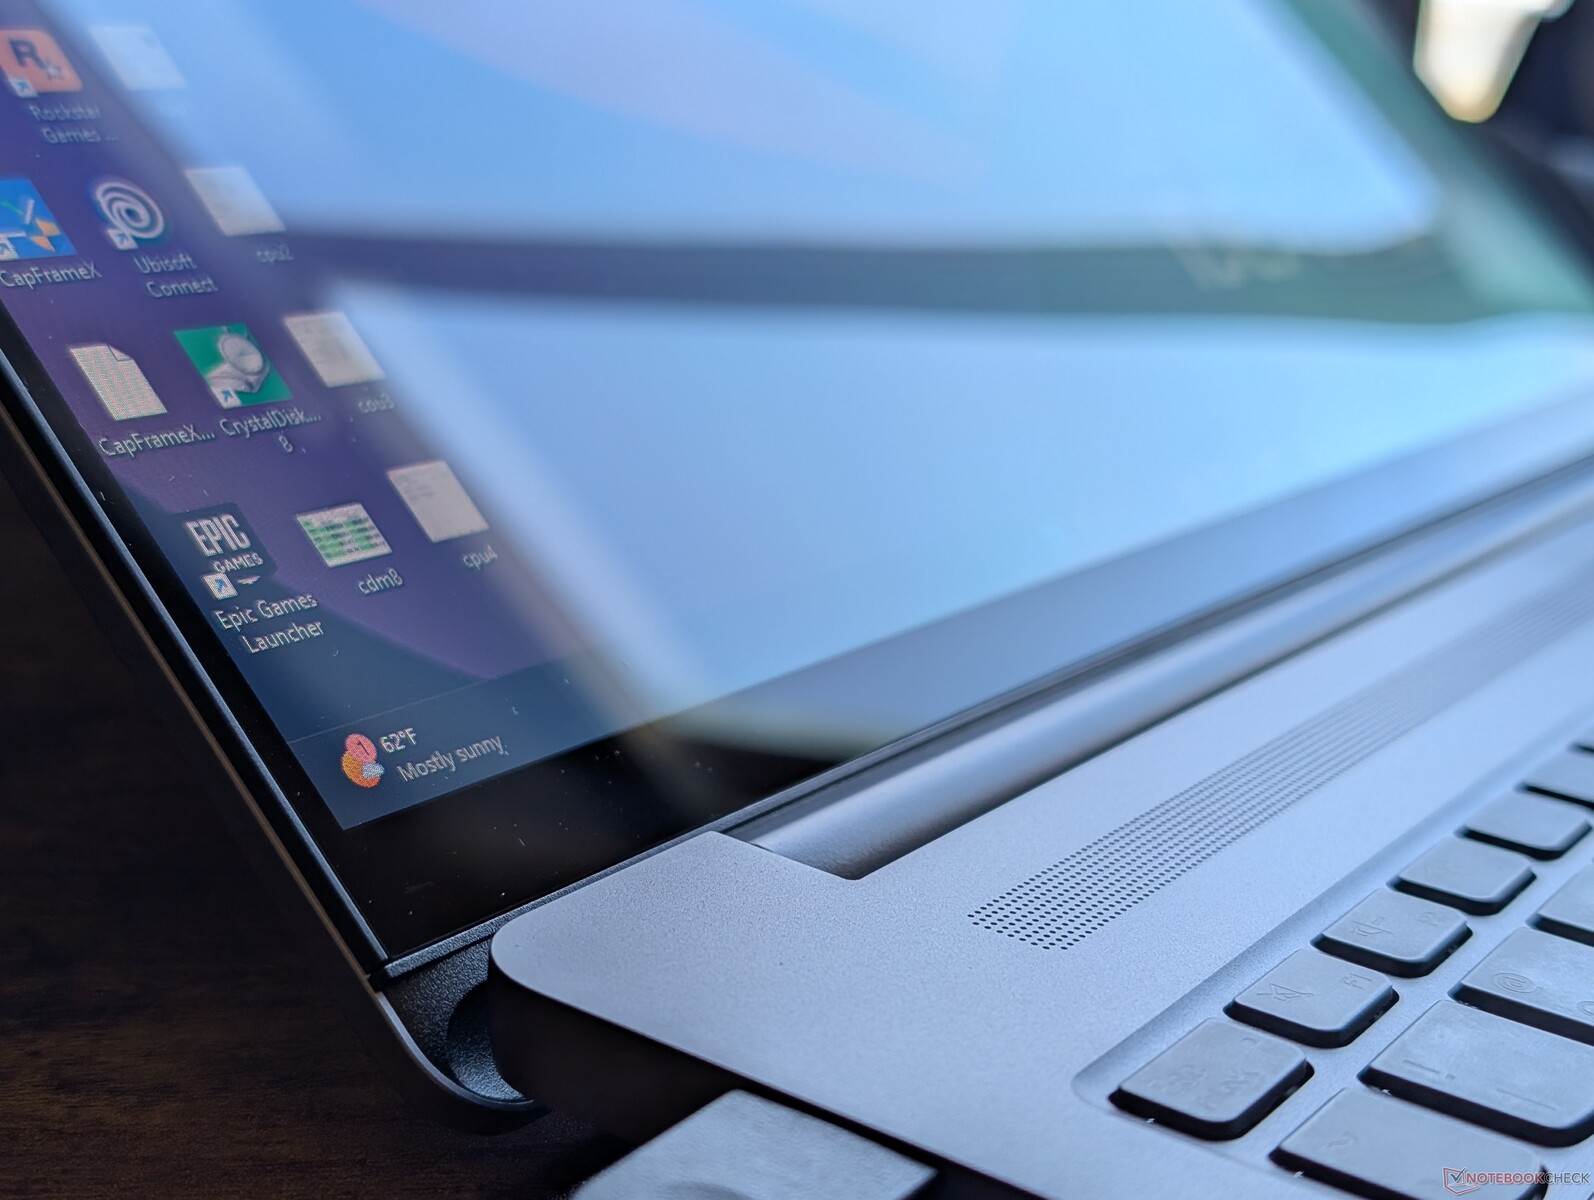
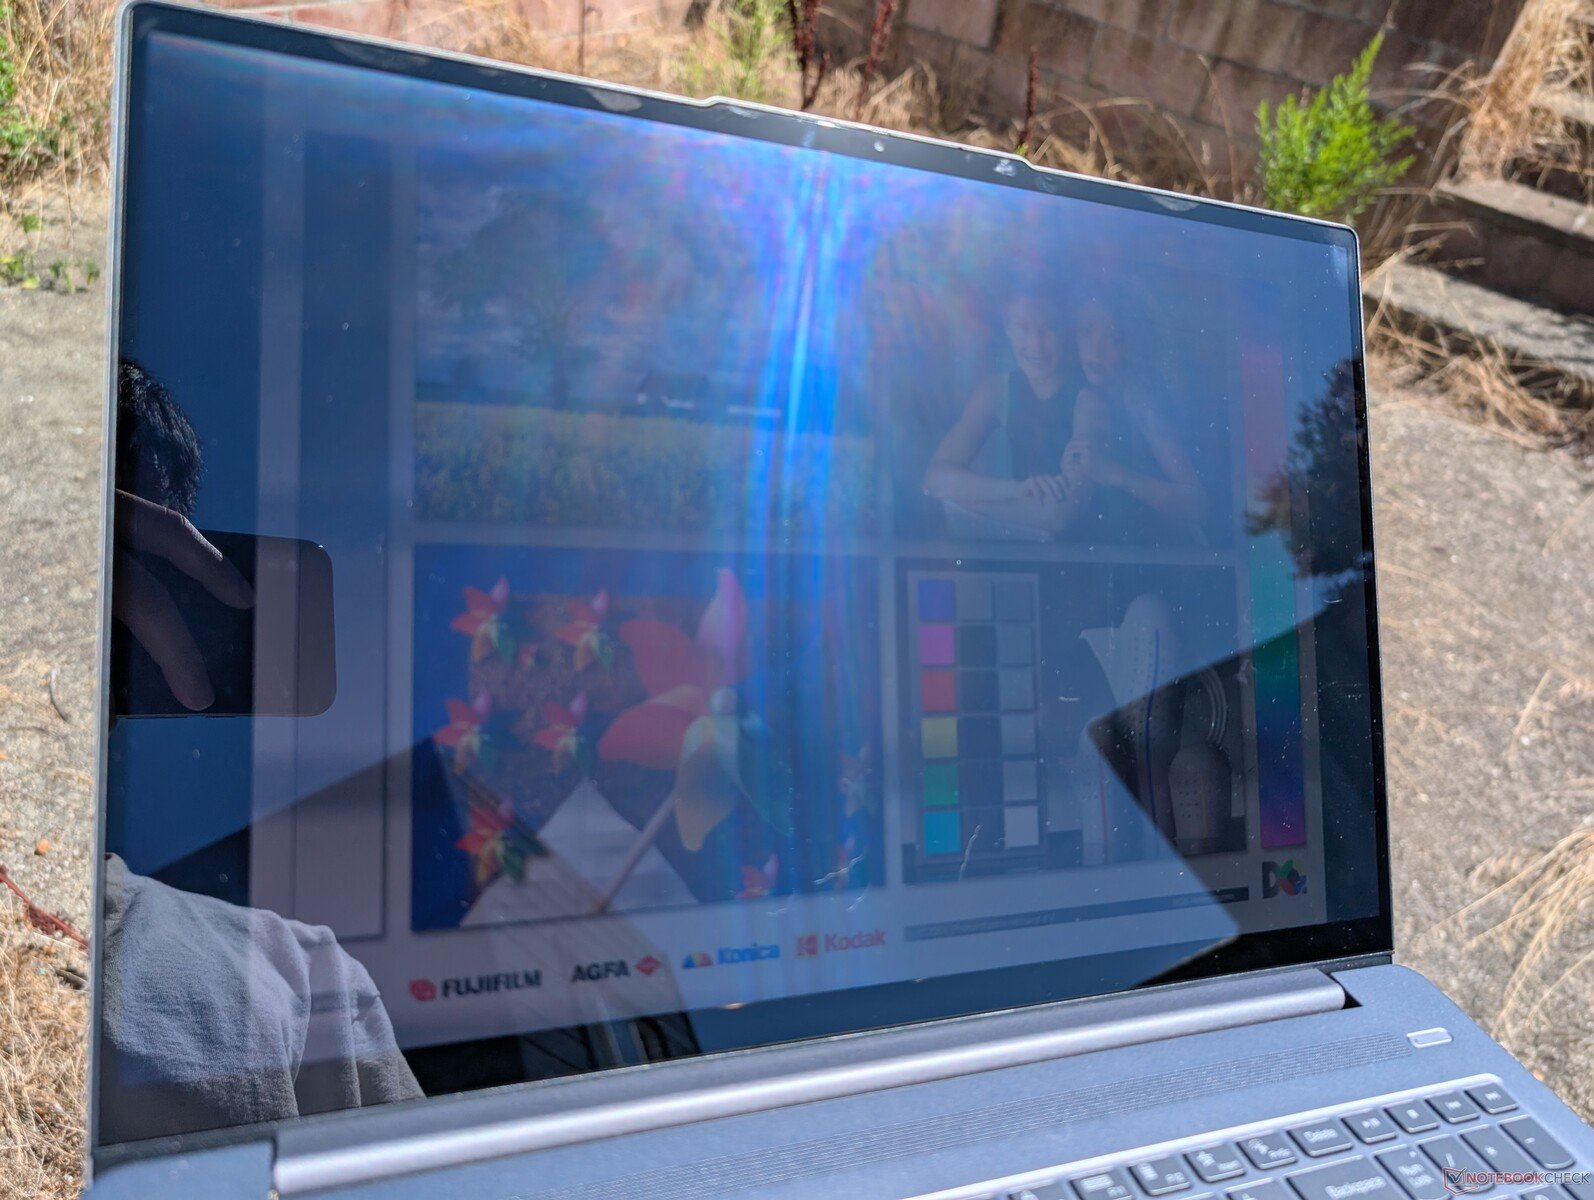
A opção OLED não é necessariamente melhor para visualização em ambientes externos do que a opção IPS, pois seus níveis máximos de brilho são praticamente os mesmos. Na verdade, a configuração OLED é pior devido à sua cobertura brilhante, enquanto a configuração IPS é fosca para reduzir o brilho.

Desempenho - O Core Ultra 9 é uma potência
Condições de teste
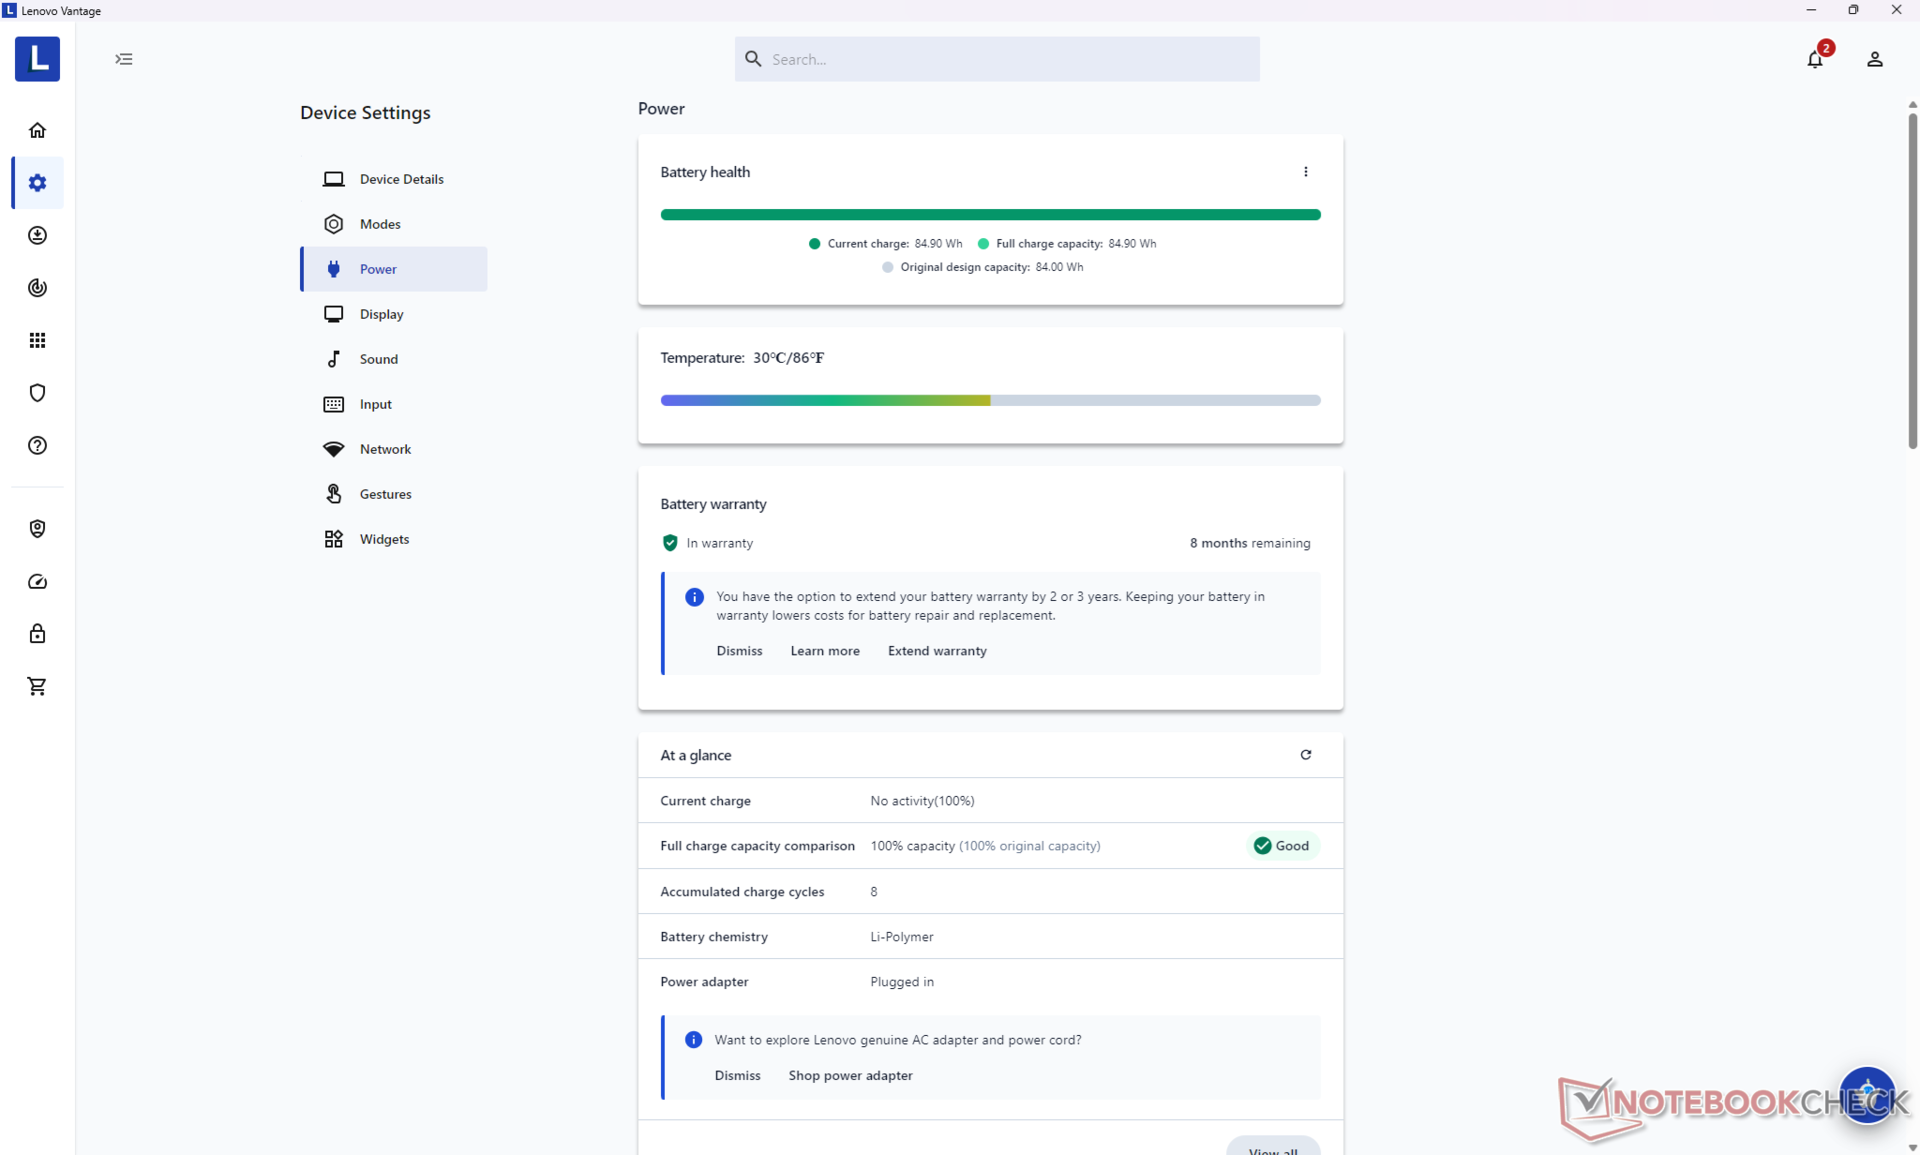
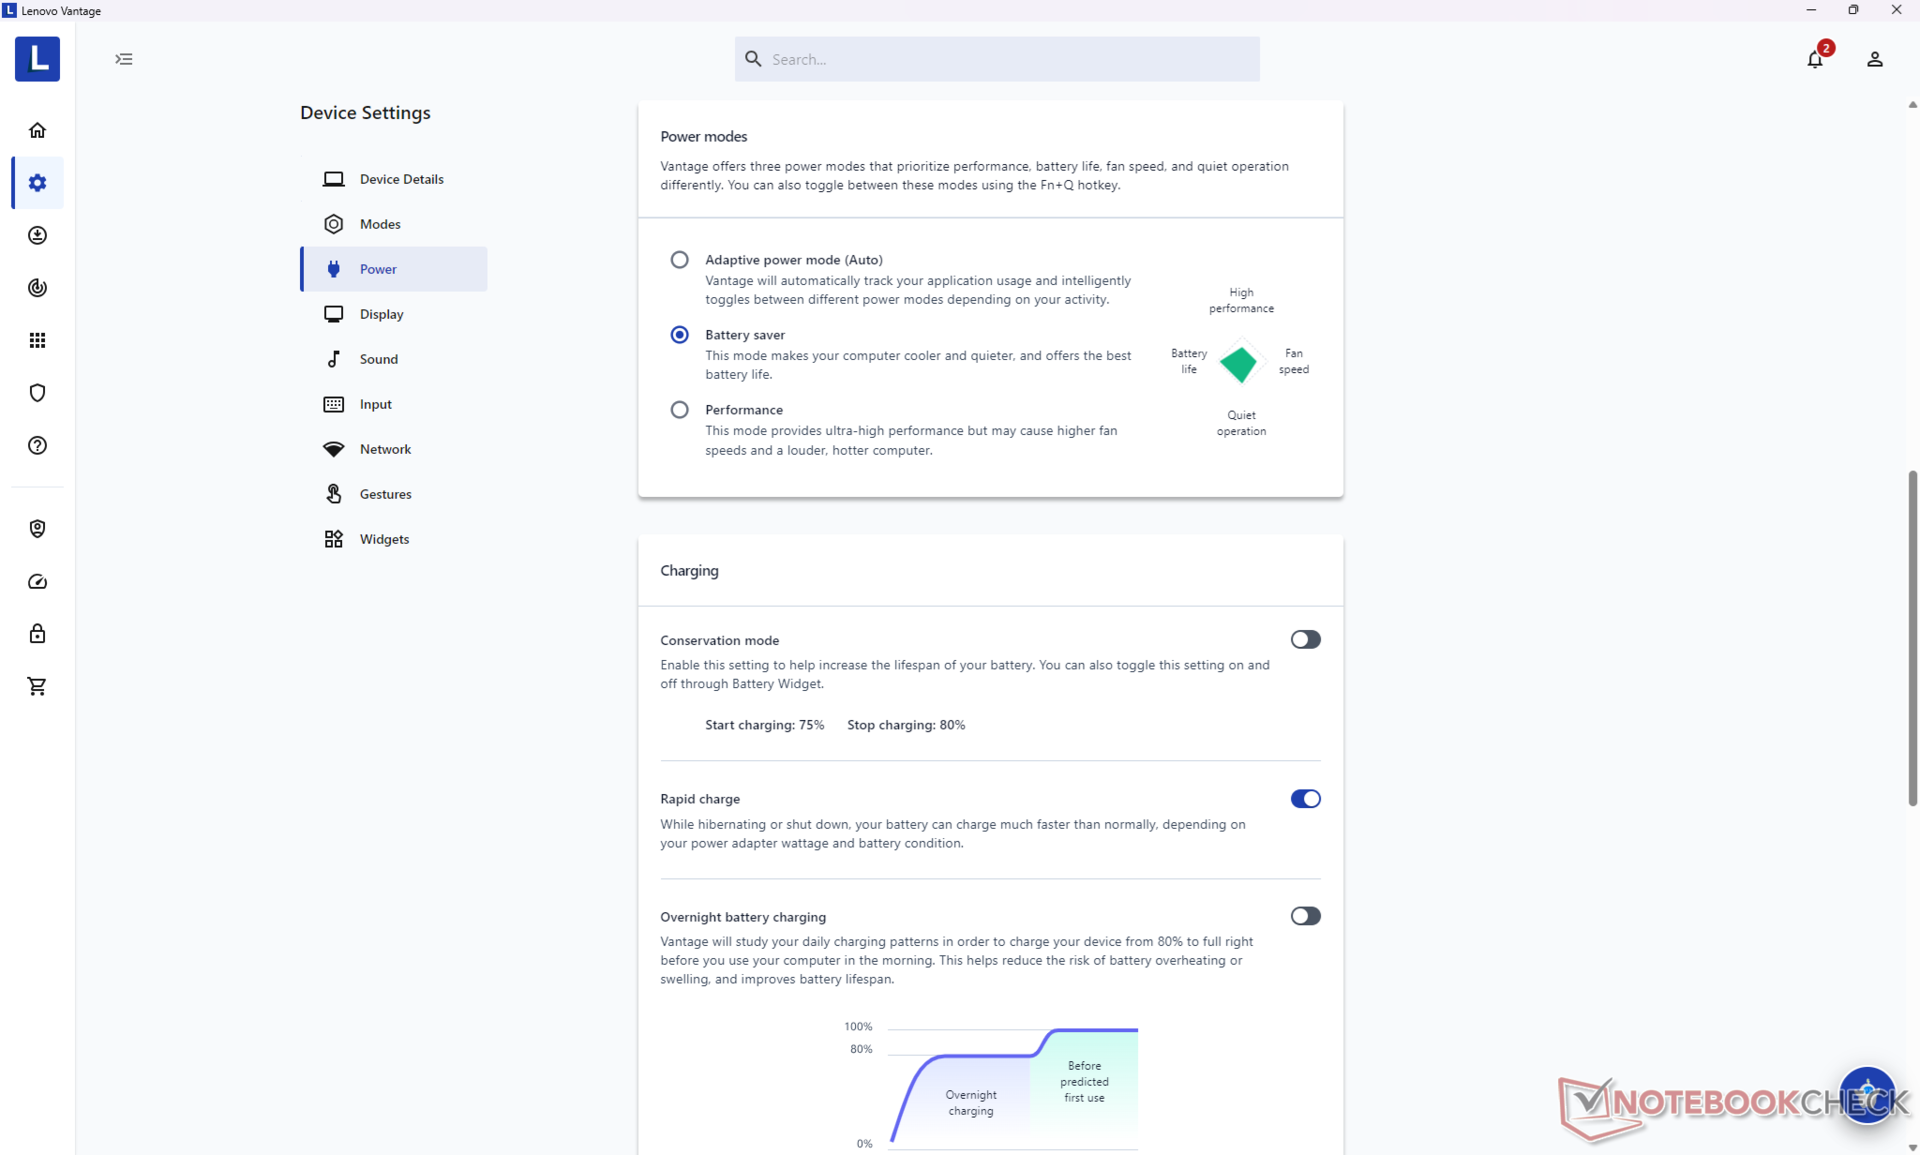
Definimos o Windows e o Lenovo Vantage para o modo Desempenho antes de executar os benchmarks abaixo. Somente o Optimus 1.0 é suportado, sem opções de G-Sync, MUX ou Windows VRR.

Processador
Três opções de CPU Meteor Lake estão disponíveis: Core Ultra 5 125H, Core Ultra 7 155He Core Ultra 9 185H. A mudança do Core Ultra 5 para o Core Ultra 7 proporciona um aumento significativo de 80% no desempenho, enquanto a mudança do Core Ultra 7 para o Core Ultra 9 acrescenta apenas mais 5% a 10%, o que é praticamente imperceptível na maioria dos cenários de uso. Portanto, a menos que o senhor queira o melhor do melhor a qualquer custo, a opção Core Ultra 7 será suficiente para a grande maioria dos usuários, especialmente porque ele ainda é mais rápido do que a maioria das outras opções nessa categoria de tamanho.
O desempenho bruto está à frente das CPUs AMD concorrentes, incluindo o Ryzen 7 8840HS e o mais recente Ryzen AI 9 HX 370. A série Raptor Lake Core i7 HX pode ser ainda mais rápida, mas essas CPUs não têm uma NPU integrada para acelerar tarefas de IA compatíveis. Observe que, infelizmente, o Co-Pilot Plus não é compatível com os processadores Meteor Lake.
Cinebench R15 Multi Loop
Cinebench R23: Multi Core | Single Core
Cinebench R20: CPU (Multi Core) | CPU (Single Core)
Cinebench R15: CPU Multi 64Bit | CPU Single 64Bit
Blender: v2.79 BMW27 CPU
7-Zip 18.03: 7z b 4 | 7z b 4 -mmt1
Geekbench 6.4: Multi-Core | Single-Core
Geekbench 5.5: Multi-Core | Single-Core
HWBOT x265 Benchmark v2.2: 4k Preset
LibreOffice : 20 Documents To PDF
R Benchmark 2.5: Overall mean
* ... menor é melhor
AIDA64: FP32 Ray-Trace | FPU Julia | CPU SHA3 | CPU Queen | FPU SinJulia | FPU Mandel | CPU AES | CPU ZLib | FP64 Ray-Trace | CPU PhotoWorxx
| Performance Rating | |
| Asus Zenbook S 16 UM5606-RK333W | |
| Lenovo IdeaPad Pro 5 16IMH G9 RTX 4050 | |
| Lenovo IdeaPad Pro 5 16IMH G9 | |
| Média Intel Core Ultra 9 185H | |
| HP Envy x360 2-in-1 16-ad0097nr | |
| Dell Inspiron 16 7640 2-in-1 | |
| Samsung Galaxy Book4 Ultra | |
| AIDA64 / FP32 Ray-Trace | |
| Asus Zenbook S 16 UM5606-RK333W | |
| HP Envy x360 2-in-1 16-ad0097nr | |
| Lenovo IdeaPad Pro 5 16IMH G9 RTX 4050 | |
| Lenovo IdeaPad Pro 5 16IMH G9 | |
| Média Intel Core Ultra 9 185H (9220 - 18676, n=19) | |
| Dell Inspiron 16 7640 2-in-1 | |
| Samsung Galaxy Book4 Ultra | |
| AIDA64 / FPU Julia | |
| Asus Zenbook S 16 UM5606-RK333W | |
| Lenovo IdeaPad Pro 5 16IMH G9 RTX 4050 | |
| Lenovo IdeaPad Pro 5 16IMH G9 | |
| Média Intel Core Ultra 9 185H (48865 - 96463, n=19) | |
| HP Envy x360 2-in-1 16-ad0097nr | |
| Dell Inspiron 16 7640 2-in-1 | |
| Samsung Galaxy Book4 Ultra | |
| AIDA64 / CPU SHA3 | |
| Asus Zenbook S 16 UM5606-RK333W | |
| Lenovo IdeaPad Pro 5 16IMH G9 RTX 4050 | |
| Média Intel Core Ultra 9 185H (2394 - 4534, n=19) | |
| Lenovo IdeaPad Pro 5 16IMH G9 | |
| HP Envy x360 2-in-1 16-ad0097nr | |
| Dell Inspiron 16 7640 2-in-1 | |
| Samsung Galaxy Book4 Ultra | |
| AIDA64 / CPU Queen | |
| HP Envy x360 2-in-1 16-ad0097nr | |
| Lenovo IdeaPad Pro 5 16IMH G9 RTX 4050 | |
| Média Intel Core Ultra 9 185H (66785 - 95241, n=19) | |
| Dell Inspiron 16 7640 2-in-1 | |
| Lenovo IdeaPad Pro 5 16IMH G9 | |
| Asus Zenbook S 16 UM5606-RK333W | |
| Samsung Galaxy Book4 Ultra | |
| AIDA64 / FPU SinJulia | |
| Asus Zenbook S 16 UM5606-RK333W | |
| HP Envy x360 2-in-1 16-ad0097nr | |
| Lenovo IdeaPad Pro 5 16IMH G9 RTX 4050 | |
| Lenovo IdeaPad Pro 5 16IMH G9 | |
| Média Intel Core Ultra 9 185H (7255 - 11392, n=19) | |
| Dell Inspiron 16 7640 2-in-1 | |
| Samsung Galaxy Book4 Ultra | |
| AIDA64 / FPU Mandel | |
| Asus Zenbook S 16 UM5606-RK333W | |
| Lenovo IdeaPad Pro 5 16IMH G9 RTX 4050 | |
| HP Envy x360 2-in-1 16-ad0097nr | |
| Lenovo IdeaPad Pro 5 16IMH G9 | |
| Média Intel Core Ultra 9 185H (24004 - 48020, n=19) | |
| Dell Inspiron 16 7640 2-in-1 | |
| Samsung Galaxy Book4 Ultra | |
| AIDA64 / CPU ZLib | |
| Lenovo IdeaPad Pro 5 16IMH G9 RTX 4050 | |
| Média Intel Core Ultra 9 185H (678 - 1341, n=19) | |
| Lenovo IdeaPad Pro 5 16IMH G9 | |
| Asus Zenbook S 16 UM5606-RK333W | |
| Dell Inspiron 16 7640 2-in-1 | |
| Samsung Galaxy Book4 Ultra | |
| HP Envy x360 2-in-1 16-ad0097nr | |
| AIDA64 / FP64 Ray-Trace | |
| Asus Zenbook S 16 UM5606-RK333W | |
| HP Envy x360 2-in-1 16-ad0097nr | |
| Lenovo IdeaPad Pro 5 16IMH G9 RTX 4050 | |
| Lenovo IdeaPad Pro 5 16IMH G9 | |
| Média Intel Core Ultra 9 185H (4428 - 10078, n=19) | |
| Dell Inspiron 16 7640 2-in-1 | |
| Samsung Galaxy Book4 Ultra | |
| AIDA64 / CPU PhotoWorxx | |
| Lenovo IdeaPad Pro 5 16IMH G9 | |
| Lenovo IdeaPad Pro 5 16IMH G9 RTX 4050 | |
| Samsung Galaxy Book4 Ultra | |
| Asus Zenbook S 16 UM5606-RK333W | |
| Média Intel Core Ultra 9 185H (44547 - 53918, n=19) | |
| Dell Inspiron 16 7640 2-in-1 | |
| HP Envy x360 2-in-1 16-ad0097nr | |
Teste de estresse
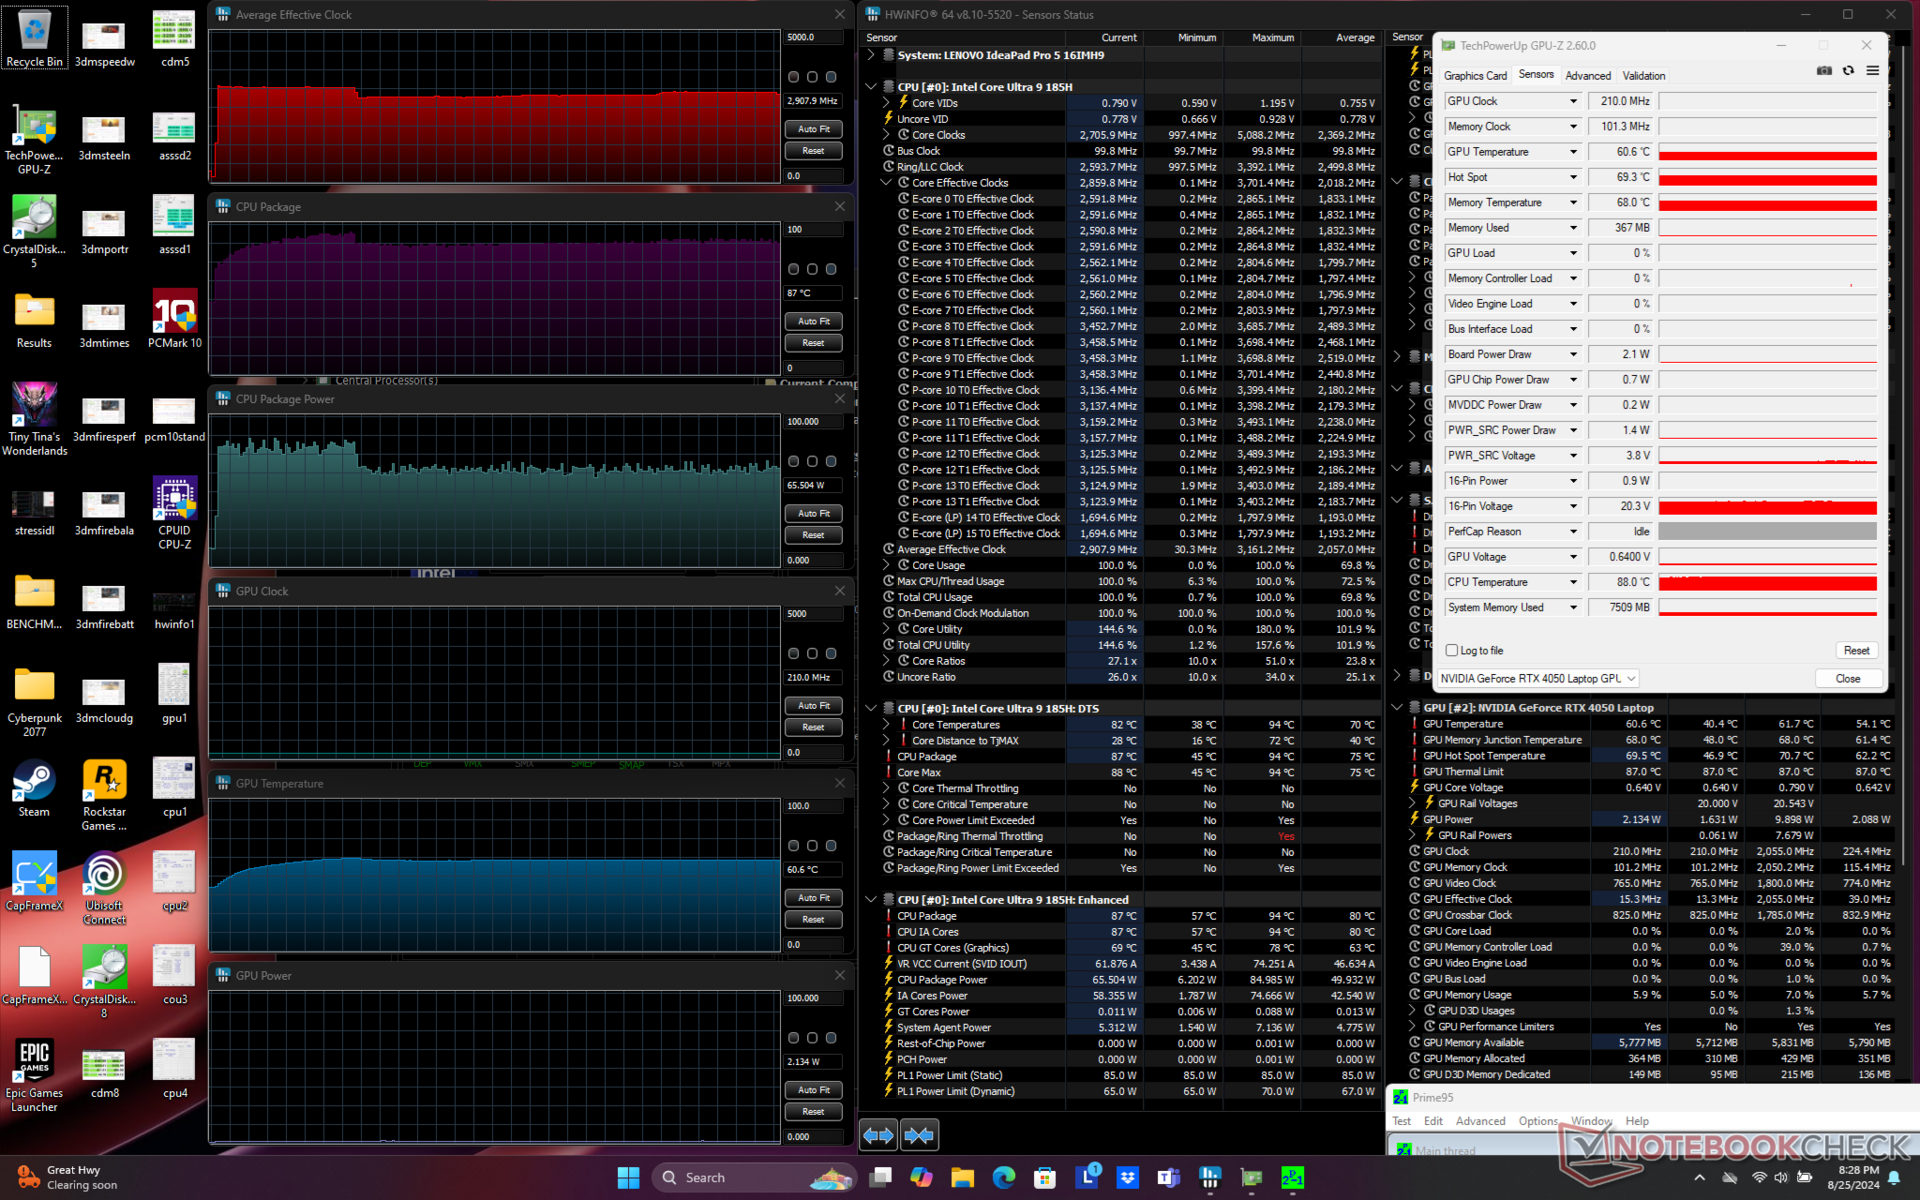
A CPU aumentaria para 3,2 GHz, 81 W e 94 °C ao iniciar o estresse do Prime95. Após cerca de um minuto, ela cairia para 2,8 GHz e 65 W para manter uma temperatura central ligeiramente mais fria de 87 C. A faixa alta de 80 C ainda é muito quente, o que sugere que o desempenho da CPU provavelmente teria sido mais rápido se o chassi fosse um pouco maior e com uma solução de resfriamento mais capaz.
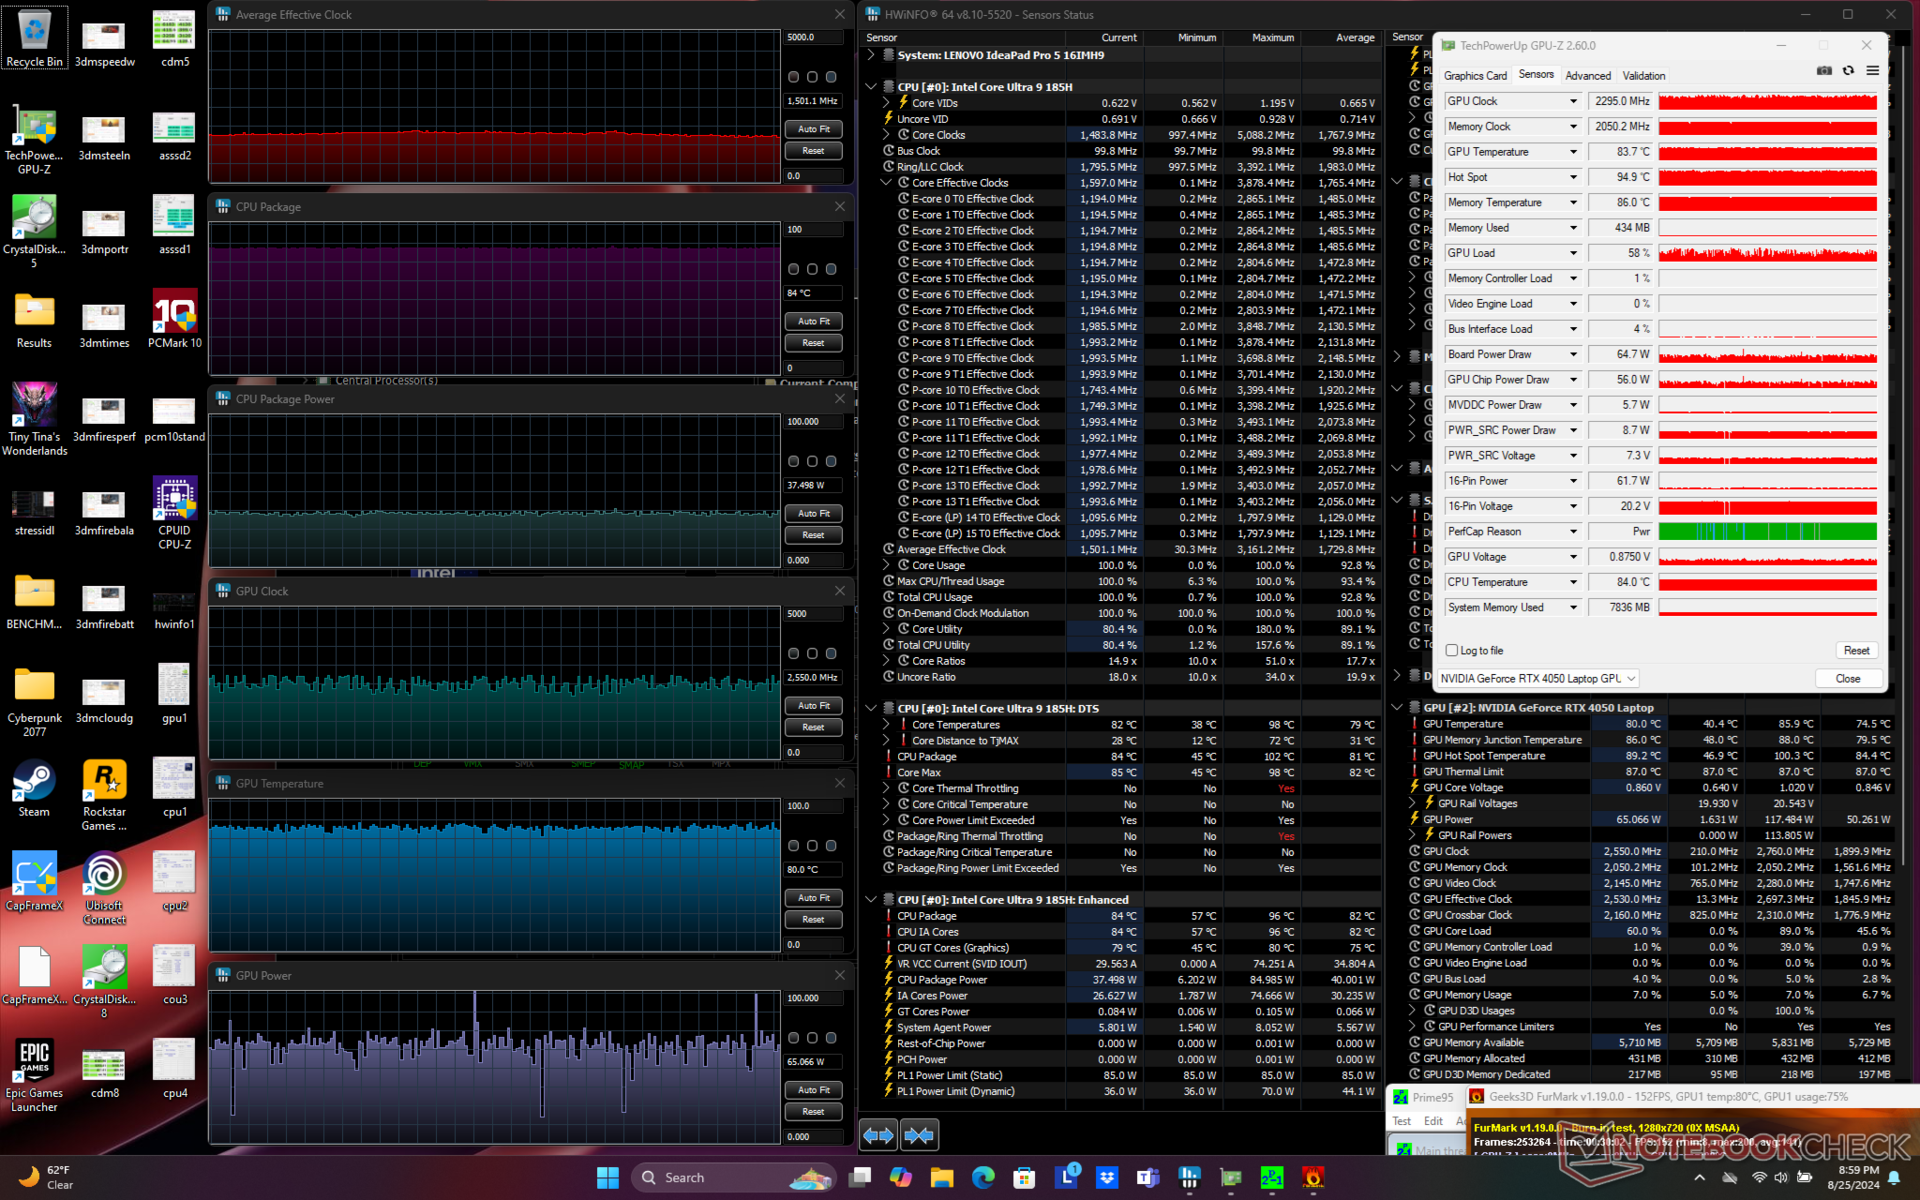
A GPU se estabilizaria em 2595 MHz, 82 C e 80 W ao executar o Cyberpunk 2077 para representar cargas típicas de jogos, em comparação com apenas 71 C e 75 C no Spectre x360 16 ou no Lenovo LOQ 15respectivamente, cada um com a mesma GPU RTX 4050. As temperaturas de funcionamento geralmente mais altas não são surpreendentes, dado o design fino do chassi, a CPU Core Ultra série H e a meta de TGP de 90 W relativamente alta.
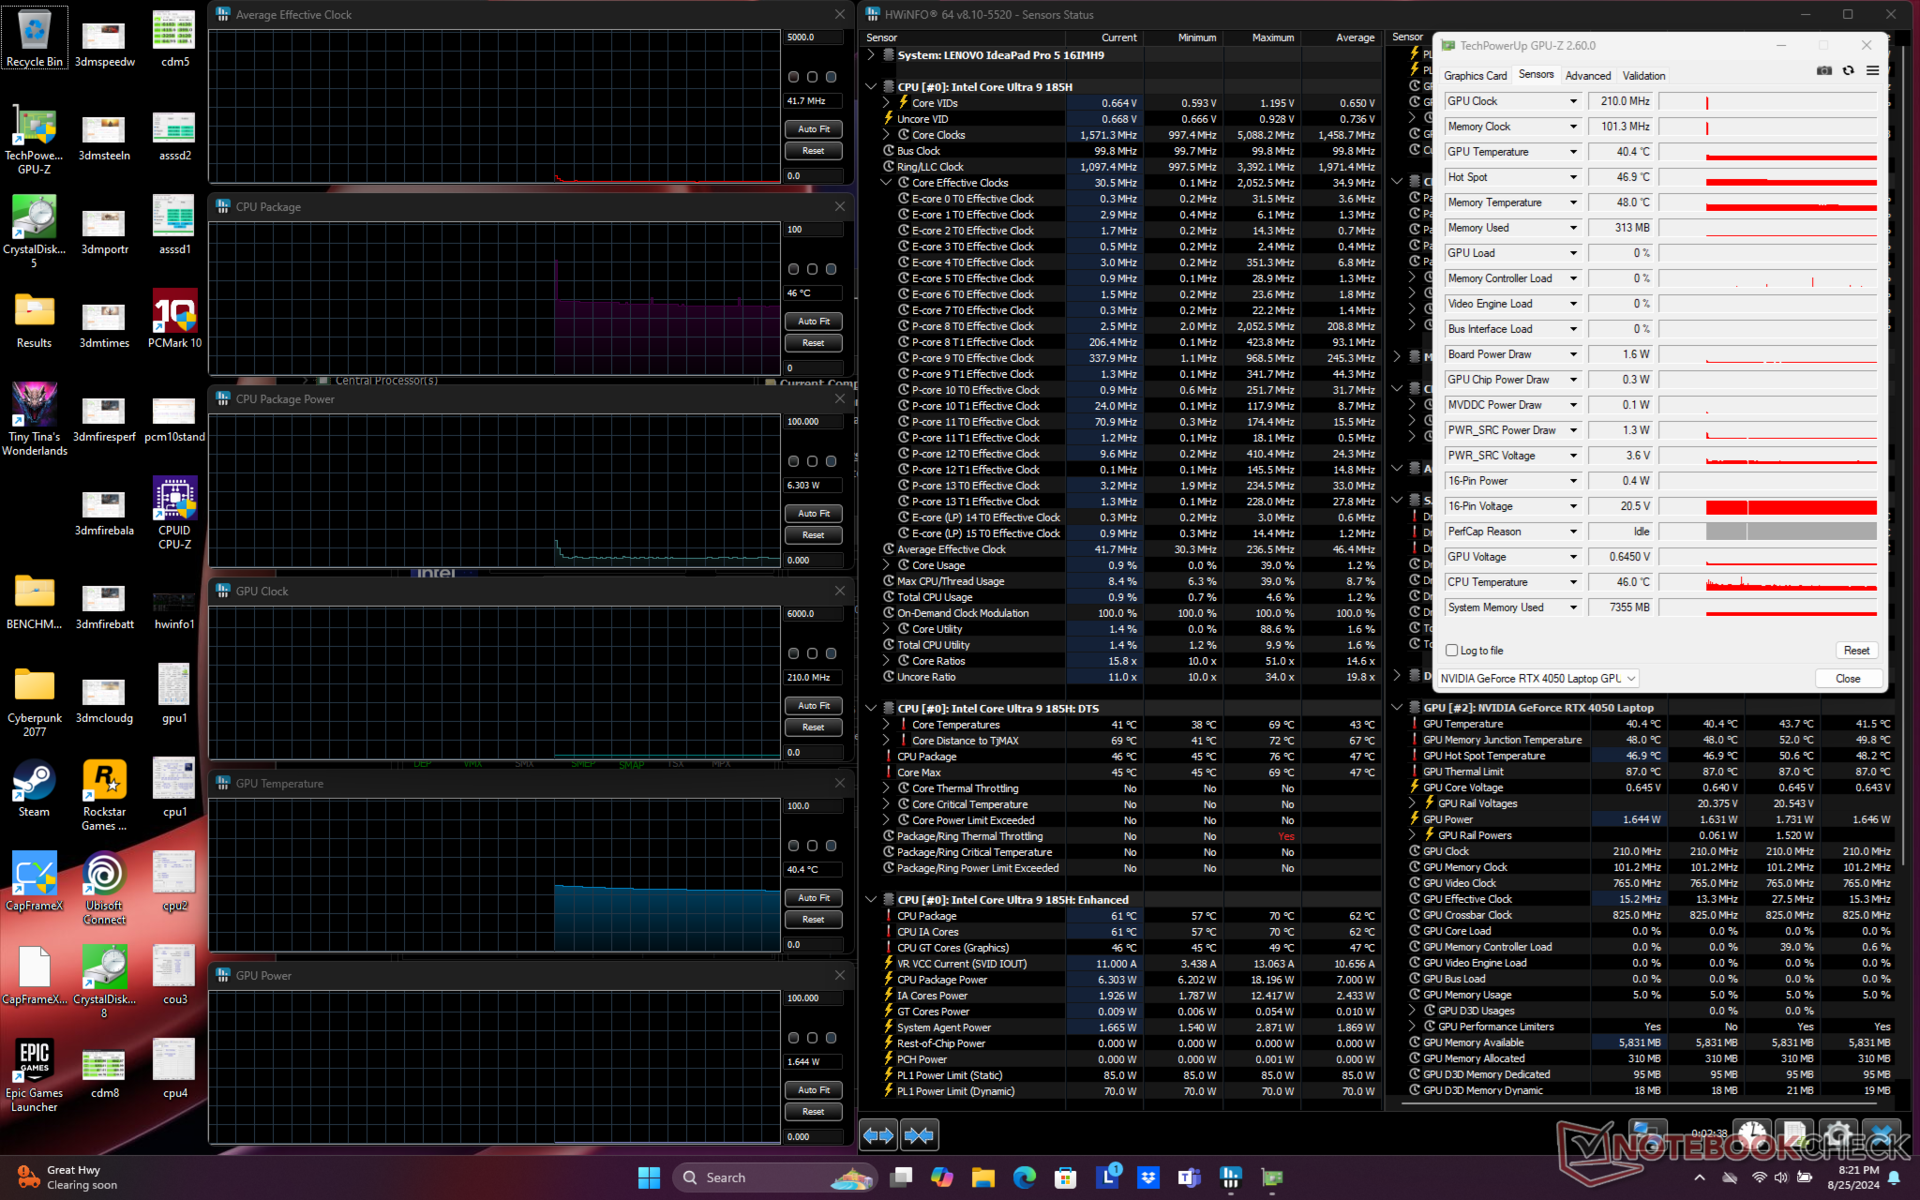
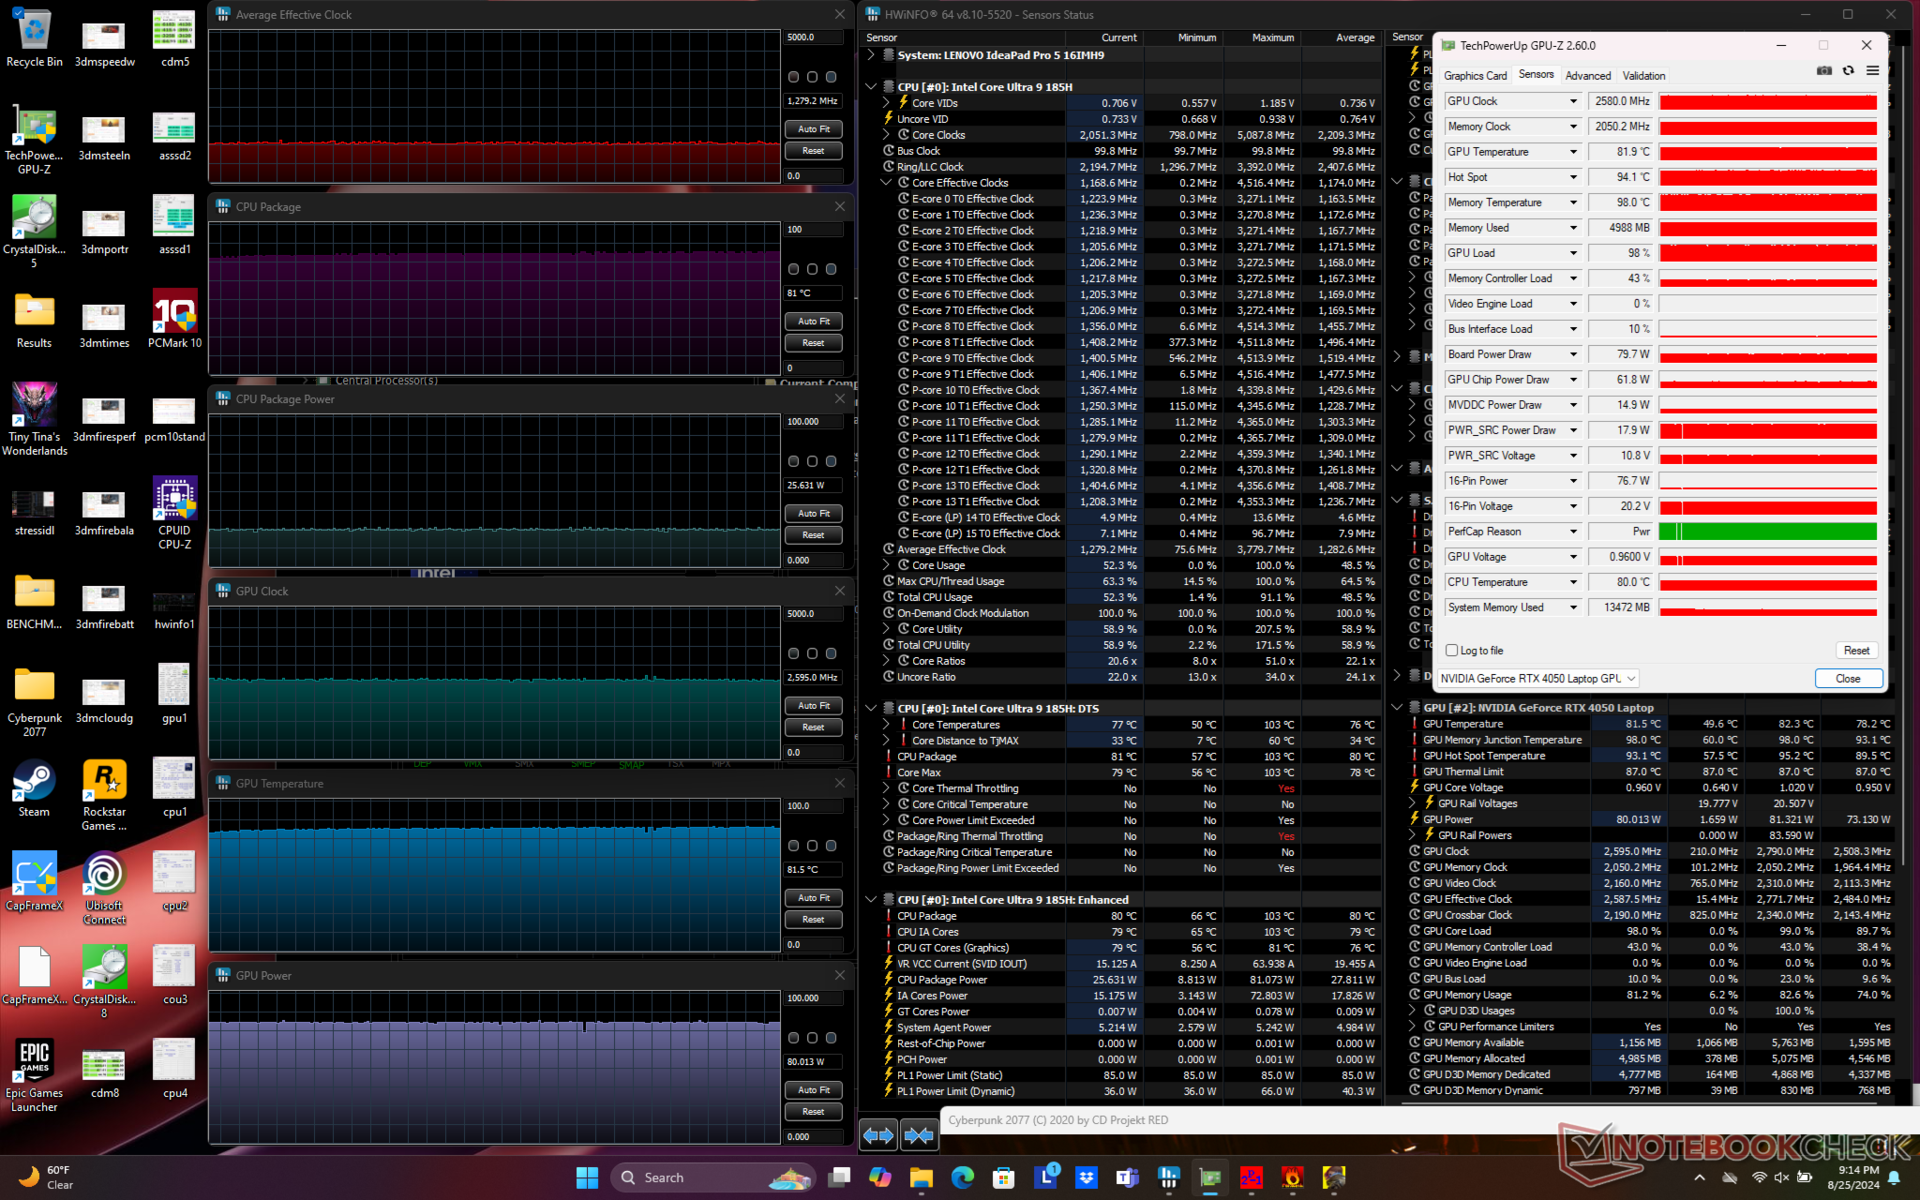
| Clock médio da CPU (GHz) | Clock da GPU (MHz) | Temperatura média da CPU (°C) | Temperatura média da GPU (°C) | |
| Sistema ocioso | -- | -- | 46 | 40 |
| Estresse do Prime95 | 2.9 | -- | 87 | 61 |
| Prime95 + FurMark Stress | 1.5 | 2295 - 2550 | 84 | 80 |
| Cyberpunk 2077 Stress | 1.3 | 2580 | 81 | 82 |
Desempenho do sistema
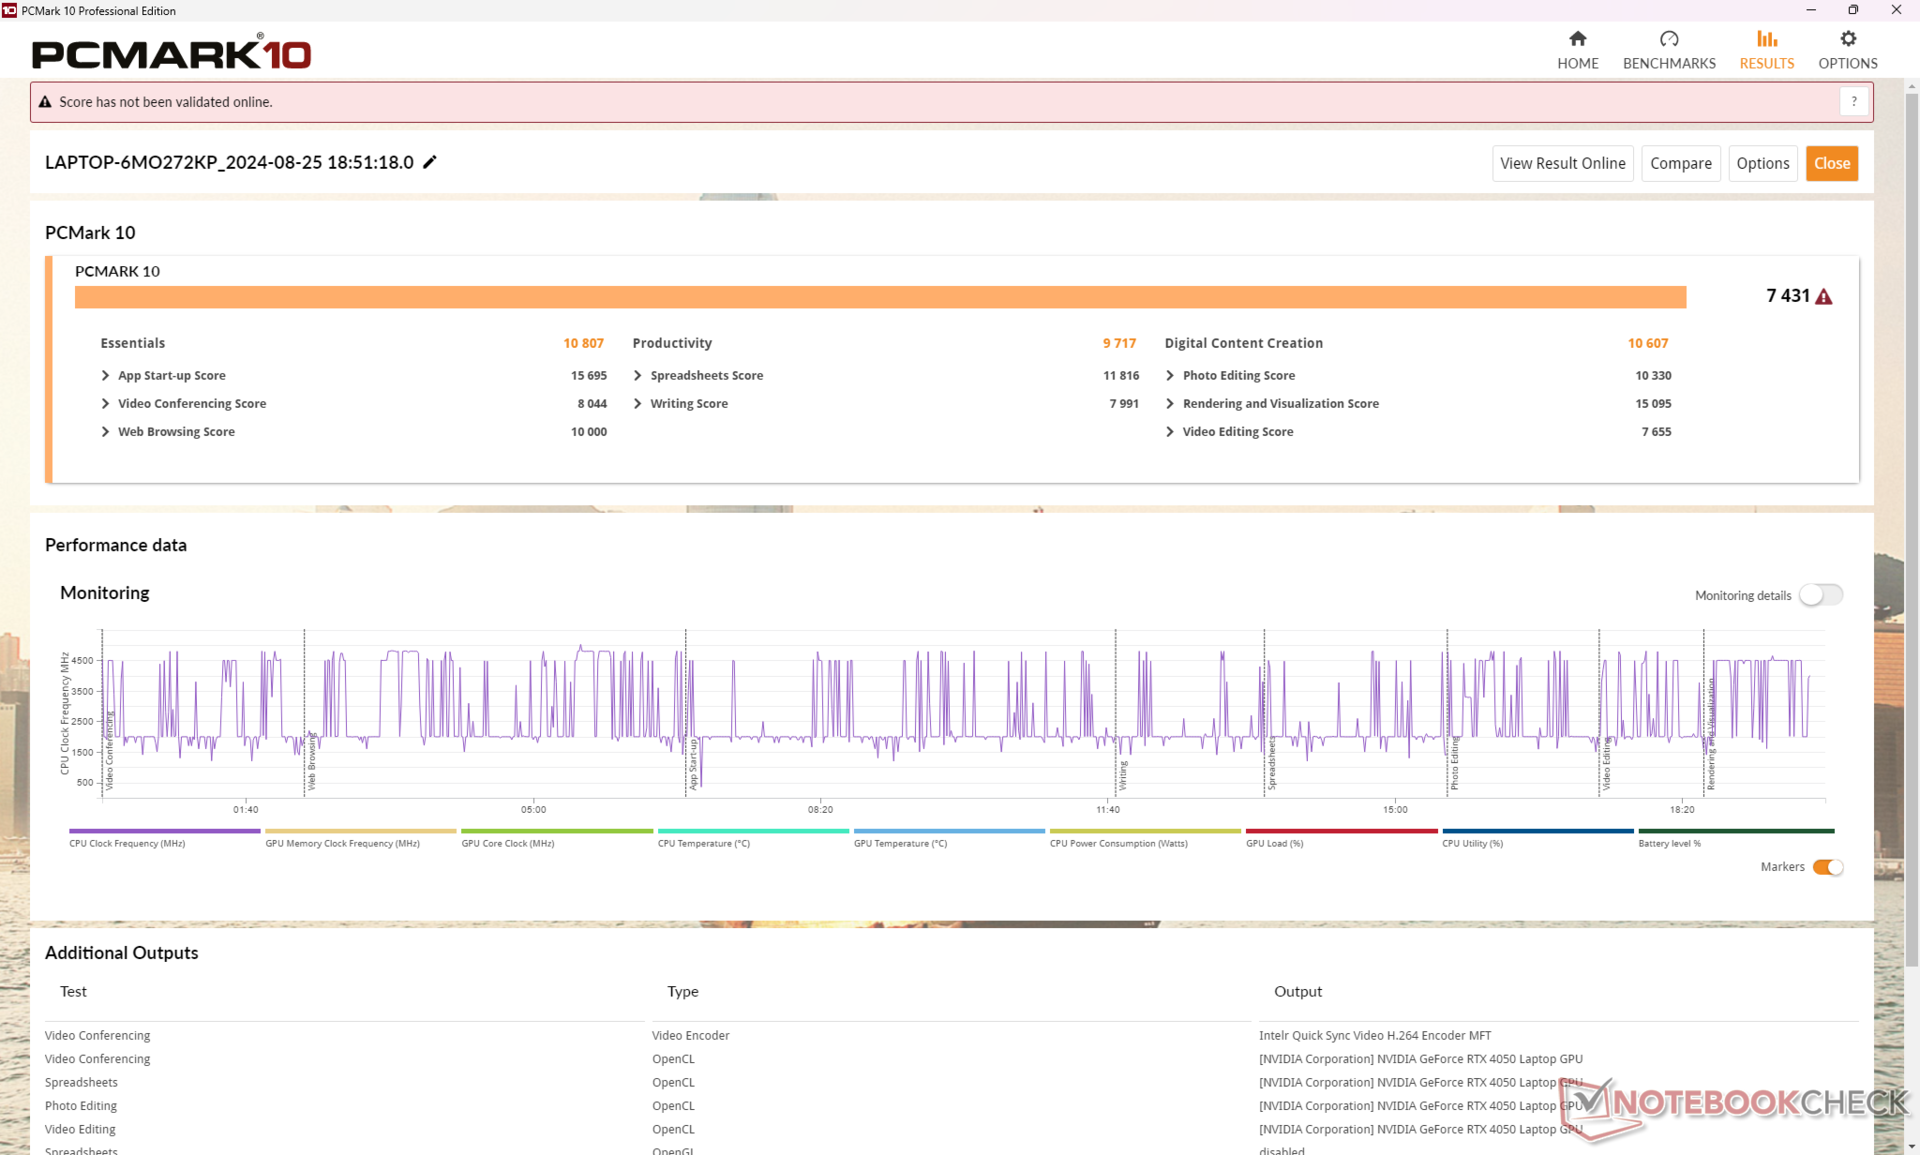
Os resultados do PCMark estão de acordo com outros notebooks multimídia de 16 polegadas com gráficos integrados mais lentos. O benchmark PCMark 10 geralmente faz um trabalho ruim ao distinguir entre laptops com dGPU e iGPU, especialmente se o MUX não for suportado.
CrossMark: Overall | Productivity | Creativity | Responsiveness
WebXPRT 3: Overall
WebXPRT 4: Overall
Mozilla Kraken 1.1: Total
| PCMark 10 / Score | |
| Média Intel Core Ultra 9 185H, NVIDIA GeForce RTX 4050 Laptop GPU (7431 - 7846, n=2) | |
| Asus Zenbook S 16 UM5606-RK333W | |
| Lenovo IdeaPad Pro 5 16IMH G9 RTX 4050 | |
| Lenovo IdeaPad Pro 5 16IMH G9 | |
| Dell Inspiron 16 7640 2-in-1 | |
| Samsung Galaxy Book4 Ultra | |
| HP Envy x360 2-in-1 16-ad0097nr | |
| PCMark 10 / Essentials | |
| Lenovo IdeaPad Pro 5 16IMH G9 | |
| Dell Inspiron 16 7640 2-in-1 | |
| Asus Zenbook S 16 UM5606-RK333W | |
| Lenovo IdeaPad Pro 5 16IMH G9 RTX 4050 | |
| Média Intel Core Ultra 9 185H, NVIDIA GeForce RTX 4050 Laptop GPU (10672 - 10807, n=2) | |
| HP Envy x360 2-in-1 16-ad0097nr | |
| Samsung Galaxy Book4 Ultra | |
| PCMark 10 / Productivity | |
| Asus Zenbook S 16 UM5606-RK333W | |
| HP Envy x360 2-in-1 16-ad0097nr | |
| Média Intel Core Ultra 9 185H, NVIDIA GeForce RTX 4050 Laptop GPU (9717 - 9986, n=2) | |
| Lenovo IdeaPad Pro 5 16IMH G9 RTX 4050 | |
| Samsung Galaxy Book4 Ultra | |
| Lenovo IdeaPad Pro 5 16IMH G9 | |
| Dell Inspiron 16 7640 2-in-1 | |
| PCMark 10 / Digital Content Creation | |
| Média Intel Core Ultra 9 185H, NVIDIA GeForce RTX 4050 Laptop GPU (10607 - 12301, n=2) | |
| Lenovo IdeaPad Pro 5 16IMH G9 RTX 4050 | |
| Lenovo IdeaPad Pro 5 16IMH G9 | |
| Asus Zenbook S 16 UM5606-RK333W | |
| Dell Inspiron 16 7640 2-in-1 | |
| Samsung Galaxy Book4 Ultra | |
| HP Envy x360 2-in-1 16-ad0097nr | |
| CrossMark / Overall | |
| Média Intel Core Ultra 9 185H, NVIDIA GeForce RTX 4050 Laptop GPU (1790 - 1811, n=2) | |
| Lenovo IdeaPad Pro 5 16IMH G9 RTX 4050 | |
| Asus Zenbook S 16 UM5606-RK333W | |
| Samsung Galaxy Book4 Ultra | |
| Dell Inspiron 16 7640 2-in-1 | |
| HP Envy x360 2-in-1 16-ad0097nr | |
| Lenovo IdeaPad Pro 5 16IMH G9 | |
| CrossMark / Productivity | |
| Média Intel Core Ultra 9 185H, NVIDIA GeForce RTX 4050 Laptop GPU (1700 - 1717, n=2) | |
| Lenovo IdeaPad Pro 5 16IMH G9 RTX 4050 | |
| Samsung Galaxy Book4 Ultra | |
| Dell Inspiron 16 7640 2-in-1 | |
| Asus Zenbook S 16 UM5606-RK333W | |
| HP Envy x360 2-in-1 16-ad0097nr | |
| Lenovo IdeaPad Pro 5 16IMH G9 | |
| CrossMark / Creativity | |
| Lenovo IdeaPad Pro 5 16IMH G9 RTX 4050 | |
| Média Intel Core Ultra 9 185H, NVIDIA GeForce RTX 4050 Laptop GPU (2037 - 2038, n=2) | |
| Asus Zenbook S 16 UM5606-RK333W | |
| Samsung Galaxy Book4 Ultra | |
| Dell Inspiron 16 7640 2-in-1 | |
| Lenovo IdeaPad Pro 5 16IMH G9 | |
| HP Envy x360 2-in-1 16-ad0097nr | |
| CrossMark / Responsiveness | |
| Samsung Galaxy Book4 Ultra | |
| Média Intel Core Ultra 9 185H, NVIDIA GeForce RTX 4050 Laptop GPU (1419 - 1493, n=2) | |
| Lenovo IdeaPad Pro 5 16IMH G9 RTX 4050 | |
| Asus Zenbook S 16 UM5606-RK333W | |
| Dell Inspiron 16 7640 2-in-1 | |
| HP Envy x360 2-in-1 16-ad0097nr | |
| Lenovo IdeaPad Pro 5 16IMH G9 | |
| WebXPRT 3 / Overall | |
| Asus Zenbook S 16 UM5606-RK333W | |
| Lenovo IdeaPad Pro 5 16IMH G9 RTX 4050 | |
| HP Envy x360 2-in-1 16-ad0097nr | |
| Média Intel Core Ultra 9 185H, NVIDIA GeForce RTX 4050 Laptop GPU (293 - 301, n=2) | |
| Lenovo IdeaPad Pro 5 16IMH G9 | |
| Dell Inspiron 16 7640 2-in-1 | |
| Samsung Galaxy Book4 Ultra | |
| WebXPRT 4 / Overall | |
| Lenovo IdeaPad Pro 5 16IMH G9 RTX 4050 | |
| Média Intel Core Ultra 9 185H, NVIDIA GeForce RTX 4050 Laptop GPU (268 - 271, n=2) | |
| Asus Zenbook S 16 UM5606-RK333W | |
| Lenovo IdeaPad Pro 5 16IMH G9 | |
| Samsung Galaxy Book4 Ultra | |
| Dell Inspiron 16 7640 2-in-1 | |
| HP Envy x360 2-in-1 16-ad0097nr | |
| Mozilla Kraken 1.1 / Total | |
| HP Envy x360 2-in-1 16-ad0097nr | |
| Dell Inspiron 16 7640 2-in-1 | |
| Lenovo IdeaPad Pro 5 16IMH G9 | |
| Média Intel Core Ultra 9 185H, NVIDIA GeForce RTX 4050 Laptop GPU (498 - 512, n=2) | |
| Lenovo IdeaPad Pro 5 16IMH G9 RTX 4050 | |
| Asus Zenbook S 16 UM5606-RK333W | |
| Samsung Galaxy Book4 Ultra | |
* ... menor é melhor
| PCMark 10 Score | 7431 pontos | |
Ajuda | ||
| AIDA64 / Memory Copy | |
| Lenovo IdeaPad Pro 5 16IMH G9 RTX 4050 | |
| Lenovo IdeaPad Pro 5 16IMH G9 | |
| Samsung Galaxy Book4 Ultra | |
| Asus Zenbook S 16 UM5606-RK333W | |
| Média Intel Core Ultra 9 185H (69929 - 95718, n=19) | |
| Dell Inspiron 16 7640 2-in-1 | |
| HP Envy x360 2-in-1 16-ad0097nr | |
| AIDA64 / Memory Read | |
| Asus Zenbook S 16 UM5606-RK333W | |
| Samsung Galaxy Book4 Ultra | |
| Lenovo IdeaPad Pro 5 16IMH G9 RTX 4050 | |
| Lenovo IdeaPad Pro 5 16IMH G9 | |
| Média Intel Core Ultra 9 185H (64619 - 87768, n=19) | |
| Dell Inspiron 16 7640 2-in-1 | |
| HP Envy x360 2-in-1 16-ad0097nr | |
| AIDA64 / Memory Write | |
| Asus Zenbook S 16 UM5606-RK333W | |
| HP Envy x360 2-in-1 16-ad0097nr | |
| Dell Inspiron 16 7640 2-in-1 | |
| Lenovo IdeaPad Pro 5 16IMH G9 | |
| Samsung Galaxy Book4 Ultra | |
| Lenovo IdeaPad Pro 5 16IMH G9 RTX 4050 | |
| Média Intel Core Ultra 9 185H (51114 - 93871, n=19) | |
| AIDA64 / Memory Latency | |
| Média Intel Core Ultra 9 185H (121.4 - 259, n=19) | |
| Dell Inspiron 16 7640 2-in-1 | |
| Samsung Galaxy Book4 Ultra | |
| Lenovo IdeaPad Pro 5 16IMH G9 | |
| Lenovo IdeaPad Pro 5 16IMH G9 RTX 4050 | |
| HP Envy x360 2-in-1 16-ad0097nr | |
| Asus Zenbook S 16 UM5606-RK333W | |
* ... menor é melhor
Latência DPC
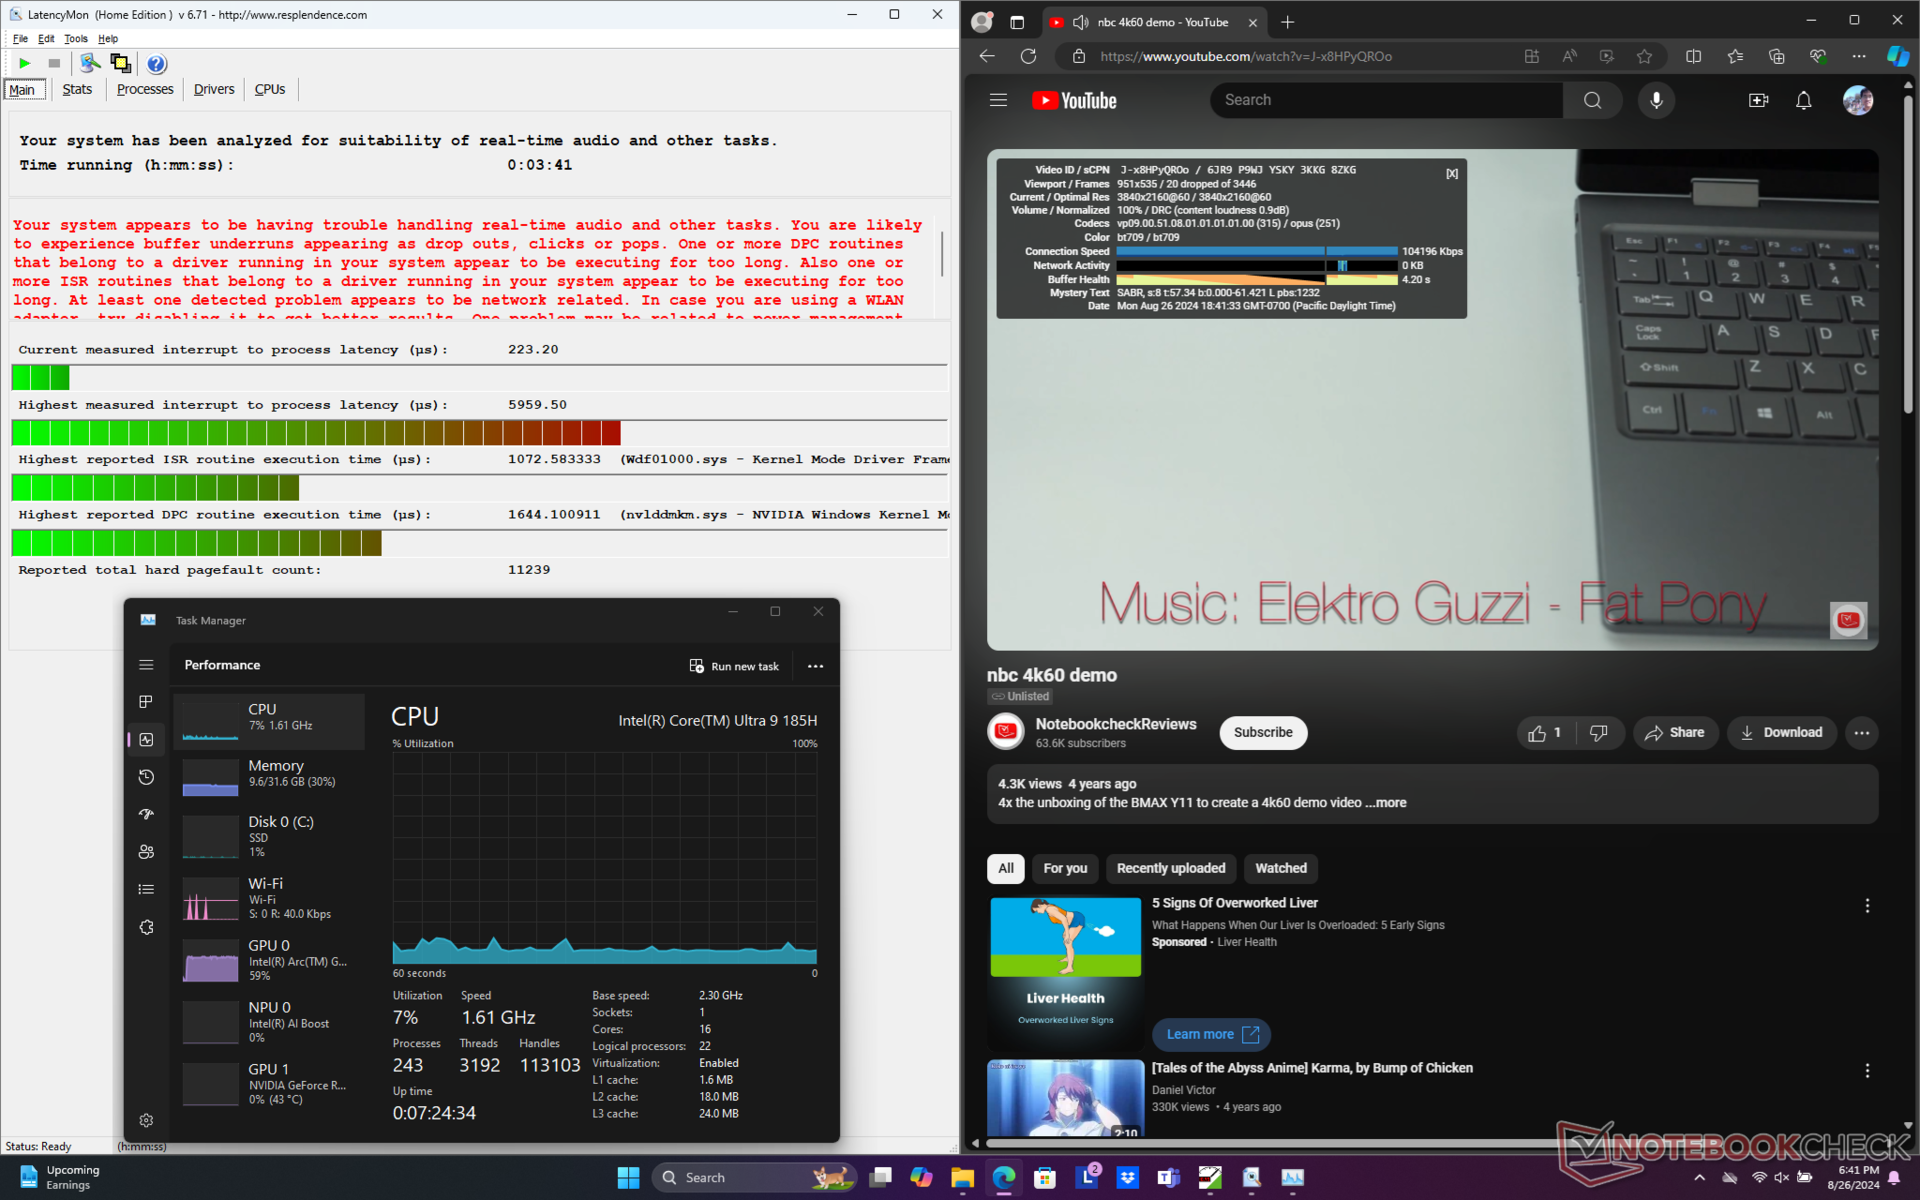
O LatencyMon revela problemas de DPC e reprodução imperfeita de vídeo 4K a 60 FPS. Conseguimos registrar 20 quadros perdidos em um intervalo de tempo de um minuto, que se manifestam como quadros perdidos durante o streaming de vídeo. É decepcionante ver isso, pois nossa configuração de iGPU não apresentaria quedas de quadros em comparação.

| DPC Latencies / LatencyMon - interrupt to process latency (max), Web, Youtube, Prime95 | |
| Lenovo IdeaPad Pro 5 16IMH G9 RTX 4050 | |
| HP Envy x360 2-in-1 16-ad0097nr | |
| Dell Inspiron 16 7640 2-in-1 | |
| Lenovo IdeaPad Pro 5 16IMH G9 | |
| Samsung Galaxy Book4 Ultra | |
* ... menor é melhor
Dispositivos de armazenamento
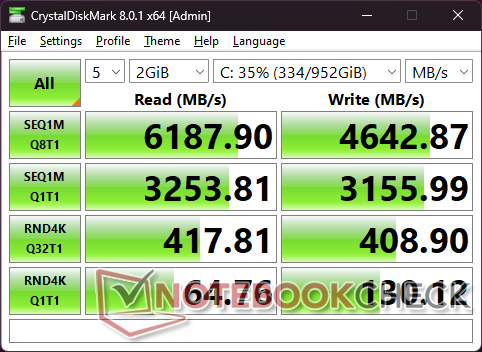
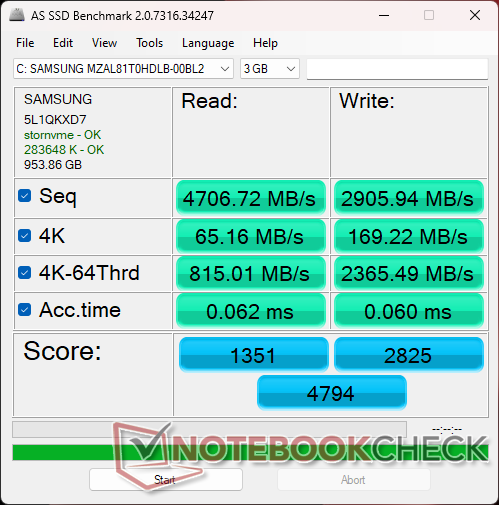
O sistema é fornecido com o mesmo Samsung PM9C1a MZAL81T0HDLB da Samsung, como na versão iGPU. Curiosamente, ele também apresenta as mesmas peculiaridades de taxa de transferência, em que o desempenho saltaria de 5100 MB/s para 6100 MB/s após alguns minutos em nosso teste de loop do DiskSpd. A maioria das outras unidades, como a Samsung PM9A1 no Galaxy Book4 Ultrapermaneceria estável do início ao fim.
Uma almofada térmica está incluída no SSD principal para ajudar a dissipar o calor na tampa de metal embaixo.

* ... menor é melhor
Disk Throttling: DiskSpd Read Loop, Queue Depth 8
Desempenho da GPU - A diferença de 90 W
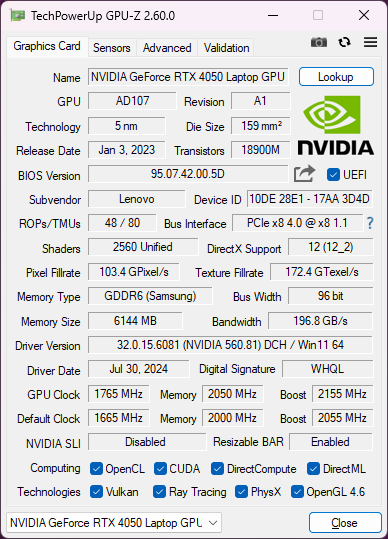
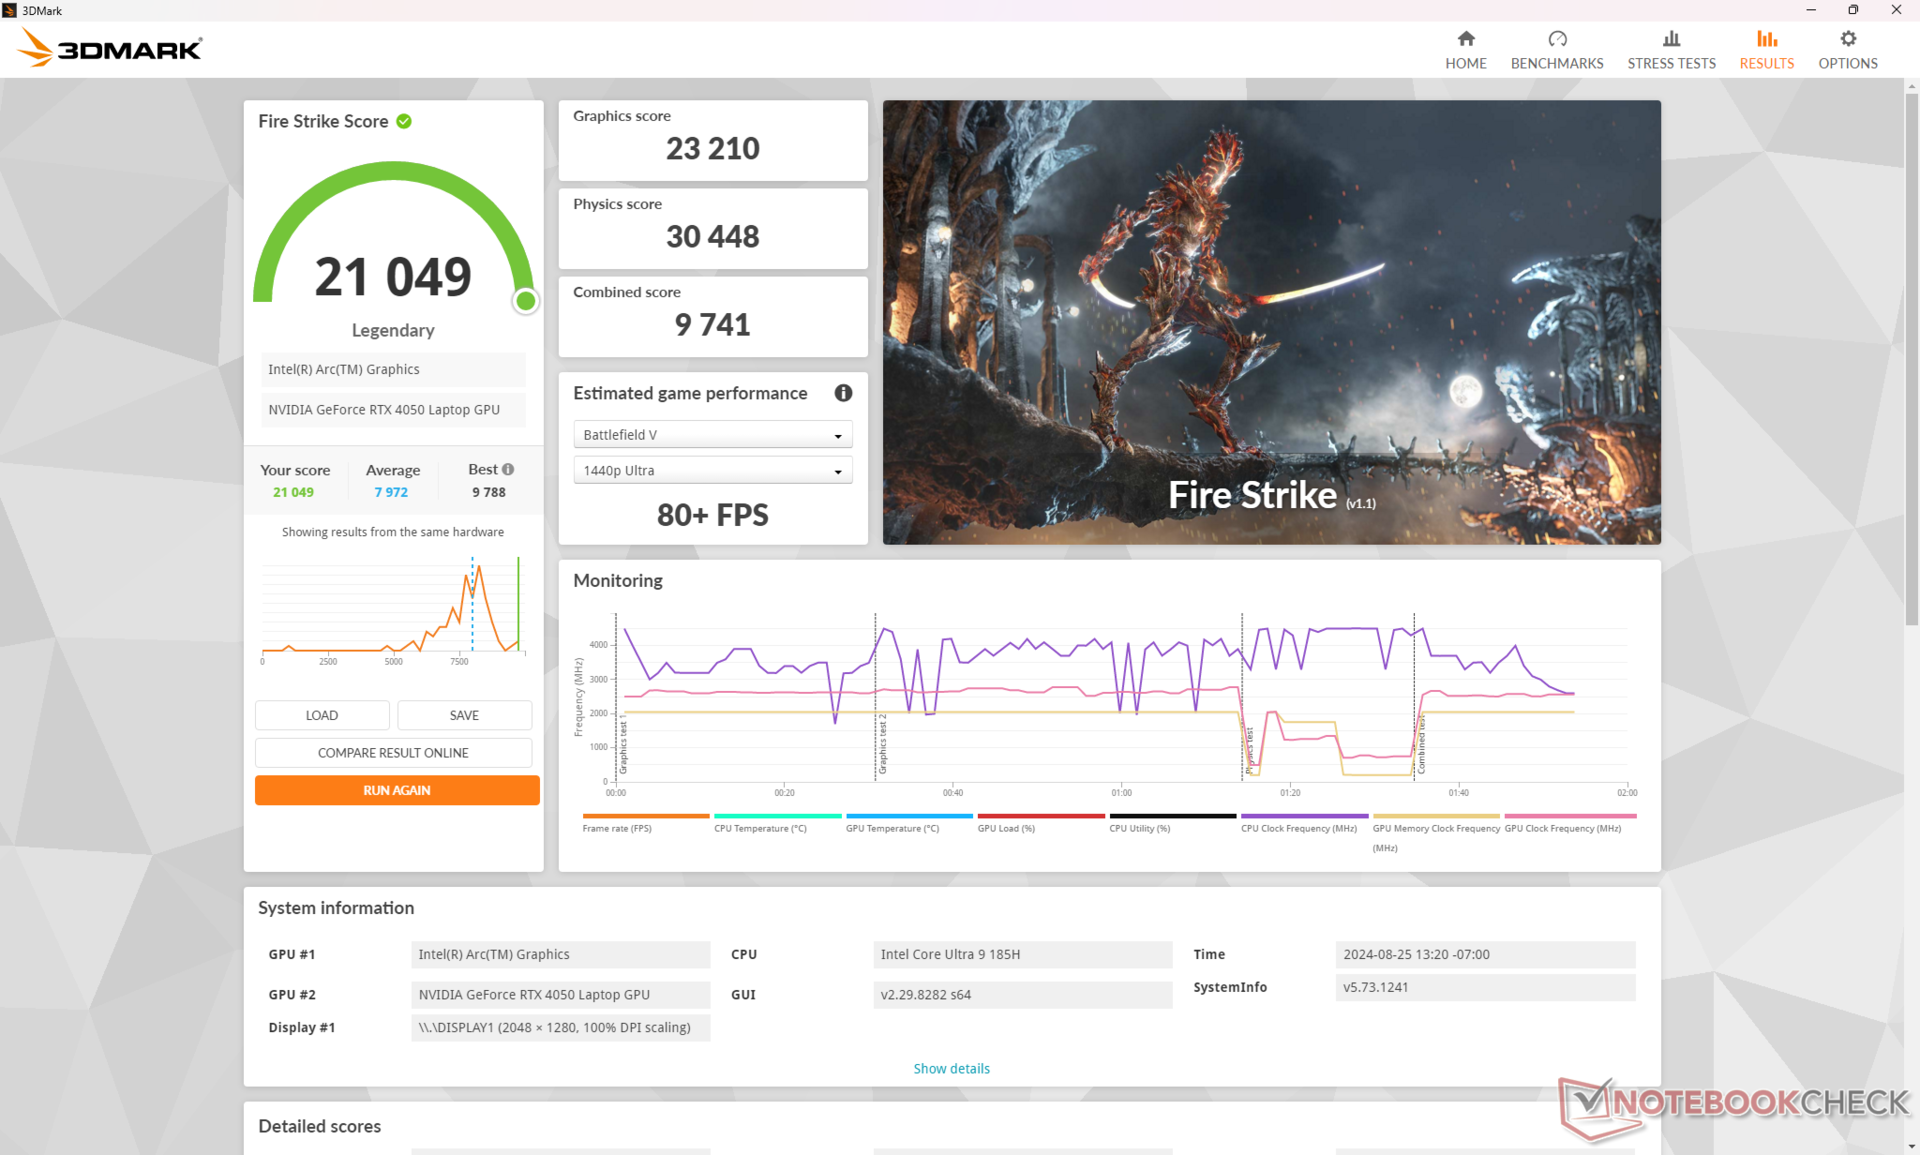
O 90 W GeForce RTX 4050 Tem como meta um teto de TGP mais alto do que em muitos outros notebooks que não são para jogos com a mesma opção de GPU. A RTX 4050 no Spectre x360 16 e no Samsung Galaxy Book3 Ultra 16por exemplo, têm valores de TGP mais baixos, de apenas 55 W e 60 W, respectivamente. Como resultado, a GPU em nosso IdeaPad Pro 5 16 G9 pode ser até 10% mais rápida do que a média dos notebooks em nosso banco de dados com a mesma GPU RTX 4050. Essa diferença é suficiente para superar de forma consistente até mesmo a RTX 4060 de 70 W do concorrente Inspiron 16 Plus 7640 de acordo com os benchmarks do 3DMark.
Os usuários que fazem upgrade do antigo GeForce RTX 3050que estava na última geração do IdeaPad Pro 5 16 G7 ou G8, podem esperar um aumento significativo de 70 a 80% no desempenho com a RTX 4050. Os benefícios são maiores, de 2x a 2,5x, quando se faz o upgrade do configuração integrada Arc 8 integrada.
| Perfil de potência | Pontuação gráfica | Pontuação de física | Pontuação combinada |
| Modo de desempenho | 23210 | 30448 | 9741 |
| Modo equilibrado | 21032 (-9%) | 30008 (-1%) | 8158 (-16%) |
| Energia da bateria | 19718 (-15%) | 30484 (-0%) | 8216 (-16%) |
A execução no modo Balanced em vez do modo Performance afeta o desempenho gráfico em até 10%, enquanto o desempenho da CPU permanece relativamente o mesmo, de acordo com nossa tabela de resultados Fire Strike acima. A execução com a energia da bateria não afeta o desempenho do processador tanto quanto esperávamos inicialmente.


| 3DMark 11 Performance | 27986 pontos | |
| 3DMark Cloud Gate Standard Score | 60960 pontos | |
| 3DMark Fire Strike Score | 21049 pontos | |
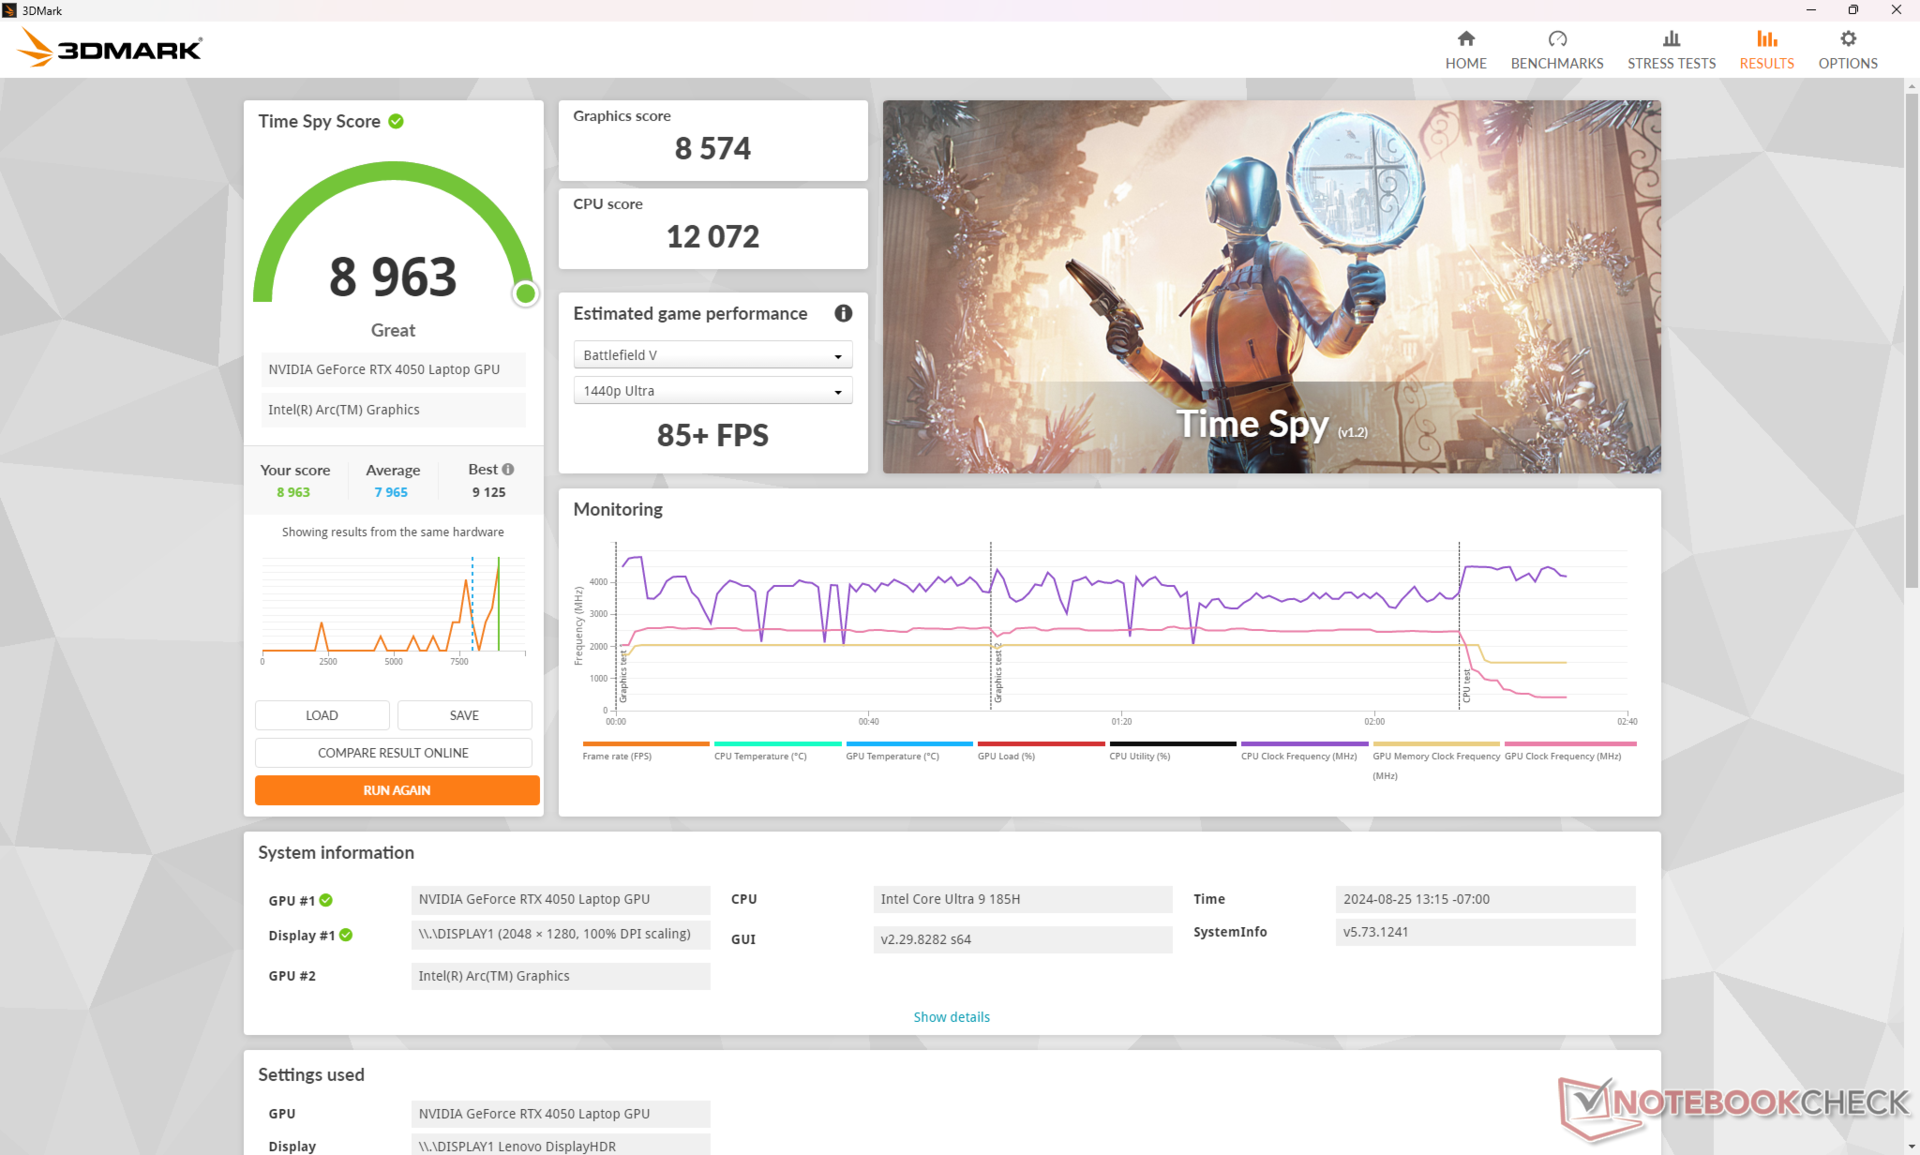
| 3DMark Time Spy Score | 8963 pontos | |
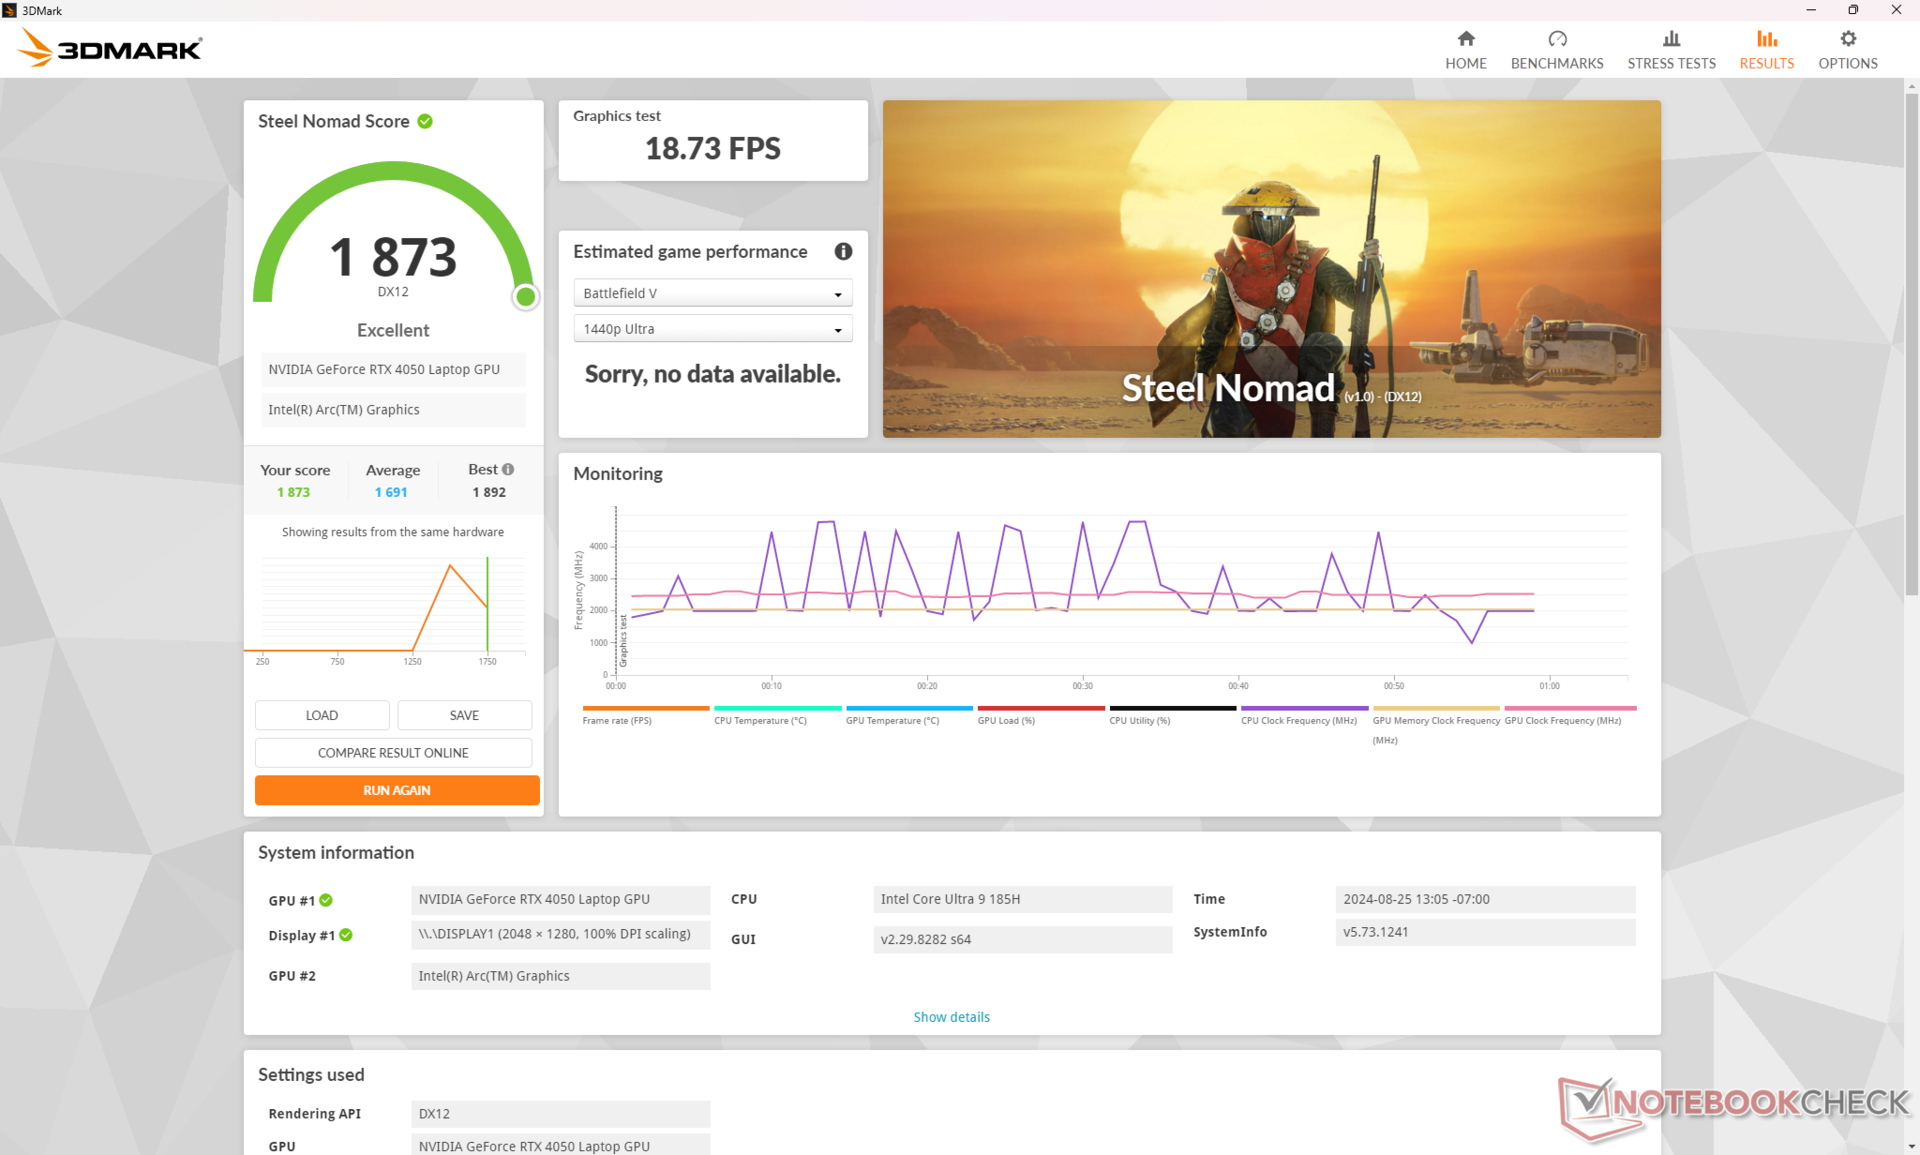
| 3DMark Steel Nomad Score | 1873 pontos | |
Ajuda | ||
* ... menor é melhor
Desempenho em jogos
Embora não seja explicitamente um laptop para jogos, o RTX 4050 de 90 W permite que o Lenovo execute jogos melhor do que o esperado. De fato, títulos como Final Fantasy XV, Cyberpunk 2077, Tiny Tina's Wonderlands e outros rodam cerca de 25 a 30% mais rápido do que no HP Spectre x360 16 com a mesma GPU RTX 4050. Nosso sistema também supera o Inspiron 16 Plus 7640 e sua GPU RTX 4060 de 70 W, conforme previsto pelas pontuações do 3DMark acima. Nesse cenário, a resolução nativa mais baixa do painel OLED é benéfica para uma experiência de jogo mais suave do que o painel IPS de 1600p.
| GTA V - 1920x1080 Highest Settings possible AA:4xMSAA + FX AF:16x | |
| Lenovo IdeaPad Pro 5 16IMH G9 RTX 4050 | |
| Samsung Galaxy Book4 Ultra | |
| Asus Zenbook S 16 UM5606-RK333W | |
| Lenovo IdeaPad Pro 5 16IMH G9 | |
| Final Fantasy XV Benchmark - 1920x1080 High Quality | |
| Lenovo IdeaPad Pro 5 16IMH G9 RTX 4050 | |
| Samsung Galaxy Book4 Ultra | |
| Lenovo IdeaPad Pro 5 16IMH G9 | |
| Asus Zenbook S 16 UM5606-RK333W | |
| Dell Inspiron 16 7640 2-in-1 | |
| HP Envy x360 2-in-1 16-ad0097nr | |
| Strange Brigade - 1920x1080 ultra AA:ultra AF:16 | |
| Lenovo IdeaPad Pro 5 16IMH G9 RTX 4050 | |
| Samsung Galaxy Book4 Ultra | |
| Lenovo IdeaPad Pro 5 16IMH G9 | |
| Asus Zenbook S 16 UM5606-RK333W | |
| Dell Inspiron 16 7640 2-in-1 | |
| HP Envy x360 2-in-1 16-ad0097nr | |
| Dota 2 Reborn - 1920x1080 ultra (3/3) best looking | |
| Lenovo IdeaPad Pro 5 16IMH G9 RTX 4050 | |
| Samsung Galaxy Book4 Ultra | |
| Lenovo IdeaPad Pro 5 16IMH G9 | |
| Dell Inspiron 16 7640 2-in-1 | |
| HP Envy x360 2-in-1 16-ad0097nr | |
| Asus Zenbook S 16 UM5606-RK333W | |
Cyberpunk 2077 ultra FPS Chart
| baixo | média | alto | ultra | |
|---|---|---|---|---|
| GTA V (2015) | 183 | 178.4 | 166.9 | 98.7 |
| Dota 2 Reborn (2015) | 167.2 | 151.9 | 145.9 | 137.4 |
| Final Fantasy XV Benchmark (2018) | 171.3 | 123.3 | 87.8 | |
| X-Plane 11.11 (2018) | 127.7 | 114.1 | 89 | |
| Far Cry 5 (2018) | 155 | 129 | 120 | 113 |
| Strange Brigade (2018) | 411 | 204 | 172.9 | 149.4 |
| Tiny Tina's Wonderlands (2022) | 181.6 | 149.2 | 96 | 74 |
| F1 22 (2022) | 211 | 204 | 156.6 | 54.1 |
| Baldur's Gate 3 (2023) | 110.1 | 91.4 | 81.3 | 78.6 |
| Cyberpunk 2077 2.2 Phantom Liberty (2023) | 103.1 | 82.2 | 69.4 | 59.8 |
Emissões - Alto e quente sob carga
Ruído do sistema
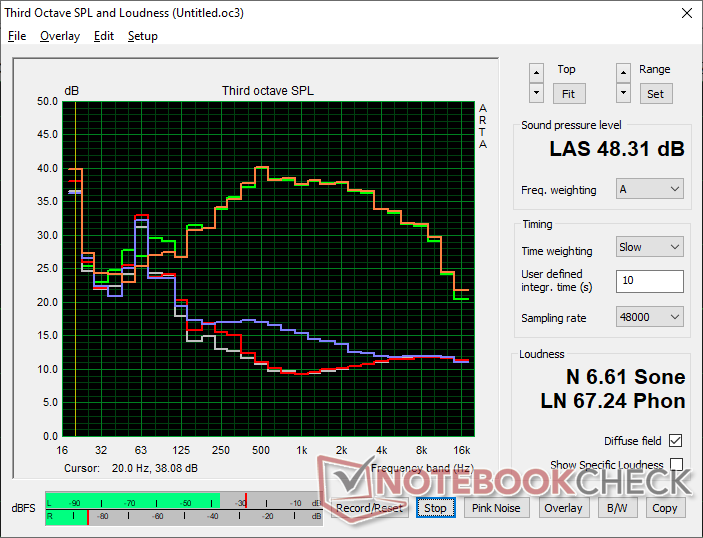
O ruído da ventoinha permanece silencioso ao executar cargas pouco exigentes, como navegadores ou Word, sem nenhum comportamento irritante de pulsação ou pico. Ao executar cargas mais pesadas, como o 3DMark 06, o ruído da ventoinha se mantém estável em torno de 26 dB(A) durante a maior parte da primeira cena do benchmark, antes de aumentar para quase 46 dB(A), que é próximo ao que registramos na configuração da iGPU.
Durante os jogos, o ruído da ventoinha chegava a pouco mais de 48 dB(A), sendo alguns decibéis mais alto do que na configuração da iGPU. Isso também é mais alto do que os notebooks de 16 polegadas da concorrência por margens decentes, incluindo o Inspiron 16 7640 2 em 1 ou o Samsung Galaxy Book4 Ultra. Portanto, a opção dGPU não é necessariamente mais barulhenta do que a opção iGPU até que o senhor comece a introduzir cargas muito mais exigentes.
Barulho
| Ocioso |
| 23 / 23.3 / 23.3 dB |
| Carga |
| 45.7 / 48.4 dB |
 | ||
30 dB silencioso 40 dB(A) audível 50 dB(A) ruidosamente alto |
||
min: | ||
| Lenovo IdeaPad Pro 5 16IMH G9 RTX 4050 NVIDIA GeForce RTX 4050 Laptop GPU, Ultra 9 185H, Samsung PM9C1a MZAL81T0HDLB | Lenovo IdeaPad Pro 5 16IMH G9 Arc 8-Core, Ultra 7 155H, Samsung PM9C1a MZAL81T0HDLB | Dell Inspiron 16 7640 2-in-1 Arc 8-Core, Ultra 7 155H, Micron 2550 1TB | Asus Zenbook S 16 UM5606-RK333W Radeon 890M, Ryzen AI 9 HX 370, Micron 2400 MTFDKBA1T0QFM | HP Envy x360 2-in-1 16-ad0097nr Radeon 780M, R7 8840HS, KIOXIA BG5 KBG50ZNV1T02 | Samsung Galaxy Book4 Ultra NVIDIA GeForce RTX 4050 Laptop GPU, Ultra 7 155H, Samsung PM9A1 MZVL2512HCJQ | |
|---|---|---|---|---|---|---|
| Noise | -4% | 1% | 5% | 10% | 2% | |
| desligado / ambiente * | 23 | 24.1 -5% | 22.9 -0% | 24.7 -7% | 22.9 -0% | 24.2 -5% |
| Idle Minimum * | 23 | 24.1 -5% | 22.9 -0% | 24.7 -7% | 23 -0% | 24.2 -5% |
| Idle Average * | 23.3 | 24.1 -3% | 22.9 2% | 24.7 -6% | 23 1% | 24.2 -4% |
| Idle Maximum * | 23.3 | 28.2 -21% | 25 -7% | 26.4 -13% | 23 1% | 24.2 -4% |
| Load Average * | 45.7 | 44.4 3% | 45.1 1% | 35.7 22% | 23.8 48% | 37.9 17% |
| Cyberpunk 2077 ultra * | 48.4 | 44.9 7% | 36.8 24% | |||
| Load Maximum * | 48.4 | 44.4 8% | 44.9 7% | 36.8 24% | 43.8 10% | 41.7 14% |
| Witcher 3 ultra * | 36.5 | 43.8 | 41.7 |
* ... menor é melhor
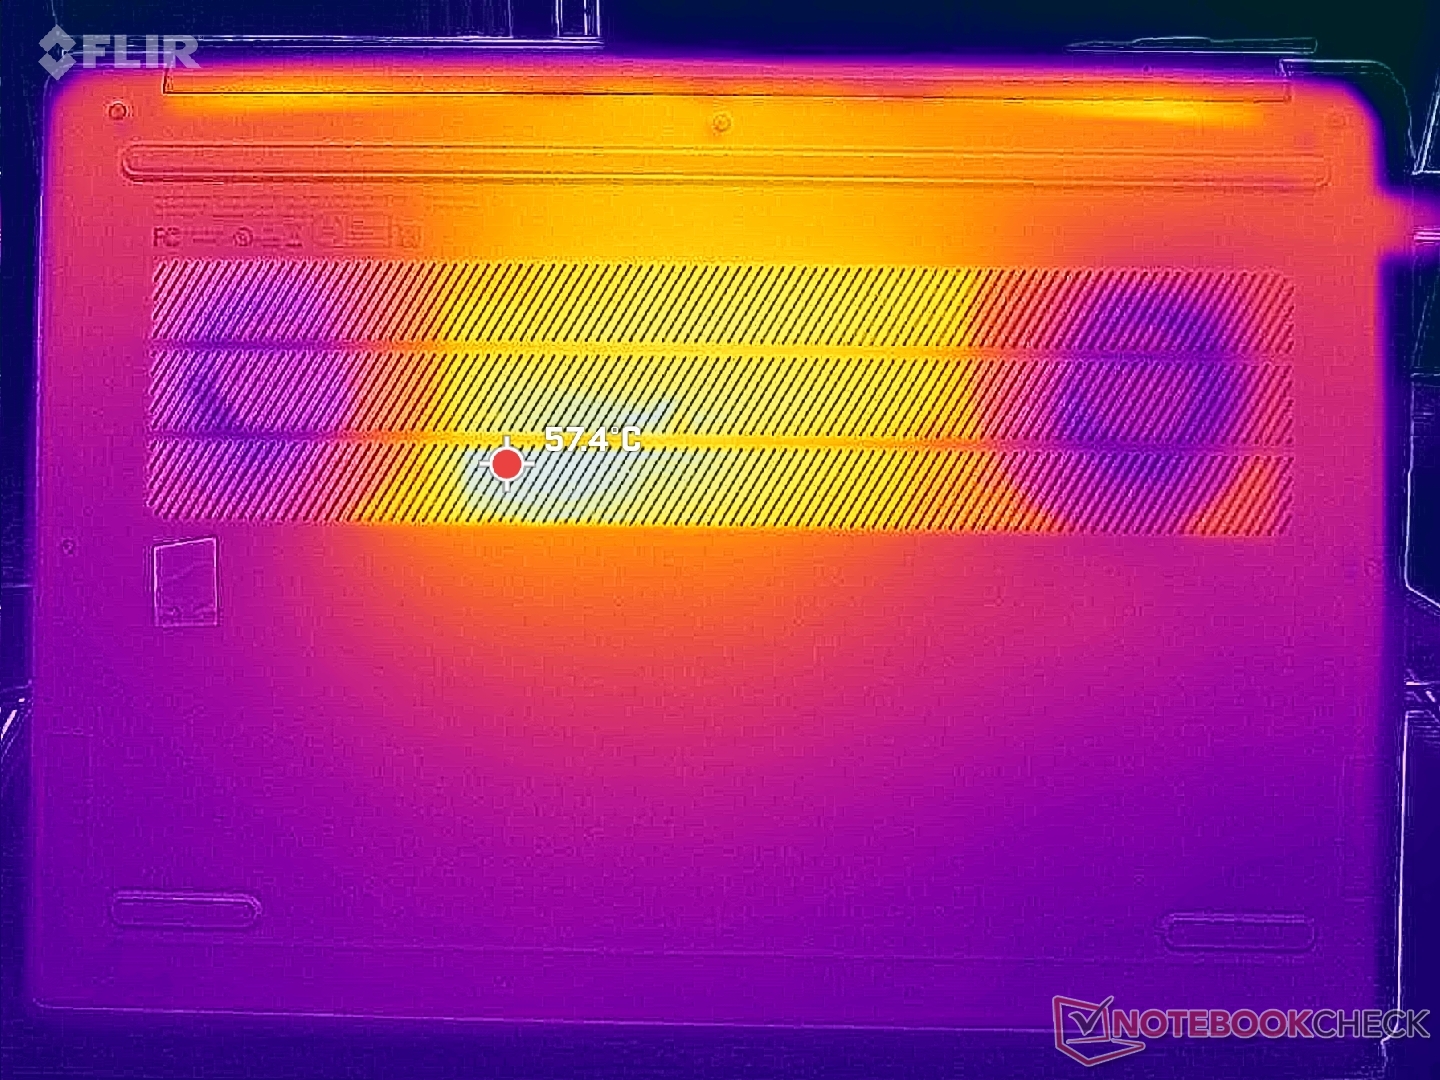
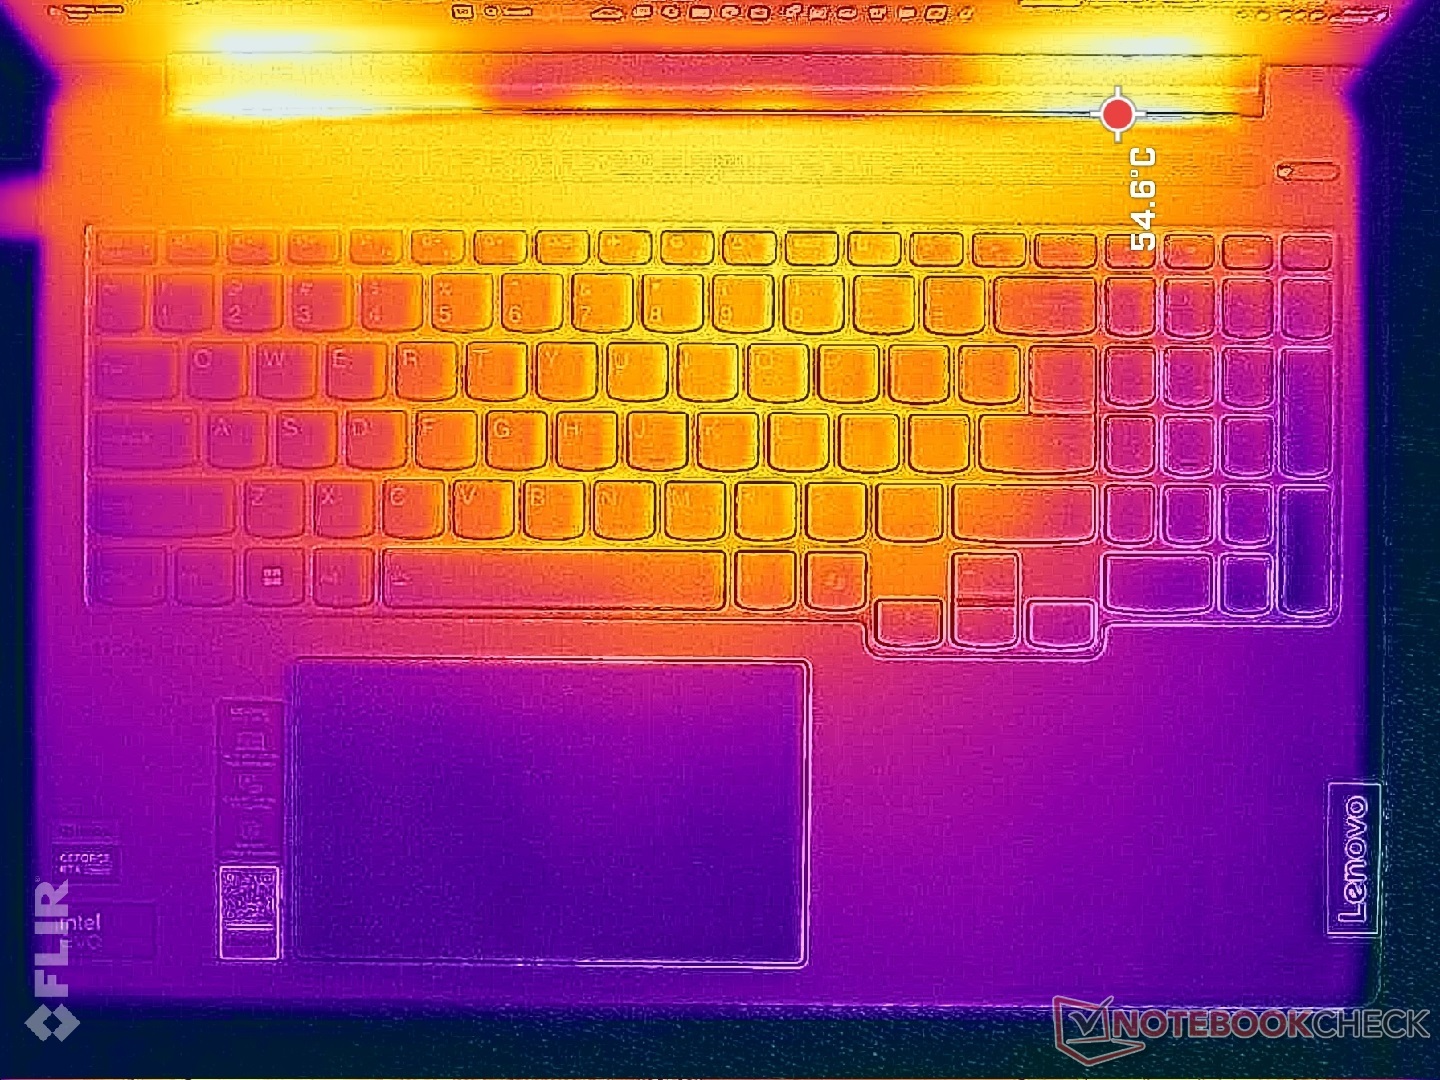
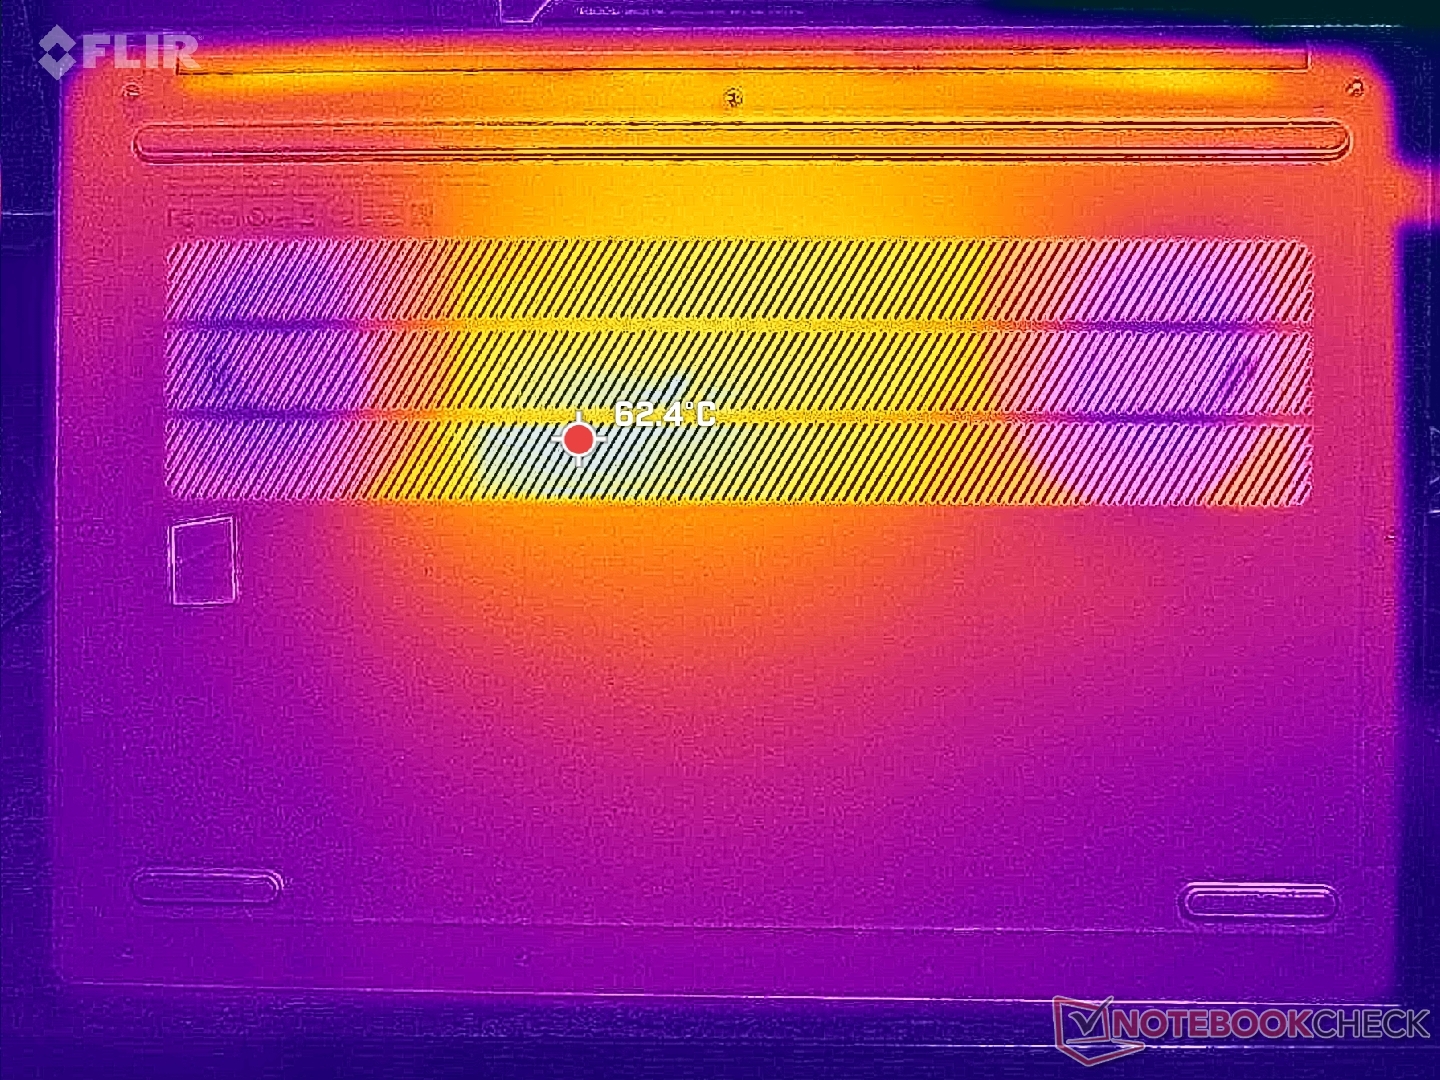
Temperatura
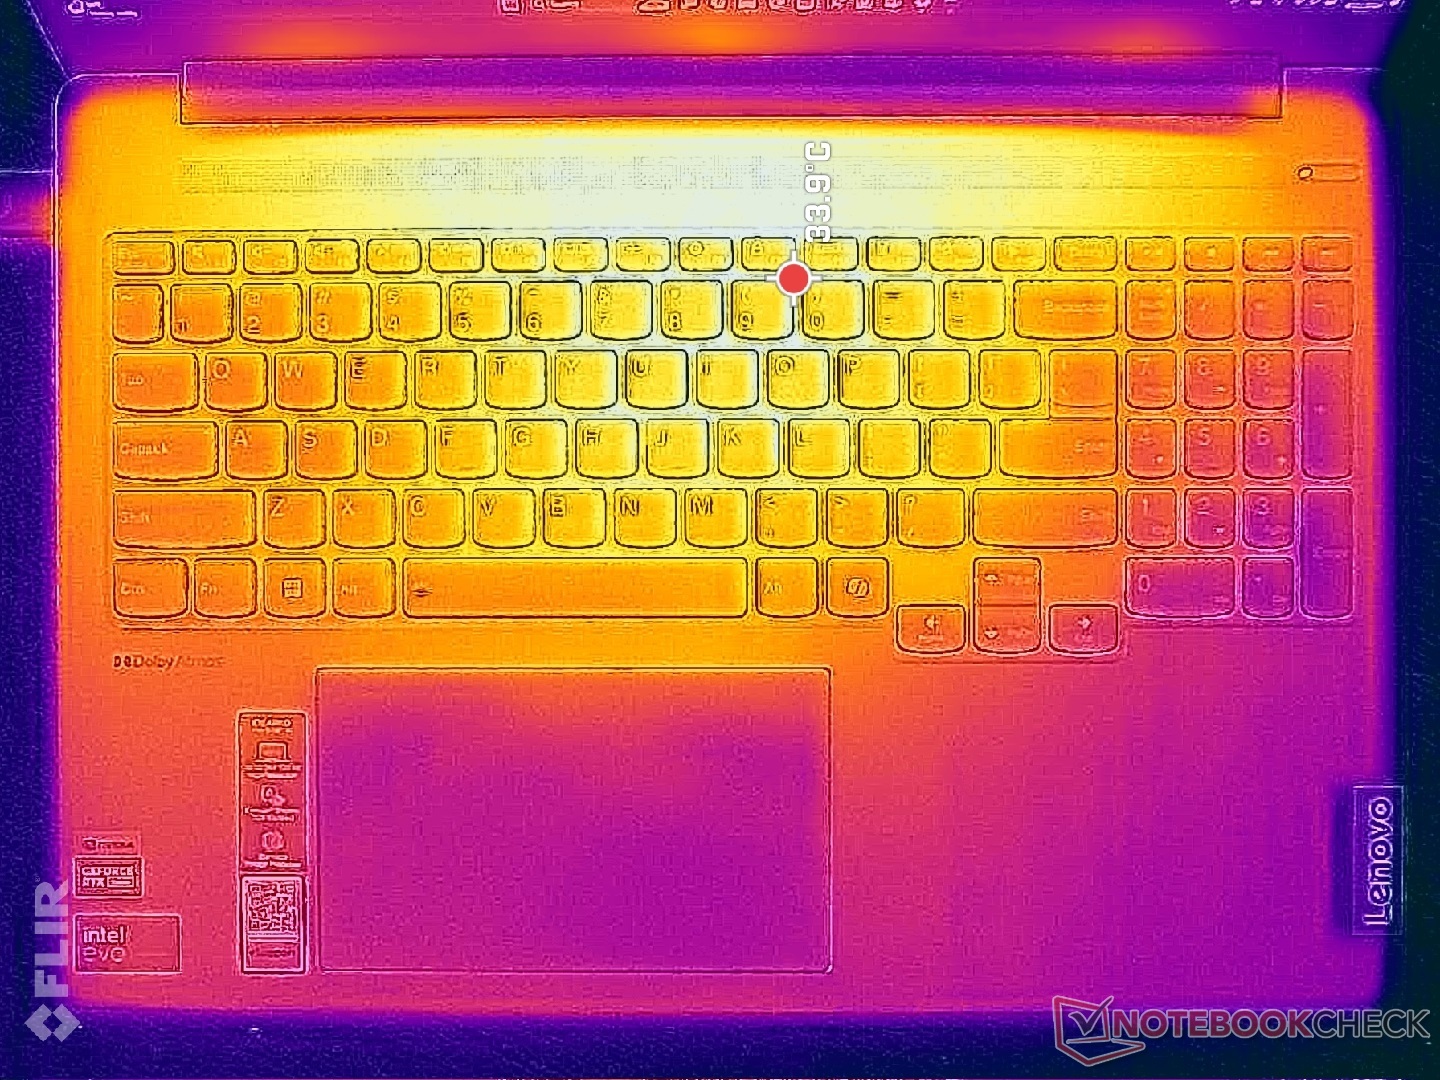
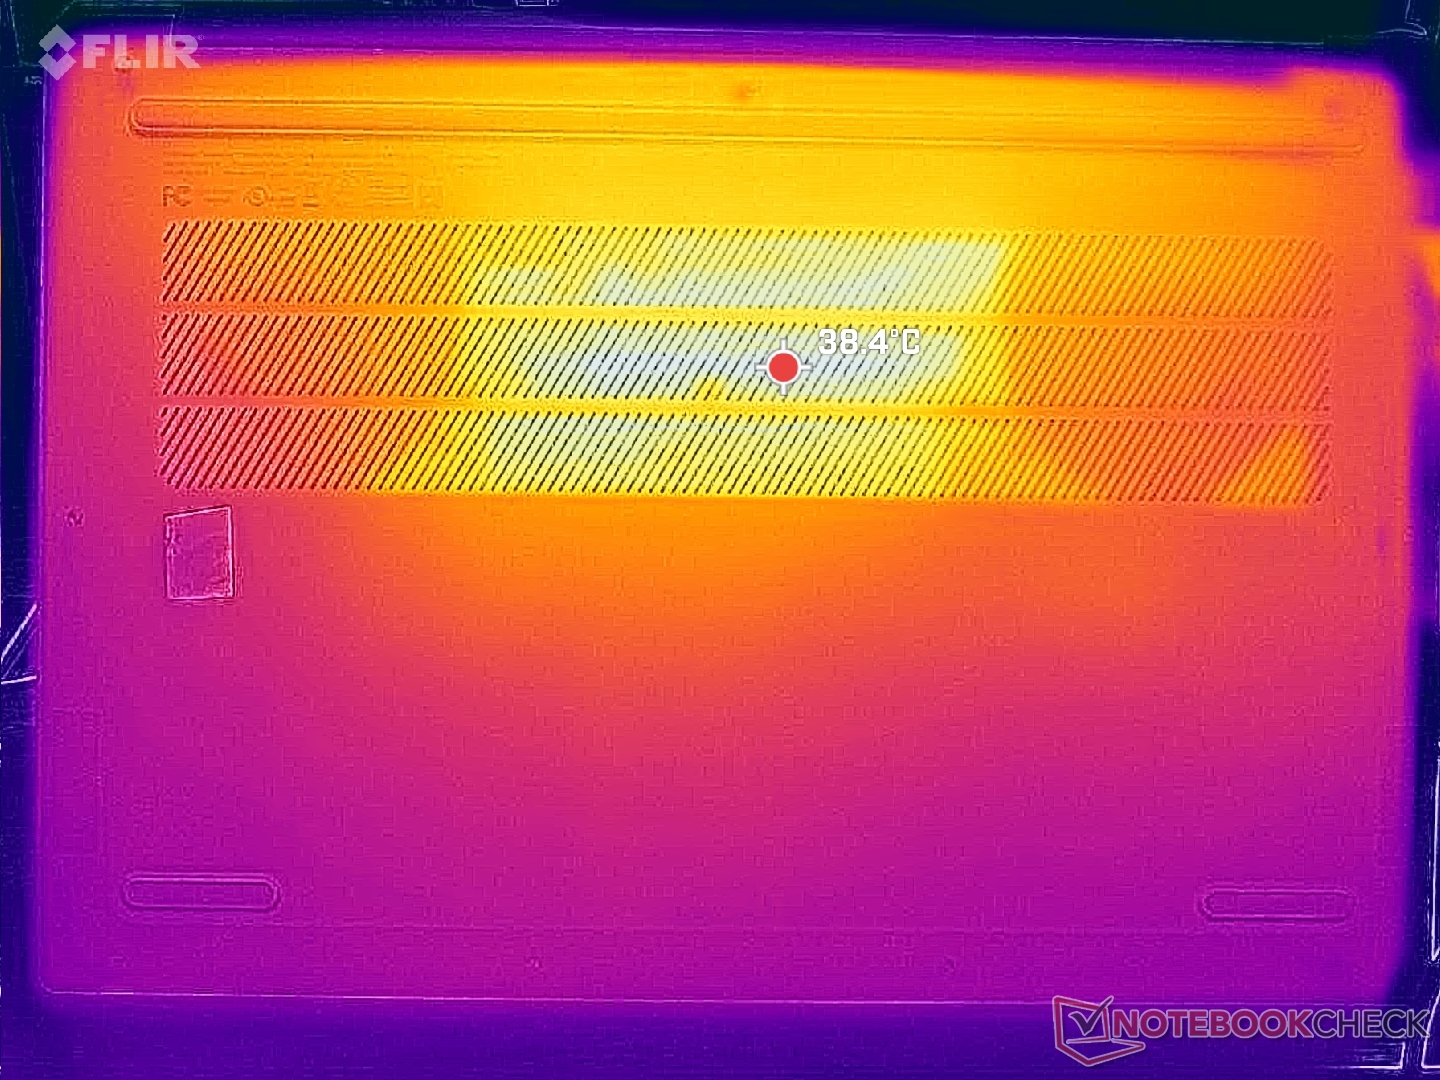
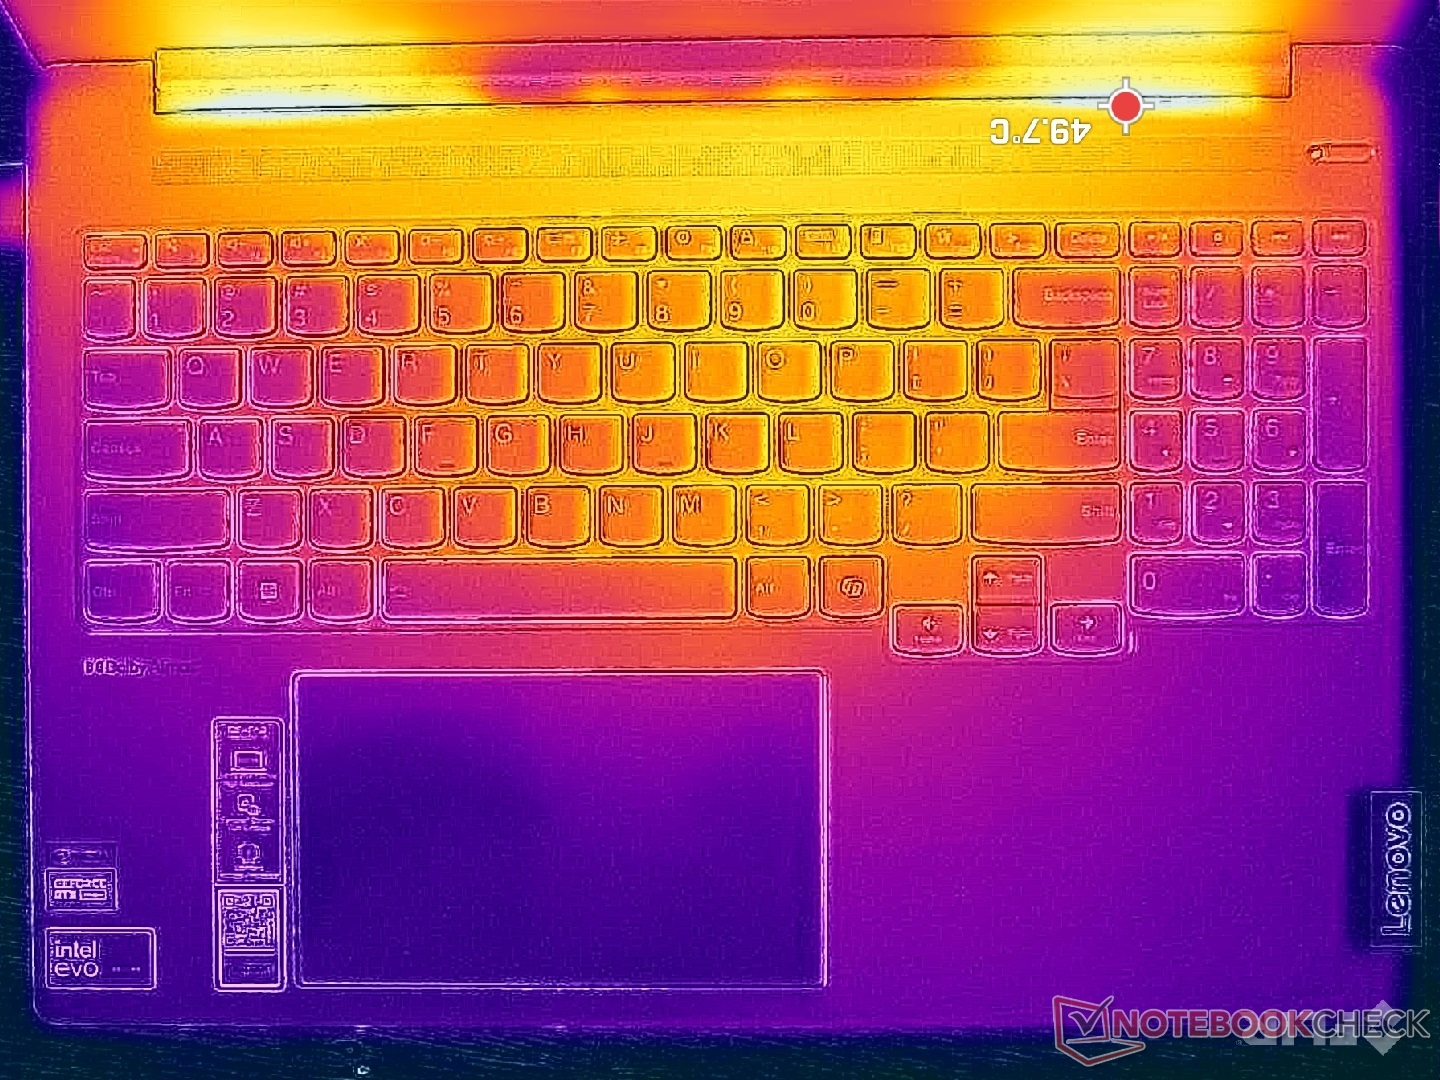
As temperaturas da superfície são visivelmente mais quentes do que a configuração da iGPU em mais de vários graus, mesmo em marcha lenta. Os pontos quentes durante os jogos podem chegar a 42 °C e 52 °C no deck do teclado e na superfície inferior, respectivamente, em comparação com apenas 32 °C e 38 °C na versão iGPU. Felizmente, os pontos quentes estão localizados na parte central do teclado, mas o senhor certamente desejará executar cargas exigentes em uma mesa plana sempre que possível para otimizar o fluxo de ar.
O sistema funciona mais quente do que o Galaxy Book4 Ultra, embora ambos os modelos sejam fornecidos com CPUs Core Ultra H semelhantes e opções de GeForce RTX.
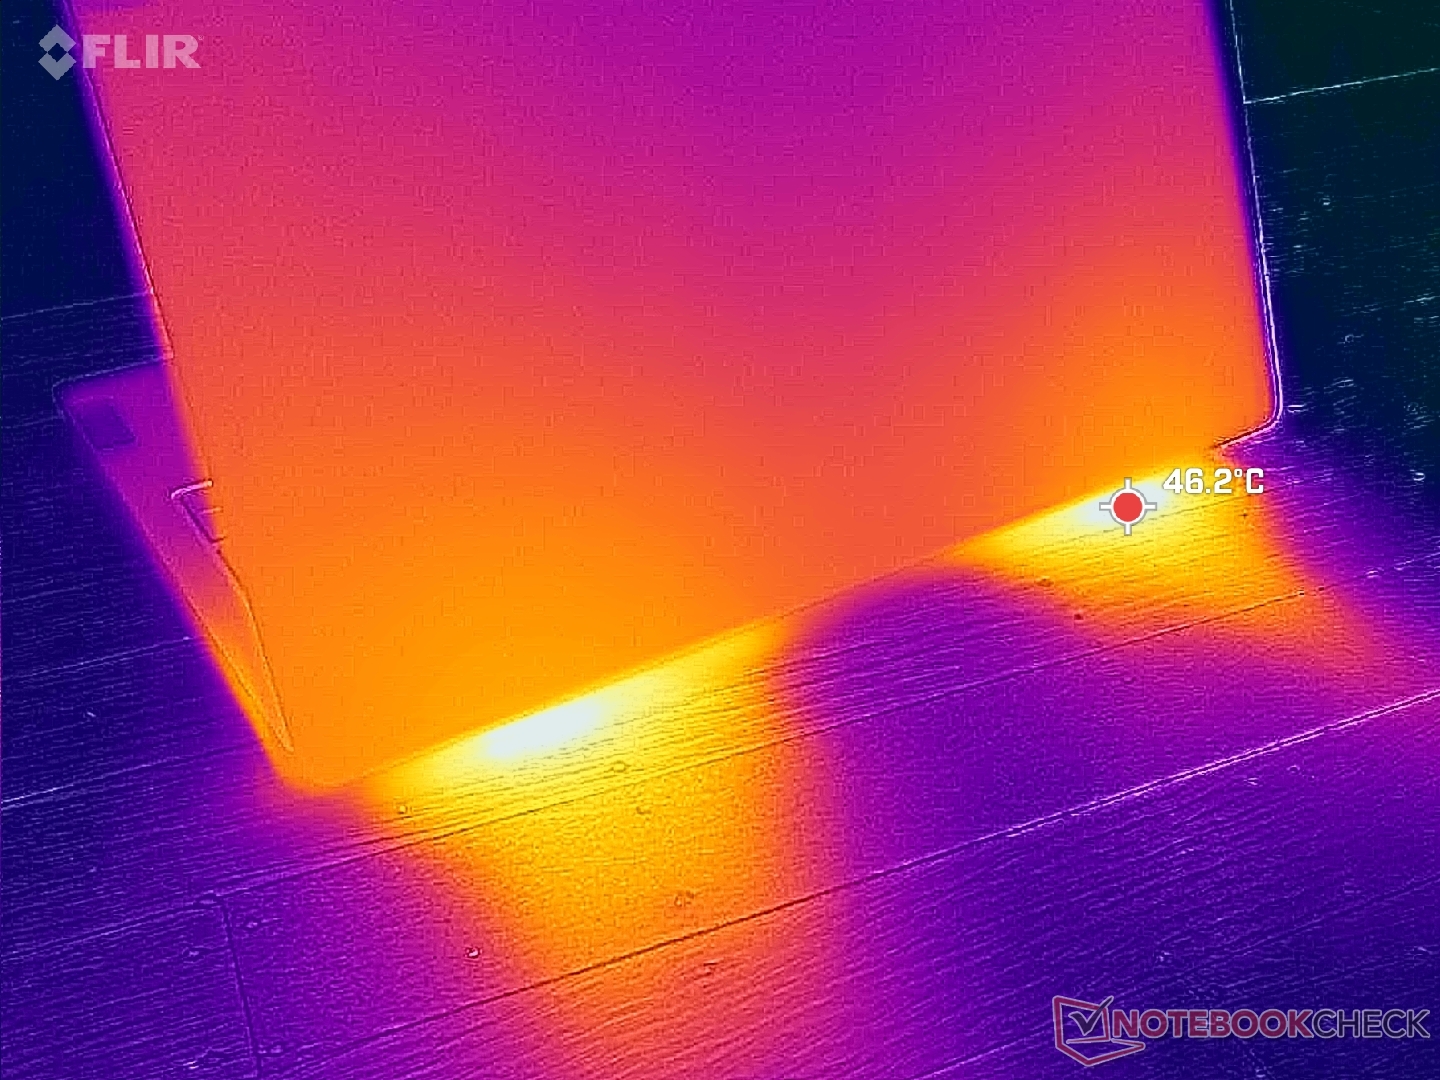
(-) A temperatura máxima no lado superior é 48.2 °C / 119 F, em comparação com a média de 36.9 °C / 98 F , variando de 21.1 a 71 °C para a classe Multimedia.
(-) A parte inferior aquece até um máximo de 59.4 °C / 139 F, em comparação com a média de 39.2 °C / 103 F
(+) Em uso inativo, a temperatura média para o lado superior é 31.2 °C / 88 F, em comparação com a média do dispositivo de 31.3 °C / ### class_avg_f### F.
(±) 3: The average temperature for the upper side is 35.7 °C / 96 F, compared to the average of 31.3 °C / 88 F for the class Multimedia.
(+) Os apoios para as mãos e o touchpad estão atingindo a temperatura máxima da pele (34.4 °C / 93.9 F) e, portanto, não estão quentes.
(-) A temperatura média da área do apoio para as mãos de dispositivos semelhantes foi 28.8 °C / 83.8 F (-5.6 °C / -10.1 F).
| Lenovo IdeaPad Pro 5 16IMH G9 RTX 4050 Intel Core Ultra 9 185H, NVIDIA GeForce RTX 4050 Laptop GPU | Lenovo IdeaPad Pro 5 16IMH G9 Intel Core Ultra 7 155H, Intel Arc 8-Core iGPU | Dell Inspiron 16 7640 2-in-1 Intel Core Ultra 7 155H, Intel Arc 8-Core iGPU | Asus Zenbook S 16 UM5606-RK333W AMD Ryzen AI 9 HX 370, AMD Radeon 890M | HP Envy x360 2-in-1 16-ad0097nr AMD Ryzen 7 8840HS, AMD Radeon 780M | Samsung Galaxy Book4 Ultra Intel Core Ultra 7 155H, NVIDIA GeForce RTX 4050 Laptop GPU | |
|---|---|---|---|---|---|---|
| Heat | 28% | 11% | 10% | 18% | 28% | |
| Maximum Upper Side * | 48.2 | 36.3 25% | 46.8 3% | 46.9 3% | 42.6 12% | 38.5 20% |
| Maximum Bottom * | 59.4 | 39.1 34% | 45.6 23% | 53.5 10% | 47.8 20% | 41.2 31% |
| Idle Upper Side * | 34.2 | 24.9 27% | 32.2 6% | 29.5 14% | 27.4 20% | 23.5 31% |
| Idle Bottom * | 34.8 | 26.1 25% | 31.4 10% | 30.2 13% | 27.8 20% | 24.1 31% |
* ... menor é melhor
Alto-falantes
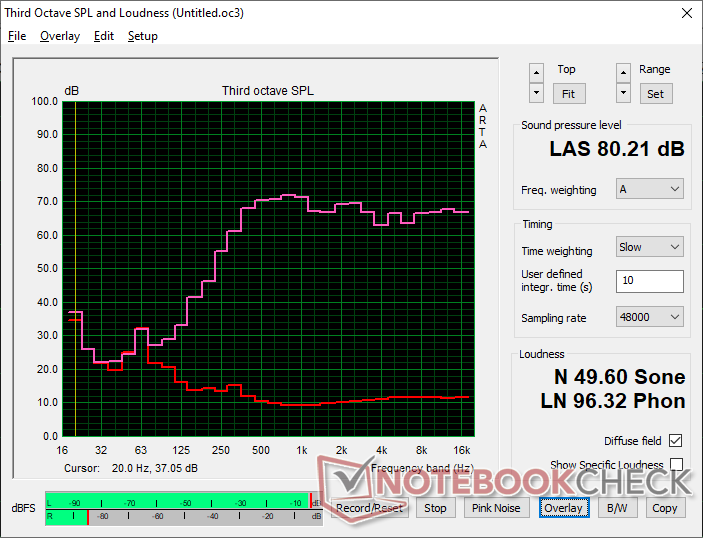
Lenovo IdeaPad Pro 5 16IMH G9 RTX 4050 análise de áudio
(±) | o volume do alto-falante é médio, mas bom (###valor### dB)
Graves 100 - 315Hz
(-) | quase nenhum baixo - em média 22.4% menor que a mediana
(±) | a linearidade dos graves é média (10.3% delta para a frequência anterior)
Médios 400 - 2.000 Hz
(+) | médios equilibrados - apenas 2.7% longe da mediana
(+) | médios são lineares (4% delta para frequência anterior)
Altos 2 - 16 kHz
(+) | agudos equilibrados - apenas 1.5% longe da mediana
(+) | os máximos são lineares (4.1% delta da frequência anterior)
Geral 100 - 16.000 Hz
(+) | o som geral é linear (14.3% diferença em relação à mediana)
Comparado com a mesma classe
» 28% de todos os dispositivos testados nesta classe foram melhores, 5% semelhantes, 67% piores
» O melhor teve um delta de 5%, a média foi 18%, o pior foi 45%
Comparado com todos os dispositivos testados
» 16% de todos os dispositivos testados foram melhores, 4% semelhantes, 80% piores
» O melhor teve um delta de 4%, a média foi 24%, o pior foi 134%
Apple MacBook Pro 16 2021 M1 Pro análise de áudio
(+) | os alto-falantes podem tocar relativamente alto (###valor### dB)
Graves 100 - 315Hz
(+) | bons graves - apenas 3.8% longe da mediana
(+) | o baixo é linear (5.2% delta para a frequência anterior)
Médios 400 - 2.000 Hz
(+) | médios equilibrados - apenas 1.3% longe da mediana
(+) | médios são lineares (2.1% delta para frequência anterior)
Altos 2 - 16 kHz
(+) | agudos equilibrados - apenas 1.9% longe da mediana
(+) | os máximos são lineares (2.7% delta da frequência anterior)
Geral 100 - 16.000 Hz
(+) | o som geral é linear (4.6% diferença em relação à mediana)
Comparado com a mesma classe
» 0% de todos os dispositivos testados nesta classe foram melhores, 0% semelhantes, 100% piores
» O melhor teve um delta de 5%, a média foi 18%, o pior foi 45%
Comparado com todos os dispositivos testados
» 0% de todos os dispositivos testados foram melhores, 0% semelhantes, 100% piores
» O melhor teve um delta de 4%, a média foi 24%, o pior foi 134%
Gerenciamento de energia
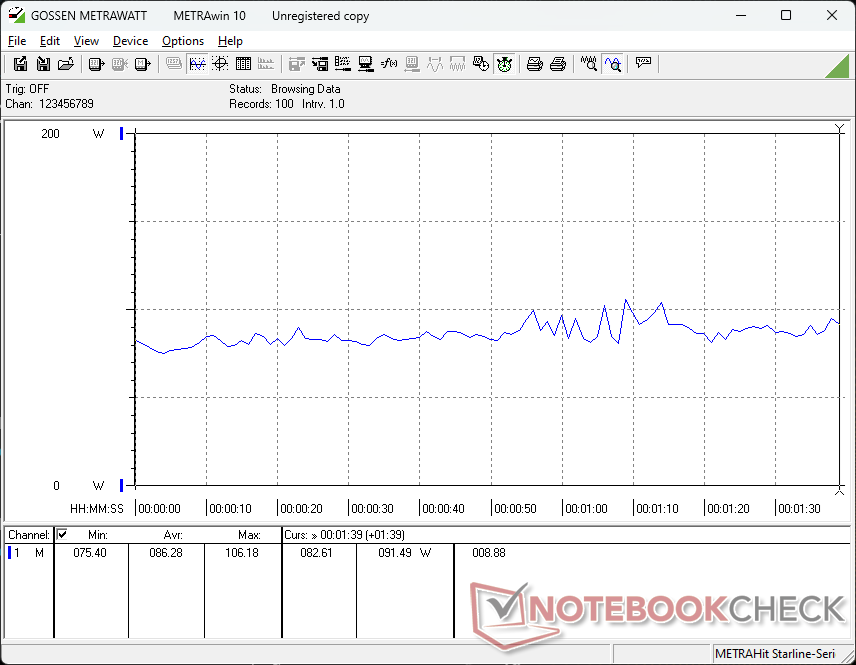
Consumo de energia
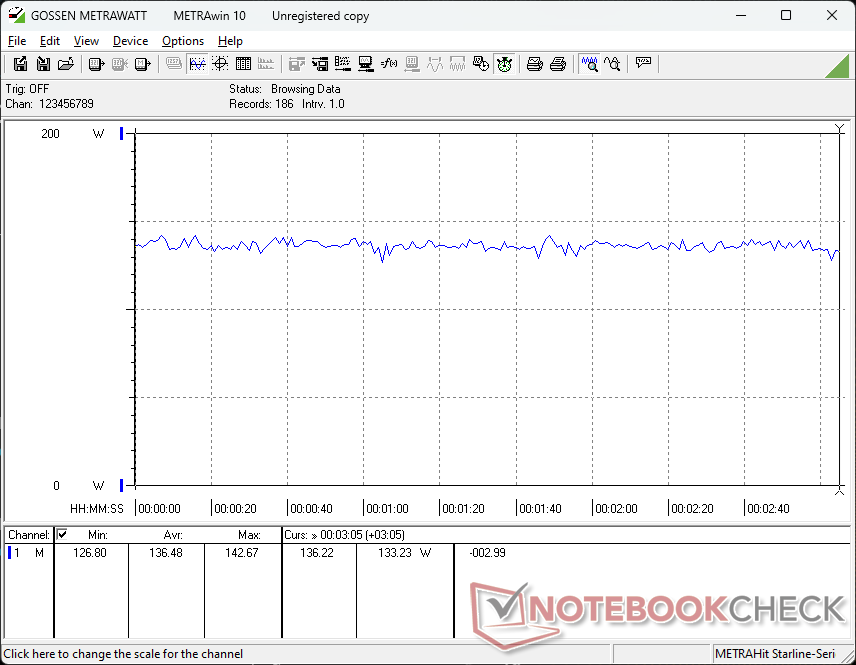
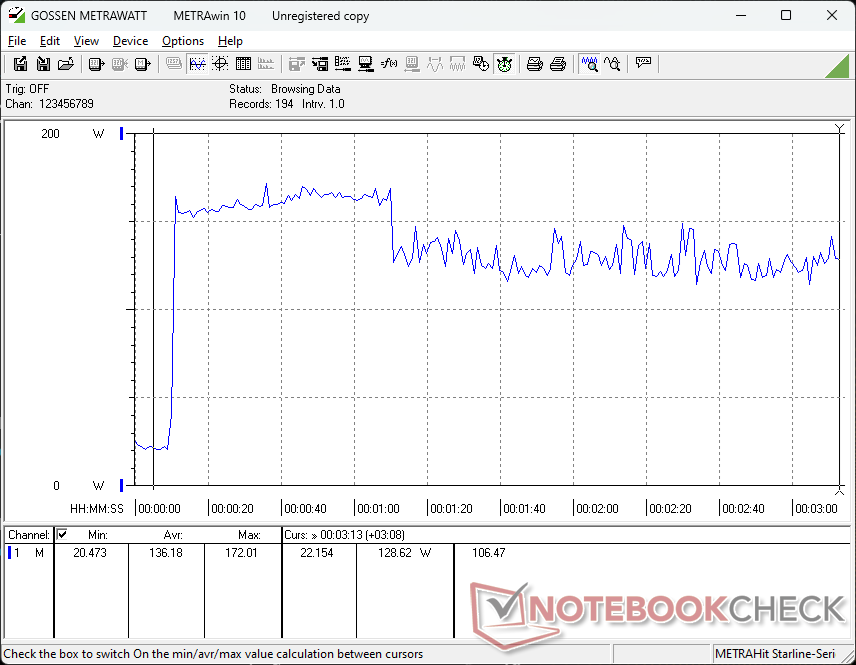
A marcha lenta no desktop exige até 15 W em comparação com apenas 10 W na configuração da iGPU devido, em grande parte, ao painel OLED. O delta aumenta muito mais, de 70 W a 80 W, ao executar cargas exigentes, como jogos. Vale a pena observar que nossa GPU RTX 4050 atinge um pouco mais de 80 W em jogos, em comparação com apenas cerca de 50 W no Galaxy Book4 Ultra e, portanto, o consumo geral de energia é visivelmente maior em nosso Lenovo, quase como um laptop para jogos de nível básico.
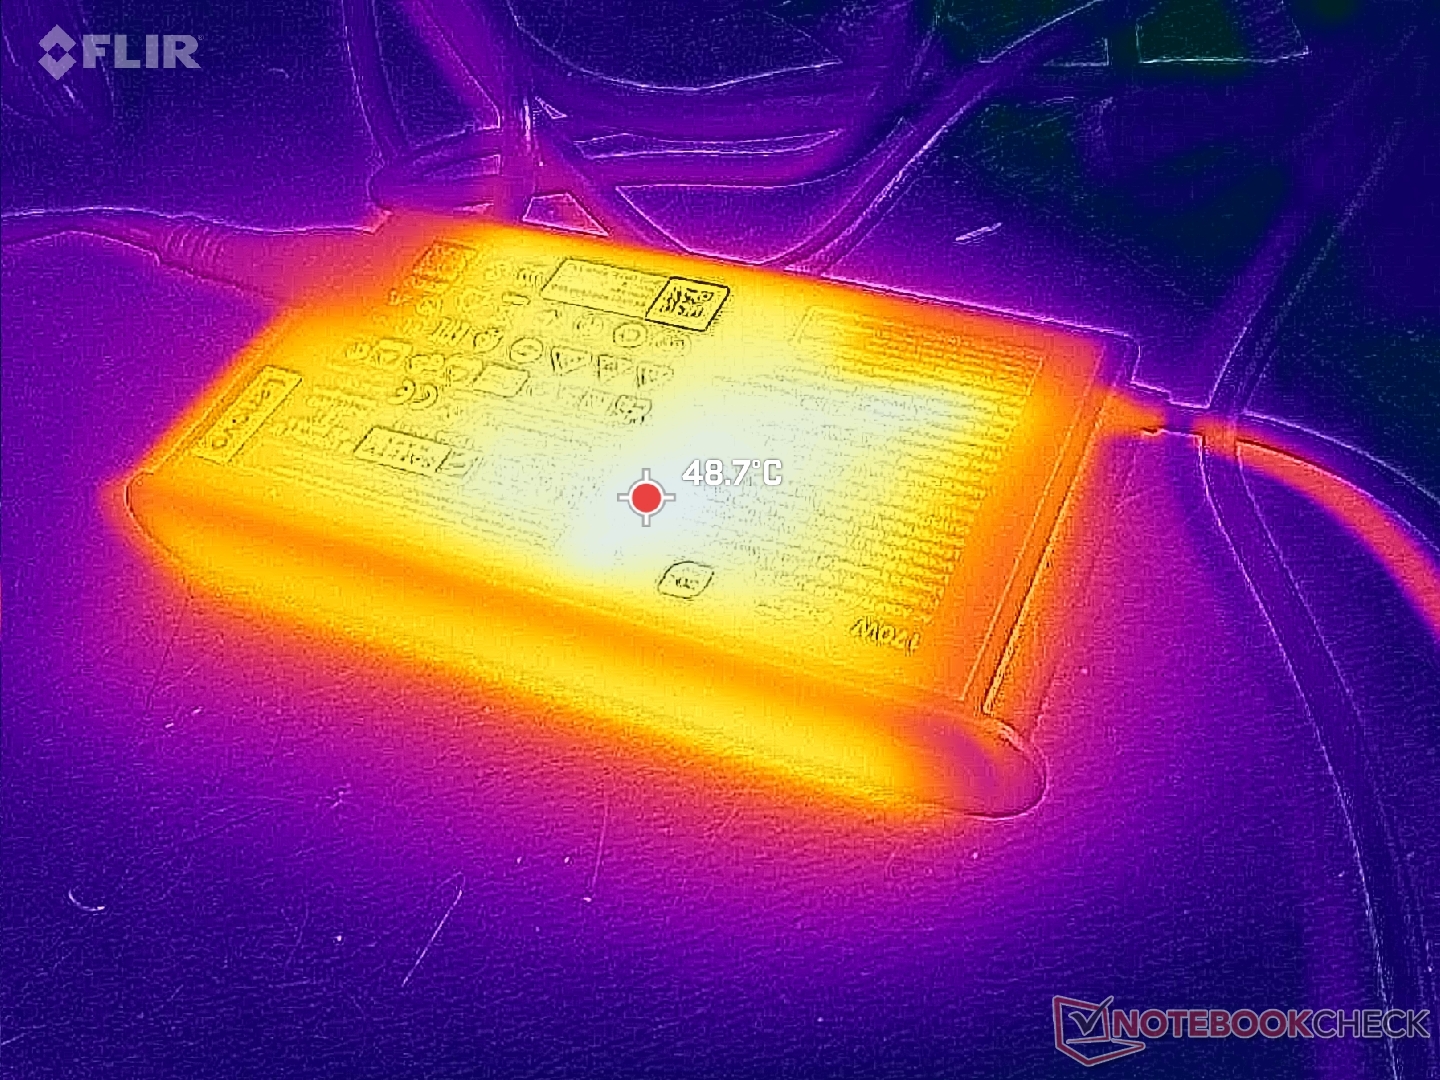
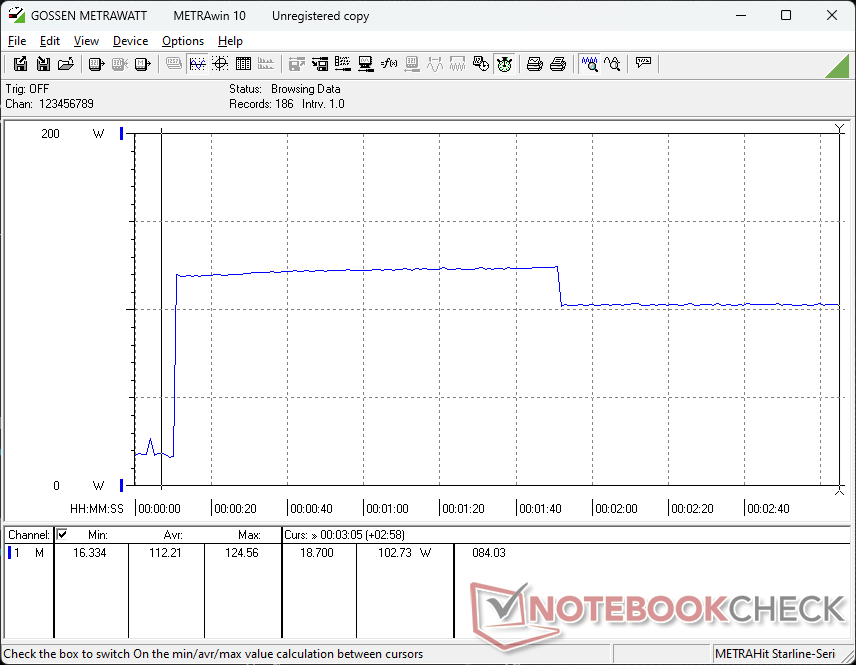
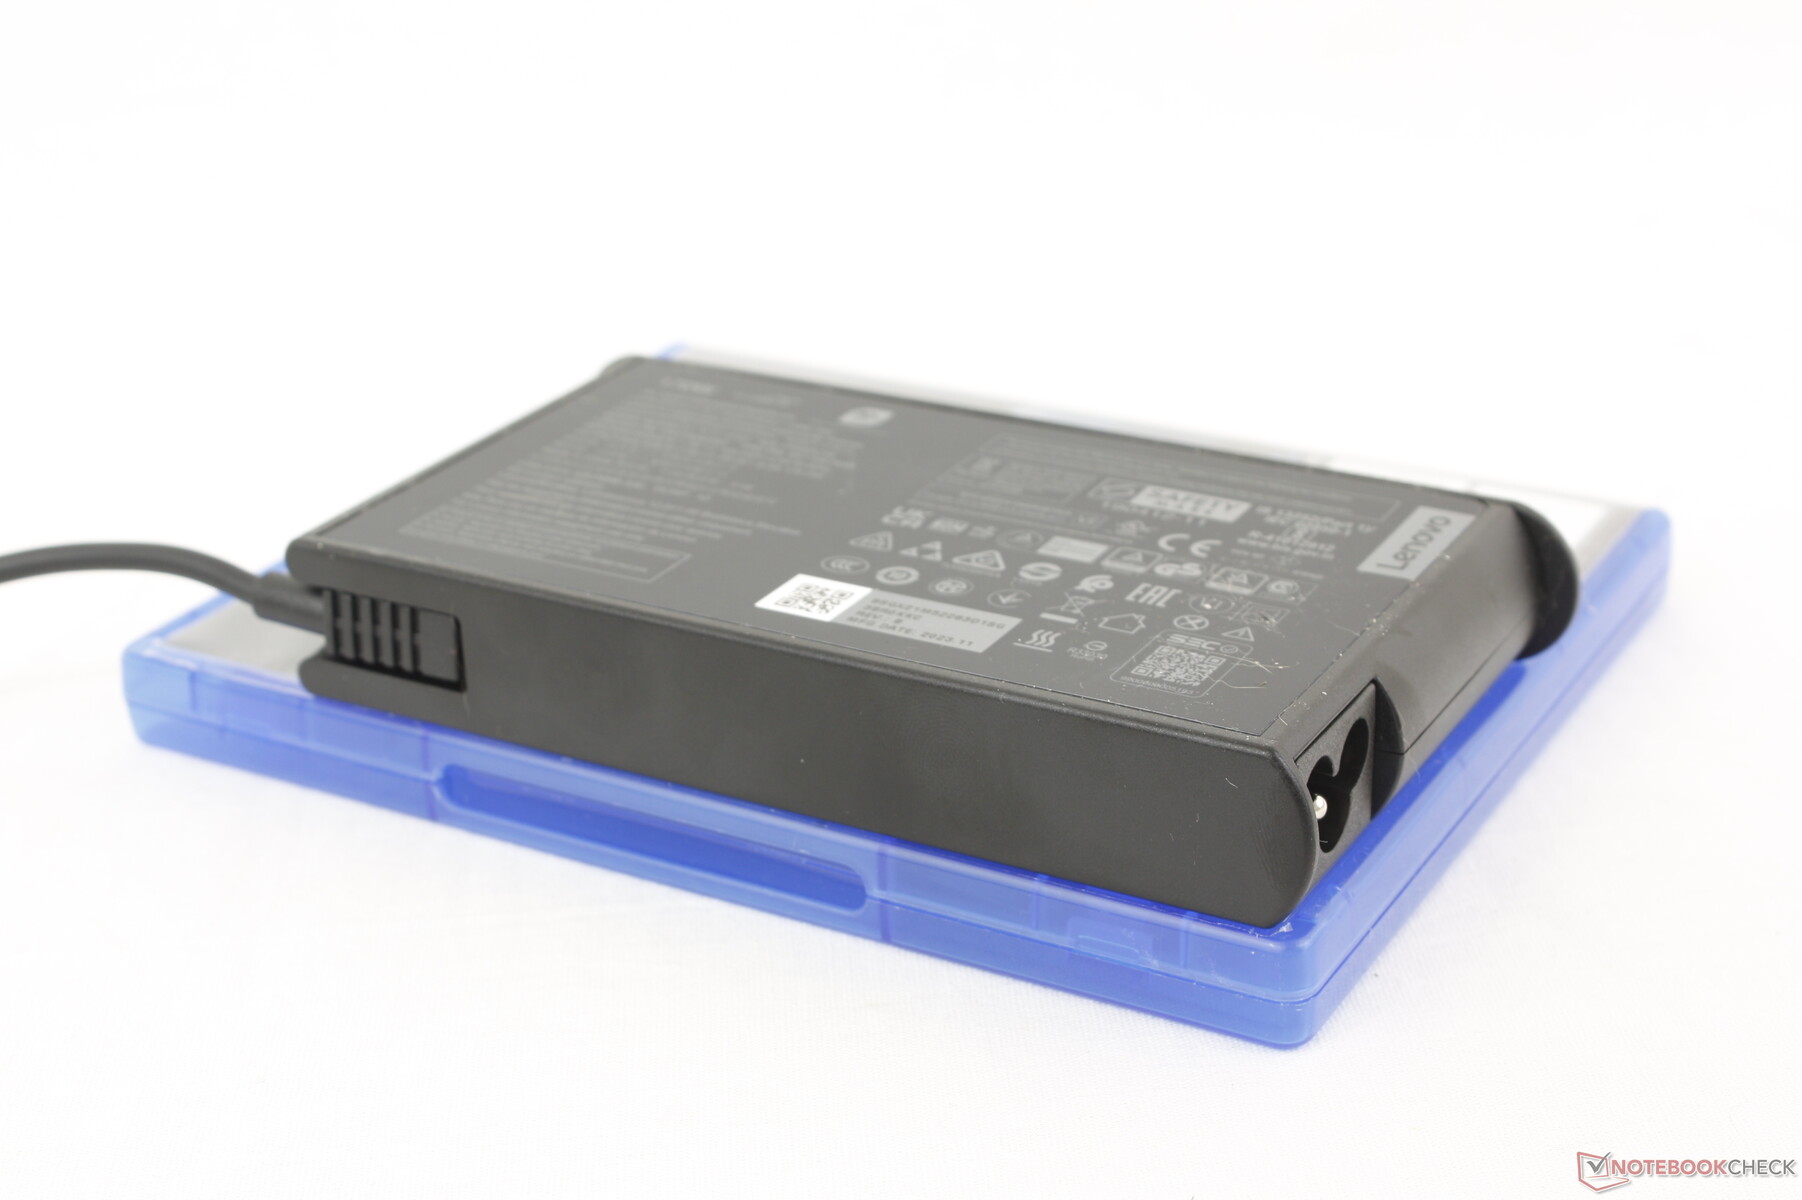
Conseguimos registrar um consumo máximo temporário de 172 W do adaptador CA de 170 W de tamanho médio (~15 x 7,8 x 2,2 cm) quando a CPU e a GPU estão com 100% de utilização. O consumo ficaria um pouco abaixo de 140 W durante os jogos e, portanto, o sistema ainda pode carregar simultaneamente a uma taxa decente, se necessário. Ficamos felizes em ver que o sistema da Lenovo suporta carregamento CA do tipo barril em vez de apenas USB-C, pois a potência mais baixa do último teria afetado severamente o desempenho. O Galaxy Book4 Ultra, por exemplo, suporta apenas carregamento por USB-C e, ainda assim, nosso Lenovo superou consistentemente o Samsung devido aos nossos limites máximos de potência mais altos.
| desligado | |
| Ocioso | |
| Carga |
|
Key:
min: | |
| Lenovo IdeaPad Pro 5 16IMH G9 RTX 4050 Ultra 9 185H, NVIDIA GeForce RTX 4050 Laptop GPU, Samsung PM9C1a MZAL81T0HDLB, OLED, 2048x1280, 16" | Lenovo IdeaPad Pro 5 16IMH G9 Ultra 7 155H, Arc 8-Core, Samsung PM9C1a MZAL81T0HDLB, IPS, 2560x1600, 16" | Dell Inspiron 16 7640 2-in-1 Ultra 7 155H, Arc 8-Core, Micron 2550 1TB, Mini-LED, 2560x1600, 16" | Asus Zenbook S 16 UM5606-RK333W Ryzen AI 9 HX 370, Radeon 890M, Micron 2400 MTFDKBA1T0QFM, OLED, 2880x1800, 16" | HP Envy x360 2-in-1 16-ad0097nr R7 8840HS, Radeon 780M, KIOXIA BG5 KBG50ZNV1T02, OLED, 2880x1800, 16" | Samsung Galaxy Book4 Ultra Ultra 7 155H, NVIDIA GeForce RTX 4050 Laptop GPU, Samsung PM9A1 MZVL2512HCJQ, OLED, 2880x1800, 16" | |
|---|---|---|---|---|---|---|
| Power Consumption | 21% | 11% | 32% | 26% | 18% | |
| Idle Minimum * | 5.6 | 3.5 37% | 6.1 -9% | 5.4 4% | 5 11% | 4.8 14% |
| Idle Average * | 7.3 | 9.6 -32% | 13.5 -85% | 10.5 -44% | 6.2 15% | 7.5 -3% |
| Idle Maximum * | 14.6 | 9.9 32% | 13.8 5% | 10.9 25% | 14.7 -1% | 7.9 46% |
| Load Average * | 86.3 | 62.7 27% | 63.6 26% | 47.8 45% | 49.9 42% | 79.3 8% |
| Cyberpunk 2077 ultra external monitor * | 135.8 | 64.6 52% | 46.7 66% | |||
| Cyberpunk 2077 ultra * | 136.4 | 67 51% | 49.2 64% | |||
| Load Maximum * | 172 | 101.2 41% | 109.7 36% | 58.6 66% | 65 62% | 125 27% |
| Witcher 3 ultra * | 55.8 | 54.5 | 79.2 |
* ... menor é melhor
Power Consumption Cyberpunk / Stress Test
Power Consumption external Monitor
Duração da bateria
Espera-se que os tempos de execução sejam mais curtos do que a configuração IPS iGPU devido aos motivos mencionados na seção acima. Mesmo assim, 10,5 horas de navegação em WLAN no mundo real ainda é bastante longo e comparável ao Inspiron 16 7640 2 em 1 ou ao Zenbook S 16.
O carregamento da capacidade vazia até a capacidade total é muito rápido, cerca de 60 minutos, em comparação com 90 minutos na maioria dos outros Ultrabooks. O carregamento com adaptadores CA USB-C será mais lento.
| Lenovo IdeaPad Pro 5 16IMH G9 RTX 4050 Ultra 9 185H, NVIDIA GeForce RTX 4050 Laptop GPU, 84 Wh | Lenovo IdeaPad Pro 5 16IMH G9 Ultra 7 155H, Arc 8-Core, 84 Wh | Dell Inspiron 16 7640 2-in-1 Ultra 7 155H, Arc 8-Core, 90 Wh | Asus Zenbook S 16 UM5606-RK333W Ryzen AI 9 HX 370, Radeon 890M, 78 Wh | HP Envy x360 2-in-1 16-ad0097nr R7 8840HS, Radeon 780M, 68 Wh | Samsung Galaxy Book4 Ultra Ultra 7 155H, NVIDIA GeForce RTX 4050 Laptop GPU, 76 Wh | |
|---|---|---|---|---|---|---|
| Duração da bateria | 27% | 30% | 57% | 25% | 30% | |
| Reader / Idle | 1338 | 1310 -2% | 935 -30% | |||
| WiFi v1.3 | 639 | 756 18% | 686 7% | 640 0% | 459 -28% | 656 3% |
| Load | 50 | 68 36% | 93 86% | 107 114% | 116 132% | 78 56% |
| H.264 | 957 | 1204 | 1076 |
Pro
Contra
Veredicto - Bem equilibrado por US$ 1.500
Enquanto a configuração iGPU de baixo custo é uma máquina multimídia respeitável, a configuração dGPU de alto custo é uma máquina de jogos no limite. Seus gráficos de 90 W GeForce RTX 4050 são mais rápidos do que na maioria dos outros notebooks multimídia, como o Samsung Galaxy Book4 Ultra e até mesmo rivaliza com muitos notebooks para jogos de nível básico equipados com gráficos RTX 4060, como o Legion LOQ. O sistema é bastante potente, considerando o perfil fino e o design monótono, semelhante ao de um escritório.
O IdeaPad Pro 5 16 G9 é mais rápido do que parece quando totalmente configurado, graças à sua robusta GPU de 90 W GeForce RTX 4050.
Todo esse desempenho em um pacote tão fino tem o custo de uma vida útil da bateria mais curta, ventoinhas mais barulhentas e temperaturas mais quentes do que a opção de iGPU de baixo custo e a maioria dos concorrentes no espaço de 16 polegadas. A Lenovo poderia ter atenuado essas desvantagens optando por uma GPU mais lenta de 50 W, mas, na verdade, gostamos do fato de que eles optaram por um teto mais alto de 90 W para distinguir melhor o IdeaPad Pro 5 16 G9 da concorrência. Ele não se destaca particularmente no trabalho de escritório da mesma forma que um ThinkPad T16 ou em jogos da mesma forma que um Legion Pro 5 16mas é melhor do que a média em ambos para ser uma boa solução para todos os tipos de trabalho.
Preço e disponibilidade
A Costco está enviando agora o Lenovo IdeaPad Pro 5i 16 com o Core Ultra 9 185H e RTX 4050 configurado por US$ 1.500 ou US$ 1.350 durante a venda por tempo limitado.
Observação: Atualizamos recentemente nosso sistema de classificação e os resultados da versão 8 não são comparáveis aos resultados da versão 7. Mais informações estão disponíveis aqui .
Lenovo IdeaPad Pro 5 16IMH G9 RTX 4050
- 09/08/2024 v8
Allen Ngo
 Total Sustainability Score:
 Transparência
A seleção dos dispositivos a serem analisados é feita pela nossa equipe editorial. A amostra de teste foi fornecida ao autor como empréstimo pelo fabricante ou varejista para fins desta revisão. O credor não teve influência nesta revisão, nem o fabricante recebeu uma cópia desta revisão antes da publicação. Não houve obrigação de publicar esta revisão. Nunca aceitamos compensação ou pagamento em troca de nossas avaliações. Como empresa de mídia independente, a Notebookcheck não está sujeita à autoridade de fabricantes, varejistas ou editores.
É assim que o Notebookcheck está testando
Todos os anos, o Notebookcheck analisa de forma independente centenas de laptops e smartphones usando procedimentos padronizados para garantir que todos os resultados sejam comparáveis. Desenvolvemos continuamente nossos métodos de teste há cerca de 20 anos e definimos padrões da indústria no processo. Em nossos laboratórios de teste, equipamentos de medição de alta qualidade são utilizados por técnicos e editores experientes. Esses testes envolvem um processo de validação em vários estágios. Nosso complexo sistema de classificação é baseado em centenas de medições e benchmarks bem fundamentados, o que mantém a objetividade.Price comparison

