

Análise do Lenovo LOQ 15: O laptop para jogos FHD com uma RTX 4060 por cerca de US$ 1.000
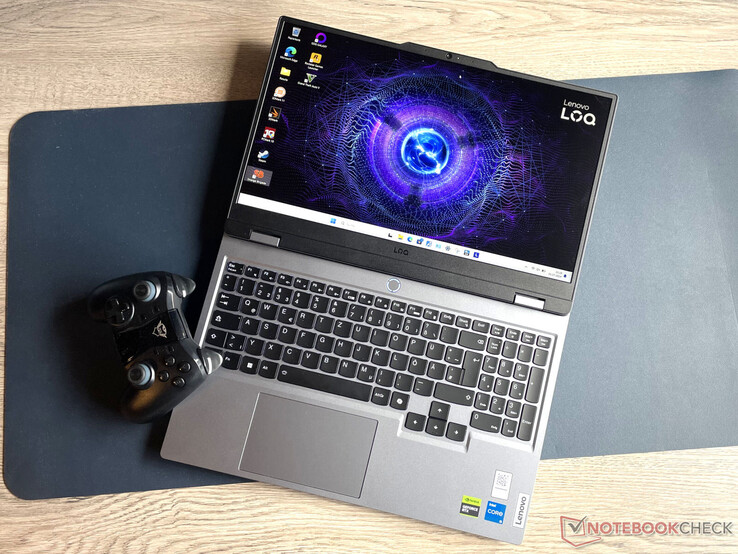
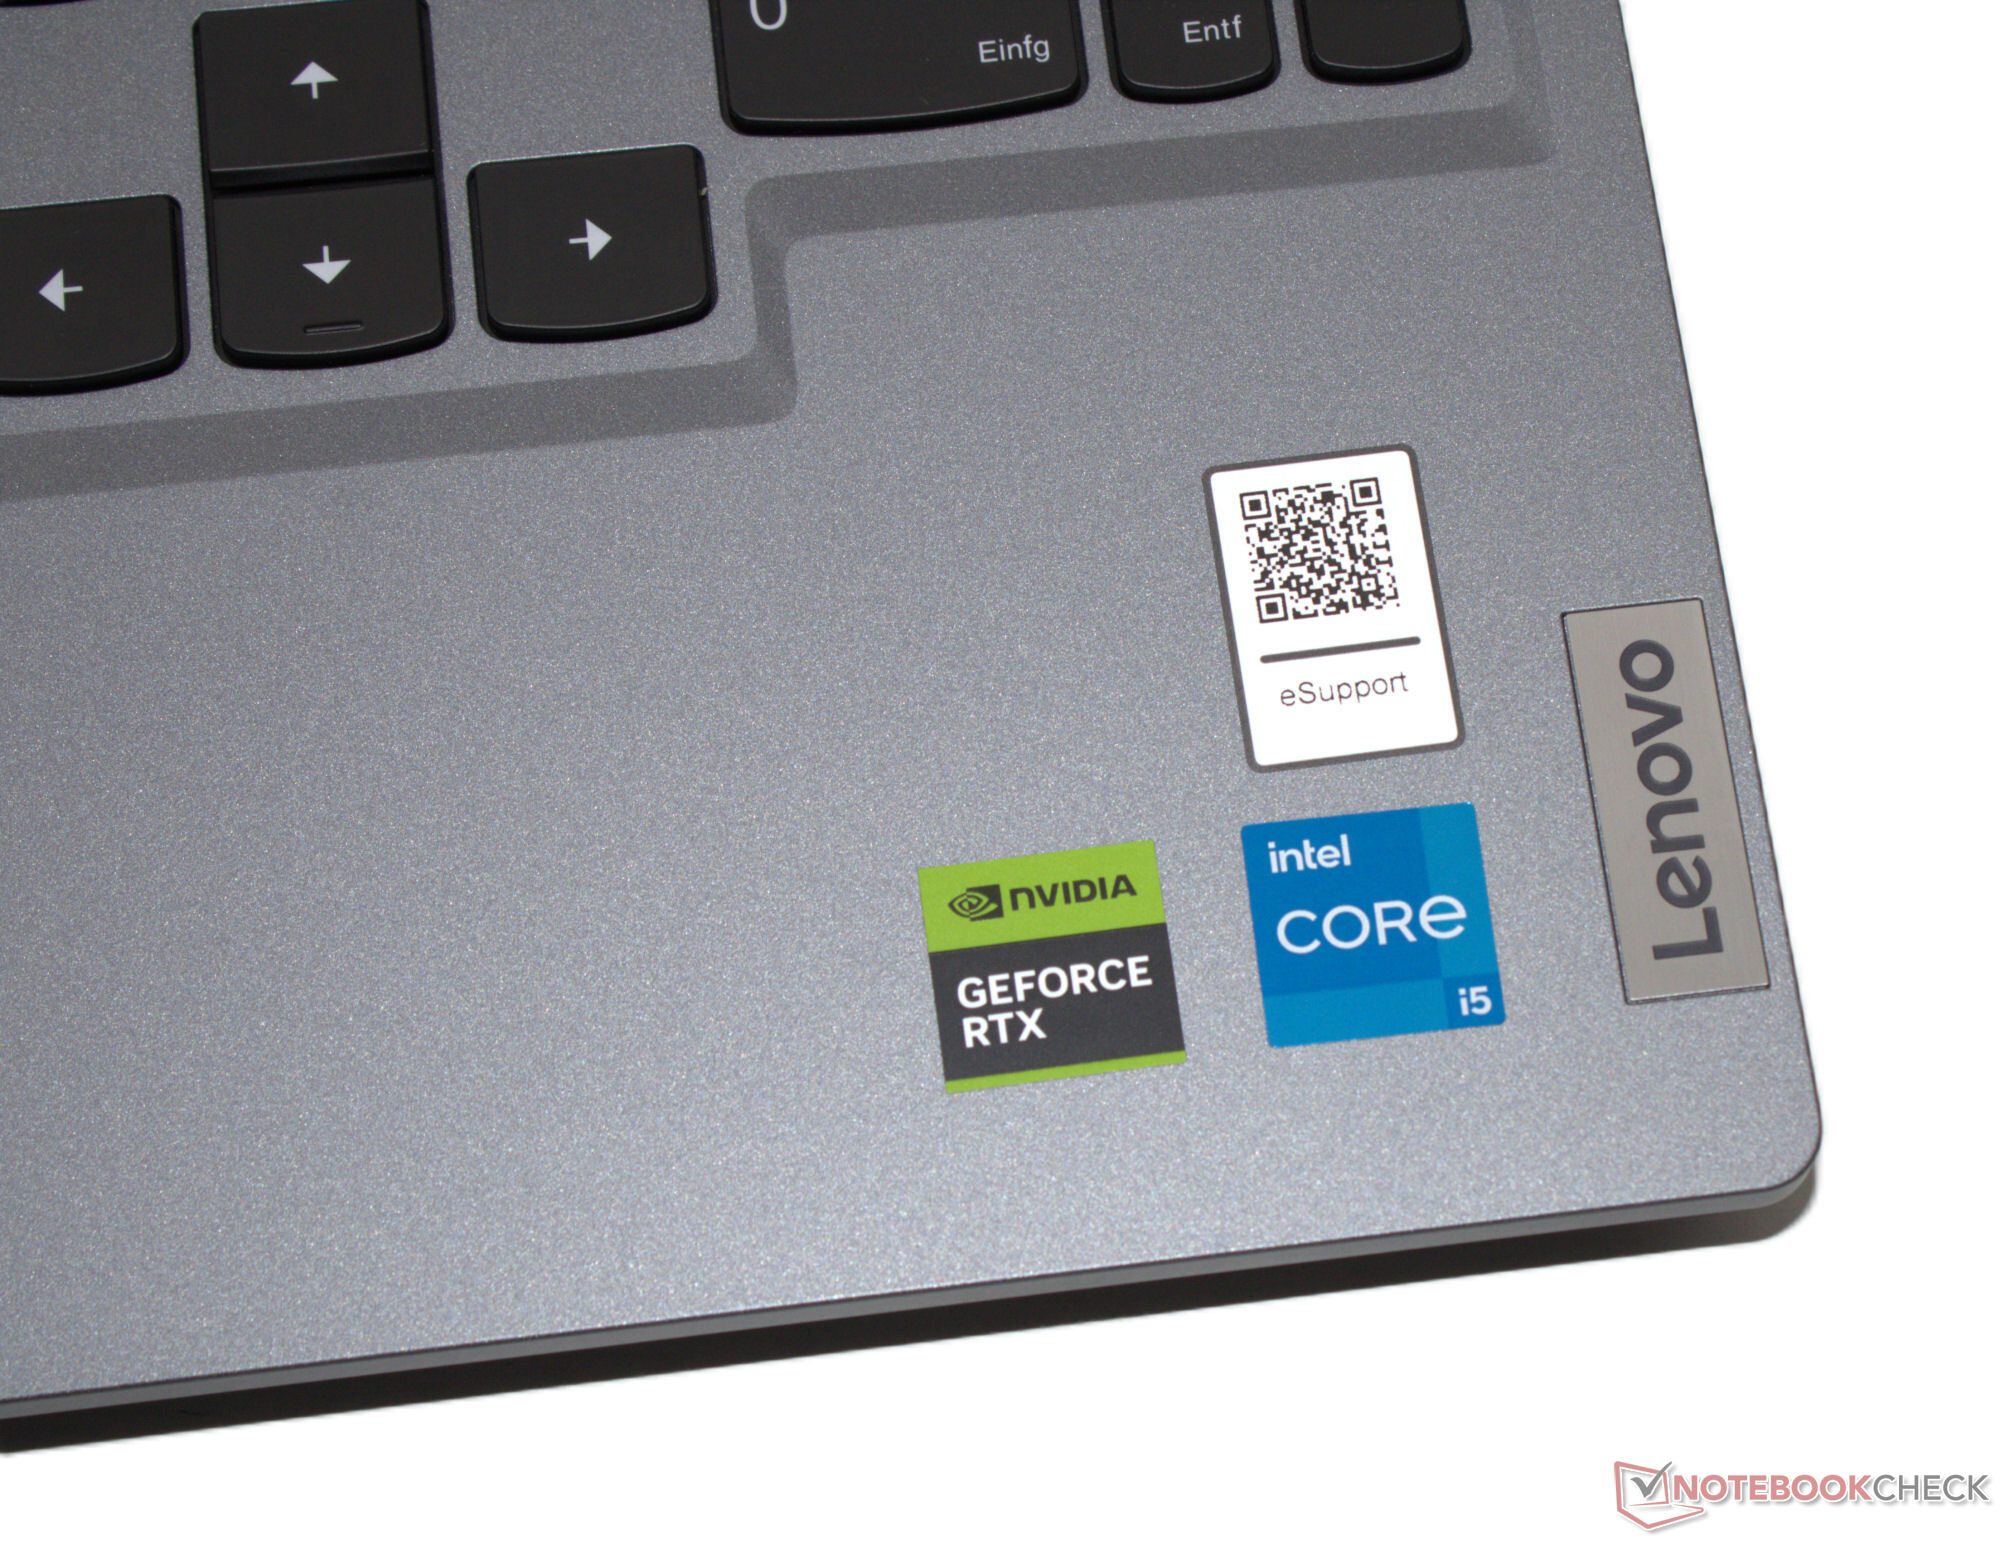
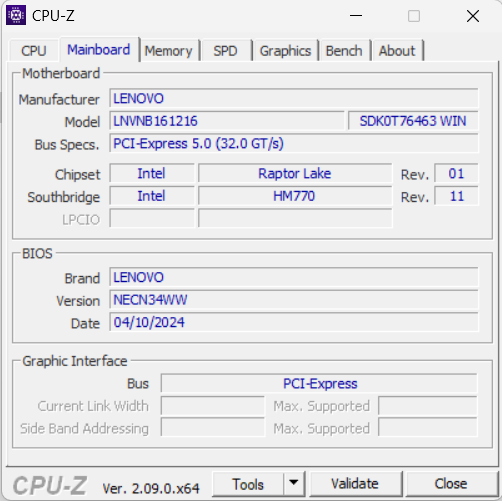
No catálogo da Lenovo, a série LOQ consiste em laptops econômicos para jogos. O presente dispositivo de teste se encaixa perfeitamente nessa categoria: O fabricante pede um pouco mais de US$ 1.000 (sem Windows) ou US$ 1.300 (com Windows 11) por esse pacote que consiste em um processador Core i5, GeForce RTX 4060, 16 GB de RAM e um SSD de 1 TB. O preço do laptop cobra seu preço: ele tem uma caixa de plástico, capacidade de bateria relativamente baixa e não tem Thunderbolt 4 ou USB 4. Os concorrentes incluem dispositivos como o Gigabyte G6X 9KG (2024), Dell G16, XMG Core 15 (M24) ou o HP Victus 16 (2024).
O gabinete do Lenovo LOQ 15IRX9 não é construído de forma idêntica aos de seus modelos irmãos que já testamos (Ryzen 7/RTX 4050, Core i7/RTX 4050).
Possíveis concorrentes em comparação
Avaliação | Versão | Data | Modelo | Peso | Altura | Size | Resolução | Preço |
|---|---|---|---|---|---|---|---|---|
| 79 % | v8 | 07/2024 | Lenovo LOQ 15IRX9 i5-13450HX, NVIDIA GeForce RTX 4060 Laptop GPU | 2.4 kg | 23.9 mm | 15.60" | 1920x1080 | |
| 83.7 % | v8 | 06/2024 | SCHENKER XMG Core 15 (M24) R7 8845HS, NVIDIA GeForce RTX 4060 Laptop GPU | 2.1 kg | 21.9 mm | 15.30" | 2560x1600 | |
| 83.2 % v7 (old) | v7 (old) | 03/2024 | Gigabyte G6X 9KG (2024) i7-13650HX, NVIDIA GeForce RTX 4060 Laptop GPU | 2.6 kg | 25.1 mm | 16.00" | 1920x1200 | |
| 84.3 % v7 (old) | v7 (old) | 05/2024 | HP Victus 16 (2024) i7-14700HX, NVIDIA GeForce RTX 4060 Laptop GPU | 2.4 kg | 23.9 mm | 16.10" | 1920x1080 | |
| 85.5 % v7 (old) | v7 (old) | 02/2024 | Dell G16, i7-13650HX, RTX 4060 i7-13650HX, NVIDIA GeForce RTX 4060 Laptop GPU | 2.8 kg | 25.65 mm | 16.00" | 2560x1600 |
Observação: Atualizamos recentemente nosso sistema de classificação e os resultados da versão 8 não são comparáveis aos resultados da versão 7. Mais informações estão disponíveis aqui .
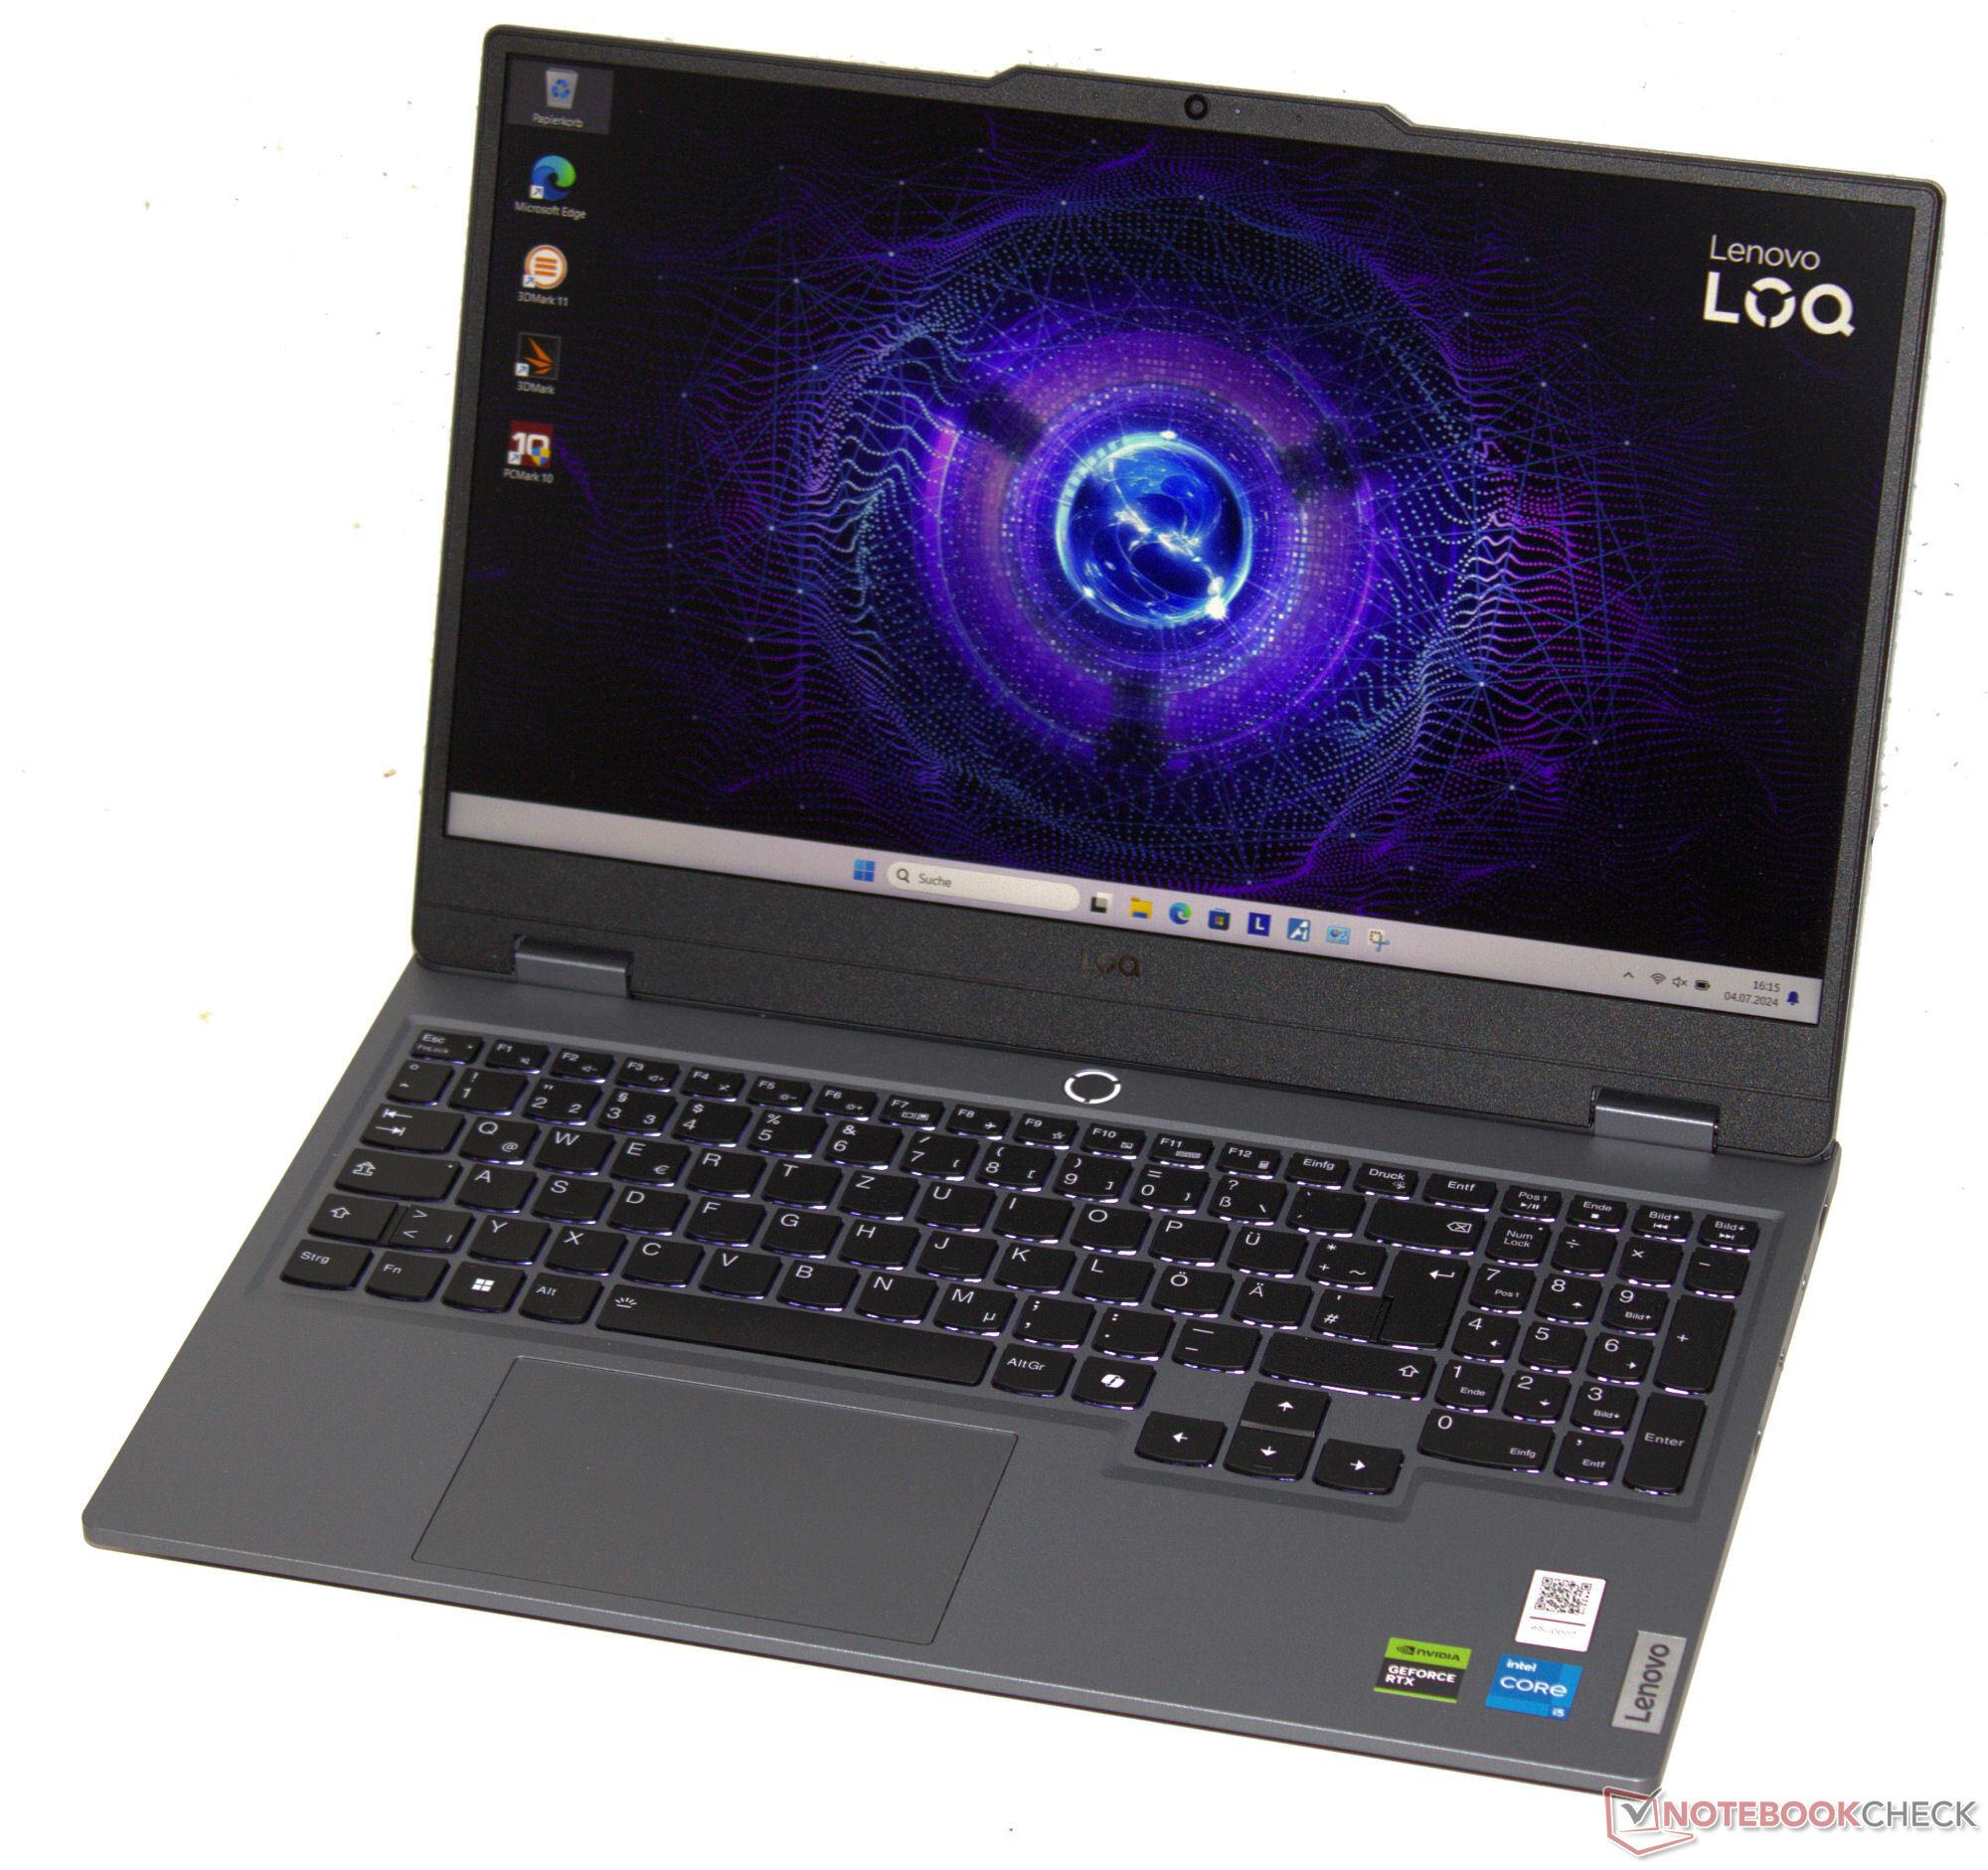
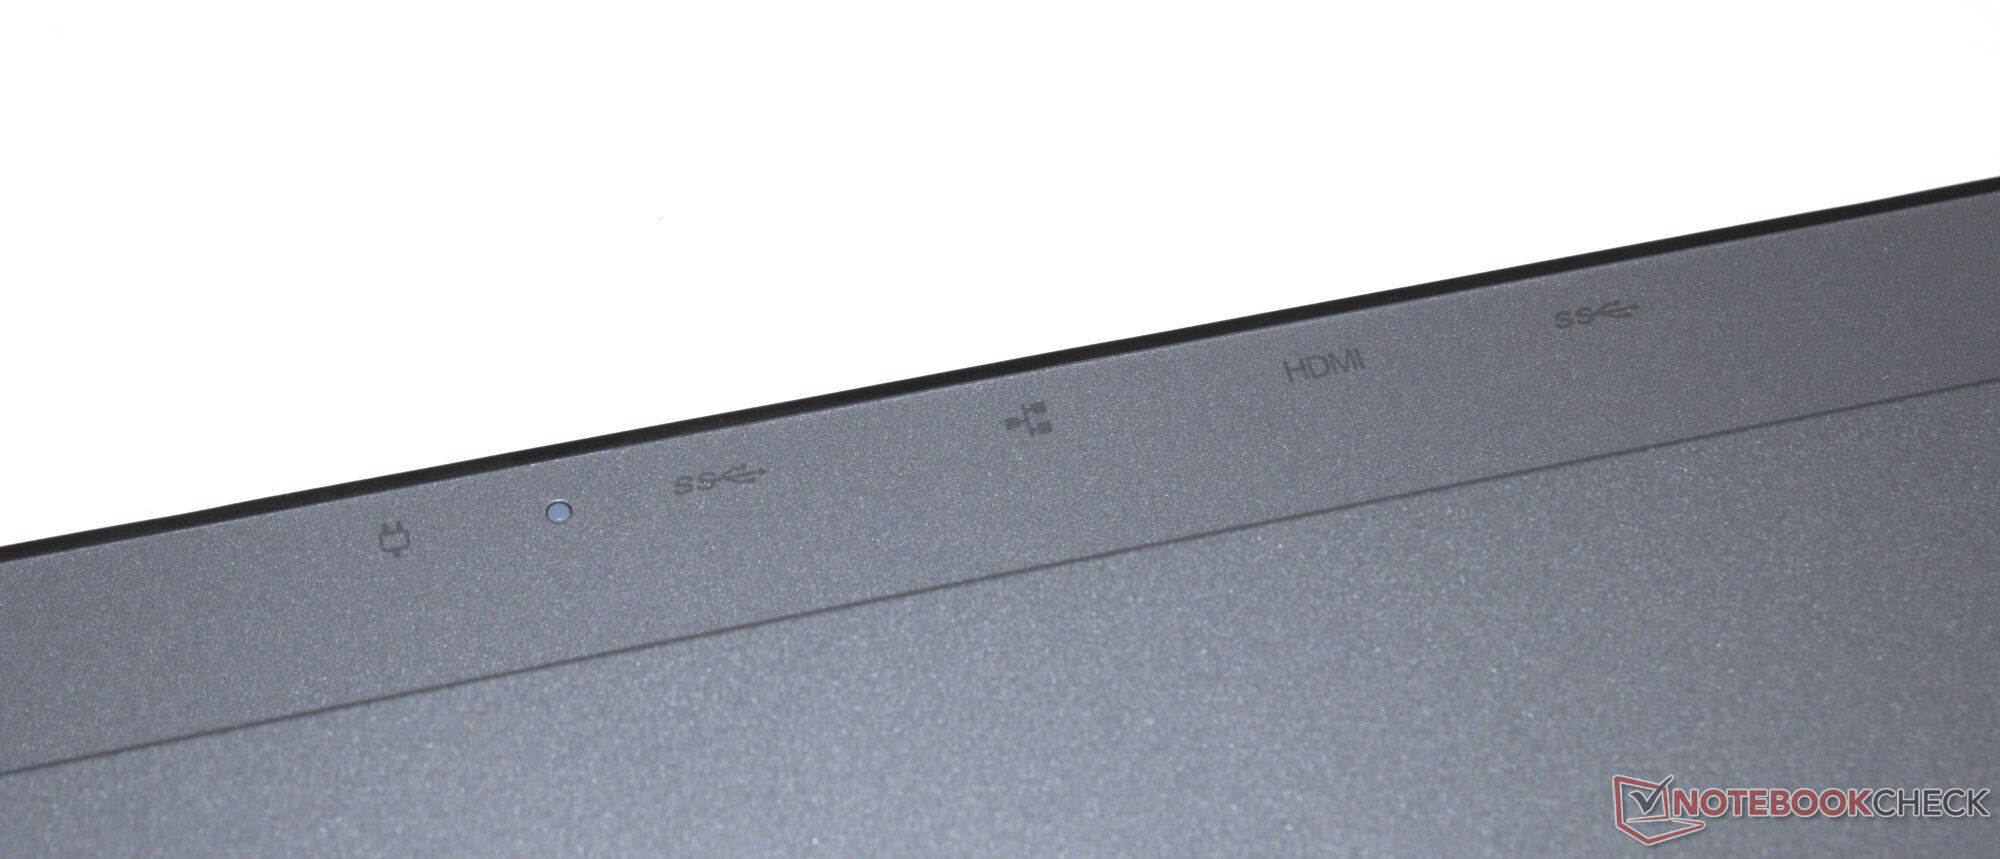
Estojo e conectividade - O LOQ sem USB 4, mas com Power Delivery
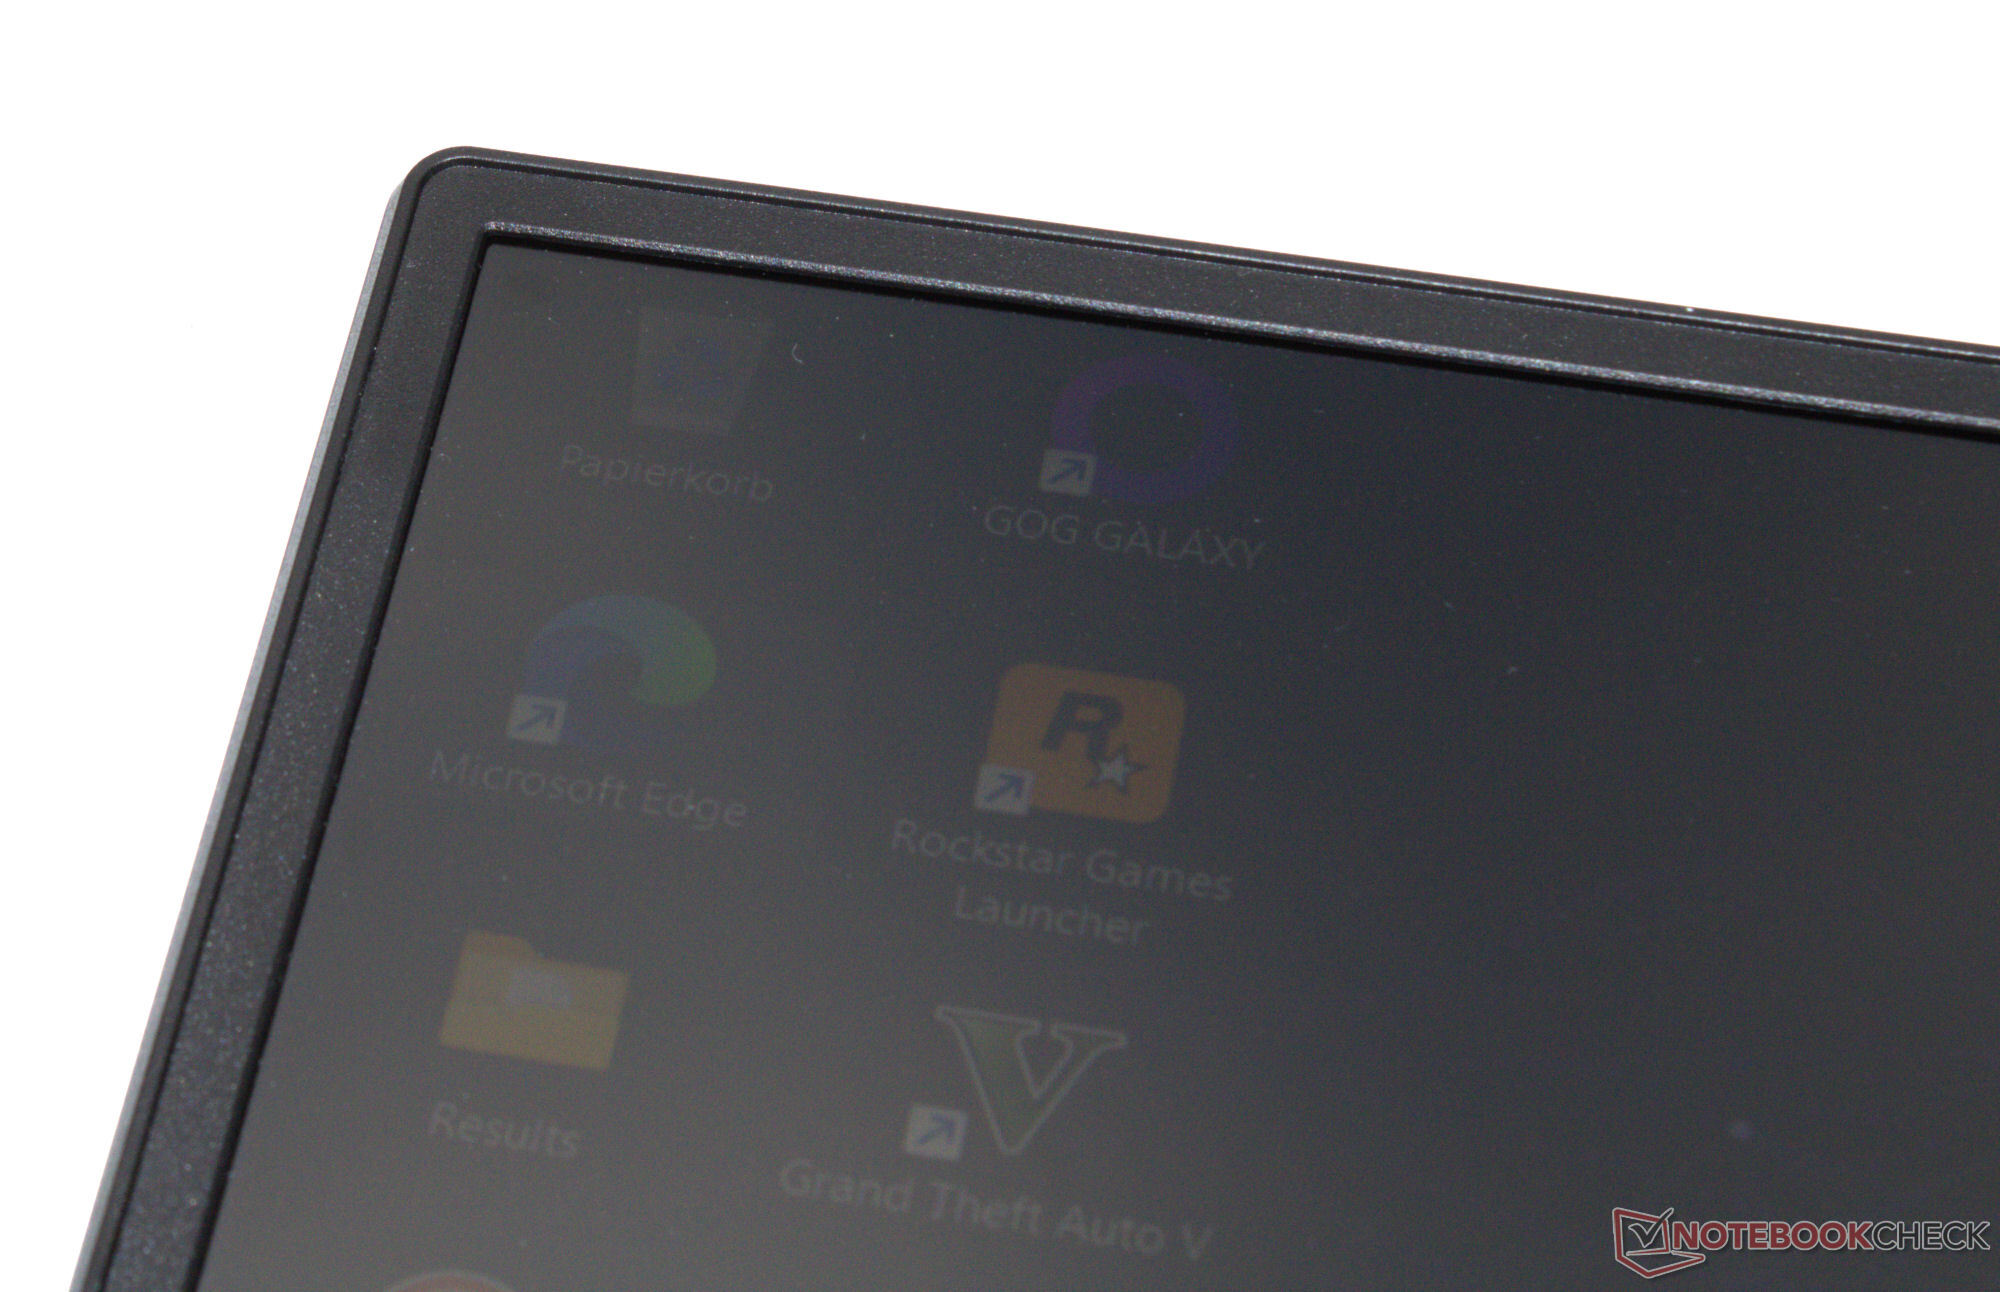
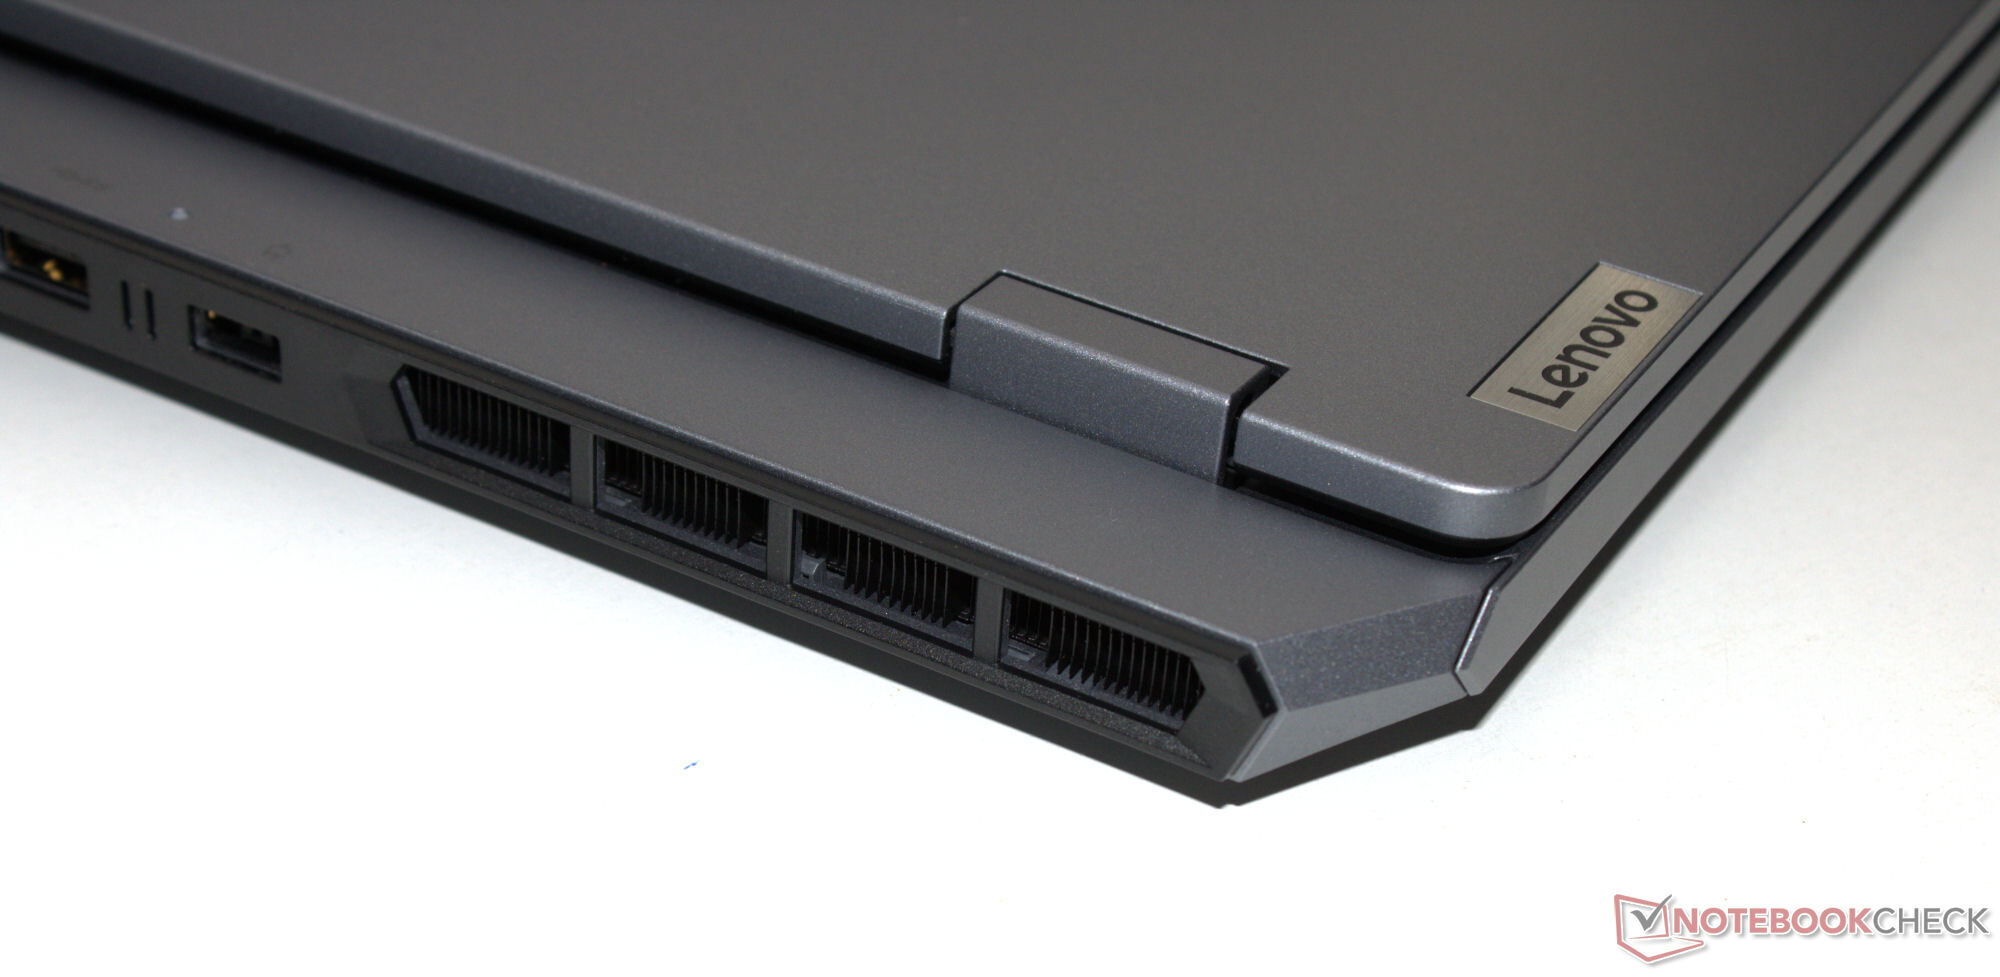
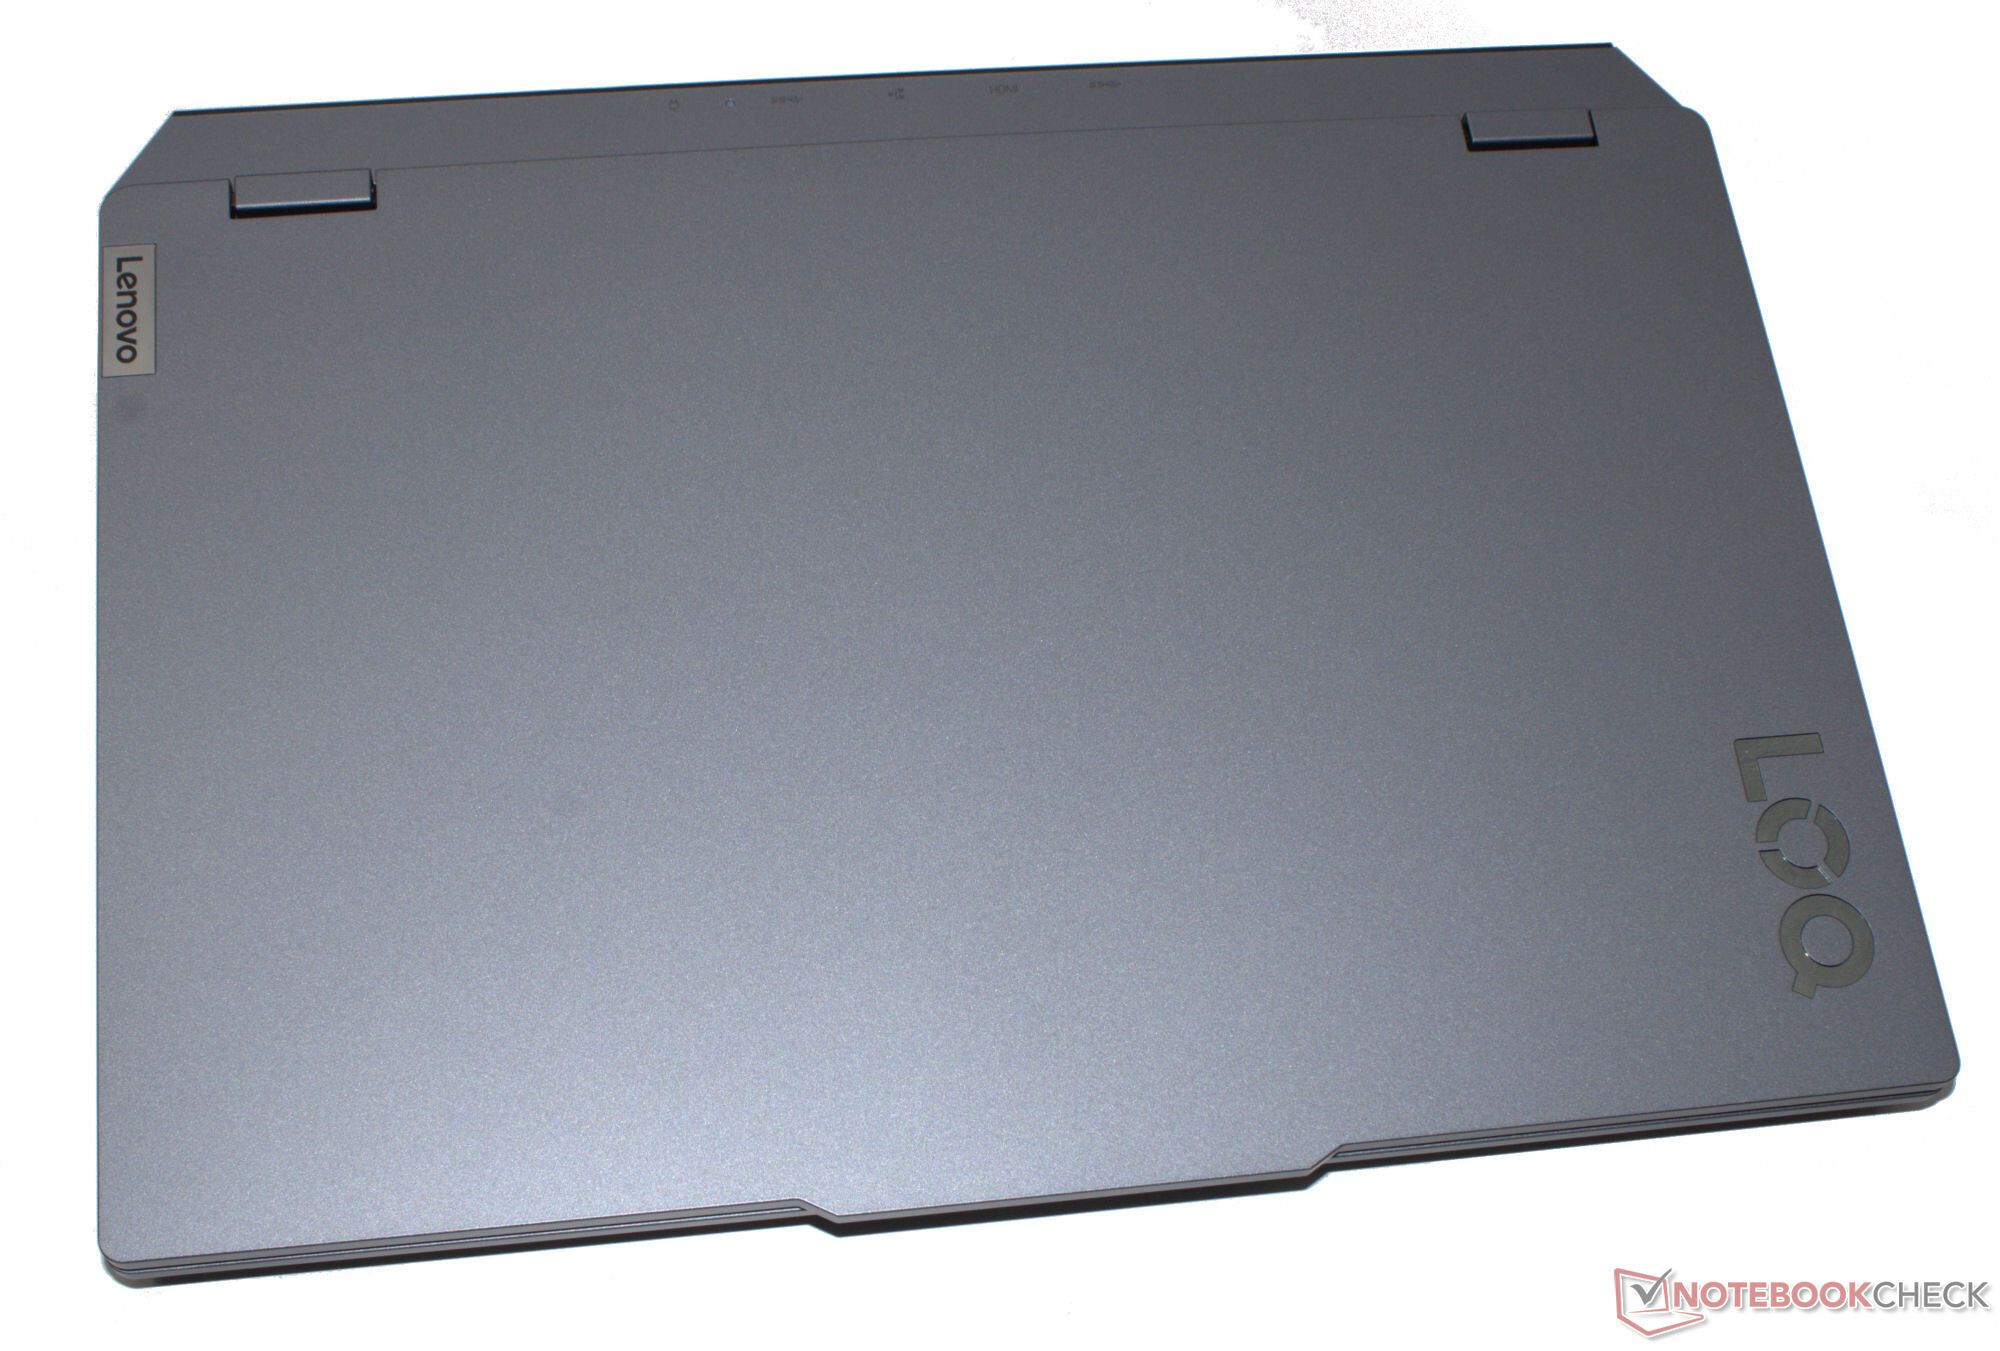
O hardware do laptop está alojado em uma caixa de plástico cinza fosco (Luna Gray) que, em geral, parece bastante elegante. A tampa e a unidade de base podem ser ligeiramente torcidas, mas isso ainda é aceitável. Sua estabilidade é boa. A tampa permite um ângulo máximo de abertura de até 180 graus. As faixas de LED típicas de laptops para jogos não são vistas nesse modelo.
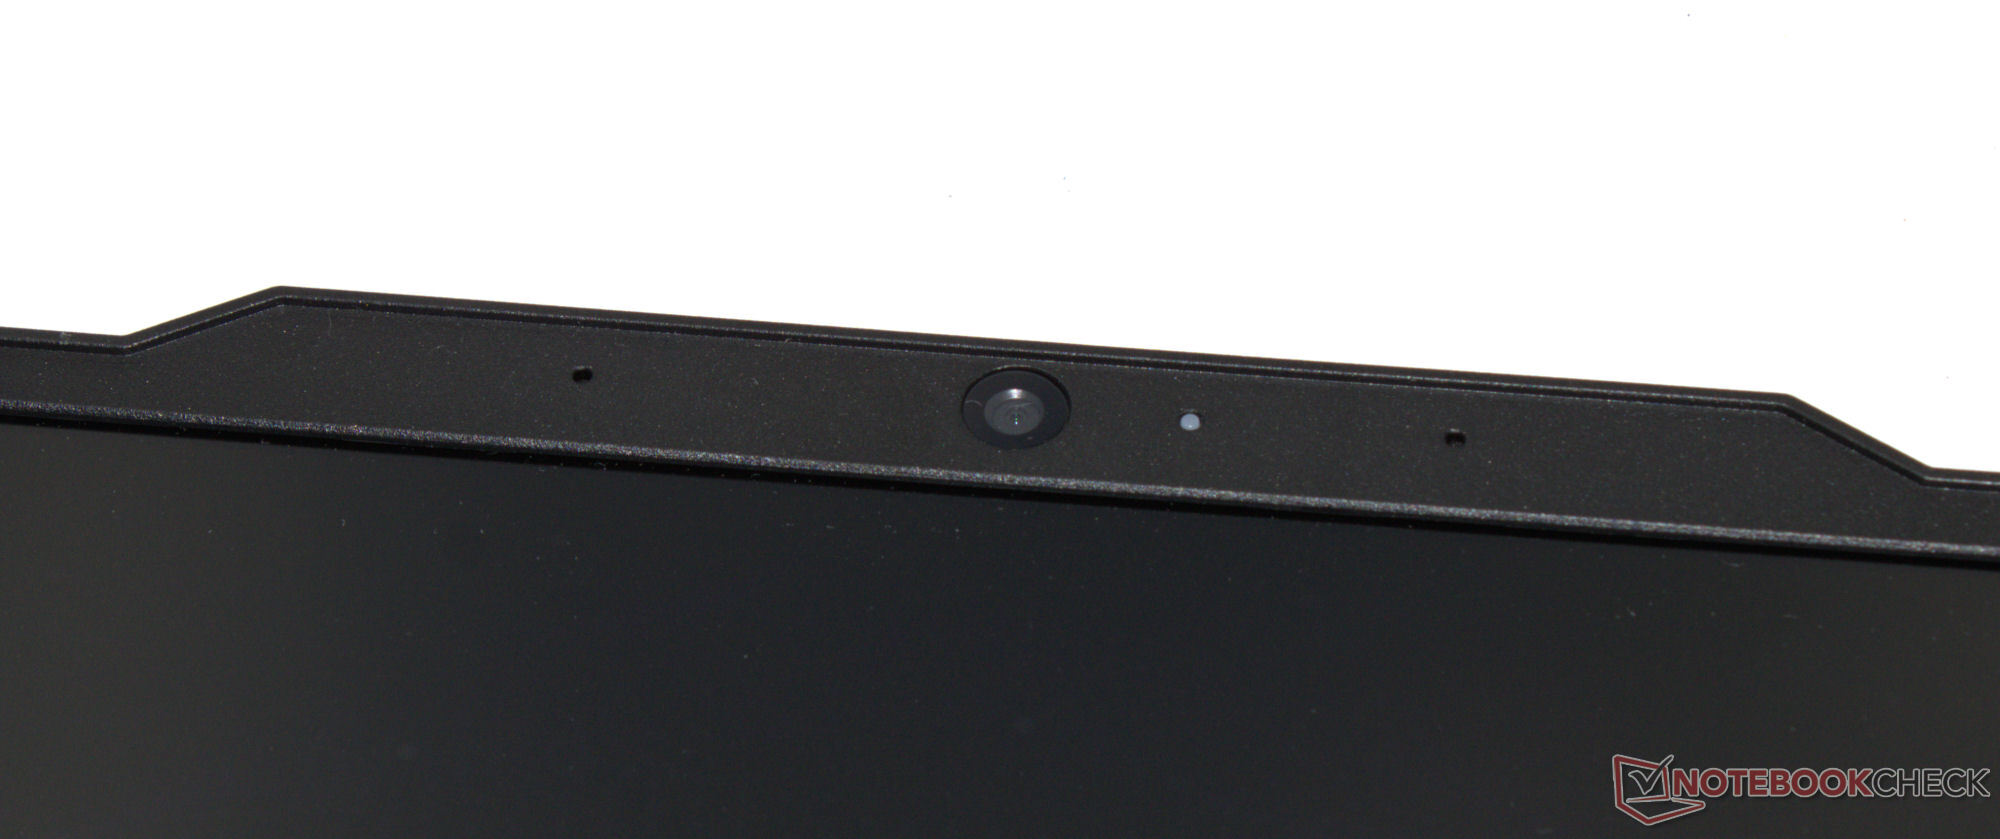
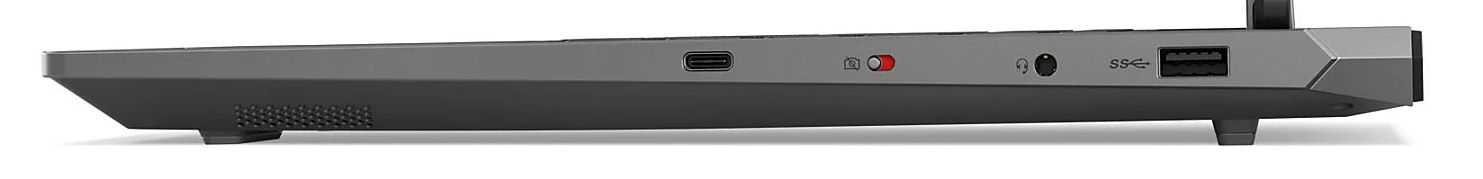
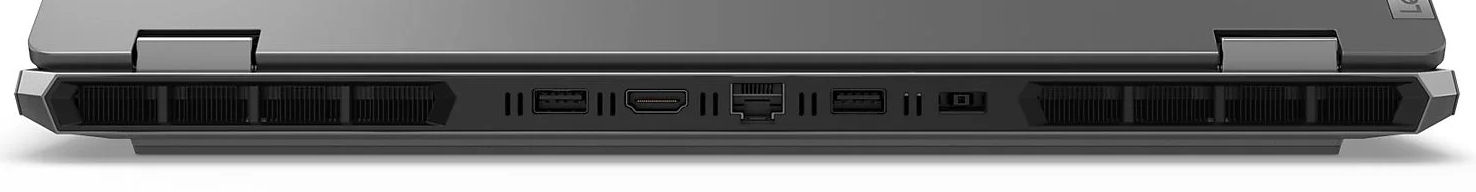
Três conexões USB-A (USB 3.2 Gen 1) e uma porta USB-C (USB 3.2 Gen 2) devem ser suficientes para a maioria dos usuários. A última suporta Power Delivery e o modo Display ALT. No total, o laptop tem duas saídas de vídeo (1x HDMI, 1x DP). Sua webcam (2.1 MP, com interruptor on/off) oferece resultados médios. A Lenovo não considerou necessário um leitor de cartões SD.
As taxas de dados WiFi que medimos são sólidas, mas ficam atrás do que é possível hoje em dia. O chip Realtek WiFi 6 (RTL8852BE) do laptop Lenovo não consegue atingir as mesmas velocidades que os chips Intel instalados em muitos de seus concorrentes.


Sustentabilidade
O laptop e a fonte de alimentação são embalados em um saco plástico cada, enquanto o LOQ é protegido durante o transporte por inserções de espuma. Os tipos de plástico usados são indicados pelo fabricante. Uma capa de papel protege a fonte de alimentação contra arranhões. Tudo isso está alojado em uma caixa de papelão - de acordo com a rotulagem, a madeira usada é proveniente de florestas sustentáveis.
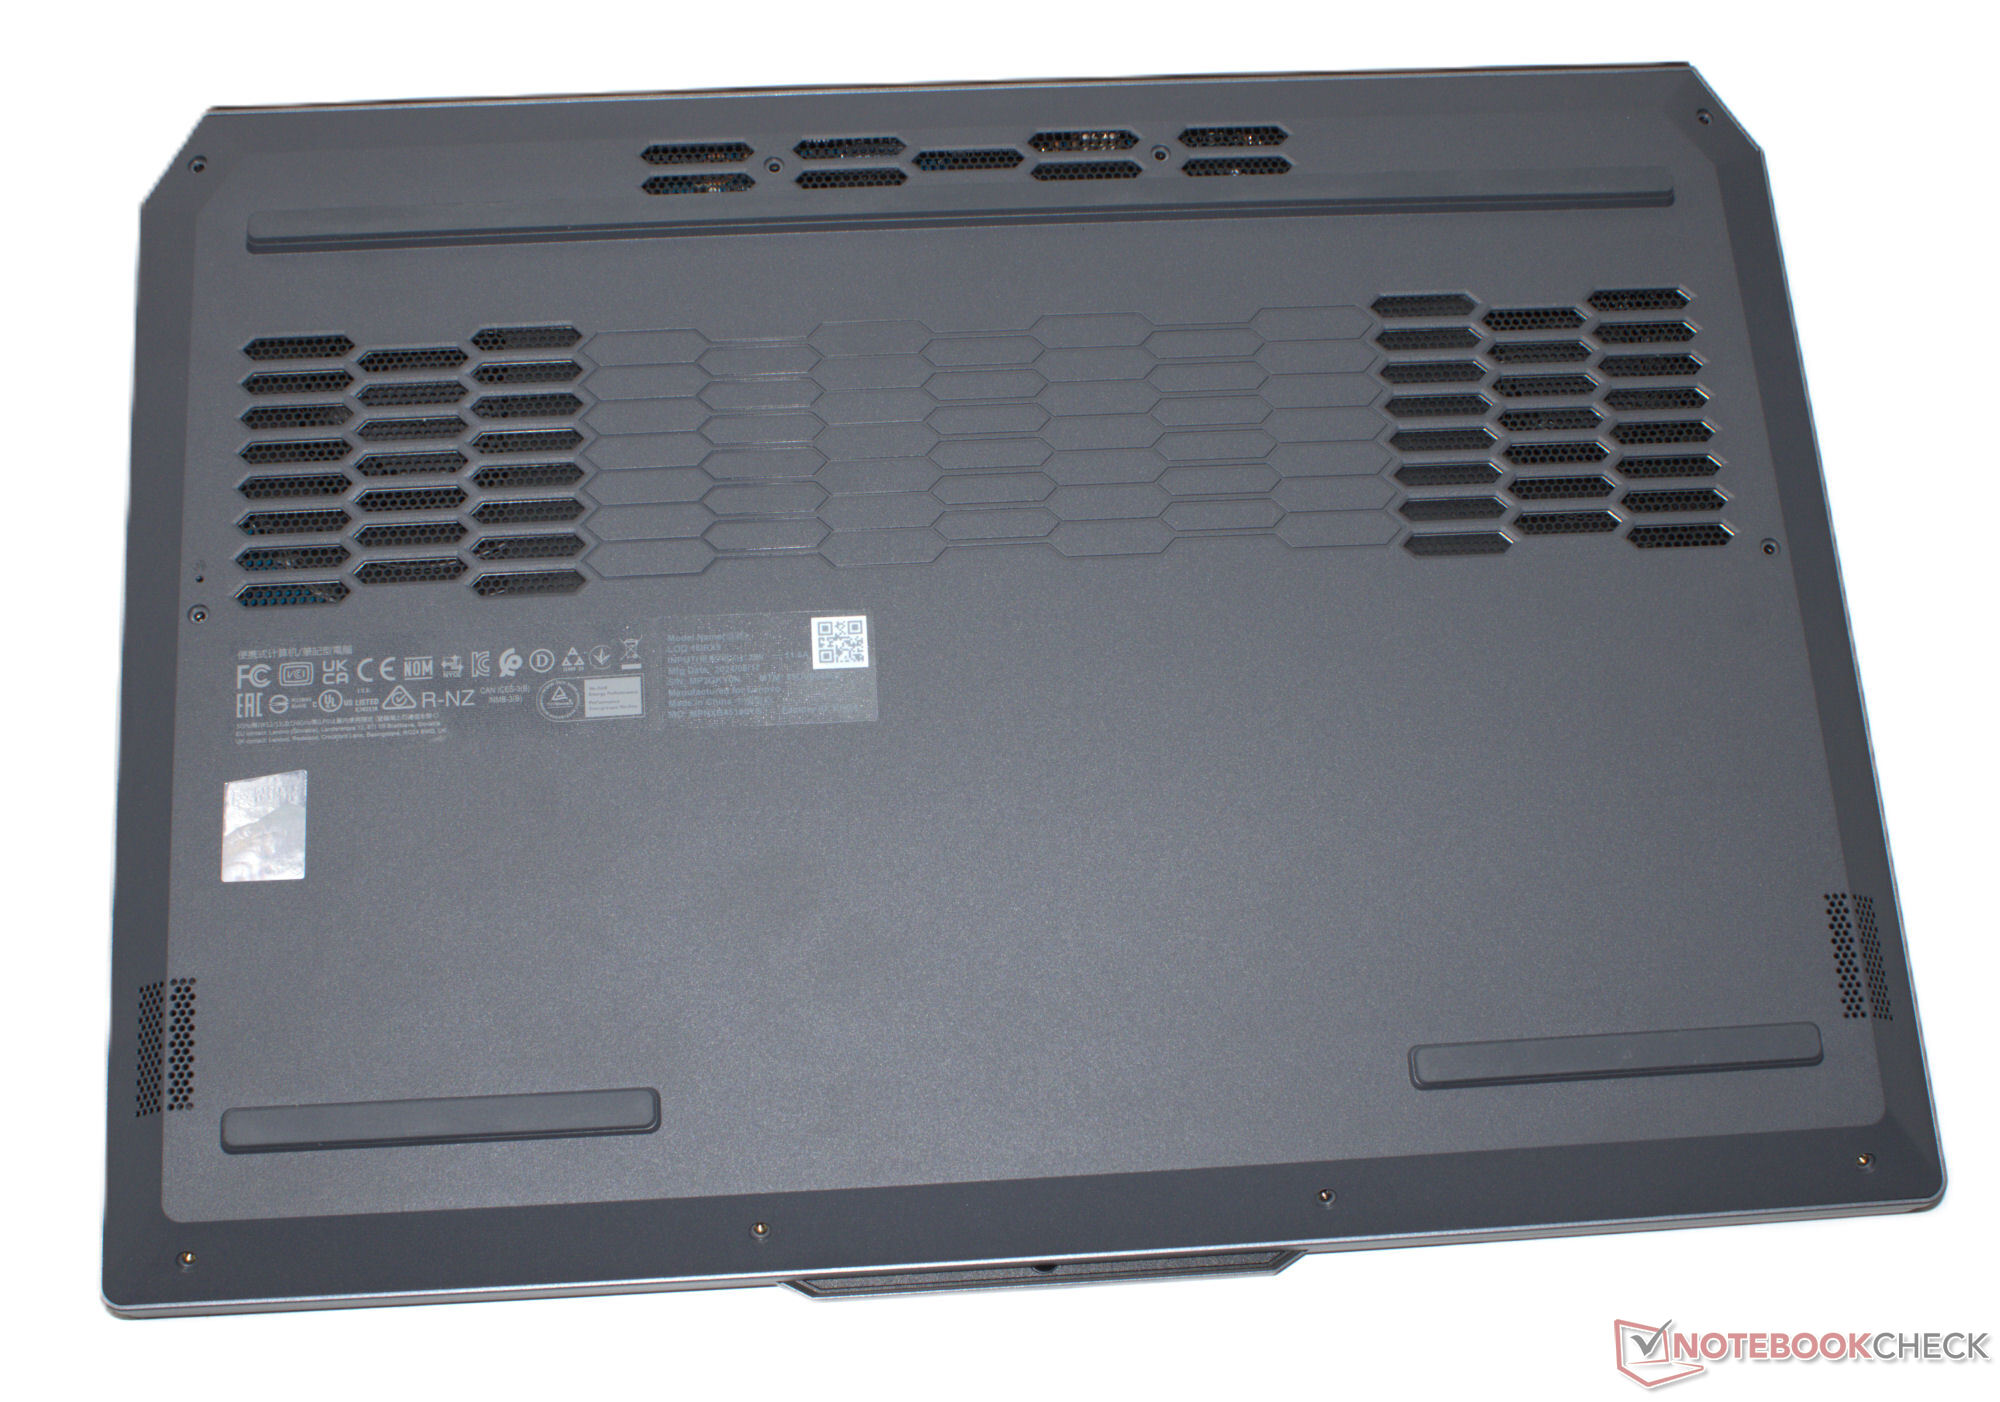
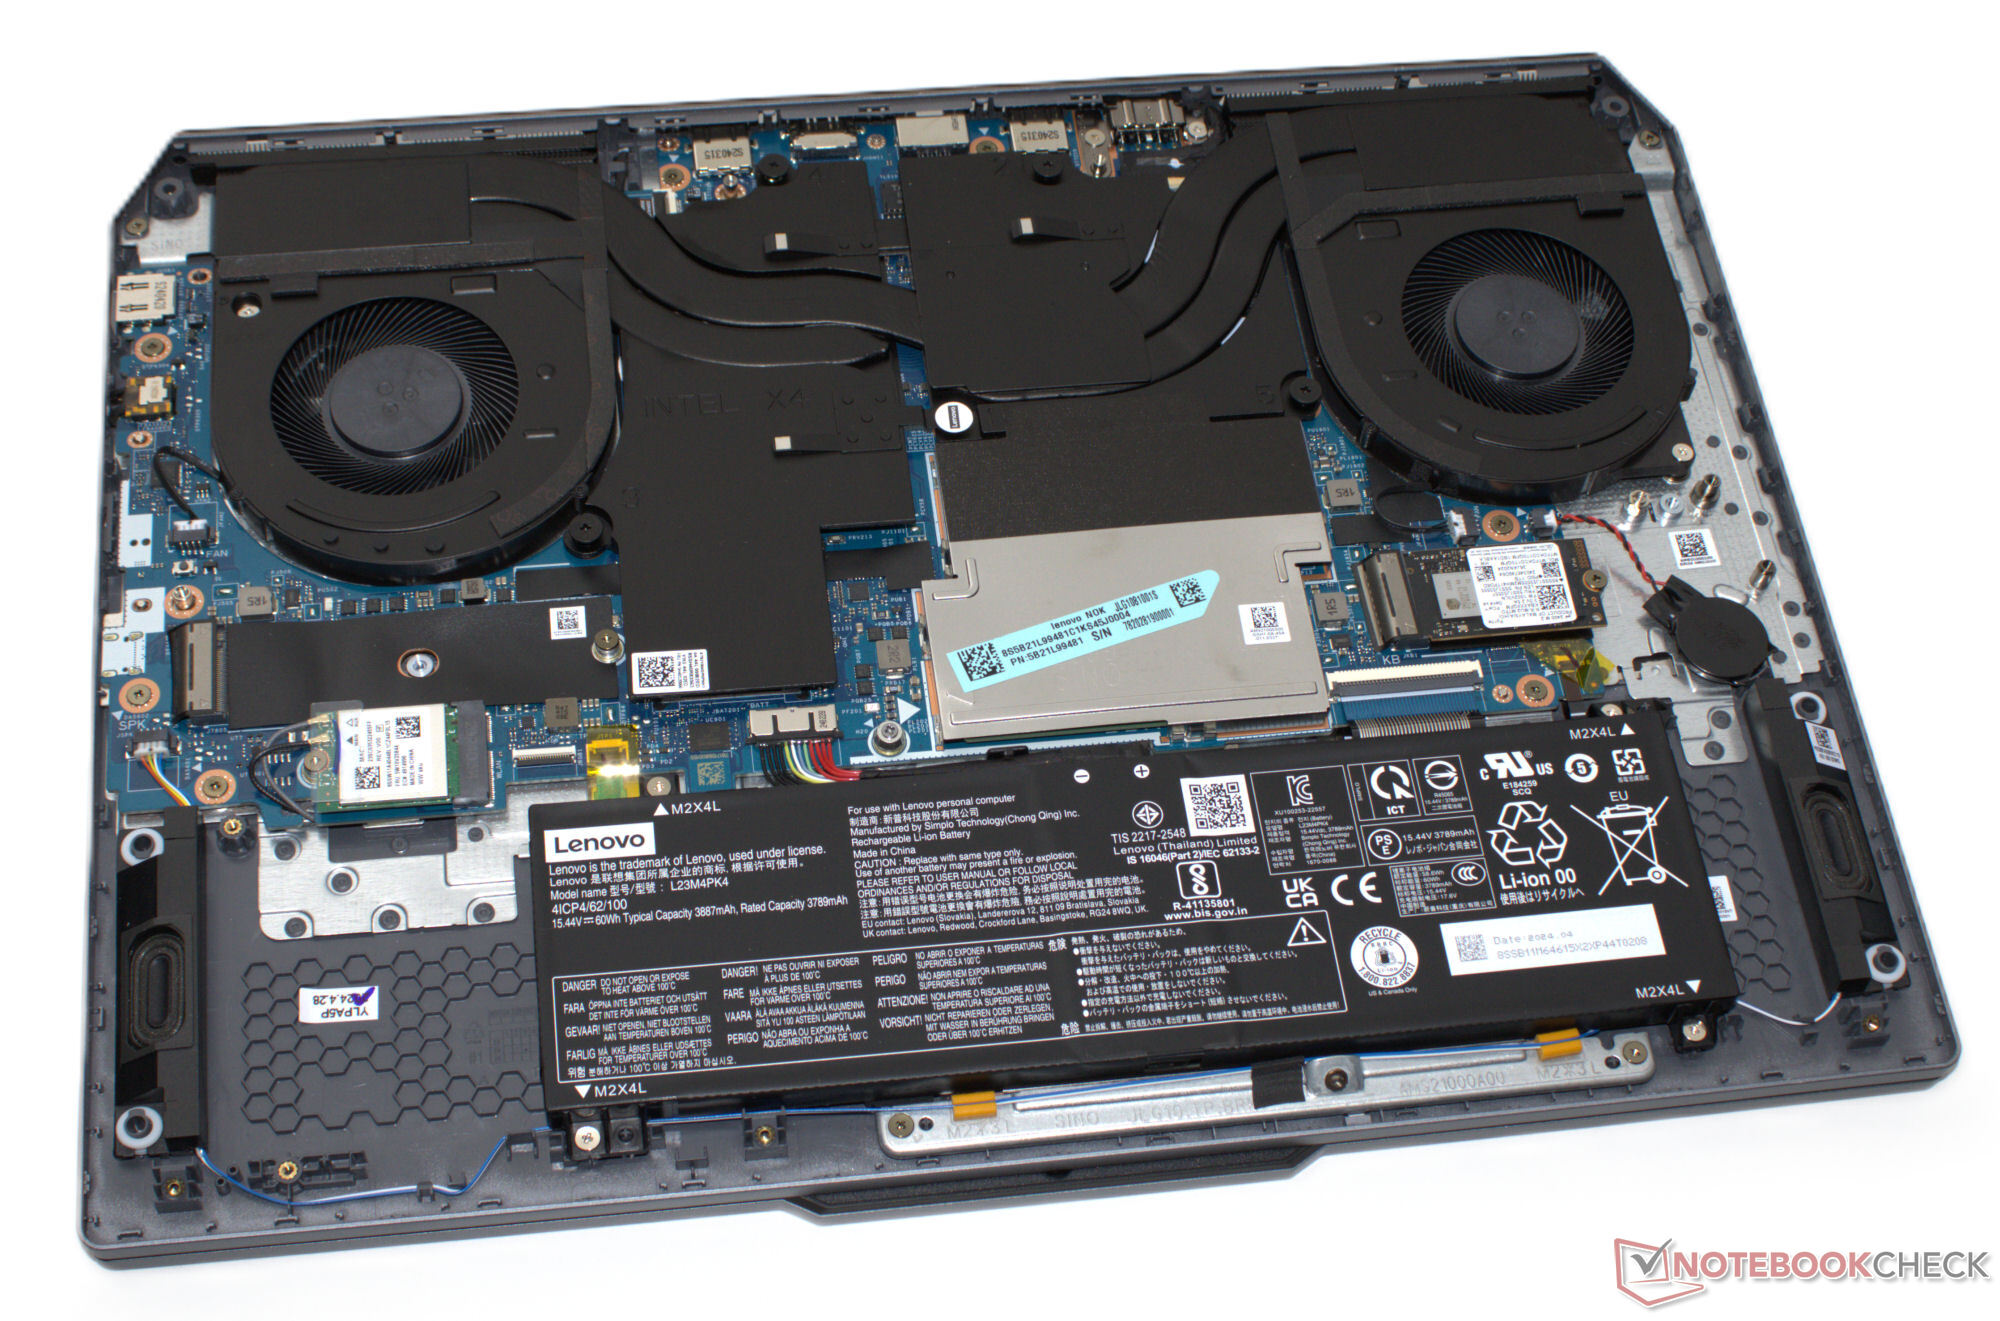
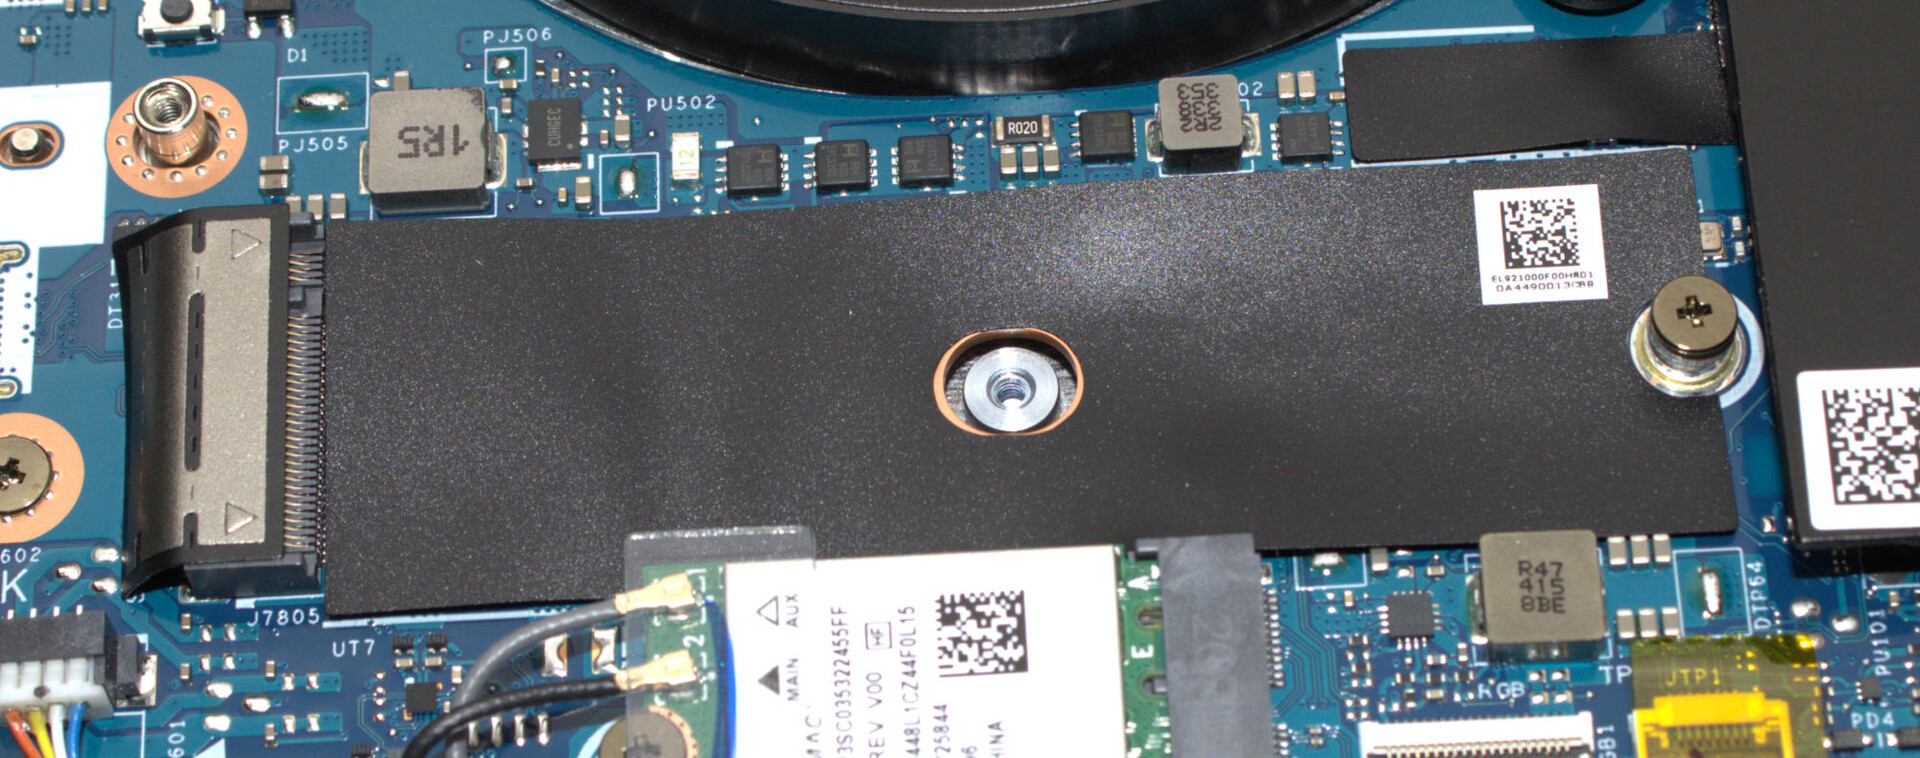
Deve ser muito fácil consertar o dispositivo: A placa inferior pode ser removida sem problemas, o que lhe dá acesso a todo o hardware. Não encontramos nenhuma peça colada dentro do gabinete. Como o Windows 11 é usado como sistema operacional, as atualizações de software devem ser garantidas para os próximos anos. O suporte da Lenovo termina em 31 de dezembro de 2029.
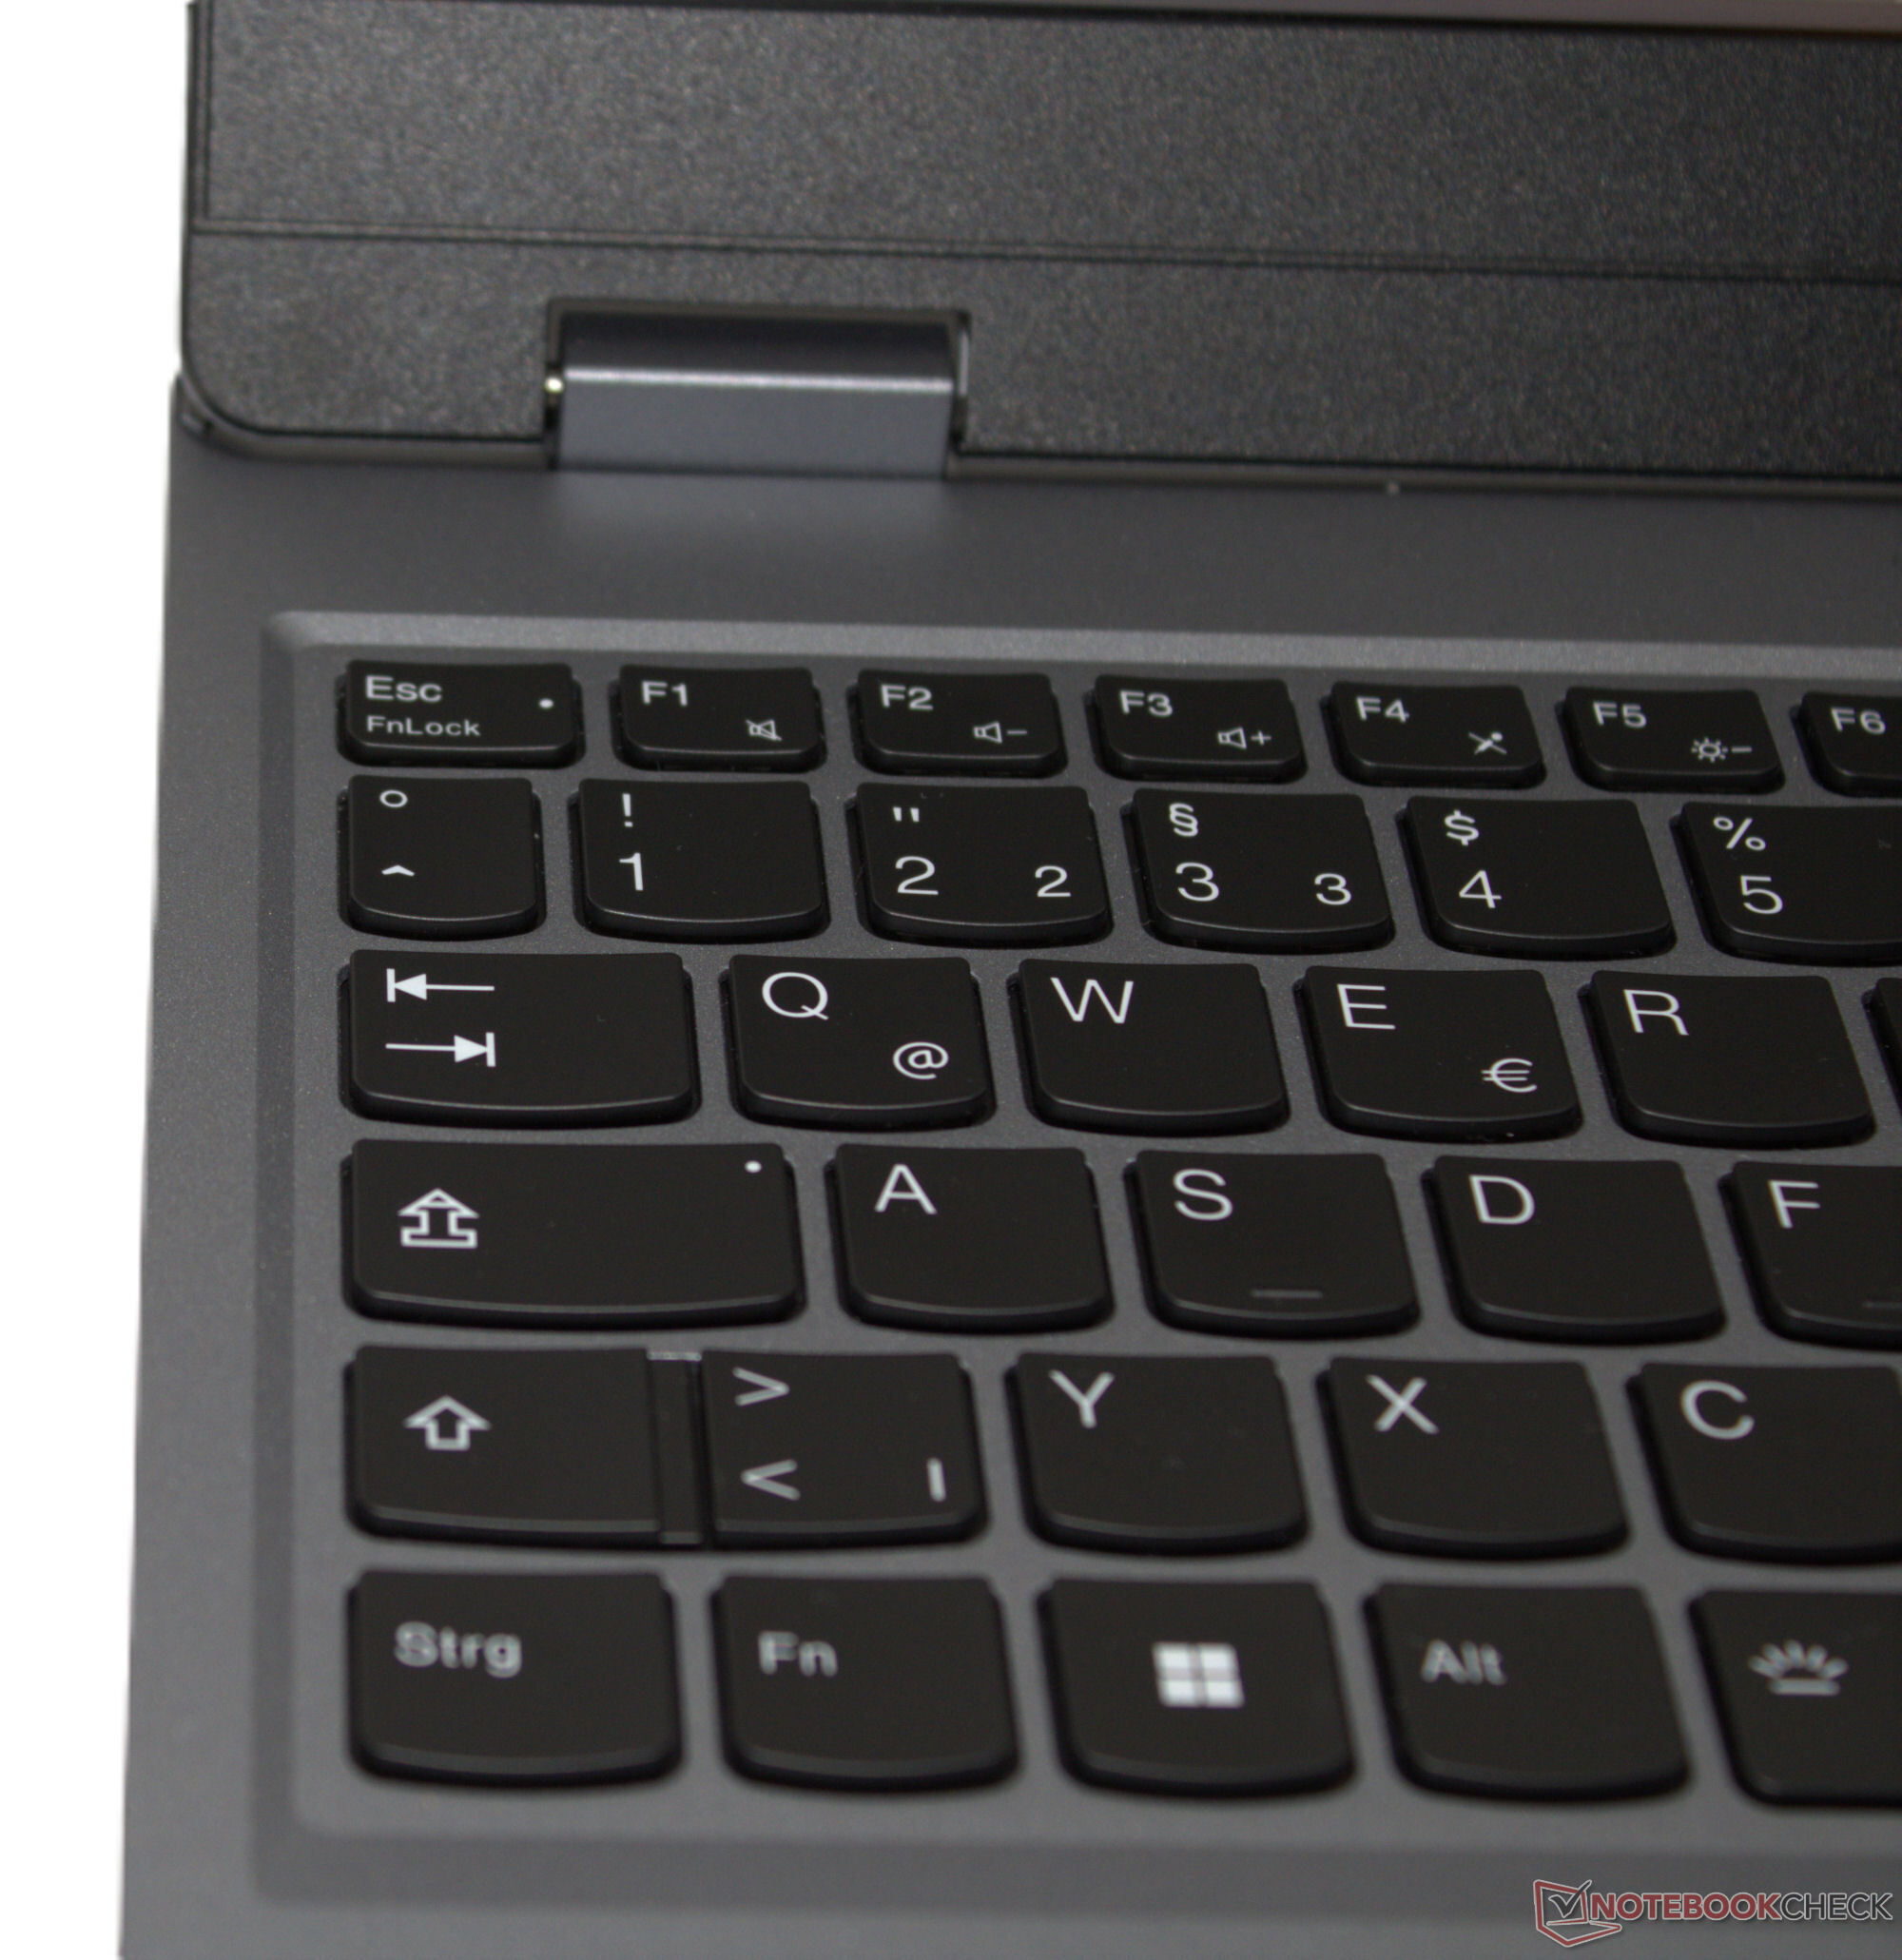
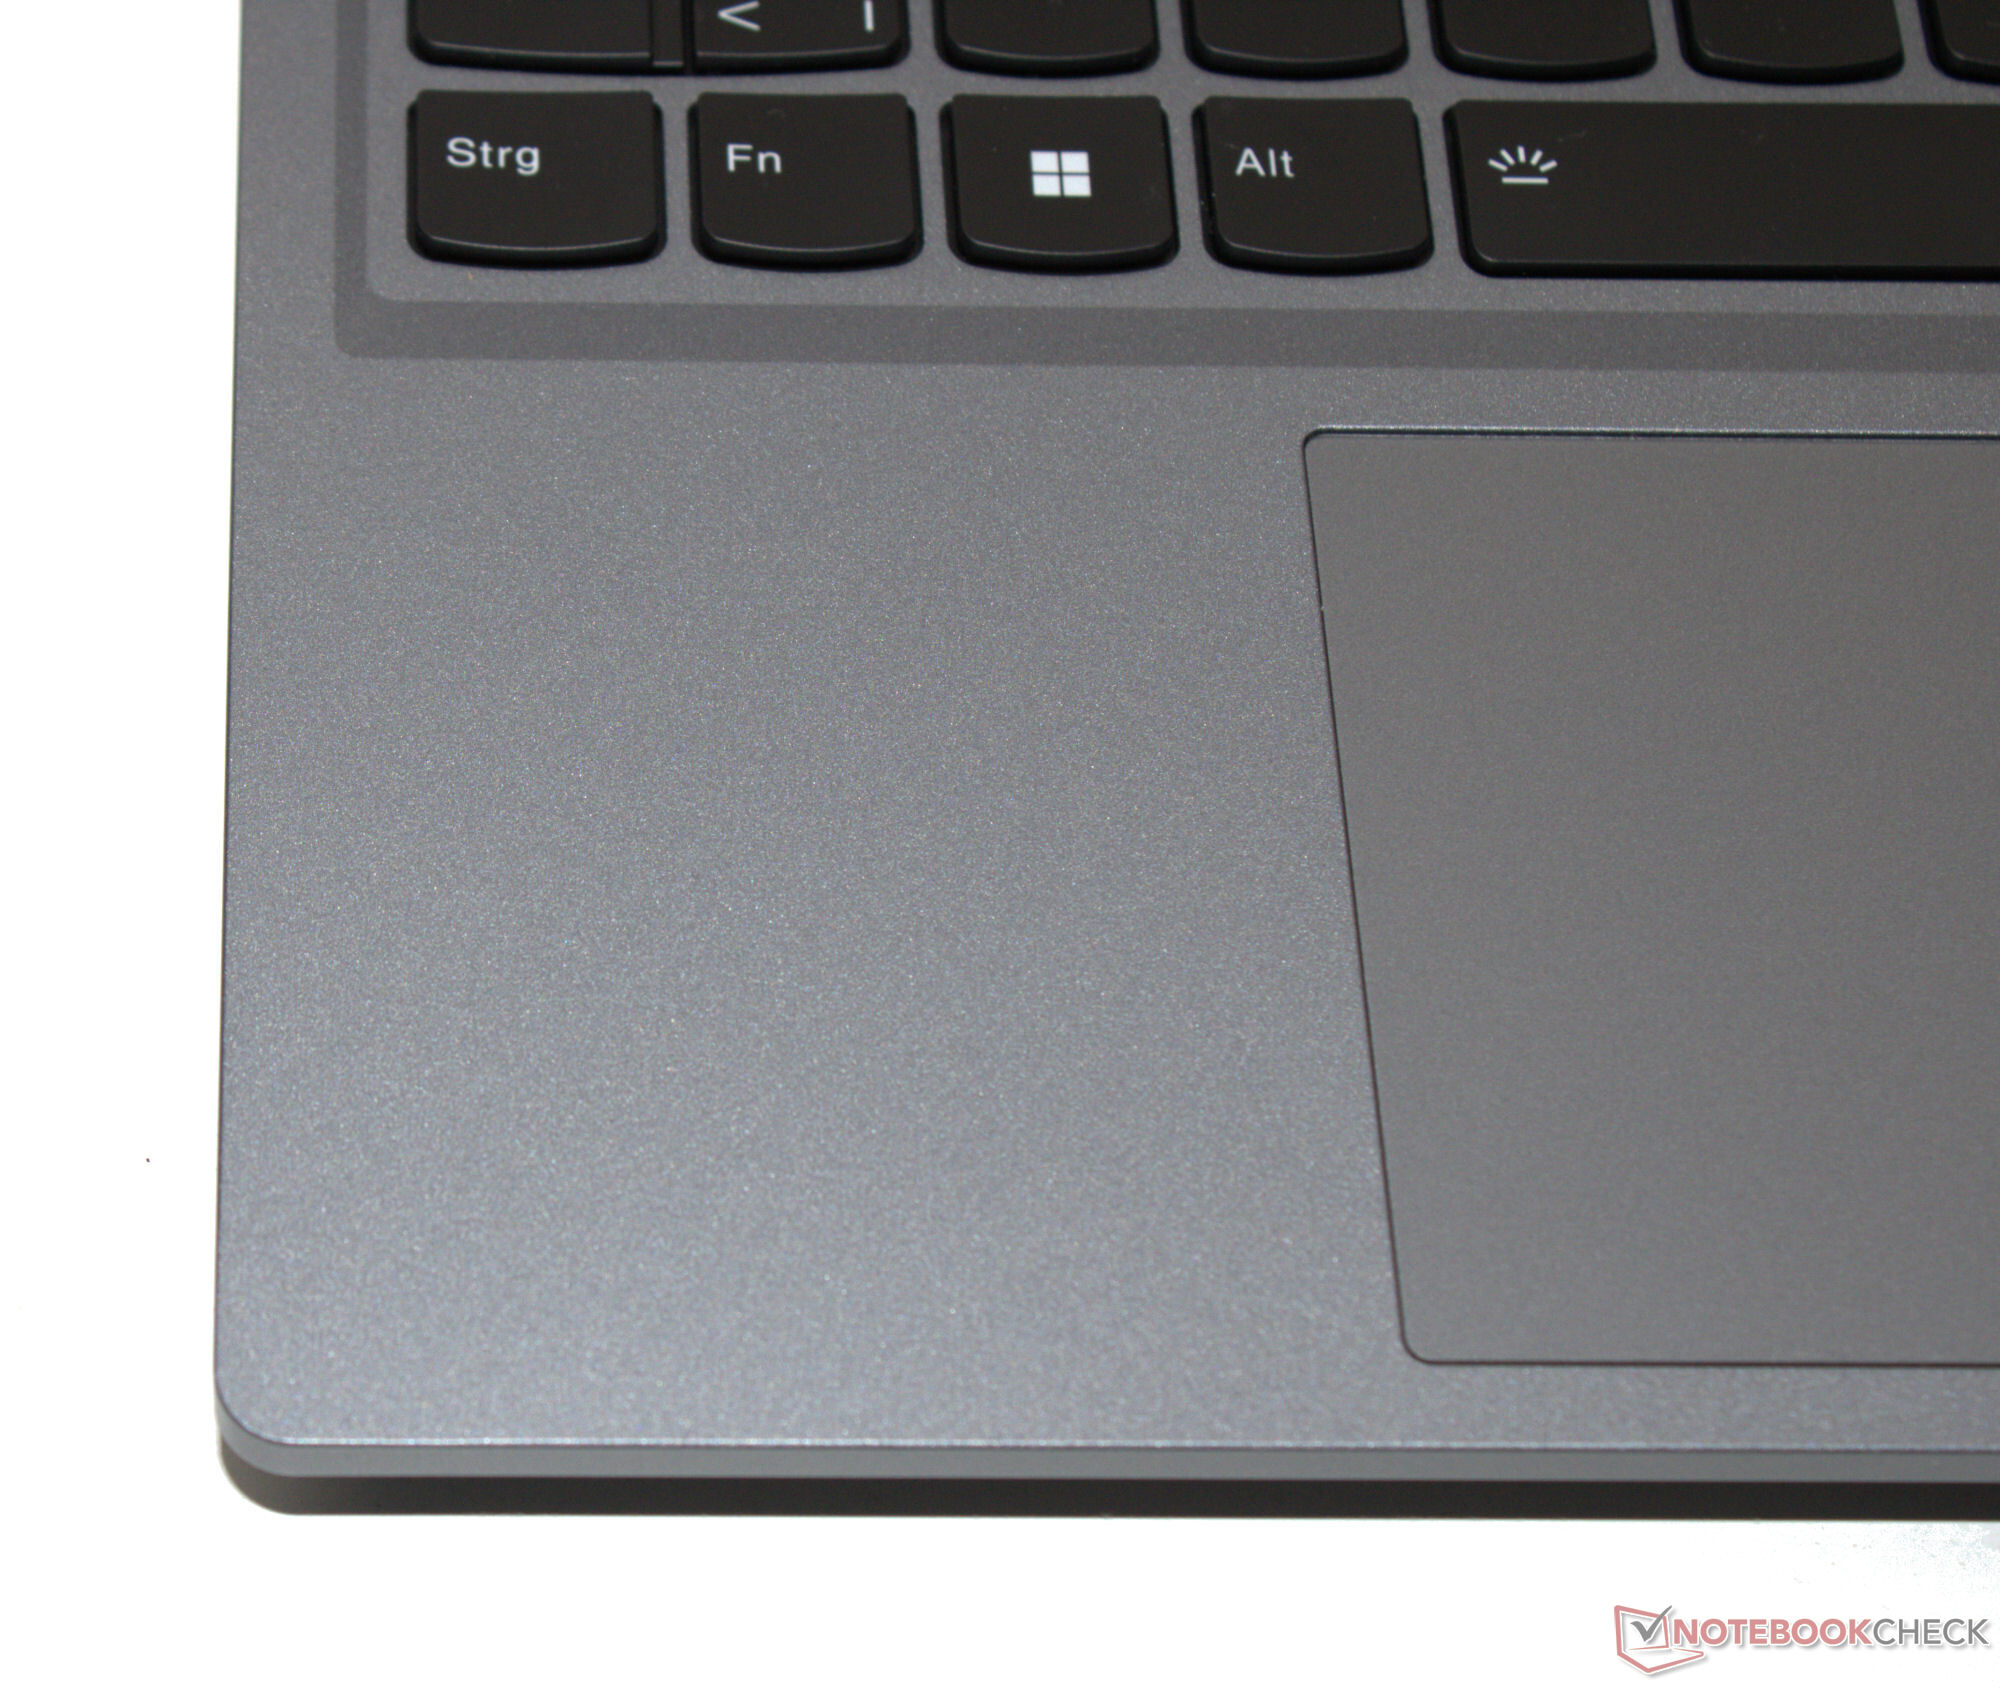
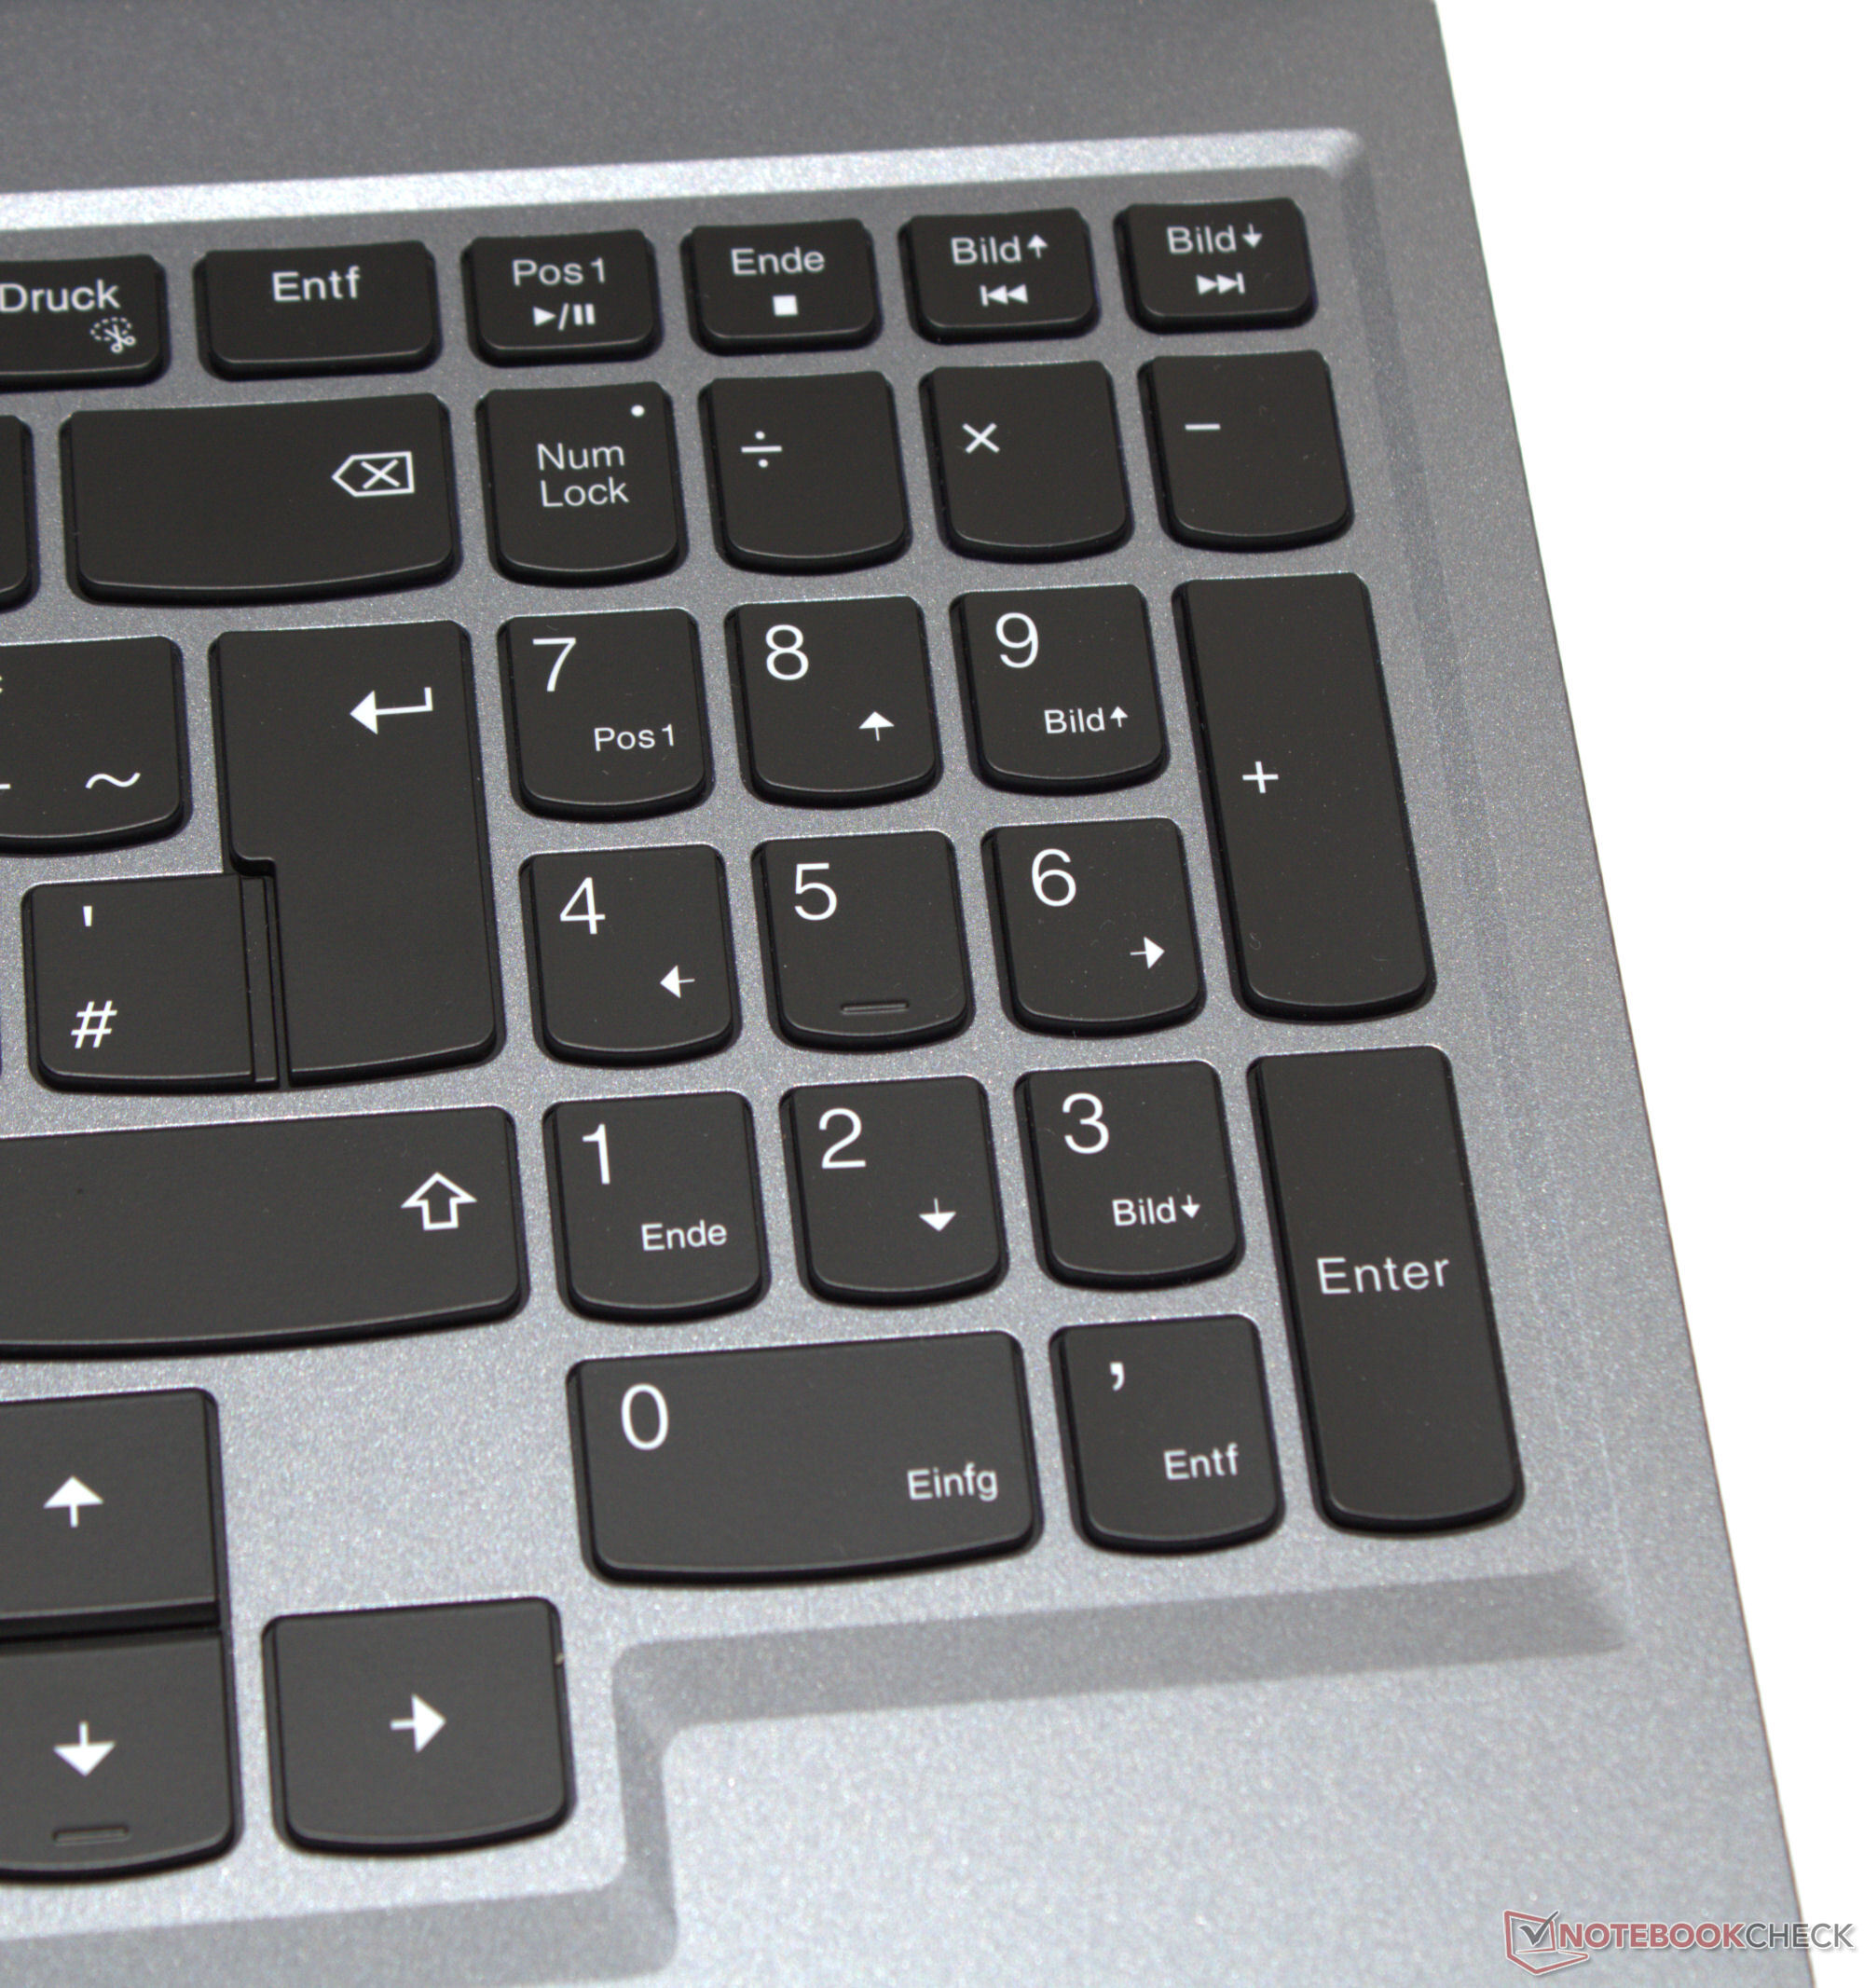
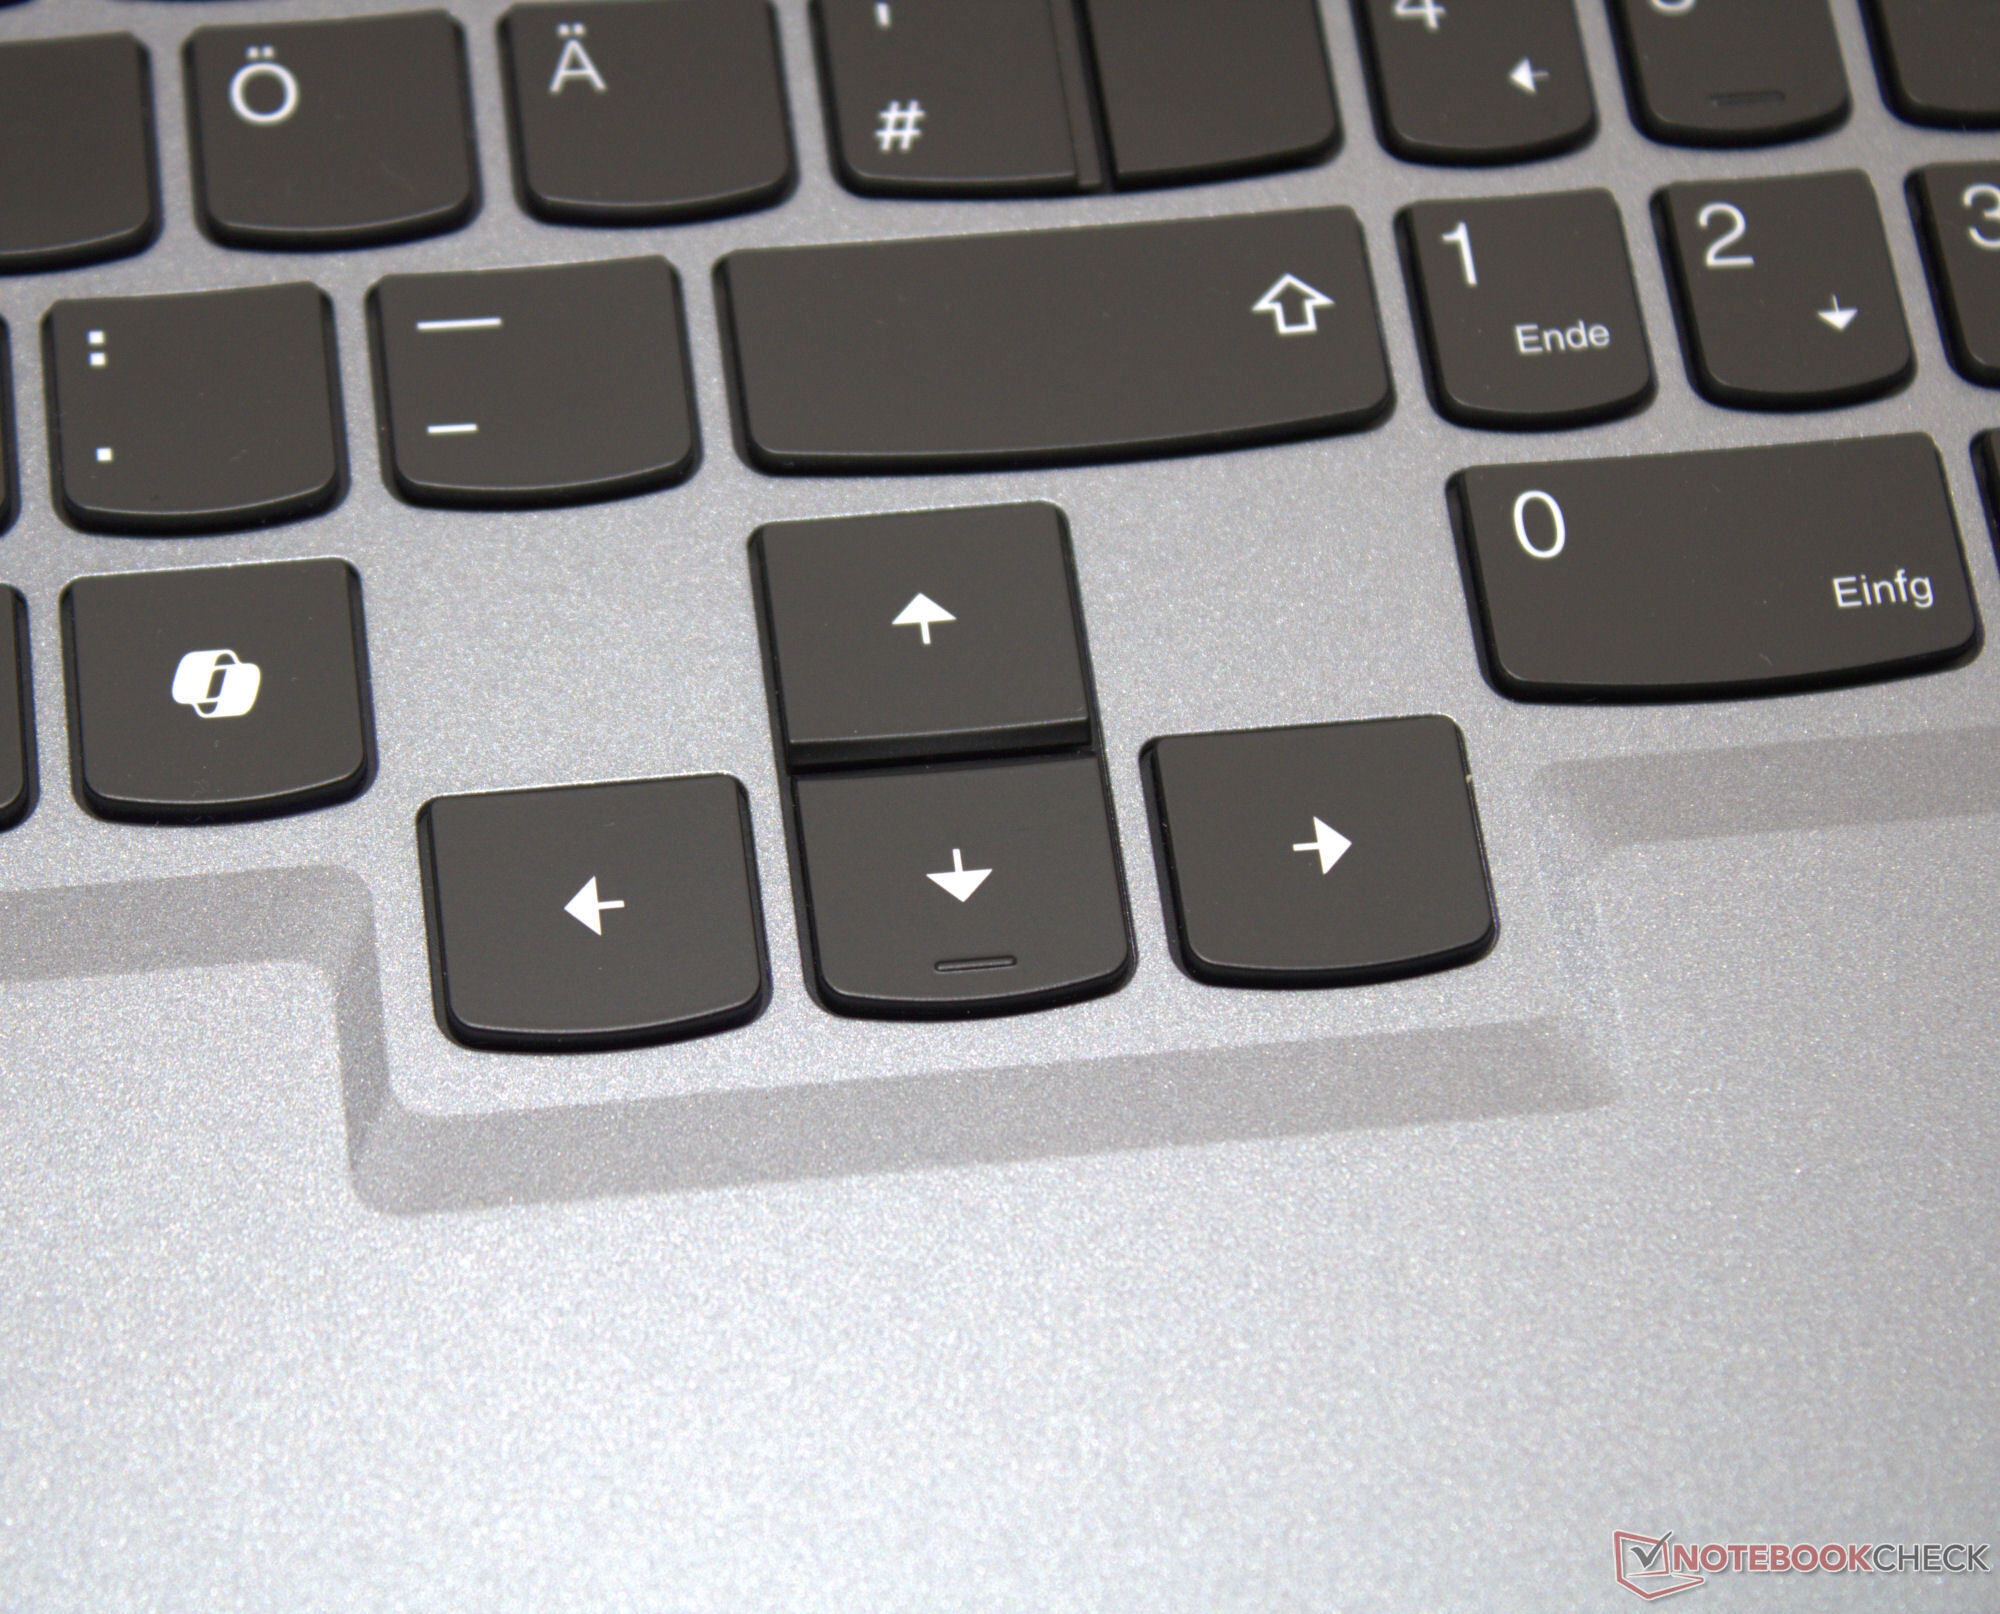
Dispositivos de entrada - O laptop Lenovo possui teclas de seta grandes
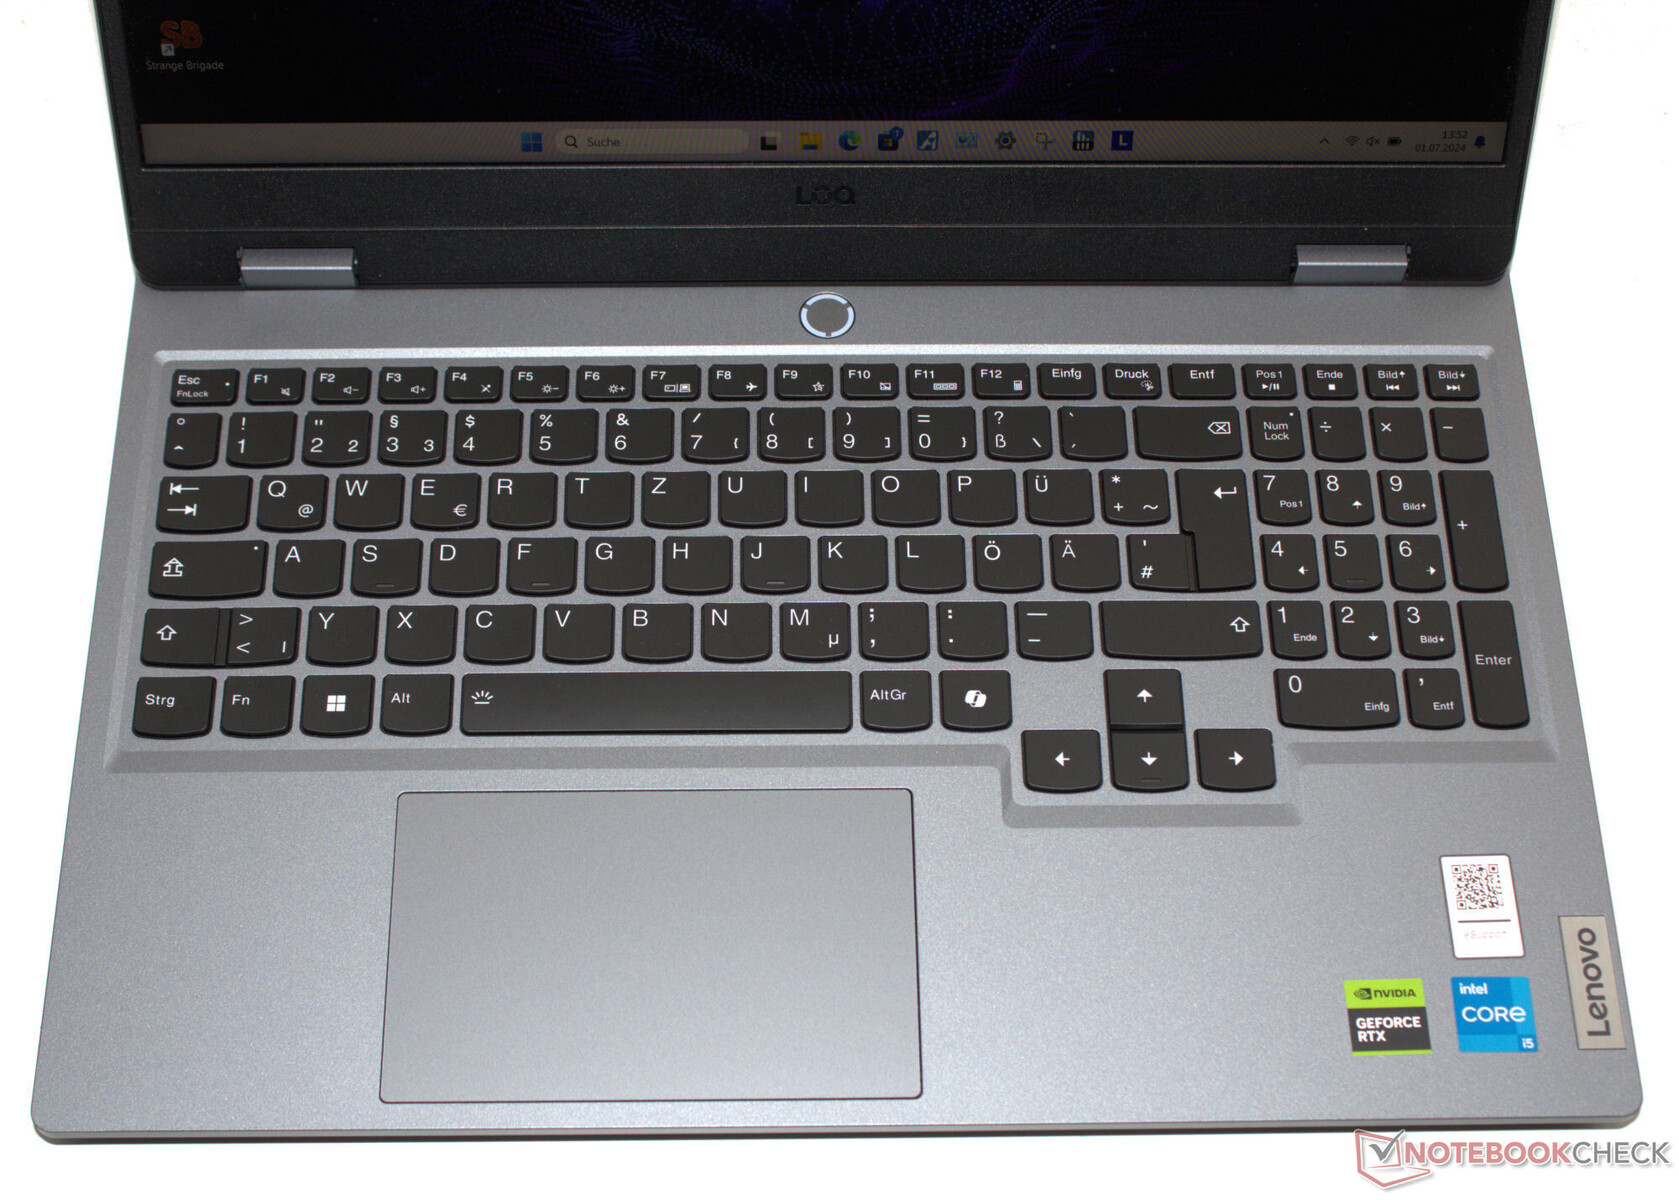
O teclado chiclet com luz de fundo branca se estende por toda a largura do laptop - além disso, ele possui um teclado numérico. A forma e a disposição das teclas correspondem ao layout familiar da Lenovo. As teclas côncavas oferecem uma boa resistência e um ponto de pressão claro. O teclado cede um pouco ao digitar, mas isso não é um problema. Um ponto positivo: As teclas de seta deslocadas e de tamanho normal são confortáveis de usar. Um clickpad multitoque (aprox. 12 x 7,5 cm) com uma elevação curta e um ponto de pressão claro serve como substituto do mouse.
Tela - IPS on board
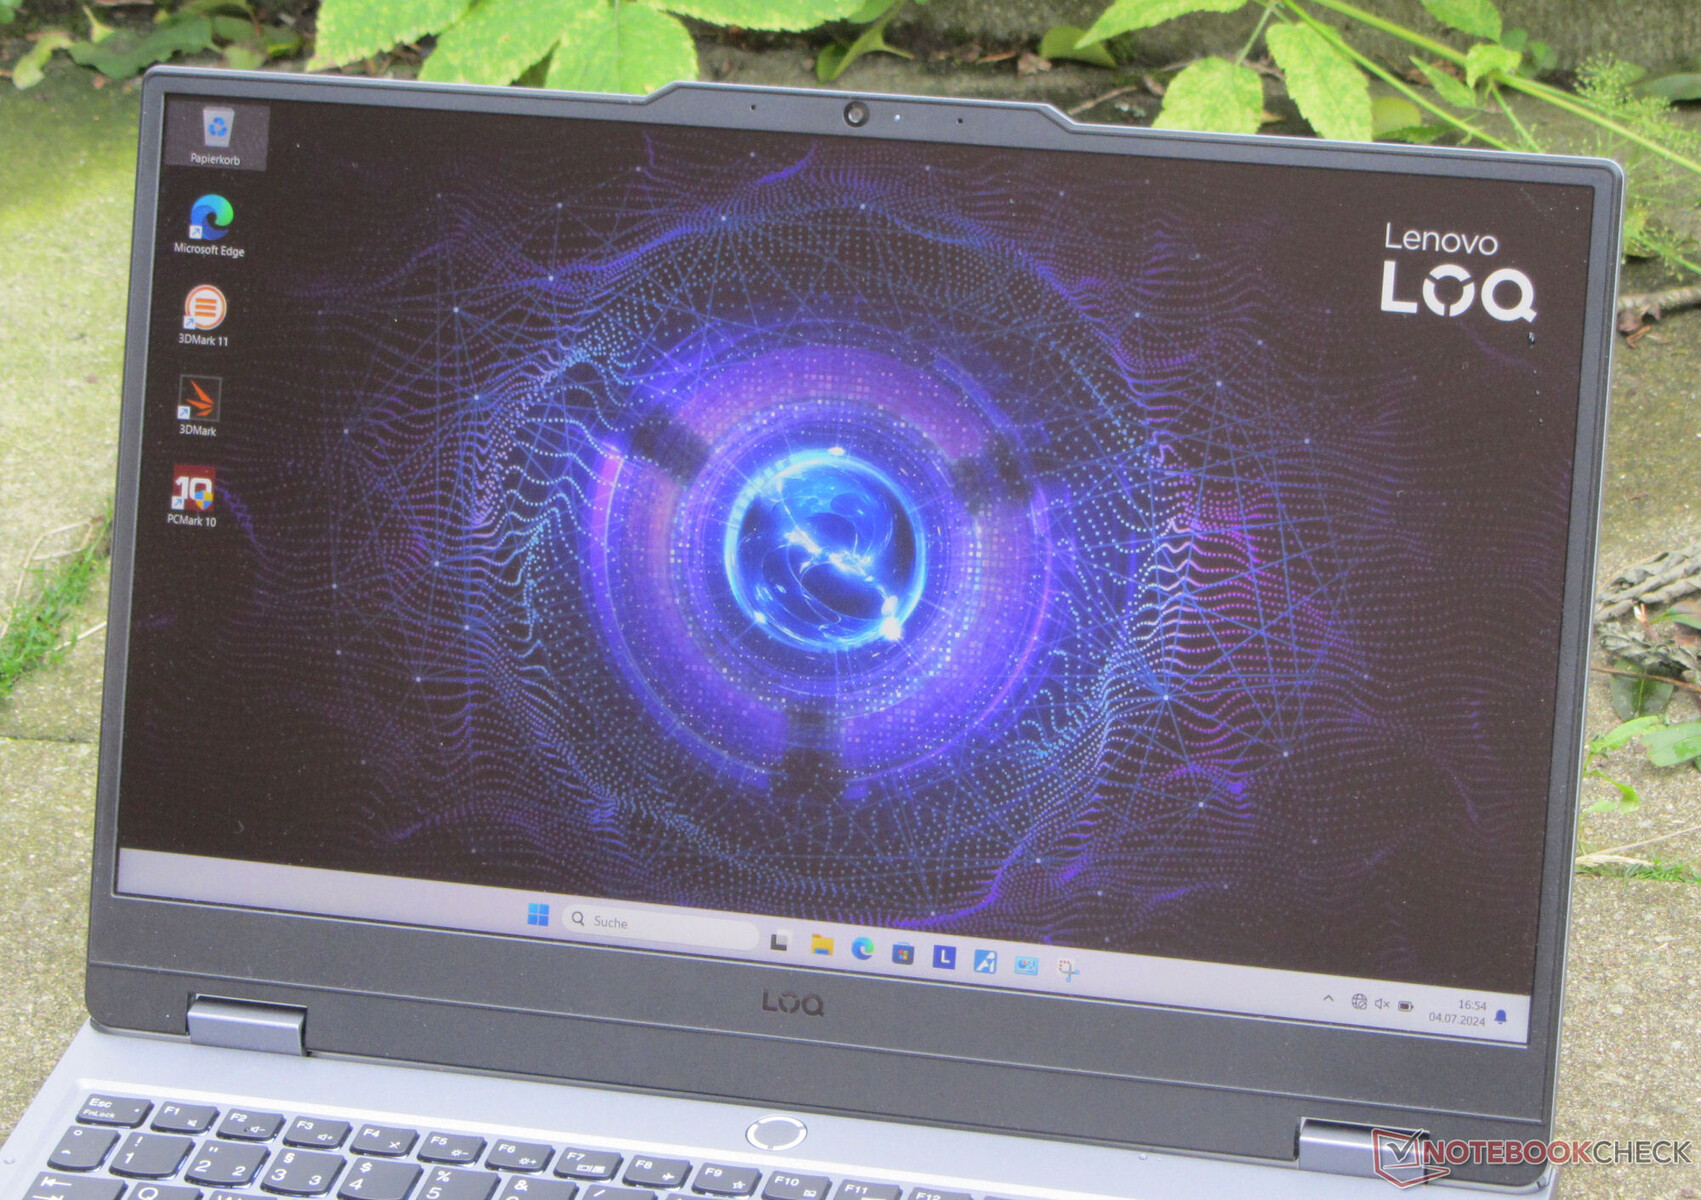
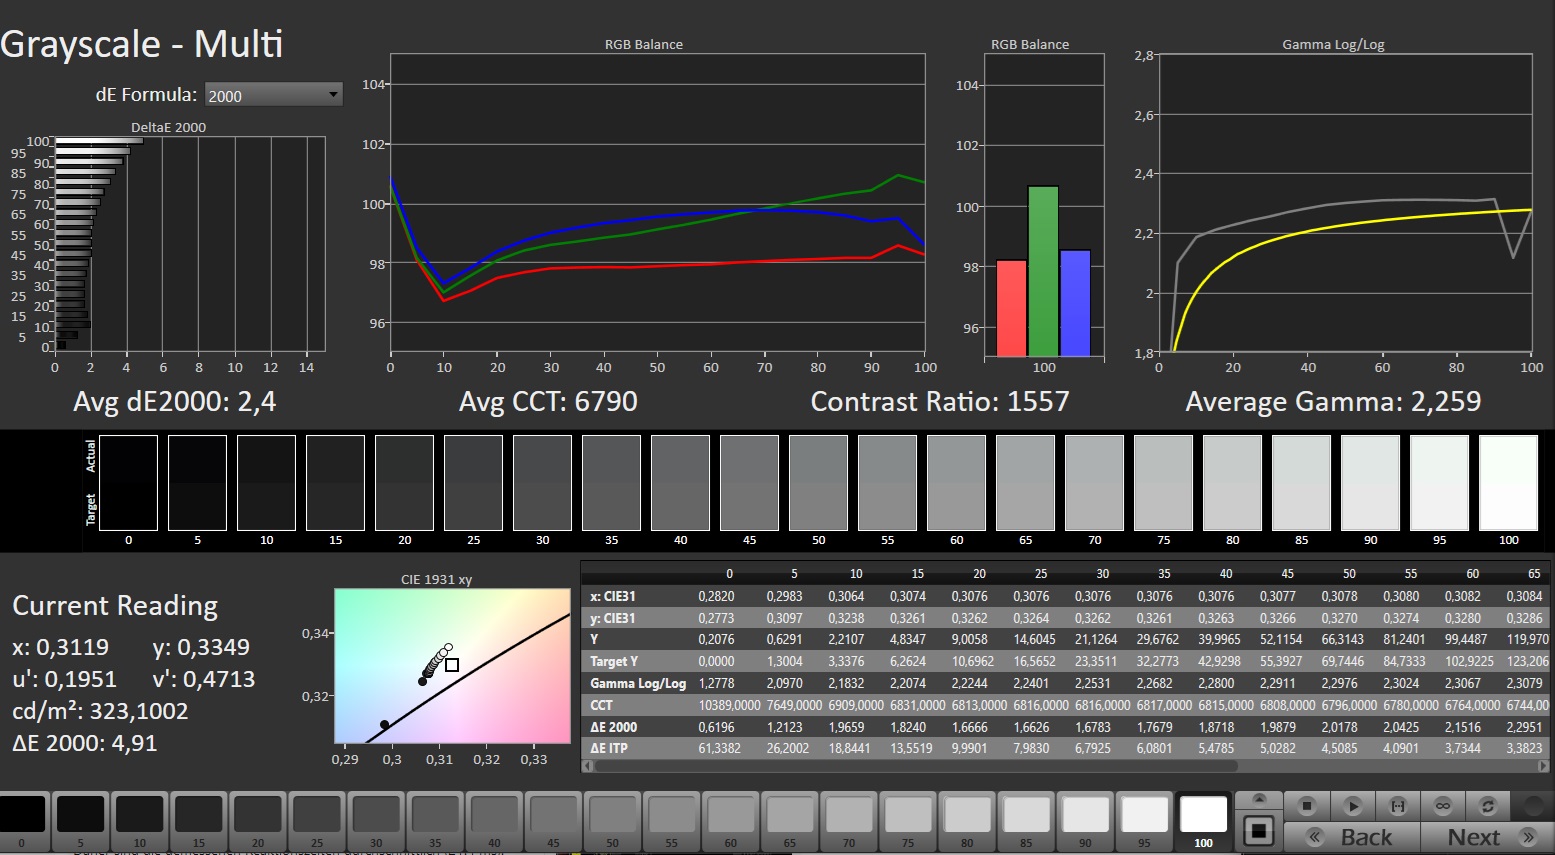
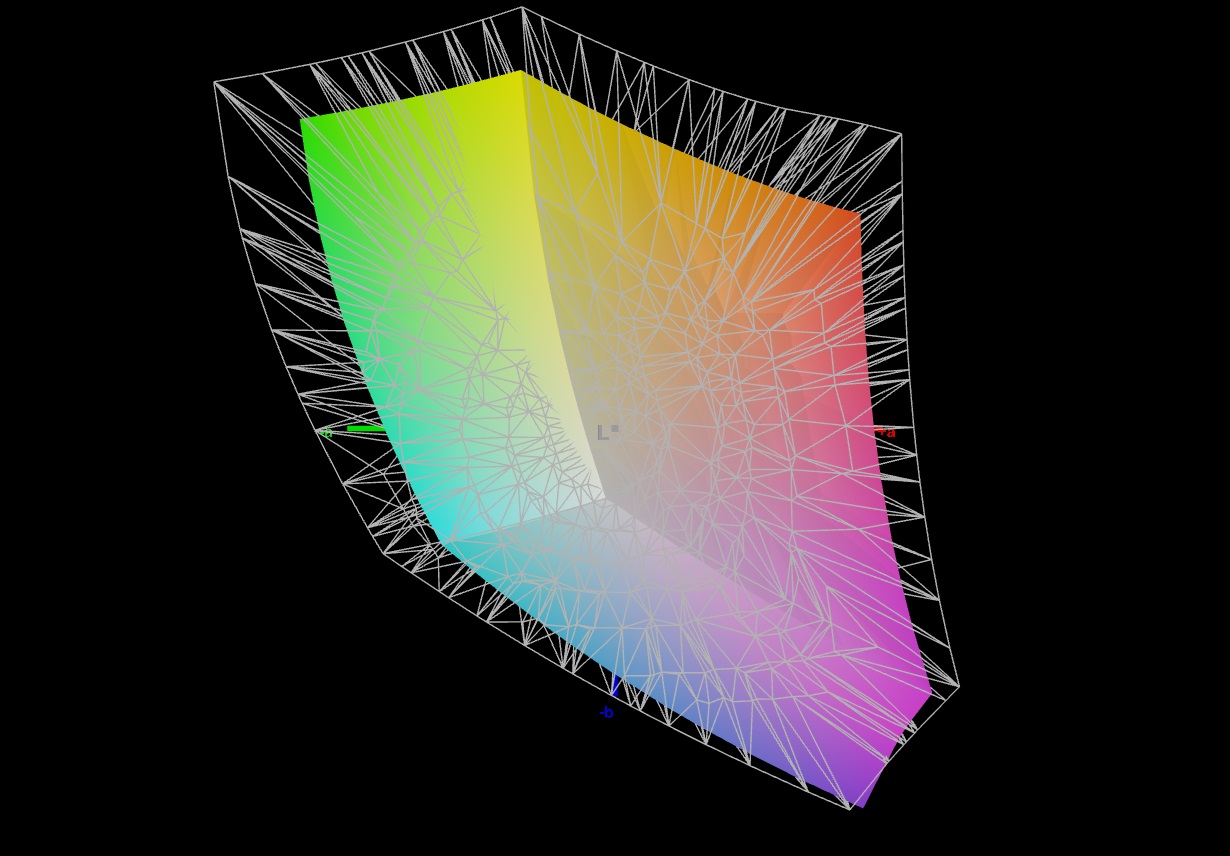
A Lenovo equipou o LOQ com um painel de 144 Hz (FHD, IPS) estável em relação ao ângulo de visão, com uma proporção de 16:9, incluindo suporte G-Sync. Os bons contrastes são compensados por um brilho máximo um pouco baixo demais. Em geral, a tela foi projetada para uso em ambientes internos, mas também pode ser lida em ambientes externos em condições climáticas adequadas. A oscilação de PWM não foi detectada em nosso teste.

| |||||||||||||||||||||||||
iluminação: 88 %
iluminação com acumulador: 306 cd/m²
Contraste: 1457:1 (Preto: 0.21 cd/m²)
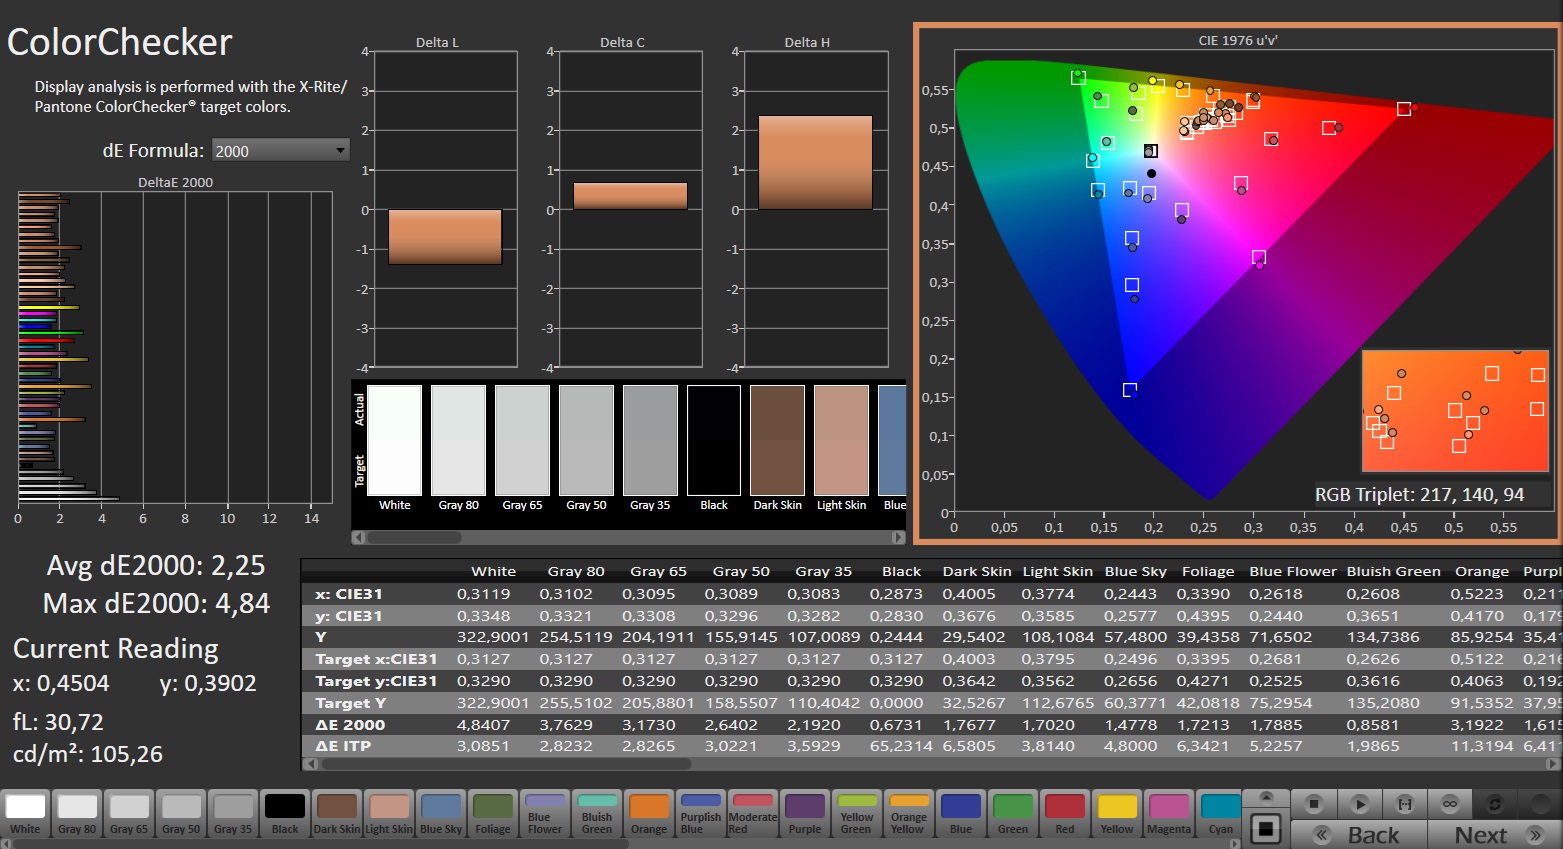
ΔE Color 2.25 | 0.5-29.43 Ø4.87, calibrated: 1.45
ΔE Greyscale 2.4 | 0.5-98 Ø5.1
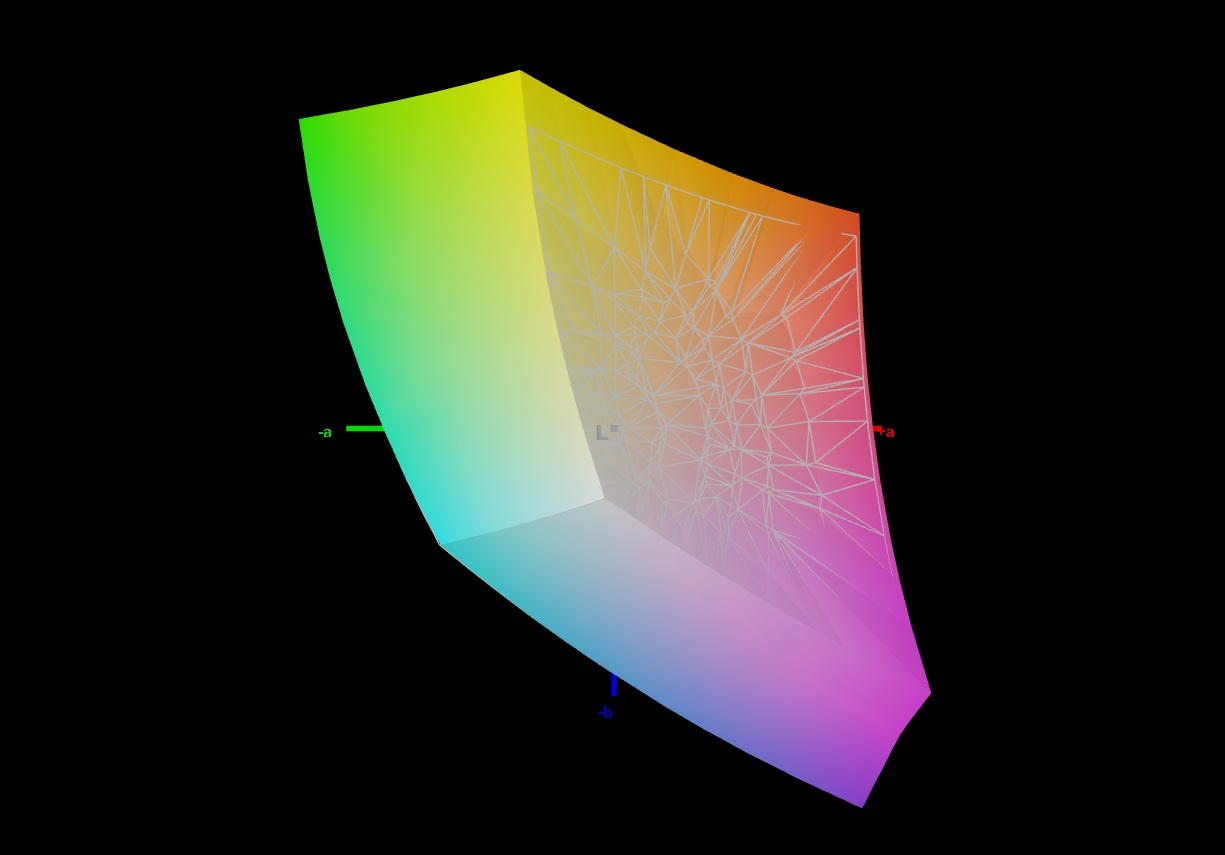
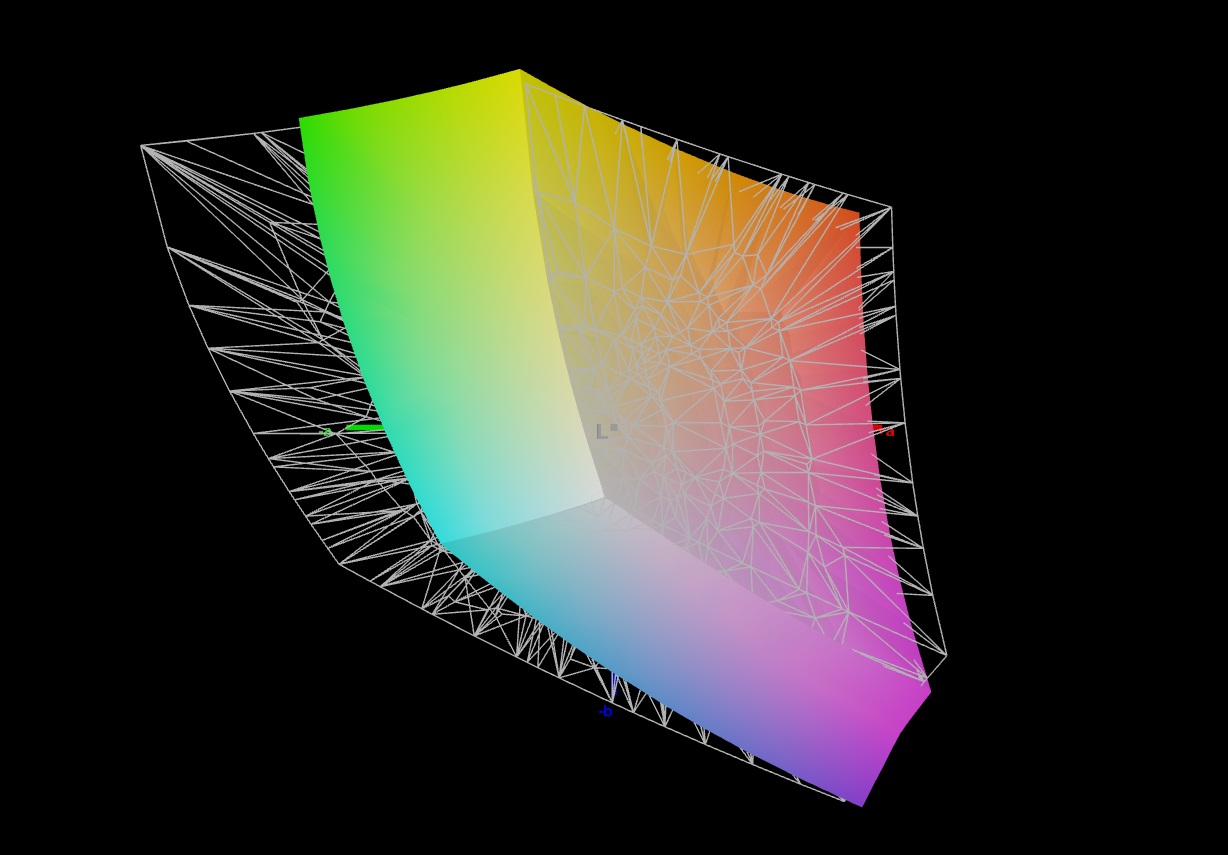
72.6% AdobeRGB 1998 (Argyll 2.2.0 3D)
99.1% sRGB (Argyll 2.2.0 3D)
73.7% Display P3 (Argyll 2.2.0 3D)
Gamma: 2.259
| Lenovo LOQ 15IRX9 BOE NJ NE156FHM-NX9, IPS, 1920x1080, 15.6" | SCHENKER XMG Core 15 (M24) BOE NJ NE153QDM-NZ1 (BOE0C8E), IPS, 2560x1600, 15.3" | Gigabyte G6X 9KG (2024) BOE NE160WUM-NX6, IPS, 1920x1200, 16" | HP Victus 16 (2024) Chi Mei CMN163E, IPS, 1920x1080, 16.1" | Dell G16, i7-13650HX, RTX 4060 Chi Mei CMN161D (160GME), IPS, 2560x1600, 16" | |
|---|---|---|---|---|---|
| Display | 1% | -40% | -41% | -5% | |
| Display P3 Coverage | 73.7 | 73.2 -1% | 41.8 -43% | 41.3 -44% | 67.5 -8% |
| sRGB Coverage | 99.1 | 100 1% | 62.4 -37% | 61.7 -38% | 98.5 -1% |
| AdobeRGB 1998 Coverage | 72.6 | 74.6 3% | 43.3 -40% | 42.7 -41% | 69.3 -5% |
| Response Times | 68% | 4% | 25% | 68% | |
| Response Time Grey 50% / Grey 80% * | 42.2 ? | 9.6 ? 77% | 40.5 ? 4% | 28.6 ? 32% | 7.6 ? 82% |
| Response Time Black / White * | 22.6 ? | 9.2 ? 59% | 21.6 ? 4% | 18.7 ? 17% | 10.4 ? 54% |
| PWM Frequency | |||||
| Screen | 6% | -68% | -78% | -15% | |
| Brightness middle | 306 | 635 108% | 353 15% | 287 -6% | 369 21% |
| Brightness | 287 | 604 110% | 318 11% | 288 0% | 344 20% |
| Brightness Distribution | 88 | 91 3% | 81 -8% | 86 -2% | 89 1% |
| Black Level * | 0.21 | 0.64 -205% | 0.21 -0% | 0.19 10% | 0.26 -24% |
| Contrast | 1457 | 992 -32% | 1681 15% | 1511 4% | 1419 -3% |
| Colorchecker dE 2000 * | 2.25 | 1.89 16% | 5.21 -132% | 5.46 -143% | 3.04 -35% |
| Colorchecker dE 2000 max. * | 4.84 | 3.14 35% | 19.95 -312% | 20.36 -321% | 5.56 -15% |
| Colorchecker dE 2000 calibrated * | 1.45 | 1.14 21% | 3.61 -149% | 3.52 -143% | 2.35 -62% |
| Greyscale dE 2000 * | 2.4 | 2.53 -5% | 3.6 -50% | 4.8 -100% | 3.38 -41% |
| Gamma | 2.259 97% | 2.36 93% | 2.367 93% | 2.108 104% | 2.47 89% |
| CCT | 6790 96% | 6434 101% | 7138 91% | 6442 101% | 6040 108% |
| Média Total (Programa/Configurações) | 25% /
14% | -35% /
-52% | -31% /
-55% | 16% /
-1% |
* ... menor é melhor
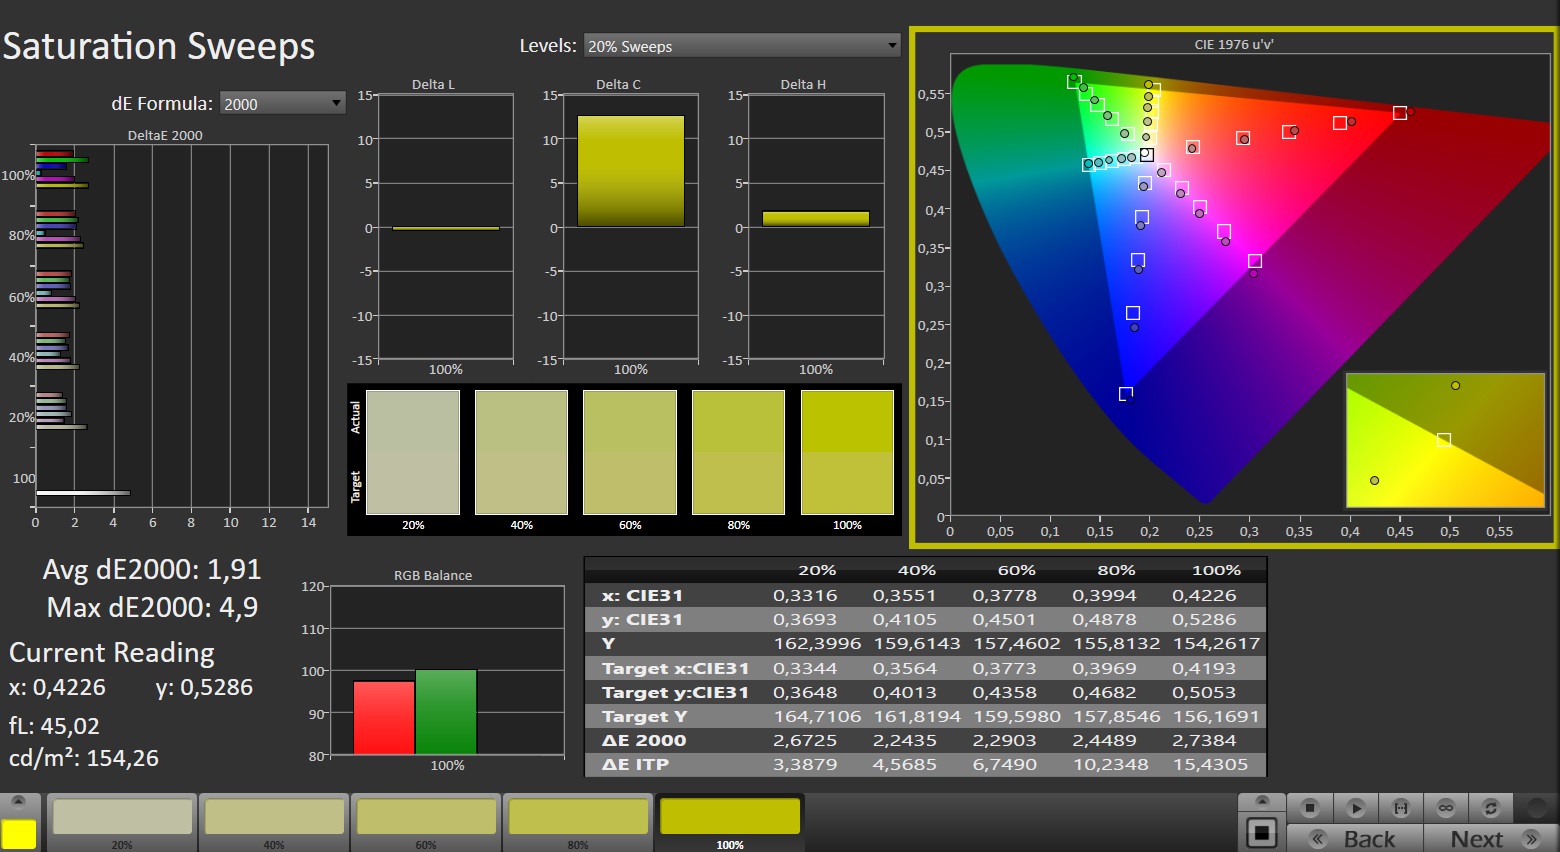
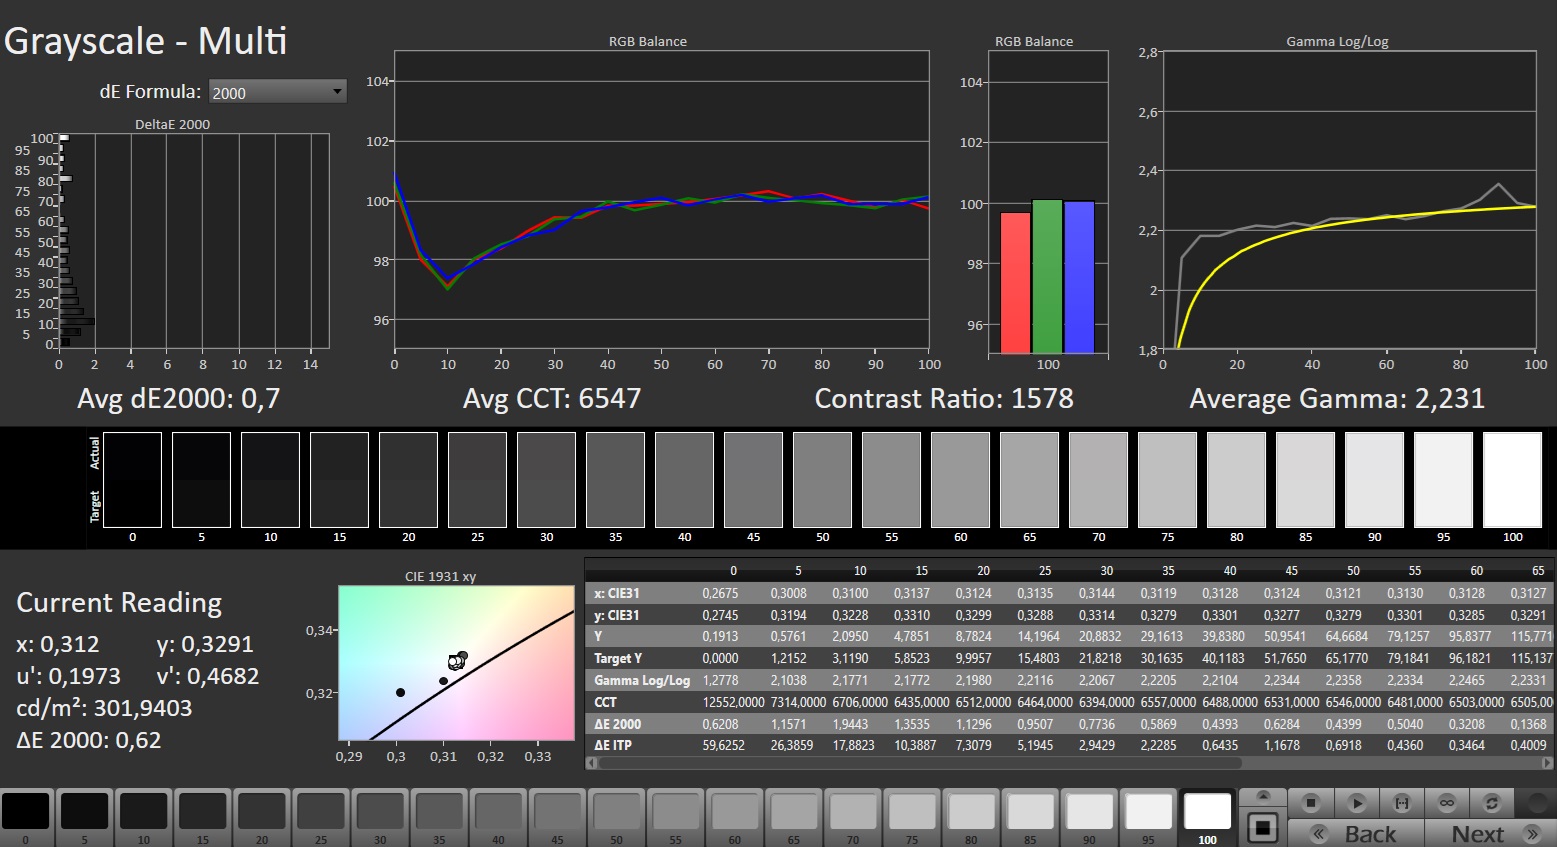
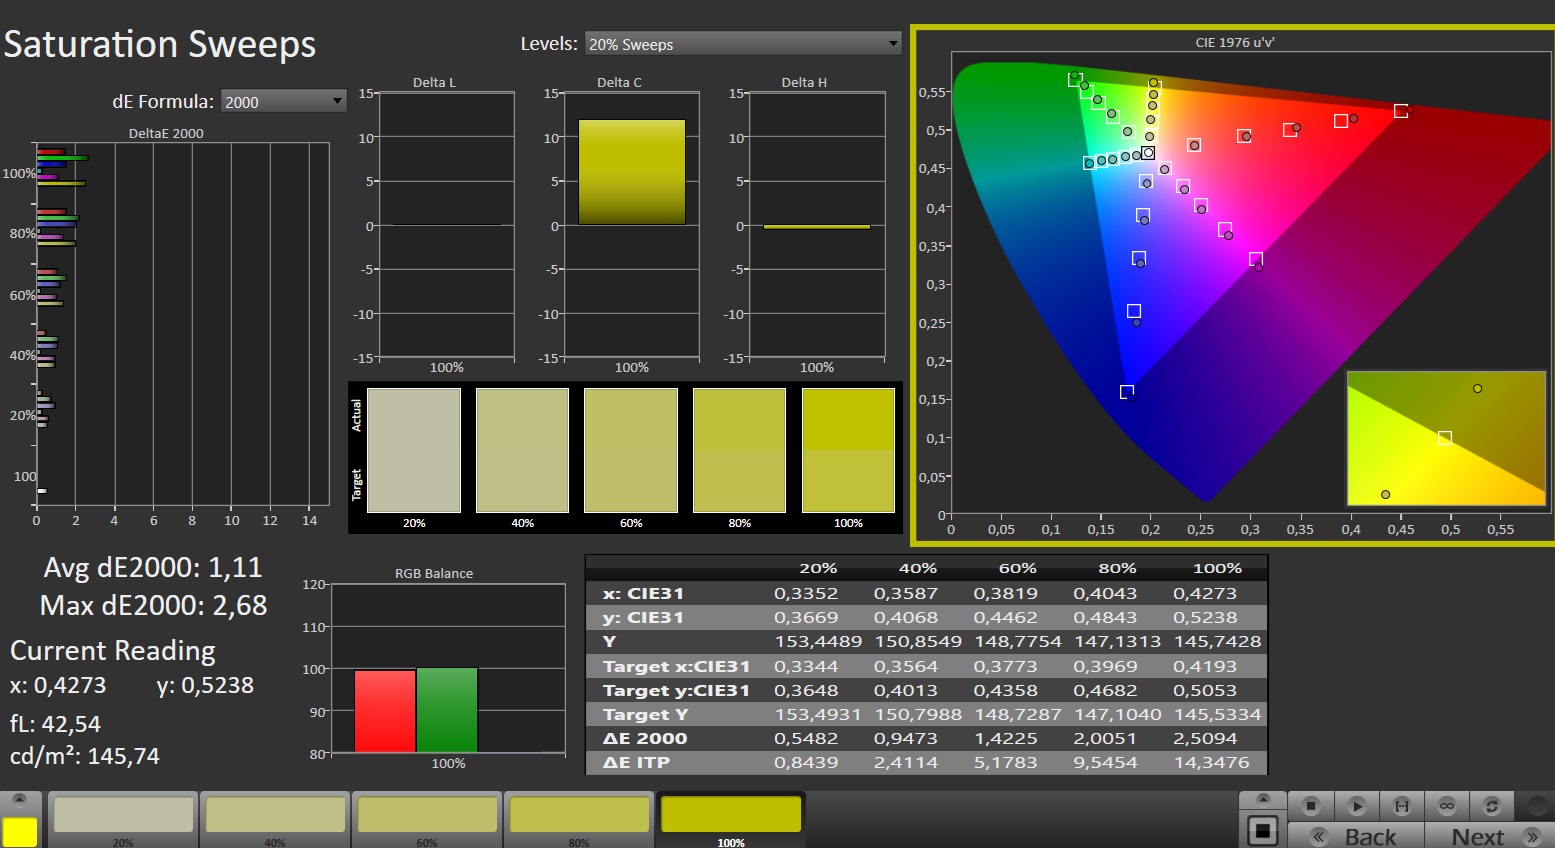
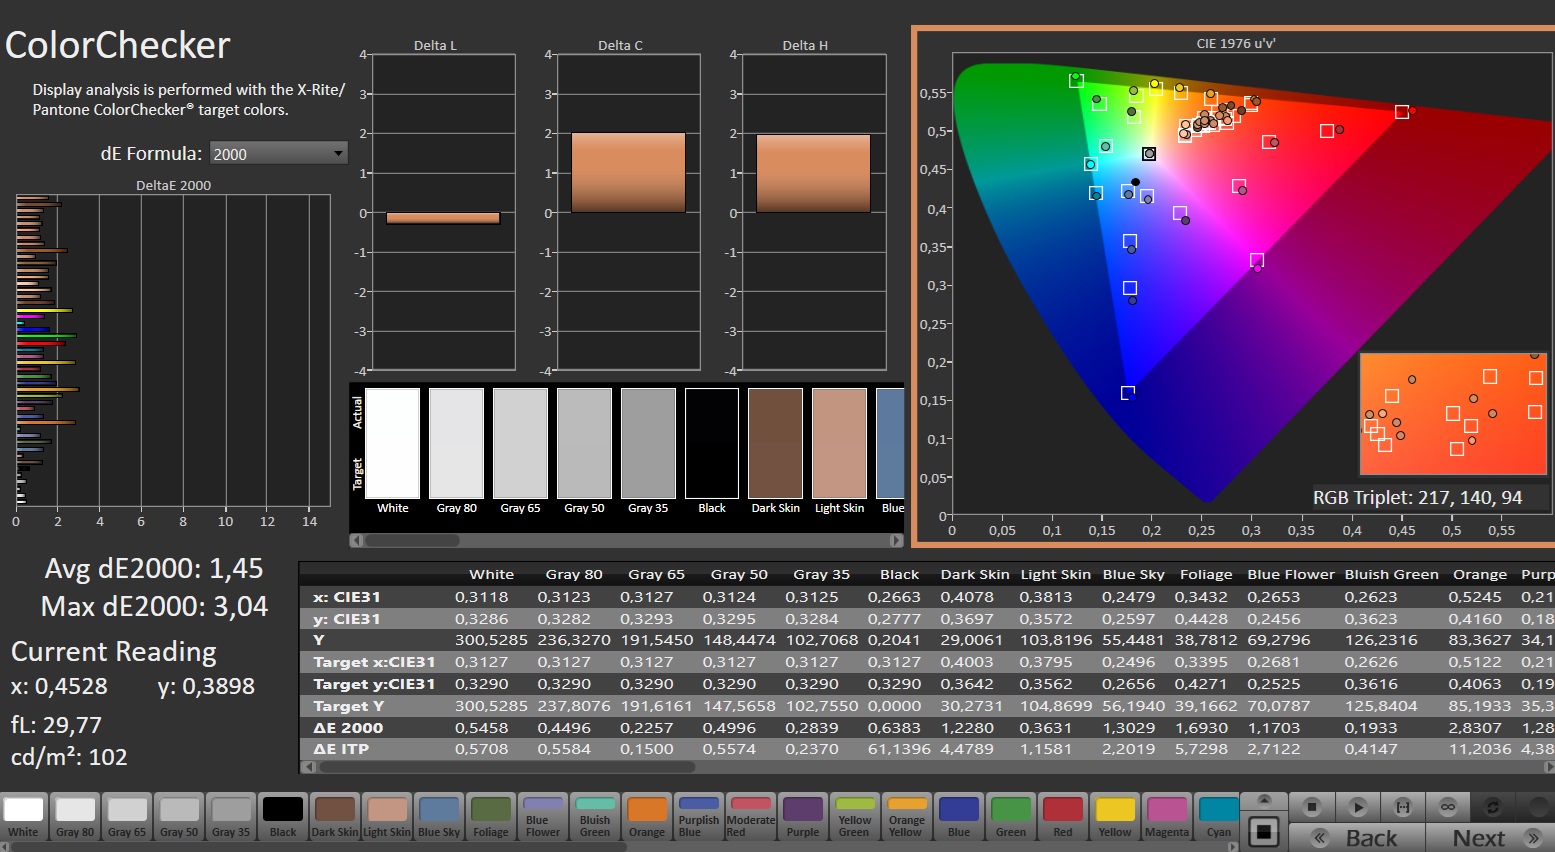
Logo que sai da caixa, o visor está bem calibrado: Com um desvio de cerca de 2,25, o valor-alvo (DeltaE < 3) foi atingido. A calibração da tela reduz os desvios para 1,45 e garante tons de cinza mais equilibrados. O painel pode representar o espaço sRGB quase em sua totalidade, mas não os espaços AdobeRGB e DCI P3.
Exibir tempos de resposta
| ↔ Tempo de resposta preto para branco | ||
|---|---|---|
| 22.6 ms ... ascensão ↗ e queda ↘ combinadas | ↗ 11.2 ms ascensão | 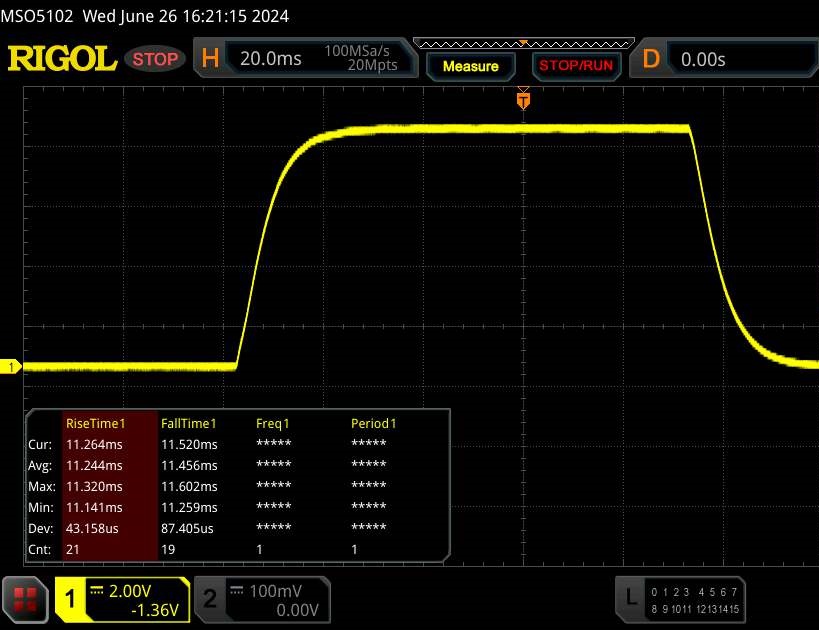 |
| ↘ 11.4 ms queda | ||
| A tela mostra boas taxas de resposta em nossos testes, mas pode ser muito lenta para jogadores competitivos. Em comparação, todos os dispositivos testados variam de 0.1 (mínimo) a 240 (máximo) ms. » 48 % de todos os dispositivos são melhores. Isso significa que o tempo de resposta medido é semelhante à média de todos os dispositivos testados (20.8 ms). | ||
| ↔ Tempo de resposta 50% cinza a 80% cinza | ||
| 42.2 ms ... ascensão ↗ e queda ↘ combinadas | ↗ 19.1 ms ascensão | 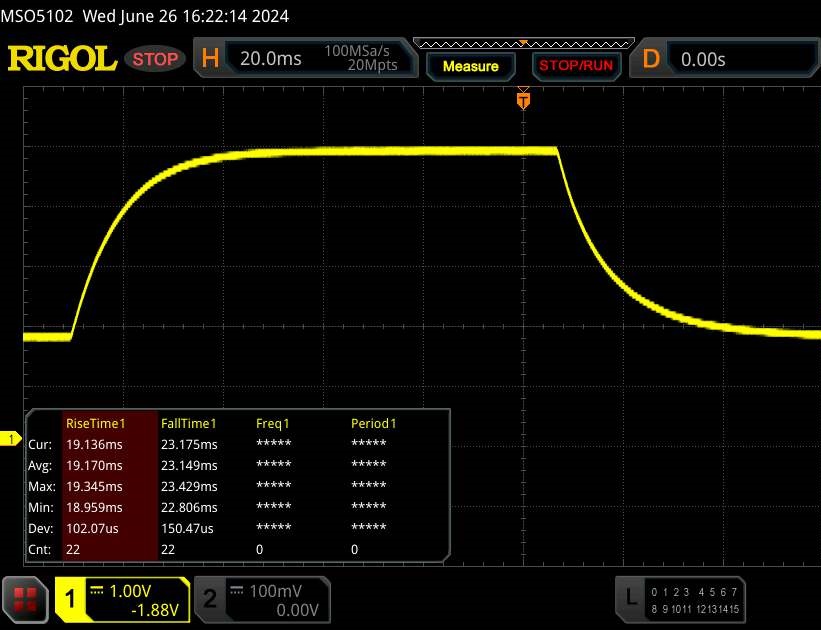 |
| ↘ 23.1 ms queda | ||
| A tela mostra taxas de resposta lentas em nossos testes e será insatisfatória para os jogadores. Em comparação, todos os dispositivos testados variam de 0.165 (mínimo) a 636 (máximo) ms. » 67 % de todos os dispositivos são melhores. Isso significa que o tempo de resposta medido é pior que a média de todos os dispositivos testados (32.5 ms). | ||
Cintilação da tela / PWM (modulação por largura de pulso)
| Tela tremeluzindo / PWM não detectado | 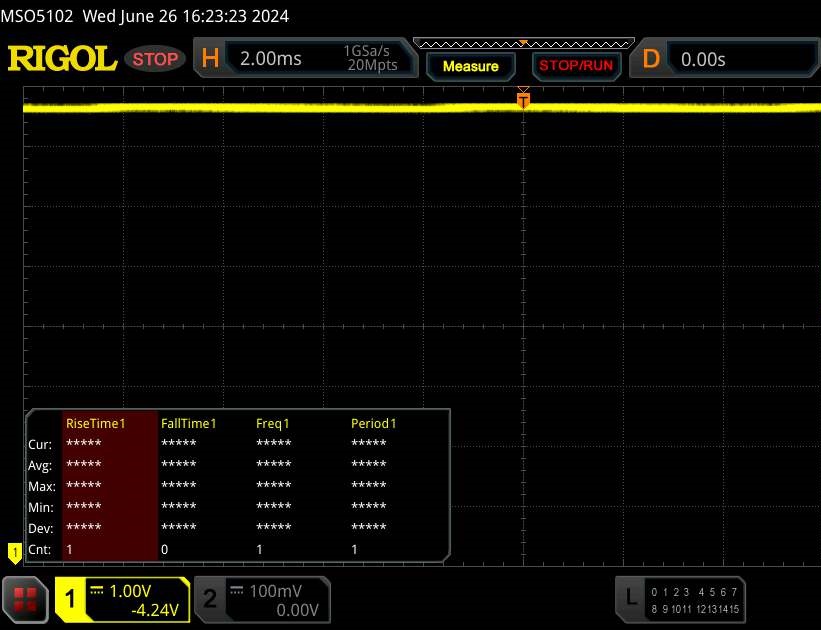 | ||
[pwm_comparison] Em comparação: 53 % de todos os dispositivos testados não usam PWM para escurecer a tela. Se PWM foi detectado, uma média de 8516 (mínimo: 5 - máximo: 343500) Hz foi medida. | |||
Desempenho - Raptor Lake e Ada Lovelace alimentam o laptop
Os modelos LOQ são notebooks para jogos de nível básico. A Lenovo oferece uma variedade de configurações diferentes, tanto com APUs AMD quanto com CPUs Intel. Raptor Lake e Ada Lovelace na forma do Core i5-13450HX e o GeForce RTX 4060 alimentam o dispositivo de teste atual. Ele pode ser adquirido por cerca de US$ 1.300 (com Windows 11) ou pouco mais de US$ 1.000 (sem Windows).
Condições de teste
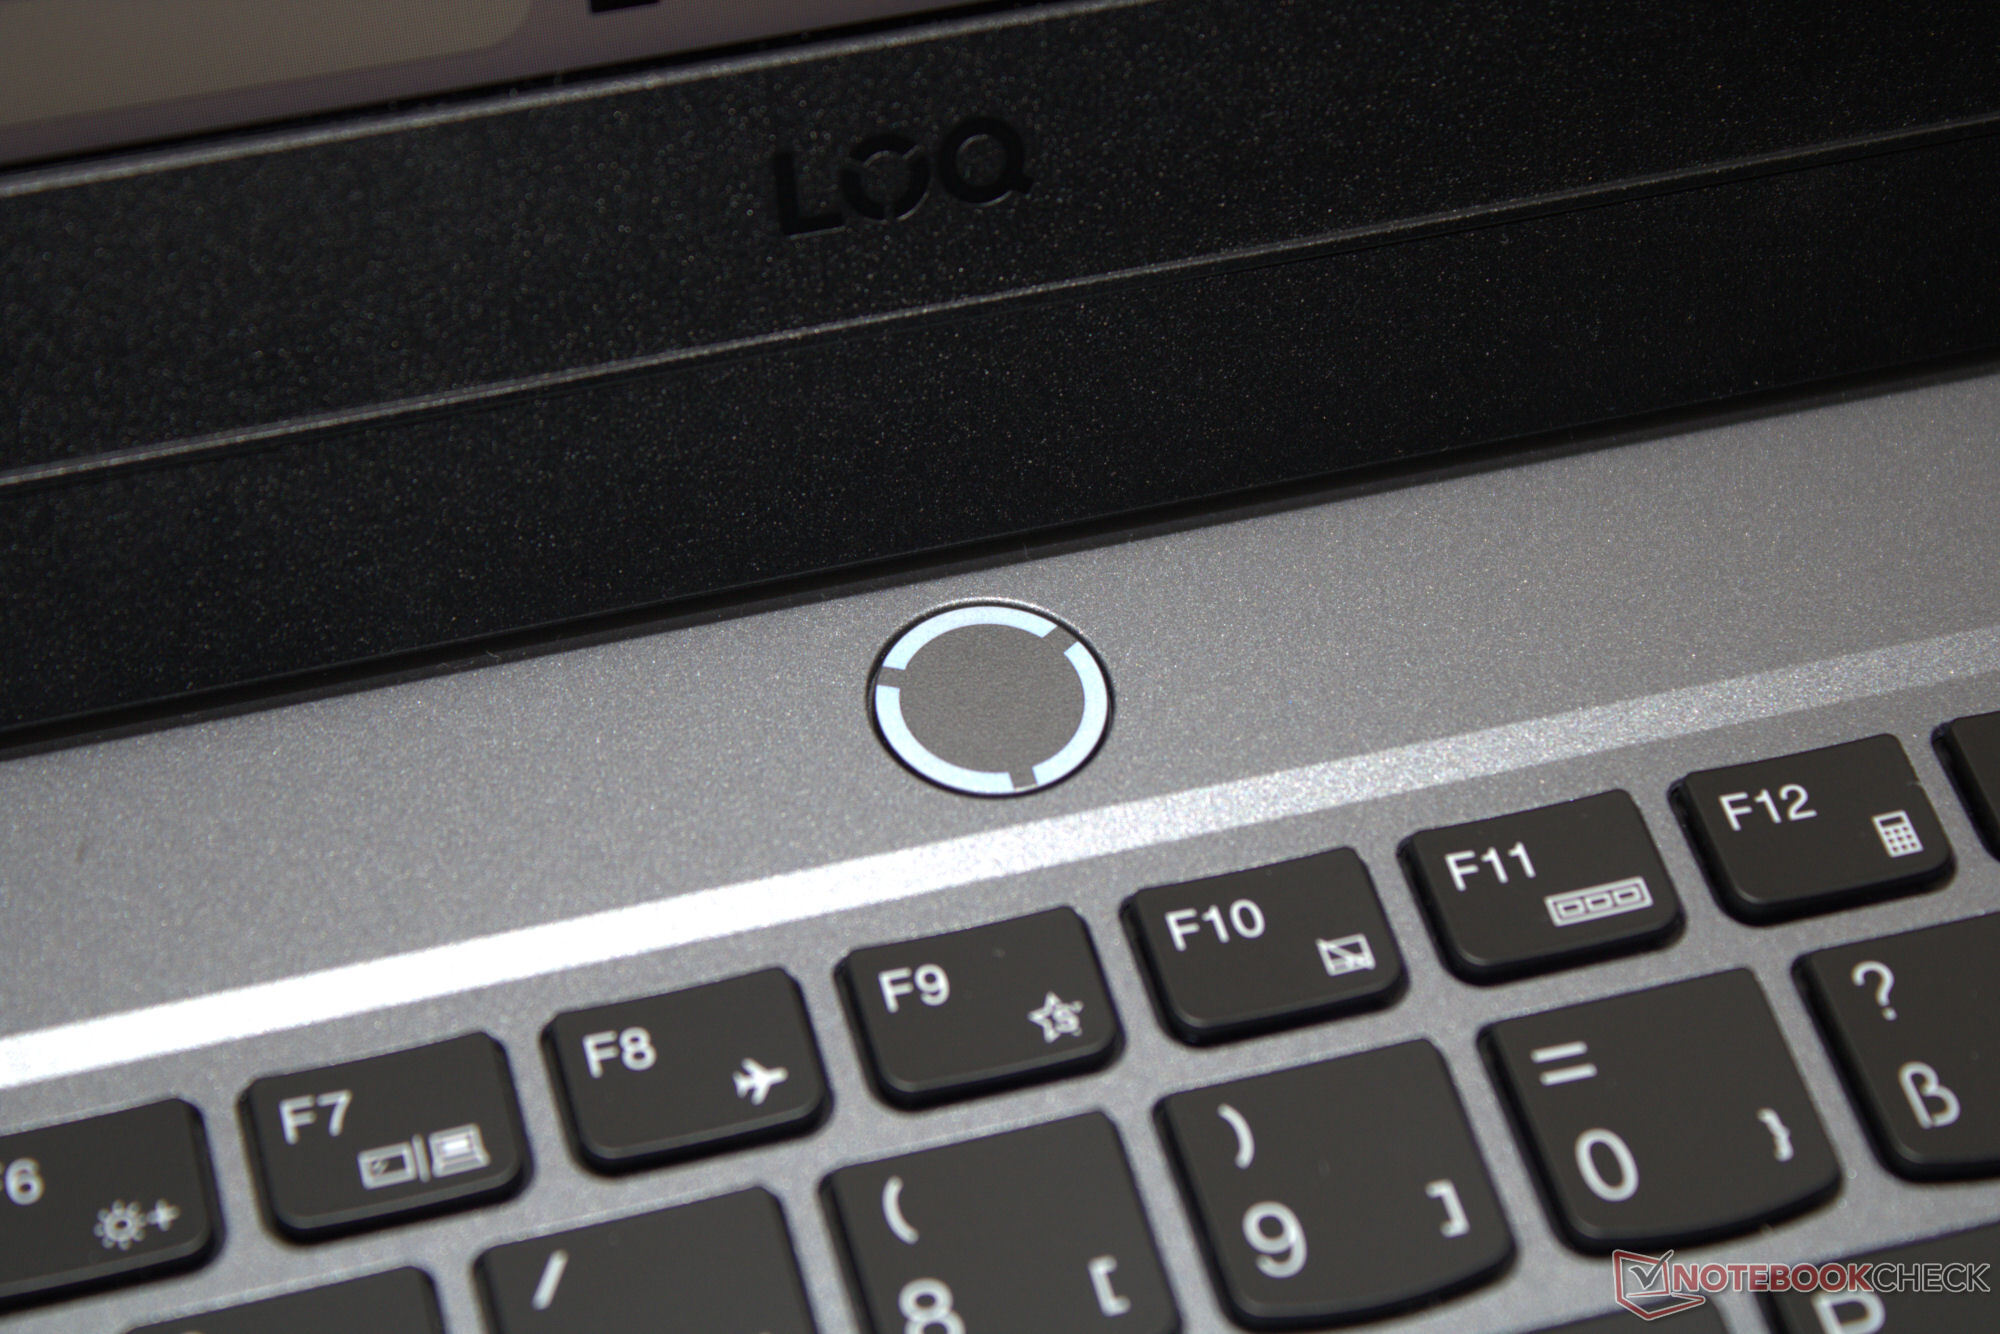
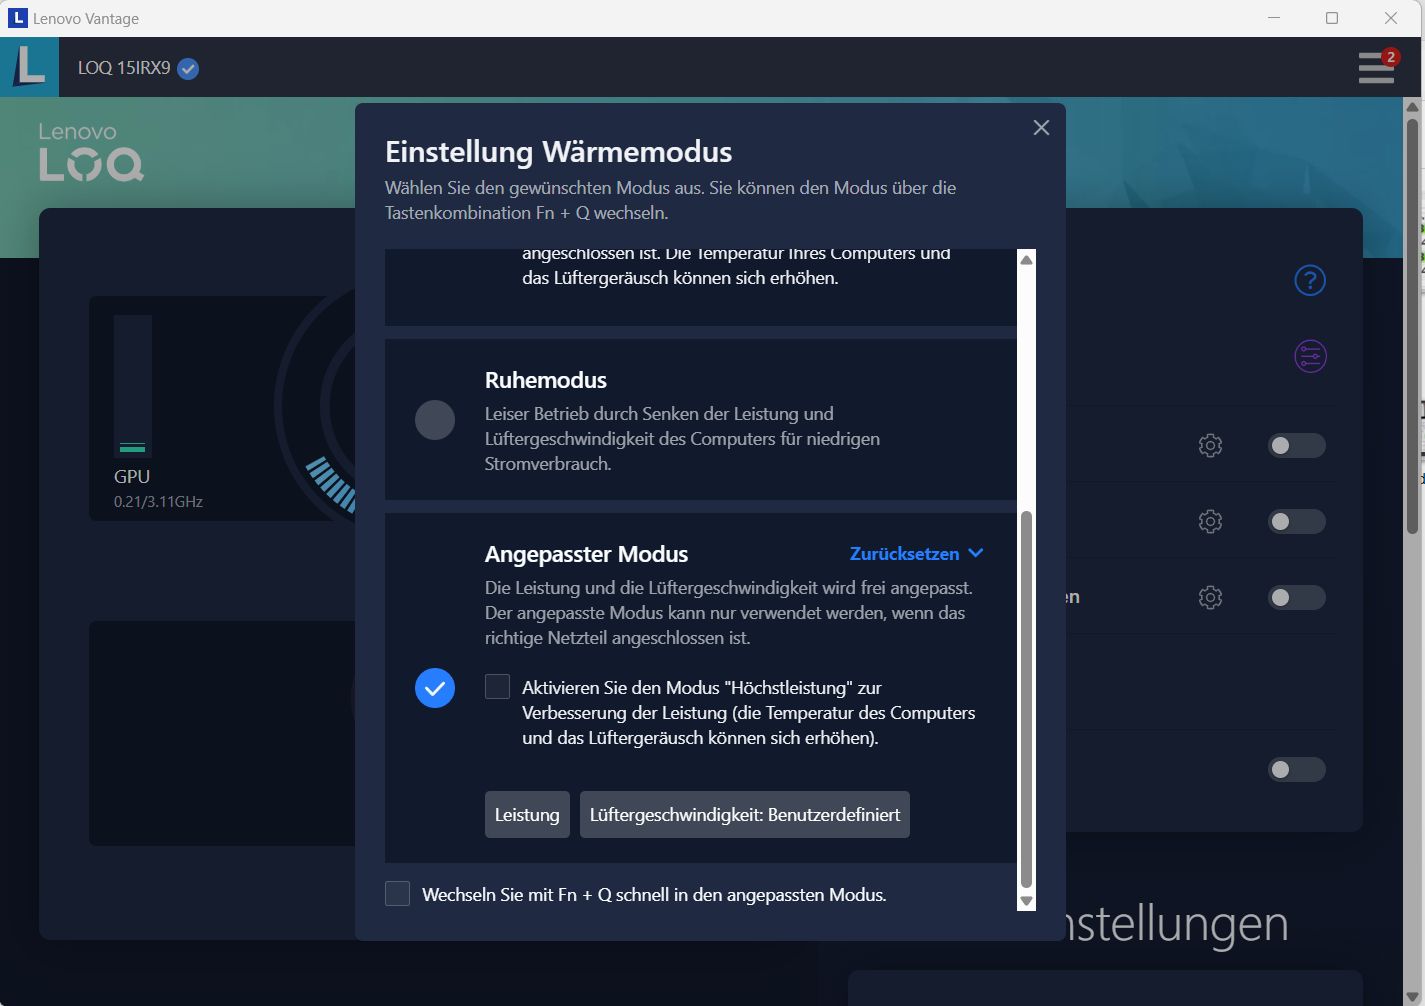
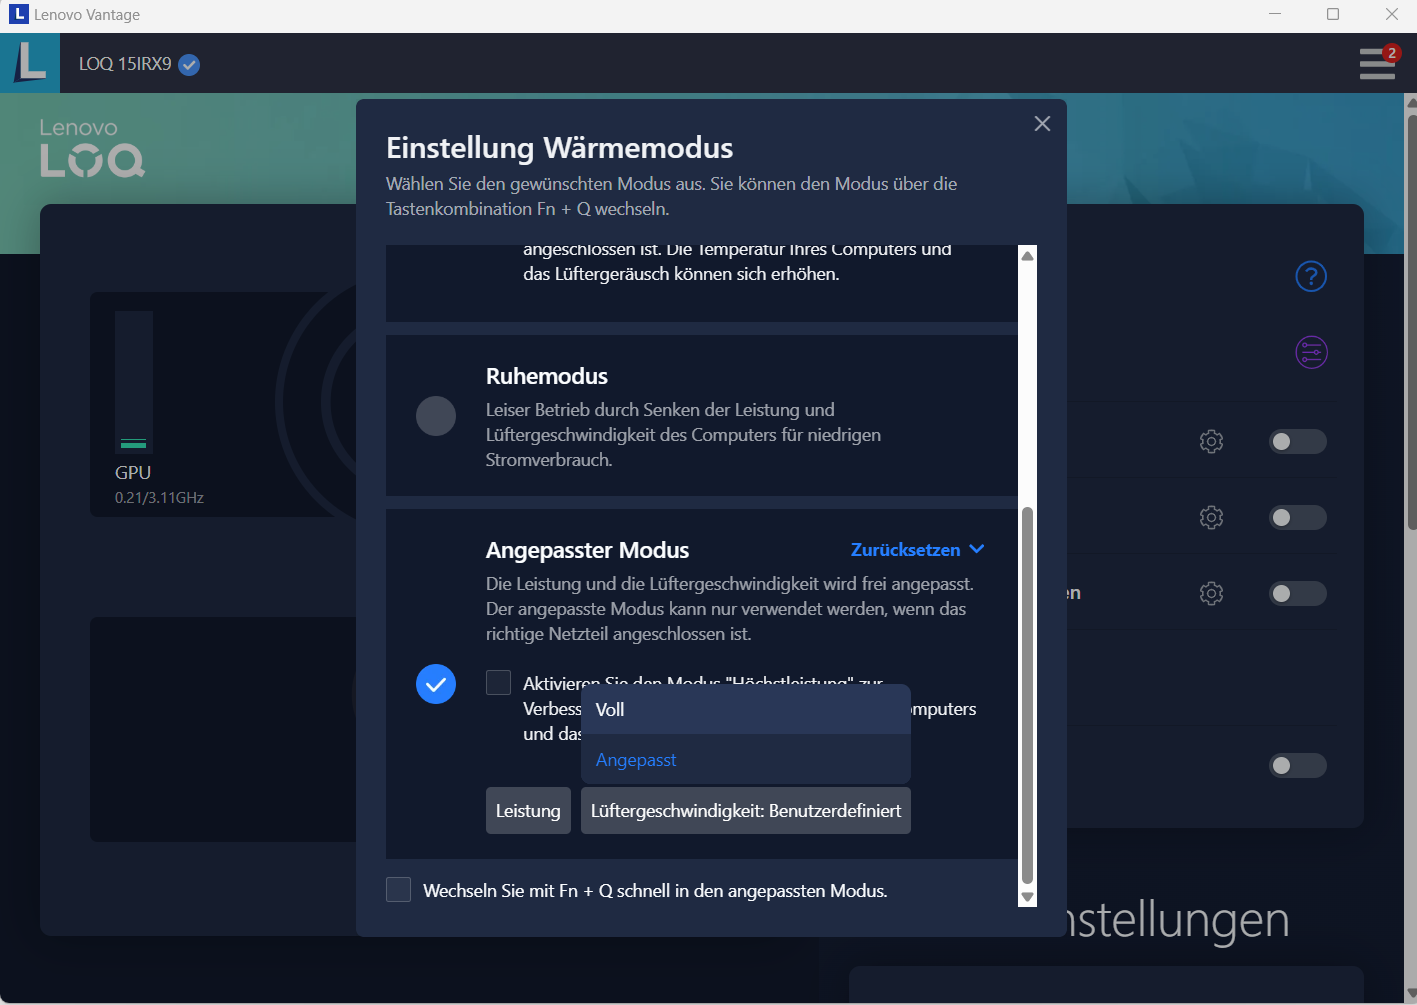
O laptop oferece três modos de desempenho específicos do fabricante (consulte a tabela), que podem ser alternados usando a combinação de teclas "Fn" + "Q". Usamos os modos balanceado (benchmarks) e silencioso (teste de bateria).
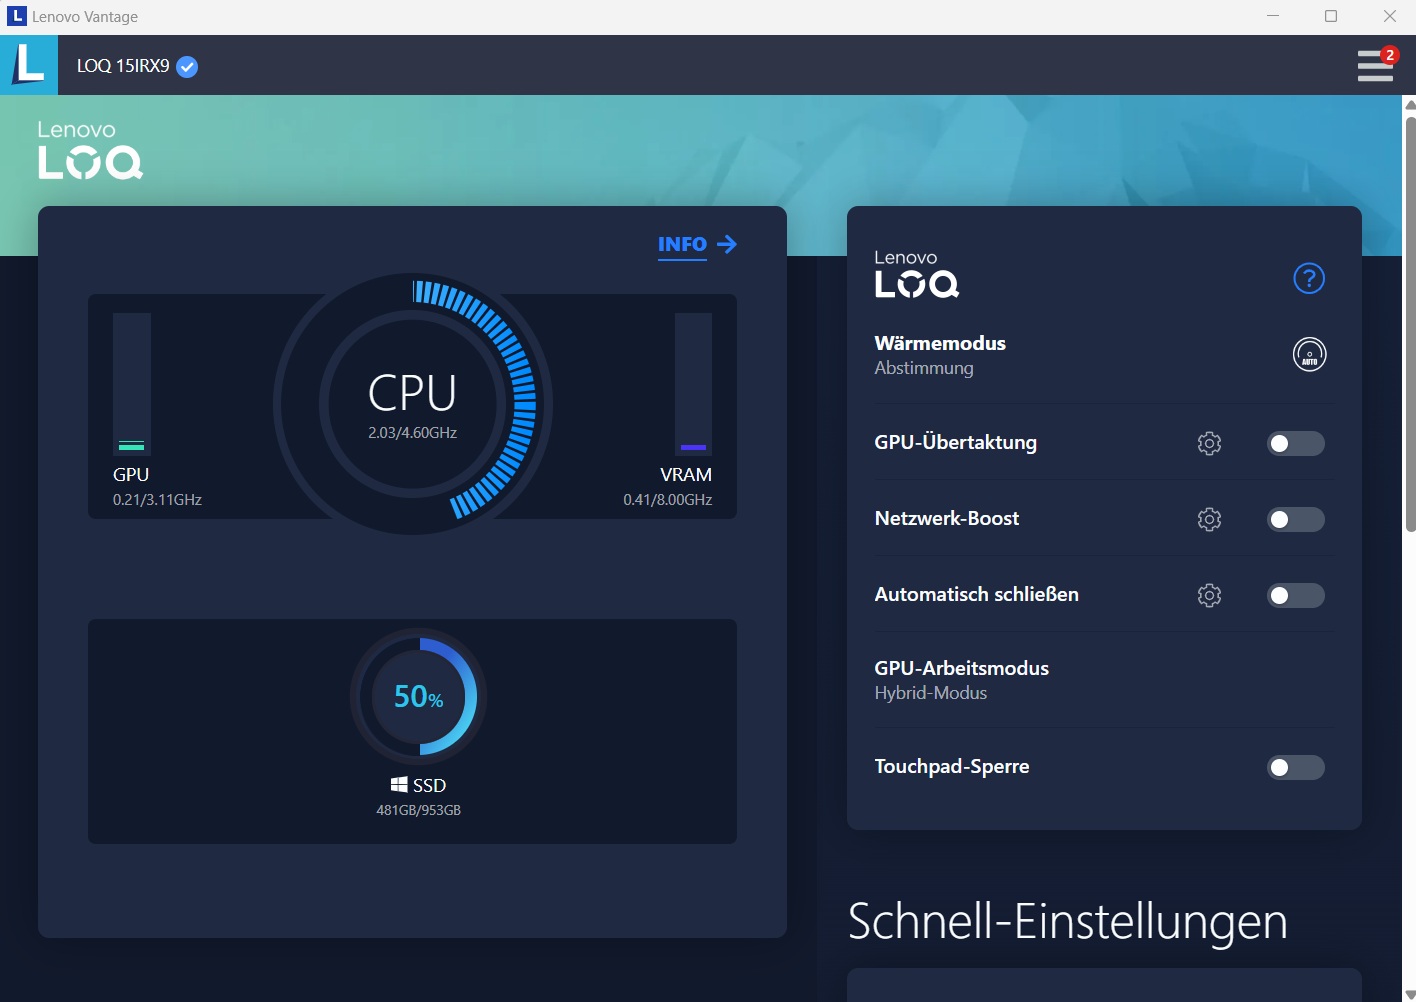
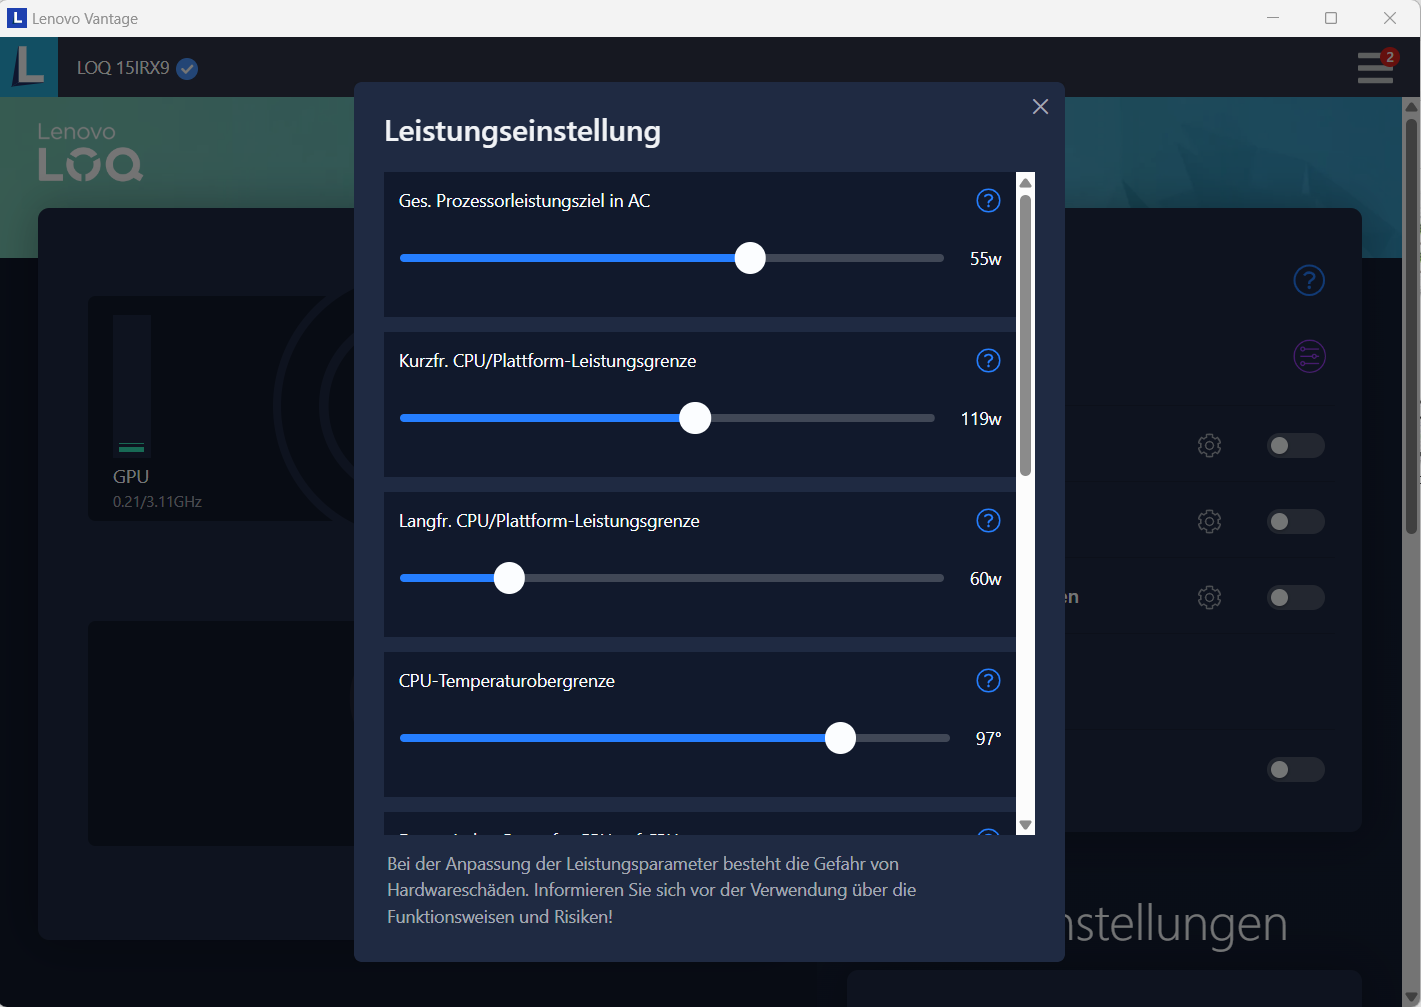
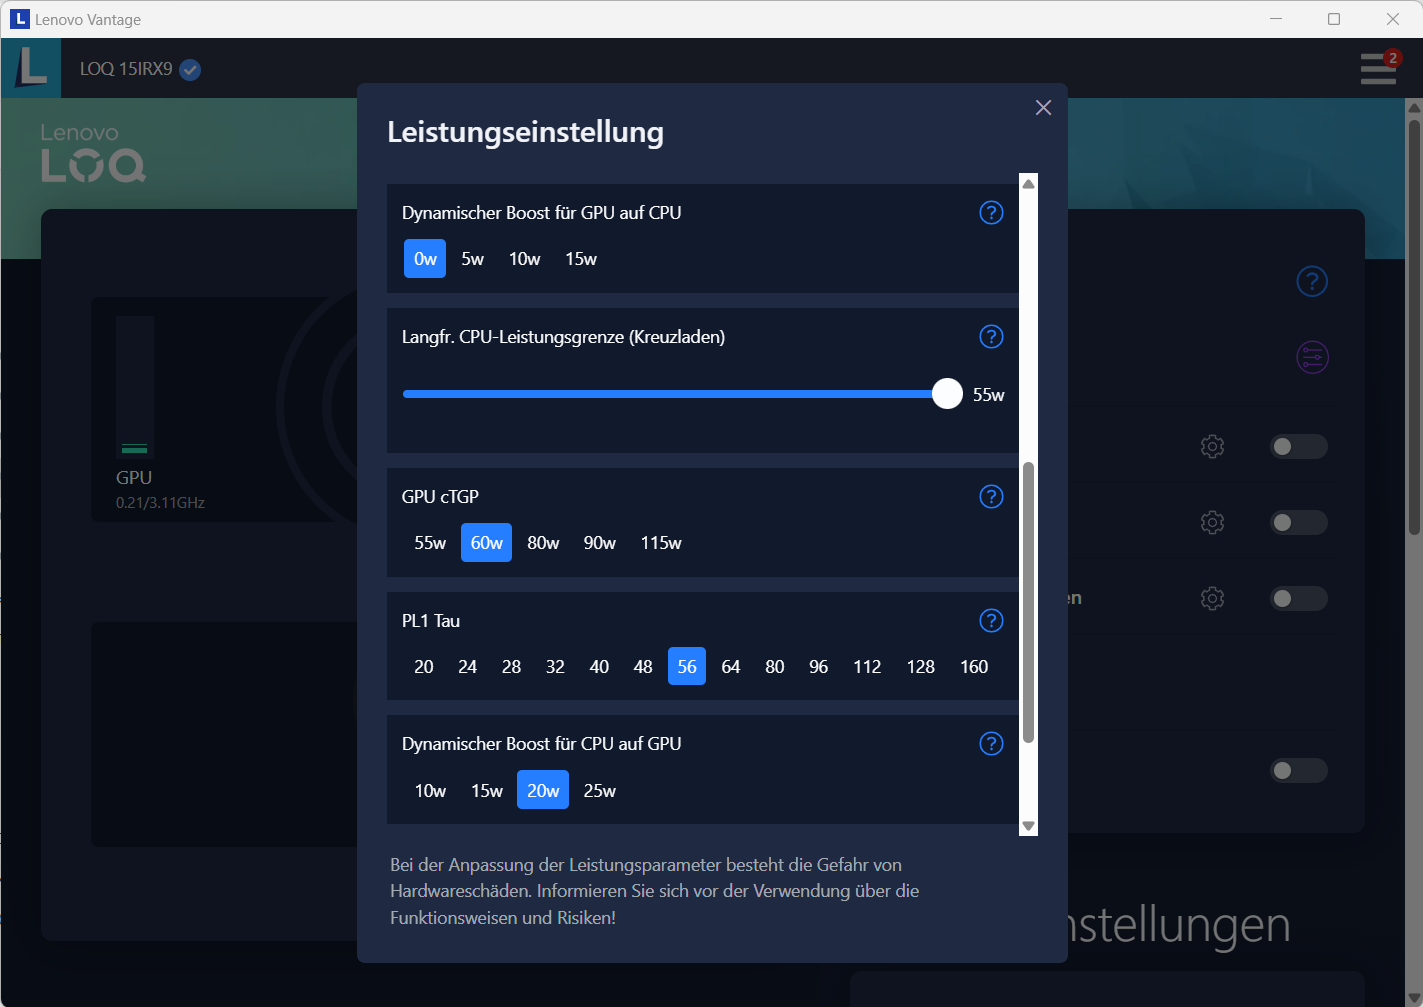
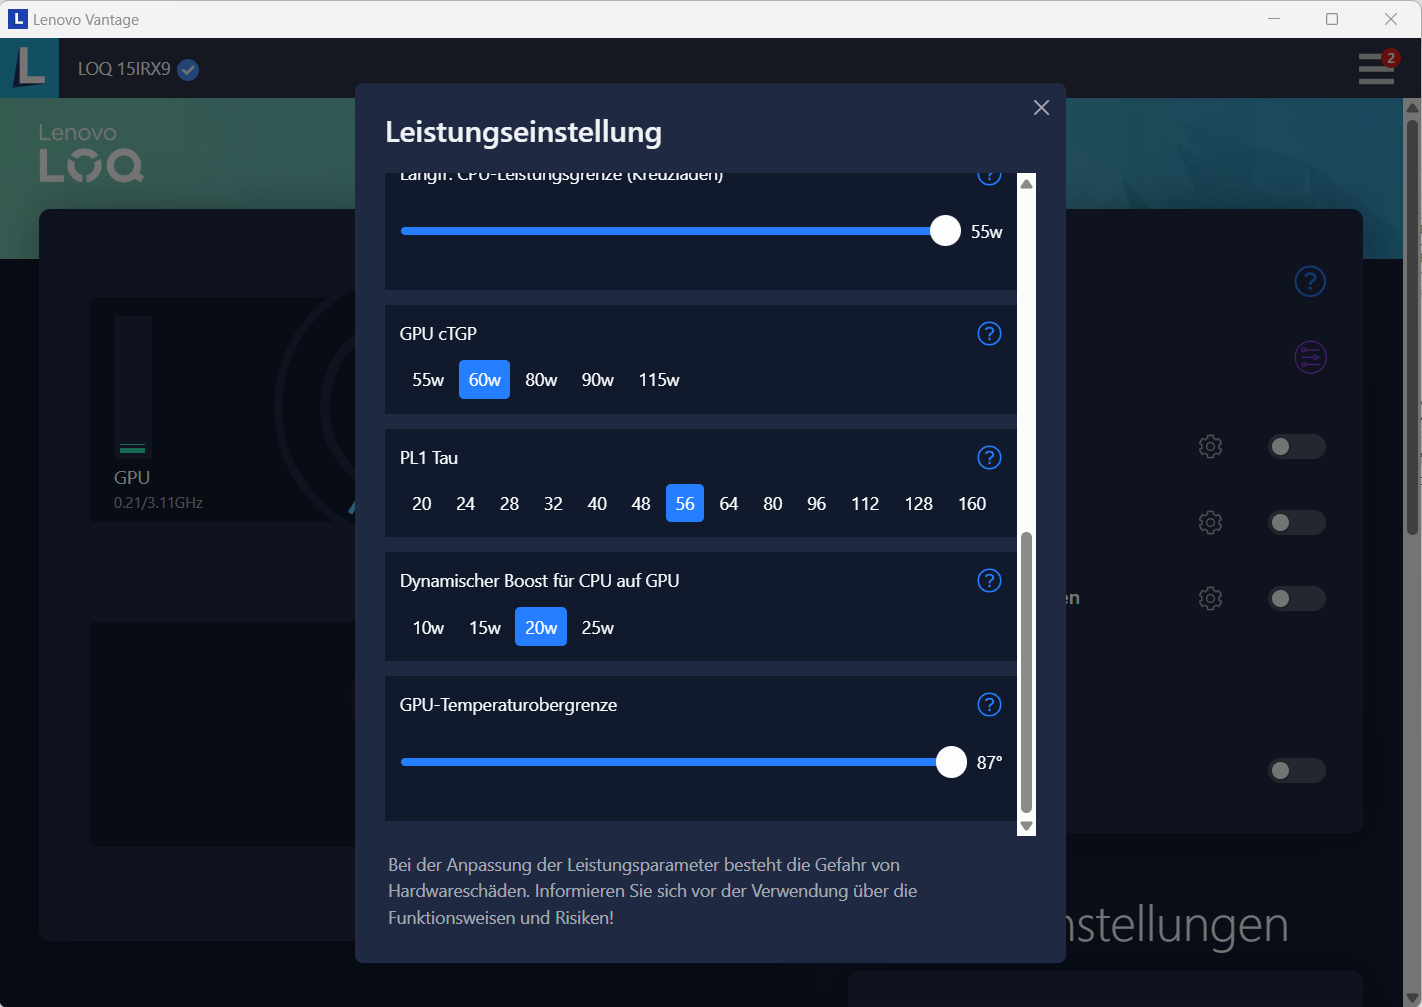
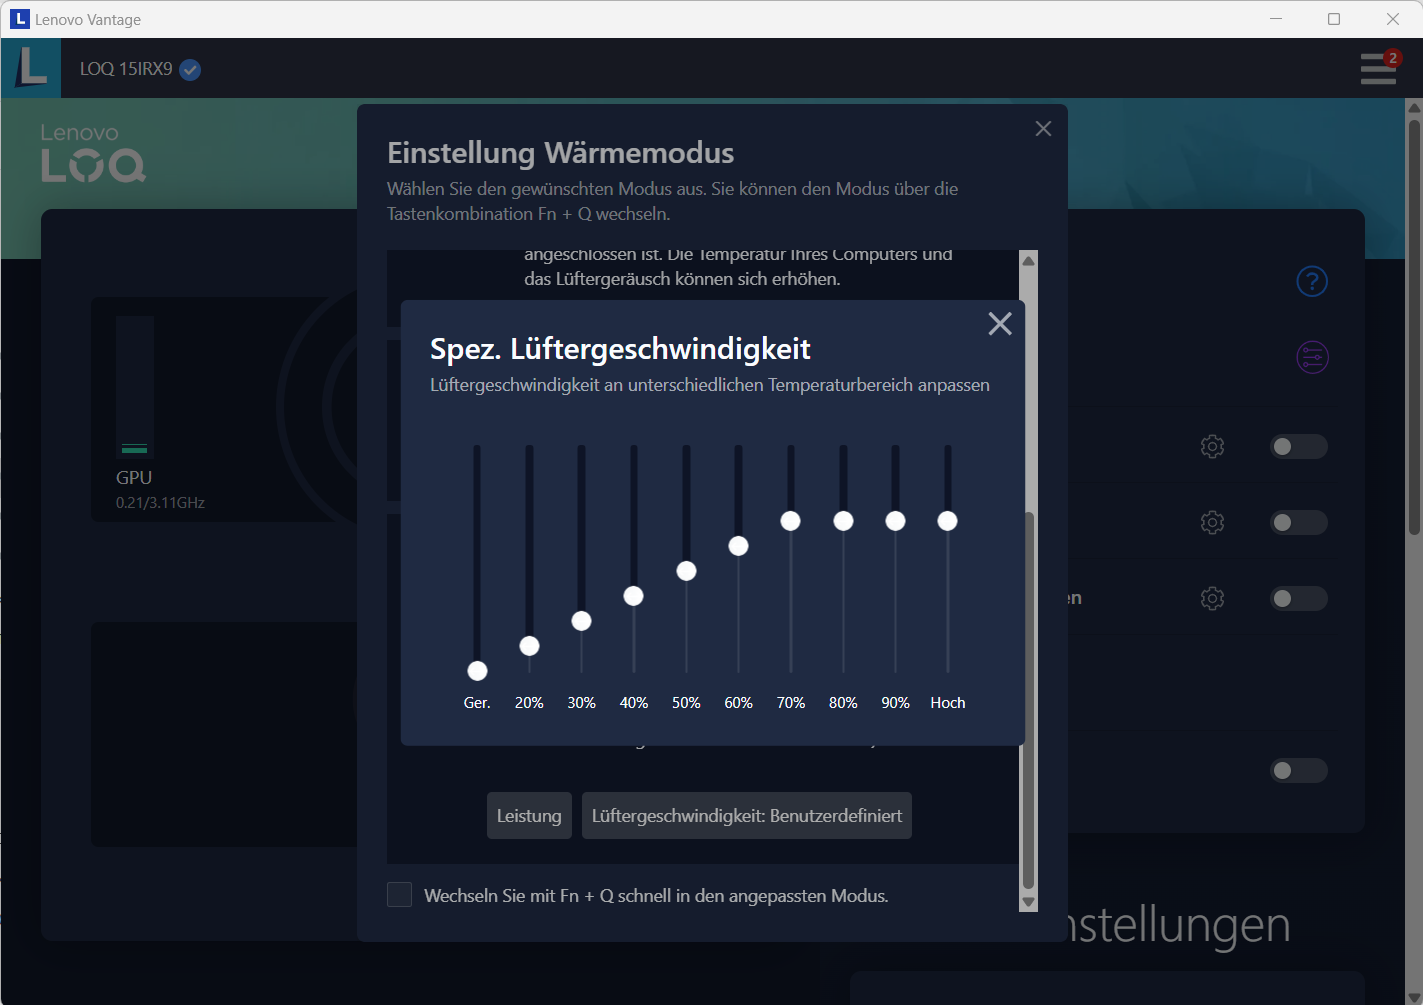
Um quarto modo(personalizado) pode ser selecionado por meio do Lenovo Vantage (centro de controle do laptop). Isso permite que as configurações de desempenho do processador (Power Limit) ou da GPU (TGP, Dynamic Boost, limite de temperatura) e a velocidade do ventilador sejam definidas individualmente. Também é possível fazer overclock da GPU e da memória gráfica independentemente do perfil.
| Modo de desempenho | Modo balanceado | Modo silencioso | |
|---|---|---|---|
| Limite de energia 1 (HWInfo) | 90 watts | 60 watts | 55 watts |
| Limite de potência 2 (HWInfo) | 162 watts | 119 watts | 65 watts |
| Ruído (CP 2077 Phantom Liberty) | 54 dB(A) | 48 dB(A) | 39 dB(A) |
| Desempenho (CP 2077 Phantom Liberty) | 70 fps | 66 fps | 52 fps |

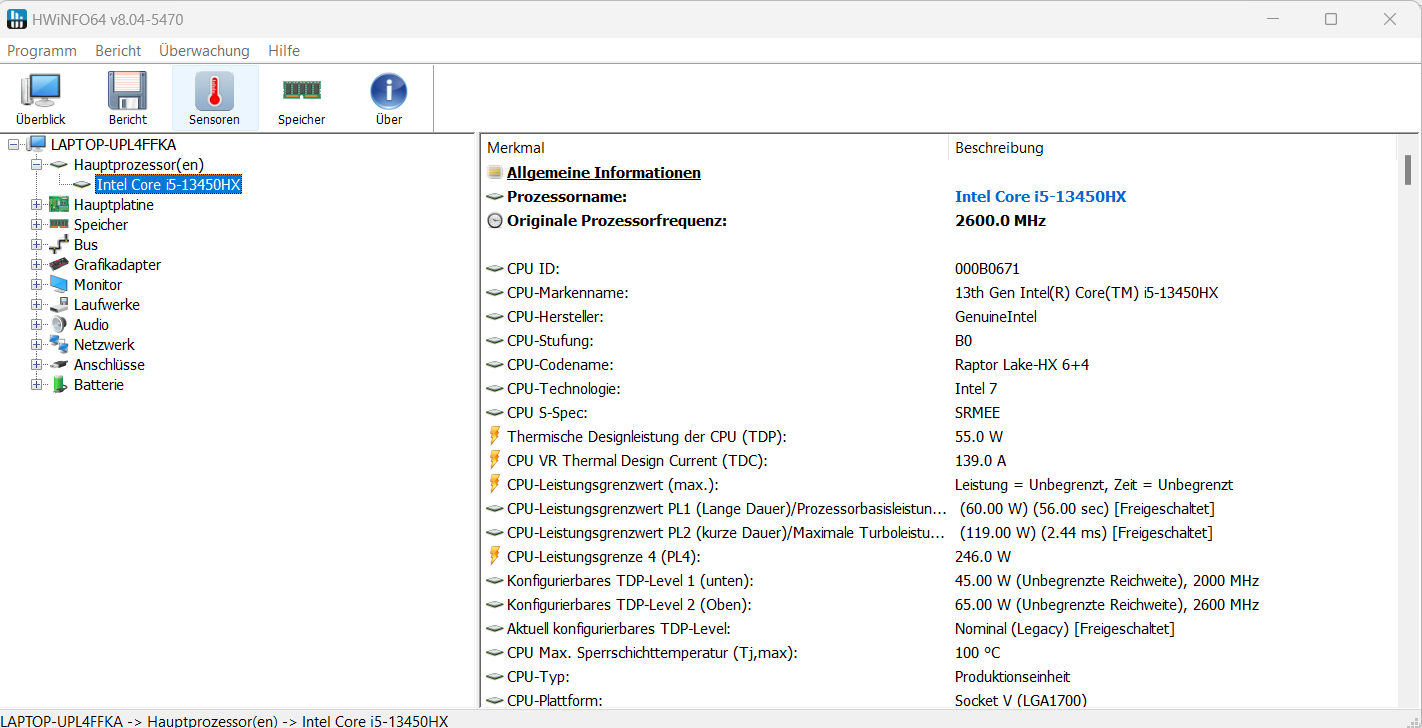
Processador
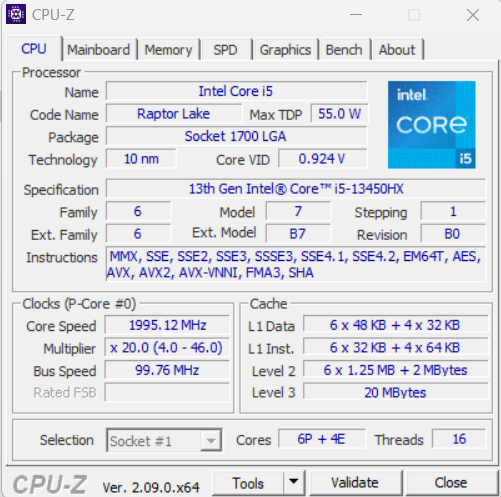
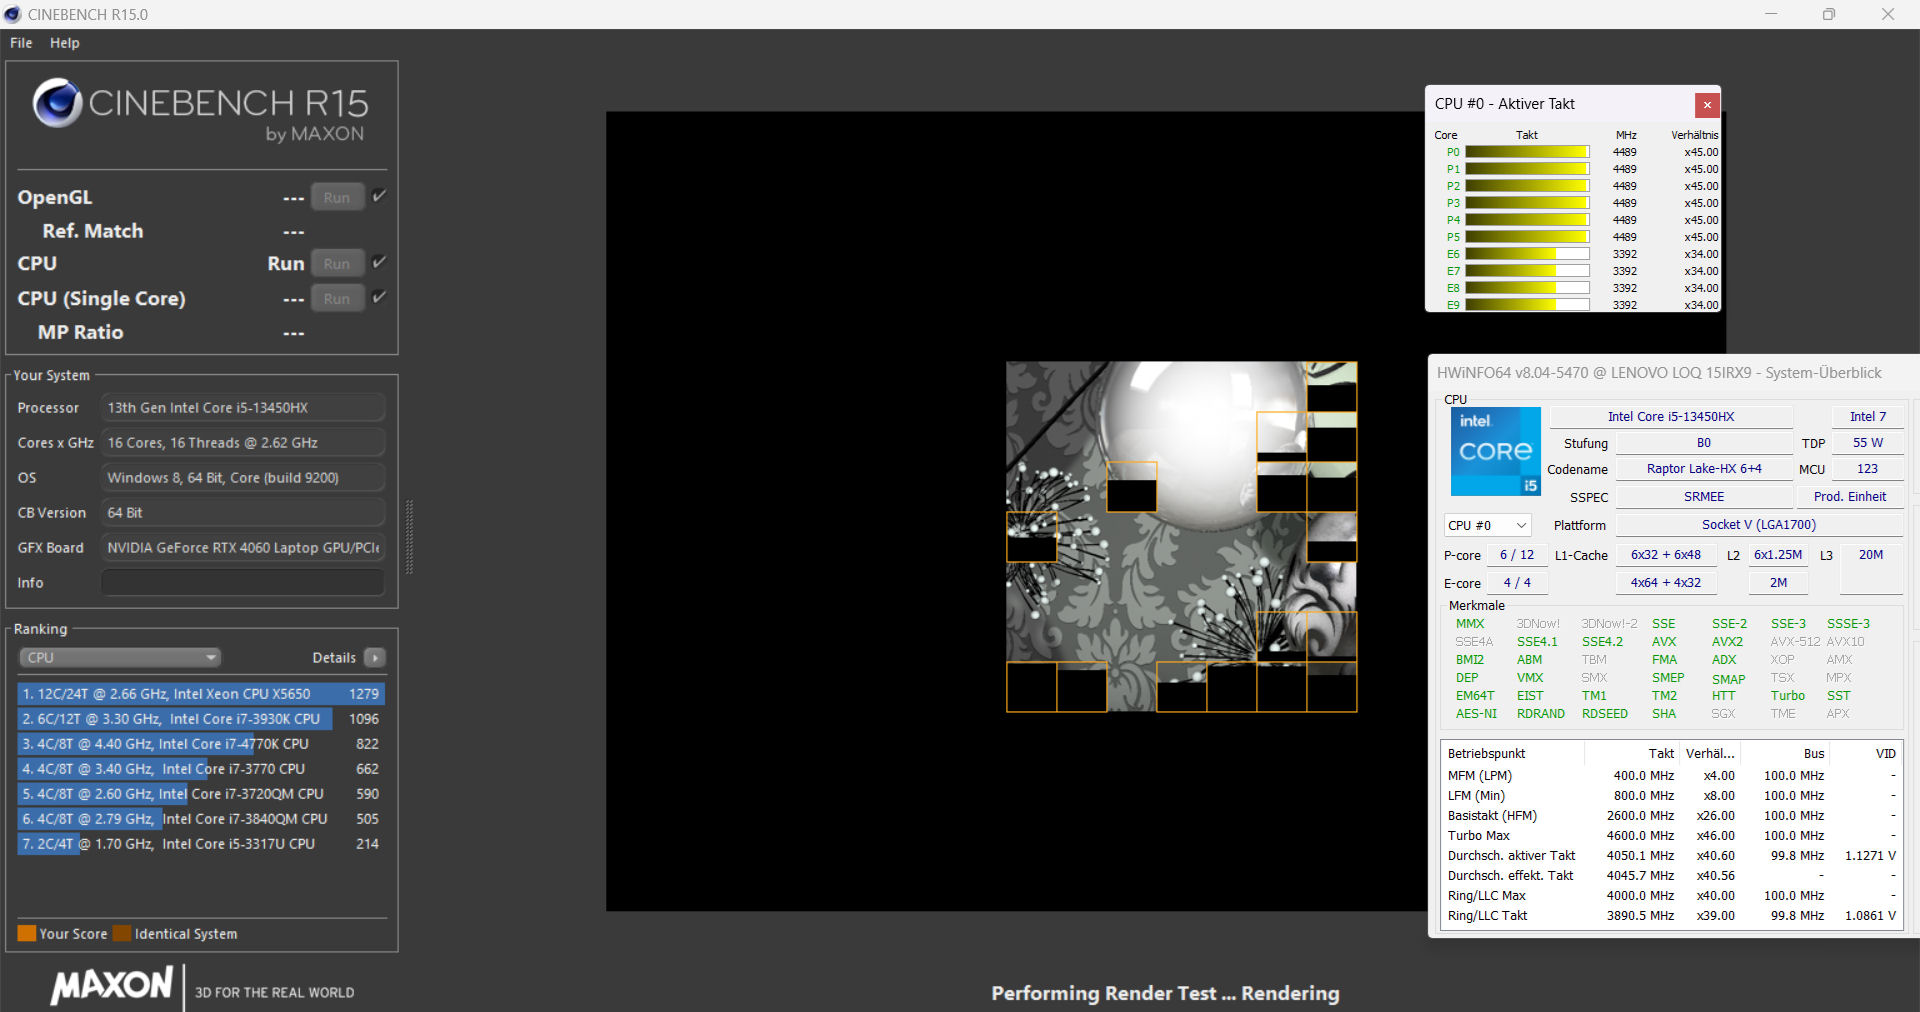
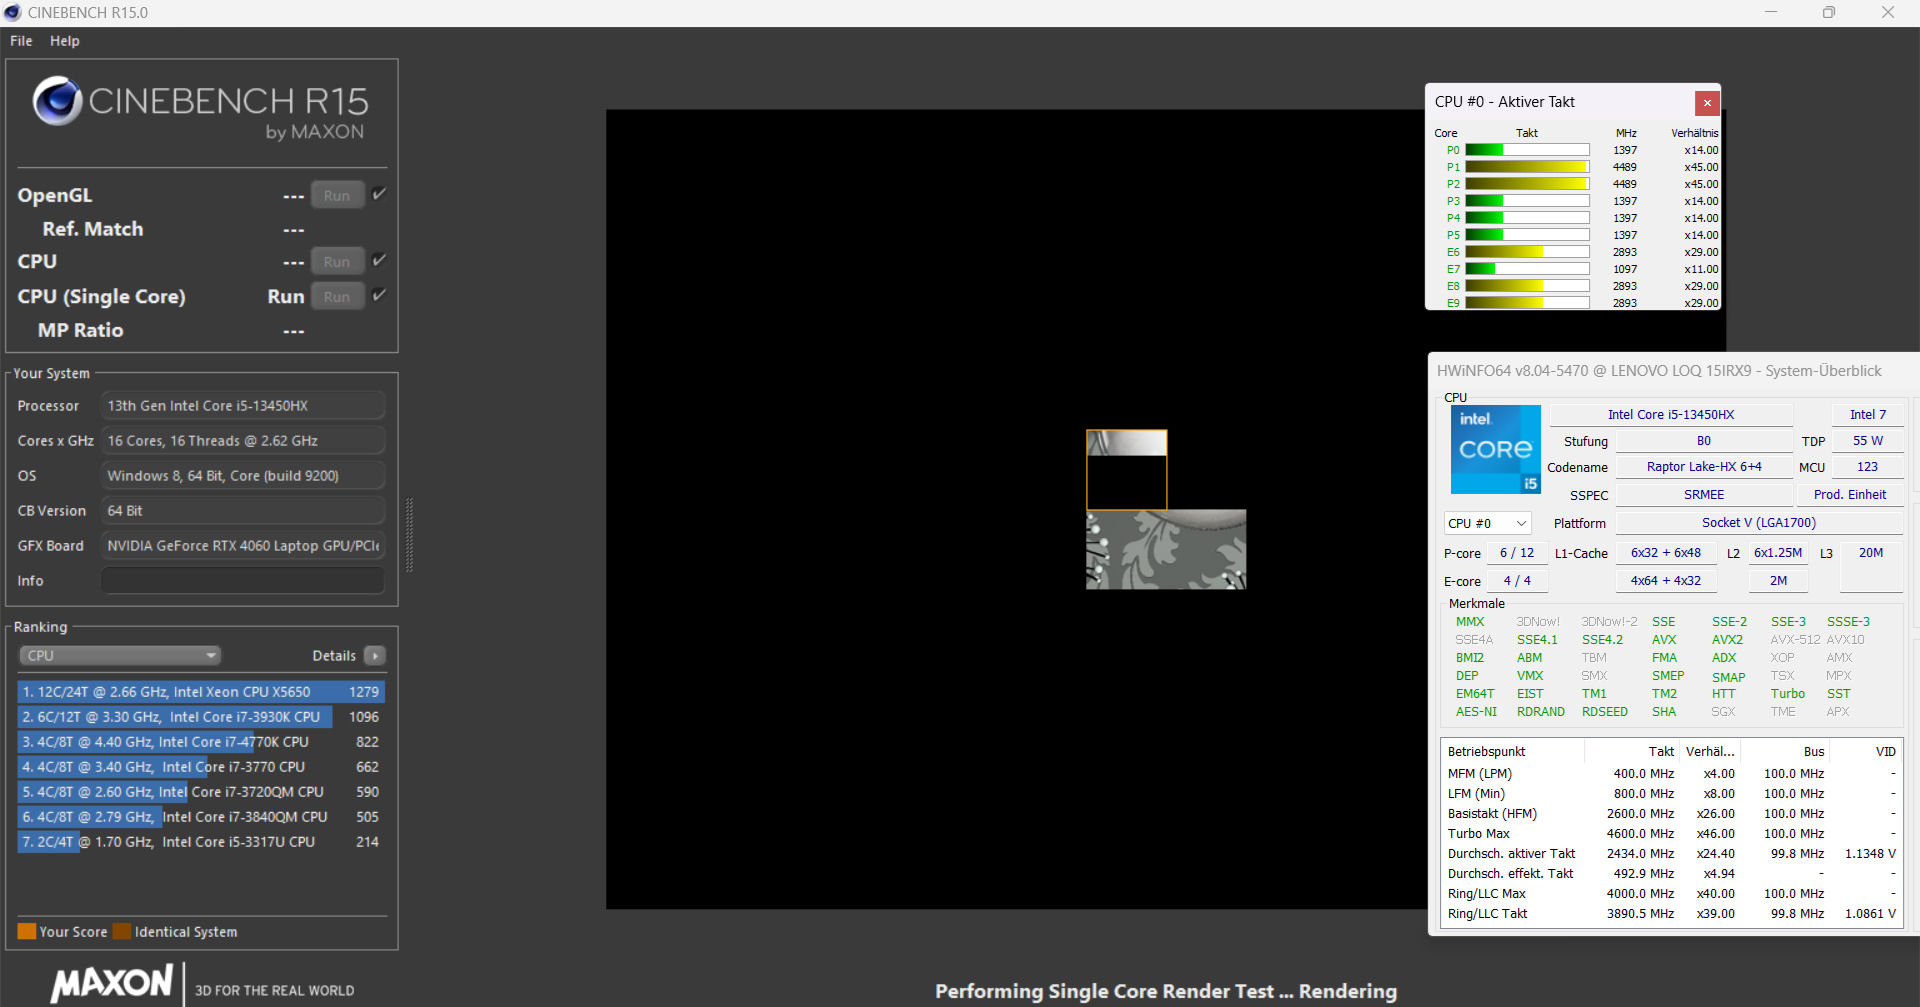
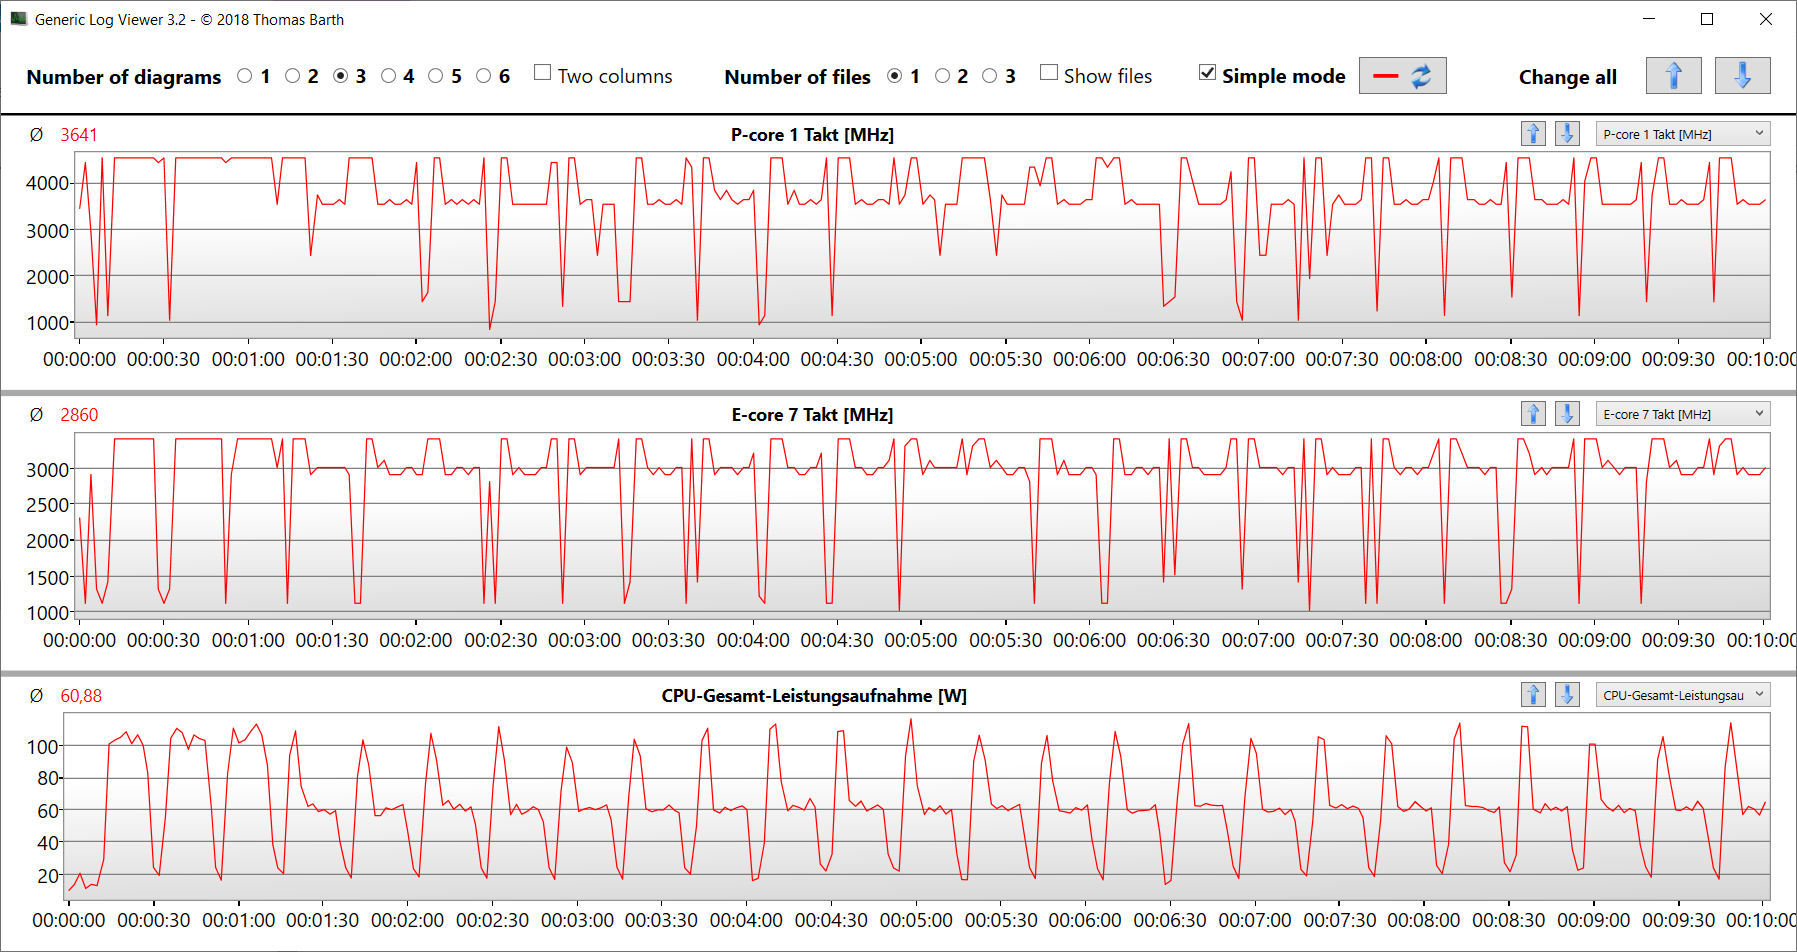
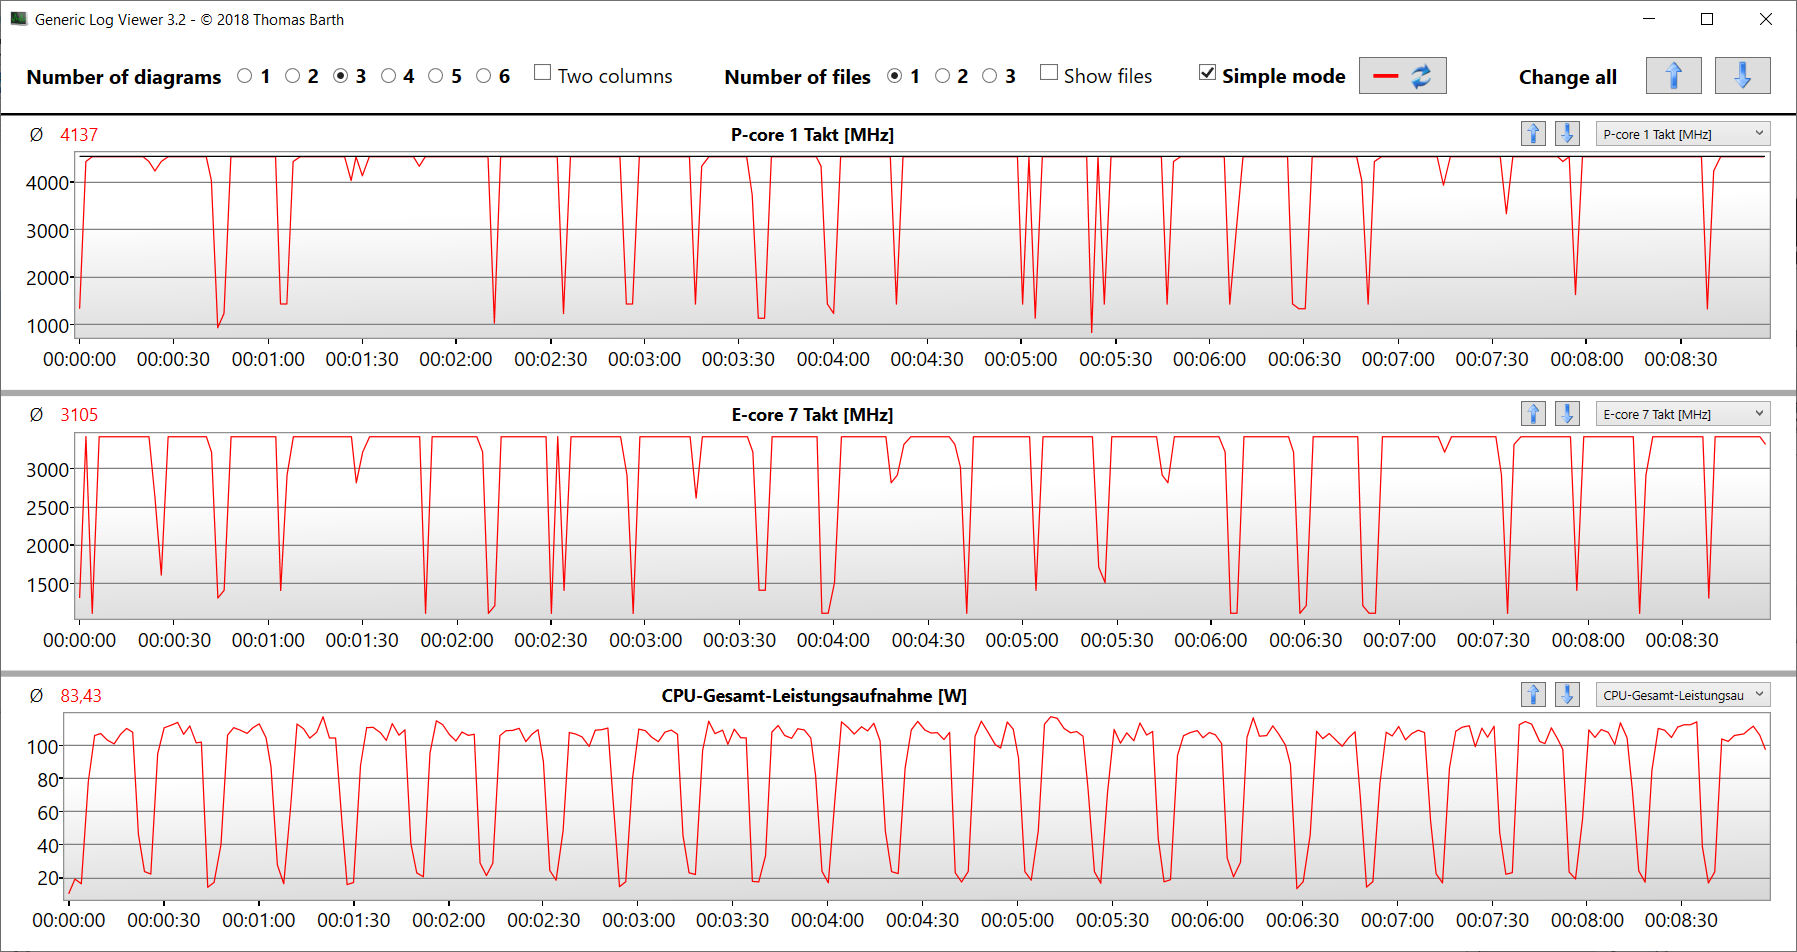
O Core i5-13450HX(Raptor Lake) com 10 núcleos de CPU (6P + 4E = 16 threads) atinge taxas de clock máximas de 4,6 GHz (P) e 3,4 GHz (E). A carga contínua de vários threads (CB15 Loop) fez com que sua taxa de clock diminuísse da primeira à quarta execução( modobalanceado ). Depois disso, ela permaneceu estável. O modo de desempenho mantém a taxa de clock em um nível permanentemente alto.
Os resultados do benchmark foram exatamente como esperávamos (modobalanceado ), e o modo de desempenho resultou em uma vantagem (muito pequena). No campo de comparação, o Core i5 teve o pior desempenho, pois tem o menor número de núcleos de computação. A CPU é uma escolha adequada para um jogador econômico.
Cinebench R15 Multi continuous test
| CPU Performance Rating - Percent | |
| Média da turma Gaming | |
| HP Victus 16 (2024) | |
| SCHENKER XMG Core 15 (M24) | |
| Dell G16, i7-13650HX, RTX 4060 | |
| Gigabyte G6X 9KG (2024) | |
| Lenovo LOQ 15IRX9 | |
| Média Intel Core i5-13450HX | |
| Lenovo LOQ 15IRX9 | |
| Cinebench R23 | |
| Multi Core | |
| HP Victus 16 (2024) | |
| Média da turma Gaming (5668 - 39652, n=151, últimos 2 anos) | |
| Dell G16, i7-13650HX, RTX 4060 | |
| Gigabyte G6X 9KG (2024) | |
| SCHENKER XMG Core 15 (M24) | |
| Lenovo LOQ 15IRX9 (Leistungsmodus) | |
| Média Intel Core i5-13450HX (16575 - 17234, n=3) | |
| Lenovo LOQ 15IRX9 | |
| Single Core | |
| Dell G16, i7-13650HX, RTX 4060 | |
| Média da turma Gaming (1136 - 2252, n=151, últimos 2 anos) | |
| Gigabyte G6X 9KG (2024) | |
| SCHENKER XMG Core 15 (M24) | |
| Lenovo LOQ 15IRX9 (Leistungsmodus) | |
| Média Intel Core i5-13450HX (1710 - 1766, n=3) | |
| Lenovo LOQ 15IRX9 | |
| HP Victus 16 (2024) | |
| Cinebench R20 | |
| CPU (Multi Core) | |
| HP Victus 16 (2024) | |
| Média da turma Gaming (2179 - 15517, n=151, últimos 2 anos) | |
| Dell G16, i7-13650HX, RTX 4060 | |
| Gigabyte G6X 9KG (2024) | |
| SCHENKER XMG Core 15 (M24) | |
| Lenovo LOQ 15IRX9 (Leistungsmodus) | |
| Média Intel Core i5-13450HX (6489 - 6595, n=3) | |
| Lenovo LOQ 15IRX9 | |
| CPU (Single Core) | |
| Média da turma Gaming (439 - 866, n=151, últimos 2 anos) | |
| Dell G16, i7-13650HX, RTX 4060 | |
| Gigabyte G6X 9KG (2024) | |
| SCHENKER XMG Core 15 (M24) | |
| Lenovo LOQ 15IRX9 (Leistungsmodus) | |
| Média Intel Core i5-13450HX (652 - 680, n=3) | |
| Lenovo LOQ 15IRX9 | |
| HP Victus 16 (2024) | |
| Cinebench R15 | |
| CPU Multi 64Bit | |
| HP Victus 16 (2024) | |
| Média da turma Gaming (905 - 6074, n=154, últimos 2 anos) | |
| Dell G16, i7-13650HX, RTX 4060 | |
| SCHENKER XMG Core 15 (M24) | |
| Gigabyte G6X 9KG (2024) | |
| Lenovo LOQ 15IRX9 (Leistungsmodus) | |
| Lenovo LOQ 15IRX9 | |
| Média Intel Core i5-13450HX (2427 - 2505, n=3) | |
| CPU Single 64Bit | |
| SCHENKER XMG Core 15 (M24) | |
| Média da turma Gaming (191.9 - 343, n=151, últimos 2 anos) | |
| Dell G16, i7-13650HX, RTX 4060 | |
| Gigabyte G6X 9KG (2024) | |
| Lenovo LOQ 15IRX9 (Leistungsmodus) | |
| Média Intel Core i5-13450HX (239 - 251, n=3) | |
| Lenovo LOQ 15IRX9 | |
| HP Victus 16 (2024) | |
| Blender - v2.79 BMW27 CPU | |
| Lenovo LOQ 15IRX9 | |
| Gigabyte G6X 9KG (2024) | |
| Média Intel Core i5-13450HX (196 - 229, n=3) | |
| Lenovo LOQ 15IRX9 (Leistungsmodus) | |
| SCHENKER XMG Core 15 (M24) | |
| Média da turma Gaming (81 - 555, n=144, últimos 2 anos) | |
| HP Victus 16 (2024) | |
| Dell G16, i7-13650HX, RTX 4060 | |
| 7-Zip 18.03 | |
| 7z b 4 | |
| HP Victus 16 (2024) | |
| Média da turma Gaming (23795 - 144064, n=149, últimos 2 anos) | |
| Dell G16, i7-13650HX, RTX 4060 | |
| SCHENKER XMG Core 15 (M24) | |
| Gigabyte G6X 9KG (2024) | |
| Lenovo LOQ 15IRX9 (Leistungsmodus) | |
| Média Intel Core i5-13450HX (59026 - 62204, n=3) | |
| Lenovo LOQ 15IRX9 | |
| 7z b 4 -mmt1 | |
| SCHENKER XMG Core 15 (M24) | |
| Média da turma Gaming (4199 - 7573, n=149, últimos 2 anos) | |
| Dell G16, i7-13650HX, RTX 4060 | |
| Gigabyte G6X 9KG (2024) | |
| HP Victus 16 (2024) | |
| Lenovo LOQ 15IRX9 (Leistungsmodus) | |
| Média Intel Core i5-13450HX (5370 - 5576, n=3) | |
| Lenovo LOQ 15IRX9 | |
| Geekbench 6.4 | |
| Multi-Core | |
| HP Victus 16 (2024) (6.2.1) | |
| Média da turma Gaming (5340 - 21668, n=119, últimos 2 anos) | |
| SCHENKER XMG Core 15 (M24) (6.2.1) | |
| Dell G16, i7-13650HX, RTX 4060 (6.2.1) | |
| Gigabyte G6X 9KG (2024) (6.2.1) | |
| Lenovo LOQ 15IRX9 (6.2.1, Leistungsmodus) | |
| Média Intel Core i5-13450HX (12619 - 12799, n=3) | |
| Lenovo LOQ 15IRX9 (6.2.1) | |
| Single-Core | |
| SCHENKER XMG Core 15 (M24) (6.2.1) | |
| Média da turma Gaming (1490 - 3219, n=119, últimos 2 anos) | |
| Dell G16, i7-13650HX, RTX 4060 (6.2.1) | |
| Gigabyte G6X 9KG (2024) (6.2.1) | |
| Lenovo LOQ 15IRX9 (6.2.1, Leistungsmodus) | |
| Média Intel Core i5-13450HX (2381 - 2448, n=3) | |
| Lenovo LOQ 15IRX9 (6.2.1) | |
| HP Victus 16 (2024) (6.2.1) | |
| Geekbench 5.5 | |
| Multi-Core | |
| HP Victus 16 (2024) | |
| Média da turma Gaming (4557 - 25855, n=148, últimos 2 anos) | |
| Gigabyte G6X 9KG (2024) | |
| SCHENKER XMG Core 15 (M24) | |
| Dell G16, i7-13650HX, RTX 4060 | |
| Lenovo LOQ 15IRX9 | |
| Média Intel Core i5-13450HX (11973 - 12022, n=3) | |
| Lenovo LOQ 15IRX9 (Leistungsmodus) | |
| Single-Core | |
| SCHENKER XMG Core 15 (M24) | |
| Média da turma Gaming (986 - 2423, n=148, últimos 2 anos) | |
| Dell G16, i7-13650HX, RTX 4060 | |
| Gigabyte G6X 9KG (2024) | |
| Lenovo LOQ 15IRX9 (Leistungsmodus) | |
| Média Intel Core i5-13450HX (1696 - 1763, n=3) | |
| HP Victus 16 (2024) | |
| Lenovo LOQ 15IRX9 | |
| HWBOT x265 Benchmark v2.2 - 4k Preset | |
| Média da turma Gaming (6.72 - 42.9, n=148, últimos 2 anos) | |
| SCHENKER XMG Core 15 (M24) | |
| HP Victus 16 (2024) | |
| Lenovo LOQ 15IRX9 (Leistungsmodus) | |
| Dell G16, i7-13650HX, RTX 4060 | |
| Gigabyte G6X 9KG (2024) | |
| Média Intel Core i5-13450HX (16.9 - 20.5, n=3) | |
| Lenovo LOQ 15IRX9 | |
| LibreOffice - 20 Documents To PDF | |
| Média Intel Core i5-13450HX (49.5 - 96.6, n=3) | |
| Lenovo LOQ 15IRX9 (6.3.4.2) | |
| HP Victus 16 (2024) (6.3.4.2) | |
| Dell G16, i7-13650HX, RTX 4060 (6.3.4.2) | |
| Lenovo LOQ 15IRX9 (6.3.4.2, Leistungsmodus) | |
| SCHENKER XMG Core 15 (M24) (6.3.4.2) | |
| Média da turma Gaming (19 - 96.6, n=147, últimos 2 anos) | |
| Gigabyte G6X 9KG (2024) (6.3.4.2) | |
| R Benchmark 2.5 - Overall mean | |
| HP Victus 16 (2024) | |
| Lenovo LOQ 15IRX9 | |
| Média Intel Core i5-13450HX (0.4582 - 0.4838, n=3) | |
| Lenovo LOQ 15IRX9 (Leistungsmodus) | |
| Média da turma Gaming (0.3609 - 0.759, n=150, últimos 2 anos) | |
| Gigabyte G6X 9KG (2024) | |
| SCHENKER XMG Core 15 (M24) | |
| Dell G16, i7-13650HX, RTX 4060 | |
| Dell G16, i7-13650HX, RTX 4060 | |
* ... menor é melhor
AIDA64: FP32 Ray-Trace | FPU Julia | CPU SHA3 | CPU Queen | FPU SinJulia | FPU Mandel | CPU AES | CPU ZLib | FP64 Ray-Trace | CPU PhotoWorxx
| Performance Rating | |
| SCHENKER XMG Core 15 (M24) | |
| Média da turma Gaming | |
| Dell G16, i7-13650HX, RTX 4060 | |
| HP Victus 16 (2024) | |
| Lenovo LOQ 15IRX9 | |
| Média Intel Core i5-13450HX | |
| Gigabyte G6X 9KG (2024) | |
| Lenovo LOQ 15IRX9 | |
| AIDA64 / FP32 Ray-Trace | |
| SCHENKER XMG Core 15 (M24) (v6.92.6600) | |
| Média da turma Gaming (4986 - 81639, n=147, últimos 2 anos) | |
| Dell G16, i7-13650HX, RTX 4060 (v6.92.6600) | |
| Lenovo LOQ 15IRX9 (v6.92.6600, Leistungsmodus) | |
| HP Victus 16 (2024) (v6.92.6600) | |
| Média Intel Core i5-13450HX (13747 - 17767, n=3) | |
| Lenovo LOQ 15IRX9 (v6.92.6600) | |
| Gigabyte G6X 9KG (2024) (v6.92.6600) | |
| AIDA64 / FPU Julia | |
| SCHENKER XMG Core 15 (M24) (v6.92.6600) | |
| Média da turma Gaming (25360 - 252486, n=147, últimos 2 anos) | |
| Dell G16, i7-13650HX, RTX 4060 (v6.92.6600) | |
| HP Victus 16 (2024) (v6.92.6600) | |
| Lenovo LOQ 15IRX9 (v6.92.6600, Leistungsmodus) | |
| Média Intel Core i5-13450HX (71834 - 83862, n=3) | |
| Lenovo LOQ 15IRX9 (v6.92.6600) | |
| Gigabyte G6X 9KG (2024) (v6.92.6600) | |
| AIDA64 / CPU SHA3 | |
| SCHENKER XMG Core 15 (M24) (v6.92.6600) | |
| Média da turma Gaming (1339 - 10389, n=147, últimos 2 anos) | |
| Dell G16, i7-13650HX, RTX 4060 (v6.92.6600) | |
| HP Victus 16 (2024) (v6.92.6600) | |
| Lenovo LOQ 15IRX9 (v6.92.6600) | |
| Lenovo LOQ 15IRX9 (v6.92.6600, Leistungsmodus) | |
| Média Intel Core i5-13450HX (3519 - 3530, n=3) | |
| Gigabyte G6X 9KG (2024) (v6.92.6600) | |
| AIDA64 / CPU Queen | |
| HP Victus 16 (2024) (v6.92.6600) | |
| SCHENKER XMG Core 15 (M24) (v6.92.6600) | |
| Média da turma Gaming (50699 - 200651, n=147, últimos 2 anos) | |
| Gigabyte G6X 9KG (2024) (v6.92.6600) | |
| Dell G16, i7-13650HX, RTX 4060 (v6.92.6600) | |
| Lenovo LOQ 15IRX9 (v6.92.6600) | |
| Média Intel Core i5-13450HX (85888 - 86148, n=3) | |
| Lenovo LOQ 15IRX9 (v6.92.6600, Leistungsmodus) | |
| AIDA64 / FPU SinJulia | |
| SCHENKER XMG Core 15 (M24) (v6.92.6600) | |
| Média da turma Gaming (4800 - 32988, n=147, últimos 2 anos) | |
| HP Victus 16 (2024) (v6.92.6600) | |
| Dell G16, i7-13650HX, RTX 4060 (v6.92.6600) | |
| Lenovo LOQ 15IRX9 (v6.92.6600, Leistungsmodus) | |
| Lenovo LOQ 15IRX9 (v6.92.6600) | |
| Média Intel Core i5-13450HX (9325 - 9354, n=3) | |
| Gigabyte G6X 9KG (2024) (v6.92.6600) | |
| AIDA64 / FPU Mandel | |
| SCHENKER XMG Core 15 (M24) (v6.92.6600) | |
| Média da turma Gaming (12321 - 134044, n=147, últimos 2 anos) | |
| Dell G16, i7-13650HX, RTX 4060 (v6.92.6600) | |
| Lenovo LOQ 15IRX9 (v6.92.6600, Leistungsmodus) | |
| HP Victus 16 (2024) (v6.92.6600) | |
| Média Intel Core i5-13450HX (34956 - 42825, n=3) | |
| Lenovo LOQ 15IRX9 (v6.92.6600) | |
| Gigabyte G6X 9KG (2024) (v6.92.6600) | |
| AIDA64 / CPU AES | |
| Média da turma Gaming (19065 - 328679, n=147, últimos 2 anos) | |
| SCHENKER XMG Core 15 (M24) (v6.92.6600) | |
| Dell G16, i7-13650HX, RTX 4060 (v6.92.6600) | |
| HP Victus 16 (2024) (v6.92.6600) | |
| Média Intel Core i5-13450HX (70296 - 70680, n=3) | |
| Lenovo LOQ 15IRX9 (v6.92.6600) | |
| Lenovo LOQ 15IRX9 (v6.92.6600, Leistungsmodus) | |
| Gigabyte G6X 9KG (2024) (v6.92.6600) | |
| AIDA64 / CPU ZLib | |
| Média da turma Gaming (373 - 2531, n=147, últimos 2 anos) | |
| Dell G16, i7-13650HX, RTX 4060 (v6.92.6600) | |
| HP Victus 16 (2024) (v6.92.6600) | |
| Gigabyte G6X 9KG (2024) (v6.92.6600) | |
| Lenovo LOQ 15IRX9 (v6.92.6600) | |
| Média Intel Core i5-13450HX (977 - 1002, n=3) | |
| Lenovo LOQ 15IRX9 (v6.92.6600, Leistungsmodus) | |
| SCHENKER XMG Core 15 (M24) (v6.92.6600) | |
| AIDA64 / FP64 Ray-Trace | |
| SCHENKER XMG Core 15 (M24) (v6.92.6600) | |
| Média da turma Gaming (2540 - 43430, n=147, últimos 2 anos) | |
| Dell G16, i7-13650HX, RTX 4060 (v6.92.6600) | |
| Lenovo LOQ 15IRX9 (v6.92.6600, Leistungsmodus) | |
| HP Victus 16 (2024) (v6.92.6600) | |
| Média Intel Core i5-13450HX (7428 - 9561, n=3) | |
| Lenovo LOQ 15IRX9 (v6.92.6600) | |
| Gigabyte G6X 9KG (2024) (v6.92.6600) | |
| AIDA64 / CPU PhotoWorxx | |
| SCHENKER XMG Core 15 (M24) (v6.92.6600) | |
| Média da turma Gaming (10805 - 60161, n=147, últimos 2 anos) | |
| HP Victus 16 (2024) (v6.92.6600) | |
| Gigabyte G6X 9KG (2024) (v6.92.6600) | |
| Lenovo LOQ 15IRX9 (v6.92.6600) | |
| Lenovo LOQ 15IRX9 (v6.92.6600, Leistungsmodus) | |
| Média Intel Core i5-13450HX (36014 - 36764, n=3) | |
| Dell G16, i7-13650HX, RTX 4060 (v6.92.6600) | |
Desempenho do sistema
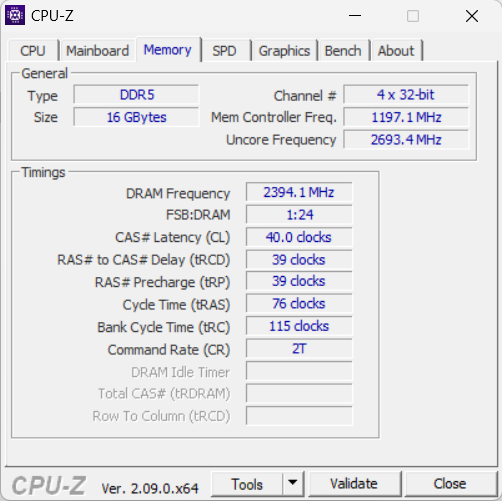
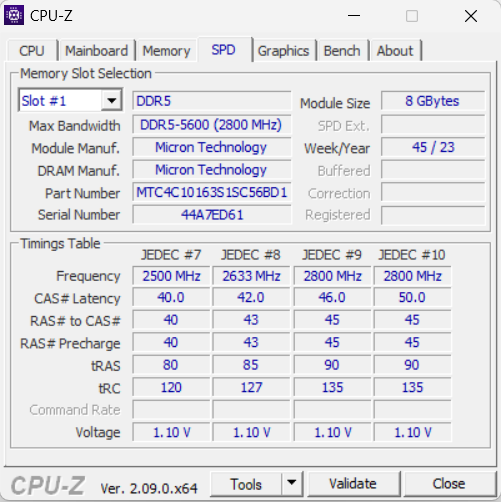
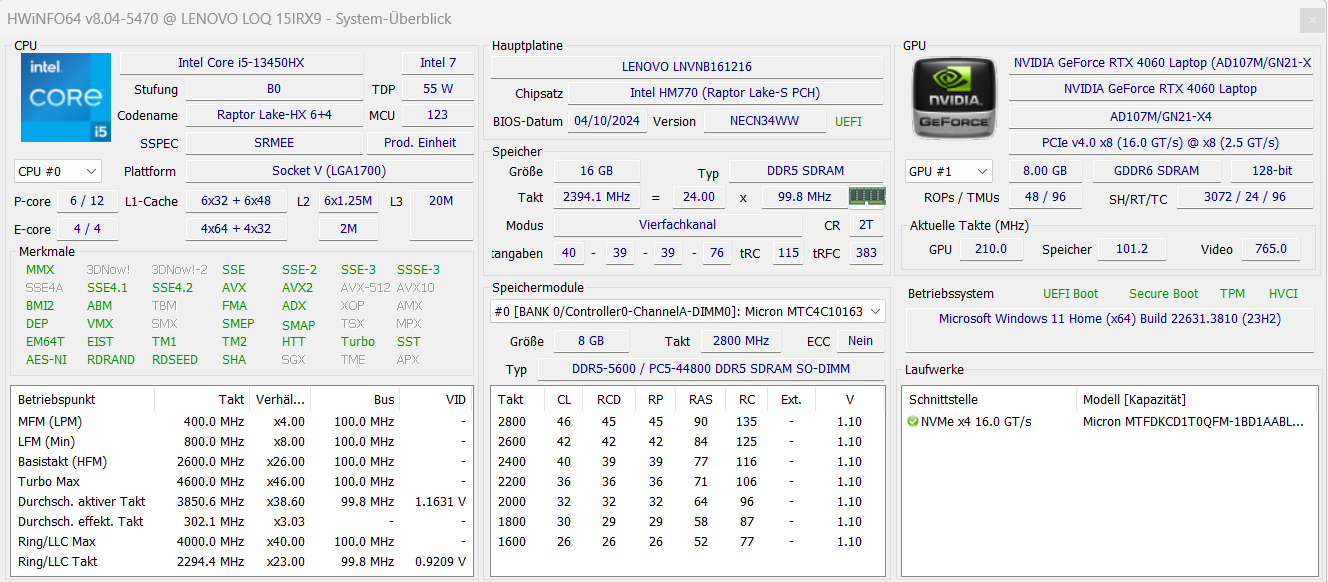
O sistema de funcionamento suave não deixa a desejar em termos de desempenho: o computador lida com jogos, renderização e streaming sem nenhum problema. As taxas de transferência da RAM são as esperadas para a RAM DDR5-5600.

CrossMark: Overall | Productivity | Creativity | Responsiveness
WebXPRT 3: Overall
WebXPRT 4: Overall
Mozilla Kraken 1.1: Total
| PCMark 10 / Score | |
| SCHENKER XMG Core 15 (M24) | |
| Média da turma Gaming (5776 - 9852, n=133, últimos 2 anos) | |
| Gigabyte G6X 9KG (2024) | |
| HP Victus 16 (2024) | |
| Dell G16, i7-13650HX, RTX 4060 | |
| Lenovo LOQ 15IRX9 | |
| Média Intel Core i5-13450HX, NVIDIA GeForce RTX 4060 Laptop GPU (n=1) | |
| PCMark 10 / Essentials | |
| HP Victus 16 (2024) | |
| Média da turma Gaming (9057 - 12600, n=133, últimos 2 anos) | |
| Gigabyte G6X 9KG (2024) | |
| SCHENKER XMG Core 15 (M24) | |
| Dell G16, i7-13650HX, RTX 4060 | |
| Lenovo LOQ 15IRX9 | |
| Média Intel Core i5-13450HX, NVIDIA GeForce RTX 4060 Laptop GPU (n=1) | |
| PCMark 10 / Productivity | |
| SCHENKER XMG Core 15 (M24) | |
| Gigabyte G6X 9KG (2024) | |
| Dell G16, i7-13650HX, RTX 4060 | |
| HP Victus 16 (2024) | |
| Média da turma Gaming (6662 - 14612, n=133, últimos 2 anos) | |
| Lenovo LOQ 15IRX9 | |
| Média Intel Core i5-13450HX, NVIDIA GeForce RTX 4060 Laptop GPU (n=1) | |
| PCMark 10 / Digital Content Creation | |
| SCHENKER XMG Core 15 (M24) | |
| Média da turma Gaming (6807 - 18475, n=133, últimos 2 anos) | |
| Dell G16, i7-13650HX, RTX 4060 | |
| Gigabyte G6X 9KG (2024) | |
| Lenovo LOQ 15IRX9 | |
| Média Intel Core i5-13450HX, NVIDIA GeForce RTX 4060 Laptop GPU (n=1) | |
| HP Victus 16 (2024) | |
| CrossMark / Overall | |
| Gigabyte G6X 9KG (2024) | |
| HP Victus 16 (2024) | |
| Média da turma Gaming (1247 - 2344, n=114, últimos 2 anos) | |
| SCHENKER XMG Core 15 (M24) | |
| Dell G16, i7-13650HX, RTX 4060 | |
| Lenovo LOQ 15IRX9 | |
| Média Intel Core i5-13450HX, NVIDIA GeForce RTX 4060 Laptop GPU (n=1) | |
| CrossMark / Productivity | |
| Gigabyte G6X 9KG (2024) | |
| Média da turma Gaming (1299 - 2204, n=114, últimos 2 anos) | |
| SCHENKER XMG Core 15 (M24) | |
| HP Victus 16 (2024) | |
| Dell G16, i7-13650HX, RTX 4060 | |
| Lenovo LOQ 15IRX9 | |
| Média Intel Core i5-13450HX, NVIDIA GeForce RTX 4060 Laptop GPU (n=1) | |
| CrossMark / Creativity | |
| HP Victus 16 (2024) | |
| SCHENKER XMG Core 15 (M24) | |
| Média da turma Gaming (1275 - 2660, n=114, últimos 2 anos) | |
| Gigabyte G6X 9KG (2024) | |
| Dell G16, i7-13650HX, RTX 4060 | |
| Lenovo LOQ 15IRX9 | |
| Média Intel Core i5-13450HX, NVIDIA GeForce RTX 4060 Laptop GPU (n=1) | |
| CrossMark / Responsiveness | |
| Gigabyte G6X 9KG (2024) | |
| HP Victus 16 (2024) | |
| Lenovo LOQ 15IRX9 | |
| Média Intel Core i5-13450HX, NVIDIA GeForce RTX 4060 Laptop GPU (n=1) | |
| Média da turma Gaming (1030 - 2330, n=114, últimos 2 anos) | |
| Dell G16, i7-13650HX, RTX 4060 | |
| SCHENKER XMG Core 15 (M24) | |
| WebXPRT 3 / Overall | |
| SCHENKER XMG Core 15 (M24) (Chrome 82) | |
| Gigabyte G6X 9KG (2024) (Chrome 82) | |
| Média da turma Gaming (215 - 480, n=127, últimos 2 anos) | |
| HP Victus 16 (2024) (Chrome 82) | |
| Dell G16, i7-13650HX, RTX 4060 (Chrome 82) | |
| Lenovo LOQ 15IRX9 (Chrome 82) | |
| Média Intel Core i5-13450HX, NVIDIA GeForce RTX 4060 Laptop GPU (n=1) | |
| WebXPRT 4 / Overall | |
| Média da turma Gaming (176.4 - 335, n=115, últimos 2 anos) | |
| SCHENKER XMG Core 15 (M24) (Chrome 105.0.0.0) | |
| Gigabyte G6X 9KG (2024) (Chrome 105.0.0.0) | |
| HP Victus 16 (2024) (Chrome 105.0.0.0) | |
| Lenovo LOQ 15IRX9 (Chrome 105.0.0.0) | |
| Média Intel Core i5-13450HX, NVIDIA GeForce RTX 4060 Laptop GPU (n=1) | |
| Mozilla Kraken 1.1 / Total | |
| Lenovo LOQ 15IRX9 (Chrome 82) | |
| Média Intel Core i5-13450HX, NVIDIA GeForce RTX 4060 Laptop GPU (n=1) | |
| HP Victus 16 (2024) (Chrome 82) | |
| Gigabyte G6X 9KG (2024) (Chrome 82) | |
| Dell G16, i7-13650HX, RTX 4060 (Chrome 82) | |
| Média da turma Gaming (409 - 674, n=139, últimos 2 anos) | |
| SCHENKER XMG Core 15 (M24) (Chrome 82) | |
* ... menor é melhor
| PCMark 10 Score | 6929 pontos | |
Ajuda | ||
| AIDA64 / Memory Copy | |
| SCHENKER XMG Core 15 (M24) (v6.92.6600) | |
| HP Victus 16 (2024) (v6.92.6600) | |
| Média da turma Gaming (21750 - 97515, n=147, últimos 2 anos) | |
| Gigabyte G6X 9KG (2024) (v6.92.6600) | |
| Dell G16, i7-13650HX, RTX 4060 (v6.92.6600) | |
| Média Intel Core i5-13450HX (58673 - 58861, n=3) | |
| Lenovo LOQ 15IRX9 (v6.92.6600) | |
| AIDA64 / Memory Read | |
| HP Victus 16 (2024) (v6.92.6600) | |
| Média da turma Gaming (22956 - 102937, n=147, últimos 2 anos) | |
| Gigabyte G6X 9KG (2024) (v6.92.6600) | |
| Lenovo LOQ 15IRX9 (v6.92.6600) | |
| Média Intel Core i5-13450HX (66626 - 69024, n=3) | |
| Dell G16, i7-13650HX, RTX 4060 (v6.92.6600) | |
| SCHENKER XMG Core 15 (M24) (v6.92.6600) | |
| AIDA64 / Memory Write | |
| SCHENKER XMG Core 15 (M24) (v6.92.6600) | |
| Média da turma Gaming (22297 - 108954, n=147, últimos 2 anos) | |
| HP Victus 16 (2024) (v6.92.6600) | |
| Gigabyte G6X 9KG (2024) (v6.92.6600) | |
| Lenovo LOQ 15IRX9 (v6.92.6600) | |
| Média Intel Core i5-13450HX (58540 - 60196, n=3) | |
| Dell G16, i7-13650HX, RTX 4060 (v6.92.6600) | |
| AIDA64 / Memory Latency | |
| HP Victus 16 (2024) (v6.92.6600) | |
| Média da turma Gaming (59.5 - 259, n=147, últimos 2 anos) | |
| Lenovo LOQ 15IRX9 (v6.92.6600) | |
| Média Intel Core i5-13450HX (90 - 94.2, n=3) | |
| Dell G16, i7-13650HX, RTX 4060 (v6.92.6600) | |
| Gigabyte G6X 9KG (2024) (v6.92.6600) | |
| SCHENKER XMG Core 15 (M24) (v6.92.6600) | |
* ... menor é melhor
Latências de DPC
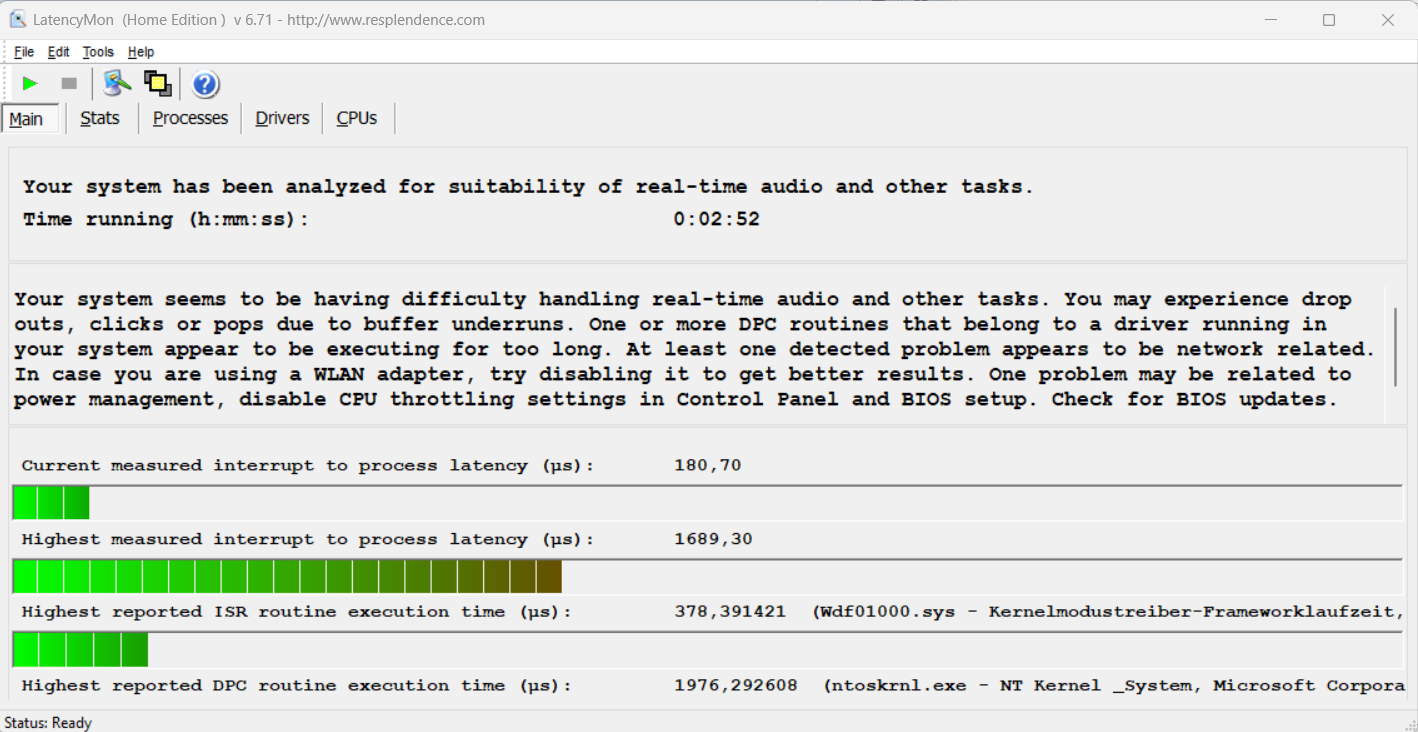
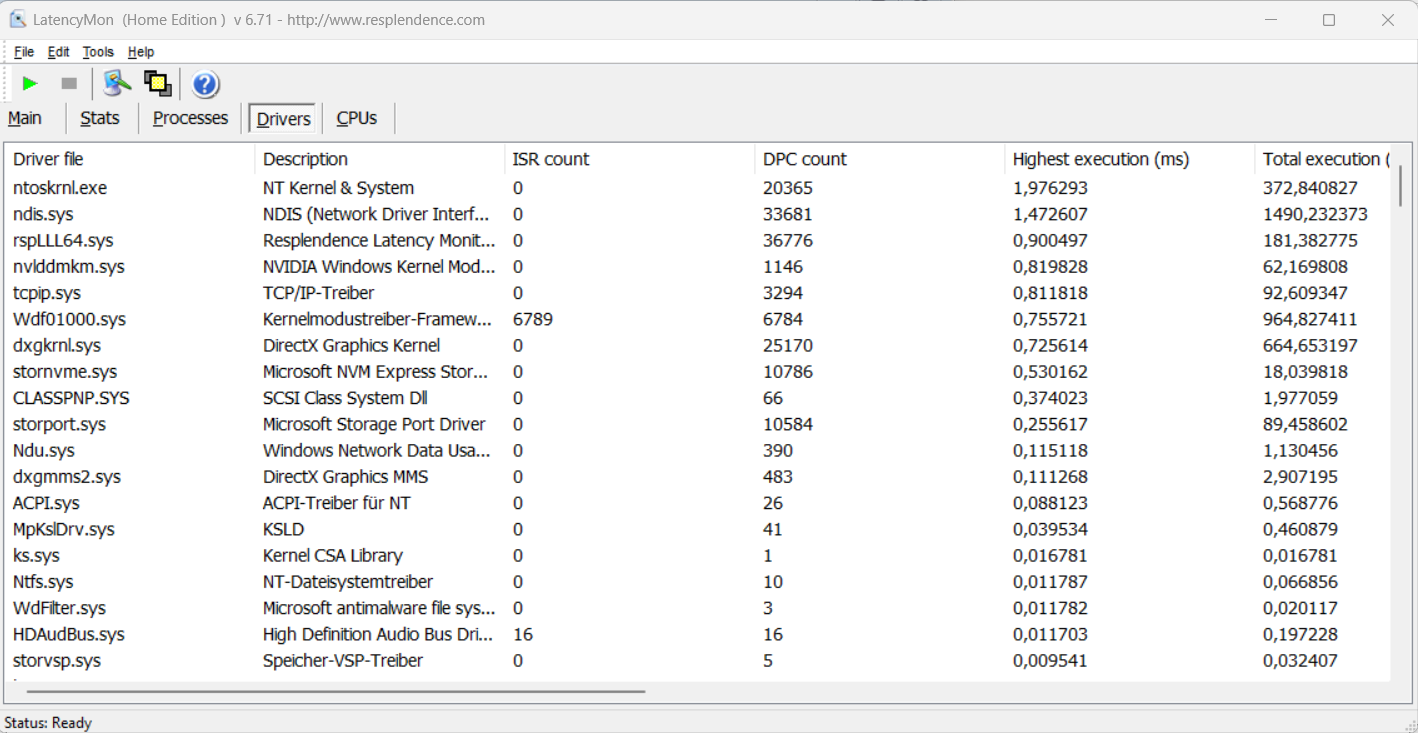
O teste de latência padronizado (navegação na Web, reprodução de vídeo 4k, alta carga do Prime95) revelou algumas anomalias. O sistema não parece ser adequado para edição de vídeo e áudio em tempo real. Futuras atualizações de software podem levar a melhorias ou até mesmo a deteriorações.
| DPC Latencies / LatencyMon - interrupt to process latency (max), Web, Youtube, Prime95 | |
| Gigabyte G6X 9KG (2024) | |
| Lenovo LOQ 15IRX9 | |
| SCHENKER XMG Core 15 (M24) | |
| Dell G16, i7-13650HX, RTX 4060 | |
| HP Victus 16 (2024) | |
* ... menor é melhor
Dispositivos de armazenamento
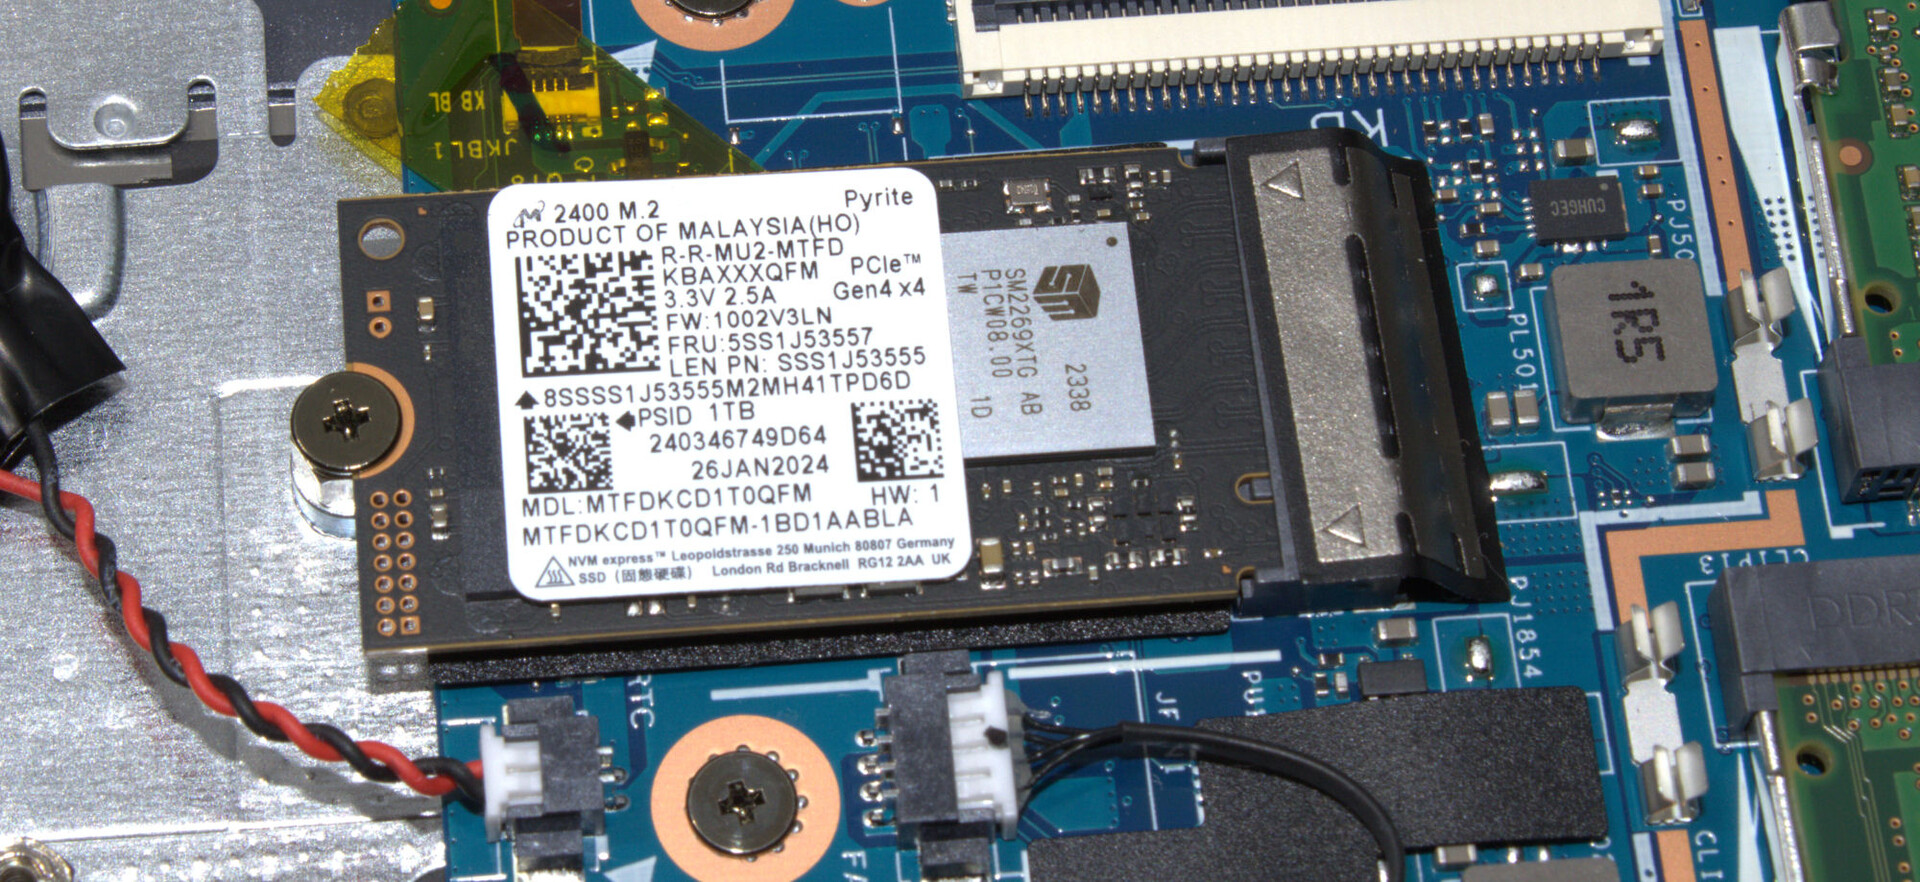
O LOQ tem espaço para um total de dois SSDs PCIe 4 (M.2 2280 ou M.2 2242). O SSD da Micron (1 TB, M.2 2242) dentro do nosso dispositivo de teste oferece boas taxas de dados, mas não pode ser classificado como um dos modelos de SSD topo de linha. Durante o curso posterior do loop do DiskSpd, notamos um estrangulamento induzido termicamente.

* ... menor é melhor
Reading continuous performance: DiskSpd Read Loop, Queue Depth 8
Placa de vídeo
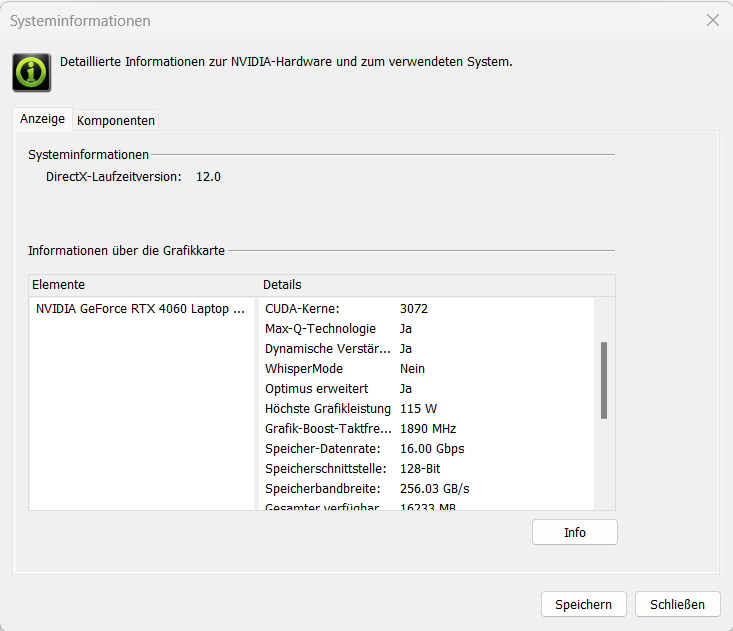
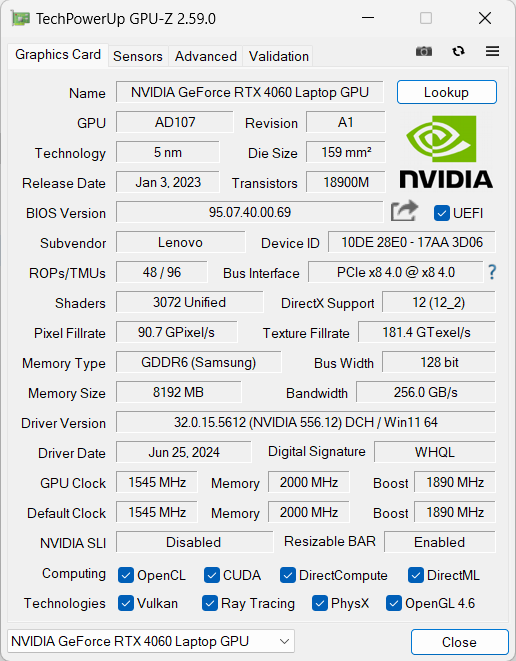
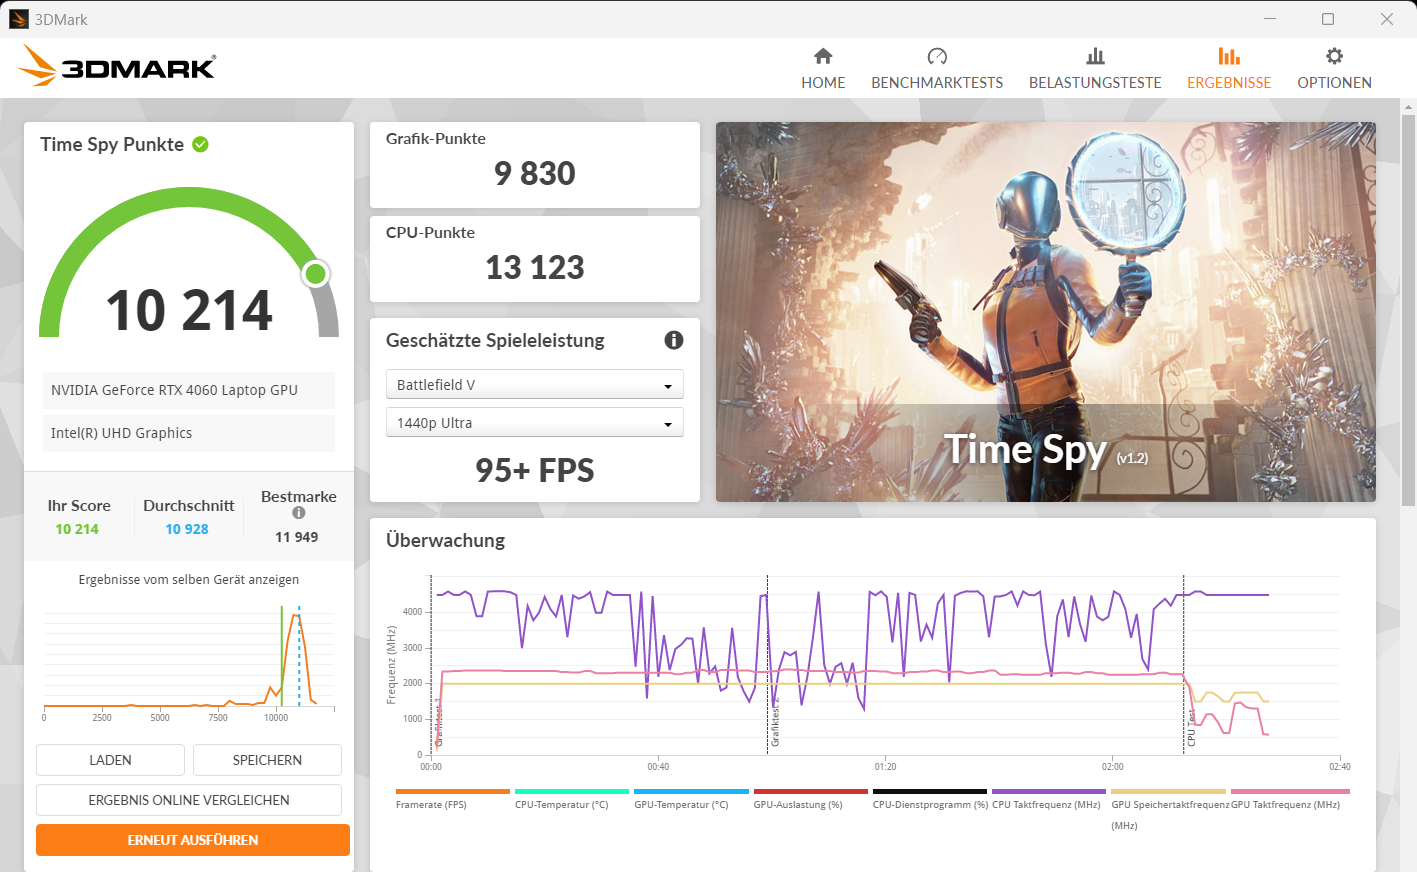
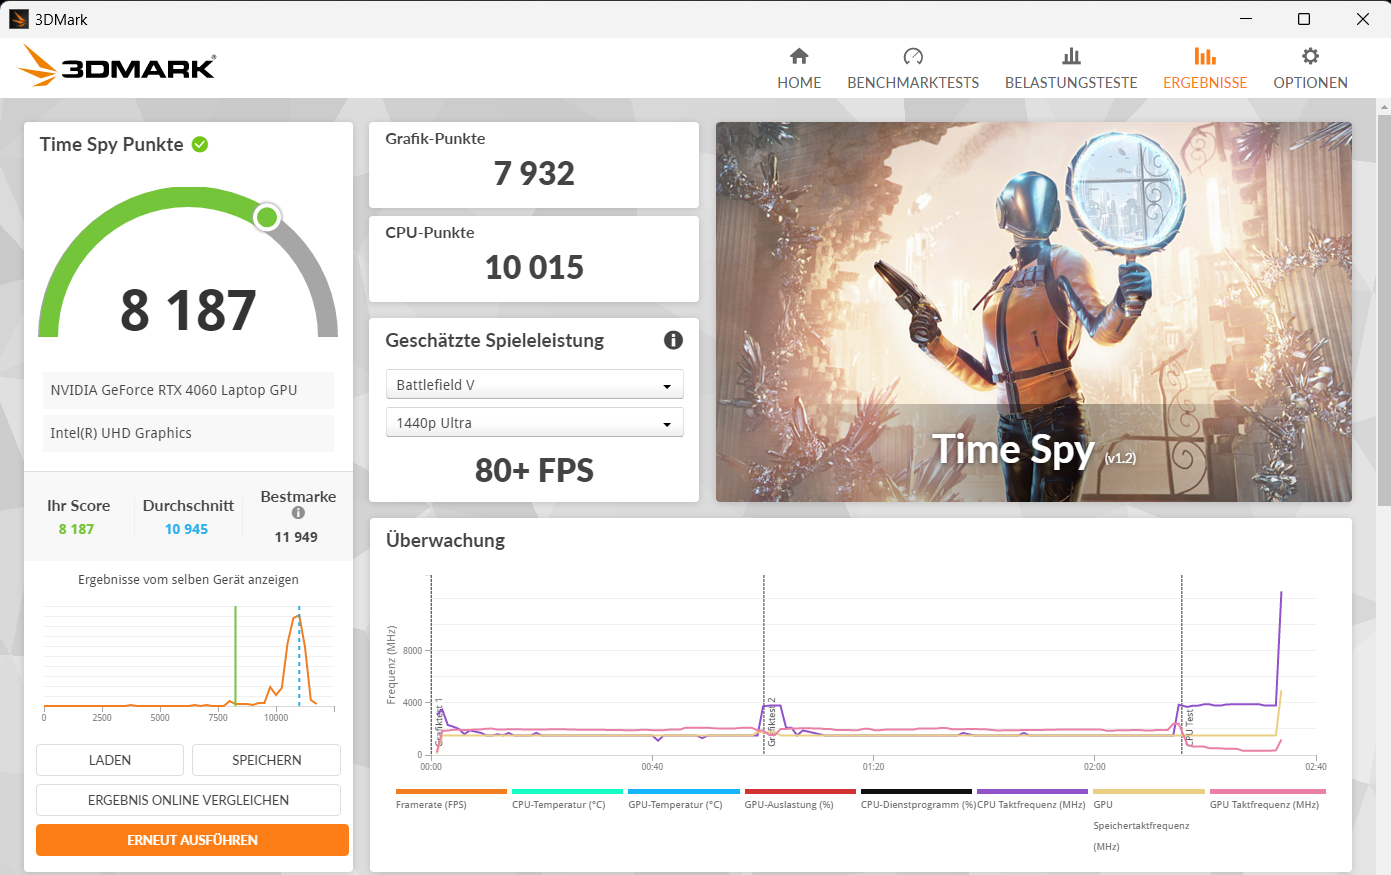
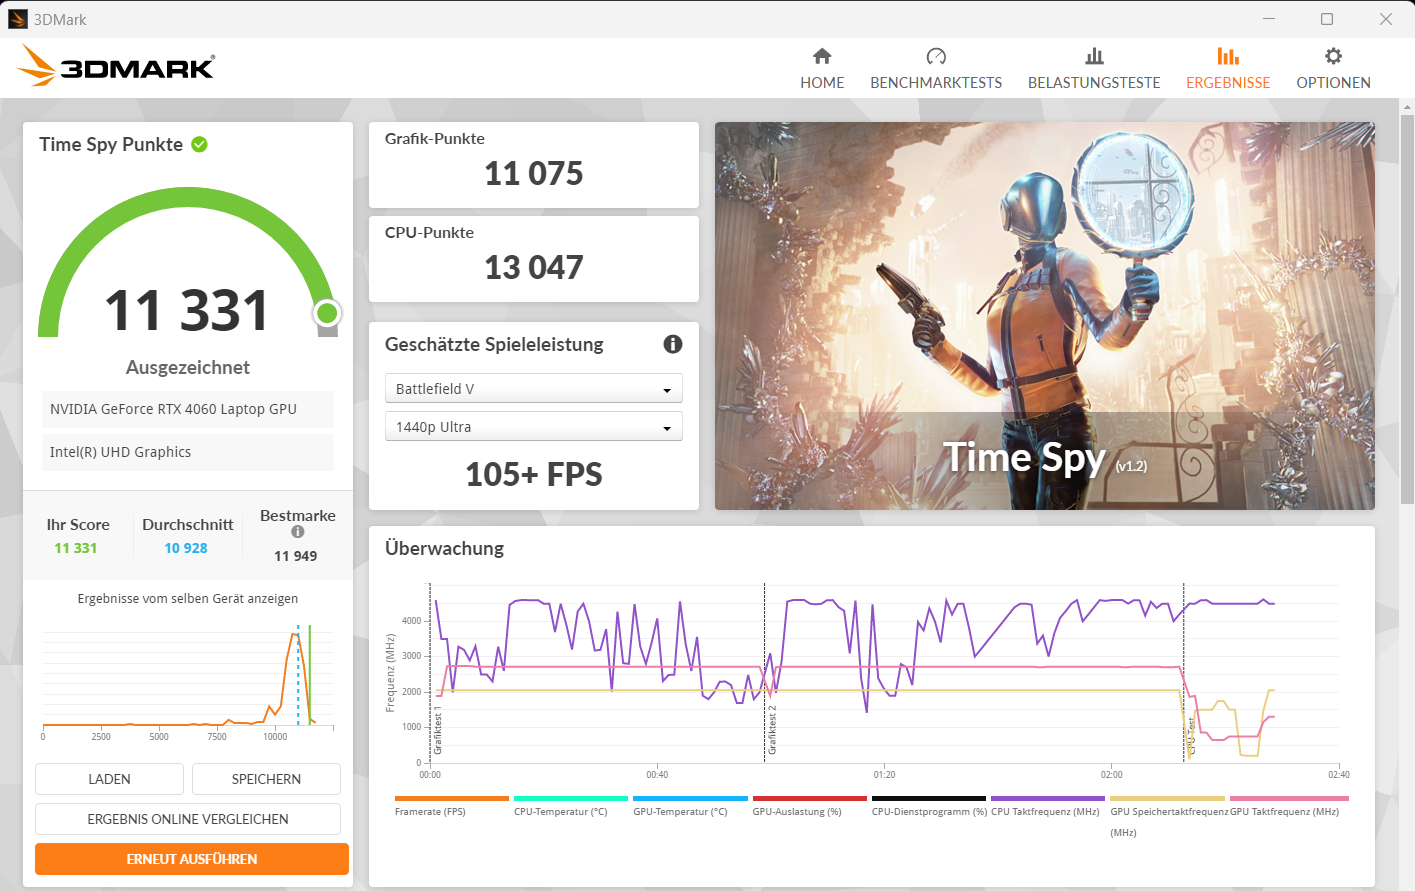
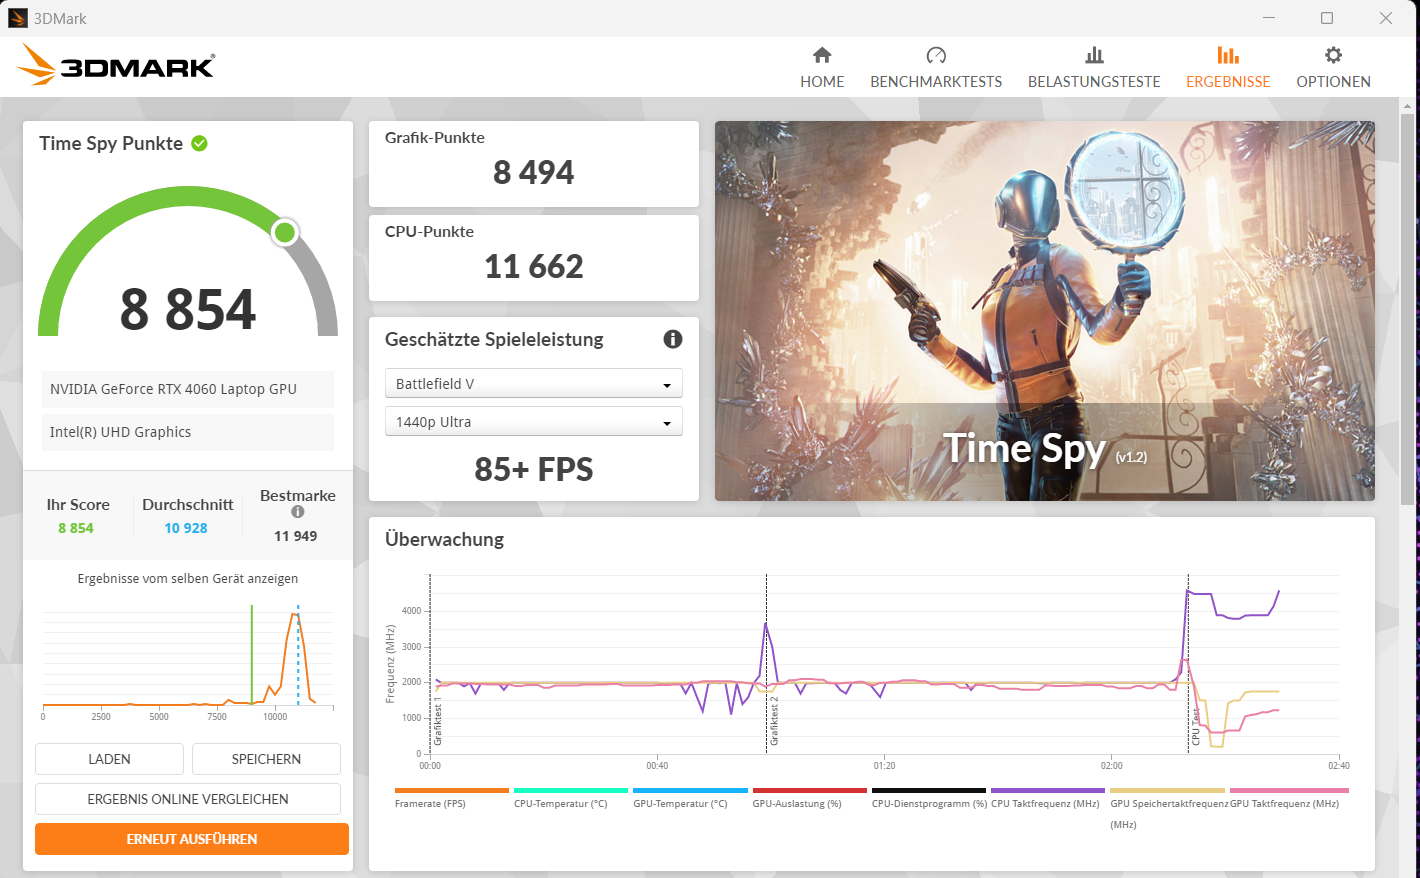
A GeForce RTX 4060 (3.072 shaders, barramento de 128 bits, 8 GB GDDR6, 115 watts) representa a faixa intermediária da atual linha de GPUs móveis da Nvidia. Ela permite jogos em FHD em configurações altas ou máximas. Seus resultados de benchmark e taxas de quadros estão praticamente no mesmo nível da média da RTX-4060( modobalanceado ). O modo de desempenho resultou em valores melhores. A mudança entre o dGPU e o Optimus não requer reinicialização: O Optimus avançado é compatível.
| 3DMark Performance Rating - Percent | |
| Média da turma Gaming | |
| SCHENKER XMG Core 15 (M24) | |
| Lenovo LOQ 15IRX9 | |
| Dell G16, i7-13650HX, RTX 4060 | |
| Lenovo LOQ 15IRX9 | |
| Gigabyte G6X 9KG (2024) | |
| HP Victus 16 (2024) | |
| Média NVIDIA GeForce RTX 4060 Laptop GPU | |
| 3DMark 11 - 1280x720 Performance GPU | |
| Média da turma Gaming (10741 - 72178, n=143, últimos 2 anos) | |
| SCHENKER XMG Core 15 (M24) | |
| Lenovo LOQ 15IRX9 (Leistungsmodus) | |
| Dell G16, i7-13650HX, RTX 4060 | |
| Lenovo LOQ 15IRX9 | |
| Gigabyte G6X 9KG (2024) | |
| HP Victus 16 (2024) | |
| Média NVIDIA GeForce RTX 4060 Laptop GPU (28136 - 38912, n=57) | |
| 3DMark | |
| 1920x1080 Fire Strike Graphics | |
| Média da turma Gaming (2913 - 56116, n=155, últimos 2 anos) | |
| SCHENKER XMG Core 15 (M24) | |
| Lenovo LOQ 15IRX9 (Leistungsmodus) | |
| Lenovo LOQ 15IRX9 | |
| Gigabyte G6X 9KG (2024) | |
| Dell G16, i7-13650HX, RTX 4060 | |
| HP Victus 16 (2024) | |
| Média NVIDIA GeForce RTX 4060 Laptop GPU (20533 - 29656, n=54) | |
| 2560x1440 Time Spy Graphics | |
| Média da turma Gaming (2295 - 24599, n=151, últimos 2 anos) | |
| SCHENKER XMG Core 15 (M24) | |
| Lenovo LOQ 15IRX9 (Leistungsmodus) | |
| Dell G16, i7-13650HX, RTX 4060 | |
| Média NVIDIA GeForce RTX 4060 Laptop GPU (7484 - 11451, n=56) | |
| HP Victus 16 (2024) | |
| Gigabyte G6X 9KG (2024) | |
| Lenovo LOQ 15IRX9 | |
| 3DMark 11 Performance | 30755 pontos | |
| 3DMark Fire Strike Score | 22788 pontos | |
| 3DMark Time Spy Score | 10214 pontos | |
| 3DMark Steel Nomad Score | 2143 pontos | |
Ajuda | ||
| Blender | |
| v3.3 Classroom OPTIX/RTX | |
| Lenovo LOQ 15IRX9 (3.3.3) | |
| Dell G16, i7-13650HX, RTX 4060 (3.3.3) | |
| Média NVIDIA GeForce RTX 4060 Laptop GPU (19 - 28, n=53) | |
| HP Victus 16 (2024) (3.3.3) | |
| Lenovo LOQ 15IRX9 (3.3.3, Leistungsmodus) | |
| Média da turma Gaming (10 - 95, n=143, últimos 2 anos) | |
| Gigabyte G6X 9KG (2024) (3.3.3) | |
| SCHENKER XMG Core 15 (M24) (3.3.3) | |
| v3.3 Classroom CUDA | |
| Dell G16, i7-13650HX, RTX 4060 (3.3.3) | |
| Lenovo LOQ 15IRX9 (3.3.3) | |
| Média NVIDIA GeForce RTX 4060 Laptop GPU (39 - 53, n=53) | |
| Lenovo LOQ 15IRX9 (3.3.3, Leistungsmodus) | |
| HP Victus 16 (2024) (3.3.3) | |
| Gigabyte G6X 9KG (2024) (3.3.3) | |
| SCHENKER XMG Core 15 (M24) (3.3.3) | |
| Média da turma Gaming (16 - 175, n=145, últimos 2 anos) | |
| v3.3 Classroom CPU | |
| Gigabyte G6X 9KG (2024) (3.3.3) | |
| Lenovo LOQ 15IRX9 (3.3.3) | |
| Lenovo LOQ 15IRX9 (3.3.3, Leistungsmodus) | |
| HP Victus 16 (2024) (3.3.3) | |
| Média NVIDIA GeForce RTX 4060 Laptop GPU (189 - 452, n=53) | |
| Média da turma Gaming (123 - 962, n=150, últimos 2 anos) | |
| SCHENKER XMG Core 15 (M24) (3.3.3) | |
| Dell G16, i7-13650HX, RTX 4060 (3.3.3) | |
| Geekbench 5.5 | |
| OpenCL Score | |
| Média da turma Gaming (5039 - 270235, n=150, últimos 2 anos) | |
| SCHENKER XMG Core 15 (M24) | |
| Lenovo LOQ 15IRX9 (Leistungsmodus) | |
| Lenovo LOQ 15IRX9 | |
| Gigabyte G6X 9KG (2024) | |
| Dell G16, i7-13650HX, RTX 4060 | |
| HP Victus 16 (2024) | |
| Média NVIDIA GeForce RTX 4060 Laptop GPU (5039 - 112238, n=53) | |
| Vulkan Score 5.5 | |
| SCHENKER XMG Core 15 (M24) | |
| Lenovo LOQ 15IRX9 (Leistungsmodus) | |
| Lenovo LOQ 15IRX9 | |
| Média da turma Gaming (9296 - 176078, n=103, últimos 2 anos) | |
| Média NVIDIA GeForce RTX 4060 Laptop GPU (28838 - 87612, n=31) | |
| HP Victus 16 (2024) | |
| Gigabyte G6X 9KG (2024) | |
| Geekbench 6.4 | |
| GPU OpenCL | |
| Média da turma Gaming (4321 - 234213, n=118, últimos 2 anos) | |
| Gigabyte G6X 9KG (2024) (6.2.1) | |
| SCHENKER XMG Core 15 (M24) (6.2.1) | |
| HP Victus 16 (2024) (6.2.1) | |
| Dell G16, i7-13650HX, RTX 4060 (6.2.1) | |
| Lenovo LOQ 15IRX9 (6.2.1, Leistungsmodus) | |
| Lenovo LOQ 15IRX9 (6.2.1) | |
| Média NVIDIA GeForce RTX 4060 Laptop GPU (4321 - 100831, n=40) | |
| GPU Vulkan | |
| SCHENKER XMG Core 15 (M24) (6.2.1) | |
| Lenovo LOQ 15IRX9 (6.2.1, Leistungsmodus) | |
| Gigabyte G6X 9KG (2024) (6.2.1) | |
| Lenovo LOQ 15IRX9 (6.2.1) | |
| HP Victus 16 (2024) (6.2.1) | |
| Média da turma Gaming (4286 - 231659, n=110, últimos 2 anos) | |
| Média NVIDIA GeForce RTX 4060 Laptop GPU (4286 - 101001, n=36) | |
| Dell G16, i7-13650HX, RTX 4060 (6.2.1) | |
| V-Ray 5 Benchmark | |
| GPU RTX | |
| Média da turma Gaming (556 - 4011, n=88, últimos 2 anos) | |
| Gigabyte G6X 9KG (2024) (5.0.1) | |
| HP Victus 16 (2024) (5.0.1) | |
| Lenovo LOQ 15IRX9 (5.0.1, Leistungsmodus) | |
| Dell G16, i7-13650HX, RTX 4060 (5.0.1) | |
| Média NVIDIA GeForce RTX 4060 Laptop GPU (1387 - 1817, n=28) | |
| Lenovo LOQ 15IRX9 (5.0.1) | |
| GPU CUDA | |
| Média da turma Gaming (300 - 3229, n=90, últimos 2 anos) | |
| Lenovo LOQ 15IRX9 (5.0.1, Leistungsmodus) | |
| Gigabyte G6X 9KG (2024) (5.0.1) | |
| Lenovo LOQ 15IRX9 (5.0.1) | |
| HP Victus 16 (2024) (5.0.1) | |
| Média NVIDIA GeForce RTX 4060 Laptop GPU (957 - 1294, n=29) | |
| Dell G16, i7-13650HX, RTX 4060 (5.0.1) | |
| CPU | |
| Média da turma Gaming (3562 - 30302, n=92, últimos 2 anos) | |
| HP Victus 16 (2024) (5.0.1) | |
| Média NVIDIA GeForce RTX 4060 Laptop GPU (8364 - 21065, n=28) | |
| Gigabyte G6X 9KG (2024) (5.0.1) | |
| Lenovo LOQ 15IRX9 (5.0.1, Leistungsmodus) | |
| Dell G16, i7-13650HX, RTX 4060 (5.0.1) | |
| Lenovo LOQ 15IRX9 (5.0.1) | |
| V-Ray Benchmark Next 4.10 | |
| GPU | |
| SCHENKER XMG Core 15 (M24) (v4.10.07 ) | |
| Média da turma Gaming (54 - 1317, n=122, últimos 2 anos) | |
| Gigabyte G6X 9KG (2024) (v4.10.07 ) | |
| Lenovo LOQ 15IRX9 (v4.10.07, Leistungsmodus) | |
| Média NVIDIA GeForce RTX 4060 Laptop GPU (483 - 715, n=46) | |
| HP Victus 16 (2024) (v4.10.07 ) | |
| Lenovo LOQ 15IRX9 (v4.10.07 ) | |
| CPU | |
| HP Victus 16 (2024) (v4.10.07 ) | |
| Média da turma Gaming (5413 - 44129, n=122, últimos 2 anos) | |
| Média NVIDIA GeForce RTX 4060 Laptop GPU (12680 - 32360, n=46) | |
| SCHENKER XMG Core 15 (M24) (v4.10.07 ) | |
| Gigabyte G6X 9KG (2024) (v4.10.07 ) | |
| Lenovo LOQ 15IRX9 (v4.10.07, Leistungsmodus) | |
| Lenovo LOQ 15IRX9 (v4.10.07 ) | |
* ... menor é melhor
| Performance Rating - Percent | |
| Média da turma Gaming | |
| SCHENKER XMG Core 15 (M24) | |
| Dell G16, i7-13650HX, RTX 4060 | |
| Lenovo LOQ 15IRX9 | |
| Gigabyte G6X 9KG (2024) | |
| Média NVIDIA GeForce RTX 4060 Laptop GPU | |
| HP Victus 16 (2024) | |
| Lenovo LOQ 15IRX9 | |
| Cyberpunk 2077 2.2 Phantom Liberty - 1920x1080 Ultra Preset (FSR off) | |
| SCHENKER XMG Core 15 (M24) (2.12) | |
| Média da turma Gaming (6.76 - 158, n=90, últimos 2 anos) | |
| Lenovo LOQ 15IRX9 (2.02, Leistungsmodus) | |
| Média NVIDIA GeForce RTX 4060 Laptop GPU (56.4 - 93.1, n=31) | |
| Lenovo LOQ 15IRX9 (2.02) | |
| Dell G16, i7-13650HX, RTX 4060 (2.11) | |
| Gigabyte G6X 9KG (2024) (2.02) | |
| HP Victus 16 (2024) (2.02) | |
| GTA V - 1920x1080 Highest Settings possible AA:4xMSAA + FX AF:16x | |
| Dell G16, i7-13650HX, RTX 4060 | |
| SCHENKER XMG Core 15 (M24) | |
| Lenovo LOQ 15IRX9 (Leistungsmodus) | |
| Gigabyte G6X 9KG (2024) | |
| Lenovo LOQ 15IRX9 | |
| Média da turma Gaming (12.1 - 168.2, n=132, últimos 2 anos) | |
| HP Victus 16 (2024) | |
| Média NVIDIA GeForce RTX 4060 Laptop GPU (76.9 - 126.3, n=48) | |
| Final Fantasy XV Benchmark - 1920x1080 High Quality | |
| Média da turma Gaming (19.2 - 201, n=144, últimos 2 anos) | |
| Lenovo LOQ 15IRX9 (1.3, Leistungsmodus) | |
| SCHENKER XMG Core 15 (M24) (1.3) | |
| Dell G16, i7-13650HX, RTX 4060 (1.3) | |
| Gigabyte G6X 9KG (2024) (1.3) | |
| Lenovo LOQ 15IRX9 (1.3) | |
| HP Victus 16 (2024) (1.3) | |
| Média NVIDIA GeForce RTX 4060 Laptop GPU (75.1 - 109.8, n=51) | |
| Strange Brigade - 1920x1080 ultra AA:ultra AF:16 | |
| Média da turma Gaming (38.9 - 420, n=140, últimos 2 anos) | |
| SCHENKER XMG Core 15 (M24) (1.47.22.14 D3D12) | |
| Dell G16, i7-13650HX, RTX 4060 (1.47.22.14 D3D12) | |
| Lenovo LOQ 15IRX9 (1.47.22.14 D3D12, Leistungsmodus) | |
| Lenovo LOQ 15IRX9 (1.47.22.14 D3D12) | |
| Gigabyte G6X 9KG (2024) (1.47.22.14 D3D12) | |
| Média NVIDIA GeForce RTX 4060 Laptop GPU (135.3 - 210, n=50) | |
| HP Victus 16 (2024) (1.47.22.14 D3D12) | |
| Dota 2 Reborn - 1920x1080 ultra (3/3) best looking | |
| HP Victus 16 (2024) | |
| Dell G16, i7-13650HX, RTX 4060 | |
| Média da turma Gaming (65.1 - 220, n=148, últimos 2 anos) | |
| Média NVIDIA GeForce RTX 4060 Laptop GPU (115 - 183.8, n=53) | |
| Lenovo LOQ 15IRX9 (Leistungsmodus) | |
| Gigabyte G6X 9KG (2024) | |
| Lenovo LOQ 15IRX9 | |
| SCHENKER XMG Core 15 (M24) | |
| X-Plane 11.11 - 1920x1080 high (fps_test=3) | |
| Dell G16, i7-13650HX, RTX 4060 | |
| Gigabyte G6X 9KG (2024) | |
| Média da turma Gaming (32.8 - 166.2, n=151, últimos 2 anos) | |
| Média NVIDIA GeForce RTX 4060 Laptop GPU (60.7 - 141.1, n=54) | |
| Lenovo LOQ 15IRX9 (Leistungsmodus) | |
| HP Victus 16 (2024) | |
| SCHENKER XMG Core 15 (M24) | |
| Lenovo LOQ 15IRX9 | |
| Dragon's Dogma 2 - 1920x1080 High Preset | |
| Média da turma Gaming (49.5 - 80, n=8, últimos 2 anos) | |
| HP Victus 16 (2024) | |
| Lenovo LOQ 15IRX9 | |
| Média NVIDIA GeForce RTX 4060 Laptop GPU (57.2 - 67.7, n=5) | |
| Razer Blade 14 Mid 23 | |
| F1 24 - 1920x1080 Ultra High Preset AA:T AF:16x | |
| Média da turma Gaming (54.1 - 148, n=19, últimos 2 anos) | |
| Média NVIDIA GeForce RTX 4060 Laptop GPU (47.5 - 61.6, n=10) | |
| Razer Blade 14 Mid 23 | |
| Lenovo LOQ 15IRX9 (1122588) | |
| Counter-Strike 2 - 1920x1080 Very High Preset | |
| Razer Blade 14 Mid 23 | |
| Média NVIDIA GeForce RTX 4060 Laptop GPU (123.9 - 139.1, n=2) | |
| Lenovo LOQ 15IRX9 | |
| Média da turma Gaming (11.5 - 189.7, n=10, últimos 2 anos) | |
| Senua's Saga Hellblade 2 - 1920x1080 High Preset | |
| Média da turma Gaming (38.4 - 78.8, n=6, últimos 2 anos) | |
| Média NVIDIA GeForce RTX 4060 Laptop GPU (37.6 - 39.5, n=3) | |
| Lenovo LOQ 15IRX9 | |
| Razer Blade 14 Mid 23 | |
| Ghost of Tsushima - 1920x1080 Very High Preset AA:T | |
| Lenovo LOQ 15IRX9 | |
| Média NVIDIA GeForce RTX 4060 Laptop GPU (55.6 - 63.4, n=5) | |
| Média da turma Gaming (28.5 - 73.7, n=7, últimos 2 anos) | |
| Razer Blade 14 Mid 23 | |
Cyberpunk 2077 ultra FPS diagram
| baixo | média | alto | ultra | |
|---|---|---|---|---|
| GTA V (2015) | 184.4 | 181.5 | 175.5 | 112.6 |
| Dota 2 Reborn (2015) | 171.2 | 156.8 | 149.4 | 141 |
| Final Fantasy XV Benchmark (2018) | 198.9 | 138.5 | 99.9 | |
| X-Plane 11.11 (2018) | 139.6 | 118.4 | 92.2 | |
| Strange Brigade (2018) | 425 | 260 | 209 | 182.7 |
| Cyberpunk 2077 2.2 Phantom Liberty (2023) | 118.9 | 94.3 | 80.1 | 71.4 |
| Counter-Strike 2 (2023) | 195.3 | 195 | 157 | 123.9 |
| Dragon's Dogma 2 (2024) | 70.6 | 63.3 | ||
| Ghost of Tsushima (2024) | 91 | 81.7 | 74.5 | 60.6 |
| Senua's Saga Hellblade 2 (2024) | 64.1 | 53.2 | 38.4 | |
| F1 24 (2024) | 216 | 201 | 162.5 | 54.1 |
Emissões e energia - O Lenovo LOQ com uma bateria de duração abaixo da média
Emissões de ruído
Quando se trata de emissões de ruído, o laptop tem o desempenho esperado para sua classe: Sob carga, ele produz muito ruído. Jogar Cyberpunk 2077 resulta em emissões de ruído de 48 dB(A)( modobalanceado ) e 54 dB(A)( modode desempenho ). O modo silencioso reduz os níveis de ruído para valores mais moderados, ao custo do desempenho do notebook. Os jogos ainda devem ser possíveis - com configurações reduzidas.
O controle da ventoinha precisa de alguns ajustes: Quando em marcha lenta, os ventiladores são acionados repetidamente por um breve período - um comportamento muito irritante a longo prazo. Às vezes, elas também funcionam permanentemente em um nível claramente audível.
Barulho
| Ocioso |
| 26 / 34 / 36 dB |
| Carga |
| 48 / 50 dB |
 | ||
30 dB silencioso 40 dB(A) audível 50 dB(A) ruidosamente alto |
||
min: | ||
| Lenovo LOQ 15IRX9 NVIDIA GeForce RTX 4060 Laptop GPU, i5-13450HX, Micron 2400 MTFDKCD1T0QFM | SCHENKER XMG Core 15 (M24) NVIDIA GeForce RTX 4060 Laptop GPU, R7 8845HS, Samsung 990 Pro 1 TB | Gigabyte G6X 9KG (2024) NVIDIA GeForce RTX 4060 Laptop GPU, i7-13650HX, Gigabyte AG450E1024-SI | HP Victus 16 (2024) NVIDIA GeForce RTX 4060 Laptop GPU, i7-14700HX, Kioxia XG8 KXG80ZNV512G | Dell G16, i7-13650HX, RTX 4060 NVIDIA GeForce RTX 4060 Laptop GPU, i7-13650HX, WD PC SN740 SDDPNQD-1T00 | |
|---|---|---|---|---|---|
| Noise | 14% | -4% | 4% | 20% | |
| desligado / ambiente * | 25 | 23 8% | 26 -4% | 25 -0% | 23 8% |
| Idle Minimum * | 26 | 23 12% | 30 -15% | 28 -8% | 23 12% |
| Idle Average * | 34 | 23 32% | 32 6% | 29 15% | 23 32% |
| Idle Maximum * | 36 | 23 36% | 35 3% | 33 8% | 27.96 22% |
| Load Average * | 48 | 38.92 19% | 51 -6% | 45 6% | 27.96 42% |
| Cyberpunk 2077 ultra * | 48 | 52.06 -8% | |||
| Load Maximum * | 50 | 52.09 -4% | 54 -8% | 48 4% | 47.89 4% |
| Witcher 3 ultra * | 50.96 | 51 | 43 | 47.89 |
* ... menor é melhor
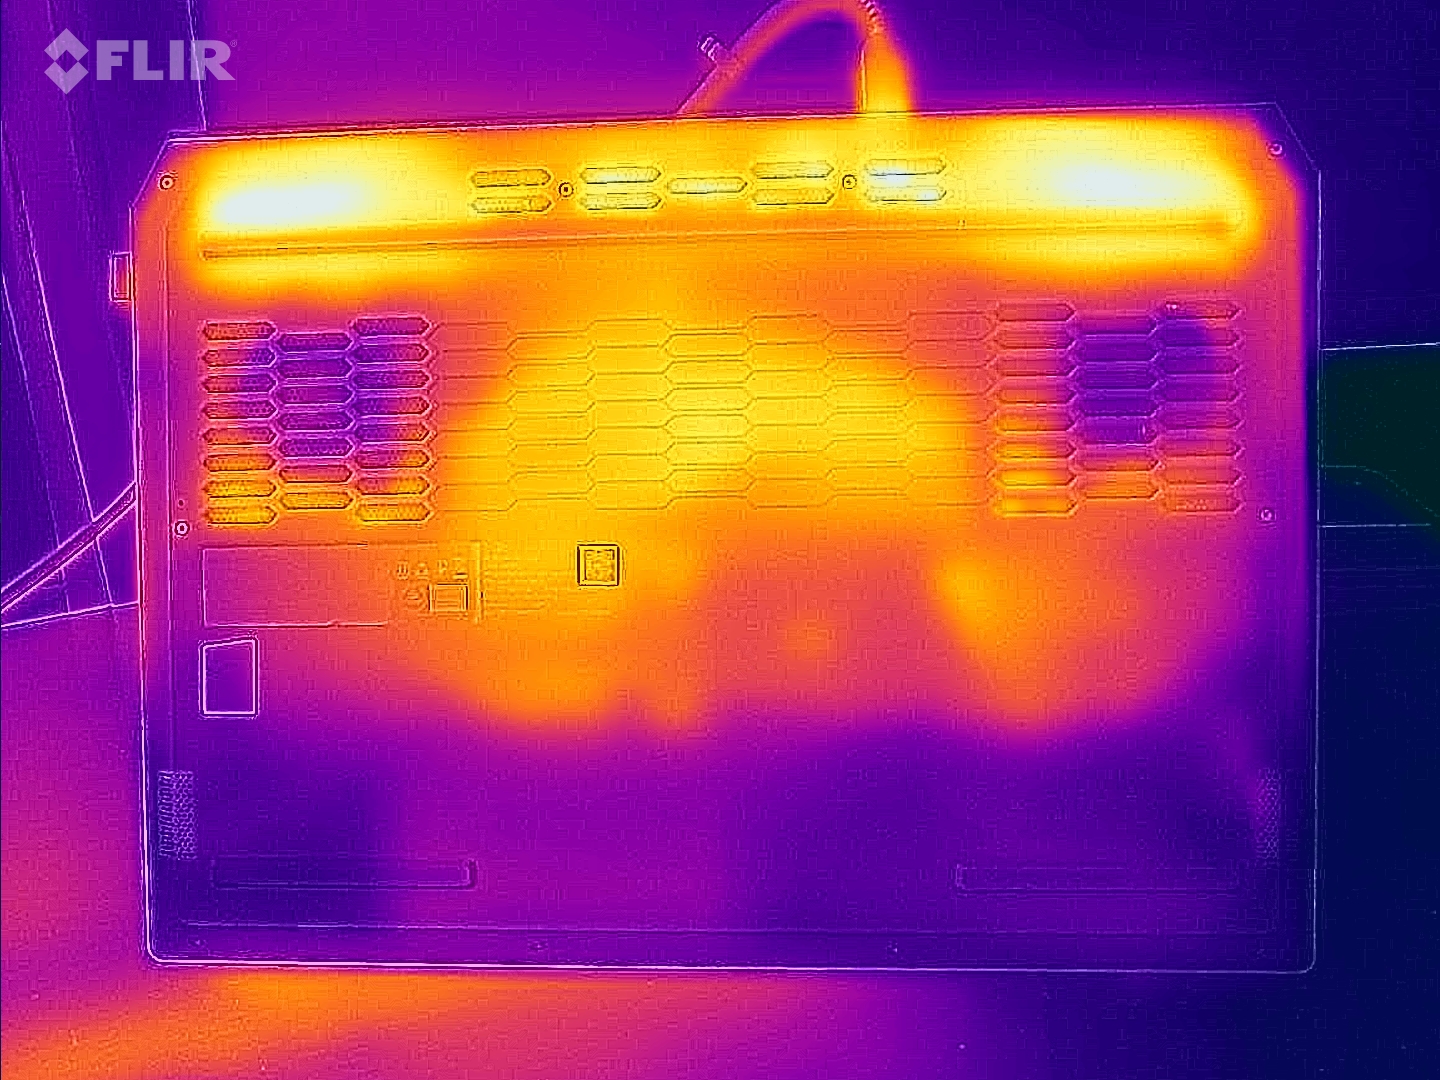
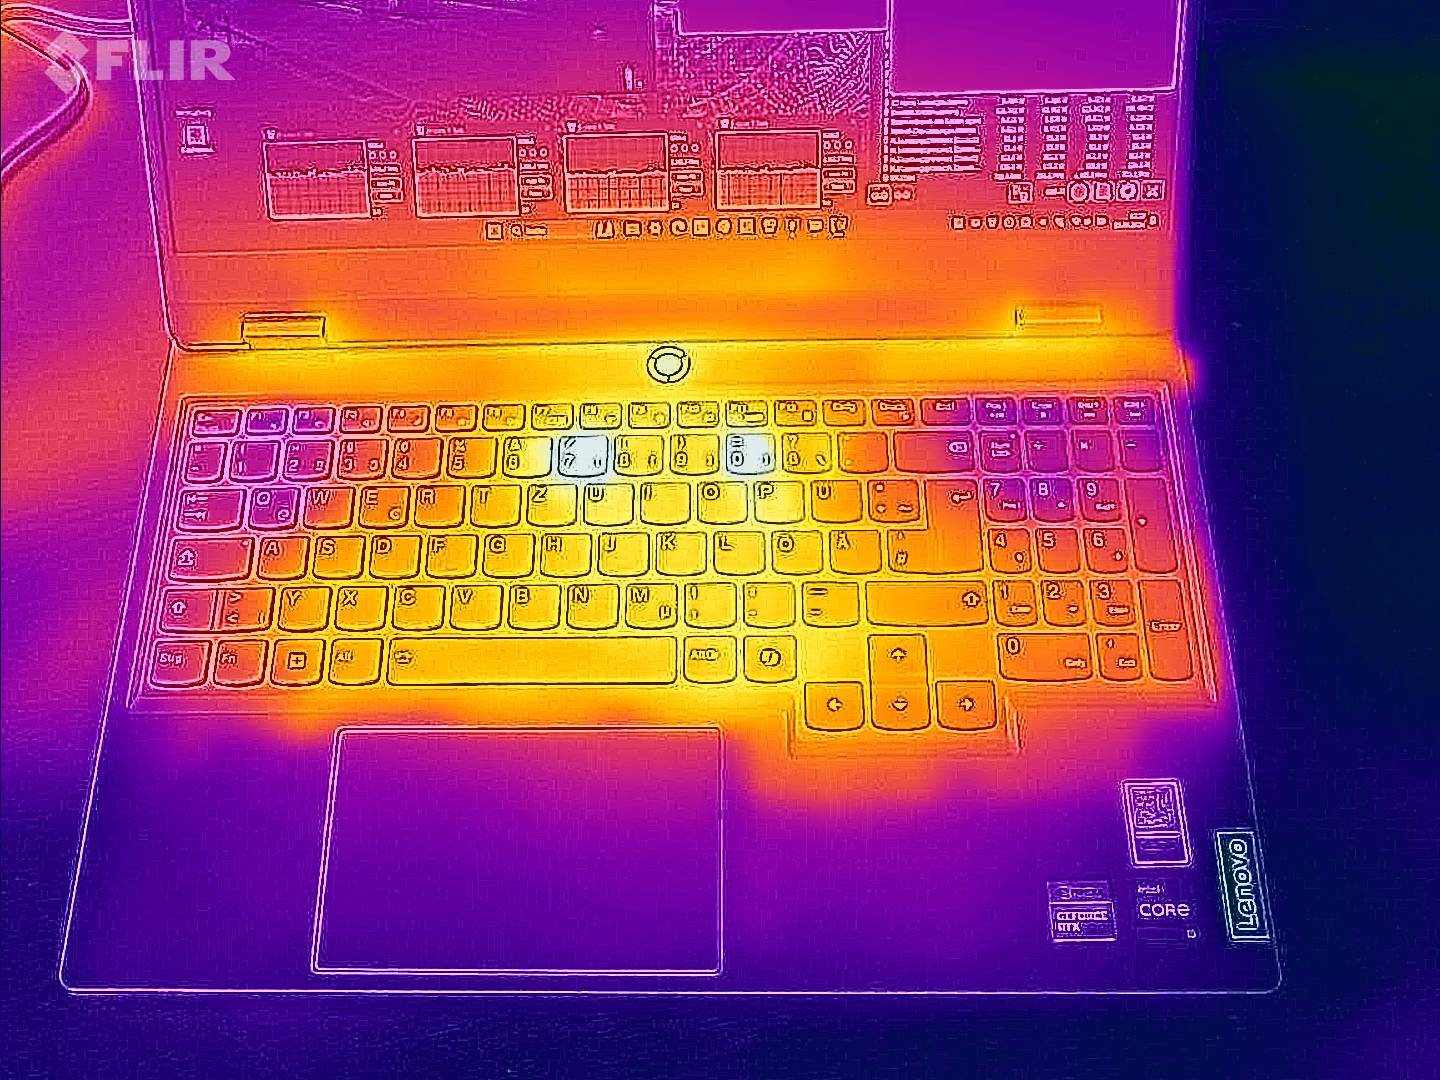
Temperatura
Sob carga (teste de estresse, Cyberpunk), o laptop fica visivelmente quente: Às vezes, ele ultrapassa a marca de 50 graus Celsius. Ele também atinge valores mais altos durante o uso diário (escritório, Internet) do que muitos dos dispositivos de comparação. As temperaturas do apoio para as mãos permanecem razoáveis.
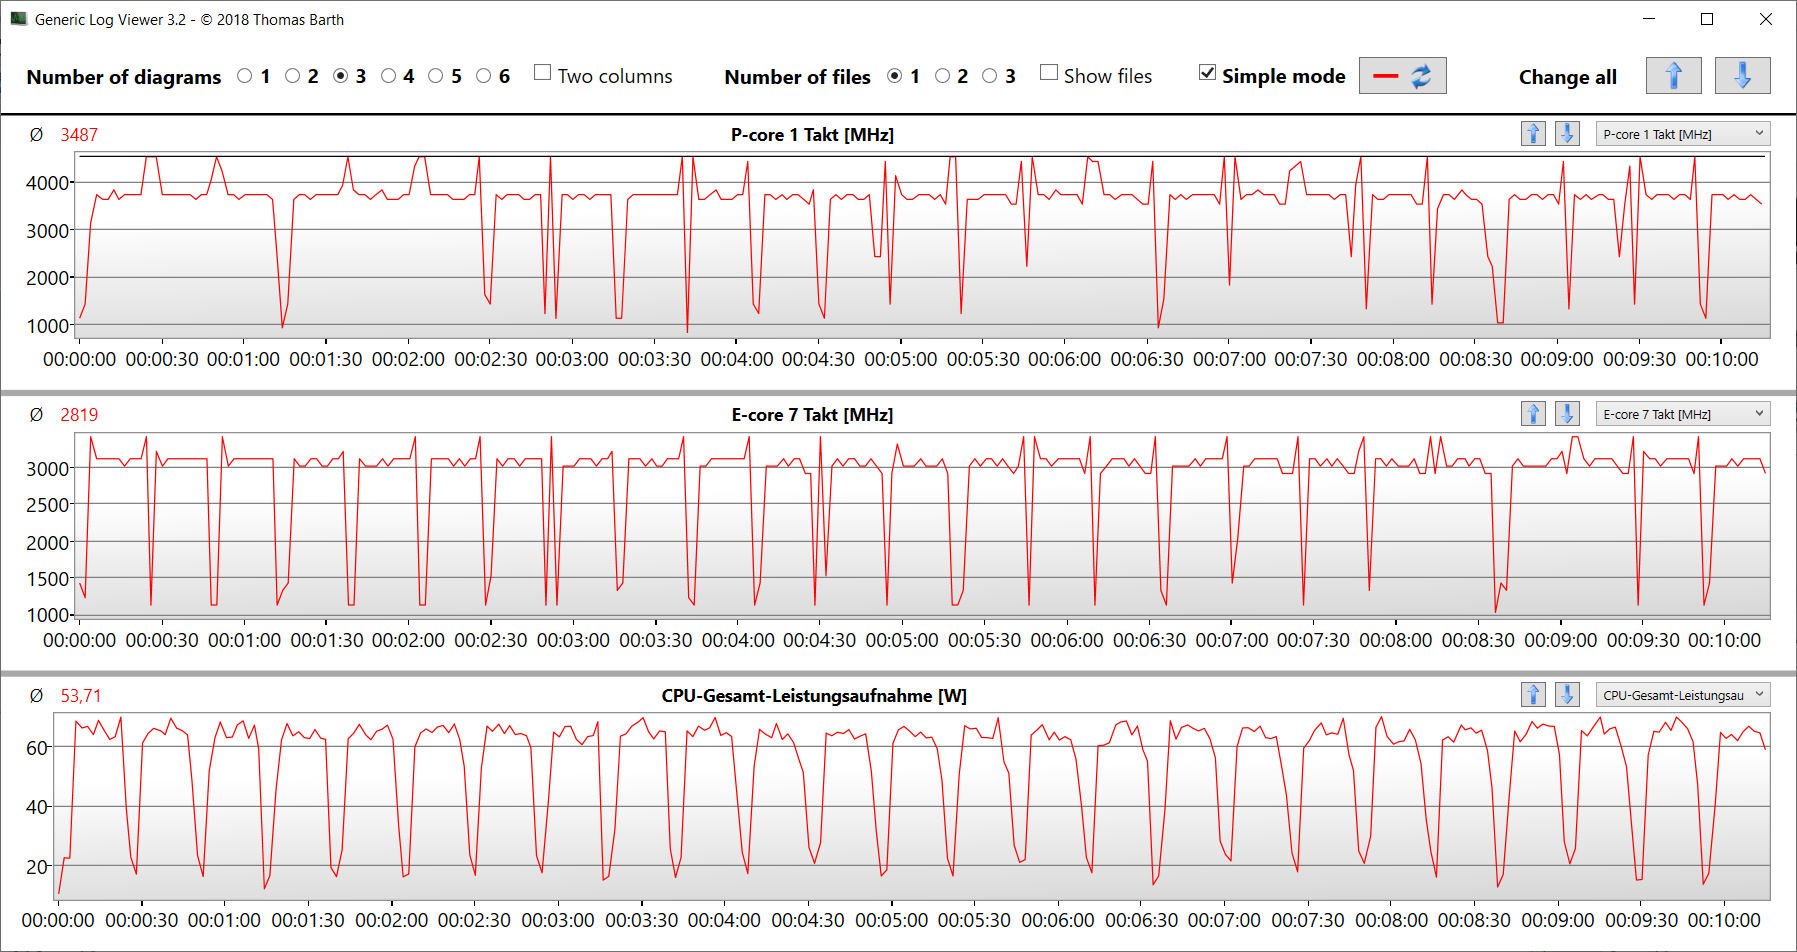
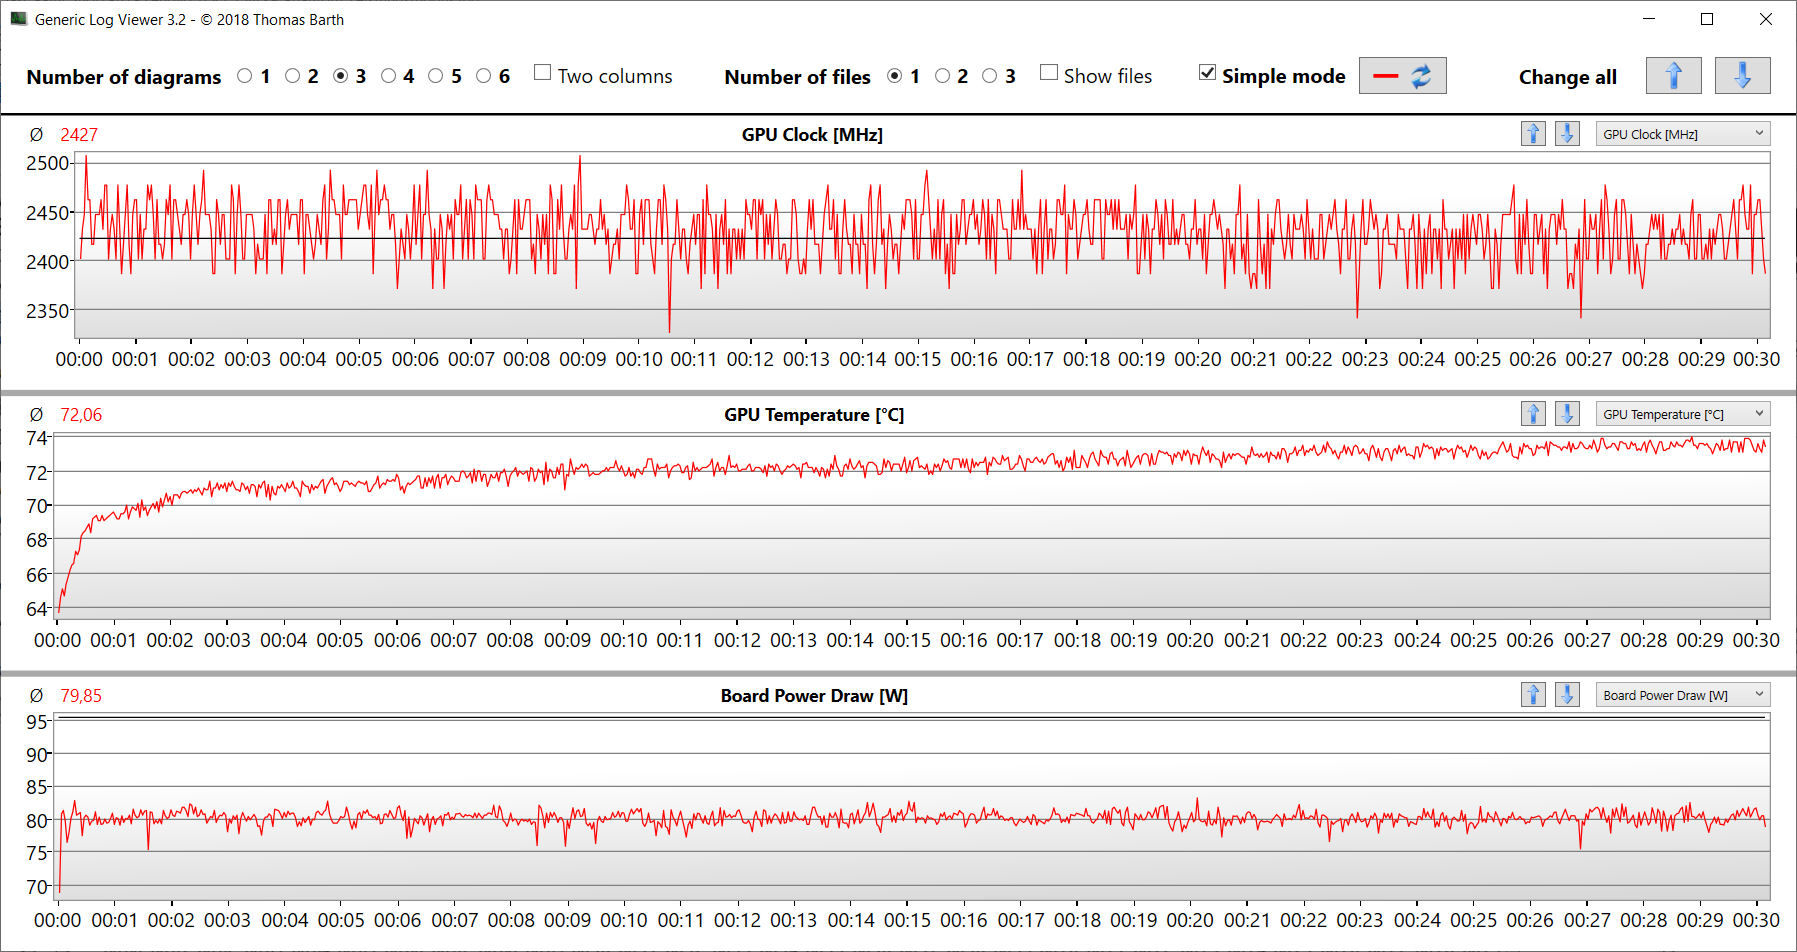
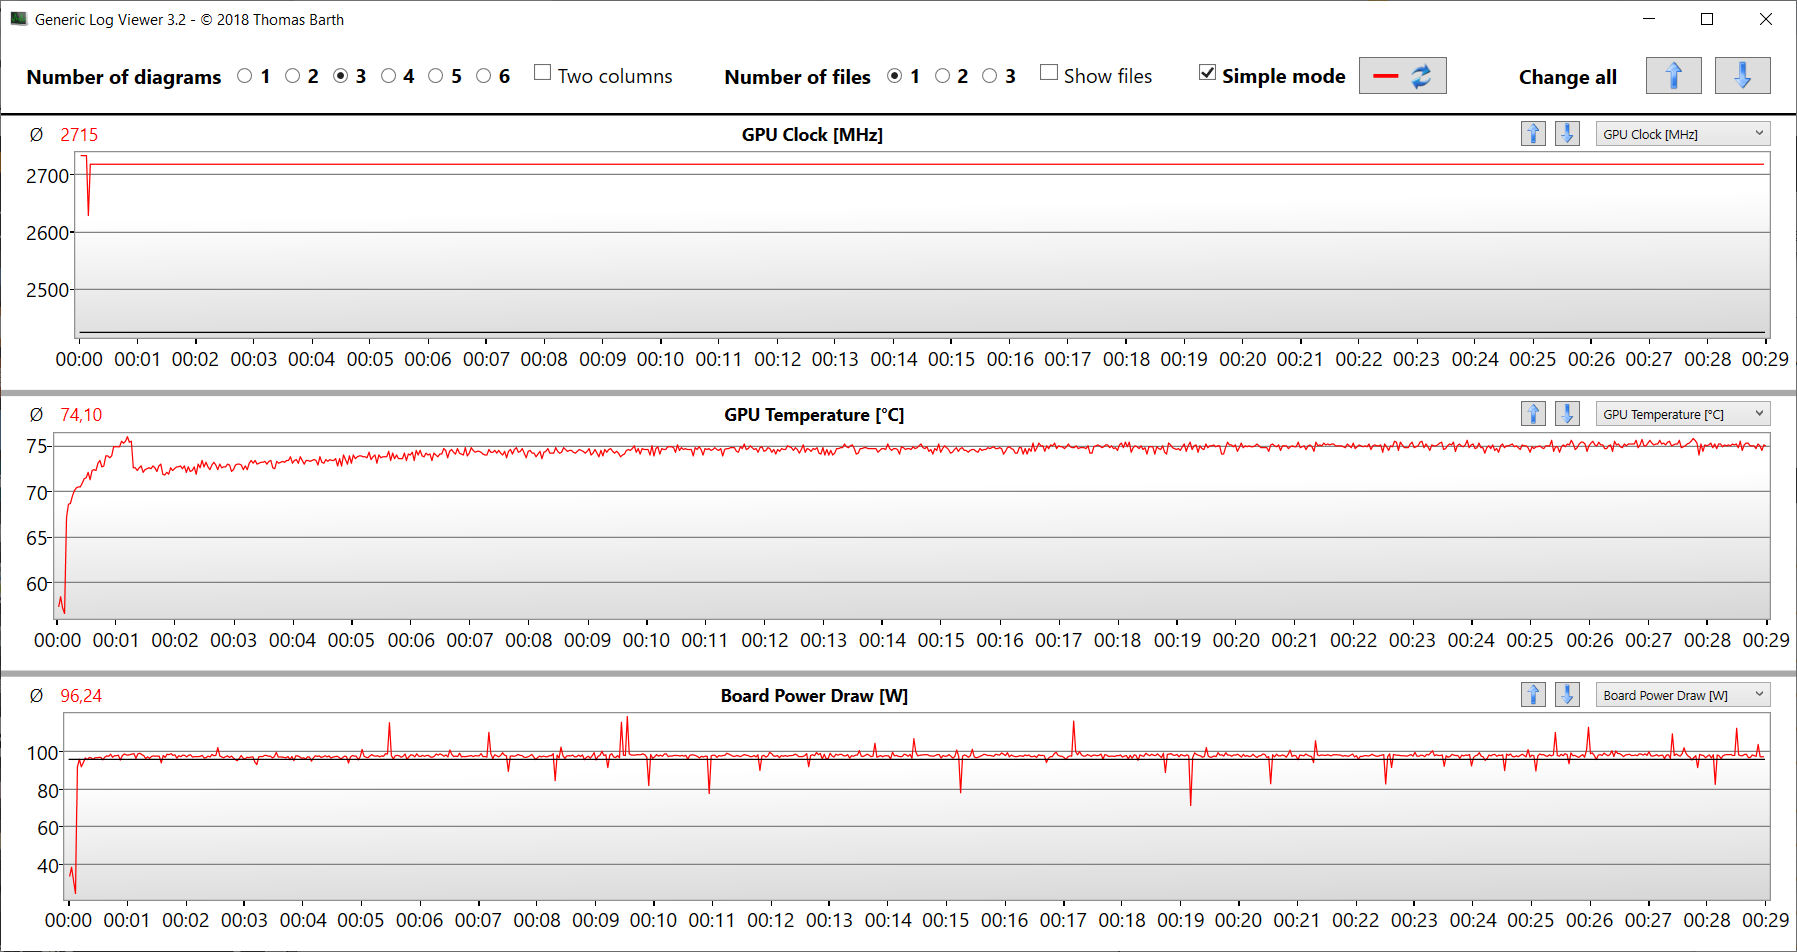
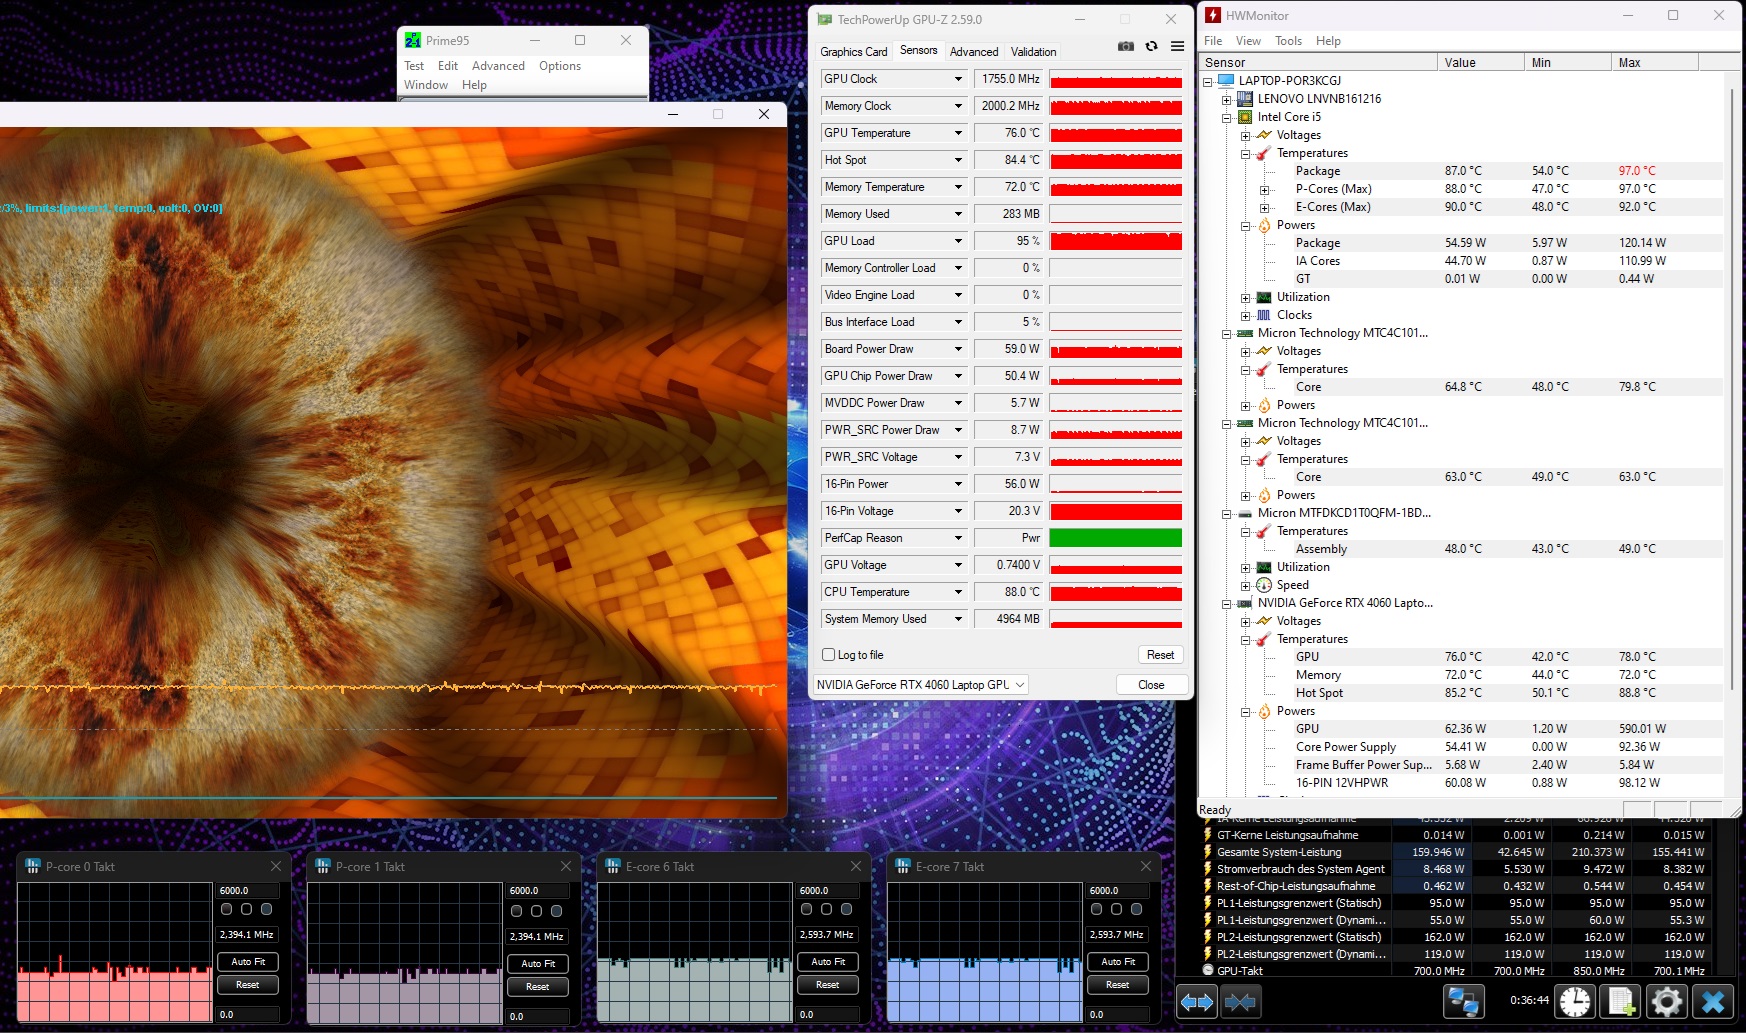
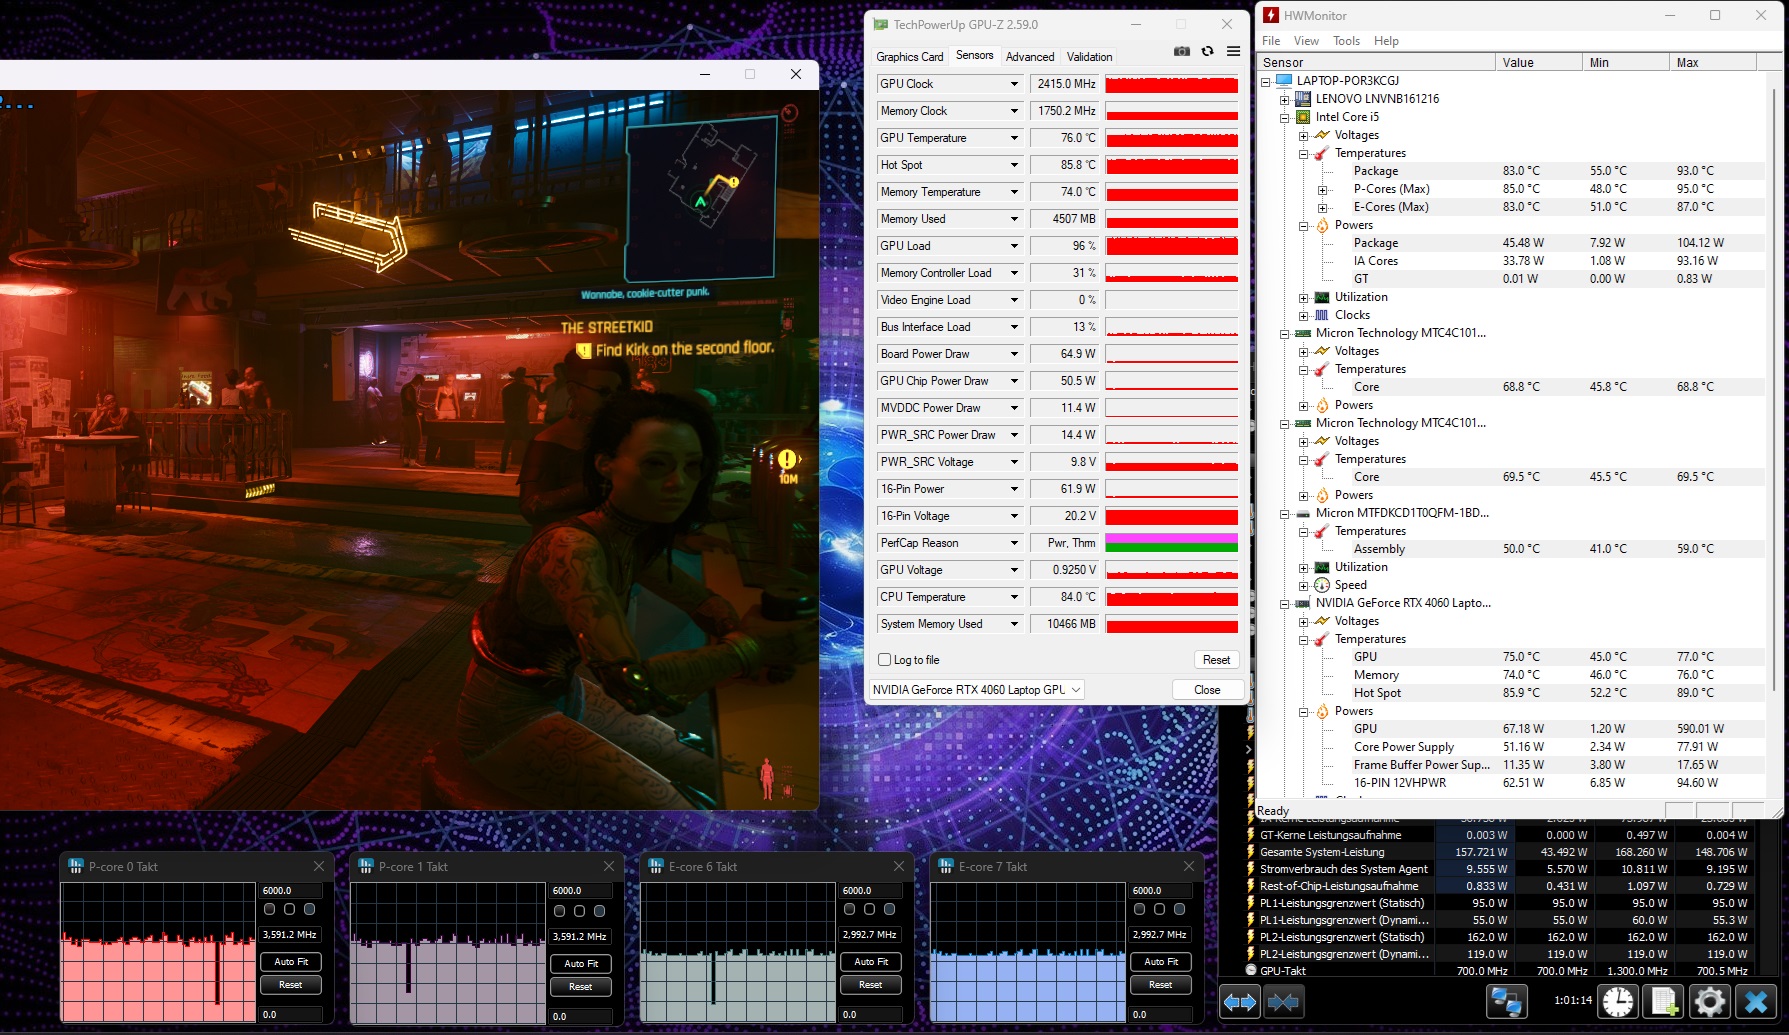
O cenário extremo (teste de estresse usando o Prime95 e o Furmark em operação contínua) verifica a estabilidade do sistema sob carga total. A CPU atingiu o clock de cerca de 2,4 GHz (P) e 2,6 GHz (E), enquanto o núcleo gráfico atingiu valores em torno de 1.800 MHz.
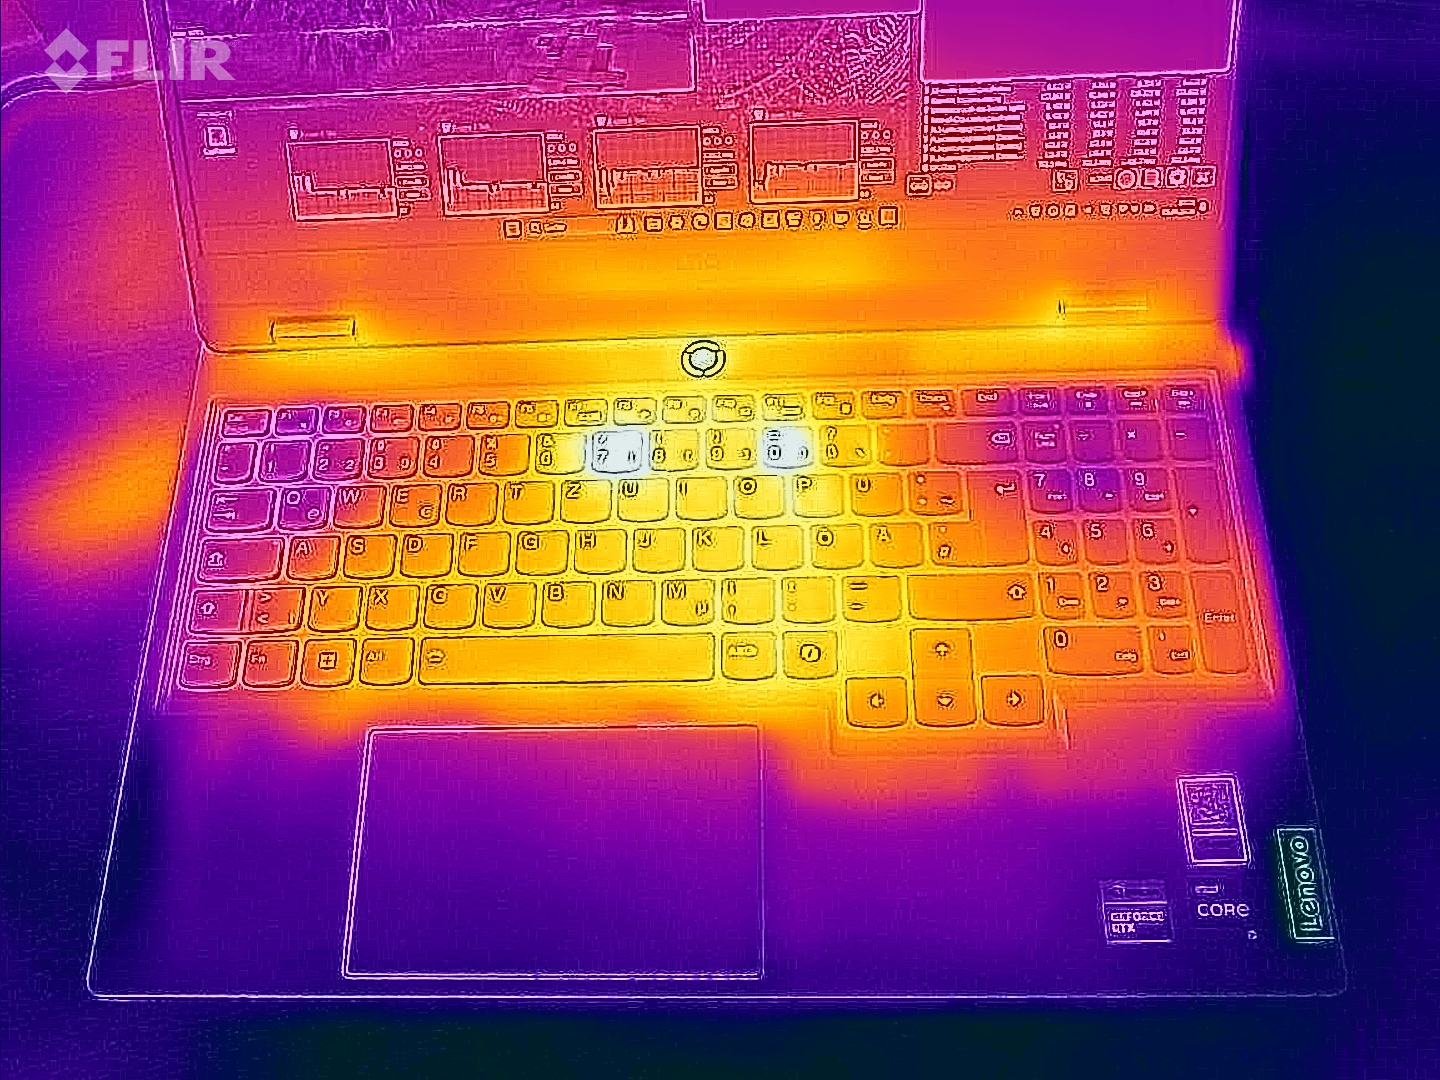
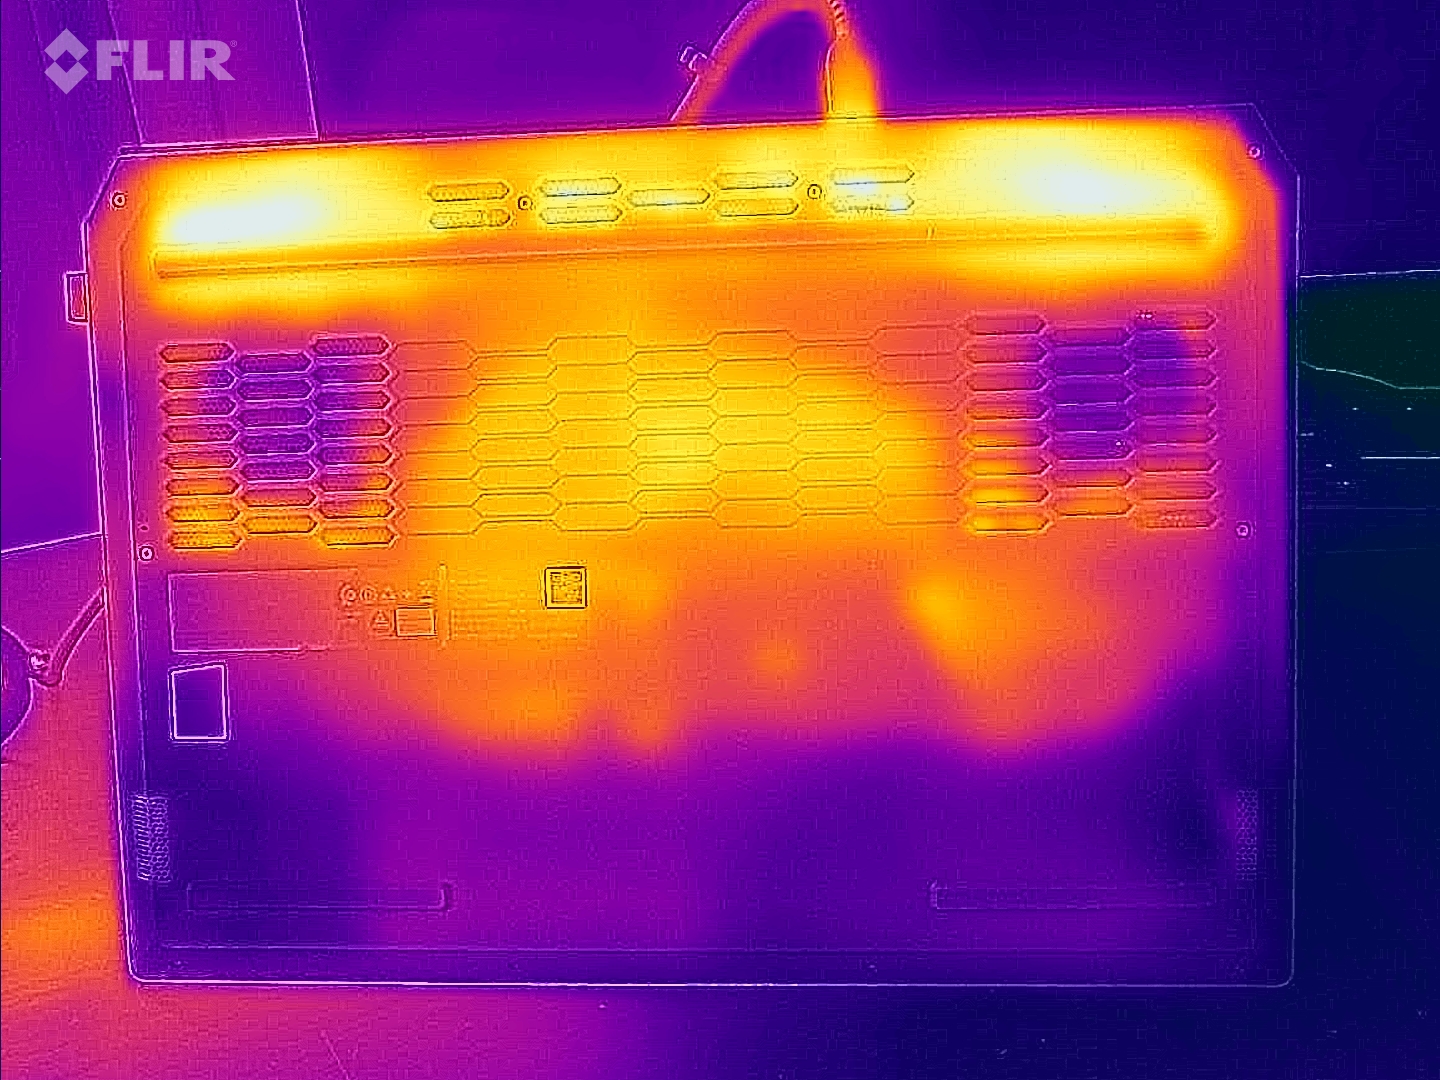
(-) A temperatura máxima no lado superior é 47 °C / 117 F, em comparação com a média de 40.4 °C / 105 F , variando de 21.2 a 68.8 °C para a classe Gaming.
(-) A parte inferior aquece até um máximo de 58 °C / 136 F, em comparação com a média de 43.2 °C / 110 F
(+) Em uso inativo, a temperatura média para o lado superior é 30.2 °C / 86 F, em comparação com a média do dispositivo de 33.9 °C / ### class_avg_f### F.
(-) 3: The average temperature for the upper side is 41.7 °C / 107 F, compared to the average of 33.9 °C / 93 F for the class Gaming.
(±) Os apoios para as mãos e o touchpad podem ficar muito quentes ao toque, com um máximo de 38 °C / 100.4 F.
(-) A temperatura média da área do apoio para as mãos de dispositivos semelhantes foi 28.9 °C / 84 F (-9.1 °C / -16.4 F).
| Lenovo LOQ 15IRX9 Intel Core i5-13450HX, NVIDIA GeForce RTX 4060 Laptop GPU | SCHENKER XMG Core 15 (M24) AMD Ryzen 7 8845HS, NVIDIA GeForce RTX 4060 Laptop GPU | Gigabyte G6X 9KG (2024) Intel Core i7-13650HX, NVIDIA GeForce RTX 4060 Laptop GPU | HP Victus 16 (2024) Intel Core i7-14700HX, NVIDIA GeForce RTX 4060 Laptop GPU | Dell G16, i7-13650HX, RTX 4060 Intel Core i7-13650HX, NVIDIA GeForce RTX 4060 Laptop GPU | |
|---|---|---|---|---|---|
| Heat | -8% | 9% | 15% | -3% | |
| Maximum Upper Side * | 47 | 52 -11% | 41 13% | 50 -6% | 49 -4% |
| Maximum Bottom * | 58 | 61 -5% | 43 26% | 50 14% | 58 -0% |
| Idle Upper Side * | 32 | 35 -9% | 32 -0% | 25 22% | 35 -9% |
| Idle Bottom * | 36 | 39 -8% | 37 -3% | 26 28% | 35 3% |
* ... menor é melhor
Alto-falantes
Em geral, os alto-falantes estéreo produzem uma paisagem sonora muito aceitável. Ainda assim, um pouco mais de graves não faria mal.
Lenovo LOQ 15IRX9 análise de áudio
(±) | o volume do alto-falante é médio, mas bom (###valor### dB)
Graves 100 - 315Hz
(±) | graves reduzidos - em média 14.6% menor que a mediana
(±) | a linearidade dos graves é média (9.6% delta para a frequência anterior)
Médios 400 - 2.000 Hz
(+) | médios equilibrados - apenas 2.1% longe da mediana
(+) | médios são lineares (3.6% delta para frequência anterior)
Altos 2 - 16 kHz
(±) | máximos mais altos - em média 5.9% maior que a mediana
(±) | a linearidade dos máximos é média (8.2% delta para frequência anterior)
Geral 100 - 16.000 Hz
(+) | o som geral é linear (14.7% diferença em relação à mediana)
Comparado com a mesma classe
» 27% de todos os dispositivos testados nesta classe foram melhores, 7% semelhantes, 66% piores
» O melhor teve um delta de 6%, a média foi 18%, o pior foi 132%
Comparado com todos os dispositivos testados
» 17% de todos os dispositivos testados foram melhores, 4% semelhantes, 79% piores
» O melhor teve um delta de 4%, a média foi 24%, o pior foi 134%
SCHENKER XMG Core 15 (M24) análise de áudio
(±) | o volume do alto-falante é médio, mas bom (###valor### dB)
Graves 100 - 315Hz
(-) | quase nenhum baixo - em média 16.7% menor que a mediana
(-) | graves não são lineares (15.7% delta para frequência anterior)
Médios 400 - 2.000 Hz
(+) | médios equilibrados - apenas 4.5% longe da mediana
(+) | médios são lineares (4.4% delta para frequência anterior)
Altos 2 - 16 kHz
(+) | agudos equilibrados - apenas 1% longe da mediana
(+) | os máximos são lineares (2.7% delta da frequência anterior)
Geral 100 - 16.000 Hz
(+) | o som geral é linear (13.7% diferença em relação à mediana)
Comparado com a mesma classe
» 20% de todos os dispositivos testados nesta classe foram melhores, 6% semelhantes, 74% piores
» O melhor teve um delta de 6%, a média foi 18%, o pior foi 132%
Comparado com todos os dispositivos testados
» 13% de todos os dispositivos testados foram melhores, 4% semelhantes, 83% piores
» O melhor teve um delta de 4%, a média foi 24%, o pior foi 134%
Consumo de energia
Seu consumo de energia é bastante normal para o hardware instalado. O Cyberpunk e os testes de estresse foram executados com consumo de energia relativamente constante. A fonte de alimentação é suficientemente potente, com 230 watts.
| desligado | |
| Ocioso | |
| Carga |
|
Key:
min: | |
| Lenovo LOQ 15IRX9 Intel Core i5-13450HX, NVIDIA GeForce RTX 4060 Laptop GPU | SCHENKER XMG Core 15 (M24) AMD Ryzen 7 8845HS, NVIDIA GeForce RTX 4060 Laptop GPU | Gigabyte G6X 9KG (2024) Intel Core i7-13650HX, NVIDIA GeForce RTX 4060 Laptop GPU | HP Victus 16 (2024) Intel Core i7-14700HX, NVIDIA GeForce RTX 4060 Laptop GPU | Dell G16, i7-13650HX, RTX 4060 Intel Core i7-13650HX, NVIDIA GeForce RTX 4060 Laptop GPU | |
|---|---|---|---|---|---|
| Power Consumption | 20% | 2% | 1% | 6% | |
| Idle Minimum * | 13 | 9.3 28% | 12 8% | 9 31% | 11 15% |
| Idle Average * | 18 | 12.9 28% | 13 28% | 15 17% | 14.8 18% |
| Idle Maximum * | 24 | 12.8 47% | 27 -13% | 23 4% | 16.8 30% |
| Load Average * | 85 | 105 -24% | 123 -45% | 103.7 -22% | |
| Cyberpunk 2077 ultra * | 155.7 | ||||
| Cyberpunk 2077 ultra external monitor * | 150.9 | ||||
| Load Maximum * | 232 | 286 -23% | 210 9% | 241 -4% | 255 -10% |
| Witcher 3 ultra * | 167 | 167.8 | 143.7 | 185 |
* ... menor é melhor
Power consumption Cyberpunk 2077 / stress test
Power consumption with external monitor
Tempos de execução
O dispositivo de 15,6 polegadas conseguiu um tempo de execução de 5:20 horas em nosso teste prático de WLAN (mapeando a carga ao acessar sites usando um script), o que não é um valor excepcional. A capacidade comparativamente baixa da bateria (60 Wh) fica evidente aqui.
Pro
Contra
Veredicto - Um jogador de orçamento sólido

O LOQ permite jogos em FHD em configurações altas ou máximas - o Core i5-13450HX e GeForce RTX 4060 tornam isso possível. Ao fazer isso, a CPU e a GPU funcionam com taxas de clock consistentemente altas. Um SSD PCIe 4 (1 TB) garante que os tempos de carregamento sejam mantidos curtos.
O LOQ 15IRX9 da Lenovo é um laptop para jogos FHD acessível que sofre de uma ou duas pequenas falhas.
As altas emissões podem ser reduzidas a níveis moderados usando o modo silencioso - ao custo do desempenho do laptop. O controle da ventoinha poderia ser melhorado: No modo inativo, as ventoinhas funcionam permanentemente ou pulsam, o que é totalmente desnecessário.
O senhor procurará por uma tela 16:10 em vão, já que a Lenovo manteve a proporção 16:9. O painel de 15,6 polegadas instalado (FHD, 144 Hz, G-Sync, sRGB) funciona muito bem, mas poderia ser um pouco mais brilhante. O laptop não oferece Thunderbolt 4 ou USB 4. Ainda assim: sua porta USB-C (USB 3.2 Gen 2) suporta Power Delivery e o modo Display ALT. A duração da bateria do dispositivo não baterá nenhum recorde mundial.
Uma alternativa poderia ser o Gigabyte G6X 9KG. Ele tem uma CPU um pouco mais potente, uma tela 16:10 de 16 polegadas e melhores tempos de execução. Em termos de cobertura de espaço de cores, ele fica atrás do LOQ.
Preço e disponibilidade
No momento da redação deste artigo, nossa configuração do Lenovo LOQ 15IRX9 pode ser adquirida na Amazon por US$ 1.279.
Observação: Atualizamos recentemente nosso sistema de classificação e os resultados da versão 8 não são comparáveis aos resultados da versão 7. Mais informações estão disponíveis aqui .
Lenovo LOQ 15IRX9
- 07/08/2024 v8
Sascha Mölck
 Total Sustainability Score:
 Transparência
A seleção dos dispositivos a serem analisados é feita pela nossa equipe editorial. A amostra de teste foi fornecida ao autor como empréstimo pelo fabricante ou varejista para fins desta revisão. O credor não teve influência nesta revisão, nem o fabricante recebeu uma cópia desta revisão antes da publicação. Não houve obrigação de publicar esta revisão. Nunca aceitamos compensação ou pagamento em troca de nossas avaliações. Como empresa de mídia independente, a Notebookcheck não está sujeita à autoridade de fabricantes, varejistas ou editores.
É assim que o Notebookcheck está testando
Todos os anos, o Notebookcheck analisa de forma independente centenas de laptops e smartphones usando procedimentos padronizados para garantir que todos os resultados sejam comparáveis. Desenvolvemos continuamente nossos métodos de teste há cerca de 20 anos e definimos padrões da indústria no processo. Em nossos laboratórios de teste, equipamentos de medição de alta qualidade são utilizados por técnicos e editores experientes. Esses testes envolvem um processo de validação em vários estágios. Nosso complexo sistema de classificação é baseado em centenas de medições e benchmarks bem fundamentados, o que mantém a objetividade.Price comparison

