

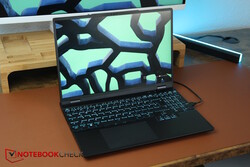
Análise do laptop SCHENKER XMG Core 15 (M24): Uma máquina para jogos premium, com gabinete de metal, da Alemanha

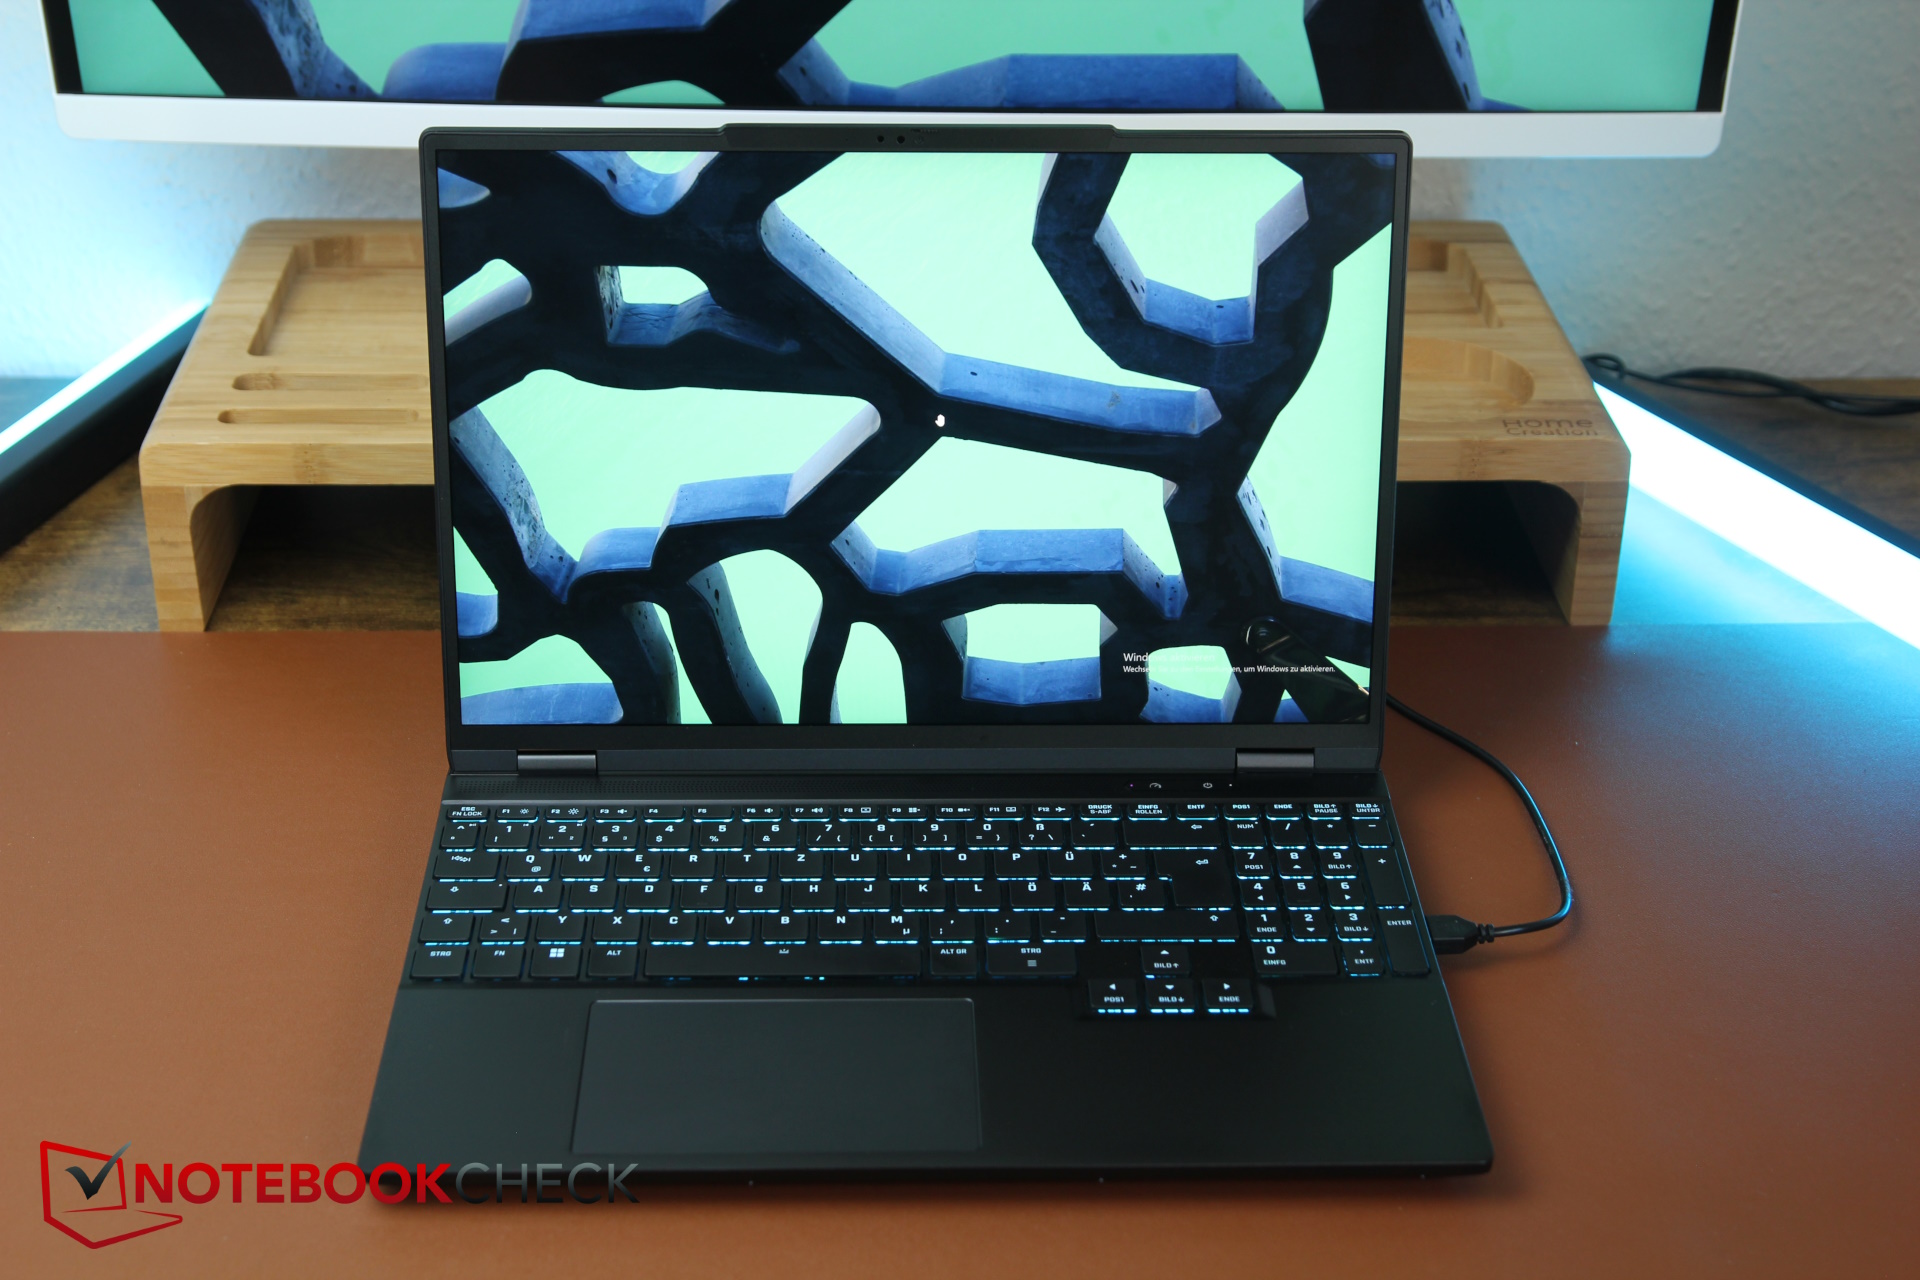
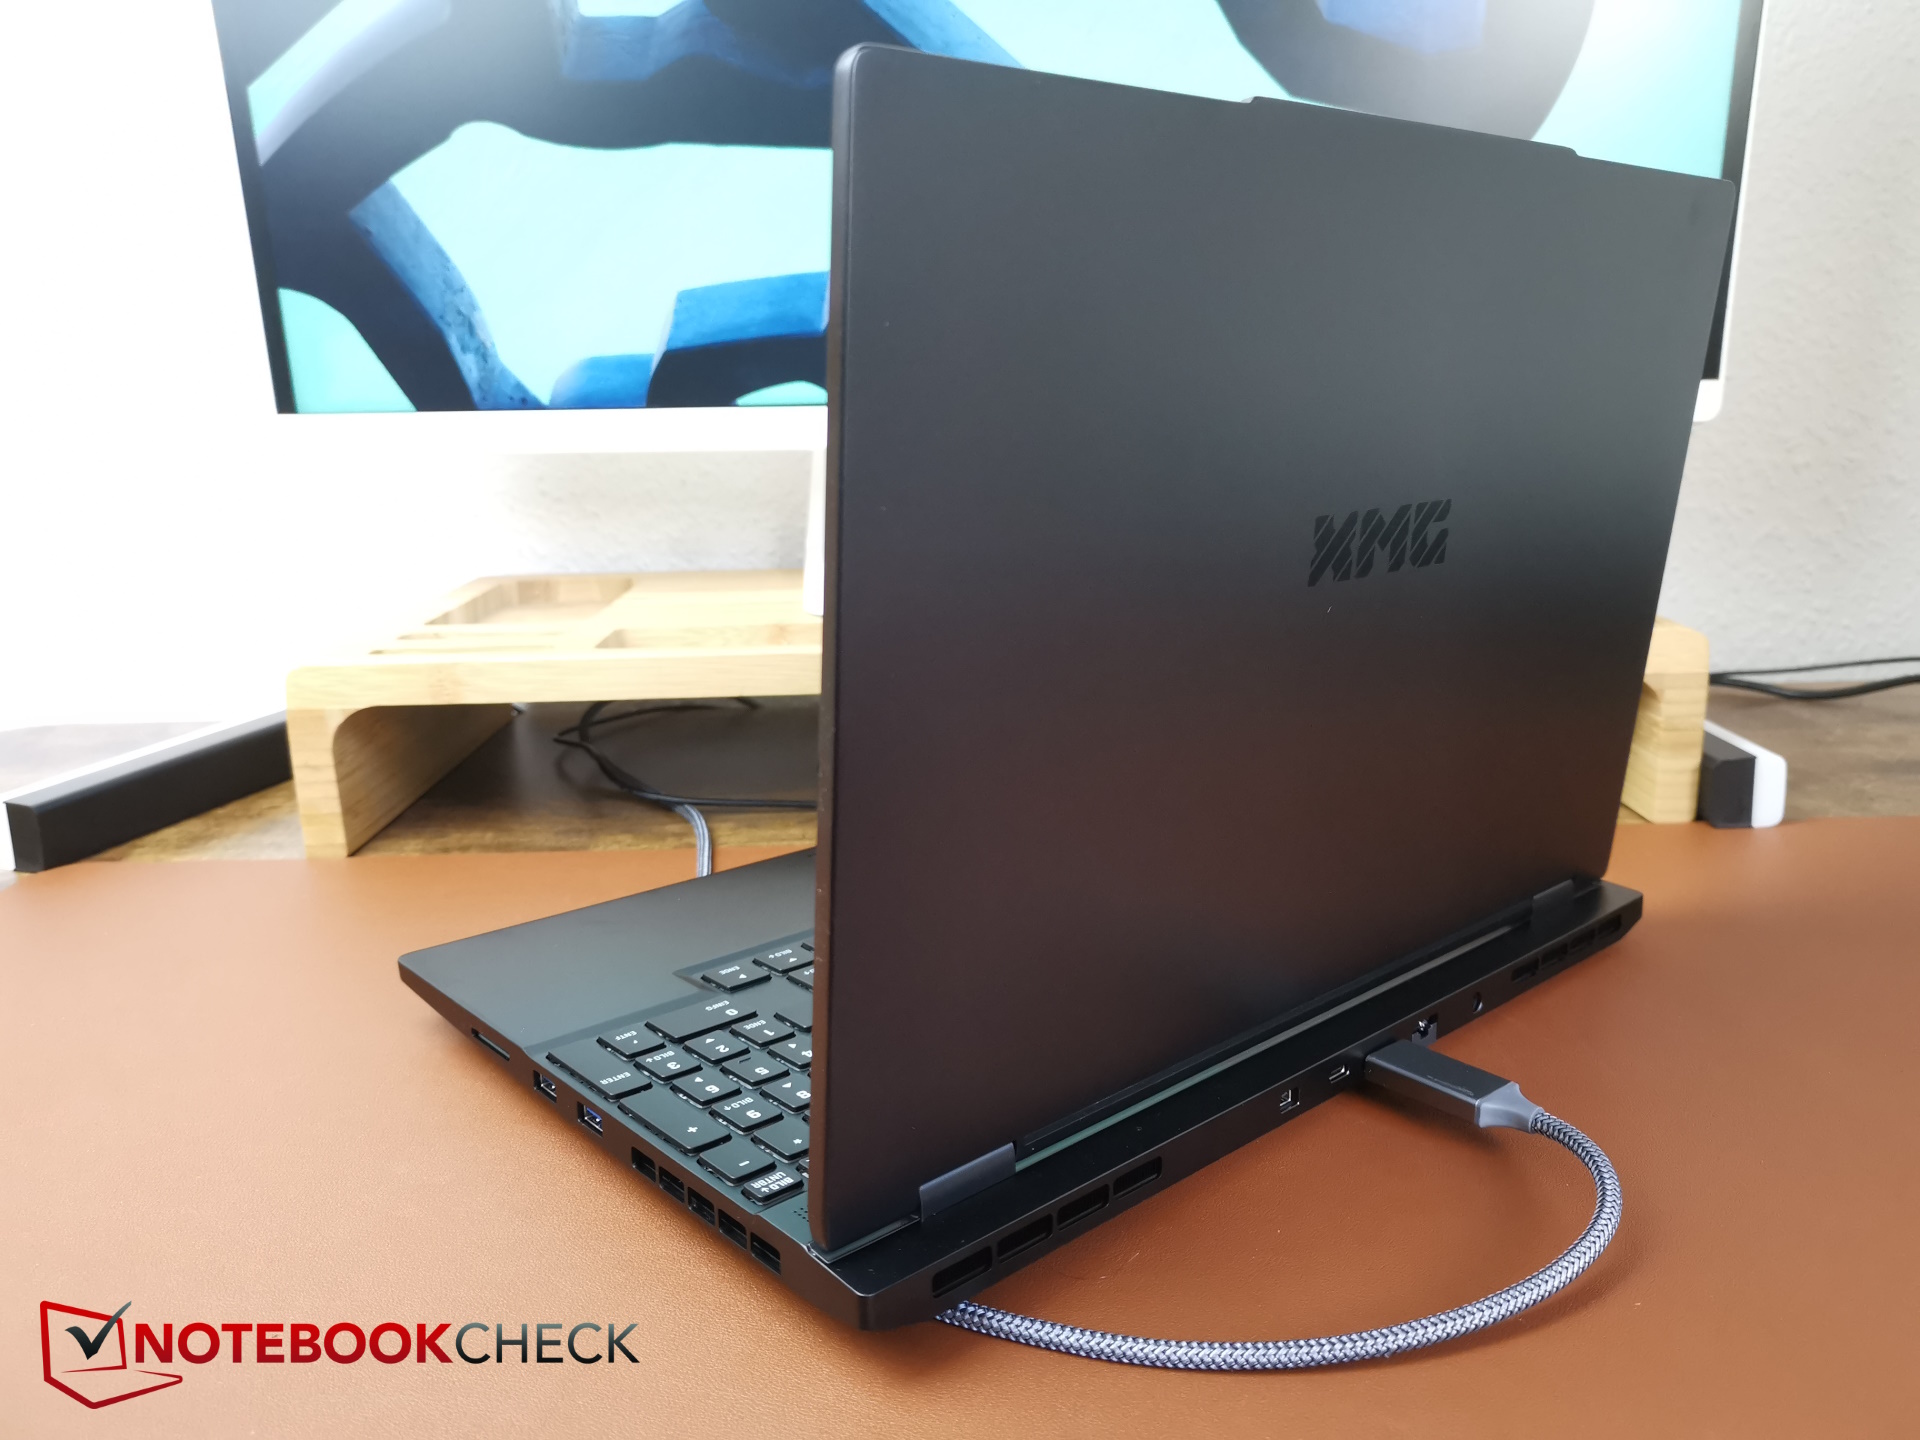
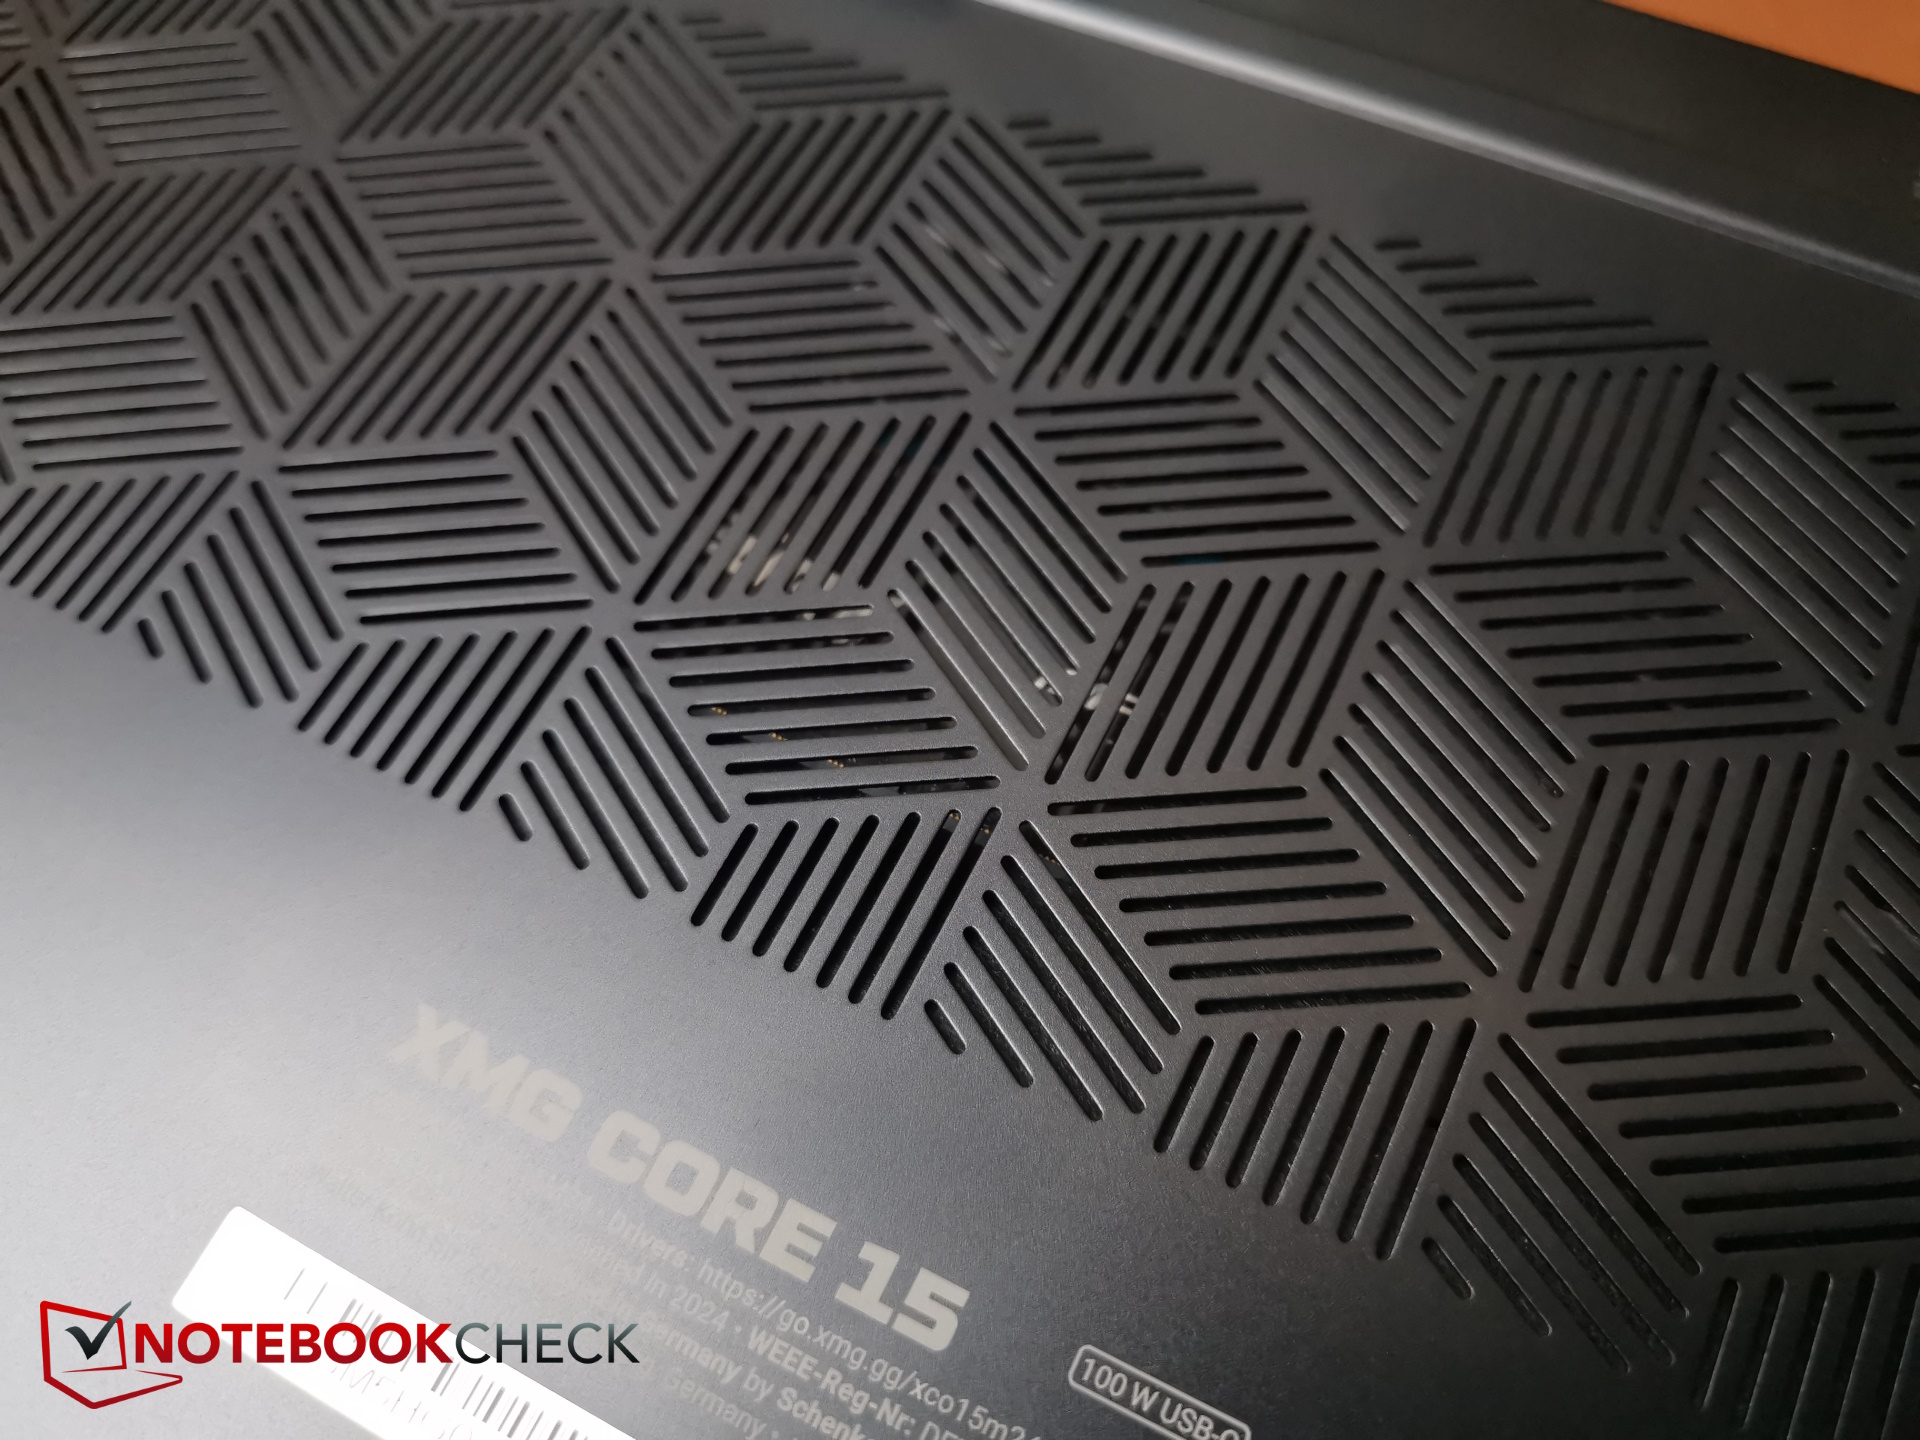
De acordo com Schenker, o Core 15 atual é uma versão ligeiramente reduzida do Fusion 15. A vantagem é um preço significativamente mais baixo, no entanto, apesar disso, o Core 15 mantém seu elegante gabinete de metal, o que lhe confere uma boa aparência. O fabricante o chama de "Undercover Gaming" (Jogo disfarçado) porque a caixa de alumínio também deve atrair os criadores sem necessariamente gritar laptop para jogos.
No entanto, o Core 15 não é apenas reduzido, ele também muda algumas coisas. Por exemplo, o processador do laptop é um AMD Ryzen da geração atual em vez de uma CPU Intel Gen14 HX, o que reduz um pouco o preço, mas não é, de forma alguma, pior.
Como não há mais praticamente nenhum notebook de 15 polegadas equipado com uma CPU atual, estamos comparando o Core 15 de 15,3 polegadas com os notebooks multimídia e para jogos de 16 polegadas que vêm com uma RTX 4060 como o Dell G16, o Lenovo Legion 5i 16 G9bem como o HP Victus 16. Além disso, é claro, fizemos comparações com o Fusion 15 e também demos uma olhada no que mudou desde o ano passado Schenker XMG Pro 15 E23.
Atenção: Nosso novo sistema de classificação é o V8, o que significa que as pontuações agora são mais baixas. Com o antigo sistema de classificação V7, o Core 15 obteve uma pontuação entre 88 e 89%. O senhor pode descobrir o que há de novo aqui.
Possíveis concorrentes em comparação
Avaliação | Data | Modelo | Peso | Altura | Size | Resolução | Preço |
|---|---|---|---|---|---|---|---|
| 83.7 % | 06/2024 | SCHENKER XMG Core 15 (M24) R7 8845HS, NVIDIA GeForce RTX 4060 Laptop GPU | 2.1 kg | 21.9 mm | 15.30" | 2560x1600 | |
| 89.1 % v7 (old) | 02/2024 | Lenovo Legion 5 16IRX G9 i7-14650HX, NVIDIA GeForce RTX 4060 Laptop GPU | 2.4 kg | 25.2 mm | 16.00" | 2560x1600 | |
| 84.3 % v7 (old) | 05/2024 | HP Victus 16 (2024) i7-14700HX, NVIDIA GeForce RTX 4060 Laptop GPU | 2.4 kg | 23.9 mm | 16.10" | 1920x1080 | |
| 85.5 % v7 (old) | 02/2024 | Dell G16, i7-13650HX, RTX 4060 i7-13650HX, NVIDIA GeForce RTX 4060 Laptop GPU | 2.8 kg | 25.65 mm | 16.00" | 2560x1600 | |
| 88.9 % v7 (old) | 05/2024 | SCHENKER XMG Fusion 15 (Early 24) i9-14900HX, NVIDIA GeForce RTX 4070 Laptop GPU | 2.1 kg | 21.9 mm | 15.30" | 2560x1600 | |
| 86.2 % v7 (old) | 07/2023 | SCHENKER XMG Pro 15 (E23) i9-13900HX, NVIDIA GeForce RTX 4060 Laptop GPU | 2.4 kg | 24.9 mm | 15.60" | 2560x1440 |
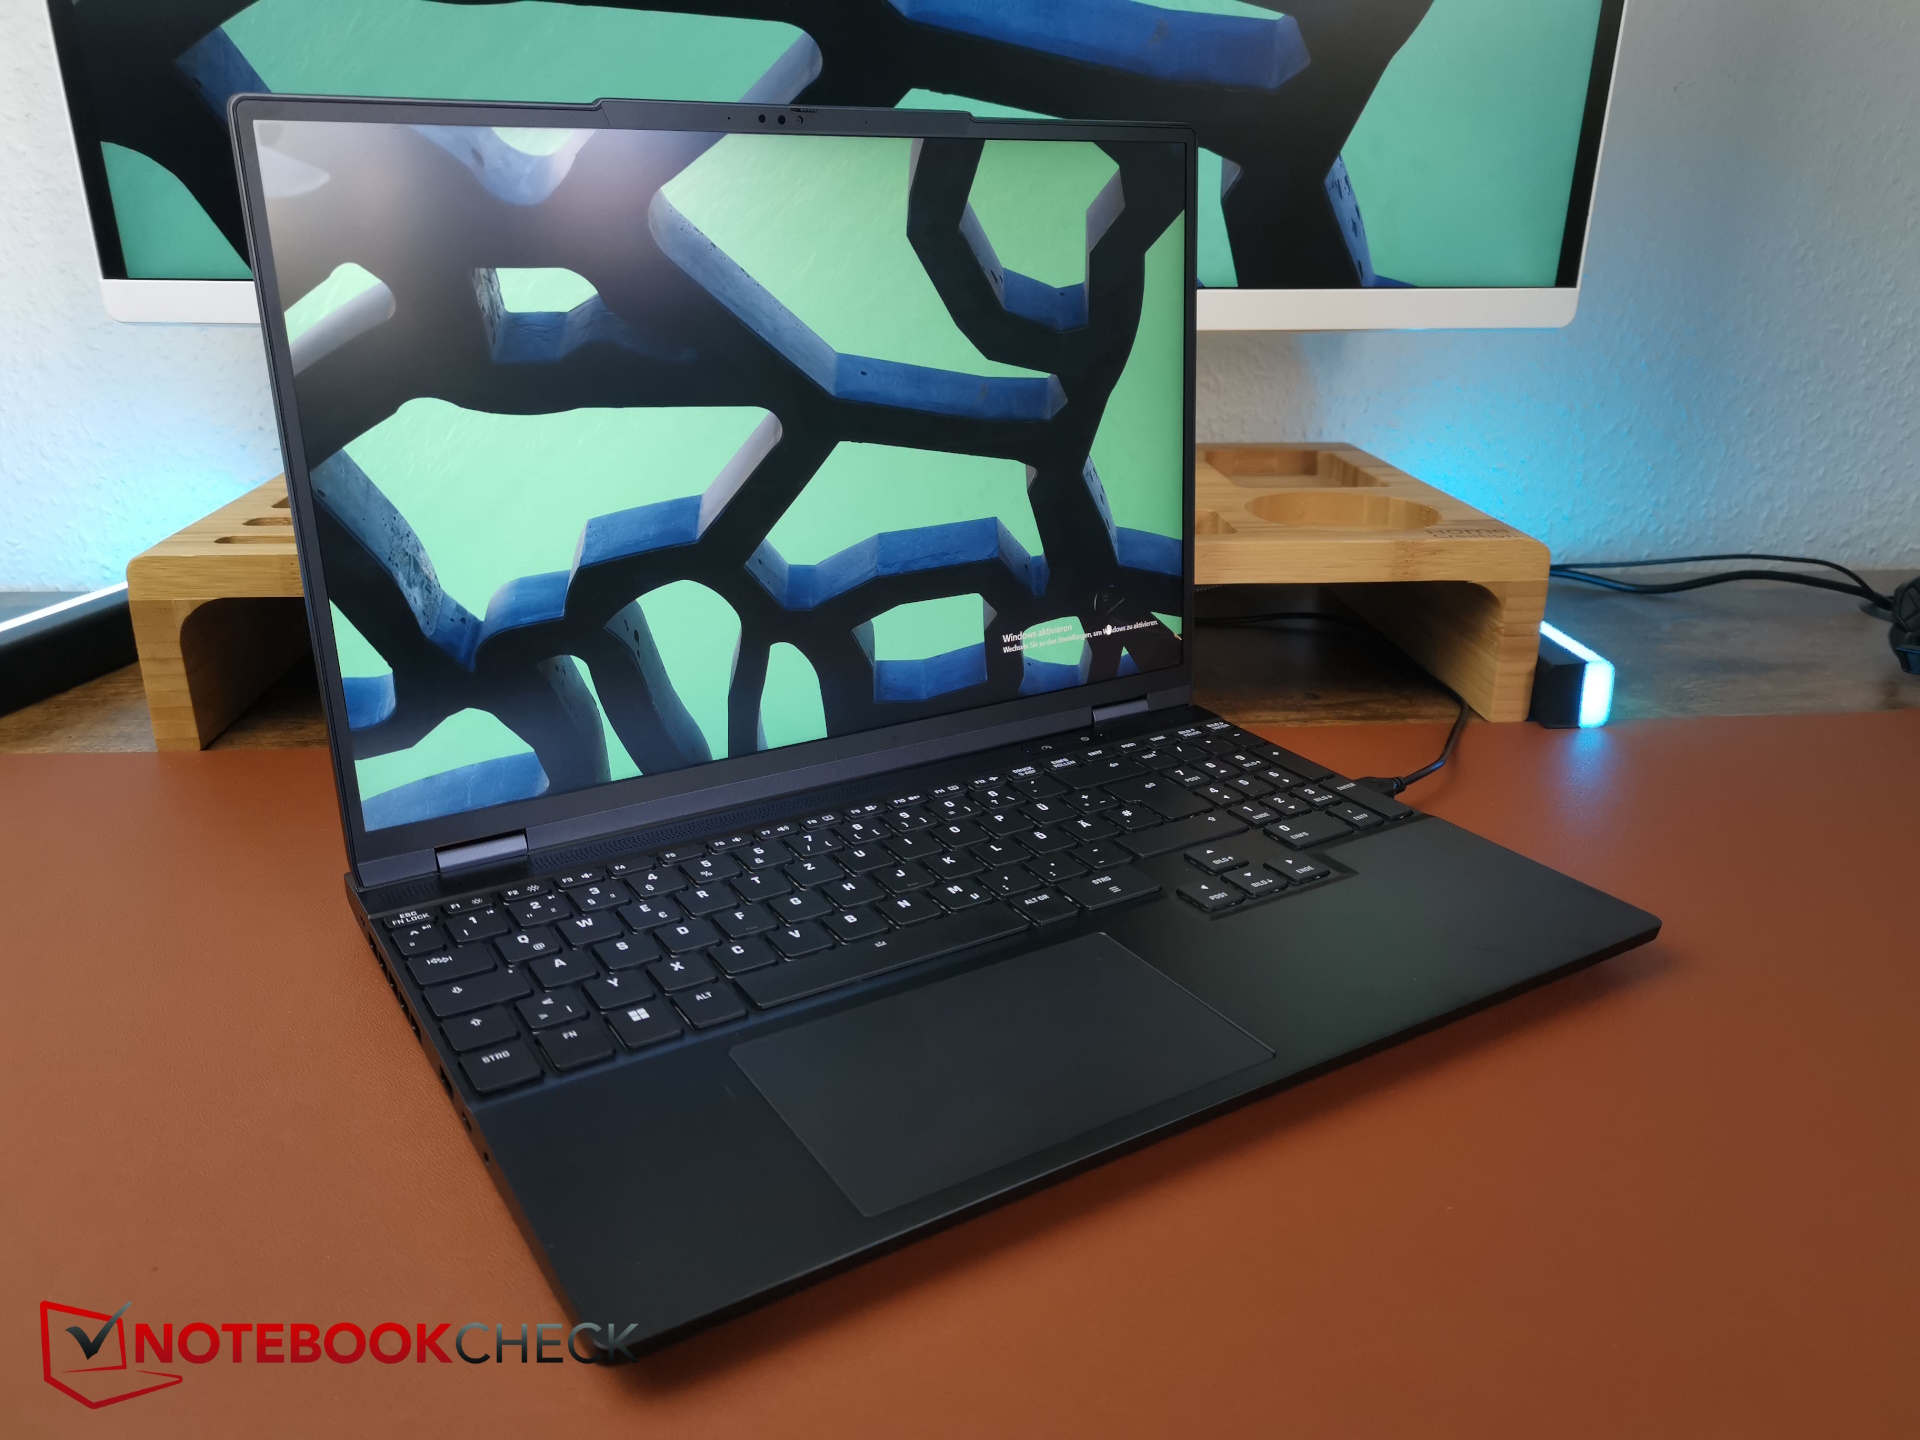
Estojo e recursos: Um elegante estojo de alumínio
Como já testamos exaustivamente os recursos visuais, recomendamos que os senhores consultem nossa Análise do XMG Fusion 15 para obter mais informações sobre o gabinete, a manutenção, as portas e os dispositivos de entrada. Aqui, listaremos apenas as alterações nesses aspectos.

Comparação de tamanhos
No momento, as máquinas para jogos de 15 polegadas com uma CPU atual parecem ter quase desaparecido e um dos recursos exclusivos do Core 15 é seu formato incomum de 15,3 polegadas. O fabricante argumenta que os laptops atuais de 16 polegadas quase não são maiores, o que significa que agora é possível obter uma tela maior em um gabinete quase do mesmo tamanho.
No entanto, com o Core 15, o senhor pode ver que alguns dos concorrentes de 16 polegadas são visivelmente maiores. Além disso, eles também são mais grossos e mais pesados. Esse último é o caso, apesar de os concorrentes usarem muito mais plástico. Essa é uma área em que o Core 15 ganha um ponto positivo em termos de mobilidade.
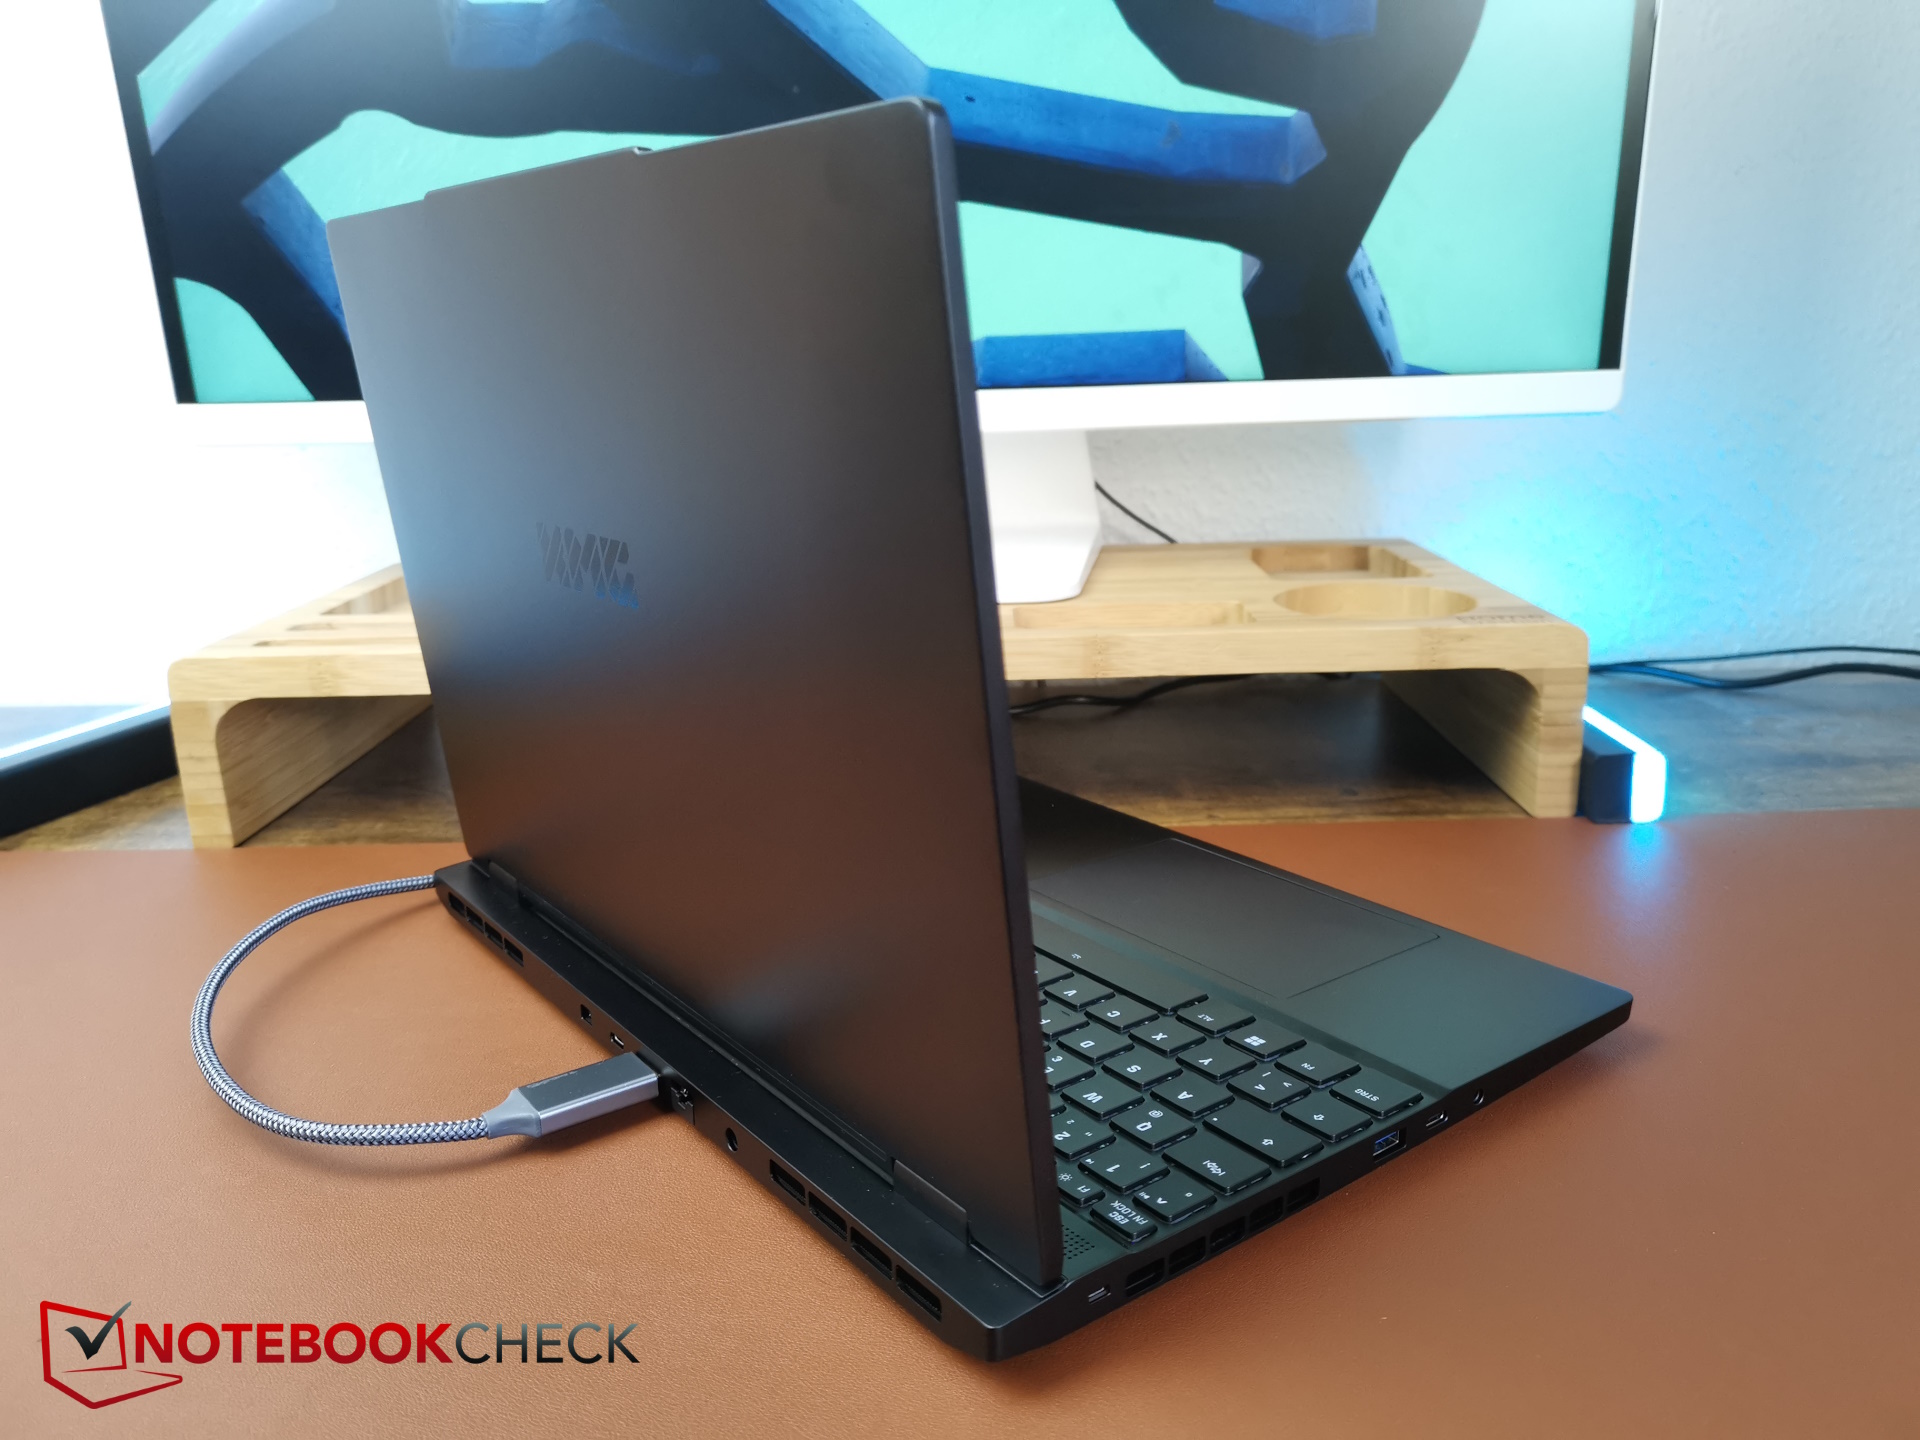
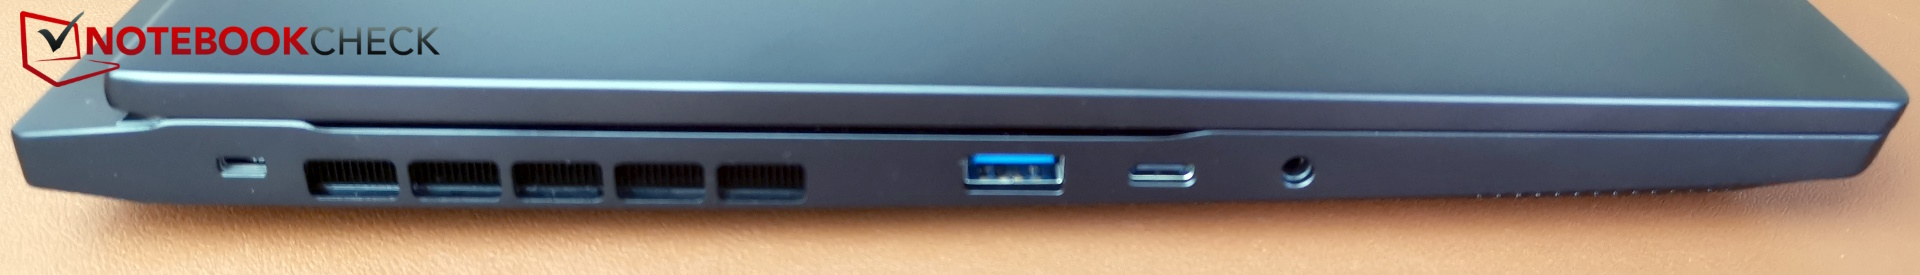
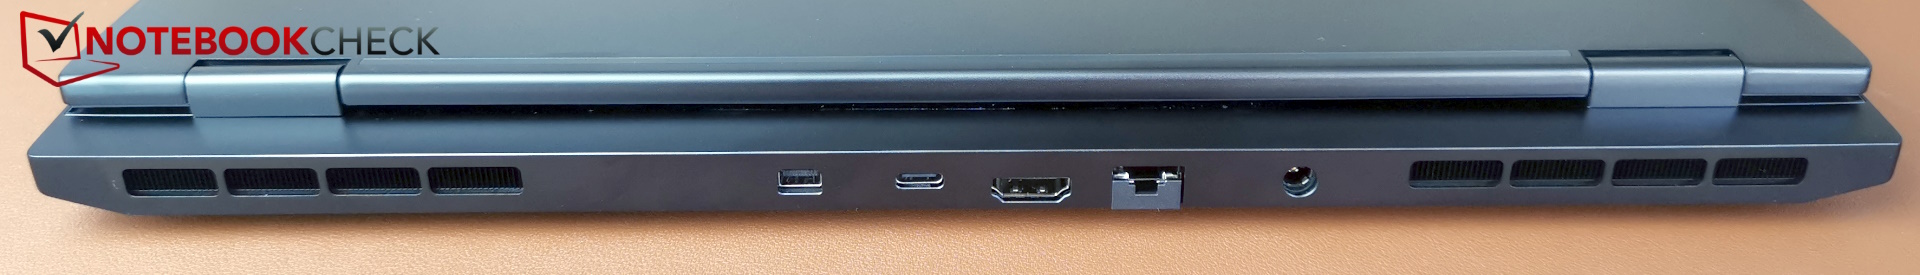
Portos
Ao contrário do Fusion equipado com CPU Intel, o AMD Core não tem Thunderbolt 4 e USB 4. Em vez disso, o senhor só tem USB-C 3.2 Gen 2, embora ele ofereça Power Delivery de até 100 W (20V, 5 A).
Há uma vantagem adicional sobre o Fusion: Com o Core, o senhor tem uma mini DisplayPort dedicada que não existe no Fusion.
Uma observação interessante: no início de 2023, nosso core 15 analisado recentemente ainda estava equipado com uma conexão de água para resfriamento externo, chamada de XMG Oasis. Essas portas agora estão ausentes no novo e mais fino Core 15 e parece que a XMG desistiu de fazer experiências com essa série de produção.
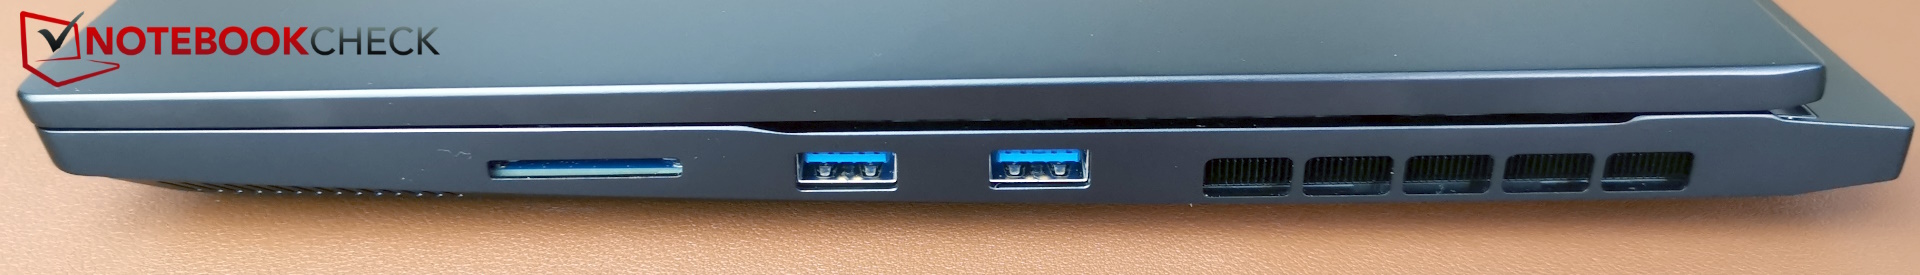
Leitor de cartão SD
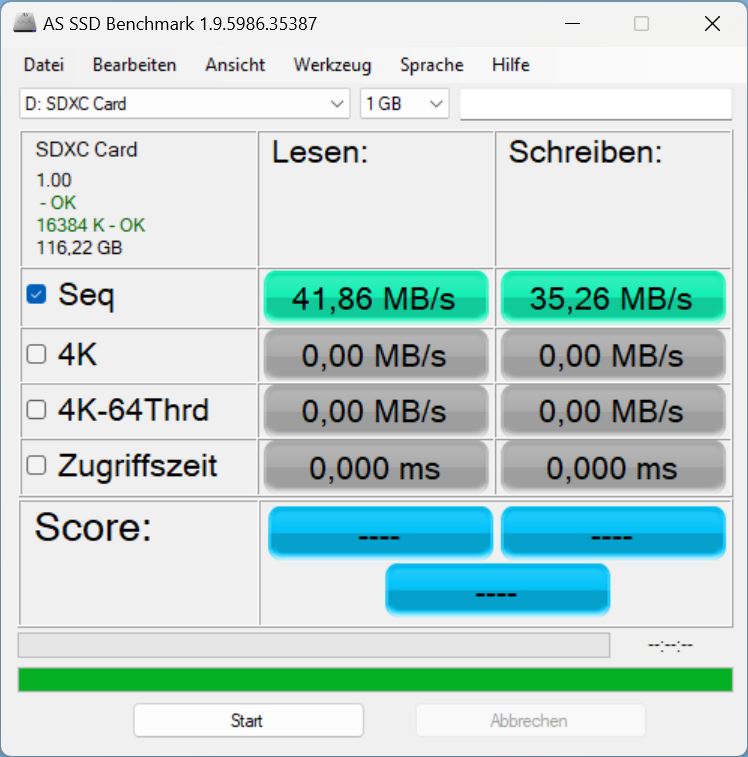
O leitor de SD aceita cartões de tamanho normal, mas não há mecanismo de travamento, o que significa que os cartões ficam para fora.
Infelizmente, o desempenho do leitor de cartões, que já é mediano, encontrado no Fusion 15 caiu pela metade novamente, o que significa que o Core 15 pertence a alguns dos mais lentos nessa categoria.
| SD Card Reader | |
| average JPG Copy Test (av. of 3 runs) | |
| Média da turma Gaming (19 - 197.3, n=68, últimos 2 anos) | |
| SCHENKER XMG Pro 15 (E23) | |
| SCHENKER XMG Fusion 15 (Early 24) (AV PRO microSD 128 GB V60) | |
| SCHENKER XMG Core 15 (M24) | |
| Lenovo Legion 5 16IRX G9 | |
| maximum AS SSD Seq Read Test (1GB) | |
| Média da turma Gaming (25.8 - 263, n=67, últimos 2 anos) | |
| SCHENKER XMG Pro 15 (E23) | |
| SCHENKER XMG Fusion 15 (Early 24) (AV PRO microSD 128 GB V60) | |
| SCHENKER XMG Core 15 (M24) | |
| Lenovo Legion 5 16IRX G9 | |
Comunicação
O fabricante nos informou, após receber o laptop, que nosso modelo de análise foi acidentalmente equipado com um Intel AX211 WiF, assim como o Fusion 15. Na verdade, esse não é o caso do Core 15.
Normalmente, o Intel AX200 vem como padrão no Core 15 e, por apenas 15 dólares adicionais, o senhor obtém o AMD Wi-Fi 6E RZ616 com Wi-Fi 6E. No entanto, no momento não podemos testar sua velocidade.

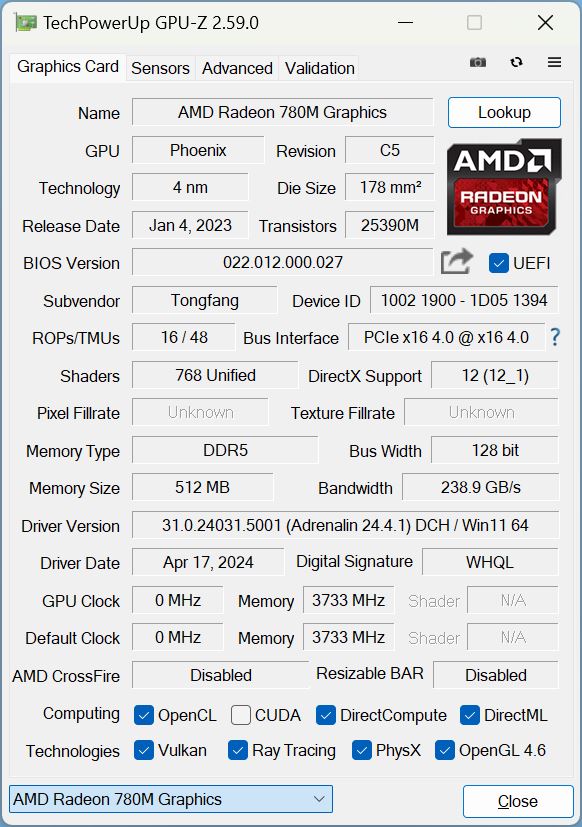
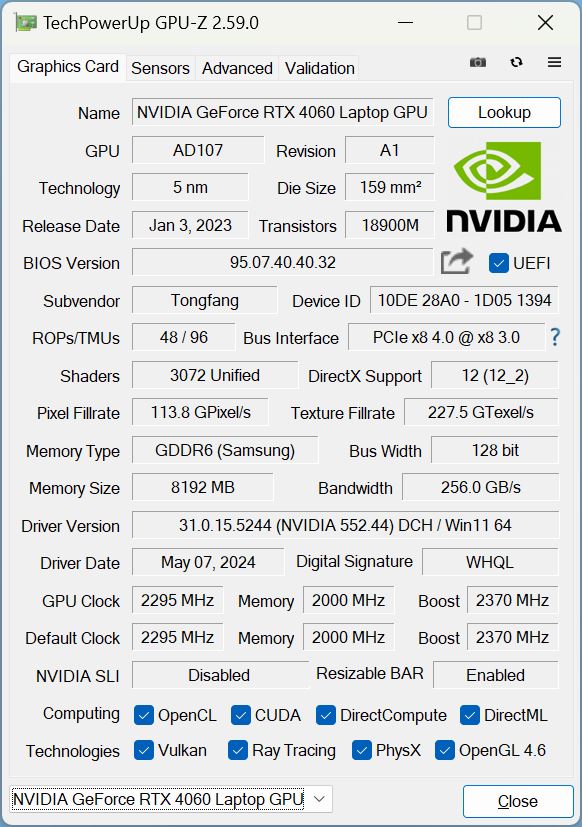
 NVIDIA GeForce RTX 4060 Laptop GPU, R7 8845HS, Samsung 990 Pro 1 TB")
 NVIDIA GeForce RTX 4060 Laptop GPU, R7 8845HS, Samsung 990 Pro 1 TB")
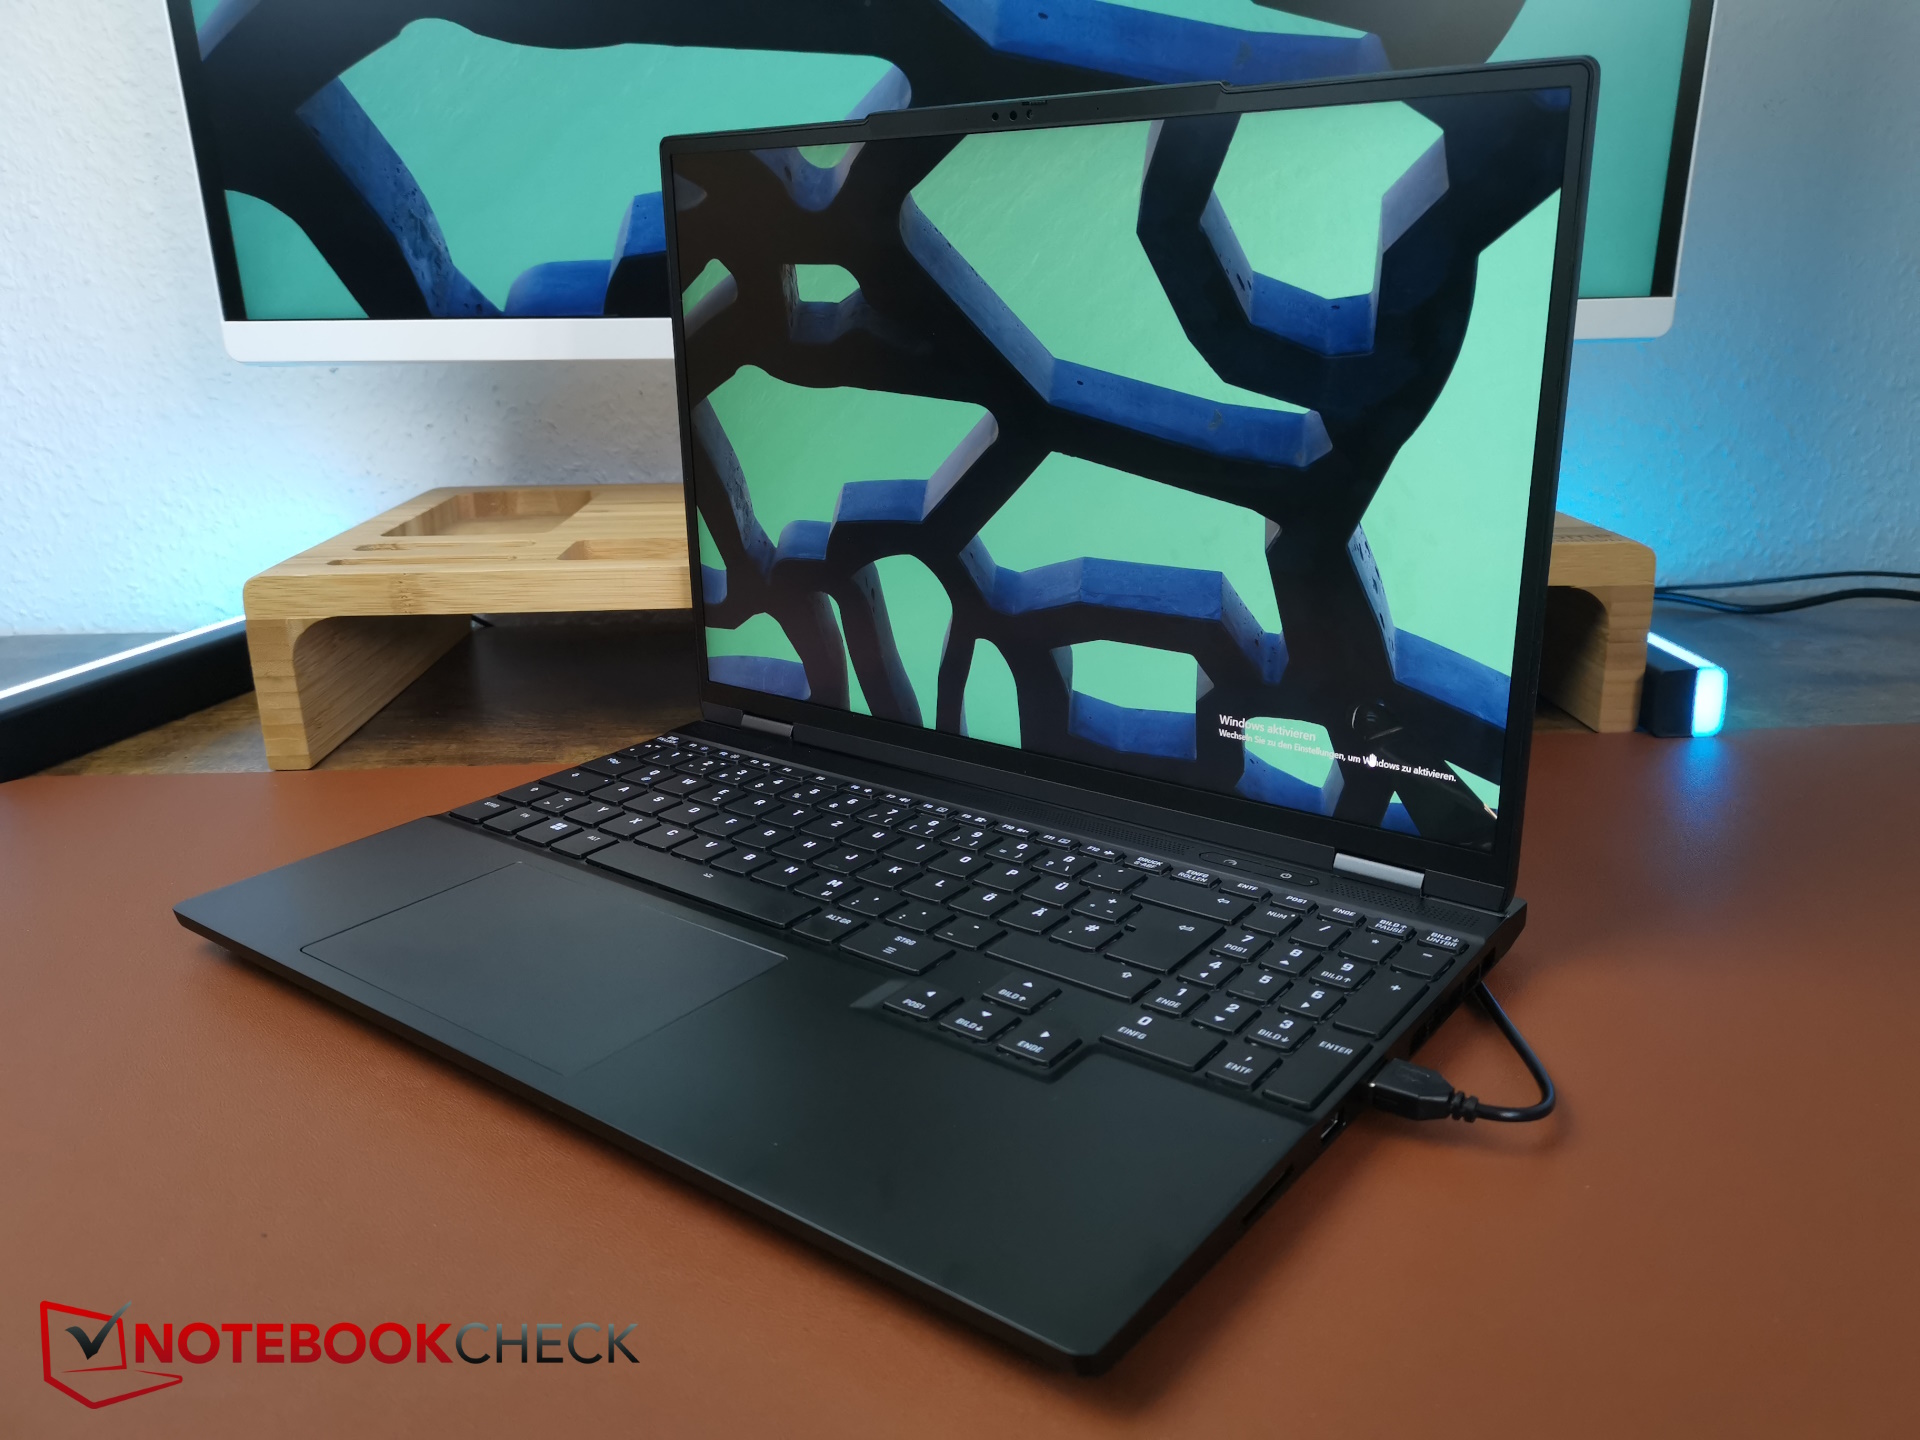
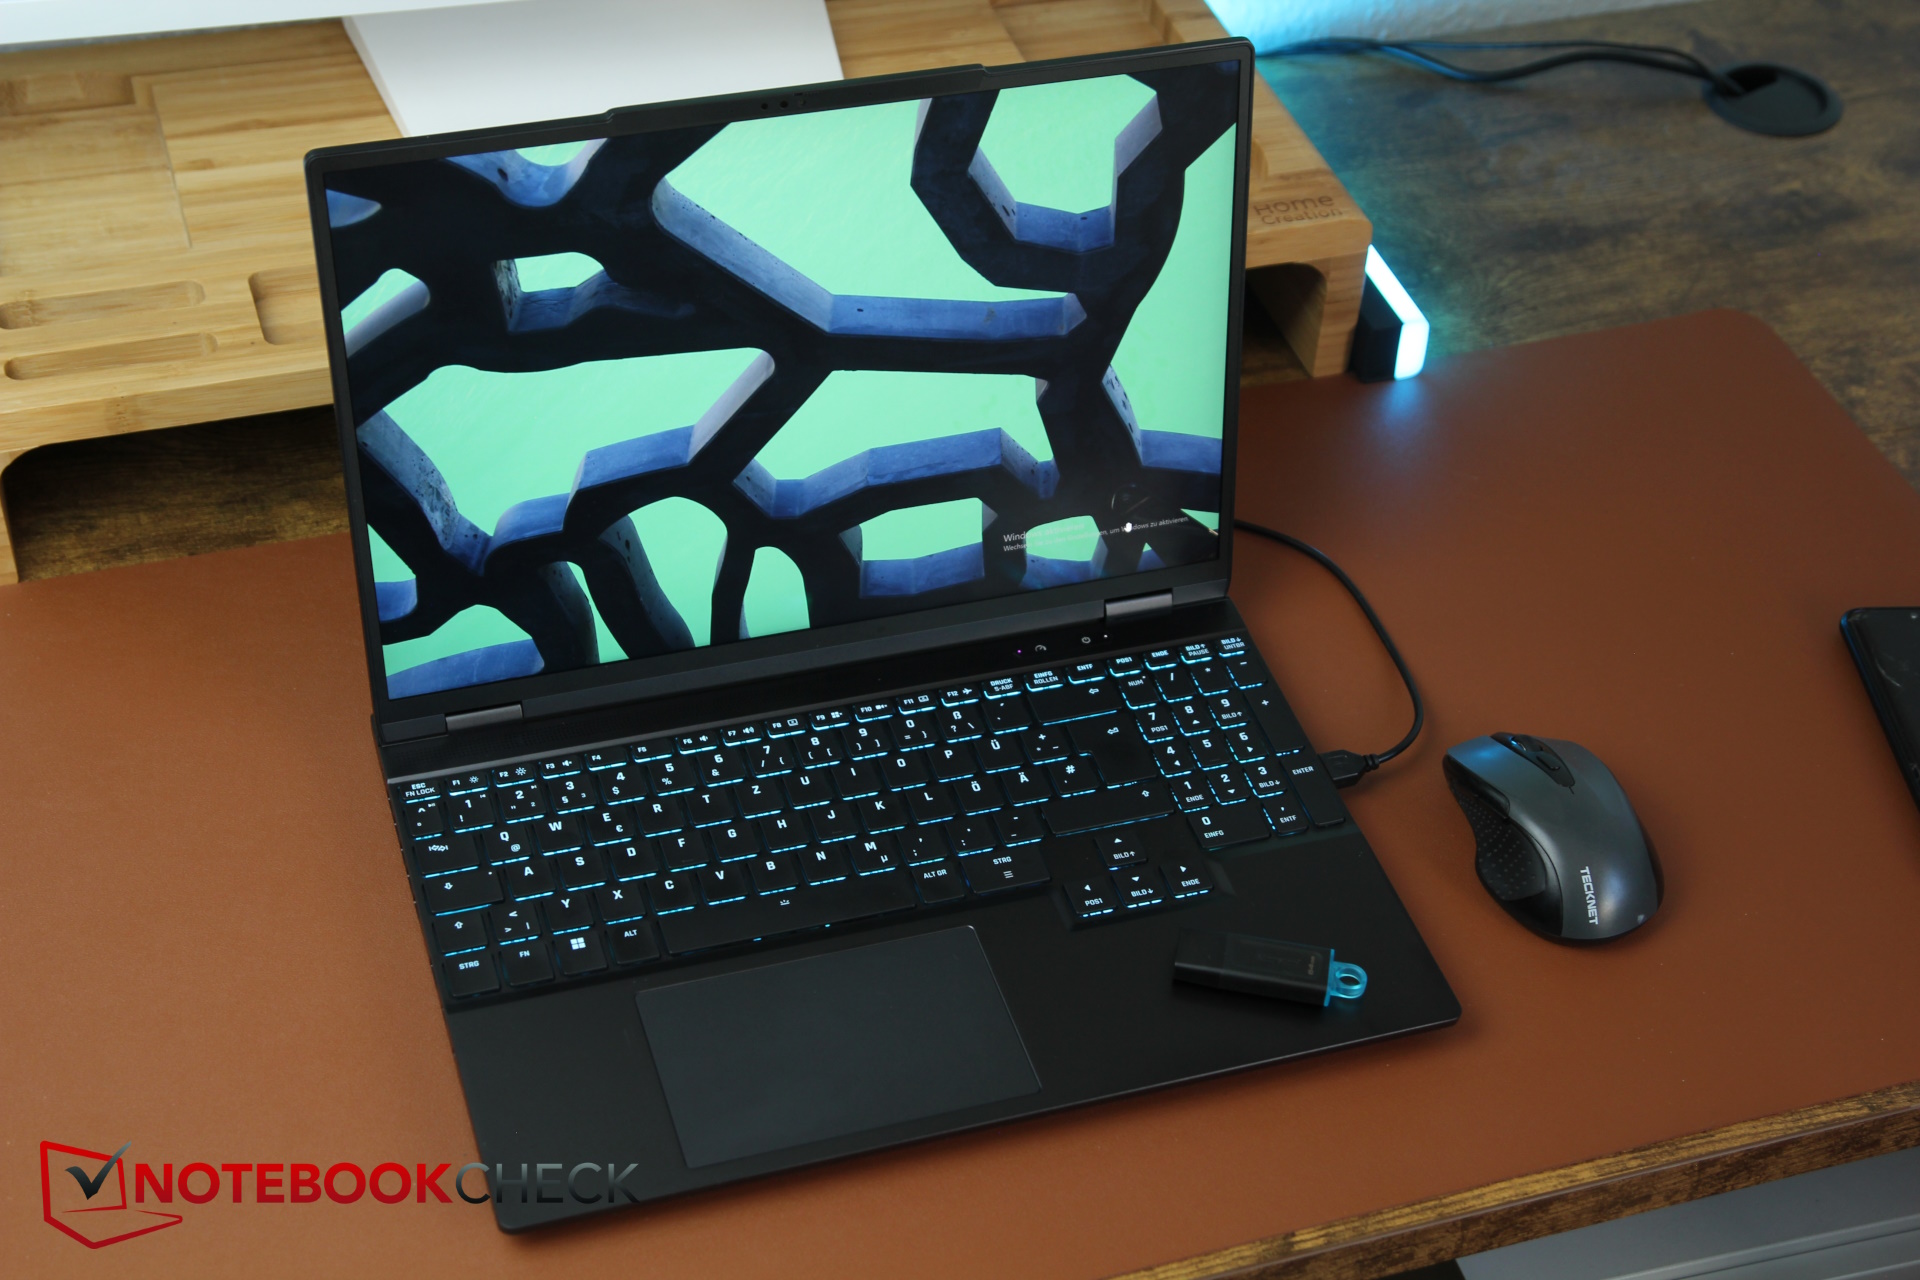
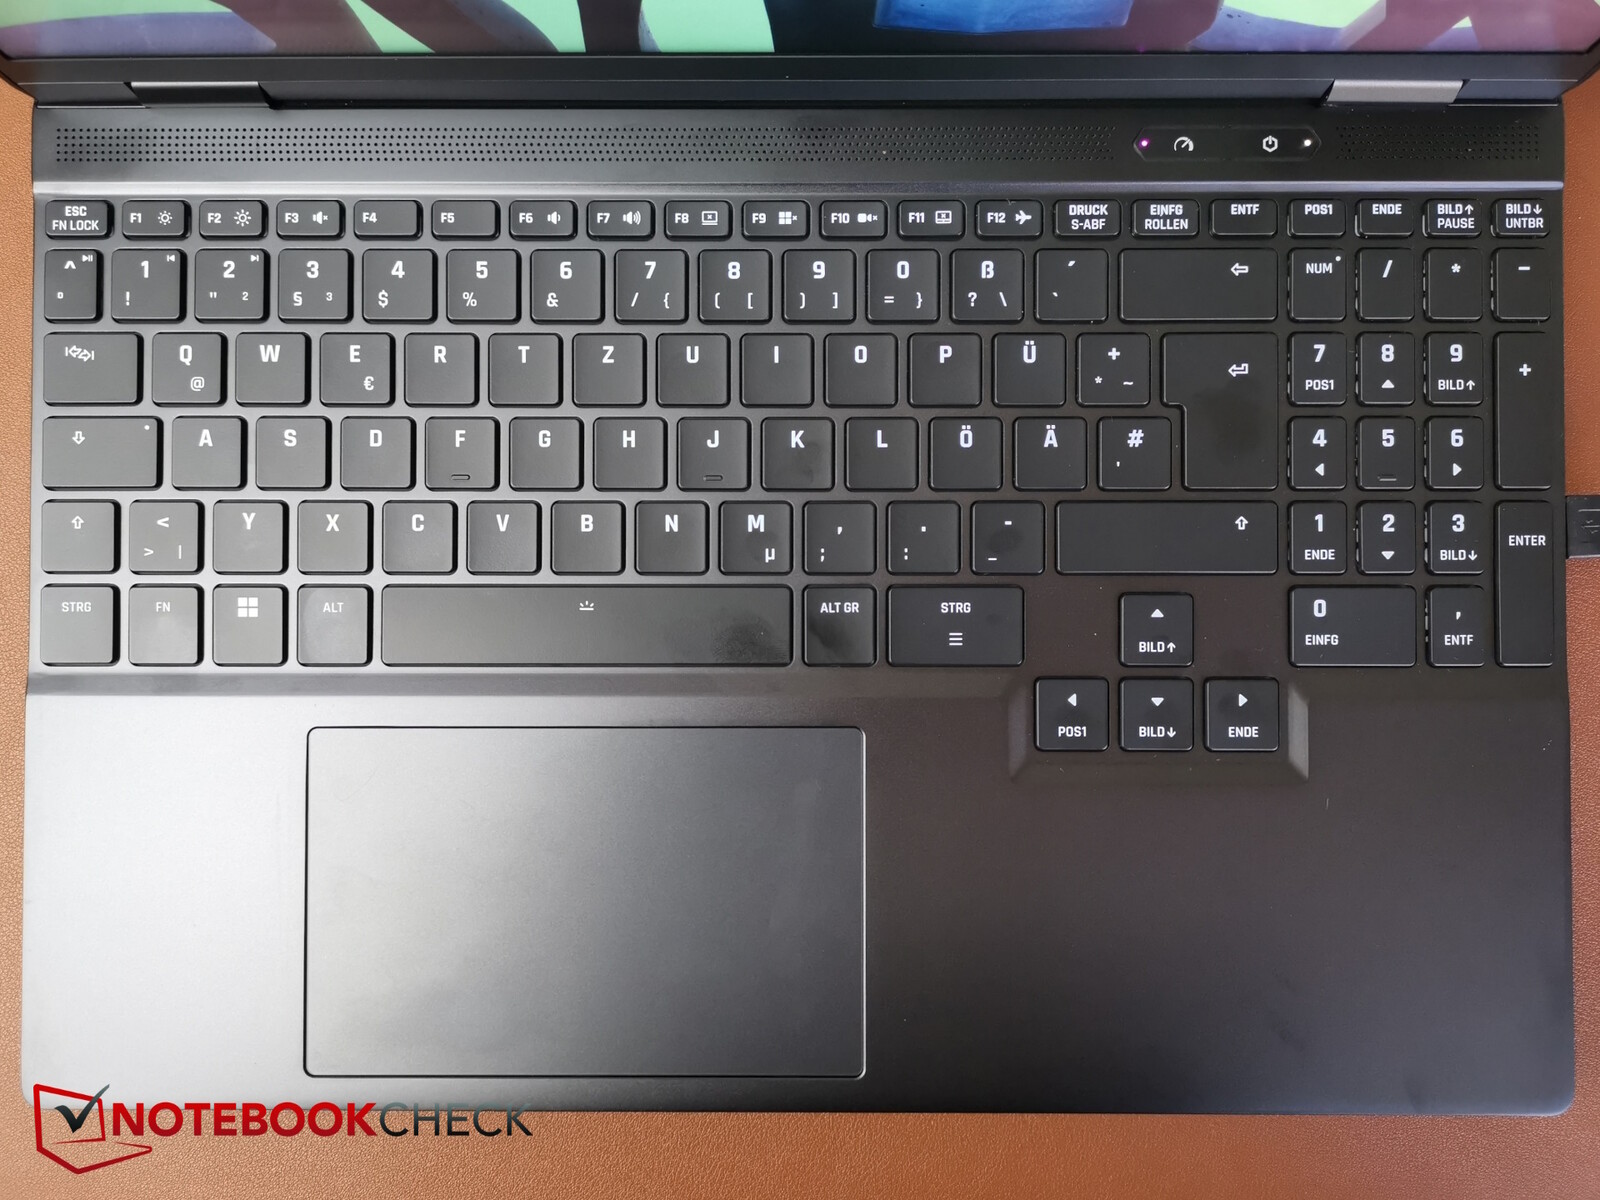
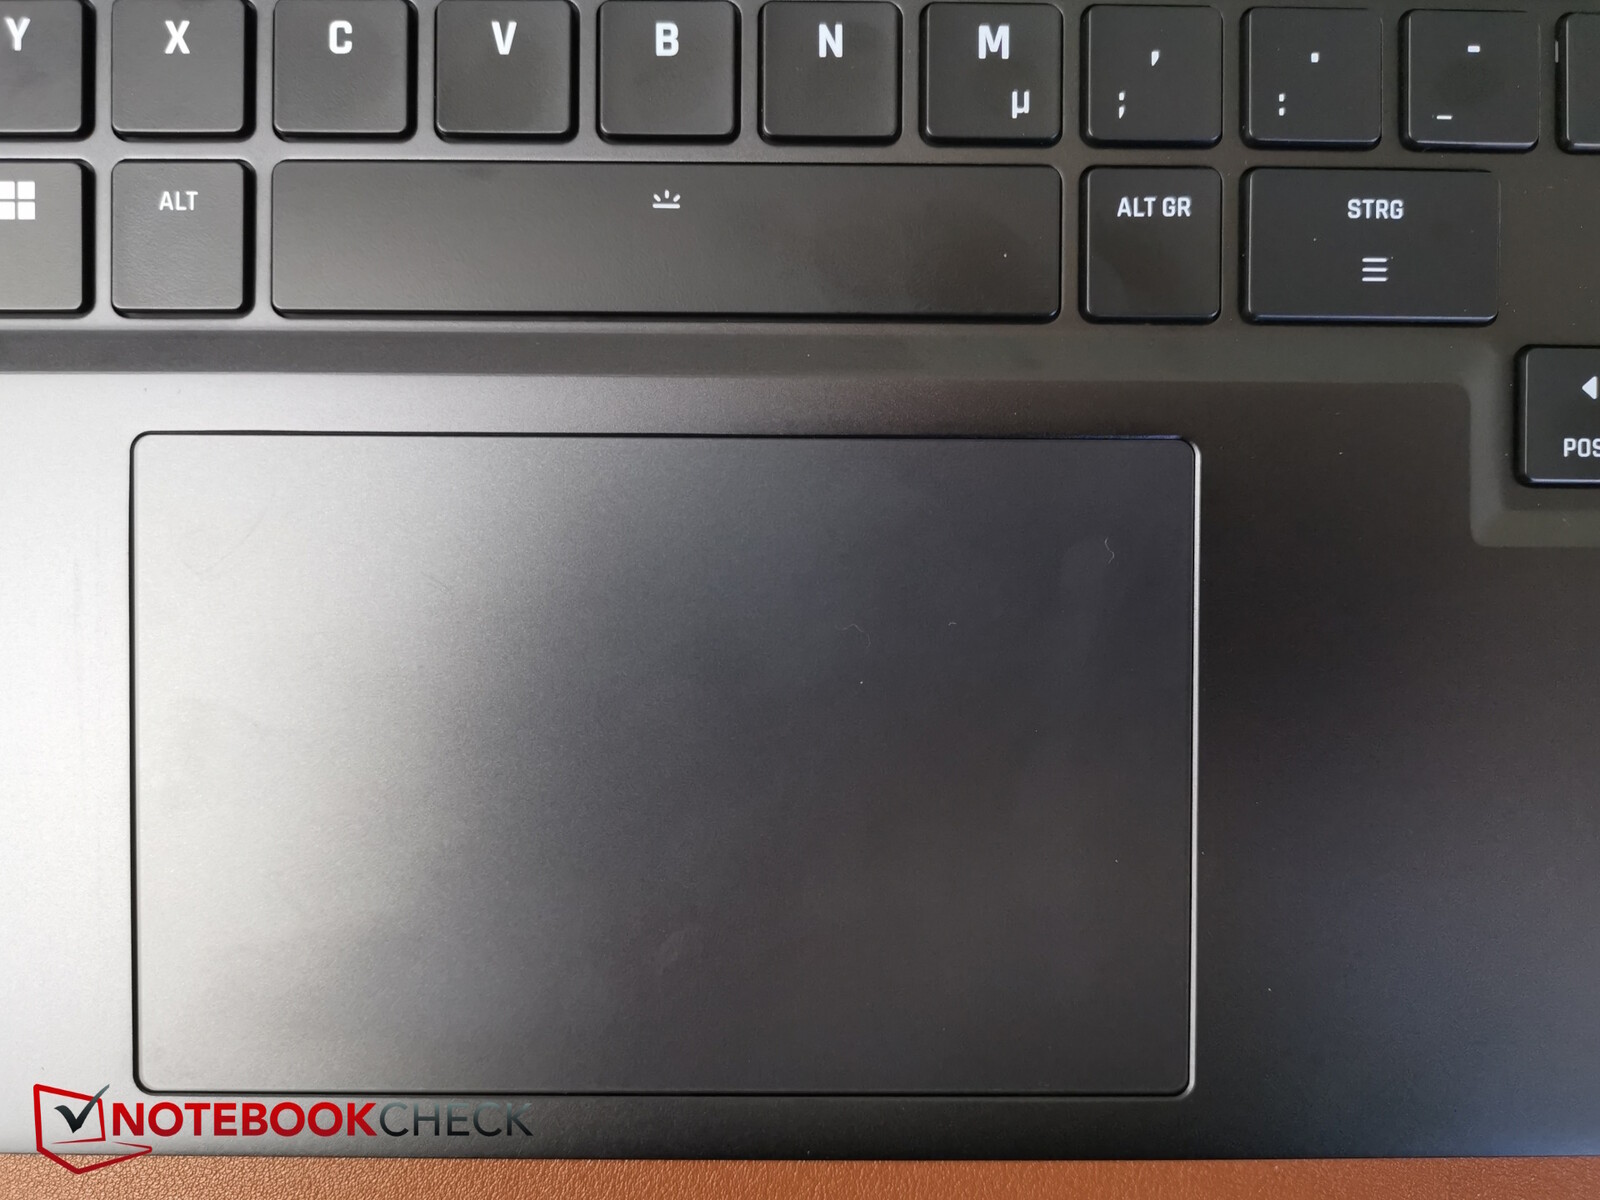
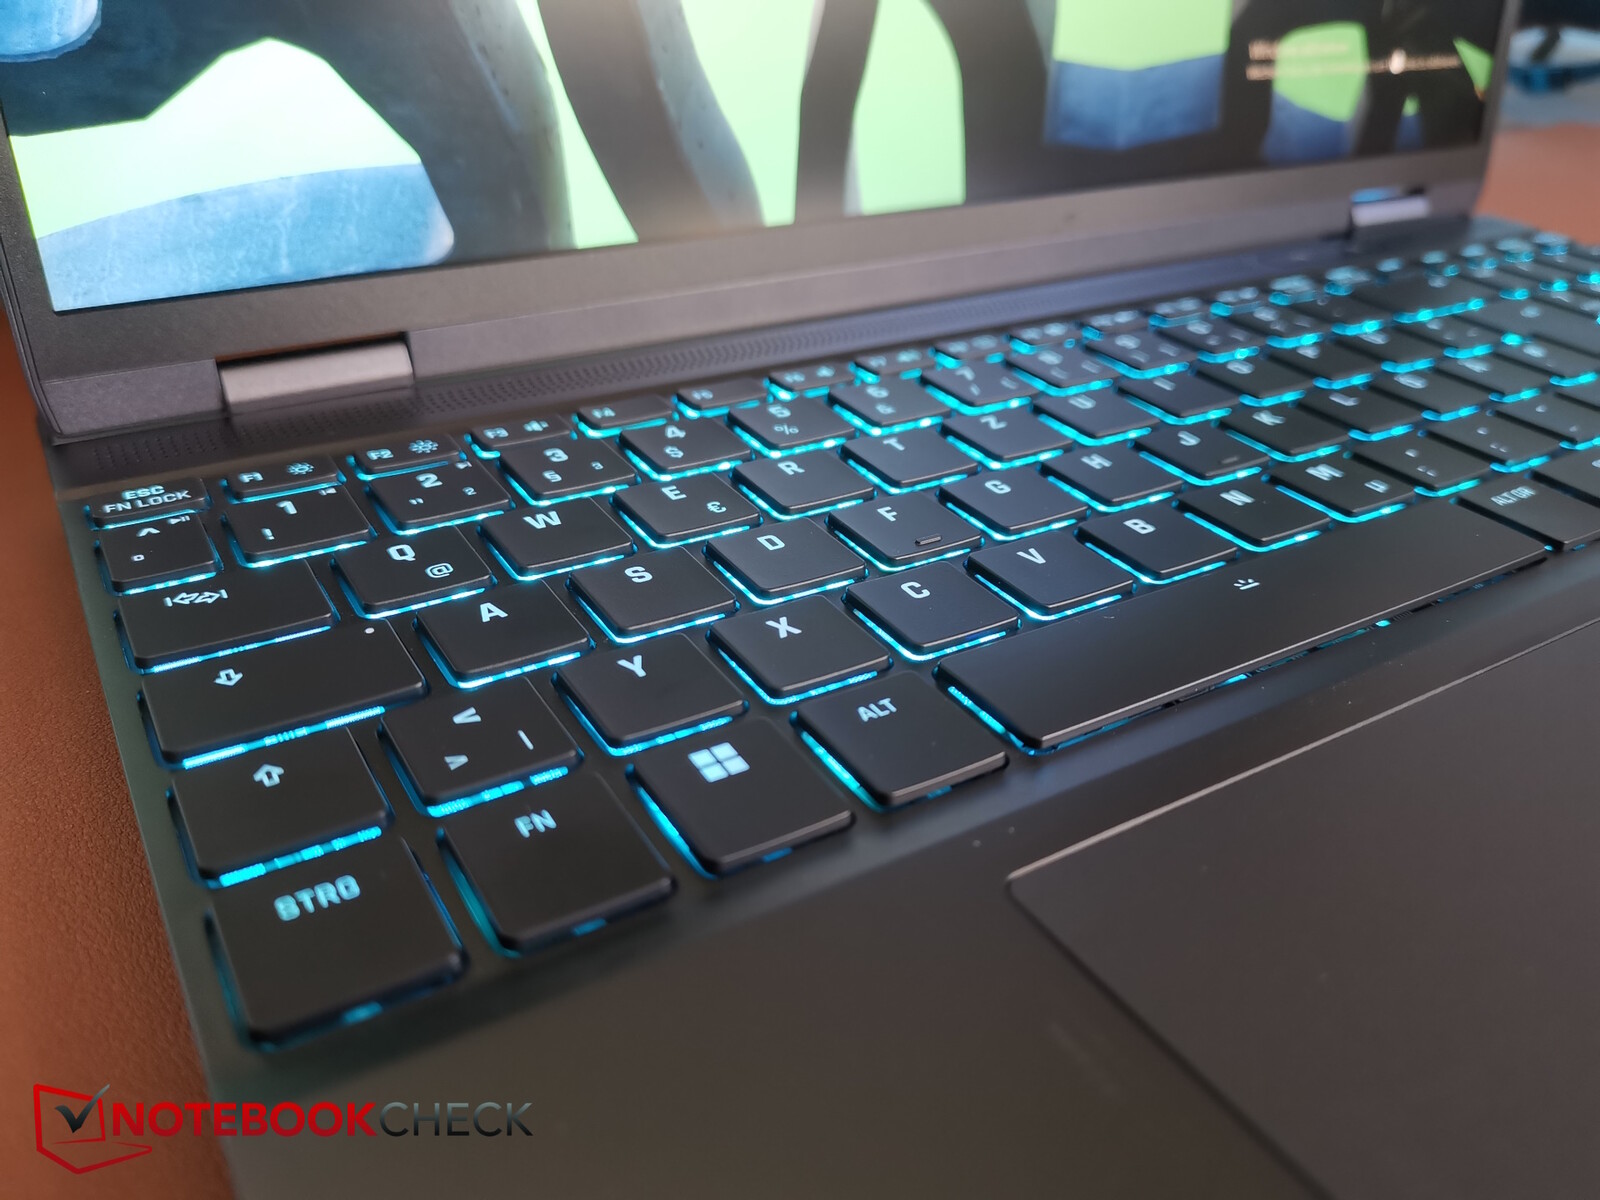
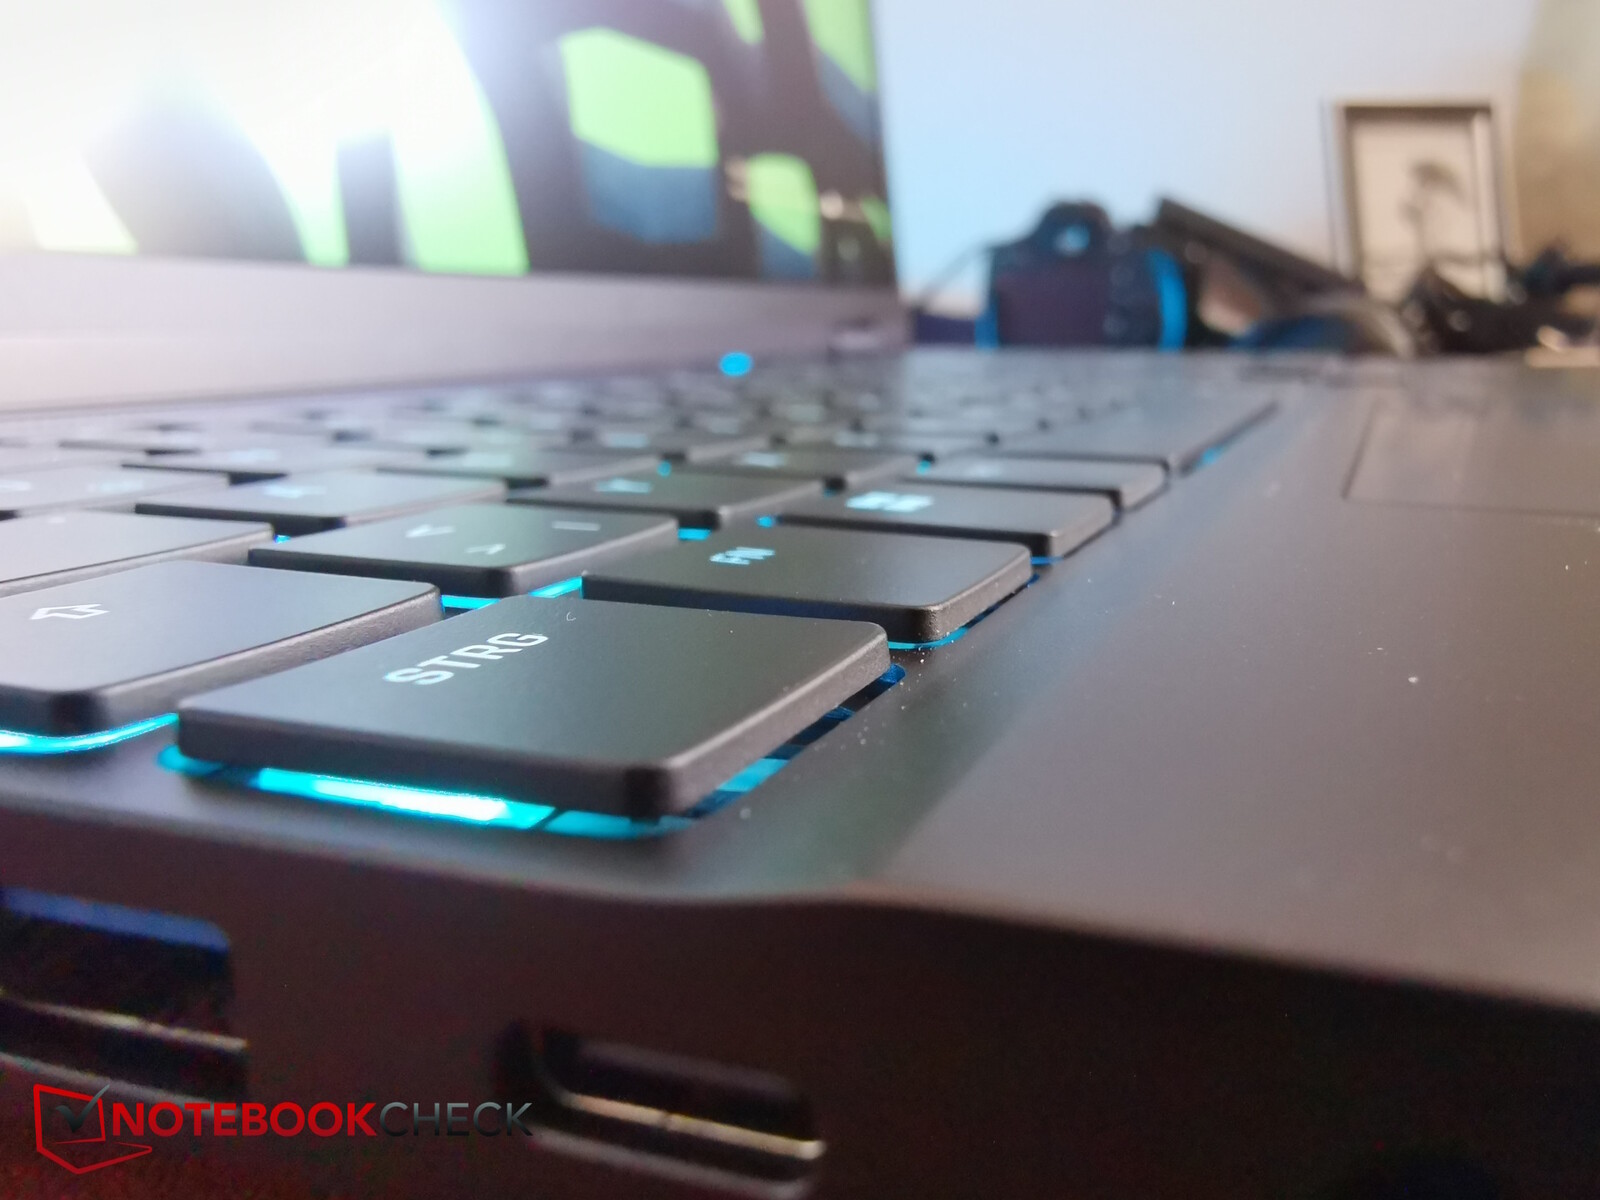
Dispositivos de entrada - Espaço usado ao máximo
Ao contrário do Fusion 15, o Core 15 não possui iluminação RGB individual para as teclas. Em vez disso, ele tem apenas uma zona de iluminação. Embora não permita tantas configurações opcionais de LED, tudo ainda é visível.
O teclado também não possui rolagem de tecla N nem anti-ghosting, pelo menos de acordo com a folha de dados. No entanto, a tecla com a qual o senhor pode alternar os perfis de desempenho está integrada.
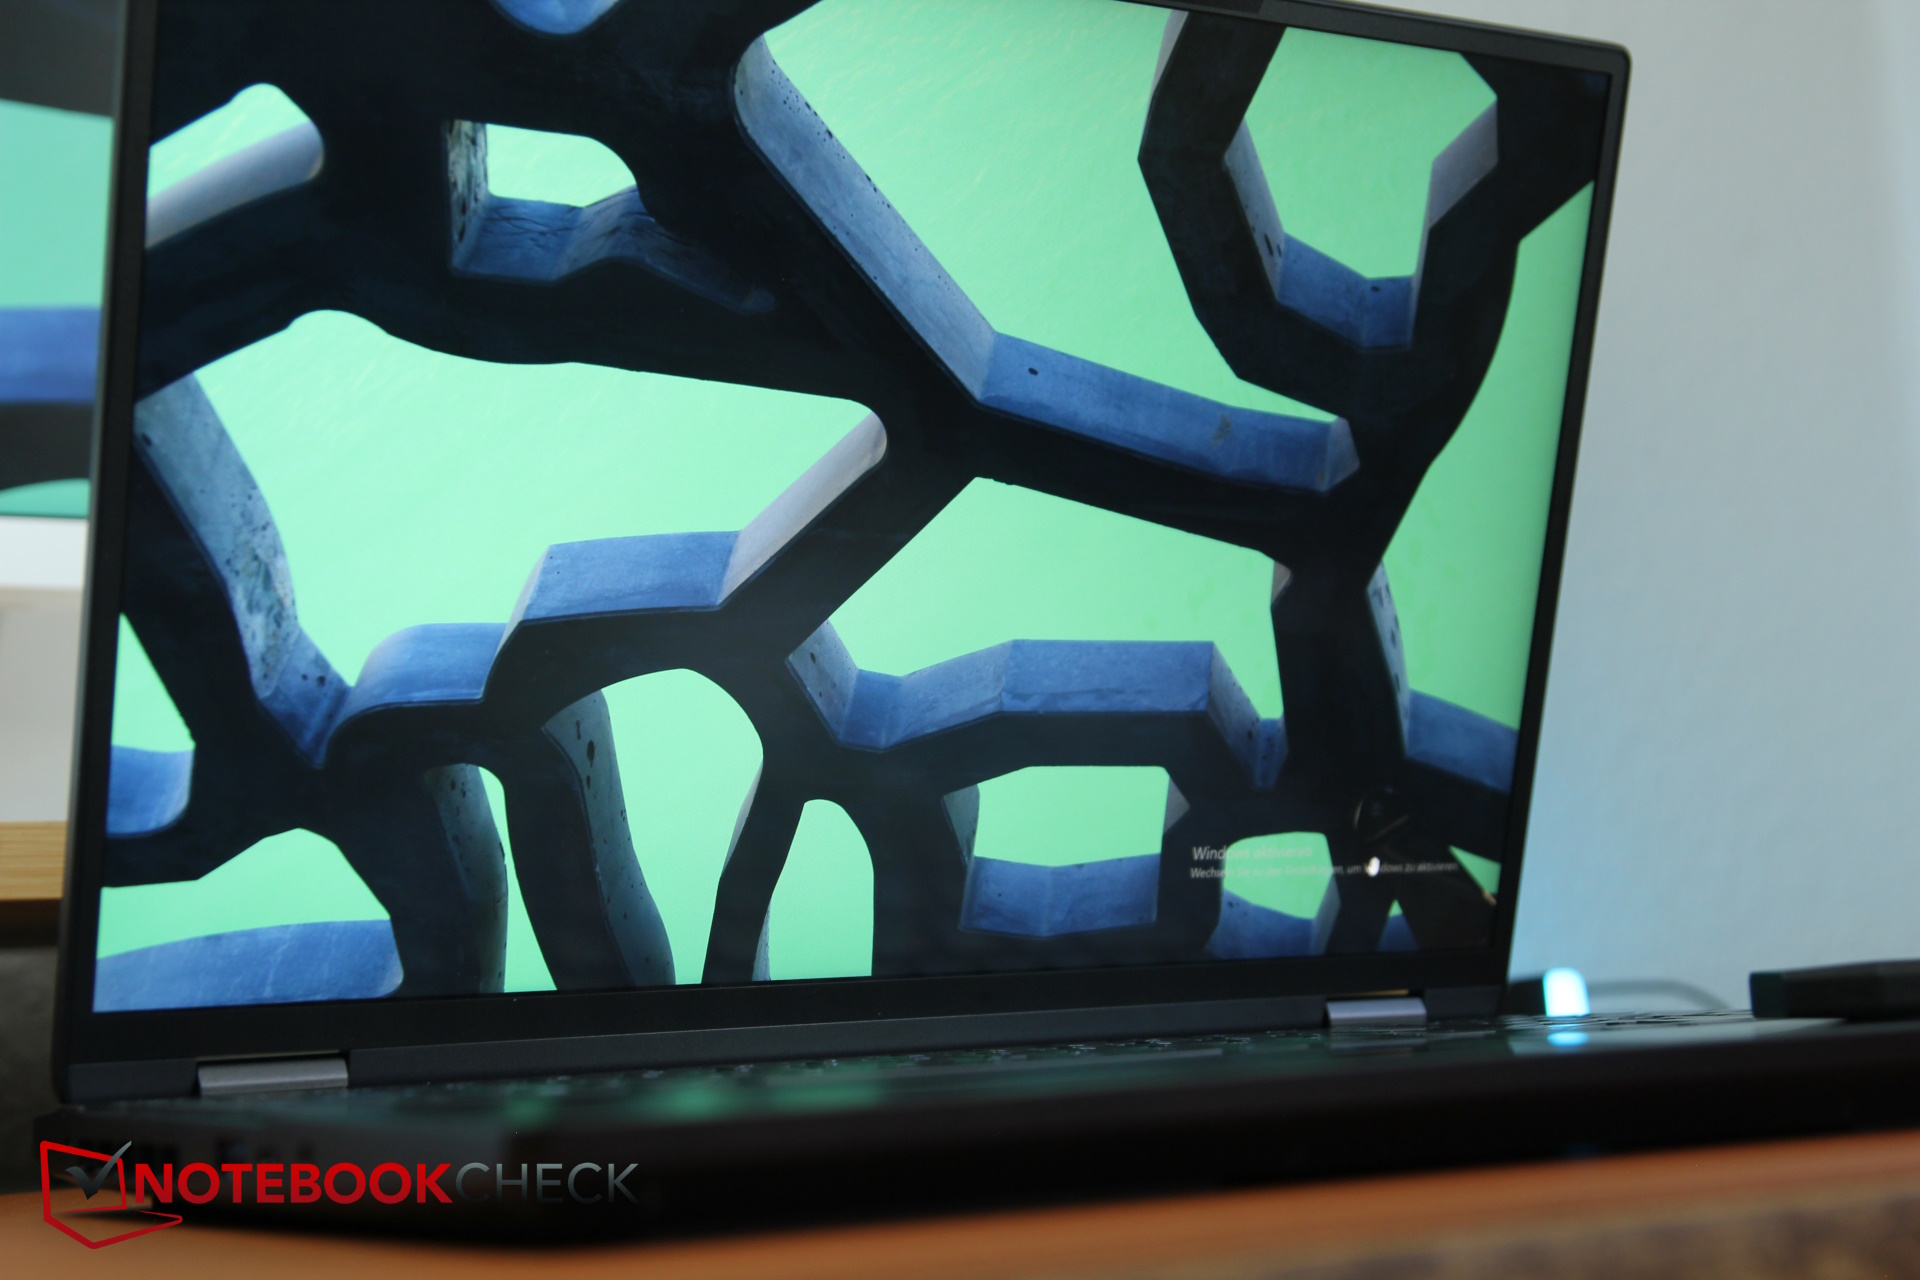
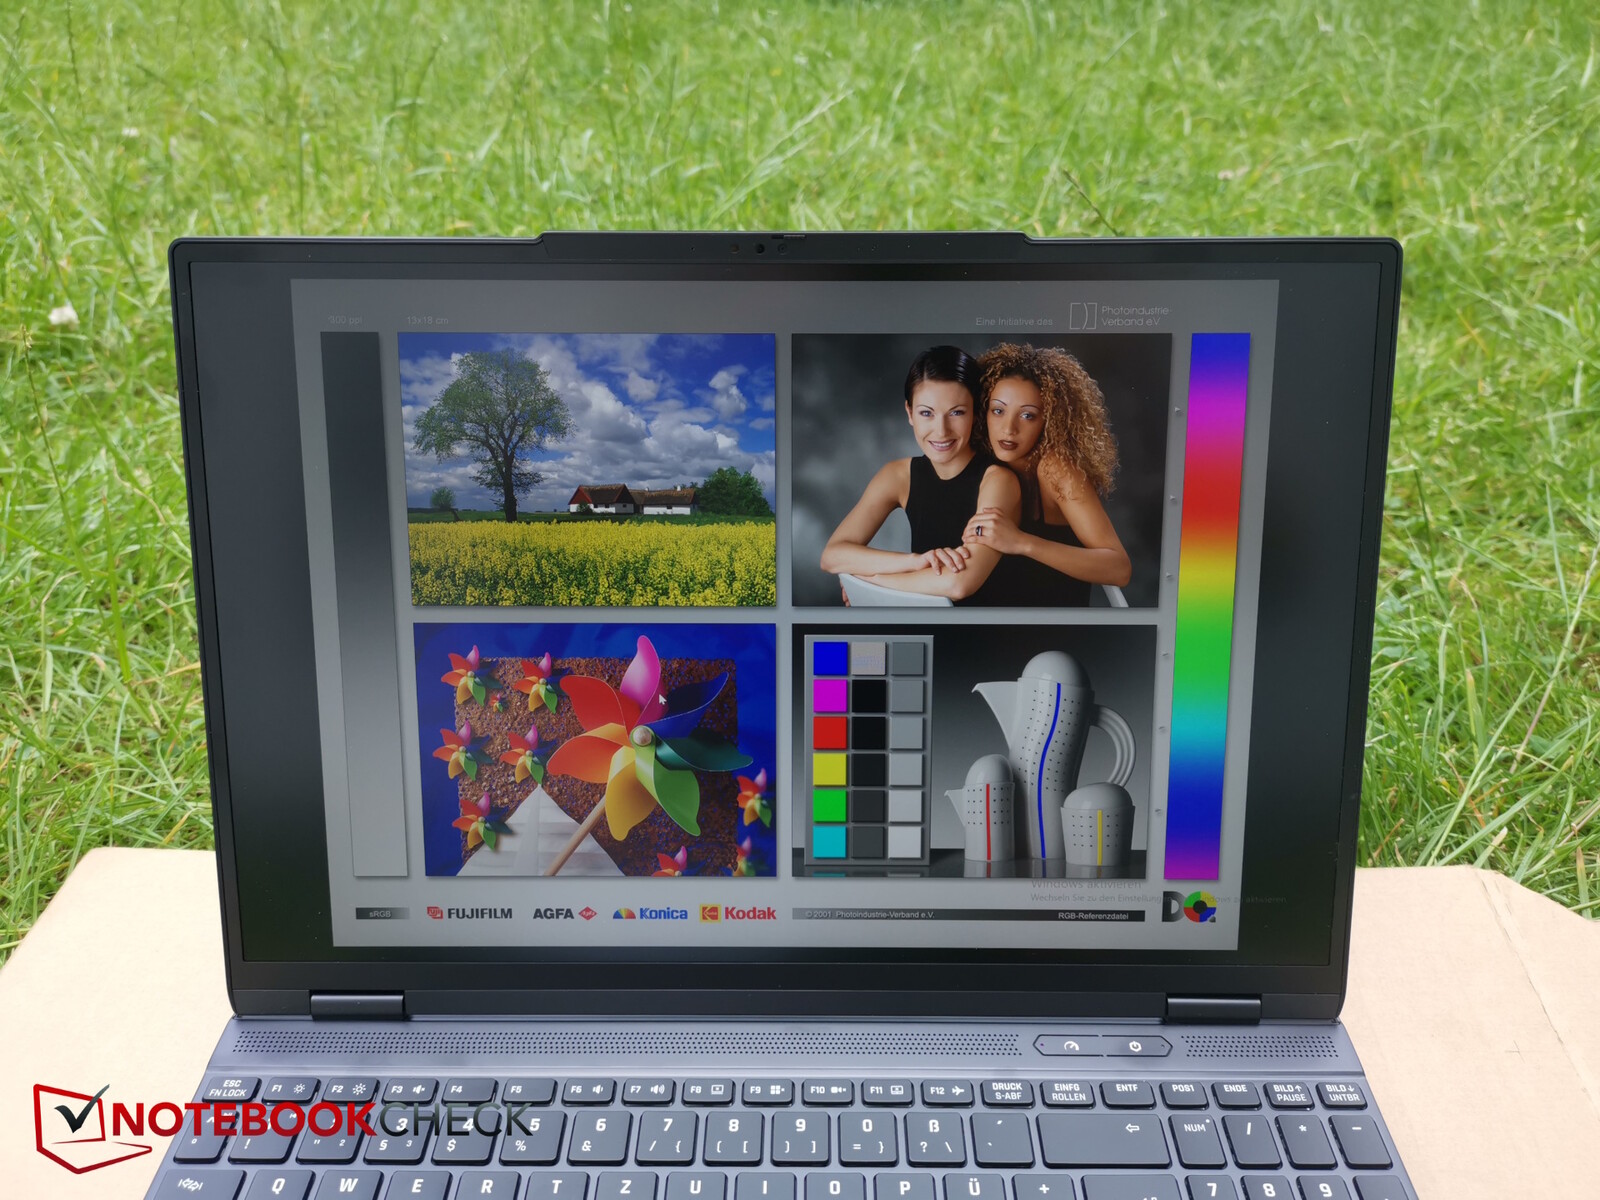
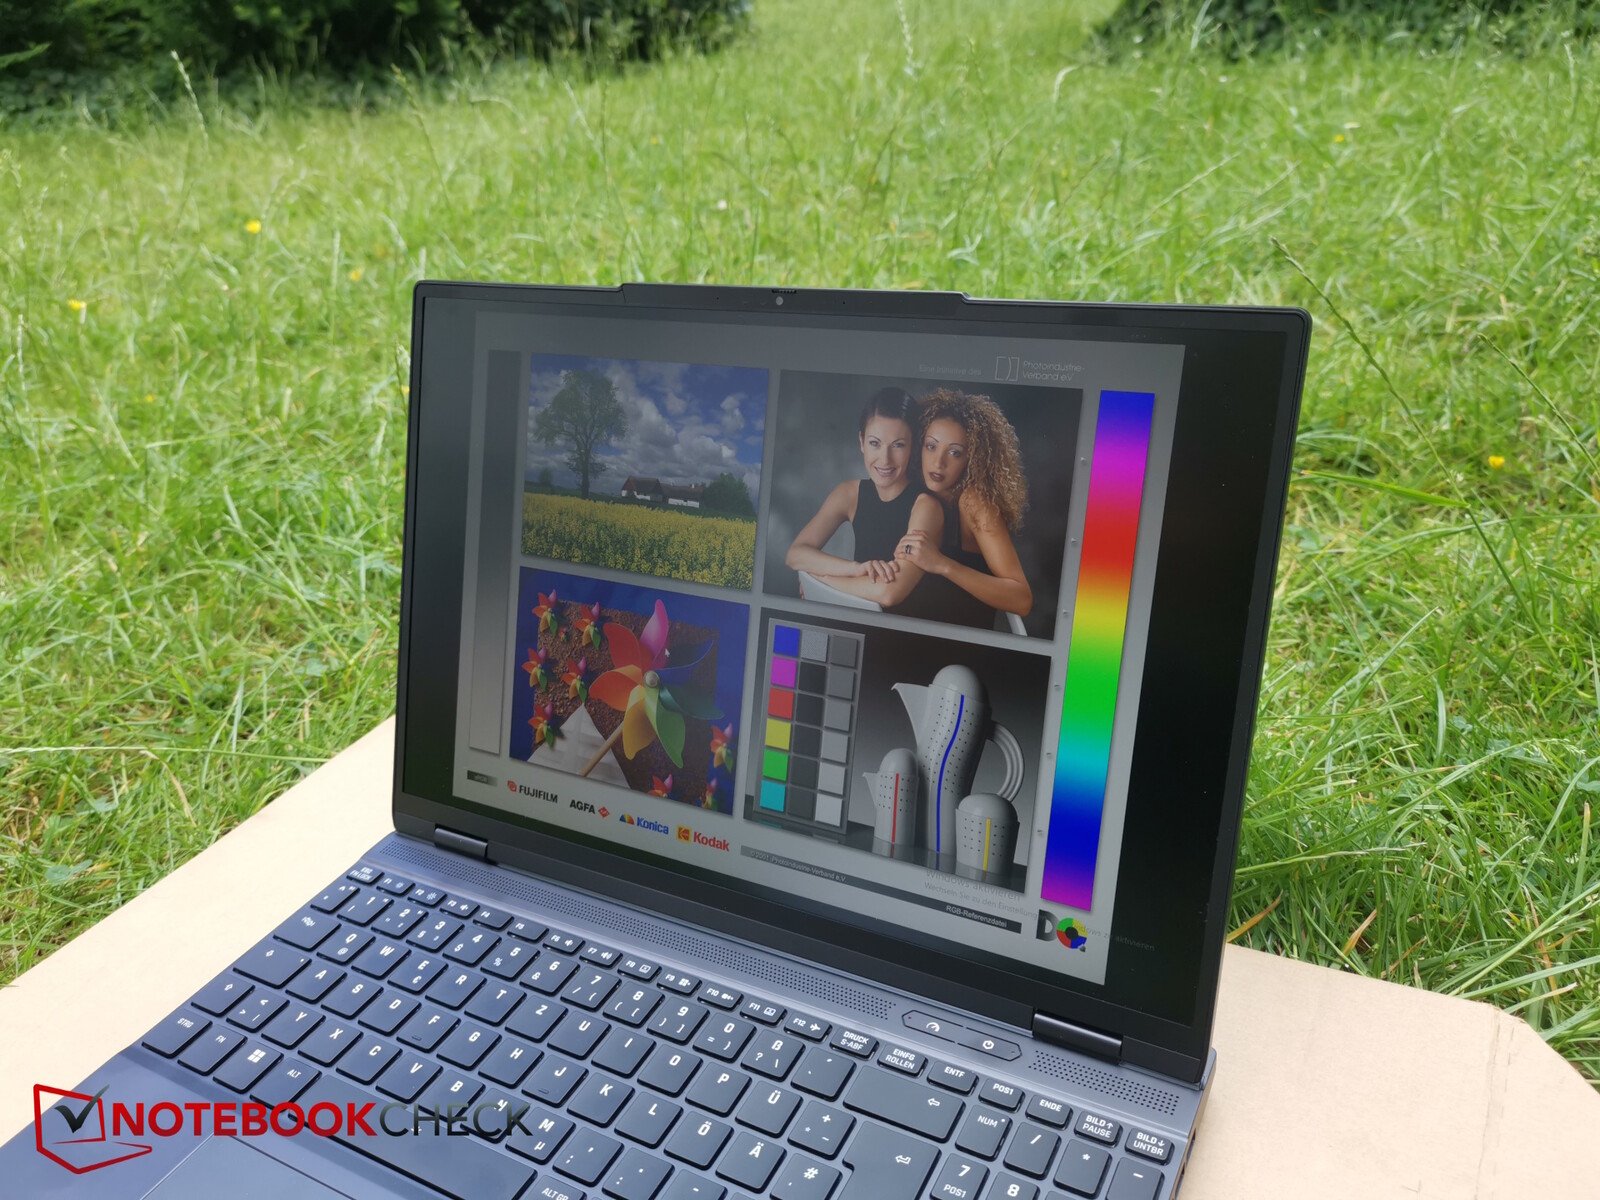
Tela - 500 nits, sRGB, 1600p
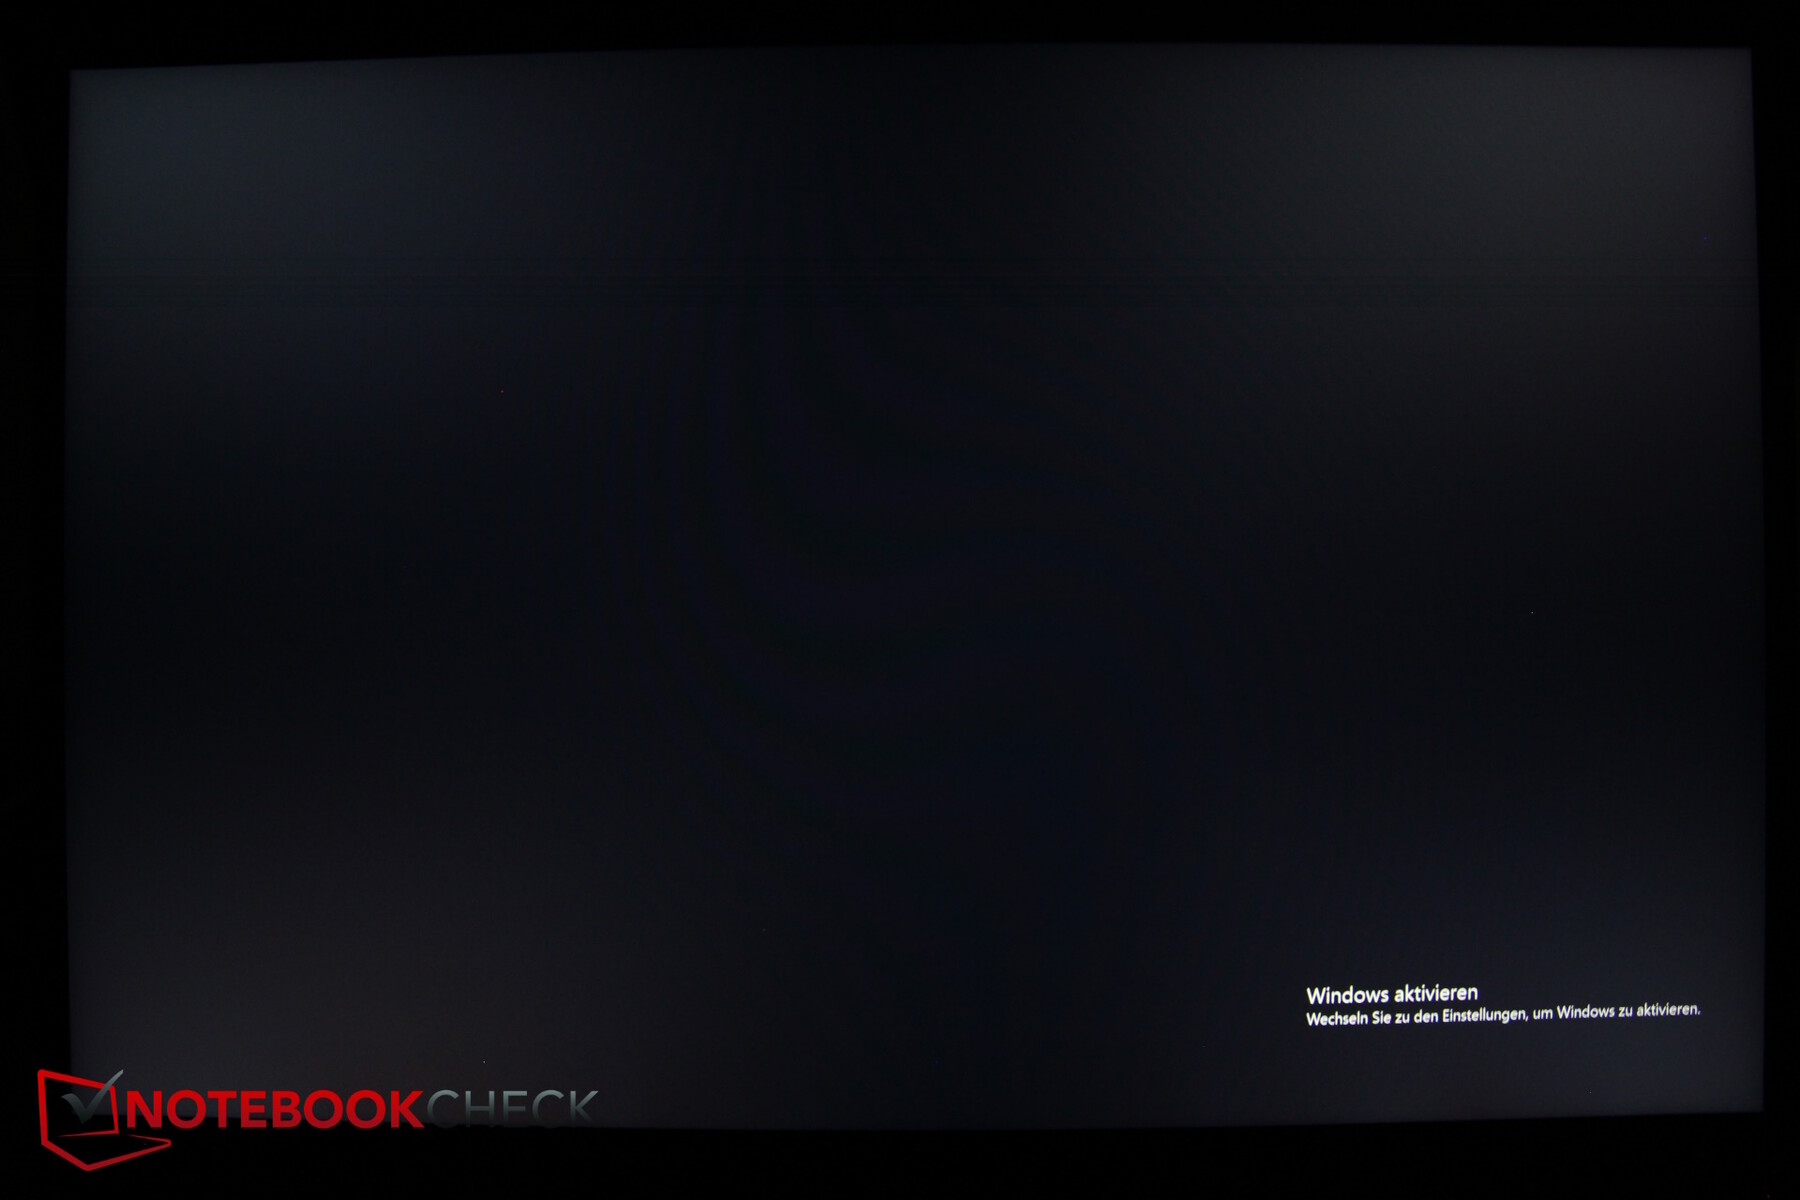
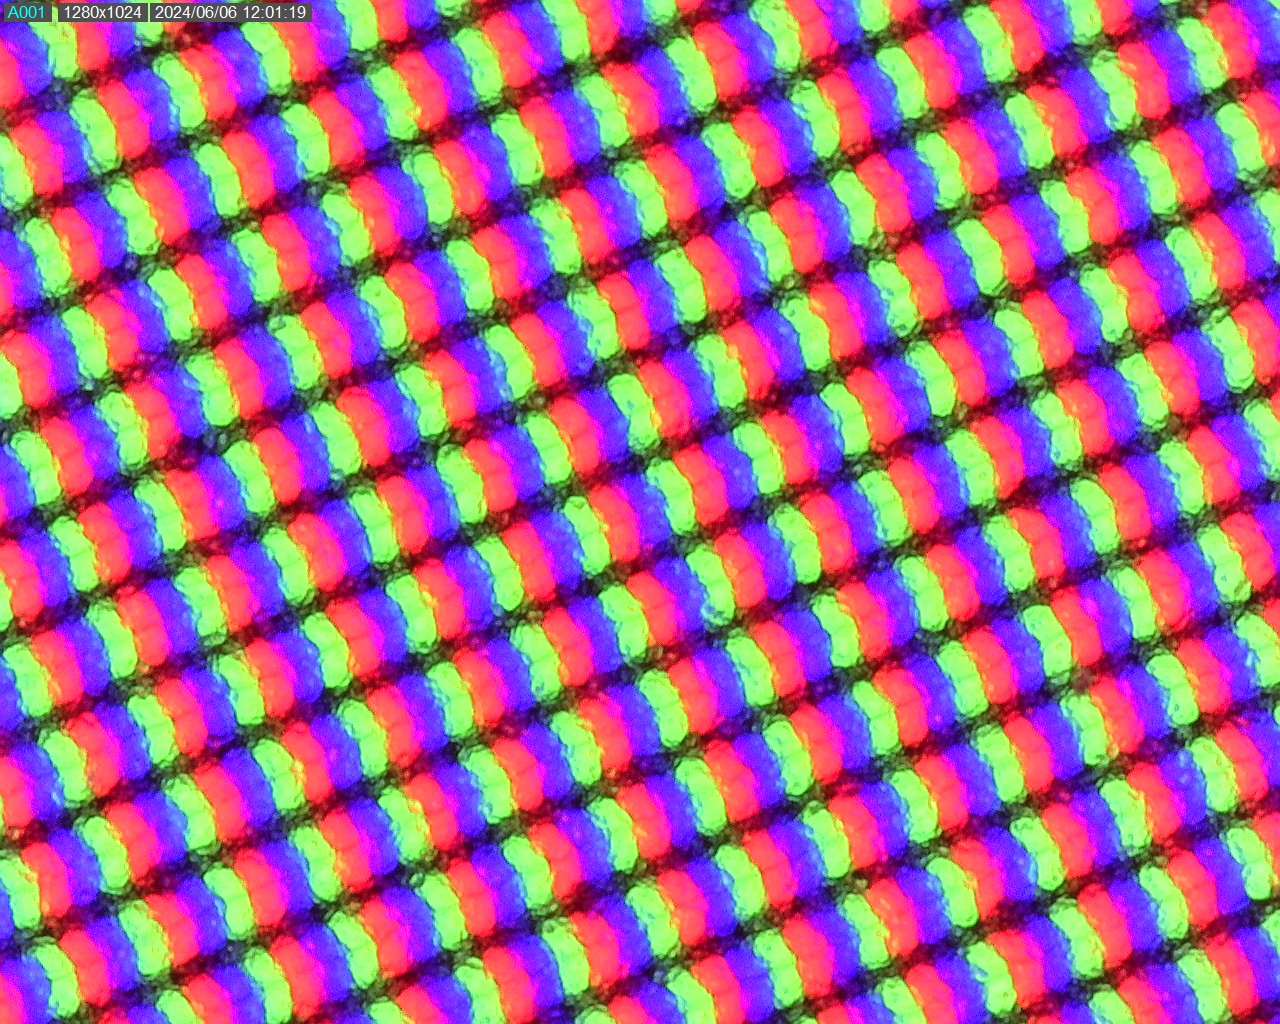
O Core usa o mesmo painel que o Fusion. Embora tenhamos medido um brilho significativamente mais alto (600 vs. 460 nits), isso tem o custo do nível de preto com o contraste sofrendo, como resultado.
Com o brilho mínimo, a luz de fundo da tela também é muito brilhante, mas ainda assim é iluminada de maneira bastante uniforme.
Com cerca de 45% de brilho (150 nits), medimos 150 nits. Com uma tela mais escura, a precisão das cores e, nem é preciso dizer, o nível de preto são um pouco melhores
Infelizmente, não há opções alternativas de tela, mas a tela é brilhante, tem tempos de resposta suficientemente rápidos, não tem PWM e, da mesma forma, o sangramento da luz de fundo também não é perceptível.
| |||||||||||||||||||||||||
iluminação: 91 %
iluminação com acumulador: 635 cd/m²
Contraste: 992:1 (Preto: 0.64 cd/m²)
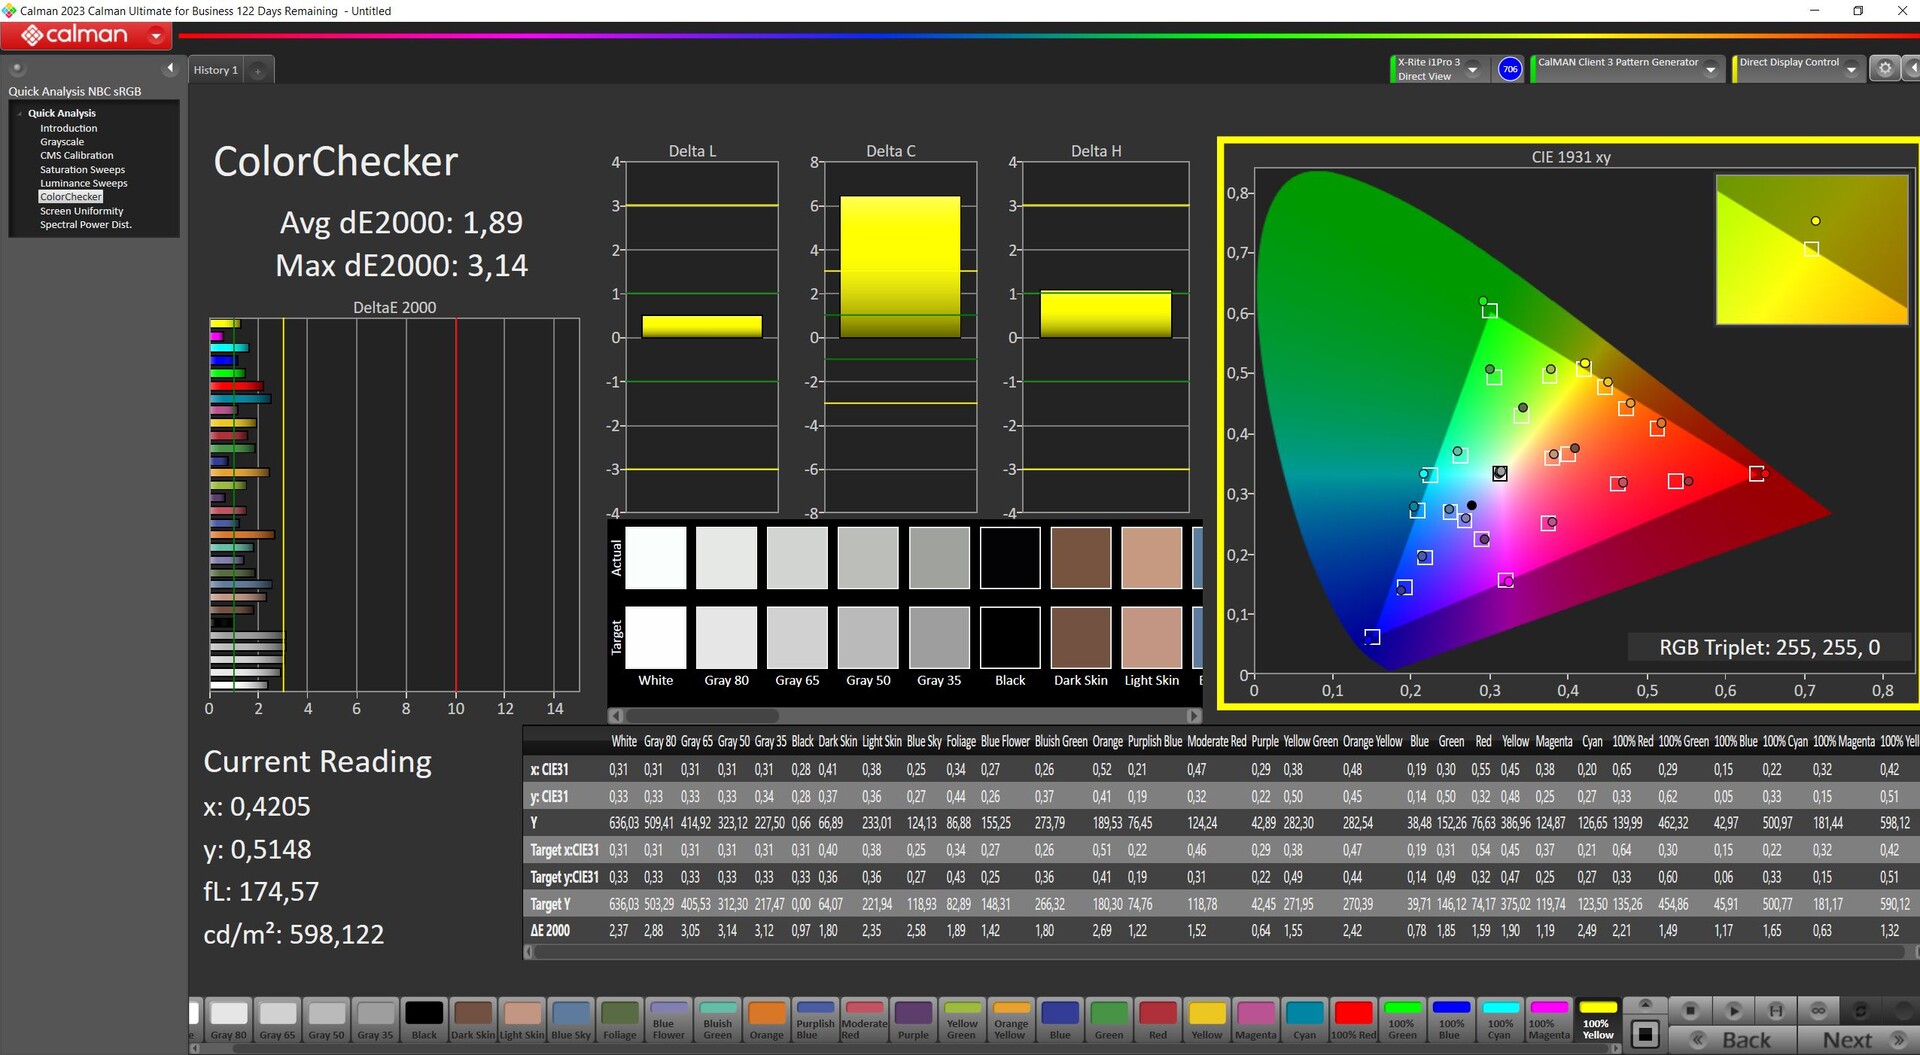
ΔE Color 1.89 | 0.5-29.43 Ø4.87, calibrated: 1.14
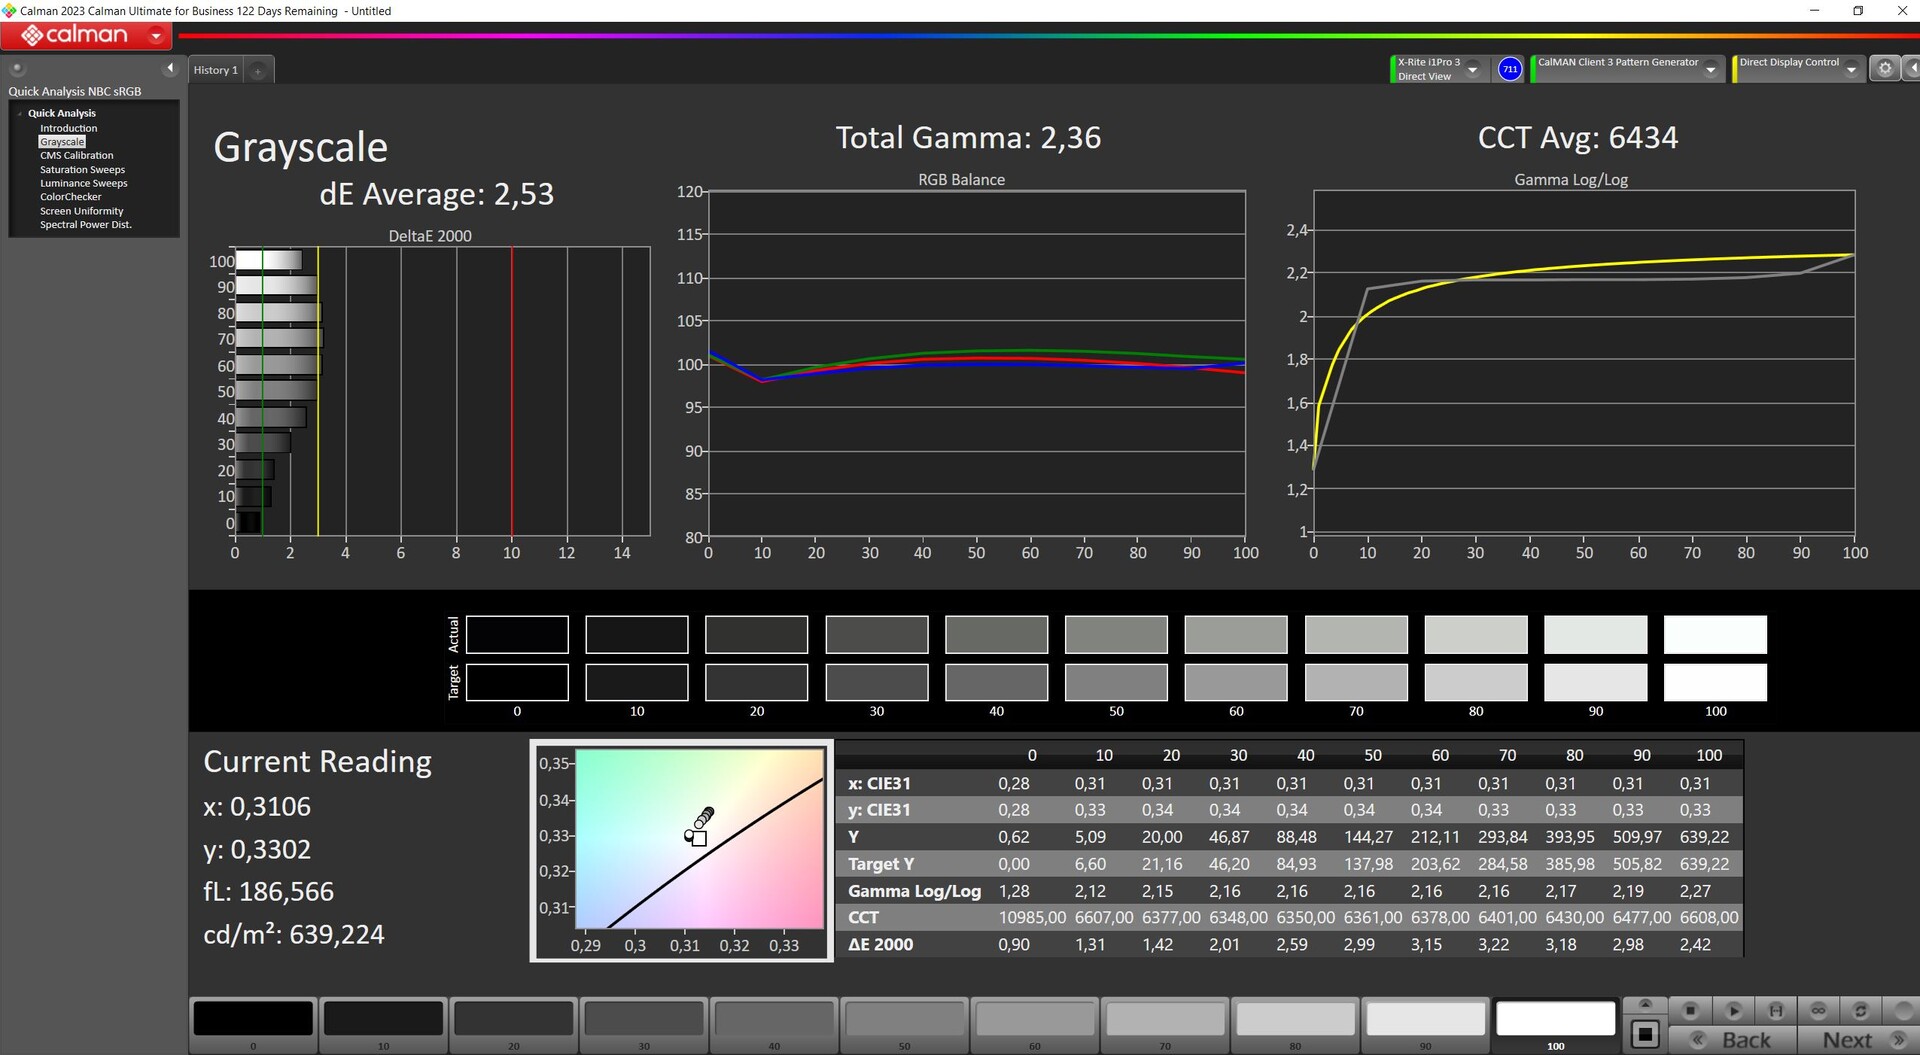
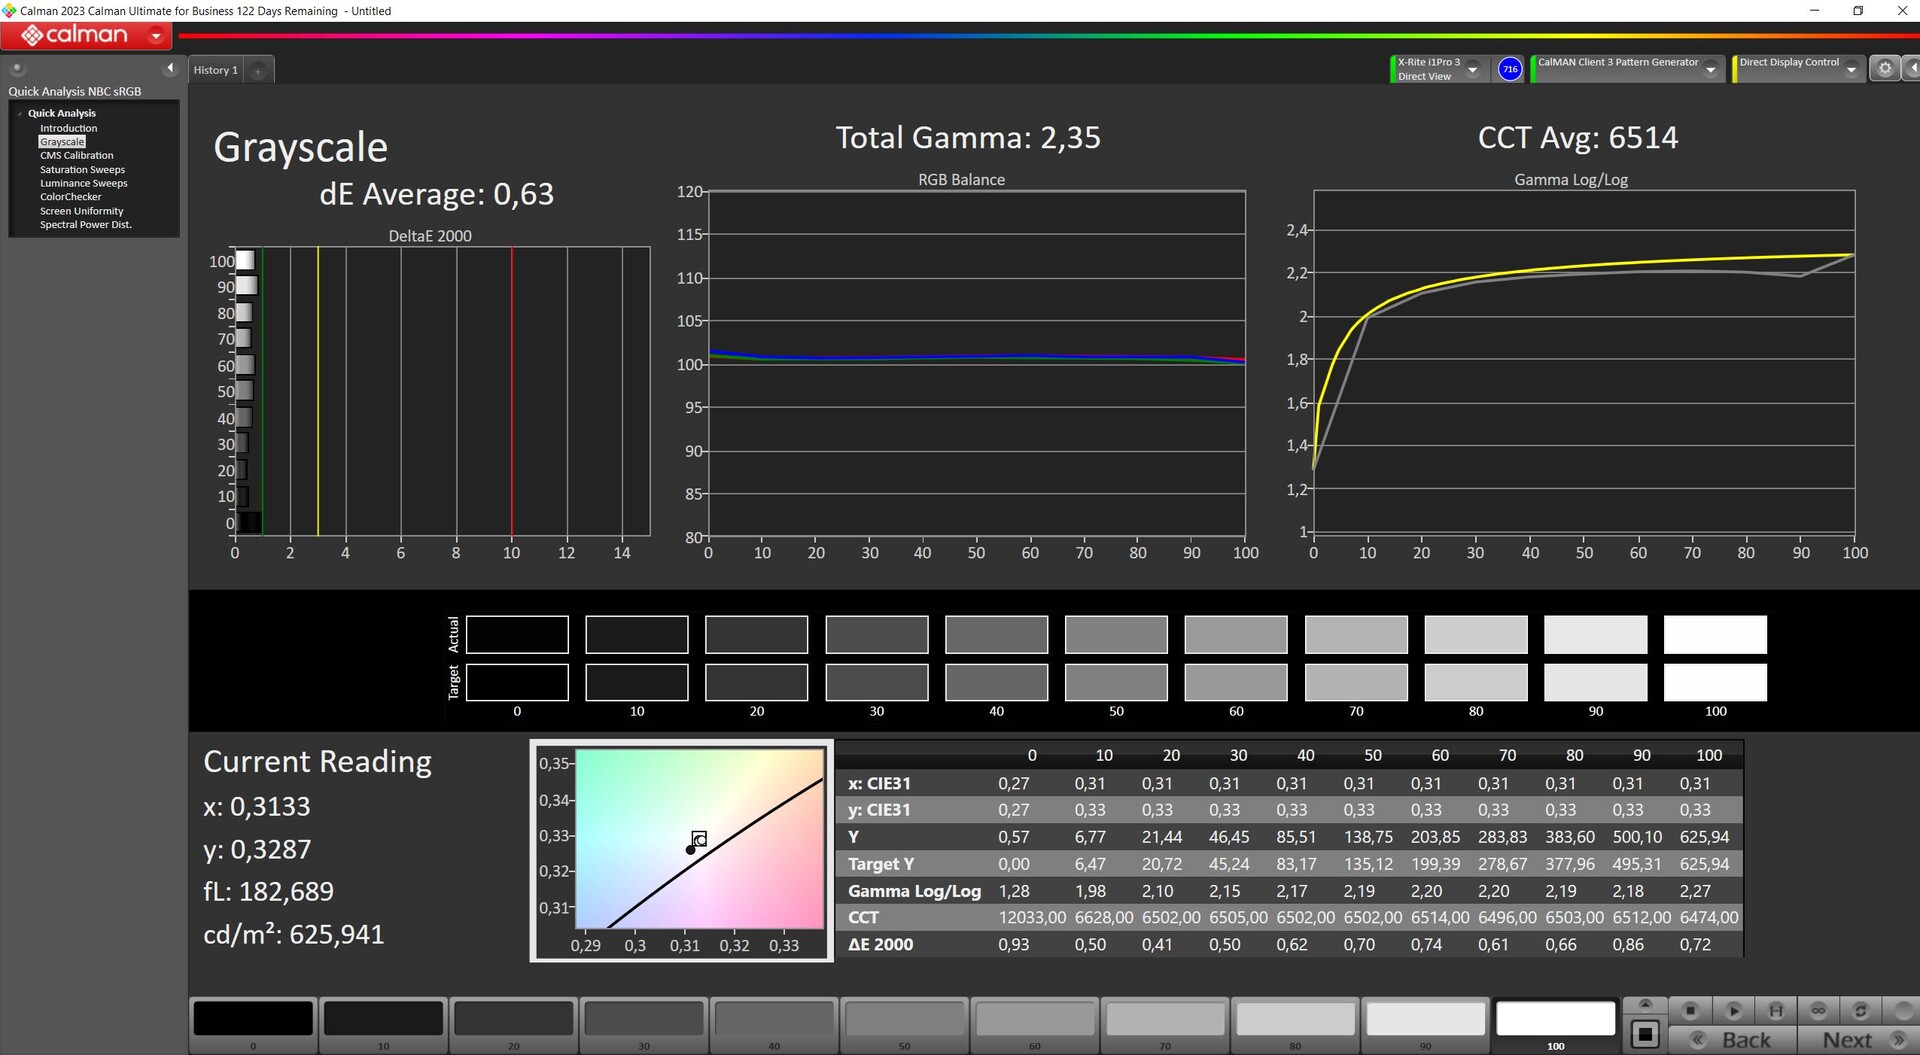
ΔE Greyscale 2.53 | 0.5-98 Ø5.1
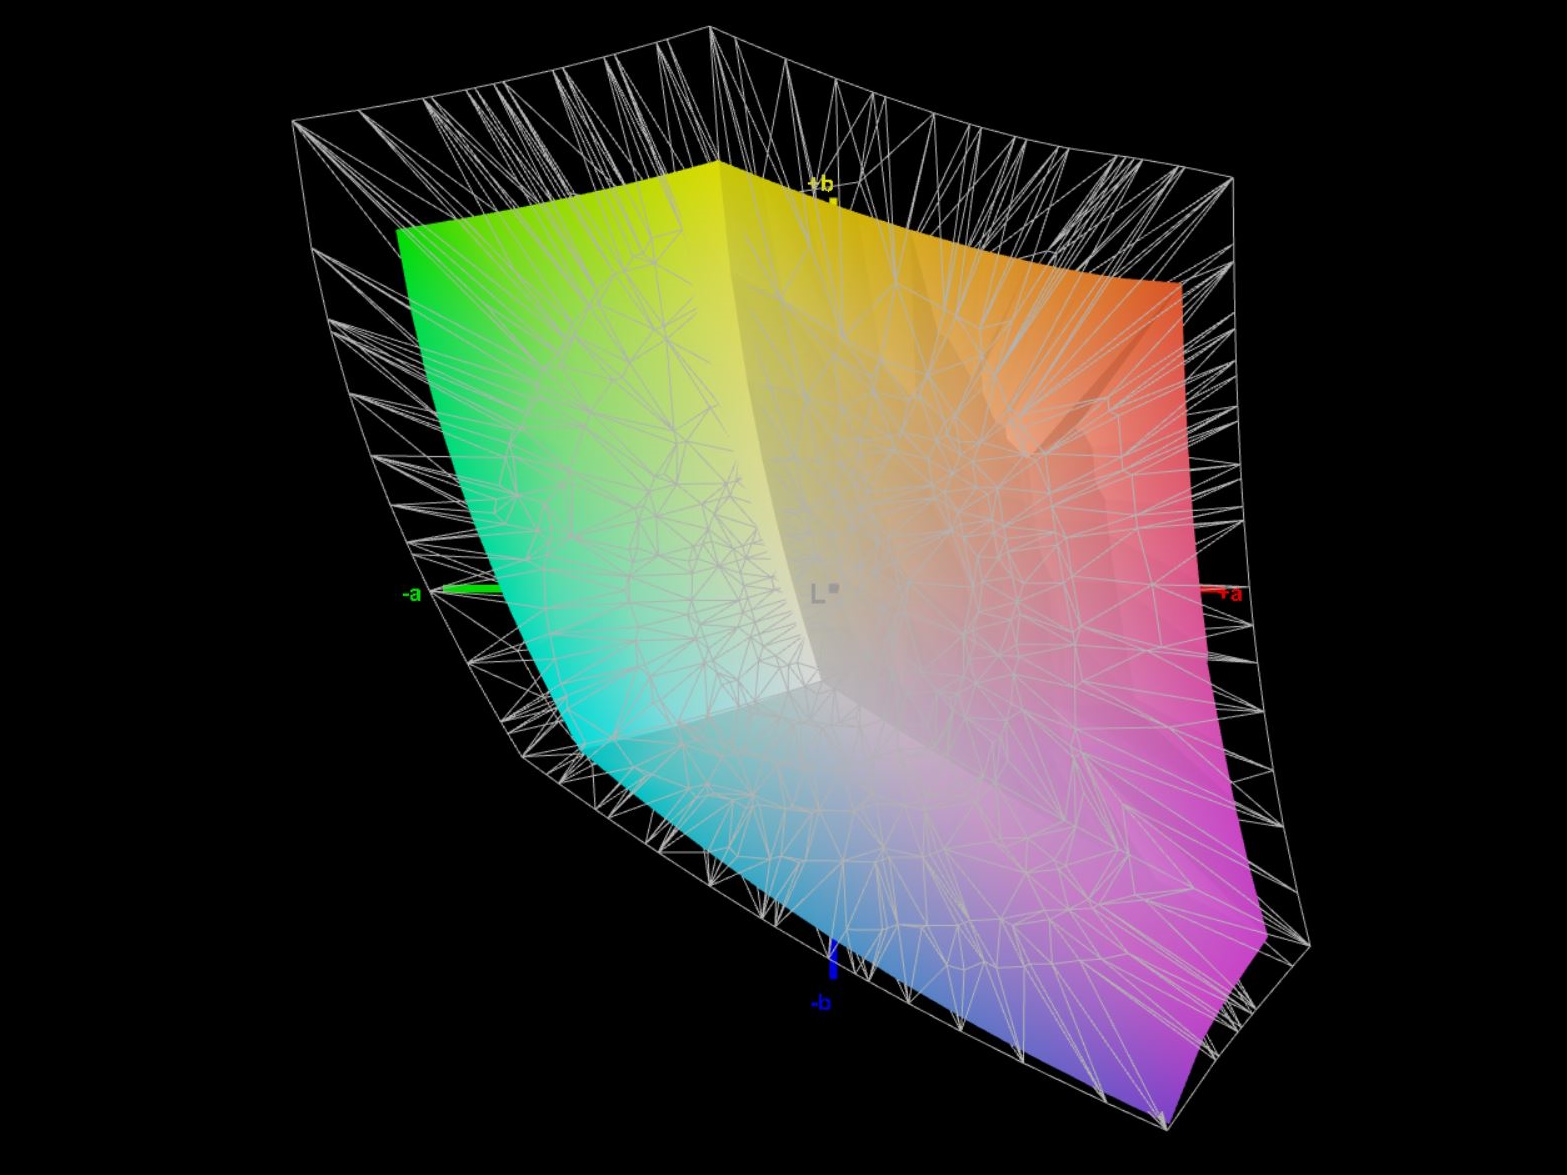
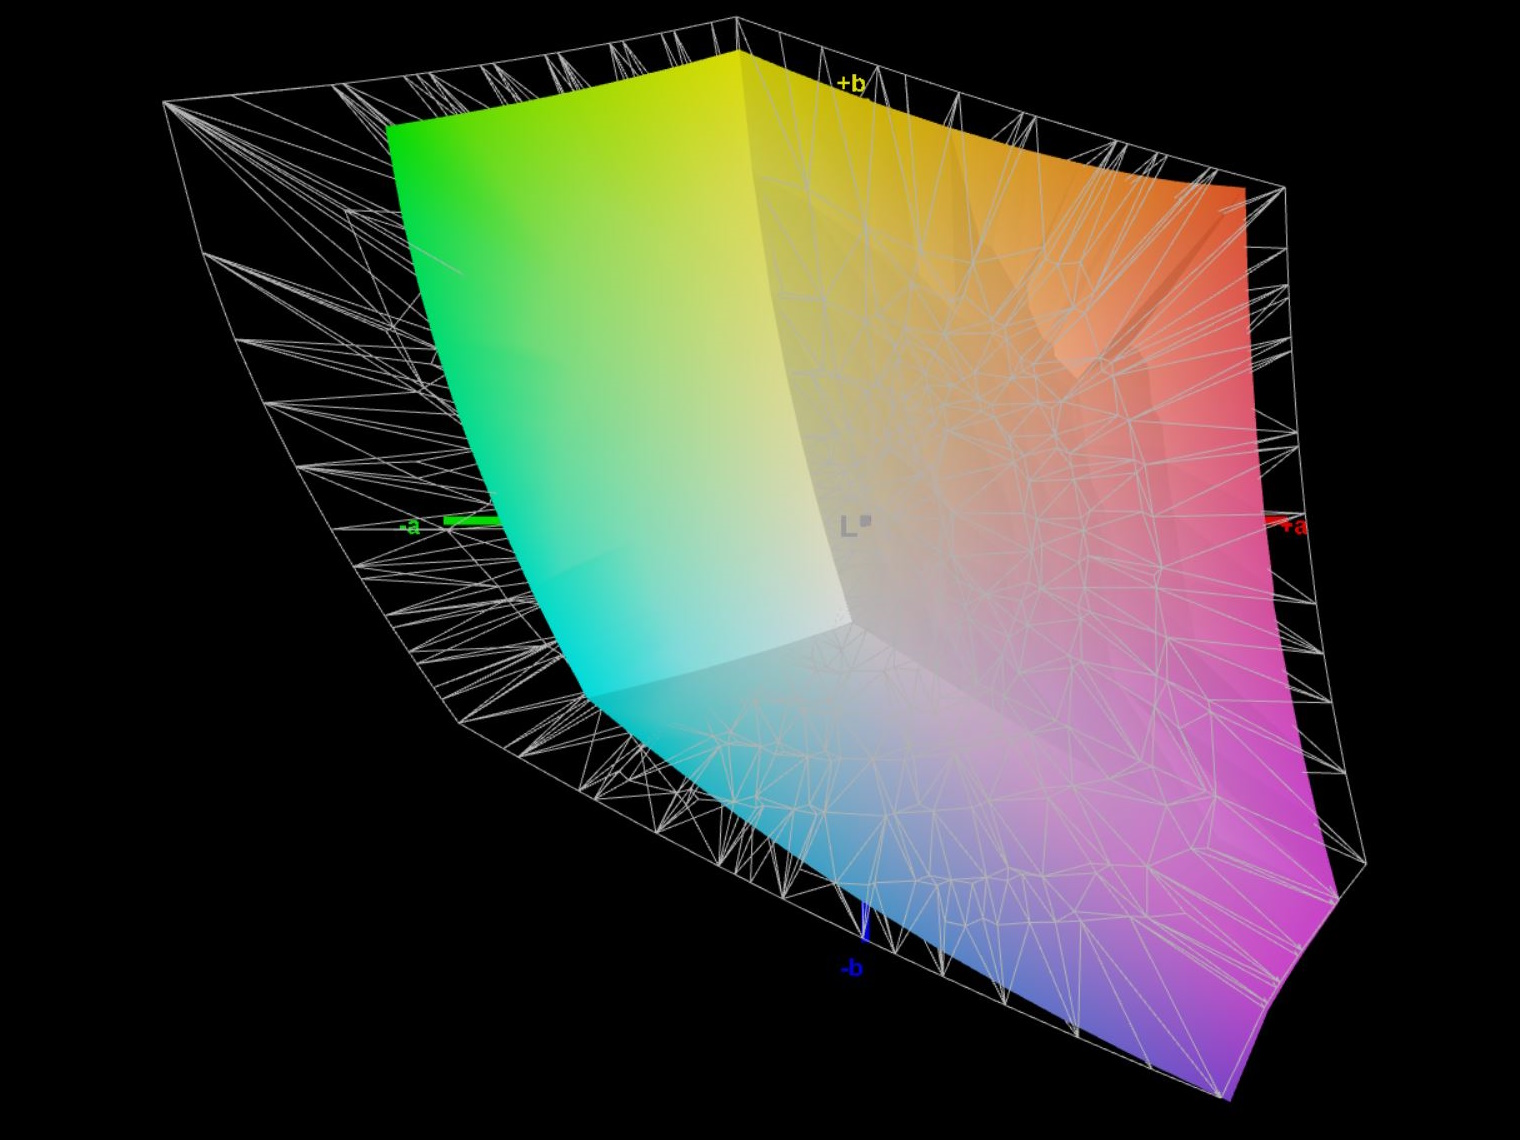
74.6% AdobeRGB 1998 (Argyll 2.2.0 3D)
100% sRGB (Argyll 2.2.0 3D)
73.2% Display P3 (Argyll 2.2.0 3D)
Gamma: 2.36
| SCHENKER XMG Core 15 (M24) BOE NJ NE153QDM-NZ1 (BOE0C8E), IPS, 2560x1600, 15.3" | Lenovo Legion 5 16IRX G9 NE160QDM-NZ3, IPS, 2560x1600, 16" | HP Victus 16 (2024) Chi Mei CMN163E, IPS, 1920x1080, 16.1" | Dell G16, i7-13650HX, RTX 4060 Chi Mei CMN161D (160GME), IPS, 2560x1600, 16" | SCHENKER XMG Fusion 15 (Early 24) BOE NJ NE153QDM-NZ1, IPS, 2560x1600, 15.3" | SCHENKER XMG Pro 15 (E23) BOE0AD1, IPS, 2560x1440, 15.6" | |
|---|---|---|---|---|---|---|
| Display | -1% | -42% | -5% | 0% | 16% | |
| Display P3 Coverage | 73.2 | 72.4 -1% | 41.3 -44% | 67.5 -8% | 73.5 0% | 97.8 34% |
| sRGB Coverage | 100 | 100 0% | 61.7 -38% | 98.5 -1% | 100 0% | 99.9 0% |
| AdobeRGB 1998 Coverage | 74.6 | 74.1 -1% | 42.7 -43% | 69.3 -7% | 75 1% | 85.4 14% |
| Response Times | -13% | -151% | 4% | 46% | -25% | |
| Response Time Grey 50% / Grey 80% * | 9.6 ? | 12.5 ? -30% | 28.6 ? -198% | 7.6 ? 21% | 5 ? 48% | 14 ? -46% |
| Response Time Black / White * | 9.2 ? | 8.7 ? 5% | 18.7 ? -103% | 10.4 ? -13% | 5.2 ? 43% | 9.6 ? -4% |
| PWM Frequency | ||||||
| Screen | 22% | -114% | -29% | -11% | -24% | |
| Brightness middle | 635 | 526 -17% | 287 -55% | 369 -42% | 491 -23% | 322 -49% |
| Brightness | 604 | 500 -17% | 288 -52% | 344 -43% | 460 -24% | 301 -50% |
| Brightness Distribution | 91 | 87 -4% | 86 -5% | 89 -2% | 89 -2% | 85 -7% |
| Black Level * | 0.64 | 0.33 48% | 0.19 70% | 0.26 59% | 0.47 27% | 0.36 44% |
| Contrast | 992 | 1594 61% | 1511 52% | 1419 43% | 1045 5% | 894 -10% |
| Colorchecker dE 2000 * | 1.89 | 1.2 37% | 5.46 -189% | 3.04 -61% | 2.16 -14% | 1.98 -5% |
| Colorchecker dE 2000 max. * | 3.14 | 2.1 33% | 20.36 -548% | 5.56 -77% | 4.44 -41% | 5.24 -67% |
| Colorchecker dE 2000 calibrated * | 1.14 | 1 12% | 3.52 -209% | 2.35 -106% | 1.14 -0% | 1.98 -74% |
| Greyscale dE 2000 * | 2.53 | 1.3 49% | 4.8 -90% | 3.38 -34% | 3.3 -30% | 2.44 4% |
| Gamma | 2.36 93% | 2.23 99% | 2.108 104% | 2.47 89% | 2.204 100% | 2.42 91% |
| CCT | 6434 101% | 6391 102% | 6442 101% | 6040 108% | 6286 103% | 6984 93% |
| Média Total (Programa/Configurações) | 3% /
13% | -102% /
-104% | -10% /
-19% | 12% /
-1% | -11% /
-15% |
* ... menor é melhor
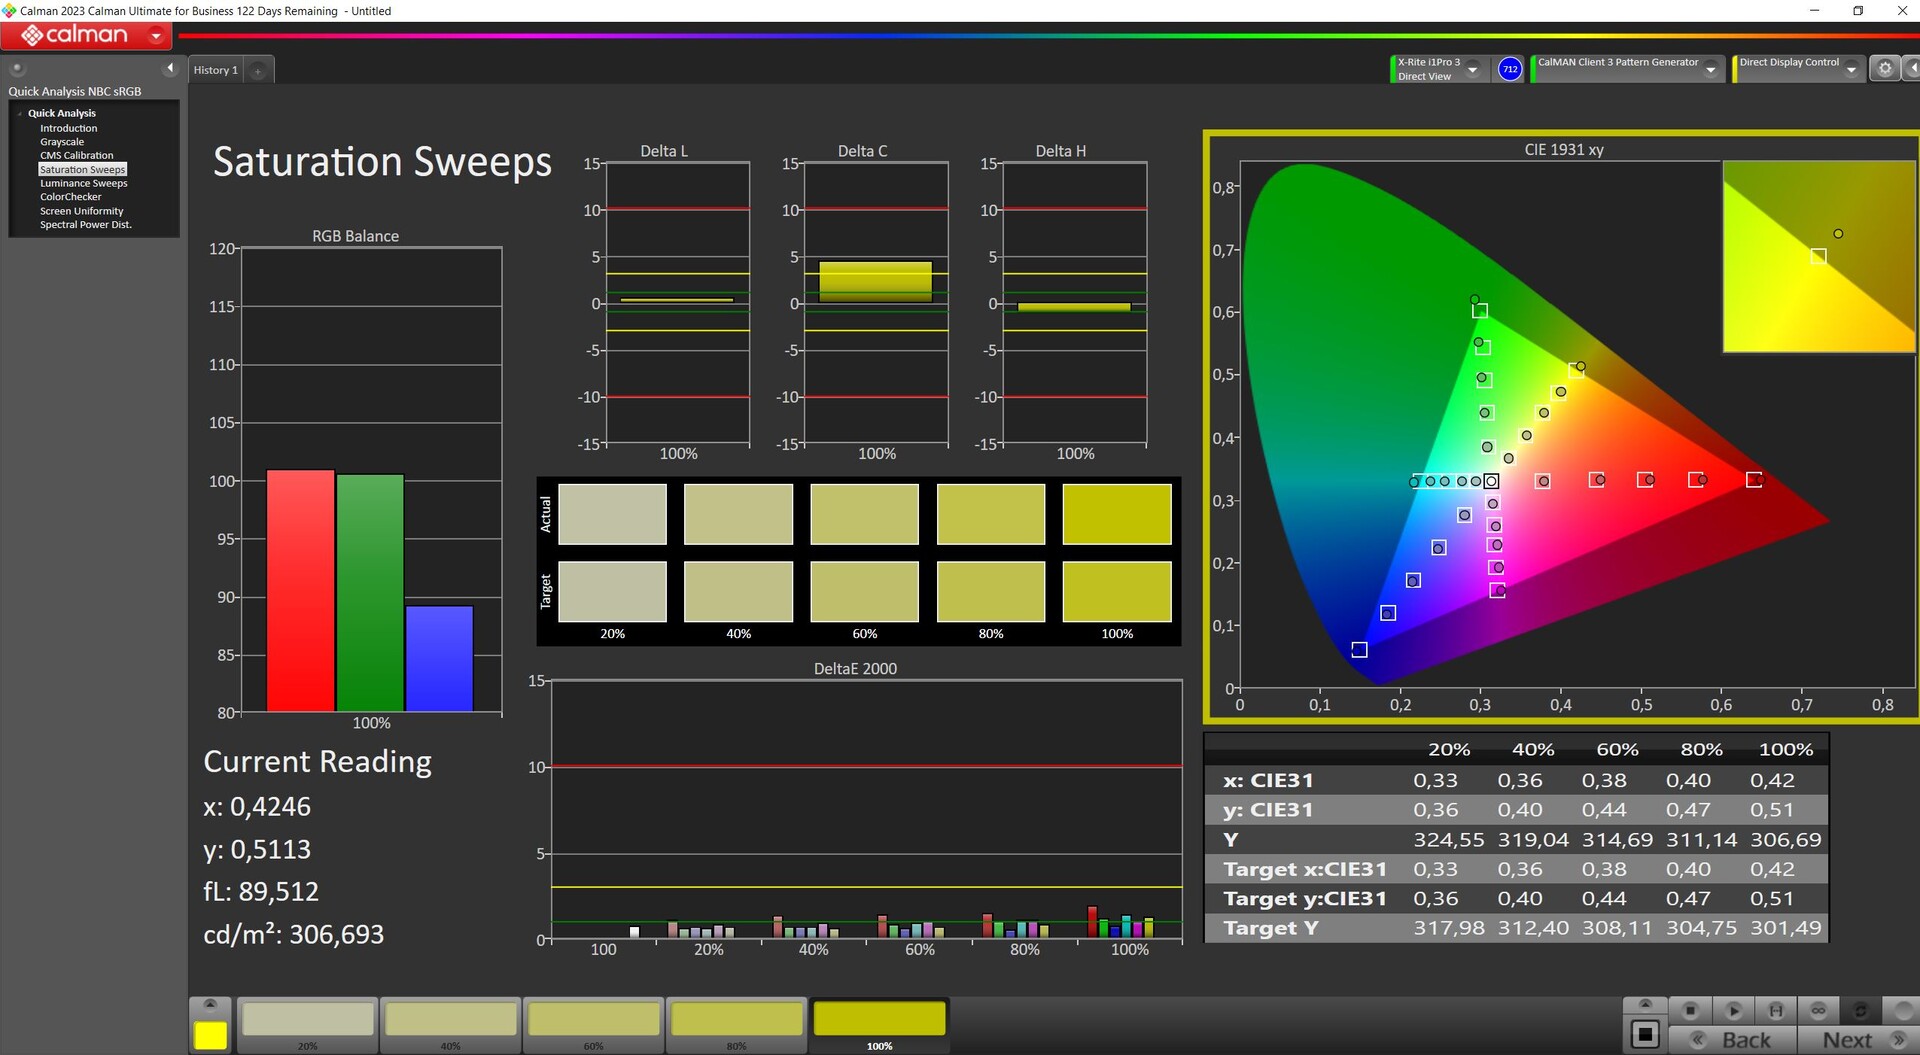
Cobertura do espaço de cores
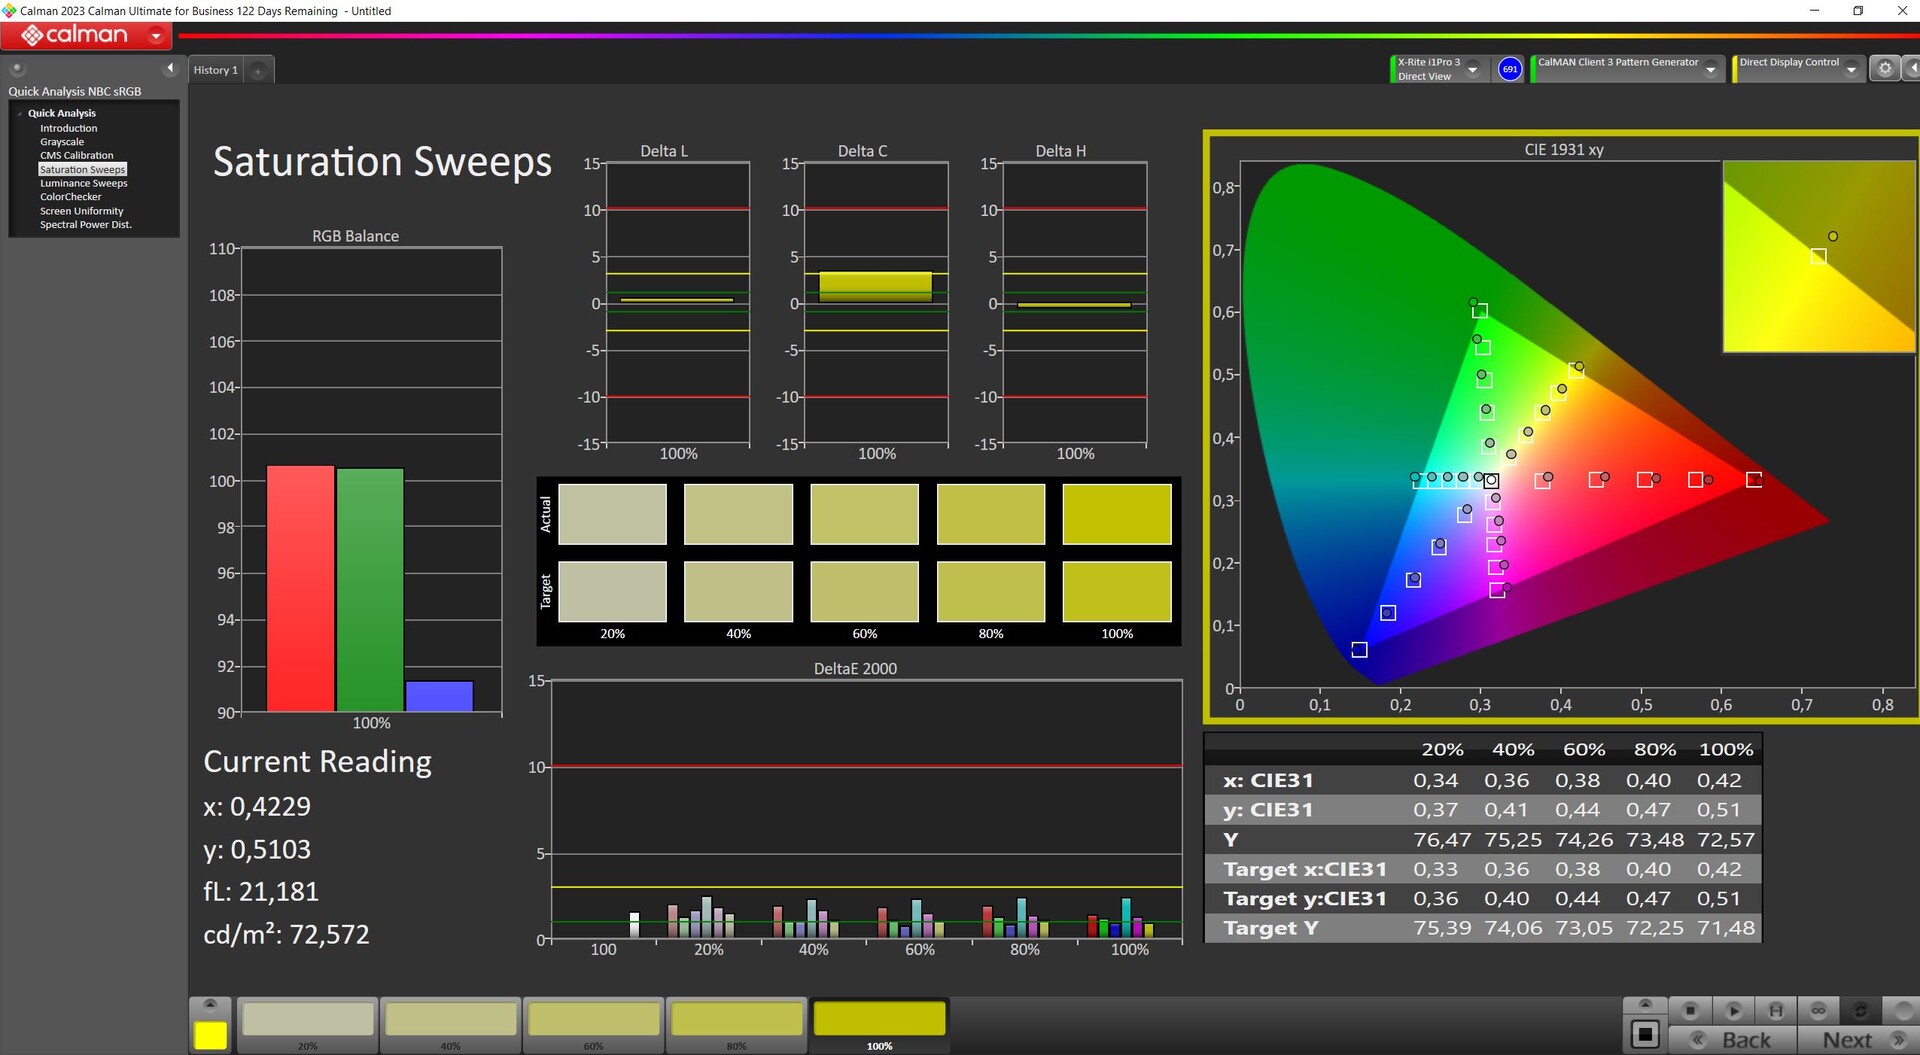
Assim como no Fusion 15, o sRGB é totalmente coberto, com o P3 e o AdobeRGB situados em torno de 73 a 75 por cento.

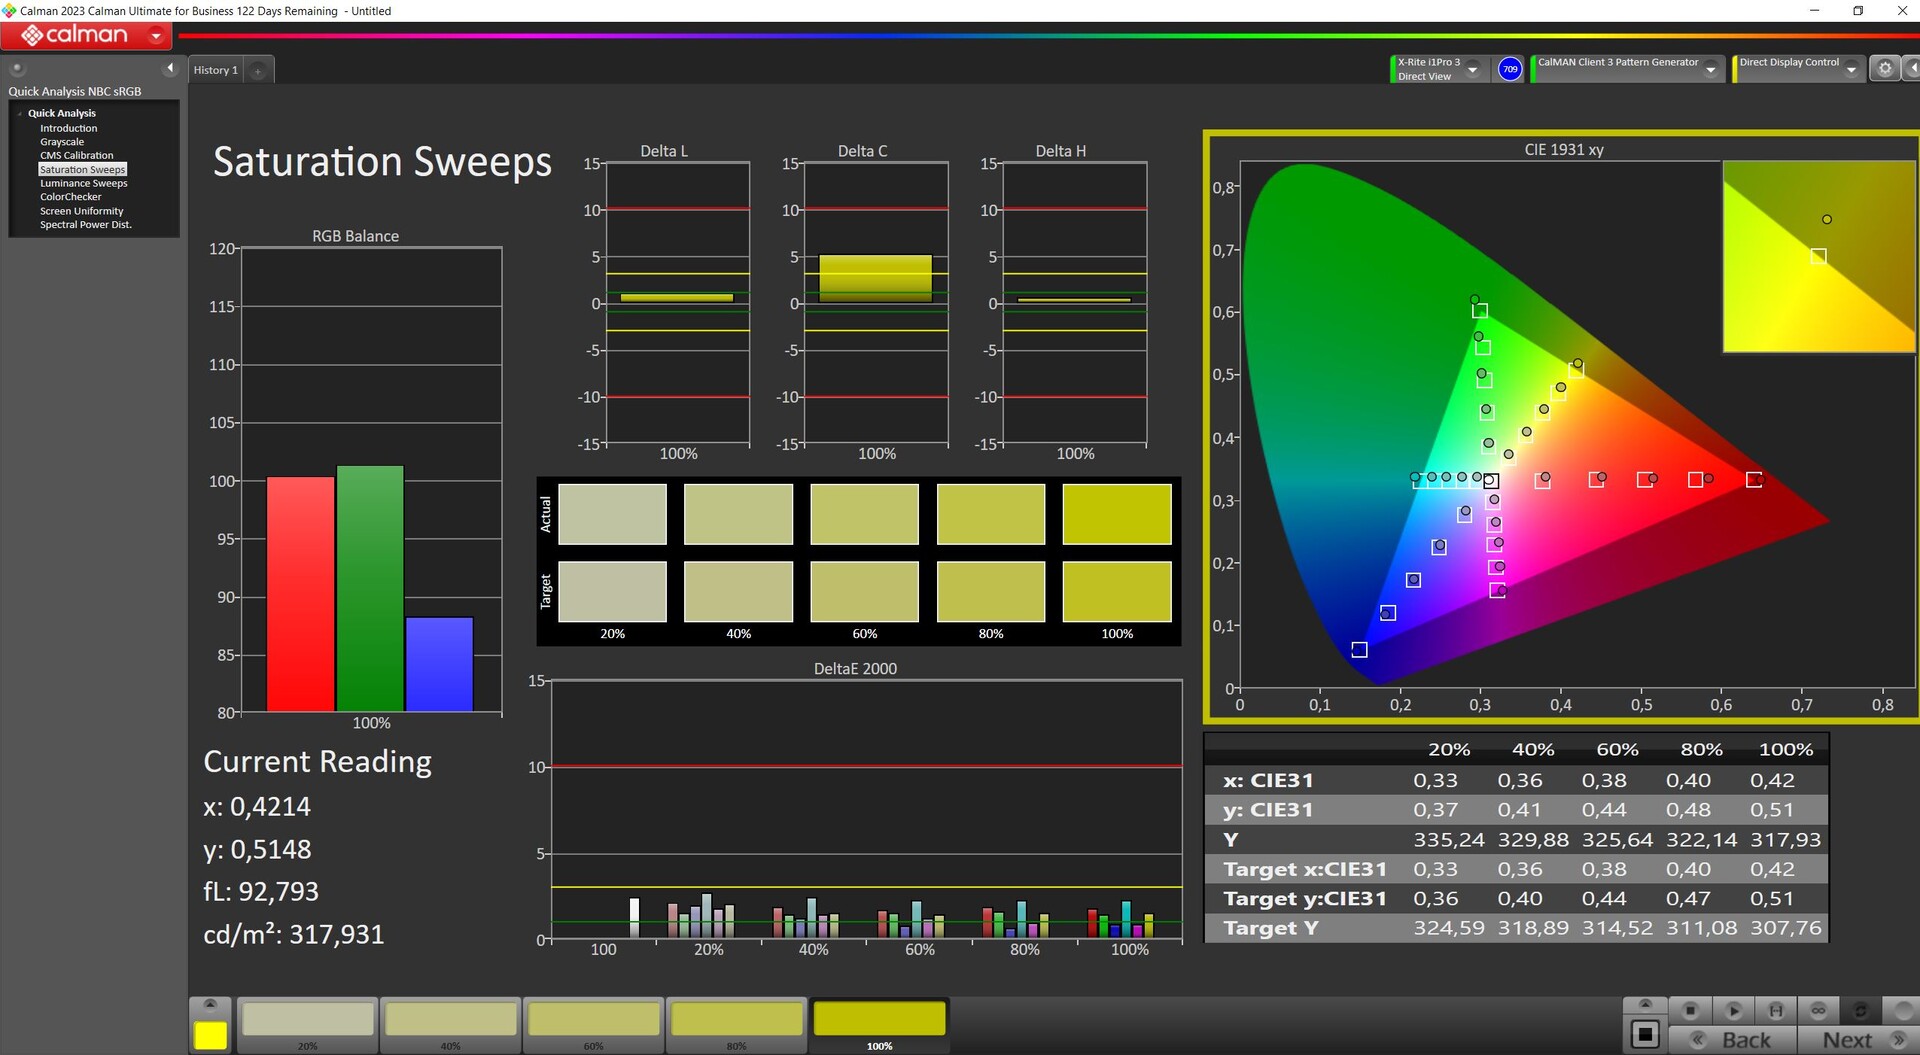
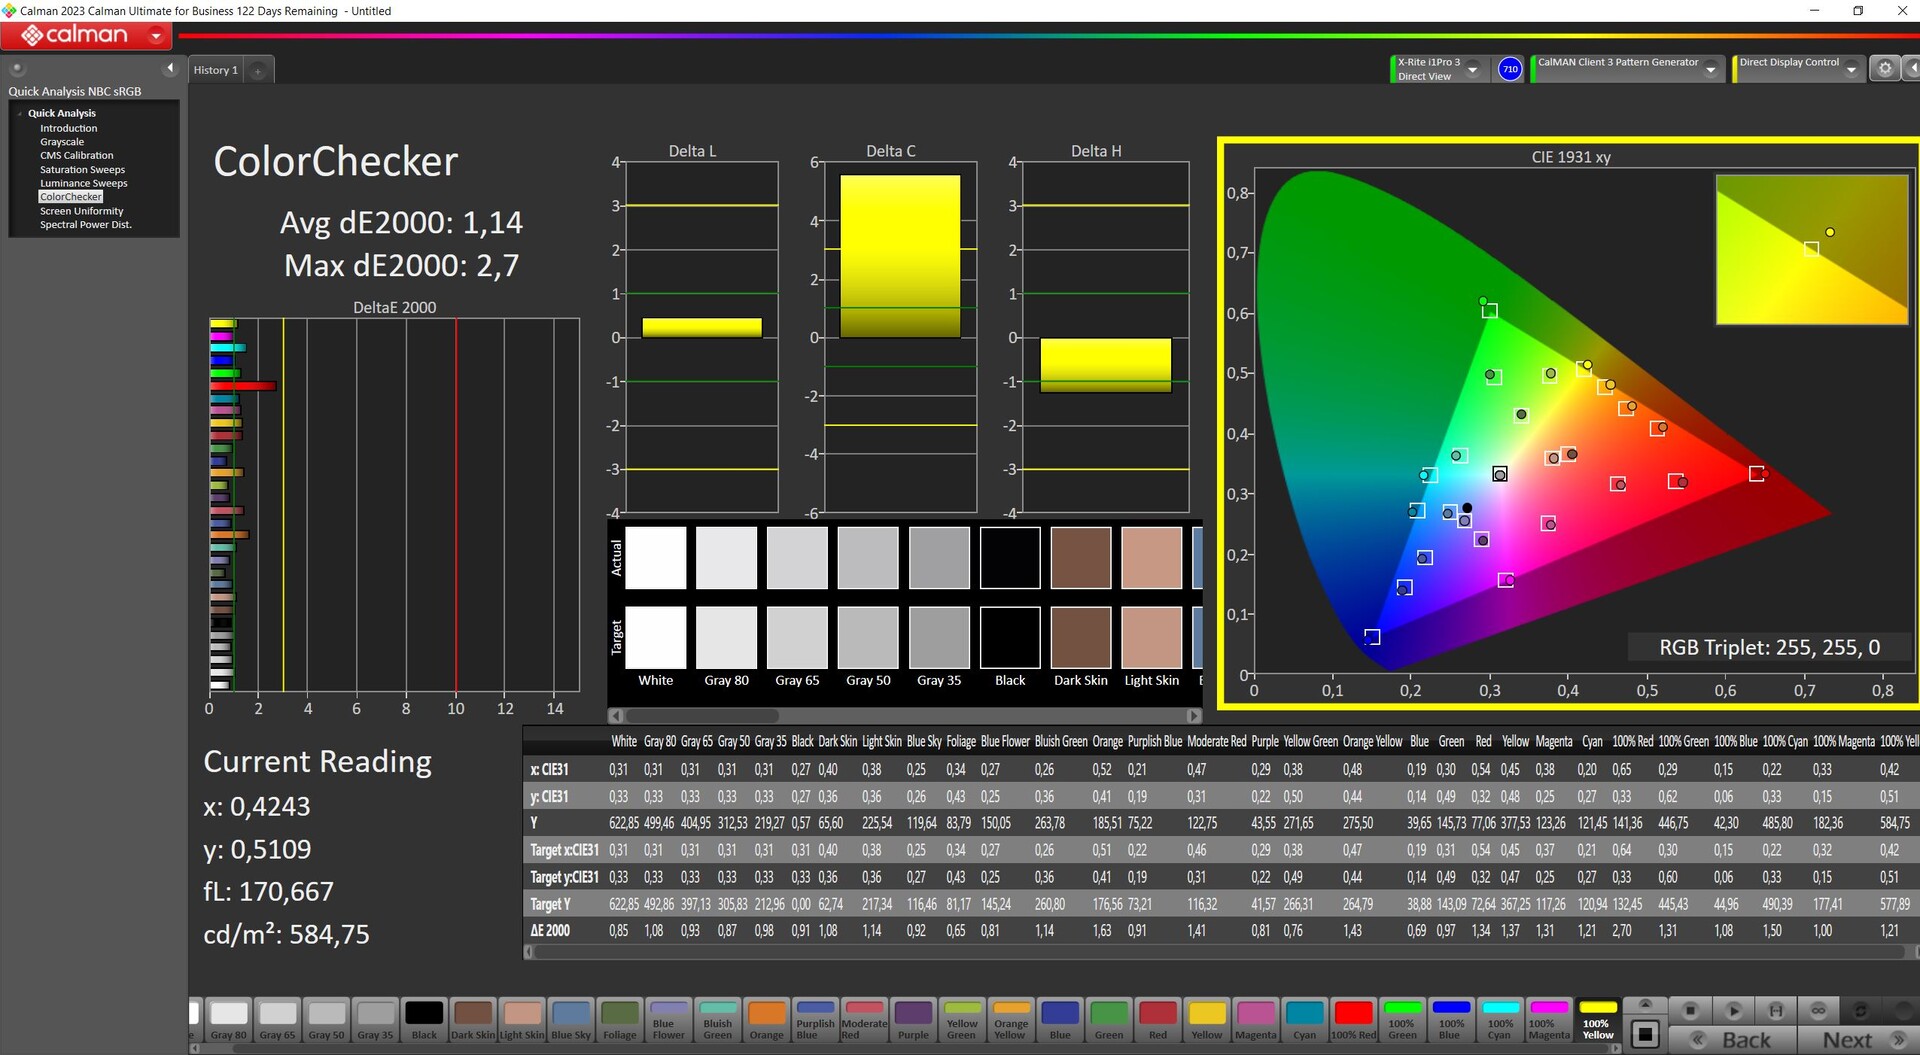
Precisão de cores
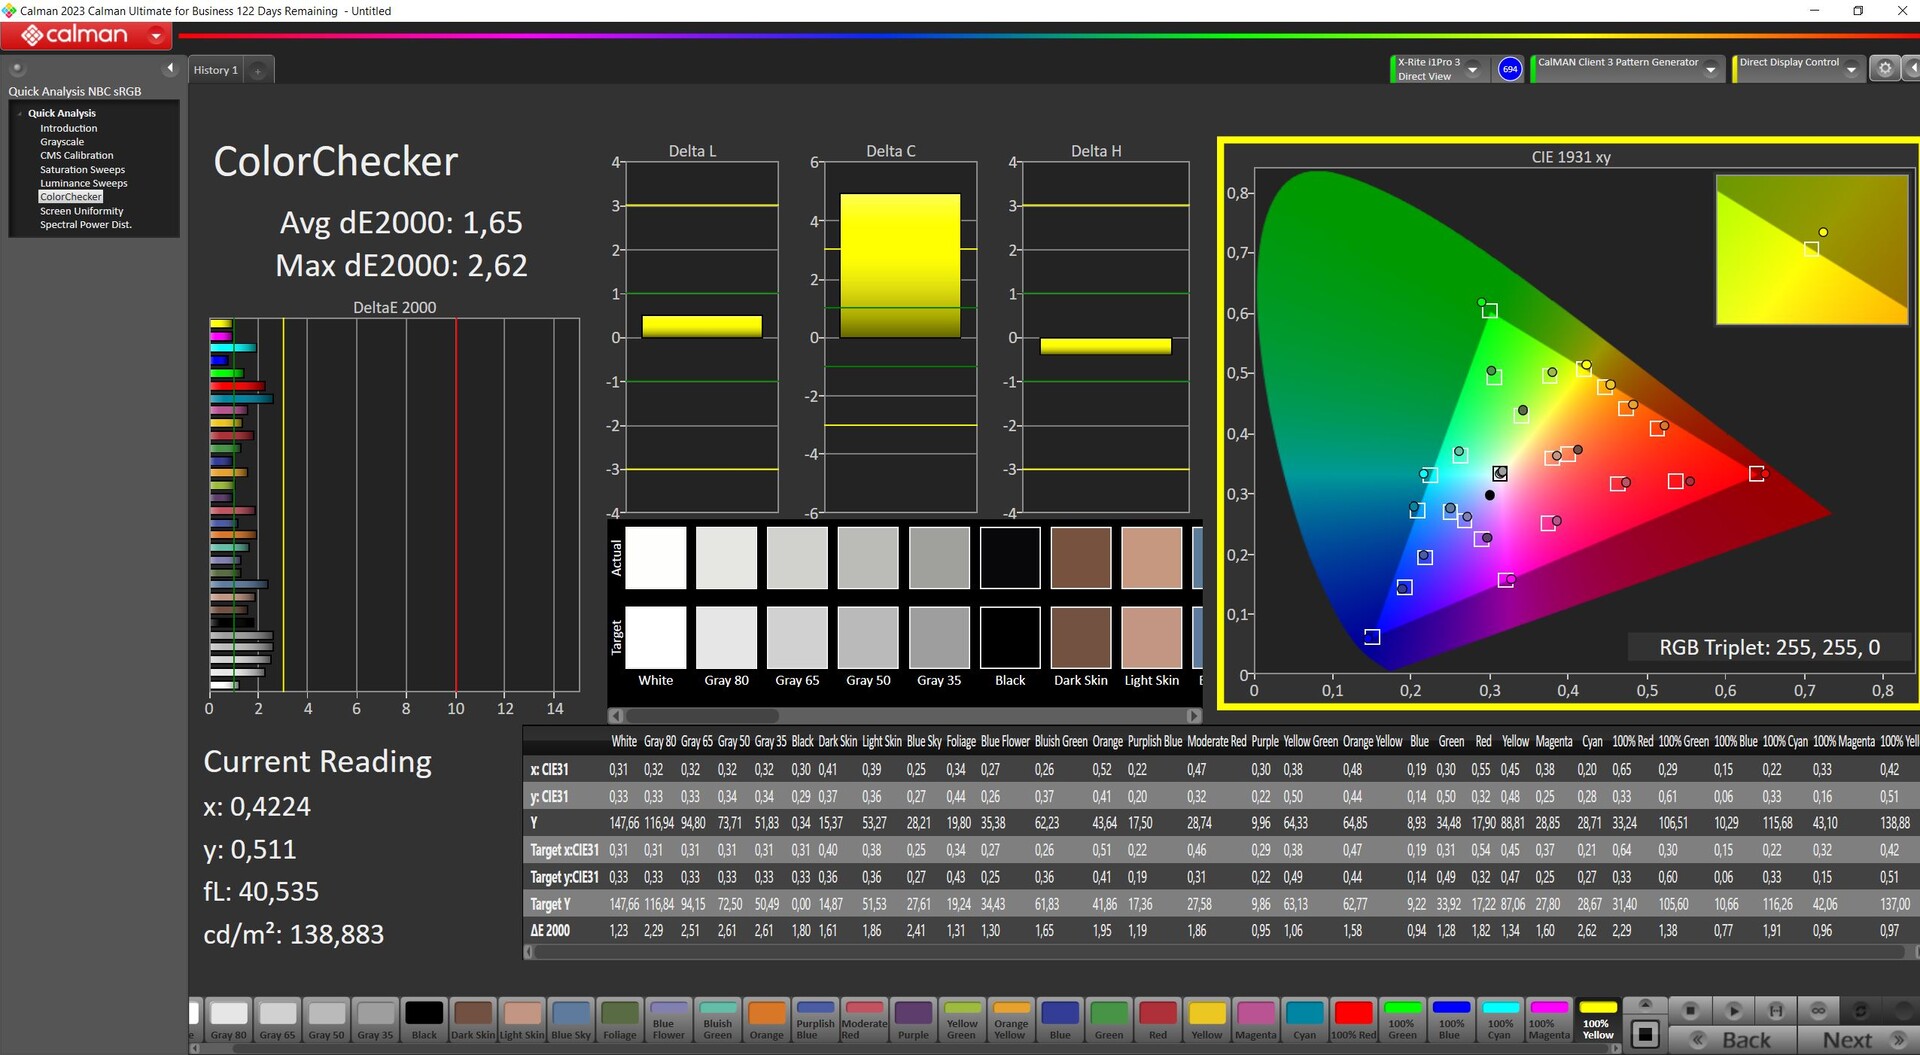
Quando sai da caixa, o painel é calibrado de forma decente, com valores DeltaE inferiores a 3. No entanto, o valor de preto é consideravelmente alto demais. Reduzir o brilho para 150 nits não apenas melhora a situação, mas também reduz um pouco os valores DeltaE.
A calibração manual no brilho máximo nativo faz maravilhas, apesar dos valores já decentes, e consegue minimizar visivelmente os desvios. Portanto, o painel pode ser calibrado muito bem e isso leva a uma precisão de cores muito boa, pelo menos em sRGB. Com o brilho máximo, o valor de preto continua sendo muito alto e isso faz com que o contraste seja prejudicado.

Exibir tempos de resposta
| ↔ Tempo de resposta preto para branco | ||
|---|---|---|
| 9.2 ms ... ascensão ↗ e queda ↘ combinadas | ↗ 4.6 ms ascensão | 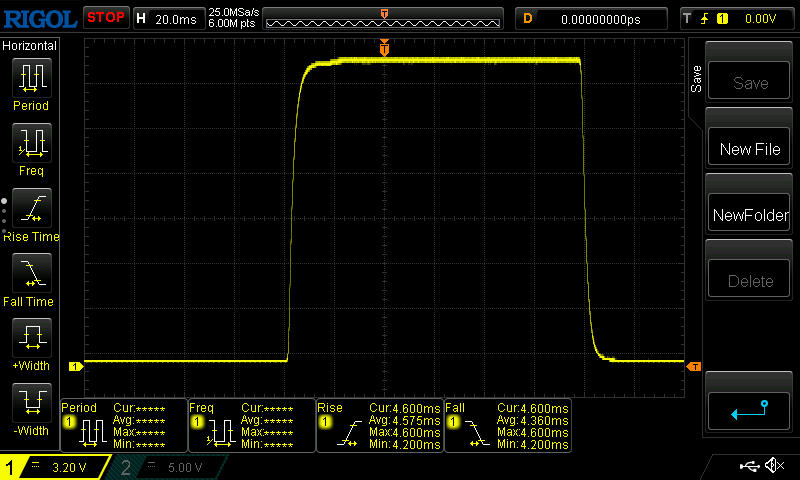 |
| ↘ 4.6 ms queda | ||
| A tela mostra taxas de resposta rápidas em nossos testes e deve ser adequada para jogos. Em comparação, todos os dispositivos testados variam de 0.1 (mínimo) a 240 (máximo) ms. » 23 % de todos os dispositivos são melhores. Isso significa que o tempo de resposta medido é melhor que a média de todos os dispositivos testados (20.8 ms). | ||
| ↔ Tempo de resposta 50% cinza a 80% cinza | ||
| 9.6 ms ... ascensão ↗ e queda ↘ combinadas | ↗ 4.6 ms ascensão | 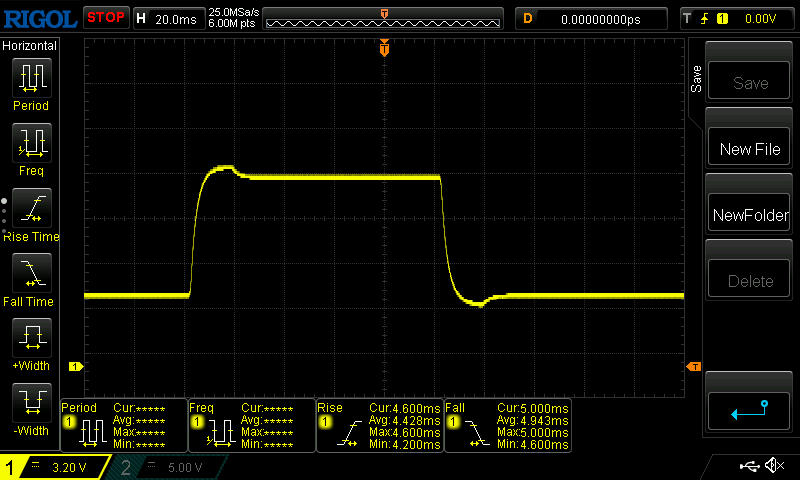 |
| ↘ 5 ms queda | ||
| A tela mostra taxas de resposta rápidas em nossos testes e deve ser adequada para jogos. Em comparação, todos os dispositivos testados variam de 0.165 (mínimo) a 636 (máximo) ms. » 20 % de todos os dispositivos são melhores. Isso significa que o tempo de resposta medido é melhor que a média de todos os dispositivos testados (32.5 ms). | ||
Cintilação da tela / PWM (modulação por largura de pulso)
| Tela tremeluzindo / PWM não detectado |  | ||
[pwm_comparison] Em comparação: 53 % de todos os dispositivos testados não usam PWM para escurecer a tela. Se PWM foi detectado, uma média de 8516 (mínimo: 5 - máximo: 343500) Hz foi medida. | |||
O alto brilho e a tela fosca garantem que o senhor não terá muitos problemas ao usar o dispositivo na sombra, pois o conteúdo permanece altamente legível. Entretanto, o contraste poderia ser um pouco maior e o senhor deve evitar a luz solar direta.

Desempenho - 20 % mais lento do que o Fusion com HX e RTX 4070
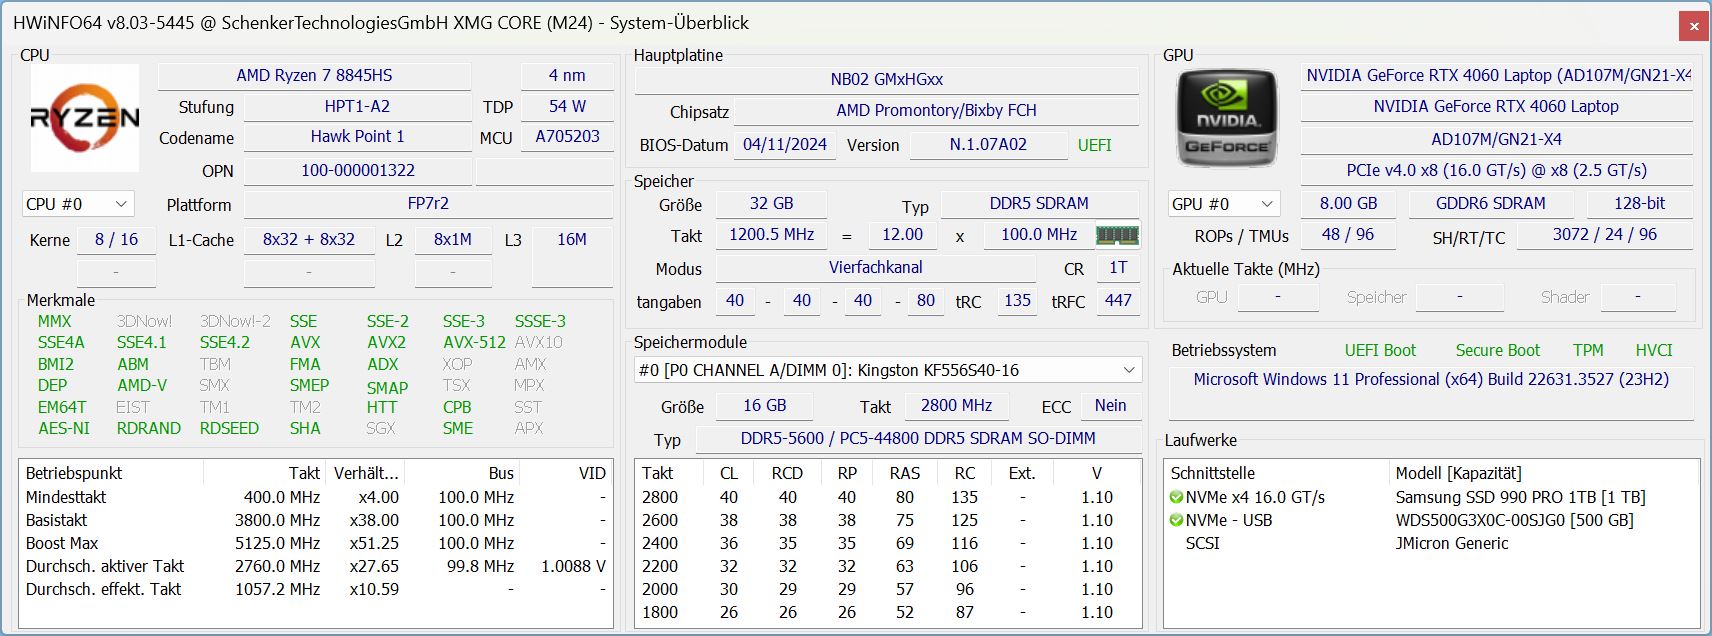
Com o Ryzen 7 8845HS, RTX 4060 e 32 GB de RAM, o XMG Core 15 se posiciona como um laptop para jogos de nível médio e também é comercializado como tal. Seu gabinete preto, relativamente fino, elegante e totalmente em alumínio dá ao laptop uma aparência discreta que também poderia torná-lo interessante para os criadores de conteúdo. Isso torna ainda mais lamentável que o Schenker não ofereça nenhuma opção de exibição adicional, pois a tela bem calibrada pode exibir "apenas" sRGB. Esse poderia ser um critério desnecessário para editores de fotos e, principalmente, de vídeos. É por isso que também gostaríamos de ver opções de DisplayP3 no futuro.
Condições de teste
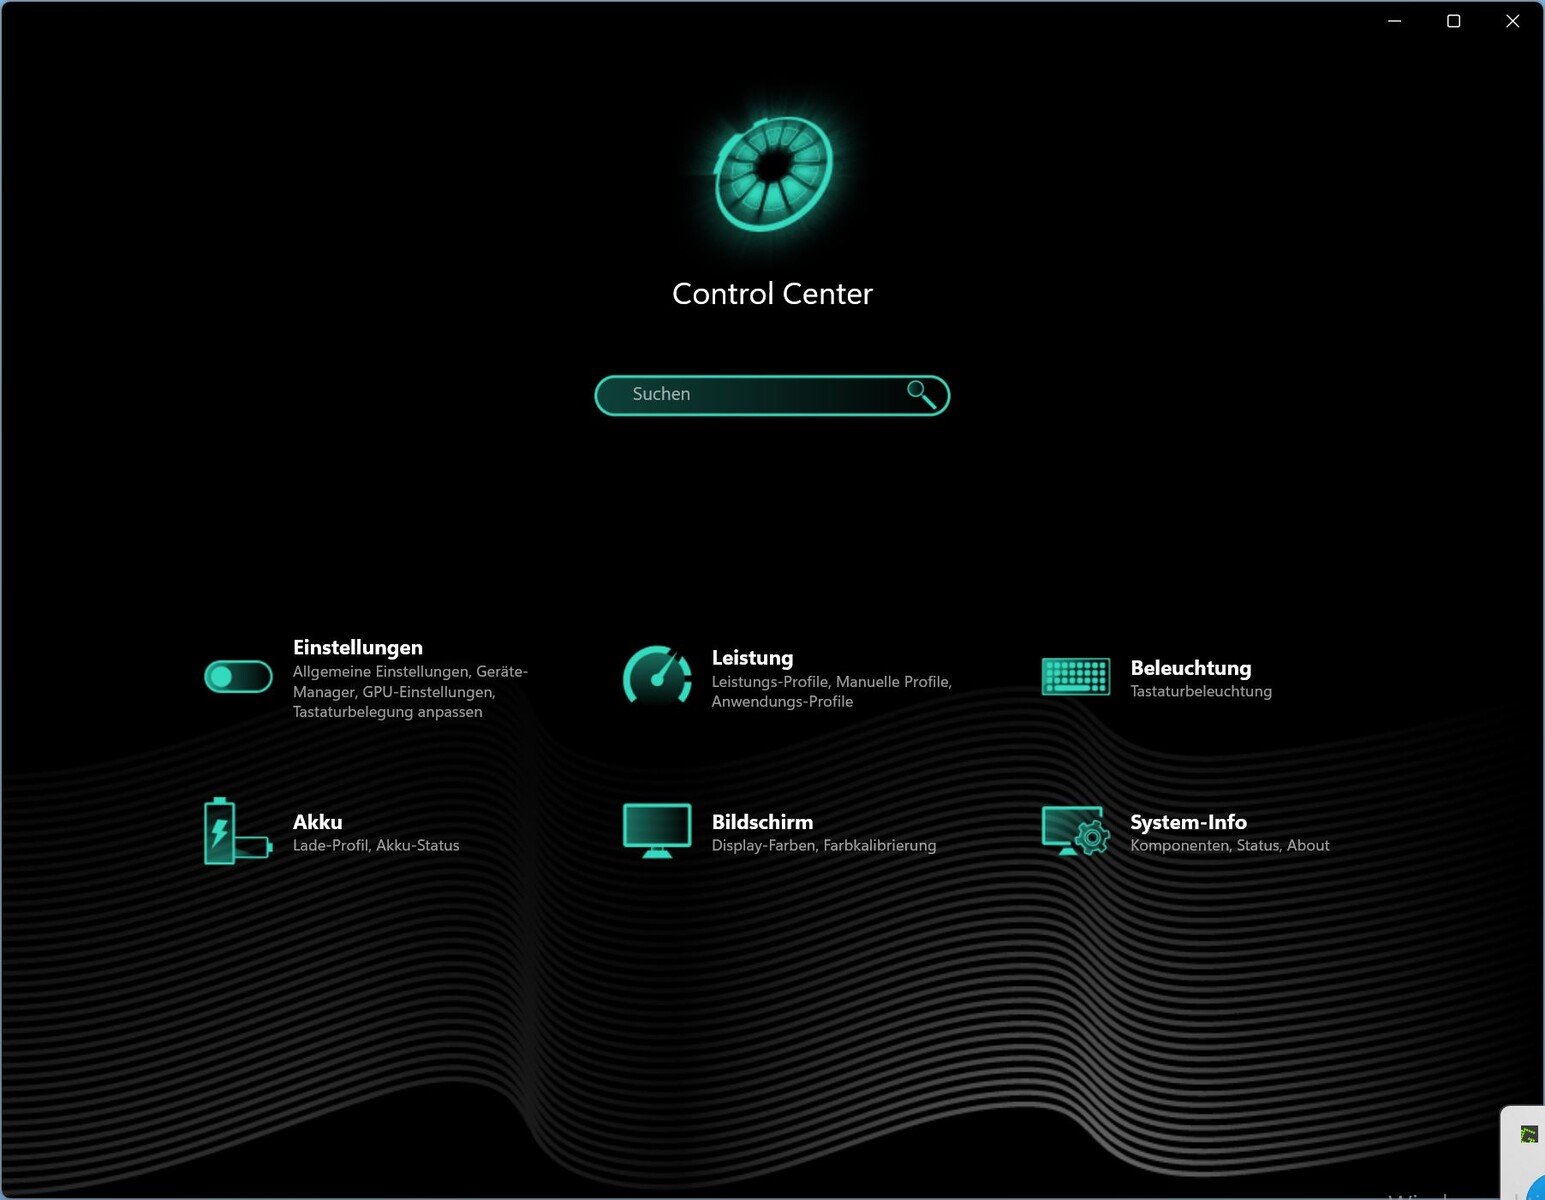
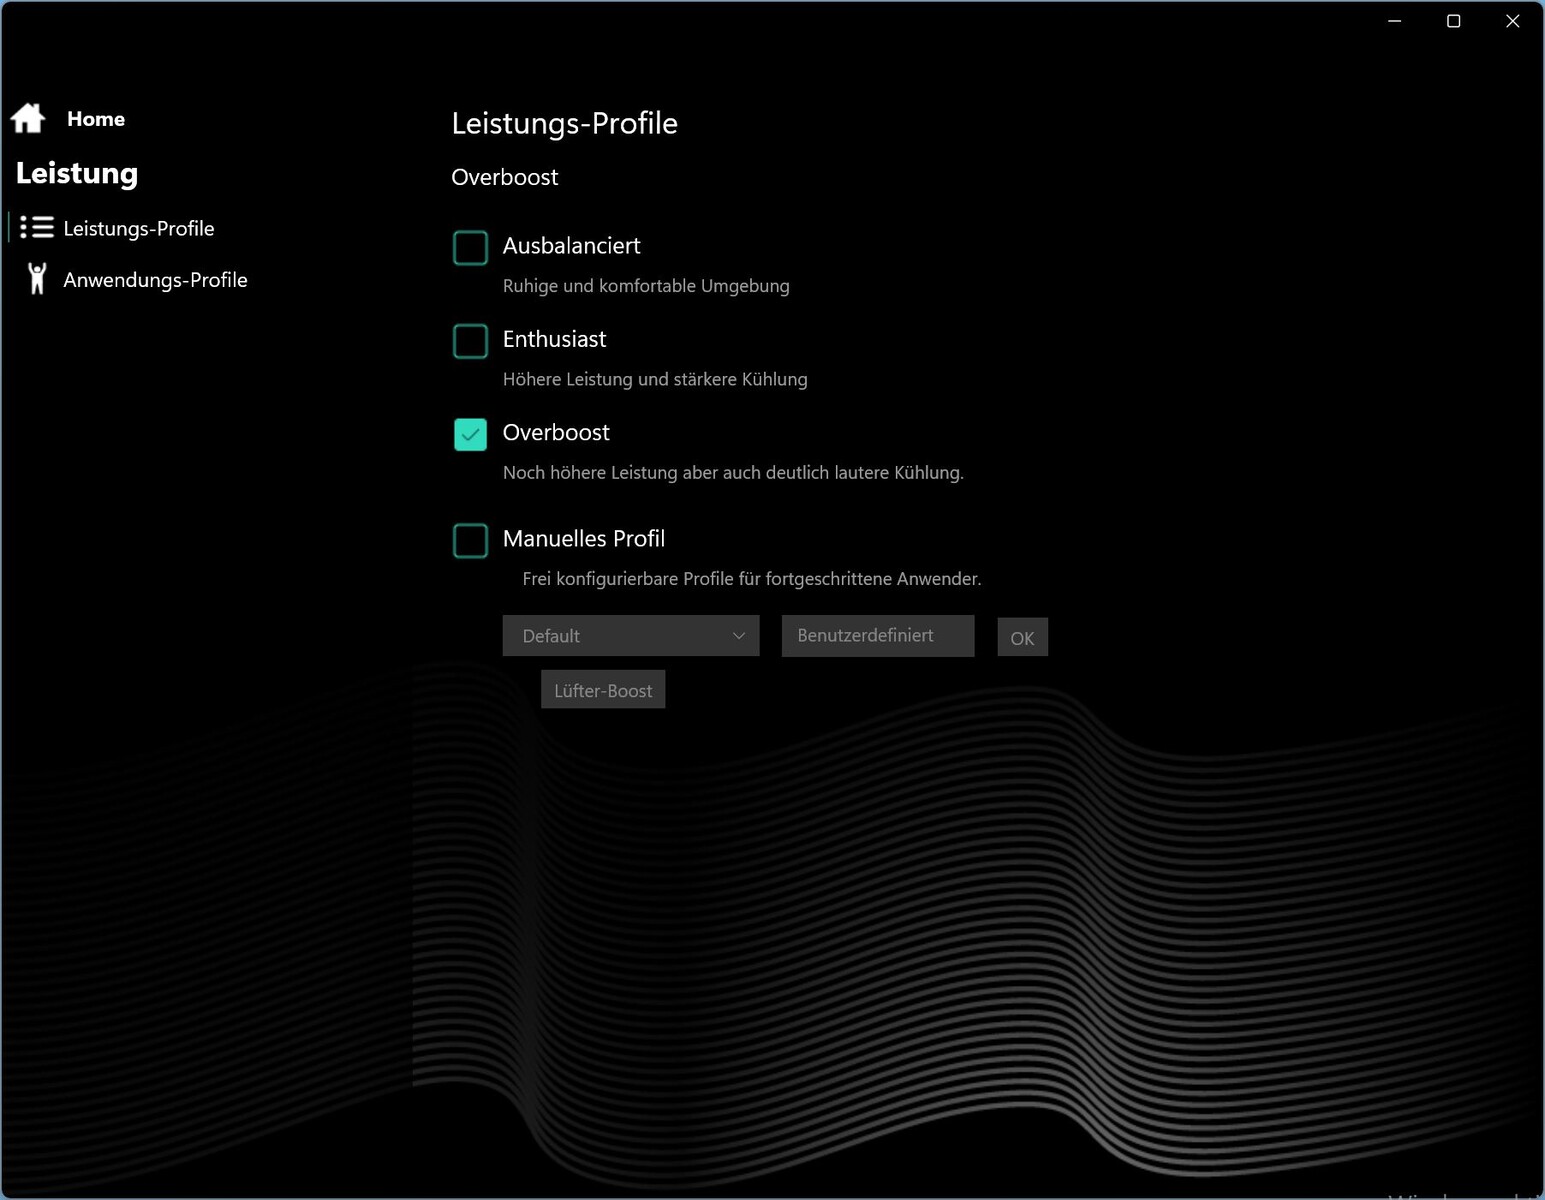
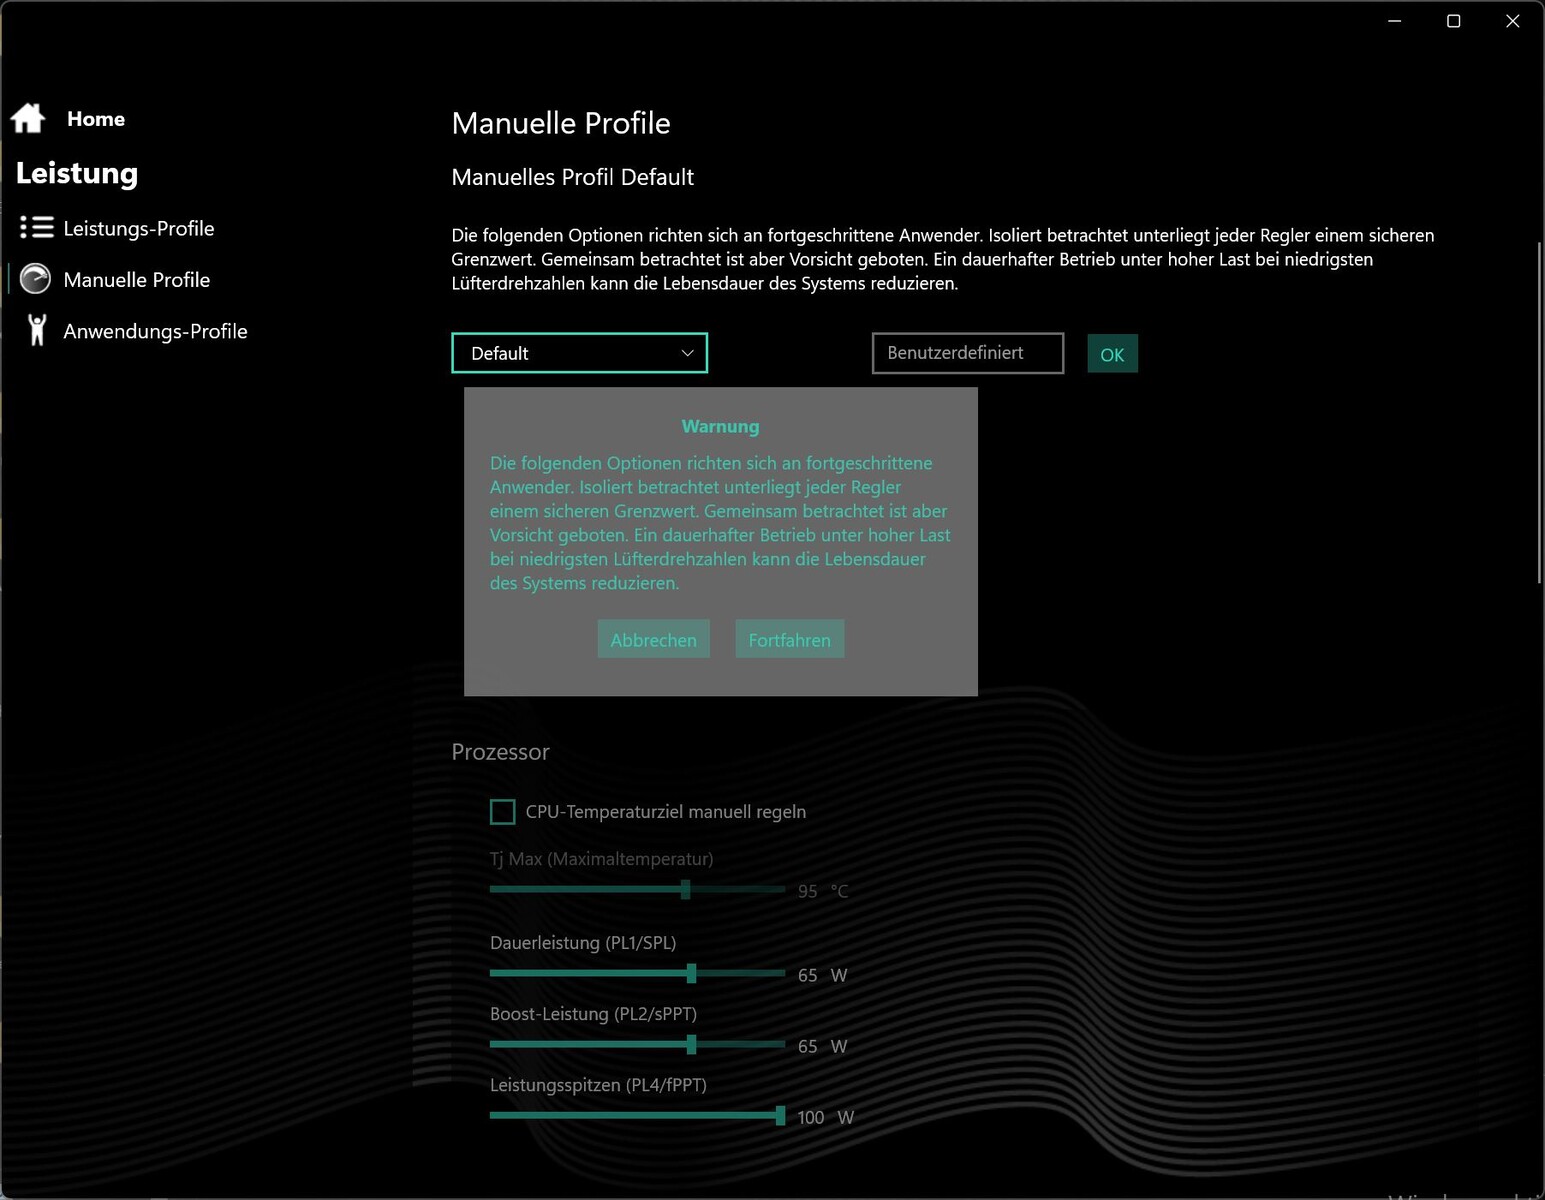
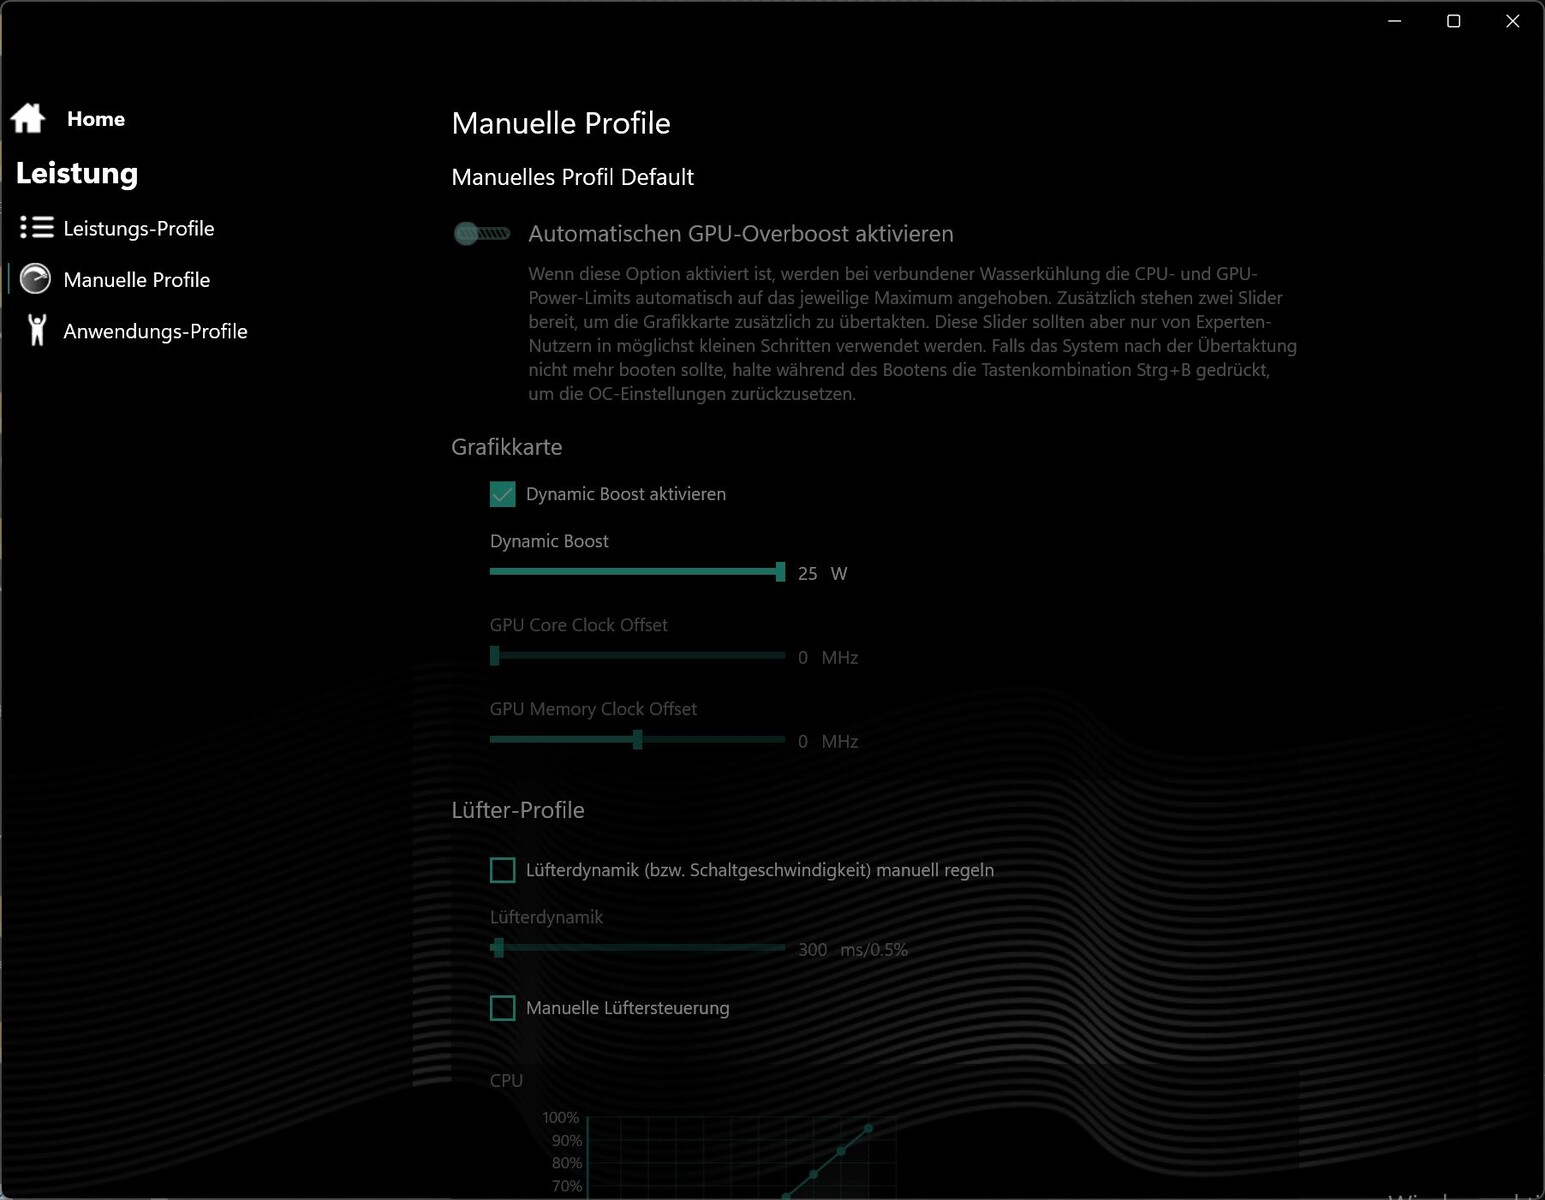
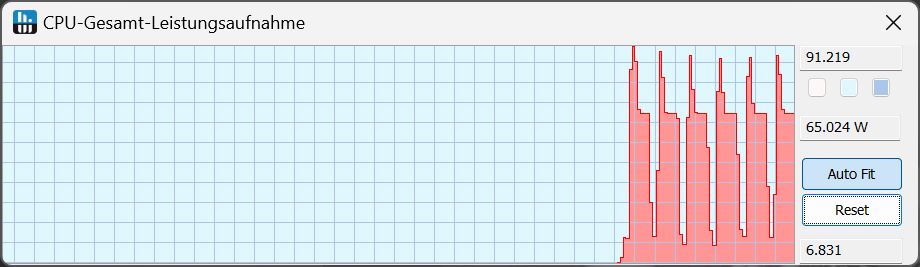
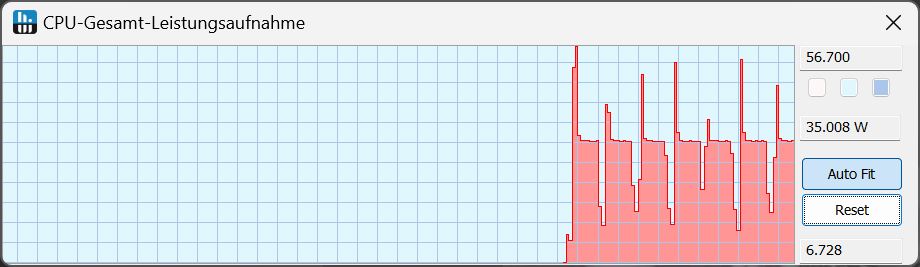
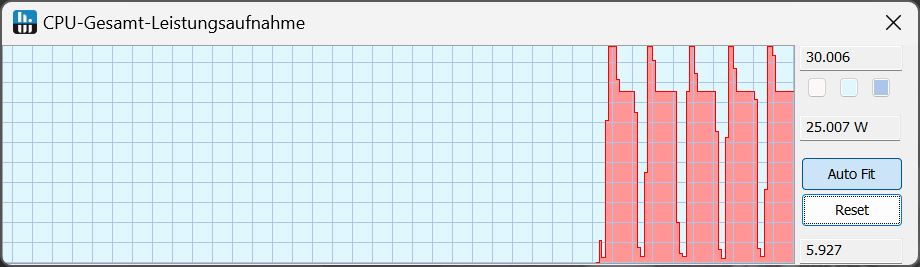
No Centro de Controle genérico (Tulpar usa, por exemplo, o mesmo CC), são oferecidos 3 perfis de desempenho predefinidos (Balanced, Enthusiast, Overboost) e um perfil manual. Nesse último, é possível ativar um aumento da ventoinha e definir a temperatura-alvo da CPU, as curvas da ventoinha (e muito mais). Nas configurações gerais via MUX, a GPU pode ser alternada de híbrida para dGPU, o que, posteriormente, requer uma reinicialização.
Para nossos benchmarks de desempenho, escolhemos o modo Overboost e, no teste de bateria, usamos o Balanced. Também apresentamos os valores de desempenho referentes aos outros modos.
Processador
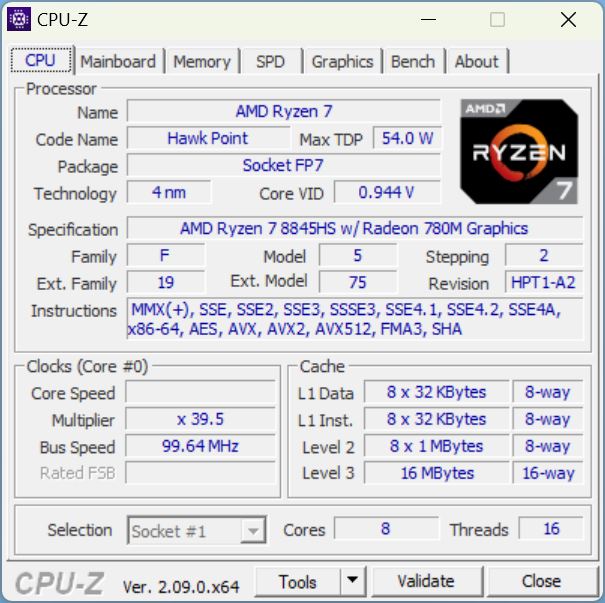
Todos os SKUs do Core 15 são equipados com o mesmo processador. O AMD Ryzen 7 8845HS é a segunda CPU mais rápida da série Hawk Point com arquitetura Zen 4. Ele tem 8 núcleos e hyperthreading, o que significa que pode processar 16 threads simultaneamente. Os núcleos têm uma velocidade de clock base de 3,8 GHz e podem ter overclock individual de até 5,1 GHz.
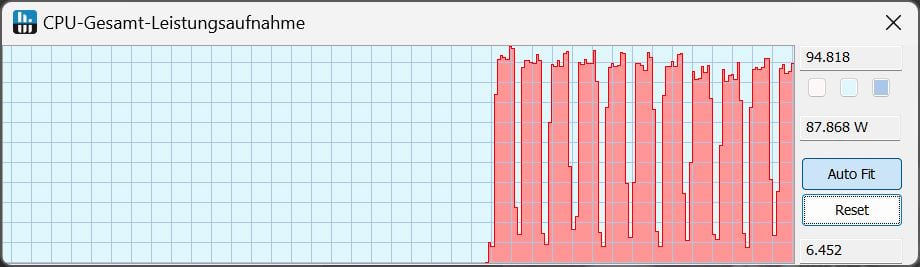
No teste contínuo Cinebench R15, nosso AMD Core 15 teve um desempenho muito consistente, mas principalmente em um nível um pouco abaixo dos notebooks equipados com uma CPU Intel Gen14 HX. Isso não é realmente surpreendente, pois a CPU AMD consome no máximo 90 W por um breve período e 80 W por um período mais longo. Com a CPU Intel no Fusion 15, esses valores são 140 W e 105 W. Somente o Dell G16 fica abaixo do nível de desempenho consistente do Ryzen 7 visto no Core após um desempenho inicial melhor.
Em todos os testes de CPU, nosso Ryzen 7 está completamente no alvo. Infelizmente, porém, nosso Core ficou em último lugar novamente, já que seus concorrentes Intel HX são simplesmente um pouco mais potentes. No entanto, a diferença em relação ao Dell G16 ou ao HP Victus 16 é realmente mínima. O Legion 5i ou o Fusion 15 com tecnologia Intel têm uma vantagem significativa.
Longe da parede, há uma queda de desempenho de cerca de 35% no teste multi-core Cinebench R15.
| Perfil de desempenho/valor medido | Pontuação do Cinebench R15 na primeira execução | Consumo de energia da CPU em W |
|---|---|---|
| Overboost | 2.908 | continuamente 80 - 94 |
| Entusiasta | 2.749 | curto 90, depois 65 |
| Equilibrado | 2.277 | brevemente 59, depois 35 |
| Bateria | 1.909 | brevemente 30, depois 25 |
Cinebench R15 Multi Continuous Test
Cinebench R23: Multi Core | Single Core
Cinebench R20: CPU (Multi Core) | CPU (Single Core)
Cinebench R15: CPU Multi 64Bit | CPU Single 64Bit
Blender: v2.79 BMW27 CPU
7-Zip 18.03: 7z b 4 | 7z b 4 -mmt1
Geekbench 6.4: Multi-Core | Single-Core
Geekbench 5.5: Multi-Core | Single-Core
HWBOT x265 Benchmark v2.2: 4k Preset
LibreOffice : 20 Documents To PDF
R Benchmark 2.5: Overall mean
| CPU Performance Rating | |
| SCHENKER XMG Fusion 15 (Early 24) | |
| Lenovo Legion 5 16IRX G9 | |
| SCHENKER XMG Pro 15 (E23) -2! | |
| Média da turma Gaming | |
| HP Victus 16 (2024) | |
| Dell G16, i7-13650HX, RTX 4060 | |
| SCHENKER XMG Core 15 (M24) | |
| Média AMD Ryzen 7 8845HS | |
| Cinebench R23 / Multi Core | |
| SCHENKER XMG Pro 15 (E23) | |
| Lenovo Legion 5 16IRX G9 | |
| HP Victus 16 (2024) | |
| SCHENKER XMG Fusion 15 (Early 24) | |
| Média da turma Gaming (5668 - 39652, n=151, últimos 2 anos) | |
| Dell G16, i7-13650HX, RTX 4060 | |
| SCHENKER XMG Core 15 (M24) | |
| Média AMD Ryzen 7 8845HS (14895 - 18037, n=12) | |
| Cinebench R23 / Single Core | |
| SCHENKER XMG Fusion 15 (Early 24) | |
| Lenovo Legion 5 16IRX G9 | |
| Dell G16, i7-13650HX, RTX 4060 | |
| Média da turma Gaming (1136 - 2252, n=151, últimos 2 anos) | |
| SCHENKER XMG Pro 15 (E23) | |
| SCHENKER XMG Core 15 (M24) | |
| Média AMD Ryzen 7 8845HS (1623 - 1783, n=12) | |
| HP Victus 16 (2024) | |
| Cinebench R20 / CPU (Multi Core) | |
| Lenovo Legion 5 16IRX G9 | |
| SCHENKER XMG Pro 15 (E23) | |
| HP Victus 16 (2024) | |
| SCHENKER XMG Fusion 15 (Early 24) | |
| Média da turma Gaming (2179 - 15517, n=151, últimos 2 anos) | |
| Dell G16, i7-13650HX, RTX 4060 | |
| SCHENKER XMG Core 15 (M24) | |
| Média AMD Ryzen 7 8845HS (5808 - 7026, n=12) | |
| Cinebench R20 / CPU (Single Core) | |
| SCHENKER XMG Fusion 15 (Early 24) | |
| Lenovo Legion 5 16IRX G9 | |
| Média da turma Gaming (439 - 866, n=151, últimos 2 anos) | |
| SCHENKER XMG Pro 15 (E23) | |
| Dell G16, i7-13650HX, RTX 4060 | |
| SCHENKER XMG Core 15 (M24) | |
| Média AMD Ryzen 7 8845HS (673 - 698, n=12) | |
| HP Victus 16 (2024) | |
| Cinebench R15 / CPU Multi 64Bit | |
| SCHENKER XMG Pro 15 (E23) | |
| HP Victus 16 (2024) | |
| Lenovo Legion 5 16IRX G9 | |
| SCHENKER XMG Fusion 15 (Early 24) | |
| Média da turma Gaming (905 - 6074, n=154, últimos 2 anos) | |
| Dell G16, i7-13650HX, RTX 4060 | |
| SCHENKER XMG Core 15 (M24) | |
| Média AMD Ryzen 7 8845HS (2342 - 2908, n=12) | |
| Cinebench R15 / CPU Single 64Bit | |
| Lenovo Legion 5 16IRX G9 | |
| SCHENKER XMG Fusion 15 (Early 24) | |
| SCHENKER XMG Core 15 (M24) | |
| Média da turma Gaming (191.9 - 343, n=151, últimos 2 anos) | |
| Média AMD Ryzen 7 8845HS (269 - 283, n=12) | |
| Dell G16, i7-13650HX, RTX 4060 | |
| SCHENKER XMG Pro 15 (E23) | |
| HP Victus 16 (2024) | |
| Blender / v2.79 BMW27 CPU | |
| Média AMD Ryzen 7 8845HS (179 - 216, n=12) | |
| SCHENKER XMG Core 15 (M24) | |
| Média da turma Gaming (81 - 555, n=144, últimos 2 anos) | |
| HP Victus 16 (2024) | |
| Dell G16, i7-13650HX, RTX 4060 | |
| SCHENKER XMG Pro 15 (E23) | |
| Lenovo Legion 5 16IRX G9 | |
| SCHENKER XMG Fusion 15 (Early 24) | |
| 7-Zip 18.03 / 7z b 4 | |
| SCHENKER XMG Fusion 15 (Early 24) | |
| Lenovo Legion 5 16IRX G9 | |
| SCHENKER XMG Pro 15 (E23) | |
| HP Victus 16 (2024) | |
| Média da turma Gaming (23795 - 144064, n=149, últimos 2 anos) | |
| Dell G16, i7-13650HX, RTX 4060 | |
| SCHENKER XMG Core 15 (M24) | |
| Média AMD Ryzen 7 8845HS (62669 - 74664, n=12) | |
| 7-Zip 18.03 / 7z b 4 -mmt1 | |
| SCHENKER XMG Fusion 15 (Early 24) | |
| Lenovo Legion 5 16IRX G9 | |
| SCHENKER XMG Core 15 (M24) | |
| SCHENKER XMG Pro 15 (E23) | |
| Média AMD Ryzen 7 8845HS (5197 - 6714, n=12) | |
| Média da turma Gaming (4199 - 7573, n=149, últimos 2 anos) | |
| Dell G16, i7-13650HX, RTX 4060 | |
| HP Victus 16 (2024) | |
| Geekbench 6.4 / Multi-Core | |
| SCHENKER XMG Fusion 15 (Early 24) | |
| Lenovo Legion 5 16IRX G9 | |
| HP Victus 16 (2024) | |
| Média da turma Gaming (5340 - 21668, n=119, últimos 2 anos) | |
| SCHENKER XMG Core 15 (M24) | |
| Dell G16, i7-13650HX, RTX 4060 | |
| Média AMD Ryzen 7 8845HS (11073 - 14014, n=16) | |
| Geekbench 6.4 / Single-Core | |
| SCHENKER XMG Fusion 15 (Early 24) | |
| Lenovo Legion 5 16IRX G9 | |
| SCHENKER XMG Core 15 (M24) | |
| Média da turma Gaming (1490 - 3219, n=119, últimos 2 anos) | |
| Média AMD Ryzen 7 8845HS (2510 - 2698, n=14) | |
| Dell G16, i7-13650HX, RTX 4060 | |
| HP Victus 16 (2024) | |
| Geekbench 5.5 / Multi-Core | |
| SCHENKER XMG Pro 15 (E23) | |
| SCHENKER XMG Fusion 15 (Early 24) | |
| Lenovo Legion 5 16IRX G9 | |
| HP Victus 16 (2024) | |
| Média da turma Gaming (4557 - 25855, n=148, últimos 2 anos) | |
| SCHENKER XMG Core 15 (M24) | |
| Dell G16, i7-13650HX, RTX 4060 | |
| Média AMD Ryzen 7 8845HS (11256 - 12726, n=13) | |
| Geekbench 5.5 / Single-Core | |
| SCHENKER XMG Fusion 15 (Early 24) | |
| SCHENKER XMG Core 15 (M24) | |
| Lenovo Legion 5 16IRX G9 | |
| Média AMD Ryzen 7 8845HS (1765 - 2004, n=13) | |
| Média da turma Gaming (986 - 2423, n=148, últimos 2 anos) | |
| Dell G16, i7-13650HX, RTX 4060 | |
| SCHENKER XMG Pro 15 (E23) | |
| HP Victus 16 (2024) | |
| HWBOT x265 Benchmark v2.2 / 4k Preset | |
| Lenovo Legion 5 16IRX G9 | |
| SCHENKER XMG Fusion 15 (Early 24) | |
| SCHENKER XMG Pro 15 (E23) | |
| Média da turma Gaming (6.72 - 42.9, n=148, últimos 2 anos) | |
| SCHENKER XMG Core 15 (M24) | |
| HP Victus 16 (2024) | |
| Dell G16, i7-13650HX, RTX 4060 | |
| Média AMD Ryzen 7 8845HS (18.6 - 22.7, n=12) | |
| LibreOffice / 20 Documents To PDF | |
| HP Victus 16 (2024) | |
| Dell G16, i7-13650HX, RTX 4060 | |
| SCHENKER XMG Pro 15 (E23) | |
| Média AMD Ryzen 7 8845HS (44.4 - 77, n=12) | |
| SCHENKER XMG Core 15 (M24) | |
| Média da turma Gaming (19 - 96.6, n=147, últimos 2 anos) | |
| Lenovo Legion 5 16IRX G9 | |
| SCHENKER XMG Fusion 15 (Early 24) | |
| R Benchmark 2.5 / Overall mean | |
| HP Victus 16 (2024) | |
| SCHENKER XMG Pro 15 (E23) | |
| Média AMD Ryzen 7 8845HS (0.4304 - 0.4935, n=12) | |
| Média da turma Gaming (0.3609 - 0.759, n=150, últimos 2 anos) | |
| SCHENKER XMG Core 15 (M24) | |
| Dell G16, i7-13650HX, RTX 4060 | |
| Dell G16, i7-13650HX, RTX 4060 | |
| Lenovo Legion 5 16IRX G9 | |
| SCHENKER XMG Fusion 15 (Early 24) | |
* ... menor é melhor
AIDA64: FP32 Ray-Trace | FPU Julia | CPU SHA3 | CPU Queen | FPU SinJulia | FPU Mandel | CPU AES | CPU ZLib | FP64 Ray-Trace | CPU PhotoWorxx
| Performance Rating | |
| SCHENKER XMG Fusion 15 (Early 24) | |
| SCHENKER XMG Core 15 (M24) | |
| Média AMD Ryzen 7 8845HS | |
| Média da turma Gaming | |
| SCHENKER XMG Pro 15 (E23) | |
| Lenovo Legion 5 16IRX G9 | |
| Dell G16, i7-13650HX, RTX 4060 | |
| HP Victus 16 (2024) | |
| AIDA64 / FP32 Ray-Trace | |
| SCHENKER XMG Core 15 (M24) | |
| Média AMD Ryzen 7 8845HS (23708 - 29544, n=12) | |
| Média da turma Gaming (4986 - 81639, n=147, últimos 2 anos) | |
| SCHENKER XMG Fusion 15 (Early 24) | |
| Lenovo Legion 5 16IRX G9 | |
| Dell G16, i7-13650HX, RTX 4060 | |
| SCHENKER XMG Pro 15 (E23) | |
| HP Victus 16 (2024) | |
| AIDA64 / FPU Julia | |
| SCHENKER XMG Core 15 (M24) | |
| Média AMD Ryzen 7 8845HS (99659 - 125873, n=12) | |
| Média da turma Gaming (25360 - 252486, n=147, últimos 2 anos) | |
| SCHENKER XMG Fusion 15 (Early 24) | |
| SCHENKER XMG Pro 15 (E23) | |
| Lenovo Legion 5 16IRX G9 | |
| Dell G16, i7-13650HX, RTX 4060 | |
| HP Victus 16 (2024) | |
| AIDA64 / CPU SHA3 | |
| SCHENKER XMG Fusion 15 (Early 24) | |
| SCHENKER XMG Core 15 (M24) | |
| Média da turma Gaming (1339 - 10389, n=147, últimos 2 anos) | |
| SCHENKER XMG Pro 15 (E23) | |
| Média AMD Ryzen 7 8845HS (4332 - 5180, n=12) | |
| Dell G16, i7-13650HX, RTX 4060 | |
| Lenovo Legion 5 16IRX G9 | |
| HP Victus 16 (2024) | |
| AIDA64 / CPU Queen | |
| SCHENKER XMG Pro 15 (E23) | |
| SCHENKER XMG Fusion 15 (Early 24) | |
| HP Victus 16 (2024) | |
| SCHENKER XMG Core 15 (M24) | |
| Média AMD Ryzen 7 8845HS (109458 - 124695, n=12) | |
| Média da turma Gaming (50699 - 200651, n=147, últimos 2 anos) | |
| Dell G16, i7-13650HX, RTX 4060 | |
| Lenovo Legion 5 16IRX G9 | |
| AIDA64 / FPU SinJulia | |
| SCHENKER XMG Core 15 (M24) | |
| Média AMD Ryzen 7 8845HS (14062 - 15519, n=12) | |
| SCHENKER XMG Fusion 15 (Early 24) | |
| Média da turma Gaming (4800 - 32988, n=147, últimos 2 anos) | |
| SCHENKER XMG Pro 15 (E23) | |
| Lenovo Legion 5 16IRX G9 | |
| HP Victus 16 (2024) | |
| Dell G16, i7-13650HX, RTX 4060 | |
| AIDA64 / FPU Mandel | |
| SCHENKER XMG Core 15 (M24) | |
| Média AMD Ryzen 7 8845HS (53436 - 67367, n=12) | |
| Média da turma Gaming (12321 - 134044, n=147, últimos 2 anos) | |
| SCHENKER XMG Fusion 15 (Early 24) | |
| Lenovo Legion 5 16IRX G9 | |
| Dell G16, i7-13650HX, RTX 4060 | |
| SCHENKER XMG Pro 15 (E23) | |
| HP Victus 16 (2024) | |
| AIDA64 / CPU AES | |
| SCHENKER XMG Fusion 15 (Early 24) | |
| Média da turma Gaming (19065 - 328679, n=147, últimos 2 anos) | |
| Média AMD Ryzen 7 8845HS (64515 - 172642, n=12) | |
| SCHENKER XMG Pro 15 (E23) | |
| SCHENKER XMG Core 15 (M24) | |
| Lenovo Legion 5 16IRX G9 | |
| Dell G16, i7-13650HX, RTX 4060 | |
| HP Victus 16 (2024) | |
| AIDA64 / CPU ZLib | |
| SCHENKER XMG Fusion 15 (Early 24) | |
| SCHENKER XMG Pro 15 (E23) | |
| Média da turma Gaming (373 - 2531, n=147, últimos 2 anos) | |
| Lenovo Legion 5 16IRX G9 | |
| Dell G16, i7-13650HX, RTX 4060 | |
| HP Victus 16 (2024) | |
| Média AMD Ryzen 7 8845HS (627 - 1080, n=12) | |
| SCHENKER XMG Core 15 (M24) | |
| AIDA64 / FP64 Ray-Trace | |
| SCHENKER XMG Core 15 (M24) | |
| Média AMD Ryzen 7 8845HS (12361 - 15911, n=12) | |
| Média da turma Gaming (2540 - 43430, n=147, últimos 2 anos) | |
| SCHENKER XMG Fusion 15 (Early 24) | |
| Dell G16, i7-13650HX, RTX 4060 | |
| Lenovo Legion 5 16IRX G9 | |
| SCHENKER XMG Pro 15 (E23) | |
| HP Victus 16 (2024) | |
| AIDA64 / CPU PhotoWorxx | |
| SCHENKER XMG Pro 15 (E23) | |
| SCHENKER XMG Fusion 15 (Early 24) | |
| SCHENKER XMG Core 15 (M24) | |
| Média da turma Gaming (10805 - 60161, n=147, últimos 2 anos) | |
| HP Victus 16 (2024) | |
| Média AMD Ryzen 7 8845HS (33192 - 41668, n=12) | |
| Dell G16, i7-13650HX, RTX 4060 | |
| Lenovo Legion 5 16IRX G9 | |
Desempenho do sistema
Embora nosso sistema de análise fique um pouco atrás em relação à pontuação pura da CPU, ele lidera a concorrência do HX no PCMark 10. Quando se trata dos aspectos essenciais, a pontuação está no meio do pelotão, mas, em termos de produtividade, ele se destaca e está entre os primeiros colocados na área de criação de conteúdo.
No CrossMark, o Dell G16 é um pouco pior, com os outros concorrentes ligeiramente à frente do nosso AMD Core 15.
CrossMark: Overall | Productivity | Creativity | Responsiveness
WebXPRT 3: Overall
WebXPRT 4: Overall
Mozilla Kraken 1.1: Total
| PCMark 10 / Score | |
| SCHENKER XMG Core 15 (M24) | |
| SCHENKER XMG Fusion 15 (Early 24) | |
| Média AMD Ryzen 7 8845HS, NVIDIA GeForce RTX 4060 Laptop GPU (7538 - 8822, n=2) | |
| Média da turma Gaming (5776 - 9852, n=133, últimos 2 anos) | |
| Lenovo Legion 5 16IRX G9 | |
| HP Victus 16 (2024) | |
| SCHENKER XMG Pro 15 (E23) | |
| Dell G16, i7-13650HX, RTX 4060 | |
| PCMark 10 / Essentials | |
| SCHENKER XMG Fusion 15 (Early 24) | |
| SCHENKER XMG Pro 15 (E23) | |
| Lenovo Legion 5 16IRX G9 | |
| HP Victus 16 (2024) | |
| Média da turma Gaming (9057 - 12600, n=133, últimos 2 anos) | |
| SCHENKER XMG Core 15 (M24) | |
| Média AMD Ryzen 7 8845HS, NVIDIA GeForce RTX 4060 Laptop GPU (9936 - 10061, n=2) | |
| Dell G16, i7-13650HX, RTX 4060 | |
| PCMark 10 / Productivity | |
| SCHENKER XMG Core 15 (M24) | |
| Média AMD Ryzen 7 8845HS, NVIDIA GeForce RTX 4060 Laptop GPU (9789 - 14612, n=2) | |
| SCHENKER XMG Fusion 15 (Early 24) | |
| SCHENKER XMG Pro 15 (E23) | |
| Dell G16, i7-13650HX, RTX 4060 | |
| HP Victus 16 (2024) | |
| Média da turma Gaming (6662 - 14612, n=133, últimos 2 anos) | |
| Lenovo Legion 5 16IRX G9 | |
| PCMark 10 / Digital Content Creation | |
| SCHENKER XMG Fusion 15 (Early 24) | |
| SCHENKER XMG Core 15 (M24) | |
| Média da turma Gaming (6807 - 18475, n=133, últimos 2 anos) | |
| Média AMD Ryzen 7 8845HS, NVIDIA GeForce RTX 4060 Laptop GPU (11953 - 12674, n=2) | |
| Lenovo Legion 5 16IRX G9 | |
| Dell G16, i7-13650HX, RTX 4060 | |
| HP Victus 16 (2024) | |
| SCHENKER XMG Pro 15 (E23) | |
| CrossMark / Overall | |
| SCHENKER XMG Fusion 15 (Early 24) | |
| Lenovo Legion 5 16IRX G9 | |
| SCHENKER XMG Pro 15 (E23) | |
| HP Victus 16 (2024) | |
| Média da turma Gaming (1247 - 2344, n=114, últimos 2 anos) | |
| SCHENKER XMG Core 15 (M24) | |
| Média AMD Ryzen 7 8845HS, NVIDIA GeForce RTX 4060 Laptop GPU (n=1) | |
| Dell G16, i7-13650HX, RTX 4060 | |
| CrossMark / Productivity | |
| SCHENKER XMG Fusion 15 (Early 24) | |
| Lenovo Legion 5 16IRX G9 | |
| SCHENKER XMG Pro 15 (E23) | |
| Média da turma Gaming (1299 - 2204, n=114, últimos 2 anos) | |
| SCHENKER XMG Core 15 (M24) | |
| Média AMD Ryzen 7 8845HS, NVIDIA GeForce RTX 4060 Laptop GPU (n=1) | |
| HP Victus 16 (2024) | |
| Dell G16, i7-13650HX, RTX 4060 | |
| CrossMark / Creativity | |
| SCHENKER XMG Fusion 15 (Early 24) | |
| Lenovo Legion 5 16IRX G9 | |
| SCHENKER XMG Pro 15 (E23) | |
| HP Victus 16 (2024) | |
| SCHENKER XMG Core 15 (M24) | |
| Média AMD Ryzen 7 8845HS, NVIDIA GeForce RTX 4060 Laptop GPU (n=1) | |
| Média da turma Gaming (1275 - 2660, n=114, últimos 2 anos) | |
| Dell G16, i7-13650HX, RTX 4060 | |
| CrossMark / Responsiveness | |
| SCHENKER XMG Fusion 15 (Early 24) | |
| Lenovo Legion 5 16IRX G9 | |
| HP Victus 16 (2024) | |
| SCHENKER XMG Pro 15 (E23) | |
| Média da turma Gaming (1030 - 2330, n=114, últimos 2 anos) | |
| Dell G16, i7-13650HX, RTX 4060 | |
| SCHENKER XMG Core 15 (M24) | |
| Média AMD Ryzen 7 8845HS, NVIDIA GeForce RTX 4060 Laptop GPU (n=1) | |
| WebXPRT 3 / Overall | |
| SCHENKER XMG Fusion 15 (Early 24) | |
| SCHENKER XMG Pro 15 (E23) | |
| Lenovo Legion 5 16IRX G9 | |
| SCHENKER XMG Core 15 (M24) | |
| Média AMD Ryzen 7 8845HS, NVIDIA GeForce RTX 4060 Laptop GPU (305 - 305, n=2) | |
| Média da turma Gaming (215 - 480, n=127, últimos 2 anos) | |
| HP Victus 16 (2024) | |
| Dell G16, i7-13650HX, RTX 4060 | |
| WebXPRT 4 / Overall | |
| SCHENKER XMG Fusion 15 (Early 24) | |
| Lenovo Legion 5 16IRX G9 | |
| SCHENKER XMG Pro 15 (E23) | |
| Média da turma Gaming (176.4 - 335, n=115, últimos 2 anos) | |
| SCHENKER XMG Core 15 (M24) | |
| HP Victus 16 (2024) | |
| Média AMD Ryzen 7 8845HS, NVIDIA GeForce RTX 4060 Laptop GPU (176.4 - 264, n=2) | |
| Mozilla Kraken 1.1 / Total | |
| HP Victus 16 (2024) | |
| SCHENKER XMG Pro 15 (E23) | |
| Média AMD Ryzen 7 8845HS, NVIDIA GeForce RTX 4060 Laptop GPU (496 - 523, n=2) | |
| Dell G16, i7-13650HX, RTX 4060 | |
| Média da turma Gaming (409 - 674, n=139, últimos 2 anos) | |
| SCHENKER XMG Core 15 (M24) | |
| Lenovo Legion 5 16IRX G9 | |
| SCHENKER XMG Fusion 15 (Early 24) | |
* ... menor é melhor
| PCMark 10 Score | 8822 pontos | |
Ajuda | ||
| AIDA64 / Memory Copy | |
| SCHENKER XMG Fusion 15 (Early 24) | |
| SCHENKER XMG Pro 15 (E23) | |
| SCHENKER XMG Core 15 (M24) | |
| Média AMD Ryzen 7 8845HS (61459 - 71873, n=12) | |
| HP Victus 16 (2024) | |
| Média da turma Gaming (21750 - 97515, n=147, últimos 2 anos) | |
| Lenovo Legion 5 16IRX G9 | |
| Dell G16, i7-13650HX, RTX 4060 | |
| AIDA64 / Memory Read | |
| SCHENKER XMG Fusion 15 (Early 24) | |
| SCHENKER XMG Pro 15 (E23) | |
| HP Victus 16 (2024) | |
| Lenovo Legion 5 16IRX G9 | |
| Média da turma Gaming (22956 - 102937, n=147, últimos 2 anos) | |
| Dell G16, i7-13650HX, RTX 4060 | |
| SCHENKER XMG Core 15 (M24) | |
| Média AMD Ryzen 7 8845HS (49866 - 61976, n=12) | |
| AIDA64 / Memory Write | |
| SCHENKER XMG Core 15 (M24) | |
| Média AMD Ryzen 7 8845HS (68425 - 93239, n=12) | |
| SCHENKER XMG Pro 15 (E23) | |
| SCHENKER XMG Fusion 15 (Early 24) | |
| Média da turma Gaming (22297 - 108954, n=147, últimos 2 anos) | |
| HP Victus 16 (2024) | |
| Dell G16, i7-13650HX, RTX 4060 | |
| Lenovo Legion 5 16IRX G9 | |
| AIDA64 / Memory Latency | |
| Média AMD Ryzen 7 8845HS (82.5 - 117, n=12) | |
| HP Victus 16 (2024) | |
| Média da turma Gaming (59.5 - 259, n=147, últimos 2 anos) | |
| Dell G16, i7-13650HX, RTX 4060 | |
| Lenovo Legion 5 16IRX G9 | |
| SCHENKER XMG Core 15 (M24) | |
| SCHENKER XMG Pro 15 (E23) | |
| SCHENKER XMG Fusion 15 (Early 24) | |
* ... menor é melhor
Latências de DPC
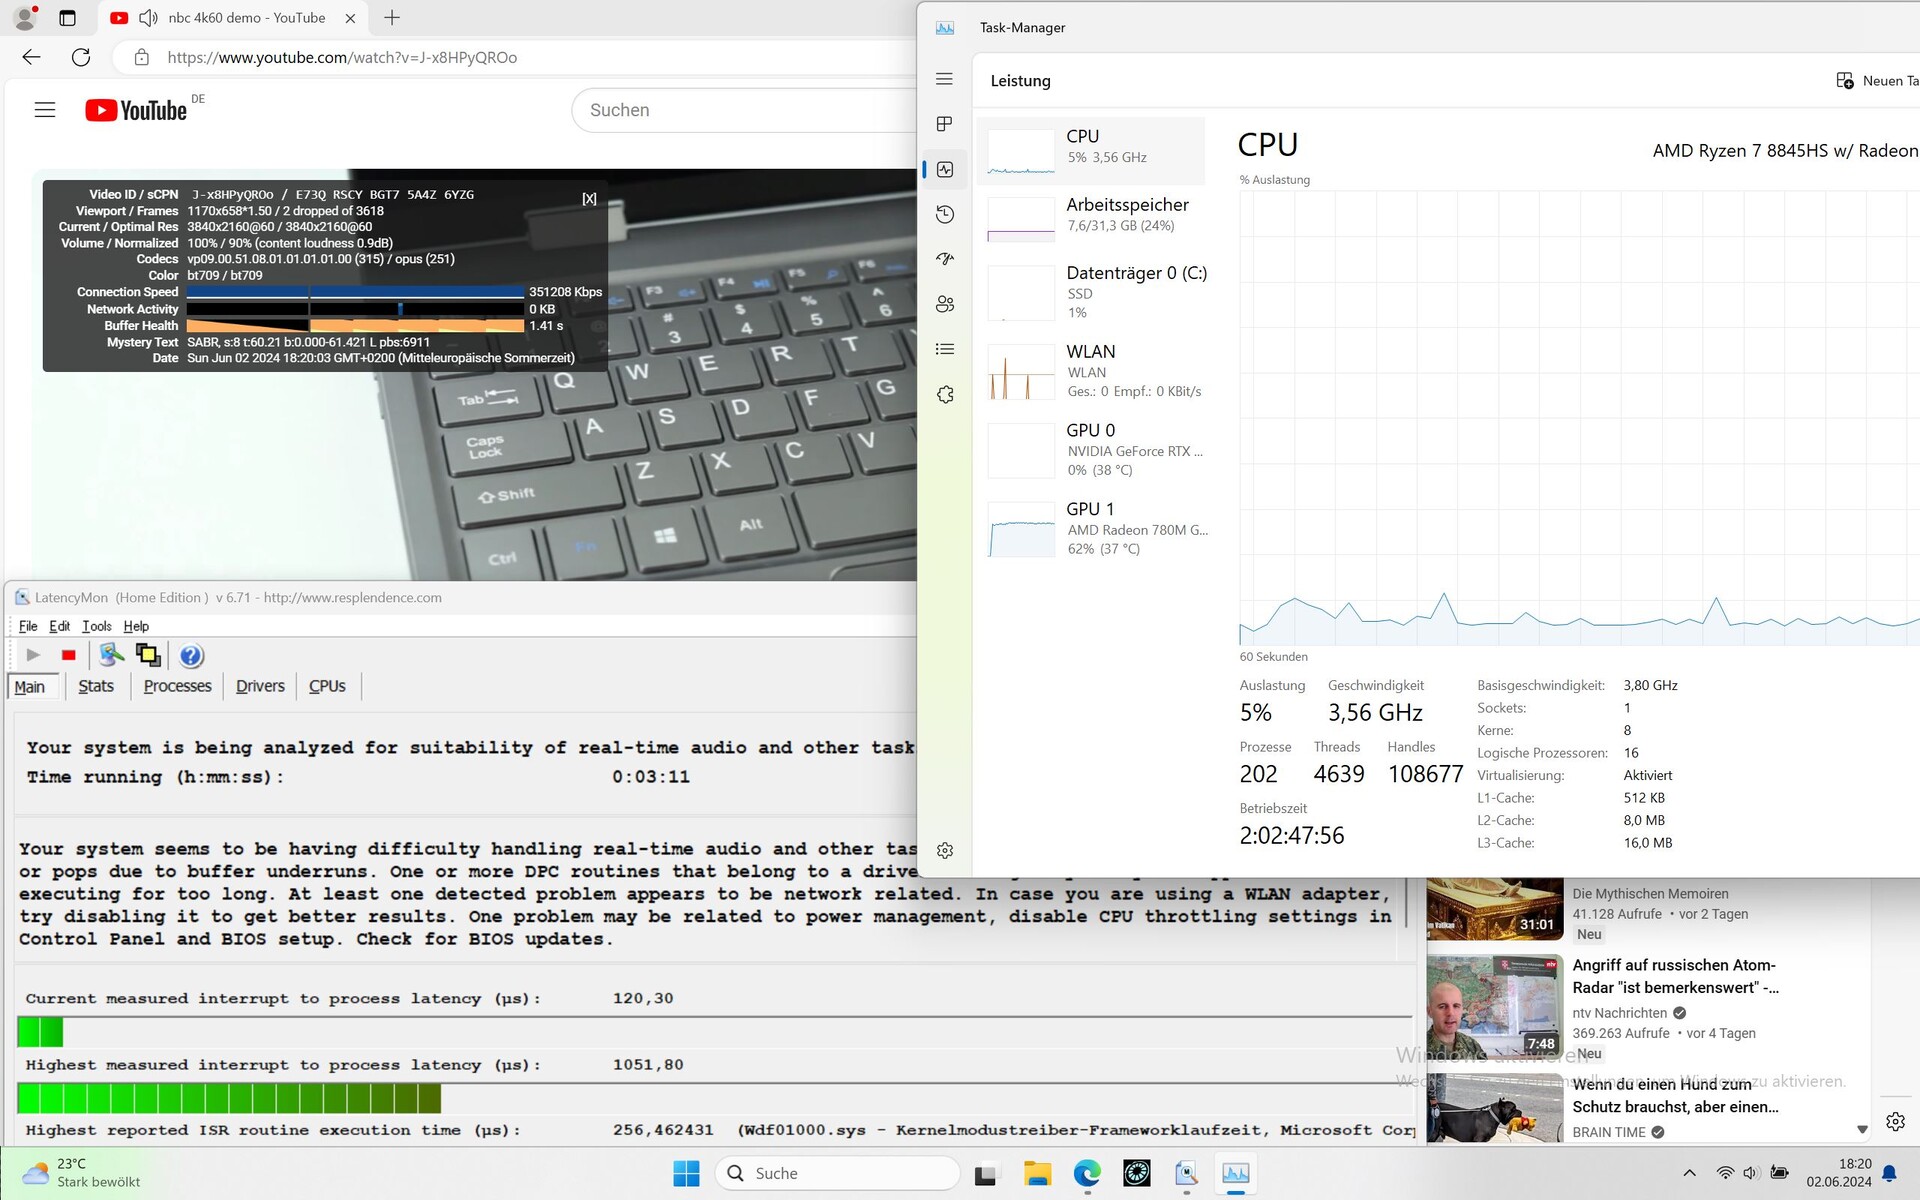
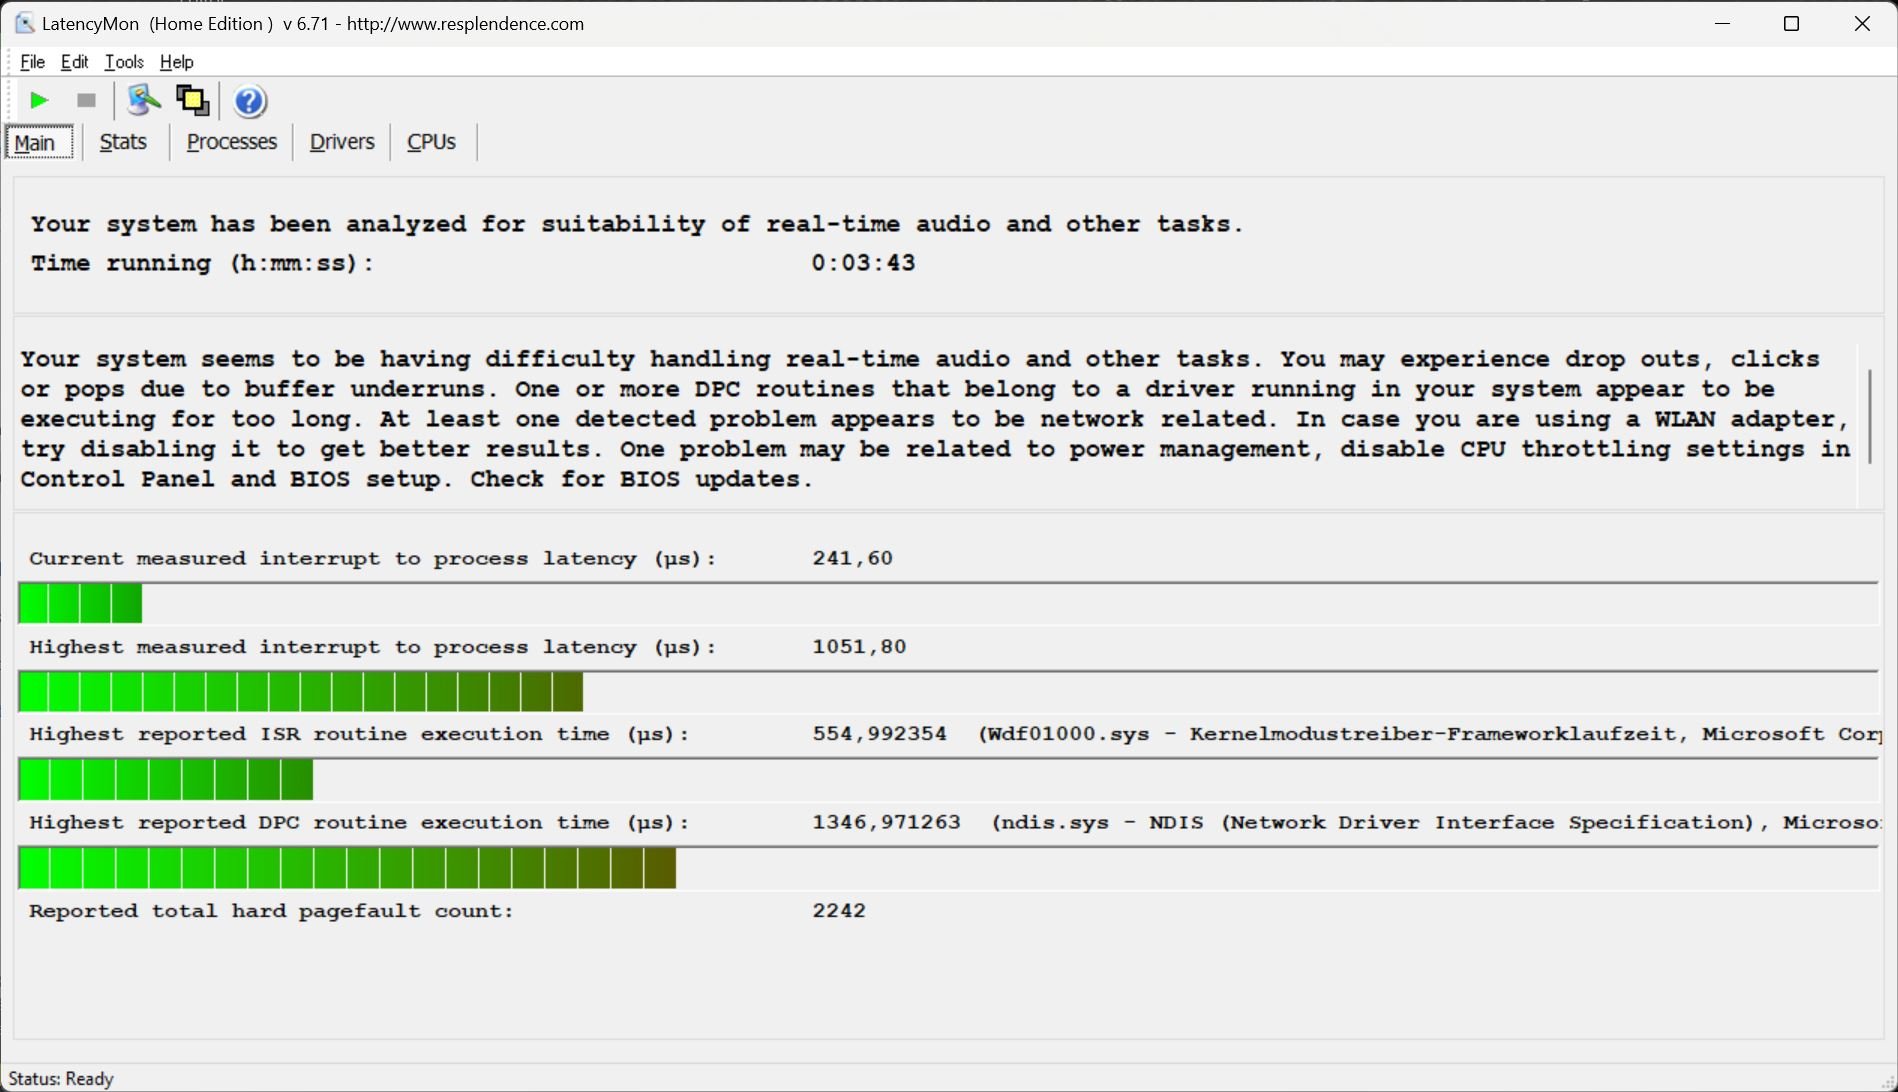
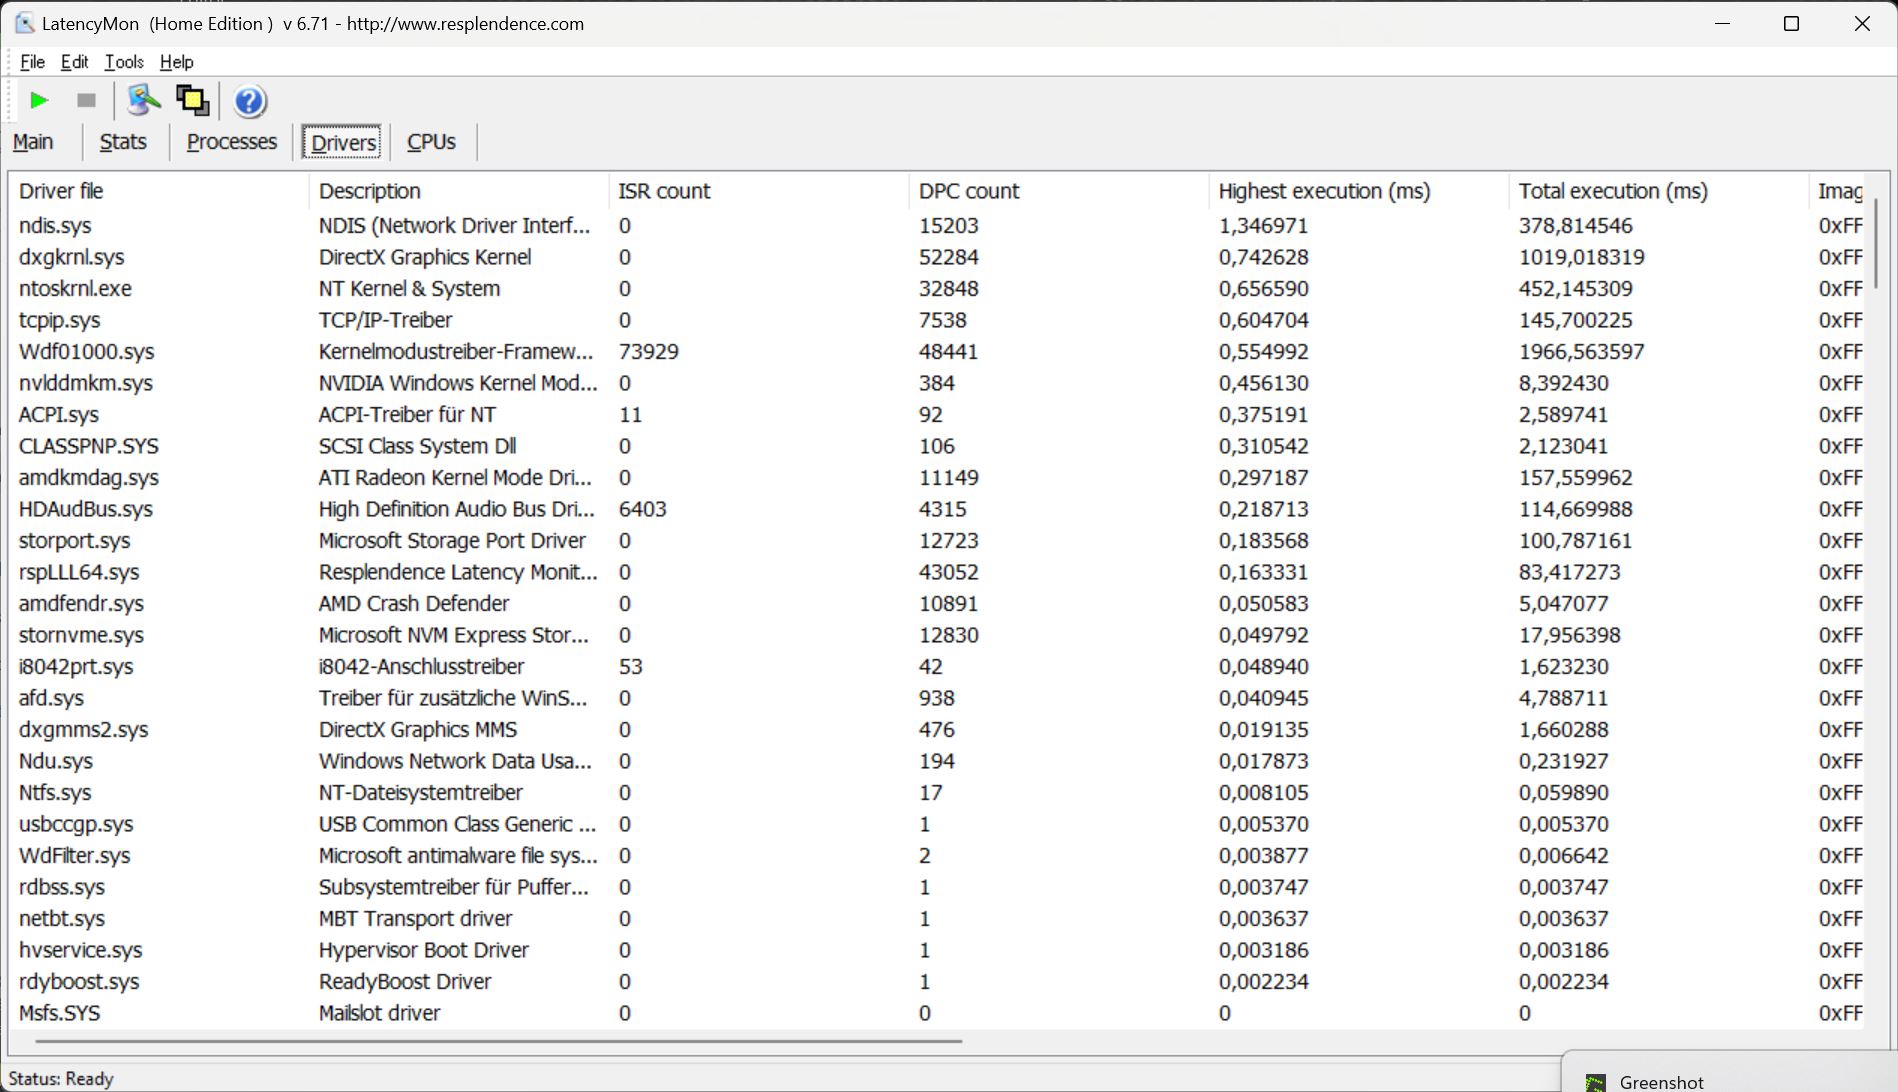
Ao abrir o navegador, há latências mínimas que não causam problemas - ainda. Quando várias guias do navegador são abertas, o valor da latência aumenta um pouco. Isso também se aplica à nossa reprodução de vídeo 4K/60fps no YouTube e, a 62%, o fator de carga da GPU interna parece ser bastante alto. O resultado são dois quadros perdidos, bem como um inglório segundo lugar na classificação de latência.
| DPC Latencies / LatencyMon - interrupt to process latency (max), Web, Youtube, Prime95 | |
| Lenovo Legion 5 16IRX G9 | |
| SCHENKER XMG Core 15 (M24) | |
| Dell G16, i7-13650HX, RTX 4060 | |
| SCHENKER XMG Pro 15 (E23) | |
| HP Victus 16 (2024) | |
| SCHENKER XMG Fusion 15 (Early 24) | |
* ... menor é melhor
Armazenamento em massa
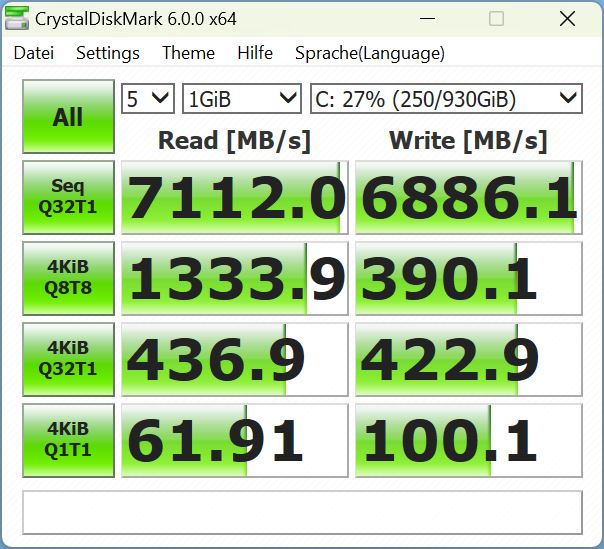
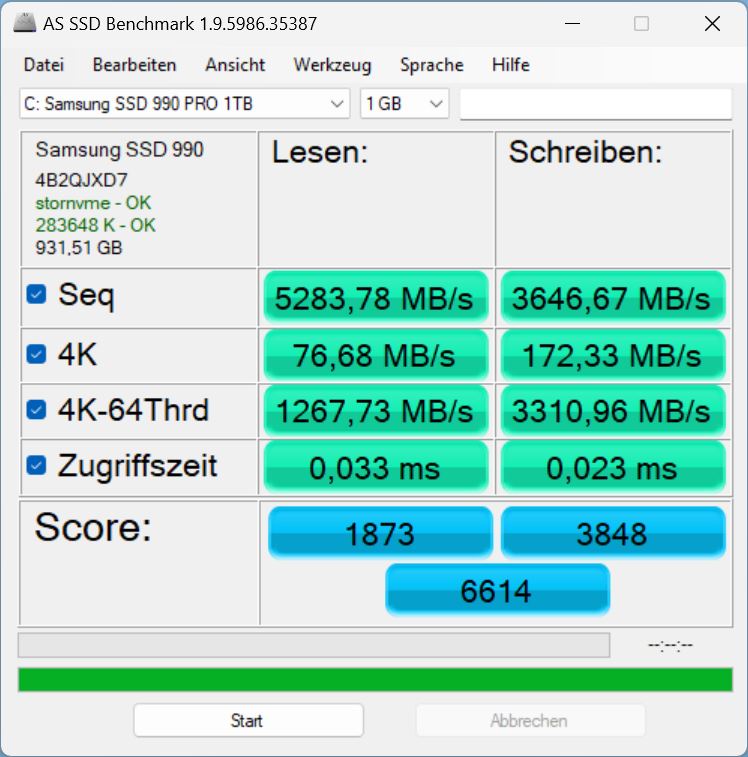
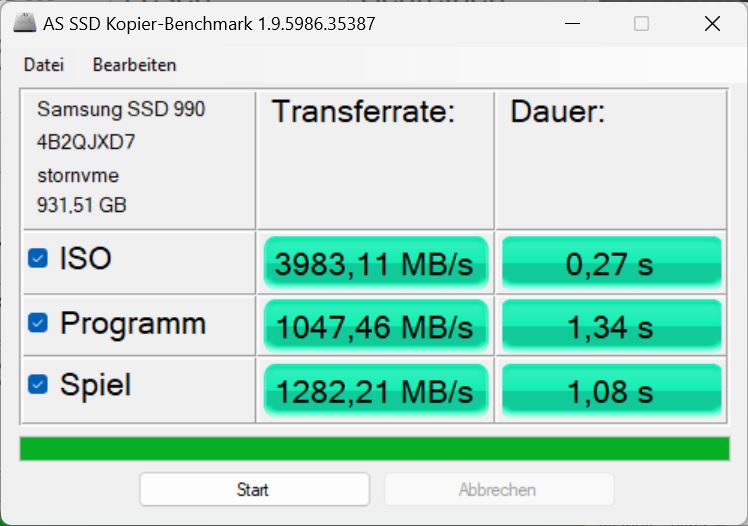
Em nosso modelo de análise, a Schenker instalou um veloz Samsung 990 Pro com 1 TB de armazenamento e o Core 15 pode ser equipado com SSDs de seis empresas diferentes, incluindo diversos modelos desse fabricante.
Dependendo do software de teste usado (CrystalDiskMark 6, AS SSD, Disksdp), a SSD se sai melhor ou pior, mas, no geral, o 990 Pro continua sendo uma SSD NVMe PCIe 4.0 muito rápida, que também demonstrou altos níveis de desempenho muito consistentes em nosso modelo de análise com o loop do Diskspd.

* ... menor é melhor
Continuous Performance Read: DiskSpd Read Loop, Queue Depth 8
Placa de vídeo
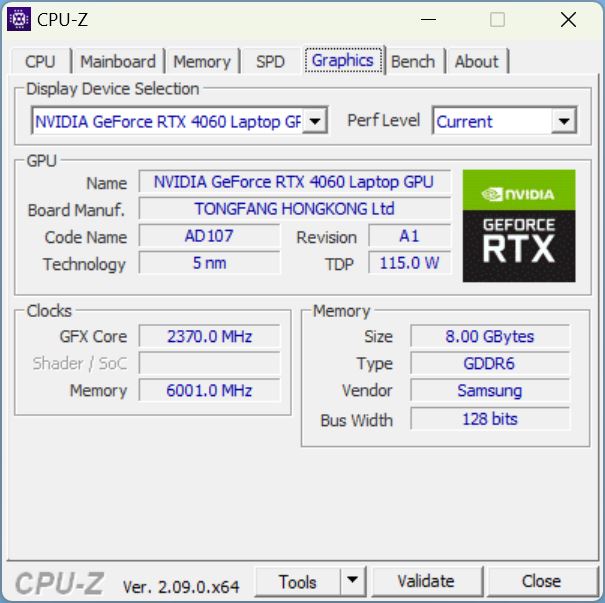
Uma Nvidia Geforce RTX 4060 serve como GPU, no entanto, por um adicional de US$ 200, o Core 15 também vem com uma RTX 4070 como a que está no Fusion 15.
Nos testes do 3DMark, o Core 15 se saiu excepcionalmente bem. Em todos os testes, até mesmo o Fusion equipado com a RTX 4070 desfruta de uma vantagem de apenas 8%, com o Core 15 ficando em segundo lugar, na frente da concorrência baseada na 4060.
O desempenho em jogos não é tão bom quanto os resultados do 3DMark, mas isso se deve inteiramente aos títulos que exigem muito da CPU, como DOTA 2 Reborn ou X-Plane. Deixando esses títulos de lado, quando se trata de jogos com uso intensivo de CPU, o Core 15 está em pé de igualdade com os melhores dispositivos de comparação RTX 4060. O último executa todos os títulos em Full HD a mais de 60 fps e nem mesmo apresenta problemas em sua resolução QHD nativa, embora títulos como Cyberpunk 2077 ocasionalmente fiquem abaixo da marca de 60 fps.
O gráfico Witcher 3 mostra um desempenho muito estável ao longo de mais de uma hora com o ritmo dia/noite habitual do jogo. Nessa área, o desempenho também está no mesmo nível da concorrência da RTX 4060. A tabela abaixo mostra as pontuações relacionadas aos vários perfis de desempenho, sendo que a única inconsistência pode ser encontrada no modo equilibrado. Nos primeiros minutos, ele exibe o mesmo desempenho que no modo entusiasta, com a taxa de quadros e o consumo caindo brevemente e conseguindo ficar apenas no nível do modo de bateria.
No modo de bateria, o desempenho 3D cai em Fire Strike cerca de 39%.
| Perfil/valor de desempenho | Witcher 3 FPS (Início - após 5 min) | Velocidade da GPU | Consumo de energia da GPU | volume | consumo |
|---|---|---|---|---|---|
| Overboost | 103 - 101 | 2.720 MHz | 108,5 W | 50,96 dB | 167 W |
| Enthusiast | 97 - 92 | 2.640 MHz | 102,7 | 49 dB | 156 W |
| Equilibrado | 97 - 65 | 1,880 MHz | 47.86 W | Inicialmente 39.75, depois de alguns minutos um consistente 31 dB | Inicialmente 154, depois 67 W |
| 3DMark 11 Performance | 34005 pontos | |
| 3DMark Cloud Gate Standard Score | 69309 pontos | |
| 3DMark Fire Strike Score | 26988 pontos | |
| 3DMark Time Spy Score | 11597 pontos | |
Ajuda | ||
* ... menor é melhor
| The Witcher 3 - 1920x1080 Ultra Graphics & Postprocessing (HBAO+) | |
| SCHENKER XMG Pro 15 (E23) | |
| SCHENKER XMG Fusion 15 (Early 24) | |
| Média da turma Gaming (18.4 - 214, n=119, últimos 2 anos) | |
| SCHENKER XMG Core 15 (M24) | |
| Dell G16, i7-13650HX, RTX 4060 | |
| HP Victus 16 (2024) | |
| Lenovo Legion 5 16IRX G9 | |
| GTA V - 1920x1080 Highest Settings possible AA:4xMSAA + FX AF:16x | |
| SCHENKER XMG Fusion 15 (Early 24) | |
| Lenovo Legion 5 16IRX G9 | |
| Dell G16, i7-13650HX, RTX 4060 | |
| SCHENKER XMG Core 15 (M24) | |
| Média da turma Gaming (12.1 - 168.2, n=132, últimos 2 anos) | |
| HP Victus 16 (2024) | |
| SCHENKER XMG Pro 15 (E23) | |
| Final Fantasy XV Benchmark - 1920x1080 High Quality | |
| SCHENKER XMG Fusion 15 (Early 24) | |
| Média da turma Gaming (19.2 - 201, n=144, últimos 2 anos) | |
| SCHENKER XMG Core 15 (M24) | |
| Lenovo Legion 5 16IRX G9 | |
| Dell G16, i7-13650HX, RTX 4060 | |
| HP Victus 16 (2024) | |
| Dota 2 Reborn - 1920x1080 ultra (3/3) best looking | |
| SCHENKER XMG Fusion 15 (Early 24) | |
| Lenovo Legion 5 16IRX G9 | |
| SCHENKER XMG Pro 15 (E23) | |
| HP Victus 16 (2024) | |
| Dell G16, i7-13650HX, RTX 4060 | |
| Média da turma Gaming (65.1 - 220, n=148, últimos 2 anos) | |
| SCHENKER XMG Core 15 (M24) | |
Witcher 3 FPS diagram
| baixo | média | alto | ultra | QHD | 4K | |
|---|---|---|---|---|---|---|
| GTA V (2015) | 185 | 180.5 | 174.7 | 116.7 | 91.7 | |
| The Witcher 3 (2015) | 402.5 | 337.4 | 215.5 | 111.7 | 83.4 | |
| Dota 2 Reborn (2015) | 165.2 | 150.9 | 145.4 | 135.2 | 131.5 | |
| Final Fantasy XV Benchmark (2018) | 225 | 153.7 | 107.2 | 79.4 | ||
| X-Plane 11.11 (2018) | 143.5 | 125.1 | 97.2 | 90.7 | ||
| Far Cry 5 (2018) | 162 | 142 | 137 | 128 | 108 | |
| Strange Brigade (2018) | 434 | 305 | 242 | 204 | 136.3 | |
| Baldur's Gate 3 (2023) | 160.3 | 125.7 | 110.7 | 105.5 | 72.2 | |
| Cyberpunk 2077 2.2 Phantom Liberty (2023) | 136.1 | 107.2 | 91 | 93.1 | 48.2 | |
| Skull & Bones (2024) | 146 | 127 | 101 | 73 | 57 |
Emissões e energia - uma batata quente, mas econômica
Emissões de ruído
Durante a execução inativa no desktop, os ventiladores permanecem inativos. No entanto, mesmo com a menor carga diária, como abrir um navegador e navegar na Internet, elas são ativadas e emitem um zumbido silencioso de 27 dB. Normalmente, esse é o tipo de volume com o qual o senhor estará lidando.
Sob carga pesada, o volume do ventilador pode aumentar para até 52 dB, mas, quando o período de carga termina, eles se acalmam rapidamente. No entanto, as coisas não voltam a ficar silenciosas por um bom tempo, mesmo quando estão ociosas.
Em comparação, o HP Victus e o Dell G16 são um pouco mais silenciosos durante os jogos e, com o Legion 5 ficando mais barulhento, o Core 15 fica em algum lugar entre os dois dispositivos.
Barulho
| Ocioso |
| 23 / 23 / 23 dB |
| Carga |
| 38.92 / 52.09 dB |
 | ||
30 dB silencioso 40 dB(A) audível 50 dB(A) ruidosamente alto |
||
min: | ||
| SCHENKER XMG Core 15 (M24) NVIDIA GeForce RTX 4060 Laptop GPU, R7 8845HS, Samsung 990 Pro 1 TB | Lenovo Legion 5 16IRX G9 NVIDIA GeForce RTX 4060 Laptop GPU, i7-14650HX, Samsung PM9A1 MZVL21T0HCLR | HP Victus 16 (2024) NVIDIA GeForce RTX 4060 Laptop GPU, i7-14700HX, Kioxia XG8 KXG80ZNV512G | Dell G16, i7-13650HX, RTX 4060 NVIDIA GeForce RTX 4060 Laptop GPU, i7-13650HX, WD PC SN740 SDDPNQD-1T00 | SCHENKER XMG Fusion 15 (Early 24) NVIDIA GeForce RTX 4070 Laptop GPU, i9-14900HX, Samsung 990 Pro 1 TB | SCHENKER XMG Pro 15 (E23) NVIDIA GeForce RTX 4060 Laptop GPU, i9-13900HX, Crucial P5 Plus 1TB CT1000P5PSSD8 | |
|---|---|---|---|---|---|---|
| Noise | -14% | -13% | 3% | -18% | -9% | |
| desligado / ambiente * | 23 | 24 -4% | 25 -9% | 23 -0% | 25 -9% | 24 -4% |
| Idle Minimum * | 23 | 24 -4% | 28 -22% | 23 -0% | 27 -17% | 24 -4% |
| Idle Average * | 23 | 28.8 -25% | 29 -26% | 23 -0% | 28 -22% | 24 -4% |
| Idle Maximum * | 23 | 32 -39% | 33 -43% | 27.96 -22% | 33 -43% | 24 -4% |
| Load Average * | 38.92 | 45.5 -17% | 45 -16% | 27.96 28% | 52 -34% | 53.65 -38% |
| Witcher 3 ultra * | 50.96 | 53.1 -4% | 43 16% | 47.89 6% | 51 -0% | 53.53 -5% |
| Cyberpunk 2077 ultra * | 52.06 | |||||
| Load Maximum * | 52.09 | 55.7 -7% | 48 8% | 47.89 8% | 53 -2% | 53.65 -3% |
* ... menor é melhor
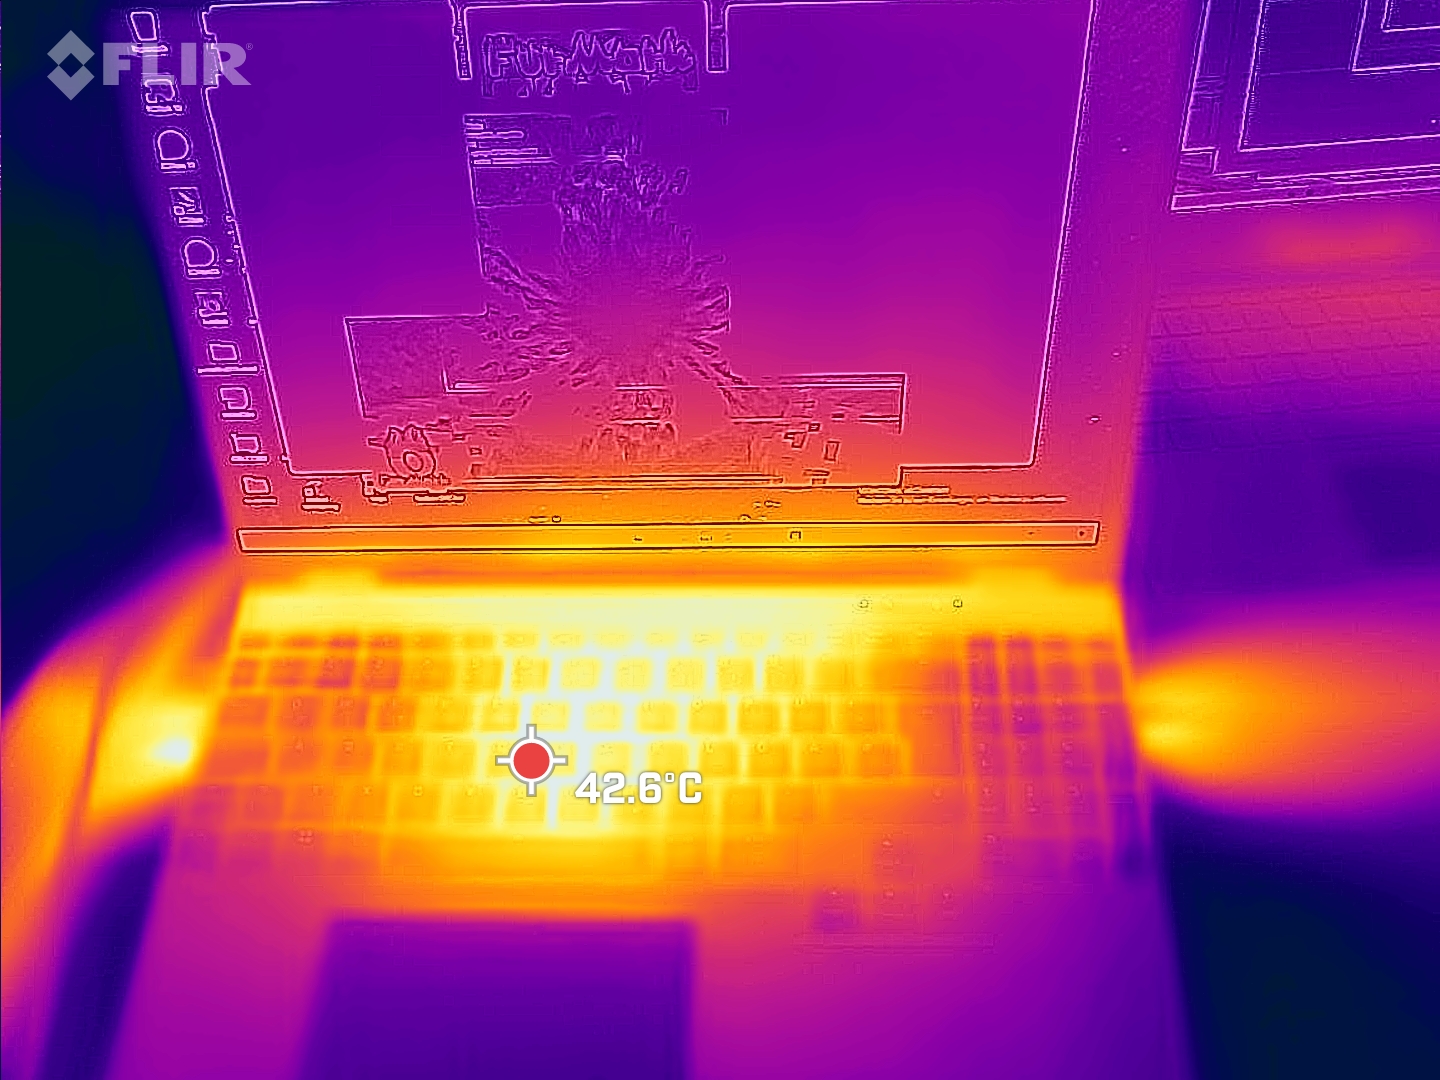
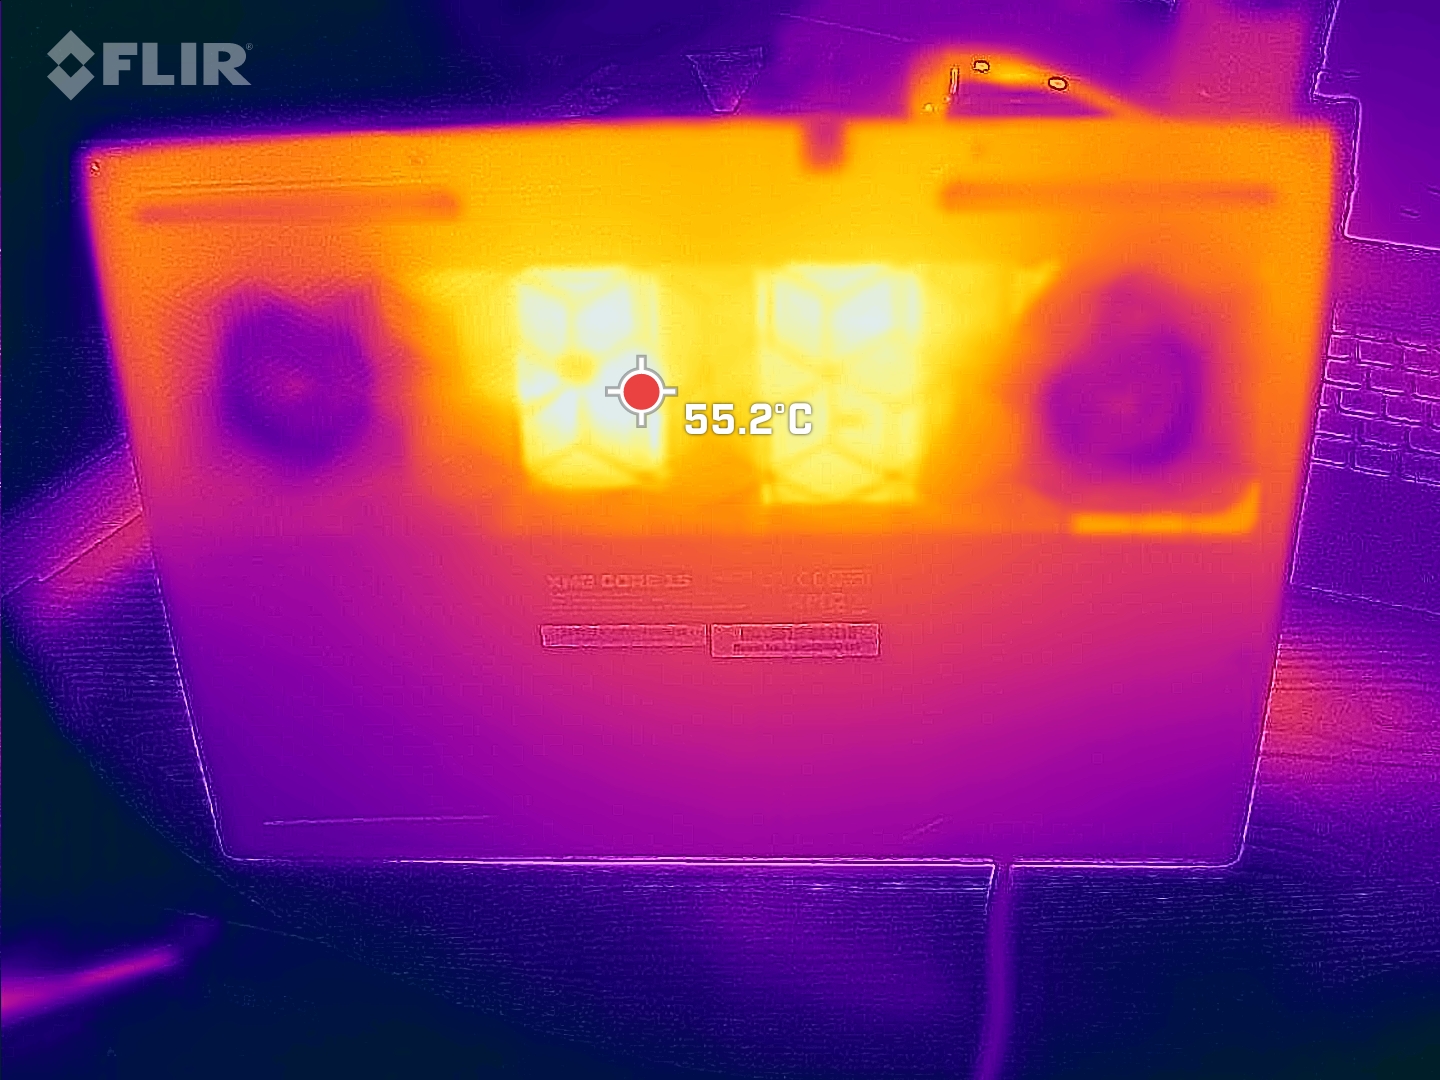
Temperatura
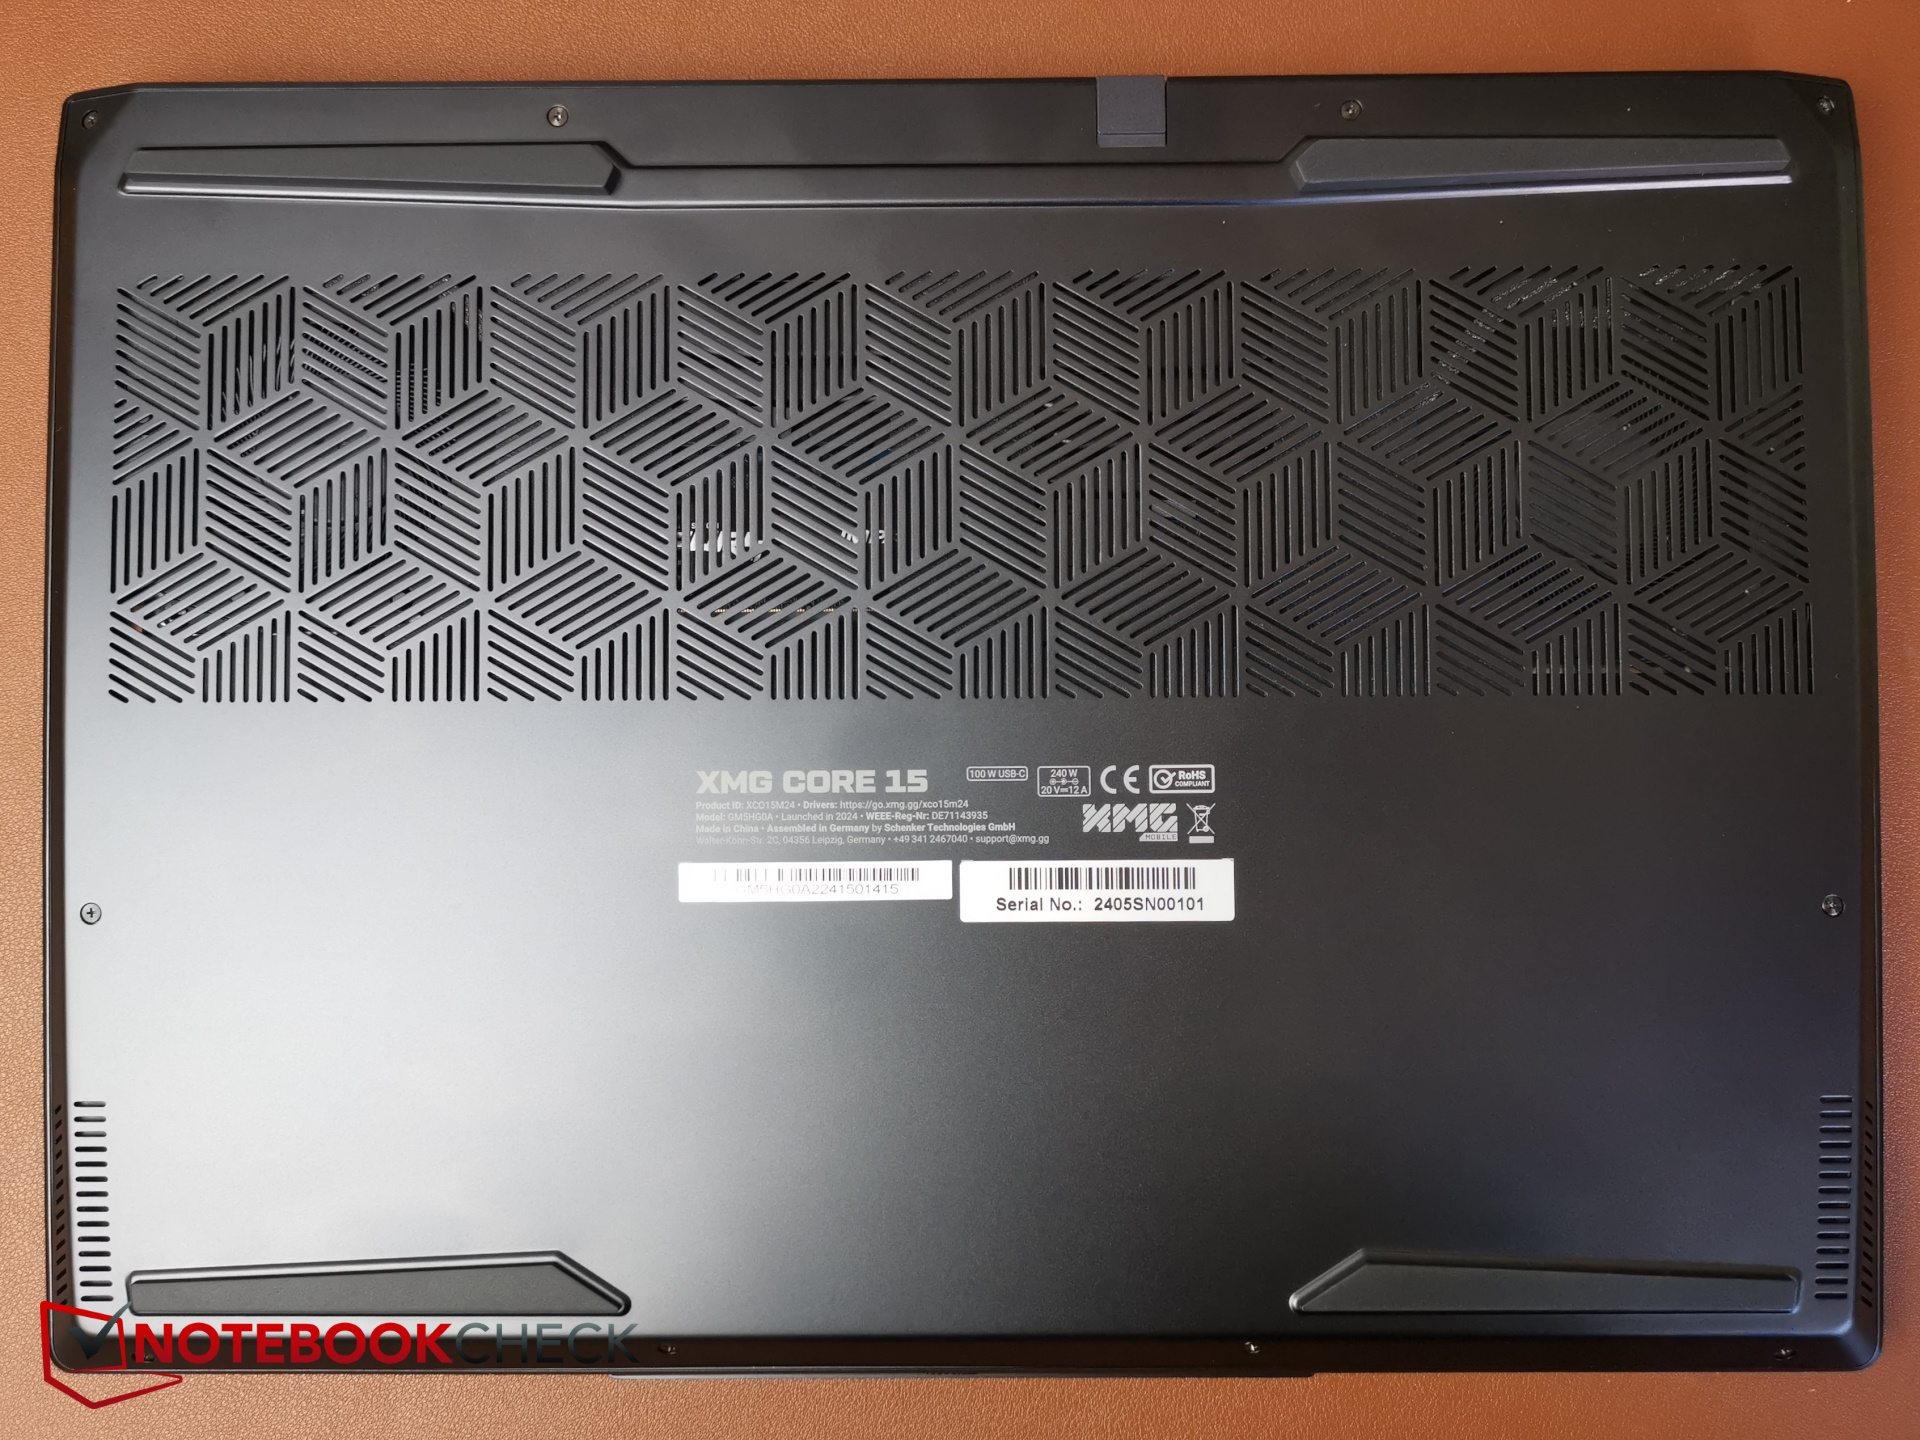
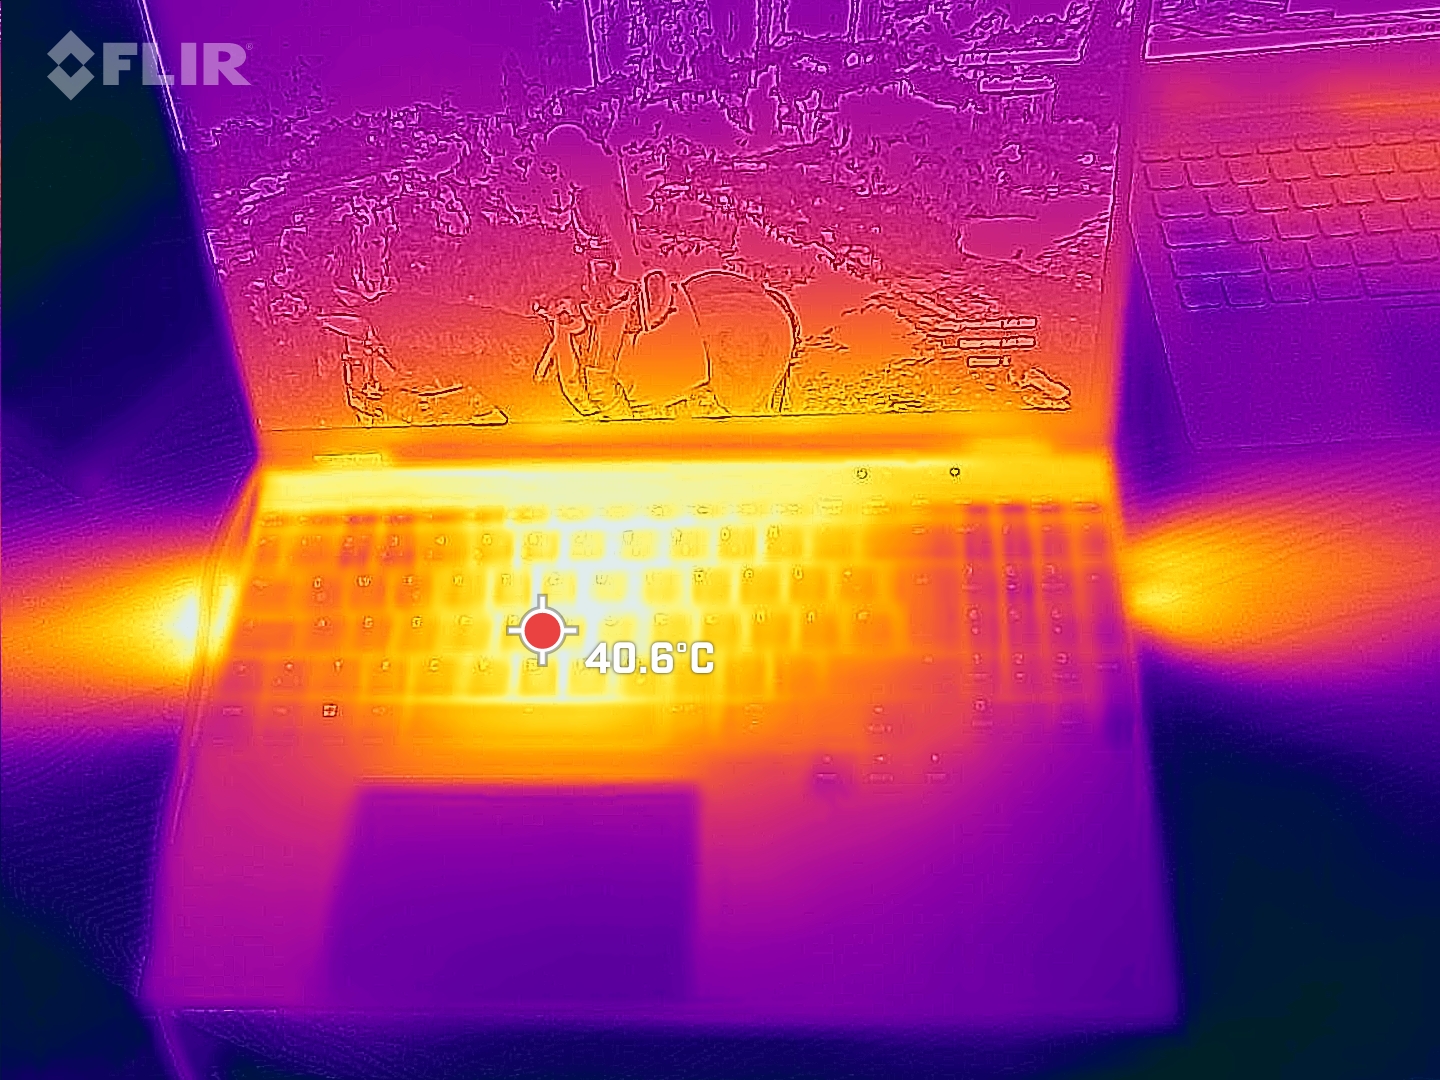
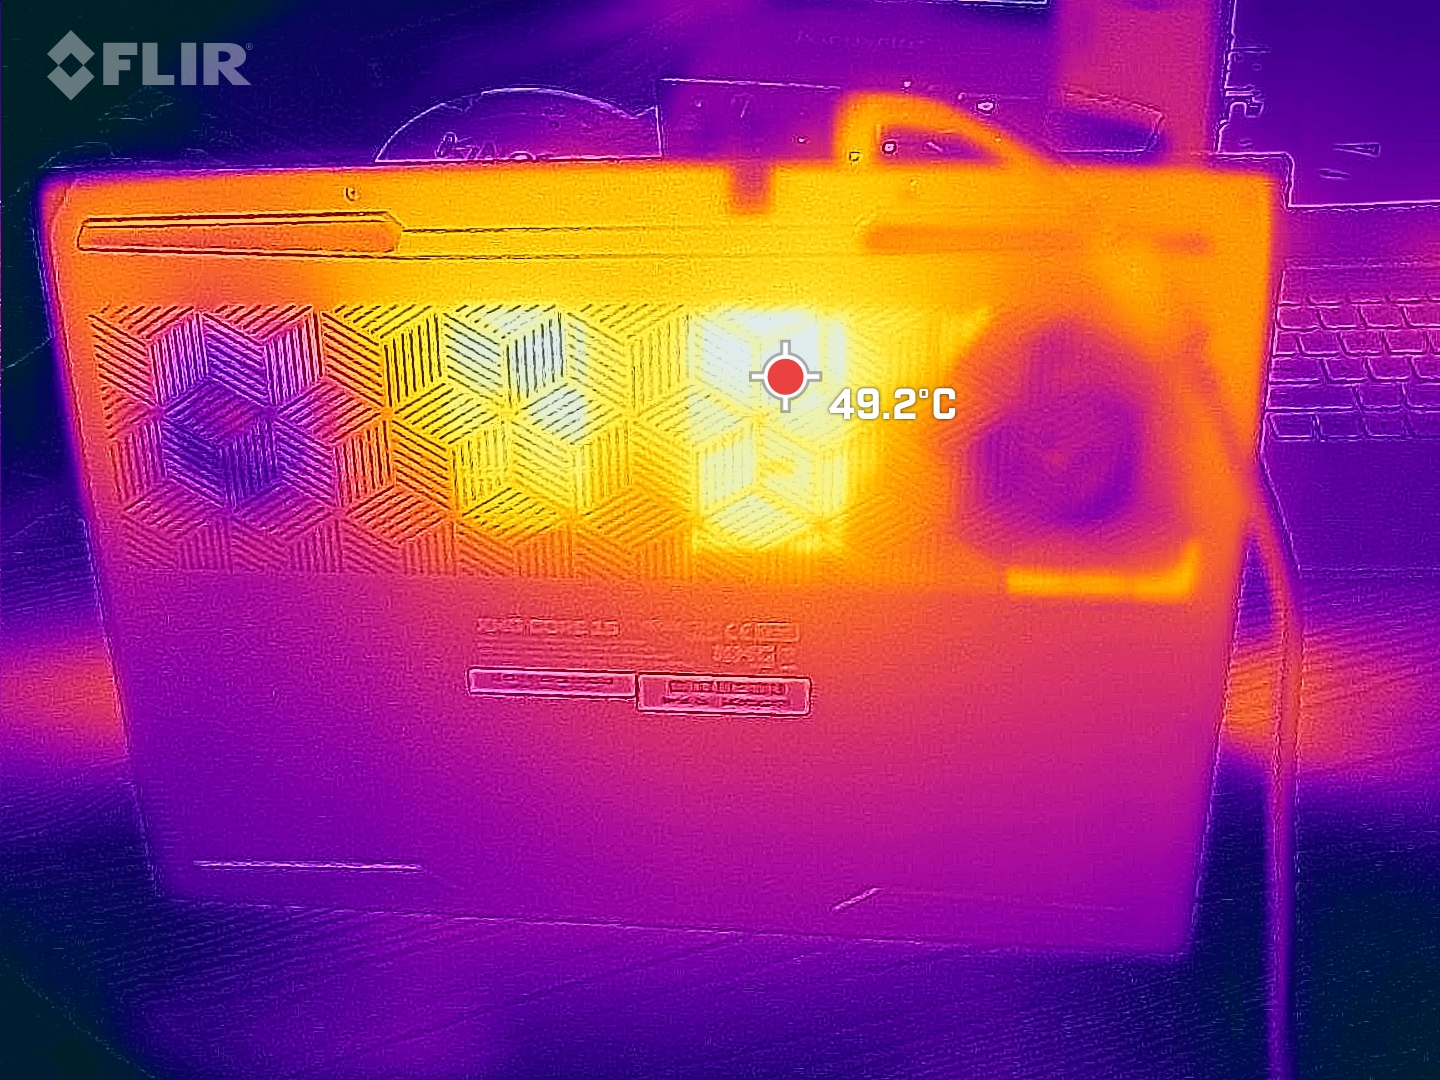
O Core 15 realmente não permanece frio, com o gabinete de metal esquentando bastante e se tornando uma fonte adicional de calor, especialmente na base da unidade. Os apoios para as mãos permanecem comparativamente frios.
Mesmo funcionando em modo inativo com os ventiladores desligados, a cerca de 35 °C, ele fica bastante quente, mas dentro de limites razoáveis. Ao jogar, o ponto de acesso na base do dispositivo, no centro da tela, aquece até 55 °C e atinge pouco mais de 60 °C no teste de estresse. É nessa área que a concorrência consegue se manter um pouco mais fria, até mesmo o Fusion 15 com sua GPU mais potente. Isso também pode ter um impacto na configuração da RTX 4070, resultando em um possível estrangulamento térmico.
(-) A temperatura máxima no lado superior é 52 °C / 126 F, em comparação com a média de 40.4 °C / 105 F , variando de 21.2 a 68.8 °C para a classe Gaming.
(-) A parte inferior aquece até um máximo de 61 °C / 142 F, em comparação com a média de 43.2 °C / 110 F
(±) Em uso inativo, a temperatura média para o lado superior é 32.7 °C / 91 F, em comparação com a média do dispositivo de 33.9 °C / ### class_avg_f### F.
(-) Jogando The Witcher 3, a temperatura média para o lado superior é 39.2 °C / 103 F, em comparação com a média do dispositivo de 33.9 °C / ## #class_avg_f### F.
(+) Os apoios para as mãos e o touchpad estão atingindo a temperatura máxima da pele (34 °C / 93.2 F) e, portanto, não estão quentes.
(-) A temperatura média da área do apoio para as mãos de dispositivos semelhantes foi 28.9 °C / 84 F (-5.1 °C / -9.2 F).
| SCHENKER XMG Core 15 (M24) AMD Ryzen 7 8845HS, NVIDIA GeForce RTX 4060 Laptop GPU | Lenovo Legion 5 16IRX G9 Intel Core i7-14650HX, NVIDIA GeForce RTX 4060 Laptop GPU | HP Victus 16 (2024) Intel Core i7-14700HX, NVIDIA GeForce RTX 4060 Laptop GPU | Dell G16, i7-13650HX, RTX 4060 Intel Core i7-13650HX, NVIDIA GeForce RTX 4060 Laptop GPU | SCHENKER XMG Fusion 15 (Early 24) Intel Core i9-14900HX, NVIDIA GeForce RTX 4070 Laptop GPU | SCHENKER XMG Pro 15 (E23) Intel Core i9-13900HX, NVIDIA GeForce RTX 4060 Laptop GPU | |
|---|---|---|---|---|---|---|
| Heat | 18% | 21% | 5% | 16% | 12% | |
| Maximum Upper Side * | 52 | 40.4 22% | 50 4% | 49 6% | 48 8% | 50 4% |
| Maximum Bottom * | 61 | 43.8 28% | 50 18% | 58 5% | 56 8% | 50 18% |
| Idle Upper Side * | 35 | 30.3 13% | 25 29% | 35 -0% | 28 20% | 33 6% |
| Idle Bottom * | 39 | 35.3 9% | 26 33% | 35 10% | 29 26% | 32 18% |
* ... menor é melhor
Alto-falantes
Os agudos e médios são lineares e equilibrados, mas os graves são quase inaudíveis e os alto-falantes também poderiam ser mais altos. A conexão de equipamentos de áudio analógico pode ser feita por meio da porta de fone de ouvido de 3,5 mm.
SCHENKER XMG Core 15 (M24) análise de áudio
(±) | o volume do alto-falante é médio, mas bom (###valor### dB)
Graves 100 - 315Hz
(-) | quase nenhum baixo - em média 16.7% menor que a mediana
(-) | graves não são lineares (15.7% delta para frequência anterior)
Médios 400 - 2.000 Hz
(+) | médios equilibrados - apenas 4.5% longe da mediana
(+) | médios são lineares (4.4% delta para frequência anterior)
Altos 2 - 16 kHz
(+) | agudos equilibrados - apenas 1% longe da mediana
(+) | os máximos são lineares (2.7% delta da frequência anterior)
Geral 100 - 16.000 Hz
(+) | o som geral é linear (13.7% diferença em relação à mediana)
Comparado com a mesma classe
» 20% de todos os dispositivos testados nesta classe foram melhores, 6% semelhantes, 74% piores
» O melhor teve um delta de 6%, a média foi 18%, o pior foi 132%
Comparado com todos os dispositivos testados
» 13% de todos os dispositivos testados foram melhores, 3% semelhantes, 83% piores
» O melhor teve um delta de 4%, a média foi 24%, o pior foi 134%
Apple MacBook Pro 16 2021 M1 Pro análise de áudio
(+) | os alto-falantes podem tocar relativamente alto (###valor### dB)
Graves 100 - 315Hz
(+) | bons graves - apenas 3.8% longe da mediana
(+) | o baixo é linear (5.2% delta para a frequência anterior)
Médios 400 - 2.000 Hz
(+) | médios equilibrados - apenas 1.3% longe da mediana
(+) | médios são lineares (2.1% delta para frequência anterior)
Altos 2 - 16 kHz
(+) | agudos equilibrados - apenas 1.9% longe da mediana
(+) | os máximos são lineares (2.7% delta da frequência anterior)
Geral 100 - 16.000 Hz
(+) | o som geral é linear (4.6% diferença em relação à mediana)
Comparado com a mesma classe
» 0% de todos os dispositivos testados nesta classe foram melhores, 0% semelhantes, 100% piores
» O melhor teve um delta de 5%, a média foi 18%, o pior foi 45%
Comparado com todos os dispositivos testados
» 0% de todos os dispositivos testados foram melhores, 0% semelhantes, 100% piores
» O melhor teve um delta de 4%, a média foi 24%, o pior foi 134%
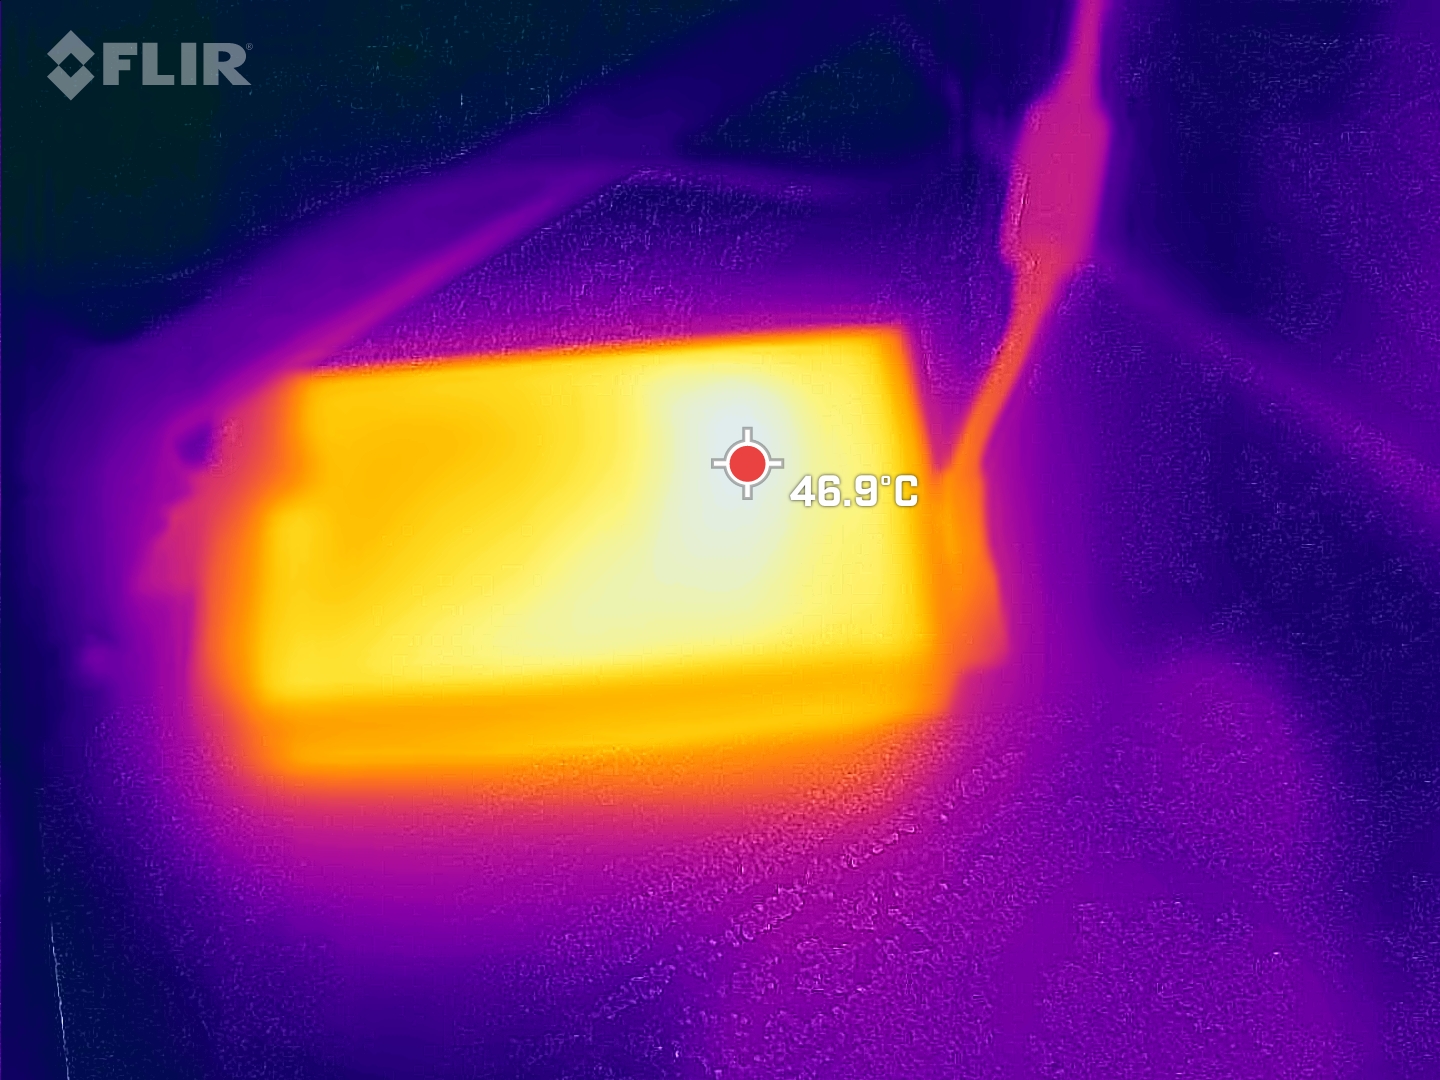
Consumo de energia
O Core 15 é um pouco mais econômico do que a concorrência, especialmente quando está ocioso - tudo muito bom. O consumo também permanece moderado durante os jogos.
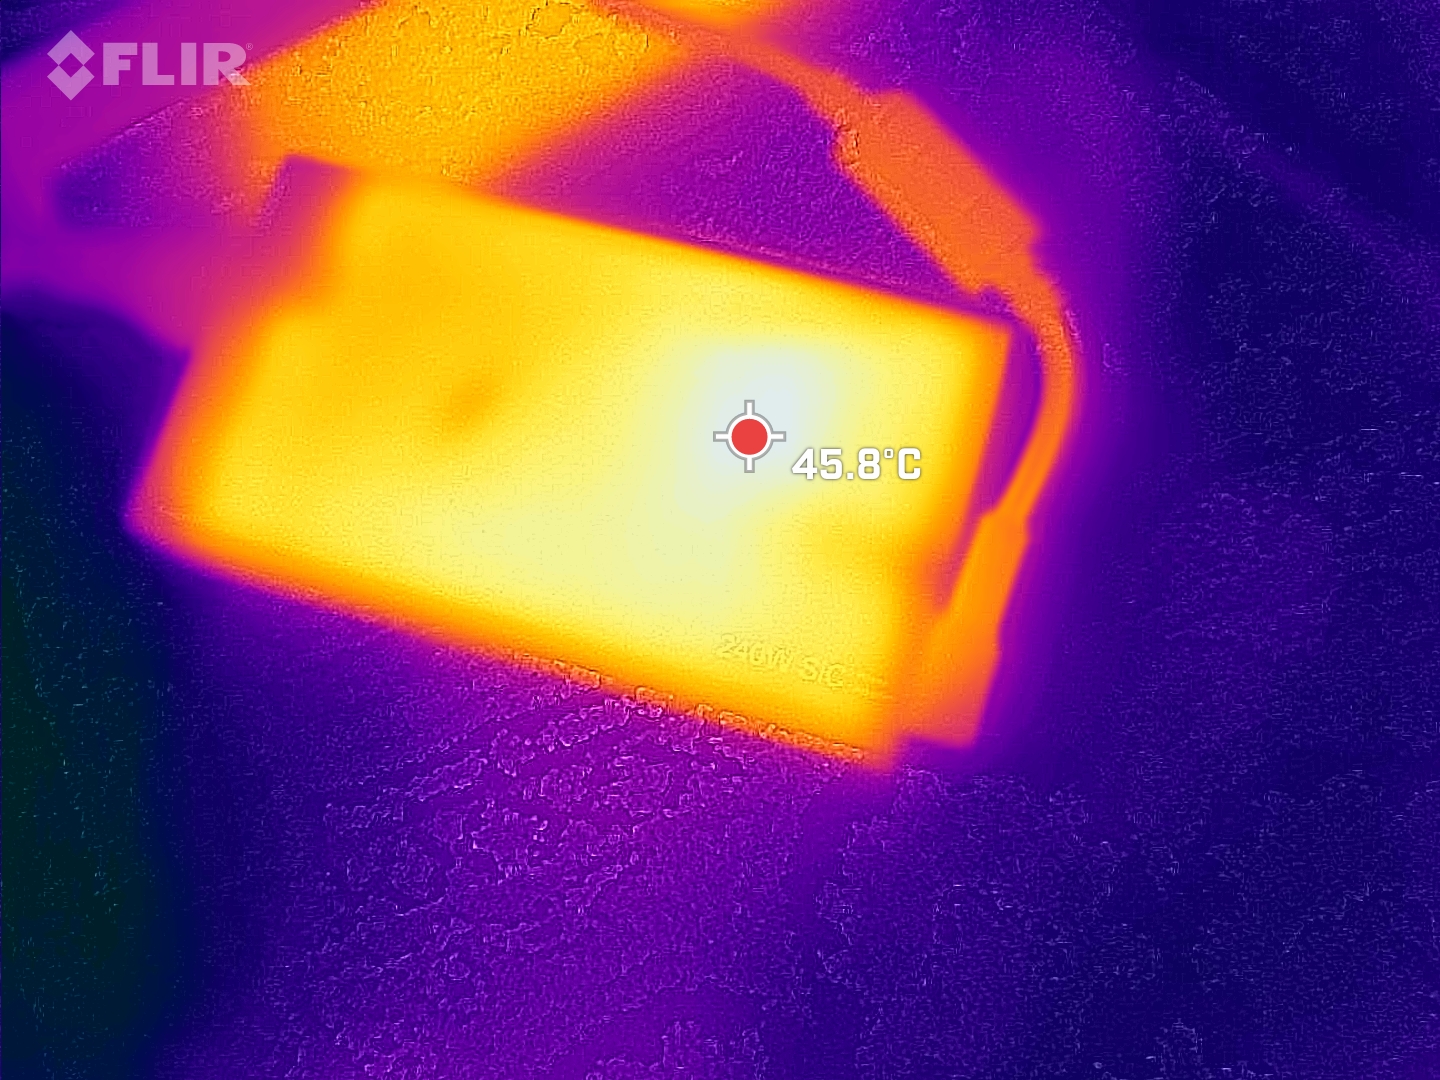
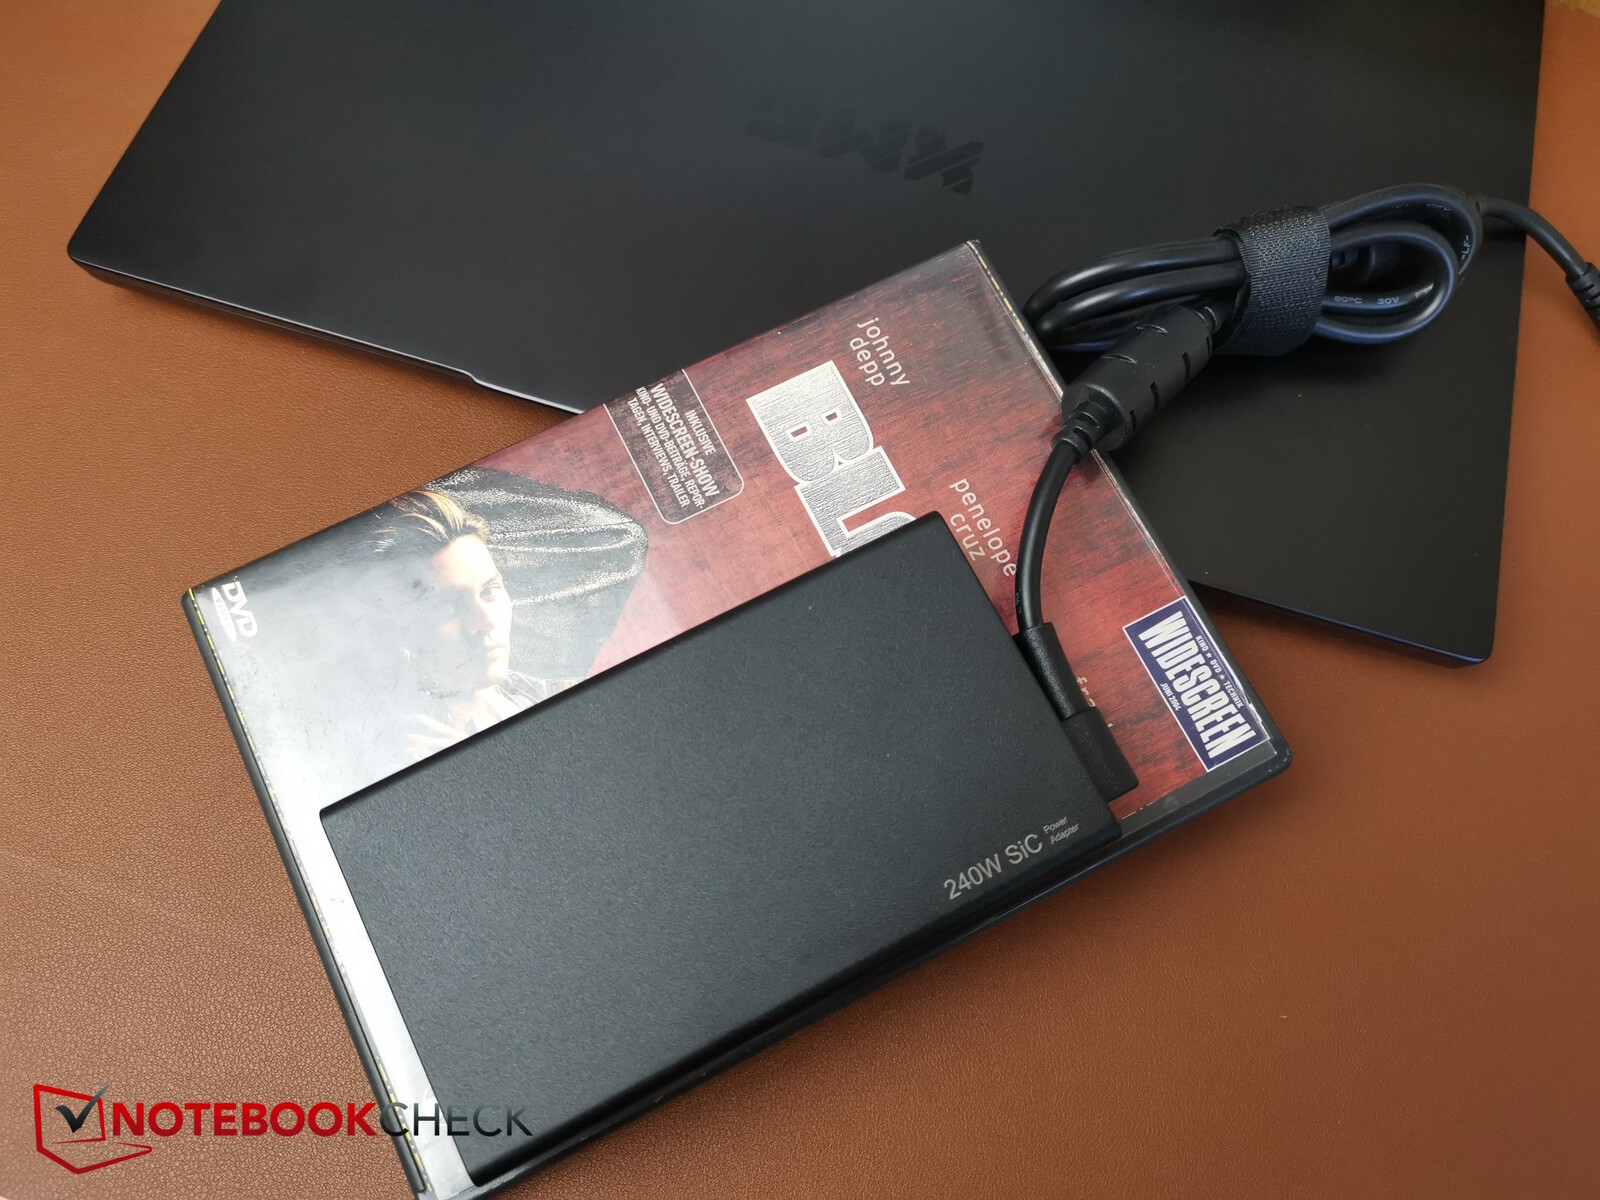
No teste de estresse, medimos temporariamente valores de consumo de até 286 W que, teoricamente, poderiam sobrecarregar um pouco a PSU de 240 W. No entanto, esses picos de carga são, na verdade, apenas temporários. Durante os jogos, medimos um consumo médio de apenas 167 W e isso é algo que a PSU deve ser capaz de suportar o tempo todo.
Falando da PSU, a Schenker parece ter feito melhorias aqui, diminuindo suas dimensões. Em vez da volumosa PSU Chicony de 240 W, o fabricante também optou por uma unidade de 240 W, mas em um formato significativamente menor. Isso é muito benéfico para a mobilidade.
| desligado | |
| Ocioso | |
| Carga |
|
Key:
min: | |
| SCHENKER XMG Core 15 (M24) R7 8845HS, NVIDIA GeForce RTX 4060 Laptop GPU, Samsung 990 Pro 1 TB, IPS, 2560x1600, 15.3" | Lenovo Legion 5 16IRX G9 i7-14650HX, NVIDIA GeForce RTX 4060 Laptop GPU, Samsung PM9A1 MZVL21T0HCLR, IPS, 2560x1600, 16" | HP Victus 16 (2024) i7-14700HX, NVIDIA GeForce RTX 4060 Laptop GPU, Kioxia XG8 KXG80ZNV512G, IPS, 1920x1080, 16.1" | Dell G16, i7-13650HX, RTX 4060 i7-13650HX, NVIDIA GeForce RTX 4060 Laptop GPU, WD PC SN740 SDDPNQD-1T00, IPS, 2560x1600, 16" | SCHENKER XMG Fusion 15 (Early 24) i9-14900HX, NVIDIA GeForce RTX 4070 Laptop GPU, Samsung 990 Pro 1 TB, IPS, 2560x1600, 15.3" | SCHENKER XMG Pro 15 (E23) i9-13900HX, NVIDIA GeForce RTX 4060 Laptop GPU, Crucial P5 Plus 1TB CT1000P5PSSD8, IPS, 2560x1440, 15.6" | Média NVIDIA GeForce RTX 4060 Laptop GPU | Média da turma Gaming | |
|---|---|---|---|---|---|---|---|---|
| Power Consumption | -36% | -13% | -13% | -20% | -100% | -20% | -45% | |
| Idle Minimum * | 9.3 | 15.4 -66% | 9 3% | 11 -18% | 8 14% | 21.6 -132% | 11.5 ? -24% | 13.4 ? -44% |
| Idle Average * | 12.9 | 19.7 -53% | 15 -16% | 14.8 -15% | 14 -9% | 29 -125% | 16 ? -24% | 18.9 ? -47% |
| Idle Maximum * | 12.8 | 20.7 -62% | 23 -80% | 16.8 -31% | 26 -103% | 42.7 -234% | 20.3 ? -59% | 26.3 ? -105% |
| Witcher 3 ultra * | 167 | 191.3 -15% | 143.7 14% | 185 -11% | 192.7 -15% | 189 -13% | ||
| Load Maximum * | 286 | 246.6 14% | 241 16% | 255 11% | 244 15% | 269 6% | 210 ? 27% | 244 ? 15% |
| Load Average * | 102.6 | 123 | 103.7 | 118 | 190 | 92.9 ? | 102.7 ? |
* ... menor é melhor
Power consumption Witcher 3 / stress test
Power consumption with an external monitor
Duração da bateria
Como padrão, a Schenker instalou uma bateria de 80 Wh. No entanto, por uma sobretaxa adicional de cerca de US$ 70, o dispositivo pode ser configurado com uma bateria maior de 99,8 Wh, que é a encontrada em nosso modelo de análise.
O Core 15 continua funcionando por cerca de 7 horas no teste de Wi-Fi ou de vídeo com 150 Nits de brilho reduzido. Se o senhor definir o brilho para o máximo, as luzes se apagam após menos de 5 horas no teste de Wi-Fi. De modo geral, estamos lidando com uma duração de bateria muito boa, embora o Legion pareça ser capaz de oferecer desempenho semelhante com uma bateria de 80 Wh.
| SCHENKER XMG Core 15 (M24) R7 8845HS, NVIDIA GeForce RTX 4060 Laptop GPU, 99.8 Wh | Lenovo Legion 5 16IRX G9 i7-14650HX, NVIDIA GeForce RTX 4060 Laptop GPU, 80 Wh | HP Victus 16 (2024) i7-14700HX, NVIDIA GeForce RTX 4060 Laptop GPU, 83 Wh | Dell G16, i7-13650HX, RTX 4060 i7-13650HX, NVIDIA GeForce RTX 4060 Laptop GPU, 86 Wh | SCHENKER XMG Fusion 15 (Early 24) i9-14900HX, NVIDIA GeForce RTX 4070 Laptop GPU, 99.8 Wh | SCHENKER XMG Pro 15 (E23) i9-13900HX, NVIDIA GeForce RTX 4060 Laptop GPU, 80 Wh | Média da turma Gaming | |
|---|---|---|---|---|---|---|---|
| Duração da bateria | -42% | -43% | -48% | -13% | -43% | -42% | |
| H.264 | 608 | 576 -5% | 381 -37% | 602 -1% | 447 ? -26% | ||
| WiFi v1.3 | 889 | 444 -50% | 511 -43% | 378 -57% | 480 -46% | 343.1 -61% | 387 ? -56% |
| Load | 151 | 46 -70% | 76 -50% | 164 9% | 115 -24% | 84.5 ? -44% | |
| Reader / Idle | 911 | 585 ? |
Pro
Contra
Veredicto - Bom e acessível, com resfriamento potencialmente aprimorado
O Core 15 custa pelo menos 200 dólares a menos que o Fusion 15. Isso tem o custo de não ter Thunderbolt e uma CPU mais potente. O último resulta em uma diferença perceptível de desempenho da CPU de quase 20%. Entretanto, isso não é algo que o senhor realmente notará na maioria dos jogos 3D. O Fusion pode ser 20% mais rápido nessa área, mas isso se deve à sua RTX 4070. A variante RTX 4060 deve ser igualmente rápida.
Gostamos da habilidade do Core com seu gabinete de metal, bem como das boas opções de expansão em termos de RAM e SSDs. O teclado, o desempenho 3D e a duração da bateria também são decentes.
A "única" crítica é a grande quantidade de calor produzida na superfície de metal da base sob carga pesada. Essa é uma área em que o fabricante deve fazer melhorias futuras e talvez otimizar o sistema de resfriamento.
O XMG Core 15 é um potente gamer 3D com boa qualidade de construção, que inclui um gabinete de metal que esquenta um pouco demais sob carga.
Uma alternativa que vale a pena dar uma olhada é o XMG Pro 15 do ano passado. A CPU HX do ano anterior ainda é mais rápida do que o processador AMD encontrado aqui e, além disso, o Pro também tem Thunderbolt 4. O Legion 5i também é uma alternativa possível, especialmente em sua variante Campuspoint mais barata.
Preço e disponibilidade
Na loja Schenker na Alemanha, os preços do Core 15 começam em torno de US$ 1.500 (taxa de conversão atual). Devido à sua bateria maior, Wi-Fi 6E, mais RAM e SSD Samsung 990 Pro, nosso modelo de análise custa cerca de US$ 1.700. Por outro lado, os preços do Fusion 15 começam em cerca de US$ 1.600.
SCHENKER XMG Core 15 (M24)
- 07/17/2024 v8
Christian Hintze
 Total Sustainability Score:
 Transparência
A seleção dos dispositivos a serem analisados é feita pela nossa equipe editorial. A amostra de teste foi fornecida ao autor como empréstimo pelo fabricante ou varejista para fins desta revisão. O credor não teve influência nesta revisão, nem o fabricante recebeu uma cópia desta revisão antes da publicação. Não houve obrigação de publicar esta revisão. Nunca aceitamos compensação ou pagamento em troca de nossas avaliações. Como empresa de mídia independente, a Notebookcheck não está sujeita à autoridade de fabricantes, varejistas ou editores.
É assim que o Notebookcheck está testando
Todos os anos, o Notebookcheck analisa de forma independente centenas de laptops e smartphones usando procedimentos padronizados para garantir que todos os resultados sejam comparáveis. Desenvolvemos continuamente nossos métodos de teste há cerca de 20 anos e definimos padrões da indústria no processo. Em nossos laboratórios de teste, equipamentos de medição de alta qualidade são utilizados por técnicos e editores experientes. Esses testes envolvem um processo de validação em vários estágios. Nosso complexo sistema de classificação é baseado em centenas de medições e benchmarks bem fundamentados, o que mantém a objetividade.Price comparison

