

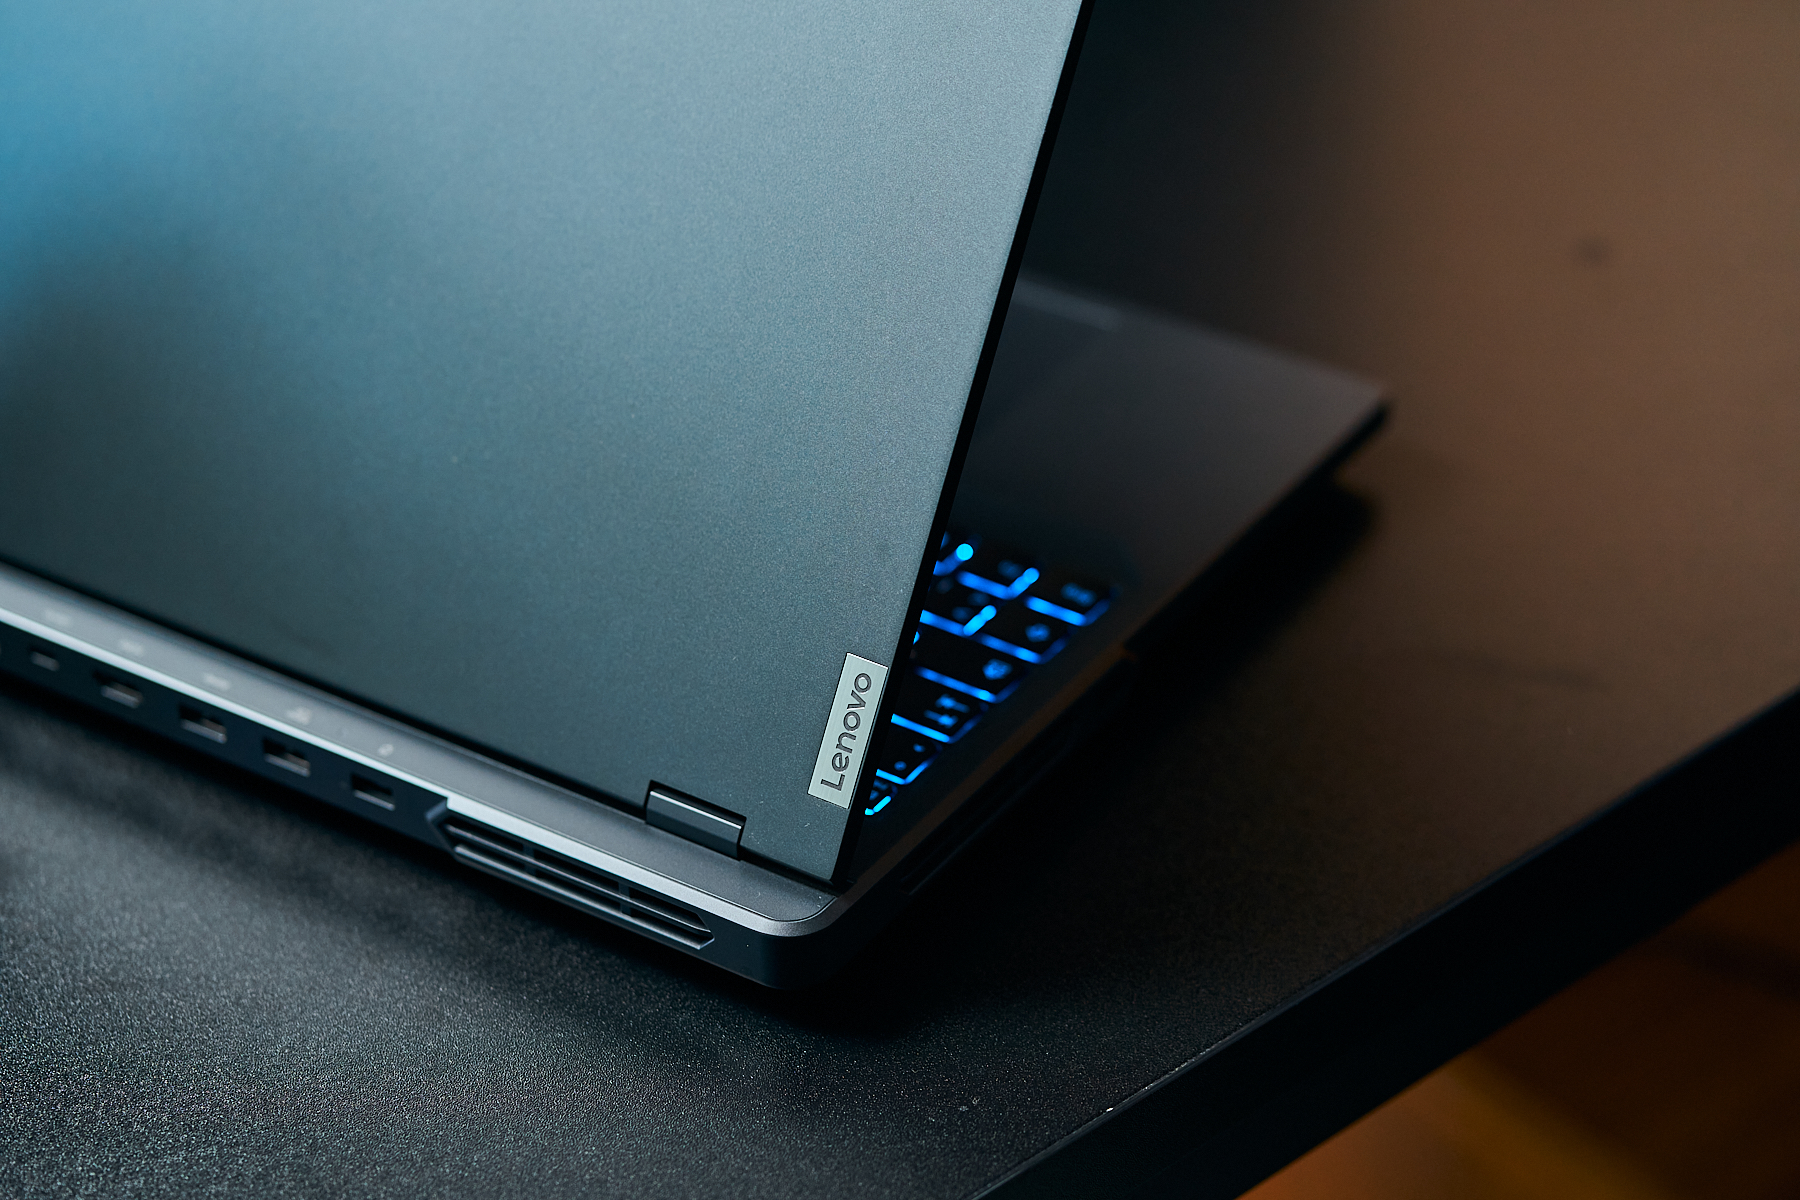
Análise do laptop Lenovo Legion Pro 5i: Desempenho superpotente do i7-14700HX e RTX 4060
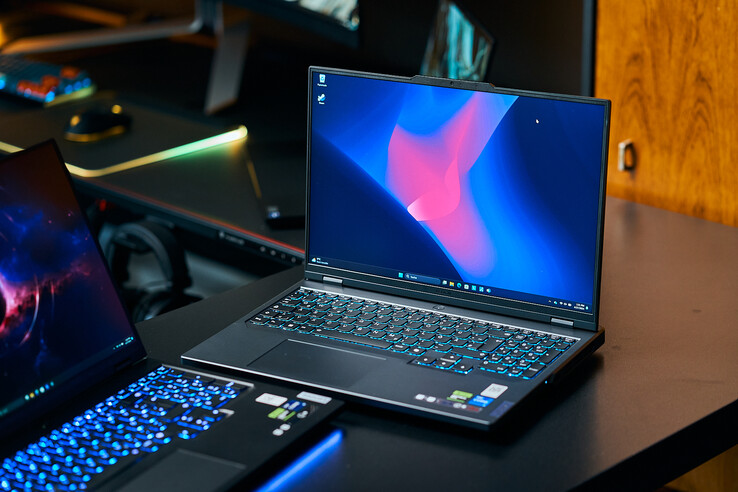
Já testamos uma das melhores configurações com uma CPU CPU Core i9 14900HX e uma GeForce RTX 4070 de 140 watts. No entanto, muitos gamers provavelmente optarão pela configuração mais econômica com um i7 14700HX e um RTX 4060 que estamos analisando hoje. Esse modelo também pode colocar em perspectiva alguns dos pontos fracos do modelo "grande", como as altas temperaturas da superfície e o sistema de resfriamento barulhento.
Além de seu irmão maior e o não profissional Legion 5estaremos comparando o Legion Pro 5 com outros gamers RTX 4060, como o Dell G16, HP Victus 16 e o XMG Core 15.
Possíveis concorrentes em comparação
Versão | Avaliação | Data | Modelo | Peso | Altura | Size | Resolução | Preço |
|---|---|---|---|---|---|---|---|---|
| v8 | 82.3 % | 07/2024 | Lenovo Legion Pro 5 16IRX9 G9 i7-14700HX, NVIDIA GeForce RTX 4060 Laptop GPU | 2.5 kg | 26.55 mm | 16.00" | 2560x1600 | |
| v7 (old) | 84.3 % v7 (old) | 05/2024 | HP Victus 16 (2024) i7-14700HX, NVIDIA GeForce RTX 4060 Laptop GPU | 2.4 kg | 23.9 mm | 16.10" | 1920x1080 | |
| v7 (old) | 85.5 % v7 (old) | 02/2024 | Dell G16, i7-13650HX, RTX 4060 i7-13650HX, NVIDIA GeForce RTX 4060 Laptop GPU | 2.8 kg | 25.65 mm | 16.00" | 2560x1600 | |
| v8 | 83.7 % | 06/2024 | SCHENKER XMG Core 15 (M24) R7 8845HS, NVIDIA GeForce RTX 4060 Laptop GPU | 2.1 kg | 21.9 mm | 15.30" | 2560x1600 | |
| v7 (old) | 89.3 % v7 (old) | 04/2024 | Lenovo Legion Pro 5 16IRX9 i9-14900HX, NVIDIA GeForce RTX 4070 Laptop GPU | 2.5 kg | 26.95 mm | 16.00" | 2560x1600 | |
| v7 (old) | 89.1 % v7 (old) | 02/2024 | Lenovo Legion 5 16IRX G9 i7-14650HX, NVIDIA GeForce RTX 4060 Laptop GPU | 2.4 kg | 25.2 mm | 16.00" | 2560x1600 |
Observação: Atualizamos nosso sistema de classificação e os resultados da versão 8 não são comparáveis aos resultados da versão 7. Mais informações estão disponíveis aqui.
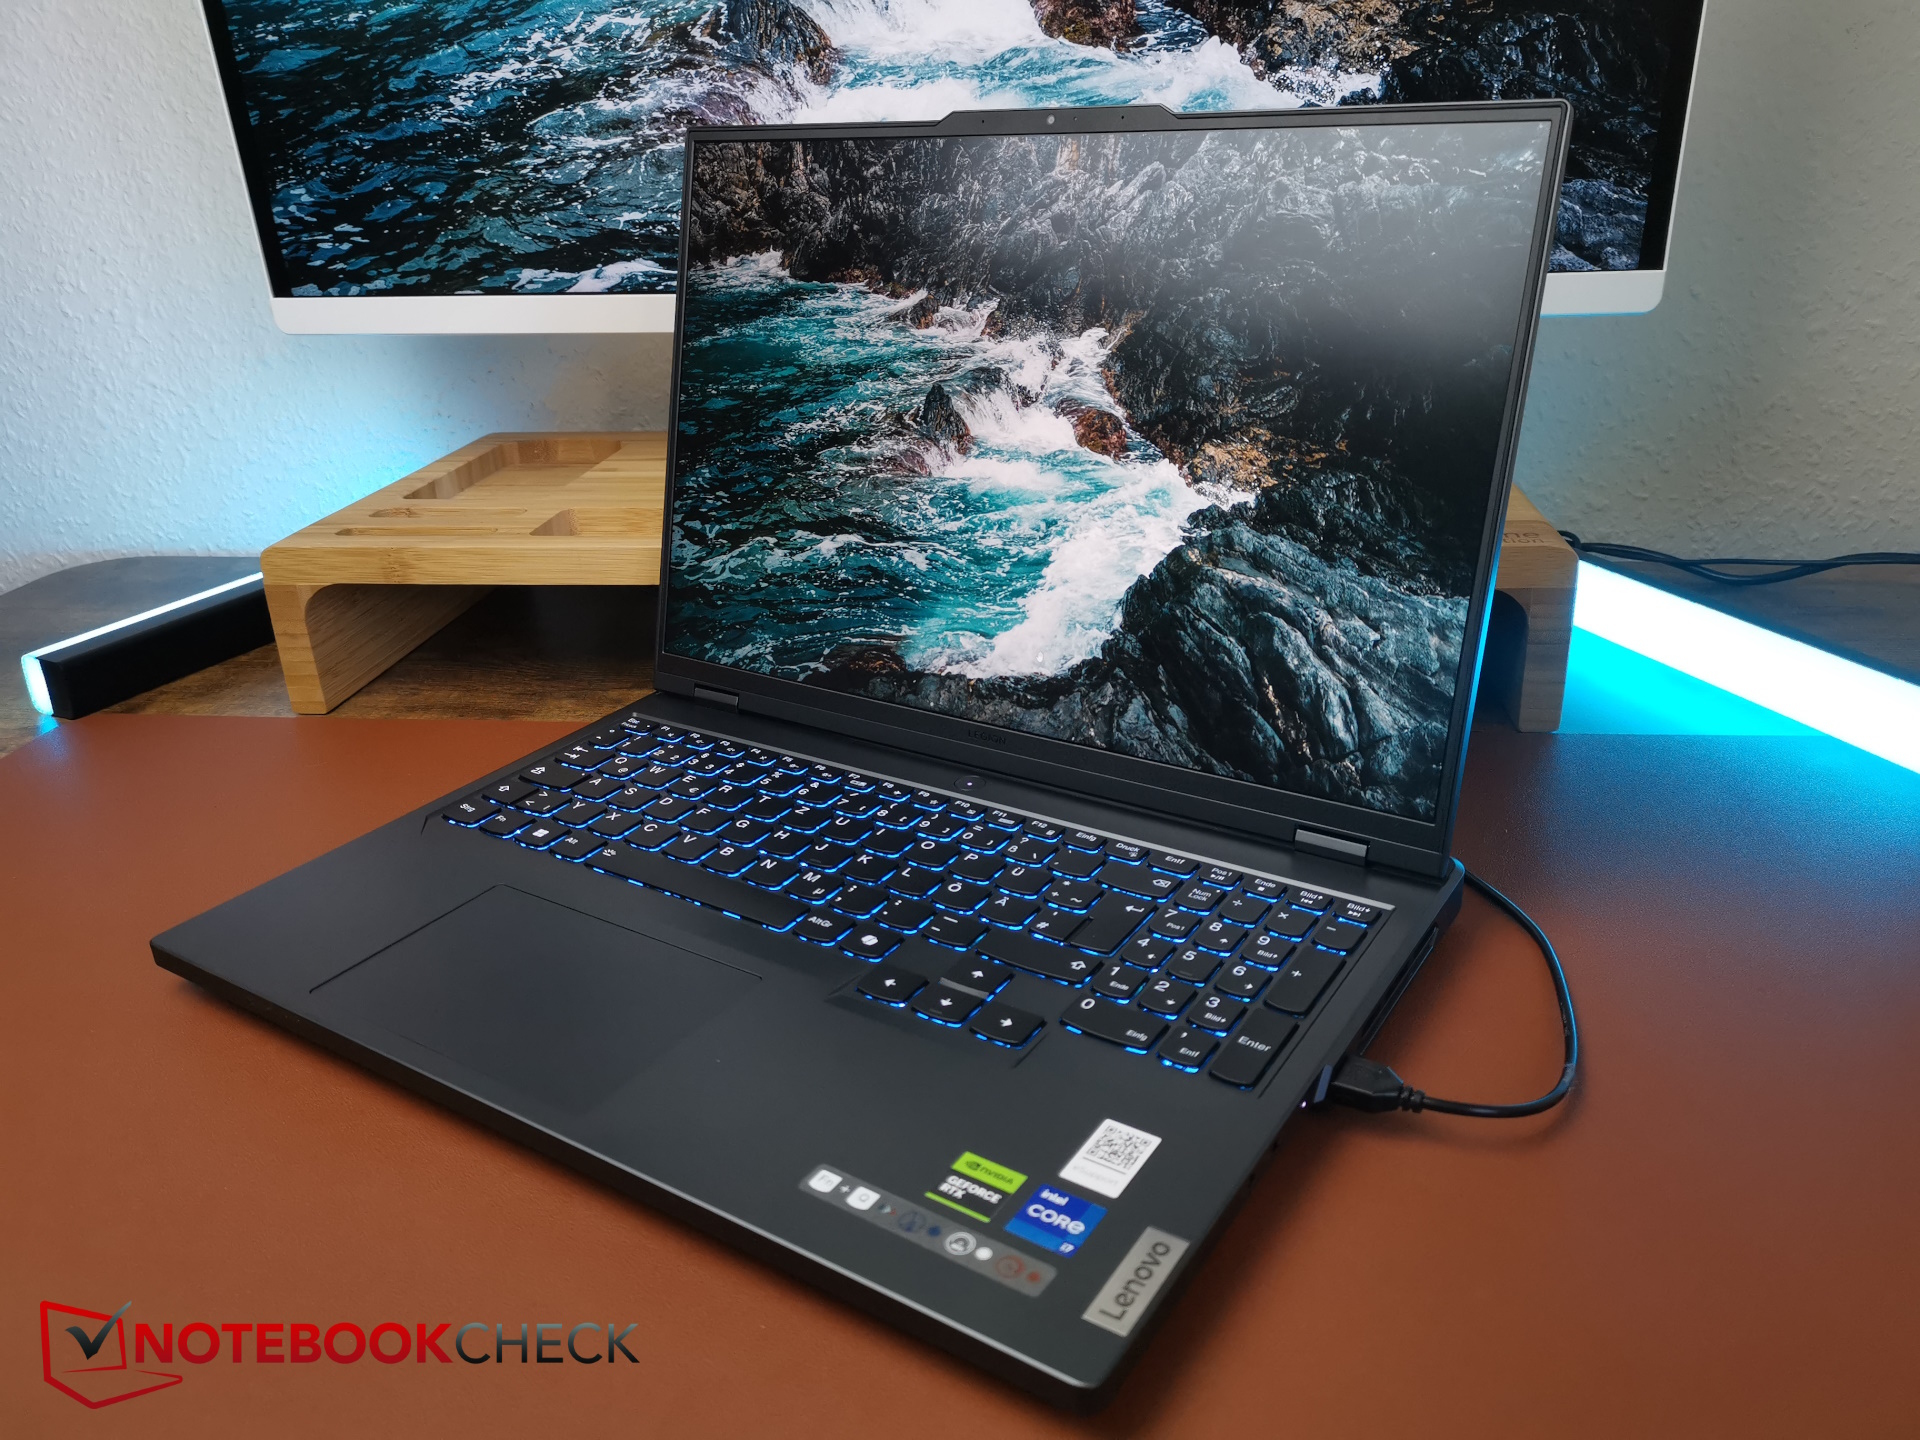
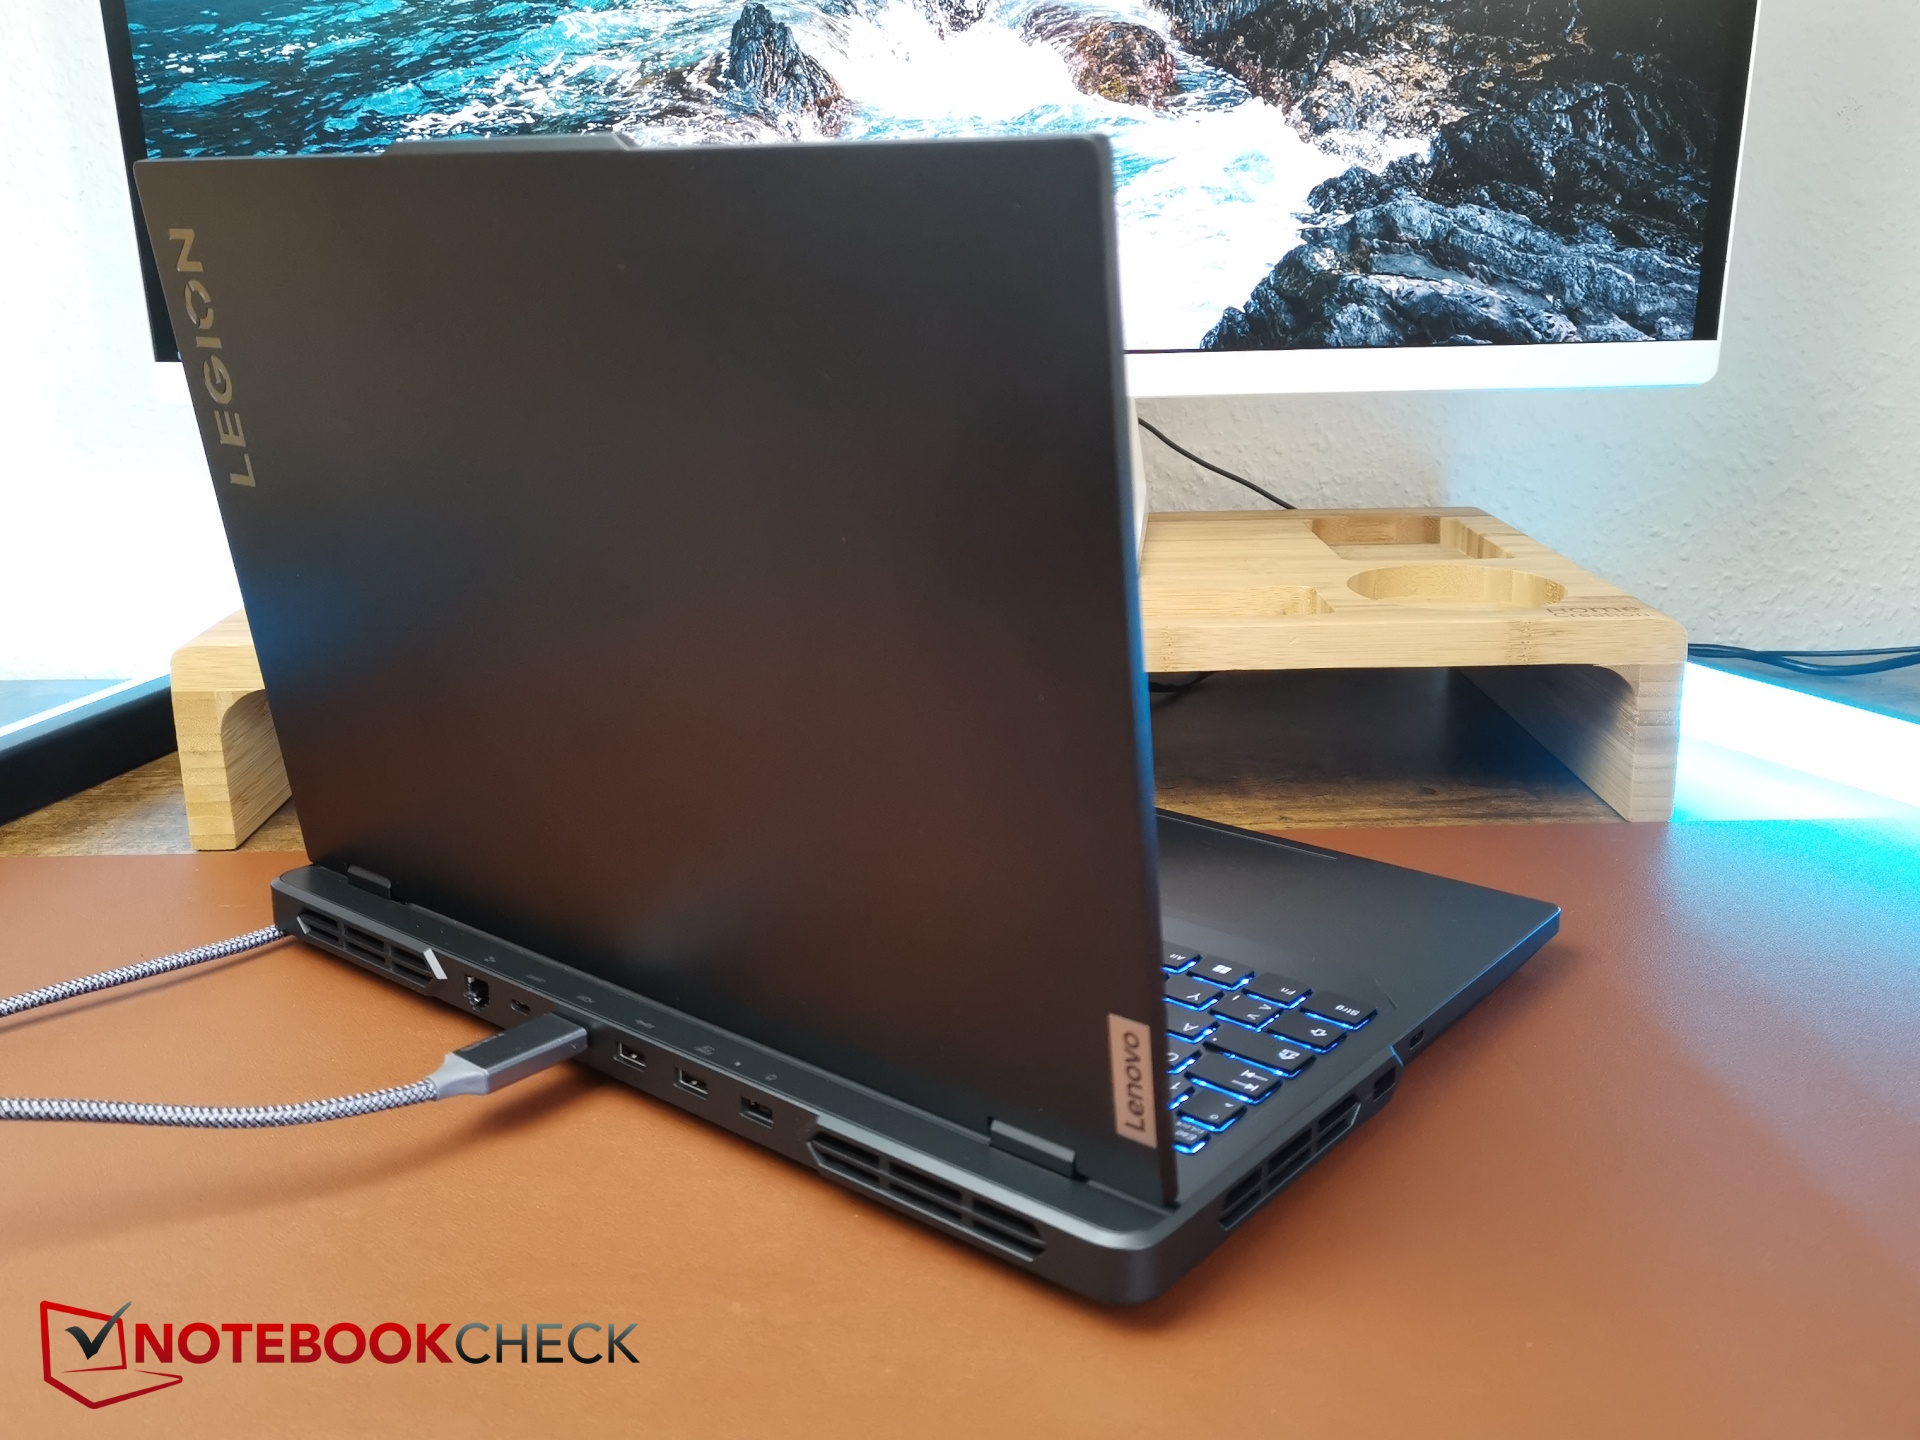
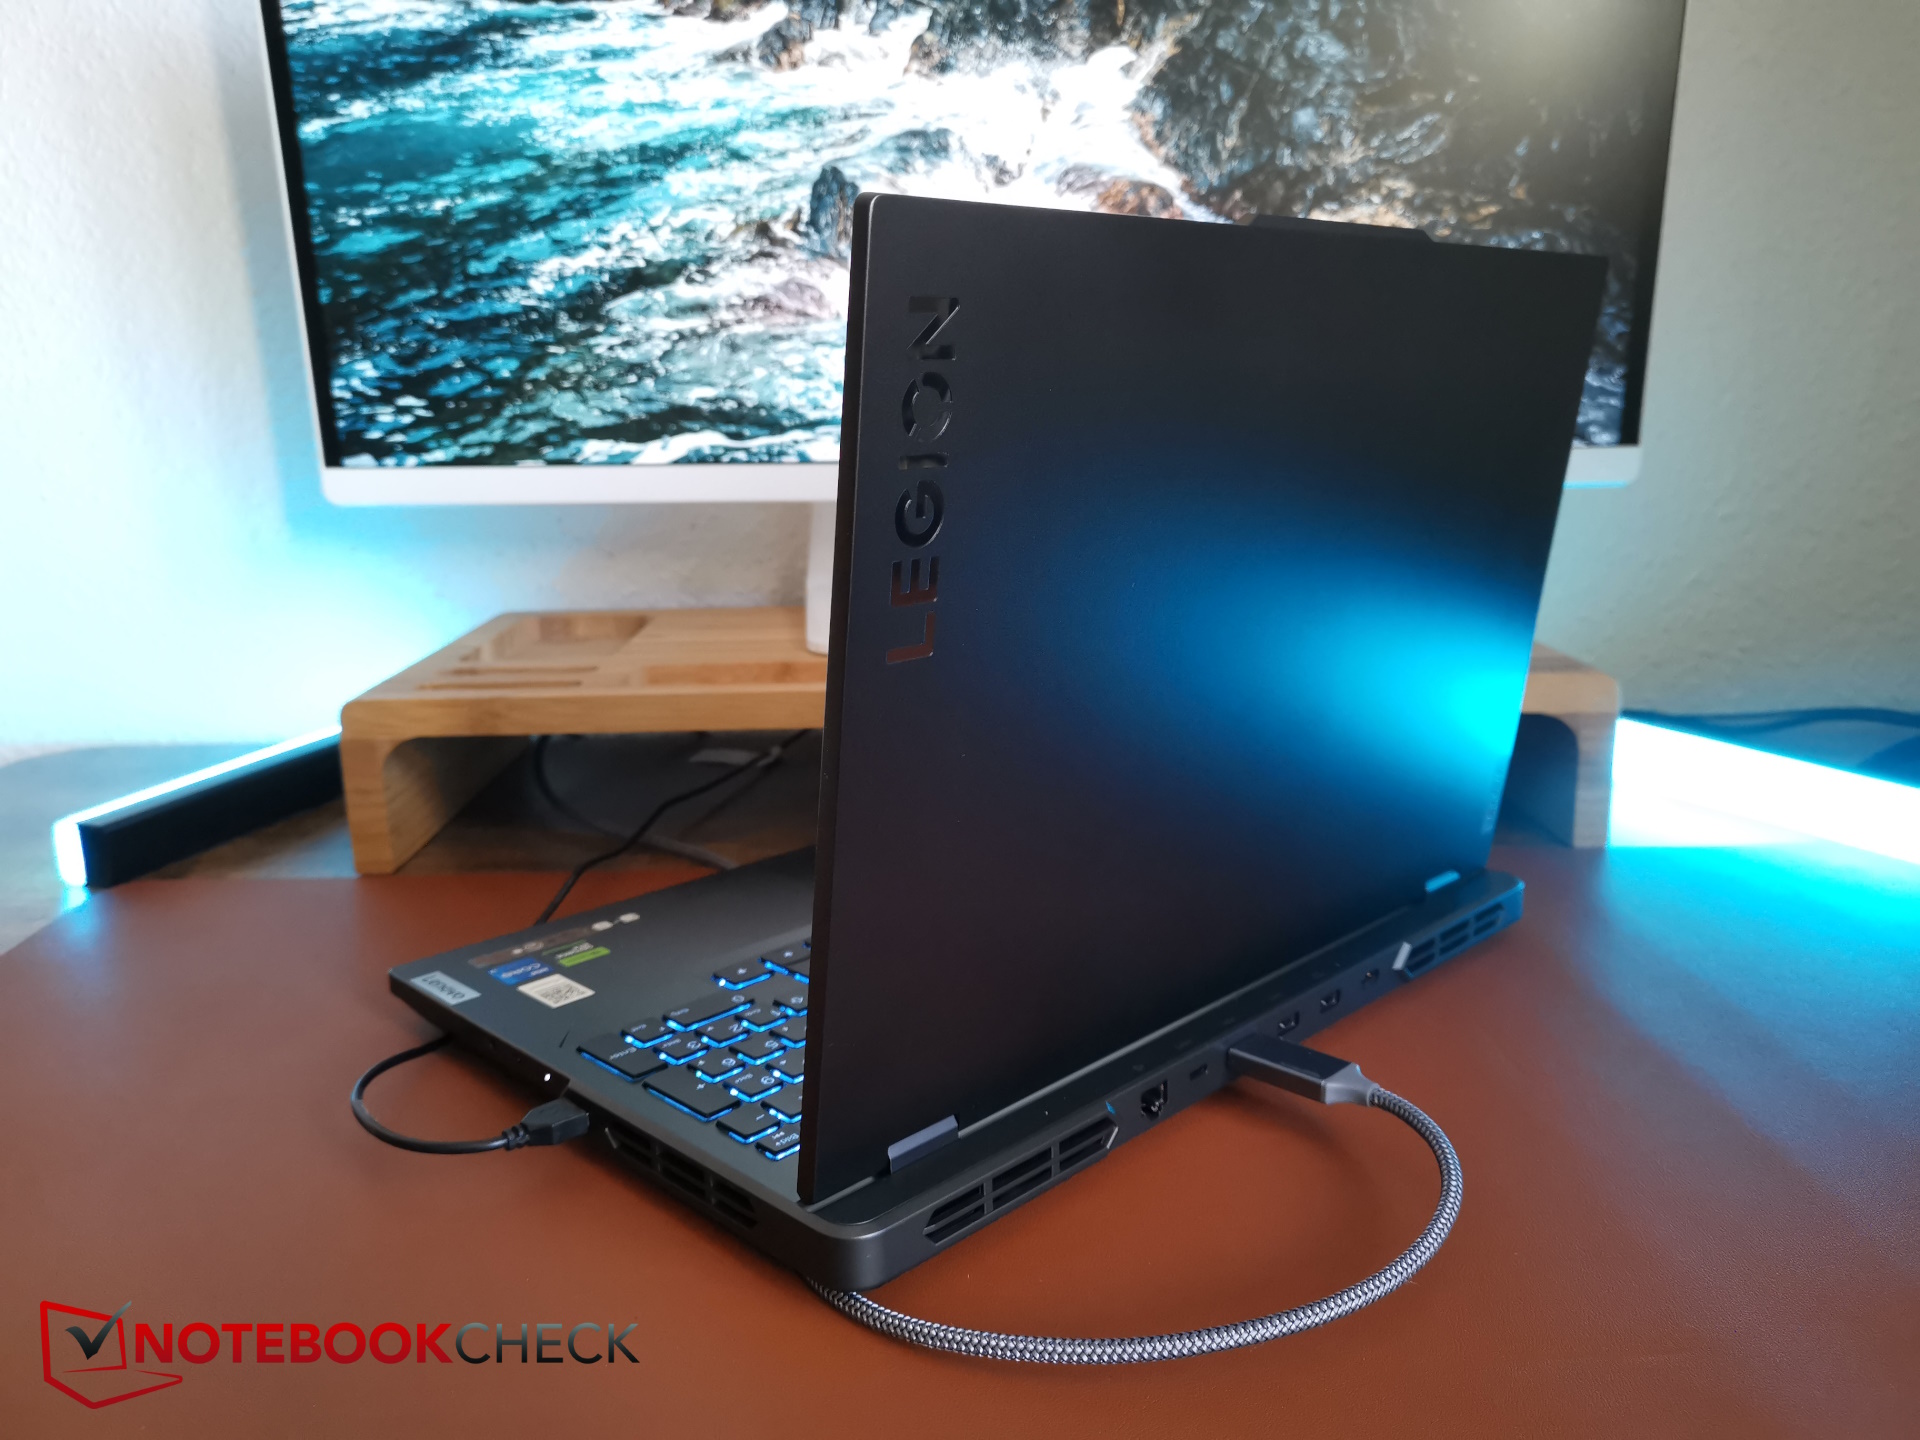
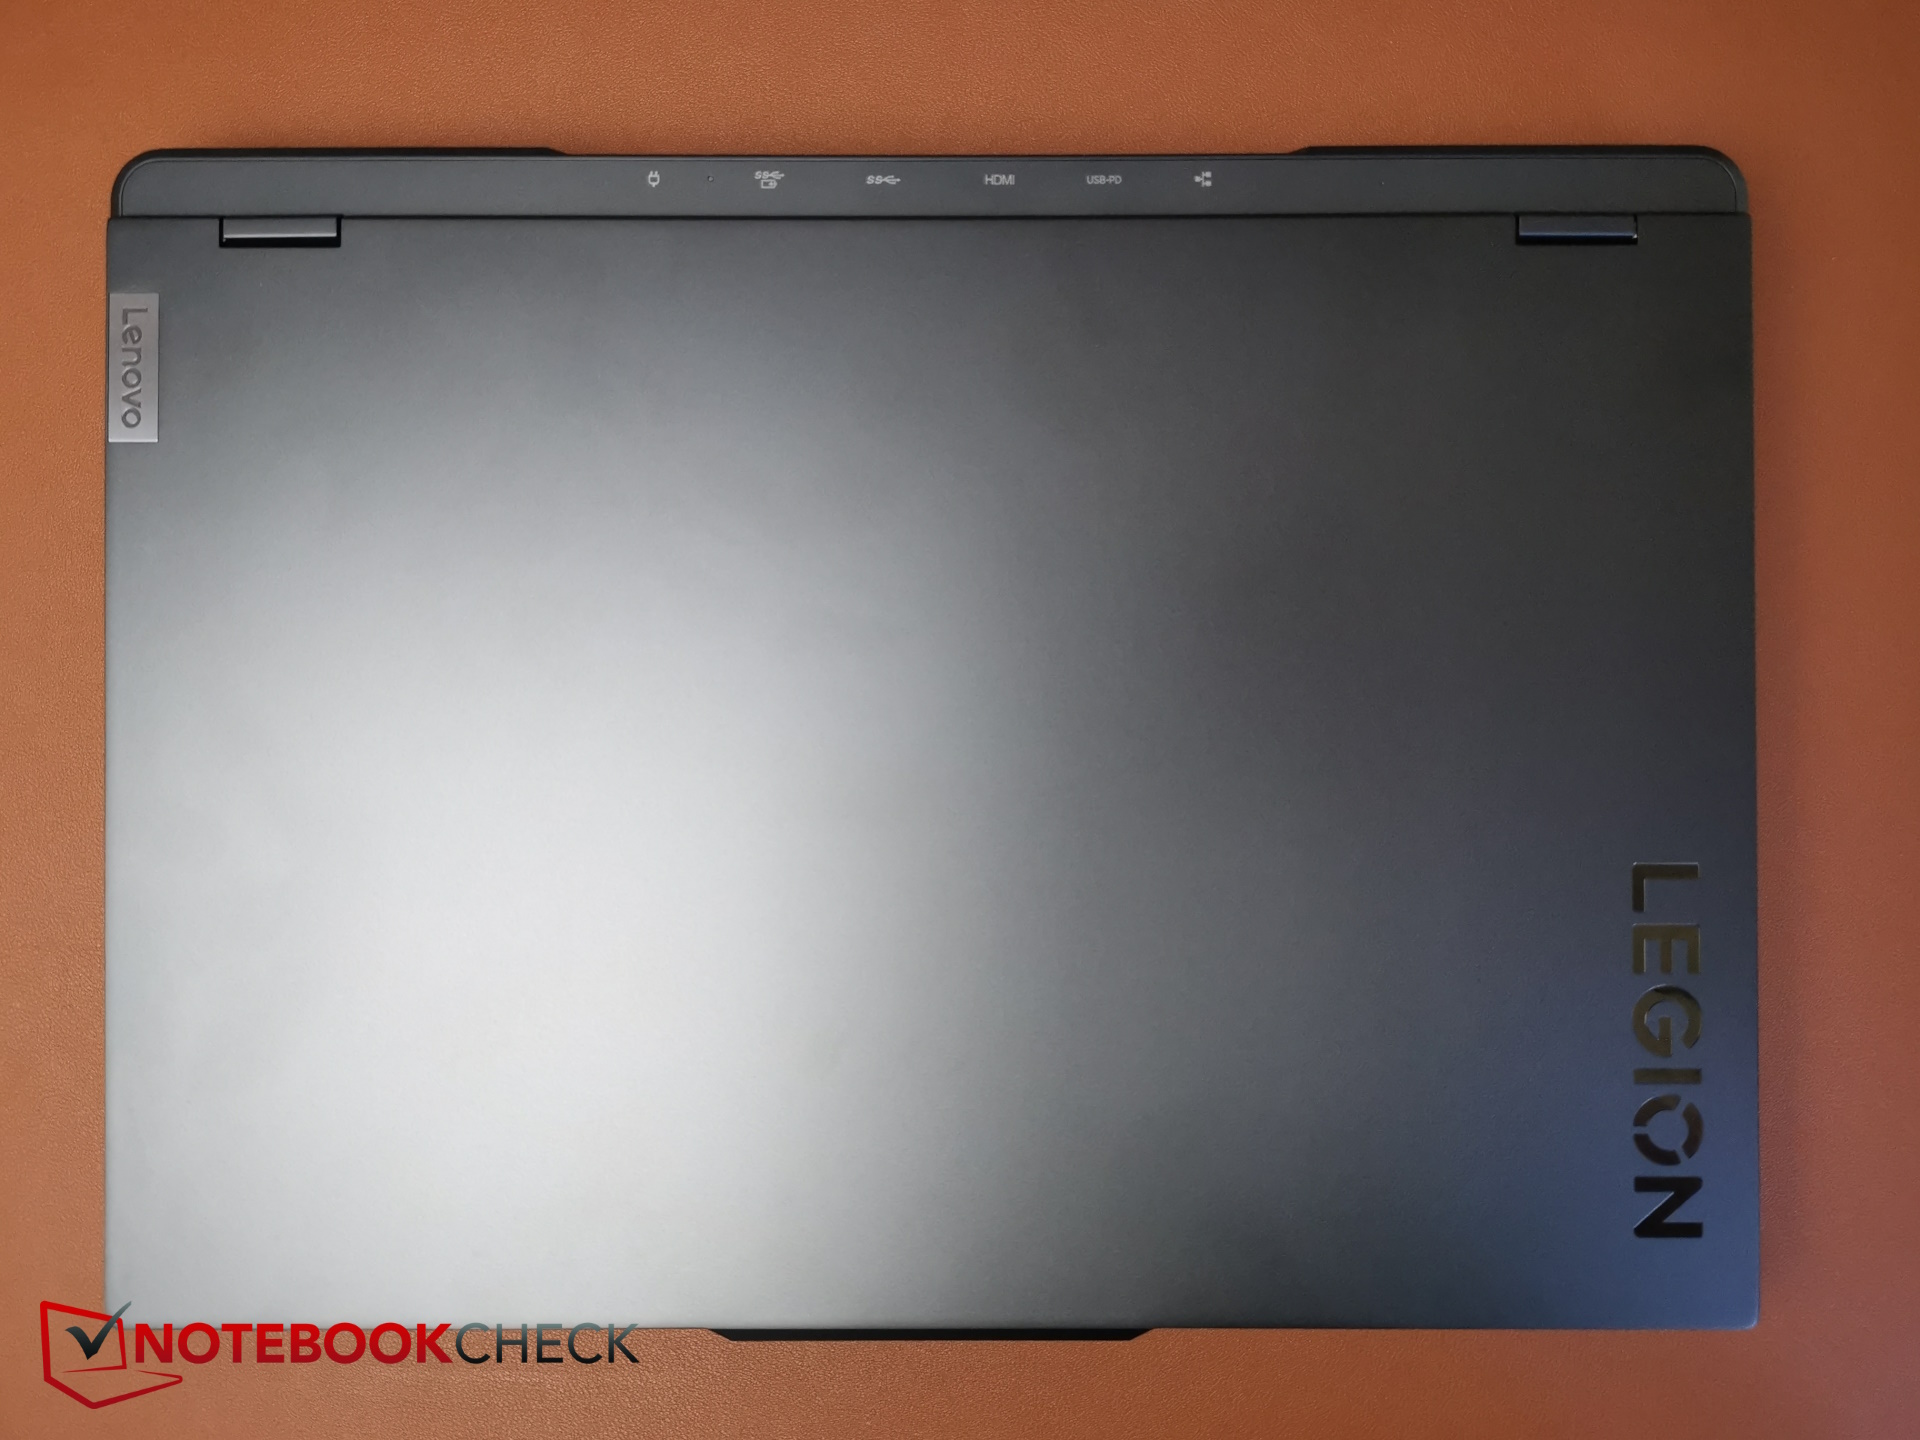
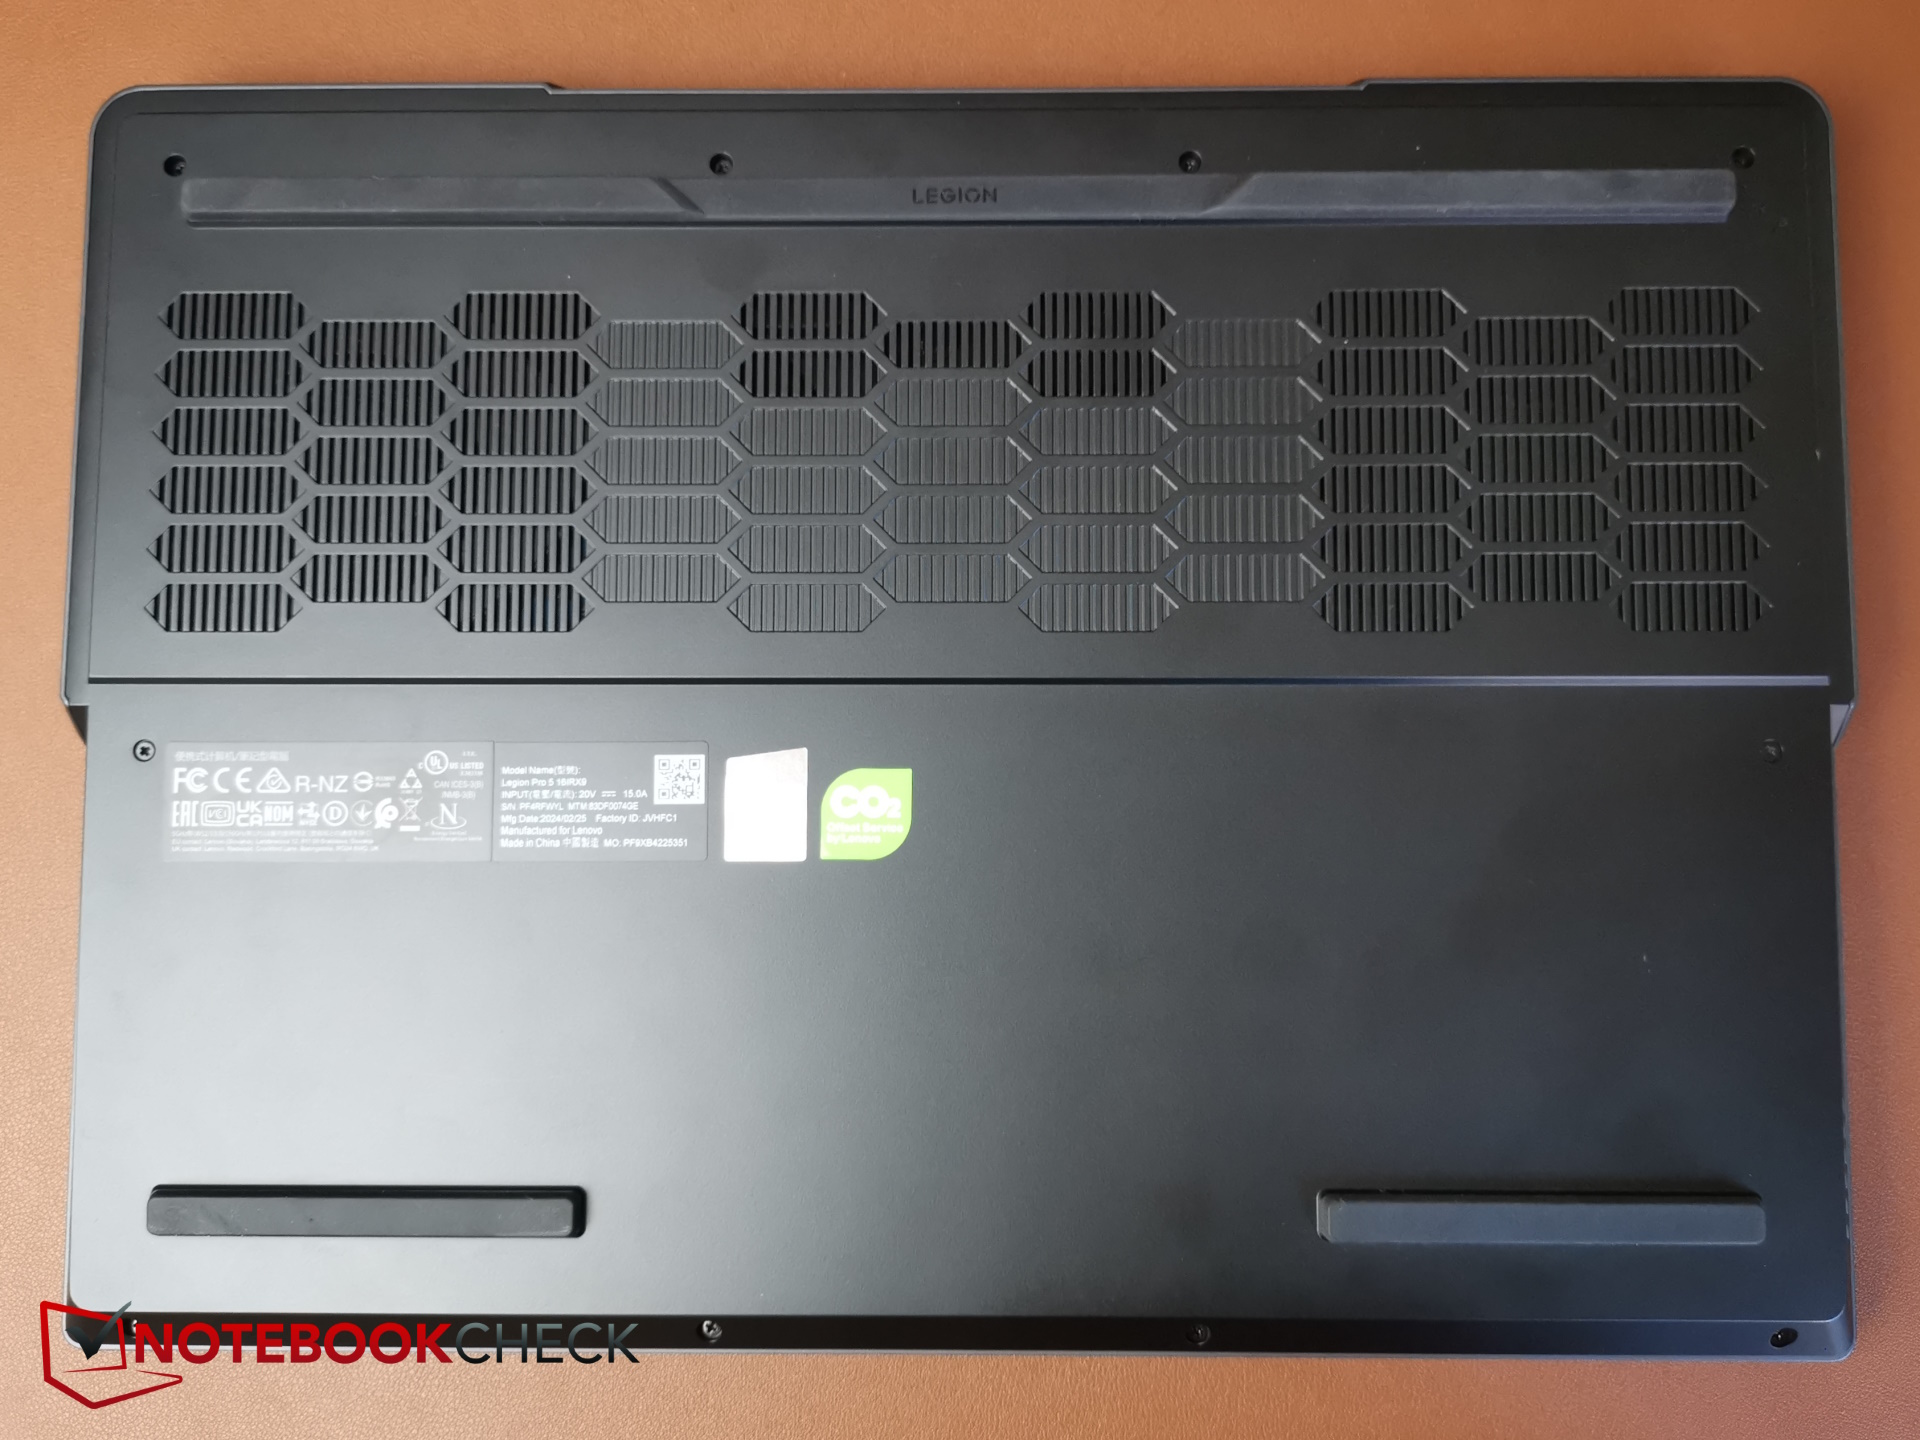
Estojo e conectividade: O Legion Pro sem um leitor de cartão SD
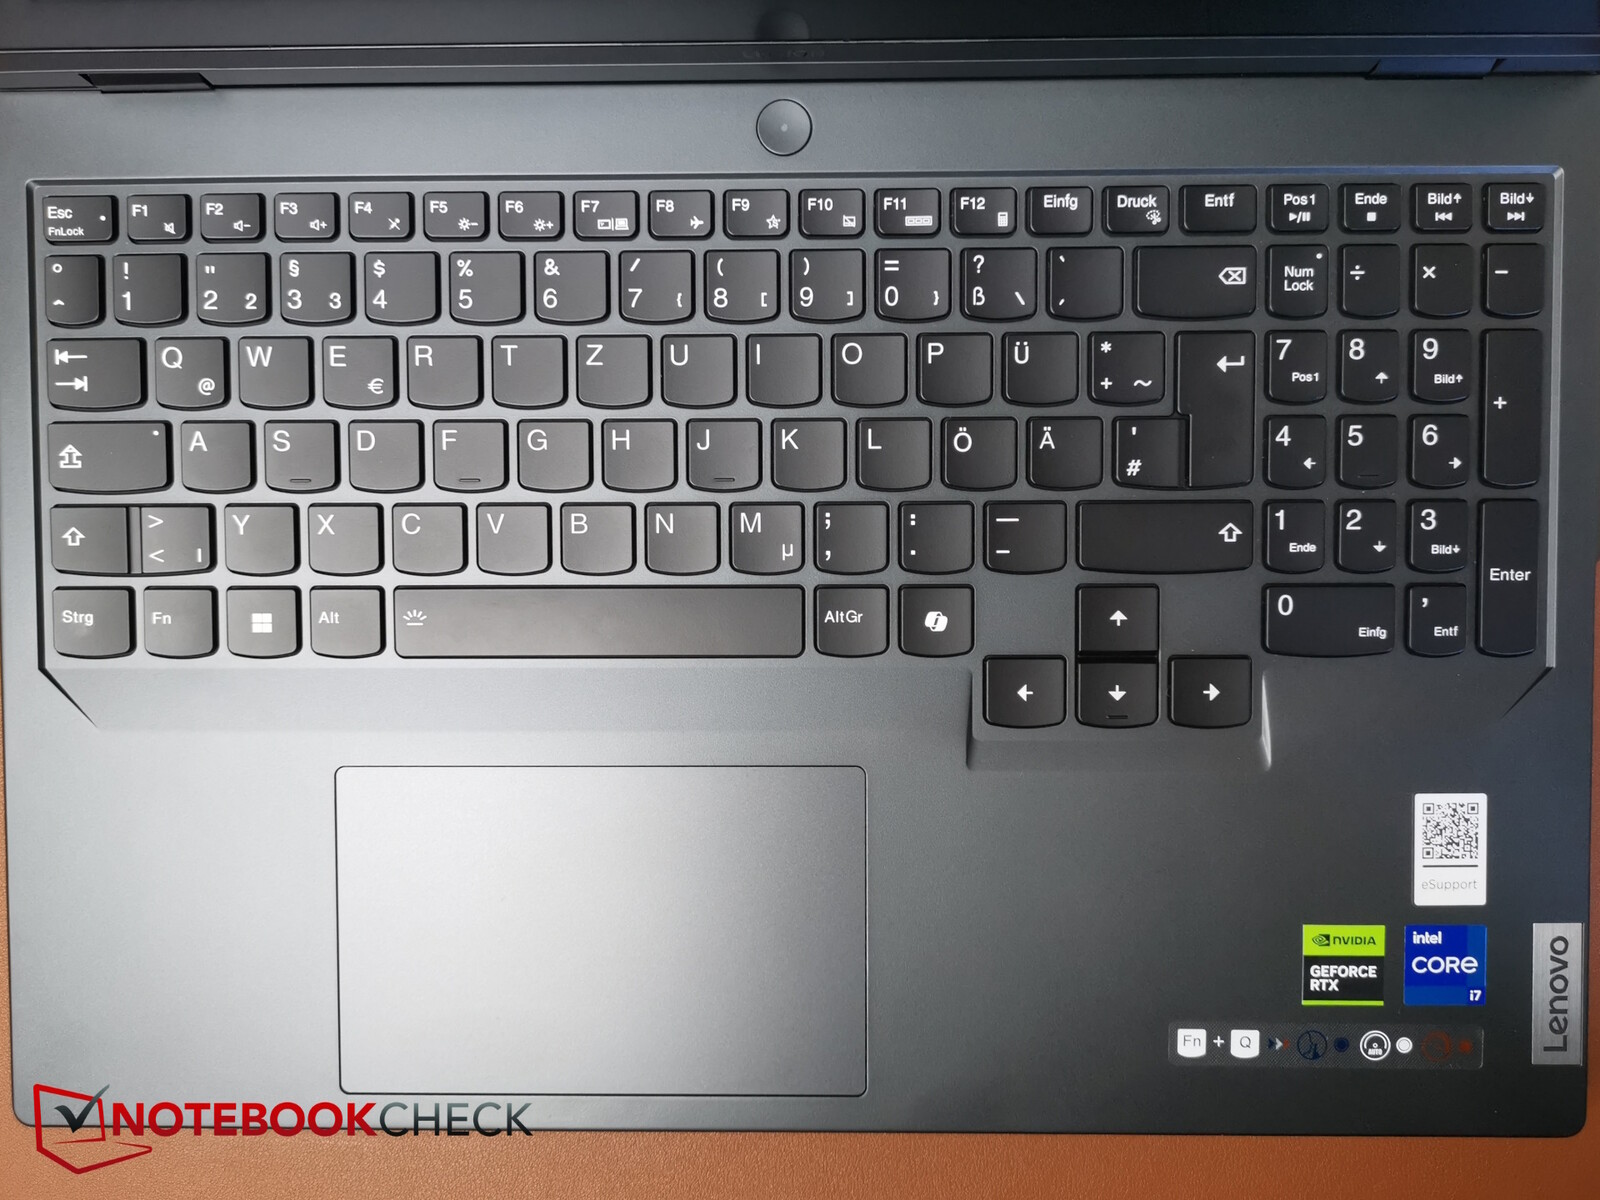
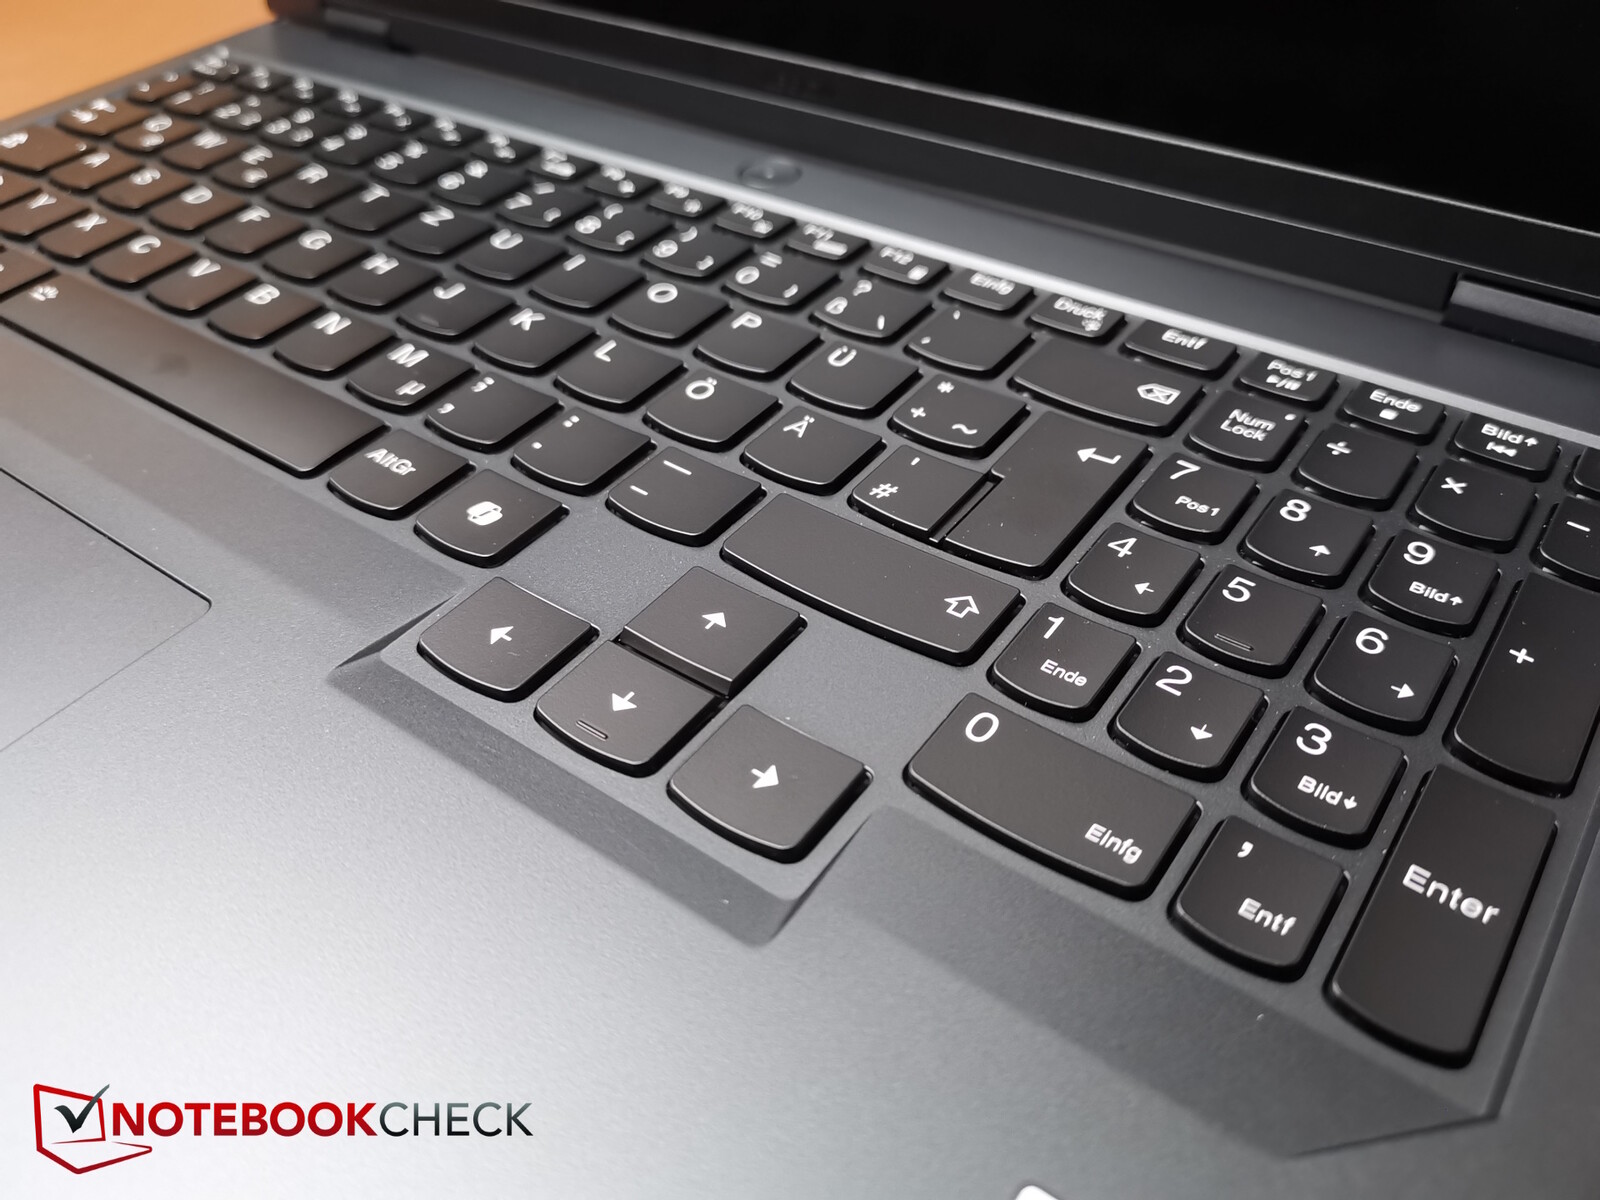
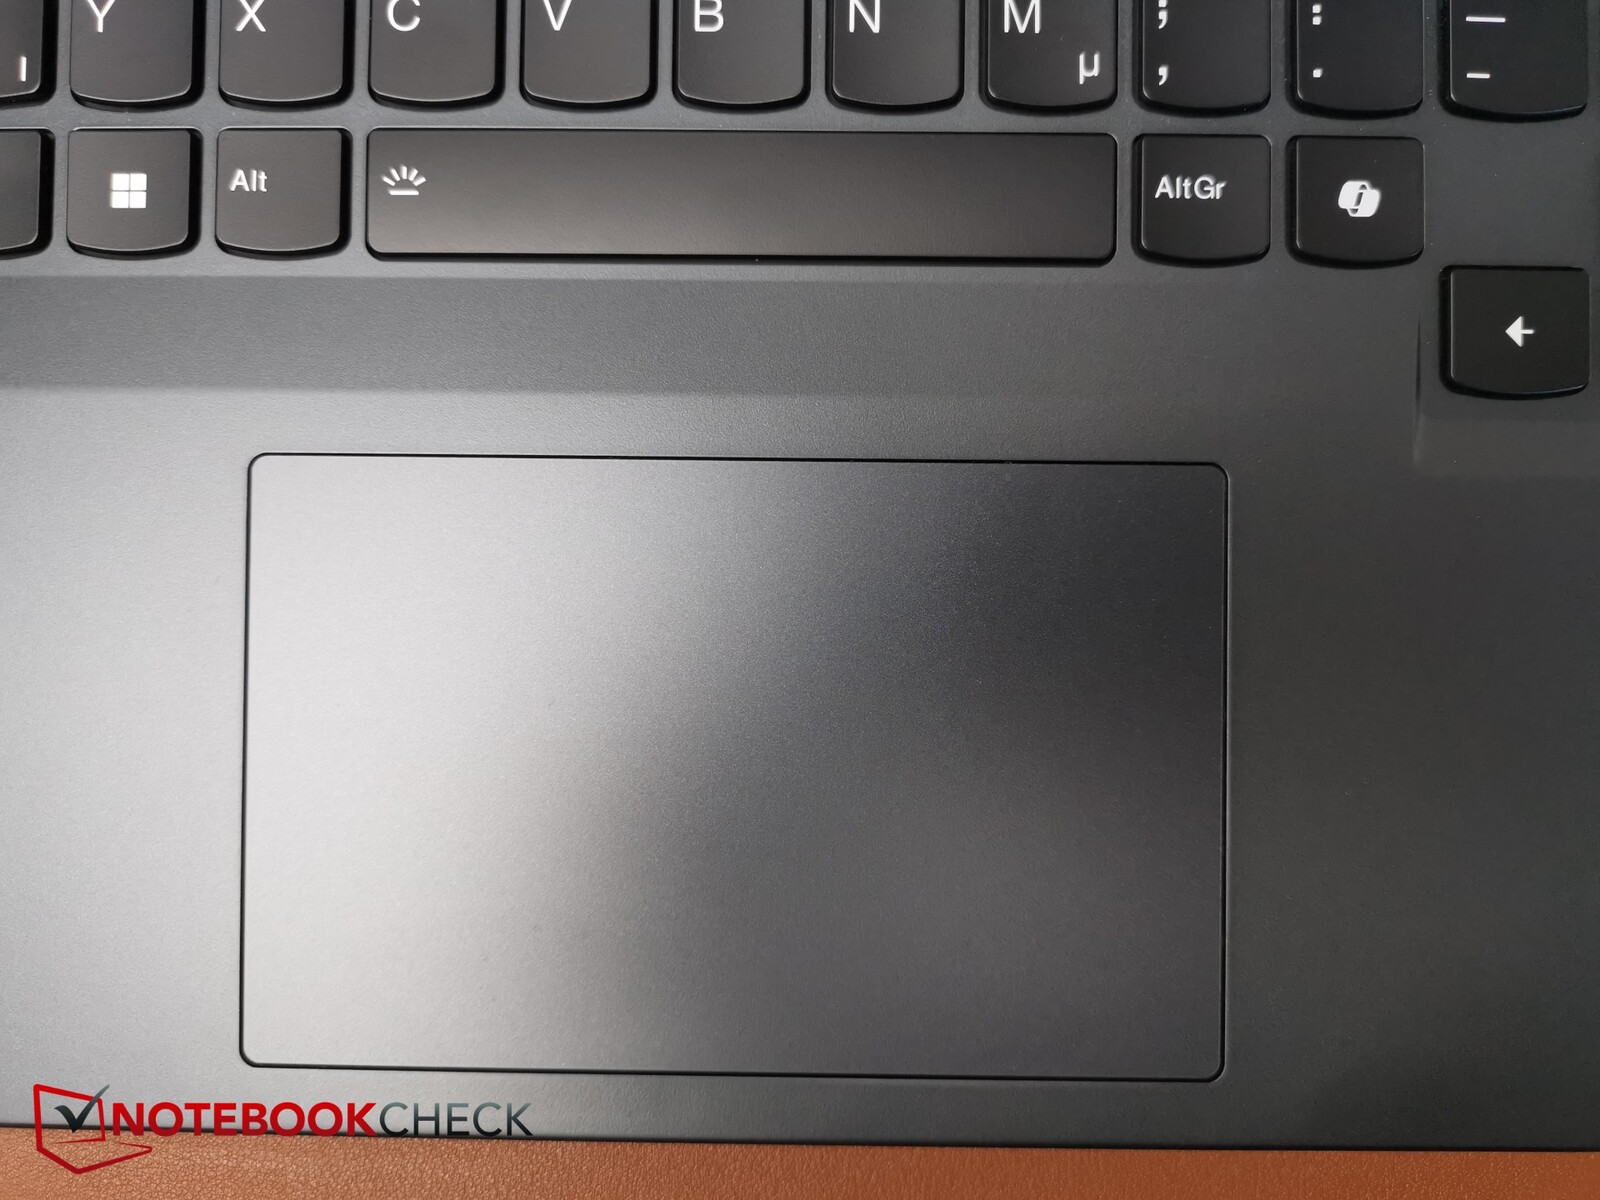
Como suas características físicas permaneceram inalteradas, recomendamos que leia nossa análise original do Lenovo Legion Pro 5 16IRX9 para obter informações sobre seu gabinete, opções de manutenção e dispositivos de entrada.


Dispositivos de entrada - Qualidade renomada Legion
Não mencionado em nosso primeiro teste do Legion Pro 5i: Sua taxa de atualização pode ser alterada entre três etapas (240, 165 e 60 Hz) usando a combinação de teclas Fn + R.

Tela - Um Legion Pro também para criadores de conteúdo


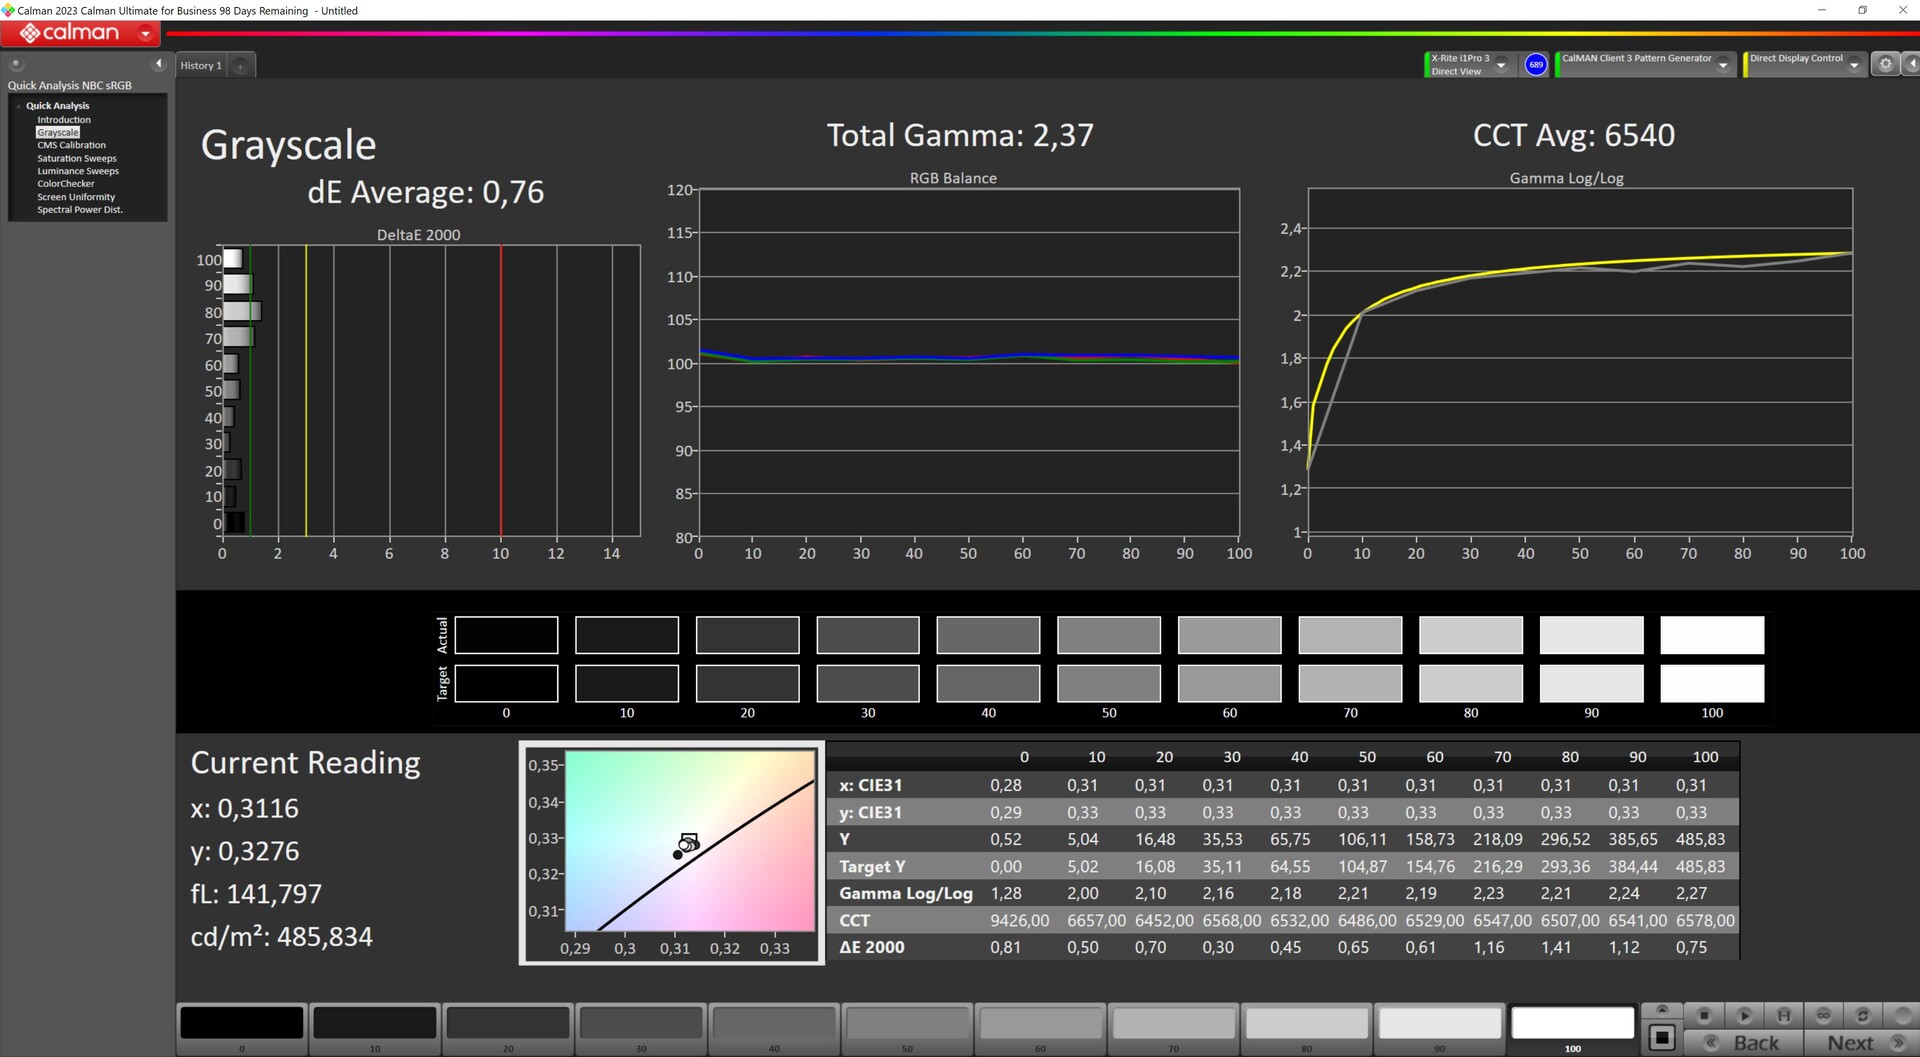
A Lenovo instalou uma tela IPS fosca com 2.560 x 1.600 pixels nesse laptop. No entanto, há três variantes de tela em oferta, todas com a mesma resolução. O modelo básico deve cobrir sRGB, tem uma taxa de atualização de 165 Hz e um brilho de 300 nits. Os outros dois modelos têm um brilho de 500 nits e uma taxa de atualização de 240 Hz, sendo que um deles também suporta DCI-P3. Nosso modelo de teste tem uma das telas de 500 nits com uma taxa de atualização de 240 Hz.
Medimos um brilho médio de 491 nits e sua iluminação de 90% é boa. No entanto, o nível de preto poderia ser um pouco melhor, mas o contraste é bom.
Observamos 150 nits em um brilho de cerca de 58%. Ele não usa PWM, portanto, o sangramento da tela não é um problema e seus tempos de resposta são bastante rápidos para um painel IPS.
| |||||||||||||||||||||||||
iluminação: 90 %
iluminação com acumulador: 518 cd/m²
Contraste: 1439:1 (Preto: 0.36 cd/m²)
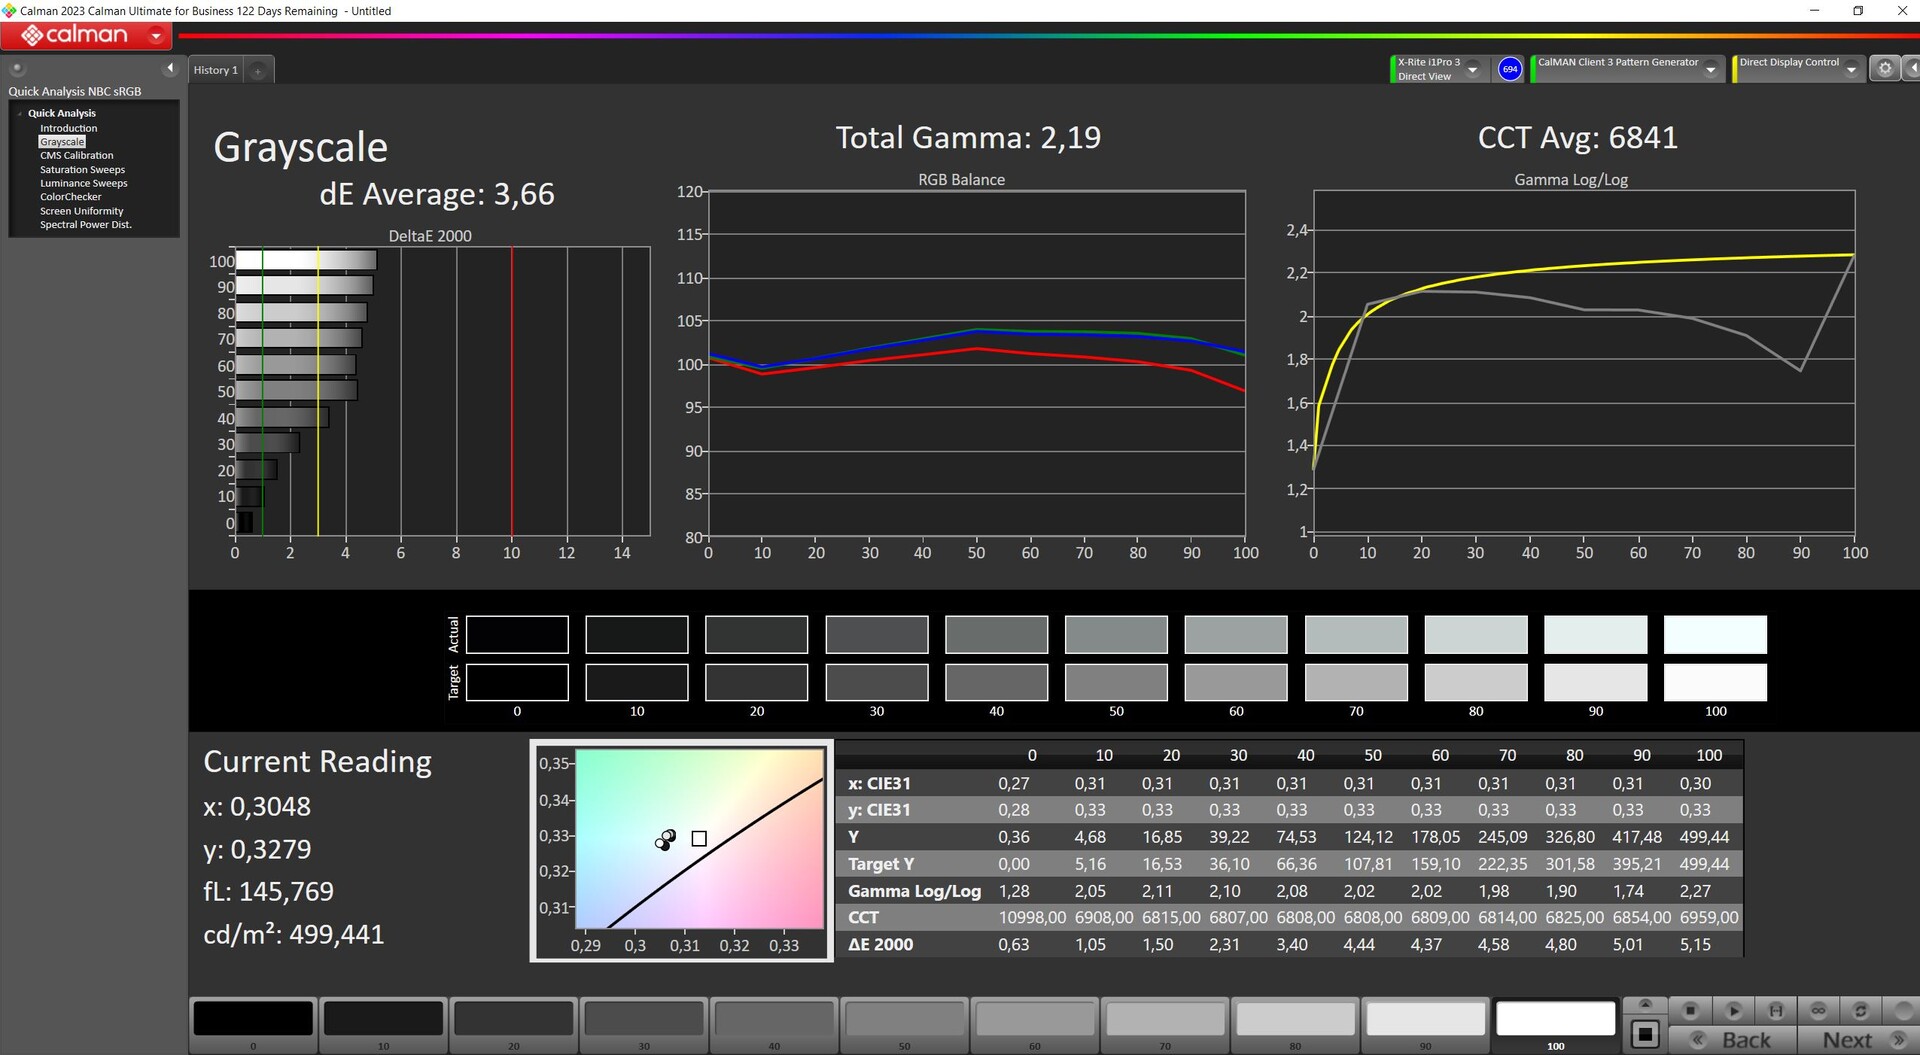
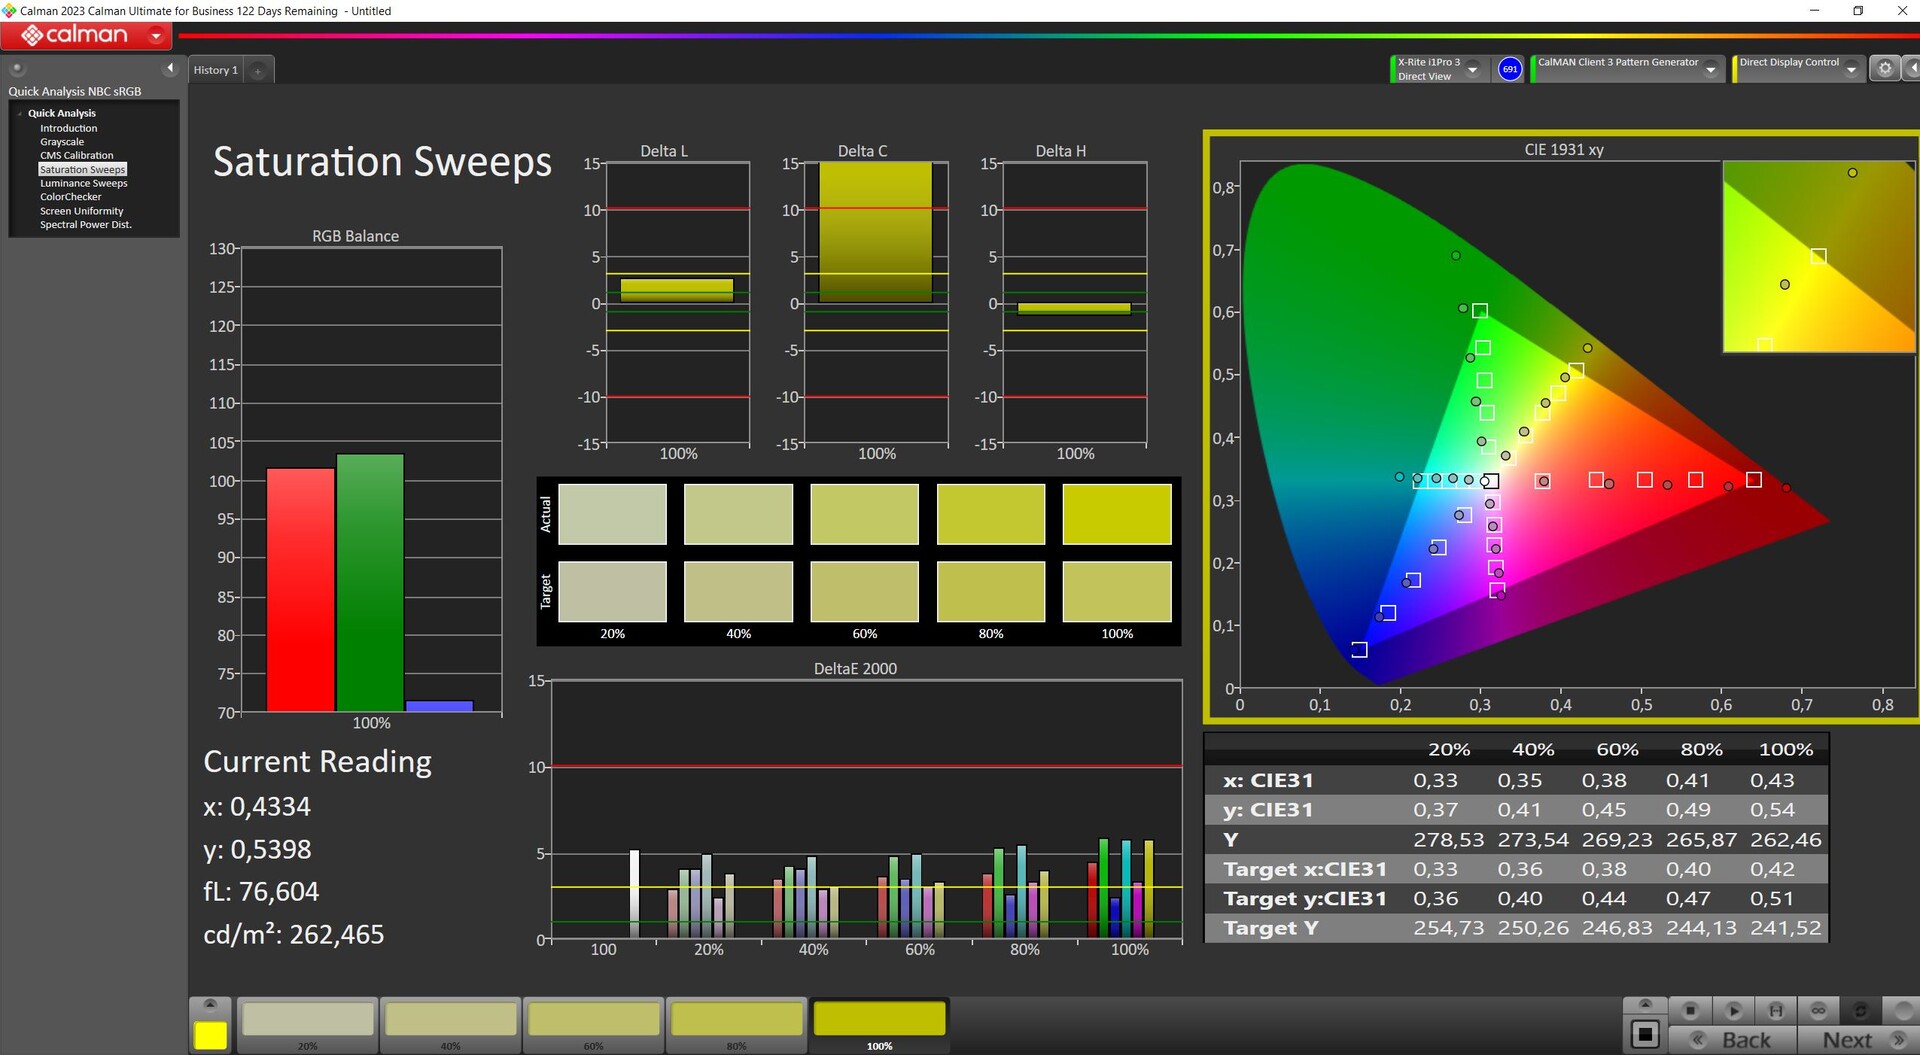
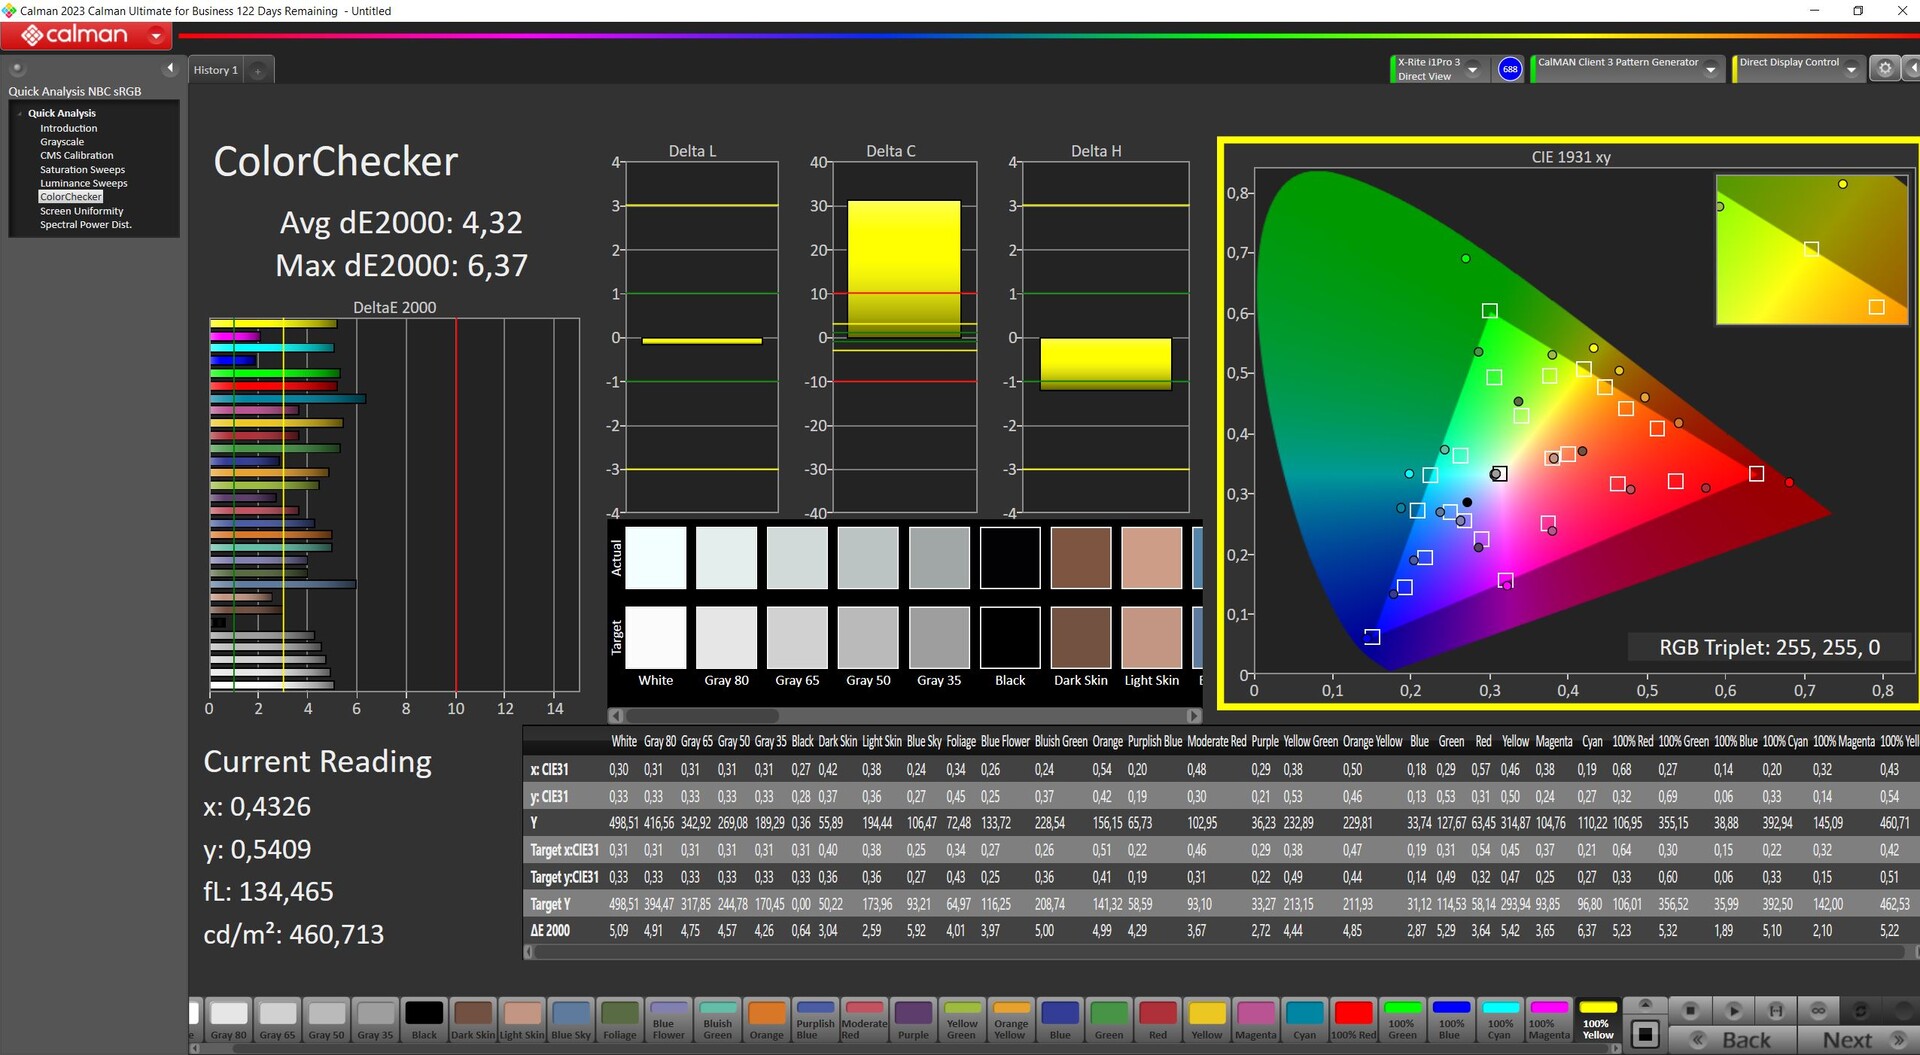
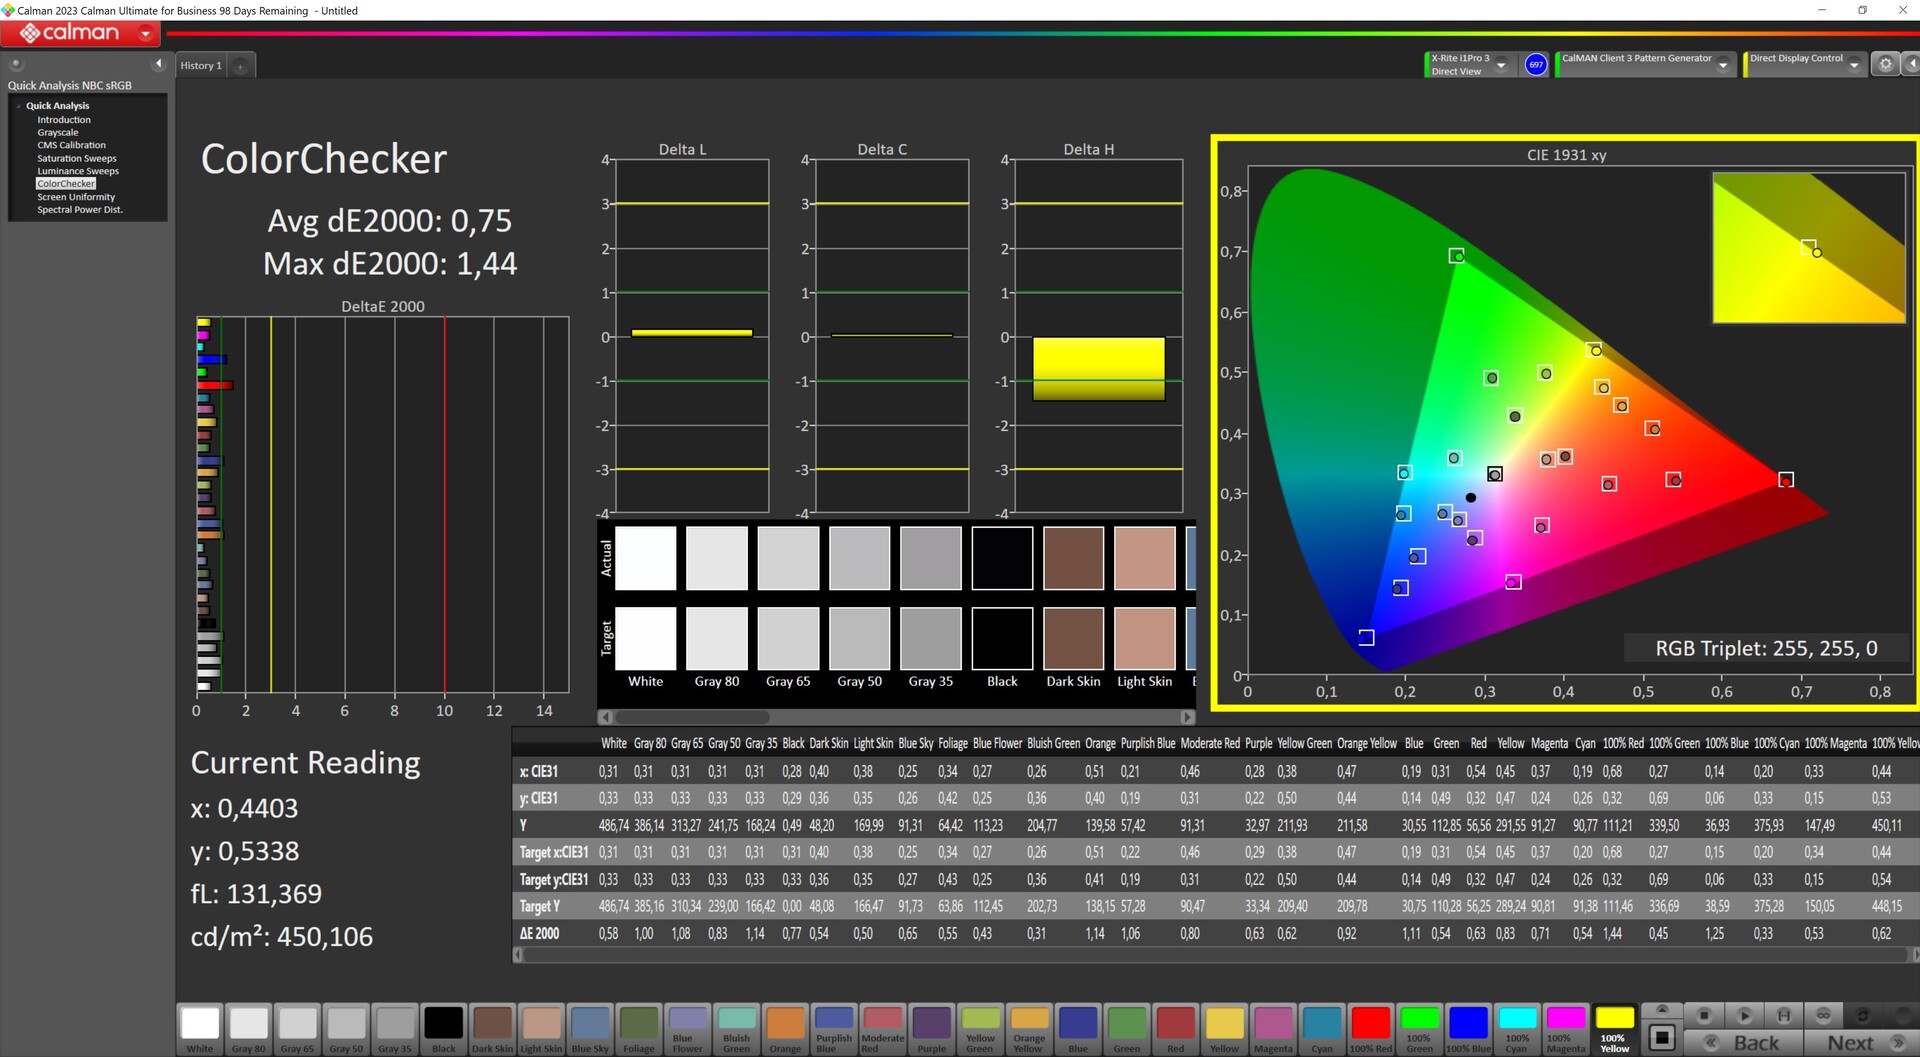
ΔE Color 4.32 | 0.5-29.43 Ø4.87, calibrated: 0.75
ΔE Greyscale 3.66 | 0.5-98 Ø5.1
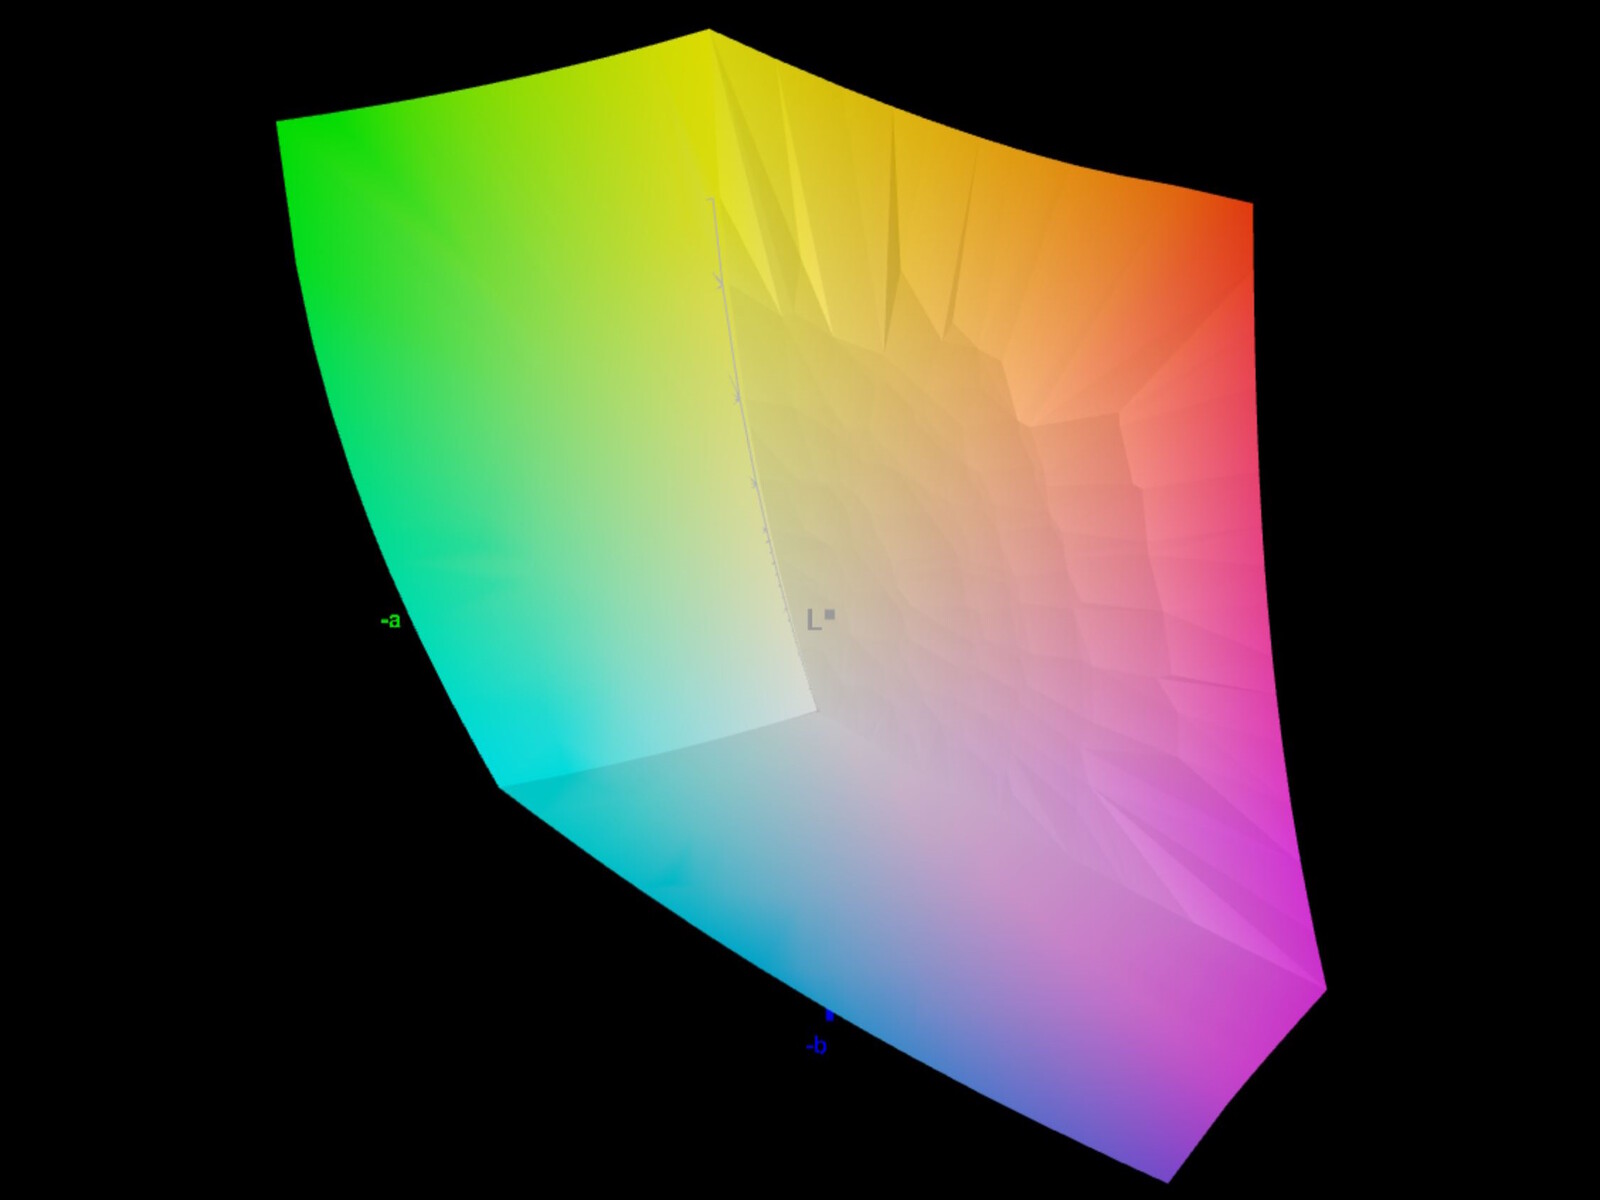
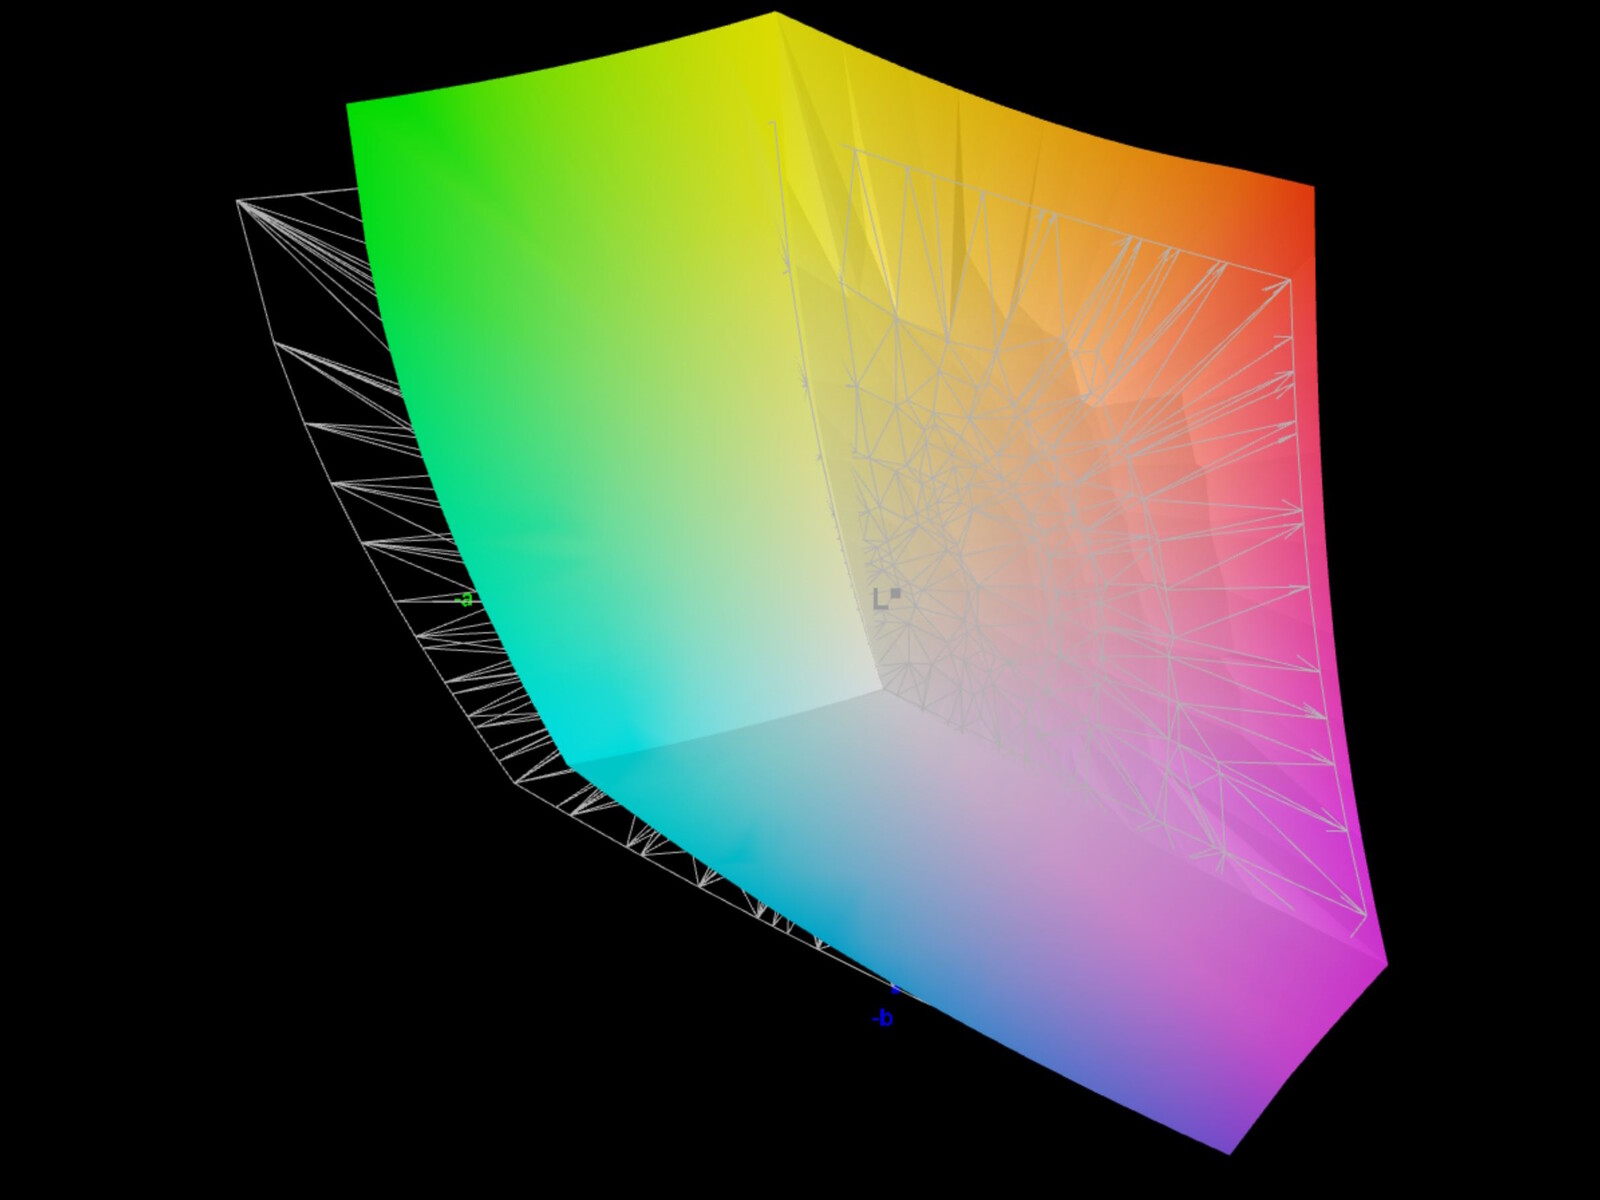
87.81% AdobeRGB 1998 (Argyll 2.2.0 3D)
99.93% sRGB (Argyll 2.2.0 3D)
99.22% Display P3 (Argyll 2.2.0 3D)
Gamma: 2.19
| Lenovo Legion Pro 5 16IRX9 G9 BOE NE160QDM-NZB, IPS, 2560x1600, 16" | HP Victus 16 (2024) Chi Mei CMN163E, IPS, 1920x1080, 16.1" | Dell G16, i7-13650HX, RTX 4060 Chi Mei CMN161D (160GME), IPS, 2560x1600, 16" | SCHENKER XMG Core 15 (M24) BOE NJ NE153QDM-NZ1 (BOE0C8E), IPS, 2560x1600, 15.3" | Lenovo Legion Pro 5 16IRX9 BOE NE160QDM-NYC, IPS, 2560x1600, 16" | Lenovo Legion 5 16IRX G9 NE160QDM-NZ3, IPS, 2560x1600, 16" | |
|---|---|---|---|---|---|---|
| Display | -49% | -18% | -14% | -17% | -14% | |
| Display P3 Coverage | 99.22 | 41.3 -58% | 67.5 -32% | 73.2 -26% | 69.3 -30% | 72.4 -27% |
| sRGB Coverage | 99.93 | 61.7 -38% | 98.5 -1% | 100 0% | 99.4 -1% | 100 0% |
| AdobeRGB 1998 Coverage | 87.81 | 42.7 -51% | 69.3 -21% | 74.6 -15% | 70.1 -20% | 74.1 -16% |
| Response Times | -300% | -36% | -50% | -73% | -78% | |
| Response Time Grey 50% / Grey 80% * | 4.8 ? | 28.6 ? -496% | 7.6 ? -58% | 9.6 ? -100% | 11.9 ? -148% | 12.5 ? -160% |
| Response Time Black / White * | 9.2 ? | 18.7 ? -103% | 10.4 ? -13% | 9.2 ? -0% | 8.9 ? 3% | 8.7 ? 5% |
| PWM Frequency | ||||||
| Screen | -76% | -22% | 3% | 12% | 21% | |
| Brightness middle | 518 | 287 -45% | 369 -29% | 635 23% | 384 -26% | 526 2% |
| Brightness | 491 | 288 -41% | 344 -30% | 604 23% | 366 -25% | 500 2% |
| Brightness Distribution | 90 | 86 -4% | 89 -1% | 91 1% | 91 1% | 87 -3% |
| Black Level * | 0.36 | 0.19 47% | 0.26 28% | 0.64 -78% | 0.35 3% | 0.33 8% |
| Contrast | 1439 | 1511 5% | 1419 -1% | 992 -31% | 1097 -24% | 1594 11% |
| Colorchecker dE 2000 * | 4.32 | 5.46 -26% | 3.04 30% | 1.89 56% | 0.97 78% | 1.2 72% |
| Colorchecker dE 2000 max. * | 6.37 | 20.36 -220% | 5.56 13% | 3.14 51% | 3.57 44% | 2.1 67% |
| Colorchecker dE 2000 calibrated * | 0.75 | 3.52 -369% | 2.35 -213% | 1.14 -52% | 0.77 -3% | 1 -33% |
| Greyscale dE 2000 * | 3.66 | 4.8 -31% | 3.38 8% | 2.53 31% | 1.5 59% | 1.3 64% |
| Gamma | 2.19 100% | 2.108 104% | 2.47 89% | 2.36 93% | 2.24 98% | 2.23 99% |
| CCT | 6841 95% | 6442 101% | 6040 108% | 6434 101% | 6709 97% | 6391 102% |
| Média Total (Programa/Configurações) | -142% /
-102% | -25% /
-23% | -20% /
-8% | -26% /
-6% | -24% /
-1% |
* ... menor é melhor
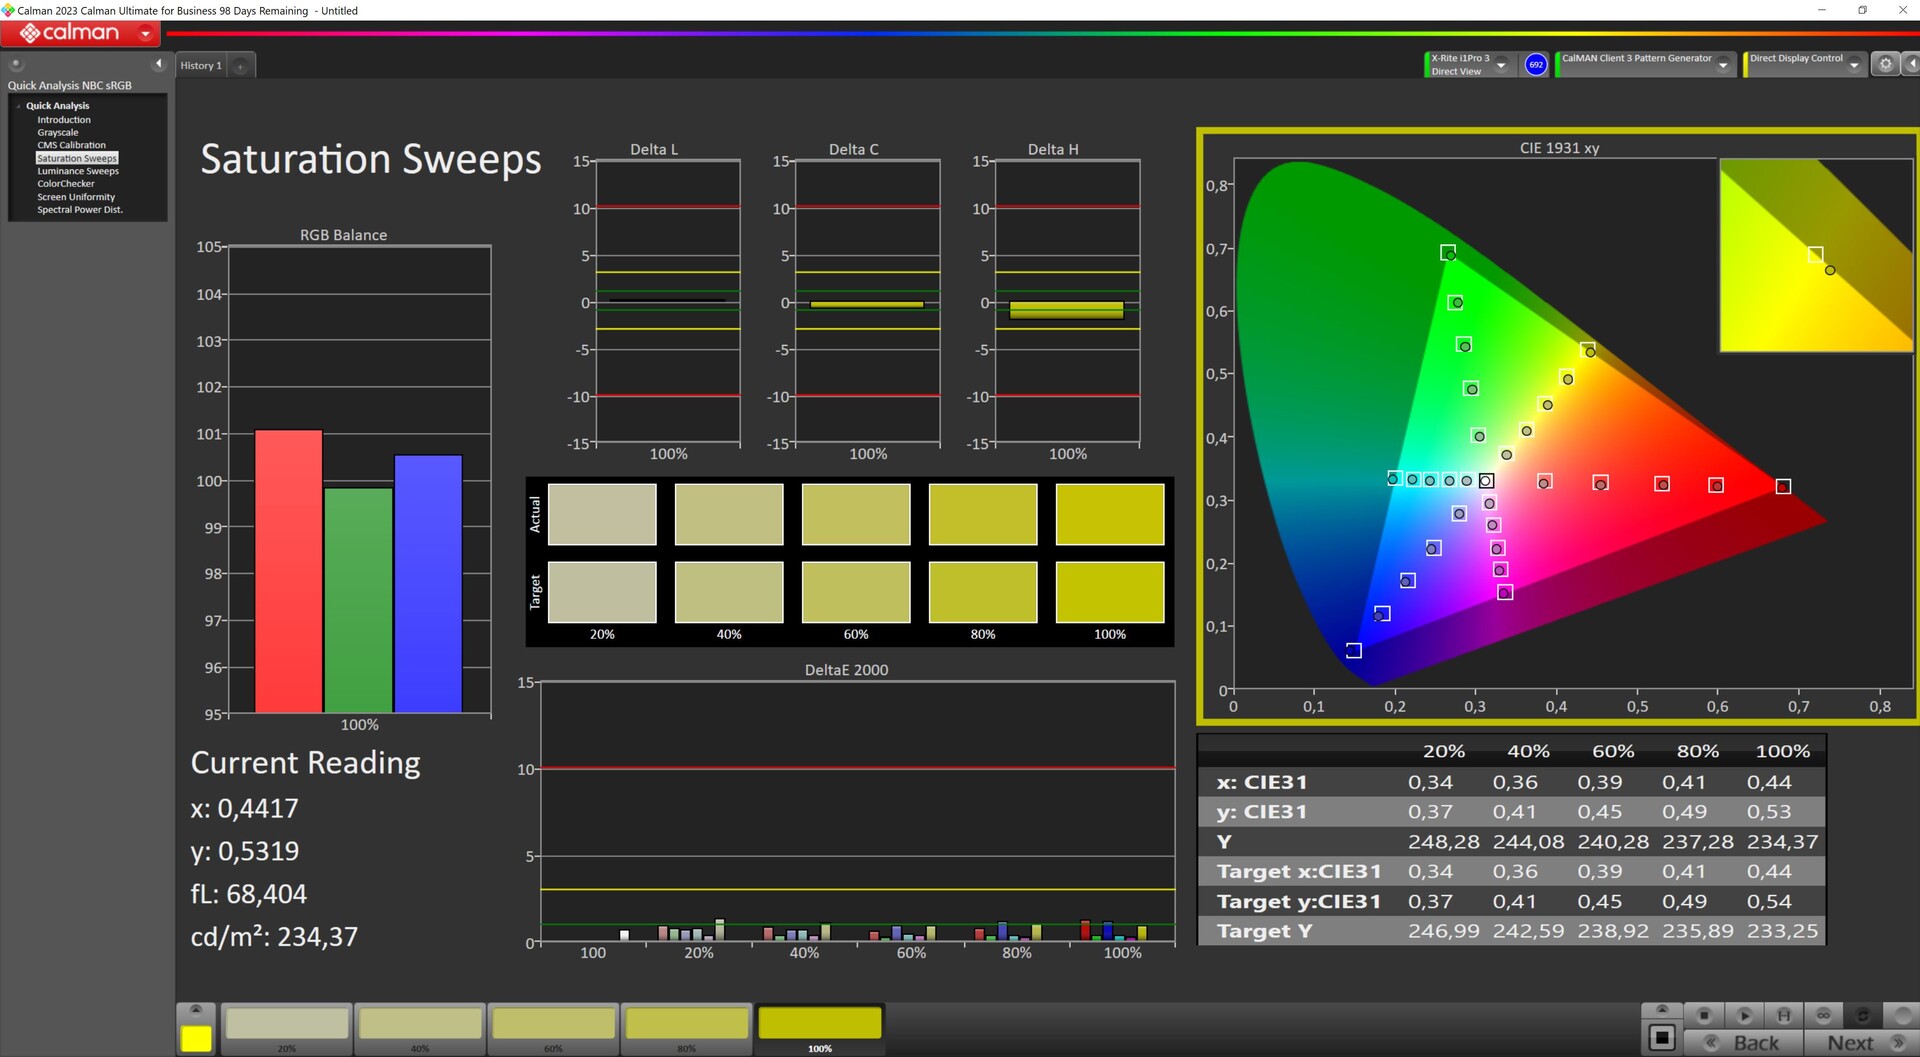
Tanto o sRGB quanto o Display P3 são quase totalmente cobertos, e o AdobeRGB é coberto por quase 88%.

Logo que sai da caixa, a tela não é calibrada de forma totalmente ideal. Nossa própria calibração, usando o dispositivo de medição de cores X-Rite i1Pro e o software Calman, levou os valores DeltaE de escala de cinza e cor para menos de 1.
Exibir tempos de resposta
| ↔ Tempo de resposta preto para branco | ||
|---|---|---|
| 9.2 ms ... ascensão ↗ e queda ↘ combinadas | ↗ 4.6 ms ascensão | 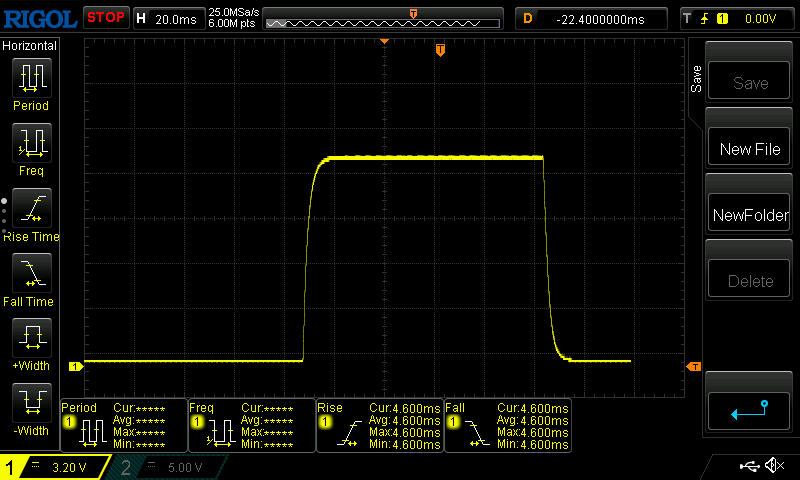 |
| ↘ 4.6 ms queda | ||
| A tela mostra taxas de resposta rápidas em nossos testes e deve ser adequada para jogos. Em comparação, todos os dispositivos testados variam de 0.1 (mínimo) a 240 (máximo) ms. » 23 % de todos os dispositivos são melhores. Isso significa que o tempo de resposta medido é melhor que a média de todos os dispositivos testados (20.8 ms). | ||
| ↔ Tempo de resposta 50% cinza a 80% cinza | ||
| 4.8 ms ... ascensão ↗ e queda ↘ combinadas | ↗ 2.2 ms ascensão | 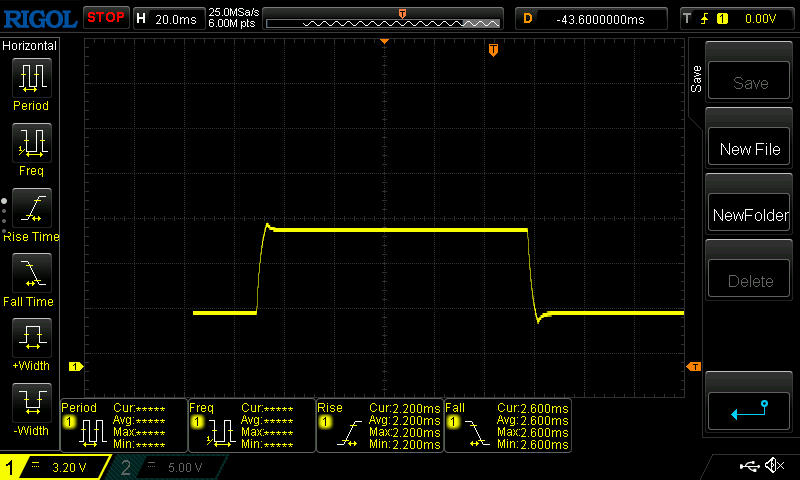 |
| ↘ 2.6 ms queda | ||
| A tela mostra taxas de resposta muito rápidas em nossos testes e deve ser muito adequada para jogos em ritmo acelerado. Em comparação, todos os dispositivos testados variam de 0.165 (mínimo) a 636 (máximo) ms. » 14 % de todos os dispositivos são melhores. Isso significa que o tempo de resposta medido é melhor que a média de todos os dispositivos testados (32.5 ms). | ||
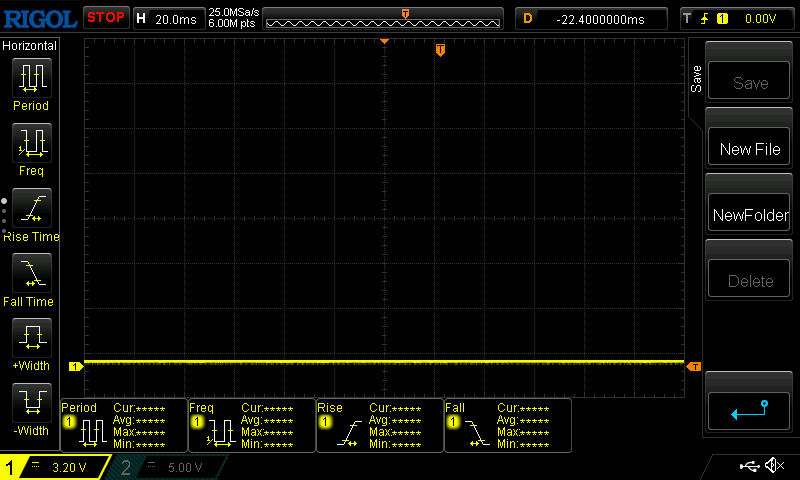
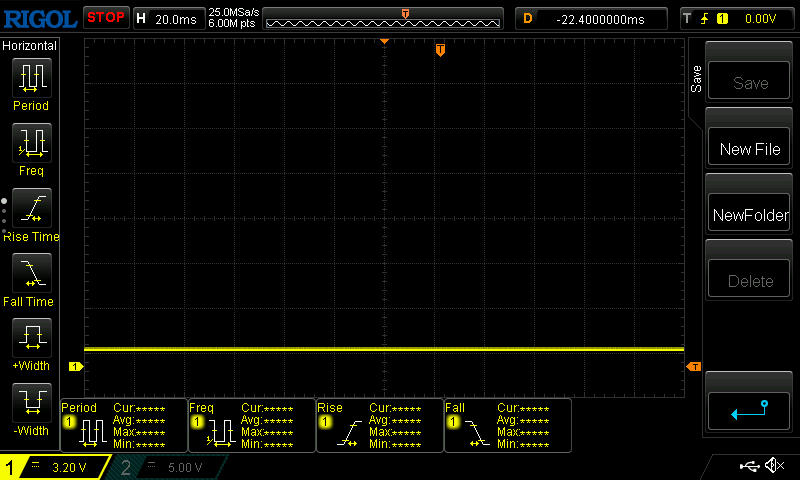
Cintilação da tela / PWM (modulação por largura de pulso)
| Tela tremeluzindo / PWM não detectado | 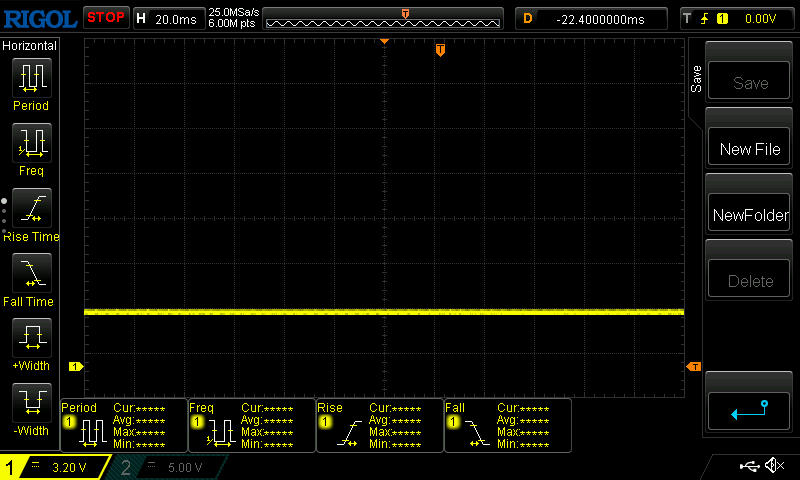 | ||
[pwm_comparison] Em comparação: 53 % de todos os dispositivos testados não usam PWM para escurecer a tela. Se PWM foi detectado, uma média de 8516 (mínimo: 5 - máximo: 343500) Hz foi medida. | |||

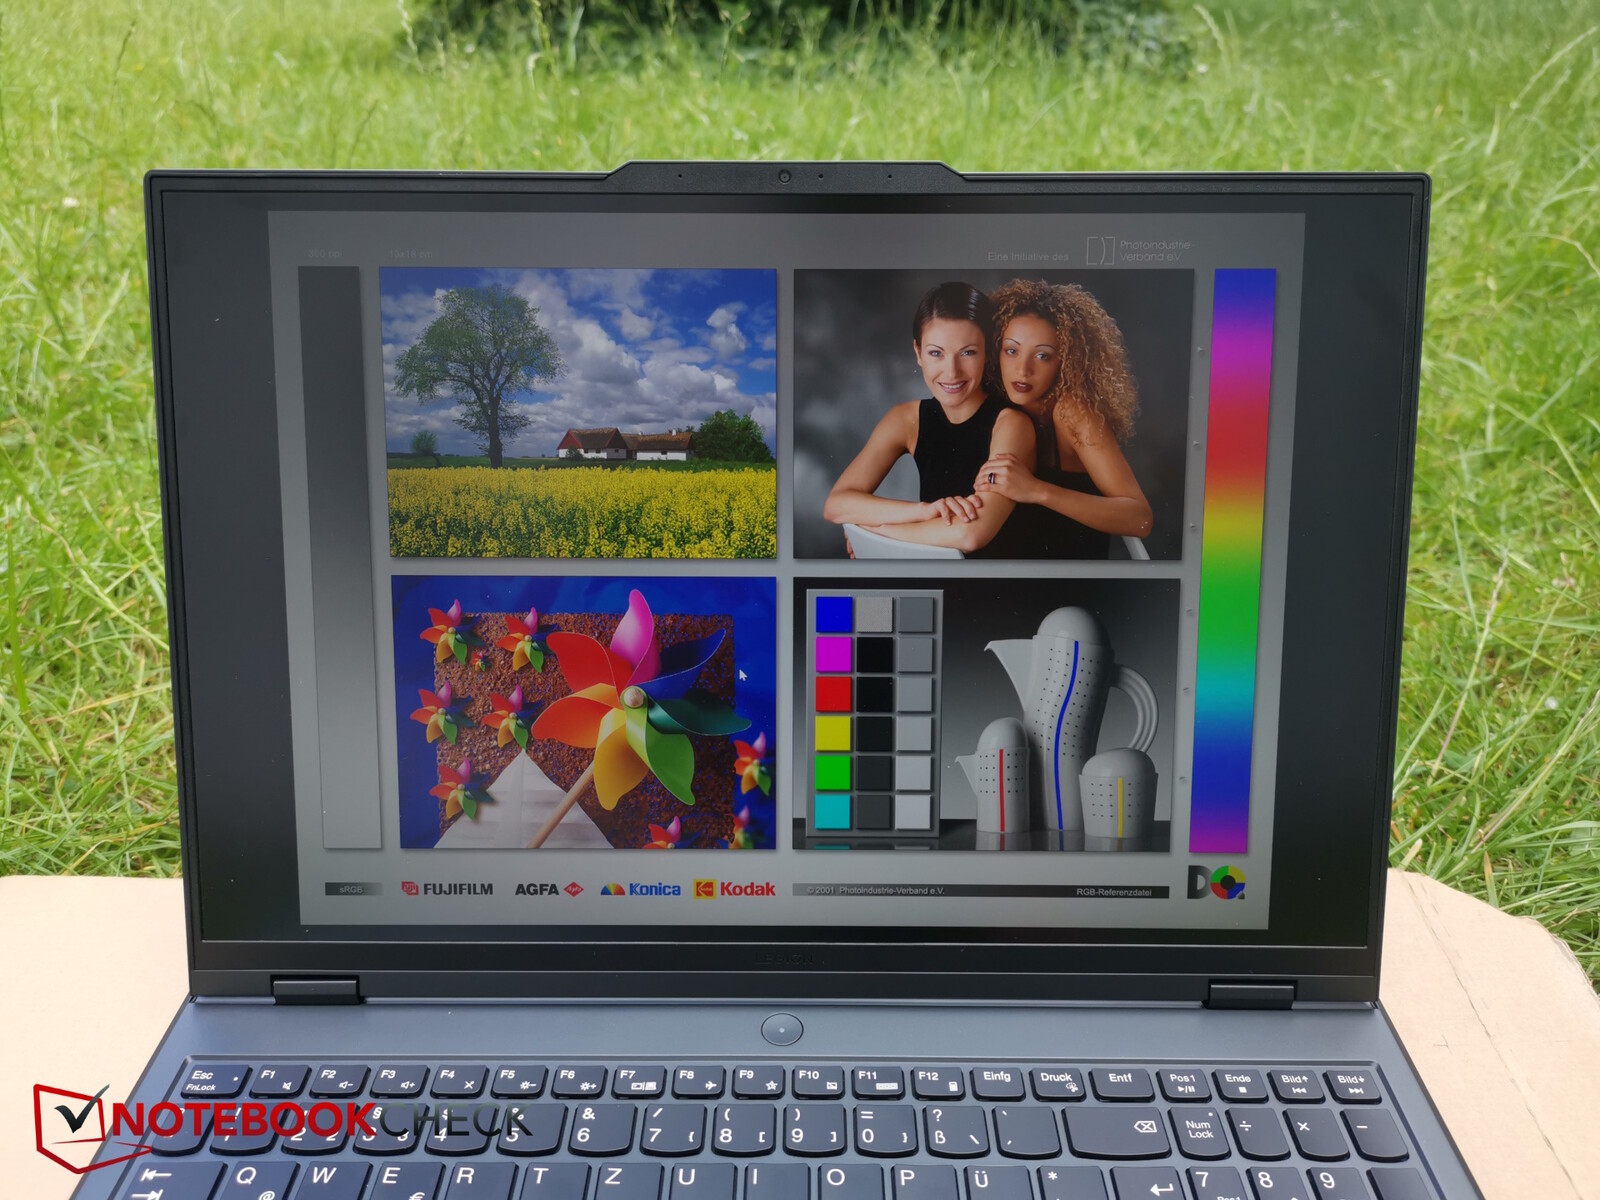
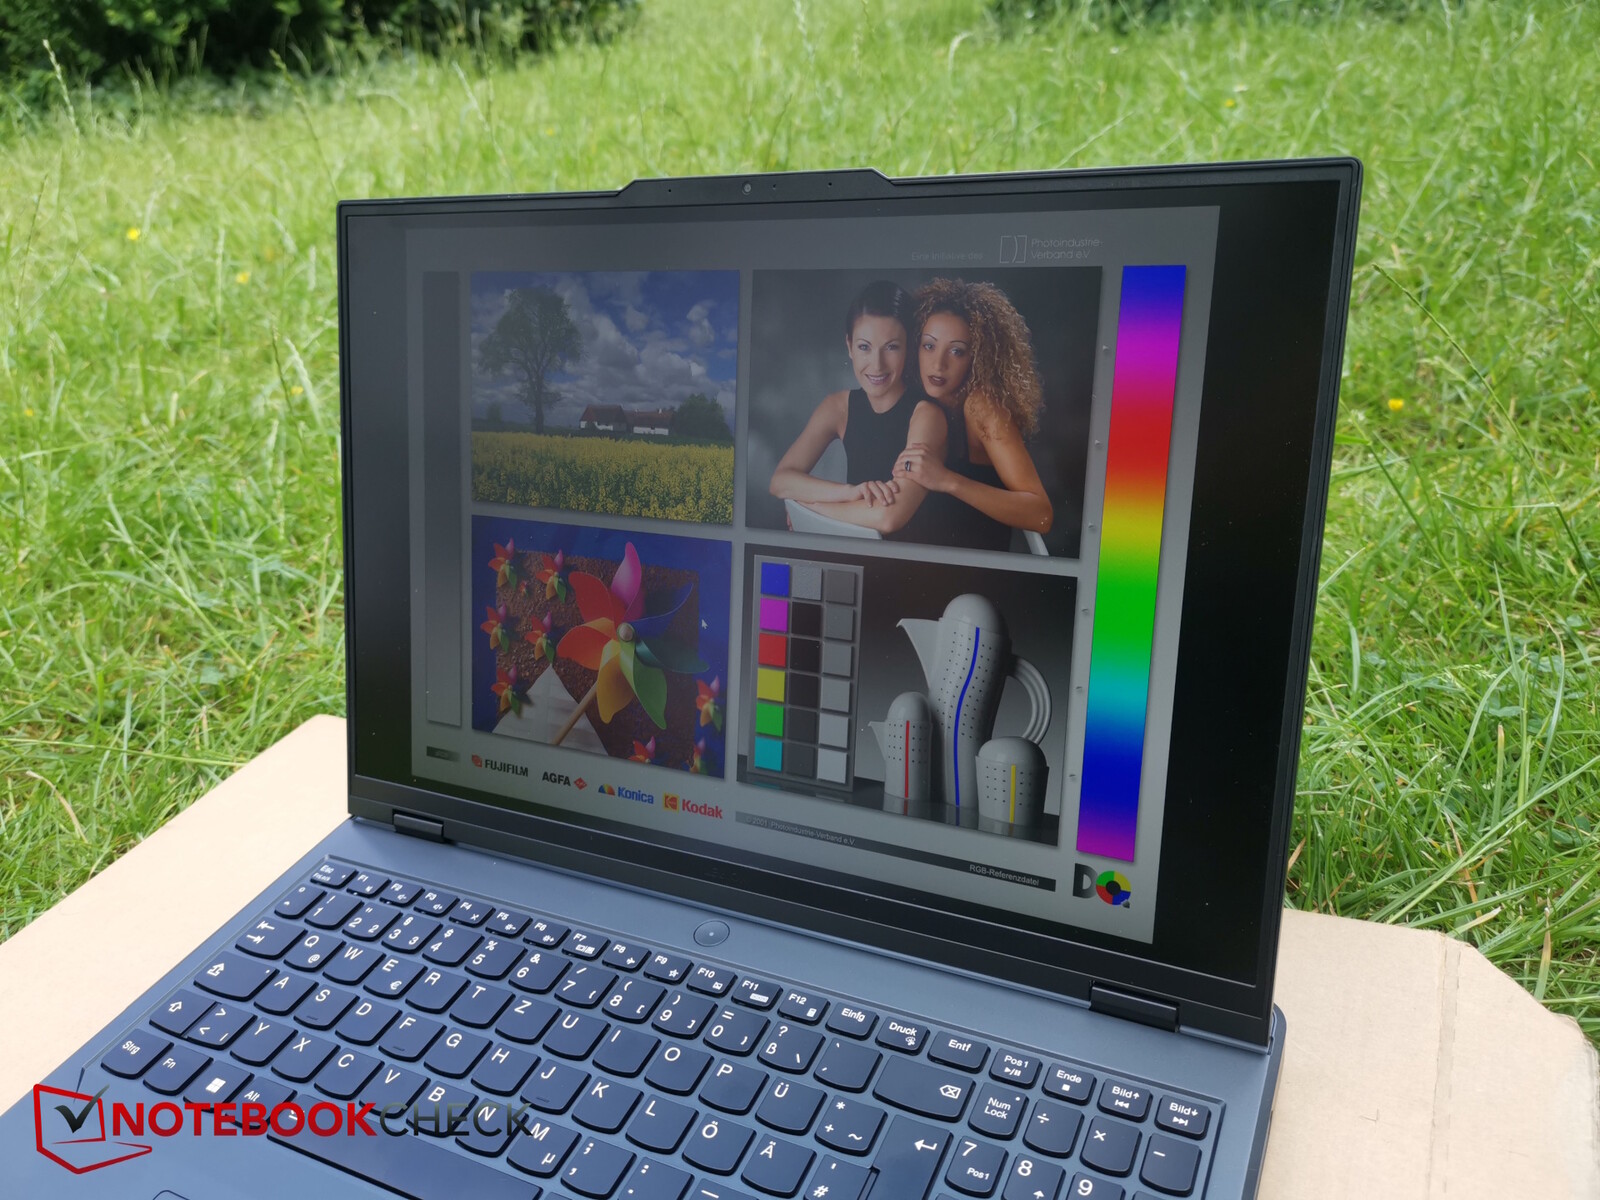
Como a tela é bastante brilhante, com quase 500 nits, e também apresenta uma superfície fosca, a maioria dos reflexos é atenuada e o usuário pode usar o laptop em ambientes externos, desde que olhe diretamente para ele e evite a luz solar direta.
Desempenho - O excelente desempenho da CPU e dos jogos do Pro 5i
Em contraste com o Legion Pro 5i com os componentes de ponta i9 14900HX e RTX 4070 que já testamos, o dispositivo de teste atual está equipado com um i7 14700HX e um RTX 4060. Isso significa que o laptop é classificado como um gamer de médio porte.
Graças à sua tela brilhante e com cores relativamente precisas, o Legion provavelmente também será do interesse de muitos criadores, embora seu design possa ser um pouco mais sutil.
Condições de teste
O software Lenovo Vantage funciona como um centro de controle dentro do Legion Pro 5i. Além dos perfis de desempenho, várias outras configurações podem ser encontradas aqui, desde a iluminação do teclado e a fonte de alimentação até o switch MUX e as atualizações do sistema.
Há três perfis de desempenho predefinidos para escolher(desempenho, equilibrado, silencioso) - um mecanismo de IA também pode ser adicionado no modo equilibrado e há outro modo personalizado no qual vários parâmetros podem ser definidos manualmente.
Usamos o modo de desempenho sem overclocking da GPU para nossos benchmarks. O modo silencioso foi usado em nossos testes de bateria. Ocasionalmente, fornecemos valores medidos para os outros modos de desempenho.


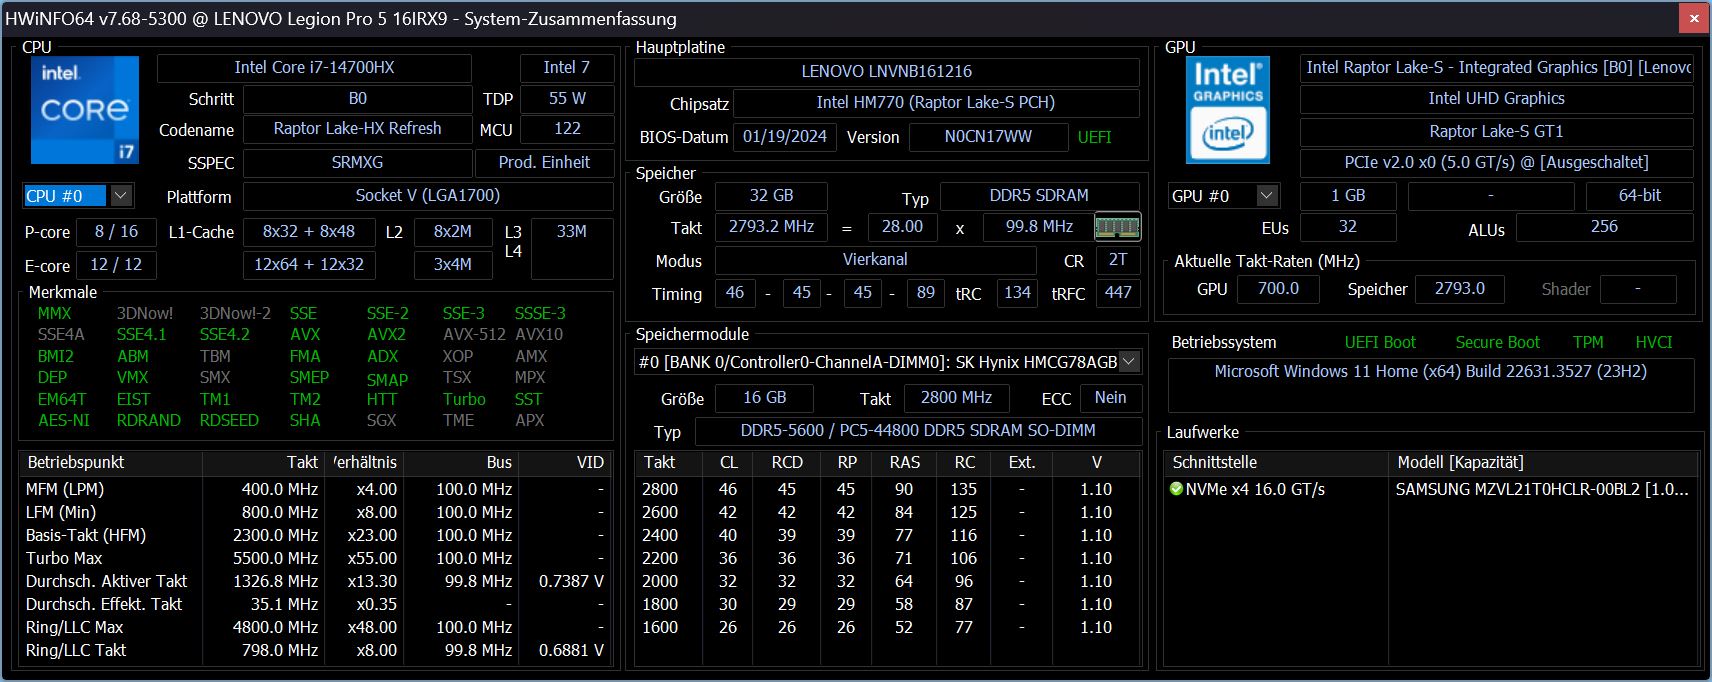
Processador
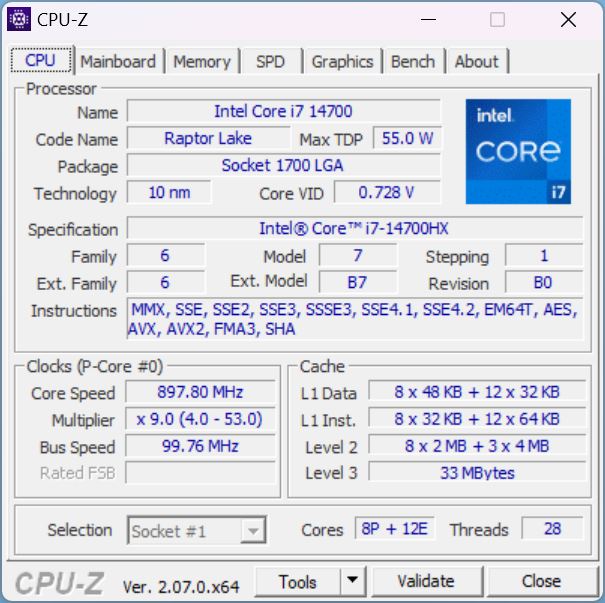
O Intel Core i7-14700HX é uma CPU de ponta baseada na nova série Raptor Lake HX Refresh. A CPU contém 8 núcleos P e 12 núcleos E e pode processar um total de 28 threads ao mesmo tempo graças ao hyperthreading.
Em nosso teste de loop, a CPU teve um desempenho muito consistente e com uma perda mínima de desempenho durante os 30 minutos. Ela superou a maioria dos concorrentes - somente o Legion Pro 5i com o i9-14900HX teve um desempenho ligeiramente melhor.
Em todos os benchmarks, no entanto, ficou claro que o processador do nosso Legion Pro 5i tem um desempenho impressionante. Ele ficou 9% acima da média do i7-14700HX de nosso banco de dados e apenas 5% atrás do i9-14900HX.
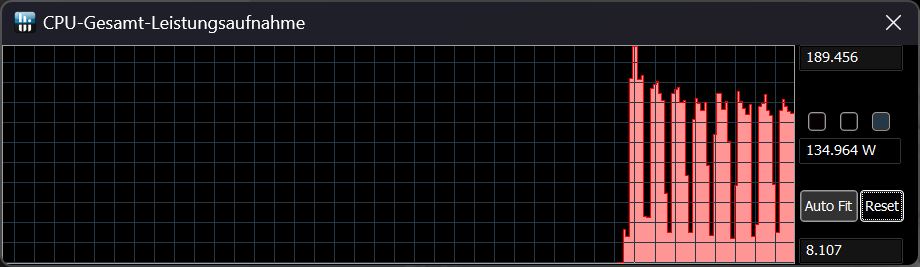
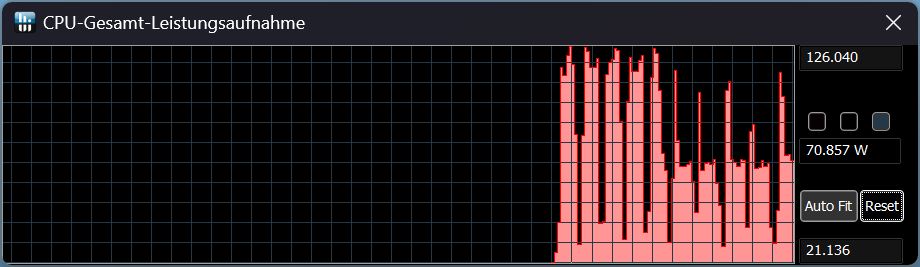
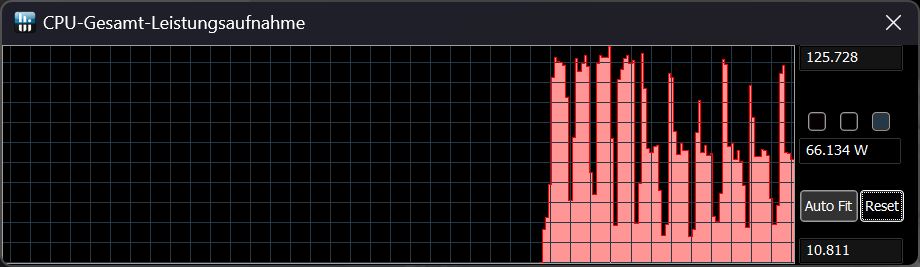
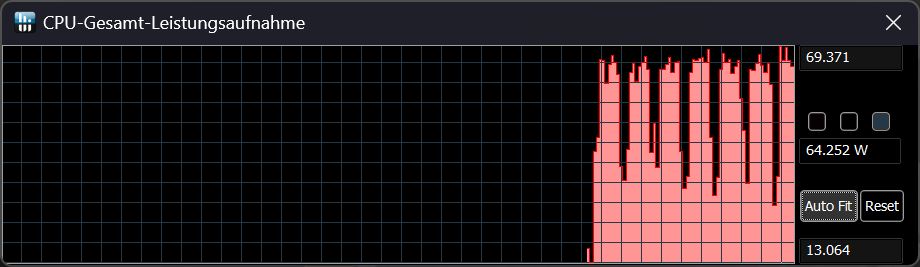
Desconectado da rede elétrica, cerca de 44% do desempenho da CPU foi perdido ao executar o Cinebench R15 Multi. A tabela abaixo mostra suas pontuações no Cinebench R15 Multi e TDPs, dependendo do perfil de desempenho, com as curvas de TDP correspondentes no respectivo modo à direita.
| Modo de desempenho/valor de medição | Cinebench R 15 Multi score | TDP |
|---|---|---|
| Desempenho | 4137 | 190 - 130 |
| Equilibrado com IA | 3650 | 125 - 70 |
| Equilibrado sem IA | 3367 | 125 - 65 |
| Silencioso | 2640 | 70 - 65 |
| Bateria | 2302 | 56 - 45 |
Cinebench R15 Multi continuous test
Cinebench R23: Multi Core | Single Core
Cinebench R20: CPU (Multi Core) | CPU (Single Core)
Cinebench R15: CPU Multi 64Bit | CPU Single 64Bit
Blender: v2.79 BMW27 CPU
7-Zip 18.03: 7z b 4 | 7z b 4 -mmt1
Geekbench 6.4: Multi-Core | Single-Core
Geekbench 5.5: Multi-Core | Single-Core
HWBOT x265 Benchmark v2.2: 4k Preset
LibreOffice : 20 Documents To PDF
R Benchmark 2.5: Overall mean
| CPU Performance Rating | |
| Lenovo Legion Pro 5 16IRX9 | |
| Lenovo Legion Pro 5 16IRX9 G9 | |
| Lenovo Legion 5 16IRX G9 | |
| Média Intel Core i7-14700HX | |
| Média da turma Gaming | |
| HP Victus 16 (2024) | |
| SCHENKER XMG Core 15 (M24) | |
| Dell G16, i7-13650HX, RTX 4060 | |
| Cinebench R23 / Multi Core | |
| Lenovo Legion Pro 5 16IRX9 | |
| Lenovo Legion Pro 5 16IRX9 G9 | |
| Média Intel Core i7-14700HX (22313 - 28122, n=7) | |
| Lenovo Legion 5 16IRX G9 | |
| HP Victus 16 (2024) | |
| Média da turma Gaming (5668 - 39652, n=151, últimos 2 anos) | |
| Dell G16, i7-13650HX, RTX 4060 | |
| SCHENKER XMG Core 15 (M24) | |
| Cinebench R23 / Single Core | |
| Lenovo Legion Pro 5 16IRX9 G9 | |
| Lenovo Legion Pro 5 16IRX9 | |
| Média Intel Core i7-14700HX (1702 - 2144, n=7) | |
| Lenovo Legion 5 16IRX G9 | |
| Dell G16, i7-13650HX, RTX 4060 | |
| Média da turma Gaming (1136 - 2252, n=151, últimos 2 anos) | |
| SCHENKER XMG Core 15 (M24) | |
| HP Victus 16 (2024) | |
| Cinebench R20 / CPU (Multi Core) | |
| Lenovo Legion Pro 5 16IRX9 | |
| Lenovo Legion Pro 5 16IRX9 G9 | |
| Lenovo Legion 5 16IRX G9 | |
| HP Victus 16 (2024) | |
| Média Intel Core i7-14700HX (8361 - 10498, n=7) | |
| Média da turma Gaming (2179 - 15517, n=151, últimos 2 anos) | |
| Dell G16, i7-13650HX, RTX 4060 | |
| SCHENKER XMG Core 15 (M24) | |
| Cinebench R20 / CPU (Single Core) | |
| Lenovo Legion Pro 5 16IRX9 G9 | |
| Lenovo Legion Pro 5 16IRX9 | |
| Média Intel Core i7-14700HX (651 - 821, n=7) | |
| Lenovo Legion 5 16IRX G9 | |
| Média da turma Gaming (439 - 866, n=151, últimos 2 anos) | |
| Dell G16, i7-13650HX, RTX 4060 | |
| SCHENKER XMG Core 15 (M24) | |
| HP Victus 16 (2024) | |
| Cinebench R15 / CPU Multi 64Bit | |
| Lenovo Legion Pro 5 16IRX9 | |
| Lenovo Legion Pro 5 16IRX9 G9 | |
| HP Victus 16 (2024) | |
| Lenovo Legion 5 16IRX G9 | |
| Média Intel Core i7-14700HX (3328 - 4137, n=7) | |
| Média da turma Gaming (905 - 6074, n=154, últimos 2 anos) | |
| Dell G16, i7-13650HX, RTX 4060 | |
| SCHENKER XMG Core 15 (M24) | |
| Cinebench R15 / CPU Single 64Bit | |
| Lenovo Legion Pro 5 16IRX9 G9 | |
| Lenovo Legion Pro 5 16IRX9 | |
| Lenovo Legion 5 16IRX G9 | |
| Média Intel Core i7-14700HX (238 - 304, n=7) | |
| SCHENKER XMG Core 15 (M24) | |
| Média da turma Gaming (191.9 - 343, n=151, últimos 2 anos) | |
| Dell G16, i7-13650HX, RTX 4060 | |
| HP Victus 16 (2024) | |
| Blender / v2.79 BMW27 CPU | |
| SCHENKER XMG Core 15 (M24) | |
| Média da turma Gaming (81 - 555, n=144, últimos 2 anos) | |
| HP Victus 16 (2024) | |
| Dell G16, i7-13650HX, RTX 4060 | |
| Média Intel Core i7-14700HX (126 - 184, n=7) | |
| Lenovo Legion 5 16IRX G9 | |
| Lenovo Legion Pro 5 16IRX9 G9 | |
| Lenovo Legion Pro 5 16IRX9 | |
| 7-Zip 18.03 / 7z b 4 | |
| Lenovo Legion Pro 5 16IRX9 | |
| Lenovo Legion Pro 5 16IRX9 G9 | |
| Média Intel Core i7-14700HX (84799 - 104730, n=7) | |
| Lenovo Legion 5 16IRX G9 | |
| HP Victus 16 (2024) | |
| Média da turma Gaming (23795 - 144064, n=149, últimos 2 anos) | |
| Dell G16, i7-13650HX, RTX 4060 | |
| SCHENKER XMG Core 15 (M24) | |
| 7-Zip 18.03 / 7z b 4 -mmt1 | |
| Lenovo Legion Pro 5 16IRX9 G9 | |
| Lenovo Legion Pro 5 16IRX9 | |
| Lenovo Legion 5 16IRX G9 | |
| Média Intel Core i7-14700HX (5641 - 7041, n=7) | |
| SCHENKER XMG Core 15 (M24) | |
| Média da turma Gaming (4199 - 7573, n=149, últimos 2 anos) | |
| Dell G16, i7-13650HX, RTX 4060 | |
| HP Victus 16 (2024) | |
| Geekbench 6.4 / Multi-Core | |
| Lenovo Legion Pro 5 16IRX9 | |
| Lenovo Legion Pro 5 16IRX9 G9 | |
| Média Intel Core i7-14700HX (14807 - 17562, n=7) | |
| Lenovo Legion 5 16IRX G9 | |
| HP Victus 16 (2024) | |
| Média da turma Gaming (5340 - 21668, n=119, últimos 2 anos) | |
| SCHENKER XMG Core 15 (M24) | |
| Dell G16, i7-13650HX, RTX 4060 | |
| Geekbench 6.4 / Single-Core | |
| Lenovo Legion Pro 5 16IRX9 | |
| Lenovo Legion Pro 5 16IRX9 G9 | |
| Média Intel Core i7-14700HX (2378 - 2975, n=7) | |
| Lenovo Legion 5 16IRX G9 | |
| SCHENKER XMG Core 15 (M24) | |
| Média da turma Gaming (1490 - 3219, n=119, últimos 2 anos) | |
| Dell G16, i7-13650HX, RTX 4060 | |
| HP Victus 16 (2024) | |
| Geekbench 5.5 / Multi-Core | |
| Lenovo Legion Pro 5 16IRX9 | |
| Lenovo Legion Pro 5 16IRX9 G9 | |
| Média Intel Core i7-14700HX (15705 - 19597, n=7) | |
| Lenovo Legion 5 16IRX G9 | |
| HP Victus 16 (2024) | |
| Média da turma Gaming (4557 - 25855, n=148, últimos 2 anos) | |
| SCHENKER XMG Core 15 (M24) | |
| Dell G16, i7-13650HX, RTX 4060 | |
| Geekbench 5.5 / Single-Core | |
| Lenovo Legion Pro 5 16IRX9 G9 | |
| Lenovo Legion Pro 5 16IRX9 | |
| Média Intel Core i7-14700HX (1700 - 2133, n=7) | |
| SCHENKER XMG Core 15 (M24) | |
| Lenovo Legion 5 16IRX G9 | |
| Média da turma Gaming (986 - 2423, n=148, últimos 2 anos) | |
| Dell G16, i7-13650HX, RTX 4060 | |
| HP Victus 16 (2024) | |
| HWBOT x265 Benchmark v2.2 / 4k Preset | |
| Lenovo Legion Pro 5 16IRX9 | |
| Lenovo Legion Pro 5 16IRX9 G9 | |
| Lenovo Legion 5 16IRX G9 | |
| Média Intel Core i7-14700HX (22 - 27.4, n=7) | |
| Média da turma Gaming (6.72 - 42.9, n=148, últimos 2 anos) | |
| SCHENKER XMG Core 15 (M24) | |
| HP Victus 16 (2024) | |
| Dell G16, i7-13650HX, RTX 4060 | |
| LibreOffice / 20 Documents To PDF | |
| HP Victus 16 (2024) | |
| Dell G16, i7-13650HX, RTX 4060 | |
| Lenovo Legion Pro 5 16IRX9 G9 | |
| SCHENKER XMG Core 15 (M24) | |
| Média da turma Gaming (19 - 96.6, n=147, últimos 2 anos) | |
| Média Intel Core i7-14700HX (41.9 - 55.3, n=7) | |
| Lenovo Legion 5 16IRX G9 | |
| Lenovo Legion Pro 5 16IRX9 | |
| R Benchmark 2.5 / Overall mean | |
| HP Victus 16 (2024) | |
| Média da turma Gaming (0.3609 - 0.759, n=150, últimos 2 anos) | |
| SCHENKER XMG Core 15 (M24) | |
| Dell G16, i7-13650HX, RTX 4060 | |
| Dell G16, i7-13650HX, RTX 4060 | |
| Lenovo Legion 5 16IRX G9 | |
| Média Intel Core i7-14700HX (0.3821 - 0.4896, n=7) | |
| Lenovo Legion Pro 5 16IRX9 G9 | |
| Lenovo Legion Pro 5 16IRX9 | |
* ... menor é melhor
AIDA64: FP32 Ray-Trace | FPU Julia | CPU SHA3 | CPU Queen | FPU SinJulia | FPU Mandel | CPU AES | CPU ZLib | FP64 Ray-Trace | CPU PhotoWorxx
| Performance Rating | |
| Lenovo Legion Pro 5 16IRX9 | |
| Lenovo Legion Pro 5 16IRX9 G9 | |
| SCHENKER XMG Core 15 (M24) | |
| Média Intel Core i7-14700HX | |
| Média da turma Gaming | |
| Lenovo Legion 5 16IRX G9 | |
| Dell G16, i7-13650HX, RTX 4060 | |
| HP Victus 16 (2024) | |
| AIDA64 / FP32 Ray-Trace | |
| SCHENKER XMG Core 15 (M24) | |
| Lenovo Legion Pro 5 16IRX9 | |
| Lenovo Legion Pro 5 16IRX9 G9 | |
| Média da turma Gaming (4986 - 81639, n=147, últimos 2 anos) | |
| Média Intel Core i7-14700HX (16932 - 23676, n=7) | |
| Lenovo Legion 5 16IRX G9 | |
| Dell G16, i7-13650HX, RTX 4060 | |
| HP Victus 16 (2024) | |
| AIDA64 / FPU Julia | |
| Lenovo Legion Pro 5 16IRX9 | |
| SCHENKER XMG Core 15 (M24) | |
| Lenovo Legion Pro 5 16IRX9 G9 | |
| Média Intel Core i7-14700HX (86338 - 116556, n=7) | |
| Média da turma Gaming (25360 - 252486, n=147, últimos 2 anos) | |
| Lenovo Legion 5 16IRX G9 | |
| Dell G16, i7-13650HX, RTX 4060 | |
| HP Victus 16 (2024) | |
| AIDA64 / CPU SHA3 | |
| Lenovo Legion Pro 5 16IRX9 | |
| Lenovo Legion Pro 5 16IRX9 G9 | |
| SCHENKER XMG Core 15 (M24) | |
| Média Intel Core i7-14700HX (4008 - 5567, n=7) | |
| Média da turma Gaming (1339 - 10389, n=147, últimos 2 anos) | |
| Dell G16, i7-13650HX, RTX 4060 | |
| Lenovo Legion 5 16IRX G9 | |
| HP Victus 16 (2024) | |
| AIDA64 / CPU Queen | |
| Lenovo Legion Pro 5 16IRX9 G9 | |
| Lenovo Legion Pro 5 16IRX9 | |
| Média Intel Core i7-14700HX (129836 - 152200, n=7) | |
| HP Victus 16 (2024) | |
| SCHENKER XMG Core 15 (M24) | |
| Média da turma Gaming (50699 - 200651, n=147, últimos 2 anos) | |
| Dell G16, i7-13650HX, RTX 4060 | |
| Lenovo Legion 5 16IRX G9 | |
| AIDA64 / FPU SinJulia | |
| SCHENKER XMG Core 15 (M24) | |
| Lenovo Legion Pro 5 16IRX9 | |
| Lenovo Legion Pro 5 16IRX9 G9 | |
| Média Intel Core i7-14700HX (11704 - 14434, n=7) | |
| Média da turma Gaming (4800 - 32988, n=147, últimos 2 anos) | |
| Lenovo Legion 5 16IRX G9 | |
| HP Victus 16 (2024) | |
| Dell G16, i7-13650HX, RTX 4060 | |
| AIDA64 / FPU Mandel | |
| SCHENKER XMG Core 15 (M24) | |
| Lenovo Legion Pro 5 16IRX9 | |
| Lenovo Legion Pro 5 16IRX9 G9 | |
| Média da turma Gaming (12321 - 134044, n=147, últimos 2 anos) | |
| Média Intel Core i7-14700HX (42125 - 58380, n=7) | |
| Lenovo Legion 5 16IRX G9 | |
| Dell G16, i7-13650HX, RTX 4060 | |
| HP Victus 16 (2024) | |
| AIDA64 / CPU AES | |
| Lenovo Legion Pro 5 16IRX9 | |
| Lenovo Legion Pro 5 16IRX9 G9 | |
| Média da turma Gaming (19065 - 328679, n=147, últimos 2 anos) | |
| Média Intel Core i7-14700HX (82161 - 113157, n=7) | |
| SCHENKER XMG Core 15 (M24) | |
| Lenovo Legion 5 16IRX G9 | |
| Dell G16, i7-13650HX, RTX 4060 | |
| HP Victus 16 (2024) | |
| AIDA64 / CPU ZLib | |
| Lenovo Legion Pro 5 16IRX9 | |
| Lenovo Legion Pro 5 16IRX9 G9 | |
| Média Intel Core i7-14700HX (1177 - 1682, n=7) | |
| Média da turma Gaming (373 - 2531, n=147, últimos 2 anos) | |
| Lenovo Legion 5 16IRX G9 | |
| Dell G16, i7-13650HX, RTX 4060 | |
| HP Victus 16 (2024) | |
| SCHENKER XMG Core 15 (M24) | |
| AIDA64 / FP64 Ray-Trace | |
| SCHENKER XMG Core 15 (M24) | |
| Lenovo Legion Pro 5 16IRX9 | |
| Lenovo Legion Pro 5 16IRX9 G9 | |
| Média da turma Gaming (2540 - 43430, n=147, últimos 2 anos) | |
| Média Intel Core i7-14700HX (9029 - 12928, n=7) | |
| Dell G16, i7-13650HX, RTX 4060 | |
| Lenovo Legion 5 16IRX G9 | |
| HP Victus 16 (2024) | |
| AIDA64 / CPU PhotoWorxx | |
| Lenovo Legion Pro 5 16IRX9 | |
| Lenovo Legion Pro 5 16IRX9 G9 | |
| Média Intel Core i7-14700HX (39151 - 49671, n=7) | |
| SCHENKER XMG Core 15 (M24) | |
| Média da turma Gaming (10805 - 60161, n=147, últimos 2 anos) | |
| HP Victus 16 (2024) | |
| Dell G16, i7-13650HX, RTX 4060 | |
| Lenovo Legion 5 16IRX G9 | |
Desempenho do sistema
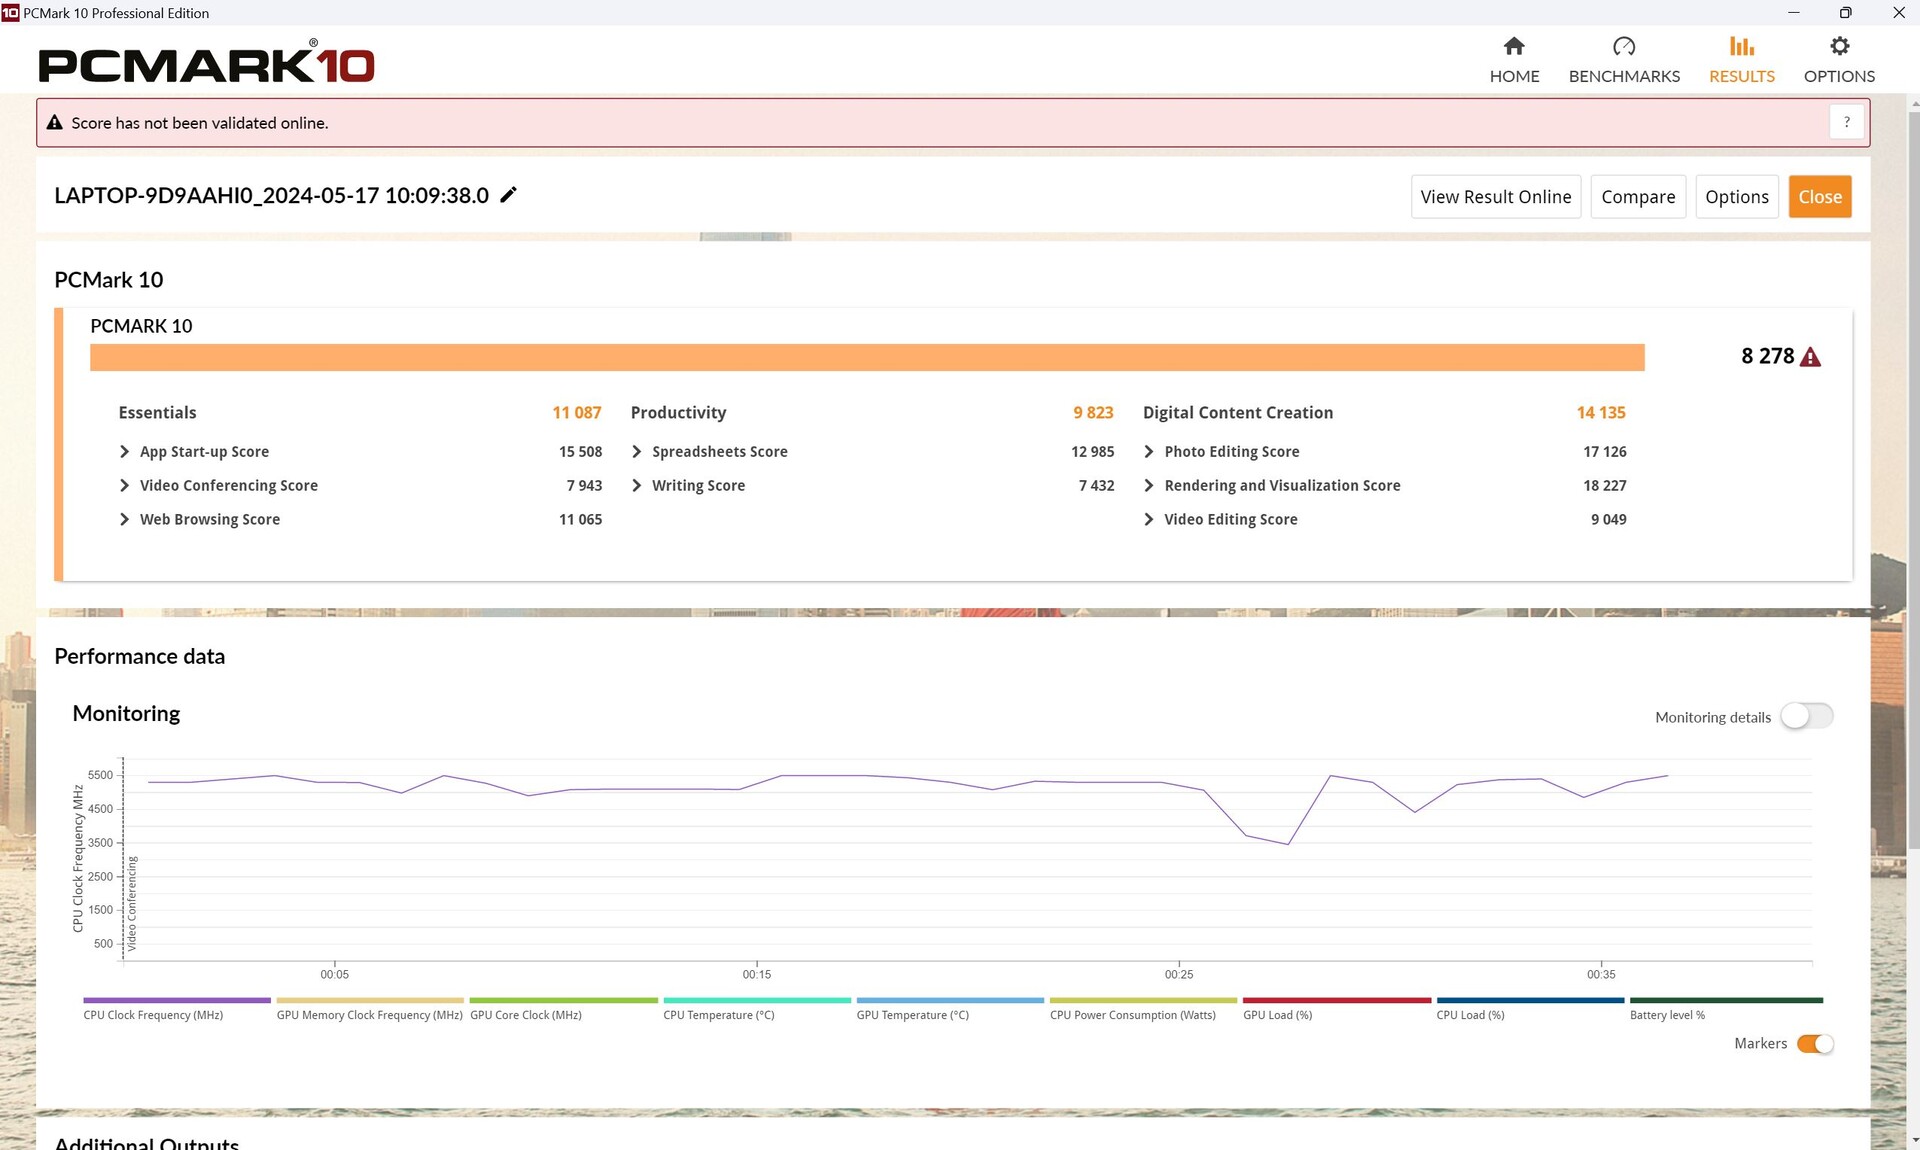
No PCMark 10, nosso Legion Pro foi apenas um pouco mais fraco quando se tratou de produtividade, mas, fora isso, ele sempre ficou em segundo lugar, diretamente atrás do Legion Pro mais bem equipado.
No CrossMark, seus resultados foram novamente muito bons e nosso modelo de teste conseguiu até mesmo superar a versão "melhor" dele mesmo.
CrossMark: Overall | Productivity | Creativity | Responsiveness
WebXPRT 3: Overall
WebXPRT 4: Overall
Mozilla Kraken 1.1: Total
| PCMark 10 / Score | |
| SCHENKER XMG Core 15 (M24) | |
| Lenovo Legion Pro 5 16IRX9 | |
| Lenovo Legion Pro 5 16IRX9 G9 | |
| Média Intel Core i7-14700HX, NVIDIA GeForce RTX 4060 Laptop GPU (7528 - 8278, n=2) | |
| Média da turma Gaming (5776 - 9852, n=133, últimos 2 anos) | |
| Lenovo Legion 5 16IRX G9 | |
| HP Victus 16 (2024) | |
| Dell G16, i7-13650HX, RTX 4060 | |
| PCMark 10 / Essentials | |
| Lenovo Legion Pro 5 16IRX9 | |
| Lenovo Legion Pro 5 16IRX9 G9 | |
| Média Intel Core i7-14700HX, NVIDIA GeForce RTX 4060 Laptop GPU (10778 - 11087, n=2) | |
| Lenovo Legion 5 16IRX G9 | |
| HP Victus 16 (2024) | |
| Média da turma Gaming (9057 - 12600, n=133, últimos 2 anos) | |
| SCHENKER XMG Core 15 (M24) | |
| Dell G16, i7-13650HX, RTX 4060 | |
| PCMark 10 / Productivity | |
| SCHENKER XMG Core 15 (M24) | |
| Lenovo Legion Pro 5 16IRX9 | |
| Dell G16, i7-13650HX, RTX 4060 | |
| HP Victus 16 (2024) | |
| Média da turma Gaming (6662 - 14612, n=133, últimos 2 anos) | |
| Média Intel Core i7-14700HX, NVIDIA GeForce RTX 4060 Laptop GPU (9823 - 9910, n=2) | |
| Lenovo Legion Pro 5 16IRX9 G9 | |
| Lenovo Legion 5 16IRX G9 | |
| PCMark 10 / Digital Content Creation | |
| Lenovo Legion Pro 5 16IRX9 | |
| Lenovo Legion Pro 5 16IRX9 G9 | |
| SCHENKER XMG Core 15 (M24) | |
| Média Intel Core i7-14700HX, NVIDIA GeForce RTX 4060 Laptop GPU (10841 - 14135, n=2) | |
| Média da turma Gaming (6807 - 18475, n=133, últimos 2 anos) | |
| Lenovo Legion 5 16IRX G9 | |
| Dell G16, i7-13650HX, RTX 4060 | |
| HP Victus 16 (2024) | |
| CrossMark / Overall | |
| Lenovo Legion Pro 5 16IRX9 G9 | |
| Lenovo Legion 5 16IRX G9 | |
| Média Intel Core i7-14700HX, NVIDIA GeForce RTX 4060 Laptop GPU (1923 - 2132, n=2) | |
| Lenovo Legion Pro 5 16IRX9 | |
| HP Victus 16 (2024) | |
| Média da turma Gaming (1247 - 2344, n=114, últimos 2 anos) | |
| SCHENKER XMG Core 15 (M24) | |
| Dell G16, i7-13650HX, RTX 4060 | |
| CrossMark / Productivity | |
| Lenovo Legion Pro 5 16IRX9 G9 | |
| Lenovo Legion 5 16IRX G9 | |
| Média Intel Core i7-14700HX, NVIDIA GeForce RTX 4060 Laptop GPU (1782 - 1973, n=2) | |
| Lenovo Legion Pro 5 16IRX9 | |
| Média da turma Gaming (1299 - 2204, n=114, últimos 2 anos) | |
| SCHENKER XMG Core 15 (M24) | |
| HP Victus 16 (2024) | |
| Dell G16, i7-13650HX, RTX 4060 | |
| CrossMark / Creativity | |
| Lenovo Legion Pro 5 16IRX9 G9 | |
| Lenovo Legion 5 16IRX G9 | |
| Lenovo Legion Pro 5 16IRX9 | |
| Média Intel Core i7-14700HX, NVIDIA GeForce RTX 4060 Laptop GPU (2107 - 2399, n=2) | |
| HP Victus 16 (2024) | |
| SCHENKER XMG Core 15 (M24) | |
| Média da turma Gaming (1275 - 2660, n=114, últimos 2 anos) | |
| Dell G16, i7-13650HX, RTX 4060 | |
| CrossMark / Responsiveness | |
| Lenovo Legion 5 16IRX G9 | |
| Lenovo Legion Pro 5 16IRX9 G9 | |
| Média Intel Core i7-14700HX, NVIDIA GeForce RTX 4060 Laptop GPU (1835 - 1885, n=2) | |
| HP Victus 16 (2024) | |
| Lenovo Legion Pro 5 16IRX9 | |
| Média da turma Gaming (1030 - 2330, n=114, últimos 2 anos) | |
| Dell G16, i7-13650HX, RTX 4060 | |
| SCHENKER XMG Core 15 (M24) | |
| WebXPRT 3 / Overall | |
| Lenovo Legion Pro 5 16IRX9 | |
| Lenovo Legion 5 16IRX G9 | |
| SCHENKER XMG Core 15 (M24) | |
| Lenovo Legion Pro 5 16IRX9 G9 | |
| Média da turma Gaming (215 - 480, n=127, últimos 2 anos) | |
| Média Intel Core i7-14700HX, NVIDIA GeForce RTX 4060 Laptop GPU (276 - 301, n=2) | |
| HP Victus 16 (2024) | |
| Dell G16, i7-13650HX, RTX 4060 | |
| WebXPRT 4 / Overall | |
| Lenovo Legion Pro 5 16IRX9 | |
| Lenovo Legion 5 16IRX G9 | |
| Lenovo Legion Pro 5 16IRX9 G9 | |
| Média da turma Gaming (176.4 - 335, n=115, últimos 2 anos) | |
| SCHENKER XMG Core 15 (M24) | |
| Média Intel Core i7-14700HX, NVIDIA GeForce RTX 4060 Laptop GPU (251 - 273, n=2) | |
| HP Victus 16 (2024) | |
| Mozilla Kraken 1.1 / Total | |
| HP Victus 16 (2024) | |
| Dell G16, i7-13650HX, RTX 4060 | |
| Média Intel Core i7-14700HX, NVIDIA GeForce RTX 4060 Laptop GPU (467 - 542, n=2) | |
| Média da turma Gaming (409 - 674, n=139, últimos 2 anos) | |
| SCHENKER XMG Core 15 (M24) | |
| Lenovo Legion 5 16IRX G9 | |
| Lenovo Legion Pro 5 16IRX9 G9 | |
| Lenovo Legion Pro 5 16IRX9 | |
* ... menor é melhor
| PCMark 10 Score | 8278 pontos | |
Ajuda | ||
| AIDA64 / Memory Copy | |
| Lenovo Legion Pro 5 16IRX9 | |
| Lenovo Legion Pro 5 16IRX9 G9 | |
| Média Intel Core i7-14700HX (63949 - 78742, n=7) | |
| SCHENKER XMG Core 15 (M24) | |
| HP Victus 16 (2024) | |
| Média da turma Gaming (21750 - 97515, n=147, últimos 2 anos) | |
| Lenovo Legion 5 16IRX G9 | |
| Dell G16, i7-13650HX, RTX 4060 | |
| AIDA64 / Memory Read | |
| Lenovo Legion Pro 5 16IRX9 | |
| Lenovo Legion Pro 5 16IRX9 G9 | |
| Média Intel Core i7-14700HX (68593 - 86175, n=7) | |
| HP Victus 16 (2024) | |
| Lenovo Legion 5 16IRX G9 | |
| Média da turma Gaming (22956 - 102937, n=147, últimos 2 anos) | |
| Dell G16, i7-13650HX, RTX 4060 | |
| SCHENKER XMG Core 15 (M24) | |
| AIDA64 / Memory Write | |
| SCHENKER XMG Core 15 (M24) | |
| Lenovo Legion Pro 5 16IRX9 | |
| Lenovo Legion Pro 5 16IRX9 G9 | |
| Média Intel Core i7-14700HX (64033 - 76689, n=7) | |
| Média da turma Gaming (22297 - 108954, n=147, últimos 2 anos) | |
| HP Victus 16 (2024) | |
| Dell G16, i7-13650HX, RTX 4060 | |
| Lenovo Legion 5 16IRX G9 | |
| AIDA64 / Memory Latency | |
| HP Victus 16 (2024) | |
| Média da turma Gaming (59.5 - 259, n=147, últimos 2 anos) | |
| Dell G16, i7-13650HX, RTX 4060 | |
| Lenovo Legion 5 16IRX G9 | |
| Média Intel Core i7-14700HX (82.7 - 96.4, n=7) | |
| SCHENKER XMG Core 15 (M24) | |
| Lenovo Legion Pro 5 16IRX9 | |
| Lenovo Legion Pro 5 16IRX9 G9 | |
* ... menor é melhor
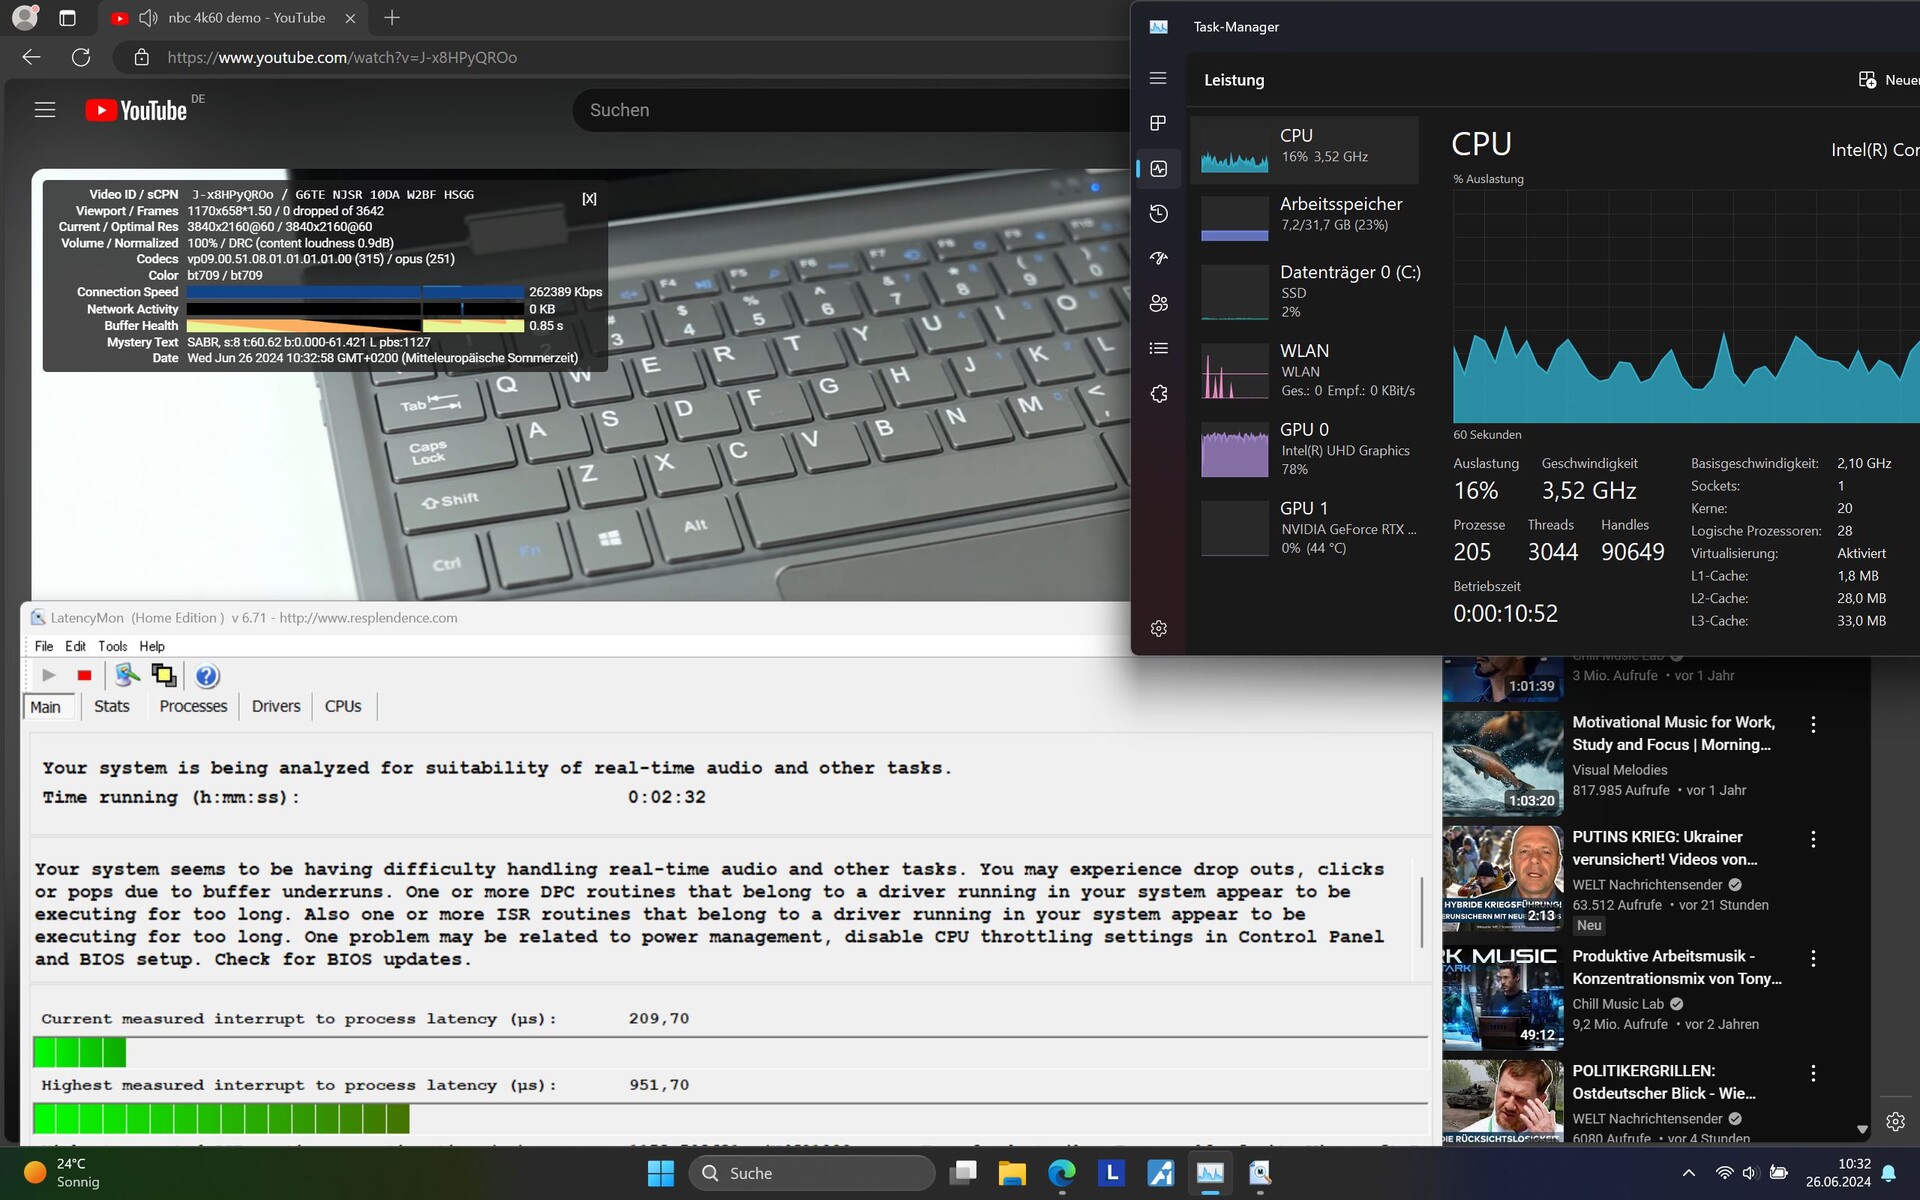
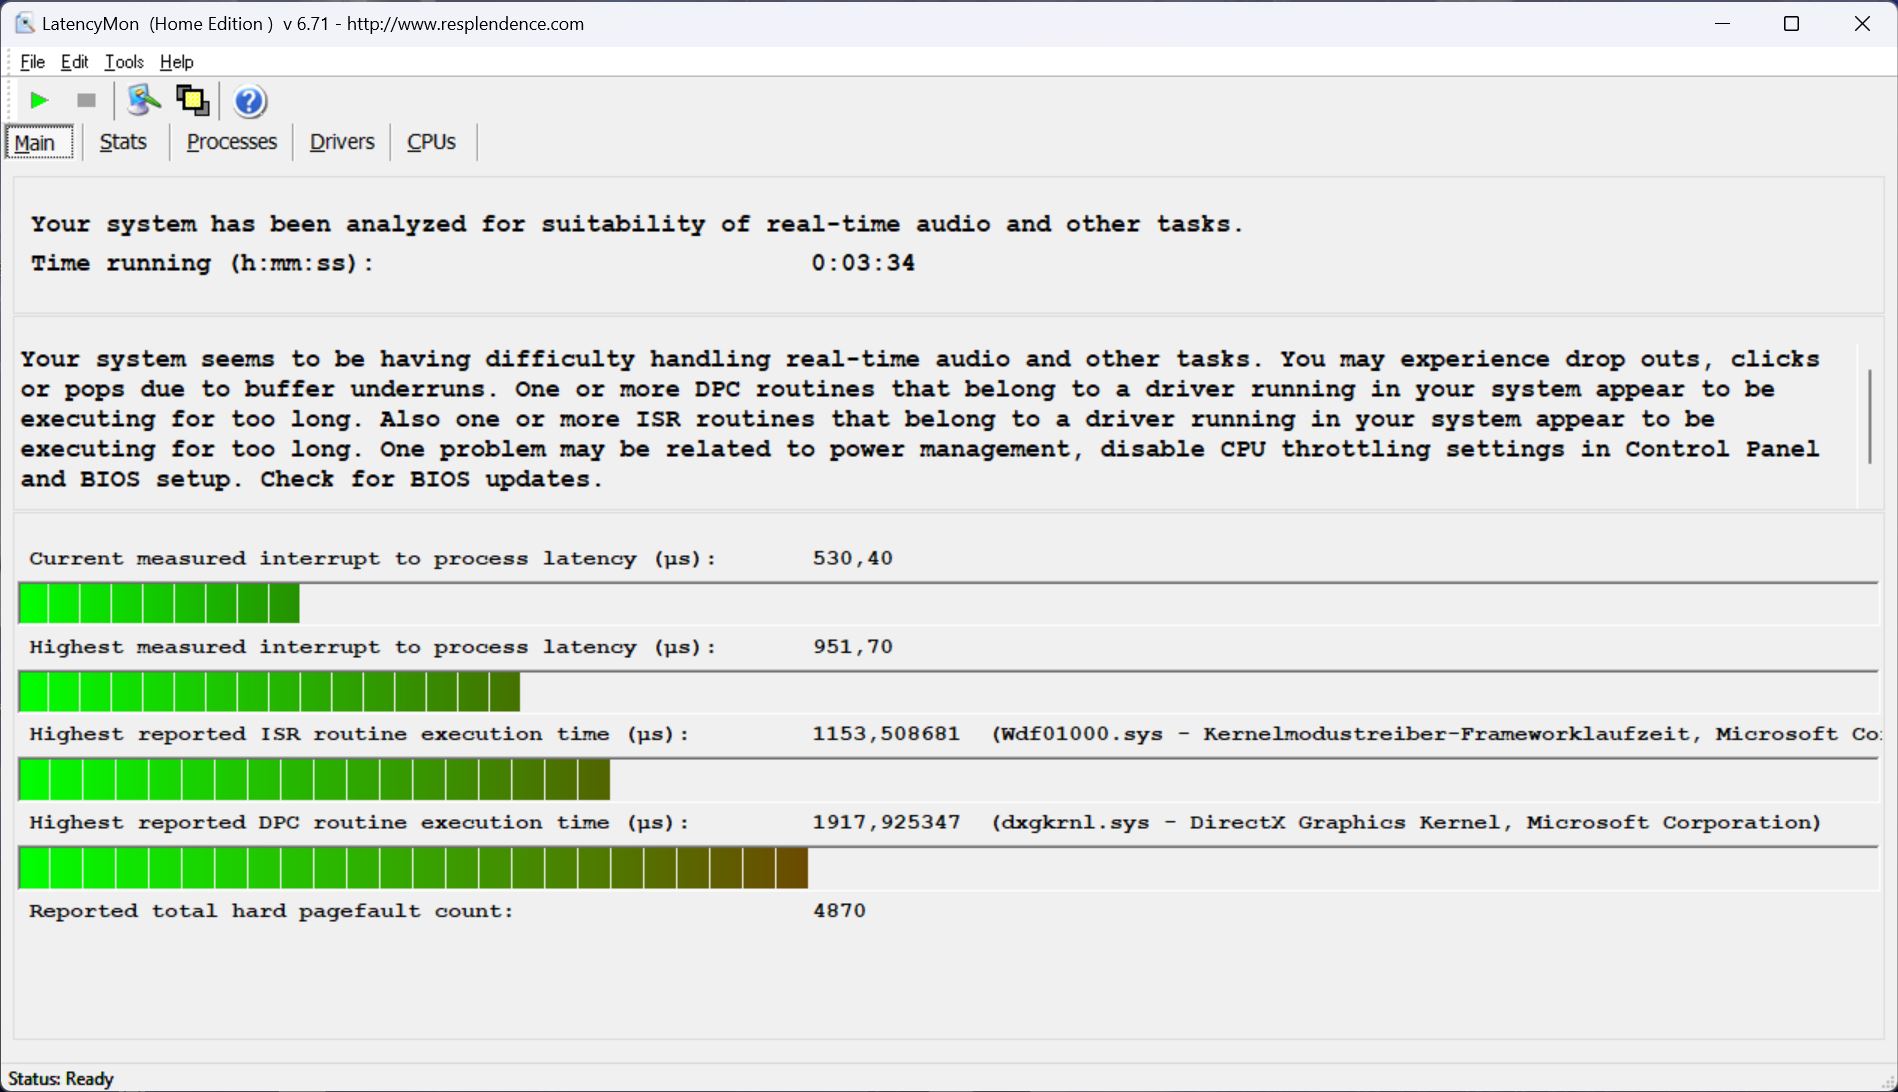
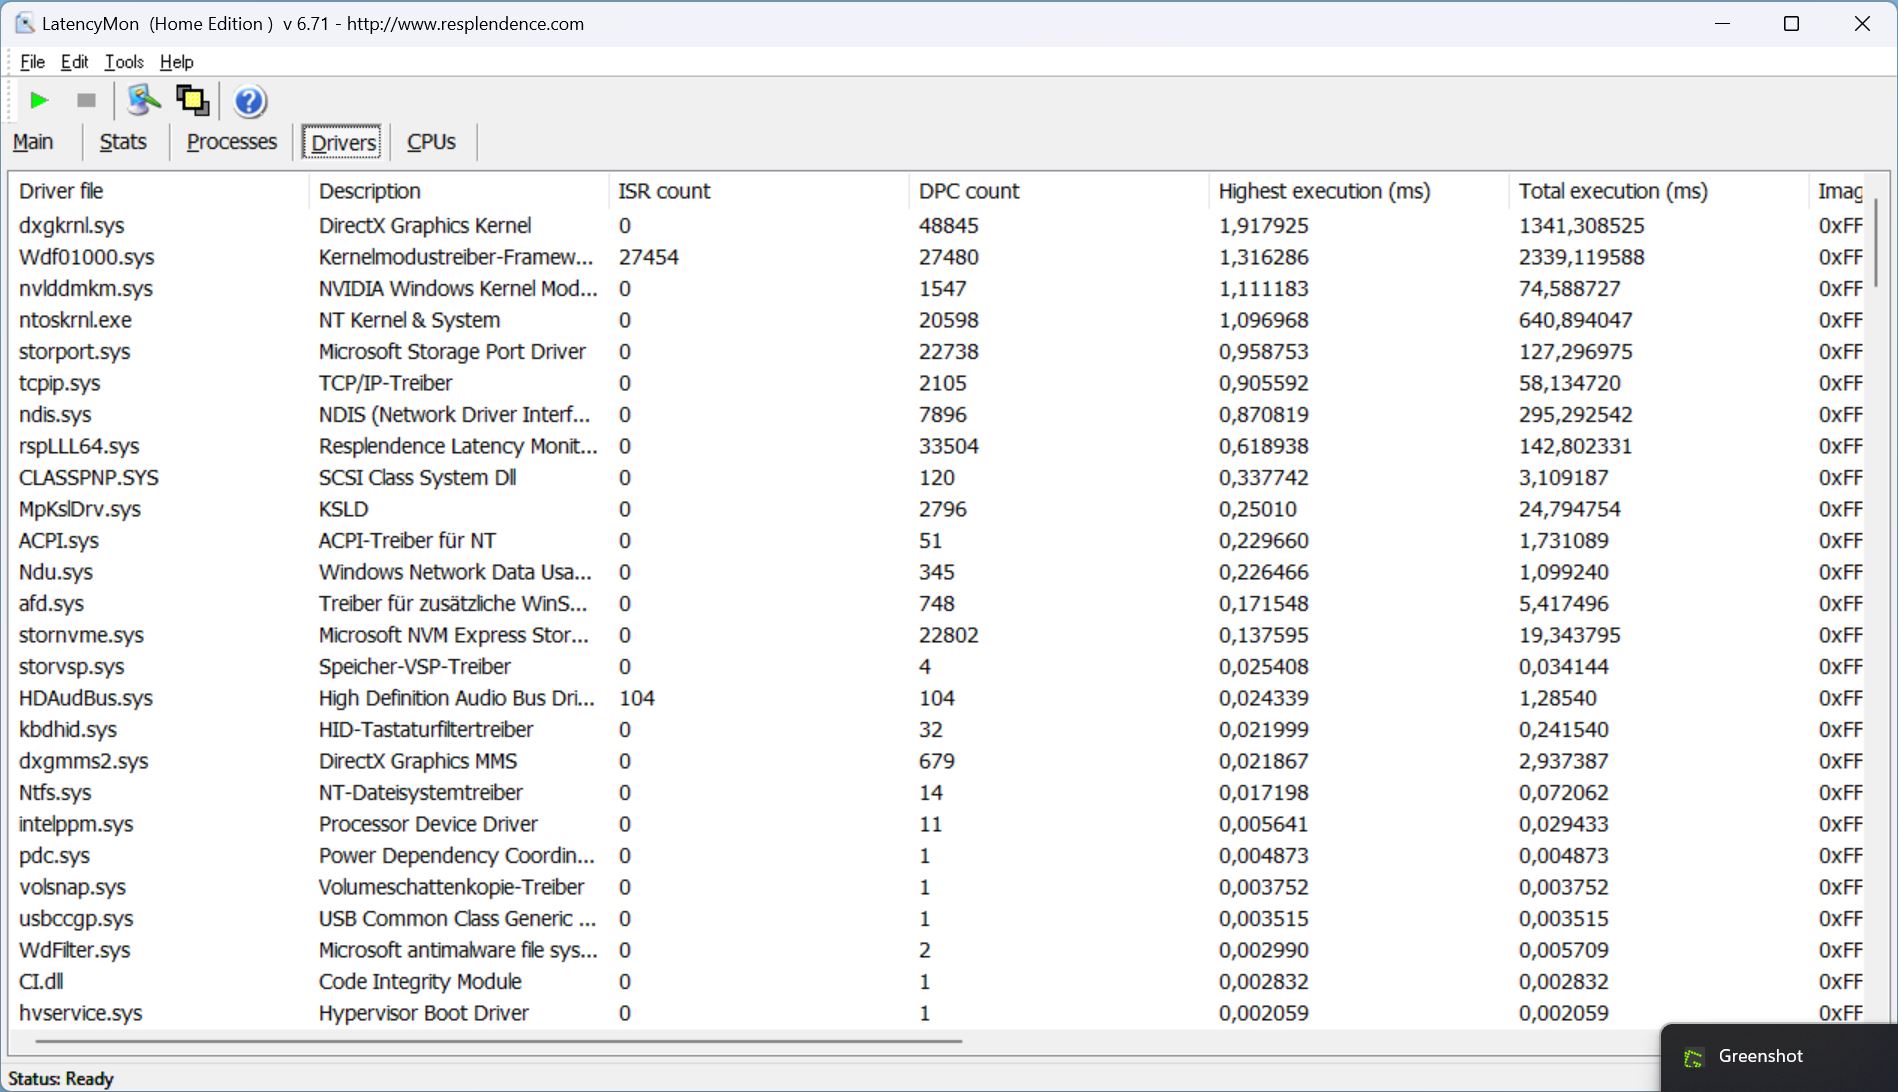
Latências de DPC
As primeiras latências menores já ocorreram ao abrir o navegador. O valor do atraso aumentou novamente, de forma ligeira, ao abrir várias guias em nosso site. No entanto, nosso vídeo 4K/60fps do YouTube foi reproduzido sem nenhum problema ou queda de quadros. A carga interna da GPU foi muito alta, 78%.
| DPC Latencies / LatencyMon - interrupt to process latency (max), Web, Youtube, Prime95 | |
| Lenovo Legion 5 16IRX G9 | |
| SCHENKER XMG Core 15 (M24) | |
| Dell G16, i7-13650HX, RTX 4060 | |
| Lenovo Legion Pro 5 16IRX9 | |
| Lenovo Legion Pro 5 16IRX9 G9 | |
| HP Victus 16 (2024) | |
* ... menor é melhor
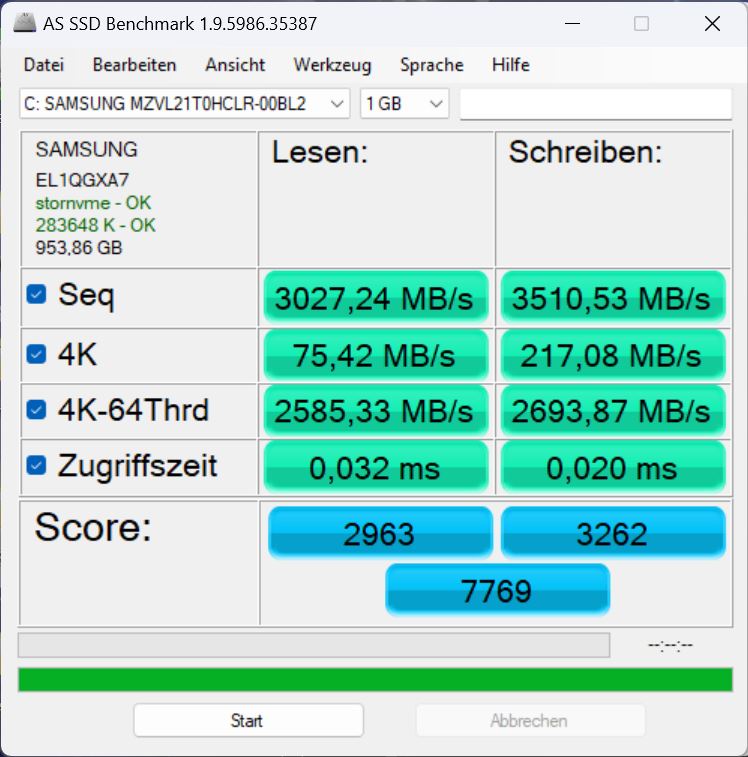
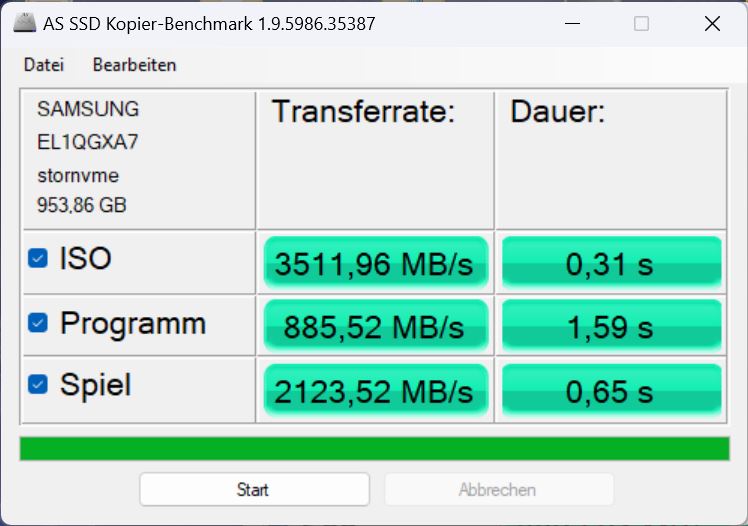
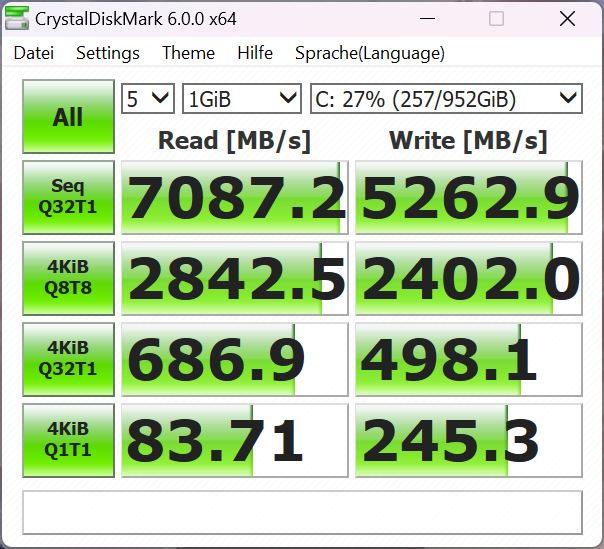
Dispositivo de armazenamento
A Lenovo instalou um SSD PCIe 4 NVMe rápido da Samsung com 1 TB de armazenamento em nosso modelo - mais precisamente uma versão OEM do conhecido 980 Pro. O modelo está em 14º lugar em nossa Lista de melhores SSDs e, portanto, é um dos dispositivos de armazenamento mais rápidos no campo de comparação.
Durante nossos benchmarks, ele alcançou bons valores em geral, mas, assim como os SSDs nos outros modelos Legion (Pro) 5, não foi capaz de manter seu desempenho por um longo período de tempo e foi termicamente estrangulado. É uma pena que a Lenovo não tenha equipado o laptop com um sistema de resfriamento melhor e que toda a série pareça ser afetada por esse problema.

* ... menor é melhor
Reading continuous performance: DiskSpd Read Loop, Queue Depth 8
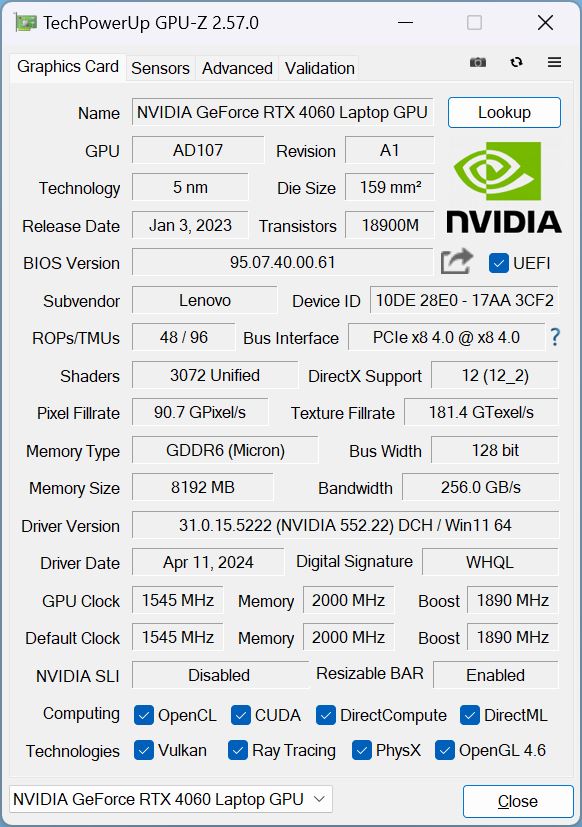
Placa de vídeo
Nossa configuração está equipada com uma Nvidia Geforce RTX 4060 com 140 watts.
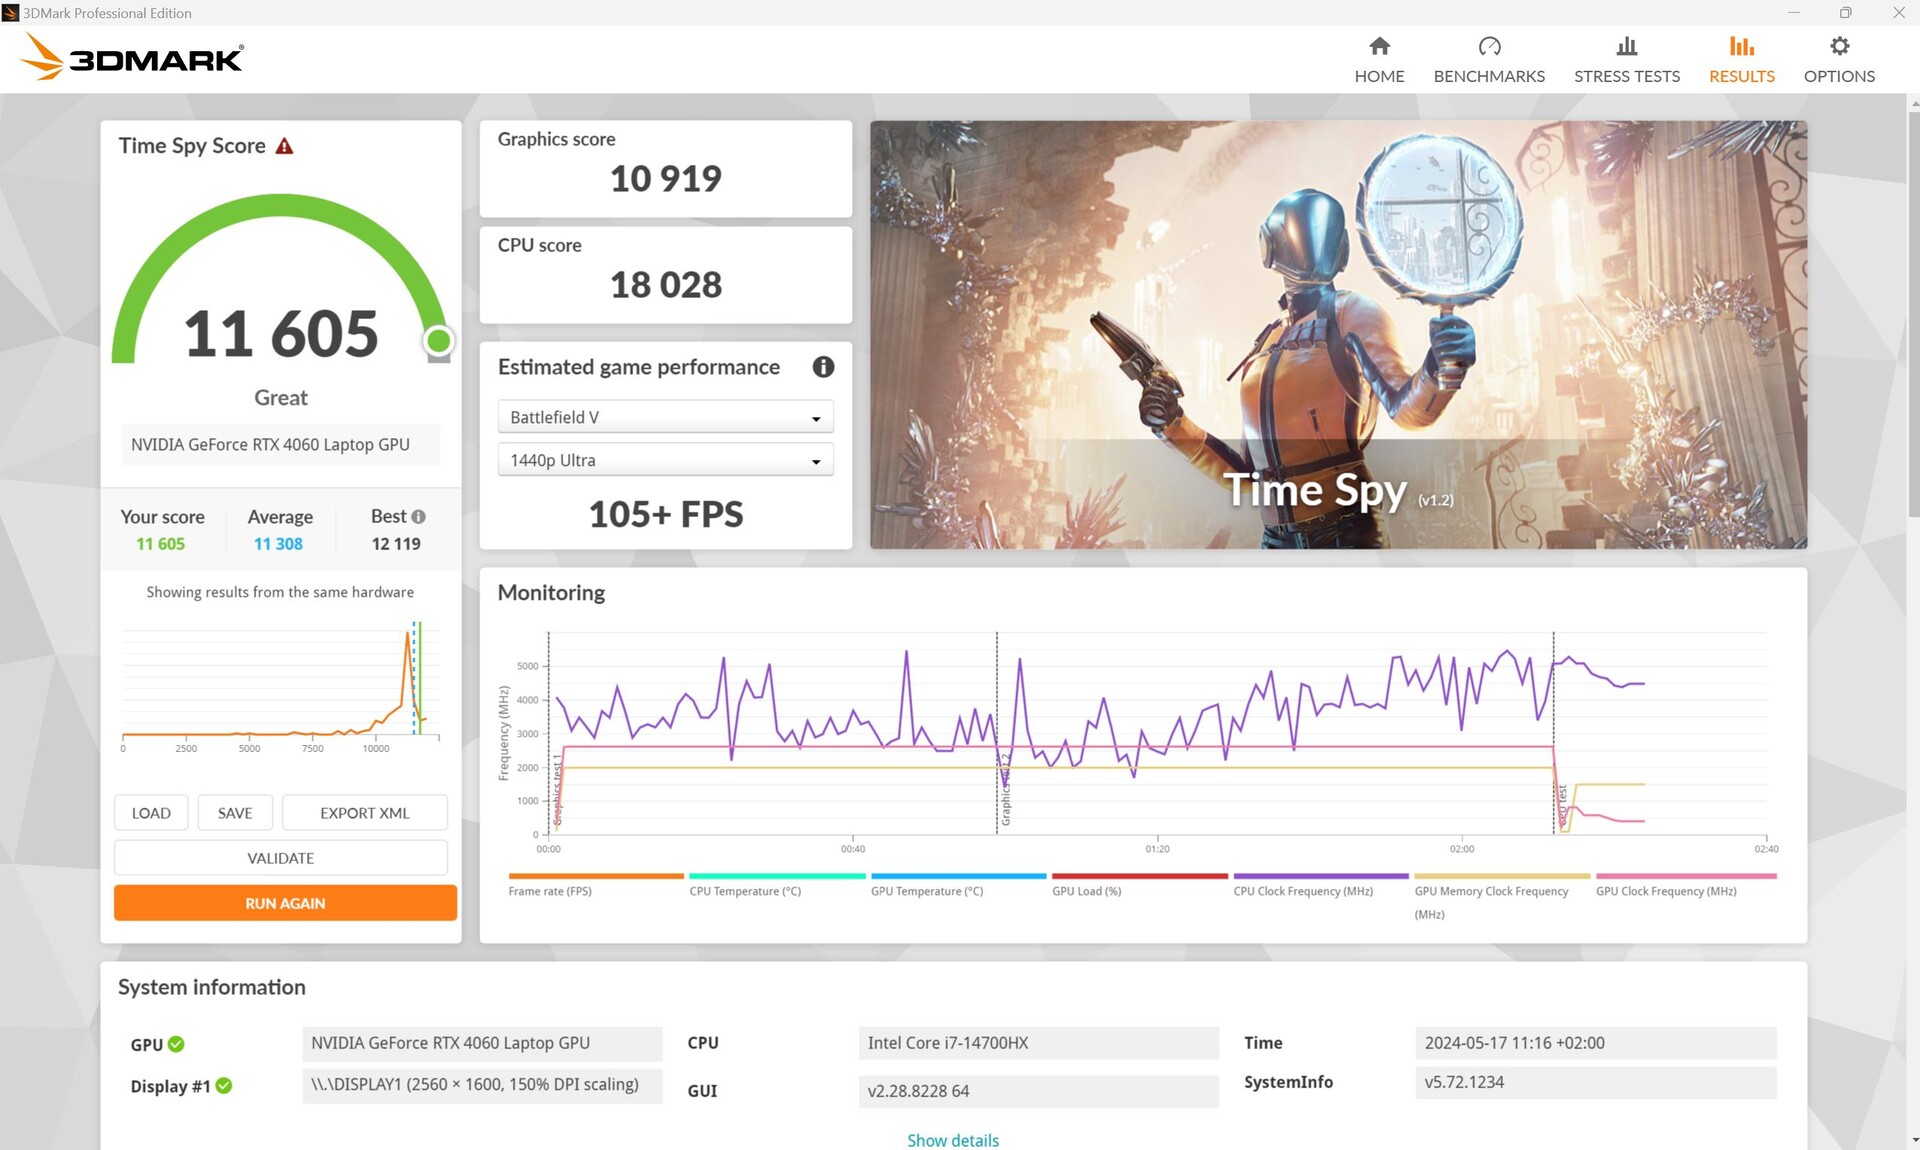
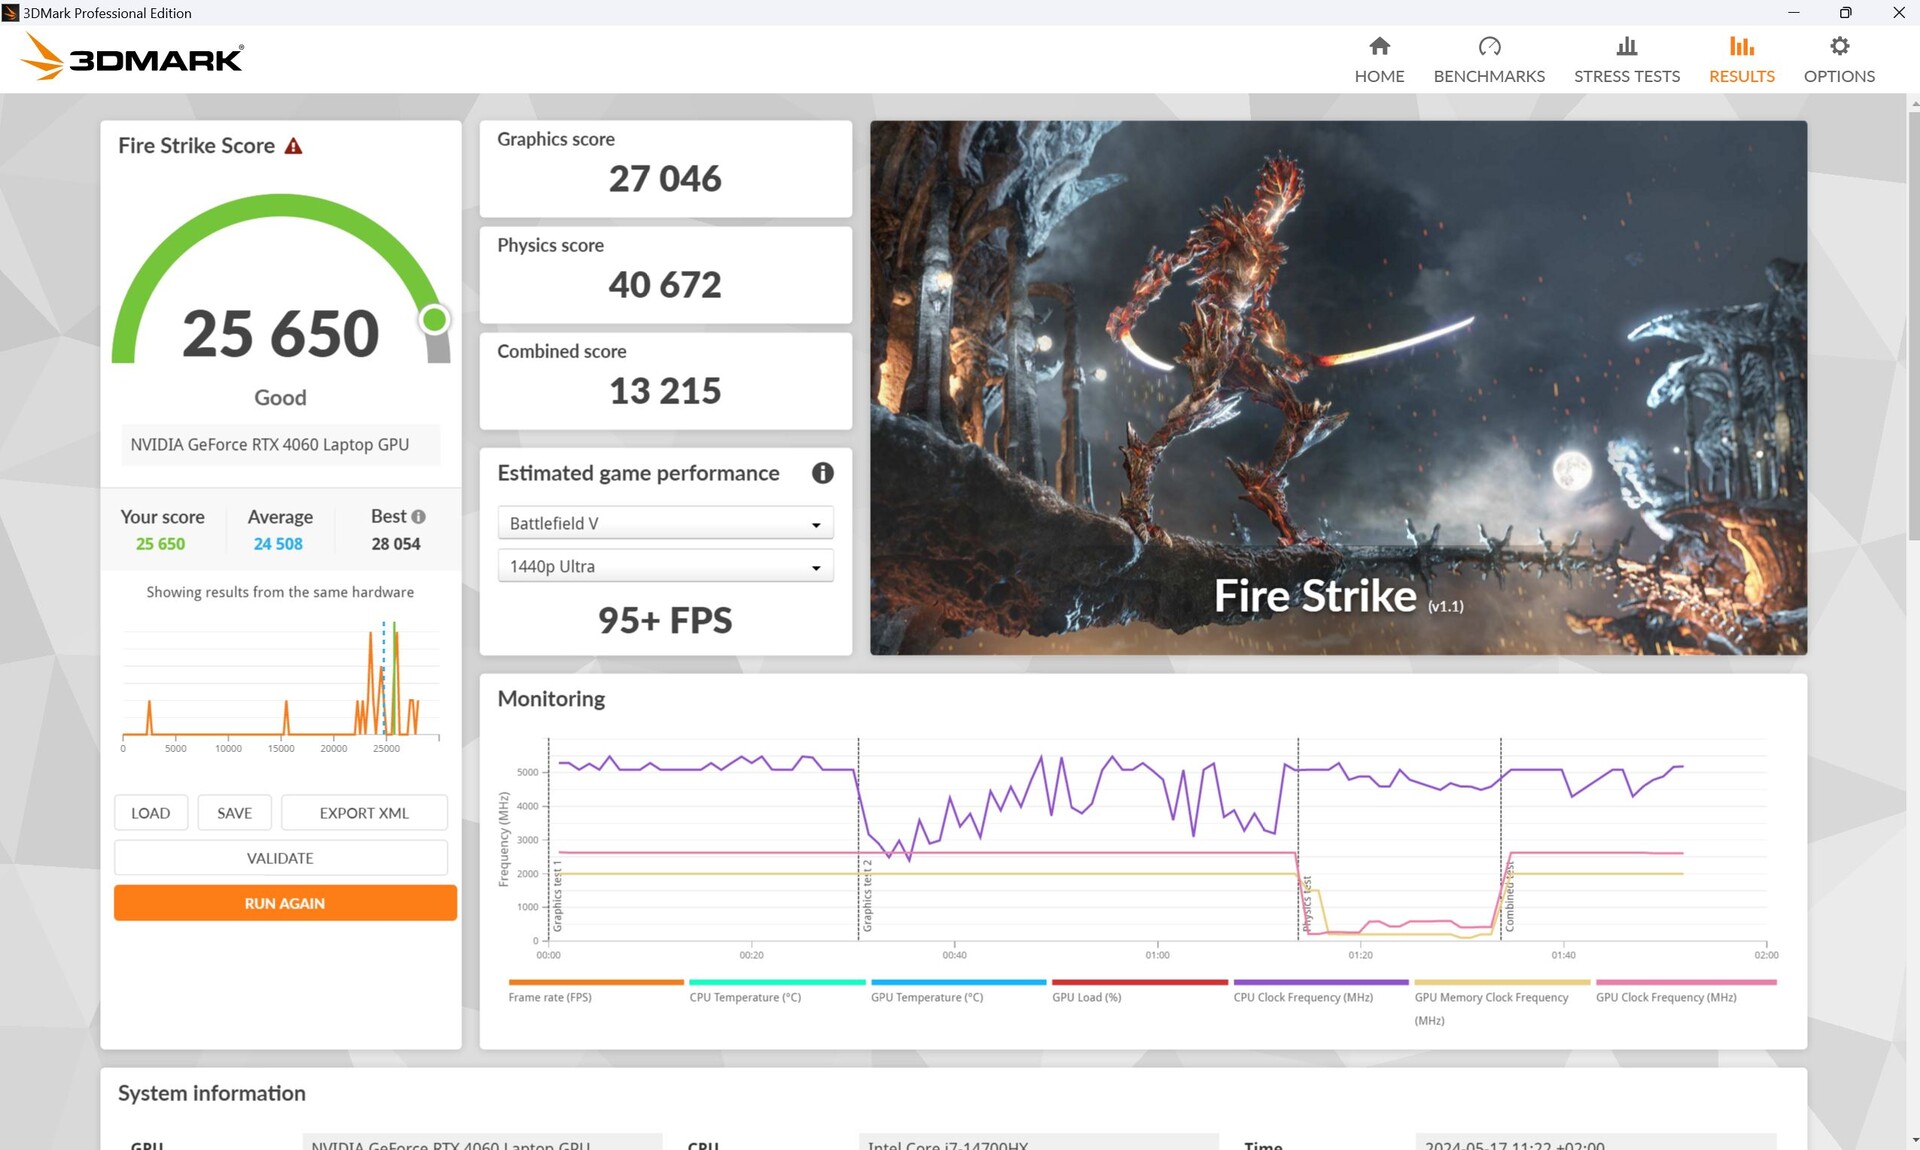
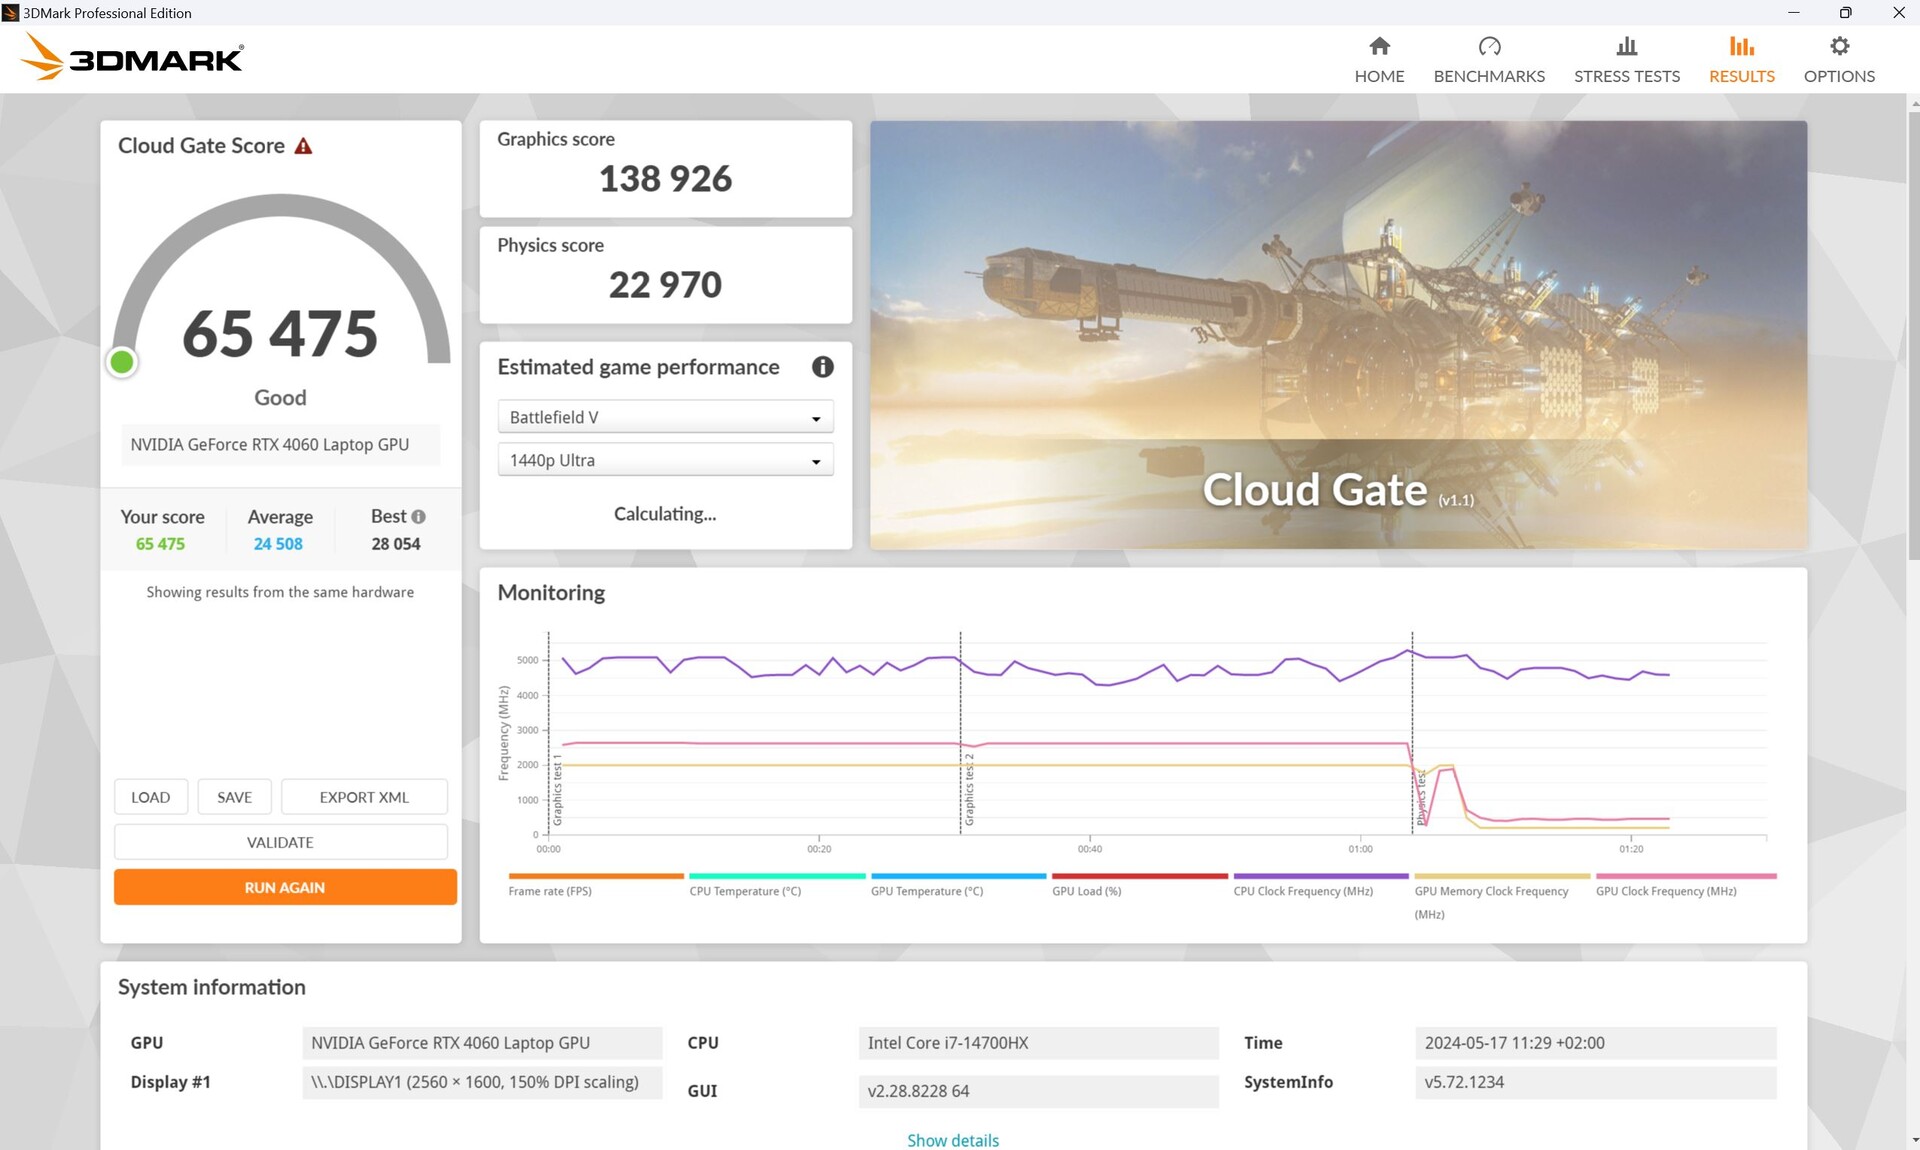
Durante os testes sintéticos do 3DMark, a GPU teve um desempenho um pouco acima da média, mas a mesma RTX 4060 foi um pouco mais rápida nos testes de Legion 5 sem o sufixo Pro. O Legion Pro 5 com a RTX 4070 e i9-14900HX foi cerca de 20% mais rápido nesses testes.
No modo de bateria, seu desempenho 3D diminuiu em 23% ao executar o Fire Strike mais uma vez.

| 3DMark 11 Performance | 33600 pontos | |
| 3DMark Cloud Gate Standard Score | 65475 pontos | |
| 3DMark Fire Strike Score | 25650 pontos | |
| 3DMark Time Spy Score | 11605 pontos | |
Ajuda | ||
* ... menor é melhor
Quando se trata de jogos, o Legion Pro 5 supera toda a concorrência com uma RTX 4060, especialmente o Victus com a mesma CPU e GPU, que ficou em último lugar, marcando 15 pontos a menos. O RTX-4070 Legion Pro ficou apenas 10 pontos à frente.
No final das contas, todos os jogos que testamos podem ser jogados em Full HD com o máximo de detalhes; em QHD, a taxa de quadros pode, às vezes, cair abaixo de 60 fps ao executar jogos exigentes, mas, mesmo assim, eles ainda funcionam sem problemas.
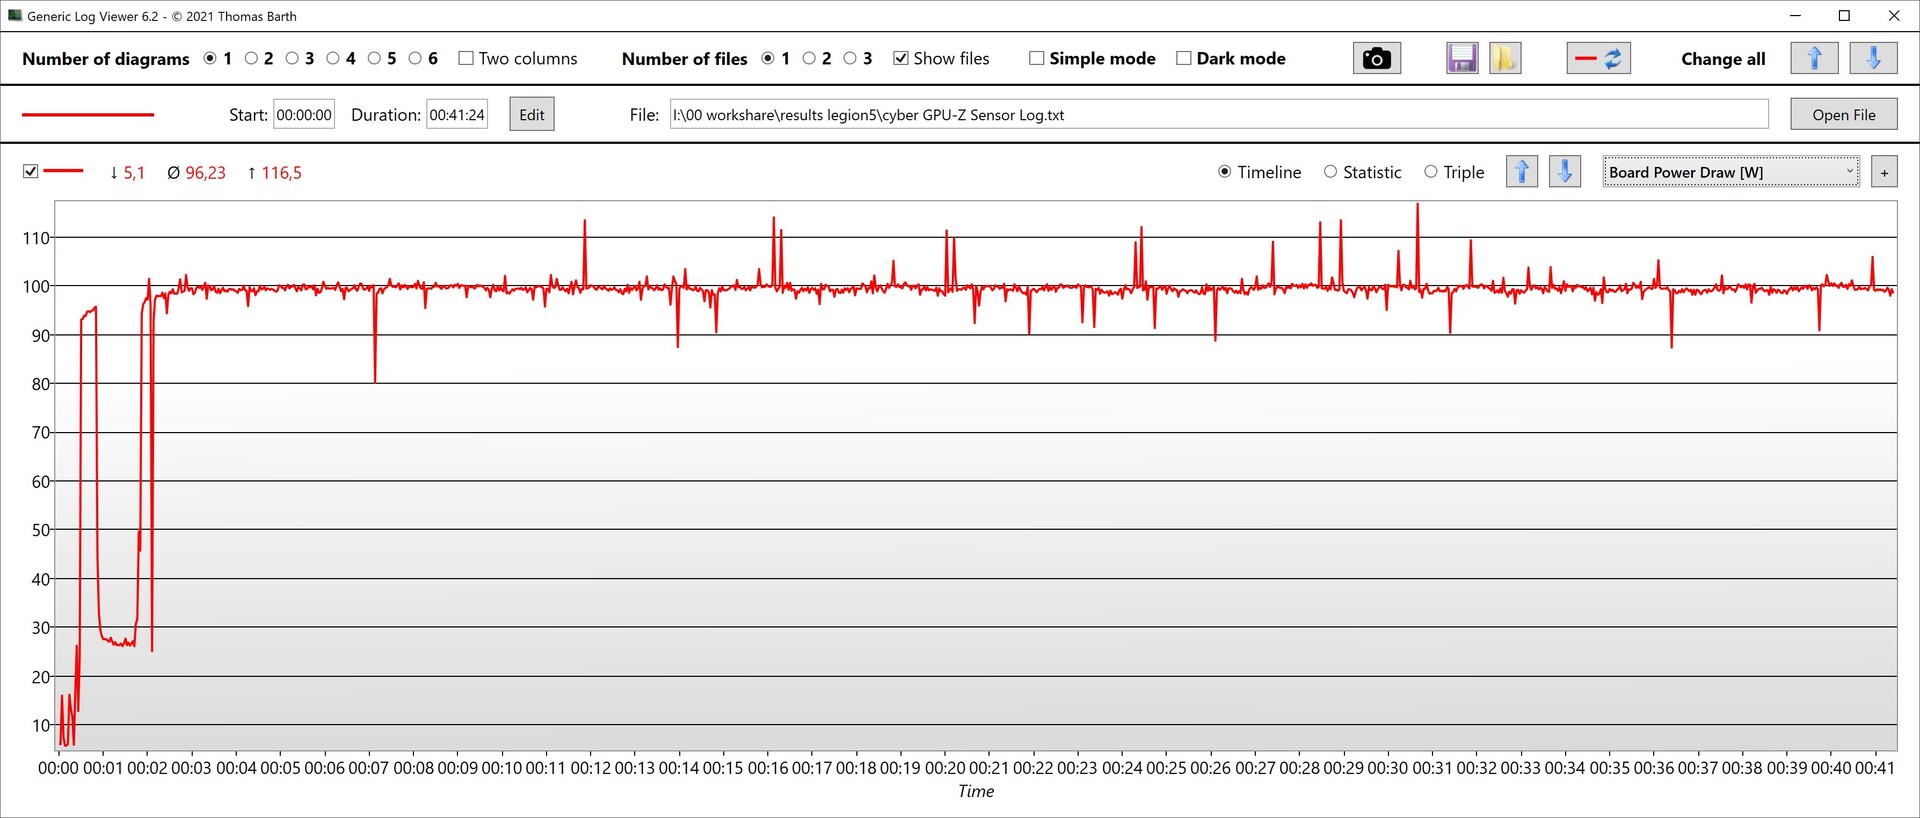
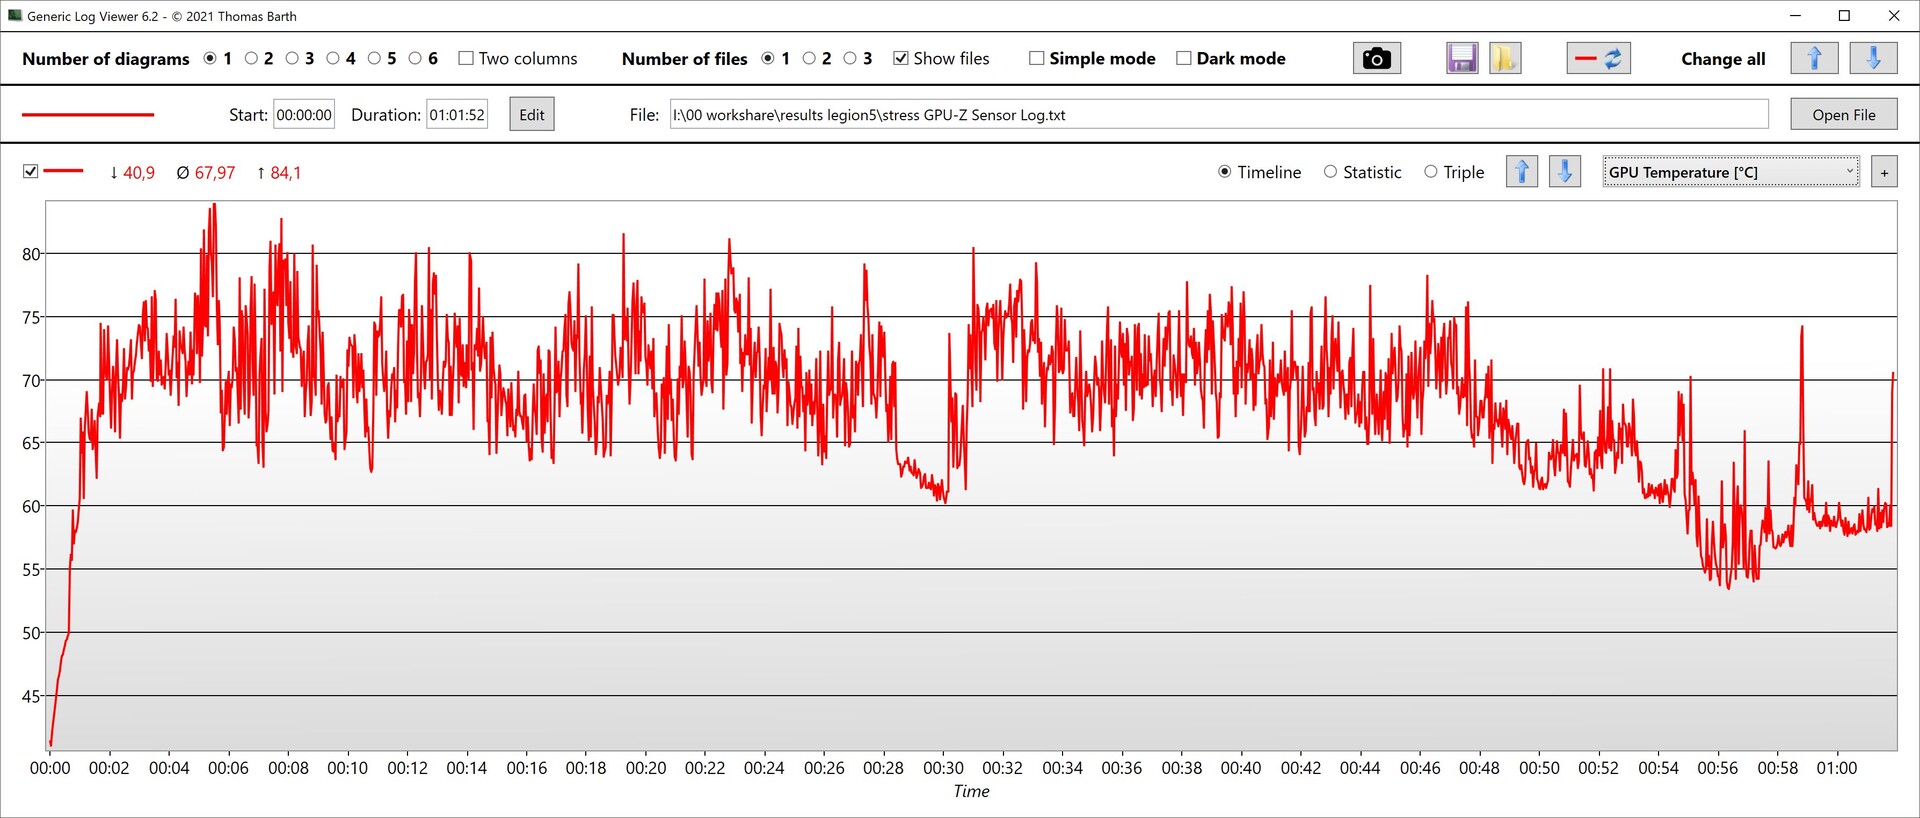
Nosso teste contínuo com o Cyberpunk 2077 revelou uma taxa de quadros muito constante, sem grandes quedas. A GPU atingiu um clock constante de 2.610 MHz e aqueceu até 75 a 79 °C. Seu consumo de energia foi de cerca de 100 watts.


| The Witcher 3 - 1920x1080 Ultra Graphics & Postprocessing (HBAO+) | |
| Lenovo Legion Pro 5 16IRX9 | |
| Média da turma Gaming (18.4 - 214, n=119, últimos 2 anos) | |
| Lenovo Legion Pro 5 16IRX9 G9 | |
| SCHENKER XMG Core 15 (M24) | |
| Dell G16, i7-13650HX, RTX 4060 | |
| HP Victus 16 (2024) | |
| Lenovo Legion 5 16IRX G9 | |
| GTA V - 1920x1080 Highest Settings possible AA:4xMSAA + FX AF:16x | |
| Lenovo Legion Pro 5 16IRX9 | |
| Lenovo Legion Pro 5 16IRX9 G9 | |
| Lenovo Legion 5 16IRX G9 | |
| Dell G16, i7-13650HX, RTX 4060 | |
| SCHENKER XMG Core 15 (M24) | |
| Média da turma Gaming (12.1 - 168.2, n=132, últimos 2 anos) | |
| HP Victus 16 (2024) | |
| Final Fantasy XV Benchmark - 1920x1080 High Quality | |
| Lenovo Legion Pro 5 16IRX9 | |
| Média da turma Gaming (19.2 - 201, n=144, últimos 2 anos) | |
| SCHENKER XMG Core 15 (M24) | |
| Lenovo Legion 5 16IRX G9 | |
| Lenovo Legion Pro 5 16IRX9 G9 | |
| Dell G16, i7-13650HX, RTX 4060 | |
| HP Victus 16 (2024) | |
| Strange Brigade - 1920x1080 ultra AA:ultra AF:16 | |
| Lenovo Legion Pro 5 16IRX9 | |
| Média da turma Gaming (38.9 - 420, n=140, últimos 2 anos) | |
| Lenovo Legion 5 16IRX G9 | |
| SCHENKER XMG Core 15 (M24) | |
| Lenovo Legion Pro 5 16IRX9 G9 | |
| Dell G16, i7-13650HX, RTX 4060 | |
| HP Victus 16 (2024) | |
| Dota 2 Reborn - 1920x1080 ultra (3/3) best looking | |
| Lenovo Legion Pro 5 16IRX9 | |
| Lenovo Legion Pro 5 16IRX9 G9 | |
| Lenovo Legion 5 16IRX G9 | |
| HP Victus 16 (2024) | |
| Dell G16, i7-13650HX, RTX 4060 | |
| Média da turma Gaming (65.1 - 220, n=148, últimos 2 anos) | |
| SCHENKER XMG Core 15 (M24) | |
| The Witcher 3 | |
| 1920x1080 High Graphics & Postprocessing (Nvidia HairWorks Off) | |
| Lenovo Legion Pro 5 16IRX9 | |
| Média da turma Gaming (40.1 - 424, n=86, últimos 2 anos) | |
| Lenovo Legion 5 16IRX G9 | |
| Lenovo Legion Pro 5 16IRX9 G9 | |
| SCHENKER XMG Core 15 (M24) | |
| Média NVIDIA GeForce RTX 4060 Laptop GPU (110 - 229, n=36) | |
| HP Victus 16 (2024) | |
| Dell G16, i7-13650HX, RTX 4060 | |
| 1920x1080 Ultra Graphics & Postprocessing (HBAO+) | |
| Lenovo Legion Pro 5 16IRX9 | |
| Média da turma Gaming (18.4 - 214, n=119, últimos 2 anos) | |
| Lenovo Legion Pro 5 16IRX9 G9 | |
| SCHENKER XMG Core 15 (M24) | |
| Dell G16, i7-13650HX, RTX 4060 | |
| Média NVIDIA GeForce RTX 4060 Laptop GPU (77 - 159.7, n=42) | |
| HP Victus 16 (2024) | |
| Lenovo Legion 5 16IRX G9 | |
| Skull & Bones | |
| 1920x1080 Ultra High Preset AA:T | |
| Média da turma Gaming (31 - 118, n=12, últimos 2 anos) | |
| SCHENKER XMG Core 15 (M24) | |
| Média NVIDIA GeForce RTX 4060 Laptop GPU (65 - 73, n=5) | |
| Lenovo Legion Pro 5 16IRX9 G9 | |
| 2560x1440 Ultra High Preset AA:T | |
| Média da turma Gaming (37 - 98, n=8, últimos 2 anos) | |
| SCHENKER XMG Core 15 (M24) | |
| Média NVIDIA GeForce RTX 4060 Laptop GPU (51 - 57, n=3) | |
| Lenovo Legion Pro 5 16IRX9 G9 | |
| F1 24 - 1920x1080 Ultra High Preset AA:T AF:16x | |
| Média da turma Gaming (54.1 - 148, n=19, últimos 2 anos) | |
| Lenovo Legion Pro 5 16IRX9 G9 | |
| Média NVIDIA GeForce RTX 4060 Laptop GPU (47.5 - 61.6, n=10) | |
Cyberpunk 2077 FPS diagram
| baixo | média | alto | ultra | QHD | 4K | |
|---|---|---|---|---|---|---|
| GTA V (2015) | 187.2 | 185.9 | 185.2 | 124.9 | 87.3 | |
| The Witcher 3 (2015) | 531 | 364 | 217 | 112 | 83 | |
| Dota 2 Reborn (2015) | 228 | 203 | 191.7 | 183.8 | 129.4 | |
| Final Fantasy XV Benchmark (2018) | 226 | 155.5 | 106.1 | 78.1 | ||
| X-Plane 11.11 (2018) | 201 | 172.9 | 135.1 | 124.7 | ||
| Far Cry 5 (2018) | 192 | 165 | 158 | 148 | 106 | |
| Strange Brigade (2018) | 526 | 295 | 231 | 199.9 | ||
| Baldur's Gate 3 (2023) | 138.6 | 85.7 | 71.1 | 66.5 | 49.1 | |
| Cyberpunk 2077 2.2 Phantom Liberty (2023) | 135.3 | 100.8 | 88.7 | 79.5 | 47.5 | |
| Skull & Bones (2024) | 137 | 124 | 98 | 69 | 53 | |
| F1 24 (2024) | 286 | 247 | 185.3 | 60.6 |
Emissões e energia: O lado esquerdo do Lenovo para jogos fica mais quente do que o direito
Emissões de ruído
No modo de desempenho, as ventoinhas estão quase sempre ativas, o que também ocorre no modo ocioso - elas giram a um nível silencioso de 25 a 26 dB. Em nosso cenário de carga média via 3DMark06, elas já atingiram até 45 dB, mas a concorrência é igualmente barulhenta.
Sob cargas mais altas, as emissões de ruído da ventoinha flutuam e não permanecem constantes. Os dados na tabela mostram seus valores máximos. Por exemplo, suas emissões flutuaram entre 47,5 dB e 52,69 dB ao jogar Cyberpunk.
Barulho
| Ocioso |
| 23 / 23 / 25 dB |
| Carga |
| 45.18 / 53.13 dB |
 | ||
30 dB silencioso 40 dB(A) audível 50 dB(A) ruidosamente alto |
||
min: | ||
| Lenovo Legion Pro 5 16IRX9 G9 NVIDIA GeForce RTX 4060 Laptop GPU, i7-14700HX, Samsung PM9A1 MZVL21T0HCLR | HP Victus 16 (2024) NVIDIA GeForce RTX 4060 Laptop GPU, i7-14700HX, Kioxia XG8 KXG80ZNV512G | Dell G16, i7-13650HX, RTX 4060 NVIDIA GeForce RTX 4060 Laptop GPU, i7-13650HX, WD PC SN740 SDDPNQD-1T00 | SCHENKER XMG Core 15 (M24) NVIDIA GeForce RTX 4060 Laptop GPU, R7 8845HS, Samsung 990 Pro 1 TB | Lenovo Legion Pro 5 16IRX9 NVIDIA GeForce RTX 4070 Laptop GPU, i9-14900HX, Samsung PM9A1 MZVL21T0HCLR | Lenovo Legion 5 16IRX G9 NVIDIA GeForce RTX 4060 Laptop GPU, i7-14650HX, Samsung PM9A1 MZVL21T0HCLR | |
|---|---|---|---|---|---|---|
| Noise | -13% | 6% | 4% | -7% | -11% | |
| desligado / ambiente * | 23 | 25 -9% | 23 -0% | 23 -0% | 23.9 -4% | 24 -4% |
| Idle Minimum * | 23 | 28 -22% | 23 -0% | 23 -0% | 24.3 -6% | 24 -4% |
| Idle Average * | 23 | 29 -26% | 23 -0% | 23 -0% | 24.3 -6% | 28.8 -25% |
| Idle Maximum * | 25 | 33 -32% | 27.96 -12% | 23 8% | 28.9 -16% | 32 -28% |
| Load Average * | 45.18 | 45 -0% | 27.96 38% | 38.92 14% | 45.8 -1% | 45.5 -1% |
| Cyberpunk 2077 ultra * | 52.69 | 52.06 1% | ||||
| Load Maximum * | 53.13 | 48 10% | 47.89 10% | 52.09 2% | 56.6 -7% | 55.7 -5% |
| Witcher 3 ultra * | 43 | 47.89 | 50.96 | 51 | 53.1 |
* ... menor é melhor
Temperatura
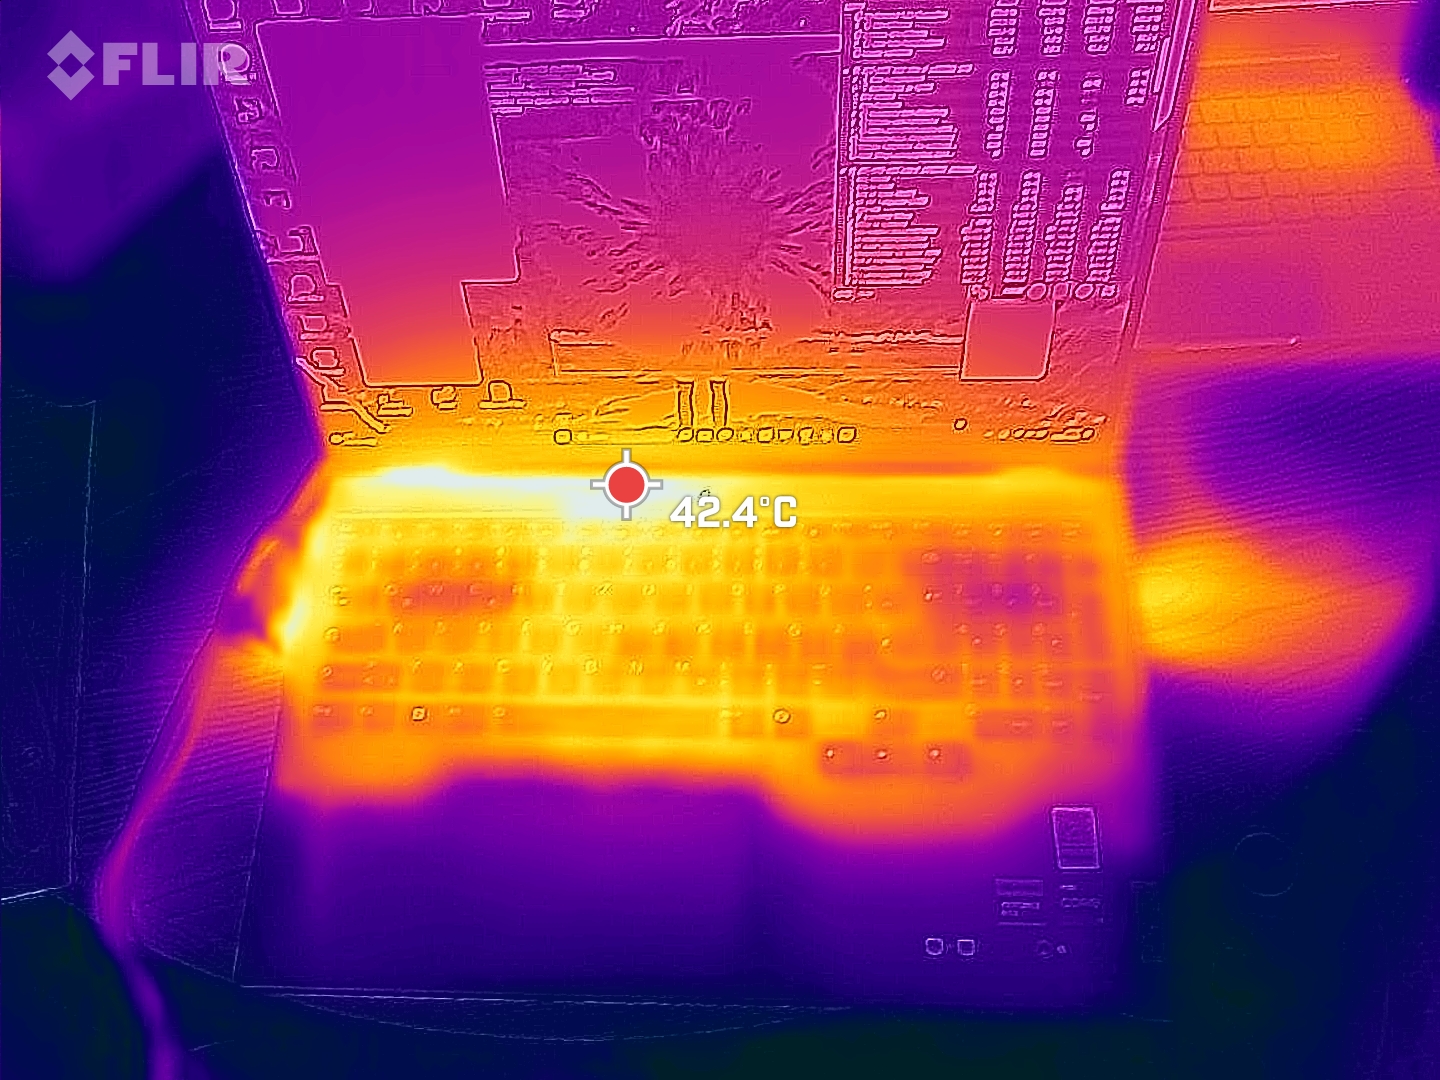
O Legion já aquece bastante quando está ocioso - medimos até 39 °C na parte inferior do dispositivo. Em geral, o lado esquerdo com as teclas WASD (que são importantes para os gamers) parece esquentar mais do que o lado direito.
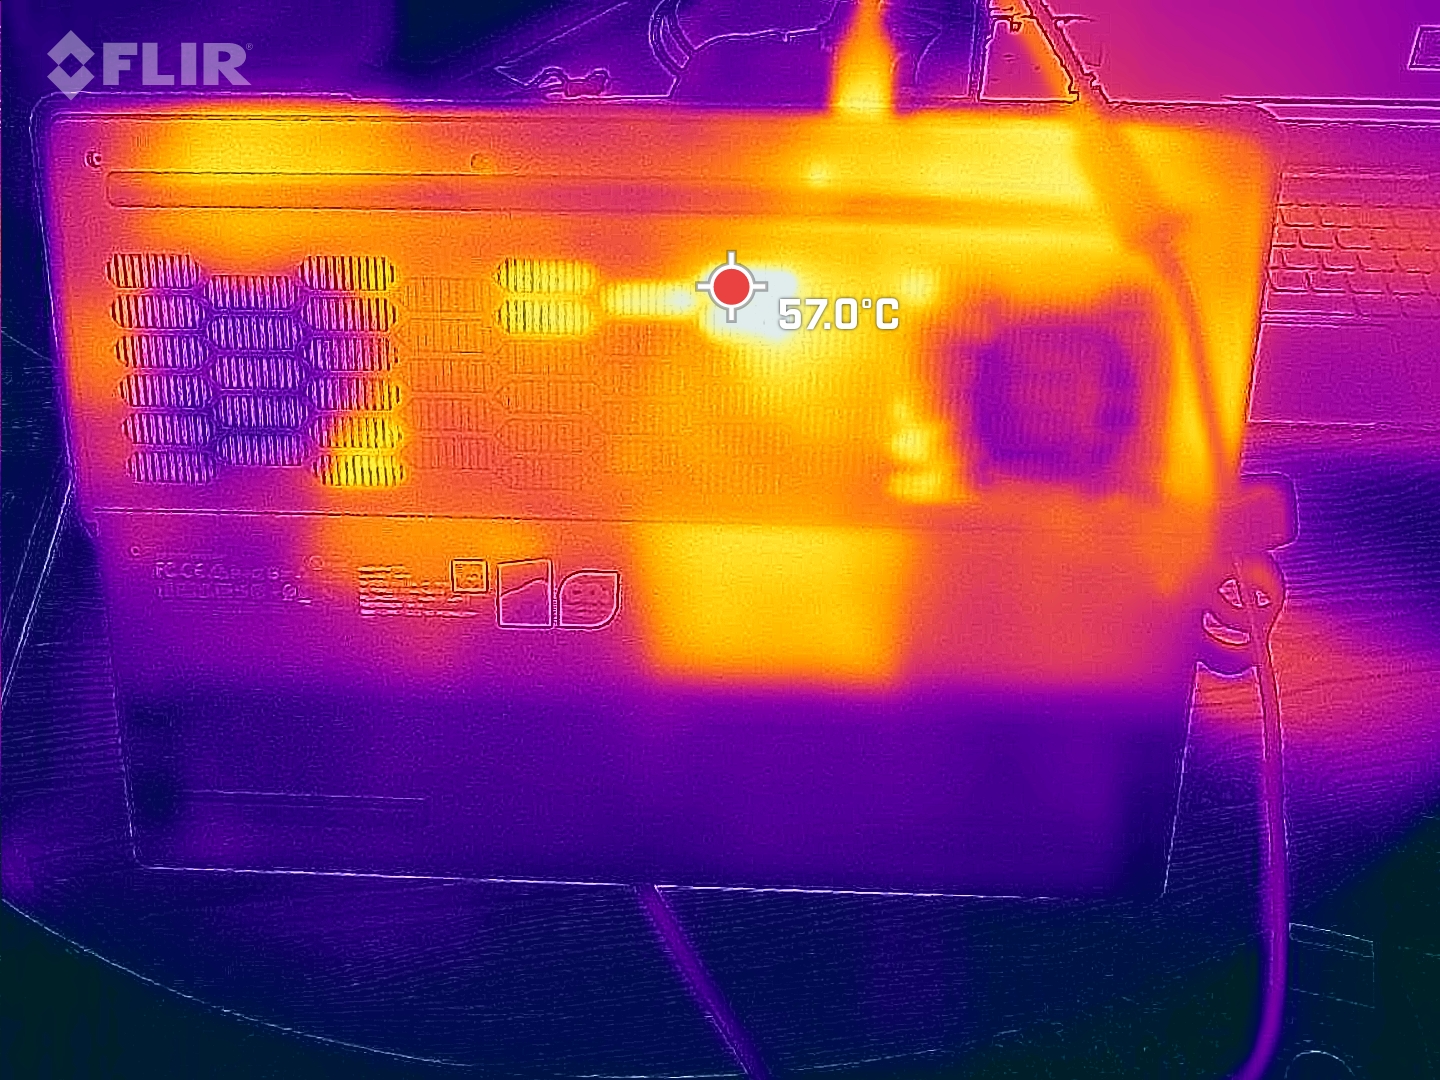
Sob carga pesada, medimos um ponto quente de 57 °C na parte inferior. O Dell G16 e o Core 15 ficaram igualmente quentes, enquanto os outros concorrentes tenderam a ficar mais frios.
(-) A temperatura máxima no lado superior é 50 °C / 122 F, em comparação com a média de 40.4 °C / 105 F , variando de 21.2 a 68.8 °C para a classe Gaming.
(-) A parte inferior aquece até um máximo de 57 °C / 135 F, em comparação com a média de 43.2 °C / 110 F
(±) Em uso inativo, a temperatura média para o lado superior é 32.9 °C / 91 F, em comparação com a média do dispositivo de 33.9 °C / ### class_avg_f### F.
(-) 3: The average temperature for the upper side is 38.4 °C / 101 F, compared to the average of 33.9 °C / 93 F for the class Gaming.
(±) Os apoios para as mãos e o touchpad podem ficar muito quentes ao toque, com um máximo de 36 °C / 96.8 F.
(-) A temperatura média da área do apoio para as mãos de dispositivos semelhantes foi 28.9 °C / 84 F (-7.1 °C / -12.8 F).
| Lenovo Legion Pro 5 16IRX9 G9 Intel Core i7-14700HX, NVIDIA GeForce RTX 4060 Laptop GPU | HP Victus 16 (2024) Intel Core i7-14700HX, NVIDIA GeForce RTX 4060 Laptop GPU | Dell G16, i7-13650HX, RTX 4060 Intel Core i7-13650HX, NVIDIA GeForce RTX 4060 Laptop GPU | SCHENKER XMG Core 15 (M24) AMD Ryzen 7 8845HS, NVIDIA GeForce RTX 4060 Laptop GPU | Lenovo Legion Pro 5 16IRX9 Intel Core i9-14900HX, NVIDIA GeForce RTX 4070 Laptop GPU | Lenovo Legion 5 16IRX G9 Intel Core i7-14650HX, NVIDIA GeForce RTX 4060 Laptop GPU | |
|---|---|---|---|---|---|---|
| Heat | 19% | 3% | -2% | 8% | 17% | |
| Maximum Upper Side * | 50 | 50 -0% | 49 2% | 52 -4% | 43.8 12% | 40.4 19% |
| Maximum Bottom * | 57 | 50 12% | 58 -2% | 61 -7% | 55.4 3% | 43.8 23% |
| Idle Upper Side * | 36 | 25 31% | 35 3% | 35 3% | 32.8 9% | 30.3 16% |
| Idle Bottom * | 39 | 26 33% | 35 10% | 39 -0% | 36 8% | 35.3 9% |
* ... menor é melhor
Alto-falantes
Os alto-falantes não se destacam positivamente da concorrência: são apenas moderadamente altos e quase não notamos nenhum baixo. Há um conector de fone de ouvido padrão disponível para conectar dispositivos analógicos.
Lenovo Legion Pro 5 16IRX9 G9 análise de áudio
(±) | o volume do alto-falante é médio, mas bom (###valor### dB)
Graves 100 - 315Hz
(-) | quase nenhum baixo - em média 18.3% menor que a mediana
(±) | a linearidade dos graves é média (12% delta para a frequência anterior)
Médios 400 - 2.000 Hz
(±) | médios mais altos - em média 6.9% maior que a mediana
(+) | médios são lineares (4.9% delta para frequência anterior)
Altos 2 - 16 kHz
(+) | agudos equilibrados - apenas 4.5% longe da mediana
(±) | a linearidade dos máximos é média (9.5% delta para frequência anterior)
Geral 100 - 16.000 Hz
(±) | a linearidade do som geral é média (21.6% diferença em relação à mediana)
Comparado com a mesma classe
» 76% de todos os dispositivos testados nesta classe foram melhores, 5% semelhantes, 19% piores
» O melhor teve um delta de 6%, a média foi 18%, o pior foi 132%
Comparado com todos os dispositivos testados
» 58% de todos os dispositivos testados foram melhores, 7% semelhantes, 34% piores
» O melhor teve um delta de 4%, a média foi 24%, o pior foi 134%
Dell G16, i7-13650HX, RTX 4060 análise de áudio
(±) | o volume do alto-falante é médio, mas bom (###valor### dB)
Graves 100 - 315Hz
(-) | quase nenhum baixo - em média 25.1% menor que a mediana
(-) | graves não são lineares (18.9% delta para frequência anterior)
Médios 400 - 2.000 Hz
(±) | médios mais altos - em média 8% maior que a mediana
(+) | médios são lineares (5.9% delta para frequência anterior)
Altos 2 - 16 kHz
(+) | agudos equilibrados - apenas 3.5% longe da mediana
(±) | a linearidade dos máximos é média (8.6% delta para frequência anterior)
Geral 100 - 16.000 Hz
(±) | a linearidade do som geral é média (23.4% diferença em relação à mediana)
Comparado com a mesma classe
» 83% de todos os dispositivos testados nesta classe foram melhores, 5% semelhantes, 12% piores
» O melhor teve um delta de 6%, a média foi 18%, o pior foi 132%
Comparado com todos os dispositivos testados
» 68% de todos os dispositivos testados foram melhores, 6% semelhantes, 26% piores
» O melhor teve um delta de 4%, a média foi 24%, o pior foi 134%
Consumo de energia
Não é muito fácil medir o verdadeiro consumo ocioso do Legion Pro 5 porque o laptop consome cerca de 50 watts do soquete quase continuamente, mesmo quando ocioso! Se o senhor esperar muito tempo, o consumo ocioso finalmente se estabiliza em valores comparativamente normais (15 a 20 watts), mas assim que o senhor altera o brilho do laptop com a tecla F, o consumo volta a 50 watts e permanece assim por um tempo excepcionalmente longo. Os valores de inatividade fornecidos na tabela são, portanto, otimisticamente baixos.
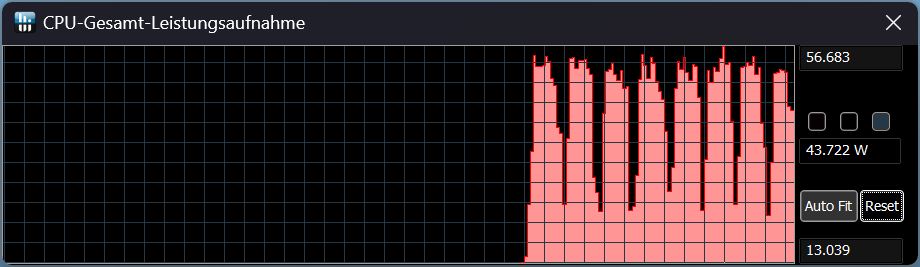
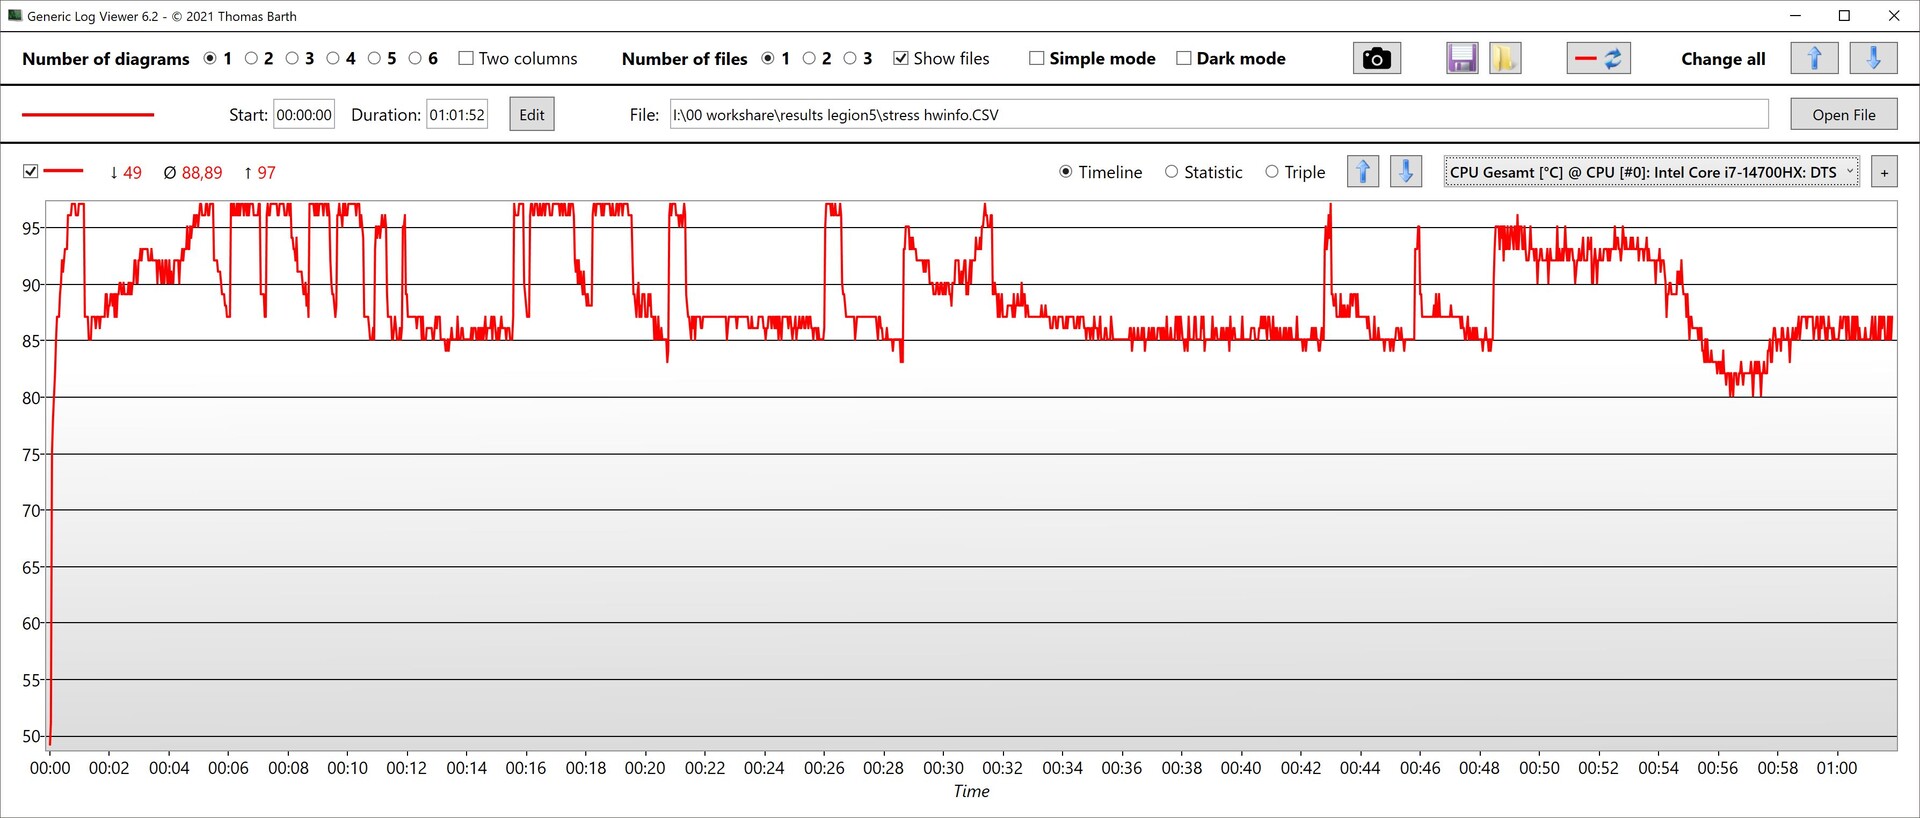
Sob carga pesada, o consumo e o desempenho da GPU flutuam bastante, como o senhor pode ver em nossos gráficos de consumo, especialmente quando a CPU e a GPU são igualmente estressadas, como em nosso teste de estresse.

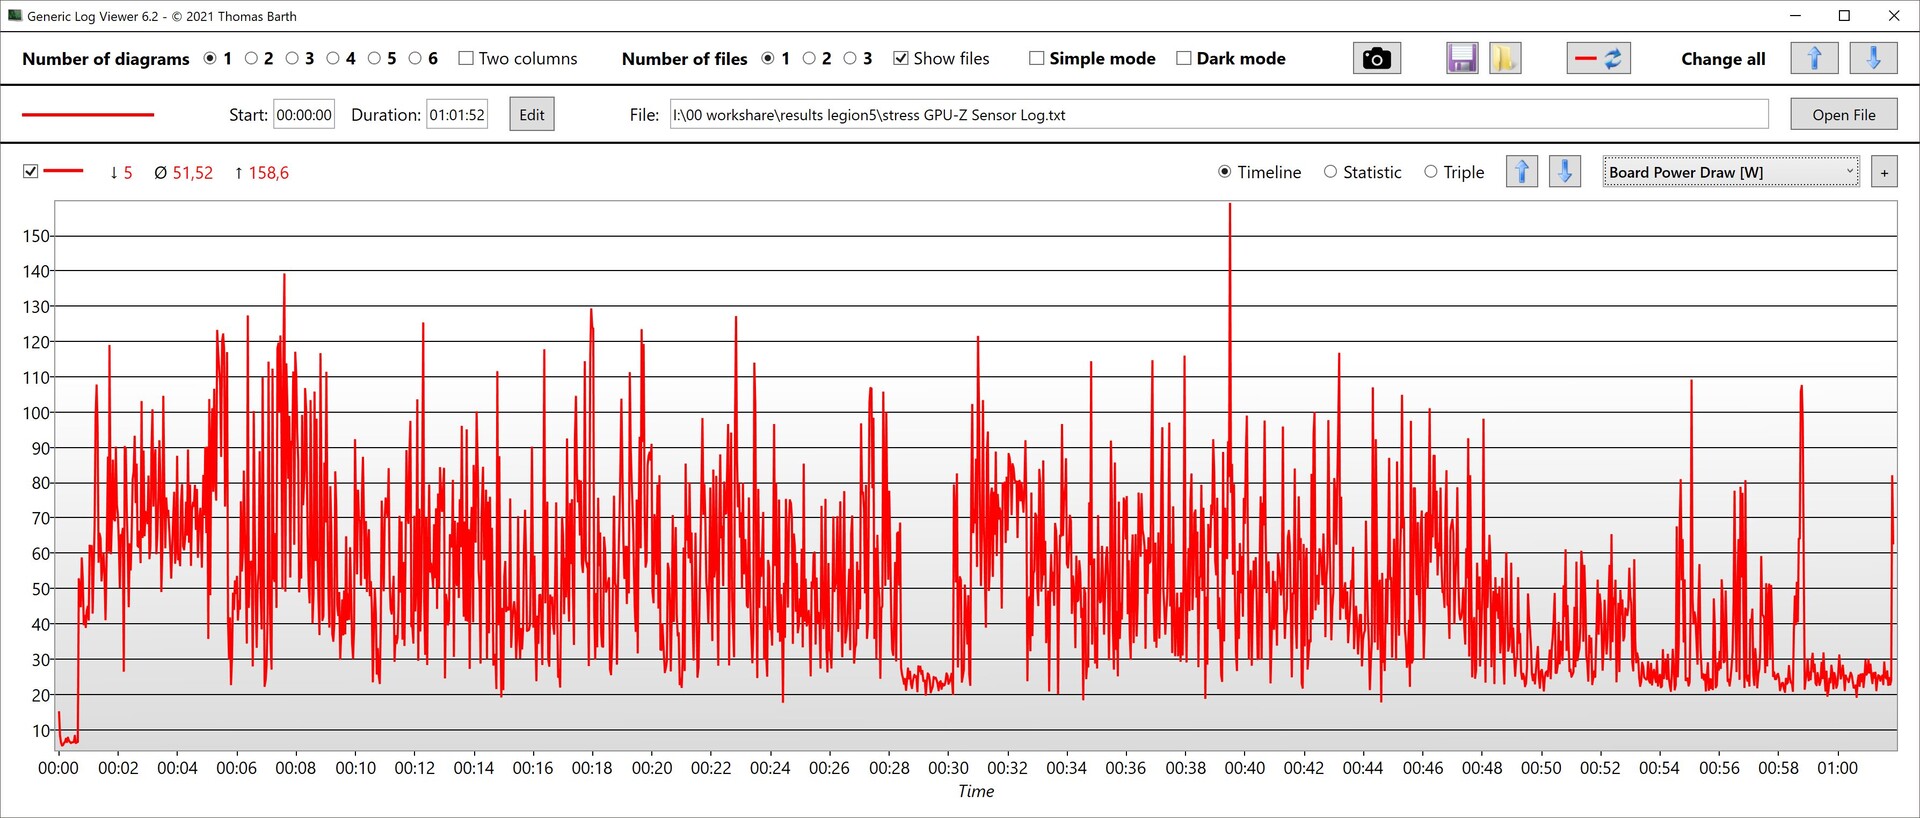
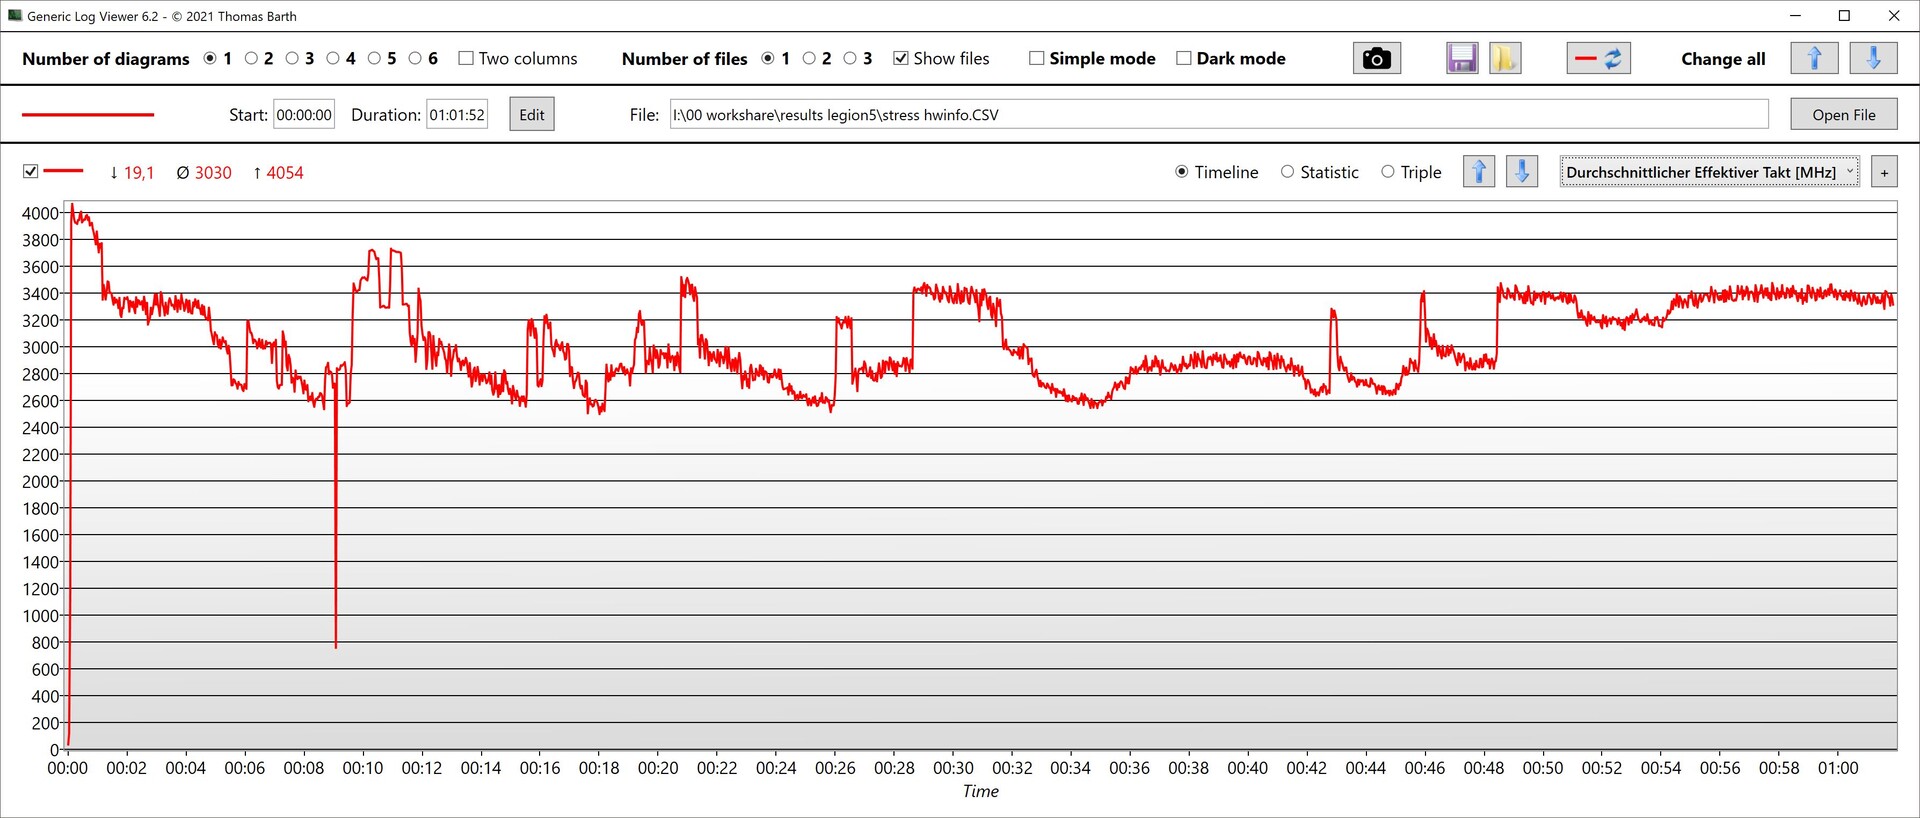
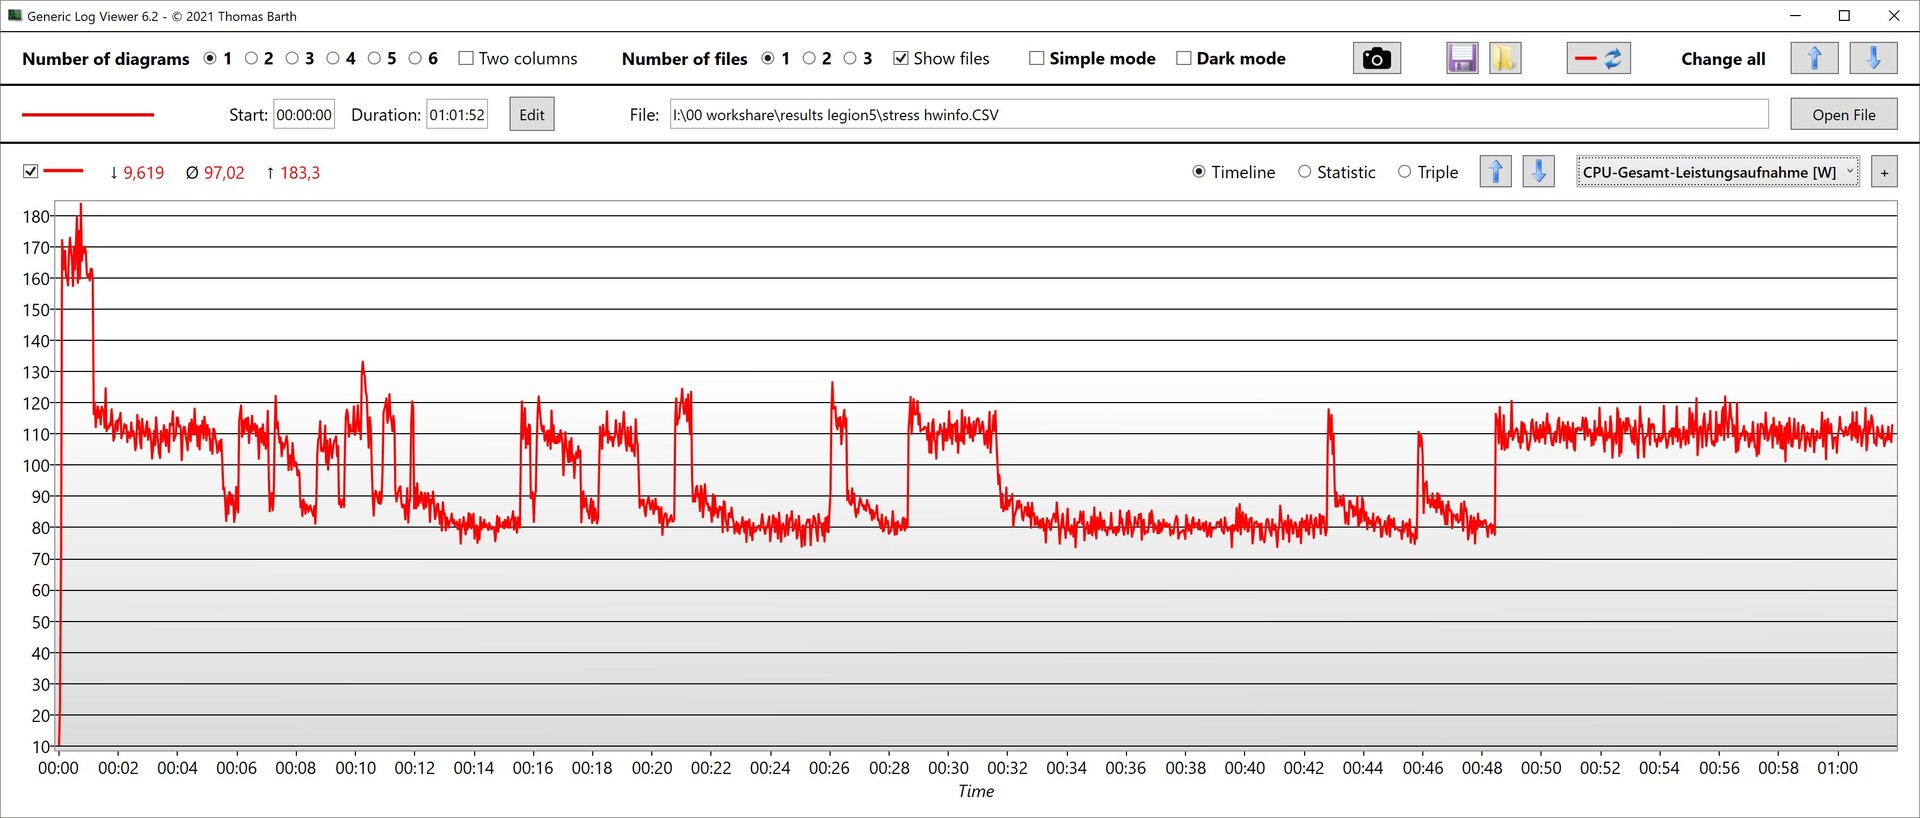
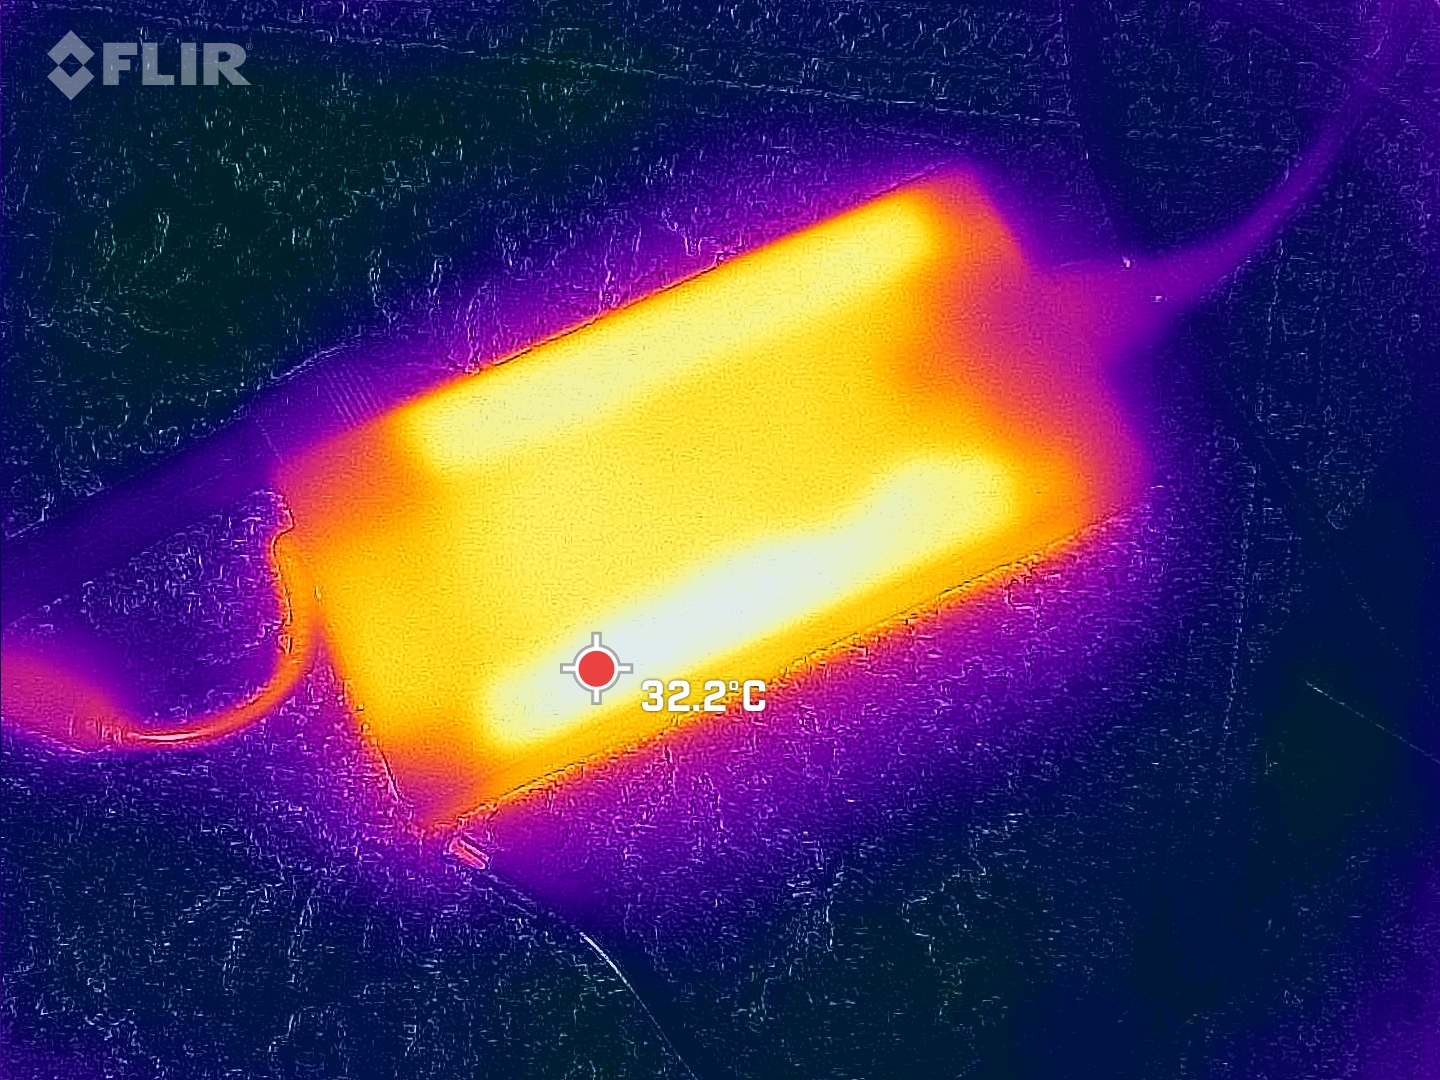
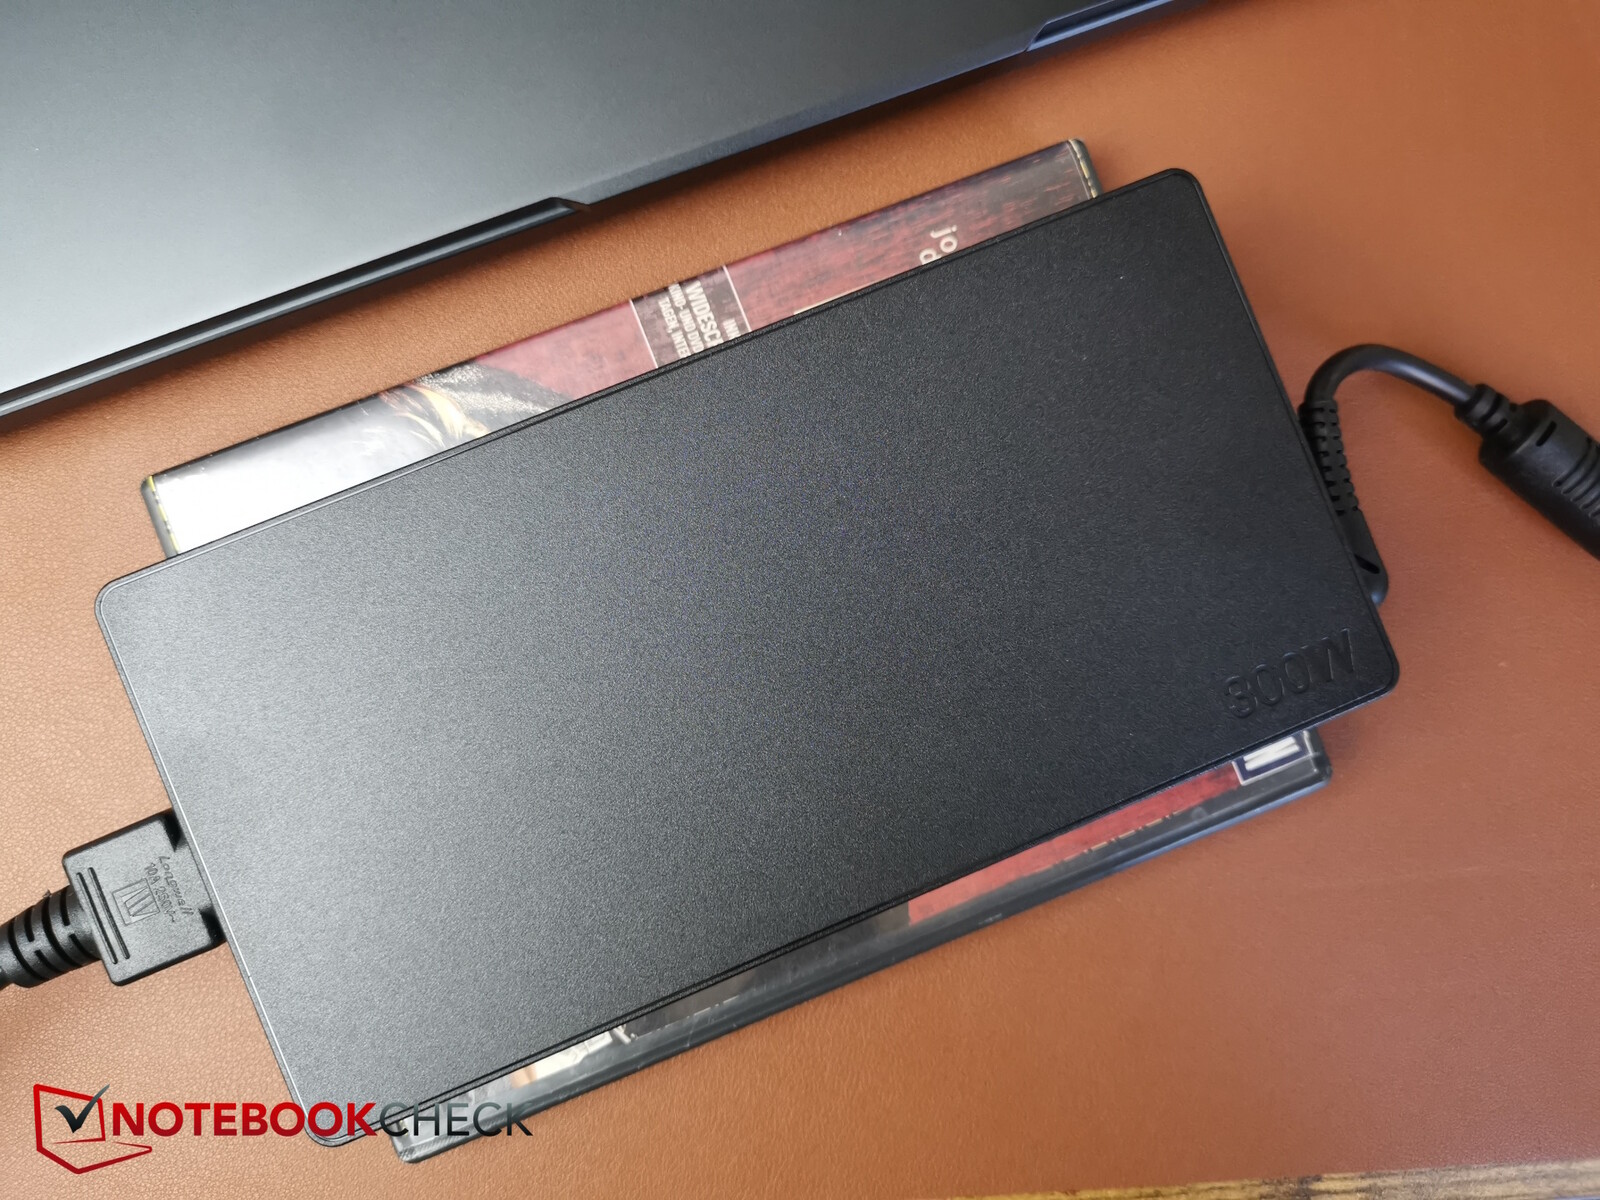
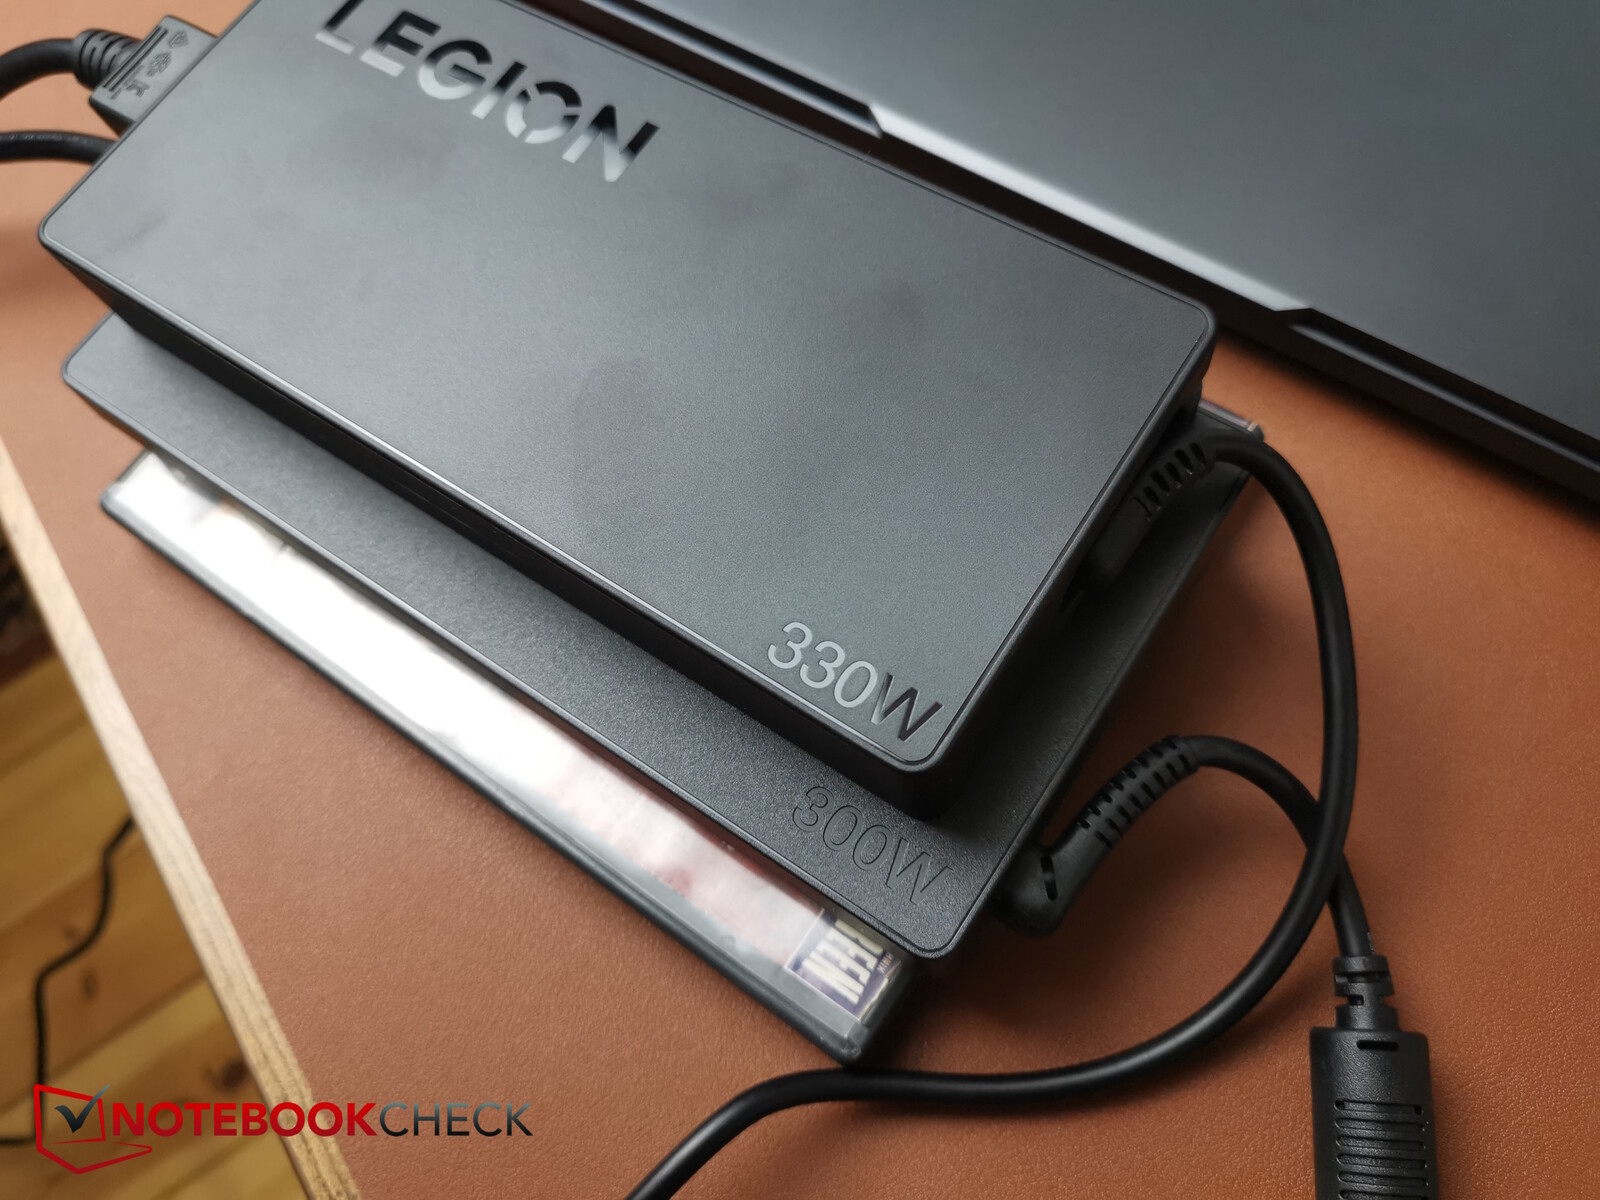
Medimos um consumo médio de 229 watts ao executar o Cyberpunk 2077. No teste de estresse, nosso dispositivo de medição registrou um consumo máximo e apenas de curto prazo de até 297 watts, com o qual a fonte de alimentação plana, mas bastante grande, de 300 watts, deve ser capaz de lidar.
Falando em unidades de fonte de alimentação: A fonte de alimentação de 300 watts fornecida com o nosso Legion Pro 5i é consideravelmente maior do que a unidade de fonte de alimentação de 330 watts do Legion 9i, mais caro.
| desligado | |
| Ocioso | |
| Carga |
|
Key:
min: | |
| Lenovo Legion Pro 5 16IRX9 G9 NVIDIA GeForce RTX 4060 Laptop GPU, i7-14700HX, Samsung PM9A1 MZVL21T0HCLR | HP Victus 16 (2024) NVIDIA GeForce RTX 4060 Laptop GPU, i7-14700HX, Kioxia XG8 KXG80ZNV512G | Dell G16, i7-13650HX, RTX 4060 NVIDIA GeForce RTX 4060 Laptop GPU, i7-13650HX, WD PC SN740 SDDPNQD-1T00 | SCHENKER XMG Core 15 (M24) NVIDIA GeForce RTX 4060 Laptop GPU, R7 8845HS, Samsung 990 Pro 1 TB | Lenovo Legion Pro 5 16IRX9 NVIDIA GeForce RTX 4070 Laptop GPU, i9-14900HX, Samsung PM9A1 MZVL21T0HCLR | Lenovo Legion 5 16IRX G9 NVIDIA GeForce RTX 4060 Laptop GPU, i7-14650HX, Samsung PM9A1 MZVL21T0HCLR | |
|---|---|---|---|---|---|---|
| Power Consumption | 11% | 14% | 23% | -22% | -8% | |
| Idle 150cd/m2 * | 16.4 | 15.4 6% | 14 15% | 11.8 28% | 21 -28% | 17.6 -7% |
| 3DMark06 Return To Proxycon * | 124 | 104 16% | 77.5 37% | |||
| Cyberpunk 2077 FHD ultra no FSR 150cd * | 229 | |||||
| 1280x720 Prime95 28.10 and Furmark 1.25 * | 211 | 176.9 16% | 190 10% | 200.6 5% | 245 -16% | 227 -8% |
* ... menor é melhor
Power consumption Witcher 3 / stress test
Power consumption with external monitor
Tempos de execução
A Lenovo instalou uma bateria de 80 Wh no laptop; além do Core 15 com uma bateria maior, a concorrência usa modelos com capacidade semelhante.
Nosso dispositivo de teste durou pouco mais de 5 horas nos testes de Wi-Fi e vídeo com o brilho reduzido para 150 nits - um valor médio a ligeiramente abaixo da média que foi frequentemente superado pela concorrência.
| Lenovo Legion Pro 5 16IRX9 G9 i7-14700HX, NVIDIA GeForce RTX 4060 Laptop GPU, 80 Wh | HP Victus 16 (2024) i7-14700HX, NVIDIA GeForce RTX 4060 Laptop GPU, 83 Wh | Dell G16, i7-13650HX, RTX 4060 i7-13650HX, NVIDIA GeForce RTX 4060 Laptop GPU, 86 Wh | SCHENKER XMG Core 15 (M24) R7 8845HS, NVIDIA GeForce RTX 4060 Laptop GPU, 99.8 Wh | Lenovo Legion Pro 5 16IRX9 i9-14900HX, NVIDIA GeForce RTX 4070 Laptop GPU, 80 Wh | Lenovo Legion 5 16IRX G9 i7-14650HX, NVIDIA GeForce RTX 4060 Laptop GPU, 80 Wh | Média da turma Gaming | |
|---|---|---|---|---|---|---|---|
| Duração da bateria | 66% | 6% | 109% | -22% | 24% | 16% | |
| H.264 | 312 | 381 22% | 608 95% | 576 85% | 447 ? 43% | ||
| WiFi v1.3 | 308 | 511 66% | 378 23% | 889 189% | 290 -6% | 444 44% | 387 ? 26% |
| Load | 105 | 76 -28% | 151 44% | 65 -38% | 46 -56% | 84.5 ? -20% | |
| Reader / Idle | 403 | 585 ? |
Pro
Contra
Veredicto - Foco total no desempenho


O Legion Pro 5 se concentra exclusivamente no desempenho. Seu já potente i7-14700HX e sua RTX 4060 funcionam mais rápido do que a média e, puramente em termos de desempenho, chegam perto da configuração com o i9-14900HX e a RTX 4070. Graças à tela potencialmente extremamente precisa em termos de cores do laptop, o Legion Pro também pode ser interessante para criadores de conteúdo.
Por outro lado, é uma pena que a tela não seja calibrada com precisão logo que sai da caixa. Considerando seu foco no desempenho em jogos, o fabricante deveria ter notado que o sistema de resfriamento funciona um pouco melhor no lado direito do que no lado WASD, o que é importante para os jogadores. Outros pontos negativos incluem o estrangulamento térmico do SSD, bem como o alto desempenho parcial do dispositivo em modo inativo, que leva um bom tempo para se acalmar novamente. Ainda assim, os pontos positivos superam os negativos no total.
Se o senhor está em busca de um laptop para jogos superpotente, não precisa procurar mais do que o Lenovo Legion Pro 5i. Os criadores de conteúdo também podem ficar satisfeitos, no entanto, alguns detalhes menores deixam mais espaço para uma possível otimização.
Preço e disponibilidade
O senhor pode encomendar o Lenovo Legion Pro 5i diretamente do fabricante. O MRSP do nosso dispositivo de teste é de US$ 1.395.
Observação: Atualizamos nosso sistema de classificação e os resultados da versão 8 não são comparáveis aos resultados da versão 7. Mais informações estão disponíveis aqui.
Lenovo Legion Pro 5 16IRX9 G9
- 07/03/2024 v8
Christian Hintze
 Total Sustainability Score:
 Transparência
A seleção dos dispositivos a serem analisados é feita pela nossa equipe editorial. A amostra de teste foi fornecida ao autor como empréstimo pelo fabricante ou varejista para fins desta revisão. O credor não teve influência nesta revisão, nem o fabricante recebeu uma cópia desta revisão antes da publicação. Não houve obrigação de publicar esta revisão. Nunca aceitamos compensação ou pagamento em troca de nossas avaliações. Como empresa de mídia independente, a Notebookcheck não está sujeita à autoridade de fabricantes, varejistas ou editores.
É assim que o Notebookcheck está testando
Todos os anos, o Notebookcheck analisa de forma independente centenas de laptops e smartphones usando procedimentos padronizados para garantir que todos os resultados sejam comparáveis. Desenvolvemos continuamente nossos métodos de teste há cerca de 20 anos e definimos padrões da indústria no processo. Em nossos laboratórios de teste, equipamentos de medição de alta qualidade são utilizados por técnicos e editores experientes. Esses testes envolvem um processo de validação em vários estágios. Nosso complexo sistema de classificação é baseado em centenas de medições e benchmarks bem fundamentados, o que mantém a objetividade.Price comparison

