Notebookcheck Logo

Análise do laptop Dell Inspiron 16 Plus 7640: Pequenas, mas importantes mudanças em relação ao modelo do ano passado
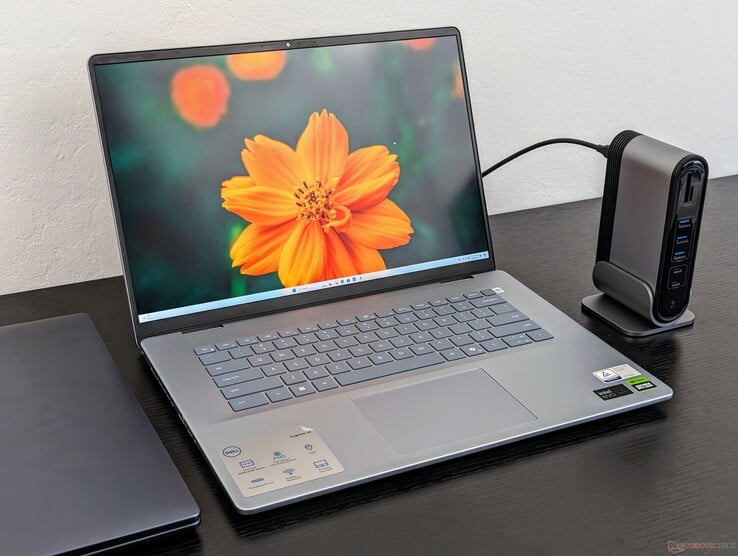
Agora suporta até dois SSDs.

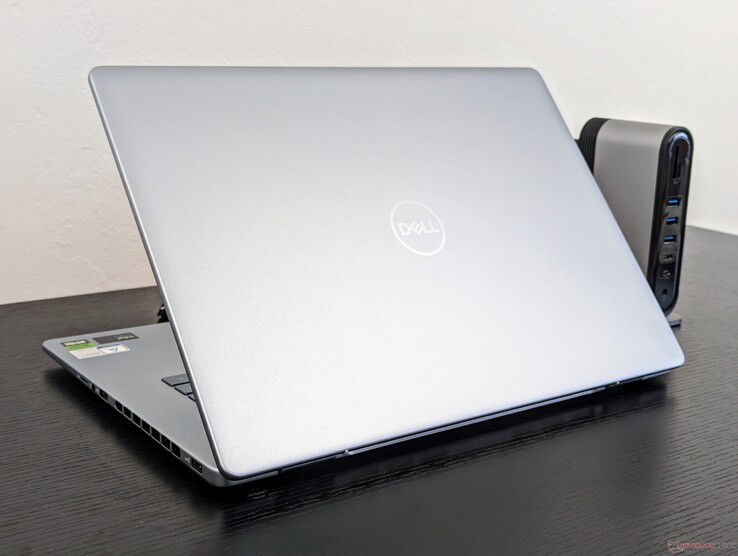
À primeira vista, ele pode parecer igual ao Inspiron 16 Plus 7630, mas o Inspiron 16 Plus 7640 traz várias atualizações que vale a pena conhecer antes de decidir pela compra.
Dell Inspiron 16 Plus 7640

O Inspiron 16 Plus 7640, apropriadamente chamado, substitui o Inspiron 16 Plus 7630 de 2023 com novos processadores prontos para IA em vez das opções Raptor Lake-H do ano passado. Além de algumas outras pequenas alterações internas e externas, o modelo é praticamente idêntico ao seu antecessor e, por isso, recomendamos que confira nossa análise do Inspiron 15 Plus 7630 para saber mais sobre os recursos físicos do Inspiron 15 Plus 7640.

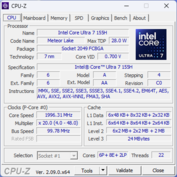
O Inspiron 16 Plus 7640 vem em várias configurações, desde o Core i7-13620H de 13ª geração até o Core Ultra 9 185H de 14ª geração, gráficos integrados UHD ou Arc até o discreto GeForce RTX 4060 e opções de tela de 1200p ou 1600p. Os SKUs AMD Zen 4 com o Ryzen 5 8540U ou Ryzen 7 8840U também estão disponíveis, embora apenas para o modelo regular Inspiron 16 7640 não-Plus sem gráficos discretos ou opção de 1600p. Nossa unidade de teste é uma configuração de ponta com o Core Ultra 7 155H, tela de 1600p e gráficos RTX 4060 por aproximadamente US$ 1.300 no varejo.

Os concorrentes incluem outros notebooks multimídia de 16 polegadas de médio porte, como o Asus VivoBook Pro 16, Lenovo Yoga 7 2 em 1 16IML9ou a Série HP Envy 16.

Mais análises da Dell:

Dell Inspiron 16 Plus 7640 (Inspiron 16 Serie)
Processador
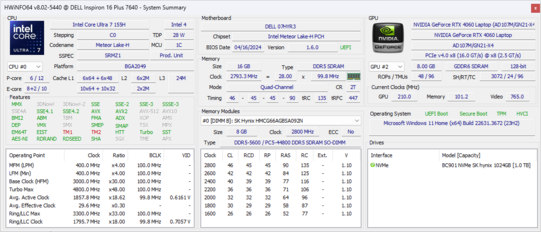
Intel Core Ultra 7 155H 16 x 3.8 - 4.8 GHz, 97 W PL2 / Short Burst, 44 W PL1 / Sustained, Meteor Lake-H
Placa gráfica
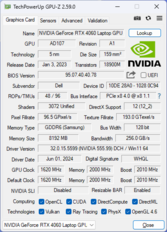
NVIDIA GeForce RTX 4060 Laptop GPU - 8 GB VRAM, Análises do: 2010 MHz, Memoría: 2000 MHz, 70 W TDP, GDDR6, 555.99, Optimus
Memória
16 GB 
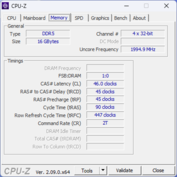
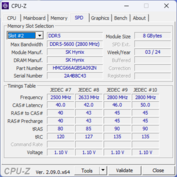
, DDR5, 5200 MT/s, Dual-Channel, 46-45-45-90
Pantalha
16.00 polegadas 16:10, 2560 x 1600 pixel 189 PPI, AU Optronics B160QAN, IPS, Dell P/N: P3FPJ, Brilhante: não, 120 Hz
placa mãe
Intel Meteor Lake-U/P/H PCH
Disco rígido
SK hynix BC901 HFS001TEJ4X164N, 1024 GB 
Placa de Som
Intel Meteor Lake-U/P/H PCH - cAVS (Audio, Voice, Speech)
Conexões
3 USB 3.0, 1 Thunderbolt, USB-C Power Delivery (PD), 1 HDMI, 1 DisplayPort, Conexões Audio: 3.5 mm headset, Card Reader: MicroSD, 1 Leitor de Impressões Digitais
Funcionamento em rede
Intel Wi-Fi 6E AX211 (a/b/g/h/n = Wi-Fi 4/ac = Wi-Fi 5/ax = Wi-Fi 6/ Wi-Fi 6E 6 GHz), Bluetooth 5.3
Tamanho
altura x largura x profundidade (em mm): 19.9 x 356.78 x 250.6
Bateria
90 Wh
Sistema Operativo
Microsoft Windows 11 Home
Camera
Webcam: 1080p
Primary Camera: 2.1 MPix
Características adicionais
Alto falantes: Quad speakers, 2W x4, Teclado: Chiclet, Iluminação do Teclado: sim, MyDell, 12 Meses Garantia
peso
2.209 kg, Suprimento de energia: 489 g
Preço
1300 USD
Amazon
Note: The manufacturer may use components from different suppliers including display panels, drives or memory sticks with similar specifications.


Possíveis concorrentes em comparação

Rating
Date
Model
Weight
Height
Size
Resolution
Price
83.4 %
06/2024
Dell Inspiron 16 Plus 7640
Ultra 7 155H, NVIDIA GeForce RTX 4060 Laptop GPU
2.2 kg19.9 mm16.00"2560x1600
87.1 %
v7 (old)
08/2023
Dell Inspiron 16 Plus 7630
i7-13700H, NVIDIA GeForce RTX 4060 Laptop GPU
2.2 kg19.95 mm16.00"2560x1600
87.4 %
v7 (old)
08/2022
Dell Inspiron 16 Plus 7620
i7-12700H, GeForce RTX 3050 Ti Laptop GPU
2.1 kg18.99 mm16.00"3072x1920
90.4 %
v7 (old)
03/2024
Samsung Galaxy Book4 Ultra
Ultra 7 155H, NVIDIA GeForce RTX 4050 Laptop GPU
1.8 kg17 mm16.00"2880x1800
89.1 %
v7 (old)
02/2024
Lenovo Legion 5 16IRX G9
i7-14650HX, NVIDIA GeForce RTX 4060 Laptop GPU
2.4 kg25.2 mm16.00"2560x1600
87.6 %
v7 (old)
11/2023
Asus VivoBook Pro 16 K6602VU
i9-13900H, NVIDIA GeForce RTX 4050 Laptop GPU
1.9 kg19 mm16.00"3200x2000

Case - Mais e maiores aberturas de ventilação

O modelo tem uma nova tecla Co-Pilot dedicada que substitui a tecla Ctrl na metade direita do teclado. A área do apoio para as mãos é mais plana, o perímetro da base é mais redondo e as grades de ventilação na parte traseira e nas laterais foram redesenhadas para serem maiores do que antes. Os materiais do chassi e as portas permanecem inalterados para que as primeiras impressões e dimensões sejam semelhantes.

Comparação de tamanho

359.7 mm 262.3 mm 25.2 mm 2.4 kg356.78 mm 251.9 mm 19.95 mm 2.2 kg356.78 mm 250.6 mm 19.9 mm 2.2 kg356.78 mm 251.9 mm 18.99 mm 2.1 kg355.3 mm 252 mm 19 mm 1.9 kg355 mm 250 mm 17 mm 1.8 kg297 mm 210 mm 1 mm 5.7 g

Leitor de cartão SD

SD Card Reader
average JPG Copy Test (av. of 3 runs)
Asus VivoBook Pro 16 K6602VU
Intel Core i9-13900H (Angelbird AV Pro V60)
163.5 (157.23min - 168.58max) MB/s +636%
Samsung Galaxy Book4 Ultra
Intel Core Ultra 7 155H (Angelbird AV Pro V60)
78.8 MB/s +255%
Lenovo Legion 5 16IRX G9
Intel Core i7-14650HX
27.1 MB/s +22%
Dell Inspiron 16 Plus 7620
Intel Core i7-12700H (Toshiba Exceria Pro SDXC 64 GB UHS-II)
27.02 MB/s +22%
Dell Inspiron 16 Plus 7640
Intel Core Ultra 7 155H (Angelbird AV Pro V60)
22.2 MB/s
Dell Inspiron 16 Plus 7630
Intel Core i7-13700H (AV Pro SD microSD 128 GB V60)
19.3 MB/s -13%
maximum AS SSD Seq Read Test (1GB)
Asus VivoBook Pro 16 K6602VU
Intel Core i9-13900H (Angelbird AV Pro V60)
232.36 MB/s +710%
Samsung Galaxy Book4 Ultra
Intel Core Ultra 7 155H (Angelbird AV Pro V60)
87.2 MB/s +204%
Lenovo Legion 5 16IRX G9
Intel Core i7-14650HX
28.8 MB/s 0%
Dell Inspiron 16 Plus 7640
Intel Core Ultra 7 155H (Angelbird AV Pro V60)
28.7 MB/s
Dell Inspiron 16 Plus 7620
Intel Core i7-12700H (Toshiba Exceria Pro SDXC 64 GB UHS-II)
28.41 MB/s -1%
Dell Inspiron 16 Plus 7630
Intel Core i7-13700H (AV Pro SD microSD 128 GB V60)
28.3 MB/s -1%

Comunicação

Networking
iperf3 transmit AXE11000
Samsung Galaxy Book4 Ultra
Intel Wi-Fi 6E AX211
1625 (1476min, 1476.87P1 - 1697max) MBit/s +100%
Asus VivoBook Pro 16 K6602VU
Intel Wi-Fi 6E AX211
1606 (1503min - 1654max) MBit/s +98%
Lenovo Legion 5 16IRX G9
Intel Wi-Fi 6E AX211
1489 (1329min, 1338.28P1 - 1686max) MBit/s +84%
Dell Inspiron 16 Plus 7630
Intel Wi-Fi 6E AX211
1261 (1137min - 1385max) MBit/s +55%
Dell Inspiron 16 Plus 7640
Intel Wi-Fi 6E AX211
811 (428min - 1008max) MBit/s
iperf3 receive AXE11000
Samsung Galaxy Book4 Ultra
Intel Wi-Fi 6E AX211
1715 (1675min, 1683.7P1 - 1731max) MBit/s +72%
Asus VivoBook Pro 16 K6602VU
Intel Wi-Fi 6E AX211
1701 (1196min - 1751max) MBit/s +70%
Lenovo Legion 5 16IRX G9
Intel Wi-Fi 6E AX211
1398 (1327min, 1333.09P1 - 1464max) MBit/s +40%
Dell Inspiron 16 Plus 7630
Intel Wi-Fi 6E AX211
1184 (1047min - 1237max) MBit/s +18%
Dell Inspiron 16 Plus 7640
Intel Wi-Fi 6E AX211
1000 (899min - 1078max) MBit/s
iperf3 transmit AXE11000 6GHz
Dell Inspiron 16 Plus 7630
Intel Wi-Fi 6E AX211
1524 (1318min - 1580max) MBit/s +116%
Asus VivoBook Pro 16 K6602VU
Intel Wi-Fi 6E AX211
1381 (1289min - 1536max) MBit/s +96%
Dell Inspiron 16 Plus 7620
Intel Wi-Fi 6E AX211
944 (526min - 1098max) MBit/s +34%
Dell Inspiron 16 Plus 7640
Intel Wi-Fi 6E AX211
705 (634min - 769max) MBit/s
iperf3 receive AXE11000 6GHz
Asus VivoBook Pro 16 K6602VU
Intel Wi-Fi 6E AX211
1628 (1393min - 1717max) MBit/s +133%
Dell Inspiron 16 Plus 7630
Intel Wi-Fi 6E AX211
1229 (1099min - 1323max) MBit/s +76%
Dell Inspiron 16 Plus 7620
Intel Wi-Fi 6E AX211
1217 (1157min - 1297max) MBit/s +74%
Dell Inspiron 16 Plus 7640
Intel Wi-Fi 6E AX211
700 (607min - 805max) MBit/s
050100150200250300350400450500550600650700750800Tooltip
Dell Inspiron 16 Plus 7640; iperf3 transmit AXE11000 6GHz; iperf 3.1.3: Ø704 (634-769)
Dell Inspiron 16 Plus 7640; iperf3 receive AXE11000 6GHz; iperf 3.1.3: Ø700 (607-805)

Webcam

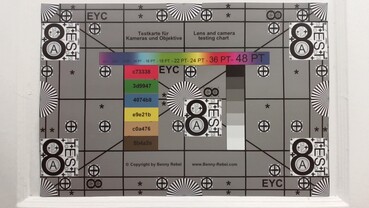
Descreva a qualidade da webcam e adicione imagens de gráficos de teste.
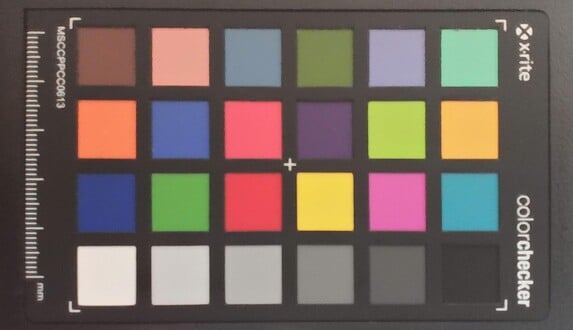
ColorChecker
6.9 ∆E
8.1 ∆E
11.1 ∆E
13 ∆E
13.4 ∆E
9.3 ∆E
13.2 ∆E
6 ∆E
11.2 ∆E
8.4 ∆E
6.1 ∆E
7.9 ∆E
4.8 ∆E
8.7 ∆E
15.4 ∆E
4.4 ∆E
11.3 ∆E
13.4 ∆E
6.7 ∆E
3.2 ∆E
6.8 ∆E
7.8 ∆E
7.4 ∆E
4 ∆E
ColorChecker Dell Inspiron 16 Plus 7640: 8.69 ∆E min: 3.19 - max: 15.36 ∆E

Manutenção

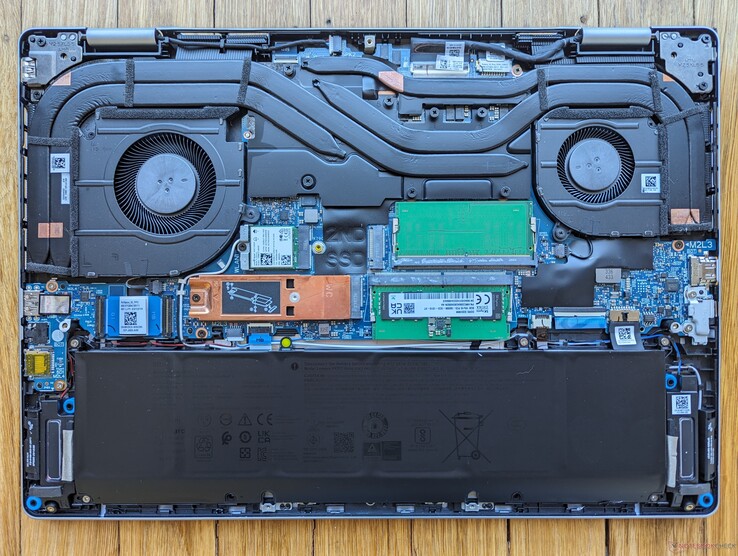
A abertura do sistema mostra uma grande diferença entre ele e seu predecessor imediato: suporte para um SSD M.2 2230 secundário. Fora isso, todo o resto parece ser praticamente idêntico ao Inspiron 16 Plus 7630, como mostram as imagens abaixo.

Inspiron 16 Plus 7640
Inspiron 16 Plus 7630 para comparação

Tela - Opções FHD+ e QHD+

Há duas opções de exibição disponíveis, como segue:

  • 1920 x 1200, 60 Hz, tela sensível ao toque, brilhante
  • 2560 x 1600, 120 Hz, tela não sensível ao toque, fosco

Nossa unidade vem com o painel em negrito acima. Observe que a página oficial do produto da Dell lista incorretamente 60 Hz para o painel de 1600p no momento em que este texto foi escrito; podemos confirmar que esse painel suporta taxas de atualização nativas de 120 Hz e 48 Hz, sem suporte ao G-Sync, como no Inspiron 16 Plus 7630 do ano passado.

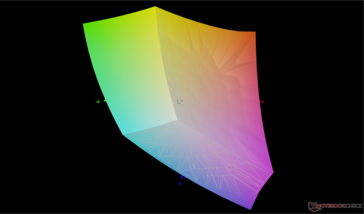
Curiosamente, a Dell trocou os fornecedores de painéis da LG Philips para a AU Optronics para o Inspiron 16 Plus 7640 deste ano. O painel mais novo oferece tempos de resposta mais rápidos para minimizar o efeito fantasma, enquanto oferece cores sRGB, níveis de brilho e taxas de contraste semelhantes aos anteriores.

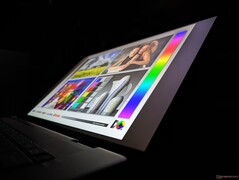
Os textos e as imagens parecem um pouco mais granulados do que uma alternativa brilhante quando olhados de perto
Apenas um leve sangramento irregular da luz de fundo
289.9
cd/m²
290.9
cd/m²
289.2
cd/m²
281.3
cd/m²
314.7
cd/m²
288.8
cd/m²
286.8
cd/m²
291.7
cd/m²
288.8
cd/m²
Distribuição do brilho
AU Optronics B160QAN tested with X-Rite i1Pro 2
Máximo: 314.7 cd/m² (Nits) Médio: 291.3 cd/m² Minimum: 17.1 cd/m²
iluminação: 89 %
iluminação com acumulador: 314.7 cd/m²
Contraste: 1124:1 (Preto: 0.28 cd/m²)
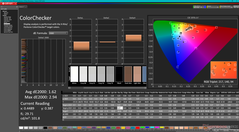
ΔE Color 1.62 | 0.5-29.43 Ø4.91, calibrated: 1.08
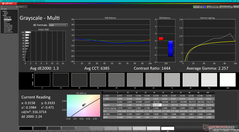
ΔE Greyscale 1.3 | 0.5-98 Ø5.2
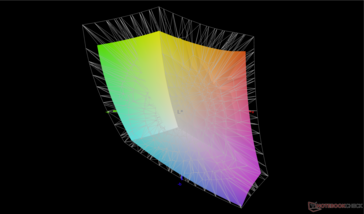
76.7% AdobeRGB 1998 (Argyll 2.2.0 3D)
99.8% sRGB (Argyll 2.2.0 3D)
76% Display P3 (Argyll 2.2.0 3D)
Gamma: 2.26
Dell Inspiron 16 Plus 7640
AU Optronics B160QAN, IPS, 2560x1600, 16"
Dell Inspiron 16 Plus 7630
LG Philips 160WQ2, IPS, 2560x1600, 16"
Dell Inspiron 16 Plus 7620
BOE NE16N41, IPS, 3072x1920, 16"
Samsung Galaxy Book4 Ultra
ATNA60CL07-0, OLED, 2880x1800, 16"
Lenovo Legion 5 16IRX G9
NE160QDM-NZ3, IPS, 2560x1600, 16"
Asus VivoBook Pro 16 K6602VU
Samsung ATNA60BX01-1, OLED, 3200x2000, 16"
Display
-5%
-4%
15%
-3%
19%
Display P3 Coverage
76
70.1
-8%
70.8
-7%
98.6
30%
72.4
-5%
98.7
30%
sRGB Coverage
99.8
99.6
0%
99.5
0%
99.9
0%
100
0%
99.7
0%
AdobeRGB 1998 Coverage
76.7
72.3
-6%
73.2
-5%
88.5
15%
74.1
-3%
96.5
26%
Response Times
-38%
-54%
97%
51%
61%
Response Time Grey 50% / Grey 80% *
25.6 ?(12.3, 13.3)
35 ?(15.7, 19.3)
-37%
38 ?(21.2, 16.8)
-48%
0.54 ?(0.29, 0.25)
98%
12.5 ?(6.1, 6.4)
51%
0.68 ?(0.32, 0.36)
97%
Response Time Black / White *
17.6 ?(8.5, 9.1)
24.2 ?(10.8, 13.4)
-38%
28 ?(13.2, 14.8)
-59%
0.69 ?(0.39, 0.3)
96%
8.7 ?(4.6, 4.1)
51%
13.2 ?(10.8, 2.4)
25%
PWM Frequency
240 ?(100)
240 ?(100)
Screen
-57%
-2%
5%
25%
-68%
Brightness middle
314.7
299.4
-5%
288.9
-8%
390
24%
526
67%
353
12%
Brightness
291
290
0%
276
-5%
393
35%
500
72%
354
22%
Brightness Distribution
89
92
3%
92
3%
98
10%
87
-2%
98
10%
Black Level *
0.28
0.21
25%
0.26
7%
0.33
-18%
Contrast
1124
1426
27%
1111
-1%
1594
42%
Colorchecker dE 2000 *
1.62
4.25
-162%
1.88
-16%
1.4
14%
1.2
26%
4.23
-161%
Colorchecker dE 2000 max. *
2.94
6.71
-128%
4.37
-49%
2.7
8%
2.1
29%
7.13
-143%
Colorchecker dE 2000 calibrated *
1.08
0.52
52%
0.42
61%
1
7%
2.42
-124%
Greyscale dE 2000 *
1.3
5.5
-323%
1.4
-8%
2.1
-62%
1.3
-0%
2.5
-92%
Gamma
2.26 97%
2.35 94%
2.3 96%
2.27 97%
2.23 99%
2.4 92%
CCT
6385 102%
6368 102%
6634 98%
6431 101%
6391 102%
6642 98%
Total Average (Program / Settings)
-33% / -43%
-20% / -10%
39% / 24%
24% / 23%
4% / -25%

* ... smaller is better

vs. sRGB
vs. sRGB
vs. P3
vs. P3

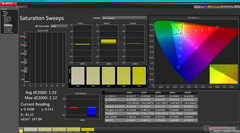
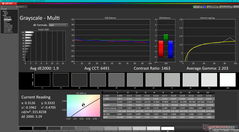
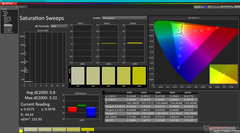
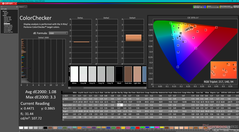
A tela vem bem calibrada, o que é surpreendente, já que a série Inspiron é normalmente mais econômica, com menos foco na precisão das cores do que a série XPS de ponta. A tentativa de calibrar o painel por conta própria resultaria em apenas pequenas melhorias nos valores médios de deltaE, conforme mostrado nas capturas de tela abaixo. Portanto, uma calibração do usuário final não é necessária para a maioria dos usuários.

Escala de cinza antes da calibração
Varreduras de saturação antes da calibração
ColorChecker antes da calibração
Escala de cinza após a calibração
Varreduras de saturação após a calibração
ColorChecker após a calibração

Display Response Times

Display response times show how fast the screen is able to change from one color to the next. Slow response times can lead to afterimages and can cause moving objects to appear blurry (ghosting). Gamers of fast-paced 3D titles should pay special attention to fast response times.
       Response Time Black to White
17.6 ms ... rise ↗ and fall ↘ combined↗ 8.5 ms rise
↘ 9.1 ms fall
The screen shows good response rates in our tests, but may be too slow for competitive gamers.
In comparison, all tested devices range from 0.1 (minimum) to 240 (maximum) ms. » 36 % of all devices are better.
This means that the measured response time is better than the average of all tested devices (20.9 ms).
       Response Time 50% Grey to 80% Grey
25.6 ms ... rise ↗ and fall ↘ combined↗ 12.3 ms rise
↘ 13.3 ms fall
The screen shows relatively slow response rates in our tests and may be too slow for gamers.
In comparison, all tested devices range from 0.165 (minimum) to 636 (maximum) ms. » 32 % of all devices are better.
This means that the measured response time is better than the average of all tested devices (32.8 ms).

Screen Flickering / PWM (Pulse-Width Modulation)

To dim the screen, some notebooks will simply cycle the backlight on and off in rapid succession - a method called Pulse Width Modulation (PWM) . This cycling frequency should ideally be undetectable to the human eye. If said frequency is too low, users with sensitive eyes may experience strain or headaches or even notice the flickering altogether.
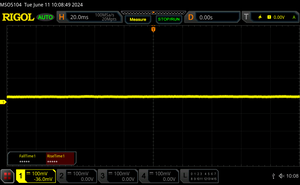
Screen flickering / PWM not detected

In comparison: 53 % of all tested devices do not use PWM to dim the display. If PWM was detected, an average of 8705 (minimum: 5 - maximum: 343500) Hz was measured.

Ao ar livre, com céu nublado
Ao ar livre, sob a sombra
Ao ar livre, com céu nublado
Amplos ângulos de visão IPS

Desempenho - Preparado para IA


Condições de teste

Colocamos o Windows no modo Desempenho antes de executar os benchmarks abaixo.

Processador

Nosso Core Ultra 7 155H é excelente, com resultados multi-thread de 15 a 20% mais rápidos do que em outros notebooks com o mesmo processador. Quando comparado com o Core i7-13700H do Inspiron 16 Plus 7630 do ano passado, no entanto, a CPU mais nova é apenas cerca de 10% mais rápida, sendo praticamente imperceptível para a grande maioria das tarefas. Na verdade, a CPU mais antiga parece ter uma pequena vantagem quando se trata de cargas de trabalho de thread único.

É claro que o Core Ultra 7 155H tem como grande trunfo a NPU integrada, que deve ser útil para tarefas aceleradas por IA assim que elas se tornarem mais prontamente disponíveis. Por outro lado, sua utilidade é extremamente limitada no momento em que este artigo foi escrito.

Cinebench R15 Multi Loop

019038057076095011401330152017101900209022802470266028503040323034203610Tooltip
Dell Inspiron 16 Plus 7640 Intel Core Ultra 7 155H: Ø2341 (1793.16-2787.26)
Dell Inspiron 16 Plus 7630 Intel Core i7-13700H: Ø2049 (1806.77-2421.45)
Dell Inspiron 16 Plus 7620 Intel Core i7-12700H: Ø1998 (1901.59-2430.28)
Samsung Galaxy Book4 Ultra Intel Core Ultra 7 155H: Ø2195 (2134.59-2575.83)
Lenovo Legion 5 16IRX G9 Intel Core i7-14650HX: Ø3471 (3409.19-3799.39)
Asus VivoBook Pro 16 K6602VU Intel Core i9-13900H: Ø2244 (2186.27-2513.98)
CPU Performance Rating: Percent
Cinebench R23: Multi Core | Single Core
Cinebench R20: CPU (Multi Core) | CPU (Single Core)
Cinebench R15: CPU Multi 64Bit | CPU Single 64Bit
Blender: v2.79 BMW27 CPU
7-Zip 18.03: 7z b 4 | 7z b 4 -mmt1
Geekbench 6.3: Multi-Core | Single-Core
Geekbench 5.5: Multi-Core | Single-Core
HWBOT x265 Benchmark v2.2: 4k Preset
LibreOffice : 20 Documents To PDF
R Benchmark 2.5: Overall mean
CPU Performance Rating
Lenovo Legion 5 16IRX G9
Intel Core i7-14650HX
87.7 pt
Lenovo Yoga Pro 9 16IMH9
Intel Core Ultra 9 185H
78.2 pt
Framework Laptop 16
AMD Ryzen 9 7940HS
73.3 pt
Dell Inspiron 16 Plus 7640
Intel Core Ultra 7 155H
70.2 pt
Dell Inspiron 16 Plus 7630
Intel Core i7-13700H
69.9 pt
Average Intel Core Ultra 7 155H
 
64.9 pt
Asus VivoBook Pro 16 K6602VU
Intel Core i9-13900H
64.4 pt
Dell Inspiron 16 Plus 7620 -2!
Intel Core i7-12700H
63.3 pt
Minisforum V3
AMD Ryzen 7 8840U
63.1 pt
Lenovo Legion S7 16ARHA7 -2!
AMD Ryzen 9 6900HX
62.6 pt
Acer Nitro 16 AN16-41 -2!
AMD Ryzen 7 7735HS
59.1 pt
Acer Nitro 16 AN16-41-R7YE
AMD Ryzen 5 7535HS
53.9 pt
Lenovo ThinkPad E16 G1-21JUS08X00
AMD Ryzen 7 7730U
50.2 pt
Lenovo Yoga 7 2-in-1 16IML9
Intel Core Ultra 5 125U
49.7 pt
Lenovo ThinkBook 16 G6 ABP
AMD Ryzen 5 7530U
47.7 pt
Cinebench R23 / Multi Core
Lenovo Legion 5 16IRX G9
Intel Core i7-14650HX
24455 Points +38%
Lenovo Yoga Pro 9 16IMH9
Intel Core Ultra 9 185H
19851 Points +12%
Dell Inspiron 16 Plus 7640
Intel Core Ultra 7 155H
17675 (14726min - 17675max) Points
Framework Laptop 16
AMD Ryzen 9 7940HS
16519 (16352.4min - 16518.9max) Points -7%
Dell Inspiron 16 Plus 7630
Intel Core i7-13700H
15922 (13533.8min - 15922.1max) Points -10%
Asus VivoBook Pro 16 K6602VU
Intel Core i9-13900H
14958 Points -15%
Average Intel Core Ultra 7 155H
  (9769 - 19007, n=48)
14932 Points -16%
Dell Inspiron 16 Plus 7620
Intel Core i7-12700H
14704 (12621.1min - 14704.4max) Points -17%
Lenovo Legion S7 16ARHA7
AMD Ryzen 9 6900HX
14584 (14179.8min - 14584.2max) Points -17%
Acer Nitro 16 AN16-41
AMD Ryzen 7 7735HS
14131 Points -20%
Minisforum V3
AMD Ryzen 7 8840U
12972 Points -27%
Acer Nitro 16 AN16-41-R7YE
AMD Ryzen 5 7535HS
10900 Points -38%
Lenovo ThinkPad E16 G1-21JUS08X00
AMD Ryzen 7 7730U
10325 Points -42%
Lenovo Yoga 7 2-in-1 16IML9
Intel Core Ultra 5 125U
9533 (8675.99min - 9532.96max) Points -46%
Lenovo ThinkBook 16 G6 ABP
AMD Ryzen 5 7530U
9347 Points -47%
Cinebench R23 / Single Core
Lenovo Legion 5 16IRX G9
Intel Core i7-14650HX
1963 Points +13%
Lenovo Yoga Pro 9 16IMH9
Intel Core Ultra 9 185H
1906 Points +10%
Dell Inspiron 16 Plus 7630
Intel Core i7-13700H
1874 Points +8%
Dell Inspiron 16 Plus 7620
Intel Core i7-12700H
1766 Points +2%
Asus VivoBook Pro 16 K6602VU
Intel Core i9-13900H
1740 Points 0%
Framework Laptop 16
AMD Ryzen 9 7940HS
1733 Points 0%
Dell Inspiron 16 Plus 7640
Intel Core Ultra 7 155H
1733 Points
Average Intel Core Ultra 7 155H
  (1496 - 1815, n=48)
1725 Points 0%
Minisforum V3
AMD Ryzen 7 8840U
1701 Points -2%
Lenovo Legion S7 16ARHA7
AMD Ryzen 9 6900HX
1614 Points -7%
Lenovo Yoga 7 2-in-1 16IML9
Intel Core Ultra 5 125U
1548 Points -11%
Acer Nitro 16 AN16-41
AMD Ryzen 7 7735HS
1546 Points -11%
Acer Nitro 16 AN16-41-R7YE
AMD Ryzen 5 7535HS
1488 Points -14%
Lenovo ThinkPad E16 G1-21JUS08X00
AMD Ryzen 7 7730U
1466 Points -15%
Lenovo ThinkBook 16 G6 ABP
AMD Ryzen 5 7530U
1463 Points -16%
Cinebench R20 / CPU (Multi Core)
Lenovo Legion 5 16IRX G9
Intel Core i7-14650HX
9349 Points +37%
Lenovo Yoga Pro 9 16IMH9
Intel Core Ultra 9 185H
7651 Points +12%
Dell Inspiron 16 Plus 7640
Intel Core Ultra 7 155H
6807 Points
Framework Laptop 16
AMD Ryzen 9 7940HS
6402 Points -6%
Dell Inspiron 16 Plus 7630
Intel Core i7-13700H
6162 Points -9%
Average Intel Core Ultra 7 155H
  (3798 - 7409, n=46)
5794 Points -15%
Asus VivoBook Pro 16 K6602VU
Intel Core i9-13900H
5774 Points -15%
Dell Inspiron 16 Plus 7620
Intel Core i7-12700H
5648 Points -17%
Lenovo Legion S7 16ARHA7
AMD Ryzen 9 6900HX
5596 Points -18%
Acer Nitro 16 AN16-41
AMD Ryzen 7 7735HS
5502 Points -19%
Minisforum V3
AMD Ryzen 7 8840U
5067 Points -26%
Acer Nitro 16 AN16-41-R7YE
AMD Ryzen 5 7535HS
4224 Points -38%
Lenovo ThinkPad E16 G1-21JUS08X00
AMD Ryzen 7 7730U
3985 Points -41%
Lenovo Yoga 7 2-in-1 16IML9
Intel Core Ultra 5 125U
3720 Points -45%
Lenovo ThinkBook 16 G6 ABP
AMD Ryzen 5 7530U
3655 Points -46%
Cinebench R20 / CPU (Single Core)
Lenovo Legion 5 16IRX G9
Intel Core i7-14650HX
754 Points +13%
Lenovo Yoga Pro 9 16IMH9
Intel Core Ultra 9 185H
735 Points +10%
Dell Inspiron 16 Plus 7630
Intel Core i7-13700H
725 Points +9%
Dell Inspiron 16 Plus 7620
Intel Core i7-12700H
680 Points +2%
Framework Laptop 16
AMD Ryzen 9 7940HS
680 Points +2%
Asus VivoBook Pro 16 K6602VU
Intel Core i9-13900H
673 Points +1%
Dell Inspiron 16 Plus 7640
Intel Core Ultra 7 155H
666 Points
Minisforum V3
AMD Ryzen 7 8840U
665 Points 0%
Average Intel Core Ultra 7 155H
  (601 - 696, n=46)
664 Points 0%
Lenovo Legion S7 16ARHA7
AMD Ryzen 9 6900HX
630 Points -5%
Lenovo Yoga 7 2-in-1 16IML9
Intel Core Ultra 5 125U
605 Points -9%
Acer Nitro 16 AN16-41
AMD Ryzen 7 7735HS
601 Points -10%
Acer Nitro 16 AN16-41-R7YE
AMD Ryzen 5 7535HS
581 Points -13%
Lenovo ThinkPad E16 G1-21JUS08X00
AMD Ryzen 7 7730U
573 Points -14%
Lenovo ThinkBook 16 G6 ABP
AMD Ryzen 5 7530U
570 Points -14%
Cinebench R15 / CPU Multi 64Bit
Lenovo Legion 5 16IRX G9
Intel Core i7-14650HX
3799 (3409.19min - 3799.39max) Points +36%
Lenovo Yoga Pro 9 16IMH9
Intel Core Ultra 9 185H
3005 (2869.44min - 3004.58max) Points +8%
Dell Inspiron 16 Plus 7640
Intel Core Ultra 7 155H
2787 (1793.16min - 2787.26max) Points
Framework Laptop 16
AMD Ryzen 9 7940HS
2653 (2587.82min - 2652.52max) Points -5%
Asus VivoBook Pro 16 K6602VU
Intel Core i9-13900H
2514 (2186.27min - 2513.98max) Points -10%
Average Intel Core Ultra 7 155H
  (1932 - 2880, n=52)
2446 Points -12%
Dell Inspiron 16 Plus 7620
Intel Core i7-12700H
2430 (1901.59min - 2430.28max) Points -13%
Dell Inspiron 16 Plus 7630
Intel Core i7-13700H
2421 (1806.77min - 2421.45max) Points -13%
Lenovo Legion S7 16ARHA7
AMD Ryzen 9 6900HX
2359 (2277.39min - 2359.33max) Points -15%
Acer Nitro 16 AN16-41
AMD Ryzen 7 7735HS
2328 Points -16%
Minisforum V3
AMD Ryzen 7 8840U
2024 Points -27%
Acer Nitro 16 AN16-41-R7YE
AMD Ryzen 5 7535HS
1757 Points -37%
Lenovo ThinkPad E16 G1-21JUS08X00
AMD Ryzen 7 7730U
1718.58 (1668.54min - 1718.58max) Points -38%
Lenovo Yoga 7 2-in-1 16IML9
Intel Core Ultra 5 125U
1657 (1250.47min - 1657.34max) Points -41%
Lenovo ThinkBook 16 G6 ABP
AMD Ryzen 5 7530U
1599 (1483.51min - 1598.53max) Points -43%
Cinebench R15 / CPU Single 64Bit
Lenovo Legion 5 16IRX G9
Intel Core i7-14650HX
287 Points +13%
Lenovo Yoga Pro 9 16IMH9
Intel Core Ultra 9 185H
280 Points +10%
Framework Laptop 16
AMD Ryzen 9 7940HS
277 Points +9%
Dell Inspiron 16 Plus 7630
Intel Core i7-13700H
265 Points +4%
Minisforum V3
AMD Ryzen 7 8840U
263 Points +3%
Lenovo Legion S7 16ARHA7
AMD Ryzen 9 6900HX
257 Points +1%
Dell Inspiron 16 Plus 7640
Intel Core Ultra 7 155H
255 Points
Dell Inspiron 16 Plus 7620
Intel Core i7-12700H
254 Points 0%
Asus VivoBook Pro 16 K6602VU
Intel Core i9-13900H
252 Points -1%
Average Intel Core Ultra 7 155H
  (99.6 - 268, n=48)
249 Points -2%
Acer Nitro 16 AN16-41
AMD Ryzen 7 7735HS
247 Points -3%
Acer Nitro 16 AN16-41-R7YE
AMD Ryzen 5 7535HS
241 Points -5%
Lenovo ThinkBook 16 G6 ABP
AMD Ryzen 5 7530U
234 Points -8%
Lenovo ThinkPad E16 G1-21JUS08X00
AMD Ryzen 7 7730U
233 Points -9%
Lenovo Yoga 7 2-in-1 16IML9
Intel Core Ultra 5 125U
226 Points -11%
Blender / v2.79 BMW27 CPU
Lenovo Yoga 7 2-in-1 16IML9
Intel Core Ultra 5 125U
358 Seconds * -87%
Lenovo ThinkBook 16 G6 ABP
AMD Ryzen 5 7530U
330 Seconds * -73%
Lenovo ThinkPad E16 G1-21JUS08X00
AMD Ryzen 7 7730U
296 Seconds * -55%
Acer Nitro 16 AN16-41-R7YE
AMD Ryzen 5 7535HS
286 Seconds * -50%
Minisforum V3
AMD Ryzen 7 8840U
239 Seconds * -25%
Dell Inspiron 16 Plus 7620
Intel Core i7-12700H
235 Seconds * -23%
Average Intel Core Ultra 7 155H
  (175 - 381, n=44)
233 Seconds * -22%
Dell Inspiron 16 Plus 7630
Intel Core i7-13700H
221 Seconds * -16%
Acer Nitro 16 AN16-41
AMD Ryzen 7 7735HS
219 Seconds * -15%
Lenovo Legion S7 16ARHA7
AMD Ryzen 9 6900HX
214 Seconds * -12%
Asus VivoBook Pro 16 K6602VU
Intel Core i9-13900H
213 Seconds * -12%
Framework Laptop 16
AMD Ryzen 9 7940HS
195 Seconds * -2%
Dell Inspiron 16 Plus 7640
Intel Core Ultra 7 155H
191 Seconds *
Lenovo Yoga Pro 9 16IMH9
Intel Core Ultra 9 185H
163 Seconds * +15%
Lenovo Legion 5 16IRX G9
Intel Core i7-14650HX
141 Seconds * +26%
7-Zip 18.03 / 7z b 4
Lenovo Legion 5 16IRX G9
Intel Core i7-14650HX
93686 MIPS +52%
Lenovo Yoga Pro 9 16IMH9
Intel Core Ultra 9 185H
76331 MIPS +24%
Framework Laptop 16
AMD Ryzen 9 7940HS
71464 MIPS +16%
Asus VivoBook Pro 16 K6602VU
Intel Core i9-13900H
64431 MIPS +4%
Lenovo Legion S7 16ARHA7
AMD Ryzen 9 6900HX
63347 MIPS +3%
Dell Inspiron 16 Plus 7640
Intel Core Ultra 7 155H
61730 MIPS
Acer Nitro 16 AN16-41
AMD Ryzen 7 7735HS
61191 MIPS -1%
Dell Inspiron 16 Plus 7620
Intel Core i7-12700H
59929 MIPS -3%
Dell Inspiron 16 Plus 7630
Intel Core i7-13700H
59433 MIPS -4%
Average Intel Core Ultra 7 155H
  (41739 - 70254, n=46)
59045 MIPS -4%
Minisforum V3
AMD Ryzen 7 8840U
57795 MIPS -6%
Acer Nitro 16 AN16-41-R7YE
AMD Ryzen 5 7535HS
48646 MIPS -21%
Lenovo ThinkPad E16 G1-21JUS08X00
AMD Ryzen 7 7730U
47733 MIPS -23%
Lenovo ThinkBook 16 G6 ABP
AMD Ryzen 5 7530U
42364 MIPS -31%
Lenovo Yoga 7 2-in-1 16IML9
Intel Core Ultra 5 125U
39065 MIPS -37%
7-Zip 18.03 / 7z b 4 -mmt1
Lenovo Legion 5 16IRX G9
Intel Core i7-14650HX
6695 MIPS +23%
Framework Laptop 16
AMD Ryzen 9 7940HS
6599 MIPS +21%
Lenovo Legion S7 16ARHA7
AMD Ryzen 9 6900HX
6070 MIPS +11%
Minisforum V3
AMD Ryzen 7 8840U
5921 MIPS +8%
Lenovo Yoga Pro 9 16IMH9
Intel Core Ultra 9 185H
5781 MIPS +6%
Asus VivoBook Pro 16 K6602VU
Intel Core i9-13900H
5721 MIPS +5%
Dell Inspiron 16 Plus 7630
Intel Core i7-13700H
5703 MIPS +4%
Acer Nitro 16 AN16-41-R7YE
AMD Ryzen 5 7535HS
5670 MIPS +4%
Acer Nitro 16 AN16-41
AMD Ryzen 7 7735HS
5584 MIPS +2%
Dell Inspiron 16 Plus 7620
Intel Core i7-12700H
5570 MIPS +2%
Dell Inspiron 16 Plus 7640
Intel Core Ultra 7 155H
5461 MIPS
Lenovo ThinkPad E16 G1-21JUS08X00
AMD Ryzen 7 7730U
5426 MIPS -1%
Lenovo ThinkBook 16 G6 ABP
AMD Ryzen 5 7530U
5352 MIPS -2%
Average Intel Core Ultra 7 155H
  (4795 - 5621, n=46)
5345 MIPS -2%
Lenovo Yoga 7 2-in-1 16IML9
Intel Core Ultra 5 125U
4492 MIPS -18%
Geekbench 6.3 / Multi-Core
Lenovo Legion 5 16IRX G9
Intel Core i7-14650HX
16010 Points +23%
Lenovo Yoga Pro 9 16IMH9
Intel Core Ultra 9 185H
14031 Points +8%
Dell Inspiron 16 Plus 7630
Intel Core i7-13700H
13406 Points +3%
Framework Laptop 16
AMD Ryzen 9 7940HS
13217 Points +2%
Dell Inspiron 16 Plus 7640
Intel Core Ultra 7 155H
13018 Points
Average Intel Core Ultra 7 155H
  (7732 - 13656, n=51)
12280 Points -6%
Minisforum V3
AMD Ryzen 7 8840U
11144 Points -14%
Asus VivoBook Pro 16 K6602VU
Intel Core i9-13900H
11118 Points -15%
Lenovo Yoga 7 2-in-1 16IML9
Intel Core Ultra 5 125U
9601 Points -26%
Acer Nitro 16 AN16-41-R7YE
AMD Ryzen 5 7535HS
8960 Points -31%
Lenovo ThinkPad E16 G1-21JUS08X00
AMD Ryzen 7 7730U
6918 Points -47%
Lenovo ThinkBook 16 G6 ABP
AMD Ryzen 5 7530U
6901 Points -47%
Geekbench 6.3 / Single-Core
Lenovo Legion 5 16IRX G9
Intel Core i7-14650HX
2761 Points +15%
Dell Inspiron 16 Plus 7630
Intel Core i7-13700H
2638 Points +10%
Framework Laptop 16
AMD Ryzen 9 7940HS
2630 Points +10%
Lenovo Yoga Pro 9 16IMH9
Intel Core Ultra 9 185H
2570 Points +7%
Minisforum V3
AMD Ryzen 7 8840U
2537 Points +6%
Asus VivoBook Pro 16 K6602VU
Intel Core i9-13900H
2437 Points +1%
Dell Inspiron 16 Plus 7640
Intel Core Ultra 7 155H
2401 Points
Average Intel Core Ultra 7 155H
  (1901 - 2473, n=48)
2376 Points -1%
Lenovo Yoga 7 2-in-1 16IML9
Intel Core Ultra 5 125U
2148 Points -11%
Acer Nitro 16 AN16-41-R7YE
AMD Ryzen 5 7535HS
2056 Points -14%
Lenovo ThinkBook 16 G6 ABP
AMD Ryzen 5 7530U
1969 Points -18%
Lenovo ThinkPad E16 G1-21JUS08X00
AMD Ryzen 7 7730U
1960 Points -18%
Geekbench 5.5 / Multi-Core
Lenovo Legion 5 16IRX G9
Intel Core i7-14650HX
16810 Points +33%
Lenovo Yoga Pro 9 16IMH9
Intel Core Ultra 9 185H
13936 Points +11%
Dell Inspiron 16 Plus 7630
Intel Core i7-13700H
12805 Points +2%
Dell Inspiron 16 Plus 7640
Intel Core Ultra 7 155H
12600 Points
Framework Laptop 16
AMD Ryzen 9 7940HS
12379 Points -2%
Average Intel Core Ultra 7 155H
  (10017 - 13556, n=48)
12022 Points -5%
Dell Inspiron 16 Plus 7620
Intel Core i7-12700H
11887 Points -6%
Asus VivoBook Pro 16 K6602VU
Intel Core i9-13900H
10214 Points -19%
Minisforum V3
AMD Ryzen 7 8840U
10014 Points -21%
Lenovo Legion S7 16ARHA7
AMD Ryzen 9 6900HX
10007 Points -21%
Acer Nitro 16 AN16-41
AMD Ryzen 7 7735HS
9683 Points -23%
Lenovo Yoga 7 2-in-1 16IML9
Intel Core Ultra 5 125U
8355 Points -34%
Acer Nitro 16 AN16-41-R7YE
AMD Ryzen 5 7535HS
7852 Points -38%
Lenovo ThinkPad E16 G1-21JUS08X00
AMD Ryzen 7 7730U
6747 Points -46%
Lenovo ThinkBook 16 G6 ABP
AMD Ryzen 5 7530U
6517 Points -48%
Geekbench 5.5 / Single-Core
Framework Laptop 16
AMD Ryzen 9 7940HS
1963 Points +9%
Lenovo Legion 5 16IRX G9
Intel Core i7-14650HX
1933 Points +8%
Dell Inspiron 16 Plus 7630
Intel Core i7-13700H
1906 Points +6%
Lenovo Yoga Pro 9 16IMH9
Intel Core Ultra 9 185H
1902 Points +6%
Minisforum V3
AMD Ryzen 7 8840U
1894 Points +6%
Dell Inspiron 16 Plus 7640
Intel Core Ultra 7 155H
1793 Points
Average Intel Core Ultra 7 155H
  (1462 - 1824, n=48)
1752 Points -2%
Asus VivoBook Pro 16 K6602VU
Intel Core i9-13900H
1735 Points -3%
Dell Inspiron 16 Plus 7620
Intel Core i7-12700H
1733 Points -3%
Lenovo Legion S7 16ARHA7
AMD Ryzen 9 6900HX
1642 Points -8%
Lenovo Yoga 7 2-in-1 16IML9
Intel Core Ultra 5 125U
1560 Points -13%
Acer Nitro 16 AN16-41
AMD Ryzen 7 7735HS
1555 Points -13%
Acer Nitro 16 AN16-41-R7YE
AMD Ryzen 5 7535HS
1502 Points -16%
Lenovo ThinkBook 16 G6 ABP
AMD Ryzen 5 7530U
1498 Points -16%
Lenovo ThinkPad E16 G1-21JUS08X00
AMD Ryzen 7 7730U
1490 Points -17%
HWBOT x265 Benchmark v2.2 / 4k Preset
Lenovo Legion 5 16IRX G9
Intel Core i7-14650HX
25.6 fps +31%
Lenovo Yoga Pro 9 16IMH9
Intel Core Ultra 9 185H
22.7 fps +16%
Framework Laptop 16
AMD Ryzen 9 7940HS
21 fps +8%
Dell Inspiron 16 Plus 7640
Intel Core Ultra 7 155H
19.5 fps
Lenovo Legion S7 16ARHA7
AMD Ryzen 9 6900HX
18.3 fps -6%
Acer Nitro 16 AN16-41
AMD Ryzen 7 7735HS
17.5 fps -10%
Asus VivoBook Pro 16 K6602VU
Intel Core i9-13900H
16.7 fps -14%
Minisforum V3
AMD Ryzen 7 8840U
16.5 fps -15%
Average Intel Core Ultra 7 155H
  (9.93 - 21.2, n=46)
16.4 fps -16%
Dell Inspiron 16 Plus 7620
Intel Core i7-12700H
16.3 fps -16%
Dell Inspiron 16 Plus 7630
Intel Core i7-13700H
15.9 fps -18%
Acer Nitro 16 AN16-41-R7YE
AMD Ryzen 5 7535HS
14.2 fps -27%
Lenovo ThinkPad E16 G1-21JUS08X00
AMD Ryzen 7 7730U
11.8 fps -39%
Lenovo ThinkBook 16 G6 ABP
AMD Ryzen 5 7530U
11.6 fps -41%
Lenovo Yoga 7 2-in-1 16IML9
Intel Core Ultra 5 125U
11.1 fps -43%
LibreOffice / 20 Documents To PDF
Asus VivoBook Pro 16 K6602VU
Intel Core i9-13900H
56.3 s * -29%
Lenovo ThinkBook 16 G6 ABP
AMD Ryzen 5 7530U
54.5 s * -25%
Acer Nitro 16 AN16-41
AMD Ryzen 7 7735HS
53.4 s * -23%
Minisforum V3
AMD Ryzen 7 8840U
52.5 s * -21%
Lenovo ThinkPad E16 G1-21JUS08X00
AMD Ryzen 7 7730U
49.6 s * -14%
Lenovo Legion S7 16ARHA7
AMD Ryzen 9 6900HX
48.9 s * -12%
Average Intel Core Ultra 7 155H
  (37.5 - 79.2, n=45)
48.8 s * -12%
Lenovo Yoga 7 2-in-1 16IML9
Intel Core Ultra 5 125U
47 s * -8%
Acer Nitro 16 AN16-41-R7YE
AMD Ryzen 5 7535HS
46.2 s * -6%
Dell Inspiron 16 Plus 7620
Intel Core i7-12700H
46.1 s * -6%
Dell Inspiron 16 Plus 7630
Intel Core i7-13700H
45.1 s * -4%
Lenovo Legion 5 16IRX G9
Intel Core i7-14650HX
43.8 s * -1%
Framework Laptop 16
AMD Ryzen 9 7940HS
43.6 s * -0%
Dell Inspiron 16 Plus 7640
Intel Core Ultra 7 155H
43.5 s *
Lenovo Yoga Pro 9 16IMH9
Intel Core Ultra 9 185H
39.7 s * +9%
R Benchmark 2.5 / Overall mean
Lenovo Yoga 7 2-in-1 16IML9
Intel Core Ultra 5 125U
0.533 sec * -13%
Lenovo ThinkBook 16 G6 ABP
AMD Ryzen 5 7530U
0.531 sec * -13%
Lenovo ThinkPad E16 G1-21JUS08X00
AMD Ryzen 7 7730U
0.515 sec * -9%
Acer Nitro 16 AN16-41-R7YE
AMD Ryzen 5 7535HS
0.503 sec * -7%
Acer Nitro 16 AN16-41
AMD Ryzen 7 7735HS
0.4958 sec * -5%
Asus VivoBook Pro 16 K6602VU
Intel Core i9-13900H
0.4834 sec * -3%
Average Intel Core Ultra 7 155H
  (0.4457 - 0.53, n=45)
0.4825 sec * -2%
Minisforum V3
AMD Ryzen 7 8840U
0.479 sec * -2%
Dell Inspiron 16 Plus 7620
Intel Core i7-12700H
0.473 sec * -0%
Dell Inspiron 16 Plus 7640
Intel Core Ultra 7 155H
0.4709 sec *
Lenovo Legion S7 16ARHA7
AMD Ryzen 9 6900HX
0.4636 sec * +2%
Framework Laptop 16
AMD Ryzen 9 7940HS
0.4467 sec * +5%
Lenovo Yoga Pro 9 16IMH9
Intel Core Ultra 9 185H
0.4457 sec * +5%
Dell Inspiron 16 Plus 7630
Intel Core i7-13700H
0.4338 sec * +8%
Lenovo Legion 5 16IRX G9
Intel Core i7-14650HX
0.4195 sec * +11%
CPU Performance Rating: Percent
Cinebench R23: Multi Core | Single Core
Cinebench R20: CPU (Multi Core) | CPU (Single Core)
Cinebench R15: CPU Multi 64Bit | CPU Single 64Bit
Blender: v2.79 BMW27 CPU
7-Zip 18.03: 7z b 4 | 7z b 4 -mmt1
Geekbench 6.3: Multi-Core | Single-Core
Geekbench 5.5: Multi-Core | Single-Core
HWBOT x265 Benchmark v2.2: 4k Preset
LibreOffice : 20 Documents To PDF
R Benchmark 2.5: Overall mean

* ... smaller is better

Cinebench R15 CPU Multi 64Bit
2787 Points
Cinebench R15 OpenGL 64Bit
196.6 fps
Cinebench R15 Ref. Match 64Bit
99.6 %
Cinebench R15 CPU Single 64Bit
255 Points
Cinebench R20 CPU (Multi Core)
6807 Points
Cinebench R20 CPU (Single Core)
666 Points
Cinebench R23 Single Core
1733 Points
Cinebench R23 Multi Core
17675 Points
Ajuda
Performance Rating
Lenovo Legion 5 16IRX G9
Intel Core i7-14650HX, NVIDIA GeForce RTX 4060 Laptop GPU
93.4 pt
Asus VivoBook Pro 16 K6602VU
Intel Core i9-13900H, NVIDIA GeForce RTX 4050 Laptop GPU
78.4 pt
Samsung Galaxy Book4 Ultra
Intel Core Ultra 7 155H, NVIDIA GeForce RTX 4050 Laptop GPU
75.9 pt
Dell Inspiron 16 Plus 7640
Intel Core Ultra 7 155H, NVIDIA GeForce RTX 4060 Laptop GPU
75.3 pt
Average Intel Core Ultra 7 155H
 
74.4 pt
Dell Inspiron 16 Plus 7630
Intel Core i7-13700H, NVIDIA GeForce RTX 4060 Laptop GPU
72.3 pt
Dell Inspiron 16 Plus 7620
Intel Core i7-12700H, GeForce RTX 3050 Ti Laptop GPU
69.2 pt
AIDA64 / FP32 Ray-Trace
Lenovo Legion 5 16IRX G9
Intel Core i7-14650HX, NVIDIA GeForce RTX 4060 Laptop GPU
19044 KRay/s +36%
Dell Inspiron 16 Plus 7640
Intel Core Ultra 7 155H, NVIDIA GeForce RTX 4060 Laptop GPU
14038 KRay/s
Dell Inspiron 16 Plus 7630
Intel Core i7-13700H, NVIDIA GeForce RTX 4060 Laptop GPU
13648 KRay/s -3%
Asus VivoBook Pro 16 K6602VU
Intel Core i9-13900H, NVIDIA GeForce RTX 4050 Laptop GPU
13642 KRay/s -3%
Samsung Galaxy Book4 Ultra
Intel Core Ultra 7 155H, NVIDIA GeForce RTX 4050 Laptop GPU
13541 KRay/s -4%
Average Intel Core Ultra 7 155H
  (6670 - 18470, n=46)
13107 KRay/s -7%
Dell Inspiron 16 Plus 7620
Intel Core i7-12700H, GeForce RTX 3050 Ti Laptop GPU
12734 KRay/s -9%
AIDA64 / FPU Julia
Lenovo Legion 5 16IRX G9
Intel Core i7-14650HX, NVIDIA GeForce RTX 4060 Laptop GPU
95271 Points +34%
Asus VivoBook Pro 16 K6602VU
Intel Core i9-13900H, NVIDIA GeForce RTX 4050 Laptop GPU
71957 Points +2%
Samsung Galaxy Book4 Ultra
Intel Core Ultra 7 155H, NVIDIA GeForce RTX 4050 Laptop GPU
71791 Points +1%
Dell Inspiron 16 Plus 7640
Intel Core Ultra 7 155H, NVIDIA GeForce RTX 4060 Laptop GPU
70839 Points
Average Intel Core Ultra 7 155H
  (40905 - 93181, n=46)
69549 Points -2%
Dell Inspiron 16 Plus 7630
Intel Core i7-13700H, NVIDIA GeForce RTX 4060 Laptop GPU
68323 Points -4%
Dell Inspiron 16 Plus 7620
Intel Core i7-12700H, GeForce RTX 3050 Ti Laptop GPU
63563 Points -10%
AIDA64 / CPU SHA3
Lenovo Legion 5 16IRX G9
Intel Core i7-14650HX, NVIDIA GeForce RTX 4060 Laptop GPU
4214 MB/s +29%
Dell Inspiron 16 Plus 7640
Intel Core Ultra 7 155H, NVIDIA GeForce RTX 4060 Laptop GPU
3277 MB/s
Asus VivoBook Pro 16 K6602VU
Intel Core i9-13900H, NVIDIA GeForce RTX 4050 Laptop GPU
3269 MB/s 0%
Samsung Galaxy Book4 Ultra
Intel Core Ultra 7 155H, NVIDIA GeForce RTX 4050 Laptop GPU
3251 MB/s -1%
Average Intel Core Ultra 7 155H
  (1940 - 4436, n=46)
3249 MB/s -1%
Dell Inspiron 16 Plus 7630
Intel Core i7-13700H, NVIDIA GeForce RTX 4060 Laptop GPU
3029 MB/s -8%
Dell Inspiron 16 Plus 7620
Intel Core i7-12700H, GeForce RTX 3050 Ti Laptop GPU
2892 MB/s -12%
AIDA64 / CPU Queen
Dell Inspiron 16 Plus 7630
Intel Core i7-13700H, NVIDIA GeForce RTX 4060 Laptop GPU
105205 Points +20%
Lenovo Legion 5 16IRX G9
Intel Core i7-14650HX, NVIDIA GeForce RTX 4060 Laptop GPU
101500 Points +16%
Asus VivoBook Pro 16 K6602VU
Intel Core i9-13900H, NVIDIA GeForce RTX 4050 Laptop GPU
94687 Points +8%
Dell Inspiron 16 Plus 7620
Intel Core i7-12700H, GeForce RTX 3050 Ti Laptop GPU
92646 Points +5%
Dell Inspiron 16 Plus 7640
Intel Core Ultra 7 155H, NVIDIA GeForce RTX 4060 Laptop GPU
87819 Points
Samsung Galaxy Book4 Ultra
Intel Core Ultra 7 155H, NVIDIA GeForce RTX 4050 Laptop GPU
84280 Points -4%
Average Intel Core Ultra 7 155H
  (64698 - 94181, n=46)
83603 Points -5%
AIDA64 / FPU SinJulia
Lenovo Legion 5 16IRX G9
Intel Core i7-14650HX, NVIDIA GeForce RTX 4060 Laptop GPU
11913 Points +20%
Dell Inspiron 16 Plus 7640
Intel Core Ultra 7 155H, NVIDIA GeForce RTX 4060 Laptop GPU
9893 Points
Samsung Galaxy Book4 Ultra
Intel Core Ultra 7 155H, NVIDIA GeForce RTX 4050 Laptop GPU
9696 Points -2%
Average Intel Core Ultra 7 155H
  (5639 - 10647, n=46)
9130 Points -8%
Dell Inspiron 16 Plus 7630
Intel Core i7-13700H, NVIDIA GeForce RTX 4060 Laptop GPU
8930 Points -10%
Asus VivoBook Pro 16 K6602VU
Intel Core i9-13900H, NVIDIA GeForce RTX 4050 Laptop GPU
8842 Points -11%
Dell Inspiron 16 Plus 7620
Intel Core i7-12700H, GeForce RTX 3050 Ti Laptop GPU
8567 Points -13%
AIDA64 / FPU Mandel
Lenovo Legion 5 16IRX G9
Intel Core i7-14650HX, NVIDIA GeForce RTX 4060 Laptop GPU
47097 Points +35%
Dell Inspiron 16 Plus 7640
Intel Core Ultra 7 155H, NVIDIA GeForce RTX 4060 Laptop GPU
35006 Points
Samsung Galaxy Book4 Ultra
Intel Core Ultra 7 155H, NVIDIA GeForce RTX 4050 Laptop GPU
34862 Points 0%
Asus VivoBook Pro 16 K6602VU
Intel Core i9-13900H, NVIDIA GeForce RTX 4050 Laptop GPU
33882 Points -3%
Average Intel Core Ultra 7 155H
  (18236 - 47685, n=46)
33785 Points -3%
Dell Inspiron 16 Plus 7630
Intel Core i7-13700H, NVIDIA GeForce RTX 4060 Laptop GPU
33737 Points -4%
Dell Inspiron 16 Plus 7620
Intel Core i7-12700H, GeForce RTX 3050 Ti Laptop GPU
31113 Points -11%
AIDA64 / CPU AES
Asus VivoBook Pro 16 K6602VU
Intel Core i9-13900H, NVIDIA GeForce RTX 4050 Laptop GPU
121588 MB/s +79%
Lenovo Legion 5 16IRX G9
Intel Core i7-14650HX, NVIDIA GeForce RTX 4060 Laptop GPU
86485 MB/s +27%
Average Intel Core Ultra 7 155H
  (45713 - 152179, n=46)
78103 MB/s +15%
Samsung Galaxy Book4 Ultra
Intel Core Ultra 7 155H, NVIDIA GeForce RTX 4050 Laptop GPU
68288 MB/s 0%
Dell Inspiron 16 Plus 7640
Intel Core Ultra 7 155H, NVIDIA GeForce RTX 4060 Laptop GPU
68050 MB/s
Dell Inspiron 16 Plus 7620
Intel Core i7-12700H, GeForce RTX 3050 Ti Laptop GPU
65597 MB/s -4%
Dell Inspiron 16 Plus 7630
Intel Core i7-13700H, NVIDIA GeForce RTX 4060 Laptop GPU
63127 MB/s -7%
AIDA64 / CPU ZLib
Lenovo Legion 5 16IRX G9
Intel Core i7-14650HX, NVIDIA GeForce RTX 4060 Laptop GPU
1289 MB/s +23%
Dell Inspiron 16 Plus 7640
Intel Core Ultra 7 155H, NVIDIA GeForce RTX 4060 Laptop GPU
1045 MB/s
Dell Inspiron 16 Plus 7620
Intel Core i7-12700H, GeForce RTX 3050 Ti Laptop GPU
969 MB/s -7%
Samsung Galaxy Book4 Ultra
Intel Core Ultra 7 155H, NVIDIA GeForce RTX 4050 Laptop GPU
968 MB/s -7%
Asus VivoBook Pro 16 K6602VU
Intel Core i9-13900H, NVIDIA GeForce RTX 4050 Laptop GPU
966 MB/s -8%
Average Intel Core Ultra 7 155H
  (557 - 1250, n=46)
962 MB/s -8%
Dell Inspiron 16 Plus 7630
Intel Core i7-13700H, NVIDIA GeForce RTX 4060 Laptop GPU
829 MB/s -21%
AIDA64 / FP64 Ray-Trace
Lenovo Legion 5 16IRX G9
Intel Core i7-14650HX, NVIDIA GeForce RTX 4060 Laptop GPU
10316 KRay/s +40%
Asus VivoBook Pro 16 K6602VU
Intel Core i9-13900H, NVIDIA GeForce RTX 4050 Laptop GPU
7420 KRay/s +1%
Dell Inspiron 16 Plus 7640
Intel Core Ultra 7 155H, NVIDIA GeForce RTX 4060 Laptop GPU
7347 KRay/s
Dell Inspiron 16 Plus 7630
Intel Core i7-13700H, NVIDIA GeForce RTX 4060 Laptop GPU
7318 KRay/s 0%
Samsung Galaxy Book4 Ultra
Intel Core Ultra 7 155H, NVIDIA GeForce RTX 4050 Laptop GPU
7087 KRay/s -4%
Average Intel Core Ultra 7 155H
  (3569 - 9802, n=46)
6853 KRay/s -7%
Dell Inspiron 16 Plus 7620
Intel Core i7-12700H, GeForce RTX 3050 Ti Laptop GPU
6747 KRay/s -8%
AIDA64 / CPU PhotoWorxx
Samsung Galaxy Book4 Ultra
Intel Core Ultra 7 155H, NVIDIA GeForce RTX 4050 Laptop GPU
50926 MPixel/s +29%
Average Intel Core Ultra 7 155H
  (32719 - 54223, n=46)
46590 MPixel/s +18%
Dell Inspiron 16 Plus 7640
Intel Core Ultra 7 155H, NVIDIA GeForce RTX 4060 Laptop GPU
39530 MPixel/s
Asus VivoBook Pro 16 K6602VU
Intel Core i9-13900H, NVIDIA GeForce RTX 4050 Laptop GPU
38636 MPixel/s -2%
Dell Inspiron 16 Plus 7630
Intel Core i7-13700H, NVIDIA GeForce RTX 4060 Laptop GPU
37857 MPixel/s -4%
Dell Inspiron 16 Plus 7620
Intel Core i7-12700H, GeForce RTX 3050 Ti Laptop GPU
35147 MPixel/s -11%
Lenovo Legion 5 16IRX G9
Intel Core i7-14650HX, NVIDIA GeForce RTX 4060 Laptop GPU
33763 MPixel/s -15%

Teste de estresse

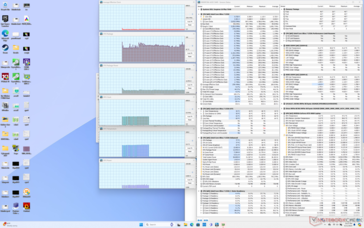
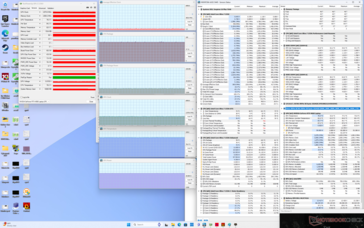
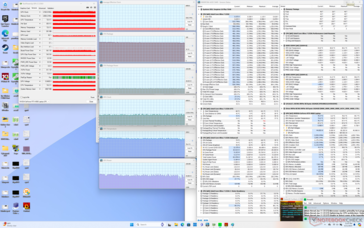
A CPU aumentaria para uma média de 3,2 GHz, 97 W e 101 C, com duração de cerca de 25 segundos ao iniciar o estresse do Prime95. Depois disso, ela cairia para ~2,3 GHz e 44 W para manter uma temperatura central mais fria de 83 C. O desempenho do Turbo Boost é, portanto, de curta duração no sistema, semelhante ao que observamos no modelo anterior.

A GPU da Nvidia se estabilizaria em 2070 MHz, 76 °C e 60 W durante a execução Witcher 3 em comparação com 2250 MHz, 72 C e 69 W no modelo do ano passado em condições de teste semelhantes. Esses resultados complementam o desempenho geralmente mais lento em jogos, conforme detalhado na seção Desempenho em jogos abaixo. A potência da GPU no novo modelo da Dell atingiria um teto de 60 W em comparação com 70 W no modelo mais antigo da Dell, mesmo quando configurado no modo Desempenho.

Sistema ocioso
Sistema ocioso
Witcher 3 estresse
Witcher 3 estresse
Estresse Prime95
Estresse Prime95
Estresse do Prime95+FurMark
Clock médio da CPU (GHz) Clock da GPU (MHz) Temperatura média da CPU (°C) Temperatura média da GPU (°C)
Sistema ocioso -- -- 63 45
Estresse doPrime95 2.1 - 2.4 -- 83 56
Prime95 + FurMark Stress 0.5 2160 74 70
Witcher 3 Estresse 0,4 2070 77 77

Desempenho do sistema

Os resultados do PCMark são comparáveis aos do modelo do ano passado, apesar da atualização da CPU, mostrando que o modelo mais novo não é necessariamente mais rápido quando se trata da maioria das operações cotidianas.

PCMark 10 Standard
PCMark 10 Standard
PCMark 10 / Score
Dell Inspiron 16 Plus 7630
NVIDIA GeForce RTX 4060 Laptop GPU, i7-13700H, WD PC SN740 SDDPTQD-1T00
7661 Points +9%
Lenovo Legion 5 16IRX G9
NVIDIA GeForce RTX 4060 Laptop GPU, i7-14650HX, Samsung PM9A1 MZVL21T0HCLR
7645 Points +9%
Asus VivoBook Pro 16 K6602VU
NVIDIA GeForce RTX 4050 Laptop GPU, i9-13900H, Micron 2400 MTFDKBA1T0QFM
7054 Points 0%
Dell Inspiron 16 Plus 7640
NVIDIA GeForce RTX 4060 Laptop GPU, Ultra 7 155H, SK hynix BC901 HFS001TEJ4X164N
7042 Points
Average Intel Core Ultra 7 155H, NVIDIA GeForce RTX 4060 Laptop GPU
  (6751 - 7370, n=5)
6985 Points -1%
Samsung Galaxy Book4 Ultra
NVIDIA GeForce RTX 4050 Laptop GPU, Ultra 7 155H, Samsung PM9A1 MZVL2512HCJQ
6973 Points -1%
Dell Inspiron 16 Plus 7620
GeForce RTX 3050 Ti Laptop GPU, i7-12700H, Kioxia BG5 KBG50ZNS512G
6846 Points -3%
PCMark 10 / Essentials
Dell Inspiron 16 Plus 7630
NVIDIA GeForce RTX 4060 Laptop GPU, i7-13700H, WD PC SN740 SDDPTQD-1T00
11200 Points +9%
Lenovo Legion 5 16IRX G9
NVIDIA GeForce RTX 4060 Laptop GPU, i7-14650HX, Samsung PM9A1 MZVL21T0HCLR
10804 Points +5%
Samsung Galaxy Book4 Ultra
NVIDIA GeForce RTX 4050 Laptop GPU, Ultra 7 155H, Samsung PM9A1 MZVL2512HCJQ
10446 Points +2%
Dell Inspiron 16 Plus 7640
NVIDIA GeForce RTX 4060 Laptop GPU, Ultra 7 155H, SK hynix BC901 HFS001TEJ4X164N
10279 Points
Asus VivoBook Pro 16 K6602VU
NVIDIA GeForce RTX 4050 Laptop GPU, i9-13900H, Micron 2400 MTFDKBA1T0QFM
10237 Points 0%
Dell Inspiron 16 Plus 7620
GeForce RTX 3050 Ti Laptop GPU, i7-12700H, Kioxia BG5 KBG50ZNS512G
10172 Points -1%
Average Intel Core Ultra 7 155H, NVIDIA GeForce RTX 4060 Laptop GPU
  (9476 - 10446, n=5)
10024 Points -2%
PCMark 10 / Productivity
Dell Inspiron 16 Plus 7630
NVIDIA GeForce RTX 4060 Laptop GPU, i7-13700H, WD PC SN740 SDDPTQD-1T00
9394 Points +16%
Lenovo Legion 5 16IRX G9
NVIDIA GeForce RTX 4060 Laptop GPU, i7-14650HX, Samsung PM9A1 MZVL21T0HCLR
9241 Points +14%
Samsung Galaxy Book4 Ultra
NVIDIA GeForce RTX 4050 Laptop GPU, Ultra 7 155H, Samsung PM9A1 MZVL2512HCJQ
9152 Points +13%
Dell Inspiron 16 Plus 7620
GeForce RTX 3050 Ti Laptop GPU, i7-12700H, Kioxia BG5 KBG50ZNS512G
9098 Points +13%
Average Intel Core Ultra 7 155H, NVIDIA GeForce RTX 4060 Laptop GPU
  (8079 - 9477, n=5)
8674 Points +7%
Asus VivoBook Pro 16 K6602VU
NVIDIA GeForce RTX 4050 Laptop GPU, i9-13900H, Micron 2400 MTFDKBA1T0QFM
8667 Points +7%
Dell Inspiron 16 Plus 7640
NVIDIA GeForce RTX 4060 Laptop GPU, Ultra 7 155H, SK hynix BC901 HFS001TEJ4X164N
8079 Points
PCMark 10 / Digital Content Creation
Lenovo Legion 5 16IRX G9
NVIDIA GeForce RTX 4060 Laptop GPU, i7-14650HX, Samsung PM9A1 MZVL21T0HCLR
12144 Points +6%
Dell Inspiron 16 Plus 7630
NVIDIA GeForce RTX 4060 Laptop GPU, i7-13700H, WD PC SN740 SDDPTQD-1T00
11598 Points +2%
Dell Inspiron 16 Plus 7640
NVIDIA GeForce RTX 4060 Laptop GPU, Ultra 7 155H, SK hynix BC901 HFS001TEJ4X164N
11413 Points
Asus VivoBook Pro 16 K6602VU
NVIDIA GeForce RTX 4050 Laptop GPU, i9-13900H, Micron 2400 MTFDKBA1T0QFM
10737 Points -6%
Average Intel Core Ultra 7 155H, NVIDIA GeForce RTX 4060 Laptop GPU
  (9811 - 11620, n=5)
10672 Points -6%
Samsung Galaxy Book4 Ultra
NVIDIA GeForce RTX 4050 Laptop GPU, Ultra 7 155H, Samsung PM9A1 MZVL2512HCJQ
9624 Points -16%
Dell Inspiron 16 Plus 7620
GeForce RTX 3050 Ti Laptop GPU, i7-12700H, Kioxia BG5 KBG50ZNS512G
9409 Points -18%
CrossMark / Overall
Lenovo Legion 5 16IRX G9
NVIDIA GeForce RTX 4060 Laptop GPU, i7-14650HX, Samsung PM9A1 MZVL21T0HCLR
2092 Points +24%
Dell Inspiron 16 Plus 7630
NVIDIA GeForce RTX 4060 Laptop GPU, i7-13700H, WD PC SN740 SDDPTQD-1T00
1849 Points +10%
Dell Inspiron 16 Plus 7620
GeForce RTX 3050 Ti Laptop GPU, i7-12700H, Kioxia BG5 KBG50ZNS512G
1740 Points +3%
Samsung Galaxy Book4 Ultra
NVIDIA GeForce RTX 4050 Laptop GPU, Ultra 7 155H, Samsung PM9A1 MZVL2512HCJQ
1740 Points +3%
Asus VivoBook Pro 16 K6602VU
NVIDIA GeForce RTX 4050 Laptop GPU, i9-13900H, Micron 2400 MTFDKBA1T0QFM
1724 Points +2%
Dell Inspiron 16 Plus 7640
NVIDIA GeForce RTX 4060 Laptop GPU, Ultra 7 155H, SK hynix BC901 HFS001TEJ4X164N
1685 Points
Average Intel Core Ultra 7 155H, NVIDIA GeForce RTX 4060 Laptop GPU
  (1540 - 1746, n=5)
1680 Points 0%
CrossMark / Productivity
Lenovo Legion 5 16IRX G9
NVIDIA GeForce RTX 4060 Laptop GPU, i7-14650HX, Samsung PM9A1 MZVL21T0HCLR
1938 Points +22%
Dell Inspiron 16 Plus 7630
NVIDIA GeForce RTX 4060 Laptop GPU, i7-13700H, WD PC SN740 SDDPTQD-1T00
1743 Points +9%
Asus VivoBook Pro 16 K6602VU
NVIDIA GeForce RTX 4050 Laptop GPU, i9-13900H, Micron 2400 MTFDKBA1T0QFM
1666 Points +5%
Samsung Galaxy Book4 Ultra
NVIDIA GeForce RTX 4050 Laptop GPU, Ultra 7 155H, Samsung PM9A1 MZVL2512HCJQ
1659 Points +4%
Dell Inspiron 16 Plus 7620
GeForce RTX 3050 Ti Laptop GPU, i7-12700H, Kioxia BG5 KBG50ZNS512G
1651 Points +4%
Average Intel Core Ultra 7 155H, NVIDIA GeForce RTX 4060 Laptop GPU
  (1436 - 1684, n=5)
1604 Points +1%
Dell Inspiron 16 Plus 7640
NVIDIA GeForce RTX 4060 Laptop GPU, Ultra 7 155H, SK hynix BC901 HFS001TEJ4X164N
1592 Points
CrossMark / Creativity
Lenovo Legion 5 16IRX G9
NVIDIA GeForce RTX 4060 Laptop GPU, i7-14650HX, Samsung PM9A1 MZVL21T0HCLR
2336 Points +21%
Dell Inspiron 16 Plus 7630
NVIDIA GeForce RTX 4060 Laptop GPU, i7-13700H, WD PC SN740 SDDPTQD-1T00
2064 Points +7%
Samsung Galaxy Book4 Ultra
NVIDIA GeForce RTX 4050 Laptop GPU, Ultra 7 155H, Samsung PM9A1 MZVL2512HCJQ
1930 Points 0%
Dell Inspiron 16 Plus 7640
NVIDIA GeForce RTX 4060 Laptop GPU, Ultra 7 155H, SK hynix BC901 HFS001TEJ4X164N
1929 Points
Dell Inspiron 16 Plus 7620
GeForce RTX 3050 Ti Laptop GPU, i7-12700H, Kioxia BG5 KBG50ZNS512G
1916 Points -1%
Average Intel Core Ultra 7 155H, NVIDIA GeForce RTX 4060 Laptop GPU
  (1811 - 1929, n=5)
1862 Points -3%
Asus VivoBook Pro 16 K6602VU
NVIDIA GeForce RTX 4050 Laptop GPU, i9-13900H, Micron 2400 MTFDKBA1T0QFM
1860 Points -4%
CrossMark / Responsiveness
Lenovo Legion 5 16IRX G9
NVIDIA GeForce RTX 4060 Laptop GPU, i7-14650HX, Samsung PM9A1 MZVL21T0HCLR
1889 Points +42%
Dell Inspiron 16 Plus 7630
NVIDIA GeForce RTX 4060 Laptop GPU, i7-13700H, WD PC SN740 SDDPTQD-1T00
1589 Points +19%
Asus VivoBook Pro 16 K6602VU
NVIDIA GeForce RTX 4050 Laptop GPU, i9-13900H, Micron 2400 MTFDKBA1T0QFM
1524 Points +14%
Dell Inspiron 16 Plus 7620
GeForce RTX 3050 Ti Laptop GPU, i7-12700H, Kioxia BG5 KBG50ZNS512G
1523 Points +14%
Samsung Galaxy Book4 Ultra
NVIDIA GeForce RTX 4050 Laptop GPU, Ultra 7 155H, Samsung PM9A1 MZVL2512HCJQ
1467 Points +10%
Average Intel Core Ultra 7 155H, NVIDIA GeForce RTX 4060 Laptop GPU
  (1165 - 1631, n=5)
1431 Points +7%
Dell Inspiron 16 Plus 7640
NVIDIA GeForce RTX 4060 Laptop GPU, Ultra 7 155H, SK hynix BC901 HFS001TEJ4X164N
1333 Points
WebXPRT 3 / Overall
Dell Inspiron 16 Plus 7630
NVIDIA GeForce RTX 4060 Laptop GPU, i7-13700H, WD PC SN740 SDDPTQD-1T00
314 Points +8%
Lenovo Legion 5 16IRX G9
NVIDIA GeForce RTX 4060 Laptop GPU, i7-14650HX, Samsung PM9A1 MZVL21T0HCLR
311 Points +7%
Dell Inspiron 16 Plus 7620
GeForce RTX 3050 Ti Laptop GPU, i7-12700H, Kioxia BG5 KBG50ZNS512G
291 Points 0%
Dell Inspiron 16 Plus 7640
NVIDIA GeForce RTX 4060 Laptop GPU, Ultra 7 155H, SK hynix BC901 HFS001TEJ4X164N
290 Points
Average Intel Core Ultra 7 155H, NVIDIA GeForce RTX 4060 Laptop GPU
  (274 - 290, n=5)
283 Points -2%
Samsung Galaxy Book4 Ultra
NVIDIA GeForce RTX 4050 Laptop GPU, Ultra 7 155H, Samsung PM9A1 MZVL2512HCJQ
281 Points -3%
WebXPRT 4 / Overall
Lenovo Legion 5 16IRX G9
NVIDIA GeForce RTX 4060 Laptop GPU, i7-14650HX, Samsung PM9A1 MZVL21T0HCLR
283 Points +10%
Dell Inspiron 16 Plus 7630
NVIDIA GeForce RTX 4060 Laptop GPU, i7-13700H, WD PC SN740 SDDPTQD-1T00
274 Points +7%
Dell Inspiron 16 Plus 7620
GeForce RTX 3050 Ti Laptop GPU, i7-12700H, Kioxia BG5 KBG50ZNS512G
258 Points 0%
Samsung Galaxy Book4 Ultra
NVIDIA GeForce RTX 4050 Laptop GPU, Ultra 7 155H, Samsung PM9A1 MZVL2512HCJQ
258 Points 0%
Dell Inspiron 16 Plus 7640
NVIDIA GeForce RTX 4060 Laptop GPU, Ultra 7 155H, SK hynix BC901 HFS001TEJ4X164N
257 Points
Average Intel Core Ultra 7 155H, NVIDIA GeForce RTX 4060 Laptop GPU
  (236 - 262, n=5)
251 Points -2%
Asus VivoBook Pro 16 K6602VU
NVIDIA GeForce RTX 4050 Laptop GPU, i9-13900H, Micron 2400 MTFDKBA1T0QFM
233 Points -9%
Mozilla Kraken 1.1 / Total
Average Intel Core Ultra 7 155H, NVIDIA GeForce RTX 4060 Laptop GPU
  (519 - 585, n=5)
548 ms * -6%
Asus VivoBook Pro 16 K6602VU
NVIDIA GeForce RTX 4050 Laptop GPU, i9-13900H, Micron 2400 MTFDKBA1T0QFM
545 ms * -5%
Dell Inspiron 16 Plus 7620
GeForce RTX 3050 Ti Laptop GPU, i7-12700H, Kioxia BG5 KBG50ZNS512G
530 ms * -2%
Dell Inspiron 16 Plus 7640
NVIDIA GeForce RTX 4060 Laptop GPU, Ultra 7 155H, SK hynix BC901 HFS001TEJ4X164N
519 ms *
Dell Inspiron 16 Plus 7630
NVIDIA GeForce RTX 4060 Laptop GPU, i7-13700H, WD PC SN740 SDDPTQD-1T00
500 ms * +4%
Lenovo Legion 5 16IRX G9
NVIDIA GeForce RTX 4060 Laptop GPU, i7-14650HX, Samsung PM9A1 MZVL21T0HCLR
486 ms * +6%
Samsung Galaxy Book4 Ultra
NVIDIA GeForce RTX 4050 Laptop GPU, Ultra 7 155H, Samsung PM9A1 MZVL2512HCJQ
416.4 ms * +20%

* ... smaller is better

PCMark 10 Score
7042 pontos
Ajuda
AIDA64 / Memory Copy
Samsung Galaxy Book4 Ultra
Intel Core Ultra 7 155H, NVIDIA GeForce RTX 4050 Laptop GPU
90918 MB/s +43%
Average Intel Core Ultra 7 155H
  (62397 - 96791, n=46)
83126 MB/s +31%
Dell Inspiron 16 Plus 7640
Intel Core Ultra 7 155H, NVIDIA GeForce RTX 4060 Laptop GPU
63520 MB/s
Lenovo Legion 5 16IRX G9
Intel Core i7-14650HX, NVIDIA GeForce RTX 4060 Laptop GPU
59727 MB/s -6%
Dell Inspiron 16 Plus 7630
Intel Core i7-13700H, NVIDIA GeForce RTX 4060 Laptop GPU
59555 MB/s -6%
Asus VivoBook Pro 16 K6602VU
Intel Core i9-13900H, NVIDIA GeForce RTX 4050 Laptop GPU
59266 MB/s -7%
Dell Inspiron 16 Plus 7620
Intel Core i7-12700H, GeForce RTX 3050 Ti Laptop GPU
54375 MB/s -14%
AIDA64 / Memory Read
Samsung Galaxy Book4 Ultra
Intel Core Ultra 7 155H, NVIDIA GeForce RTX 4050 Laptop GPU
89474 MB/s +16%
Average Intel Core Ultra 7 155H
  (60544 - 90647, n=46)
80035 MB/s +4%
Dell Inspiron 16 Plus 7640
Intel Core Ultra 7 155H, NVIDIA GeForce RTX 4060 Laptop GPU
77153 MB/s
Lenovo Legion 5 16IRX G9
Intel Core i7-14650HX, NVIDIA GeForce RTX 4060 Laptop GPU
71455 MB/s -7%
Dell Inspiron 16 Plus 7630
Intel Core i7-13700H, NVIDIA GeForce RTX 4060 Laptop GPU
68066 MB/s -12%
Asus VivoBook Pro 16 K6602VU
Intel Core i9-13900H, NVIDIA GeForce RTX 4050 Laptop GPU
67398 MB/s -13%
Dell Inspiron 16 Plus 7620
Intel Core i7-12700H, GeForce RTX 3050 Ti Laptop GPU
62046 MB/s -20%
AIDA64 / Memory Write
Samsung Galaxy Book4 Ultra
Intel Core Ultra 7 155H, NVIDIA GeForce RTX 4050 Laptop GPU
75813 MB/s +16%
Average Intel Core Ultra 7 155H
  (58692 - 93451, n=46)
72600 MB/s +11%
Dell Inspiron 16 Plus 7640
Intel Core Ultra 7 155H, NVIDIA GeForce RTX 4060 Laptop GPU
65616 MB/s
Asus VivoBook Pro 16 K6602VU
Intel Core i9-13900H, NVIDIA GeForce RTX 4050 Laptop GPU
60548 MB/s -8%
Dell Inspiron 16 Plus 7630
Intel Core i7-13700H, NVIDIA GeForce RTX 4060 Laptop GPU
59733 MB/s -9%
Dell Inspiron 16 Plus 7620
Intel Core i7-12700H, GeForce RTX 3050 Ti Laptop GPU
57432 MB/s -12%
Lenovo Legion 5 16IRX G9
Intel Core i7-14650HX, NVIDIA GeForce RTX 4060 Laptop GPU
51138 MB/s -22%
AIDA64 / Memory Latency
Average Intel Core Ultra 7 155H
  (116.2 - 233, n=46)
143.6 ns * -19%
Samsung Galaxy Book4 Ultra
Intel Core Ultra 7 155H, NVIDIA GeForce RTX 4050 Laptop GPU
141.4 ns * -18%
Dell Inspiron 16 Plus 7640
Intel Core Ultra 7 155H, NVIDIA GeForce RTX 4060 Laptop GPU
120.2 ns *
Dell Inspiron 16 Plus 7620
Intel Core i7-12700H, GeForce RTX 3050 Ti Laptop GPU
94.7 ns * +21%
Dell Inspiron 16 Plus 7630
Intel Core i7-13700H, NVIDIA GeForce RTX 4060 Laptop GPU
93.7 ns * +22%
Asus VivoBook Pro 16 K6602VU
Intel Core i9-13900H, NVIDIA GeForce RTX 4050 Laptop GPU
93.7 ns * +22%
Lenovo Legion 5 16IRX G9
Intel Core i7-14650HX, NVIDIA GeForce RTX 4060 Laptop GPU
89.8 ns * +25%

* ... smaller is better

Latência DPC

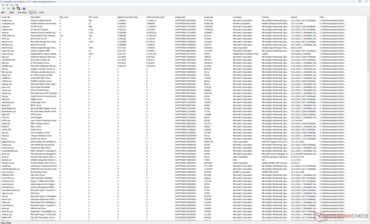
O LatencyMon revela apenas pequenos problemas de DPC ao abrir várias guias do navegador em nossa página inicial. a reprodução de vídeo 4K a 60 FPS é perfeita, sem registro de queda de quadros.

LatencyMon
LatencyMon
Lista de motoristas
Lista de motoristas
DPC Latencies / LatencyMon - interrupt to process latency (max), Web, Youtube, Prime95
Lenovo Legion 5 16IRX G9
NVIDIA GeForce RTX 4060 Laptop GPU, i7-14650HX, Samsung PM9A1 MZVL21T0HCLR
2024.9 μs * -163%
Asus VivoBook Pro 16 K6602VU
NVIDIA GeForce RTX 4050 Laptop GPU, i9-13900H, Micron 2400 MTFDKBA1T0QFM
1753.6 μs * -128%
Dell Inspiron 16 Plus 7630
NVIDIA GeForce RTX 4060 Laptop GPU, i7-13700H, WD PC SN740 SDDPTQD-1T00
1020.2 μs * -32%
Dell Inspiron 16 Plus 7620
GeForce RTX 3050 Ti Laptop GPU, i7-12700H, Kioxia BG5 KBG50ZNS512G
989.5 μs * -28%
Dell Inspiron 16 Plus 7640
NVIDIA GeForce RTX 4060 Laptop GPU, Ultra 7 155H, SK hynix BC901 HFS001TEJ4X164N
770.1 μs *
Samsung Galaxy Book4 Ultra
NVIDIA GeForce RTX 4050 Laptop GPU, Ultra 7 155H, Samsung PM9A1 MZVL2512HCJQ
596.3 μs * +23%

* ... smaller is better

Dispositivos de armazenamento

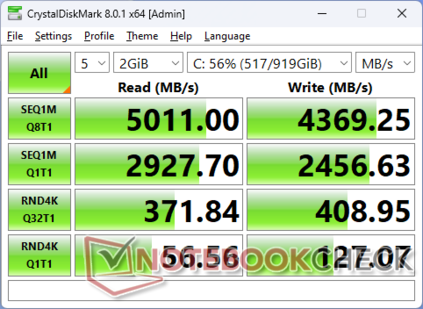
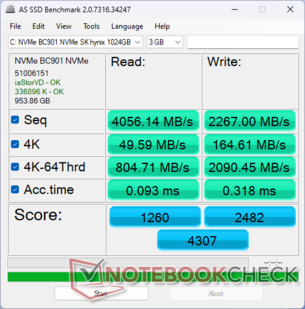
Nossa unidade de teste vem com uma unidade unidade SK Hynix mais lenta em vez da unidade Western Digital do modelo do ano passado. A unidade SK Hynix é visivelmente mais lenta, conforme demonstrado em nossos testes de benchmark, mas não apresenta nenhum problema de limitação de desempenho para taxas de transferência mais estáveis em geral.

MDL 8
MDL 8
SSD AS
SSD AS
SK hynix BC901 HFS001TEJ4X164N
CDM 5/6 Read Seq Q32T1: 4990 MB/s
CDM 5/6 Write Seq Q32T1: 4141 MB/s
CDM 5/6 Read 4K Q32T1: 371.6 MB/s
CDM 5/6 Write 4K Q32T1: 416.5 MB/s
CDM 5 Read Seq: 2923 MB/s
CDM 5 Write Seq: 2600 MB/s
CDM 5/6 Read 4K: 58.31 MB/s
CDM 5/6 Write 4K: 125.3 MB/s
Drive Performance Rating - Percent
Lenovo Legion 5 16IRX G9
Samsung PM9A1 MZVL21T0HCLR
96 pt
Samsung Galaxy Book4 Ultra
Samsung PM9A1 MZVL2512HCJQ
83.6 pt
Dell Inspiron 16 Plus 7630
WD PC SN740 SDDPTQD-1T00
63.4 pt
Asus VivoBook Pro 16 K6602VU
Micron 2400 MTFDKBA1T0QFM
50.7 pt
Dell Inspiron 16 Plus 7640
SK hynix BC901 HFS001TEJ4X164N
46.8 pt
Dell Inspiron 16 Plus 7620
Kioxia BG5 KBG50ZNS512G
44.9 pt
DiskSpd
seq read
Lenovo Legion 5 16IRX G9
Samsung PM9A1 MZVL21T0HCLR
4182 (4112.68min - 4181.96max) MB/s +86%
Samsung Galaxy Book4 Ultra
Samsung PM9A1 MZVL2512HCJQ
3712 (3688.85min - 3711.75max) MB/s +65%
Dell Inspiron 16 Plus 7630
WD PC SN740 SDDPTQD-1T00
3156 (3078.2min - 3156.21max) MB/s +40%
Dell Inspiron 16 Plus 7620
Kioxia BG5 KBG50ZNS512G
2355 (2335.33min - 2354.8max) MB/s +5%
Dell Inspiron 16 Plus 7640
SK hynix BC901 HFS001TEJ4X164N
2253 (2222.1min - 2252.66max) MB/s
Asus VivoBook Pro 16 K6602VU
Micron 2400 MTFDKBA1T0QFM
1939 (1922.39min - 1939.24max) MB/s -14%
seq write
Samsung Galaxy Book4 Ultra
Samsung PM9A1 MZVL2512HCJQ
4152 (3343.49min - 4151.61max) MB/s +75%
Lenovo Legion 5 16IRX G9
Samsung PM9A1 MZVL21T0HCLR
4064 (3527.07min - 4064.49max) MB/s +72%
Dell Inspiron 16 Plus 7630
WD PC SN740 SDDPTQD-1T00
3503 (3341.99min - 3503.29max) MB/s +48%
Asus VivoBook Pro 16 K6602VU
Micron 2400 MTFDKBA1T0QFM
2433 (2278.56min - 2432.65max) MB/s +3%
Dell Inspiron 16 Plus 7640
SK hynix BC901 HFS001TEJ4X164N
2368 (2226.29min - 2367.89max) MB/s
Dell Inspiron 16 Plus 7620
Kioxia BG5 KBG50ZNS512G
2020 (1893.72min - 2020.34max) MB/s -15%
seq q8 t1 read
Lenovo Legion 5 16IRX G9
Samsung PM9A1 MZVL21T0HCLR
6651 (5971.64min - 6651.33max) MB/s +102%
Samsung Galaxy Book4 Ultra
Samsung PM9A1 MZVL2512HCJQ
5759 (4945.05min - 5758.78max) MB/s +75%
Dell Inspiron 16 Plus 7630
WD PC SN740 SDDPTQD-1T00
5187 (4478.95min - 5186.89max) MB/s +58%
Asus VivoBook Pro 16 K6602VU
Micron 2400 MTFDKBA1T0QFM
4529 (3752.85min - 4529.22max) MB/s +38%
Dell Inspiron 16 Plus 7640
SK hynix BC901 HFS001TEJ4X164N
3290 (2756.65min - 3289.51max) MB/s
Dell Inspiron 16 Plus 7620
Kioxia BG5 KBG50ZNS512G
2569 (2176.89min - 2569.43max) MB/s -22%
seq q8 t1 write
Samsung Galaxy Book4 Ultra
Samsung PM9A1 MZVL2512HCJQ
5032 (4977.28min - 5031.91max) MB/s +24%
Lenovo Legion 5 16IRX G9
Samsung PM9A1 MZVL21T0HCLR
4952 (4919.08min - 4952.42max) MB/s +22%
Dell Inspiron 16 Plus 7630
WD PC SN740 SDDPTQD-1T00
4824 (4712.92min - 4824.08max) MB/s +19%
Dell Inspiron 16 Plus 7640
SK hynix BC901 HFS001TEJ4X164N
4053 (3806.69min - 4053.03max) MB/s
Asus VivoBook Pro 16 K6602VU
Micron 2400 MTFDKBA1T0QFM
3154 (3143.42min - 3153.68max) MB/s -22%
Dell Inspiron 16 Plus 7620
Kioxia BG5 KBG50ZNS512G
2752 (2520.98min - 2752.46max) MB/s -32%
4k q1 t1 read
Lenovo Legion 5 16IRX G9
Samsung PM9A1 MZVL21T0HCLR
83.9 (83.66min - 83.86max) MB/s +89%
Samsung Galaxy Book4 Ultra
Samsung PM9A1 MZVL2512HCJQ
78.3 (76.54min - 78.34max) MB/s +76%
Dell Inspiron 16 Plus 7630
WD PC SN740 SDDPTQD-1T00
73.2 (70.67min - 73.2max) MB/s +64%
Dell Inspiron 16 Plus 7620
Kioxia BG5 KBG50ZNS512G
62.7 (61.51min - 62.72max) MB/s +41%
Dell Inspiron 16 Plus 7640
SK hynix BC901 HFS001TEJ4X164N
44.5 (43.13min - 44.5max) MB/s
Asus VivoBook Pro 16 K6602VU
Micron 2400 MTFDKBA1T0QFM
14.6 (12.18min - 14.59max) MB/s -67%
4k q1 t1 write
Lenovo Legion 5 16IRX G9
Samsung PM9A1 MZVL21T0HCLR
246 (236.18min - 245.56max) MB/s +100%
Asus VivoBook Pro 16 K6602VU
Micron 2400 MTFDKBA1T0QFM
205 (179.98min - 205.28max) MB/s +67%
Samsung Galaxy Book4 Ultra
Samsung PM9A1 MZVL2512HCJQ
164.2 (156.89min - 164.15max) MB/s +33%
Dell Inspiron 16 Plus 7620
Kioxia BG5 KBG50ZNS512G
162.6 (156.2min - 162.6max) MB/s +32%
Dell Inspiron 16 Plus 7630
WD PC SN740 SDDPTQD-1T00
158.8 (155.42min - 158.82max) MB/s +29%
Dell Inspiron 16 Plus 7640
SK hynix BC901 HFS001TEJ4X164N
123 (117.55min - 122.97max) MB/s
4k q32 t16 read
Lenovo Legion 5 16IRX G9
Samsung PM9A1 MZVL21T0HCLR
4010 (4002.81min - 4009.85max) MB/s +597%
Samsung Galaxy Book4 Ultra
Samsung PM9A1 MZVL2512HCJQ
2181 (2156.61min - 2181.46max) MB/s +279%
Asus VivoBook Pro 16 K6602VU
Micron 2400 MTFDKBA1T0QFM
1015 (955.09min - 1015.02max) MB/s +77%
Dell Inspiron 16 Plus 7630
WD PC SN740 SDDPTQD-1T00
725 (704.24min - 724.66max) MB/s +26%
Dell Inspiron 16 Plus 7620
Kioxia BG5 KBG50ZNS512G
652 (637.52min - 651.63max) MB/s +13%
Dell Inspiron 16 Plus 7640
SK hynix BC901 HFS001TEJ4X164N
575 (568.91min - 575.1max) MB/s
4k q32 t16 write
Samsung Galaxy Book4 Ultra
Samsung PM9A1 MZVL2512HCJQ
3101 (2756.05min - 3100.73max) MB/s +687%
Lenovo Legion 5 16IRX G9
Samsung PM9A1 MZVL21T0HCLR
2646 (2422.02min - 2645.88max) MB/s +572%
Asus VivoBook Pro 16 K6602VU
Micron 2400 MTFDKBA1T0QFM
649 (615.74min - 649.21max) MB/s +65%
Dell Inspiron 16 Plus 7630
WD PC SN740 SDDPTQD-1T00
513 (490.37min - 513.26max) MB/s +30%
Dell Inspiron 16 Plus 7620
Kioxia BG5 KBG50ZNS512G
408 (386.27min - 408.12max) MB/s +4%
Dell Inspiron 16 Plus 7640
SK hynix BC901 HFS001TEJ4X164N
394 (375.37min - 394.14max) MB/s
AS SSD
Score Total
Lenovo Legion 5 16IRX G9
Samsung PM9A1 MZVL21T0HCLR
8677 Points +101%
Samsung Galaxy Book4 Ultra
Samsung PM9A1 MZVL2512HCJQ
7043 Points +64%
Dell Inspiron 16 Plus 7630
WD PC SN740 SDDPTQD-1T00
4383 Points +2%
Dell Inspiron 16 Plus 7640
SK hynix BC901 HFS001TEJ4X164N
4307 Points
Asus VivoBook Pro 16 K6602VU
Micron 2400 MTFDKBA1T0QFM
4175 Points -3%
Dell Inspiron 16 Plus 7620
Kioxia BG5 KBG50ZNS512G
2529 Points -41%
Score Read
Lenovo Legion 5 16IRX G9
Samsung PM9A1 MZVL21T0HCLR
3242 Points +157%
Samsung Galaxy Book4 Ultra
Samsung PM9A1 MZVL2512HCJQ
2413 Points +92%
Asus VivoBook Pro 16 K6602VU
Micron 2400 MTFDKBA1T0QFM
1675 Points +33%
Dell Inspiron 16 Plus 7630
WD PC SN740 SDDPTQD-1T00
1459 Points +16%
Dell Inspiron 16 Plus 7640
SK hynix BC901 HFS001TEJ4X164N
1260 Points
Dell Inspiron 16 Plus 7620
Kioxia BG5 KBG50ZNS512G
1190 Points -6%
Score Write
Lenovo Legion 5 16IRX G9
Samsung PM9A1 MZVL21T0HCLR
3846 Points +55%
Samsung Galaxy Book4 Ultra
Samsung PM9A1 MZVL2512HCJQ
3462 Points +39%
Dell Inspiron 16 Plus 7640
SK hynix BC901 HFS001TEJ4X164N
2482 Points
Dell Inspiron 16 Plus 7630
WD PC SN740 SDDPTQD-1T00
2233 Points -10%
Asus VivoBook Pro 16 K6602VU
Micron 2400 MTFDKBA1T0QFM
1707 Points -31%
Dell Inspiron 16 Plus 7620
Kioxia BG5 KBG50ZNS512G
762 Points -69%
Seq Read
Lenovo Legion 5 16IRX G9
Samsung PM9A1 MZVL21T0HCLR
5413 MB/s +33%
Samsung Galaxy Book4 Ultra
Samsung PM9A1 MZVL2512HCJQ
5351 MB/s +32%
Dell Inspiron 16 Plus 7630
WD PC SN740 SDDPTQD-1T00
4349.04 MB/s +7%
Dell Inspiron 16 Plus 7640
SK hynix BC901 HFS001TEJ4X164N
4056.14 MB/s
Asus VivoBook Pro 16 K6602VU
Micron 2400 MTFDKBA1T0QFM
3615.69 MB/s -11%
Dell Inspiron 16 Plus 7620
Kioxia BG5 KBG50ZNS512G
2693.29 MB/s -34%
Seq Write
Lenovo Legion 5 16IRX G9
Samsung PM9A1 MZVL21T0HCLR
3979 MB/s +76%
Samsung Galaxy Book4 Ultra
Samsung PM9A1 MZVL2512HCJQ
3925 MB/s +73%
Dell Inspiron 16 Plus 7630
WD PC SN740 SDDPTQD-1T00
2904.62 MB/s +28%
Dell Inspiron 16 Plus 7640
SK hynix BC901 HFS001TEJ4X164N
2267 MB/s
Asus VivoBook Pro 16 K6602VU
Micron 2400 MTFDKBA1T0QFM
2237.69 MB/s -1%
Dell Inspiron 16 Plus 7620
Kioxia BG5 KBG50ZNS512G
1683.46 MB/s -26%
4K Read
Lenovo Legion 5 16IRX G9
Samsung PM9A1 MZVL21T0HCLR
81.2 MB/s +64%
Dell Inspiron 16 Plus 7630
WD PC SN740 SDDPTQD-1T00
65.43 MB/s +32%
Samsung Galaxy Book4 Ultra
Samsung PM9A1 MZVL2512HCJQ
65.3 MB/s +32%
Dell Inspiron 16 Plus 7620
Kioxia BG5 KBG50ZNS512G
65.01 MB/s +31%
Asus VivoBook Pro 16 K6602VU
Micron 2400 MTFDKBA1T0QFM
50.14 MB/s +1%
Dell Inspiron 16 Plus 7640
SK hynix BC901 HFS001TEJ4X164N
49.59 MB/s
4K Write
Asus VivoBook Pro 16 K6602VU
Micron 2400 MTFDKBA1T0QFM
287.67 MB/s +75%
Dell Inspiron 16 Plus 7630
WD PC SN740 SDDPTQD-1T00
225.06 MB/s +37%
Dell Inspiron 16 Plus 7620
Kioxia BG5 KBG50ZNS512G
197.81 MB/s +20%
Lenovo Legion 5 16IRX G9
Samsung PM9A1 MZVL21T0HCLR
194.6 MB/s +18%
Dell Inspiron 16 Plus 7640
SK hynix BC901 HFS001TEJ4X164N
164.61 MB/s
Samsung Galaxy Book4 Ultra
Samsung PM9A1 MZVL2512HCJQ
153.2 MB/s -7%
4K-64 Read
Lenovo Legion 5 16IRX G9
Samsung PM9A1 MZVL21T0HCLR
2619 MB/s +225%
Samsung Galaxy Book4 Ultra
Samsung PM9A1 MZVL2512HCJQ
1813 MB/s +125%
Asus VivoBook Pro 16 K6602VU
Micron 2400 MTFDKBA1T0QFM
1263.15 MB/s +57%
Dell Inspiron 16 Plus 7630
WD PC SN740 SDDPTQD-1T00
959.03 MB/s +19%
Dell Inspiron 16 Plus 7620
Kioxia BG5 KBG50ZNS512G
855.48 MB/s +6%
Dell Inspiron 16 Plus 7640
SK hynix BC901 HFS001TEJ4X164N
804.71 MB/s
4K-64 Write
Lenovo Legion 5 16IRX G9
Samsung PM9A1 MZVL21T0HCLR
3253 MB/s +56%
Samsung Galaxy Book4 Ultra
Samsung PM9A1 MZVL2512HCJQ
2916 MB/s +39%
Dell Inspiron 16 Plus 7640
SK hynix BC901 HFS001TEJ4X164N
2090.45 MB/s
Dell Inspiron 16 Plus 7630
WD PC SN740 SDDPTQD-1T00
1717.85 MB/s -18%
Asus VivoBook Pro 16 K6602VU
Micron 2400 MTFDKBA1T0QFM
1195.4 MB/s -43%
Dell Inspiron 16 Plus 7620
Kioxia BG5 KBG50ZNS512G
395.8 MB/s -81%
Access Time Read
Asus VivoBook Pro 16 K6602VU
Micron 2400 MTFDKBA1T0QFM
0.116 ms * -25%
Dell Inspiron 16 Plus 7640
SK hynix BC901 HFS001TEJ4X164N
0.093 ms *
Dell Inspiron 16 Plus 7620
Kioxia BG5 KBG50ZNS512G
0.078 ms * +16%
Dell Inspiron 16 Plus 7630
WD PC SN740 SDDPTQD-1T00
0.057 ms * +39%
Samsung Galaxy Book4 Ultra
Samsung PM9A1 MZVL2512HCJQ
0.033 ms * +65%
Lenovo Legion 5 16IRX G9
Samsung PM9A1 MZVL21T0HCLR
0.021 ms * +77%
Access Time Write
Dell Inspiron 16 Plus 7640
SK hynix BC901 HFS001TEJ4X164N
0.318 ms *
Asus VivoBook Pro 16 K6602VU
Micron 2400 MTFDKBA1T0QFM
0.104 ms * +67%
Dell Inspiron 16 Plus 7630
WD PC SN740 SDDPTQD-1T00
0.07 ms * +78%
Dell Inspiron 16 Plus 7620
Kioxia BG5 KBG50ZNS512G
0.06 ms * +81%
Samsung Galaxy Book4 Ultra
Samsung PM9A1 MZVL2512HCJQ
0.027 ms * +92%
Lenovo Legion 5 16IRX G9
Samsung PM9A1 MZVL21T0HCLR
0.02 ms * +94%

* ... smaller is better

Disk Throttling: DiskSpd Read Loop, Queue Depth 8

02655307951060132515901855212023852650291531803445371039754240450547705035Tooltip
Dell Inspiron 16 Plus 7640 SK hynix BC901 HFS001TEJ4X164N; diskspd 2.0.17 f: Ø3418 (2978.08-3468.04)
Dell Inspiron 16 Plus 7630 WD PC SN740 SDDPTQD-1T00: Ø3914 (2328.05-5205.69)

Desempenho da GPU

As opções de GPU da Nvidia permanecem as mesmas com GeForce RTX 4050 e 4060 opções. os resultados do 3DMark são alguns pontos percentuais mais altos do que antes, mas isso infelizmente não se traduz em desempenho real em jogos.

Espera-se que o downgrade para a RTX 4050 afete o desempenho em apenas 10%. Optar por nenhuma placa de vídeo discreta terá um impacto muito mais significativo no desempenho, de 60% a 80%.

Perfil de energiaPontuação de gráficosPontuação de físicaPontuação combinada
Modo de desempenho224762631710876
Modo equilibrado22542 (-0%)27226 (-0%)10829 (-0%)
Energia da bateria21957 (-2%)26817 (-0%)9623 (-12%)

A execução no modo balanceado em vez do modo de desempenho não parece afetar o desempenho de forma significativa, conforme mostrado na tabela de resultados do site Fire Strike acima. Mesmo a execução com baterias preserva muito bem o desempenho.

Speed Way
Speed Way
Nômade de Aço
Nômade de Aço
Fire Strike Desempenho
Time Spy
Time Spy
3DMark Performance Rating - Percent
Acer Nitro 16 AN16-41
NVIDIA GeForce RTX 4070 Laptop GPU, AMD Ryzen 7 7735HS
99.6 pt
Lenovo Legion 5 16IRX G9
NVIDIA GeForce RTX 4060 Laptop GPU, Intel Core i7-14650HX
94.6 pt
Framework Laptop 16
AMD Radeon RX 7700S, AMD Ryzen 9 7940HS
86.9 pt
Average NVIDIA GeForce RTX 4060 Laptop GPU
 
85.6 pt
Lenovo Legion S7 16ARHA7
AMD Radeon RX 6800S, AMD Ryzen 9 6900HX
80.8 pt
Acer Nitro 16 AN16-41-R7YE
NVIDIA GeForce RTX 4050 Laptop GPU, AMD Ryzen 5 7535HS
73.3 pt
Dell Inspiron 16 Plus 7640
NVIDIA GeForce RTX 4060 Laptop GPU, Intel Core Ultra 7 155H
72.8 pt
Dell Inspiron 16 Plus 7630
NVIDIA GeForce RTX 4060 Laptop GPU, Intel Core i7-13700H
69.7 pt
Asus VivoBook Pro 16 K6602VU
NVIDIA GeForce RTX 4050 Laptop GPU, Intel Core i9-13900H
65.4 pt
Dell Inspiron 16 Plus 7620
NVIDIA GeForce RTX 3050 Ti Laptop GPU, Intel Core i7-12700H
46.6 pt
Acer Swift Edge SFE16 Ryzen 7 7840U
AMD Radeon 780M, AMD Ryzen 7 7840U
23.6 pt
Lenovo Yoga 7 2-in-1 16IML9
Intel Graphics 4-Cores iGPU (Arc), Intel Core Ultra 5 125U
15.8 pt
Lenovo ThinkPad E16 G1-21JUS08X00
AMD Radeon RX Vega 8 (Ryzen 4000/5000), AMD Ryzen 7 7730U
11.8 pt
Lenovo ThinkBook 16 G6 ABP
AMD Radeon RX Vega 7, AMD Ryzen 5 7530U
11.3 pt
3DMark 11 - 1280x720 Performance GPU
Acer Nitro 16 AN16-41
NVIDIA GeForce RTX 4070 Laptop GPU, AMD Ryzen 7 7735HS
40995 Points +36%
Framework Laptop 16
AMD Radeon RX 7700S, AMD Ryzen 9 7940HS
37918 Points +26%
Lenovo Legion 5 16IRX G9
NVIDIA GeForce RTX 4060 Laptop GPU, Intel Core i7-14650HX
37410 Points +24%
Lenovo Legion S7 16ARHA7
AMD Radeon RX 6800S, AMD Ryzen 9 6900HX
35198 Points +17%
Average NVIDIA GeForce RTX 4060 Laptop GPU
  (28136 - 38912, n=56)
34832 Points +16%
Acer Nitro 16 AN16-41-R7YE
NVIDIA GeForce RTX 4050 Laptop GPU, AMD Ryzen 5 7535HS
30717 Points +2%
Dell Inspiron 16 Plus 7640
NVIDIA GeForce RTX 4060 Laptop GPU, Intel Core Ultra 7 155H
30097 Points
Dell Inspiron 16 Plus 7630
NVIDIA GeForce RTX 4060 Laptop GPU, Intel Core i7-13700H
28621 Points -5%
Asus VivoBook Pro 16 K6602VU
NVIDIA GeForce RTX 4050 Laptop GPU, Intel Core i9-13900H
27686 Points -8%
Dell Inspiron 16 Plus 7620
NVIDIA GeForce RTX 3050 Ti Laptop GPU, Intel Core i7-12700H
18679 Points -38%
Acer Swift Edge SFE16 Ryzen 7 7840U
AMD Radeon 780M, AMD Ryzen 7 7840U
11636 Points -61%
Lenovo Yoga 7 2-in-1 16IML9
Intel Graphics 4-Cores iGPU (Arc), Intel Core Ultra 5 125U
6711 Points -78%
Lenovo ThinkPad E16 G1-21JUS08X00
AMD Radeon RX Vega 8 (Ryzen 4000/5000), AMD Ryzen 7 7730U
5847 Points -81%
Lenovo ThinkBook 16 G6 ABP
AMD Radeon RX Vega 7, AMD Ryzen 5 7530U
5517 Points -82%
3DMark
1920x1080 Fire Strike Graphics
Acer Nitro 16 AN16-41
NVIDIA GeForce RTX 4070 Laptop GPU, AMD Ryzen 7 7735HS
29853 Points +33%
Lenovo Legion 5 16IRX G9
NVIDIA GeForce RTX 4060 Laptop GPU, Intel Core i7-14650HX
27474 Points +22%
Average NVIDIA GeForce RTX 4060 Laptop GPU
  (20533 - 29656, n=53)
25748 Points +15%
Lenovo Legion S7 16ARHA7
AMD Radeon RX 6800S, AMD Ryzen 9 6900HX
25625 Points +14%
Framework Laptop 16
AMD Radeon RX 7700S, AMD Ryzen 9 7940HS
24246 Points +8%
Acer Nitro 16 AN16-41-R7YE
NVIDIA GeForce RTX 4050 Laptop GPU, AMD Ryzen 5 7535HS
23204 Points +3%
Dell Inspiron 16 Plus 7640
NVIDIA GeForce RTX 4060 Laptop GPU, Intel Core Ultra 7 155H
22476 Points
Dell Inspiron 16 Plus 7630
NVIDIA GeForce RTX 4060 Laptop GPU, Intel Core i7-13700H
21600 Points -4%
Asus VivoBook Pro 16 K6602VU
NVIDIA GeForce RTX 4050 Laptop GPU, Intel Core i9-13900H
20359 Points -9%
Dell Inspiron 16 Plus 7620
NVIDIA GeForce RTX 3050 Ti Laptop GPU, Intel Core i7-12700H
13760 Points -39%
Acer Swift Edge SFE16 Ryzen 7 7840U
AMD Radeon 780M, AMD Ryzen 7 7840U
7156 Points -68%
Lenovo Yoga 7 2-in-1 16IML9
Intel Graphics 4-Cores iGPU (Arc), Intel Core Ultra 5 125U
4786 Points -79%
Lenovo ThinkPad E16 G1-21JUS08X00
AMD Radeon RX Vega 8 (Ryzen 4000/5000), AMD Ryzen 7 7730U
3516 Points -84%
Lenovo ThinkBook 16 G6 ABP
AMD Radeon RX Vega 7, AMD Ryzen 5 7530U
3437 Points -85%
2560x1440 Time Spy Graphics
Acer Nitro 16 AN16-41
NVIDIA GeForce RTX 4070 Laptop GPU, AMD Ryzen 7 7735HS
11868 Points +44%
Lenovo Legion 5 16IRX G9
NVIDIA GeForce RTX 4060 Laptop GPU, Intel Core i7-14650HX
11267 Points +37%
Framework Laptop 16
AMD Radeon RX 7700S, AMD Ryzen 9 7940HS
10206 Points +24%
Average NVIDIA GeForce RTX 4060 Laptop GPU
  (7484 - 11451, n=55)
9936 Points +21%
Lenovo Legion S7 16ARHA7
AMD Radeon RX 6800S, AMD Ryzen 9 6900HX
8820 Points +7%
Acer Nitro 16 AN16-41-R7YE
NVIDIA GeForce RTX 4050 Laptop GPU, AMD Ryzen 5 7535HS
8363 Points +2%
Dell Inspiron 16 Plus 7640
NVIDIA GeForce RTX 4060 Laptop GPU, Intel Core Ultra 7 155H
8229 Points
Dell Inspiron 16 Plus 7630
NVIDIA GeForce RTX 4060 Laptop GPU, Intel Core i7-13700H
7877 Points -4%
Asus VivoBook Pro 16 K6602VU
NVIDIA GeForce RTX 4050 Laptop GPU, Intel Core i9-13900H
7391 Points -10%
Dell Inspiron 16 Plus 7620
NVIDIA GeForce RTX 3050 Ti Laptop GPU, Intel Core i7-12700H
5352 Points -35%
Acer Swift Edge SFE16 Ryzen 7 7840U
AMD Radeon 780M, AMD Ryzen 7 7840U
2363 Points -71%
Lenovo Yoga 7 2-in-1 16IML9
Intel Graphics 4-Cores iGPU (Arc), Intel Core Ultra 5 125U
1704 Points -79%
Lenovo ThinkPad E16 G1-21JUS08X00
AMD Radeon RX Vega 8 (Ryzen 4000/5000), AMD Ryzen 7 7730U
1164 Points -86%
Lenovo ThinkBook 16 G6 ABP
AMD Radeon RX Vega 7, AMD Ryzen 5 7530U
1123 Points -86%
2560x1440 Time Spy Score
Lenovo Legion 5 16IRX G9
NVIDIA GeForce RTX 4060 Laptop GPU, Intel Core i7-14650HX
11731 Points +37%
Acer Nitro 16 AN16-41
NVIDIA GeForce RTX 4070 Laptop GPU, AMD Ryzen 7 7735HS
11530 Points +34%
Framework Laptop 16
AMD Radeon RX 7700S, AMD Ryzen 9 7940HS
10294 Points +20%
Average NVIDIA GeForce RTX 4060 Laptop GPU
  (7918 - 11738, n=55)
10246 Points +19%
Lenovo Legion S7 16ARHA7
AMD Radeon RX 6800S, AMD Ryzen 9 6900HX
9060 Points +6%
Dell Inspiron 16 Plus 7640
NVIDIA GeForce RTX 4060 Laptop GPU, Intel Core Ultra 7 155H
8576 Points
Dell Inspiron 16 Plus 7630
NVIDIA GeForce RTX 4060 Laptop GPU, Intel Core i7-13700H
8240 Points -4%
Acer Nitro 16 AN16-41-R7YE
NVIDIA GeForce RTX 4050 Laptop GPU, AMD Ryzen 5 7535HS
8227 Points -4%
Asus VivoBook Pro 16 K6602VU
NVIDIA GeForce RTX 4050 Laptop GPU, Intel Core i9-13900H
7458 Points -13%
Dell Inspiron 16 Plus 7620
NVIDIA GeForce RTX 3050 Ti Laptop GPU, Intel Core i7-12700H
5835 Points -32%
Acer Swift Edge SFE16 Ryzen 7 7840U
AMD Radeon 780M, AMD Ryzen 7 7840U
2613 Points -70%
Lenovo Yoga 7 2-in-1 16IML9
Intel Graphics 4-Cores iGPU (Arc), Intel Core Ultra 5 125U
1919 Points -78%
Lenovo ThinkPad E16 G1-21JUS08X00
AMD Radeon RX Vega 8 (Ryzen 4000/5000), AMD Ryzen 7 7730U
1328 Points -85%
Lenovo ThinkBook 16 G6 ABP
AMD Radeon RX Vega 7, AMD Ryzen 5 7530U
1275 Points -85%
3DMark 11 Performance
21491 pontos
3DMark Fire Strike Score
20719 pontos
3DMark Time Spy Score
8576 pontos
3DMark Steel Nomad Score
1829 pontos
Ajuda
Blender
v3.3 Classroom HIP/AMD
Lenovo ThinkBook 16 G6 ABP
AMD Radeon RX Vega 7, AMD Ryzen 5 7530U
710 Seconds *
Lenovo ThinkPad E16 G1-21JUS08X00
AMD Radeon RX Vega 8 (Ryzen 4000/5000), AMD Ryzen 7 7730U
697 Seconds *
Lenovo Legion S7 16ARHA7
AMD Radeon RX 6800S, AMD Ryzen 9 6900HX
75 Seconds *
v3.3 Classroom OPTIX/RTX
Dell Inspiron 16 Plus 7620
NVIDIA GeForce RTX 3050 Ti Laptop GPU, Intel Core i7-12700H
49 Seconds * -104%
Asus VivoBook Pro 16 K6602VU
NVIDIA GeForce RTX 4050 Laptop GPU, Intel Core i9-13900H
29 Seconds * -21%
Dell Inspiron 16 Plus 7630
NVIDIA GeForce RTX 4060 Laptop GPU, Intel Core i7-13700H
27 Seconds * -13%
Acer Nitro 16 AN16-41-R7YE
NVIDIA GeForce RTX 4050 Laptop GPU, AMD Ryzen 5 7535HS
26 Seconds * -8%
Dell Inspiron 16 Plus 7640
NVIDIA GeForce RTX 4060 Laptop GPU, Intel Core Ultra 7 155H
24 Seconds *
Lenovo Legion 5 16IRX G9
NVIDIA GeForce RTX 4060 Laptop GPU, Intel Core i7-14650HX
23 Seconds * +4%
Average NVIDIA GeForce RTX 4060 Laptop GPU
  (19 - 28, n=52)
23 Seconds * +4%
Acer Nitro 16 AN16-41
NVIDIA GeForce RTX 4070 Laptop GPU, AMD Ryzen 7 7735HS
21 Seconds * +12%
v3.3 Classroom CUDA
Dell Inspiron 16 Plus 7620
NVIDIA GeForce RTX 3050 Ti Laptop GPU, Intel Core i7-12700H
84 Seconds * -91%
Asus VivoBook Pro 16 K6602VU
NVIDIA GeForce RTX 4050 Laptop GPU, Intel Core i9-13900H
53 Seconds * -20%
Acer Nitro 16 AN16-41-R7YE
NVIDIA GeForce RTX 4050 Laptop GPU, AMD Ryzen 5 7535HS
50 Seconds * -14%
Dell Inspiron 16 Plus 7630
NVIDIA GeForce RTX 4060 Laptop GPU, Intel Core i7-13700H
49 Seconds * -11%
Dell Inspiron 16 Plus 7640
NVIDIA GeForce RTX 4060 Laptop GPU, Intel Core Ultra 7 155H
44 Seconds *
Average NVIDIA GeForce RTX 4060 Laptop GPU
  (39 - 53, n=52)
43.2 Seconds * +2%
Lenovo Legion 5 16IRX G9
NVIDIA GeForce RTX 4060 Laptop GPU, Intel Core i7-14650HX
41 Seconds * +7%
Acer Nitro 16 AN16-41
NVIDIA GeForce RTX 4070 Laptop GPU, AMD Ryzen 7 7735HS
35 Seconds * +20%
v3.3 Classroom CPU
Lenovo Yoga 7 2-in-1 16IML9
Intel Graphics 4-Cores iGPU (Arc), Intel Core Ultra 5 125U
648 Seconds * -78%
Lenovo ThinkBook 16 G6 ABP
AMD Radeon RX Vega 7, AMD Ryzen 5 7530U
583 Seconds * -60%
Lenovo ThinkPad E16 G1-21JUS08X00
AMD Radeon RX Vega 8 (Ryzen 4000/5000), AMD Ryzen 7 7730U
524 Seconds * -44%
Acer Nitro 16 AN16-41-R7YE
NVIDIA GeForce RTX 4050 Laptop GPU, AMD Ryzen 5 7535HS
481 Seconds * -32%
Acer Swift Edge SFE16 Ryzen 7 7840U
AMD Radeon 780M, AMD Ryzen 7 7840U
460 Seconds * -26%
Dell Inspiron 16 Plus 7620
NVIDIA GeForce RTX 3050 Ti Laptop GPU, Intel Core i7-12700H
436 Seconds * -19%
Dell Inspiron 16 Plus 7630
NVIDIA GeForce RTX 4060 Laptop GPU, Intel Core i7-13700H
400 Seconds * -10%
Asus VivoBook Pro 16 K6602VU
NVIDIA GeForce RTX 4050 Laptop GPU, Intel Core i9-13900H
377 Seconds * -3%
Dell Inspiron 16 Plus 7640
NVIDIA GeForce RTX 4060 Laptop GPU, Intel Core Ultra 7 155H
365 Seconds *
Acer Nitro 16 AN16-41
NVIDIA GeForce RTX 4070 Laptop GPU, AMD Ryzen 7 7735HS
364 Seconds * -0%
Lenovo Legion S7 16ARHA7
AMD Radeon RX 6800S, AMD Ryzen 9 6900HX
361 Seconds * +1%
Framework Laptop 16
AMD Radeon RX 7700S, AMD Ryzen 9 7940HS
311 Seconds * +15%
Average NVIDIA GeForce RTX 4060 Laptop GPU
  (189 - 452, n=52)
311 Seconds * +15%
Lenovo Legion 5 16IRX G9
NVIDIA GeForce RTX 4060 Laptop GPU, Intel Core i7-14650HX
247 Seconds * +32%

* ... smaller is better

Desempenho em jogos

O desempenho em jogos não mudou e pode até ser um pouco pior do que antes. O Final Fantasy XV, por exemplo, pode ser executado 10% mais lentamente do que no Inspiron 16 Plus 7630 e déficits menores também podem ser observados em outros jogos, incluindo F1 22 e Strange Brigade.

Performance Rating - Percent
Lenovo Legion 5 16IRX G9
Intel Core i7-14650HX, NVIDIA GeForce RTX 4060 Laptop GPU
100 pt
Dell Inspiron 16 Plus 7630
Intel Core i7-13700H, NVIDIA GeForce RTX 4060 Laptop GPU
82.4 pt
Dell Inspiron 16 Plus 7640
Intel Core Ultra 7 155H, NVIDIA GeForce RTX 4060 Laptop GPU
75.8 pt
Asus VivoBook Pro 16 K6602VU
Intel Core i9-13900H, NVIDIA GeForce RTX 4050 Laptop GPU
73.5 pt
Dell Inspiron 16 Plus 7620 -1!
Intel Core i7-12700H, NVIDIA GeForce RTX 3050 Ti Laptop GPU
61.8 pt
Samsung Galaxy Book4 Ultra
Intel Core Ultra 7 155H, NVIDIA GeForce RTX 4050 Laptop GPU
59.2 pt
The Witcher 3 - 1920x1080 Ultra Graphics & Postprocessing (HBAO+)
Lenovo Legion 5 16IRX G9
Intel Core i7-14650HX, NVIDIA GeForce RTX 4060 Laptop GPU
97.2 (93min, 94P1) fps +16%
Dell Inspiron 16 Plus 7630
Intel Core i7-13700H, NVIDIA GeForce RTX 4060 Laptop GPU
90.9 (85min) fps +8%
Dell Inspiron 16 Plus 7640
Intel Core Ultra 7 155H, NVIDIA GeForce RTX 4060 Laptop GPU
84.1 (80min) fps
Asus VivoBook Pro 16 K6602VU
Intel Core i9-13900H, NVIDIA GeForce RTX 4050 Laptop GPU
76.6 (69min, 69.34P1) fps -9%
Dell Inspiron 16 Plus 7620
Intel Core i7-12700H, NVIDIA GeForce RTX 3050 Ti Laptop GPU
57 (53min) fps -32%
Samsung Galaxy Book4 Ultra
Intel Core Ultra 7 155H, NVIDIA GeForce RTX 4050 Laptop GPU
54.5 (51min, 52P1) fps -35%
Final Fantasy XV Benchmark - 1920x1080 High Quality
Lenovo Legion 5 16IRX G9
Intel Core i7-14650HX, NVIDIA GeForce RTX 4060 Laptop GPU
106.3 fps +35%
Dell Inspiron 16 Plus 7630
Intel Core i7-13700H, NVIDIA GeForce RTX 4060 Laptop GPU
88.9 fps +13%
Dell Inspiron 16 Plus 7640
Intel Core Ultra 7 155H, NVIDIA GeForce RTX 4060 Laptop GPU
78.8 fps
Asus VivoBook Pro 16 K6602VU
Intel Core i9-13900H, NVIDIA GeForce RTX 4050 Laptop GPU
75.6 fps -4%
Samsung Galaxy Book4 Ultra
Intel Core Ultra 7 155H, NVIDIA GeForce RTX 4050 Laptop GPU
56.7 fps -28%
Dell Inspiron 16 Plus 7620
Intel Core i7-12700H, NVIDIA GeForce RTX 3050 Ti Laptop GPU
54.1 fps -31%
Strange Brigade - 1920x1080 ultra AA:ultra AF:16
Lenovo Legion 5 16IRX G9
Intel Core i7-14650HX, NVIDIA GeForce RTX 4060 Laptop GPU
210 fps +37%
Dell Inspiron 16 Plus 7630
Intel Core i7-13700H, NVIDIA GeForce RTX 4060 Laptop GPU
161 (79.8min, 120.7P1) fps +5%
Dell Inspiron 16 Plus 7640
Intel Core Ultra 7 155H, NVIDIA GeForce RTX 4060 Laptop GPU
153.5 (48min, 114.7P1) fps
Asus VivoBook Pro 16 K6602VU
Intel Core i9-13900H, NVIDIA GeForce RTX 4050 Laptop GPU
132 (22.5min, 102.9P1) fps -14%
Samsung Galaxy Book4 Ultra
Intel Core Ultra 7 155H, NVIDIA GeForce RTX 4050 Laptop GPU
113 fps -26%
Dell Inspiron 16 Plus 7620
Intel Core i7-12700H, NVIDIA GeForce RTX 3050 Ti Laptop GPU
95.2 (68.1min, 72.5P1) fps -38%
Dota 2 Reborn - 1920x1080 ultra (3/3) best looking
Lenovo Legion 5 16IRX G9
Intel Core i7-14650HX, NVIDIA GeForce RTX 4060 Laptop GPU
168.7 (146.8min) fps +25%
Dell Inspiron 16 Plus 7630
Intel Core i7-13700H, NVIDIA GeForce RTX 4060 Laptop GPU
146.1 (126.2min) fps +8%
Dell Inspiron 16 Plus 7620
Intel Core i7-12700H, NVIDIA GeForce RTX 3050 Ti Laptop GPU
140.7 (122.6min) fps +4%
Dell Inspiron 16 Plus 7640
Intel Core Ultra 7 155H, NVIDIA GeForce RTX 4060 Laptop GPU
135.1 (116.3min) fps
Samsung Galaxy Book4 Ultra
Intel Core Ultra 7 155H, NVIDIA GeForce RTX 4050 Laptop GPU
126.8 (108.1min) fps -6%
Asus VivoBook Pro 16 K6602VU
Intel Core i9-13900H, NVIDIA GeForce RTX 4050 Laptop GPU
126 (107.9min) fps -7%
X-Plane 11.11 - 1920x1080 high (fps_test=3)
Lenovo Legion 5 16IRX G9
Intel Core i7-14650HX, NVIDIA GeForce RTX 4060 Laptop GPU
130.9 fps +51%
Dell Inspiron 16 Plus 7630
Intel Core i7-13700H, NVIDIA GeForce RTX 4060 Laptop GPU
109.7 fps +27%
Asus VivoBook Pro 16 K6602VU
Intel Core i9-13900H, NVIDIA GeForce RTX 4050 Laptop GPU
108.4 fps +25%
Dell Inspiron 16 Plus 7620
Intel Core i7-12700H, NVIDIA GeForce RTX 3050 Ti Laptop GPU
92.8 fps +7%
Dell Inspiron 16 Plus 7640
Intel Core Ultra 7 155H, NVIDIA GeForce RTX 4060 Laptop GPU
86.5 fps
Samsung Galaxy Book4 Ultra
Intel Core Ultra 7 155H, NVIDIA GeForce RTX 4050 Laptop GPU
81.5 fps -6%
Far Cry 5 - 1920x1080 Ultra Preset AA:T
Lenovo Legion 5 16IRX G9
Intel Core i7-14650HX, NVIDIA GeForce RTX 4060 Laptop GPU
147 fps +34%
Dell Inspiron 16 Plus 7640
Intel Core Ultra 7 155H, NVIDIA GeForce RTX 4060 Laptop GPU
110 (81min) fps
Asus VivoBook Pro 16 K6602VU
Intel Core i9-13900H, NVIDIA GeForce RTX 4050 Laptop GPU
104 (73min) fps -5%
Dell Inspiron 16 Plus 7630
Intel Core i7-13700H, NVIDIA GeForce RTX 4060 Laptop GPU
103 (74min) fps -6%
Samsung Galaxy Book4 Ultra
Intel Core Ultra 7 155H, NVIDIA GeForce RTX 4050 Laptop GPU
80 fps -27%
Tiny Tina's Wonderlands
1920x1080 Low Preset (DX12)
Average NVIDIA GeForce RTX 4060 Laptop GPU
  (164.4 - 235, n=9)
199.9 fps +13%
Framework Laptop 16
AMD Ryzen 9 7940HS, AMD Radeon RX 7700S
183.5 fps +3%
Dell Inspiron 16 Plus 7640
Intel Core Ultra 7 155H, NVIDIA GeForce RTX 4060 Laptop GPU
177.4 fps
Dell Inspiron 16 Plus 7630
Intel Core i7-13700H, NVIDIA GeForce RTX 4060 Laptop GPU
169.5 fps -4%
Acer Swift Edge SFE16 Ryzen 7 7840U
AMD Ryzen 7 7840U, AMD Radeon 780M
34.3 fps -81%
Lenovo Yoga 7 2-in-1 16IML9
Intel Core Ultra 5 125U, Intel Graphics 4-Cores iGPU (Arc)
29.9 fps -83%
1920x1080 Medium Preset (DX12)
Average NVIDIA GeForce RTX 4060 Laptop GPU
  (116 - 192.3, n=9)
159.7 fps +38%
Dell Inspiron 16 Plus 7630
Intel Core i7-13700H, NVIDIA GeForce RTX 4060 Laptop GPU
141.5 fps +22%
Framework Laptop 16
AMD Ryzen 9 7940HS, AMD Radeon RX 7700S
140.4 fps +21%
Dell Inspiron 16 Plus 7640
Intel Core Ultra 7 155H, NVIDIA GeForce RTX 4060 Laptop GPU
116 fps
Acer Swift Edge SFE16 Ryzen 7 7840U
AMD Ryzen 7 7840U, AMD Radeon 780M
28.4 fps -76%
Lenovo Yoga 7 2-in-1 16IML9
Intel Core Ultra 5 125U, Intel Graphics 4-Cores iGPU (Arc)
24 fps -79%
1920x1080 High Preset (DX12)
Average NVIDIA GeForce RTX 4060 Laptop GPU
  (86.6 - 121.2, n=10)
106.3 fps +16%
Dell Inspiron 16 Plus 7630
Intel Core i7-13700H, NVIDIA GeForce RTX 4060 Laptop GPU
92.1 fps 0%
Framework Laptop 16
AMD Ryzen 9 7940HS, AMD Radeon RX 7700S
92 fps 0%
Dell Inspiron 16 Plus 7640
Intel Core Ultra 7 155H, NVIDIA GeForce RTX 4060 Laptop GPU
91.9 fps
Acer Swift Edge SFE16 Ryzen 7 7840U
AMD Ryzen 7 7840U, AMD Radeon 780M
18.6 fps -80%
Lenovo Yoga 7 2-in-1 16IML9
Intel Core Ultra 5 125U, Intel Graphics 4-Cores iGPU (Arc)
16.1 fps -82%
1920x1080 Badass Preset (DX12)
Average NVIDIA GeForce RTX 4060 Laptop GPU
  (67.5 - 92.7, n=11)
82.5 fps +16%
Dell Inspiron 16 Plus 7630
Intel Core i7-13700H, NVIDIA GeForce RTX 4060 Laptop GPU
71.4 fps 0%
Framework Laptop 16
AMD Ryzen 9 7940HS, AMD Radeon RX 7700S
71.2 fps 0%
Dell Inspiron 16 Plus 7640
Intel Core Ultra 7 155H, NVIDIA GeForce RTX 4060 Laptop GPU
71.1 fps
Acer Swift Edge SFE16 Ryzen 7 7840U
AMD Ryzen 7 7840U, AMD Radeon 780M
16.5 fps -77%
Lenovo Yoga 7 2-in-1 16IML9
Intel Core Ultra 5 125U, Intel Graphics 4-Cores iGPU (Arc)
12.7 fps -82%
2560x1440 Badass Preset (DX12)
Average NVIDIA GeForce RTX 4060 Laptop GPU
  (45.3 - 64.2, n=9)
55.4 fps +15%
Dell Inspiron 16 Plus 7630
Intel Core i7-13700H, NVIDIA GeForce RTX 4060 Laptop GPU
48 fps 0%
Dell Inspiron 16 Plus 7640
Intel Core Ultra 7 155H, NVIDIA GeForce RTX 4060 Laptop GPU
48 fps
Framework Laptop 16
AMD Ryzen 9 7940HS, AMD Radeon RX 7700S
47.3 fps -1%
The Witcher 3
1366x768 Medium Graphics & Postprocessing
Average NVIDIA GeForce RTX 4060 Laptop GPU
  (176.4 - 369, n=28)
295 fps +7%
Framework Laptop 16
AMD Ryzen 9 7940HS, AMD Radeon RX 7700S
277.5 (216min) fps 0%
Dell Inspiron 16 Plus 7640
Intel Core Ultra 7 155H, NVIDIA GeForce RTX 4060 Laptop GPU
276.8 (262min) fps
Dell Inspiron 16 Plus 7630
Intel Core i7-13700H, NVIDIA GeForce RTX 4060 Laptop GPU
275.3 (249min) fps -1%
Acer Nitro 16 AN16-41-R7YE
AMD Ryzen 5 7535HS, NVIDIA GeForce RTX 4050 Laptop GPU
262.4 (229min) fps -5%
Asus VivoBook Pro 16 K6602VU
Intel Core i9-13900H, NVIDIA GeForce RTX 4050 Laptop GPU
258 (224min, 224.31P1) fps -7%
Lenovo Legion S7 16ARHA7
AMD Ryzen 9 6900HX, AMD Radeon RX 6800S
223 (223min) fps -19%
Dell Inspiron 16 Plus 7620
Intel Core i7-12700H, NVIDIA GeForce RTX 3050 Ti Laptop GPU
183 (168min) fps -34%
Lenovo Yoga 7 2-in-1 16IML9
Intel Core Ultra 5 125U, Intel Graphics 4-Cores iGPU (Arc)
49.6 (40min) fps -82%
1920x1080 High Graphics & Postprocessing (Nvidia HairWorks Off)
Lenovo Legion 5 16IRX G9
Intel Core i7-14650HX, NVIDIA GeForce RTX 4060 Laptop GPU
229 fps +43%
Acer Nitro 16 AN16-41
AMD Ryzen 7 7735HS, NVIDIA GeForce RTX 4070 Laptop GPU
213.3 (182min) fps +33%
Average NVIDIA GeForce RTX 4060 Laptop GPU
  (110 - 229, n=36)
185.1 fps +15%
Dell Inspiron 16 Plus 7630
Intel Core i7-13700H, NVIDIA GeForce RTX 4060 Laptop GPU
169.5 (158min) fps +6%
Lenovo Legion S7 16ARHA7
AMD Ryzen 9 6900HX, AMD Radeon RX 6800S
164 (156min) fps +2%
Dell Inspiron 16 Plus 7640
Intel Core Ultra 7 155H, NVIDIA GeForce RTX 4060 Laptop GPU
160.3 (154min) fps
Acer Nitro 16 AN16-41-R7YE
AMD Ryzen 5 7535HS, NVIDIA GeForce RTX 4050 Laptop GPU
156.2 (136min) fps -3%
Framework Laptop 16
AMD Ryzen 9 7940HS, AMD Radeon RX 7700S
147.1 (136min) fps -8%
Asus VivoBook Pro 16 K6602VU
Intel Core i9-13900H, NVIDIA GeForce RTX 4050 Laptop GPU
138.7 (123min, 123.66P1) fps -13%
Dell Inspiron 16 Plus 7620
Intel Core i7-12700H, NVIDIA GeForce RTX 3050 Ti Laptop GPU
108.4 (94min) fps -32%
Acer Swift Edge SFE16 Ryzen 7 7840U
AMD Ryzen 7 7840U, AMD Radeon 780M
36.1 (27min) fps -77%
Lenovo Yoga 7 2-in-1 16IML9
Intel Core Ultra 5 125U, Intel Graphics 4-Cores iGPU (Arc)
28.4 (25min) fps -82%
Lenovo ThinkPad E16 G1-21JUS08X00
AMD Ryzen 7 7730U, AMD Radeon RX Vega 8 (Ryzen 4000/5000)
20 fps -88%
Lenovo ThinkBook 16 G6 ABP
AMD Ryzen 5 7530U, AMD Radeon RX Vega 7
20 fps -88%
1920x1080 Ultra Graphics & Postprocessing (HBAO+)
Acer Nitro 16 AN16-41
AMD Ryzen 7 7735HS, NVIDIA GeForce RTX 4070 Laptop GPU
113.2 (98min) fps +35%
Average NVIDIA GeForce RTX 4060 Laptop GPU
  (77 - 159.7, n=42)
100.4 fps +19%
Lenovo Legion 5 16IRX G9
Intel Core i7-14650HX, NVIDIA GeForce RTX 4060 Laptop GPU
97.2 (93min, 94P1) fps +16%
Dell Inspiron 16 Plus 7630
Intel Core i7-13700H, NVIDIA GeForce RTX 4060 Laptop GPU
90.9 (85min) fps +8%
Lenovo Legion S7 16ARHA7
AMD Ryzen 9 6900HX, AMD Radeon RX 6800S
90.7 (86min) fps +8%
Dell Inspiron 16 Plus 7640
Intel Core Ultra 7 155H, NVIDIA GeForce RTX 4060 Laptop GPU
84.1 (80min) fps
Framework Laptop 16
AMD Ryzen 9 7940HS, AMD Radeon RX 7700S
84 (79min) fps 0%
Acer Nitro 16 AN16-41-R7YE
AMD Ryzen 5 7535HS, NVIDIA GeForce RTX 4050 Laptop GPU
83.9 (71min) fps 0%
Asus VivoBook Pro 16 K6602VU
Intel Core i9-13900H, NVIDIA GeForce RTX 4050 Laptop GPU
76.6 (69min, 69.34P1) fps -9%
Dell Inspiron 16 Plus 7620
Intel Core i7-12700H, NVIDIA GeForce RTX 3050 Ti Laptop GPU
57 (53min) fps -32%
Acer Swift Edge SFE16 Ryzen 7 7840U
AMD Ryzen 7 7840U, AMD Radeon 780M
20.4 (18min) fps -76%
Lenovo Yoga 7 2-in-1 16IML9
Intel Core Ultra 5 125U, Intel Graphics 4-Cores iGPU (Arc)
15 (11min) fps -82%
Lenovo ThinkPad E16 G1-21JUS08X00
AMD Ryzen 7 7730U, AMD Radeon RX Vega 8 (Ryzen 4000/5000)
12.9 (12min, 12P1) fps -85%
Lenovo ThinkBook 16 G6 ABP
AMD Ryzen 5 7530U, AMD Radeon RX Vega 7
12.9 (9min, 10P1) fps -85%
2560x1440 Ultra Graphics & Postprocessing (HBAO+)
Lenovo Legion 5 16IRX G9
Intel Core i7-14650HX, NVIDIA GeForce RTX 4060 Laptop GPU
83 fps +34%
Average NVIDIA GeForce RTX 4060 Laptop GPU
  (42.4 - 83.4, n=14)
72.4 fps +17%
Dell Inspiron 16 Plus 7630
Intel Core i7-13700H, NVIDIA GeForce RTX 4060 Laptop GPU
68 (65min) fps +10%
Dell Inspiron 16 Plus 7640
Intel Core Ultra 7 155H, NVIDIA GeForce RTX 4060 Laptop GPU
61.9 (58min) fps
Asus VivoBook Pro 16 K6602VU
Intel Core i9-13900H, NVIDIA GeForce RTX 4050 Laptop GPU
56.1 (50min, 50.33P1) fps -9%
Final Fantasy XV Benchmark
1920x1080 Standard Quality
Lenovo Legion 5 16IRX G9
Intel Core i7-14650HX, NVIDIA GeForce RTX 4060 Laptop GPU
154.2 fps +57%
Acer Nitro 16 AN16-41
AMD Ryzen 7 7735HS, NVIDIA GeForce RTX 4070 Laptop GPU
147.7 fps +50%
Average NVIDIA GeForce RTX 4060 Laptop GPU
  (98.4 - 161.2, n=43)
135.1 fps +37%
Dell Inspiron 16 Plus 7630
Intel Core i7-13700H, NVIDIA GeForce RTX 4060 Laptop GPU
122.2 fps +24%
Lenovo Legion S7 16ARHA7
AMD Ryzen 9 6900HX, AMD Radeon RX 6800S
120.1 fps +22%
Acer Nitro 16 AN16-41-R7YE
AMD Ryzen 5 7535HS, NVIDIA GeForce RTX 4050 Laptop GPU
116.2 fps +18%
Asus VivoBook Pro 16 K6602VU
Intel Core i9-13900H, NVIDIA GeForce RTX 4050 Laptop GPU
107.2 fps +9%
Framework Laptop 16
AMD Ryzen 9 7940HS, AMD Radeon RX 7700S
106 fps +8%
Dell Inspiron 16 Plus 7640
Intel Core Ultra 7 155H, NVIDIA GeForce RTX 4060 Laptop GPU
98.4 fps
Dell Inspiron 16 Plus 7620
Intel Core i7-12700H, NVIDIA GeForce RTX 3050 Ti Laptop GPU
77.7 fps -21%
Acer Swift Edge SFE16 Ryzen 7 7840U
AMD Ryzen 7 7840U, AMD Radeon 780M
27.4 fps -72%
Lenovo Yoga 7 2-in-1 16IML9
Intel Core Ultra 5 125U, Intel Graphics 4-Cores iGPU (Arc)
23 fps -77%
Lenovo ThinkPad E16 G1-21JUS08X00
AMD Ryzen 7 7730U, AMD Radeon RX Vega 8 (Ryzen 4000/5000)
17.1 fps -83%
Lenovo ThinkBook 16 G6 ABP
AMD Ryzen 5 7530U, AMD Radeon RX Vega 7
17 fps -83%
1920x1080 High Quality
Acer Nitro 16 AN16-41
AMD Ryzen 7 7735HS, NVIDIA GeForce RTX 4070 Laptop GPU
109.1 fps +38%
Lenovo Legion 5 16IRX G9
Intel Core i7-14650HX, NVIDIA GeForce RTX 4060 Laptop GPU
106.3 fps +35%
Average NVIDIA GeForce RTX 4060 Laptop GPU
  (75.1 - 109.8, n=50)
97.3 fps +23%
Dell Inspiron 16 Plus 7630
Intel Core i7-13700H, NVIDIA GeForce RTX 4060 Laptop GPU
88.9 fps +13%
Lenovo Legion S7 16ARHA7
AMD Ryzen 9 6900HX, AMD Radeon RX 6800S
87.6 fps +11%
Acer Nitro 16 AN16-41-R7YE
AMD Ryzen 5 7535HS, NVIDIA GeForce RTX 4050 Laptop GPU
83.5 fps +6%
Dell Inspiron 16 Plus 7640
Intel Core Ultra 7 155H, NVIDIA GeForce RTX 4060 Laptop GPU
78.8 fps
Asus VivoBook Pro 16 K6602VU
Intel Core i9-13900H, NVIDIA GeForce RTX 4050 Laptop GPU
75.6 fps -4%
Framework Laptop 16
AMD Ryzen 9 7940HS, AMD Radeon RX 7700S
74.8 fps -5%
Dell Inspiron 16 Plus 7620
Intel Core i7-12700H, NVIDIA GeForce RTX 3050 Ti Laptop GPU
54.1 fps -31%
Acer Swift Edge SFE16 Ryzen 7 7840U
AMD Ryzen 7 7840U, AMD Radeon 780M
21.2 fps -73%
Lenovo Yoga 7 2-in-1 16IML9
Intel Core Ultra 5 125U, Intel Graphics 4-Cores iGPU (Arc)
16.3 fps -79%
Lenovo ThinkPad E16 G1-21JUS08X00
AMD Ryzen 7 7730U, AMD Radeon RX Vega 8 (Ryzen 4000/5000)
12.4 fps -84%
Lenovo ThinkBook 16 G6 ABP
AMD Ryzen 5 7530U, AMD Radeon RX Vega 7
11.9 fps -85%
2560x1440 High Quality
Acer Nitro 16 AN16-41
AMD Ryzen 7 7735HS, NVIDIA GeForce RTX 4070 Laptop GPU
81.2 fps +38%
Lenovo Legion 5 16IRX G9
Intel Core i7-14650HX, NVIDIA GeForce RTX 4060 Laptop GPU
77.5 fps +32%
Average NVIDIA GeForce RTX 4060 Laptop GPU
  (56 - 79.4, n=34)
71.5 fps +22%
Dell Inspiron 16 Plus 7630
Intel Core i7-13700H, NVIDIA GeForce RTX 4060 Laptop GPU
64.4 fps +10%
Lenovo Legion S7 16ARHA7
AMD Ryzen 9 6900HX, AMD Radeon RX 6800S
62.1 fps +6%
Dell Inspiron 16 Plus 7640
Intel Core Ultra 7 155H, NVIDIA GeForce RTX 4060 Laptop GPU
58.8 fps
Framework Laptop 16
AMD Ryzen 9 7940HS, AMD Radeon RX 7700S
54.5 fps -7%
Asus VivoBook Pro 16 K6602VU
Intel Core i9-13900H, NVIDIA GeForce RTX 4050 Laptop GPU
53.6 fps -9%
Dell Inspiron 16 Plus 7620
Intel Core i7-12700H, NVIDIA GeForce RTX 3050 Ti Laptop GPU
38.1 fps -35%
Dota 2 Reborn
1280x720 min (0/3) fastest
Lenovo Legion 5 16IRX G9
Intel Core i7-14650HX, NVIDIA GeForce RTX 4060 Laptop GPU
209 (180.8min) fps +20%
Dell Inspiron 16 Plus 7630
Intel Core i7-13700H, NVIDIA GeForce RTX 4060 Laptop GPU
184.7 (161.7min) fps +6%
Average NVIDIA GeForce RTX 4060 Laptop GPU
  (146 - 234, n=50)
181.4 fps +5%
Framework Laptop 16
AMD Ryzen 9 7940HS, AMD Radeon RX 7700S
174 (148.3min) fps 0%
Dell Inspiron 16 Plus 7640
Intel Core Ultra 7 155H, NVIDIA GeForce RTX 4060 Laptop GPU
173.5 (150.9min) fps
Dell Inspiron 16 Plus 7620
Intel Core i7-12700H, NVIDIA GeForce RTX 3050 Ti Laptop GPU
171.8 (151.3min) fps -1%
Asus VivoBook Pro 16 K6602VU
Intel Core i9-13900H, NVIDIA GeForce RTX 4050 Laptop GPU
169.6 (146.3min) fps -2%
Acer Nitro 16 AN16-41-R7YE
AMD Ryzen 5 7535HS, NVIDIA GeForce RTX 4050 Laptop GPU
151 (132.6min) fps -13%
Lenovo Legion S7 16ARHA7
AMD Ryzen 9 6900HX, AMD Radeon RX 6800S
150 (126.8min) fps -14%
Acer Nitro 16 AN16-41
AMD Ryzen 7 7735HS, NVIDIA GeForce RTX 4070 Laptop GPU
137.7 (119.1min) fps -21%
Acer Swift Edge SFE16 Ryzen 7 7840U
AMD Ryzen 7 7840U, AMD Radeon 780M
128.1 (105.1min) fps -26%
Lenovo ThinkBook 16 G6 ABP
AMD Ryzen 5 7530U, AMD Radeon RX Vega 7
111.5 (91.2min) fps -36%
Lenovo ThinkPad E16 G1-21JUS08X00
AMD Ryzen 7 7730U, AMD Radeon RX Vega 8 (Ryzen 4000/5000)
107.8 (93.7min) fps -38%
Lenovo Yoga 7 2-in-1 16IML9
Intel Core Ultra 5 125U, Intel Graphics 4-Cores iGPU (Arc)
101.9 (62min) fps -41%
1366x768 med (1/3)
Lenovo Legion 5 16IRX G9
Intel Core i7-14650HX, NVIDIA GeForce RTX 4060 Laptop GPU
189.7 (166.8min) fps +25%
Dell Inspiron 16 Plus 7630
Intel Core i7-13700H, NVIDIA GeForce RTX 4060 Laptop GPU
166.6 (145.3min) fps +10%
Average NVIDIA GeForce RTX 4060 Laptop GPU
  (130 - 208, n=50)
163.6 fps +8%
Framework Laptop 16
AMD Ryzen 9 7940HS, AMD Radeon RX 7700S
159.8 (135.6min) fps +5%
Dell Inspiron 16 Plus 7620
Intel Core i7-12700H, NVIDIA GeForce RTX 3050 Ti Laptop GPU
157.5 (139.3min) fps +4%
Asus VivoBook Pro 16 K6602VU
Intel Core i9-13900H, NVIDIA GeForce RTX 4050 Laptop GPU
153.7 (135.6min) fps +1%
Dell Inspiron 16 Plus 7640
Intel Core Ultra 7 155H, NVIDIA GeForce RTX 4060 Laptop GPU
152.1 (133.4min) fps
Acer Nitro 16 AN16-41-R7YE
AMD Ryzen 5 7535HS, NVIDIA GeForce RTX 4050 Laptop GPU
136.5 (119.3min) fps -10%
Acer Nitro 16 AN16-41
AMD Ryzen 7 7735HS, NVIDIA GeForce RTX 4070 Laptop GPU
131.9 (113.4min) fps -13%
Lenovo Legion S7 16ARHA7
AMD Ryzen 9 6900HX, AMD Radeon RX 6800S
128.4 (109.4min) fps -16%
Acer Swift Edge SFE16 Ryzen 7 7840U
AMD Ryzen 7 7840U, AMD Radeon 780M
101.5 (86.7min) fps -33%
Lenovo ThinkBook 16 G6 ABP
AMD Ryzen 5 7530U, AMD Radeon RX Vega 7
87.8 (70.1min) fps -42%
Lenovo ThinkPad E16 G1-21JUS08X00
AMD Ryzen 7 7730U, AMD Radeon RX Vega 8 (Ryzen 4000/5000)
85.5 (72.3min) fps -44%
Lenovo Yoga 7 2-in-1 16IML9
Intel Core Ultra 5 125U, Intel Graphics 4-Cores iGPU (Arc)
60.7 (38.1min) fps -60%
1920x1080 high (2/3)
Lenovo Legion 5 16IRX G9
Intel Core i7-14650HX, NVIDIA GeForce RTX 4060 Laptop GPU
179.9 (157.8min) fps +26%
Dell Inspiron 16 Plus 7630
Intel Core i7-13700H, NVIDIA GeForce RTX 4060 Laptop GPU
157.9 (135min) fps +10%
Framework Laptop 16
AMD Ryzen 9 7940HS, AMD Radeon RX 7700S
156.5 (129.7min) fps +9%
Average NVIDIA GeForce RTX 4060 Laptop GPU
  (124 - 199, n=52)
155.7 fps +9%
Dell Inspiron 16 Plus 7620
Intel Core i7-12700H, NVIDIA GeForce RTX 3050 Ti Laptop GPU
148 (128.8min) fps +3%
Dell Inspiron 16 Plus 7640
Intel Core Ultra 7 155H, NVIDIA GeForce RTX 4060 Laptop GPU
143.2 (112.1min) fps
Asus VivoBook Pro 16 K6602VU
Intel Core i9-13900H, NVIDIA GeForce RTX 4050 Laptop GPU
140.1 (117.9min) fps -2%
Lenovo Legion S7 16ARHA7
AMD Ryzen 9 6900HX, AMD Radeon RX 6800S
134.7 (97.6min) fps -6%
Acer Nitro 16 AN16-41-R7YE
AMD Ryzen 5 7535HS, NVIDIA GeForce RTX 4050 Laptop GPU
132.1 (115.6min) fps -8%
Acer Nitro 16 AN16-41
AMD Ryzen 7 7735HS, NVIDIA GeForce RTX 4070 Laptop GPU
118.9 (102.5min) fps -17%
Acer Swift Edge SFE16 Ryzen 7 7840U
AMD Ryzen 7 7840U, AMD Radeon 780M
66.8 (55.4min) fps -53%
Lenovo Yoga 7 2-in-1 16IML9
Intel Core Ultra 5 125U, Intel Graphics 4-Cores iGPU (Arc)
61.1 (37.9min) fps -57%
Lenovo ThinkPad E16 G1-21JUS08X00
AMD Ryzen 7 7730U, AMD Radeon RX Vega 8 (Ryzen 4000/5000)
50.7 (46.3min) fps -65%
Lenovo ThinkBook 16 G6 ABP
AMD Ryzen 5 7530U, AMD Radeon RX Vega 7
49.1 (45.3min) fps -66%
1920x1080 ultra (3/3) best looking
Lenovo Legion 5 16IRX G9
Intel Core i7-14650HX, NVIDIA GeForce RTX 4060 Laptop GPU
168.7 (146.8min) fps +25%
Dell Inspiron 16 Plus 7630
Intel Core i7-13700H, NVIDIA GeForce RTX 4060 Laptop GPU
146.1 (126.2min) fps +8%
Average NVIDIA GeForce RTX 4060 Laptop GPU
  (115 - 183.8, n=52)
145 fps +7%
Dell Inspiron 16 Plus 7620
Intel Core i7-12700H, NVIDIA GeForce RTX 3050 Ti Laptop GPU
140.7 (122.6min) fps +4%
Framework Laptop 16
AMD Ryzen 9 7940HS, AMD Radeon RX 7700S
136.8 (116min) fps +1%
Dell Inspiron 16 Plus 7640
Intel Core Ultra 7 155H, NVIDIA GeForce RTX 4060 Laptop GPU
135.1 (116.3min) fps
Asus VivoBook Pro 16 K6602VU
Intel Core i9-13900H, NVIDIA GeForce RTX 4050 Laptop GPU
126 (107.9min) fps -7%
Acer Nitro 16 AN16-41-R7YE
AMD Ryzen 5 7535HS, NVIDIA GeForce RTX 4050 Laptop GPU
125.2 (109.9min) fps -7%
Acer Nitro 16 AN16-41
AMD Ryzen 7 7735HS, NVIDIA GeForce RTX 4070 Laptop GPU
114.8 (97.8min) fps -15%
Lenovo Legion S7 16ARHA7
AMD Ryzen 9 6900HX, AMD Radeon RX 6800S
99.4 (82.9min) fps -26%
Acer Swift Edge SFE16 Ryzen 7 7840U
AMD Ryzen 7 7840U, AMD Radeon 780M
61.4 (52min) fps -55%
Lenovo Yoga 7 2-in-1 16IML9
Intel Core Ultra 5 125U, Intel Graphics 4-Cores iGPU (Arc)
57.6 (37.5min) fps -57%
Lenovo ThinkPad E16 G1-21JUS08X00
AMD Ryzen 7 7730U, AMD Radeon RX Vega 8 (Ryzen 4000/5000)
47.7 (43.2min) fps -65%
Lenovo ThinkBook 16 G6 ABP
AMD Ryzen 5 7530U, AMD Radeon RX Vega 7
45.8 (42.7min) fps -66%
X-Plane 11.11
1280x720 low (fps_test=1)
Lenovo Legion 5 16IRX G9
Intel Core i7-14650HX, NVIDIA GeForce RTX 4060 Laptop GPU
180.8 fps +46%
Asus VivoBook Pro 16 K6602VU
Intel Core i9-13900H, NVIDIA GeForce RTX 4050 Laptop GPU
159.2 fps +29%
Dell Inspiron 16 Plus 7630
Intel Core i7-13700H, NVIDIA GeForce RTX 4060 Laptop GPU
153.5 fps +24%
Average NVIDIA GeForce RTX 4060 Laptop GPU
  (87.1 - 209, n=51)
148.1 fps +20%
Dell Inspiron 16 Plus 7620
Intel Core i7-12700H, NVIDIA GeForce RTX 3050 Ti Laptop GPU
132.5 fps +7%
Dell Inspiron 16 Plus 7640
Intel Core Ultra 7 155H, NVIDIA GeForce RTX 4060 Laptop GPU
123.7 fps
Acer Nitro 16 AN16-41-R7YE
AMD Ryzen 5 7535HS, NVIDIA GeForce RTX 4050 Laptop GPU
115.3 fps -7%
Acer Nitro 16 AN16-41
AMD Ryzen 7 7735HS, NVIDIA GeForce RTX 4070 Laptop GPU
107 fps -14%
Framework Laptop 16
AMD Ryzen 9 7940HS, AMD Radeon RX 7700S
97.6 fps -21%
Lenovo Legion S7 16ARHA7
AMD Ryzen 9 6900HX, AMD Radeon RX 6800S
75.2 fps -39%
Acer Swift Edge SFE16 Ryzen 7 7840U
AMD Ryzen 7 7840U, AMD Radeon 780M
49.1 fps -60%
Lenovo ThinkPad E16 G1-21JUS08X00
AMD Ryzen 7 7730U, AMD Radeon RX Vega 8 (Ryzen 4000/5000)
40.9 fps -67%
Lenovo ThinkBook 16 G6 ABP
AMD Ryzen 5 7530U, AMD Radeon RX Vega 7
37.5 fps -70%
Lenovo Yoga 7 2-in-1 16IML9
Intel Core Ultra 5 125U, Intel Graphics 4-Cores iGPU (Arc)
36.5 fps -70%
1920x1080 med (fps_test=2)
Lenovo Legion 5 16IRX G9
Intel Core i7-14650HX, NVIDIA GeForce RTX 4060 Laptop GPU
171 fps +57%
Dell Inspiron 16 Plus 7630
Intel Core i7-13700H, NVIDIA GeForce RTX 4060 Laptop GPU
135.7 fps +24%
Asus VivoBook Pro 16 K6602VU
Intel Core i9-13900H, NVIDIA GeForce RTX 4050 Laptop GPU
134.6 fps +23%
Average NVIDIA GeForce RTX 4060 Laptop GPU
  (81.8 - 184, n=51)
129.8 fps +19%
Dell Inspiron 16 Plus 7620
Intel Core i7-12700H, NVIDIA GeForce RTX 3050 Ti Laptop GPU
115.6 fps +6%
Dell Inspiron 16 Plus 7640
Intel Core Ultra 7 155H, NVIDIA GeForce RTX 4060 Laptop GPU
109 fps
Acer Nitro 16 AN16-41-R7YE
AMD Ryzen 5 7535HS, NVIDIA GeForce RTX 4050 Laptop GPU
101.6 fps -7%
Acer Nitro 16 AN16-41
AMD Ryzen 7 7735HS, NVIDIA GeForce RTX 4070 Laptop GPU
94.2 fps -14%
Framework Laptop 16
AMD Ryzen 9 7940HS, AMD Radeon RX 7700S
79.3 fps -27%
Lenovo Legion S7 16ARHA7
AMD Ryzen 9 6900HX, AMD Radeon RX 6800S
61.5 fps -44%
Acer Swift Edge SFE16 Ryzen 7 7840U
AMD Ryzen 7 7840U, AMD Radeon 780M
37 fps -66%
Lenovo ThinkPad E16 G1-21JUS08X00
AMD Ryzen 7 7730U, AMD Radeon RX Vega 8 (Ryzen 4000/5000)
31.4 fps -71%
Lenovo ThinkBook 16 G6 ABP
AMD Ryzen 5 7530U, AMD Radeon RX Vega 7
30 fps -72%
Lenovo Yoga 7 2-in-1 16IML9
Intel Core Ultra 5 125U, Intel Graphics 4-Cores iGPU (Arc)
28 fps -74%
1920x1080 high (fps_test=3)
Lenovo Legion 5 16IRX G9
Intel Core i7-14650HX, NVIDIA GeForce RTX 4060 Laptop GPU
130.9 fps +51%
Dell Inspiron 16 Plus 7630
Intel Core i7-13700H, NVIDIA GeForce RTX 4060 Laptop GPU
109.7 fps +27%
Asus VivoBook Pro 16 K6602VU
Intel Core i9-13900H, NVIDIA GeForce RTX 4050 Laptop GPU
108.4 fps +25%
Average NVIDIA GeForce RTX 4060 Laptop GPU
  (60.7 - 141.1, n=53)
102.1 fps +18%
Dell Inspiron 16 Plus 7620
Intel Core i7-12700H, NVIDIA GeForce RTX 3050 Ti Laptop GPU
92.8 fps +7%
Dell Inspiron 16 Plus 7640
Intel Core Ultra 7 155H, NVIDIA GeForce RTX 4060 Laptop GPU
86.5 fps
Acer Nitro 16 AN16-41-R7YE
AMD Ryzen 5 7535HS, NVIDIA GeForce RTX 4050 Laptop GPU
81.4 fps -6%
Acer Nitro 16 AN16-41
AMD Ryzen 7 7735HS, NVIDIA GeForce RTX 4070 Laptop GPU
76.3 fps -12%
Framework Laptop 16
AMD Ryzen 9 7940HS, AMD Radeon RX 7700S
65 fps -25%
Lenovo Legion S7 16ARHA7
AMD Ryzen 9 6900HX, AMD Radeon RX 6800S
52.3 fps -40%
Acer Swift Edge SFE16 Ryzen 7 7840U
AMD Ryzen 7 7840U, AMD Radeon 780M
30.3 fps -65%
Lenovo ThinkPad E16 G1-21JUS08X00
AMD Ryzen 7 7730U, AMD Radeon RX Vega 8 (Ryzen 4000/5000)
27.8 fps -68%
Lenovo ThinkBook 16 G6 ABP
AMD Ryzen 5 7530U, AMD Radeon RX Vega 7
26.2 fps -70%
Lenovo Yoga 7 2-in-1 16IML9
Intel Core Ultra 5 125U, Intel Graphics 4-Cores iGPU (Arc)
23.4 fps -73%
Far Cry 5
1920x1080 Medium Preset AA:T
Lenovo Legion 5 16IRX G9
Intel Core i7-14650HX, NVIDIA GeForce RTX 4060 Laptop GPU
161 fps +29%
Average NVIDIA GeForce RTX 4060 Laptop GPU
  (110 - 165, n=30)
135 fps +8%
Framework Laptop 16
AMD Ryzen 9 7940HS, AMD Radeon RX 7700S
130 (108min) fps +4%
Dell Inspiron 16 Plus 7640
Intel Core Ultra 7 155H, NVIDIA GeForce RTX 4060 Laptop GPU
125 (94min) fps
Acer Nitro 16 AN16-41
AMD Ryzen 7 7735HS, NVIDIA GeForce RTX 4070 Laptop GPU
120 (90min) fps -4%
Dell Inspiron 16 Plus 7630
Intel Core i7-13700H, NVIDIA GeForce RTX 4060 Laptop GPU
120 (89min) fps -4%
Acer Nitro 16 AN16-41-R7YE
AMD Ryzen 5 7535HS, NVIDIA GeForce RTX 4050 Laptop GPU
114 (89min) fps -9%
Asus VivoBook Pro 16 K6602VU
Intel Core i9-13900H, NVIDIA GeForce RTX 4050 Laptop GPU
114 (80min) fps -9%
Acer Swift Edge SFE16 Ryzen 7 7840U
AMD Ryzen 7 7840U, AMD Radeon 780M
28 (6min) fps -78%
Lenovo Yoga 7 2-in-1 16IML9
Intel Core Ultra 5 125U, Intel Graphics 4-Cores iGPU (Arc)
25 (17min) fps -80%
Lenovo ThinkPad E16 G1-21JUS08X00
AMD Ryzen 7 7730U, AMD Radeon RX Vega 8 (Ryzen 4000/5000)
21 fps -83%
Lenovo ThinkBook 16 G6 ABP
AMD Ryzen 5 7530U, AMD Radeon RX Vega 7
20 fps -84%
1920x1080 High Preset AA:T
Lenovo Legion 5 16IRX G9
Intel Core i7-14650HX, NVIDIA GeForce RTX 4060 Laptop GPU
155 fps +31%
Average NVIDIA GeForce RTX 4060 Laptop GPU
  (104 - 158, n=33)
129.2 fps +9%
Framework Laptop 16
AMD Ryzen 9 7940HS, AMD Radeon RX 7700S
123 (106min) fps +4%
Dell Inspiron 16 Plus 7640
Intel Core Ultra 7 155H, NVIDIA GeForce RTX 4060 Laptop GPU
118 (88min) fps
Acer Nitro 16 AN16-41
AMD Ryzen 7 7735HS, NVIDIA GeForce RTX 4070 Laptop GPU
116 (88min) fps -2%
Dell Inspiron 16 Plus 7630
Intel Core i7-13700H, NVIDIA GeForce RTX 4060 Laptop GPU
115 (74min) fps -3%
Acer Nitro 16 AN16-41-R7YE
AMD Ryzen 5 7535HS, NVIDIA GeForce RTX 4050 Laptop GPU
108 (82min) fps -8%
Asus VivoBook Pro 16 K6602VU
Intel Core i9-13900H, NVIDIA GeForce RTX 4050 Laptop GPU
107 (69min) fps -9%
Acer Swift Edge SFE16 Ryzen 7 7840U
AMD Ryzen 7 7840U, AMD Radeon 780M
26 (16min) fps -78%
Lenovo Yoga 7 2-in-1 16IML9
Intel Core Ultra 5 125U, Intel Graphics 4-Cores iGPU (Arc)
25 (22min) fps -79%
Lenovo ThinkBook 16 G6 ABP
AMD Ryzen 5 7530U, AMD Radeon RX Vega 7
19 fps -84%
Lenovo ThinkPad E16 G1-21JUS08X00
AMD Ryzen 7 7730U, AMD Radeon RX Vega 8 (Ryzen 4000/5000)
18 fps -85%
1920x1080 Ultra Preset AA:T
Lenovo Legion 5 16IRX G9
Intel Core i7-14650HX, NVIDIA GeForce RTX 4060 Laptop GPU
147 fps +34%
Average NVIDIA GeForce RTX 4060 Laptop GPU
  (95 - 148, n=34)
121.8 fps +11%
Framework Laptop 16
AMD Ryzen 9 7940HS, AMD Radeon RX 7700S
117 (96min) fps +6%
Dell Inspiron 16 Plus 7640
Intel Core Ultra 7 155H, NVIDIA GeForce RTX 4060 Laptop GPU
110 (81min) fps
Acer Nitro 16 AN16-41
AMD Ryzen 7 7735HS, NVIDIA GeForce RTX 4070 Laptop GPU
109 (81min) fps -1%
Asus VivoBook Pro 16 K6602VU
Intel Core i9-13900H, NVIDIA GeForce RTX 4050 Laptop GPU
104 (73min) fps -5%
Dell Inspiron 16 Plus 7630
Intel Core i7-13700H, NVIDIA GeForce RTX 4060 Laptop GPU
103 (74min) fps -6%
Acer Nitro 16 AN16-41-R7YE
AMD Ryzen 5 7535HS, NVIDIA GeForce RTX 4050 Laptop GPU
102 (70min) fps -7%
Acer Swift Edge SFE16 Ryzen 7 7840U
AMD Ryzen 7 7840U, AMD Radeon 780M
24 (22min) fps -78%
Lenovo Yoga 7 2-in-1 16IML9
Intel Core Ultra 5 125U, Intel Graphics 4-Cores iGPU (Arc)
23 (20min) fps -79%
Lenovo ThinkBook 16 G6 ABP
AMD Ryzen 5 7530U, AMD Radeon RX Vega 7
18 fps -84%
Lenovo ThinkPad E16 G1-21JUS08X00
AMD Ryzen 7 7730U, AMD Radeon RX Vega 8 (Ryzen 4000/5000)
17 fps -85%
2560x1440 Ultra Preset AA:T
Lenovo Legion 5 16IRX G9
Intel Core i7-14650HX, NVIDIA GeForce RTX 4060 Laptop GPU
111 fps +34%
Acer Nitro 16 AN16-41
AMD Ryzen 7 7735HS, NVIDIA GeForce RTX 4070 Laptop GPU
102 (78min) fps +23%
Average NVIDIA GeForce RTX 4060 Laptop GPU
  (71 - 111, n=26)
94.9 fps +14%
Dell Inspiron 16 Plus 7630
Intel Core i7-13700H, NVIDIA GeForce RTX 4060 Laptop GPU
83 (74min) fps 0%
Dell Inspiron 16 Plus 7640
Intel Core Ultra 7 155H, NVIDIA GeForce RTX 4060 Laptop GPU
83 (72min) fps
Framework Laptop 16
AMD Ryzen 9 7940HS, AMD Radeon RX 7700S
81 (65min) fps -2%
Asus VivoBook Pro 16 K6602VU
Intel Core i9-13900H, NVIDIA GeForce RTX 4050 Laptop GPU
68 (31min) fps -18%
Strange Brigade
1920x1080 medium AA:medium AF:4
Acer Nitro 16 AN16-41
AMD Ryzen 7 7735HS, NVIDIA GeForce RTX 4070 Laptop GPU
273 (146.3min, 211P1) fps +21%
Average NVIDIA GeForce RTX 4060 Laptop GPU
  (195.4 - 305, n=41)
261 fps +16%
Lenovo Legion S7 16ARHA7
AMD Ryzen 9 6900HX, AMD Radeon RX 6800S
243 (172.7min, 208P1) fps +8%
Dell Inspiron 16 Plus 7630
Intel Core i7-13700H, NVIDIA GeForce RTX 4060 Laptop GPU
234 (137.3min, 187.4P1) fps +4%
Dell Inspiron 16 Plus 7640
Intel Core Ultra 7 155H, NVIDIA GeForce RTX 4060 Laptop GPU
225 (62.5min, 186.2P1) fps
Acer Nitro 16 AN16-41-R7YE
AMD Ryzen 5 7535HS, NVIDIA GeForce RTX 4050 Laptop GPU
209 (108.8min, 180.4P1) fps -7%
Framework Laptop 16
AMD Ryzen 9 7940HS, AMD Radeon RX 7700S
202 (102.7min, 166.3P1) fps -10%
Asus VivoBook Pro 16 K6602VU
Intel Core i9-13900H, NVIDIA GeForce RTX 4050 Laptop GPU
187.4 (68.1min, 163.7P1) fps -17%
Dell Inspiron 16 Plus 7620
Intel Core i7-12700H, NVIDIA GeForce RTX 3050 Ti Laptop GPU
138.3 (84.4min, 116.2P1) fps -39%
Acer Swift Edge SFE16 Ryzen 7 7840U
AMD Ryzen 7 7840U, AMD Radeon 780M
60.6 (11.7min, 51.7P1) fps -73%
Lenovo Yoga 7 2-in-1 16IML9
Intel Core Ultra 5 125U, Intel Graphics 4-Cores iGPU (Arc)
50 (24.3min, 41.3P1) fps -78%
Lenovo ThinkBook 16 G6 ABP
AMD Ryzen 5 7530U, AMD Radeon RX Vega 7
29.7 (24.7min, 25.9P1) fps -87%
Lenovo ThinkPad E16 G1-21JUS08X00
AMD Ryzen 7 7730U, AMD Radeon RX Vega 8 (Ryzen 4000/5000)
29.3 (22.1min, 26P1) fps -87%
1920x1080 high AA:high AF:8
Lenovo Legion 5 16IRX G9
Intel Core i7-14650HX, NVIDIA GeForce RTX 4060 Laptop GPU
243 fps +36%
Acer Nitro 16 AN16-41
AMD Ryzen 7 7735HS, NVIDIA GeForce RTX 4070 Laptop GPU
221 (35.6min, 162.5P1) fps +24%
Average NVIDIA GeForce RTX 4060 Laptop GPU
  (156.1 - 243, n=45)
210 fps +18%
Lenovo Legion S7 16ARHA7
AMD Ryzen 9 6900HX, AMD Radeon RX 6800S
195.7 (90.9min, 141.8P1) fps +10%
Dell Inspiron 16 Plus 7630
Intel Core i7-13700H, NVIDIA GeForce RTX 4060 Laptop GPU
185.9 (60.8min, 136.8P1) fps +4%
Dell Inspiron 16 Plus 7640
Intel Core Ultra 7 155H, NVIDIA GeForce RTX 4060 Laptop GPU
178.1 (44.1min, 131.8P1) fps
Acer Nitro 16 AN16-41-R7YE
AMD Ryzen 5 7535HS, NVIDIA GeForce RTX 4050 Laptop GPU
169.3 (91.4min, 130.3P1) fps -5%
Framework Laptop 16
AMD Ryzen 9 7940HS, AMD Radeon RX 7700S
167.4 (88.3min, 121P1) fps -6%
Asus VivoBook Pro 16 K6602VU
Intel Core i9-13900H, NVIDIA GeForce RTX 4050 Laptop GPU
151.6 (21.1min, 116.6P1) fps -15%
Dell Inspiron 16 Plus 7620
Intel Core i7-12700H, NVIDIA GeForce RTX 3050 Ti Laptop GPU
110.2 (76.2min, 84.7P1) fps -38%
Acer Swift Edge SFE16 Ryzen 7 7840U
AMD Ryzen 7 7840U, AMD Radeon 780M
49.5 (8min, 13.9P1) fps -72%
Lenovo Yoga 7 2-in-1 16IML9
Intel Core Ultra 5 125U, Intel Graphics 4-Cores iGPU (Arc)
39.2 (10min, 24P1) fps -78%
Lenovo ThinkPad E16 G1-21JUS08X00
AMD Ryzen 7 7730U, AMD Radeon RX Vega 8 (Ryzen 4000/5000)
24.5 (5.8min, 8.47P1) fps -86%
Lenovo ThinkBook 16 G6 ABP
AMD Ryzen 5 7530U, AMD Radeon RX Vega 7
24.5 (18.1min, 19.1P1) fps -86%
1920x1080 ultra AA:ultra AF:16
Lenovo Legion 5 16IRX G9
Intel Core i7-14650HX, NVIDIA GeForce RTX 4060 Laptop GPU
210 fps +37%
Acer Nitro 16 AN16-41
AMD Ryzen 7 7735HS, NVIDIA GeForce RTX 4070 Laptop GPU
192.6 (25.1min, 144.3P1) fps +25%
Average NVIDIA GeForce RTX 4060 Laptop GPU
  (135.3 - 210, n=49)
181.3 fps +18%
Lenovo Legion S7 16ARHA7
AMD Ryzen 9 6900HX, AMD Radeon RX 6800S
171.1 (119.3min, 125.3P1) fps +11%
Dell Inspiron 16 Plus 7630
Intel Core i7-13700H, NVIDIA GeForce RTX 4060 Laptop GPU
161 (79.8min, 120.7P1) fps +5%
Dell Inspiron 16 Plus 7640
Intel Core Ultra 7 155H, NVIDIA GeForce RTX 4060 Laptop GPU
153.5 (48min, 114.7P1) fps
Acer Nitro 16 AN16-41-R7YE
AMD Ryzen 5 7535HS, NVIDIA GeForce RTX 4050 Laptop GPU
146.8 (93.6min, 114.3P1) fps -4%
Framework Laptop 16
AMD Ryzen 9 7940HS, AMD Radeon RX 7700S
143.9 (84.9min, 104.3P1) fps -6%
Asus VivoBook Pro 16 K6602VU
Intel Core i9-13900H, NVIDIA GeForce RTX 4050 Laptop GPU
132 (22.5min, 102.9P1) fps -14%
Dell Inspiron 16 Plus 7620
Intel Core i7-12700H, NVIDIA GeForce RTX 3050 Ti Laptop GPU
95.2 (68.1min, 72.5P1) fps -38%
Acer Swift Edge SFE16 Ryzen 7 7840U
AMD Ryzen 7 7840U, AMD Radeon 780M
41.3 (7.5min, 9.37P1) fps -73%
Lenovo Yoga 7 2-in-1 16IML9
Intel Core Ultra 5 125U, Intel Graphics 4-Cores iGPU (Arc)
30.2 (7.6min, 10.6P1) fps -80%
Lenovo ThinkPad E16 G1-21JUS08X00
AMD Ryzen 7 7730U, AMD Radeon RX Vega 8 (Ryzen 4000/5000)
20.9 (5.1min, 6.57P1) fps -86%
Lenovo ThinkBook 16 G6 ABP
AMD Ryzen 5 7530U, AMD Radeon RX Vega 7
20.6 (7.3min, 9.63P1) fps -87%
2560x1440 ultra AA:ultra AF:16
Lenovo Legion 5 16IRX G9
Intel Core i7-14650HX, NVIDIA GeForce RTX 4060 Laptop GPU
130 fps +24%
Acer Nitro 16 AN16-41
AMD Ryzen 7 7735HS, NVIDIA GeForce RTX 4070 Laptop GPU
129 (62.9min, 106.6P1) fps +23%
Average NVIDIA GeForce RTX 4060 Laptop GPU
  (102 - 136.3, n=28)
123.4 fps +17%
Lenovo Legion S7 16ARHA7
AMD Ryzen 9 6900HX, AMD Radeon RX 6800S
111.4 (85.9min, 89.9P1) fps +6%
Dell Inspiron 16 Plus 7630
Intel Core i7-13700H, NVIDIA GeForce RTX 4060 Laptop GPU
110.9 (68.7min, 89.9P1) fps +5%
Dell Inspiron 16 Plus 7640
Intel Core Ultra 7 155H, NVIDIA GeForce RTX 4060 Laptop GPU
105.2 (52.2min, 85.3P1) fps
Framework Laptop 16
AMD Ryzen 9 7940HS, AMD Radeon RX 7700S
91.9 (66min, 75.1P1) fps -13%
Dell Inspiron 16 Plus 7620
Intel Core i7-12700H, NVIDIA GeForce RTX 3050 Ti Laptop GPU
69.1 (51.2min, 55.5P1) fps -34%
F1 22
1920x1080 Low Preset AA:T AF:16x
Lenovo Legion 5 16IRX G9
Intel Core i7-14650HX, NVIDIA GeForce RTX 4060 Laptop GPU
296 (217min, 162P1) fps +50%
Framework Laptop 16
AMD Ryzen 9 7940HS, AMD Radeon RX 7700S
251 (206min, 170P1) fps +27%
Acer Nitro 16 AN16-41-R7YE
AMD Ryzen 5 7535HS, NVIDIA GeForce RTX 4050 Laptop GPU
237 (178min, 148P1) fps +20%
Acer Nitro 16 AN16-41-R7YE
AMD Ryzen 5 7535HS, NVIDIA GeForce RTX 4050 Laptop GPU
207 (152min, 121P1) fps +5%
Average NVIDIA GeForce RTX 4060 Laptop GPU
  (169.8 - 296, n=21)
231 fps +17%
Acer Nitro 16 AN16-41
AMD Ryzen 7 7735HS, NVIDIA GeForce RTX 4070 Laptop GPU
225 (166min, 138P1) fps +14%
Dell Inspiron 16 Plus 7630
Intel Core i7-13700H, NVIDIA GeForce RTX 4060 Laptop GPU
205 (156min, 114P1) fps +4%
Dell Inspiron 16 Plus 7640
Intel Core Ultra 7 155H, NVIDIA GeForce RTX 4060 Laptop GPU
197 (138min, 114P1) fps
Asus VivoBook Pro 16 K6602VU
Intel Core i9-13900H, NVIDIA GeForce RTX 4050 Laptop GPU
182.4 (97min, 86P1) fps -7%
Acer Swift Edge SFE16 Ryzen 7 7840U
AMD Ryzen 7 7840U, AMD Radeon 780M
65.4 (52min, 37P1) fps -67%
Lenovo Yoga 7 2-in-1 16IML9
Intel Core Ultra 5 125U, Intel Graphics 4-Cores iGPU (Arc)
41.7 (34min, 33P1) fps -79%
Lenovo ThinkBook 16 G6 ABP
AMD Ryzen 5 7530U, AMD Radeon RX Vega 7
33.8 (28min, 26P1) fps -83%
Lenovo ThinkPad E16 G1-21JUS08X00
AMD Ryzen 7 7730U, AMD Radeon RX Vega 8 (Ryzen 4000/5000)
33.7 (25min, 25P1) fps -83%
1920x1080 Medium Preset AA:T AF:16x
Lenovo Legion 5 16IRX G9
Intel Core i7-14650HX, NVIDIA GeForce RTX 4060 Laptop GPU
287 (232min, 168P1) fps +56%
Acer Nitro 16 AN16-41
AMD Ryzen 7 7735HS, NVIDIA GeForce RTX 4070 Laptop GPU
222 (172min, 141P1) fps +20%
Average NVIDIA GeForce RTX 4060 Laptop GPU
  (162.3 - 287, n=21)
222 fps +20%
Framework Laptop 16
AMD Ryzen 9 7940HS, AMD Radeon RX 7700S
221 (193min, 157P1) fps +20%
Dell Inspiron 16 Plus 7630
Intel Core i7-13700H, NVIDIA GeForce RTX 4060 Laptop GPU
201 (162min, 111P1) fps +9%
Acer Nitro 16 AN16-41-R7YE
AMD Ryzen 5 7535HS, NVIDIA GeForce RTX 4050 Laptop GPU
198.1 (152min, 123P1) fps +7%
Asus VivoBook Pro 16 K6602VU
Intel Core i9-13900H, NVIDIA GeForce RTX 4050 Laptop GPU
193.1 (139min, 105P1) fps +5%
Dell Inspiron 16 Plus 7640
Intel Core Ultra 7 155H, NVIDIA GeForce RTX 4060 Laptop GPU
184.3 (102min, 90P1) fps
Acer Swift Edge SFE16 Ryzen 7 7840U
AMD Ryzen 7 7840U, AMD Radeon 780M
62.1 (47min, 37P1) fps -66%
Lenovo Yoga 7 2-in-1 16IML9
Intel Core Ultra 5 125U, Intel Graphics 4-Cores iGPU (Arc)
39.7 (33min, 32P1) fps -78%
Lenovo ThinkPad E16 G1-21JUS08X00
AMD Ryzen 7 7730U, AMD Radeon RX Vega 8 (Ryzen 4000/5000)
30.1 (24min, 21P1) fps -84%
Lenovo ThinkBook 16 G6 ABP
AMD Ryzen 5 7530U, AMD Radeon RX Vega 7
29.3 (23min, 22P1) fps -84%
1920x1080 High Preset AA:T AF:16x
Lenovo Legion 5 16IRX G9
Intel Core i7-14650HX, NVIDIA GeForce RTX 4060 Laptop GPU
217 (187min, 135P1) fps +43%
Acer Nitro 16 AN16-41
AMD Ryzen 7 7735HS, NVIDIA GeForce RTX 4070 Laptop GPU
205 (164min, 128P1) fps +35%
Average NVIDIA GeForce RTX 4060 Laptop GPU
  (124.7 - 217, n=23)
172.9 fps +14%
Framework Laptop 16
AMD Ryzen 9 7940HS, AMD Radeon RX 7700S
168 (142min, 123P1) fps +11%
Acer Nitro 16 AN16-41-R7YE
AMD Ryzen 5 7535HS, NVIDIA GeForce RTX 4050 Laptop GPU
166.8 (144min, 110P1) fps +10%
Asus VivoBook Pro 16 K6602VU
Intel Core i9-13900H, NVIDIA GeForce RTX 4050 Laptop GPU
152.1 (101min, 92P1) fps +1%
Dell Inspiron 16 Plus 7640
Intel Core Ultra 7 155H, NVIDIA GeForce RTX 4060 Laptop GPU
151.3 (101min, 89P1) fps
Dell Inspiron 16 Plus 7630
Intel Core i7-13700H, NVIDIA GeForce RTX 4060 Laptop GPU
148.4 (129min, 89P1) fps -2%
Acer Swift Edge SFE16 Ryzen 7 7840U
AMD Ryzen 7 7840U, AMD Radeon 780M
42.6 (31min, 27P1) fps -72%
Lenovo ThinkPad E16 G1-21JUS08X00
AMD Ryzen 7 7730U, AMD Radeon RX Vega 8 (Ryzen 4000/5000)
22.5 (16min, 14P1) fps -85%
Lenovo ThinkBook 16 G6 ABP
AMD Ryzen 5 7530U, AMD Radeon RX Vega 7
21.9 (13min, 13P1) fps -86%
1920x1080 Ultra High Preset AA:T AF:16x
Acer Nitro 16 AN16-41
AMD Ryzen 7 7735HS, NVIDIA GeForce RTX 4070 Laptop GPU
79.3 (66min, 59P1) fps +53%
Lenovo Legion 5 16IRX G9
Intel Core i7-14650HX, NVIDIA GeForce RTX 4060 Laptop GPU
71.4 (61min, 56P1) fps +38%
Average NVIDIA GeForce RTX 4060 Laptop GPU
  (48.7 - 71.4, n=23)
60.8 fps +17%
Dell Inspiron 16 Plus 7630
Intel Core i7-13700H, NVIDIA GeForce RTX 4060 Laptop GPU
53.8 (46min, 45P1) fps +4%
Acer Nitro 16 AN16-41-R7YE
AMD Ryzen 5 7535HS, NVIDIA GeForce RTX 4050 Laptop GPU
52.9 (43min, 44P1) fps +2%
Dell Inspiron 16 Plus 7640
Intel Core Ultra 7 155H, NVIDIA GeForce RTX 4060 Laptop GPU
51.8 (44min, 43P1) fps
Framework Laptop 16
AMD Ryzen 9 7940HS, AMD Radeon RX 7700S
47.7 (32min, 34P1) fps -8%
Asus VivoBook Pro 16 K6602VU
Intel Core i9-13900H, NVIDIA GeForce RTX 4050 Laptop GPU
47.5 (40min, 34P1) fps -8%
Acer Swift Edge SFE16 Ryzen 7 7840U
AMD Ryzen 7 7840U, AMD Radeon 780M
9.92 (7min, 7P1) fps -81%
2560x1440 Ultra High Preset AA:T AF:16x
Acer Nitro 16 AN16-41
AMD Ryzen 7 7735HS, NVIDIA GeForce RTX 4070 Laptop GPU
50.3 (43min, 41P1) fps +57%
Lenovo Legion 5 16IRX G9
Intel Core i7-14650HX, NVIDIA GeForce RTX 4060 Laptop GPU
45.2 (39min, 37P1) fps +41%
Average NVIDIA GeForce RTX 4060 Laptop GPU
  (31 - 45.2, n=18)
39.1 fps +22%
Dell Inspiron 16 Plus 7630
Intel Core i7-13700H, NVIDIA GeForce RTX 4060 Laptop GPU
34.1 (28min, 28P1) fps +6%
Dell Inspiron 16 Plus 7640
Intel Core Ultra 7 155H, NVIDIA GeForce RTX 4060 Laptop GPU
32.1 (27min, 26P1) fps
Framework Laptop 16
AMD Ryzen 9 7940HS, AMD Radeon RX 7700S
29.9 (20min, 21P1) fps -7%
Asus VivoBook Pro 16 K6602VU
Intel Core i9-13900H, NVIDIA GeForce RTX 4050 Laptop GPU
29.6 (24min, 22P1) fps -8%
Baldur's Gate 3
1920x1080 Low Preset
Average NVIDIA GeForce RTX 4060 Laptop GPU
  (102.8 - 160.3, n=14)
127.9 fps +15%
Dell Inspiron 16 Plus 7640
Intel Core Ultra 7 155H, NVIDIA GeForce RTX 4060 Laptop GPU
111.1 fps
Framework Laptop 16
AMD Ryzen 9 7940HS, AMD Radeon RX 7700S
106.8 fps -4%
Lenovo Yoga 7 2-in-1 16IML9
Intel Core Ultra 5 125U, Intel Graphics 4-Cores iGPU (Arc)
15.4 fps -86%
1920x1080 Medium Preset
Average NVIDIA GeForce RTX 4060 Laptop GPU
  (77.5 - 125.7, n=17)
100.5 fps +8%
Dell Inspiron 16 Plus 7640
Intel Core Ultra 7 155H, NVIDIA GeForce RTX 4060 Laptop GPU
93.2 fps
Framework Laptop 16
AMD Ryzen 9 7940HS, AMD Radeon RX 7700S
88 fps -6%
1920x1080 High Preset
Average NVIDIA GeForce RTX 4060 Laptop GPU
  (68.7 - 110.7, n=17)
87.1 fps +6%
Dell Inspiron 16 Plus 7640
Intel Core Ultra 7 155H, NVIDIA GeForce RTX 4060 Laptop GPU
82.4 fps
Framework Laptop 16
AMD Ryzen 9 7940HS, AMD Radeon RX 7700S
76.4 fps -7%
1920x1080 Ultra Preset
Average NVIDIA GeForce RTX 4060 Laptop GPU
  (66.5 - 105.5, n=18)
84.6 fps +10%
Dell Inspiron 16 Plus 7640
Intel Core Ultra 7 155H, NVIDIA GeForce RTX 4060 Laptop GPU
76.7 fps
Framework Laptop 16
AMD Ryzen 9 7940HS, AMD Radeon RX 7700S
73.6 fps -4%
2560x1440 Ultra Preset
Average NVIDIA GeForce RTX 4060 Laptop GPU
  (45.2 - 72.2, n=14)
58.2 fps +9%
Dell Inspiron 16 Plus 7640
Intel Core Ultra 7 155H, NVIDIA GeForce RTX 4060 Laptop GPU
53.2 fps
Framework Laptop 16
AMD Ryzen 9 7940HS, AMD Radeon RX 7700S
51.1 fps -4%
Cyberpunk 2077 2.1 Phantom Liberty
1920x1080 Low Preset (FSR off)
Lenovo Legion 5 16IRX G9
Intel Core i7-14650HX, NVIDIA GeForce RTX 4060 Laptop GPU
133.1 (21.2min) fps +38%
Average NVIDIA GeForce RTX 4060 Laptop GPU
  (96.7 - 136.1, n=21)
117.1 fps +21%
Framework Laptop 16
AMD Ryzen 9 7940HS, AMD Radeon RX 7700S
100.7 (55.4min) fps +4%
Dell Inspiron 16 Plus 7640
Intel Core Ultra 7 155H, NVIDIA GeForce RTX 4060 Laptop GPU
96.8 (78.1min) fps
Lenovo Yoga 7 2-in-1 16IML9
Intel Core Ultra 5 125U, Intel Graphics 4-Cores iGPU (Arc)
20.9 (8.34min) fps -78%
1920x1080 Medium Preset (FSR off)
Lenovo Legion 5 16IRX G9
Intel Core i7-14650HX, NVIDIA GeForce RTX 4060 Laptop GPU
110.4 (18.7min) fps +33%
Average NVIDIA GeForce RTX 4060 Laptop GPU
  (77.7 - 110.4, n=22)
93.8 fps +13%
Dell Inspiron 16 Plus 7640
Intel Core Ultra 7 155H, NVIDIA GeForce RTX 4060 Laptop GPU
83.1 (71.3min) fps
Framework Laptop 16
AMD Ryzen 9 7940HS, AMD Radeon RX 7700S
80.5 (59.6min) fps -3%
Lenovo Yoga 7 2-in-1 16IML9
Intel Core Ultra 5 125U, Intel Graphics 4-Cores iGPU (Arc)
16.9 (7.96min) fps -80%
1920x1080 High Preset (FSR off)
Lenovo Legion 5 16IRX G9
Intel Core i7-14650HX, NVIDIA GeForce RTX 4060 Laptop GPU
95.3 (18.5min) fps +36%
Average NVIDIA GeForce RTX 4060 Laptop GPU
  (65.2 - 102, n=25)
80.6 fps +15%
Dell Inspiron 16 Plus 7640
Intel Core Ultra 7 155H, NVIDIA GeForce RTX 4060 Laptop GPU
69.9 (60.2min) fps
Framework Laptop 16
AMD Ryzen 9 7940HS, AMD Radeon RX 7700S
68.1 (47.8min) fps -3%
Lenovo Yoga 7 2-in-1 16IML9
Intel Core Ultra 5 125U, Intel Graphics 4-Cores iGPU (Arc)
14.3 (3.34min) fps -80%
1920x1080 Ultra Preset (FSR off)
Lenovo Legion 5 16IRX G9
Intel Core i7-14650HX, NVIDIA GeForce RTX 4060 Laptop GPU
81.8 (19.5min) fps +37%
Average NVIDIA GeForce RTX 4060 Laptop GPU
  (56.4 - 93.1, n=30)
71.5 fps +20%
Framework Laptop 16
AMD Ryzen 9 7940HS, AMD Radeon RX 7700S
60.7 (46.5min) fps +2%
Dell Inspiron 16 Plus 7640
Intel Core Ultra 7 155H, NVIDIA GeForce RTX 4060 Laptop GPU
59.8 (50.5min) fps
Lenovo Yoga 7 2-in-1 16IML9
Intel Core Ultra 5 125U, Intel Graphics 4-Cores iGPU (Arc)
12.5 (2.72min) fps -79%
2560x1440 Ultra Preset (FSR off)
Lenovo Legion 5 16IRX G9
Intel Core i7-14650HX, NVIDIA GeForce RTX 4060 Laptop GPU
49.7 (26.6min) fps +35%
Average NVIDIA GeForce RTX 4060 Laptop GPU
  (32.9 - 51.8, n=19)
43.8 fps +19%
Framework Laptop 16
AMD Ryzen 9 7940HS, AMD Radeon RX 7700S
37.3 (30.7min) fps +1%
Dell Inspiron 16 Plus 7640
Intel Core Ultra 7 155H, NVIDIA GeForce RTX 4060 Laptop GPU
36.8 (32min) fps

Witcher 3 FPS Chart

05101520253035404550556065707580Tooltip
Dell Inspiron 16 Plus 7640 Ultra 7 155H, NVIDIA GeForce RTX 4060 Laptop GPU: Ø78.8 (75-84)
baixomédiaaltoultraQHD
The Witcher 3 (2015) 375.8 276.8 160.3 84.1 61.9
Dota 2 Reborn (2015) 173.5 152.1 143.2 135.1
Final Fantasy XV Benchmark (2018) 137.6 98.4 78.8 58.8
X-Plane 11.11 (2018) 123.7 109 86.5
Far Cry 5 (2018) 138 125 118 110 83
Strange Brigade (2018) 360 225 178.1 153.5 105.2
Tiny Tina's Wonderlands (2022) 177.4 116 91.9 71.1 48
F1 22 (2022) 197 184.3 151.3 51.8 32.1
Baldur's Gate 3 (2023) 111.1 93.2 82.4 76.7 53.2
Cyberpunk 2077 2.1 Phantom Liberty (2023) 96.8 83.1 69.9 59.8 36.8

Emissões

Ruído do sistema - alto durante os jogos

As ventoinhas internas conseguem permanecer mais silenciosas por mais tempo do que no modelo do ano passado. Ao executar o 3DMark 06, por exemplo, o ruído da ventoinha fica em torno de 29 dB(A) até o final da primeira cena do benchmark, enquanto o Inspiron 16 Plus 7630 fica muito mais alto, com 35 dB(A). Por outro lado, os dois notebooks se estabilizam em mais de 50 dB(A) cada um ao executar cargas mais exigentes, como jogos, por um longo período de tempo.

Perfil de ruído do ventilador (Branco: Fundo, vermelho: Sistema ocioso, Azul: 3DMark 06, Laranja: Witcher 3, Verde: Estresse do Prime95)

Barulho

Ocioso
24.2 / 24.2 / 24.2 dB
Carga
28.9 / 51 dB
  red to green bar
 
 
30 dB
silencioso
40 dB(A)
audível
50 dB(A)
ruidosamente alto
 
min: dark, med: mid, max: light   Earthworks M23R, Arta (15 cm de distância)   environment noise: 23.8 dB(A)
dB(A) 0102030405060708090Deep BassMiddle BassHigh BassLower RangeMidsHigher MidsLower HighsMid HighsUpper HighsSuper Highs2036.136.935.237.337.62526.328.82926.934.13124.826.924.525.828.54023.822.220.52023.55027.727.525.423.328.76327.828.628.228.627.58030.122.422.42230.210023.720.52018.627.112522.326.118.915.924.916025.218.815.115.426.120025.526.616.81626.525029.72116.51429.631531.520.917.915.730.940031.41814.613.831.350031.220.912.612.131.163032.916.913.611.632.980033.915.711.611.133.9100035.616.110.610.835.812503816.810.110.338160038.316.210.710.438.2200039.417.810.710.939.4250039.518.71110.939.2315039.415.311.611.439.4400040.913.911.81240.4500042.613.312.31242.7630041.713.712.412.241.7800038.815.412.612.338.71000033.615.112.512.433.51250030.514.312.712.430.31600027.114.112.211.527.1SPL5128.924.223.850.9N7.41.20.60.57.3median 33.6median 16.8median 12.5median 12.1median 33.5Delta5.92.721.95.9hearing rangehide median Fan NoiseDell Inspiron 16 Plus 7640
Dell Inspiron 16 Plus 7640
NVIDIA GeForce RTX 4060 Laptop GPU, Ultra 7 155H, SK hynix BC901 HFS001TEJ4X164N
Dell Inspiron 16 Plus 7630
NVIDIA GeForce RTX 4060 Laptop GPU, i7-13700H, WD PC SN740 SDDPTQD-1T00
Dell Inspiron 16 Plus 7620
GeForce RTX 3050 Ti Laptop GPU, i7-12700H, Kioxia BG5 KBG50ZNS512G
Samsung Galaxy Book4 Ultra
NVIDIA GeForce RTX 4050 Laptop GPU, Ultra 7 155H, Samsung PM9A1 MZVL2512HCJQ
Lenovo Legion 5 16IRX G9
NVIDIA GeForce RTX 4060 Laptop GPU, i7-14650HX, Samsung PM9A1 MZVL21T0HCLR
Asus VivoBook Pro 16 K6602VU
NVIDIA GeForce RTX 4050 Laptop GPU, i9-13900H, Micron 2400 MTFDKBA1T0QFM
Noise
-2%
-13%
0%
-17%
-11%
off / environment *
23.8
23.2
3%
23.3
2%
24.2
-2%
24
-1%
20.96
12%
Idle Minimum *
24.2
23.2
4%
25.7
-6%
24.2
-0%
24
1%
25.28
-4%
Idle Average *
24.2
23.2
4%
26.1
-8%
24.2
-0%
28.8
-19%
25.28
-4%
Idle Maximum *
24.2
23.2
4%
30.6
-26%
24.2
-0%
32
-32%
25.28
-4%
Load Average *
28.9
35.1
-21%
46.2
-60%
37.9
-31%
45.5
-57%
51.88
-80%
Witcher 3 ultra *
51
52.5
-3%
49.2
4%
41.7
18%
53.1
-4%
49
4%
Load Maximum *
51
52.5
-3%
49.4
3%
41.7
18%
55.7
-9%
51.8
-2%

* ... smaller is better

Temperatura

As temperaturas da superfície podem ficar bastante quentes, apesar das muitas grades de ventilação ao longo das bordas. Os pontos quentes durante os jogos podem chegar a 43 °C nas tampas C e D do chassi, o que é comparável ao Lenovo Legion 5i 16 G9 laptop para jogos.

Exaustão na parte traseira e nas laterais
O adaptador CA atinge mais de 47 °C ao operar cargas exigentes
Carga Máxima
 41.2 °C43.4 °C41 °C 
 41.4 °C42.6 °C38.8 °C 
 35.2 °C34.6 °C32.2 °C 
Máximo: 43.4 °C
Médio: 38.9 °C
38 °C41.6 °C37.4 °C
37 °C41.2 °C40.4 °C
33.6 °C35.2 °C34.6 °C
Máximo: 41.6 °C
Médio: 37.7 °C
alimentação elétrica  48 °C | Temperatura do quarto 20 °C | Fluke 62 Mini IR Thermometer
(-) The average temperature for the upper side under maximal load is 38.9 °C / 102 F, compared to the average of 31.3 °C / 88 F for the devices in the class Multimedia.
(±) The maximum temperature on the upper side is 43.4 °C / 110 F, compared to the average of 36.9 °C / 98 F, ranging from 21.1 to 71 °C for the class Multimedia.
(±) The bottom heats up to a maximum of 41.6 °C / 107 F, compared to the average of 39.2 °C / 103 F
(+) In idle usage, the average temperature for the upper side is 29.9 °C / 86 F, compared to the device average of 31.3 °C / 88 F.
(+) The palmrests and touchpad are reaching skin temperature as a maximum (35.2 °C / 95.4 F) and are therefore not hot.
(-) The average temperature of the palmrest area of similar devices was 28.8 °C / 83.8 F (-6.4 °C / -11.6 F).
Sistema inativo (parte superior)
Sistema inativo (parte inferior)
Estresse do Prime95+FurMark (topo)
Estresse do Prime95+FurMark (parte inferior)
Dell Inspiron 16 Plus 7640
Intel Core Ultra 7 155H, NVIDIA GeForce RTX 4060 Laptop GPU
Dell Inspiron 16 Plus 7630
Intel Core i7-13700H, NVIDIA GeForce RTX 4060 Laptop GPU
Dell Inspiron 16 Plus 7620
Intel Core i7-12700H, NVIDIA GeForce RTX 3050 Ti Laptop GPU
Samsung Galaxy Book4 Ultra
Intel Core Ultra 7 155H, NVIDIA GeForce RTX 4050 Laptop GPU
Lenovo Legion 5 16IRX G9
Intel Core i7-14650HX, NVIDIA GeForce RTX 4060 Laptop GPU
Asus VivoBook Pro 16 K6602VU
Intel Core i9-13900H, NVIDIA GeForce RTX 4050 Laptop GPU
Heat
-7%
-0%
17%
0%
-14%
Maximum Upper Side *
43.4
47.8
-10%
46
-6%
38.5
11%
40.4
7%
42.6
2%
Maximum Bottom *
41.6
42.2
-1%
45.8
-10%
41.2
1%
43.8
-5%
48.4
-16%
Idle Upper Side *
32.8
35.2
-7%
29.2
11%
23.5
28%
30.3
8%
39.4
-20%
Idle Bottom *
32.4
35
-8%
31
4%
24.1
26%
35.3
-9%
39.8
-23%

* ... smaller is better

Alto-falantes

O ruído rosa mostra um ótimo volume máximo e uma reprodução de graves respeitável para um laptop multimídia
dB(A) 0102030405060708090Deep BassMiddle BassHigh BassLower RangeMidsHigher MidsLower HighsMid HighsUpper HighsSuper Highs2038.335.238.32528.12928.13125.324.525.34022.320.522.3502325.4236321.528.221.5802422.42410030.62030.612544.318.944.316060.615.160.620069.516.869.525071.816.571.83157117.97140071.614.671.650070.612.670.663075.813.675.880075.611.675.610007410.674125077.110.177.1160078.910.778.9200076.610.776.6250073.31173.3315069.611.669.6400067.311.867.3500065.912.365.9630075.412.475.4800078.412.678.4100007812.5781250068.112.768.11600067.912.267.9SPL87.124.287.1N75.20.675.2median 71.8median 12.5median 71.8Delta5.225.226.325.821.422.12624.925.127.622.532.523.448.72655.818.860.922.167.2267019.372.317.674.217.774.319.575.31571.711.871.311.27410.574.21072.710.17210.67210.97511.374.811.671.71269.71269.612.371.112.669.61270.111.269.824.784.70.666.6median 12median 71.73.42.2hearing rangehide median Pink NoiseDell Inspiron 16 Plus 7640Apple MacBook Pro 16 2021 M1 Pro
Frequency diagram (checkboxes can be checked and unchecked to compare devices)
Dell Inspiron 16 Plus 7640 audio analysis

(+) | speakers can play relatively loud (87.1 dB)
Bass 100 - 315 Hz
(±) | reduced bass - on average 13.9% lower than median
(±) | linearity of bass is average (13.7% delta to prev. frequency)
Mids 400 - 2000 Hz
(+) | balanced mids - only 3.6% away from median
(+) | mids are linear (3.4% delta to prev. frequency)
Highs 2 - 16 kHz
(+) | balanced highs - only 4.3% away from median
(+) | highs are linear (5.7% delta to prev. frequency)
Overall 100 - 16.000 Hz
(+) | overall sound is linear (11.3% difference to median)
Compared to same class
» 13% of all tested devices in this class were better, 4% similar, 83% worse
» The best had a delta of 5%, average was 18%, worst was 45%
Compared to all devices tested
» 6% of all tested devices were better, 2% similar, 93% worse
» The best had a delta of 4%, average was 25%, worst was 134%

Apple MacBook Pro 16 2021 M1 Pro audio analysis

(+) | speakers can play relatively loud (84.7 dB)
Bass 100 - 315 Hz
(+) | good bass - only 3.8% away from median
(+) | bass is linear (5.2% delta to prev. frequency)
Mids 400 - 2000 Hz
(+) | balanced mids - only 1.3% away from median
(+) | mids are linear (2.1% delta to prev. frequency)
Highs 2 - 16 kHz
(+) | balanced highs - only 1.9% away from median
(+) | highs are linear (2.7% delta to prev. frequency)
Overall 100 - 16.000 Hz
(+) | overall sound is linear (4.6% difference to median)
Compared to same class
» 0% of all tested devices in this class were better, 0% similar, 100% worse
» The best had a delta of 5%, average was 18%, worst was 45%
Compared to all devices tested
» 0% of all tested devices were better, 0% similar, 100% worse
» The best had a delta of 4%, average was 25%, worst was 134%

Gerenciamento de energia

Consumo de energia

O consumo de energia é visivelmente mais baixo do que no modelo do ano passado quando em modo inativo no desktop, o que pode explicar a vida útil da bateria geralmente mais longa na próxima seção abaixo. O sistema exigiria entre 4 W e 16 W em comparação com 16 W a 21 W no Inspiron 16 Plus 7630. O consumo ao executar aplicativos mais exigentes, como jogos, é praticamente o mesmo, se não for ligeiramente menor em alguns watts.

Curiosamente, o modelo é fornecido com um adaptador CA USB-C universal de 130 W (~14,3 x 6,5 x 2,2 cm) em vez do carregador de barril CA proprietário de 130 W que veio com o modelo do ano passado. No entanto, a porta do adaptador CA de barril permanece, o que significa que o senhor ainda pode recarregar o sistema por meio de um carregador de barril compatível. Conseguimos registrar um consumo máximo temporário de 138 W ao executar o Prime95 e o FurMark simultaneamente.

consumo do 3DMark 06
Witcher 3 ultra consumo de 1080p
O consumo chegava a 138 W e durava cerca de 25 segundos ao iniciar o estresse do Prime95, antes de cair e se estabilizar em 75 W devido às limitações do Turbo Boost
Prime95+FurMark estresse iniciado aos 10s
Consumo de energia
desligadodarklight 0.25 / 1.2 Watt
Ociosodarkmidlight 4.2 / 6.9 / 15.2 Watt
Carga midlight 70.4 / 137.4 Watt
 color bar
Key: min: dark, med: mid, max: light        Metrahit Energy
Dell Inspiron 16 Plus 7640
Ultra 7 155H, NVIDIA GeForce RTX 4060 Laptop GPU, SK hynix BC901 HFS001TEJ4X164N, IPS, 2560x1600, 16"
Dell Inspiron 16 Plus 7630
i7-13700H, NVIDIA GeForce RTX 4060 Laptop GPU, WD PC SN740 SDDPTQD-1T00, IPS, 2560x1600, 16"
Dell Inspiron 16 Plus 7620
i7-12700H, GeForce RTX 3050 Ti Laptop GPU, Kioxia BG5 KBG50ZNS512G, IPS, 3072x1920, 16"
Samsung Galaxy Book4 Ultra
Ultra 7 155H, NVIDIA GeForce RTX 4050 Laptop GPU, Samsung PM9A1 MZVL2512HCJQ, OLED, 2880x1800, 16"
Lenovo Legion 5 16IRX G9
i7-14650HX, NVIDIA GeForce RTX 4060 Laptop GPU, Samsung PM9A1 MZVL21T0HCLR, IPS, 2560x1600, 16"
Asus VivoBook Pro 16 K6602VU
i9-13900H, NVIDIA GeForce RTX 4050 Laptop GPU, Micron 2400 MTFDKBA1T0QFM, OLED, 3200x2000, 16"
Power Consumption
-82%
-30%
9%
-113%
-116%
Idle Minimum *
4.2
15.6
-271%
6.8
-62%
4.8
-14%
15.4
-267%
21.06
-401%
Idle Average *
6.9
17.7
-157%
9.6
-39%
7.5
-9%
19.7
-186%
24.27
-252%
Idle Maximum *
15.2
20.6
-36%
17
-12%
7.9
48%
20.7
-36%
25.12
-65%
Load Average *
70.4
87.4
-24%
117.5
-67%
79.3
-13%
102.6
-46%
52.4
26%
Witcher 3 ultra *
115.9
121.7
-5%
113.1
2%
79.2
32%
191.3
-65%
110.2
5%
Load Maximum *
137.4
138
-0%
137.4
-0%
125
9%
246.6
-79%
146
-6%

* ... smaller is better
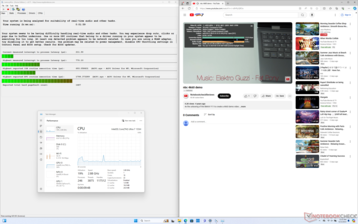
Power Consumption Witcher 3 / Stresstest

0102030405060708090100110120130Tooltip
Dell Inspiron 16 Plus 7640 Ultra 7 155H, NVIDIA GeForce RTX 4060 Laptop GPU; Witcher 3 ultra: Ø115.9 (111.1-127.1)
Dell Inspiron 16 Plus 7630 i7-13700H, NVIDIA GeForce RTX 4060 Laptop GPU; Witcher 3 ultra: Ø121.7 (116-127.6)
Dell Inspiron 16 Plus 7640 Ultra 7 155H, NVIDIA GeForce RTX 4060 Laptop GPU; 1280x720 Prime95 28.10 and Furmark 1.25: Ø119.2 (91.3-137.4)
Dell Inspiron 16 Plus 7630 i7-13700H, NVIDIA GeForce RTX 4060 Laptop GPU; 1280x720 Prime95 28.10 and Furmark 1.25: Ø120.3 (102.4-138)
Dell Inspiron 16 Plus 7640 Ultra 7 155H, NVIDIA GeForce RTX 4060 Laptop GPU; Idle 150cd/m2: Ø6.58 (3.03-17.2)
Dell Inspiron 16 Plus 7630 i7-13700H, NVIDIA GeForce RTX 4060 Laptop GPU; Idle 150cd/m2: Ø17.1 (16.2-22.9)

Power Consumption external Monitor

0102030405060708090100110120130Tooltip
Dell Inspiron 16 Plus 7640 Ultra 7 155H, NVIDIA GeForce RTX 4060 Laptop GPU; Prime95 V2810 Stress (external Monitor): Ø84.9 (72.3-137.4)
Dell Inspiron 16 Plus 7630 i7-13700H, NVIDIA GeForce RTX 4060 Laptop GPU; Prime95 V2810 Stress (external Monitor): Ø82.1 (62.2-138)
Dell Inspiron 16 Plus 7640 Ultra 7 155H, NVIDIA GeForce RTX 4060 Laptop GPU; Cinebench R15 Multi (external Monitor): Ø84.8 (49-121.2)
Dell Inspiron 16 Plus 7630 i7-13700H, NVIDIA GeForce RTX 4060 Laptop GPU; Cinebench R15 Multi (external Monitor): Ø119.9 (110.7-133.4)
Dell Inspiron 16 Plus 7640 Ultra 7 155H, NVIDIA GeForce RTX 4060 Laptop GPU; 1280x720 FurMark 1.19 GPU Stress Test (external Monitor): Ø94.2 (91-111.7)
Dell Inspiron 16 Plus 7630 i7-13700H, NVIDIA GeForce RTX 4060 Laptop GPU; 1280x720 FurMark 1.19 GPU Stress Test (external Monitor): Ø103.6 (98.1-126.3)
Dell Inspiron 16 Plus 7640 Ultra 7 155H, NVIDIA GeForce RTX 4060 Laptop GPU; 1920x1080 The Witcher 3 ultra (external Monitor): Ø106.6 (100.5-116.2)
Dell Inspiron 16 Plus 7630 i7-13700H, NVIDIA GeForce RTX 4060 Laptop GPU; 1920x1080 The Witcher 3 ultra (external Monitor): Ø120.7 (116.9-127.8)
Dell Inspiron 16 Plus 7640 Ultra 7 155H, NVIDIA GeForce RTX 4060 Laptop GPU; Idle 1min (external Monitor): Ø4.09 (2.1-5.85)
Dell Inspiron 16 Plus 7630 i7-13700H, NVIDIA GeForce RTX 4060 Laptop GPU; Idle 1min (external Monitor): Ø16.3 (14.3-26.2)

Duração da bateria

Os tempos de execução são muito mais longos do que antes, provavelmente devido às otimizações e à mudança para uma CPU Intel de geração mais recente. Conseguimos registrar uma duração de bateria WLAN no mundo real de quase 13,5 horas, em comparação com 9,5 horas no modelo do ano passado.

O carregamento da bateria vazia até a capacidade total leva cerca de 2 horas com o adaptador USB-C incluído.

Tempo de Execução da Bateria
WiFi Websurfing
13h 19min
Dell Inspiron 16 Plus 7640
Ultra 7 155H, NVIDIA GeForce RTX 4060 Laptop GPU, 90 Wh
Dell Inspiron 16 Plus 7630
i7-13700H, NVIDIA GeForce RTX 4060 Laptop GPU, 86 Wh
Dell Inspiron 16 Plus 7620
i7-12700H, GeForce RTX 3050 Ti Laptop GPU, 86 Wh
Samsung Galaxy Book4 Ultra
Ultra 7 155H, NVIDIA GeForce RTX 4050 Laptop GPU, 76 Wh
Lenovo Legion 5 16IRX G9
i7-14650HX, NVIDIA GeForce RTX 4060 Laptop GPU, 80 Wh
Asus VivoBook Pro 16 K6602VU
i9-13900H, NVIDIA GeForce RTX 4050 Laptop GPU, 96 Wh
Battery Runtime
-29%
-28%
-18%
-44%
-24%
WiFi v1.3
799
566
-29%
575
-28%
656
-18%
444
-44%
606
-24%
Reader / Idle
1055
1114
Load
85
69
78
46
H.264
1076
576
585

Pro

+ tela de 120 Hz bem calibrada com cores sRGB completas
+ nPU integrada para aceleração de IA
+ agora suporta até dois SSDs M.2
+ Suporte a Thunderbolt 4
+ boa duração da bateria

Contra

- desempenho single-thread ligeiramente mais lento do que no ano passado
- desempenho em jogos um pouco mais lento do que no ano passado
- porta de carregamento de barril dedicada parece desnecessária
- sem G-Sync ou Windows VRR
- apenas uma porta USB-C

Veredicto - Remendando alguns pequenos buracos

Em análise: Dell Inspiron 16 Plus 7640

Embora o Inspiron 16 Plus 7640 2024 possa ser muito parecido com a versão 2023ele traz novidades suficientes além da esperada atualização anual do processador que os compradores interessados podem querer conhecer. O modelo mais novo suporta até dois SSDs, oferece tempos de resposta mais rápidos em preto e branco e cinza, maior duração da bateria e aceleração de IA. Essas mudanças subjacentes são importantes para os entusiastas que valorizam a expansão do armazenamento, jogos rápidos, viagens e programas assistidos por IA, como o Co-Pilot. Nesse aspecto, o Inspiron 16 Plus 7640 se torna um produto sem igual em relação ao seu antecessor.

O Inspiron 16 Plus 7640 aborda algumas das desvantagens do seu antecessor para ser uma máquina multimídia ainda melhor do que antes. No entanto, o desempenho da CPU de thread único e o desempenho em jogos dão um pequeno passo para trás.

Infelizmente, o desempenho em jogos é prejudicado com o novo modelo, pois a maioria dos jogos tende a ser executada um pouco mais lentamente do que antes. Os jogadores mais exigentes podem achar isso decepcionante, mas o déficit não deve ser suficiente para deter os jogadores casuais, para os quais a série Inspiron foi projetada. Os jogadores que realmente querem obter mais desempenho de seus laptops terão que considerar modelos maiores e mais caros, como os da série Série Dell G16, Série Asus Zephyrus G16ou Série Razer Blade 16 onde o TGP pode chegar a três dígitos.

Preço e disponibilidade

Nossa configuração de análise do Core Ultra 7, RTX 4060 e 1600p está sendo enviada diretamente pela Dell por US$ 1.300. Enquanto isso, o Core i7 de baixo custo com UHD Graphics SKU custa a partir de apenas US$ 900.

Dell Inspiron 16 Plus 7640 - 06/21/2024 v8
Allen Ngo

Acabamento
84 / 98 → 85%
Teclado
82%
Mouse
78%
Conectividade
60 / 80 → 75%
Peso
62 / 20-74 → 77%
Bateria
89 / 95 → 94%
Pantalha
82%
Desempenho do jogos
76 / 88 → 87%
Desempenho da aplicação
81 / 92 → 88%
Temperatura
88%
Ruído
80 / 95 → 84%
Audio
83%
Camera
38 / 75 → 50%
Médio
76%
83%
Multimedia - Médio equilibrado

Transparency

The selection of devices to be reviewed is made by our editorial team. The test sample was provided to the author as a loan by the manufacturer or retailer for the purpose of this review. The lender had no influence on this review, nor did the manufacturer receive a copy of this review before publication. There was no obligation to publish this review. We never accept compensation or payment in return for our reviews. As an independent media company, Notebookcheck is not subjected to the authority of manufacturers, retailers or publishers.

This is how Notebookcheck is testing

Every year, Notebookcheck independently reviews hundreds of laptops and smartphones using standardized procedures to ensure that all results are comparable. We have continuously developed our test methods for around 20 years and set industry standards in the process. In our test labs, high-quality measuring equipment is utilized by experienced technicians and editors. These tests involve a multi-stage validation process. Our complex rating system is based on hundreds of well-founded measurements and benchmarks, which maintains objectivity. Further information on our test methods can be found here.

Price comparison

Please share our article, every link counts!
Mail Logo
> Análises e revisões de portáteis e celulares > Análises > Análises > Análise do laptop Dell Inspiron 16 Plus 7640: Pequenas, mas importantes mudanças em relação ao modelo do ano passado
Allen Ngo, 2024-06-22 (Update: 2024-06-22)