

Análise da estação de trabalho Dell Precision 5690: Pronto para a revolução da IA

O Precision 5690 é o sucessor do Precision 5680 do ano passado, substituindo as CPUs Raptor Lake-H mais antigas pelas CPUs Meteor Lake-H mais novas, com NPUs integradas. Os dois modelos são idênticos, com as mesmas opções de tela e GPU. Recomendamos conferir nossa análise do Precision 5680 para saber mais sobre os recursos físicos da série inspirados no XPS 16.
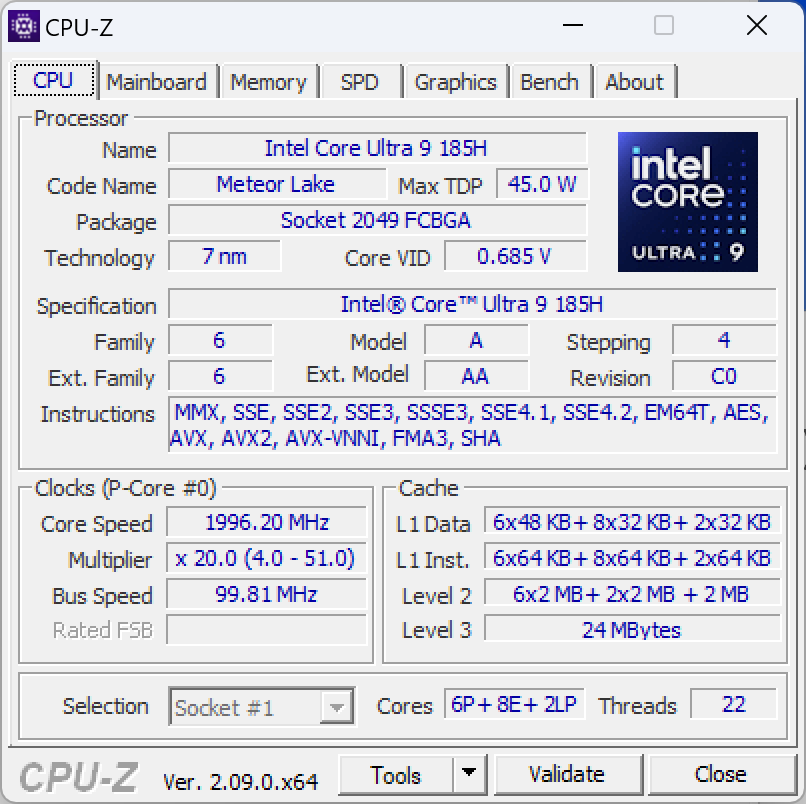
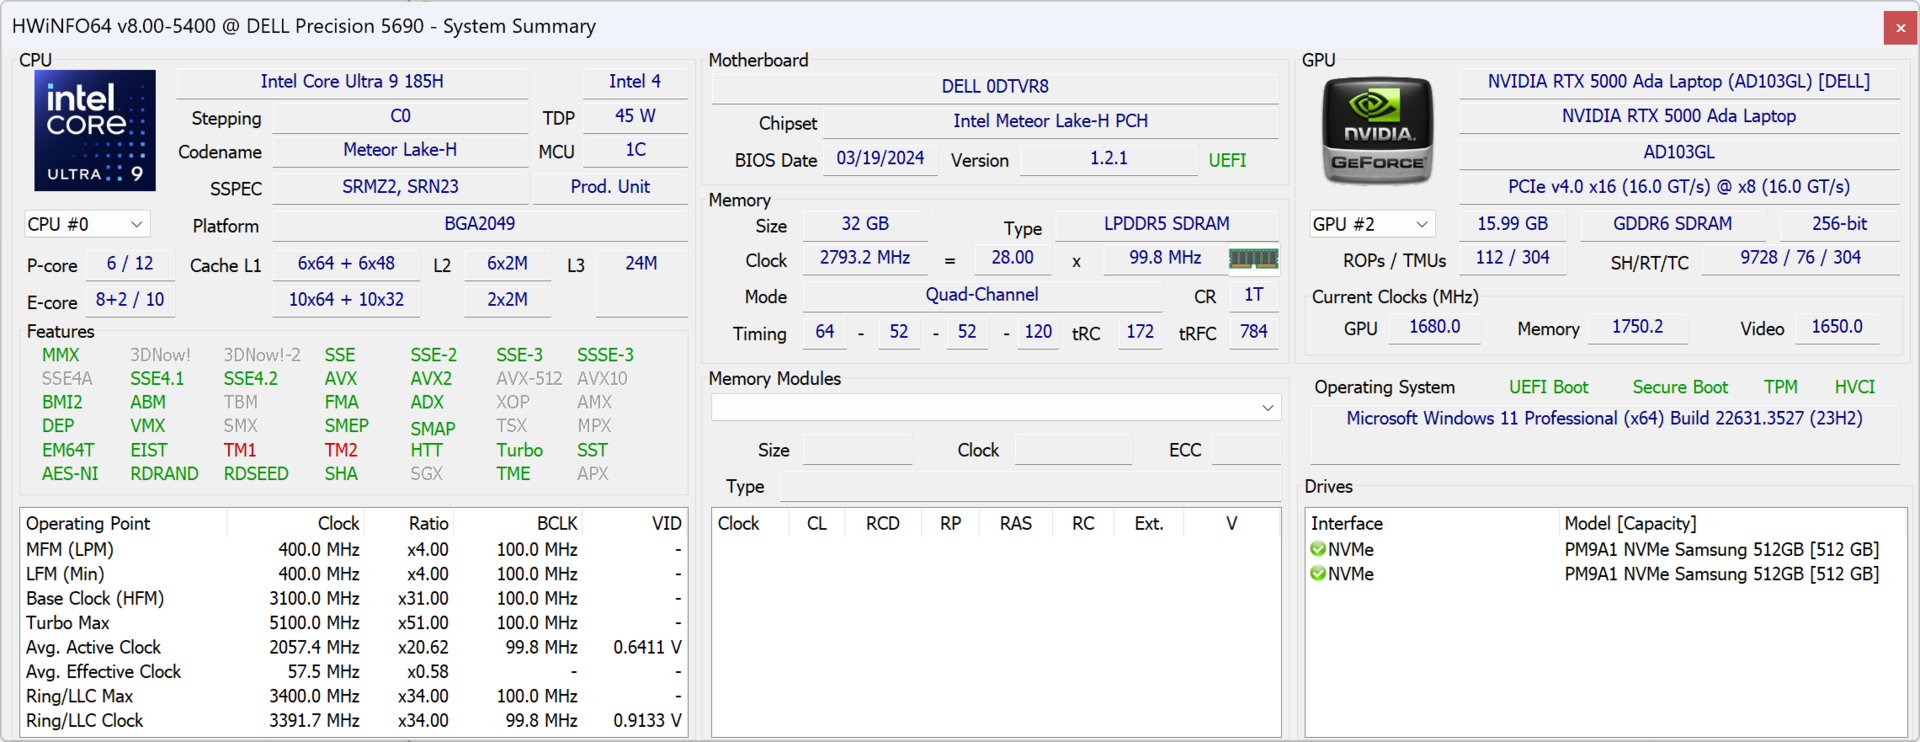
Nossa unidade em análise é a configuração mais avançada com CPU Core Ultra 9 185H vPro, GPU Nvidia 5000 Ada e tela sensível ao toque OLED 2400p de 16 polegadas por aproximadamente US$ 5900. As SKUs menores começam com o Core Ultra 5 135H vPro, somente com gráficos Arc integrados e tela IPS de 1200p por apenas US$ 2.300.
As alternativas ao Precision 5690 incluem outras estações de trabalho de 16 polegadas, como o Lenovo ThinkPad P16 G2, HP ZBook Fury 16 G10ou o MSI CreatorPro Z16P.
Mais análises da Dell:
Possíveis concorrentes em comparação
Avaliação | Data | Modelo | Peso | Altura | Size | Resolução | Preço |
|---|---|---|---|---|---|---|---|
| 88.3 % v7 (old) | 05/2024 | Dell Precision 5690 Ultra 9 185H, NVIDIA RTX 5000 Ada Generation Laptop GPU | 2.3 kg | 22.17 mm | 16.00" | 3840x2400 | |
| 89 % v7 (old) | 08/2023 | Dell Precision 5000 5680 i9-13900H, NVIDIA RTX 5000 Ada Generation Laptop GPU | 2.3 kg | 22.17 mm | 16.00" | 3840x2400 | |
| 90.2 % v7 (old) | 03/2024 | Lenovo ThinkPad P16 G2 21FA000FGE i7-13700HX, NVIDIA RTX 2000 Ada Generation Laptop GPU | 3 kg | 30.23 mm | 16.00" | 2560x1600 | |
| 91.7 % v7 (old) | 10/2023 | Lenovo ThinkPad P1 G6-21FV000DGE i9-13900H, NVIDIA RTX 2000 Ada Generation Laptop GPU | 1.9 kg | 17.5 mm | 16.00" | 2560x1600 | |
| 92.3 % v7 (old) | 09/2023 | HP ZBook Fury 16 G10 i9-13950HX, NVIDIA RTX 5000 Ada Generation Laptop GPU | 2.6 kg | 28.5 mm | 16.00" | 3840x2400 | |
| 84.3 % v7 (old) | 11/2022 | MSI CreatorPro Z16P B12UKST i7-12700H, RTX A3000 Laptop GPU | 2.4 kg | 19 mm | 16.00" | 2560x1600 |
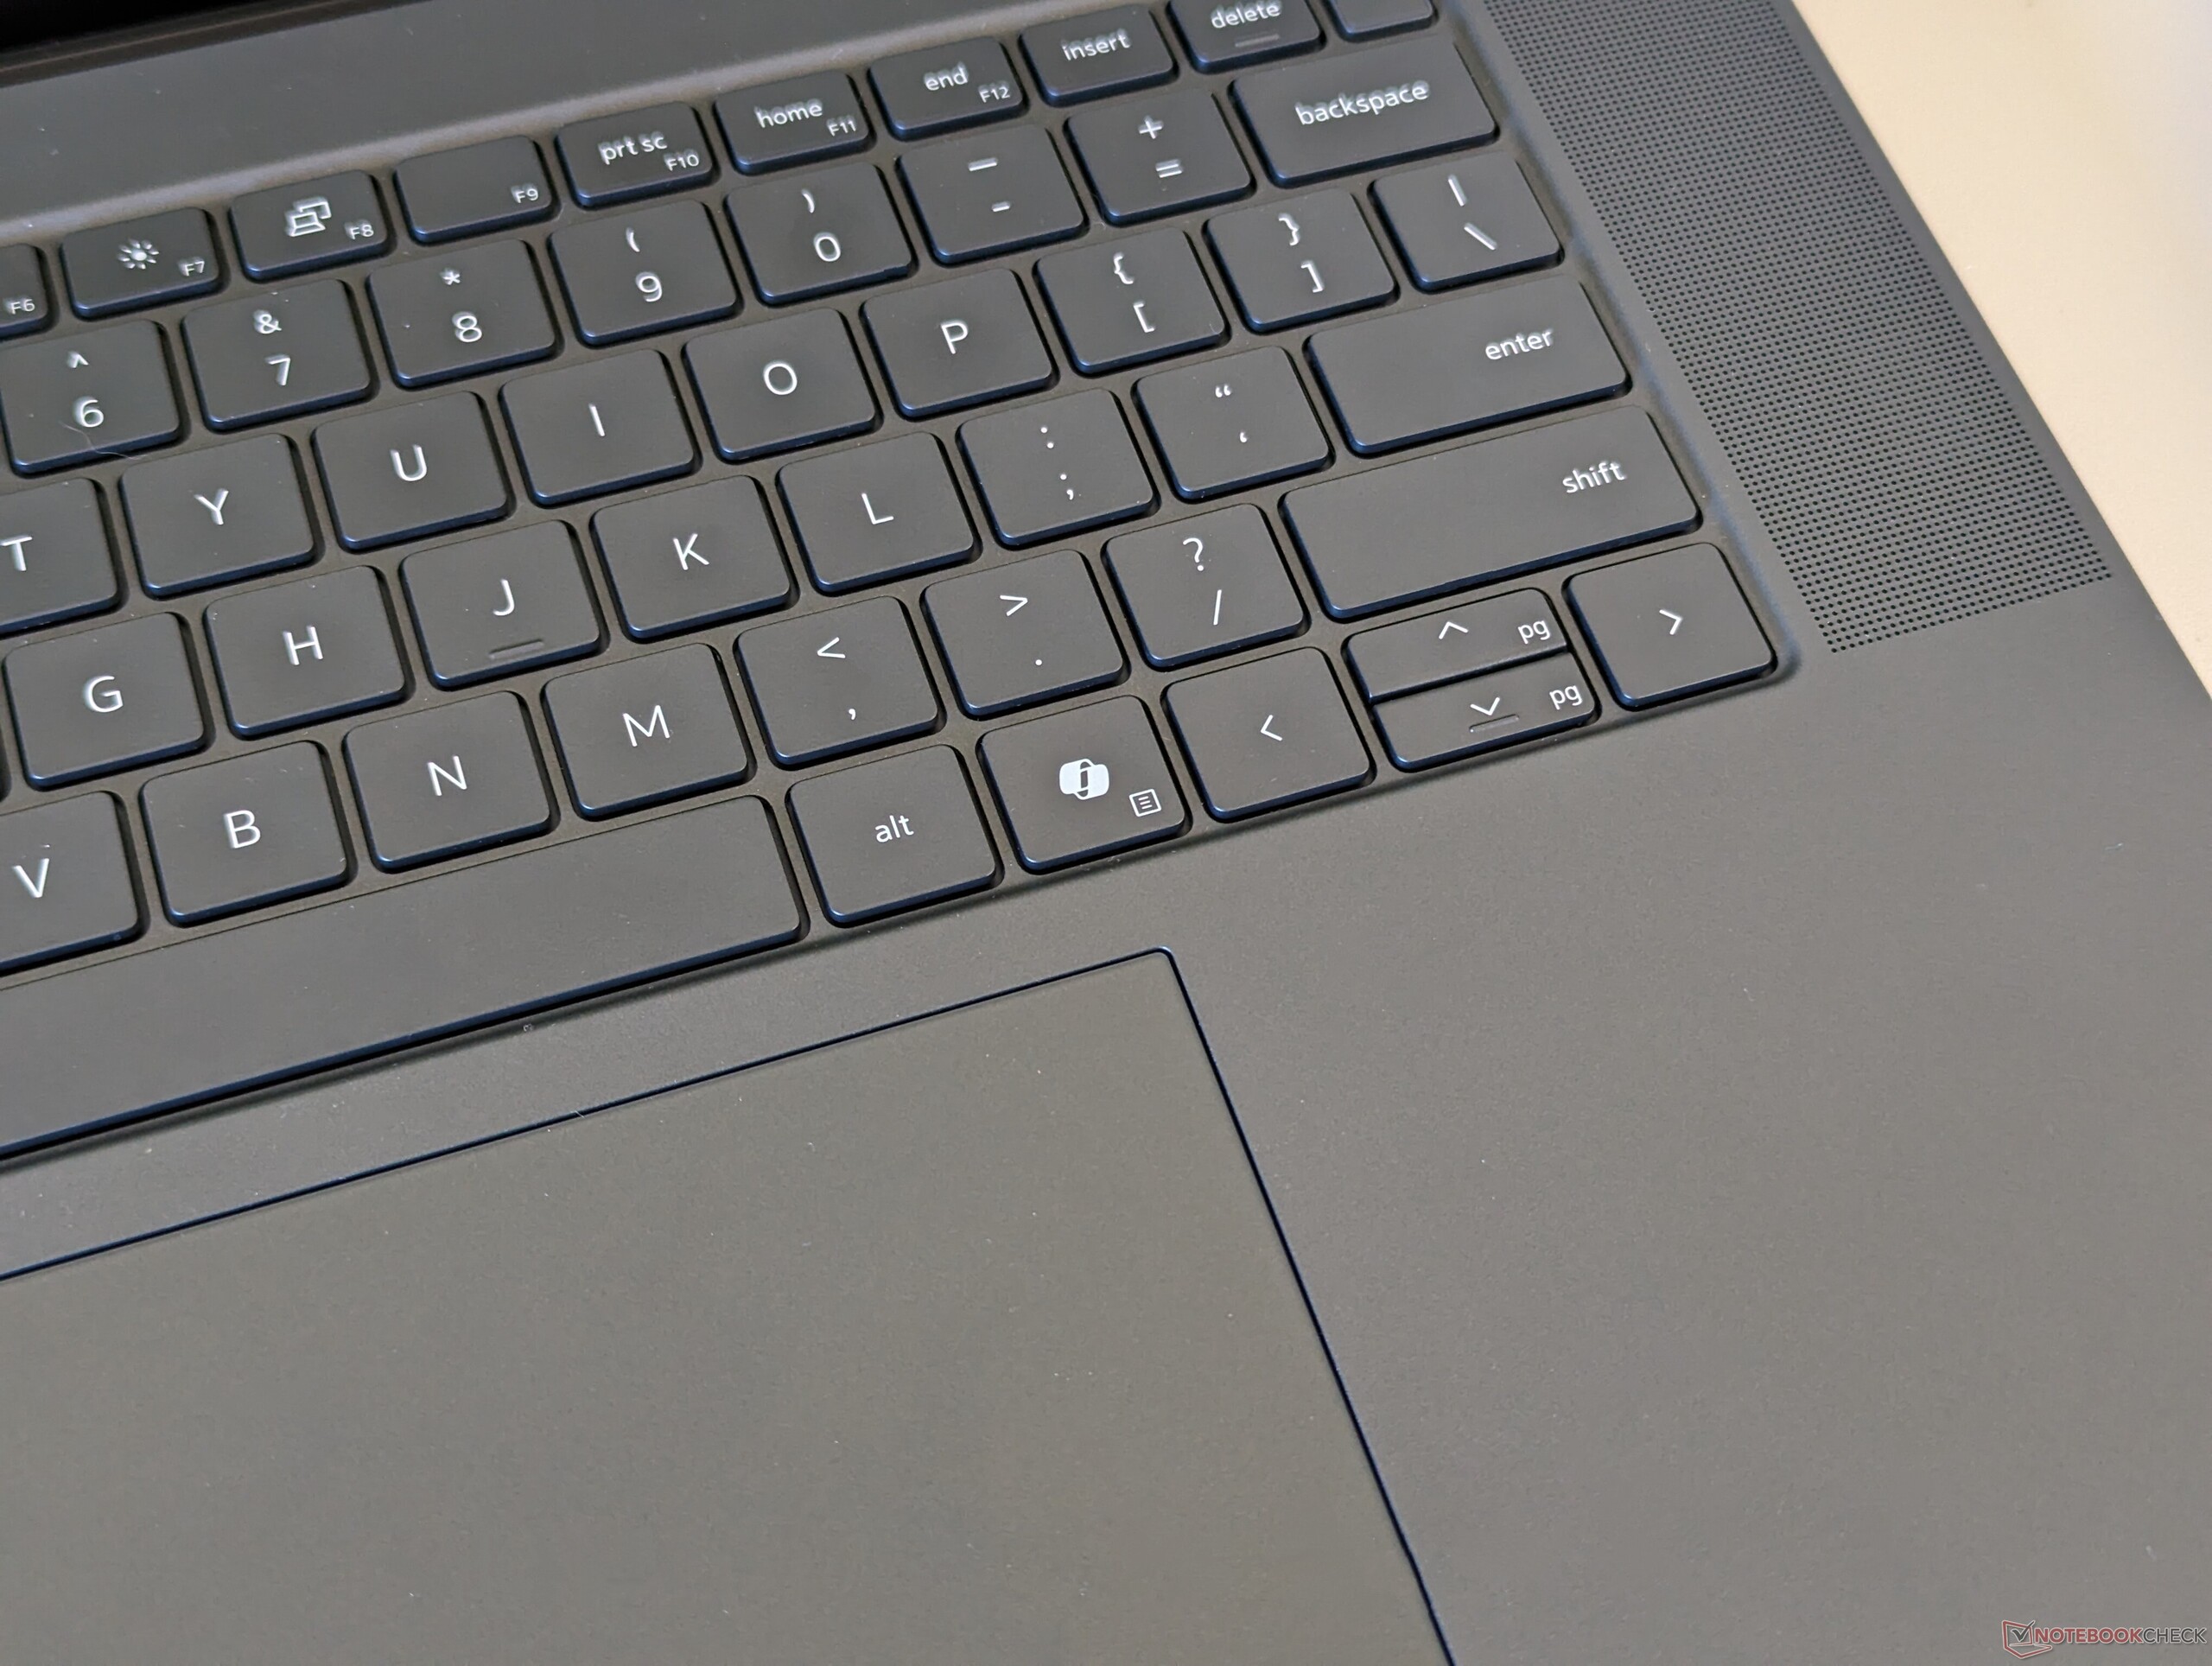
Case - Inspirado no XPS 16
O teclado agora integra uma tecla Microsoft Co-Pilot dedicada no lugar da tecla Ctrl direita para separar visualmente o Precision 5690 do 5680.
Conectividade


Comunicação
A WLAN foi atualizada do Intel AX211 para o Intel BE200 para oferecer suporte à conectividade Wi-Fi 7. No entanto, a grande maioria dos usuários ainda está limitada ao Wi-Fi 6E ou a redes mais antigas e, portanto, a maioria não perceberá nenhum benefício de desempenho por enquanto.
Webcam

")
")
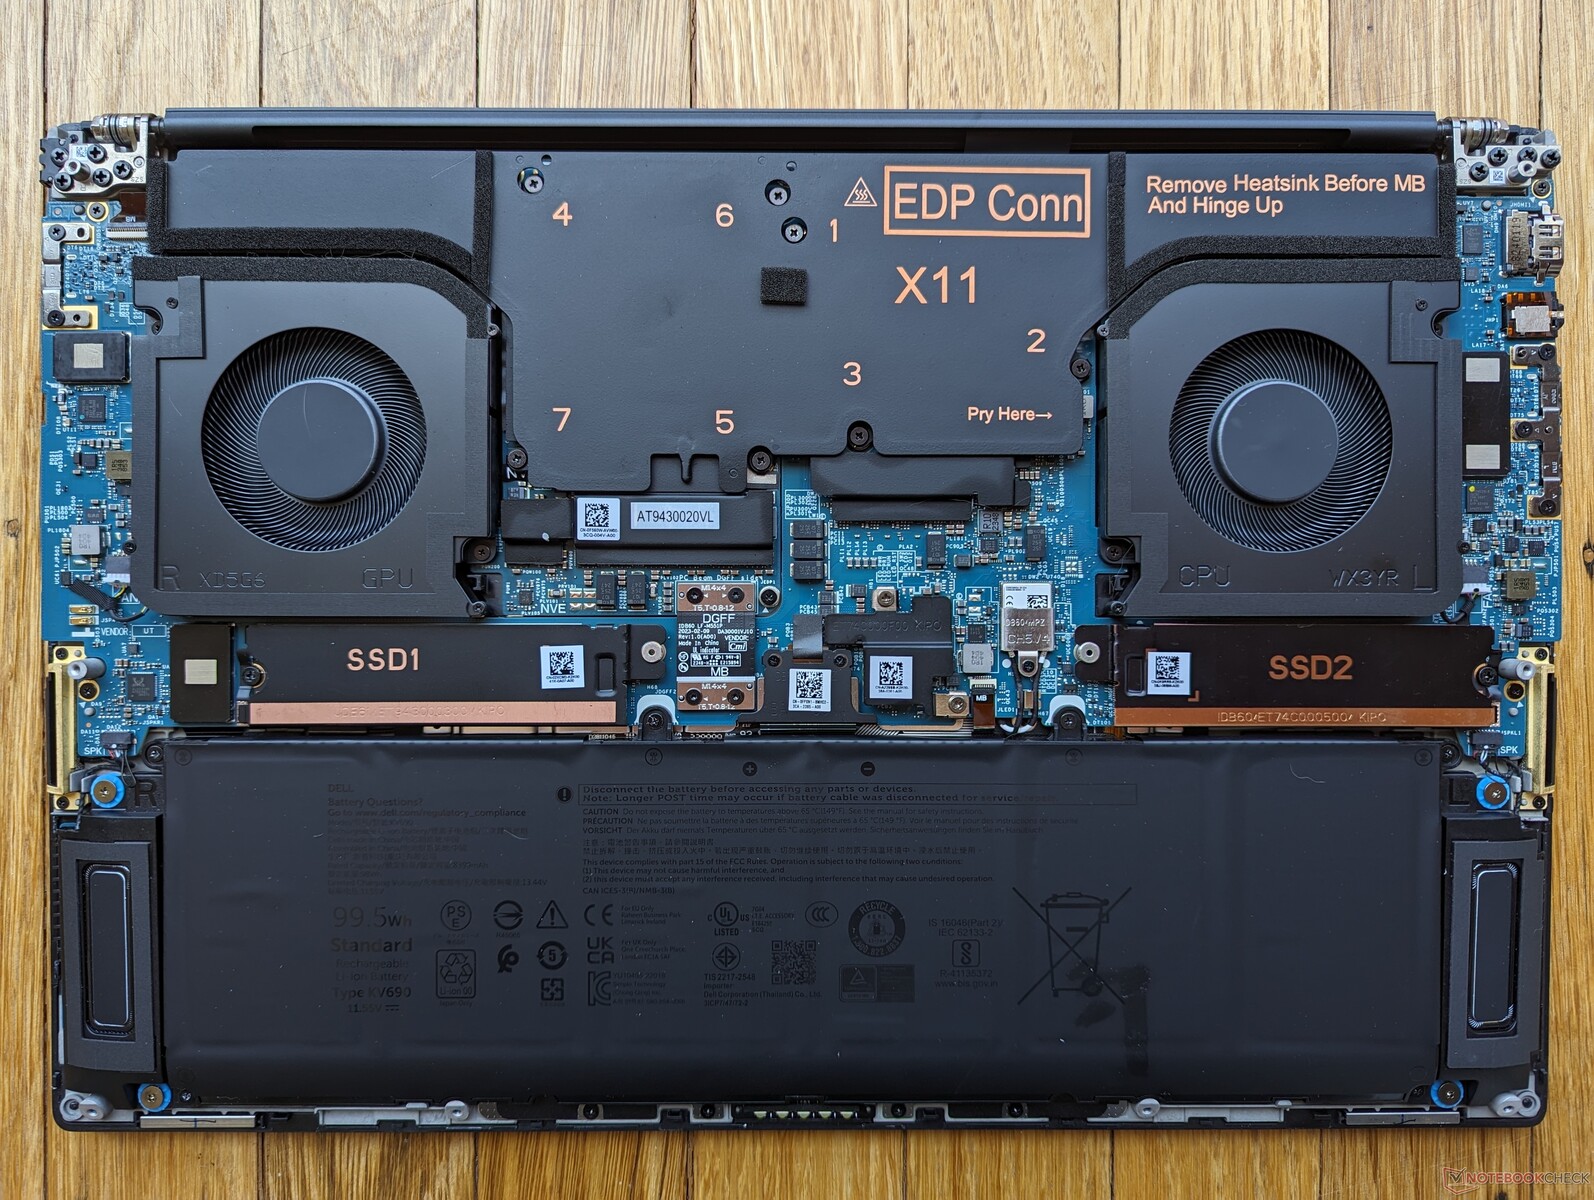
Manutenção
Não há diferenças internas notáveis entre o Precision 5690 e o antigo 5680.

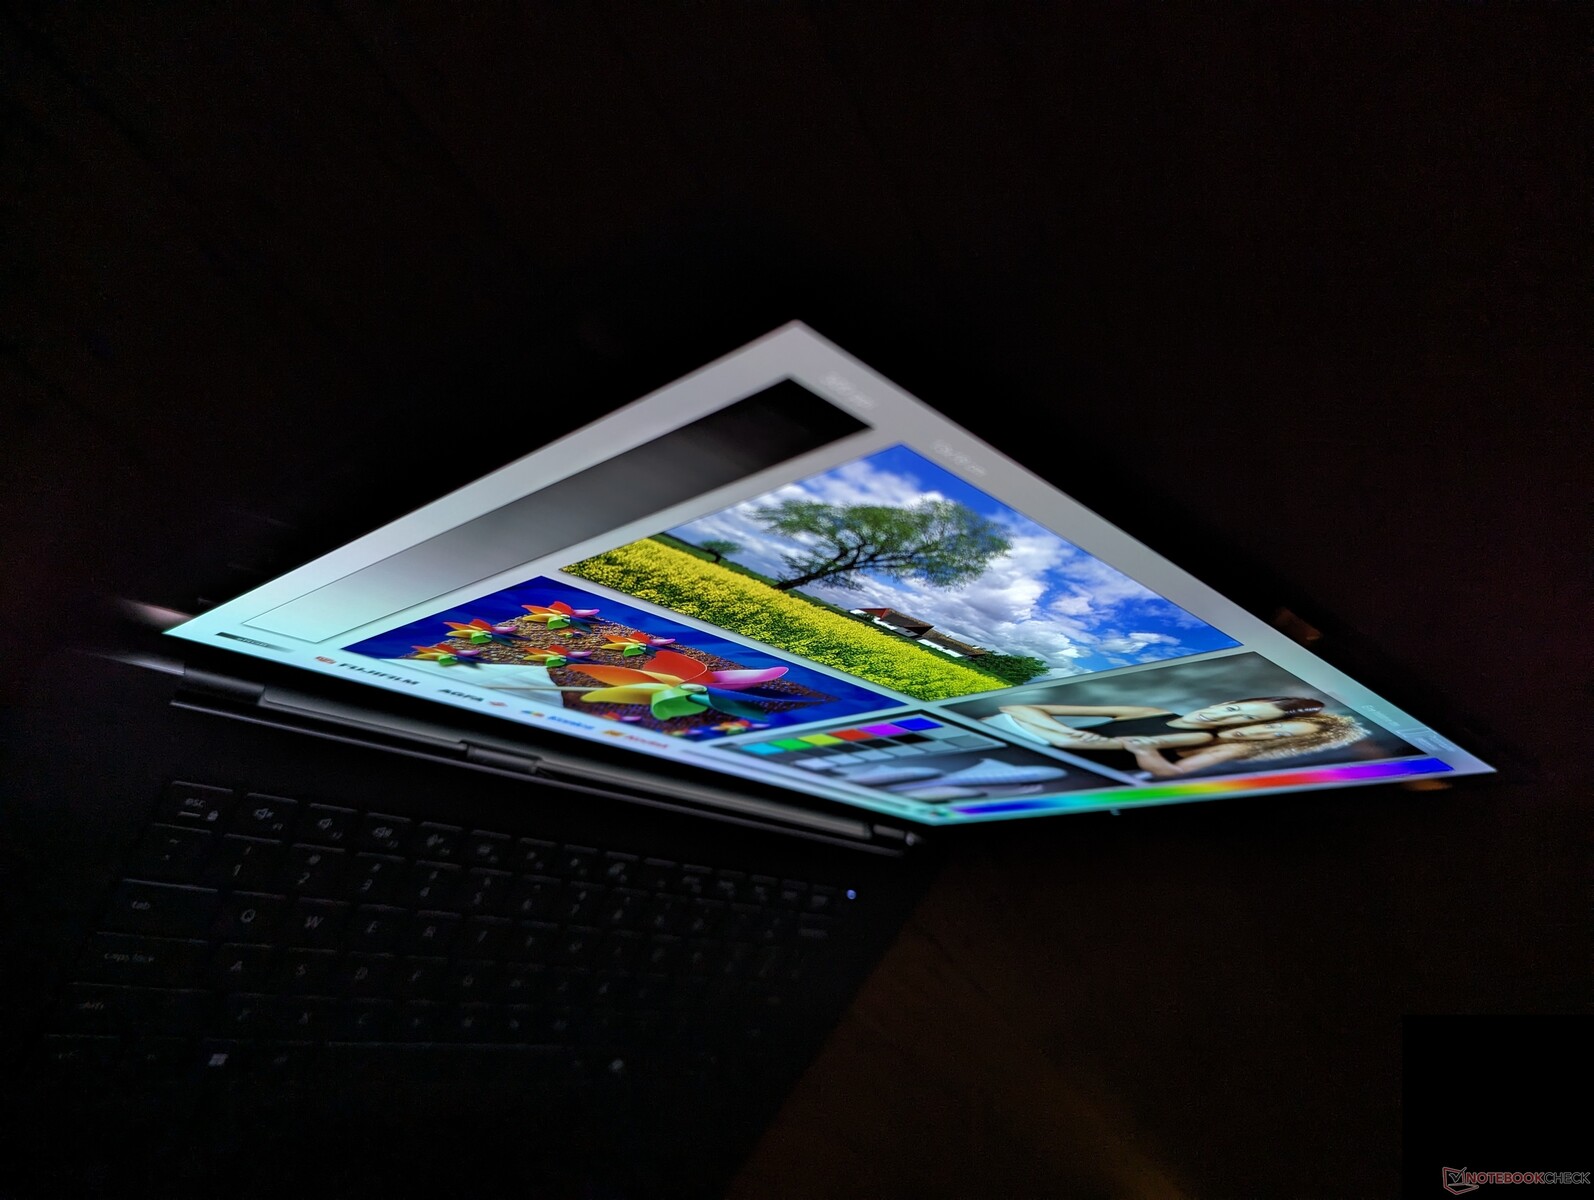
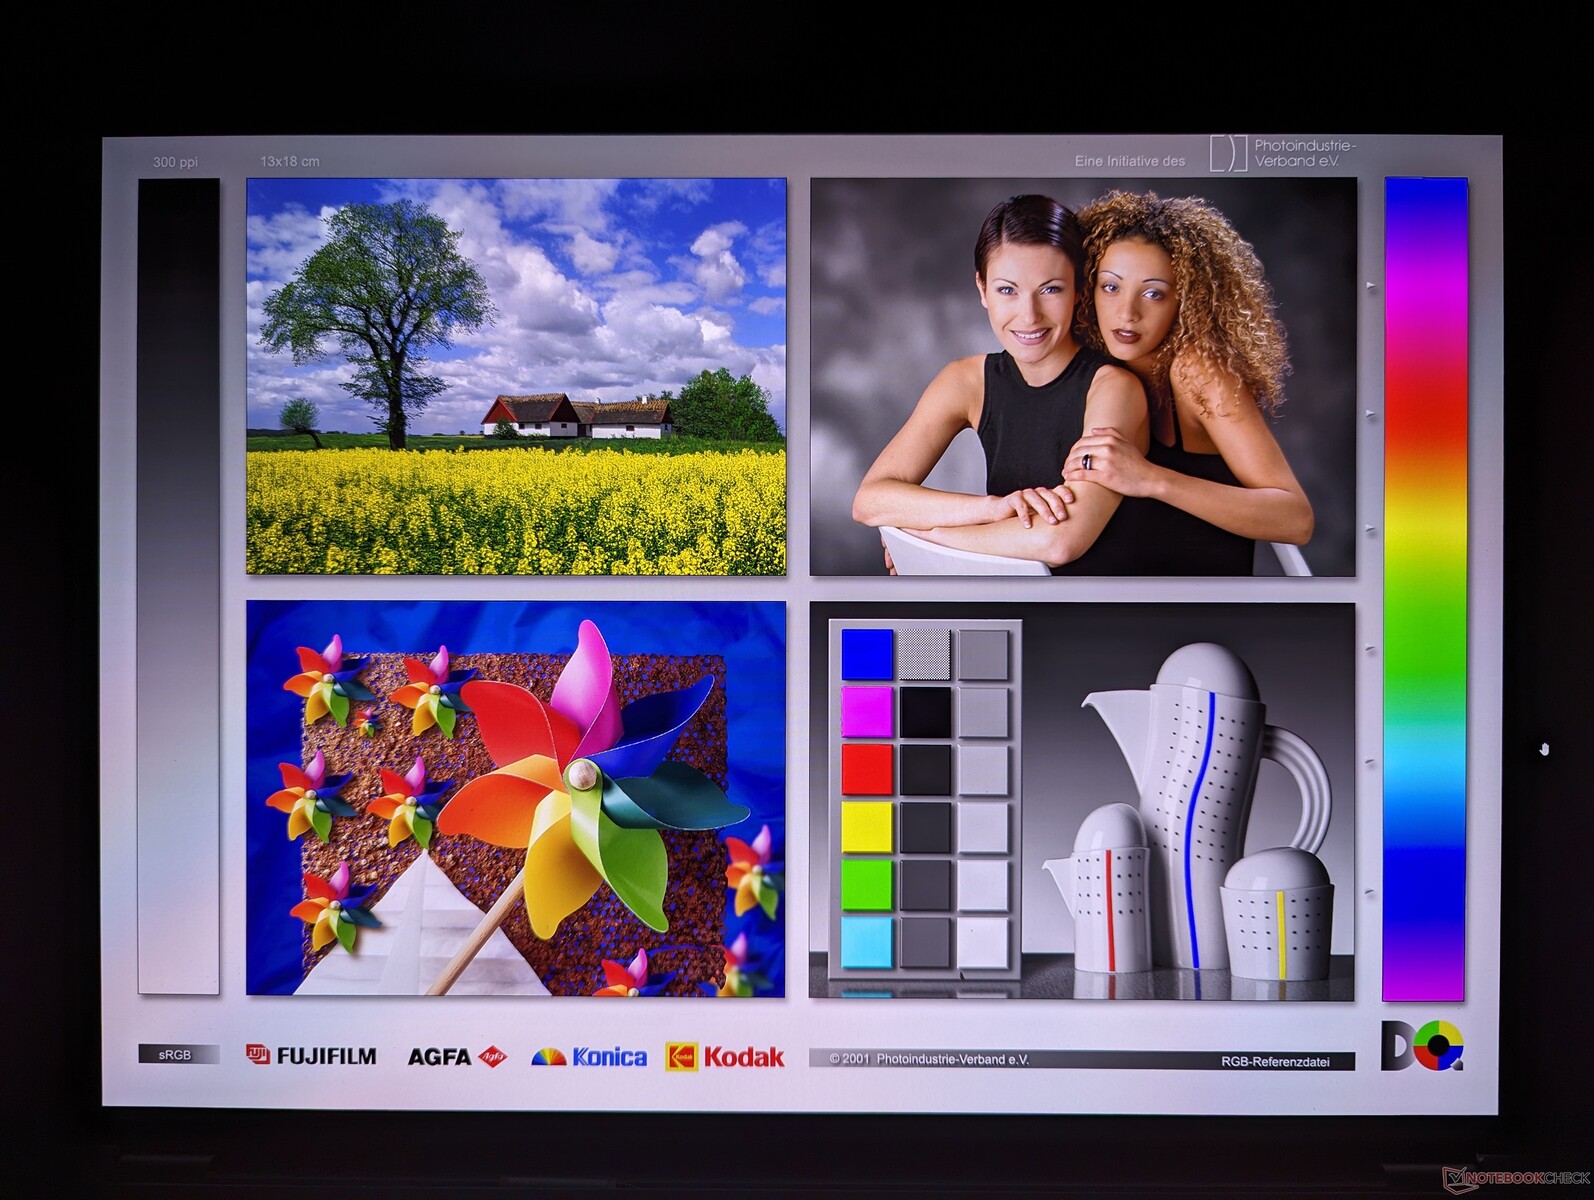
Tela - HDR OLED a 60 Hz
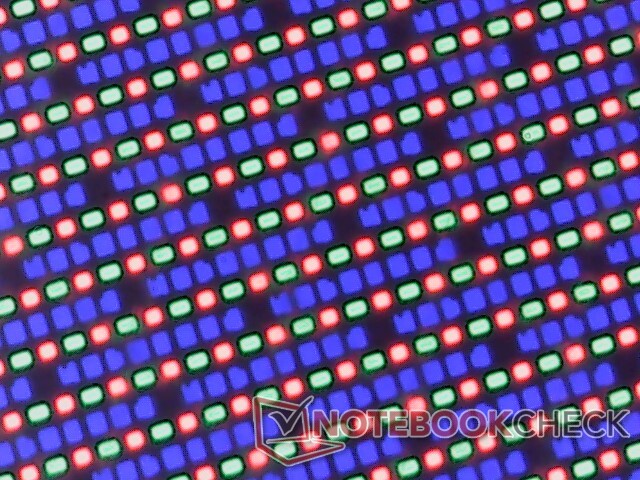
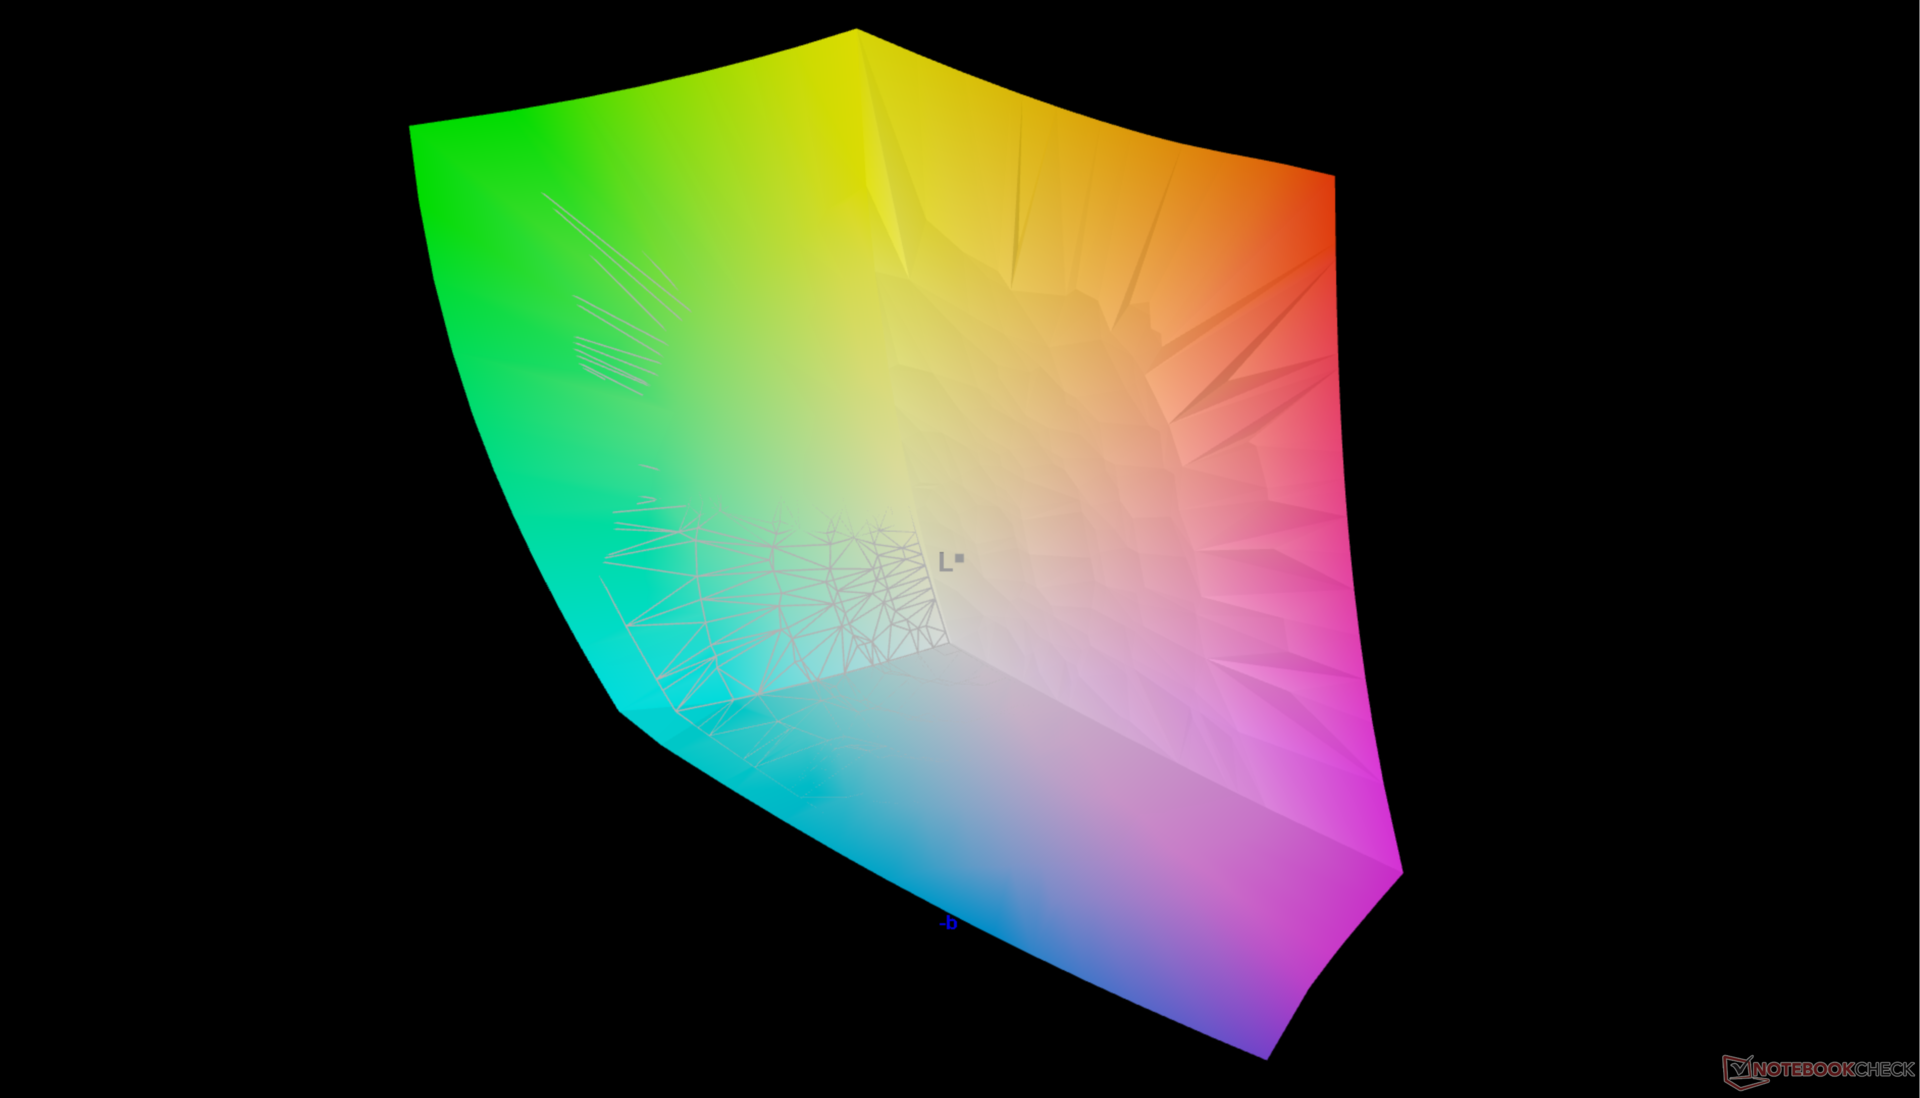
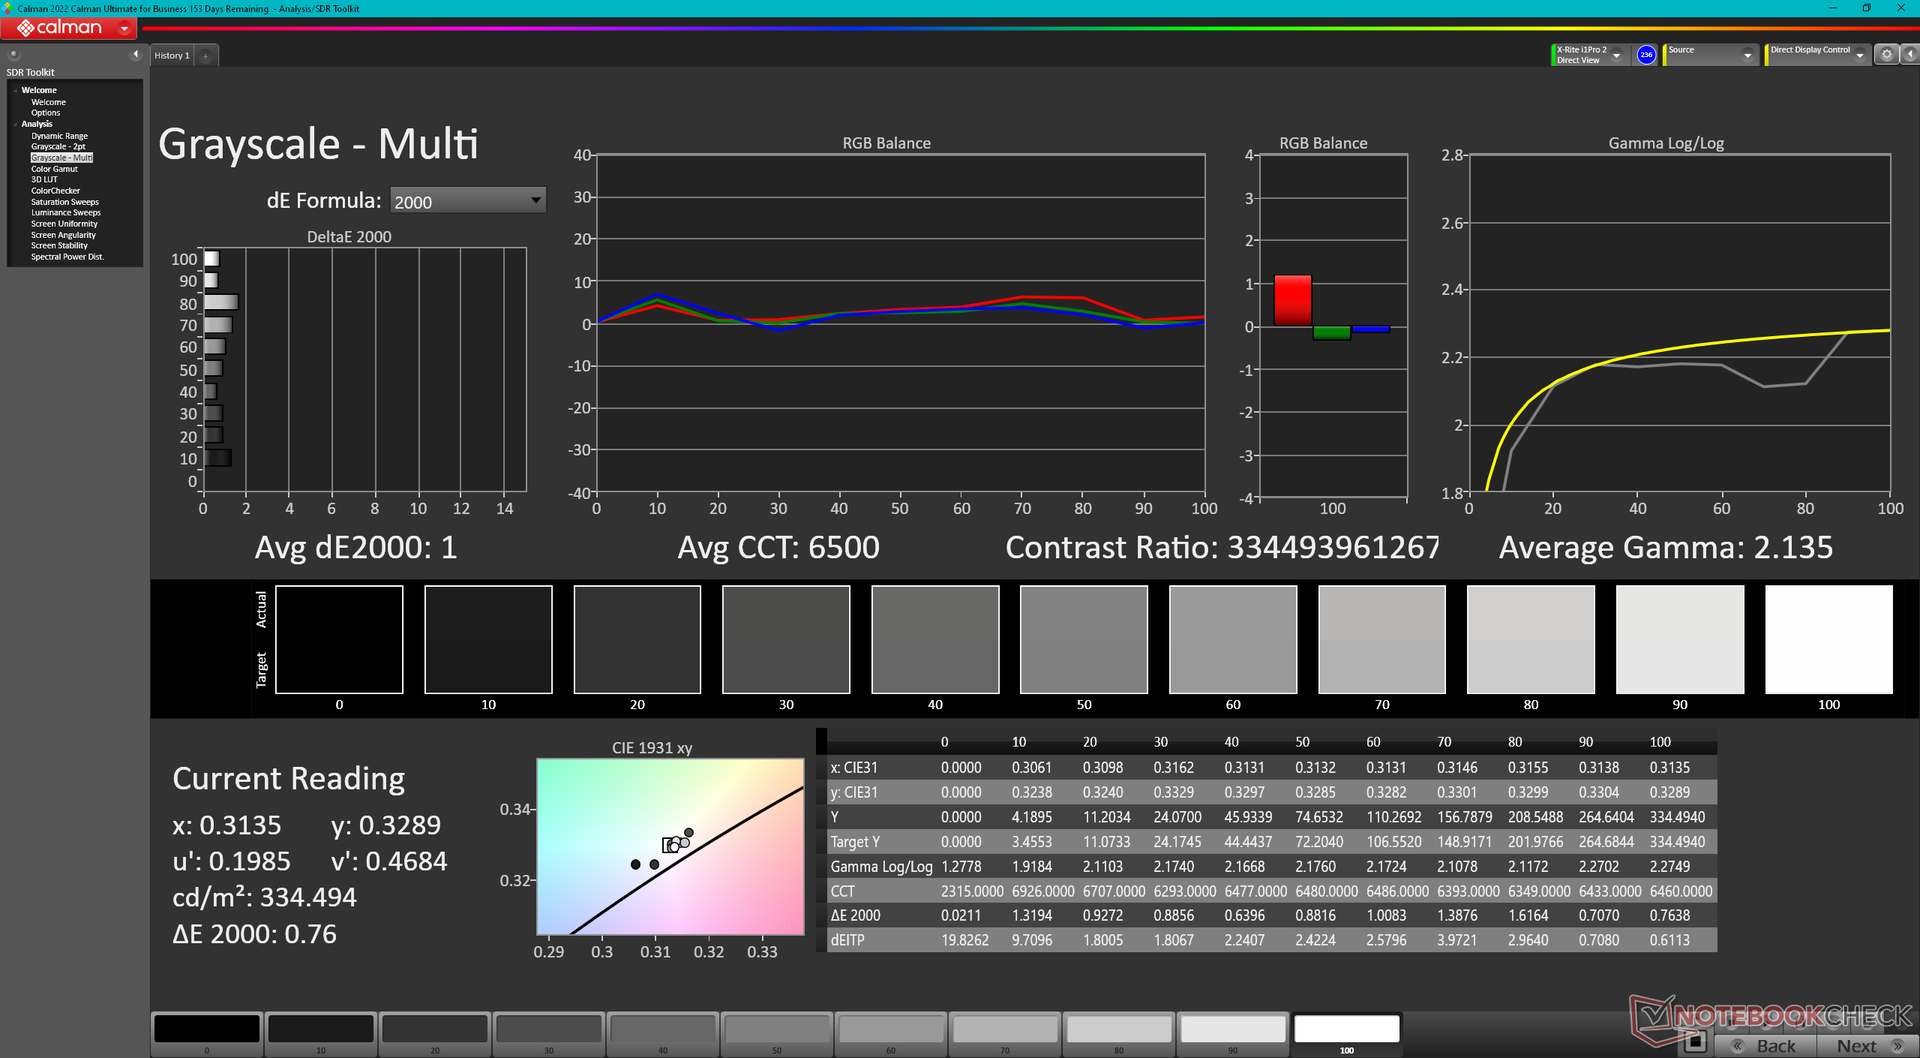
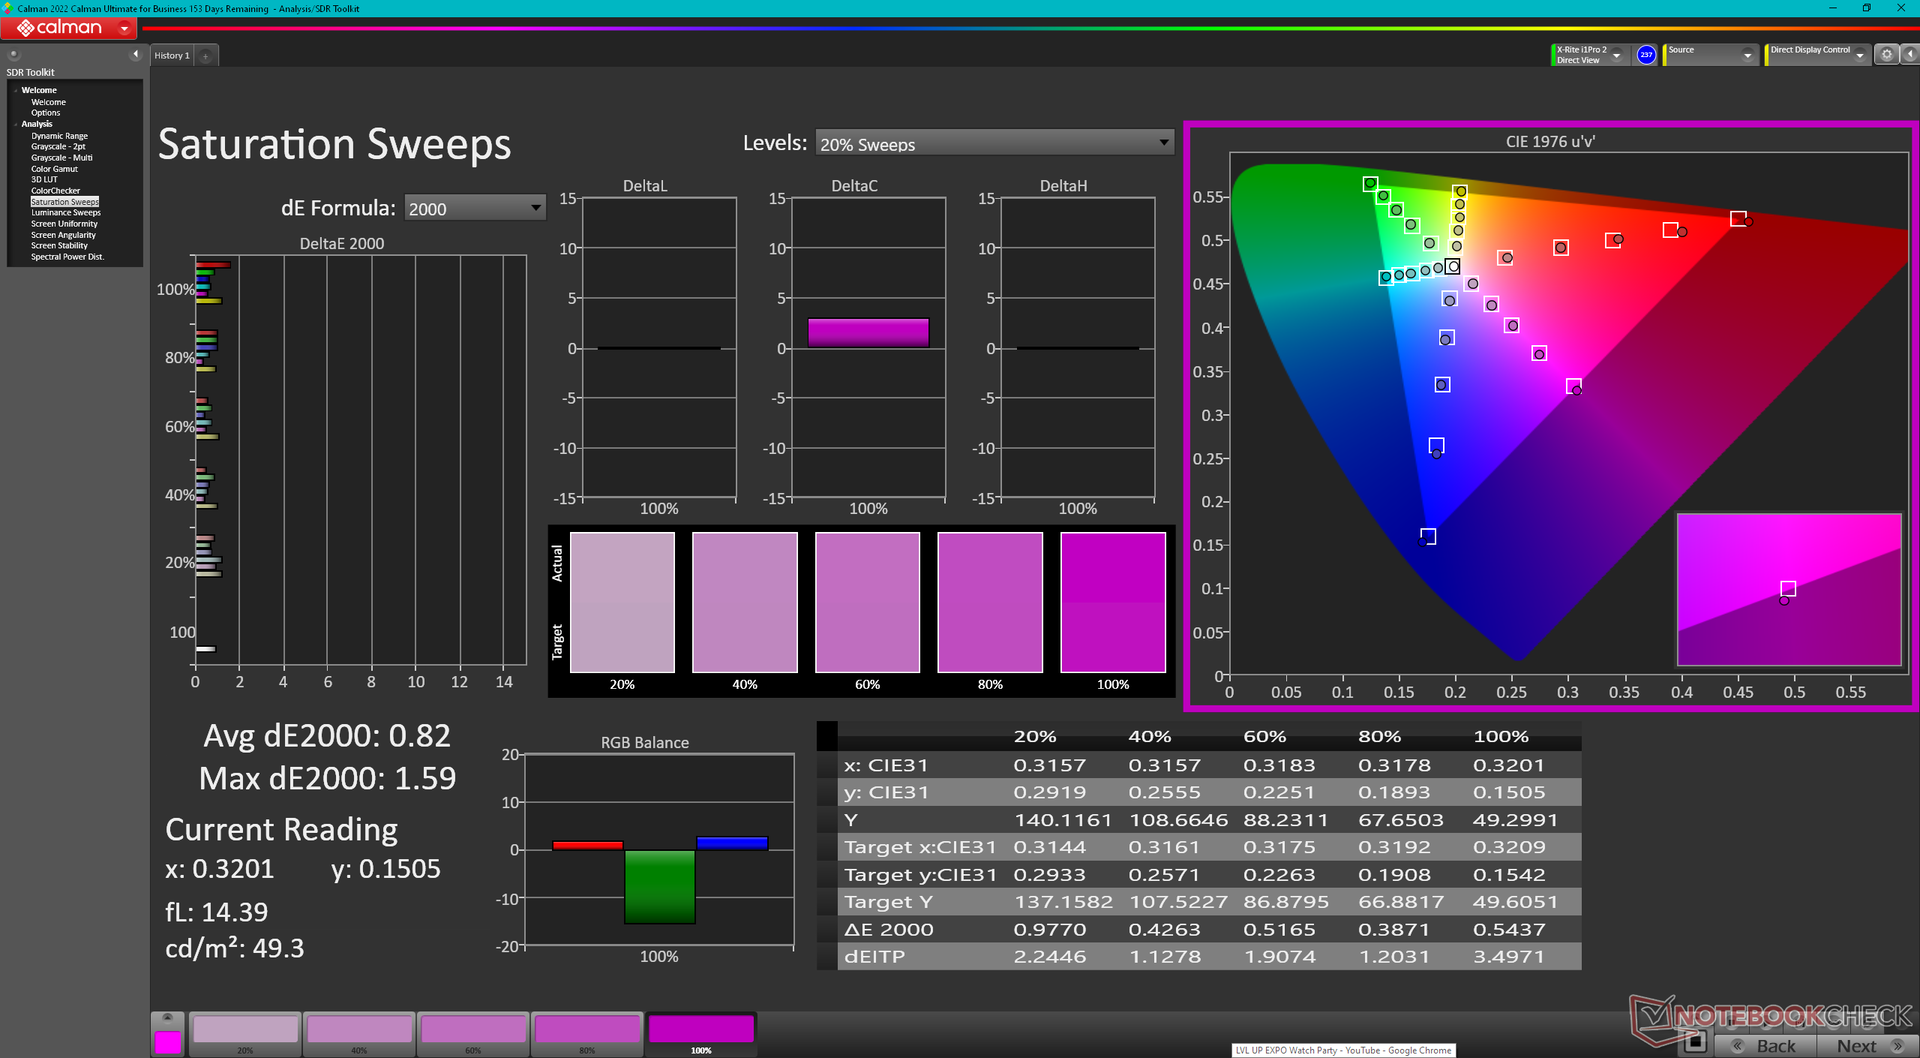
O modelo 2024 utiliza o mesmo painel OLED 4K Samsung 160YV03 e o número de peça D3KJF do ano anterior para não alterar a experiência visual. Por um lado, isso é excelente, pois o painel OLED vem pré-calibrado com cores DCI-P3 completas e suporte a toque. Por outro lado, teria sido ótimo ver taxas de atualização mais altas com opções adaptativas, pois a taxa de atualização padrão de 60 Hz está começando a envelhecer.
O brilho máximo nos modos SDR e HDR pode chegar a 350 nits e 600 nits, respectivamente.
| |||||||||||||||||||||||||
iluminação: 97 %
iluminação com acumulador: 348.1 cd/m²
Contraste: ∞:1 (Preto: 0 cd/m²)
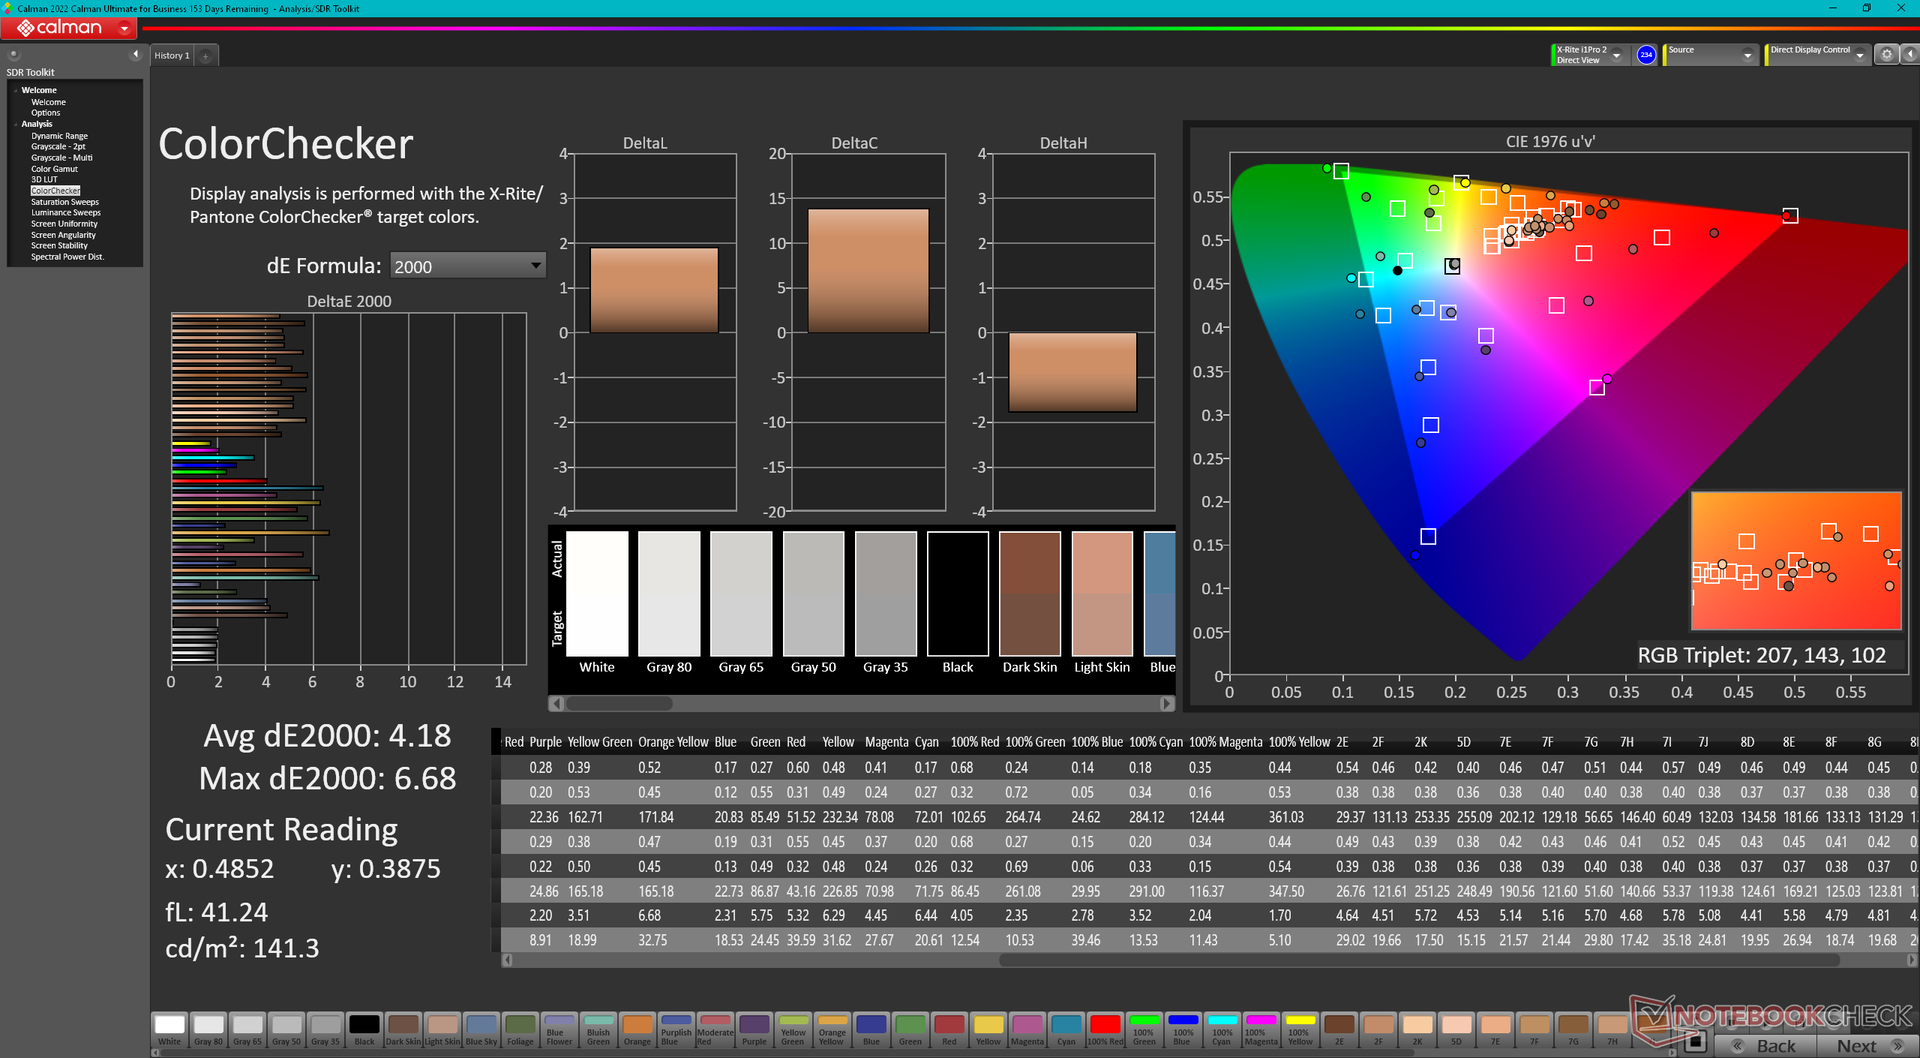
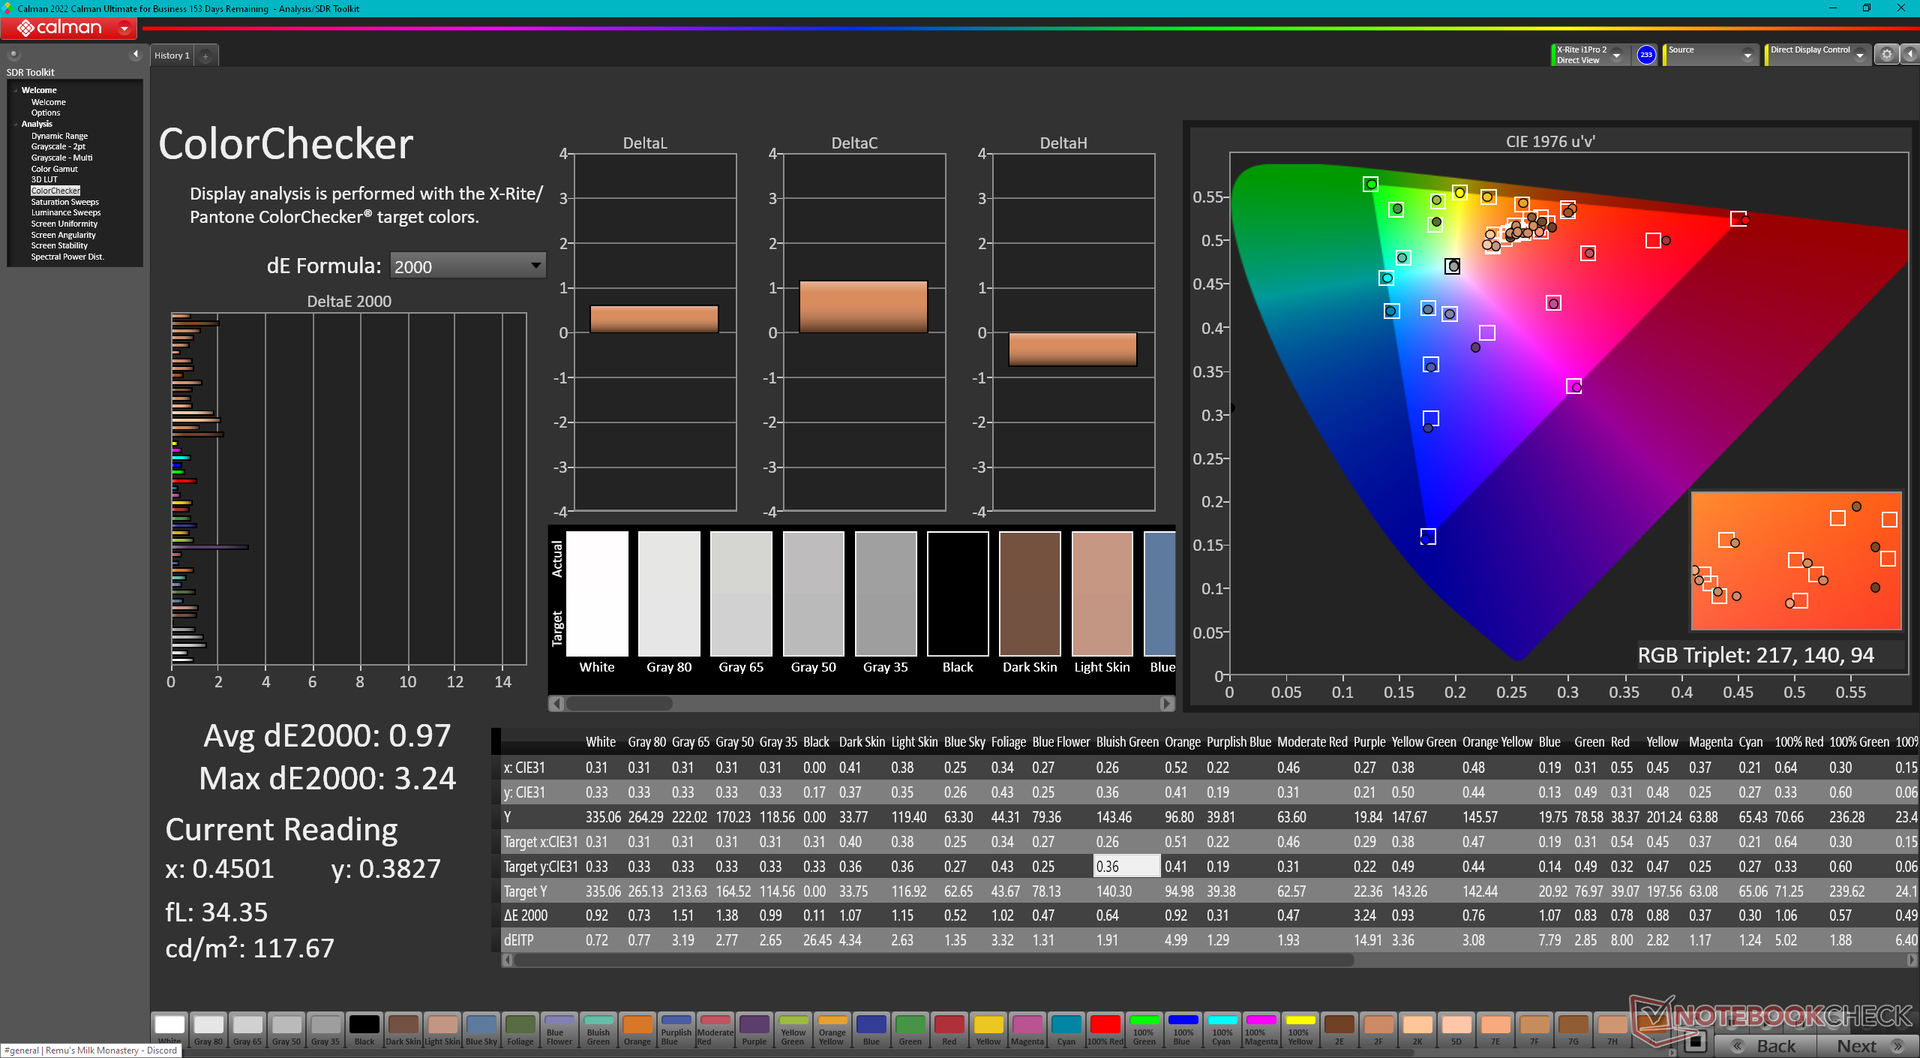
ΔE Color 4.18 | 0.5-29.43 Ø4.87, calibrated: 0.97
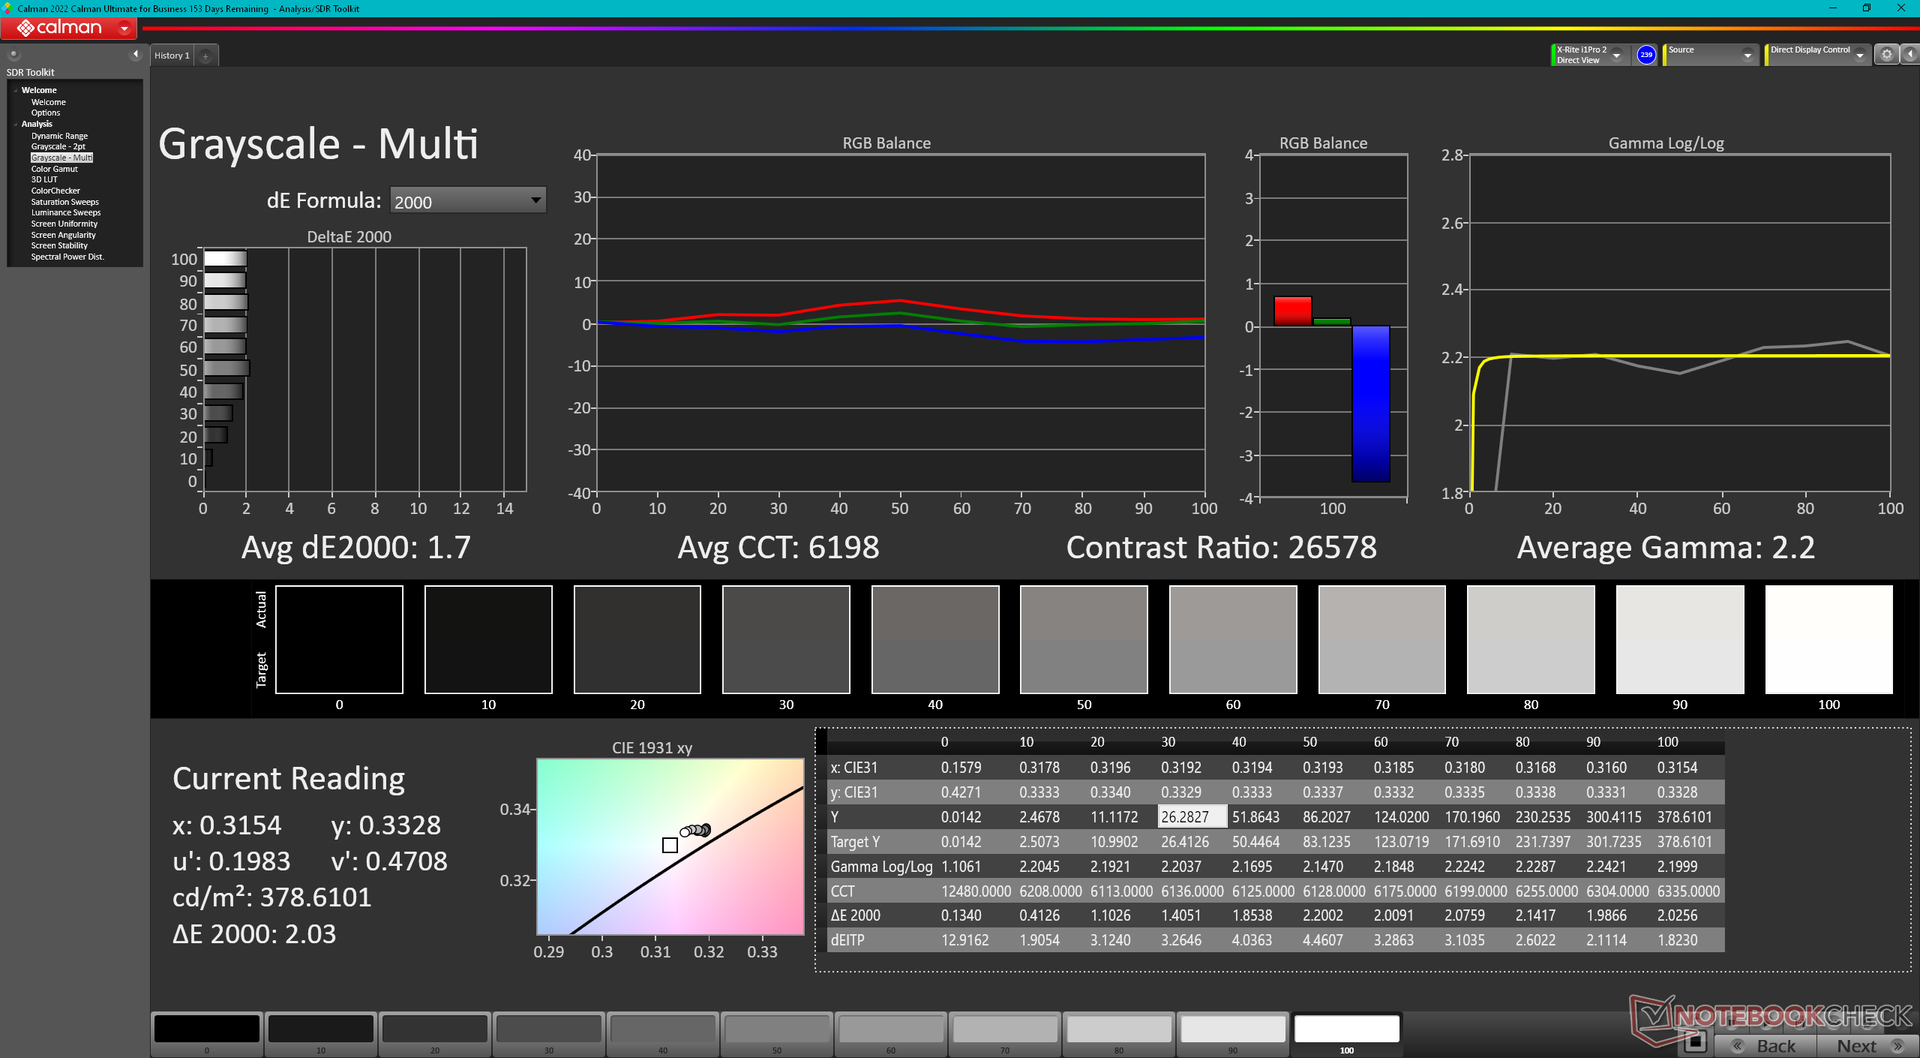
ΔE Greyscale 1.7 | 0.5-98 Ø5.1
96.6% AdobeRGB 1998 (Argyll 2.2.0 3D)
100% sRGB (Argyll 2.2.0 3D)
99.8% Display P3 (Argyll 2.2.0 3D)
Gamma: 2.2
| Dell Precision 5690 Samsung 160YV03, OLED, 3840x2400, 16" | Dell Precision 5000 5680 Samsung 160YV03, OLED, 3840x2400, 16" | Lenovo ThinkPad P16 G2 21FA000FGE MNG007DA1-9, IPS LED, 2560x1600, 16" | Lenovo ThinkPad P1 G6-21FV000DGE NE160QDM-NY1, IPS, 2560x1600, 16" | HP ZBook Fury 16 G10 AUO87A8, IPS, 3840x2400, 16" | MSI CreatorPro Z16P B12UKST B160QAN02.N, IPS, 2560x1600, 16" | |
|---|---|---|---|---|---|---|
| Display | 0% | -18% | -20% | -4% | -4% | |
| Display P3 Coverage | 99.8 | 99.9 0% | 71 -29% | 68.1 -32% | 98 -2% | 97.6 -2% |
| sRGB Coverage | 100 | 100 0% | 99.2 -1% | 97.5 -2% | 99.9 0% | 99.9 0% |
| AdobeRGB 1998 Coverage | 96.6 | 97.5 1% | 73.2 -24% | 70.2 -27% | 86.2 -11% | 87.4 -10% |
| Response Times | -1% | -574% | -586% | -533% | -494% | |
| Response Time Grey 50% / Grey 80% * | 1.7 ? | 1.68 ? 1% | 12.8 ? -653% | 13.7 ? -706% | 11.9 ? -600% | 12.8 ? -653% |
| Response Time Black / White * | 1.7 ? | 1.77 ? -4% | 10.1 ? -494% | 9.6 ? -465% | 9.6 ? -465% | 7.4 ? -335% |
| PWM Frequency | 60 ? | 60 ? 0% | ||||
| Screen | -11% | -15% | 33% | 36% | 22% | |
| Brightness middle | 348.1 | 345.7 -1% | 510 47% | 521 50% | 514.6 48% | 407 17% |
| Brightness | 351 | 349 -1% | 517 47% | 484 38% | 495 41% | 388 11% |
| Brightness Distribution | 97 | 98 1% | 89 -8% | 89 -8% | 90 -7% | 88 -9% |
| Black Level * | 0.37 | 0.36 | 0.46 | 0.36 | ||
| Colorchecker dE 2000 * | 4.18 | 3.59 14% | 2.6 38% | 1.2 71% | 2.4 43% | 1.3 69% |
| Colorchecker dE 2000 max. * | 6.68 | 7.02 -5% | 5.2 22% | 2.5 63% | 4.86 27% | 2.5 63% |
| Colorchecker dE 2000 calibrated * | 0.97 | 0.99 -2% | 2.3 -137% | 1 -3% | 0.4 59% | 0.7 28% |
| Greyscale dE 2000 * | 1.7 | 3.1 -82% | 3.6 -112% | 1.4 18% | 1 41% | 2.1 -24% |
| Gamma | 2.2 100% | 2.13 103% | 2.26 97% | 2.25 98% | 2.3 96% | 2.26 97% |
| CCT | 6198 105% | 6448 101% | 5969 109% | 6682 97% | 6553 99% | 6437 101% |
| Contrast | 1378 | 1447 | 1119 | 1131 | ||
| Média Total (Programa/Configurações) | -4% /
-6% | -202% /
-109% | -191% /
-84% | -167% /
-69% | -159% /
-70% |
* ... menor é melhor
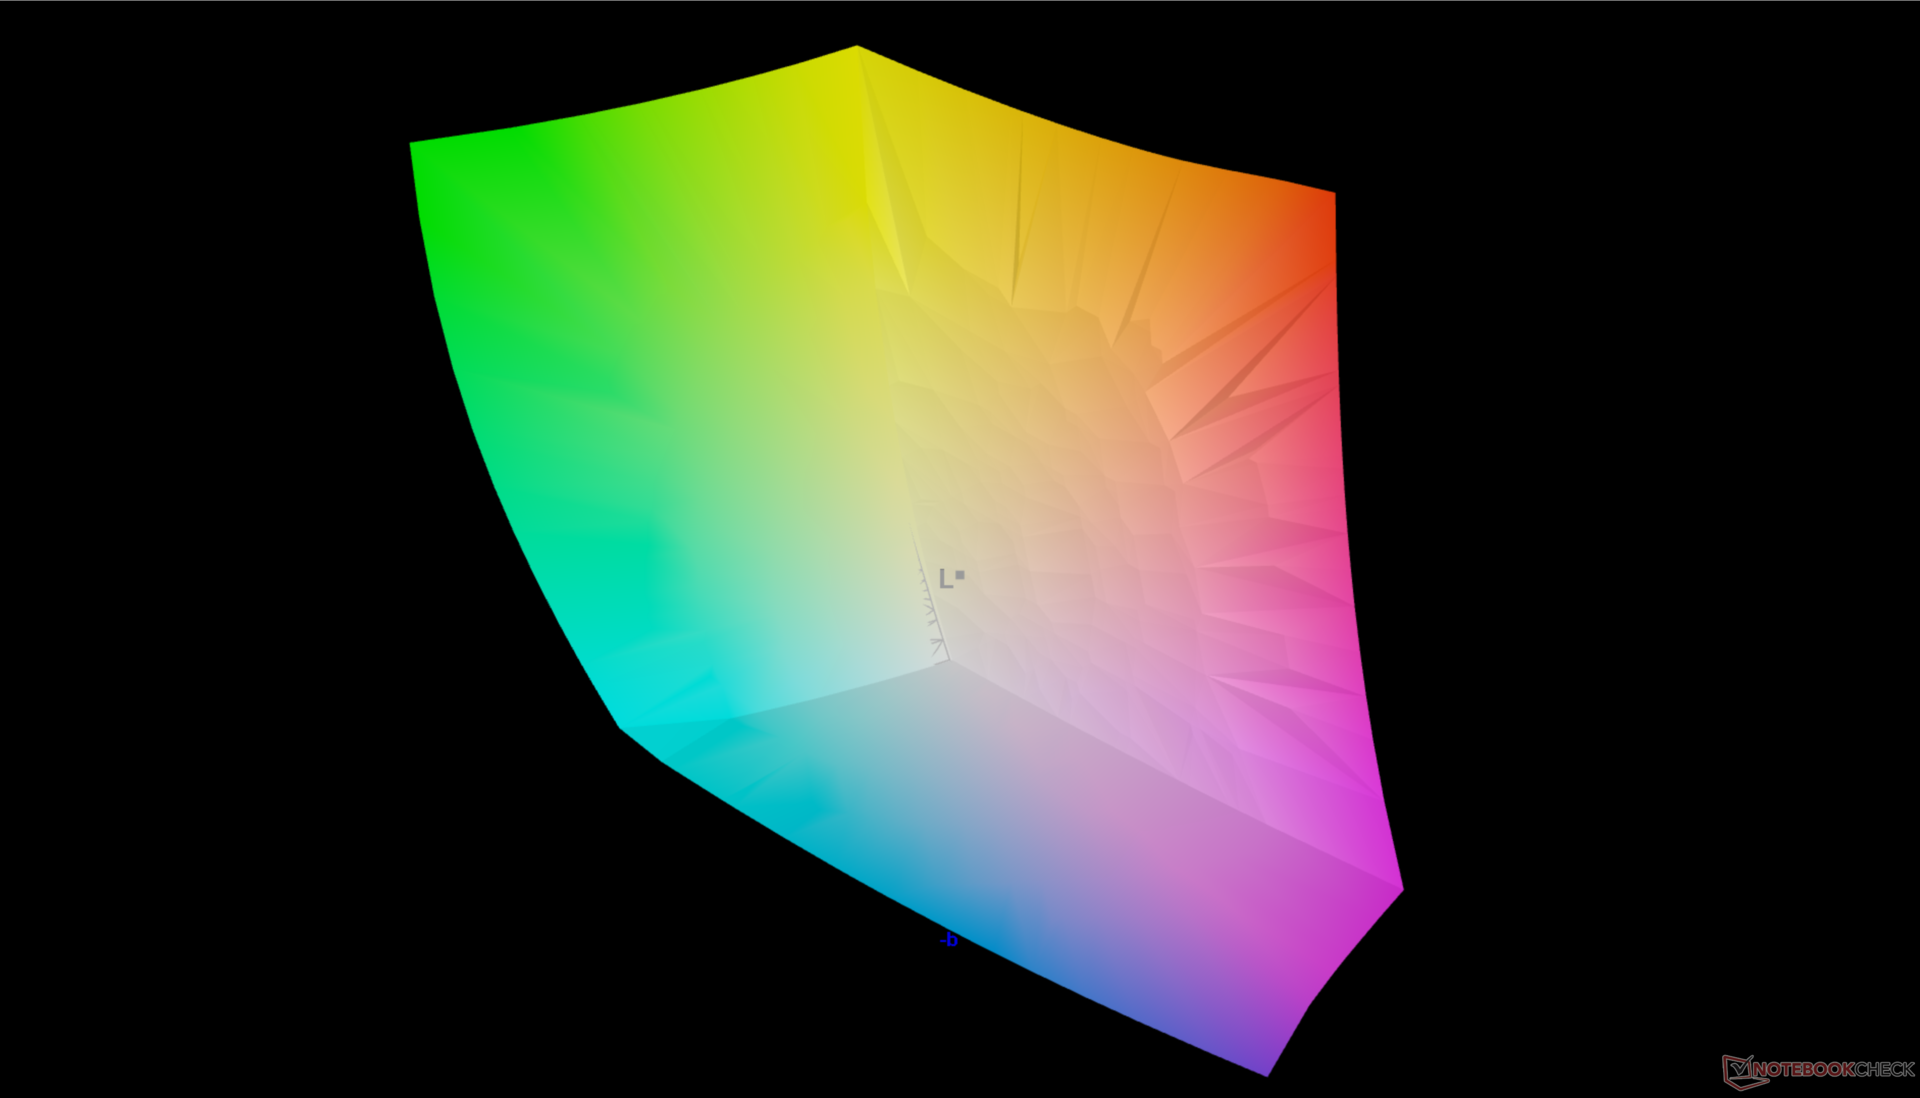
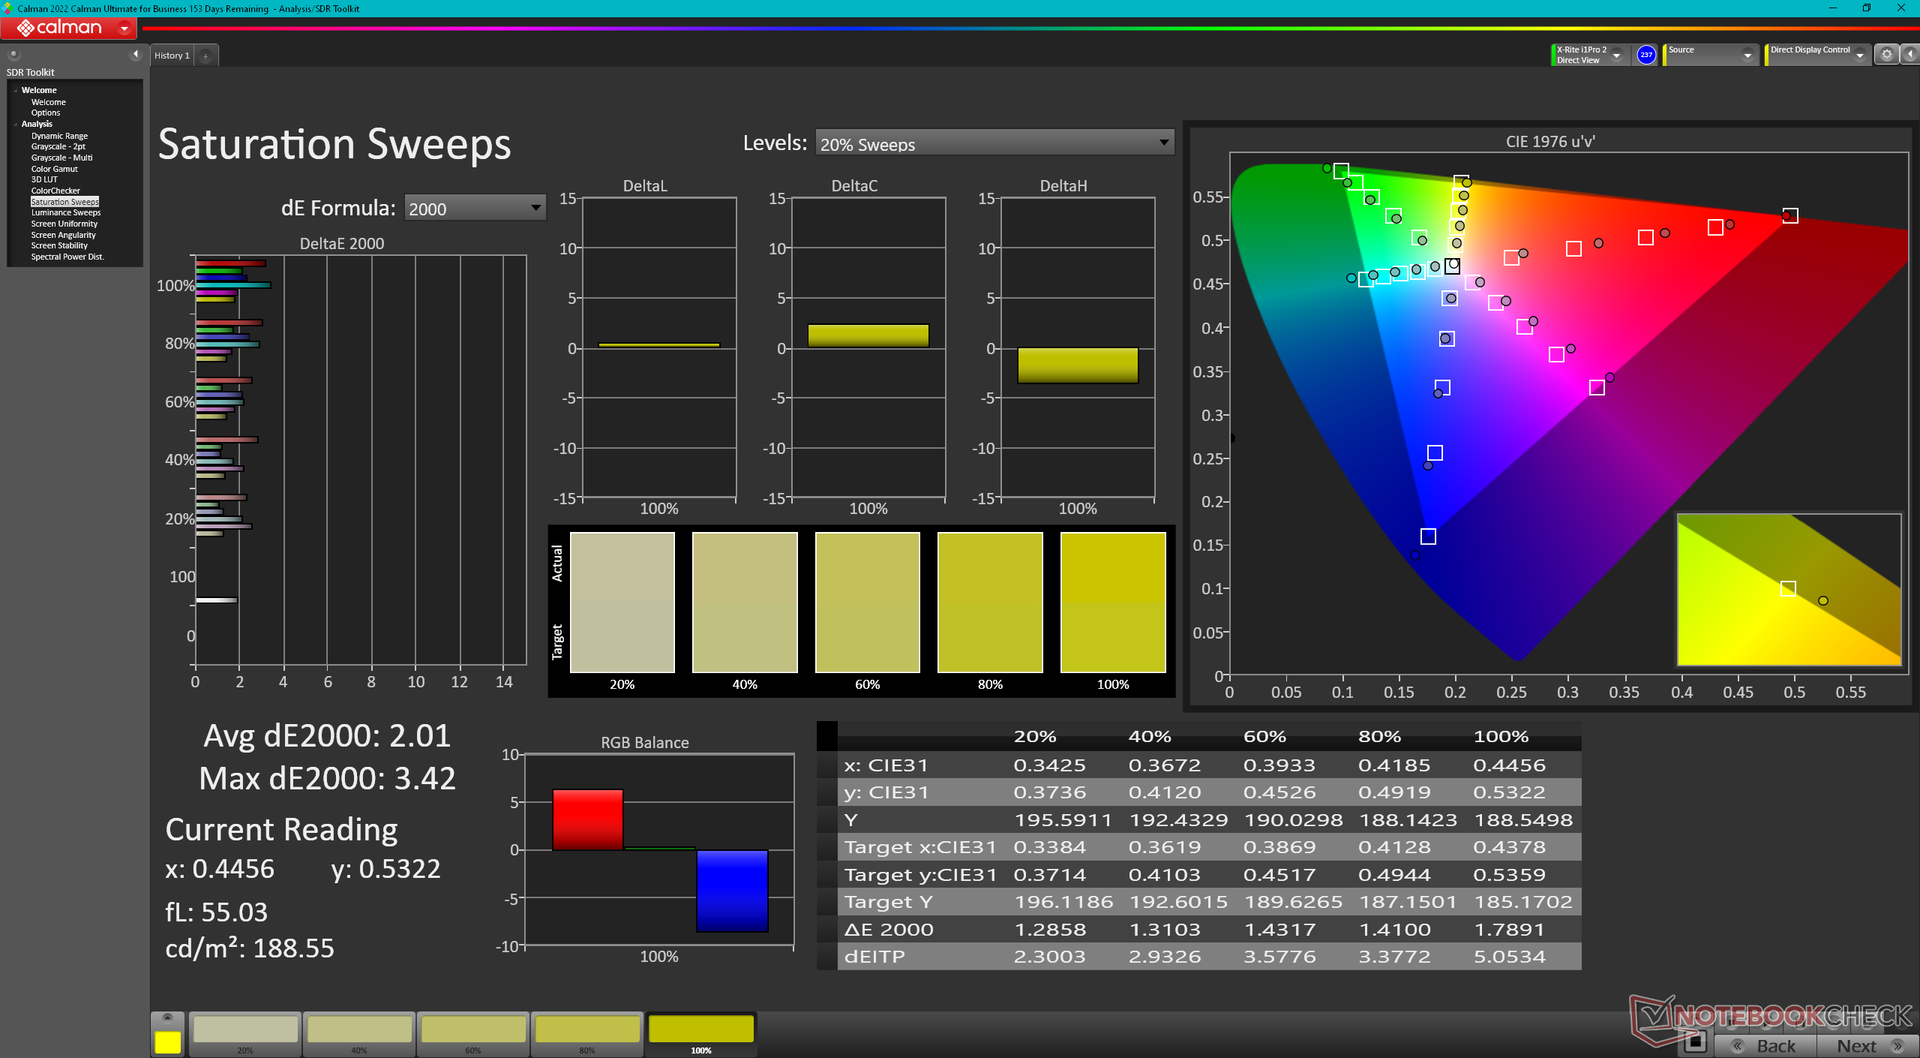
A tela vem bem calibrada em relação ao padrão P3 com valores DeltaE médios de escala de cinza e cor de apenas 1,7 e 4,18, respectivamente.
Exibir tempos de resposta
| ↔ Tempo de resposta preto para branco | ||
|---|---|---|
| 1.7 ms ... ascensão ↗ e queda ↘ combinadas | ↗ 0.74 ms ascensão | 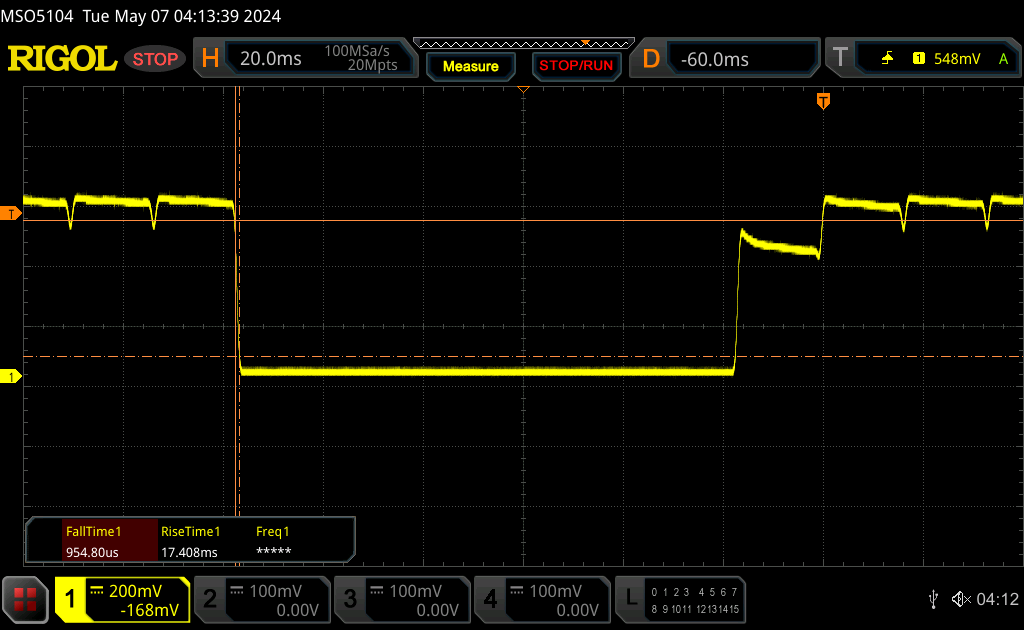 |
| ↘ 0.96 ms queda | ||
| A tela mostra taxas de resposta muito rápidas em nossos testes e deve ser muito adequada para jogos em ritmo acelerado. Em comparação, todos os dispositivos testados variam de 0.1 (mínimo) a 240 (máximo) ms. » 7 % de todos os dispositivos são melhores. Isso significa que o tempo de resposta medido é melhor que a média de todos os dispositivos testados (20.8 ms). | ||
| ↔ Tempo de resposta 50% cinza a 80% cinza | ||
| 1.7 ms ... ascensão ↗ e queda ↘ combinadas | ↗ 0.88 ms ascensão | 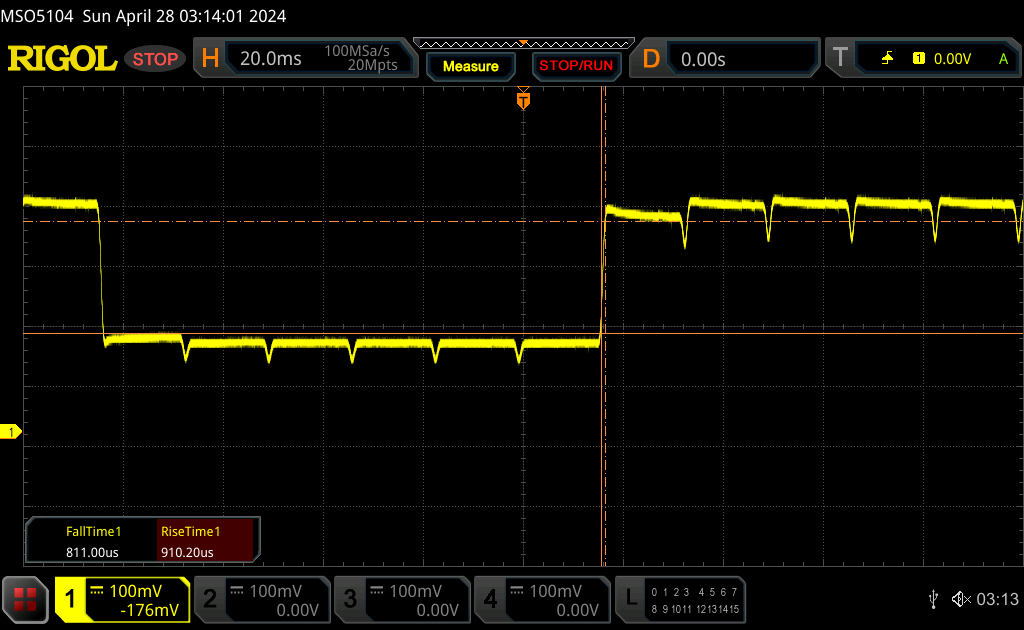 |
| ↘ 0.82 ms queda | ||
| A tela mostra taxas de resposta muito rápidas em nossos testes e deve ser muito adequada para jogos em ritmo acelerado. Em comparação, todos os dispositivos testados variam de 0.165 (mínimo) a 636 (máximo) ms. » 6 % de todos os dispositivos são melhores. Isso significa que o tempo de resposta medido é melhor que a média de todos os dispositivos testados (32.5 ms). | ||
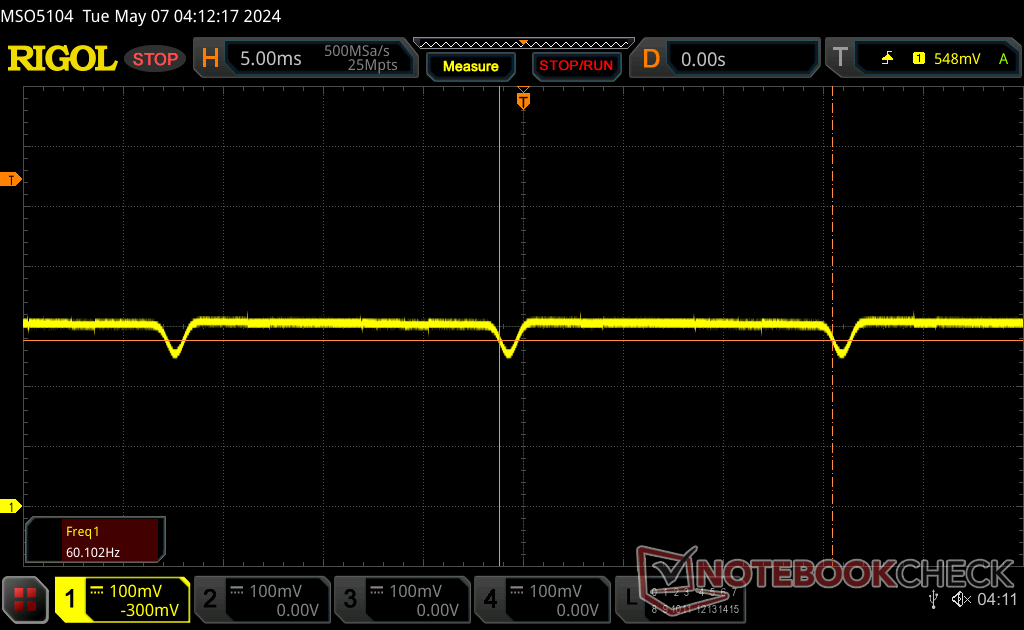
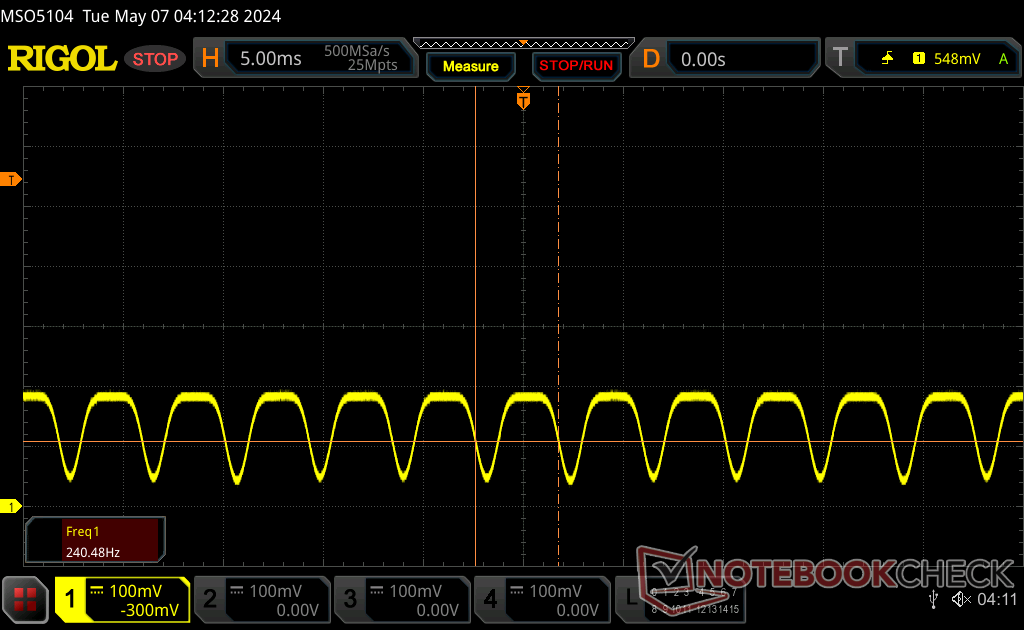
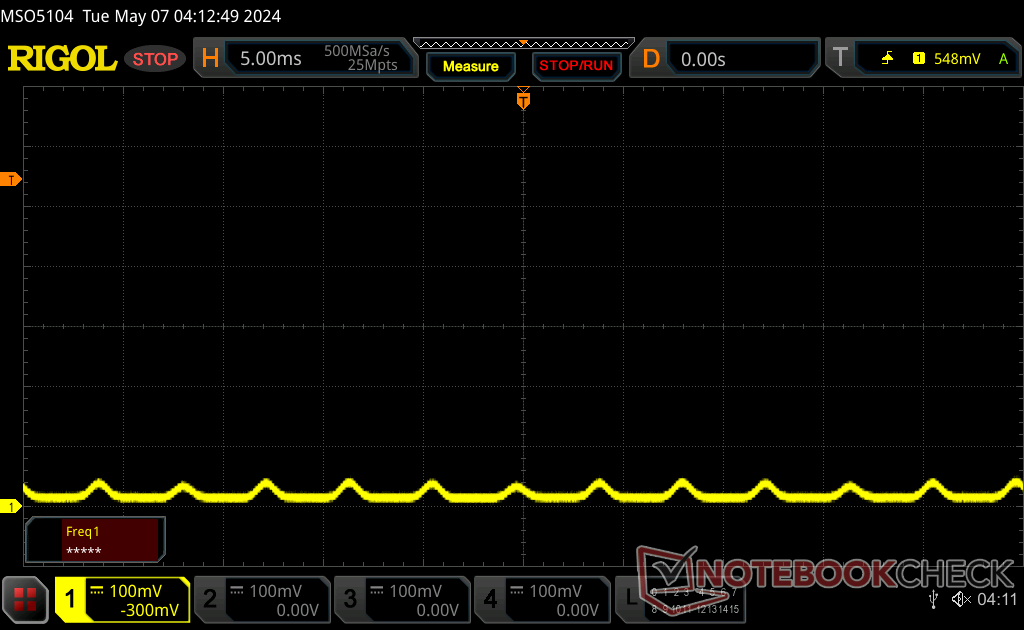
Cintilação da tela / PWM (modulação por largura de pulso)
| Tela tremeluzindo/PWM detectado | 60 Hz | ≤ 100 % configuração de brilho | 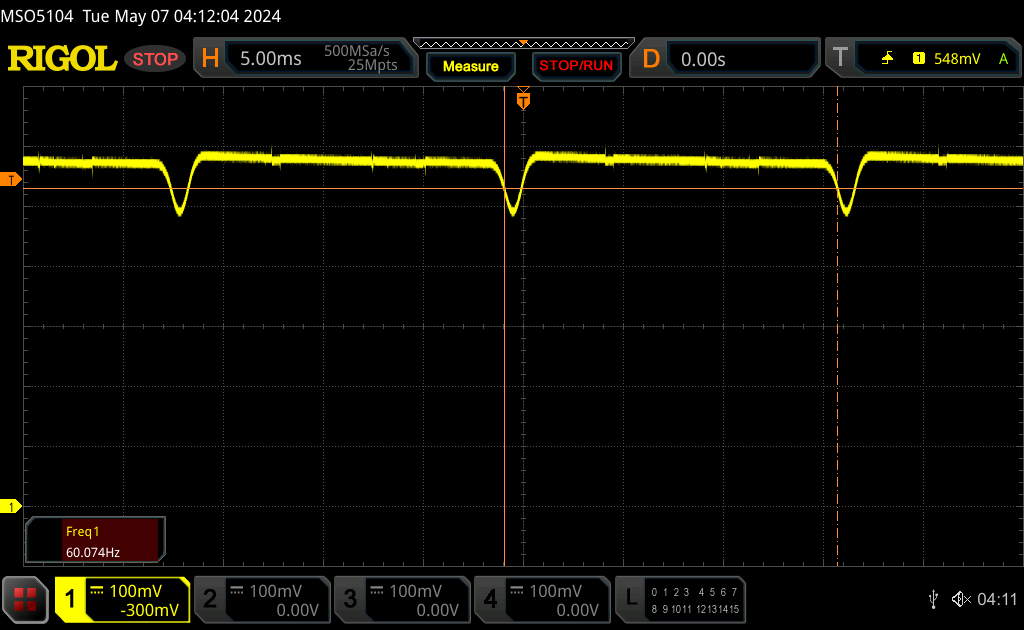 |
A luz de fundo da tela pisca em 60 Hz (pior caso, por exemplo, utilizando PWM) Cintilação detectada em uma configuração de brilho de 100 % e abaixo. Não deve haver cintilação ou PWM acima desta configuração de brilho. A frequência de 60 Hz é muito baixa, portanto a oscilação pode causar fadiga ocular e dores de cabeça após uso prolongado. [pwm_comparison] Em comparação: 53 % de todos os dispositivos testados não usam PWM para escurecer a tela. Se PWM foi detectado, uma média de 8516 (mínimo: 5 - máximo: 343500) Hz foi medida. | |||


Desempenho
Condições de teste
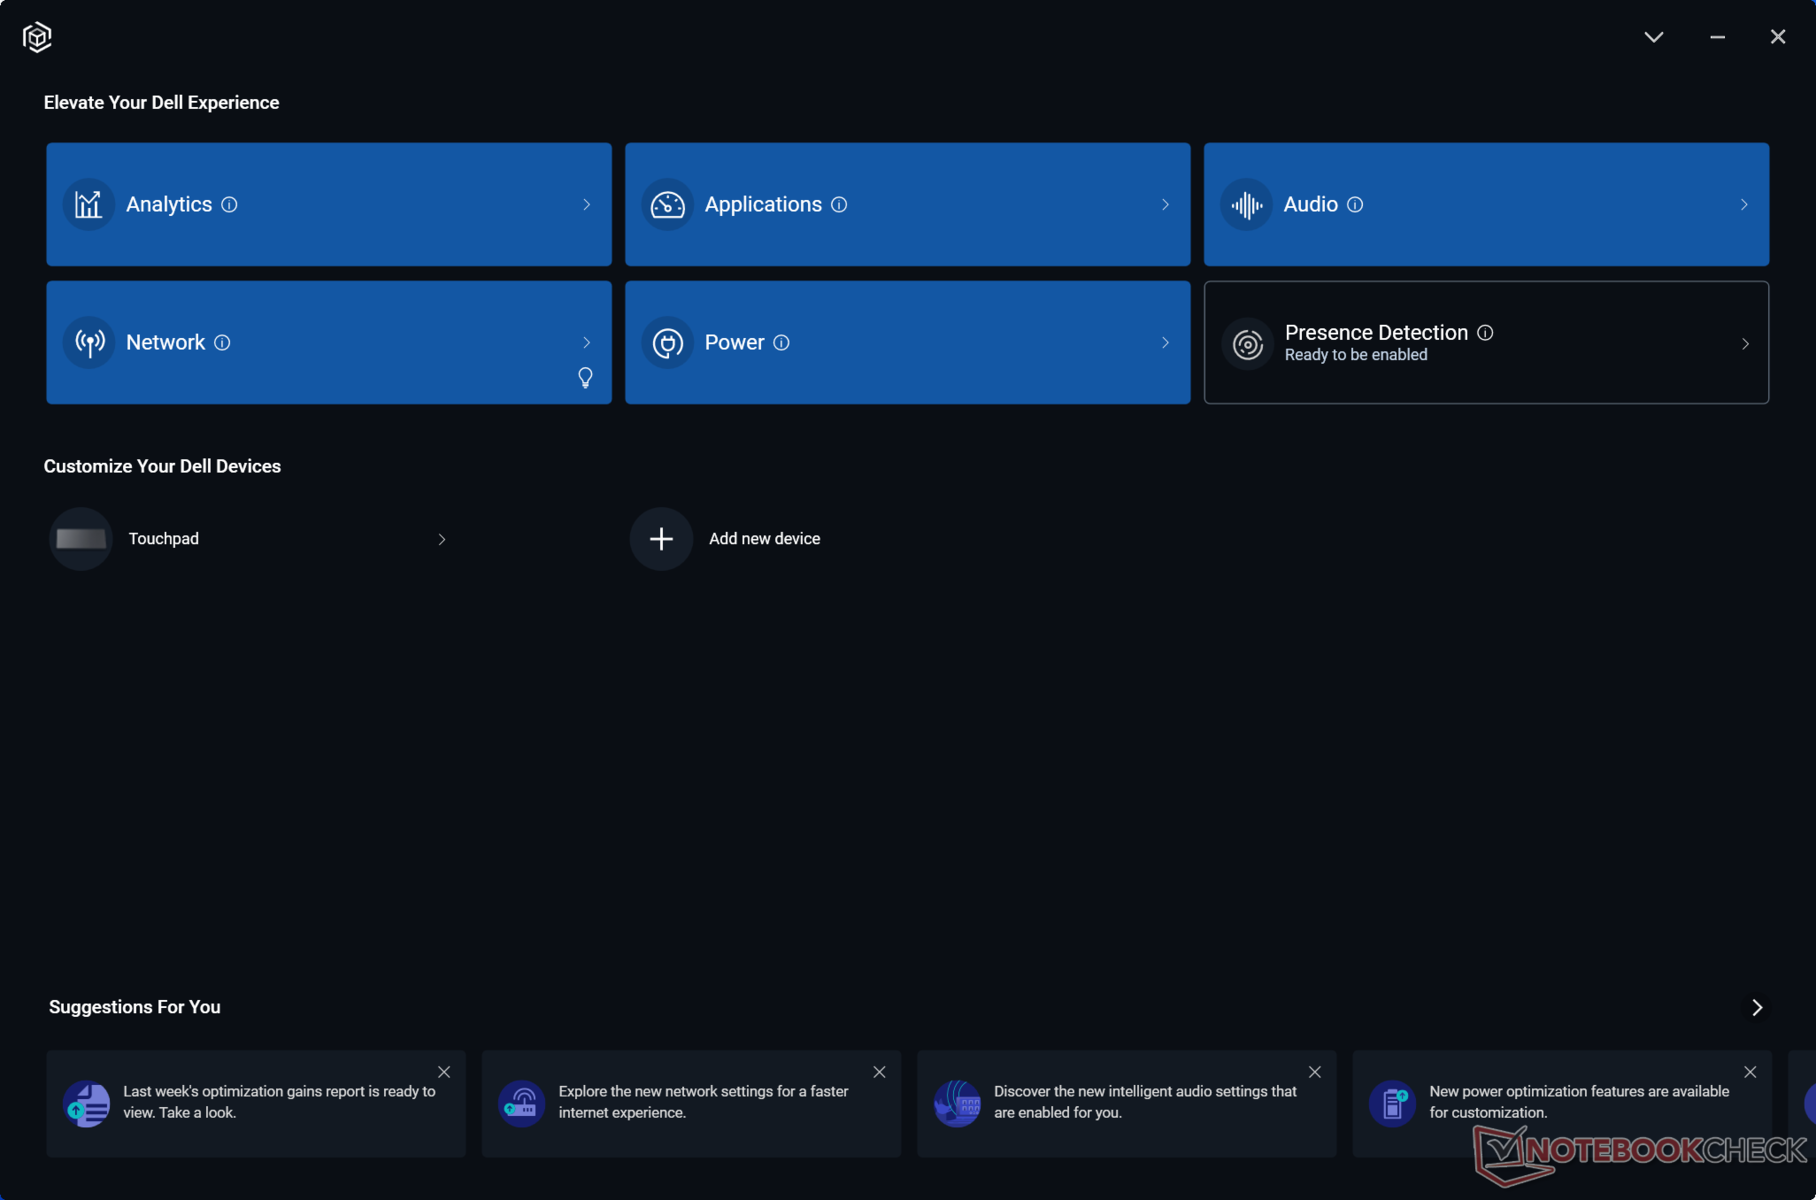
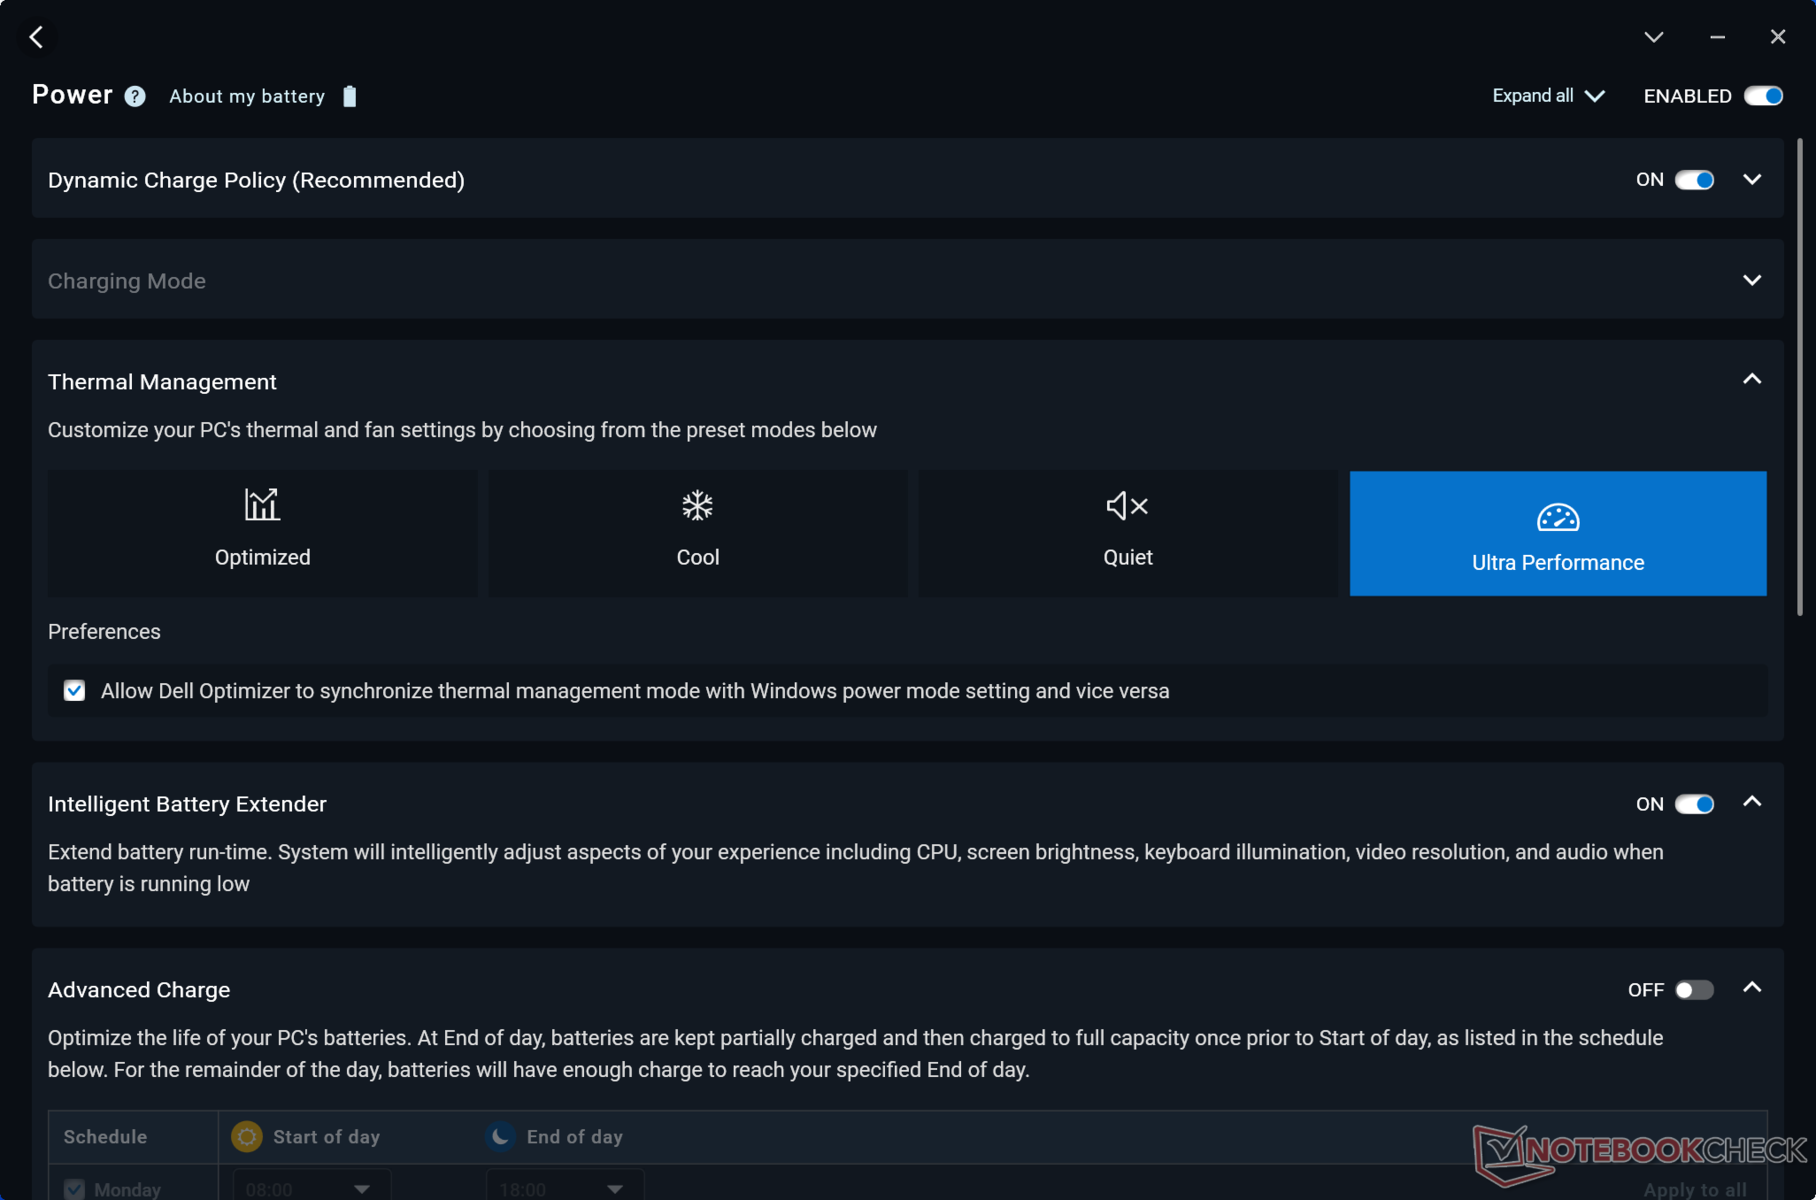
Definimos o Dell Optimizer para o modo Ultra Performance antes de executar os benchmarks abaixo. Também desativamos a ECC VRAM por meio do painel de controle da Nvidia. A ativação da ECC VRAM reduz a memória acessível em cerca de 1 GB.
Processador
O Core Ultra 9 185H tem um desempenho quase idêntico ao do Core i9-13900H em cargas de trabalho de thread único e multi-thread. Ele se beneficia mais do Turbo Boost para aquela explosão inicial de velocidade mais rápida, mas essa vantagem é apenas temporária antes de se estabelecer em níveis de desempenho semelhantes aos do Core i9 Precision 5680 mais antigo, conforme mostra o gráfico de comparação abaixo.
Fazendo downgrade para o Core Ultra 7 165H e Ultra 5 135H deverá afetar o desempenho do processador em 5 a 10% e 40 a 50%, respectivamente, o que significa que o delta de desempenho é significativamente maior entre o Core Ultra 5 e o Ultra 7 do que entre o Core Ultra 7 e o Ultra 9. O Precision 5690 não inclui nenhuma CPU Raptor Lake-HX de 14ª geração, o que teria aumentado o desempenho ainda mais rapidamente do que o Core Ultra 9 185H. Em compensação, no entanto, as CPUs Core Ultra incluem NPUs integradas para acelerar as tarefas locais de IA quando elas se tornarem mais prontamente disponíveis em um futuro próximo.
Cinebench R15 Multi Loop
Cinebench R23: Multi Core | Single Core
Cinebench R20: CPU (Multi Core) | CPU (Single Core)
Cinebench R15: CPU Multi 64Bit | CPU Single 64Bit
Blender: v2.79 BMW27 CPU
7-Zip 18.03: 7z b 4 | 7z b 4 -mmt1
Geekbench 6.4: Multi-Core | Single-Core
Geekbench 5.5: Multi-Core | Single-Core
HWBOT x265 Benchmark v2.2: 4k Preset
LibreOffice : 20 Documents To PDF
R Benchmark 2.5: Overall mean
| Geekbench 6.4 / Multi-Core | |
| HP ZBook Fury 16 G10 | |
| Dell Precision 5000 5680 | |
| Dell Precision 5690 | |
| Dell XPS 16 9640 | |
| Média Intel Core Ultra 9 185H (9140 - 14540, n=19) | |
| Lenovo ThinkPad P1 G6-21FV000DGE | |
| Lenovo ThinkPad P16s G2 21K9000CGE | |
| Samsung Galaxy Book4 Pro 360 | |
| Lenovo ThinkPad P16v G1 AMD | |
| Geekbench 6.4 / Single-Core | |
| HP ZBook Fury 16 G10 | |
| Lenovo ThinkPad P1 G6-21FV000DGE | |
| Dell Precision 5000 5680 | |
| Lenovo ThinkPad P16v G1 AMD | |
| Dell Precision 5690 | |
| Lenovo ThinkPad P16s G2 21K9000CGE | |
| Média Intel Core Ultra 9 185H (1490 - 2573, n=19) | |
| Dell XPS 16 9640 | |
| Samsung Galaxy Book4 Pro 360 | |
Cinebench R23: Multi Core | Single Core
Cinebench R20: CPU (Multi Core) | CPU (Single Core)
Cinebench R15: CPU Multi 64Bit | CPU Single 64Bit
Blender: v2.79 BMW27 CPU
7-Zip 18.03: 7z b 4 | 7z b 4 -mmt1
Geekbench 6.4: Multi-Core | Single-Core
Geekbench 5.5: Multi-Core | Single-Core
HWBOT x265 Benchmark v2.2: 4k Preset
LibreOffice : 20 Documents To PDF
R Benchmark 2.5: Overall mean
* ... menor é melhor
AIDA64: FP32 Ray-Trace | FPU Julia | CPU SHA3 | CPU Queen | FPU SinJulia | FPU Mandel | CPU AES | CPU ZLib | FP64 Ray-Trace | CPU PhotoWorxx
| Performance Rating | |
| HP ZBook Fury 16 G10 | |
| Dell Precision 5690 | |
| Lenovo ThinkPad P16 G2 21FA000FGE | |
| Média Intel Core Ultra 9 185H | |
| Dell Precision 5000 5680 | |
| MSI CreatorPro Z16P B12UKST | |
| Lenovo ThinkPad P1 G6-21FV000DGE | |
| AIDA64 / FP32 Ray-Trace | |
| HP ZBook Fury 16 G10 | |
| Dell Precision 5690 | |
| Lenovo ThinkPad P16 G2 21FA000FGE | |
| Média Intel Core Ultra 9 185H (9220 - 18676, n=19) | |
| Lenovo ThinkPad P1 G6-21FV000DGE | |
| Dell Precision 5000 5680 | |
| MSI CreatorPro Z16P B12UKST | |
| AIDA64 / FPU Julia | |
| HP ZBook Fury 16 G10 | |
| Dell Precision 5690 | |
| Lenovo ThinkPad P16 G2 21FA000FGE | |
| Média Intel Core Ultra 9 185H (48865 - 96463, n=19) | |
| Lenovo ThinkPad P1 G6-21FV000DGE | |
| Dell Precision 5000 5680 | |
| MSI CreatorPro Z16P B12UKST | |
| AIDA64 / CPU SHA3 | |
| HP ZBook Fury 16 G10 | |
| Dell Precision 5690 | |
| Lenovo ThinkPad P16 G2 21FA000FGE | |
| Média Intel Core Ultra 9 185H (2394 - 4534, n=19) | |
| Lenovo ThinkPad P1 G6-21FV000DGE | |
| MSI CreatorPro Z16P B12UKST | |
| Dell Precision 5000 5680 | |
| AIDA64 / CPU Queen | |
| HP ZBook Fury 16 G10 | |
| Dell Precision 5000 5680 | |
| Lenovo ThinkPad P1 G6-21FV000DGE | |
| Lenovo ThinkPad P16 G2 21FA000FGE | |
| MSI CreatorPro Z16P B12UKST | |
| Dell Precision 5690 | |
| Média Intel Core Ultra 9 185H (66785 - 95241, n=19) | |
| AIDA64 / FPU SinJulia | |
| HP ZBook Fury 16 G10 | |
| Lenovo ThinkPad P16 G2 21FA000FGE | |
| Dell Precision 5690 | |
| Média Intel Core Ultra 9 185H (7255 - 11392, n=19) | |
| Lenovo ThinkPad P1 G6-21FV000DGE | |
| Dell Precision 5000 5680 | |
| MSI CreatorPro Z16P B12UKST | |
| AIDA64 / FPU Mandel | |
| HP ZBook Fury 16 G10 | |
| Dell Precision 5690 | |
| Lenovo ThinkPad P16 G2 21FA000FGE | |
| Média Intel Core Ultra 9 185H (24004 - 48020, n=19) | |
| Lenovo ThinkPad P1 G6-21FV000DGE | |
| Dell Precision 5000 5680 | |
| MSI CreatorPro Z16P B12UKST | |
| AIDA64 / CPU AES | |
| MSI CreatorPro Z16P B12UKST | |
| HP ZBook Fury 16 G10 | |
| Média Intel Core Ultra 9 185H (53116 - 154066, n=19) | |
| Dell Precision 5690 | |
| Lenovo ThinkPad P16 G2 21FA000FGE | |
| Lenovo ThinkPad P1 G6-21FV000DGE | |
| Dell Precision 5000 5680 | |
| AIDA64 / CPU ZLib | |
| HP ZBook Fury 16 G10 | |
| Dell Precision 5690 | |
| Média Intel Core Ultra 9 185H (678 - 1341, n=19) | |
| Lenovo ThinkPad P16 G2 21FA000FGE | |
| Lenovo ThinkPad P1 G6-21FV000DGE | |
| MSI CreatorPro Z16P B12UKST | |
| Dell Precision 5000 5680 | |
| AIDA64 / FP64 Ray-Trace | |
| HP ZBook Fury 16 G10 | |
| Lenovo ThinkPad P16 G2 21FA000FGE | |
| Dell Precision 5690 | |
| Lenovo ThinkPad P1 G6-21FV000DGE | |
| Média Intel Core Ultra 9 185H (4428 - 10078, n=19) | |
| Dell Precision 5000 5680 | |
| MSI CreatorPro Z16P B12UKST | |
| AIDA64 / CPU PhotoWorxx | |
| Dell Precision 5690 | |
| Média Intel Core Ultra 9 185H (44547 - 53918, n=19) | |
| Dell Precision 5000 5680 | |
| MSI CreatorPro Z16P B12UKST | |
| HP ZBook Fury 16 G10 | |
| Lenovo ThinkPad P16 G2 21FA000FGE | |
| Lenovo ThinkPad P1 G6-21FV000DGE | |
Teste de estresse
Ao iniciar o estresse do Prime95, a CPU aumentava para 3,7 GHz e 120 W até atingir uma temperatura de núcleo de 100 C apenas alguns segundos depois. Em seguida, ela cairia para 3 GHz e 73 W e permaneceria relativamente estável durante todo o tempo. Tanto a temperatura do núcleo quanto o consumo de energia do pacote seriam ligeiramente mais altos do que os registrados no Precision 5680.
O consumo de energia da placa da GPU durante a execução Witcher 3 seria estável em 72 W, embora a GPU esteja listada como 90 W no Nvidia Control Center. Os resultados são semelhantes aos que registramos no modelo do ano passado.
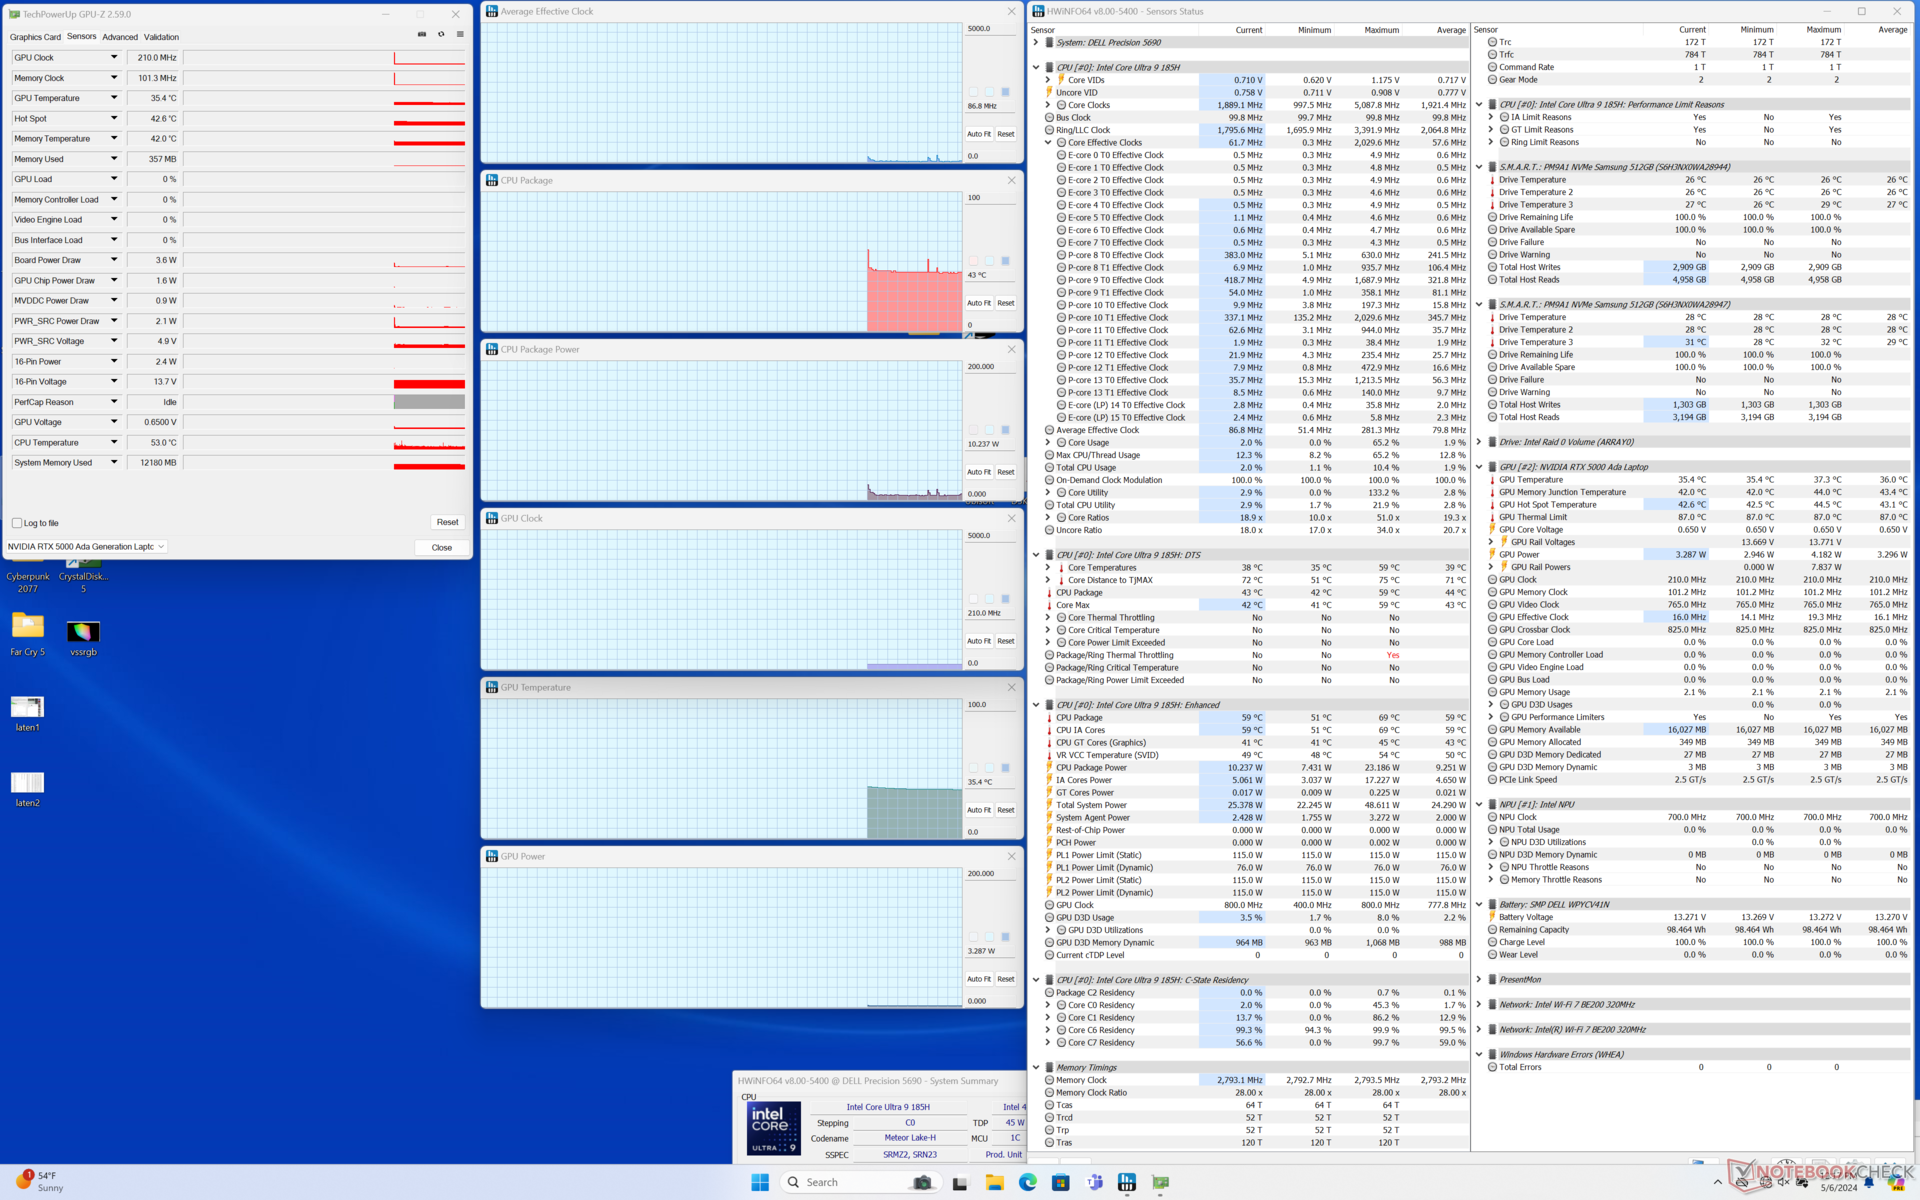
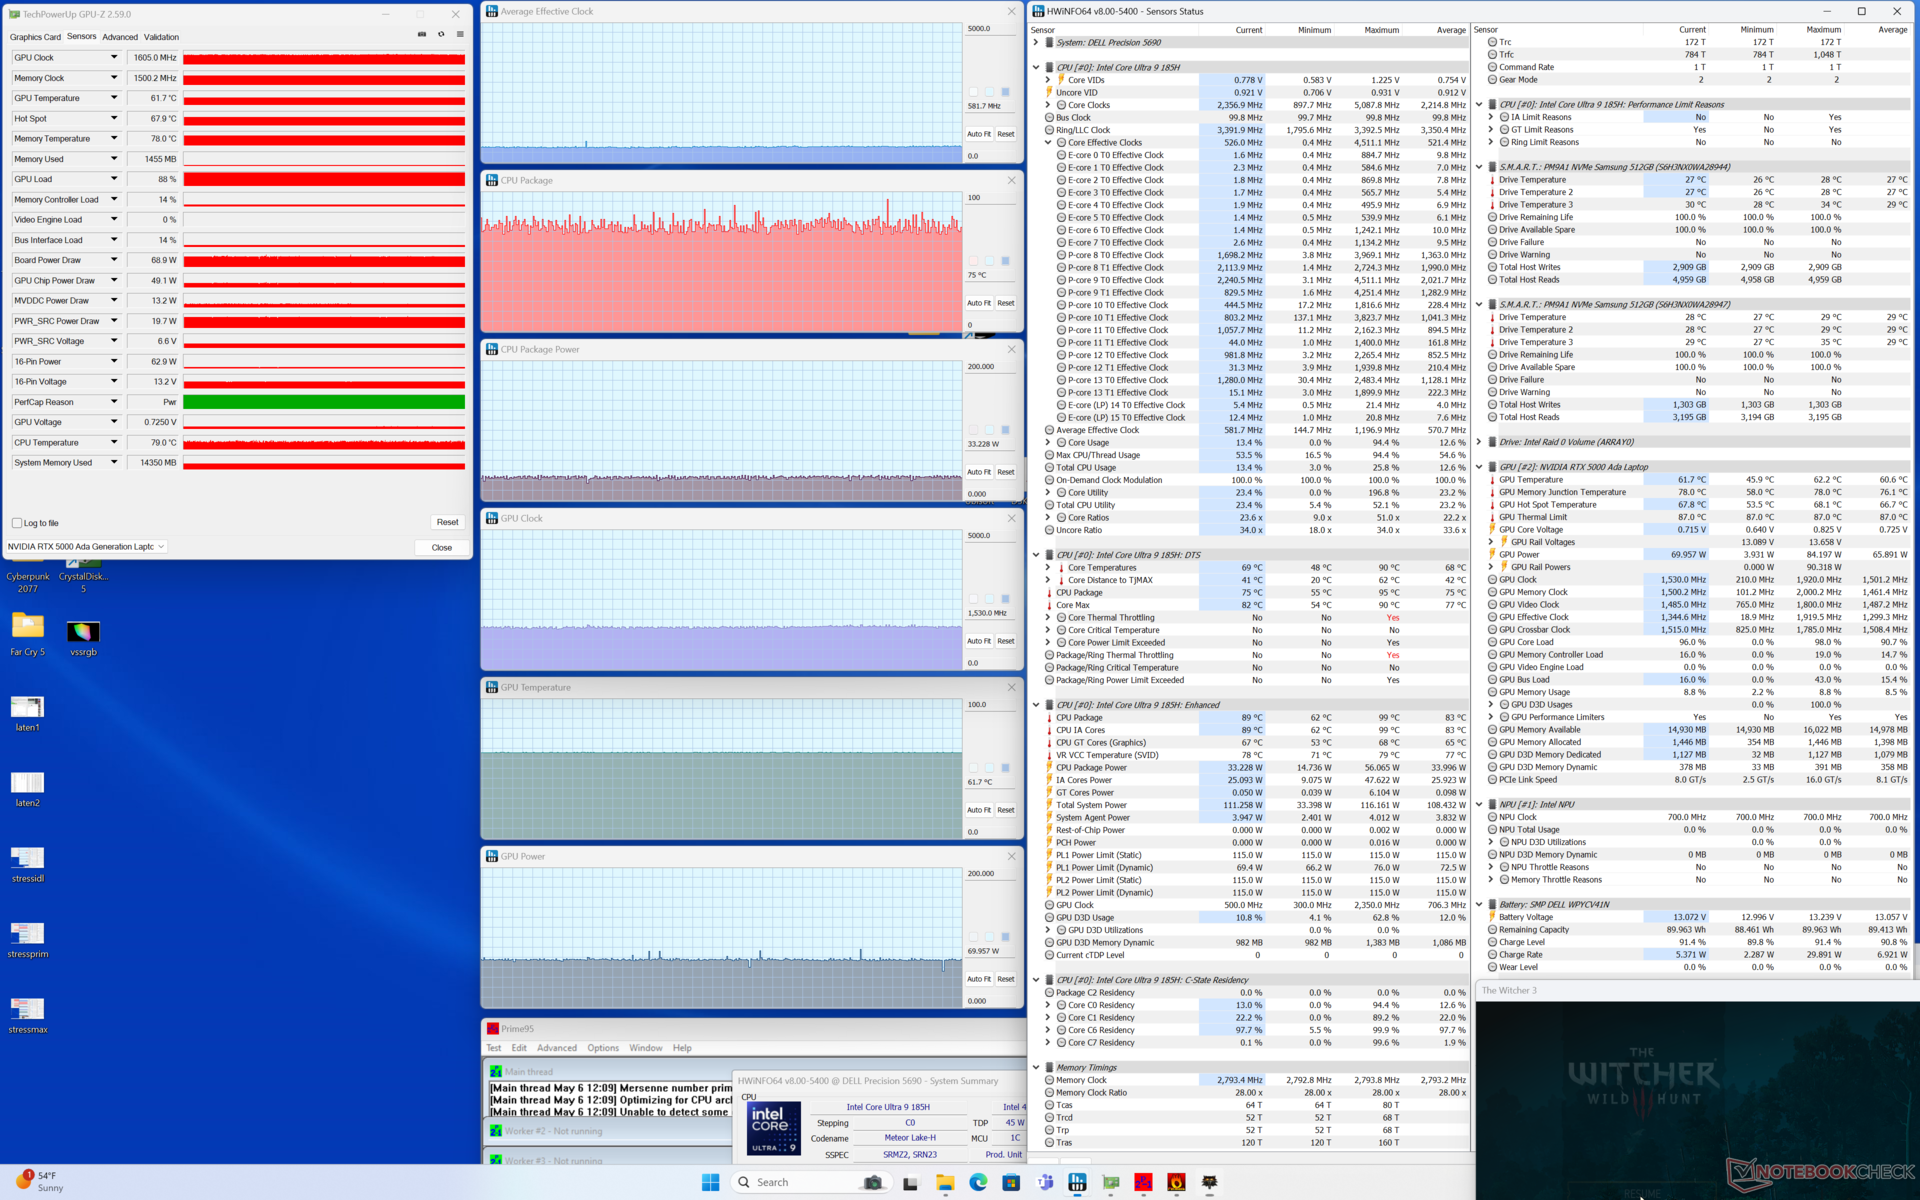
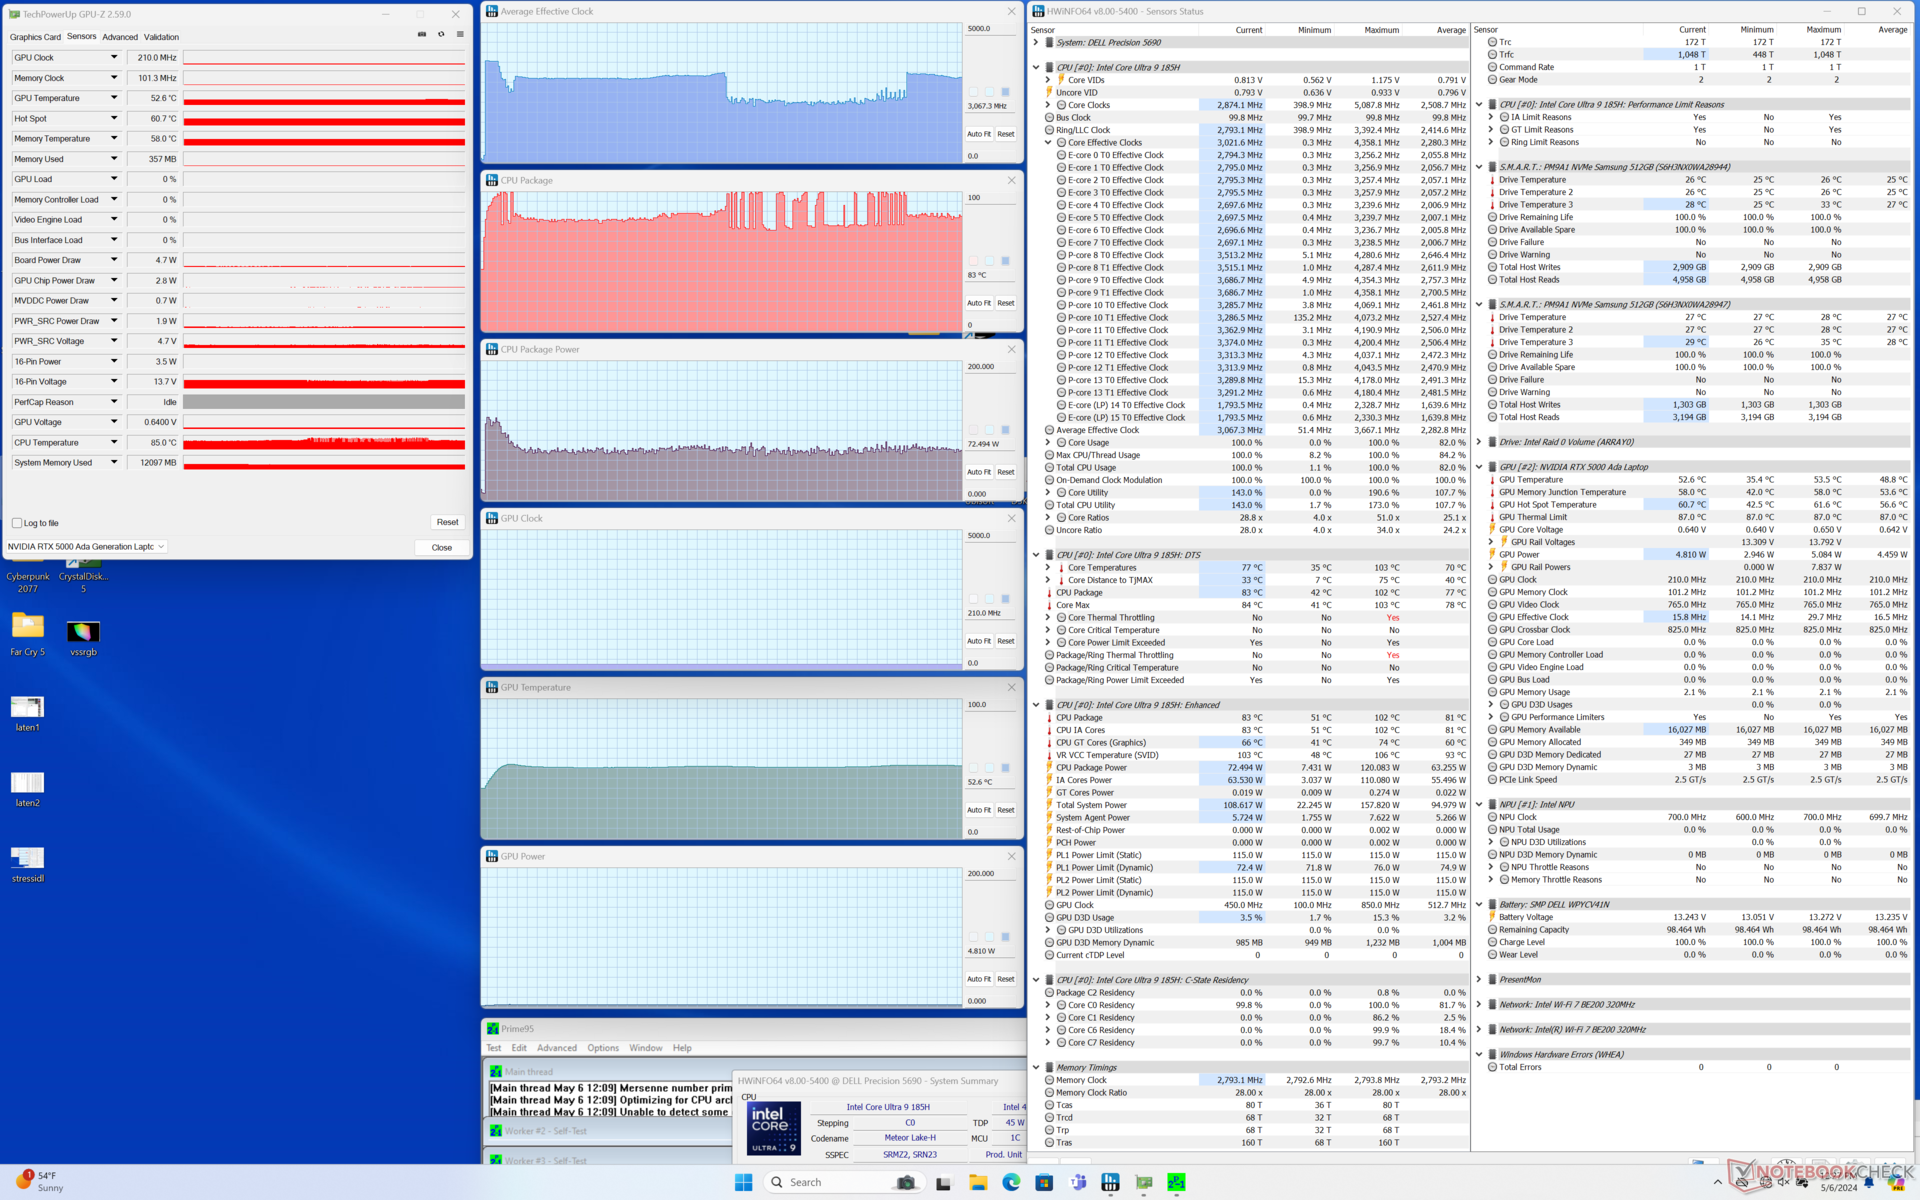
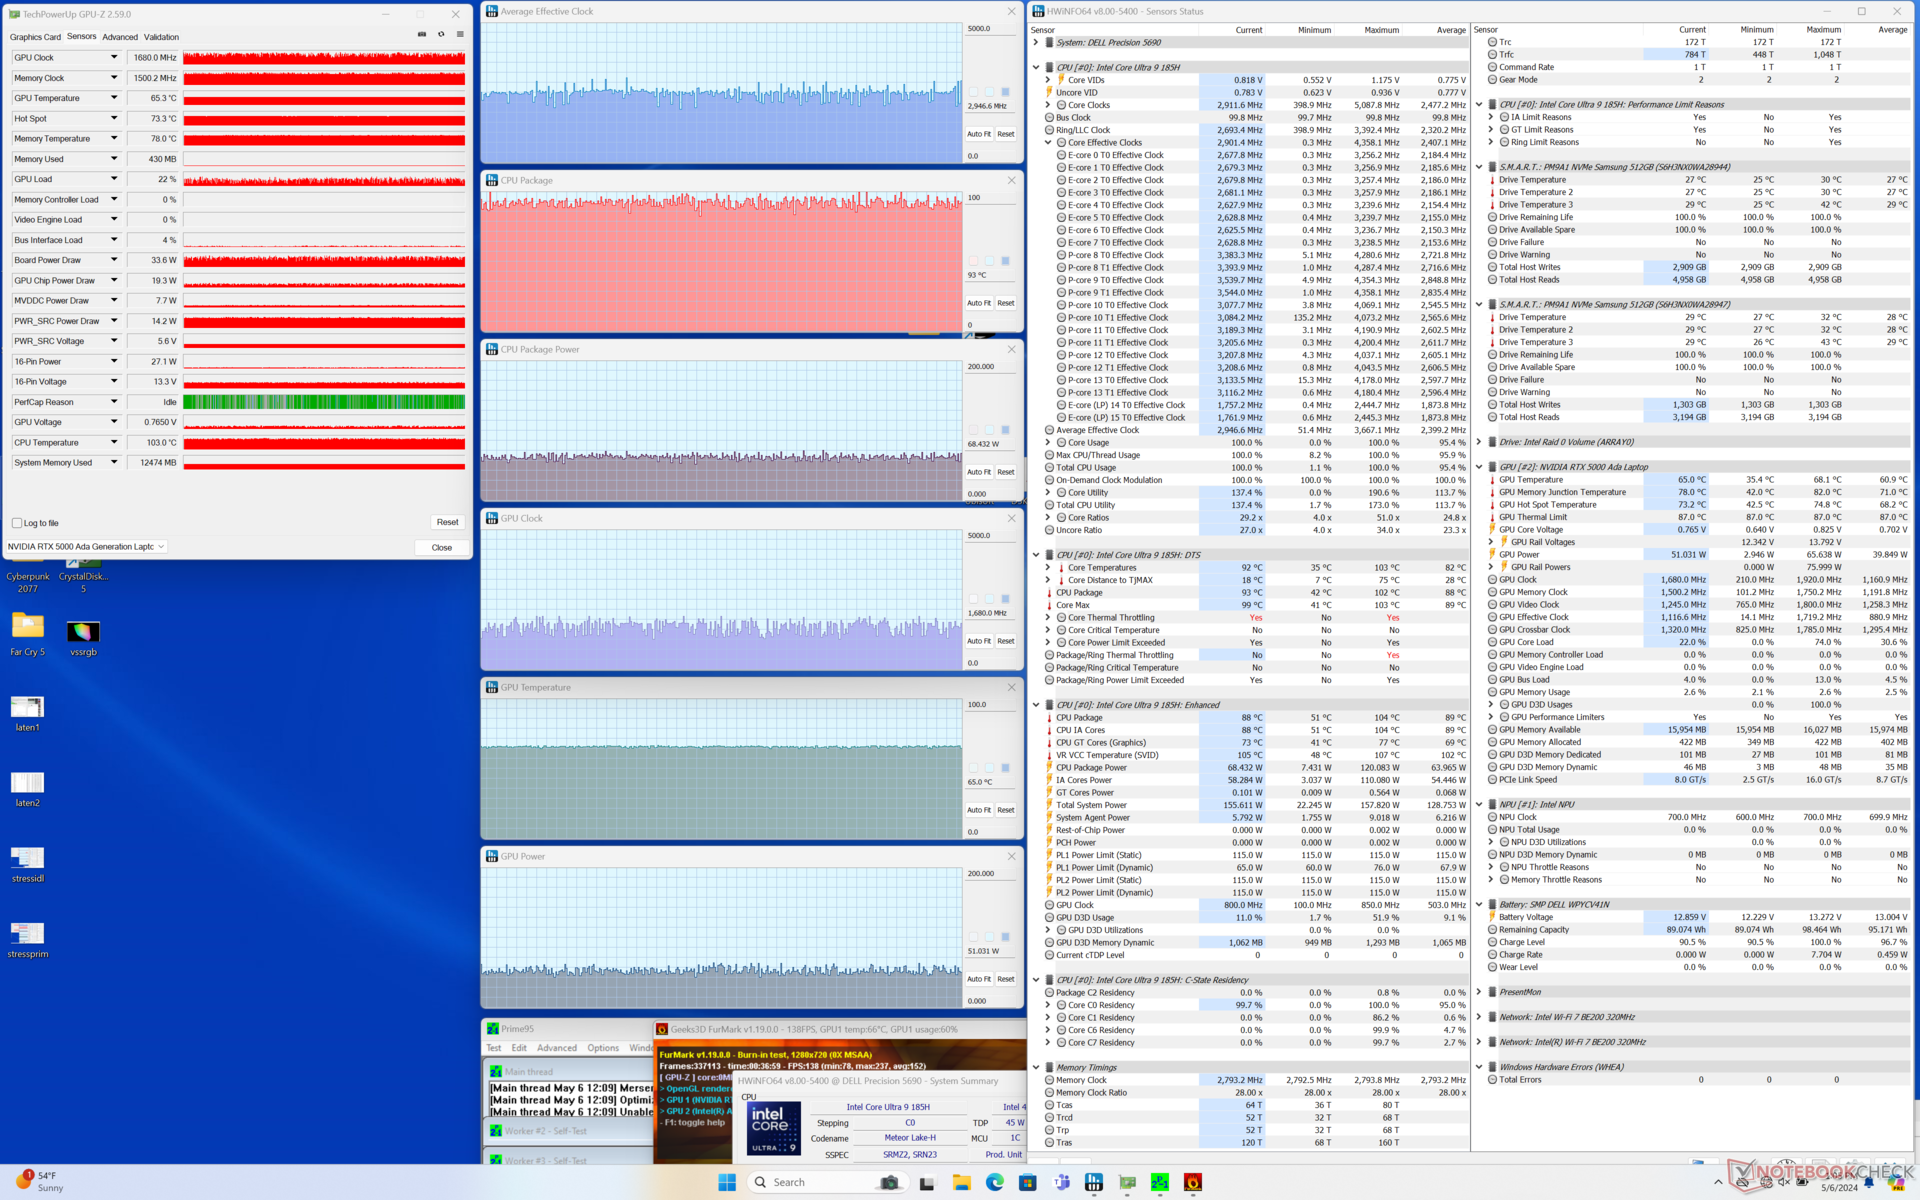
| CPU Clock (GHz) | GPU Clock (MHz) | Temperatura média da CPU (°C) | Temperatura média da GPU (°C) | |
| Sistema ocioso | -- | -- | 43 | 35 |
| Estresse doPrime95 | 3.0 | -- | 83 | 53 |
| Prime95 + FurMark Stress | ~3.0 | ~1680 | 93 | 65 |
| Witcher 3 Estresse | ~0,6 | 1530 | 75 | 62 |
Desempenho do sistema
As pontuações do PCMark 10 são essencialmente idênticas às que registramos no Precision 5680, o que sugere que não há grandes diferenças de desempenho entre os dois modelos quando se trata de tarefas tradicionais.
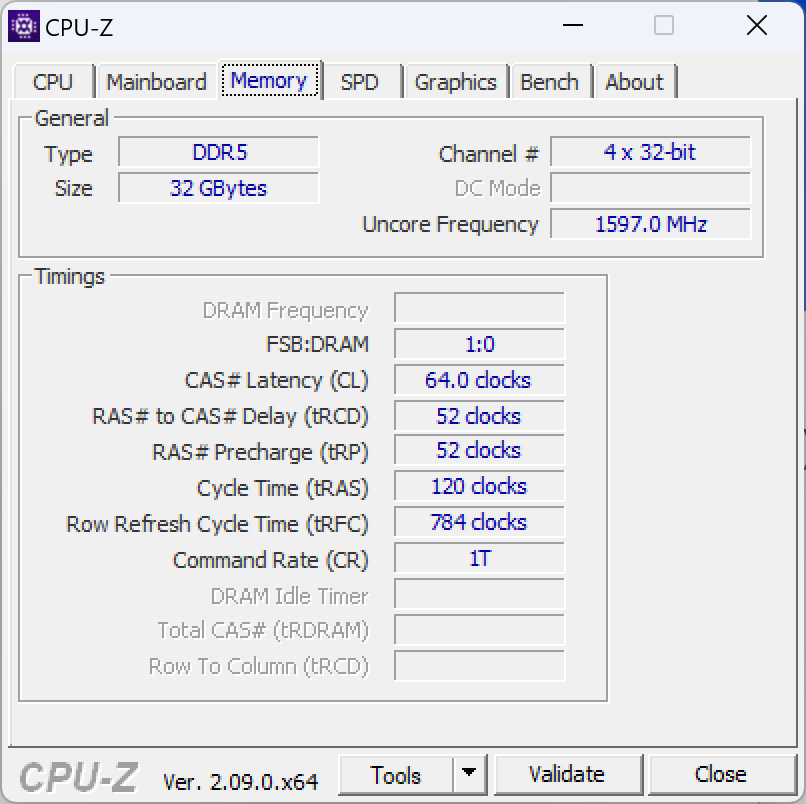
A RAM do sistema está um pouco mais rápida este ano (7467 vs. 6000 MT/s) e isso se reflete nos melhores resultados do benchmark AIDA64.

CrossMark: Overall | Productivity | Creativity | Responsiveness
WebXPRT 3: Overall
WebXPRT 4: Overall
Mozilla Kraken 1.1: Total
| PCMark 10 / Score | |
| Dell Precision 5000 5680 | |
| HP ZBook Fury 16 G10 | |
| Dell Precision 5690 | |
| Média Intel Core Ultra 9 185H, Nvidia RTX 5000 Ada Generation Laptop GPU (n=1) | |
| Lenovo ThinkPad P1 G6-21FV000DGE | |
| Lenovo ThinkPad P16 G2 21FA000FGE | |
| MSI CreatorPro Z16P B12UKST | |
| PCMark 10 / Essentials | |
| Dell Precision 5000 5680 | |
| Lenovo ThinkPad P1 G6-21FV000DGE | |
| HP ZBook Fury 16 G10 | |
| Dell Precision 5690 | |
| Média Intel Core Ultra 9 185H, Nvidia RTX 5000 Ada Generation Laptop GPU (n=1) | |
| Lenovo ThinkPad P16 G2 21FA000FGE | |
| MSI CreatorPro Z16P B12UKST | |
| PCMark 10 / Productivity | |
| Dell Precision 5000 5680 | |
| Dell Precision 5690 | |
| Média Intel Core Ultra 9 185H, Nvidia RTX 5000 Ada Generation Laptop GPU (n=1) | |
| Lenovo ThinkPad P1 G6-21FV000DGE | |
| Lenovo ThinkPad P16 G2 21FA000FGE | |
| MSI CreatorPro Z16P B12UKST | |
| HP ZBook Fury 16 G10 | |
| PCMark 10 / Digital Content Creation | |
| HP ZBook Fury 16 G10 | |
| Dell Precision 5000 5680 | |
| Dell Precision 5690 | |
| Média Intel Core Ultra 9 185H, Nvidia RTX 5000 Ada Generation Laptop GPU (n=1) | |
| Lenovo ThinkPad P1 G6-21FV000DGE | |
| MSI CreatorPro Z16P B12UKST | |
| Lenovo ThinkPad P16 G2 21FA000FGE | |
| CrossMark / Overall | |
| MSI CreatorPro Z16P B12UKST | |
| Dell Precision 5000 5680 | |
| HP ZBook Fury 16 G10 | |
| Lenovo ThinkPad P1 G6-21FV000DGE | |
| Lenovo ThinkPad P16 G2 21FA000FGE | |
| Dell Precision 5690 | |
| Média Intel Core Ultra 9 185H, Nvidia RTX 5000 Ada Generation Laptop GPU (n=1) | |
| CrossMark / Productivity | |
| HP ZBook Fury 16 G10 | |
| MSI CreatorPro Z16P B12UKST | |
| Dell Precision 5000 5680 | |
| Lenovo ThinkPad P1 G6-21FV000DGE | |
| Dell Precision 5690 | |
| Média Intel Core Ultra 9 185H, Nvidia RTX 5000 Ada Generation Laptop GPU (n=1) | |
| Lenovo ThinkPad P16 G2 21FA000FGE | |
| CrossMark / Creativity | |
| Dell Precision 5000 5680 | |
| Lenovo ThinkPad P16 G2 21FA000FGE | |
| HP ZBook Fury 16 G10 | |
| MSI CreatorPro Z16P B12UKST | |
| Lenovo ThinkPad P1 G6-21FV000DGE | |
| Dell Precision 5690 | |
| Média Intel Core Ultra 9 185H, Nvidia RTX 5000 Ada Generation Laptop GPU (n=1) | |
| CrossMark / Responsiveness | |
| MSI CreatorPro Z16P B12UKST | |
| HP ZBook Fury 16 G10 | |
| Lenovo ThinkPad P1 G6-21FV000DGE | |
| Dell Precision 5000 5680 | |
| Dell Precision 5690 | |
| Média Intel Core Ultra 9 185H, Nvidia RTX 5000 Ada Generation Laptop GPU (n=1) | |
| Lenovo ThinkPad P16 G2 21FA000FGE | |
| WebXPRT 3 / Overall | |
| Dell Precision 5000 5680 | |
| HP ZBook Fury 16 G10 | |
| Lenovo ThinkPad P16 G2 21FA000FGE | |
| Lenovo ThinkPad P1 G6-21FV000DGE | |
| MSI CreatorPro Z16P B12UKST | |
| Dell Precision 5690 | |
| Média Intel Core Ultra 9 185H, Nvidia RTX 5000 Ada Generation Laptop GPU (n=1) | |
| WebXPRT 4 / Overall | |
| Lenovo ThinkPad P1 G6-21FV000DGE | |
| HP ZBook Fury 16 G10 | |
| Dell Precision 5000 5680 | |
| Dell Precision 5690 | |
| Média Intel Core Ultra 9 185H, Nvidia RTX 5000 Ada Generation Laptop GPU (n=1) | |
| MSI CreatorPro Z16P B12UKST | |
| Mozilla Kraken 1.1 / Total | |
| MSI CreatorPro Z16P B12UKST | |
| Dell Precision 5690 | |
| Média Intel Core Ultra 9 185H, Nvidia RTX 5000 Ada Generation Laptop GPU (n=1) | |
| Lenovo ThinkPad P16 G2 21FA000FGE | |
| Dell Precision 5000 5680 | |
| Lenovo ThinkPad P1 G6-21FV000DGE | |
| HP ZBook Fury 16 G10 | |
* ... menor é melhor
| PCMark 10 Score | 8065 pontos | |
Ajuda | ||
| AIDA64 / Memory Copy | |
| Dell Precision 5690 | |
| Média Intel Core Ultra 9 185H (69929 - 95718, n=19) | |
| Dell Precision 5000 5680 | |
| MSI CreatorPro Z16P B12UKST | |
| HP ZBook Fury 16 G10 | |
| Lenovo ThinkPad P16 G2 21FA000FGE | |
| Lenovo ThinkPad P1 G6-21FV000DGE | |
| AIDA64 / Memory Read | |
| Dell Precision 5690 | |
| Média Intel Core Ultra 9 185H (64619 - 87768, n=19) | |
| Dell Precision 5000 5680 | |
| MSI CreatorPro Z16P B12UKST | |
| HP ZBook Fury 16 G10 | |
| Lenovo ThinkPad P16 G2 21FA000FGE | |
| Lenovo ThinkPad P1 G6-21FV000DGE | |
| AIDA64 / Memory Write | |
| Dell Precision 5000 5680 | |
| Dell Precision 5690 | |
| Média Intel Core Ultra 9 185H (51114 - 93871, n=19) | |
| MSI CreatorPro Z16P B12UKST | |
| HP ZBook Fury 16 G10 | |
| Lenovo ThinkPad P16 G2 21FA000FGE | |
| Lenovo ThinkPad P1 G6-21FV000DGE | |
| AIDA64 / Memory Latency | |
| Média Intel Core Ultra 9 185H (121.4 - 259, n=19) | |
| Dell Precision 5690 | |
| HP ZBook Fury 16 G10 | |
| Lenovo ThinkPad P16 G2 21FA000FGE | |
| MSI CreatorPro Z16P B12UKST | |
| Dell Precision 5000 5680 | |
| Lenovo ThinkPad P1 G6-21FV000DGE | |
* ... menor é melhor
Latência DPC
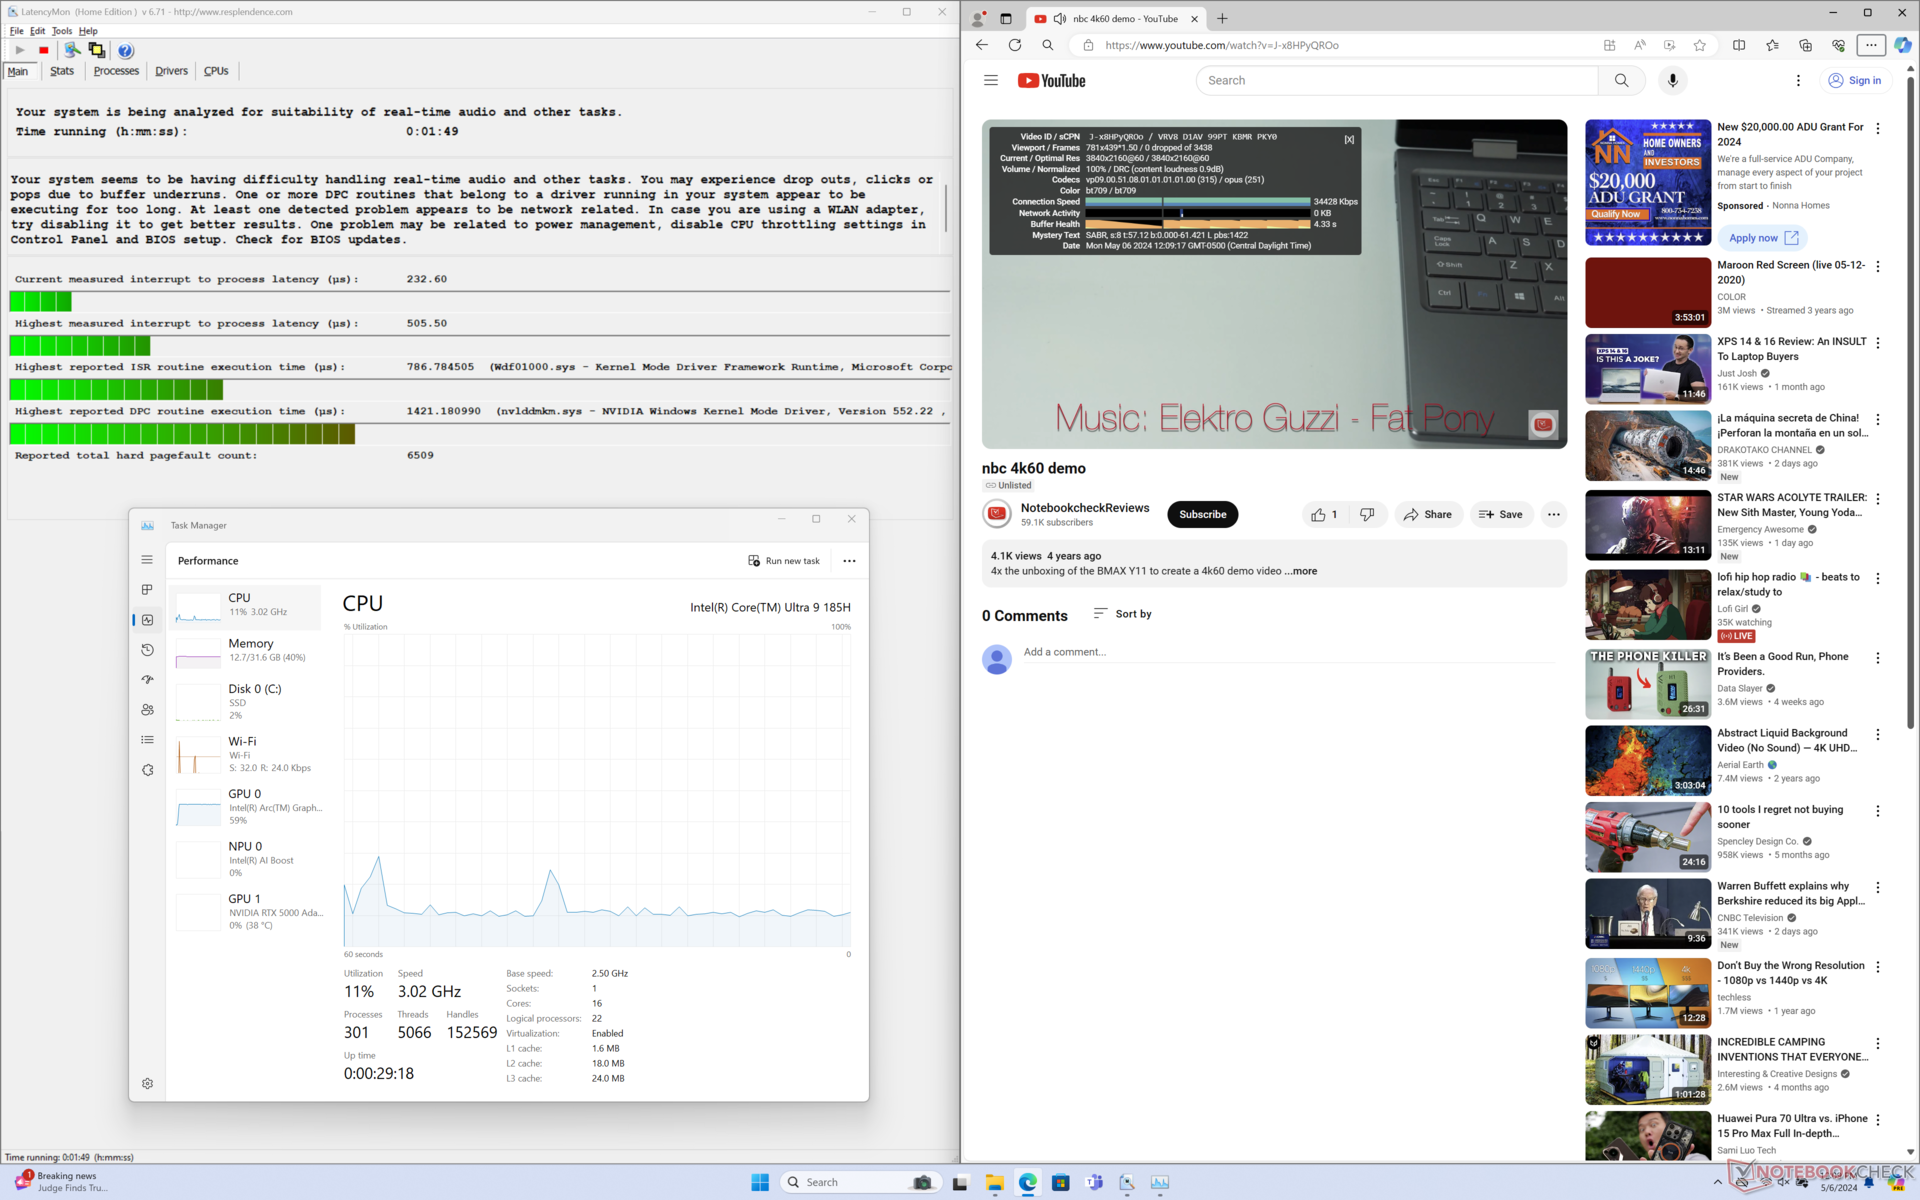
O LatencyMon revela apenas pequenos problemas de DPC ao abrir várias guias do navegador em nossa página inicial. a reprodução de vídeo 4K a 60 FPS é perfeita, sem registro de queda de quadros.

| DPC Latencies / LatencyMon - interrupt to process latency (max), Web, Youtube, Prime95 | |
| HP ZBook Fury 16 G10 | |
| Lenovo ThinkPad P1 G6-21FV000DGE | |
| Dell Precision 5000 5680 | |
| Lenovo ThinkPad P16 G2 21FA000FGE | |
| MSI CreatorPro Z16P B12UKST | |
| Dell Precision 5690 | |
* ... menor é melhor
Dispositivos de armazenamento
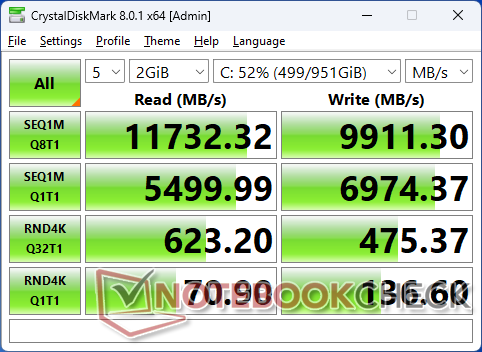
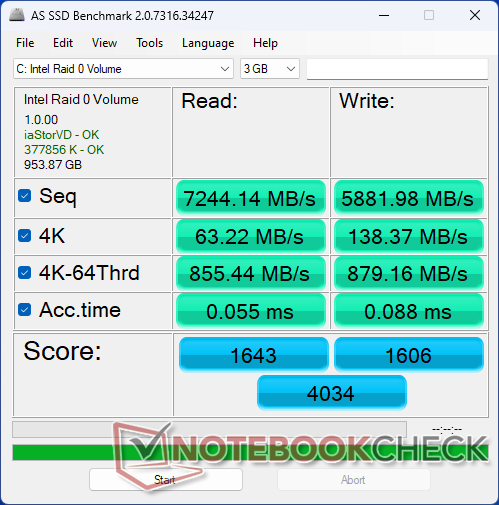
Nossa unidade de teste vem com dois Samsung PM9A1 PCIe4 x4 NVMe da Samsung na configuração RAID 0 para taxas de leitura e gravação superiores a 12.000 MB/s e 9.000 MB/s, respectivamente. O desempenho é estável, sem nenhuma limitação registrada ao executar o DiskSpd em um loop.

| Drive Performance Rating - Percent | |
| MSI CreatorPro Z16P B12UKST -8! | |
| Lenovo ThinkPad P1 G6-21FV000DGE | |
| Dell Precision 5690 | |
| HP ZBook Fury 16 G10 | |
| Dell Precision 5000 5680 | |
| Lenovo ThinkPad P16 G2 21FA000FGE | |
* ... menor é melhor
Disk Throttling: DiskSpd Read Loop, Queue Depth 8
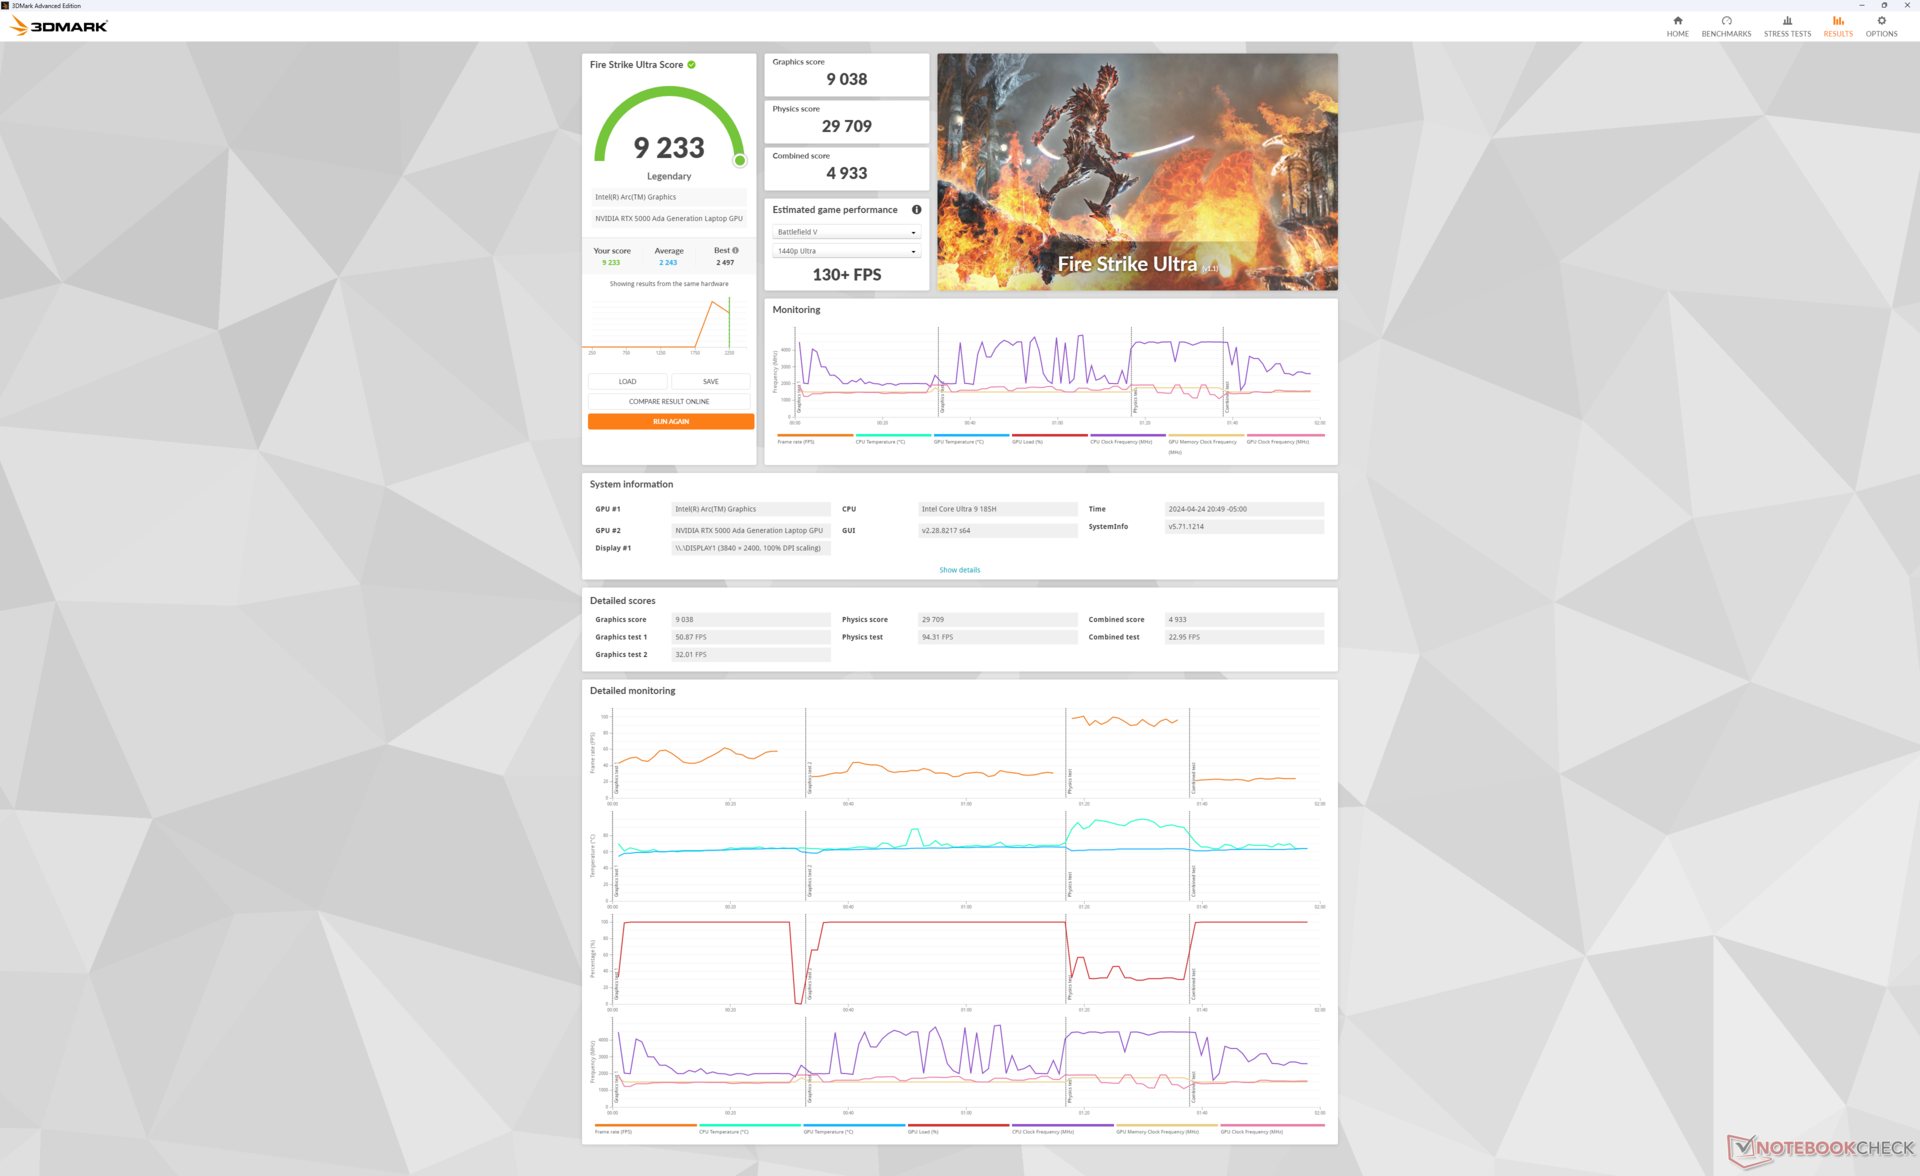
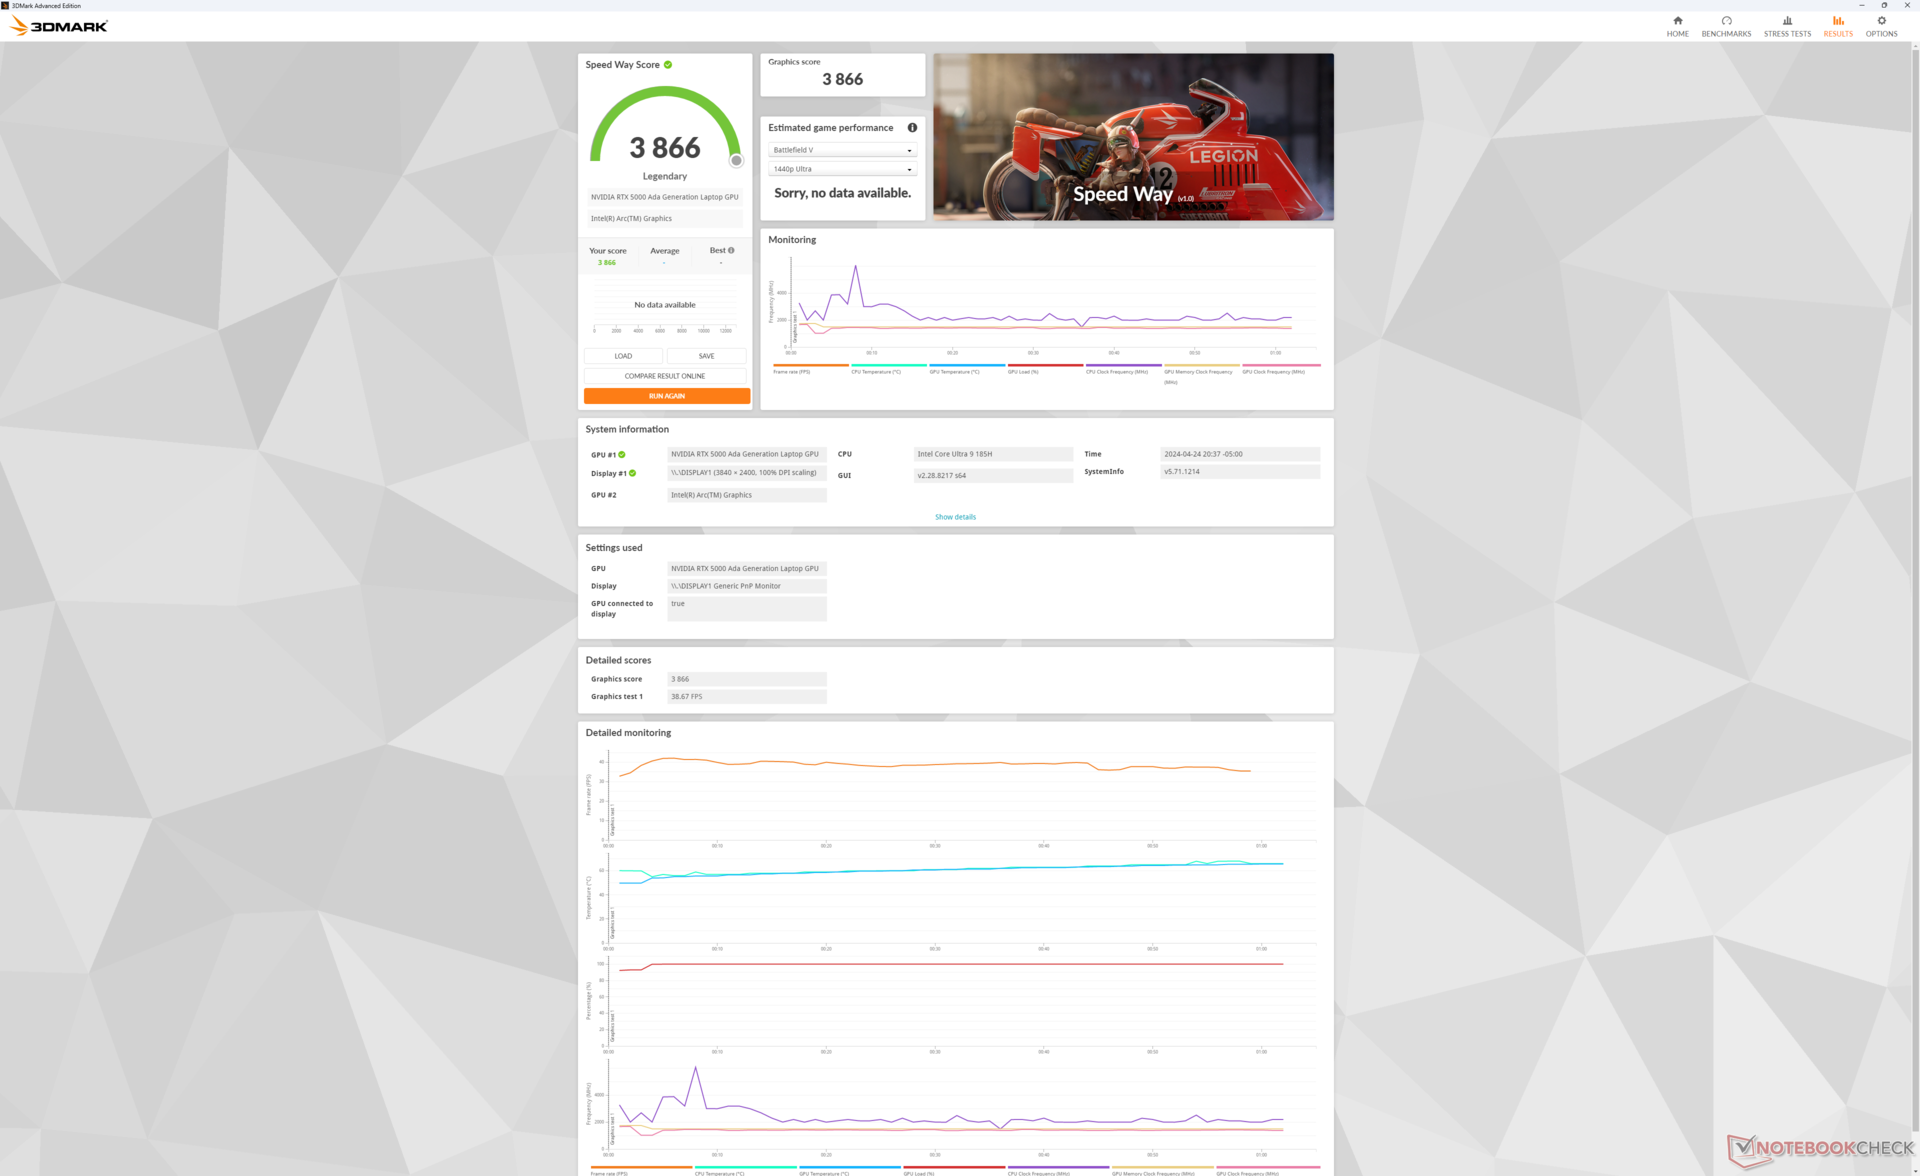
Desempenho da GPU - Até RTX 5000 Ada
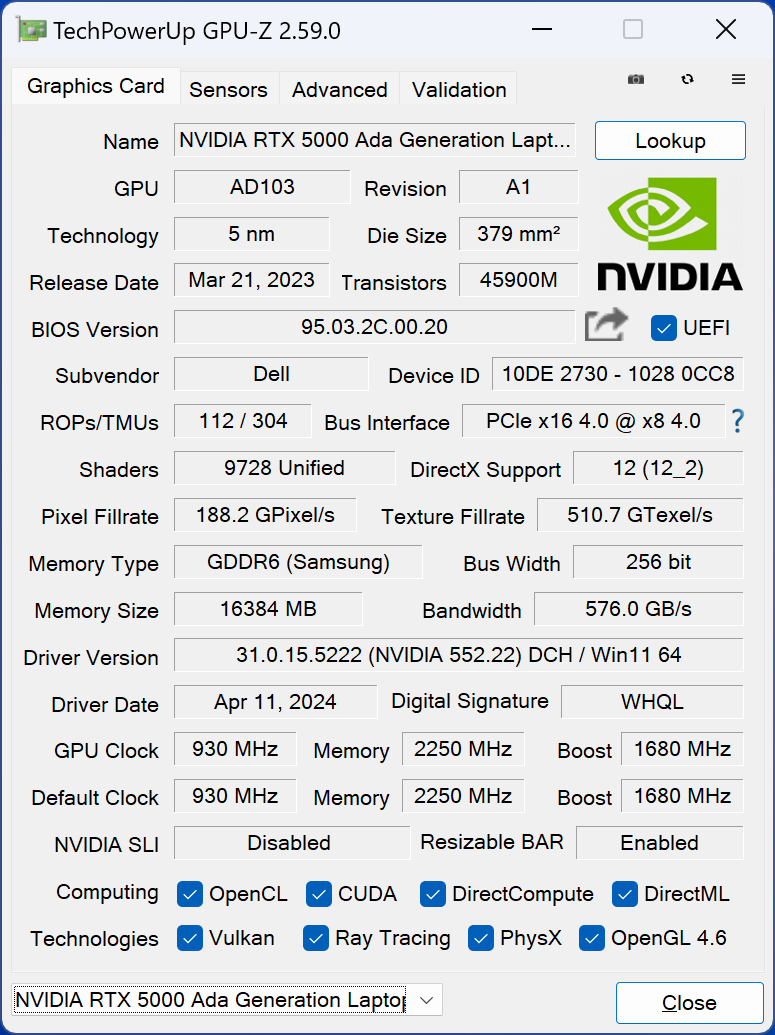
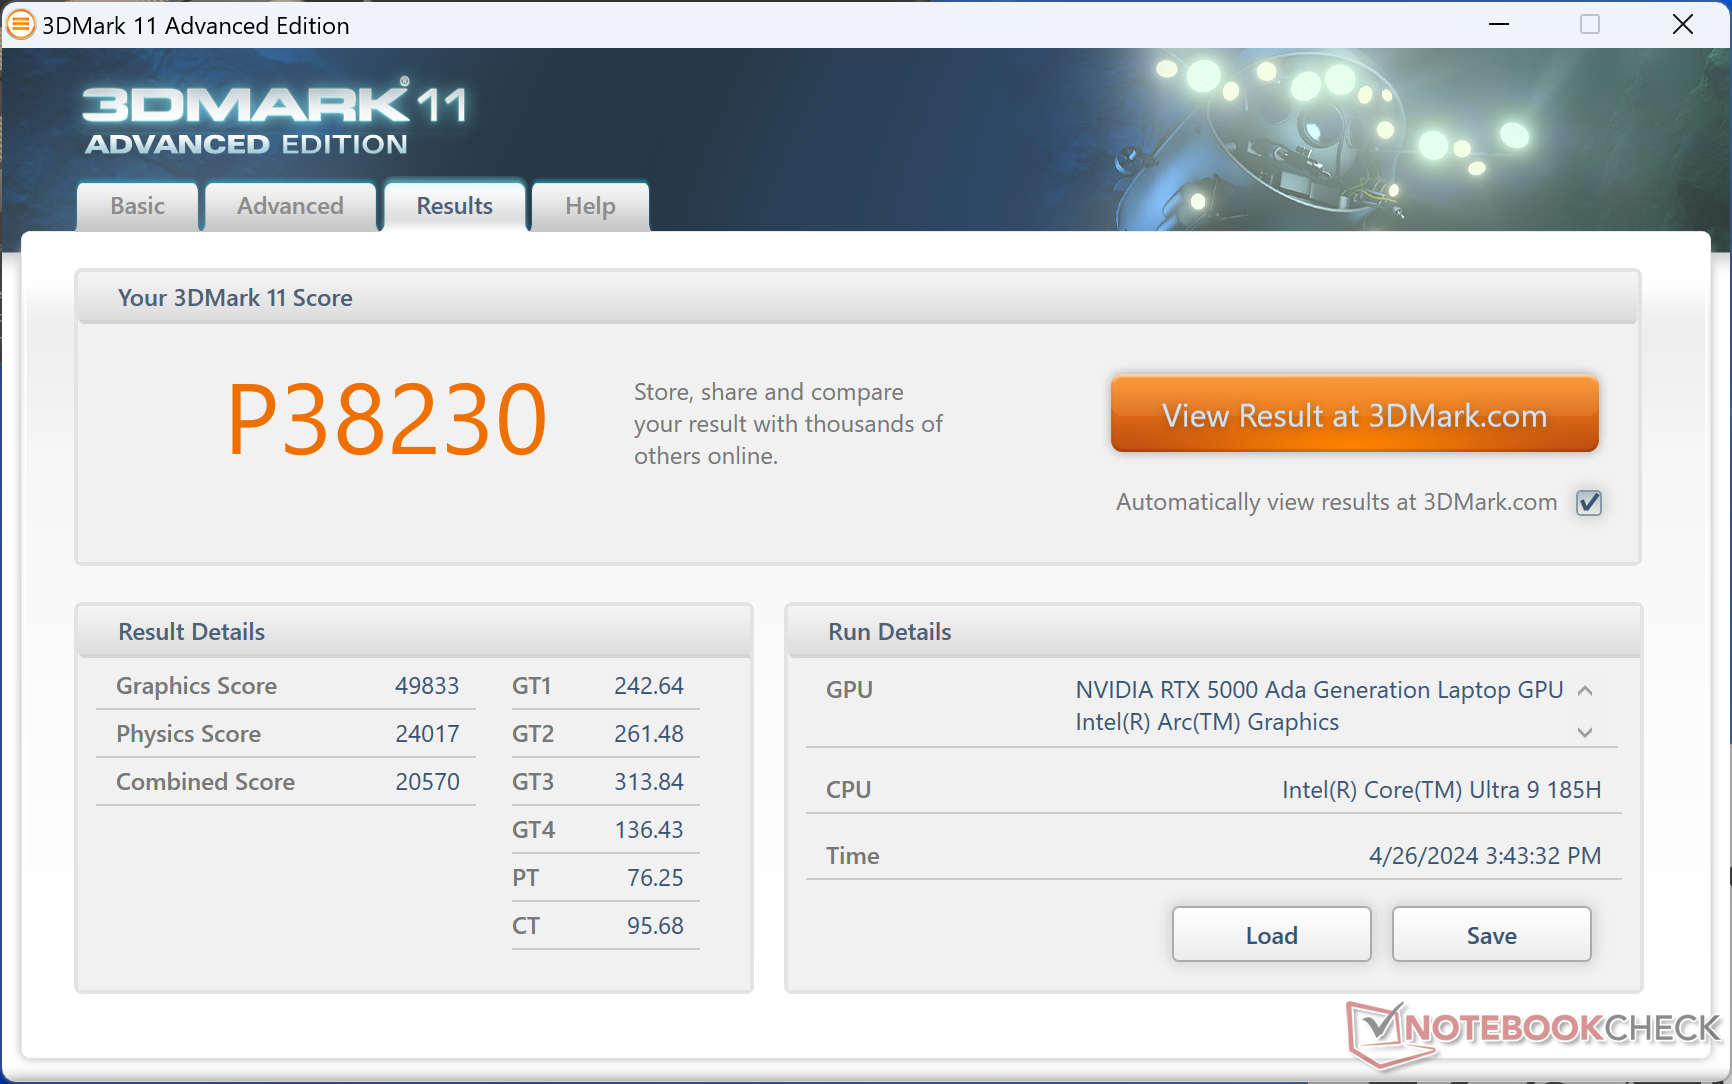
As opções de GPU da Nvidia não mudaram em relação ao passado e, portanto, a RTX 5000 Ada continua a ser a opção topo de linha. Essa GPU é derivada da GeForce RTX 4090 e, portanto, inclui 16 GB de VRAM em vez de 12 GB se configurada com a RTX 4000 Ada ou 3500 Ada mais lenta. Os usuários têm uma ampla gama de GPUs RTX Ada para configurar, incluindo a RTX 1000 Ada até a nossa configuração RTX 5000 Ada.
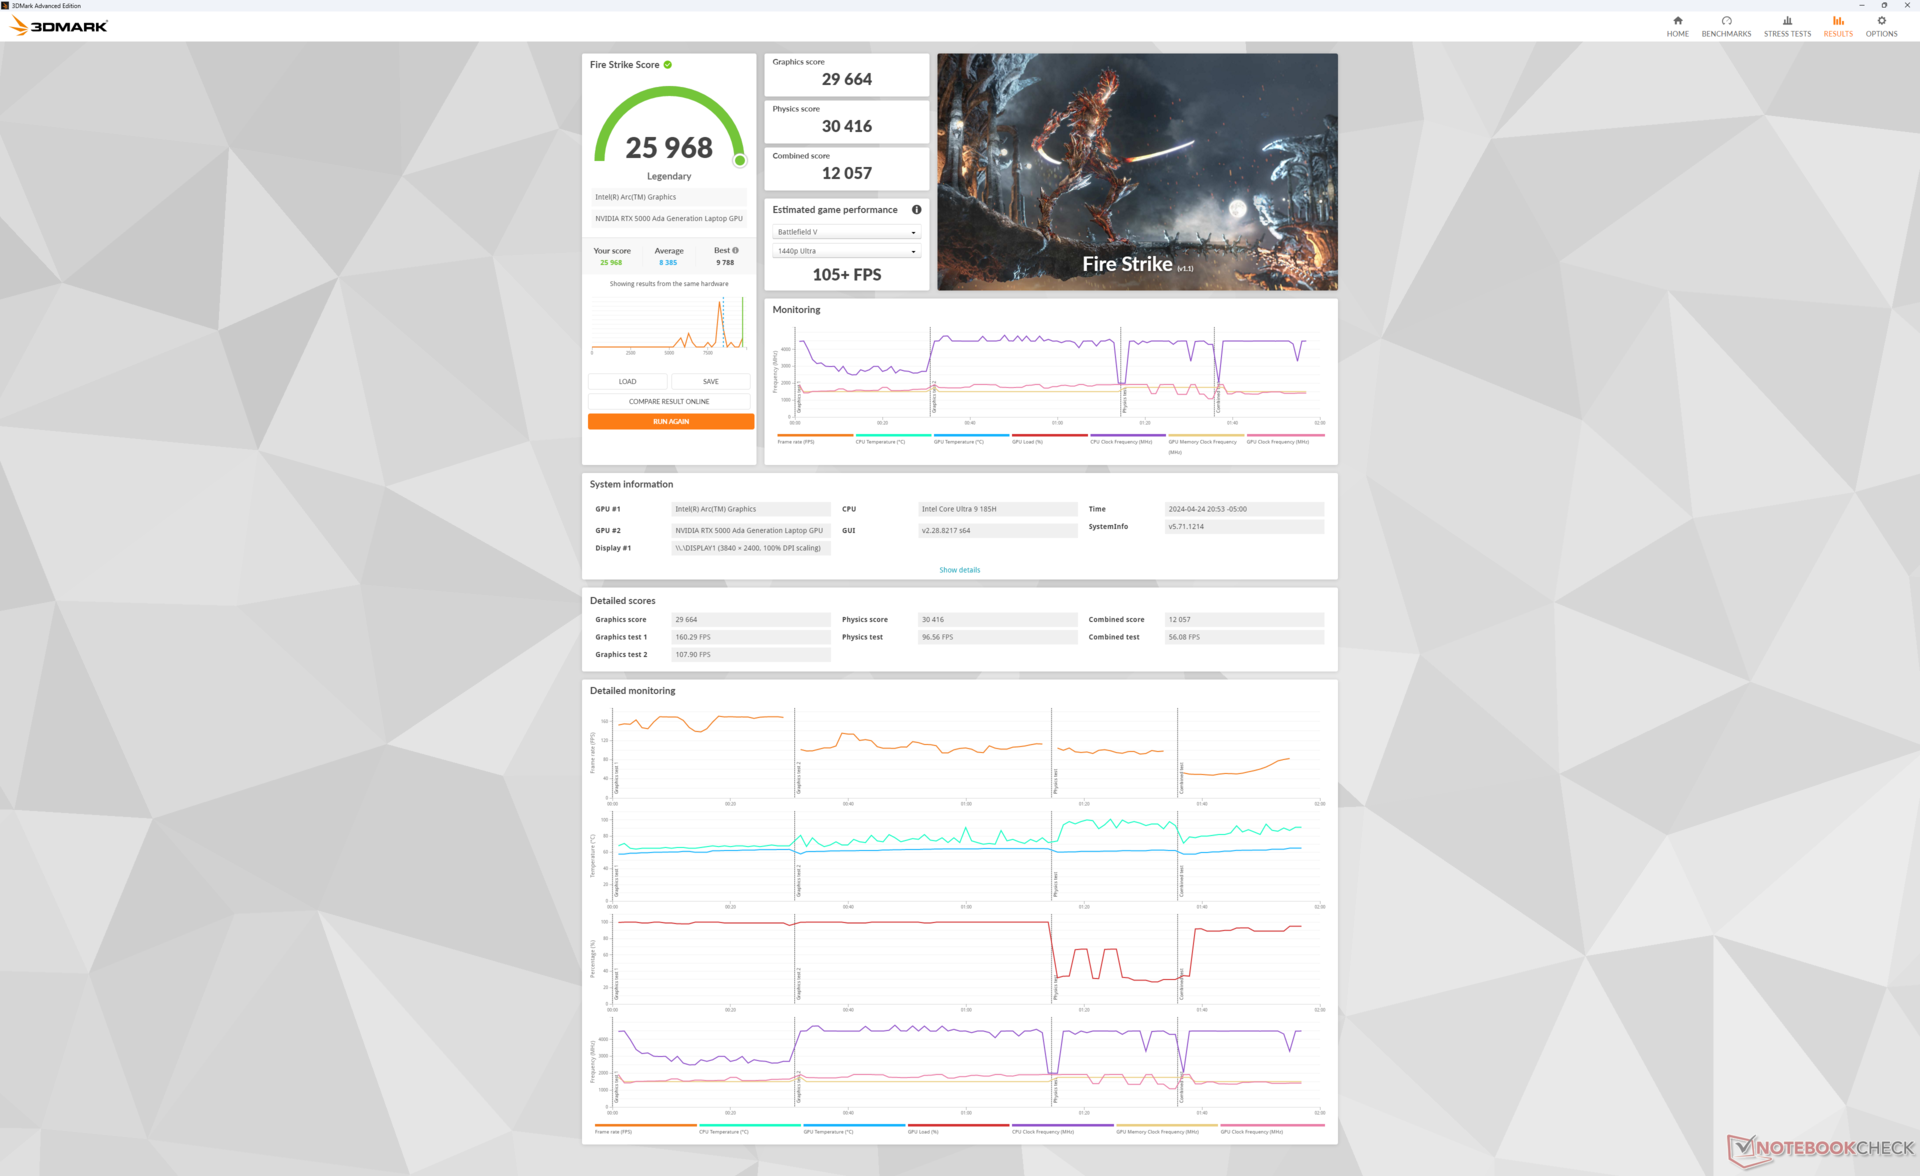
| Perfil de potência | Pontuação de gráficos | Pontuação de física | Pontuação combinada |
| Modo de desempenho | 29664 | 30416 | 12057 |
| Modo equilibrado | 29771 (-0%) | 27199 (-11%) | 11770 (-2%) |
| Energia da bateria | 26674 (-10%) | 20268 (-33%) | 9539 (-21%) |
A execução no modo Balanced afeta o desempenho do processador, enquanto o desempenho gráfico permaneceria o mesmo, conforme demonstrado pelos resultados do site Fire Strike acima.
| 3DMark Performance Rating - Percent | |
| HP ZBook Fury 16 G10 -2! | |
| Média Nvidia RTX 5000 Ada Generation Laptop GPU | |
| Dell Precision 5690 -2! | |
| Dell Precision 5000 5680 -2! | |
| Asus ProArt StudioBook 16 W7600H5A-2BL2 -20! | |
| HP ZBook Fury 16 G9 -2! | |
| Dell XPS 16 9640 -35! | |
| Lenovo ThinkPad P1 G6-21FV000DGE -16! | |
| Lenovo ThinkPad P16 G2 21FA000FGE -18! | |
| MSI CreatorPro Z16P B12UKST -17! | |
| Lenovo ThinkPad P16v G1 AMD -16! | |
| Lenovo ThinkPad P16 G1 21D6001DMB -18! | |
| Lenovo ThinkPad P1 G4-20Y30017GE -18! | |
| Lenovo ThinkPad P16s G2 21K9000CGE -18! | |
| 3DMark 11 Performance | 38230 pontos | |
| 3DMark Fire Strike Score | 25968 pontos | |
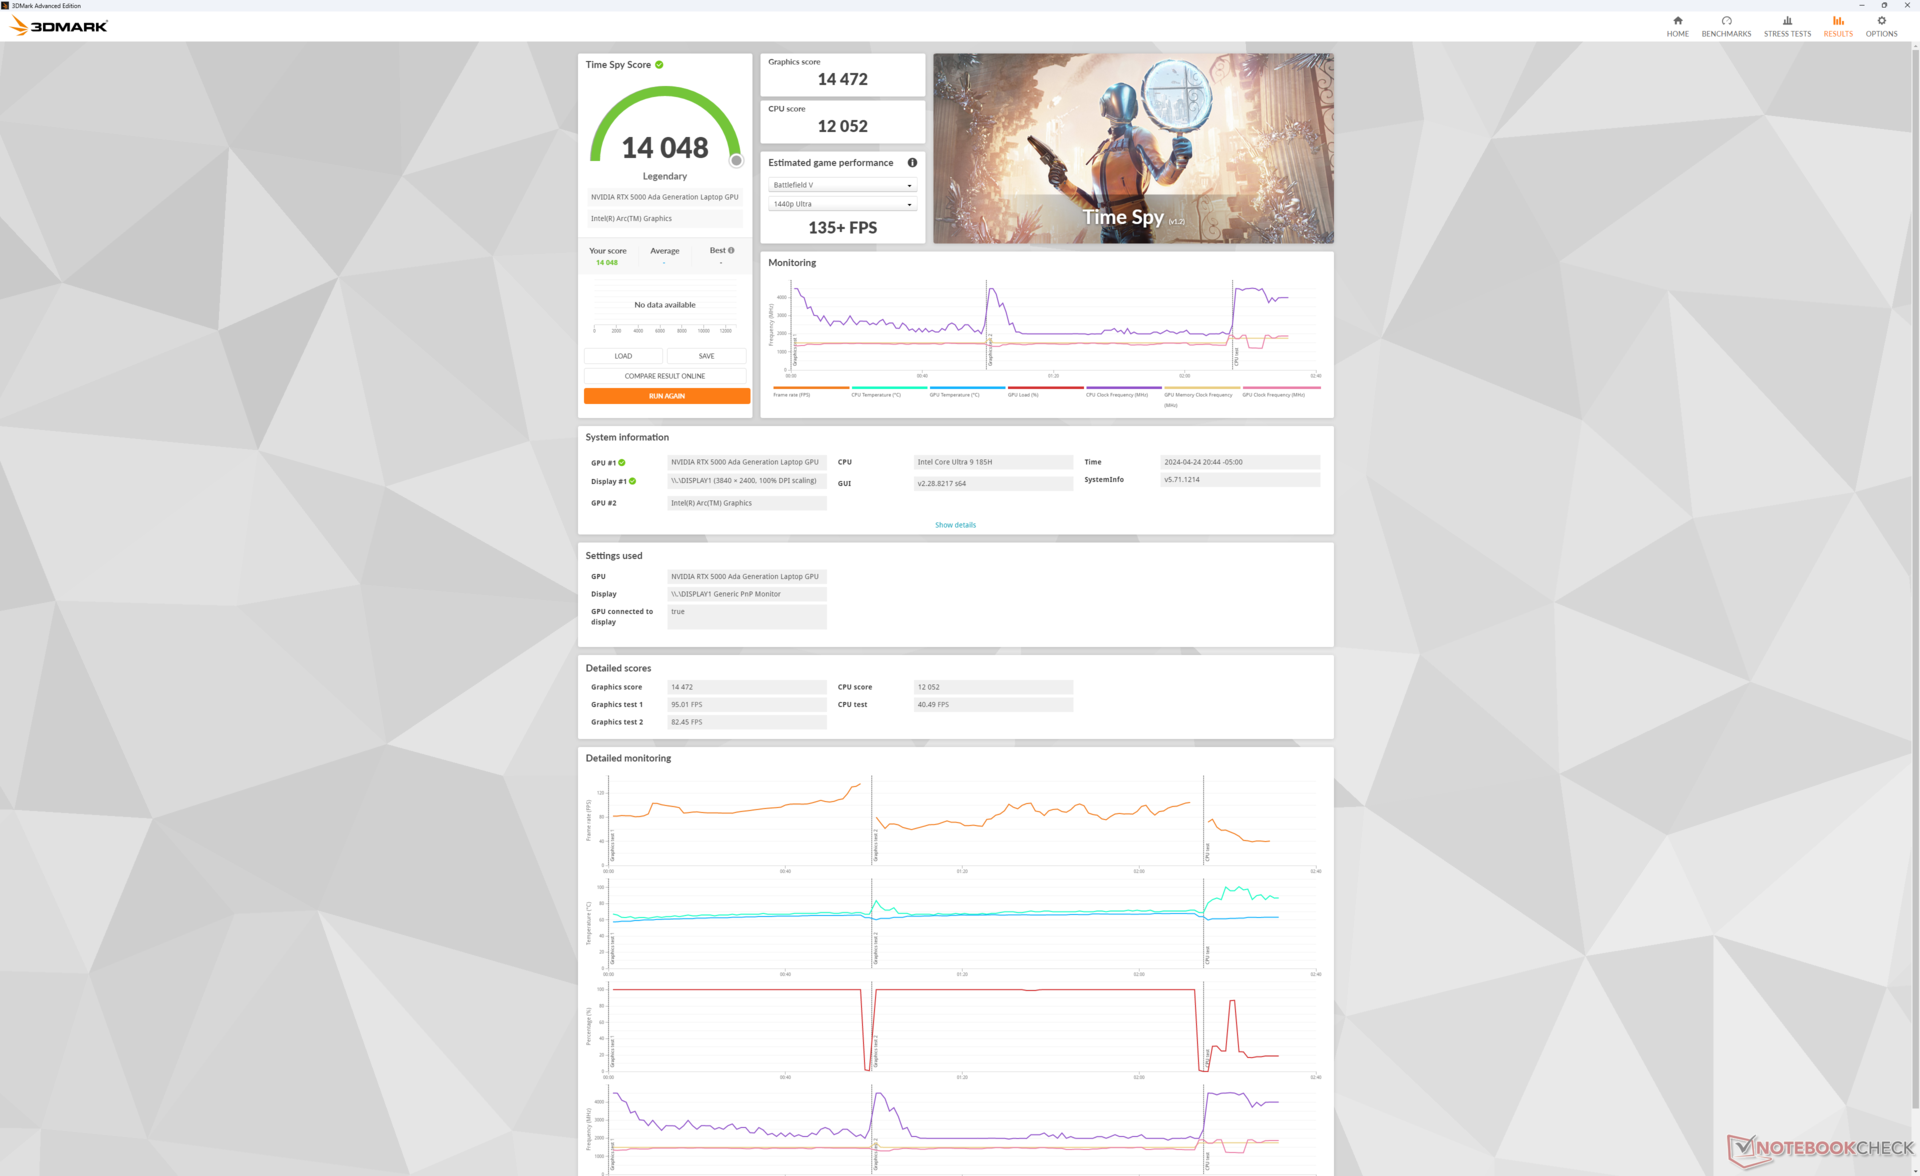
| 3DMark Time Spy Score | 14048 pontos | |
Ajuda | ||
* ... menor é melhor
| Performance Rating - Percent | |
| HP ZBook Fury 16 G10 | |
| Dell Precision 5000 5680 -1! | |
| Dell Precision 5690 | |
| Lenovo ThinkPad P16 G2 21FA000FGE | |
| Lenovo ThinkPad P1 G6-21FV000DGE | |
| MSI CreatorPro Z16P B12UKST | |
| The Witcher 3 - 1920x1080 Ultra Graphics & Postprocessing (HBAO+) | |
| HP ZBook Fury 16 G10 | |
| Dell Precision 5690 | |
| Dell Precision 5000 5680 | |
| Lenovo ThinkPad P16 G2 21FA000FGE | |
| Lenovo ThinkPad P1 G6-21FV000DGE | |
| MSI CreatorPro Z16P B12UKST | |
| Final Fantasy XV Benchmark - 1920x1080 High Quality | |
| HP ZBook Fury 16 G10 | |
| Dell Precision 5690 | |
| Dell Precision 5000 5680 | |
| Lenovo ThinkPad P16 G2 21FA000FGE | |
| Lenovo ThinkPad P1 G6-21FV000DGE | |
| MSI CreatorPro Z16P B12UKST | |
| Strange Brigade - 1920x1080 ultra AA:ultra AF:16 | |
| HP ZBook Fury 16 G10 | |
| Dell Precision 5690 | |
| Lenovo ThinkPad P16 G2 21FA000FGE | |
| Lenovo ThinkPad P1 G6-21FV000DGE | |
| MSI CreatorPro Z16P B12UKST | |
| Dota 2 Reborn - 1920x1080 ultra (3/3) best looking | |
| HP ZBook Fury 16 G10 | |
| Lenovo ThinkPad P16 G2 21FA000FGE | |
| MSI CreatorPro Z16P B12UKST | |
| Dell Precision 5000 5680 | |
| Dell Precision 5690 | |
| Lenovo ThinkPad P1 G6-21FV000DGE | |
| X-Plane 11.11 - 1920x1080 high (fps_test=3) | |
| HP ZBook Fury 16 G10 | |
| Lenovo ThinkPad P1 G6-21FV000DGE | |
| Lenovo ThinkPad P16 G2 21FA000FGE | |
| Dell Precision 5000 5680 | |
| MSI CreatorPro Z16P B12UKST | |
| Dell Precision 5690 | |
| Baldur's Gate 3 | |
| 1920x1080 High Preset | |
| Dell Precision 5690 | |
| Média Nvidia RTX 5000 Ada Generation Laptop GPU (n=1) | |
| Dell XPS 16 9640 | |
| 1920x1080 Ultra Preset | |
| Dell Precision 5690 | |
| Média Nvidia RTX 5000 Ada Generation Laptop GPU (n=1) | |
| Dell XPS 16 9640 | |
| 2560x1440 Ultra Preset | |
| Dell Precision 5690 | |
| Média Nvidia RTX 5000 Ada Generation Laptop GPU (n=1) | |
| Dell XPS 16 9640 | |
| 3840x2160 Ultra Preset | |
| Dell Precision 5690 | |
| Média Nvidia RTX 5000 Ada Generation Laptop GPU (n=1) | |
| 3840x2160 Ultra Preset + Quality DLSS | |
| Dell Precision 5690 | |
| Média Nvidia RTX 5000 Ada Generation Laptop GPU (n=1) | |
| Cyberpunk 2077 2.2 Phantom Liberty | |
| 1920x1080 High Preset (FSR off) | |
| Dell Precision 5690 | |
| Média Nvidia RTX 5000 Ada Generation Laptop GPU (n=1) | |
| Dell XPS 16 9640 | |
| Lenovo ThinkPad P16v G1 AMD | |
| 1920x1080 Ultra Preset (FSR off) | |
| Dell Precision 5690 | |
| Média Nvidia RTX 5000 Ada Generation Laptop GPU (n=1) | |
| Dell XPS 16 9640 | |
| Lenovo ThinkPad P16v G1 AMD | |
| 2560x1440 Ultra Preset (FSR off) | |
| Dell Precision 5690 | |
| Média Nvidia RTX 5000 Ada Generation Laptop GPU (n=1) | |
| Dell XPS 16 9640 | |
| 3840x2160 Ultra Preset (FSR off) | |
| Dell Precision 5690 | |
| Média Nvidia RTX 5000 Ada Generation Laptop GPU (n=1) | |
| 1920x1080 Ray Tracing Ultra Preset (DLSS off) | |
| Dell Precision 5690 | |
| Média Nvidia RTX 5000 Ada Generation Laptop GPU (n=1) | |
| Tiny Tina's Wonderlands | |
| 1920x1080 High Preset (DX12) | |
| HP ZBook Fury 16 G10 | |
| Média Nvidia RTX 5000 Ada Generation Laptop GPU (145.5 - 171.7, n=3) | |
| Dell Precision 5000 5680 | |
| Dell Precision 5690 | |
| HP ZBook Fury 16 G9 | |
| 1920x1080 Badass Preset (DX12) | |
| HP ZBook Fury 16 G10 | |
| Média Nvidia RTX 5000 Ada Generation Laptop GPU (124 - 139.4, n=3) | |
| Dell Precision 5000 5680 | |
| Dell Precision 5690 | |
| HP ZBook Fury 16 G9 | |
| 2560x1440 Badass Preset (DX12) | |
| HP ZBook Fury 16 G10 | |
| Média Nvidia RTX 5000 Ada Generation Laptop GPU (87.1 - 99.4, n=3) | |
| Dell Precision 5000 5680 | |
| Dell Precision 5690 | |
| HP ZBook Fury 16 G9 | |
| 3840x2160 Badass Preset (DX12) | |
| HP ZBook Fury 16 G10 | |
| Média Nvidia RTX 5000 Ada Generation Laptop GPU (48.4 - 53.9, n=3) | |
| Dell Precision 5000 5680 | |
| Dell Precision 5690 | |
| HP ZBook Fury 16 G9 | |
Witcher 3 FPS Chart
| baixo | média | alto | ultra | QHD | 4K DLSS | 4K | |
|---|---|---|---|---|---|---|---|
| The Witcher 3 (2015) | 411.3 | 351.2 | 258.7 | 137.6 | 103.9 | ||
| Dota 2 Reborn (2015) | 169.4 | 149.2 | 150.1 | 139.9 | 130 | ||
| Final Fantasy XV Benchmark (2018) | 196.6 | 165.4 | 132.5 | 103.8 | 63.2 | ||
| X-Plane 11.11 (2018) | 132.8 | 113.9 | 88.7 | 74.8 | |||
| Far Cry 5 (2018) | 144 | 134 | 127 | 119 | 113 | 72 | |
| Strange Brigade (2018) | 405 | 314 | 276 | 252 | 190.6 | 105.3 | |
| Tiny Tina's Wonderlands (2022) | 196.5 | 179.4 | 145.5 | 124 | 87.1 | 48.4 | |
| F1 22 (2022) | 228 | 224 | 217 | 91.1 | 60.1 | 29.6 | |
| Baldur's Gate 3 (2023) | 172.3 | 155.2 | 139.2 | 134.6 | 100.5 | 87.8 | 53.3 |
| Cyberpunk 2077 2.2 Phantom Liberty (2023) | 125 | 116.6 | 94.6 | 108.5 | 63.7 | 28.8 |
Emissões
Ruído do sistema - alto e no comando
O ruído do ventilador é sensível ao perfil de energia selecionado. No modo Quiet (Silencioso), por exemplo, o ruído da ventoinha tende a ficar abaixo de 25 dB(A) contra um fundo silencioso de 23,4 dB(A). Por outro lado, os ventiladores tendem a pulsar mais prontamente até 30 dB(A) se estiverem configurados nos modos Balanced ou Performance, mesmo durante tarefas rotineiras como navegação na Web.
O teto de ruído da ventoinha é igual ao que registramos no Precision 5680 com 51 dB(A), que é tão alto quanto o de muitos laptops para jogos. Esse máximo pode ser atingido ao executar cargas exigentes de GPU por mais de alguns minutos.

Barulho
| Ocioso |
| 23.6 / 24.9 / 30.9 dB |
| Carga |
| 40.4 / 51.9 dB |
 | ||
30 dB silencioso 40 dB(A) audível 50 dB(A) ruidosamente alto |
||
min: | ||
| Dell Precision 5690 NVIDIA RTX 5000 Ada Generation Laptop GPU, Ultra 9 185H, 2x Samsung PM9A1 1TB (RAID 0) | Dell Precision 5000 5680 NVIDIA RTX 5000 Ada Generation Laptop GPU, i9-13900H, 2x SK hynix PC801 HFS512GEJ9X101N RAID 0 | Lenovo ThinkPad P16 G2 21FA000FGE NVIDIA RTX 2000 Ada Generation Laptop GPU, i7-13700HX, SK hynix PC801 HFS001TEJ9X162N | Lenovo ThinkPad P1 G6-21FV000DGE NVIDIA RTX 2000 Ada Generation Laptop GPU, i9-13900H, SK Hynix PC711 1TB HFS001TDE9X084N | HP ZBook Fury 16 G10 NVIDIA RTX 5000 Ada Generation Laptop GPU, i9-13950HX, SK hynix PC801 HFS001TEJ9X101N | MSI CreatorPro Z16P B12UKST RTX A3000 Laptop GPU, i7-12700H, Samsung PM9A1 MZVL21T0HCLR | |
|---|---|---|---|---|---|---|
| Noise | 6% | -1% | 3% | 6% | -0% | |
| desligado / ambiente * | 23.4 | 22.8 3% | 23.5 -0% | 24.5 -5% | 22.9 2% | 24.1 -3% |
| Idle Minimum * | 23.6 | 23 3% | 23.5 -0% | 24.5 -4% | 22.9 3% | 27.1 -15% |
| Idle Average * | 24.9 | 23 8% | 29.2 -17% | 24.5 2% | 22.9 8% | 27.1 -9% |
| Idle Maximum * | 30.9 | 23 26% | 29.5 5% | 24.5 21% | 28.5 8% | 27.1 12% |
| Load Average * | 40.4 | 37.2 8% | 32.7 19% | 48 -19% | 40.6 -0% | 42.9 -6% |
| Witcher 3 ultra * | 48.3 | 51 -6% | 50.6 -5% | 40.7 16% | 44.1 9% | 44 9% |
| Load Maximum * | 51.9 | 51 2% | 56.6 -9% | 48 8% | 45.8 12% | 47 9% |
* ... menor é melhor
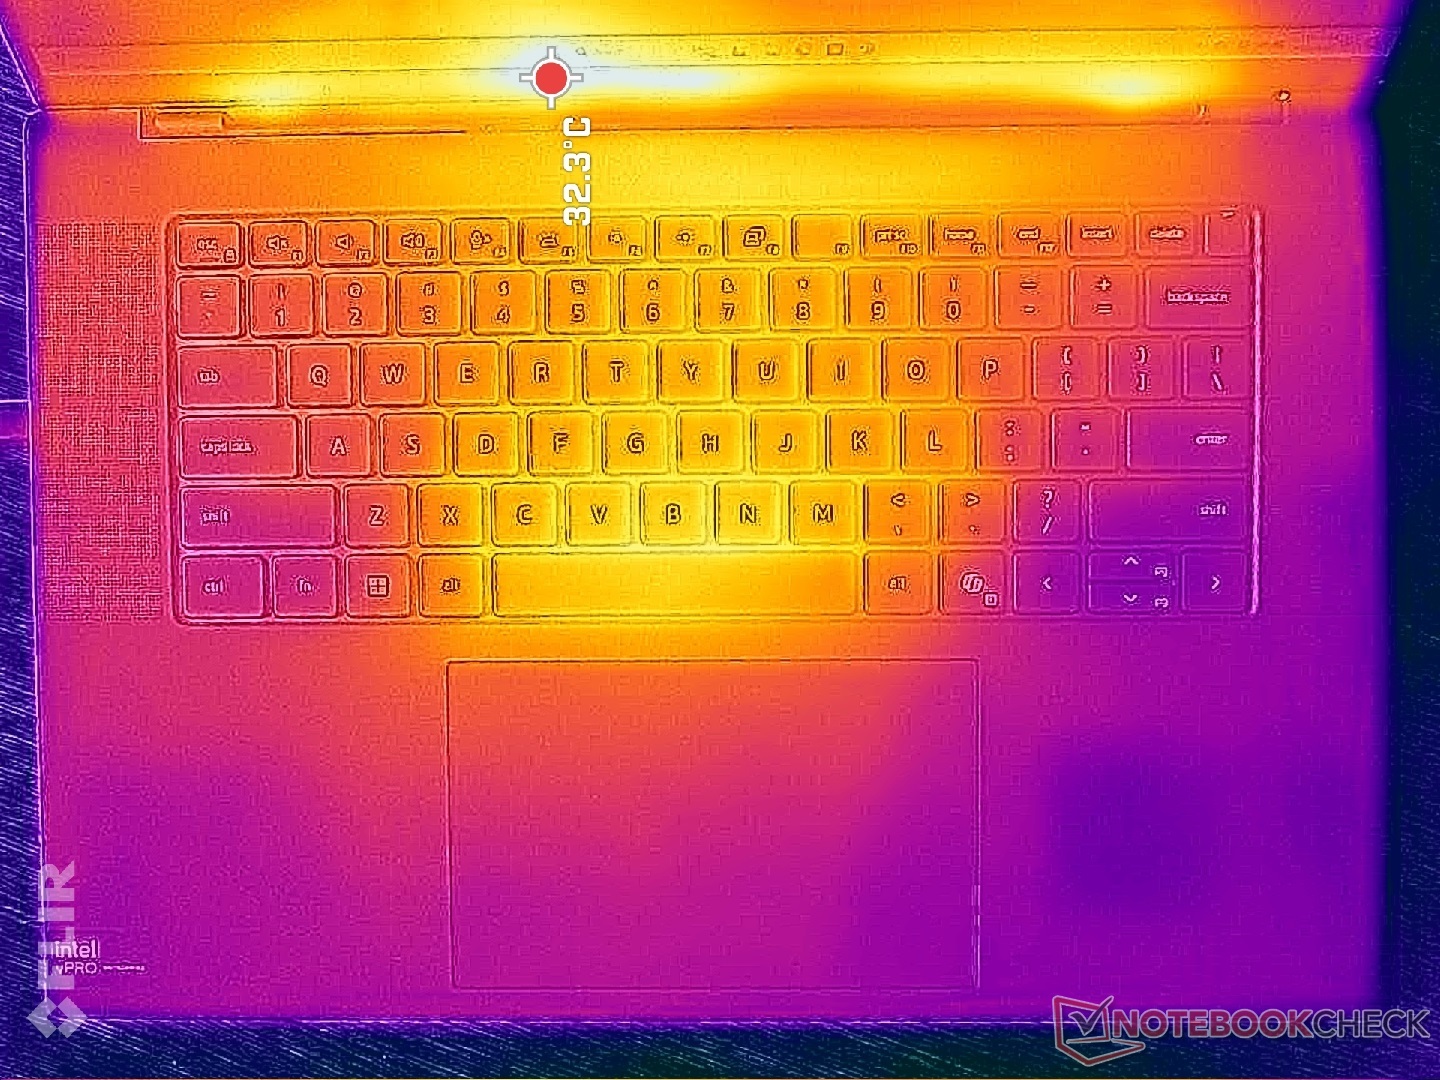
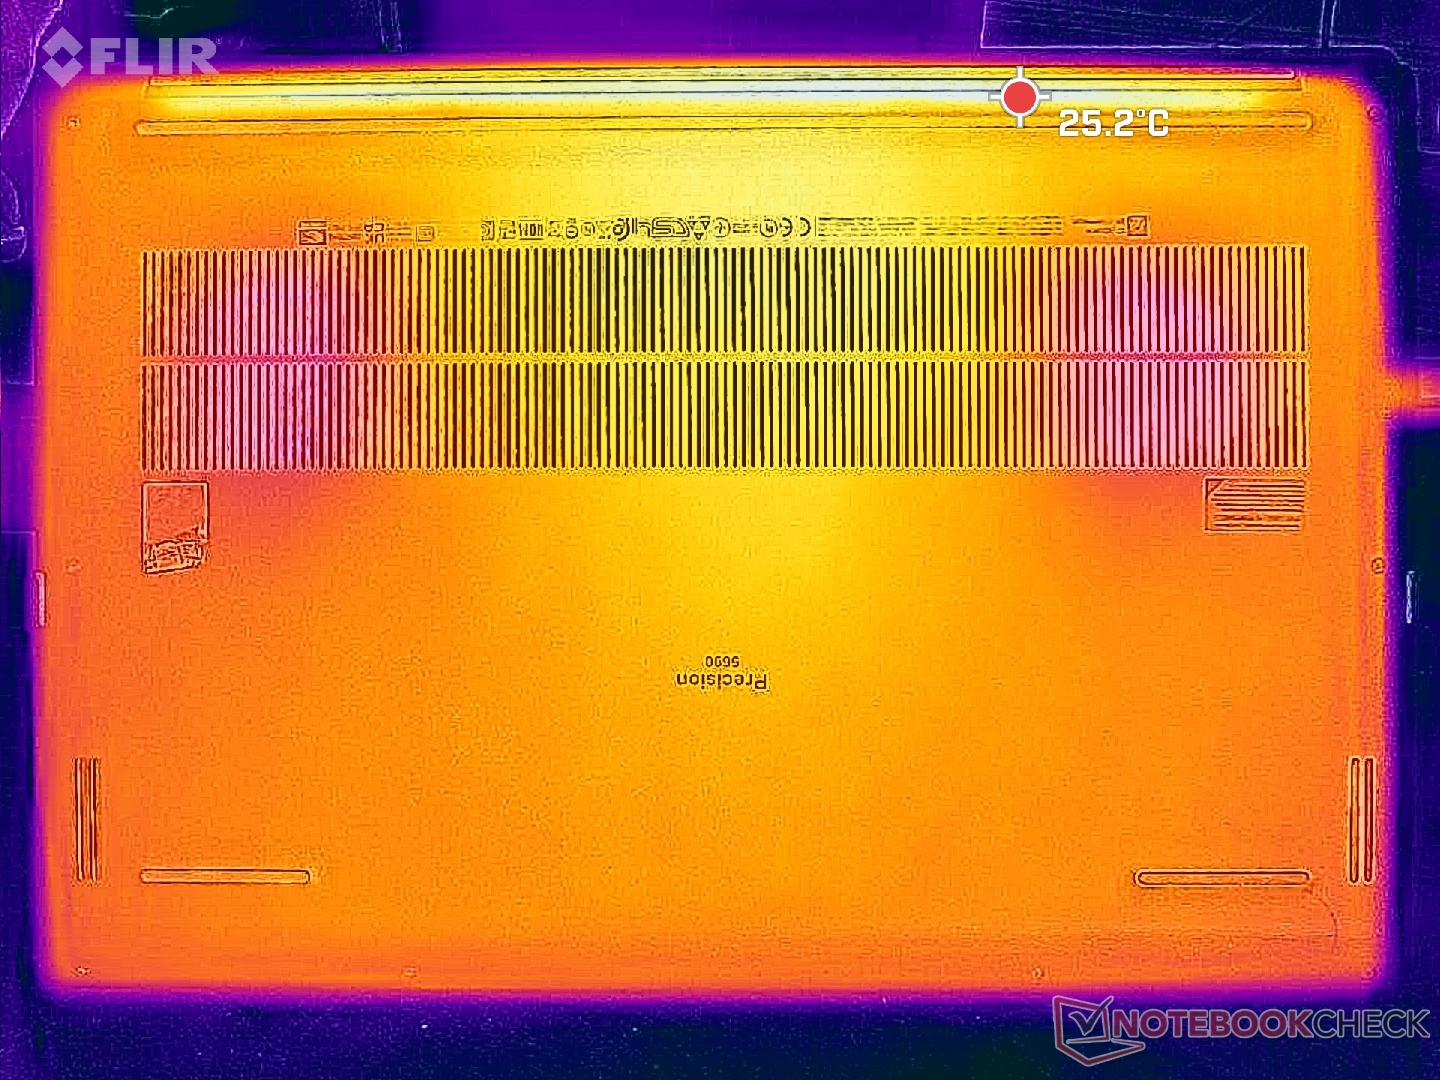
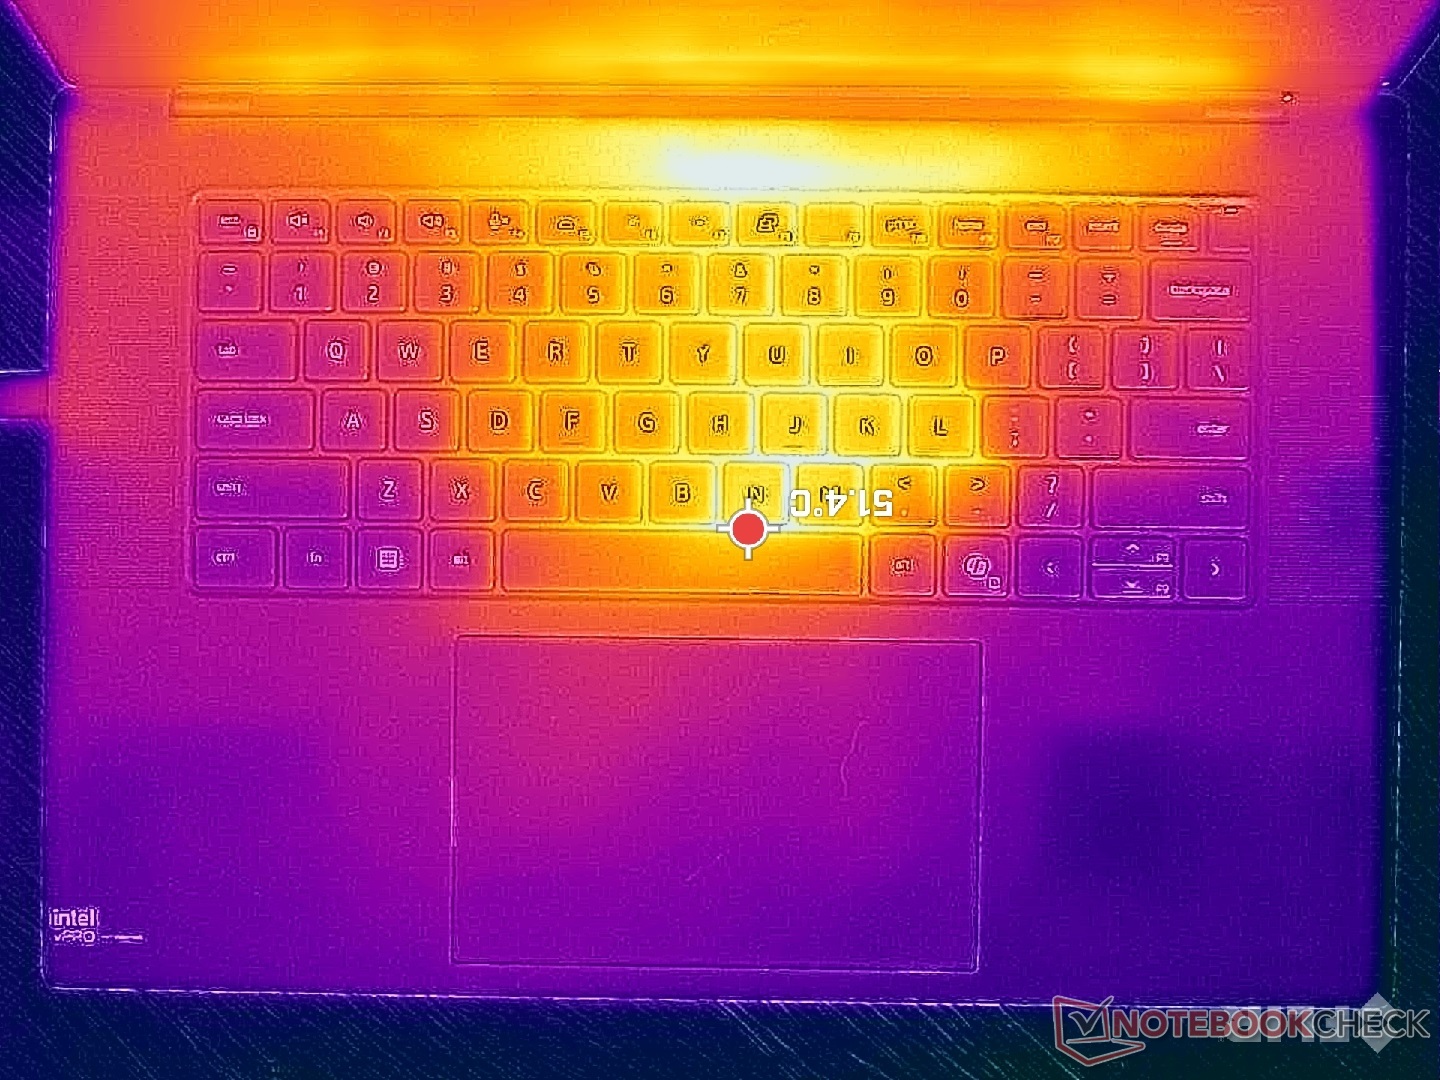
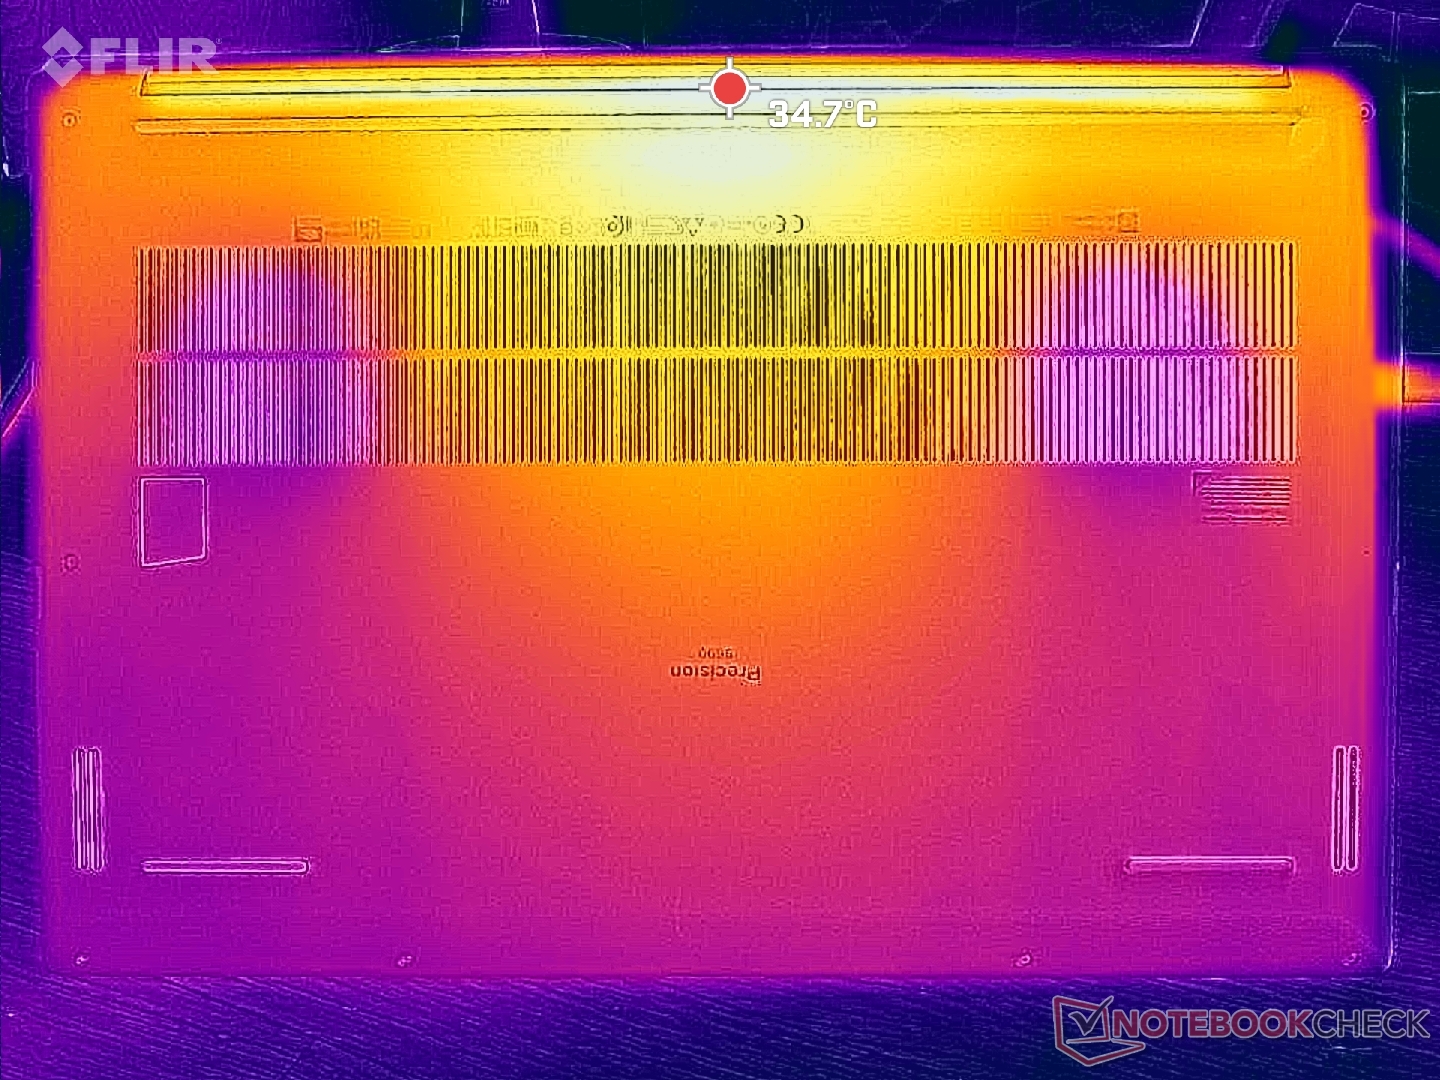
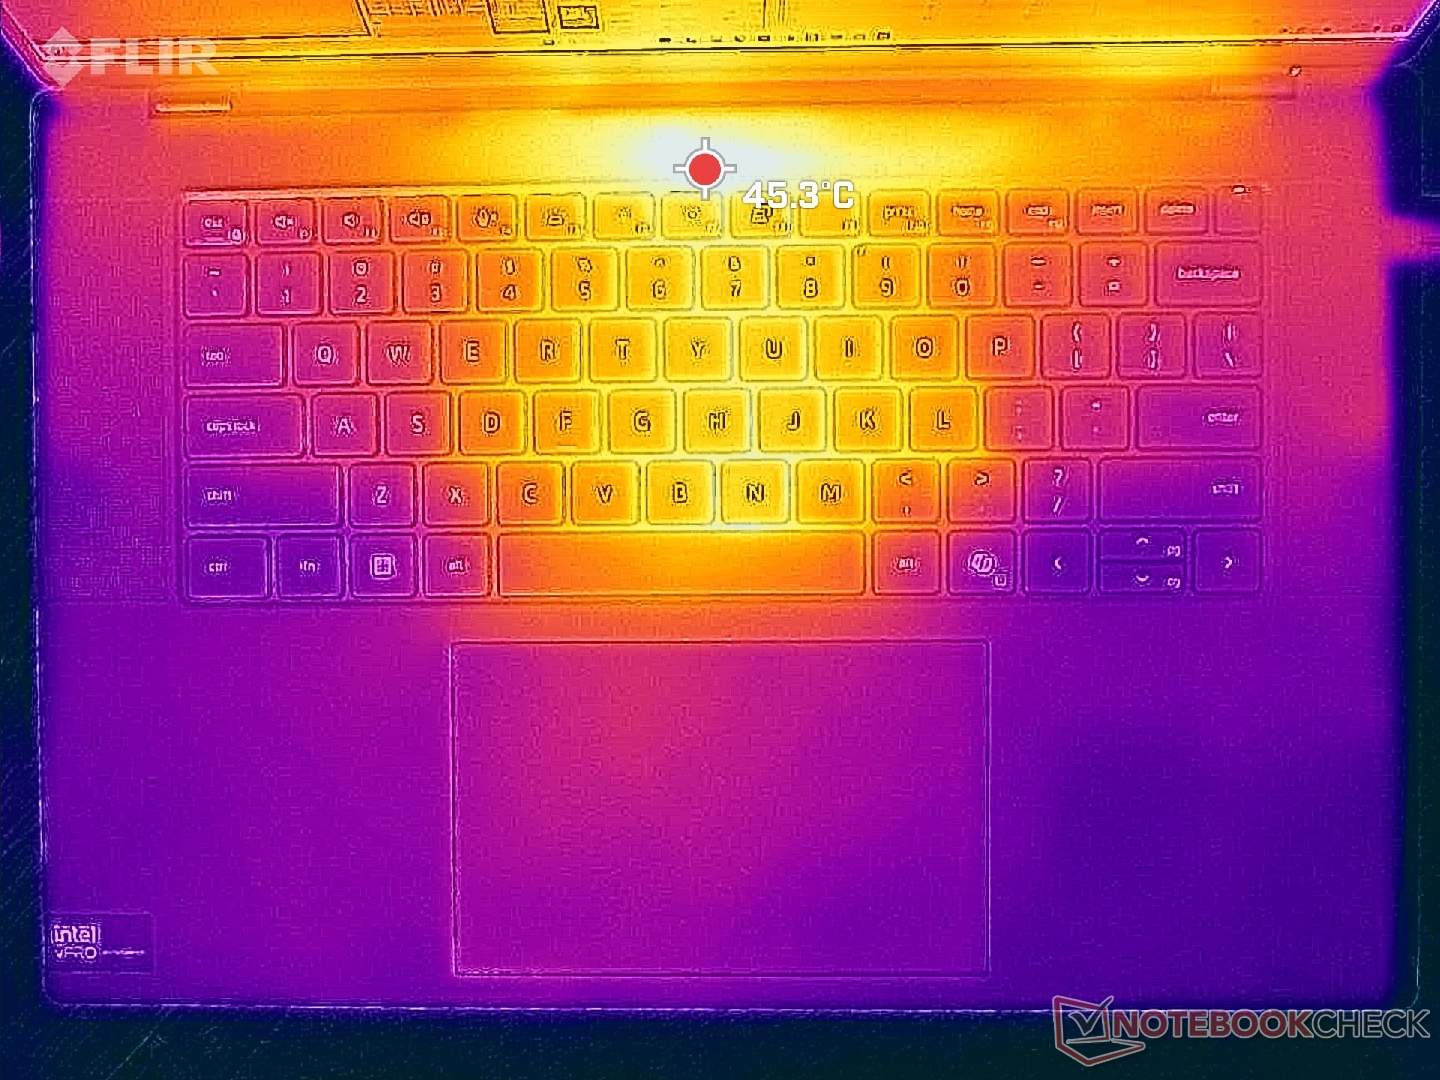
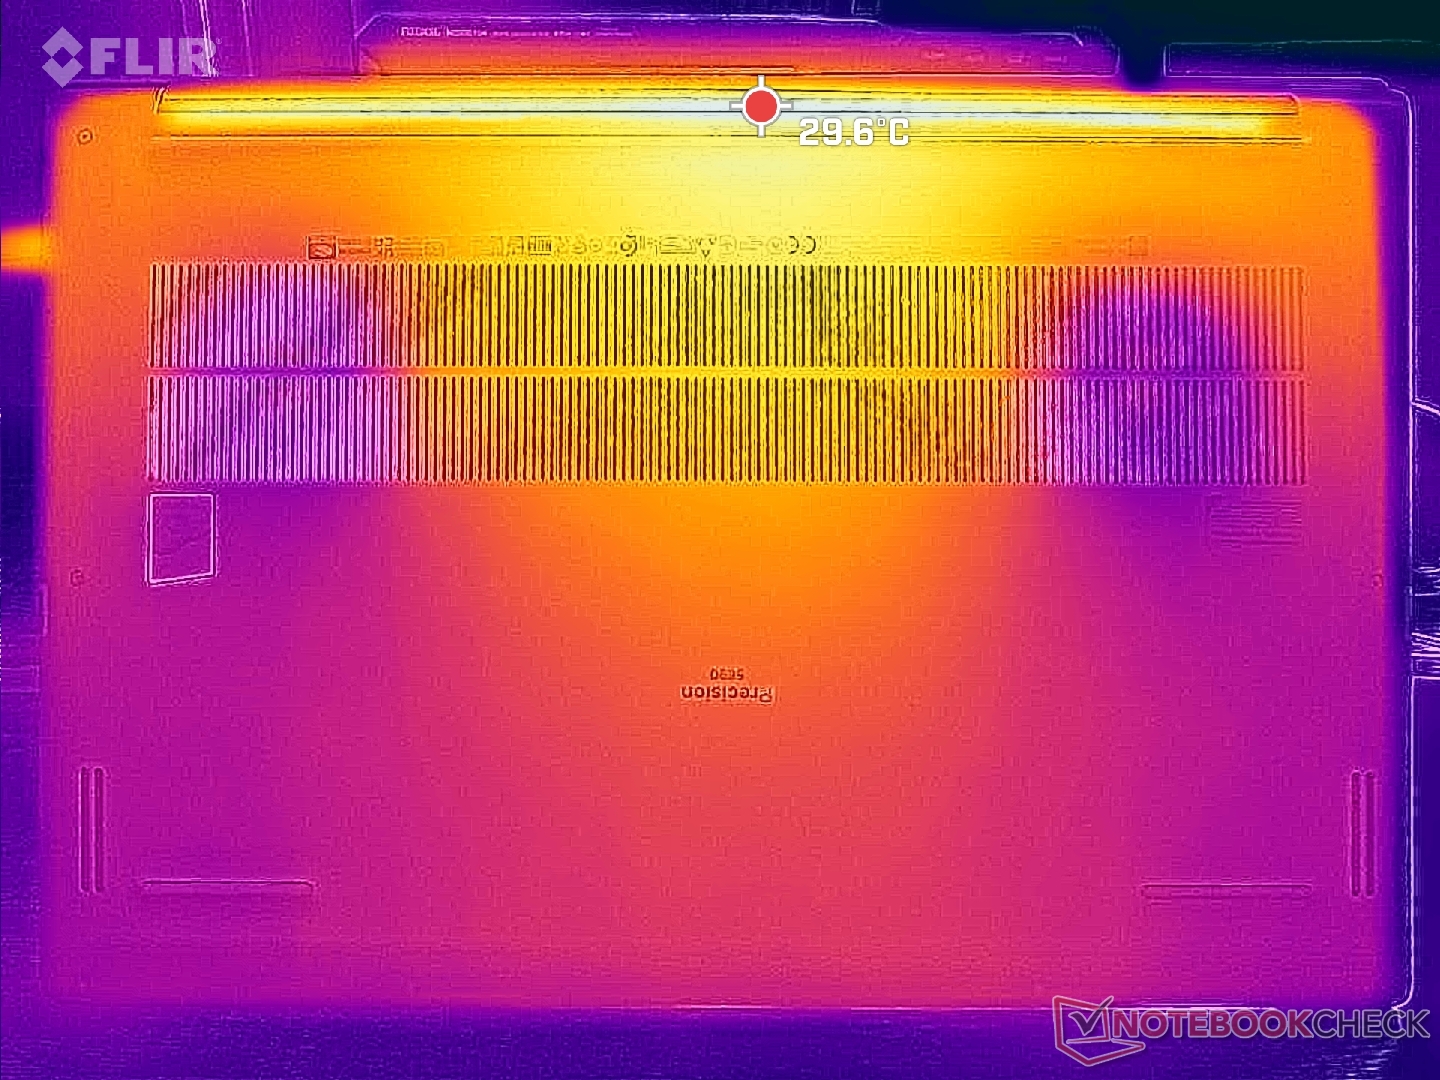
Temperatura
O desenvolvimento da temperatura da superfície é simétrico, com pontos quentes de 43 C a 47 C próximos ao centro do teclado. A parte inferior do chassi permaneceria visivelmente mais fria do que a plataforma do teclado, mesmo ao executar cargas exigentes.
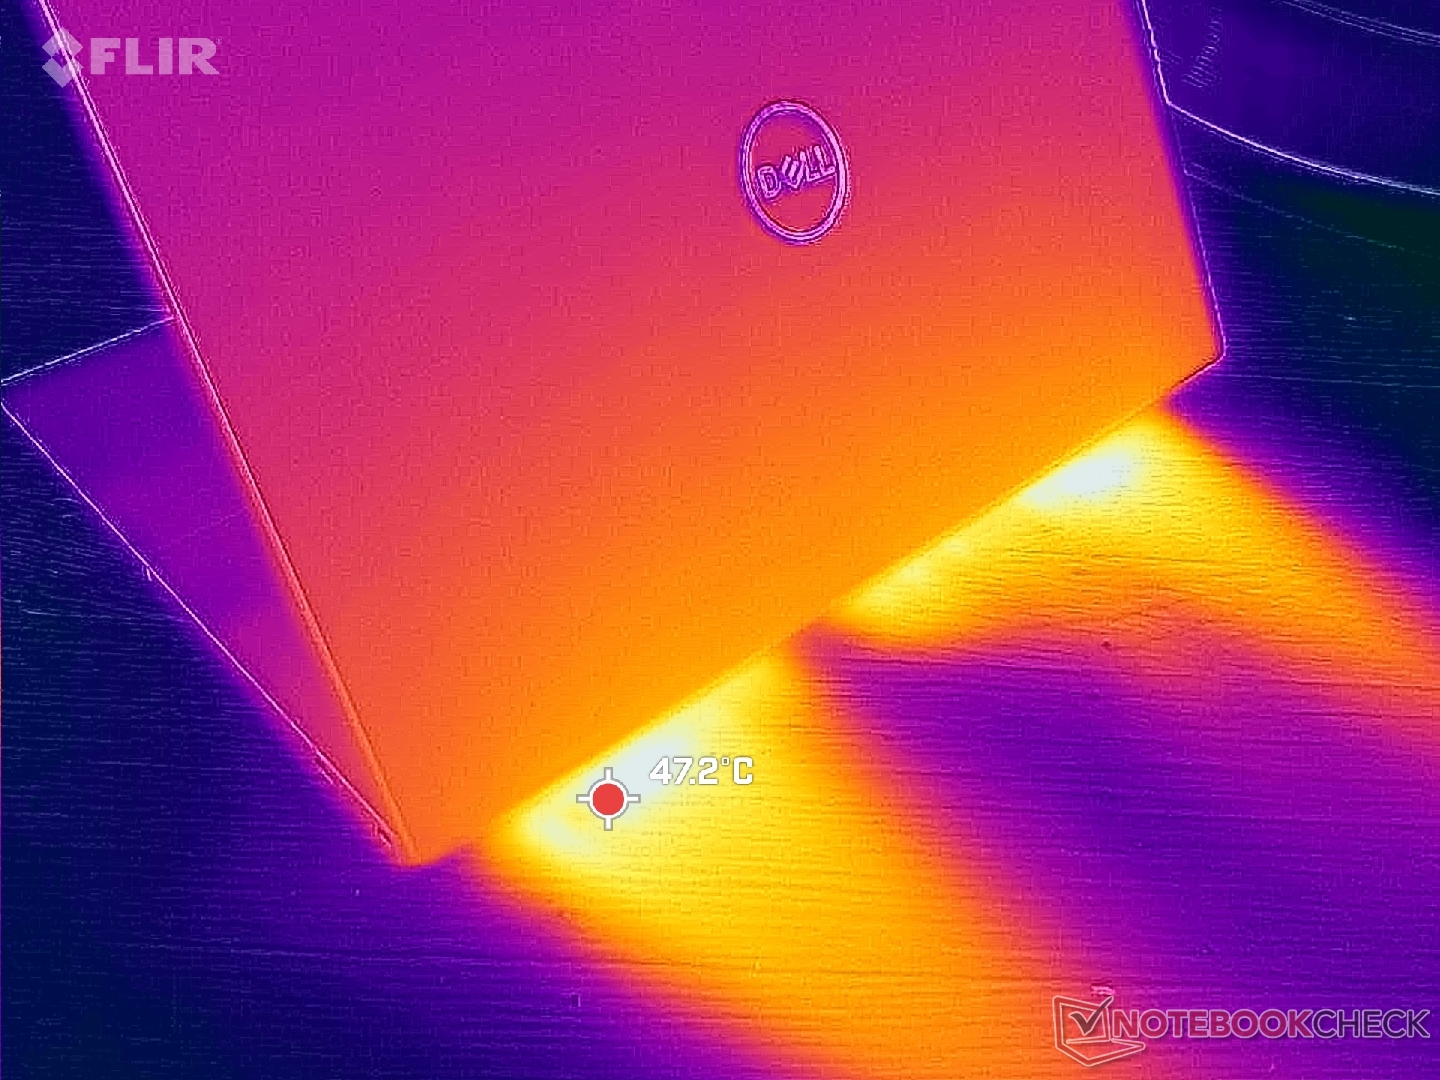
(-) A temperatura máxima no lado superior é 46.6 °C / 116 F, em comparação com a média de 38.2 °C / 101 F , variando de 22.2 a 69.8 °C para a classe Workstation.
(+) A parte inferior aquece até um máximo de 33 °C / 91 F, em comparação com a média de 41.2 °C / 106 F
(+) Em uso inativo, a temperatura média para o lado superior é 29.2 °C / 85 F, em comparação com a média do dispositivo de 32 °C / ### class_avg_f### F.
(±) Jogando The Witcher 3, a temperatura média para o lado superior é 34 °C / 93 F, em comparação com a média do dispositivo de 32 °C / ## #class_avg_f### F.
(+) Os apoios para as mãos e o touchpad são mais frios que a temperatura da pele, com um máximo de 27.6 °C / 81.7 F e, portanto, são frios ao toque.
(±) A temperatura média da área do apoio para as mãos de dispositivos semelhantes foi 27.8 °C / 82 F (+0.2 °C / 0.3 F).
| Dell Precision 5690 Intel Core Ultra 9 185H, Nvidia RTX 5000 Ada Generation Laptop GPU | Dell Precision 5000 5680 Intel Core i9-13900H, Nvidia RTX 5000 Ada Generation Laptop GPU | Lenovo ThinkPad P16 G2 21FA000FGE Intel Core i7-13700HX, NVIDIA RTX 2000 Ada Generation Laptop GPU | Lenovo ThinkPad P1 G6-21FV000DGE Intel Core i9-13900H, NVIDIA RTX 2000 Ada Generation Laptop GPU | HP ZBook Fury 16 G10 Intel Core i9-13950HX, Nvidia RTX 5000 Ada Generation Laptop GPU | MSI CreatorPro Z16P B12UKST Intel Core i7-12700H, NVIDIA RTX A3000 Laptop GPU | |
|---|---|---|---|---|---|---|
| Heat | -7% | 2% | -13% | -16% | -24% | |
| Maximum Upper Side * | 46.6 | 50.2 -8% | 47.2 -1% | 47.1 -1% | 44.8 4% | 56.3 -21% |
| Maximum Bottom * | 33 | 32 3% | 39.5 -20% | 56.5 -71% | 50 -52% | 68.3 -107% |
| Idle Upper Side * | 32.4 | 37.4 -15% | 28.1 13% | 28.1 13% | 34.4 -6% | 25.2 22% |
| Idle Bottom * | 29.4 | 31.2 -6% | 25.3 14% | 27.6 6% | 31.8 -8% | 25.9 12% |
* ... menor é melhor
Alto-falantes
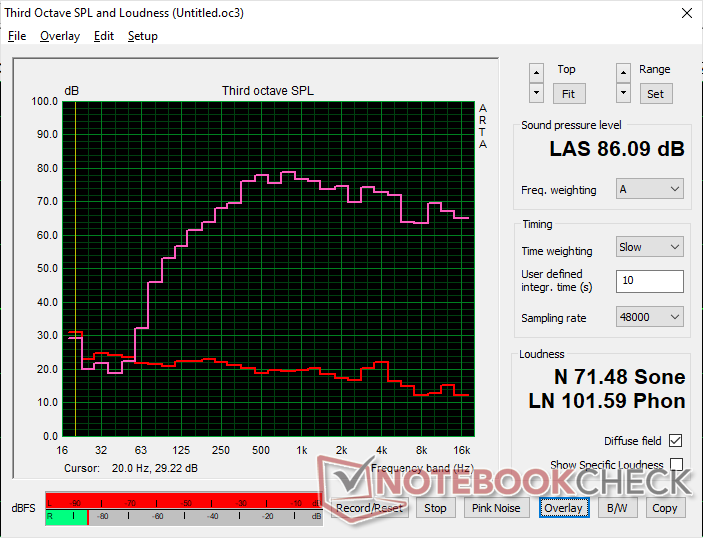
Dell Precision 5690 análise de áudio
(+) | os alto-falantes podem tocar relativamente alto (###valor### dB)
Graves 100 - 315Hz
(±) | graves reduzidos - em média 9.4% menor que a mediana
(±) | a linearidade dos graves é média (7.6% delta para a frequência anterior)
Médios 400 - 2.000 Hz
(+) | médios equilibrados - apenas 4.7% longe da mediana
(+) | médios são lineares (4.8% delta para frequência anterior)
Altos 2 - 16 kHz
(+) | agudos equilibrados - apenas 3.4% longe da mediana
(±) | a linearidade dos máximos é média (7.3% delta para frequência anterior)
Geral 100 - 16.000 Hz
(+) | o som geral é linear (11.1% diferença em relação à mediana)
Comparado com a mesma classe
» 10% de todos os dispositivos testados nesta classe foram melhores, 3% semelhantes, 87% piores
» O melhor teve um delta de 7%, a média foi 18%, o pior foi 35%
Comparado com todos os dispositivos testados
» 6% de todos os dispositivos testados foram melhores, 2% semelhantes, 93% piores
» O melhor teve um delta de 4%, a média foi 24%, o pior foi 134%
Apple MacBook Pro 16 2021 M1 Pro análise de áudio
(+) | os alto-falantes podem tocar relativamente alto (###valor### dB)
Graves 100 - 315Hz
(+) | bons graves - apenas 3.8% longe da mediana
(+) | o baixo é linear (5.2% delta para a frequência anterior)
Médios 400 - 2.000 Hz
(+) | médios equilibrados - apenas 1.3% longe da mediana
(+) | médios são lineares (2.1% delta para frequência anterior)
Altos 2 - 16 kHz
(+) | agudos equilibrados - apenas 1.9% longe da mediana
(+) | os máximos são lineares (2.7% delta da frequência anterior)
Geral 100 - 16.000 Hz
(+) | o som geral é linear (4.6% diferença em relação à mediana)
Comparado com a mesma classe
» 0% de todos os dispositivos testados nesta classe foram melhores, 0% semelhantes, 100% piores
» O melhor teve um delta de 5%, a média foi 18%, o pior foi 45%
Comparado com todos os dispositivos testados
» 0% de todos os dispositivos testados foram melhores, 0% semelhantes, 100% piores
» O melhor teve um delta de 4%, a média foi 24%, o pior foi 134%
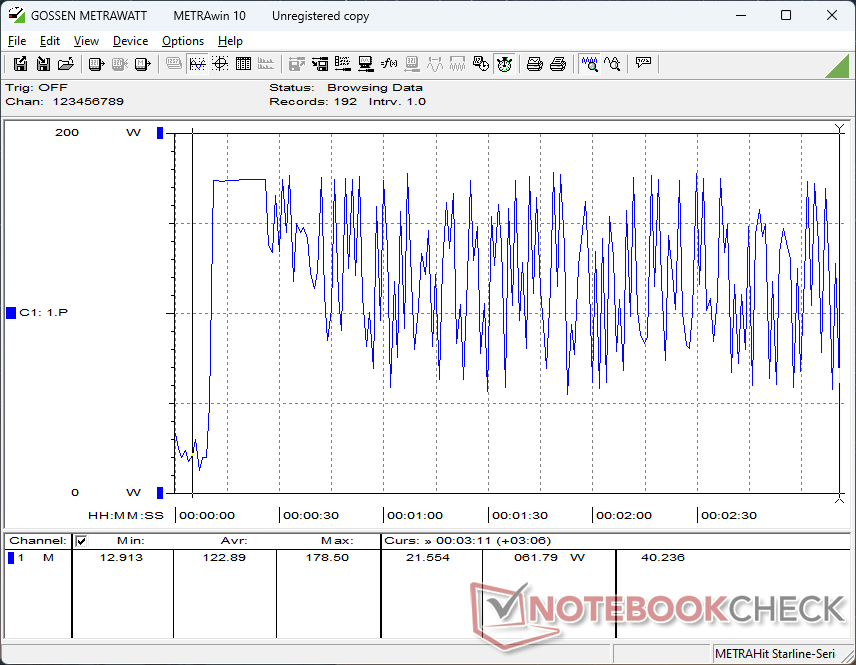
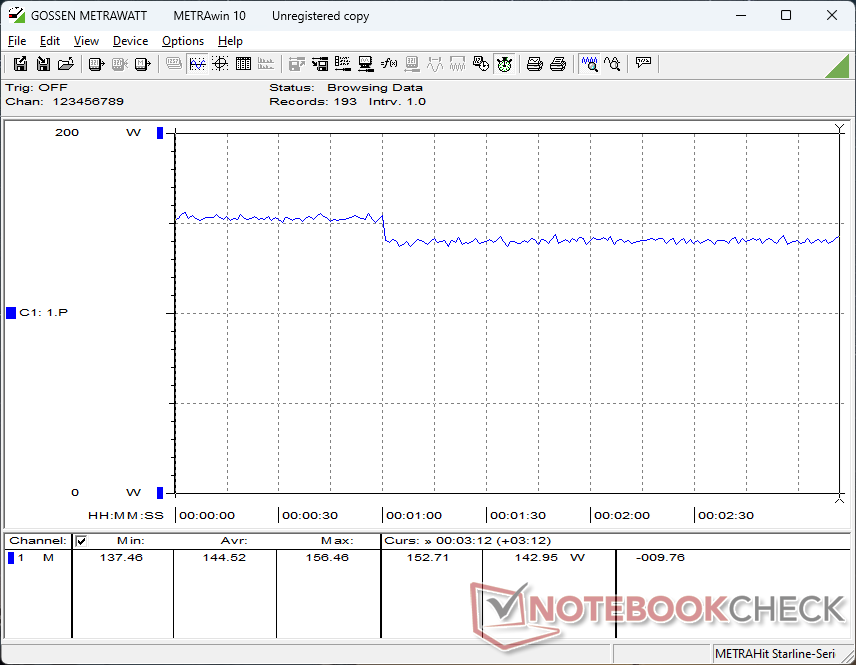
Gerenciamento de energia
Consumo de energia
A inatividade no desktop pode exigir desde 8 W na configuração de brilho mínimo até 29 W na configuração de brilho máximo com um fundo totalmente branco. Essa faixa é mais ampla do que na maioria dos laptops IPS devido ao funcionamento do OLED. Tarefas como navegação na Web, processamento de texto ou entradas de planilhas podem esgotar a bateria mais rapidamente do que se poderia esperar, pois essas janelas são, em sua maioria, de cor branca. Diminuir o brilho ou selecionar cores mais escuras pode ajudar a prolongar a vida útil da bateria mais do que em uma alternativa IPS.
O consumo de energia ao executar cargas mais altas, como Witcher 3 seria praticamente o mesmo que o registrado no antigo Precision 5680. Isso corrobora nossos dados de benchmark acima, que também mostram apenas diferenças marginais de desempenho, na melhor das hipóteses, entre os dois modelos.
Estranhamente, o consumo flutuava muito ao executar o estresse do Prime95, mesmo depois de vários novos testes. De resto, o desempenho parece ser estável.
| desligado | |
| Ocioso | |
| Carga |
|
Key:
min: | |
| Dell Precision 5690 Ultra 9 185H, NVIDIA RTX 5000 Ada Generation Laptop GPU, 2x Samsung PM9A1 1TB (RAID 0), OLED, 3840x2400, 16" | Dell Precision 5000 5680 i9-13900H, NVIDIA RTX 5000 Ada Generation Laptop GPU, 2x SK hynix PC801 HFS512GEJ9X101N RAID 0, OLED, 3840x2400, 16" | Lenovo ThinkPad P16 G2 21FA000FGE i7-13700HX, NVIDIA RTX 2000 Ada Generation Laptop GPU, SK hynix PC801 HFS001TEJ9X162N, IPS LED, 2560x1600, 16" | Lenovo ThinkPad P1 G6-21FV000DGE i9-13900H, NVIDIA RTX 2000 Ada Generation Laptop GPU, SK Hynix PC711 1TB HFS001TDE9X084N, IPS, 2560x1600, 16" | HP ZBook Fury 16 G10 i9-13950HX, NVIDIA RTX 5000 Ada Generation Laptop GPU, SK hynix PC801 HFS001TEJ9X101N, IPS, 3840x2400, 16" | MSI CreatorPro Z16P B12UKST i7-12700H, RTX A3000 Laptop GPU, Samsung PM9A1 MZVL21T0HCLR, IPS, 2560x1600, 16" | |
|---|---|---|---|---|---|---|
| Power Consumption | 6% | -5% | 10% | -39% | -9% | |
| Idle Minimum * | 7.9 | 8 -1% | 9.3 -18% | 8.3 -5% | 15.3 -94% | 10.8 -37% |
| Idle Average * | 12 | 10.4 13% | 14.1 -18% | 14.5 -21% | 18.2 -52% | 16.3 -36% |
| Idle Maximum * | 28.6 | 30.5 -7% | 15.5 46% | 15.3 47% | 28 2% | 16.9 41% |
| Load Average * | 98.8 | 75.4 24% | 133.6 -35% | 91.8 7% | 137.9 -40% | 111.7 -13% |
| Witcher 3 ultra * | 144.5 | 134 7% | 144.9 -0% | 104.7 28% | 189.4 -31% | 152.1 -5% |
| Load Maximum * | 174.8 | 175 -0% | 179.6 -3% | 164.5 6% | 202 -16% | 177.4 -1% |
* ... menor é melhor
Power Consumption Witcher 3 / Stresstest
Power Consumption external Monitor
Duração da bateria
O tempo de execução é praticamente o mesmo de antes, se não for um pouco menor. Nosso teste de WLAN durou pouco mais de 9 horas, enquanto o Precision 5680 ficou próximo de 10 horas em condições semelhantes.
| Dell Precision 5690 Ultra 9 185H, NVIDIA RTX 5000 Ada Generation Laptop GPU, 98 Wh | Dell Precision 5000 5680 i9-13900H, NVIDIA RTX 5000 Ada Generation Laptop GPU, 98 Wh | Lenovo ThinkPad P16 G2 21FA000FGE i7-13700HX, NVIDIA RTX 2000 Ada Generation Laptop GPU, 94 Wh | Lenovo ThinkPad P1 G6-21FV000DGE i9-13900H, NVIDIA RTX 2000 Ada Generation Laptop GPU, 90 Wh | HP ZBook Fury 16 G10 i9-13950HX, NVIDIA RTX 5000 Ada Generation Laptop GPU, 95 Wh | MSI CreatorPro Z16P B12UKST i7-12700H, RTX A3000 Laptop GPU, 90 Wh | |
|---|---|---|---|---|---|---|
| Duração da bateria | 8% | -6% | 3% | -21% | -37% | |
| WiFi v1.3 | 549 | 592 8% | 515 -6% | 567 3% | 435 -21% | 348 -37% |
| Reader / Idle | 1072 | |||||
| Load | 101 | 67 | ||||
| H.264 | 674 |
Pro
Contra
Veredicto - Pronto para a revolução da IA
O Precision 5680 foi lançado com um novo e elegante design derivado do XPS 16 completo, com CPUs vPro e gráficos Nvidia RTX Ada de alta qualidade. Posteriormente, ele se tornaria uma das estações de trabalho de 16 polegadas mais rápidas disponíveis em relação ao seu tamanho e peso. O problema aqui é que o Precision 5680 tem apenas meio ano de idade e ainda é bastante recente. O mais novo Precision 5690 oferece o mesmo chassi, GPU, tela, níveis de consumo de energia, duração da bateria e desempenho do processador que o Precision 5680. Se o senhor quiser economizar um pouco, o Precision 5680 do ano passado pode oferecer essencialmente a mesma experiência de usuário e o mesmo desempenho por menos.
)(()()
O principal fator de diferenciação entre o 2024 Precision 5690 e o 2023 Precision 5680 se resume à NPU integrada nas CPUs da série Meteor Lake-H. O modelo mais recente da Dell está, portanto, "pronto para IA" quando o Windows for otimizado para tarefas locais de IA. Se o senhor já utiliza o Co-Pilot ou espera executar mais aplicativos aprimorados por IA em um futuro próximo, por exemplo, o Precision 5690 deve ter uma vantagem notável devido à aceleração da NPU. Caso contrário, a maioria das tarefas "tradicionais" não será executada de forma visivelmente mais rápida no modelo mais recente.
Preço e disponibilidade
A Dell agora está enviando o Precision 5690 a partir de US$ 2290 para a CPU Core Ultra 5 135H, somente gráficos integrados e tela IPS de 1200p, até bem mais de US$ 5000 se configurado com o Core Ultra 9 185H, RTX 5000 Ada e tela sensível ao toque OLED de 2400p.
Dell Precision 5690
- 05/08/2024 v7 (old)
Allen Ngo
Transparência
A seleção dos dispositivos a serem analisados é feita pela nossa equipe editorial. A amostra de teste foi fornecida ao autor como empréstimo pelo fabricante ou varejista para fins desta revisão. O credor não teve influência nesta revisão, nem o fabricante recebeu uma cópia desta revisão antes da publicação. Não houve obrigação de publicar esta revisão. Nunca aceitamos compensação ou pagamento em troca de nossas avaliações. Como empresa de mídia independente, a Notebookcheck não está sujeita à autoridade de fabricantes, varejistas ou editores.
É assim que o Notebookcheck está testando
Todos os anos, o Notebookcheck analisa de forma independente centenas de laptops e smartphones usando procedimentos padronizados para garantir que todos os resultados sejam comparáveis. Desenvolvemos continuamente nossos métodos de teste há cerca de 20 anos e definimos padrões da indústria no processo. Em nossos laboratórios de teste, equipamentos de medição de alta qualidade são utilizados por técnicos e editores experientes. Esses testes envolvem um processo de validação em vários estágios. Nosso complexo sistema de classificação é baseado em centenas de medições e benchmarks bem fundamentados, o que mantém a objetividade.Price comparison

