

Análise do laptop Alienware x16 R2: Um passo à frente do x16 R1

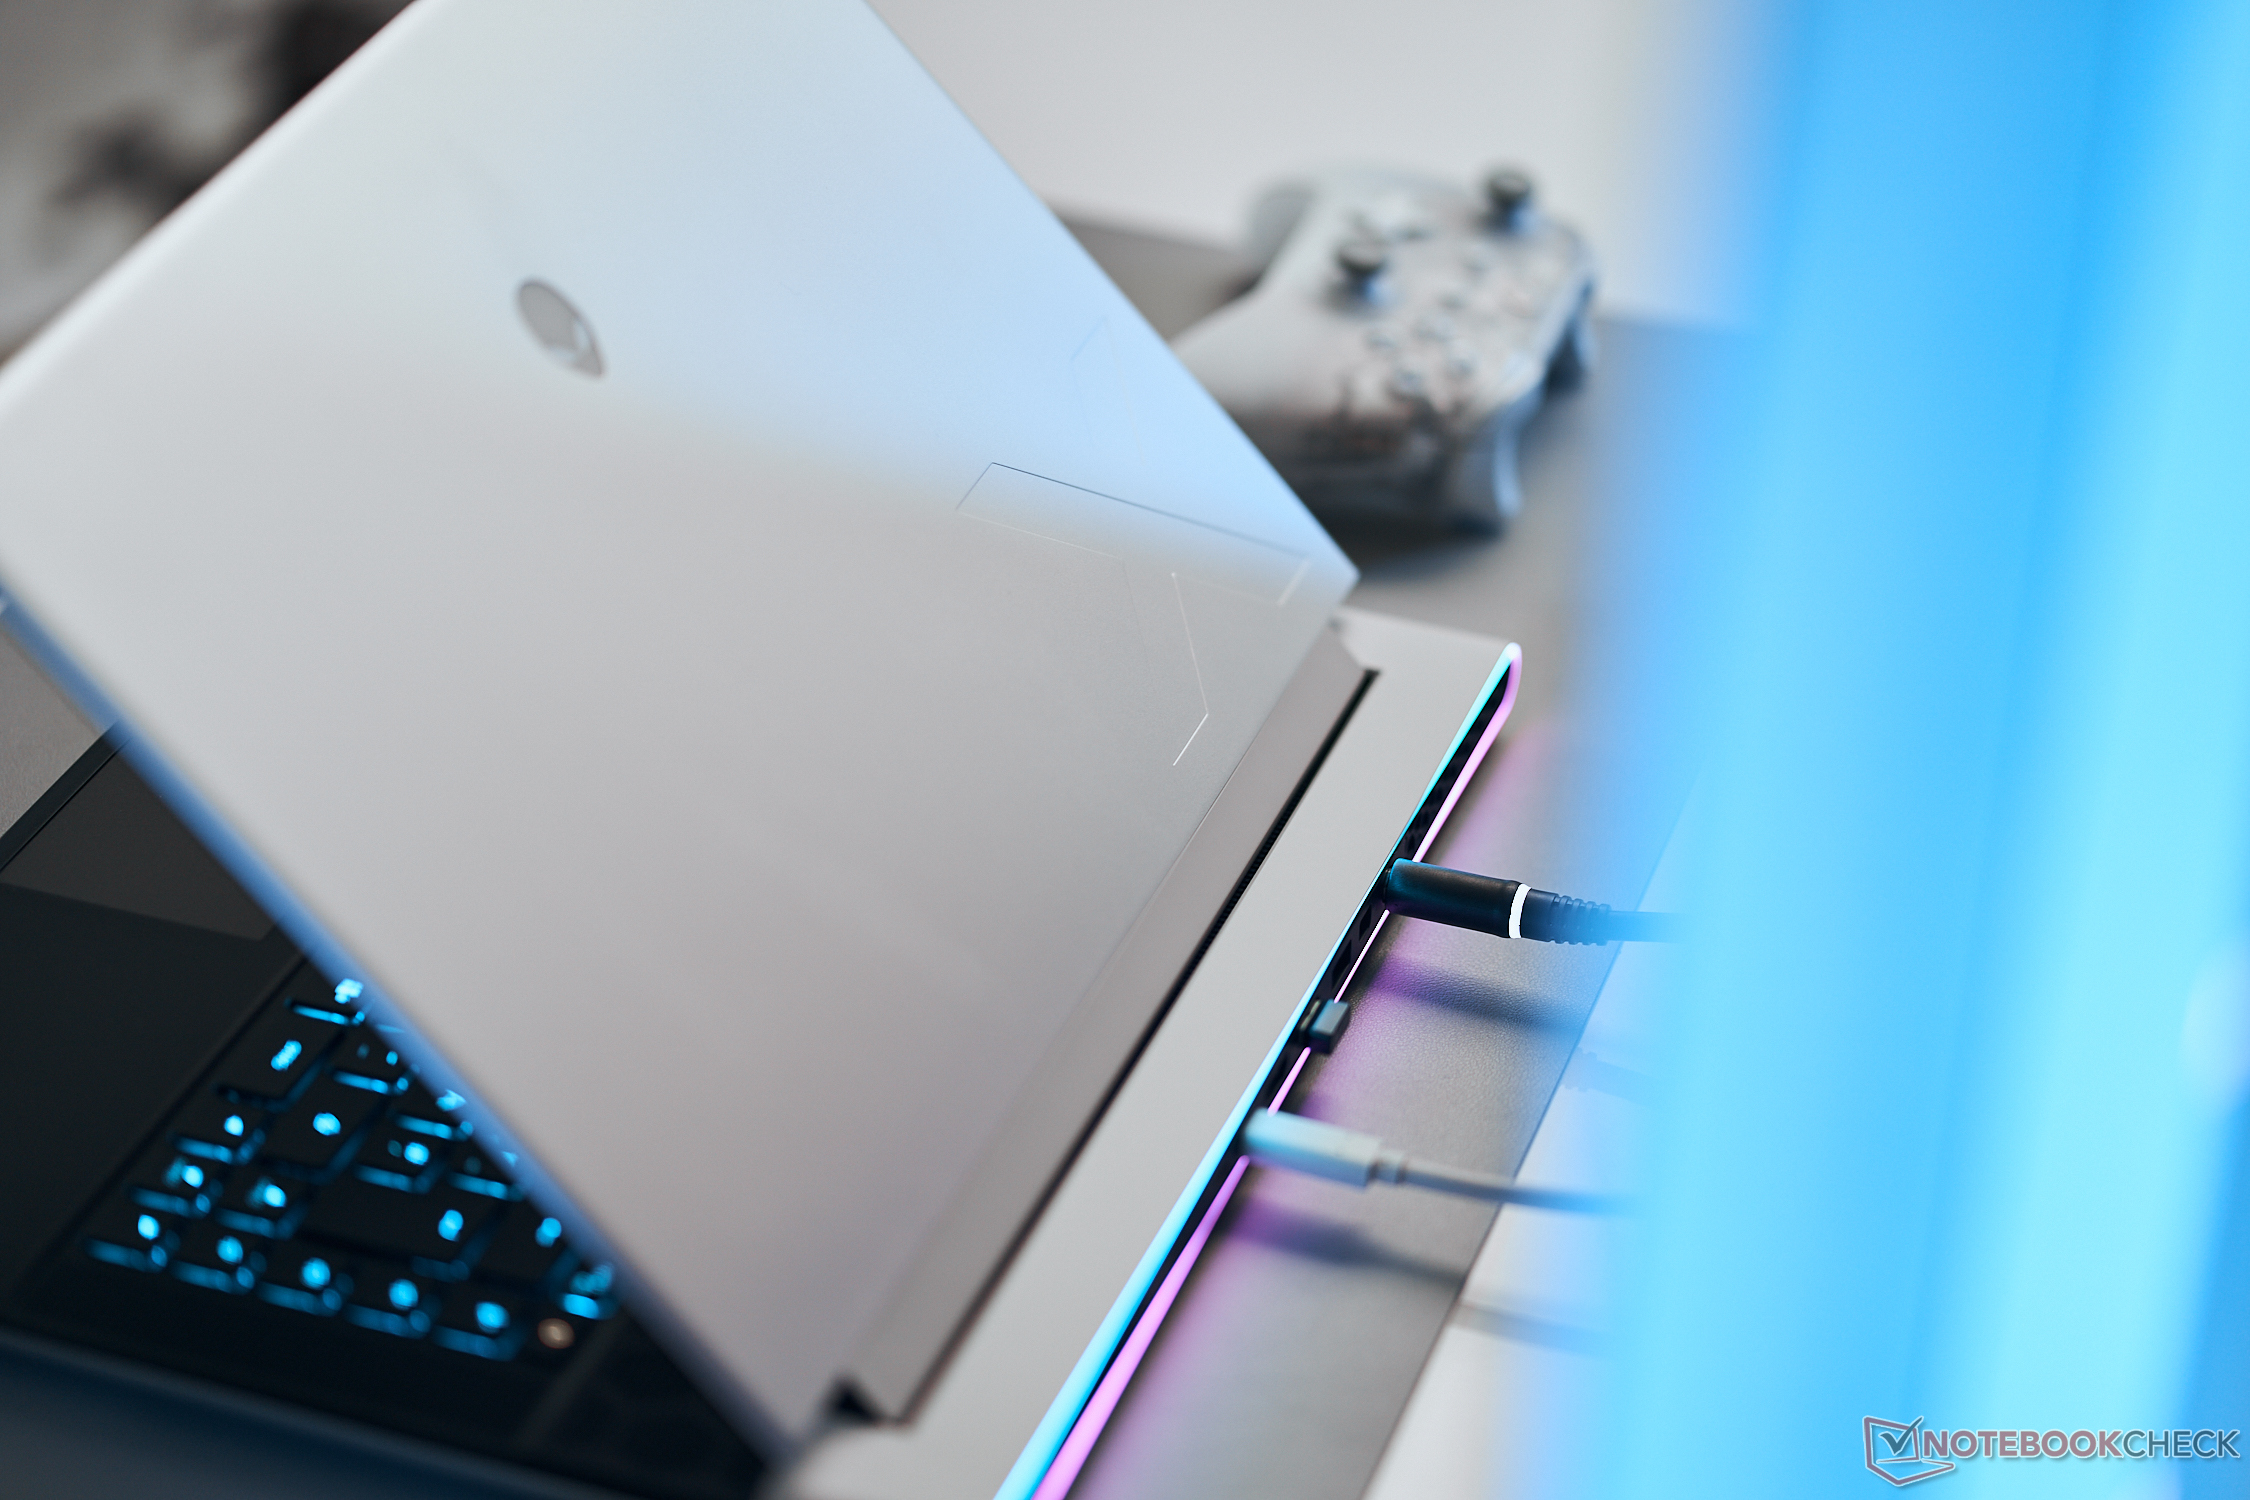
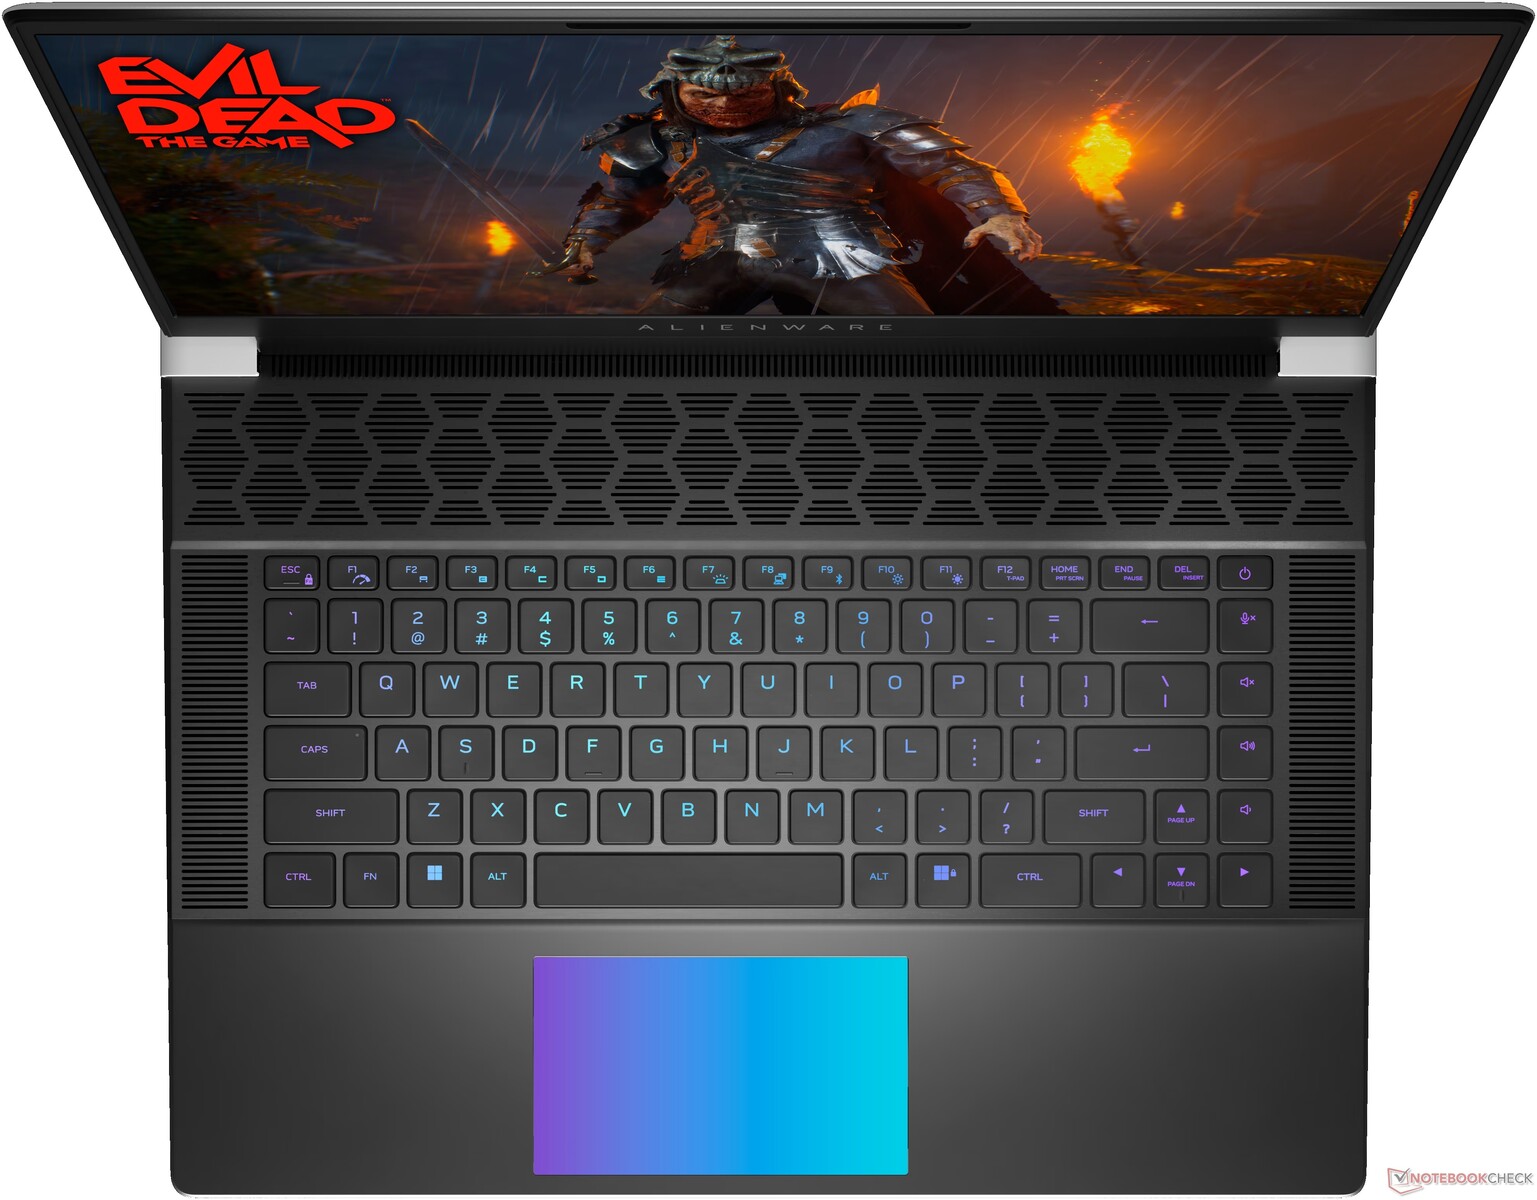
A série ultrafina Alienware x16 foi lançada no final do ano passado com o lançamento do Alienware x16 R1. Para 2024, a série foi atualizada com o x16 R2. O modelo mais recente troca as opções mais antigas do processador Raptor Lake-H por opções Meteor Lake-H prontas para IA, enquanto todo o resto permanece essencialmente igual ao design original do x16 R1. Portanto, recomendamos que você confira nossa análise do x16 R1 já que a maioria de nossos comentários ainda se aplica ao x16 R2, visualmente idêntico. Quaisquer diferenças notáveis serão registradas nesta análise.
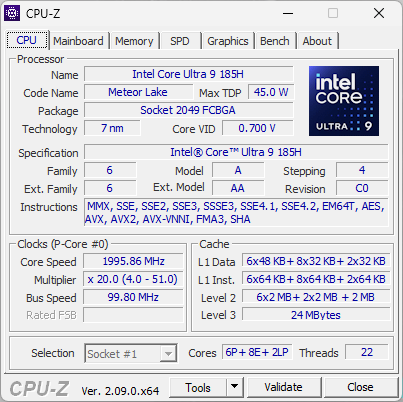
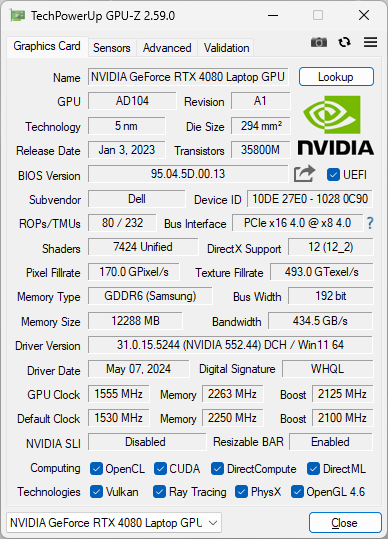
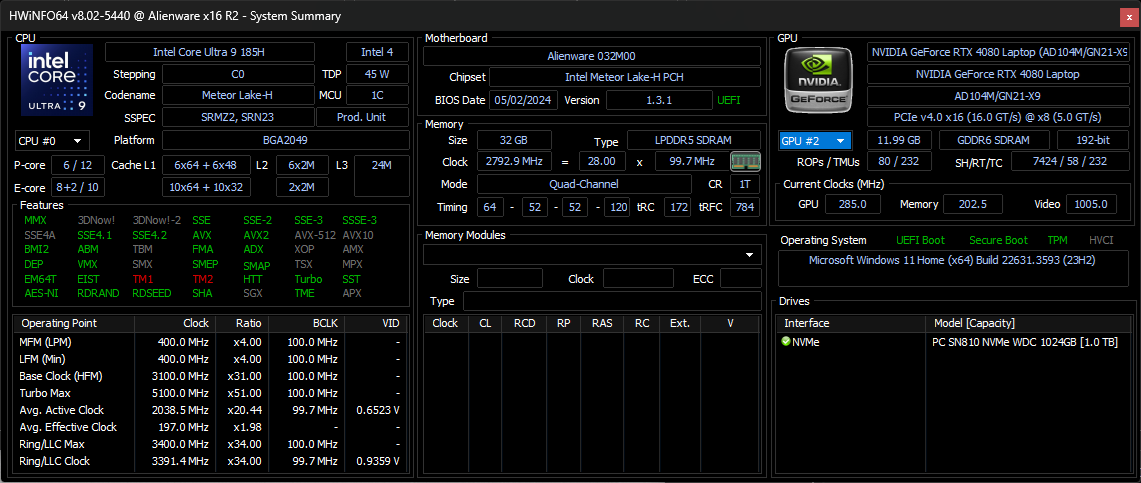
Nossa unidade em análise é uma configuração de ponta com CPU Core Ultra 9 185H, GPU GeForce RTX 4080 de 175 W, tela de 1600p 240 Hz e teclas mecânicas CherryMX de perfil ultrabaixo por aproximadamente US$ 3200. Outras SKUs incluem teclas de membrana comuns e o Core Ultra 7 155H com gráficos GeForce RTX 4060, 4070 ou 4090 e tela IPS de 1200p 480 Hz.
As alternativas ao Alienware x16 R2 incluem outros notebooks para jogos de 16 polegadas de alta qualidade, como o Razer Blade 16,Asus ROG Strix Scar 16,Lenovo Legion Pro 7 16ou MSI Vector 16 HX.
Mais análises da Dell:
Possíveis concorrentes em comparação
Avaliação | Data | Modelo | Peso | Altura | Size | Resolução | Preço |
|---|---|---|---|---|---|---|---|
| 88.4 % v7 (old) | 05/2024 | Alienware x16 R2 P120F Ultra 9 185H, NVIDIA GeForce RTX 4080 Laptop GPU | 2.7 kg | 18.57 mm | 16.00" | 2560x1600 | |
| 88.4 % v7 (old) | 06/2023 | Alienware x16 R1 i9-13900HK, NVIDIA GeForce RTX 4080 Laptop GPU | 2.6 kg | 18.57 mm | 16.00" | 2560x1600 | |
| 90.2 % v7 (old) | 03/2024 | Alienware m16 R2 Ultra 7 155H, NVIDIA GeForce RTX 4070 Laptop GPU | 2.5 kg | 23.5 mm | 16.00" | 2560x1600 | |
| 87.6 % v7 (old) | 04/2024 | Asus ROG Strix Scar 16 G634JZR i9-14900HX, NVIDIA GeForce RTX 4080 Laptop GPU | 2.7 kg | 30.4 mm | 16.00" | 2560x1600 | |
| 89.5 % v7 (old) | 03/2024 | Lenovo Legion Pro 7 16IRX9H i9-14900HX, NVIDIA GeForce RTX 4080 Laptop GPU | 2.7 kg | 21.95 mm | 16.00" | 2560x1600 | |
| 88 % v7 (old) | 02/2024 | MSI Vector 16 HX A14V i9-14900HX, NVIDIA GeForce RTX 4080 Laptop GPU | 2.7 kg | 28.55 mm | 16.00" | 2560x1600 |
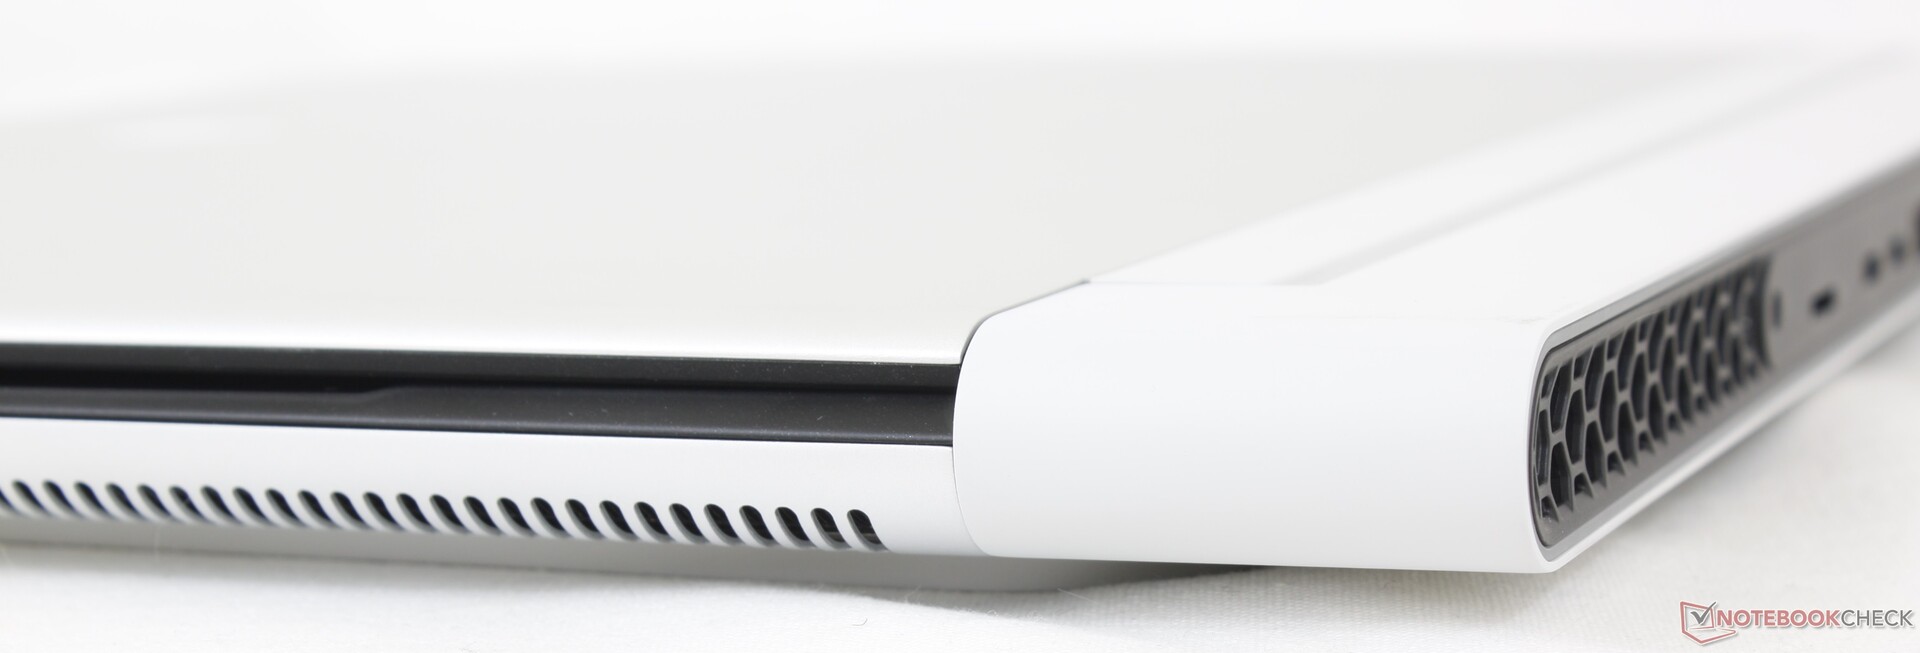
Caso - Sem alterações externas
Conectividade


Leitor de cartão SD
É interessante notar que o leitor de MicroSD em nosso x16 R2 não apresentou nenhum dos problemas de taxa de transferência que tivemos no x16 R1 do ano passado.
| SD Card Reader | |
| average JPG Copy Test (av. of 3 runs) | |
| Alienware x16 R2 P120F (AV PRO microSD 128 GB V60) | |
| MSI Vector 16 HX A14V (Toshiba Exceria Pro SDXC 64 GB UHS-II) | |
| Alienware m16 R2 (AV PRO microSD 128 GB V60) | |
| Alienware x16 R1 (AV PRO microSD 128 GB V60) | |
| maximum AS SSD Seq Read Test (1GB) | |
| Alienware x16 R2 P120F (AV PRO microSD 128 GB V60) | |
| Alienware x16 R1 (AV PRO microSD 128 GB V60) | |
| Alienware m16 R2 (AV PRO microSD 128 GB V60) | |
| MSI Vector 16 HX A14V (Toshiba Exceria Pro SDXC 64 GB UHS-II) | |
Comunicação
A Dell atualizou o módulo WLAN para a atualização deste ano para suportar o Wi-Fi 7.
Webcam


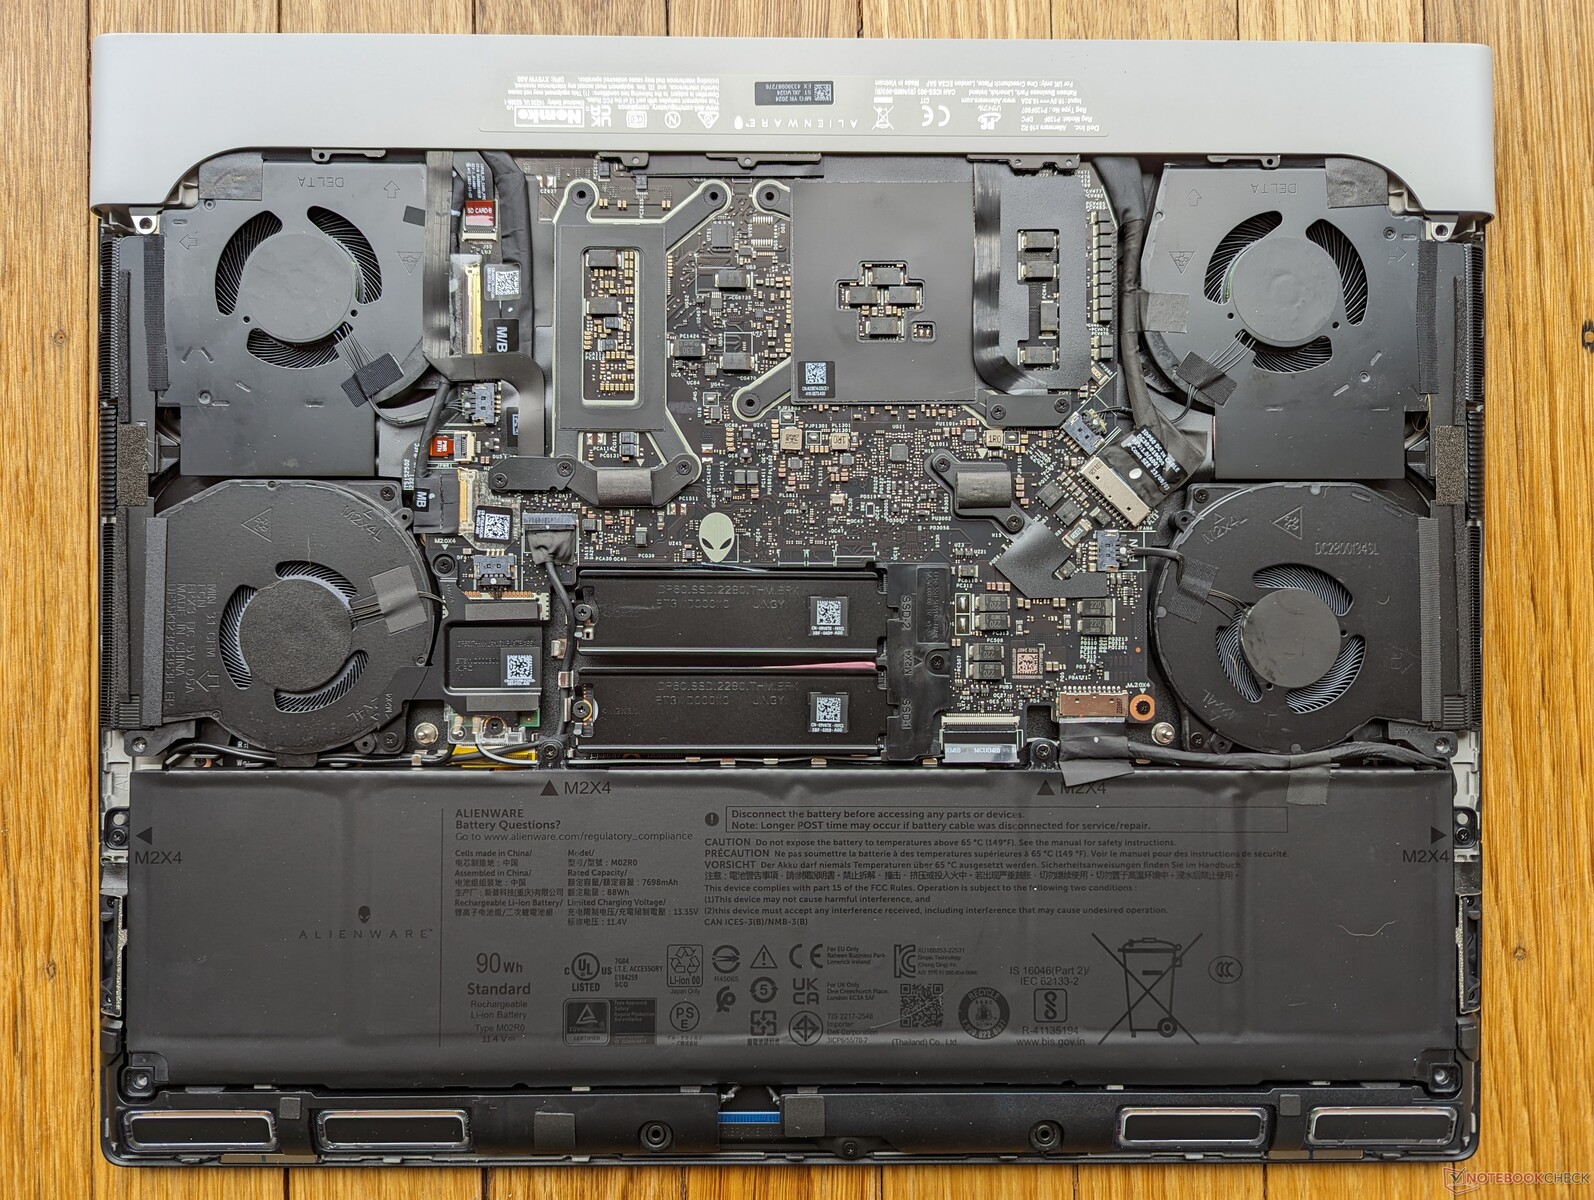
Manutenção

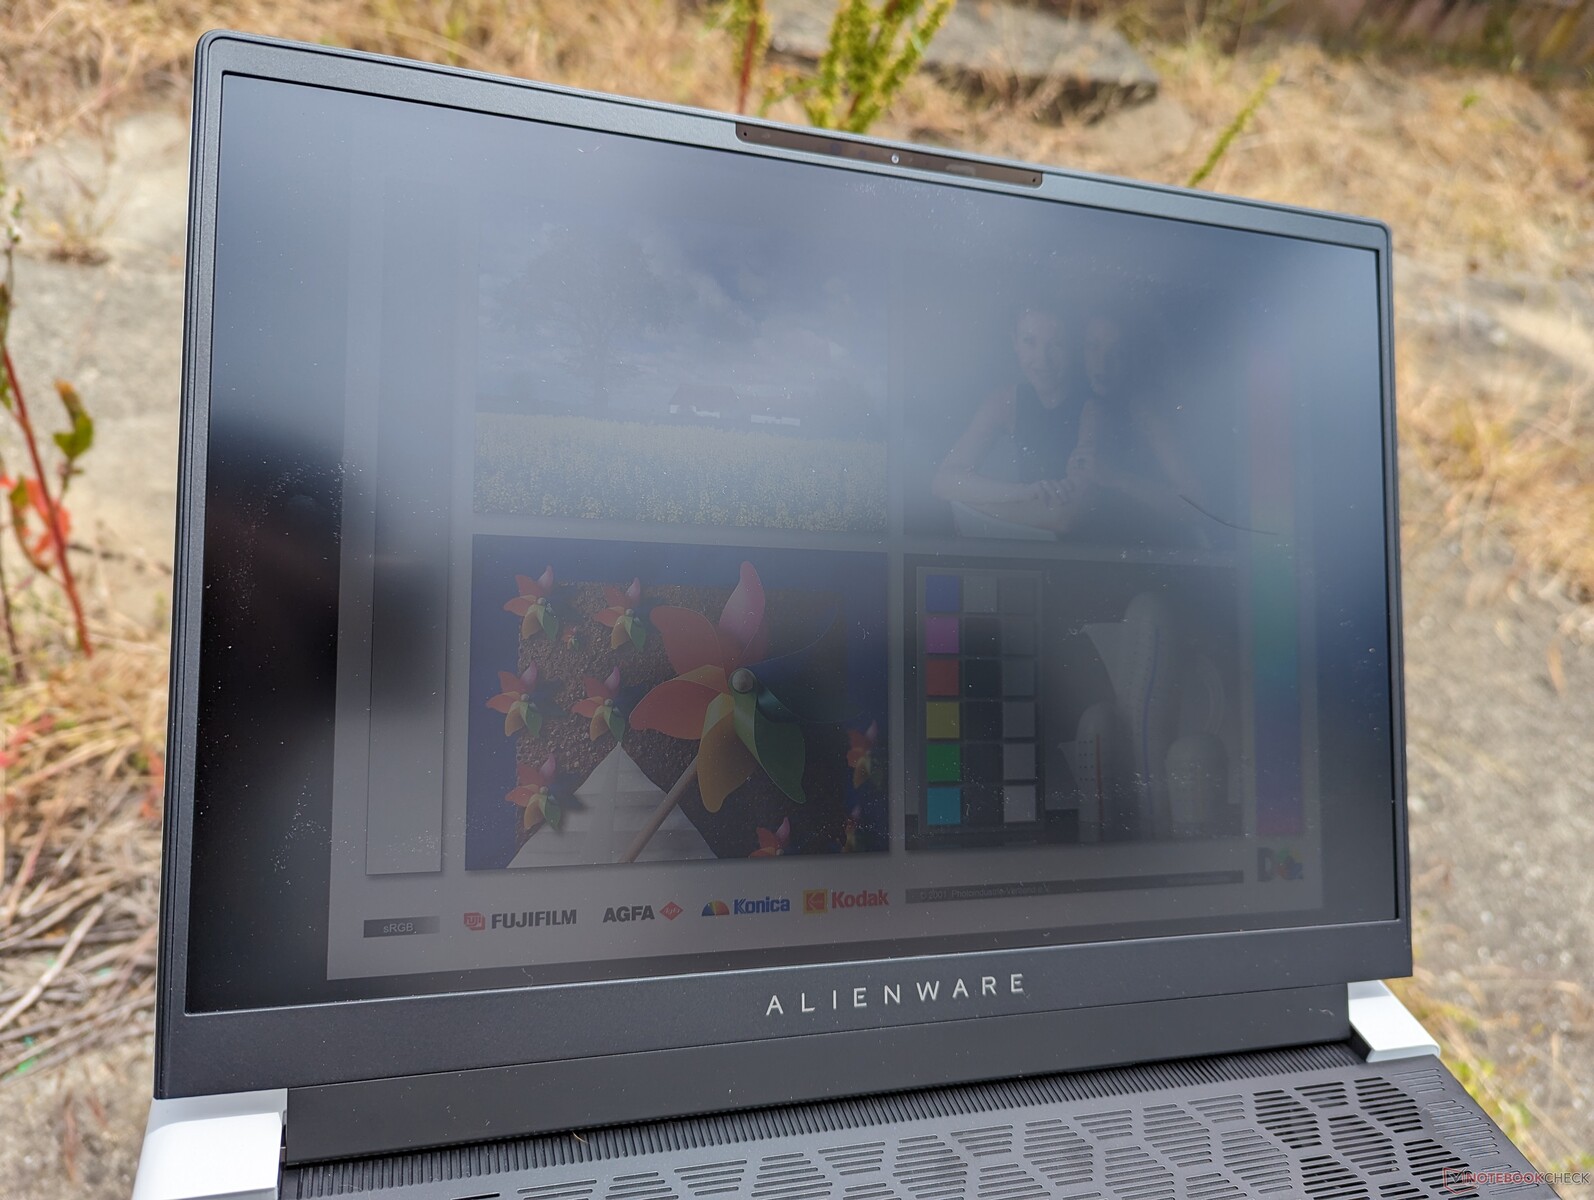
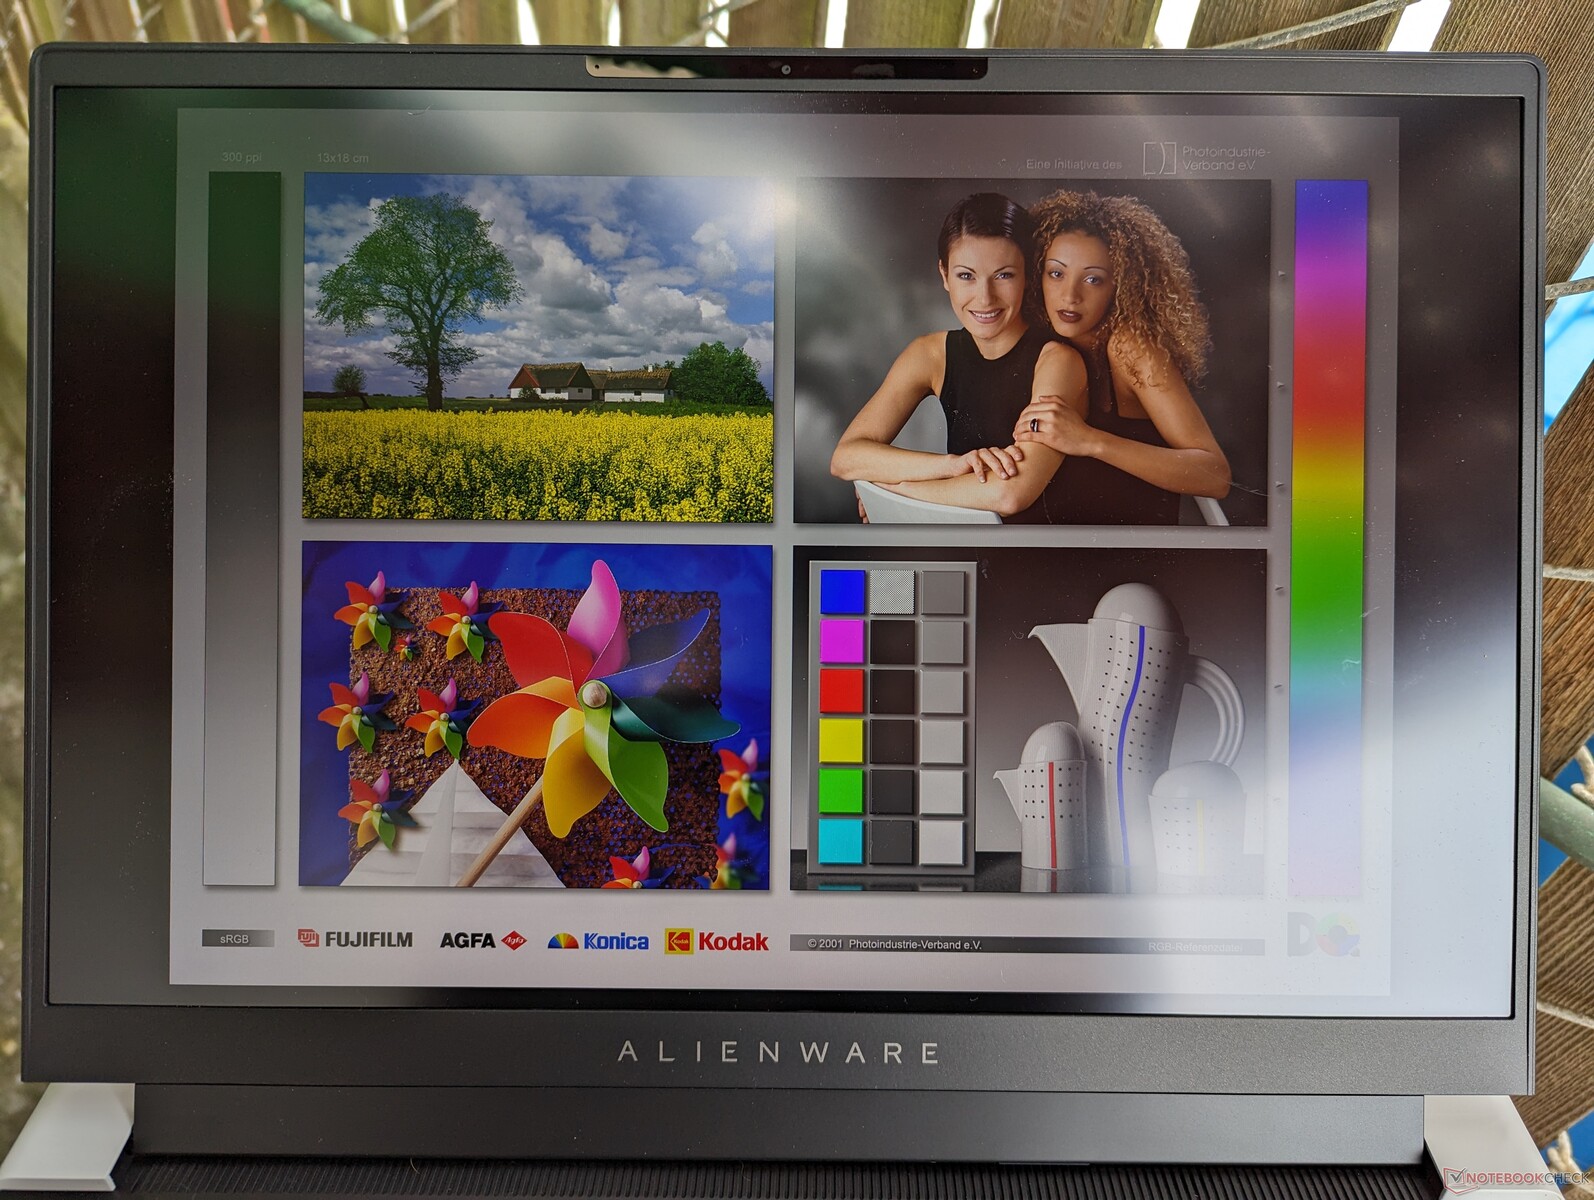
Tela - Não há mais a opção de 165 Hz
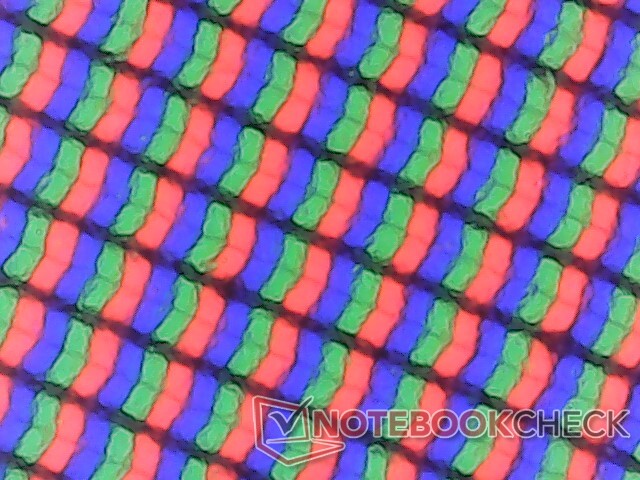
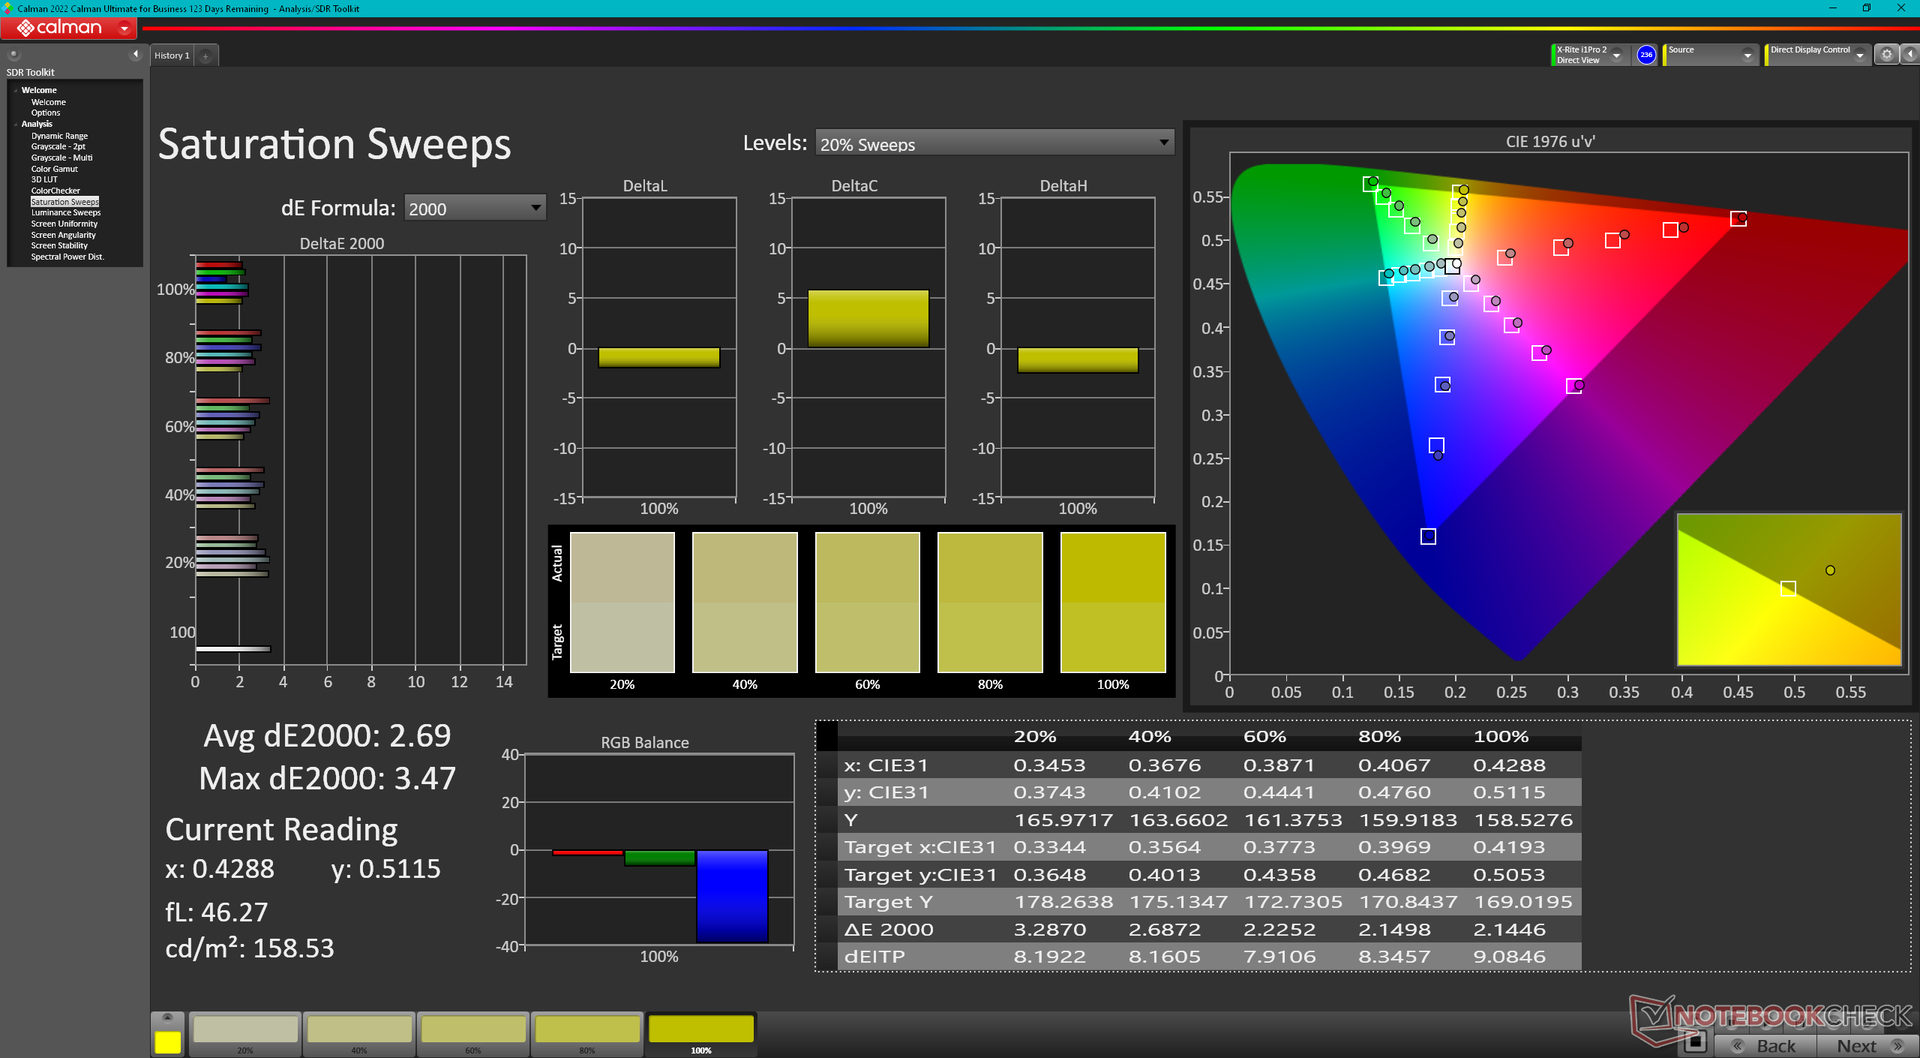
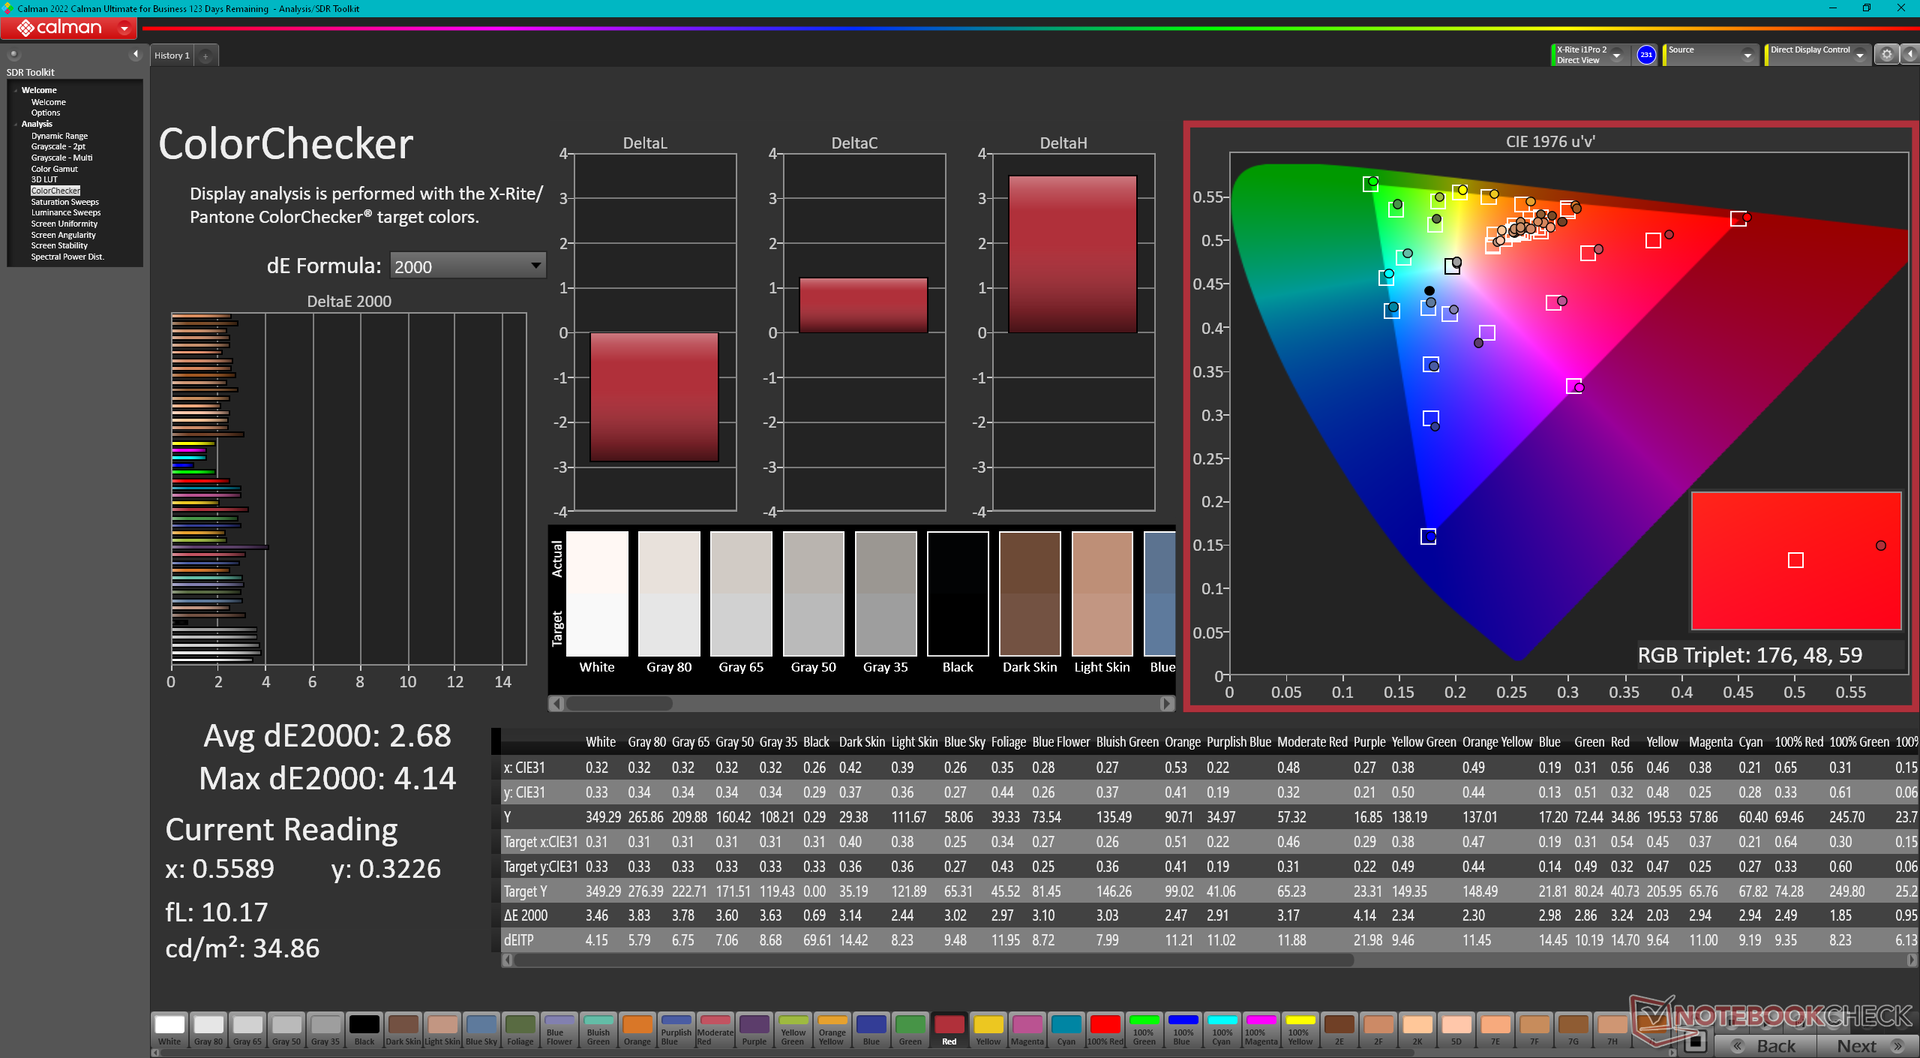
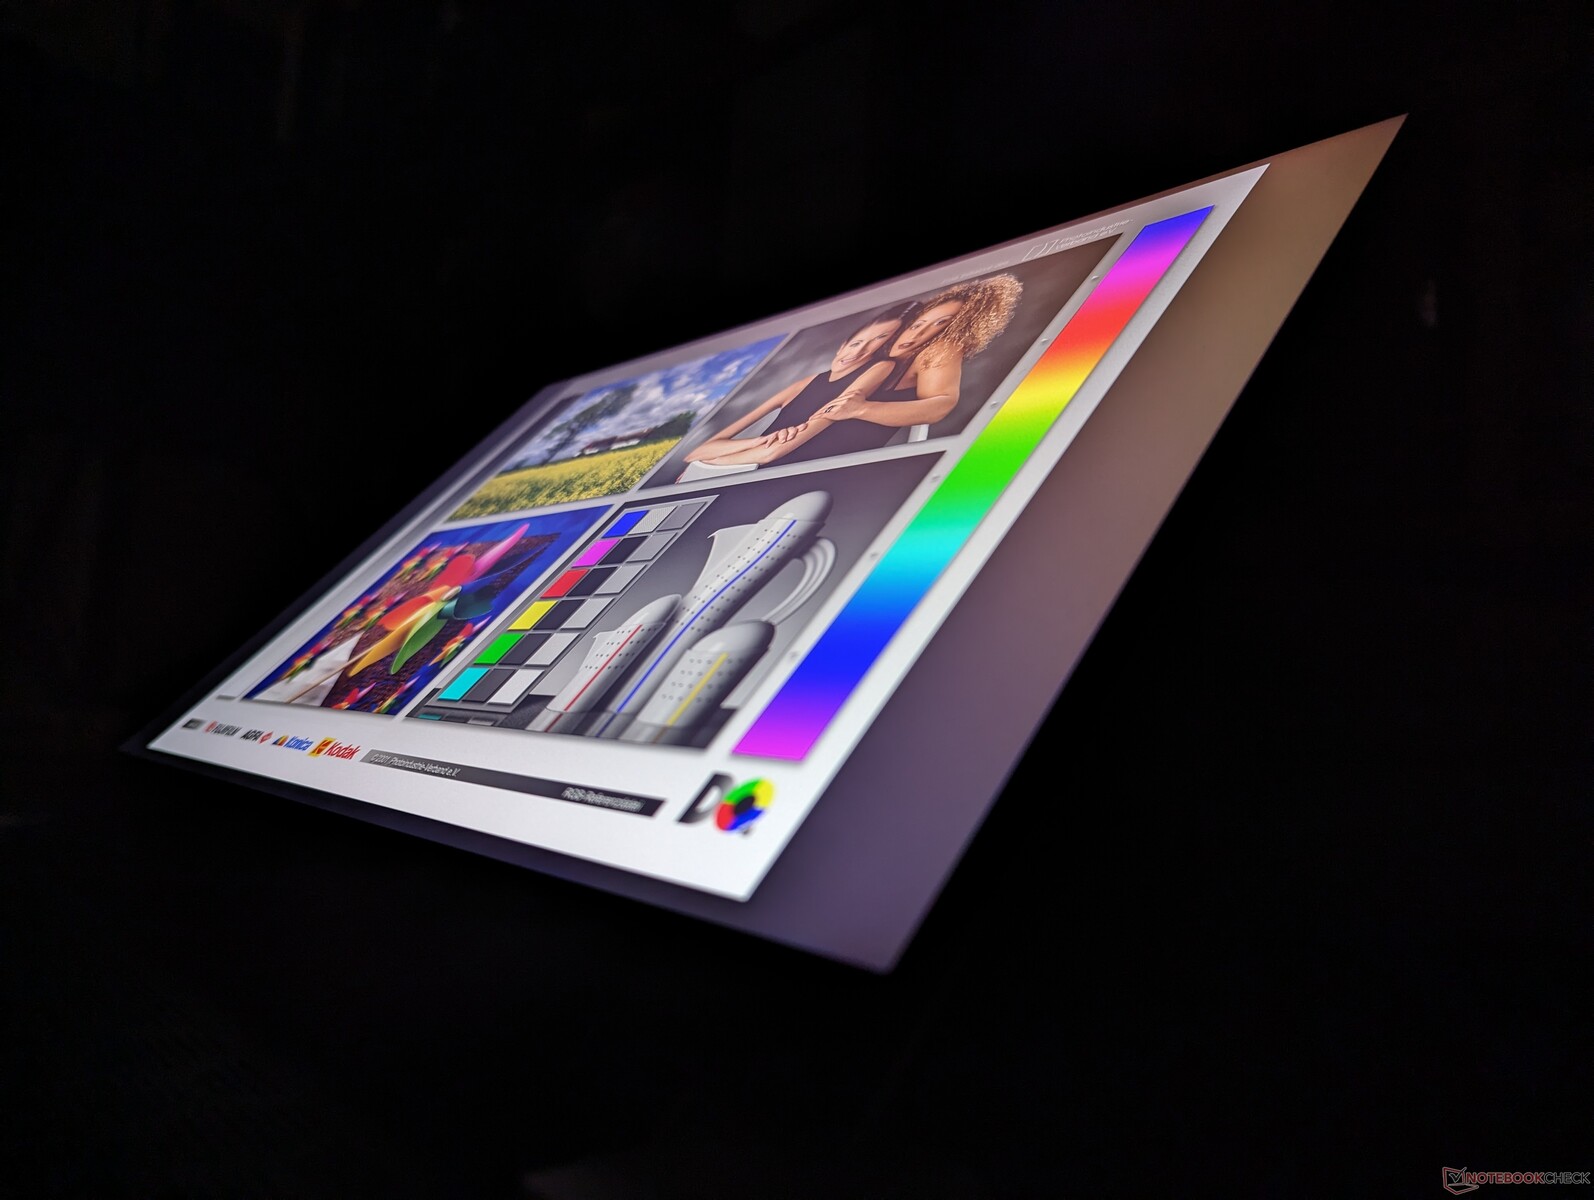
A Dell trocou o painel BOE NE16NZ4 no x16 R1 do ano passado pelo BOE B160QAN no x16 R2 deste ano. No entanto, os dois painéis são praticamente idênticos em termos de reprodução de cores, tempos de resposta, níveis de brilho e contraste para uma experiência de visualização essencialmente idêntica.
A taxa de atualização nativa pode ser definida como 240 Hz ou 60 Hz, sem opções variáveis. O G-Sync é compatível somente quando definido para o modo dGPU e não para o modo Optimus.
Os usuários podem configurar entre dois monitores, conforme mostrado abaixo, enquanto o x16 R1 tinha três:
- 2560 x 1600, 240 Hz, 100% DCI-P3, G-Sync, Advanced Optimus
- 1920 x 1200, 480 Hz, 100% DCI-P3, G-Sync, Advanced Optimus
| |||||||||||||||||||||||||
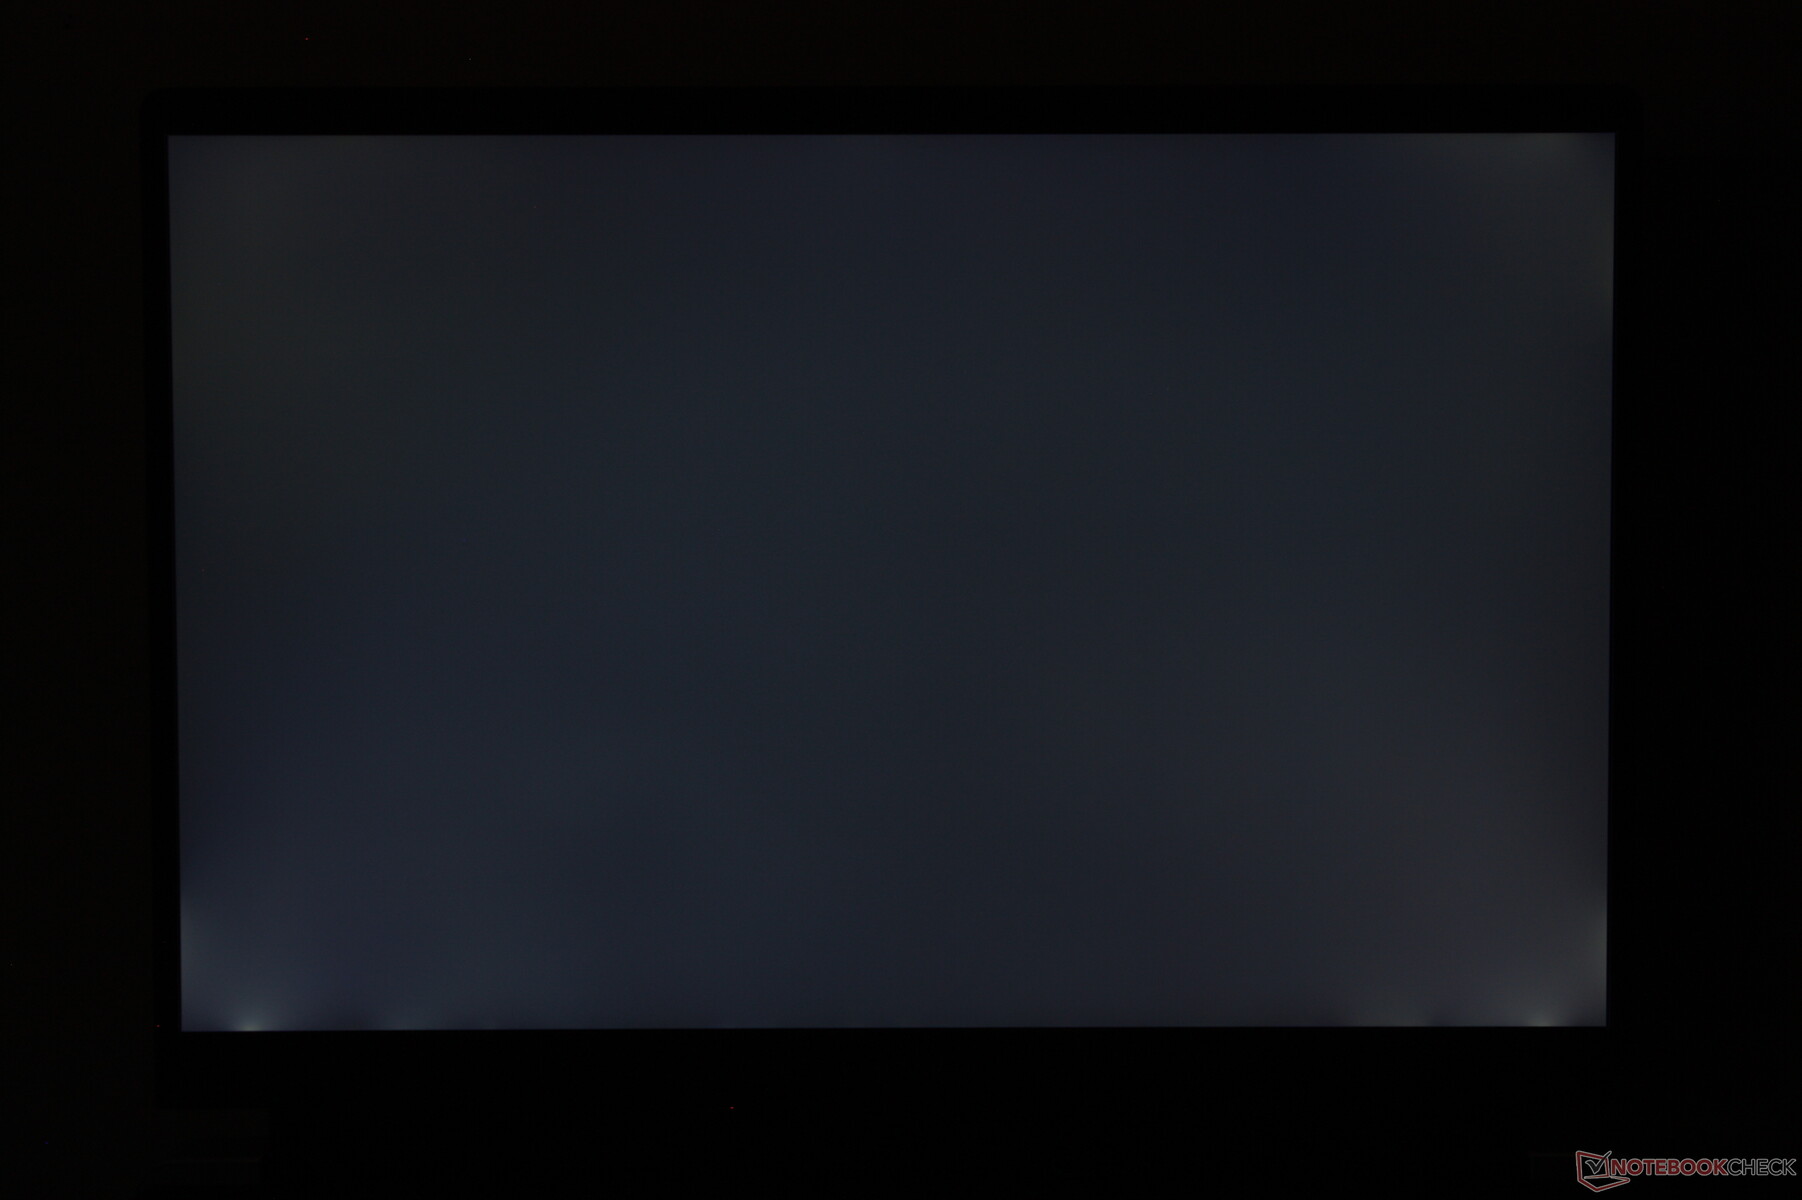
iluminação: 90 %
iluminação com acumulador: 348.4 cd/m²
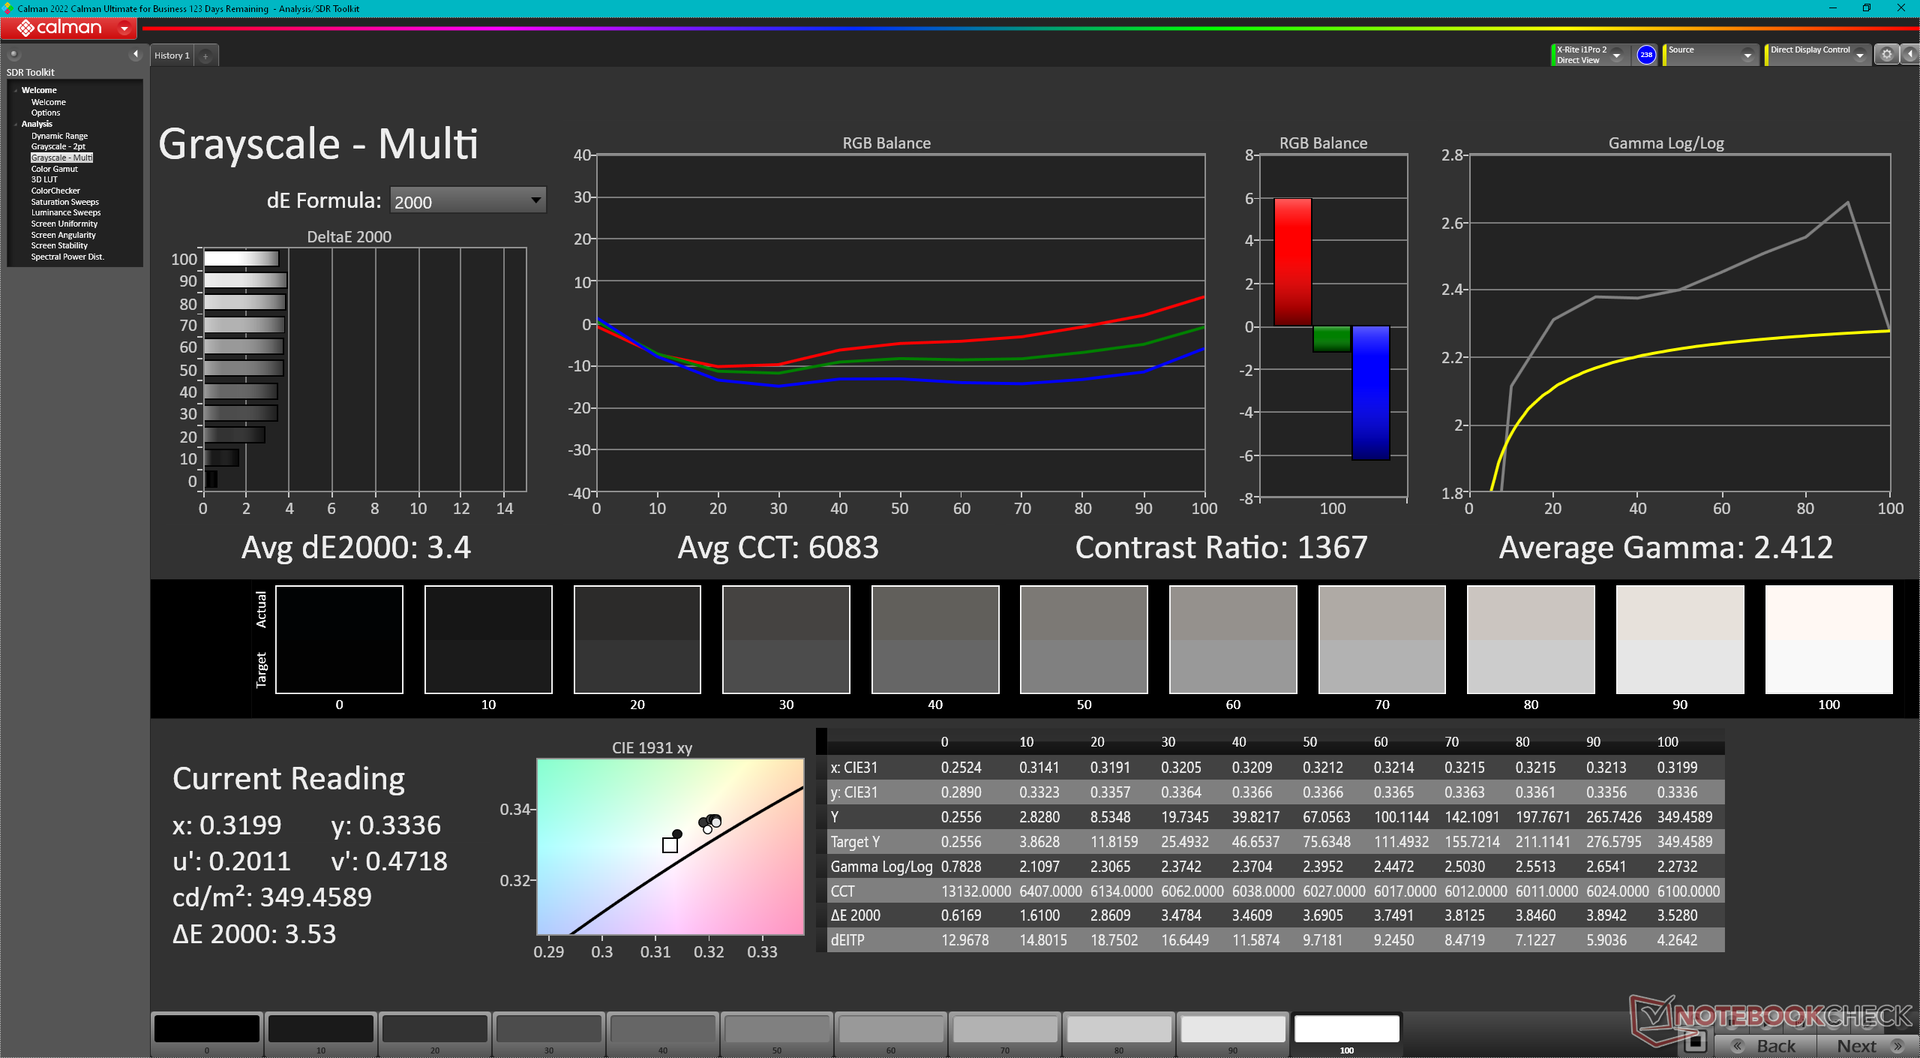
Contraste: 1056:1 (Preto: 0.33 cd/m²)
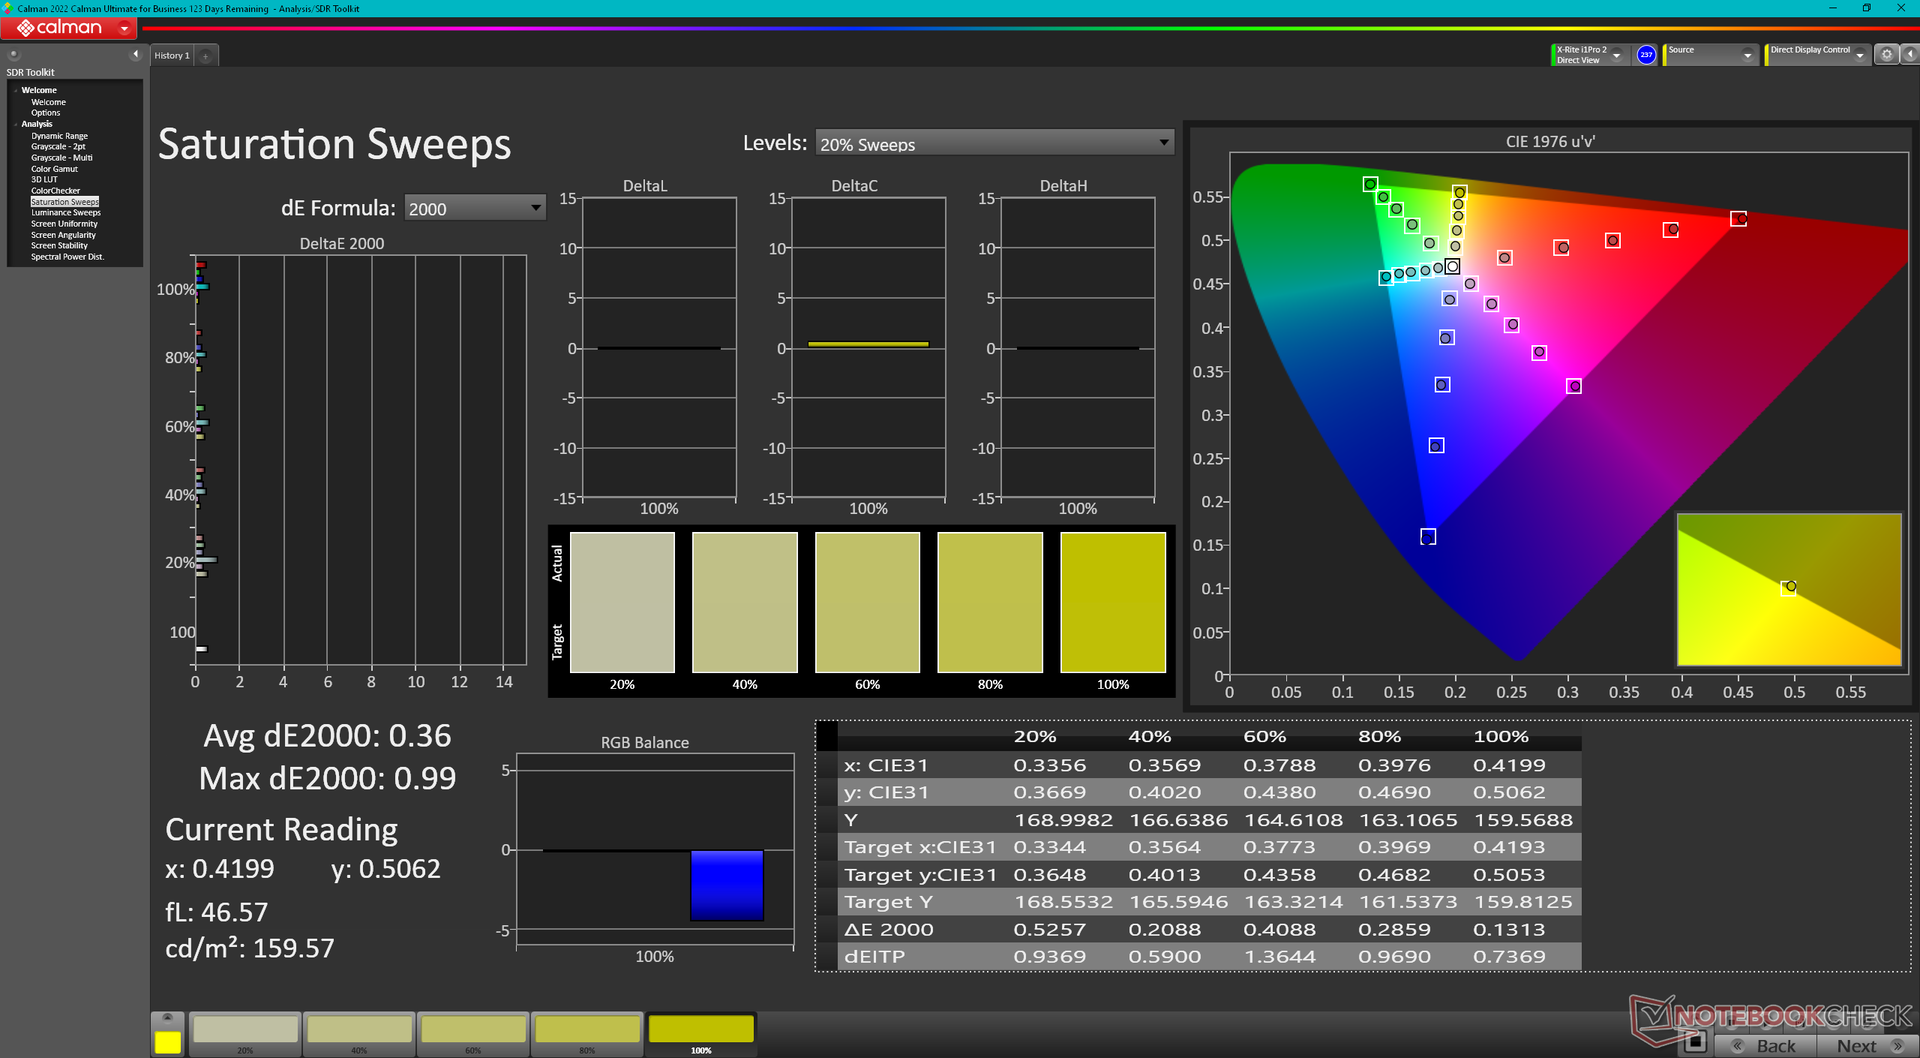
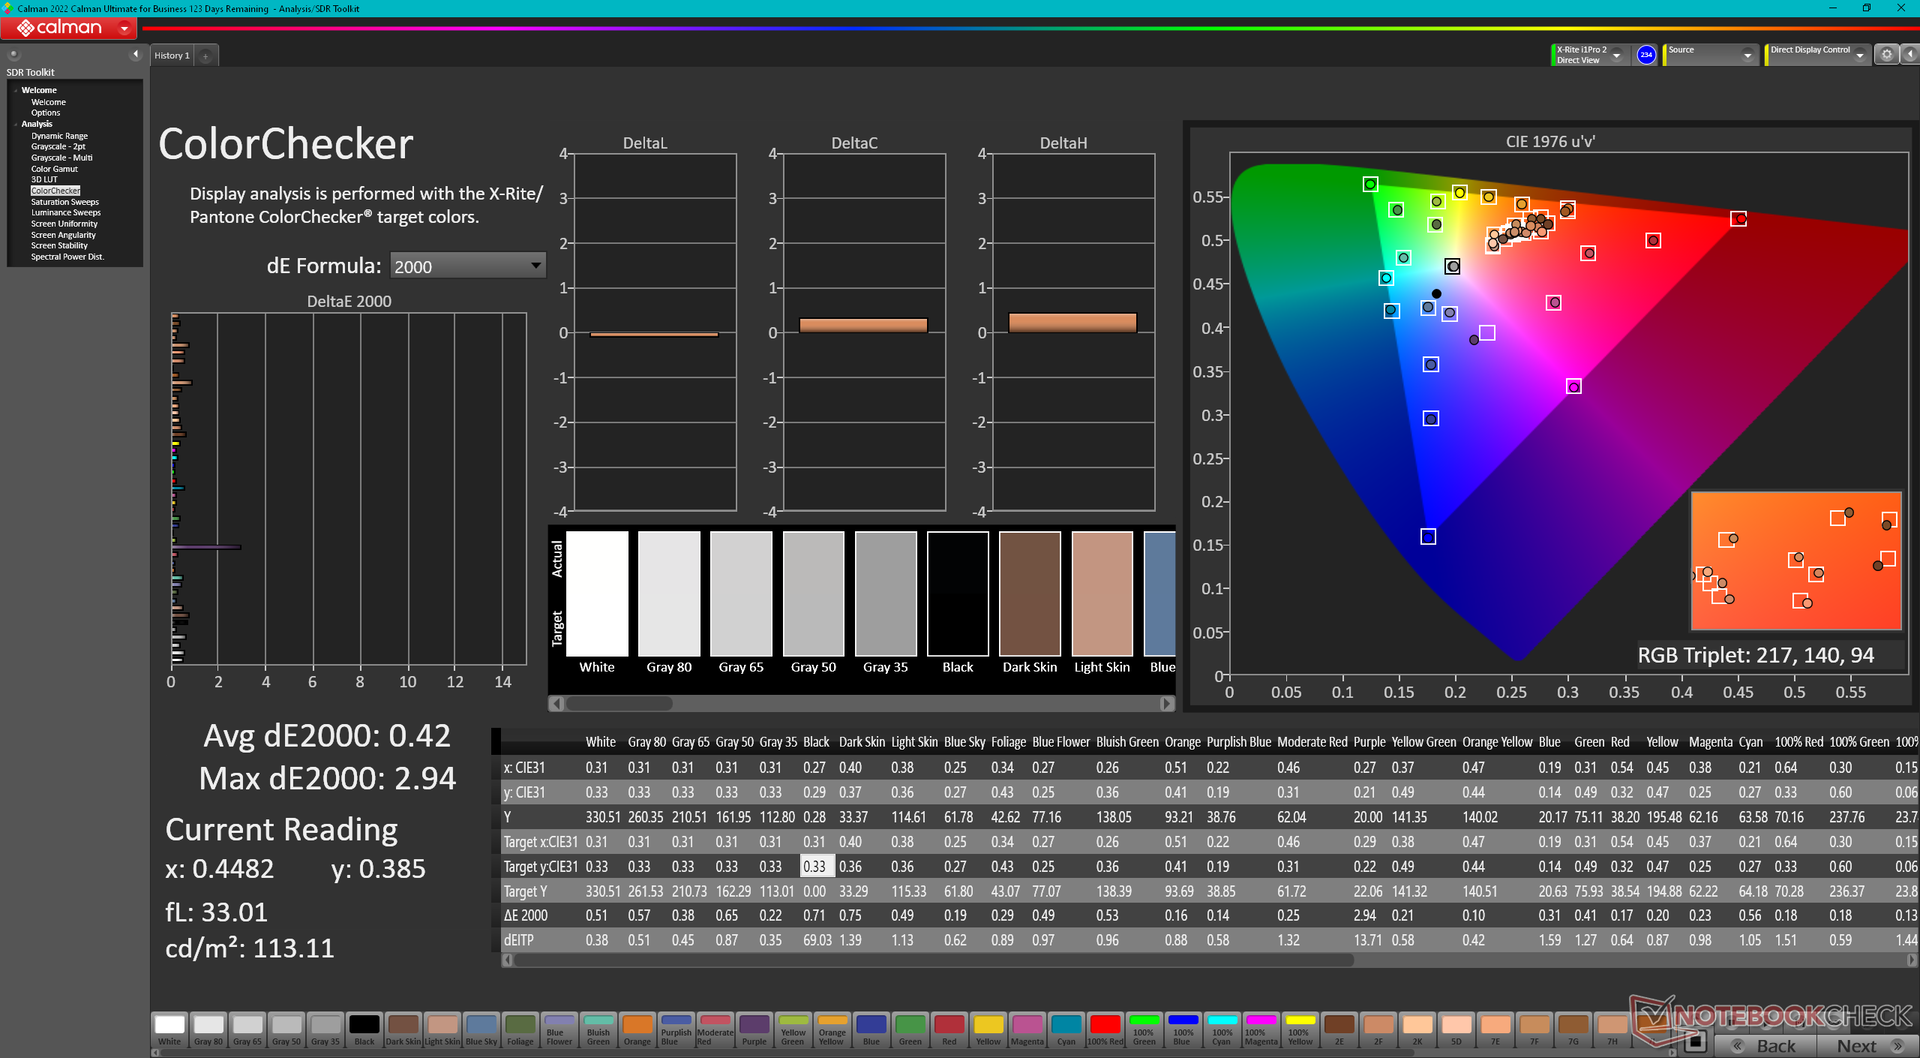
ΔE Color 2.68 | 0.5-29.43 Ø4.87, calibrated: 0.42
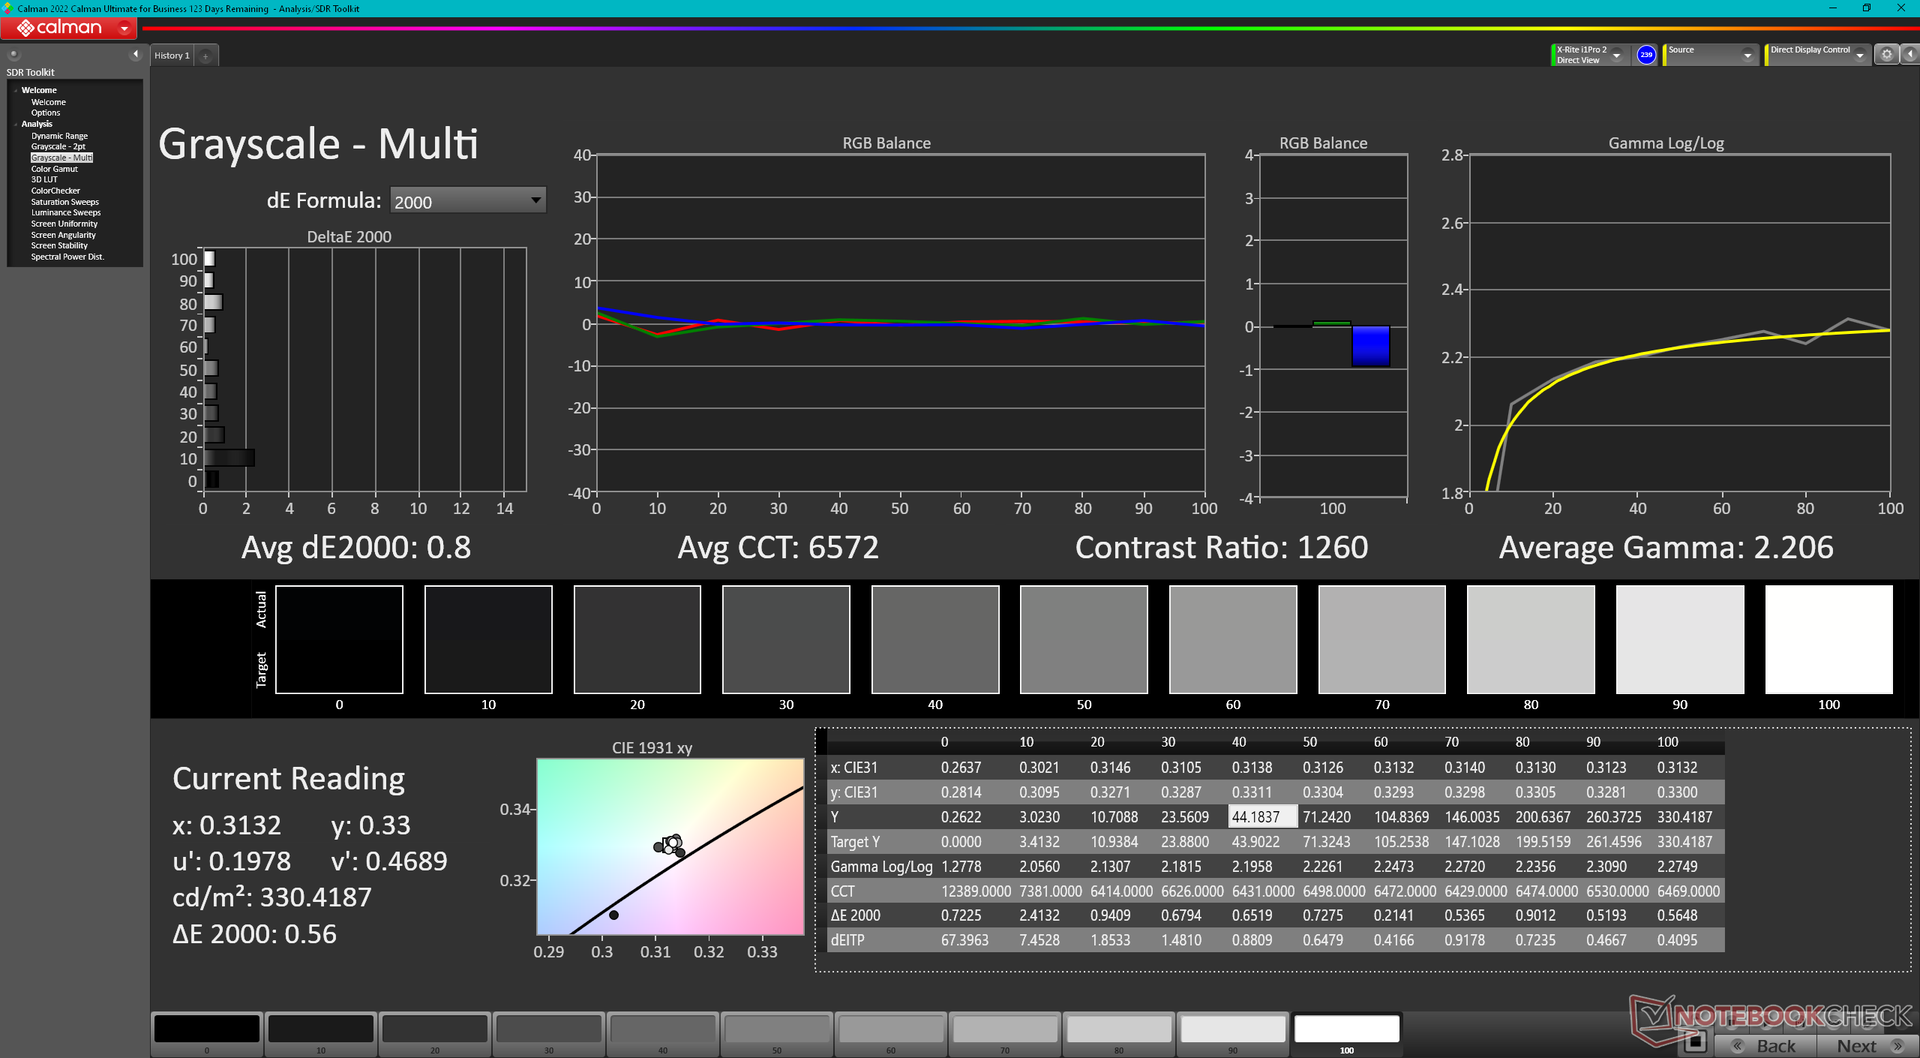
ΔE Greyscale 3.4 | 0.5-98 Ø5.1
88.8% AdobeRGB 1998 (Argyll 2.2.0 3D)
100% sRGB (Argyll 2.2.0 3D)
98.3% Display P3 (Argyll 2.2.0 3D)
Gamma: 2.41
| Alienware x16 R2 P120F BOE B160QAN, IPS, 2560x1600, 16" | Alienware x16 R1 BOE NE16NZ4, IPS, 2560x1600, 16" | Alienware m16 R2 BOE NE16NYH, IPS, 2560x1600, 16" | Asus ROG Strix Scar 16 G634JZR BOE NE160QDM-NM7, Mini LED, 2560x1600, 16" | Lenovo Legion Pro 7 16IRX9H BOE CQ NE16QDM-NZB, IPS, 2560x1600, 16" | MSI Vector 16 HX A14V Chi Mei N160GME-GTB, IPS, 2560x1600, 16" | |
|---|---|---|---|---|---|---|
| Display | 0% | -16% | 1% | -1% | -2% | |
| Display P3 Coverage | 98.3 | 99.2 1% | 71 -28% | 99.8 2% | 98.5 0% | 95.4 -3% |
| sRGB Coverage | 100 | 100 0% | 100 0% | 100 0% | 99.9 0% | 99.7 0% |
| AdobeRGB 1998 Coverage | 88.8 | 88.6 0% | 71.4 -20% | 90.8 2% | 86.7 -2% | 85.4 -4% |
| Response Times | -32% | -29% | -31% | -99% | -46% | |
| Response Time Grey 50% / Grey 80% * | 3.9 ? | 5.1 ? -31% | 5.7 ? -46% | 5 ? -28% | 12.6 ? -223% | 5.7 ? -46% |
| Response Time Black / White * | 7.8 ? | 10.3 ? -32% | 8.7 ? -12% | 10.4 ? -33% | 5.8 ? 26% | 11.4 ? -46% |
| PWM Frequency | 2040 ? | |||||
| Screen | -13% | 5% | 16% | 21% | -27% | |
| Brightness middle | 348.4 | 302.2 -13% | 345.8 -1% | 490 41% | 487 40% | 557.2 60% |
| Brightness | 340 | 285 -16% | 337 -1% | 487 43% | 460 35% | 506 49% |
| Brightness Distribution | 90 | 89 -1% | 87 -3% | 94 4% | 88 -2% | 83 -8% |
| Black Level * | 0.33 | 0.26 21% | 0.3 9% | 0.4 -21% | 0.42 -27% | 0.41 -24% |
| Contrast | 1056 | 1162 10% | 1153 9% | 1225 16% | 1160 10% | 1359 29% |
| Colorchecker dE 2000 * | 2.68 | 1.63 39% | 1.99 26% | 1.08 60% | 1.12 58% | 2.91 -9% |
| Colorchecker dE 2000 max. * | 4.14 | 4.13 -0% | 3.52 15% | 2.38 43% | 2.26 45% | 5.94 -43% |
| Colorchecker dE 2000 calibrated * | 0.42 | 1.17 -179% | 0.62 -48% | 0.9 -114% | 0.54 -29% | 1.63 -288% |
| Greyscale dE 2000 * | 3.4 | 2.5 26% | 2.1 38% | 1.1 68% | 1.4 59% | 3.8 -12% |
| Gamma | 2.41 91% | 2.23 99% | 2.32 95% | 2.13 103% | 2.242 98% | 2.23 99% |
| CCT | 6083 107% | 6590 99% | 6369 102% | 6724 97% | 6809 95% | 6408 101% |
| Média Total (Programa/Configurações) | -15% /
-13% | -13% /
-4% | -5% /
6% | -26% /
-1% | -25% /
-25% |
* ... menor é melhor
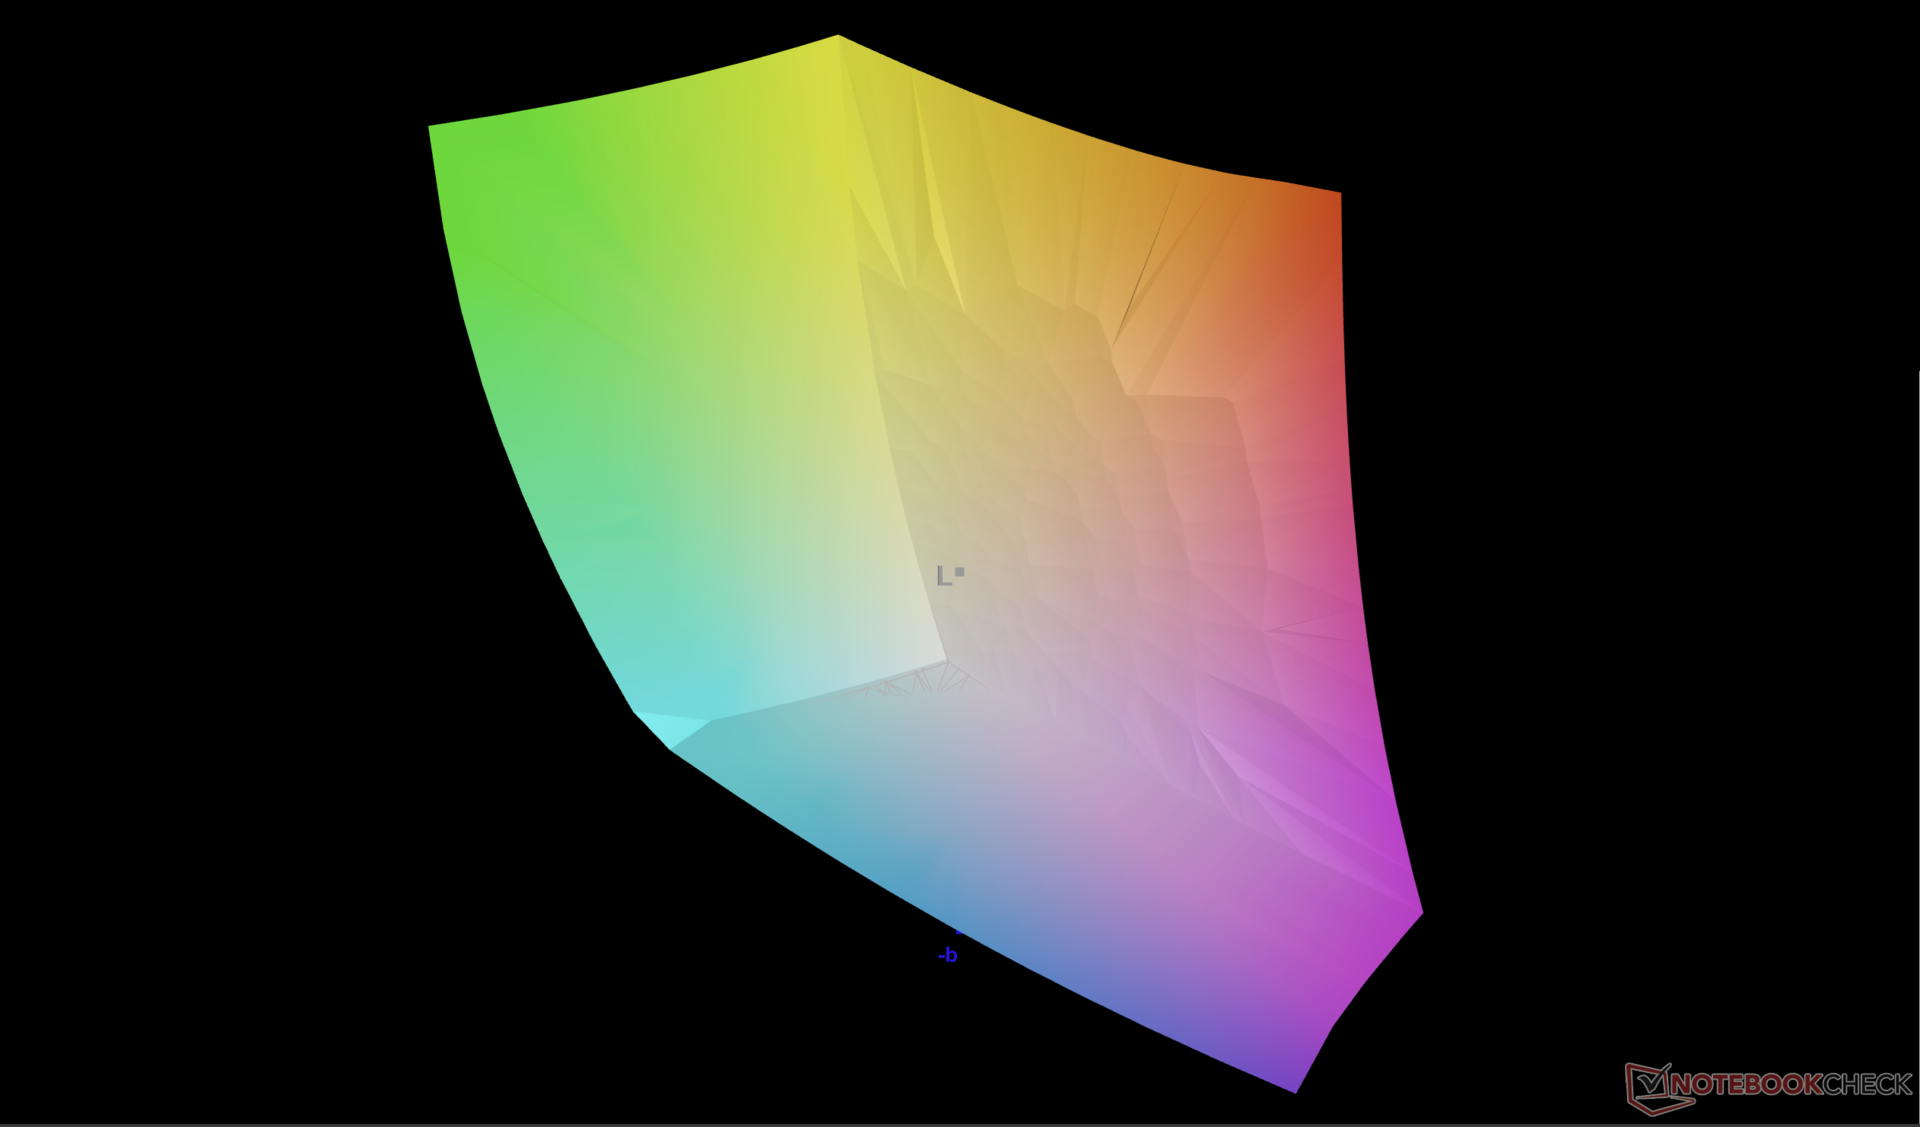
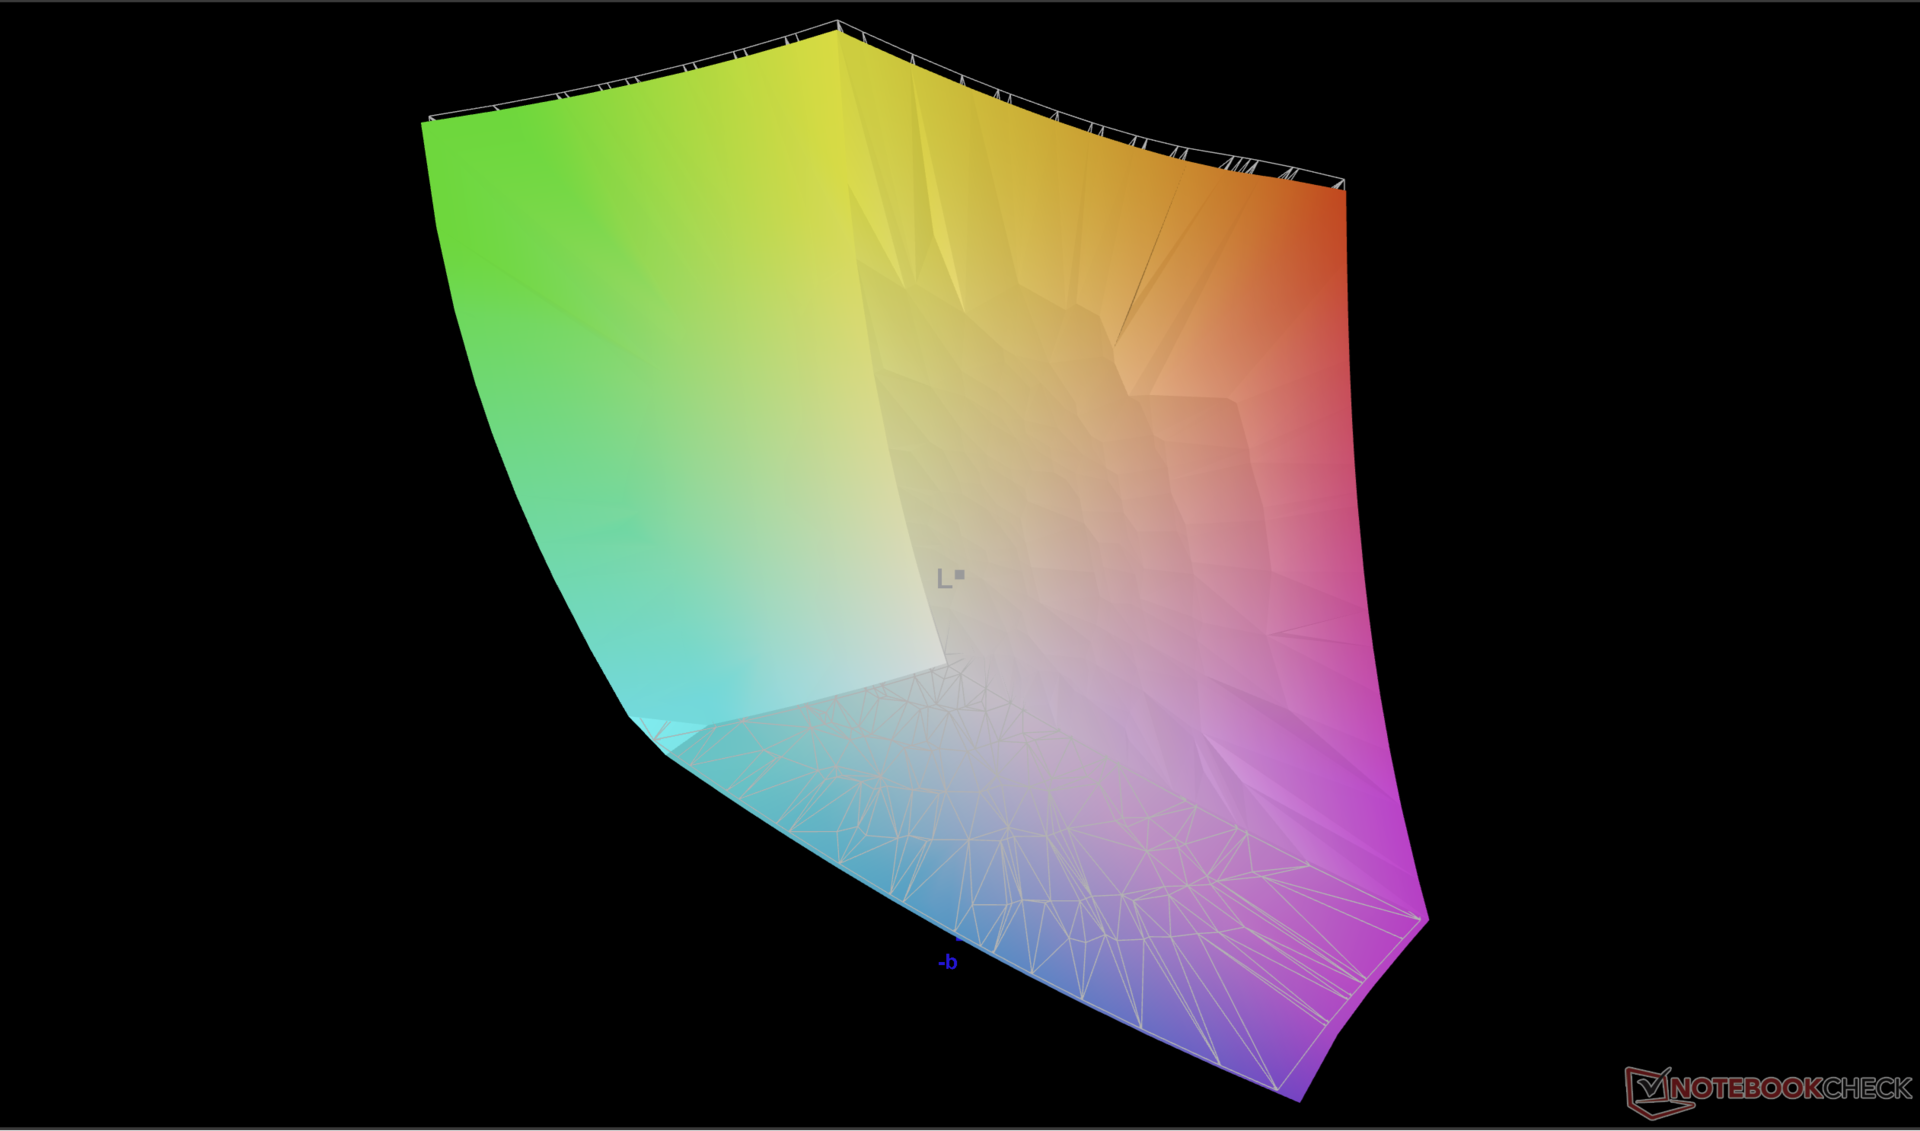
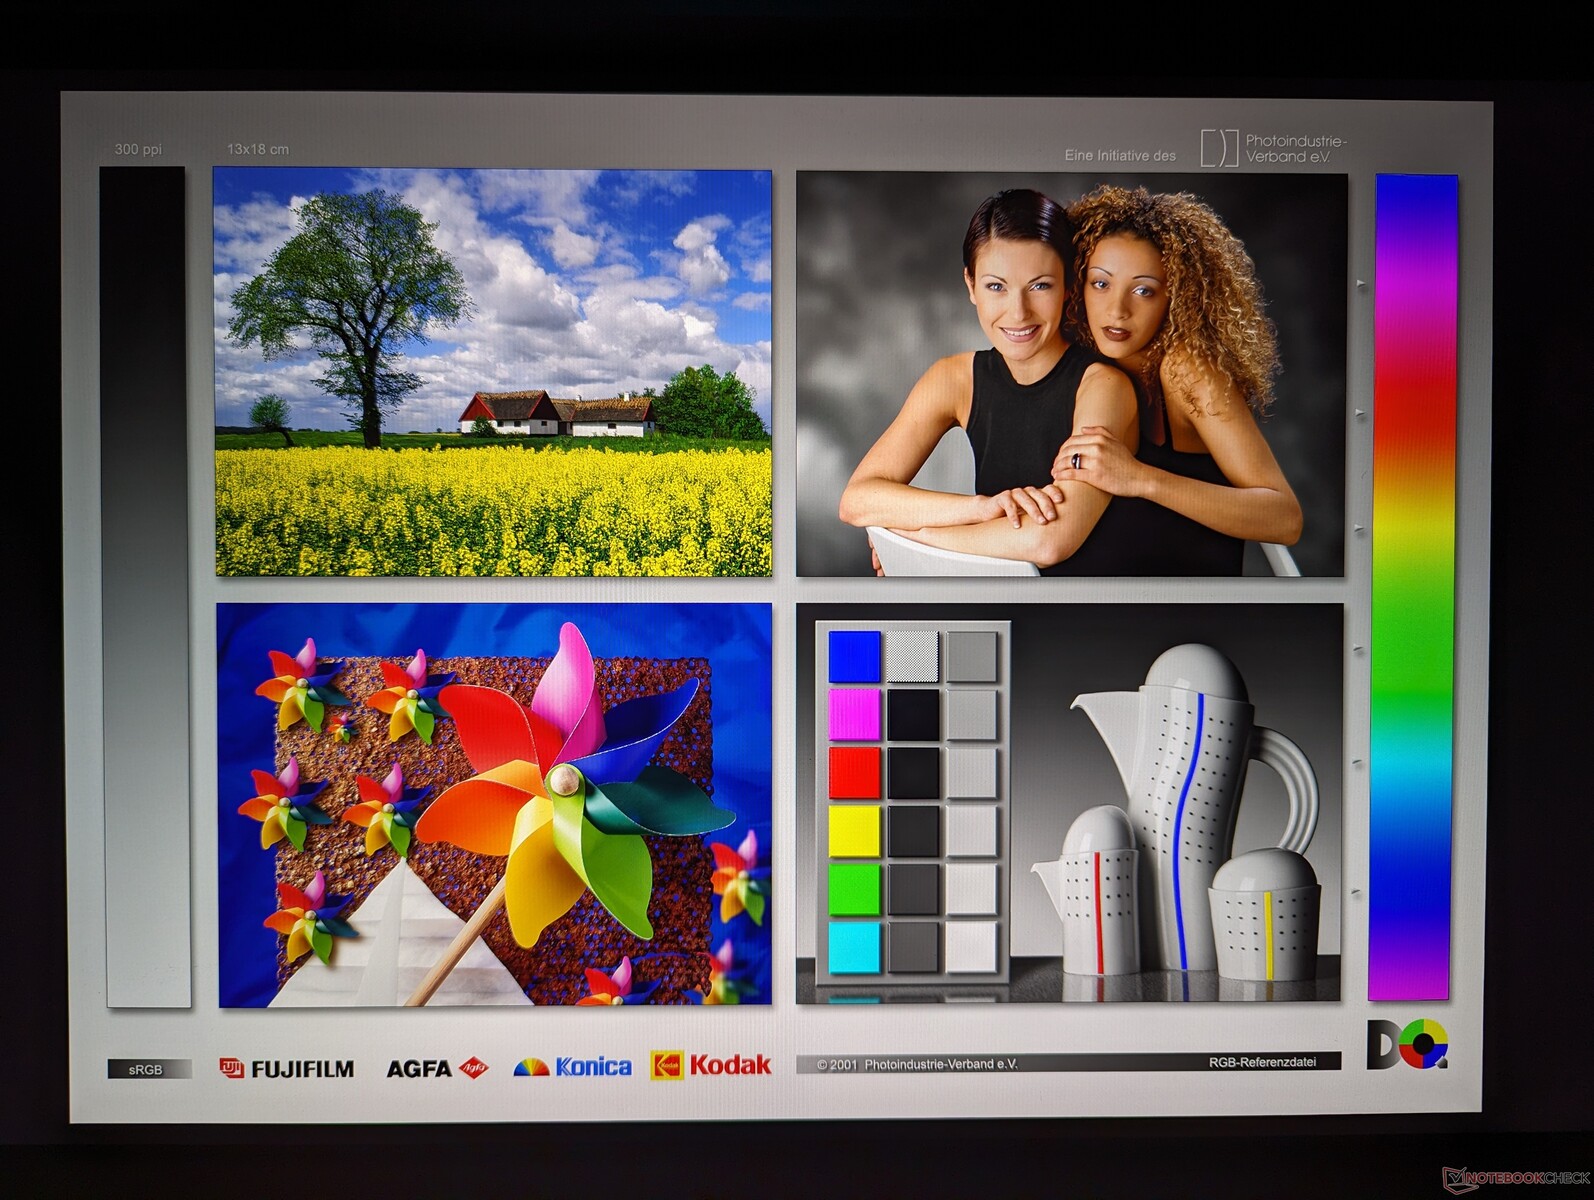
A tela é definida como sRGB por padrão, embora suporte cores P3 completas. No entanto, ele está decentemente calibrado, embora a temperatura da cor esteja um pouco quente demais.
Exibir tempos de resposta
| ↔ Tempo de resposta preto para branco | ||
|---|---|---|
| 7.8 ms ... ascensão ↗ e queda ↘ combinadas | ↗ 3.9 ms ascensão | 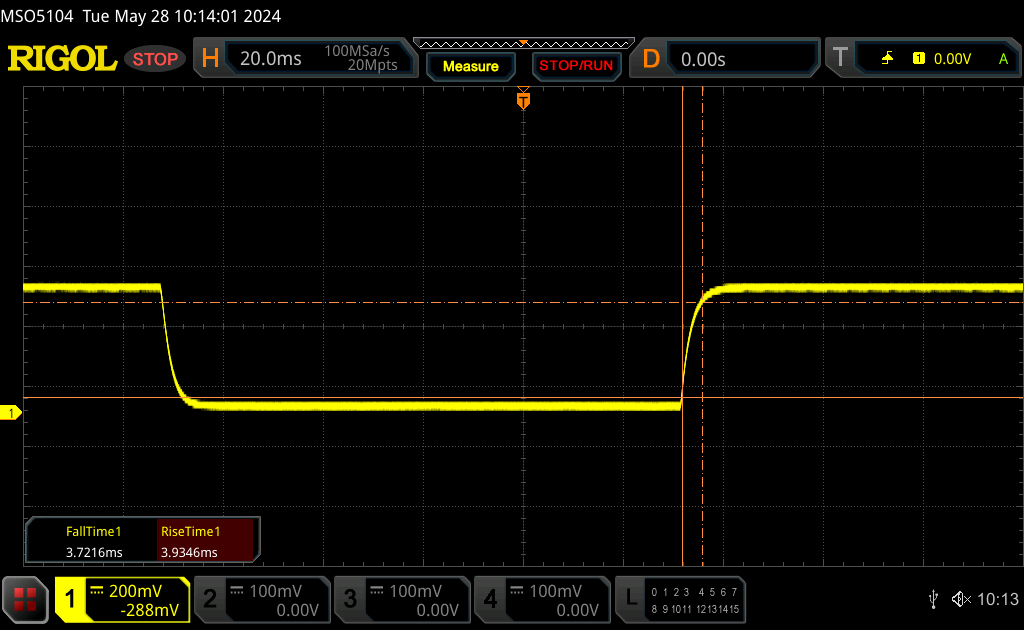 |
| ↘ 3.7 ms queda | ||
| A tela mostra taxas de resposta muito rápidas em nossos testes e deve ser muito adequada para jogos em ritmo acelerado. Em comparação, todos os dispositivos testados variam de 0.1 (mínimo) a 240 (máximo) ms. » 19 % de todos os dispositivos são melhores. Isso significa que o tempo de resposta medido é melhor que a média de todos os dispositivos testados (20.8 ms). | ||
| ↔ Tempo de resposta 50% cinza a 80% cinza | ||
| 3.9 ms ... ascensão ↗ e queda ↘ combinadas | ↗ 1.7 ms ascensão | 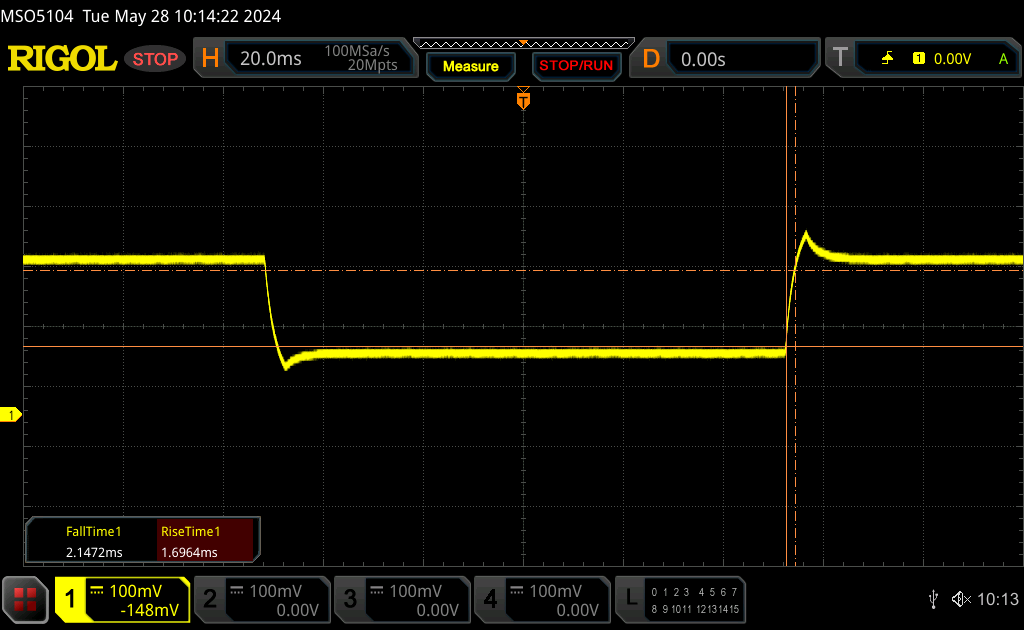 |
| ↘ 2.2 ms queda | ||
| A tela mostra taxas de resposta muito rápidas em nossos testes e deve ser muito adequada para jogos em ritmo acelerado. Em comparação, todos os dispositivos testados variam de 0.165 (mínimo) a 636 (máximo) ms. » 12 % de todos os dispositivos são melhores. Isso significa que o tempo de resposta medido é melhor que a média de todos os dispositivos testados (32.5 ms). | ||
Cintilação da tela / PWM (modulação por largura de pulso)
| Tela tremeluzindo / PWM não detectado | 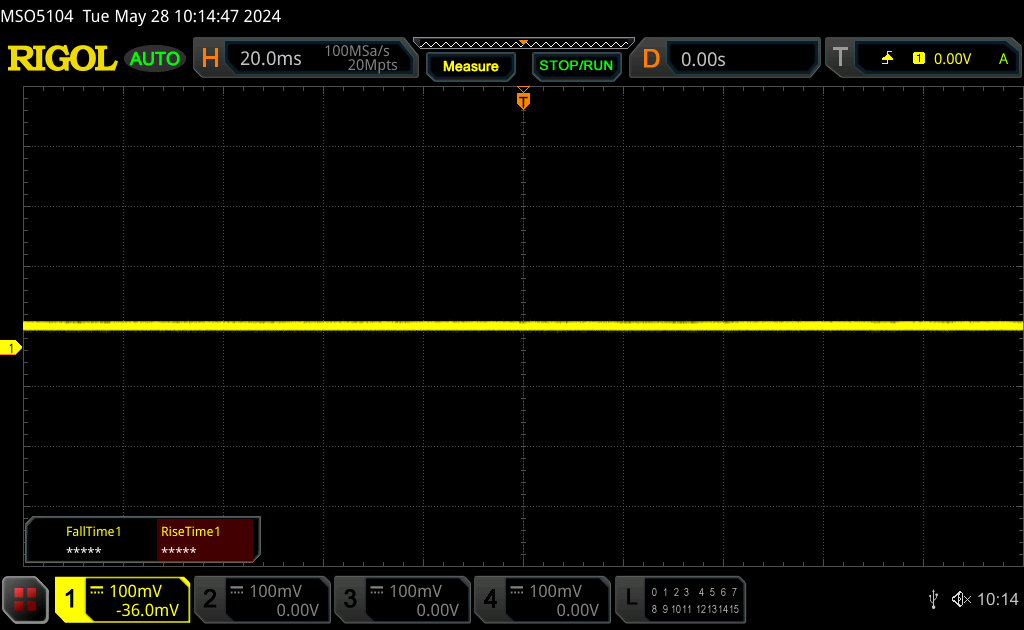 | ||
[pwm_comparison] Em comparação: 53 % de todos os dispositivos testados não usam PWM para escurecer a tela. Se PWM foi detectado, uma média de 8516 (mínimo: 5 - máximo: 343500) Hz foi medida. | |||

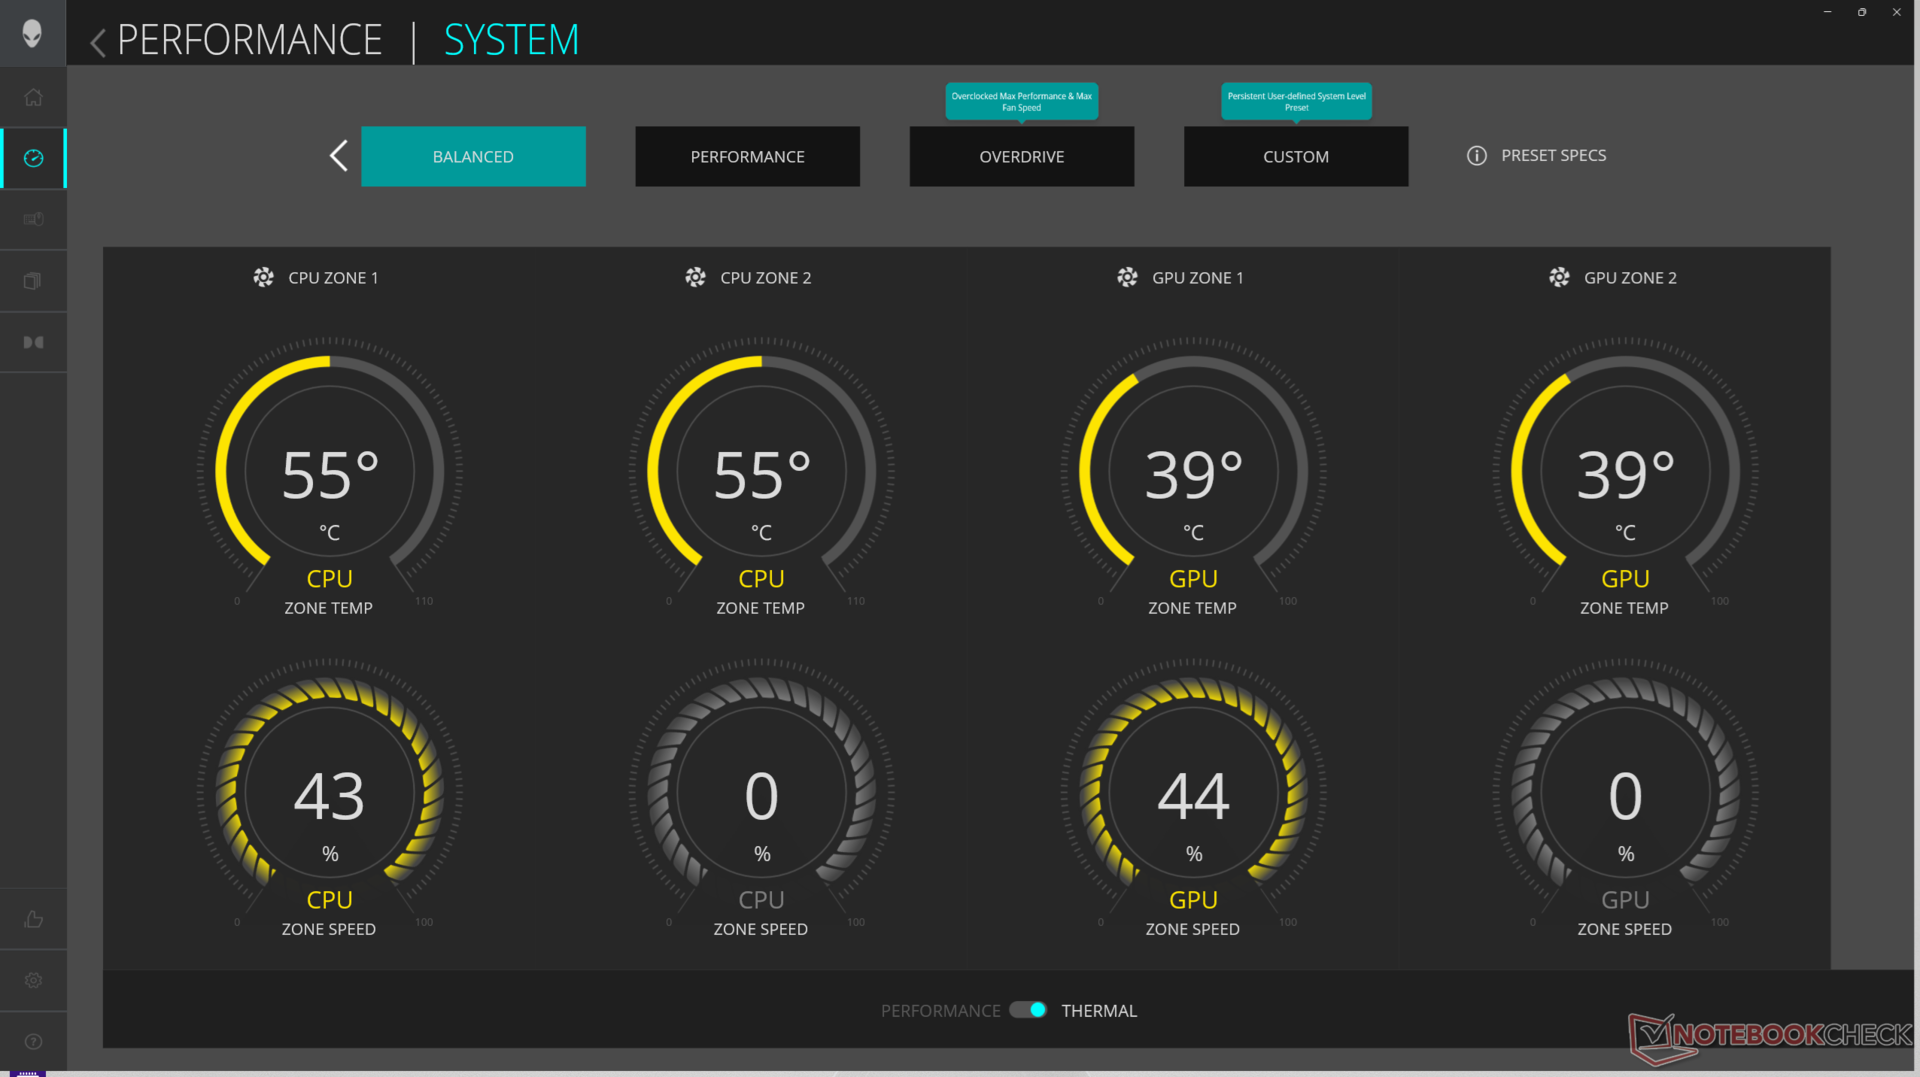
Desempenho - Core Ultra 9 185H vs. Core i9-13900HK
Condições de teste
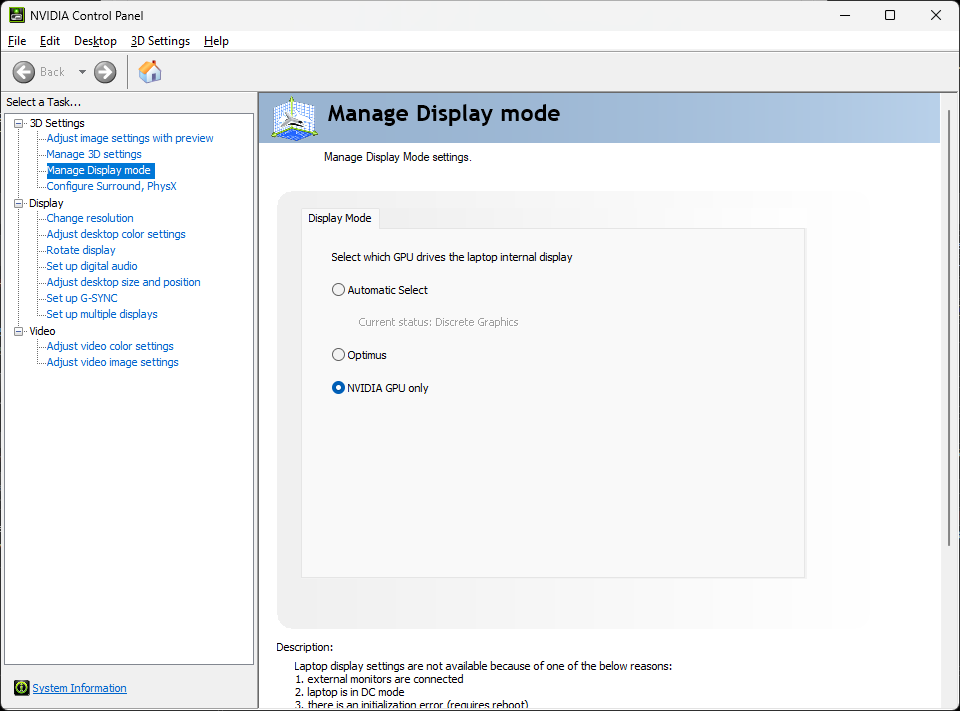
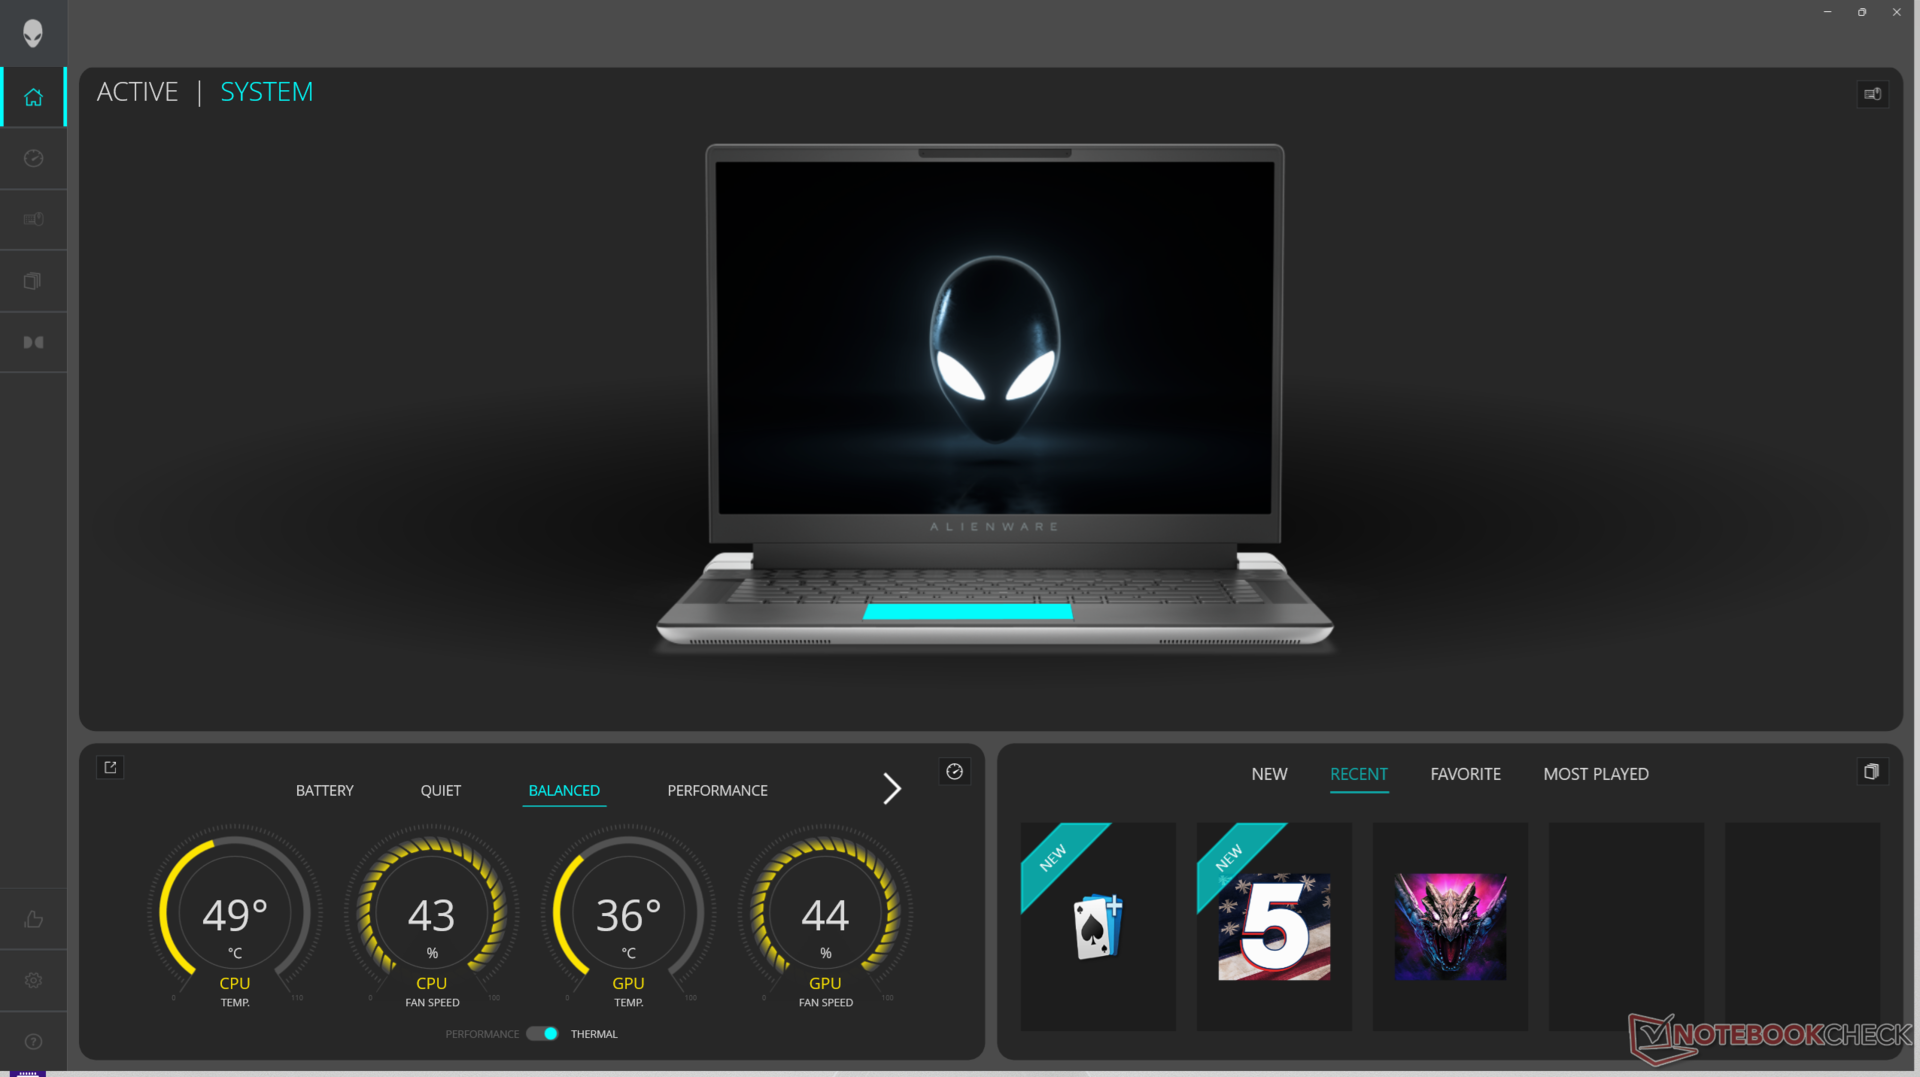
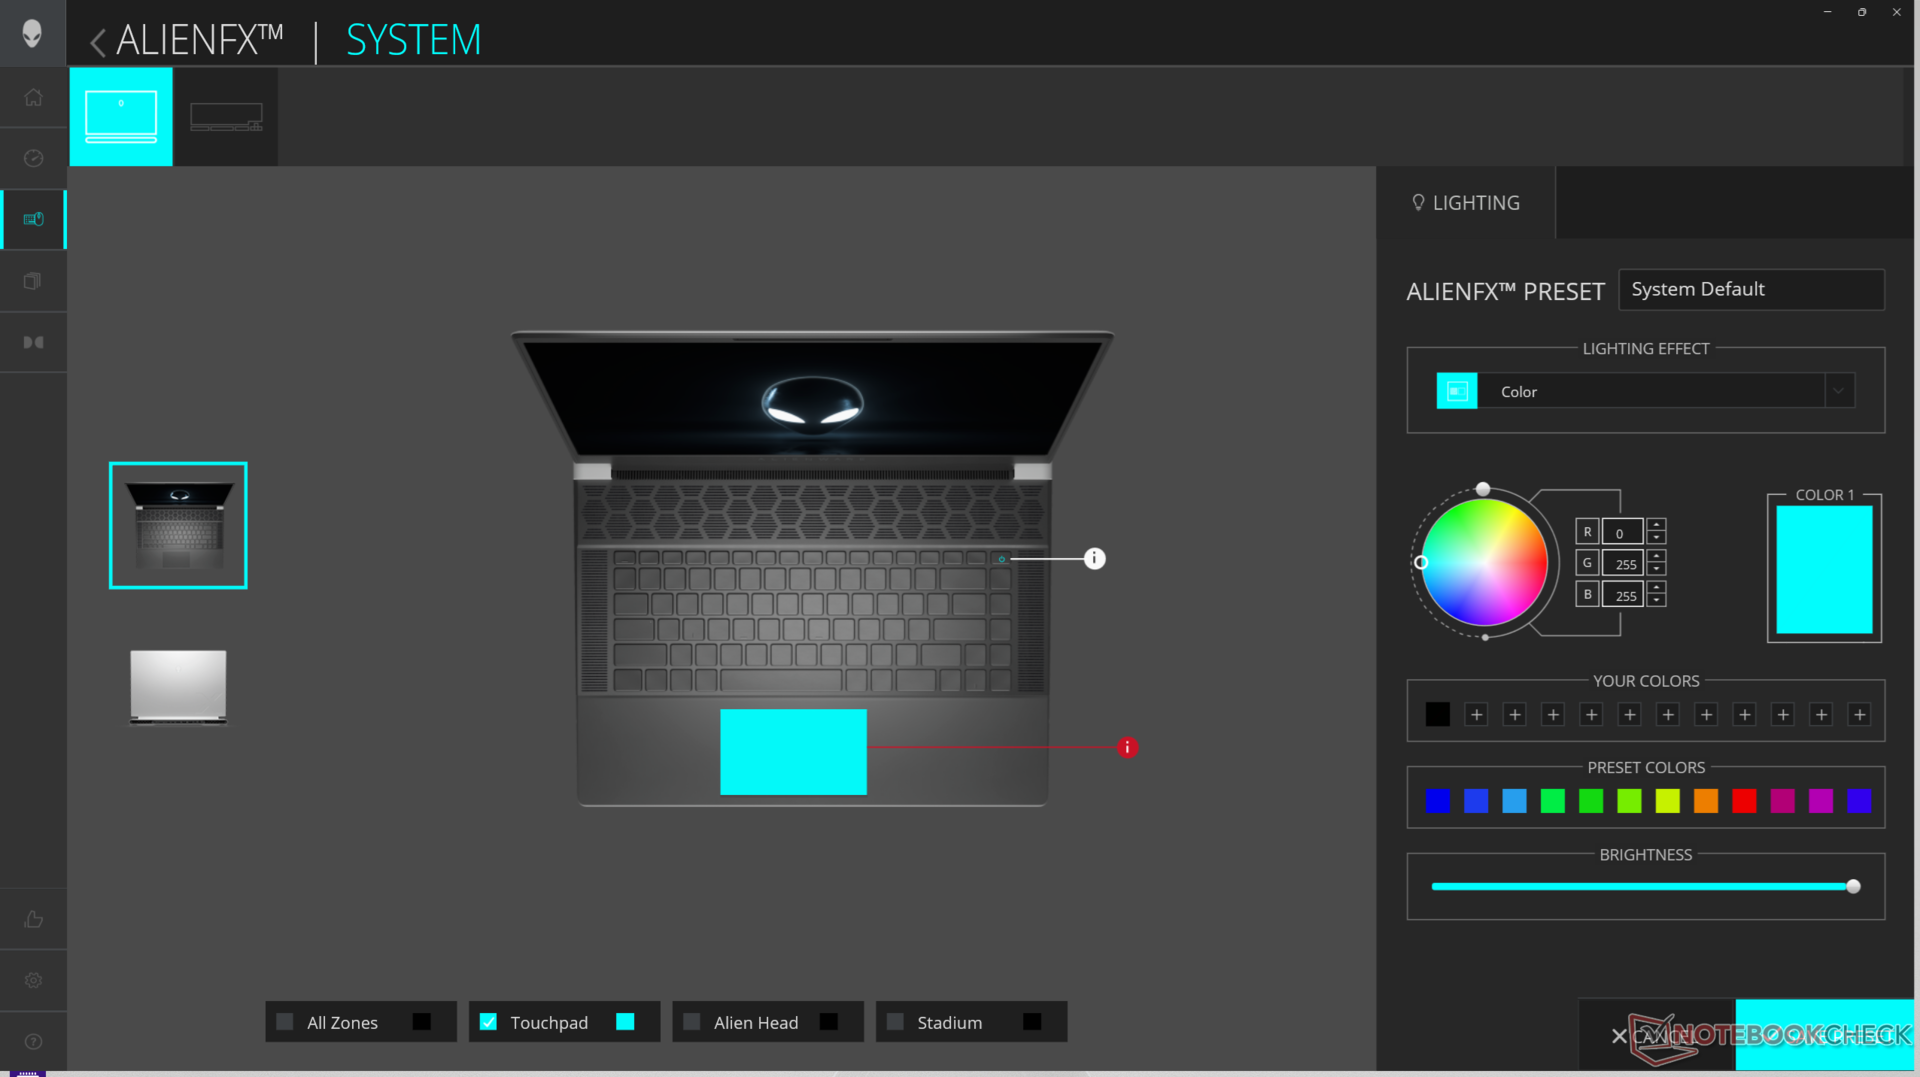
Definimos o Alienware Command Center para o modo Overdrive e os gráficos para o modo dGPU para obter os melhores resultados de benchmark possíveis. Os proprietários são incentivados a se familiarizar com o Command Center, pois ele é o centro de ajuste dos efeitos de iluminação RGB e dos perfis de desempenho.
O Painel de Controle da Nvidia não oferece o modo "somente iGPU", como mostra a captura de tela acima.
Processador
O Core Ultra 9 185H é aproximadamente 5 a 10 por cento e 15 a 20 por cento mais lento do que o Core i9-13900HK no x16 R1 do ano passado, quando se trata de aplicativos multi-threaded e single-threaded, respectivamente. É interessante notar que o downgrade para o Core Ultra 7 155H não deverá afetar o desempenho de forma significativa em nosso tempo com o Alienware m16 R2 como mostra o gráfico de comparação abaixo.
As opções Raptor Lake-HX, como o Core i9-14900HX não estão disponíveis na série Alienware x16, provavelmente devido a limitações térmicas, pois esses processadores exigem mais energia do que a série Meteor Lake-H. Essas opções teriam oferecido um desempenho significativamente mais rápido do que o Core i9-13900HK ou o Core Ultra 9 185H.
Cinebench R15 Multi Loop
Cinebench R23: Multi Core | Single Core
Cinebench R20: CPU (Multi Core) | CPU (Single Core)
Cinebench R15: CPU Multi 64Bit | CPU Single 64Bit
Blender: v2.79 BMW27 CPU
7-Zip 18.03: 7z b 4 | 7z b 4 -mmt1
Geekbench 6.4: Multi-Core | Single-Core
Geekbench 5.5: Multi-Core | Single-Core
HWBOT x265 Benchmark v2.2: 4k Preset
LibreOffice : 20 Documents To PDF
R Benchmark 2.5: Overall mean
* ... menor é melhor
AIDA64: FP32 Ray-Trace | FPU Julia | CPU SHA3 | CPU Queen | FPU SinJulia | FPU Mandel | CPU AES | CPU ZLib | FP64 Ray-Trace | CPU PhotoWorxx
| Performance Rating | |
| MSI Vector 16 HX A14V | |
| Lenovo Legion Pro 7 16IRX9H | |
| Asus ROG Strix Scar 16 G634JZR | |
| Alienware x16 R2 P120F | |
| Alienware x16 R1 | |
| Alienware m16 R2 | |
| Média Intel Core Ultra 9 185H | |
| AIDA64 / FP32 Ray-Trace | |
| MSI Vector 16 HX A14V | |
| Lenovo Legion Pro 7 16IRX9H | |
| Asus ROG Strix Scar 16 G634JZR | |
| Alienware x16 R2 P120F | |
| Alienware m16 R2 | |
| Alienware x16 R1 | |
| Média Intel Core Ultra 9 185H (9220 - 18676, n=19) | |
| AIDA64 / FPU Julia | |
| MSI Vector 16 HX A14V | |
| Lenovo Legion Pro 7 16IRX9H | |
| Asus ROG Strix Scar 16 G634JZR | |
| Alienware x16 R2 P120F | |
| Alienware m16 R2 | |
| Alienware x16 R1 | |
| Média Intel Core Ultra 9 185H (48865 - 96463, n=19) | |
| AIDA64 / CPU SHA3 | |
| Lenovo Legion Pro 7 16IRX9H | |
| MSI Vector 16 HX A14V | |
| Asus ROG Strix Scar 16 G634JZR | |
| Alienware x16 R2 P120F | |
| Alienware m16 R2 | |
| Alienware x16 R1 | |
| Média Intel Core Ultra 9 185H (2394 - 4534, n=19) | |
| AIDA64 / CPU Queen | |
| Asus ROG Strix Scar 16 G634JZR | |
| Lenovo Legion Pro 7 16IRX9H | |
| MSI Vector 16 HX A14V | |
| Alienware x16 R1 | |
| Alienware x16 R2 P120F | |
| Média Intel Core Ultra 9 185H (66785 - 95241, n=19) | |
| Alienware m16 R2 | |
| AIDA64 / FPU SinJulia | |
| Lenovo Legion Pro 7 16IRX9H | |
| MSI Vector 16 HX A14V | |
| Asus ROG Strix Scar 16 G634JZR | |
| Alienware x16 R1 | |
| Alienware x16 R2 P120F | |
| Alienware m16 R2 | |
| Média Intel Core Ultra 9 185H (7255 - 11392, n=19) | |
| AIDA64 / FPU Mandel | |
| MSI Vector 16 HX A14V | |
| Lenovo Legion Pro 7 16IRX9H | |
| Asus ROG Strix Scar 16 G634JZR | |
| Alienware x16 R2 P120F | |
| Alienware m16 R2 | |
| Alienware x16 R1 | |
| Média Intel Core Ultra 9 185H (24004 - 48020, n=19) | |
| AIDA64 / CPU AES | |
| Asus ROG Strix Scar 16 G634JZR | |
| Lenovo Legion Pro 7 16IRX9H | |
| MSI Vector 16 HX A14V | |
| Média Intel Core Ultra 9 185H (53116 - 154066, n=19) | |
| Alienware x16 R2 P120F | |
| Alienware m16 R2 | |
| Alienware x16 R1 | |
| AIDA64 / CPU ZLib | |
| Lenovo Legion Pro 7 16IRX9H | |
| MSI Vector 16 HX A14V | |
| Asus ROG Strix Scar 16 G634JZR | |
| Alienware x16 R2 P120F | |
| Alienware x16 R1 | |
| Alienware m16 R2 | |
| Média Intel Core Ultra 9 185H (678 - 1341, n=19) | |
| AIDA64 / FP64 Ray-Trace | |
| MSI Vector 16 HX A14V | |
| Lenovo Legion Pro 7 16IRX9H | |
| Asus ROG Strix Scar 16 G634JZR | |
| Alienware x16 R2 P120F | |
| Alienware x16 R1 | |
| Alienware m16 R2 | |
| Média Intel Core Ultra 9 185H (4428 - 10078, n=19) | |
| AIDA64 / CPU PhotoWorxx | |
| Alienware x16 R2 P120F | |
| Asus ROG Strix Scar 16 G634JZR | |
| Alienware x16 R1 | |
| MSI Vector 16 HX A14V | |
| Média Intel Core Ultra 9 185H (44547 - 53918, n=19) | |
| Lenovo Legion Pro 7 16IRX9H | |
| Alienware m16 R2 | |
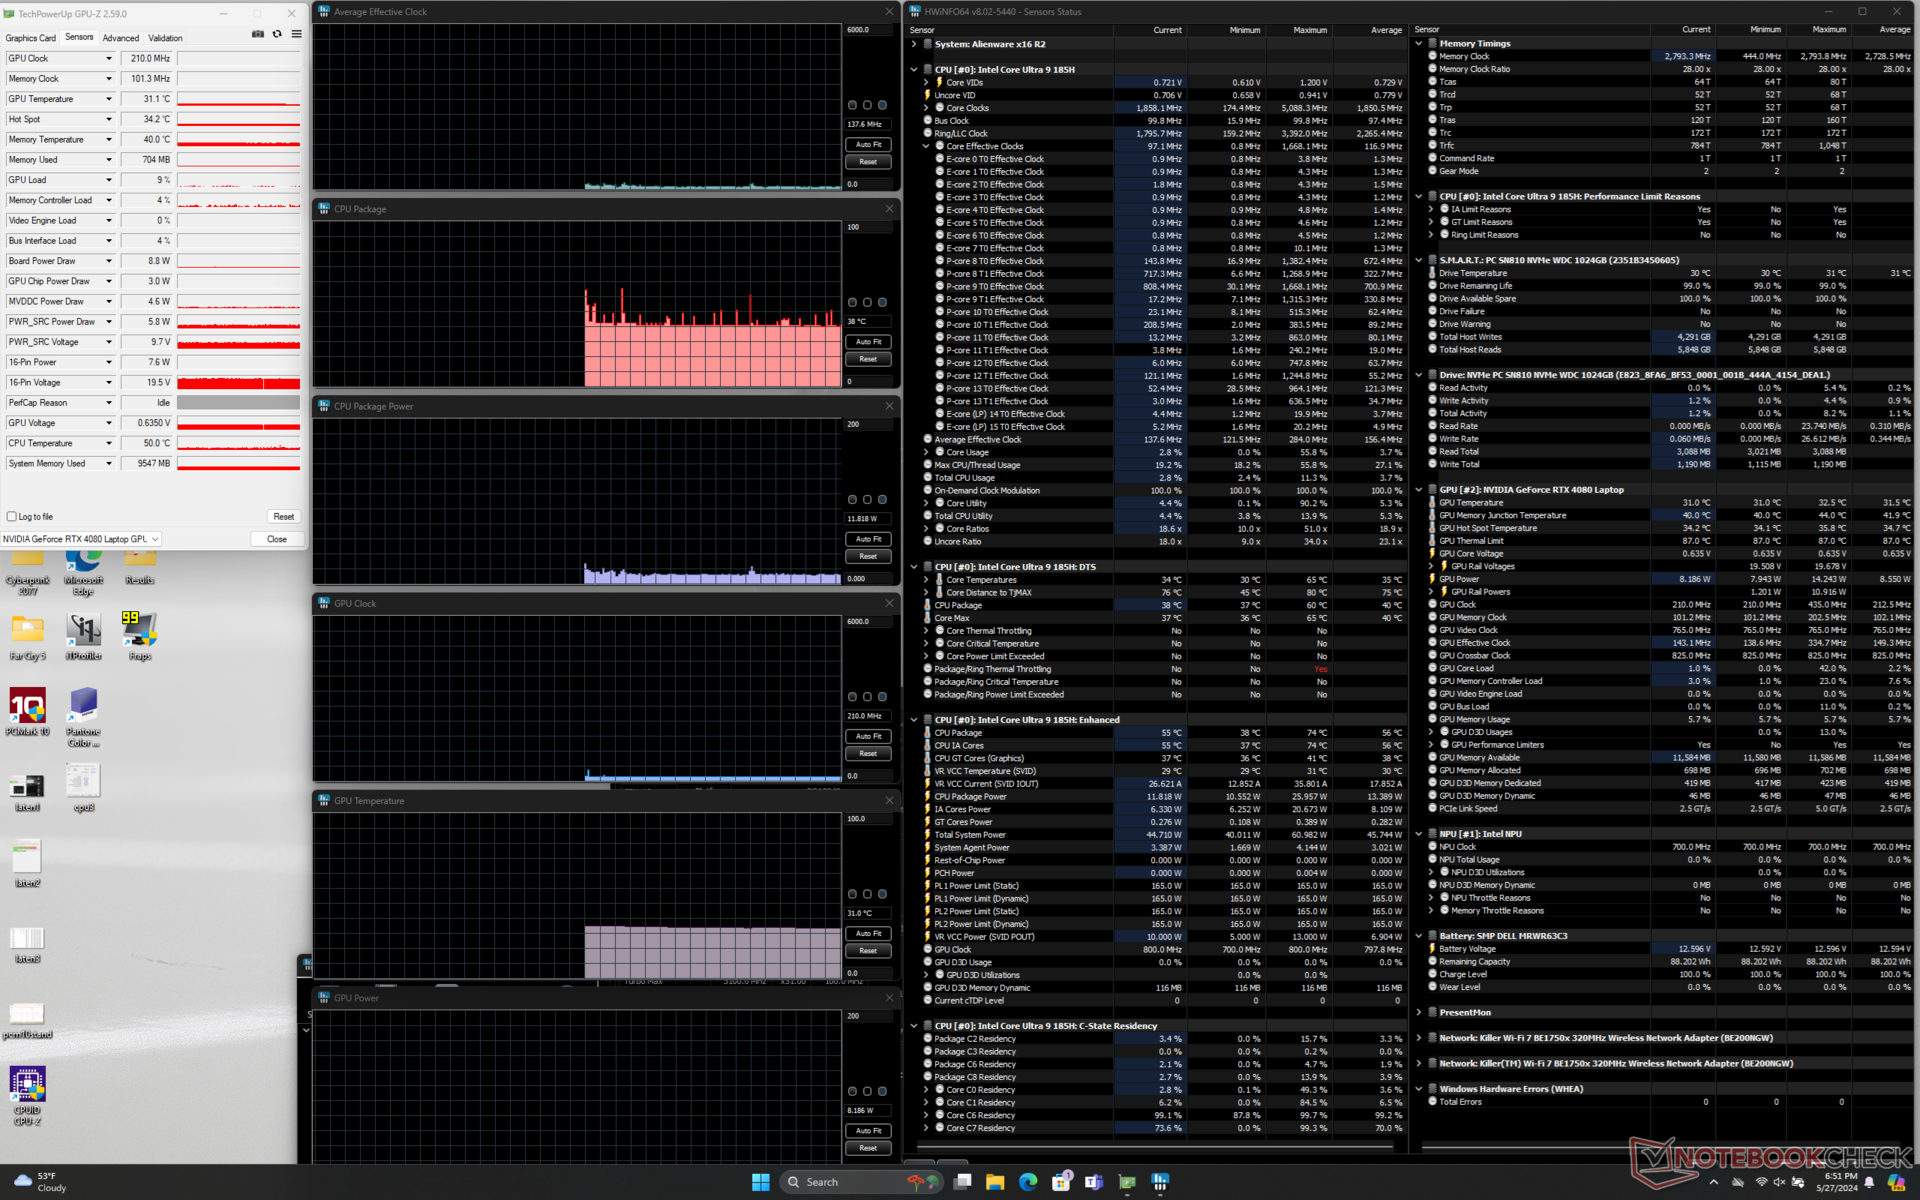
Teste de estresse
As temperaturas do núcleo entre a CPU e a GPU são tão altas quanto as que registramos no x16 R1. A CPU, em particular, ainda se estabiliza em quase 100 °C (!) ao executar o Prime95, enquanto a GPU se estabiliza na faixa de 80 °C ao executar o Witcher 3. É interessante notar que a taxa de clock da GPU está baixa em toda a linha em comparação com o x16 R1. A GPU varia entre 2100 e 2325 MHz, dependendo do perfil de energia, em comparação com 2460 MHz no x16 R1 original. O consumo de energia da placa também seria menor no modelo x16 R2 mais recente (150 W vs. 165 W). Essas descobertas estão correlacionadas com o desempenho gráfico geralmente mais lento na seção Desempenho da GPU abaixo.
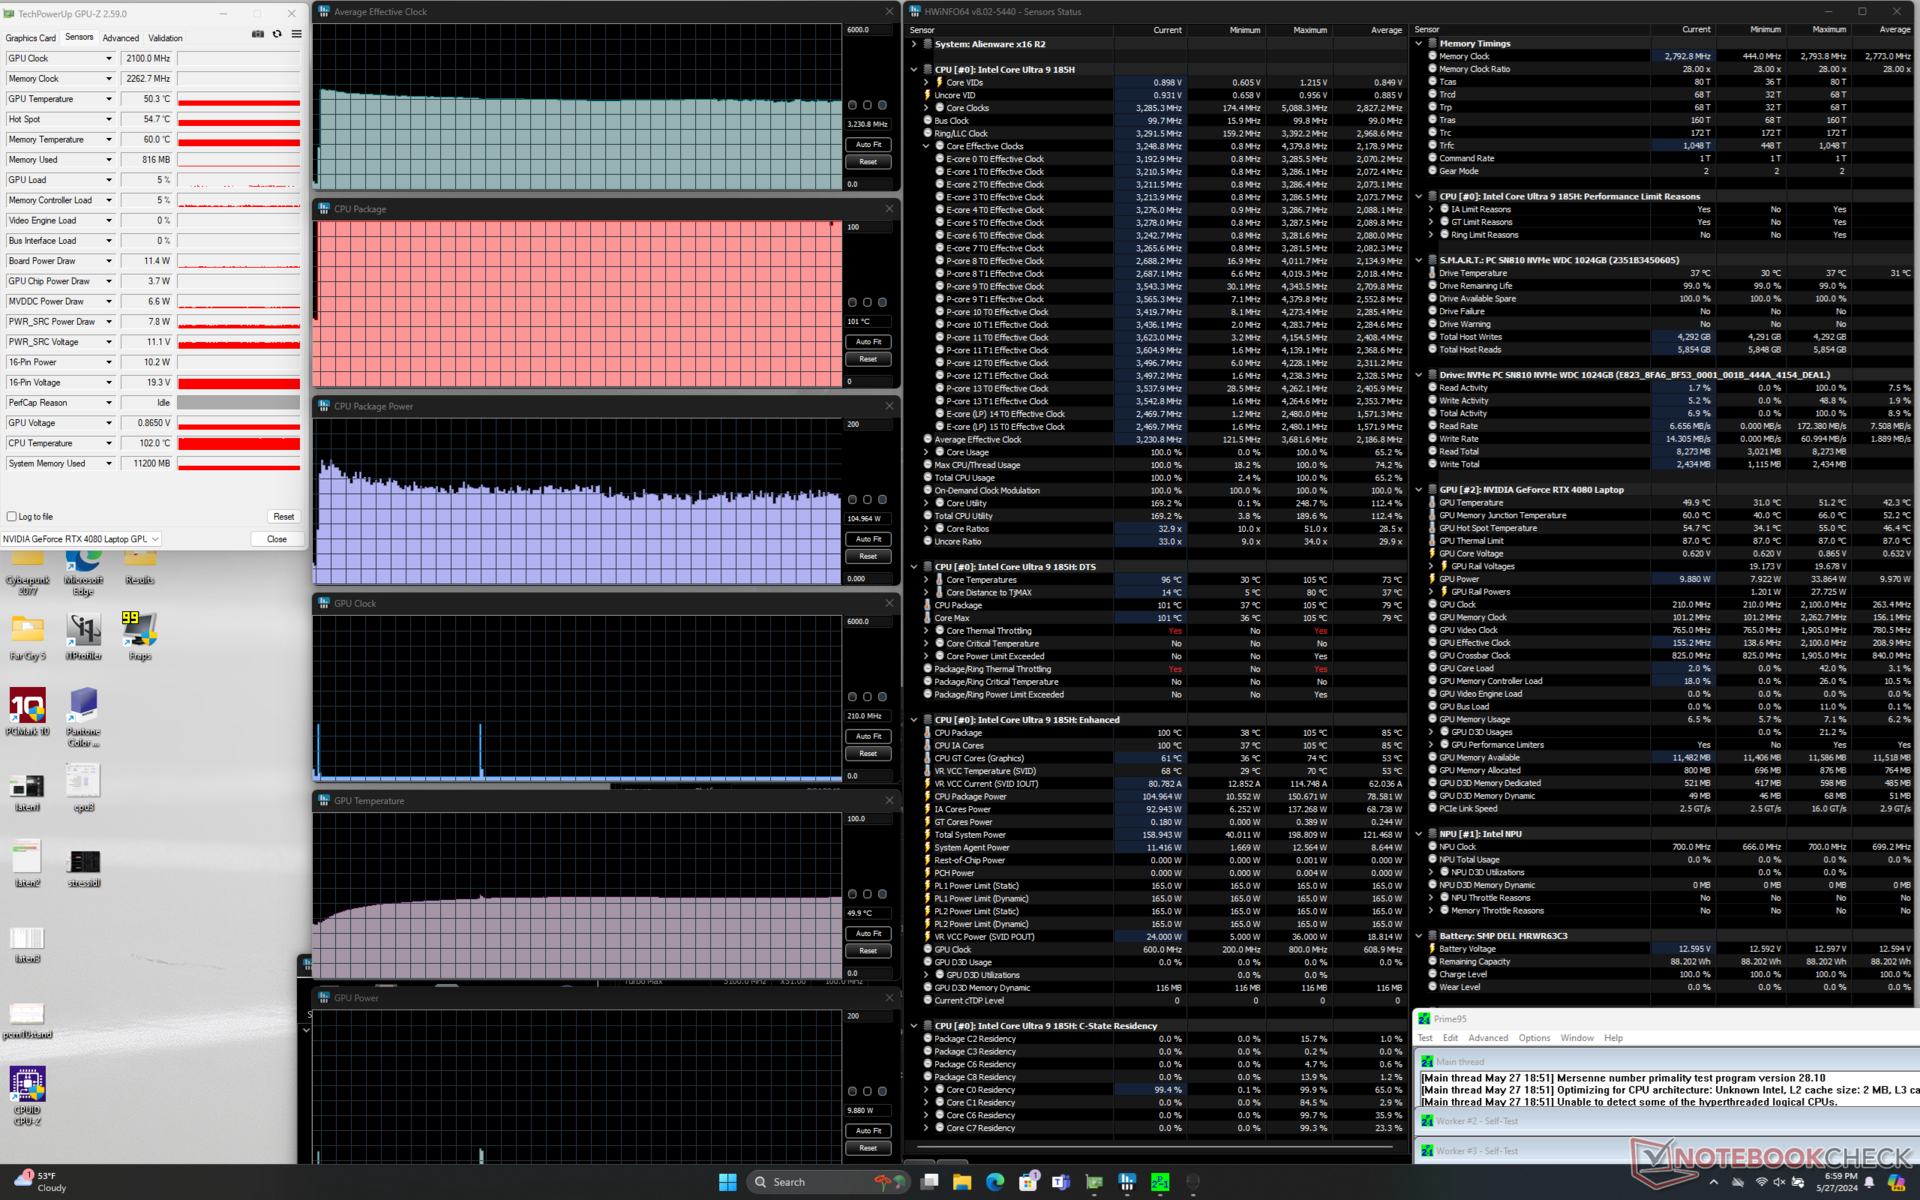
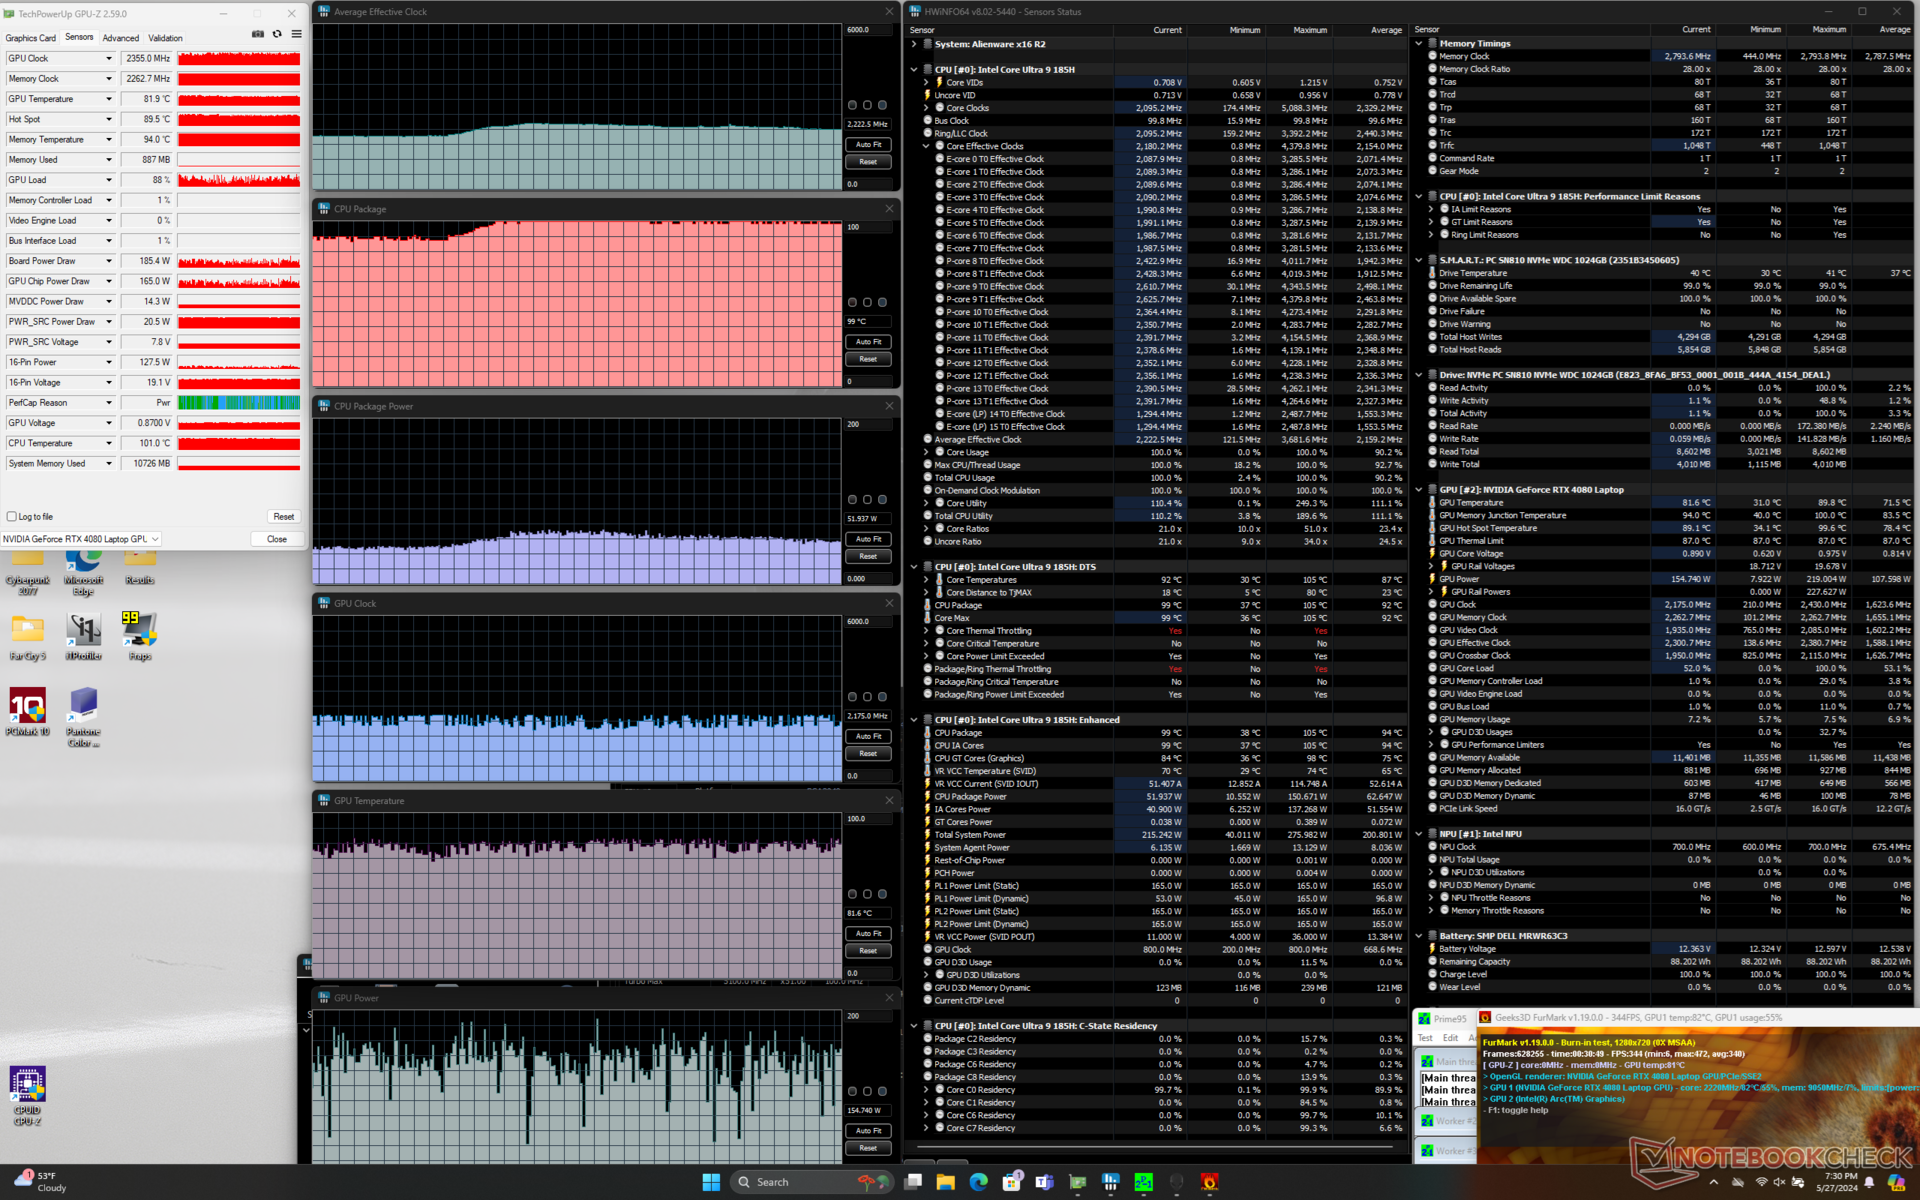
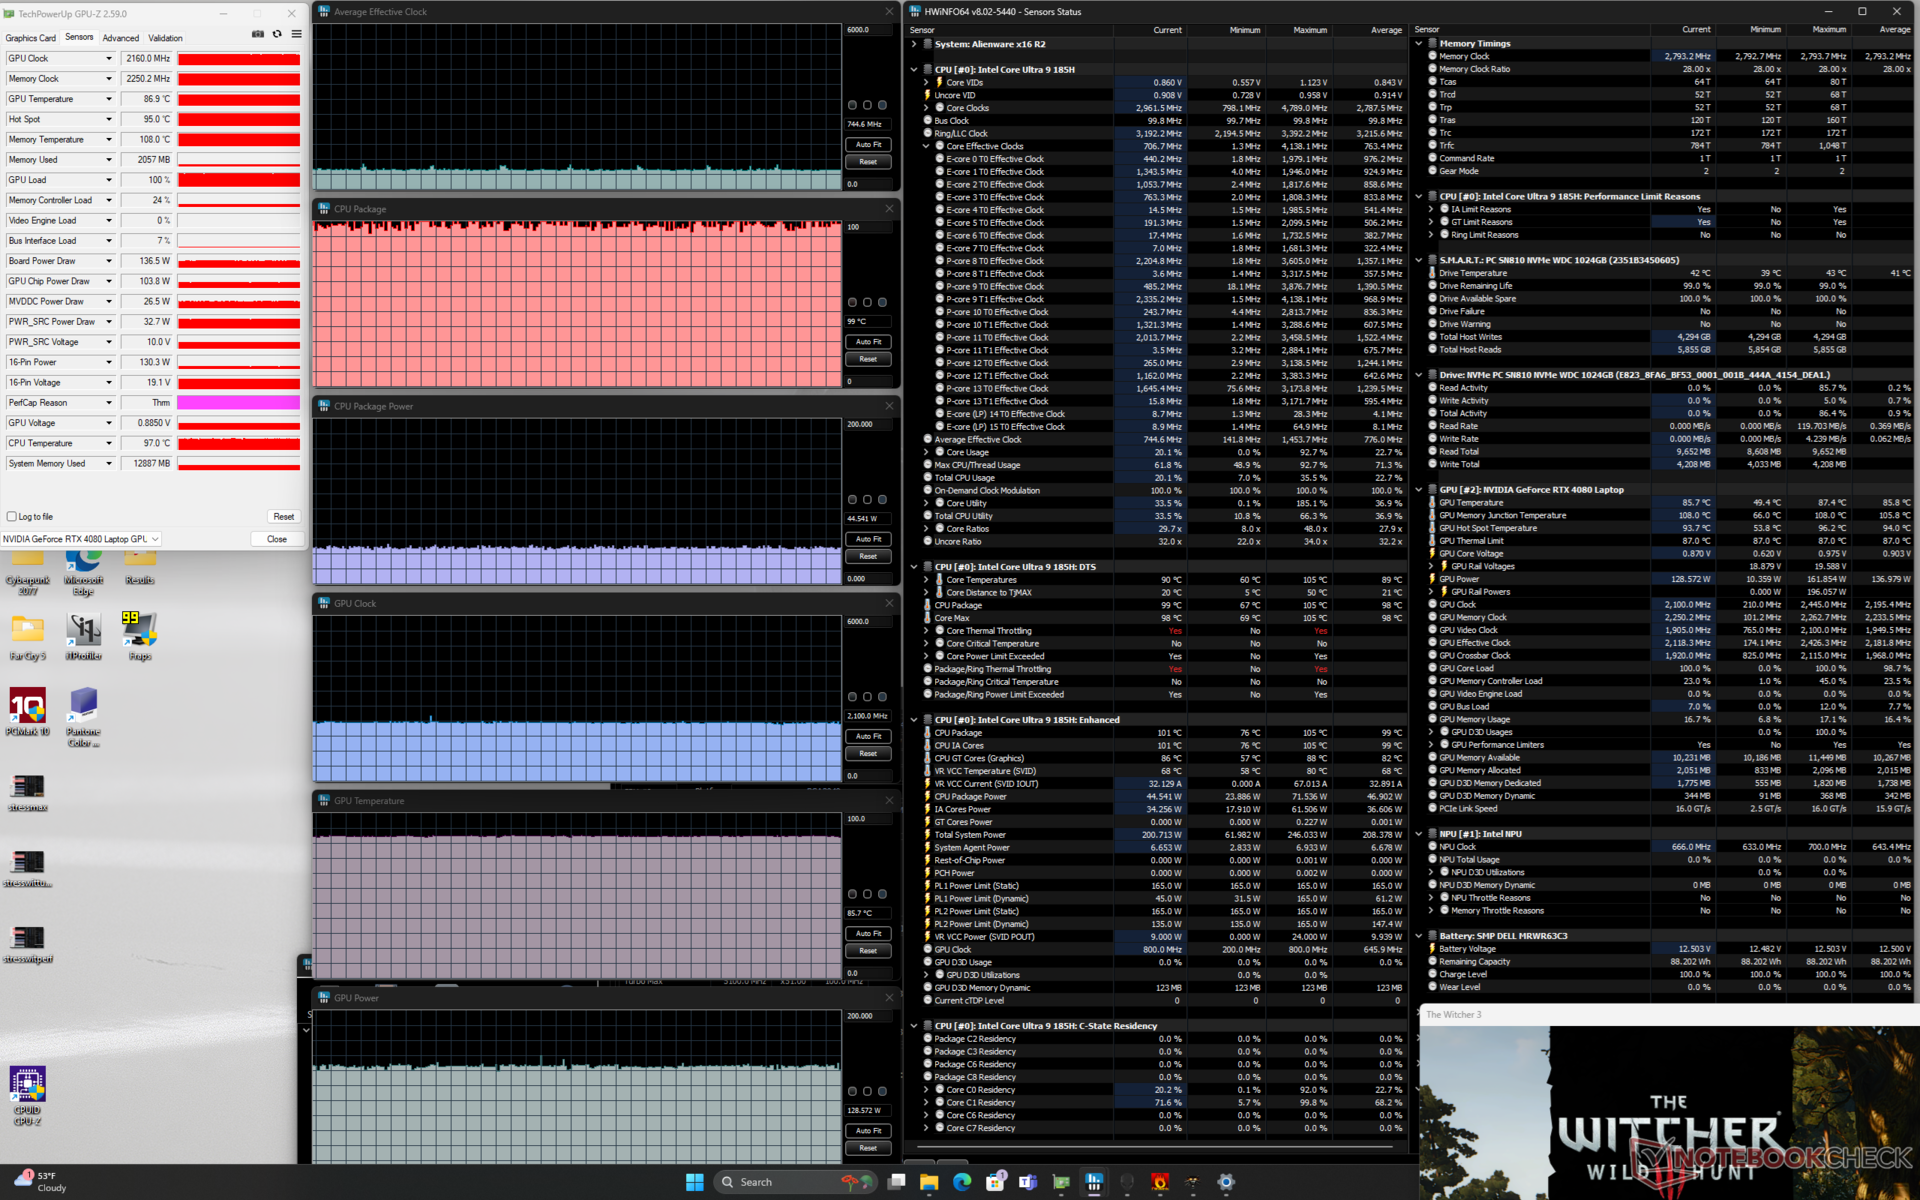
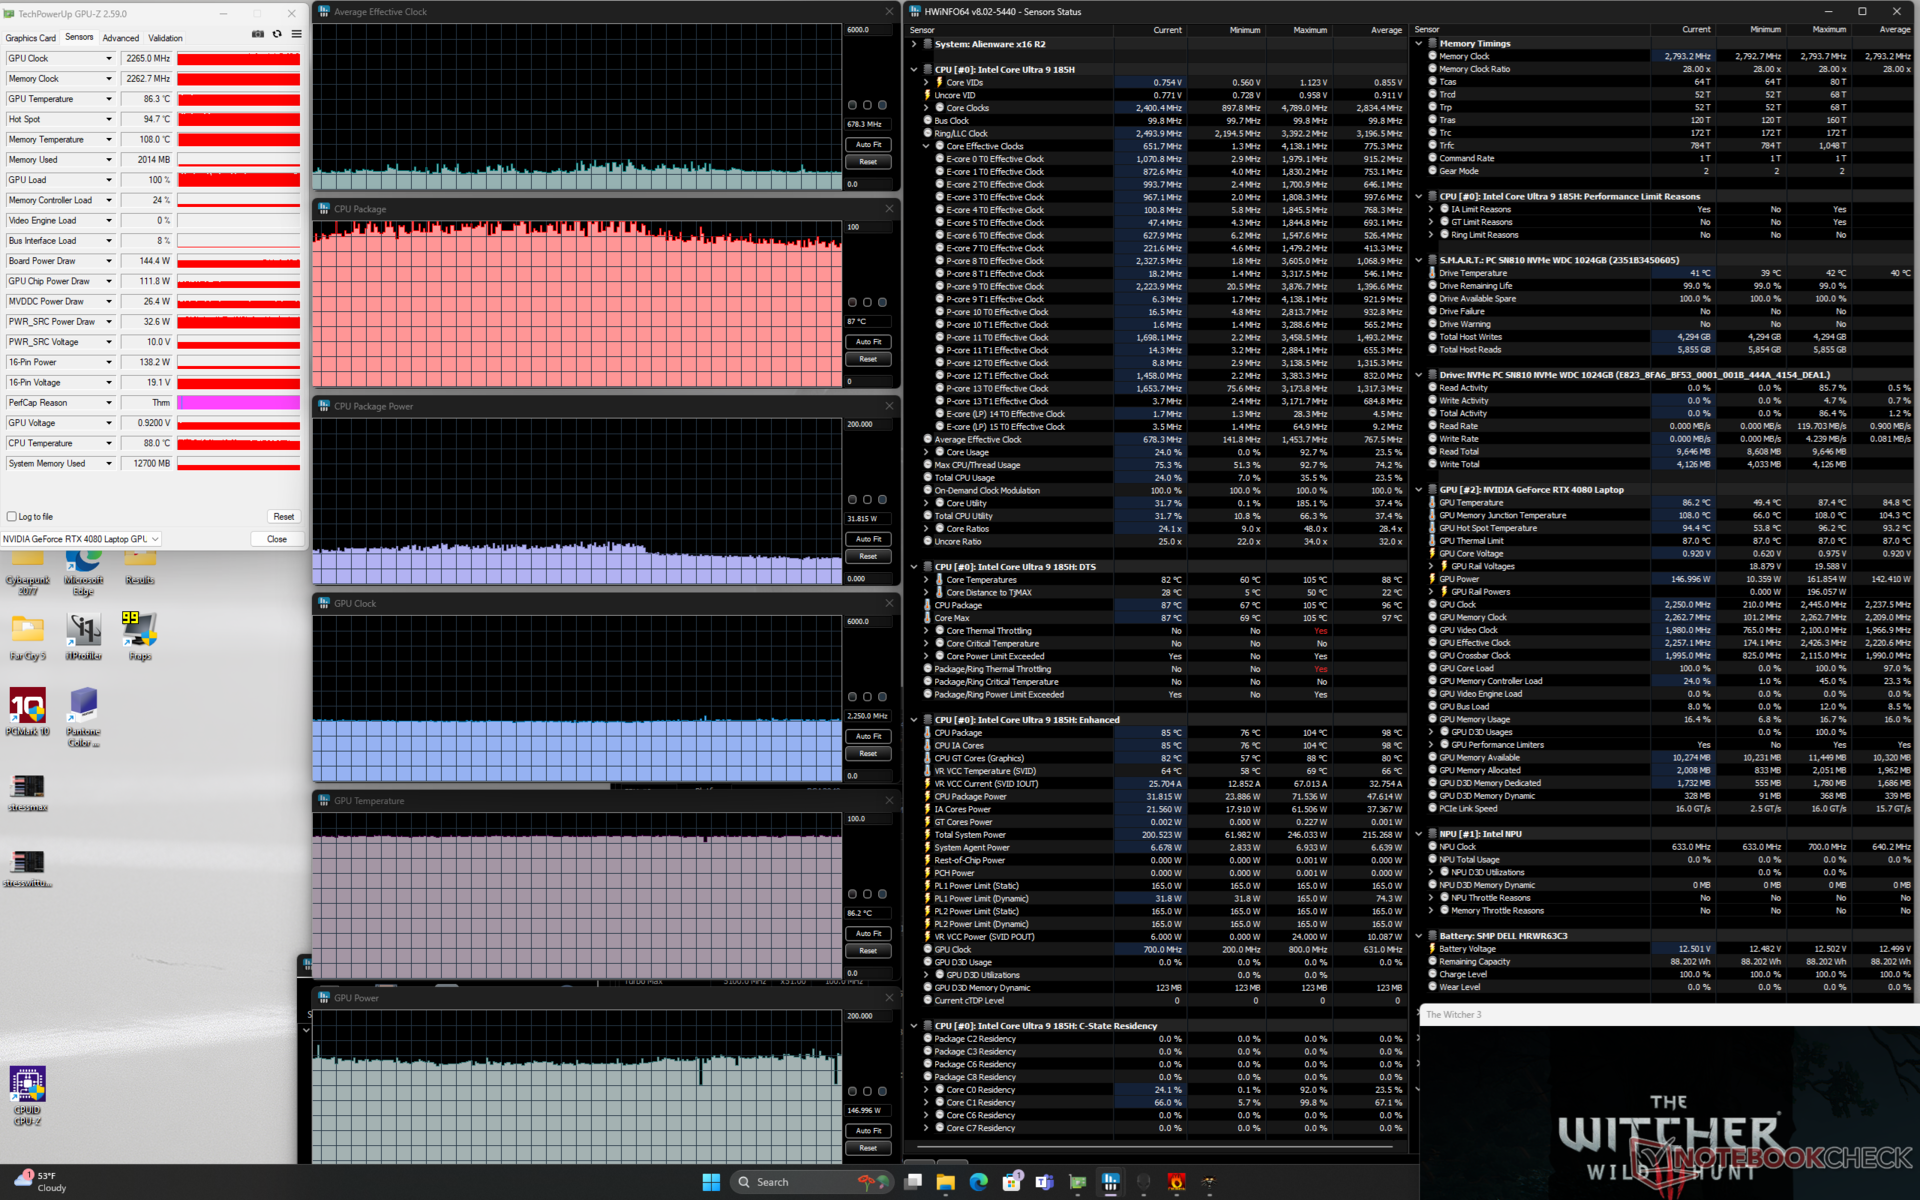
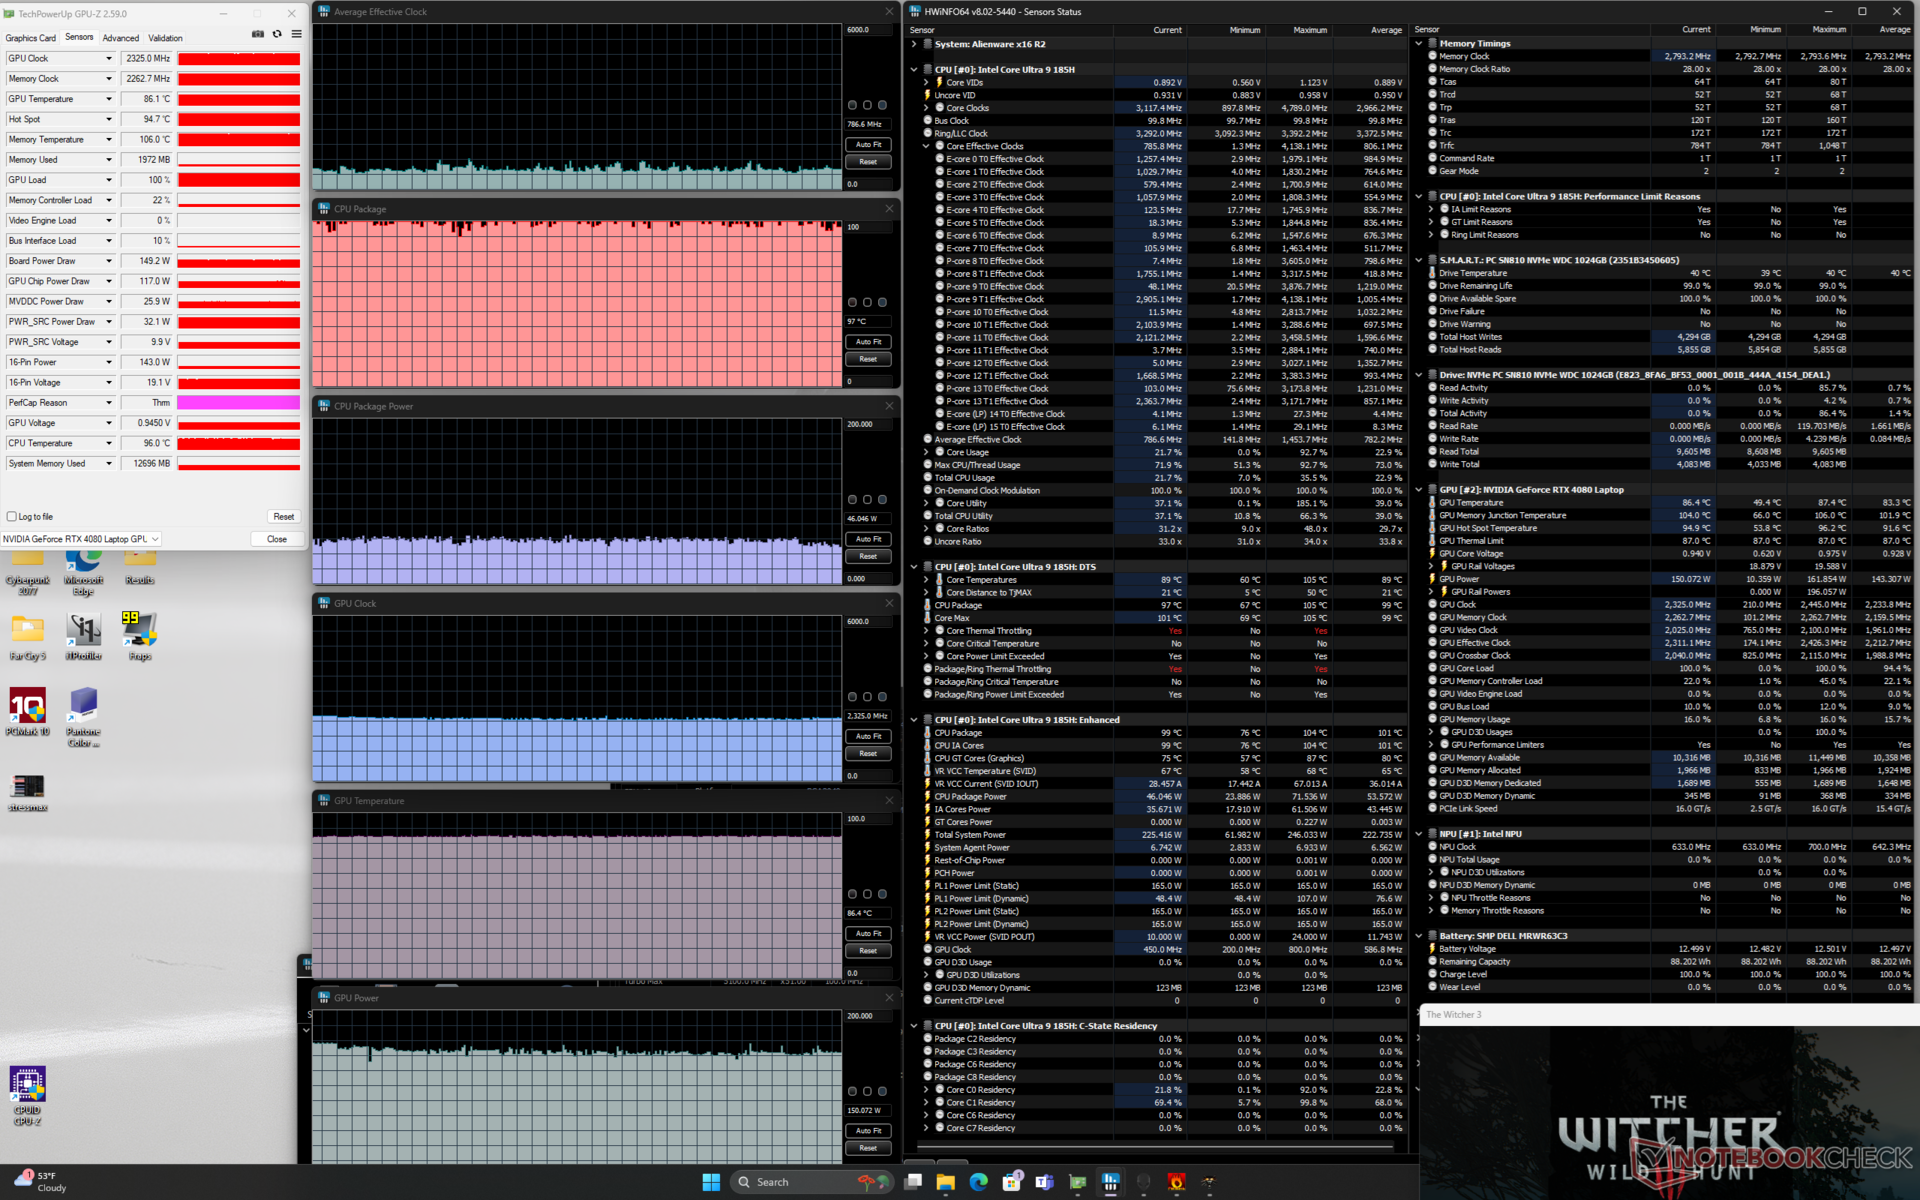
| Clock médio da CPU (GHz) | Clock da GPU (MHz) | Temperatura média da CPU (°C) | Temperatura média da GPU (°C) | |
| Sistema ocioso | -- | -- | 38 | 31 |
| Estresse doPrime95 | 3.2 | -- | 101 | 50 |
| Estresse doPrime95 + FurMark | 2.2 | 2175 | 99 | 82 |
| Witcher 3 Estresse(modo balanceado) | 0,7 | 2100 | 99 | 86 |
| Witcher 3 Estresse (modo Performance) | 0,7 | 2250 | 87 | 86 |
| Witcher 3 Estresse (modo Overdrive) | 0,8 | 2325 | 97 | 86 |
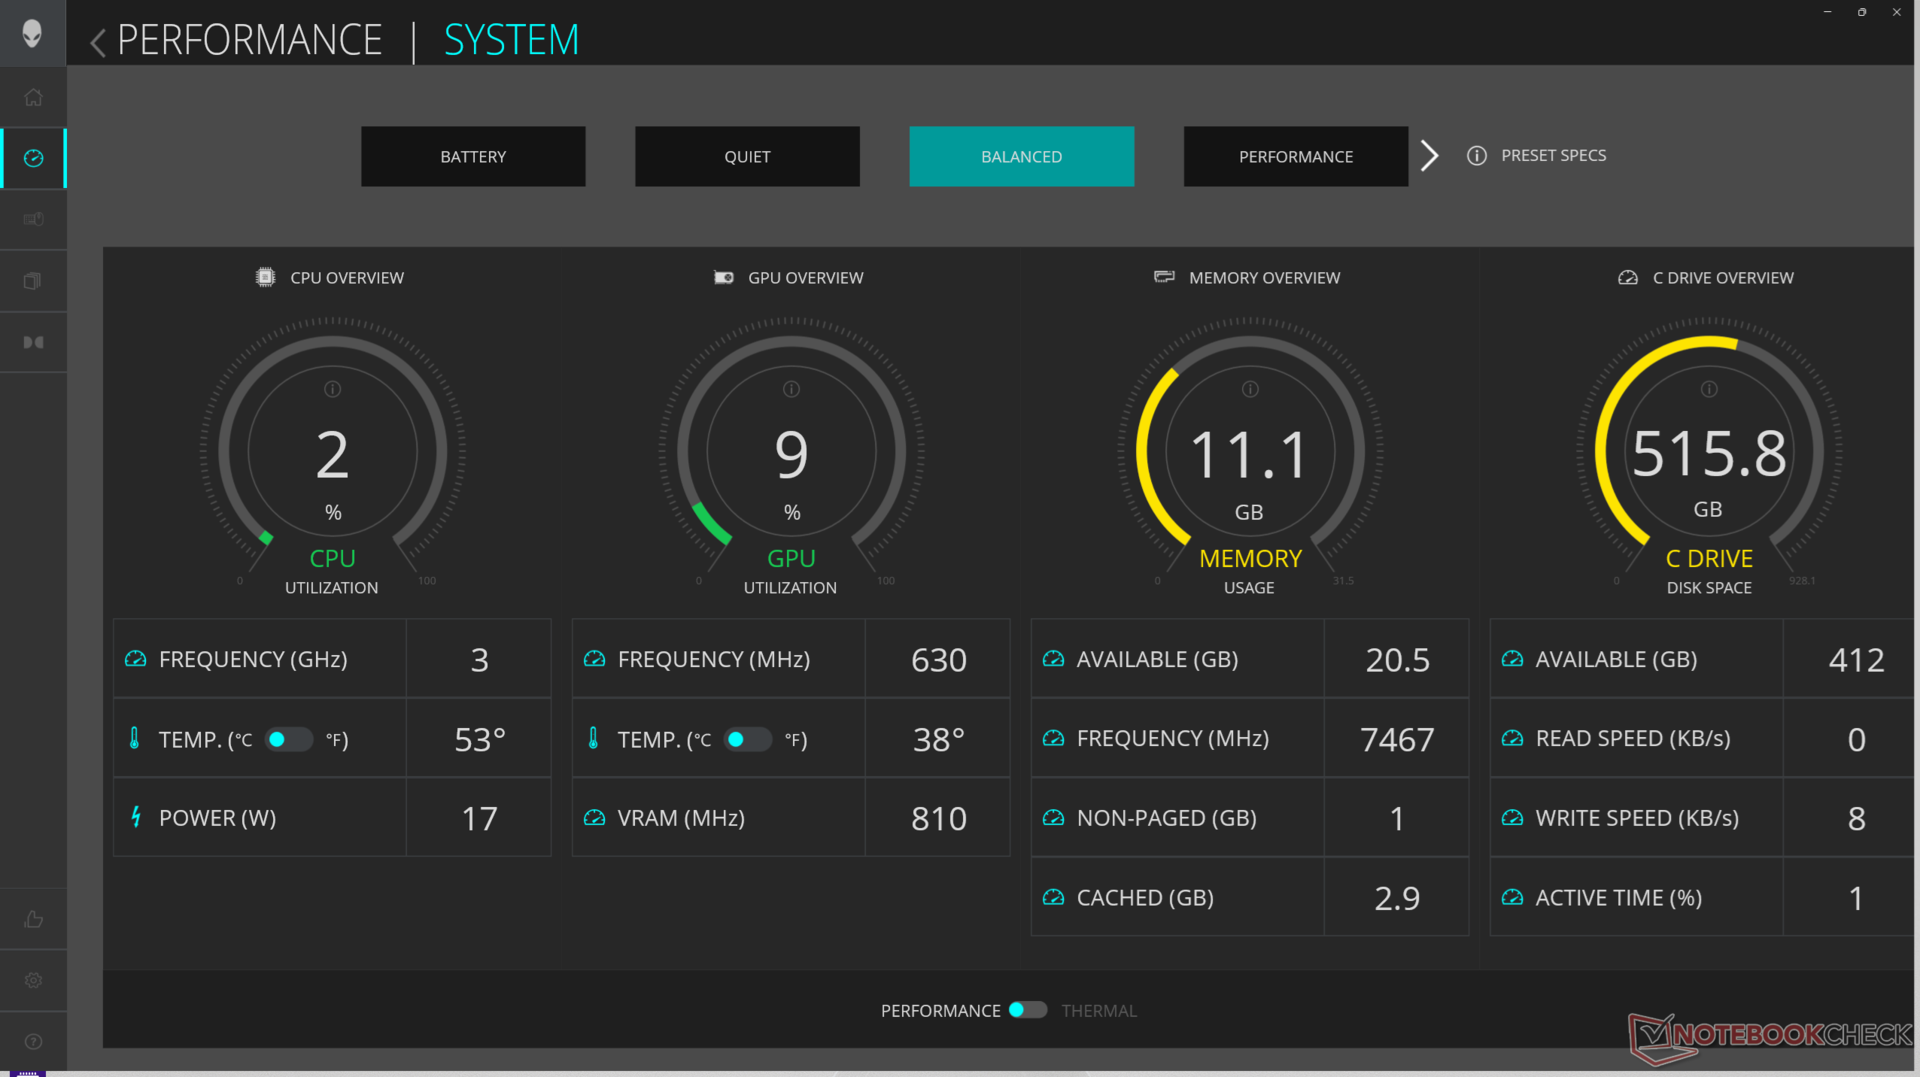
Desempenho do sistema
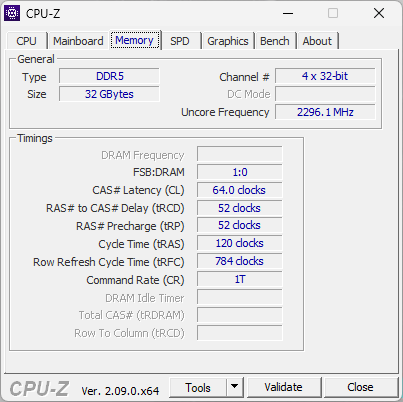
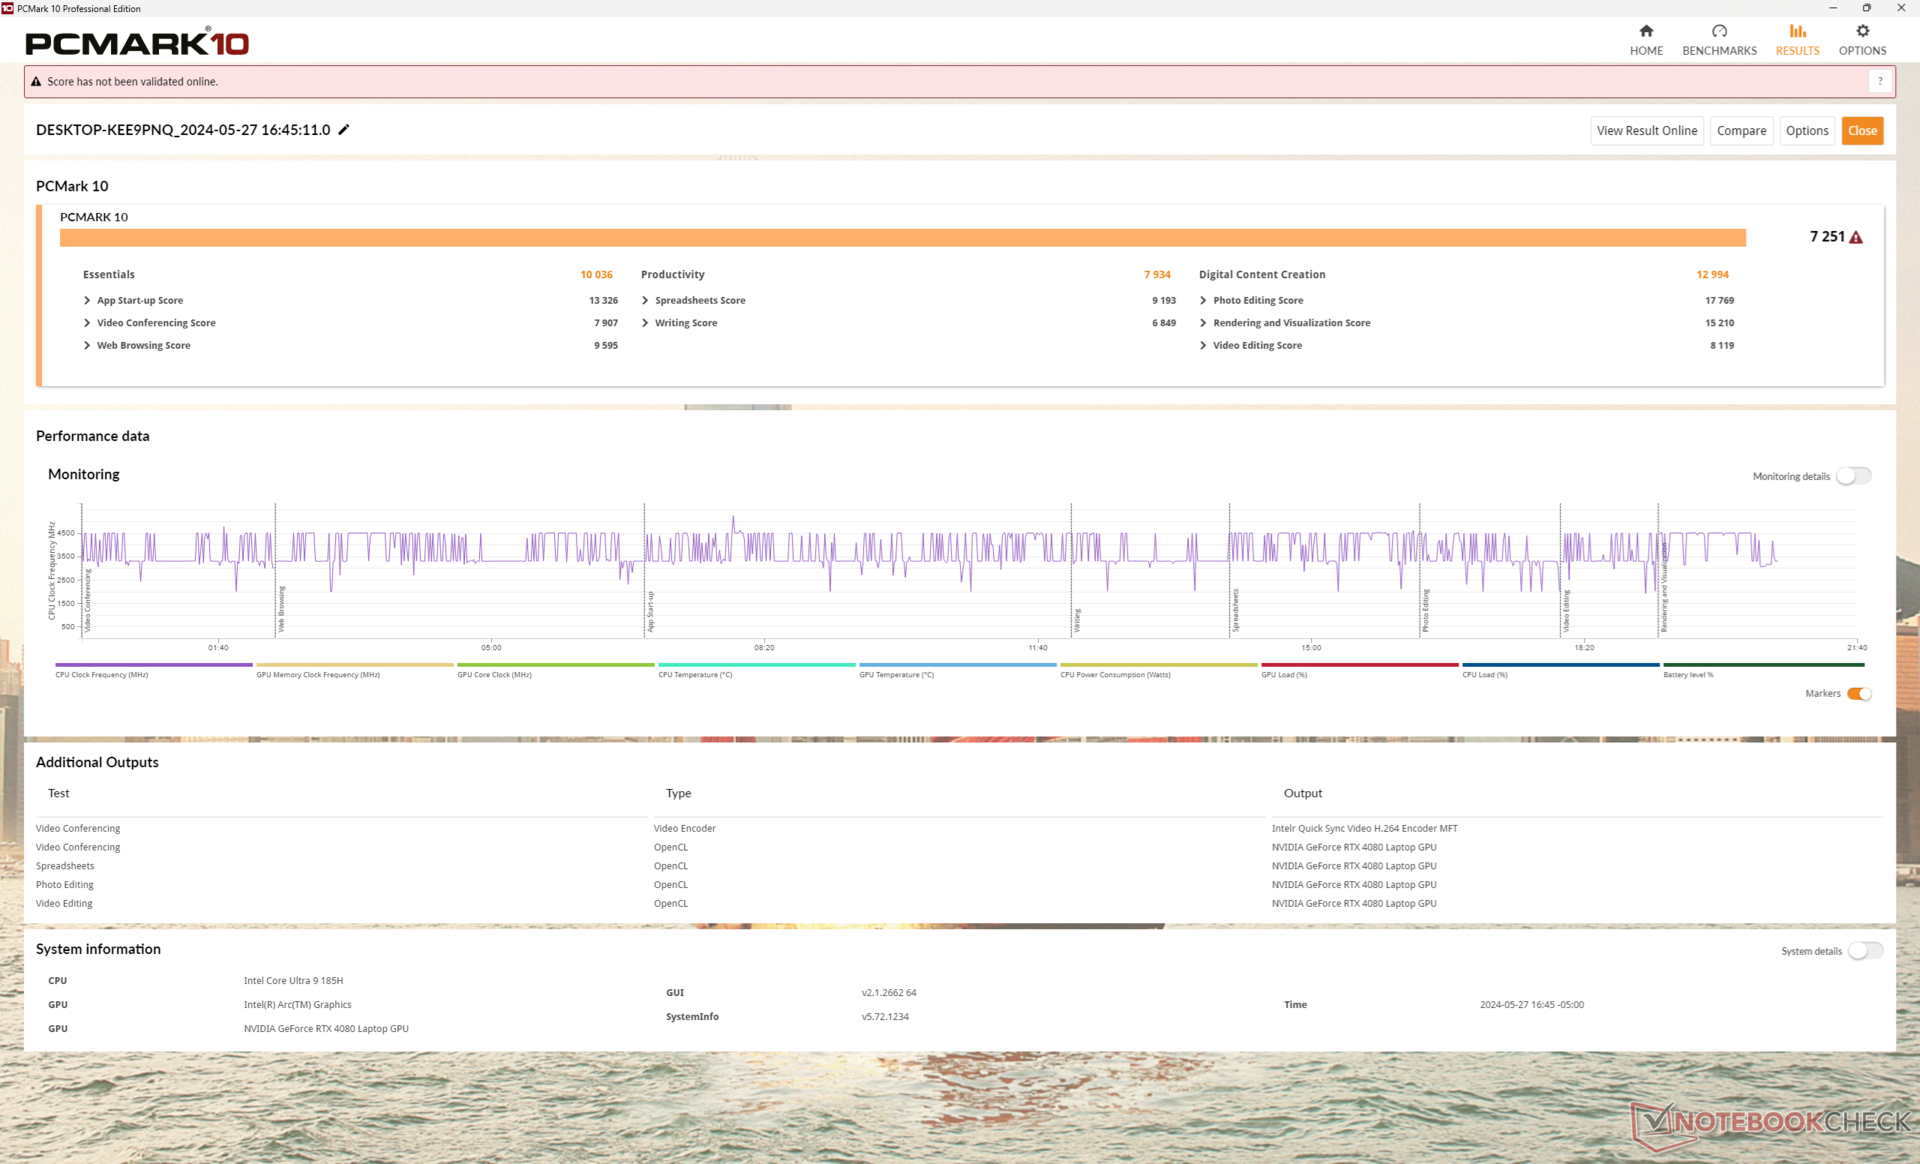
Os resultados do PCMark são praticamente os mesmos, se não inferiores, aos anteriores. Enquanto isso, a RAM está um pouco mais rápida este ano (7467 MT/s vs. 6000 MT/s) para resultados de cópia/leitura do AIDA64 um pouco mais altos, mas resultados de gravação e latência mais lentos.
CrossMark: Overall | Productivity | Creativity | Responsiveness
WebXPRT 3: Overall
WebXPRT 4: Overall
Mozilla Kraken 1.1: Total
| PCMark 10 / Score | |
| Lenovo Legion Pro 7 16IRX9H | |
| MSI Vector 16 HX A14V | |
| Alienware x16 R1 | |
| Alienware m16 R2 | |
| Asus ROG Strix Scar 16 G634JZR | |
| Alienware x16 R2 P120F | |
| Média Intel Core Ultra 9 185H, NVIDIA GeForce RTX 4080 Laptop GPU (n=1) | |
| PCMark 10 / Essentials | |
| Lenovo Legion Pro 7 16IRX9H | |
| Asus ROG Strix Scar 16 G634JZR | |
| MSI Vector 16 HX A14V | |
| Alienware x16 R1 | |
| Alienware m16 R2 | |
| Alienware x16 R2 P120F | |
| Média Intel Core Ultra 9 185H, NVIDIA GeForce RTX 4080 Laptop GPU (n=1) | |
| PCMark 10 / Productivity | |
| Lenovo Legion Pro 7 16IRX9H | |
| Alienware x16 R1 | |
| MSI Vector 16 HX A14V | |
| Alienware m16 R2 | |
| Alienware x16 R2 P120F | |
| Média Intel Core Ultra 9 185H, NVIDIA GeForce RTX 4080 Laptop GPU (n=1) | |
| Asus ROG Strix Scar 16 G634JZR | |
| PCMark 10 / Digital Content Creation | |
| Asus ROG Strix Scar 16 G634JZR | |
| MSI Vector 16 HX A14V | |
| Lenovo Legion Pro 7 16IRX9H | |
| Alienware x16 R1 | |
| Alienware m16 R2 | |
| Alienware x16 R2 P120F | |
| Média Intel Core Ultra 9 185H, NVIDIA GeForce RTX 4080 Laptop GPU (n=1) | |
| CrossMark / Overall | |
| Lenovo Legion Pro 7 16IRX9H | |
| MSI Vector 16 HX A14V | |
| Asus ROG Strix Scar 16 G634JZR | |
| Alienware x16 R1 | |
| Alienware m16 R2 | |
| Alienware x16 R2 P120F | |
| Média Intel Core Ultra 9 185H, NVIDIA GeForce RTX 4080 Laptop GPU (n=1) | |
| CrossMark / Productivity | |
| Lenovo Legion Pro 7 16IRX9H | |
| MSI Vector 16 HX A14V | |
| Asus ROG Strix Scar 16 G634JZR | |
| Alienware x16 R1 | |
| Alienware m16 R2 | |
| Alienware x16 R2 P120F | |
| Média Intel Core Ultra 9 185H, NVIDIA GeForce RTX 4080 Laptop GPU (n=1) | |
| CrossMark / Creativity | |
| Lenovo Legion Pro 7 16IRX9H | |
| MSI Vector 16 HX A14V | |
| Asus ROG Strix Scar 16 G634JZR | |
| Alienware x16 R1 | |
| Alienware m16 R2 | |
| Alienware x16 R2 P120F | |
| Média Intel Core Ultra 9 185H, NVIDIA GeForce RTX 4080 Laptop GPU (n=1) | |
| CrossMark / Responsiveness | |
| Lenovo Legion Pro 7 16IRX9H | |
| MSI Vector 16 HX A14V | |
| Alienware x16 R1 | |
| Asus ROG Strix Scar 16 G634JZR | |
| Alienware x16 R2 P120F | |
| Média Intel Core Ultra 9 185H, NVIDIA GeForce RTX 4080 Laptop GPU (n=1) | |
| Alienware m16 R2 | |
| WebXPRT 3 / Overall | |
| Lenovo Legion Pro 7 16IRX9H | |
| MSI Vector 16 HX A14V | |
| Asus ROG Strix Scar 16 G634JZR | |
| Alienware x16 R1 | |
| Alienware m16 R2 | |
| Alienware x16 R2 P120F | |
| Média Intel Core Ultra 9 185H, NVIDIA GeForce RTX 4080 Laptop GPU (n=1) | |
| WebXPRT 4 / Overall | |
| Lenovo Legion Pro 7 16IRX9H | |
| Asus ROG Strix Scar 16 G634JZR | |
| MSI Vector 16 HX A14V | |
| Alienware x16 R1 | |
| Alienware m16 R2 | |
| Alienware x16 R2 P120F | |
| Média Intel Core Ultra 9 185H, NVIDIA GeForce RTX 4080 Laptop GPU (n=1) | |
| Mozilla Kraken 1.1 / Total | |
| Alienware x16 R2 P120F | |
| Média Intel Core Ultra 9 185H, NVIDIA GeForce RTX 4080 Laptop GPU (n=1) | |
| Alienware m16 R2 | |
| Alienware x16 R1 | |
| MSI Vector 16 HX A14V | |
| Asus ROG Strix Scar 16 G634JZR | |
| Lenovo Legion Pro 7 16IRX9H | |
* ... menor é melhor
| PCMark 10 Score | 7251 pontos | |
Ajuda | ||
| AIDA64 / Memory Copy | |
| Alienware x16 R2 P120F | |
| Média Intel Core Ultra 9 185H (69929 - 95718, n=19) | |
| Asus ROG Strix Scar 16 G634JZR | |
| Lenovo Legion Pro 7 16IRX9H | |
| MSI Vector 16 HX A14V | |
| Alienware x16 R1 | |
| Alienware m16 R2 | |
| AIDA64 / Memory Read | |
| Asus ROG Strix Scar 16 G634JZR | |
| Lenovo Legion Pro 7 16IRX9H | |
| MSI Vector 16 HX A14V | |
| Alienware x16 R2 P120F | |
| Média Intel Core Ultra 9 185H (64619 - 87768, n=19) | |
| Alienware m16 R2 | |
| Alienware x16 R1 | |
| AIDA64 / Memory Write | |
| Alienware x16 R1 | |
| Asus ROG Strix Scar 16 G634JZR | |
| MSI Vector 16 HX A14V | |
| Alienware x16 R2 P120F | |
| Média Intel Core Ultra 9 185H (51114 - 93871, n=19) | |
| Lenovo Legion Pro 7 16IRX9H | |
| Alienware m16 R2 | |
| AIDA64 / Memory Latency | |
| Média Intel Core Ultra 9 185H (121.4 - 259, n=19) | |
| Alienware x16 R2 P120F | |
| Alienware m16 R2 | |
| Alienware x16 R1 | |
| MSI Vector 16 HX A14V | |
| Asus ROG Strix Scar 16 G634JZR | |
| Lenovo Legion Pro 7 16IRX9H | |
* ... menor é melhor
Latência DPC
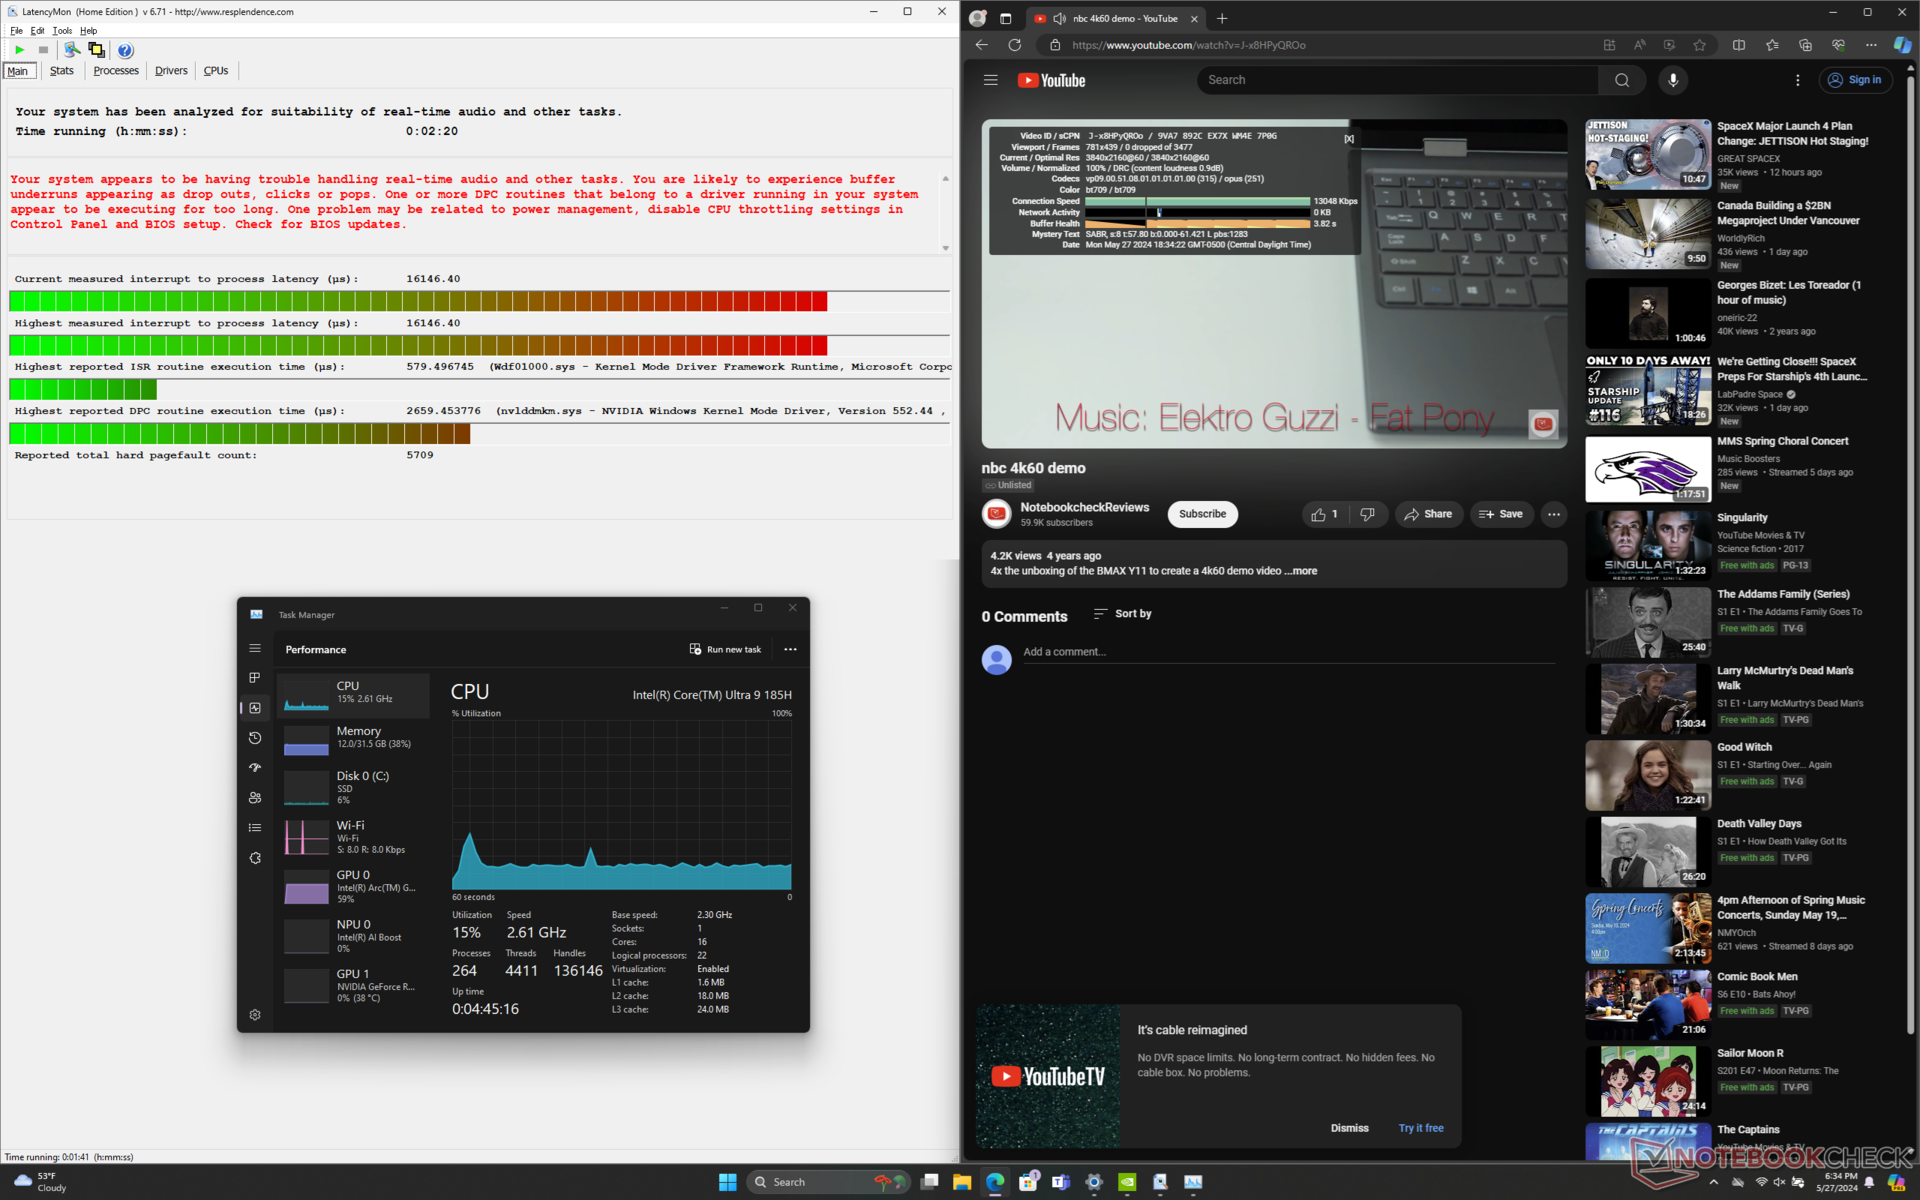
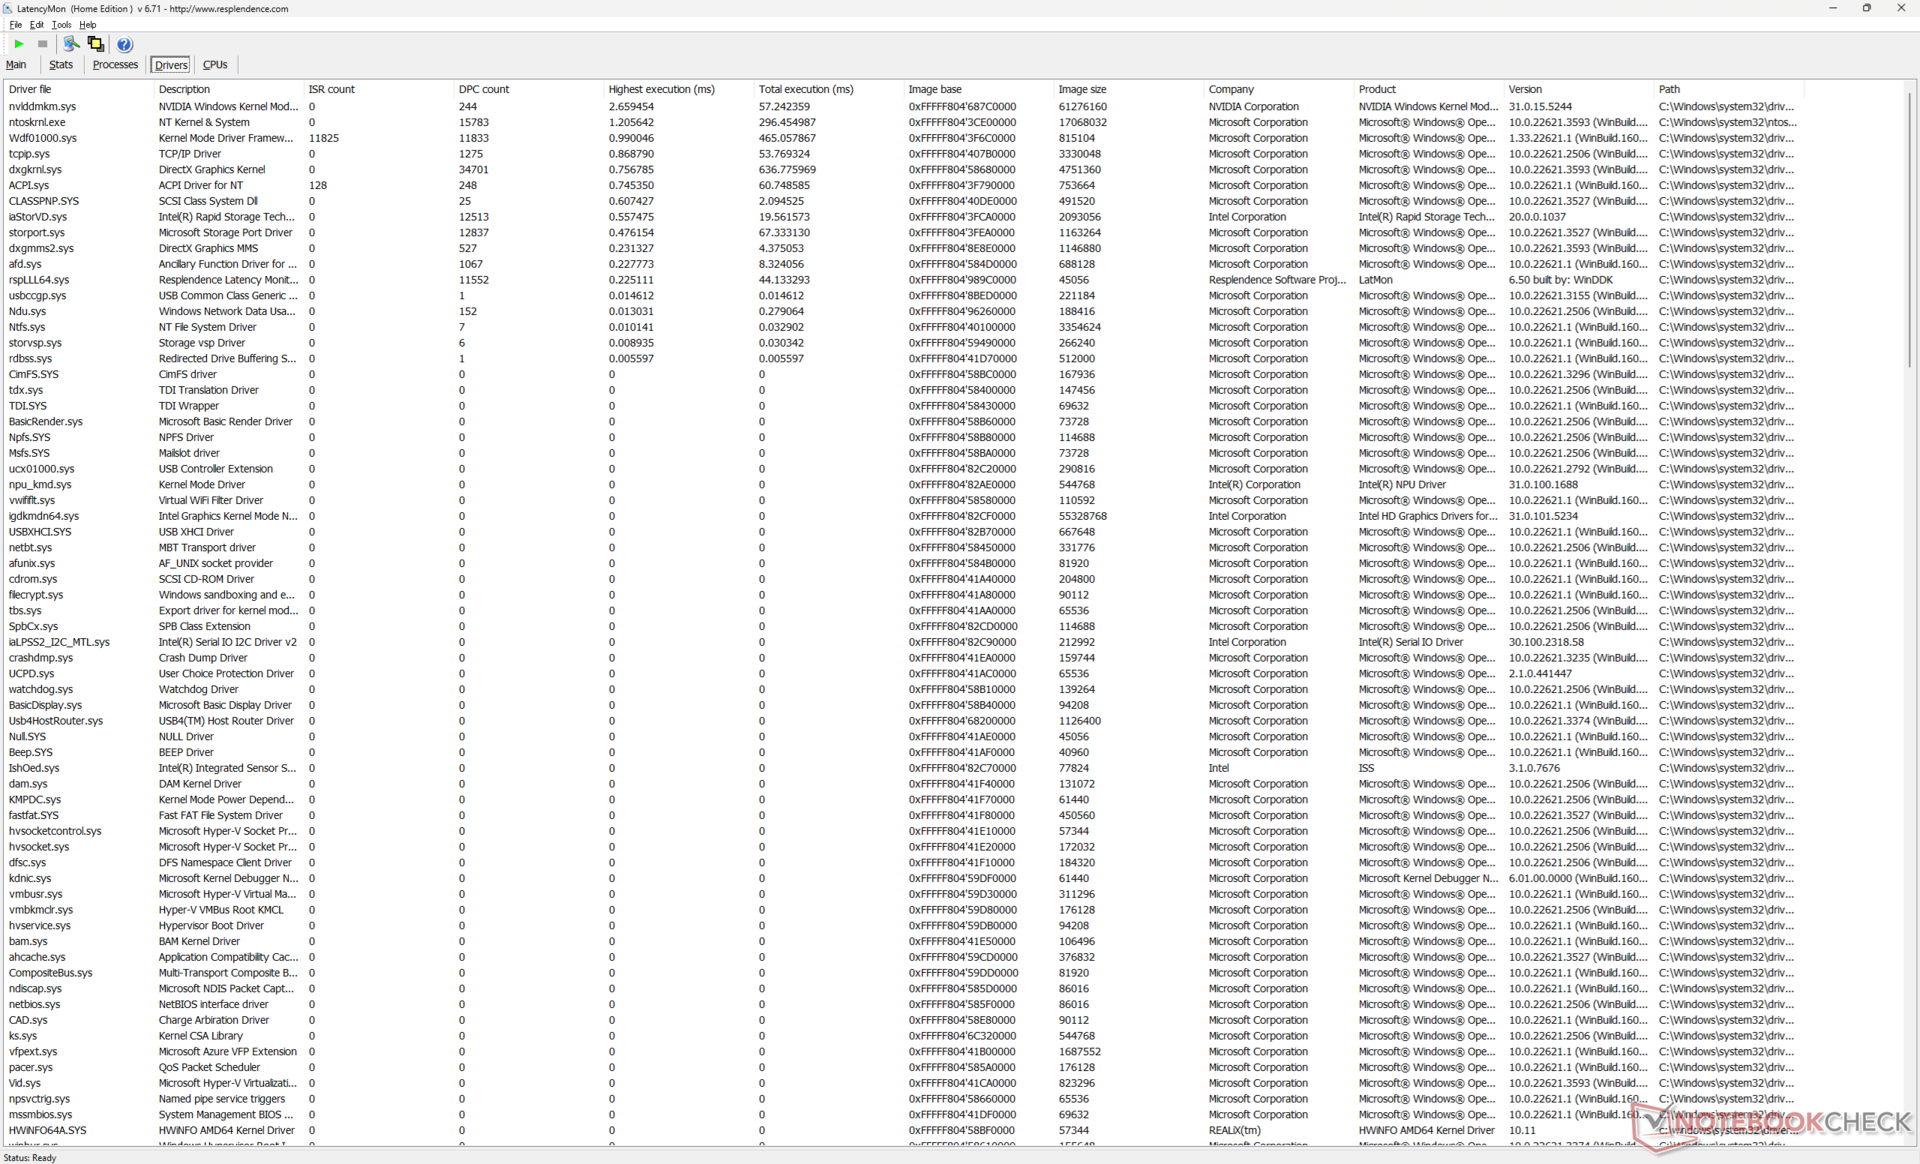
O LatencyMon revela problemas notáveis de DPC ao abrir várias guias do navegador da nossa página inicial, mesmo após várias tentativas no modo Optimus. Não tivemos esses problemas no x16 R1 original. a reprodução de vídeo 4K a 60 FPS é perfeita, sem registro de queda de quadros.
| DPC Latencies / LatencyMon - interrupt to process latency (max), Web, Youtube, Prime95 | |
| Alienware x16 R2 P120F | |
| Asus ROG Strix Scar 16 G634JZR | |
| Alienware m16 R2 | |
| MSI Vector 16 HX A14V | |
| Alienware x16 R1 | |
| Lenovo Legion Pro 7 16IRX9H | |
* ... menor é melhor
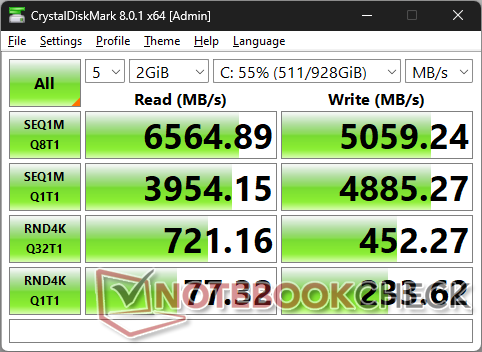
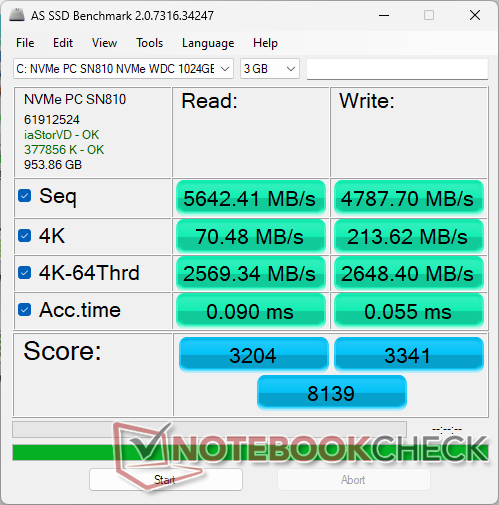
Dispositivos de armazenamento
Nossa unidade de teste é fornecida com o WDC PC SN810 em vez do SK Hynix PC801 do modelo do ano passado. A unidade da Western Digital pode manter as taxas máximas de transferência por mais tempo do que a SK Hynix, como mostra o gráfico de loop do DiskSpd abaixo, mas as taxas de gravação são geralmente mais lentas.

| Drive Performance Rating - Percent | |
| Lenovo Legion Pro 7 16IRX9H | |
| Alienware x16 R1 | |
| Alienware x16 R2 P120F | |
| Alienware m16 R2 | |
| Asus ROG Strix Scar 16 G634JZR | |
| MSI Vector 16 HX A14V | |
* ... menor é melhor
Disk Throttling: DiskSpd Read Loop, Queue Depth 8
Desempenho da GPU
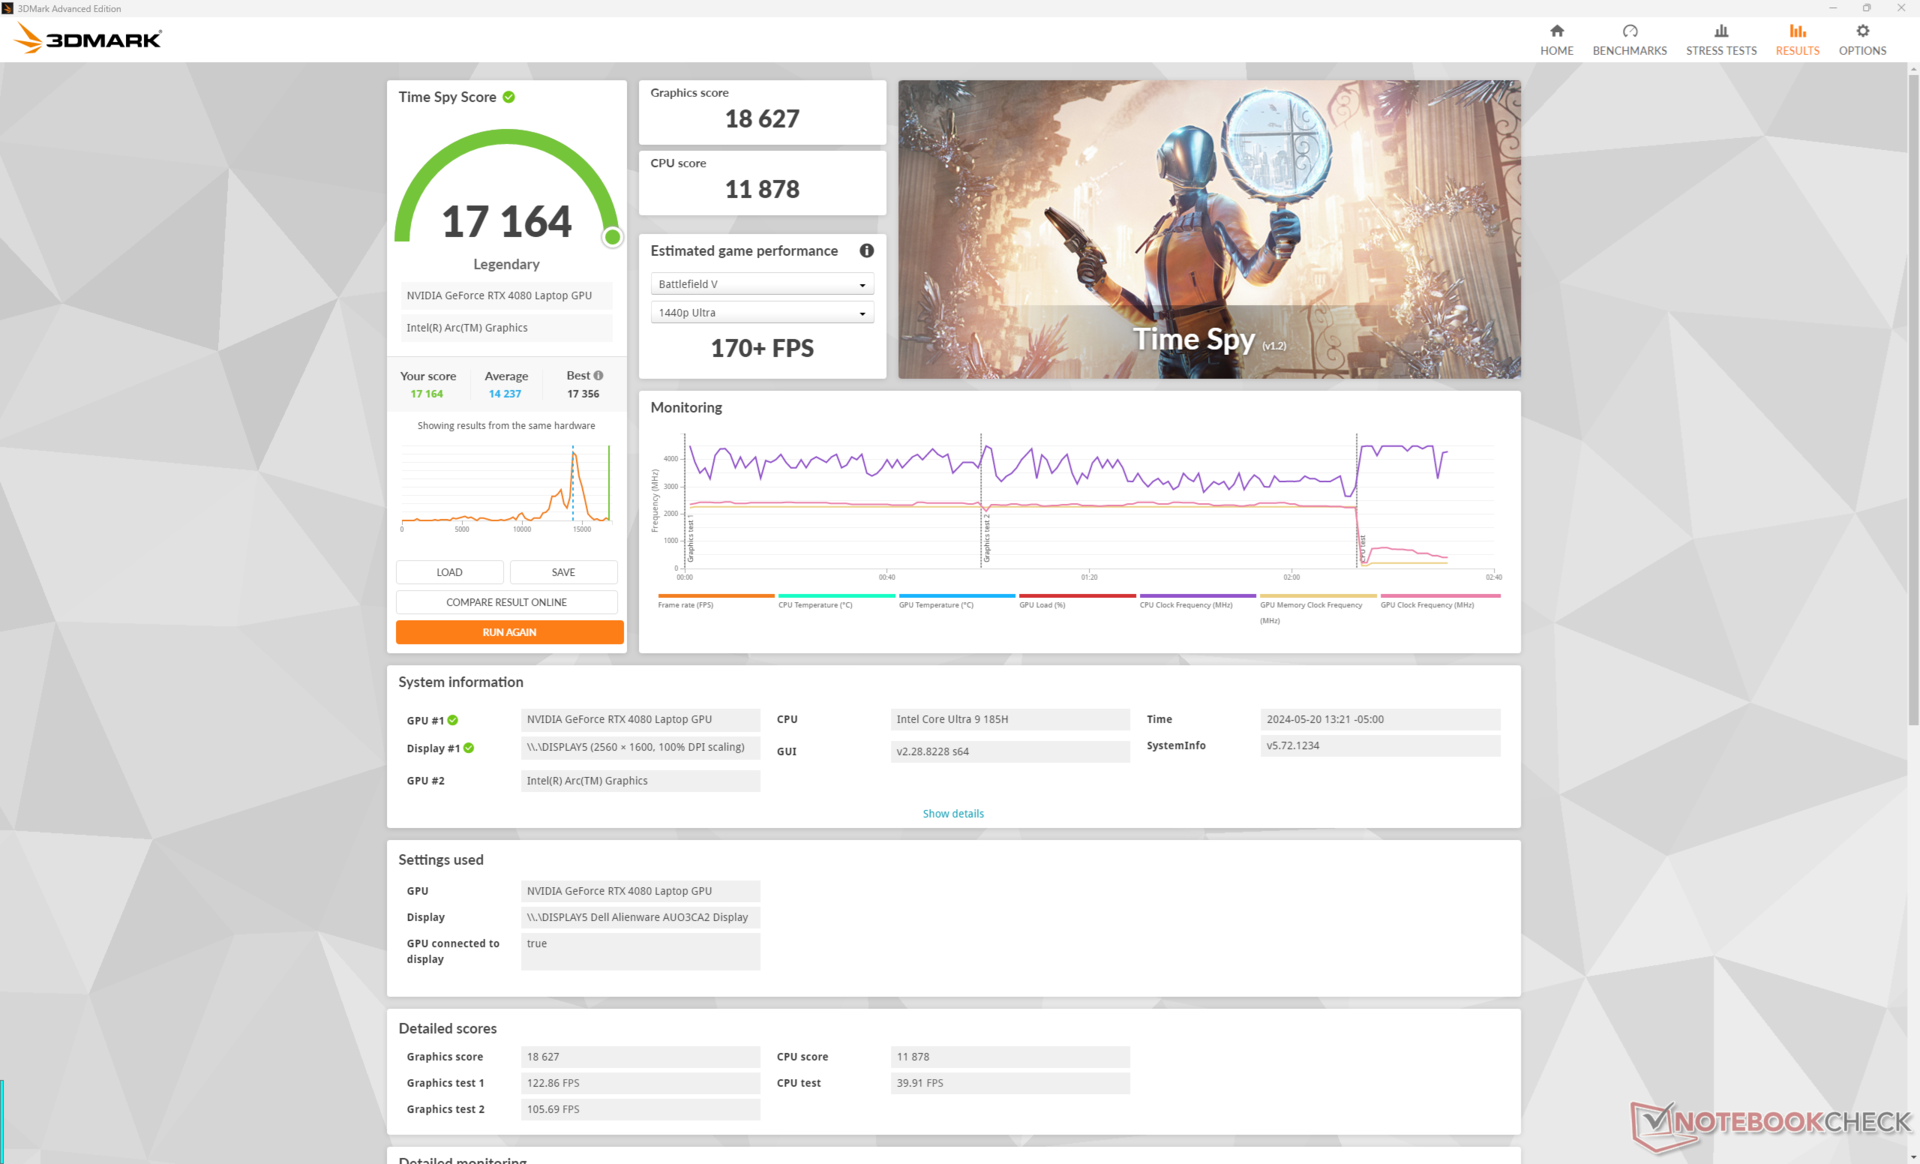
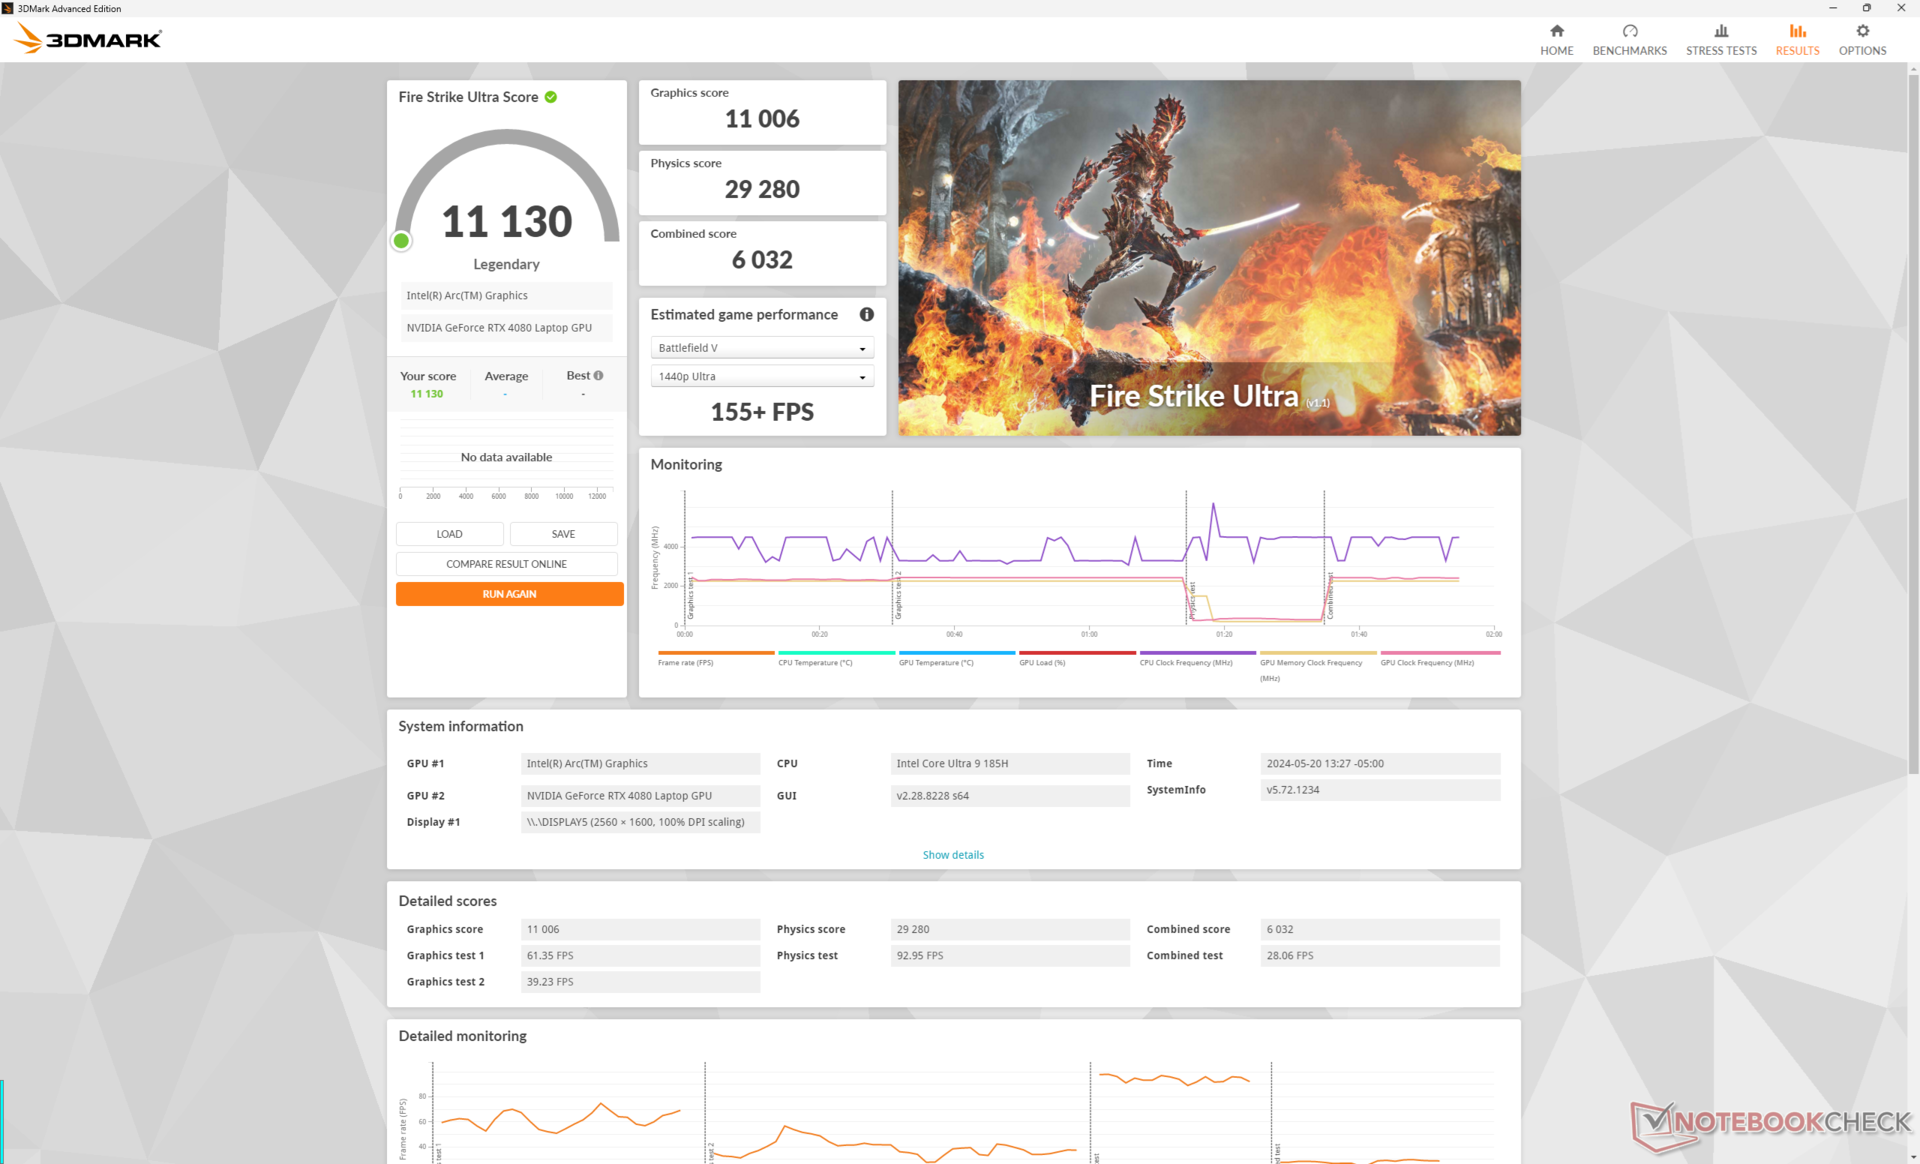
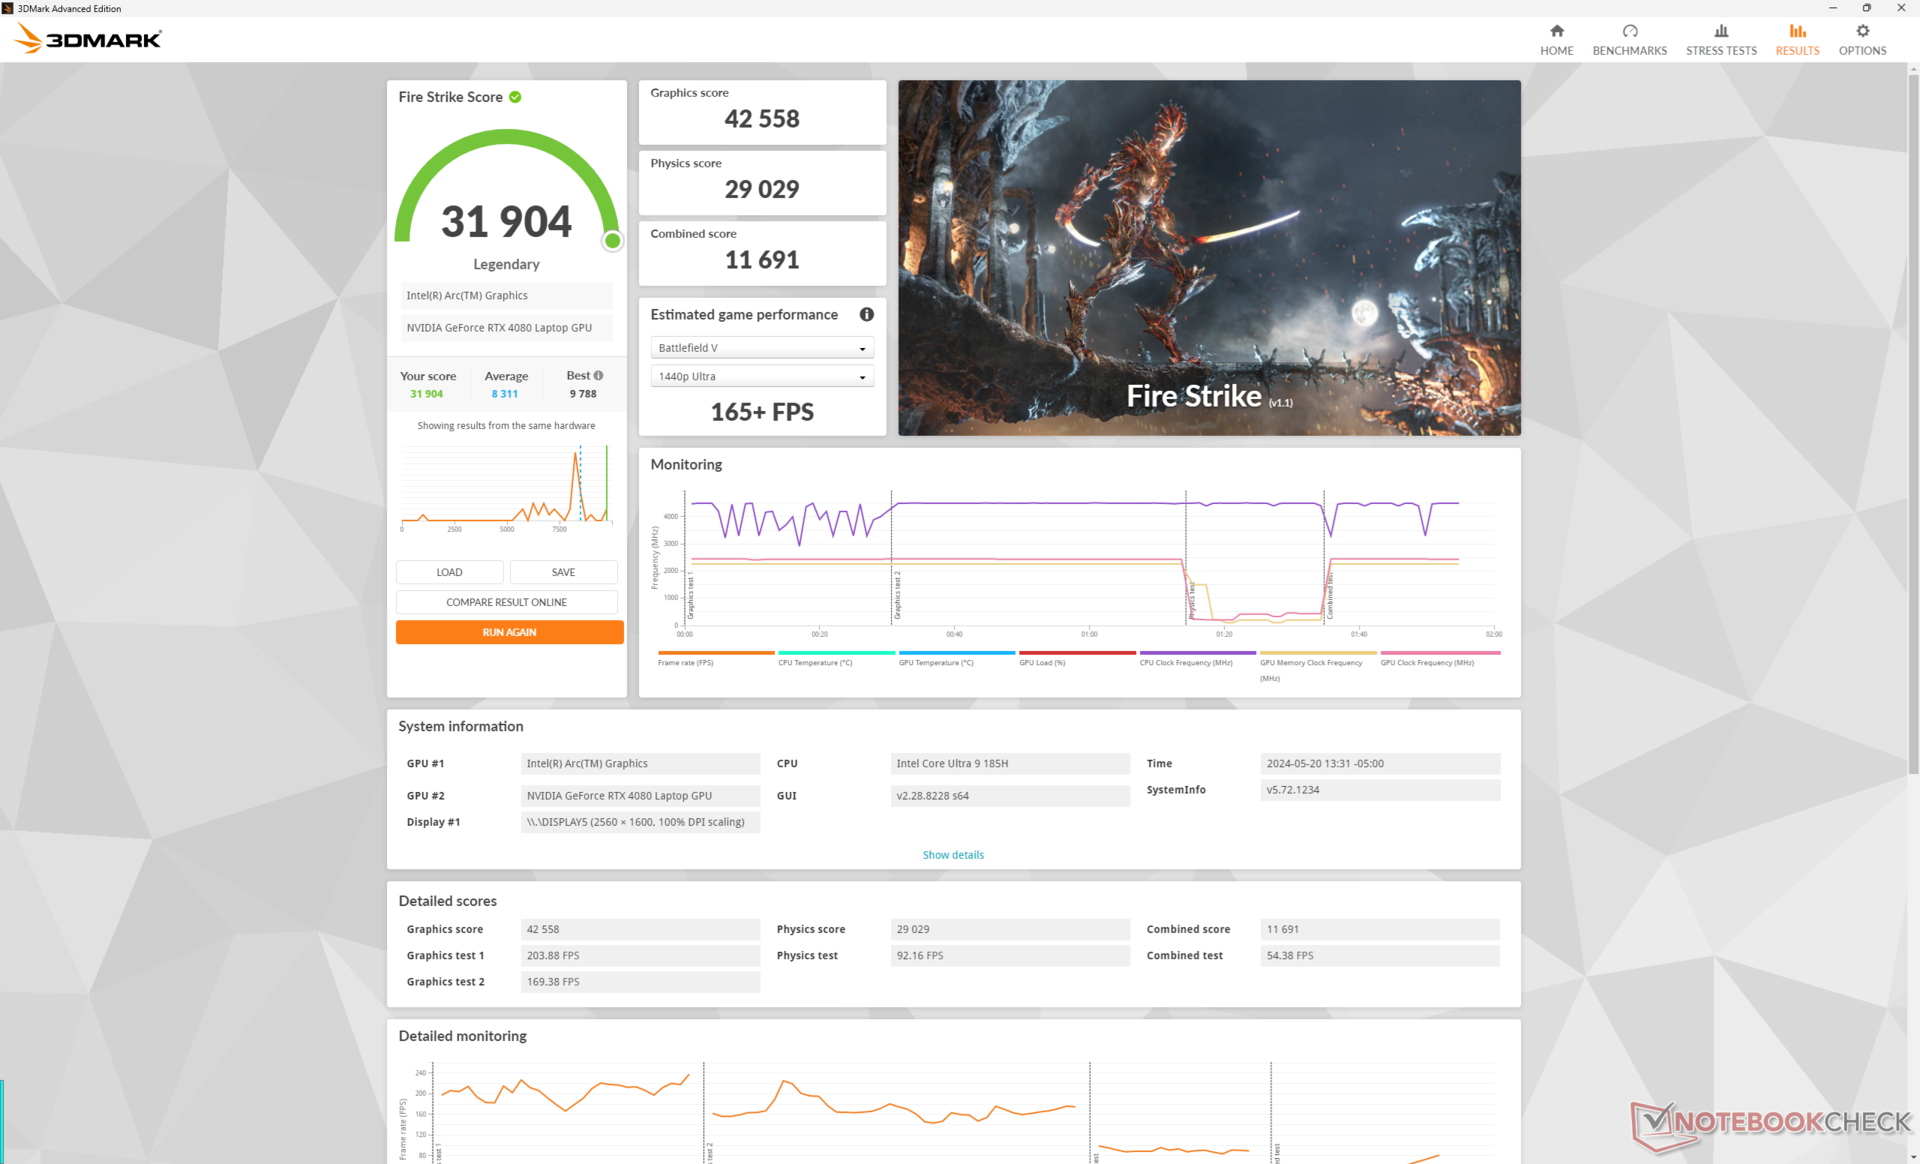
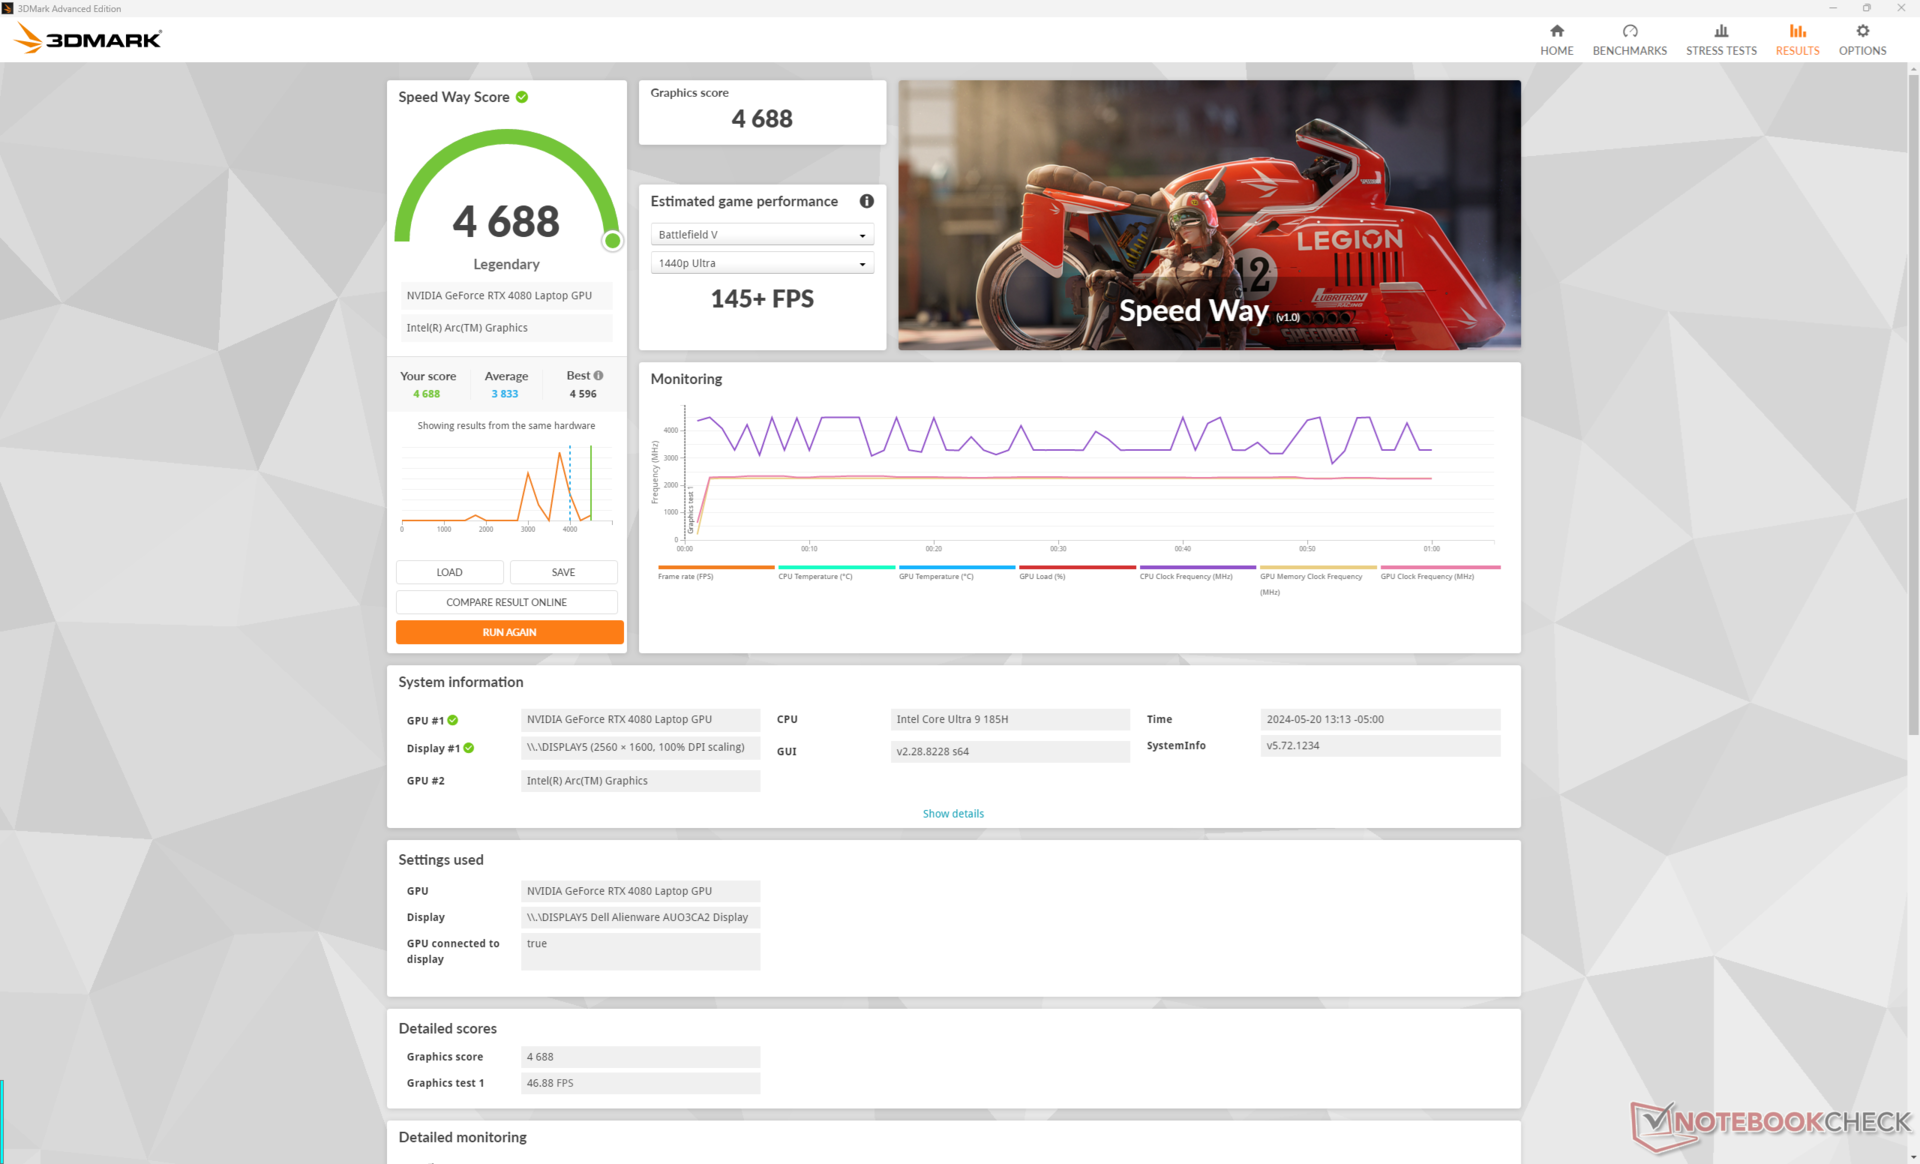
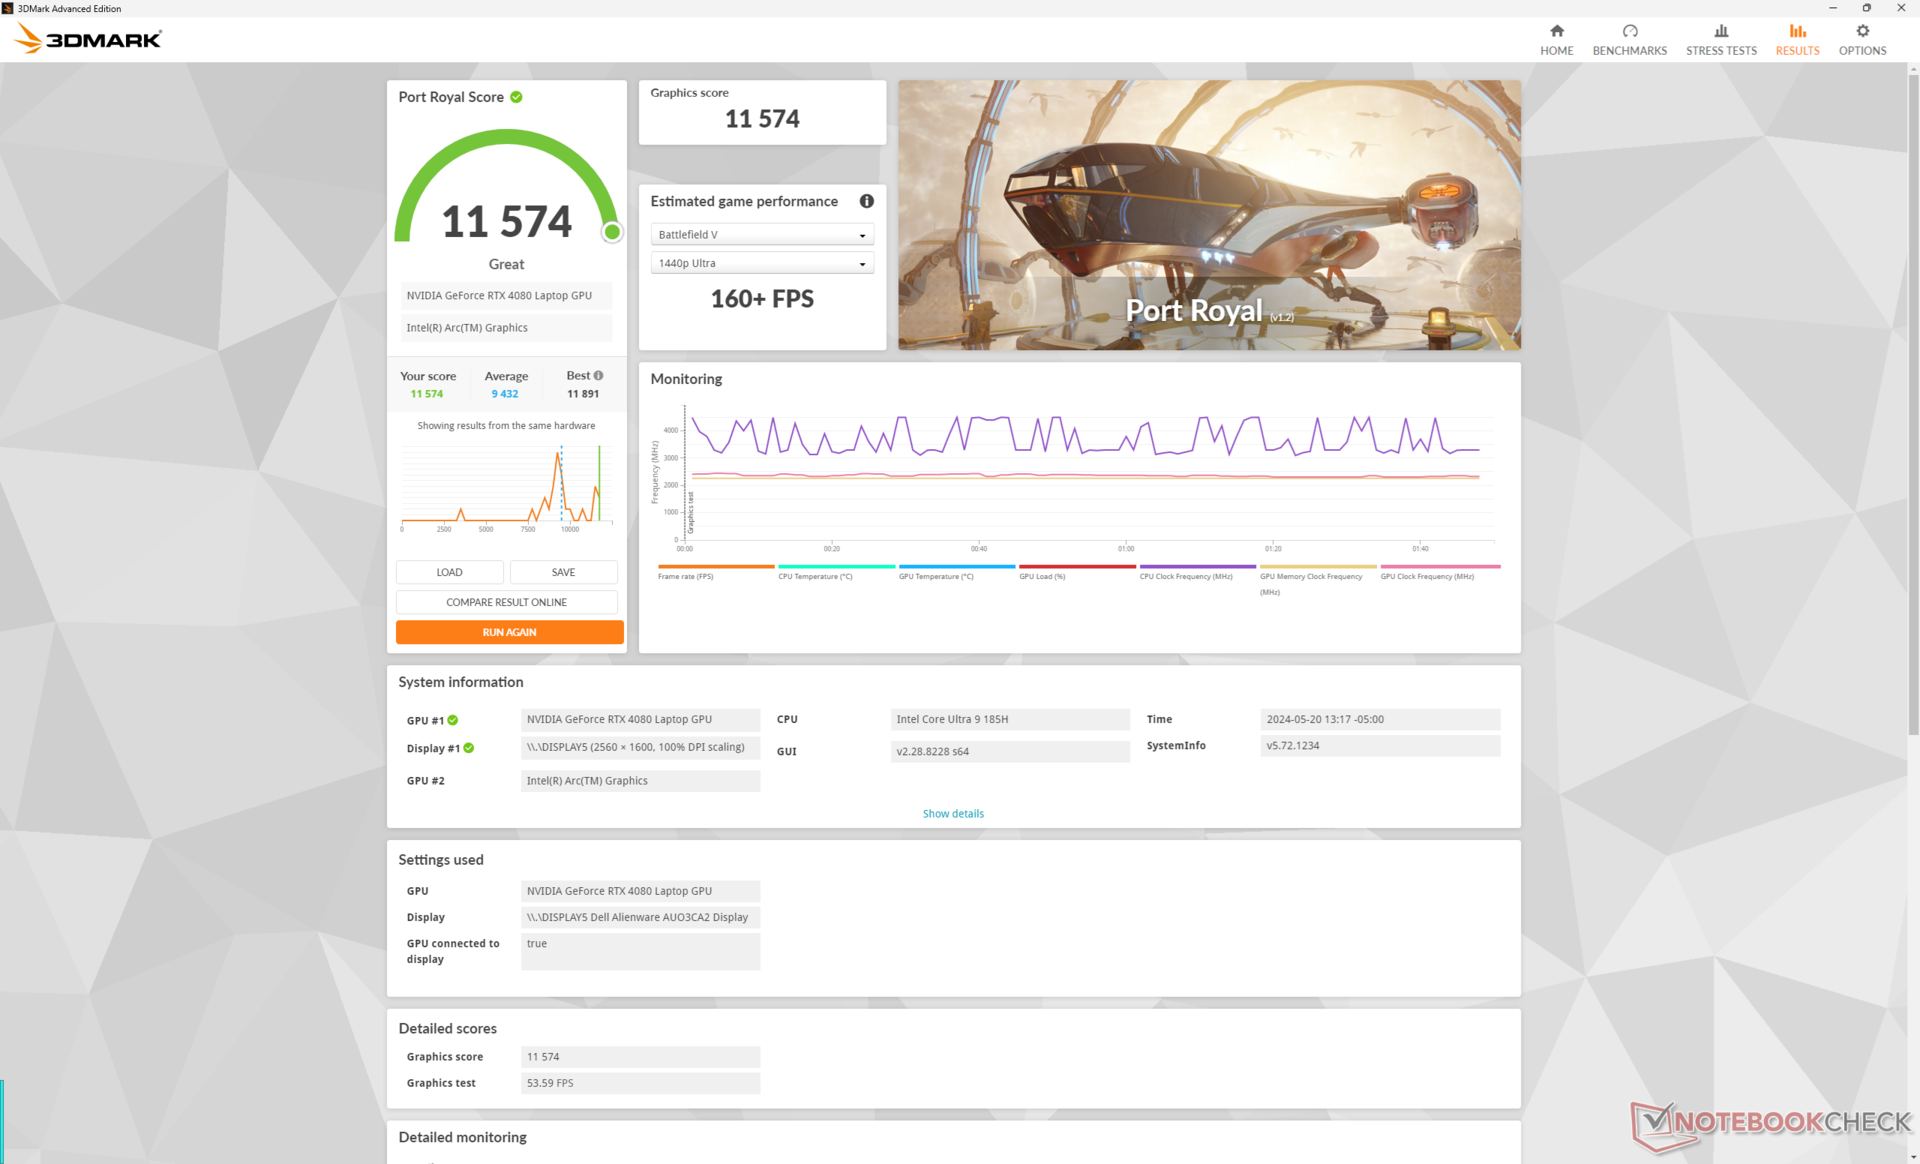
O 175 W móvel GeForce RTX 4080 Permanece a mesma, embora com pontuações no 3DMark que são cerca de 5% mais lentas do que as registradas na x16 R1. A atualização para a RTX 4090 deverá melhorar o desempenho em apenas 5 a 15 por cento, enquanto o downgrade para a configuração RTX 4070 ou 4060 reduzirá o desempenho em até 30% e 45%, respectivamente.
| Perfil de energia | Pontuação gráfica | Pontuação de física | Pontuação combinada |
| Modo Overdrive | 42558 | 29029 | 11691 |
| Modo de desempenho | 40773 (-4%) | 26070 (-10%) | 12450 (-7%) |
| Modo equilibrado | 40593 (-5%) | 26746 (-8%) | 12237 (-5%) |
| Energia da bateria | 21754 (-49%) | 25880 (-11%) | 9863 (-16%) |
A execução do sistema no modo Performance em vez do modo Overdrive afetará ligeiramente o desempenho geral, conforme mostrado na tabela de resultados do site Fire Strike acima. É interessante notar que a diferença entre os modos Performance e Balanced é comparativamente muito menor.
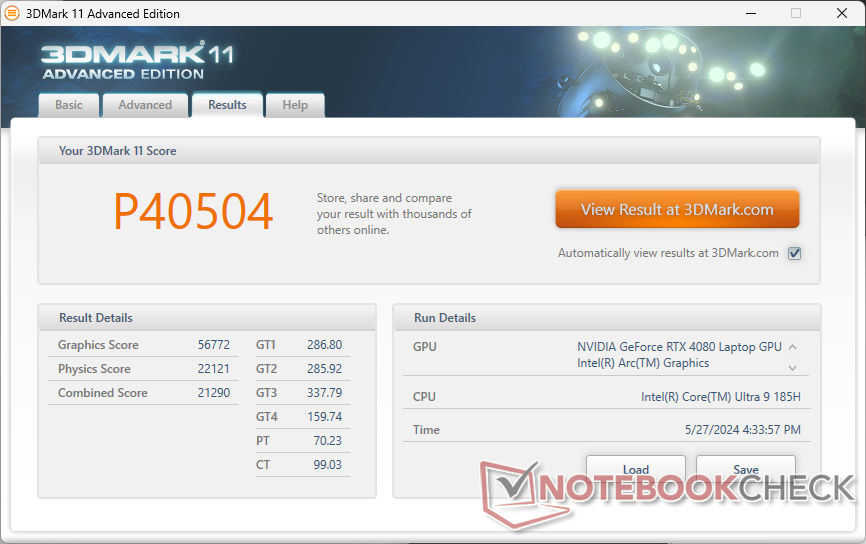
| 3DMark 11 Performance | 40504 pontos | |
| 3DMark Fire Strike Score | 31904 pontos | |
| 3DMark Time Spy Score | 17164 pontos | |
Ajuda | ||
* ... menor é melhor
Desempenho em jogos
Infelizmente, o desempenho em jogos seria consistentemente mais lento do que o registrado no x16 R1 em cerca de 5 a 15%. Os deltas maiores ocorriam em resoluções mais baixas, enquanto os deltas menores ocorriam em resoluções mais altas, o que é consistente com os resultados mais lentos do desempenho bruto da CPU em comparação com o Core i9-14900HK mencionado acima.
| Baldur's Gate 3 | |
| 1920x1080 Ultra Preset | |
| Alienware x16 R2 P120F | |
| Média NVIDIA GeForce RTX 4080 Laptop GPU (111.8 - 181.2, n=6) | |
| Alienware m16 R2 | |
| Framework Laptop 16 | |
| 2560x1440 Ultra Preset | |
| Alienware x16 R2 P120F | |
| Média NVIDIA GeForce RTX 4080 Laptop GPU (88.3 - 129.3, n=6) | |
| Alienware m16 R2 | |
| Framework Laptop 16 | |
| 3840x2160 Ultra Preset | |
| Alienware x16 R2 P120F | |
| Média NVIDIA GeForce RTX 4080 Laptop GPU (48.8 - 68.4, n=4) | |
| Alienware m16 R2 | |
| Framework Laptop 16 | |
| 3840x2160 Ultra Preset + Quality DLSS | |
| Alienware x16 R2 P120F | |
| Média NVIDIA GeForce RTX 4080 Laptop GPU (90.9 - 104.4, n=2) | |
| Cyberpunk 2077 2.2 Phantom Liberty | |
| 1920x1080 Ultra Preset (FSR off) | |
| Média NVIDIA GeForce RTX 4080 Laptop GPU (83.9 - 127.1, n=13) | |
| Alienware x16 R2 P120F | |
| Alienware m16 R2 | |
| Framework Laptop 16 | |
| 2560x1440 Ultra Preset (FSR off) | |
| Média NVIDIA GeForce RTX 4080 Laptop GPU (56.2 - 86.3, n=17) | |
| Alienware x16 R2 P120F | |
| Alienware m16 R2 | |
| Framework Laptop 16 | |
| 3840x2160 Ultra Preset (FSR off) | |
| Média NVIDIA GeForce RTX 4080 Laptop GPU (25.8 - 39.8, n=7) | |
| Alienware x16 R2 P120F | |
| Alienware m16 R2 | |
| Framework Laptop 16 | |
| 1920x1080 Ray Tracing Ultra Preset (DLSS off) | |
| Alienware x16 R2 P120F | |
| Média NVIDIA GeForce RTX 4080 Laptop GPU (43.8 - 67.2, n=12) | |
| Alienware m16 R2 | |
| Framework Laptop 16 | |
| 3840x2160 Ray Tracing Ultra Preset (DLSS off, no Path Tracing) | |
| Média NVIDIA GeForce RTX 4080 Laptop GPU (16 - 20, n=4) | |
| Alienware x16 R2 P120F | |
| Alienware m16 R2 | |
Witcher 3 FPS Chart
| baixo | média | alto | ultra | QHD | 4K DLSS | 4K | |
|---|---|---|---|---|---|---|---|
| The Witcher 3 (2015) | 364.4 | 340.7 | 292.1 | 166.3 | 118.5 | ||
| Dota 2 Reborn (2015) | 155.7 | 142 | 139.2 | 133 | 127.9 | ||
| Final Fantasy XV Benchmark (2018) | 188 | 169.3 | 139.8 | 120.8 | 70.2 | ||
| X-Plane 11.11 (2018) | 134 | 117.4 | 89.3 | 78 | |||
| Far Cry 5 (2018) | 137 | 127 | 122 | 114 | 114 | 91 | |
| Strange Brigade (2018) | 427 | 336 | 317 | 293 | 226 | 112.9 | |
| Tiny Tina's Wonderlands (2022) | 220.8 | 199.6 | 166.7 | 144.5 | 99 | 50.1 | |
| F1 22 (2022) | 219 | 211 | 185.7 | 108.5 | 65.6 | 36.6 | |
| Baldur's Gate 3 (2023) | 186.8 | 172.9 | 161.2 | 159.4 | 124.3 | 104.4 | 65 |
| Cyberpunk 2077 2.2 Phantom Liberty (2023) | 121.5 | 118.7 | 109 | 99.7 | 75.4 | 32.5 |
Emissões
Ruído do sistema
As ventoinhas do x16 R2 conseguem permanecer mais silenciosas por períodos mais longos antes de precisar aumentar a velocidade e o ruído. Por outro lado, o limite de ruído é semelhante ao que registramos no x16 R1, com cerca de 50 dB(A) e 54 dB(A) ao jogar no modo Performance e no modo Overdrive, respectivamente. Observe que o ruído da ventoinha ao jogar no modo Balanced seria exatamente o mesmo do modo Performance, o que se alinha com os resultados do 3DMark acima.
Barulho
| Ocioso |
| 23.8 / 28.5 / 28.5 dB |
| Carga |
| 28.8 / 54.2 dB |
 | ||
30 dB silencioso 40 dB(A) audível 50 dB(A) ruidosamente alto |
||
min: | ||
| Alienware x16 R2 P120F NVIDIA GeForce RTX 4080 Laptop GPU, Ultra 9 185H, WDC PC SN810 1TB | Alienware x16 R1 NVIDIA GeForce RTX 4080 Laptop GPU, i9-13900HK, SK hynix PC801 HFS001TEJ9X101N | Alienware m16 R2 NVIDIA GeForce RTX 4070 Laptop GPU, Ultra 7 155H, Samsung PM9A1 MZVL21T0HCLR | Asus ROG Strix Scar 16 G634JZR NVIDIA GeForce RTX 4080 Laptop GPU, i9-14900HX, SK hynix PC801 HFS002TEJ9X101N | Lenovo Legion Pro 7 16IRX9H NVIDIA GeForce RTX 4080 Laptop GPU, i9-14900HX, SK Hynix HFS001TEJ9X115N | MSI Vector 16 HX A14V NVIDIA GeForce RTX 4080 Laptop GPU, i9-14900HX, WD PC SN560 SDDPNQE-1T00 | |
|---|---|---|---|---|---|---|
| Noise | -2% | -3% | -20% | -22% | -28% | |
| desligado / ambiente * | 23.4 | 22.7 3% | 24.7 -6% | 21.07 10% | 24 -3% | 23.2 1% |
| Idle Minimum * | 23.8 | 23.1 3% | 25.3 -6% | 29.75 -25% | 25 -5% | 33.5 -41% |
| Idle Average * | 28.5 | 25.8 9% | 25.3 11% | 29.75 -4% | 30 -5% | 33.5 -18% |
| Idle Maximum * | 28.5 | 25.8 9% | 25.3 11% | 29.75 -4% | 45 -58% | 33.5 -18% |
| Load Average * | 28.8 | 39.3 -36% | 31.7 -10% | 54.85 -90% | 50 -74% | 52.1 -81% |
| Witcher 3 ultra * | 49.5 | 49.9 -1% | 53.8 -9% | 57.8 -17% | 54 -9% | 62 -25% |
| Load Maximum * | 54.2 | 54.8 -1% | 62 -14% | 58 -7% | 56 -3% | 62 -14% |
* ... menor é melhor
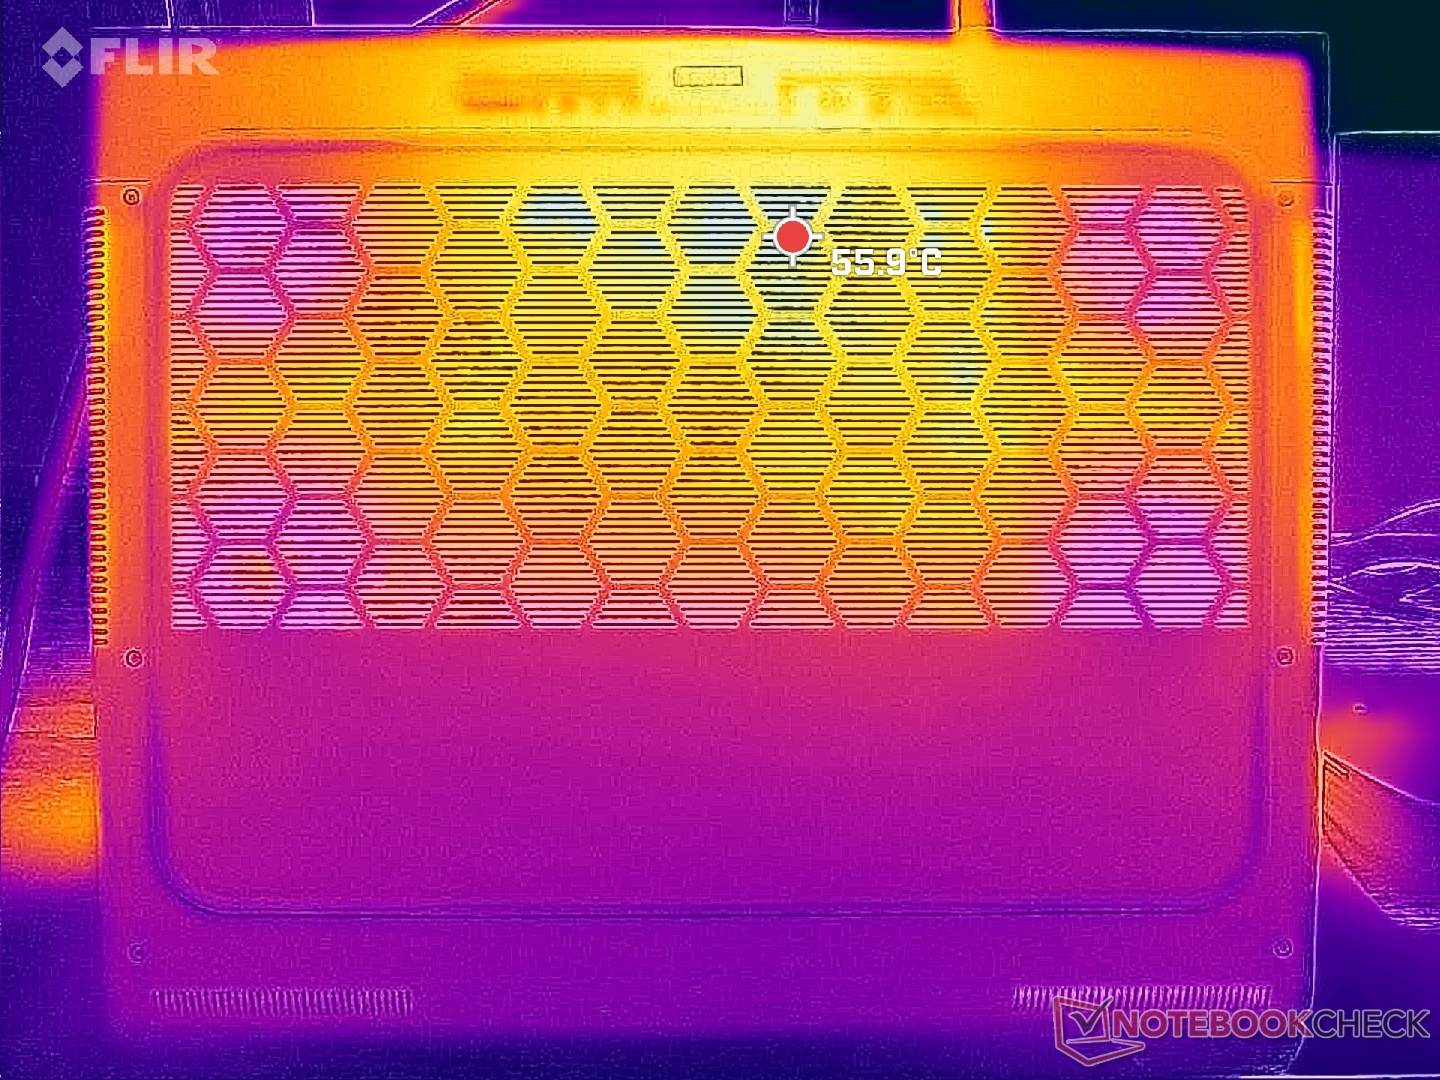
Temperatura
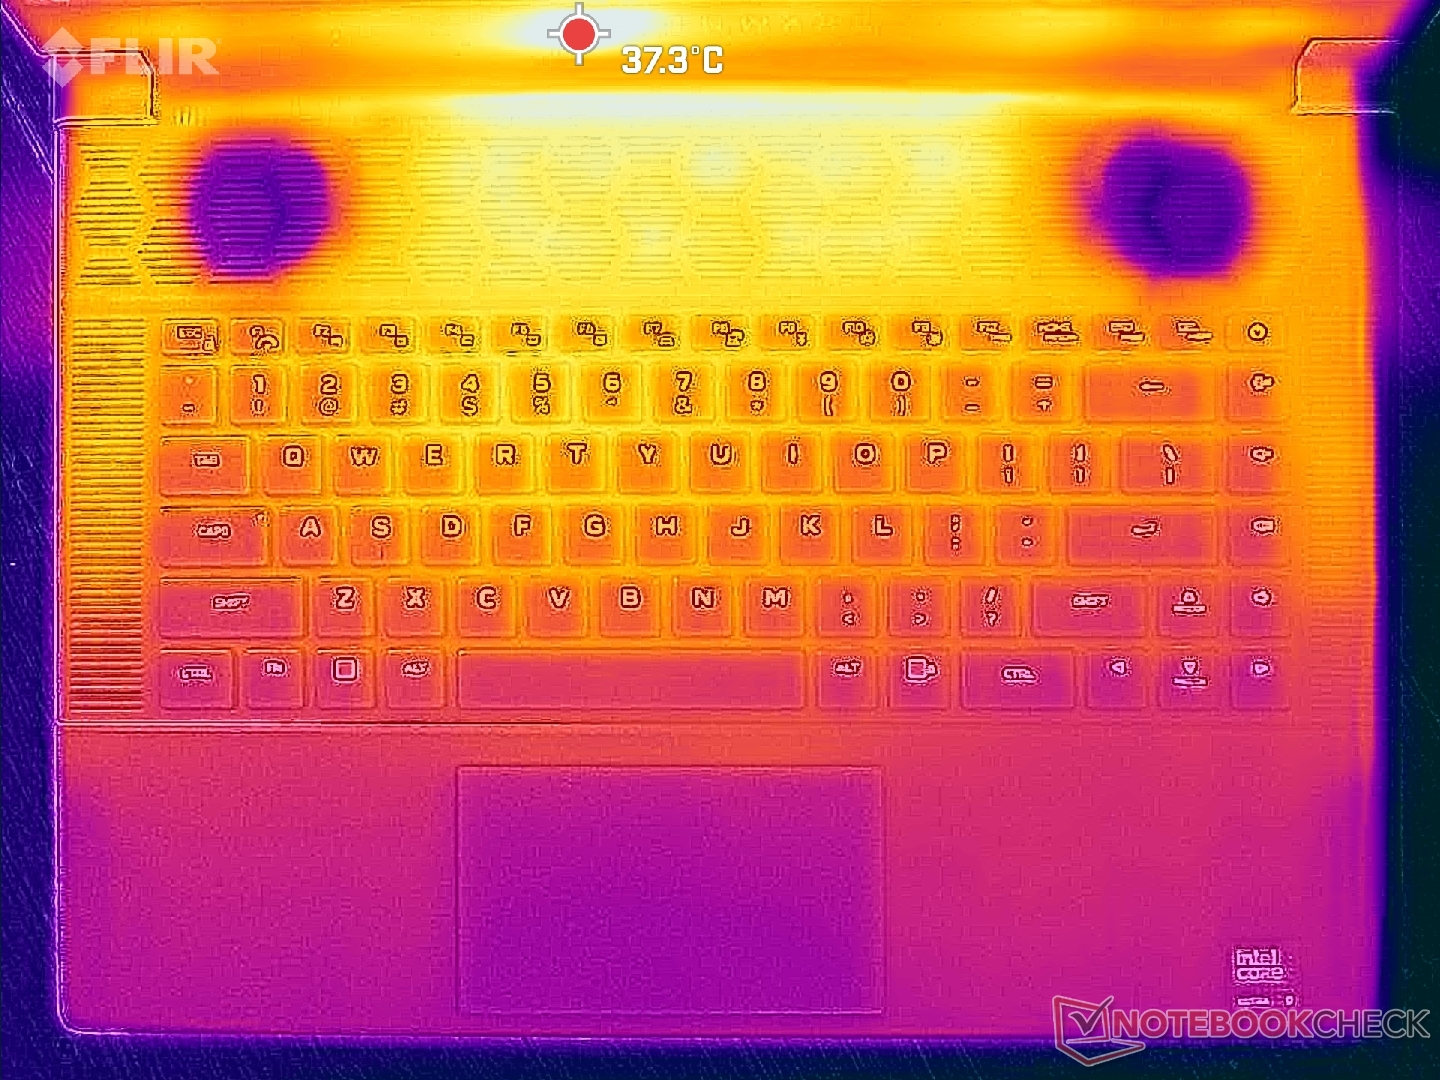
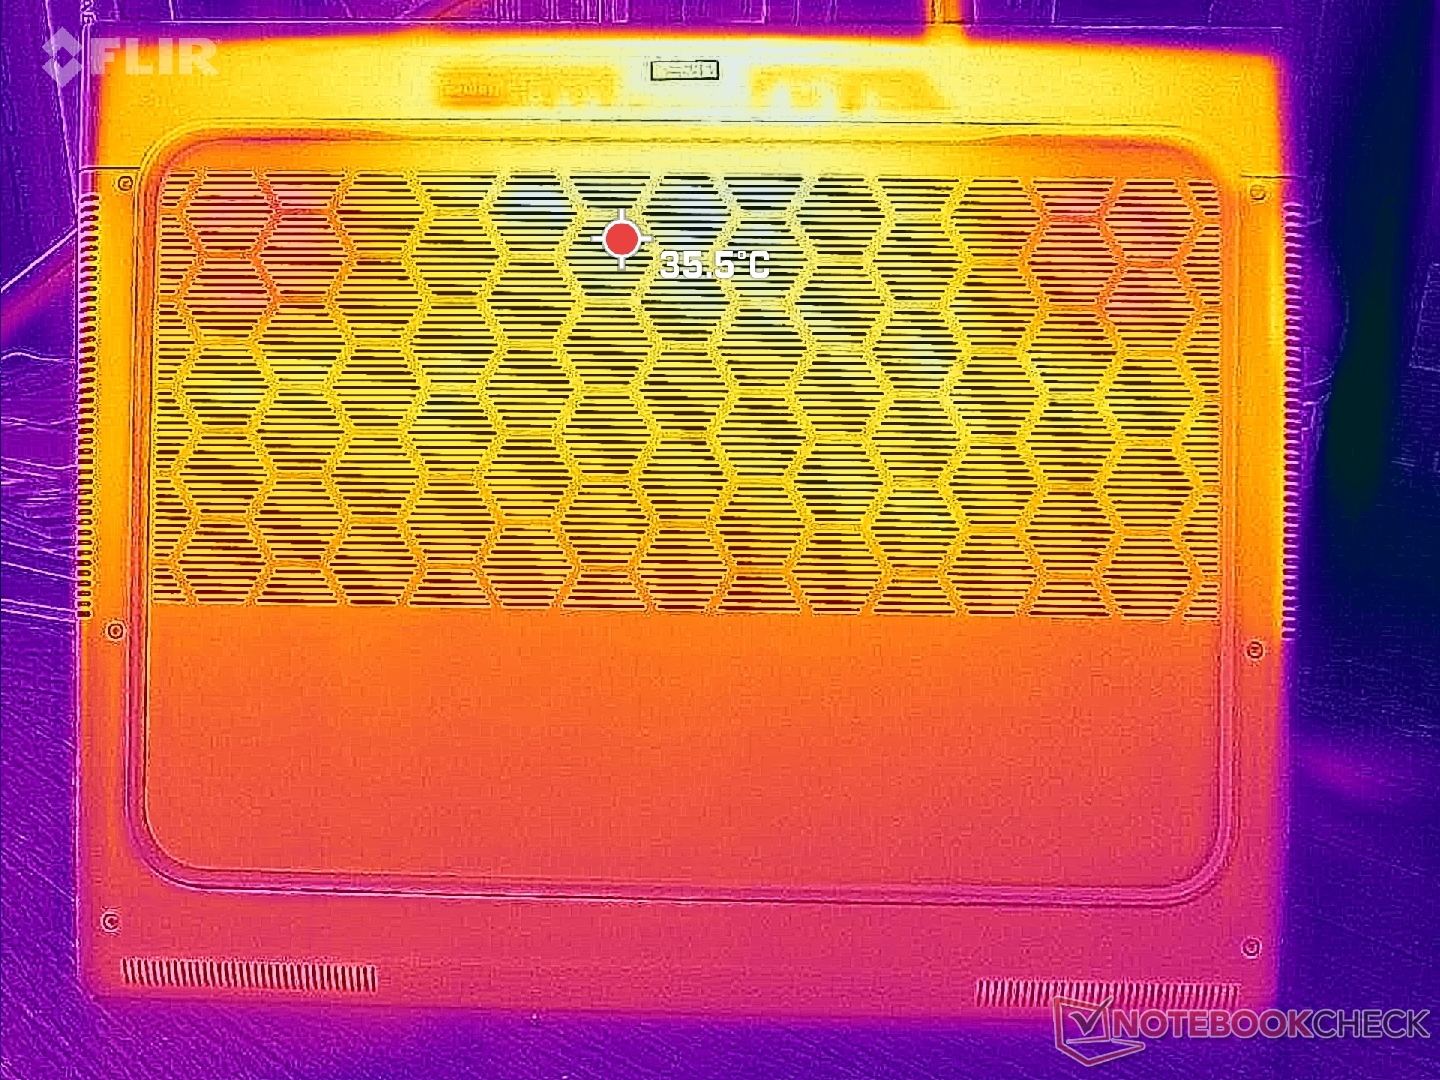
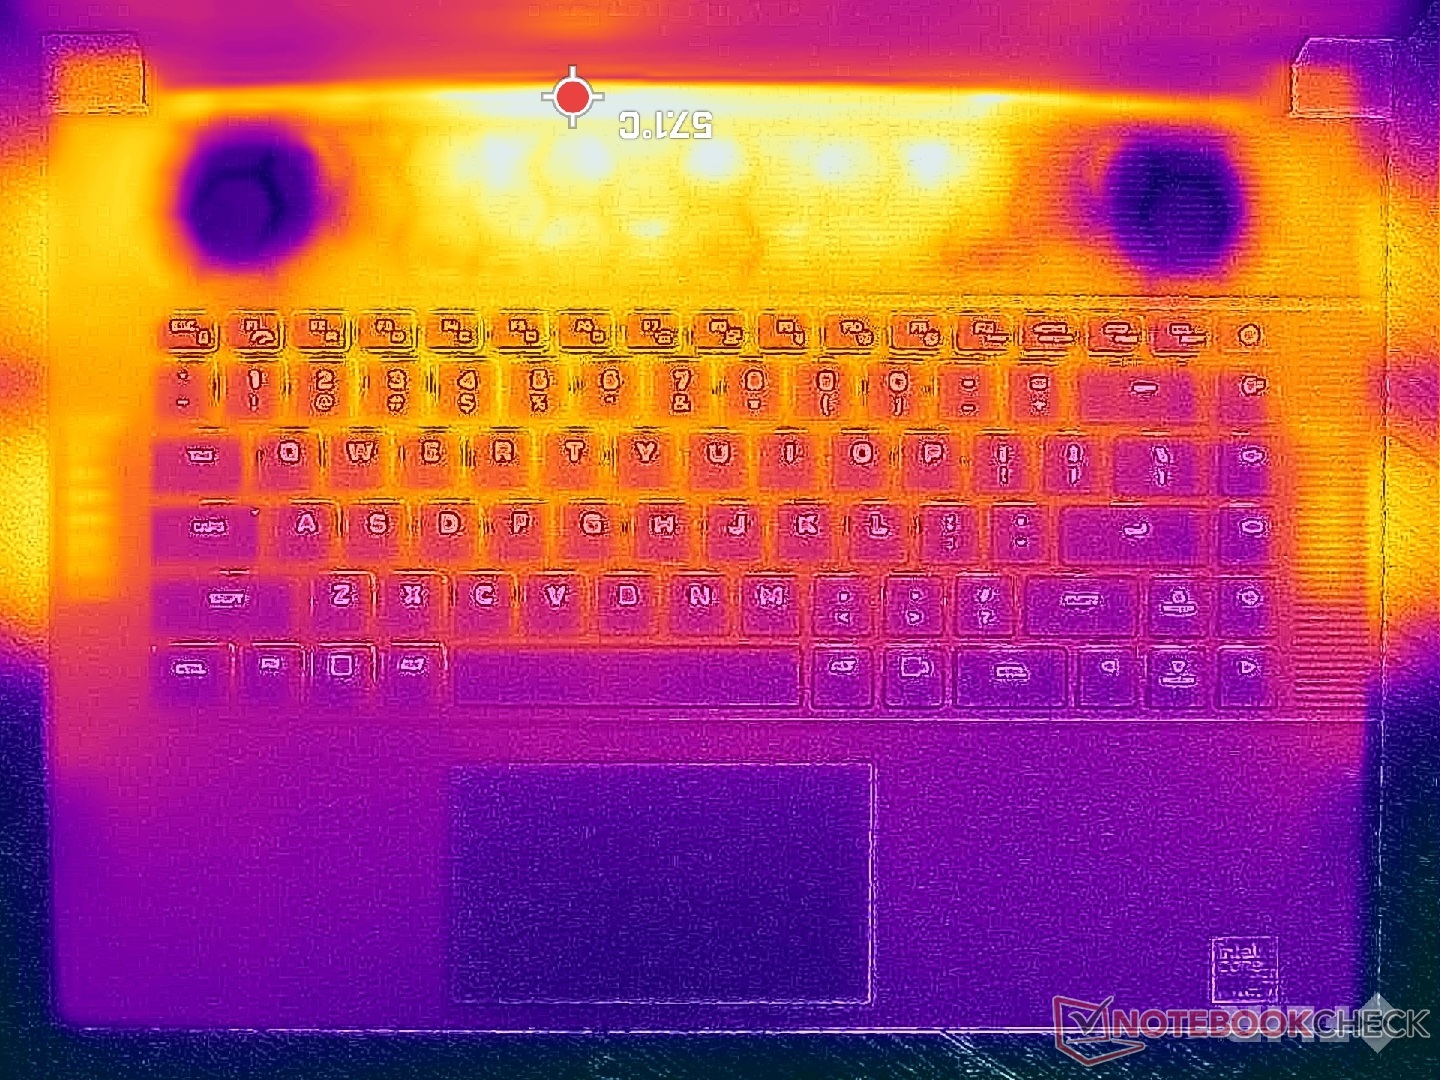
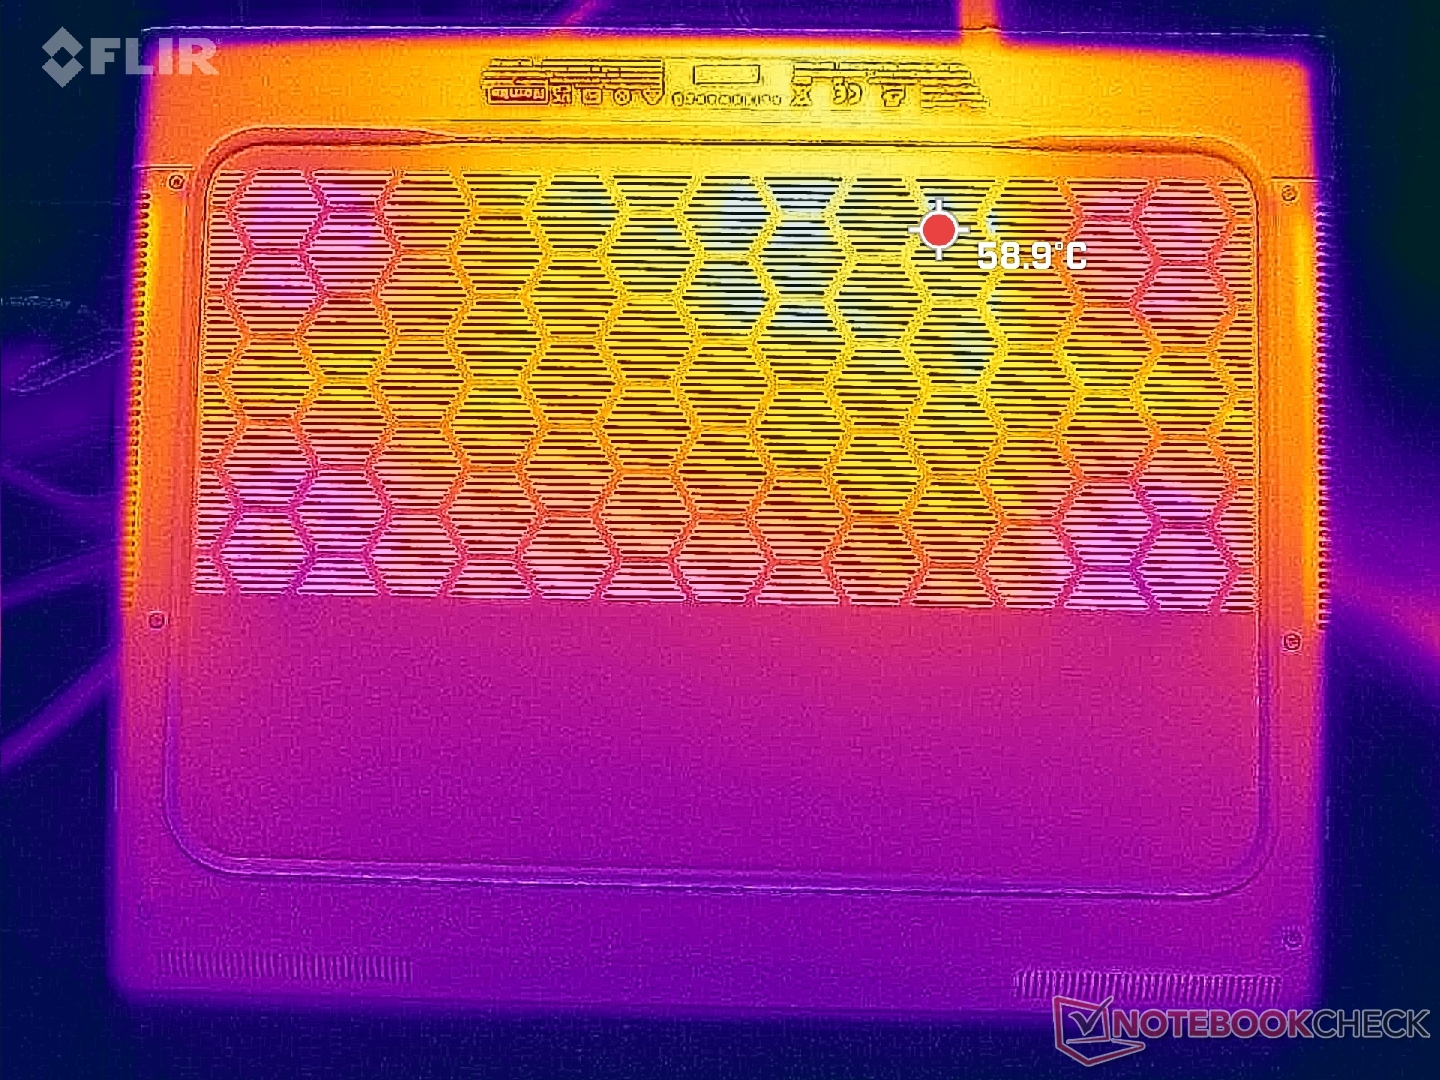
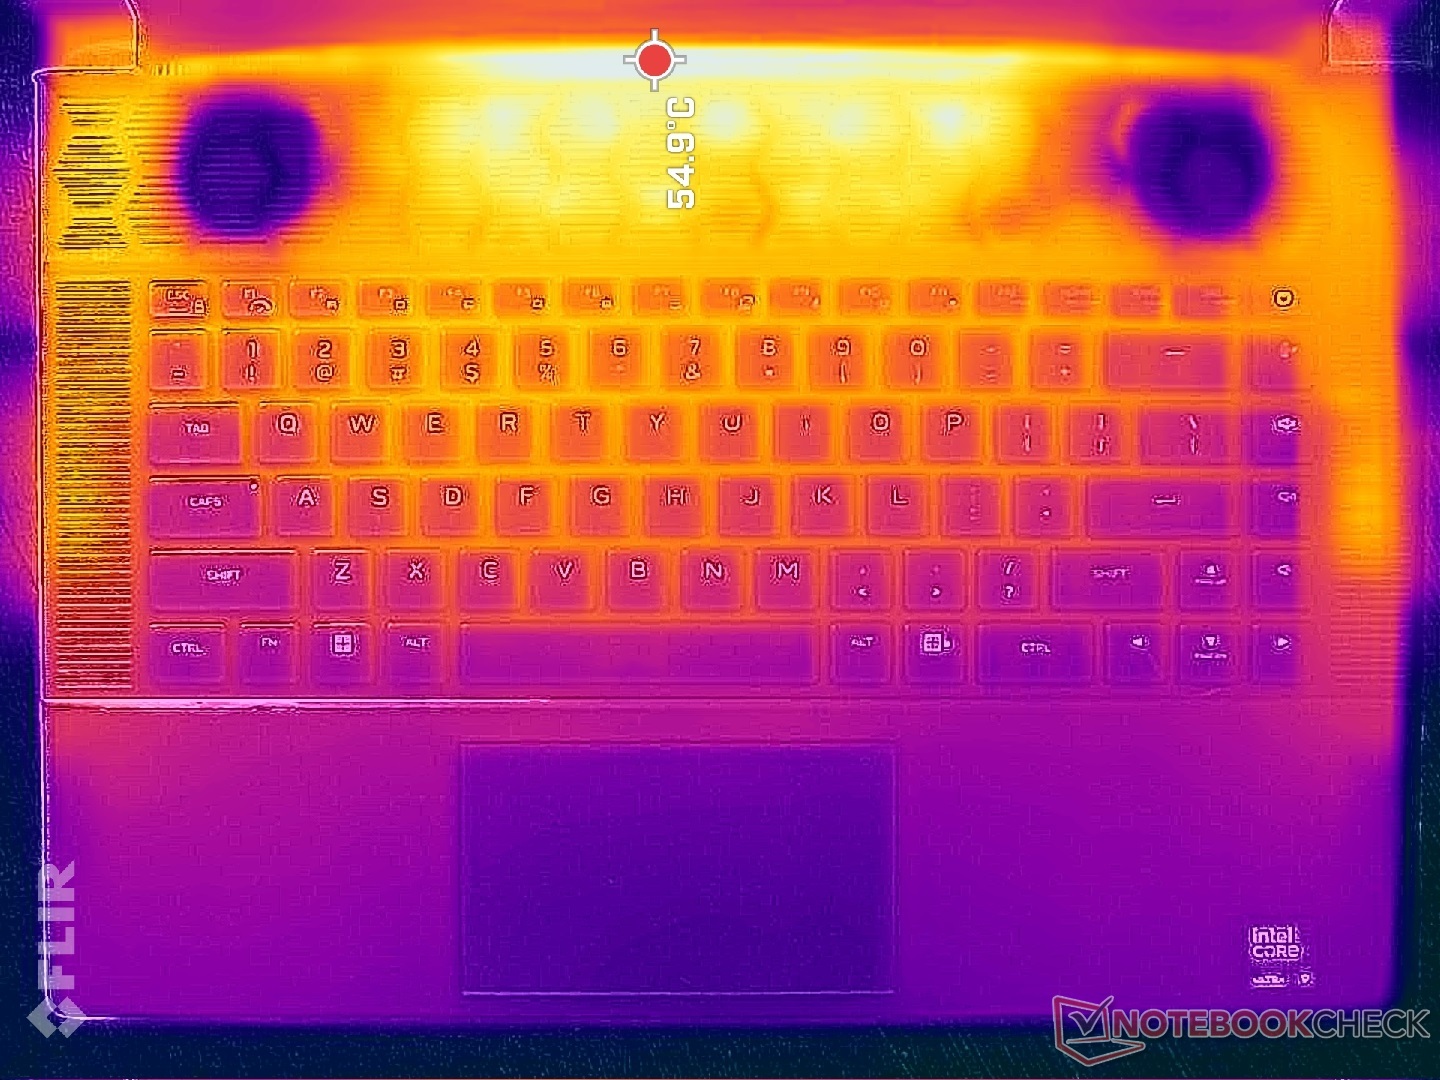
As temperaturas da superfície são muito quentes na parte de trás do chassi, enquanto a parte da frente é visivelmente mais fria para as palmas das mãos e os dedos. A série x16 da Alienware utiliza mais grades de ventilação do que a série m16 por necessidade, já que o design x16 é definido por sua espessura fina.
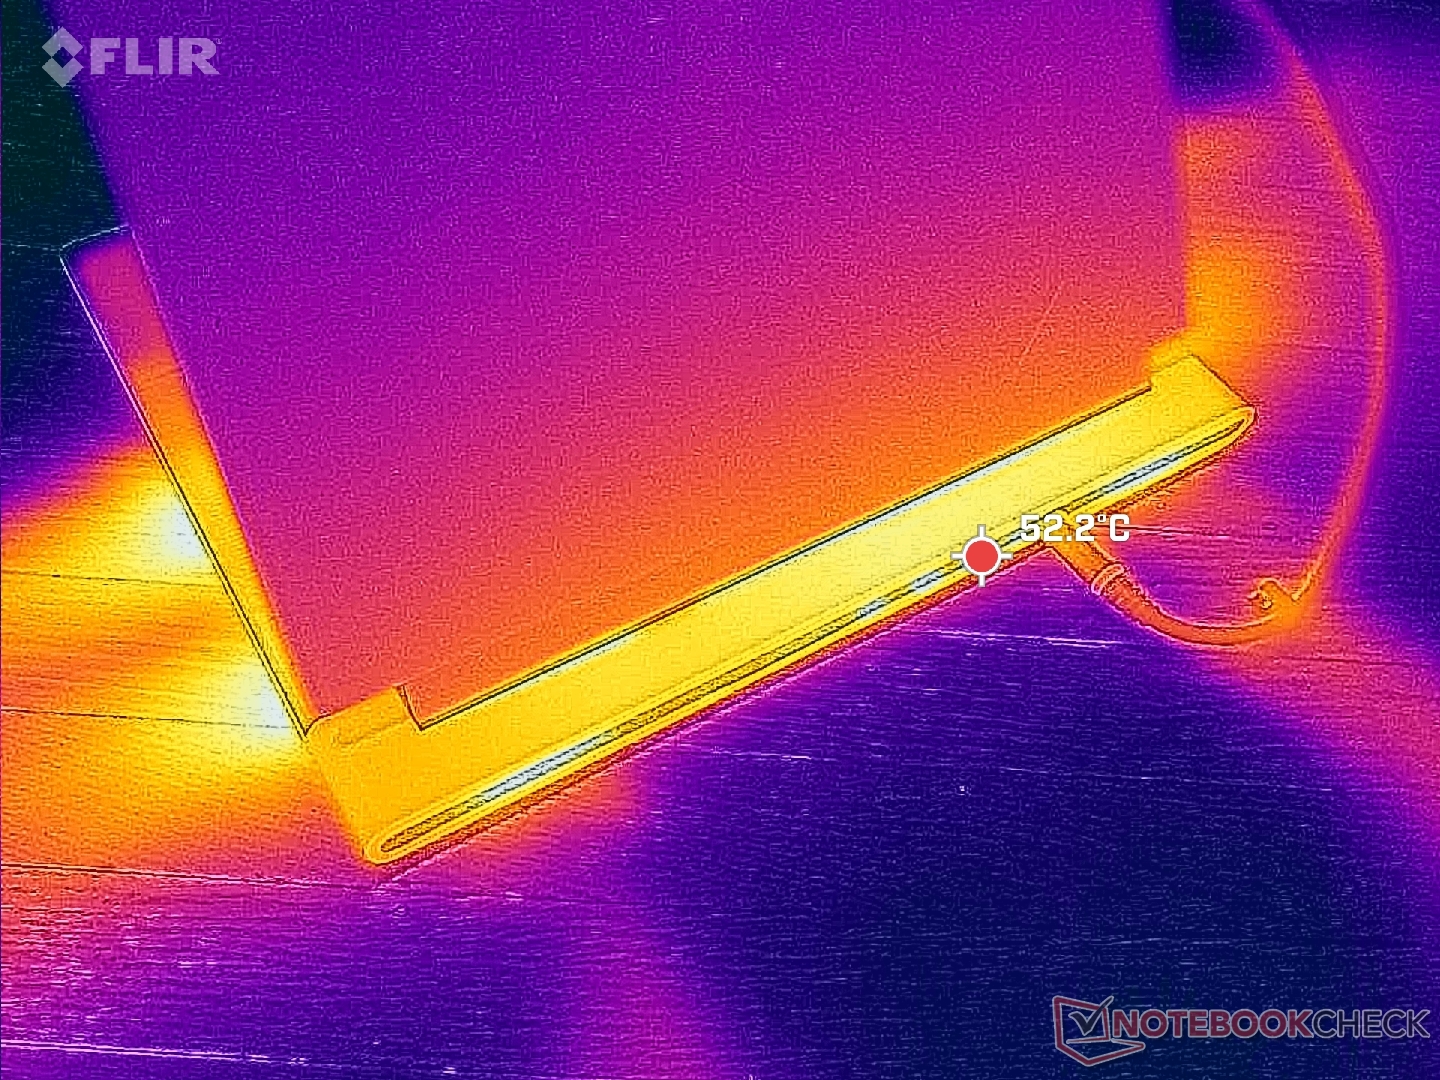
(-) A temperatura máxima no lado superior é 51 °C / 124 F, em comparação com a média de 40.4 °C / 105 F , variando de 21.2 a 68.8 °C para a classe Gaming.
(-) A parte inferior aquece até um máximo de 50.8 °C / 123 F, em comparação com a média de 43.2 °C / 110 F
(+) Em uso inativo, a temperatura média para o lado superior é 31.3 °C / 88 F, em comparação com a média do dispositivo de 33.9 °C / ### class_avg_f### F.
(-) Jogando The Witcher 3, a temperatura média para o lado superior é 42.4 °C / 108 F, em comparação com a média do dispositivo de 33.9 °C / ## #class_avg_f### F.
(+) Os apoios para as mãos e o touchpad estão atingindo a temperatura máxima da pele (33.2 °C / 91.8 F) e, portanto, não estão quentes.
(-) A temperatura média da área do apoio para as mãos de dispositivos semelhantes foi 28.9 °C / 84 F (-4.3 °C / -7.8 F).
| Alienware x16 R2 P120F Intel Core Ultra 9 185H, NVIDIA GeForce RTX 4080 Laptop GPU | Alienware x16 R1 Intel Core i9-13900HK, NVIDIA GeForce RTX 4080 Laptop GPU | Alienware m16 R2 Intel Core Ultra 7 155H, NVIDIA GeForce RTX 4070 Laptop GPU | Asus ROG Strix Scar 16 G634JZR Intel Core i9-14900HX, NVIDIA GeForce RTX 4080 Laptop GPU | Lenovo Legion Pro 7 16IRX9H Intel Core i9-14900HX, NVIDIA GeForce RTX 4080 Laptop GPU | MSI Vector 16 HX A14V Intel Core i9-14900HX, NVIDIA GeForce RTX 4080 Laptop GPU | |
|---|---|---|---|---|---|---|
| Heat | 3% | -1% | 5% | 1% | 27% | |
| Maximum Upper Side * | 51 | 47.2 7% | 44.8 12% | 47.8 6% | 46 10% | 36.4 29% |
| Maximum Bottom * | 50.8 | 47.8 6% | 48 6% | 52.2 -3% | 49 4% | 35.6 30% |
| Idle Upper Side * | 36.6 | 36.8 -1% | 37.2 -2% | 32.4 11% | 38 -4% | 26.6 27% |
| Idle Bottom * | 35.2 | 35.8 -2% | 42 -19% | 33 6% | 37 -5% | 27 23% |
* ... menor é melhor
Alto-falantes
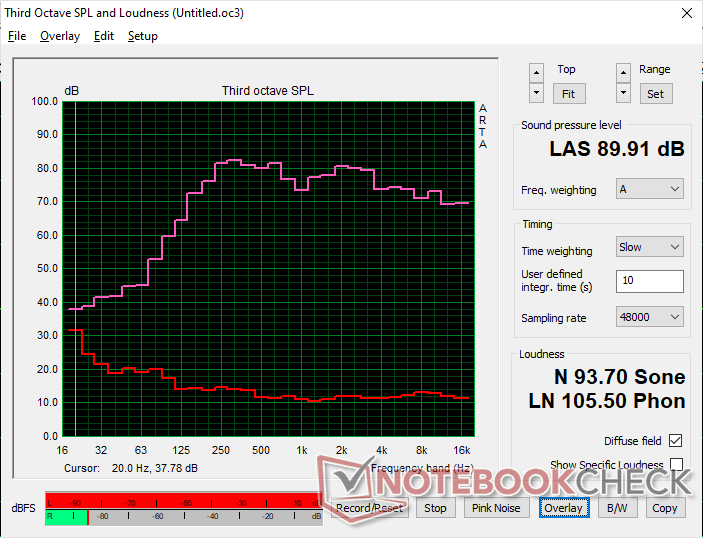
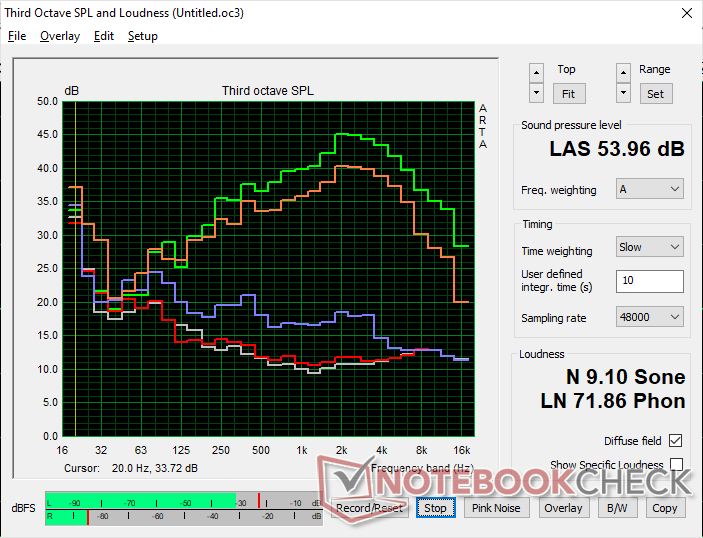
Alienware x16 R2 P120F análise de áudio
(+) | os alto-falantes podem tocar relativamente alto (###valor### dB)
Graves 100 - 315Hz
(±) | graves reduzidos - em média 7.4% menor que a mediana
(±) | a linearidade dos graves é média (7.6% delta para a frequência anterior)
Médios 400 - 2.000 Hz
(+) | médios equilibrados - apenas 2.6% longe da mediana
(+) | médios são lineares (3.6% delta para frequência anterior)
Altos 2 - 16 kHz
(+) | agudos equilibrados - apenas 3.4% longe da mediana
(+) | os máximos são lineares (2.8% delta da frequência anterior)
Geral 100 - 16.000 Hz
(+) | o som geral é linear (8.2% diferença em relação à mediana)
Comparado com a mesma classe
» 1% de todos os dispositivos testados nesta classe foram melhores, 1% semelhantes, 98% piores
» O melhor teve um delta de 6%, a média foi 18%, o pior foi 132%
Comparado com todos os dispositivos testados
» 1% de todos os dispositivos testados foram melhores, 1% semelhantes, 98% piores
» O melhor teve um delta de 4%, a média foi 24%, o pior foi 134%
Apple MacBook Pro 16 2021 M1 Pro análise de áudio
(+) | os alto-falantes podem tocar relativamente alto (###valor### dB)
Graves 100 - 315Hz
(+) | bons graves - apenas 3.8% longe da mediana
(+) | o baixo é linear (5.2% delta para a frequência anterior)
Médios 400 - 2.000 Hz
(+) | médios equilibrados - apenas 1.3% longe da mediana
(+) | médios são lineares (2.1% delta para frequência anterior)
Altos 2 - 16 kHz
(+) | agudos equilibrados - apenas 1.9% longe da mediana
(+) | os máximos são lineares (2.7% delta da frequência anterior)
Geral 100 - 16.000 Hz
(+) | o som geral é linear (4.6% diferença em relação à mediana)
Comparado com a mesma classe
» 0% de todos os dispositivos testados nesta classe foram melhores, 0% semelhantes, 100% piores
» O melhor teve um delta de 5%, a média foi 18%, o pior foi 45%
Comparado com todos os dispositivos testados
» 0% de todos os dispositivos testados foram melhores, 0% semelhantes, 100% piores
» O melhor teve um delta de 4%, a média foi 24%, o pior foi 134%
Gerenciamento de energia
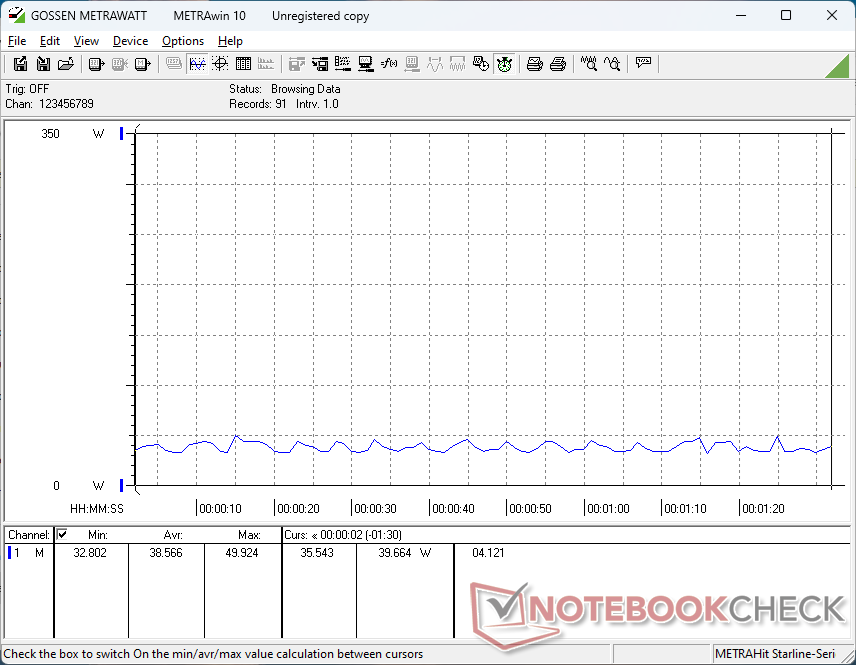
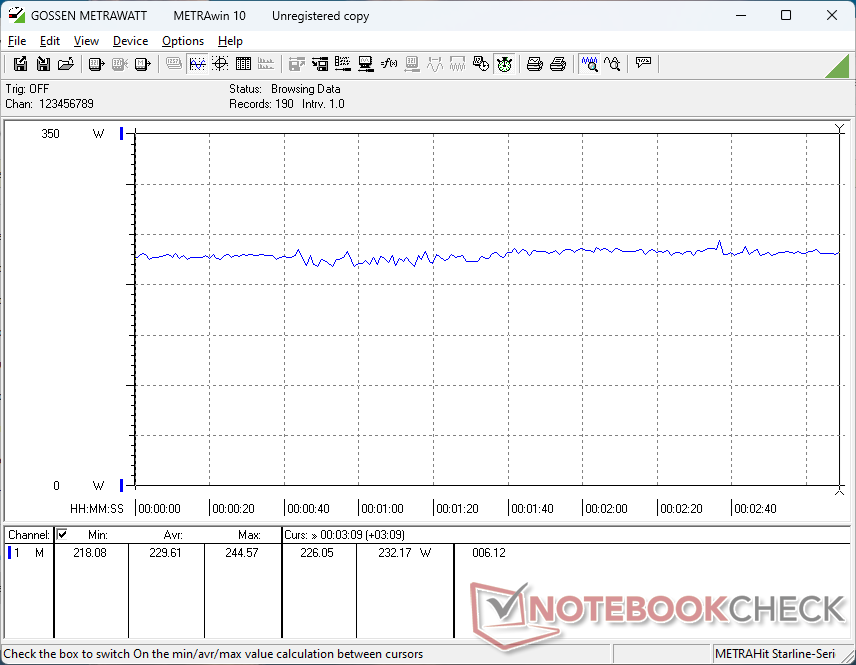
Consumo de energia
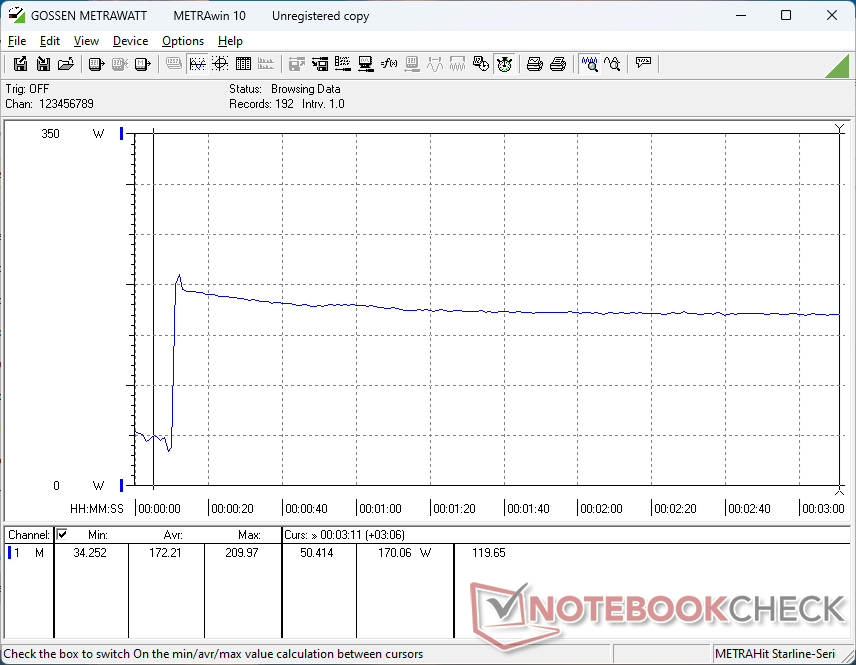
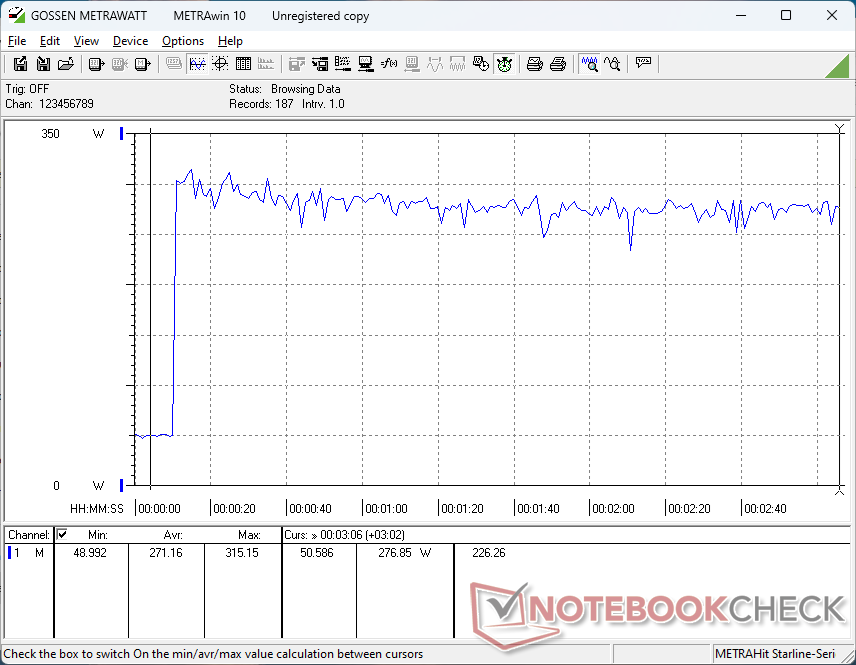
O consumo geral é geralmente menor do que o registrado no x16 R1 em cerca de 10 a 15% ao executar cargas exigentes, como jogos ou estresse do Prime95. No entanto, esse déficit acompanha os resultados mais lentos da CPU e da GPU mencionados acima. Portanto, o desempenho por watt é praticamente o mesmo em relação ao ano anterior, apesar da mudança na CPU.
Encontramos um erro no modo Standby. Se definido como Optimus, o modo Standby funcionaria normalmente com um consumo de energia baixo, inferior a 1 watt. No entanto, se definido para o modo dGPU e Overdrive, o modo de espera exigiria até 39 W, o que resultaria em um laptop desnecessariamente quente e alto consumo de bateria.
| desligado | |
| Ocioso | |
| Carga |
|
Key:
min: | |
| Alienware x16 R2 P120F Ultra 9 185H, NVIDIA GeForce RTX 4080 Laptop GPU, WDC PC SN810 1TB, IPS, 2560x1600, 16" | Alienware x16 R1 i9-13900HK, NVIDIA GeForce RTX 4080 Laptop GPU, SK hynix PC801 HFS001TEJ9X101N, IPS, 2560x1600, 16" | Alienware m16 R2 Ultra 7 155H, NVIDIA GeForce RTX 4070 Laptop GPU, Samsung PM9A1 MZVL21T0HCLR, IPS, 2560x1600, 16" | Asus ROG Strix Scar 16 G634JZR i9-14900HX, NVIDIA GeForce RTX 4080 Laptop GPU, SK hynix PC801 HFS002TEJ9X101N, Mini LED, 2560x1600, 16" | Lenovo Legion Pro 7 16IRX9H i9-14900HX, NVIDIA GeForce RTX 4080 Laptop GPU, SK Hynix HFS001TEJ9X115N, IPS, 2560x1600, 16" | MSI Vector 16 HX A14V i9-14900HX, NVIDIA GeForce RTX 4080 Laptop GPU, WD PC SN560 SDDPNQE-1T00, IPS, 2560x1600, 16" | |
|---|---|---|---|---|---|---|
| Power Consumption | -55% | 11% | -10% | -30% | -27% | |
| Idle Minimum * | 9.9 | 25.2 -155% | 8.1 18% | 10.71 -8% | 16 -62% | 15.8 -60% |
| Idle Average * | 14.5 | 29.9 -106% | 13 10% | 14.75 -2% | 21 -45% | 23.3 -61% |
| Idle Maximum * | 33.5 | 49.8 -49% | 40.3 -20% | 30 10% | 36 -7% | 30 10% |
| Load Average * | 97.5 | 105.4 -8% | 79 19% | 135 -38% | 132 -35% | 123.9 -27% |
| Witcher 3 ultra * | 230 | 263 -14% | 188.1 18% | 286 -24% | 267 -16% | 285 -24% |
| Load Maximum * | 315.2 | 313.8 -0% | 254.9 19% | 307 3% | 360 -14% | 306 3% |
* ... menor é melhor
Power Consumption Witcher 3 / Stresstest
Power Consumption external Monitor
Duração da bateria
Os tempos de execução são um pouco mais longos desta vez, provavelmente devido ao menor consumo geral de energia mencionado acima. Conseguimos registrar um tempo de execução de WLAN de mais de 40 minutos a mais do que no x16 R1, mas a maioria dos outros notebooks para jogos ainda consegue durar muito mais, incluindo o próprio Alienware m16 R2.
| Alienware x16 R2 P120F Ultra 9 185H, NVIDIA GeForce RTX 4080 Laptop GPU, 90 Wh | Alienware x16 R1 i9-13900HK, NVIDIA GeForce RTX 4080 Laptop GPU, 90 Wh | Alienware m16 R2 Ultra 7 155H, NVIDIA GeForce RTX 4070 Laptop GPU, 90 Wh | Asus ROG Strix Scar 16 G634JZR i9-14900HX, NVIDIA GeForce RTX 4080 Laptop GPU, 90 Wh | Lenovo Legion Pro 7 16IRX9H i9-14900HX, NVIDIA GeForce RTX 4080 Laptop GPU, 99.9 Wh | MSI Vector 16 HX A14V i9-14900HX, NVIDIA GeForce RTX 4080 Laptop GPU, 90 Wh | |
|---|---|---|---|---|---|---|
| Duração da bateria | -23% | 150% | 125% | 93% | 72% | |
| WiFi v1.3 | 193 | 149 -23% | 483 150% | 434 125% | 373 93% | 332 72% |
| Reader / Idle | 436 | 758 | 641 | |||
| Load | 44 | 60 | 51 | 84 | ||
| H.264 | 451 | |||||
| Witcher 3 ultra | 57 |
Pro
Contra
Veredicto - O Alienware x16 R1 é mais rápido para jogos puros
A grande vantagem do Alienware x16 R2 em relação ao x16 R1 é sua NPU integrada para acelerar as tarefas de IA do Windows. Espera-se que esses recursos se tornem comuns no próximo ano, mais ou menos, por meio do Microsoft Co-Pilot e de outros aplicativos futuros orientados por IA. Para fins de jogos, no entanto, a NPU não traz nada para melhorar a experiência a partir de 2024. Na verdade, ela é prejudicial, pois o desempenho bruto da CPU caiu em comparação com o Core i9-13900HK do x16 R1 do ano passado, já que um espaço precioso foi reservado para o novo processador neural.
O Alienware x16 R2 apresenta as novas CPUs Meteor Lake-H com uma NPU integrada para compatibilidade com os futuros recursos de IA do Windows. Infelizmente, como resultado, o desempenho bruto dos jogos foi prejudicado.
O desempenho geralmente mais lento também levou a um menor consumo de energia e a tempos de execução mais longos do que o modelo de lançamento original. No entanto, os entusiastas de jogos que gostam de comprar Alienware provavelmente não estão muito animados com a troca do desempenho pela duração da bateria. Essa mudança teria sido mais aceitável no modelo de baixo custo Série Dell G de baixo custo.
Recomendamos considerar o Alienware x16 R1 já que o x16 R2 não oferece novas opções de GPU, opções de tela, nem mesmo cores de chassi ou mudanças externas. A atualização da CPU é desejável apenas para aqueles que desejam "preparar o futuro" de seu espaço de trabalho com a NPU integrada.
Preço e disponibilidade
A Dell está enviando o Alienware x16 R2 a partir de US$ 2100 para a configuração Core Ultra 7, GeForce RTX 4060, teclado padrão e IPS 1600p240 ou até US$ 3500 se configurado com o Core Ultra 9, RTX 4090 e teclado mecânico.
Alienware x16 R2 P120F
- 05/29/2024 v7 (old)
Allen Ngo
Transparência
A seleção dos dispositivos a serem analisados é feita pela nossa equipe editorial. A amostra de teste foi fornecida ao autor como empréstimo pelo fabricante ou varejista para fins desta revisão. O credor não teve influência nesta revisão, nem o fabricante recebeu uma cópia desta revisão antes da publicação. Não houve obrigação de publicar esta revisão. Nunca aceitamos compensação ou pagamento em troca de nossas avaliações. Como empresa de mídia independente, a Notebookcheck não está sujeita à autoridade de fabricantes, varejistas ou editores.
É assim que o Notebookcheck está testando
Todos os anos, o Notebookcheck analisa de forma independente centenas de laptops e smartphones usando procedimentos padronizados para garantir que todos os resultados sejam comparáveis. Desenvolvemos continuamente nossos métodos de teste há cerca de 20 anos e definimos padrões da indústria no processo. Em nossos laboratórios de teste, equipamentos de medição de alta qualidade são utilizados por técnicos e editores experientes. Esses testes envolvem um processo de validação em vários estágios. Nosso complexo sistema de classificação é baseado em centenas de medições e benchmarks bem fundamentados, o que mantém a objetividade.Price comparison

