Notebookcheck Logo

Análise do Dell XPS 13 9345 Snapdragon X Elite: Superando o Intel Core Ultra 7
snapdragon X Elite de US$ 1.300 vs. Core Ultra 7 de US$ 1.400.

O impulso para o Windows em ARM está ficando maior, com a popular série XPS 13 agora entrando no trem do Snapdragon Elite. Seu preço de US$ 1.300 é, na verdade, mais barato do que o modelo Intel Core Ultra 7, mas o senhor deve estar preparado para alguns compromissos relacionados ao software.
Dell XPS 13 9345
Dell XPS 13 9345

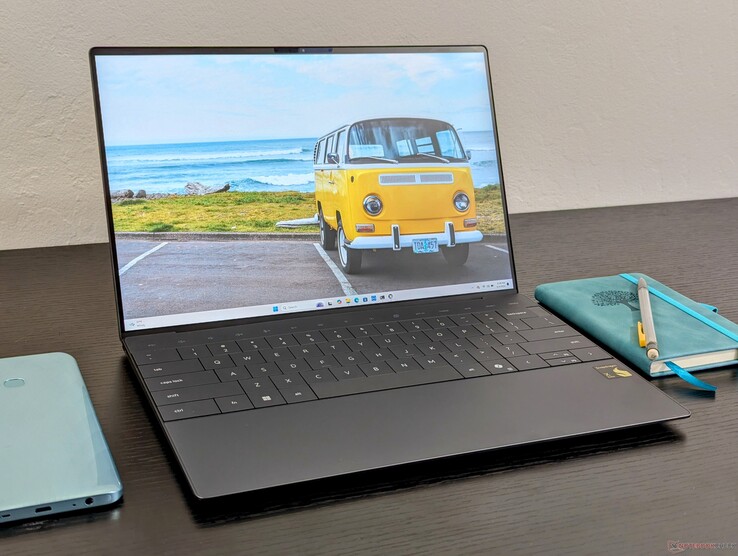
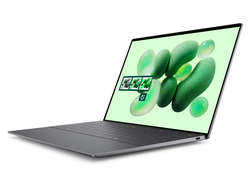
Que melhor maneira de exibir seu processador do que estreá-lo em um dos laptops mais populares da Dell? O chassi do XPS 13 Plus 9320/9340 foi reaproveitado com a mais recente CPU Snapdragon X Elite para estar entre os poucos laptops Windows com tecnologia Qualcomm lançados este ano. Chamado de XPS 13 9345, o modelo Snapdragon é visualmente idêntico ao atual XPS 13 Plus 9320 ou 9340 com CPUs Intel tradicionais.

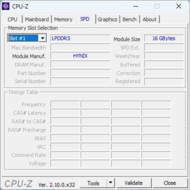
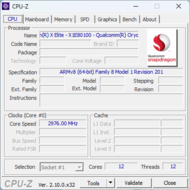
Nossa configuração de análise vem equipada com o Snapdragon X1 Elite X1E-80-100, 16 GB de RAM LPDDR5X-8448 e tela IPS de 1200p 120 Hz por aproximadamente US$ 1300. Há painéis OLED mais sofisticados disponíveis e algumas regiões podem incluir uma segunda opção de processador Snapdragon X1 Plus X1P, mas a GPU integrada permanece a mesma em todos os casos.

As alternativas ao XPS 13 9345 incluem o Microsoft Surface Pro ou o Samsung Galaxy Book4 Edge 16 ambos equipados com o mesmo processador Snapdragon X1 Elite X1E-80-100. Obviamente, ele também concorre diretamente com subnotebooks de escritório mais convencionais de 13 e 14 polegadas, como o Lenovo ThinkBook 13x G4, Asus ZenBook S13ou o XPS 13 9340 da própria Dell.

Mais análises da Dell:

Dell XPS 13 9345 (XPS 13 Serie)
Processador
Placa gráfica
Memória
16 GB 
, LPDDR5x, 8448 MT/s, Dual-Channel, soldered
Pantalha
13.40 polegadas 16:10, 1920 x 1200 pixel 169 PPI, IPS, Brilhante: não, 120 Hz, Adaptive Sync
Conexões
2 USB 4.0 40 Gbps, USB-C Power Delivery (PD), 2 DisplayPort, Brightness Sensor
Funcionamento em rede
Qualcomm FastConnect 7800 (b/g/n = Wi-Fi 4/ac = Wi-Fi 5/ax = Wi-Fi 6/ Wi-Fi 6E 6 GHz be = Wi-Fi 7), Bluetooth 5.4
Tamanho
altura x largura x profundidade (em mm): 15.3 x 295.3 x 199.1
Bateria
55 Wh Lítio-Polímero
Sistema Operativo
Microsoft Windows 11 Home
Camera
Webcam: 1080p + IR
Primary Camera: 2 MPix
Características adicionais
Alto falantes: Quad (2x 2 W + 2x 2 W), Teclado: Zero-Lattice, Iluminação do Teclado: sim, Dell Digital Delivery, MyDell, 12 Meses Garantia
peso
1.228 kg, Suprimento de energia: 287 g
Preço
1300 USD
Note: The manufacturer may use components from different suppliers including display panels, drives or memory sticks with similar specifications.


Possíveis concorrentes em comparação

Rating
Version
Date
Model
Weight
Height
Size
Resolution
Price
84.5 %v8
08/2024
Dell XPS 13 9345
SD X Elite X1E-80-100, Adreno X1-85 3.8 TFLOPS
1.2 kg15.3 mm13.40"1920x1200
86.5 %
v7 (old)
v7 (old)
05/2024
Dell XPS 13 9340 Core Ultra 7
Ultra 7 155H, Arc 8-Core
1.2 kg15.3 mm13.40"1920x1200
86.2 %v8
07/2024
Microsoft Surface Laptop 7 13.8 Copilot+
SD X Elite X1E-80-100, Adreno X1-85 3.8 TFLOPS
1.3 kg17.5 mm13.80"2304x1536
90.1 %
v7 (old)
v7 (old)
05/2024
Lenovo ThinkBook 13x G4 21KR0008GE
Ultra 5 125H, Arc 7-Core
1.2 kg12.9 mm13.50"2880x1920
82.3 %v8
07/2024
HP EliteBook Ultra G1q 14
SD X Elite X1E-78-100, Adreno X1-85 3.8 TFLOPS
1.3 kg11.2 mm14.00"2240x1400
85.4 %
v7 (old)
v7 (old)
05/2023
Asus ZenBook S13 OLED UX5304
i7-1355U, Iris Xe G7 96EUs
1 kg11.8 mm13.30"2880x1800

Observação: Nosso sistema de classificação foi atualizado recentemente e os resultados da versão 8 não podem ser comparados com os resultados da versão 7. Outras informações sobre o assunto estão aqui disponíveis.

Observação: Atualizamos recentemente nosso sistema de classificação e os resultados da versão 8 não são comparáveis aos resultados da versão 7. Mais informações estão disponíveis aqui .

Case - aparência e sensação familiares

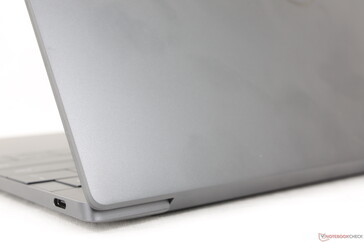
Não há diferenças externas que separem o modelo da Qualcomm do modelo da Intel e, portanto, nossos nossos comentários sobre o modelo da Intel também se aplicam aqui. Teria sido bom ter novas opções de cores, mas as opções Platinum e Graphite são as mesmas. Preferimos um pouco a opção Platinum, pois sua cor branca brilhante oculta melhor as impressões digitais do que a opção Graphite mais escura da nossa unidade de teste da Qualcomm, especialmente ao longo dos apoios para as mãos e da tampa externa.

O chassi vem nas opções de cor cinza Graphite ou branco Platinum
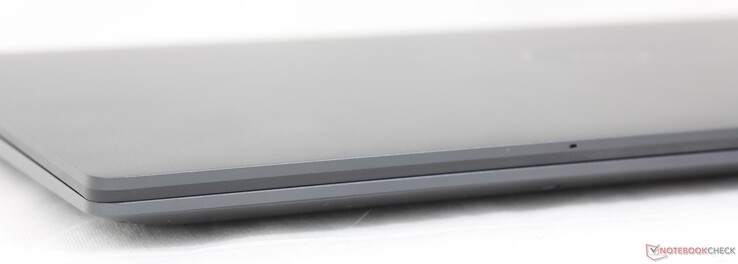
A textura metálica fosca mais suave é herdada do design da última geração do XPS
O ângulo máximo da tampa é relativamente estreito (~140 graus) em comparação com a maioria dos outros laptops
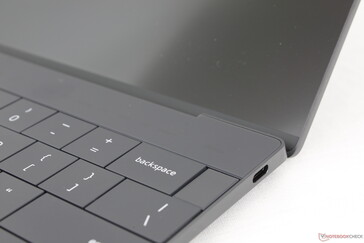
Botão liga/desliga habilitado para impressão digital
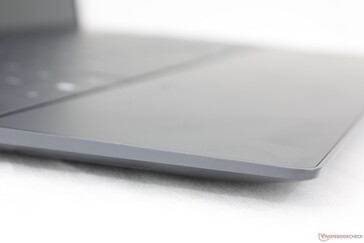
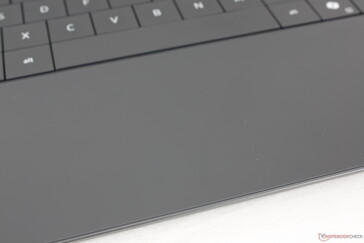
Uma única superfície de vidro lisa se estende por toda a área de apoio para as mãos
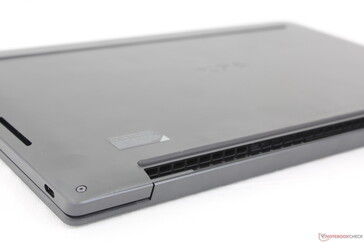
As bordas são mais planas e mais nítidas do que o design do XPS anterior. As grades de ventilação estão ocultas sob as dobradiças

Comparação de tamanho

312.7 mm 223.3 mm 11.2 mm 1.3 kg301 mm 220 mm 17.5 mm 1.3 kg295.3 mm 199.1 mm 15.3 mm 1.2 kg295.3 mm 199.1 mm 15.3 mm 1.2 kg296.2 mm 216.3 mm 11.8 mm 1 kg292.9 mm 205 mm 12.9 mm 1.2 kg297 mm 210 mm 1 mm 5.7 g

Conectividade

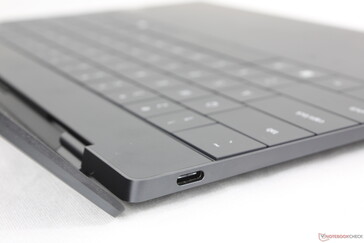
Há duas portas USB-C 4.0, assim como na versão Intel do XPS 13. No entanto, as portas aqui não têm suporte para Thunderbolt e, portanto, a compatibilidade com eGPU não é garantida. Ao tentar conectar nossa Caixa para jogos Aorus RTX 2080 Tipor exemplo, o laptop da Qualcomm não conseguiria reconhecer a eGPU, enquanto um PC habilitado para Thunderbolt a reconheceria automaticamente por meio do Gerenciador de dispositivos. A Qualcomm disse que qualquer suporte e drivers aplicáveis dependeriam dos fabricantes individuais de eGPU, o que não é promissor para os proprietários de eGPU existentes.

Frente: Sem portas
Frente: Sem portas
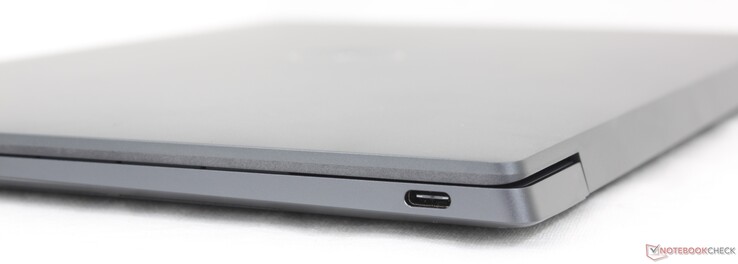
Direito: USB-C 4 (40 Gbps) com Power Delivery + DisplayPort
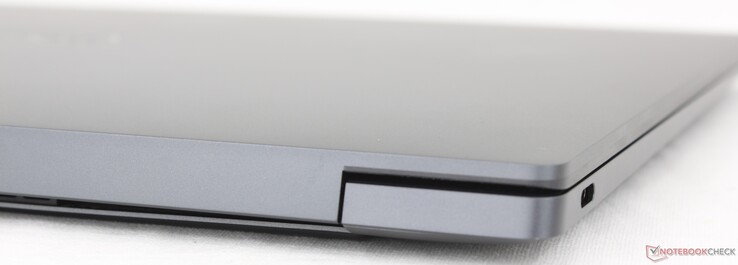
Traseira: Sem portas
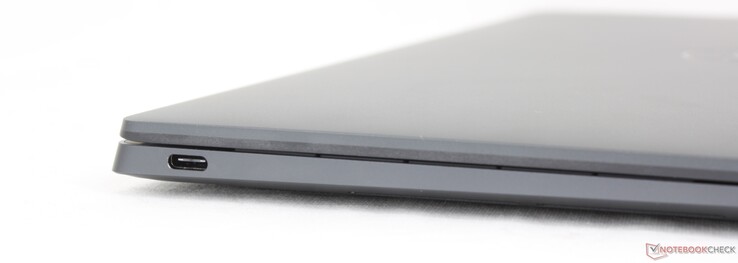
Esquerda: USB-C 4 (40 Gbps) com Power Delivery + DisplayPort

Comunicação

A Dell trocou o BE200 do Intel XPS 13 pelo FastConnect 7800 no Qualcomm XPS 13. O módulo suporta conectividade Wi-Fi 7, que ainda é incomum na maioria das residências. No entanto, o desempenho é estável quando emparelhado com nosso roteador de teste Wi-Fi 6E AXE11000.

Módulo WLAN soldado
Módulo WLAN soldado
Networking
iperf3 transmit AXE11000
Lenovo ThinkBook 13x G4 21KR0008GE
Intel Wi-Fi 6E AX211
1666 (1537min, 1551.79P1 - 1751max) MBit/s +98%
Dell XPS 13 9340 Core Ultra 7
Intel Wi-Fi 7 BE200 320MHz
1615 (1517min, 1522.22P1 - 1687max) MBit/s +92%
Asus ZenBook S13 OLED UX5304
Intel Wi-Fi 6E AX211
1555 (1319min - 1613max) MBit/s +85%
Microsoft Surface Laptop 7 13.8 Copilot+
Qualcomm FastConnect 7800
1483 (1390min - 1582max) MBit/s +76%
Dell XPS 13 9345
Qualcomm FastConnect 7800
842 (782min - 873max) MBit/s
HP EliteBook Ultra G1q 14
Qualcomm Fast Connect 6900 Wi-Fi 6E Dual Band Simultaneous
684 (612min - 770max) MBit/s -19%
iperf3 receive AXE11000
Microsoft Surface Laptop 7 13.8 Copilot+
Qualcomm FastConnect 7800
1720 (1619min - 1751max) MBit/s +89%
Lenovo ThinkBook 13x G4 21KR0008GE
Intel Wi-Fi 6E AX211
1709 (1689min, 1690.74P1 - 1723max) MBit/s +88%
Dell XPS 13 9340 Core Ultra 7
Intel Wi-Fi 7 BE200 320MHz
1504 (1431min, 1431.87P1 - 1544max) MBit/s +65%
Asus ZenBook S13 OLED UX5304
Intel Wi-Fi 6E AX211
1439 (1353min - 1469max) MBit/s +58%
HP EliteBook Ultra G1q 14
Qualcomm Fast Connect 6900 Wi-Fi 6E Dual Band Simultaneous
912 (893min - 928max) MBit/s 0%
Dell XPS 13 9345
Qualcomm FastConnect 7800
911 (801min - 946max) MBit/s
iperf3 transmit AXE11000 6GHz
Microsoft Surface Laptop 7 13.8 Copilot+
Qualcomm FastConnect 7800
1546 (1484min - 1644max) MBit/s +59%
HP EliteBook Ultra G1q 14
Qualcomm Fast Connect 6900 Wi-Fi 6E Dual Band Simultaneous
1430 (1268min - 1550max) MBit/s +47%
Dell XPS 13 9345
Qualcomm FastConnect 7800
973 (935min - 1001max) MBit/s
iperf3 receive AXE11000 6GHz
Microsoft Surface Laptop 7 13.8 Copilot+
Qualcomm FastConnect 7800
1775 (1757min - 1789max) MBit/s +23%
HP EliteBook Ultra G1q 14
Qualcomm Fast Connect 6900 Wi-Fi 6E Dual Band Simultaneous
1703 (1611min - 1768max) MBit/s +18%
Dell XPS 13 9345
Qualcomm FastConnect 7800
1447 (1327min - 1488max) MBit/s
0501001502002503003504004505005506006507007508008509009501000105011001150120012501300135014001450Tooltip
Dell XPS 13 9345; iperf3 transmit AXE11000 6GHz; iperf 3.1.3: Ø973 (935-1001)
Dell XPS 13 9345; iperf3 receive AXE11000 6GHz; iperf 3.1.3: Ø1447 (1327-1488)

Webcam

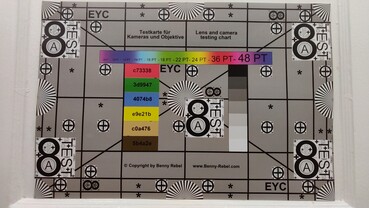
O modelo vem de fábrica com a mesma webcam de 2 MP encontrada no XPS 13 9340, em vez da webcam de 1 MP do XPS 13 9320 original. O IR também está embutido para suportar o reconhecimento facial do Windows Hello. No entanto, ainda não há tampa da câmera ou interruptor de interrupção.

ColorChecker
5.4 ∆E
5.4 ∆E
6 ∆E
8 ∆E
8.4 ∆E
6.5 ∆E
8.5 ∆E
2 ∆E
6.3 ∆E
2.9 ∆E
4.5 ∆E
4.7 ∆E
3.8 ∆E
5.3 ∆E
3.4 ∆E
7.3 ∆E
3.6 ∆E
4.2 ∆E
15 ∆E
9.2 ∆E
2.5 ∆E
1.4 ∆E
2.6 ∆E
5.7 ∆E
ColorChecker Dell XPS 13 9345: 5.53 ∆E min: 1.37 - max: 15.01 ∆E

Manutenção

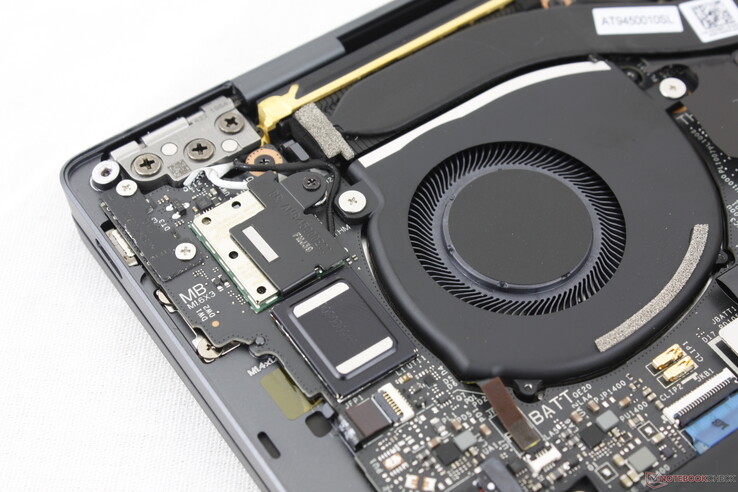
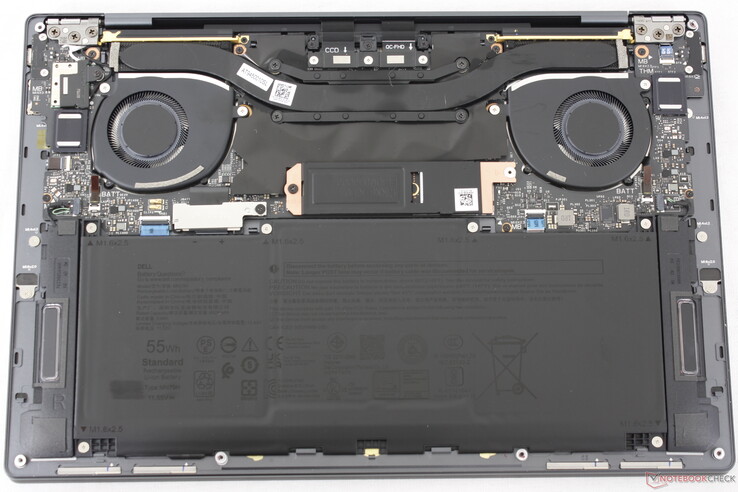
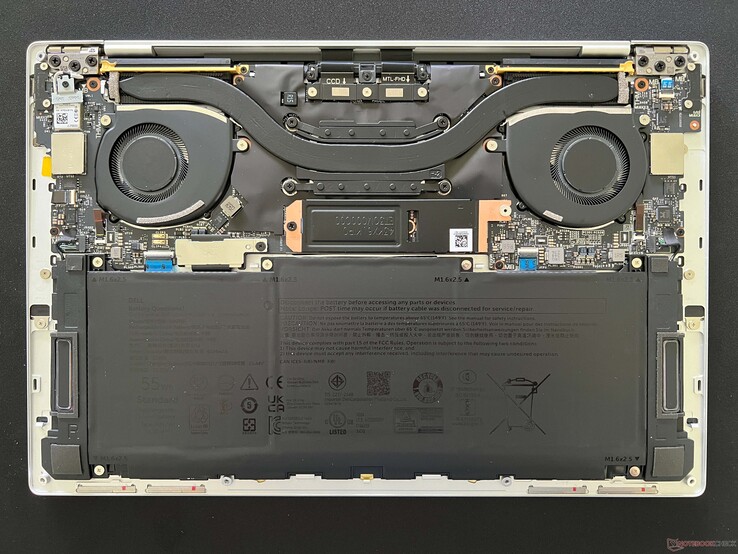
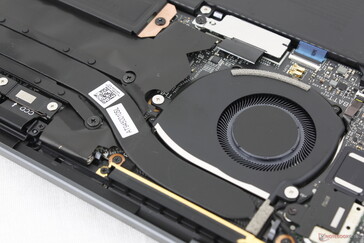
O painel inferior requer apenas uma chave de fenda Torx para ser removido. Não há nada para atualizar além do único SSD M.2, pois a RAM e a WLAN são soldadas.

XPS 13 9345
XPS 13 9345
XPS 13 9340 para comparação. Não há grandes diferenças internas entre as variantes Intel e Qualcomm do XPS 13

Sustentabilidade

A embalagem consiste em 75% de material reciclado e 25% de material renovável para ser totalmente reciclável. Enquanto isso, o próprio laptop foi fabricado com pelo menos 20% de alumínio e vidro reciclados.

Acessórios e garantia

Não há nenhum extra na caixa além do adaptador CA e da documentação, enquanto os modelos XPS baseados em Intel geralmente incluem um adaptador USB-C para USB-A gratuitamente.
A garantia limitada de um ano do fabricante se aplica se o produto for comprado nos EUA.
Dispositivos de entrada - aparência mais limpa em detrimento da usabilidade

Teclado

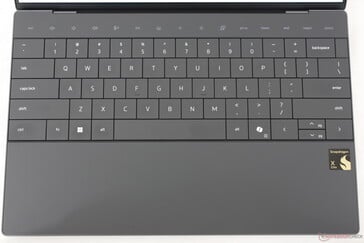
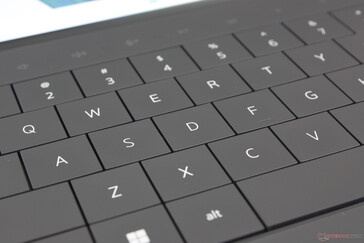
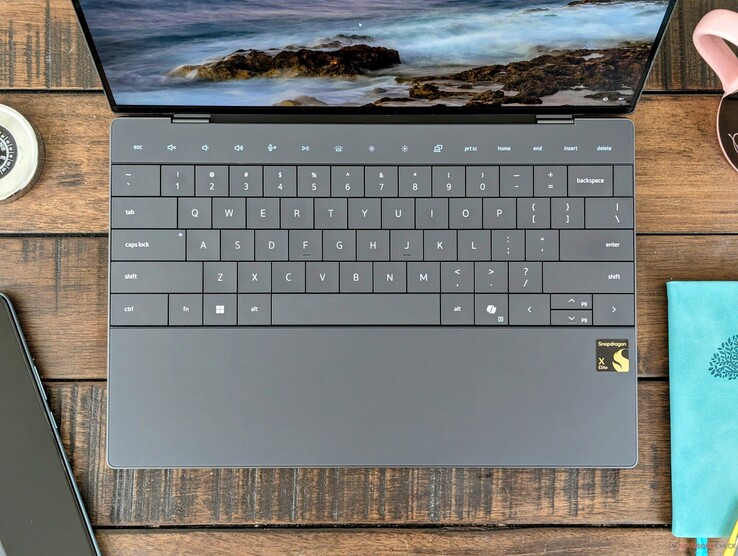
O teclado de grade zero leva algum tempo para se acostumar quando comparado com os teclados tradicionais da maioria dos outros subnotebooks. O curso das teclas é ainda menor do que o normal, com apenas 1,0 mm, e o feedback é relativamente suave para uma experiência de digitação mais suave. A diferença é noite e dia quando se alterna entre o XPS 13 9345 e as teclas mais firmes do HP Spectre x360 14.

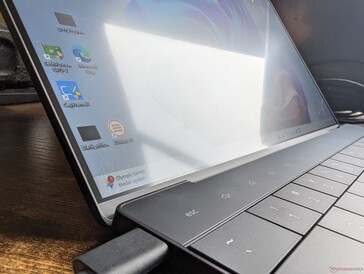
As teclas de função habilitadas para toque também são um misto. A Lenovo implementou algo muito semelhante em sua série ThinkPad há vários anos, antes de abandoná-la prontamente e, portanto, é um pouco surpreendente vê-la reaparecer em um fabricante concorrente. O principal problema é que as teclas são sensíveis até mesmo ao menor dos toques, o que pode levar a entradas acidentais.

Touchpad

O clickpad invisível do XPS tornou-se famoso por sua falta de facilidade de uso e a tendência continua no modelo com Snapdragon. Embora a área de superfície utilizável seja bastante espaçosa para um formato de 13 polegadas, com aproximadamente 11,5 x 7,5 cm, o clique é insatisfatório devido ao feedback fraco. Pior ainda, a força necessária para inserir um clique é muito menor do que na maioria dos outros laptops, o que leva a muitos cliques e arrastamentos acidentais quando o usuário está simplesmente tentando mover o cursor. Esperávamos algumas melhorias nesse aspecto depois de dois anos com esse design, mas infelizmente não é o caso.

Teclado de estrutura zero com layout QWERTY familiar
O clickpad é espaçoso, mas o tato é fraco e sensível demais
As teclas de função ativadas por toque alternam entre as funções F e as funções secundárias
O curso da chave é superficial, com apenas 1 mm. O feedback poderia ter sido mais firme

Tela

Três opções de tela estão disponíveis, como segue. Nossa configuração de análise vem com a opção em negrito.

  • 1920 x 1200, IPS, 120 Hz, sem toque, fosco
  • 2560 x 1600, IPS, 120 Hz, sensível ao toque, brilhante
  • 2880 x 1800, OLED, 60 Hz, sensível ao toque, brilhante

Tudo indica que nosso painel de 120 Hz é exatamente o mesmo painel usado no XPS 13 baseado em Intel. Tudo, desde o suporte a VRR até 30 Hz, os tempos de resposta adequados e o brilho máximo de 500 nit são recursos semelhantes encontrados em nossa recente unidade de teste do XPS 13 com Core Ultra 7. O mais notável é a alta taxa de contraste de quase 2000:1 em comparação com 1000:1 na maioria dos painéis IPS encontrados em outros notebooks. As telas dos modelos XPS sempre foram algumas das melhores da categoria e, portanto, até mesmo a opção IPS mais barata ainda tem uma aparência fantástica.

A cobertura de cores é limitada a >95% sRGB se configurada com a opção básica, enquanto as cores DCI-P3 são reservadas para os painéis IPS 1600p e OLED 1800p mais caros. Os usuários talvez queiram desativar o Adaptive Color para evitar alterações mínimas de cor durante a edição de fotos.

Algo que vale a pena mencionar sobre esse painel é seu nível de brilho mínimo relativamente alto de 49 nits, algo que também notamos em nosso modelo Core i7. Em comparação, as telas da maioria dos outros notebooks normalmente atingem 15 nits ou menos quando estão na configuração de brilho mínimo. O piso de brilho mais alto do Dell pode causar mais fadiga ocular em ambientes escuros. Esse problema em potencial não está presente na configuração OLED, que pode atingir níveis de brilho muito mais fracos.

A sobreposição fosca de borda a borda é muito fina para ajudar a destacar as cores
Molduras laterais mais estreitas do que a maioria dos outros designs
Luz - sangramento irregular moderado da luz de fundo nos cantos superiores
Subpixels RGB nítidos, sem problemas de granulação
479.7
cd/m²
481.2
cd/m²
460.8
cd/m²
517.9
cd/m²
518.3
cd/m²
486
cd/m²
493.2
cd/m²
499.9
cd/m²
447.2
cd/m²
Distribuição do brilho
tested with X-Rite i1Pro 2
Máximo: 518.3 cd/m² (Nits) Médio: 487.1 cd/m² Minimum: 49 cd/m²
iluminação: 86 %
iluminação com acumulador: 518.3 cd/m²
Contraste: 1993:1 (Preto: 0.26 cd/m²)
ΔE Color 3.4 | 0.5-29.43 Ø4.92
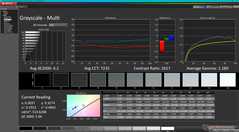
ΔE Greyscale 4.2 | 0.5-98 Ø5.2
71.7% AdobeRGB 1998 (Argyll 2.2.0 3D)
97.8% sRGB (Argyll 2.2.0 3D)
69.4% Display P3 (Argyll 2.2.0 3D)
Gamma: 2.29
Dell XPS 13 9345
IPS, 1920x1200, 13.4", 120 Hz
Dell XPS 13 9340 Core Ultra 7
SHP1593, IPS, 1920x1200, 13.4", 120 Hz
Microsoft Surface Laptop 7 13.8 Copilot+
LQ138P1JX61, IPS, 2304x1536, 13.8", 120 Hz
Lenovo ThinkBook 13x G4 21KR0008GE
LEN135WQ+, IPS, 2880x1920, 13.5", 120 Hz
HP EliteBook Ultra G1q 14
IPS, 2240x1400, 14", 60 Hz
Asus ZenBook S13 OLED UX5304
SDC417B, OLED, 2880x1800, 13.3", 60 Hz
Display
0%
21%
-4%
27%
Display P3 Coverage
69.4
69.4
0%
97.8
41%
65.5
-6%
99.7
44%
sRGB Coverage
97.8
97.8
0%
98.2
0%
97.3
-1%
100
2%
AdobeRGB 1998 Coverage
71.7
71.7
0%
87.3
22%
67.7
-6%
96.9
35%
Response Times
-25%
5%
32%
27%
94%
Response Time Grey 50% / Grey 80% *
35.2 ?(15.2, 20)
43.2 ?(21.1, 22.1)
-23%
38.9 ?(17.6, 21.3)
-11%
27.3 ?(12.8, 14.5)
22%
22.8 ?(9.3, 13.5)
35%
2 ?(1.1, 0.9)
94%
Response Time Black / White *
21.8 ?(10.5, 11.3)
27.6 ?(16, 11.6)
-27%
17.4 ?(5.7, 11.7)
20%
12.8 ?(4.4, 8.4)
41%
17.9 ?(10.3, 7.6)
18%
1.6 ?(0.8, 0.8)
93%
PWM Frequency
240 ?(57, 88)
Screen
-6%
16%
10%
-58%
27%
Brightness middle
518.3
429
-17%
606
17%
539
4%
341.4
-34%
361
-30%
Brightness
487
407
-16%
592
22%
513
5%
315
-35%
365
-25%
Brightness Distribution
86
90
5%
94
9%
89
3%
87
1%
98
14%
Black Level *
0.26
0.28
-8%
0.43
-65%
0.38
-46%
0.39
-50%
Contrast
1993
1532
-23%
1409
-29%
1418
-29%
875
-56%
Colorchecker dE 2000 *
3.4
2.6
24%
1.3
62%
1.4
59%
5.63
-66%
1.2
65%
Colorchecker dE 2000 max. *
5.68
6.6
-16%
2.1
63%
3.5
38%
11.94
-110%
1.9
67%
Greyscale dE 2000 *
4.2
4
5%
2.1
50%
2.2
48%
8.8
-110%
1.2
71%
Gamma
2.29 96%
2.23 99%
2.16 102%
2.19 100%
2.14 103%
2.27 97%
CCT
7235 90%
7332 89%
6842 95%
6710 97%
6034 108%
6486 100%
Colorchecker dE 2000 calibrated *
1.4
0.7
Total Average (Program / Settings)
-10% / -7%
14% / 15%
13% / 10%
-16% / -41%
49% / 39%

* ... smaller is better

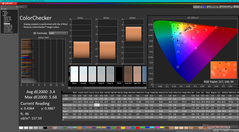
Nosso colorímetro X-Rite mostra que a tela tem como alvo o sRGB com valores médios decentes de escala de cinza e deltaE de cor de 4,2 e 3,4, respectivamente. A temperatura da cor, no entanto, é um pouco fria demais em 7235, o que prejudica a precisão das cores em níveis de saturação mais baixos. É uma pena que a Dell não calibre o painel na fábrica, já que a maioria dos softwares de calibração ainda não são compatíveis com o ARM, incluindo o i1Profiler.

Escala de cinza
Escala de cinza
Varreduras de saturação
ColorChecker
ColorChecker

Display Response Times

Display response times show how fast the screen is able to change from one color to the next. Slow response times can lead to afterimages and can cause moving objects to appear blurry (ghosting). Gamers of fast-paced 3D titles should pay special attention to fast response times.
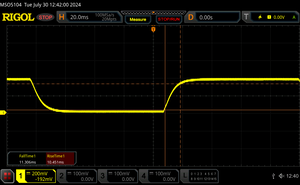
       Response Time Black to White
21.8 ms ... rise ↗ and fall ↘ combined↗ 10.5 ms rise
↘ 11.3 ms fall
The screen shows good response rates in our tests, but may be too slow for competitive gamers.
In comparison, all tested devices range from 0.1 (minimum) to 240 (maximum) ms. » 44 % of all devices are better.
This means that the measured response time is similar to the average of all tested devices (21 ms).
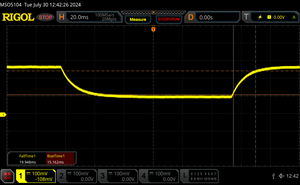
       Response Time 50% Grey to 80% Grey
35.2 ms ... rise ↗ and fall ↘ combined↗ 15.2 ms rise
↘ 20 ms fall
The screen shows slow response rates in our tests and will be unsatisfactory for gamers.
In comparison, all tested devices range from 0.165 (minimum) to 636 (maximum) ms. » 45 % of all devices are better.
This means that the measured response time is similar to the average of all tested devices (32.9 ms).

Screen Flickering / PWM (Pulse-Width Modulation)

To dim the screen, some notebooks will simply cycle the backlight on and off in rapid succession - a method called Pulse Width Modulation (PWM) . This cycling frequency should ideally be undetectable to the human eye. If said frequency is too low, users with sensitive eyes may experience strain or headaches or even notice the flickering altogether.
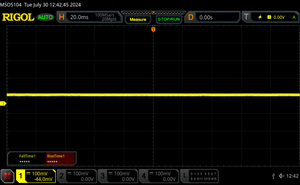
Screen flickering / PWM not detected

In comparison: 53 % of all tested devices do not use PWM to dim the display. If PWM was detected, an average of 8746 (minimum: 5 - maximum: 343500) Hz was measured.

Ao ar livre, com céu nublado
Ao ar livre, sob a sombra. A tela pode ser vista sob a sombra, com brilho tolerável
Ao ar livre, com céu nublado
Amplos ângulos de visão IPS

Desempenho

Condições de teste

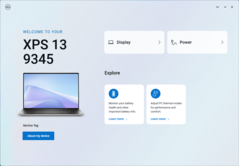
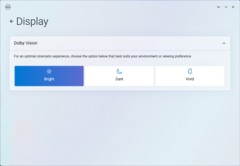
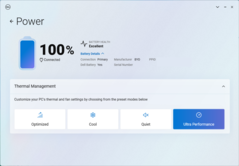
Definimos o Windows e o MyDell para o modo Desempenho antes de executar os benchmarks abaixo. O MyDell foi redesenhado no modelo Snapdragon para ser mais simples de usar em comparação com o mesmo software no XPS 13 baseado em Intel. Alguns recursos encontrados anteriormente no software, como a Detecção de Presença, foram movidos para o menu Energia e Bateria do Windows.

Tela inicial do MyDell
Exibir menu
Exibir menu
Menu de perfil de energia

Processador

Reprodução perfeita de vídeo 4K60 sem gravação de quadros perdidos

O desempenho depende muito do fato de o aplicativo ser nativo ou emulado. Por exemplo, o processador se destaca no CineBench 2024 e no GeekBench 6, pois ambos foram otimizados para um ambiente ARM. Nosso Snapdragon X Elite X1E-80-100 superaria o desempenho do Core Ultra 7 155H em operações multi-thread e single-thread nessas condições. Por outro lado, os benchmarks emulados reduzem nossa CPU Snapdragon a níveis de desempenho mais parecidos com o antigo Core i5-1240P ou Core i7-1260P. Em outras palavras, a CPU da Qualcomm pode ser competitiva em relação ao Core Ultra 7 155H, como o fabricante gosta de afirmar, mas as condições e os aplicativos precisam ser os ideais para que esses benefícios se manifestem.

A consistência do desempenho também pode ser difícil de medir entre as CPUs Snapdragon. Em nosso exemplo, nosso Snapdragon X Elite X1E-80-100 superaria com folga o Snapdragon X Elite X1E-78-100 no EliteBook Ultra G1q 14 no CineBench 2024, mas o oposto é verdadeiro no CineBench R23 e R15.

Cinebench R15 Multi Loop

011523034546057569080592010351150126513801495161017251840195520702185Tooltip
Dell XPS 13 9345 Qualcomm Snapdragon X Elite X1E-80-100: Ø1626 (1572.7-1665.14)
Dell XPS 13 9340 Core Ultra 7 Intel Core Ultra 7 155H: Ø1635 (1358.56-2230.28)
Microsoft Surface Laptop 7 13.8 Copilot+ Qualcomm Snapdragon X Elite X1E-80-100: Ø1681 (1597.25-2095.89)
Lenovo ThinkBook 13x G4 21KR0008GE Intel Core Ultra 5 125H: Ø1373 (1247-1702.49)
HP EliteBook Ultra G1q 14 Qualcomm Snapdragon X Elite X1E-78-100: Ø1602 (1524.39-2175.45)
Asus ZenBook S13 OLED UX5304 Intel Core i7-1355U: Ø1024 (989.63-1358.19)
CPU Performance Rating: Percent
Cinebench 2024: CPU Multi Core | CPU Single Core
Cinebench R23: Multi Core | Single Core
Cinebench R20: CPU (Multi Core) | CPU (Single Core)
Cinebench R15: CPU Multi 64Bit | CPU Single 64Bit
Blender: v2.79 BMW27 CPU
7-Zip 18.03: 7z b 4 | 7z b 4 -mmt1
Geekbench 6.3: Multi-Core | Single-Core
HWBOT x265 Benchmark v2.2: 4k Preset
LibreOffice : 20 Documents To PDF
R Benchmark 2.5: Overall mean
CPU Performance Rating
Dell XPS 14 2024 OLED
Intel Core Ultra 7 155H
85 pt
Dell XPS 13 9340 Core Ultra 7
Intel Core Ultra 7 155H
82.2 pt
Dell XPS 13 Plus 9320 Core i7-1360P -4!
Intel Core i7-1360P
78.7 pt
Dell XPS 13 Plus 9320 i7-1280P OLED -4!
Intel Core i7-1280P
75.1 pt
Dell XPS 13 Plus 9320 4K -4!
Intel Core i7-1260P
71.4 pt
Microsoft Surface Laptop 7 13.8 Copilot+
Qualcomm Snapdragon X Elite X1E-80-100
70.5 pt
Dell XPS 13 9345
Qualcomm Snapdragon X Elite X1E-80-100
70 pt
Average Qualcomm Snapdragon X Elite X1E-80-100
 
69.3 pt
HP EliteBook Ultra G1q 14
Qualcomm Snapdragon X Elite X1E-78-100
65.8 pt
Medion SPRCHRGD 14 S1 Elite
Qualcomm Snapdragon X Elite X1E-78-100
65.8 pt
Dell XPS 13 Plus 9320 i5-1240p -4!
Intel Core i5-1240P
65.6 pt
Lenovo ThinkPad T14s Gen 6 21N10007GE
Qualcomm Snapdragon X Elite X1E-78-100
65.1 pt
Dell XPS 13 9315 2-in-1 Core i5-1230U -4!
Intel Core i5-1230U
58 pt
Dell XPS 13 9315, i5-1230U -8!
Intel Core i5-1230U
48.8 pt
Dell XPS 13 9310 Core i7 4K -4!
Intel Core i7-1185G7
48.1 pt
Dell XPS 13 9310 OLED -4!
Intel Core i7-1185G7
46.5 pt
Dell XPS 13 9310 2-in-1 -5!
Intel Core i7-1165G7
45 pt
Dell XPS 13 9305 Core i5 FHD -6!
Intel Core i5-1135G7
42.3 pt
Cinebench 2024 / CPU Multi Core
Dell XPS 13 9345
Qualcomm Snapdragon X Elite X1E-80-100
927 Points
Microsoft Surface Laptop 7 13.8 Copilot+
Qualcomm Snapdragon X Elite X1E-80-100
897 Points -3%
Average Qualcomm Snapdragon X Elite X1E-80-100
  (621 - 927, n=5)
839 Points -9%
Medion SPRCHRGD 14 S1 Elite
Qualcomm Snapdragon X Elite X1E-78-100
794 Points -14%
HP EliteBook Ultra G1q 14
Qualcomm Snapdragon X Elite X1E-78-100
768 Points -17%
Lenovo ThinkPad T14s Gen 6 21N10007GE
Qualcomm Snapdragon X Elite X1E-78-100
746 Points -20%
Dell XPS 13 9340 Core Ultra 7
Intel Core Ultra 7 155H
675 Points -27%
Dell XPS 14 2024 OLED
Intel Core Ultra 7 155H
667 Points -28%
Cinebench 2024 / CPU Single Core
Microsoft Surface Laptop 7 13.8 Copilot+
Qualcomm Snapdragon X Elite X1E-80-100
123 Points 0%
Average Qualcomm Snapdragon X Elite X1E-80-100
  (122 - 123, n=5)
122.7 Points 0%
Dell XPS 13 9345
Qualcomm Snapdragon X Elite X1E-80-100
122.5 Points
Lenovo ThinkPad T14s Gen 6 21N10007GE
Qualcomm Snapdragon X Elite X1E-78-100
108 Points -12%
Medion SPRCHRGD 14 S1 Elite
Qualcomm Snapdragon X Elite X1E-78-100
108 Points -12%
HP EliteBook Ultra G1q 14
Qualcomm Snapdragon X Elite X1E-78-100
102.8 Points -16%
Dell XPS 14 2024 OLED
Intel Core Ultra 7 155H
101.8 Points -17%
Dell XPS 13 9340 Core Ultra 7
Intel Core Ultra 7 155H
100 Points -18%
Cinebench R23 / Multi Core
Dell XPS 14 2024 OLED
Intel Core Ultra 7 155H
14166 Points +61%
Dell XPS 13 9340 Core Ultra 7
Intel Core Ultra 7 155H
13511 Points +53%
Dell XPS 13 Plus 9320 i7-1280P OLED
Intel Core i7-1280P
11852 (9209.64min - 11852max) Points +34%
Dell XPS 13 Plus 9320 Core i7-1360P
Intel Core i7-1360P
11503 (9427.43min - 11502.9max) Points +30%
HP EliteBook Ultra G1q 14
Qualcomm Snapdragon X Elite X1E-78-100
10960 (8060.14min - 10959.7max) Points +24%
Microsoft Surface Laptop 7 13.8 Copilot+
Qualcomm Snapdragon X Elite X1E-80-100
10028 Points +14%
Lenovo ThinkPad T14s Gen 6 21N10007GE
Qualcomm Snapdragon X Elite X1E-78-100
9996 Points +13%
Dell XPS 13 Plus 9320 4K
Intel Core i7-1260P
9743 Points +10%
Dell XPS 13 Plus 9320 i5-1240p
Intel Core i5-1240P
9392 Points +6%
Average Qualcomm Snapdragon X Elite X1E-80-100
  (6772 - 10028, n=5)
8991 Points +2%
Dell XPS 13 9345
Qualcomm Snapdragon X Elite X1E-80-100
8819 (8513.51min - 8819.34max) Points
Medion SPRCHRGD 14 S1 Elite
Qualcomm Snapdragon X Elite X1E-78-100
8726 Points -1%
Dell XPS 13 9315 2-in-1 Core i5-1230U
Intel Core i5-1230U
7264 (4444.94min - 7264.12max) Points -18%
Dell XPS 13 9305 Core i5 FHD
Intel Core i5-1135G7
5447 (4192.8min - 5447.26max) Points -38%
Dell XPS 13 9310 Core i7 4K
Intel Core i7-1185G7
5062 (4319.28min - 5062.12max) Points -43%
Dell XPS 13 9310 OLED
Intel Core i7-1185G7
5013 (4398.92min - 5012.66max) Points -43%
Dell XPS 13 9310 2-in-1
Intel Core i7-1165G7
4946 (4082.87min - 4945.54max) Points -44%
Dell XPS 13 9315, i5-1230U
Intel Core i5-1230U
4402 Points -50%
Cinebench R23 / Single Core
Dell XPS 13 Plus 9320 Core i7-1360P
Intel Core i7-1360P
1848 Points +45%
Dell XPS 14 2024 OLED
Intel Core Ultra 7 155H
1775 Points +39%
Dell XPS 13 9340 Core Ultra 7
Intel Core Ultra 7 155H
1685 Points +32%
Dell XPS 13 Plus 9320 4K
Intel Core i7-1260P
1678 Points +31%
Dell XPS 13 Plus 9320 i5-1240p
Intel Core i5-1240P
1621 Points +27%
Dell XPS 13 Plus 9320 i7-1280P OLED
Intel Core i7-1280P
1615 Points +26%
Dell XPS 13 9315 2-in-1 Core i5-1230U
Intel Core i5-1230U
1512 Points +18%
Dell XPS 13 9310 OLED
Intel Core i7-1185G7
1457 Points +14%
Dell XPS 13 9310 Core i7 4K
Intel Core i7-1185G7
1440 Points +13%
Dell XPS 13 9310 2-in-1
Intel Core i7-1165G7
1402 Points +10%
Microsoft Surface Laptop 7 13.8 Copilot+
Qualcomm Snapdragon X Elite X1E-80-100
1321 Points +3%
Dell XPS 13 9315, i5-1230U
Intel Core i5-1230U
1310 Points +3%
Dell XPS 13 9305 Core i5 FHD
Intel Core i5-1135G7
1308 Points +2%
Average Qualcomm Snapdragon X Elite X1E-80-100
  (1273 - 1321, n=5)
1296 Points +1%
Dell XPS 13 9345
Qualcomm Snapdragon X Elite X1E-80-100
1277 Points
Medion SPRCHRGD 14 S1 Elite
Qualcomm Snapdragon X Elite X1E-78-100
1130 Points -12%
Lenovo ThinkPad T14s Gen 6 21N10007GE
Qualcomm Snapdragon X Elite X1E-78-100
1124 Points -12%
HP EliteBook Ultra G1q 14
Qualcomm Snapdragon X Elite X1E-78-100
1111 Points -13%
Cinebench R20 / CPU (Multi Core)
Dell XPS 14 2024 OLED
Intel Core Ultra 7 155H
6099 Points +81%
Dell XPS 13 9340 Core Ultra 7
Intel Core Ultra 7 155H
5181 Points +54%
Dell XPS 13 Plus 9320 i7-1280P OLED
Intel Core i7-1280P
4571 Points +36%
Dell XPS 13 Plus 9320 Core i7-1360P
Intel Core i7-1360P
4424 Points +31%
HP EliteBook Ultra G1q 14
Qualcomm Snapdragon X Elite X1E-78-100
4128 Points +23%
Dell XPS 13 Plus 9320 4K
Intel Core i7-1260P
3909 Points +16%
Microsoft Surface Laptop 7 13.8 Copilot+
Qualcomm Snapdragon X Elite X1E-80-100
3802 Points +13%
Lenovo ThinkPad T14s Gen 6 21N10007GE
Qualcomm Snapdragon X Elite X1E-78-100
3548 Points +5%
Dell XPS 13 Plus 9320 i5-1240p
Intel Core i5-1240P
3424 Points +2%
Average Qualcomm Snapdragon X Elite X1E-80-100
  (2539 - 3802, n=5)
3380 Points 0%
Dell XPS 13 9345
Qualcomm Snapdragon X Elite X1E-80-100
3365 Points
Medion SPRCHRGD 14 S1 Elite
Qualcomm Snapdragon X Elite X1E-78-100
3203 Points -5%
Dell XPS 13 9315 2-in-1 Core i5-1230U
Intel Core i5-1230U
2802 Points -17%
Dell XPS 13 9310 Core i7 4K
Intel Core i7-1185G7
1936 Points -42%
Dell XPS 13 9310 OLED
Intel Core i7-1185G7
1873 Points -44%
Dell XPS 13 9305 Core i5 FHD
Intel Core i5-1135G7
1863 Points -45%
Dell XPS 13 9315, i5-1230U
Intel Core i5-1230U
1653 Points -51%
Dell XPS 13 9310 2-in-1
Intel Core i7-1165G7
1564 Points -54%
Cinebench R20 / CPU (Single Core)
Dell XPS 13 Plus 9320 Core i7-1360P
Intel Core i7-1360P
707 Points +50%
Dell XPS 14 2024 OLED
Intel Core Ultra 7 155H
672 Points +43%
Dell XPS 13 9340 Core Ultra 7
Intel Core Ultra 7 155H
656 Points +40%
Dell XPS 13 Plus 9320 4K
Intel Core i7-1260P
648 Points +38%
Dell XPS 13 Plus 9320 i7-1280P OLED
Intel Core i7-1280P
622 Points +32%
Dell XPS 13 Plus 9320 i5-1240p
Intel Core i5-1240P
616 Points +31%
Dell XPS 13 9315 2-in-1 Core i5-1230U
Intel Core i5-1230U
580 Points +23%
Dell XPS 13 9310 Core i7 4K
Intel Core i7-1185G7
567 Points +21%
Dell XPS 13 9310 OLED
Intel Core i7-1185G7
556 Points +18%
Dell XPS 13 9305 Core i5 FHD
Intel Core i5-1135G7
504 Points +7%
Microsoft Surface Laptop 7 13.8 Copilot+
Qualcomm Snapdragon X Elite X1E-80-100
495 Points +5%
Average Qualcomm Snapdragon X Elite X1E-80-100
  (470 - 495, n=5)
483 Points +3%
Dell XPS 13 9310 2-in-1
Intel Core i7-1165G7
475 Points +1%
Dell XPS 13 9345
Qualcomm Snapdragon X Elite X1E-80-100
470 Points
Dell XPS 13 9315, i5-1230U
Intel Core i5-1230U
469 Points 0%
Medion SPRCHRGD 14 S1 Elite
Qualcomm Snapdragon X Elite X1E-78-100
425 Points -10%
Lenovo ThinkPad T14s Gen 6 21N10007GE
Qualcomm Snapdragon X Elite X1E-78-100
422 Points -10%
HP EliteBook Ultra G1q 14
Qualcomm Snapdragon X Elite X1E-78-100
416 Points -11%
Cinebench R15 / CPU Multi 64Bit
Dell XPS 14 2024 OLED
Intel Core Ultra 7 155H
2620 (1743.3min - 2620.37max) Points +57%
Medion SPRCHRGD 14 S1 Elite
Qualcomm Snapdragon X Elite X1E-78-100
2351 Points +41%
Dell XPS 13 9340 Core Ultra 7
Intel Core Ultra 7 155H
2230 (1358.56min - 2230.28max) Points +34%
Lenovo ThinkPad T14s Gen 6 21N10007GE
Qualcomm Snapdragon X Elite X1E-78-100
2219 (1471.4min - 2218.89max) Points +33%
HP EliteBook Ultra G1q 14
Qualcomm Snapdragon X Elite X1E-78-100
2175 (1524.39min - 2175.45max) Points +31%
Microsoft Surface Laptop 7 13.8 Copilot+
Qualcomm Snapdragon X Elite X1E-80-100
2096 (1597.25min - 2095.89max) Points +26%
Dell XPS 13 Plus 9320 Core i7-1360P
Intel Core i7-1360P
1951 (1397.72min - 1950.55max) Points +17%
Dell XPS 13 Plus 9320 i7-1280P OLED
Intel Core i7-1280P
1905 (1369.16min - 1905.49max) Points +14%
Average Qualcomm Snapdragon X Elite X1E-80-100
  (1476 - 2249, n=5)
1836 Points +10%
Dell XPS 13 Plus 9320 4K
Intel Core i7-1260P
1677 (1481.98min - 1677.36max) Points +1%
Dell XPS 13 Plus 9320 4K
Intel Core i7-1260P
1626 (983.94min - 1625.95max) Points -2%
Dell XPS 13 9345
Qualcomm Snapdragon X Elite X1E-80-100
1665 (1572.7min - 1665.14max) Points
Dell XPS 13 Plus 9320 i5-1240p
Intel Core i5-1240P
1592 Points -4%
Dell XPS 13 9315 2-in-1 Core i5-1230U
Intel Core i5-1230U
1254 (632min - 1254.35max) Points -25%
Dell XPS 13 9310 Core i7 4K
Intel Core i7-1185G7
871 (631.55min - 870.74max) Points -48%
Dell XPS 13 9310 OLED
Intel Core i7-1185G7
766 (607.28min - 765.86max) Points -54%
Dell XPS 13 9310 2-in-1
Intel Core i7-1165G7
763 (481.71min - 762.89max) Points -54%
Dell XPS 13 9305 Core i5 FHD
Intel Core i5-1135G7
733 (584.31min - 733.42max) Points -56%
Dell XPS 13 9315, i5-1230U
Intel Core i5-1230U
514 (482min - 513.59max) Points -69%
Cinebench R15 / CPU Single 64Bit
Dell XPS 13 Plus 9320 Core i7-1360P
Intel Core i7-1360P
263 Points +14%
Dell XPS 14 2024 OLED
Intel Core Ultra 7 155H
255 Points +11%
Dell XPS 13 9340 Core Ultra 7
Intel Core Ultra 7 155H
253 Points +10%
Microsoft Surface Laptop 7 13.8 Copilot+
Qualcomm Snapdragon X Elite X1E-80-100
243 Points +6%
Dell XPS 13 Plus 9320 4K
Intel Core i7-1260P
240 Points +4%
Average Qualcomm Snapdragon X Elite X1E-80-100
  (230 - 248, n=5)
239 Points +4%
Dell XPS 13 9345
Qualcomm Snapdragon X Elite X1E-80-100
230 Points
Dell XPS 13 Plus 9320 i7-1280P OLED
Intel Core i7-1280P
229 Points 0%
Dell XPS 13 Plus 9320 i5-1240p
Intel Core i5-1240P
226 Points -2%
Dell XPS 13 9310 OLED
Intel Core i7-1185G7
221 Points -4%
Dell XPS 13 9315 2-in-1 Core i5-1230U
Intel Core i5-1230U
221 Points -4%
Dell XPS 13 9310 Core i7 4K
Intel Core i7-1185G7
217.1 Points -6%
Lenovo ThinkPad T14s Gen 6 21N10007GE
Qualcomm Snapdragon X Elite X1E-78-100
216 Points -6%
HP EliteBook Ultra G1q 14
Qualcomm Snapdragon X Elite X1E-78-100
208 Points -10%
Medion SPRCHRGD 14 S1 Elite
Qualcomm Snapdragon X Elite X1E-78-100
208 Points -10%
Dell XPS 13 9315, i5-1230U
Intel Core i5-1230U
186.8 Points -19%
Dell XPS 13 9310 2-in-1
Intel Core i7-1165G7
170 Points -26%
Blender / v2.79 BMW27 CPU
Dell XPS 13 9310 Core i7 4K
Intel Core i7-1185G7
652 Seconds * -86%
Dell XPS 13 9310 2-in-1
Intel Core i7-1165G7
647 Seconds * -84%
Dell XPS 13 9310 OLED
Intel Core i7-1185G7
637 Seconds * -81%
Dell XPS 13 9305 Core i5 FHD
Intel Core i5-1135G7
630 Seconds * -79%
Dell XPS 13 9315 2-in-1 Core i5-1230U
Intel Core i5-1230U
503 Seconds * -43%
Lenovo ThinkPad T14s Gen 6 21N10007GE
Qualcomm Snapdragon X Elite X1E-78-100
428 Seconds * -22%
Medion SPRCHRGD 14 S1 Elite
Qualcomm Snapdragon X Elite X1E-78-100
383 Seconds * -9%
Average Qualcomm Snapdragon X Elite X1E-80-100
  (339 - 510, n=5)
380 Seconds * -8%
Dell XPS 13 Plus 9320 i5-1240p
Intel Core i5-1240P
369 Seconds * -5%
HP EliteBook Ultra G1q 14
Qualcomm Snapdragon X Elite X1E-78-100
356 Seconds * -1%
Dell XPS 13 9345
Qualcomm Snapdragon X Elite X1E-80-100
351 Seconds *
Microsoft Surface Laptop 7 13.8 Copilot+
Qualcomm Snapdragon X Elite X1E-80-100
339 Seconds * +3%
Dell XPS 13 Plus 9320 4K
Intel Core i7-1260P
319 Seconds * +9%
Dell XPS 13 Plus 9320 Core i7-1360P
Intel Core i7-1360P
279 Seconds * +21%
Dell XPS 13 Plus 9320 i7-1280P OLED
Intel Core i7-1280P
268 Seconds * +24%
Dell XPS 14 2024 OLED
Intel Core Ultra 7 155H
253 Seconds * +28%
Dell XPS 13 9340 Core Ultra 7
Intel Core Ultra 7 155H
243 Seconds * +31%
7-Zip 18.03 / 7z b 4
Dell XPS 13 9340 Core Ultra 7
Intel Core Ultra 7 155H
58233 MIPS +38%
Dell XPS 14 2024 OLED
Intel Core Ultra 7 155H
54409 MIPS +29%
Dell XPS 13 Plus 9320 i7-1280P OLED
Intel Core i7-1280P
49572 MIPS +17%
Dell XPS 13 Plus 9320 Core i7-1360P
Intel Core i7-1360P
47737 MIPS +13%
HP EliteBook Ultra G1q 14
Qualcomm Snapdragon X Elite X1E-78-100
46889 MIPS +11%
Microsoft Surface Laptop 7 13.8 Copilot+
Qualcomm Snapdragon X Elite X1E-80-100
45905 MIPS +9%
Medion SPRCHRGD 14 S1 Elite
Qualcomm Snapdragon X Elite X1E-78-100
43999 MIPS +4%
Dell XPS 13 Plus 9320 4K
Intel Core i7-1260P
43056 MIPS +2%
Dell XPS 13 9345
Qualcomm Snapdragon X Elite X1E-80-100
42231 MIPS
Average Qualcomm Snapdragon X Elite X1E-80-100
  (34299 - 45905, n=5)
42121 MIPS 0%
Dell XPS 13 Plus 9320 i5-1240p
Intel Core i5-1240P
40777 MIPS -3%
Lenovo ThinkPad T14s Gen 6 21N10007GE
Qualcomm Snapdragon X Elite X1E-78-100
38047 MIPS -10%
Dell XPS 13 9315 2-in-1 Core i5-1230U
Intel Core i5-1230U
34505 MIPS -18%
Dell XPS 13 9310 2-in-1
Intel Core i7-1165G7
25215 MIPS -40%
Dell XPS 13 9305 Core i5 FHD
Intel Core i5-1135G7
24447 MIPS -42%
Dell XPS 13 9310 Core i7 4K
Intel Core i7-1185G7
20478 MIPS -52%
Dell XPS 13 9315, i5-1230U
Intel Core i5-1230U
20092 MIPS -52%
Dell XPS 13 9310 OLED
Intel Core i7-1185G7
18812 MIPS -55%
7-Zip 18.03 / 7z b 4 -mmt1
Dell XPS 13 Plus 9320 Core i7-1360P
Intel Core i7-1360P
5526 MIPS +4%
Dell XPS 13 9340 Core Ultra 7
Intel Core Ultra 7 155H
5410 MIPS +2%
Dell XPS 14 2024 OLED
Intel Core Ultra 7 155H
5395 MIPS +1%
Microsoft Surface Laptop 7 13.8 Copilot+
Qualcomm Snapdragon X Elite X1E-80-100
5338 MIPS 0%
Dell XPS 13 Plus 9320 4K
Intel Core i7-1260P
5325 MIPS 0%
Dell XPS 13 9345
Qualcomm Snapdragon X Elite X1E-80-100
5318 MIPS
Average Qualcomm Snapdragon X Elite X1E-80-100
  (5242 - 5359, n=5)
5306 MIPS 0%
Dell XPS 13 9310 2-in-1
Intel Core i7-1165G7
5121 MIPS -4%
Dell XPS 13 9310 Core i7 4K
Intel Core i7-1185G7
5099 MIPS -4%
Dell XPS 13 Plus 9320 i7-1280P OLED
Intel Core i7-1280P
4995 MIPS -6%
Dell XPS 13 9315 2-in-1 Core i5-1230U
Intel Core i5-1230U
4870 MIPS -8%
Dell XPS 13 Plus 9320 i5-1240p
Intel Core i5-1240P
4791 MIPS -10%
Medion SPRCHRGD 14 S1 Elite
Qualcomm Snapdragon X Elite X1E-78-100
4701 MIPS -12%
Dell XPS 13 9305 Core i5 FHD
Intel Core i5-1135G7
4579 MIPS -14%
Lenovo ThinkPad T14s Gen 6 21N10007GE
Qualcomm Snapdragon X Elite X1E-78-100
4511 MIPS -15%
HP EliteBook Ultra G1q 14
Qualcomm Snapdragon X Elite X1E-78-100
4341 MIPS -18%
Dell XPS 13 9315, i5-1230U
Intel Core i5-1230U
3873 MIPS -27%
Dell XPS 13 9310 OLED
Intel Core i7-1185G7
3678 MIPS -31%
Geekbench 6.3 / Multi-Core
Lenovo ThinkPad T14s Gen 6 21N10007GE
Qualcomm Snapdragon X Elite X1E-78-100
14767 Points +3%
Average Qualcomm Snapdragon X Elite X1E-80-100
  (14234 - 14646, n=5)
14424 Points 0%
Dell XPS 13 9345
Qualcomm Snapdragon X Elite X1E-80-100
14393 Points
Medion SPRCHRGD 14 S1 Elite
Qualcomm Snapdragon X Elite X1E-78-100
14330 Points 0%
Microsoft Surface Laptop 7 13.8 Copilot+
Qualcomm Snapdragon X Elite X1E-80-100
14234 Points -1%
Dell XPS 14 2024 OLED
Intel Core Ultra 7 155H
13301 Points -8%
HP EliteBook Ultra G1q 14
Qualcomm Snapdragon X Elite X1E-78-100
13287 Points -8%
Dell XPS 13 9340 Core Ultra 7
Intel Core Ultra 7 155H
11982 Points -17%
Geekbench 6.3 / Single-Core
Dell XPS 13 9345
Qualcomm Snapdragon X Elite X1E-80-100
2825 Points
Microsoft Surface Laptop 7 13.8 Copilot+
Qualcomm Snapdragon X Elite X1E-80-100
2805 Points -1%
Average Qualcomm Snapdragon X Elite X1E-80-100
  (2751 - 2845, n=5)
2799 Points -1%
Lenovo ThinkPad T14s Gen 6 21N10007GE
Qualcomm Snapdragon X Elite X1E-78-100
2462 Points -13%
Medion SPRCHRGD 14 S1 Elite
Qualcomm Snapdragon X Elite X1E-78-100
2456 Points -13%
Dell XPS 14 2024 OLED
Intel Core Ultra 7 155H
2440 Points -14%
Dell XPS 13 9340 Core Ultra 7
Intel Core Ultra 7 155H
2408 Points -15%
HP EliteBook Ultra G1q 14
Qualcomm Snapdragon X Elite X1E-78-100
2354 Points -17%
HWBOT x265 Benchmark v2.2 / 4k Preset
Dell XPS 14 2024 OLED
Intel Core Ultra 7 155H
15.6 fps +128%
Dell XPS 13 9340 Core Ultra 7
Intel Core Ultra 7 155H
15.5 fps +127%
Dell XPS 13 Plus 9320 i7-1280P OLED
Intel Core i7-1280P
13.8 fps +102%
Dell XPS 13 Plus 9320 Core i7-1360P
Intel Core i7-1360P
13.2 fps +93%
Dell XPS 13 Plus 9320 4K
Intel Core i7-1260P
11.8 fps +73%
Dell XPS 13 Plus 9320 i5-1240p
Intel Core i5-1240P
11.5 fps +68%
Dell XPS 13 9315 2-in-1 Core i5-1230U
Intel Core i5-1230U
8.33 fps +22%
Microsoft Surface Laptop 7 13.8 Copilot+
Qualcomm Snapdragon X Elite X1E-80-100
7.23 fps +6%
Dell XPS 13 9345
Qualcomm Snapdragon X Elite X1E-80-100
6.83 fps
HP EliteBook Ultra G1q 14
Qualcomm Snapdragon X Elite X1E-78-100
6.65 fps -3%
Medion SPRCHRGD 14 S1 Elite
Qualcomm Snapdragon X Elite X1E-78-100
6.58 fps -4%
Average Qualcomm Snapdragon X Elite X1E-80-100
  (4.74 - 7.23, n=5)
6.47 fps -5%
Lenovo ThinkPad T14s Gen 6 21N10007GE
Qualcomm Snapdragon X Elite X1E-78-100
6.39 fps -6%
Dell XPS 13 9310 OLED
Intel Core i7-1185G7
6.34 fps -7%
Dell XPS 13 9310 2-in-1
Intel Core i7-1165G7
6.32 fps -7%
Dell XPS 13 9310 Core i7 4K
Intel Core i7-1185G7
5.58 fps -18%
LibreOffice / 20 Documents To PDF
Microsoft Surface Laptop 7 13.8 Copilot+
Qualcomm Snapdragon X Elite X1E-80-100
98.5 s * -91%
Dell XPS 13 Plus 9320 i5-1240p
Intel Core i5-1240P
61.8 s * -20%
Average Qualcomm Snapdragon X Elite X1E-80-100
  (51.7 - 98.5, n=5)
61.8 s * -20%
HP EliteBook Ultra G1q 14
Qualcomm Snapdragon X Elite X1E-78-100
59.3 s * -15%
Dell XPS 13 9305 Core i5 FHD
Intel Core i5-1135G7
58.8 s * -14%
Lenovo ThinkPad T14s Gen 6 21N10007GE
Qualcomm Snapdragon X Elite X1E-78-100
57.6 s * -11%
Medion SPRCHRGD 14 S1 Elite
Qualcomm Snapdragon X Elite X1E-78-100
57 s * -10%
Dell XPS 13 9345
Qualcomm Snapdragon X Elite X1E-80-100
51.7 s *
Dell XPS 13 9315 2-in-1 Core i5-1230U
Intel Core i5-1230U
51.2 s * +1%
Dell XPS 14 2024 OLED
Intel Core Ultra 7 155H
49.6 s * +4%
Dell XPS 13 Plus 9320 i7-1280P OLED
Intel Core i7-1280P
49.2 s * +5%
Dell XPS 13 9340 Core Ultra 7
Intel Core Ultra 7 155H
47.8 s * +8%
Dell XPS 13 9310 Core i7 4K
Intel Core i7-1185G7
47.7 s * +8%
Dell XPS 13 Plus 9320 Core i7-1360P
Intel Core i7-1360P
46.5 s * +10%
Dell XPS 13 Plus 9320 4K
Intel Core i7-1260P
44.6 s * +14%
Dell XPS 13 9310 OLED
Intel Core i7-1185G7
43.2 s * +16%
R Benchmark 2.5 / Overall mean
HP EliteBook Ultra G1q 14
Qualcomm Snapdragon X Elite X1E-78-100
0.77 sec * -15%
Medion SPRCHRGD 14 S1 Elite
Qualcomm Snapdragon X Elite X1E-78-100
0.732 sec * -9%
Lenovo ThinkPad T14s Gen 6 21N10007GE
Qualcomm Snapdragon X Elite X1E-78-100
0.724 sec * -8%
Dell XPS 13 9345
Qualcomm Snapdragon X Elite X1E-80-100
0.67 sec *
Average Qualcomm Snapdragon X Elite X1E-80-100
  (0.63 - 0.67, n=5)
0.652 sec * +3%
Dell XPS 13 9305 Core i5 FHD
Intel Core i5-1135G7
0.651 sec * +3%
Microsoft Surface Laptop 7 13.8 Copilot+
Qualcomm Snapdragon X Elite X1E-80-100
0.63 sec * +6%
Dell XPS 13 9310 2-in-1
Intel Core i7-1165G7
0.612 sec * +9%
Dell XPS 13 9310 Core i7 4K
Intel Core i7-1185G7
0.605 sec * +10%
Dell XPS 13 9310 OLED
Intel Core i7-1185G7
0.594 sec * +11%
Dell XPS 13 9315 2-in-1 Core i5-1230U
Intel Core i5-1230U
0.527 sec * +21%
Dell XPS 13 Plus 9320 i5-1240p
Intel Core i5-1240P
0.524 sec * +22%
Dell XPS 13 Plus 9320 i7-1280P OLED
Intel Core i7-1280P
0.4998 sec * +25%
Dell XPS 13 Plus 9320 4K
Intel Core i7-1260P
0.4928 sec * +26%
Dell XPS 13 9340 Core Ultra 7
Intel Core Ultra 7 155H
0.4829 sec * +28%
Dell XPS 14 2024 OLED
Intel Core Ultra 7 155H
0.4711 sec * +30%
Dell XPS 13 Plus 9320 Core i7-1360P
Intel Core i7-1360P
0.4675 sec * +30%
CPU Performance Rating: Percent
Cinebench 2024: CPU Multi Core | CPU Single Core
Cinebench R23: Multi Core | Single Core
Cinebench R20: CPU (Multi Core) | CPU (Single Core)
Cinebench R15: CPU Multi 64Bit | CPU Single 64Bit
Blender: v2.79 BMW27 CPU
7-Zip 18.03: 7z b 4 | 7z b 4 -mmt1
Geekbench 6.3: Multi-Core | Single-Core
HWBOT x265 Benchmark v2.2: 4k Preset
LibreOffice : 20 Documents To PDF
R Benchmark 2.5: Overall mean

* ... smaller is better

Cinebench R15 CPU Multi 64Bit
1665 Points
Cinebench R15 OpenGL 64Bit
25.1 fps
Cinebench R15 Ref. Match 64Bit
98 %
Cinebench R15 CPU Single 64Bit
230 Points
Cinebench R20 CPU (Single Core)
470 Points
Cinebench R20 CPU (Multi Core)
3365 Points
Cinebench R23 Multi Core
8819 Points
Cinebench R23 Single Core
1277 Points
Cinebench 2024 CPU Multi Core
927 Points
Cinebench 2024 CPU Single Core
122.5 Points
Ajuda
Performance Rating
Dell XPS 13 9340 Core Ultra 7
Intel Core Ultra 7 155H, Arc 8-Core
99 pt
Lenovo ThinkBook 13x G4 21KR0008GE
Intel Core Ultra 5 125H, Arc 7-Core
76.1 pt
Microsoft Surface Laptop 7 13.8 Copilot+
Qualcomm Snapdragon X Elite X1E-80-100, Adreno X1-85 3.8 TFLOPS
66.8 pt
Dell XPS 13 9345
Qualcomm Snapdragon X Elite X1E-80-100, Adreno X1-85 3.8 TFLOPS
65.3 pt
HP EliteBook Ultra G1q 14
Qualcomm Snapdragon X Elite X1E-78-100, Adreno X1-85 3.8 TFLOPS
64.4 pt
Average Qualcomm Snapdragon X Elite X1E-80-100
 
61.1 pt
Asus ZenBook S13 OLED UX5304
Intel Core i7-1355U, Iris Xe G7 96EUs
56.5 pt
AIDA64 / FP32 Ray-Trace
Dell XPS 13 9340 Core Ultra 7
Intel Core Ultra 7 155H, Arc 8-Core
11809 KRay/s +64%
Lenovo ThinkBook 13x G4 21KR0008GE
Intel Core Ultra 5 125H, Arc 7-Core
8430 KRay/s +17%
HP EliteBook Ultra G1q 14
Qualcomm Snapdragon X Elite X1E-78-100, Adreno X1-85 3.8 TFLOPS
8083 KRay/s +12%
Microsoft Surface Laptop 7 13.8 Copilot+
Qualcomm Snapdragon X Elite X1E-80-100, Adreno X1-85 3.8 TFLOPS
7339 KRay/s +2%
Dell XPS 13 9345
Qualcomm Snapdragon X Elite X1E-80-100, Adreno X1-85 3.8 TFLOPS
7216 KRay/s
Asus ZenBook S13 OLED UX5304
Intel Core i7-1355U, Iris Xe G7 96EUs
5981 KRay/s -17%
Average Qualcomm Snapdragon X Elite X1E-80-100
  (2184 - 7339, n=5)
5756 KRay/s -20%
AIDA64 / FPU Julia
Dell XPS 13 9340 Core Ultra 7
Intel Core Ultra 7 155H, Arc 8-Core
63371 Points +141%
Lenovo ThinkBook 13x G4 21KR0008GE
Intel Core Ultra 5 125H, Arc 7-Core
44947 Points +71%
Asus ZenBook S13 OLED UX5304
Intel Core i7-1355U, Iris Xe G7 96EUs
31092 Points +18%
Microsoft Surface Laptop 7 13.8 Copilot+
Qualcomm Snapdragon X Elite X1E-80-100, Adreno X1-85 3.8 TFLOPS
26391 Points +1%
Dell XPS 13 9345
Qualcomm Snapdragon X Elite X1E-80-100, Adreno X1-85 3.8 TFLOPS
26253 Points
HP EliteBook Ultra G1q 14
Qualcomm Snapdragon X Elite X1E-78-100, Adreno X1-85 3.8 TFLOPS
24109 Points -8%
Average Qualcomm Snapdragon X Elite X1E-80-100
  (5687 - 26391, n=5)
18279 Points -30%
AIDA64 / CPU SHA3
HP EliteBook Ultra G1q 14
Qualcomm Snapdragon X Elite X1E-78-100, Adreno X1-85 3.8 TFLOPS
3187 MB/s +11%
Microsoft Surface Laptop 7 13.8 Copilot+
Qualcomm Snapdragon X Elite X1E-80-100, Adreno X1-85 3.8 TFLOPS
2949 MB/s +3%
Dell XPS 13 9340 Core Ultra 7
Intel Core Ultra 7 155H, Arc 8-Core
2923 MB/s +2%
Dell XPS 13 9345
Qualcomm Snapdragon X Elite X1E-80-100, Adreno X1-85 3.8 TFLOPS
2871 MB/s
Average Qualcomm Snapdragon X Elite X1E-80-100
  (2607 - 2949, n=5)
2790 MB/s -3%
Lenovo ThinkBook 13x G4 21KR0008GE
Intel Core Ultra 5 125H, Arc 7-Core
2047 MB/s -29%
Asus ZenBook S13 OLED UX5304
Intel Core i7-1355U, Iris Xe G7 96EUs
1632 MB/s -43%
AIDA64 / CPU Queen
Lenovo ThinkBook 13x G4 21KR0008GE
Intel Core Ultra 5 125H, Arc 7-Core
79986 Points +17%
Dell XPS 13 9340 Core Ultra 7
Intel Core Ultra 7 155H, Arc 8-Core
79760 Points +17%
Microsoft Surface Laptop 7 13.8 Copilot+
Qualcomm Snapdragon X Elite X1E-80-100, Adreno X1-85 3.8 TFLOPS
69319 Points +2%
Average Qualcomm Snapdragon X Elite X1E-80-100
  (68253 - 69762, n=5)
68917 Points +1%
Dell XPS 13 9345
Qualcomm Snapdragon X Elite X1E-80-100, Adreno X1-85 3.8 TFLOPS
68253 Points
HP EliteBook Ultra G1q 14
Qualcomm Snapdragon X Elite X1E-78-100, Adreno X1-85 3.8 TFLOPS
67909 Points -1%
Asus ZenBook S13 OLED UX5304
Intel Core i7-1355U, Iris Xe G7 96EUs
66531 Points -3%
AIDA64 / FPU SinJulia
Dell XPS 13 9340 Core Ultra 7
Intel Core Ultra 7 155H, Arc 8-Core
8689 Points +318%
Lenovo ThinkBook 13x G4 21KR0008GE
Intel Core Ultra 5 125H, Arc 7-Core
6588 Points +217%
Asus ZenBook S13 OLED UX5304
Intel Core i7-1355U, Iris Xe G7 96EUs
4216 Points +103%
Microsoft Surface Laptop 7 13.8 Copilot+
Qualcomm Snapdragon X Elite X1E-80-100, Adreno X1-85 3.8 TFLOPS
2130 Points +3%
Dell XPS 13 9345
Qualcomm Snapdragon X Elite X1E-80-100, Adreno X1-85 3.8 TFLOPS
2078 Points
Average Qualcomm Snapdragon X Elite X1E-80-100
  (1521 - 2357, n=5)
1950 Points -6%
HP EliteBook Ultra G1q 14
Qualcomm Snapdragon X Elite X1E-78-100, Adreno X1-85 3.8 TFLOPS
1518 Points -27%
AIDA64 / FPU Mandel
Dell XPS 13 9340 Core Ultra 7
Intel Core Ultra 7 155H, Arc 8-Core
30785 Points +137%
Lenovo ThinkBook 13x G4 21KR0008GE
Intel Core Ultra 5 125H, Arc 7-Core
21210 Points +63%
Asus ZenBook S13 OLED UX5304
Intel Core i7-1355U, Iris Xe G7 96EUs
15222 Points +17%
HP EliteBook Ultra G1q 14
Qualcomm Snapdragon X Elite X1E-78-100, Adreno X1-85 3.8 TFLOPS
14459 Points +11%
Microsoft Surface Laptop 7 13.8 Copilot+
Qualcomm Snapdragon X Elite X1E-80-100, Adreno X1-85 3.8 TFLOPS
13559 Points +4%
Average Qualcomm Snapdragon X Elite X1E-80-100
  (10117 - 15669, n=5)
13537 Points +4%
Dell XPS 13 9345
Qualcomm Snapdragon X Elite X1E-80-100, Adreno X1-85 3.8 TFLOPS
12996 Points
AIDA64 / CPU AES
HP EliteBook Ultra G1q 14
Qualcomm Snapdragon X Elite X1E-78-100, Adreno X1-85 3.8 TFLOPS
64583 MB/s +8%
Dell XPS 13 9340 Core Ultra 7
Intel Core Ultra 7 155H, Arc 8-Core
63548 MB/s +7%
Microsoft Surface Laptop 7 13.8 Copilot+
Qualcomm Snapdragon X Elite X1E-80-100, Adreno X1-85 3.8 TFLOPS
60080 MB/s +1%
Average Qualcomm Snapdragon X Elite X1E-80-100
  (39956 - 71089, n=5)
59937 MB/s +1%
Dell XPS 13 9345
Qualcomm Snapdragon X Elite X1E-80-100, Adreno X1-85 3.8 TFLOPS
59559 MB/s
Lenovo ThinkBook 13x G4 21KR0008GE
Intel Core Ultra 5 125H, Arc 7-Core
48373 MB/s -19%
Asus ZenBook S13 OLED UX5304
Intel Core i7-1355U, Iris Xe G7 96EUs
32647 MB/s -45%
AIDA64 / CPU ZLib
Dell XPS 13 9340 Core Ultra 7
Intel Core Ultra 7 155H, Arc 8-Core
883 MB/s +27%
HP EliteBook Ultra G1q 14
Qualcomm Snapdragon X Elite X1E-78-100, Adreno X1-85 3.8 TFLOPS
745 MB/s +8%
Microsoft Surface Laptop 7 13.8 Copilot+
Qualcomm Snapdragon X Elite X1E-80-100, Adreno X1-85 3.8 TFLOPS
721 MB/s +4%
Dell XPS 13 9345
Qualcomm Snapdragon X Elite X1E-80-100, Adreno X1-85 3.8 TFLOPS
693 MB/s
Average Qualcomm Snapdragon X Elite X1E-80-100
  (398 - 802, n=5)
646 MB/s -7%
Lenovo ThinkBook 13x G4 21KR0008GE
Intel Core Ultra 5 125H, Arc 7-Core
612 MB/s -12%
Asus ZenBook S13 OLED UX5304
Intel Core i7-1355U, Iris Xe G7 96EUs
488 MB/s -30%
AIDA64 / FP64 Ray-Trace
Dell XPS 13 9340 Core Ultra 7
Intel Core Ultra 7 155H, Arc 8-Core
6069 KRay/s +58%
Lenovo ThinkBook 13x G4 21KR0008GE
Intel Core Ultra 5 125H, Arc 7-Core
4421 KRay/s +15%
Microsoft Surface Laptop 7 13.8 Copilot+
Qualcomm Snapdragon X Elite X1E-80-100, Adreno X1-85 3.8 TFLOPS
4044 KRay/s +5%
Dell XPS 13 9345
Qualcomm Snapdragon X Elite X1E-80-100, Adreno X1-85 3.8 TFLOPS
3846 KRay/s
Average Qualcomm Snapdragon X Elite X1E-80-100
  (2581 - 4044, n=5)
3531 KRay/s -8%
Asus ZenBook S13 OLED UX5304
Intel Core i7-1355U, Iris Xe G7 96EUs
3134 KRay/s -19%
HP EliteBook Ultra G1q 14
Qualcomm Snapdragon X Elite X1E-78-100, Adreno X1-85 3.8 TFLOPS
2957 KRay/s -23%
AIDA64 / CPU PhotoWorxx
Dell XPS 13 9340 Core Ultra 7
Intel Core Ultra 7 155H, Arc 8-Core
51100 MPixel/s +34%
Lenovo ThinkBook 13x G4 21KR0008GE
Intel Core Ultra 5 125H, Arc 7-Core
47353 MPixel/s +24%
Asus ZenBook S13 OLED UX5304
Intel Core i7-1355U, Iris Xe G7 96EUs
38665 MPixel/s +1%
Microsoft Surface Laptop 7 13.8 Copilot+
Qualcomm Snapdragon X Elite X1E-80-100, Adreno X1-85 3.8 TFLOPS
38204 MPixel/s 0%
Dell XPS 13 9345
Qualcomm Snapdragon X Elite X1E-80-100, Adreno X1-85 3.8 TFLOPS
38096 MPixel/s
Average Qualcomm Snapdragon X Elite X1E-80-100
  (28474 - 38707, n=5)
35539 MPixel/s -7%
HP EliteBook Ultra G1q 14
Qualcomm Snapdragon X Elite X1E-78-100, Adreno X1-85 3.8 TFLOPS
27950 MPixel/s -27%

Desempenho do sistema

O WebXPRT e o Kraken, que são executados nativamente no navegador Edge otimizado para ARM, classificam nosso Qualcomm XPS à frente do Intel XPS por margens decentes.

CrossMark: Overall | Productivity | Creativity | Responsiveness
WebXPRT 3: Overall
WebXPRT 4: Overall
Mozilla Kraken 1.1: Total
CrossMark / Overall
Dell XPS 13 9340 Core Ultra 7
Arc 8-Core, Ultra 7 155H, Micron 2550 512GB
1680 Points +24%
Asus ZenBook S13 OLED UX5304
Iris Xe G7 96EUs, i7-1355U, Samsung PM9A1 MZVL21T0HCLR
1592 Points +17%
Lenovo ThinkBook 13x G4 21KR0008GE
Arc 7-Core, Ultra 5 125H, Samsung PM9C1a MZAL8512HDLU
1548 Points +14%
Microsoft Surface Laptop 7 13.8 Copilot+
Adreno X1-85 3.8 TFLOPS, SD X Elite X1E-80-100, Samsung MZ9L4512HBLU-00BMV
1402 Points +3%
Average Qualcomm Snapdragon X Elite X1E-80-100, Qualcomm SD X Adreno X1-85 3.8 TFLOPS
  (1356 - 1443, n=5)
1396 Points +3%
Dell XPS 13 9345
Adreno X1-85 3.8 TFLOPS, SD X Elite X1E-80-100
1356 Points
HP EliteBook Ultra G1q 14
Adreno X1-85 3.8 TFLOPS, SD X Elite X1E-78-100, SK hynix PC801 HFS512GEJ9X101N BF
1027 Points -24%
CrossMark / Productivity
Dell XPS 13 9340 Core Ultra 7
Arc 8-Core, Ultra 7 155H, Micron 2550 512GB
1618 Points +27%
Asus ZenBook S13 OLED UX5304
Iris Xe G7 96EUs, i7-1355U, Samsung PM9A1 MZVL21T0HCLR
1566 Points +23%
Lenovo ThinkBook 13x G4 21KR0008GE
Arc 7-Core, Ultra 5 125H, Samsung PM9C1a MZAL8512HDLU
1483 Points +17%
Microsoft Surface Laptop 7 13.8 Copilot+
Adreno X1-85 3.8 TFLOPS, SD X Elite X1E-80-100, Samsung MZ9L4512HBLU-00BMV
1334 Points +5%
Average Qualcomm Snapdragon X Elite X1E-80-100, Qualcomm SD X Adreno X1-85 3.8 TFLOPS
  (1271 - 1375, n=5)
1318 Points +4%
Dell XPS 13 9345
Adreno X1-85 3.8 TFLOPS, SD X Elite X1E-80-100
1271 Points
HP EliteBook Ultra G1q 14
Adreno X1-85 3.8 TFLOPS, SD X Elite X1E-78-100, SK hynix PC801 HFS512GEJ9X101N BF
980 Points -23%
CrossMark / Creativity
Dell XPS 13 9340 Core Ultra 7
Arc 8-Core, Ultra 7 155H, Micron 2550 512GB
1854 Points +24%
Lenovo ThinkBook 13x G4 21KR0008GE
Arc 7-Core, Ultra 5 125H, Samsung PM9C1a MZAL8512HDLU
1727 Points +16%
Asus ZenBook S13 OLED UX5304
Iris Xe G7 96EUs, i7-1355U, Samsung PM9A1 MZVL21T0HCLR
1696 Points +14%
Average Qualcomm Snapdragon X Elite X1E-80-100, Qualcomm SD X Adreno X1-85 3.8 TFLOPS
  (1492 - 1537, n=5)
1513 Points +1%
Microsoft Surface Laptop 7 13.8 Copilot+
Adreno X1-85 3.8 TFLOPS, SD X Elite X1E-80-100, Samsung MZ9L4512HBLU-00BMV
1497 Points 0%
Dell XPS 13 9345
Adreno X1-85 3.8 TFLOPS, SD X Elite X1E-80-100
1492 Points
HP EliteBook Ultra G1q 14
Adreno X1-85 3.8 TFLOPS, SD X Elite X1E-78-100, SK hynix PC801 HFS512GEJ9X101N BF
1102 Points -26%
CrossMark / Responsiveness
Dell XPS 13 9340 Core Ultra 7
Arc 8-Core, Ultra 7 155H, Micron 2550 512GB
1397 Points +13%
Asus ZenBook S13 OLED UX5304
Iris Xe G7 96EUs, i7-1355U, Samsung PM9A1 MZVL21T0HCLR
1386 Points +12%
Microsoft Surface Laptop 7 13.8 Copilot+
Adreno X1-85 3.8 TFLOPS, SD X Elite X1E-80-100, Samsung MZ9L4512HBLU-00BMV
1338 Points +8%
Average Qualcomm Snapdragon X Elite X1E-80-100, Qualcomm SD X Adreno X1-85 3.8 TFLOPS
  (1237 - 1401, n=5)
1305 Points +5%
Lenovo ThinkBook 13x G4 21KR0008GE
Arc 7-Core, Ultra 5 125H, Samsung PM9C1a MZAL8512HDLU
1270 Points +3%
Dell XPS 13 9345
Adreno X1-85 3.8 TFLOPS, SD X Elite X1E-80-100
1238 Points
HP EliteBook Ultra G1q 14
Adreno X1-85 3.8 TFLOPS, SD X Elite X1E-78-100, SK hynix PC801 HFS512GEJ9X101N BF
958 Points -23%
WebXPRT 3 / Overall
Average Qualcomm Snapdragon X Elite X1E-80-100, Qualcomm SD X Adreno X1-85 3.8 TFLOPS
  (430 - 455, n=5)
442 Points +3%
Microsoft Surface Laptop 7 13.8 Copilot+
Adreno X1-85 3.8 TFLOPS, SD X Elite X1E-80-100, Samsung MZ9L4512HBLU-00BMV
434 Points +1%
Dell XPS 13 9345
Adreno X1-85 3.8 TFLOPS, SD X Elite X1E-80-100
430 Points
HP EliteBook Ultra G1q 14
Adreno X1-85 3.8 TFLOPS, SD X Elite X1E-78-100, SK hynix PC801 HFS512GEJ9X101N BF
395 Points -8%
Asus ZenBook S13 OLED UX5304
Iris Xe G7 96EUs, i7-1355U, Samsung PM9A1 MZVL21T0HCLR
291 Points -32%
Dell XPS 13 9340 Core Ultra 7
Arc 8-Core, Ultra 7 155H, Micron 2550 512GB
272 Points -37%
Lenovo ThinkBook 13x G4 21KR0008GE
Arc 7-Core, Ultra 5 125H, Samsung PM9C1a MZAL8512HDLU
250 Points -42%
WebXPRT 4 / Overall
Dell XPS 13 9345
Adreno X1-85 3.8 TFLOPS, SD X Elite X1E-80-100
324 Points
Average Qualcomm Snapdragon X Elite X1E-80-100, Qualcomm SD X Adreno X1-85 3.8 TFLOPS
  (295 - 324, n=5)
310 Points -4%
Microsoft Surface Laptop 7 13.8 Copilot+
Adreno X1-85 3.8 TFLOPS, SD X Elite X1E-80-100, Samsung MZ9L4512HBLU-00BMV
309 Points -5%
HP EliteBook Ultra G1q 14
Adreno X1-85 3.8 TFLOPS, SD X Elite X1E-78-100, SK hynix PC801 HFS512GEJ9X101N BF
286 Points -12%
Dell XPS 13 9340 Core Ultra 7
Arc 8-Core, Ultra 7 155H, Micron 2550 512GB
257 Points -21%
Asus ZenBook S13 OLED UX5304
Iris Xe G7 96EUs, i7-1355U, Samsung PM9A1 MZVL21T0HCLR
252 Points -22%
Lenovo ThinkBook 13x G4 21KR0008GE
Arc 7-Core, Ultra 5 125H, Samsung PM9C1a MZAL8512HDLU
240 Points -26%
Mozilla Kraken 1.1 / Total
Lenovo ThinkBook 13x G4 21KR0008GE
Arc 7-Core, Ultra 5 125H, Samsung PM9C1a MZAL8512HDLU
560 ms * -36%
Dell XPS 13 9340 Core Ultra 7
Arc 8-Core, Ultra 7 155H, Micron 2550 512GB
528 ms * -28%
Asus ZenBook S13 OLED UX5304
Iris Xe G7 96EUs, i7-1355U, Samsung PM9A1 MZVL21T0HCLR
515 ms * -25%
HP EliteBook Ultra G1q 14
Adreno X1-85 3.8 TFLOPS, SD X Elite X1E-78-100, SK hynix PC801 HFS512GEJ9X101N BF
459.8 ms * -11%
Dell XPS 13 9345
Adreno X1-85 3.8 TFLOPS, SD X Elite X1E-80-100
412.4 ms *
Average Qualcomm Snapdragon X Elite X1E-80-100, Qualcomm SD X Adreno X1-85 3.8 TFLOPS
  (391 - 422, n=5)
406 ms * +2%
Microsoft Surface Laptop 7 13.8 Copilot+
Adreno X1-85 3.8 TFLOPS, SD X Elite X1E-80-100, Samsung MZ9L4512HBLU-00BMV
390.9 ms * +5%

* ... smaller is better

AIDA64 / Memory Copy
Dell XPS 13 9340 Core Ultra 7
Intel Core Ultra 7 155H, Arc 8-Core
96791 MB/s +54%
Lenovo ThinkBook 13x G4 21KR0008GE
Intel Core Ultra 5 125H, Arc 7-Core
87473 MB/s +40%
Dell XPS 13 9345
Qualcomm Snapdragon X Elite X1E-80-100, Adreno X1-85 3.8 TFLOPS
62684 MB/s
Microsoft Surface Laptop 7 13.8 Copilot+
Qualcomm Snapdragon X Elite X1E-80-100, Adreno X1-85 3.8 TFLOPS
62380 MB/s 0%
Asus ZenBook S13 OLED UX5304
Intel Core i7-1355U, Iris Xe G7 96EUs
59942 MB/s -4%
Average Qualcomm Snapdragon X Elite X1E-80-100
  (44795 - 63495, n=5)
59272 MB/s -5%
HP EliteBook Ultra G1q 14
Qualcomm Snapdragon X Elite X1E-78-100, Adreno X1-85 3.8 TFLOPS
45988 MB/s -27%
AIDA64 / Memory Read
Dell XPS 13 9345
Qualcomm Snapdragon X Elite X1E-80-100, Adreno X1-85 3.8 TFLOPS
118956 MB/s
Microsoft Surface Laptop 7 13.8 Copilot+
Qualcomm Snapdragon X Elite X1E-80-100, Adreno X1-85 3.8 TFLOPS
118043 MB/s -1%
Average Qualcomm Snapdragon X Elite X1E-80-100
  (58855 - 125604, n=5)
108255 MB/s -9%
Dell XPS 13 9340 Core Ultra 7
Intel Core Ultra 7 155H, Arc 8-Core
84022 MB/s -29%
Lenovo ThinkBook 13x G4 21KR0008GE
Intel Core Ultra 5 125H, Arc 7-Core
76803 MB/s -35%
HP EliteBook Ultra G1q 14
Qualcomm Snapdragon X Elite X1E-78-100, Adreno X1-85 3.8 TFLOPS
60078 MB/s -49%
Asus ZenBook S13 OLED UX5304
Intel Core i7-1355U, Iris Xe G7 96EUs
49758 MB/s -58%
AIDA64 / Memory Write
Dell XPS 13 9340 Core Ultra 7
Intel Core Ultra 7 155H, Arc 8-Core
75665 MB/s +70%
Asus ZenBook S13 OLED UX5304
Intel Core i7-1355U, Iris Xe G7 96EUs
72418 MB/s +62%
Lenovo ThinkBook 13x G4 21KR0008GE
Intel Core Ultra 5 125H, Arc 7-Core
69575 MB/s +56%
Dell XPS 13 9345
Qualcomm Snapdragon X Elite X1E-80-100, Adreno X1-85 3.8 TFLOPS
44638 MB/s
Microsoft Surface Laptop 7 13.8 Copilot+
Qualcomm Snapdragon X Elite X1E-80-100, Adreno X1-85 3.8 TFLOPS
43959 MB/s -2%
Average Qualcomm Snapdragon X Elite X1E-80-100
  (37270 - 45265, n=5)
43175 MB/s -3%
HP EliteBook Ultra G1q 14
Qualcomm Snapdragon X Elite X1E-78-100, Adreno X1-85 3.8 TFLOPS
37763 MB/s -15%
AIDA64 / Memory Latency
Lenovo ThinkBook 13x G4 21KR0008GE
Intel Core Ultra 5 125H, Arc 7-Core
133.4 ns * -1655%
Dell XPS 13 9340 Core Ultra 7
Intel Core Ultra 7 155H, Arc 8-Core
131.8 ns * -1634%
Asus ZenBook S13 OLED UX5304
Intel Core i7-1355U, Iris Xe G7 96EUs
90.1 ns * -1086%
Average Qualcomm Snapdragon X Elite X1E-80-100
  (7.4 - 8.8, n=5)
7.9 ns * -4%
HP EliteBook Ultra G1q 14
Qualcomm Snapdragon X Elite X1E-78-100, Adreno X1-85 3.8 TFLOPS
7.8 ns * -3%
Dell XPS 13 9345
Qualcomm Snapdragon X Elite X1E-80-100, Adreno X1-85 3.8 TFLOPS
7.6 ns *
Microsoft Surface Laptop 7 13.8 Copilot+
Qualcomm Snapdragon X Elite X1E-80-100, Adreno X1-85 3.8 TFLOPS
7.4 ns * +3%

* ... smaller is better

Dispositivos de armazenamento

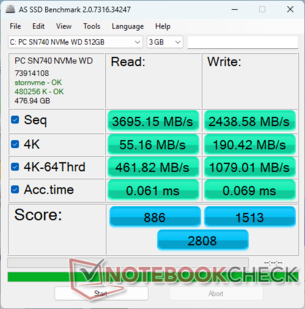
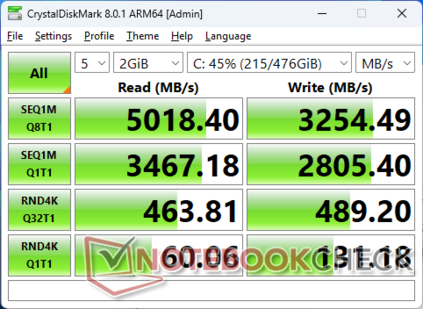
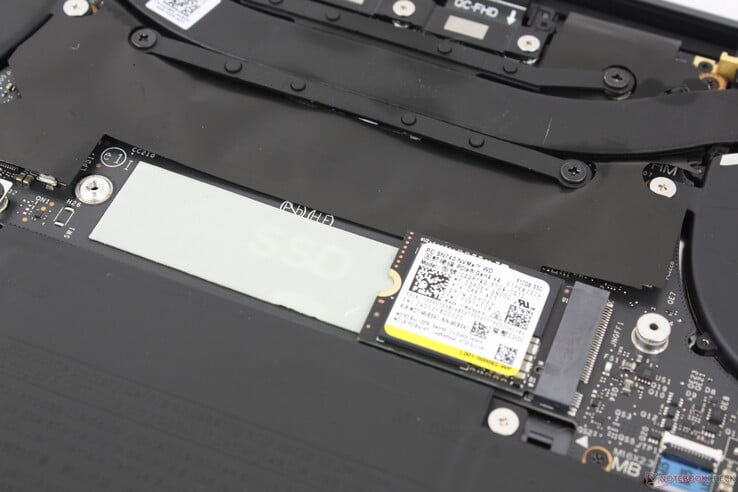
A Dell obtém seus SSDs de uma grande variedade de fabricantes e, portanto, é difícil saber qual unidade o senhor está adquirindo antes de comprar. Por exemplo, tivemos unidades da Micron, Samsung, WD, Toshiba e SK Hynix em mais de 10 unidades internas diferentes do XPS 13. Nossa unidade específica da Qualcomm vem com o WD SN740 de médio porte que oferece taxas de transferência estáveis de até 5000 MB/s. Não observamos nenhum comportamento de estrangulamento, apesar do pequeno comprimento de 42 mm, provavelmente devido, em parte, ao dissipador de calor do SSD incluído.

SSD AS
SSD AS
MDL 8
MDL 8
O modelo suporta unidades M.2 de até 80 mm de comprimento, embora possa ser fornecido com uma unidade mais curta
CDM 5/6 Read Seq Q32T1: 4978 MB/s
CDM 5/6 Write Seq Q32T1: 3875 MB/s
CDM 5/6 Read 4K Q32T1: 447.7 MB/s
CDM 5/6 Write 4K Q32T1: 480 MB/s
CDM 5 Read Seq: 3460 MB/s
CDM 5 Write Seq: 2792 MB/s
CDM 5/6 Read 4K: 61.73 MB/s
CDM 5/6 Write 4K: 130.4 MB/s
Drive Performance Rating - Percent
Asus ZenBook S13 OLED UX5304
Samsung PM9A1 MZVL21T0HCLR
84.9 pt
Dell XPS 13 9340 Core Ultra 7
Micron 2550 512GB
80.4 pt
Lenovo ThinkBook 13x G4 21KR0008GE
Samsung PM9C1a MZAL8512HDLU
80 pt
HP EliteBook Ultra G1q 14
SK hynix PC801 HFS512GEJ9X101N BF
76.2 pt
Dell XPS 13 9345
 
70.8 pt
Microsoft Surface Laptop 7 13.8 Copilot+
Samsung MZ9L4512HBLU-00BMV
67.3 pt
DiskSpd
seq read
HP EliteBook Ultra G1q 14
SK hynix PC801 HFS512GEJ9X101N BF
4035 (4021.63min - 4034.92max) MB/s +21%
Asus ZenBook S13 OLED UX5304
Samsung PM9A1 MZVL21T0HCLR
4001 (3943.69min - 4000.53max) MB/s +20%
Dell XPS 13 9345
 
3327 (3292.32min - 3326.71max) MB/s
Lenovo ThinkBook 13x G4 21KR0008GE
Samsung PM9C1a MZAL8512HDLU
2565 (1389.73min - 2564.61max) MB/s -23%
Dell XPS 13 9340 Core Ultra 7
Micron 2550 512GB
2507 (2473.59min - 2507.37max) MB/s -25%
Microsoft Surface Laptop 7 13.8 Copilot+
Samsung MZ9L4512HBLU-00BMV
2423 (2394.98min - 2422.63max) MB/s -27%
seq write
Asus ZenBook S13 OLED UX5304
Samsung PM9A1 MZVL21T0HCLR
3321 (3143.21min - 3321.26max) MB/s +7%
Dell XPS 13 9340 Core Ultra 7
Micron 2550 512GB
3250 (3033.11min - 3250.17max) MB/s +4%
Dell XPS 13 9345
 
3112 (2992.31min - 3112.17max) MB/s
Lenovo ThinkBook 13x G4 21KR0008GE
Samsung PM9C1a MZAL8512HDLU
2983 (2793.48min - 2982.57max) MB/s -4%
Microsoft Surface Laptop 7 13.8 Copilot+
Samsung MZ9L4512HBLU-00BMV
1965 (1920.09min - 1965.09max) MB/s -37%
HP EliteBook Ultra G1q 14
SK hynix PC801 HFS512GEJ9X101N BF
1000 (878.84min - 1000.02max) MB/s -68%
seq q8 t1 read
Asus ZenBook S13 OLED UX5304
Samsung PM9A1 MZVL21T0HCLR
7036 (6223.64min - 7035.55max) MB/s +38%
HP EliteBook Ultra G1q 14
SK hynix PC801 HFS512GEJ9X101N BF
6861 (3940.76min - 6860.95max) MB/s +35%
Lenovo ThinkBook 13x G4 21KR0008GE
Samsung PM9C1a MZAL8512HDLU
6068 (5239.11min - 6068.32max) MB/s +19%
Dell XPS 13 9345
 
5101 (4800.8min - 5101.19max) MB/s
Dell XPS 13 9340 Core Ultra 7
Micron 2550 512GB
4992 (4031.47min - 4991.51max) MB/s -2%
Microsoft Surface Laptop 7 13.8 Copilot+
Samsung MZ9L4512HBLU-00BMV
3592 (3041.29min - 3592.16max) MB/s -30%
seq q8 t1 write
Asus ZenBook S13 OLED UX5304
Samsung PM9A1 MZVL21T0HCLR
5179 (4831.64min - 5178.79max) MB/s +38%
HP EliteBook Ultra G1q 14
SK hynix PC801 HFS512GEJ9X101N BF
4940 (837.81min - 4939.63max) MB/s +32%
Lenovo ThinkBook 13x G4 21KR0008GE
Samsung PM9C1a MZAL8512HDLU
4715 (4689.23min - 4715.24max) MB/s +26%
Dell XPS 13 9340 Core Ultra 7
Micron 2550 512GB
4045 (3979.76min - 4045.08max) MB/s +8%
Dell XPS 13 9345
 
3746 (3722.97min - 3745.57max) MB/s
Microsoft Surface Laptop 7 13.8 Copilot+
Samsung MZ9L4512HBLU-00BMV
2432 (2397.46min - 2432.28max) MB/s -35%
4k q1 t1 read
Asus ZenBook S13 OLED UX5304
Samsung PM9A1 MZVL21T0HCLR
83.3 (77.84min - 83.26max) MB/s +18%
Dell XPS 13 9345
 
70.8 (66.07min - 70.78max) MB/s
Microsoft Surface Laptop 7 13.8 Copilot+
Samsung MZ9L4512HBLU-00BMV
64.9 (63.83min - 64.93max) MB/s -8%
Dell XPS 13 9340 Core Ultra 7
Micron 2550 512GB
63.6 (63.1min - 63.62max) MB/s -10%
Lenovo ThinkBook 13x G4 21KR0008GE
Samsung PM9C1a MZAL8512HDLU
63 (61.94min - 62.98max) MB/s -11%
HP EliteBook Ultra G1q 14
SK hynix PC801 HFS512GEJ9X101N BF
57.1 (56.27min - 57.06max) MB/s -19%
4k q1 t1 write
Dell XPS 13 9345
 
212 (146.41min - 212.44max) MB/s
Dell XPS 13 9340 Core Ultra 7
Micron 2550 512GB
143.5 (142.41min - 143.53max) MB/s -32%
Asus ZenBook S13 OLED UX5304
Samsung PM9A1 MZVL21T0HCLR
140.8 (131.23min - 140.77max) MB/s -34%
HP EliteBook Ultra G1q 14
SK hynix PC801 HFS512GEJ9X101N BF
126.9 (125.92min - 126.89max) MB/s -40%
Microsoft Surface Laptop 7 13.8 Copilot+
Samsung MZ9L4512HBLU-00BMV
125.5 (123.95min - 125.49max) MB/s -41%
Lenovo ThinkBook 13x G4 21KR0008GE
Samsung PM9C1a MZAL8512HDLU
119.2 (114.62min - 119.17max) MB/s -44%
4k q32 t16 read
Dell XPS 13 9345
 
1099 (1072.87min - 1098.5max) MB/s
Microsoft Surface Laptop 7 13.8 Copilot+
Samsung MZ9L4512HBLU-00BMV
1025 (993.39min - 1025.04max) MB/s -7%
HP EliteBook Ultra G1q 14
SK hynix PC801 HFS512GEJ9X101N BF
999 (972.11min - 999.13max) MB/s -9%
Lenovo ThinkBook 13x G4 21KR0008GE
Samsung PM9C1a MZAL8512HDLU
703 (627.88min - 703.14max) MB/s -36%
Dell XPS 13 9340 Core Ultra 7
Micron 2550 512GB
551 (537.25min - 551.44max) MB/s -50%
Asus ZenBook S13 OLED UX5304
Samsung PM9A1 MZVL21T0HCLR
494 (392.19min - 494.04max) MB/s -55%
4k q32 t16 write
Dell XPS 13 9345
 
698 (665.78min - 697.53max) MB/s
Microsoft Surface Laptop 7 13.8 Copilot+
Samsung MZ9L4512HBLU-00BMV
631 (620.68min - 630.94max) MB/s -10%
HP EliteBook Ultra G1q 14
SK hynix PC801 HFS512GEJ9X101N BF
626 (611.56min - 626.31max) MB/s -10%
Lenovo ThinkBook 13x G4 21KR0008GE
Samsung PM9C1a MZAL8512HDLU
397 (338.3min - 396.83max) MB/s -43%
Dell XPS 13 9340 Core Ultra 7
Micron 2550 512GB
382 (370.53min - 381.81max) MB/s -45%
Asus ZenBook S13 OLED UX5304
Samsung PM9A1 MZVL21T0HCLR
372 (323.75min - 372.35max) MB/s -47%
AS SSD
Score Total
Dell XPS 13 9340 Core Ultra 7
Micron 2550 512GB
4347 Points +55%
Lenovo ThinkBook 13x G4 21KR0008GE
Samsung PM9C1a MZAL8512HDLU
4180 Points +49%
Asus ZenBook S13 OLED UX5304
Samsung PM9A1 MZVL21T0HCLR
4048 Points +44%
HP EliteBook Ultra G1q 14
SK hynix PC801 HFS512GEJ9X101N BF
3686 Points +31%
Microsoft Surface Laptop 7 13.8 Copilot+
Samsung MZ9L4512HBLU-00BMV
3044 Points +8%
Dell XPS 13 9345
 
2808 Points
Score Read
Lenovo ThinkBook 13x G4 21KR0008GE
Samsung PM9C1a MZAL8512HDLU
1211 Points +37%
Dell XPS 13 9340 Core Ultra 7
Micron 2550 512GB
1149 Points +30%
Asus ZenBook S13 OLED UX5304
Samsung PM9A1 MZVL21T0HCLR
1040 Points +17%
HP EliteBook Ultra G1q 14
SK hynix PC801 HFS512GEJ9X101N BF
986 Points +11%
Dell XPS 13 9345
 
886 Points
Microsoft Surface Laptop 7 13.8 Copilot+
Samsung MZ9L4512HBLU-00BMV
791 Points -11%
Score Write
Dell XPS 13 9340 Core Ultra 7
Micron 2550 512GB
2661 Points +76%
Asus ZenBook S13 OLED UX5304
Samsung PM9A1 MZVL21T0HCLR
2568 Points +70%
Lenovo ThinkBook 13x G4 21KR0008GE
Samsung PM9C1a MZAL8512HDLU
2426 Points +60%
HP EliteBook Ultra G1q 14
SK hynix PC801 HFS512GEJ9X101N BF
2301 Points +52%
Microsoft Surface Laptop 7 13.8 Copilot+
Samsung MZ9L4512HBLU-00BMV
1875 Points +24%
Dell XPS 13 9345
 
1513 Points
Seq Read
Asus ZenBook S13 OLED UX5304
Samsung PM9A1 MZVL21T0HCLR
5107 MB/s +38%
HP EliteBook Ultra G1q 14
SK hynix PC801 HFS512GEJ9X101N BF
4857.17 MB/s +31%
Lenovo ThinkBook 13x G4 21KR0008GE
Samsung PM9C1a MZAL8512HDLU
4488 MB/s +21%
Dell XPS 13 9340 Core Ultra 7
Micron 2550 512GB
3952 MB/s +7%
Dell XPS 13 9345
 
3695.15 MB/s
Microsoft Surface Laptop 7 13.8 Copilot+
Samsung MZ9L4512HBLU-00BMV
2805 MB/s -24%
Seq Write
Asus ZenBook S13 OLED UX5304
Samsung PM9A1 MZVL21T0HCLR
2849 MB/s +17%
Lenovo ThinkBook 13x G4 21KR0008GE
Samsung PM9C1a MZAL8512HDLU
2595 MB/s +6%
Dell XPS 13 9340 Core Ultra 7
Micron 2550 512GB
2570 MB/s +5%
Dell XPS 13 9345
 
2438.58 MB/s
HP EliteBook Ultra G1q 14
SK hynix PC801 HFS512GEJ9X101N BF
2412.89 MB/s -1%
Microsoft Surface Laptop 7 13.8 Copilot+
Samsung MZ9L4512HBLU-00BMV
1865 MB/s -24%
4K Read
Lenovo ThinkBook 13x G4 21KR0008GE
Samsung PM9C1a MZAL8512HDLU
65.3 MB/s +18%
Asus ZenBook S13 OLED UX5304
Samsung PM9A1 MZVL21T0HCLR
64.1 MB/s +16%
Dell XPS 13 9340 Core Ultra 7
Micron 2550 512GB
63.6 MB/s +15%
Microsoft Surface Laptop 7 13.8 Copilot+
Samsung MZ9L4512HBLU-00BMV
58.7 MB/s +6%
Dell XPS 13 9345
 
55.16 MB/s
HP EliteBook Ultra G1q 14
SK hynix PC801 HFS512GEJ9X101N BF
54.78 MB/s -1%
4K Write
HP EliteBook Ultra G1q 14
SK hynix PC801 HFS512GEJ9X101N BF
216.83 MB/s +14%
Dell XPS 13 9340 Core Ultra 7
Micron 2550 512GB
201 MB/s +6%
Microsoft Surface Laptop 7 13.8 Copilot+
Samsung MZ9L4512HBLU-00BMV
198.9 MB/s +4%
Asus ZenBook S13 OLED UX5304
Samsung PM9A1 MZVL21T0HCLR
198.7 MB/s +4%
Dell XPS 13 9345
 
190.42 MB/s
Lenovo ThinkBook 13x G4 21KR0008GE
Samsung PM9C1a MZAL8512HDLU
156.9 MB/s -18%
4K-64 Read
Lenovo ThinkBook 13x G4 21KR0008GE
Samsung PM9C1a MZAL8512HDLU
697 MB/s +51%
Dell XPS 13 9340 Core Ultra 7
Micron 2550 512GB
690 MB/s +49%
Asus ZenBook S13 OLED UX5304
Samsung PM9A1 MZVL21T0HCLR
466 MB/s +1%
Dell XPS 13 9345
 
461.82 MB/s
Microsoft Surface Laptop 7 13.8 Copilot+
Samsung MZ9L4512HBLU-00BMV
452 MB/s -2%
HP EliteBook Ultra G1q 14
SK hynix PC801 HFS512GEJ9X101N BF
445.94 MB/s -3%
4K-64 Write
Dell XPS 13 9340 Core Ultra 7
Micron 2550 512GB
2203 MB/s +104%
Asus ZenBook S13 OLED UX5304
Samsung PM9A1 MZVL21T0HCLR
2084 MB/s +93%
Lenovo ThinkBook 13x G4 21KR0008GE
Samsung PM9C1a MZAL8512HDLU
2010 MB/s +86%
HP EliteBook Ultra G1q 14
SK hynix PC801 HFS512GEJ9X101N BF
1843.14 MB/s +71%
Microsoft Surface Laptop 7 13.8 Copilot+
Samsung MZ9L4512HBLU-00BMV
1489 MB/s +38%
Dell XPS 13 9345
 
1079.01 MB/s
Access Time Read
Dell XPS 13 9345
 
0.061 ms *
HP EliteBook Ultra G1q 14
SK hynix PC801 HFS512GEJ9X101N BF
0.044 ms * +28%
Lenovo ThinkBook 13x G4 21KR0008GE
Samsung PM9C1a MZAL8512HDLU
0.036 ms * +41%
Dell XPS 13 9340 Core Ultra 7
Micron 2550 512GB
0.032 ms * +48%
Microsoft Surface Laptop 7 13.8 Copilot+
Samsung MZ9L4512HBLU-00BMV
0.031 ms * +49%
Asus ZenBook S13 OLED UX5304
Samsung PM9A1 MZVL21T0HCLR
0.025 ms * +59%
Access Time Write
Dell XPS 13 9345
 
0.069 ms *
HP EliteBook Ultra G1q 14
SK hynix PC801 HFS512GEJ9X101N BF
0.053 ms * +23%
Microsoft Surface Laptop 7 13.8 Copilot+
Samsung MZ9L4512HBLU-00BMV
0.033 ms * +52%
Asus ZenBook S13 OLED UX5304
Samsung PM9A1 MZVL21T0HCLR
0.025 ms * +64%
Lenovo ThinkBook 13x G4 21KR0008GE
Samsung PM9C1a MZAL8512HDLU
0.023 ms * +67%
Dell XPS 13 9340 Core Ultra 7
Micron 2550 512GB
0.02 ms * +71%

* ... smaller is better

Disk Throttling: DiskSpd Read Loop, Queue Depth 8

02605207801040130015601820208023402600286031203380364039004160442046804940Tooltip
Dell XPS 13 9345  ; diskspd 2.0.17 f: Ø5089 (4590.46-5102.16)
Dell XPS 13 9340 Core Ultra 7 Micron 2550 512GB; diskspd 2.0.17 f: Ø4801 (3765.46-4966.19)

Desempenho da GPU

O desempenho gráfico de acordo com o 3DMark emulado está no mesmo nível da Iris Xe 96 EUs mas bem atrás do Arc 8 ou da Radeon 680M/780M em até 20 a 40 por cento. No entanto, os resultados são consistentemente melhores do que os do HP EliteBook Ultra G1q 14 mesmo que os deltas sejam pequenos, em média.

Perfil de potênciaPontuação de gráficosPontuação de físicaPontuação combinada
Modo de desempenho6283173182611
Modo equilibrado6209183482643
Alimentação da bateria6287181562687

Não há queda significativa no desempenho ao alternar entre os modos Performance, Balanced ou Battery Power, conforme exemplificado em nossa tabela de resultados Fire Strike acima.

3DMark 11
3DMark 11
Cloud Gate
Cloud Gate
Fire Strike
Fire Strike
Time Spy
Time Spy
3DMark Performance Rating - Percent
Dell XPS 14 2024 OLED -1!
NVIDIA GeForce RTX 4050 Laptop GPU, Intel Core Ultra 7 155H
100 pt
Dell XPS 13 9340 Core Ultra 7 -1!
Intel Arc 8-Core iGPU, Intel Core Ultra 7 155H
63.2 pt
Dell XPS 13 9345
Qualcomm SD X Adreno X1-85 3.8 TFLOPS, Qualcomm Snapdragon X Elite X1E-80-100
52.5 pt
Average Qualcomm SD X Adreno X1-85 3.8 TFLOPS
 
49.1 pt
Dell XPS 13 Plus 9320 i7-1280P OLED
Intel Iris Xe Graphics G7 96EUs, Intel Core i7-1280P
45.1 pt
Dell XPS 13 9310 2-in-1
Intel Iris Xe Graphics G7 96EUs, Intel Core i7-1165G7
44.2 pt
HP EliteBook Ultra G1q 14
Qualcomm SD X Adreno X1-85 3.8 TFLOPS, Qualcomm Snapdragon X Elite X1E-78-100
42.9 pt
Dell XPS 13 Plus 9320 4K
Intel Iris Xe Graphics G7 96EUs, Intel Core i7-1260P
42.1 pt
Dell XPS 13 9310 Core i7 4K
Intel Iris Xe Graphics G7 96EUs, Intel Core i7-1185G7
42.1 pt
Dell XPS 13 Plus 9320 Core i7-1360P -1!
Intel Iris Xe Graphics G7 96EUs, Intel Core i7-1360P
41.9 pt
Medion SPRCHRGD 14 S1 Elite -1!
Qualcomm SD X Adreno X1-85 3.8 TFLOPS, Qualcomm Snapdragon X Elite X1E-78-100
41.4 pt
Dell XPS 13 9310 OLED
Intel Iris Xe Graphics G7 96EUs, Intel Core i7-1185G7
40.8 pt
Microsoft Surface Laptop 7 13.8 Copilot+ -1!
Qualcomm SD X Adreno X1-85 3.8 TFLOPS, Qualcomm Snapdragon X Elite X1E-80-100
39.7 pt
Lenovo ThinkPad T14s Gen 6 21N10007GE -2!
Qualcomm SD X Adreno X1-85 3.8 TFLOPS, Qualcomm Snapdragon X Elite X1E-78-100
38.9 pt
Dell XPS 13 9305 Core i5 FHD -1!
Intel Iris Xe Graphics G7 80EUs, Intel Core i5-1135G7
33.4 pt
Dell XPS 13 Plus 9320 i5-1240p
Intel Iris Xe Graphics G7 80EUs, Intel Core i5-1240P
30.4 pt
Dell XPS 13 9315, i5-1230U
Intel Iris Xe Graphics G7 80EUs, Intel Core i5-1230U
28 pt
Dell XPS 13 9315 2-in-1 Core i5-1230U
Intel Iris Xe Graphics G7 80EUs, Intel Core i5-1230U
27.3 pt
3DMark 11 - 1280x720 Performance GPU
Dell XPS 14 2024 OLED
NVIDIA GeForce RTX 4050 Laptop GPU, Intel Core Ultra 7 155H
13339 Points +109%
Dell XPS 13 9340 Core Ultra 7
Intel Arc 8-Core iGPU, Intel Core Ultra 7 155H
10624 Points +67%
Dell XPS 13 Plus 9320 i7-1280P OLED
Intel Iris Xe Graphics G7 96EUs, Intel Core i7-1280P
7016 Points +10%
Dell XPS 13 Plus 9320 4K
Intel Iris Xe Graphics G7 96EUs, Intel Core i7-1260P
6956 Points +9%
Dell XPS 13 Plus 9320 Core i7-1360P
Intel Iris Xe Graphics G7 96EUs, Intel Core i7-1360P
6815 Points +7%
Dell XPS 13 9310 OLED
Intel Iris Xe Graphics G7 96EUs, Intel Core i7-1185G7
6647 Points +4%
Dell XPS 13 9310 2-in-1
Intel Iris Xe Graphics G7 96EUs, Intel Core i7-1165G7
6569 Points +3%
Medion SPRCHRGD 14 S1 Elite
Qualcomm SD X Adreno X1-85 3.8 TFLOPS, Qualcomm Snapdragon X Elite X1E-78-100
6459 Points +1%
Dell XPS 13 9345
Qualcomm SD X Adreno X1-85 3.8 TFLOPS, Qualcomm Snapdragon X Elite X1E-80-100
6368 Points
Microsoft Surface Laptop 7 13.8 Copilot+
Qualcomm SD X Adreno X1-85 3.8 TFLOPS, Qualcomm Snapdragon X Elite X1E-80-100
6340 Points 0%
Average Qualcomm SD X Adreno X1-85 3.8 TFLOPS
  (4823 - 6515, n=10)
6119 Points -4%
Dell XPS 13 9305 Core i5 FHD
Intel Iris Xe Graphics G7 80EUs, Intel Core i5-1135G7
5978 Points -6%
Dell XPS 13 9310 Core i7 4K
Intel Iris Xe Graphics G7 96EUs, Intel Core i7-1185G7
5339 Points -16%
Dell XPS 13 Plus 9320 i5-1240p
Intel Iris Xe Graphics G7 80EUs, Intel Core i5-1240P
5104 Points -20%
HP EliteBook Ultra G1q 14
Qualcomm SD X Adreno X1-85 3.8 TFLOPS, Qualcomm Snapdragon X Elite X1E-78-100
4823 Points -24%
Dell XPS 13 9315, i5-1230U
Intel Iris Xe Graphics G7 80EUs, Intel Core i5-1230U
3847 Points -40%
Dell XPS 13 9315 2-in-1 Core i5-1230U
Intel Iris Xe Graphics G7 80EUs, Intel Core i5-1230U
3844 Points -40%
3DMark
1280x720 Cloud Gate Standard Graphics
Dell XPS 13 9345
Qualcomm SD X Adreno X1-85 3.8 TFLOPS, Qualcomm Snapdragon X Elite X1E-80-100
40436 Points
Average Qualcomm SD X Adreno X1-85 3.8 TFLOPS
  (29343 - 40436, n=2)
34890 Points -14%
HP EliteBook Ultra G1q 14
Qualcomm SD X Adreno X1-85 3.8 TFLOPS, Qualcomm Snapdragon X Elite X1E-78-100
29343 Points -27%
Dell XPS 13 9310 2-in-1
Intel Iris Xe Graphics G7 96EUs, Intel Core i7-1165G7
27967 Points -31%
Dell XPS 13 9310 Core i7 4K
Intel Iris Xe Graphics G7 96EUs, Intel Core i7-1185G7
26820 Points -34%
Dell XPS 13 Plus 9320 i7-1280P OLED
Intel Iris Xe Graphics G7 96EUs, Intel Core i7-1280P
25076 Points -38%
Dell XPS 13 9310 OLED
Intel Iris Xe Graphics G7 96EUs, Intel Core i7-1185G7
24591 Points -39%
Dell XPS 13 9315, i5-1230U
Intel Iris Xe Graphics G7 80EUs, Intel Core i5-1230U
19854 Points -51%
Dell XPS 13 Plus 9320 4K
Intel Iris Xe Graphics G7 96EUs, Intel Core i7-1260P
19215 Points -52%
Dell XPS 13 9315 2-in-1 Core i5-1230U
Intel Iris Xe Graphics G7 80EUs, Intel Core i5-1230U
18566 Points -54%
Dell XPS 13 Plus 9320 i5-1240p
Intel Iris Xe Graphics G7 80EUs, Intel Core i5-1240P
15200 Points -62%
1920x1080 Fire Strike Graphics
Dell XPS 14 2024 OLED
NVIDIA GeForce RTX 4050 Laptop GPU, Intel Core Ultra 7 155H
13591 Points +116%
Dell XPS 13 9340 Core Ultra 7
Intel Arc 8-Core iGPU, Intel Core Ultra 7 155H
7946 Points +26%
Medion SPRCHRGD 14 S1 Elite
Qualcomm SD X Adreno X1-85 3.8 TFLOPS, Qualcomm Snapdragon X Elite X1E-78-100
6454 Points +3%
Lenovo ThinkPad T14s Gen 6 21N10007GE
Qualcomm SD X Adreno X1-85 3.8 TFLOPS, Qualcomm Snapdragon X Elite X1E-78-100
6345 Points +1%
Dell XPS 13 9345
Qualcomm SD X Adreno X1-85 3.8 TFLOPS, Qualcomm Snapdragon X Elite X1E-80-100
6283 Points
Average Qualcomm SD X Adreno X1-85 3.8 TFLOPS
  (5560 - 6454, n=11)
6170 Points -2%
Dell XPS 13 Plus 9320 Core i7-1360P
Intel Iris Xe Graphics G7 96EUs, Intel Core i7-1360P
5981 Points -5%
Microsoft Surface Laptop 7 13.8 Copilot+
Qualcomm SD X Adreno X1-85 3.8 TFLOPS, Qualcomm Snapdragon X Elite X1E-80-100
5953 Points -5%
HP EliteBook Ultra G1q 14
Qualcomm SD X Adreno X1-85 3.8 TFLOPS, Qualcomm Snapdragon X Elite X1E-78-100
5569 Points -11%
Dell XPS 13 9310 Core i7 4K
Intel Iris Xe Graphics G7 96EUs, Intel Core i7-1185G7
5498 Points -12%
Dell XPS 13 Plus 9320 4K
Intel Iris Xe Graphics G7 96EUs, Intel Core i7-1260P
5421 Points -14%
Dell XPS 13 Plus 9320 i7-1280P OLED
Intel Iris Xe Graphics G7 96EUs, Intel Core i7-1280P
5393 Points -14%
Dell XPS 13 9310 2-in-1
Intel Iris Xe Graphics G7 96EUs, Intel Core i7-1165G7
5208 Points -17%
Dell XPS 13 9310 OLED
Intel Iris Xe Graphics G7 96EUs, Intel Core i7-1185G7
5191 Points -17%
Dell XPS 13 9305 Core i5 FHD
Intel Iris Xe Graphics G7 80EUs, Intel Core i5-1135G7
4705 Points -25%
Dell XPS 13 Plus 9320 i5-1240p
Intel Iris Xe Graphics G7 80EUs, Intel Core i5-1240P
4086 Points -35%
Dell XPS 13 9315, i5-1230U
Intel Iris Xe Graphics G7 80EUs, Intel Core i5-1230U
3247 Points -48%
Dell XPS 13 9315 2-in-1 Core i5-1230U
Intel Iris Xe Graphics G7 80EUs, Intel Core i5-1230U
3227 Points -49%
2560x1440 Time Spy Graphics
Dell XPS 14 2024 OLED
NVIDIA GeForce RTX 4050 Laptop GPU, Intel Core Ultra 7 155H
5107 Points +198%
Dell XPS 13 9340 Core Ultra 7
Intel Arc 8-Core iGPU, Intel Core Ultra 7 155H
2911 Points +70%
Dell XPS 13 Plus 9320 Core i7-1360P
Intel Iris Xe Graphics G7 96EUs, Intel Core i7-1360P
1791 Points +5%
Dell XPS 13 Plus 9320 i7-1280P OLED
Intel Iris Xe Graphics G7 96EUs, Intel Core i7-1280P
1760 Points +3%
Dell XPS 13 Plus 9320 4K
Intel Iris Xe Graphics G7 96EUs, Intel Core i7-1260P
1758 Points +3%
Lenovo ThinkPad T14s Gen 6 21N10007GE
Qualcomm SD X Adreno X1-85 3.8 TFLOPS, Qualcomm Snapdragon X Elite X1E-78-100
1739 Points +2%
Medion SPRCHRGD 14 S1 Elite
Qualcomm SD X Adreno X1-85 3.8 TFLOPS, Qualcomm Snapdragon X Elite X1E-78-100
1731 Points +1%
Dell XPS 13 9345
Qualcomm SD X Adreno X1-85 3.8 TFLOPS, Qualcomm Snapdragon X Elite X1E-80-100
1712 Points
Average Qualcomm SD X Adreno X1-85 3.8 TFLOPS
  (1546 - 1739, n=11)
1690 Points -1%
Microsoft Surface Laptop 7 13.8 Copilot+
Qualcomm SD X Adreno X1-85 3.8 TFLOPS, Qualcomm Snapdragon X Elite X1E-80-100
1678 Points -2%
HP EliteBook Ultra G1q 14
Qualcomm SD X Adreno X1-85 3.8 TFLOPS, Qualcomm Snapdragon X Elite X1E-78-100
1617 Points -6%
Dell XPS 13 9310 Core i7 4K
Intel Iris Xe Graphics G7 96EUs, Intel Core i7-1185G7
1603 Points -6%
Dell XPS 13 9310 2-in-1
Intel Iris Xe Graphics G7 96EUs, Intel Core i7-1165G7
1596 Points -7%
Dell XPS 13 9310 OLED
Intel Iris Xe Graphics G7 96EUs, Intel Core i7-1185G7
1382 Points -19%
Dell XPS 13 9305 Core i5 FHD
Intel Iris Xe Graphics G7 80EUs, Intel Core i5-1135G7
1351 Points -21%
Dell XPS 13 Plus 9320 i5-1240p
Intel Iris Xe Graphics G7 80EUs, Intel Core i5-1240P
1134 Points -34%
Dell XPS 13 9315, i5-1230U
Intel Iris Xe Graphics G7 80EUs, Intel Core i5-1230U
945 Points -45%
Dell XPS 13 9315 2-in-1 Core i5-1230U
Intel Iris Xe Graphics G7 80EUs, Intel Core i5-1230U
936 Points -45%
2560x1440 Time Spy Score
Dell XPS 14 2024 OLED
NVIDIA GeForce RTX 4050 Laptop GPU, Intel Core Ultra 7 155H
5395 Points +184%
Dell XPS 13 9340 Core Ultra 7
Intel Arc 8-Core iGPU, Intel Core Ultra 7 155H
3106 Points +63%
Dell XPS 13 Plus 9320 Core i7-1360P
Intel Iris Xe Graphics G7 96EUs, Intel Core i7-1360P
2021 Points +6%
Dell XPS 13 Plus 9320 i7-1280P OLED
Intel Iris Xe Graphics G7 96EUs, Intel Core i7-1280P
1986 Points +5%
Dell XPS 13 Plus 9320 4K
Intel Iris Xe Graphics G7 96EUs, Intel Core i7-1260P
1974 Points +4%
Lenovo ThinkPad T14s Gen 6 21N10007GE
Qualcomm SD X Adreno X1-85 3.8 TFLOPS, Qualcomm Snapdragon X Elite X1E-78-100
1934 Points +2%
Medion SPRCHRGD 14 S1 Elite
Qualcomm SD X Adreno X1-85 3.8 TFLOPS, Qualcomm Snapdragon X Elite X1E-78-100
1924 Points +1%
Dell XPS 13 9345
Qualcomm SD X Adreno X1-85 3.8 TFLOPS, Qualcomm Snapdragon X Elite X1E-80-100
1900 Points
Average Qualcomm SD X Adreno X1-85 3.8 TFLOPS
  (1690 - 1934, n=11)
1874 Points -1%
Microsoft Surface Laptop 7 13.8 Copilot+
Qualcomm SD X Adreno X1-85 3.8 TFLOPS, Qualcomm Snapdragon X Elite X1E-80-100
1868 Points -2%
HP EliteBook Ultra G1q 14
Qualcomm SD X Adreno X1-85 3.8 TFLOPS, Qualcomm Snapdragon X Elite X1E-78-100
1799 Points -5%
Dell XPS 13 9310 2-in-1
Intel Iris Xe Graphics G7 96EUs, Intel Core i7-1165G7
1778 Points -6%
Dell XPS 13 9310 Core i7 4K
Intel Iris Xe Graphics G7 96EUs, Intel Core i7-1185G7
1749 Points -8%
Dell XPS 13 9310 OLED
Intel Iris Xe Graphics G7 96EUs, Intel Core i7-1185G7
1526 Points -20%
Dell XPS 13 9305 Core i5 FHD
Intel Iris Xe Graphics G7 80EUs, Intel Core i5-1135G7
1490 Points -22%
Dell XPS 13 Plus 9320 i5-1240p
Intel Iris Xe Graphics G7 80EUs, Intel Core i5-1240P
1290 Points -32%
Dell XPS 13 9315 2-in-1 Core i5-1230U
Intel Iris Xe Graphics G7 80EUs, Intel Core i5-1230U
1055 Points -44%
Dell XPS 13 9315, i5-1230U
Intel Iris Xe Graphics G7 80EUs, Intel Core i5-1230U
1053 Points -45%
3DMark 11 Performance
6884 pontos
3DMark Cloud Gate Standard Score
24813 pontos
3DMark Fire Strike Score
6012 pontos
3DMark Time Spy Score
1900 pontos
Ajuda
Blender
v3.3 Classroom OPTIX/RTX
Dell XPS 14 2024 OLED
NVIDIA GeForce RTX 4050 Laptop GPU, Intel Core Ultra 7 155H
37 Seconds *
v3.3 Classroom CUDA
Dell XPS 14 2024 OLED
NVIDIA GeForce RTX 4050 Laptop GPU, Intel Core Ultra 7 155H
67 Seconds *
v3.3 Classroom CPU
Dell XPS 13 9315 2-in-1 Core i5-1230U
Intel Iris Xe Graphics G7 80EUs, Intel Core i5-1230U
1023 Seconds * -66%
HP EliteBook Ultra G1q 14
Qualcomm SD X Adreno X1-85 3.8 TFLOPS, Qualcomm Snapdragon X Elite X1E-78-100
676 Seconds * -10%
Average Qualcomm SD X Adreno X1-85 3.8 TFLOPS
  (545 - 899, n=9)
667 Seconds * -8%
Medion SPRCHRGD 14 S1 Elite
Qualcomm SD X Adreno X1-85 3.8 TFLOPS, Qualcomm Snapdragon X Elite X1E-78-100
652 Seconds * -6%
Microsoft Surface Laptop 7 13.8 Copilot+
Qualcomm SD X Adreno X1-85 3.8 TFLOPS, Qualcomm Snapdragon X Elite X1E-80-100
628 Seconds * -2%
Dell XPS 13 9345
Qualcomm SD X Adreno X1-85 3.8 TFLOPS, Qualcomm Snapdragon X Elite X1E-80-100
616 Seconds *
Dell XPS 13 Plus 9320 4K
Intel Iris Xe Graphics G7 96EUs, Intel Core i7-1260P
598 Seconds * +3%
Dell XPS 13 Plus 9320 i7-1280P OLED
Intel Iris Xe Graphics G7 96EUs, Intel Core i7-1280P
537 Seconds * +13%
Dell XPS 13 Plus 9320 Core i7-1360P
Intel Iris Xe Graphics G7 96EUs, Intel Core i7-1360P
531 Seconds * +14%
Dell XPS 13 9340 Core Ultra 7
Intel Arc 8-Core iGPU, Intel Core Ultra 7 155H
481 Seconds * +22%
Dell XPS 14 2024 OLED
NVIDIA GeForce RTX 4050 Laptop GPU, Intel Core Ultra 7 155H
447 Seconds * +27%

* ... smaller is better

Desempenho em jogos

Nossos resultados ligeiramente superiores no 3DMark em relação ao EliteBook Ultra G1q 14 se traduzem em um desempenho ligeiramente mais rápido nos títulos testados abaixo. É interessante notar que alguns títulos foram executados em nossa unidade Dell, mas não em nossa unidade HP e vice-versa. Por exemplo, Far Cry 5 funcionava em nosso Dell, mas não no HP, e Baldur's Gate 3 funcionava em nosso HP, mas não no Dell, independentemente do modo DirectX. A discrepância pode ser devida a diferenças de driver entre os dois modelos, mas isso também mostra que é preciso trabalhar mais com relação ao driver gráfico.

Performance Rating - Percent
Lenovo ThinkBook 13x G4 21KR0008GE -2!
Intel Core Ultra 5 125H, Intel Arc 7-Core iGPU
92.8 pt
Dell XPS 13 9340 Core Ultra 7 -2!
Intel Core Ultra 7 155H, Intel Arc 8-Core iGPU
90.1 pt
Dell XPS 13 9345
Qualcomm Snapdragon X Elite X1E-80-100, Qualcomm SD X Adreno X1-85 3.8 TFLOPS
85 pt
Microsoft Surface Laptop 7 13.8 Copilot+ -2!
Qualcomm Snapdragon X Elite X1E-80-100, Qualcomm SD X Adreno X1-85 3.8 TFLOPS
84.4 pt
HP EliteBook Ultra G1q 14 -1!
Qualcomm Snapdragon X Elite X1E-78-100, Qualcomm SD X Adreno X1-85 3.8 TFLOPS
77.4 pt
Asus ZenBook S13 OLED UX5304 -1!
Intel Core i7-1355U, Intel Iris Xe Graphics G7 96EUs
59.4 pt
The Witcher 3 - 1920x1080 Ultra Graphics & Postprocessing (HBAO+)
Lenovo ThinkBook 13x G4 21KR0008GE
Intel Core Ultra 5 125H, Intel Arc 7-Core iGPU
23.4 (18min, 20P1) fps +22%
Dell XPS 13 9340 Core Ultra 7
Intel Core Ultra 7 155H, Intel Arc 8-Core iGPU
20.8 (16min, 19P1) fps +8%
Dell XPS 13 9345
Qualcomm Snapdragon X Elite X1E-80-100, Qualcomm SD X Adreno X1-85 3.8 TFLOPS
19.2 (15min) fps
HP EliteBook Ultra G1q 14
Qualcomm Snapdragon X Elite X1E-78-100, Qualcomm SD X Adreno X1-85 3.8 TFLOPS
17.5 (14min) fps -9%
Asus ZenBook S13 OLED UX5304
Intel Core i7-1355U, Intel Iris Xe Graphics G7 96EUs
12.3 (11min, 11P1) fps -36%
GTA V - 1920x1080 Highest Settings possible AA:4xMSAA + FX AF:16x
Microsoft Surface Laptop 7 13.8 Copilot+
Qualcomm Snapdragon X Elite X1E-80-100, Qualcomm SD X Adreno X1-85 3.8 TFLOPS
21.5 (2.47min, 13P1) fps +1%
Dell XPS 13 9345
Qualcomm Snapdragon X Elite X1E-80-100, Qualcomm SD X Adreno X1-85 3.8 TFLOPS
21.2 (2.94min, 12.2P1) fps
Lenovo ThinkBook 13x G4 21KR0008GE
Intel Core Ultra 5 125H, Intel Arc 7-Core iGPU
14.8 (1.279min, 5.78P1) fps -30%
Dell XPS 13 9340 Core Ultra 7
Intel Core Ultra 7 155H, Intel Arc 8-Core iGPU
14.7 (2.21min, 10.8P1) fps -31%
Asus ZenBook S13 OLED UX5304
Intel Core i7-1355U, Intel Iris Xe Graphics G7 96EUs
9.42 (3.26min, 5.92P1) fps -56%
Final Fantasy XV Benchmark - 1920x1080 High Quality
Dell XPS 13 9340 Core Ultra 7
Intel Core Ultra 7 155H, Intel Arc 8-Core iGPU
26.4 fps +67%
Lenovo ThinkBook 13x G4 21KR0008GE
Intel Core Ultra 5 125H, Intel Arc 7-Core iGPU
25.3 fps +60%
Microsoft Surface Laptop 7 13.8 Copilot+
Qualcomm Snapdragon X Elite X1E-80-100, Qualcomm SD X Adreno X1-85 3.8 TFLOPS
15.8 fps 0%
Dell XPS 13 9345
Qualcomm Snapdragon X Elite X1E-80-100, Qualcomm SD X Adreno X1-85 3.8 TFLOPS
15.8 fps
Asus ZenBook S13 OLED UX5304
Intel Core i7-1355U, Intel Iris Xe Graphics G7 96EUs
14.9 fps -6%
HP EliteBook Ultra G1q 14
Qualcomm Snapdragon X Elite X1E-78-100, Qualcomm SD X Adreno X1-85 3.8 TFLOPS
14.3 fps -9%
Strange Brigade - 1920x1080 ultra AA:ultra AF:16
Lenovo ThinkBook 13x G4 21KR0008GE
Intel Core Ultra 5 125H, Intel Arc 7-Core iGPU
44 fps +30%
Dell XPS 13 9340 Core Ultra 7
Intel Core Ultra 7 155H, Intel Arc 8-Core iGPU
41 fps +21%
Microsoft Surface Laptop 7 13.8 Copilot+
Qualcomm Snapdragon X Elite X1E-80-100, Qualcomm SD X Adreno X1-85 3.8 TFLOPS
36 fps +6%
Dell XPS 13 9345
Qualcomm Snapdragon X Elite X1E-80-100, Qualcomm SD X Adreno X1-85 3.8 TFLOPS
33.9 (6.3min, 9.25P1) fps
HP EliteBook Ultra G1q 14
Qualcomm Snapdragon X Elite X1E-78-100, Qualcomm SD X Adreno X1-85 3.8 TFLOPS
32 (6.7min, 9.01P1) fps -6%
Asus ZenBook S13 OLED UX5304
Intel Core i7-1355U, Intel Iris Xe Graphics G7 96EUs
23.6 (5min, 6.37P1) fps -30%
Dota 2 Reborn - 1920x1080 ultra (3/3) best looking
Dell XPS 13 9340 Core Ultra 7
Intel Core Ultra 7 155H, Intel Arc 8-Core iGPU
65.2 (48.8min) fps +29%
Lenovo ThinkBook 13x G4 21KR0008GE
Intel Core Ultra 5 125H, Intel Arc 7-Core iGPU
64.9 (45.5min) fps +28%
Microsoft Surface Laptop 7 13.8 Copilot+
Qualcomm Snapdragon X Elite X1E-80-100, Qualcomm SD X Adreno X1-85 3.8 TFLOPS
53.2 (39min) fps +5%
Asus ZenBook S13 OLED UX5304
Intel Core i7-1355U, Intel Iris Xe Graphics G7 96EUs
51.1 (42.7min) fps +1%
Dell XPS 13 9345
Qualcomm Snapdragon X Elite X1E-80-100, Qualcomm SD X Adreno X1-85 3.8 TFLOPS
50.7 (37.8min) fps
HP EliteBook Ultra G1q 14
Qualcomm Snapdragon X Elite X1E-78-100, Qualcomm SD X Adreno X1-85 3.8 TFLOPS
49.3 (35.9min) fps -3%
Tiny Tina's Wonderlands - 1920x1080 Badass Preset (DX12)
Dell XPS 13 9345
Qualcomm Snapdragon X Elite X1E-80-100, Qualcomm SD X Adreno X1-85 3.8 TFLOPS
18 fps
HP EliteBook Ultra G1q 14
Qualcomm Snapdragon X Elite X1E-78-100, Qualcomm SD X Adreno X1-85 3.8 TFLOPS
16.8 fps -7%
F1 22 - 1920x1080 High Preset AA:T AF:16x
Dell XPS 13 9345
Qualcomm Snapdragon X Elite X1E-80-100, Qualcomm SD X Adreno X1-85 3.8 TFLOPS
38.5 (26min, 26P1) fps
Microsoft Surface Laptop 7 13.8 Copilot+
Qualcomm Snapdragon X Elite X1E-80-100, Qualcomm SD X Adreno X1-85 3.8 TFLOPS
38 (27min, 26P1) fps -1%
HP EliteBook Ultra G1q 14
Qualcomm Snapdragon X Elite X1E-78-100, Qualcomm SD X Adreno X1-85 3.8 TFLOPS
36.2 (24min, 22P1) fps -6%
Asus ZenBook S13 OLED UX5304
Intel Core i7-1355U, Intel Iris Xe Graphics G7 96EUs
27.6 (21min, 21P1) fps -28%
Far Cry 5
1280x720 Low Preset AA:T
Dell XPS 14 2024 OLED
Intel Core Ultra 7 155H, NVIDIA GeForce RTX 4050 Laptop GPU
108 fps +157%
Dell XPS 13 Plus 9320 i5-1240p
Intel Core i5-1240P, Intel Iris Xe Graphics G7 80EUs
61 fps +45%
Dell XPS 13 Plus 9320 4K
Intel Core i7-1260P, Intel Iris Xe Graphics G7 96EUs
59 fps +40%
Dell XPS 13 9340 Core Ultra 7
Intel Core Ultra 7 155H, Intel Arc 8-Core iGPU
57 fps +36%
Dell XPS 13 9310 2-in-1
Intel Core i7-1165G7, Intel Iris Xe Graphics G7 96EUs
49 (43min) fps +17%
Dell XPS 13 9345
Qualcomm Snapdragon X Elite X1E-80-100, Qualcomm SD X Adreno X1-85 3.8 TFLOPS
42 (20min) fps
Average Qualcomm SD X Adreno X1-85 3.8 TFLOPS
  (32 - 44, n=5)
38 fps -10%
Lenovo ThinkPad T14s Gen 6 21N10007GE
Qualcomm Snapdragon X Elite X1E-78-100, Qualcomm SD X Adreno X1-85 3.8 TFLOPS
35 (4min) fps -17%
Dell XPS 13 9315, i5-1230U
Intel Core i5-1230U, Intel Iris Xe Graphics G7 80EUs
22 (12min) fps -48%
1920x1080 Low Preset AA:T
Dell XPS 13 9310 2-in-1
Intel Core i7-1165G7, Intel Iris Xe Graphics G7 96EUs
27 (24min) fps
1920x1080 Medium Preset AA:T
Dell XPS 14 2024 OLED
Intel Core Ultra 7 155H, NVIDIA GeForce RTX 4050 Laptop GPU
85 fps +158%
Dell XPS 13 9340 Core Ultra 7
Intel Core Ultra 7 155H, Intel Arc 8-Core iGPU
33 fps 0%
Dell XPS 13 9345
Qualcomm Snapdragon X Elite X1E-80-100, Qualcomm SD X Adreno X1-85 3.8 TFLOPS
33 (19min) fps
Dell XPS 13 Plus 9320 4K
Intel Core i7-1260P, Intel Iris Xe Graphics G7 96EUs
32 fps -3%
Average Qualcomm SD X Adreno X1-85 3.8 TFLOPS
  (25 - 34, n=5)
29.6 fps -10%
Dell XPS 13 Plus 9320 i5-1240p
Intel Core i5-1240P, Intel Iris Xe Graphics G7 80EUs
28 fps -15%
Lenovo ThinkPad T14s Gen 6 21N10007GE
Qualcomm Snapdragon X Elite X1E-78-100, Qualcomm SD X Adreno X1-85 3.8 TFLOPS
26 (5min) fps -21%
Dell XPS 13 9310 2-in-1
Intel Core i7-1165G7, Intel Iris Xe Graphics G7 96EUs
23 (21min) fps -30%
Dell XPS 13 9315, i5-1230U
Intel Core i5-1230U, Intel Iris Xe Graphics G7 80EUs
14 (11min) fps -58%
1920x1080 High Preset AA:T
Dell XPS 14 2024 OLED
Intel Core Ultra 7 155H, NVIDIA GeForce RTX 4050 Laptop GPU
80 fps +158%
Dell XPS 13 9345
Qualcomm Snapdragon X Elite X1E-80-100, Qualcomm SD X Adreno X1-85 3.8 TFLOPS
31 (27min) fps
Dell XPS 13 9340 Core Ultra 7
Intel Core Ultra 7 155H, Intel Arc 8-Core iGPU
30 fps -3%
Dell XPS 13 Plus 9320 4K
Intel Core i7-1260P, Intel Iris Xe Graphics G7 96EUs
29 fps -6%
Average Qualcomm SD X Adreno X1-85 3.8 TFLOPS
  (23 - 31, n=5)
27.4 fps -12%
Lenovo ThinkPad T14s Gen 6 21N10007GE
Qualcomm Snapdragon X Elite X1E-78-100, Qualcomm SD X Adreno X1-85 3.8 TFLOPS
24 (19min) fps -23%
Dell XPS 13 9310 2-in-1
Intel Core i7-1165G7, Intel Iris Xe Graphics G7 96EUs
22 (19min) fps -29%
1920x1080 Ultra Preset AA:T
Dell XPS 14 2024 OLED
Intel Core Ultra 7 155H, NVIDIA GeForce RTX 4050 Laptop GPU
76 fps +171%
Dell XPS 13 9340 Core Ultra 7
Intel Core Ultra 7 155H, Intel Arc 8-Core iGPU
28 fps 0%
Dell XPS 13 9345
Qualcomm Snapdragon X Elite X1E-80-100, Qualcomm SD X Adreno X1-85 3.8 TFLOPS
28 (20min) fps
Dell XPS 13 Plus 9320 4K
Intel Core i7-1260P, Intel Iris Xe Graphics G7 96EUs
26 fps -7%
Average Qualcomm SD X Adreno X1-85 3.8 TFLOPS
  (22 - 29, n=5)
25.6 fps -9%
Dell XPS 13 9310 2-in-1
Intel Core i7-1165G7, Intel Iris Xe Graphics G7 96EUs
22 (19min) fps -21%
Lenovo ThinkPad T14s Gen 6 21N10007GE
Qualcomm Snapdragon X Elite X1E-78-100, Qualcomm SD X Adreno X1-85 3.8 TFLOPS
22 (9min) fps -21%
F1 22
1280x720 Ultra Low Preset AA:T AF:16x
Dell XPS 13 9345
Qualcomm Snapdragon X Elite X1E-80-100, Qualcomm SD X Adreno X1-85 3.8 TFLOPS
101 (66min, 66P1) fps
HP EliteBook Ultra G1q 14
Qualcomm Snapdragon X Elite X1E-78-100, Qualcomm SD X Adreno X1-85 3.8 TFLOPS
94.2 (63min, 49P1) fps -7%
Lenovo ThinkPad T14s Gen 6 21N10007GE
Qualcomm Snapdragon X Elite X1E-78-100, Qualcomm SD X Adreno X1-85 3.8 TFLOPS
92.6 (57min, 60P1) fps -8%
Average Qualcomm SD X Adreno X1-85 3.8 TFLOPS
  (60 - 101, n=4)
87 fps -14%
Dell XPS 13 Plus 9320 Core i7-1360P
Intel Core i7-1360P, Intel Iris Xe Graphics G7 96EUs
81.5 (61min, 60P1) fps -19%
1920x1080 Low Preset AA:T AF:16x
Dell XPS 13 9345
Qualcomm Snapdragon X Elite X1E-80-100, Qualcomm SD X Adreno X1-85 3.8 TFLOPS
62.9 (38min, 39P1) fps
Average Qualcomm SD X Adreno X1-85 3.8 TFLOPS
  (54.7 - 64, n=8)
59.2 fps -6%
HP EliteBook Ultra G1q 14
Qualcomm Snapdragon X Elite X1E-78-100, Qualcomm SD X Adreno X1-85 3.8 TFLOPS
57.6 (35min, 35P1) fps -8%
Microsoft Surface Laptop 7 13.8 Copilot+
Qualcomm Snapdragon X Elite X1E-80-100, Qualcomm SD X Adreno X1-85 3.8 TFLOPS
57 (36min, 36P1) fps -9%
Lenovo ThinkPad T14s Gen 6 21N10007GE
Qualcomm Snapdragon X Elite X1E-78-100, Qualcomm SD X Adreno X1-85 3.8 TFLOPS
55.2 (32min, 33P1) fps -12%
Dell XPS 13 Plus 9320 Core i7-1360P
Intel Core i7-1360P, Intel Iris Xe Graphics G7 96EUs
47.5 (40min, 37P1) fps -24%
1920x1080 Medium Preset AA:T AF:16x
Dell XPS 13 9345
Qualcomm Snapdragon X Elite X1E-80-100, Qualcomm SD X Adreno X1-85 3.8 TFLOPS
55.4 (36min, 36P1) fps
Average Qualcomm SD X Adreno X1-85 3.8 TFLOPS
  (49.6 - 56.6, n=8)
52.8 fps -5%
HP EliteBook Ultra G1q 14
Qualcomm Snapdragon X Elite X1E-78-100, Qualcomm SD X Adreno X1-85 3.8 TFLOPS
51 (32min, 28P1) fps -8%
Microsoft Surface Laptop 7 13.8 Copilot+
Qualcomm Snapdragon X Elite X1E-80-100, Qualcomm SD X Adreno X1-85 3.8 TFLOPS
50.1 (29min, 30P1) fps -10%
Lenovo ThinkPad T14s Gen 6 21N10007GE
Qualcomm Snapdragon X Elite X1E-78-100, Qualcomm SD X Adreno X1-85 3.8 TFLOPS
50.1 (31min, 31P1) fps -10%
Dell XPS 13 Plus 9320 Core i7-1360P
Intel Core i7-1360P, Intel Iris Xe Graphics G7 96EUs
42.8 (37min, 36P1) fps -23%
1920x1080 High Preset AA:T AF:16x
Dell XPS 13 9345
Qualcomm Snapdragon X Elite X1E-80-100, Qualcomm SD X Adreno X1-85 3.8 TFLOPS
38.5 (26min, 26P1) fps
Microsoft Surface Laptop 7 13.8 Copilot+
Qualcomm Snapdragon X Elite X1E-80-100, Qualcomm SD X Adreno X1-85 3.8 TFLOPS
38 (27min, 26P1) fps -1%
Average Qualcomm SD X Adreno X1-85 3.8 TFLOPS
  (35.3 - 38.7, n=8)
37.4 fps -3%
HP EliteBook Ultra G1q 14
Qualcomm Snapdragon X Elite X1E-78-100, Qualcomm SD X Adreno X1-85 3.8 TFLOPS
36.2 (24min, 22P1) fps -6%
Lenovo ThinkPad T14s Gen 6 21N10007GE
Qualcomm Snapdragon X Elite X1E-78-100, Qualcomm SD X Adreno X1-85 3.8 TFLOPS
35.3 (25min, 25P1) fps -8%
Dell XPS 13 Plus 9320 Core i7-1360P
Intel Core i7-1360P, Intel Iris Xe Graphics G7 96EUs
31.9 (24min, 26P1) fps -17%
The Witcher 3
1024x768 Low Graphics & Postprocessing
Dell XPS 13 9340 Core Ultra 7
Intel Core Ultra 7 155H, Intel Arc 8-Core iGPU
152 fps +46%
HP EliteBook Ultra G1q 14
Qualcomm Snapdragon X Elite X1E-78-100, Qualcomm SD X Adreno X1-85 3.8 TFLOPS
109.2 (81min) fps +5%
Dell XPS 13 9310 Core i7 4K
Intel Core i7-1185G7, Intel Iris Xe Graphics G7 96EUs
107 (92min) fps +3%
Dell XPS 13 Plus 9320 i7-1280P OLED
Intel Core i7-1280P, Intel Iris Xe Graphics G7 96EUs
104.8 (61min) fps +1%
Dell XPS 13 9345
Qualcomm Snapdragon X Elite X1E-80-100, Qualcomm SD X Adreno X1-85 3.8 TFLOPS
104 (72min) fps
Lenovo ThinkPad T14s Gen 6 21N10007GE
Qualcomm Snapdragon X Elite X1E-78-100, Qualcomm SD X Adreno X1-85 3.8 TFLOPS
103.7 (6.54min, 21.6P0.1, 60.3P1) fps 0%
Average Qualcomm SD X Adreno X1-85 3.8 TFLOPS
  (79 - 112, n=8)
103.2 fps -1%
Dell XPS 13 Plus 9320 4K
Intel Core i7-1260P, Intel Iris Xe Graphics G7 96EUs
99 fps -5%
Dell XPS 13 9310 OLED
Intel Core i7-1185G7, Intel Iris Xe Graphics G7 96EUs
98.6 (83min) fps -5%
Dell XPS 13 Plus 9320 Core i7-1360P
Intel Core i7-1360P, Intel Iris Xe Graphics G7 96EUs
86.7 (48min) fps -17%
Dell XPS 13 9310 2-in-1
Intel Core i7-1165G7, Intel Iris Xe Graphics G7 96EUs
86.2 (43min) fps -17%
Dell XPS 13 Plus 9320 i5-1240p
Intel Core i5-1240P, Intel Iris Xe Graphics G7 80EUs
75.5 fps -27%
Dell XPS 13 9315, i5-1230U
Intel Core i5-1230U, Intel Iris Xe Graphics G7 80EUs
67 fps -36%
Dell XPS 13 9315 2-in-1 Core i5-1230U
Intel Core i5-1230U, Intel Iris Xe Graphics G7 80EUs
57.7 (15min) fps -45%
1366x768 Medium Graphics & Postprocessing
Dell XPS 13 9340 Core Ultra 7
Intel Core Ultra 7 155H, Intel Arc 8-Core iGPU
89 fps +19%
Dell XPS 13 9345
Qualcomm Snapdragon X Elite X1E-80-100, Qualcomm SD X Adreno X1-85 3.8 TFLOPS
74.5 (68min) fps
HP EliteBook Ultra G1q 14
Qualcomm Snapdragon X Elite X1E-78-100, Qualcomm SD X Adreno X1-85 3.8 TFLOPS
70.9 (68min) fps -5%
Average Qualcomm SD X Adreno X1-85 3.8 TFLOPS
  (54 - 74.5, n=8)
68.2 fps -8%
Dell XPS 13 Plus 9320 i7-1280P OLED
Intel Core i7-1280P, Intel Iris Xe Graphics G7 96EUs
65.7 (62min) fps -12%
Lenovo ThinkPad T14s Gen 6 21N10007GE
Qualcomm Snapdragon X Elite X1E-78-100, Qualcomm SD X Adreno X1-85 3.8 TFLOPS
63.9 (4.88min, 19P0.1, 42.9P1) fps -14%
Dell XPS 13 Plus 9320 4K
Intel Core i7-1260P, Intel Iris Xe Graphics G7 96EUs
62 fps -17%
Dell XPS 13 9310 Core i7 4K
Intel Core i7-1185G7, Intel Iris Xe Graphics G7 96EUs
61.9 (59min) fps -17%
Dell XPS 13 9310 OLED
Intel Core i7-1185G7, Intel Iris Xe Graphics G7 96EUs
61.1 (55min) fps -18%
Dell XPS 13 Plus 9320 Core i7-1360P
Intel Core i7-1360P, Intel Iris Xe Graphics G7 96EUs
56.1 (52min) fps -25%
Dell XPS 13 9310 2-in-1
Intel Core i7-1165G7, Intel Iris Xe Graphics G7 96EUs
54.3 (50min) fps -27%
Dell XPS 13 Plus 9320 i5-1240p
Intel Core i5-1240P, Intel Iris Xe Graphics G7 80EUs
48.1 fps -35%
Dell XPS 13 9305 Core i5 FHD
Intel Core i5-1135G7, Intel Iris Xe Graphics G7 80EUs
47.7 fps -36%
Dell XPS 13 9315, i5-1230U
Intel Core i5-1230U, Intel Iris Xe Graphics G7 80EUs
47 fps -37%
Dell XPS 13 9315 2-in-1 Core i5-1230U
Intel Core i5-1230U, Intel Iris Xe Graphics G7 80EUs
38.9 (36min) fps -48%
1920x1080 High Graphics & Postprocessing (Nvidia HairWorks Off)
Dell XPS 14 2024 OLED
Intel Core Ultra 7 155H, NVIDIA GeForce RTX 4050 Laptop GPU
98 fps +124%
Dell XPS 13 9340 Core Ultra 7
Intel Core Ultra 7 155H, Intel Arc 8-Core iGPU
47 fps +8%
Dell XPS 13 9345
Qualcomm Snapdragon X Elite X1E-80-100, Qualcomm SD X Adreno X1-85 3.8 TFLOPS
43.7 (42min) fps
Lenovo ThinkPad T14s Gen 6 21N10007GE
Qualcomm Snapdragon X Elite X1E-78-100, Qualcomm SD X Adreno X1-85 3.8 TFLOPS
39.9 (1.229min, 13P0.1, 22P1) fps -9%
HP EliteBook Ultra G1q 14
Qualcomm Snapdragon X Elite X1E-78-100, Qualcomm SD X Adreno X1-85 3.8 TFLOPS
39.7 (35min) fps -9%
Average Qualcomm SD X Adreno X1-85 3.8 TFLOPS
  (31 - 43.7, n=8)
39.5 fps -10%
Dell XPS 13 Plus 9320 i7-1280P OLED
Intel Core i7-1280P, Intel Iris Xe Graphics G7 96EUs
36.9 (33min) fps -16%
Dell XPS 13 9310 Core i7 4K
Intel Core i7-1185G7, Intel Iris Xe Graphics G7 96EUs
34.5 (32min) fps -21%
Dell XPS 13 Plus 9320 4K
Intel Core i7-1260P, Intel Iris Xe Graphics G7 96EUs
34 fps -22%
Dell XPS 13 Plus 9320 Core i7-1360P
Intel Core i7-1360P, Intel Iris Xe Graphics G7 96EUs
33.9 (31min) fps -22%
Dell XPS 13 9310 OLED
Intel Core i7-1185G7, Intel Iris Xe Graphics G7 96EUs
32 (29min) fps -27%
Dell XPS 13 Plus 9320 i5-1240p
Intel Core i5-1240P, Intel Iris Xe Graphics G7 80EUs
31.9 fps -27%
Dell XPS 13 9310 2-in-1
Intel Core i7-1165G7, Intel Iris Xe Graphics G7 96EUs
29.9 (27min) fps -32%
Dell XPS 13 9315, i5-1230U
Intel Core i5-1230U, Intel Iris Xe Graphics G7 80EUs
22 fps -50%
Dell XPS 13 9315 2-in-1 Core i5-1230U
Intel Core i5-1230U, Intel Iris Xe Graphics G7 80EUs
19.9 (17min) fps -54%
Dell XPS 13 9305 Core i5 FHD
Intel Core i5-1135G7, Intel Iris Xe Graphics G7 80EUs
18.5 fps -58%
1920x1080 Ultra Graphics & Postprocessing (HBAO+)
Dell XPS 14 2024 OLED
Intel Core Ultra 7 155H, NVIDIA GeForce RTX 4050 Laptop GPU
52.4 (50min, 50.99P1) fps +173%
Dell XPS 13 9340 Core Ultra 7
Intel Core Ultra 7 155H, Intel Arc 8-Core iGPU
20.8 (16min, 19P1) fps +8%
Dell XPS 13 9345
Qualcomm Snapdragon X Elite X1E-80-100, Qualcomm SD X Adreno X1-85 3.8 TFLOPS
19.2 (15min) fps
Average Qualcomm SD X Adreno X1-85 3.8 TFLOPS
  (16 - 20, n=8)
18.5 fps -4%
Lenovo ThinkPad T14s Gen 6 21N10007GE
Qualcomm Snapdragon X Elite X1E-78-100, Qualcomm SD X Adreno X1-85 3.8 TFLOPS
18.1 (8.6min, 8.76P0.1, 14P1) fps -6%
HP EliteBook Ultra G1q 14
Qualcomm Snapdragon X Elite X1E-78-100, Qualcomm SD X Adreno X1-85 3.8 TFLOPS
17.5 (14min) fps -9%
Dell XPS 13 Plus 9320 i7-1280P OLED
Intel Core i7-1280P, Intel Iris Xe Graphics G7 96EUs
16.4 (14min) fps -15%
Dell XPS 13 Plus 9320 Core i7-1360P
Intel Core i7-1360P, Intel Iris Xe Graphics G7 96EUs
15.4 (14min) fps -20%
Dell XPS 13 9310 Core i7 4K
Intel Core i7-1185G7, Intel Iris Xe Graphics G7 96EUs
15.3 (13min) fps -20%
Dell XPS 13 9310 2-in-1
Intel Core i7-1165G7, Intel Iris Xe Graphics G7 96EUs
14.7 (12min) fps -23%
Dell XPS 13 Plus 9320 4K
Intel Core i7-1260P, Intel Iris Xe Graphics G7 96EUs
14.3 (12min, 13P1) fps -26%
Dell XPS 13 9310 OLED
Intel Core i7-1185G7, Intel Iris Xe Graphics G7 96EUs
13.9 (12min) fps -28%
Dell XPS 13 Plus 9320 i5-1240p
Intel Core i5-1240P, Intel Iris Xe Graphics G7 80EUs
13.1 fps -32%
Dell XPS 13 9305 Core i5 FHD
Intel Core i5-1135G7, Intel Iris Xe Graphics G7 80EUs
12 fps -37%
Dell XPS 13 9315 2-in-1 Core i5-1230U
Intel Core i5-1230U, Intel Iris Xe Graphics G7 80EUs
8.5 (7min) fps -56%
Dell XPS 13 9315, i5-1230U
Intel Core i5-1230U, Intel Iris Xe Graphics G7 80EUs
8 fps -58%
Strange Brigade
1280x720 lowest AF:1
Dell XPS 14 2024 OLED
Intel Core Ultra 7 155H, NVIDIA GeForce RTX 4050 Laptop GPU
239 fps +93%
Dell XPS 13 9340 Core Ultra 7
Intel Core Ultra 7 155H, Intel Arc 8-Core iGPU
156 fps +26%
Microsoft Surface Laptop 7 13.8 Copilot+
Qualcomm Snapdragon X Elite X1E-80-100, Qualcomm SD X Adreno X1-85 3.8 TFLOPS
137 fps +11%
Dell XPS 13 9345
Qualcomm Snapdragon X Elite X1E-80-100, Qualcomm SD X Adreno X1-85 3.8 TFLOPS
123.9 (30.8min, 58.7P1) fps
Lenovo ThinkPad T14s Gen 6 21N10007GE
Qualcomm Snapdragon X Elite X1E-78-100, Qualcomm SD X Adreno X1-85 3.8 TFLOPS
121.3 (25.7min, 55.7P1) fps -2%
Average Qualcomm SD X Adreno X1-85 3.8 TFLOPS
  (68 - 140, n=11)
115 fps -7%
HP EliteBook Ultra G1q 14
Qualcomm Snapdragon X Elite X1E-78-100, Qualcomm SD X Adreno X1-85 3.8 TFLOPS
114.3 (30.7min, 55.8P1) fps -8%
Dell XPS 13 Plus 9320 i7-1280P OLED
Intel Core i7-1280P, Intel Iris Xe Graphics G7 96EUs
100.2 (22.5min, 36.9P1) fps -19%
Dell XPS 13 Plus 9320 4K
Intel Core i7-1260P, Intel Iris Xe Graphics G7 96EUs
95.2 (21min, 33.1P1) fps -23%
Dell XPS 13 Plus 9320 Core i7-1360P
Intel Core i7-1360P, Intel Iris Xe Graphics G7 96EUs
93.9 (20.3min, 37.7P1) fps -24%
Dell XPS 13 9310 OLED
Intel Core i7-1185G7, Intel Iris Xe Graphics G7 96EUs
88.4 (19.6min, 30.6P1) fps -29%
Medion SPRCHRGD 14 S1 Elite
Qualcomm Snapdragon X Elite X1E-78-100, Qualcomm SD X Adreno X1-85 3.8 TFLOPS
78.8 (31.1min, 33.8P1) fps -36%
Dell XPS 13 9310 2-in-1
Intel Core i7-1165G7, Intel Iris Xe Graphics G7 96EUs
78.1 (16.9min, 28.3P1) fps -37%
Dell XPS 13 9305 Core i5 FHD
Intel Core i5-1135G7, Intel Iris Xe Graphics G7 80EUs
76.1 (16.7min, 22.9P1) fps -39%
Dell XPS 13 Plus 9320 i5-1240p
Intel Core i5-1240P, Intel Iris Xe Graphics G7 80EUs
67.7 (15.5min, 23.7P1) fps -45%
Dell XPS 13 9315, i5-1230U
Intel Core i5-1230U, Intel Iris Xe Graphics G7 80EUs
47.5 (10.8min, 14.4P1) fps -62%
1920x1080 medium AA:medium AF:4
Dell XPS 14 2024 OLED
Intel Core Ultra 7 155H, NVIDIA GeForce RTX 4050 Laptop GPU
130 fps +156%
Dell XPS 13 9340 Core Ultra 7
Intel Core Ultra 7 155H, Intel Arc 8-Core iGPU
68 fps +34%
Microsoft Surface Laptop 7 13.8 Copilot+
Qualcomm Snapdragon X Elite X1E-80-100, Qualcomm SD X Adreno X1-85 3.8 TFLOPS
51 fps 0%
Dell XPS 13 9345
Qualcomm Snapdragon X Elite X1E-80-100, Qualcomm SD X Adreno X1-85 3.8 TFLOPS
50.8 (17.9min, 34.8P1) fps
Medion SPRCHRGD 14 S1 Elite
Qualcomm Snapdragon X Elite X1E-78-100, Qualcomm SD X Adreno X1-85 3.8 TFLOPS
49.3 (19.8min, 29.7P1) fps -3%
Average Qualcomm SD X Adreno X1-85 3.8 TFLOPS
  (41 - 52, n=11)
48.8 fps -4%
Lenovo ThinkPad T14s Gen 6 21N10007GE
Qualcomm Snapdragon X Elite X1E-78-100, Qualcomm SD X Adreno X1-85 3.8 TFLOPS
47.5 (16.6min, 26.7P1) fps -6%
Dell XPS 13 Plus 9320 4K
Intel Core i7-1260P, Intel Iris Xe Graphics G7 96EUs
45.9 (21.6min, 25.1P1) fps -10%
Dell XPS 13 Plus 9320 i7-1280P OLED
Intel Core i7-1280P, Intel Iris Xe Graphics G7 96EUs
45.4 (16.6min, 25.1P1) fps -11%
Dell XPS 13 Plus 9320 Core i7-1360P
Intel Core i7-1360P, Intel Iris Xe Graphics G7 96EUs
43.8 (15.4min, 25.5P1) fps -14%
HP EliteBook Ultra G1q 14
Qualcomm Snapdragon X Elite X1E-78-100, Qualcomm SD X Adreno X1-85 3.8 TFLOPS
43.6 (12.1min, 24.4P1) fps -14%
Dell XPS 13 9310 2-in-1
Intel Core i7-1165G7, Intel Iris Xe Graphics G7 96EUs
36.8 (15.7min, 20.6P1) fps -28%
Dell XPS 13 9310 OLED
Intel Core i7-1185G7, Intel Iris Xe Graphics G7 96EUs
33.2 (8.8min, 17.6P1) fps -35%
Dell XPS 13 Plus 9320 i5-1240p
Intel Core i5-1240P, Intel Iris Xe Graphics G7 80EUs
30.7 (10.4min, 16.6P1) fps -40%
Dell XPS 13 9305 Core i5 FHD
Intel Core i5-1135G7, Intel Iris Xe Graphics G7 80EUs
30.5 (10.6min, 16.5P1) fps -40%
Dell XPS 13 9315, i5-1230U
Intel Core i5-1230U, Intel Iris Xe Graphics G7 80EUs
6 (5min, 5P1) fps -88%
1920x1080 high AA:high AF:8
Dell XPS 14 2024 OLED
Intel Core Ultra 7 155H, NVIDIA GeForce RTX 4050 Laptop GPU
105 fps +151%
Dell XPS 13 9340 Core Ultra 7
Intel Core Ultra 7 155H, Intel Arc 8-Core iGPU
54 fps +29%
Microsoft Surface Laptop 7 13.8 Copilot+
Qualcomm Snapdragon X Elite X1E-80-100, Qualcomm SD X Adreno X1-85 3.8 TFLOPS
43 fps +3%
Dell XPS 13 9345
Qualcomm Snapdragon X Elite X1E-80-100, Qualcomm SD X Adreno X1-85 3.8 TFLOPS
41.8 (10.6min, 14.6P1) fps
Medion SPRCHRGD 14 S1 Elite
Qualcomm Snapdragon X Elite X1E-78-100, Qualcomm SD X Adreno X1-85 3.8 TFLOPS
41.7 (9.9min, 15.9P1) fps 0%
Average Qualcomm SD X Adreno X1-85 3.8 TFLOPS
  (33 - 43, n=11)
40.6 fps -3%
Lenovo ThinkPad T14s Gen 6 21N10007GE
Qualcomm Snapdragon X Elite X1E-78-100, Qualcomm SD X Adreno X1-85 3.8 TFLOPS
39.1 (9.2min, 18.3P1) fps -6%
HP EliteBook Ultra G1q 14
Qualcomm Snapdragon X Elite X1E-78-100, Qualcomm SD X Adreno X1-85 3.8 TFLOPS
36.7 (8.4min, 12.7P1) fps -12%
Dell XPS 13 Plus 9320 i7-1280P OLED
Intel Core i7-1280P, Intel Iris Xe Graphics G7 96EUs
36.5 (18min, 19.9P1) fps -13%
Dell XPS 13 Plus 9320 4K
Intel Core i7-1260P, Intel Iris Xe Graphics G7 96EUs
36.4 (9.7min, 20.1P1) fps -13%
Dell XPS 13 Plus 9320 Core i7-1360P
Intel Core i7-1360P, Intel Iris Xe Graphics G7 96EUs
35.4 (5.4min, 17.4P1) fps -15%
Dell XPS 13 9310 OLED
Intel Core i7-1185G7, Intel Iris Xe Graphics G7 96EUs
29.7 (10.1min, 11.4P1) fps -29%
Dell XPS 13 9310 2-in-1
Intel Core i7-1165G7, Intel Iris Xe Graphics G7 96EUs
29.4 (10.6min, 15.9P1) fps -30%
Dell XPS 13 9305 Core i5 FHD
Intel Core i5-1135G7, Intel Iris Xe Graphics G7 80EUs
26.4 (6.1min, 9.74P1) fps -37%
Dell XPS 13 Plus 9320 i5-1240p
Intel Core i5-1240P, Intel Iris Xe Graphics G7 80EUs
24.4 (8.4min, 13.2P1) fps -42%
Dell XPS 13 9315, i5-1230U
Intel Core i5-1230U, Intel Iris Xe Graphics G7 80EUs
17.8 (6.6min, 9.19P1) fps -57%
1920x1080 ultra AA:ultra AF:16
Dell XPS 14 2024 OLED
Intel Core Ultra 7 155H, NVIDIA GeForce RTX 4050 Laptop GPU
92 fps +171%
Dell XPS 13 9340 Core Ultra 7
Intel Core Ultra 7 155H, Intel Arc 8-Core iGPU
41 fps +21%
Medion SPRCHRGD 14 S1 Elite
Qualcomm Snapdragon X Elite X1E-78-100, Qualcomm SD X Adreno X1-85 3.8 TFLOPS
36.7 (7.1min, 10.9P1) fps +8%
Microsoft Surface Laptop 7 13.8 Copilot+
Qualcomm Snapdragon X Elite X1E-80-100, Qualcomm SD X Adreno X1-85 3.8 TFLOPS
36 fps +6%
Average Qualcomm SD X Adreno X1-85 3.8 TFLOPS
  (30 - 38, n=11)
35 fps +3%
Lenovo ThinkPad T14s Gen 6 21N10007GE
Qualcomm Snapdragon X Elite X1E-78-100, Qualcomm SD X Adreno X1-85 3.8 TFLOPS
33.9 (6.3min, 9.52P1) fps 0%
Dell XPS 13 9345
Qualcomm Snapdragon X Elite X1E-80-100, Qualcomm SD X Adreno X1-85 3.8 TFLOPS
33.9 (6.3min, 9.25P1) fps
HP EliteBook Ultra G1q 14
Qualcomm Snapdragon X Elite X1E-78-100, Qualcomm SD X Adreno X1-85 3.8 TFLOPS
32 (6.7min, 9.01P1) fps -6%
Dell XPS 13 Plus 9320 i7-1280P OLED
Intel Core i7-1280P, Intel Iris Xe Graphics G7 96EUs
29.6 (9min, 10.7P1) fps -13%
Dell XPS 13 Plus 9320 4K
Intel Core i7-1260P, Intel Iris Xe Graphics G7 96EUs
29.5 (8.2min, 10.5P1) fps -13%
Dell XPS 13 Plus 9320 Core i7-1360P
Intel Core i7-1360P, Intel Iris Xe Graphics G7 96EUs
27.5 (5.6min, 7.31P1) fps -19%
Dell XPS 13 9310 2-in-1
Intel Core i7-1165G7, Intel Iris Xe Graphics G7 96EUs
24 (5.9min, 7.34P1) fps -29%
Dell XPS 13 9310 OLED
Intel Core i7-1185G7, Intel Iris Xe Graphics G7 96EUs
22.3 (5min, 6.12P1) fps -34%
Dota 2 Reborn
1280x720 min (0/3) fastest
Dell XPS 13 Plus 9320 i5-1240p
Intel Core i5-1240P, Intel Iris Xe Graphics G7 80EUs
134.4 (81.4min) fps +68%
Dell XPS 13 Plus 9320 Core i7-1360P
Intel Core i7-1360P, Intel Iris Xe Graphics G7 96EUs
125.6 (99.1min) fps +57%
Dell XPS 14 2024 OLED
Intel Core Ultra 7 155H, NVIDIA GeForce RTX 4050 Laptop GPU
119.7 (112.3min) fps +50%
Dell XPS 13 Plus 9320 i7-1280P OLED
Intel Core i7-1280P, Intel Iris Xe Graphics G7 96EUs
110.3 (87.2min) fps +38%
Dell XPS 13 Plus 9320 4K
Intel Core i7-1260P, Intel Iris Xe Graphics G7 96EUs
109.9 (88.7min) fps +37%
Dell XPS 13 9310 2-in-1
Intel Core i7-1165G7, Intel Iris Xe Graphics G7 96EUs
109 (93.4min) fps +36%
Dell XPS 13 9340 Core Ultra 7
Intel Core Ultra 7 155H, Intel Arc 8-Core iGPU
106.2 (58min) fps +33%
Dell XPS 13 9315 2-in-1 Core i5-1230U
Intel Core i5-1230U, Intel Iris Xe Graphics G7 80EUs
101.2 (80.9min) fps +27%
Microsoft Surface Laptop 7 13.8 Copilot+
Qualcomm Snapdragon X Elite X1E-80-100, Qualcomm SD X Adreno X1-85 3.8 TFLOPS
85.9 (59.4min) fps +7%
Lenovo ThinkPad T14s Gen 6 21N10007GE
Qualcomm Snapdragon X Elite X1E-78-100, Qualcomm SD X Adreno X1-85 3.8 TFLOPS
81.6 (57.1min) fps +2%
Dell XPS 13 9310 Core i7 4K
Intel Core i7-1185G7, Intel Iris Xe Graphics G7 96EUs
80.7 (45.7min) fps +1%
Dell XPS 13 9345
Qualcomm Snapdragon X Elite X1E-80-100, Qualcomm SD X Adreno X1-85 3.8 TFLOPS
80 (57.7min) fps
Dell XPS 13 9305 Core i5 FHD
Intel Core i5-1135G7, Intel Iris Xe Graphics G7 80EUs
78.9 (46.5min) fps -1%
HP EliteBook Ultra G1q 14
Qualcomm Snapdragon X Elite X1E-78-100, Qualcomm SD X Adreno X1-85 3.8 TFLOPS
77.9 (55min) fps -3%
Average Qualcomm SD X Adreno X1-85 3.8 TFLOPS
  (61.4 - 85.9, n=11)
77.8 fps -3%
Dell XPS 13 9310 OLED
Intel Core i7-1185G7, Intel Iris Xe Graphics G7 96EUs
76.1 (46.6min) fps -5%
Medion SPRCHRGD 14 S1 Elite
Qualcomm Snapdragon X Elite X1E-78-100, Qualcomm SD X Adreno X1-85 3.8 TFLOPS
73.2 (38.1min) fps -8%
1366x768 med (1/3)
Dell XPS 13 Plus 9320 i5-1240p
Intel Core i5-1240P, Intel Iris Xe Graphics G7 80EUs
119.5 (103.4min) fps +97%
Dell XPS 14 2024 OLED
Intel Core Ultra 7 155H, NVIDIA GeForce RTX 4050 Laptop GPU
118.5 (105.9min) fps +95%
Dell XPS 13 Plus 9320 Core i7-1360P
Intel Core i7-1360P, Intel Iris Xe Graphics G7 96EUs
97.7 (75.8min) fps +61%
Dell XPS 13 9340 Core Ultra 7
Intel Core Ultra 7 155H, Intel Arc 8-Core iGPU
89.8 (52.9min) fps +48%
Dell XPS 13 Plus 9320 i7-1280P OLED
Intel Core i7-1280P, Intel Iris Xe Graphics G7 96EUs
86.8 (68min) fps +43%
Dell XPS 13 Plus 9320 4K
Intel Core i7-1260P, Intel Iris Xe Graphics G7 96EUs
85.2 (68min) fps +40%
Dell XPS 13 9315 2-in-1 Core i5-1230U
Intel Core i5-1230U, Intel Iris Xe Graphics G7 80EUs
75.8 (62.3min) fps +25%
Dell XPS 13 9310 OLED
Intel Core i7-1185G7, Intel Iris Xe Graphics G7 96EUs
74.7 (48.1min) fps +23%
Dell XPS 13 9305 Core i5 FHD
Intel Core i5-1135G7, Intel Iris Xe Graphics G7 80EUs
70.5 (47.6min) fps +16%
Microsoft Surface Laptop 7 13.8 Copilot+
Qualcomm Snapdragon X Elite X1E-80-100, Qualcomm SD X Adreno X1-85 3.8 TFLOPS
65.7 (43.9min) fps +8%
Lenovo ThinkPad T14s Gen 6 21N10007GE
Qualcomm Snapdragon X Elite X1E-78-100, Qualcomm SD X Adreno X1-85 3.8 TFLOPS
63.5 (43.8min) fps +5%
Dell XPS 13 9310 2-in-1
Intel Core i7-1165G7, Intel Iris Xe Graphics G7 96EUs
61.4 (45.3min) fps +1%
HP EliteBook Ultra G1q 14
Qualcomm Snapdragon X Elite X1E-78-100, Qualcomm SD X Adreno X1-85 3.8 TFLOPS
60.9 (42.8min) fps 0%
Dell XPS 13 9345
Qualcomm Snapdragon X Elite X1E-80-100, Qualcomm SD X Adreno X1-85 3.8 TFLOPS
60.7 (43.3min) fps
Average Qualcomm SD X Adreno X1-85 3.8 TFLOPS
  (46.3 - 65.7, n=11)
60 fps -1%
Medion SPRCHRGD 14 S1 Elite
Qualcomm Snapdragon X Elite X1E-78-100, Qualcomm SD X Adreno X1-85 3.8 TFLOPS
56.2 (36.9min) fps -7%
Dell XPS 13 9310 Core i7 4K
Intel Core i7-1185G7, Intel Iris Xe Graphics G7 96EUs
51.4 (33.4min) fps -15%
1920x1080 high (2/3)
Dell XPS 14 2024 OLED
Intel Core Ultra 7 155H, NVIDIA GeForce RTX 4050 Laptop GPU
116.5 (102.1min) fps +103%
Dell XPS 13 9340 Core Ultra 7
Intel Core Ultra 7 155H, Intel Arc 8-Core iGPU
72 (49.5min) fps +25%
Dell XPS 13 Plus 9320 i5-1240p
Intel Core i5-1240P, Intel Iris Xe Graphics G7 80EUs
70.9 (59.6min) fps +24%
Dell XPS 13 Plus 9320 Core i7-1360P
Intel Core i7-1360P, Intel Iris Xe Graphics G7 96EUs
68.7 (58.6min) fps +20%
Dell XPS 13 Plus 9320 4K
Intel Core i7-1260P, Intel Iris Xe Graphics G7 96EUs
68.2 (59.4min) fps +19%
Dell XPS 13 Plus 9320 i7-1280P OLED
Intel Core i7-1280P, Intel Iris Xe Graphics G7 96EUs
68.1 (57.9min) fps +19%
Microsoft Surface Laptop 7 13.8 Copilot+
Qualcomm Snapdragon X Elite X1E-80-100, Qualcomm SD X Adreno X1-85 3.8 TFLOPS
61.7 (43.5min) fps +7%
Lenovo ThinkPad T14s Gen 6 21N10007GE
Qualcomm Snapdragon X Elite X1E-78-100, Qualcomm SD X Adreno X1-85 3.8 TFLOPS
59.2 (40.8min) fps +3%
Dell XPS 13 9345
Qualcomm Snapdragon X Elite X1E-80-100, Qualcomm SD X Adreno X1-85 3.8 TFLOPS
57.4 (41.1min) fps
HP EliteBook Ultra G1q 14
Qualcomm Snapdragon X Elite X1E-78-100, Qualcomm SD X Adreno X1-85 3.8 TFLOPS
55.9 (40min) fps -3%
Average Qualcomm SD X Adreno X1-85 3.8 TFLOPS
  (46.1 - 61.7, n=11)
55.9 fps -3%
Medion SPRCHRGD 14 S1 Elite
Qualcomm Snapdragon X Elite X1E-78-100, Qualcomm SD X Adreno X1-85 3.8 TFLOPS
54.5 (41.5min) fps -5%
Dell XPS 13 9310 2-in-1
Intel Core i7-1165G7, Intel Iris Xe Graphics G7 96EUs
52.8 (41.6min) fps -8%
Dell XPS 13 9305 Core i5 FHD
Intel Core i5-1135G7, Intel Iris Xe Graphics G7 80EUs
45.8 (29.7min) fps -20%
Dell XPS 13 9310 OLED
Intel Core i7-1185G7, Intel Iris Xe Graphics G7 96EUs
41.6 (16.9min) fps -28%
Dell XPS 13 9310 Core i7 4K
Intel Core i7-1185G7, Intel Iris Xe Graphics G7 96EUs
38.2 (26.2min) fps -33%
Dell XPS 13 9315 2-in-1 Core i5-1230U
Intel Core i5-1230U, Intel Iris Xe Graphics G7 80EUs
37.6 (35min) fps -34%
1920x1080 ultra (3/3) best looking
Dell XPS 14 2024 OLED
Intel Core Ultra 7 155H, NVIDIA GeForce RTX 4050 Laptop GPU
103.6 (85.7min) fps +104%
Dell XPS 13 Plus 9320 i5-1240p
Intel Core i5-1240P, Intel Iris Xe Graphics G7 80EUs
66.1 (49.7min) fps +30%
Dell XPS 13 9340 Core Ultra 7
Intel Core Ultra 7 155H, Intel Arc 8-Core iGPU
65.2 (48.8min) fps +29%
Dell XPS 13 Plus 9320 Core i7-1360P
Intel Core i7-1360P, Intel Iris Xe Graphics G7 96EUs
61.6 (52.9min) fps +21%
Dell XPS 13 Plus 9320 4K
Intel Core i7-1260P, Intel Iris Xe Graphics G7 96EUs
60.6 (52.5min) fps +20%
Dell XPS 13 Plus 9320 i7-1280P OLED
Intel Core i7-1280P, Intel Iris Xe Graphics G7 96EUs
58.7 (50.7min) fps +16%
Microsoft Surface Laptop 7 13.8 Copilot+
Qualcomm Snapdragon X Elite X1E-80-100, Qualcomm SD X Adreno X1-85 3.8 TFLOPS
53.2 (39min) fps +5%
Dell XPS 13 9310 2-in-1
Intel Core i7-1165G7, Intel Iris Xe Graphics G7 96EUs
52.8 (45.1min) fps +4%
Lenovo ThinkPad T14s Gen 6 21N10007GE
Qualcomm Snapdragon X Elite X1E-78-100, Qualcomm SD X Adreno X1-85 3.8 TFLOPS
52 (38.6min) fps +3%
Medion SPRCHRGD 14 S1 Elite
Qualcomm Snapdragon X Elite X1E-78-100, Qualcomm SD X Adreno X1-85 3.8 TFLOPS
50.8 (38.5min) fps 0%
Dell XPS 13 9345
Qualcomm Snapdragon X Elite X1E-80-100, Qualcomm SD X Adreno X1-85 3.8 TFLOPS
50.7 (37.8min) fps
Average Qualcomm SD X Adreno X1-85 3.8 TFLOPS
  (42.9 - 53.2, n=11)
50.1 fps -1%
HP EliteBook Ultra G1q 14
Qualcomm Snapdragon X Elite X1E-78-100, Qualcomm SD X Adreno X1-85 3.8 TFLOPS
49.3 (35.9min) fps -3%
Dell XPS 13 9305 Core i5 FHD
Intel Core i5-1135G7, Intel Iris Xe Graphics G7 80EUs
44 (29.1min) fps -13%
Dell XPS 13 9310 OLED
Intel Core i7-1185G7, Intel Iris Xe Graphics G7 96EUs
43.4 (15.3min) fps -14%
Dell XPS 13 9310 Core i7 4K
Intel Core i7-1185G7, Intel Iris Xe Graphics G7 96EUs
38.6 (23.1min) fps -24%
Dell XPS 13 9315 2-in-1 Core i5-1230U
Intel Core i5-1230U, Intel Iris Xe Graphics G7 80EUs
34.2 (31.2min) fps -33%
Final Fantasy XV Benchmark
1280x720 Lite Quality
Dell XPS 14 2024 OLED
Intel Core Ultra 7 155H, NVIDIA GeForce RTX 4050 Laptop GPU
99.2 fps +77%
Dell XPS 13 9340 Core Ultra 7
Intel Core Ultra 7 155H, Intel Arc 8-Core iGPU
61.3 fps +9%
Microsoft Surface Laptop 7 13.8 Copilot+
Qualcomm Snapdragon X Elite X1E-80-100, Qualcomm SD X Adreno X1-85 3.8 TFLOPS
57.3 fps +2%
Dell XPS 13 9345
Qualcomm Snapdragon X Elite X1E-80-100, Qualcomm SD X Adreno X1-85 3.8 TFLOPS
56.1 fps
Medion SPRCHRGD 14 S1 Elite
Qualcomm Snapdragon X Elite X1E-78-100, Qualcomm SD X Adreno X1-85 3.8 TFLOPS
54.5 fps -3%
Average Qualcomm SD X Adreno X1-85 3.8 TFLOPS
  (43.9 - 57.6, n=11)
53.6 fps -4%
HP EliteBook Ultra G1q 14
Qualcomm Snapdragon X Elite X1E-78-100, Qualcomm SD X Adreno X1-85 3.8 TFLOPS
51 fps -9%
Lenovo ThinkPad T14s Gen 6 21N10007GE
Qualcomm Snapdragon X Elite X1E-78-100, Qualcomm SD X Adreno X1-85 3.8 TFLOPS
46.7 fps -17%
Dell XPS 13 Plus 9320 i7-1280P OLED
Intel Core i7-1280P, Intel Iris Xe Graphics G7 96EUs
46.1 fps -18%
Dell XPS 13 Plus 9320 4K
Intel Core i7-1260P, Intel Iris Xe Graphics G7 96EUs
44.7 fps -20%
Dell XPS 13 Plus 9320 Core i7-1360P
Intel Core i7-1360P, Intel Iris Xe Graphics G7 96EUs
44.5 fps -21%
Dell XPS 13 9310 2-in-1
Intel Core i7-1165G7, Intel Iris Xe Graphics G7 96EUs
36.8 fps -34%
Dell XPS 13 Plus 9320 i5-1240p
Intel Core i5-1240P, Intel Iris Xe Graphics G7 80EUs
36.3 fps -35%
Dell XPS 13 9305 Core i5 FHD
Intel Core i5-1135G7, Intel Iris Xe Graphics G7 80EUs
35.3 fps -37%
Dell XPS 13 9310 OLED
Intel Core i7-1185G7, Intel Iris Xe Graphics G7 96EUs
35 fps -38%
Dell XPS 13 9310 Core i7 4K
Intel Core i7-1185G7, Intel Iris Xe Graphics G7 96EUs
31.3 fps -44%
Dell XPS 13 9315 2-in-1 Core i5-1230U
Intel Core i5-1230U, Intel Iris Xe Graphics G7 80EUs
27 fps -52%
Dell XPS 13 9315, i5-1230U
Intel Core i5-1230U, Intel Iris Xe Graphics G7 80EUs
18.9 fps -66%
1920x1080 Standard Quality
Dell XPS 14 2024 OLED
Intel Core Ultra 7 155H, NVIDIA GeForce RTX 4050 Laptop GPU
70.8 fps +183%
Dell XPS 13 9340 Core Ultra 7
Intel Core Ultra 7 155H, Intel Arc 8-Core iGPU
36.2 fps +45%
Medion SPRCHRGD 14 S1 Elite
Qualcomm Snapdragon X Elite X1E-78-100, Qualcomm SD X Adreno X1-85 3.8 TFLOPS
25.4 fps +2%
Dell XPS 13 Plus 9320 4K
Intel Core i7-1260P, Intel Iris Xe Graphics G7 96EUs
25.3 fps +1%
Dell XPS 13 Plus 9320 i7-1280P OLED
Intel Core i7-1280P, Intel Iris Xe Graphics G7 96EUs
25.3 fps +1%
Dell XPS 13 Plus 9320 Core i7-1360P
Intel Core i7-1360P, Intel Iris Xe Graphics G7 96EUs
25.2 fps +1%
Dell XPS 13 9345
Qualcomm Snapdragon X Elite X1E-80-100, Qualcomm SD X Adreno X1-85 3.8 TFLOPS
25 fps
Microsoft Surface Laptop 7 13.8 Copilot+
Qualcomm Snapdragon X Elite X1E-80-100, Qualcomm SD X Adreno X1-85 3.8 TFLOPS
24.9 fps 0%
Average Qualcomm SD X Adreno X1-85 3.8 TFLOPS
  (20.1 - 25.4, n=11)
24.3 fps -3%
Lenovo ThinkPad T14s Gen 6 21N10007GE
Qualcomm Snapdragon X Elite X1E-78-100, Qualcomm SD X Adreno X1-85 3.8 TFLOPS
23.8 fps -5%
HP EliteBook Ultra G1q 14
Qualcomm Snapdragon X Elite X1E-78-100, Qualcomm SD X Adreno X1-85 3.8 TFLOPS
23 fps -8%
Dell XPS 13 9310 2-in-1
Intel Core i7-1165G7, Intel Iris Xe Graphics G7 96EUs
21.8 fps -13%
Dell XPS 13 9305 Core i5 FHD
Intel Core i5-1135G7, Intel Iris Xe Graphics G7 80EUs
20.3 fps -19%
Dell XPS 13 9310 OLED
Intel Core i7-1185G7, Intel Iris Xe Graphics G7 96EUs
19.9 fps -20%
Dell XPS 13 Plus 9320 i5-1240p
Intel Core i5-1240P, Intel Iris Xe Graphics G7 80EUs
19.7 fps -21%
Dell XPS 13 9310 Core i7 4K
Intel Core i7-1185G7, Intel Iris Xe Graphics G7 96EUs
18.8 fps -25%
Dell XPS 13 9315, i5-1230U
Intel Core i5-1230U, Intel Iris Xe Graphics G7 80EUs
10.8 fps -57%
1920x1080 High Quality
Dell XPS 14 2024 OLED
Intel Core Ultra 7 155H, NVIDIA GeForce RTX 4050 Laptop GPU
52.3 fps +231%
Dell XPS 13 9340 Core Ultra 7
Intel Core Ultra 7 155H, Intel Arc 8-Core iGPU
26.4 fps +67%
Dell XPS 13 Plus 9320 4K
Intel Core i7-1260P, Intel Iris Xe Graphics G7 96EUs
25.3 fps +60%
Dell XPS 13 9305 Core i5 FHD
Intel Core i5-1135G7, Intel Iris Xe Graphics G7 80EUs
20.3 fps +28%
Dell XPS 13 Plus 9320 i7-1280P OLED
Intel Core i7-1280P, Intel Iris Xe Graphics G7 96EUs
17.6 fps +11%
Dell XPS 13 Plus 9320 Core i7-1360P
Intel Core i7-1360P, Intel Iris Xe Graphics G7 96EUs
17.5 fps +11%
Dell XPS 13 9310 2-in-1
Intel Core i7-1165G7, Intel Iris Xe Graphics G7 96EUs
15.9 fps +1%
Medion SPRCHRGD 14 S1 Elite
Qualcomm Snapdragon X Elite X1E-78-100, Qualcomm SD X Adreno X1-85 3.8 TFLOPS
15.9 fps +1%
Microsoft Surface Laptop 7 13.8 Copilot+
Qualcomm Snapdragon X Elite X1E-80-100, Qualcomm SD X Adreno X1-85 3.8 TFLOPS
15.8 fps 0%
Lenovo ThinkPad T14s Gen 6 21N10007GE
Qualcomm Snapdragon X Elite X1E-78-100, Qualcomm SD X Adreno X1-85 3.8 TFLOPS
15.8 fps 0%
Dell XPS 13 9345
Qualcomm Snapdragon X Elite X1E-80-100, Qualcomm SD X Adreno X1-85 3.8 TFLOPS
15.8 fps
Average Qualcomm SD X Adreno X1-85 3.8 TFLOPS
  (12.4 - 15.9, n=11)
15.3 fps -3%
Dell XPS 13 9310 OLED
Intel Core i7-1185G7, Intel Iris Xe Graphics G7 96EUs
15.1 fps -4%
Dell XPS 13 9310 Core i7 4K
Intel Core i7-1185G7, Intel Iris Xe Graphics G7 96EUs
14.6 fps -8%
HP EliteBook Ultra G1q 14
Qualcomm Snapdragon X Elite X1E-78-100, Qualcomm SD X Adreno X1-85 3.8 TFLOPS
14.3 fps -9%
Dell XPS 13 Plus 9320 i5-1240p
Intel Core i5-1240P, Intel Iris Xe Graphics G7 80EUs
11.7 fps -26%
Dell XPS 13 9315, i5-1230U
Intel Core i5-1230U, Intel Iris Xe Graphics G7 80EUs
5.24 fps -67%
X-Plane 11.11 - 1280x720 low (fps_test=1)
Dell XPS 14 2024 OLED
Intel Core Ultra 7 155H, NVIDIA GeForce RTX 4050 Laptop GPU
109.8 fps +189%
Dell XPS 13 Plus 9320 4K
Intel Core i7-1260P, Intel Iris Xe Graphics G7 96EUs
55.5 fps +46%
Dell XPS 13 Plus 9320 i7-1280P OLED
Intel Core i7-1280P, Intel Iris Xe Graphics G7 96EUs
55.2 fps +45%
Dell XPS 13 9340 Core Ultra 7
Intel Core Ultra 7 155H, Intel Arc 8-Core iGPU
53 fps +39%
Dell XPS 13 9305 Core i5 FHD
Intel Core i5-1135G7, Intel Iris Xe Graphics G7 80EUs
43.4 fps +14%
Dell XPS 13 Plus 9320 Core i7-1360P
Intel Core i7-1360P, Intel Iris Xe Graphics G7 96EUs
42.7 fps +12%
Dell XPS 13 9345
Qualcomm Snapdragon X Elite X1E-80-100, Qualcomm SD X Adreno X1-85 3.8 TFLOPS
38 fps
Microsoft Surface Laptop 7 13.8 Copilot+
Qualcomm Snapdragon X Elite X1E-80-100, Qualcomm SD X Adreno X1-85 3.8 TFLOPS
37.8 fps -1%
Lenovo ThinkPad T14s Gen 6 21N10007GE
Qualcomm Snapdragon X Elite X1E-78-100, Qualcomm SD X Adreno X1-85 3.8 TFLOPS
36.9 fps -3%
HP EliteBook Ultra G1q 14
Qualcomm Snapdragon X Elite X1E-78-100, Qualcomm SD X Adreno X1-85 3.8 TFLOPS
36.4 fps -4%
Average Qualcomm SD X Adreno X1-85 3.8 TFLOPS
  (29.5 - 39, n=11)
35.9 fps -6%
Dell XPS 13 9315 2-in-1 Core i5-1230U
Intel Core i5-1230U, Intel Iris Xe Graphics G7 80EUs
31.2 fps -18%
Medion SPRCHRGD 14 S1 Elite
Qualcomm Snapdragon X Elite X1E-78-100, Qualcomm SD X Adreno X1-85 3.8 TFLOPS
29.9 fps -21%
Dell XPS 13 Plus 9320 i5-1240p
Intel Core i5-1240P, Intel Iris Xe Graphics G7 80EUs
28.5 fps -25%
Dell XPS 13 9310 Core i7 4K
Intel Core i7-1185G7, Intel Iris Xe Graphics G7 96EUs
26 fps -32%
Dell XPS 13 9310 OLED
Intel Core i7-1185G7, Intel Iris Xe Graphics G7 96EUs
25.1 fps -34%
Dell XPS 13 9310 2-in-1
Intel Core i7-1165G7, Intel Iris Xe Graphics G7 96EUs
23.5 fps -38%
Tiny Tina's Wonderlands
1280x720 Lowest Preset (DX12)
Dell XPS 13 9345
Qualcomm Snapdragon X Elite X1E-80-100, Qualcomm SD X Adreno X1-85 3.8 TFLOPS
72.9 fps
Average Qualcomm SD X Adreno X1-85 3.8 TFLOPS
  (67.6 - 72.9, n=2)
70.3 fps -4%
HP EliteBook Ultra G1q 14
Qualcomm Snapdragon X Elite X1E-78-100, Qualcomm SD X Adreno X1-85 3.8 TFLOPS
67.6 fps -7%
Dell XPS 13 Plus 9320 Core i7-1360P
Intel Core i7-1360P, Intel Iris Xe Graphics G7 96EUs
53.5 fps -27%
1920x1080 Low Preset (DX12)
Dell XPS 13 9345
Qualcomm Snapdragon X Elite X1E-80-100, Qualcomm SD X Adreno X1-85 3.8 TFLOPS
44.5 fps
Average Qualcomm SD X Adreno X1-85 3.8 TFLOPS
  (41.5 - 44.5, n=2)
43 fps -3%
HP EliteBook Ultra G1q 14
Qualcomm Snapdragon X Elite X1E-78-100, Qualcomm SD X Adreno X1-85 3.8 TFLOPS
41.5 fps -7%
Dell XPS 13 Plus 9320 Core i7-1360P
Intel Core i7-1360P, Intel Iris Xe Graphics G7 96EUs
29.6 fps -33%
1920x1080 Medium Preset (DX12)
Dell XPS 13 9345
Qualcomm Snapdragon X Elite X1E-80-100, Qualcomm SD X Adreno X1-85 3.8 TFLOPS
33.6 fps
Average Qualcomm SD X Adreno X1-85 3.8 TFLOPS
  (30.8 - 33.6, n=2)
32.2 fps -4%
HP EliteBook Ultra G1q 14
Qualcomm Snapdragon X Elite X1E-78-100, Qualcomm SD X Adreno X1-85 3.8 TFLOPS
30.8 fps -8%
Dell XPS 13 Plus 9320 Core i7-1360P
Intel Core i7-1360P, Intel Iris Xe Graphics G7 96EUs
23.7 fps -29%
1920x1080 High Preset (DX12)
Dell XPS 13 9345
Qualcomm Snapdragon X Elite X1E-80-100, Qualcomm SD X Adreno X1-85 3.8 TFLOPS
22.4 fps
Average Qualcomm SD X Adreno X1-85 3.8 TFLOPS
  (20.6 - 22.4, n=2)
21.5 fps -4%
HP EliteBook Ultra G1q 14
Qualcomm Snapdragon X Elite X1E-78-100, Qualcomm SD X Adreno X1-85 3.8 TFLOPS
20.6 fps -8%
Dell XPS 13 Plus 9320 Core i7-1360P
Intel Core i7-1360P, Intel Iris Xe Graphics G7 96EUs
15.2 fps -32%
1920x1080 Badass Preset (DX12)
Dell XPS 13 9345
Qualcomm Snapdragon X Elite X1E-80-100, Qualcomm SD X Adreno X1-85 3.8 TFLOPS
18 fps
Average Qualcomm SD X Adreno X1-85 3.8 TFLOPS
  (16.8 - 18, n=2)
17.4 fps -3%
HP EliteBook Ultra G1q 14
Qualcomm Snapdragon X Elite X1E-78-100, Qualcomm SD X Adreno X1-85 3.8 TFLOPS
16.8 fps -7%
Dell XPS 13 Plus 9320 Core i7-1360P
Intel Core i7-1360P, Intel Iris Xe Graphics G7 96EUs
12.2 fps -32%
Cyberpunk 2077 2.1 Phantom Liberty
1280x720 Low Preset (FSR off)
Lenovo ThinkPad T14s Gen 6 21N10007GE
Qualcomm Snapdragon X Elite X1E-78-100, Qualcomm SD X Adreno X1-85 3.8 TFLOPS
36.3 (26.4min) fps +16%
HP EliteBook Ultra G1q 14
Qualcomm Snapdragon X Elite X1E-78-100, Qualcomm SD X Adreno X1-85 3.8 TFLOPS
34.6 (25.2min) fps +11%
Medion SPRCHRGD 14 S1 Elite
Qualcomm Snapdragon X Elite X1E-78-100, Qualcomm SD X Adreno X1-85 3.8 TFLOPS
34.1 (25.5min) fps +9%
Average Qualcomm SD X Adreno X1-85 3.8 TFLOPS
  (31.3 - 36.3, n=4)
34.1 fps +9%
Dell XPS 13 9345
Qualcomm Snapdragon X Elite X1E-80-100, Qualcomm SD X Adreno X1-85 3.8 TFLOPS
31.3 (22.4min) fps
1920x1080 Low Preset (FSR off)
Dell XPS 14 2024 OLED
Intel Core Ultra 7 155H, NVIDIA GeForce RTX 4050 Laptop GPU
67.2 (55min) fps +179%
Medion SPRCHRGD 14 S1 Elite
Qualcomm Snapdragon X Elite X1E-78-100, Qualcomm SD X Adreno X1-85 3.8 TFLOPS
24.6 (19.1min) fps +2%
Dell XPS 13 9345
Qualcomm Snapdragon X Elite X1E-80-100, Qualcomm SD X Adreno X1-85 3.8 TFLOPS
24.1 (18.8min) fps
Lenovo ThinkPad T14s Gen 6 21N10007GE
Qualcomm Snapdragon X Elite X1E-78-100, Qualcomm SD X Adreno X1-85 3.8 TFLOPS
23.1 (18min) fps -4%
Microsoft Surface Laptop 7 13.8 Copilot+
Qualcomm Snapdragon X Elite X1E-80-100, Qualcomm SD X Adreno X1-85 3.8 TFLOPS
22.7 (17.6min) fps -6%
Average Qualcomm SD X Adreno X1-85 3.8 TFLOPS
  (16.3 - 24.6, n=11)
22.6 fps -6%
HP EliteBook Ultra G1q 14
Qualcomm Snapdragon X Elite X1E-78-100, Qualcomm SD X Adreno X1-85 3.8 TFLOPS
22.1 (17.2min) fps -8%
1920x1080 Medium Preset (FSR off)
Dell XPS 14 2024 OLED
Intel Core Ultra 7 155H, NVIDIA GeForce RTX 4050 Laptop GPU
50.1 (42.7min) fps +157%
Medion SPRCHRGD 14 S1 Elite
Qualcomm Snapdragon X Elite X1E-78-100, Qualcomm SD X Adreno X1-85 3.8 TFLOPS
19.6 (15.6min) fps +1%
Dell XPS 13 9345
Qualcomm Snapdragon X Elite X1E-80-100, Qualcomm SD X Adreno X1-85 3.8 TFLOPS
19.5 (15.4min) fps
Lenovo ThinkPad T14s Gen 6 21N10007GE
Qualcomm Snapdragon X Elite X1E-78-100, Qualcomm SD X Adreno X1-85 3.8 TFLOPS
19 (15.1min) fps -3%
Microsoft Surface Laptop 7 13.8 Copilot+
Qualcomm Snapdragon X Elite X1E-80-100, Qualcomm SD X Adreno X1-85 3.8 TFLOPS
18.9 (15min) fps -3%
Average Qualcomm SD X Adreno X1-85 3.8 TFLOPS
  (14.8 - 19.7, n=11)
18.5 fps -5%
HP EliteBook Ultra G1q 14
Qualcomm Snapdragon X Elite X1E-78-100, Qualcomm SD X Adreno X1-85 3.8 TFLOPS
18.3 (14.4min) fps -6%
1920x1080 High Preset (FSR off)
Dell XPS 14 2024 OLED
Intel Core Ultra 7 155H, NVIDIA GeForce RTX 4050 Laptop GPU
42.4 (36.1min) fps +151%
Medion SPRCHRGD 14 S1 Elite
Qualcomm Snapdragon X Elite X1E-78-100, Qualcomm SD X Adreno X1-85 3.8 TFLOPS
17.3 (13.6min) fps +2%
Dell XPS 13 9345
Qualcomm Snapdragon X Elite X1E-80-100, Qualcomm SD X Adreno X1-85 3.8 TFLOPS
16.9 (13.3min) fps
Microsoft Surface Laptop 7 13.8 Copilot+
Qualcomm Snapdragon X Elite X1E-80-100, Qualcomm SD X Adreno X1-85 3.8 TFLOPS
16.4 (12.8min) fps -3%
Lenovo ThinkPad T14s Gen 6 21N10007GE
Qualcomm Snapdragon X Elite X1E-78-100, Qualcomm SD X Adreno X1-85 3.8 TFLOPS
16.1 (12.6min) fps -5%
Average Qualcomm SD X Adreno X1-85 3.8 TFLOPS
  (12.8 - 17.3, n=10)
16.1 fps -5%
1920x1080 Ultra Preset (FSR off)
Dell XPS 14 2024 OLED
Intel Core Ultra 7 155H, NVIDIA GeForce RTX 4050 Laptop GPU
35.8 (30min) fps +144%
Dell XPS 13 9345
Qualcomm Snapdragon X Elite X1E-80-100, Qualcomm SD X Adreno X1-85 3.8 TFLOPS
14.7 (11.6min) fps
Microsoft Surface Laptop 7 13.8 Copilot+
Qualcomm Snapdragon X Elite X1E-80-100, Qualcomm SD X Adreno X1-85 3.8 TFLOPS
14.3 (11.1min) fps -3%
Medion SPRCHRGD 14 S1 Elite
Qualcomm Snapdragon X Elite X1E-78-100, Qualcomm SD X Adreno X1-85 3.8 TFLOPS
14.3 (11.5min) fps -3%
Average Qualcomm SD X Adreno X1-85 3.8 TFLOPS
  (11.2 - 14.9, n=10)
14 fps -5%
Lenovo ThinkPad T14s Gen 6 21N10007GE
Qualcomm Snapdragon X Elite X1E-78-100, Qualcomm SD X Adreno X1-85 3.8 TFLOPS
13.9 (10.2min) fps -5%
GTA V
1024x768 Lowest Settings possible
Dell XPS 13 9340 Core Ultra 7
Intel Core Ultra 7 155H, Intel Arc 8-Core iGPU
157.8 (4.43min, 83.3P1) fps +64%
Dell XPS 13 Plus 9320 Core i7-1360P
Intel Core i7-1360P, Intel Iris Xe Graphics G7 96EUs
130.6 (21.7min, 71.4P1) fps +36%
Dell XPS 13 Plus 9320 i7-1280P OLED
Intel Core i7-1280P, Intel Iris Xe Graphics G7 96EUs
123.7 (11.7min, 76.9P1) fps +28%
Dell XPS 13 Plus 9320 4K
Intel Core i7-1260P, Intel Iris Xe Graphics G7 96EUs
115.1 (17.6min, 76.9P1) fps +20%
Lenovo ThinkPad T14s Gen 6 21N10007GE
Qualcomm Snapdragon X Elite X1E-78-100, Qualcomm SD X Adreno X1-85 3.8 TFLOPS
102.6 (10.7min, 52.6P1) fps +7%
Microsoft Surface Laptop 7 13.8 Copilot+
Qualcomm Snapdragon X Elite X1E-80-100, Qualcomm SD X Adreno X1-85 3.8 TFLOPS
100.6 (1.11min, 33.3P1) fps +4%
Dell XPS 13 9310 2-in-1
Intel Core i7-1165G7, Intel Iris Xe Graphics G7 96EUs
96.7 (16.2min, 58.8P1) fps 0%
Dell XPS 13 9345
Qualcomm Snapdragon X Elite X1E-80-100, Qualcomm SD X Adreno X1-85 3.8 TFLOPS
96.3 (1.239min, 33.3P1) fps
Average Qualcomm SD X Adreno X1-85 3.8 TFLOPS
  (71.8 - 104.2, n=10)
95.3 fps -1%
Medion SPRCHRGD 14 S1 Elite
Qualcomm Snapdragon X Elite X1E-78-100, Qualcomm SD X Adreno X1-85 3.8 TFLOPS
89.8 (1.166min, 32.3P1) fps -7%
Dell XPS 13 9305 Core i5 FHD
Intel Core i5-1135G7, Intel Iris Xe Graphics G7 80EUs
81 fps -16%
Dell XPS 13 9310 Core i7 4K
Intel Core i7-1185G7, Intel Iris Xe Graphics G7 96EUs
80.8 (14.5min, 40P1) fps -16%
Dell XPS 13 9315 2-in-1 Core i5-1230U
Intel Core i5-1230U, Intel Iris Xe Graphics G7 80EUs
60.9 (8.61min, 28.6P1) fps -37%
1920x1080 Lowest Settings possible
Dell XPS 13 Plus 9320 i7-1280P OLED
Intel Core i7-1280P, Intel Iris Xe Graphics G7 96EUs
101.7 (13.1min, 66.7P1) fps +12%
Dell XPS 13 Plus 9320 Core i7-1360P
Intel Core i7-1360P, Intel Iris Xe Graphics G7 96EUs
95.6 (11.2min, 52.6P1) fps +6%
Dell XPS 13 9345
Qualcomm Snapdragon X Elite X1E-80-100, Qualcomm SD X Adreno X1-85 3.8 TFLOPS
90.5 (11min, 50P1) fps
Average Qualcomm SD X Adreno X1-85 3.8 TFLOPS
  (79.3 - 90.5, n=3)
84.2 fps -7%
Lenovo ThinkPad T14s Gen 6 21N10007GE
Qualcomm Snapdragon X Elite X1E-78-100, Qualcomm SD X Adreno X1-85 3.8 TFLOPS
82.7 (10min, 45.5P1) fps -9%
Medion SPRCHRGD 14 S1 Elite
Qualcomm Snapdragon X Elite X1E-78-100, Qualcomm SD X Adreno X1-85 3.8 TFLOPS
79.3 (8.86min, 41.7P1) fps -12%
Dell XPS 13 9310 2-in-1
Intel Core i7-1165G7, Intel Iris Xe Graphics G7 96EUs
79 (14.5min, 52.6P1) fps -13%
Dell XPS 13 9310 Core i7 4K
Intel Core i7-1185G7, Intel Iris Xe Graphics G7 96EUs
64.7 (14.8min, 31.3P1) fps -29%
Dell XPS 13 9315 2-in-1 Core i5-1230U
Intel Core i5-1230U, Intel Iris Xe Graphics G7 80EUs
36.2 (8.37min, 16.9P1) fps -60%
1366x768 Normal/Off AF:4x
Dell XPS 13 9340 Core Ultra 7
Intel Core Ultra 7 155H, Intel Arc 8-Core iGPU
129.8 (4.39min, 58.8P1) fps +38%
Dell XPS 14 2024 OLED
Intel Core Ultra 7 155H, NVIDIA GeForce RTX 4050 Laptop GPU
119.9 (16.5min, 111.1P1) fps +27%
Dell XPS 13 Plus 9320 i7-1280P OLED
Intel Core i7-1280P, Intel Iris Xe Graphics G7 96EUs
108.7 (12.4min, 62.5P1) fps +15%
Dell XPS 13 Plus 9320 Core i7-1360P
Intel Core i7-1360P, Intel Iris Xe Graphics G7 96EUs
105.3 (6.65min, 55.6P1) fps +12%
Dell XPS 13 Plus 9320 4K
Intel Core i7-1260P, Intel Iris Xe Graphics G7 96EUs
102.1 (18.6min, 66.7P1) fps +8%
Microsoft Surface Laptop 7 13.8 Copilot+
Qualcomm Snapdragon X Elite X1E-80-100, Qualcomm SD X Adreno X1-85 3.8 TFLOPS
96.3 (5.13min, 47.6P1) fps +2%
Dell XPS 13 9345
Qualcomm Snapdragon X Elite X1E-80-100, Qualcomm SD X Adreno X1-85 3.8 TFLOPS
94.2 (5.6min, 47.6P1) fps
Dell XPS 13 Plus 9320 i5-1240p
Intel Core i5-1240P, Intel Iris Xe Graphics G7 80EUs
91 fps -3%
Lenovo ThinkPad T14s Gen 6 21N10007GE
Qualcomm Snapdragon X Elite X1E-78-100, Qualcomm SD X Adreno X1-85 3.8 TFLOPS
89.2 (4.95min, 43.5P1) fps -5%
Average Qualcomm SD X Adreno X1-85 3.8 TFLOPS
  (66.7 - 97.7, n=10)
89.2 fps -5%
Medion SPRCHRGD 14 S1 Elite
Qualcomm Snapdragon X Elite X1E-78-100, Qualcomm SD X Adreno X1-85 3.8 TFLOPS
83.2 (5.39min, 40P1) fps -12%
Dell XPS 13 9310 2-in-1
Intel Core i7-1165G7, Intel Iris Xe Graphics G7 96EUs
80.5 (13.1min, 47.6P1) fps -15%
Dell XPS 13 9305 Core i5 FHD
Intel Core i5-1135G7, Intel Iris Xe Graphics G7 80EUs
76 fps -19%
Dell XPS 13 9310 Core i7 4K
Intel Core i7-1185G7, Intel Iris Xe Graphics G7 96EUs
64.6 (14.2min, 29.4P1) fps -31%
Dell XPS 13 9315 2-in-1 Core i5-1230U
Intel Core i5-1230U, Intel Iris Xe Graphics G7 80EUs
38.4 (8.67min, 21.3P1) fps -59%
Dell XPS 13 9315, i5-1230U
Intel Core i5-1230U, Intel Iris Xe Graphics G7 80EUs
31 fps -67%
1920x1080 Normal/Off AF:4x
Dell XPS 13 Plus 9320 i7-1280P OLED
Intel Core i7-1280P, Intel Iris Xe Graphics G7 96EUs
90.7 (13min, 55.6P1) fps +3%
Dell XPS 13 Plus 9320 Core i7-1360P
Intel Core i7-1360P, Intel Iris Xe Graphics G7 96EUs
90.3 (13.3min, 52.6P1) fps +3%
Dell XPS 13 9345
Qualcomm Snapdragon X Elite X1E-80-100, Qualcomm SD X Adreno X1-85 3.8 TFLOPS
87.7 (9.79min, 50P1) fps
Average Qualcomm SD X Adreno X1-85 3.8 TFLOPS
  (72.9 - 87.7, n=3)
79.6 fps -9%
Lenovo ThinkPad T14s Gen 6 21N10007GE
Qualcomm Snapdragon X Elite X1E-78-100, Qualcomm SD X Adreno X1-85 3.8 TFLOPS
78.3 (9.49min, 41.7P1) fps -11%
Medion SPRCHRGD 14 S1 Elite
Qualcomm Snapdragon X Elite X1E-78-100, Qualcomm SD X Adreno X1-85 3.8 TFLOPS
72.9 (10.9min, 40P1) fps -17%
Dell XPS 13 9310 2-in-1
Intel Core i7-1165G7, Intel Iris Xe Graphics G7 96EUs
69.8 (12.6min, 45.5P1) fps -20%
Dell XPS 13 9310 Core i7 4K
Intel Core i7-1185G7, Intel Iris Xe Graphics G7 96EUs
60.7 (13.7min, 27.8P1) fps -31%
Dell XPS 13 9315 2-in-1 Core i5-1230U
Intel Core i5-1230U, Intel Iris Xe Graphics G7 80EUs
30 (8.55min, 15.4P1) fps -66%
1920x1080 High/On (Advanced Graphics Off) AA:2xMSAA + FX AF:8x
Dell XPS 14 2024 OLED
Intel Core Ultra 7 155H, NVIDIA GeForce RTX 4050 Laptop GPU
106 (7.9min, 55.6P1) fps +114%
Microsoft Surface Laptop 7 13.8 Copilot+
Qualcomm Snapdragon X Elite X1E-80-100, Qualcomm SD X Adreno X1-85 3.8 TFLOPS
50 (0.665min, 16.1P1) fps +1%
Dell XPS 13 9345
Qualcomm Snapdragon X Elite X1E-80-100, Qualcomm SD X Adreno X1-85 3.8 TFLOPS
49.5 (0.727min, 15.9P1) fps
Medion SPRCHRGD 14 S1 Elite
Qualcomm Snapdragon X Elite X1E-78-100, Qualcomm SD X Adreno X1-85 3.8 TFLOPS
47.5 (0.653min, 14.3P1) fps -4%
Average Qualcomm SD X Adreno X1-85 3.8 TFLOPS
  (34.7 - 50, n=10)
46.6 fps -6%
Lenovo ThinkPad T14s Gen 6 21N10007GE
Qualcomm Snapdragon X Elite X1E-78-100, Qualcomm SD X Adreno X1-85 3.8 TFLOPS
42.1 (0.601min, 12.2P1) fps -15%
Dell XPS 13 9340 Core Ultra 7
Intel Core Ultra 7 155H, Intel Arc 8-Core iGPU
32.8 (2.29min, 20.8P1) fps -34%
Dell XPS 13 Plus 9320 i5-1240p
Intel Core i5-1240P, Intel Iris Xe Graphics G7 80EUs
32 fps -35%
Dell XPS 13 Plus 9320 i7-1280P OLED
Intel Core i7-1280P, Intel Iris Xe Graphics G7 96EUs
27.6 (7.19min, 18.5P1) fps -44%
Dell XPS 13 Plus 9320 Core i7-1360P
Intel Core i7-1360P, Intel Iris Xe Graphics G7 96EUs
26.6 (7.8min, 18.5P1) fps -46%
Dell XPS 13 Plus 9320 4K
Intel Core i7-1260P, Intel Iris Xe Graphics G7 96EUs
26.2 (8.16min, 20P1) fps -47%
Dell XPS 13 9310 2-in-1
Intel Core i7-1165G7, Intel Iris Xe Graphics G7 96EUs
25.4 (6.93min, 18.5P1) fps -49%
Dell XPS 13 9305 Core i5 FHD
Intel Core i5-1135G7, Intel Iris Xe Graphics G7 80EUs
23 fps -54%
Dell XPS 13 9310 Core i7 4K
Intel Core i7-1185G7, Intel Iris Xe Graphics G7 96EUs
20.5 (5.61min, 13P1) fps -59%
Dell XPS 13 9315 2-in-1 Core i5-1230U
Intel Core i5-1230U, Intel Iris Xe Graphics G7 80EUs
11.7 (3.09min, 5.59P1) fps -76%
Dell XPS 13 9315, i5-1230U
Intel Core i5-1230U, Intel Iris Xe Graphics G7 80EUs
10 fps -80%
1920x1080 Highest Settings possible AA:4xMSAA + FX AF:16x
Dell XPS 14 2024 OLED
Intel Core Ultra 7 155H, NVIDIA GeForce RTX 4050 Laptop GPU
62.7 (6.01min, 40P1) fps +196%
Microsoft Surface Laptop 7 13.8 Copilot+
Qualcomm Snapdragon X Elite X1E-80-100, Qualcomm SD X Adreno X1-85 3.8 TFLOPS
21.5 (2.47min, 13P1) fps +1%
Dell XPS 13 9345
Qualcomm Snapdragon X Elite X1E-80-100, Qualcomm SD X Adreno X1-85 3.8 TFLOPS
21.2 (2.94min, 12.2P1) fps
Medion SPRCHRGD 14 S1 Elite
Qualcomm Snapdragon X Elite X1E-78-100, Qualcomm SD X Adreno X1-85 3.8 TFLOPS
20.9 (3.9min, 12.7P1) fps -1%
Average Qualcomm SD X Adreno X1-85 3.8 TFLOPS
  (16.2 - 21.5, n=9)
20.2 fps -5%
Lenovo ThinkPad T14s Gen 6 21N10007GE
Qualcomm Snapdragon X Elite X1E-78-100, Qualcomm SD X Adreno X1-85 3.8 TFLOPS
18.1 (3.68min, 11.1P1) fps -15%
Dell XPS 13 9340 Core Ultra 7
Intel Core Ultra 7 155H, Intel Arc 8-Core iGPU
14.7 (2.21min, 10.8P1) fps -31%
Dell XPS 13 Plus 9320 Core i7-1360P
Intel Core i7-1360P, Intel Iris Xe Graphics G7 96EUs
11.6 (4.4min, 6.99P1) fps -45%
Dell XPS 13 Plus 9320 i7-1280P OLED
Intel Core i7-1280P, Intel Iris Xe Graphics G7 96EUs
11.5 (4.27min, 7.69P1) fps -46%
Dell XPS 13 Plus 9320 4K
Intel Core i7-1260P, Intel Iris Xe Graphics G7 96EUs
11 (4.3min, 8.62P1) fps -48%
Dell XPS 13 9310 2-in-1
Intel Core i7-1165G7, Intel Iris Xe Graphics G7 96EUs
10 (3.09min, 7.58P1) fps -53%
Dell XPS 13 9310 Core i7 4K
Intel Core i7-1185G7, Intel Iris Xe Graphics G7 96EUs
9.75 (2.72min, 6.99P1) fps -54%
Dell XPS 13 9305 Core i5 FHD
Intel Core i5-1135G7, Intel Iris Xe Graphics G7 80EUs
9.7 fps -54%
Dell XPS 13 9315 2-in-1 Core i5-1230U
Intel Core i5-1230U, Intel Iris Xe Graphics G7 80EUs
6.06 (1.275min, 2.14P1) fps -71%

Cyberpunk 2077 ultra FPS Chart

012345678910111213Tooltip
Dell XPS 13 9345 SD X Elite X1E-80-100, Adreno X1-85 3.8 TFLOPS: Ø12.9 (12.4-13.5)
baixomédiaaltoultra
GTA V (2015) 96.3 94.2 49.5 21.2
The Witcher 3 (2015) 104 74.5 43.7 19.2
Dota 2 Reborn (2015) 80 60.7 57.4 50.7
Final Fantasy XV Benchmark (2018) 56.1 25 15.8
X-Plane 11.11 (2018) 38
Far Cry 5 (2018) 42 33 31 28
Strange Brigade (2018) 123.9 50.8 41.8 33.9
Tiny Tina's Wonderlands (2022) 44.5 33.6 22.4 18
F1 22 (2022) 62.9 55.4 38.5
Cyberpunk 2077 2.1 Phantom Liberty (2023) 24.1 19.5 16.9 14.7

Emissões

Ruído do sistema - Atividade do ventilador mais tranquila

O ruído do ventilador é ligeiramente mais silencioso do que o do modelo Modelo Intel Core Ultra 7 no sentido de que as ventoinhas internas aumentam de velocidade mais lentamente em resposta ao aumento de cargas. Caso contrário, as ventoinhas entre os dois modelos se estabeleceriam em RPMs máximas semelhantes ao executar cargas exigentes por períodos prolongados. Por exemplo, o ruído da ventoinha chegaria a 32,8 dB(A) no final da primeira cena de benchmark de 90 segundos no 3DMark 06, em comparação com 37,4 dB(A) no modelo Intel em condições semelhantes. Ao rodar jogos como Cyberpunk 2077, no entanto, ambos os modelos se estabeleceram na faixa baixa de 40 dB(A). O sistema com tecnologia Qualcomm não é necessariamente mais silencioso ao executar cargas elevadas, mas também é menos provável que o senhor perceba qualquer atividade da ventoinha ao navegar na Web ou fazer streaming de vídeo.

Ventoinhas duplas de 35 a 40 mm com um tubo de calor de cobre entre elas
Não notamos nenhum ruído eletrônico ou ruído da bobina em nossa unidade
Perfil de ruído do ventilador (Branco: Fundo, vermelho: Sistema inativo, Azul: 3DMark 06, Laranja: Cyberpunk 2077, Verde: Prime95+FurMark stress)

Barulho

Ocioso
22.9 / 22.9 / 22.9 dB
Carga
32.8 / 40.6 dB
  red to green bar
 
 
30 dB
silencioso
40 dB(A)
audível
50 dB(A)
ruidosamente alto
 
min: dark, med: mid, max: light   Earthworks M23R, Arta (15 cm de distância)   environment noise: 22.9 dB(A)
dB(A) 0102030405060708090Deep BassMiddle BassHigh BassLower RangeMidsHigher MidsLower HighsMid HighsUpper HighsSuper Highs2036.133.135.933.235.92523.222.524.622.326.93121.321.120.718.424.24019.519.918.417.724.45020.52618.418.521.66318.923.918.819.222.28019.22116.818.123.610019.118.915.617.221.512516.215.613.313.418.116019.819.113.613.120.120019.516.712.712.919.925020.517.311.311.120.531525.32011.610.925.440026.721.91212.126.550028.222.210.41127.663029.221.710.110.128.580027.218.89.71026.9100026.320.29.79.526.6125027.320.19.69.427.6160028.220.79.89.728.5200029.42210.210.329.5250029.521.910.210.429.6315029.322111129400029.221.611.311.429.1500031.121.311.611.530.9630030.32011.811.530.2800025.71611.811.725.5100002412.811.811.723.71250017.412.411.711.517.1160001512.610.910.914.6SPL40.632.822.922.940.5N3.51.70.40.43.5median 26.7median 20median 11.3median 11.1median 26.6Delta4.42.70.80.74.1hearing rangehide median Fan NoiseDell XPS 13 9345
Dell XPS 13 9345
Adreno X1-85 3.8 TFLOPS, SD X Elite X1E-80-100
Dell XPS 13 9340 Core Ultra 7
Arc 8-Core, Ultra 7 155H, Micron 2550 512GB
Microsoft Surface Laptop 7 13.8 Copilot+
Adreno X1-85 3.8 TFLOPS, SD X Elite X1E-80-100, Samsung MZ9L4512HBLU-00BMV
Lenovo ThinkBook 13x G4 21KR0008GE
Arc 7-Core, Ultra 5 125H, Samsung PM9C1a MZAL8512HDLU
HP EliteBook Ultra G1q 14
Adreno X1-85 3.8 TFLOPS, SD X Elite X1E-78-100, SK hynix PC801 HFS512GEJ9X101N BF
Asus ZenBook S13 OLED UX5304
Iris Xe G7 96EUs, i7-1355U, Samsung PM9A1 MZVL21T0HCLR
Noise
-10%
4%
-7%
4%
-4%
off / environment *
22.9
25.1
-10%
23.8
-4%
24.5
-7%
23.4
-2%
23.3
-2%
Idle Minimum *
22.9
25.1
-10%
23.8
-4%
24.5
-7%
23.4
-2%
23.3
-2%
Idle Average *
22.9
25.1
-10%
23.8
-4%
24.5
-7%
23.4
-2%
23.3
-2%
Idle Maximum *
22.9
25.1
-10%
23.8
-4%
27.1
-18%
24.3
-6%
23.3
-2%
Load Average *
32.8
37.4
-14%
26
21%
33.3
-2%
25
24%
37.7
-15%
Cyberpunk 2077 ultra *
40.6
31.5
22%
Load Maximum *
40.6
42.5
-5%
40.3
1%
40.7
-0%
34.8
14%
40.1
1%
Witcher 3 ultra *
42.5
36.8
30.6
40.1

* ... smaller is better

Temperatura

As temperaturas de superfície são muito próximas das que registramos no XPS 13 9340 com tecnologia Intel para mostrar que o modelo da Qualcomm não funciona visivelmente mais quente ou mais frio, apesar da troca de processador. Os pontos quentes no centro do sistema podem chegar a 45 °C, o que é semelhante ao modelo Intel quando ambos estão executando cargas exigentes por longos períodos. As temperaturas médias são mais baixas do que as registradas no Microsoft Surface Laptop 7 13.8 mas mais quentes do que no HP EliteBook Ultra G1q 14 cada um com CPUs Snapdragon Elite semelhantes.

Escapamento traseiro duplo
O adaptador CA pode esquentar bastante, a mais de 53 °C, ao executar cargas exigentes
Carga Máxima
 38.6 °C45.2 °C40.6 °C 
 32 °C36.6 °C31.6 °C 
 34.4 °C33.6 °C32.8 °C 
Máximo: 45.2 °C
Médio: 36.2 °C
42.4 °C44.2 °C42 °C
37 °C41.4 °C38.8 °C
33.4 °C35.4 °C36.8 °C
Máximo: 44.2 °C
Médio: 39 °C
alimentação elétrica  52.6 °C | Temperatura do quarto 20 °C | Fluke 62 Mini IR Thermometer
(±) The average temperature for the upper side under maximal load is 36.2 °C / 97 F, compared to the average of 30.8 °C / 87 F for the devices in the class Subnotebook.
(-) The maximum temperature on the upper side is 45.2 °C / 113 F, compared to the average of 35.9 °C / 97 F, ranging from 21.4 to 59 °C for the class Subnotebook.
(±) The bottom heats up to a maximum of 44.2 °C / 112 F, compared to the average of 39.4 °C / 103 F
(+) In idle usage, the average temperature for the upper side is 29.1 °C / 84 F, compared to the device average of 30.8 °C / 87 F.
(+) The palmrests and touchpad are reaching skin temperature as a maximum (34.4 °C / 93.9 F) and are therefore not hot.
(-) The average temperature of the palmrest area of similar devices was 28.3 °C / 82.9 F (-6.1 °C / -11 F).
Sistema inativo (tampa C)
Sistema inativo (tampa D)
Estresse de Prime95+FurMark (capa C)
Estresse Prime95+FurMark (capa D)
Dell XPS 13 9345
Qualcomm Snapdragon X Elite X1E-80-100, Qualcomm SD X Adreno X1-85 3.8 TFLOPS
Dell XPS 13 9340 Core Ultra 7
Intel Core Ultra 7 155H, Intel Arc 8-Core iGPU
Microsoft Surface Laptop 7 13.8 Copilot+
Qualcomm Snapdragon X Elite X1E-80-100, Qualcomm SD X Adreno X1-85 3.8 TFLOPS
Lenovo ThinkBook 13x G4 21KR0008GE
Intel Core Ultra 5 125H, Intel Arc 7-Core iGPU
HP EliteBook Ultra G1q 14
Qualcomm Snapdragon X Elite X1E-78-100, Qualcomm SD X Adreno X1-85 3.8 TFLOPS
Asus ZenBook S13 OLED UX5304
Intel Core i7-1355U, Intel Iris Xe Graphics G7 96EUs
Heat
12%
9%
9%
4%
6%
Maximum Upper Side *
45.2
41
9%
47.1
-4%
43.1
5%
40.8
10%
43.1
5%
Maximum Bottom *
44.2
43.5
2%
44.6
-1%
39.2
11%
40.4
9%
45
-2%
Idle Upper Side *
30.4
25.3
17%
24.7
19%
28.3
7%
32.2
-6%
27.3
10%
Idle Bottom *
31.6
25.5
19%
24.5
22%
28
11%
31.2
1%
27.8
12%

* ... smaller is better

Alto-falantes

Os alto-falantes quádruplos consistem em 2 alto-falantes principais de 2 W + 2 tweeters de 2 W para um total de 8 W
O volume máximo é decente e a qualidade do áudio é surpreendentemente bem equilibrada para um formato tão pequeno
dB(A) 0102030405060708090Deep BassMiddle BassHigh BassLower RangeMidsHigher MidsLower HighsMid HighsUpper HighsSuper Highs2035.935.935.92523.324.623.33120.920.720.94020.618.420.65019.518.419.56321.118.821.18025.916.825.910040.415.640.412554.913.354.916062.213.662.220062.712.762.725064.411.364.431568.611.668.640069.81269.850070.310.470.363068.310.168.380066.69.766.6100072.19.772.1125070.79.670.7160071.69.871.6200070.510.270.5250068.710.268.7315070.71170.7400070.211.370.2500071.811.671.8630068.811.868.8800069.711.869.71000071.711.871.7125006511.7651600062.410.962.4SPL82.322.982.3N58.90.458.9median 68.8median 11.3median 68.8Delta3.70.83.726.325.821.422.12624.925.127.622.532.523.448.72655.818.860.922.167.2267019.372.317.674.217.774.319.575.31571.711.871.311.27410.574.21072.710.17210.67210.97511.374.811.671.71269.71269.612.371.112.669.61270.111.269.824.784.70.666.6median 12median 71.73.42.2hearing rangehide median Pink NoiseDell XPS 13 9345Apple MacBook Pro 16 2021 M1 Pro
Frequency diagram (checkboxes can be checked and unchecked to compare devices)
Dell XPS 13 9345 audio analysis

(+) | speakers can play relatively loud (82.3 dB)
Bass 100 - 315 Hz
(±) | reduced bass - on average 9.9% lower than median
(±) | linearity of bass is average (12.4% delta to prev. frequency)
Mids 400 - 2000 Hz
(+) | balanced mids - only 1.9% away from median
(+) | mids are linear (3.2% delta to prev. frequency)
Highs 2 - 16 kHz
(+) | balanced highs - only 1.5% away from median
(+) | highs are linear (3% delta to prev. frequency)
Overall 100 - 16.000 Hz
(+) | overall sound is linear (8.2% difference to median)
Compared to same class
» 1% of all tested devices in this class were better, 1% similar, 98% worse
» The best had a delta of 5%, average was 19%, worst was 53%
Compared to all devices tested
» 1% of all tested devices were better, 1% similar, 98% worse
» The best had a delta of 4%, average was 25%, worst was 134%

Apple MacBook Pro 16 2021 M1 Pro audio analysis

(+) | speakers can play relatively loud (84.7 dB)
Bass 100 - 315 Hz
(+) | good bass - only 3.8% away from median
(+) | bass is linear (5.2% delta to prev. frequency)
Mids 400 - 2000 Hz
(+) | balanced mids - only 1.3% away from median
(+) | mids are linear (2.1% delta to prev. frequency)
Highs 2 - 16 kHz
(+) | balanced highs - only 1.9% away from median
(+) | highs are linear (2.7% delta to prev. frequency)
Overall 100 - 16.000 Hz
(+) | overall sound is linear (4.6% difference to median)
Compared to same class
» 0% of all tested devices in this class were better, 0% similar, 100% worse
» The best had a delta of 5%, average was 18%, worst was 45%
Compared to all devices tested
» 0% of all tested devices were better, 0% similar, 100% worse
» The best had a delta of 4%, average was 25%, worst was 134%

Gerenciamento de energia

Consumo de energia

As medições de consumo de energia mostram alguns resultados interessantes quando comparadas com o Core Ultra 7 XPS 13. Ao executar cargas médias ou baixas, nosso Snapdragon XPS 13 exigiria consistentemente menos energia do que a versão Intel, o que abre caminho para uma vida útil mais longa da bateria, conforme exemplificado na próxima seção abaixo. Ao executar cargas mais exigentes, como jogos, no entanto, o consumo médio seria praticamente o mesmo, em torno de 40 W cada, embora o Core Ultra 7 geralmente ofereça um desempenho gráfico mais rápido.

O consumo durante a execução do Prime95 para estressar a CPU mostra que o modelo Snapdragon exige mais energia do que o modelo Intel, em média, já que o último se reduziria mais acentuadamente ao longo do tempo. Por outro lado, o consumo ao executar o FurMark para estressar a GPU seria em média de apenas 18 W, em comparação com 34 W ou mais no modelo Intel. Isso sugere que a Qualcomm pode estar dedicando menos área de superfície ou orçamento de silício para seu design de GPU integrada do que a série Arc 8 da concorrência, que é mais potente e mais exigente, em média.

O consumo máximo pode chegar a 64 W com o adaptador CA USB-C extrapequeno (~6,5 x 5,5 x 2,3 cm) de 65 W, exatamente como no modelo da Intel.

consumo do 3DMark 06
O consumo aumentaria para 64 W ao iniciar o estresse do Prime95 antes de cair para 52 W alguns segundos depois, mostrando que as altas taxas de clock têm vida curta
Cyberpunk 2077 1080p Ultra consumo
Prime95+FurMark estresse iniciado aos 10s
Consumo de energia
desligadodarklight 0.29 / 0.8 Watt
Ociosodarkmidlight 2.8 / 4.9 / 5.7 Watt
Carga midlight 40.6 / 64 Watt
 color bar
Key: min: dark, med: mid, max: light        Metrahit Energy
Dell XPS 13 9345
SD X Elite X1E-80-100, Adreno X1-85 3.8 TFLOPS, , IPS, 1920x1200, 13.4"
Dell XPS 13 9340 Core Ultra 7
Ultra 7 155H, Arc 8-Core, Micron 2550 512GB, IPS, 1920x1200, 13.4"
Microsoft Surface Laptop 7 13.8 Copilot+
SD X Elite X1E-80-100, Adreno X1-85 3.8 TFLOPS, Samsung MZ9L4512HBLU-00BMV, IPS, 2304x1536, 13.8"
Lenovo ThinkBook 13x G4 21KR0008GE
Ultra 5 125H, Arc 7-Core, Samsung PM9C1a MZAL8512HDLU, IPS, 2880x1920, 13.5"
HP EliteBook Ultra G1q 14
SD X Elite X1E-78-100, Adreno X1-85 3.8 TFLOPS, SK hynix PC801 HFS512GEJ9X101N BF, IPS, 2240x1400, 14"
Asus ZenBook S13 OLED UX5304
i7-1355U, Iris Xe G7 96EUs, Samsung PM9A1 MZVL21T0HCLR, OLED, 2880x1800, 13.3"
Power Consumption
-27%
11%
-48%
11%
-43%
Idle Minimum *
2.8
3.8
-36%
1.4
50%
5.4
-93%
2.5
11%
5.8
-107%
Idle Average *
4.9
7
-43%
6.3
-29%
7.8
-59%
5.7
-16%
8.5
-73%
Idle Maximum *
5.7
7.3
-28%
7.6
-33%
8.9
-56%
5.8
-2%
8.8
-54%
Load Average *
40.6
52.6
-30%
26.9
34%
49.4
-22%
24.2
40%
35.1
14%
Cyberpunk 2077 ultra external monitor *
39.4
26.8
32%
Cyberpunk 2077 ultra *
40.7
38.5
5%
33.5
18%
Load Maximum *
64
62.7
2%
40.7
36%
68.8
-8%
66.4
-4%
59.5
7%
Witcher 3 ultra *
38.3
44.4
23.1
27.6

* ... smaller is better

Power Consumption Cyberpunk / Stress Test

051015202530354045505560Tooltip
Dell XPS 13 9345 SD X Elite X1E-80-100, Adreno X1-85 3.8 TFLOPS; 1280x720 Prime95 28.10 and Furmark 1.25: Ø57.8 (55-63.6)
Dell XPS 13 9340 Core Ultra 7 Ultra 7 155H, Arc 8-Core; 1280x720 Prime95 28.10 and Furmark 1.25: Ø45.9 (36.1-62.7)
Dell XPS 13 9345 SD X Elite X1E-80-100, Adreno X1-85 3.8 TFLOPS; Idle 150cd/m2: Ø3.37 (2.99-5.36)
Dell XPS 13 9340 Core Ultra 7 Ultra 7 155H, Arc 8-Core; Idle 150cd/m2: Ø5.65 (4.77-8.8)
Dell XPS 13 9345 SD X Elite X1E-80-100, Adreno X1-85 3.8 TFLOPS; Cyberpunk 2077 FHD ultra no FSR 150cd: Ø40.7 (39.3-44.4)

Power Consumption external Monitor

051015202530354045505560Tooltip
Dell XPS 13 9345 SD X Elite X1E-80-100, Adreno X1-85 3.8 TFLOPS; Prime95 V2810 Stress (external Monitor): Ø54.2 (47.8-63.6)
Dell XPS 13 9340 Core Ultra 7 Ultra 7 155H, Arc 8-Core; Prime95 V2810 Stress (external Monitor): Ø47.3 (35.8-62.4)
Dell XPS 13 9345 SD X Elite X1E-80-100, Adreno X1-85 3.8 TFLOPS; Cinebench R15 Multi (external Monitor): Ø57.9 (50.5-63.6)
Dell XPS 13 9340 Core Ultra 7 Ultra 7 155H, Arc 8-Core; Cinebench R15 Multi (external Monitor): Ø60.7 (56.8-61.4)
Dell XPS 13 9345 SD X Elite X1E-80-100, Adreno X1-85 3.8 TFLOPS; 1280x720 FurMark 1.19 GPU Stress Test (external Monitor): Ø19.9 (17.2-24.2)
Dell XPS 13 9340 Core Ultra 7 Ultra 7 155H, Arc 8-Core; 1280x720 FurMark 1.19 GPU Stress Test (external Monitor): Ø40.3 (32.6-57.5)
Dell XPS 13 9345 SD X Elite X1E-80-100, Adreno X1-85 3.8 TFLOPS; Idle 1min (external Monitor): Ø3.06 (2.67-4.66)
Dell XPS 13 9340 Core Ultra 7 Ultra 7 155H, Arc 8-Core; Idle 1min (external Monitor): Ø6.88 (5.99-8.6)
Dell XPS 13 9345 SD X Elite X1E-80-100, Adreno X1-85 3.8 TFLOPS; Cyberpunk 2077 FHD ultra no FSR - external Monitor: Ø39.4 (38-48.6)

Duração da bateria

O mesmo adaptador CA USB-C de 65 W que acompanha o Intel XPS 13

Se há um aspecto em que o sistema se destaca inequivocamente, é a duração da bateria. Conseguimos registrar um tempo de execução de navegação WLAN no mundo real de quase 26,5 horas ou mais de duas vezes mais do que o XPS 13 9340 equipado com o Core Ultra 7 155H e tela IPS de 1200p idêntica. É garantido que o tempo de execução será menor se for configurado com o painel OLED, mas ainda assim será incrivelmente longo e um dos mais longos de qualquer subnotebook de 13 polegadas, incluindo até mesmo o Série MacBook Air.

Nosso teste foi realizado após a aplicação da atualização mais recente do BIOS da Dell, que foi projetada especificamente para melhorar a vida útil da bateria no modelo Snapdragon. Recomendamos que o senhor instale a atualização aqui.

O carregamento de uma bateria vazia até a capacidade total leva um pouco mais de 90 minutos, o que é comum na maioria dos laptops.

Tempo de Execução da Bateria
Ocioso (sem WLAN, min brilho)
46h 25min
WiFi Websurfing
26h 25min
Carga (máximo brilho)
0h 57min
Dell XPS 13 9345
SD X Elite X1E-80-100, Adreno X1-85 3.8 TFLOPS, 55 Wh
Dell XPS 13 9340 Core Ultra 7
Ultra 7 155H, Arc 8-Core, 55 Wh
Microsoft Surface Laptop 7 13.8 Copilot+
SD X Elite X1E-80-100, Adreno X1-85 3.8 TFLOPS, 54 Wh
Lenovo ThinkBook 13x G4 21KR0008GE
Ultra 5 125H, Arc 7-Core, 74 Wh
HP EliteBook Ultra G1q 14
SD X Elite X1E-78-100, Adreno X1-85 3.8 TFLOPS, 59 Wh
Asus ZenBook S13 OLED UX5304
i7-1355U, Iris Xe G7 96EUs, 63 Wh
Battery Runtime
40%
-3%
24%
4%
50%
Reader / Idle
2785
1222
-56%
WiFi v1.3
1585
769
-51%
852
-46%
684
-57%
792
-50%
678
-57%
Load
57
131
130%
80
40%
116
104%
124
118%
146
156%
H.264
1053
1181
1229
829

Pro

+ vantagem de preço em relação ao Core Ultra 7 do XPS 13
+ bom desempenho da CPU para aplicativos nativos
+ maior duração da bateria do que o modelo Intel
+ as ventoinhas tendem a ser um pouco mais silenciosas
+ Pronto para o Co-Pilot

Contra

- o teclado e o clickpad com zero lattice podem não ser adequados para todos
- problemas inevitáveis de compatibilidade com alguns aplicativos
- o driver gráfico poderia ser melhorado
- ainda não há obturador de privacidade da webcam
- suporte instável ao Thunderbolt

Veredicto - Alternativa respeitável ao Intel XPS 13

Em análise: Dell XPS 13 9345

O Snapdragon XPS 13 de US$ 1.300 é um pouco mais barato do que o XPS 13 de US$ 1.400 Core Ultra 7 XPS 13 de US$ 1.400, oferecendo uma duração de bateria significativamente maior, integração com o Co-Pilot+ e recursos de hardware idênticos. A experiência real do usuário, no entanto, dependerá muito da carga de trabalho e do aplicativo. Se for usado principalmente para navegação, processamento de texto, vídeo e streaming, o Snapdragon XPS 13 tende a ser mais eficiente, especialmente quando os programas podem ser executados nativamente em ARM. Por outro lado, tarefas mais exigentes, como edição de gráficos, codificação de vídeo, docking Thunderbolt ou aplicativos específicos que precisam ser emulados em ARM, seriam mais adequadas para o tradicional Intel XPS 13. Para isso, o modelo Intel oferece um nível de desempenho mais previsível em todos os cenários de uso, o que, sem dúvida, supera os poucos casos extremos em que o modelo Snapdragon pode sair na frente.

O XPS 13 com Snapdragon é uma ótima alternativa ao XPS 13 com Intel, dólar por dólar. A experiência do usuário, no entanto, varia muito, dependendo dos tipos de aplicativos e tarefas para os quais o senhor pretende usar o sistema.

As vantagens na duração da bateria e a compatibilidade com o Co-Pilot+ podem não ser suficientes para convencer os compradores, uma vez que a duração da bateria do Intel XPS 13 já é muito boa e que o Co-Pilot+ deverá ser incluído nas futuras CPUs da Intel e da AMD. No entanto, os usuários que desejam maximizar os tempos de execução e experimentar os mais recentes recursos de IA da Microsoft hoje podem achar que o Snapdragon XPS 13 é a opção mais produtiva.

Preço e disponibilidade

A Dell agora está enviando o XPS 13 9345 configurado por US$ 1.300 até US$ 1.800+ se configurado com o painel OLED.

Observação: Nosso sistema de classificação foi atualizado recentemente e os resultados da versão 8 não podem ser comparados com os resultados da versão 7. Outras informações sobre o assunto estão aqui disponíveis.

Observação: Atualizamos recentemente nosso sistema de classificação e os resultados da versão 8 não são comparáveis aos resultados da versão 7. Mais informações estão disponíveis aqui .

Dell XPS 13 9345 - 08/04/2024 v8
Allen Ngo

Acabamento
87 / 98 → 88%
Teclado
78%
Mouse
83%
Conectividade
58 / 74 → 79%
Peso
72 / 20-77 → 92%
Bateria
94%
Pantalha
85%
Desempenho do jogos
39 / 75 → 52%
Desempenho da aplicação
82 / 92 → 89%
Temperatura
88%
Ruído
87%
Audio
85 / 91 → 94%
Camera
33 / 75 → 43%
Médio
66%
85%
Subnotebook - Médio equilibrado
CO2 Emissions
No Data
Materials
50%
Packaging
100%
Power Use
85.5%
Repairability
40%
Software Updates
22.3%
Recycle Logo Total Sustainability Score: 49.6%

Transparency

The selection of devices to be reviewed is made by our editorial team. The test sample was provided to the author as a loan by the manufacturer or retailer for the purpose of this review. The lender had no influence on this review, nor did the manufacturer receive a copy of this review before publication. There was no obligation to publish this review. We never accept compensation or payment in return for our reviews. As an independent media company, Notebookcheck is not subjected to the authority of manufacturers, retailers or publishers.

This is how Notebookcheck is testing

Every year, Notebookcheck independently reviews hundreds of laptops and smartphones using standardized procedures to ensure that all results are comparable. We have continuously developed our test methods for around 20 years and set industry standards in the process. In our test labs, high-quality measuring equipment is utilized by experienced technicians and editors. These tests involve a multi-stage validation process. Our complex rating system is based on hundreds of well-founded measurements and benchmarks, which maintains objectivity. Further information on our test methods can be found here.

Price comparison

Please share our article, every link counts!
Mail Logo
> Análises e revisões de portáteis e celulares > Análises > Análises > Análise do Dell XPS 13 9345 Snapdragon X Elite: Superando o Intel Core Ultra 7
Allen Ngo, 2024-08- 6 (Update: 2024-08- 6)