

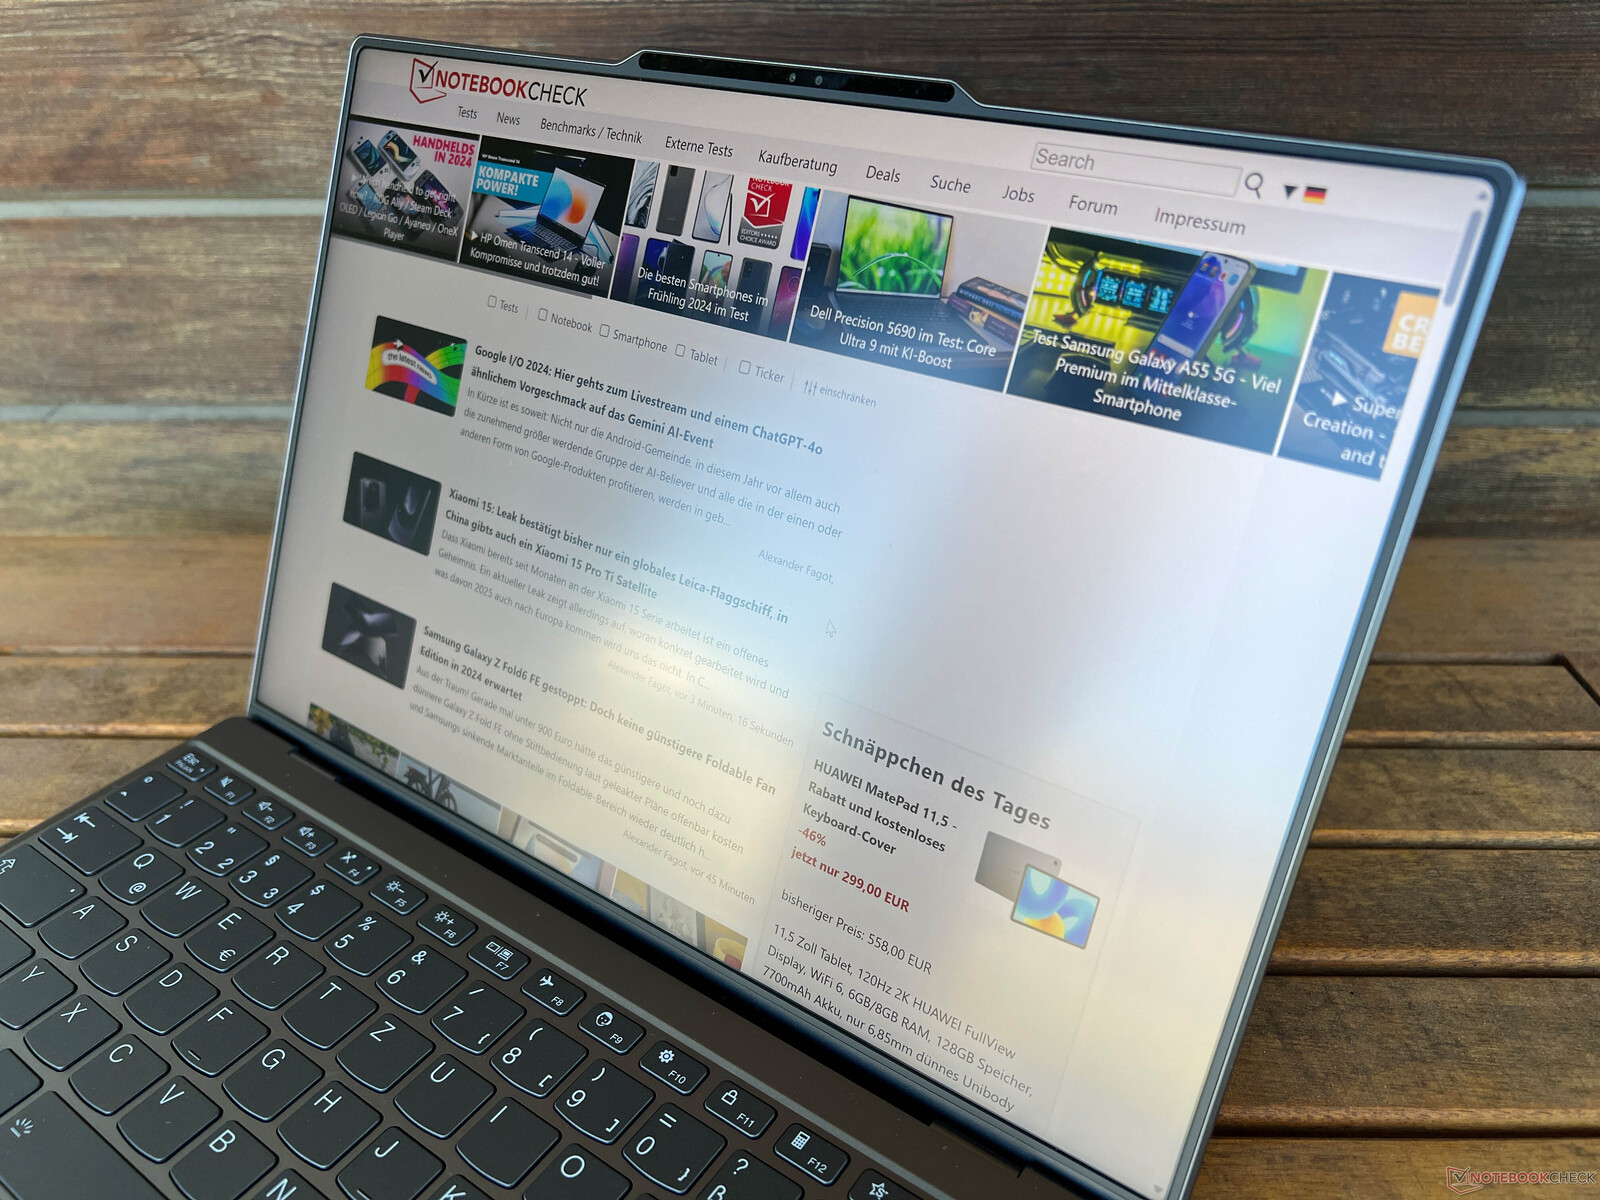
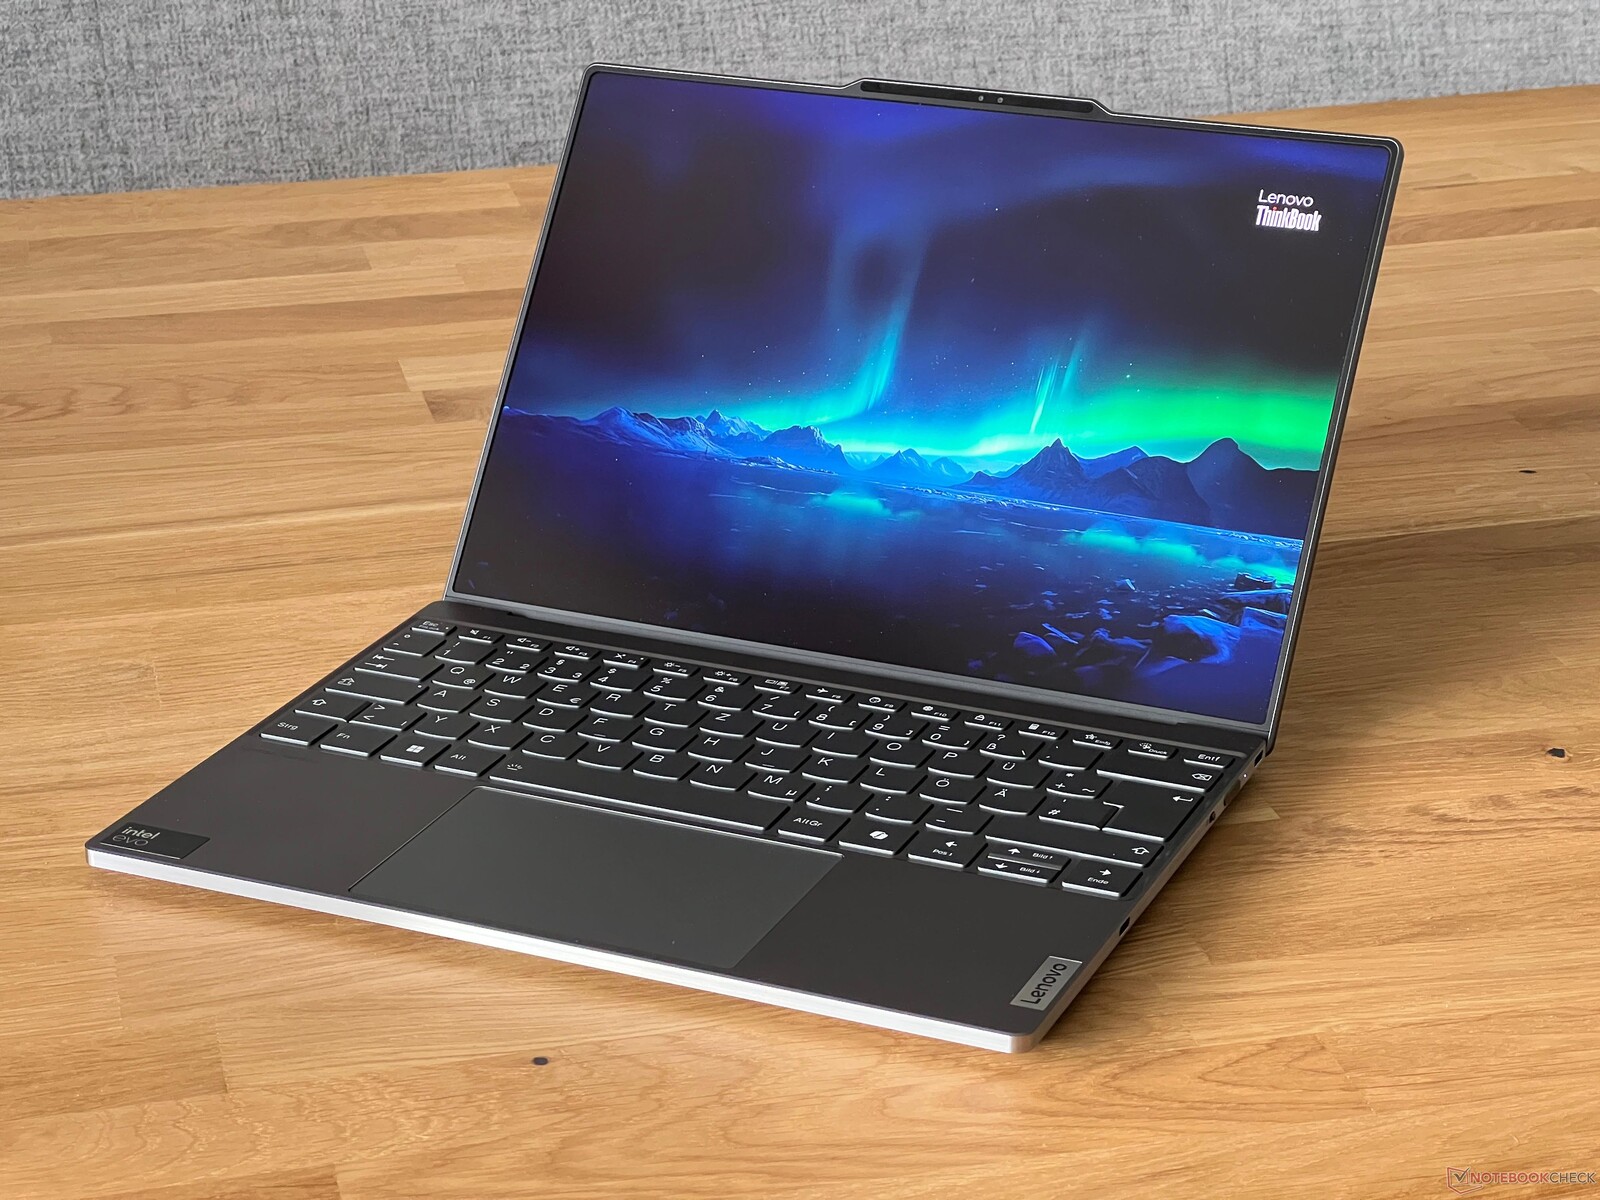
Análise do laptop Lenovo ThinkBook 13x G4: Um dos melhores subnotebooks, com exceção do teclado
Os modelos da série ThinkBook são voltados principalmente para clientes empresariais que não querem gastar os altos preços dos ThinkPads com seus funcionários. O novo ThinkBook 13x G4 é um subnotebook compacto que também pode interessar aos compradores individuais, pois oferece desempenho decente, uma bateria grande, uma tela IPS 3:2 de alta resolução com uma superfície fosca e um chassi de alumínio por cerca de US$ 1.100
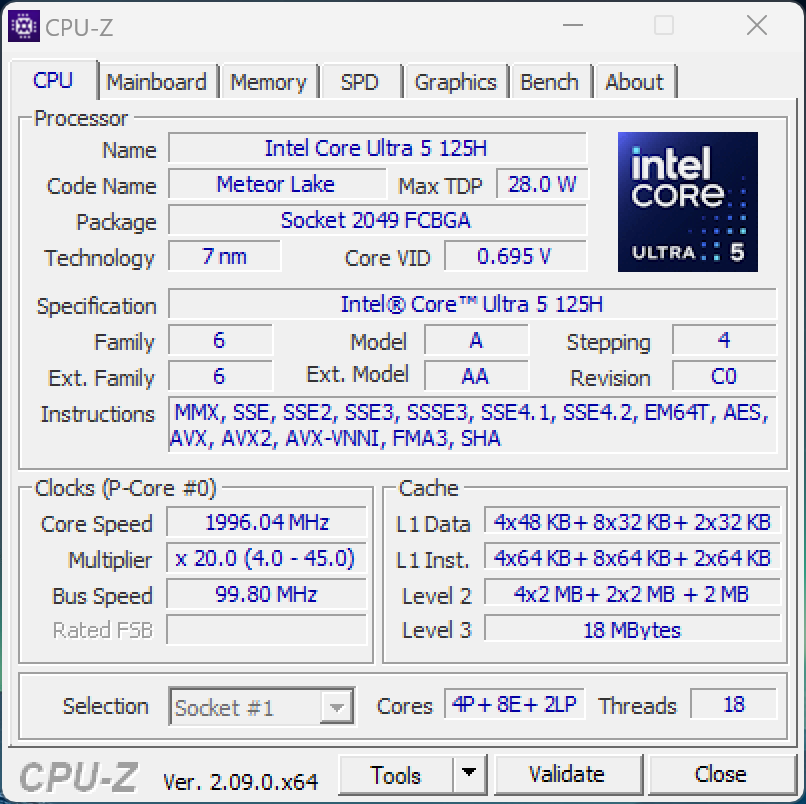
Nosso modelo de teste do ThinkBook 13x G4 tem o número de modelo 21KR0008GE e vem com o Core Ultra 5 125H16 GB de RAM, 512 GB de armazenamento SSD e uma tela de 2,8K (2880 x 1920) por US$ 1.106.
Possíveis concorrentes em comparação
Avaliação | Data | Modelo | Peso | Altura | Size | Resolução | Preço |
|---|---|---|---|---|---|---|---|
| 90.1 % v7 (old) | 05/2024 | Lenovo ThinkBook 13x G4 21KR0008GE Ultra 5 125H, Arc 7-Core | 1.2 kg | 12.9 mm | 13.50" | 2880x1920 | |
| 86.5 % v7 (old) | 05/2024 | Dell XPS 13 9340 Core Ultra 7 Ultra 7 155H, Arc 8-Core | 1.2 kg | 15.3 mm | 13.40" | 1920x1200 | |
| 92.4 % v7 (old) | 03/2024 | Apple MacBook Air 13 M3 10C GPU M3, M3 10-Core GPU | 1.2 kg | 11.3 mm | 13.60" | 2560x1664 | |
| 86.6 % v7 (old) | 03/2024 | MSI Prestige 13 AI Evo Ultra 7 155H, Arc 8-Core | 967 g | 16.9 mm | 13.30" | 2880x1800 | |
| 89.5 % v7 (old) | 01/2024 | Lenovo ThinkPad Z13 Gen 2 R7 PRO 7840U, Radeon 780M | 1.2 kg | 13.99 mm | 13.30" | 2880x1800 | |
| 91.9 % v7 (old) | 07/2023 | HP Dragonfly G4 i7-1365U, Iris Xe G7 96EUs | 1.1 kg | 16.3 mm | 13.50" | 1920x1280 |
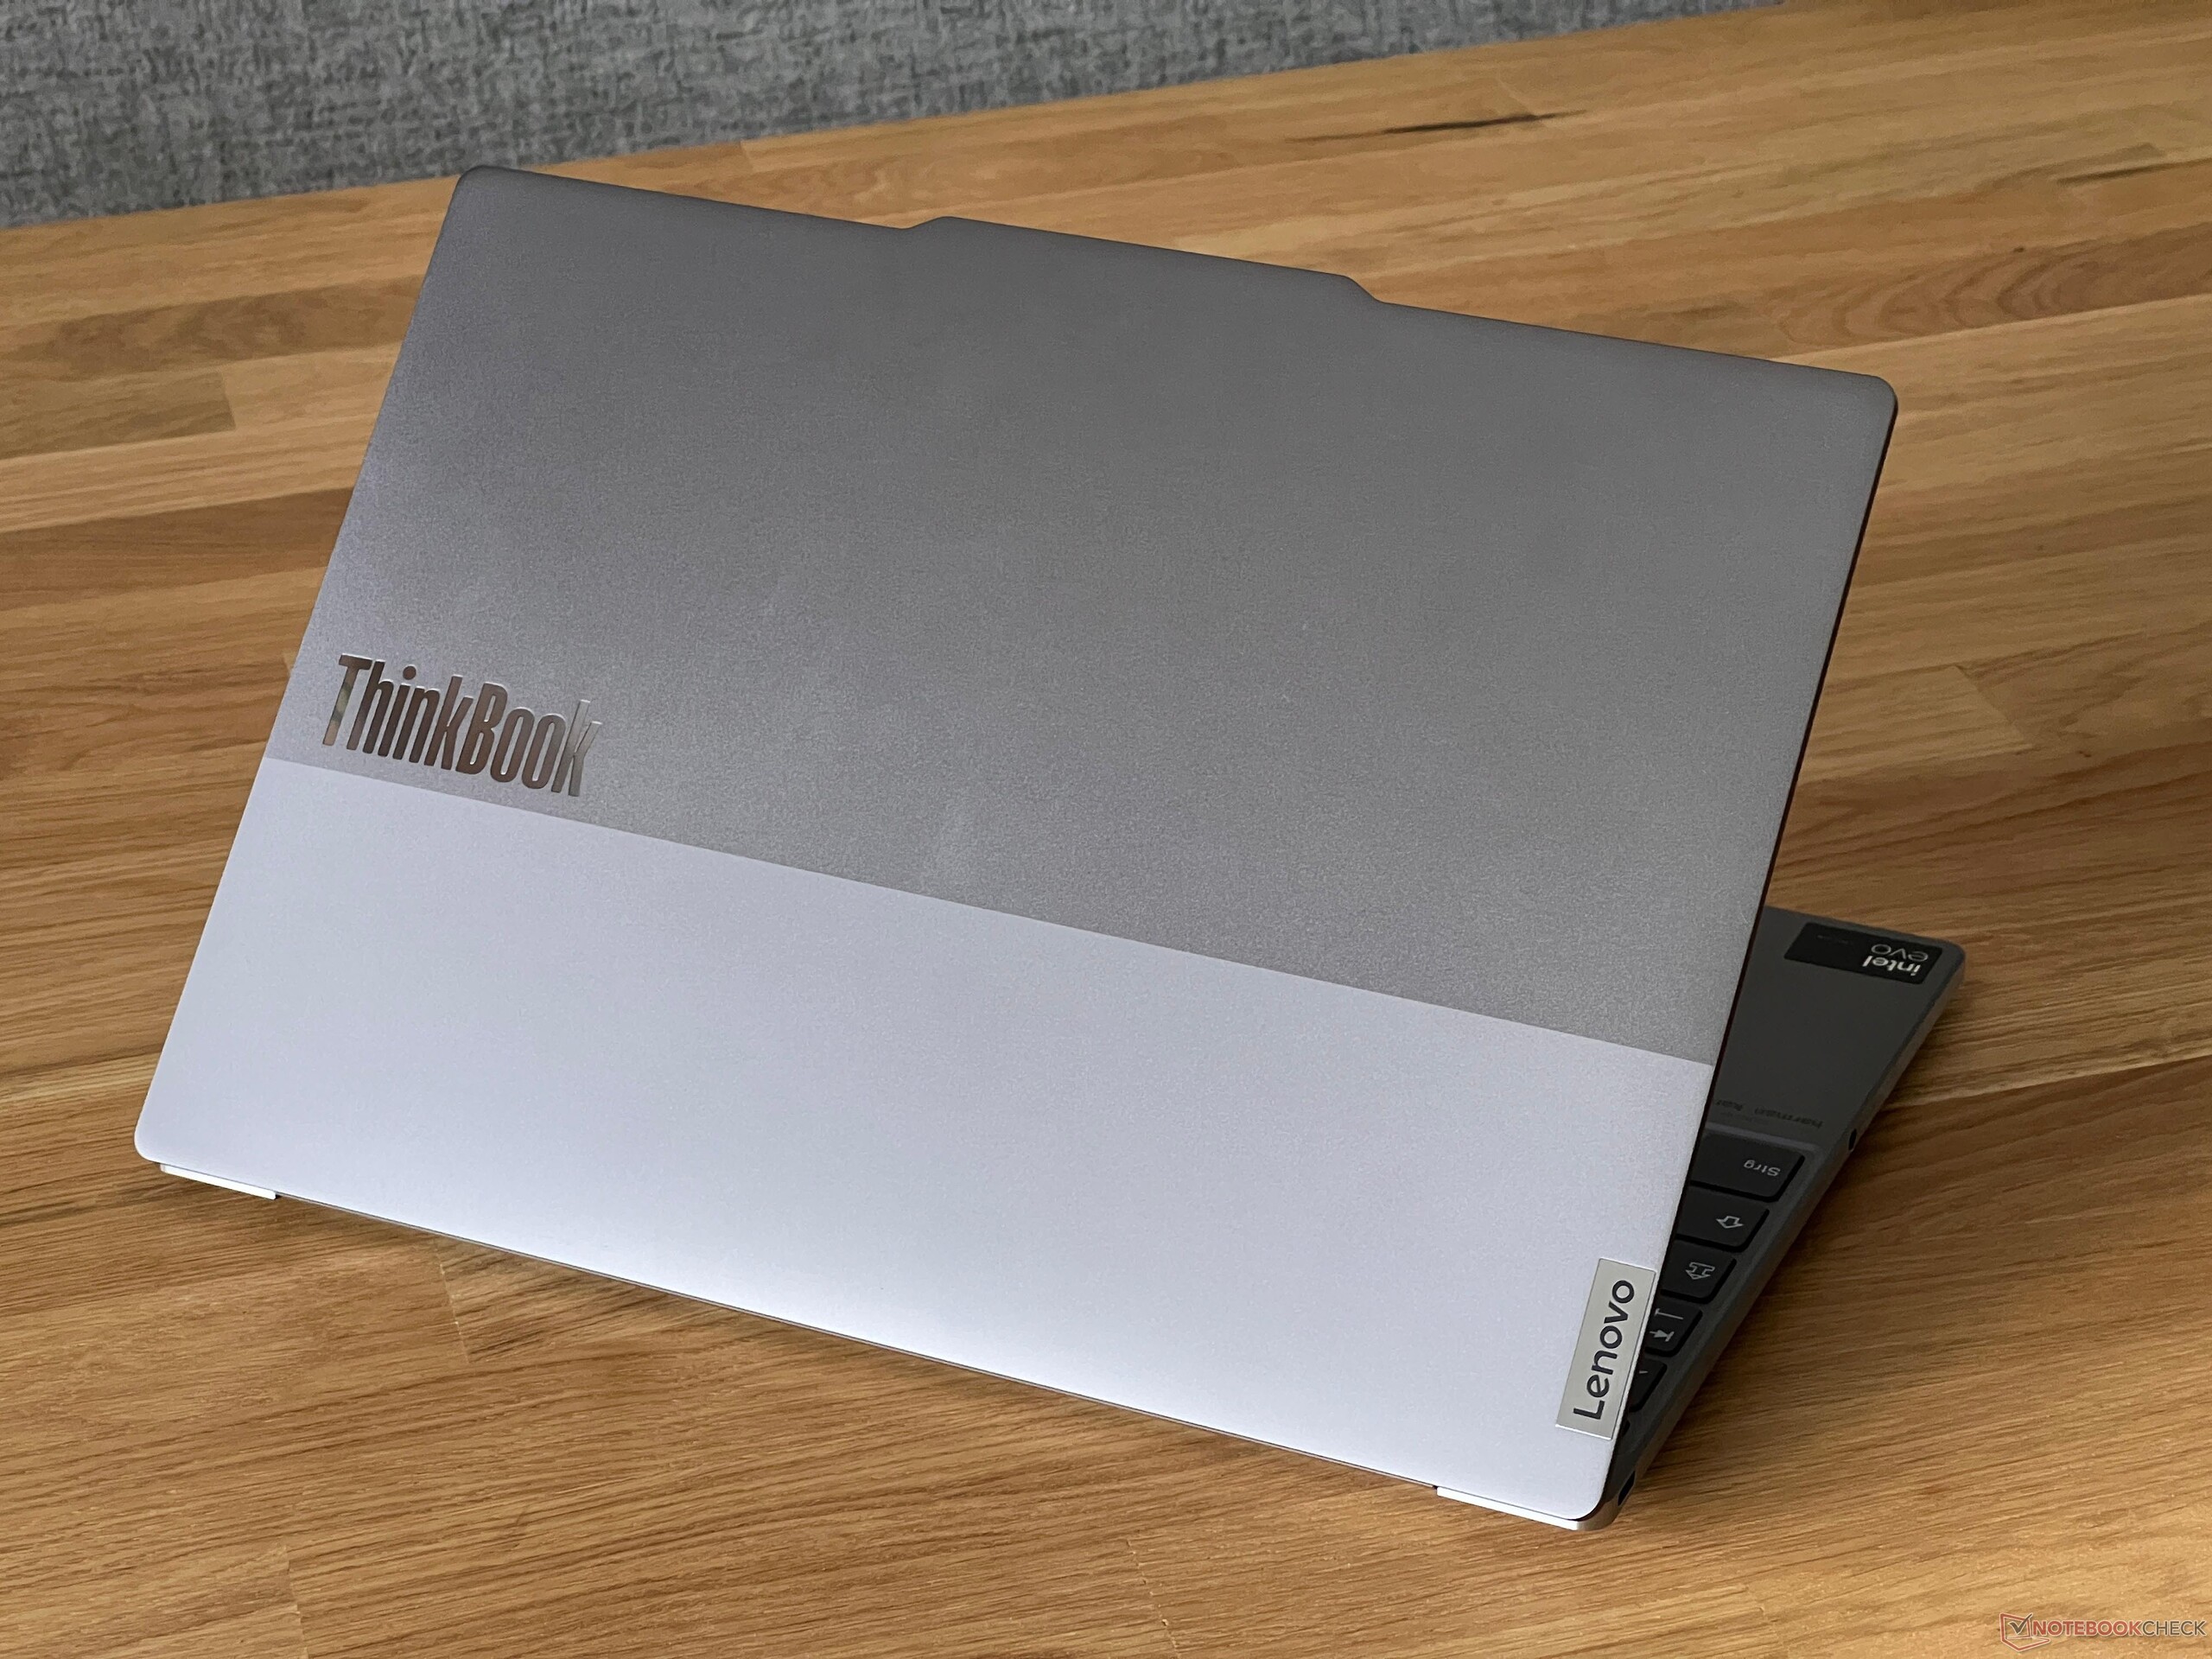
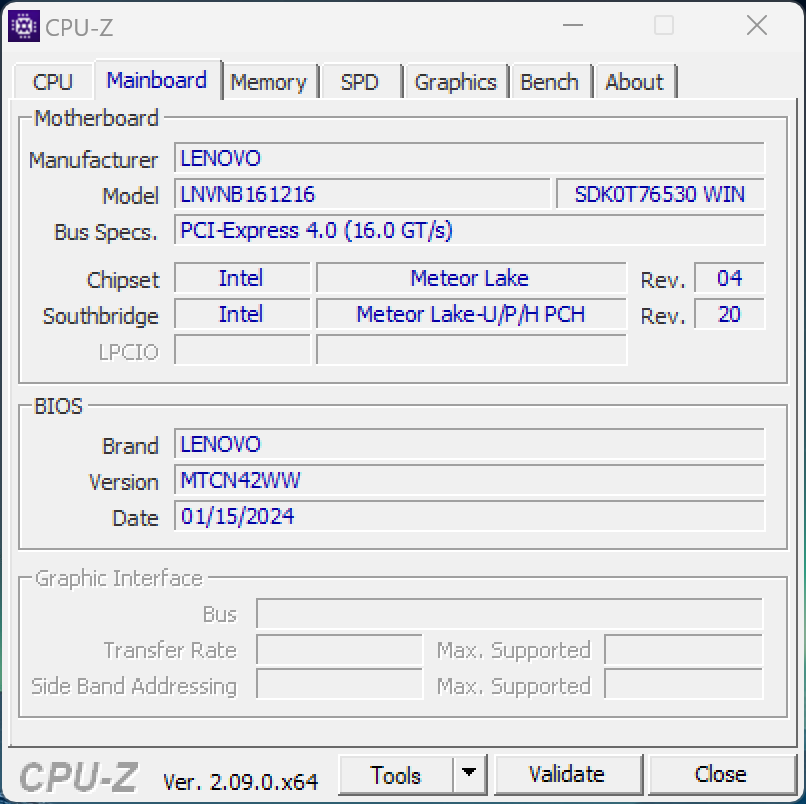
Case - ThinkBook com chassi de alumínio
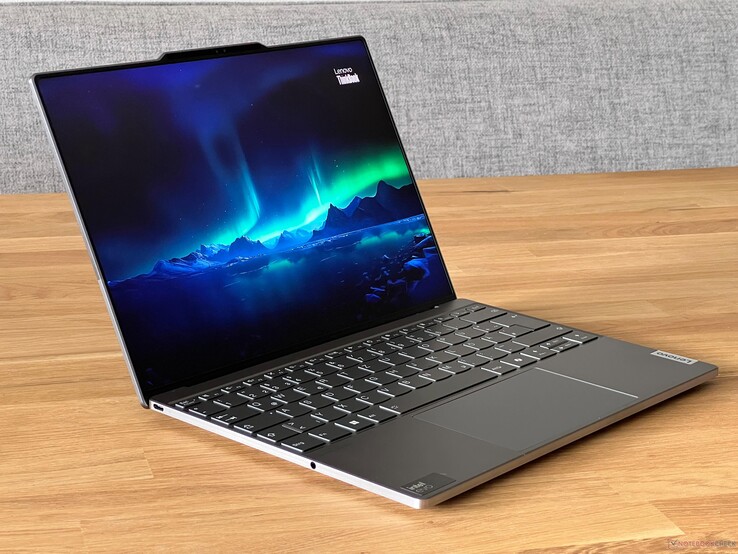
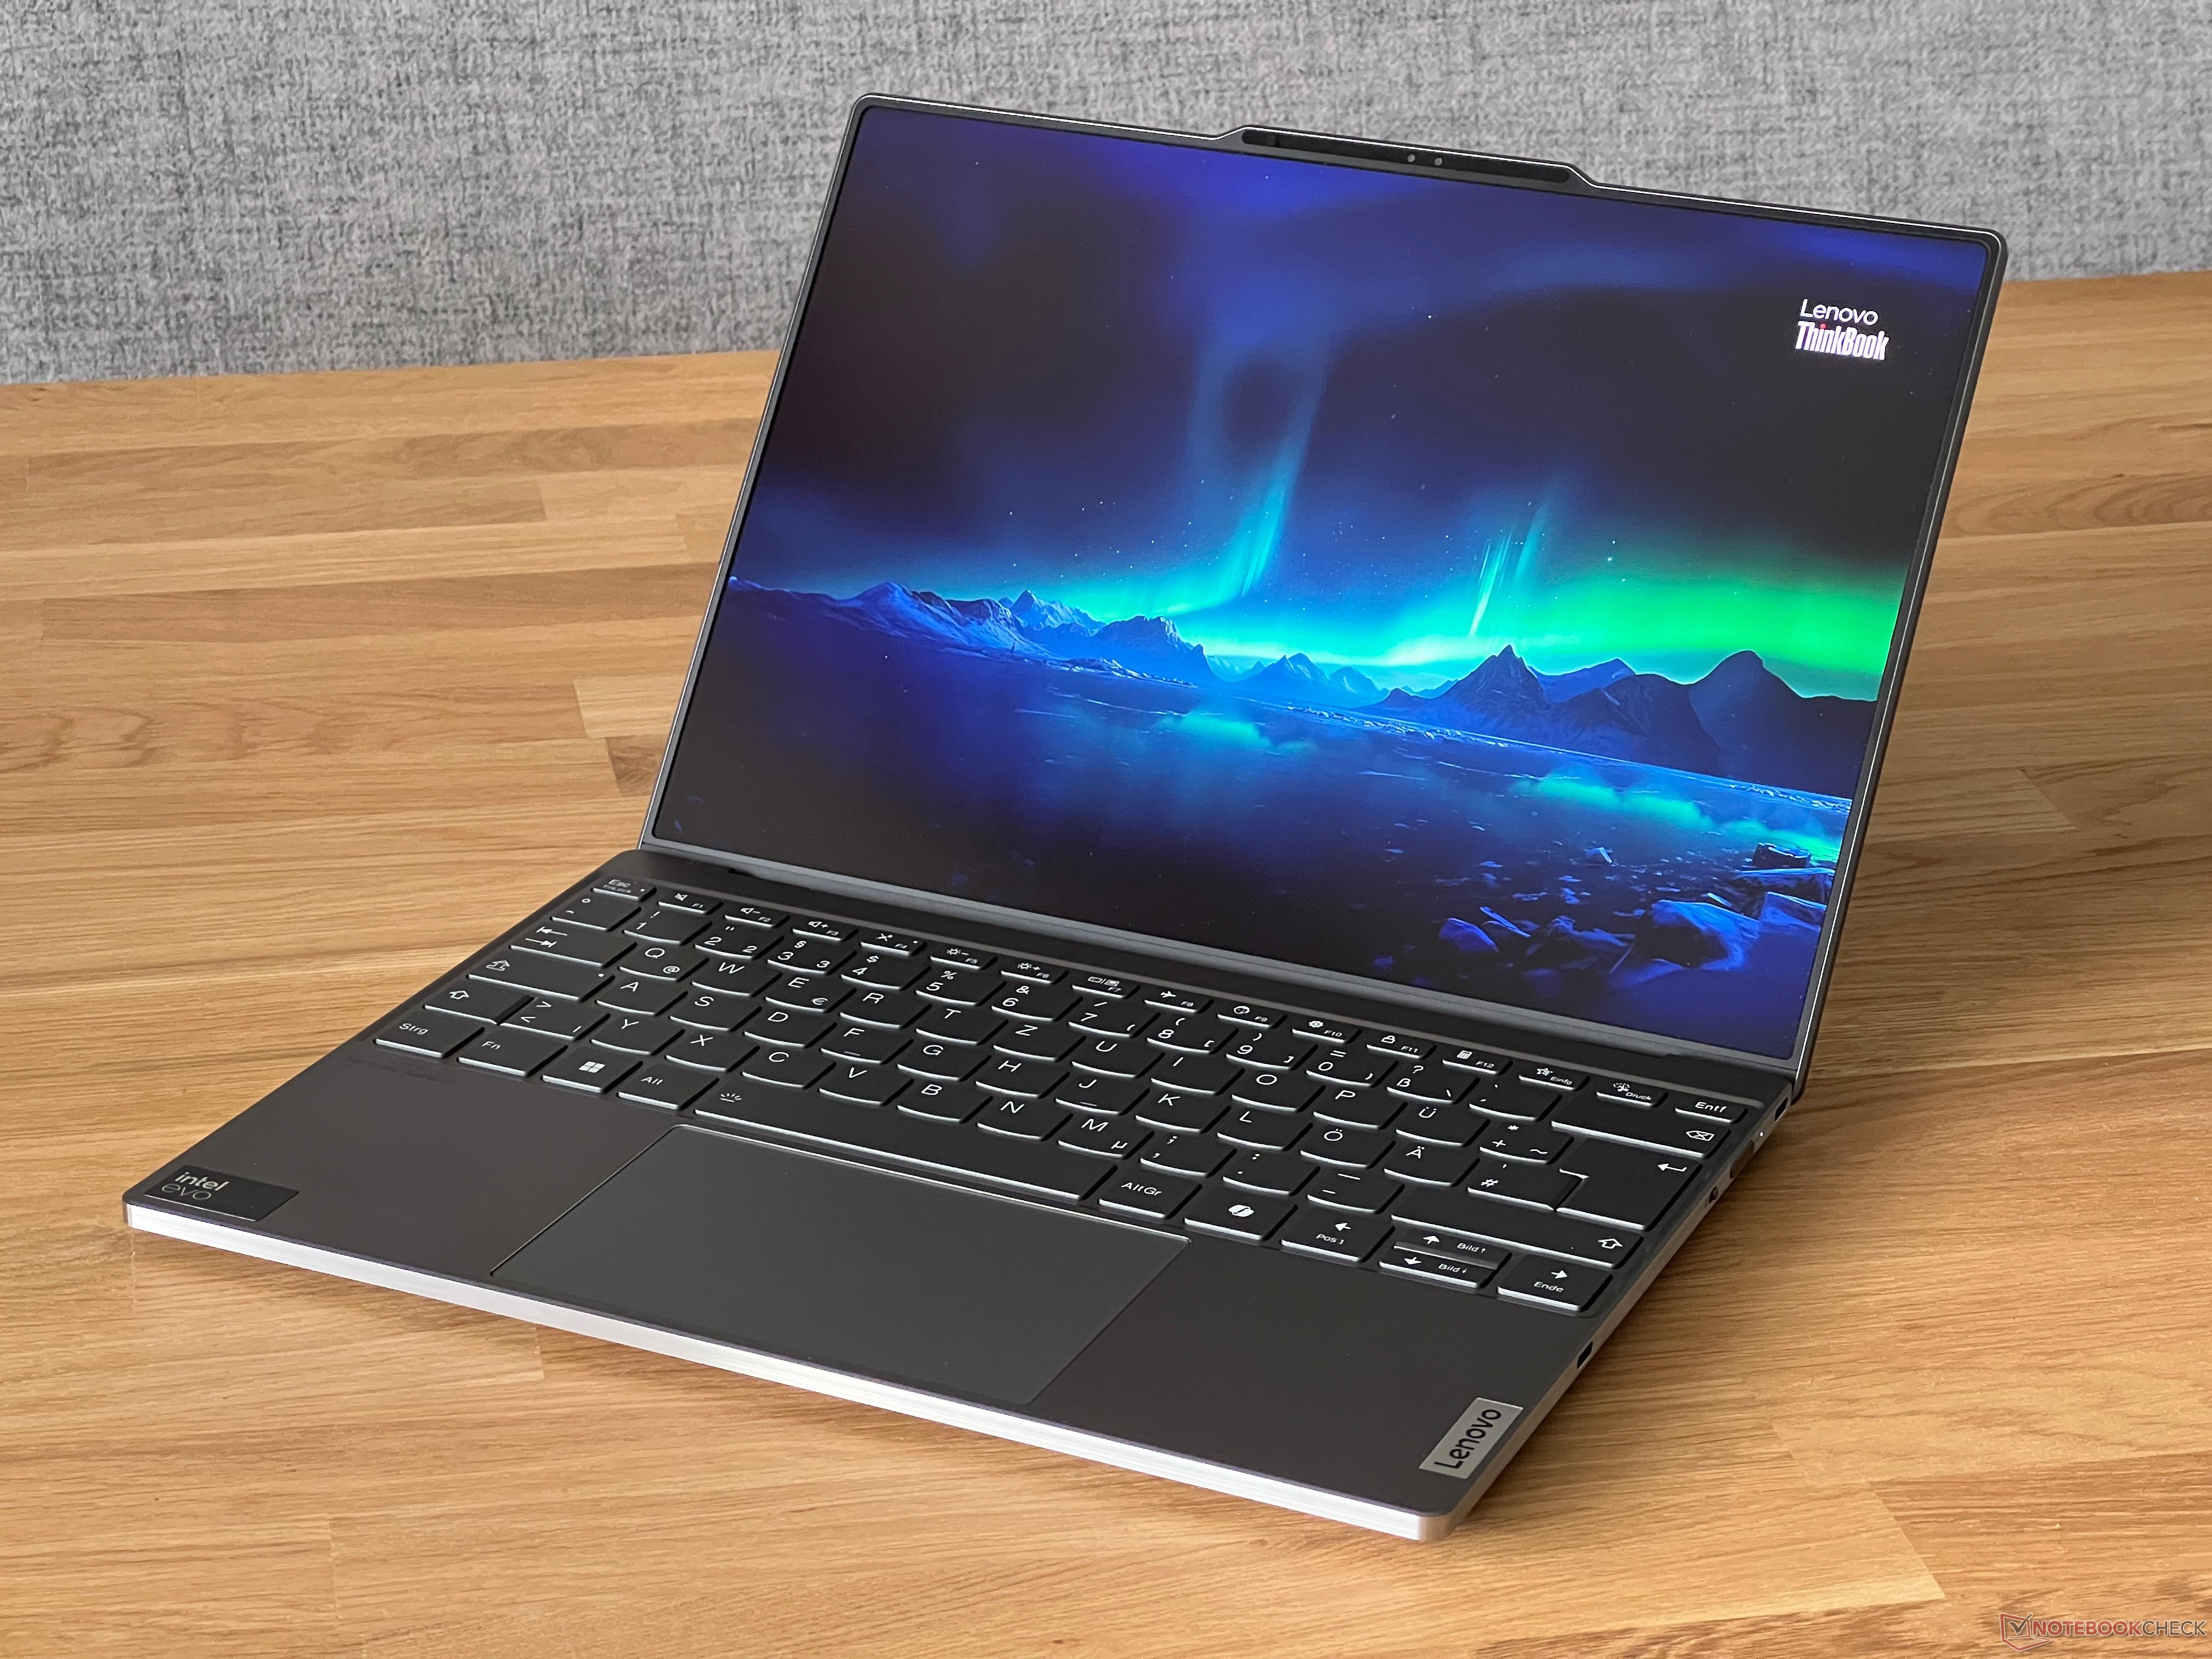
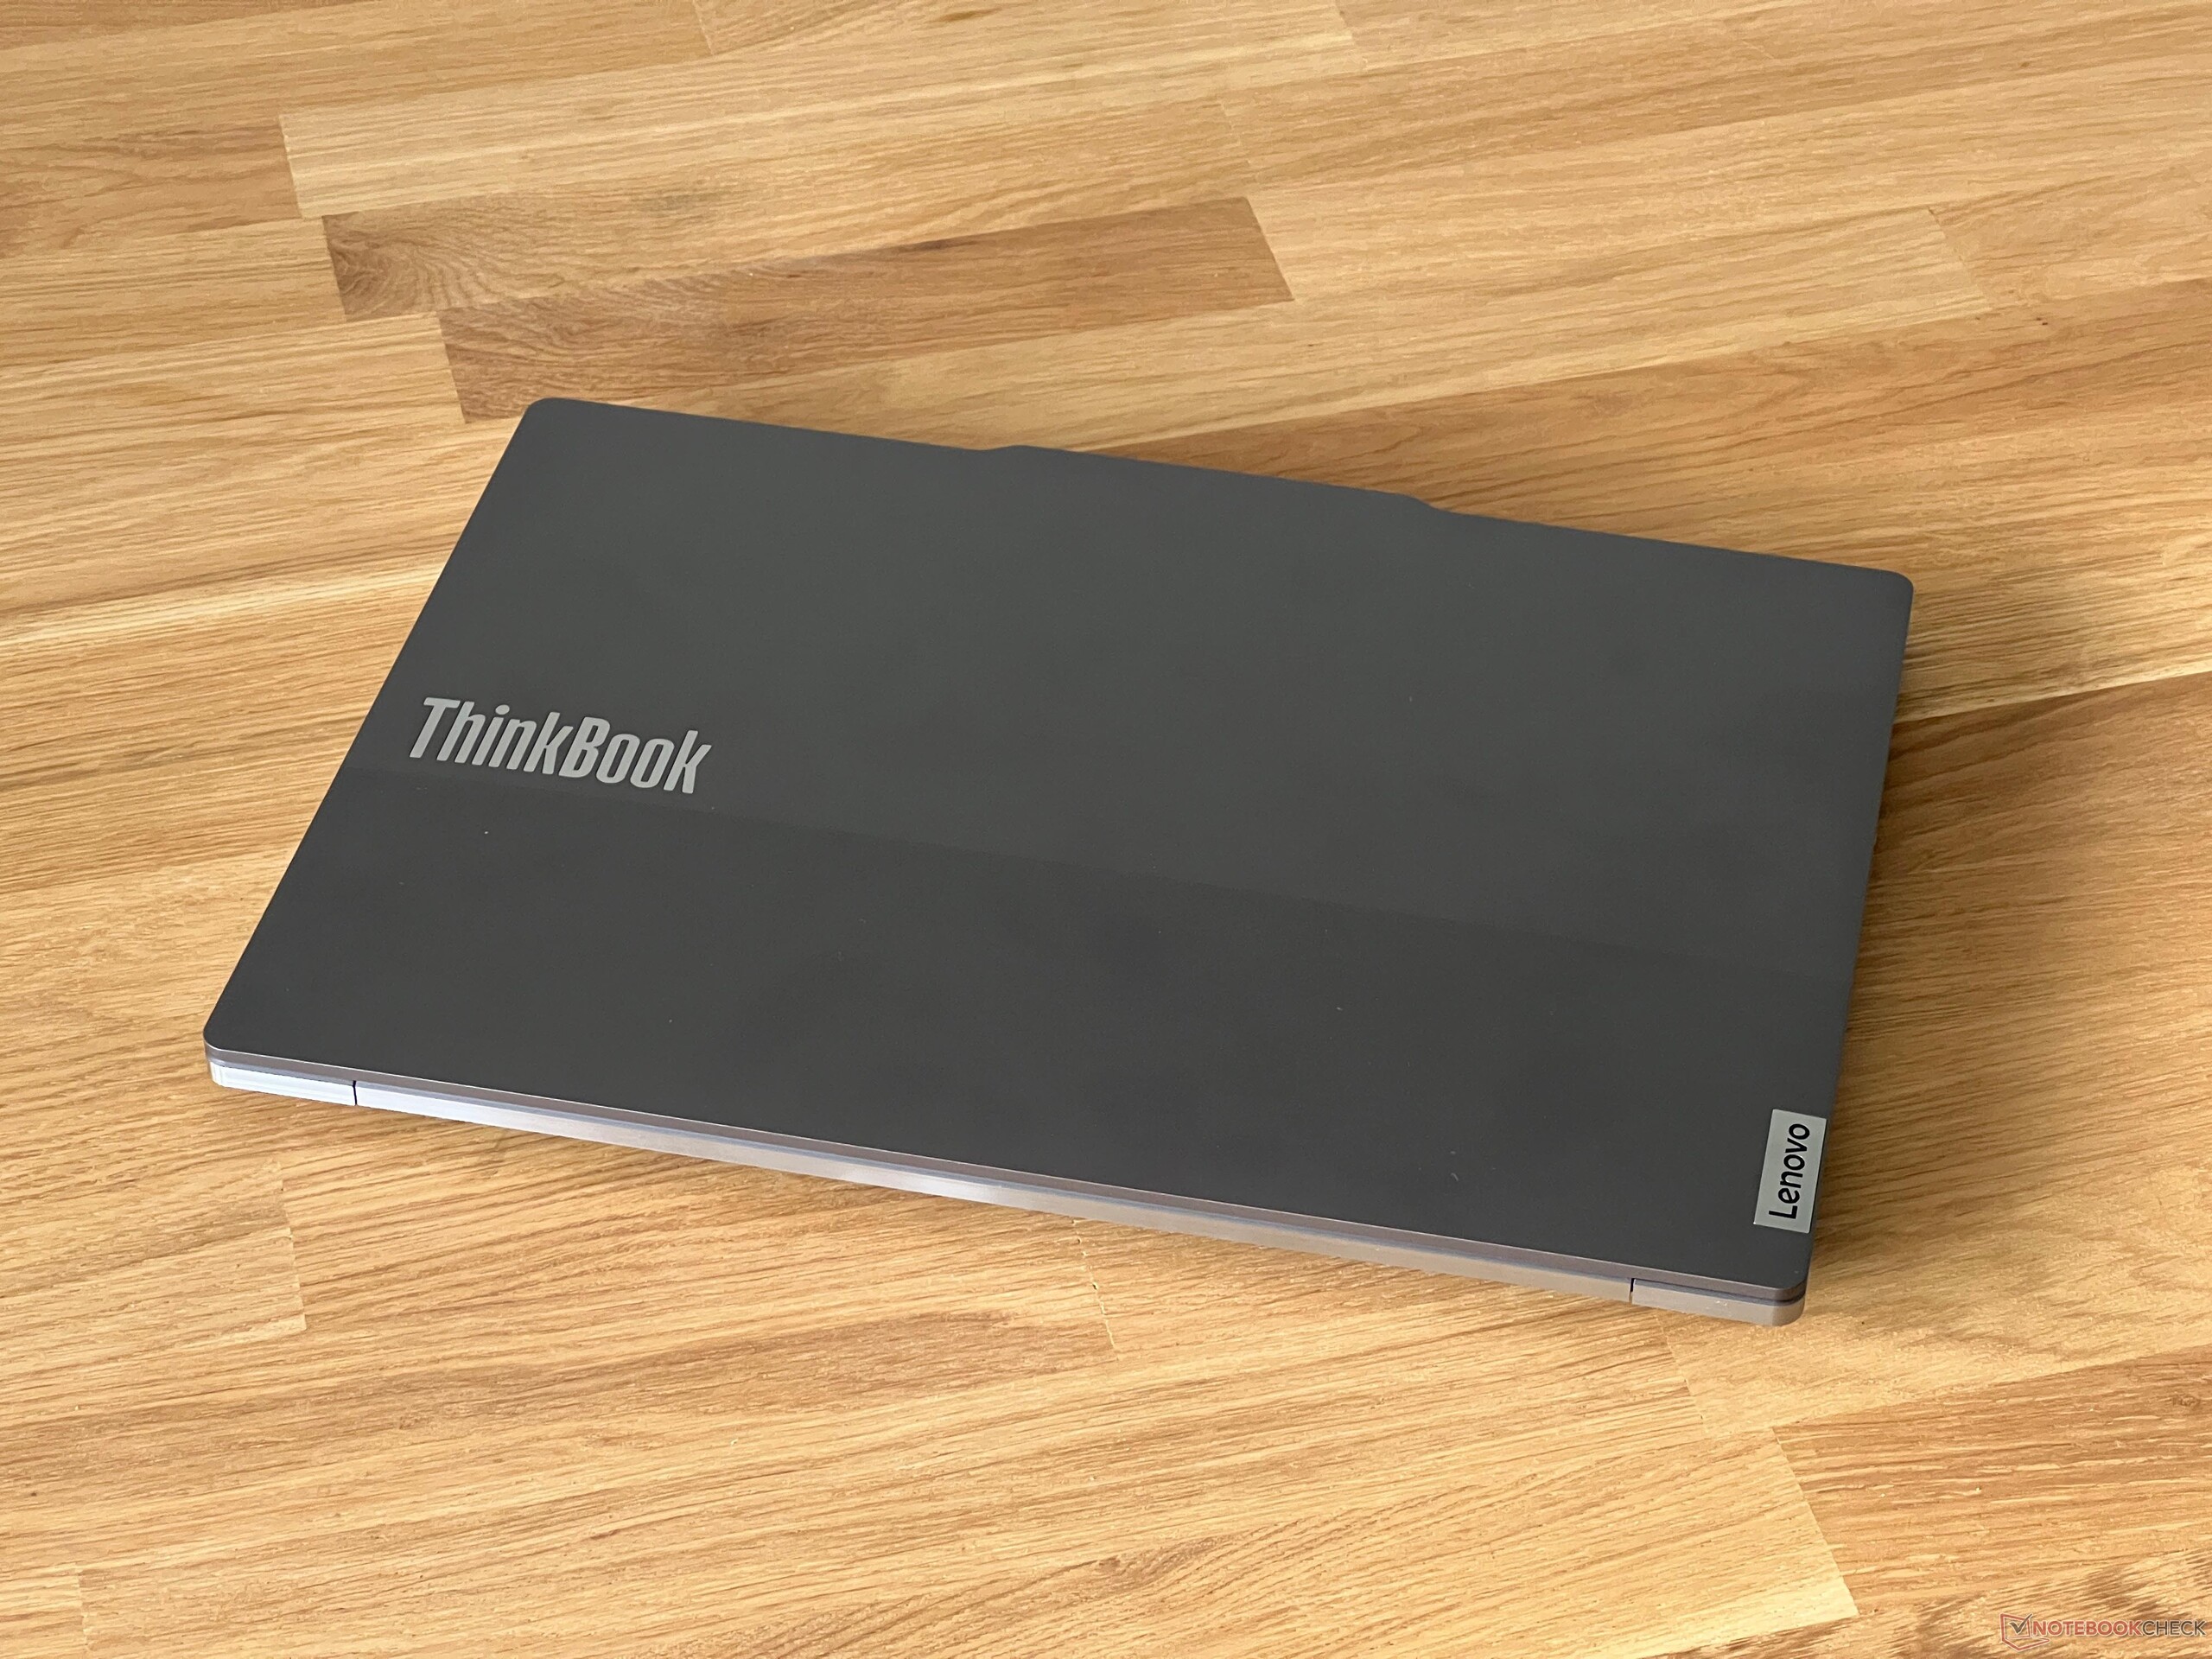
Fundamentalmente, o design do ThinkBook 13x G4 não difere de seus irmãos mais baratos, pois o gabinete cinza-prateado tem uma tampa de dois tons com letras grandes e parece muito simples à primeira vista. Enquanto os modelos mais baratos, como o ThinkBook 16 G6, geralmente têm apenas uma tampa de tela de alumínio e o resto do gabinete é feito de plástico, o ThinkBook 13x G4 também usa alumínio para a unidade de base. As laterais da unidade de base são polidas e o dispositivo tem uma aparência geral de alta qualidade. A unidade de base não é afunilada nas laterais, o que faz com que o dispositivo pareça um pouco mais volumoso do que realmente é.
Como em todos os outros modelos, a Lenovo usa uma saliência para a câmera, que parece muito grande aqui. Não parece bom, mas pelo menos ajuda na hora de abrir a tampa. Duas coisas são notáveis ao abrir a tampa: as bordas muito estreitas da tela e o ângulo de abertura significativamente limitado de um máximo de 135 graus em comparação com os ThinkPads. No entanto, as dobradiças são bem ajustadas e mantêm a tampa firmemente no lugar, com exceção de uma quantidade mínima de balanço ao ajustar o ângulo. Apesar do design fino, a tampa é muito estável e não conseguimos detectar nenhum erro ou distorção na imagem. A estabilidade da unidade de base é excelente e somente a área central do teclado cede um pouco sob pressão. Não foram detectados ruídos de rangidos. O acabamento também não é motivo de críticas.

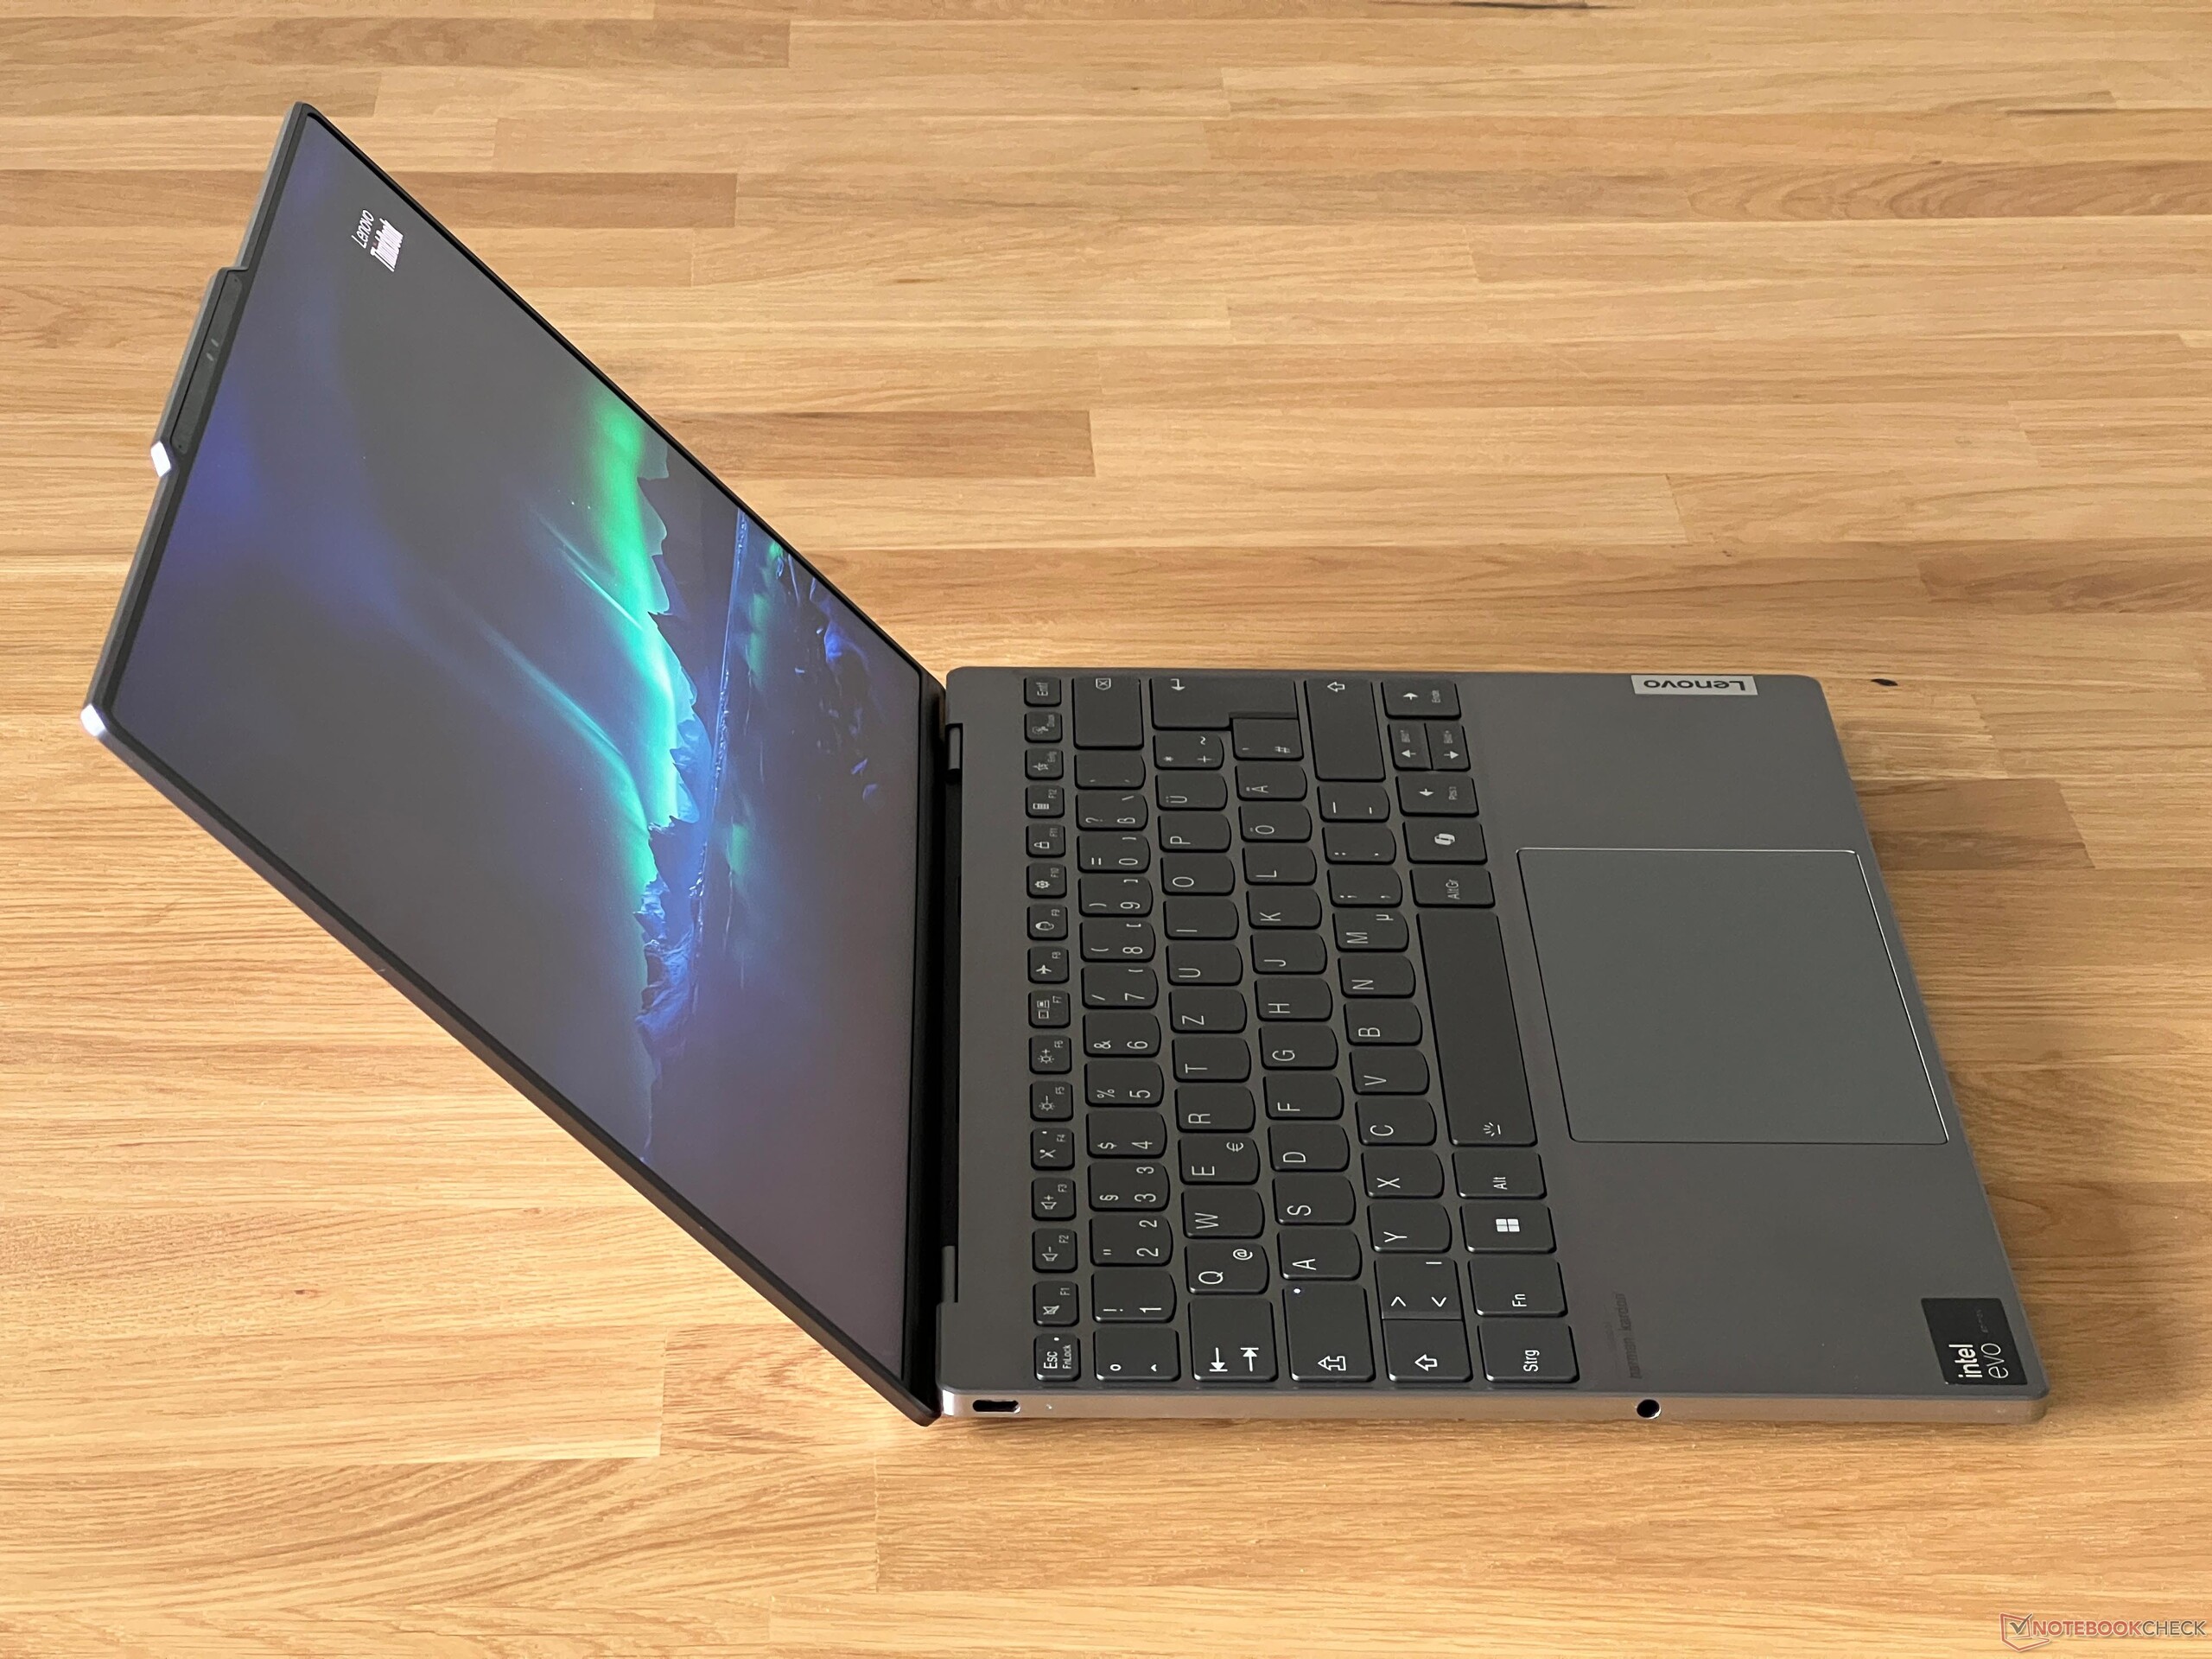
Conforme descrito anteriormente, o ThinkBook 13x G4 parece um pouco mais espesso devido ao seu design, mas as aparências enganam e, com uma altura de apenas 12,9 mm, é um dos dispositivos mais finos em nosso grupo de comparação e só é superado pelo MacBook Air M3. Por outro lado, o laptop da Lenovo ocupa menos espaço na mesa do que o Air M3 e também é um dos modelos mais compactos em geral, portanto, pode ser facilmente guardado em qualquer bolsa. No entanto, com 1,2 kg, ele também é um dos dispositivos mais pesados aqui e a fonte de alimentação de 65 watts adiciona mais 191 gramas. A folha de dados oficial também menciona um modelo de magnésio com peso de cerca de 1 kg, mas não conseguimos encontrar uma configuração correspondente.
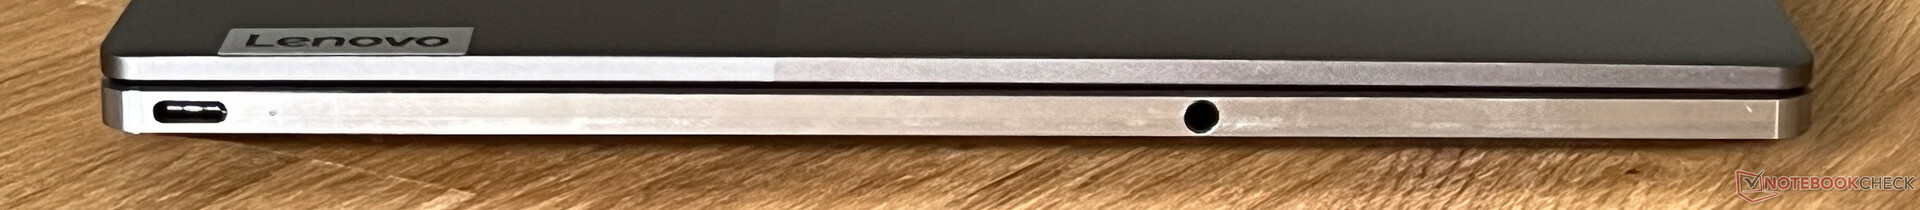
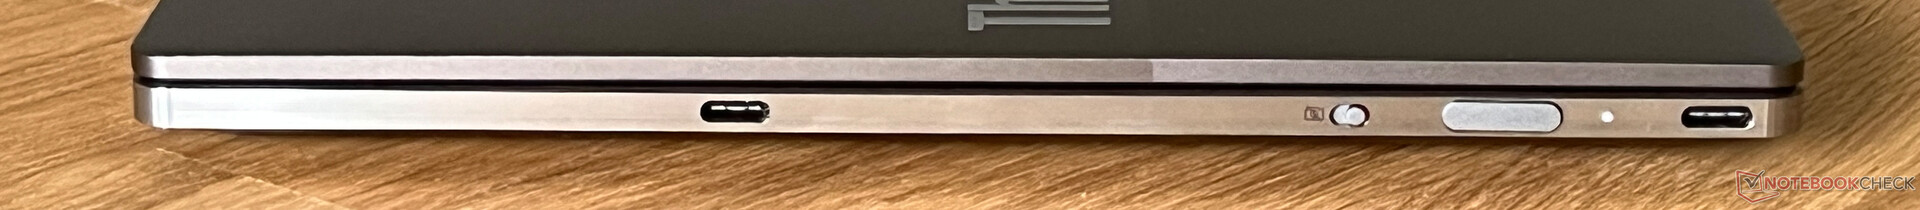
Equipamento - 3x Thunderbolt 4
A Lenovo equipa o ThinkBook 13x G4 com três portas USB-C rápidas, incluindo a Thunderbolt 4. O posicionamento parece um pouco incomum no início, mas acaba sendo bastante prático na prática. Uma das portas fica na parte frontal direita, onde o senhor pode conectar facilmente pendrives USB, e o dispositivo pode ser carregado em ambos os lados. No entanto, são necessários adaptadores para dispositivos USB-A e também não há leitor de cartões. Há modelos opcionais com a conexão Magic Bay da Lenovo, caso em que a câmera é mais grossa e equipada com pinos de pogo. Acessórios opcionais, como uma webcam 4K, podem ser conectados aqui.
Comunicação
Um módulo WiFi 7 ainda não está instalado no ThinkBook 13x G4, mas o conhecido módulo AX211 da Intel está. Ele suporta WiFi 6E, bem como Bluetooth 5.3. Nos testes com nosso roteador de referência Asus, as taxas de transferência foram muito altas e estáveis. Também não tivemos problemas com a estabilidade do sinal.
| Networking | |
| Lenovo ThinkBook 13x G4 21KR0008GE | |
| iperf3 transmit AXE11000 | |
| iperf3 receive AXE11000 | |
| Dell XPS 13 9340 Core Ultra 7 | |
| iperf3 transmit AXE11000 | |
| iperf3 receive AXE11000 | |
| Apple MacBook Air 13 M3 10C GPU | |
| iperf3 transmit AXE11000 | |
| iperf3 receive AXE11000 | |
| MSI Prestige 13 AI Evo | |
| iperf3 transmit AXE11000 | |
| iperf3 receive AXE11000 | |
| Lenovo ThinkPad Z13 Gen 2 | |
| iperf3 transmit AXE11000 | |
| iperf3 receive AXE11000 | |
| iperf3 transmit AXE11000 6GHz | |
| iperf3 receive AXE11000 6GHz | |
| HP Dragonfly G4 | |
| iperf3 transmit AXE11000 | |
| iperf3 receive AXE11000 | |
| iperf3 transmit AXE11000 6GHz | |
| iperf3 receive AXE11000 6GHz | |
Webcam
A webcam de 1080p na moldura superior da tela faz seu trabalho, mas o senhor não deve esperar milagres. Há também um sensor IR para reconhecimento facial via Windows Hello.


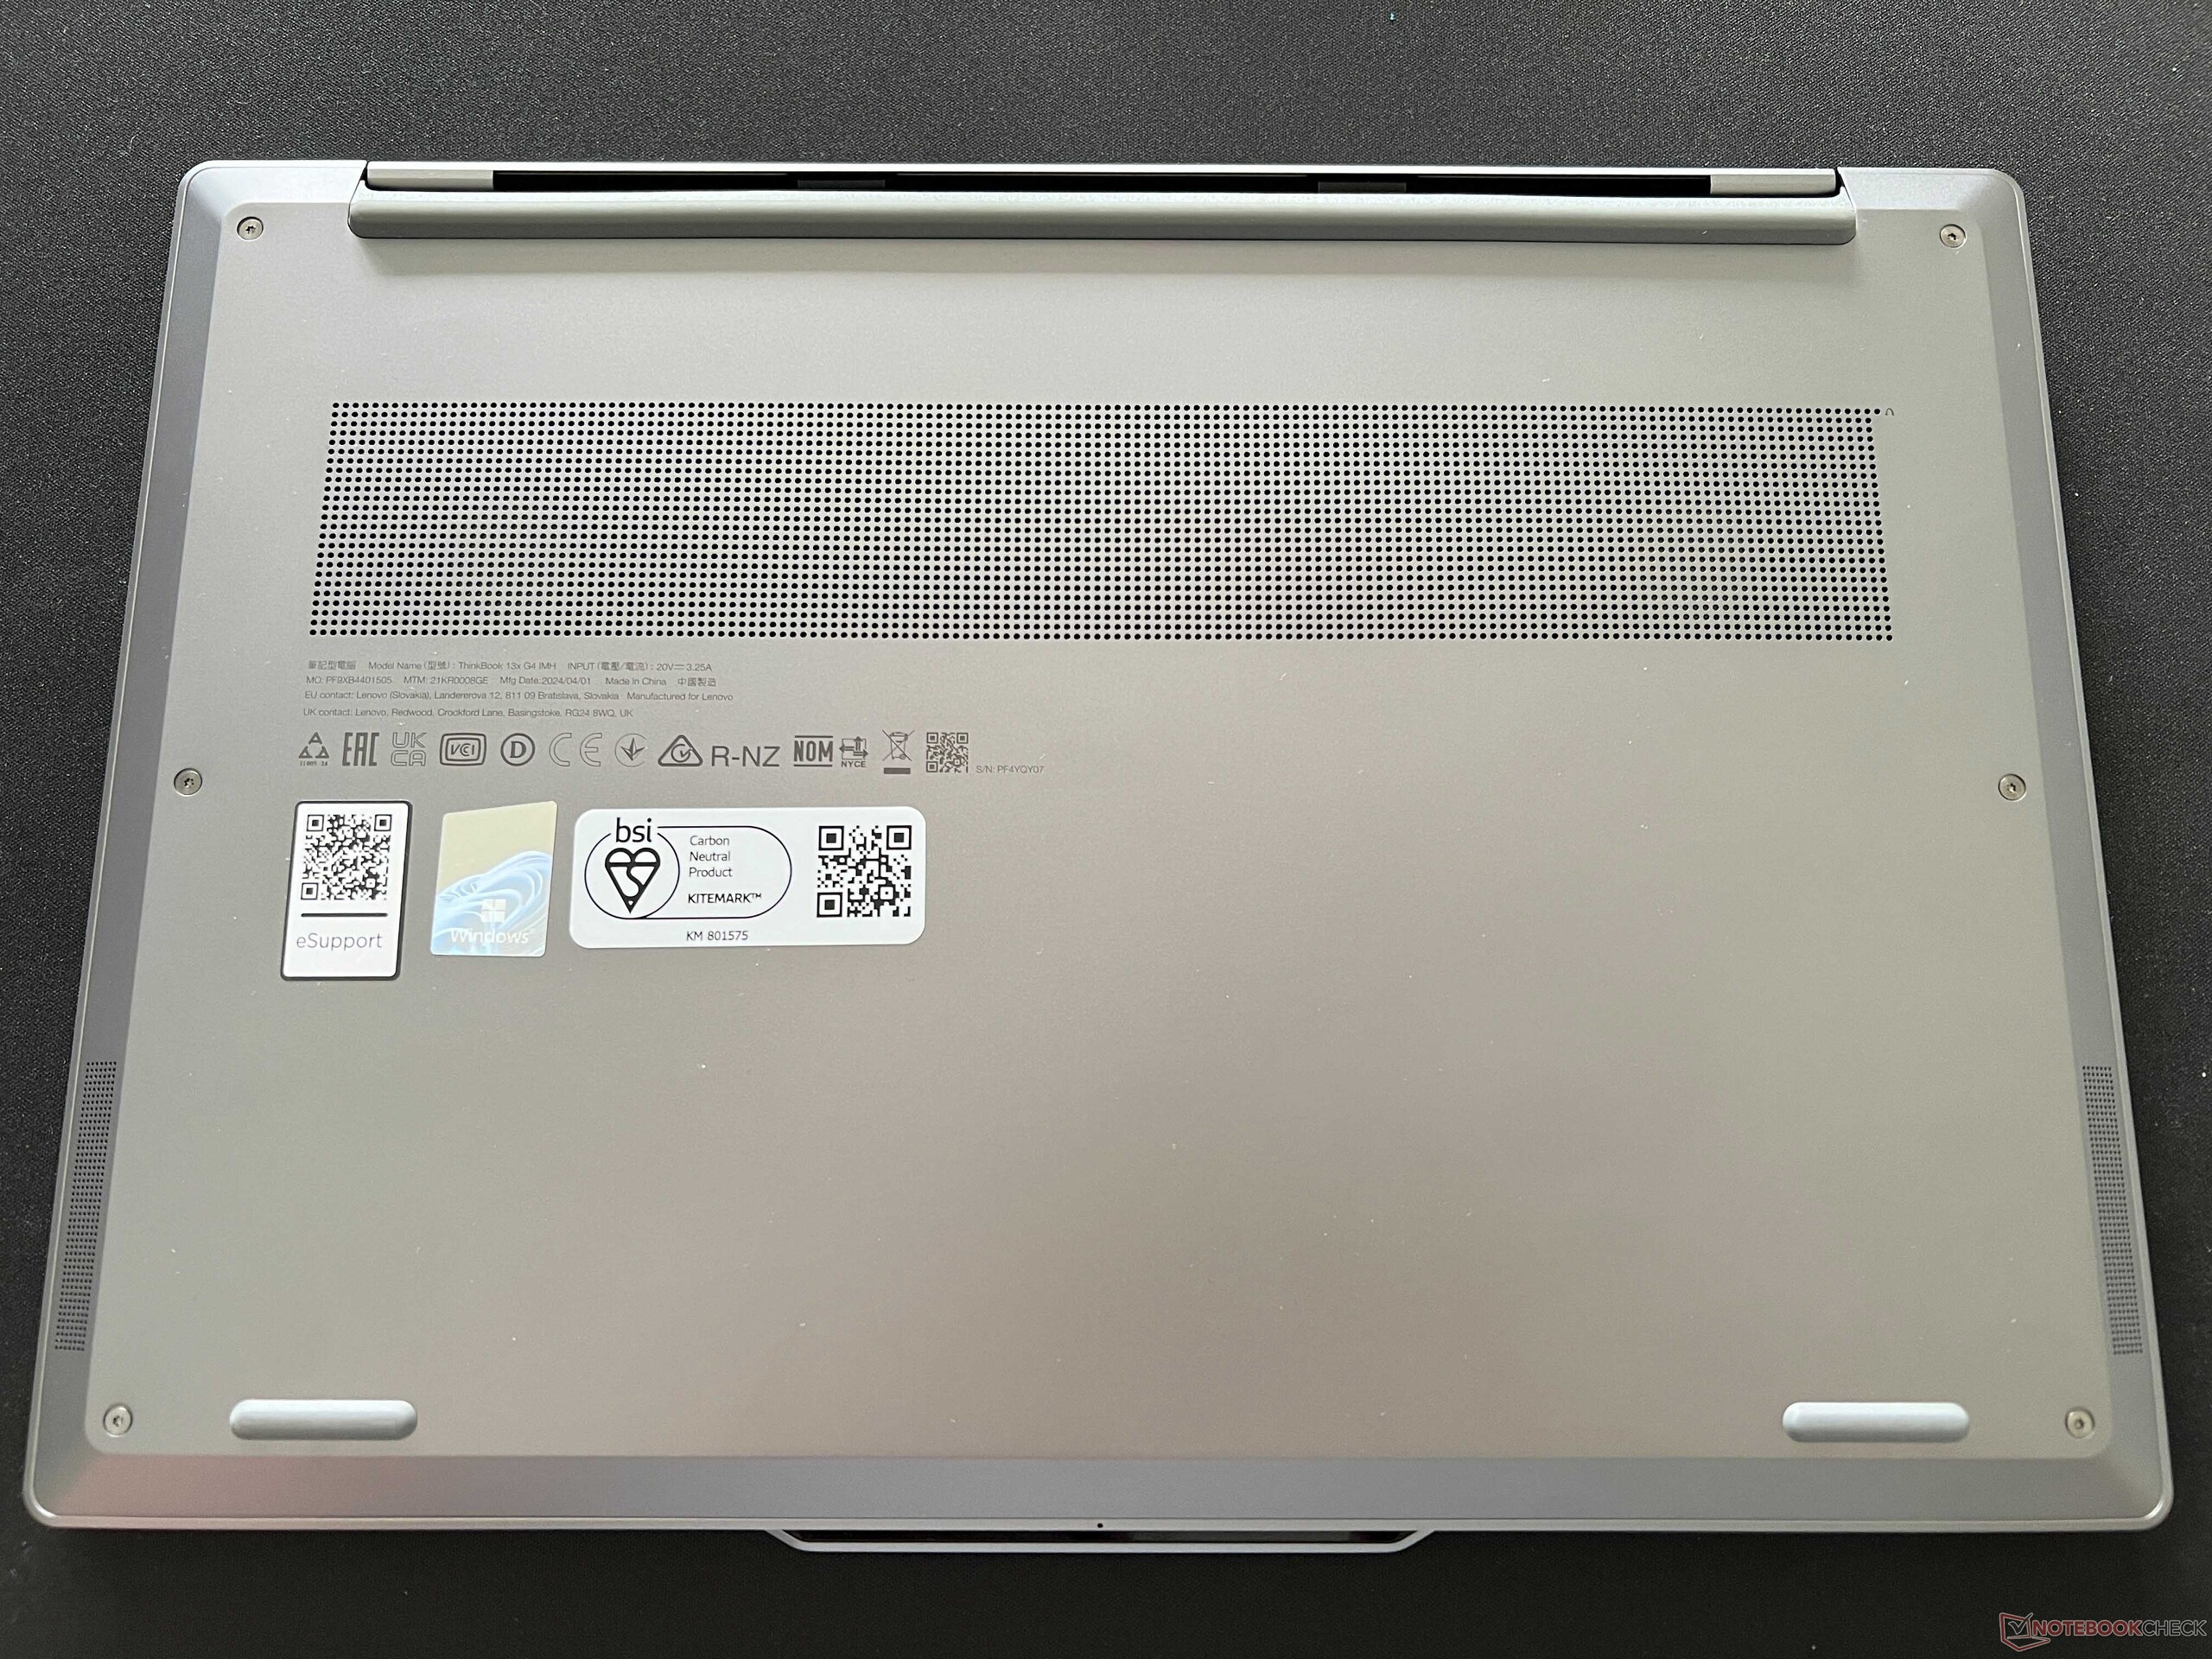
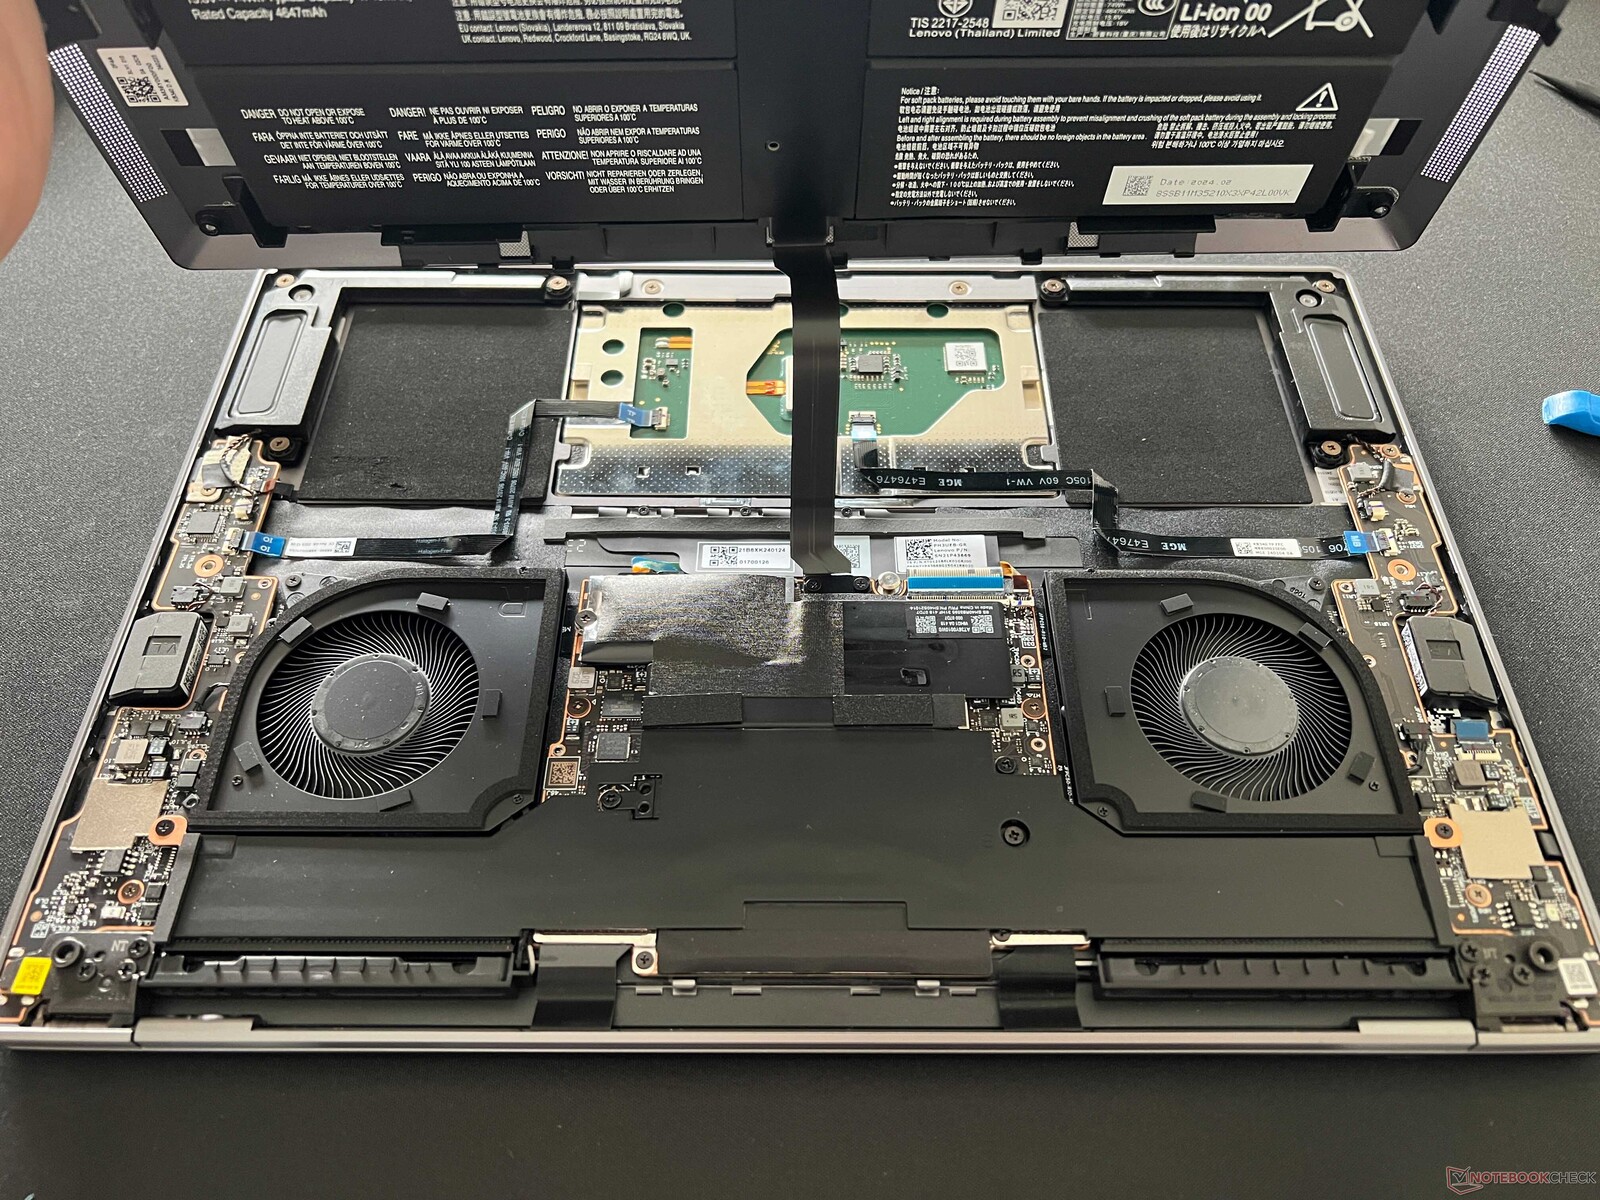
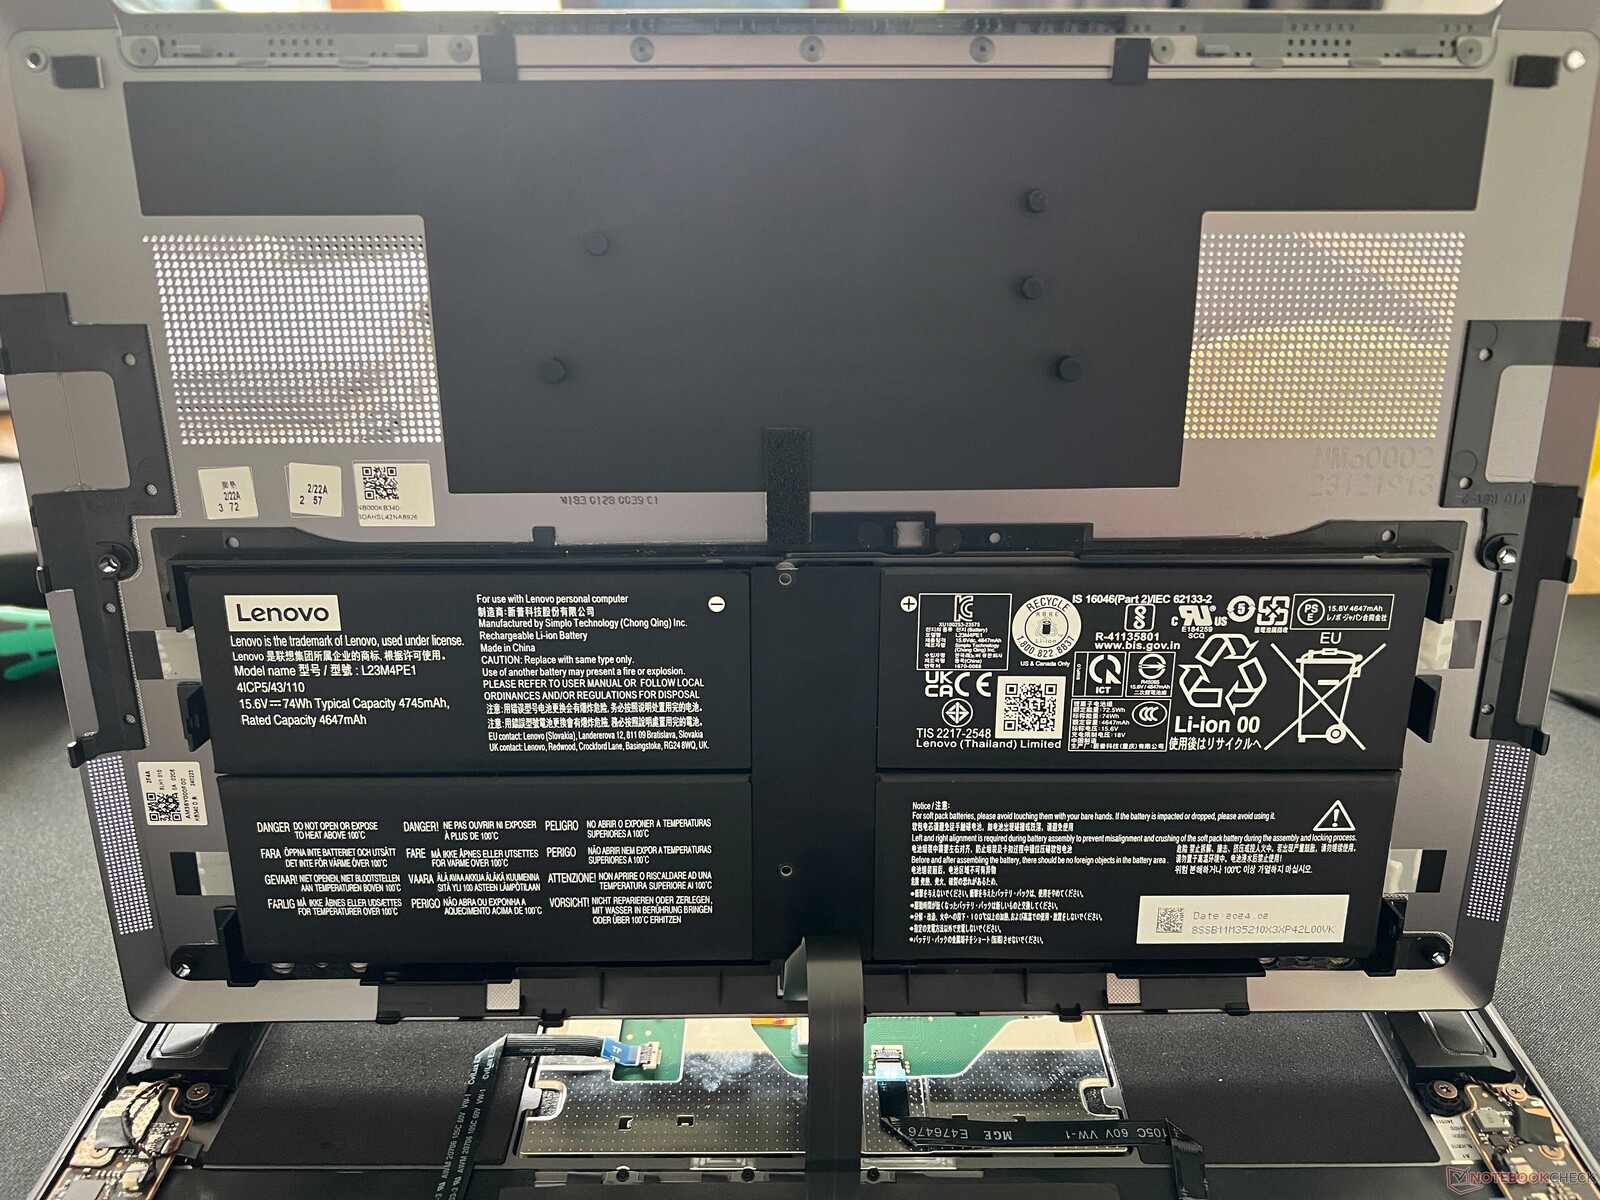
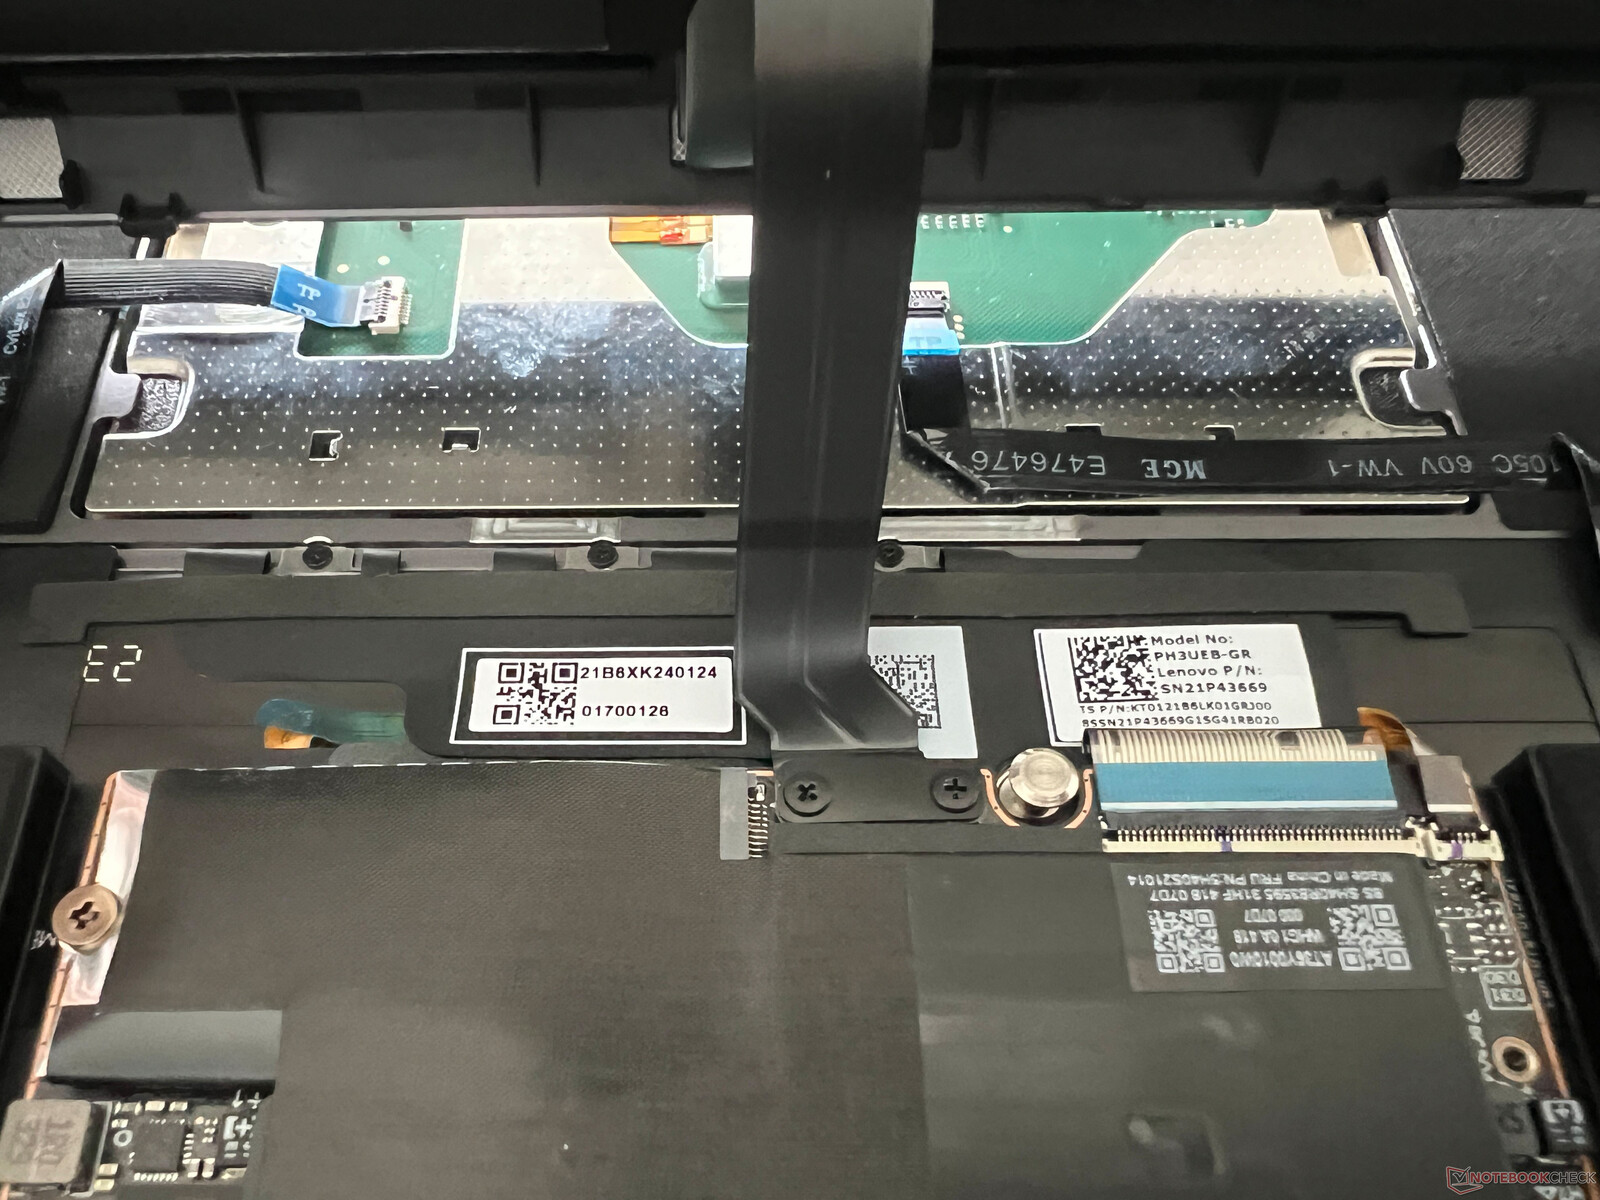
Manutenção
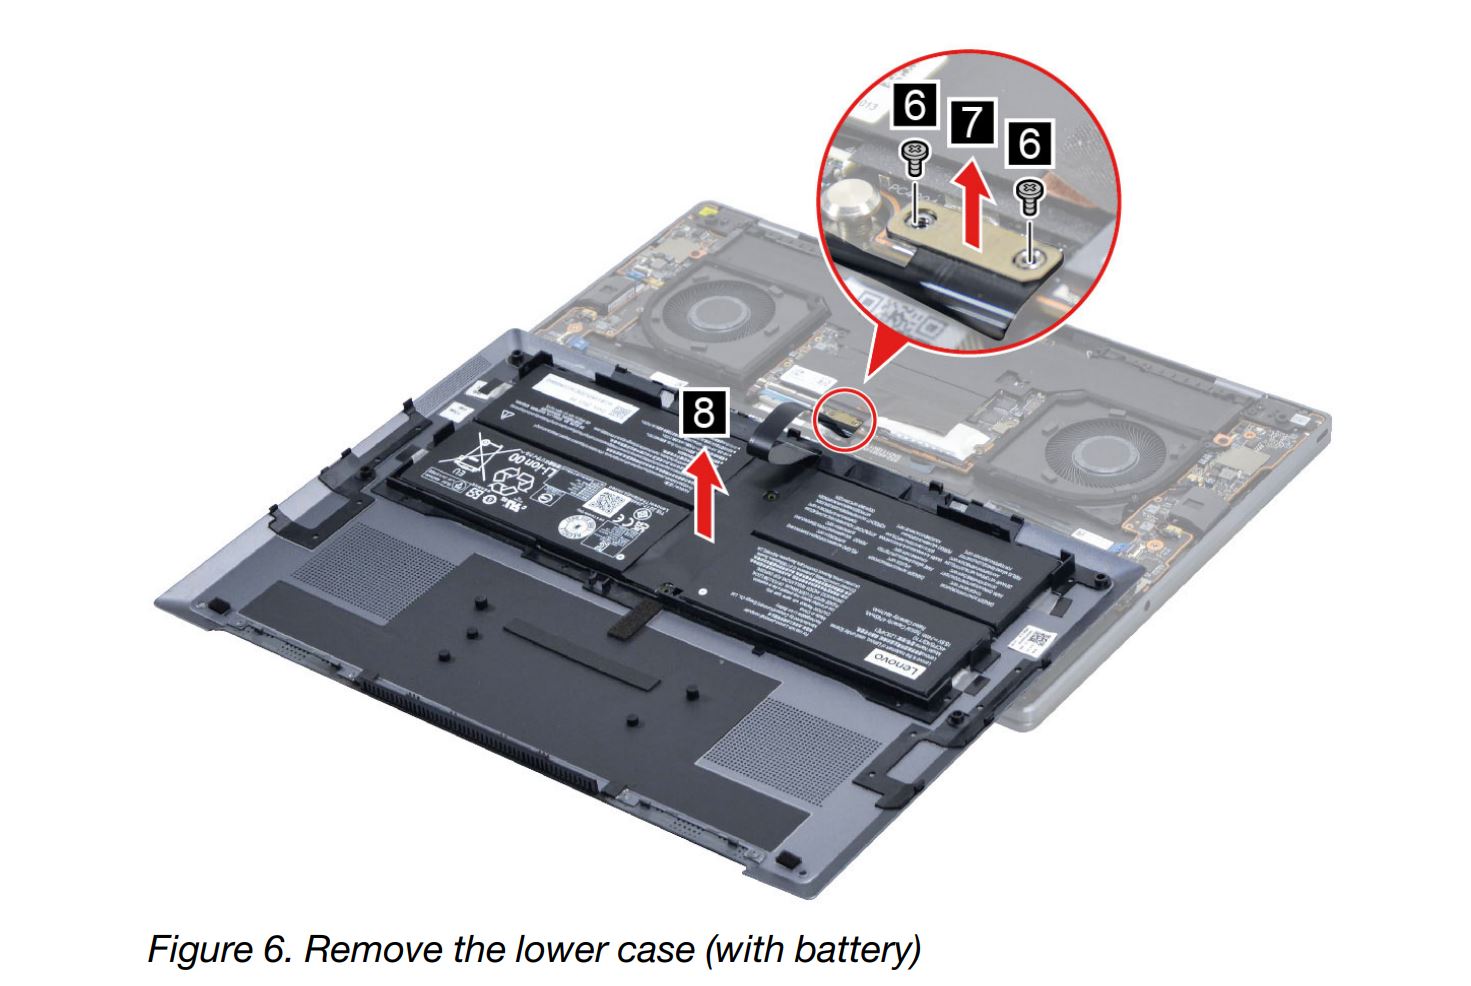
Ficamos surpresos quando abrimos o gabinete: embora a placa de base possa ser facilmente removida, as opções de manutenção são extremamente limitadas. A bateria é fixada na tampa da base e conectada à placa principal com um cabo de fita, que também é parafusado no lugar. Isso também está descrito no manual de manutenção, mas o procedimento pode ser complicado para usuários inexperientes.
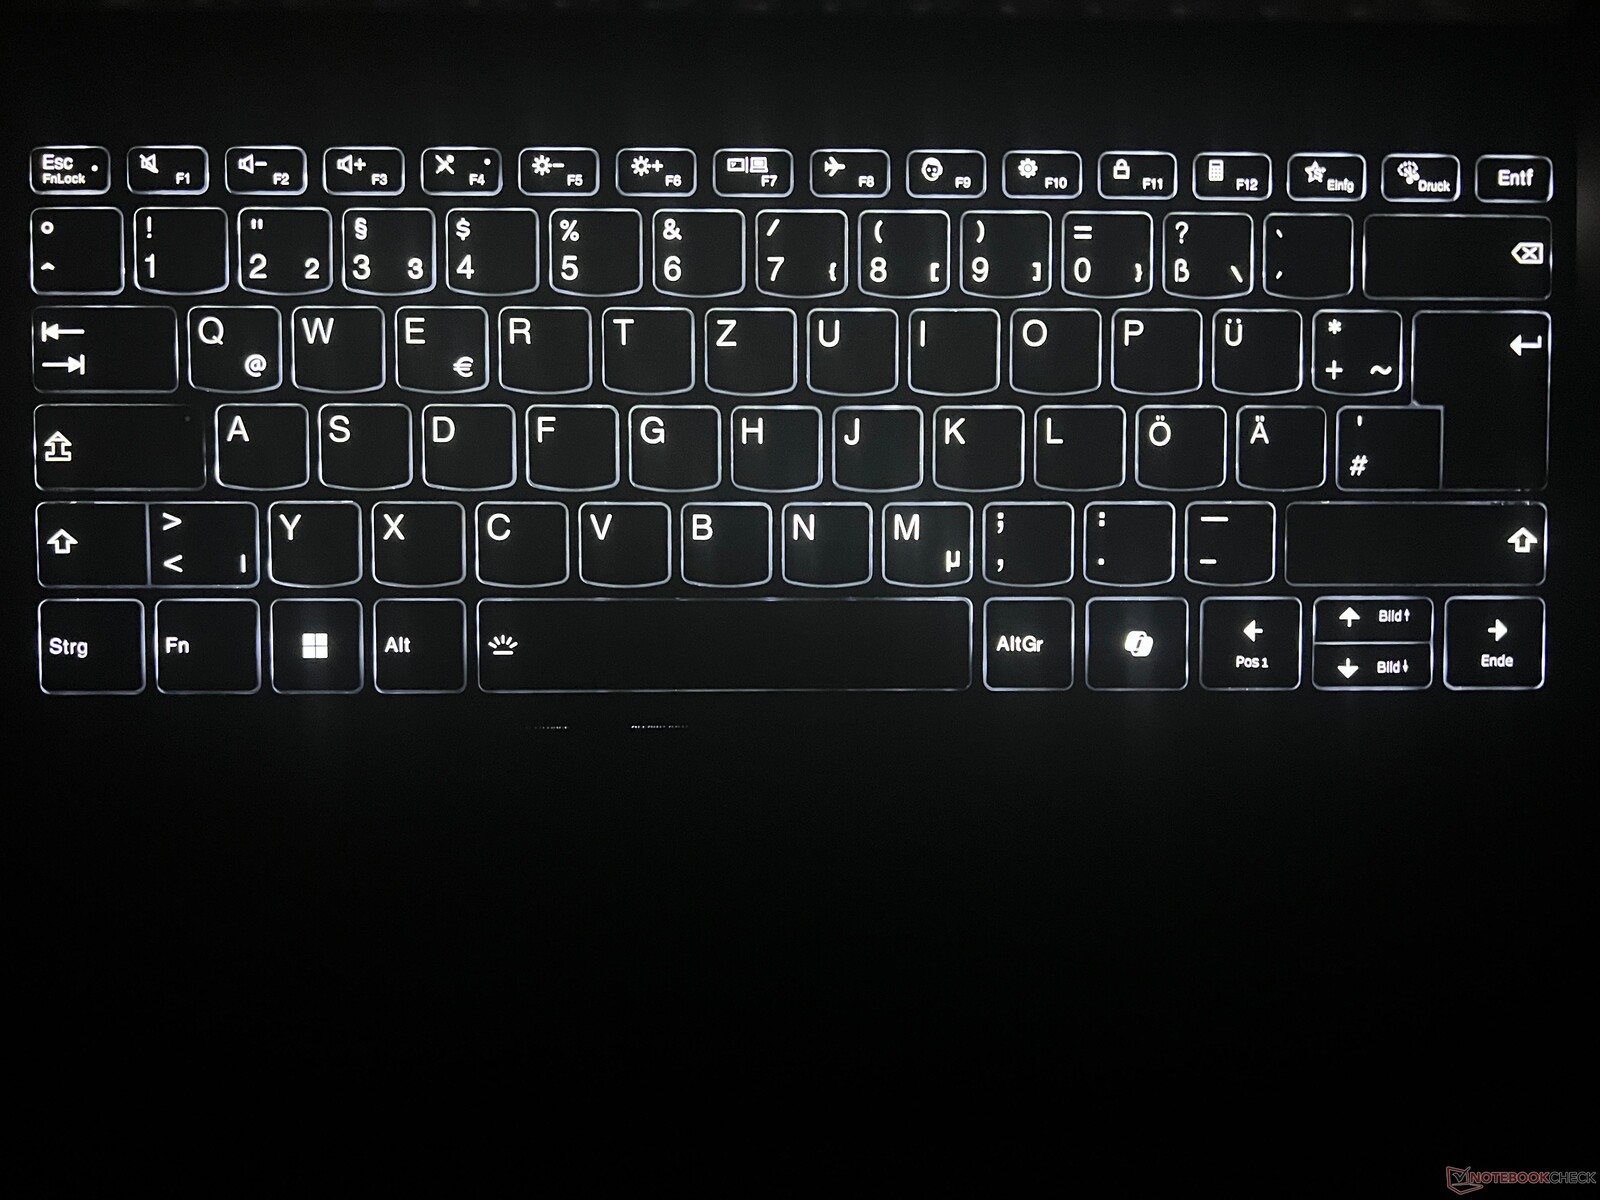
Dispositivos de entrada - Touchpad háptico, mas teclado fraco
O teclado é um dos pontos fracos do ThinkBook 13x G4, pois o curso das teclas é muito curto e a experiência de digitação não é muito confortável. As teclas são precisas e não muito barulhentas, mas se o senhor digita muito e está acostumado a um teclado com maior deslocamento das teclas, deve testar a entrada antes de comprar, se possível. O layout é simples e agora há também uma tecla de copiloto, embora as teclas de seta verticais sejam bem pequenas. Está disponível uma luz de fundo branca de dois estágios, que também pode ser ativada automaticamente por meio de um sensor.

Um touchpad háptico está disponível para controle do ponteiro, que fornece feedback por meio de motores de vibração. Isso funciona muito bem, mas o ruído do clique poderia ser um pouco mais baixo. A vantagem dessa solução é que o usuário pode clicar em qualquer lugar do pad e obter o mesmo feedback. As propriedades de deslizamento da superfície de vidro são excelentes. Com 12 x 7,5 cm, há espaço suficiente para movimentos/gestos.
Tela - 2.8K IPS com 120 Hz

A Lenovo renuncia a uma tela OLED no ThinkBook 13x G4 e em seu lugar instala um painel IPS de alta resolução no formato 3:2. Graças à resolução de 2880 x 1920, todo o conteúdo é muito nítido e as cores são vivas, mesmo que não no nível do OLED. No geral, a qualidade subjetiva da imagem é muito boa, pois as áreas claras não parecem granuladas e os movimentos se beneficiam do aumento da frequência. A ausência de cintilação PWM também é uma grande vantagem e os tempos de resposta também são discretos. Tanto o brilho quanto a temperatura da cor são ajustados automaticamente por meio de um sensor.
O brilho médio é de 513 cd/m² e o nível de preto é um pouco mais alto, 0,38 cd/m², mas isso ainda resulta em uma relação de contraste muito boa. Os halos não são um grande problema e o painel também suporta conteúdo HDR, mas o brilho máximo ainda é de 540 cd/m².
| |||||||||||||||||||||||||
iluminação: 89 %
iluminação com acumulador: 539 cd/m²
Contraste: 1418:1 (Preto: 0.38 cd/m²)
ΔE Color 1.4 | 0.5-29.43 Ø4.87, calibrated: 0.7
ΔE Greyscale 2.2 | 0.5-98 Ø5.1
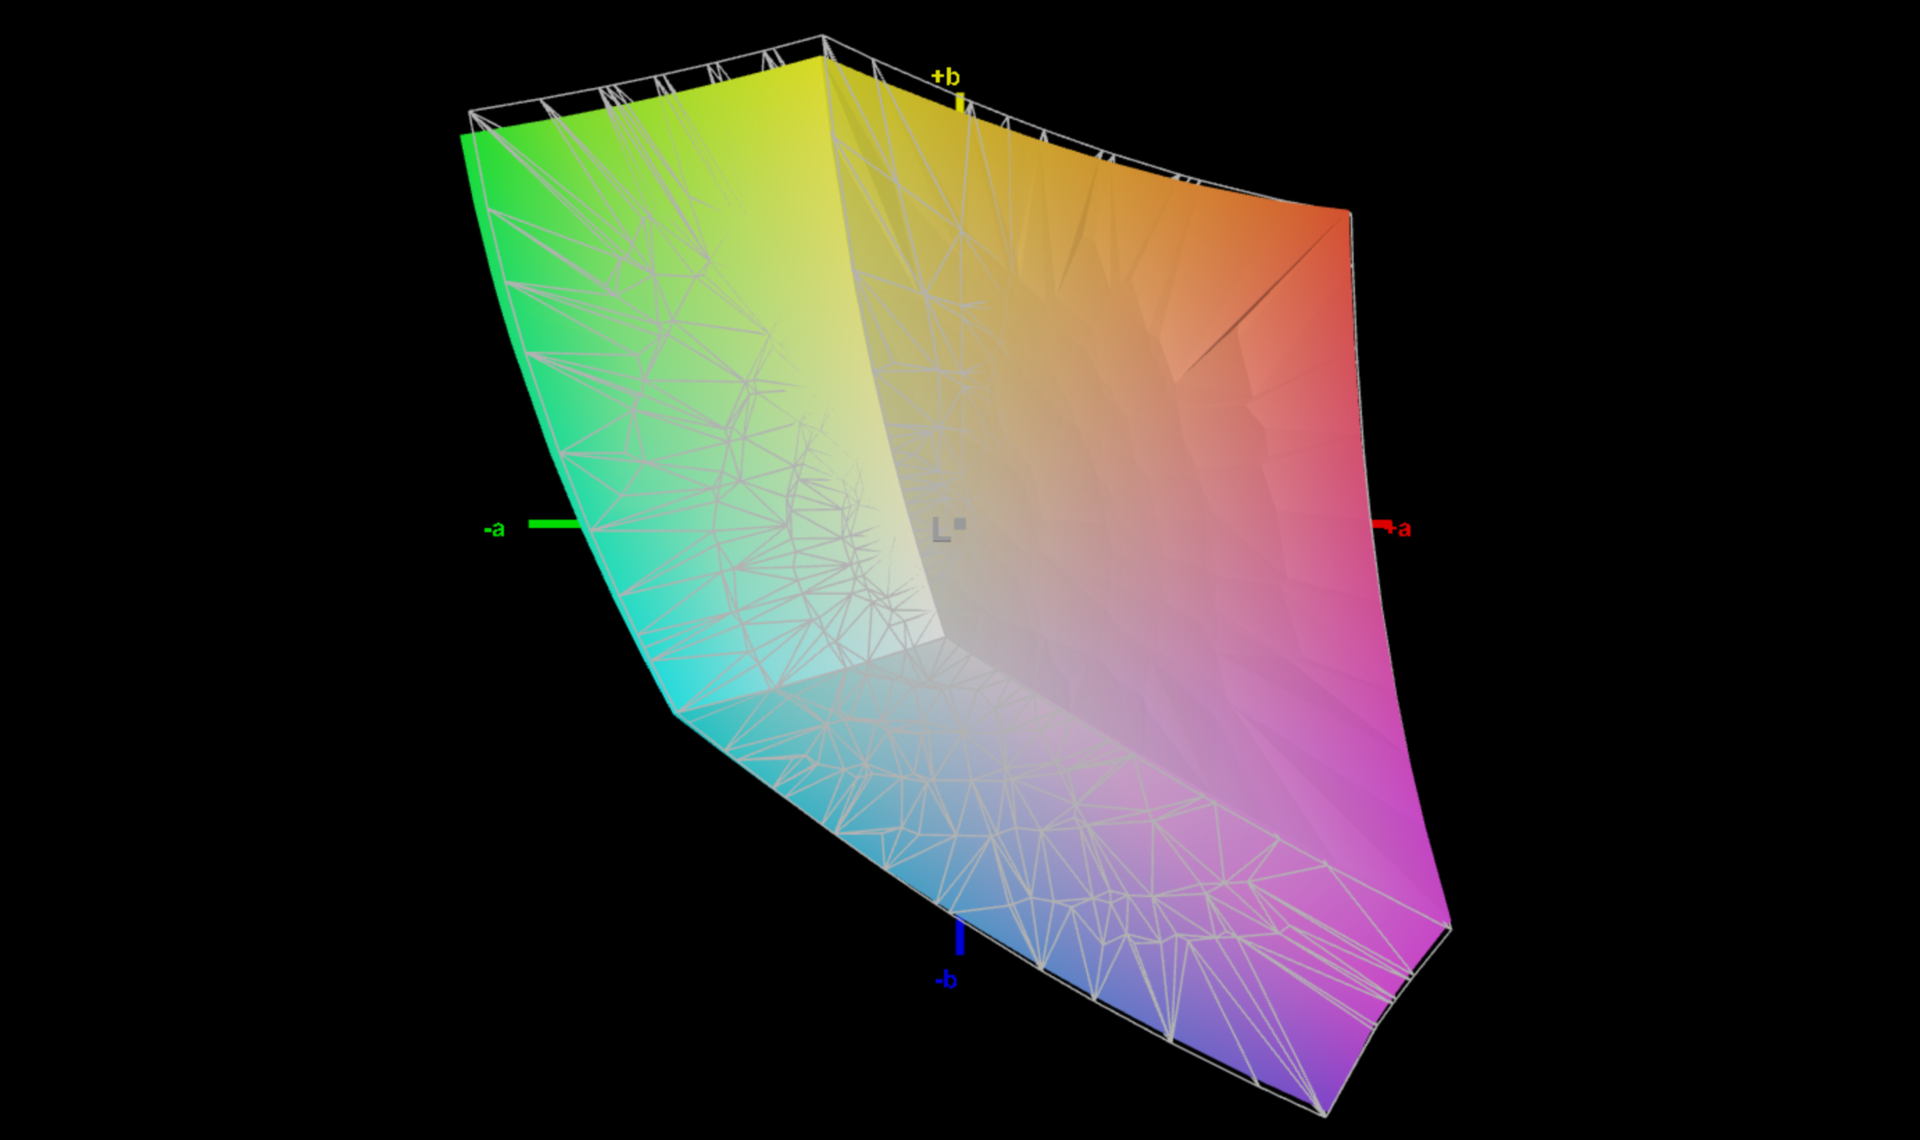
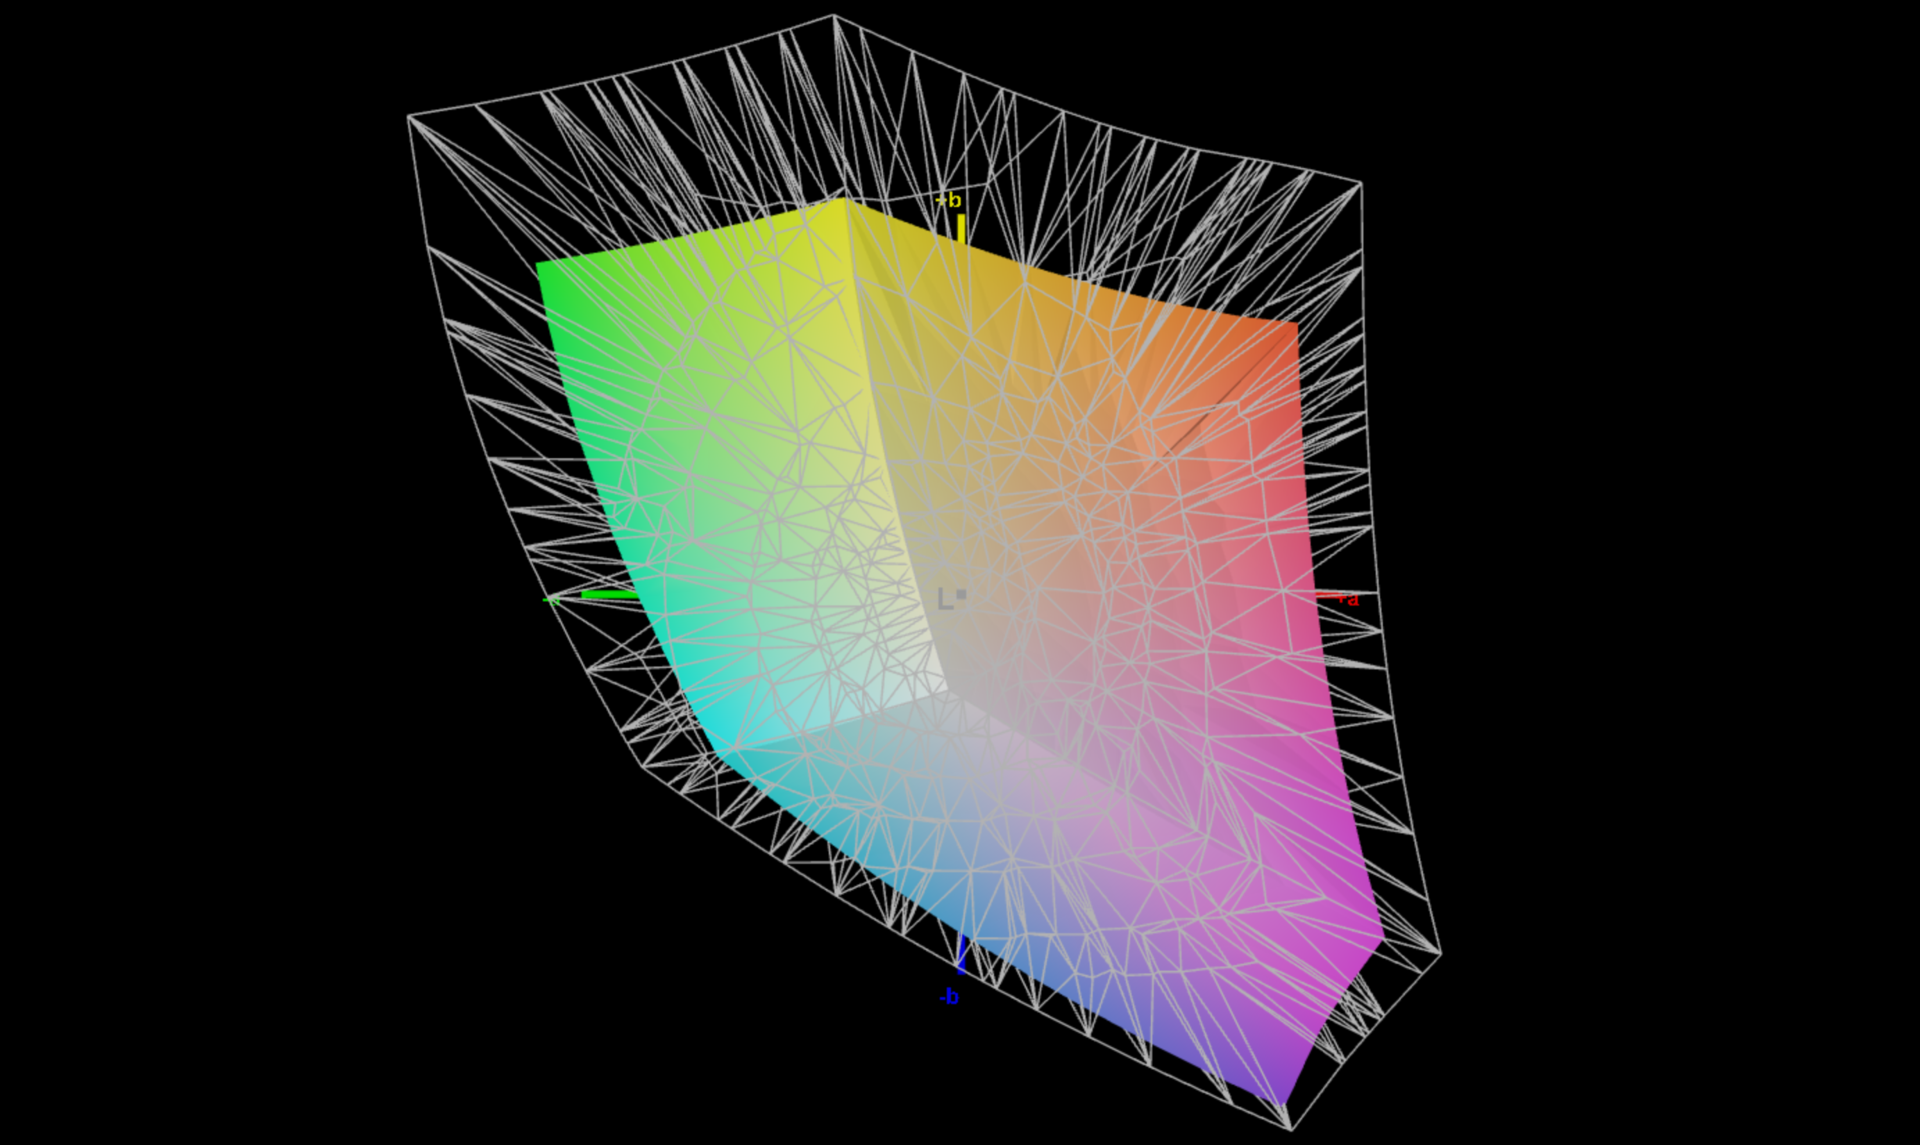
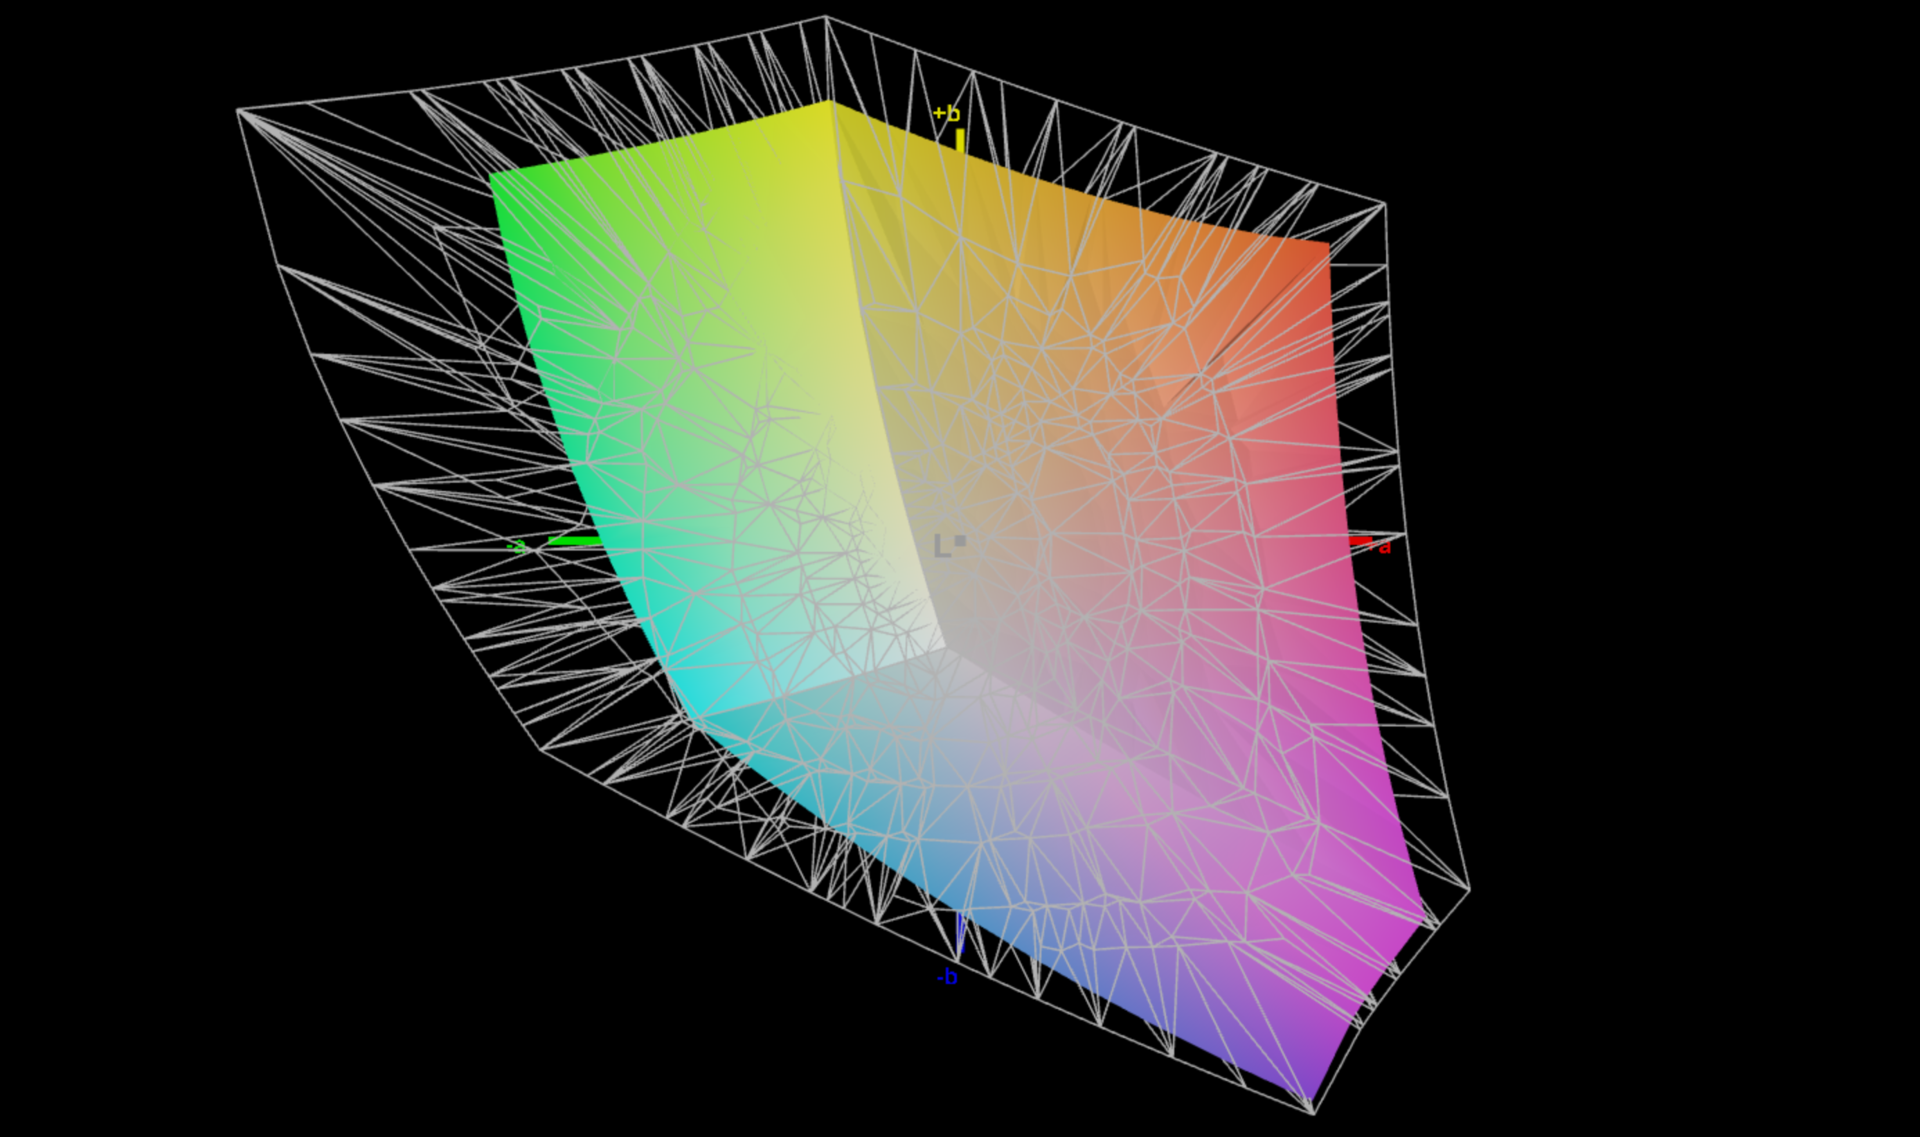
67.7% AdobeRGB 1998 (Argyll 2.2.0 3D)
97.3% sRGB (Argyll 2.2.0 3D)
65.5% Display P3 (Argyll 2.2.0 3D)
Gamma: 2.19
| Lenovo ThinkBook 13x G4 21KR0008GE LEN135WQ+, IPS, 2880x1920, 13.5" | Dell XPS 13 9340 Core Ultra 7 SHP1593, IPS, 1920x1200, 13.4" | Apple MacBook Air 13 M3 10C GPU IPS, 2560x1664, 13.6" | MSI Prestige 13 AI Evo ATNA33AA07-0, OLED, 2880x1800, 13.3" | Lenovo ThinkPad Z13 Gen 2 ATNA33AA02-0, OLED, 2880x1800, 13.3" | HP Dragonfly G4 Chi Mei CMN13C0, IPS, 1920x1280, 13.5" | |
|---|---|---|---|---|---|---|
| Display | 4% | 28% | 33% | 33% | 3% | |
| Display P3 Coverage | 65.5 | 69.4 6% | 98.4 50% | 99.9 53% | 99.7 52% | 68.4 4% |
| sRGB Coverage | 97.3 | 97.8 1% | 99.9 3% | 100 3% | 100 3% | 98.3 1% |
| AdobeRGB 1998 Coverage | 67.7 | 71.7 6% | 87.9 30% | 97.8 44% | 97.3 44% | 70.4 4% |
| Response Times | -87% | -70% | 92% | 88% | -112% | |
| Response Time Grey 50% / Grey 80% * | 27.3 ? | 43.2 ? -58% | 34.5 ? -26% | 1.54 ? 94% | 2.1 ? 92% | 48.8 ? -79% |
| Response Time Black / White * | 12.8 ? | 27.6 ? -116% | 27.2 ? -113% | 1.44 ? 89% | 2.2 ? 83% | 31.3 ? -145% |
| PWM Frequency | 240 ? | 60.1 ? | ||||
| Screen | -40% | 1% | -11% | 7% | -9% | |
| Brightness middle | 539 | 429 -20% | 525 -3% | 404 -25% | 372 -31% | 408.8 -24% |
| Brightness | 513 | 407 -21% | 506 -1% | 407 -21% | 375 -27% | 399 -22% |
| Brightness Distribution | 89 | 90 1% | 92 3% | 98 10% | 99 11% | 90 1% |
| Black Level * | 0.38 | 0.28 26% | 0.42 -11% | 0.32 16% | ||
| Contrast | 1418 | 1532 8% | 1250 -12% | 1278 -10% | ||
| Colorchecker dE 2000 * | 1.4 | 2.6 -86% | 1.4 -0% | 2.1 -50% | 0.88 37% | 2.02 -44% |
| Colorchecker dE 2000 max. * | 3.5 | 6.6 -89% | 2.8 20% | 4.3 -23% | 3.22 8% | 3.84 -10% |
| Colorchecker dE 2000 calibrated * | 0.7 | 1.4 -100% | 0.61 13% | |||
| Greyscale dE 2000 * | 2.2 | 4 -82% | 2 9% | 1.2 45% | 1.2 45% | 2.3 -5% |
| Gamma | 2.19 100% | 2.23 99% | 2.2 100% | 2.16 102% | 2.18 101% | 2.2 100% |
| CCT | 6710 97% | 7332 89% | 6876 95% | 6465 101% | 6326 103% | 6203 105% |
| Média Total (Programa/Configurações) | -41% /
-37% | -14% /
-4% | 38% /
20% | 43% /
29% | -39% /
-21% |
* ... menor é melhor
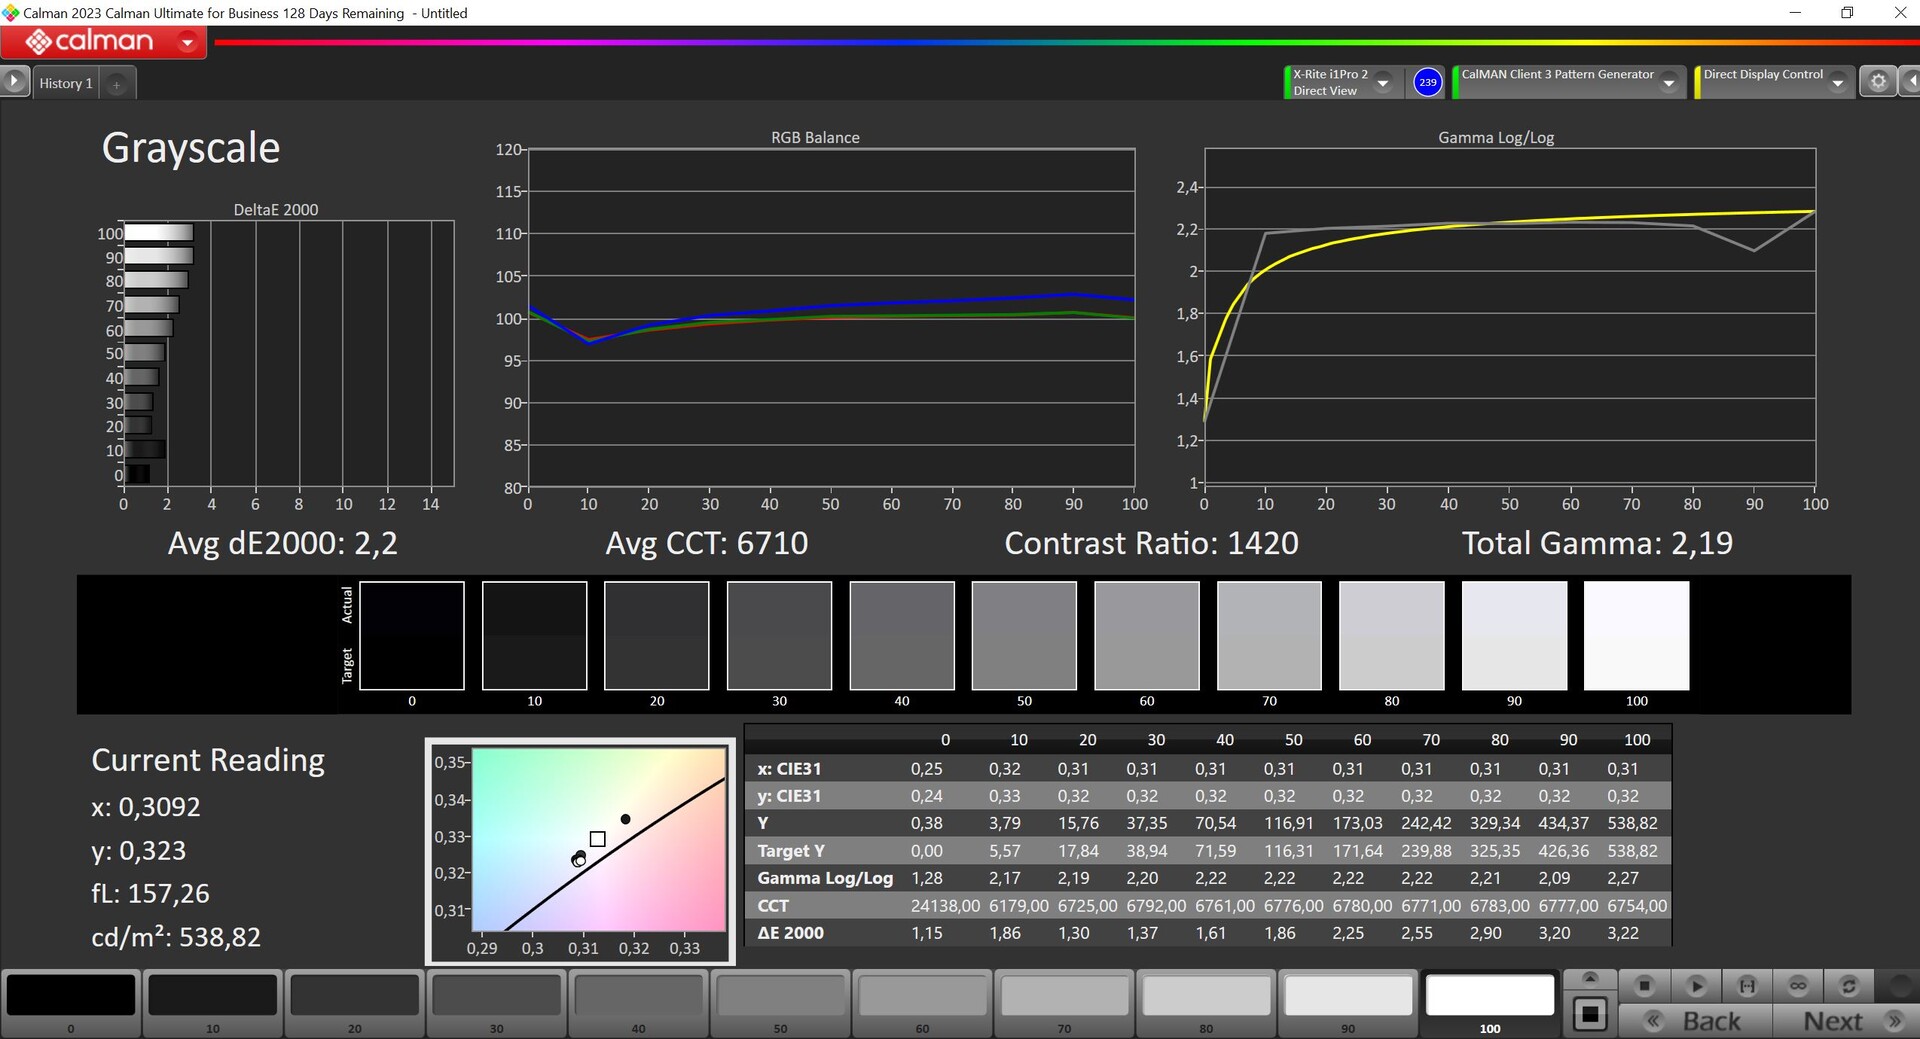
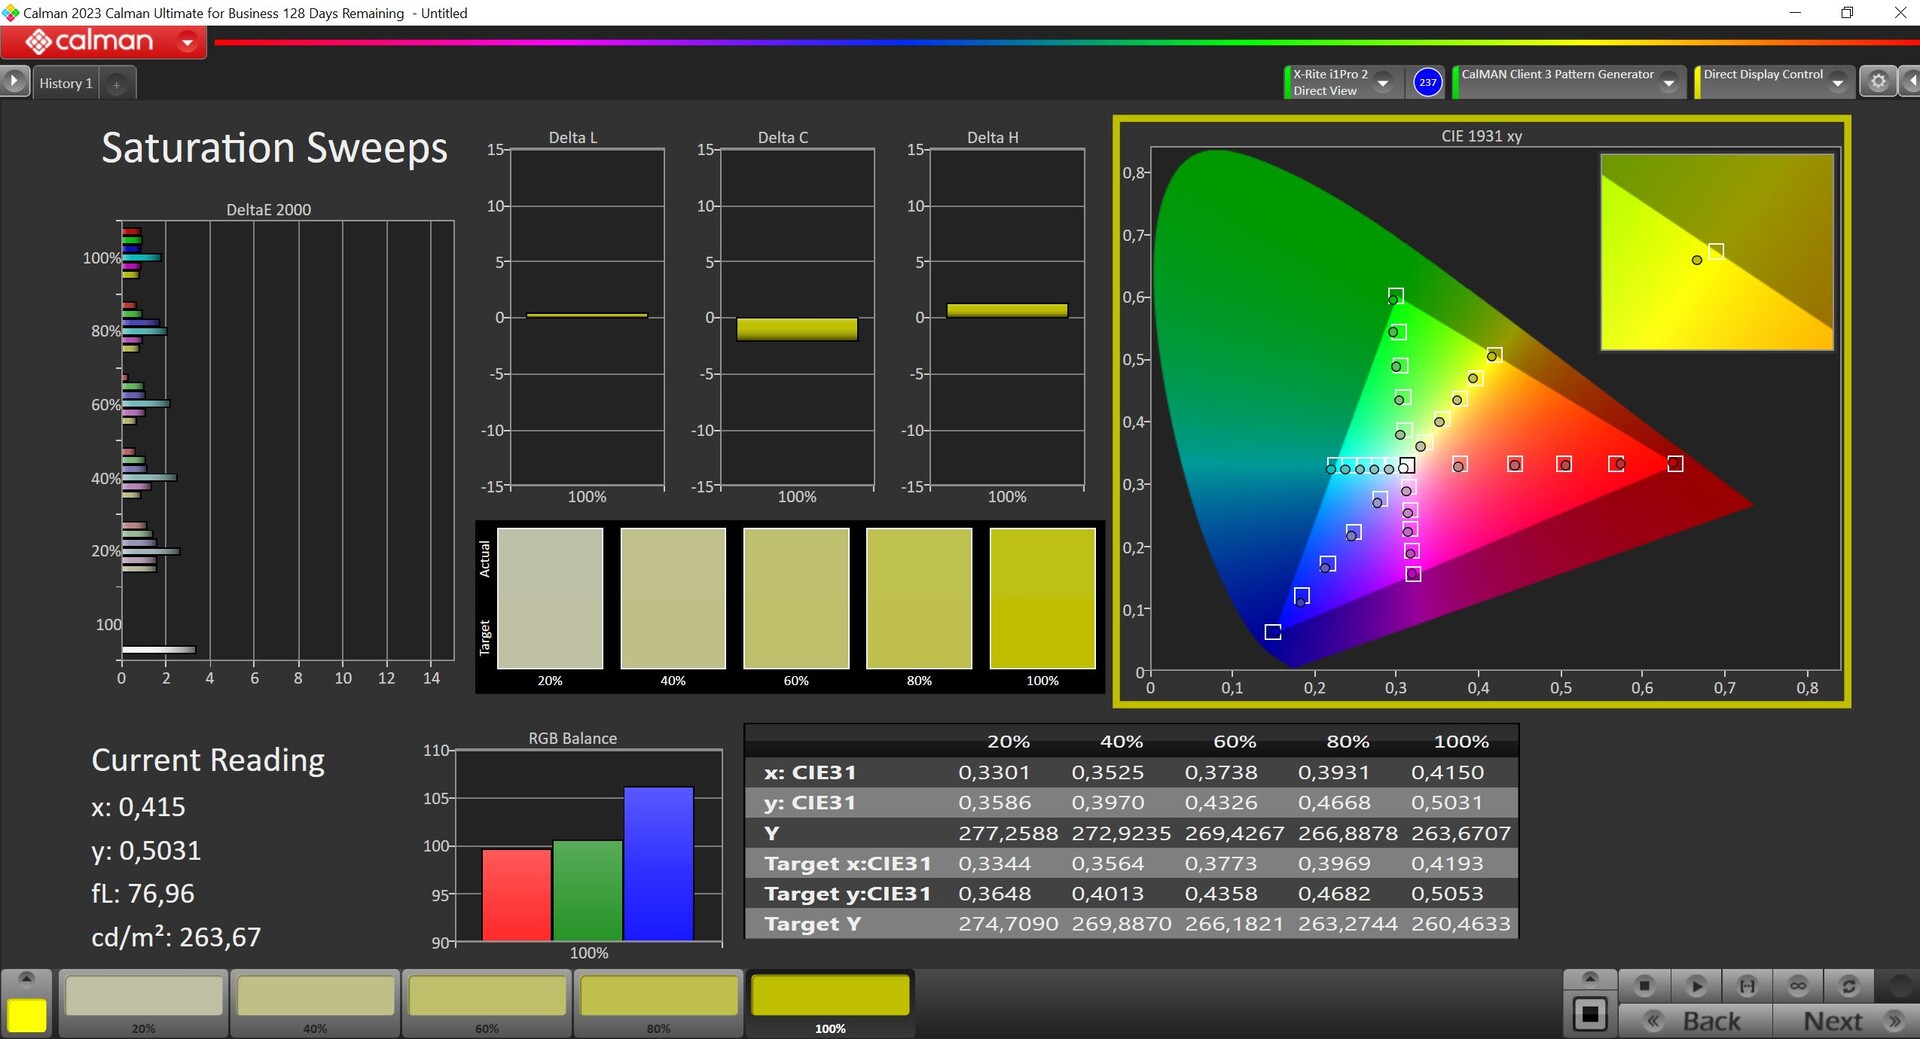
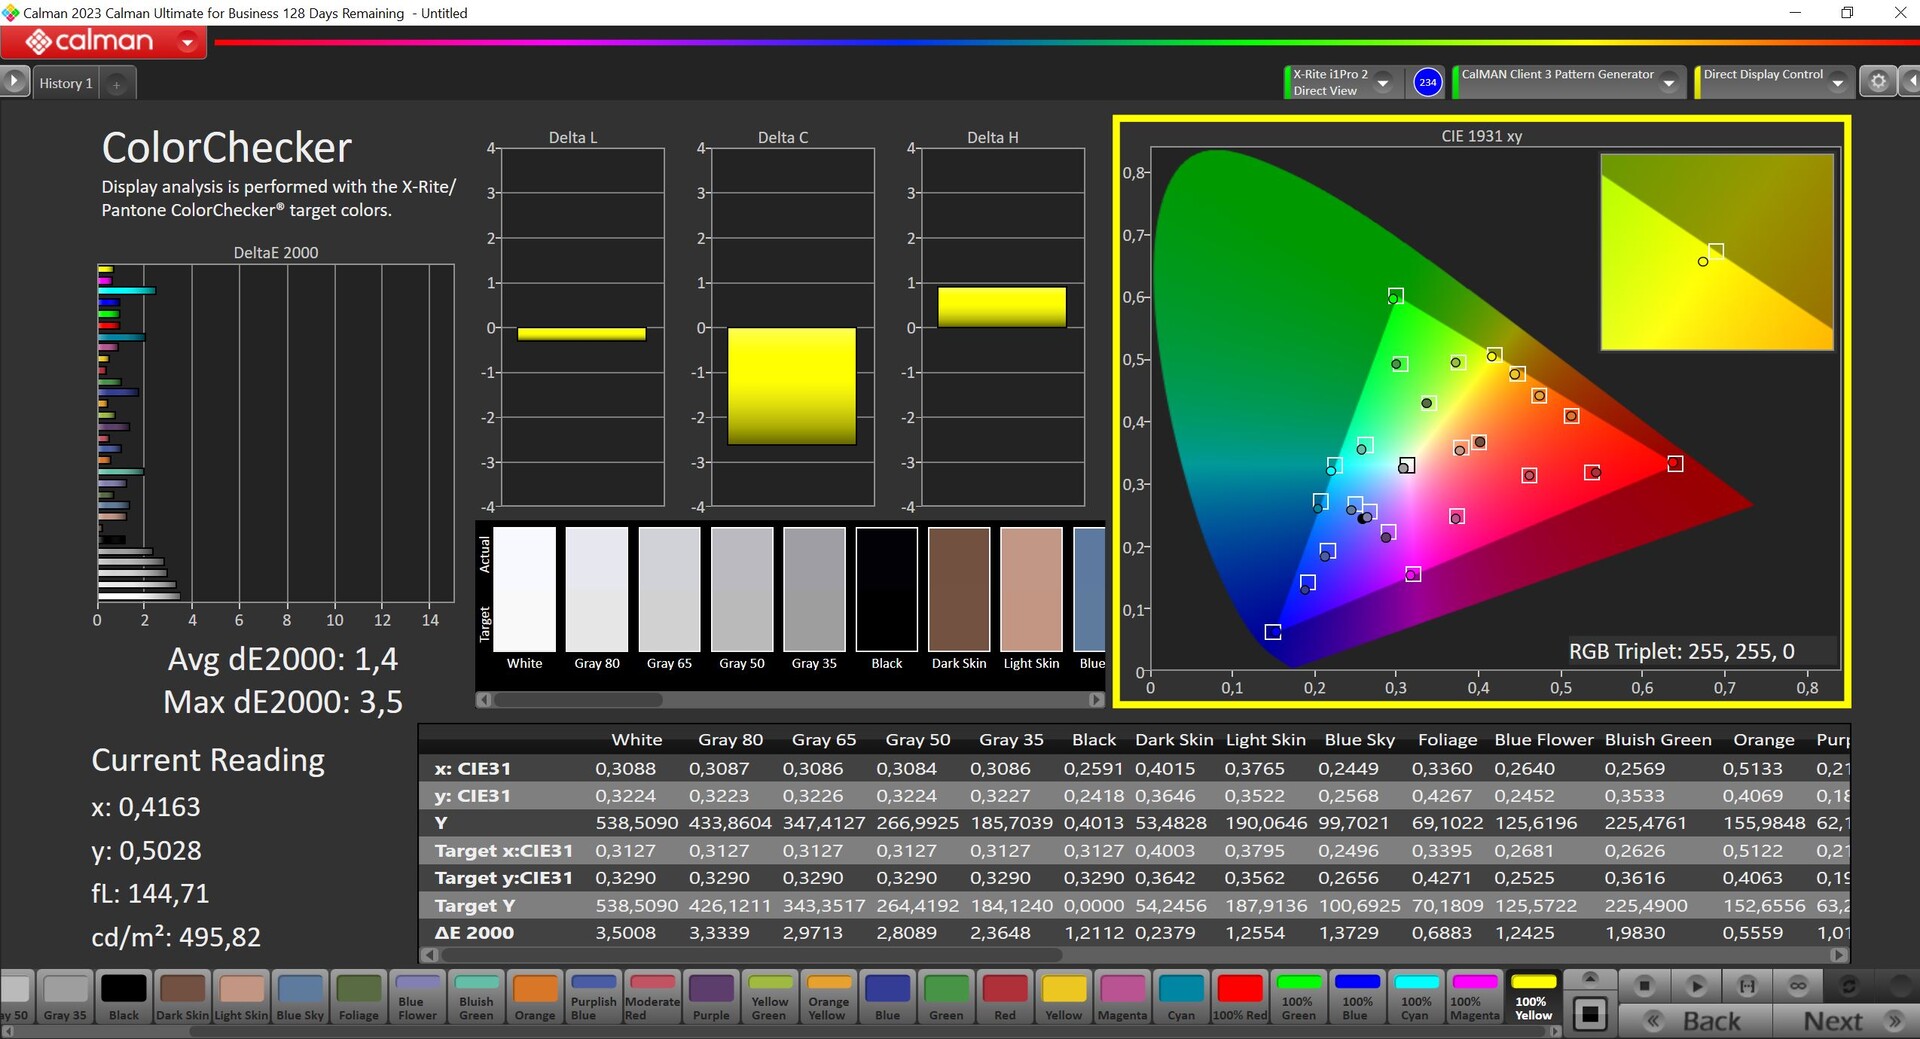
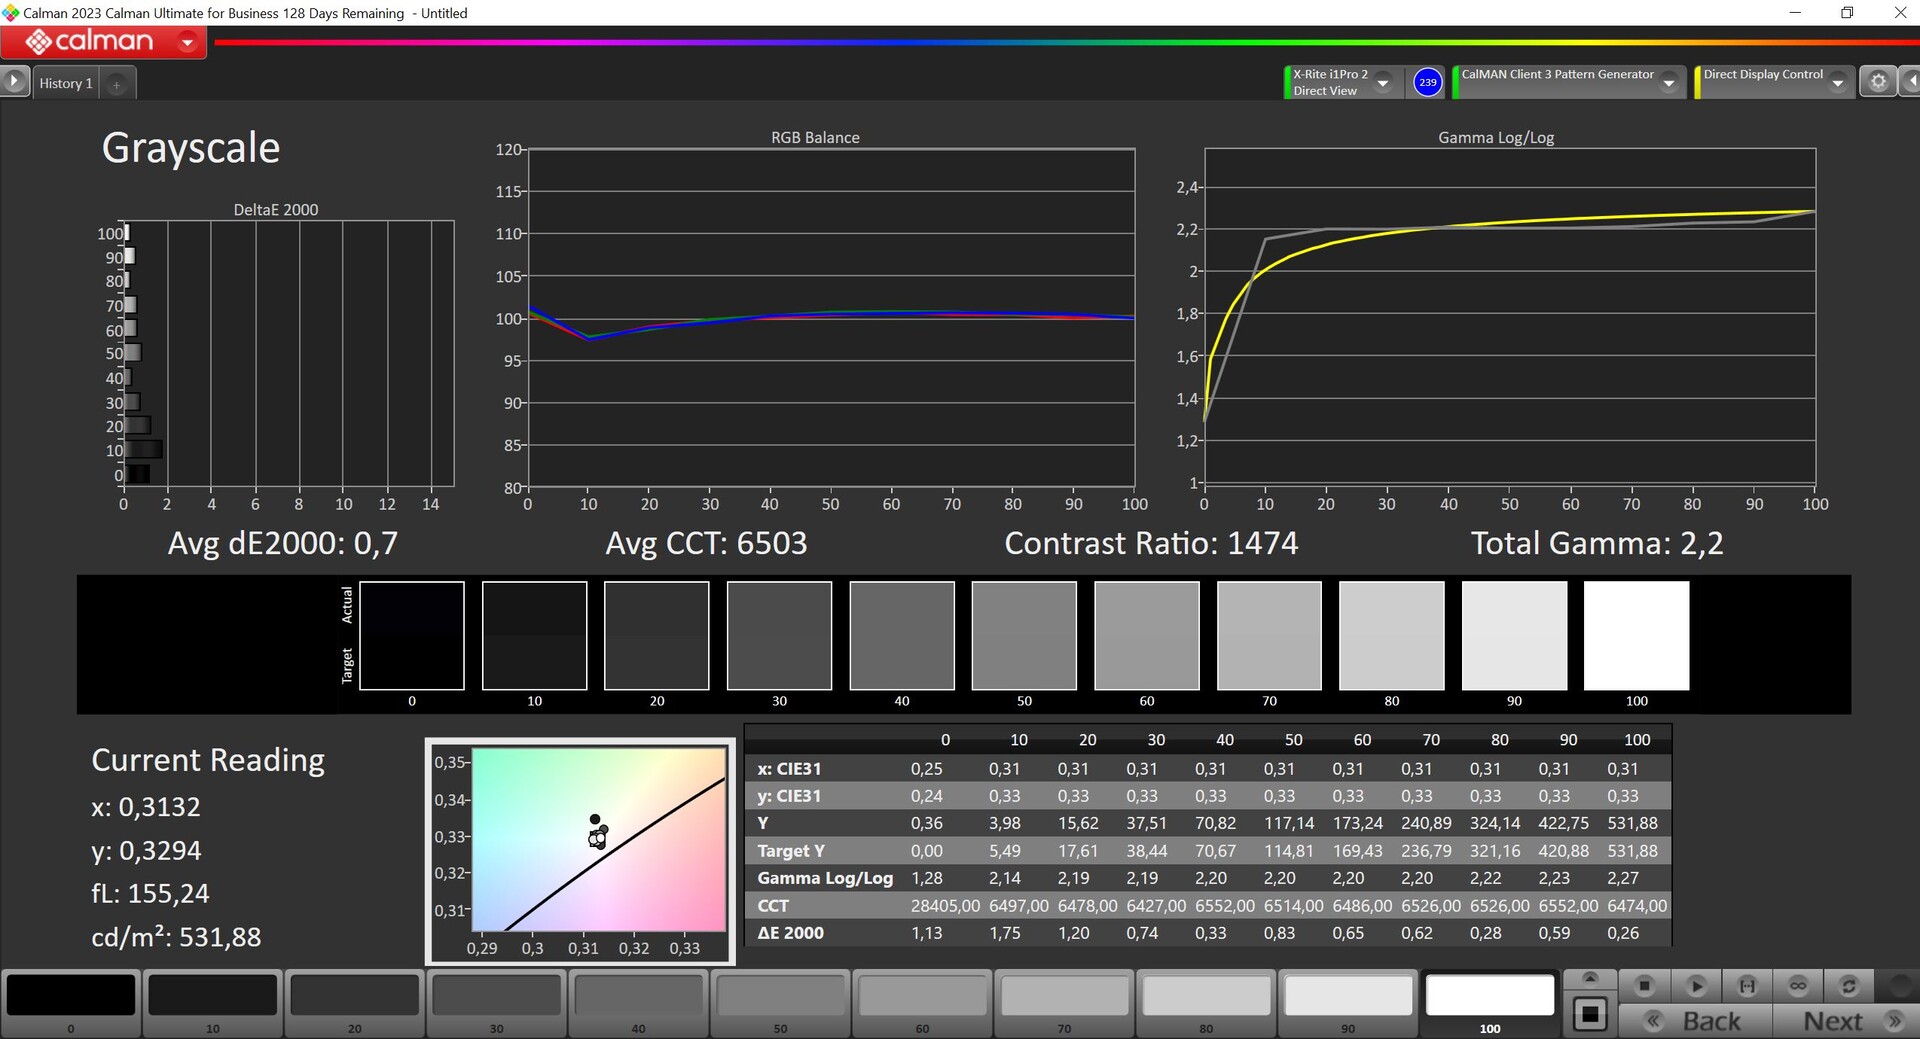


A tela já está bem ajustada para funcionar e nossa análise com o software profissional CalMAN (X-Rite i1 Pro 2) mostra apenas um mínimo de projeção azul, que não é perceptível na prática. Todas as cores já estão abaixo do importante limite DeltaE-2000 de 3 em comparação com o espaço de cores de referência sRGB, portanto, a calibração não é absolutamente necessária. Conseguimos melhorar um pouco a tela com nossa própria calibração (o perfil correspondente está disponível para download gratuito acima) e também eliminar o mínimo de projeção de cores. O espaço de cores sRGB é quase totalmente coberto, portanto o ThinkBook é adequado para edição de vídeo e imagem.
Exibir tempos de resposta
| ↔ Tempo de resposta preto para branco | ||
|---|---|---|
| 12.8 ms ... ascensão ↗ e queda ↘ combinadas | ↗ 4.4 ms ascensão | 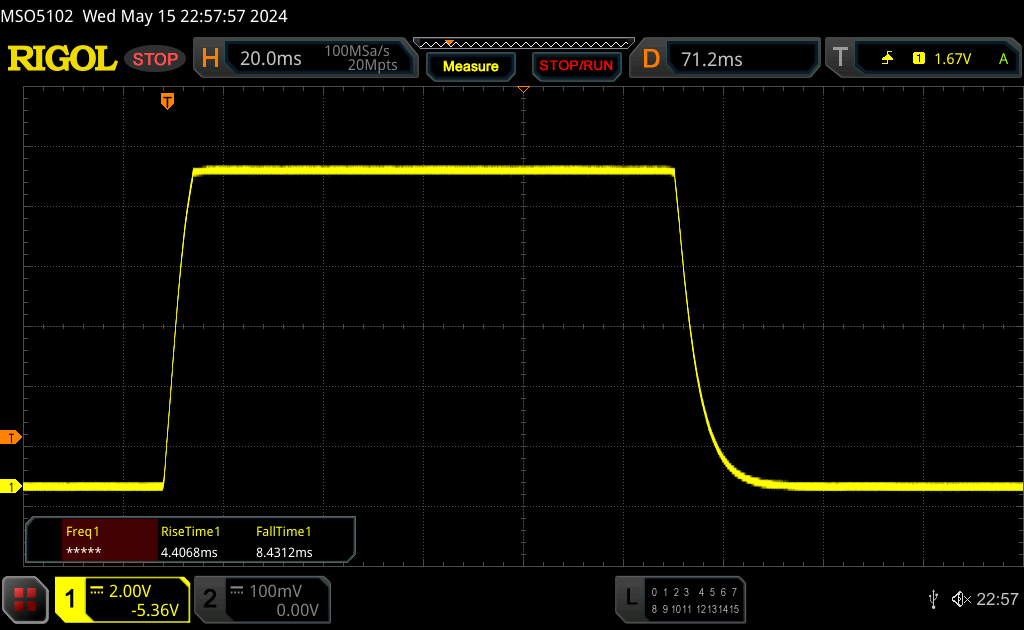 |
| ↘ 8.4 ms queda | ||
| A tela mostra boas taxas de resposta em nossos testes, mas pode ser muito lenta para jogadores competitivos. Em comparação, todos os dispositivos testados variam de 0.1 (mínimo) a 240 (máximo) ms. » 30 % de todos os dispositivos são melhores. Isso significa que o tempo de resposta medido é melhor que a média de todos os dispositivos testados (20.8 ms). | ||
| ↔ Tempo de resposta 50% cinza a 80% cinza | ||
| 27.3 ms ... ascensão ↗ e queda ↘ combinadas | ↗ 12.8 ms ascensão | 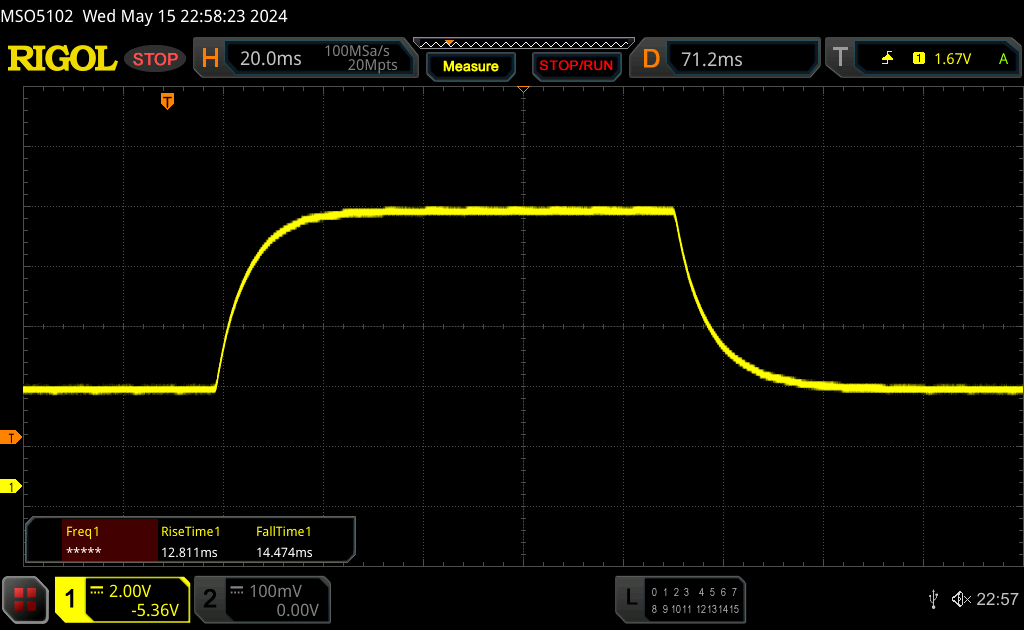 |
| ↘ 14.5 ms queda | ||
| A tela mostra taxas de resposta relativamente lentas em nossos testes e pode ser muito lenta para os jogadores. Em comparação, todos os dispositivos testados variam de 0.165 (mínimo) a 636 (máximo) ms. » 34 % de todos os dispositivos são melhores. Isso significa que o tempo de resposta medido é melhor que a média de todos os dispositivos testados (32.5 ms). | ||
Cintilação da tela / PWM (modulação por largura de pulso)
| Tela tremeluzindo / PWM não detectado | 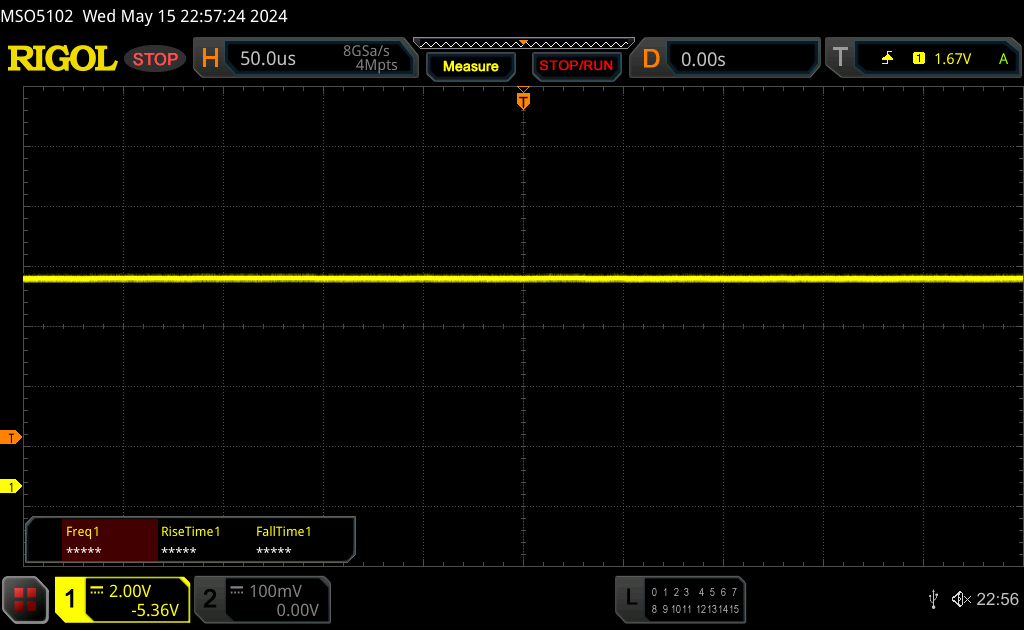 | ||
[pwm_comparison] Em comparação: 53 % de todos os dispositivos testados não usam PWM para escurecer a tela. Se PWM foi detectado, uma média de 8516 (mínimo: 5 - máximo: 343500) Hz foi medida. | |||
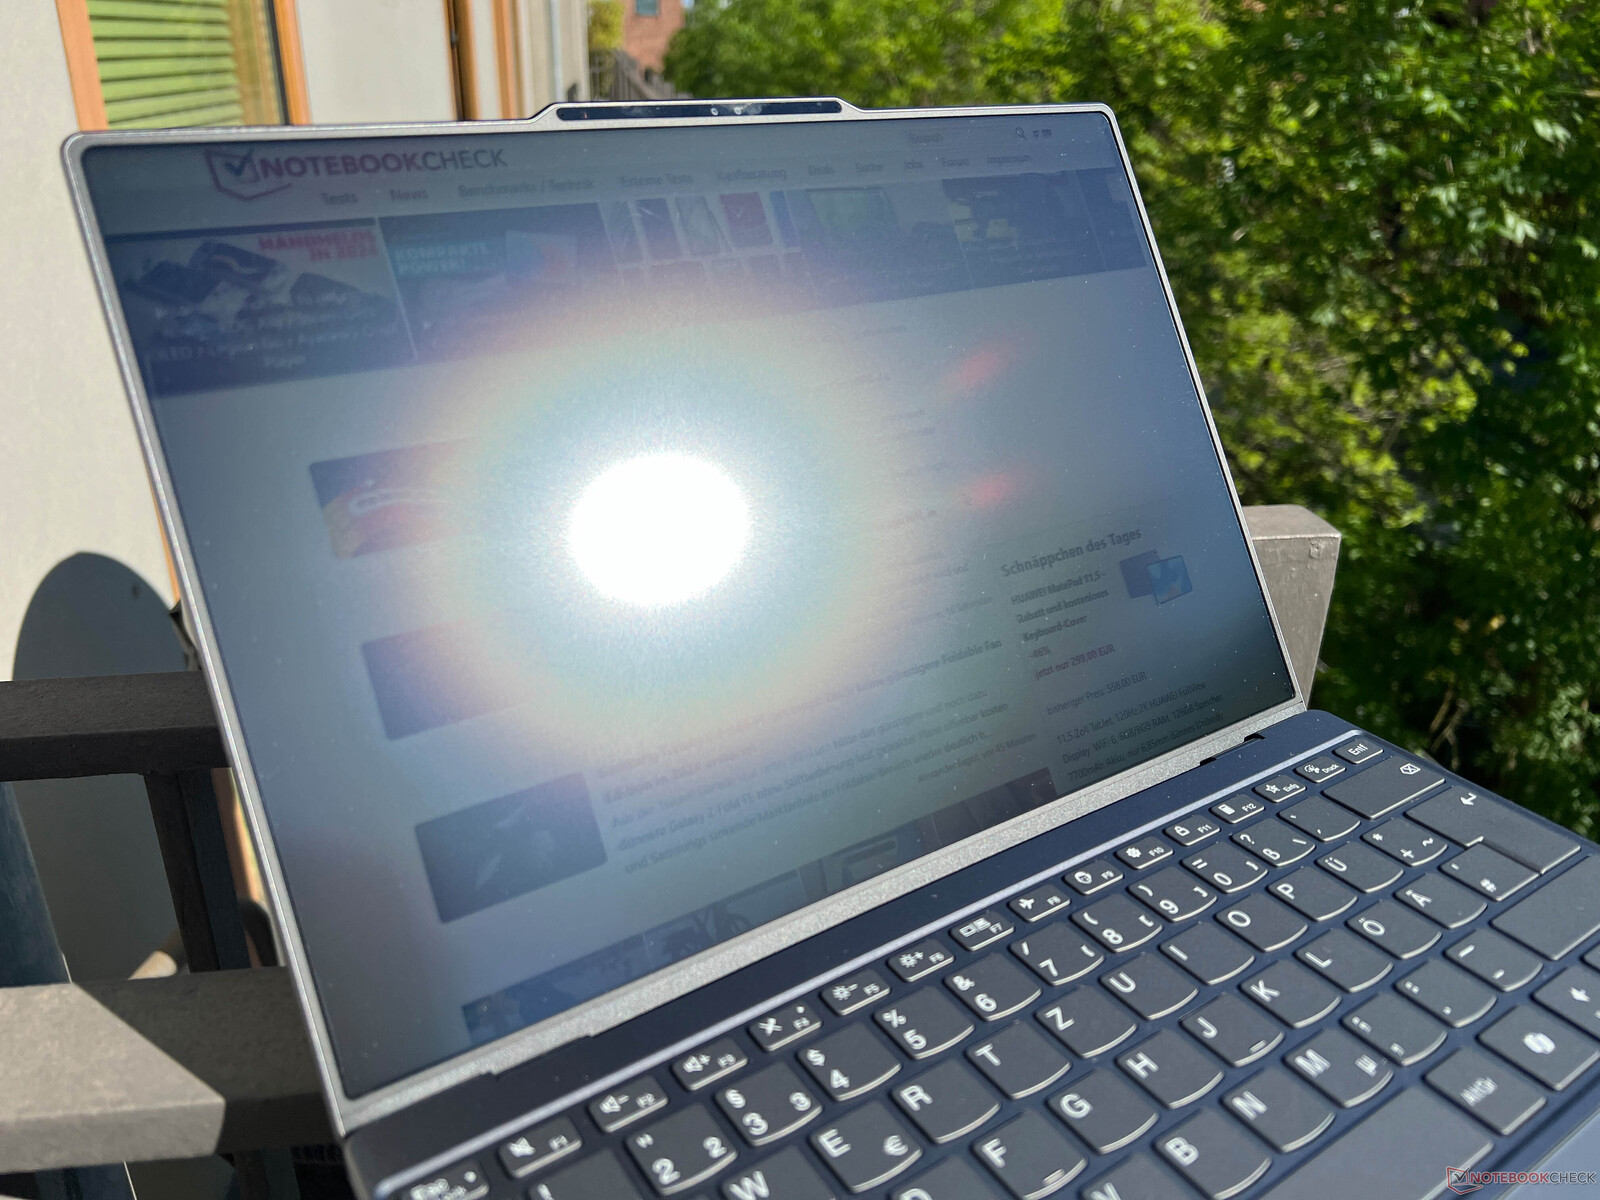
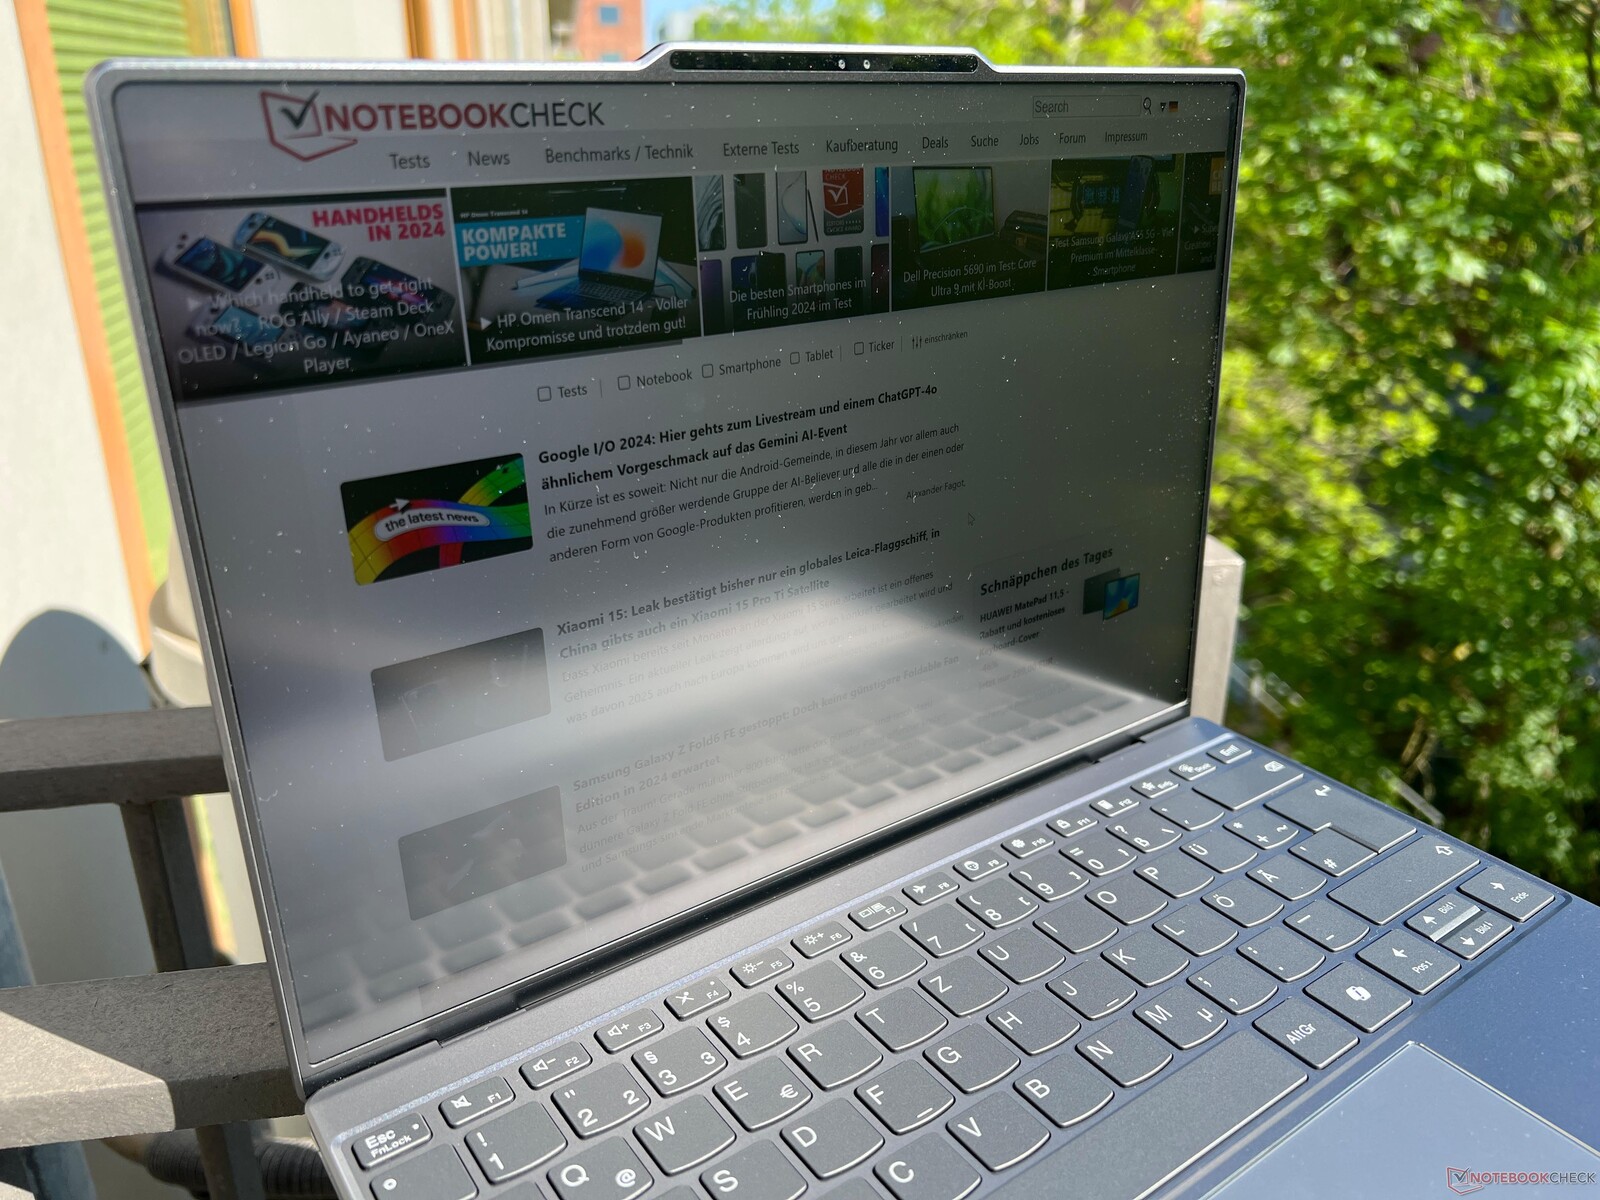
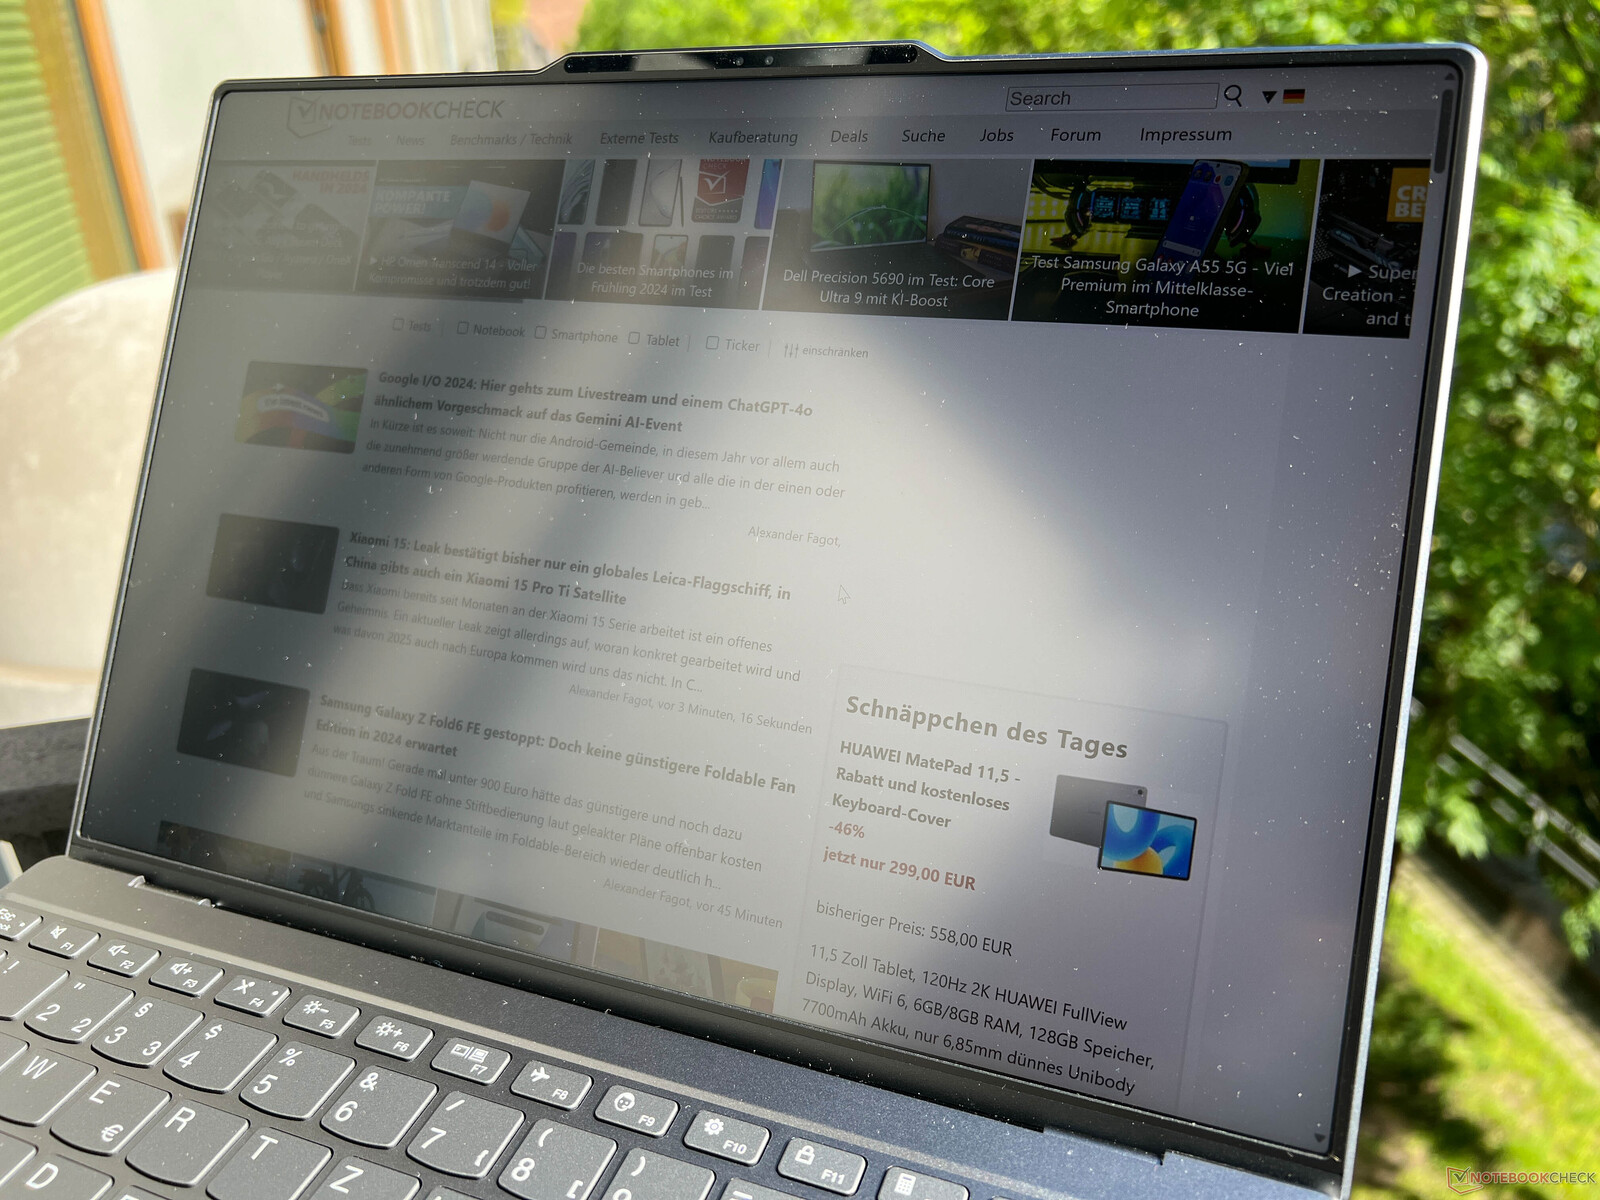
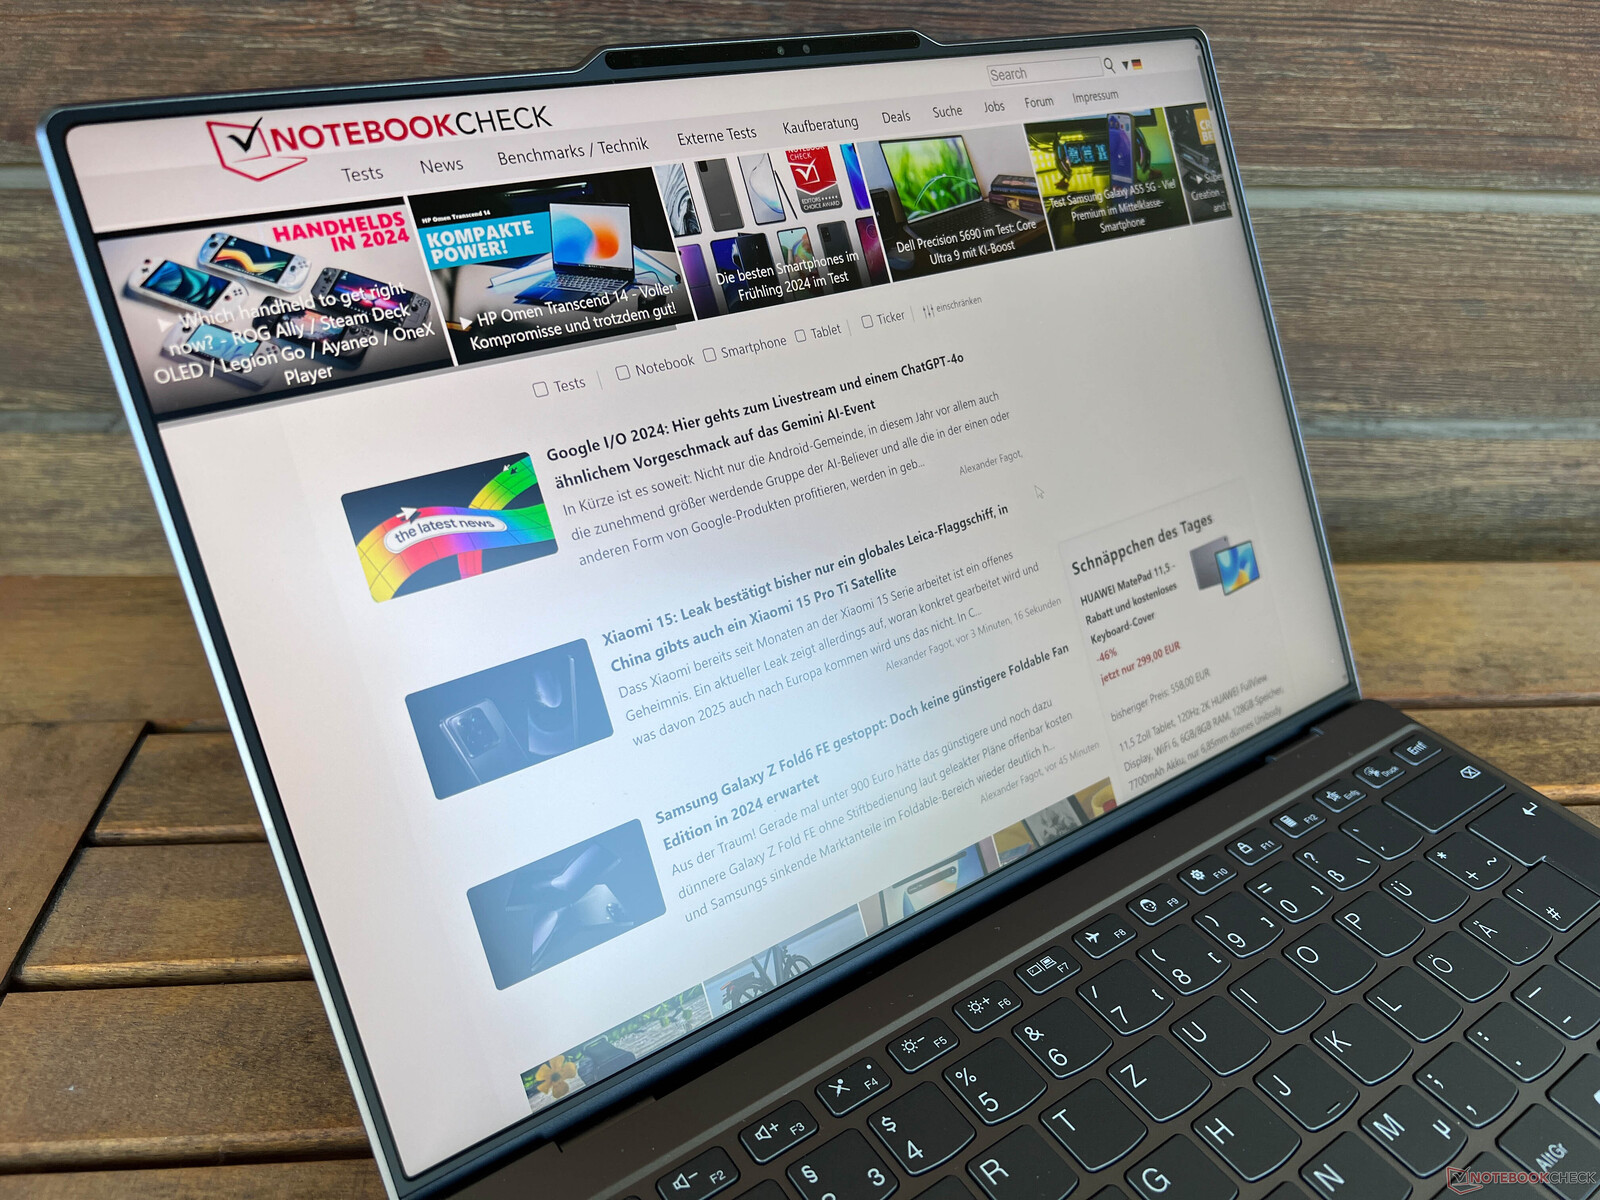
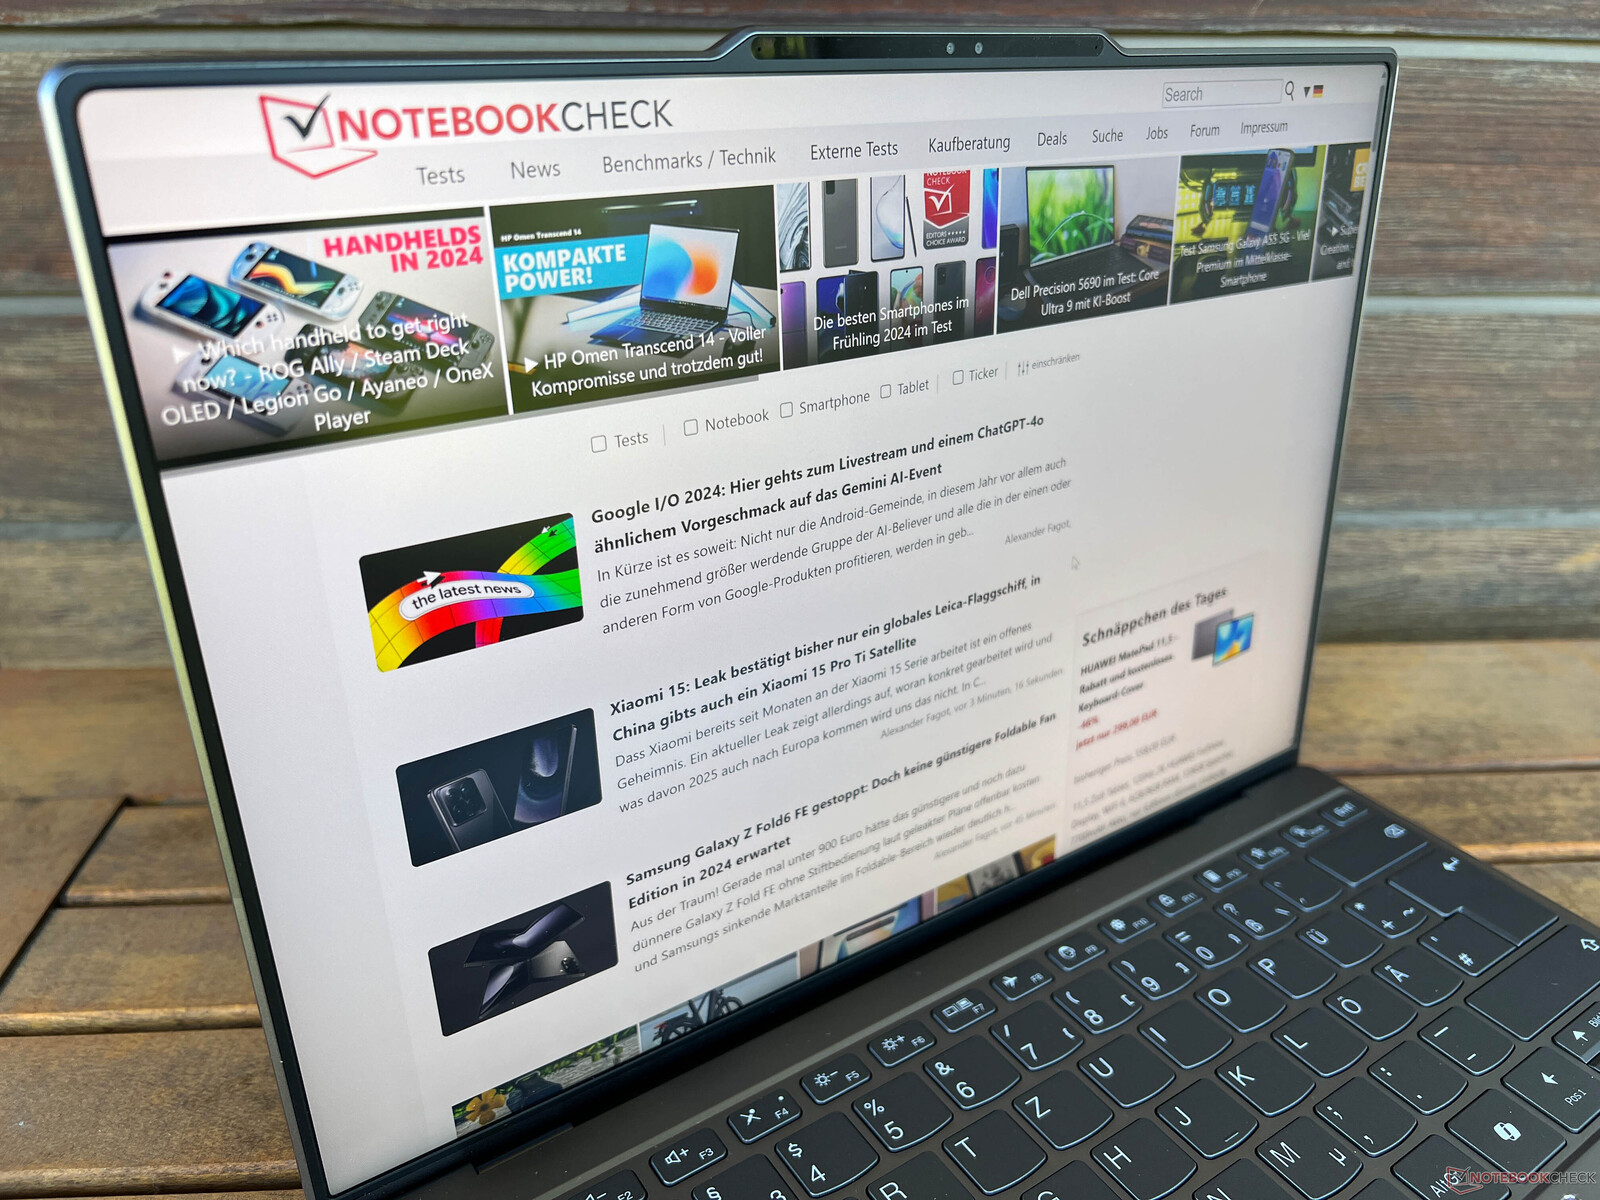
O painel IPS brilhante e fosco funciona muito bem em ambientes externos, embora a luz solar direta e seus reflexos (veja a imagem) devam ser evitados. Também não há problemas com a estabilidade do ângulo de visão.

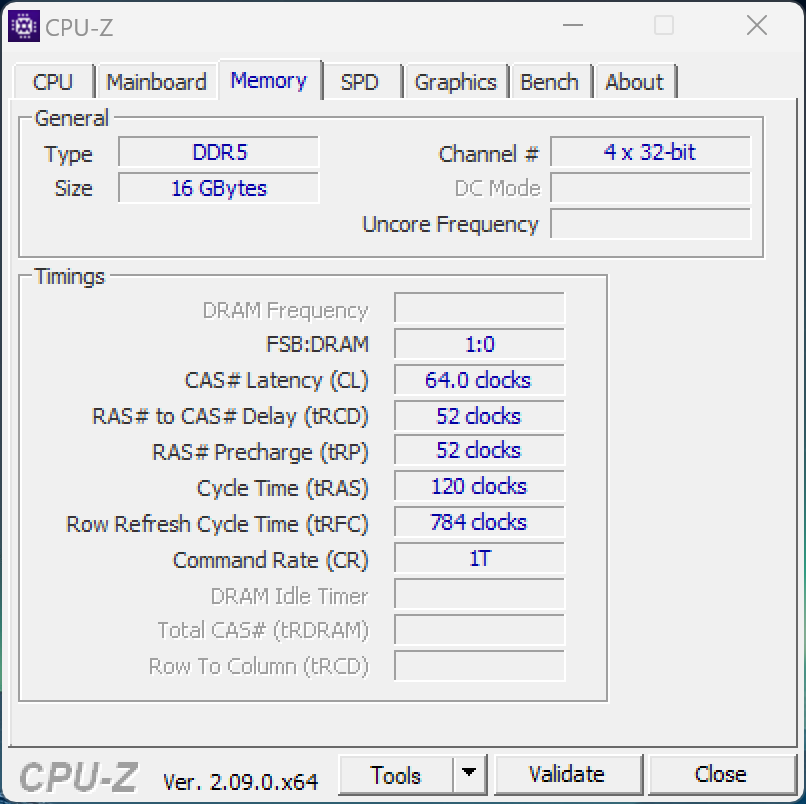
Desempenho - Core Ultra e até 32 GB de RAM
É interessante notar que a Lenovo só oferece o ThinkBook 13x G4 com o Core Ultra 5 125H ou com o Core Ultra 9 185Hmas o popular Core Ultra 7 155H não está disponível. O senhor também precisa escolher o Core Ultra 9 para fazer upgrade de 16 para 32 GB de RAM, ambos com sobretaxas moderadas.
Condições de teste
Como de costume, a Lenovo oferece vários modos de energia e, diferentemente dos modelos ThinkPad, estes não estão diretamente vinculados aos ajustes de energia do Windows. Os perfis podem ser trocados através do software Vantage pré-instalado ou da combinação de teclas Fn+Q. Listamos os valores de TDP correspondentes na tabela abaixo. Para nossos testes, usamos o perfil Auto, que está ativo por padrão.
| Modo de energia | TDP | CB R23 Multi | Time Spy Gráficos | volume máximo do ventilador |
|---|---|---|---|---|
| Economia de bateria | 44 -> 18 watts | 5.536 pontos | 2.471 pontos | 33,9 dB(A) |
| Auto | 51 -> 28 watts | 9.194 pontos | 3.248 pontos | 40,7 dB(A) -> 36,8 dB(A) |
| Desempenho | 51 -> 35 watts | 12.188 pontos | 3.382 pontos | 42,5 dB(A) |
No modo de desempenho, o processador funciona por muito mais tempo a 51 watts, enquanto no modo automático são apenas alguns segundos. Se o senhor precisar do desempenho máximo da CPU, esse modo vale a pena. Para tarefas menos exigentes no dia a dia, o senhor pode usar o modo de economia de bateria sem hesitação e se beneficiar de ventoinhas mais silenciosas.
Processador - Core Ultra 5 125H
O Core Ultra 5 125H em nosso dispositivo de teste pertence à atual geração Meteor Lake da Intel e oferece dois núcleos de desempenho a menos do que o amplamente utilizado Core Ultra 7 155H. Os quatro núcleos P existentes também atingem uma taxa de clock máxima menor, de até 4,5 GHz. No ThinkBook, o processador consome até 51 watts por alguns segundos antes de se estabilizar em 28 watts, o que pode ser visto claramente em nosso loop Cinebench. Esse nível de desempenho é perfeitamente suficiente para as tarefas diárias, mas os resultados não são realmente bons e o Core Ultra 5 não tem chance contra um processador Zen4 da AMD. Apple o processador M3 M3 com resfriamento passivo da AMD M3 da AMD também oferece melhor desempenho, tanto em testes de núcleo único quanto de múltiplos núcleos. No modo de bateria, o processador também pode consumir até 51 watts, mas depois cai rapidamente para 25 watts, razão pela qual o desempenho aqui é ligeiramente inferior ao da operação com a rede elétrica (-4%). Outros benchmarks de CPU estão disponíveis em nossa seção de tecnologia.
Cinebench R15 Multi Sustained Load
Cinebench R23: Multi Core | Single Core
Cinebench R20: CPU (Multi Core) | CPU (Single Core)
Cinebench R15: CPU Multi 64Bit | CPU Single 64Bit
Blender: v2.79 BMW27 CPU
7-Zip 18.03: 7z b 4 | 7z b 4 -mmt1
Geekbench 6.4: Multi-Core | Single-Core
Geekbench 5.5: Multi-Core | Single-Core
HWBOT x265 Benchmark v2.2: 4k Preset
LibreOffice : 20 Documents To PDF
R Benchmark 2.5: Overall mean
| CPU Performance Rating | |
| Lenovo ThinkPad Z13 Gen 2 | |
| Apple MacBook Air 13 M3 10C GPU -9! | |
| Dell XPS 13 9340 Core Ultra 7 | |
| Média da turma Subnotebook | |
| MSI Prestige 13 AI Evo | |
| Média Intel Core Ultra 5 125H | |
| Lenovo ThinkBook 13x G4 21KR0008GE -1! | |
| HP Dragonfly G4 -2! | |
| Cinebench R23 / Multi Core | |
| Lenovo ThinkPad Z13 Gen 2 | |
| Dell XPS 13 9340 Core Ultra 7 | |
| Média Intel Core Ultra 5 125H (9194 - 14564, n=6) | |
| Média da turma Subnotebook (1555 - 21812, n=75, últimos 2 anos) | |
| Apple MacBook Air 13 M3 10C GPU | |
| MSI Prestige 13 AI Evo | |
| Lenovo ThinkBook 13x G4 21KR0008GE | |
| HP Dragonfly G4 | |
| Cinebench R23 / Single Core | |
| Apple MacBook Air 13 M3 10C GPU | |
| HP Dragonfly G4 | |
| Lenovo ThinkPad Z13 Gen 2 | |
| Dell XPS 13 9340 Core Ultra 7 | |
| Média da turma Subnotebook (358 - 2165, n=75, últimos 2 anos) | |
| MSI Prestige 13 AI Evo | |
| Média Intel Core Ultra 5 125H (1549 - 1735, n=6) | |
| Lenovo ThinkBook 13x G4 21KR0008GE | |
| Cinebench R20 / CPU (Multi Core) | |
| Lenovo ThinkPad Z13 Gen 2 | |
| Dell XPS 13 9340 Core Ultra 7 | |
| Média Intel Core Ultra 5 125H (3673 - 5618, n=6) | |
| Média da turma Subnotebook (579 - 8541, n=70, últimos 2 anos) | |
| MSI Prestige 13 AI Evo | |
| Lenovo ThinkBook 13x G4 21KR0008GE | |
| HP Dragonfly G4 | |
| Cinebench R20 / CPU (Single Core) | |
| HP Dragonfly G4 | |
| Lenovo ThinkPad Z13 Gen 2 | |
| Dell XPS 13 9340 Core Ultra 7 | |
| Lenovo ThinkBook 13x G4 21KR0008GE | |
| Média Intel Core Ultra 5 125H (622 - 664, n=6) | |
| Média da turma Subnotebook (128 - 826, n=70, últimos 2 anos) | |
| MSI Prestige 13 AI Evo | |
| Cinebench R15 / CPU Multi 64Bit | |
| Dell XPS 13 9340 Core Ultra 7 | |
| Lenovo ThinkPad Z13 Gen 2 | |
| MSI Prestige 13 AI Evo | |
| Média Intel Core Ultra 5 125H (1700 - 2245, n=6) | |
| Média da turma Subnotebook (327 - 3345, n=75, últimos 2 anos) | |
| Lenovo ThinkBook 13x G4 21KR0008GE | |
| HP Dragonfly G4 | |
| Cinebench R15 / CPU Single 64Bit | |
| Lenovo ThinkPad Z13 Gen 2 | |
| HP Dragonfly G4 | |
| Dell XPS 13 9340 Core Ultra 7 | |
| Média da turma Subnotebook (72.4 - 322, n=71, últimos 2 anos) | |
| Lenovo ThinkBook 13x G4 21KR0008GE | |
| Média Intel Core Ultra 5 125H (235 - 251, n=6) | |
| MSI Prestige 13 AI Evo | |
| Blender / v2.79 BMW27 CPU | |
| Apple MacBook Air 13 M3 10C GPU | |
| HP Dragonfly G4 | |
| Média da turma Subnotebook (159 - 2271, n=74, últimos 2 anos) | |
| Lenovo ThinkBook 13x G4 21KR0008GE | |
| MSI Prestige 13 AI Evo | |
| Média Intel Core Ultra 5 125H (228 - 364, n=6) | |
| Dell XPS 13 9340 Core Ultra 7 | |
| Lenovo ThinkPad Z13 Gen 2 | |
| 7-Zip 18.03 / 7z b 4 | |
| Lenovo ThinkPad Z13 Gen 2 | |
| Dell XPS 13 9340 Core Ultra 7 | |
| Média da turma Subnotebook (11668 - 77867, n=66, últimos 2 anos) | |
| MSI Prestige 13 AI Evo | |
| HP Dragonfly G4 | |
| Média Intel Core Ultra 5 125H (0 - 0, n=2) | |
| 7-Zip 18.03 / 7z b 4 -mmt1 | |
| HP Dragonfly G4 | |
| Lenovo ThinkPad Z13 Gen 2 | |
| Média da turma Subnotebook (2643 - 6442, n=68, últimos 2 anos) | |
| MSI Prestige 13 AI Evo | |
| Dell XPS 13 9340 Core Ultra 7 | |
| Lenovo ThinkBook 13x G4 21KR0008GE | |
| Média Intel Core Ultra 5 125H (4663 - 5136, n=6) | |
| Geekbench 6.4 / Multi-Core | |
| Lenovo ThinkPad Z13 Gen 2 | |
| Apple MacBook Air 13 M3 10C GPU | |
| Dell XPS 13 9340 Core Ultra 7 | |
| Média da turma Subnotebook (2244 - 17489, n=72, últimos 2 anos) | |
| Média Intel Core Ultra 5 125H (11087 - 11749, n=6) | |
| Lenovo ThinkBook 13x G4 21KR0008GE | |
| MSI Prestige 13 AI Evo | |
| Geekbench 6.4 / Single-Core | |
| Apple MacBook Air 13 M3 10C GPU | |
| Média da turma Subnotebook (960 - 3655, n=67, últimos 2 anos) | |
| Lenovo ThinkPad Z13 Gen 2 | |
| MSI Prestige 13 AI Evo | |
| Dell XPS 13 9340 Core Ultra 7 | |
| Lenovo ThinkBook 13x G4 21KR0008GE | |
| Média Intel Core Ultra 5 125H (2199 - 2316, n=6) | |
| Geekbench 5.5 / Multi-Core | |
| Dell XPS 13 9340 Core Ultra 7 | |
| Lenovo ThinkPad Z13 Gen 2 | |
| Apple MacBook Air 13 M3 10C GPU | |
| Média Intel Core Ultra 5 125H (9696 - 10856, n=6) | |
| Lenovo ThinkBook 13x G4 21KR0008GE | |
| Média da turma Subnotebook (2557 - 17218, n=67, últimos 2 anos) | |
| MSI Prestige 13 AI Evo | |
| HP Dragonfly G4 | |
| Geekbench 5.5 / Single-Core | |
| Apple MacBook Air 13 M3 10C GPU | |
| HP Dragonfly G4 | |
| Lenovo ThinkPad Z13 Gen 2 | |
| Média da turma Subnotebook (726 - 2350, n=67, últimos 2 anos) | |
| Dell XPS 13 9340 Core Ultra 7 | |
| MSI Prestige 13 AI Evo | |
| Lenovo ThinkBook 13x G4 21KR0008GE | |
| Média Intel Core Ultra 5 125H (1593 - 1699, n=6) | |
| HWBOT x265 Benchmark v2.2 / 4k Preset | |
| Lenovo ThinkPad Z13 Gen 2 | |
| Dell XPS 13 9340 Core Ultra 7 | |
| Média Intel Core Ultra 5 125H (9.7 - 16.7, n=6) | |
| Média da turma Subnotebook (0.97 - 25.1, n=69, últimos 2 anos) | |
| MSI Prestige 13 AI Evo | |
| Lenovo ThinkBook 13x G4 21KR0008GE | |
| HP Dragonfly G4 | |
| LibreOffice / 20 Documents To PDF | |
| Média da turma Subnotebook (38.5 - 220, n=67, últimos 2 anos) | |
| Média Intel Core Ultra 5 125H (42.7 - 70.9, n=6) | |
| Lenovo ThinkBook 13x G4 21KR0008GE | |
| Lenovo ThinkPad Z13 Gen 2 | |
| Dell XPS 13 9340 Core Ultra 7 | |
| HP Dragonfly G4 | |
| MSI Prestige 13 AI Evo | |
| R Benchmark 2.5 / Overall mean | |
| Média da turma Subnotebook (0.403 - 1.456, n=69, últimos 2 anos) | |
| Média Intel Core Ultra 5 125H (0.4898 - 0.53, n=6) | |
| Lenovo ThinkBook 13x G4 21KR0008GE | |
| Dell XPS 13 9340 Core Ultra 7 | |
| Lenovo ThinkPad Z13 Gen 2 | |
| MSI Prestige 13 AI Evo | |
| HP Dragonfly G4 | |
* ... menor é melhor
AIDA64: FP32 Ray-Trace | FPU Julia | CPU SHA3 | CPU Queen | FPU SinJulia | FPU Mandel | CPU AES | CPU ZLib | FP64 Ray-Trace | CPU PhotoWorxx
| Performance Rating | |
| Lenovo ThinkPad Z13 Gen 2 | |
| Dell XPS 13 9340 Core Ultra 7 | |
| Média Intel Core Ultra 5 125H | |
| Média da turma Subnotebook | |
| Lenovo ThinkBook 13x G4 21KR0008GE | |
| MSI Prestige 13 AI Evo | |
| HP Dragonfly G4 | |
| AIDA64 / FP32 Ray-Trace | |
| Lenovo ThinkPad Z13 Gen 2 | |
| Média da turma Subnotebook (1135 - 32888, n=69, últimos 2 anos) | |
| Dell XPS 13 9340 Core Ultra 7 | |
| Média Intel Core Ultra 5 125H (8430 - 13639, n=6) | |
| Lenovo ThinkBook 13x G4 21KR0008GE | |
| HP Dragonfly G4 | |
| MSI Prestige 13 AI Evo | |
| AIDA64 / FPU Julia | |
| Lenovo ThinkPad Z13 Gen 2 | |
| Dell XPS 13 9340 Core Ultra 7 | |
| Média da turma Subnotebook (5218 - 123315, n=69, últimos 2 anos) | |
| Média Intel Core Ultra 5 125H (43652 - 70880, n=6) | |
| MSI Prestige 13 AI Evo | |
| Lenovo ThinkBook 13x G4 21KR0008GE | |
| HP Dragonfly G4 | |
| AIDA64 / CPU SHA3 | |
| Lenovo ThinkPad Z13 Gen 2 | |
| Dell XPS 13 9340 Core Ultra 7 | |
| Média da turma Subnotebook (444 - 5287, n=69, últimos 2 anos) | |
| Média Intel Core Ultra 5 125H (2047 - 3404, n=6) | |
| Lenovo ThinkBook 13x G4 21KR0008GE | |
| MSI Prestige 13 AI Evo | |
| HP Dragonfly G4 | |
| AIDA64 / CPU Queen | |
| Lenovo ThinkPad Z13 Gen 2 | |
| Lenovo ThinkBook 13x G4 21KR0008GE | |
| Dell XPS 13 9340 Core Ultra 7 | |
| Média Intel Core Ultra 5 125H (77892 - 79986, n=6) | |
| Média da turma Subnotebook (10579 - 115682, n=69, últimos 2 anos) | |
| HP Dragonfly G4 | |
| MSI Prestige 13 AI Evo | |
| AIDA64 / FPU SinJulia | |
| Lenovo ThinkPad Z13 Gen 2 | |
| Dell XPS 13 9340 Core Ultra 7 | |
| Média Intel Core Ultra 5 125H (6588 - 7851, n=6) | |
| Média da turma Subnotebook (744 - 18418, n=69, últimos 2 anos) | |
| Lenovo ThinkBook 13x G4 21KR0008GE | |
| MSI Prestige 13 AI Evo | |
| HP Dragonfly G4 | |
| AIDA64 / FPU Mandel | |
| Lenovo ThinkPad Z13 Gen 2 | |
| Dell XPS 13 9340 Core Ultra 7 | |
| Média da turma Subnotebook (3341 - 65433, n=69, últimos 2 anos) | |
| Média Intel Core Ultra 5 125H (21210 - 35321, n=6) | |
| MSI Prestige 13 AI Evo | |
| Lenovo ThinkBook 13x G4 21KR0008GE | |
| HP Dragonfly G4 | |
| AIDA64 / CPU AES | |
| Lenovo ThinkPad Z13 Gen 2 | |
| Média Intel Core Ultra 5 125H (45524 - 108402, n=6) | |
| Dell XPS 13 9340 Core Ultra 7 | |
| Média da turma Subnotebook (638 - 161430, n=69, últimos 2 anos) | |
| Lenovo ThinkBook 13x G4 21KR0008GE | |
| MSI Prestige 13 AI Evo | |
| HP Dragonfly G4 | |
| AIDA64 / CPU ZLib | |
| Lenovo ThinkPad Z13 Gen 2 | |
| Dell XPS 13 9340 Core Ultra 7 | |
| Média Intel Core Ultra 5 125H (594 - 994, n=6) | |
| Média da turma Subnotebook (164.9 - 1379, n=69, últimos 2 anos) | |
| Lenovo ThinkBook 13x G4 21KR0008GE | |
| MSI Prestige 13 AI Evo | |
| HP Dragonfly G4 | |
| AIDA64 / FP64 Ray-Trace | |
| Lenovo ThinkPad Z13 Gen 2 | |
| Média da turma Subnotebook (610 - 17495, n=69, últimos 2 anos) | |
| Dell XPS 13 9340 Core Ultra 7 | |
| Média Intel Core Ultra 5 125H (4345 - 7221, n=6) | |
| Lenovo ThinkBook 13x G4 21KR0008GE | |
| MSI Prestige 13 AI Evo | |
| HP Dragonfly G4 | |
| AIDA64 / CPU PhotoWorxx | |
| Dell XPS 13 9340 Core Ultra 7 | |
| Lenovo ThinkBook 13x G4 21KR0008GE | |
| Média Intel Core Ultra 5 125H (45724 - 49844, n=6) | |
| MSI Prestige 13 AI Evo | |
| Média da turma Subnotebook (6569 - 64588, n=69, últimos 2 anos) | |
| Lenovo ThinkPad Z13 Gen 2 | |
| HP Dragonfly G4 | |
Desempenho do sistema
No uso diário, o ThinkBook 13x G4 é um laptop rápido que processa todas as entradas sem atrasos perceptíveis. Os resultados de benchmark estão de acordo com as expectativas e não tivemos problemas com a estabilidade do sistema durante os testes.
CrossMark: Overall | Productivity | Creativity | Responsiveness
WebXPRT 3: Overall
WebXPRT 4: Overall
Mozilla Kraken 1.1: Total
| PCMark 10 / Score | |
| Lenovo ThinkPad Z13 Gen 2 | |
| Dell XPS 13 9340 Core Ultra 7 | |
| Média da turma Subnotebook (4993 - 7788, n=58, últimos 2 anos) | |
| Média Intel Core Ultra 5 125H, Intel Arc 7-Core iGPU (6194 - 6463, n=6) | |
| Lenovo ThinkBook 13x G4 21KR0008GE | |
| MSI Prestige 13 AI Evo | |
| HP Dragonfly G4 | |
| PCMark 10 / Essentials | |
| Lenovo ThinkPad Z13 Gen 2 | |
| HP Dragonfly G4 | |
| Dell XPS 13 9340 Core Ultra 7 | |
| Média da turma Subnotebook (9363 - 11331, n=58, últimos 2 anos) | |
| Média Intel Core Ultra 5 125H, Intel Arc 7-Core iGPU (9427 - 10697, n=6) | |
| Lenovo ThinkBook 13x G4 21KR0008GE | |
| MSI Prestige 13 AI Evo | |
| PCMark 10 / Productivity | |
| Lenovo ThinkPad Z13 Gen 2 | |
| MSI Prestige 13 AI Evo | |
| Média da turma Subnotebook (5435 - 10623, n=58, últimos 2 anos) | |
| Dell XPS 13 9340 Core Ultra 7 | |
| Lenovo ThinkBook 13x G4 21KR0008GE | |
| Média Intel Core Ultra 5 125H, Intel Arc 7-Core iGPU (7042 - 8000, n=6) | |
| HP Dragonfly G4 | |
| PCMark 10 / Digital Content Creation | |
| Lenovo ThinkPad Z13 Gen 2 | |
| Média Intel Core Ultra 5 125H, Intel Arc 7-Core iGPU (8198 - 9506, n=6) | |
| Média da turma Subnotebook (5305 - 12442, n=58, últimos 2 anos) | |
| Dell XPS 13 9340 Core Ultra 7 | |
| Lenovo ThinkBook 13x G4 21KR0008GE | |
| MSI Prestige 13 AI Evo | |
| HP Dragonfly G4 | |
| CrossMark / Overall | |
| Apple MacBook Air 13 M3 10C GPU | |
| Dell XPS 13 9340 Core Ultra 7 | |
| HP Dragonfly G4 | |
| Média da turma Subnotebook (365 - 2018, n=67, últimos 2 anos) | |
| Média Intel Core Ultra 5 125H, Intel Arc 7-Core iGPU (1522 - 1633, n=5) | |
| Lenovo ThinkBook 13x G4 21KR0008GE | |
| Lenovo ThinkPad Z13 Gen 2 | |
| MSI Prestige 13 AI Evo | |
| CrossMark / Productivity | |
| Apple MacBook Air 13 M3 10C GPU | |
| HP Dragonfly G4 | |
| Dell XPS 13 9340 Core Ultra 7 | |
| Média da turma Subnotebook (364 - 1875, n=67, últimos 2 anos) | |
| Média Intel Core Ultra 5 125H, Intel Arc 7-Core iGPU (1432 - 1594, n=5) | |
| Lenovo ThinkBook 13x G4 21KR0008GE | |
| Lenovo ThinkPad Z13 Gen 2 | |
| MSI Prestige 13 AI Evo | |
| CrossMark / Creativity | |
| Apple MacBook Air 13 M3 10C GPU | |
| Dell XPS 13 9340 Core Ultra 7 | |
| Lenovo ThinkPad Z13 Gen 2 | |
| Média da turma Subnotebook (372 - 2396, n=67, últimos 2 anos) | |
| HP Dragonfly G4 | |
| Média Intel Core Ultra 5 125H, Intel Arc 7-Core iGPU (1683 - 1765, n=5) | |
| Lenovo ThinkBook 13x G4 21KR0008GE | |
| MSI Prestige 13 AI Evo | |
| CrossMark / Responsiveness | |
| Dell XPS 13 9340 Core Ultra 7 | |
| HP Dragonfly G4 | |
| Apple MacBook Air 13 M3 10C GPU | |
| Média Intel Core Ultra 5 125H, Intel Arc 7-Core iGPU (1171 - 1520, n=5) | |
| Média da turma Subnotebook (312 - 1899, n=67, últimos 2 anos) | |
| MSI Prestige 13 AI Evo | |
| Lenovo ThinkBook 13x G4 21KR0008GE | |
| Lenovo ThinkPad Z13 Gen 2 | |
| WebXPRT 3 / Overall | |
| Apple MacBook Air 13 M3 10C GPU | |
| Média da turma Subnotebook (156 - 479, n=66, últimos 2 anos) | |
| HP Dragonfly G4 | |
| Lenovo ThinkPad Z13 Gen 2 | |
| Dell XPS 13 9340 Core Ultra 7 | |
| MSI Prestige 13 AI Evo | |
| Média Intel Core Ultra 5 125H, Intel Arc 7-Core iGPU (245 - 263, n=6) | |
| Lenovo ThinkBook 13x G4 21KR0008GE | |
| WebXPRT 4 / Overall | |
| Apple MacBook Air 13 M3 10C GPU | |
| HP Dragonfly G4 | |
| Média da turma Subnotebook (132 - 348, n=67, últimos 2 anos) | |
| Dell XPS 13 9340 Core Ultra 7 | |
| MSI Prestige 13 AI Evo | |
| Lenovo ThinkBook 13x G4 21KR0008GE | |
| Lenovo ThinkPad Z13 Gen 2 | |
| Média Intel Core Ultra 5 125H, Intel Arc 7-Core iGPU (227 - 240, n=5) | |
| Mozilla Kraken 1.1 / Total | |
| Média Intel Core Ultra 5 125H, Intel Arc 7-Core iGPU (560 - 595, n=6) | |
| Lenovo ThinkPad Z13 Gen 2 | |
| Lenovo ThinkBook 13x G4 21KR0008GE | |
| MSI Prestige 13 AI Evo | |
| Dell XPS 13 9340 Core Ultra 7 | |
| Média da turma Subnotebook (278 - 1104, n=75, últimos 2 anos) | |
| HP Dragonfly G4 | |
| Apple MacBook Air 13 M3 10C GPU | |
* ... menor é melhor
| PCMark 10 Score | 6293 pontos | |
Ajuda | ||
| AIDA64 / Memory Copy | |
| Dell XPS 13 9340 Core Ultra 7 | |
| Lenovo ThinkBook 13x G4 21KR0008GE | |
| MSI Prestige 13 AI Evo | |
| Média Intel Core Ultra 5 125H (67482 - 87473, n=6) | |
| Média da turma Subnotebook (14554 - 109035, n=69, últimos 2 anos) | |
| Lenovo ThinkPad Z13 Gen 2 | |
| HP Dragonfly G4 | |
| AIDA64 / Memory Read | |
| Dell XPS 13 9340 Core Ultra 7 | |
| Lenovo ThinkBook 13x G4 21KR0008GE | |
| Média Intel Core Ultra 5 125H (70520 - 76803, n=6) | |
| MSI Prestige 13 AI Evo | |
| Média da turma Subnotebook (15948 - 122210, n=69, últimos 2 anos) | |
| Lenovo ThinkPad Z13 Gen 2 | |
| HP Dragonfly G4 | |
| AIDA64 / Memory Write | |
| Lenovo ThinkPad Z13 Gen 2 | |
| Média da turma Subnotebook (15709 - 117898, n=69, últimos 2 anos) | |
| MSI Prestige 13 AI Evo | |
| Dell XPS 13 9340 Core Ultra 7 | |
| HP Dragonfly G4 | |
| Média Intel Core Ultra 5 125H (63162 - 72443, n=6) | |
| Lenovo ThinkBook 13x G4 21KR0008GE | |
| AIDA64 / Memory Latency | |
| MSI Prestige 13 AI Evo | |
| Média Intel Core Ultra 5 125H (127.3 - 184.8, n=6) | |
| Lenovo ThinkPad Z13 Gen 2 | |
| Lenovo ThinkBook 13x G4 21KR0008GE | |
| Dell XPS 13 9340 Core Ultra 7 | |
| Média da turma Subnotebook (7.2 - 187.8, n=68, últimos 2 anos) | |
| HP Dragonfly G4 | |
* ... menor é melhor
Latência DPC
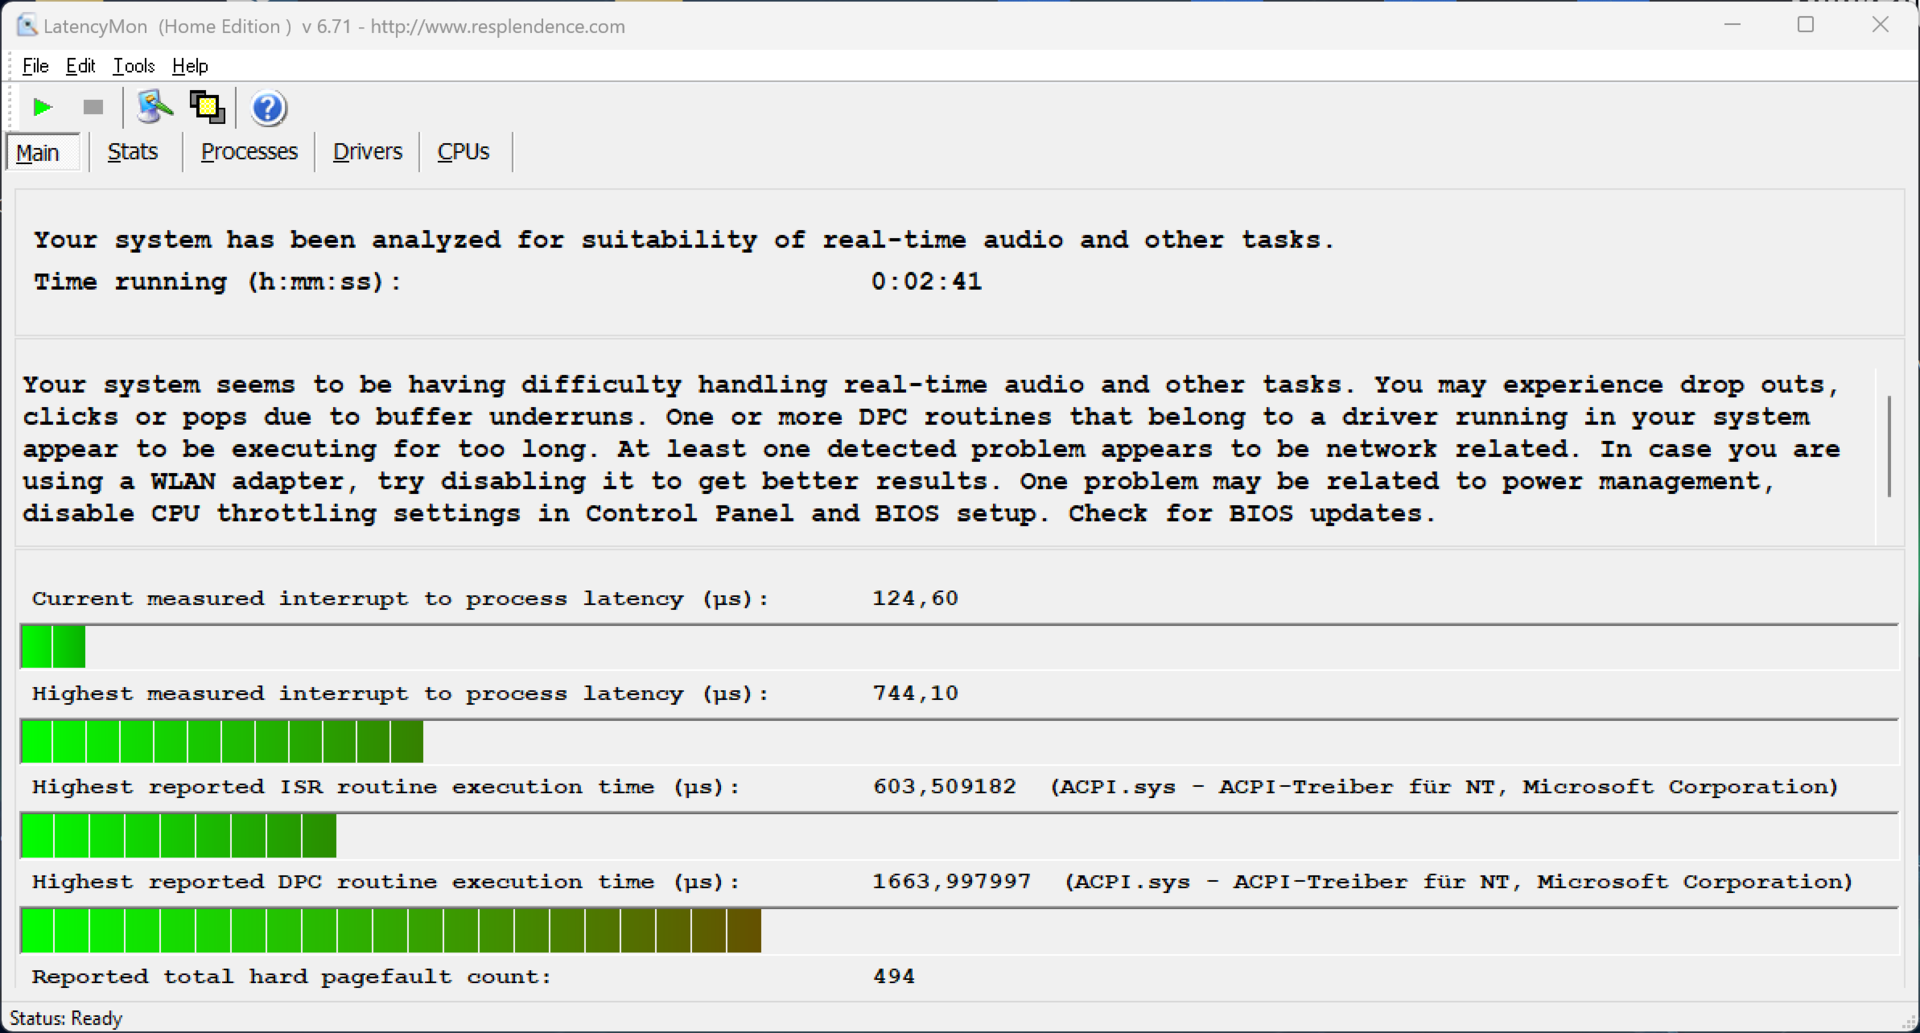
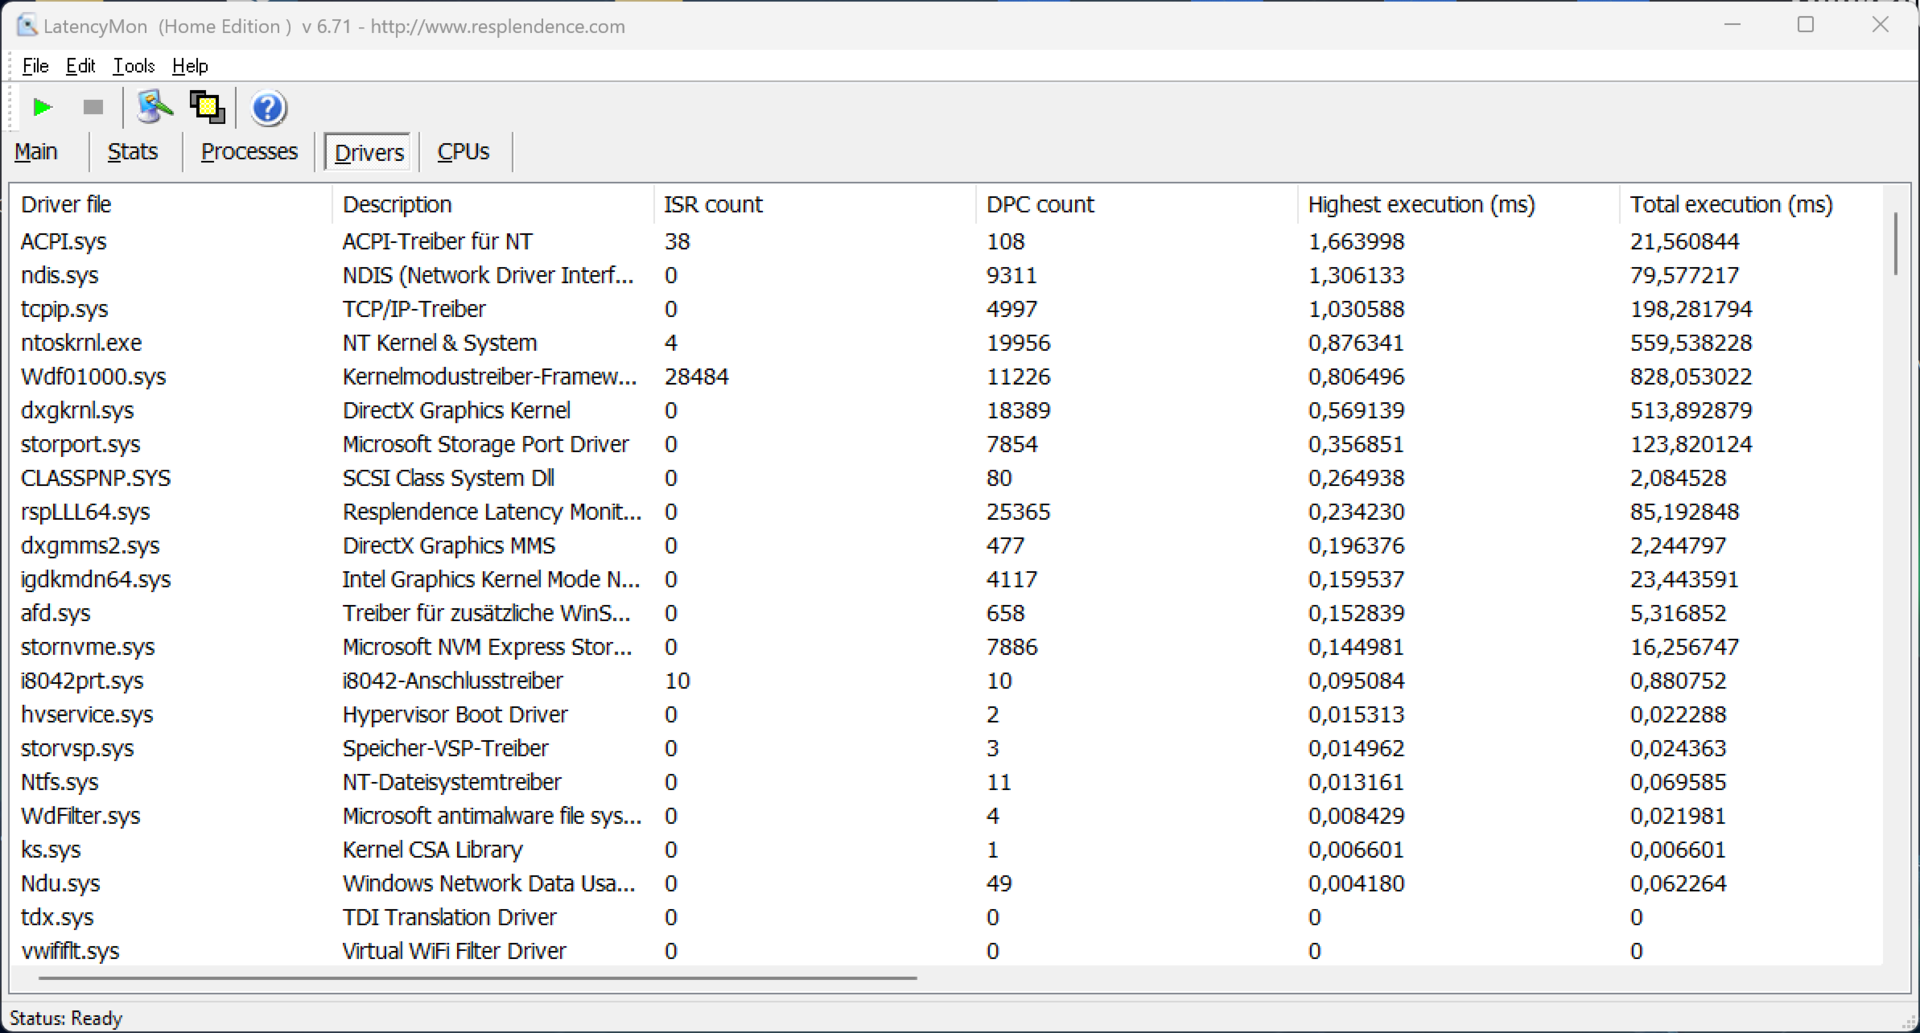
Em nosso teste de latência padronizado (navegação na Web, reprodução de 4K no YouTube, carga da CPU), nosso dispositivo de teste não mostra limitações com sua versão atual do BIOS. Embora um dos drivers mostre um pico, o valor importante de "latência de interrupção para processo" é baixo.
| DPC Latencies / LatencyMon - interrupt to process latency (max), Web, Youtube, Prime95 | |
| MSI Prestige 13 AI Evo | |
| Lenovo ThinkPad Z13 Gen 2 | |
| HP Dragonfly G4 | |
| Lenovo ThinkBook 13x G4 21KR0008GE | |
| Dell XPS 13 9340 Core Ultra 7 | |
* ... menor é melhor
Dispositivos de armazenamento
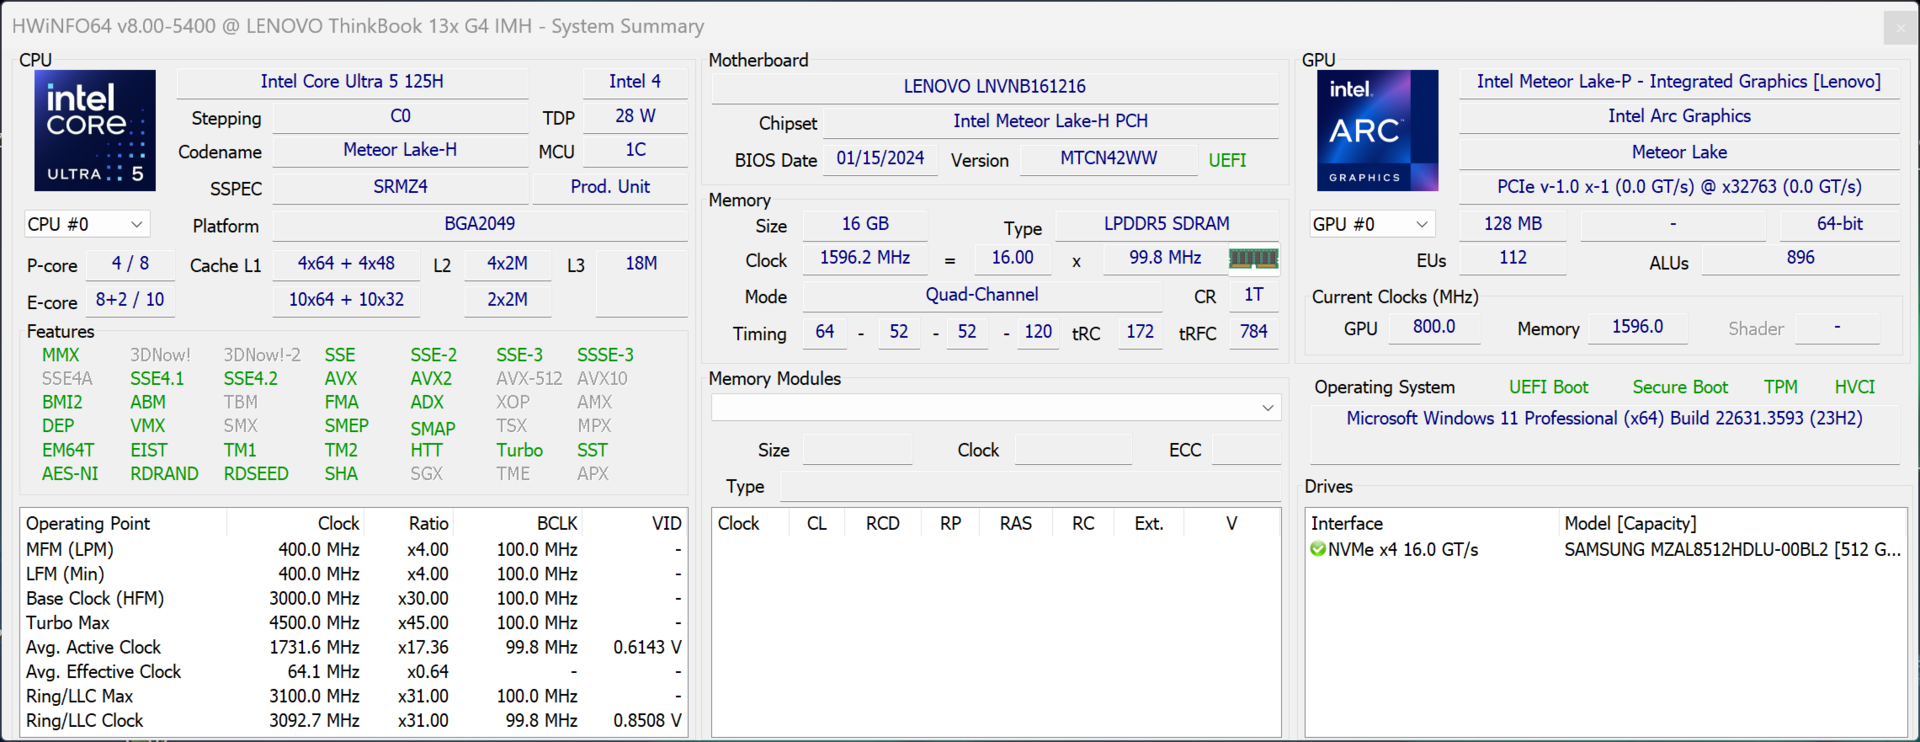
A Lenovo instala um SSD compacto M.2-2242 com uma conexão PCIe 4.0, que em nosso dispositivo de teste vem da Samsung (PM9C1a) e oferece uma capacidade de armazenamento de 512 GB. Após a primeira inicialização, restam 422 GB. As taxas de transferência são boas, mas o desempenho não se mantém estável sob carga prolongada. No entanto, no uso diário, isso não tem efeito, pois o desempenho ainda é suficiente (acima de 3,3 GB/s). Outros benchmarks de SSD estão listados aqui.

* ... menor é melhor
Sustained Read Performance: DiskSpd Read Loop, Queue Depth 8
Placa de vídeo - Arc Graphics com 7 núcleos Xe
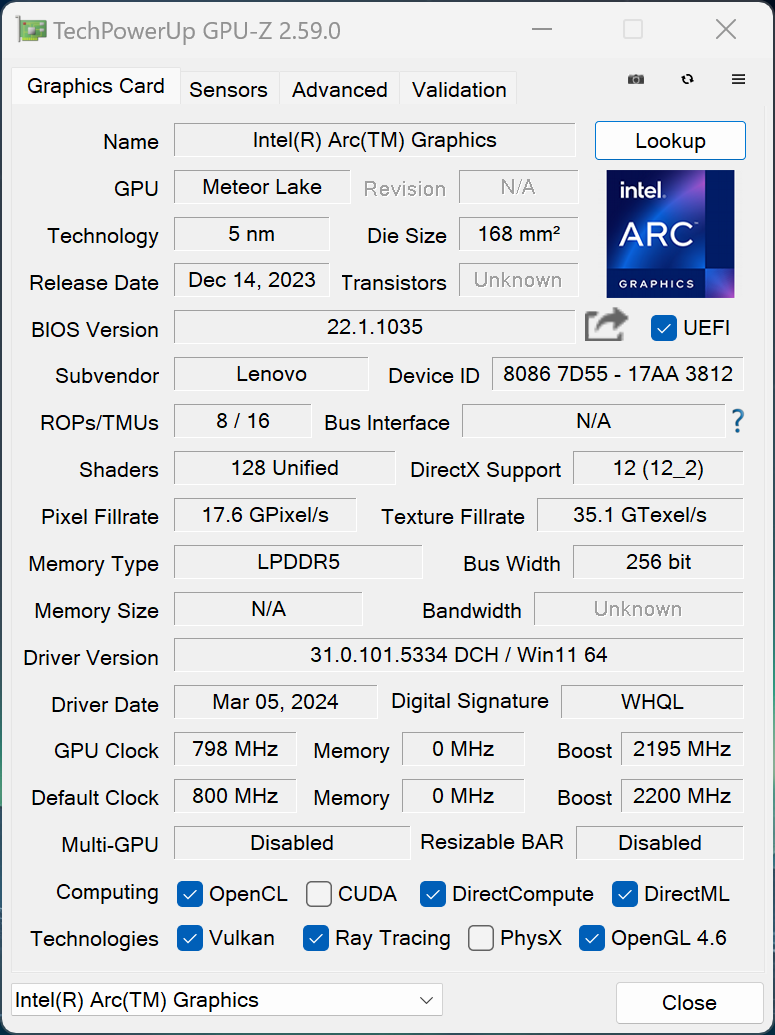
Em conjunto com o Core Ultra 5 125H, é usada a placa gráfica integrada mais lenta Intel Arc Graphics com 7 núcleos Xe. Graças à RAM rápida, o desempenho gráfico é muito bom em geral e praticamente não difere dos notebooks com a variante mais rápida de 8 núcleos que testamos até agora. Isso também se aplica ao Dell XPS 13 9340 e MSI Prestige 13 AI Evo. O ThinkPad Z13 Gen2 com o processador AMD e a Radeon 780M também foi superado nos testes sintéticos.
A Radeon 780M ainda tem uma pequena vantagem nos benchmarks de jogos, mas o ThinkBook 13x G4 está mais uma vez à frente dos supostamente mais rápidos Dell XPS 13 e MSI Prestige 13. Também não notamos nenhum problema com quedas de quadros durante os jogos. Em geral, muitos títulos mais antigos ou menos exigentes podem ser jogados sem problemas com detalhes médios a altos em 1080p. No entanto, com títulos modernos, como Cyberpunk 2077, as coisas ficam difíceis e, além da resolução reduzida ou dos detalhes reduzidos, as tecnologias de upscaling também devem ser usadas aqui.
O desempenho gráfico permanece estável sob carga prolongada e no modo de bateria. Outros benchmarks de gráficos estão disponíveis em nossa seção de tecnologia.
| 3DMark 11 Performance | 11306 pontos | |
| 3DMark Fire Strike Score | 7500 pontos | |
| 3DMark Time Spy Score | 3498 pontos | |
Ajuda | ||
| Blender / v3.3 Classroom CPU | |
| HP Dragonfly G4 | |
| Lenovo ThinkBook 13x G4 21KR0008GE | |
| MSI Prestige 13 AI Evo | |
| Média da turma Subnotebook (241 - 1127, n=71, últimos 2 anos) | |
| Apple MacBook Air 13 M3 10C GPU | |
| Média Intel Arc 7-Core iGPU (391 - 671, n=6) | |
| Dell XPS 13 9340 Core Ultra 7 | |
| Lenovo ThinkPad Z13 Gen 2 | |
| Blender / v3.3 Classroom METAL | |
| Média da turma Subnotebook (103 - 237, n=4, últimos 2 anos) | |
| Apple MacBook Air 13 M3 10C GPU | |
* ... menor é melhor
| Performance Rating - Percent | |
| Lenovo ThinkPad Z13 Gen 2 -1! | |
| Média da turma Subnotebook | |
| Lenovo ThinkBook 13x G4 21KR0008GE | |
| Dell XPS 13 9340 Core Ultra 7 | |
| MSI Prestige 13 AI Evo | |
| HP Dragonfly G4 | |
| The Witcher 3 - 1920x1080 Ultra Graphics & Postprocessing (HBAO+) | |
| Lenovo ThinkPad Z13 Gen 2 | |
| Lenovo ThinkBook 13x G4 21KR0008GE | |
| Média da turma Subnotebook (8.5 - 43.7, n=49, últimos 2 anos) | |
| Dell XPS 13 9340 Core Ultra 7 | |
| HP Dragonfly G4 | |
| MSI Prestige 13 AI Evo | |
| GTA V - 1920x1080 Highest Settings possible AA:4xMSAA + FX AF:16x | |
| Média da turma Subnotebook (7.81 - 53, n=66, últimos 2 anos) | |
| Lenovo ThinkBook 13x G4 21KR0008GE | |
| Dell XPS 13 9340 Core Ultra 7 | |
| HP Dragonfly G4 | |
| MSI Prestige 13 AI Evo | |
| Final Fantasy XV Benchmark - 1920x1080 High Quality | |
| Lenovo ThinkPad Z13 Gen 2 | |
| Dell XPS 13 9340 Core Ultra 7 | |
| Lenovo ThinkBook 13x G4 21KR0008GE | |
| Média da turma Subnotebook (11.9 - 44.2, n=71, últimos 2 anos) | |
| MSI Prestige 13 AI Evo | |
| HP Dragonfly G4 | |
| Strange Brigade - 1920x1080 ultra AA:ultra AF:16 | |
| Lenovo ThinkBook 13x G4 21KR0008GE | |
| Lenovo ThinkPad Z13 Gen 2 | |
| Média da turma Subnotebook (17.7 - 70.7, n=70, últimos 2 anos) | |
| Dell XPS 13 9340 Core Ultra 7 | |
| MSI Prestige 13 AI Evo | |
| HP Dragonfly G4 | |
| Dota 2 Reborn - 1920x1080 ultra (3/3) best looking | |
| Lenovo ThinkPad Z13 Gen 2 | |
| Dell XPS 13 9340 Core Ultra 7 | |
| Lenovo ThinkBook 13x G4 21KR0008GE | |
| Média da turma Subnotebook (13 - 99.5, n=74, últimos 2 anos) | |
| HP Dragonfly G4 | |
| MSI Prestige 13 AI Evo | |
| X-Plane 11.11 - 1920x1080 high (fps_test=3) | |
| Lenovo ThinkBook 13x G4 21KR0008GE | |
| Média da turma Subnotebook (20.7 - 97.1, n=63, últimos 2 anos) | |
| MSI Prestige 13 AI Evo | |
| Dell XPS 13 9340 Core Ultra 7 | |
| HP Dragonfly G4 | |
| Lenovo ThinkPad Z13 Gen 2 | |
Witcher 3 FPS chart
| baixo | média | alto | ultra | |
|---|---|---|---|---|
| GTA V (2015) | 116.9 | 106.4 | 32.4 | 14.8 |
| The Witcher 3 (2015) | 126 | 80 | 45 | 23.4 |
| Dota 2 Reborn (2015) | 93.8 | 83 | 68.4 | 64.9 |
| Final Fantasy XV Benchmark (2018) | 59.8 | 33.4 | 25.3 | |
| X-Plane 11.11 (2018) | 52 | 40.1 | 34.2 | |
| Far Cry 5 (2018) | 64 | 37 | 35 | 31 |
| Strange Brigade (2018) | 141 | 68 | 54 | 44 |
| F1 23 (2023) | 58.7 | 53.5 | 37.3 | |
| Cyberpunk 2077 2.2 Phantom Liberty (2023) | 23.2 | 19.8 | 16.6 | 14.8 |
Emissões - Excelentes alto-falantes
Ruído
As duas ventoinhas geralmente permanecem muito silenciosas ou desativadas no uso diário e não incomodam em nada, mesmo sob alta carga. Registramos apenas um valor máximo de 40,7 dB(A) por um curto período de tempo antes de as ventoinhas se estabilizarem em 36,8 dB(A). No modo de desempenho, o máximo é 42,5 dB(A) e 33,9 dB(A) no modo de economia de bateria. Não foram detectados outros ruídos eletrônicos, como o zumbido da bobina.
Barulho
| Ocioso |
| 24.5 / 24.5 / 27.1 dB |
| Carga |
| 33.3 / 40.7 dB |
 | ||
30 dB silencioso 40 dB(A) audível 50 dB(A) ruidosamente alto |
||
min: | ||
| Lenovo ThinkBook 13x G4 21KR0008GE Arc 7-Core, Ultra 5 125H, Samsung PM9C1a MZAL8512HDLU | Dell XPS 13 9340 Core Ultra 7 Arc 8-Core, Ultra 7 155H, Micron 2550 512GB | MSI Prestige 13 AI Evo Arc 8-Core, Ultra 7 155H, Samsung PM9A1 MZVL21T0HCLR | Lenovo ThinkPad Z13 Gen 2 Radeon 780M, R7 PRO 7840U, SK hynix BC901 HFS001TEJ4X164N | HP Dragonfly G4 Iris Xe G7 96EUs, i7-1365U, Micron 3400 MTFDKBA512TFH 512GB | |
|---|---|---|---|---|---|
| Noise | -4% | 2% | -5% | 8% | |
| desligado / ambiente * | 24.5 | 25.1 -2% | 23.4 4% | 25.1 -2% | 23.3 5% |
| Idle Minimum * | 24.5 | 25.1 -2% | 23.4 4% | 25.8 -5% | 23.5 4% |
| Idle Average * | 24.5 | 25.1 -2% | 26.9 -10% | 25.8 -5% | 23.5 4% |
| Idle Maximum * | 27.1 | 25.1 7% | 26.9 1% | 28.3 -4% | 26.8 1% |
| Load Average * | 33.3 | 37.4 -12% | 32 4% | 28.3 15% | 27.2 18% |
| Witcher 3 ultra * | 36.8 | 42.5 -15% | 32 13% | 44.8 -22% | 32.7 11% |
| Load Maximum * | 40.7 | 42.5 -4% | 40.3 1% | 44.8 -10% | 35 14% |
* ... menor é melhor
Temperatura
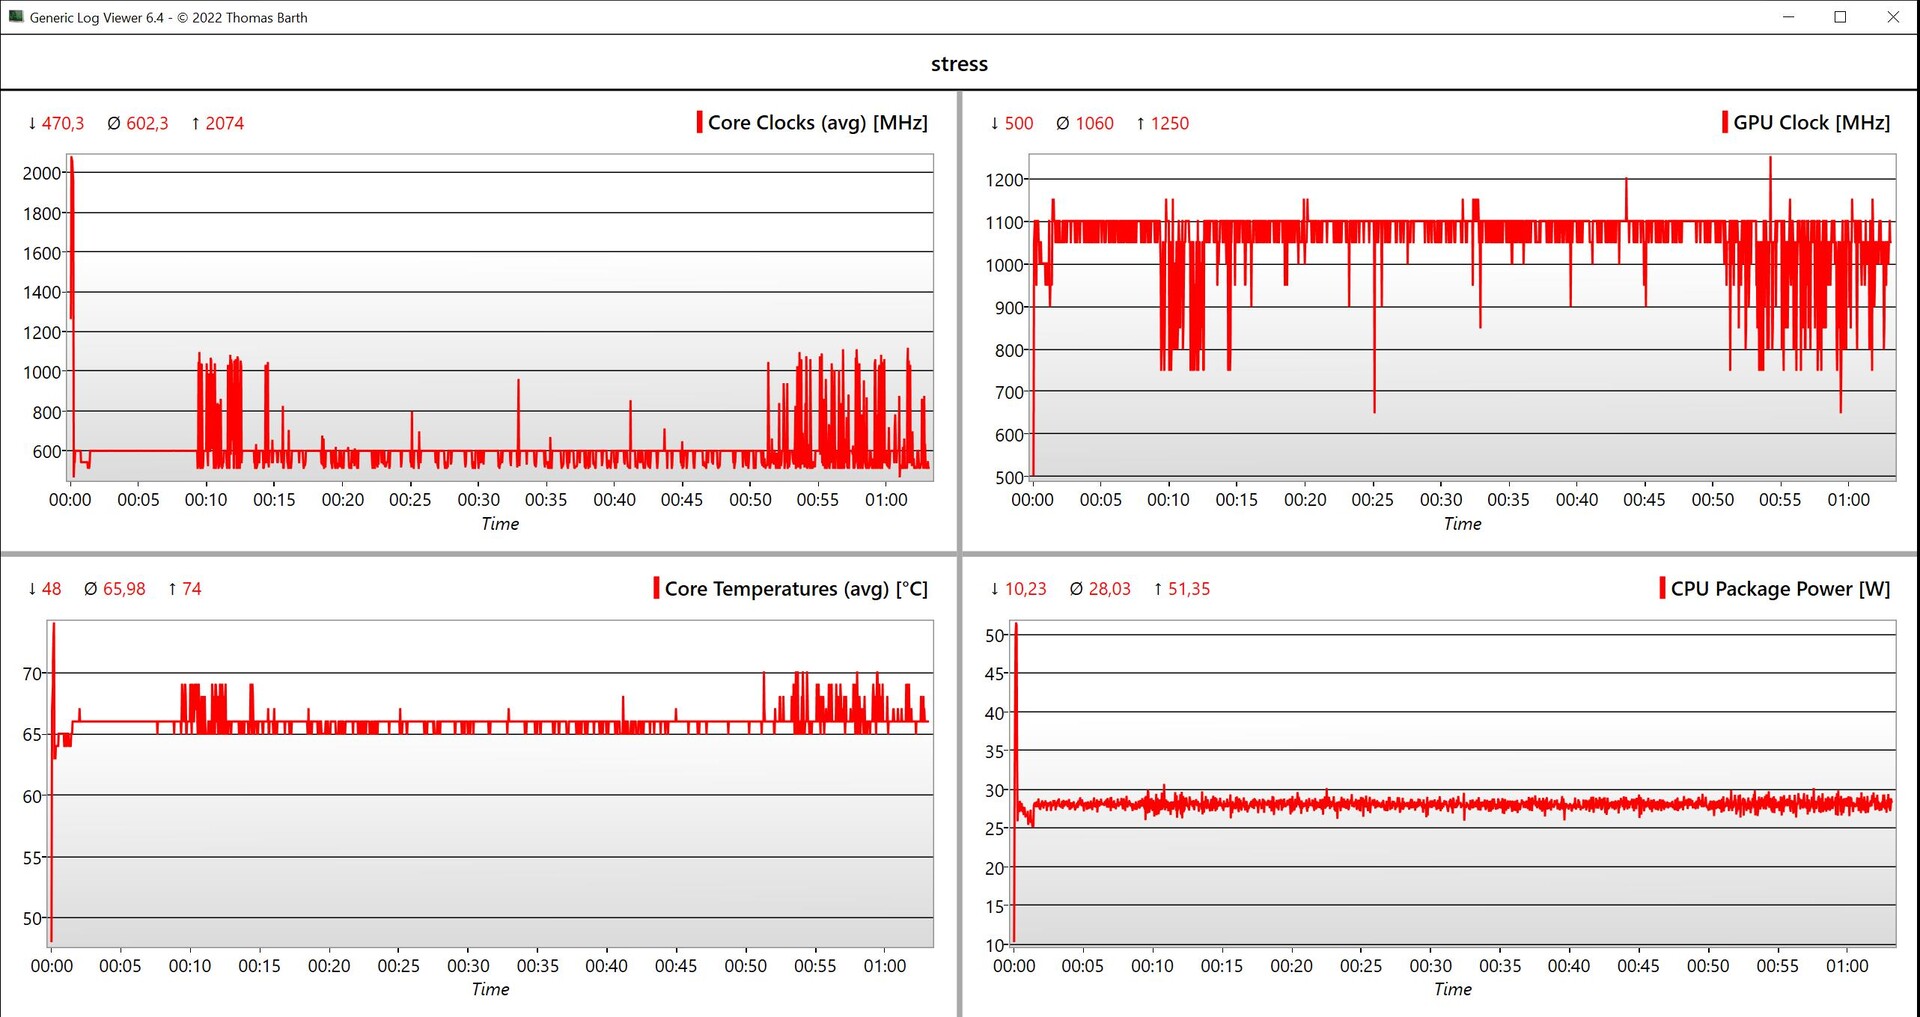
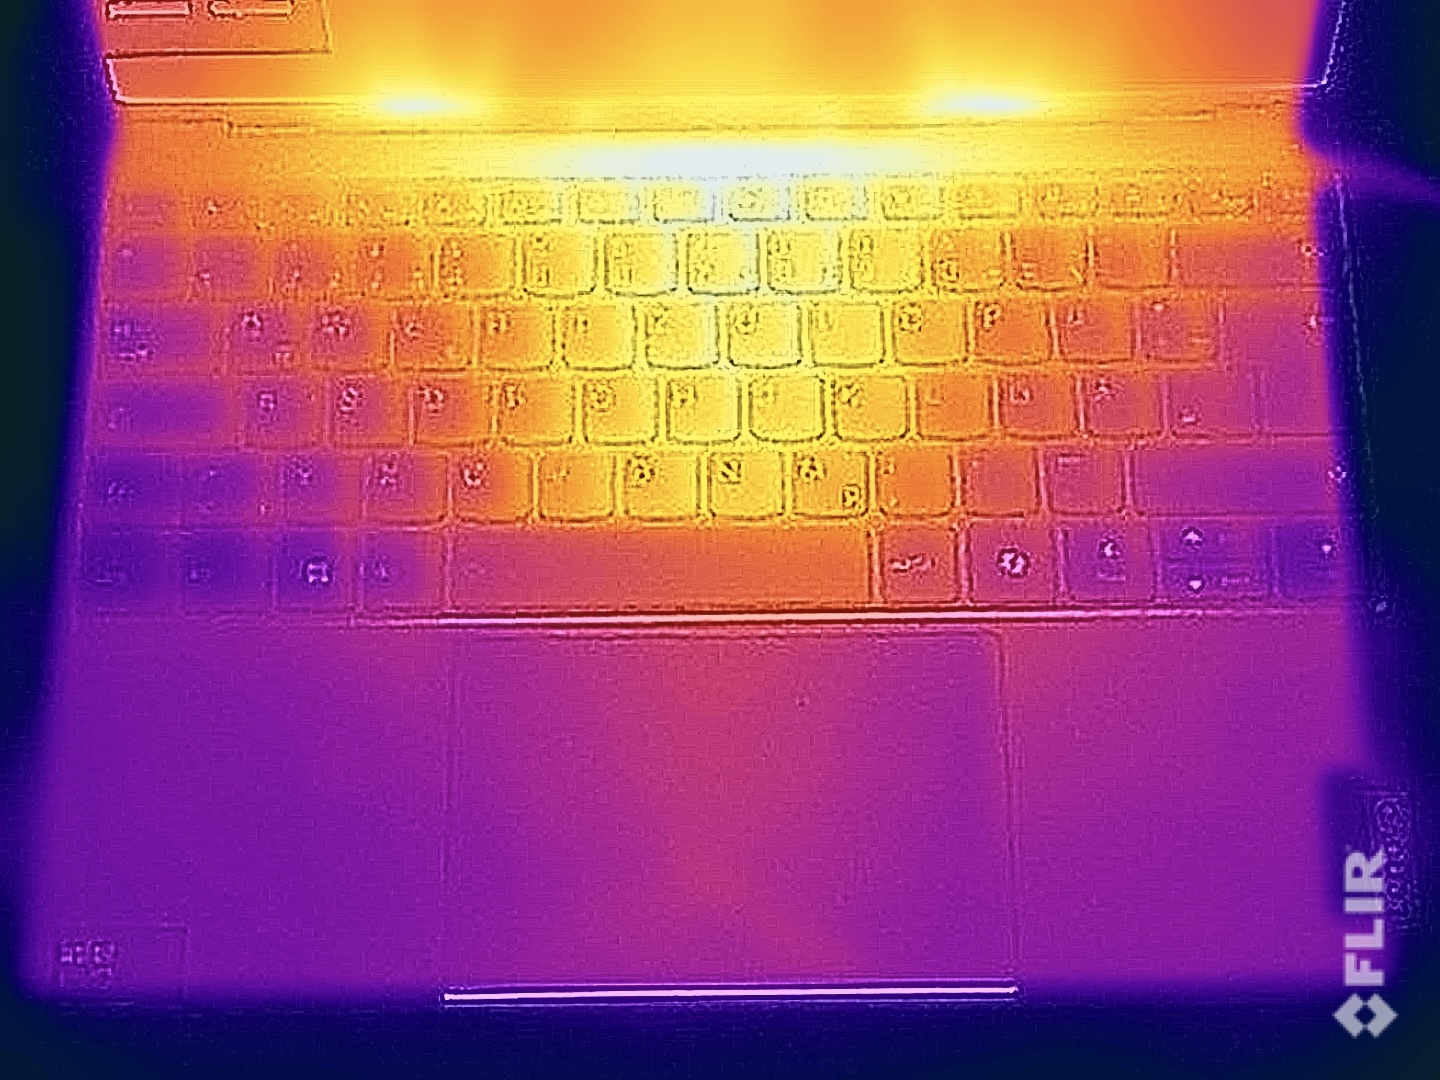
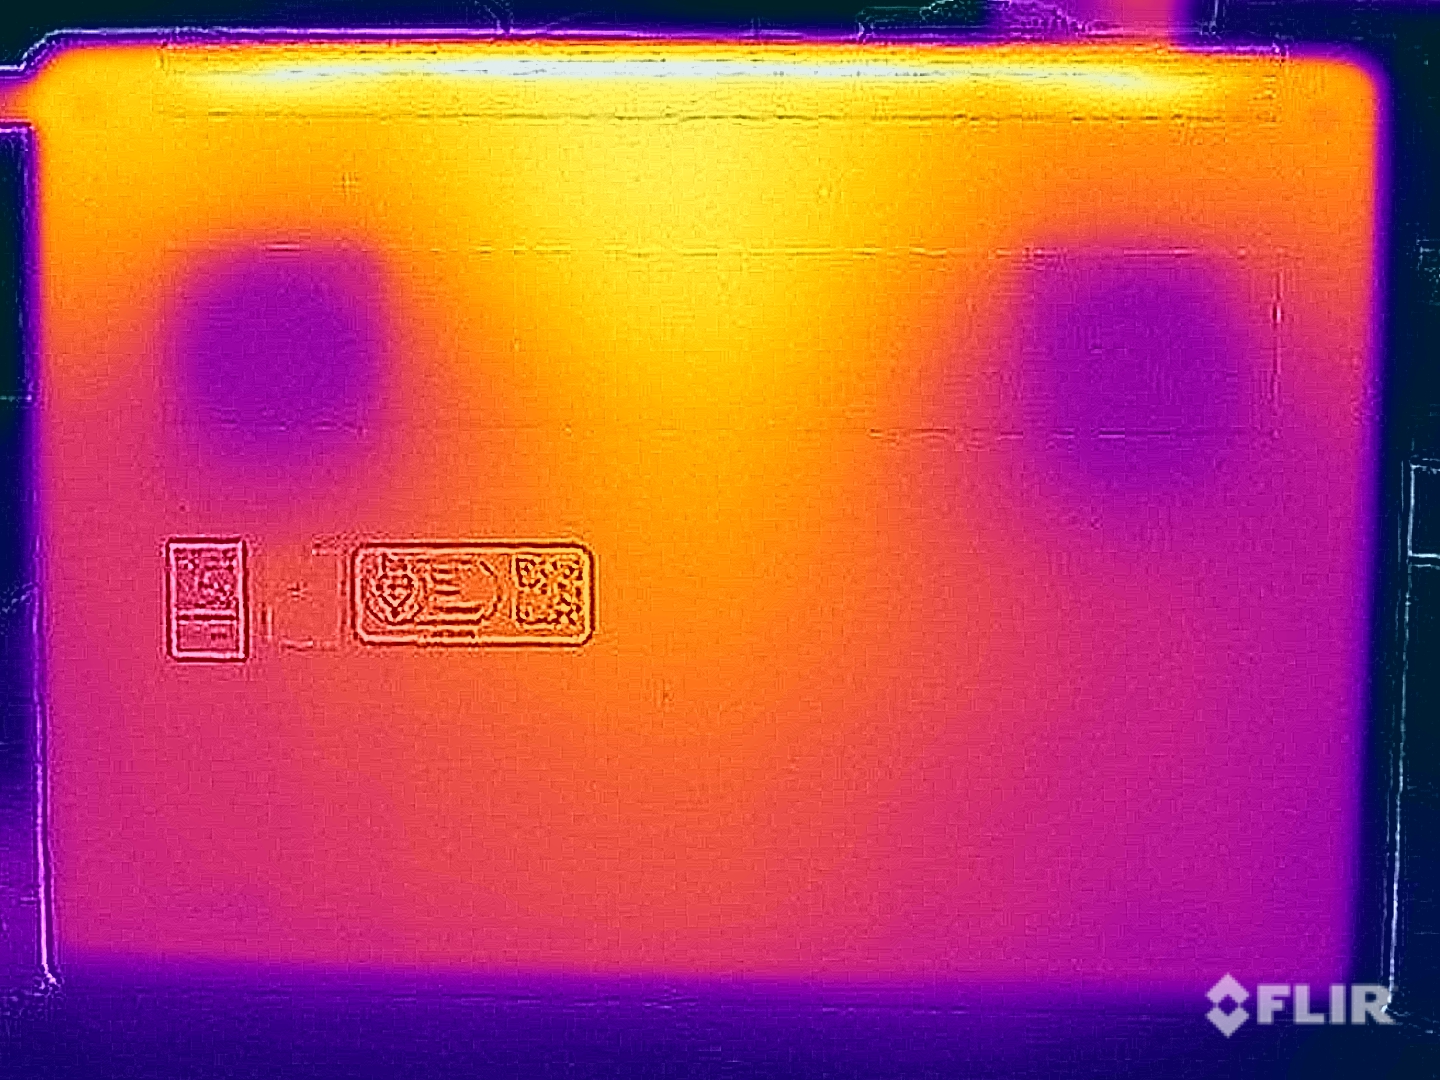
A Lenovo tem as temperaturas da superfície do ThinkBook 13x G4 bem sob controle. O dispositivo praticamente não esquenta quando está em marcha lenta e sob baixa carga, e há apenas um ponto de acesso onde medimos mais de 40 °C sob carga. Isso ocorre na parte superior da unidade básica, acima do teclado, onde o usuário não toca no dispositivo. A temperatura máxima na parte inferior é de 39 °C, portanto, o senhor pode colocar o dispositivo sobre as coxas sem problemas, mesmo sob carga. No teste de estresse com carga combinada de CPU/GPU, o SoC se estabiliza rapidamente em 28 watts e permanece nesse nível.
(±) A temperatura máxima no lado superior é 43.1 °C / 110 F, em comparação com a média de 35.9 °C / 97 F , variando de 21.4 a 59 °C para a classe Subnotebook.
(+) A parte inferior aquece até um máximo de 39.2 °C / 103 F, em comparação com a média de 39.3 °C / 103 F
(+) Em uso inativo, a temperatura média para o lado superior é 27.1 °C / 81 F, em comparação com a média do dispositivo de 30.8 °C / ### class_avg_f### F.
(±) Jogando The Witcher 3, a temperatura média para o lado superior é 35 °C / 95 F, em comparação com a média do dispositivo de 30.8 °C / ## #class_avg_f### F.
(+) Os apoios para as mãos e o touchpad são mais frios que a temperatura da pele, com um máximo de 29.3 °C / 84.7 F e, portanto, são frios ao toque.
(±) A temperatura média da área do apoio para as mãos de dispositivos semelhantes foi 28.2 °C / 82.8 F (-1.1 °C / -1.9 F).
| Lenovo ThinkBook 13x G4 21KR0008GE Intel Core Ultra 5 125H, Intel Arc 7-Core iGPU | Dell XPS 13 9340 Core Ultra 7 Intel Core Ultra 7 155H, Intel Arc 8-Core iGPU | Apple MacBook Air 13 M3 10C GPU Apple M3, Apple M3 10-Core GPU | MSI Prestige 13 AI Evo Intel Core Ultra 7 155H, Intel Arc 8-Core iGPU | Lenovo ThinkPad Z13 Gen 2 AMD Ryzen 7 PRO 7840U, AMD Radeon 780M | HP Dragonfly G4 Intel Core i7-1365U, Intel Iris Xe Graphics G7 96EUs | |
|---|---|---|---|---|---|---|
| Heat | 4% | 7% | 6% | 2% | 1% | |
| Maximum Upper Side * | 43.1 | 41 5% | 44.3 -3% | 40.9 5% | 46.2 -7% | 38.6 10% |
| Maximum Bottom * | 39.2 | 43.5 -11% | 43.4 -11% | 40.4 -3% | 48.4 -23% | 40.4 -3% |
| Idle Upper Side * | 28.3 | 25.3 11% | 22.3 21% | 25 12% | 23.2 18% | 28.2 -0% |
| Idle Bottom * | 28 | 25.5 9% | 22.1 21% | 25.5 9% | 23 18% | 29 -4% |
* ... menor é melhor
Alto-falantes
O ThinkBook 13x G4 oferece quatro alto-falantes compostos por dois tweeters e dois woofers com 2 watts cada, o que resulta em excelente qualidade de som. Aqui, o ThinkBook pode até mesmo enfrentar o MacBook Air 13. Os graves são um pouco limitados em comparação com laptops multimídia maiores, mas o resultado ainda é muito bom, considerando o tamanho do chassi.
Lenovo ThinkBook 13x G4 21KR0008GE análise de áudio
(+) | os alto-falantes podem tocar relativamente alto (###valor### dB)
Graves 100 - 315Hz
(±) | graves reduzidos - em média 9% menor que a mediana
(±) | a linearidade dos graves é média (8% delta para a frequência anterior)
Médios 400 - 2.000 Hz
(+) | médios equilibrados - apenas 2.4% longe da mediana
(+) | médios são lineares (2.9% delta para frequência anterior)
Altos 2 - 16 kHz
(+) | agudos equilibrados - apenas 3.2% longe da mediana
(+) | os máximos são lineares (3.4% delta da frequência anterior)
Geral 100 - 16.000 Hz
(+) | o som geral é linear (8.6% diferença em relação à mediana)
Comparado com a mesma classe
» 3% de todos os dispositivos testados nesta classe foram melhores, 1% semelhantes, 97% piores
» O melhor teve um delta de 5%, a média foi 19%, o pior foi 53%
Comparado com todos os dispositivos testados
» 2% de todos os dispositivos testados foram melhores, 1% semelhantes, 97% piores
» O melhor teve um delta de 4%, a média foi 24%, o pior foi 134%
Dell XPS 13 9340 Core Ultra 7 análise de áudio
(+) | os alto-falantes podem tocar relativamente alto (###valor### dB)
Graves 100 - 315Hz
(-) | quase nenhum baixo - em média 17% menor que a mediana
(±) | a linearidade dos graves é média (9.3% delta para a frequência anterior)
Médios 400 - 2.000 Hz
(+) | médios equilibrados - apenas 2.1% longe da mediana
(+) | médios são lineares (4.7% delta para frequência anterior)
Altos 2 - 16 kHz
(+) | agudos equilibrados - apenas 2.5% longe da mediana
(+) | os máximos são lineares (4.6% delta da frequência anterior)
Geral 100 - 16.000 Hz
(+) | o som geral é linear (11.6% diferença em relação à mediana)
Comparado com a mesma classe
» 12% de todos os dispositivos testados nesta classe foram melhores, 3% semelhantes, 85% piores
» O melhor teve um delta de 5%, a média foi 19%, o pior foi 53%
Comparado com todos os dispositivos testados
» 7% de todos os dispositivos testados foram melhores, 2% semelhantes, 91% piores
» O melhor teve um delta de 4%, a média foi 24%, o pior foi 134%
Apple MacBook Air 13 M3 10C GPU análise de áudio
(+) | os alto-falantes podem tocar relativamente alto (###valor### dB)
Graves 100 - 315Hz
(±) | graves reduzidos - em média 13.3% menor que a mediana
(±) | a linearidade dos graves é média (11.3% delta para a frequência anterior)
Médios 400 - 2.000 Hz
(+) | médios equilibrados - apenas 0.4% longe da mediana
(+) | médios são lineares (1.6% delta para frequência anterior)
Altos 2 - 16 kHz
(+) | agudos equilibrados - apenas 4.5% longe da mediana
(+) | os máximos são lineares (1.9% delta da frequência anterior)
Geral 100 - 16.000 Hz
(+) | o som geral é linear (10.7% diferença em relação à mediana)
Comparado com a mesma classe
» 8% de todos os dispositivos testados nesta classe foram melhores, 3% semelhantes, 89% piores
» O melhor teve um delta de 5%, a média foi 19%, o pior foi 53%
Comparado com todos os dispositivos testados
» 5% de todos os dispositivos testados foram melhores, 1% semelhantes, 94% piores
» O melhor teve um delta de 4%, a média foi 24%, o pior foi 134%
Gerenciamento de energia - Longos tempos de operação
Consumo de energia
Nossas medições de consumo não mostram surpresas e, como esperado, o painel de alta resolução e brilho requer um pouco mais de energia do que o XPS 13 com tela de 1080p, por exemplo. Com um máximo de 8,9 watts no modo inativo, o consumo não é muito alto. Sob carga máxima, o dispositivo atinge brevemente o limite da fonte de alimentação de 65 watts, mas cai para ~45 watts após apenas alguns segundos e permanece nesse nível.
| desligado | |
| Ocioso | |
| Carga |
|
Key:
min: | |
| Lenovo ThinkBook 13x G4 21KR0008GE Ultra 5 125H, Arc 7-Core, Samsung PM9C1a MZAL8512HDLU, IPS, 2880x1920, 13.5" | Dell XPS 13 9340 Core Ultra 7 Ultra 7 155H, Arc 8-Core, Micron 2550 512GB, IPS, 1920x1200, 13.4" | Apple MacBook Air 13 M3 10C GPU M3, M3 10-Core GPU, Apple SSD AP0512Z, IPS, 2560x1664, 13.6" | MSI Prestige 13 AI Evo Ultra 7 155H, Arc 8-Core, Samsung PM9A1 MZVL21T0HCLR, OLED, 2880x1800, 13.3" | Lenovo ThinkPad Z13 Gen 2 R7 PRO 7840U, Radeon 780M, SK hynix BC901 HFS001TEJ4X164N, OLED, 2880x1800, 13.3" | HP Dragonfly G4 i7-1365U, Iris Xe G7 96EUs, Micron 3400 MTFDKBA512TFH 512GB, IPS, 1920x1280, 13.5" | Média Intel Arc 7-Core iGPU | Média da turma Subnotebook | |
|---|---|---|---|---|---|---|---|---|
| Power Consumption | 13% | 28% | 14% | 1% | 14% | -20% | 7% | |
| Idle Minimum * | 5.4 | 3.8 30% | 1.95 64% | 4.5 17% | 5.8 -7% | 4.1 24% | 6.88 ? -27% | 4.31 ? 20% |
| Idle Average * | 7.8 | 7 10% | 8.7 -12% | 8 -3% | 6.2 21% | 7.5 4% | 9.02 ? -16% | 7.33 ? 6% |
| Idle Maximum * | 8.9 | 7.3 18% | 8.9 -0% | 8.7 2% | 12.7 -43% | 8.2 8% | 12.2 ? -37% | 9.09 ? -2% |
| Load Average * | 49.4 | 52.6 -6% | 34.3 31% | 36.1 27% | 27.2 45% | 35.5 28% | 51.4 ? -4% | 44.9 ? 9% |
| Witcher 3 ultra * | 44.4 | 38.3 14% | 28.6 36% | 29.7 33% | 54.1 -22% | 37.5 16% | ||
| Load Maximum * | 68.8 | 62.7 9% | 35.4 49% | 65 6% | 61.4 11% | 66.5 3% | 78.3 ? -14% | 68.7 ? -0% |
* ... menor é melhor
Power consumption Witcher 3 / Stress test
Power consumption with external monitor
Duração da bateria
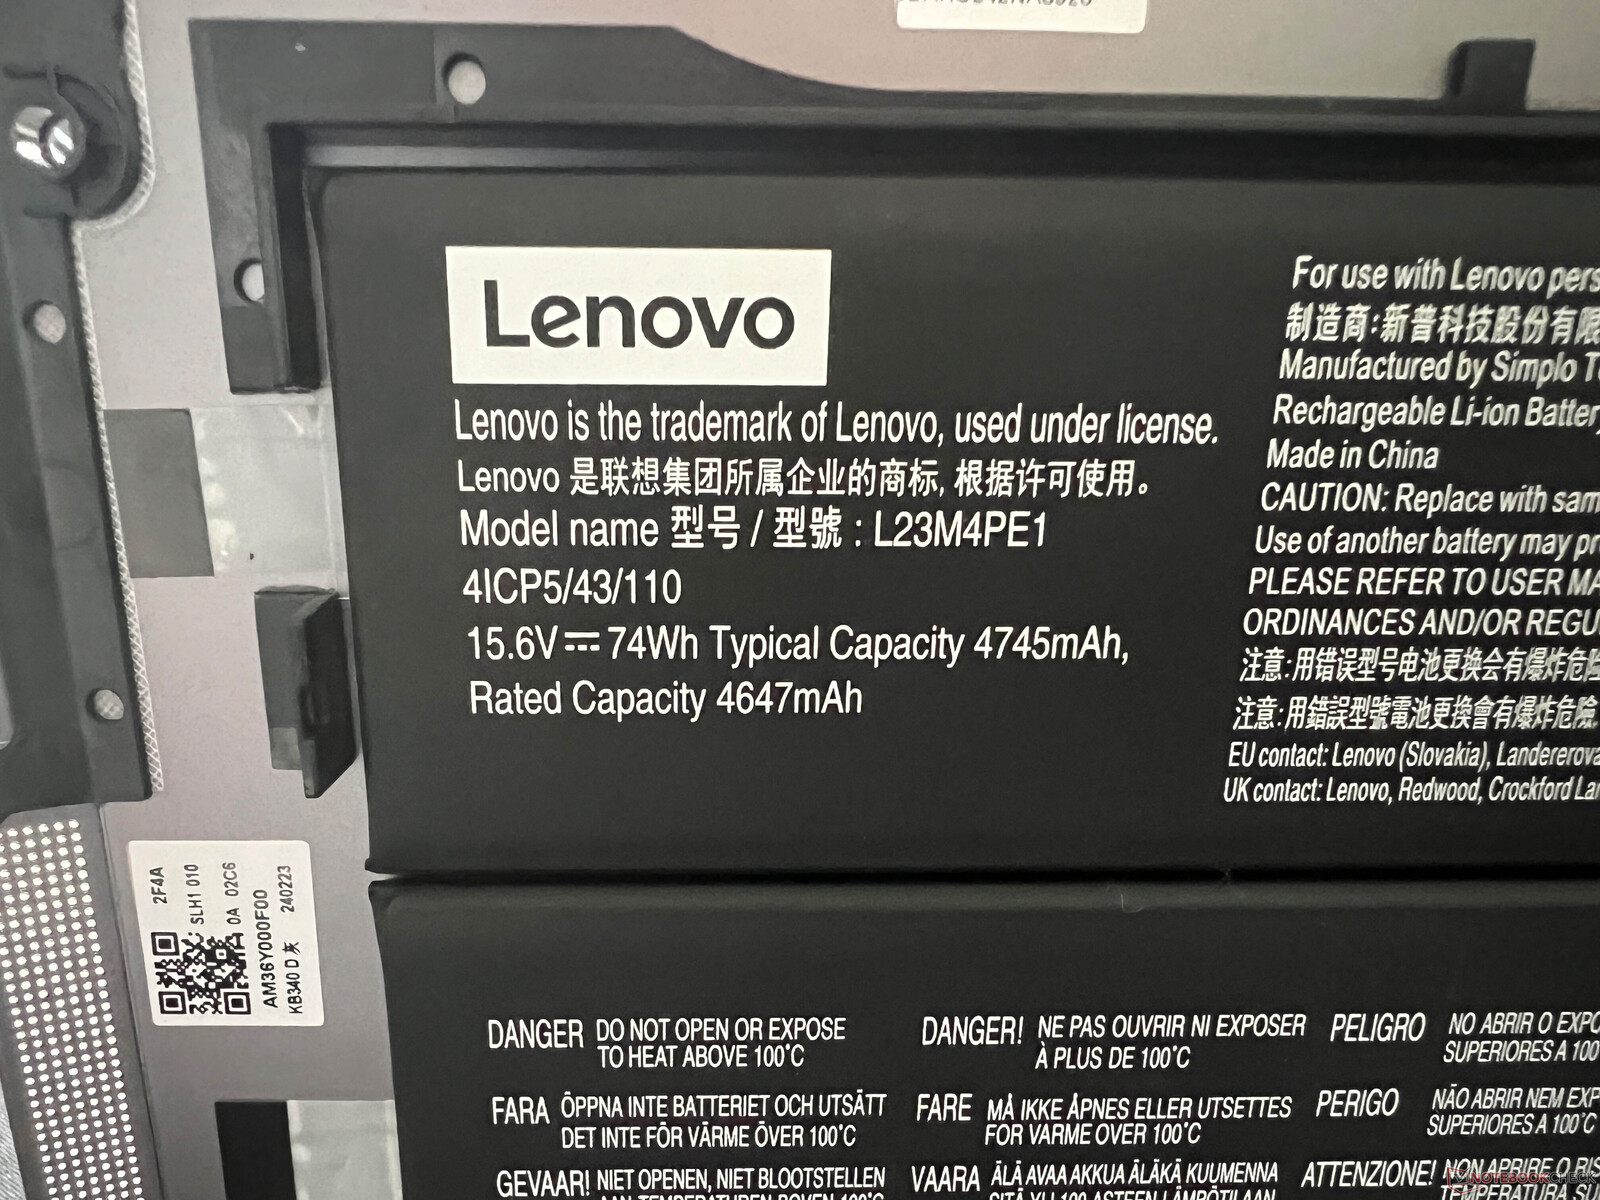
Com sua grande bateria de 74 Wh, o ThinkBook 13x G4 alcança tempos de execução bons, mas não excepcionais, em nosso teste WLAN. A 150 cd/m² (correspondente a 56% do brilho máximo do dispositivo de teste), medimos pouco menos de 11,5 horas a 60 Hz e cerca de 10,5 horas a 120 Hz. Com brilho total, ainda conseguimos 9 horas (60 Hz) e 7,5 horas (120 Hz). No teste de vídeo a 150 cd/m², o ThinkBook alcança a incrível marca de 20,5 horas e supera claramente todos os concorrentes. Sob carga total e brilho máximo, ele termina após pouco menos de 2 horas. Uma carga completa leva 113 minutos com o dispositivo ligado (80% após 66 minutos). Há também um modo de carregamento expresso, mas ele não oferece nenhuma vantagem com a fonte de alimentação de 65 watts.
| Lenovo ThinkBook 13x G4 21KR0008GE Ultra 5 125H, Arc 7-Core, 74 Wh | Dell XPS 13 9340 Core Ultra 7 Ultra 7 155H, Arc 8-Core, 55 Wh | Apple MacBook Air 13 M3 10C GPU M3, M3 10-Core GPU, 52.6 Wh | MSI Prestige 13 AI Evo Ultra 7 155H, Arc 8-Core, 75 Wh | Lenovo ThinkPad Z13 Gen 2 R7 PRO 7840U, Radeon 780M, 51.5 Wh | HP Dragonfly G4 i7-1365U, Iris Xe G7 96EUs, 68 Wh | Média da turma Subnotebook | |
|---|---|---|---|---|---|---|---|
| Duração da bateria | 4% | 22% | 10% | -31% | 53% | -2% | |
| H.264 | 1229 | 1053 -14% | 1044 -15% | 1002 -18% | 963 ? -22% | ||
| WiFi v1.3 | 684 | 769 12% | 914 34% | 694 1% | 469 -31% | 954 39% | 757 ? 11% |
| Load | 116 | 131 13% | 171 47% | 169 46% | 192 66% | 122 ? 5% |
Pro
Contra
Veredicto - O ThinkBook 13x G4 é um ótimo subnotebook se o senhor conseguir se adaptar ao teclado

O ThinkBook 13x G4 nos surpreendeu porque a Lenovo oferece um ultrabook muito móvel com um chassi de metal de alta qualidade e uma tela 3:2 fosca. Não há limitações em termos de acabamento ou estabilidade, e o senhor não esperaria um chassi de metal em um ThinkBook (geralmente apenas a tampa é feita de alumínio). Há três portas Thunderbolt 4, que às vezes requerem adaptadores no uso diário, mas devem ser suficientes. No entanto, as opções de manutenção são limitadas, pois a bateria é fixada na parte inferior do chassi.
O desempenho do Core Ultra 5 125H é suficiente para o uso diário, mas não bate nenhum recorde. Na verdade, teríamos preferido um processador AMD, dado o limite de energia de 28 watts. O Core Ultra 9 185H também está disponível como opção, mas apenas por um alto custo adicional. 32 GB de RAM também só podem ser combinados com o Core Ultra 9. A tela IPS fosca com 120 Hz é impressionante em todos os aspectos. A qualidade subjetiva da imagem não é tão boa quanto a dos painéis OLED, mas não há reflexos e a oscilação do PWM é inexistente. A duração da bateria é perfeitamente aceitável. Um excelente sistema de áudio com quatro alto-falantes também está integrado.
O ThinkBook 13x G4 da Lenovo impressiona com um chassi de alta qualidade, ótimos alto-falantes, uma boa tela IPS e bateria de longa duração. No entanto, o teclado tem suas limitações.
Além das poucas opções de manutenção, incluindo a RAM soldada, o outro grande ponto fraco do ThinkBook 13x G4 é o teclado. Embora as teclas sejam firmes, o curso das teclas é muito limitado, o que afeta visivelmente o conforto da digitação. Certamente, é possível se acostumar com o teclado e isso também depende um pouco do tipo de teclado que o senhor já usou antes, mas isso poderia ter sido facilmente evitado com um pouco mais de deslocamento das teclas. O teclado do Dell XPS 13 9340por exemplo, é mais confortável, mas os usuários têm que suportar o layout incomum e as teclas de função capacitivas. Em geral, o 13x G4 oferece uma relação preço-desempenho significativamente melhor. O Apple MacBook Air M3 continua sendo um forte concorrente, oferecendo mais desempenho em combinação com resfriamento passivo, mas usa apenas uma tela de 60 Hz.
Preço e disponibilidade
Na loja virtual da Lenovo nos EUA, o modelo básico do Thinkbook 13x Gen 4 custa a partir de US$ 1106,00. Naturalmente, ele pode ser configurado com uma CPU mais potente, RAM extra e mais armazenamento.
Lenovo ThinkBook 13x G4 21KR0008GE
- 05/23/2024 v7 (old)
Andreas Osthoff
Transparência
A seleção dos dispositivos a serem analisados é feita pela nossa equipe editorial. A amostra de teste foi fornecida ao autor como empréstimo pelo fabricante ou varejista para fins desta revisão. O credor não teve influência nesta revisão, nem o fabricante recebeu uma cópia desta revisão antes da publicação. Não houve obrigação de publicar esta revisão. Nunca aceitamos compensação ou pagamento em troca de nossas avaliações. Como empresa de mídia independente, a Notebookcheck não está sujeita à autoridade de fabricantes, varejistas ou editores.
É assim que o Notebookcheck está testando
Todos os anos, o Notebookcheck analisa de forma independente centenas de laptops e smartphones usando procedimentos padronizados para garantir que todos os resultados sejam comparáveis. Desenvolvemos continuamente nossos métodos de teste há cerca de 20 anos e definimos padrões da indústria no processo. Em nossos laboratórios de teste, equipamentos de medição de alta qualidade são utilizados por técnicos e editores experientes. Esses testes envolvem um processo de validação em vários estágios. Nosso complexo sistema de classificação é baseado em centenas de medições e benchmarks bem fundamentados, o que mantém a objetividade.Price comparison

