Análise do Microsoft Surface Laptop 7 13.8 Copilot+ - Graças ao Snapdragon X Elite, finalmente um concorrente sério do MacBook Air?
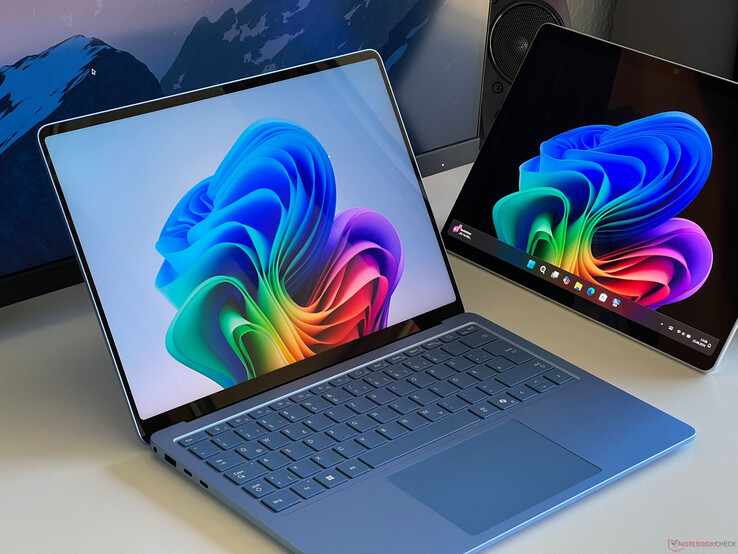
Além do Surface Pro, a Microsoft agora também está equipando o Surface Laptop com os novos processadores Snapdragon da Qualcomm. Agora em sua sétima geração, dois tamanhos (13,8 e 15 polegadas) estão disponíveis mais uma vez, mas é o modelo de 13,8 polegadas que vamos analisar primeiro. O preço base do Snapdragon X Plus (10 núcleos, 16 GB de RAM e um SSD de 256 GB) é de US$ 1.069; nossa configuração de análise com o Snapdragon X Elite (12 núcleos), 16 GB de RAM e um SSD de 512 GB custa US$ 1.669.
Possíveis concorrentes em comparação
Avaliação | Versão | Data | Modelo | Peso | Altura | Size | Resolução | Preço |
|---|---|---|---|---|---|---|---|---|
| 86.2 % | v8 | 07/2024 | Microsoft Surface Laptop 7 13.8 Copilot+ SD X Elite X1E-80-100, Adreno X1-85 3.8 TFLOPS | 1.3 kg | 17.5 mm | 13.80" | 2304x1536 | |
| 90.1 % v7 (old) | v7 (old) | 05/2024 | Lenovo ThinkBook 13x G4 21KR0008GE Ultra 5 125H, Arc 7-Core | 1.2 kg | 12.9 mm | 13.50" | 2880x1920 | |
| 86.5 % v7 (old) | v7 (old) | 05/2024 | Dell XPS 13 9340 Core Ultra 7 Ultra 7 155H, Arc 8-Core | 1.2 kg | 15.3 mm | 13.40" | 1920x1200 | |
| 92.4 % v7 (old) | v7 (old) | 03/2024 | Apple MacBook Air 13 M3 10C GPU M3, M3 10-Core GPU | 1.2 kg | 11.3 mm | 13.60" | 2560x1664 | |
| 87.5 % v7 (old) | v7 (old) | 10/2023 | Framework Laptop 13.5 Ryzen 7 7840U R7 7840U, Radeon 780M | 1.3 kg | 15.85 mm | 13.50" | 2256x1504 | |
| 91.9 % v7 (old) | v7 (old) | 07/2023 | HP Dragonfly G4 i7-1365U, Iris Xe G7 96EUs | 1.1 kg | 16.3 mm | 13.50" | 1920x1280 |
Os Top 10
» Os Top 10 Portáteis Multimídia
» Os Top 10 Portáteis de Jogos
» Os Top 10 Portáteis Leves para Jogos
» Os Top 10 Portáteis Acessíveis de Escritório/Empresariais
» Os Top 10 Portáteis Premium de Escritório/Empresariais
» Os Top 10 dos Portáteis Workstation
» Os Top 10 Subportáteis
» Os Top 10 Ultrabooks
» Os Top 10 Conversíveis
» Os Top 10 Tablets
» Os Top 10 Smartphones
» A melhores Telas de Portáteis Analisadas Pela Notebookcheck
» Top 10 dos portáteis abaixo dos 500 Euros da Notebookcheck
» Top 10 dos Portáteis abaixo dos 300 Euros
Observação: Atualizamos recentemente nosso sistema de classificação e os resultados da versão 8 não são comparáveis aos resultados da versão 7. Mais informações estão disponíveis aqui .
Estojo - Um estojo de metal com possibilidade de manutenção
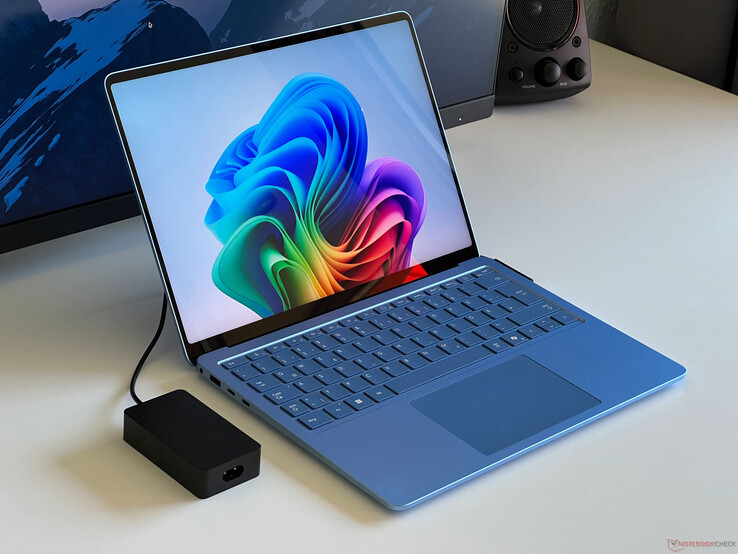
Nada mudou em relação ao design da sétima geração do Surface Laptop e, externamente, o senhor não saberá dizer se está lidando com um novo modelo Snapdragon. Isso só fica evidente com o novo botão Copilot. A caixa de metal ainda é maravilhosamente construída e a Microsoft oferece o laptop nas cores preto, platina, cinza-bege ou azul-safira, que é a cor do nosso dispositivo de análise. Dependendo de como a luz incide, o modelo azul safira é muito chamativo e nós gostamos dele. Além disso, não há problemas com impressões digitais.
A estabilidade é muito boa, com uma quantidade mínima de flexão que requer muita pressão aplicada. No entanto, não conseguimos provocar nenhum ruído de rangido. As dobradiças são basicamente bem calibradas, mas não é possível evitar uma leve oscilação ao ajustar o ângulo de abertura (máximo de 135 graus). Não há problemas quando o chão treme (por exemplo, em uma viagem de trem). Um novo recurso dos dispositivos de 7ª geração é uma opção de manutenção, pois a tampa não é mais colada (falaremos mais sobre isso daqui a pouco).
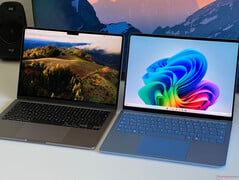
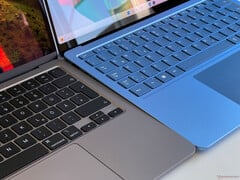
O Surface Laptop 13.8 não é um dispositivo especialmente fino ou leve. Com um pouco mais de 1,3 kg e uma espessura de 17,5 mm na parte traseira, estamos lidando com o laptop mais espesso desta comparação. No entanto, o laptop é geralmente muito compacto e pode ser facilmente guardado em uma mochila. Em uma comparação direta com o MacBook Air 13 M3 (veja as imagens a seguir), o senhor percebe a espessura do Surface Laptop e que ele ocupa um espaço um pouco maior. A PSU de 39 watts fornecida pesa 213 gramas.
Recursos - USB 4 e Wi-Fi 7
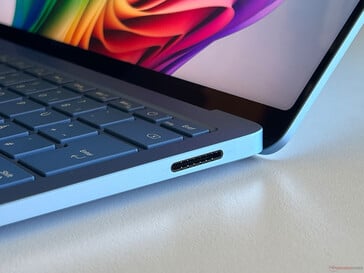
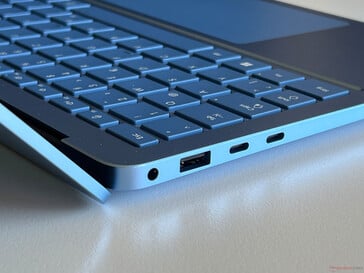
A Microsoft continua optando por sua porta Surface Connect, por meio da qual o dispositivo também pode ser carregado como padrão (o carregamento via USB-C também é possível). Além disso, estão disponíveis duas interfaces USB 4.0 e uma porta USB-A comum. No entanto, o senhor terá que ficar sem um leitor de cartões.
Comunicação
O processador Snapdragon é equipado com o módulo Wi-Fi FastConnect 7800, que também suporta o novo padrão Wi-Fi 7 e o Bluetooth 5.4. Em nossa análise com o roteador de referência da Asus, as velocidades de transferência foram altas e estáveis; no entanto, o desempenho de envio não é tão alto quanto o do MacBook Air ou o ThinkBook 13x.
| Networking | |
| Microsoft Surface Laptop 7 13.8 Copilot+ | |
| iperf3 transmit AXE11000 | |
| iperf3 receive AXE11000 | |
| iperf3 transmit AXE11000 6GHz | |
| iperf3 receive AXE11000 6GHz | |
| Lenovo ThinkBook 13x G4 21KR0008GE | |
| iperf3 transmit AXE11000 | |
| iperf3 receive AXE11000 | |
| Dell XPS 13 9340 Core Ultra 7 | |
| iperf3 transmit AXE11000 | |
| iperf3 receive AXE11000 | |
| Apple MacBook Air 13 M3 10C GPU | |
| iperf3 transmit AXE11000 | |
| iperf3 receive AXE11000 | |
| Framework Laptop 13.5 Ryzen 7 7840U | |
| iperf3 transmit AXE11000 | |
| iperf3 receive AXE11000 | |
| iperf3 transmit AXE11000 6GHz | |
| iperf3 receive AXE11000 6GHz | |
| HP Dragonfly G4 | |
| iperf3 transmit AXE11000 | |
| iperf3 receive AXE11000 | |
| iperf3 transmit AXE11000 6GHz | |
| iperf3 receive AXE11000 6GHz | |
Webcam
A Microsoft optou por uma webcam de 1080p que, obviamente, também é compatível com o Studio Effects atual. Em termos de qualidade, os resultados são decentes, mas não se comparam às câmeras muito boas encontradas no Surface Pro 2 em 1. Não há um obturador mecânico/eletrônico, mas há um sensor IR para o reconhecimento facial via Windows Hello.

Manutenção
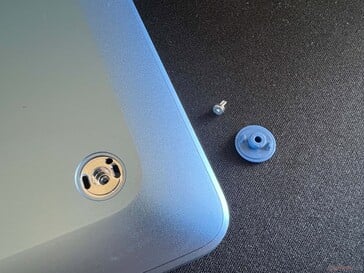
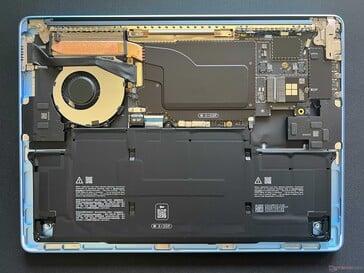
Nessa seção, há uma melhoria significativa em comparação com os modelos antigos, pois a base do Surface Laptop 7 agora é parafusada em vez de colada. Os quatro parafusos (Torx T5) estão ocultos, mas são facilmente acessados sob os pés de borracha. Internamente, a ventoinha, a bateria e o SSD compacto M.2 2230 também são facilmente acessíveis. No entanto, a RAM e o Wi-Fi são soldados.
Garantia
O fabricante oferece uma garantia de 12 meses. Na Alemanha, há também, é claro, a cobertura adicional legal de dois anos. Sob o nome Microsoft Complete, o fabricante oferece uma garantia estendida de dois, três ou quatro anos (+ $149, $219 ou $249). Obviamente, isso também cobre danos acidentais. Um serviço no local não está incluído, o que significa que o dispositivo terá que ser enviado para reparo.
Dispositivos de entrada - Uma tela sensível ao toque e um touchpad háptico
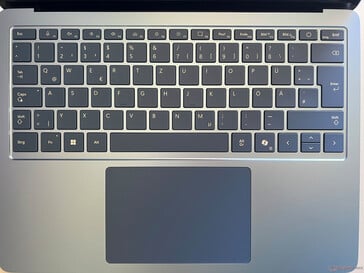
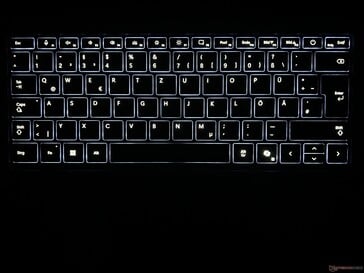
O teclado do Surface Laptop 7 proporciona uma experiência de digitação confortável. Nos modelos anteriores, as teclas pareciam um pouco frágeis, mas esse não é mais o caso aqui. O deslocamento das teclas é suficiente e o ponto de pressão é agradável, o que significa que até mesmo textos mais longos podem ser compilados confortavelmente. Embora o layout com o novo botão Copilot não ofereça nenhuma surpresa, as teclas de seta são muito pequenas. A luz de fundo branca oferece três níveis de intensidade, mas não pode ser ativada automaticamente pelo sensor.
O novo Surface Laptop possui o touchpad háptico visto no Surface Studio 2. Ele não possui nenhuma parte móvel e o feedback do clique é criado por meio dos motores de vibração. Isso significa que qualquer lugar em que o touchpad for clicado resultará no mesmo feedback (que é agradavelmente silencioso). Na prática, ele funciona muito bem com a superfície lisa (12 x 8 cm). Além disso, há também uma tela sensível ao toque capacitiva que funciona perfeitamente.
Tela - Um painel IPS agora com 600 cd/m²
A Microsoft deixou as propriedades básicas da tela inalteradas (fornecedor: Sharp) porque, mais uma vez, estamos lidando com uma tela sensível ao toque IPS 3:2 com uma resolução de 2.304 x 1.536 pixels. Com uma medida diagonal de 13,8 polegadas, a tela é suficientemente nítida e a qualidade subjetiva da imagem é boa, já que o painel suporta uma frequência de 120 Hz. No entanto, a qualidade da tela do Surface Laptop não atinge os níveis alcançados pelos painéis OLED e a opção OLED vista no Surface Pro certamente teria sido interessante. No entanto, em comparação com o MacBook Aira alta frequência é uma vantagem.
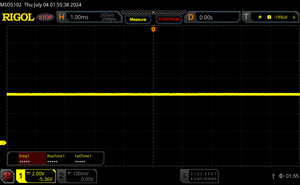
O brilho aumentou e agora está em uma média de quase 600 cd/m². Isso significa que o valor de preto sofre e, com 0,43 cd/m², é um pouco alto demais. A taxa de contraste máxima ainda gira em torno de ~1.400:1. O conteúdo HDR é suportado, mas o brilho máximo permanece inalterado. A cintilação PWM não aparece em lugar algum e os tempos de resposta são imperceptíveis. Além disso, o vazamento de luz não apresenta nenhum problema, apesar do alto brilho. Tanto o brilho quanto a temperatura da cor podem ser ajustados à luz ambiente por meio do sensor.
| |||||||||||||||||||||||||
iluminação: 94 %
iluminação com acumulador: 603 cd/m²
Contraste: 1409:1 (Preto: 0.43 cd/m²)
ΔE Color 1.3 | 0.5-29.43 Ø4.87
ΔE Greyscale 2.1 | 0.5-98 Ø5.1
87.3% AdobeRGB 1998 (Argyll 2.2.0 3D)
98.2% sRGB (Argyll 2.2.0 3D)
97.8% Display P3 (Argyll 2.2.0 3D)
Gamma: 2.16
| Microsoft Surface Laptop 7 13.8 Copilot+ LQ138P1JX61, IPS, 2304x1536, 13.8" | Lenovo ThinkBook 13x G4 21KR0008GE LEN135WQ+, IPS, 2880x1920, 13.5" | Dell XPS 13 9340 Core Ultra 7 SHP1593, IPS, 1920x1200, 13.4" | Apple MacBook Air 13 M3 10C GPU IPS, 2560x1664, 13.6" | Framework Laptop 13.5 Ryzen 7 7840U BOE CQ NE135FBM-N41, IPS, 2256x1504, 13.5" | HP Dragonfly G4 Chi Mei CMN13C0, IPS, 1920x1280, 13.5" | |
|---|---|---|---|---|---|---|
| Display | -19% | -16% | 1% | -16% | -16% | |
| Display P3 Coverage | 97.8 | 65.5 -33% | 69.4 -29% | 98.4 1% | 69 -29% | 68.4 -30% |
| sRGB Coverage | 98.2 | 97.3 -1% | 97.8 0% | 99.9 2% | 99.1 1% | 98.3 0% |
| AdobeRGB 1998 Coverage | 87.3 | 67.7 -22% | 71.7 -18% | 87.9 1% | 71.1 -19% | 70.4 -19% |
| Response Times | 28% | -35% | -23% | -56% | -53% | |
| Response Time Grey 50% / Grey 80% * | 38.9 ? | 27.3 ? 30% | 43.2 ? -11% | 34.5 ? 11% | 50.4 ? -30% | 48.8 ? -25% |
| Response Time Black / White * | 17.4 ? | 12.8 ? 26% | 27.6 ? -59% | 27.2 ? -56% | 31.5 ? -81% | 31.3 ? -80% |
| PWM Frequency | ||||||
| Screen | -12% | -53% | -9% | -33% | -25% | |
| Brightness middle | 606 | 539 -11% | 429 -29% | 525 -13% | 436 -28% | 408.8 -33% |
| Brightness | 592 | 513 -13% | 407 -31% | 506 -15% | 416 -30% | 399 -33% |
| Brightness Distribution | 94 | 89 -5% | 90 -4% | 92 -2% | 89 -5% | 90 -4% |
| Black Level * | 0.43 | 0.38 12% | 0.28 35% | 0.42 2% | 0.36 16% | 0.32 26% |
| Contrast | 1409 | 1418 1% | 1532 9% | 1250 -11% | 1211 -14% | 1278 -9% |
| Colorchecker dE 2000 * | 1.3 | 1.4 -8% | 2.6 -100% | 1.4 -8% | 1.81 -39% | 2.02 -55% |
| Colorchecker dE 2000 max. * | 2.1 | 3.5 -67% | 6.6 -214% | 2.8 -33% | 4.73 -125% | 3.84 -83% |
| Greyscale dE 2000 * | 2.1 | 2.2 -5% | 4 -90% | 2 5% | 2.9 -38% | 2.3 -10% |
| Gamma | 2.16 102% | 2.19 100% | 2.23 99% | 2.2 100% | 2.27 97% | 2.2 100% |
| CCT | 6842 95% | 6710 97% | 7332 89% | 6876 95% | 6784 96% | 6203 105% |
| Colorchecker dE 2000 calibrated * | 0.7 | 1.4 | 0.45 | 0.61 | ||
| Média Total (Programa/Configurações) | -1% /
-7% | -35% /
-42% | -10% /
-9% | -35% /
-32% | -31% /
-27% |
* ... menor é melhor
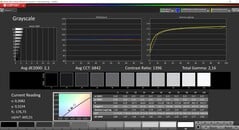
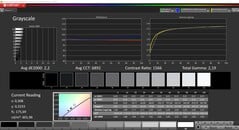
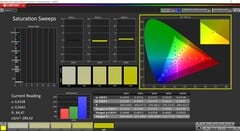
Medimos o painel usando o software profissional CalMAN e a Microsoft forneceu dois perfis: Vivid e sRGB. Como padrão, o perfil Vivid está ativo e abrange o espaço de cores P3 maior. Ambos os perfis são muito precisos e é bom que não seja necessária uma calibração, pois no momento não podemos realizá-la. Nosso software i1Profiler é atualmente incompatível com o sistema ARM. Devido à cobertura completa dos espaços de cores P3 e sRGB, a edição de imagens e vídeos funciona sem problemas.
Exibir tempos de resposta
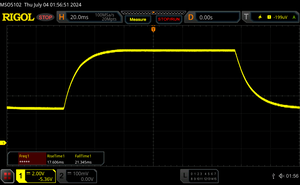
| ↔ Tempo de resposta preto para branco | ||
|---|---|---|
| 17.4 ms ... ascensão ↗ e queda ↘ combinadas | ↗ 5.7 ms ascensão | |
| ↘ 11.7 ms queda | ||
| A tela mostra boas taxas de resposta em nossos testes, mas pode ser muito lenta para jogadores competitivos. Em comparação, todos os dispositivos testados variam de 0.1 (mínimo) a 240 (máximo) ms. » 37 % de todos os dispositivos são melhores. Isso significa que o tempo de resposta medido é melhor que a média de todos os dispositivos testados (20.7 ms). | ||
| ↔ Tempo de resposta 50% cinza a 80% cinza | ||
| 38.9 ms ... ascensão ↗ e queda ↘ combinadas | ↗ 17.6 ms ascensão | |
| ↘ 21.3 ms queda | ||
| A tela mostra taxas de resposta lentas em nossos testes e será insatisfatória para os jogadores. Em comparação, todos os dispositivos testados variam de 0.165 (mínimo) a 636 (máximo) ms. » 56 % de todos os dispositivos são melhores. Isso significa que o tempo de resposta medido é pior que a média de todos os dispositivos testados (32.5 ms). | ||
Cintilação da tela / PWM (modulação por largura de pulso)
| Tela tremeluzindo / PWM não detectado | |||
[pwm_comparison] Em comparação: 53 % de todos os dispositivos testados não usam PWM para escurecer a tela. Se PWM foi detectado, uma média de 8492 (mínimo: 5 - máximo: 343500) Hz foi medida. | |||
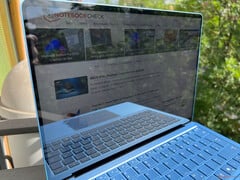
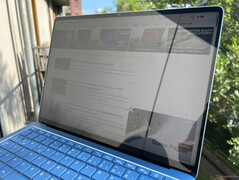
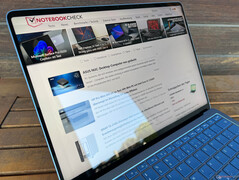
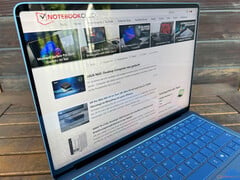
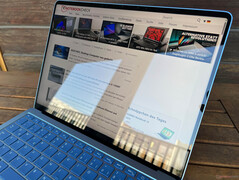
A tela sensível ao toque é muito reflexiva e, em ambientes externos, o senhor terá problemas com reflexos. O alto brilho pode compensar um pouco isso, mas, nesse aspecto, uma tela menos reflexiva, como a vista na tela sensível ao toque do atual Huawei Matebook X Pro é uma vantagem. Não há limitações quando se trata da estabilidade do ângulo de visão.
Desempenho - Snapdragon X Elite com turbo dual-core
O novo Surface Laptop 7 13.8 está disponível com o Snapdragon X Plus (X1P-64-100) ou o Snapdragon X Elite (X1E-80-100). Como padrão, são instalados 16 GB de RAM (LPDDR5x-8448) e também há atualmente uma configuração com 32 GB de RAM por US$ 1.999. Além disso, as sobretaxas para mais armazenamento SSD são muito altas.
Fizemos nosso curso normal de testes, mas nem todos os programas são compatíveis e muitos testes também não têm um aplicativo ARM nativo. Como o senhor será confrontado com a emulação no uso diário, mostraremos esses resultados também.
Condições de teste
A Microsoft não fornece seus dispositivos com seus próprios perfis de energia, mas, em vez disso, oferece modos de desempenho do Windows. Esses modos sempre tiveram nomes diferentes nos dispositivos Surface: Recomendado (representa a Melhor Economia de Energia), Melhor Desempenho (representa Equilibrado) e Melhor Desempenho. Realizamos os seguintes benchmarks e medições usando, como padrão, o modo Melhor Desempenho .
Processador - Snapdragon X1E-80-100
Um Snapdragon X Elite X1E-80-100 é usado no mais caro dos novos modelos do Surface Laptop. Ele tem uma velocidade de clock de até 3,4 GHz em todos os 12 núcleos e também suporta um turbo dual-core de até 4,0 GHz. Mais detalhes técnicos podem ser encontrados em nosso artigo de análise. Como no caso do Surface Pro, assumimos um TDP entre 23 e 30 watts e os resultados dos dois dispositivos da Microsoft são comparáveis. Nos benchmarks de CPU, os testes nativos do Cinebench 2024 e do Geekbench 6 são particularmente interessantes. Essa é uma área em que o processador Snapdragon também apresenta resultados melhores do que o concorrente direto equipado com CPUs AMD e Intel. Apple o chip M3 com resfriamento passivo do M3 resfriado passivamente é mais lento nos testes de vários núcleos, mas tem uma vantagem nos testes de núcleo único. No modo de bateria, o desempenho permaneceu consistente. O Snapdragon X Plus no Surface Pro (e, portanto, comparável ao Surface Laptop) é apenas 7 a 13% mais lento em ambos os testes nativos.
Geekbench 6.4: Multi-Core | Single-Core
Cinebench R23: Multi Core | Single Core
Cinebench R20: CPU (Multi Core) | CPU (Single Core)
Cinebench R15: CPU Multi 64Bit | CPU Single 64Bit
Blender: v2.79 BMW27 CPU
7-Zip 18.03: 7z b 4 | 7z b 4 -mmt1
Geekbench 5.5: Multi-Core | Single-Core
HWBOT x265 Benchmark v2.2: 4k Preset
LibreOffice : 20 Documents To PDF
R Benchmark 2.5: Overall mean
| Cinebench 2024 / CPU Multi Core | |
| Microsoft Surface Laptop 7 13.8 Copilot+ | |
| Microsoft Surface Pro OLED Copilot+ | |
| Média Qualcomm Snapdragon X Elite X1E-80-100 (621 - 927, n=7) | |
| Microsoft Surface Pro Copilot+ | |
| Média da turma Subnotebook (148 - 1162, n=62, últimos 2 anos) | |
| Dell XPS 13 9340 Core Ultra 7 | |
| Apple MacBook Air 13 M3 10C GPU | |
| Lenovo ThinkBook 13x G4 21KR0008GE | |
| Cinebench 2024 / CPU Single Core | |
| Apple MacBook Air 13 M3 10C GPU | |
| Microsoft Surface Pro OLED Copilot+ | |
| Microsoft Surface Laptop 7 13.8 Copilot+ | |
| Média Qualcomm Snapdragon X Elite X1E-80-100 (122 - 123, n=7) | |
| Média da turma Subnotebook (35 - 173, n=45, últimos 2 anos) | |
| Microsoft Surface Pro Copilot+ | |
| Dell XPS 13 9340 Core Ultra 7 | |
| Lenovo ThinkBook 13x G4 21KR0008GE | |
| Geekbench 6.4 / Multi-Core | |
| Microsoft Surface Pro OLED Copilot+ | |
| Microsoft Surface Laptop 7 13.8 Copilot+ | |
| Microsoft Surface Pro Copilot+ | |
| Média Qualcomm Snapdragon X Elite X1E-80-100 (7596 - 14998, n=9) | |
| Apple MacBook Air 13 M3 10C GPU | |
| Dell XPS 13 9340 Core Ultra 7 | |
| Média da turma Subnotebook (2244 - 17489, n=74, últimos 2 anos) | |
| Framework Laptop 13.5 Ryzen 7 7840U | |
| Lenovo ThinkBook 13x G4 21KR0008GE | |
| Geekbench 6.4 / Single-Core | |
| Apple MacBook Air 13 M3 10C GPU | |
| Microsoft Surface Pro OLED Copilot+ | |
| Microsoft Surface Laptop 7 13.8 Copilot+ | |
| Média Qualcomm Snapdragon X Elite X1E-80-100 (1896 - 2845, n=9) | |
| Média da turma Subnotebook (960 - 3820, n=69, últimos 2 anos) | |
| Framework Laptop 13.5 Ryzen 7 7840U | |
| Microsoft Surface Pro Copilot+ | |
| Dell XPS 13 9340 Core Ultra 7 | |
| Lenovo ThinkBook 13x G4 21KR0008GE | |
| Cinebench R23 / Multi Core | |
| Framework Laptop 13.5 Ryzen 7 7840U | |
| Dell XPS 13 9340 Core Ultra 7 | |
| Média da turma Subnotebook (1555 - 21812, n=74, últimos 2 anos) | |
| Apple MacBook Air 13 M3 10C GPU | |
| Microsoft Surface Laptop 7 13.8 Copilot+ | |
| Microsoft Surface Pro OLED Copilot+ | |
| Média Qualcomm Snapdragon X Elite X1E-80-100 (6772 - 10792, n=7) | |
| Lenovo ThinkBook 13x G4 21KR0008GE | |
| Microsoft Surface Pro Copilot+ | |
| HP Dragonfly G4 | |
| Cinebench R23 / Single Core | |
| Apple MacBook Air 13 M3 10C GPU | |
| HP Dragonfly G4 | |
| Dell XPS 13 9340 Core Ultra 7 | |
| Média da turma Subnotebook (358 - 2165, n=74, últimos 2 anos) | |
| Framework Laptop 13.5 Ryzen 7 7840U | |
| Lenovo ThinkBook 13x G4 21KR0008GE | |
| Microsoft Surface Pro OLED Copilot+ | |
| Microsoft Surface Laptop 7 13.8 Copilot+ | |
| Média Qualcomm Snapdragon X Elite X1E-80-100 (1273 - 1321, n=7) | |
| Microsoft Surface Pro Copilot+ | |
| Cinebench R20 / CPU (Multi Core) | |
| Framework Laptop 13.5 Ryzen 7 7840U | |
| Dell XPS 13 9340 Core Ultra 7 | |
| Média da turma Subnotebook (579 - 8541, n=69, últimos 2 anos) | |
| Microsoft Surface Laptop 7 13.8 Copilot+ | |
| Lenovo ThinkBook 13x G4 21KR0008GE | |
| Microsoft Surface Pro OLED Copilot+ | |
| Média Qualcomm Snapdragon X Elite X1E-80-100 (2539 - 4107, n=7) | |
| Microsoft Surface Pro Copilot+ | |
| HP Dragonfly G4 | |
| Cinebench R20 / CPU (Single Core) | |
| HP Dragonfly G4 | |
| Dell XPS 13 9340 Core Ultra 7 | |
| Lenovo ThinkBook 13x G4 21KR0008GE | |
| Framework Laptop 13.5 Ryzen 7 7840U | |
| Média da turma Subnotebook (128 - 826, n=69, últimos 2 anos) | |
| Microsoft Surface Laptop 7 13.8 Copilot+ | |
| Microsoft Surface Pro OLED Copilot+ | |
| Média Qualcomm Snapdragon X Elite X1E-80-100 (470 - 495, n=7) | |
| Microsoft Surface Pro Copilot+ | |
| Cinebench R15 / CPU Multi 64Bit | |
| Microsoft Surface Pro OLED Copilot+ | |
| Dell XPS 13 9340 Core Ultra 7 | |
| Framework Laptop 13.5 Ryzen 7 7840U | |
| Microsoft Surface Laptop 7 13.8 Copilot+ | |
| Microsoft Surface Pro Copilot+ | |
| Média da turma Subnotebook (327 - 3345, n=74, últimos 2 anos) | |
| Média Qualcomm Snapdragon X Elite X1E-80-100 (1476 - 2249, n=7) | |
| Lenovo ThinkBook 13x G4 21KR0008GE | |
| HP Dragonfly G4 | |
| Cinebench R15 / CPU Single 64Bit | |
| HP Dragonfly G4 | |
| Dell XPS 13 9340 Core Ultra 7 | |
| Média da turma Subnotebook (72.4 - 322, n=70, últimos 2 anos) | |
| Framework Laptop 13.5 Ryzen 7 7840U | |
| Microsoft Surface Pro OLED Copilot+ | |
| Lenovo ThinkBook 13x G4 21KR0008GE | |
| Microsoft Surface Laptop 7 13.8 Copilot+ | |
| Média Qualcomm Snapdragon X Elite X1E-80-100 (230 - 248, n=7) | |
| Microsoft Surface Pro Copilot+ | |
| Blender / v2.79 BMW27 CPU | |
| Apple MacBook Air 13 M3 10C GPU | |
| HP Dragonfly G4 | |
| Microsoft Surface Pro Copilot+ | |
| Média da turma Subnotebook (159 - 2271, n=72, últimos 2 anos) | |
| Média Qualcomm Snapdragon X Elite X1E-80-100 (331 - 510, n=7) | |
| Lenovo ThinkBook 13x G4 21KR0008GE | |
| Microsoft Surface Pro OLED Copilot+ | |
| Microsoft Surface Laptop 7 13.8 Copilot+ | |
| Dell XPS 13 9340 Core Ultra 7 | |
| Framework Laptop 13.5 Ryzen 7 7840U | |
| 7-Zip 18.03 / 7z b 4 | |
| Framework Laptop 13.5 Ryzen 7 7840U | |
| Dell XPS 13 9340 Core Ultra 7 | |
| Média da turma Subnotebook (11668 - 77867, n=65, últimos 2 anos) | |
| Microsoft Surface Laptop 7 13.8 Copilot+ | |
| Microsoft Surface Pro OLED Copilot+ | |
| Média Qualcomm Snapdragon X Elite X1E-80-100 (34299 - 46146, n=7) | |
| Microsoft Surface Pro Copilot+ | |
| HP Dragonfly G4 | |
| 7-Zip 18.03 / 7z b 4 -mmt1 | |
| Framework Laptop 13.5 Ryzen 7 7840U | |
| HP Dragonfly G4 | |
| Média da turma Subnotebook (2643 - 6442, n=67, últimos 2 anos) | |
| Dell XPS 13 9340 Core Ultra 7 | |
| Microsoft Surface Pro OLED Copilot+ | |
| Microsoft Surface Laptop 7 13.8 Copilot+ | |
| Média Qualcomm Snapdragon X Elite X1E-80-100 (5242 - 5359, n=7) | |
| Lenovo ThinkBook 13x G4 21KR0008GE | |
| Microsoft Surface Pro Copilot+ | |
| Geekbench 5.5 / Multi-Core | |
| Dell XPS 13 9340 Core Ultra 7 | |
| Apple MacBook Air 13 M3 10C GPU | |
| Framework Laptop 13.5 Ryzen 7 7840U | |
| Lenovo ThinkBook 13x G4 21KR0008GE | |
| Média da turma Subnotebook (2557 - 17218, n=66, últimos 2 anos) | |
| HP Dragonfly G4 | |
| Geekbench 5.5 / Single-Core | |
| Apple MacBook Air 13 M3 10C GPU | |
| Framework Laptop 13.5 Ryzen 7 7840U | |
| HP Dragonfly G4 | |
| Média da turma Subnotebook (726 - 2350, n=66, últimos 2 anos) | |
| Dell XPS 13 9340 Core Ultra 7 | |
| Lenovo ThinkBook 13x G4 21KR0008GE | |
| HWBOT x265 Benchmark v2.2 / 4k Preset | |
| Framework Laptop 13.5 Ryzen 7 7840U | |
| Dell XPS 13 9340 Core Ultra 7 | |
| Média da turma Subnotebook (0.97 - 25.1, n=68, últimos 2 anos) | |
| Lenovo ThinkBook 13x G4 21KR0008GE | |
| HP Dragonfly G4 | |
| Microsoft Surface Laptop 7 13.8 Copilot+ | |
| Microsoft Surface Pro OLED Copilot+ | |
| Média Qualcomm Snapdragon X Elite X1E-80-100 (4.74 - 7.53, n=7) | |
| Microsoft Surface Pro Copilot+ | |
| LibreOffice / 20 Documents To PDF | |
| Microsoft Surface Laptop 7 13.8 Copilot+ | |
| Média Qualcomm Snapdragon X Elite X1E-80-100 (50.9 - 98.5, n=7) | |
| Microsoft Surface Pro Copilot+ | |
| Média da turma Subnotebook (38.5 - 220, n=66, últimos 2 anos) | |
| Microsoft Surface Pro OLED Copilot+ | |
| Lenovo ThinkBook 13x G4 21KR0008GE | |
| Dell XPS 13 9340 Core Ultra 7 | |
| HP Dragonfly G4 | |
| Framework Laptop 13.5 Ryzen 7 7840U | |
| R Benchmark 2.5 / Overall mean | |
| Microsoft Surface Pro Copilot+ | |
| Média Qualcomm Snapdragon X Elite X1E-80-100 (0.63 - 0.67, n=7) | |
| Microsoft Surface Pro OLED Copilot+ | |
| Microsoft Surface Laptop 7 13.8 Copilot+ | |
| Média da turma Subnotebook (0.403 - 1.456, n=68, últimos 2 anos) | |
| Lenovo ThinkBook 13x G4 21KR0008GE | |
| Dell XPS 13 9340 Core Ultra 7 | |
| HP Dragonfly G4 | |
| Framework Laptop 13.5 Ryzen 7 7840U | |
* ... menor é melhor
AIDA64: FP32 Ray-Trace | FPU Julia | CPU SHA3 | CPU Queen | FPU SinJulia | FPU Mandel | CPU AES | CPU ZLib | FP64 Ray-Trace | CPU PhotoWorxx
| Performance Rating | |
| Framework Laptop 13.5 Ryzen 7 7840U | |
| Dell XPS 13 9340 Core Ultra 7 | |
| Média da turma Subnotebook | |
| Lenovo ThinkBook 13x G4 21KR0008GE | |
| Microsoft Surface Laptop 7 13.8 Copilot+ | |
| Média Qualcomm Snapdragon X Elite X1E-80-100 | |
| Microsoft Surface Pro OLED Copilot+ | |
| HP Dragonfly G4 | |
| AIDA64 / FP32 Ray-Trace | |
| Framework Laptop 13.5 Ryzen 7 7840U | |
| Média da turma Subnotebook (1135 - 32888, n=68, últimos 2 anos) | |
| Dell XPS 13 9340 Core Ultra 7 | |
| Lenovo ThinkBook 13x G4 21KR0008GE | |
| Microsoft Surface Laptop 7 13.8 Copilot+ | |
| HP Dragonfly G4 | |
| Média Qualcomm Snapdragon X Elite X1E-80-100 (2184 - 7469, n=7) | |
| Microsoft Surface Pro OLED Copilot+ | |
| AIDA64 / FPU Julia | |
| Framework Laptop 13.5 Ryzen 7 7840U | |
| Dell XPS 13 9340 Core Ultra 7 | |
| Média da turma Subnotebook (5218 - 123315, n=68, últimos 2 anos) | |
| Lenovo ThinkBook 13x G4 21KR0008GE | |
| HP Dragonfly G4 | |
| Microsoft Surface Laptop 7 13.8 Copilot+ | |
| Média Qualcomm Snapdragon X Elite X1E-80-100 (5687 - 26391, n=7) | |
| Microsoft Surface Pro OLED Copilot+ | |
| AIDA64 / CPU SHA3 | |
| Framework Laptop 13.5 Ryzen 7 7840U | |
| Microsoft Surface Laptop 7 13.8 Copilot+ | |
| Dell XPS 13 9340 Core Ultra 7 | |
| Média da turma Subnotebook (444 - 5287, n=68, últimos 2 anos) | |
| Média Qualcomm Snapdragon X Elite X1E-80-100 (2607 - 3122, n=7) | |
| Microsoft Surface Pro OLED Copilot+ | |
| Lenovo ThinkBook 13x G4 21KR0008GE | |
| HP Dragonfly G4 | |
| AIDA64 / CPU Queen | |
| Framework Laptop 13.5 Ryzen 7 7840U | |
| Lenovo ThinkBook 13x G4 21KR0008GE | |
| Dell XPS 13 9340 Core Ultra 7 | |
| Média da turma Subnotebook (10579 - 115682, n=68, últimos 2 anos) | |
| HP Dragonfly G4 | |
| Microsoft Surface Pro OLED Copilot+ | |
| Microsoft Surface Laptop 7 13.8 Copilot+ | |
| Média Qualcomm Snapdragon X Elite X1E-80-100 (67219 - 69762, n=7) | |
| AIDA64 / FPU SinJulia | |
| Framework Laptop 13.5 Ryzen 7 7840U | |
| Dell XPS 13 9340 Core Ultra 7 | |
| Média da turma Subnotebook (744 - 18418, n=68, últimos 2 anos) | |
| Lenovo ThinkBook 13x G4 21KR0008GE | |
| HP Dragonfly G4 | |
| Microsoft Surface Pro OLED Copilot+ | |
| Microsoft Surface Laptop 7 13.8 Copilot+ | |
| Média Qualcomm Snapdragon X Elite X1E-80-100 (1521 - 2357, n=7) | |
| AIDA64 / FPU Mandel | |
| Framework Laptop 13.5 Ryzen 7 7840U | |
| Média da turma Subnotebook (3341 - 65433, n=68, últimos 2 anos) | |
| Dell XPS 13 9340 Core Ultra 7 | |
| Lenovo ThinkBook 13x G4 21KR0008GE | |
| HP Dragonfly G4 | |
| Microsoft Surface Pro OLED Copilot+ | |
| Microsoft Surface Laptop 7 13.8 Copilot+ | |
| Média Qualcomm Snapdragon X Elite X1E-80-100 (10117 - 15669, n=7) | |
| AIDA64 / CPU AES | |
| Framework Laptop 13.5 Ryzen 7 7840U | |
| Microsoft Surface Pro OLED Copilot+ | |
| Dell XPS 13 9340 Core Ultra 7 | |
| Microsoft Surface Laptop 7 13.8 Copilot+ | |
| Média Qualcomm Snapdragon X Elite X1E-80-100 (39956 - 71089, n=7) | |
| Média da turma Subnotebook (638 - 161430, n=68, últimos 2 anos) | |
| Lenovo ThinkBook 13x G4 21KR0008GE | |
| HP Dragonfly G4 | |
| AIDA64 / CPU ZLib | |
| Framework Laptop 13.5 Ryzen 7 7840U | |
| Dell XPS 13 9340 Core Ultra 7 | |
| Microsoft Surface Pro OLED Copilot+ | |
| Média da turma Subnotebook (164.9 - 1379, n=68, últimos 2 anos) | |
| Microsoft Surface Laptop 7 13.8 Copilot+ | |
| Média Qualcomm Snapdragon X Elite X1E-80-100 (398 - 802, n=7) | |
| Lenovo ThinkBook 13x G4 21KR0008GE | |
| HP Dragonfly G4 | |
| AIDA64 / FP64 Ray-Trace | |
| Framework Laptop 13.5 Ryzen 7 7840U | |
| Média da turma Subnotebook (610 - 17495, n=68, últimos 2 anos) | |
| Dell XPS 13 9340 Core Ultra 7 | |
| Lenovo ThinkBook 13x G4 21KR0008GE | |
| Microsoft Surface Laptop 7 13.8 Copilot+ | |
| Média Qualcomm Snapdragon X Elite X1E-80-100 (2581 - 4044, n=7) | |
| HP Dragonfly G4 | |
| Microsoft Surface Pro OLED Copilot+ | |
| AIDA64 / CPU PhotoWorxx | |
| Dell XPS 13 9340 Core Ultra 7 | |
| Lenovo ThinkBook 13x G4 21KR0008GE | |
| Média da turma Subnotebook (6569 - 64588, n=68, últimos 2 anos) | |
| Microsoft Surface Pro OLED Copilot+ | |
| Microsoft Surface Laptop 7 13.8 Copilot+ | |
| HP Dragonfly G4 | |
| Média Qualcomm Snapdragon X Elite X1E-80-100 (28474 - 38707, n=7) | |
| Framework Laptop 13.5 Ryzen 7 7840U | |
Desempenho do sistema
Em situações cotidianas, o Surface Laptop é muito ágil e é aqui que o senhor não percebe nenhuma diferença em relação à concorrência. No entanto, é importante observar que as versões ARM não estão disponíveis para todos os aplicativos ou drivers. Em comparação com os laptops AMD/Intel, o senhor está limitado, especialmente quando se trata de periféricos mais antigos que exigem seu próprio driver (por exemplo, impressoras, scanners, placas de som externas etc.).
WebXPRT 3: Overall
WebXPRT 4: Overall
Mozilla Kraken 1.1: Total
| CrossMark / Overall | |
| Apple MacBook Air 13 M3 10C GPU | |
| Framework Laptop 13.5 Ryzen 7 7840U | |
| Dell XPS 13 9340 Core Ultra 7 | |
| HP Dragonfly G4 | |
| Média da turma Subnotebook (365 - 2038, n=67, últimos 2 anos) | |
| Lenovo ThinkBook 13x G4 21KR0008GE | |
| Microsoft Surface Pro OLED Copilot+ | |
| Microsoft Surface Laptop 7 13.8 Copilot+ | |
| Média Qualcomm Snapdragon X Elite X1E-80-100, Qualcomm SD X Adreno X1-85 3.8 TFLOPS (1356 - 1443, n=7) | |
| CrossMark / Productivity | |
| Apple MacBook Air 13 M3 10C GPU | |
| Framework Laptop 13.5 Ryzen 7 7840U | |
| HP Dragonfly G4 | |
| Dell XPS 13 9340 Core Ultra 7 | |
| Média da turma Subnotebook (364 - 1918, n=67, últimos 2 anos) | |
| Lenovo ThinkBook 13x G4 21KR0008GE | |
| Microsoft Surface Pro OLED Copilot+ | |
| Microsoft Surface Laptop 7 13.8 Copilot+ | |
| Média Qualcomm Snapdragon X Elite X1E-80-100, Qualcomm SD X Adreno X1-85 3.8 TFLOPS (1271 - 1375, n=7) | |
| CrossMark / Creativity | |
| Apple MacBook Air 13 M3 10C GPU | |
| Dell XPS 13 9340 Core Ultra 7 | |
| Framework Laptop 13.5 Ryzen 7 7840U | |
| Média da turma Subnotebook (372 - 2396, n=67, últimos 2 anos) | |
| HP Dragonfly G4 | |
| Lenovo ThinkBook 13x G4 21KR0008GE | |
| Microsoft Surface Pro OLED Copilot+ | |
| Microsoft Surface Laptop 7 13.8 Copilot+ | |
| Média Qualcomm Snapdragon X Elite X1E-80-100, Qualcomm SD X Adreno X1-85 3.8 TFLOPS (1402 - 1537, n=7) | |
| CrossMark / Responsiveness | |
| Framework Laptop 13.5 Ryzen 7 7840U | |
| Microsoft Surface Pro OLED Copilot+ | |
| Dell XPS 13 9340 Core Ultra 7 | |
| HP Dragonfly G4 | |
| Apple MacBook Air 13 M3 10C GPU | |
| Média da turma Subnotebook (312 - 1899, n=67, últimos 2 anos) | |
| Microsoft Surface Laptop 7 13.8 Copilot+ | |
| Média Qualcomm Snapdragon X Elite X1E-80-100, Qualcomm SD X Adreno X1-85 3.8 TFLOPS (1237 - 1401, n=7) | |
| Lenovo ThinkBook 13x G4 21KR0008GE | |
| WebXPRT 3 / Overall | |
| Apple MacBook Air 13 M3 10C GPU | |
| Média Qualcomm Snapdragon X Elite X1E-80-100, Qualcomm SD X Adreno X1-85 3.8 TFLOPS (430 - 455, n=7) | |
| Microsoft Surface Pro OLED Copilot+ | |
| Microsoft Surface Laptop 7 13.8 Copilot+ | |
| Framework Laptop 13.5 Ryzen 7 7840U | |
| Média da turma Subnotebook (156 - 482, n=66, últimos 2 anos) | |
| HP Dragonfly G4 | |
| Dell XPS 13 9340 Core Ultra 7 | |
| Lenovo ThinkBook 13x G4 21KR0008GE | |
| WebXPRT 4 / Overall | |
| Apple MacBook Air 13 M3 10C GPU | |
| Média Qualcomm Snapdragon X Elite X1E-80-100, Qualcomm SD X Adreno X1-85 3.8 TFLOPS (295 - 324, n=7) | |
| Microsoft Surface Laptop 7 13.8 Copilot+ | |
| Microsoft Surface Pro OLED Copilot+ | |
| HP Dragonfly G4 | |
| Média da turma Subnotebook (132 - 348, n=67, últimos 2 anos) | |
| Dell XPS 13 9340 Core Ultra 7 | |
| Framework Laptop 13.5 Ryzen 7 7840U | |
| Lenovo ThinkBook 13x G4 21KR0008GE | |
| Mozilla Kraken 1.1 / Total | |
| Lenovo ThinkBook 13x G4 21KR0008GE | |
| Dell XPS 13 9340 Core Ultra 7 | |
| Framework Laptop 13.5 Ryzen 7 7840U | |
| Média da turma Subnotebook (265 - 1104, n=75, últimos 2 anos) | |
| HP Dragonfly G4 | |
| Média Qualcomm Snapdragon X Elite X1E-80-100, Qualcomm SD X Adreno X1-85 3.8 TFLOPS (391 - 422, n=7) | |
| Microsoft Surface Pro OLED Copilot+ | |
| Microsoft Surface Laptop 7 13.8 Copilot+ | |
| Apple MacBook Air 13 M3 10C GPU | |
* ... menor é melhor
| AIDA64 / Memory Copy | |
| Dell XPS 13 9340 Core Ultra 7 | |
| Lenovo ThinkBook 13x G4 21KR0008GE | |
| Média da turma Subnotebook (14554 - 109035, n=68, últimos 2 anos) | |
| Microsoft Surface Pro OLED Copilot+ | |
| Framework Laptop 13.5 Ryzen 7 7840U | |
| Microsoft Surface Laptop 7 13.8 Copilot+ | |
| Média Qualcomm Snapdragon X Elite X1E-80-100 (44795 - 63495, n=7) | |
| HP Dragonfly G4 | |
| AIDA64 / Memory Read | |
| Microsoft Surface Pro OLED Copilot+ | |
| Microsoft Surface Laptop 7 13.8 Copilot+ | |
| Média Qualcomm Snapdragon X Elite X1E-80-100 (58855 - 125604, n=7) | |
| Dell XPS 13 9340 Core Ultra 7 | |
| Lenovo ThinkBook 13x G4 21KR0008GE | |
| Média da turma Subnotebook (15948 - 122210, n=68, últimos 2 anos) | |
| Framework Laptop 13.5 Ryzen 7 7840U | |
| HP Dragonfly G4 | |
| AIDA64 / Memory Write | |
| Média da turma Subnotebook (15709 - 117898, n=68, últimos 2 anos) | |
| Framework Laptop 13.5 Ryzen 7 7840U | |
| Dell XPS 13 9340 Core Ultra 7 | |
| HP Dragonfly G4 | |
| Lenovo ThinkBook 13x G4 21KR0008GE | |
| Microsoft Surface Pro OLED Copilot+ | |
| Microsoft Surface Laptop 7 13.8 Copilot+ | |
| Média Qualcomm Snapdragon X Elite X1E-80-100 (37270 - 45265, n=7) | |
| AIDA64 / Memory Latency | |
| Lenovo ThinkBook 13x G4 21KR0008GE | |
| Dell XPS 13 9340 Core Ultra 7 | |
| Média da turma Subnotebook (7.2 - 187.8, n=67, últimos 2 anos) | |
| HP Dragonfly G4 | |
| Framework Laptop 13.5 Ryzen 7 7840U | |
| Média Qualcomm Snapdragon X Elite X1E-80-100 (7.4 - 8.8, n=5) | |
| Microsoft Surface Laptop 7 13.8 Copilot+ | |
* ... menor é melhor
Latências de DPC
Não foi possível realizar nosso teste de latência padronizado, pois o aplicativo LatencyMon não é inicializado em sistemas ARM. Ao reproduzir um vídeo 4K do YouTube, não houve, pelo menos, nenhum problema de queda de quadros.
Armazenamento em massa
A Microsoft instalou um SSD M.2 2230 que pode ser substituído com facilidade. Nosso dispositivo de análise abriga uma versão Samsung PM9B1 de 512 GB, embora o senhor só tenha 416 GB à sua disposição após a instalação inicial. Com até 3,6 GB/s, o desempenho da SSD é absolutamente suficiente para o uso diário e, além disso, as velocidades de transferência são estáveis, mesmo durante períodos de carga contínua. Outros benchmarks de SSD estão listados aqui.
* ... menor é melhor
Continuous Performance Read: DiskSpd Read Loop, Queue Depth 8
Placa de vídeo - Adreno X1-85
Atualmente, há duas variantes da Adreno-X1-85-GPU e, combinada com o X1E-80-100, é usada a versão mais lenta, com velocidade de clock de 1,2 GHz (3,8 TFLOPS). Em situações reais, a iGPU é mais do que suficiente e não há problemas, mesmo ao reproduzir vídeos de alta resolução. Quando analisamos o benchmark nativo da GPU, WildLife Extreme Unlimited, o Surface Laptop se posiciona entre o Intel Arc Graphics com 8 núcleos, bem como a AMD Radeon 780M.
Até aí tudo bem, mas, assim que o senhor tenta jogar, as coisas ficam problemáticas. Há pouquíssimos jogos ARM nativos e sempre encontramos problemas em nossos testes. Às vezes, os jogos nem sequer inicializavam(Far Cry 5, Prince of Persia The Lost Crown, Witcher 3, F1 23 e F1 24) e, às vezes, havia erros gráficos/crashes em configurações mais altas(Shadow of the Tomb Raider, Total War Pharaoh) ou simplesmente havia crashes regulares no jogo(Cyberpunk 2077). No futuro, a situação deve melhorar, mas quem quiser jogar ocasionalmente alguns jogos deve evitar laptops com Snapdragon.
O desempenho da GPU permaneceu estável durante os períodos de carga contínua e também no modo de bateria. Outros benchmarks de GPU estão disponíveis aqui.
| 3DMark 11 Performance | 6855 pontos | |
| 3DMark Fire Strike Score | 5727 pontos | |
| 3DMark Time Spy Score | 1868 pontos | |
| 3DMark Steel Nomad Score | 476 pontos | |
| 3DMark Steel Nomad Light Score | 2005 pontos | |
| 3DMark Steel Nomad Light Unlimited Score | 1932 pontos | |
Ajuda | ||
| Blender / v3.3 Classroom METAL | |
| Média da turma Subnotebook (103 - 237, n=5, últimos 2 anos) | |
| Apple MacBook Air 13 M3 10C GPU | |
| Blender / v3.3 Classroom CPU | |
| HP Dragonfly G4 | |
| Lenovo ThinkBook 13x G4 21KR0008GE | |
| Média Qualcomm SD X Adreno X1-85 3.8 TFLOPS (545 - 899, n=12) | |
| Microsoft Surface Pro OLED Copilot+ | |
| Microsoft Surface Laptop 7 13.8 Copilot+ | |
| Média da turma Subnotebook (241 - 1127, n=71, últimos 2 anos) | |
| Apple MacBook Air 13 M3 10C GPU | |
| Dell XPS 13 9340 Core Ultra 7 | |
| Framework Laptop 13.5 Ryzen 7 7840U | |
* ... menor é melhor
| Cyberpunk 2077 2.2 Phantom Liberty - 1920x1080 Ultra Preset (FSR off) | |
| Média da turma Subnotebook (8.48 - 31.4, n=49, últimos 2 anos) | |
| Lenovo ThinkBook 13x G4 21KR0008GE | |
| Microsoft Surface Laptop 7 13.8 Copilot+ | |
| Microsoft Surface Pro OLED Copilot+ | |
| GTA V - 1920x1080 Highest Settings possible AA:4xMSAA + FX AF:16x | |
| Microsoft Surface Laptop 7 13.8 Copilot+ | |
| Média da turma Subnotebook (7.81 - 53, n=65, últimos 2 anos) | |
| Lenovo ThinkBook 13x G4 21KR0008GE | |
| Dell XPS 13 9340 Core Ultra 7 | |
| HP Dragonfly G4 | |
| Baldur's Gate 3 - 1920x1080 Ultra Preset | |
| Média da turma Subnotebook (12.1 - 31.1, n=45, últimos 2 anos) | |
| Apple MacBook Air 13 M3 10C GPU | |
| Microsoft Surface Laptop 7 13.8 Copilot+ | |
| Microsoft Surface Pro OLED Copilot+ | |
Cyberpunk 2077 ultra FPS diagram
| baixo | média | alto | ultra | |
|---|---|---|---|---|
| GTA V (2015) | 100.6 | 96.3 | 50 | 21.5 |
| Dota 2 Reborn (2015) | 85.9 | 65.7 | 61.7 | 53.2 |
| Final Fantasy XV Benchmark (2018) | 57.3 | 24.9 | 15.8 | |
| X-Plane 11.11 (2018) | 37.8 | |||
| Strange Brigade (2018) | 137 | 51 | 43 | 36 |
| Shadow of the Tomb Raider (2018) | 60 | 25 | 23 | |
| F1 22 (2022) | 57 | 50.1 | 38 | |
| Baldur's Gate 3 (2023) | 24.7 | 20.3 | 17.5 | 17 |
| Cyberpunk 2077 2.2 Phantom Liberty (2023) | 22.7 | 18.9 | 16.4 | 14.3 |
| Total War Pharaoh (2023) | 87.6 | 55.2 |
Emissões - Muito silenciosas em situações cotidianas
Emissões de ruído
A ventoinha do Surface Laptop 13.8 é geralmente inaudível no uso diário. Ela permanece desativada por longos períodos de tempo e, com 26 dB(A) sob uma pequena carga, também permanece muito silenciosa. Ao jogar, conseguimos extrair um máximo de 31,5 dB(A) do dispositivo. A ventoinha só conseguiu atingir rapidamente seu nível mais alto, em torno de 40 dB(A), sob carga total da CPU e durante o teste de estresse. Não foi possível detectar nenhum outro ruído eletrônico.
Barulho
| Ocioso |
| 23.8 / 23.8 / 23.8 dB |
| Carga |
| 26 / 40.3 dB |
 | ||
30 dB silencioso 40 dB(A) audível 50 dB(A) ruidosamente alto |
||
min: | ||
| Microsoft Surface Laptop 7 13.8 Copilot+ Adreno X1-85 3.8 TFLOPS, SD X Elite X1E-80-100, Samsung MZ9L4512HBLU-00BMV | Lenovo ThinkBook 13x G4 21KR0008GE Arc 7-Core, Ultra 5 125H, Samsung PM9C1a MZAL8512HDLU | Dell XPS 13 9340 Core Ultra 7 Arc 8-Core, Ultra 7 155H, Micron 2550 512GB | Apple MacBook Air 13 M3 10C GPU M3 10-Core GPU, M3, Apple SSD AP0512Z | Framework Laptop 13.5 Ryzen 7 7840U Radeon 780M, R7 7840U, WD PC SN740 512GB SDDPNQD-512G | HP Dragonfly G4 Iris Xe G7 96EUs, i7-1365U, Micron 3400 MTFDKBA512TFH 512GB | |
|---|---|---|---|---|---|---|
| Noise | -9% | -12% | -8% | -0% | ||
| desligado / ambiente * | 23.8 | 24.5 -3% | 25.1 -5% | 22.6 5% | 23.3 2% | |
| Idle Minimum * | 23.8 | 24.5 -3% | 25.1 -5% | 22.6 5% | 23.5 1% | |
| Idle Average * | 23.8 | 24.5 -3% | 25.1 -5% | 22.6 5% | 23.5 1% | |
| Idle Maximum * | 23.8 | 27.1 -14% | 25.1 -5% | 24.2 -2% | 26.8 -13% | |
| Load Average * | 26 | 33.3 -28% | 37.4 -44% | 35.8 -38% | 27.2 -5% | |
| Cyberpunk 2077 ultra * | 31.5 | |||||
| Load Maximum * | 40.3 | 40.7 -1% | 42.5 -5% | 48.9 -21% | 35 13% | |
| Witcher 3 ultra * | 36.8 | 42.5 | 46.5 | 32.7 |
* ... menor é melhor
Temperatura
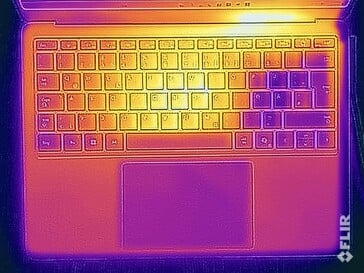
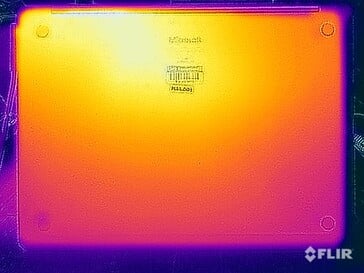
Em modo inativo e durante tarefas pouco exigentes da vida real, a caixa de metal praticamente não esquenta. Ao jogar e, em particular, sob alta carga da CPU, isso muda rapidamente e medimos até 47 °C na base do dispositivo. Isso já é desagradável devido à caixa de metal e, nesse tipo de situação, o senhor deve evitar colocar o laptop no colo. Da mesma forma, o teclado fica desagradavelmente quente e isso pode levar a limitações ao digitar.
(-) A temperatura máxima no lado superior é 47.1 °C / 117 F, em comparação com a média de 35.9 °C / 97 F , variando de 21.4 a 59 °C para a classe Subnotebook.
(±) A parte inferior aquece até um máximo de 44.6 °C / 112 F, em comparação com a média de 39.3 °C / 103 F
(+) Em uso inativo, a temperatura média para o lado superior é 24.3 °C / 76 F, em comparação com a média do dispositivo de 30.8 °C / ### class_avg_f### F.
(-) 3: The average temperature for the upper side is 40.9 °C / 106 F, compared to the average of 30.8 °C / 87 F for the class Subnotebook.
(+) Os apoios para as mãos e o touchpad estão atingindo a temperatura máxima da pele (35.8 °C / 96.4 F) e, portanto, não estão quentes.
(-) A temperatura média da área do apoio para as mãos de dispositivos semelhantes foi 28.2 °C / 82.8 F (-7.6 °C / -13.6 F).
| Microsoft Surface Laptop 7 13.8 Copilot+ Qualcomm Snapdragon X Elite X1E-80-100, Qualcomm SD X Adreno X1-85 3.8 TFLOPS | Lenovo ThinkBook 13x G4 21KR0008GE Intel Core Ultra 5 125H, Intel Arc 7-Core iGPU | Dell XPS 13 9340 Core Ultra 7 Intel Core Ultra 7 155H, Intel Arc 8-Core iGPU | Apple MacBook Air 13 M3 10C GPU Apple M3, Apple M3 10-Core GPU | Framework Laptop 13.5 Ryzen 7 7840U AMD Ryzen 7 7840U, AMD Radeon 780M | HP Dragonfly G4 Intel Core i7-1365U, Intel Iris Xe Graphics G7 96EUs | |
|---|---|---|---|---|---|---|
| Heat | -2% | 2% | 7% | -8% | -1% | |
| Maximum Upper Side * | 47.1 | 43.1 8% | 41 13% | 44.3 6% | 42 11% | 38.6 18% |
| Maximum Bottom * | 44.6 | 39.2 12% | 43.5 2% | 43.4 3% | 47.4 -6% | 40.4 9% |
| Idle Upper Side * | 24.7 | 28.3 -15% | 25.3 -2% | 22.3 10% | 28.8 -17% | 28.2 -14% |
| Idle Bottom * | 24.5 | 28 -14% | 25.5 -4% | 22.1 10% | 29.6 -21% | 29 -18% |
* ... menor é melhor
Alto-falantes
Os alto-falantes estéreo fazem bem o seu trabalho e, no geral, a qualidade é semelhante à do Dell XPS 13 9340 mas um pouco pior do que o MacBook Air 13 M3 e, especialmente, do ThinkBook 13x G4. Embora o senhor só perceba isso em uma comparação direta.
Microsoft Surface Laptop 7 13.8 Copilot+ análise de áudio
(±) | o volume do alto-falante é médio, mas bom (###valor### dB)
Graves 100 - 315Hz
(±) | graves reduzidos - em média 12.7% menor que a mediana
(±) | a linearidade dos graves é média (9.8% delta para a frequência anterior)
Médios 400 - 2.000 Hz
(+) | médios equilibrados - apenas 4.1% longe da mediana
(+) | médios são lineares (2.4% delta para frequência anterior)
Altos 2 - 16 kHz
(+) | agudos equilibrados - apenas 2.1% longe da mediana
(+) | os máximos são lineares (2.5% delta da frequência anterior)
Geral 100 - 16.000 Hz
(+) | o som geral é linear (12.1% diferença em relação à mediana)
Comparado com a mesma classe
» 14% de todos os dispositivos testados nesta classe foram melhores, 4% semelhantes, 82% piores
» O melhor teve um delta de 5%, a média foi 19%, o pior foi 53%
Comparado com todos os dispositivos testados
» 8% de todos os dispositivos testados foram melhores, 2% semelhantes, 90% piores
» O melhor teve um delta de 4%, a média foi 24%, o pior foi 134%
Lenovo ThinkBook 13x G4 21KR0008GE análise de áudio
(+) | os alto-falantes podem tocar relativamente alto (###valor### dB)
Graves 100 - 315Hz
(±) | graves reduzidos - em média 9% menor que a mediana
(±) | a linearidade dos graves é média (8% delta para a frequência anterior)
Médios 400 - 2.000 Hz
(+) | médios equilibrados - apenas 2.4% longe da mediana
(+) | médios são lineares (2.9% delta para frequência anterior)
Altos 2 - 16 kHz
(+) | agudos equilibrados - apenas 3.2% longe da mediana
(+) | os máximos são lineares (3.4% delta da frequência anterior)
Geral 100 - 16.000 Hz
(+) | o som geral é linear (8.6% diferença em relação à mediana)
Comparado com a mesma classe
» 3% de todos os dispositivos testados nesta classe foram melhores, 1% semelhantes, 97% piores
» O melhor teve um delta de 5%, a média foi 19%, o pior foi 53%
Comparado com todos os dispositivos testados
» 2% de todos os dispositivos testados foram melhores, 1% semelhantes, 97% piores
» O melhor teve um delta de 4%, a média foi 24%, o pior foi 134%
Dell XPS 13 9340 Core Ultra 7 análise de áudio
(+) | os alto-falantes podem tocar relativamente alto (###valor### dB)
Graves 100 - 315Hz
(-) | quase nenhum baixo - em média 17% menor que a mediana
(±) | a linearidade dos graves é média (9.3% delta para a frequência anterior)
Médios 400 - 2.000 Hz
(+) | médios equilibrados - apenas 2.1% longe da mediana
(+) | médios são lineares (4.7% delta para frequência anterior)
Altos 2 - 16 kHz
(+) | agudos equilibrados - apenas 2.5% longe da mediana
(+) | os máximos são lineares (4.6% delta da frequência anterior)
Geral 100 - 16.000 Hz
(+) | o som geral é linear (11.6% diferença em relação à mediana)
Comparado com a mesma classe
» 12% de todos os dispositivos testados nesta classe foram melhores, 3% semelhantes, 85% piores
» O melhor teve um delta de 5%, a média foi 19%, o pior foi 53%
Comparado com todos os dispositivos testados
» 7% de todos os dispositivos testados foram melhores, 2% semelhantes, 91% piores
» O melhor teve um delta de 4%, a média foi 24%, o pior foi 134%
Apple MacBook Air 13 M3 10C GPU análise de áudio
(+) | os alto-falantes podem tocar relativamente alto (###valor### dB)
Graves 100 - 315Hz
(±) | graves reduzidos - em média 13.3% menor que a mediana
(±) | a linearidade dos graves é média (11.3% delta para a frequência anterior)
Médios 400 - 2.000 Hz
(+) | médios equilibrados - apenas 0.4% longe da mediana
(+) | médios são lineares (1.6% delta para frequência anterior)
Altos 2 - 16 kHz
(+) | agudos equilibrados - apenas 4.5% longe da mediana
(+) | os máximos são lineares (1.9% delta da frequência anterior)
Geral 100 - 16.000 Hz
(+) | o som geral é linear (10.7% diferença em relação à mediana)
Comparado com a mesma classe
» 8% de todos os dispositivos testados nesta classe foram melhores, 3% semelhantes, 89% piores
» O melhor teve um delta de 5%, a média foi 19%, o pior foi 53%
Comparado com todos os dispositivos testados
» 5% de todos os dispositivos testados foram melhores, 1% semelhantes, 94% piores
» O melhor teve um delta de 4%, a média foi 24%, o pior foi 134%
Gerenciamento de energia - Maior eficiência
Consumo de energia
O novo Surface Laptop é particularmente eficiente quando está ocioso com o brilho mínimo da tela, mas, é claro, com o brilho alto, os 600 cd/m² se destacam. Sob carga, o consumo fica em um máximo de 41 watts e, ao jogar, esse número fica um pouco abaixo de 39 watts. A PSU de 39 watts incluída é suficiente para lidar com as demandas de energia, mas, nesse caso de uso, ela não tem a capacidade de carregar a bateria simultaneamente. A Microsoft deveria ter enviado as versões do Snapdragon X Elite com uma PSU mais potente.
| desligado | |
| Ocioso | |
| Carga |
|
Key:
min: | |
| Microsoft Surface Laptop 7 13.8 Copilot+ SD X Elite X1E-80-100, Adreno X1-85 3.8 TFLOPS, Samsung MZ9L4512HBLU-00BMV, IPS, 2304x1536, 13.8" | Lenovo ThinkBook 13x G4 21KR0008GE Ultra 5 125H, Arc 7-Core, Samsung PM9C1a MZAL8512HDLU, IPS, 2880x1920, 13.5" | Dell XPS 13 9340 Core Ultra 7 Ultra 7 155H, Arc 8-Core, Micron 2550 512GB, IPS, 1920x1200, 13.4" | Apple MacBook Air 13 M3 10C GPU M3, M3 10-Core GPU, Apple SSD AP0512Z, IPS, 2560x1664, 13.6" | Framework Laptop 13.5 Ryzen 7 7840U R7 7840U, Radeon 780M, WD PC SN740 512GB SDDPNQD-512G, IPS, 2256x1504, 13.5" | HP Dragonfly G4 i7-1365U, Iris Xe G7 96EUs, Micron 3400 MTFDKBA512TFH 512GB, IPS, 1920x1280, 13.5" | Média Qualcomm SD X Adreno X1-85 3.8 TFLOPS | Média da turma Subnotebook | |
|---|---|---|---|---|---|---|---|---|
| Power Consumption | -96% | -66% | -22% | -58% | -63% | -47% | -75% | |
| Idle Minimum * | 1.4 | 5.4 -286% | 3.8 -171% | 1.95 -39% | 4 -186% | 4.1 -193% | 3.61 ? -158% | 4.24 ? -203% |
| Idle Average * | 6.3 | 7.8 -24% | 7 -11% | 8.7 -38% | 6.5 -3% | 7.5 -19% | 6.9 ? -10% | 7.34 ? -17% |
| Idle Maximum * | 7.6 | 8.9 -17% | 7.3 4% | 8.9 -17% | 6.8 11% | 8.2 -8% | 7.87 ? -4% | 9.03 ? -19% |
| Load Average * | 26.9 | 49.4 -84% | 52.6 -96% | 34.3 -28% | 48 -78% | 35.5 -32% | 30.2 ? -12% | 45.1 ? -68% |
| Cyberpunk 2077 ultra * | 38.5 | |||||||
| Load Maximum * | 40.7 | 68.8 -69% | 62.7 -54% | 35.4 13% | 55.2 -36% | 66.5 -63% | 61 ? -50% | 68.5 ? -68% |
| Witcher 3 ultra * | 44.4 | 38.3 | 28.6 | 52.3 | 37.5 |
* ... menor é melhor
Power consumption Cyberpunk 2077 / stress test
Power consumption with an external monitor
Duração da bateria
Os tempos de execução com a bateria de 55 Wh são muito bons, mas não excepcionais. No teste de Wi-Fi, a 150 d/m² (representando 57% do brilho máximo do dispositivo de análise), conseguimos um pouco mais de 14 horas a 60 Hz e 13 horas a 120 Hz. Com brilho total, esses números diminuem para 7 horas e 47 minutos (60 Hz) e 7 horas e 27 minutos (120 Hz). Isso significa que o Surface Laptop fica atrás do MacBook Air e do HP Dragonfly G4.
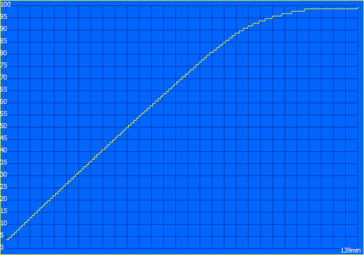
Com 19 horas e 41 minutos no teste de vídeo, o laptop da Microsoft teve um desempenho muito bom, mas é superado nesse cenário, por exemplo, pelo ThinkBook 13x G4. Por outro lado, sob carga, as luzes se apagam após 80 minutos. Com o dispositivo ligado, um ciclo de carregamento completo com a PSU de 39 watts leva 139 minutos (80% após 82 minutos) e com uma PSU de 65 watts leva 111 minutos (80% após 58 minutos).
| Microsoft Surface Laptop 7 13.8 Copilot+ SD X Elite X1E-80-100, Adreno X1-85 3.8 TFLOPS, 54 Wh | Lenovo ThinkBook 13x G4 21KR0008GE Ultra 5 125H, Arc 7-Core, 74 Wh | Dell XPS 13 9340 Core Ultra 7 Ultra 7 155H, Arc 8-Core, 55 Wh | Apple MacBook Air 13 M3 10C GPU M3, M3 10-Core GPU, 52.6 Wh | Framework Laptop 13.5 Ryzen 7 7840U R7 7840U, Radeon 780M, 61 Wh | HP Dragonfly G4 i7-1365U, Iris Xe G7 96EUs, 68 Wh | Média da turma Subnotebook | |
|---|---|---|---|---|---|---|---|
| Duração da bateria | 10% | 14% | 36% | -15% | 76% | 8% | |
| H.264 | 1181 | 1229 4% | 1053 -11% | 1044 -12% | 968 ? -18% | ||
| WiFi v1.3 | 852 | 684 -20% | 769 -10% | 914 7% | 726 -15% | 954 12% | 762 ? -11% |
| Load | 80 | 116 45% | 131 64% | 171 114% | 192 140% | 121.9 ? 52% |
Pro
Contra
Veredicto - Um bom laptop com problemas de compatibilidade
O novo Surface Laptop Copilot+ é basicamente um bom laptop, mas há limitações que os clientes devem conhecer. Em essência, o novo processador Snapdragon oferece bom desempenho e a versão ARM do Windows também funciona muito bem. É por isso que o senhor não deve notar nenhuma diferença entre o dispositivo ARM e os processadores baseados em AMD ou Intel quando se trata do uso diário. Entretanto, há limitações de compatibilidade, pois nem todos os aplicativos funcionam e, em particular, há problemas com versões mais antigas de software ou programas que exigem drivers especiais. Isso também se aplica aos jogos, onde há muitos problemas. Além disso, sob carga total, o senhor percebe que o pequeno sistema de resfriamento do laptop fica muito barulhento e quente.
Em termos do hardware em si, só temos motivos para uma pequena quantidade de críticas, pois a caixa de metal é premium e pode ser facilmente aberta. Os dispositivos de entrada são muito bons, o IPS impressiona, exceto pelos fortes reflexos, e a duração da bateria também é muito boa, considerando a capacidade da bateria. No entanto, como de costume, depende de como o senhor o utiliza, pois se forçar muito o dispositivo, a bateria ficará sem energia após menos de 1,5 horas. Alguns dos concorrentes também conseguem tempos de execução mais longos.
O novo Surface Laptop 13.8 Copilot+ é um computador muito bom para usuários comuns que usam as versões atuais do software e não querem jogar. No entanto, a versão básica mais barata com o Snapdragon X Plus faz muito mais sentido para esse cenário.
Se o senhor puder lidar com as limitações, ainda assim recomendamos a variante básica com o Snapdragon X Plus. As especificações são mais ou menos idênticas e, em nossa análisejá observamos que o Snapdragon X Plus não é mais lento em situações cotidianas. O SSD de 256 GB pode ser facilmente trocado, o que significa que o senhor pode evitar as altas sobretaxas da Microsoft (US$ 250 para o upgrade de 256 para 512 GB).
Em comparação com o Apple MacBook Air 13o Surface Laptop oferece algumas vantagens, por exemplo, a expansão do SSD, a tela sensível ao toque de 120 Hz um pouco mais brilhante ou a porta USB-A, que ainda é relevante no uso diário. No que diz respeito à duração da bateria, as coisas são iguais, mas o MacBook Air é consideravelmente mais fino e ainda tem a grande vantagem de ser resfriado passivamente.
Uma comparação com outros laptops Windows atuais também não é vantajosa para o Surface Laptop, já que o preço do dispositivo analisado é alto e, além dos ventiladores um pouco mais silenciosos em situações cotidianas, bem como a função adicional Copilot+ AI (que, no entanto, é limitada por tempo e logo estará disponível nos próximos laptops Zen5 e Lunar Lake), não há argumentos reais para um laptop Windows com um processador ARM. Com um modem 5G padrão, seria possível obter uma vantagem, mas a Microsoft optou por não implementar isso em seu Surface Laptop.
Preço e disponibilidade
O novo Surface Laptop 13 Copilot+ com o Snapdragon X Elite pode ser encomendado na Amazon por US$ 1.669. O modelo básico com o Snapdragon X Plus e um SSD de 256 GB custa US$ 1.069.
Observação: Atualizamos recentemente nosso sistema de classificação e os resultados da versão 8 não são comparáveis aos resultados da versão 7. Mais informações estão disponíveis aqui .
Microsoft Surface Laptop 7 13.8 Copilot+
- 07/04/2024 v8
Andreas Osthoff
Transparência
A seleção dos dispositivos a serem analisados é feita pela nossa equipe editorial. A amostra de teste foi fornecida ao autor como empréstimo pelo fabricante ou varejista para fins desta revisão. O credor não teve influência nesta revisão, nem o fabricante recebeu uma cópia desta revisão antes da publicação. Não houve obrigação de publicar esta revisão. Nunca aceitamos compensação ou pagamento em troca de nossas avaliações. Como empresa de mídia independente, a Notebookcheck não está sujeita à autoridade de fabricantes, varejistas ou editores.
É assim que o Notebookcheck está testando
Todos os anos, o Notebookcheck analisa de forma independente centenas de laptops e smartphones usando procedimentos padronizados para garantir que todos os resultados sejam comparáveis. Desenvolvemos continuamente nossos métodos de teste há cerca de 20 anos e definimos padrões da indústria no processo. Em nossos laboratórios de teste, equipamentos de medição de alta qualidade são utilizados por técnicos e editores experientes. Esses testes envolvem um processo de validação em vários estágios. Nosso complexo sistema de classificação é baseado em centenas de medições e benchmarks bem fundamentados, o que mantém a objetividade.















 Total Sustainability Score:


