Estreia do desempenho da Nvidia RTX 3500 Ada: Análise da estação de trabalho HP ZBook Fury 16 G11
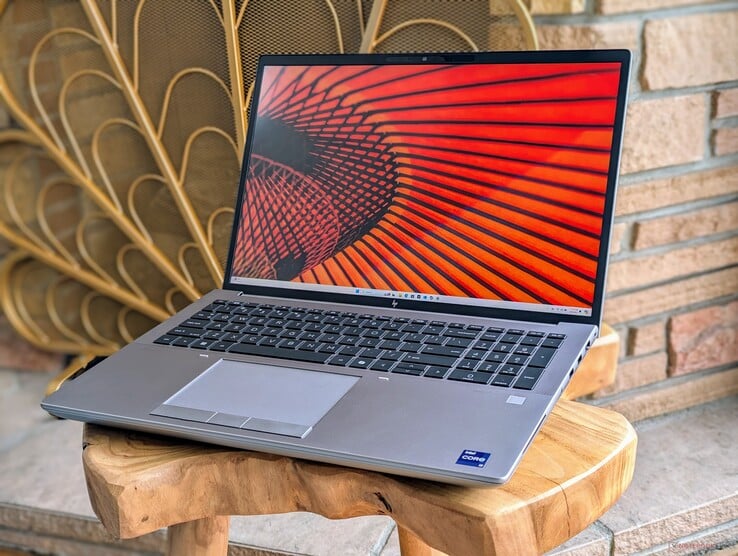
O ZBook Fury 16 G11 2024 é o sucessor do 2023 Fury 16 G10 trocando as CPUs Raptor Lake-HX pelas opções mais recentes do Raptor Lake-HX Refresh. Fora isso, o chassi permanece idêntico ao Fury 16 G10 ou Fury 16 G9, assim como muitas das opções configuráveis. Recomendamos que confira nossa análise do Fury 16 G9 para saber mais sobre as características físicas do modelo.
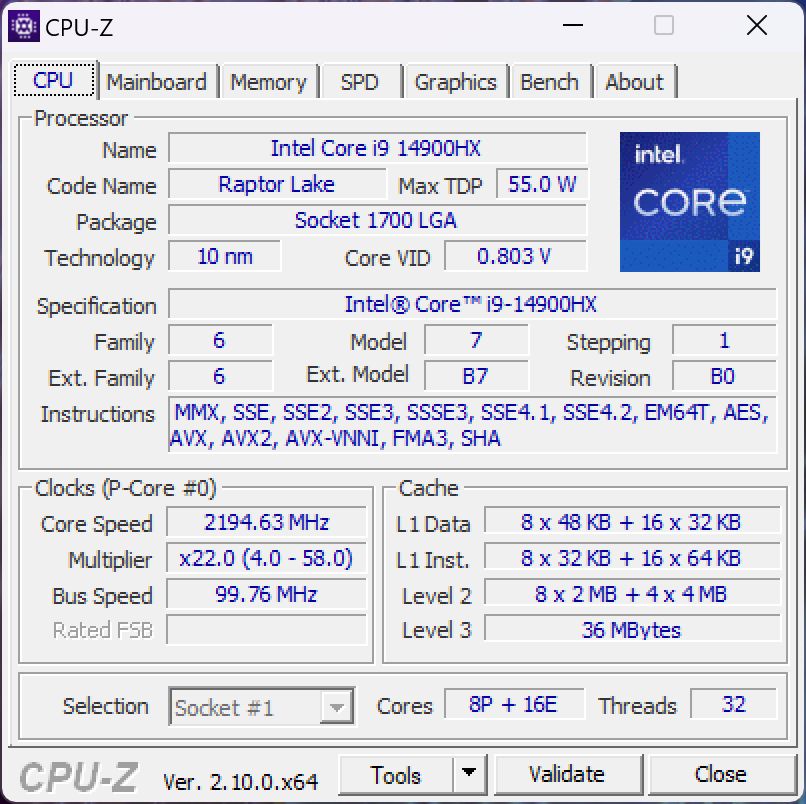
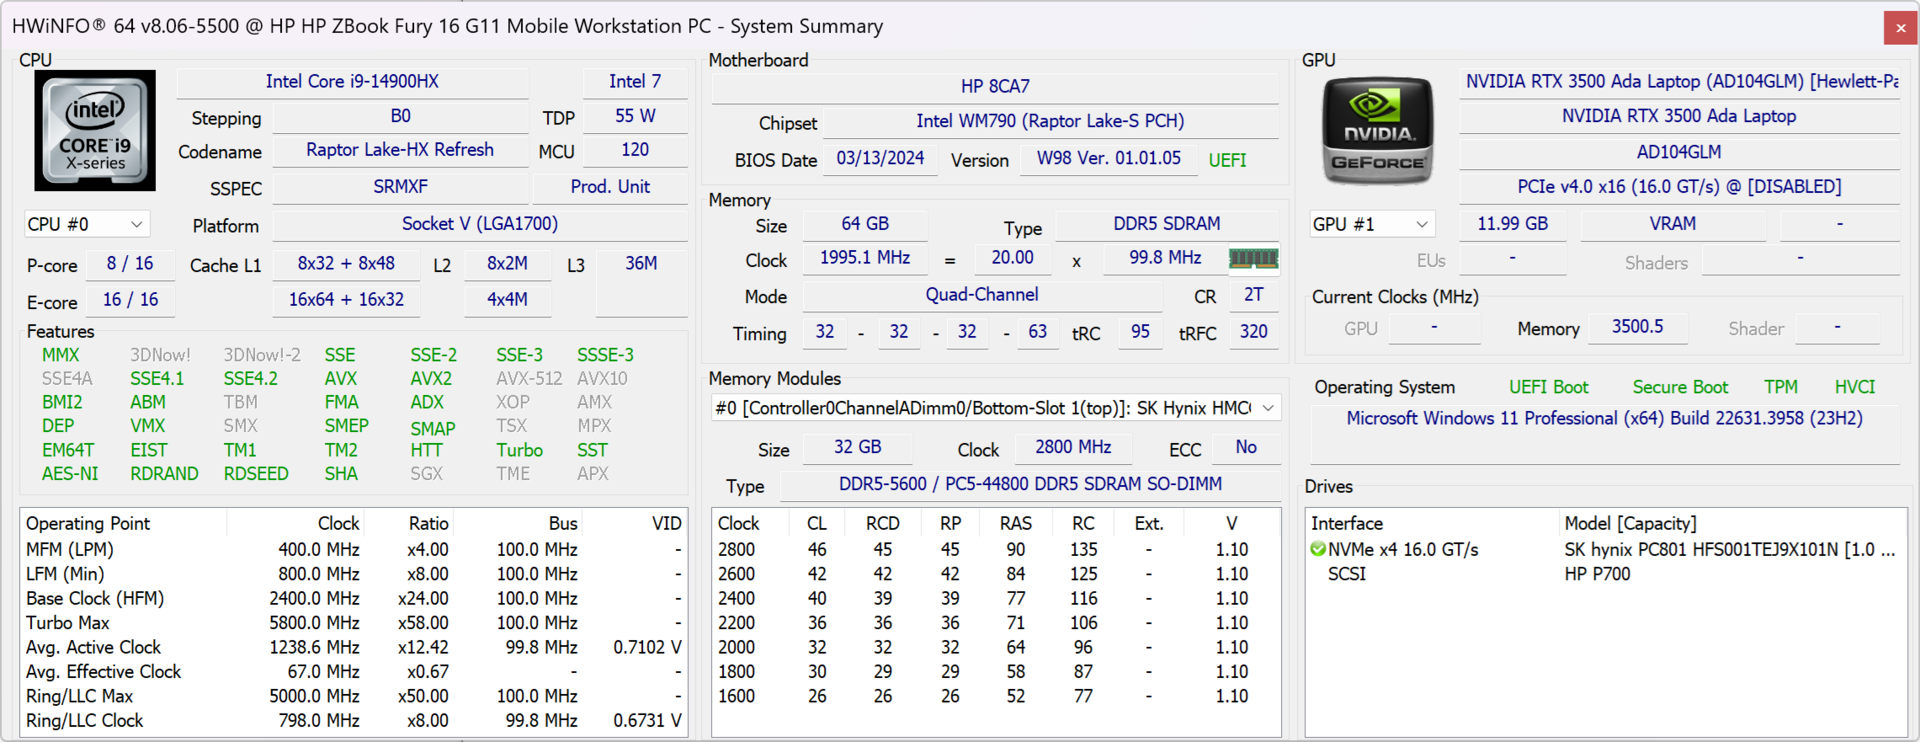
Nossa unidade de teste é uma configuração de gama média-alta com CPU Core i9-14900HX, GPU RTX 3500 Ada e tela IPS de 120 Hz 3840 x 2400 por aproximadamente US$ 3300. Outras SKUs começam com o Core i5-13600HX até o RTX 5000 Ada e a tela touchscreen OLED de 2400p. Não há opções de CPU Meteor Lake.
Os concorrentes do ZBook Fury 16 G11 incluem outras estações de trabalho de 16 polegadas, como o Dell Precision 5690, Lenovo ThinkPad P16 G2ou Asus ProArt Studiobook 16.
Mais análises da HP:
Possíveis concorrentes em comparação
Avaliação | Versão | Data | Modelo | Peso | Altura | Size | Resolução | Preço |
|---|---|---|---|---|---|---|---|---|
| 85.9 % | v8 | 08/2024 | HP ZBook Fury 16 G11 i9-14900HX, RTX 3500 Ada Generation Laptop | 2.6 kg | 28.5 mm | 16.00" | 3840x2400 | |
| 92.3 % v7 (old) | v7 (old) | 09/2023 | HP ZBook Fury 16 G10 i9-13950HX, RTX 5000 Ada Generation Laptop | 2.6 kg | 28.5 mm | 16.00" | 3840x2400 | |
| 91 % v7 (old) | v7 (old) | 06/2023 | HP ZBook Fury 16 G9 i9-12950HX, RTX A5500 Laptop GPU | 2.6 kg | 28.5 mm | 16.00" | 3840x2400 | |
| 88.3 % v7 (old) | v7 (old) | 05/2024 | Dell Precision 5690 Ultra 9 185H, RTX 5000 Ada Generation Laptop | 2.3 kg | 22.17 mm | 16.00" | 3840x2400 | |
| 90.2 % v7 (old) | v7 (old) | 03/2024 | Lenovo ThinkPad P16 G2 21FA000FGE i7-13700HX, RTX 2000 Ada Generation Laptop | 3 kg | 30.23 mm | 16.00" | 2560x1600 | |
| 90.1 % v7 (old) | v7 (old) | 12/2023 | Lenovo ThinkPad P1 G6 21FV001KUS i7-13800H, GeForce RTX 4080 Laptop GPU | 1.9 kg | 17.5 mm | 16.00" | 3480x2400 | |
| 86.1 % v7 (old) | v7 (old) | 06/2023 | Asus ProArt Studiobook 16 OLED H7604 i9-13980HX, GeForce RTX 4070 Laptop GPU | 2.4 kg | 23.9 mm | 16.00" | 3200x2000 |
Observação: Nosso sistema de classificação foi atualizado recentemente e os resultados da versão 8 não podem ser comparados com os resultados da versão 7. Outras informações sobre o assunto estão aqui disponíveis.
Observação: Atualizamos recentemente nosso sistema de classificação e os resultados da versão 8 não são comparáveis aos resultados da versão 7. Mais informações estão disponíveis aqui .
Caso
Uma maneira fácil de distinguir o ZBook Fury 16 G11 das versões anteriores é procurar a tecla Co-Pilot no teclado. Fora isso, o design do chassi continua o mesmo de antes.

Conectividade


Leitor de cartão SD
| SD Card Reader | |
| average JPG Copy Test (av. of 3 runs) | |
| Lenovo ThinkPad P1 G6 21FV001KUS (Toshiba Exceria Pro SDXC 64 GB UHS-II) | |
| HP ZBook Fury 16 G11 (Toshiba Exceria Pro SDXC 64 GB UHS-II) | |
| HP ZBook Fury 16 G10 (Toshiba Exceria Pro SDXC 64 GB UHS-II) | |
| HP ZBook Fury 16 G9 (PNY EliteX-PRO60) | |
| Asus ProArt Studiobook 16 OLED H7604 (Angelibird AV Pro V60) | |
| Lenovo ThinkPad P16 G2 21FA000FGE | |
| maximum AS SSD Seq Read Test (1GB) | |
| HP ZBook Fury 16 G11 (Toshiba Exceria Pro SDXC 64 GB UHS-II) | |
| Lenovo ThinkPad P1 G6 21FV001KUS (Toshiba Exceria Pro SDXC 64 GB UHS-II) | |
| HP ZBook Fury 16 G10 (Toshiba Exceria Pro SDXC 64 GB UHS-II) | |
| HP ZBook Fury 16 G9 (PNY EliteX-PRO60) | |
| Lenovo ThinkPad P16 G2 21FA000FGE | |
| Asus ProArt Studiobook 16 OLED H7604 (Angelibird AV Pro V60) | |
Comunicação
A WLAN foi atualizada do Intel AX211 para o BE200 para oferecer suporte adequado ao Wi-Fi 7. Na prática, porém, a maioria dos usuários ainda se conectará a pontos de acesso Wi-Fi 6 ou 6E.
Webcam


Manutenção
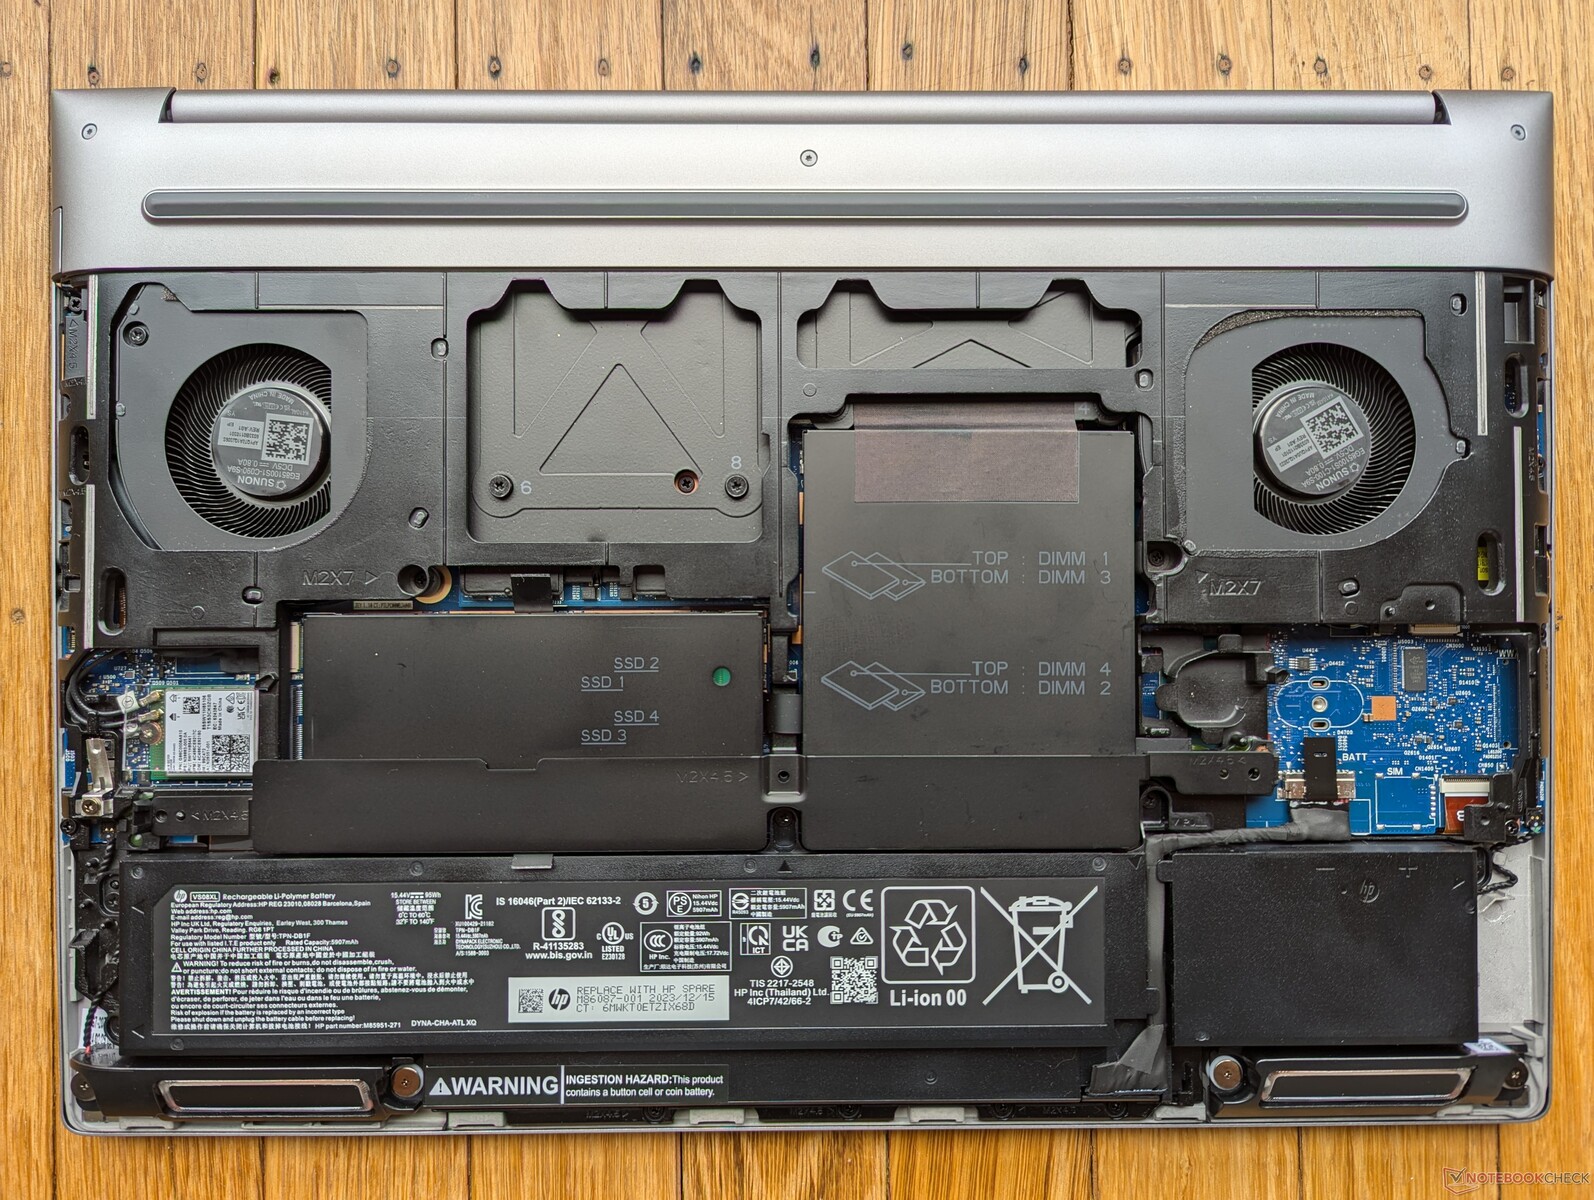
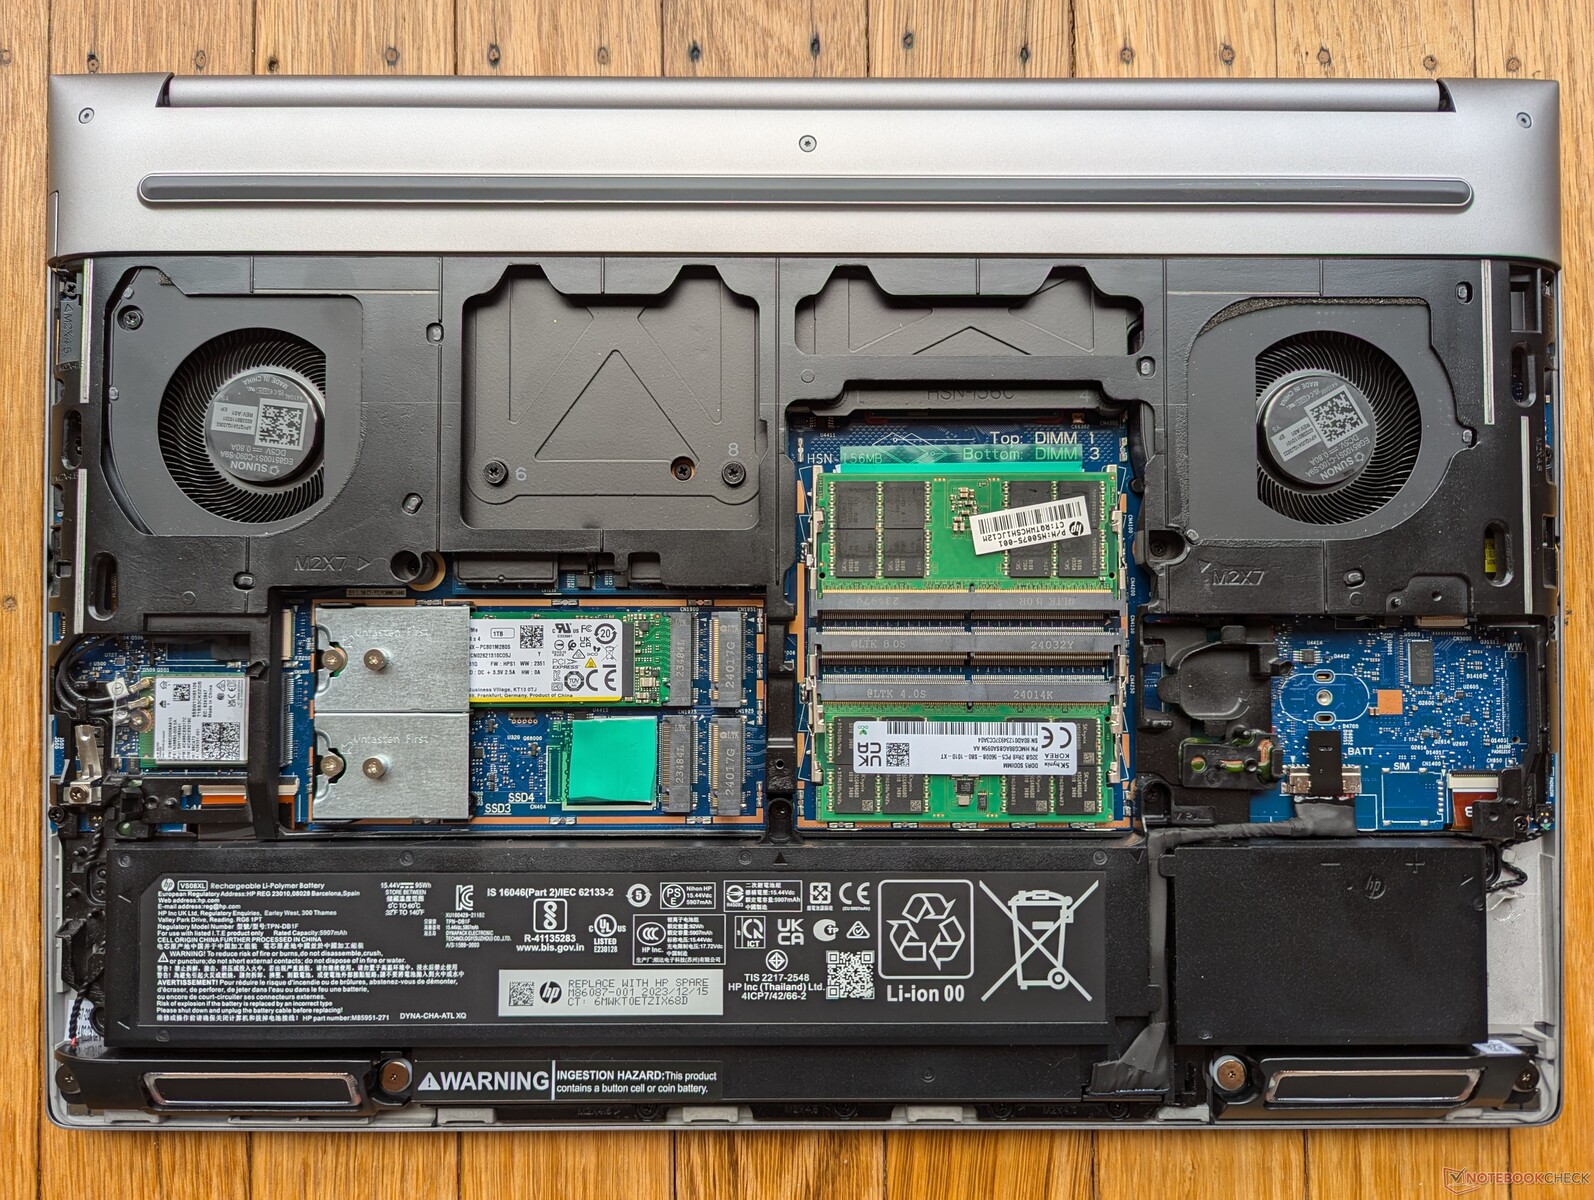
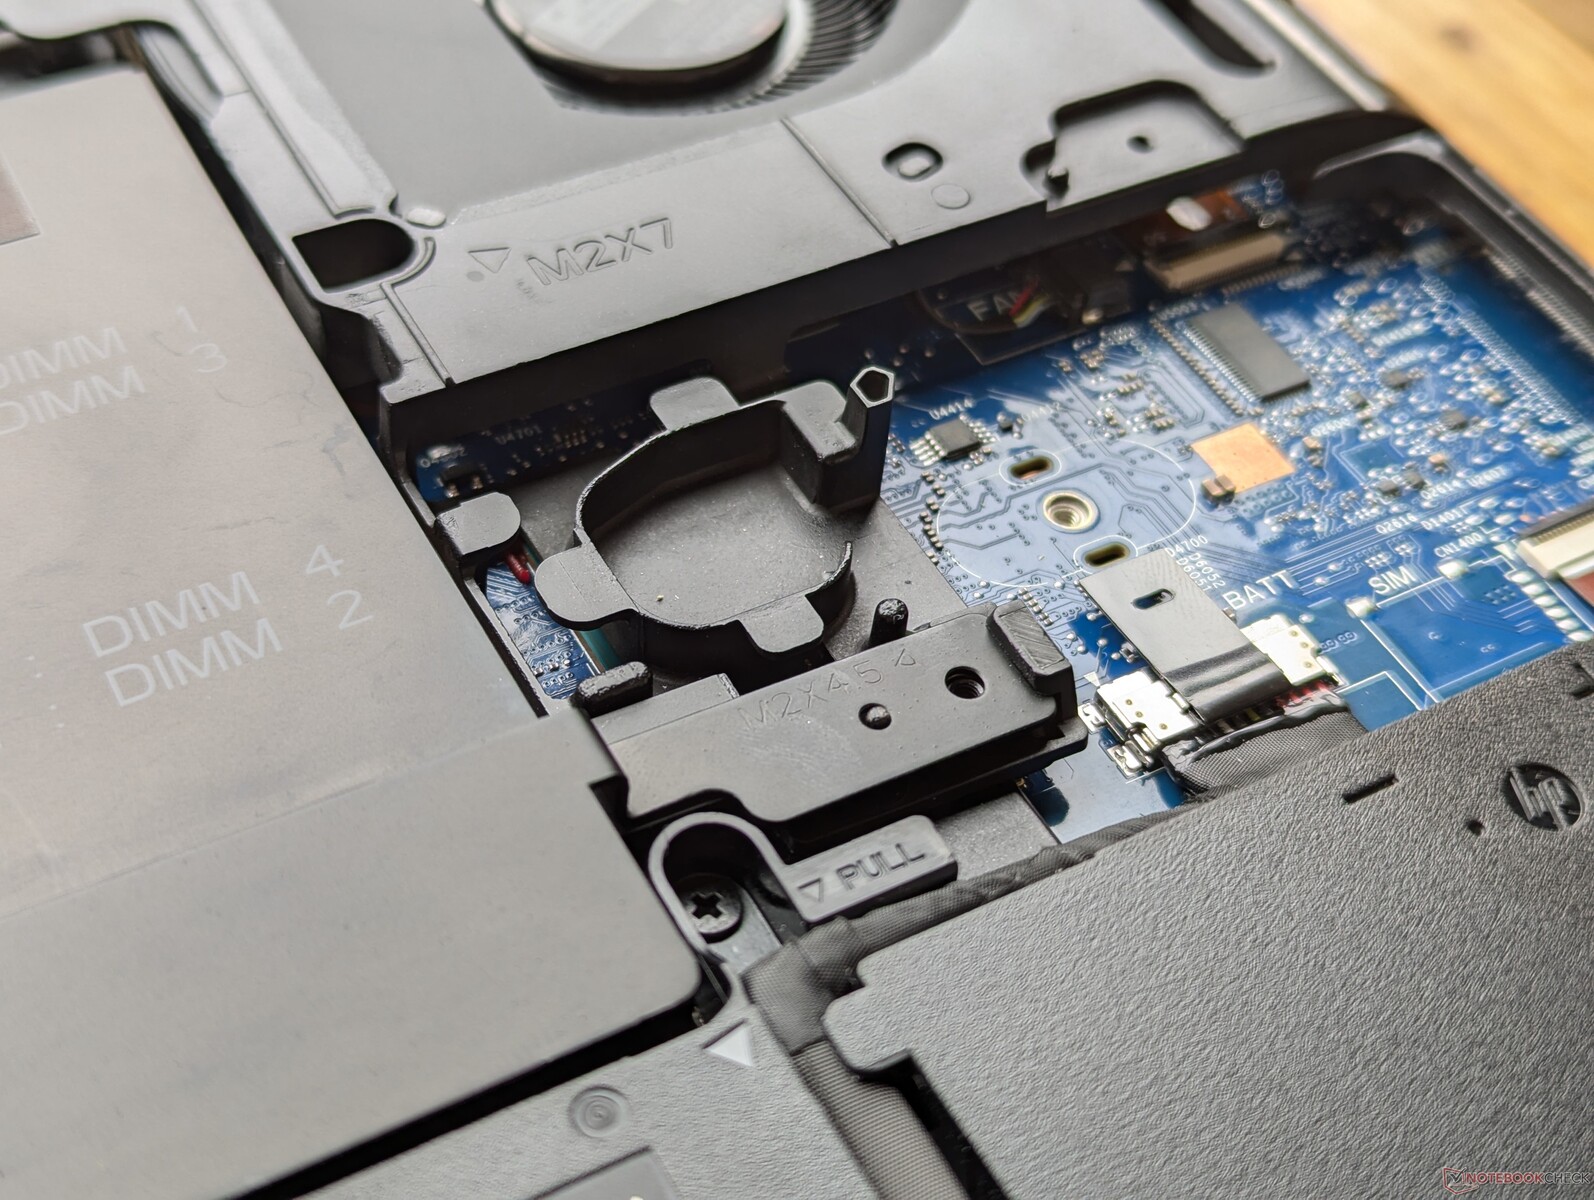
A HP vem se gabando da manutenção sem ferramentas para sua série Fury 16 desde o modelo G9 no início do ano passado. Embora o painel inferior deslizasse facilmente sem nenhuma ferramenta, os módulos de RAM e SODIMM ainda estavam protegidos por uma tampa de alumínio que exigia uma chave de fenda para ser removida. Essa tampa de alumínio foi redesenhada com travas em vez de parafusos no modelo G11, o que significa que os usuários agora podem instalar módulos de RAM sem nenhuma ferramenta.
Os SSDs, no entanto, ainda estão presos à placa-mãe com parafusos e, portanto, ainda é necessária uma chave de fenda para trocar as unidades. O sistema pode suportar até quatro SSDs e quatro módulos de RAM.

Sustentabilidade
A embalagem é totalmente reciclável e consiste principalmente de papel. O adaptador CA é o único item que vem embalado em plástico.
Acessórios e garantia
A caixa de varejo não inclui nenhum extra além do adaptador CA e da documentação. Uma garantia de três anos do fabricante é padrão se o produto for comprado nos EUA.
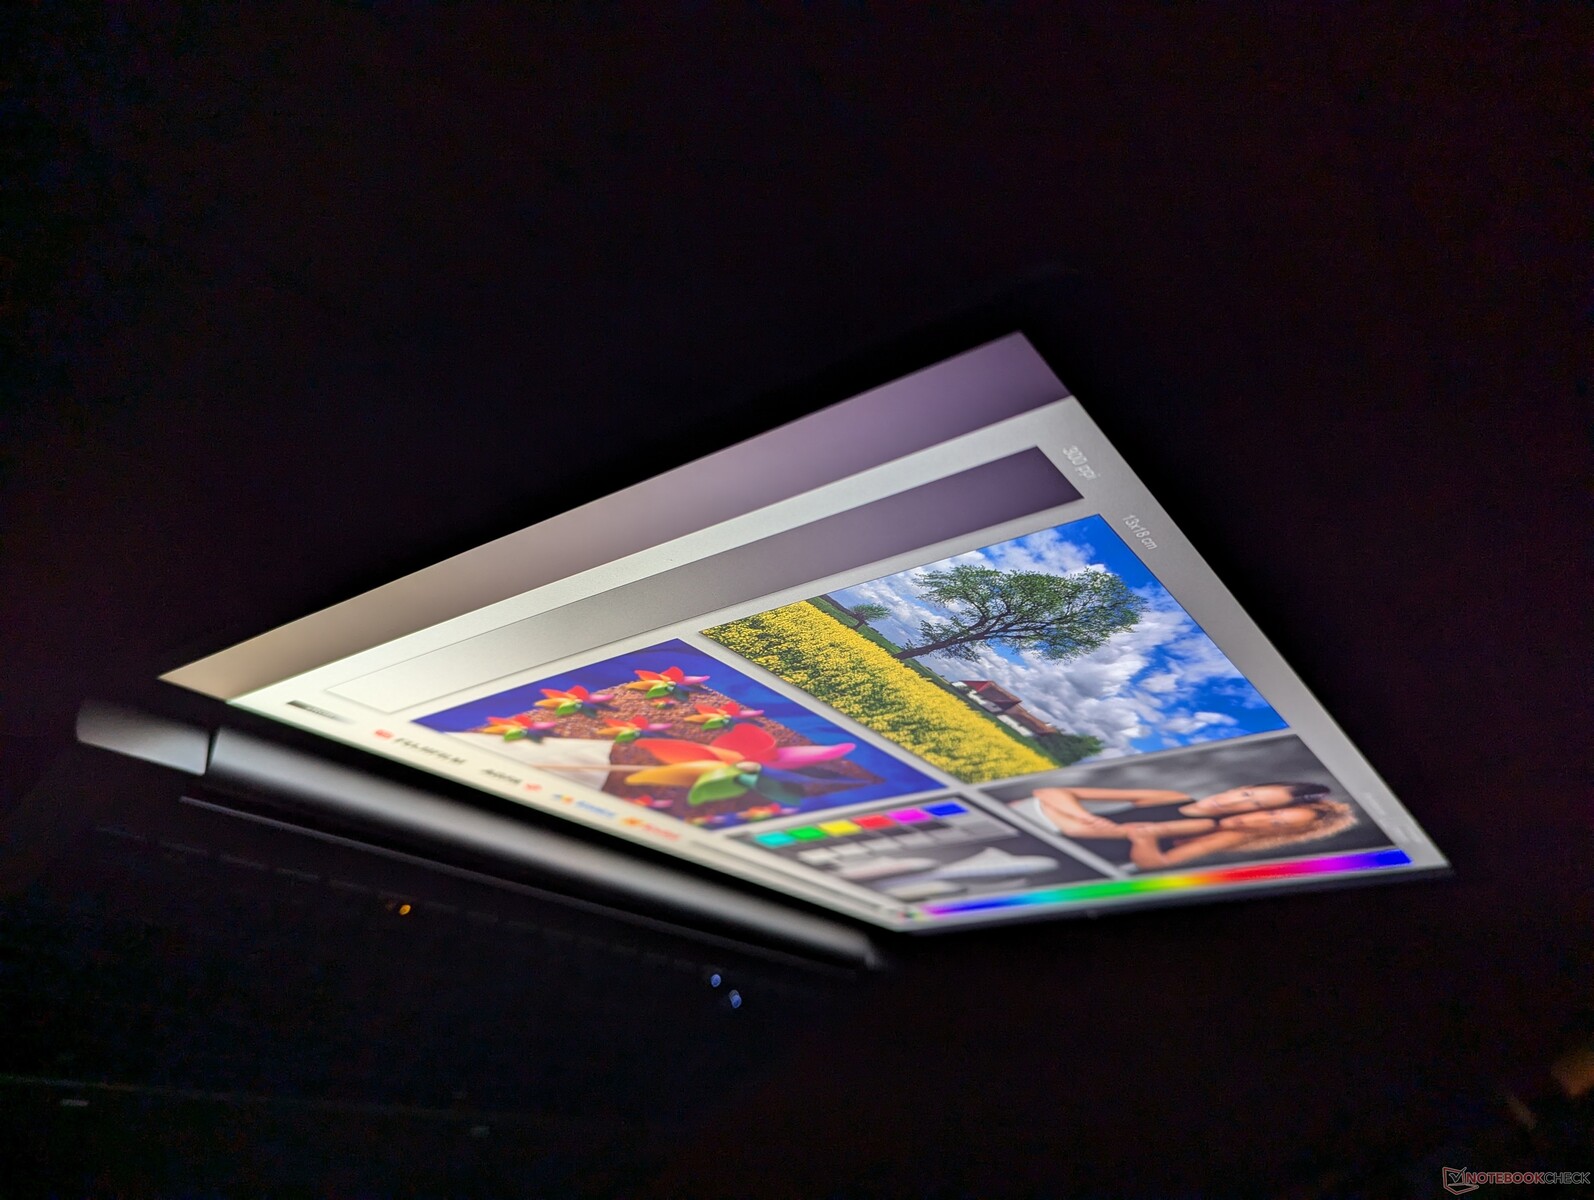
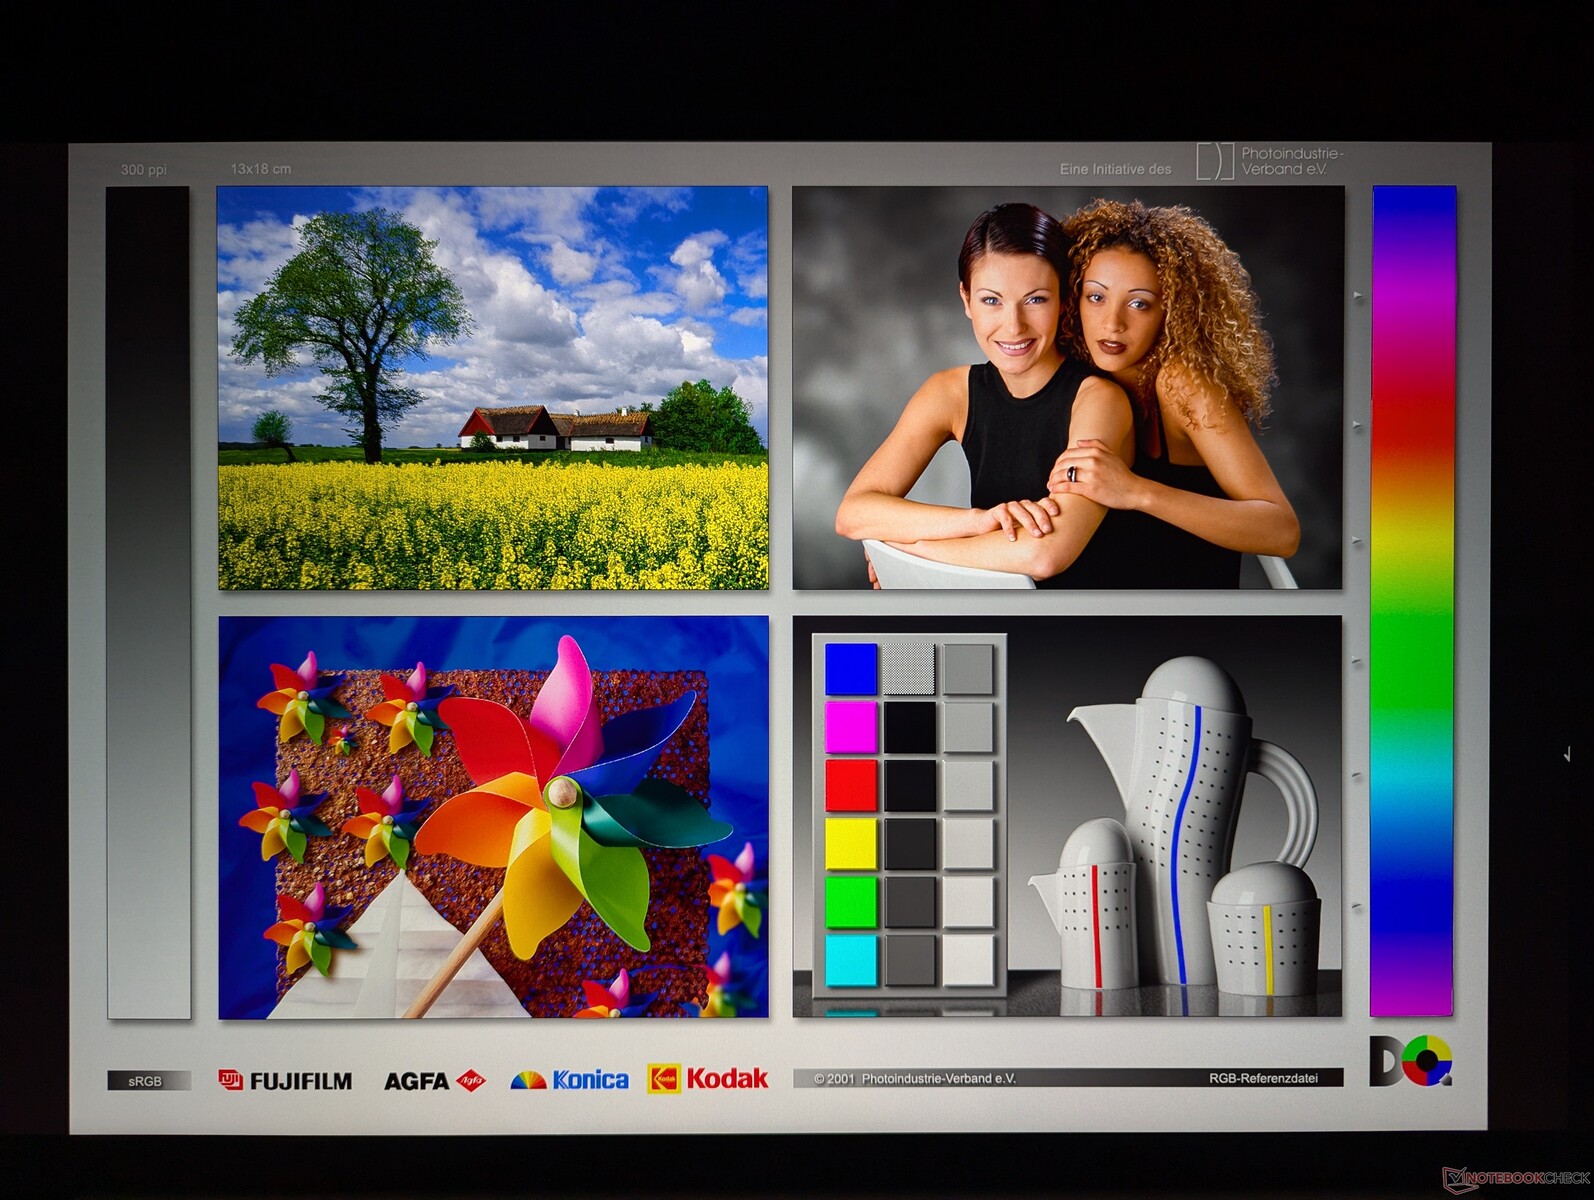
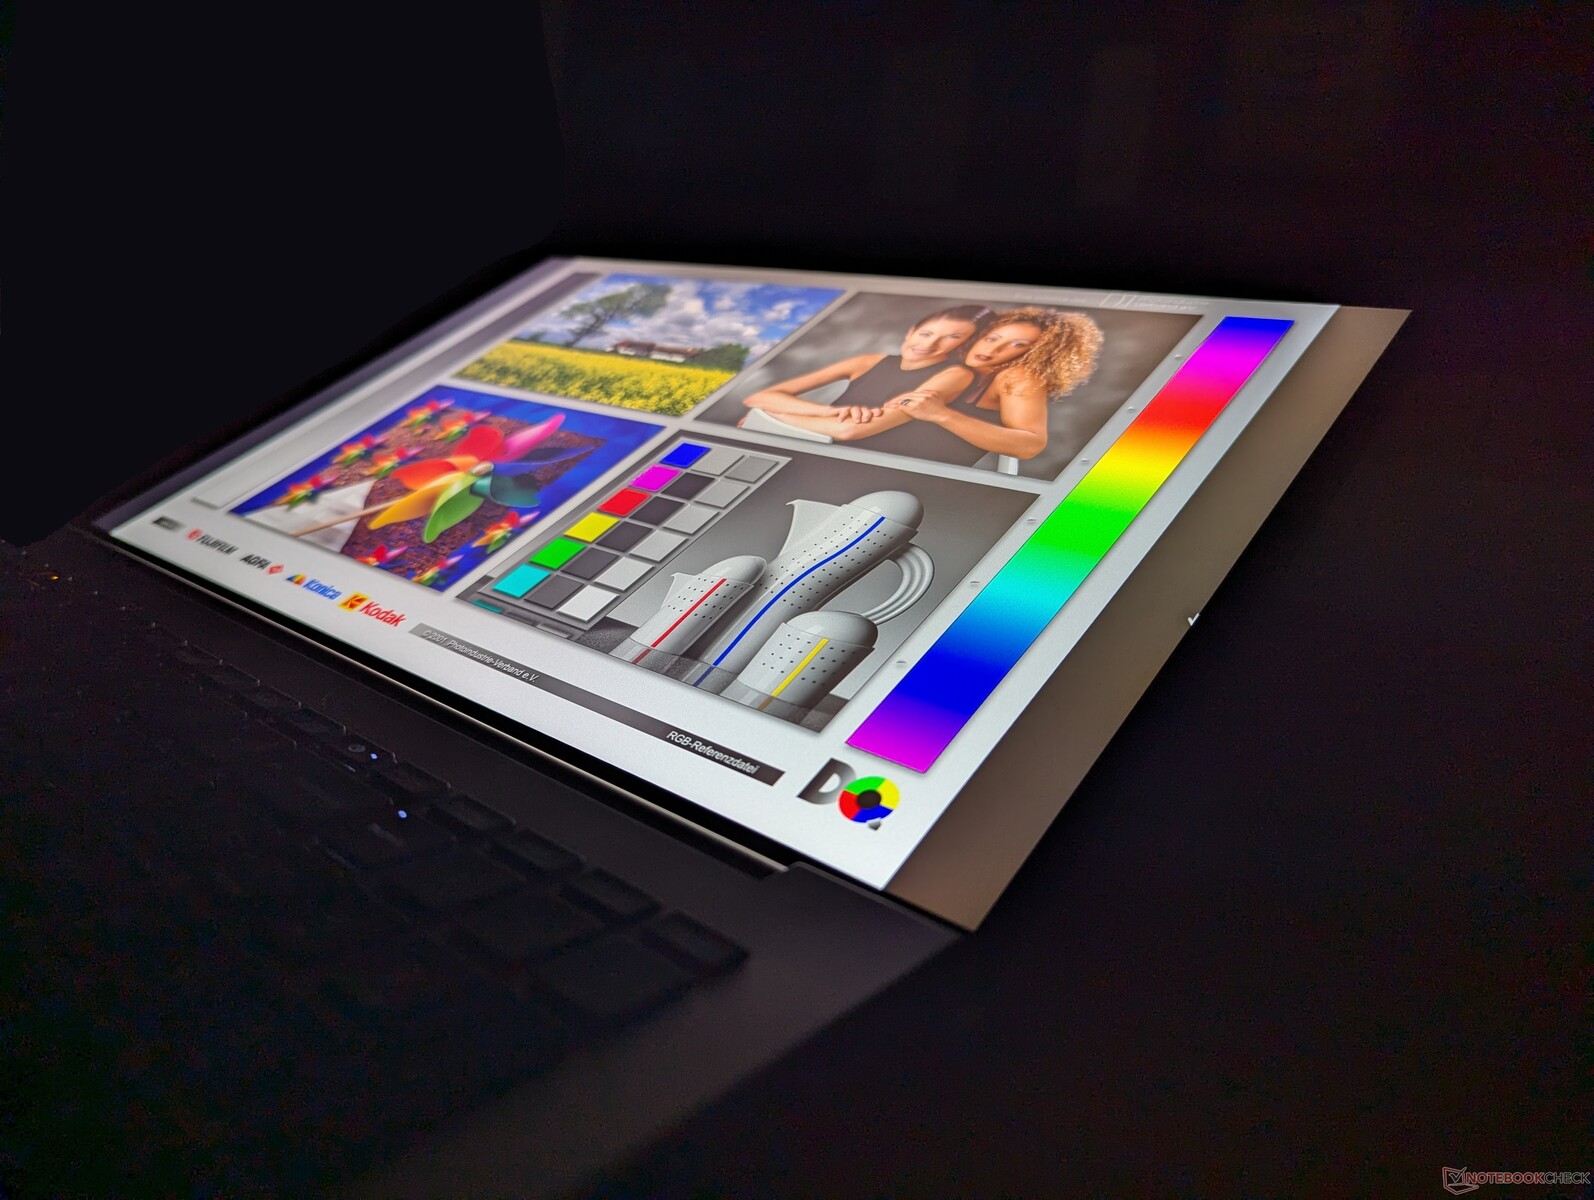
Tela
Cinco opções de tela estão disponíveis, como segue. Nossa unidade de teste específica vem com o painel em negrito.
- 3840 x 2400, OLED, tela sensível ao toque, brilhante, 400 nits, 100% DCI-P3, 60 Hz
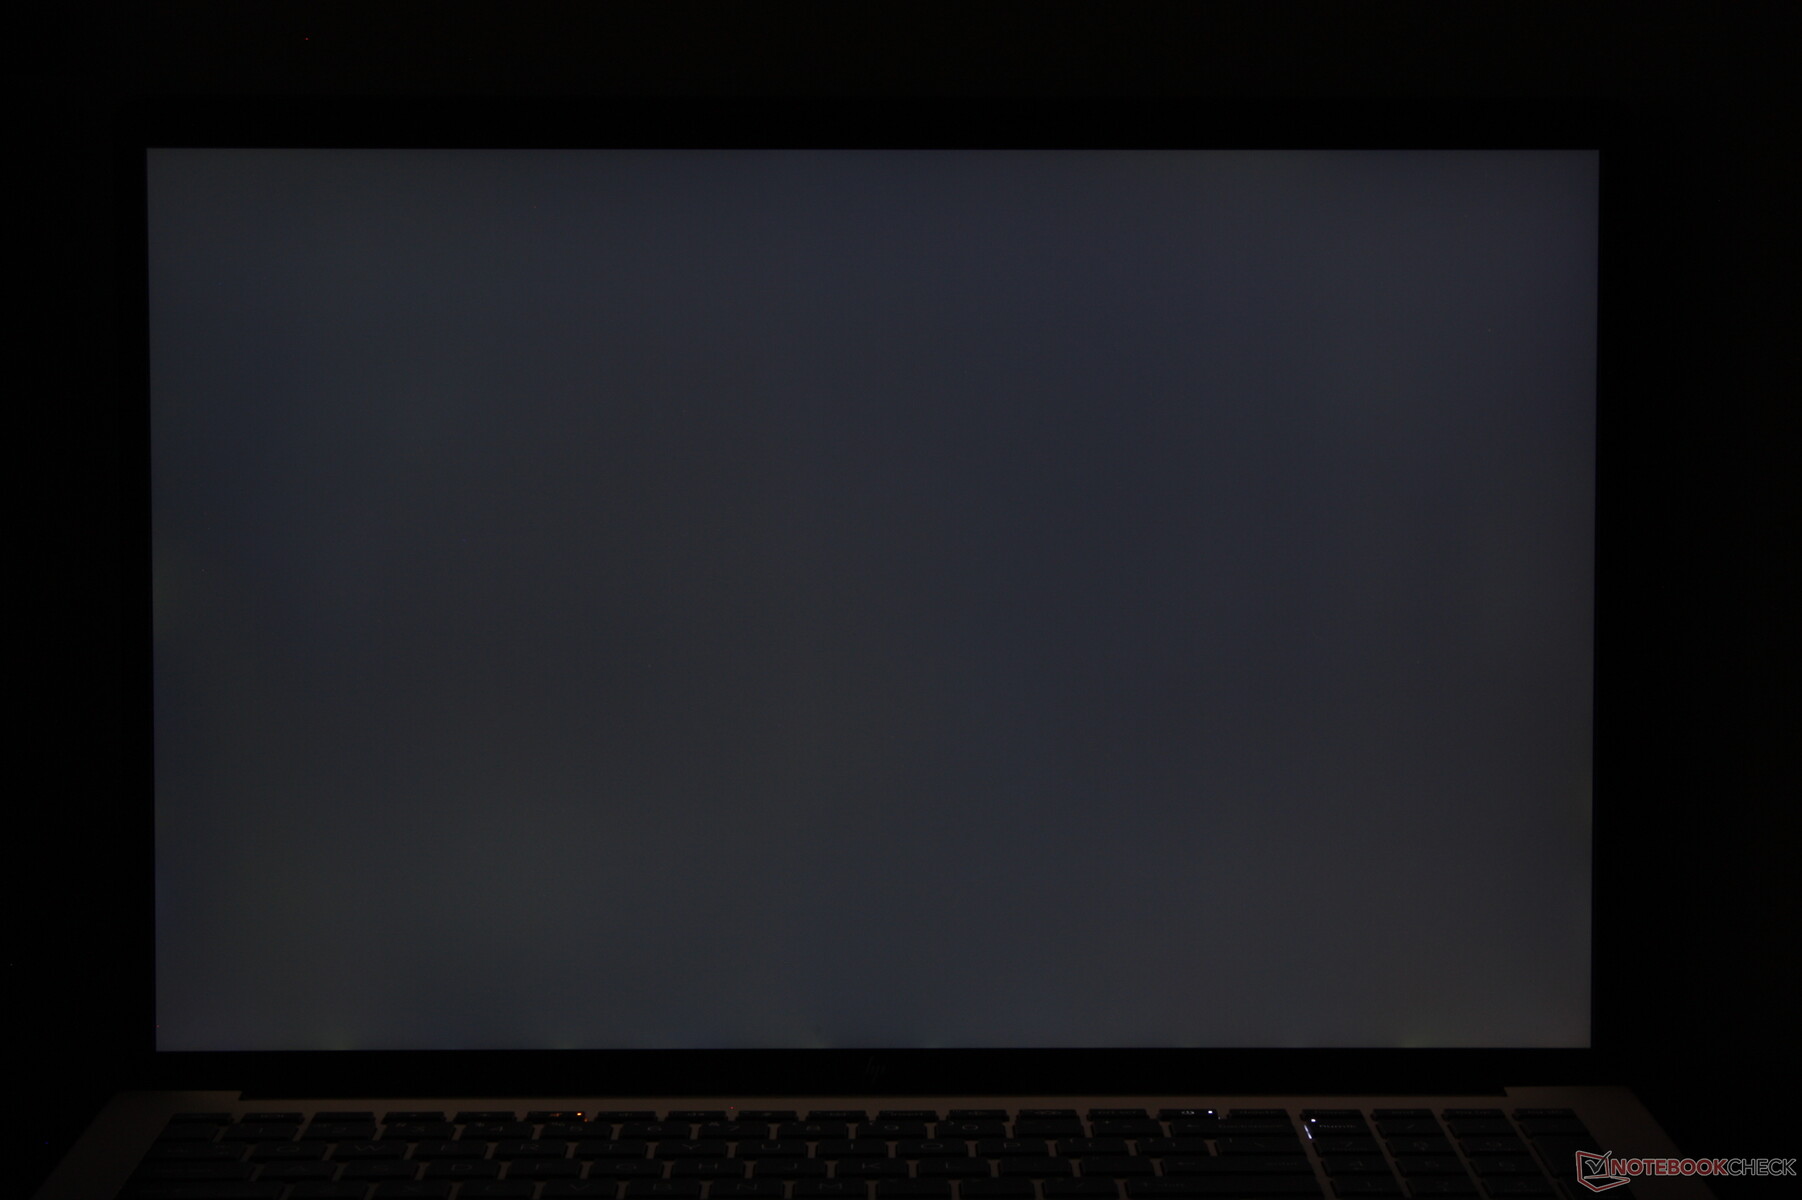
- 3840 x 2400, IPS, sem toque, fosco, 500 nits, 100% DCI-P3, 120 Hz
- 1920 x 1200, IPS, sem toque, fosco, 400 nits, 100% sRGB, 60 Hz
- 1920 x 1200, IPS, sem toque, fosco, 1000 nits, 100% sRGB, 60 Hz, Sure View Integrated
- 1920 x 1200, IPS, tela sensível ao toque, brilhante, 400 nits, 100% sRGB, 60 Hz
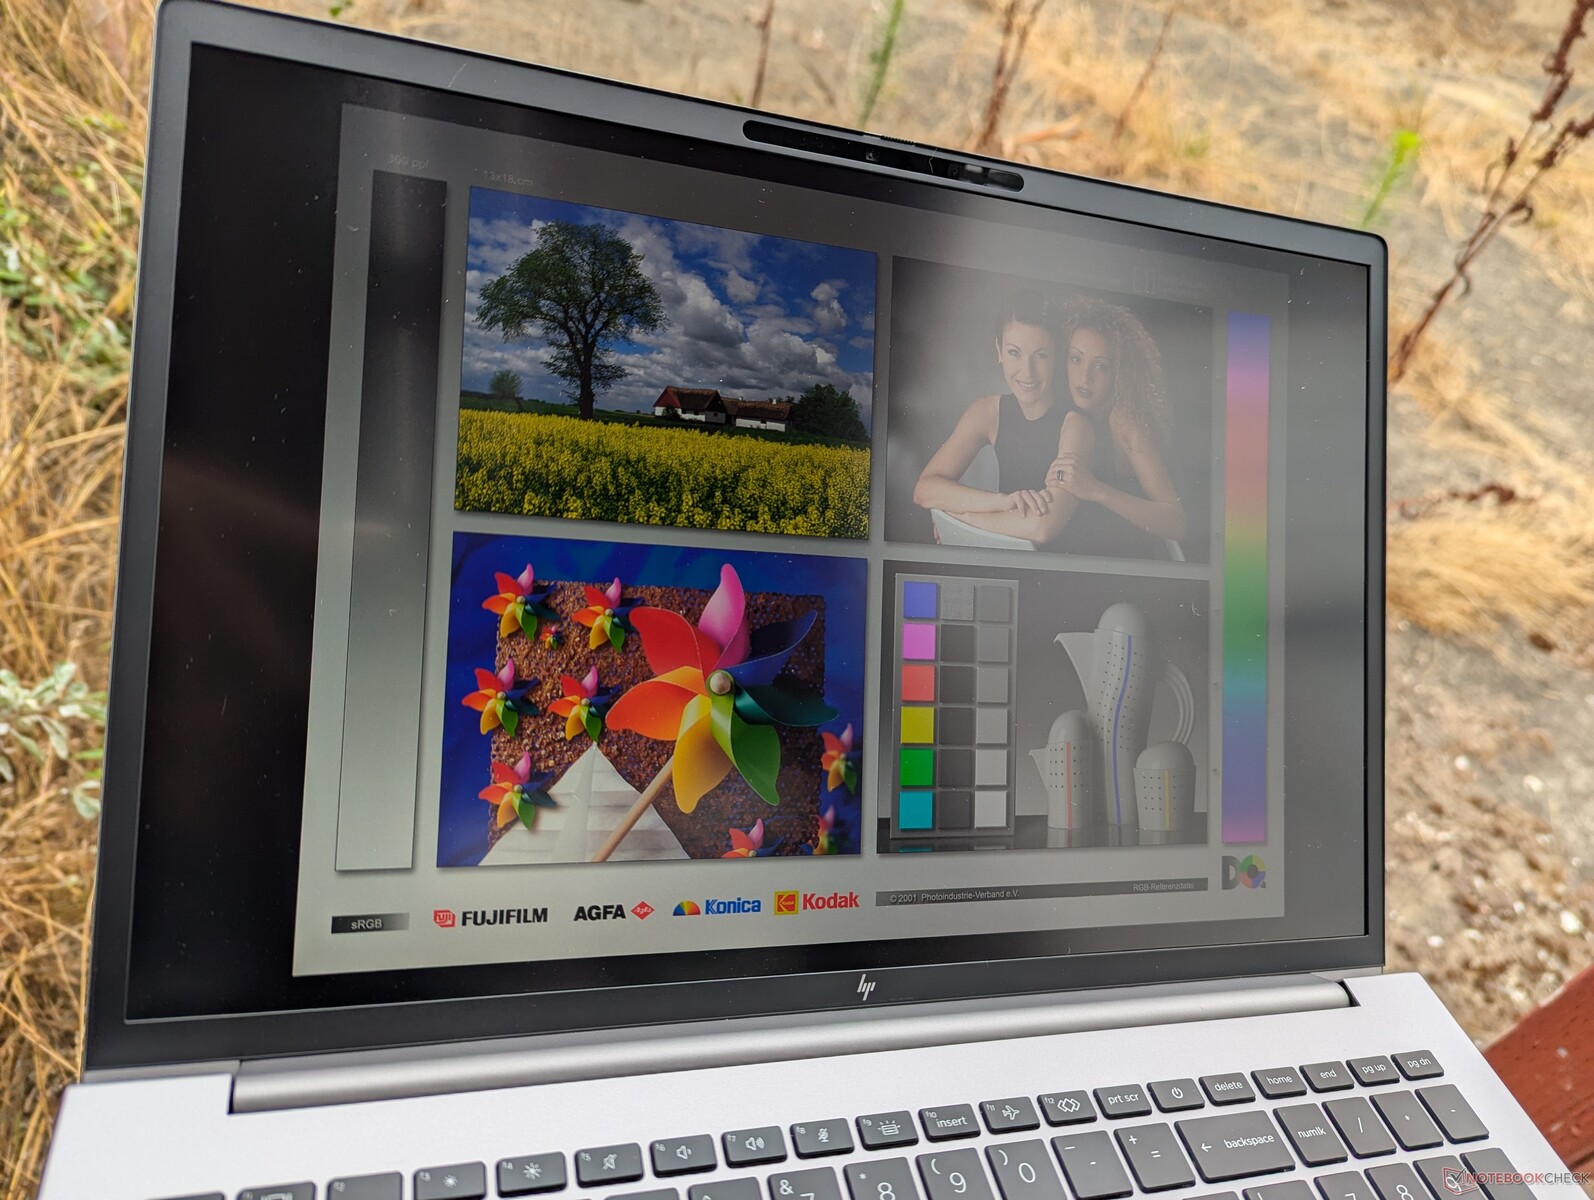
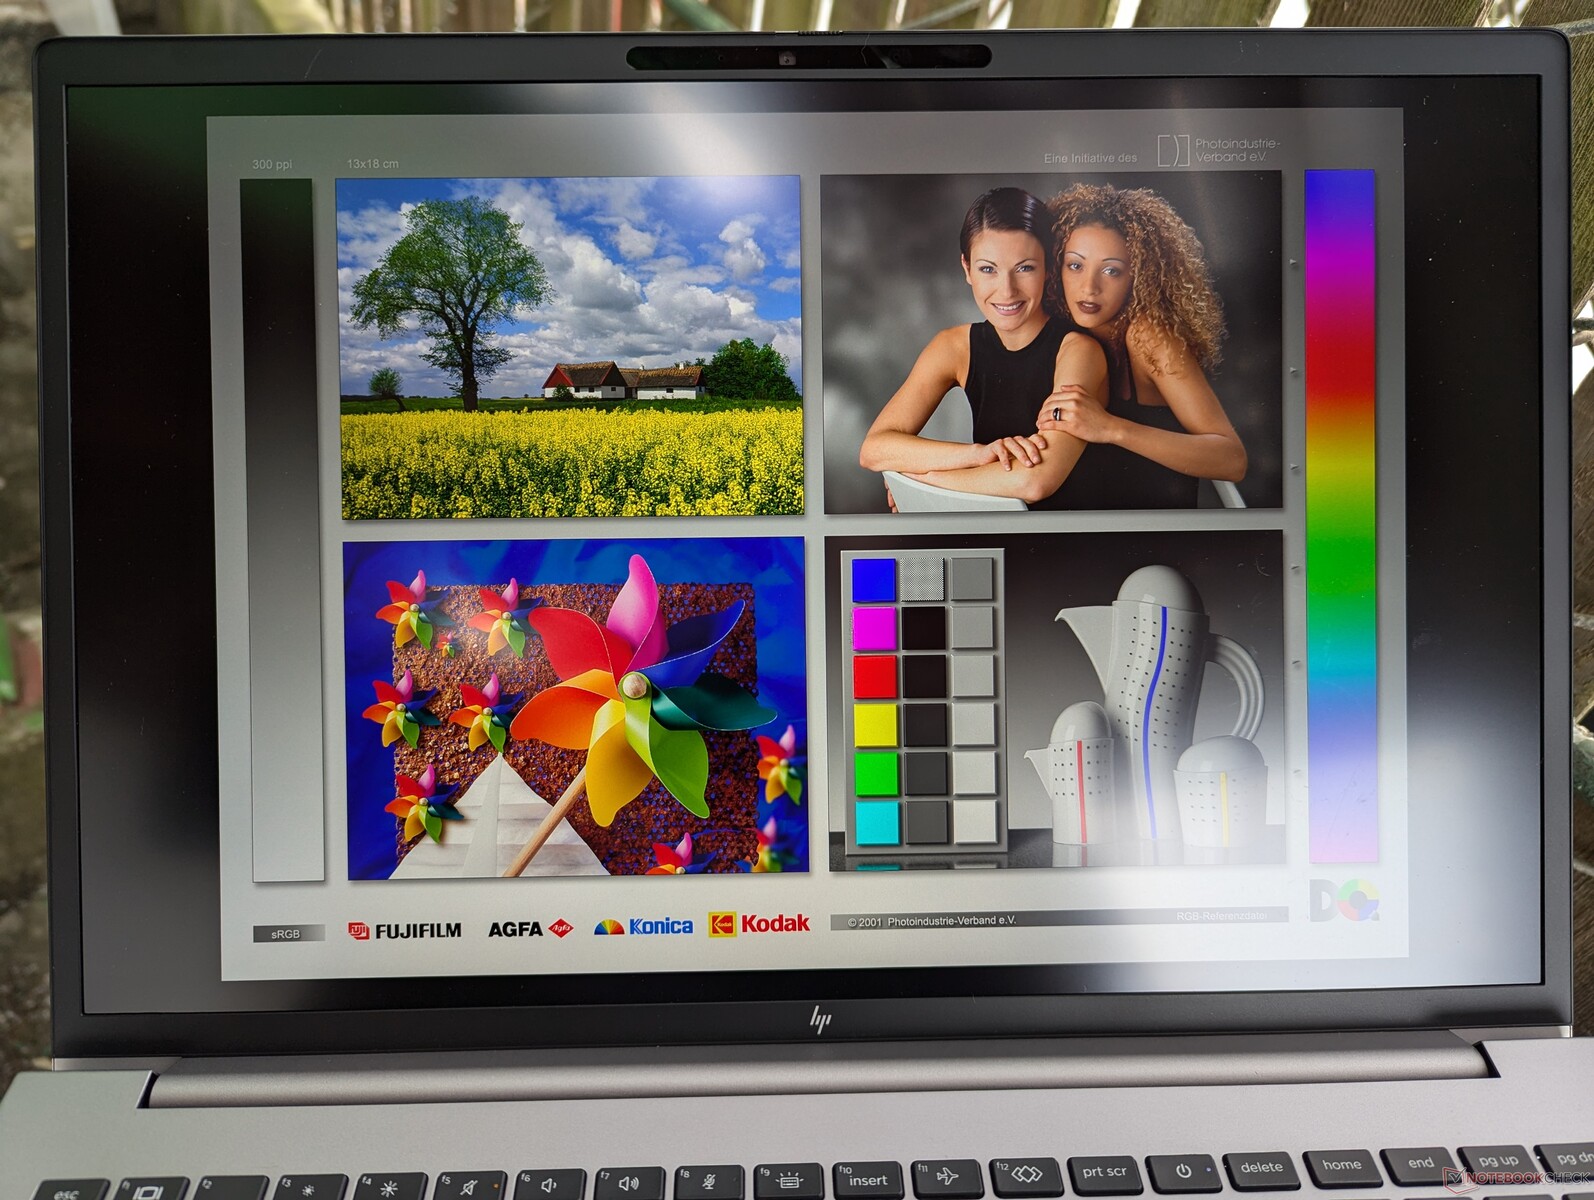
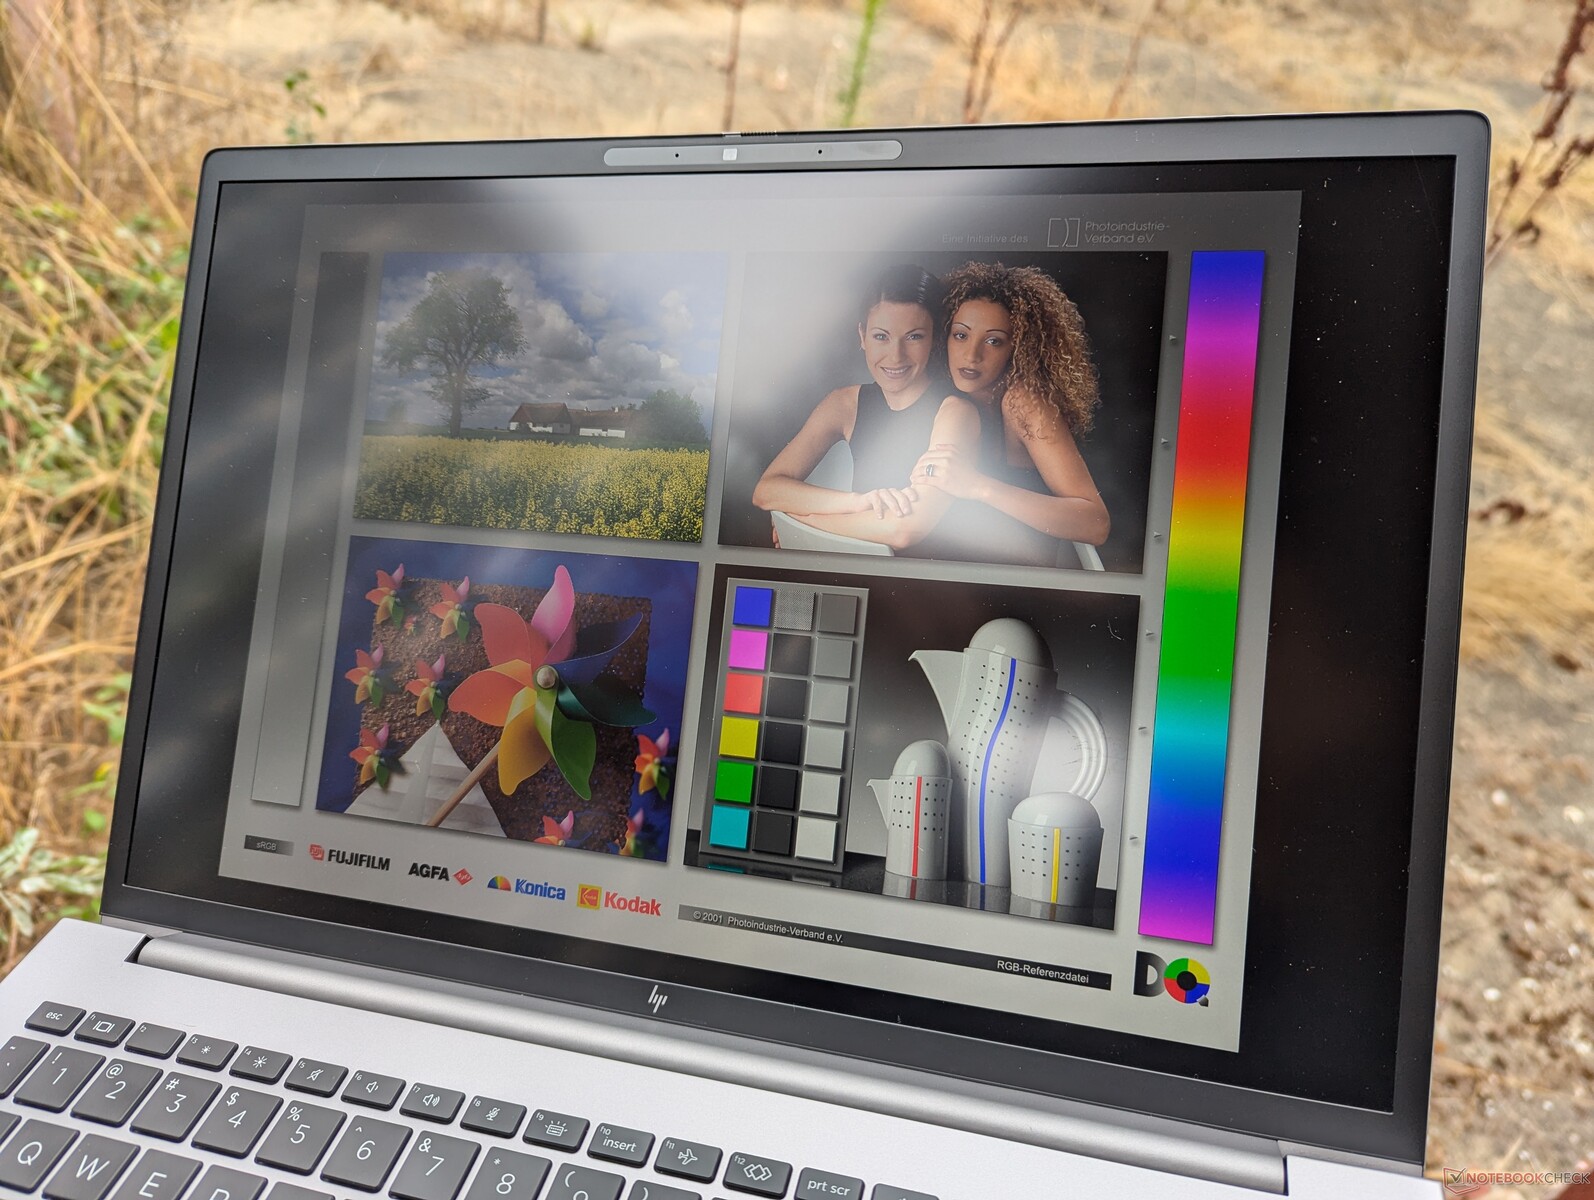
Esse painel específico é o mesmo que foi enviado com o ZBook Fury 16 G10 e, portanto, a experiência visual permanece idêntica. Os compradores que pretendem usar o laptop em ambientes externos talvez queiram considerar a opção de 1000 nits, mas esse painel infelizmente está vinculado ao Sure View, que limita significativamente os ângulos de visão, tornando a tela mais difícil de ser compartilhada com outras pessoas. Enquanto isso, a opção OLED oferecerá níveis de preto muito superiores para atender a artistas digitais e aplicativos de edição de multimídia, mas sua sobreposição brilhante e a escassa taxa de atualização de 60 Hz podem ser um problema.
A taxa de atualização dinâmica do Windows é suportada somente até 60 Hz em nosso painel configurado.
| |||||||||||||||||||||||||
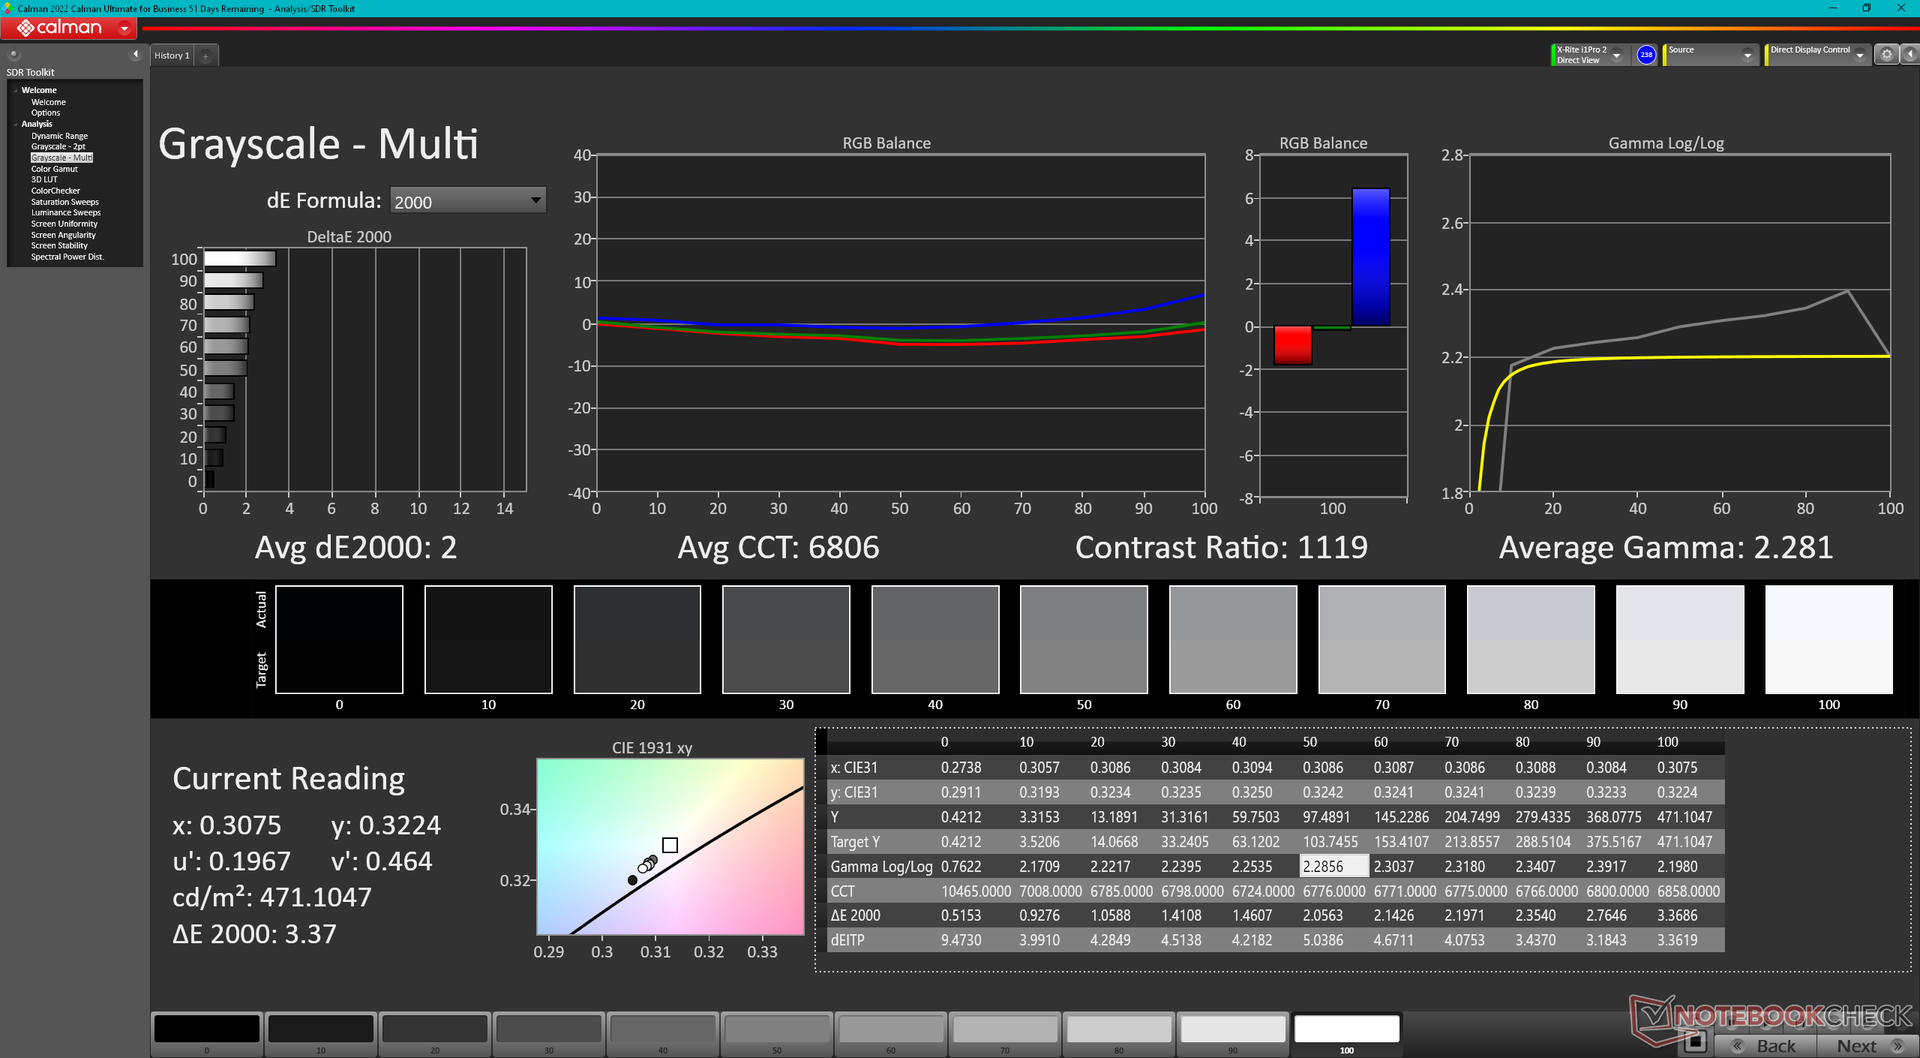
iluminação: 83 %
iluminação com acumulador: 457.6 cd/m²
Contraste: 1064:1 (Preto: 0.43 cd/m²)
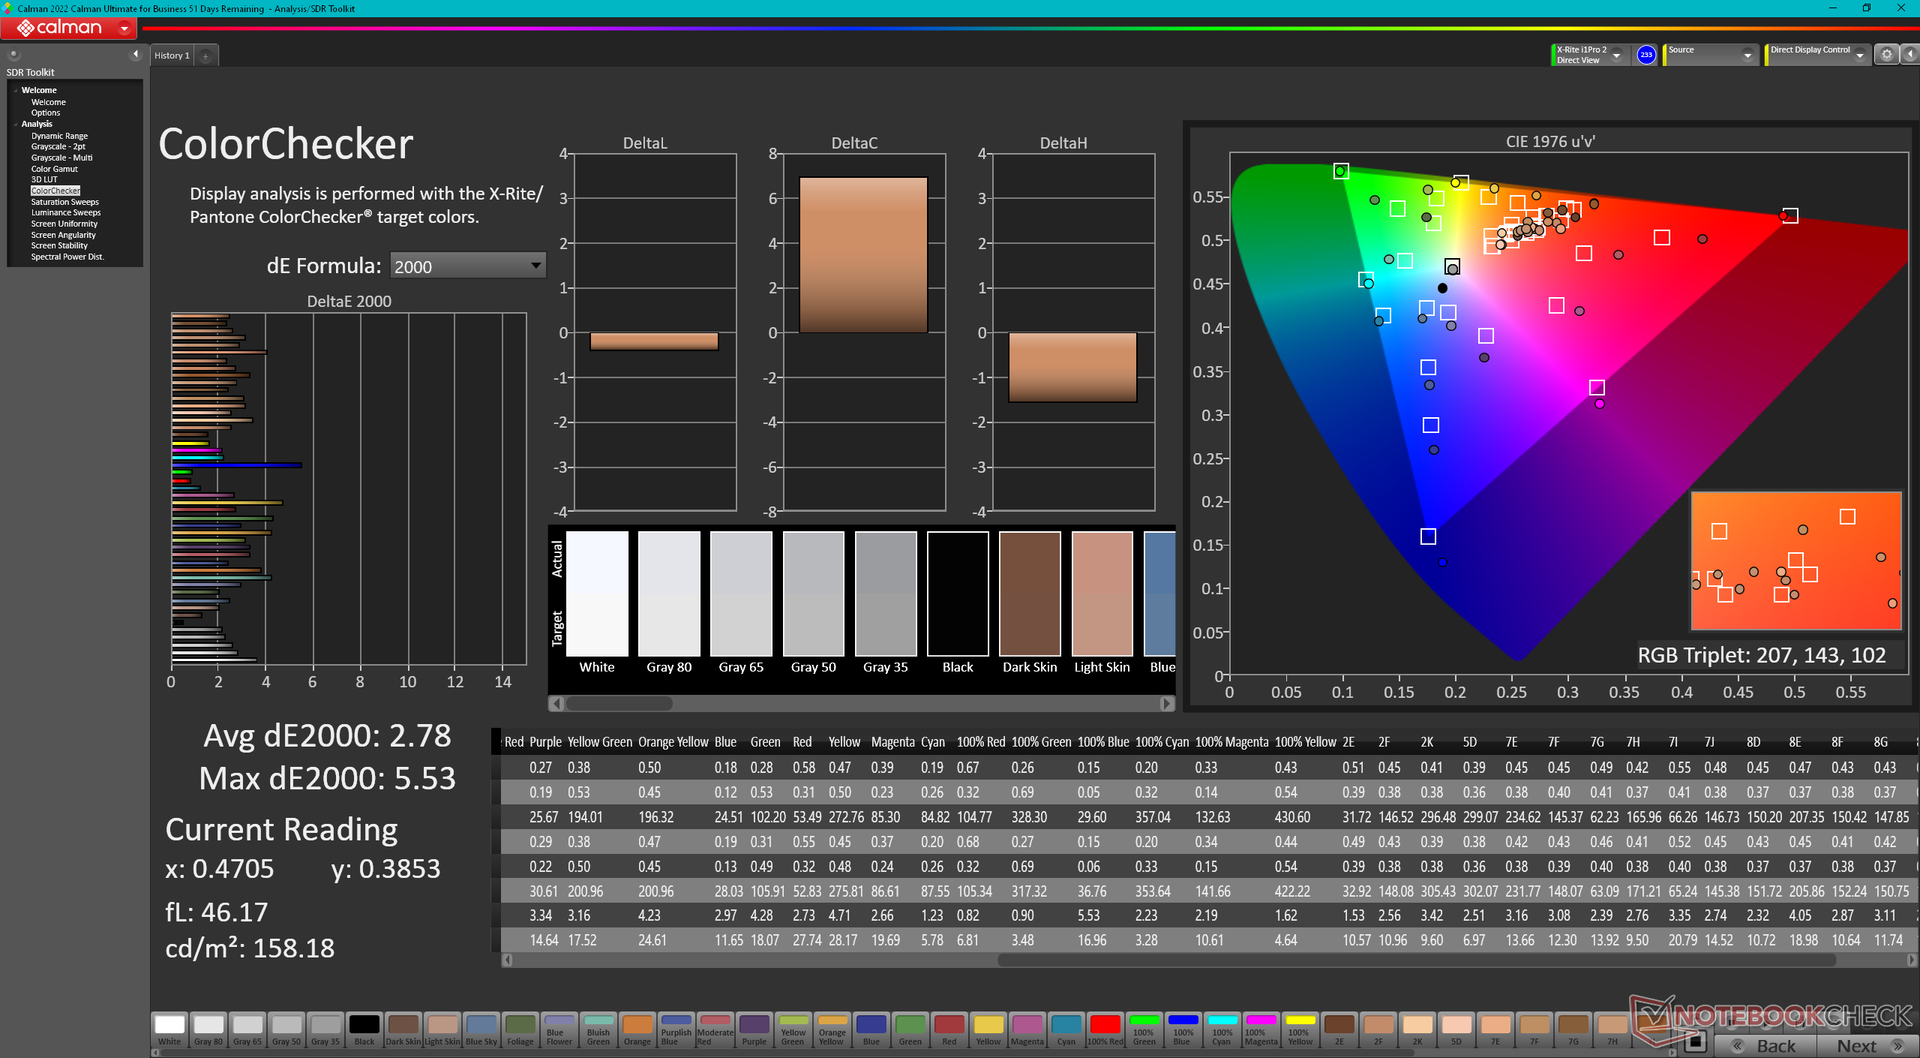
ΔE ColorChecker Calman: 2.78 | ∀{0.5-29.43 Ø4.73}
calibrated: 1.37
ΔE Greyscale Calman: 2 | ∀{0.09-98 Ø4.97}
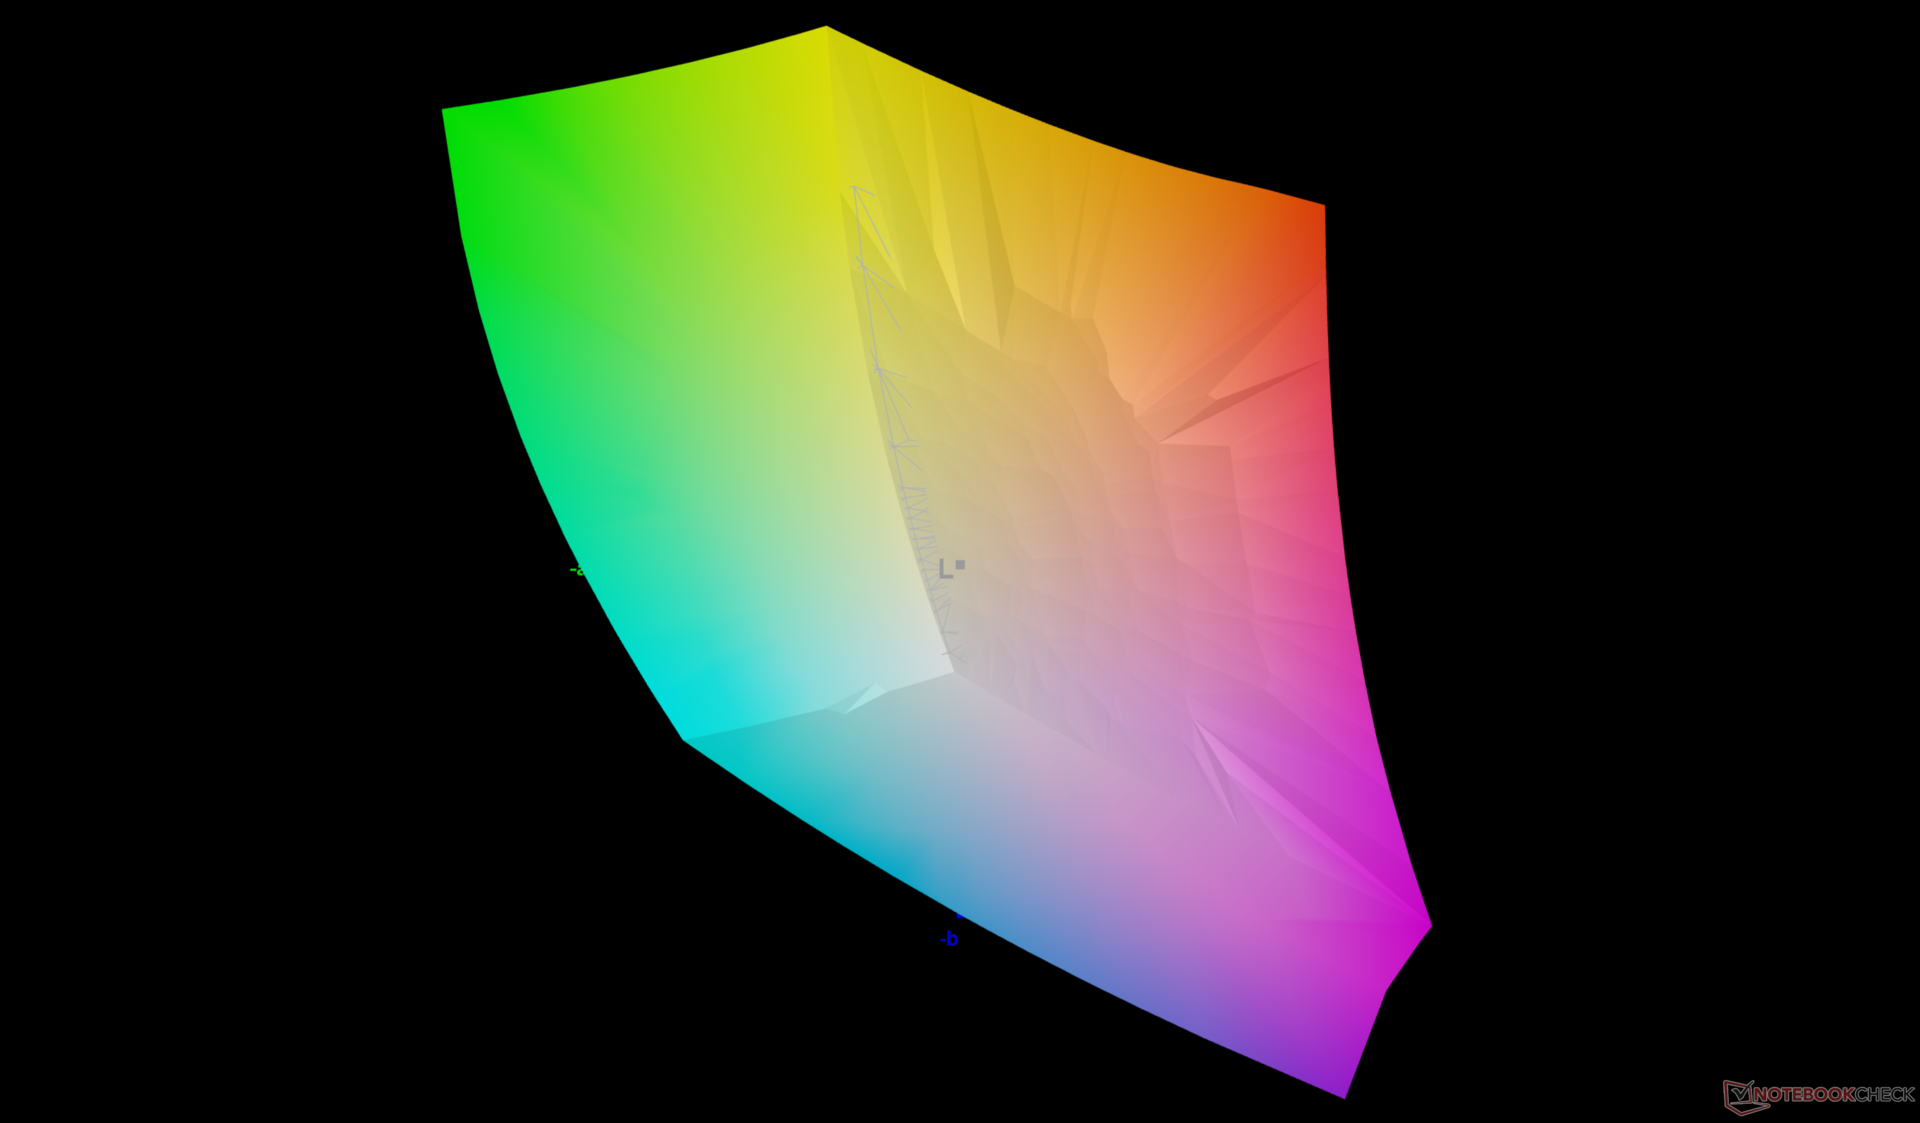
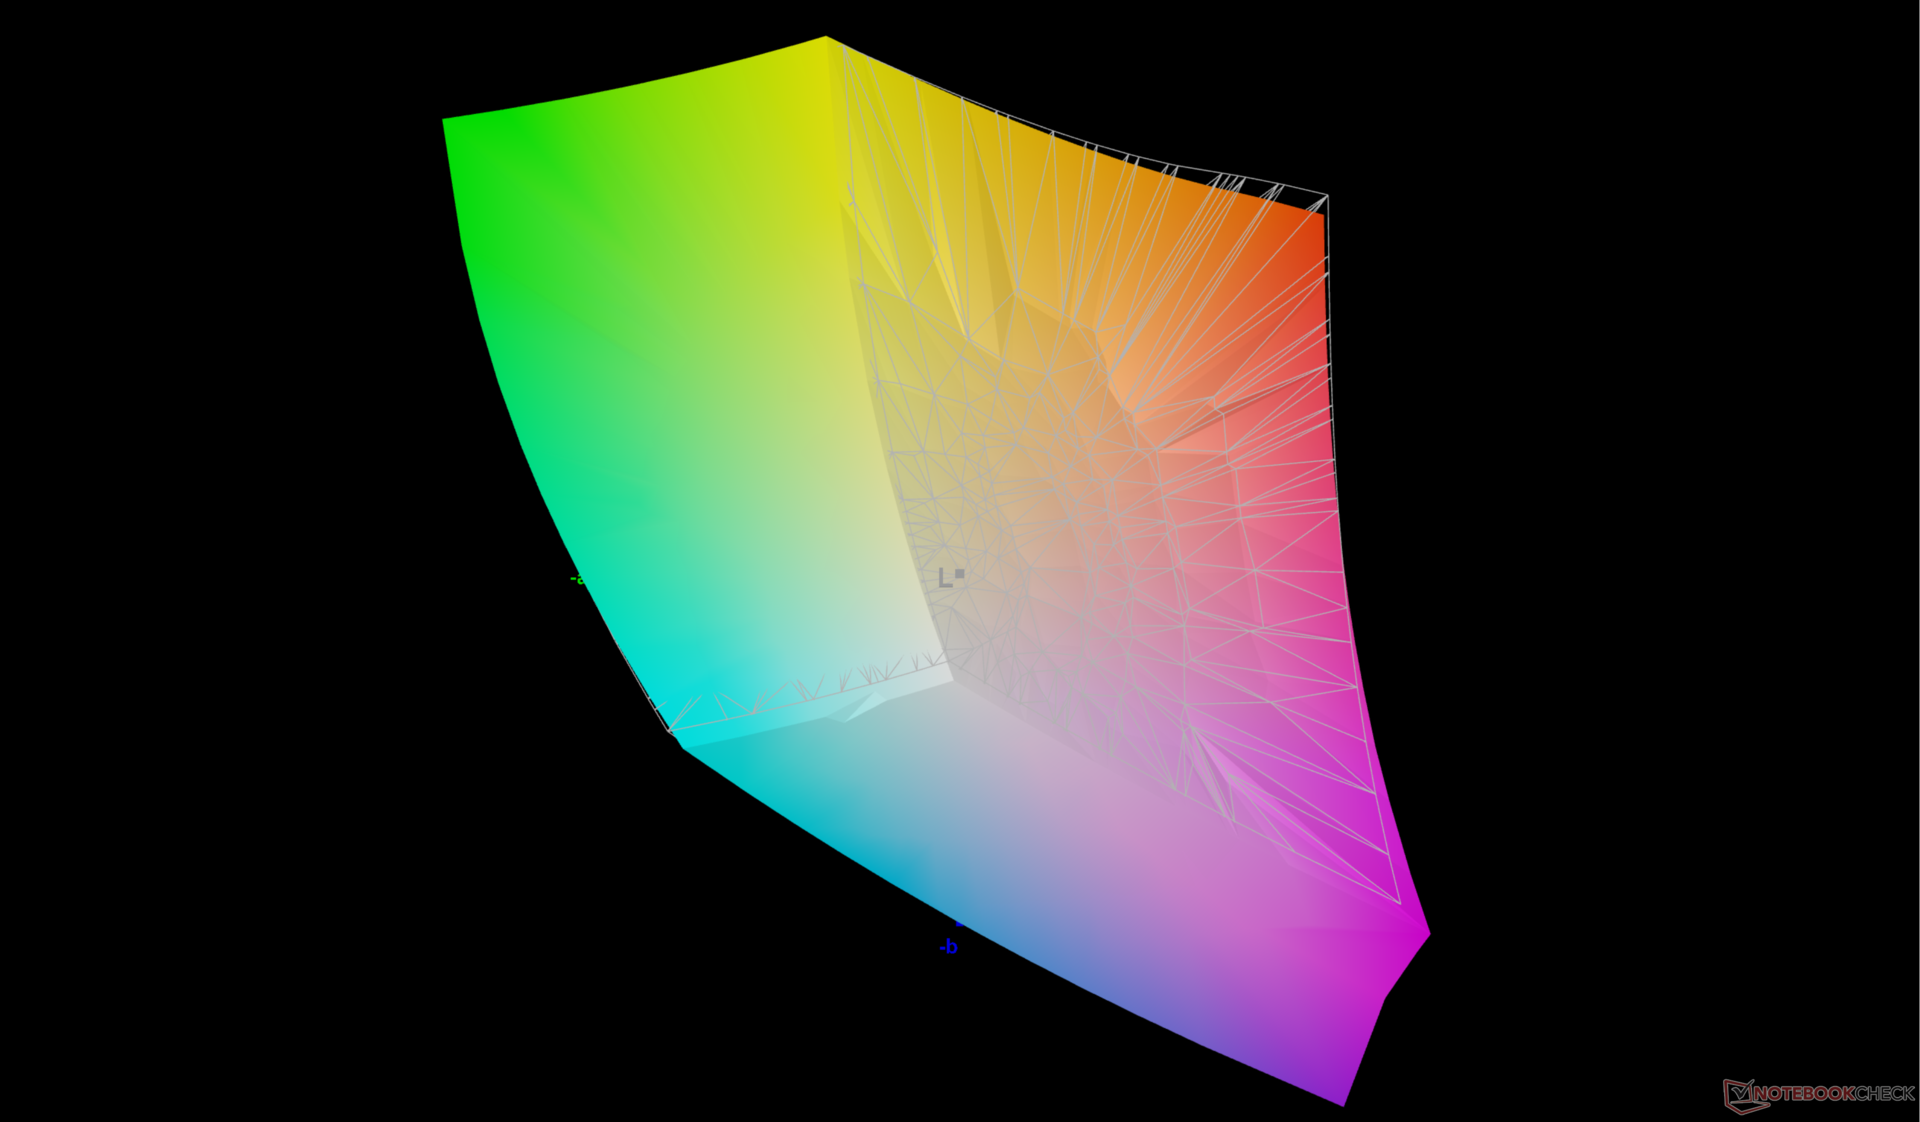
86% AdobeRGB 1998 (Argyll 3D)
99.9% sRGB (Argyll 3D)
98.4% Display P3 (Argyll 3D)
Gamma: 2.28
CCT: 6806 K
| HP ZBook Fury 16 G11 AUO87A8, IPS, 3840x2400, 16", 120 Hz | HP ZBook Fury 16 G10 AUO87A8, IPS, 3840x2400, 16", 120 Hz | HP ZBook Fury 16 G9 BOE0A52, IPS, 3840x2400, 16", 60 Hz | Dell Precision 5690 Samsung 160YV03, OLED, 3840x2400, 16", 60 Hz | Lenovo ThinkPad P16 G2 21FA000FGE MNG007DA1-9, IPS LED, 2560x1600, 16", 165 Hz | Lenovo ThinkPad P1 G6 21FV001KUS Samsung ATNA60YV04-0, OLED, 3480x2400, 16", 60 Hz | Asus ProArt Studiobook 16 OLED H7604 ATNA60BX01-1, OLED, 3200x2000, 16", 120 Hz | |
|---|---|---|---|---|---|---|---|
| Display | 0% | -0% | 4% | -15% | 5% | 2% | |
| Display P3 Coverage (%) | 98.4 | 98 0% | 97.4 -1% | 99.8 1% | 71 -28% | 99.8 1% | 99.6 1% |
| sRGB Coverage (%) | 99.9 | 99.9 0% | 99.9 0% | 100 0% | 99.2 -1% | 100 0% | 100 0% |
| AdobeRGB 1998 Coverage (%) | 86 | 86.2 0% | 86.3 0% | 96.6 12% | 73.2 -15% | 97.9 14% | 89.4 4% |
| Response Times | -9% | -11% | 83% | -16% | 82% | 93% | |
| Response Time Grey 50% / Grey 80% * (ms) | 11.4 ? | 11.9 ? -4% | 13.7 ? -20% | 1.7 ? 85% | 12.8 ? -12% | 1.69 ? 85% | 0.59 ? 95% |
| Response Time Black / White * (ms) | 8.4 ? | 9.6 ? -14% | 8.6 ? -2% | 1.7 ? 80% | 10.1 ? -20% | 1.73 ? 79% | 0.79 ? 91% |
| PWM Frequency (Hz) | 60 ? | 60 ? | 240 ? | ||||
| Screen | 19% | -25% | -8% | -7% | 19% | 179% | |
| Brightness middle (cd/m²) | 457.6 | 514.6 12% | 530.5 16% | 348.1 -24% | 510 11% | 375.1 -18% | 349 -24% |
| Brightness (cd/m²) | 466 | 495 6% | 476 2% | 351 -25% | 517 11% | 379 -19% | 350 -25% |
| Brightness Distribution (%) | 83 | 90 8% | 83 0% | 97 17% | 89 7% | 98 18% | 95 14% |
| Black Level * (cd/m²) | 0.43 | 0.46 -7% | 0.57 -33% | 0.37 14% | 0.02 95% | ||
| Contrast (:1) | 1064 | 1119 5% | 931 -12% | 1378 30% | 17450 1540% | ||
| Colorchecker dE 2000 * | 2.78 | 2.4 14% | 2.26 19% | 4.18 -50% | 2.6 6% | 1.16 58% | 2.1 24% |
| Colorchecker dE 2000 max. * | 5.53 | 4.86 12% | 6.68 -21% | 5.2 6% | 2.94 47% | 5.5 1% | |
| Colorchecker dE 2000 calibrated * | 1.37 | 0.4 71% | 4.73 -245% | 0.97 29% | 2.3 -68% | 2.1 -53% | |
| Greyscale dE 2000 * | 2 | 1 50% | 1 50% | 1.7 15% | 3.6 -80% | 1.4 30% | 1.2 40% |
| Gamma | 2.28 96% | 2.3 96% | 2.28 96% | 2.2 100% | 2.26 97% | 2.2 100% | 2.19 100% |
| CCT | 6806 96% | 6553 99% | 6543 99% | 6198 105% | 5969 109% | 6325 103% | 6545 99% |
| Média Total (Programa/Configurações) | 3% /
11% | -12% /
-17% | 26% /
10% | -13% /
-10% | 35% /
27% | 91% /
129% |
* ... menor é melhor
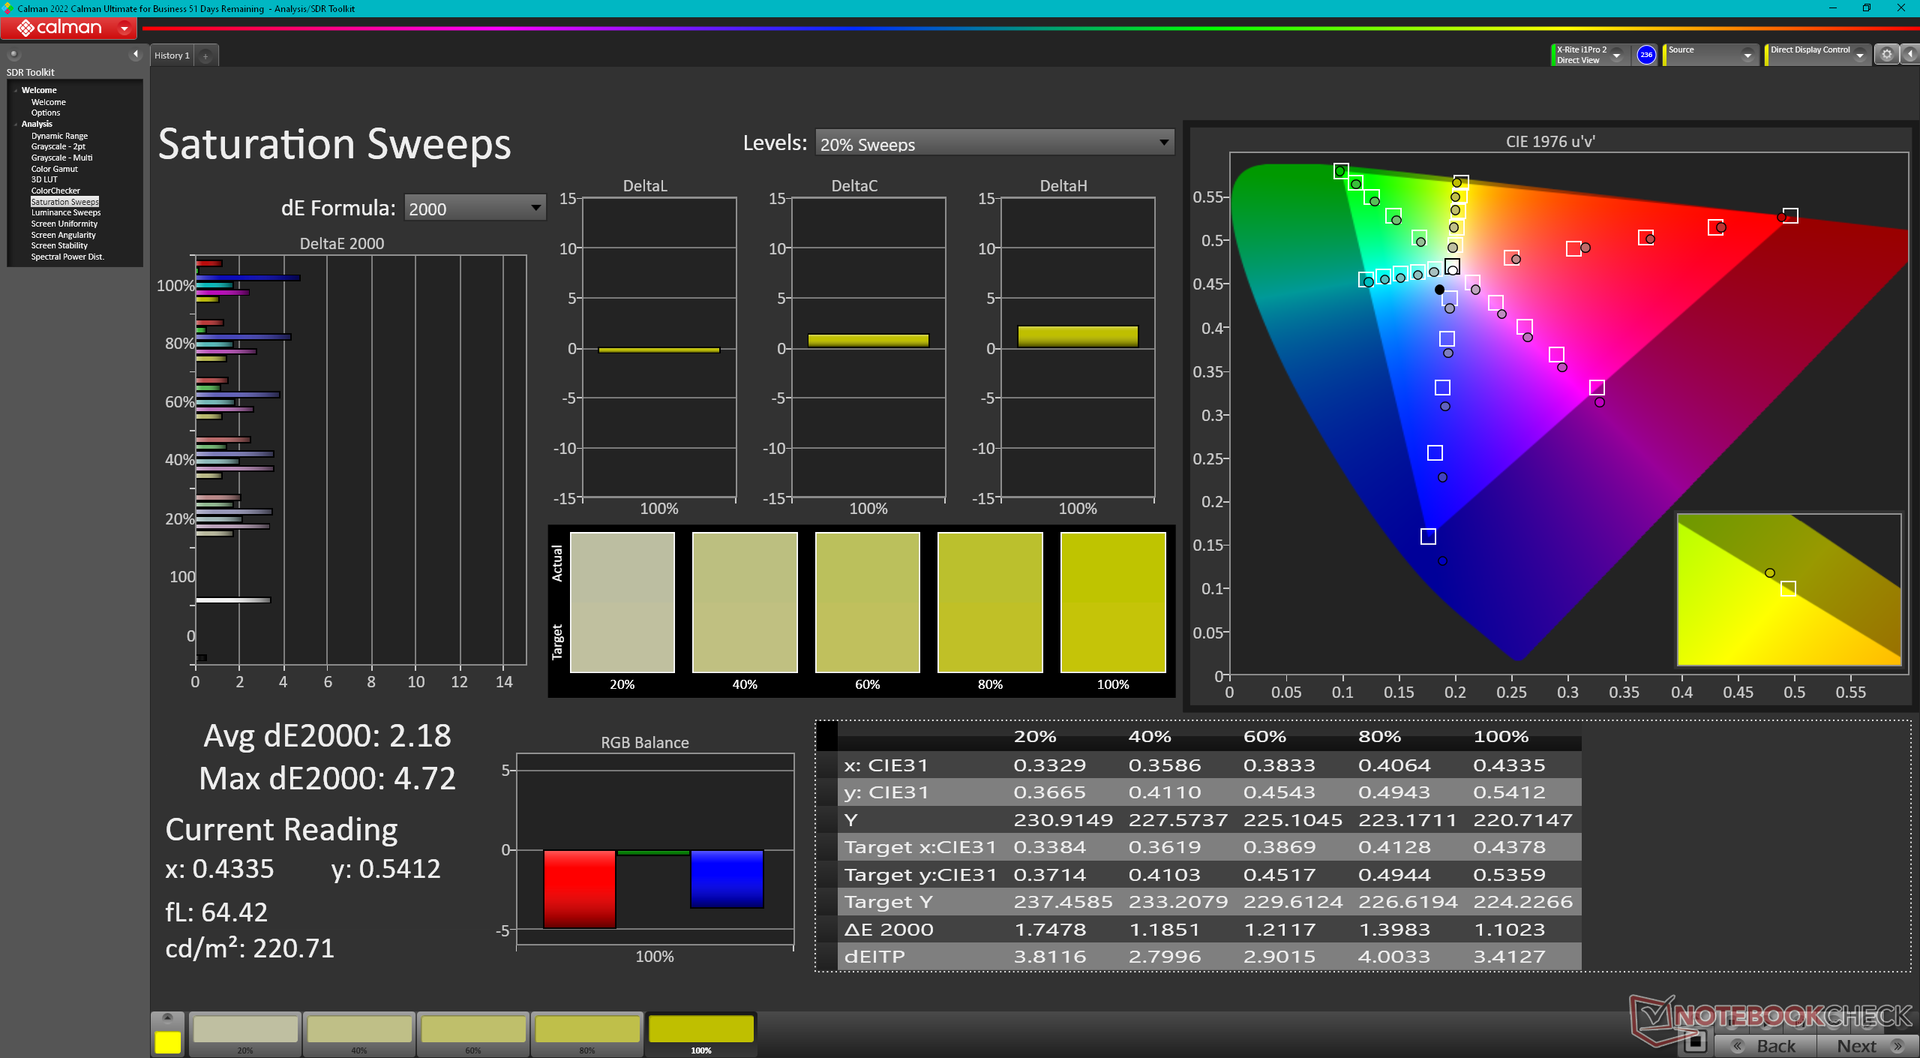
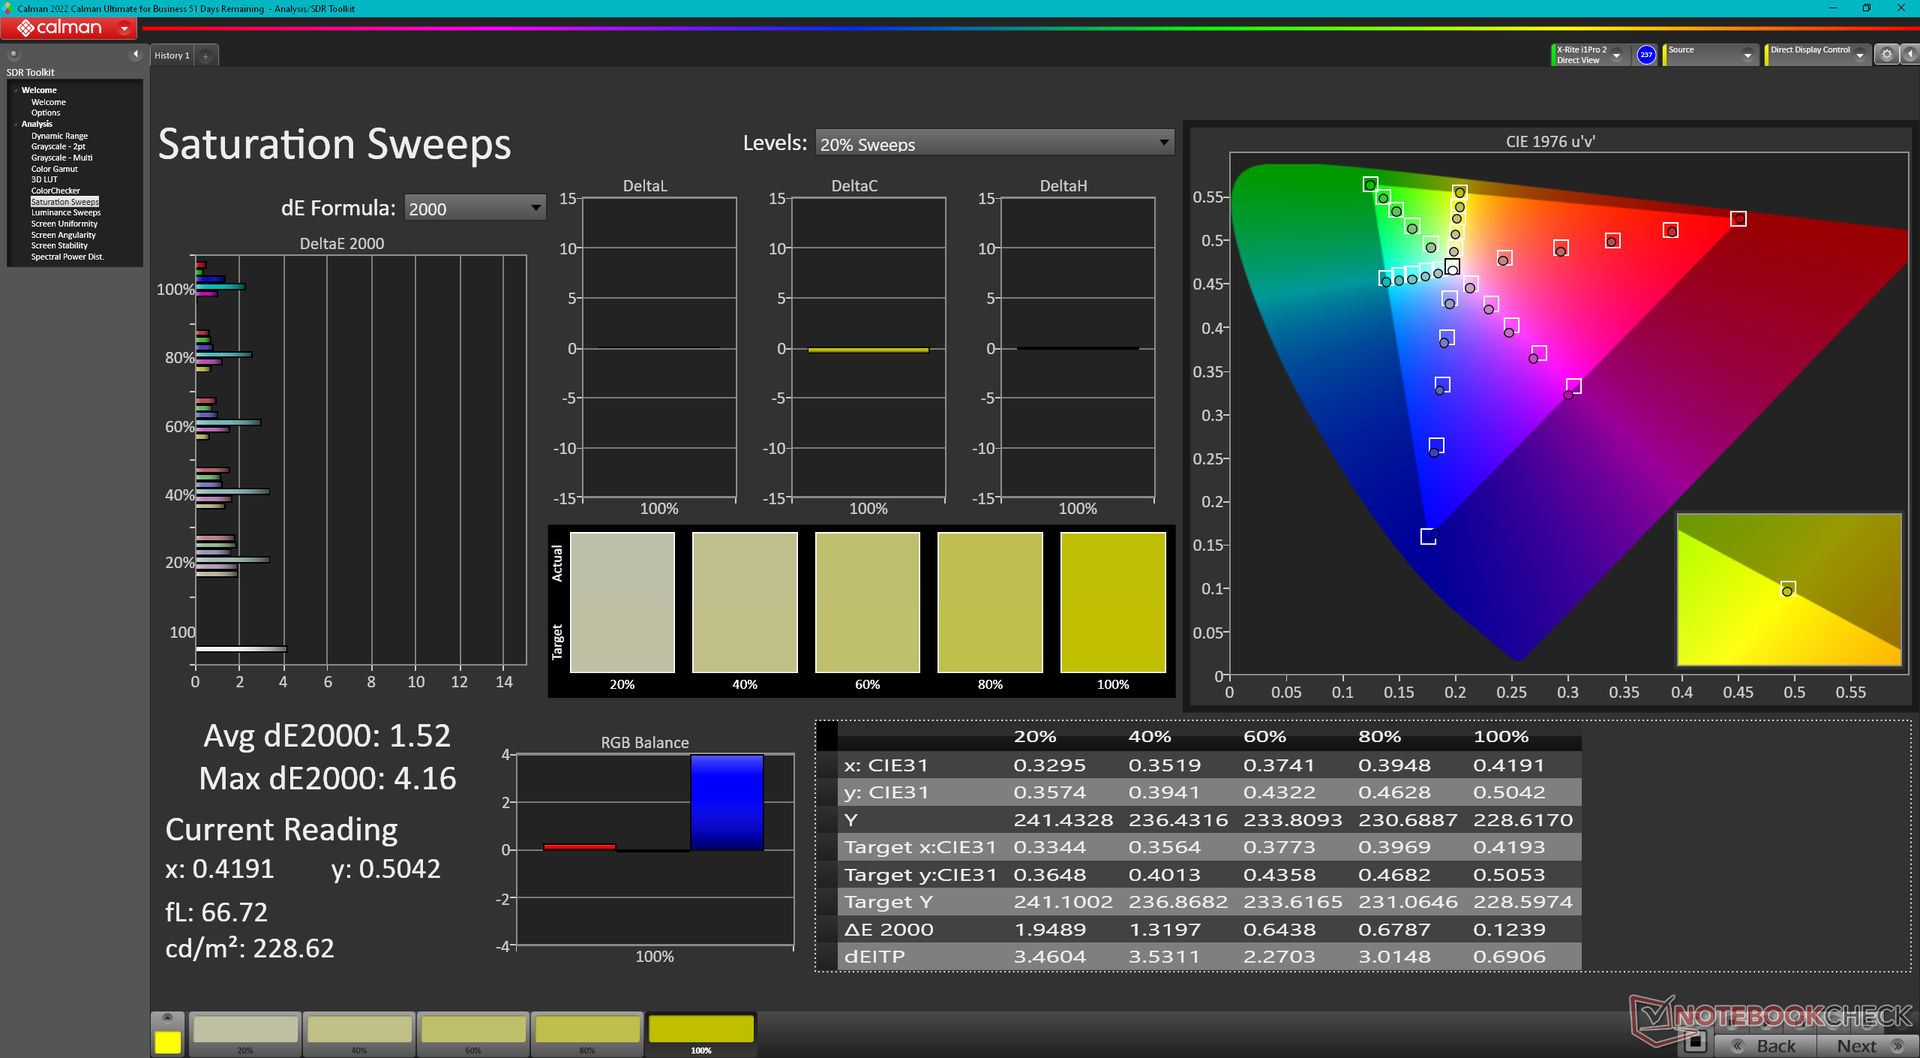
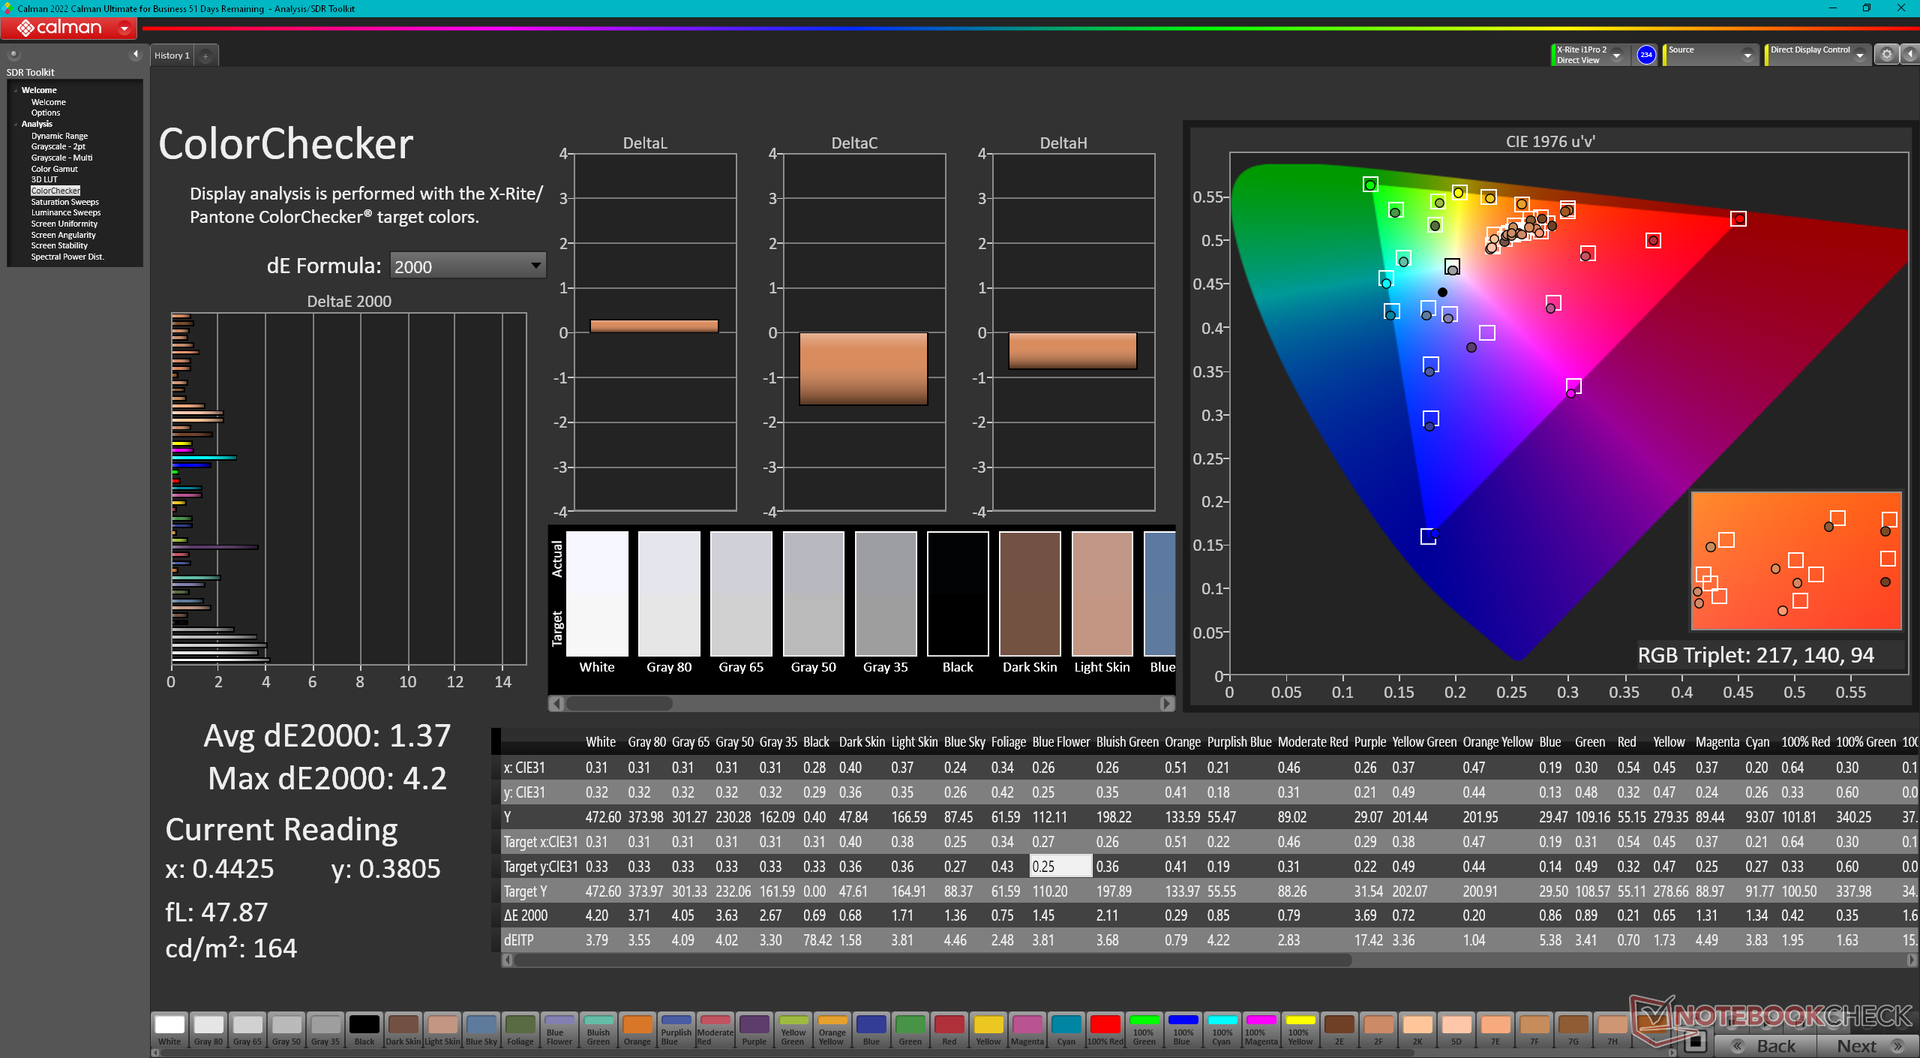
A tela está bem calibrada em relação ao padrão P3 com valores médios de escala de cinza e cor deltaE de apenas 2 e 2,18, respectivamente. Calibrar ainda mais o painel com o nosso colorímetro X-Rite melhoraria apenas um pouco a precisão e seria desnecessário para a maioria dos usuários.
Exibir tempos de resposta
| ↔ Tempo de resposta preto para branco | ||
|---|---|---|
| 8.4 ms ... ascensão ↗ e queda ↘ combinadas | ↗ 4.7 ms ascensão | 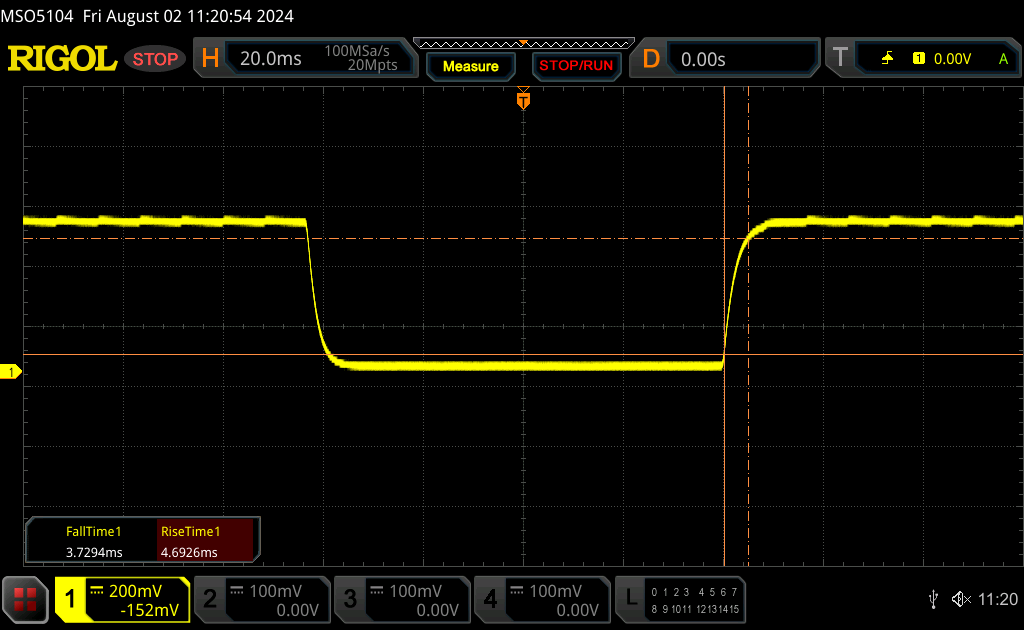 |
| ↘ 3.7 ms queda | ||
| A tela mostra taxas de resposta rápidas em nossos testes e deve ser adequada para jogos. Em comparação, todos os dispositivos testados variam de 0.1 (mínimo) a 240 (máximo) ms. » 24 % de todos os dispositivos são melhores. Isso significa que o tempo de resposta medido é melhor que a média de todos os dispositivos testados (19.9 ms). | ||
| ↔ Tempo de resposta 50% cinza a 80% cinza | ||
| 11.4 ms ... ascensão ↗ e queda ↘ combinadas | ↗ 5.3 ms ascensão | 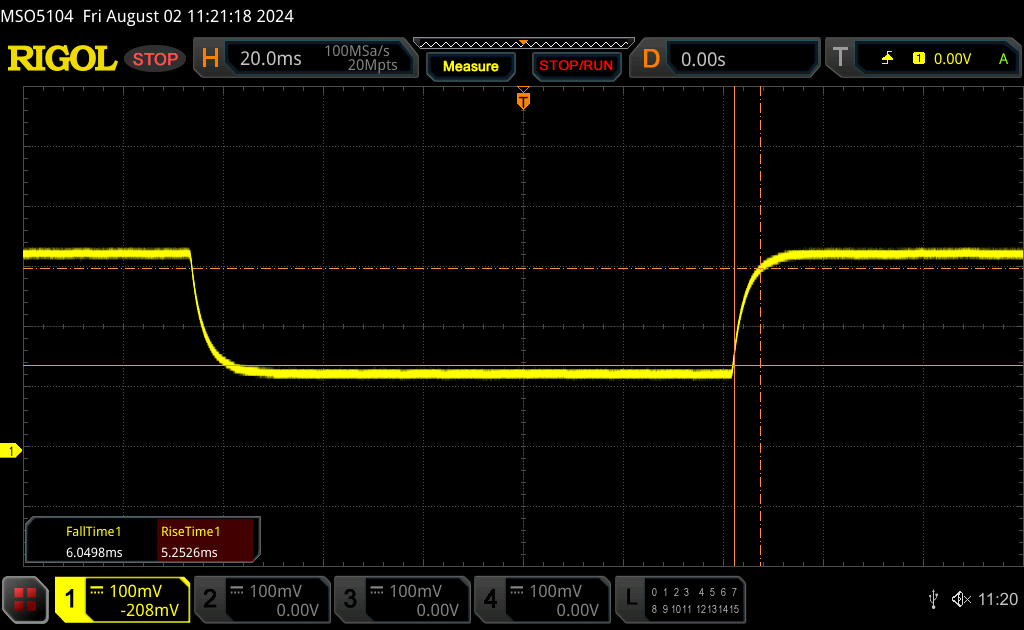 |
| ↘ 6.1 ms queda | ||
| A tela mostra boas taxas de resposta em nossos testes, mas pode ser muito lenta para jogadores competitivos. Em comparação, todos os dispositivos testados variam de 0.165 (mínimo) a 636 (máximo) ms. » 25 % de todos os dispositivos são melhores. Isso significa que o tempo de resposta medido é melhor que a média de todos os dispositivos testados (31.1 ms). | ||
Cintilação da tela / PWM (modulação por largura de pulso)
| Tela tremeluzindo / PWM não detectado |  | ||
[pwm_comparison] Em comparação: 52 % de todos os dispositivos testados não usam PWM para escurecer a tela. Se PWM foi detectado, uma média de 7798 (mínimo: 5 - máximo: 343500) Hz foi medida. | |||
Desempenho - Maior potencial de turbo boost
Condições de teste
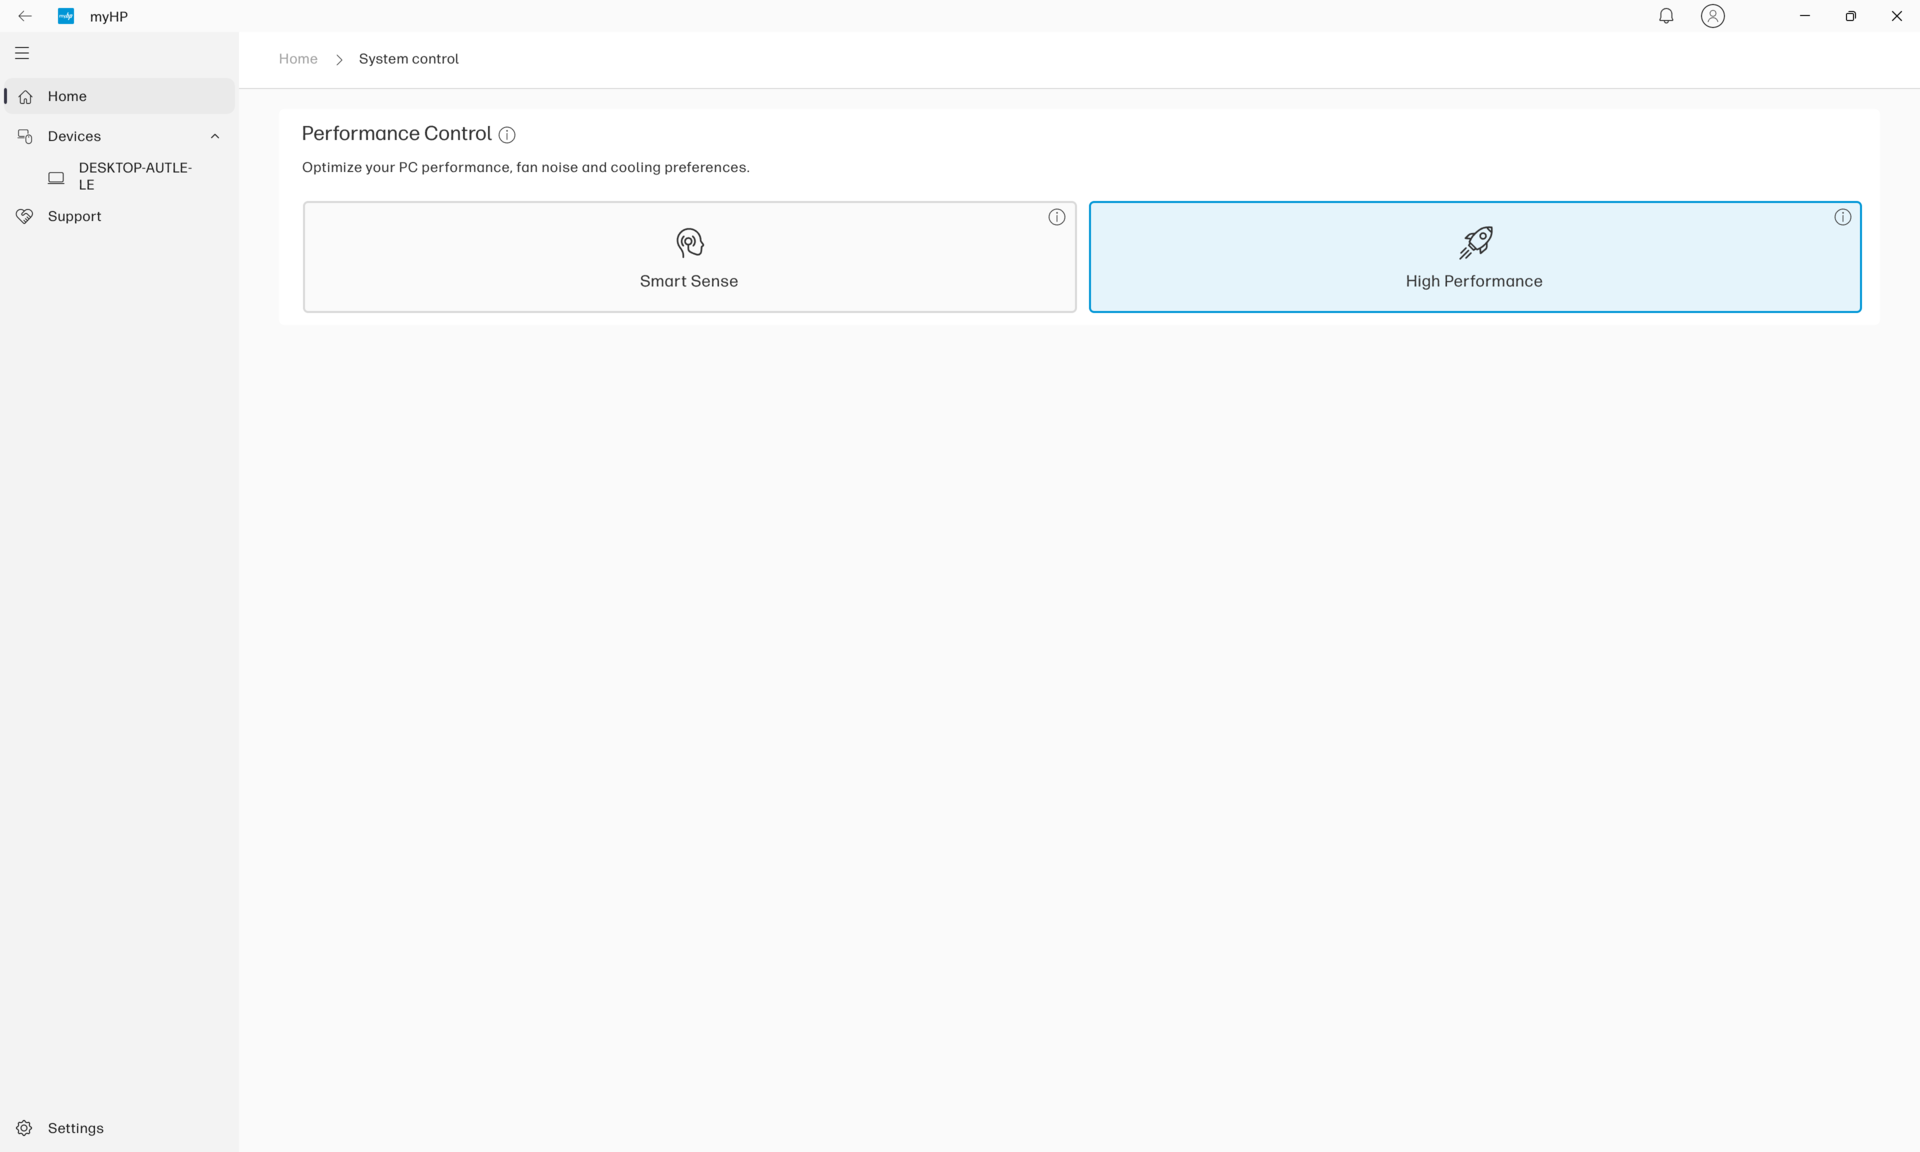
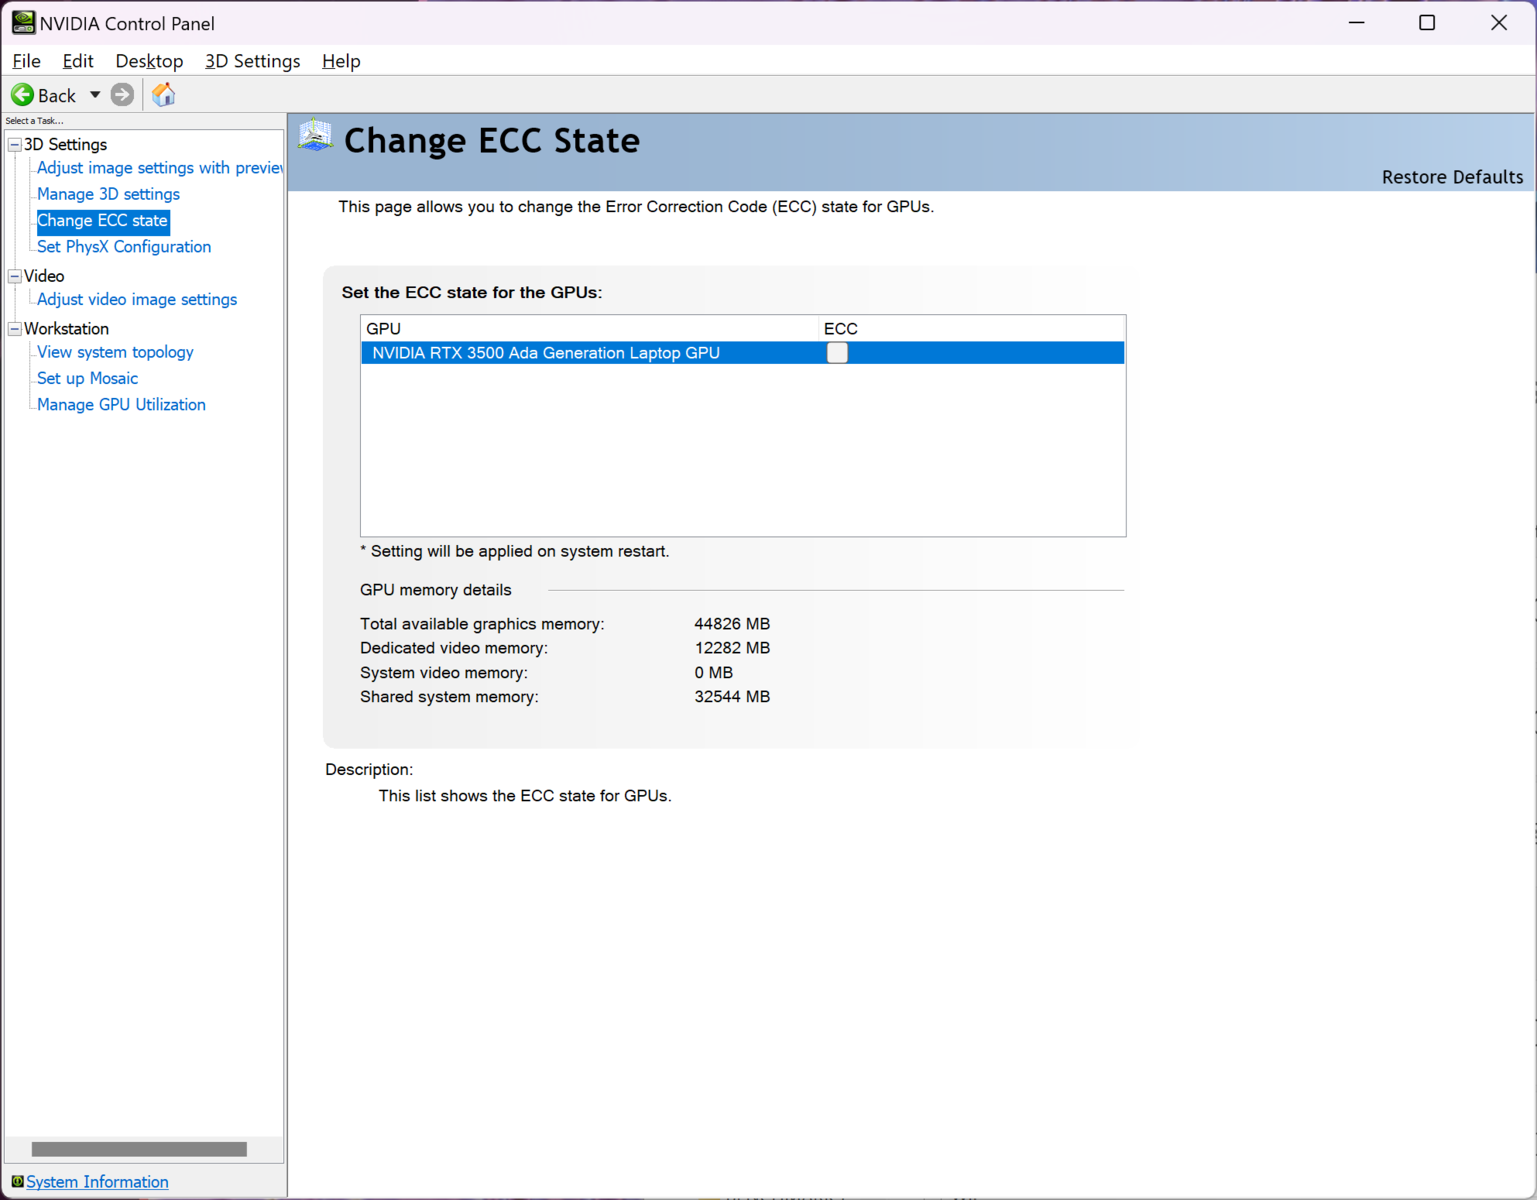
Colocamos o Windows e o MyHP no modo Desempenho antes de executar os benchmarks abaixo. Também desativamos o modo ECC da GPU por meio do painel de controle da Nvidia.
Processador
Saltando do Core i9-12950HX no ZBook Fury 16 G9 para o Core i9-13950HX no ZBook Fury 16 G10 trouxe ganhos significativos de desempenho. Infelizmente, o mesmo não pode ser dito quando se passa do Core i9-13950HX no Fury 16 G10 para o Core i9-14900HX em nossa configuração do Fury 16 G11. Os ganhos são muito menores, cerca de 10 a 15%, antes de levar em conta qualquer limitação. Uma vez considerado o estrangulamento, o desempenho geral do processador seria essencialmente idêntico ao do Core i9-13950HX, conforme demonstrado pelos resultados do teste de loop CineBench R15 xT abaixo. O Core i9-14900HX utiliza a mesma arquitetura subjacente do Core i9-13950HX e, portanto, pode ser considerado uma reformulação das opções do ano passado. Portanto, o teto mais alto do Turbo Boost é sua principal vantagem sobre o processador anterior, mesmo que essas velocidades mais altas do Turbo Boost tenham vida curta.
O Lenovo Legion 9 16IRX9que vem com o mesmo Core i9-14900HX que o nosso HP, funcionaria até 20% mais rápido, provavelmente devido à sua solução de resfriamento mais capaz de sustentar taxas de clock mais altas do Turbo Boost.
Cinebench R15 Multi Loop
Cinebench R23: Multi Core | Single Core
Cinebench R20: CPU (Multi Core) | CPU (Single Core)
Cinebench R15: CPU Multi 64Bit | CPU Single 64Bit
Blender: v2.79 BMW27 CPU
7-Zip 18.03: 7z b 4 | 7z b 4 -mmt1
Geekbench 6.7: Multi-Core | Single-Core
Geekbench 5.5: Multi-Core | Single-Core
HWBOT x265 Benchmark v2.2: 4k Preset
LibreOffice : 20 Documents To PDF
R Benchmark 2.5: Overall mean
| Geekbench 6.7 / Multi-Core | |
| Média Intel Core i9-14900HX (13158 - 19665, n=37) | |
| HP ZBook Fury 16 G10 | |
| HP ZBook Fury 16 G11 | |
| Dell Precision 5000 5680 | |
| Dell Precision 5690 | |
| Lenovo ThinkPad P1 G6 21FV001KUS | |
| Lenovo ThinkPad P1 G6-21FV000DGE | |
| Lenovo ThinkPad P16v G1 AMD | |
| Geekbench 6.7 / Single-Core | |
| Média Intel Core i9-14900HX (2419 - 3129, n=37) | |
| HP ZBook Fury 16 G10 | |
| HP ZBook Fury 16 G11 | |
| Lenovo ThinkPad P1 G6 21FV001KUS | |
| Lenovo ThinkPad P1 G6-21FV000DGE | |
| Dell Precision 5000 5680 | |
| Lenovo ThinkPad P16v G1 AMD | |
| Dell Precision 5690 | |
Cinebench R23: Multi Core | Single Core
Cinebench R20: CPU (Multi Core) | CPU (Single Core)
Cinebench R15: CPU Multi 64Bit | CPU Single 64Bit
Blender: v2.79 BMW27 CPU
7-Zip 18.03: 7z b 4 | 7z b 4 -mmt1
Geekbench 6.7: Multi-Core | Single-Core
Geekbench 5.5: Multi-Core | Single-Core
HWBOT x265 Benchmark v2.2: 4k Preset
LibreOffice : 20 Documents To PDF
R Benchmark 2.5: Overall mean
* ... menor é melhor
AIDA64: FP32 Ray-Trace | FPU Julia | CPU SHA3 | CPU Queen | FPU SinJulia | FPU Mandel | CPU AES | CPU ZLib | FP64 Ray-Trace | CPU PhotoWorxx
| Performance rating | |
| Asus ProArt Studiobook 16 OLED H7604 | |
| Média Intel Core i9-14900HX | |
| HP ZBook Fury 16 G10 | |
| HP ZBook Fury 16 G11 | |
| Dell Precision 5690 | |
| Lenovo ThinkPad P16 G2 21FA000FGE | |
| HP ZBook Fury 16 G9 | |
| Lenovo ThinkPad P1 G6 21FV001KUS | |
| AIDA64 / FP32 Ray-Trace | |
| Asus ProArt Studiobook 16 OLED H7604 | |
| Média Intel Core i9-14900HX (13098 - 33474, n=36) | |
| HP ZBook Fury 16 G10 | |
| HP ZBook Fury 16 G11 | |
| Dell Precision 5690 | |
| Lenovo ThinkPad P16 G2 21FA000FGE | |
| HP ZBook Fury 16 G9 | |
| Lenovo ThinkPad P1 G6 21FV001KUS | |
| AIDA64 / FPU SinJulia | |
| Asus ProArt Studiobook 16 OLED H7604 | |
| Média Intel Core i9-14900HX (10475 - 18517, n=36) | |
| HP ZBook Fury 16 G11 | |
| HP ZBook Fury 16 G10 | |
| Lenovo ThinkPad P16 G2 21FA000FGE | |
| HP ZBook Fury 16 G9 | |
| Dell Precision 5690 | |
| Lenovo ThinkPad P1 G6 21FV001KUS | |
| AIDA64 / FPU Mandel | |
| Asus ProArt Studiobook 16 OLED H7604 | |
| Média Intel Core i9-14900HX (32543 - 83662, n=36) | |
| HP ZBook Fury 16 G10 | |
| HP ZBook Fury 16 G11 | |
| Dell Precision 5690 | |
| HP ZBook Fury 16 G9 | |
| Lenovo ThinkPad P16 G2 21FA000FGE | |
| Lenovo ThinkPad P1 G6 21FV001KUS | |
| AIDA64 / FP64 Ray-Trace | |
| Asus ProArt Studiobook 16 OLED H7604 | |
| Média Intel Core i9-14900HX (6809 - 18349, n=36) | |
| HP ZBook Fury 16 G10 | |
| HP ZBook Fury 16 G11 | |
| Lenovo ThinkPad P16 G2 21FA000FGE | |
| Dell Precision 5690 | |
| Lenovo ThinkPad P1 G6 21FV001KUS | |
| HP ZBook Fury 16 G9 | |
| AIDA64 / CPU PhotoWorxx | |
| Dell Precision 5690 | |
| Asus ProArt Studiobook 16 OLED H7604 | |
| Média Intel Core i9-14900HX (23903 - 54702, n=36) | |
| HP ZBook Fury 16 G10 | |
| HP ZBook Fury 16 G9 | |
| HP ZBook Fury 16 G11 | |
| Lenovo ThinkPad P16 G2 21FA000FGE | |
| Lenovo ThinkPad P1 G6 21FV001KUS | |
Teste de estresse
Ao executar o Prime95 para estressar a CPU, as taxas de clock do núcleo e o consumo de energia do pacote aumentavam para 3,7 GHz e 139 W, respectivamente, durando apenas um minuto, no máximo, com a temperatura do núcleo também aumentando para 99 C. A CPU acabava se estabilizando em 2,3 GHz e 69 W para manter uma temperatura do núcleo mais gerenciável de 82 C. A queda relativamente acentuada no desempenho ao longo do tempo leva às pontuações de loop do CineBench R15 xT progressivamente mais baixas mencionadas acima.
As temperaturas da CPU e da GPU ao executar cargas mais altas, como jogos, se estabilizariam praticamente nas mesmas leituras que registramos no ZBook Fury 16 G10 do ano passado, apesar das diferenças de desempenho.
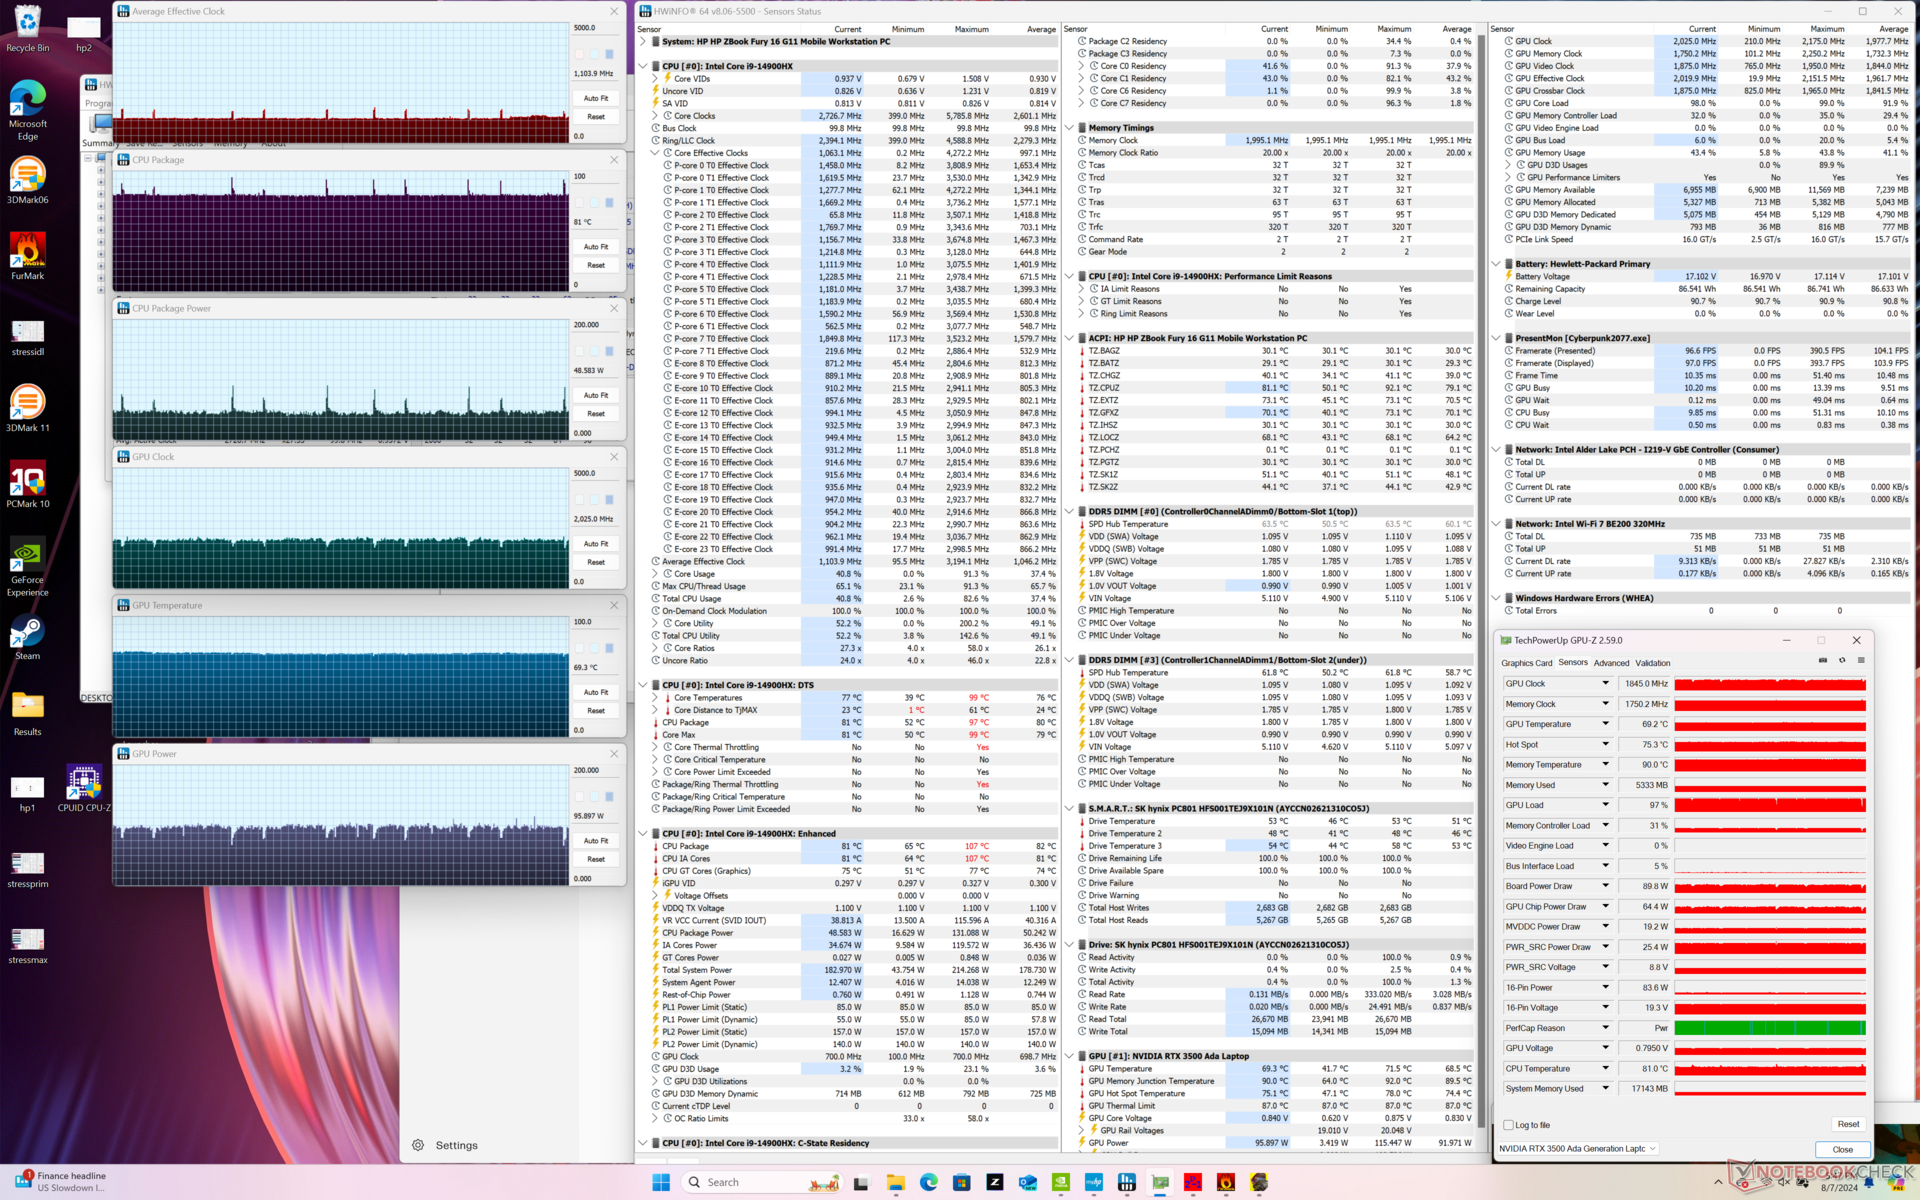
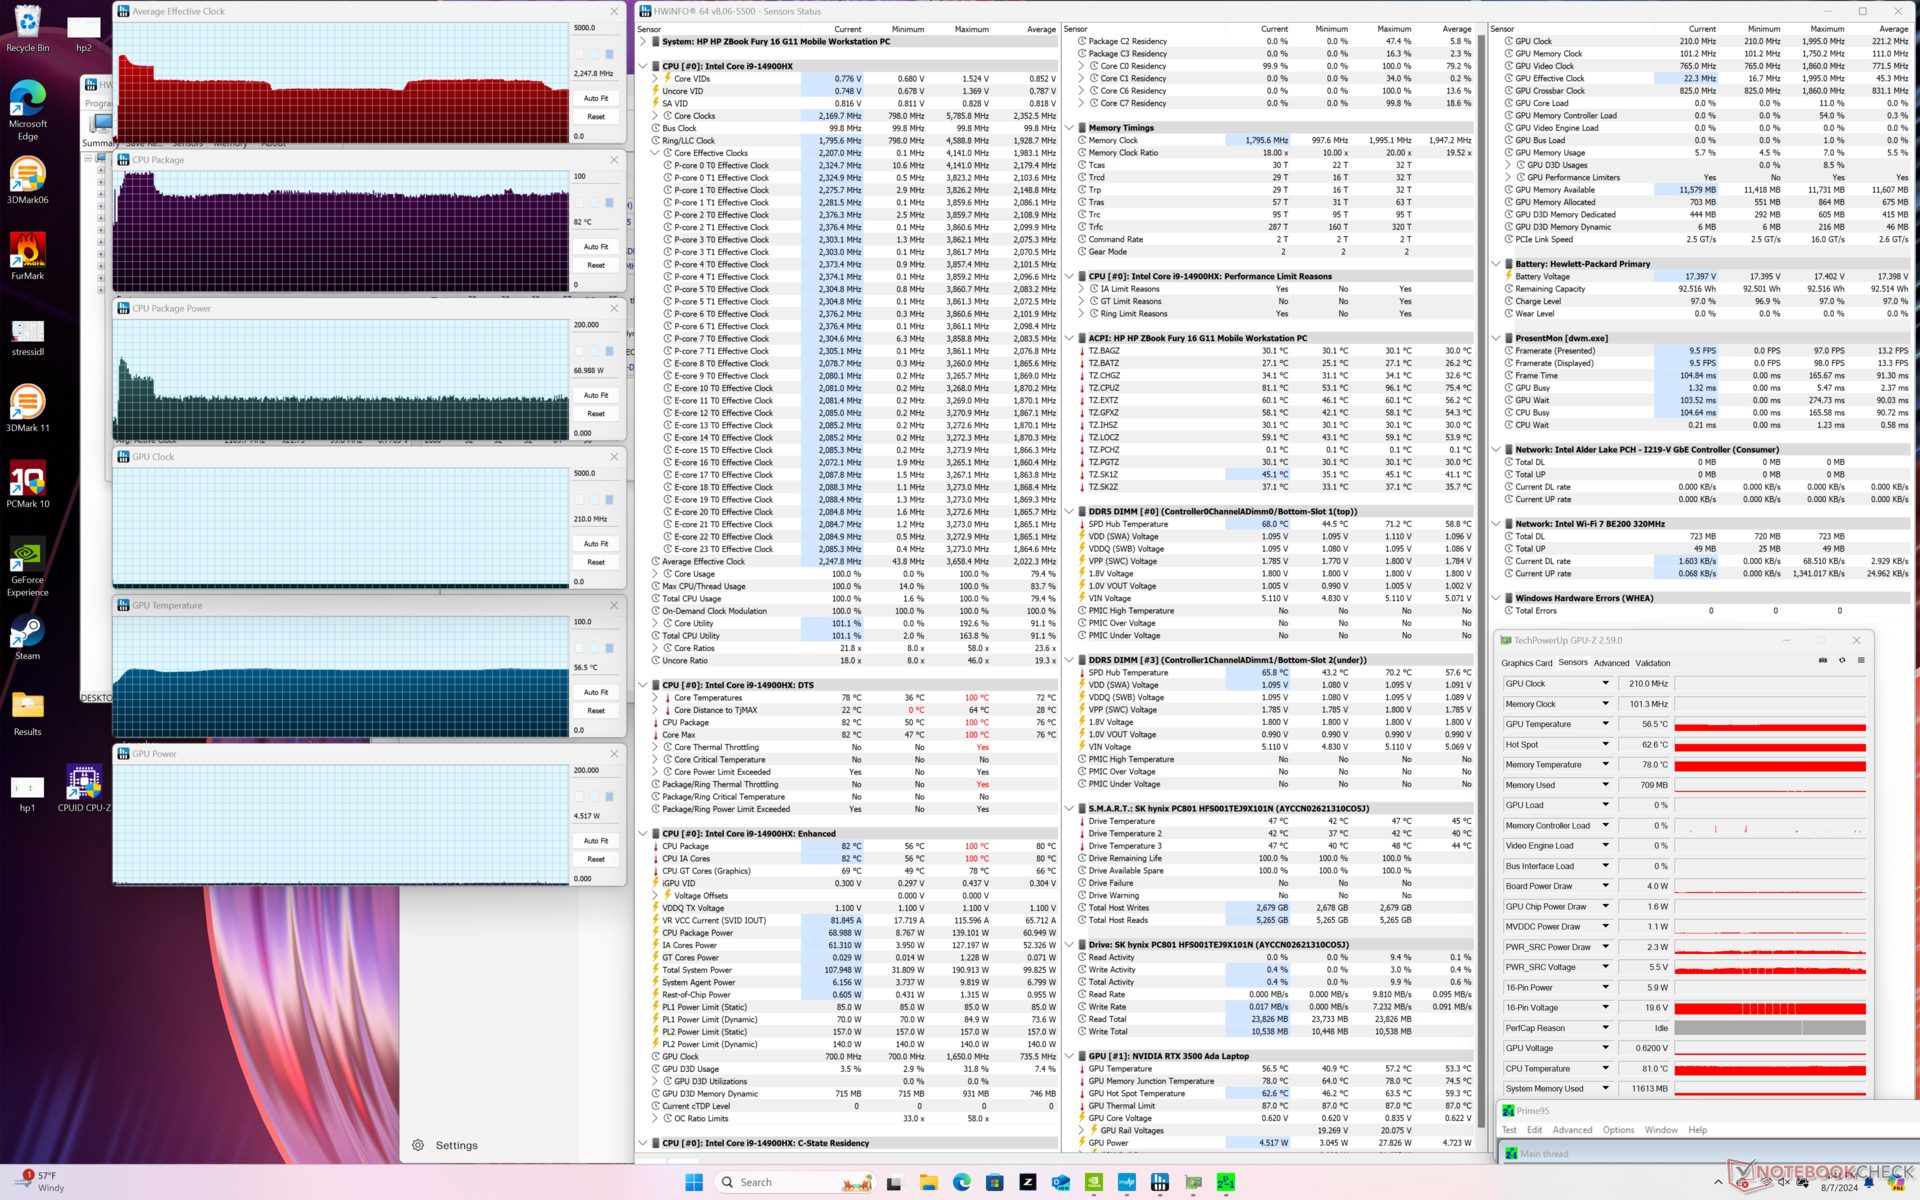
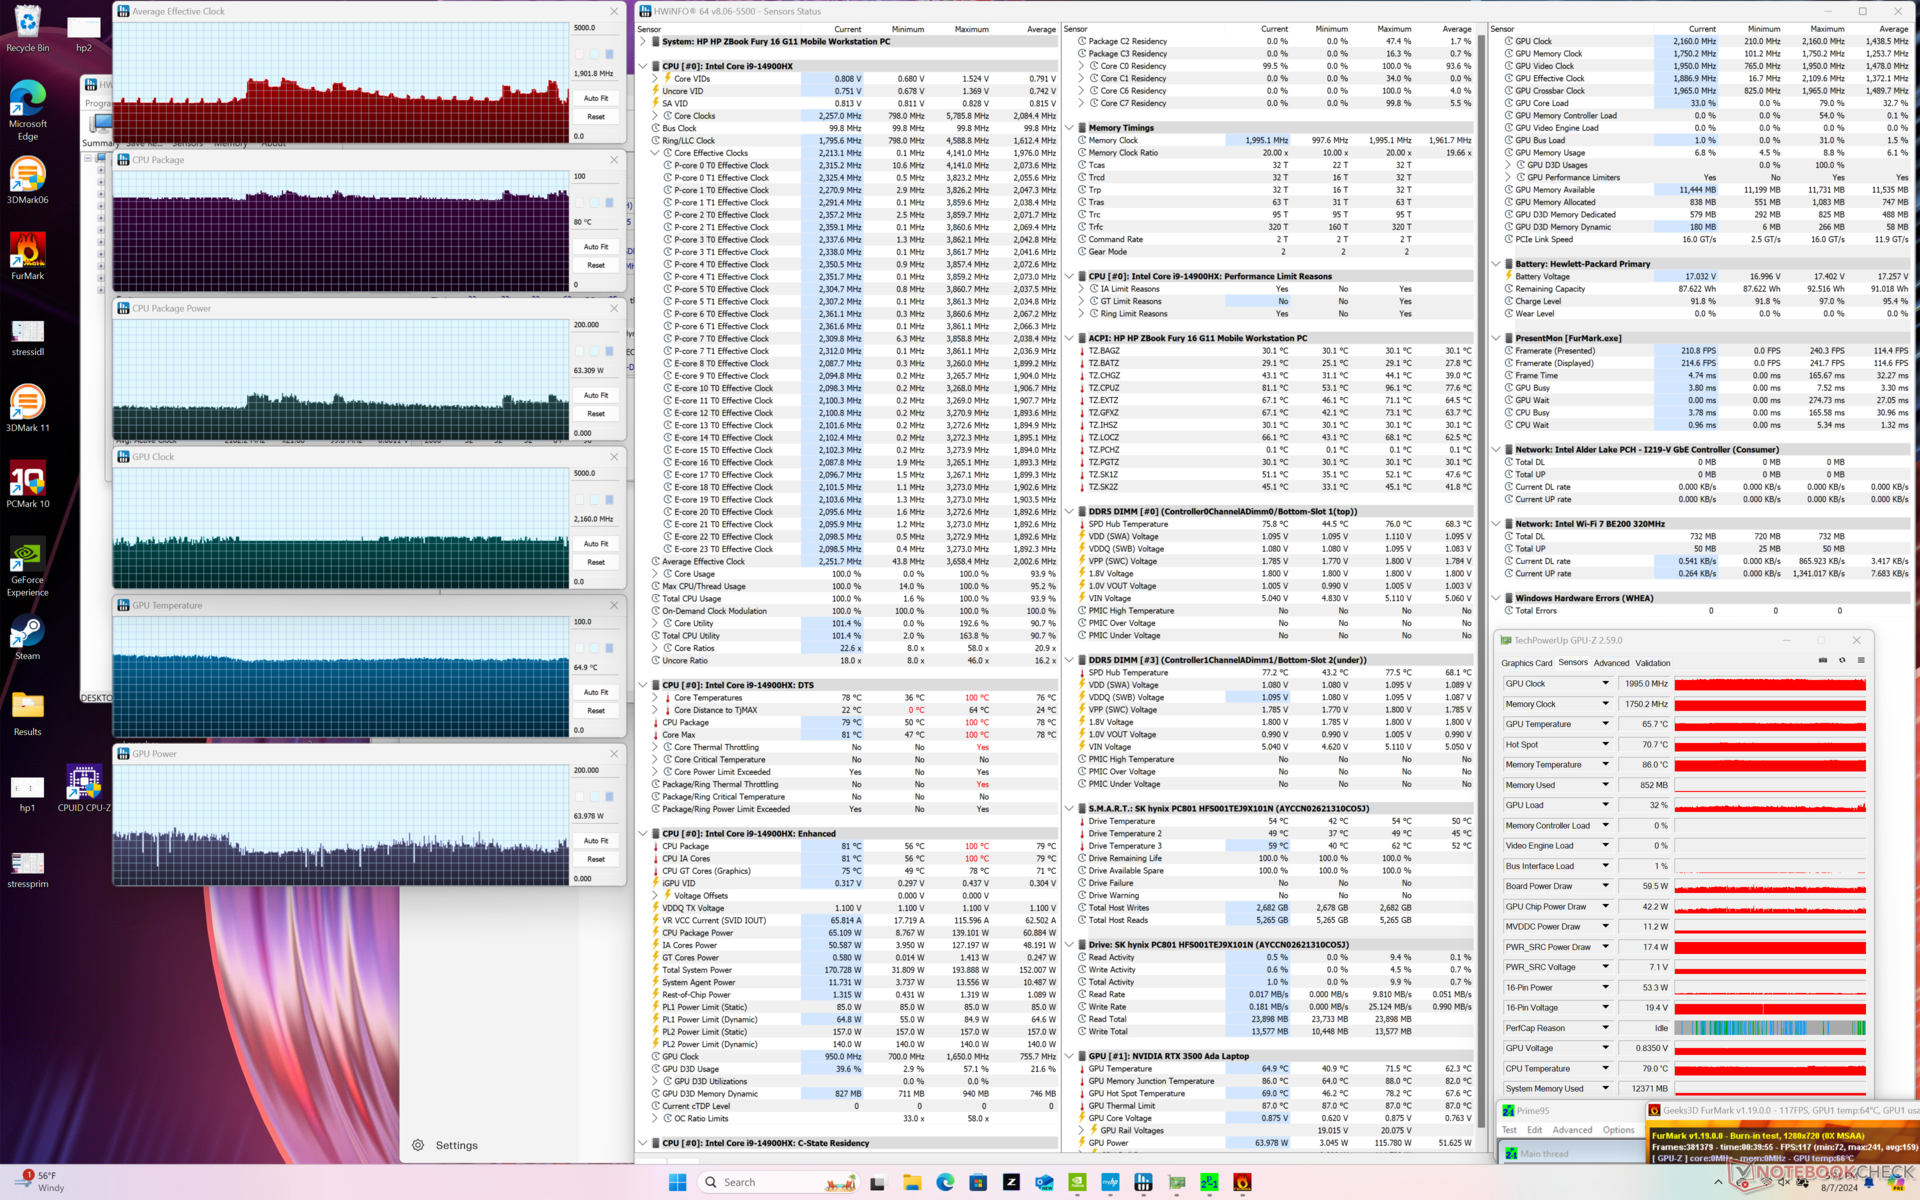
| Clock médio da CPU (GHz) | Clock da GPU (MHz) | Temperatura média da CPU (°C) | Temperatura média da GPU (°C) | |
| Sistema ocioso | -- | -- | 51 | 42 |
| Estresse do Prime95 | 2.2 - 2.6 | -- | 82 | 57 |
| Prime95 + FurMark Stress | 1.8 | 1995 | 81 | 65 |
| Cyberpunk 2077 Stress | 1.1 | 1845 | 81 | 69 |
Desempenho do sistema
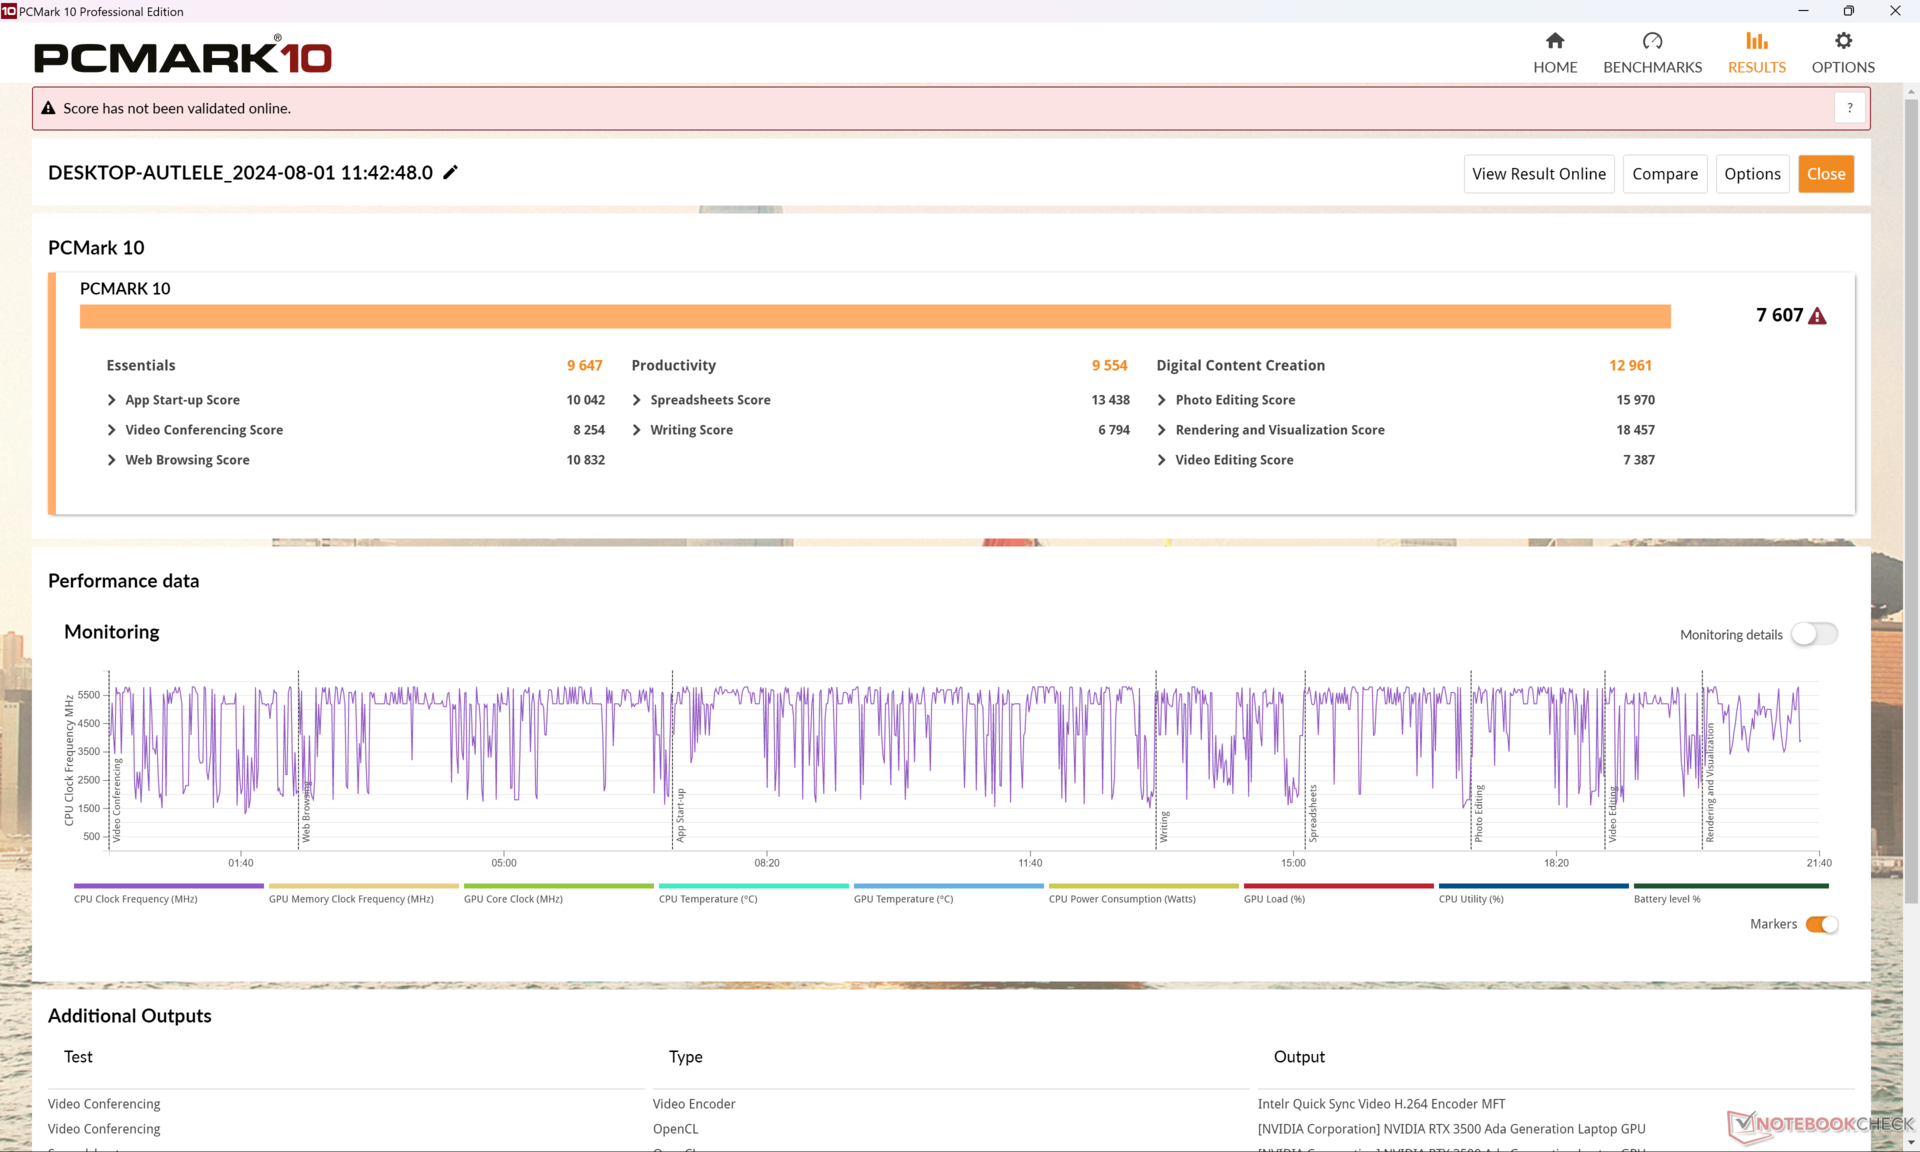
Os resultados do PCMark são semelhantes aos que registramos no ZBook Fury 16 G10 do ano passado, sugerindo que o ZBook Fury 16 G11 não executará a maioria das tarefas diárias mais rapidamente do que seu antecessor.
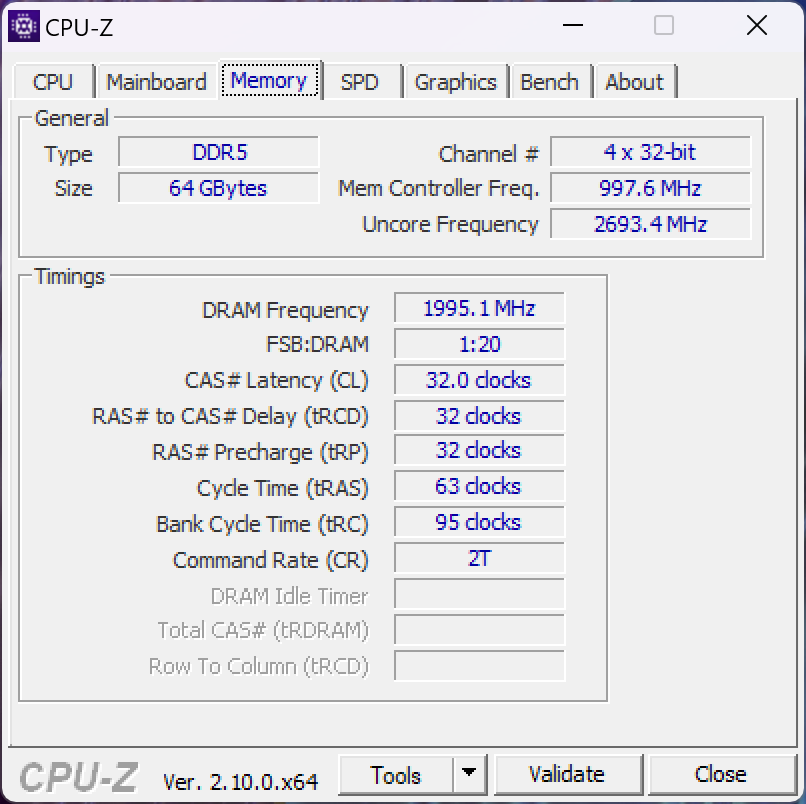
Lembre-se de que a velocidade máxima da RAM é limitada a apenas 4000 MT/s se configurada com 128 GB de memória devido às limitações do padrão SODIMM. O modelo suporta RAM ECC e RAM não ECC.
CrossMark: Overall | Productivity | Creativity | Responsiveness
WebXPRT 3: Overall
WebXPRT 4: Overall
Mozilla Kraken 1.1: Total
| PCMark 10 / Score | |
| HP ZBook Fury 16 G10 | |
| Dell Precision 5690 | |
| Lenovo ThinkPad P1 G6 21FV001KUS | |
| HP ZBook Fury 16 G11 | |
| Média Intel Core i9-14900HX, NVIDIA RTX 3500 Ada Generation Laptop (n=1) | |
| Asus ProArt Studiobook 16 OLED H7604 | |
| Lenovo ThinkPad P16 G2 21FA000FGE | |
| HP ZBook Fury 16 G9 | |
| PCMark 10 / Essentials | |
| Lenovo ThinkPad P1 G6 21FV001KUS | |
| HP ZBook Fury 16 G10 | |
| Dell Precision 5690 | |
| Lenovo ThinkPad P16 G2 21FA000FGE | |
| HP ZBook Fury 16 G9 | |
| Asus ProArt Studiobook 16 OLED H7604 | |
| HP ZBook Fury 16 G11 | |
| Média Intel Core i9-14900HX, NVIDIA RTX 3500 Ada Generation Laptop (n=1) | |
| PCMark 10 / Productivity | |
| Dell Precision 5690 | |
| Lenovo ThinkPad P1 G6 21FV001KUS | |
| Asus ProArt Studiobook 16 OLED H7604 | |
| HP ZBook Fury 16 G11 | |
| Média Intel Core i9-14900HX, NVIDIA RTX 3500 Ada Generation Laptop (n=1) | |
| Lenovo ThinkPad P16 G2 21FA000FGE | |
| HP ZBook Fury 16 G10 | |
| HP ZBook Fury 16 G9 | |
| PCMark 10 / Digital Content Creation | |
| HP ZBook Fury 16 G10 | |
| HP ZBook Fury 16 G11 | |
| Média Intel Core i9-14900HX, NVIDIA RTX 3500 Ada Generation Laptop (n=1) | |
| Lenovo ThinkPad P1 G6 21FV001KUS | |
| Dell Precision 5690 | |
| Asus ProArt Studiobook 16 OLED H7604 | |
| Lenovo ThinkPad P16 G2 21FA000FGE | |
| HP ZBook Fury 16 G9 | |
| CrossMark / Overall | |
| Asus ProArt Studiobook 16 OLED H7604 | |
| HP ZBook Fury 16 G11 | |
| Média Intel Core i9-14900HX, NVIDIA RTX 3500 Ada Generation Laptop (n=1) | |
| HP ZBook Fury 16 G10 | |
| HP ZBook Fury 16 G9 | |
| Lenovo ThinkPad P16 G2 21FA000FGE | |
| Lenovo ThinkPad P1 G6 21FV001KUS | |
| Dell Precision 5690 | |
| CrossMark / Productivity | |
| Asus ProArt Studiobook 16 OLED H7604 | |
| HP ZBook Fury 16 G11 | |
| Média Intel Core i9-14900HX, NVIDIA RTX 3500 Ada Generation Laptop (n=1) | |
| HP ZBook Fury 16 G10 | |
| HP ZBook Fury 16 G9 | |
| Dell Precision 5690 | |
| Lenovo ThinkPad P1 G6 21FV001KUS | |
| Lenovo ThinkPad P16 G2 21FA000FGE | |
| CrossMark / Creativity | |
| Asus ProArt Studiobook 16 OLED H7604 | |
| HP ZBook Fury 16 G11 | |
| Média Intel Core i9-14900HX, NVIDIA RTX 3500 Ada Generation Laptop (n=1) | |
| Lenovo ThinkPad P16 G2 21FA000FGE | |
| HP ZBook Fury 16 G9 | |
| HP ZBook Fury 16 G10 | |
| Lenovo ThinkPad P1 G6 21FV001KUS | |
| Dell Precision 5690 | |
| CrossMark / Responsiveness | |
| Asus ProArt Studiobook 16 OLED H7604 | |
| HP ZBook Fury 16 G11 | |
| Média Intel Core i9-14900HX, NVIDIA RTX 3500 Ada Generation Laptop (n=1) | |
| HP ZBook Fury 16 G10 | |
| HP ZBook Fury 16 G9 | |
| Dell Precision 5690 | |
| Lenovo ThinkPad P1 G6 21FV001KUS | |
| Lenovo ThinkPad P16 G2 21FA000FGE | |
| WebXPRT 3 / Overall | |
| HP ZBook Fury 16 G10 | |
| Asus ProArt Studiobook 16 OLED H7604 | |
| Lenovo ThinkPad P16 G2 21FA000FGE | |
| HP ZBook Fury 16 G11 | |
| Média Intel Core i9-14900HX, NVIDIA RTX 3500 Ada Generation Laptop (n=1) | |
| Lenovo ThinkPad P1 G6 21FV001KUS | |
| HP ZBook Fury 16 G9 | |
| Dell Precision 5690 | |
| WebXPRT 4 / Overall | |
| HP ZBook Fury 16 G11 | |
| Média Intel Core i9-14900HX, NVIDIA RTX 3500 Ada Generation Laptop (n=1) | |
| HP ZBook Fury 16 G10 | |
| Asus ProArt Studiobook 16 OLED H7604 | |
| Lenovo ThinkPad P1 G6 21FV001KUS | |
| HP ZBook Fury 16 G9 | |
| Dell Precision 5690 | |
| Mozilla Kraken 1.1 / Total | |
| Dell Precision 5690 | |
| HP ZBook Fury 16 G9 | |
| Lenovo ThinkPad P16 G2 21FA000FGE | |
| Lenovo ThinkPad P1 G6 21FV001KUS | |
| HP ZBook Fury 16 G10 | |
| HP ZBook Fury 16 G11 | |
| Média Intel Core i9-14900HX, NVIDIA RTX 3500 Ada Generation Laptop (n=1) | |
| Asus ProArt Studiobook 16 OLED H7604 | |
* ... menor é melhor
| PCMark 10 Score | 7607 pontos | |
Ajuda | ||
| AIDA64 / Memory Copy | |
| Dell Precision 5690 | |
| Média Intel Core i9-14900HX (38028 - 83392, n=36) | |
| Asus ProArt Studiobook 16 OLED H7604 | |
| HP ZBook Fury 16 G10 | |
| HP ZBook Fury 16 G9 | |
| HP ZBook Fury 16 G11 | |
| Lenovo ThinkPad P16 G2 21FA000FGE | |
| Lenovo ThinkPad P1 G6 21FV001KUS | |
| AIDA64 / Memory Read | |
| Dell Precision 5690 | |
| Média Intel Core i9-14900HX (43306 - 87568, n=36) | |
| Asus ProArt Studiobook 16 OLED H7604 | |
| HP ZBook Fury 16 G10 | |
| HP ZBook Fury 16 G11 | |
| HP ZBook Fury 16 G9 | |
| Lenovo ThinkPad P16 G2 21FA000FGE | |
| Lenovo ThinkPad P1 G6 21FV001KUS | |
| AIDA64 / Memory Write | |
| Dell Precision 5690 | |
| Média Intel Core i9-14900HX (37146 - 80589, n=36) | |
| Asus ProArt Studiobook 16 OLED H7604 | |
| HP ZBook Fury 16 G10 | |
| HP ZBook Fury 16 G9 | |
| Lenovo ThinkPad P16 G2 21FA000FGE | |
| HP ZBook Fury 16 G11 | |
| Lenovo ThinkPad P1 G6 21FV001KUS | |
| AIDA64 / Memory Latency | |
| Dell Precision 5690 | |
| HP ZBook Fury 16 G10 | |
| Lenovo ThinkPad P16 G2 21FA000FGE | |
| HP ZBook Fury 16 G11 | |
| HP ZBook Fury 16 G9 | |
| Asus ProArt Studiobook 16 OLED H7604 | |
| Lenovo ThinkPad P1 G6 21FV001KUS | |
| Média Intel Core i9-14900HX (76.1 - 105, n=36) | |
* ... menor é melhor
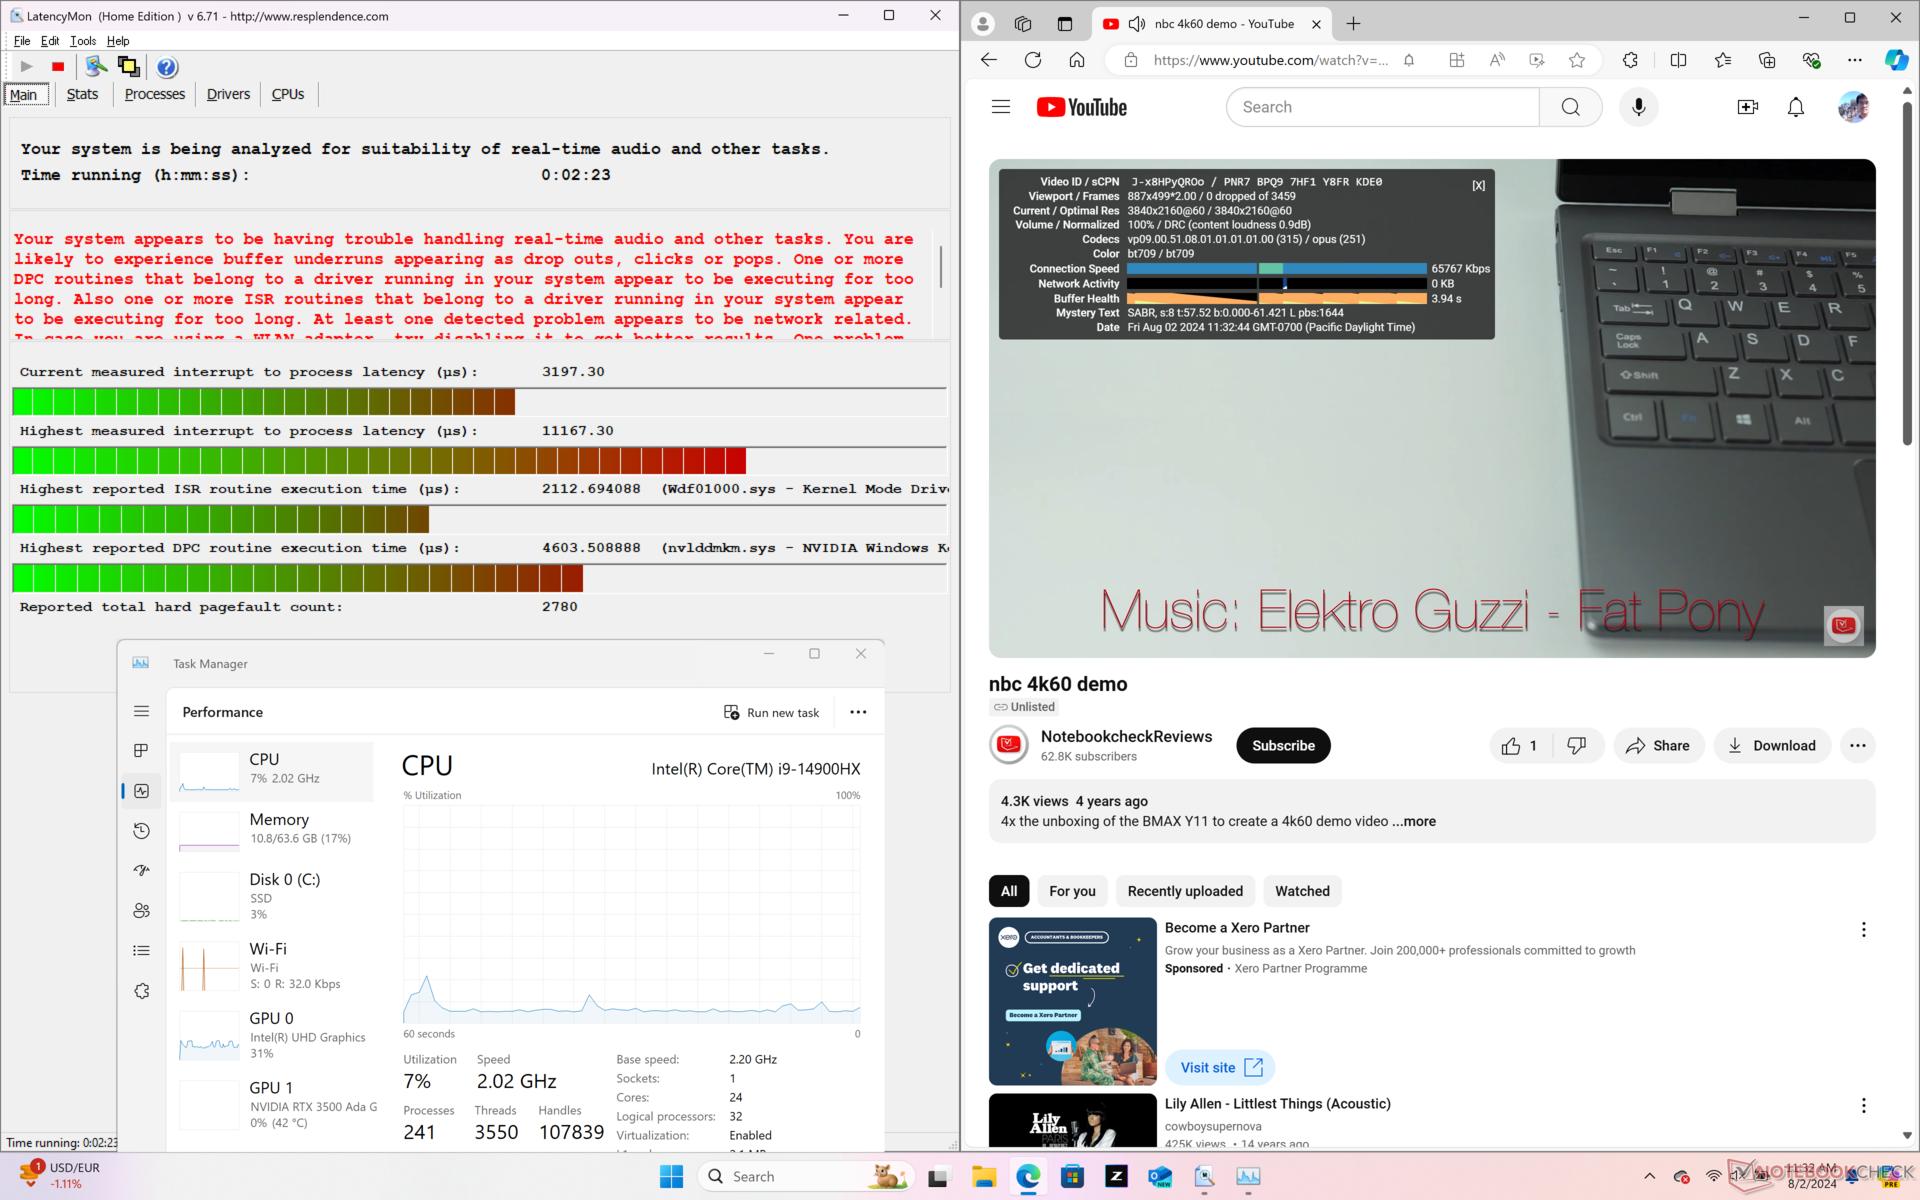
Latência DPC
O LatencyMon revela problemas de DPC ao abrir várias guias do navegador em nossa página inicial. a reprodução de vídeo 4K a 60 FPS é perfeita, sem registro de queda de quadros.

| DPC Latencies / LatencyMon - interrupt to process latency (max), Web, Youtube, Prime95 | |
| HP ZBook Fury 16 G11 | |
| HP ZBook Fury 16 G10 | |
| HP ZBook Fury 16 G9 | |
| Asus ProArt Studiobook 16 OLED H7604 | |
| Lenovo ThinkPad P1 G6 21FV001KUS | |
| Lenovo ThinkPad P16 G2 21FA000FGE | |
| Dell Precision 5690 | |
* ... menor é melhor
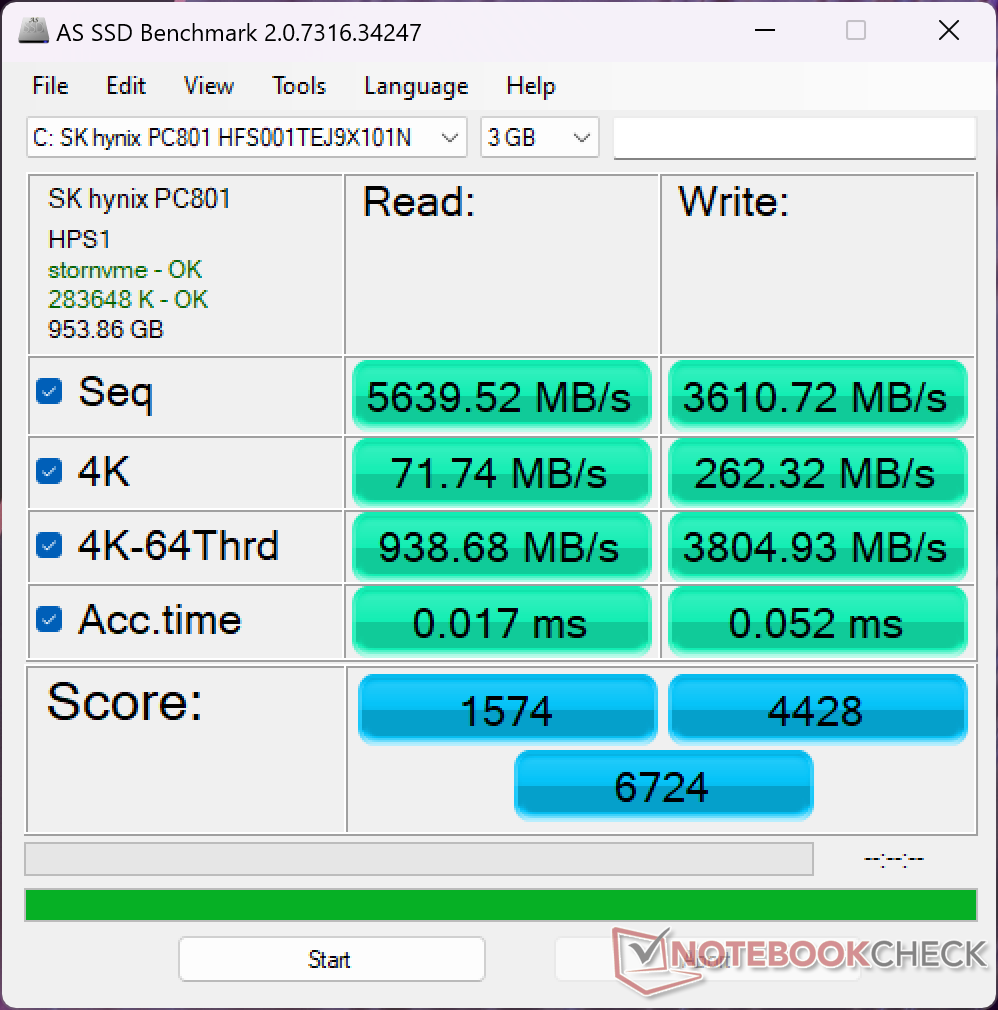
Dispositivos de armazenamento
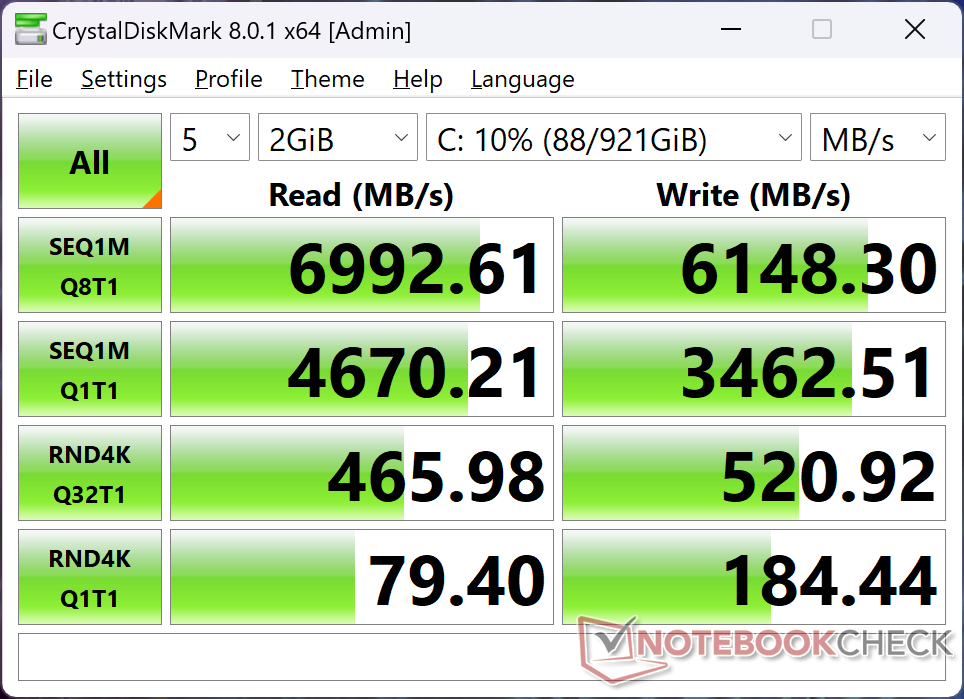
Nossa unidade de teste vem com a mesma unidade de 1 TB SK Hynix PC801 HFS001TEJ9X101N PCIe4 M.2 de 1 TB encontrado no ZBook Fury 16 G10 do ano passado. Infelizmente, a unidade também apresenta os mesmos problemas de redução de desempenho. Ao executar o DiskSpd em um loop, as taxas de transferência começavam muito altas, com quase 7000 MB/s, antes de cair para 3400 MB/s apenas alguns minutos depois, como mostra o gráfico abaixo. Isso pode ser atribuído ao resfriamento insuficiente das unidades, mas talvez esse seja o preço a pagar por suportar mais unidades individuais do que a maioria dos outros notebooks.

* ... menor é melhor
Disk Throttling: DiskSpd Read Loop, Queue Depth 8
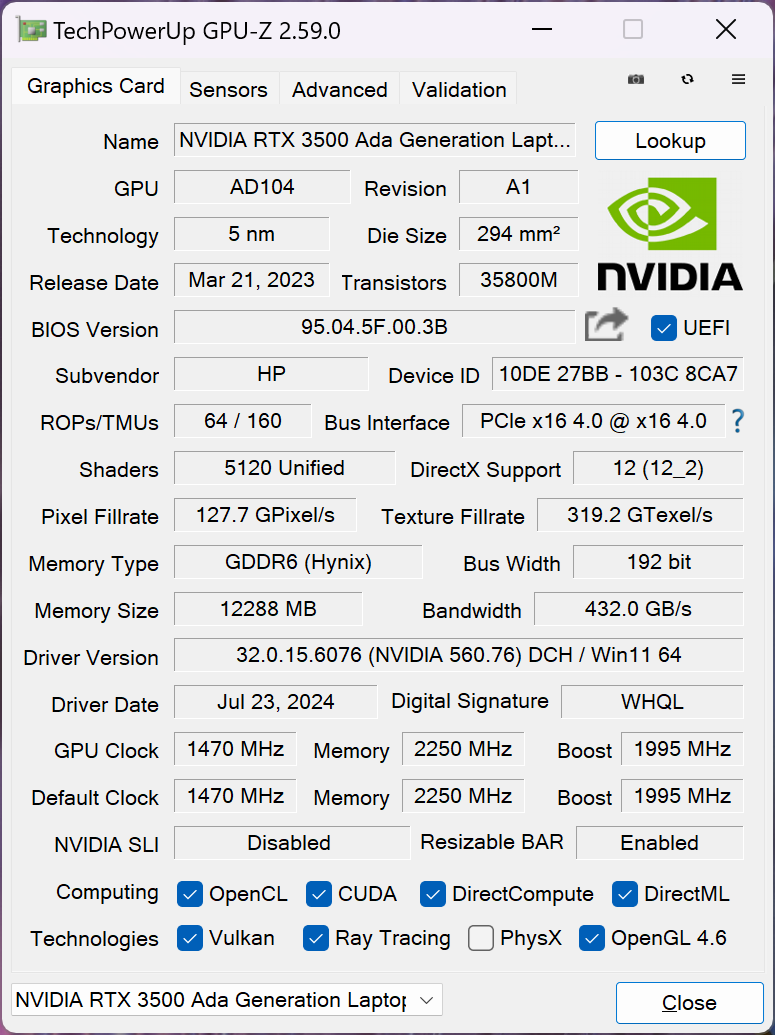
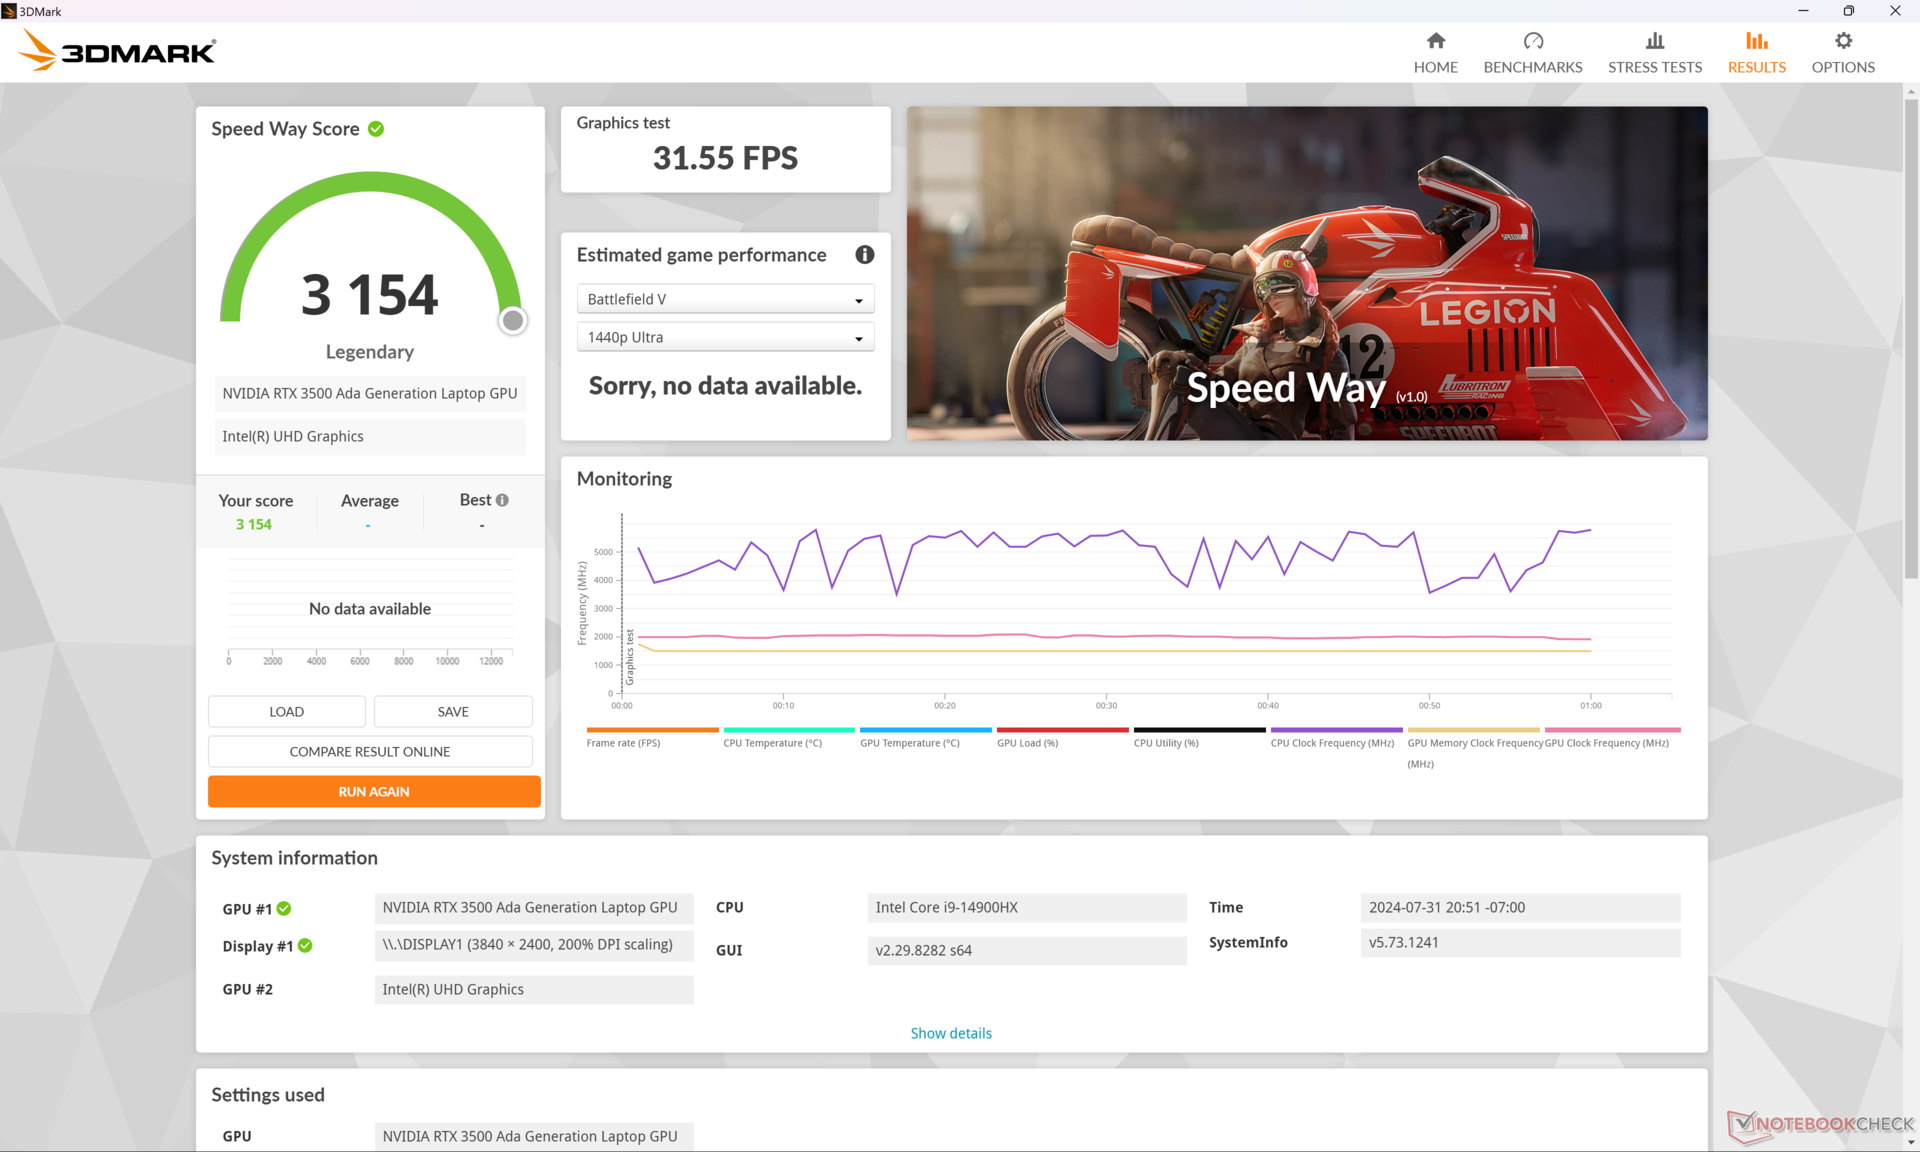
Desempenho da GPU
Os usuários podem esperar o RTX 3500 Ada tenha um desempenho cerca de 20 a 30 por cento mais lento do que o RTX 5000 Ada. Como a Nvidia ainda não apresentou uma nova geração de GPUs móveis, o ZBook Fury 16 G11 vem com as mesmas opções de GPU do modelo do ano passado, sem nenhum ganho de desempenho digno de nota. A RTA 5000 Ada continua sendo a GPU de estação de trabalho móvel mais rápida disponível.
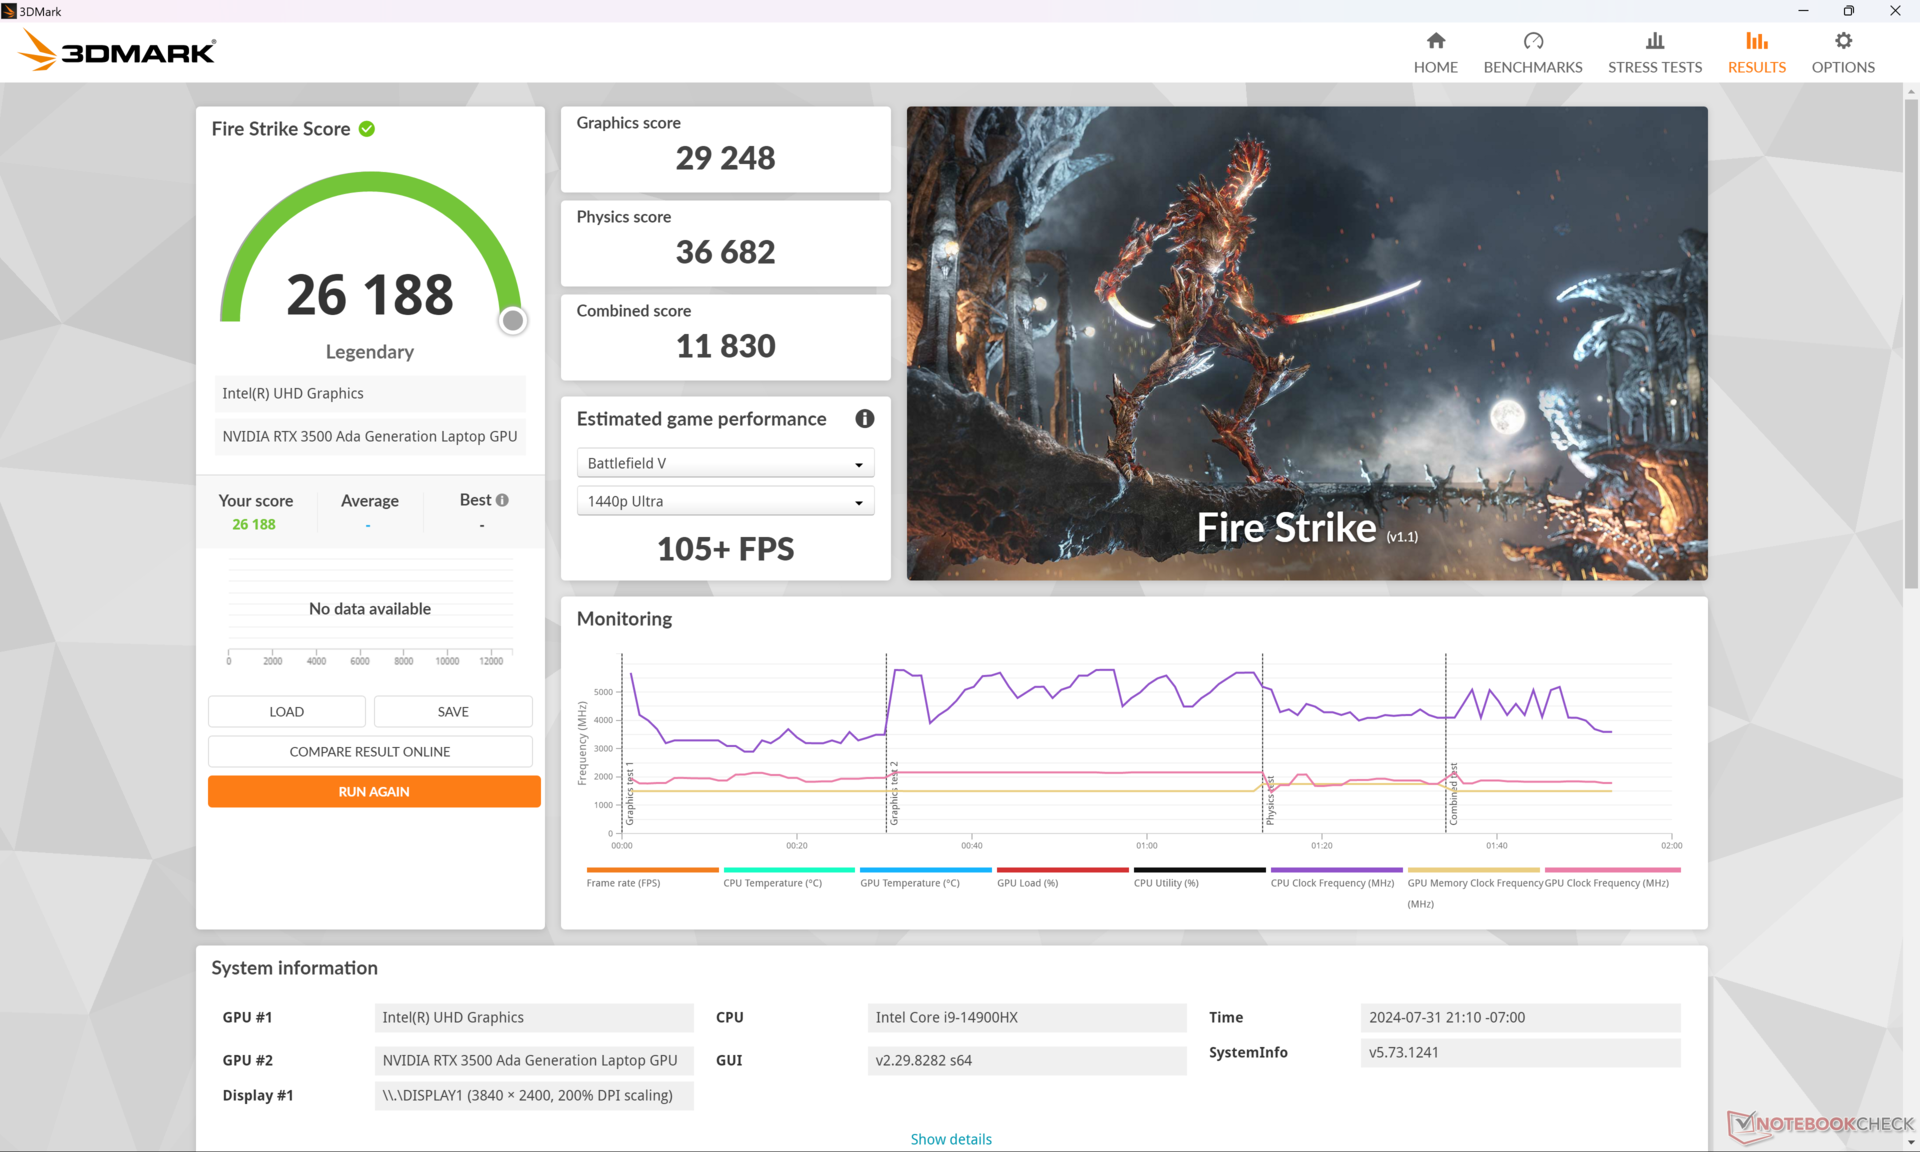
| Perfil de potência | Pontuação de gráficos | Pontuação de física | Pontuação combinada |
| Modo de desempenho | 29248 | 36682 | 11830 |
| Modo equilibrado | 28214 (-4%) | 33094 (-10%) | 10246 (-13%) |
| Energia da bateria | 16618 (-43%) | 25118 (-32%) | 4101 (-65%) |
A execução no modo balanceado em vez do modo de desempenho afetaria o desempenho em até 10 a 15%, conforme mostrado na tabela Fire Strike acima. O déficit de desempenho aumenta ainda mais se a execução for feita com a energia da bateria, o que é de se esperar da maioria dos notebooks de alto desempenho.
| 3DMark Performance rating - Percent | |
| HP ZBook Fury 16 G10 -2! | |
| Dell Precision 5690 -2! | |
| Dell Precision 5000 5680 -2! | |
| HP ZBook Fury 16 G11 | |
| Média NVIDIA RTX 3500 Ada Generation Laptop | |
| Lenovo ThinkPad P1 G6 21FV001KUS -2! | |
| Lenovo ThinkPad P1 G6-21FV000DGE -17! | |
| HP ZBook Fury 16 G9 -2! | |
| Lenovo ThinkPad P16 G2 21FA000FGE -17! | |
| MSI CreatorPro Z16P B12UKST -17! | |
| Asus ProArt Studiobook 16 OLED H7604 -17! | |
| Asus ExpertBook B6 Flip B6602FC2 -17! | |
| Lenovo ThinkPad P1 G4-20Y4S0KS00 -10! | |
| Lenovo ThinkPad P16v G1 AMD -17! | |
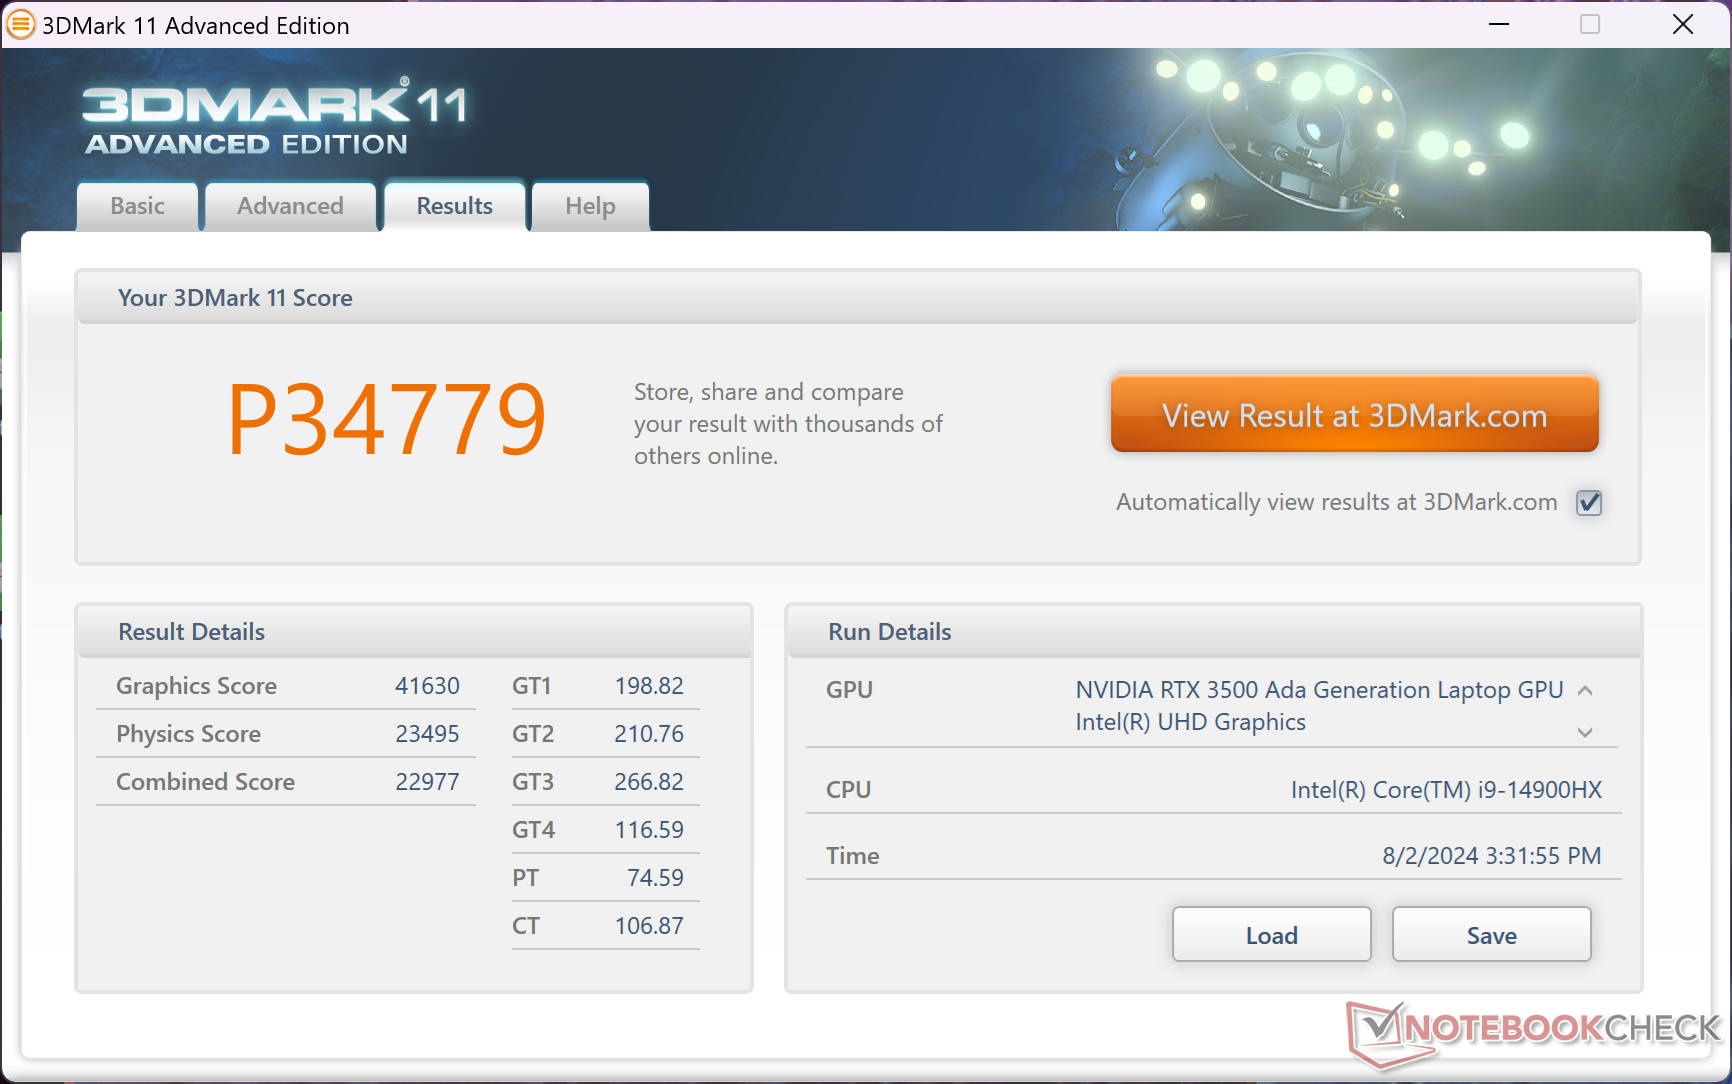
| 3DMark 11 Performance | 34779 pontos | |
| 3DMark Fire Strike Score | 26188 pontos | |
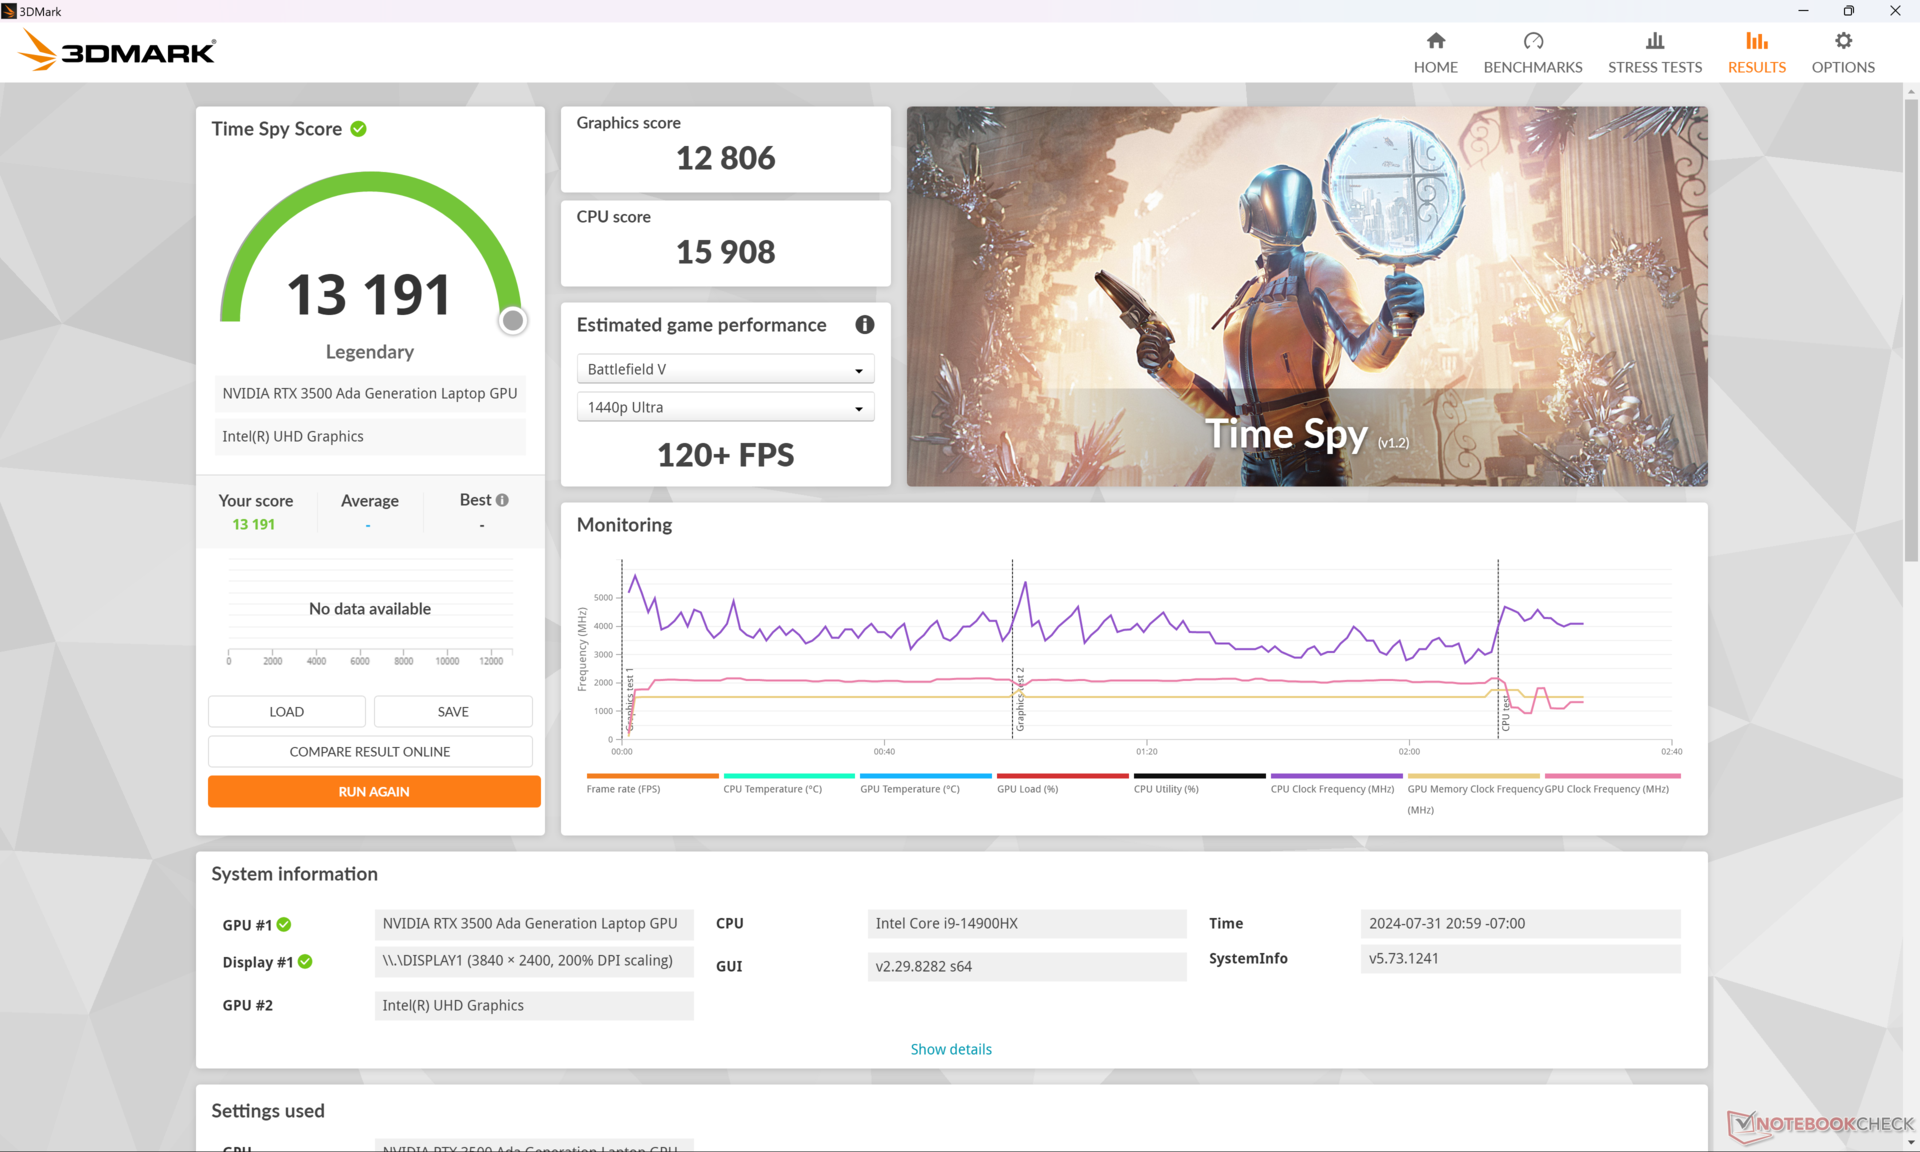
| 3DMark Time Spy Score | 13191 pontos | |
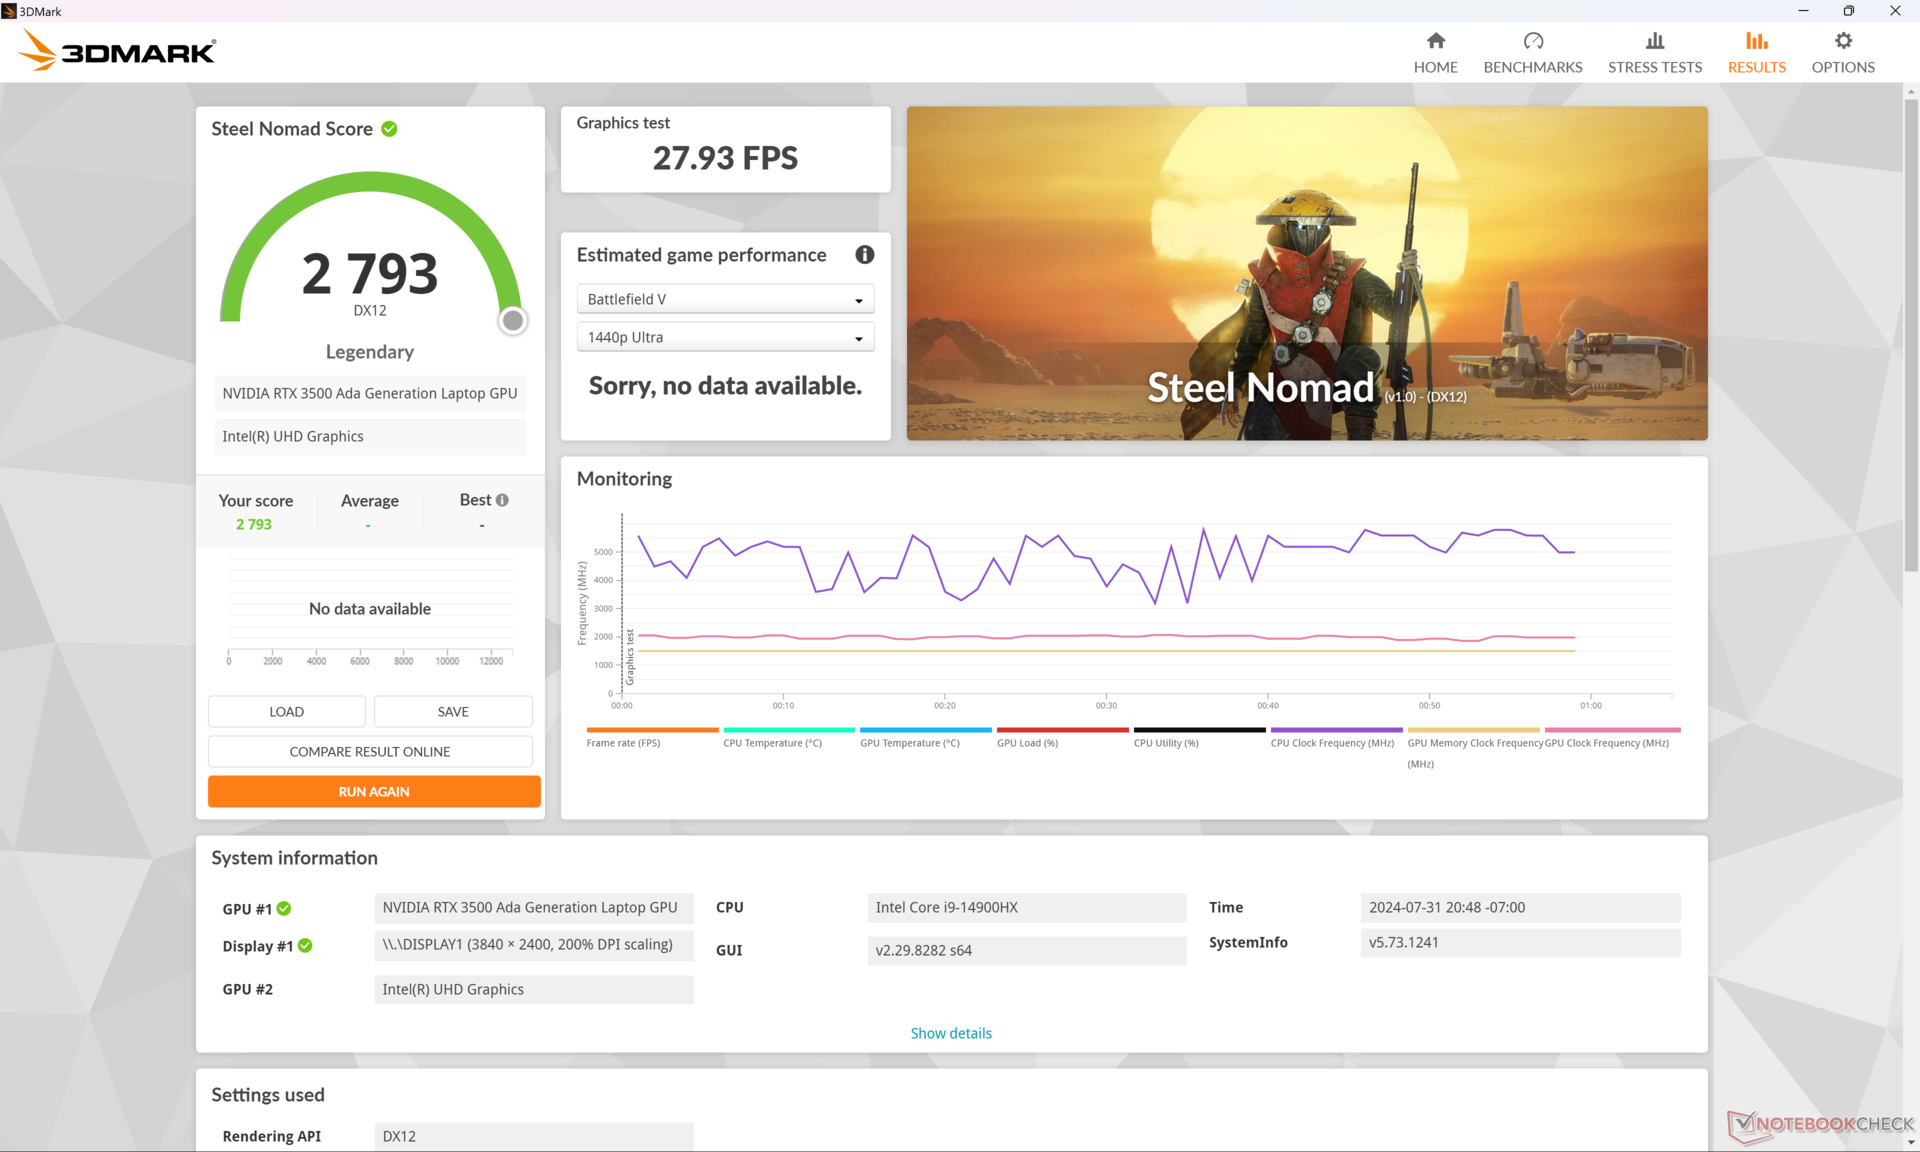
| 3DMark Steel Nomad Score | 2793 pontos | |
Ajuda | ||
* ... menor é melhor
Desempenho em jogos
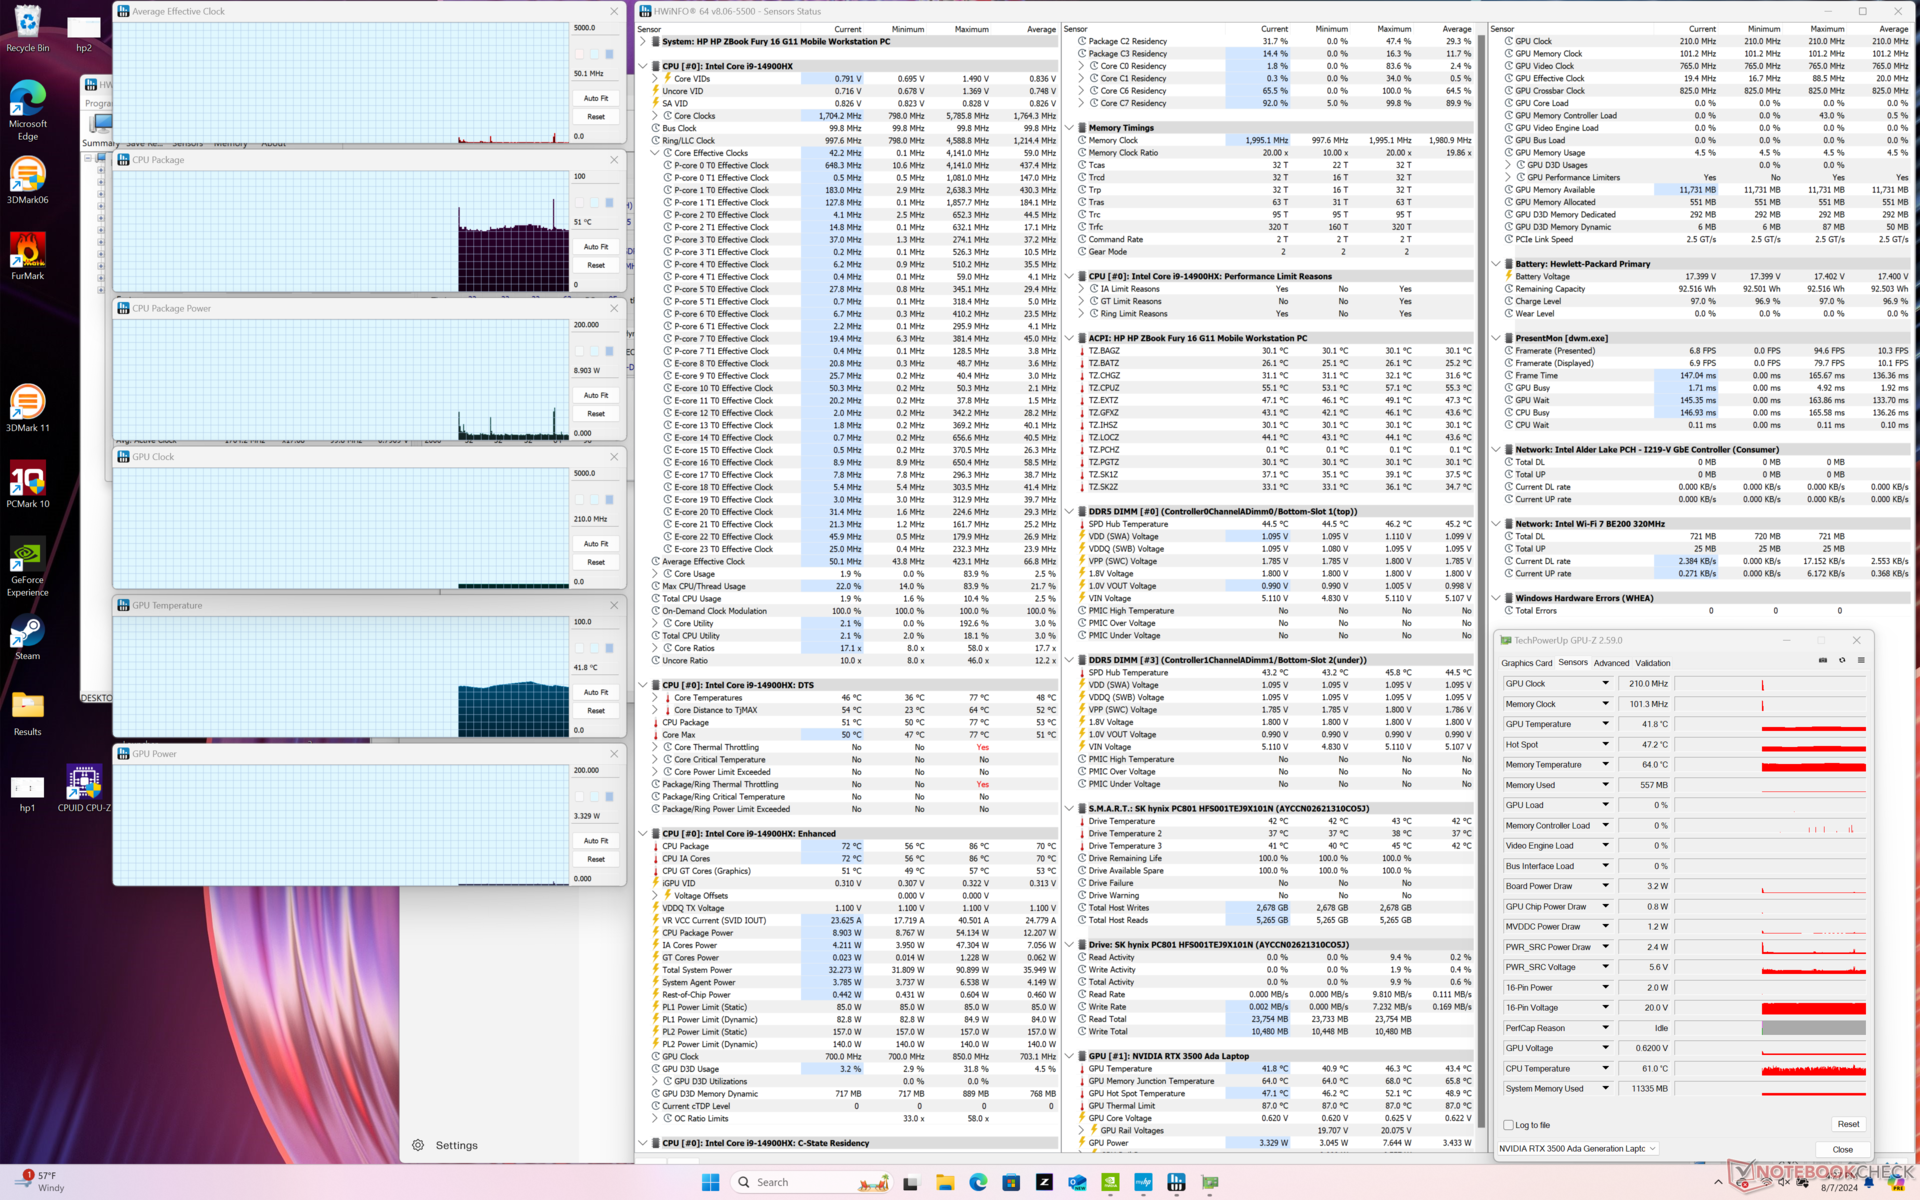
Embora não tenha sido projetado para jogos, o RTX 3500 Ada tem um desempenho ligeiramente superior ao móvel GeForce RTX 4070 mas abaixo do RTX 4080 móvel, especialmente quando se considera o número de pipelines unificados, núcleos tensores e largura de banda da memória. No entanto, o desempenho pode diminuir gradualmente ao longo do tempo quando estressado, pois as velocidades de aumento da GPU não são indefinidas. Por exemplo, quando o Cyberpunk 2077 está ocioso nas configurações Ultra de 1080p, o desempenho começa com pouco mais de 70 FPS antes de cair gradualmente para a faixa de 60 FPS após apenas 30 minutos, como mostra o gráfico abaixo.
| Performance rating - Percent | |
| HP ZBook Fury 16 G10 -2! | |
| Lenovo ThinkPad P1 G6 21FV001KUS -1! | |
| HP ZBook Fury 16 G11 | |
| Asus ProArt Studiobook 16 OLED H7604 -1! | |
| Dell Precision 5690 -1! | |
| HP ZBook Fury 16 G9 -1! | |
| Lenovo ThinkPad P16 G2 21FA000FGE -1! | |
| GTA V - 1920x1080 Highest AA:4xMSAA + FX AF:16x | |
| Asus ProArt Studiobook 16 OLED H7604 | |
| Lenovo ThinkPad P1 G6 21FV001KUS | |
| HP ZBook Fury 16 G9 | |
| HP ZBook Fury 16 G11 | |
| Lenovo ThinkPad P16 G2 21FA000FGE | |
| Final Fantasy XV Benchmark - 1920x1080 High Quality | |
| HP ZBook Fury 16 G10 | |
| Lenovo ThinkPad P1 G6 21FV001KUS | |
| Dell Precision 5690 | |
| HP ZBook Fury 16 G11 | |
| Asus ProArt Studiobook 16 OLED H7604 | |
| HP ZBook Fury 16 G9 | |
| Lenovo ThinkPad P16 G2 21FA000FGE | |
| Strange Brigade - 1920x1080 ultra AA:ultra AF:16 | |
| HP ZBook Fury 16 G10 | |
| Dell Precision 5690 | |
| HP ZBook Fury 16 G11 | |
| HP ZBook Fury 16 G9 | |
| Lenovo ThinkPad P16 G2 21FA000FGE | |
| Asus ProArt Studiobook 16 OLED H7604 | |
| Dota 2 Reborn - 1920x1080 ultra (3/3) best looking | |
| Asus ProArt Studiobook 16 OLED H7604 | |
| HP ZBook Fury 16 G10 | |
| HP ZBook Fury 16 G11 | |
| HP ZBook Fury 16 G9 | |
| Lenovo ThinkPad P16 G2 21FA000FGE | |
| Lenovo ThinkPad P1 G6 21FV001KUS | |
| Dell Precision 5690 | |
| Cyberpunk 2077 - 1920x1080 Ultra Preset (FSR off) | |
| Dell Precision 5690 | |
| Lenovo ThinkPad P1 G6 21FV001KUS | |
| HP ZBook Fury 16 G11 | |
| Baldur's Gate 3 | |
| 1920x1080 Ultra Preset AA:T | |
| Dell Precision 5690 | |
| Lenovo ThinkPad P1 G6 21FV001KUS | |
| HP ZBook Fury 16 G11 | |
| Média NVIDIA RTX 3500 Ada Generation Laptop (n=1) | |
| 2560x1440 Ultra Preset AA:T | |
| Dell Precision 5690 | |
| Lenovo ThinkPad P1 G6 21FV001KUS | |
| HP ZBook Fury 16 G11 | |
| Média NVIDIA RTX 3500 Ada Generation Laptop (n=1) | |
| 3840x2160 Ultra Preset AA:T | |
| Dell Precision 5690 | |
| Lenovo ThinkPad P1 G6 21FV001KUS | |
| HP ZBook Fury 16 G11 | |
| Média NVIDIA RTX 3500 Ada Generation Laptop (n=1) | |
Cyberpunk 2077 ultra FPS Chart
| baixo | média | alto | ultra | QHD | 4K | |
|---|---|---|---|---|---|---|
| GTA V (2015) | 184.3 | 181 | 170.1 | 115.5 | 97.5 | 59.6 |
| Dota 2 Reborn (2015) | 201 | 177.7 | 162.1 | 153.9 | 134.4 | |
| Final Fantasy XV Benchmark (2018) | 200 | 167.6 | 128.9 | 97.5 | 54.2 | |
| X-Plane 11.11 (2018) | 144.6 | 137.8 | 110.9 | 92.7 | ||
| Far Cry 5 (2018) | 133 | 135 | 127 | 109 | 62 | |
| Strange Brigade (2018) | 411 | 296 | 235 | 223 | 159.2 | 78.6 |
| Tiny Tina's Wonderlands (2022) | 232.5 | 195.4 | 137.9 | 109.3 | 74.4 | 41.6 |
| F1 22 (2022) | 228 | 223 | 182.8 | 72.9 | 48.3 | 24 |
| Baldur's Gate 3 (2023) | 164.8 | 136.2 | 118.6 | 117.3 | 80.2 | 41.2 |
| Cyberpunk 2077 (2023) | 121.2 | 113.1 | 101.8 | 90.3 | 60.2 | 21.3 |
Emissões
Ruído do sistema
O ruído e o comportamento da ventoinha são praticamente os mesmos que registramos no modelo do ano passado, se não um pouco mais altos ao executar cargas mais elevadas. Os ventiladores ainda pulsam ocasionalmente quando estão em repouso na área de trabalho, mesmo quando configurados no modo Balanced sem aplicativos em execução. Pior ainda, nossa unidade específica sofre com um ruído perceptível da bobina que persiste durante todo o período de teste.
Barulho
| Ocioso |
| 23.2 / 23.2 / 29.5 dB |
| Carga |
| 43 / 48.2 dB |
 | ||
30 dB silencioso 40 dB(A) audível 50 dB(A) ruidosamente alto |
||
min: | ||
| HP ZBook Fury 16 G11 RTX 3500 Ada Generation Laptop, i9-14900HX, SK hynix PC801 HFS001TEJ9X101N | HP ZBook Fury 16 G10 RTX 5000 Ada Generation Laptop, i9-13950HX, SK hynix PC801 HFS001TEJ9X101N | HP ZBook Fury 16 G9 RTX A5500 Laptop GPU, i9-12950HX, Micron 3400 1TB MTFDKBA1T0TFH | Dell Precision 5690 RTX 5000 Ada Generation Laptop, Ultra 9 185H, 2x Samsung PM9A1 1TB (RAID 0) | Lenovo ThinkPad P16 G2 21FA000FGE RTX 2000 Ada Generation Laptop, i7-13700HX, SK hynix PC801 HFS001TEJ9X162N | Lenovo ThinkPad P1 G6 21FV001KUS GeForce RTX 4080 Laptop GPU, i7-13800H, Kioxia XG8 KXG8AZNV1T02 | Asus ProArt Studiobook 16 OLED H7604 GeForce RTX 4070 Laptop GPU, i9-13980HX, Phison EM2804TBMTCB47 | |
|---|---|---|---|---|---|---|---|
| Noise | 3% | 4% | -3% | -4% | 9% | -5% | |
| desligado / ambiente * (dB) | 23.2 | 22.9 1% | 22.6 3% | 23.4 -1% | 23.5 -1% | 22.5 3% | 24.5 -6% |
| Idle Minimum * (dB) | 23.2 | 22.9 1% | 22.7 2% | 23.6 -2% | 23.5 -1% | 22.5 3% | 24.5 -6% |
| Idle Average * (dB) | 23.2 | 22.9 1% | 22.7 2% | 24.9 -7% | 29.2 -26% | 22.5 3% | 24.5 -6% |
| Idle Maximum * (dB) | 29.5 | 28.5 3% | 28.8 2% | 30.9 -5% | 29.5 -0% | 22.5 24% | 24.5 17% |
| Load Average * (dB) | 43 | 40.6 6% | 36.2 16% | 40.4 6% | 32.7 24% | 28.7 33% | 47.6 -11% |
| Cyberpunk 2077 ultra * (dB) | 48.2 | ||||||
| Load Maximum * (dB) | 48.2 | 45.8 5% | 49.3 -2% | 51.9 -8% | 56.6 -17% | 54.4 -13% | 56.7 -18% |
| Witcher 3 ultra * (dB) | 44.1 | 49.5 | 48.3 | 50.6 | 47.5 | 55.9 |
* ... menor é melhor
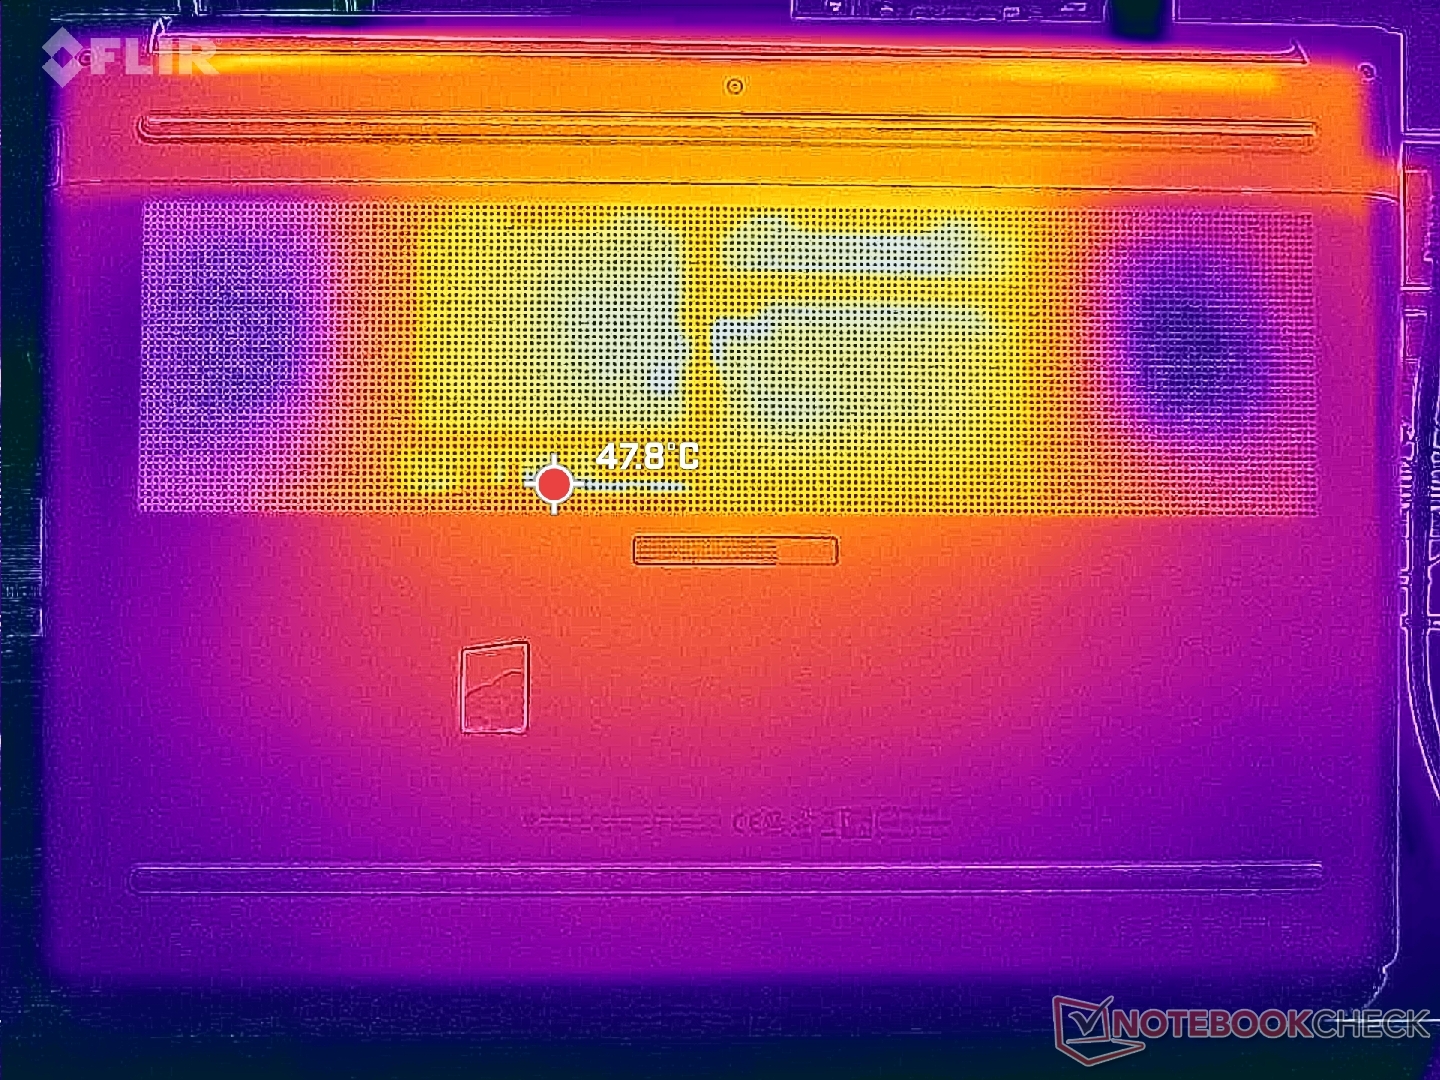
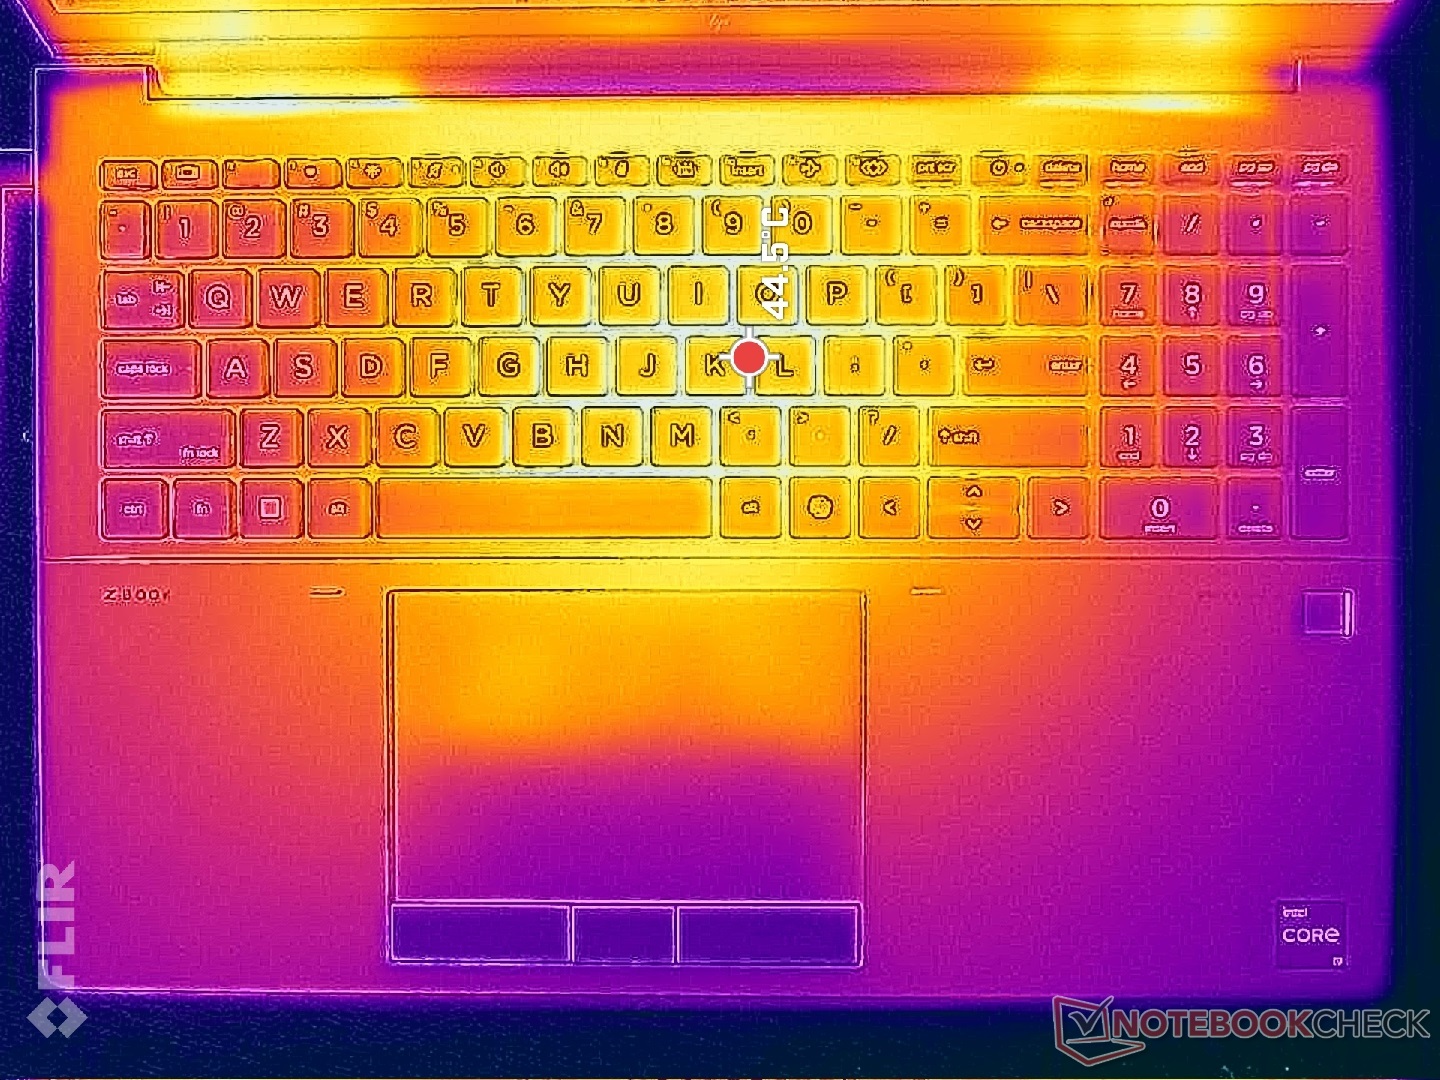
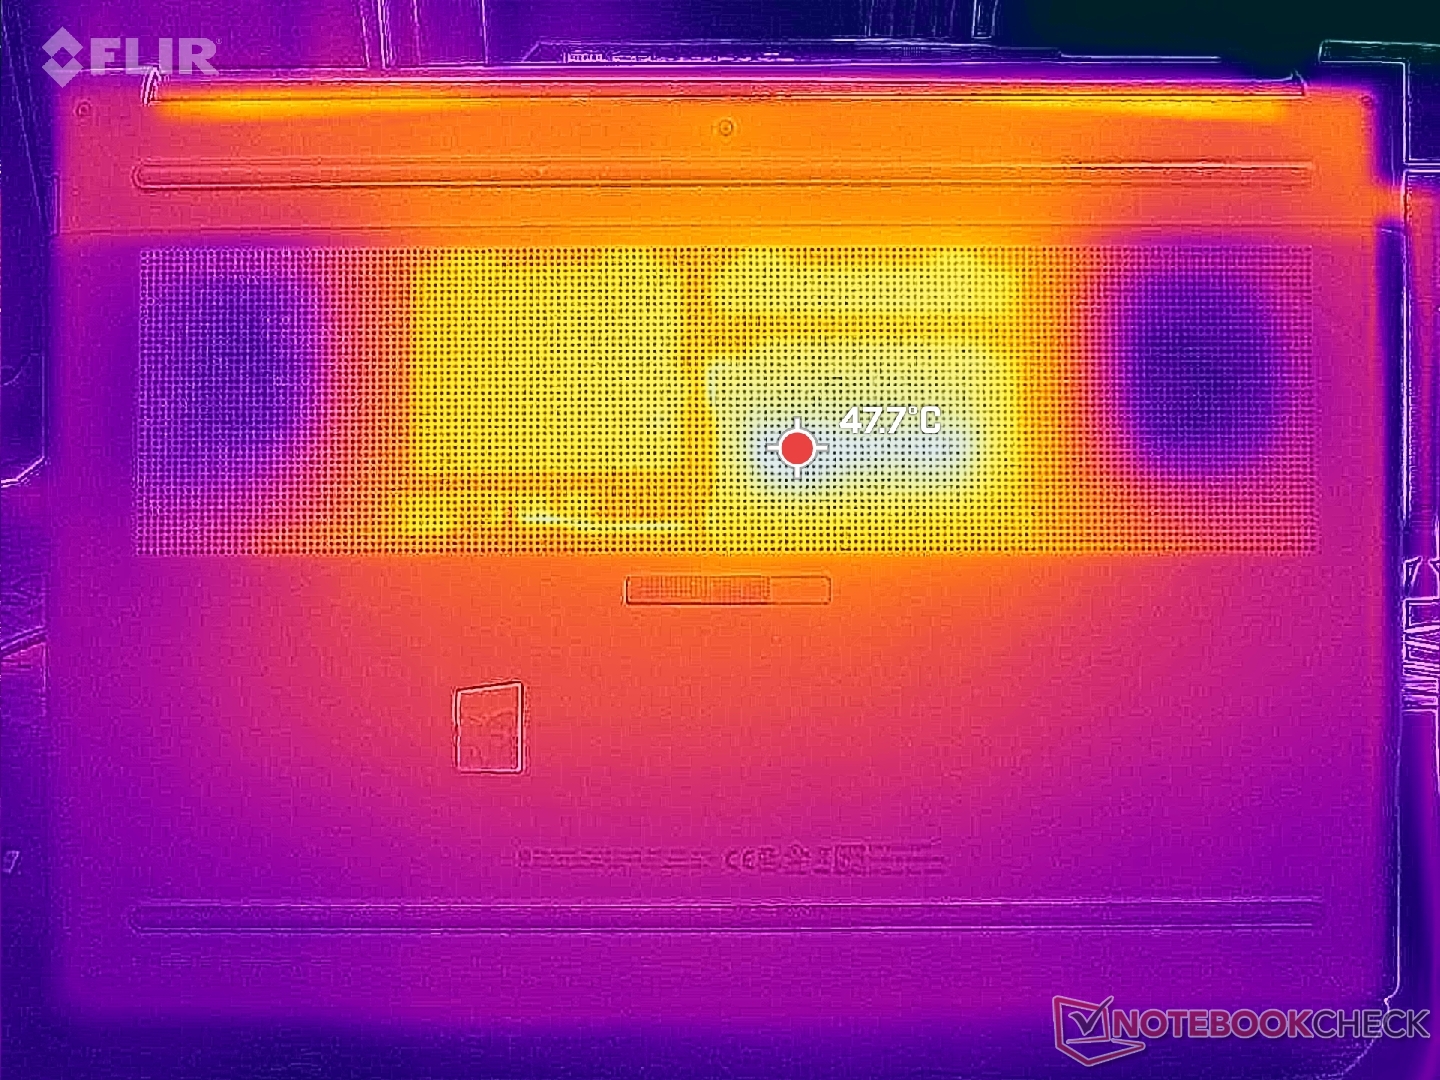
Temperatura
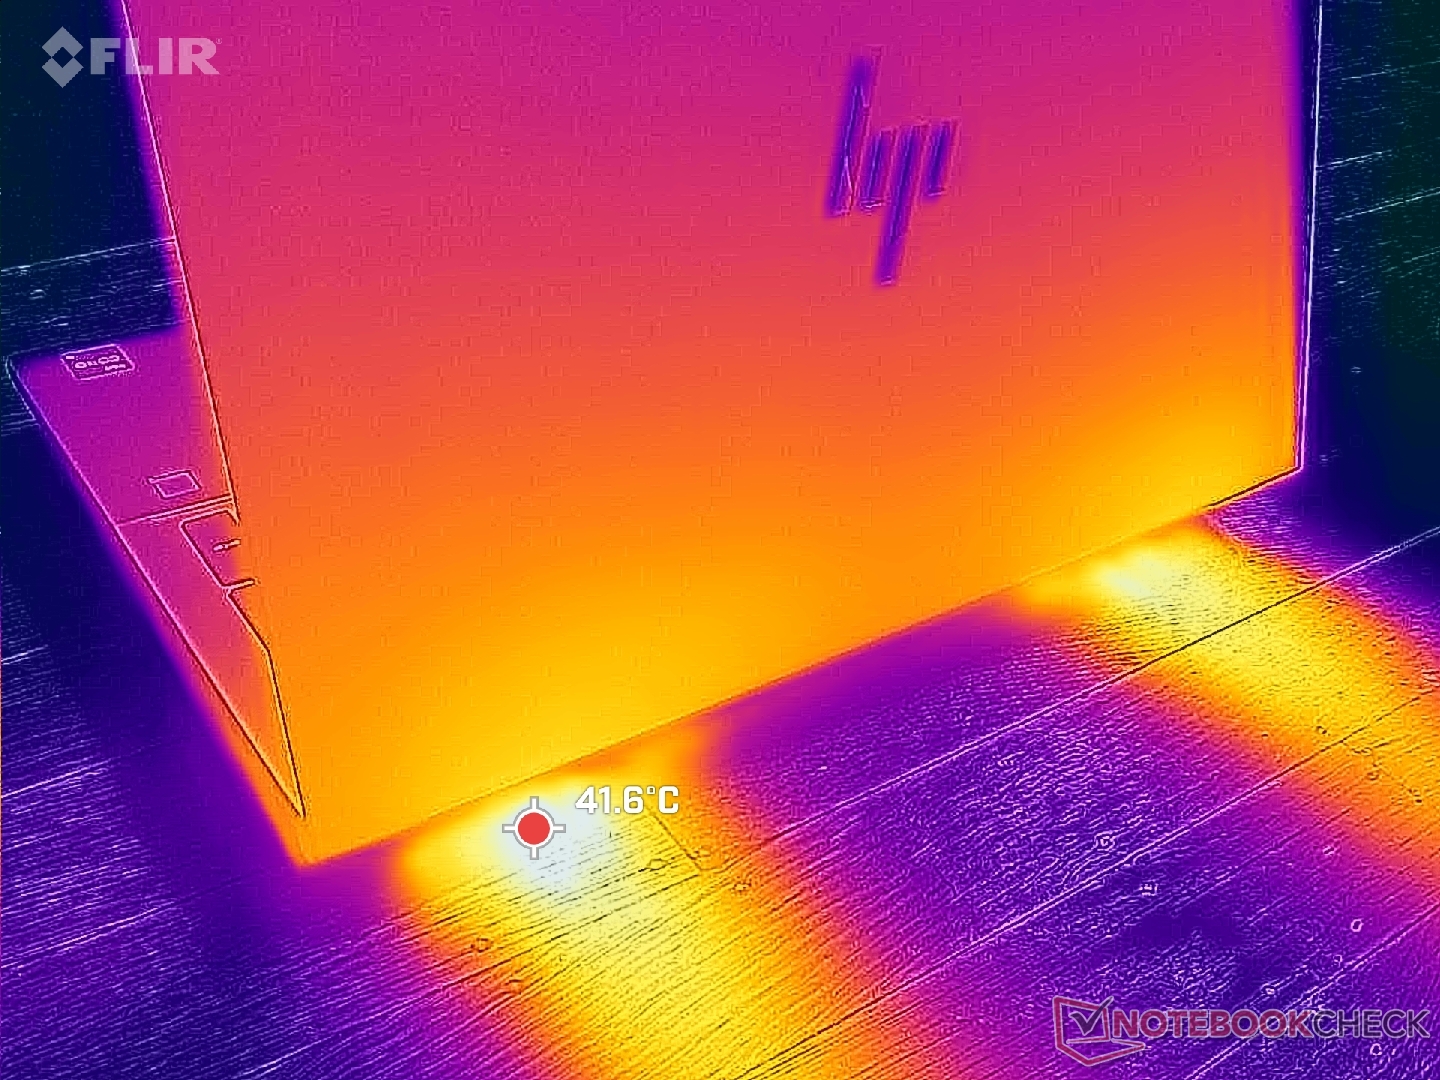
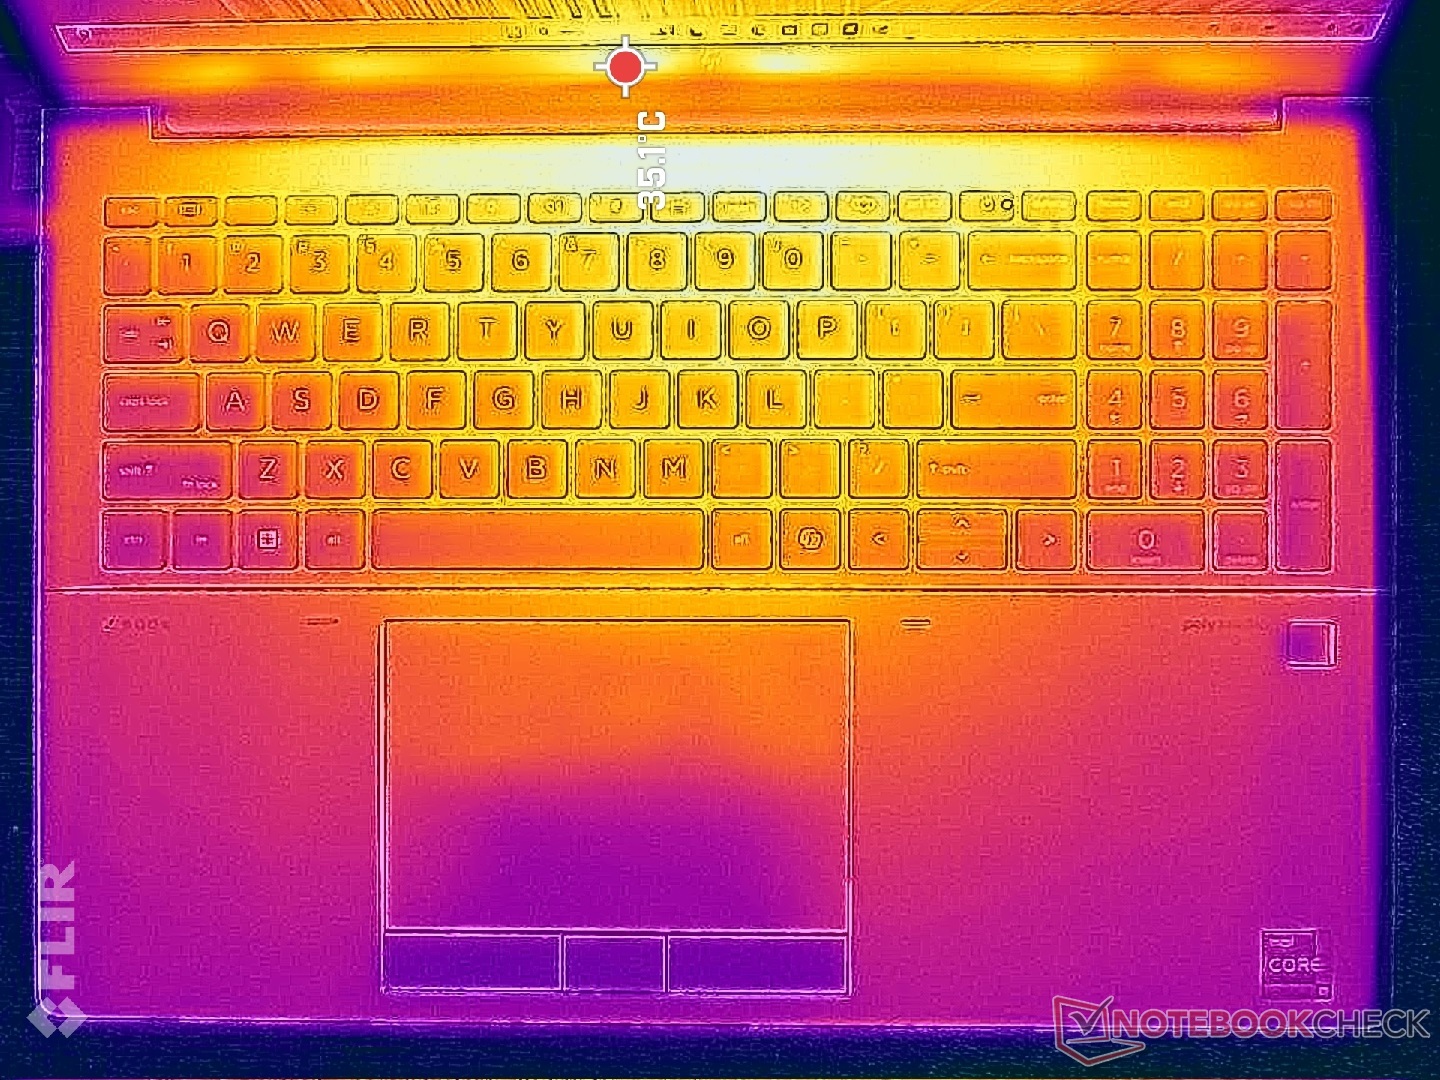
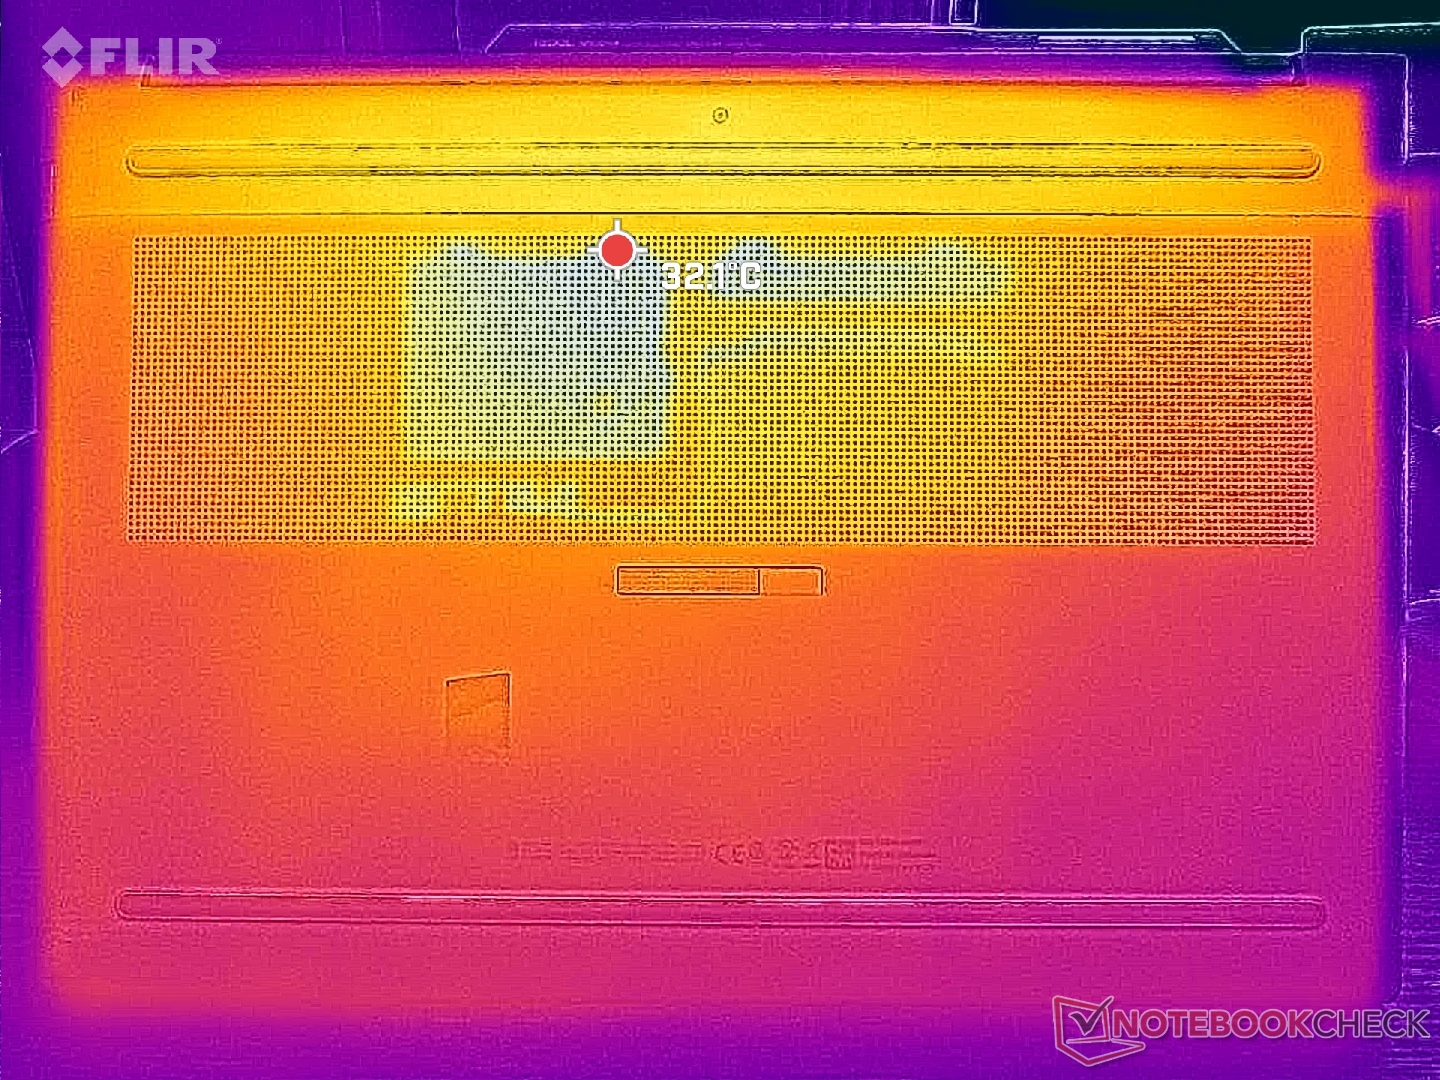
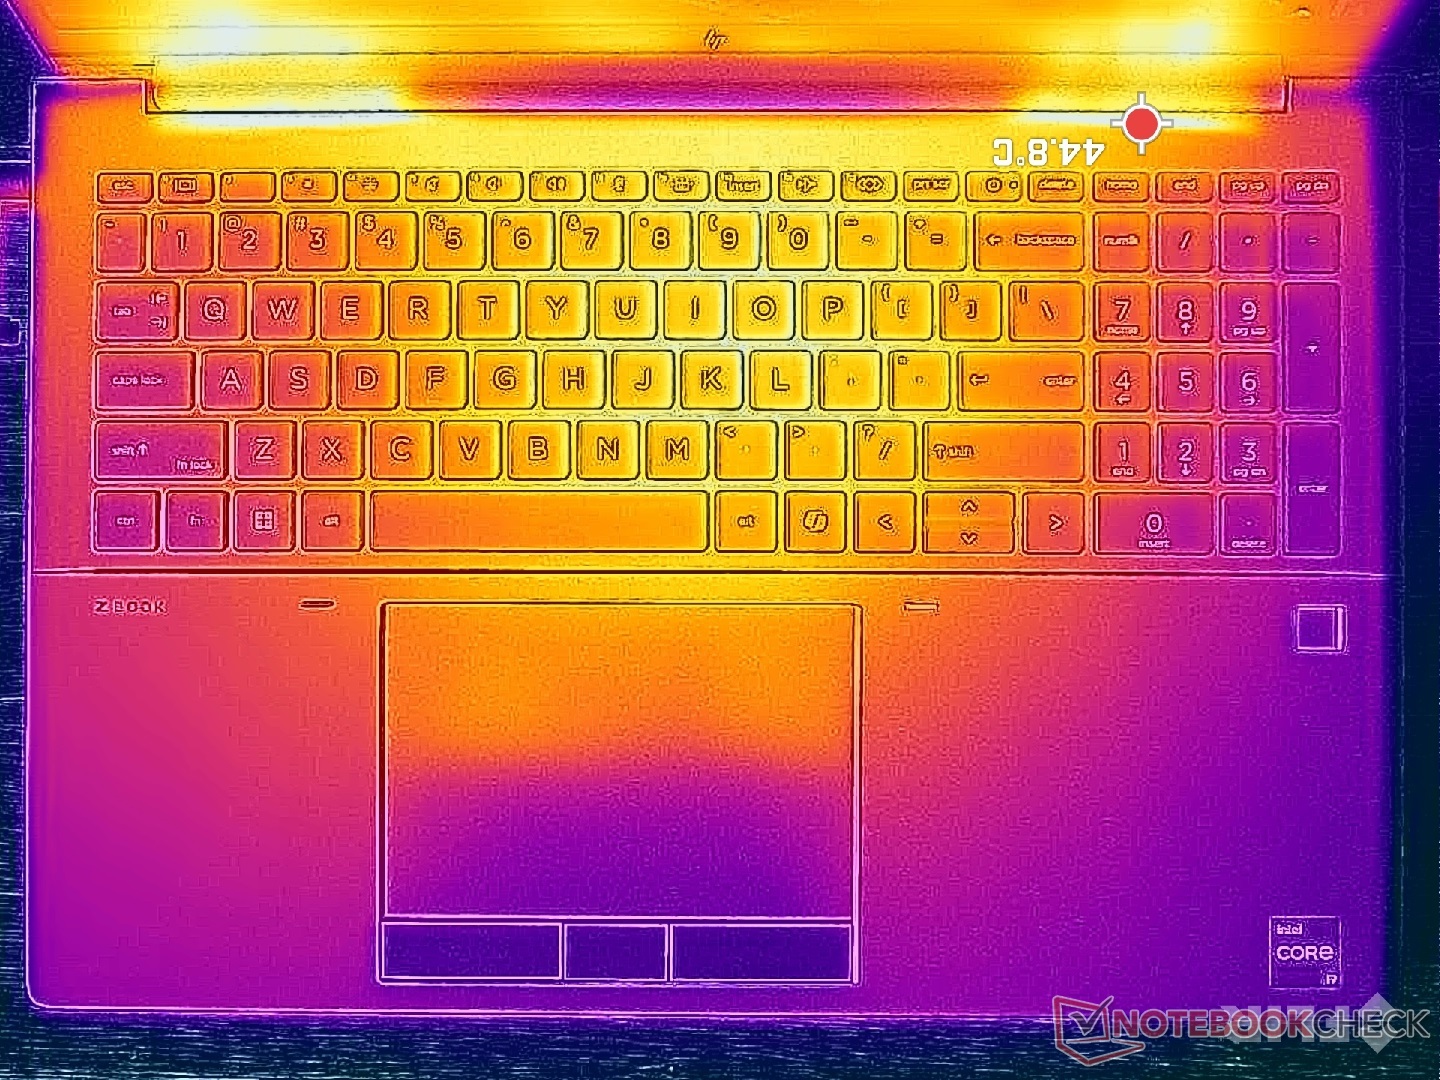
(±) A temperatura máxima no lado superior é 42.2 °C / 108 F, em comparação com a média de 38.2 °C / 101 F , variando de 22.2 a 69.8 °C para a classe Workstation.
(-) A parte inferior aquece até um máximo de 48 °C / 118 F, em comparação com a média de 41.1 °C / 106 F
(±) Em uso inativo, a temperatura média para o lado superior é 33.8 °C / 93 F, em comparação com a média do dispositivo de 32 °C / ### class_avg_f### F.
(-) 3: The average temperature for the upper side is 38.5 °C / 101 F, compared to the average of 32 °C / 90 F for the class Workstation.
(±) Os apoios para as mãos e o touchpad podem ficar muito quentes ao toque, com um máximo de 37.6 °C / 99.7 F.
(-) A temperatura média da área do apoio para as mãos de dispositivos semelhantes foi 27.8 °C / 82 F (-9.8 °C / -17.7 F).
| HP ZBook Fury 16 G11 Intel Core i9-14900HX, NVIDIA RTX 3500 Ada Generation Laptop | HP ZBook Fury 16 G10 Intel Core i9-13950HX, NVIDIA RTX 5000 Ada Generation Laptop | HP ZBook Fury 16 G9 Intel Core i9-12950HX, NVIDIA RTX A5500 Laptop GPU | Dell Precision 5690 Intel Core Ultra 9 185H, NVIDIA RTX 5000 Ada Generation Laptop | Lenovo ThinkPad P16 G2 21FA000FGE Intel Core i7-13700HX, NVIDIA RTX 2000 Ada Generation Laptop | Lenovo ThinkPad P1 G6 21FV001KUS Intel Core i7-13800H, NVIDIA GeForce RTX 4080 Laptop GPU | Asus ProArt Studiobook 16 OLED H7604 Intel Core i9-13980HX, NVIDIA GeForce RTX 4070 Laptop GPU | |
|---|---|---|---|---|---|---|---|
| Heat | 3% | 10% | 13% | 15% | 4% | 3% | |
| Maximum Upper Side * (°C) | 42.2 | 44.8 -6% | 43.2 -2% | 46.6 -10% | 47.2 -12% | 42 -0% | 44.1 -5% |
| Maximum Bottom * (°C) | 48 | 50 -4% | 50.4 -5% | 33 31% | 39.5 18% | 45.2 6% | 48 -0% |
| Idle Upper Side * (°C) | 37 | 34.4 7% | 28.6 23% | 32.4 12% | 28.1 24% | 33 11% | 32.7 12% |
| Idle Bottom * (°C) | 36.8 | 31.8 14% | 28.2 23% | 29.4 20% | 25.3 31% | 37 -1% | 34.9 5% |
* ... menor é melhor
Alto-falantes
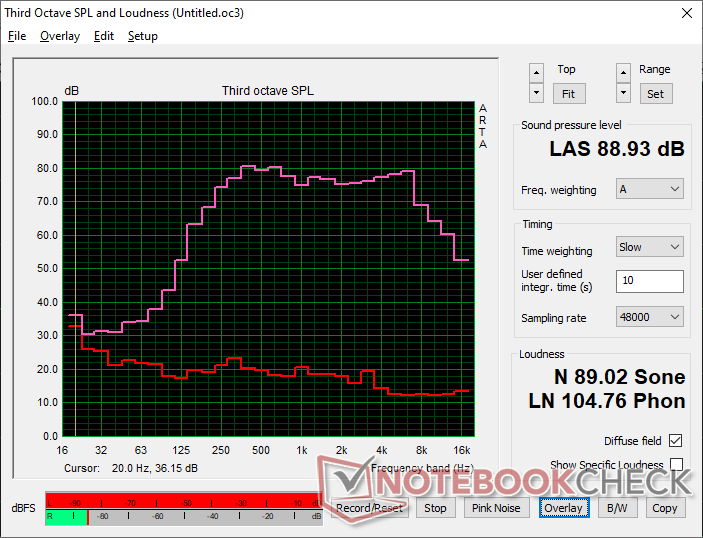
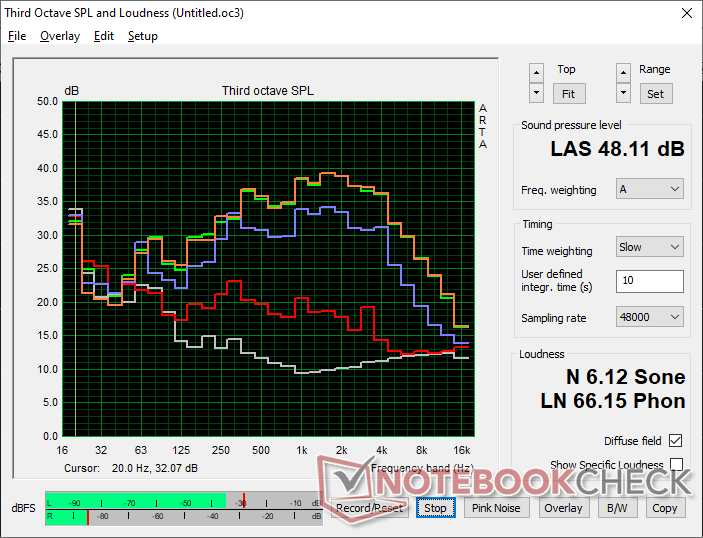
HP ZBook Fury 16 G11 análise de áudio
(+) | os alto-falantes podem tocar relativamente alto (###valor### dB)
Graves 100 - 315Hz
(±) | graves reduzidos - em média 13.3% menor que a mediana
(±) | a linearidade dos graves é média (11.2% delta para a frequência anterior)
Médios 400 - 2.000 Hz
(+) | médios equilibrados - apenas 2.2% longe da mediana
(+) | médios são lineares (3.2% delta para frequência anterior)
Altos 2 - 16 kHz
(+) | agudos equilibrados - apenas 3.7% longe da mediana
(+) | os máximos são lineares (4.6% delta da frequência anterior)
Geral 100 - 16.000 Hz
(+) | o som geral é linear (12.9% diferença em relação à mediana)
Comparado com a mesma classe
» 21% de todos os dispositivos testados nesta classe foram melhores, 6% semelhantes, 72% piores
» O melhor teve um delta de 7%, a média foi 17%, o pior foi 35%
Comparado com todos os dispositivos testados
» 12% de todos os dispositivos testados foram melhores, 3% semelhantes, 85% piores
» O melhor teve um delta de 4%, a média foi 24%, o pior foi 134%
Apple MacBook Pro 16 2021 M1 Pro análise de áudio
(+) | os alto-falantes podem tocar relativamente alto (###valor### dB)
Graves 100 - 315Hz
(+) | bons graves - apenas 3.8% longe da mediana
(+) | o baixo é linear (5.2% delta para a frequência anterior)
Médios 400 - 2.000 Hz
(+) | médios equilibrados - apenas 1.3% longe da mediana
(+) | médios são lineares (2.1% delta para frequência anterior)
Altos 2 - 16 kHz
(+) | agudos equilibrados - apenas 1.9% longe da mediana
(+) | os máximos são lineares (2.7% delta da frequência anterior)
Geral 100 - 16.000 Hz
(+) | o som geral é linear (4.6% diferença em relação à mediana)
Comparado com a mesma classe
» 0% de todos os dispositivos testados nesta classe foram melhores, 0% semelhantes, 100% piores
» O melhor teve um delta de 5%, a média foi 17%, o pior foi 45%
Comparado com todos os dispositivos testados
» 0% de todos os dispositivos testados foram melhores, 0% semelhantes, 100% piores
» O melhor teve um delta de 4%, a média foi 24%, o pior foi 134%
Gerenciamento de energia
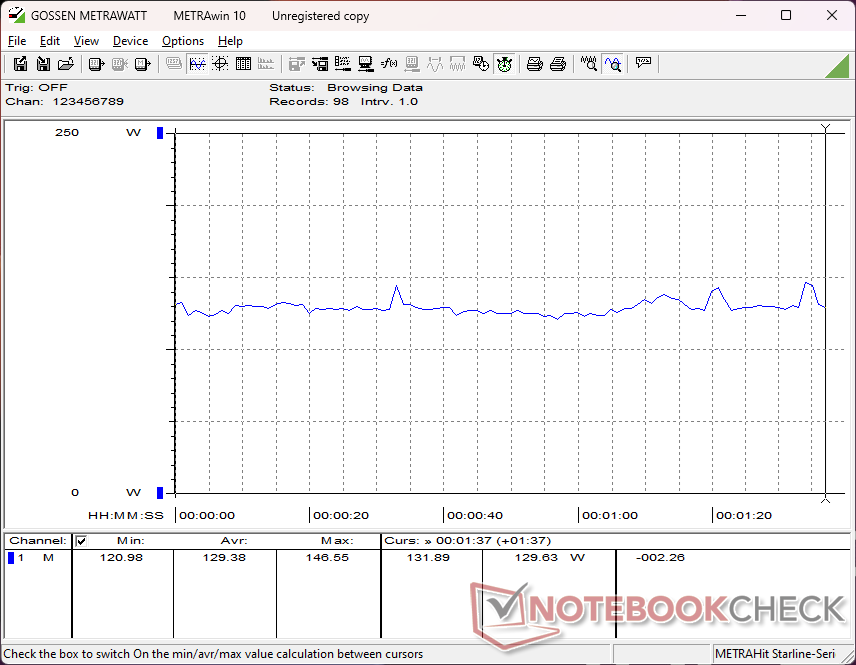
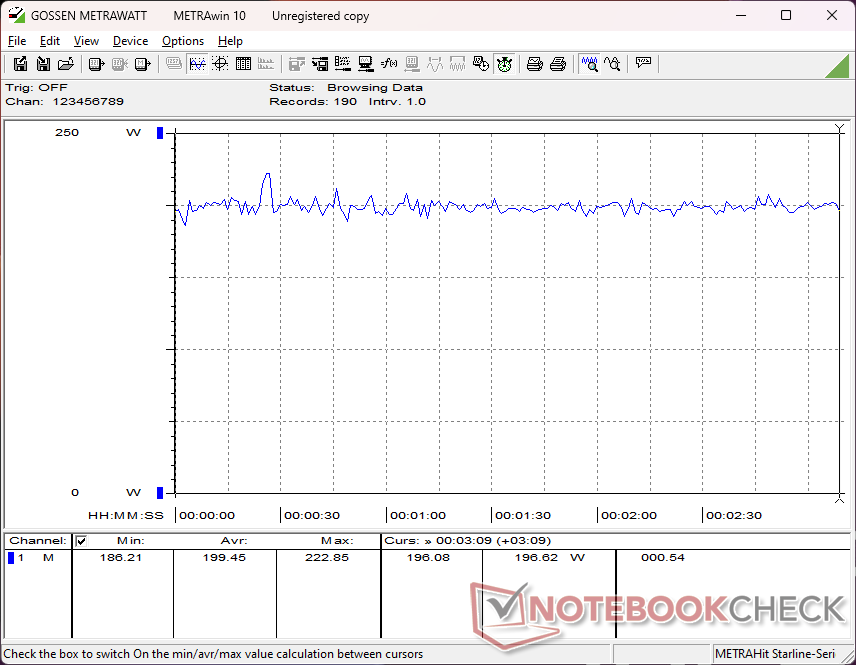
Consumo de energia
O sistema é mais eficiente quando está ocioso no desktop em comparação com o nosso ZBook Fury 16 G10 configuração. Por outro lado, o consumo se torna praticamente o mesmo ao executar cargas mais exigentes, como jogos, embora as GPUs configuradas sejam diferentes entre nossos dois exemplos. Portanto, o desempenho por watt aumenta ao selecionar configurações de GPU de ponta em comparação com nossa RTX 3500 Ada de médio porte.
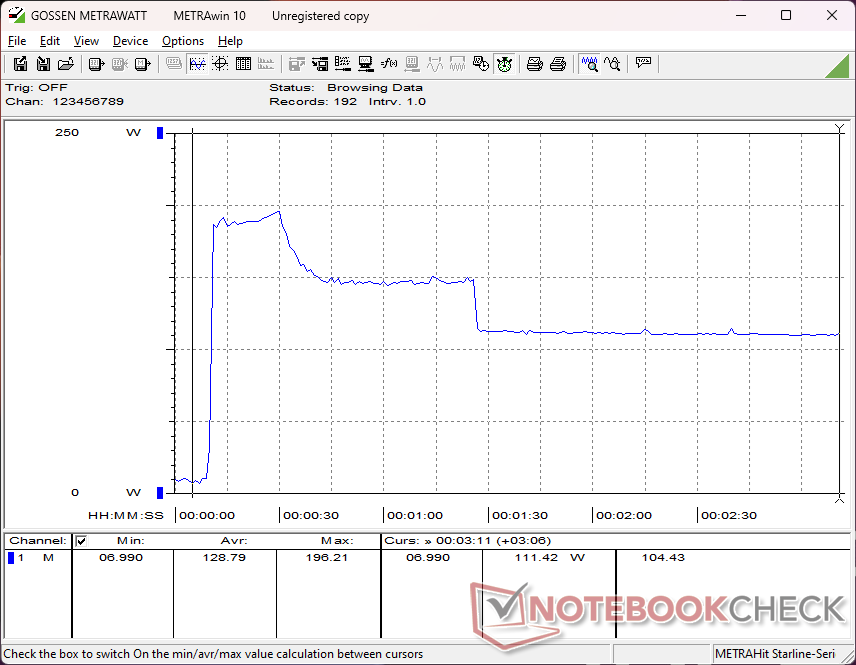
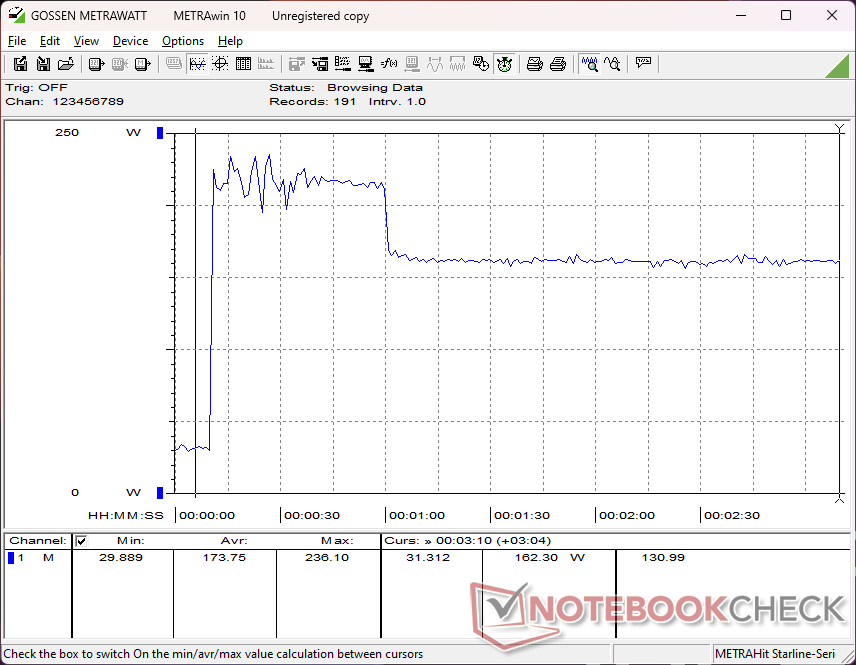
O consumo ao executar o Prime95 ou o CineBench R15 xT seria visivelmente maior em nossa unidade em comparação com o modelo do ano passado devido ao maior potencial de Turbo Boost do nosso processador Core i9-14900HX. No entanto, após cerca de um minuto, o consumo cairia para ficar quase na mesma linha do que medimos no modelo do ano passado, como mostra o gráfico de comparação abaixo, que se alinha com as observações do loop do CineBench R15 xT acima. Portanto, nosso maior potencial de Turbo Boost inicial é a principal vantagem entre o novo Core i9-14900HX e o Core i9-13950HX mais antigo.
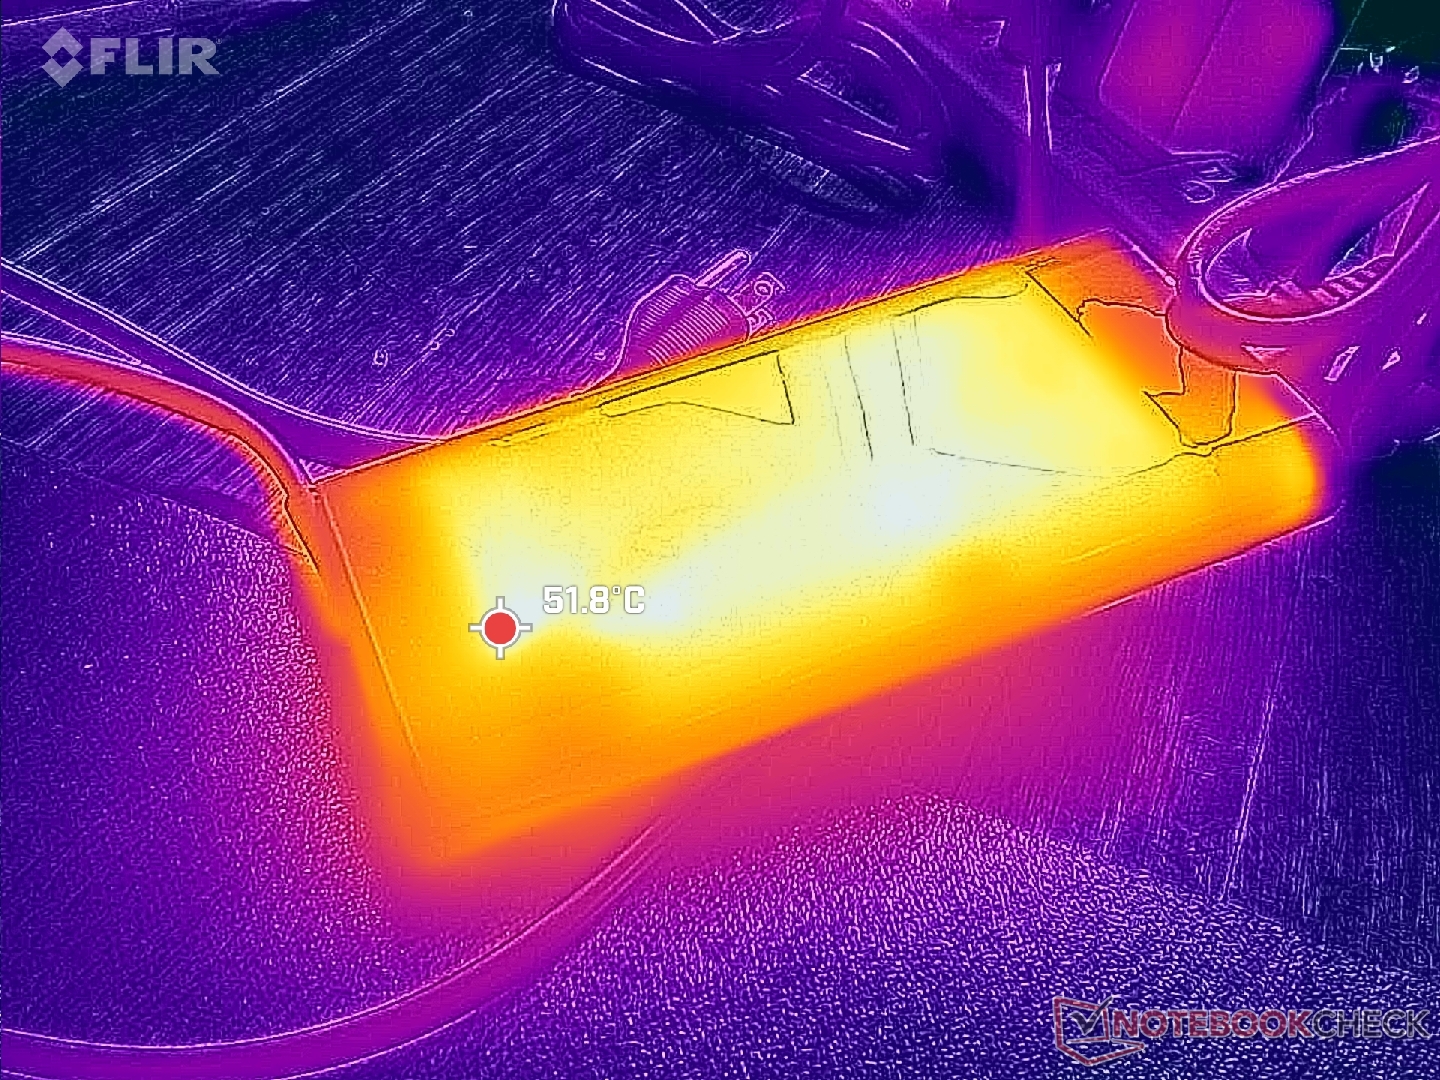
Conseguimos registrar um consumo máximo de 236 W do grande adaptador CA de 230 W (~18 x 8,8 x 2,5 cm) quando a CPU e a GPU estão com 100% de utilização.
| desligado | |
| Ocioso | |
| Carga |
|
Key:
min: | |
| HP ZBook Fury 16 G11 i9-14900HX, RTX 3500 Ada Generation Laptop, SK hynix PC801 HFS001TEJ9X101N, IPS, 3840x2400, 16" | HP ZBook Fury 16 G10 i9-13950HX, RTX 5000 Ada Generation Laptop, SK hynix PC801 HFS001TEJ9X101N, IPS, 3840x2400, 16" | HP ZBook Fury 16 G9 i9-12950HX, RTX A5500 Laptop GPU, Micron 3400 1TB MTFDKBA1T0TFH, IPS, 3840x2400, 16" | Dell Precision 5690 Ultra 9 185H, RTX 5000 Ada Generation Laptop, 2x Samsung PM9A1 1TB (RAID 0), OLED, 3840x2400, 16" | Lenovo ThinkPad P16 G2 21FA000FGE i7-13700HX, RTX 2000 Ada Generation Laptop, SK hynix PC801 HFS001TEJ9X162N, IPS LED, 2560x1600, 16" | Lenovo ThinkPad P1 G6 21FV001KUS i7-13800H, GeForce RTX 4080 Laptop GPU, Kioxia XG8 KXG8AZNV1T02, OLED, 3480x2400, 16" | Asus ProArt Studiobook 16 OLED H7604 i9-13980HX, GeForce RTX 4070 Laptop GPU, Phison EM2804TBMTCB47, OLED, 3200x2000, 16" | |
|---|---|---|---|---|---|---|---|
| Power Consumption | -34% | -77% | -1% | 4% | 7% | -24% | |
| Idle Minimum * (Watt) | 8.6 | 15.3 -78% | 19.5 -127% | 7.9 8% | 9.3 -8% | 8 7% | 12.8 -49% |
| Idle Average * (Watt) | 14.8 | 18.2 -23% | 29 -96% | 12 19% | 14.1 5% | 9.5 36% | 19.9 -34% |
| Idle Maximum * (Watt) | 15.7 | 28 -78% | 40.7 -159% | 28.6 -82% | 15.5 1% | 23.7 -51% | 20.3 -29% |
| Load Average * (Watt) | 129.4 | 137.9 -7% | 142.1 -10% | 98.8 24% | 133.6 -3% | 97.2 25% | 131.4 -2% |
| Cyberpunk 2077 ultra external monitor * (Watt) | 192.6 | ||||||
| Cyberpunk 2077 ultra * (Watt) | 199.4 | ||||||
| Load Maximum * (Watt) | 236.1 | 202 14% | 224.4 5% | 174.8 26% | 179.6 24% | 197.2 16% | 246.8 -5% |
| Witcher 3 ultra * (Watt) | 189.4 | 188.6 | 144.5 | 144.9 | 144 | 196.5 |
* ... menor é melhor
Power Consumption Cyberpunk / Stress Test
Power Consumption external Monitor
Duração da bateria
O tempo de execução é muito semelhante ao do ZBook Fury 16 G11 do ano passado, se não for um pouco mais curto, provavelmente devido ao limite máximo do Turbo Boost para a CPU Raptor Lake-HX Refresh. Os modelos concorrentes, como o Precision 5690 ou o ThinkPad P16 G2, podem durar pelo menos uma hora ou mais a mais em comparação.
O carregamento da capacidade vazia até a capacidade total com o adaptador CA de barril incluído é relativamente rápido, com pouco mais de 60 minutos.
| HP ZBook Fury 16 G11 i9-14900HX, RTX 3500 Ada Generation Laptop, 95 Wh | HP ZBook Fury 16 G10 i9-13950HX, RTX 5000 Ada Generation Laptop, 95 Wh | HP ZBook Fury 16 G9 i9-12950HX, RTX A5500 Laptop GPU, 95 Wh | Dell Precision 5690 Ultra 9 185H, RTX 5000 Ada Generation Laptop, 98 Wh | Lenovo ThinkPad P16 G2 21FA000FGE i7-13700HX, RTX 2000 Ada Generation Laptop, 94 Wh | Lenovo ThinkPad P1 G6 21FV001KUS i7-13800H, GeForce RTX 4080 Laptop GPU, 90 Wh | Asus ProArt Studiobook 16 OLED H7604 i9-13980HX, GeForce RTX 4070 Laptop GPU, 90 Wh | |
|---|---|---|---|---|---|---|---|
| Duração da bateria | 9% | -10% | 37% | 28% | -37% | -16% | |
| WiFi v1.3 (h) | 6.7 | 7.3 9% | 6 -10% | 9.2 37% | 8.6 28% | 4.2 -37% | 5.6 -16% |
| Reader / Idle (h) | 5.3 | ||||||
| Load (h) | 1.2 | 1.1 | |||||
| H.264 (h) | 6 |
Pro
Contra
Veredicto - Design robusto prejudicado pelo Turbo Boost limitado
Adoramos o design do ZBook Fury 16 G11. Embora permaneça o mesmo do Fury 16 G9, sua facilidade de manutenção, as amplas opções configuráveis, o suporte à RAM ECC e o teclado e touchpad confortáveis preenchem todos os requisitos para os usuários de estações de trabalho.
Em vez disso, os principais problemas do ZBook Fury 16 G11 estão em seu desempenho. Quando outro laptop como o Lenovo Legion 9 16IRX9 pode executar exatamente o mesmo CPU Core i9-14900HX até 20% mais rápido do que o nosso ZBook, então a solução de resfriamento da HP poderia definitivamente usar uma atualização para suportar velocidades mais altas do Turbo Boost por mais tempo. Da mesma forma, os SSDs M.2 poderiam se beneficiar de dissipadores de calor pelo mesmo motivo, já que eles também se tornam mais lentos quando estão sob tensão. Essas limitações prejudicam os benefícios da CPU Core i9 e do SSD PCIe4, pois eles podem ter um desempenho potencialmente mais rápido em máquinas concorrentes da Dell ou da Lenovo.
O ZBook Fury 16 G11 é apenas uma pequena atualização em relação ao ZBook Fury G10 do ano passado. Embora a aparência e a sensação ainda sejam ótimas, o desempenho tende a diminuir em cenários de uso mais intenso.
Por fim, é um pouco lamentável que o modelo não ofereça opções de Meteor Lake para nenhuma aceleração local de IA. É verdade que esse recurso provavelmente só atrai um pequeno subconjunto de usuários de estações de trabalho, mas teria ajudado a distinguir ainda mais o Fury 16 G11 do Fury 16 G10. O senhor pode obter essencialmente o mesmo desempenho e os mesmos recursos com o Fury 16 G10, que tem apenas um ano de idade Fury 16 G10 e no mais recente Fury 16 G11.
Preço e disponibilidade
O ZBook Fury 16 G11 está sendo enviado atualmente por cerca de US$ 3400, conforme configurado com o Core i9-14900HX e RTX 3500 Ada, até mais de US$ 5500, se totalmente configurado com o RTX 5000 Ada.
Observação: Nosso sistema de classificação foi atualizado recentemente e os resultados da versão 8 não podem ser comparados com os resultados da versão 7. Outras informações sobre o assunto estão aqui disponíveis.
Observação: Atualizamos recentemente nosso sistema de classificação e os resultados da versão 8 não são comparáveis aos resultados da versão 7. Mais informações estão disponíveis aqui .
HP ZBook Fury 16 G11
- 08/12/2024 v8
Allen Ngo
 Total Sustainability Score:
 Transparência
A seleção dos dispositivos a serem analisados é feita pela nossa equipe editorial. A amostra de teste foi fornecida ao autor como empréstimo pelo fabricante ou varejista para fins desta revisão. O credor não teve influência nesta revisão, nem o fabricante recebeu uma cópia desta revisão antes da publicação. Não houve obrigação de publicar esta revisão. Como empresa de mídia independente, a Notebookcheck não está sujeita à autoridade de fabricantes, varejistas ou editores.
É assim que o Notebookcheck está testando
Todos os anos, o Notebookcheck analisa de forma independente centenas de laptops e smartphones usando procedimentos padronizados para garantir que todos os resultados sejam comparáveis. Desenvolvemos continuamente nossos métodos de teste há cerca de 20 anos e definimos padrões da indústria no processo. Em nossos laboratórios de teste, equipamentos de medição de alta qualidade são utilizados por técnicos e editores experientes. Esses testes envolvem um processo de validação em vários estágios. Nosso complexo sistema de classificação é baseado em centenas de medições e benchmarks bem fundamentados, o que mantém a objetividade.Price comparison

