

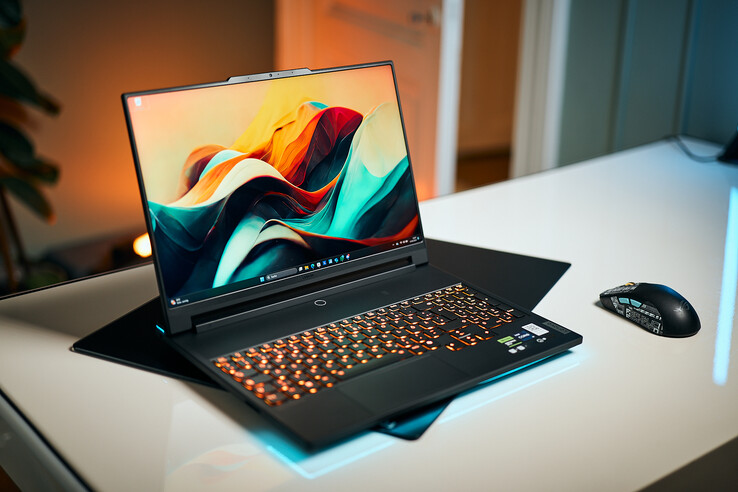
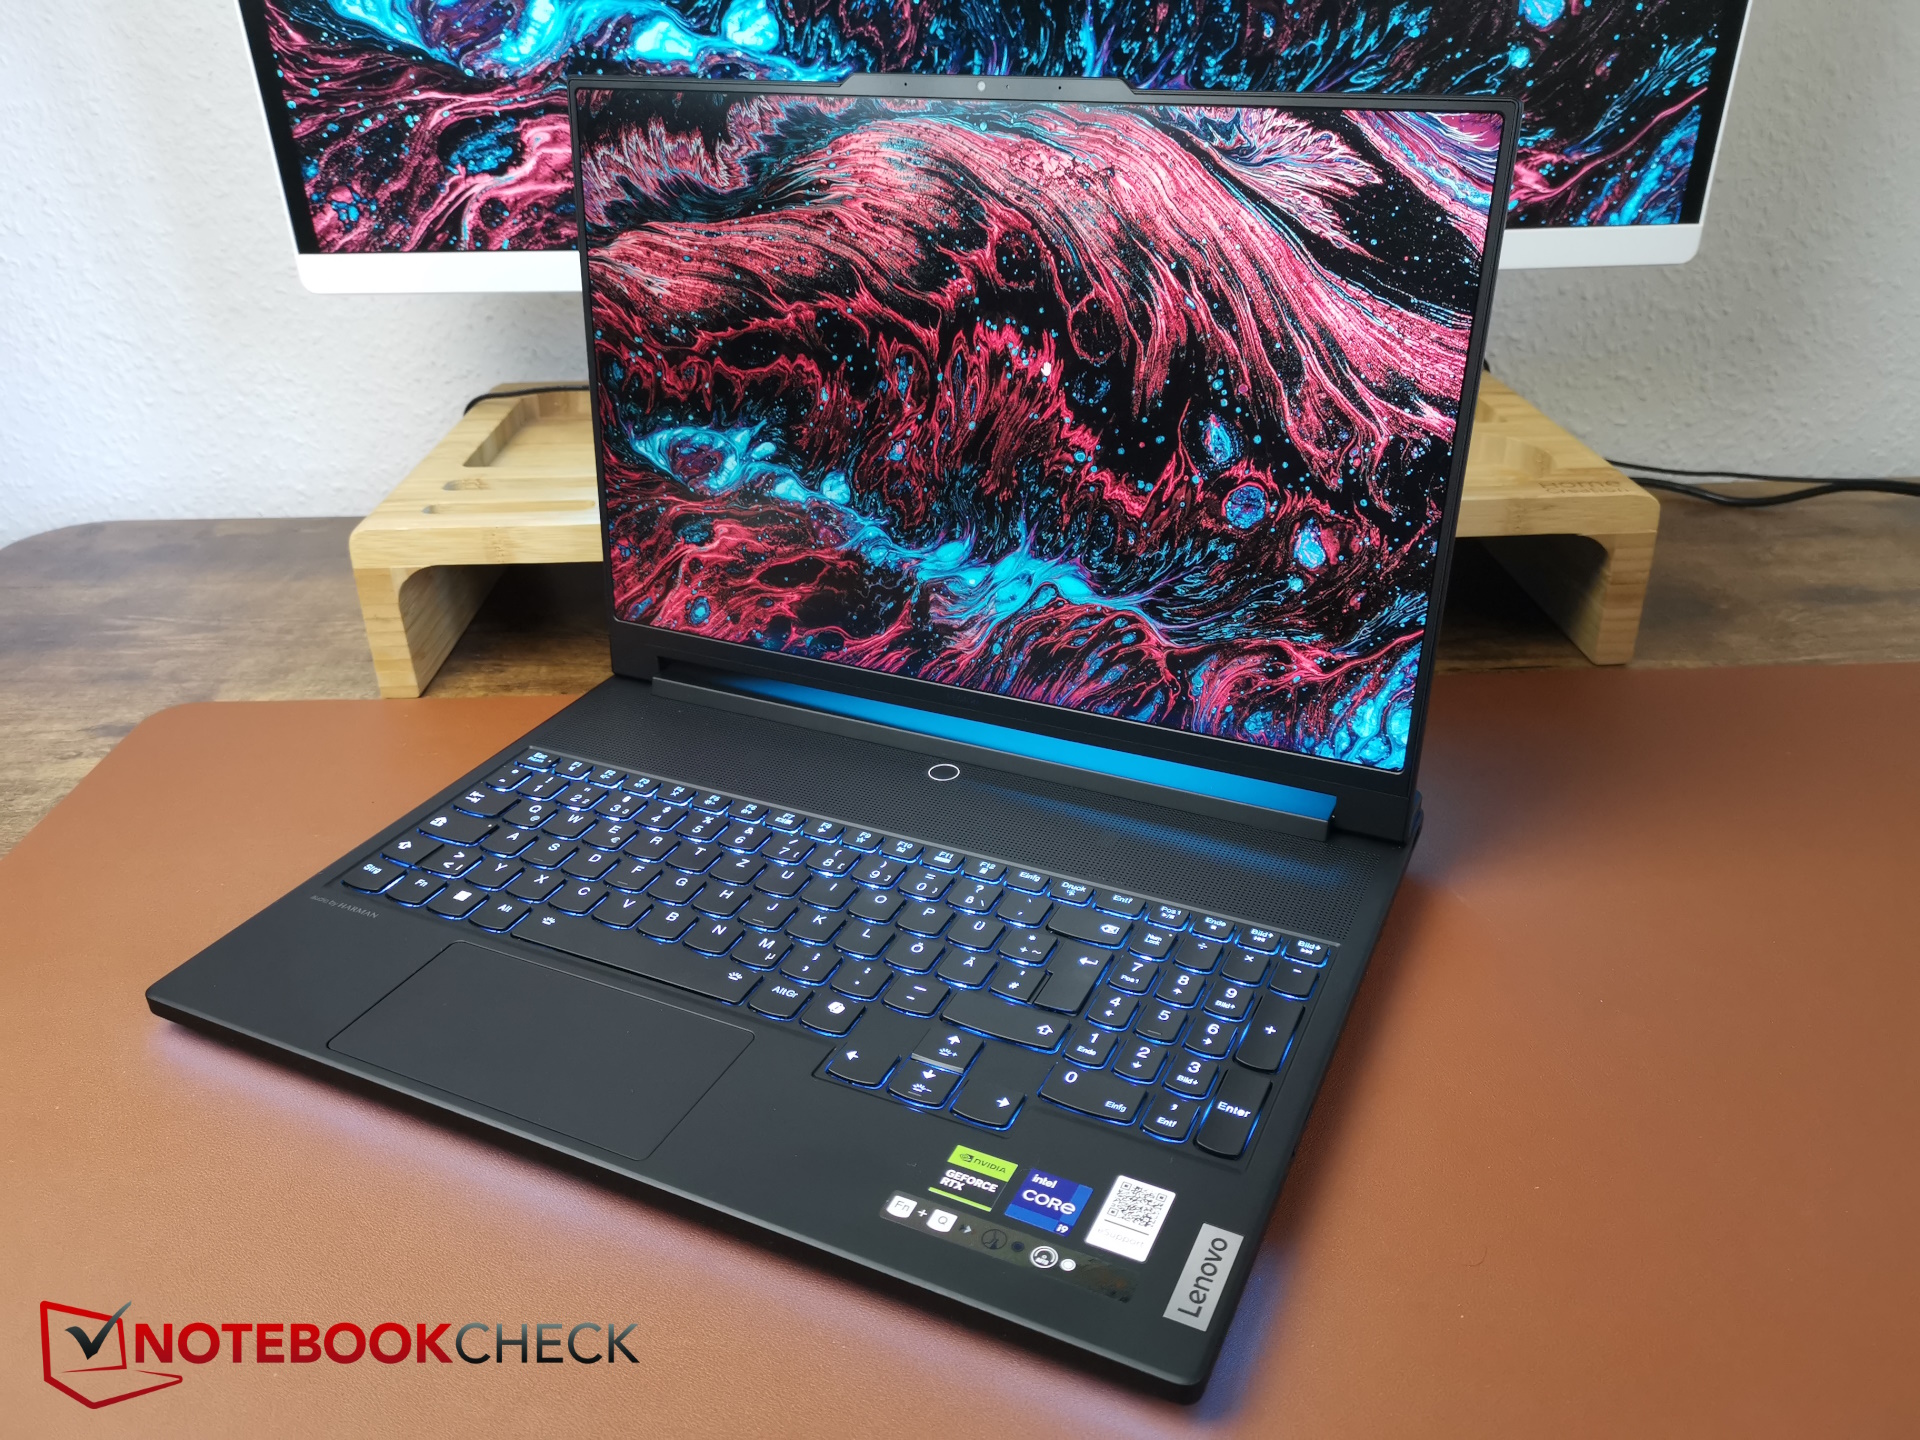
Análise do Lenovo Legion 9 16IRX9 (Legion 9i): Quão sofisticada é a RTX 4090 gamer?
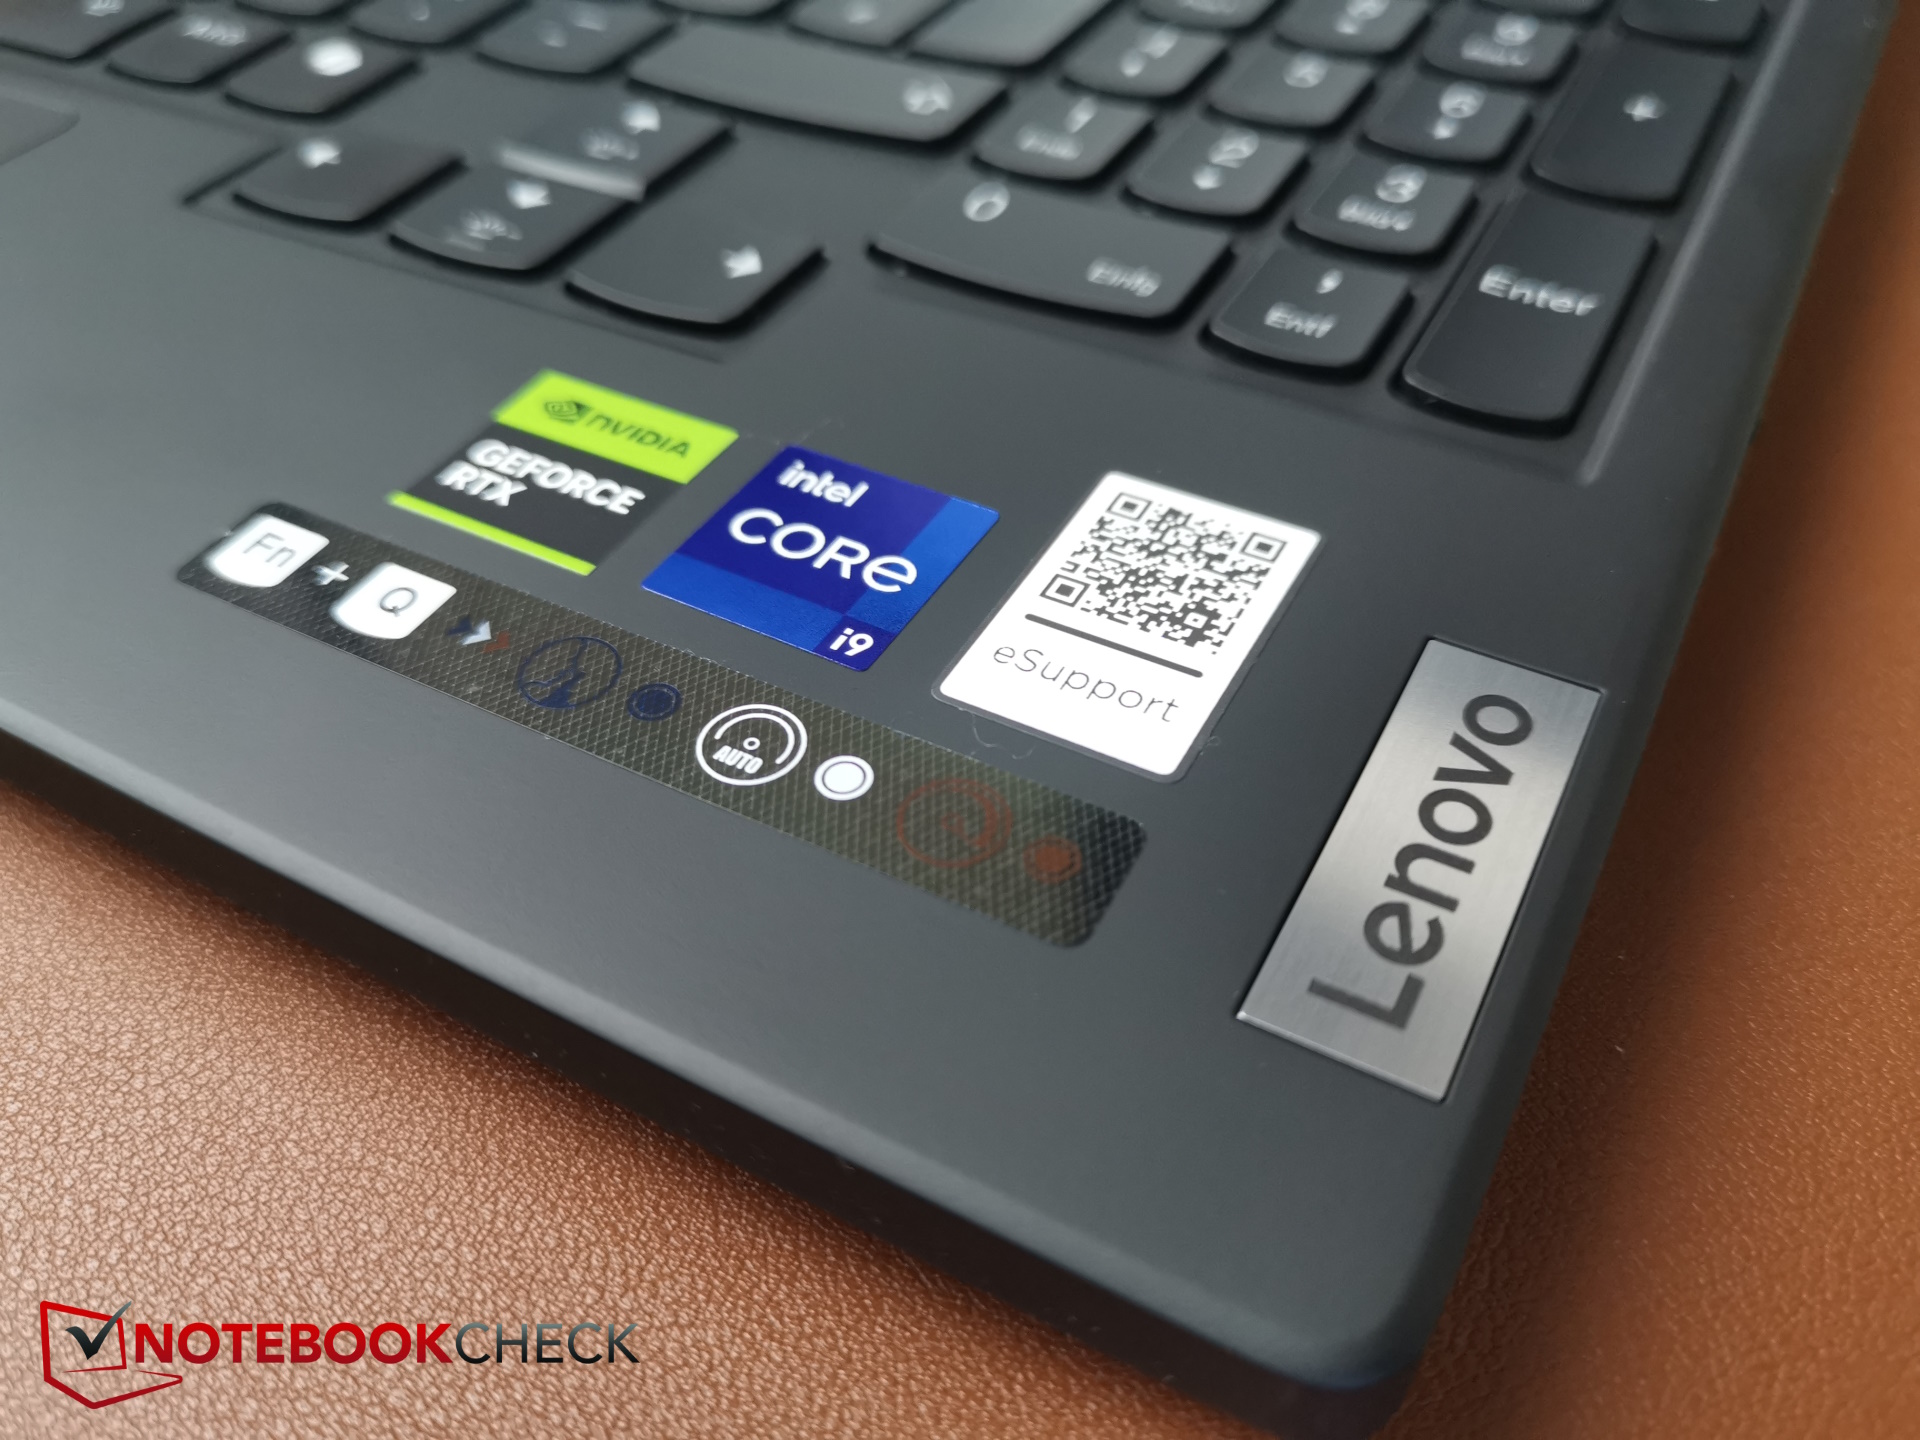
No ano passado, chamamos o Legion 9i de "o laptop para jogos mais ambicioso da Lenovo até hoje". A próxima geração pode não ser menos ambiciosa, no entanto, as mudanças realmente feitas para o gamer de ponta são severamente limitadas. Apenas a CPU foi trocada pela mais recente 14ª geração da Intel, o que também torna o laptop mais compatível com IA.
Como os laptops de 16 polegadas não costumam ser equipados com a RTX 4090estaremos comparando-a com sua antecessor, o Razer Blade 16 (2024) bem como com os gamers de 18 polegadas, como o Alienware m18 R2 e o Asus ROG Strix Scar 18 (2024)e o de 17 polegadas Medion Erazer Beast X40 (2024).
Atualização: devido aos problemas mencionados neste teste (quedas na taxa de quadros, baixa pontuação de núcleo único), entramos em contato com o fabricante (por meio de sua agência). Um dispositivo de substituição em potencial apresentou a mesma pontuação de núcleo único (medida pela agência), portanto, pelo menos isso foi confirmado. Ainda estamos em contato sobre suas taxas de quadros e publicaremos uma resposta assim que possível.
Possíveis concorrentes em comparação
Avaliação | Versão | Data | Modelo | Peso | Altura | Size | Resolução | Preço |
|---|---|---|---|---|---|---|---|---|
| 83.9 % | v8 | 06/2024 | Lenovo Legion 9 16IRX9, RTX 4090 i9-14900HX, NVIDIA GeForce RTX 4090 Laptop GPU | 2.5 kg | 22.7 mm | 16.00" | 3200x2000 | |
| 90.2 % v7 (old) | v7 (old) | 10/2023 | Lenovo Legion 9 16IRX8 i9-13980HX, NVIDIA GeForce RTX 4090 Laptop GPU | 2.6 kg | 22.7 mm | 16.00" | 3200x2000 | |
| 91.1 % v7 (old) | v7 (old) | 02/2024 | Razer Blade 16 2024, RTX 4090 i9-14900HX, NVIDIA GeForce RTX 4090 Laptop GPU | 2.5 kg | 22 mm | 16.00" | 2560x1600 | |
| 89.5 % v7 (old) | v7 (old) | 03/2024 | Alienware m18 R2 i9-14900HX, NVIDIA GeForce RTX 4090 Laptop GPU | 4 kg | 26.7 mm | 18.00" | 2560x1600 | |
| 88.3 % v7 (old) | v7 (old) | 02/2024 | Asus ROG Strix Scar 18 G834JYR (2024) i9-14900HX, NVIDIA GeForce RTX 4090 Laptop GPU | 3.1 kg | 30.8 mm | 18.00" | 2560x1600 | |
| 89.2 % v7 (old) | v7 (old) | 02/2024 | Medion Erazer Beast X40 2024 i9-14900HX, NVIDIA GeForce RTX 4090 Laptop GPU | 2.9 kg | 36 mm | 17.00" | 2560x1600 |
Observação: Atualizamos recentemente nosso sistema de classificação e os resultados da versão 8 não são comparáveis aos resultados da versão 7. Mais informações estão disponíveis aqui .
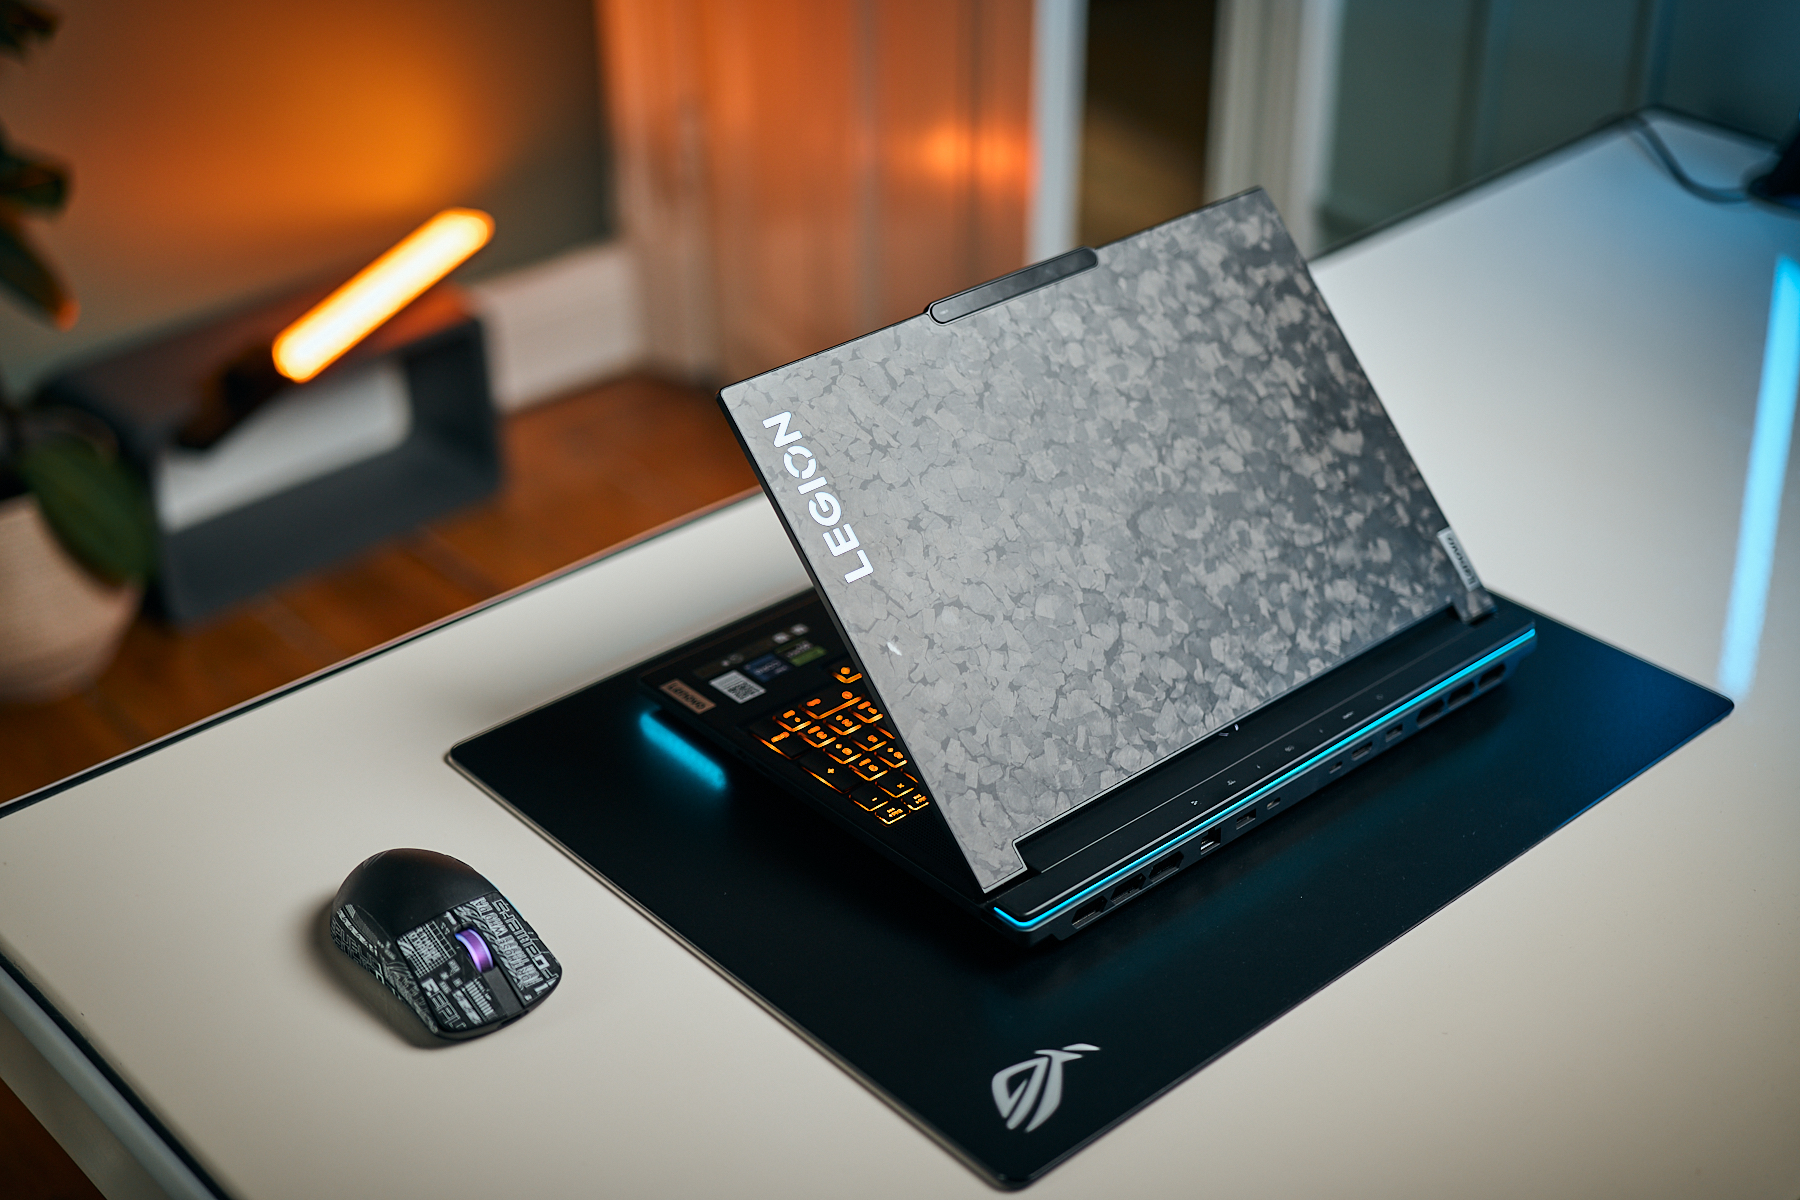
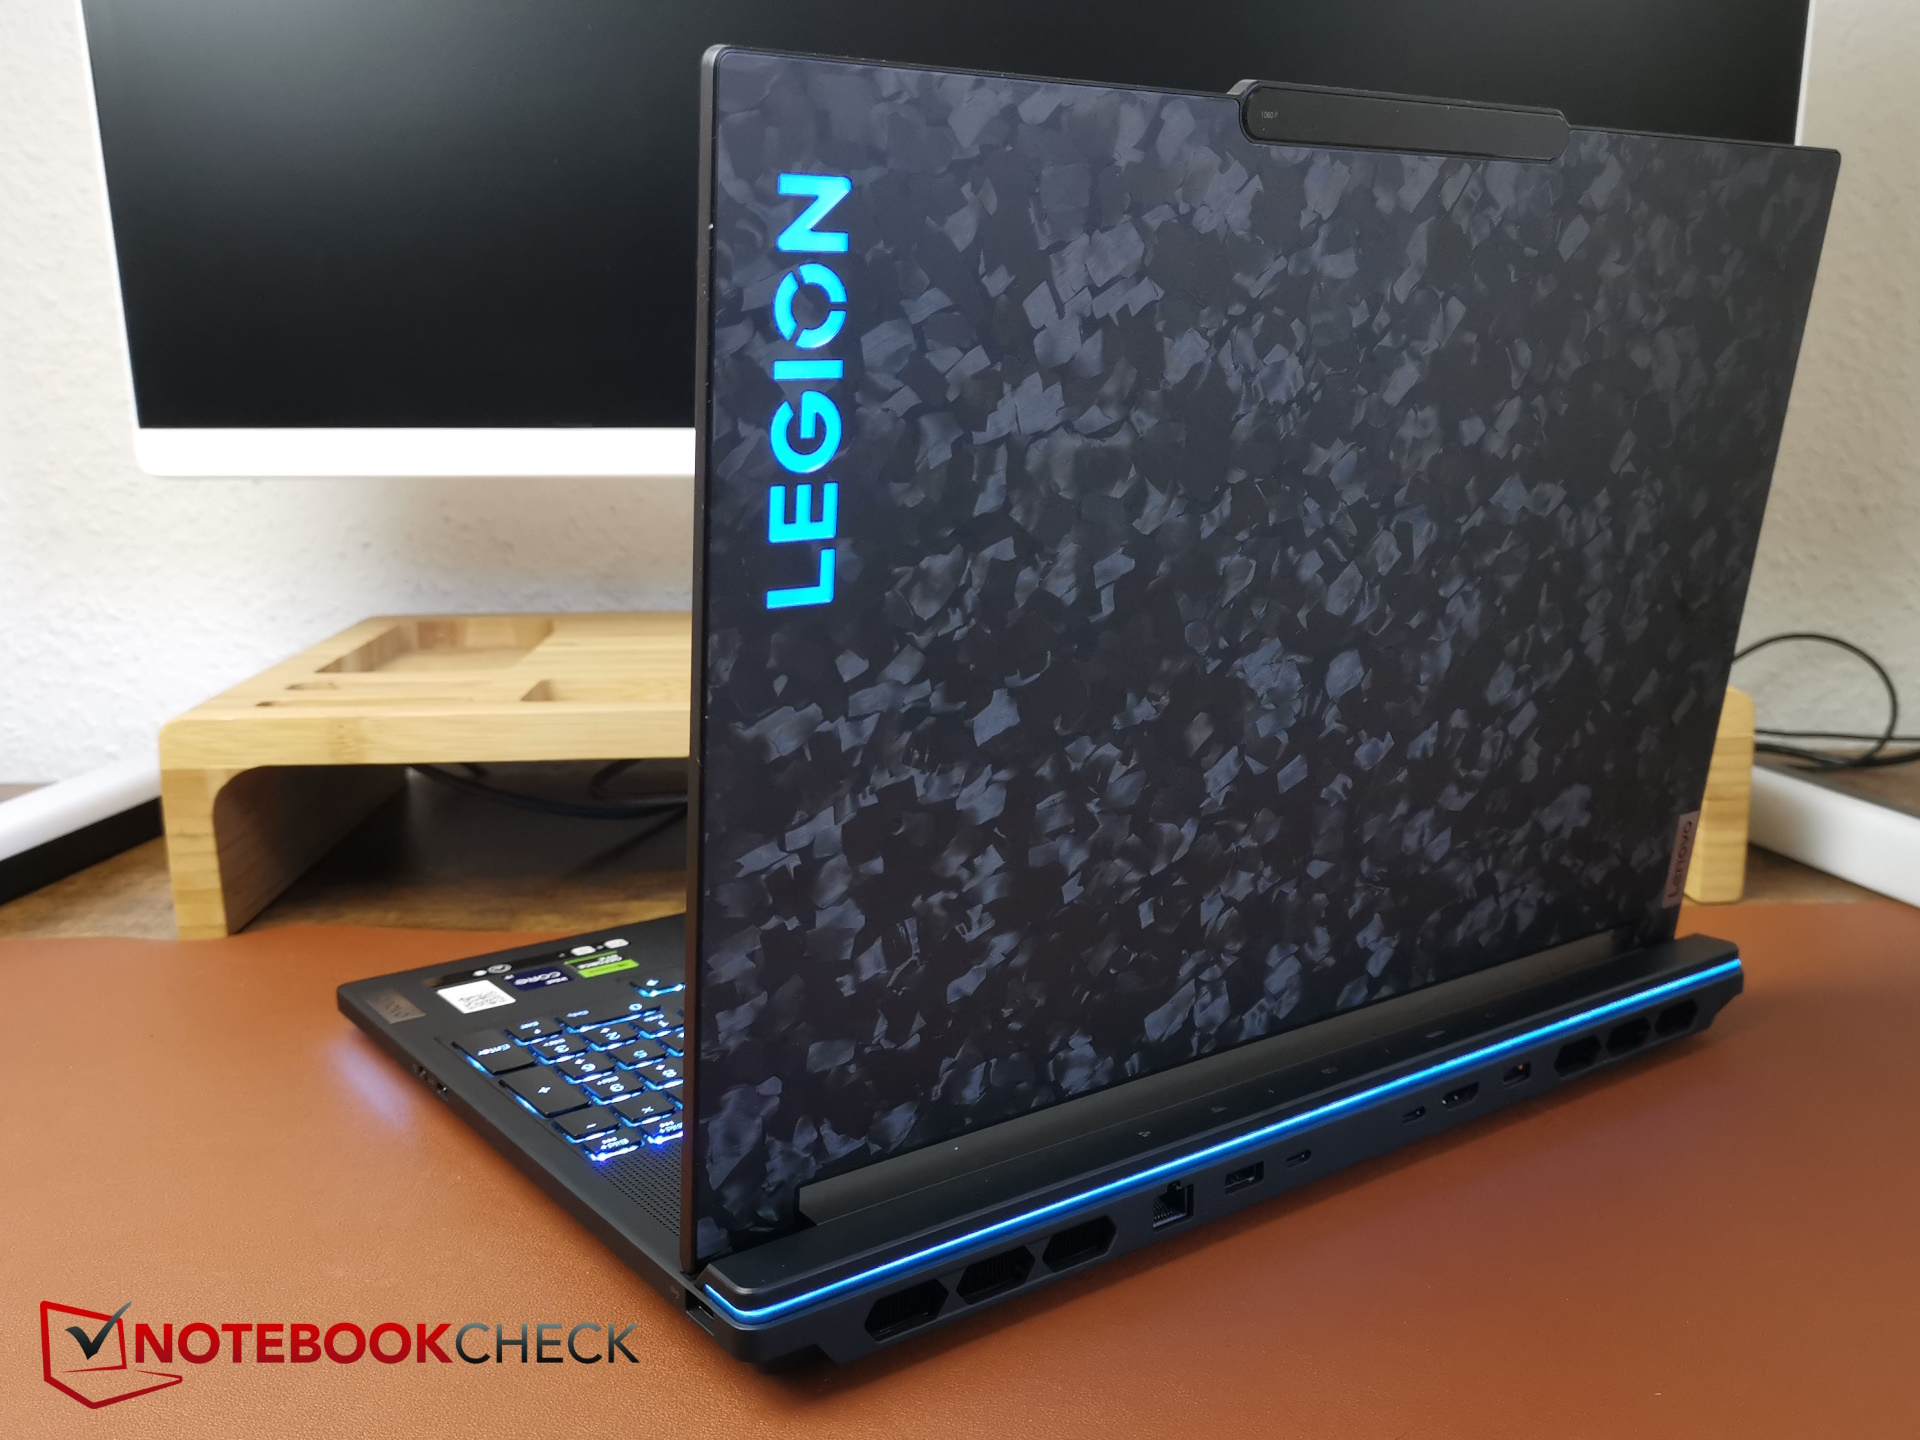
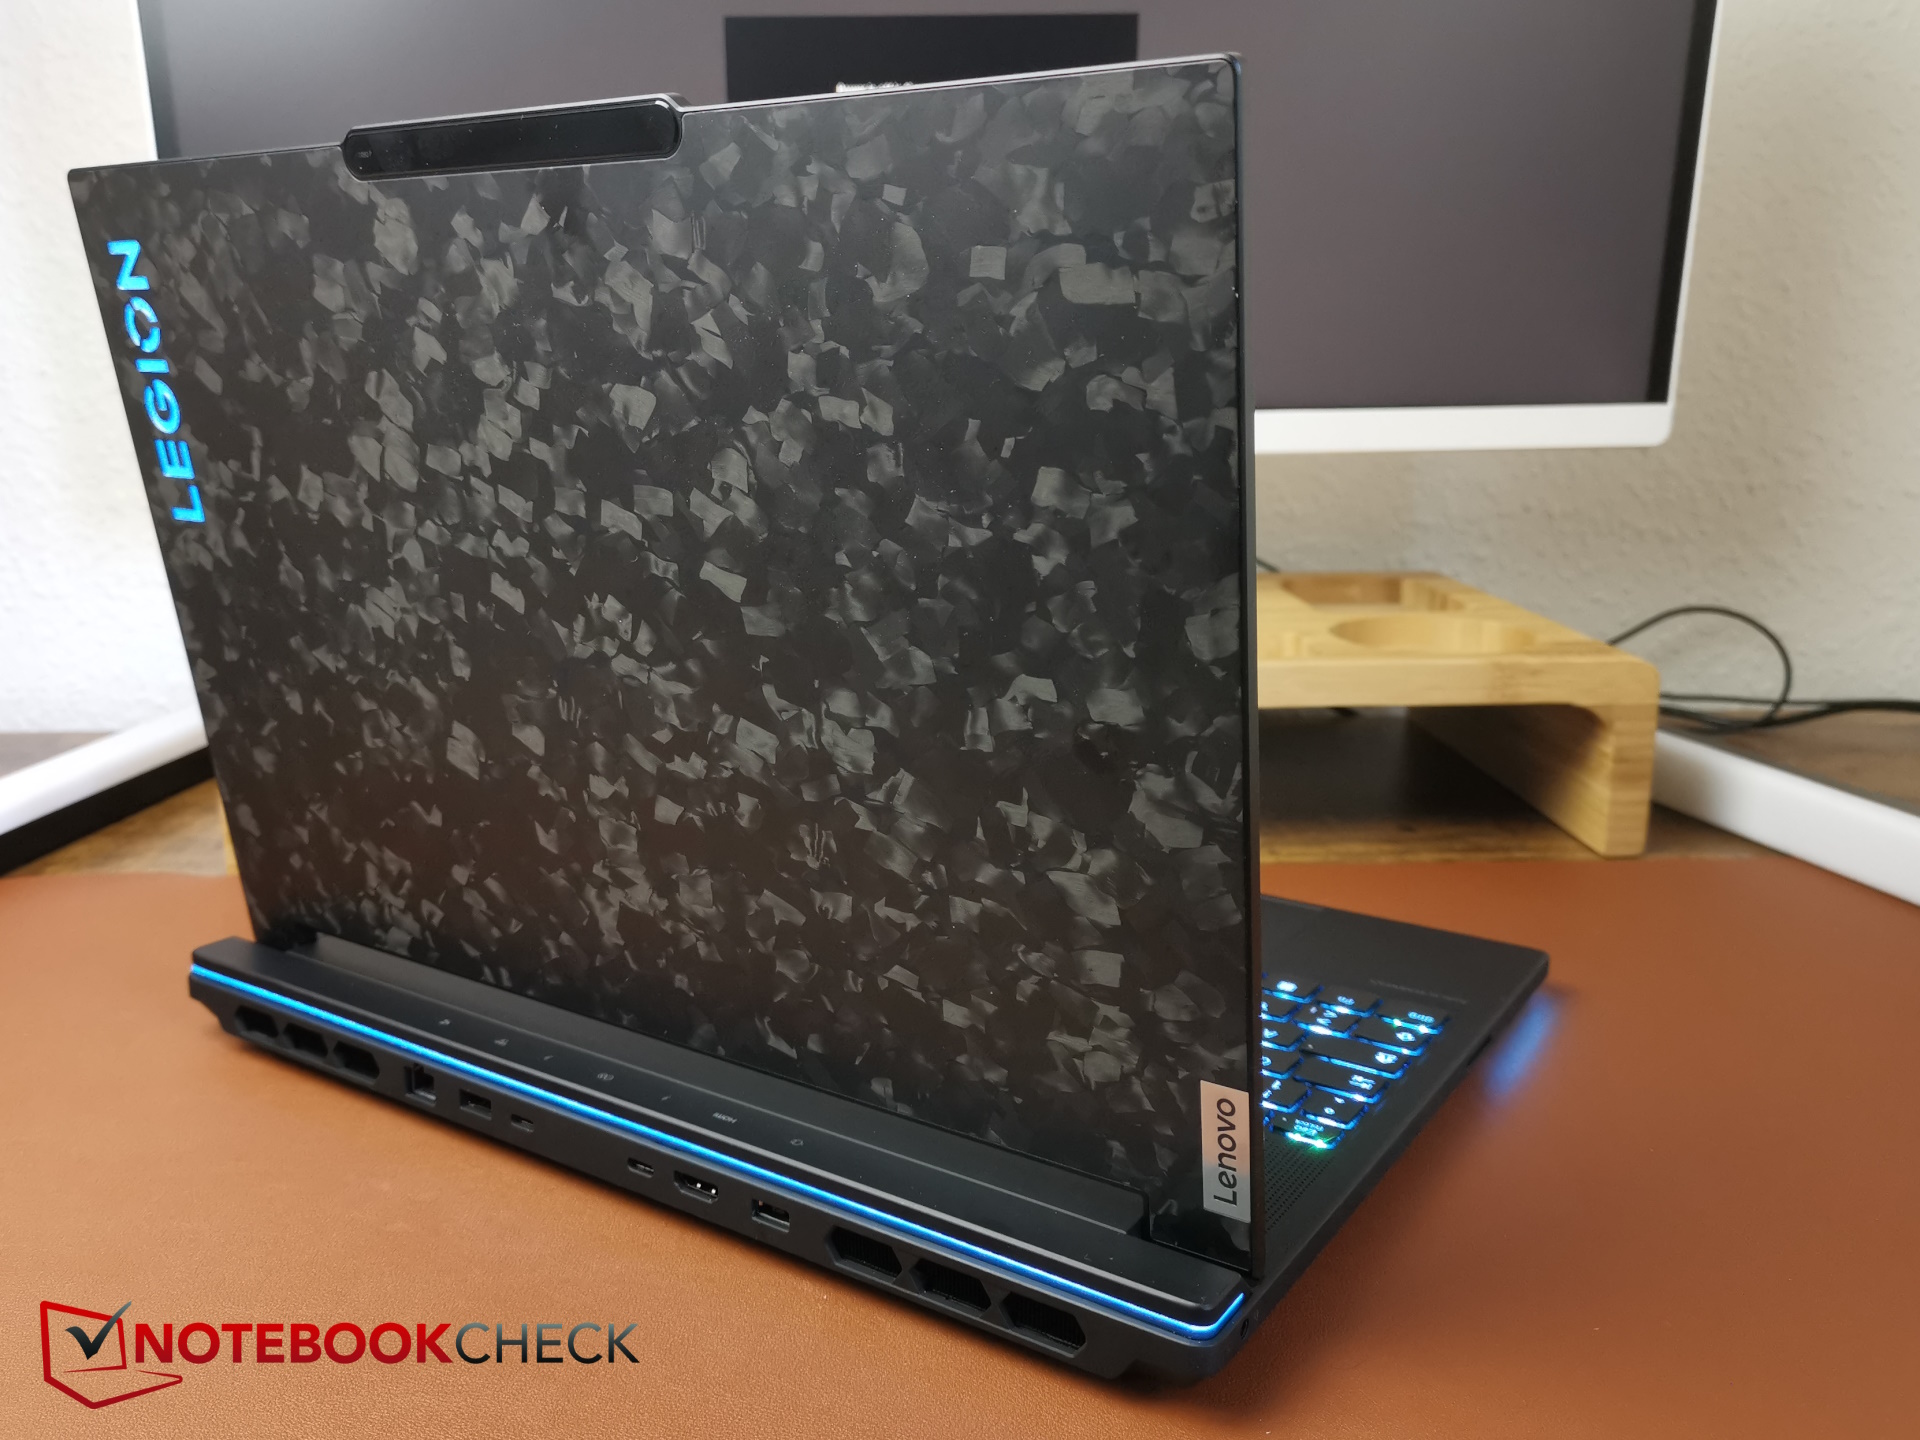
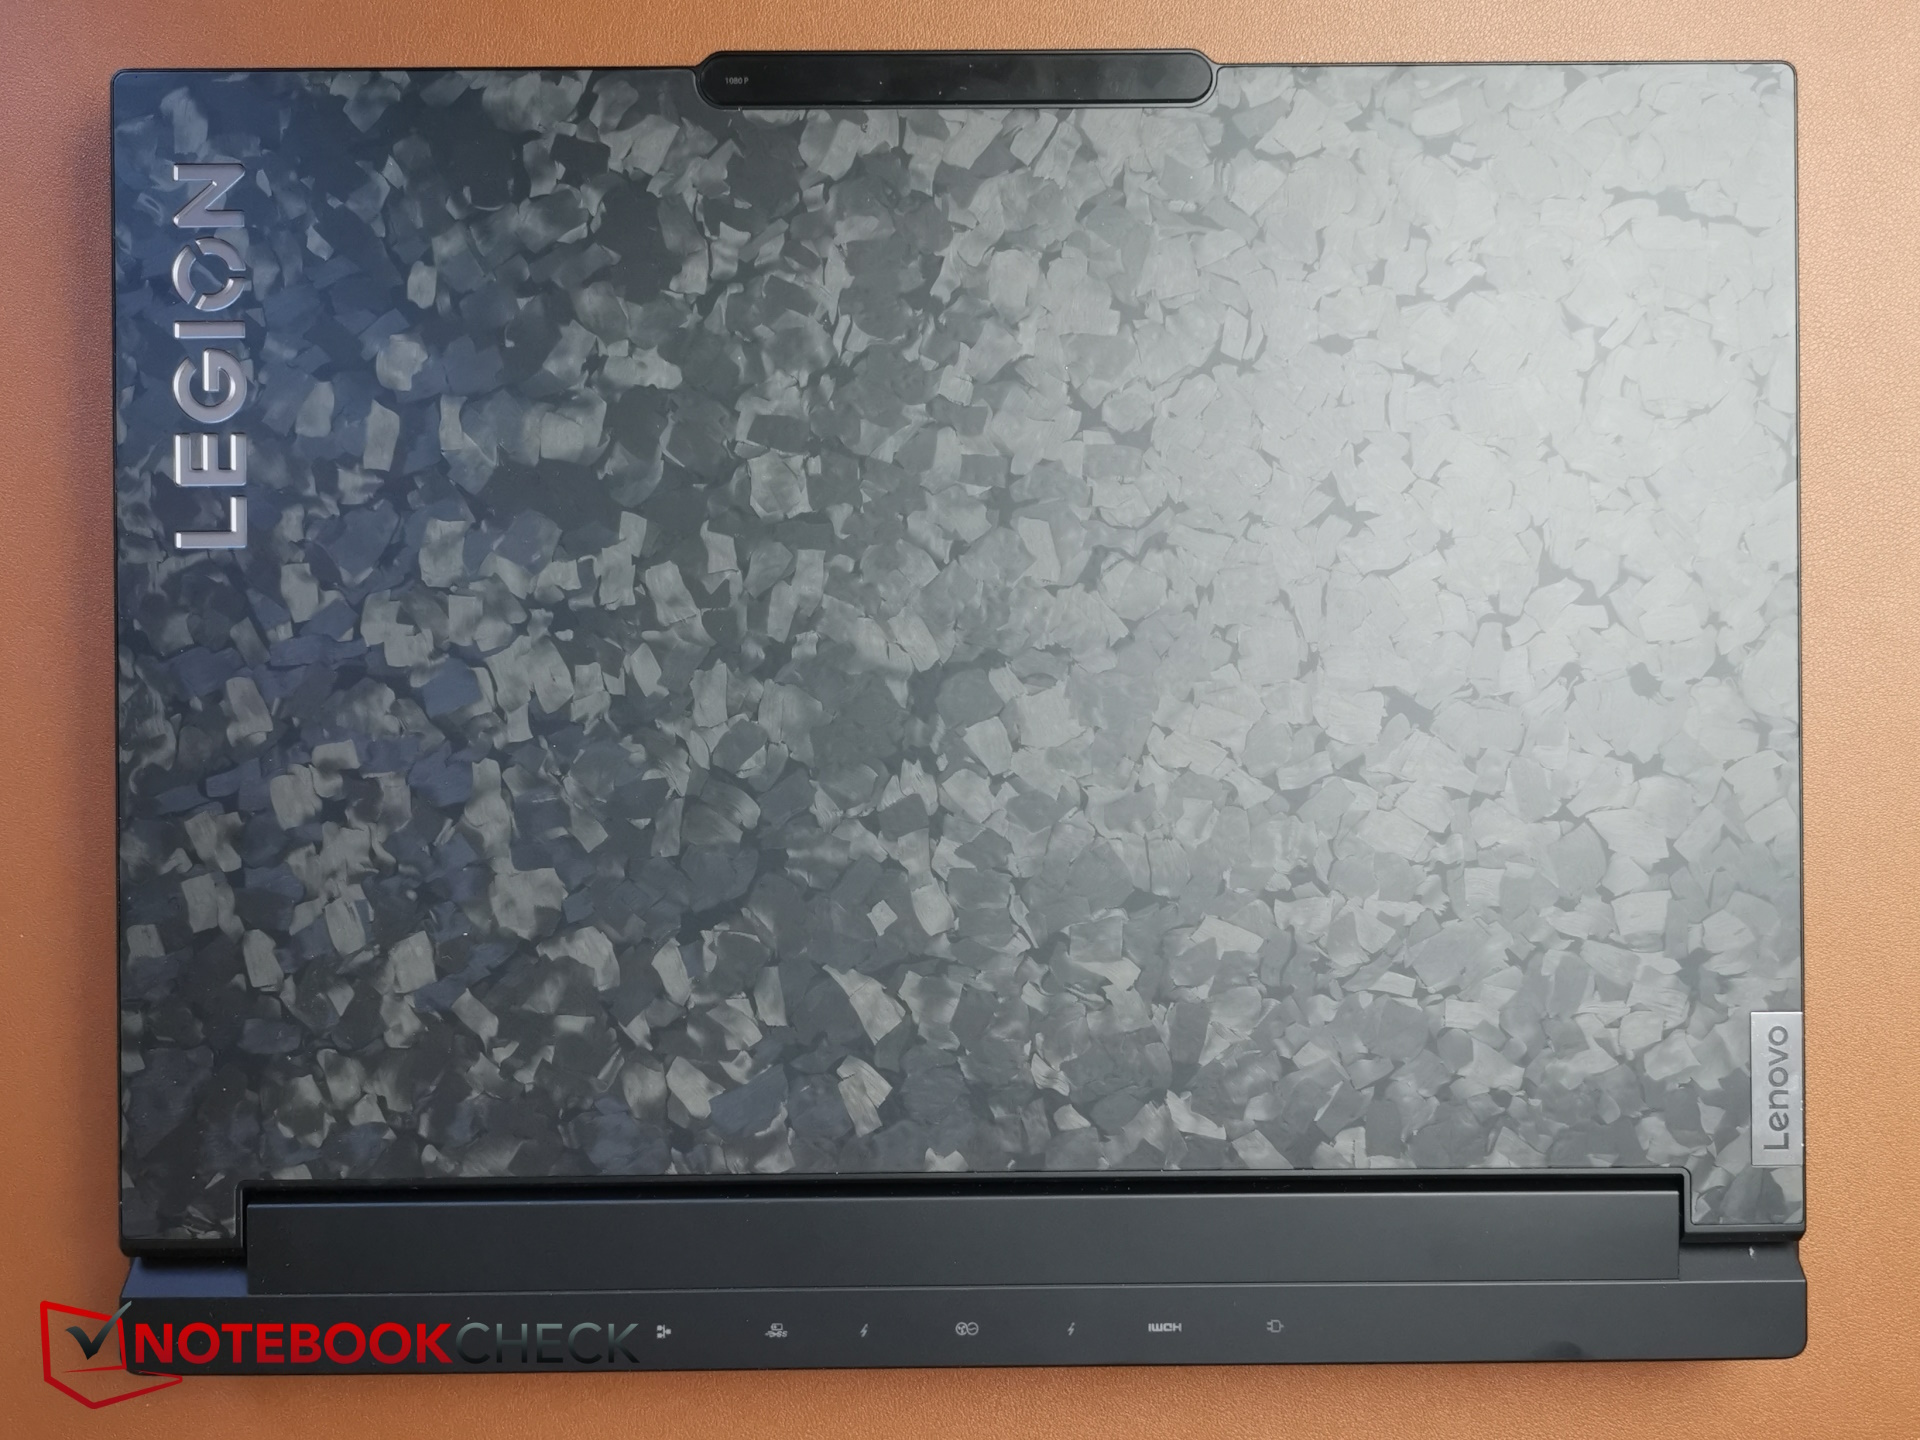
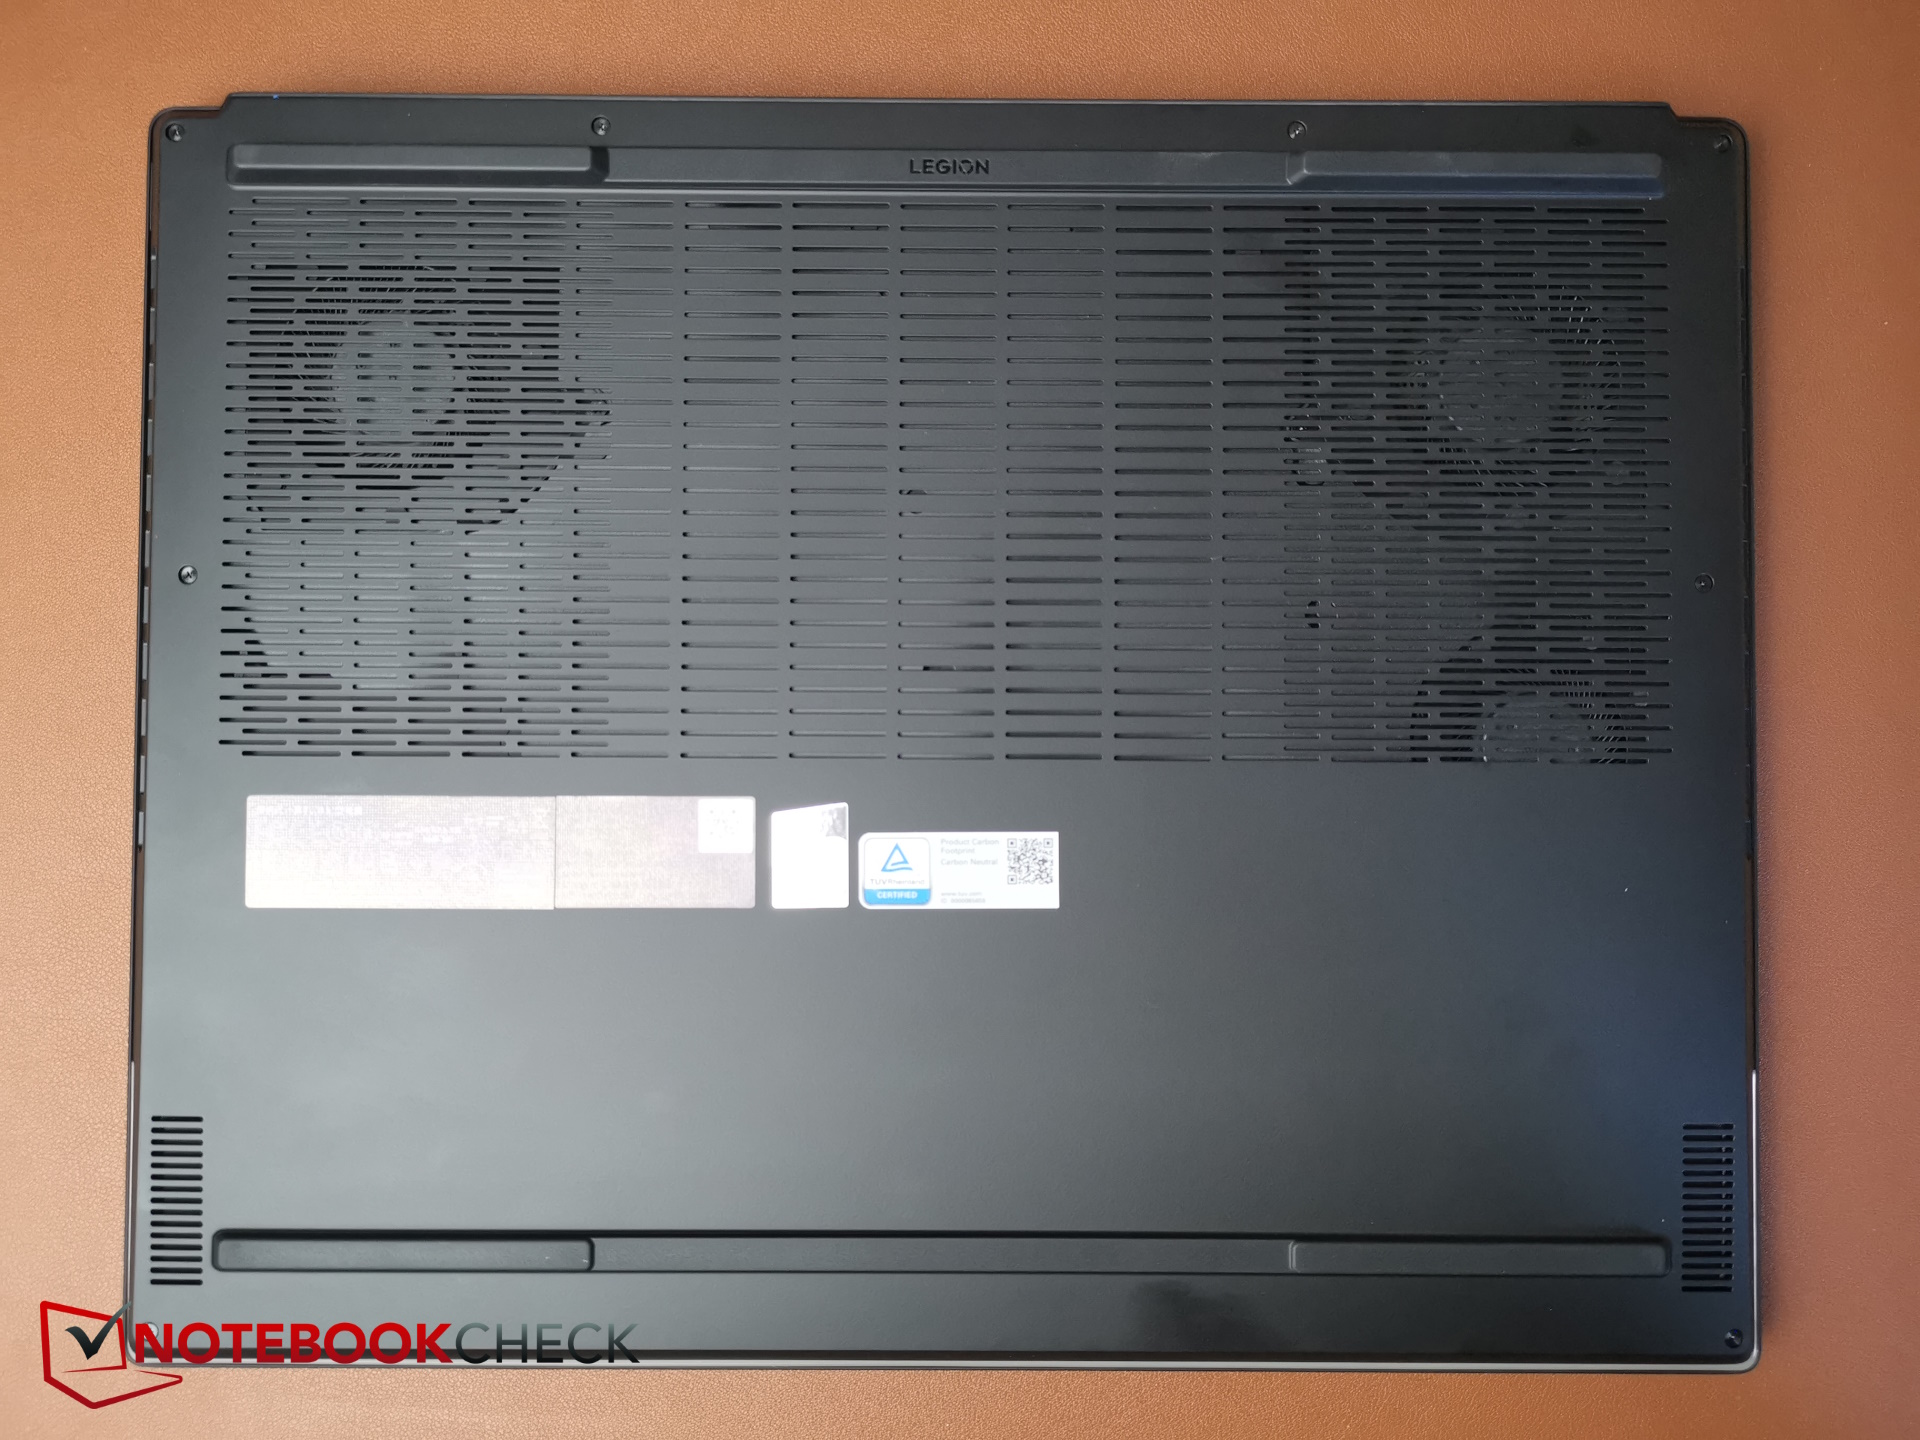
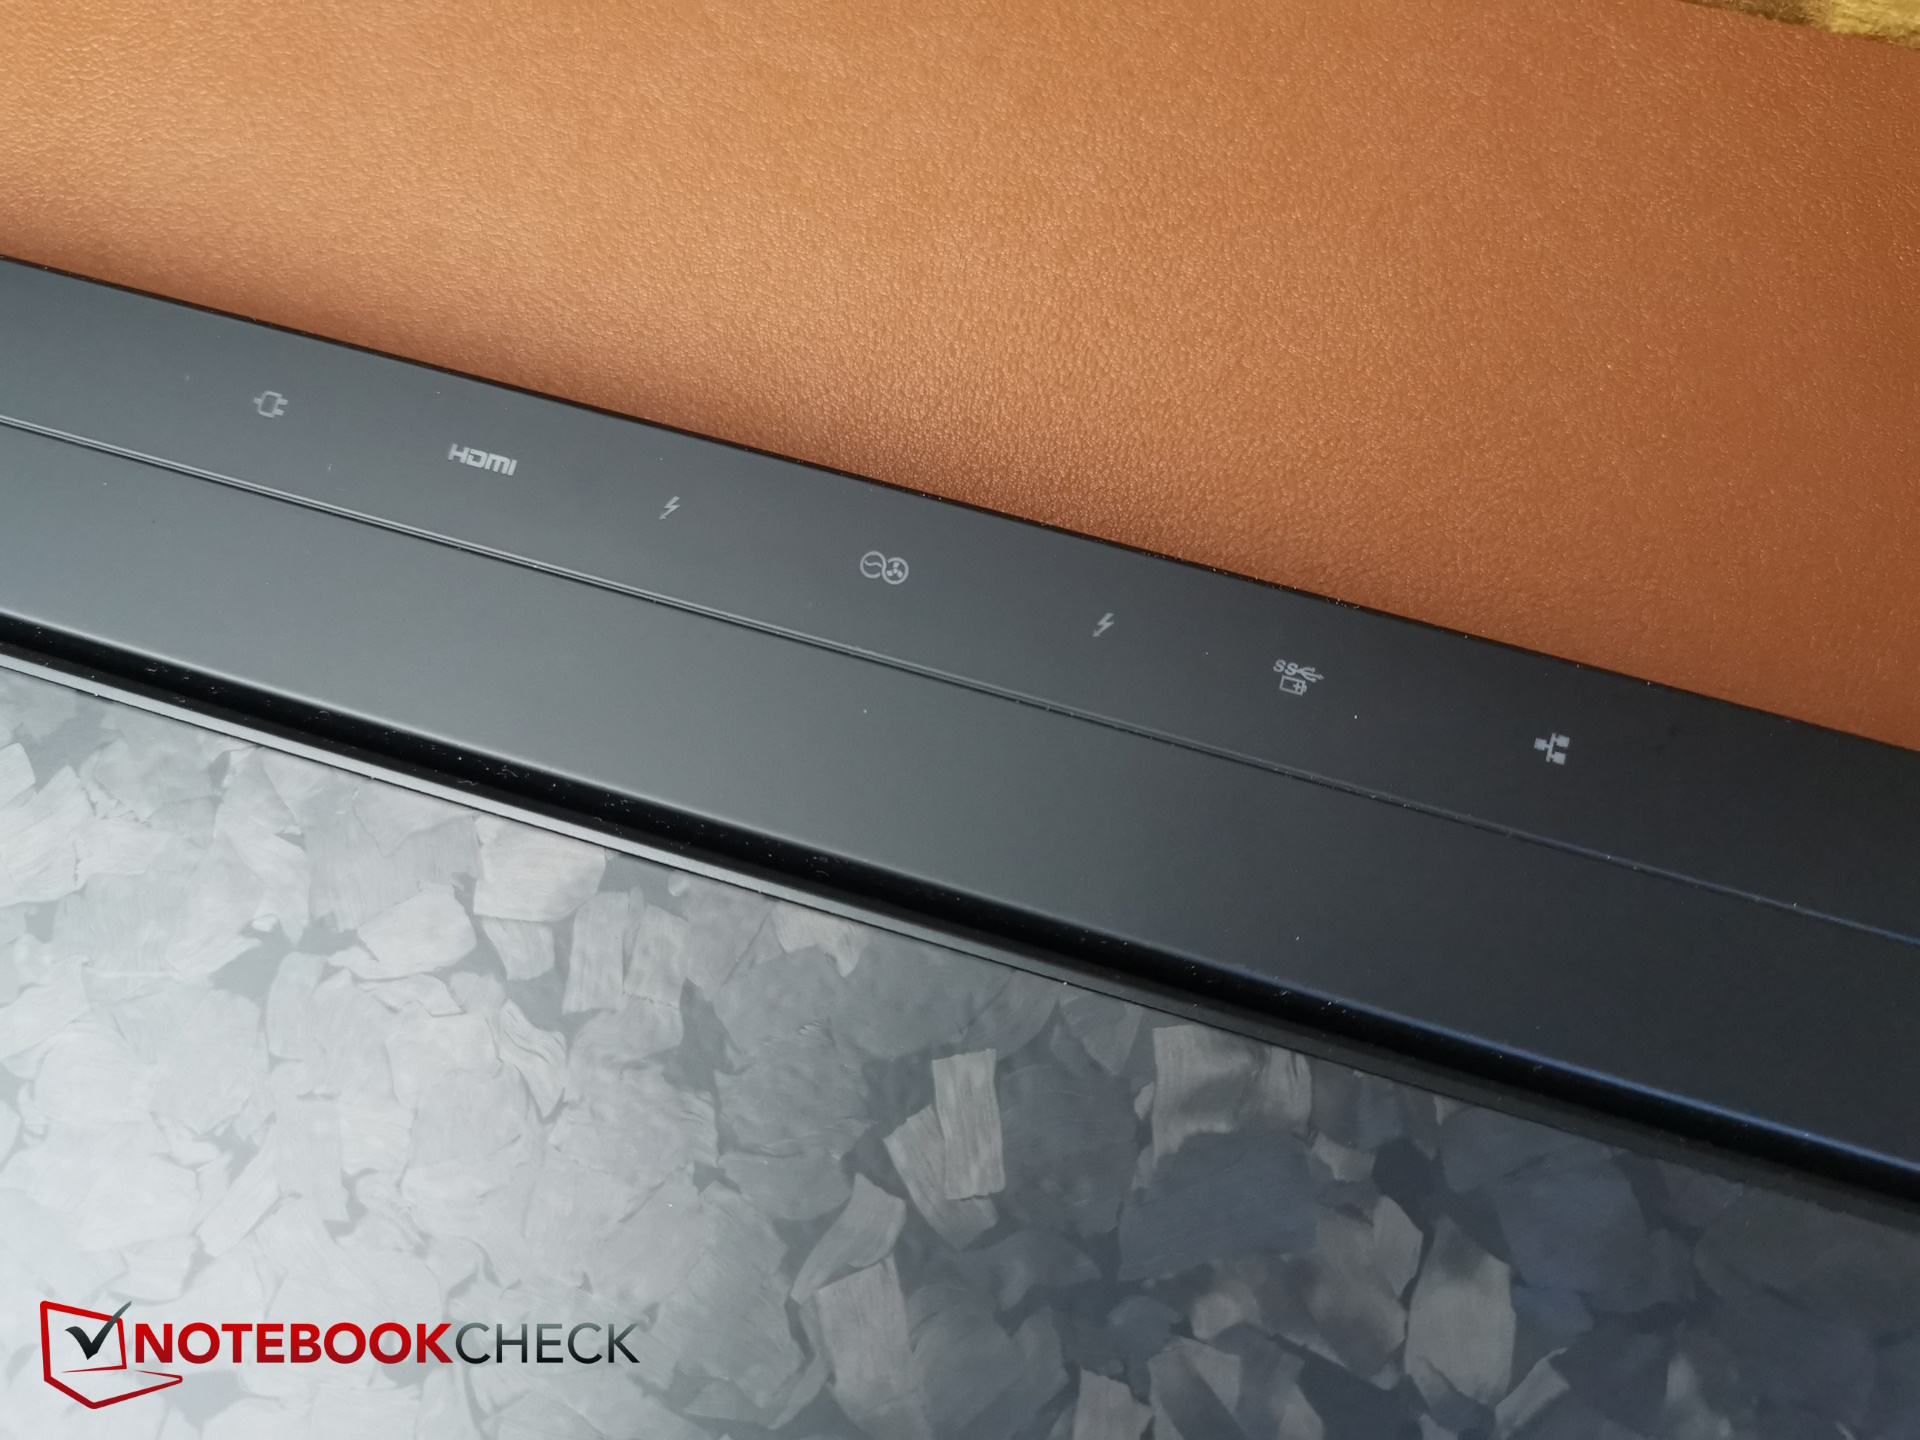
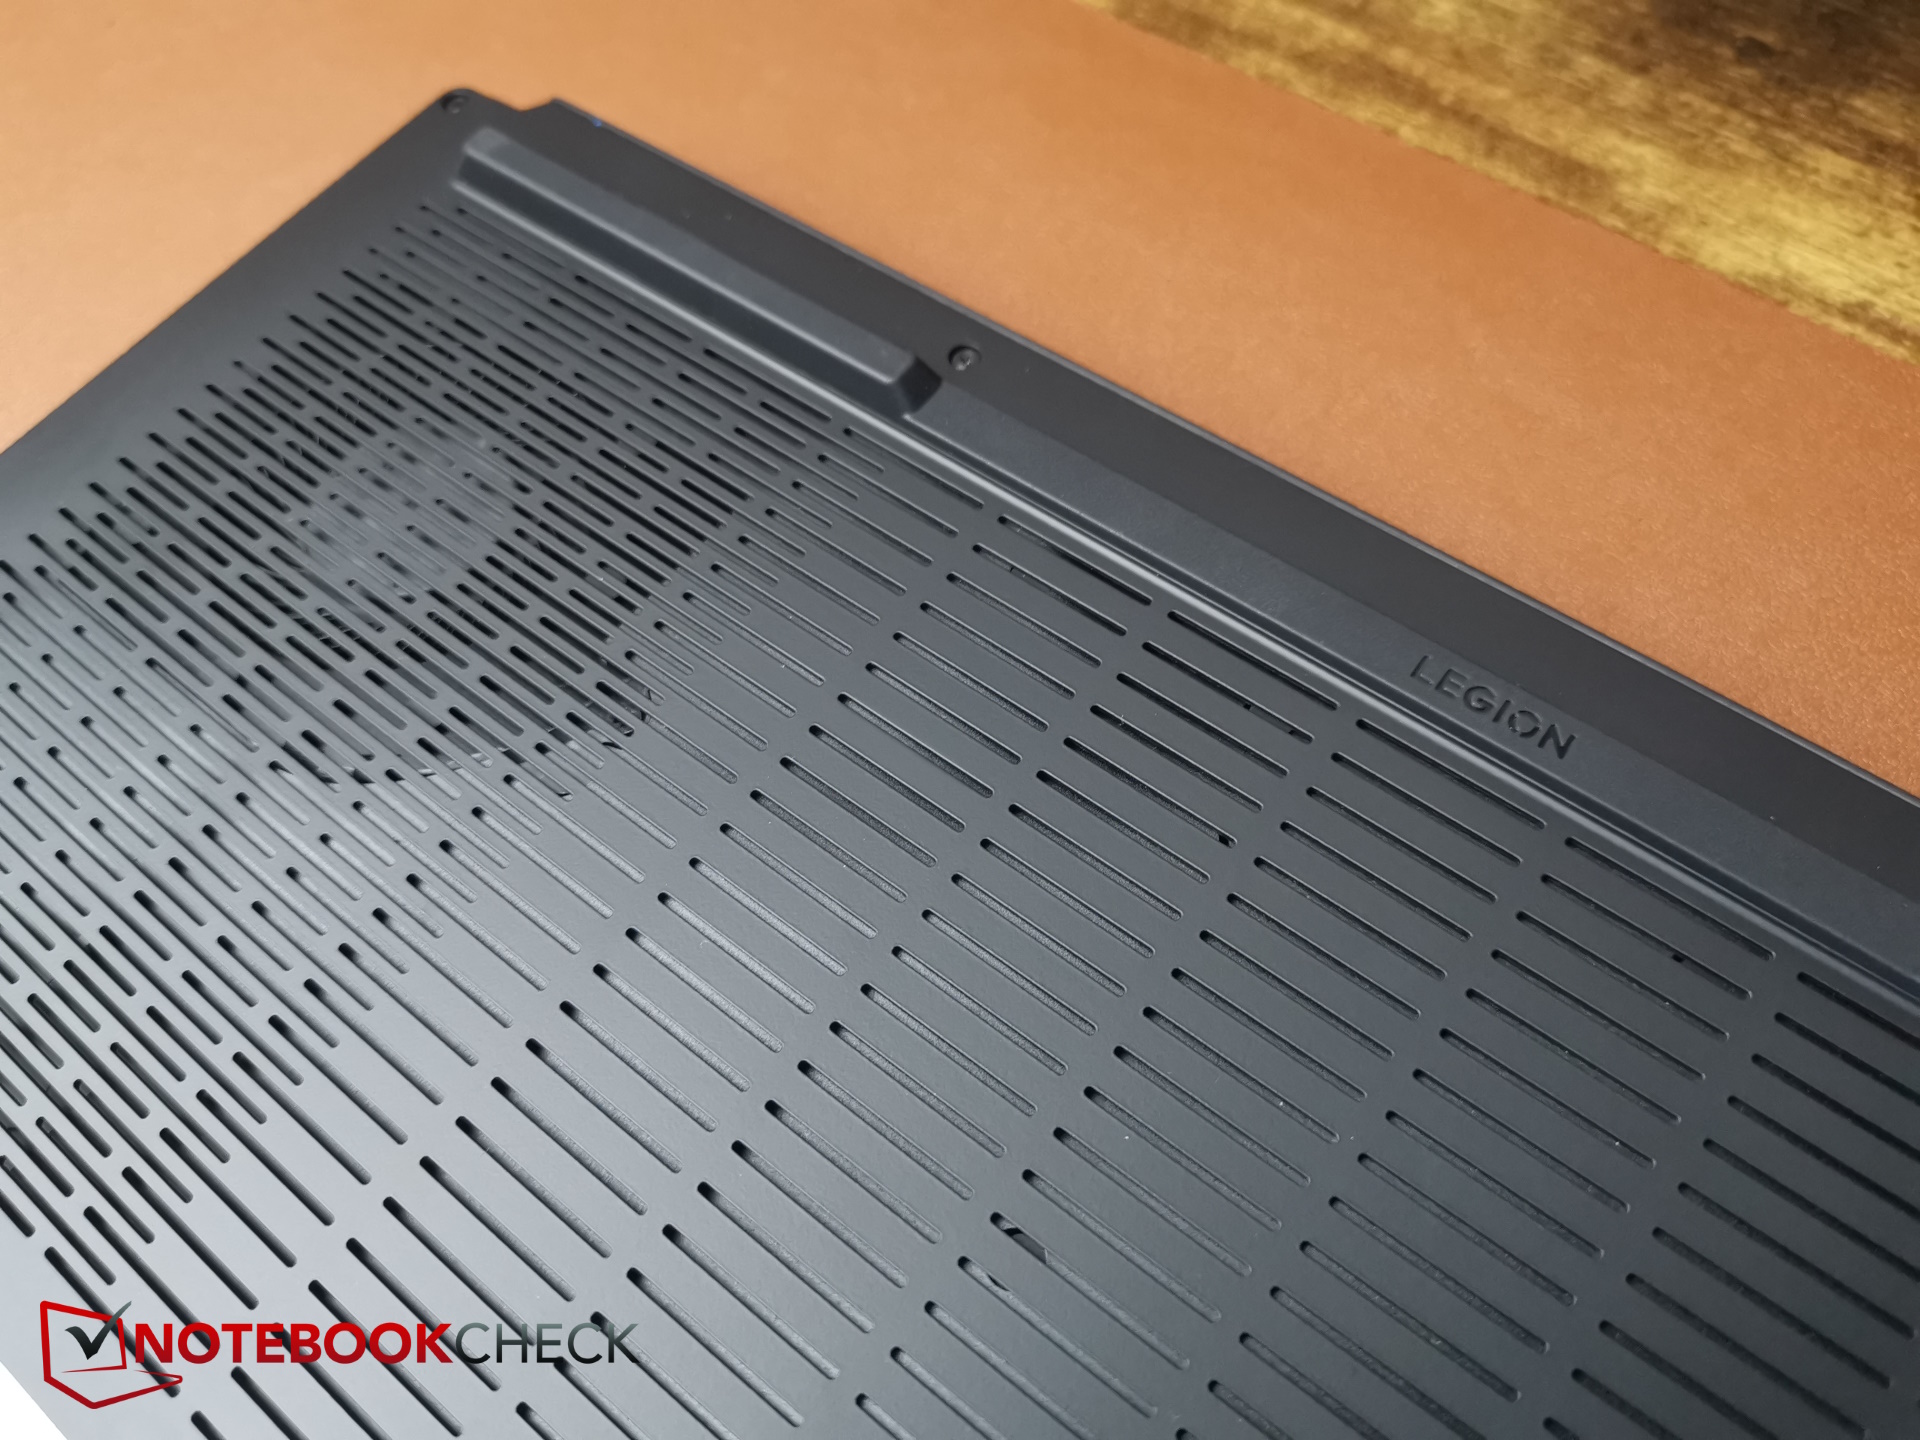
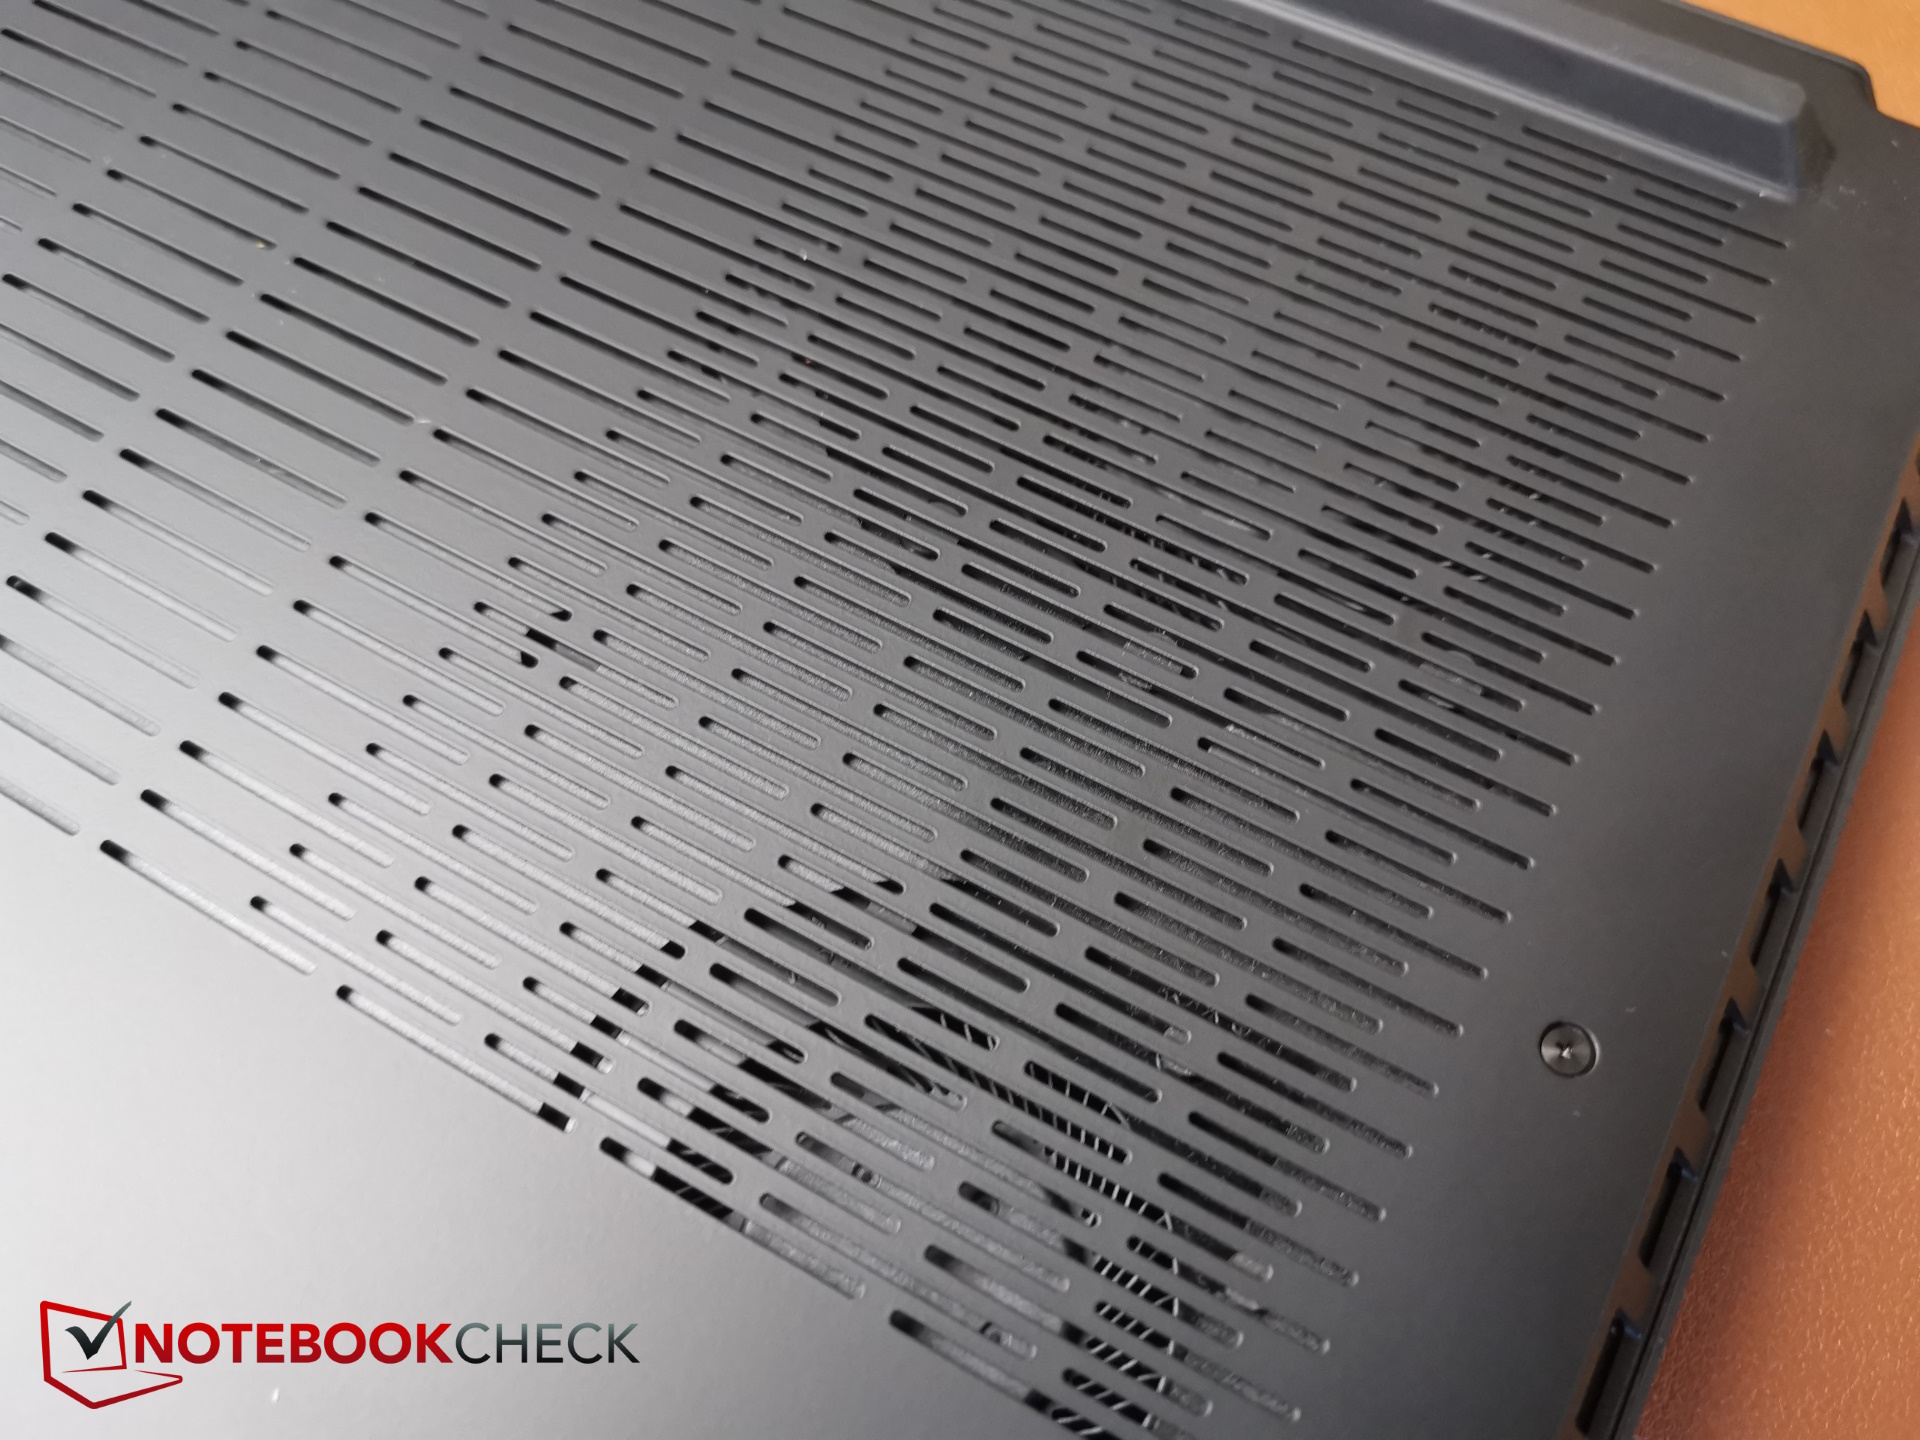
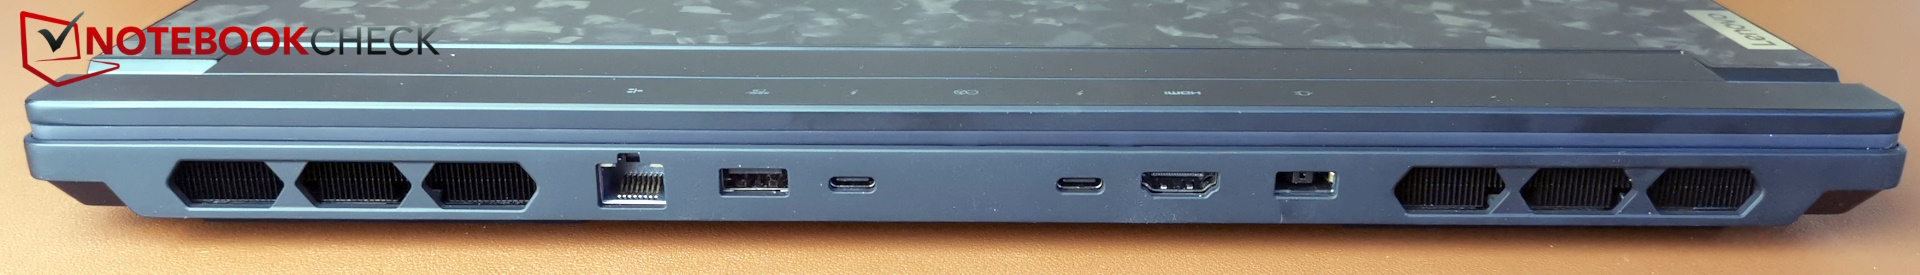
Caixa e conectividade - Carbono forjado
Como, pelo menos visualmente, tudo permaneceu igual no novo modelo, recomendamos que o senhor dê uma olhada em nossa análise do Lenovo Legion 9i Gen8 para obter informações sobre seu gabinete forjado em carbono, opções de manutenção e dispositivos de entrada.
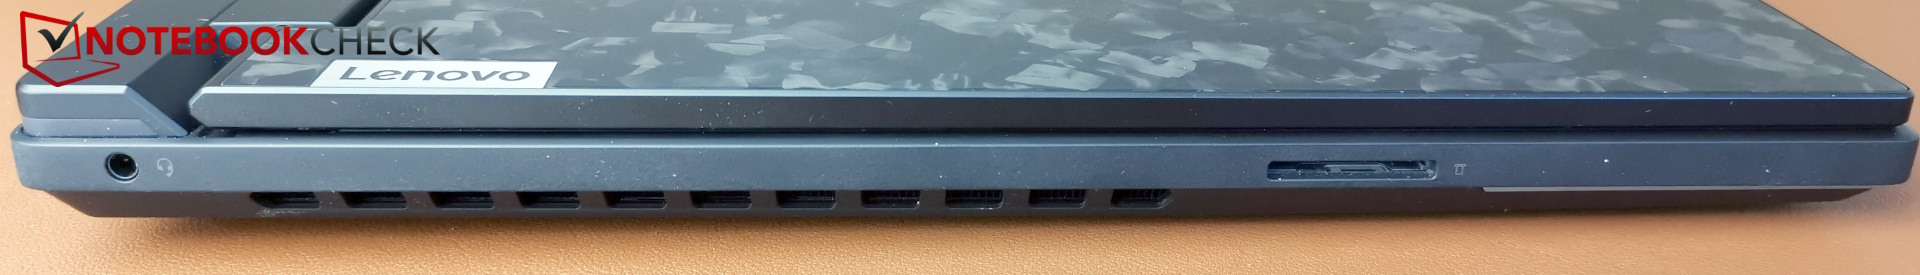
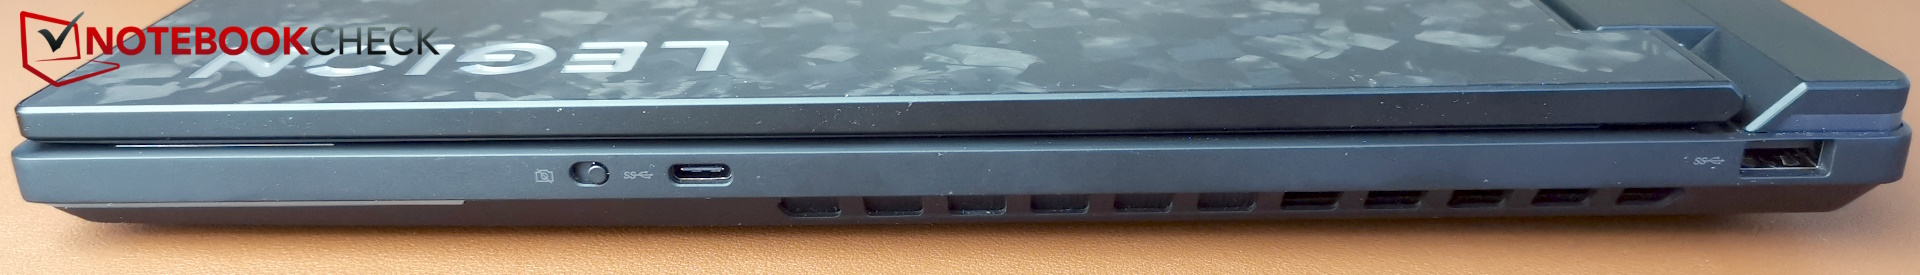
Leitor de cartão SD
Para um laptop de última geração, as taxas de transferência do leitor de cartão SD são decepcionantes. Elas são um pouco piores do que as do ano passado e estão a quilômetros de distância das taxas de transferência de um Razer Blade 16 ou Alienware m18 R2.
| SD Card Reader | |
| average JPG Copy Test (av. of 3 runs) | |
| Alienware m18 R2 (Toshiba Exceria Pro SDXC 64 GB UHS-II) | |
| Razer Blade 16 2024, RTX 4090 | |
| Média da turma Gaming (19 - 197.3, n=68, últimos 2 anos) | |
| Lenovo Legion 9 16IRX8 (Toshiba Exceria Pro SDXC 64 GB UHS-II) | |
| Medion Erazer Beast X40 2024 (AV PRO microSD 128 GB V60) | |
| Lenovo Legion 9 16IRX9, RTX 4090 | |
| maximum AS SSD Seq Read Test (1GB) | |
| Alienware m18 R2 (Toshiba Exceria Pro SDXC 64 GB UHS-II) | |
| Razer Blade 16 2024, RTX 4090 | |
| Média da turma Gaming (25.8 - 263, n=67, últimos 2 anos) | |
| Medion Erazer Beast X40 2024 (AV PRO microSD 128 GB V60) | |
| Lenovo Legion 9 16IRX9, RTX 4090 | |
| Lenovo Legion 9 16IRX8 (Toshiba Exceria Pro SDXC 64 GB UHS-II) | |
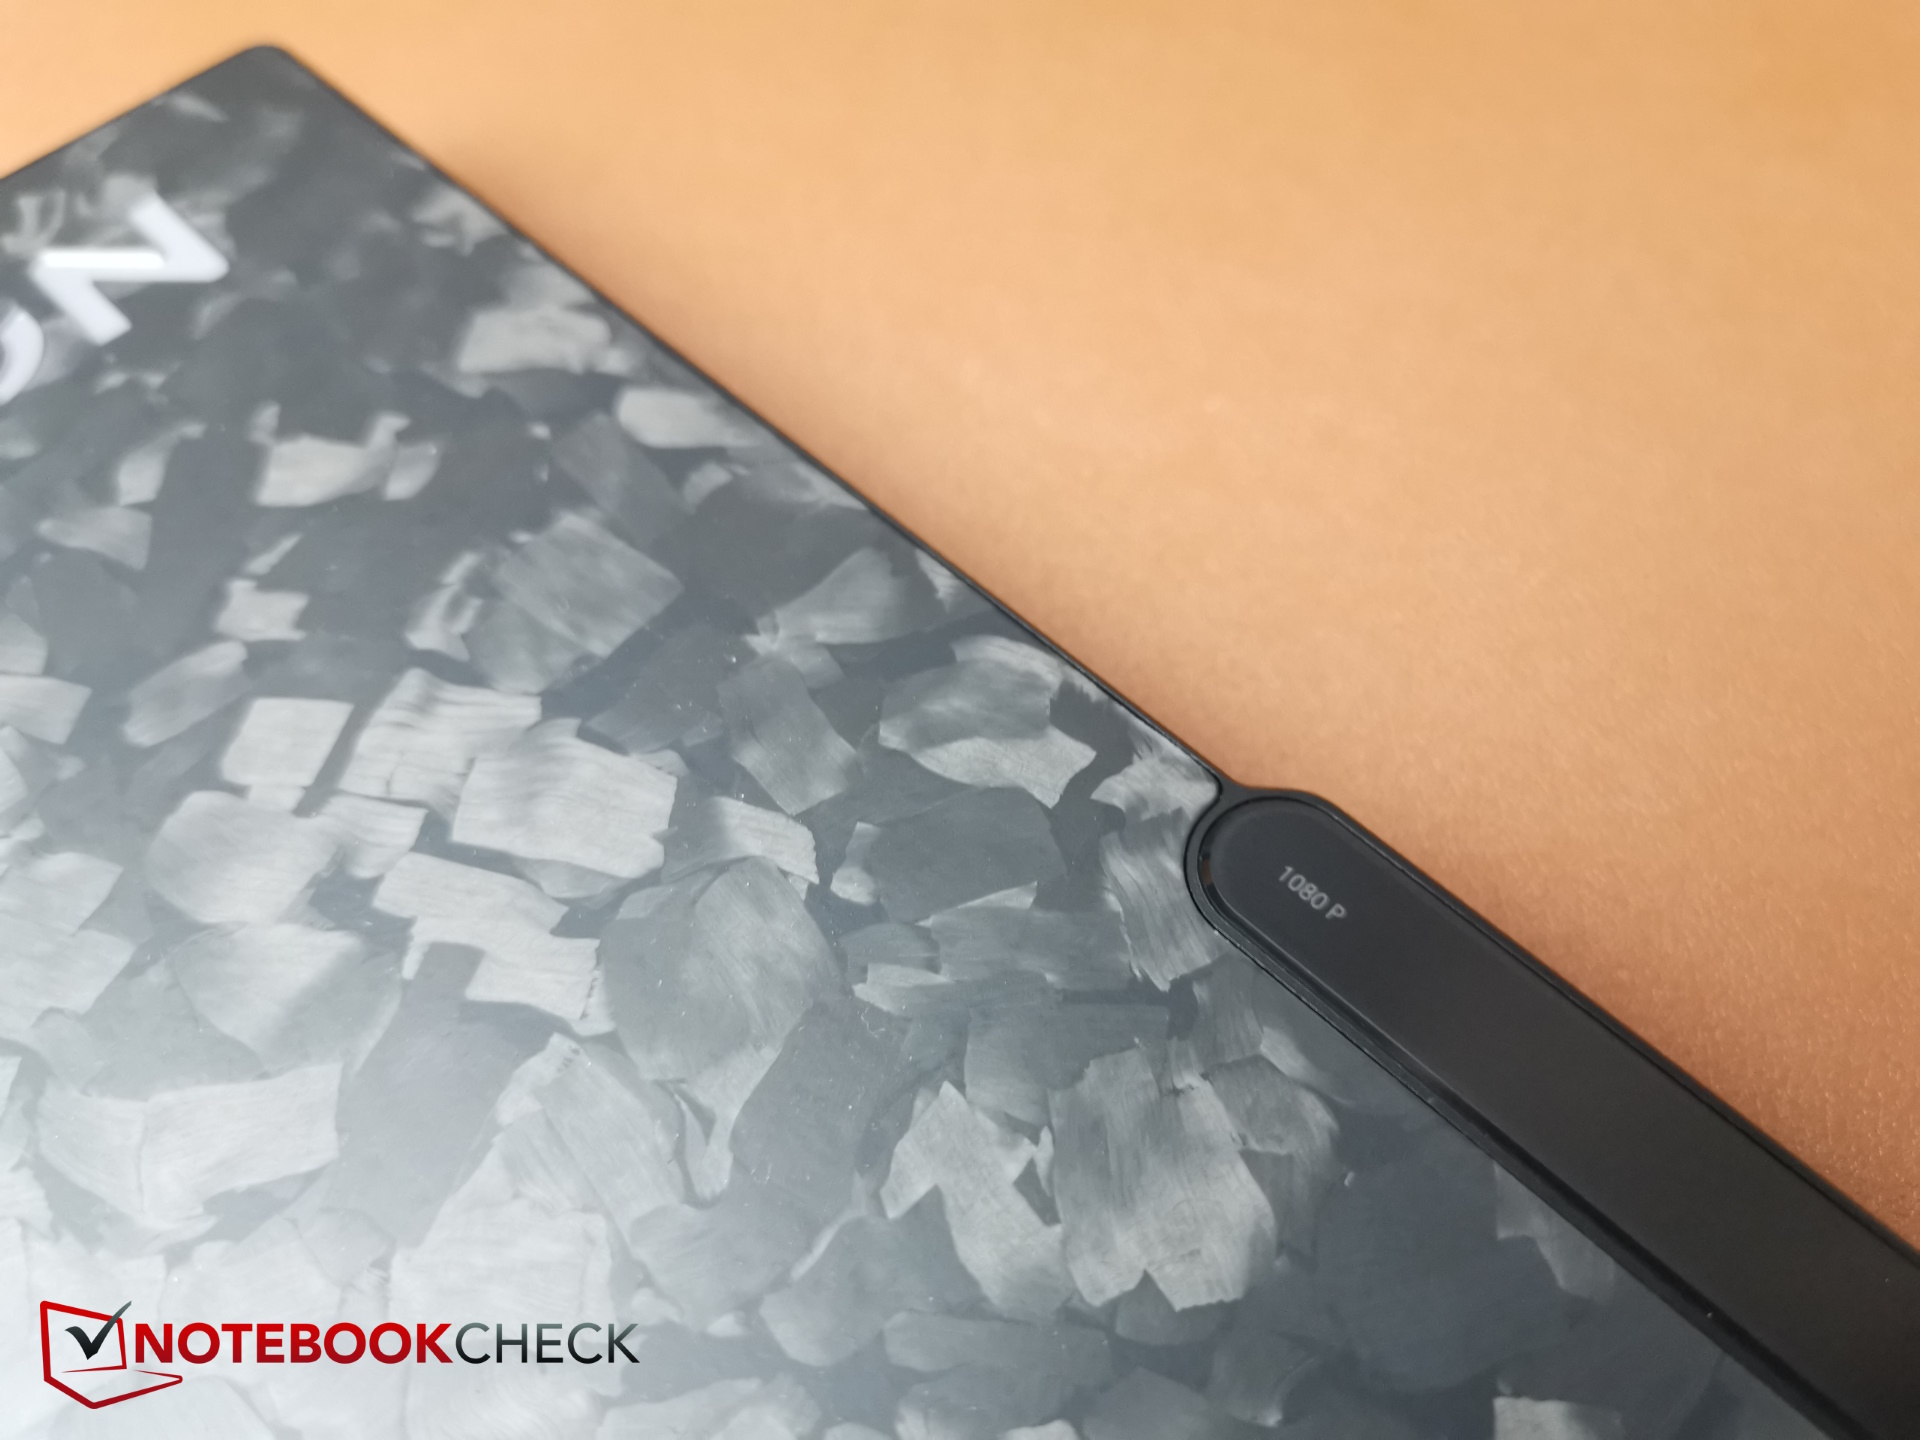
Webcam
A webcam Full HD de 1.080p tem desvios de cor médios a altos e a nitidez da imagem é boa.


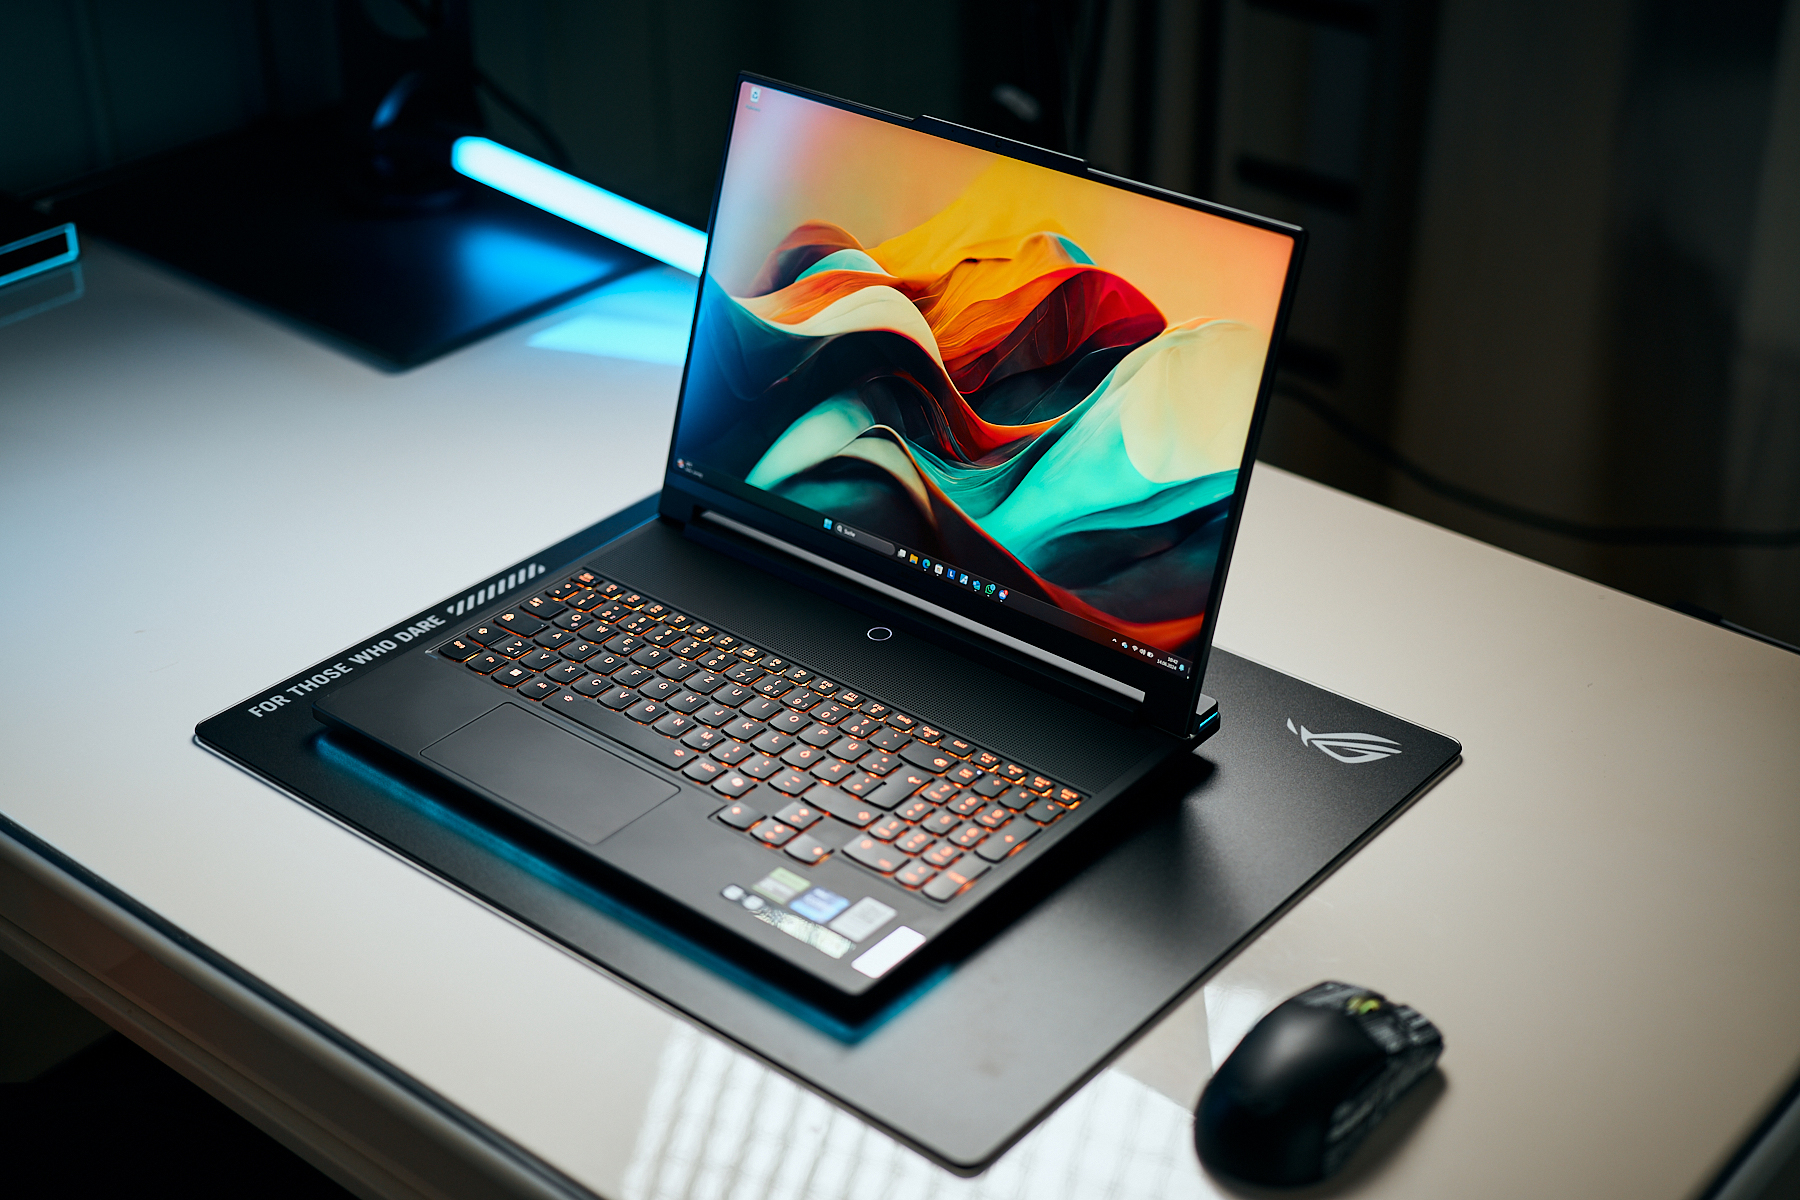
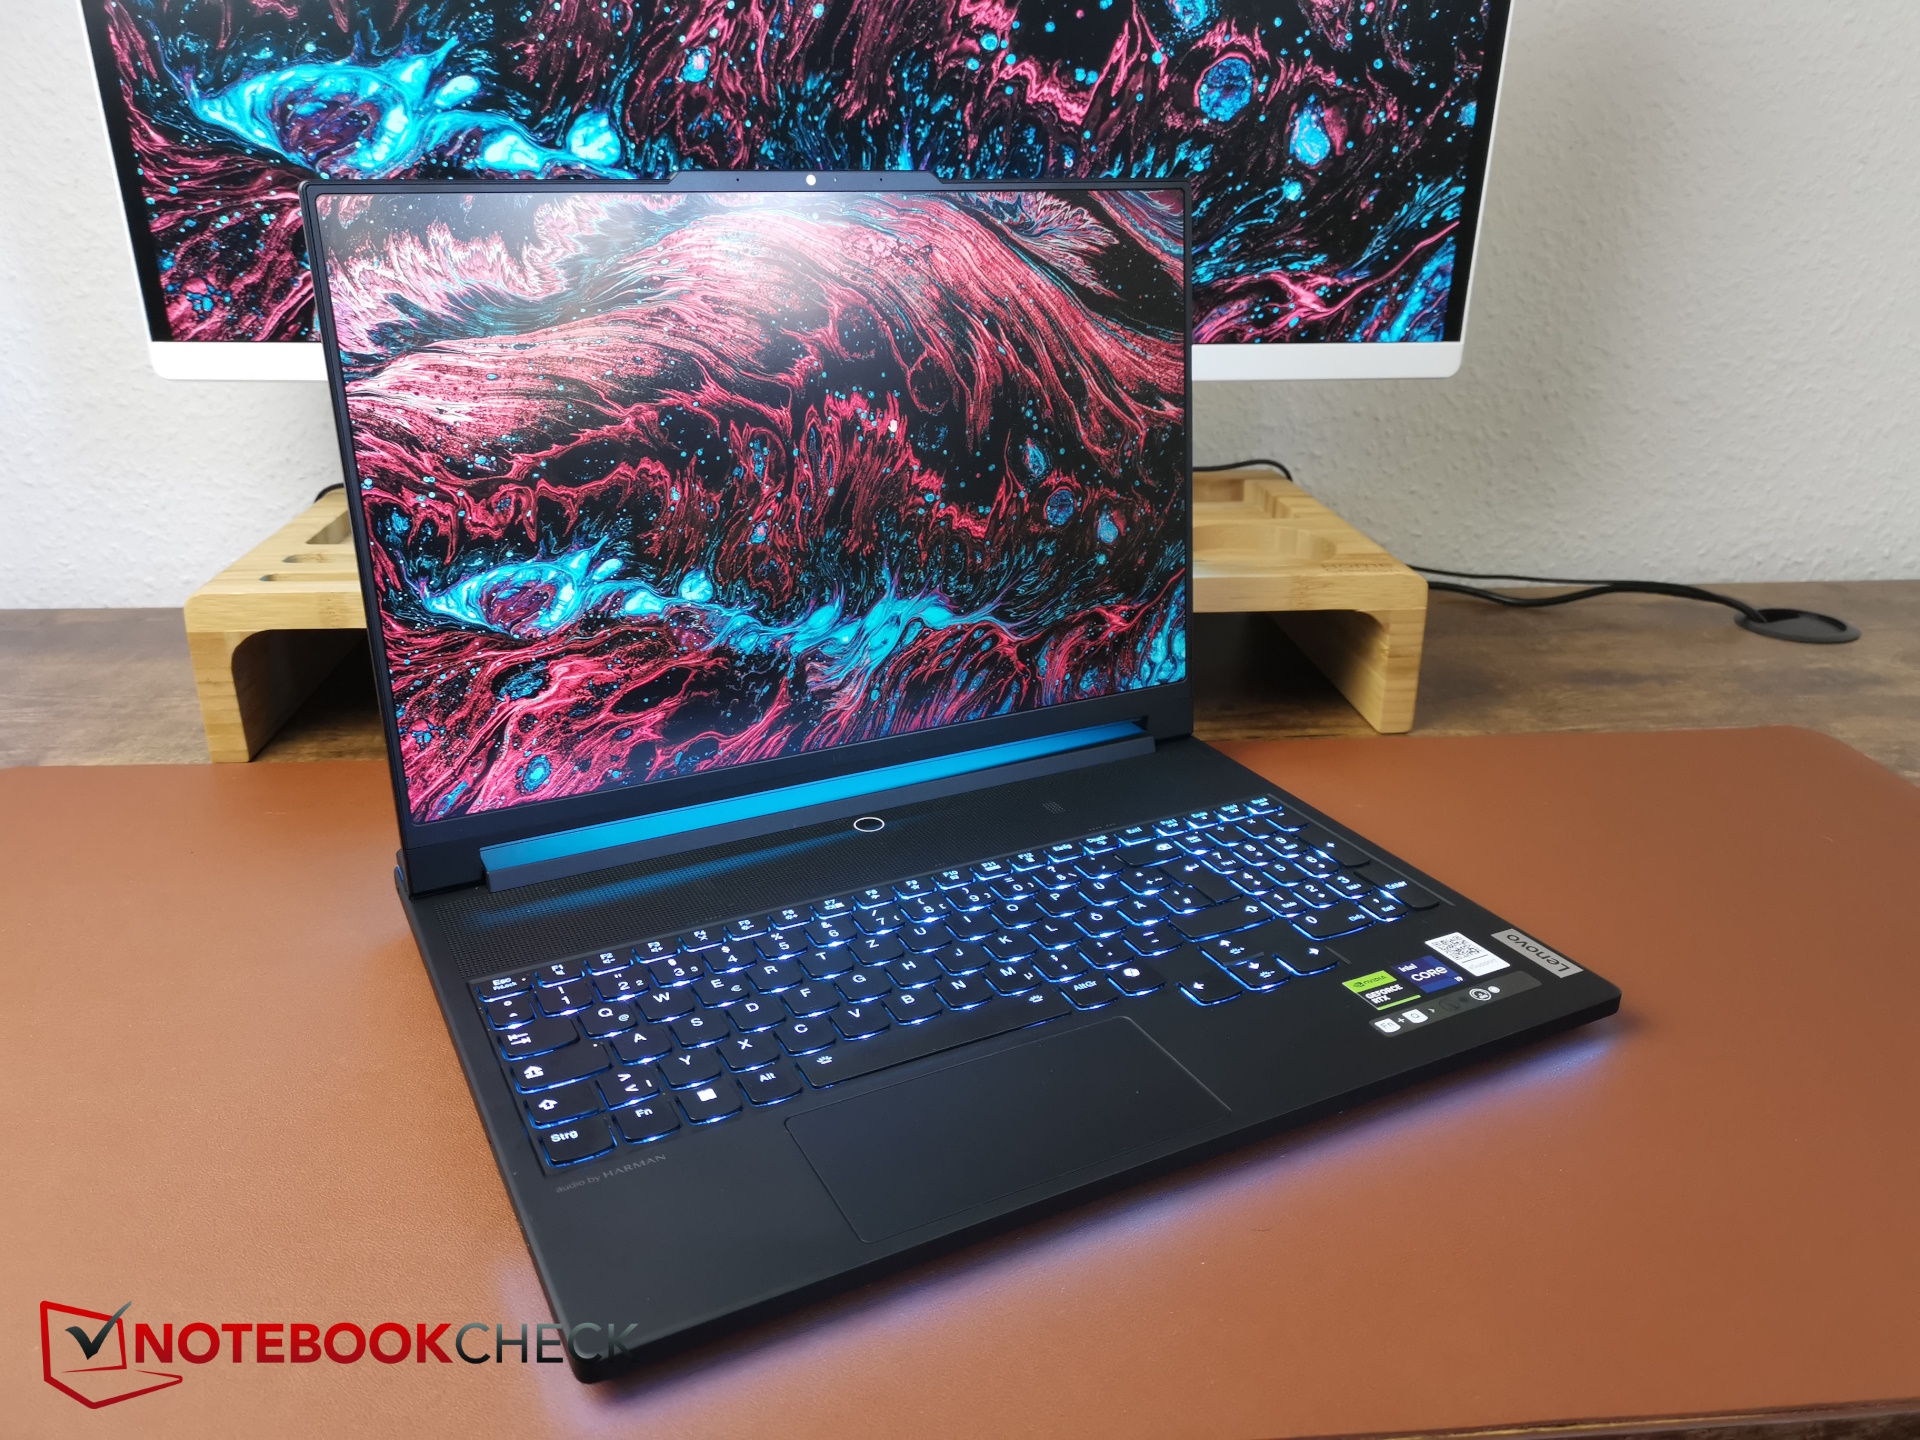
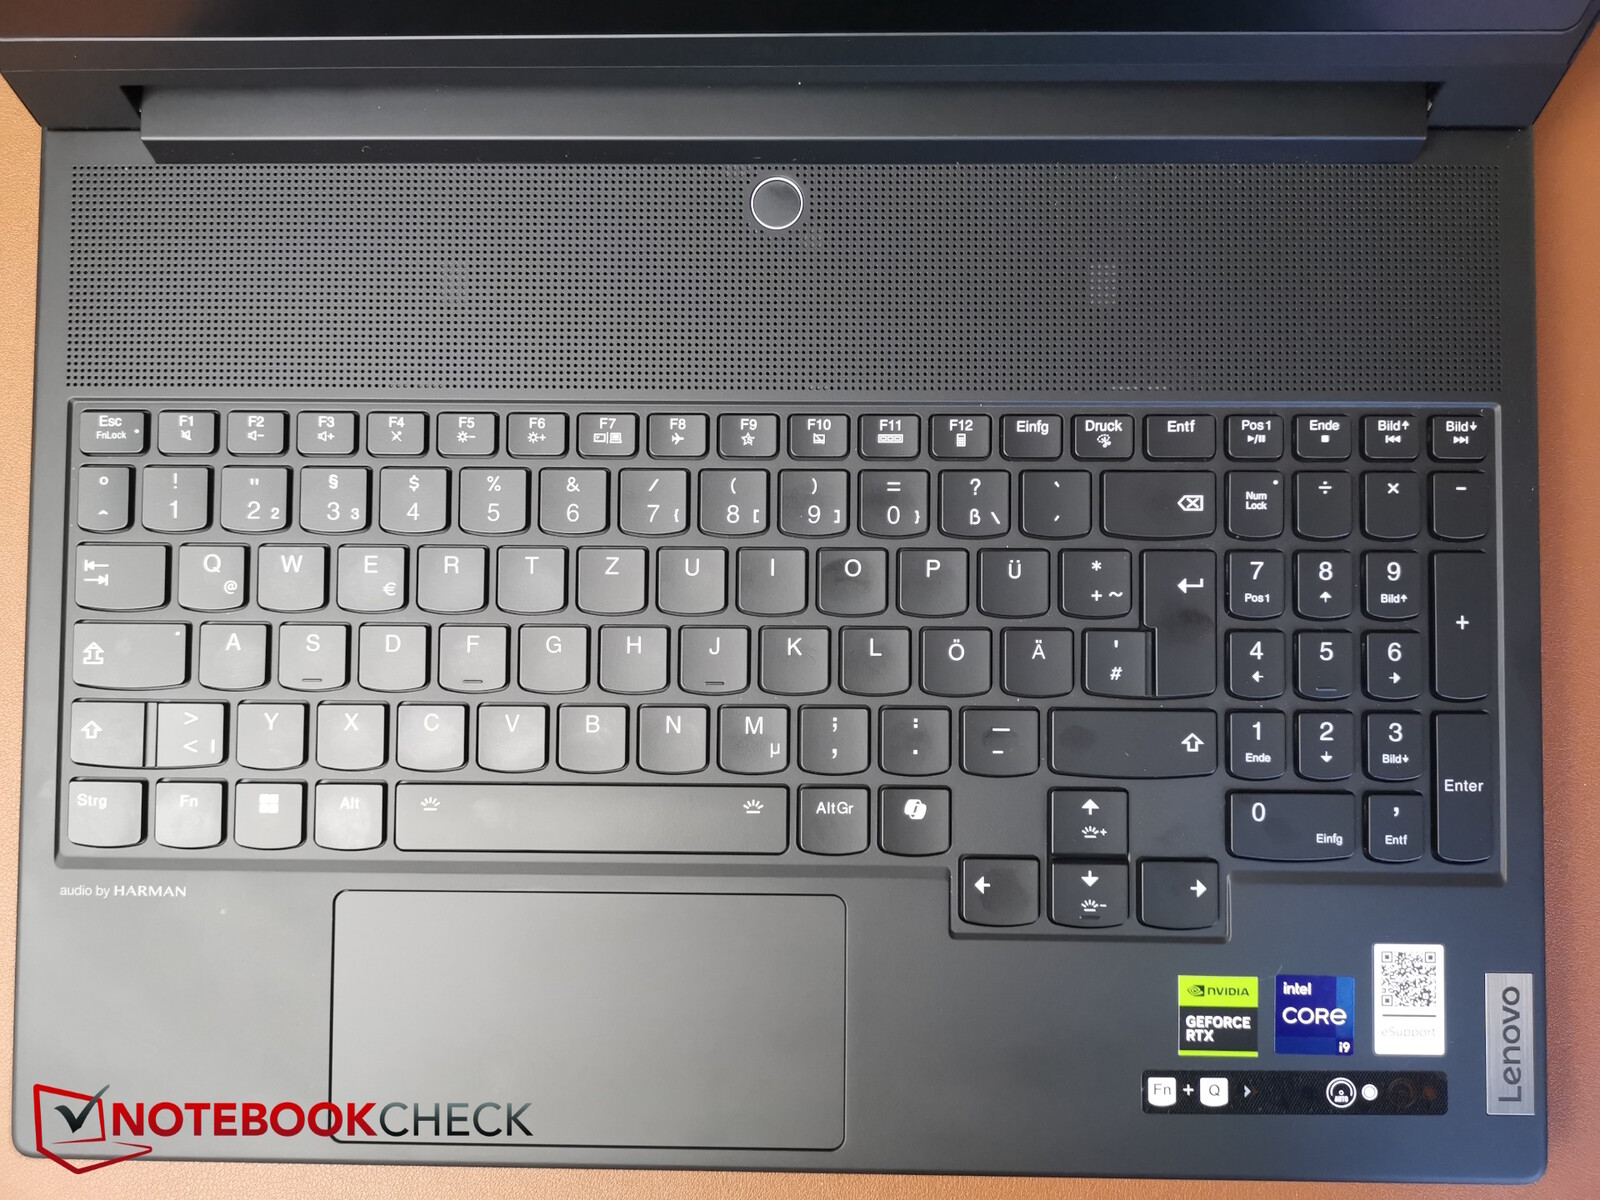
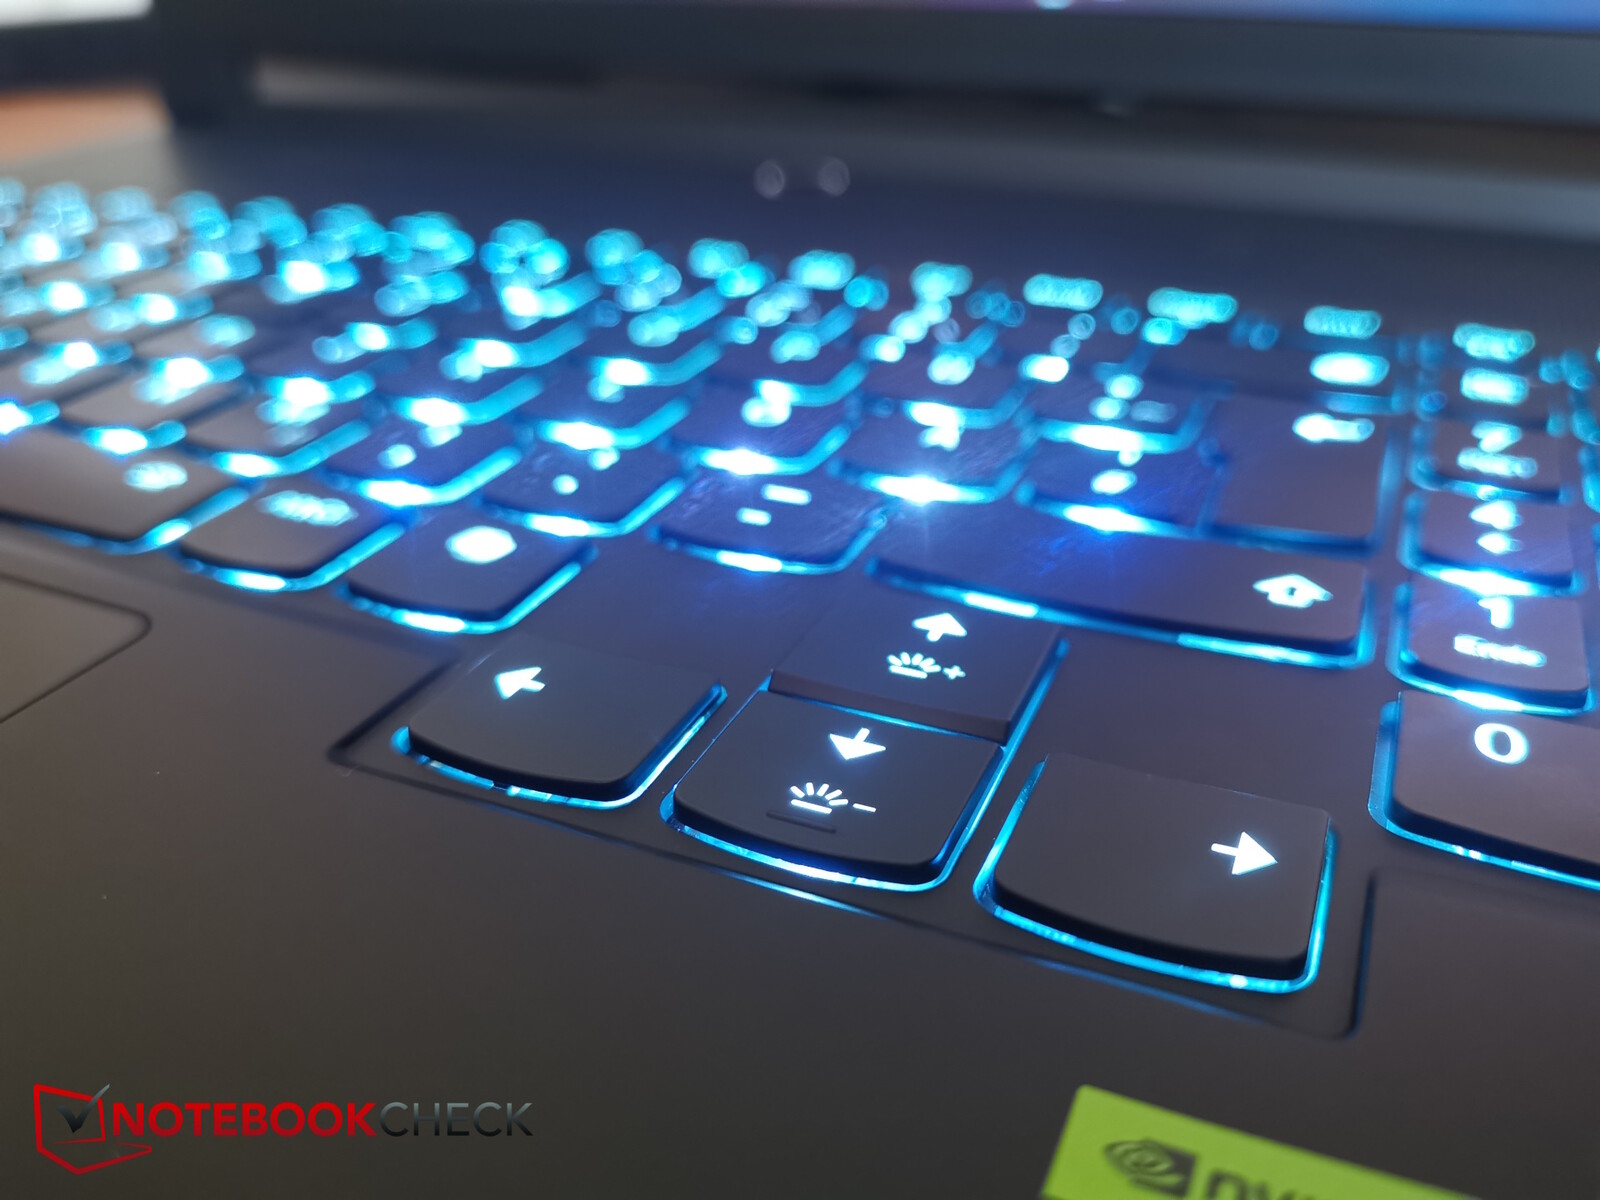
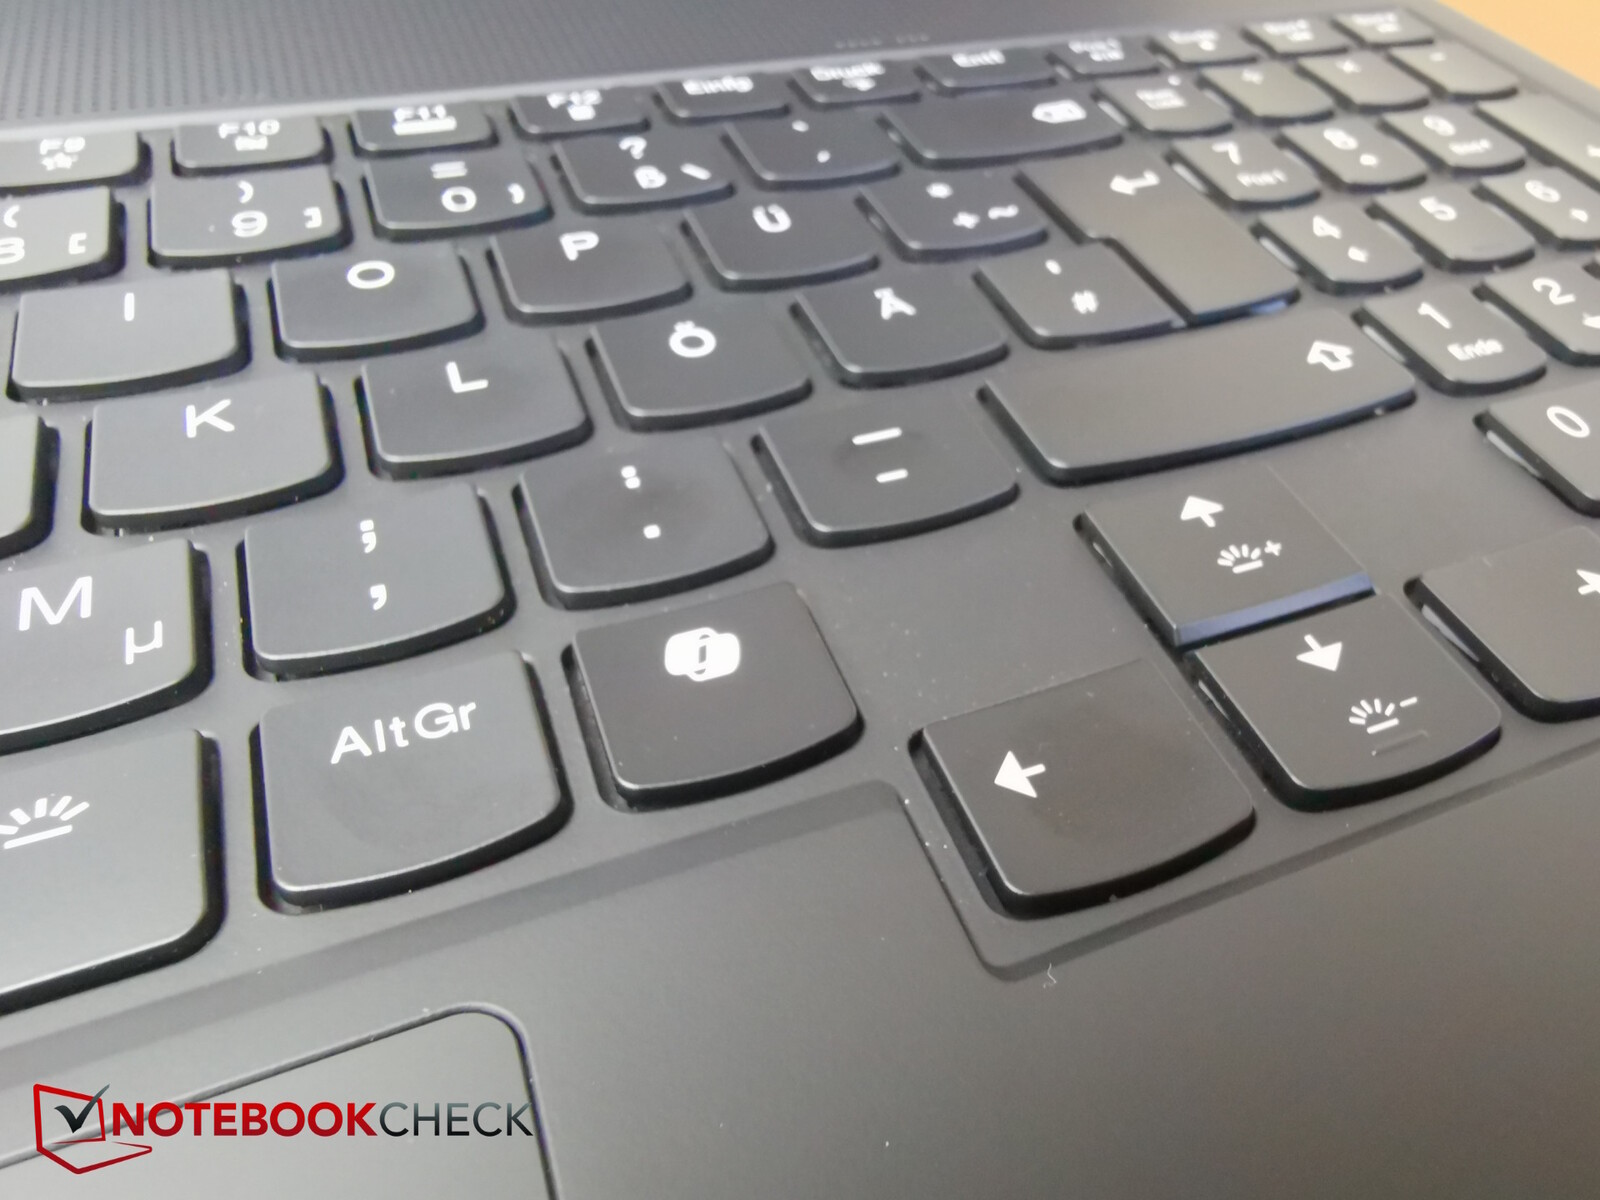
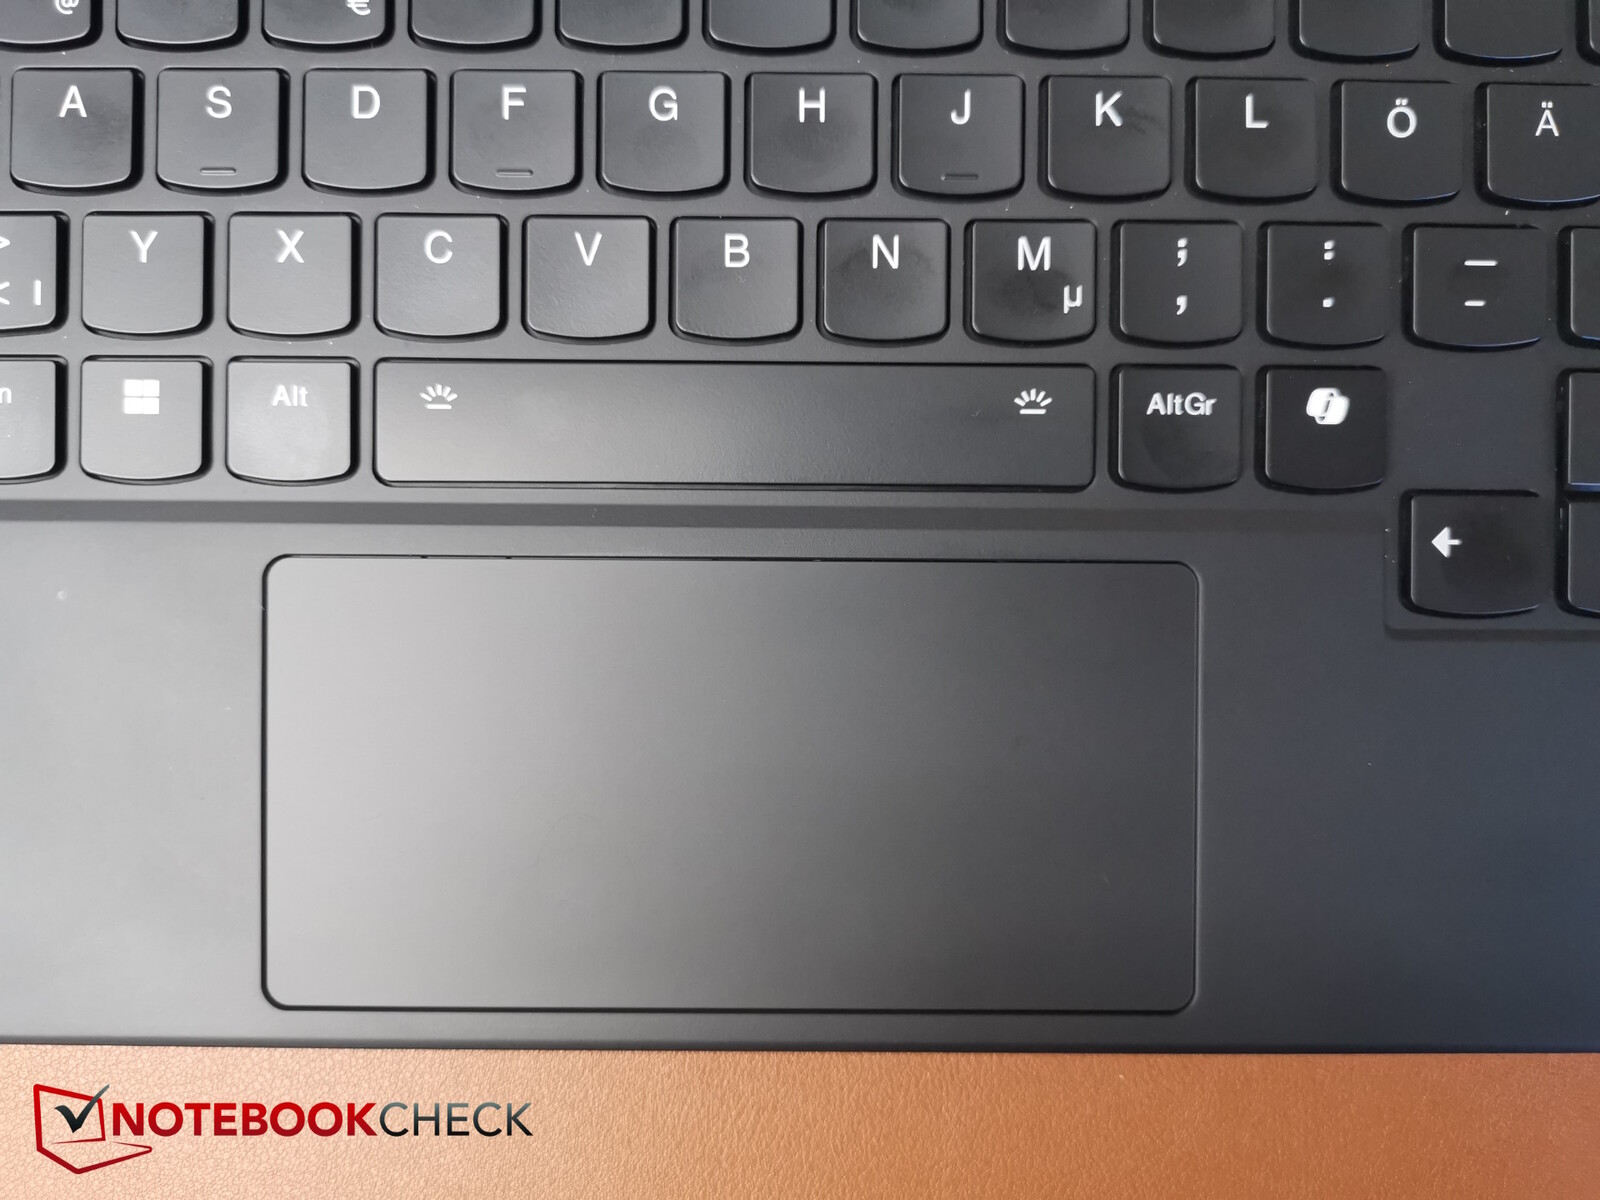
Dispositivos de entrada - Agora com o Co-Pilot
Seu confortável teclado de membrana e touchpad permanecem praticamente inalterados. O último ainda é muito estreito, com apenas 5,9 cm. Uma tecla Co-Pilot foi adicionada ao teclado. A tecla Ctrl do lado direito teve que dar lugar a ela.
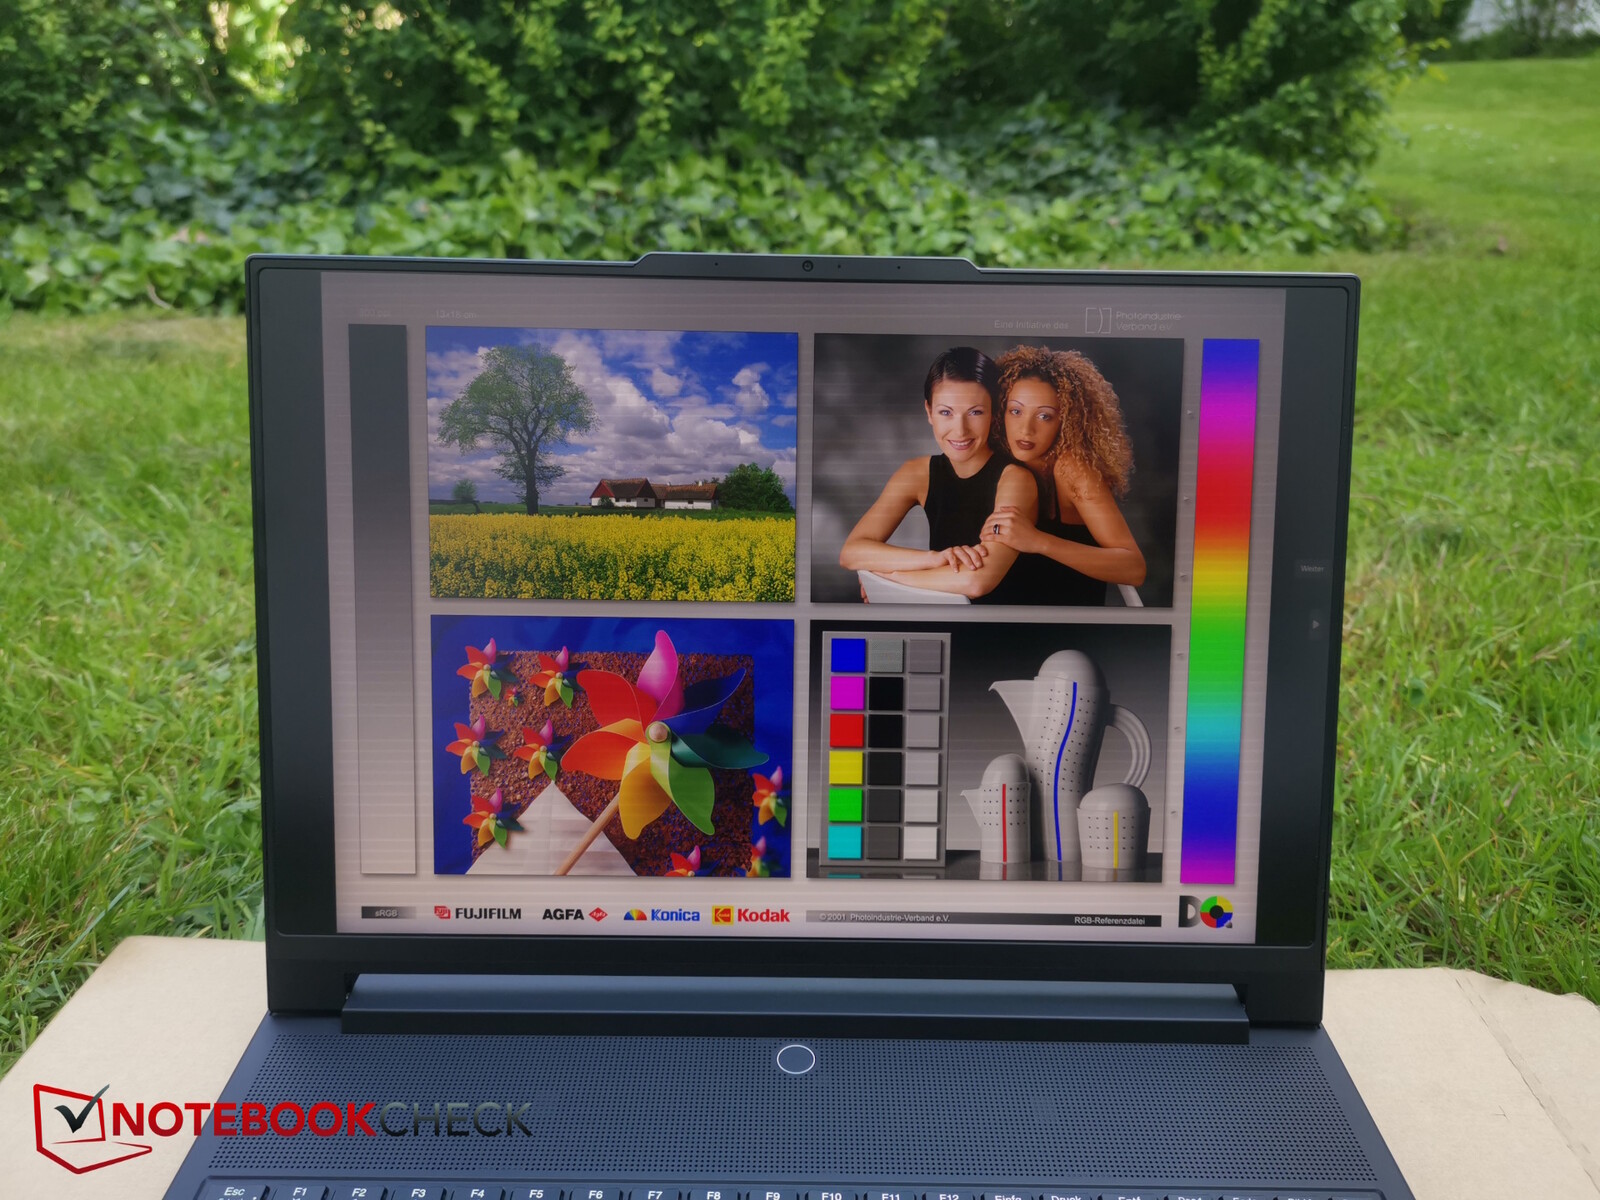
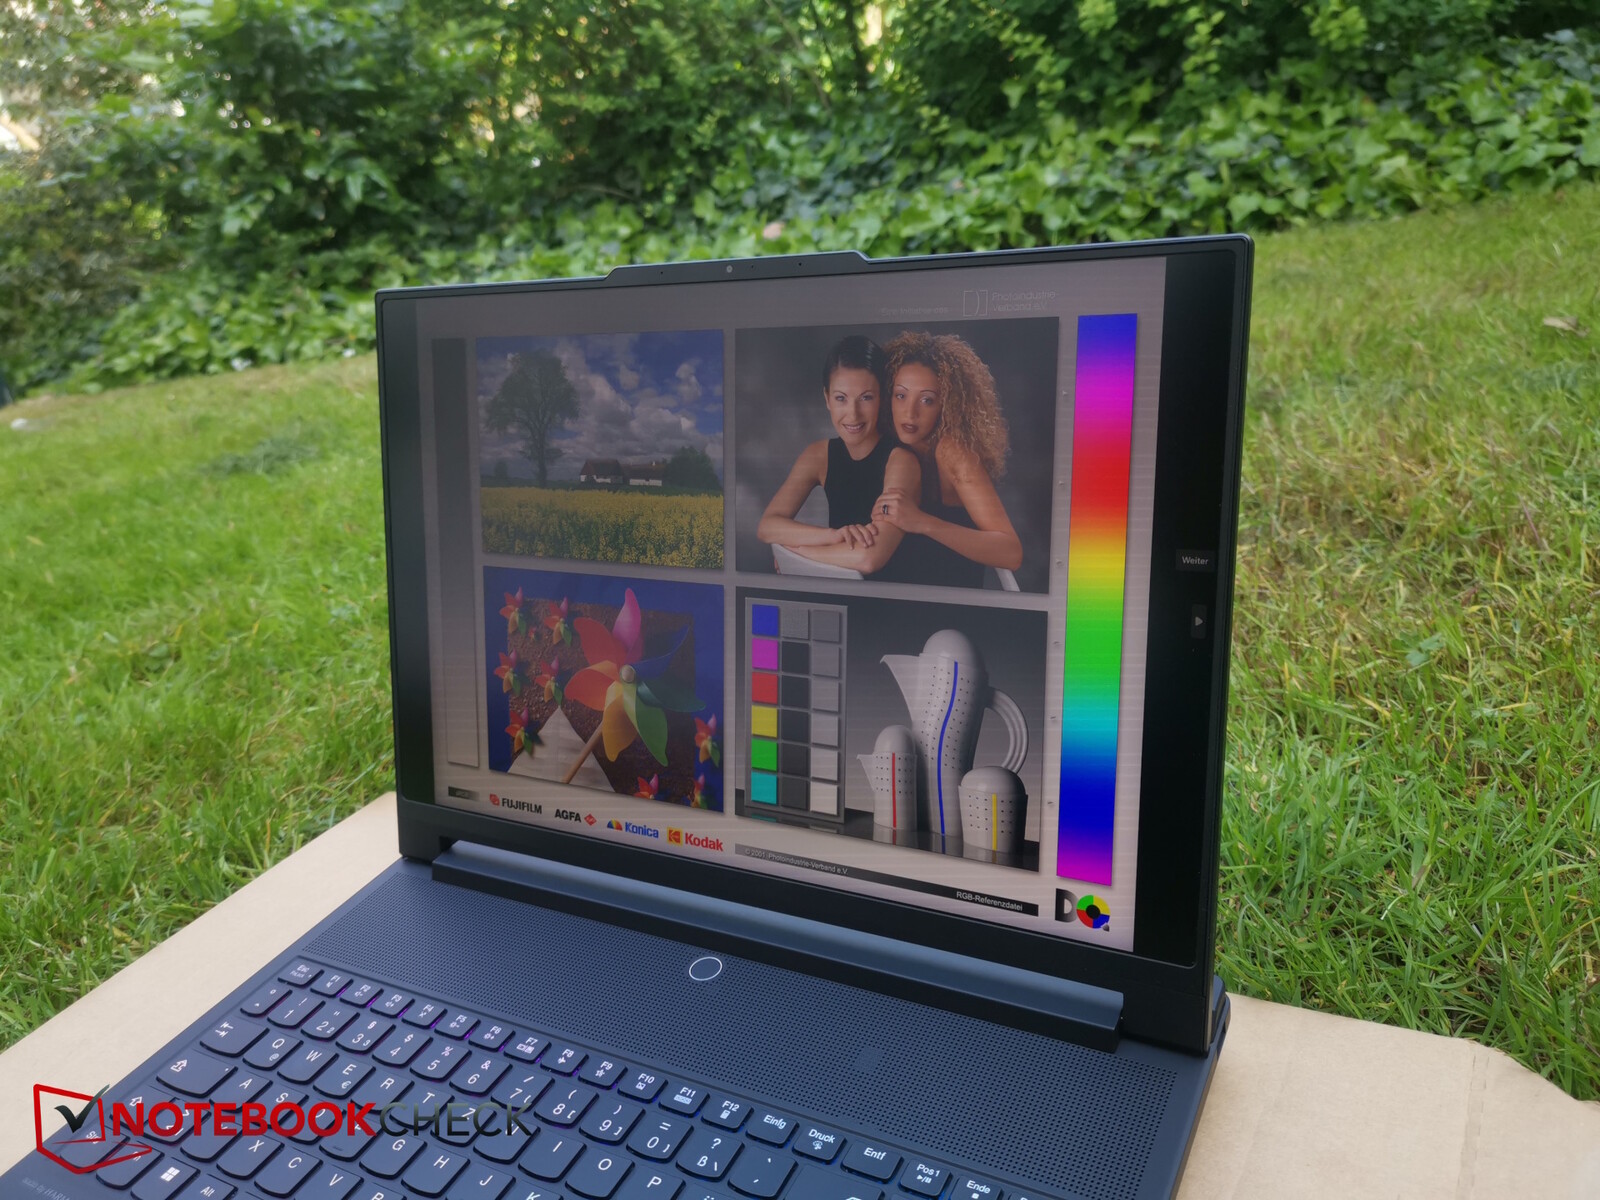
Tela - MiniLED de 1.200 nits
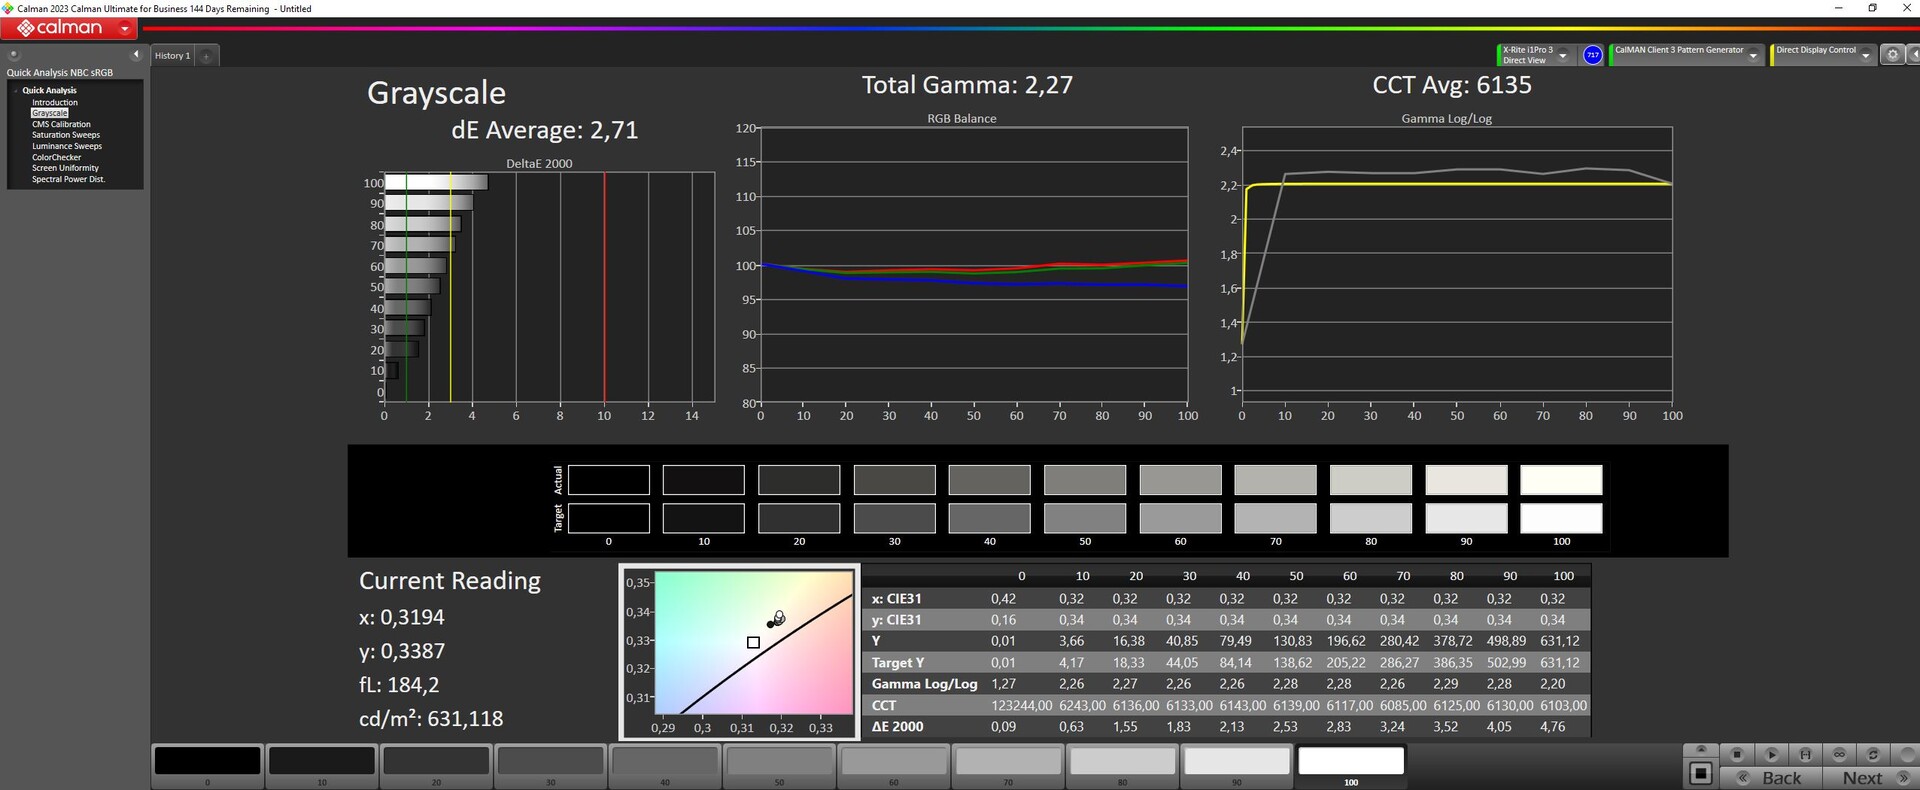
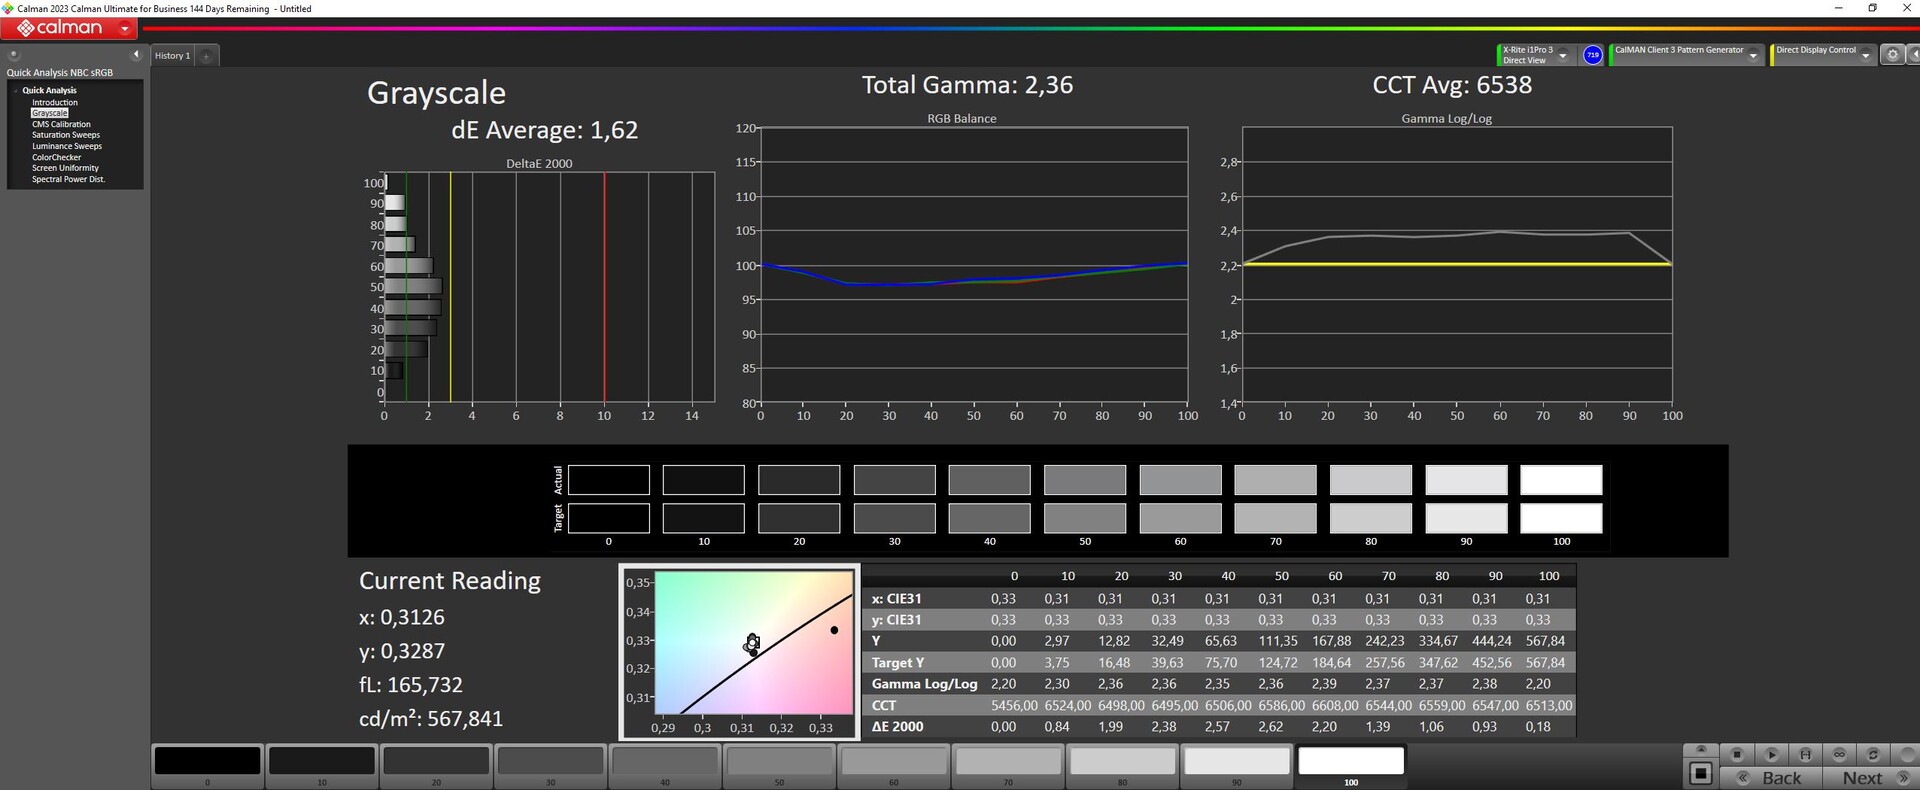
A minitela LED 3.2K (3.200 x 2.000) de 16 polegadas com Dolby Vision e G-Sync ainda é uma das principais atrações do Legion 9. Diz-se que ela tem um brilho de até 1.200 nits e, portanto, atende ao padrão HDR 1000. Na verdade, medimos mais de 1.000 nits no modo HDR.
No modo SD com melhor precisão de cores, a tela ainda brilha com uma média de 664 nits! Com 43% de brilho da tela, seu valor de brilho é de cerca de 150 nits, que é o valor que usamos para alguns dos nossos testes de bateria. Seu nível de preto é excelente graças aos mini LEDs que podem ser desligados em várias zonas, o que resulta em contrastes muito altos.
Não há nenhum sangramento da luz de fundo e os tempos de resposta também são suficientemente rápidos, embora não cheguem ao nível do OLED, é claro. Conseguimos medir o PWM, embora em uma frequência bastante alta de 5 kHz a 40 kHz, o que não deve ser um problema, mesmo para pessoas sensíveis.
| |||||||||||||||||||||||||
iluminação: 91 %
iluminação com acumulador: 630 cd/m²
Contraste: 21033:1 (Preto: 0.03 cd/m²)
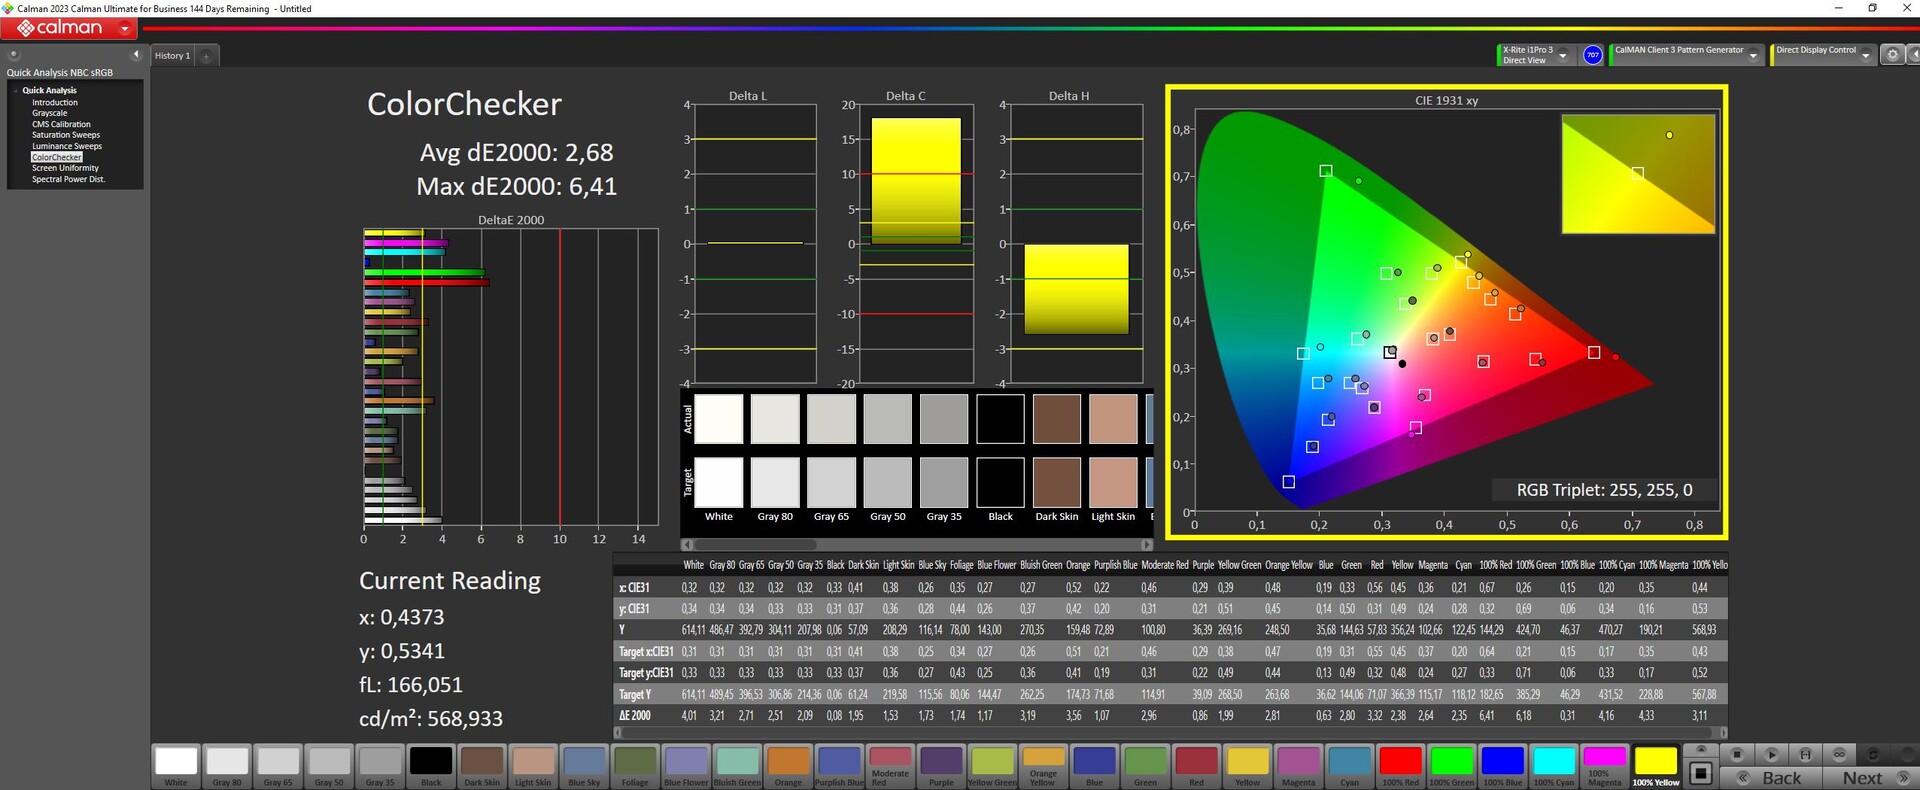
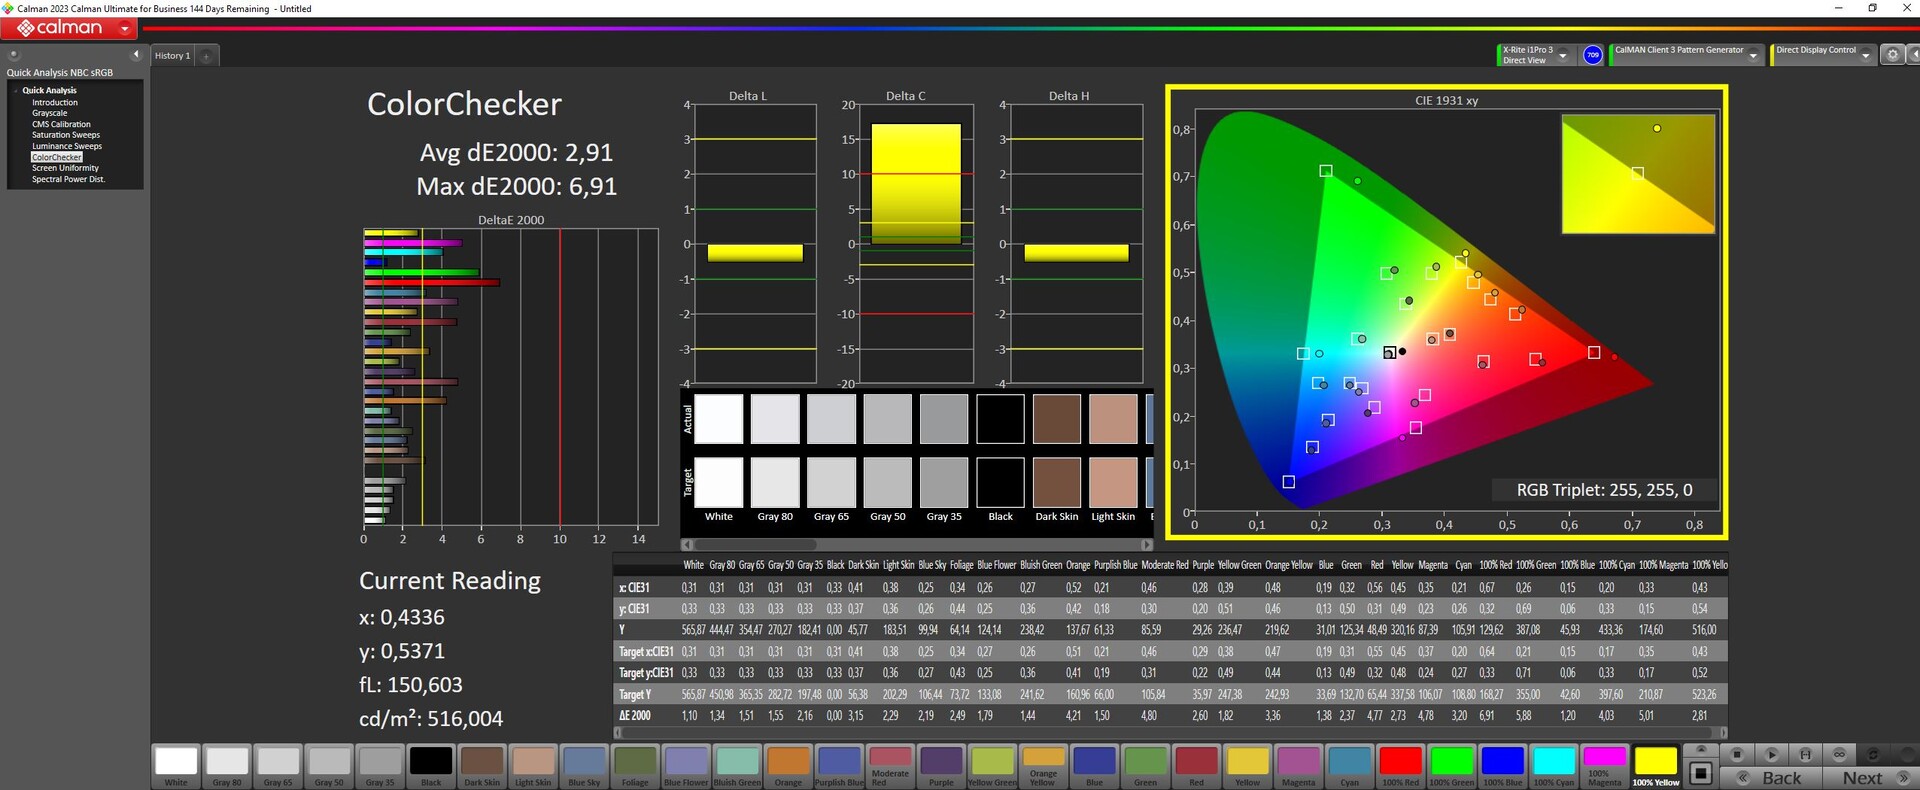
ΔE Color 2.68 | 0.5-29.43 Ø4.87, calibrated: 2.68
ΔE Greyscale 2.71 | 0.5-98 Ø5.1
86.6% AdobeRGB 1998 (Argyll 2.2.0 3D)
99.9% sRGB (Argyll 2.2.0 3D)
95.3% Display P3 (Argyll 2.2.0 3D)
Gamma: 2.27
| Lenovo Legion 9 16IRX9, RTX 4090 CSOT T3 MNG007ZA2-2, MiniLED, 3200x2000, 16" | Lenovo Legion 9 16IRX8 CSOT T3 MNG007ZA2-2, Mini-LED, 3200x2000, 16" | Razer Blade 16 2024, RTX 4090 Samsung SDC41AB (ATNA60DL03-0), OLED, 2560x1600, 16" | Alienware m18 R2 BOE NE18NZ1, IPS, 2560x1600, 18" | Asus ROG Strix Scar 18 G834JYR (2024) BOE NE180QDM-NM1, Mini LED, 2560x1600, 18" | Medion Erazer Beast X40 2024 BOE NE170QDM-NZ1, IPS, 2560x1600, 17" | |
|---|---|---|---|---|---|---|
| Display | 1% | 5% | 2% | 3% | -16% | |
| Display P3 Coverage | 95.3 | 97.2 2% | 99.1 4% | 97.8 3% | 99.9 5% | 68.1 -29% |
| sRGB Coverage | 99.9 | 99.9 0% | 99.9 0% | 99.5 0% | 100 0% | 99.5 0% |
| AdobeRGB 1998 Coverage | 86.6 | 87 0% | 95.6 10% | 88.9 3% | 90 4% | 69 -20% |
| Response Times | -12% | 37% | 27% | 1% | 19% | |
| Response Time Grey 50% / Grey 80% * | 12.6 ? | 13.3 ? -6% | 0.24 ? 98% | 5.3 ? 58% | 12 ? 5% | 11.7 ? 7% |
| Response Time Black / White * | 10 ? | 11.6 ? -16% | 0.4 ? 96% | 10.4 ? -4% | 10.7 ? -7% | 6.9 ? 31% |
| PWM Frequency | 5430 | 4742 -13% | 960 -82% | 5733 ? 6% | ||
| Screen | -0% | 21% | -107% | 14% | -136% | |
| Brightness middle | 631 | 674.9 7% | 418 -34% | 271.8 -57% | 937 48% | 422 -33% |
| Brightness | 664 | 682 3% | 420 -37% | 275 -59% | 934 41% | 388 -42% |
| Brightness Distribution | 91 | 96 5% | 98 8% | 78 -14% | 89 -2% | 87 -4% |
| Black Level * | 0.03 | 0.04 -33% | 0.02 33% | 0.27 -800% | 0.066 -120% | 0.42 -1300% |
| Contrast | 21033 | 16873 -20% | 20900 -1% | 1007 -95% | 14197 -33% | 1005 -95% |
| Colorchecker dE 2000 * | 2.68 | 2.56 4% | 1.07 60% | 2.48 7% | 1.52 43% | 1.42 47% |
| Colorchecker dE 2000 max. * | 6.41 | 4.16 35% | 4.04 37% | 5.59 13% | 2.82 56% | 1.97 69% |
| Colorchecker dE 2000 calibrated * | 2.68 | 2.47 8% | 1.07 60% | 0.56 79% | 1.21 55% | 0.7 74% |
| Greyscale dE 2000 * | 2.71 | 3 -11% | 1.12 59% | 3.7 -37% | 1.7 37% | 1.2 56% |
| Gamma | 2.27 97% | 2.38 92% | 2.29 96% | 2.2 100% | 2.042 108% | 2.078 106% |
| CCT | 6135 106% | 6799 96% | 6417 101% | 6355 102% | 6578 99% | 6581 99% |
| Média Total (Programa/Configurações) | -4% /
-2% | 21% /
21% | -26% /
-65% | 6% /
9% | -44% /
-89% |
* ... menor é melhor
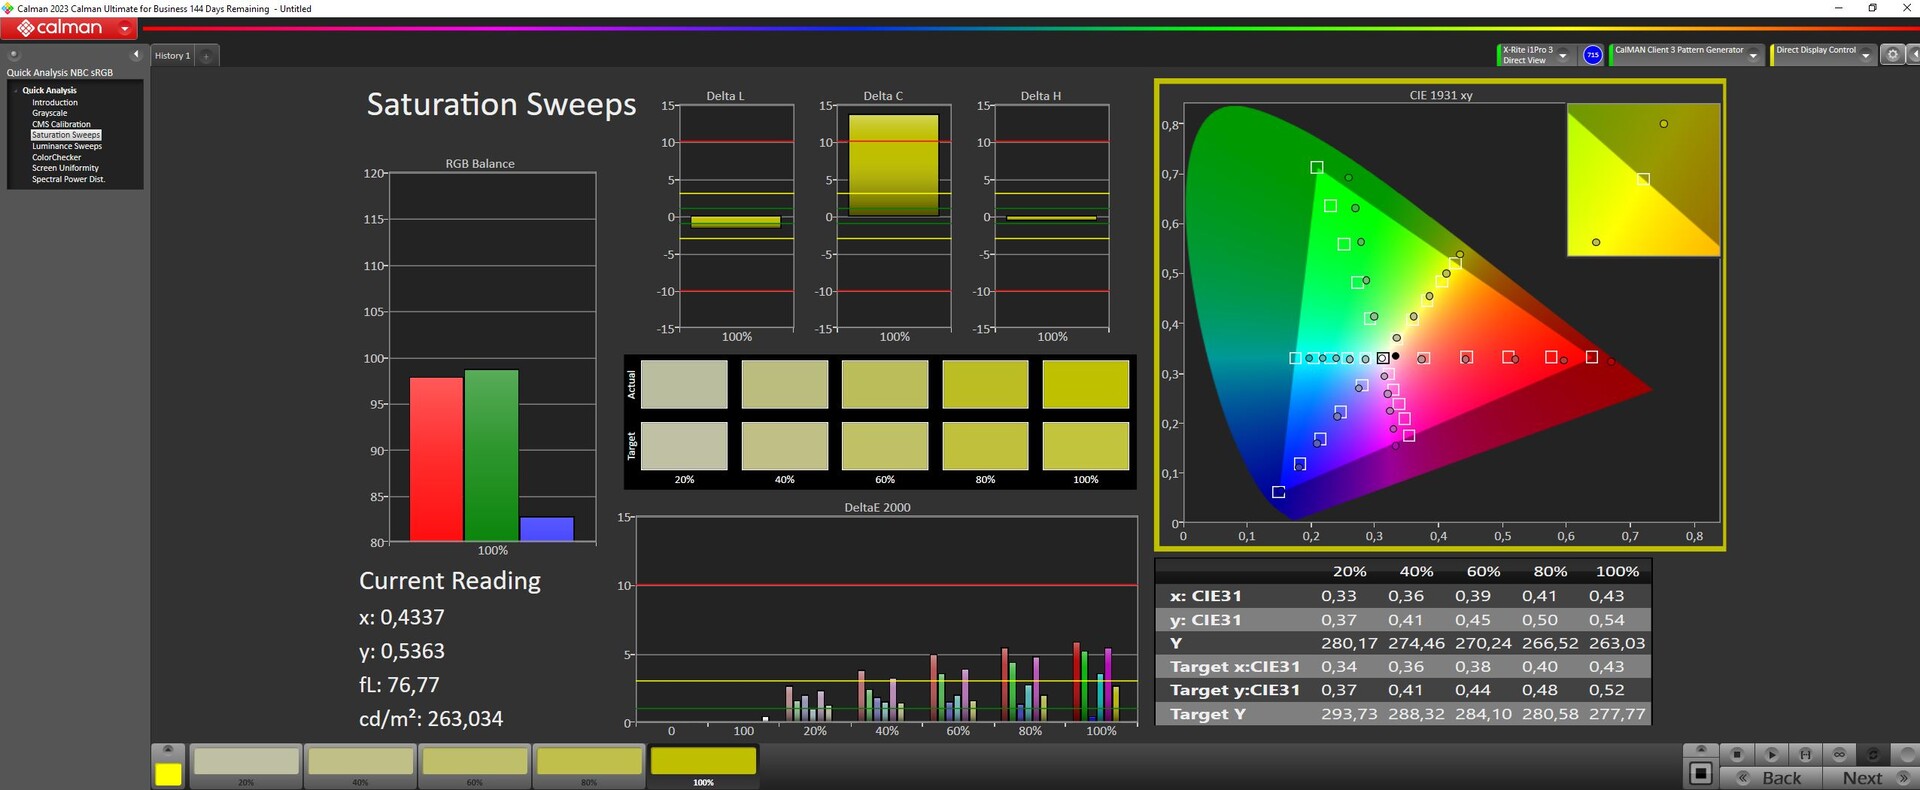
O DisplayP3 é coberto por cerca de 95%, o sRGB completamente e o AdobeRGB por 86 a 87%.
Ex funciona, o monitor está devidamente calibrado em relação ao padrão P3. Nossa recalibração melhorou os valores DeltaE da escala de cinza, mas piorou os valores DeltaE do ClocChecker, por isso não vale a pena o esforço. No entanto, seus desvios de cor não são ideais, com uma média de 2,68 e outliers de até 6,41.

Exibir tempos de resposta
| ↔ Tempo de resposta preto para branco | ||
|---|---|---|
| 10 ms ... ascensão ↗ e queda ↘ combinadas | ↗ 5.2 ms ascensão | 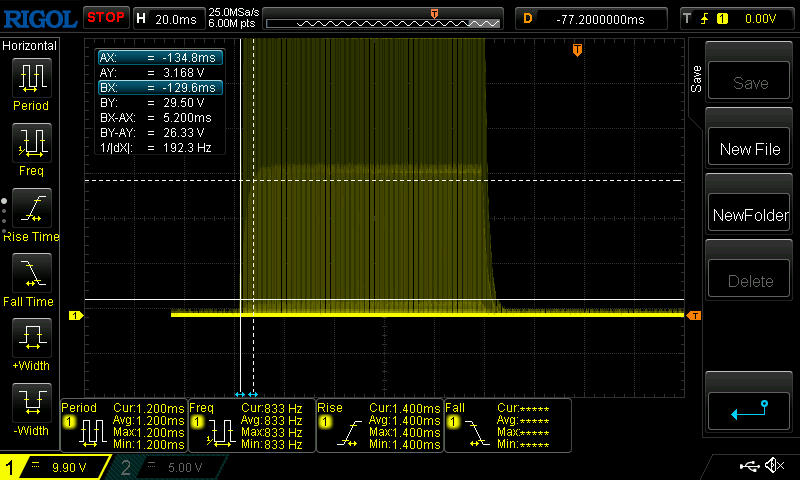 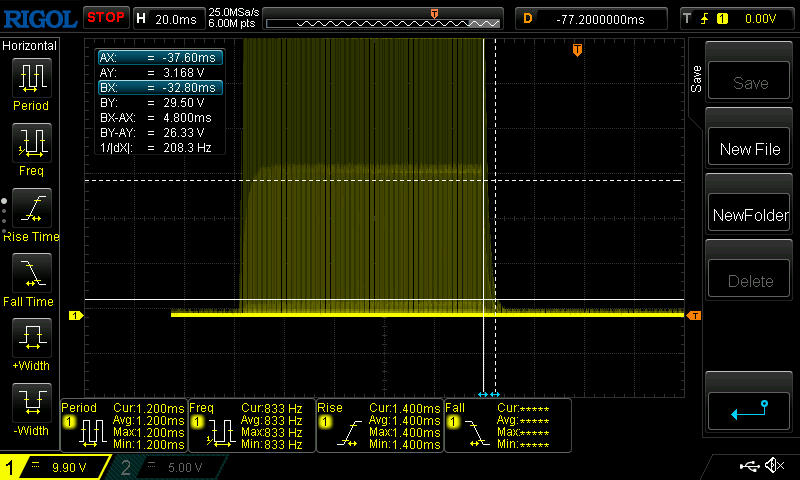 |
| ↘ 4.8 ms queda | ||
| A tela mostra boas taxas de resposta em nossos testes, mas pode ser muito lenta para jogadores competitivos. Em comparação, todos os dispositivos testados variam de 0.1 (mínimo) a 240 (máximo) ms. » 24 % de todos os dispositivos são melhores. Isso significa que o tempo de resposta medido é melhor que a média de todos os dispositivos testados (20.8 ms). | ||
| ↔ Tempo de resposta 50% cinza a 80% cinza | ||
| 12.6 ms ... ascensão ↗ e queda ↘ combinadas | ↗ 6.6 ms ascensão | 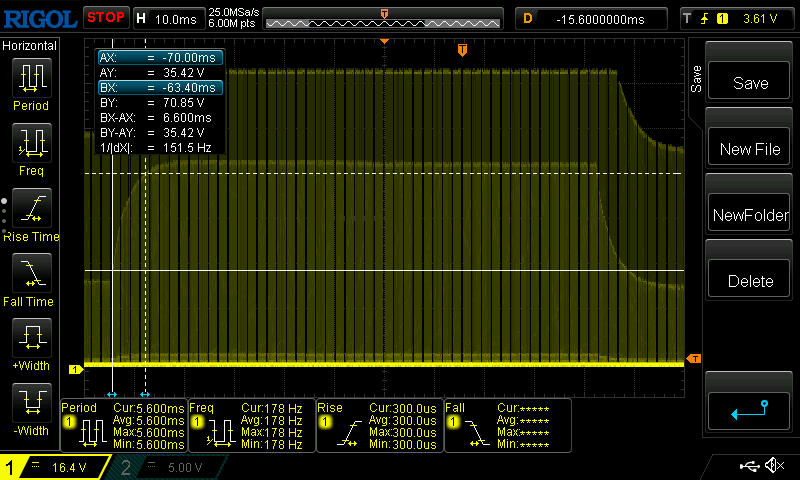 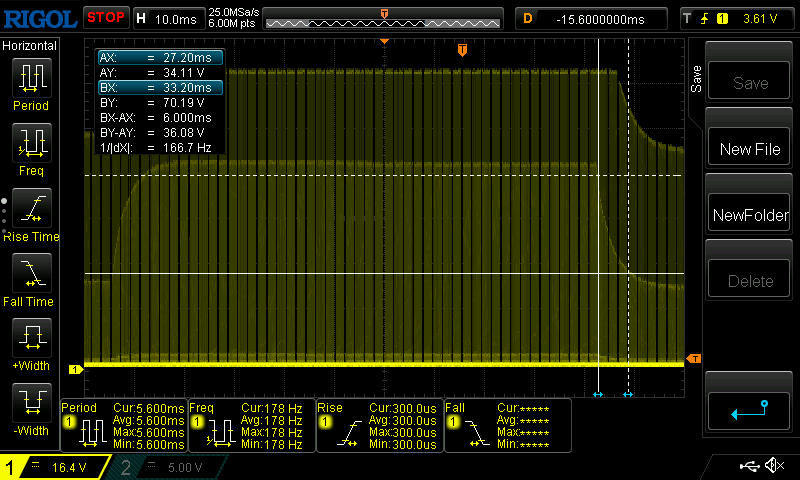 |
| ↘ 6 ms queda | ||
| A tela mostra boas taxas de resposta em nossos testes, mas pode ser muito lenta para jogadores competitivos. Em comparação, todos os dispositivos testados variam de 0.165 (mínimo) a 636 (máximo) ms. » 23 % de todos os dispositivos são melhores. Isso significa que o tempo de resposta medido é melhor que a média de todos os dispositivos testados (32.5 ms). | ||
Cintilação da tela / PWM (modulação por largura de pulso)
| Tela tremeluzindo/PWM detectado | 5430 Hz Amplitude: 8 % | |
A luz de fundo da tela pisca em 5430 Hz (pior caso, por exemplo, utilizando PWM) . A frequência de 5430 Hz é bastante alta, então a maioria dos usuários sensíveis ao PWM não deve notar nenhuma oscilação. [pwm_comparison] Em comparação: 53 % de todos os dispositivos testados não usam PWM para escurecer a tela. Se PWM foi detectado, uma média de 8516 (mínimo: 5 - máximo: 343500) Hz foi medida. | ||

Na parte externa, a visibilidade é muito boa graças ao alto brilho da tela e à superfície fosca. Mesmo assim, a luz solar direta deve ser evitada.

Desempenho - Alto, mas não isento de problemas
O novo i9-14900HX em combinação com a poderosa RTX 4090 e 64 GB de RAM tornam claramente o Legion 9i um gamer de ponta. Isso também é sugerido por seu design saliente na parte traseira, razão pela qual os criadores podem procurar alternativas mais sutis, apesar do desempenho potencialmente alto do dispositivo.
Condições de teste
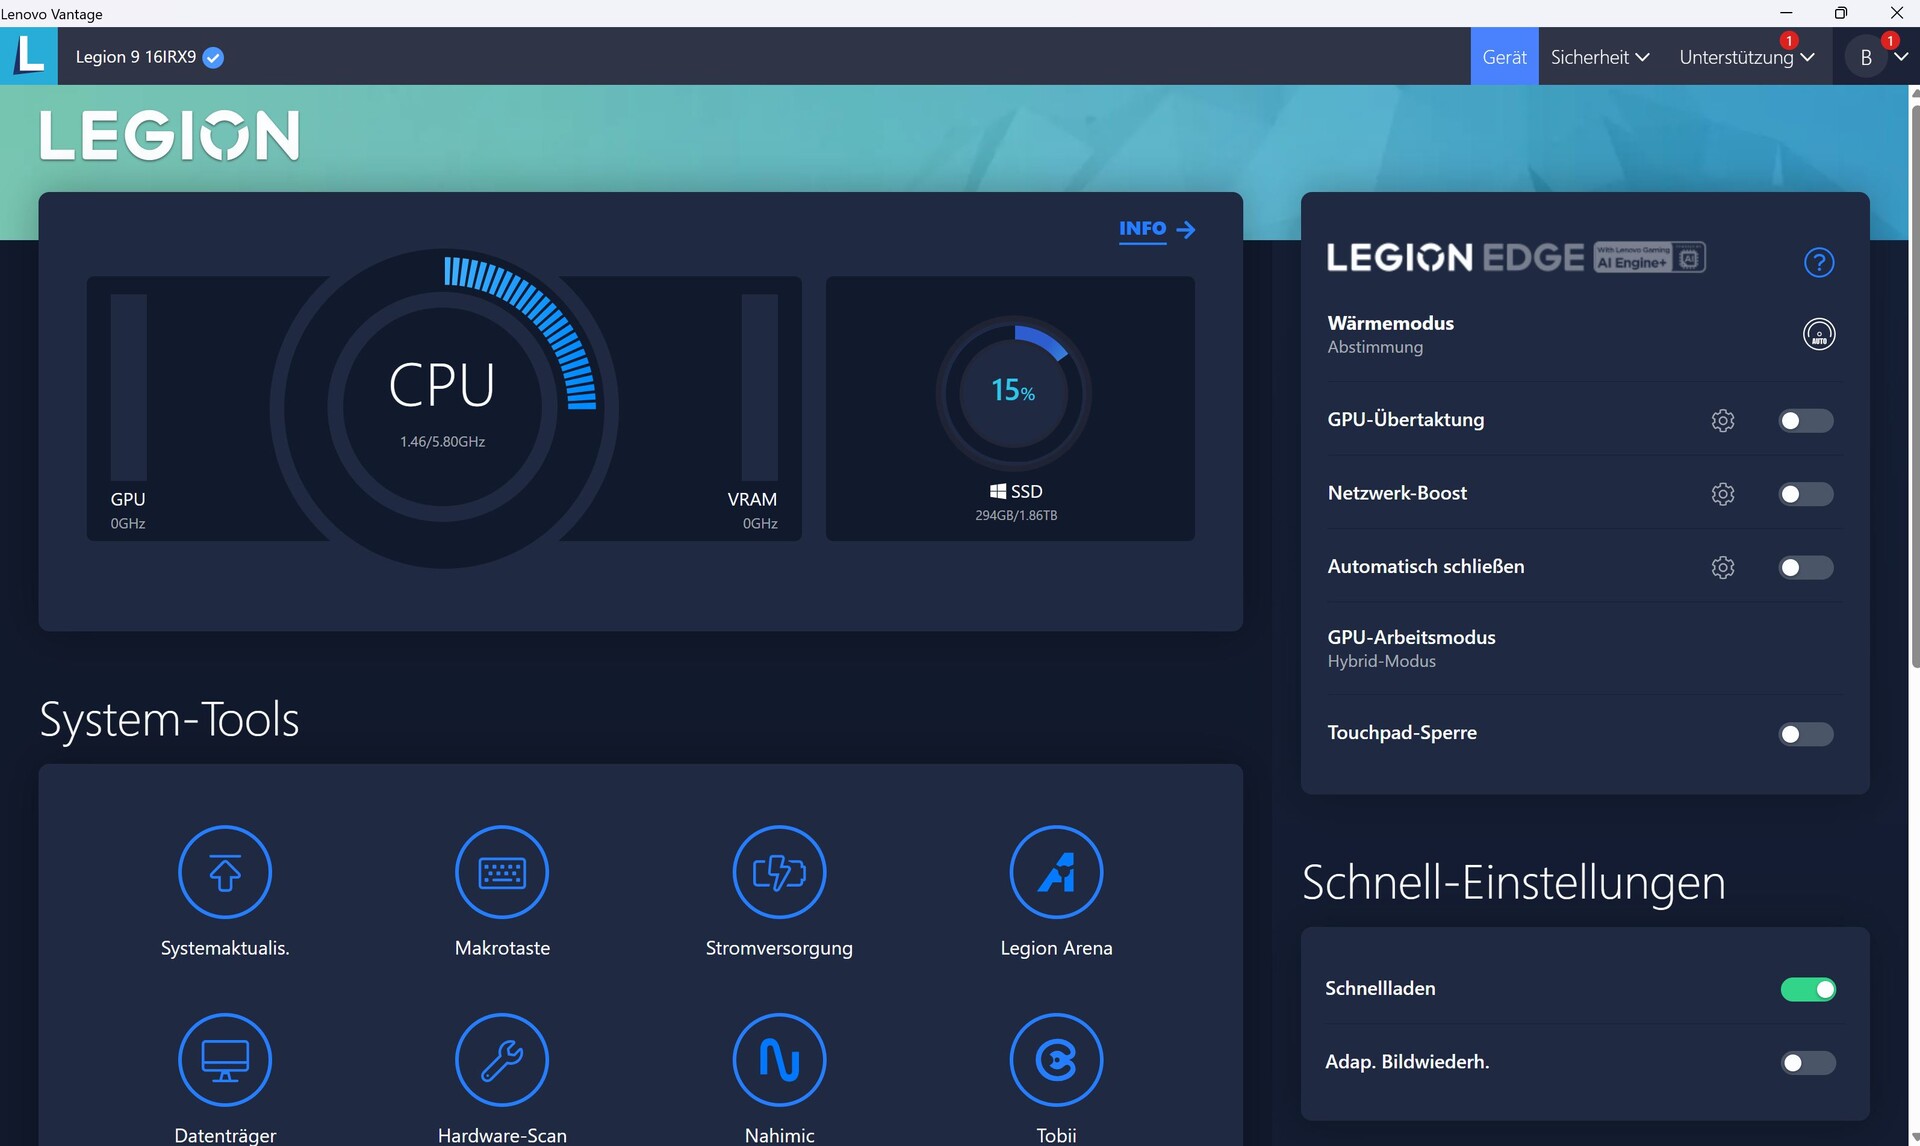
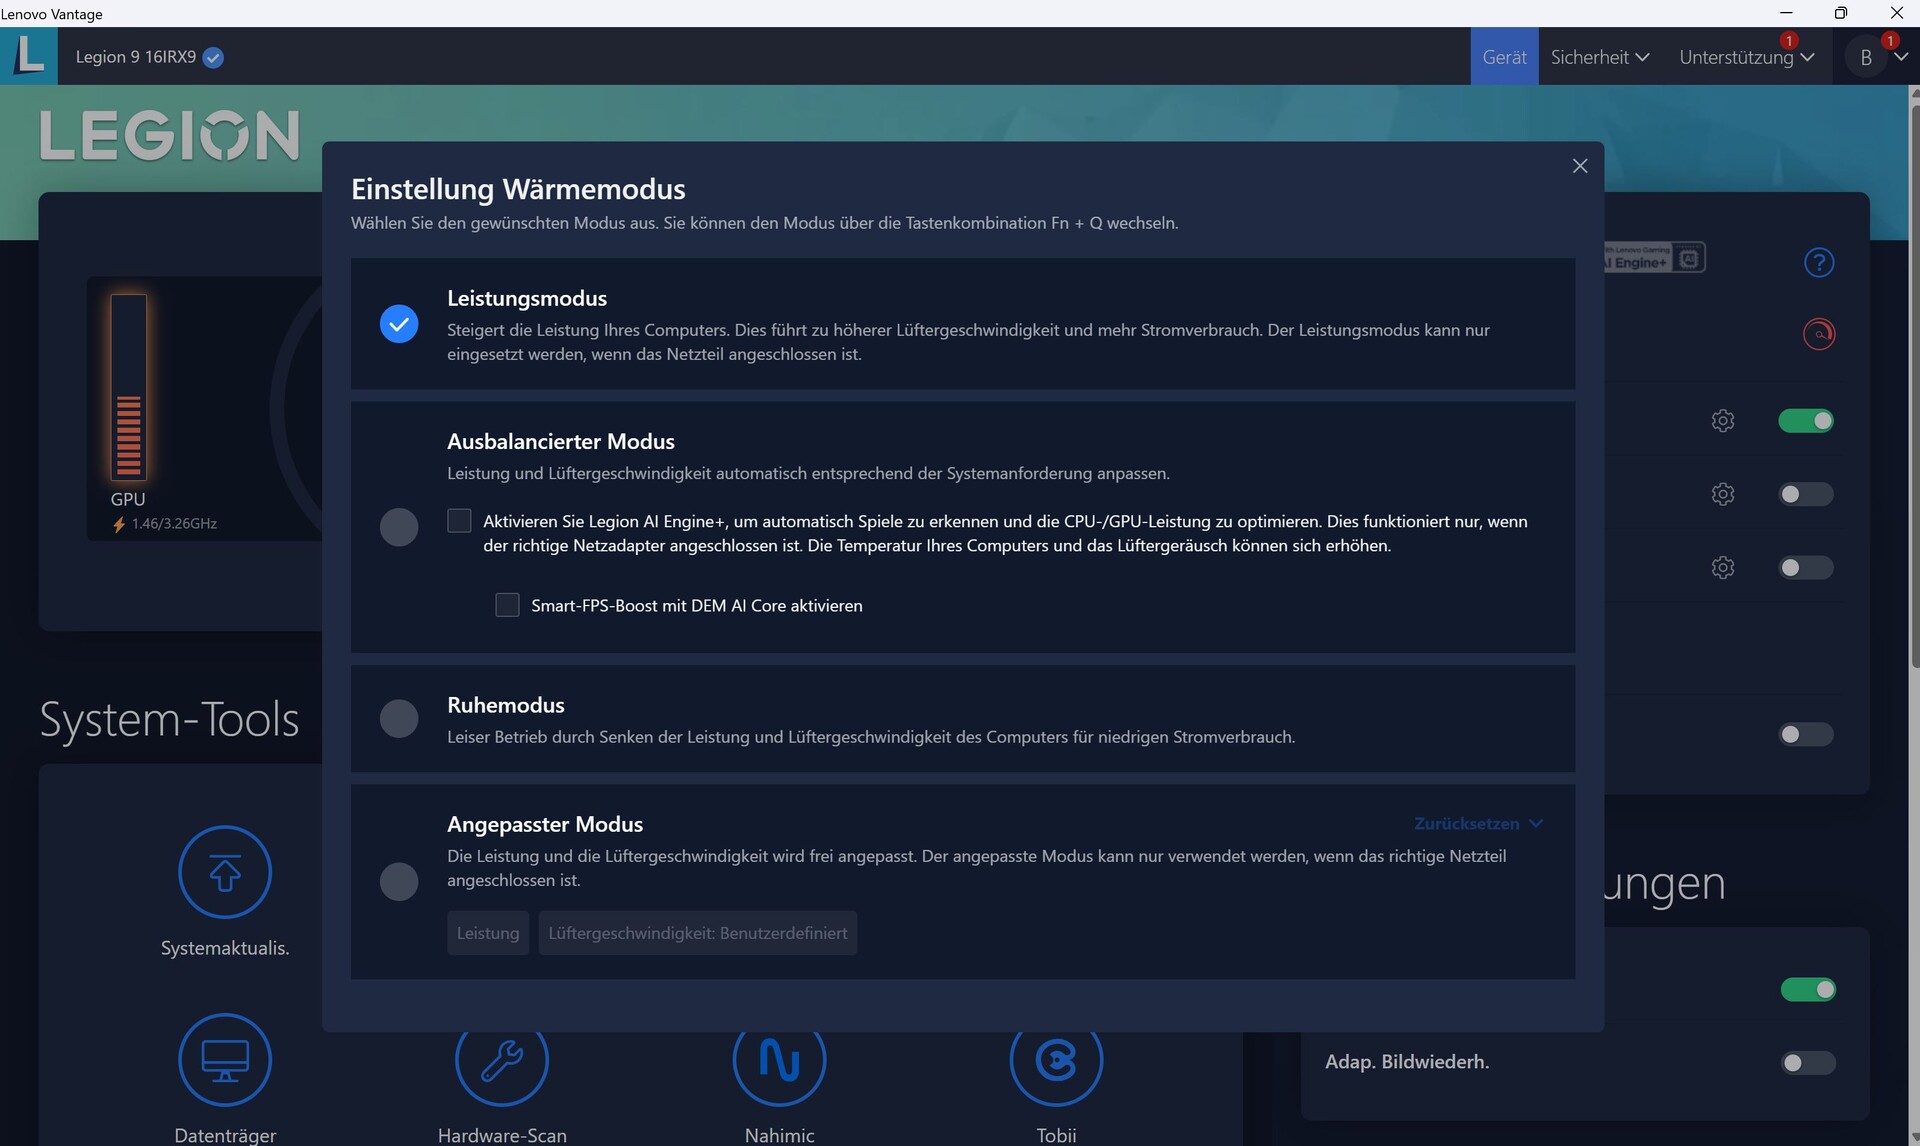
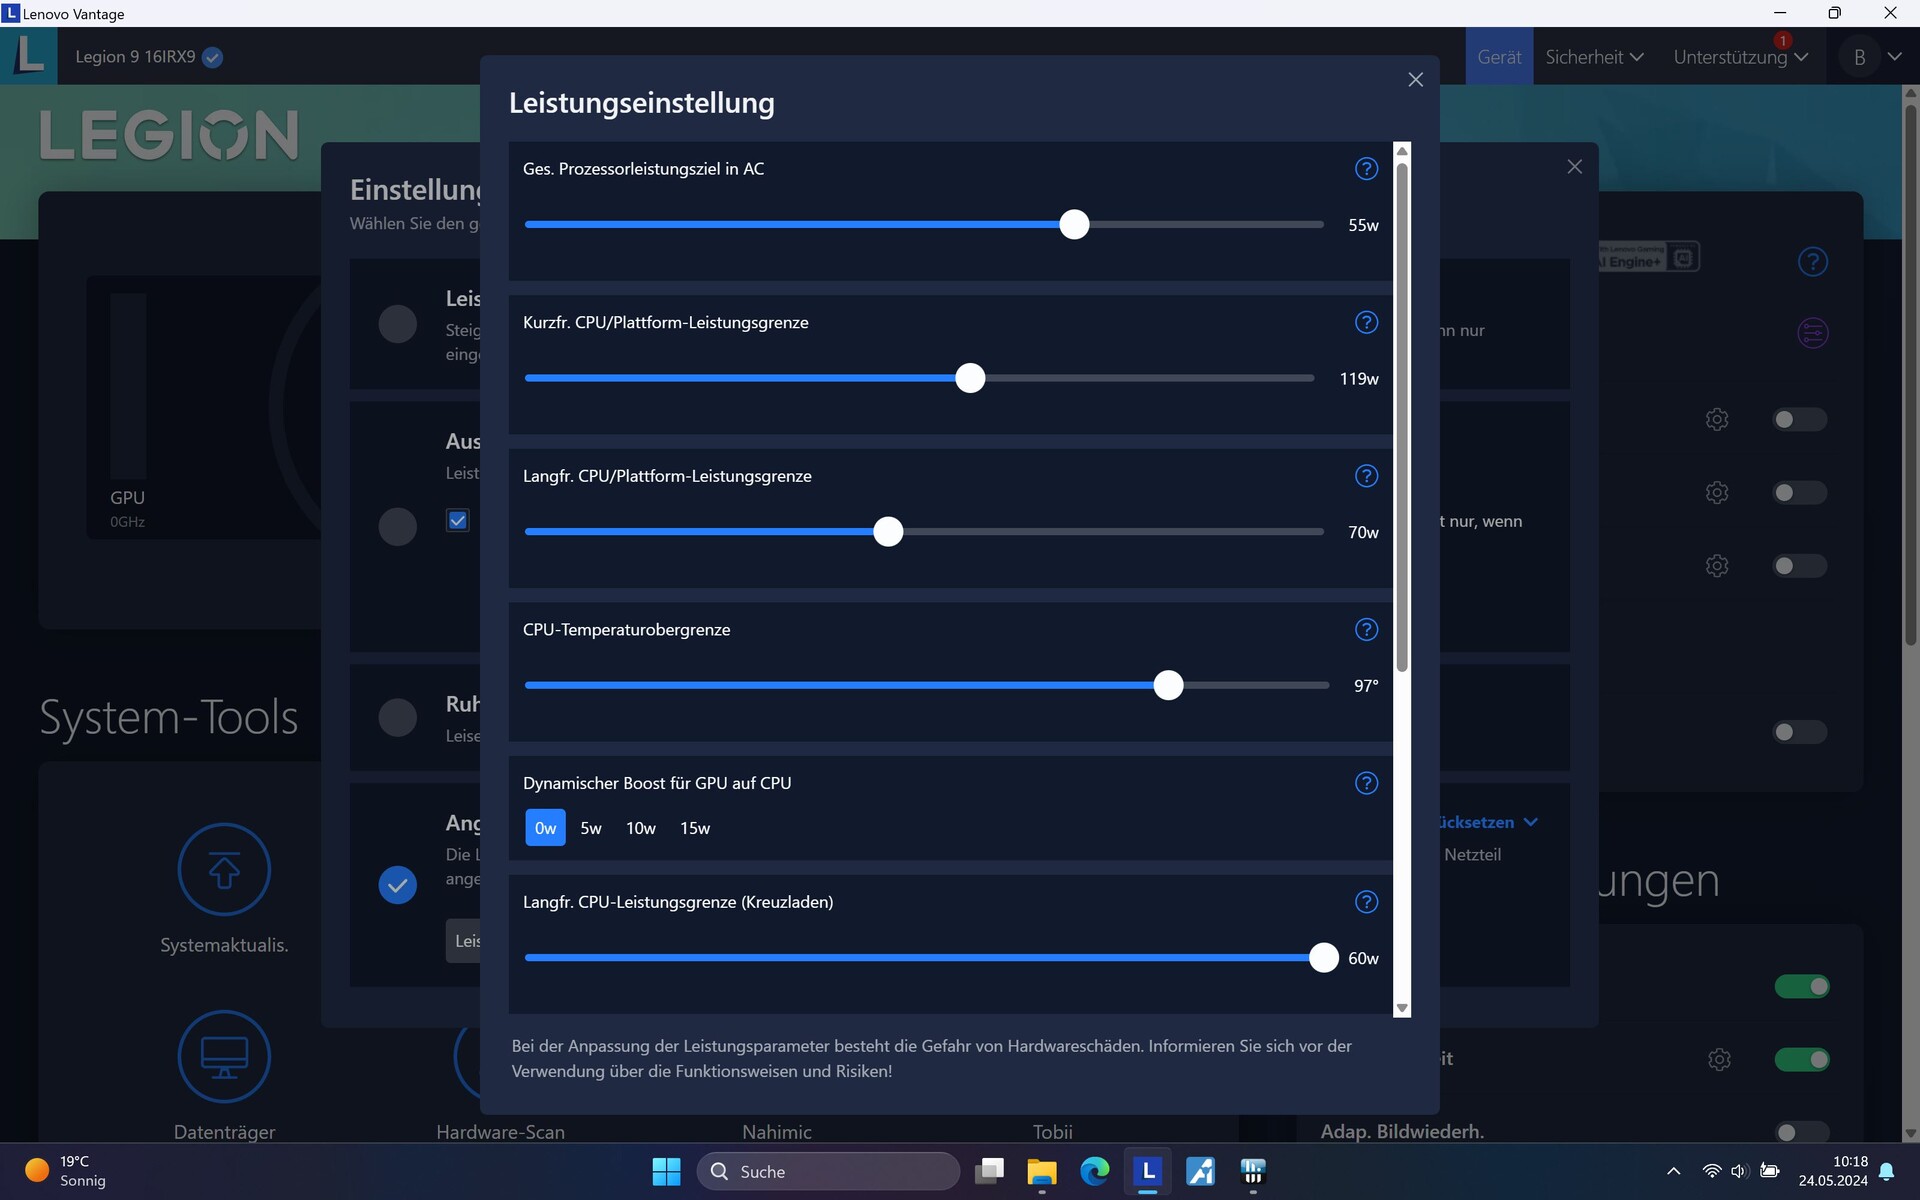
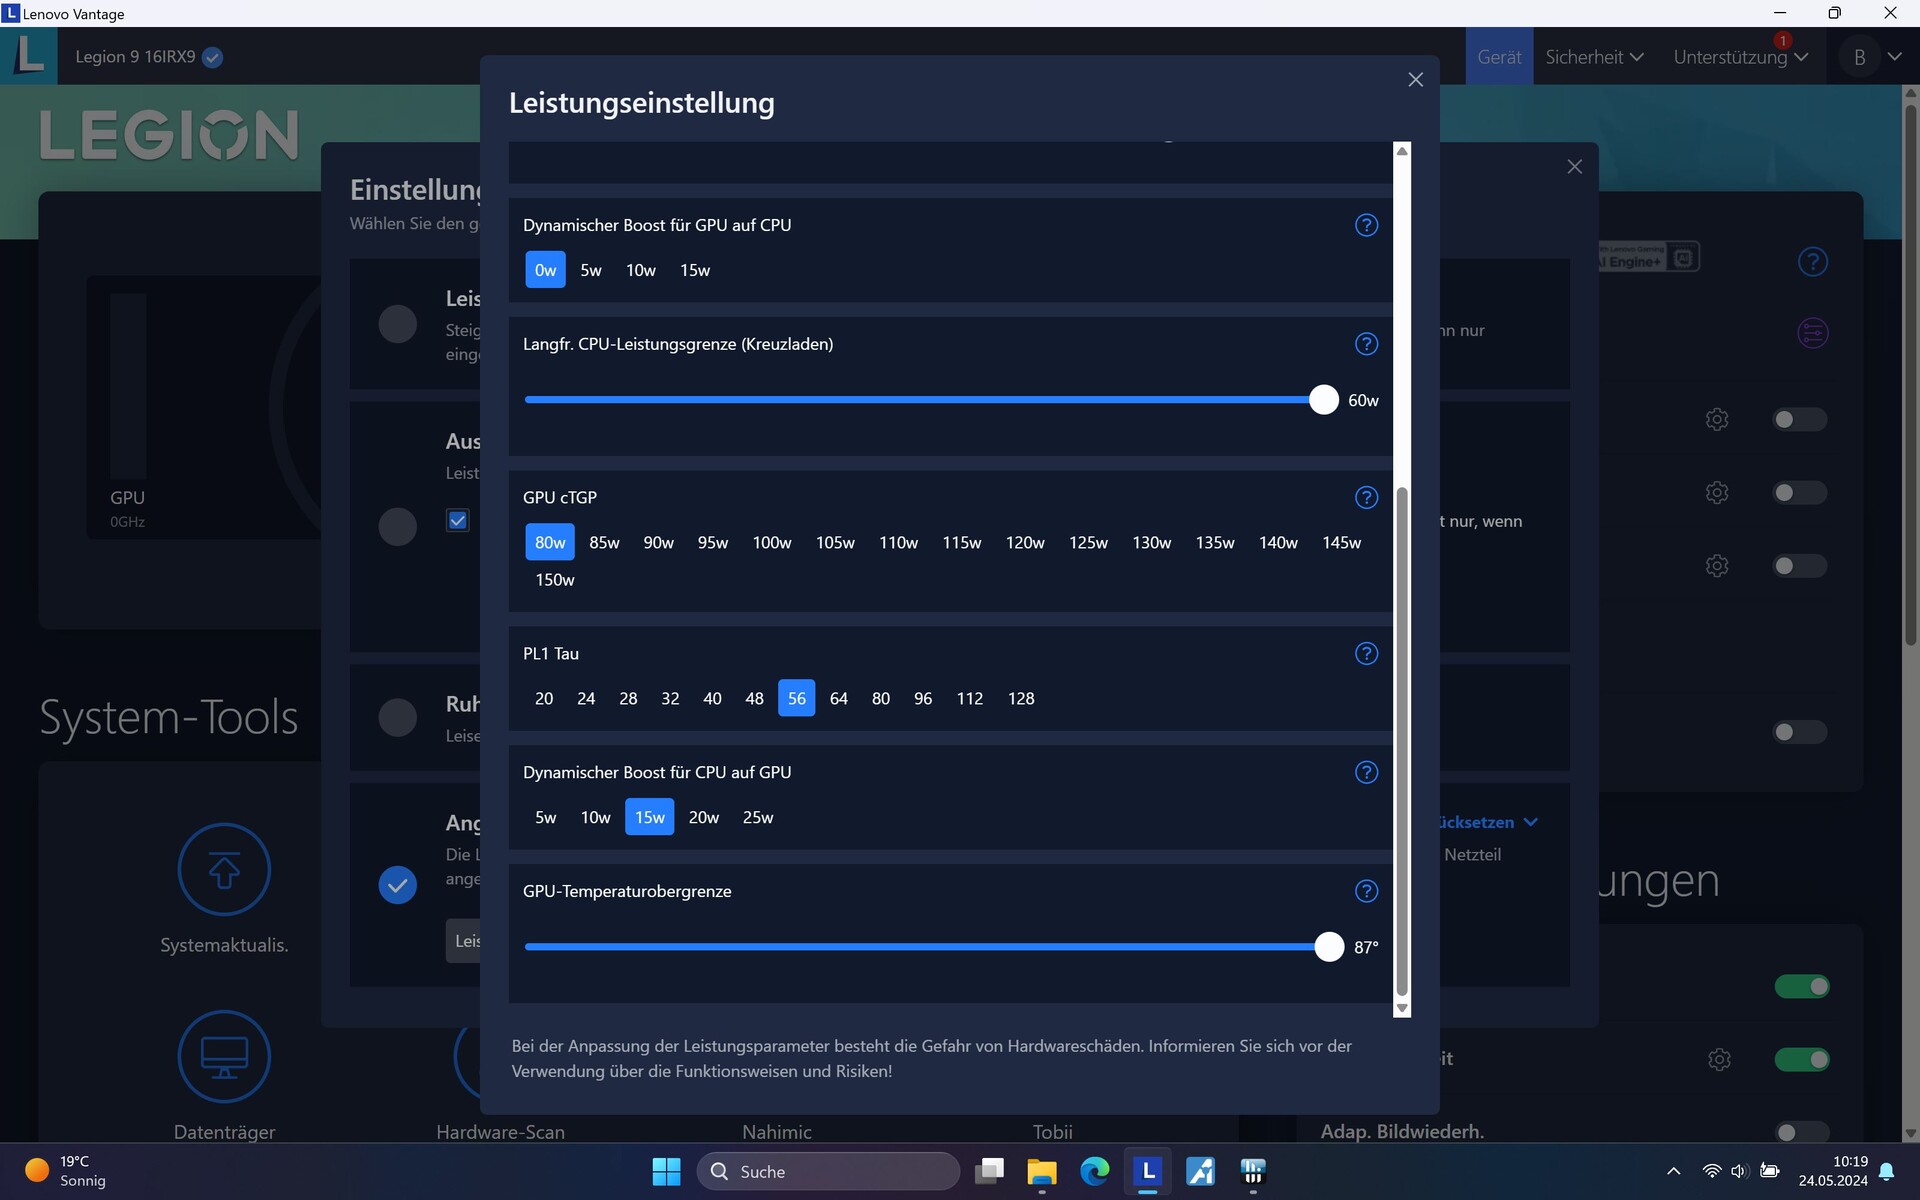
Lenovo Vantage é o nome do Centro de Controle do Legion 9, que inclui os perfis de desempenho Performance, Balanced (aqui também é possível selecionar AI para otimização) e Quiet. Há também o modo Customizado, que permite que o senhor defina vários parâmetros manualmente.
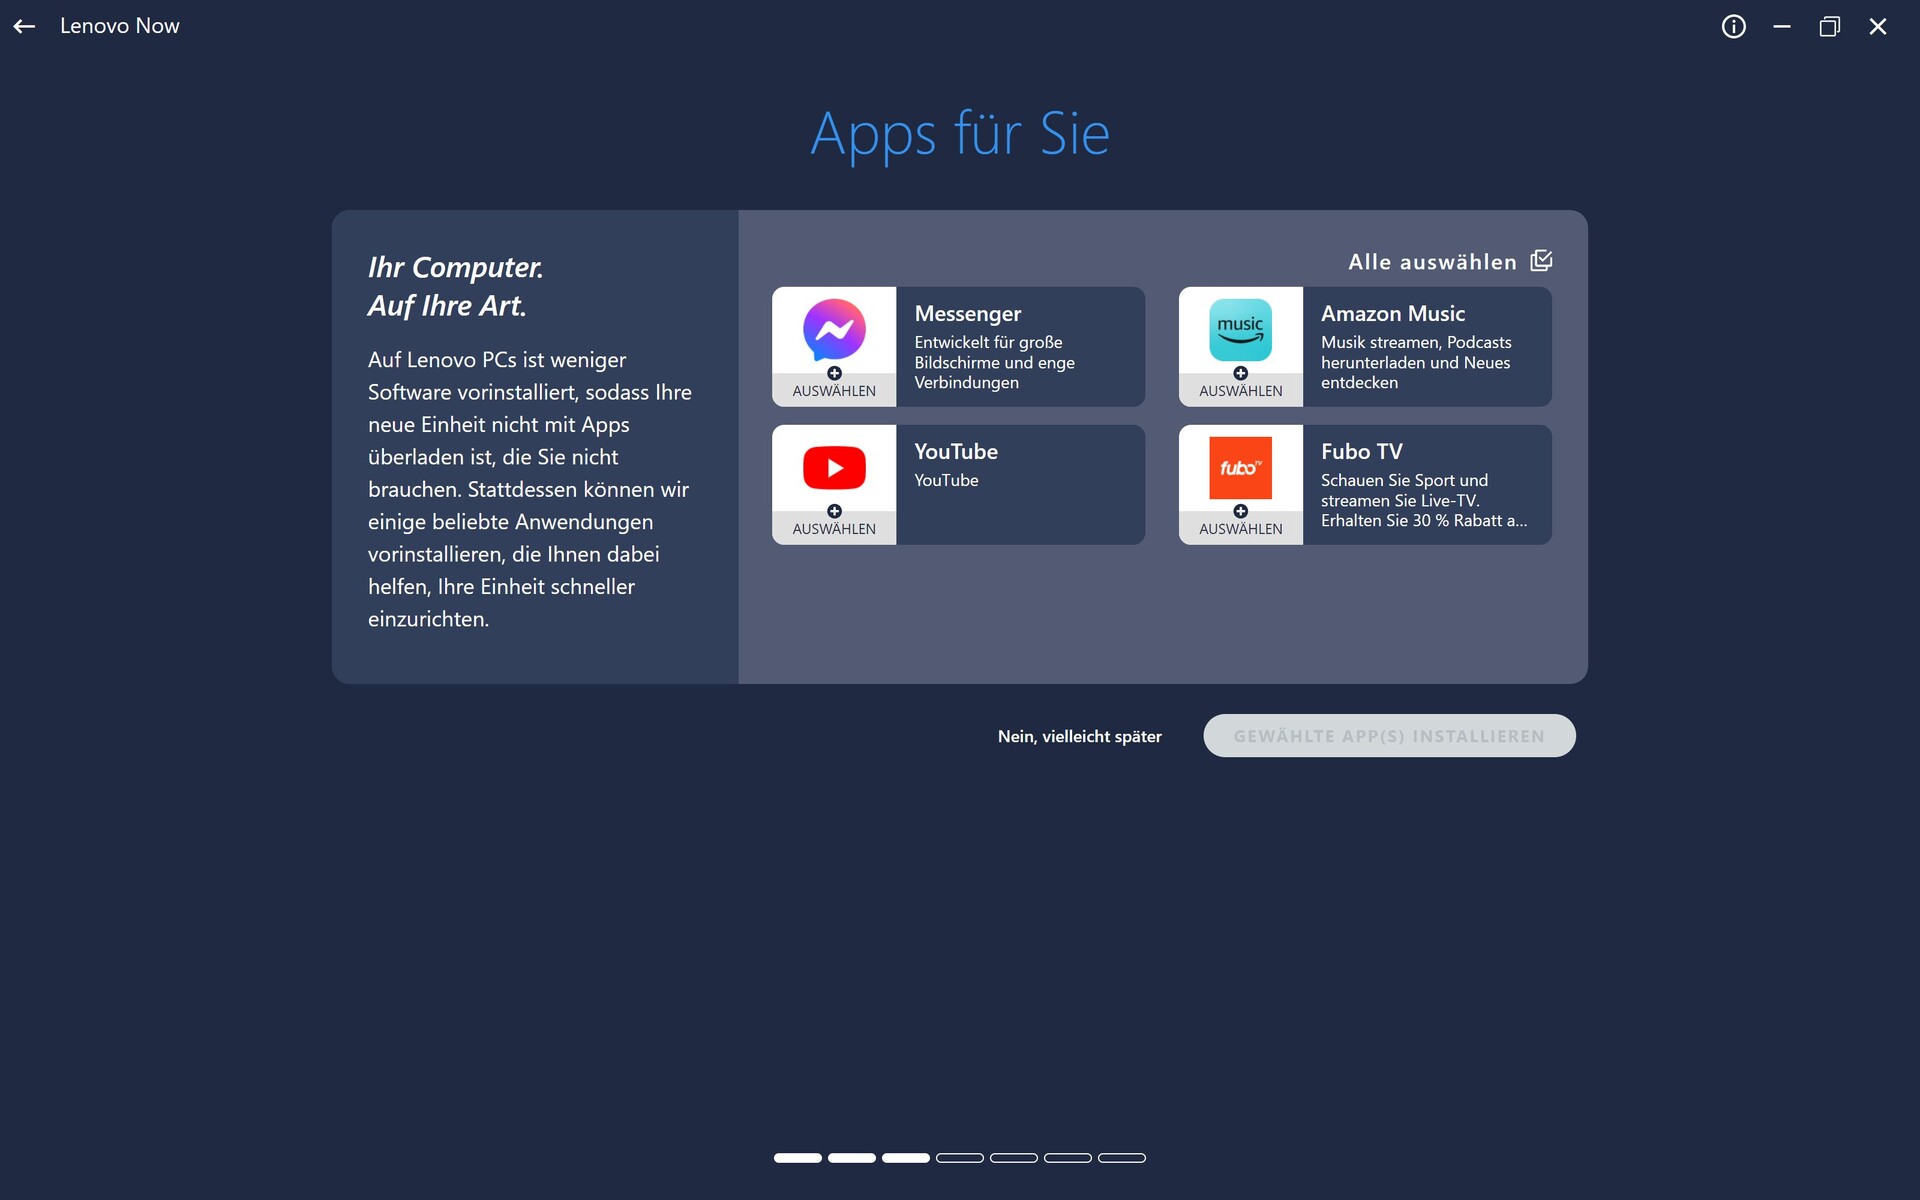
Infelizmente, o Vantage às vezes nos incomodava com publicidade, por exemplo, para o Amazon Music, aplicativos do YouTube etc. Isso ocorre porque as mensagens de marketing estão ativas por padrão no Vantage e o usuário precisa primeiro desativá-las para não ser incomodado por elas.
Selecionamos o modo Performance para nossos benchmarks, mas deixamos o botão para overclocking da GPU desativado.

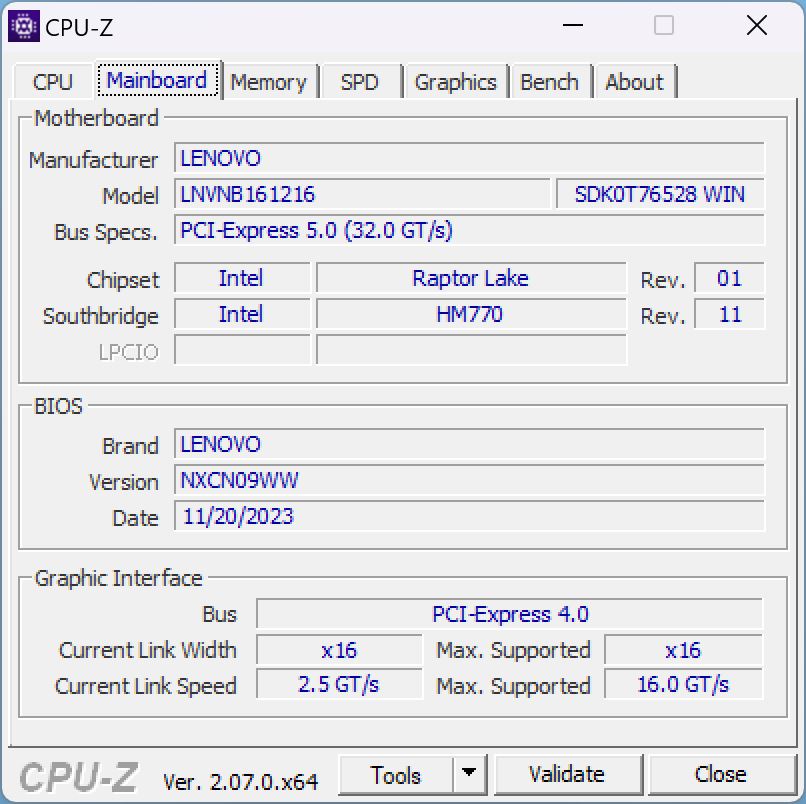
Processador
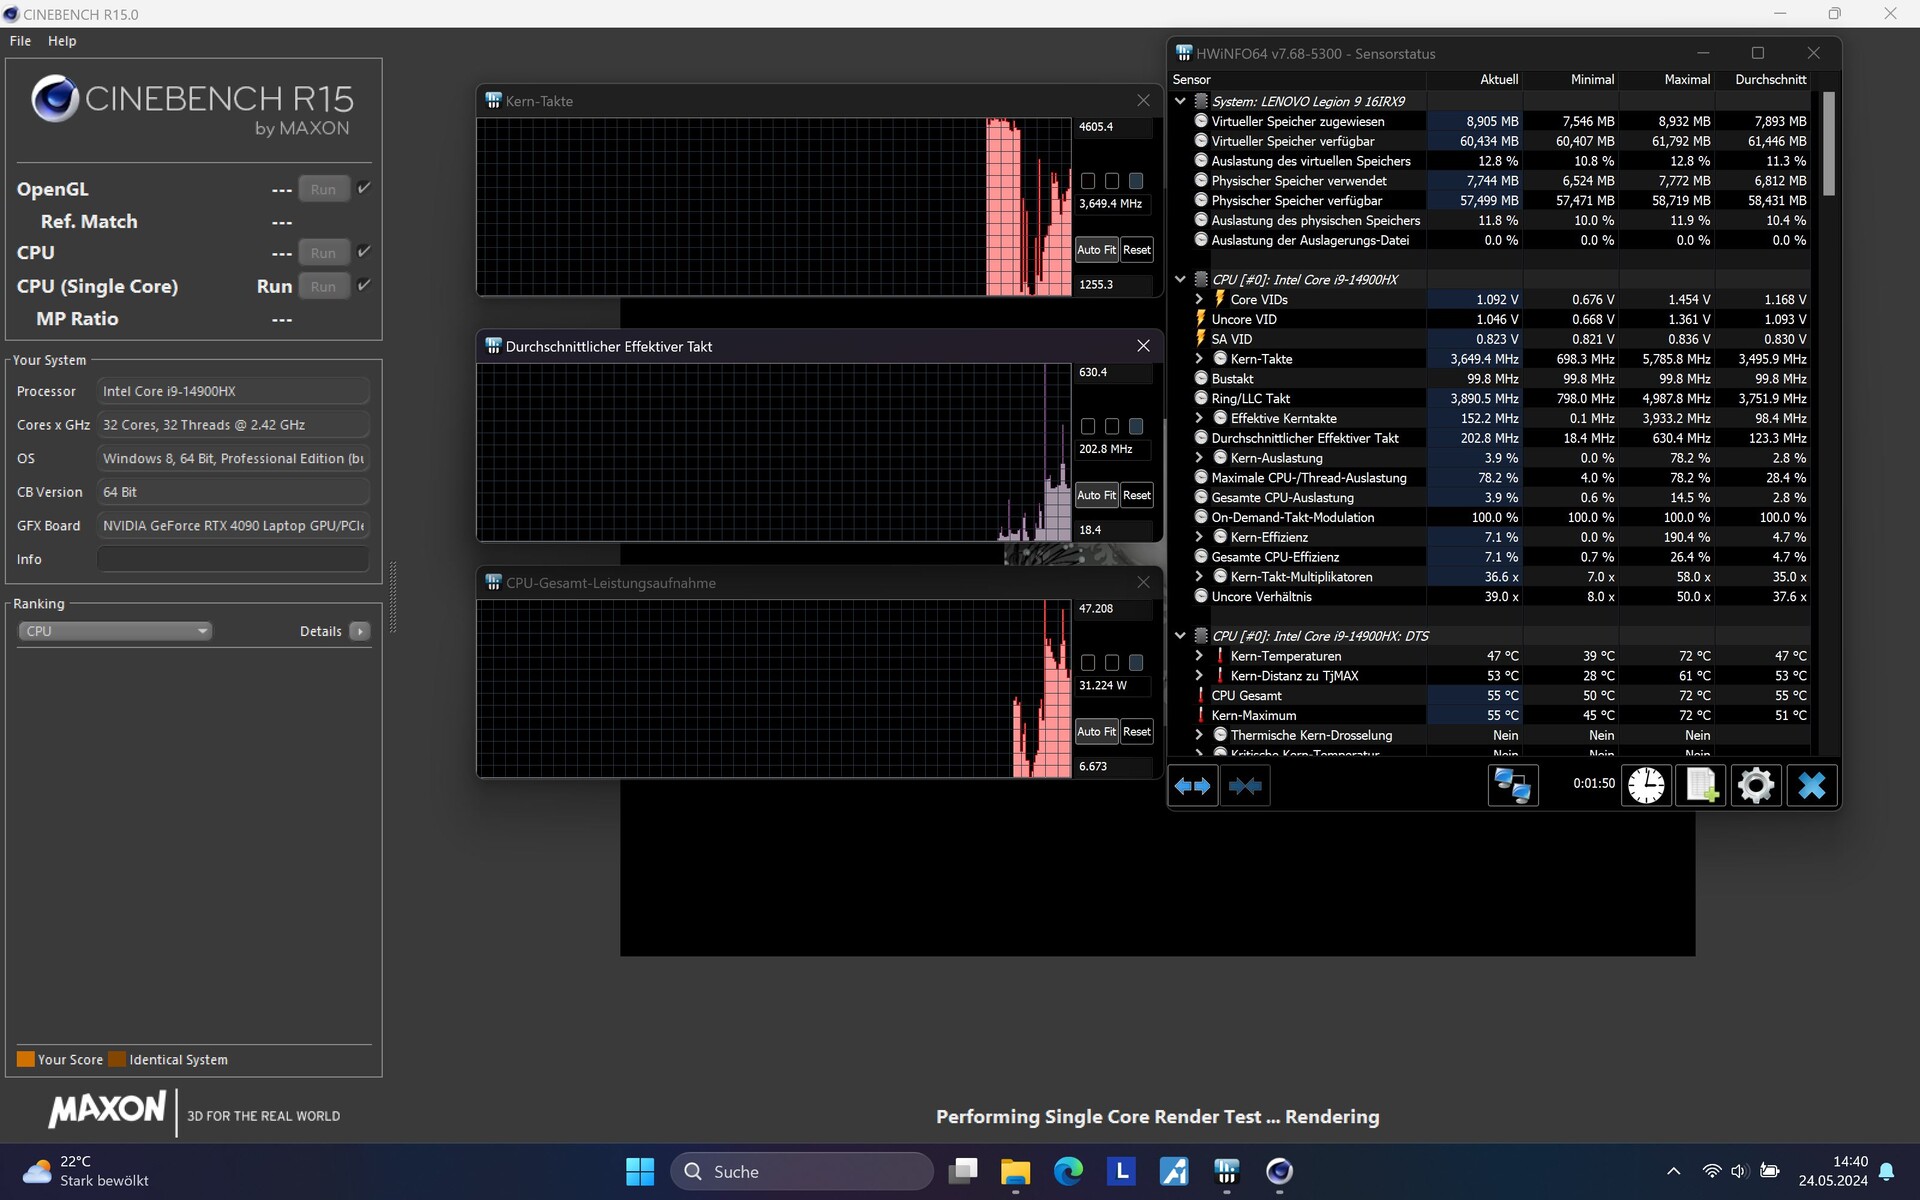
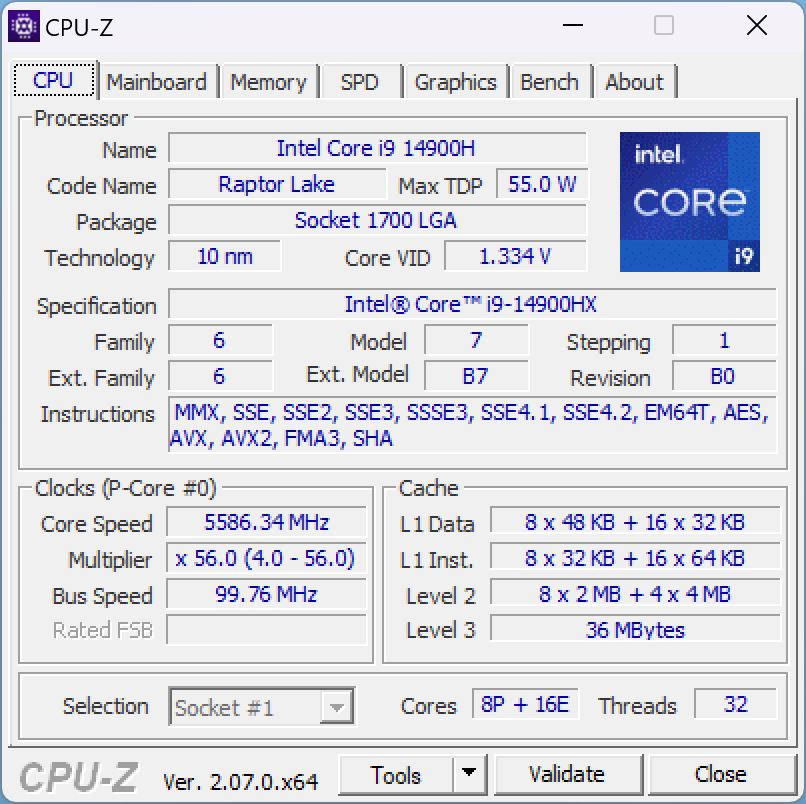
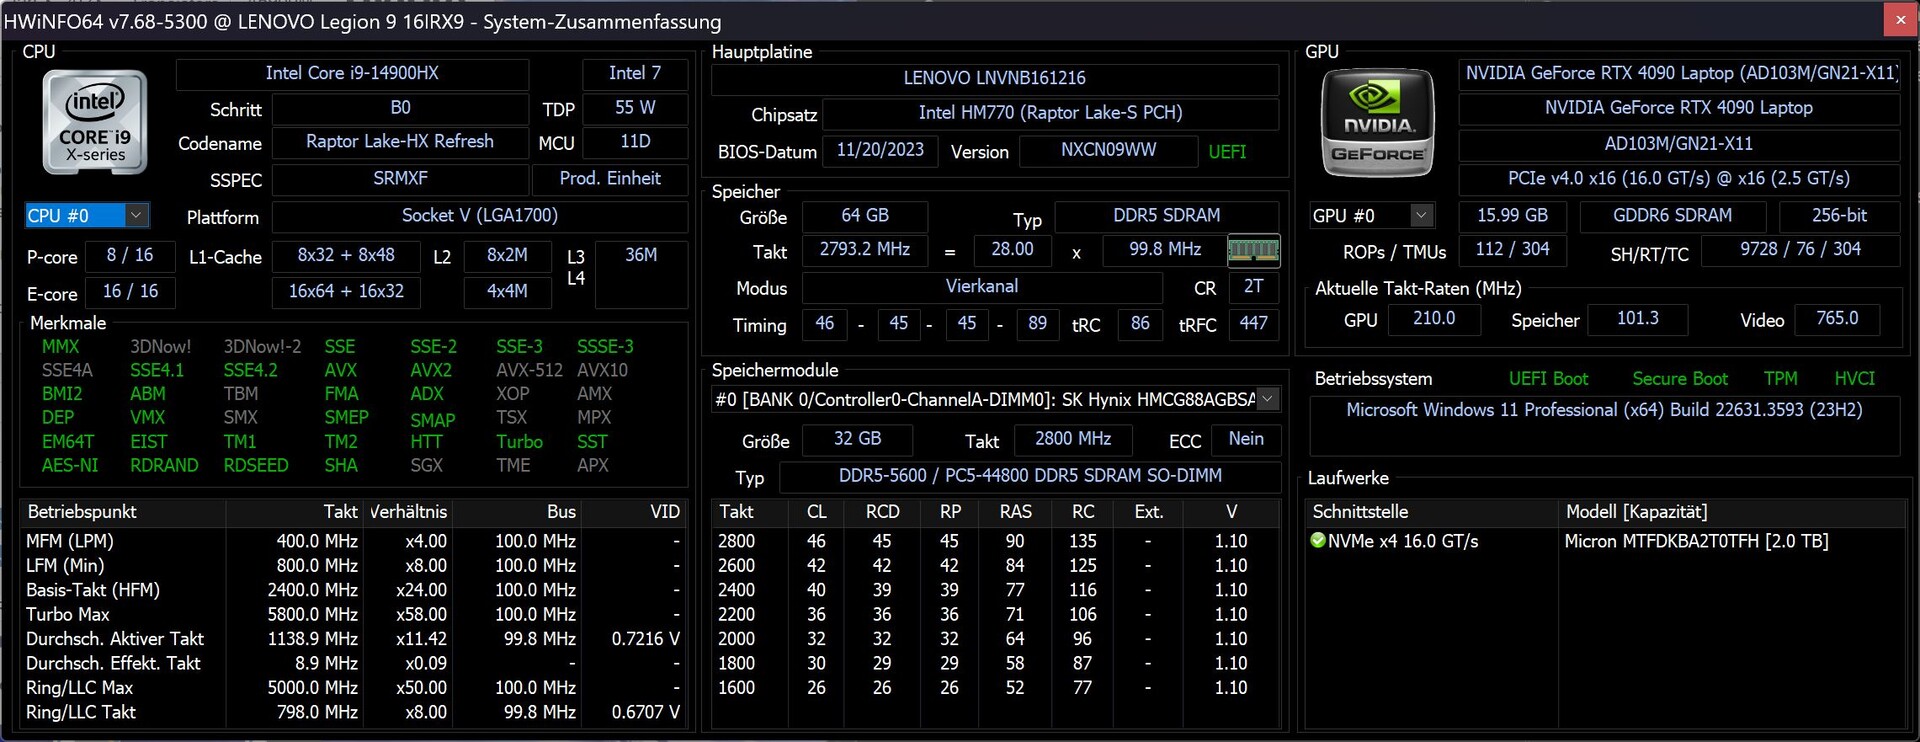
O i9-14900HX é uma CPU de ponta da mais recente série Raptor Lake Refresh da Intel. Seus 8 núcleos P têm clock de até 5,8 GHz e a taxa de clock base dos 16 núcleos E é de 1,6 GHz. Juntos, eles podem processar um total de 32 threads.
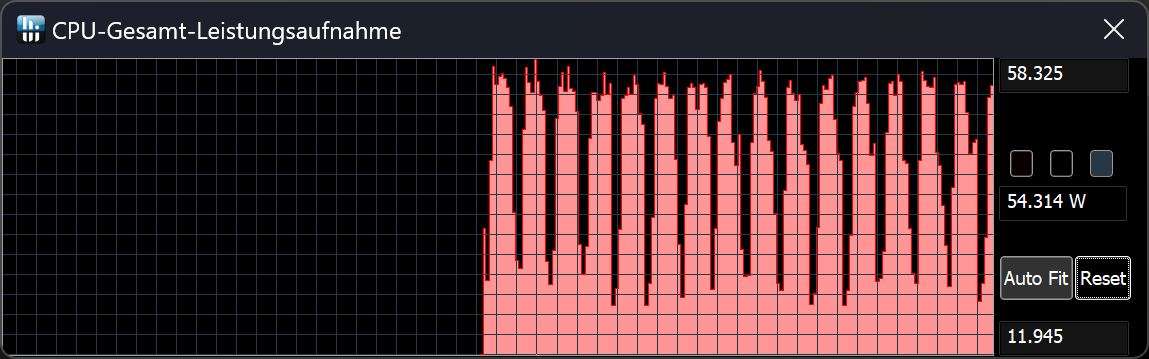
Durante o loop do Cinebench R15, nosso Legion 9i teve o melhor desempenho inicial; no entanto, diferentemente da concorrência com a mesma CPU, seu desempenho caiu consistentemente ao longo do tempo - cerca de 7,5% após meia hora. Em seguida, seu desempenho ficou apenas um pouco acima do desempenho de seu predecessor com o i9-13980HX. Mesmo assim, a CPU no interior do Legion 9 ainda é uma das mais rápidas no campo de comparação, embora o aumento de desempenho em relação ao seu antecessor seja bastante baixo.
Embora seu desempenho multi-thread seja indiscutível, o
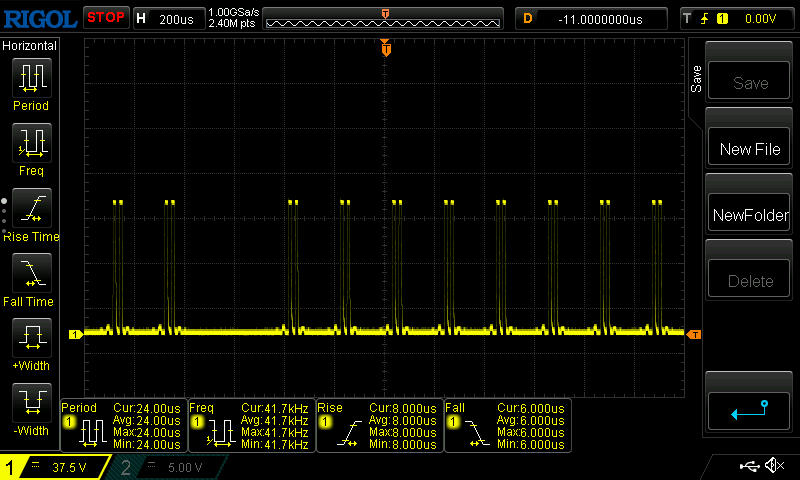
Legion 9i claramente enfraqueceu quando se tratou do desempenho de núcleo único em todos os benchmarks de CPU. Isso foi reproduzível - aparentemente, suas reservas de desempenho de núcleo único não se esgotam no modo Performance, para o qual o senhor teria que aumentar manualmente os índices usando o modo Customized.Portanto, demos uma olhada nos índices: No Cinebench R15 Single Core, o núcleo inicialmente atingiu o clock de 4,6 GHz. Após cerca de 50 segundos, o clock do núcleo caiu brevemente para apenas 1,2 GHz e depois se estabilizou entre 3 e 3,5 GHz. O TDP ficou em torno de 30 watts. Em outro teste, a queda foi significativamente menos acentuada.
Com o plugue de energia desligado, o desempenho multi-thread no Cinebench R15 caiu cerca de 48,5%, ou seja, quase a metade em comparação com o uso do laptop conectado à rede elétrica!
| Perfil de desempenho/valor de medição | Cinebench-15-Score 1st run | Consumo de energia da CPU em watts |
|---|---|---|
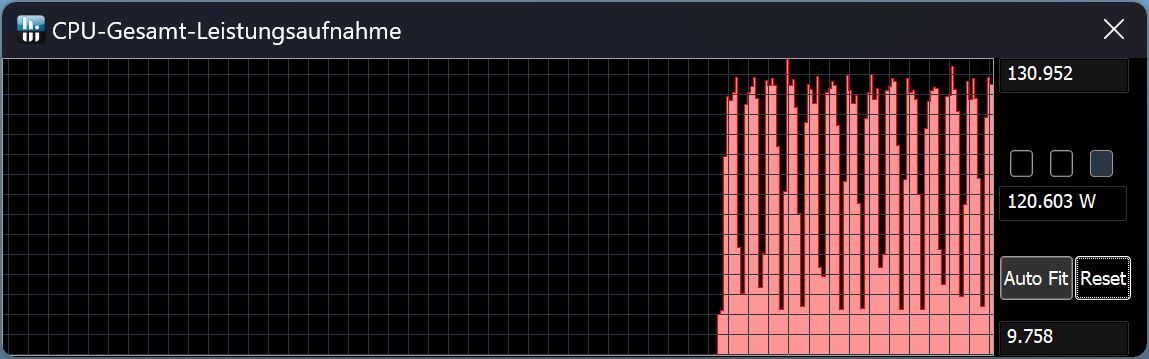
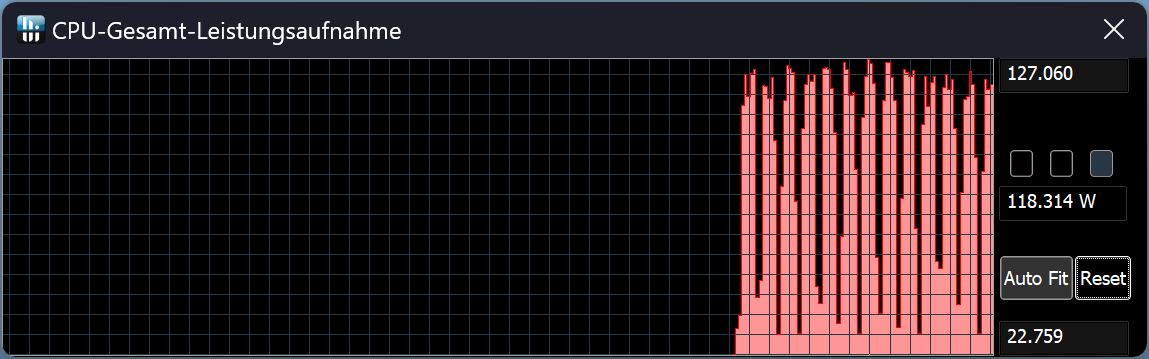
| Desempenho sem overclocking da CPU | 4.879 | 140 - 180 |
| Equilibrado com IA | 4.115 | 120 - 130 |
| Equilibrado sem IA | 4.091 | 115 - 127 |
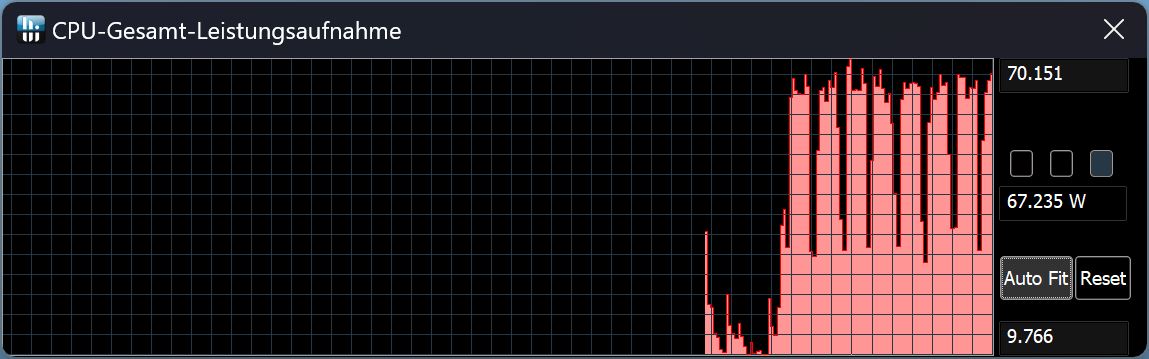
| Silencioso | 2.938 | 65 - 70 |
| Bateria | 2.516 | 40 - 58 |
Cinebench R15 Multi continuous test
Cinebench R23: Multi Core | Single Core
Cinebench R20: CPU (Multi Core) | CPU (Single Core)
Cinebench R15: CPU Multi 64Bit | CPU Single 64Bit
Blender: v2.79 BMW27 CPU
7-Zip 18.03: 7z b 4 | 7z b 4 -mmt1
Geekbench 6.4: Multi-Core | Single-Core
Geekbench 5.5: Multi-Core | Single-Core
HWBOT x265 Benchmark v2.2: 4k Preset
LibreOffice : 20 Documents To PDF
R Benchmark 2.5: Overall mean
| CPU Performance Rating | |
| Alienware m18 R2 | |
| Lenovo Legion 9 16IRX8 | |
| Razer Blade 16 2024, RTX 4090 | |
| Asus ROG Strix Scar 18 G834JYR (2024) | |
| Média Intel Core i9-14900HX | |
| Lenovo Legion 9 16IRX9, RTX 4090 | |
| Medion Erazer Beast X40 2024 | |
| Média da turma Gaming | |
| Cinebench R23 / Multi Core | |
| Lenovo Legion 9 16IRX9, RTX 4090 | |
| Alienware m18 R2 | |
| Lenovo Legion 9 16IRX8 | |
| Razer Blade 16 2024, RTX 4090 | |
| Média Intel Core i9-14900HX (17078 - 36249, n=37) | |
| Asus ROG Strix Scar 18 G834JYR (2024) | |
| Medion Erazer Beast X40 2024 | |
| Média da turma Gaming (5668 - 39652, n=152, últimos 2 anos) | |
| Cinebench R23 / Single Core | |
| Alienware m18 R2 | |
| Medion Erazer Beast X40 2024 | |
| Asus ROG Strix Scar 18 G834JYR (2024) | |
| Média Intel Core i9-14900HX (1720 - 2245, n=37) | |
| Lenovo Legion 9 16IRX8 | |
| Razer Blade 16 2024, RTX 4090 | |
| Média da turma Gaming (1136 - 2252, n=152, últimos 2 anos) | |
| Lenovo Legion 9 16IRX9, RTX 4090 | |
| Cinebench R20 / CPU (Multi Core) | |
| Lenovo Legion 9 16IRX9, RTX 4090 | |
| Alienware m18 R2 | |
| Lenovo Legion 9 16IRX8 | |
| Média Intel Core i9-14900HX (6579 - 13832, n=37) | |
| Razer Blade 16 2024, RTX 4090 | |
| Asus ROG Strix Scar 18 G834JYR (2024) | |
| Medion Erazer Beast X40 2024 | |
| Média da turma Gaming (2179 - 15517, n=152, últimos 2 anos) | |
| Cinebench R20 / CPU (Single Core) | |
| Medion Erazer Beast X40 2024 | |
| Alienware m18 R2 | |
| Asus ROG Strix Scar 18 G834JYR (2024) | |
| Média Intel Core i9-14900HX (657 - 859, n=37) | |
| Razer Blade 16 2024, RTX 4090 | |
| Média da turma Gaming (439 - 866, n=152, últimos 2 anos) | |
| Lenovo Legion 9 16IRX8 | |
| Lenovo Legion 9 16IRX9, RTX 4090 | |
| Cinebench R15 / CPU Multi 64Bit | |
| Lenovo Legion 9 16IRX9, RTX 4090 | |
| Alienware m18 R2 | |
| Lenovo Legion 9 16IRX8 | |
| Razer Blade 16 2024, RTX 4090 | |
| Média Intel Core i9-14900HX (3263 - 5589, n=38) | |
| Asus ROG Strix Scar 18 G834JYR (2024) | |
| Média da turma Gaming (905 - 6074, n=155, últimos 2 anos) | |
| Medion Erazer Beast X40 2024 | |
| Cinebench R15 / CPU Single 64Bit | |
| Alienware m18 R2 | |
| Medion Erazer Beast X40 2024 | |
| Razer Blade 16 2024, RTX 4090 | |
| Média Intel Core i9-14900HX (247 - 323, n=37) | |
| Lenovo Legion 9 16IRX8 | |
| Asus ROG Strix Scar 18 G834JYR (2024) | |
| Média da turma Gaming (191.9 - 343, n=152, últimos 2 anos) | |
| Lenovo Legion 9 16IRX9, RTX 4090 | |
| Blender / v2.79 BMW27 CPU | |
| Média da turma Gaming (81 - 555, n=145, últimos 2 anos) | |
| Medion Erazer Beast X40 2024 | |
| Média Intel Core i9-14900HX (91 - 206, n=37) | |
| Asus ROG Strix Scar 18 G834JYR (2024) | |
| Razer Blade 16 2024, RTX 4090 | |
| Lenovo Legion 9 16IRX9, RTX 4090 | |
| Lenovo Legion 9 16IRX8 | |
| Alienware m18 R2 | |
| 7-Zip 18.03 / 7z b 4 | |
| Lenovo Legion 9 16IRX9, RTX 4090 | |
| Alienware m18 R2 | |
| Lenovo Legion 9 16IRX8 | |
| Razer Blade 16 2024, RTX 4090 | |
| Asus ROG Strix Scar 18 G834JYR (2024) | |
| Média Intel Core i9-14900HX (66769 - 136645, n=37) | |
| Medion Erazer Beast X40 2024 | |
| Média da turma Gaming (23795 - 144064, n=150, últimos 2 anos) | |
| 7-Zip 18.03 / 7z b 4 -mmt1 | |
| Medion Erazer Beast X40 2024 | |
| Asus ROG Strix Scar 18 G834JYR (2024) | |
| Alienware m18 R2 | |
| Média Intel Core i9-14900HX (5452 - 7545, n=37) | |
| Razer Blade 16 2024, RTX 4090 | |
| Lenovo Legion 9 16IRX8 | |
| Média da turma Gaming (4199 - 7573, n=150, últimos 2 anos) | |
| Lenovo Legion 9 16IRX9, RTX 4090 | |
| Geekbench 6.4 / Multi-Core | |
| Alienware m18 R2 | |
| Asus ROG Strix Scar 18 G834JYR (2024) | |
| Razer Blade 16 2024, RTX 4090 | |
| Lenovo Legion 9 16IRX9, RTX 4090 | |
| Lenovo Legion 9 16IRX8 | |
| Média Intel Core i9-14900HX (13158 - 19665, n=37) | |
| Medion Erazer Beast X40 2024 | |
| Média da turma Gaming (5340 - 21668, n=120, últimos 2 anos) | |
| Geekbench 6.4 / Single-Core | |
| Medion Erazer Beast X40 2024 | |
| Alienware m18 R2 | |
| Asus ROG Strix Scar 18 G834JYR (2024) | |
| Média Intel Core i9-14900HX (2419 - 3129, n=37) | |
| Razer Blade 16 2024, RTX 4090 | |
| Lenovo Legion 9 16IRX8 | |
| Média da turma Gaming (1490 - 3219, n=120, últimos 2 anos) | |
| Lenovo Legion 9 16IRX9, RTX 4090 | |
| Geekbench 5.5 / Multi-Core | |
| Lenovo Legion 9 16IRX9, RTX 4090 | |
| Alienware m18 R2 | |
| Lenovo Legion 9 16IRX8 | |
| Asus ROG Strix Scar 18 G834JYR (2024) | |
| Média Intel Core i9-14900HX (8618 - 23194, n=37) | |
| Razer Blade 16 2024, RTX 4090 | |
| Medion Erazer Beast X40 2024 | |
| Média da turma Gaming (4557 - 25855, n=149, últimos 2 anos) | |
| Geekbench 5.5 / Single-Core | |
| Alienware m18 R2 | |
| Medion Erazer Beast X40 2024 | |
| Lenovo Legion 9 16IRX8 | |
| Razer Blade 16 2024, RTX 4090 | |
| Asus ROG Strix Scar 18 G834JYR (2024) | |
| Média Intel Core i9-14900HX (1669 - 2210, n=37) | |
| Média da turma Gaming (986 - 2423, n=149, últimos 2 anos) | |
| Lenovo Legion 9 16IRX9, RTX 4090 | |
| HWBOT x265 Benchmark v2.2 / 4k Preset | |
| Alienware m18 R2 | |
| Lenovo Legion 9 16IRX8 | |
| Lenovo Legion 9 16IRX9, RTX 4090 | |
| Razer Blade 16 2024, RTX 4090 | |
| Média Intel Core i9-14900HX (16.8 - 38.9, n=37) | |
| Asus ROG Strix Scar 18 G834JYR (2024) | |
| Medion Erazer Beast X40 2024 | |
| Média da turma Gaming (6.72 - 42.9, n=149, últimos 2 anos) | |
| LibreOffice / 20 Documents To PDF | |
| Lenovo Legion 9 16IRX9, RTX 4090 | |
| Razer Blade 16 2024, RTX 4090 | |
| Média da turma Gaming (19 - 96.6, n=148, últimos 2 anos) | |
| Alienware m18 R2 | |
| Asus ROG Strix Scar 18 G834JYR (2024) | |
| Medion Erazer Beast X40 2024 | |
| Média Intel Core i9-14900HX (19 - 85.1, n=37) | |
| Lenovo Legion 9 16IRX8 | |
| R Benchmark 2.5 / Overall mean | |
| Lenovo Legion 9 16IRX9, RTX 4090 | |
| Média da turma Gaming (0.3609 - 0.759, n=151, últimos 2 anos) | |
| Asus ROG Strix Scar 18 G834JYR (2024) | |
| Média Intel Core i9-14900HX (0.3604 - 0.4859, n=37) | |
| Lenovo Legion 9 16IRX8 | |
| Razer Blade 16 2024, RTX 4090 | |
| Alienware m18 R2 | |
| Medion Erazer Beast X40 2024 | |
* ... menor é melhor
AIDA64: FP32 Ray-Trace | FPU Julia | CPU SHA3 | CPU Queen | FPU SinJulia | FPU Mandel | CPU AES | CPU ZLib | FP64 Ray-Trace | CPU PhotoWorxx
| Performance Rating | |
| Alienware m18 R2 | |
| Lenovo Legion 9 16IRX9, RTX 4090 | |
| Lenovo Legion 9 16IRX8 | |
| Razer Blade 16 2024, RTX 4090 | |
| Asus ROG Strix Scar 18 G834JYR (2024) | |
| Média Intel Core i9-14900HX | |
| Medion Erazer Beast X40 2024 | |
| Média da turma Gaming | |
| AIDA64 / FP32 Ray-Trace | |
| Alienware m18 R2 | |
| Lenovo Legion 9 16IRX9, RTX 4090 | |
| Lenovo Legion 9 16IRX8 | |
| Razer Blade 16 2024, RTX 4090 | |
| Asus ROG Strix Scar 18 G834JYR (2024) | |
| Média Intel Core i9-14900HX (13098 - 33474, n=36) | |
| Média da turma Gaming (4986 - 81639, n=148, últimos 2 anos) | |
| Medion Erazer Beast X40 2024 | |
| AIDA64 / FPU Julia | |
| Alienware m18 R2 | |
| Lenovo Legion 9 16IRX9, RTX 4090 | |
| Lenovo Legion 9 16IRX8 | |
| Asus ROG Strix Scar 18 G834JYR (2024) | |
| Razer Blade 16 2024, RTX 4090 | |
| Média Intel Core i9-14900HX (67573 - 166040, n=36) | |
| Média da turma Gaming (25360 - 252486, n=148, últimos 2 anos) | |
| Medion Erazer Beast X40 2024 | |
| AIDA64 / CPU SHA3 | |
| Alienware m18 R2 | |
| Lenovo Legion 9 16IRX9, RTX 4090 | |
| Lenovo Legion 9 16IRX8 | |
| Asus ROG Strix Scar 18 G834JYR (2024) | |
| Razer Blade 16 2024, RTX 4090 | |
| Média Intel Core i9-14900HX (3589 - 7979, n=36) | |
| Medion Erazer Beast X40 2024 | |
| Média da turma Gaming (1339 - 10389, n=148, últimos 2 anos) | |
| AIDA64 / CPU Queen | |
| Asus ROG Strix Scar 18 G834JYR (2024) | |
| Alienware m18 R2 | |
| Razer Blade 16 2024, RTX 4090 | |
| Média Intel Core i9-14900HX (118405 - 148966, n=36) | |
| Lenovo Legion 9 16IRX8 | |
| Medion Erazer Beast X40 2024 | |
| Lenovo Legion 9 16IRX9, RTX 4090 | |
| Média da turma Gaming (50699 - 200651, n=148, últimos 2 anos) | |
| AIDA64 / FPU SinJulia | |
| Alienware m18 R2 | |
| Lenovo Legion 9 16IRX9, RTX 4090 | |
| Asus ROG Strix Scar 18 G834JYR (2024) | |
| Razer Blade 16 2024, RTX 4090 | |
| Lenovo Legion 9 16IRX8 | |
| Média Intel Core i9-14900HX (10475 - 18517, n=36) | |
| Medion Erazer Beast X40 2024 | |
| Média da turma Gaming (4800 - 32988, n=148, últimos 2 anos) | |
| AIDA64 / FPU Mandel | |
| Alienware m18 R2 | |
| Lenovo Legion 9 16IRX9, RTX 4090 | |
| Lenovo Legion 9 16IRX8 | |
| Razer Blade 16 2024, RTX 4090 | |
| Asus ROG Strix Scar 18 G834JYR (2024) | |
| Média Intel Core i9-14900HX (32543 - 83662, n=36) | |
| Média da turma Gaming (12321 - 134044, n=148, últimos 2 anos) | |
| Medion Erazer Beast X40 2024 | |
| AIDA64 / CPU AES | |
| Média Intel Core i9-14900HX (86964 - 241777, n=36) | |
| Alienware m18 R2 | |
| Lenovo Legion 9 16IRX9, RTX 4090 | |
| Lenovo Legion 9 16IRX8 | |
| Razer Blade 16 2024, RTX 4090 | |
| Asus ROG Strix Scar 18 G834JYR (2024) | |
| Média da turma Gaming (19065 - 328679, n=148, últimos 2 anos) | |
| Medion Erazer Beast X40 2024 | |
| AIDA64 / CPU ZLib | |
| Alienware m18 R2 | |
| Lenovo Legion 9 16IRX9, RTX 4090 | |
| Lenovo Legion 9 16IRX8 | |
| Razer Blade 16 2024, RTX 4090 | |
| Média Intel Core i9-14900HX (1054 - 2292, n=36) | |
| Asus ROG Strix Scar 18 G834JYR (2024) | |
| Medion Erazer Beast X40 2024 | |
| Média da turma Gaming (373 - 2531, n=148, últimos 2 anos) | |
| AIDA64 / FP64 Ray-Trace | |
| Alienware m18 R2 | |
| Lenovo Legion 9 16IRX8 | |
| Lenovo Legion 9 16IRX9, RTX 4090 | |
| Razer Blade 16 2024, RTX 4090 | |
| Asus ROG Strix Scar 18 G834JYR (2024) | |
| Média Intel Core i9-14900HX (6809 - 18349, n=36) | |
| Média da turma Gaming (2540 - 43430, n=148, últimos 2 anos) | |
| Medion Erazer Beast X40 2024 | |
| AIDA64 / CPU PhotoWorxx | |
| Lenovo Legion 9 16IRX9, RTX 4090 | |
| Lenovo Legion 9 16IRX8 | |
| Alienware m18 R2 | |
| Asus ROG Strix Scar 18 G834JYR (2024) | |
| Razer Blade 16 2024, RTX 4090 | |
| Medion Erazer Beast X40 2024 | |
| Média Intel Core i9-14900HX (23903 - 54702, n=36) | |
| Média da turma Gaming (10805 - 60161, n=148, últimos 2 anos) | |
Desempenho do sistema
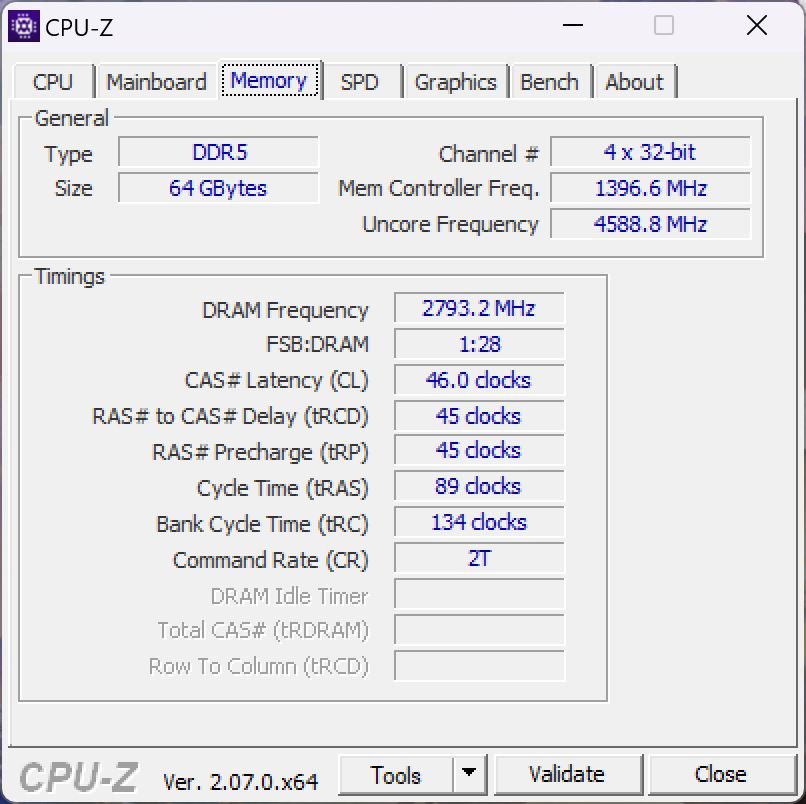
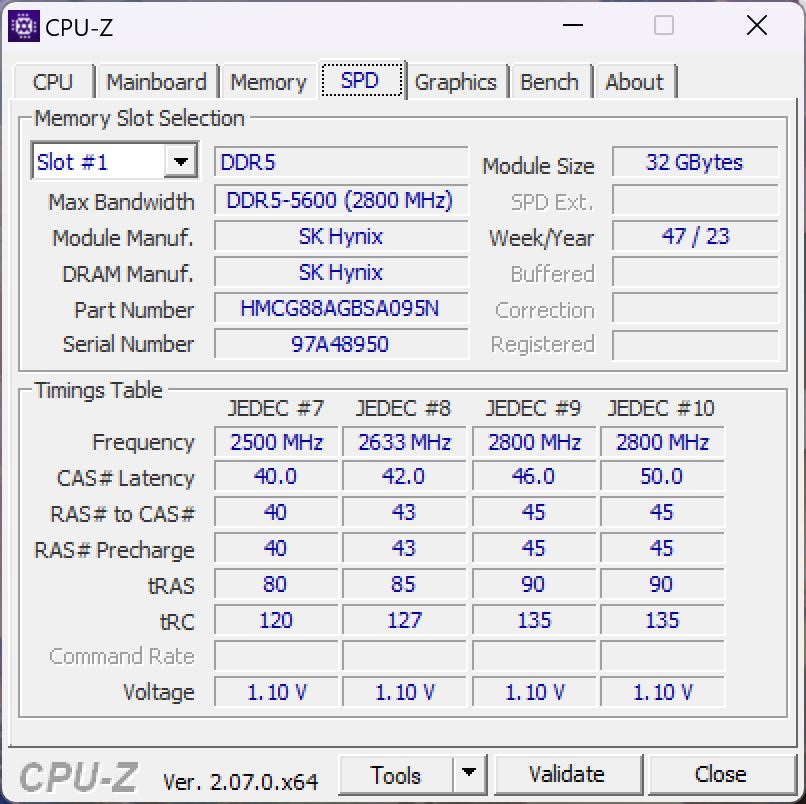
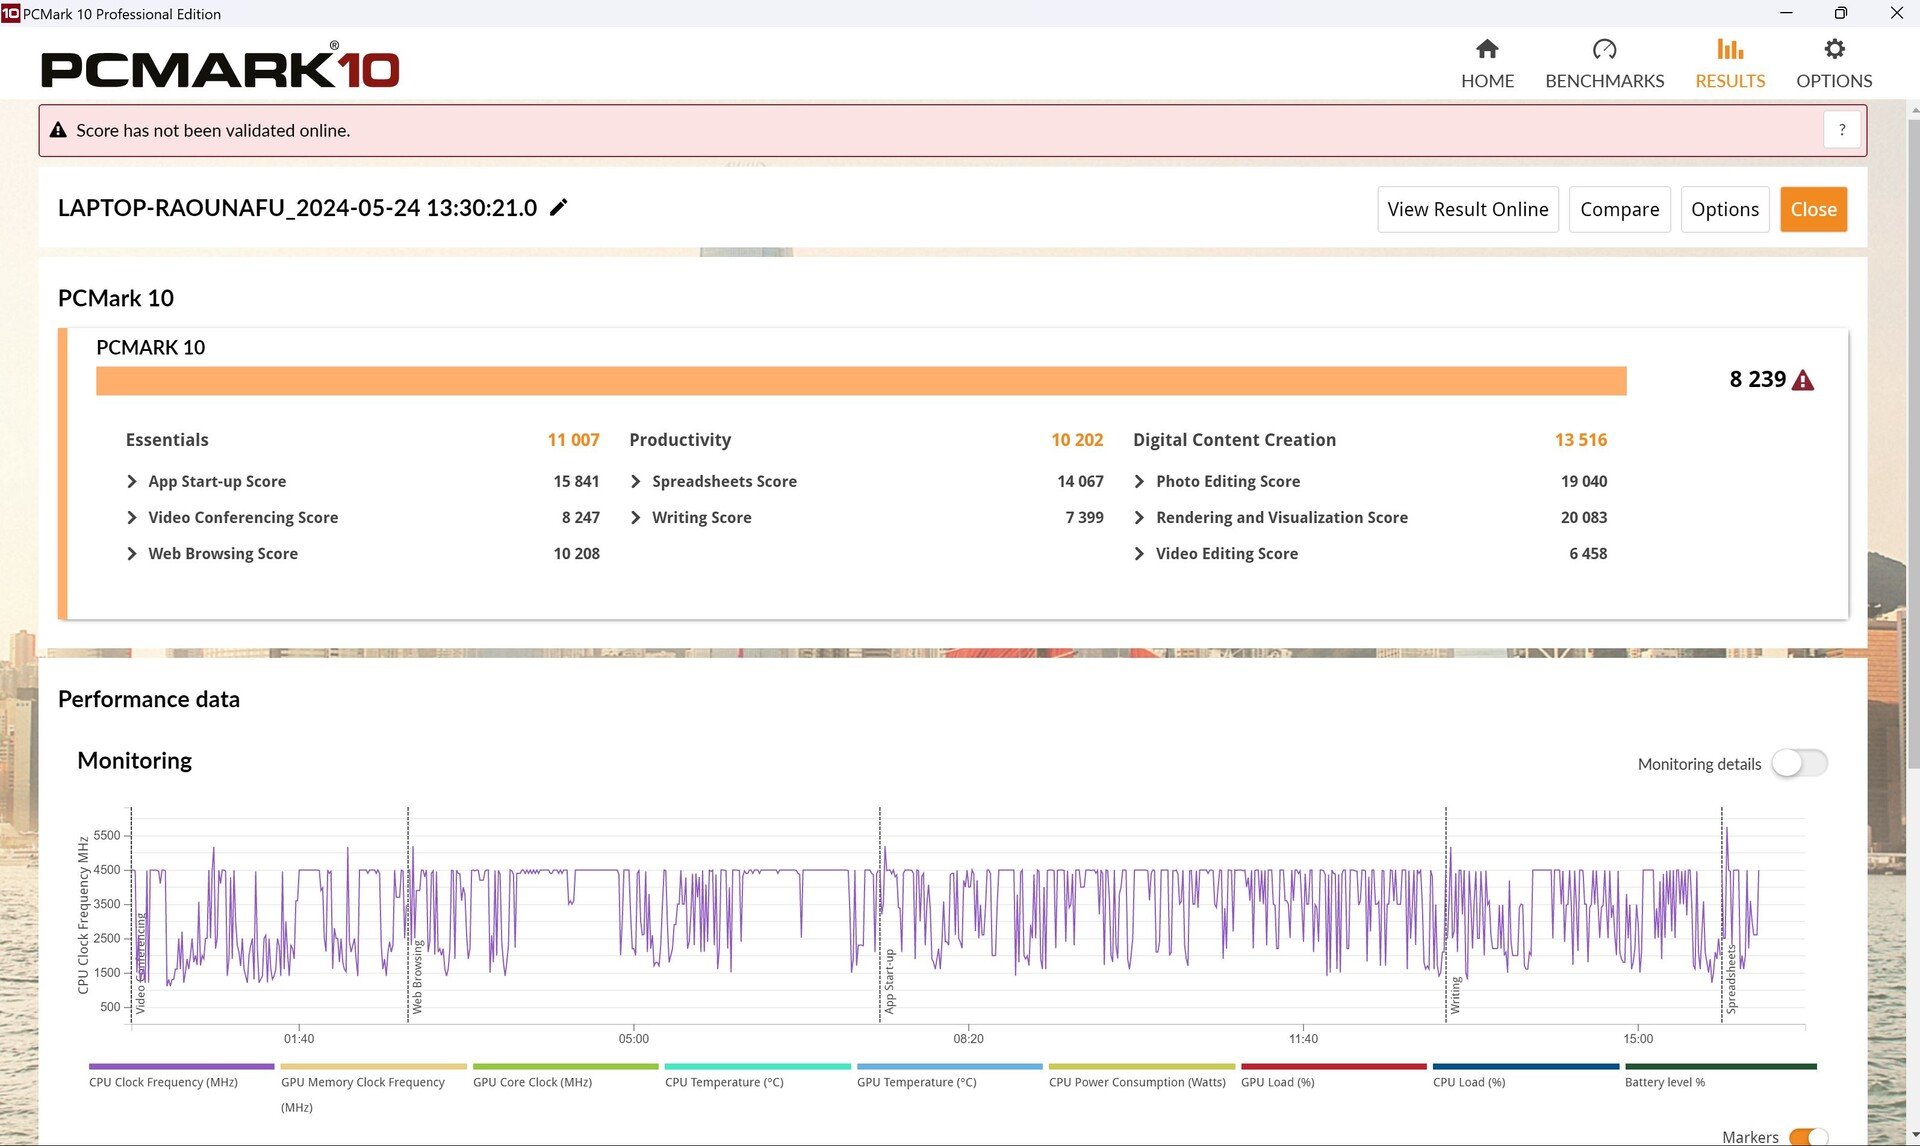
Seu desempenho no PCMark 10 ficou cerca de 5% abaixo da média dos notebooks com a mesma combinação CPU/GPU. O Aida também mostrou que, embora sua RAM ofereça boas taxas de leitura e gravação, a latência da memória é excepcionalmente alta, levando a resultados piores do que o esperado em alguns benchmarks, como aqui.
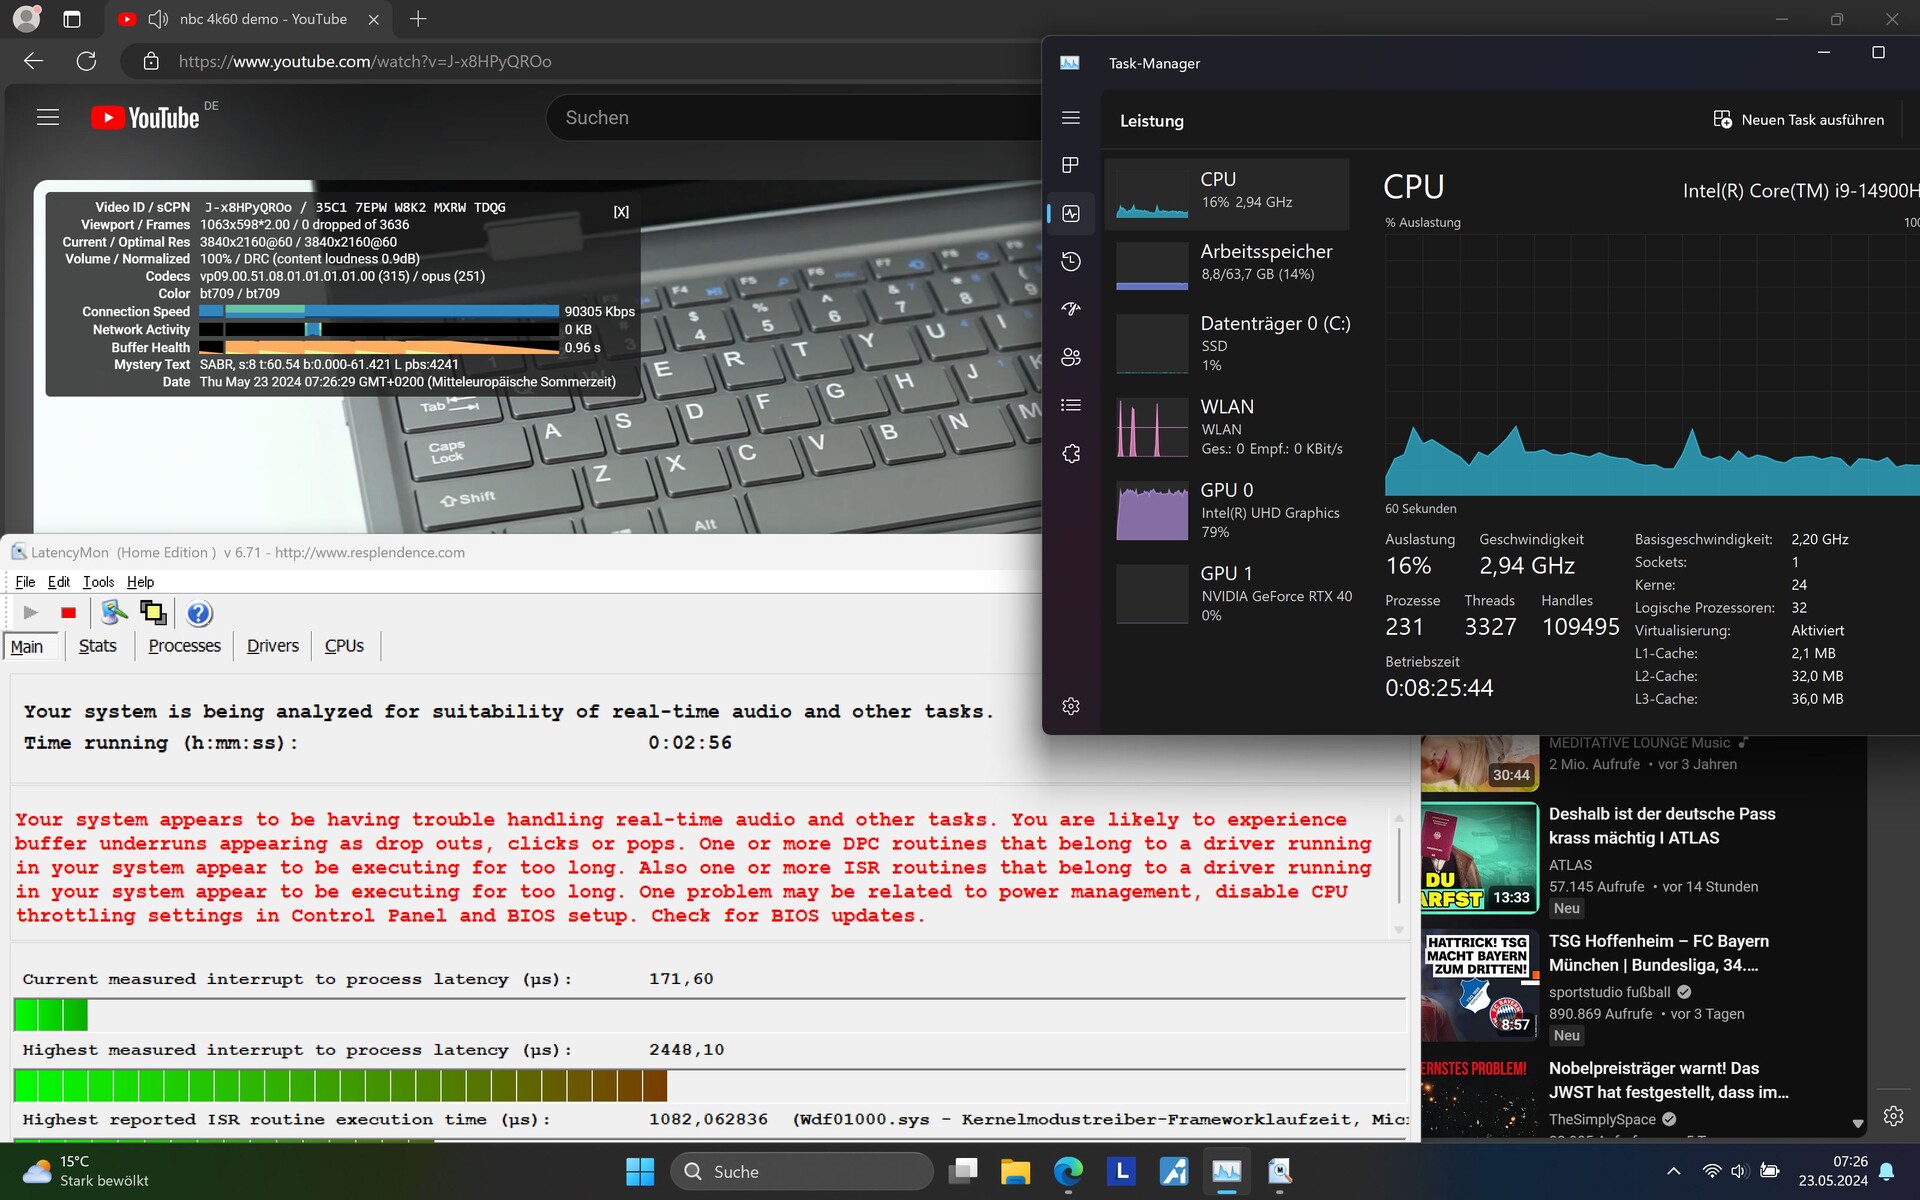
Subjetivamente, notamos que, embora o laptop funcione sem problemas na maior parte do tempo, ele ocasionalmente "engata" ao executar jogos. Isso também foi confirmado pelo gráfico da taxa de quadros do Far Cry 5, por exemplo, em que a taxa de quadros parece cair brevemente, o que parece ocorrer com mais frequência. Suas latências de DPC também são bastante altas, veja a próxima seção. Seus resultados usando aplicativos da Web também foram repetidamente fracos.
CrossMark: Overall | Productivity | Creativity | Responsiveness
WebXPRT 3: Overall
WebXPRT 4: Overall
Mozilla Kraken 1.1: Total
| PCMark 10 / Score | |
| Alienware m18 R2 | |
| Lenovo Legion 9 16IRX8 | |
| Medion Erazer Beast X40 2024 | |
| Asus ROG Strix Scar 18 G834JYR (2024) | |
| Média Intel Core i9-14900HX, NVIDIA GeForce RTX 4090 Laptop GPU (8230 - 9234, n=13) | |
| Razer Blade 16 2024, RTX 4090 | |
| Lenovo Legion 9 16IRX9, RTX 4090 | |
| Média da turma Gaming (5776 - 9852, n=133, últimos 2 anos) | |
| PCMark 10 / Essentials | |
| Lenovo Legion 9 16IRX8 | |
| Alienware m18 R2 | |
| Asus ROG Strix Scar 18 G834JYR (2024) | |
| Média Intel Core i9-14900HX, NVIDIA GeForce RTX 4090 Laptop GPU (10778 - 11628, n=13) | |
| Lenovo Legion 9 16IRX9, RTX 4090 | |
| Razer Blade 16 2024, RTX 4090 | |
| Medion Erazer Beast X40 2024 | |
| Média da turma Gaming (9057 - 12600, n=133, últimos 2 anos) | |
| PCMark 10 / Productivity | |
| Medion Erazer Beast X40 2024 | |
| Alienware m18 R2 | |
| Razer Blade 16 2024, RTX 4090 | |
| Lenovo Legion 9 16IRX8 | |
| Média Intel Core i9-14900HX, NVIDIA GeForce RTX 4090 Laptop GPU (9458 - 11759, n=13) | |
| Asus ROG Strix Scar 18 G834JYR (2024) | |
| Lenovo Legion 9 16IRX9, RTX 4090 | |
| Média da turma Gaming (6662 - 14612, n=133, últimos 2 anos) | |
| PCMark 10 / Digital Content Creation | |
| Alienware m18 R2 | |
| Lenovo Legion 9 16IRX8 | |
| Asus ROG Strix Scar 18 G834JYR (2024) | |
| Medion Erazer Beast X40 2024 | |
| Média Intel Core i9-14900HX, NVIDIA GeForce RTX 4090 Laptop GPU (13219 - 16462, n=13) | |
| Lenovo Legion 9 16IRX9, RTX 4090 | |
| Razer Blade 16 2024, RTX 4090 | |
| Média da turma Gaming (6807 - 18475, n=133, últimos 2 anos) | |
| CrossMark / Overall | |
| Asus ROG Strix Scar 18 G834JYR (2024) | |
| Razer Blade 16 2024, RTX 4090 | |
| Medion Erazer Beast X40 2024 | |
| Média Intel Core i9-14900HX, NVIDIA GeForce RTX 4090 Laptop GPU (1877 - 2344, n=10) | |
| Alienware m18 R2 | |
| Lenovo Legion 9 16IRX9, RTX 4090 | |
| Lenovo Legion 9 16IRX8 | |
| Média da turma Gaming (1247 - 2344, n=114, últimos 2 anos) | |
| CrossMark / Productivity | |
| Medion Erazer Beast X40 2024 | |
| Asus ROG Strix Scar 18 G834JYR (2024) | |
| Razer Blade 16 2024, RTX 4090 | |
| Média Intel Core i9-14900HX, NVIDIA GeForce RTX 4090 Laptop GPU (1738 - 2162, n=10) | |
| Alienware m18 R2 | |
| Média da turma Gaming (1299 - 2204, n=114, últimos 2 anos) | |
| Lenovo Legion 9 16IRX8 | |
| Lenovo Legion 9 16IRX9, RTX 4090 | |
| CrossMark / Creativity | |
| Asus ROG Strix Scar 18 G834JYR (2024) | |
| Razer Blade 16 2024, RTX 4090 | |
| Alienware m18 R2 | |
| Média Intel Core i9-14900HX, NVIDIA GeForce RTX 4090 Laptop GPU (2195 - 2660, n=10) | |
| Medion Erazer Beast X40 2024 | |
| Lenovo Legion 9 16IRX8 | |
| Lenovo Legion 9 16IRX9, RTX 4090 | |
| Média da turma Gaming (1275 - 2660, n=114, últimos 2 anos) | |
| CrossMark / Responsiveness | |
| Asus ROG Strix Scar 18 G834JYR (2024) | |
| Medion Erazer Beast X40 2024 | |
| Média Intel Core i9-14900HX, NVIDIA GeForce RTX 4090 Laptop GPU (1478 - 2327, n=10) | |
| Razer Blade 16 2024, RTX 4090 | |
| Alienware m18 R2 | |
| Lenovo Legion 9 16IRX9, RTX 4090 | |
| Média da turma Gaming (1030 - 2330, n=114, últimos 2 anos) | |
| Lenovo Legion 9 16IRX8 | |
| WebXPRT 3 / Overall | |
| Lenovo Legion 9 16IRX8 | |
| Razer Blade 16 2024, RTX 4090 | |
| Medion Erazer Beast X40 2024 | |
| Alienware m18 R2 | |
| Média Intel Core i9-14900HX, NVIDIA GeForce RTX 4090 Laptop GPU (279 - 339, n=10) | |
| Asus ROG Strix Scar 18 G834JYR (2024) | |
| Média da turma Gaming (215 - 480, n=128, últimos 2 anos) | |
| Lenovo Legion 9 16IRX9, RTX 4090 | |
| WebXPRT 4 / Overall | |
| Alienware m18 R2 | |
| Lenovo Legion 9 16IRX8 | |
| Asus ROG Strix Scar 18 G834JYR (2024) | |
| Medion Erazer Beast X40 2024 | |
| Média Intel Core i9-14900HX, NVIDIA GeForce RTX 4090 Laptop GPU (246 - 309, n=8) | |
| Média da turma Gaming (176.4 - 335, n=116, últimos 2 anos) | |
| Lenovo Legion 9 16IRX9, RTX 4090 | |
| Mozilla Kraken 1.1 / Total | |
| Lenovo Legion 9 16IRX9, RTX 4090 | |
| Média da turma Gaming (408 - 674, n=140, últimos 2 anos) | |
| Média Intel Core i9-14900HX, NVIDIA GeForce RTX 4090 Laptop GPU (428 - 535, n=11) | |
| Razer Blade 16 2024, RTX 4090 | |
| Asus ROG Strix Scar 18 G834JYR (2024) | |
| Lenovo Legion 9 16IRX8 | |
| Medion Erazer Beast X40 2024 | |
| Alienware m18 R2 | |
* ... menor é melhor
| PCMark 10 Score | 8239 pontos | |
Ajuda | ||
| AIDA64 / Memory Copy | |
| Asus ROG Strix Scar 18 G834JYR (2024) | |
| Lenovo Legion 9 16IRX9, RTX 4090 | |
| Alienware m18 R2 | |
| Razer Blade 16 2024, RTX 4090 | |
| Lenovo Legion 9 16IRX8 | |
| Medion Erazer Beast X40 2024 | |
| Média Intel Core i9-14900HX (38028 - 83392, n=36) | |
| Média da turma Gaming (21750 - 97515, n=148, últimos 2 anos) | |
| AIDA64 / Memory Read | |
| Asus ROG Strix Scar 18 G834JYR (2024) | |
| Razer Blade 16 2024, RTX 4090 | |
| Alienware m18 R2 | |
| Lenovo Legion 9 16IRX8 | |
| Medion Erazer Beast X40 2024 | |
| Lenovo Legion 9 16IRX9, RTX 4090 | |
| Média Intel Core i9-14900HX (43306 - 87568, n=36) | |
| Média da turma Gaming (22956 - 102937, n=148, últimos 2 anos) | |
| AIDA64 / Memory Write | |
| Lenovo Legion 9 16IRX9, RTX 4090 | |
| Asus ROG Strix Scar 18 G834JYR (2024) | |
| Medion Erazer Beast X40 2024 | |
| Alienware m18 R2 | |
| Lenovo Legion 9 16IRX8 | |
| Razer Blade 16 2024, RTX 4090 | |
| Média Intel Core i9-14900HX (37146 - 80589, n=36) | |
| Média da turma Gaming (22297 - 108954, n=148, últimos 2 anos) | |
| AIDA64 / Memory Latency | |
| Média da turma Gaming (59.5 - 259, n=148, últimos 2 anos) | |
| Lenovo Legion 9 16IRX9, RTX 4090 | |
| Alienware m18 R2 | |
| Média Intel Core i9-14900HX (76.1 - 105, n=36) | |
| Lenovo Legion 9 16IRX8 | |
| Razer Blade 16 2024, RTX 4090 | |
| Asus ROG Strix Scar 18 G834JYR (2024) | |
| Medion Erazer Beast X40 2024 | |
* ... menor é melhor
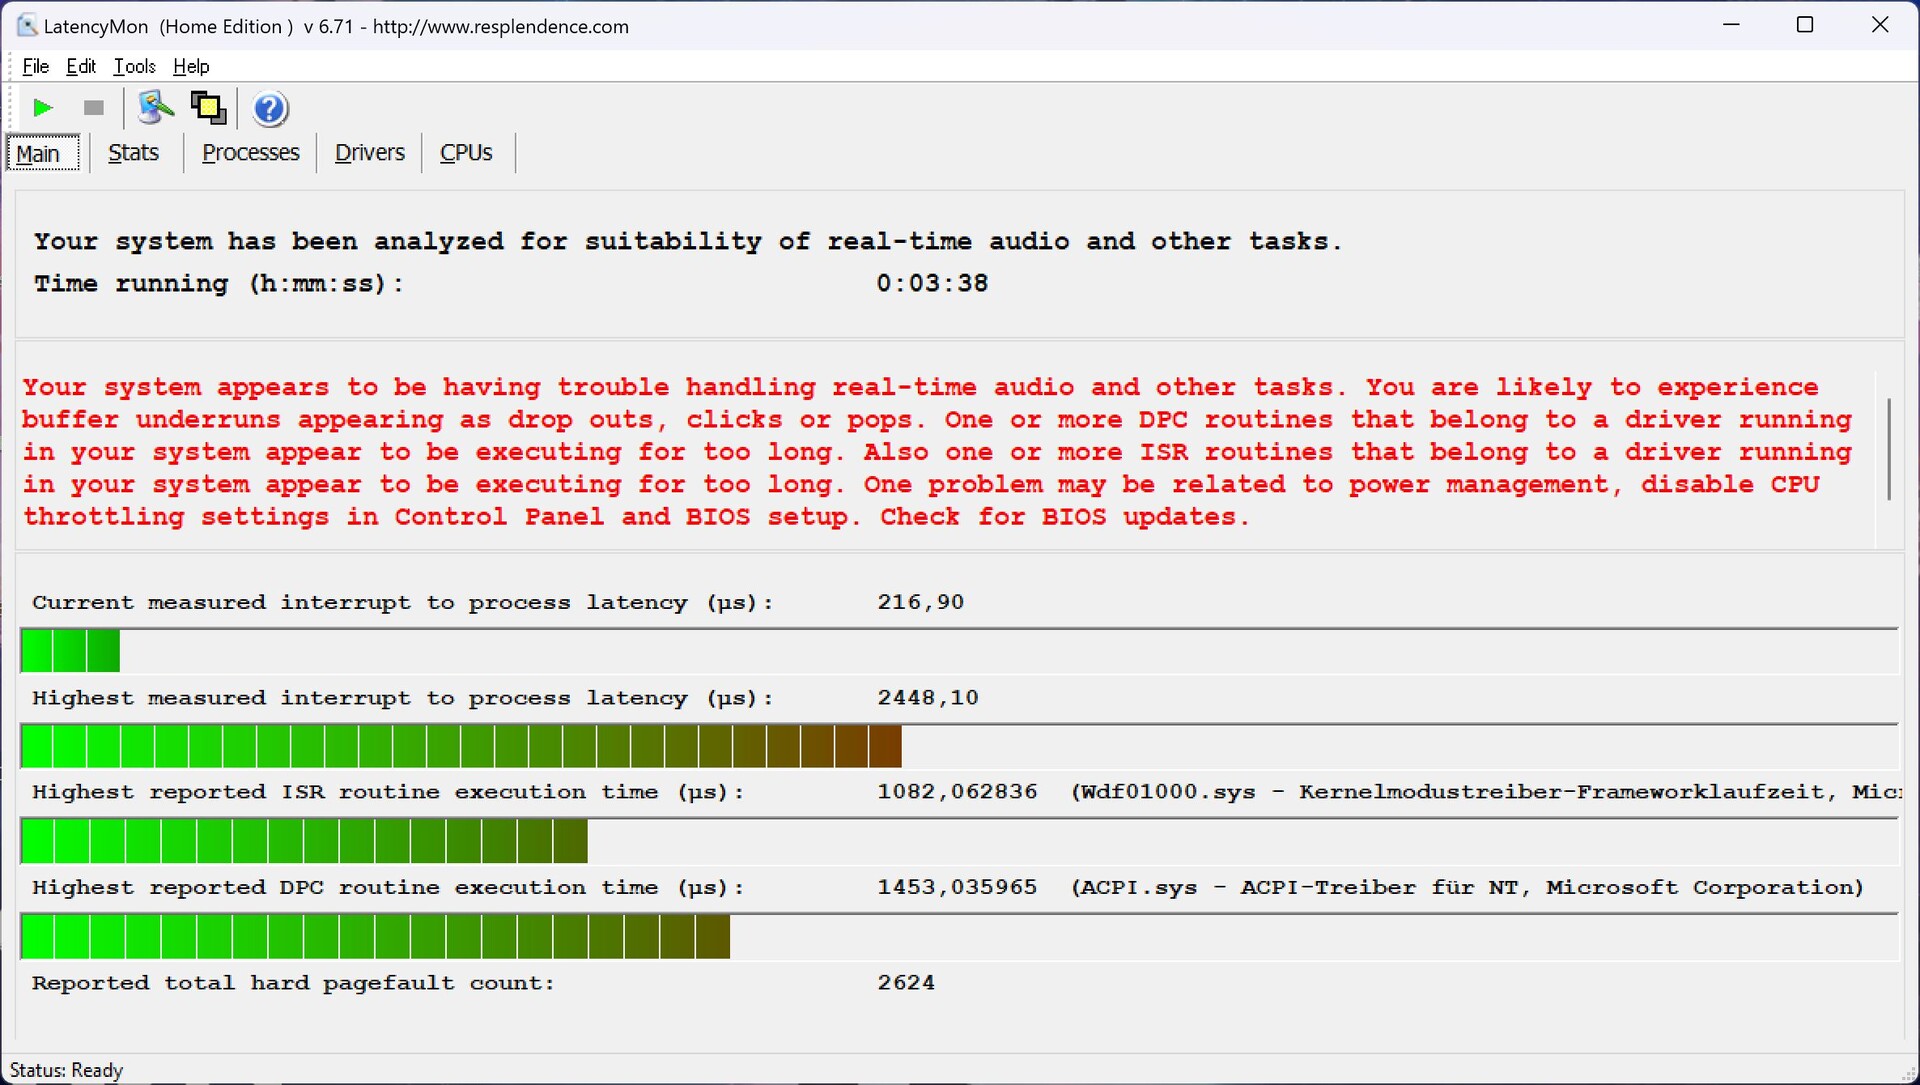
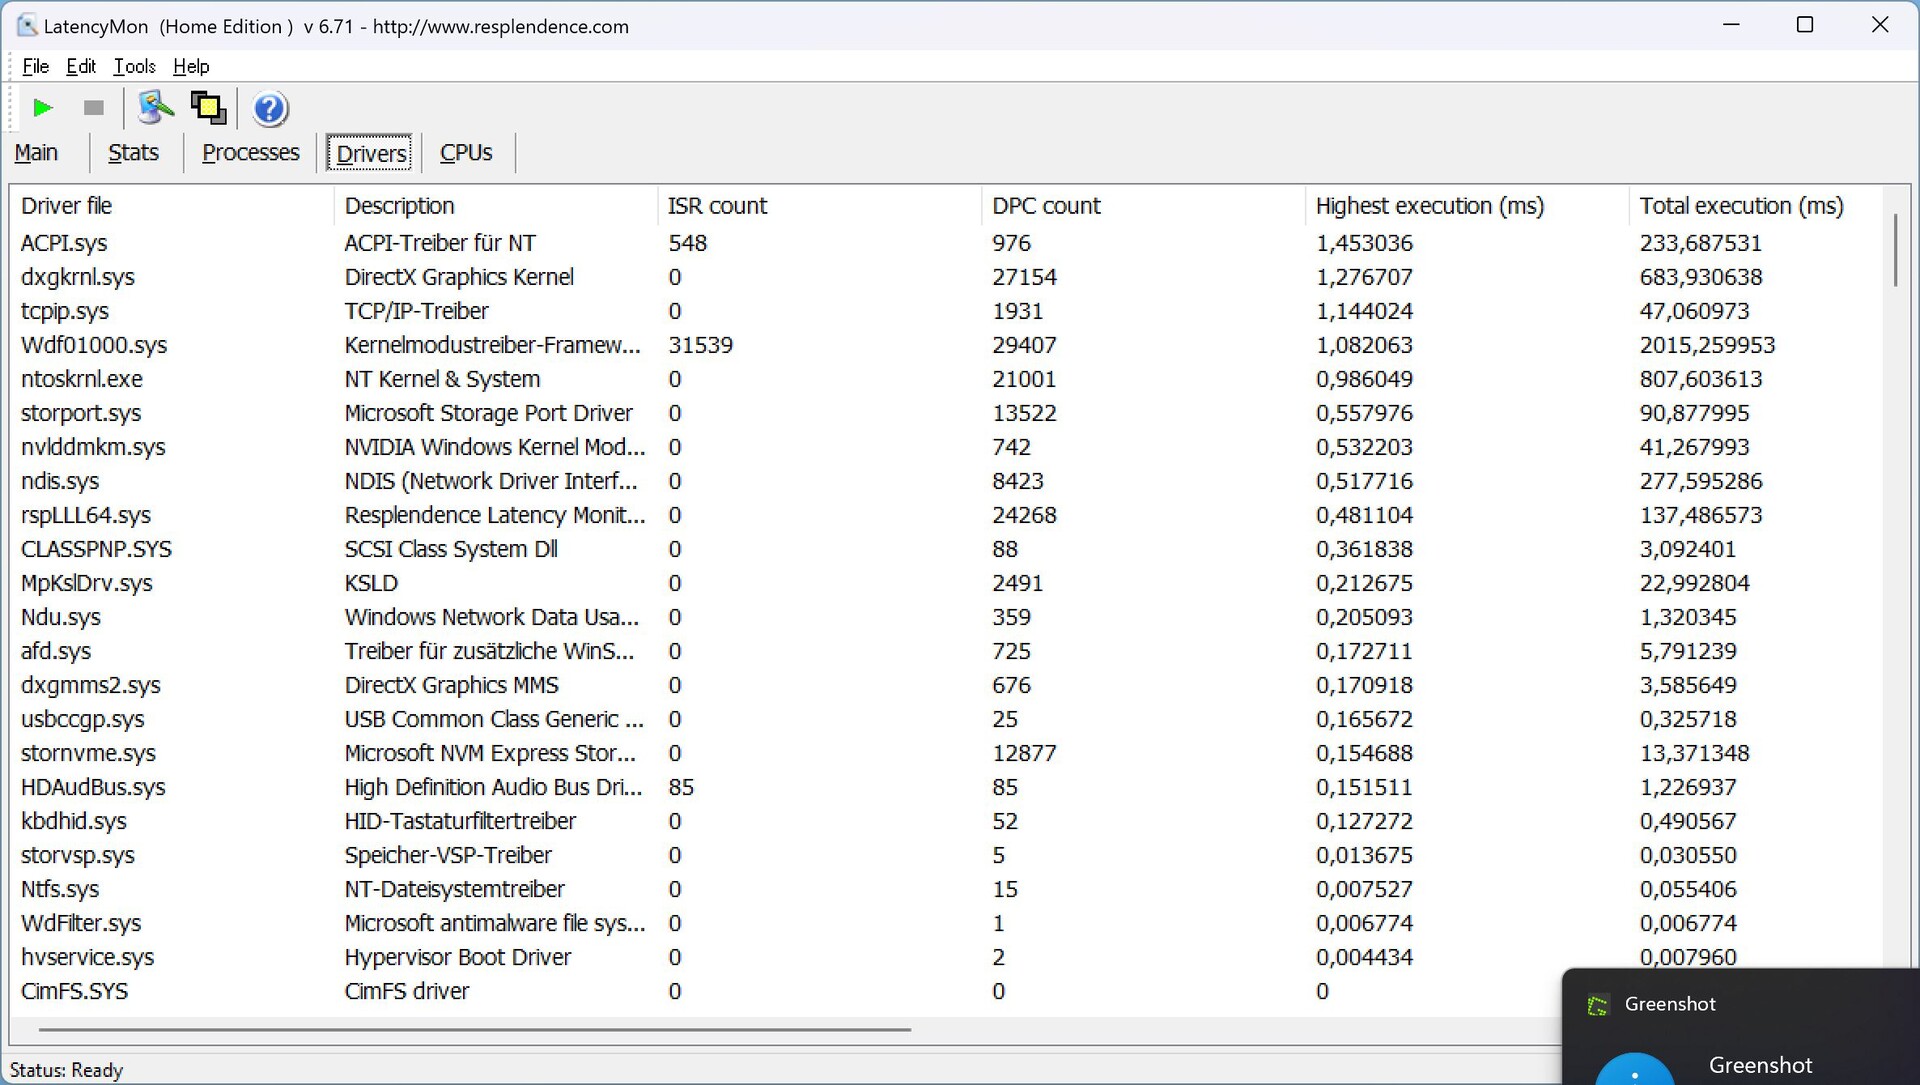
Latências de DPC
As primeiras latências ocorreram assim que o navegador foi aberto. O valor aumentou minimamente ao abrir várias guias em nosso site. No entanto, foi principalmente a reprodução do nosso vídeo do YouTube em 4K/60 fps que fez com que o valor da latência disparasse.
Além disso, a carga interna da GPU, que estava ativa nesse caso, estava constantemente em um nível excepcionalmente alto de 79%; valores em torno de 20% seriam normais! No entanto, não houve quedas de quadros das quais o senhor possa se queixar.
| DPC Latencies / LatencyMon - interrupt to process latency (max), Web, Youtube, Prime95 | |
| Alienware m18 R2 | |
| Lenovo Legion 9 16IRX9, RTX 4090 | |
| Lenovo Legion 9 16IRX8 | |
| Razer Blade 16 2024, RTX 4090 | |
| Medion Erazer Beast X40 2024 | |
| Asus ROG Strix Scar 18 G834JYR (2024) | |
* ... menor é melhor
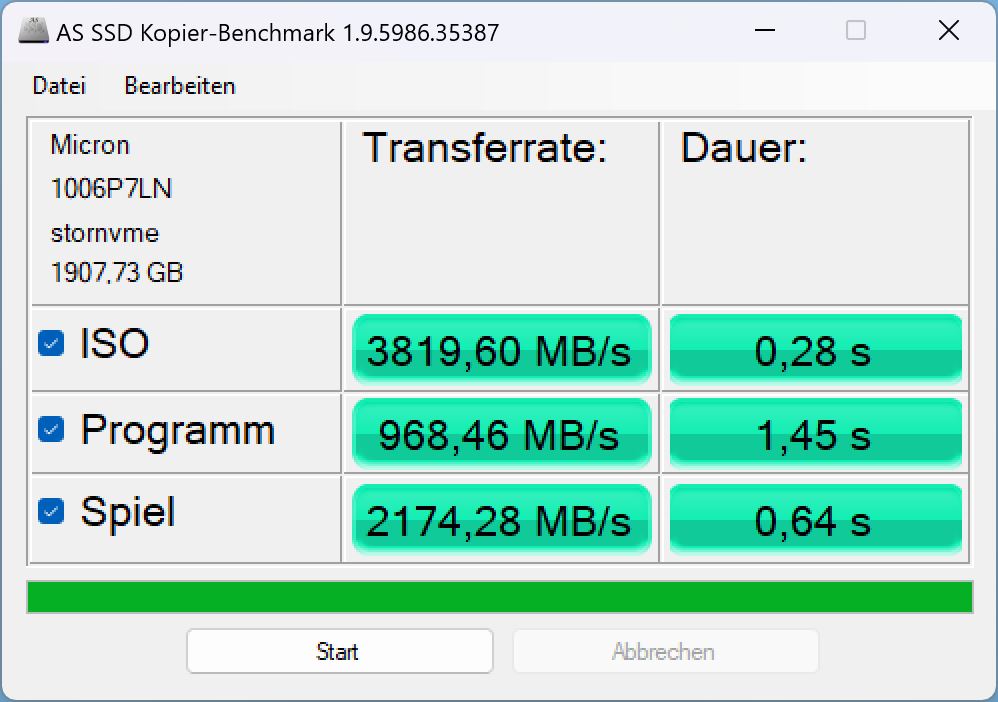
Dispositivo de armazenamento
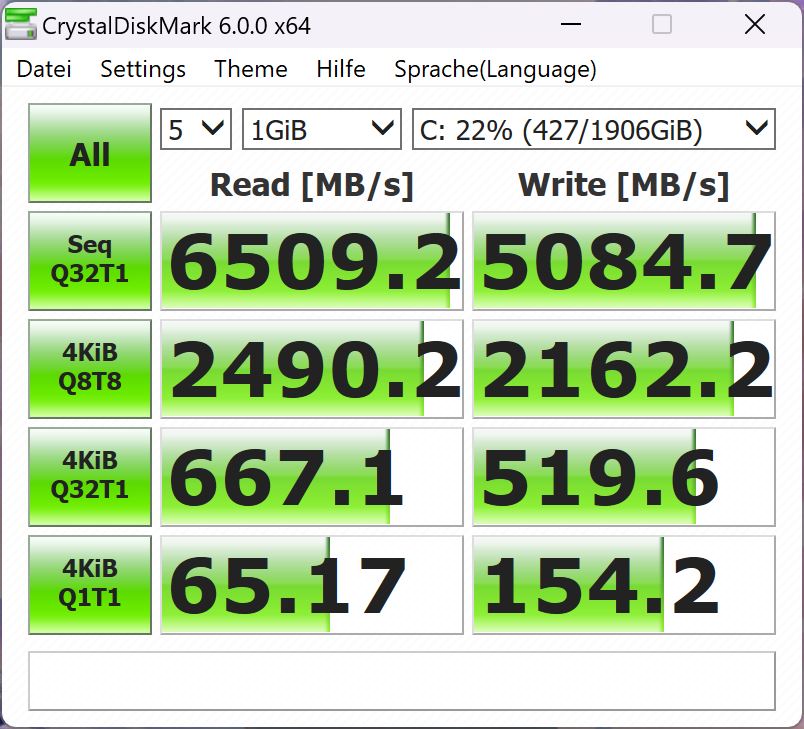
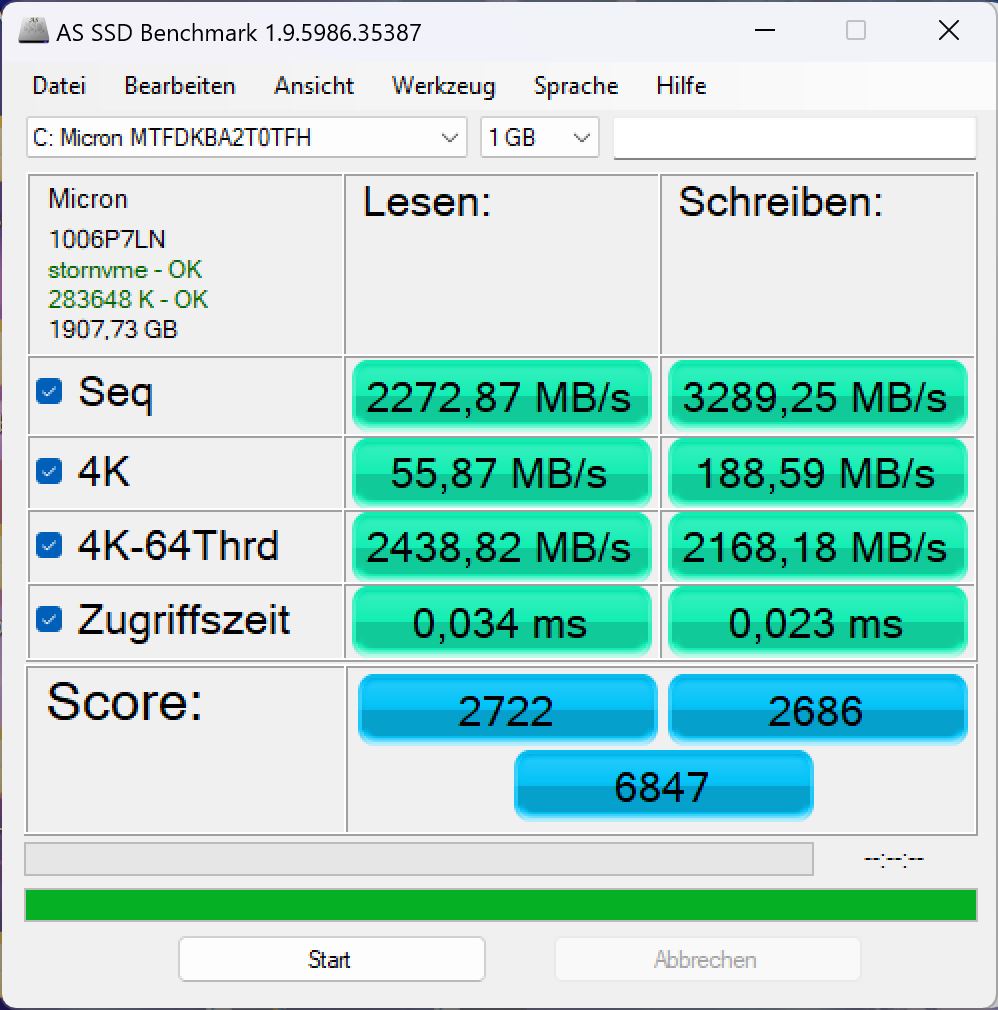
A Lenovo instalou um Micron 3400 com 2 TB de armazenamento em nosso modelo de teste. Ele está classificado em 121º lugar em nossa Lista dos melhores SSDso que significa que, na melhor das hipóteses, ele é de médio porte. De acordo com a Micron, ele deve atingir taxas de leitura sequencial de até 6.600 MB/s e taxas de gravação sequencial de 5.000 MB/s, mas nosso modelo estava tão longe disso quanto a média dos laptops com o mesmo SSD em nosso banco de dados. Somente o Crystaldiskmark pôde confirmar valores altos, enquanto o DiskSpd e o AS SSD mediram taxas de dados significativamente mais baixas.
O comportamento de carga contínua do laptop é incomum: enquanto outros modelos às vezes esquentavam depois de um certo tempo e eram então estrangulados, o dispositivo de armazenamento dentro do Legion 9 se comportava exatamente ao contrário. No início do teste, seu desempenho oscilou muito e caiu várias vezes. Entretanto, a SSD funcionou constantemente na velocidade máxima nos últimos dois terços do teste. Isso pode ser um sinal de que o sistema de resfriamento do Legion 9i entra em ação um pouco tarde demais ou que ele só atinge sua capacidade de resfriamento ideal muito tarde.

* ... menor é melhor
Reading continuous performance: DiskSpd Read Loop, Queue Depth 8
Placa de vídeo
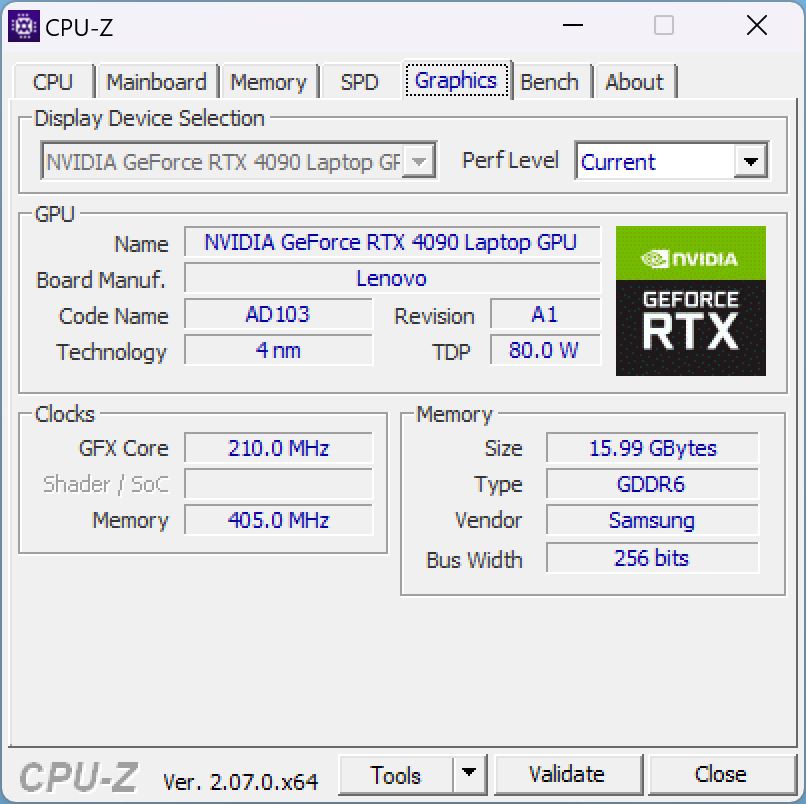
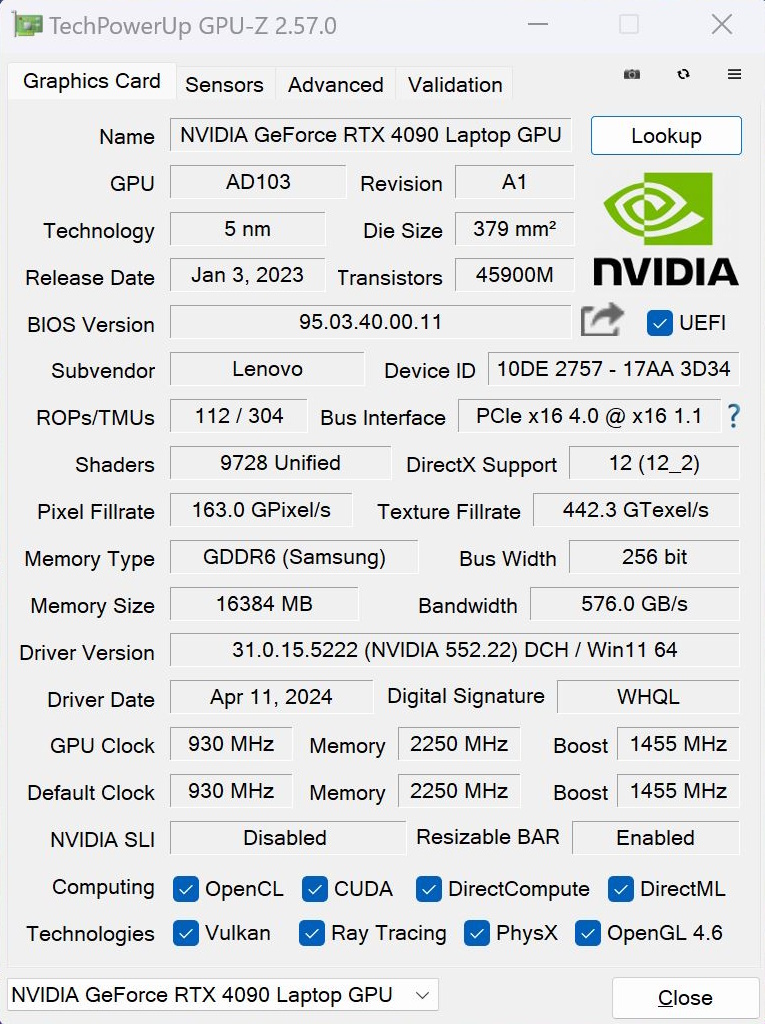
A Nvidia Geforce RTX 4090 no interior do Legion 9i é a atual ponta de lança das placas de vídeo para laptop. Dessa forma, ela deve ser capaz de executar todos os jogos atuais em alta resolução e com o máximo de detalhes.
Nos testes sintéticos do 3DMark, seu desempenho estava mais ou menos no nível esperado, mas, novamente, estava um pouco abaixo e a concorrência direta era muitas vezes alguns pontos percentuais mais rápida - coincidentemente também o Blade 16, significativamente menor e mais fino.
Se o senhor desconectar o laptop da fonte de alimentação, a pontuação do Fire Strike cai em cerca de 40% quando se trata de desempenho 3D.
Nos jogos, seu desempenho é praticamente comparável ao do Razer Blade 16. Seus resultados possivelmente seriam mais altos se não fossem as breves quedas na taxa de quadros mencionadas anteriormente. O senhor pode ver o problema claramente nos valores da taxa de quadros do nosso teste de 1 hora no site Witcher 3. As quedas na taxa de quadros ocorreram principalmente nos estágios iniciais, após o que o sistema funcionou de forma estável e seu desempenho estava no mesmo nível da concorrência.
Somente ao executar jogos muito atuais e exigentes, como Skull & Bones, a taxa de quadros em 4K às vezes fica abaixo da marca de 60 fps; caso contrário, todos os jogos são executados sem problemas a mais de 60 fps, mesmo em 4K.
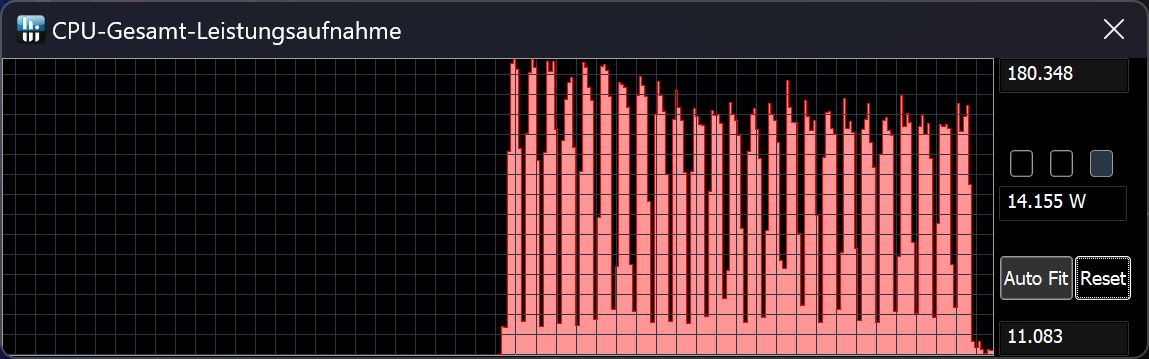
| Perfil de desempenho/valor de medição | Witcher 3 fps inicial | Witcher 3 fps após 10 min | Consumo em watts | Consumo de energia da GPU em watts | Relógio médio da GPU em MHz | Emissões de ruído em dB |
|---|---|---|---|---|---|---|
| Desempenho | 203 | 192 | 246 | 162 | 2.120 | 55,32 |
| Desempenho com aumento de GPU | 201 | 193 | 254 | 160,5 | 2.180 | 55,32 |
| Equilibrado com IA | 197 | 182 | 254 | 159 | 2.080 | 54,81 |
| Equilibrado sem IA | 161 | 145 | 184 | 103 | 1.530 | 47,98 |
| Silencioso | 108 | 60 | 101 | 43 | primeiros 1.000, após 2 minutos 800 | 32,19 |
| 3DMark 11 Performance | 46826 pontos | |
| 3DMark Cloud Gate Standard Score | 67697 pontos | |
| 3DMark Fire Strike Score | 34686 pontos | |
| 3DMark Time Spy Score | 20099 pontos | |
Ajuda | ||
* ... menor é melhor
| The Witcher 3 - 1920x1080 Ultra Graphics & Postprocessing (HBAO+) | |
| Lenovo Legion 9 16IRX8 | |
| Alienware m18 R2 | |
| Medion Erazer Beast X40 2024 | |
| Lenovo Legion 9 16IRX9, RTX 4090 | |
| Razer Blade 16 2024, RTX 4090 | |
| Asus ROG Strix Scar 18 G834JYR (2024) | |
| Média da turma Gaming (18.4 - 214, n=119, últimos 2 anos) | |
| GTA V - 1920x1080 Highest Settings possible AA:4xMSAA + FX AF:16x | |
| Lenovo Legion 9 16IRX8 | |
| Medion Erazer Beast X40 2024 | |
| Razer Blade 16 2024, RTX 4090 | |
| Alienware m18 R2 | |
| Lenovo Legion 9 16IRX9, RTX 4090 | |
| Asus ROG Strix Scar 18 G834JYR (2024) | |
| Média da turma Gaming (12.1 - 168.2, n=132, últimos 2 anos) | |
| Final Fantasy XV Benchmark - 1920x1080 High Quality | |
| Alienware m18 R2 | |
| Lenovo Legion 9 16IRX8 | |
| Medion Erazer Beast X40 2024 | |
| Asus ROG Strix Scar 18 G834JYR (2024) | |
| Lenovo Legion 9 16IRX9, RTX 4090 | |
| Razer Blade 16 2024, RTX 4090 | |
| Média da turma Gaming (19.2 - 201, n=144, últimos 2 anos) | |
Witcher 3 FPS diagram
| baixo | média | alto | ultra | QHD | 4K DLSS | 4K FSR | 4K | |
|---|---|---|---|---|---|---|---|---|
| GTA V (2015) | 186.9 | 185.2 | 183.3 | 136.2 | 138.9 | 95 | ||
| The Witcher 3 (2015) | 540 | 494 | 370 | 203.4 | 165 | 104.5 | ||
| Dota 2 Reborn (2015) | 201 | 181.8 | 174.4 | 164.5 | 160.8 | |||
| Final Fantasy XV Benchmark (2018) | 228 | 194.9 | 165.1 | 142 | ||||
| X-Plane 11.11 (2018) | 193.5 | 166.3 | 125.6 | 109.6 | ||||
| Far Cry 5 (2018) | 201 | 173 | 166 | 155 | 146 | 104 | ||
| Strange Brigade (2018) | 499 | 403 | 387 | 369 | 290 | |||
| F1 23 (2023) | 151.5 | 149.2 | 144.6 | |||||
| Cyberpunk 2077 2.2 Phantom Liberty (2023) | 127 | 86 | ||||||
| Skull & Bones (2024) | 164 | 140 | 149 | 118 | 98 | 90 | 81 | 61 |
| F1 24 (2024) | 339 | 304 | 113.6 | 72.1 |
Emissões e potência - Alto e quente
Emissões de ruído
Quando ociosas no desktop, as ventoinhas do laptop são quase sempre silenciosas. Ocasionalmente, elas podem acelerar brevemente, mas depois se acalmam novamente. Entretanto, assim que o usuário coloca o dispositivo sob cargas diárias, como navegar na Web, as ventoinhas começam a funcionar rapidamente, mesmo no modo Silencioso.
Durante o 3DMark06, as ventoinhas primeiro aceleraram continuamente até pouco mais de 40 dB, depois se acalmaram novamente para 35 dB antes de se estabilizarem em cerca de 39 dB no último terço. Isso também pode ser um sinal de que o sistema ajusta o resfriamento e o desempenho às condições térmicas muito tarde e só atinge os valores ideais depois de algum tempo.
Ao jogar e no modo Desempenho, as ventoinhas funcionam a cerca de 55 dB no máximo, o que é bastante alto em comparação; o Blade 16, por exemplo, permanece mais silencioso. No modo Equilibrado (sem IA), as emissões de ruído do laptop caem para 47 dB mais moderados, mas seu desempenho em jogos diminui sensivelmente, ou seja, de 20 a 25%.
Barulho
| Ocioso |
| 23 / 23 / 23 dB |
| Carga |
| 39 / 55.56 dB |
 | ||
30 dB silencioso 40 dB(A) audível 50 dB(A) ruidosamente alto |
||
min: | ||
| Lenovo Legion 9 16IRX9, RTX 4090 NVIDIA GeForce RTX 4090 Laptop GPU, i9-14900HX, Micron 3400 2TB MTFDKBA2T0TFH | Lenovo Legion 9 16IRX8 NVIDIA GeForce RTX 4090 Laptop GPU, i9-13980HX, 2x SK Hynix HFS001TEJ9X115N (RAID 0) | Razer Blade 16 2024, RTX 4090 NVIDIA GeForce RTX 4090 Laptop GPU, i9-14900HX, Samsung PM9A1 MZVL22T0HBLB | Alienware m18 R2 NVIDIA GeForce RTX 4090 Laptop GPU, i9-14900HX, SK Hynix PC811 HFS002TEM9X152N | Asus ROG Strix Scar 18 G834JYR (2024) NVIDIA GeForce RTX 4090 Laptop GPU, i9-14900HX, Samsung PM9A1a MZVL22T0HDLB | Medion Erazer Beast X40 2024 NVIDIA GeForce RTX 4090 Laptop GPU, i9-14900HX, Phison E18-1TB-PHISON-SSD-BICS5 | |
|---|---|---|---|---|---|---|
| Noise | -2% | -1% | -5% | -13% | -15% | |
| desligado / ambiente * | 23 | 23.7 -3% | 23 -0% | 23.6 -3% | 24 -4% | 25 -9% |
| Idle Minimum * | 23 | 24 -4% | 23 -0% | 23.8 -3% | 27 -17% | 28 -22% |
| Idle Average * | 23 | 24 -4% | 23 -0% | 26.1 -13% | 28 -22% | 29 -26% |
| Idle Maximum * | 23 | 30.4 -32% | 27.66 -20% | 31.5 -37% | 32 -39% | 32 -39% |
| Load Average * | 39 | 30.4 22% | 43.76 -12% | 31.5 19% | 50 -28% | 48 -23% |
| Witcher 3 ultra * | 55.32 | 52.2 6% | 46.81 15% | 52.1 6% | 50 10% | 50 10% |
| Load Maximum * | 55.56 | 54.9 1% | 50.37 9% | 56.6 -2% | 52 6% | 52 6% |
* ... menor é melhor
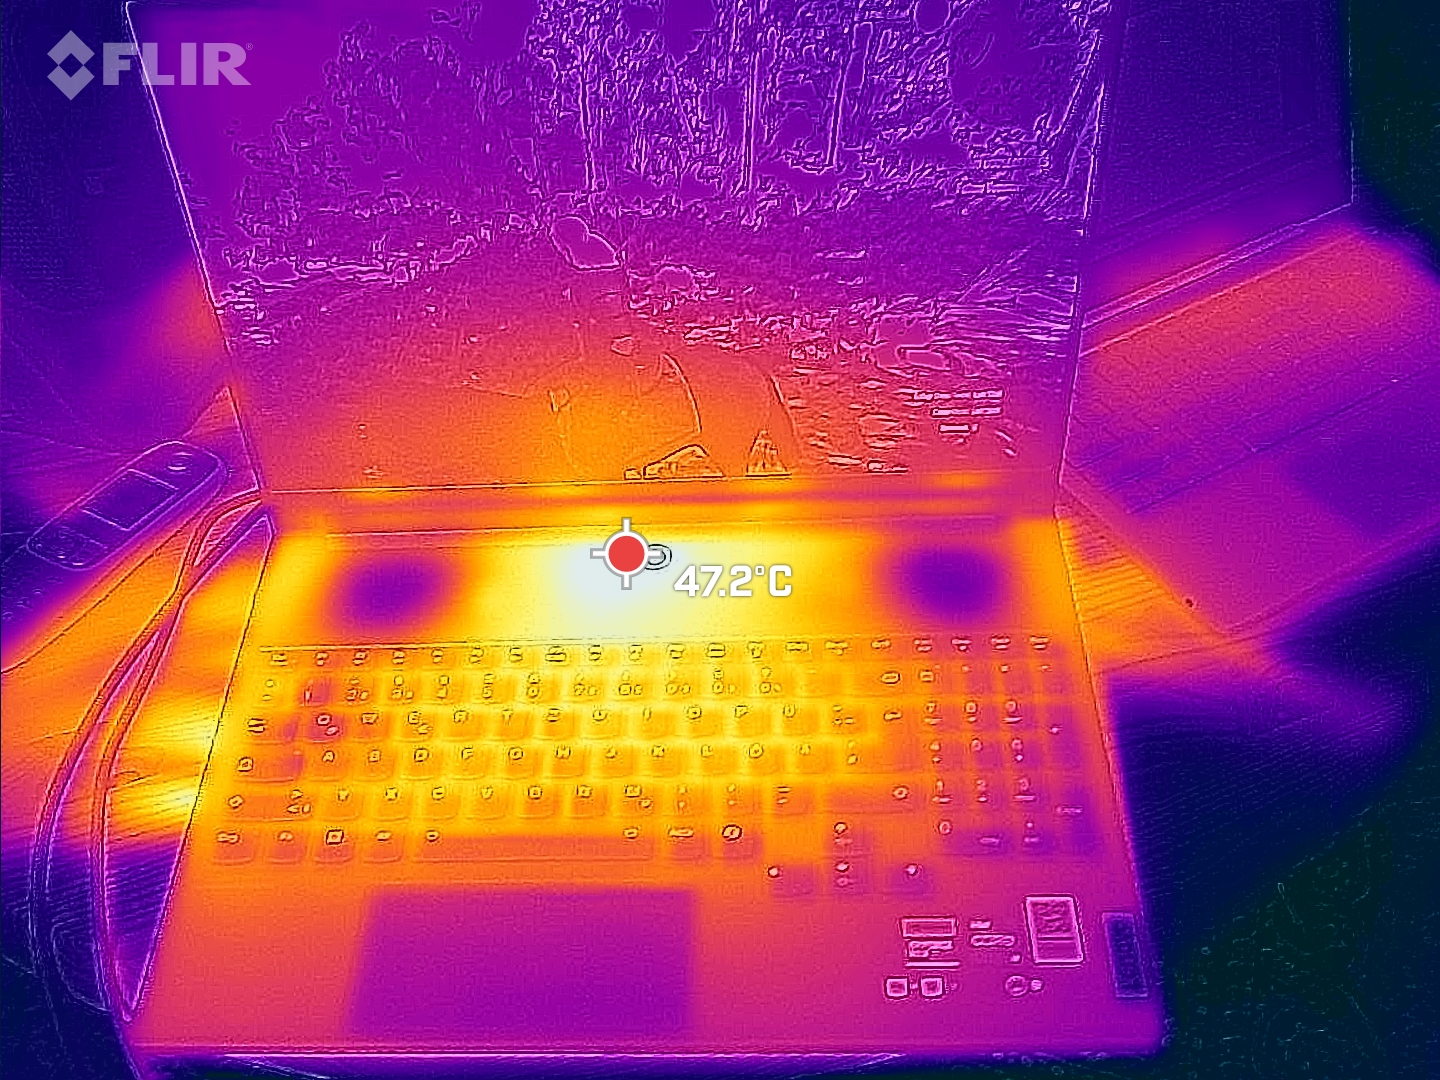
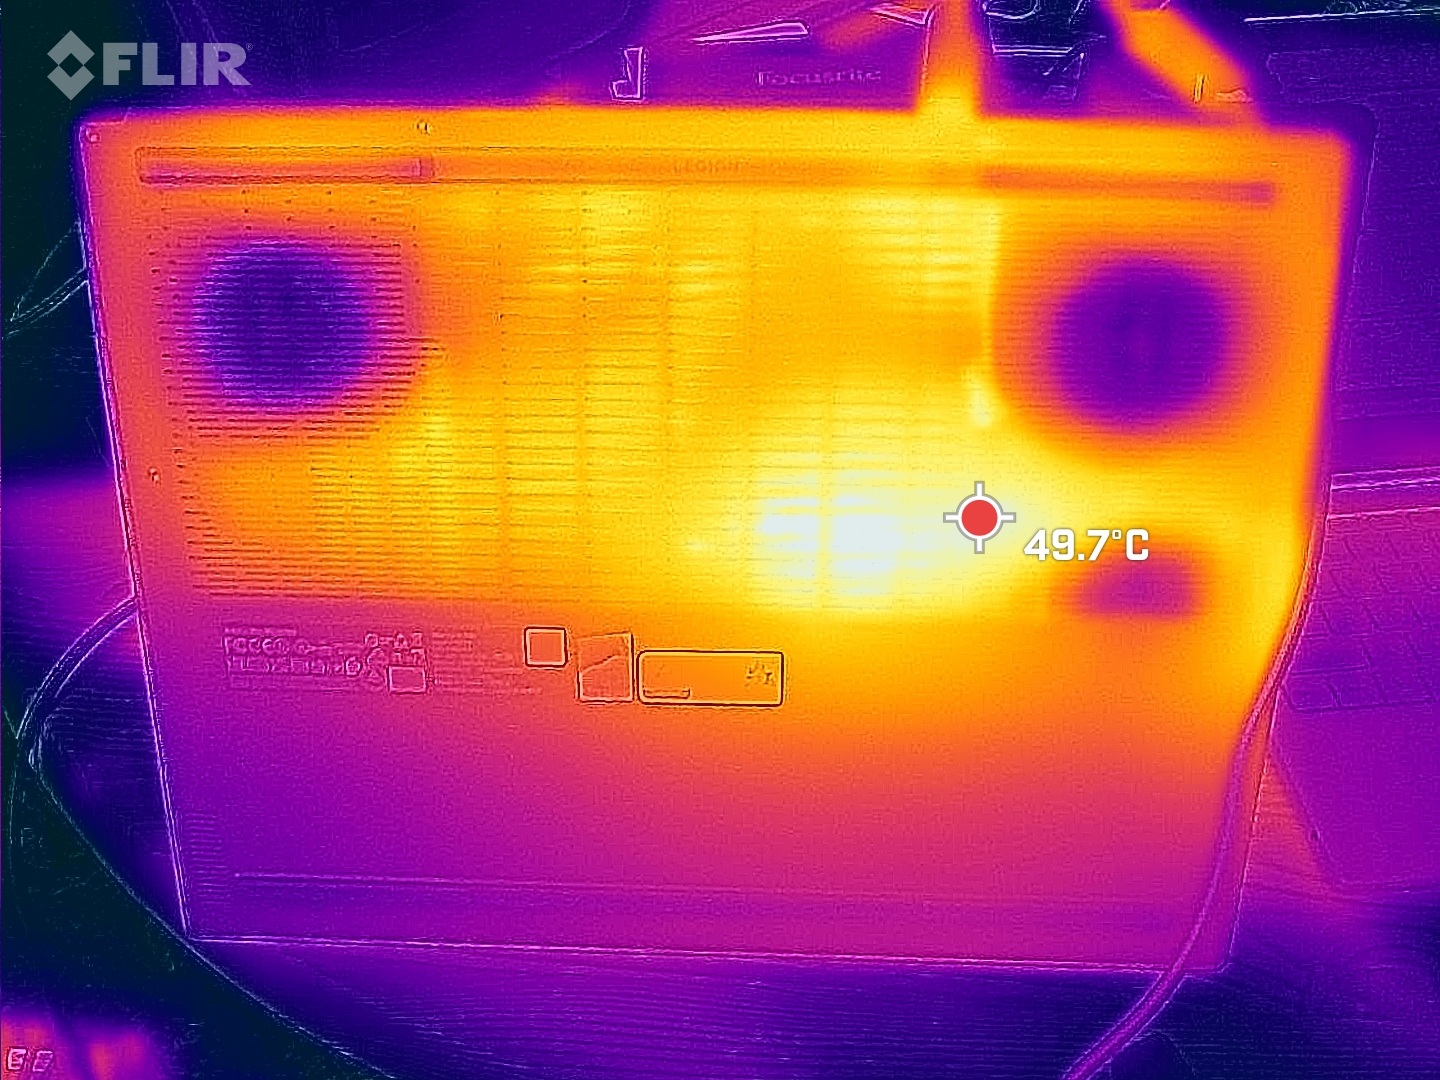
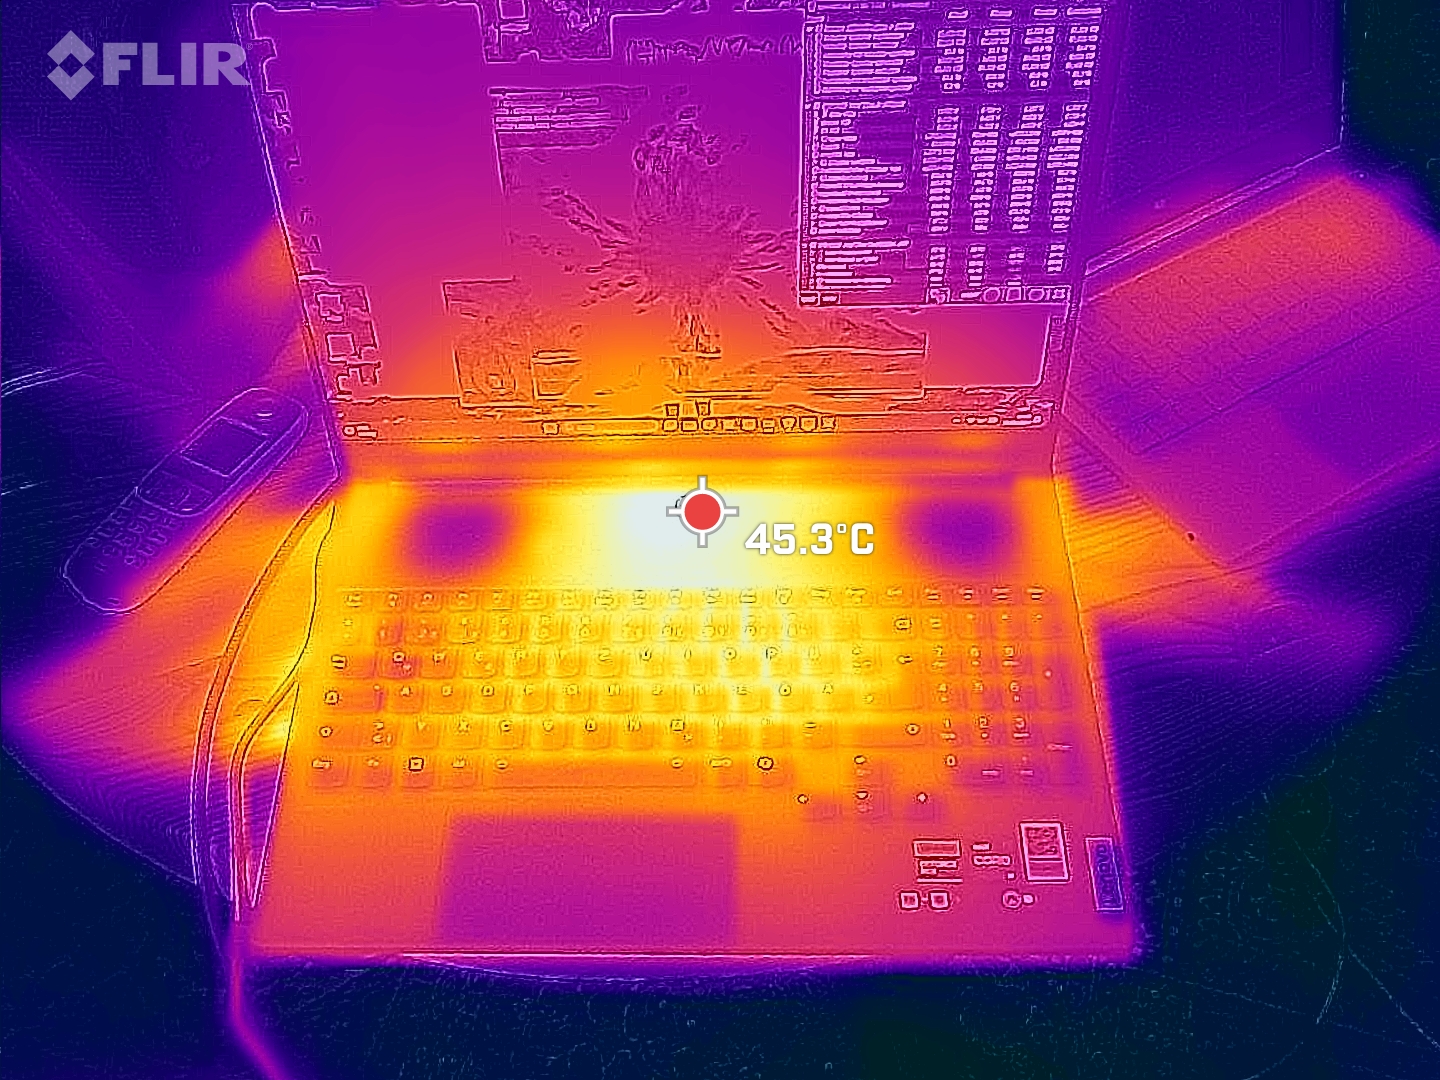
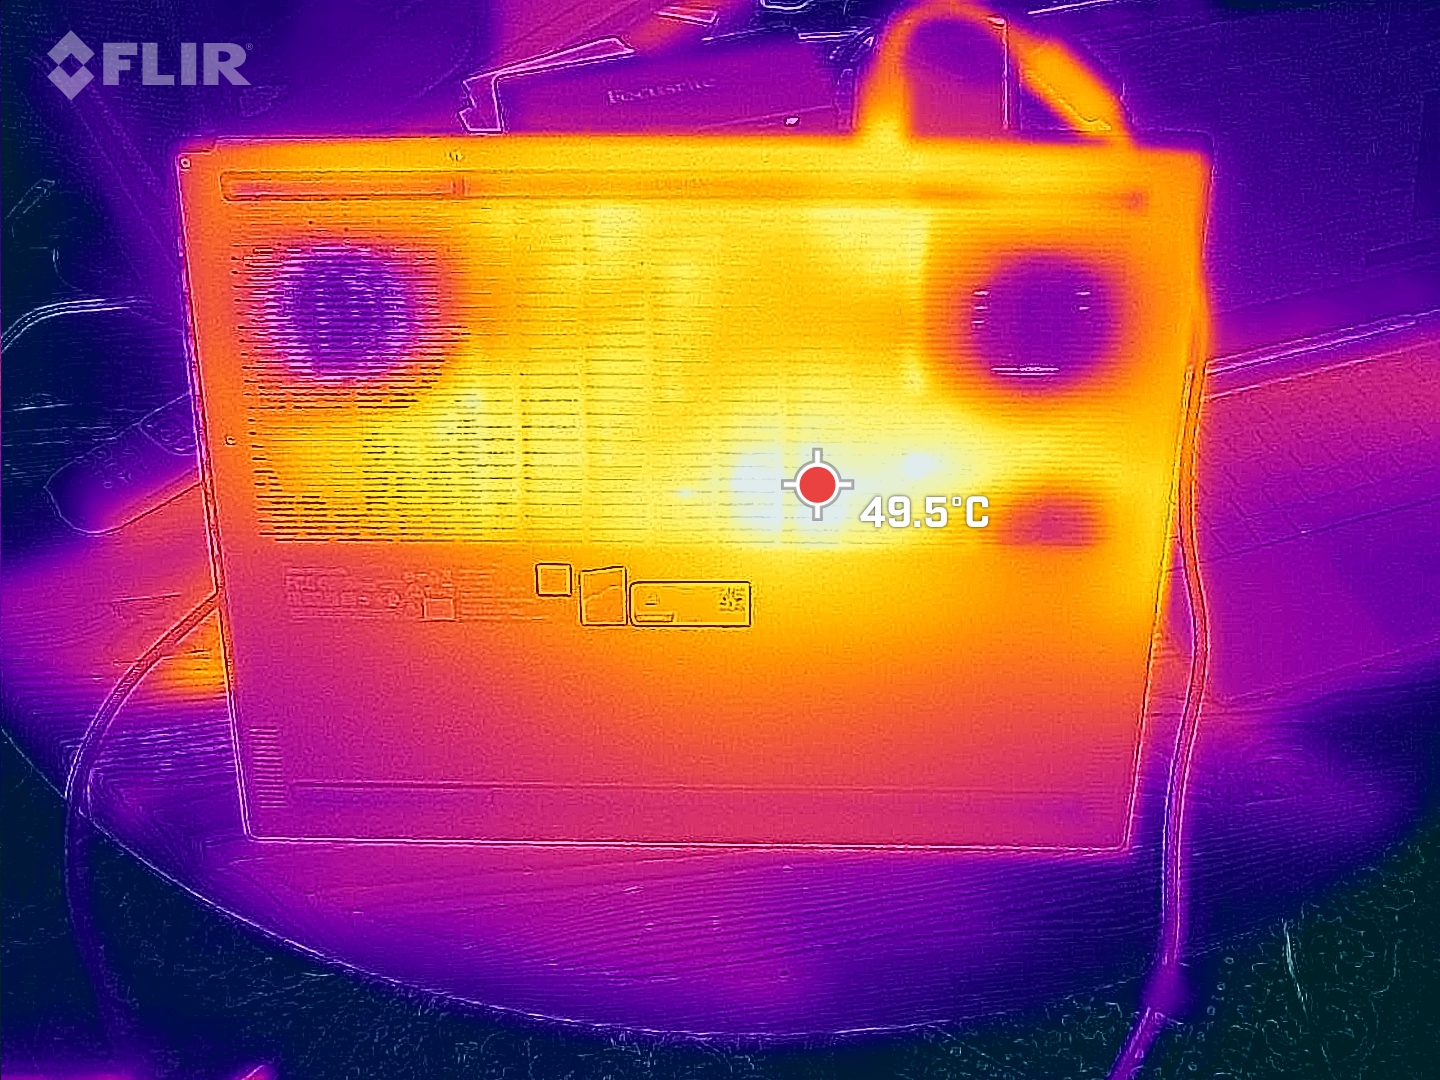
Temperatura
Apesar de seu sistema de resfriamento bastante barulhento, as temperaturas do laptop são bastante altas em comparação. Os pontos quentes durante os jogos e sob outras cargas pesadas estão no centro e na direção da tela. Ele também pode ficar bastante quente ao redor das teclas WASD - medimos 46 °C. Pelo menos os apoios para as mãos continuam bons. Mesmo seu antecessor não era ideal nesse aspecto, mas a Lenovo obviamente não fez nenhuma melhoria.
(-) A temperatura máxima no lado superior é 56 °C / 133 F, em comparação com a média de 40.4 °C / 105 F , variando de 21.2 a 68.8 °C para a classe Gaming.
(-) A parte inferior aquece até um máximo de 53 °C / 127 F, em comparação com a média de 43.2 °C / 110 F
(±) Em uso inativo, a temperatura média para o lado superior é 33.6 °C / 92 F, em comparação com a média do dispositivo de 33.9 °C / ### class_avg_f### F.
(-) Jogando The Witcher 3, a temperatura média para o lado superior é 42.3 °C / 108 F, em comparação com a média do dispositivo de 33.9 °C / ## #class_avg_f### F.
(±) Os apoios para as mãos e o touchpad podem ficar muito quentes ao toque, com um máximo de 36 °C / 96.8 F.
(-) A temperatura média da área do apoio para as mãos de dispositivos semelhantes foi 28.9 °C / 84 F (-7.1 °C / -12.8 F).
| Lenovo Legion 9 16IRX9, RTX 4090 Intel Core i9-14900HX, NVIDIA GeForce RTX 4090 Laptop GPU | Lenovo Legion 9 16IRX8 Intel Core i9-13980HX, NVIDIA GeForce RTX 4090 Laptop GPU | Razer Blade 16 2024, RTX 4090 Intel Core i9-14900HX, NVIDIA GeForce RTX 4090 Laptop GPU | Alienware m18 R2 Intel Core i9-14900HX, NVIDIA GeForce RTX 4090 Laptop GPU | Asus ROG Strix Scar 18 G834JYR (2024) Intel Core i9-14900HX, NVIDIA GeForce RTX 4090 Laptop GPU | Medion Erazer Beast X40 2024 Intel Core i9-14900HX, NVIDIA GeForce RTX 4090 Laptop GPU | |
|---|---|---|---|---|---|---|
| Heat | 11% | 21% | 9% | 17% | 13% | |
| Maximum Upper Side * | 56 | 49.6 11% | 45 20% | 41.2 26% | 49 12% | 47 16% |
| Maximum Bottom * | 53 | 48.6 8% | 45 15% | 34.6 35% | 47 11% | 54 -2% |
| Idle Upper Side * | 38 | 33.2 13% | 29 24% | 42.8 -13% | 29 24% | 30 21% |
| Idle Bottom * | 39 | 34.2 12% | 30 23% | 43.6 -12% | 31 21% | 32 18% |
* ... menor é melhor
Alto-falantes
A faixa audível é muito linear, os tons altos e médios são bem equilibrados. No entanto, os graves são naturalmente reduzidos, mas ainda assim perceptíveis. Os alto-falantes também poderiam ser um pouco mais potentes, ou seja, mais altos.
Lenovo Legion 9 16IRX9, RTX 4090 análise de áudio
(±) | o volume do alto-falante é médio, mas bom (###valor### dB)
Graves 100 - 315Hz
(±) | graves reduzidos - em média 13.2% menor que a mediana
(±) | a linearidade dos graves é média (8.9% delta para a frequência anterior)
Médios 400 - 2.000 Hz
(+) | médios equilibrados - apenas 3.2% longe da mediana
(+) | médios são lineares (3.4% delta para frequência anterior)
Altos 2 - 16 kHz
(+) | agudos equilibrados - apenas 1.8% longe da mediana
(+) | os máximos são lineares (4% delta da frequência anterior)
Geral 100 - 16.000 Hz
(+) | o som geral é linear (11.3% diferença em relação à mediana)
Comparado com a mesma classe
» 8% de todos os dispositivos testados nesta classe foram melhores, 3% semelhantes, 89% piores
» O melhor teve um delta de 6%, a média foi 18%, o pior foi 132%
Comparado com todos os dispositivos testados
» 6% de todos os dispositivos testados foram melhores, 2% semelhantes, 92% piores
» O melhor teve um delta de 4%, a média foi 24%, o pior foi 134%
Razer Blade 16 2024, RTX 4090 análise de áudio
(±) | o volume do alto-falante é médio, mas bom (###valor### dB)
Graves 100 - 315Hz
(±) | graves reduzidos - em média 8.2% menor que a mediana
(±) | a linearidade dos graves é média (7.4% delta para a frequência anterior)
Médios 400 - 2.000 Hz
(+) | médios equilibrados - apenas 3.3% longe da mediana
(+) | médios são lineares (5.9% delta para frequência anterior)
Altos 2 - 16 kHz
(+) | agudos equilibrados - apenas 1.6% longe da mediana
(+) | os máximos são lineares (3.1% delta da frequência anterior)
Geral 100 - 16.000 Hz
(+) | o som geral é linear (9.2% diferença em relação à mediana)
Comparado com a mesma classe
» 3% de todos os dispositivos testados nesta classe foram melhores, 1% semelhantes, 96% piores
» O melhor teve um delta de 6%, a média foi 18%, o pior foi 132%
Comparado com todos os dispositivos testados
» 3% de todos os dispositivos testados foram melhores, 1% semelhantes, 97% piores
» O melhor teve um delta de 4%, a média foi 24%, o pior foi 134%
Consumo de energia
Seu consumo pode ter melhorado um pouco em comparação com o modelo anterior, tanto em marcha lenta quanto fora dela. No entanto, não muito - até mesmo os concorrentes de 18 polegadas costumam ser mais econômicos, pelo menos em marcha lenta.
O suposto problema do novo Legion 9 pode ser visto novamente em seus gráficos de consumo, pois seu consumo (e, portanto, também seu desempenho) caiu muito brevemente de tempos em tempos em vários testes. O que ainda era normal no Cinebench 23 deixou de ser nos testes Witcher 3 ou Furmark.
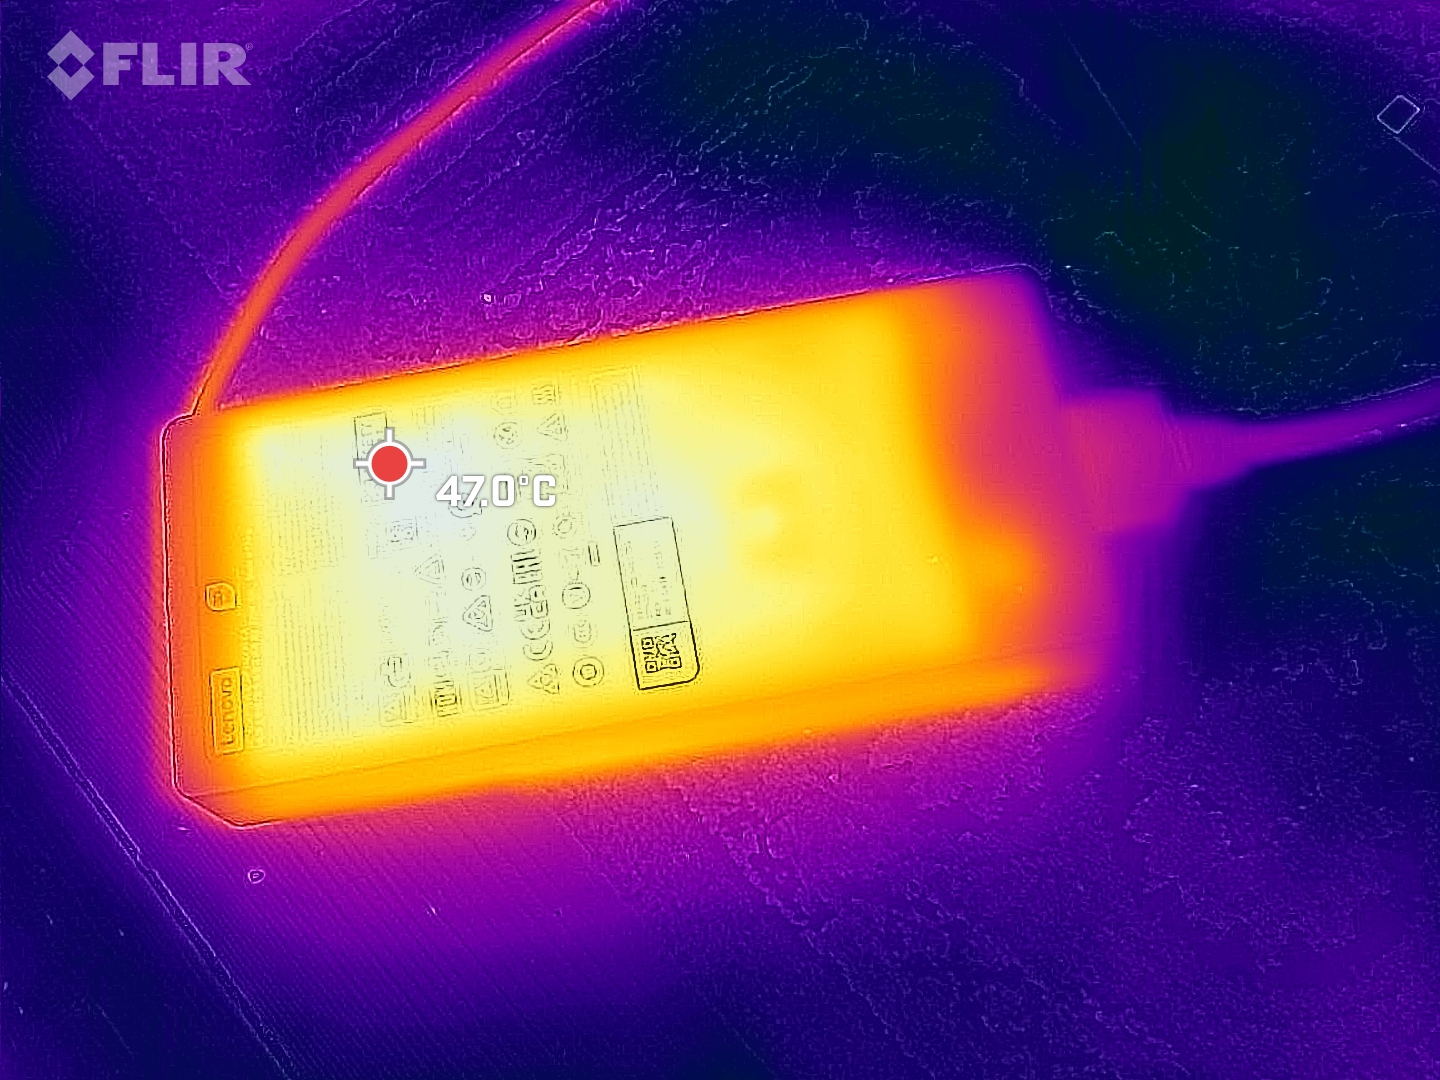
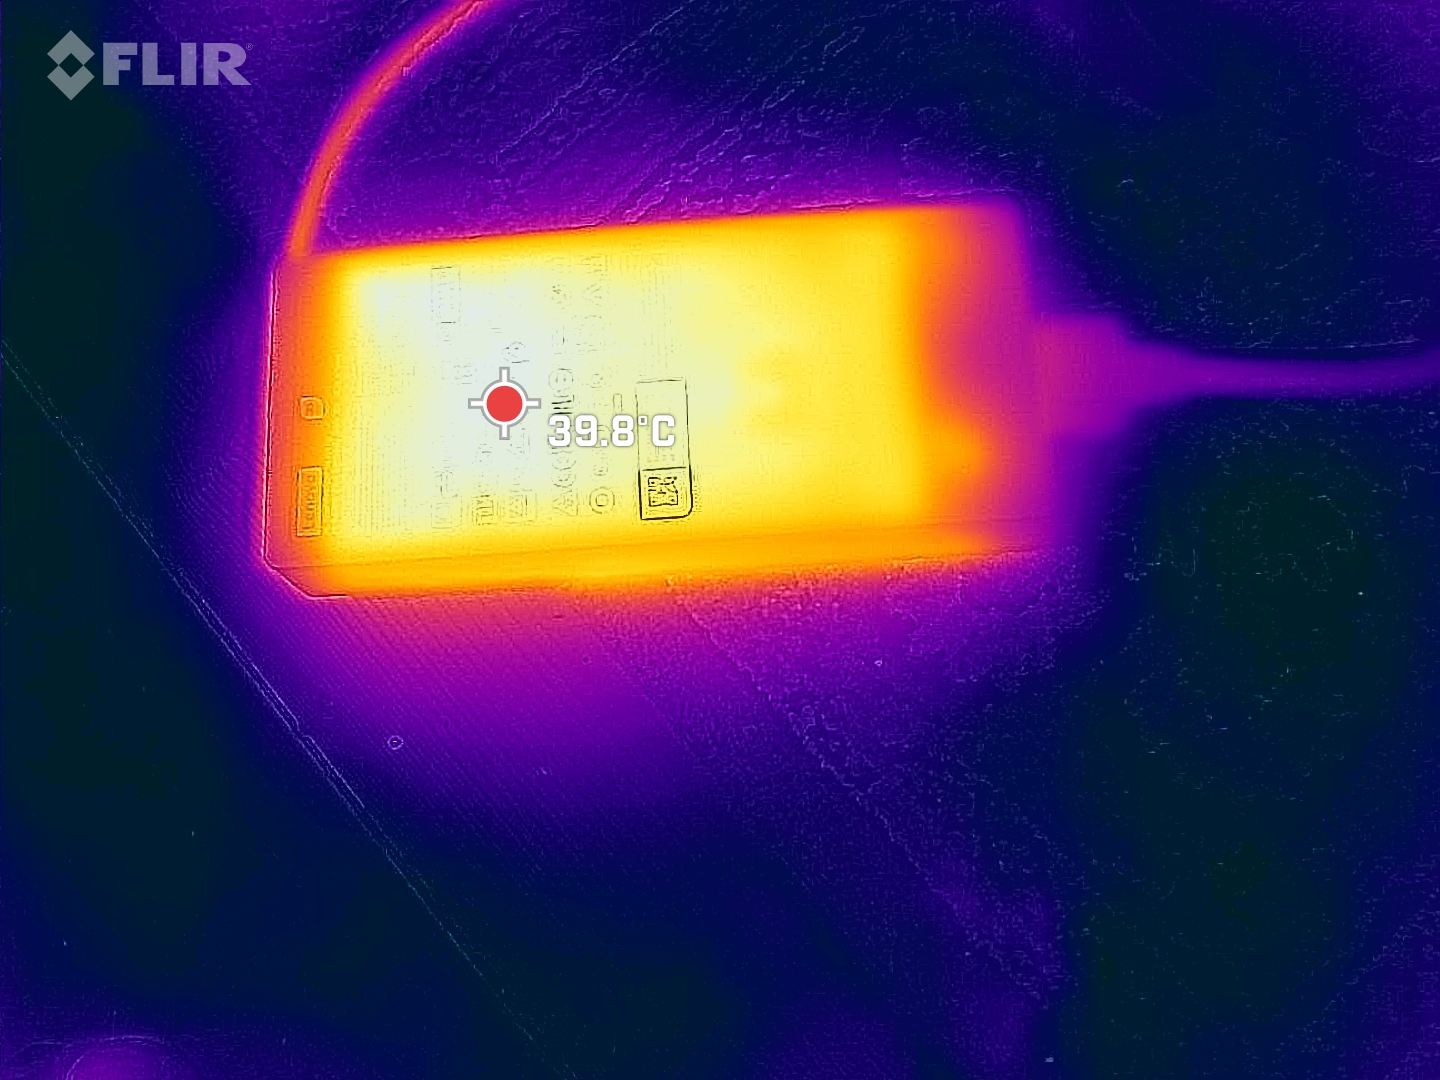
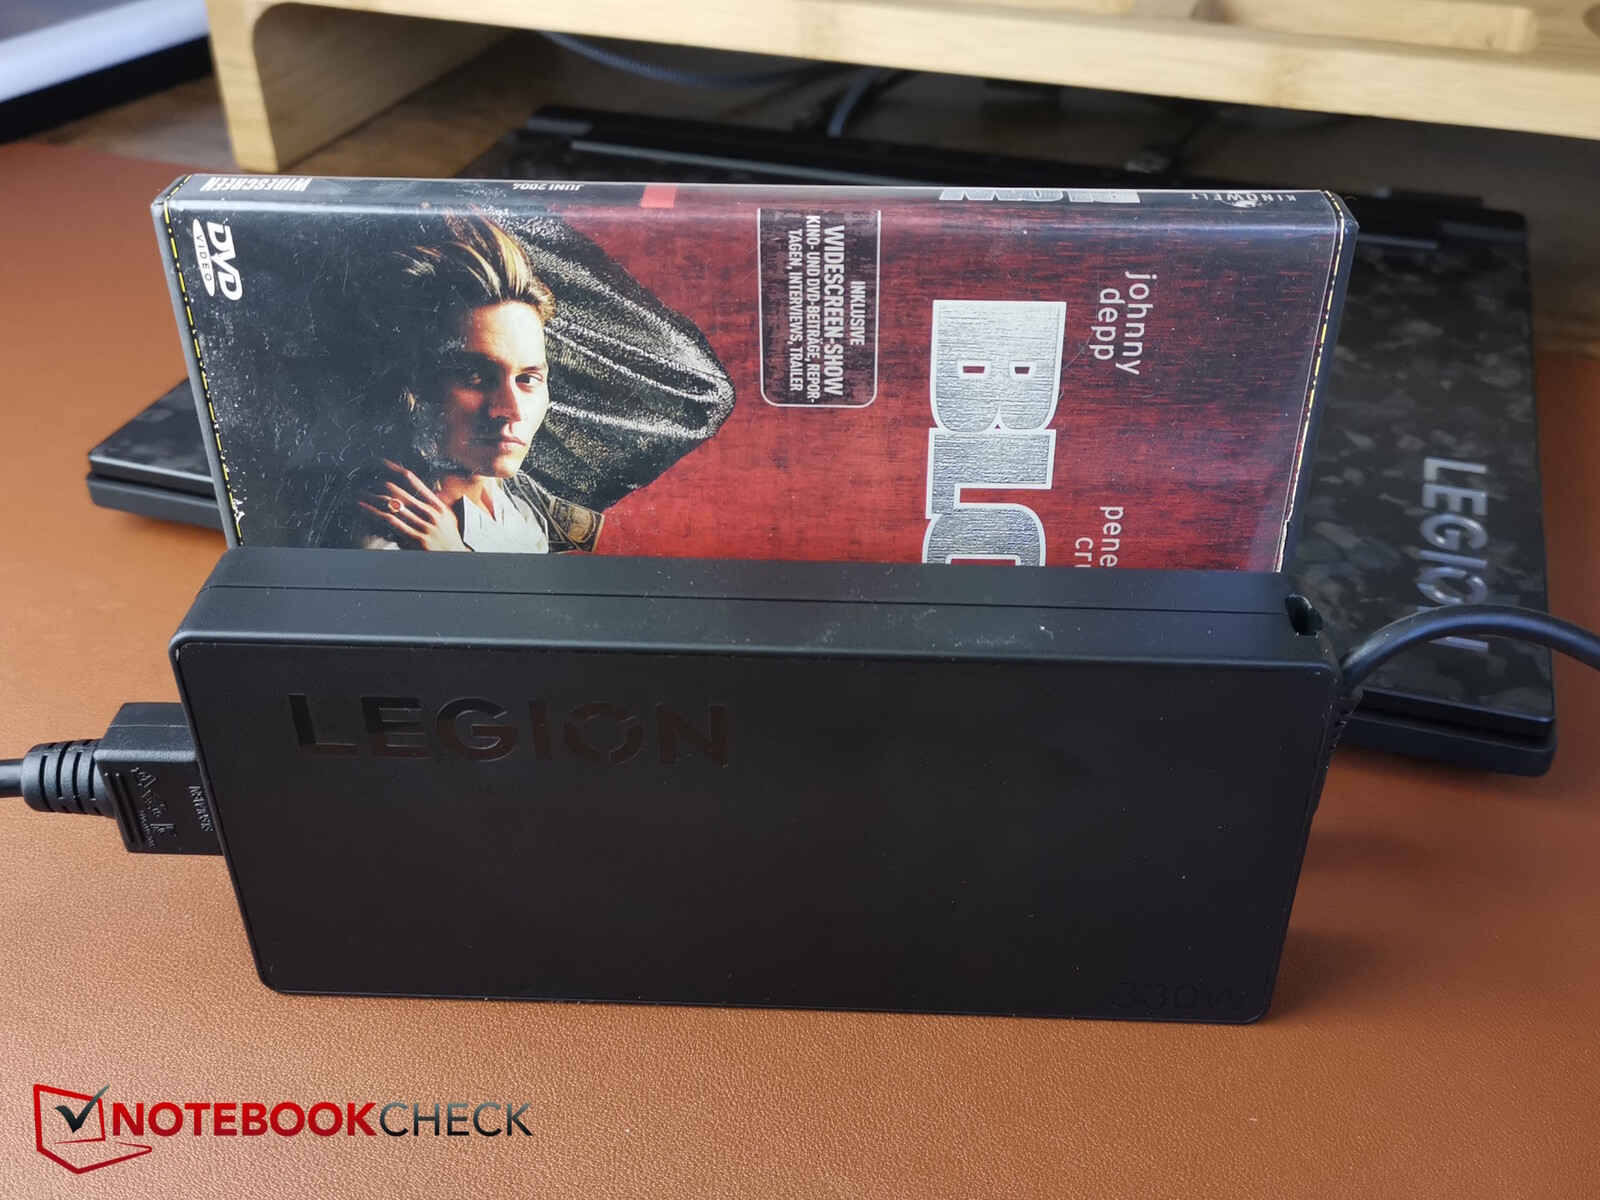
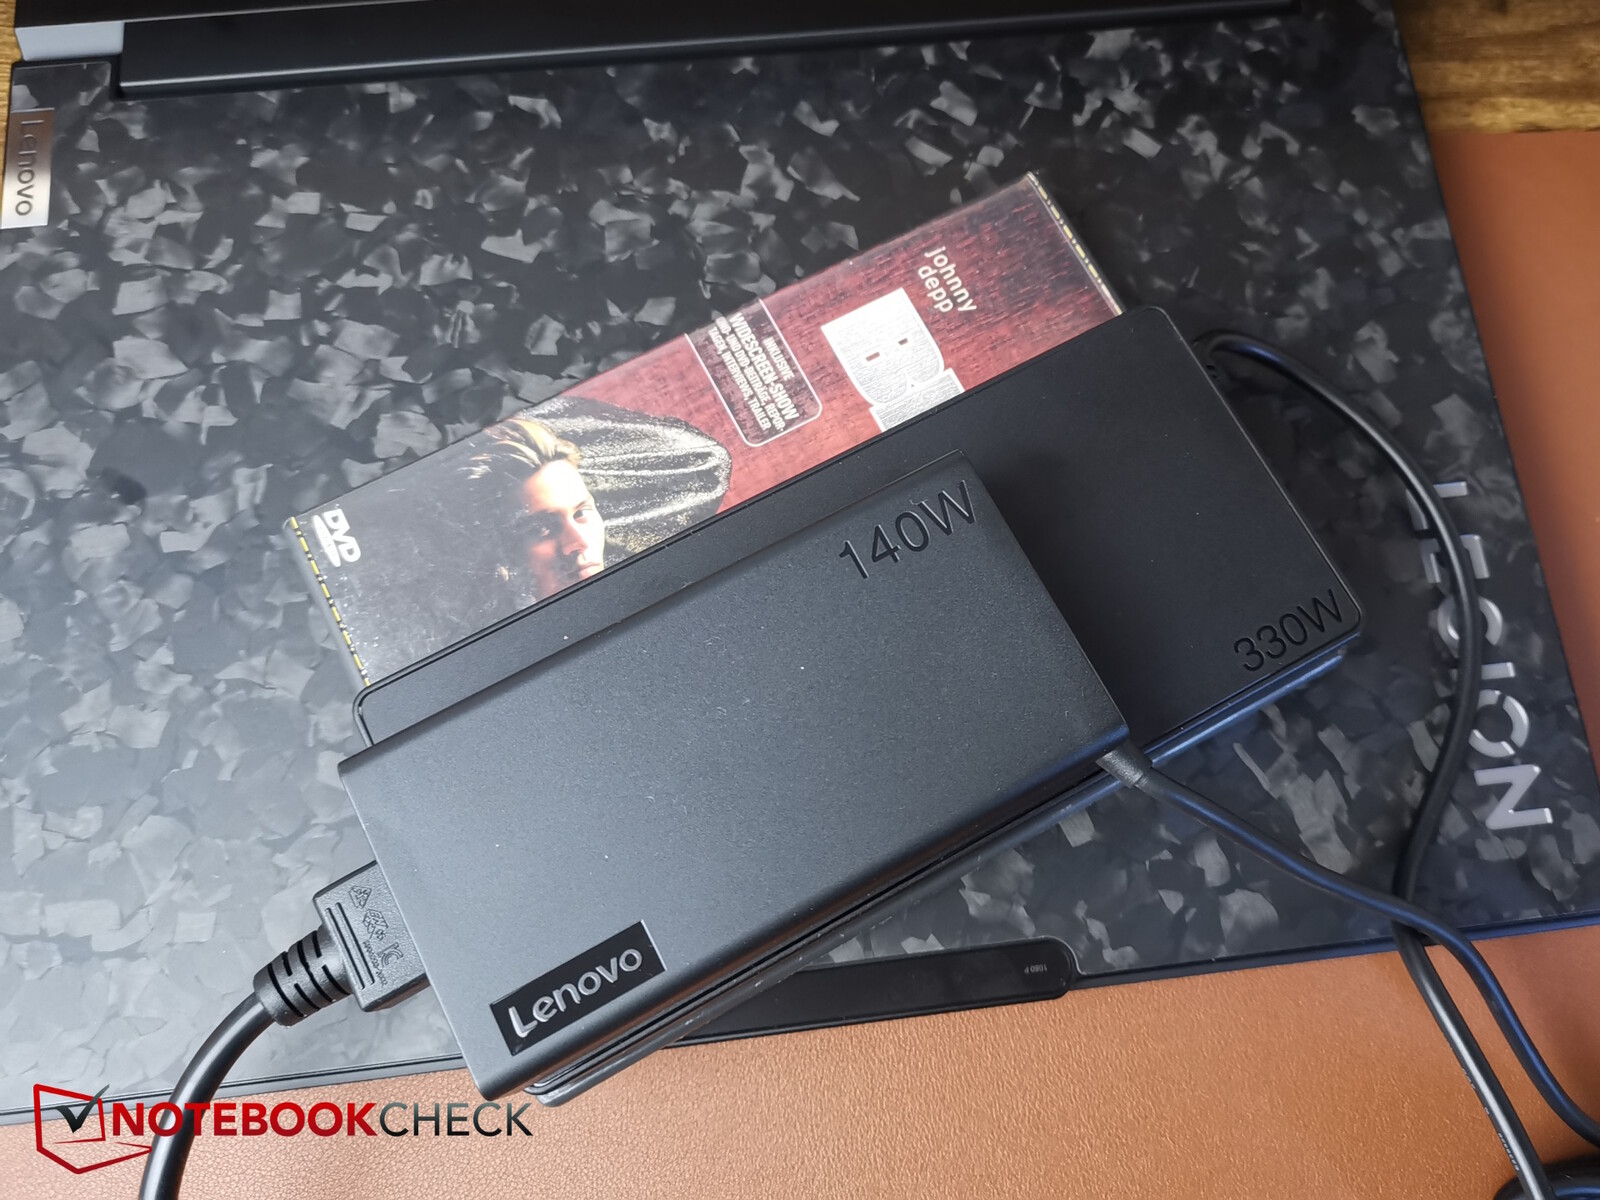
Medimos um consumo máximo de curto prazo de 323 watts usando a unidade de fonte de alimentação plana e comparativamente pequena. Essa unidade foi projetada para 330 watts e, portanto, não deve ter problemas para fornecer energia ao laptop em todas as situações.
Um recurso exclusivo: O Legion 9 também vem com uma segunda unidade de fonte de alimentação, uma unidade de fonte de alimentação USB-C muito menor, de 140 watts. Se o senhor não estiver jogando, é claro que o adaptador menor é ainda mais adequado para uso em trânsito.
| desligado | |
| Ocioso | |
| Carga |
|
Key:
min: | |
| Lenovo Legion 9 16IRX9, RTX 4090 i9-14900HX, NVIDIA GeForce RTX 4090 Laptop GPU, Micron 3400 2TB MTFDKBA2T0TFH, MiniLED, 3200x2000, 16" | Lenovo Legion 9 16IRX8 i9-13980HX, NVIDIA GeForce RTX 4090 Laptop GPU, 2x SK Hynix HFS001TEJ9X115N (RAID 0), Mini-LED, 3200x2000, 16" | Razer Blade 16 2024, RTX 4090 i9-14900HX, NVIDIA GeForce RTX 4090 Laptop GPU, Samsung PM9A1 MZVL22T0HBLB, OLED, 2560x1600, 16" | Asus ROG Strix Scar 18 G834JYR (2024) i9-14900HX, NVIDIA GeForce RTX 4090 Laptop GPU, Samsung PM9A1a MZVL22T0HDLB, Mini LED, 2560x1600, 18" | Medion Erazer Beast X40 2024 i9-14900HX, NVIDIA GeForce RTX 4090 Laptop GPU, Phison E18-1TB-PHISON-SSD-BICS5, IPS, 2560x1600, 17" | Média NVIDIA GeForce RTX 4090 Laptop GPU | Média da turma Gaming | |
|---|---|---|---|---|---|---|---|
| Power Consumption | -34% | 12% | 11% | 13% | 1% | 22% | |
| Idle Minimum * | 20.5 | 32.3 -58% | 16.9 18% | 14 32% | 7 66% | 16.2 ? 21% | 13.6 ? 34% |
| Idle Average * | 27.7 | 42.6 -54% | 17.8 36% | 17 39% | 15 46% | 23.1 ? 17% | 19 ? 31% |
| Idle Maximum * | 32.1 | 57.9 -80% | 19.6 39% | 24 25% | 33 -3% | 34.2 ? -7% | 26.4 ? 18% |
| Load Average * | 105 | 121 -15% | 128 -22% | 143 -36% | 134 -28% | 130.5 ? -24% | 102.9 ? 2% |
| Witcher 3 ultra * | 246 | 254 -3% | 243 1% | 251 -2% | 280 -14% | ||
| Load Maximum * | 323 | 297.7 8% | 328 -2% | 302 7% | 294 9% | 324 ? -0% | 246 ? 24% |
* ... menor é melhor
Power consumption Witcher 3 / stress test
Power consumption with external monitor
Tempos de execução
A bateria integrada tem uma capacidade de cerca de 100 Wh, o que é semelhante à concorrência. No entanto, seus tempos de funcionamento são geralmente mais curtos - um problema que seu antecessor e outros notebooks com telas MiniLED já enfrentam. Embora sua duração tenha sido melhorada, os dispositivos de comparação (exceto o laptop Alienware) obtêm durações mais longas de suas baterias. O mesmo se aplica ao Asus ROG Scar Strix, por exemplo, que também tem uma tela MiniLED.
Ainda assim, é suficiente para pouco menos de 5 horas assistindo a vídeos ou navegando na Web com o brilho reduzido para 150 nits. O dispositivo da Asus dura mais de 6 horas aqui.
O laptop Lenovo suporta uma função de carregamento rápido, que primeiro precisa ser ativada no software Vantage. Depois disso, uma carga completa leva apenas cerca de uma hora.
| Lenovo Legion 9 16IRX9, RTX 4090 i9-14900HX, NVIDIA GeForce RTX 4090 Laptop GPU, 99.99 Wh | Lenovo Legion 9 16IRX8 i9-13980HX, NVIDIA GeForce RTX 4090 Laptop GPU, 99.9 Wh | Razer Blade 16 2024, RTX 4090 i9-14900HX, NVIDIA GeForce RTX 4090 Laptop GPU, 95.2 Wh | Alienware m18 R2 i9-14900HX, NVIDIA GeForce RTX 4090 Laptop GPU, 97 Wh | Asus ROG Strix Scar 18 G834JYR (2024) i9-14900HX, NVIDIA GeForce RTX 4090 Laptop GPU, 90 Wh | Medion Erazer Beast X40 2024 i9-14900HX, NVIDIA GeForce RTX 4090 Laptop GPU, 99.8 Wh | Média da turma Gaming | |
|---|---|---|---|---|---|---|---|
| Duração da bateria | -50% | 10% | 0% | 24% | 29% | 17% | |
| H.264 | 294 | 456 55% | 447 52% | 447 ? 52% | |||
| WiFi v1.3 | 290 | 159 -45% | 329 13% | 290 0% | 461 59% | 374 29% | 387 ? 33% |
| Load | 129 | 58 -55% | 79 -39% | 77 -40% | 84.5 ? -34% | ||
| Reader / Idle | 404 | 612 | 585 ? |
Pro
Contra
Veredicto - Mais problemas do que o esperado
Quando se trata de preço, o Lenovo Legion 9i é um gamer de ponta com design atraente, bons materiais, boa qualidade de construção e uma tela Mini LED brilhante com HDR1000. Sua fonte de alimentação plana, que não pode ser encontrada na concorrência, bem como sua fonte de alimentação USB-C adicional de 140 watts, podem ser classificadas como outros pontos positivos.
No entanto, enquanto os modelos menores do Legion impressionam com sua boa otimização do sistema, o modelo superior apresenta muito mais pontos fracos e problemas do que o esperado. O primeiro e mais importante são os problemas de latência que não se tornaram aparentes apenas durante o teste do LatencyMon - também os notamos ao testar a latência da RAM e, mesmo ao jogar, é possível ver alguns quadros perdidos visíveis. Além disso, o desempenho excepcionalmente fraco de um único núcleo. Outro problema maior é o sistema de resfriamento abaixo do ideal. Parece que ele resfria muito tarde e, às vezes, muito pouco, resultando, por exemplo, na aceleração da SSD. Além disso, ele fica muito barulhento sob carga e não evita altas temperaturas de superfície tão bem quanto seus concorrentes. Embora a duração da bateria tenha sido aprimorada, ela não é tão boa quanto a da concorrência. Portanto, no total, há muito espaço para melhorias.
O Legion 9i é um gamer elegante de alto nível, mas, diferentemente dos modelos menores do Legion, o modelo caro de alto nível acaba sofrendo com problemas irritantes, como um sistema de resfriamento abaixo do ideal e grandes problemas de latência.
Uma alternativa poderia ser o Razer Blade 16, por exemplo, que oferece desempenho comparável em um gabinete menor e não tem tantos problemas quanto o Legion 9i. Além disso, seu antecessor parecia, na verdade, um sistema mais maduro e até mesmo apresenta desempenho superior como resultado dos muitos problemas do modelo sucessor. Como resultado, atualmente não vale a pena comprar o novo Legion 9i.
Atualização de setembro de 2024: Chegou uma atualização da BIOS que corrige os problemas de velocidade de fotogramas.
Preço e disponibilidade
Nossa configuração do Lenovo Legion 9 16IRX9 ou do Lenovo Legion 9i pode ser adquirida diretamente da Lenovo por US$ 3.804,66.
Observação: Atualizamos recentemente nosso sistema de classificação e os resultados da versão 8 não são comparáveis aos resultados da versão 7. Mais informações estão disponíveis aqui .
Lenovo Legion 9 16IRX9, RTX 4090
- 09/27/2024 v8
Christian Hintze
 Total Sustainability Score:
 Transparência
A seleção dos dispositivos a serem analisados é feita pela nossa equipe editorial. A amostra de teste foi fornecida ao autor como empréstimo pelo fabricante ou varejista para fins desta revisão. O credor não teve influência nesta revisão, nem o fabricante recebeu uma cópia desta revisão antes da publicação. Não houve obrigação de publicar esta revisão. Nunca aceitamos compensação ou pagamento em troca de nossas avaliações. Como empresa de mídia independente, a Notebookcheck não está sujeita à autoridade de fabricantes, varejistas ou editores.
É assim que o Notebookcheck está testando
Todos os anos, o Notebookcheck analisa de forma independente centenas de laptops e smartphones usando procedimentos padronizados para garantir que todos os resultados sejam comparáveis. Desenvolvemos continuamente nossos métodos de teste há cerca de 20 anos e definimos padrões da indústria no processo. Em nossos laboratórios de teste, equipamentos de medição de alta qualidade são utilizados por técnicos e editores experientes. Esses testes envolvem um processo de validação em vários estágios. Nosso complexo sistema de classificação é baseado em centenas de medições e benchmarks bem fundamentados, o que mantém a objetividade.Price comparison

