

Análise do HP Omen 17 (2024): RTX 4070 e Ryzen 7 mostram seu tamanho no laptop para jogos
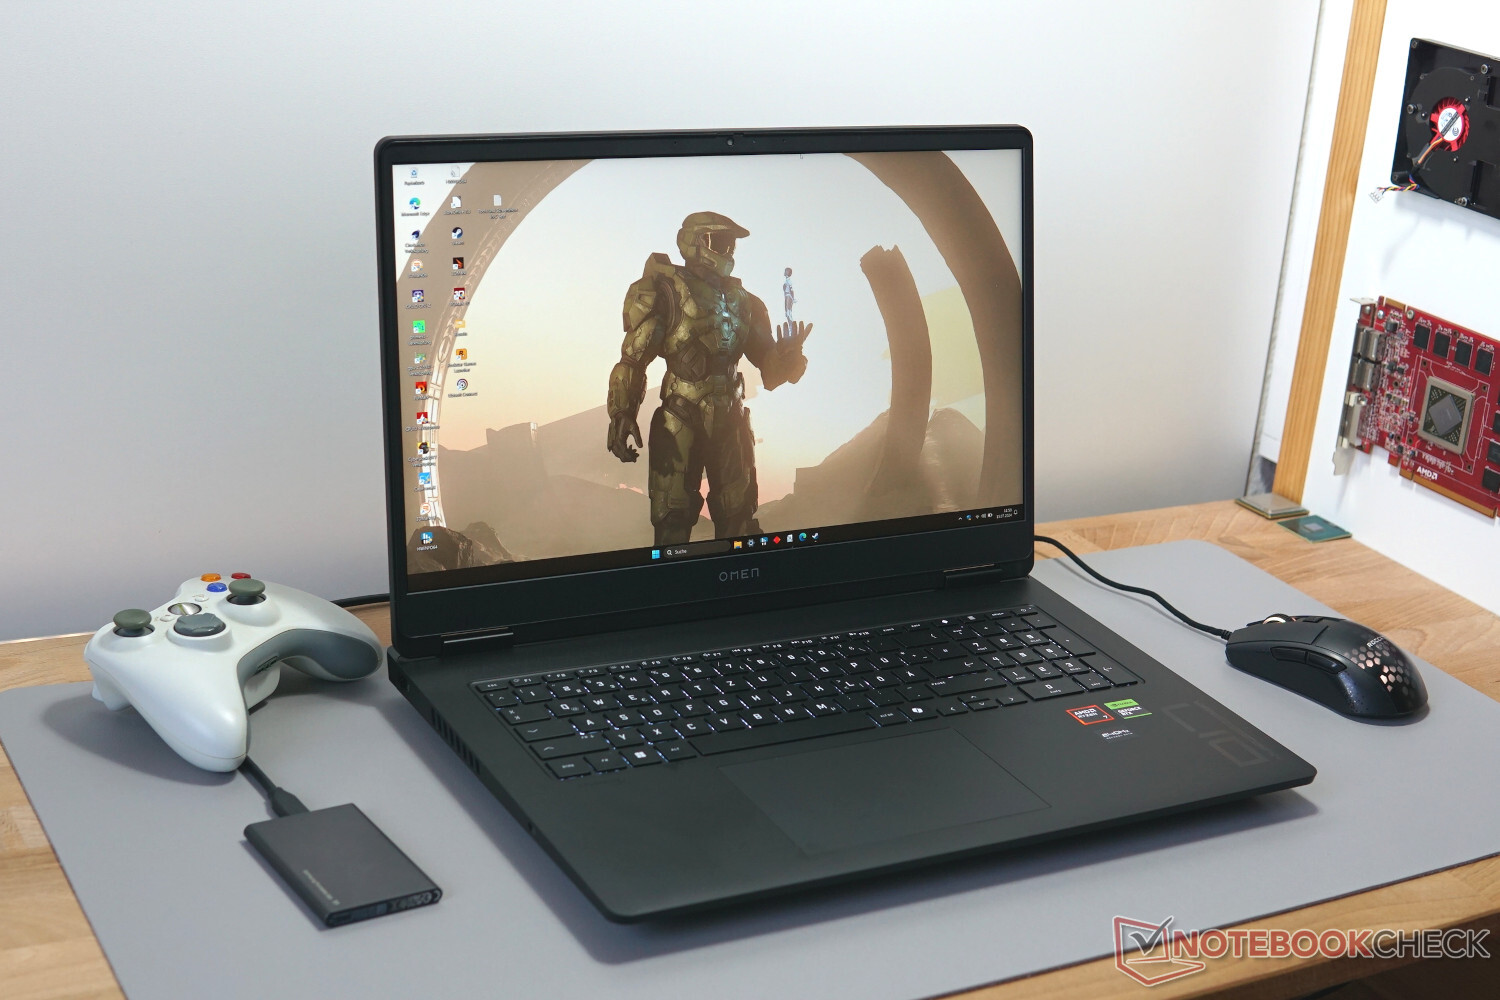
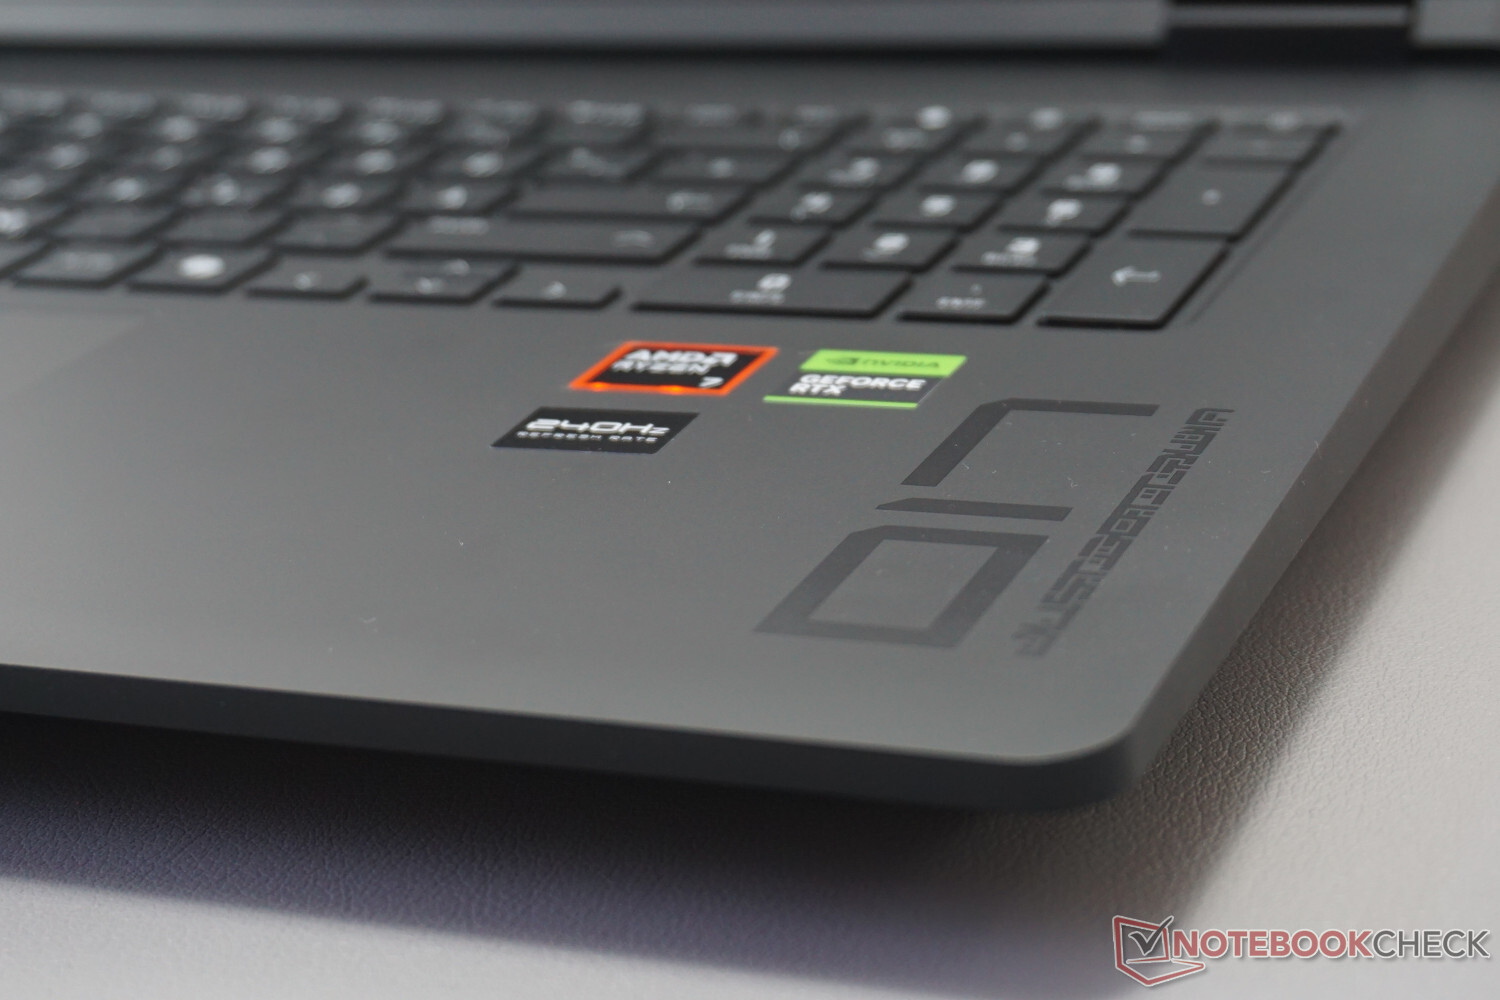
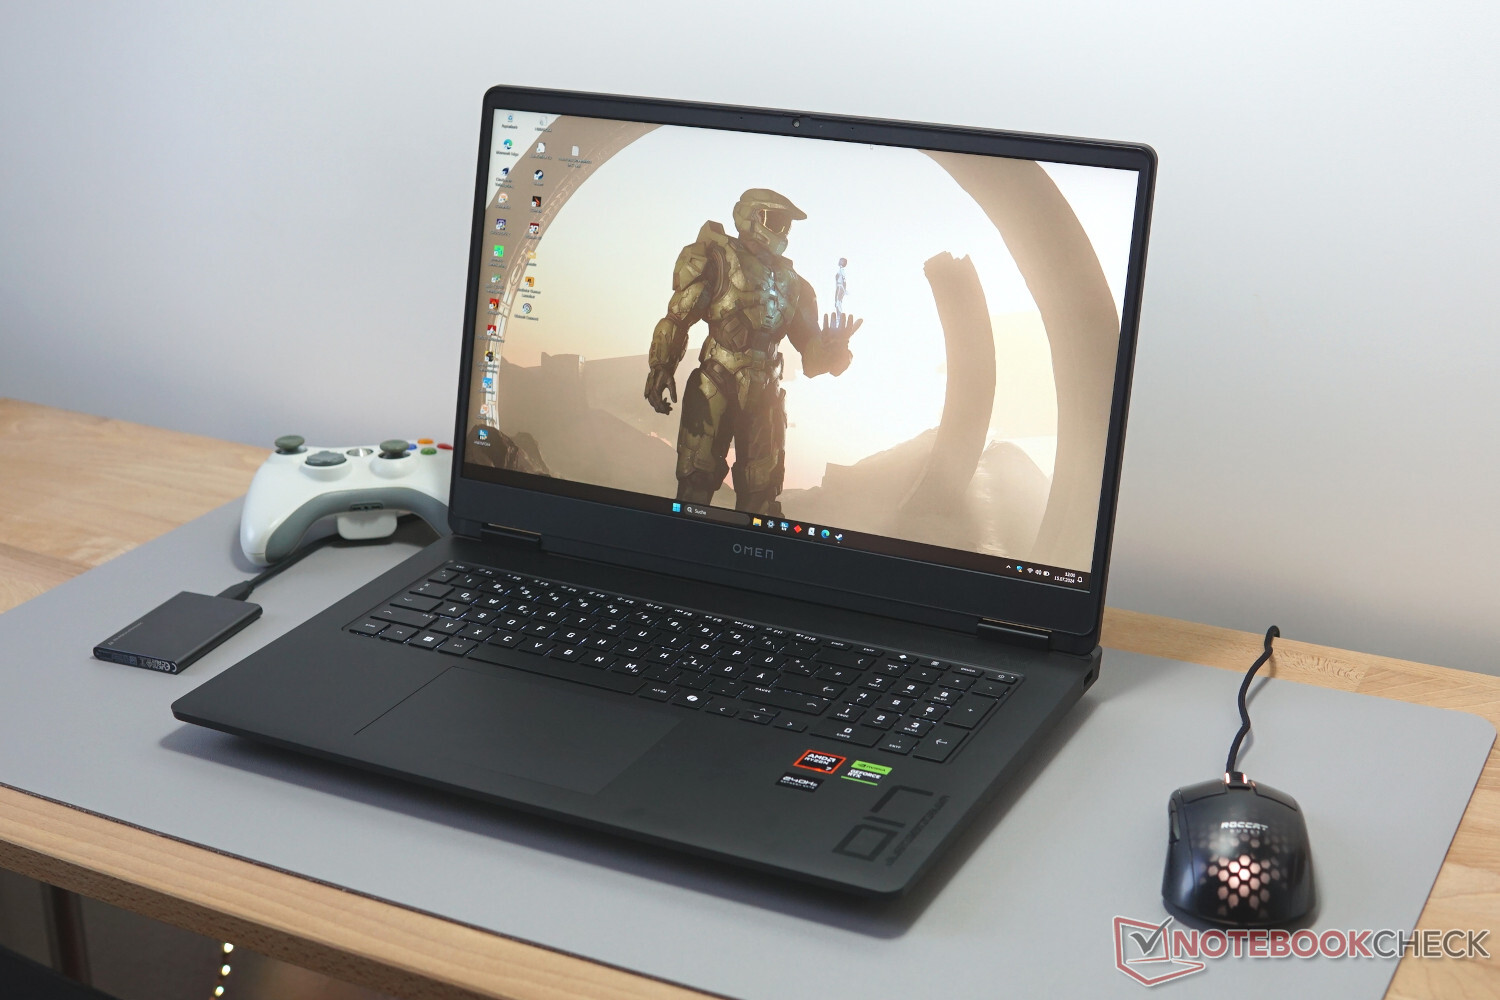
Bem equipado para todos os jogos atuais em um nível alto com uma RTX 4070 e AMD Ryzen 7 8845HS, o HP Omen 17 (2024) está nos blocos iniciais da faixa média elevada. Além disso, há uma tela QHD com uma resolução adequada que também oferece uma taxa de atualização de 240 Hertz. Com isso, todos os elementos básicos de um bom laptop para jogos estão cobertos
Com tanto espaço, especialmente no interior, também podemos esperar alguns valores de desempenho estáveis que devem ser melhores do que os de laptops menores. Avaliamos isso em vários benchmarks e testes de jogos.
O fato de nossa unidade de teste permanecer abaixo da marca de preço de 2.000 euros (~$2.172), apesar de seu elevado nível de equipamento, não é mais um dado adquirido neste momento. Para conseguir isso, o senhor também precisa aceitar vários compromissos, alguns dos quais são desnecessários. Nosso teste mostrará se isso ainda é suficiente para ficar à frente dos concorrentes, como o Acer Predator Helios Neo 16 com um processador Intel ou o Asus TUF Gaming A17 com a geração anterior do AMD Ryzen 9.
Possíveis concorrentes em comparação
Avaliação | Versão | Data | Modelo | Peso | Altura | Size | Resolução | Preço |
|---|---|---|---|---|---|---|---|---|
| 80.4 % | v8 | 07/2024 | HP Omen 17-db0079ng R7 8845HS, NVIDIA GeForce RTX 4070 Laptop GPU | 2.8 kg | 30.1 mm | 17.30" | 2560x1440 | |
| 80.3 % | v8 | 07/2024 | Asus TUF Gaming A15 FA507UV R9 8945H, NVIDIA GeForce RTX 4060 Laptop GPU | 2.1 kg | 22.4 mm | 15.60" | 1920x1080 | |
| 90.2 % v7 (old) | v7 (old) | 03/2024 | Alienware m16 R2 Ultra 7 155H, NVIDIA GeForce RTX 4070 Laptop GPU | 2.5 kg | 23.5 mm | 16.00" | 2560x1600 | |
| 87.6 % v7 (old) | v7 (old) | 04/2024 | Asus ROG Strix Scar 16 G634JZR i9-14900HX, NVIDIA GeForce RTX 4080 Laptop GPU | 2.7 kg | 30.4 mm | 16.00" | 2560x1600 | |
| 86.8 % v7 (old) | v7 (old) | 05/2024 | Acer Predator Helios Neo 16 (2024) i7-14700HX, NVIDIA GeForce RTX 4070 Laptop GPU | 2.6 kg | 25.95 mm | 16.00" | 2560x1600 | |
| 85.6 % v7 (old) | v7 (old) | 01/2024 | Asus TUF Gaming A17 FA707XI-NS94 R9 7940HS, NVIDIA GeForce RTX 4070 Laptop GPU | 2.5 kg | 25.4 mm | 17.30" | 1920x1080 |
Observe que atualizamos recentemente nosso sistema de classificação e que os resultados da versão 8 não são mais comparáveis aos da versão 7. O senhor pode encontrar informações adicionais sobre isso aqui.
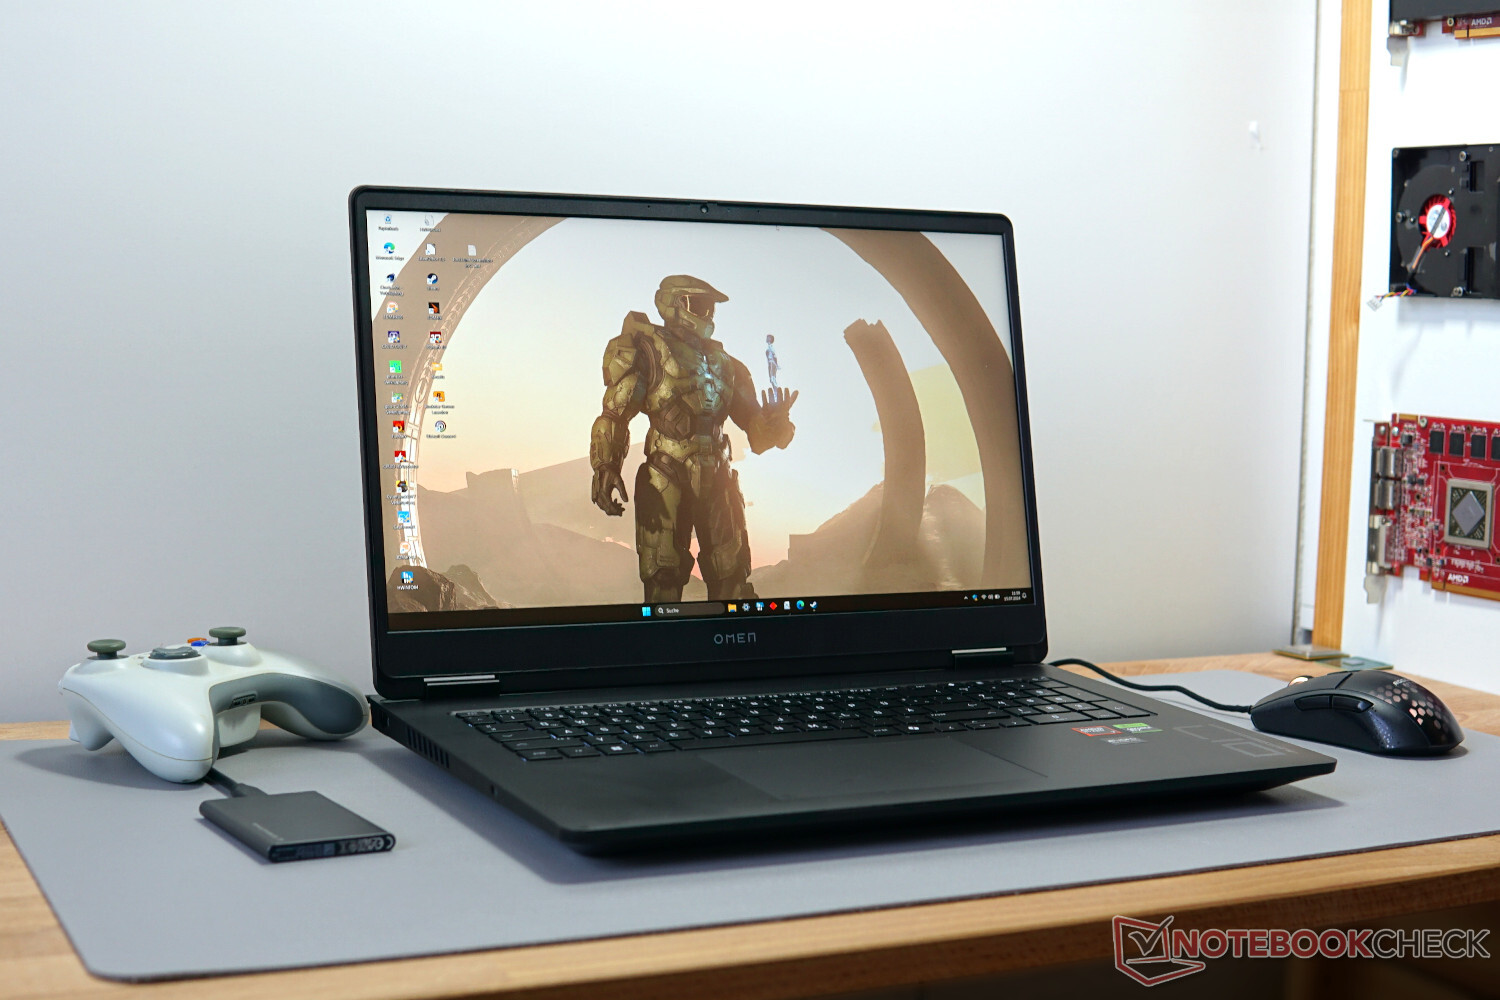
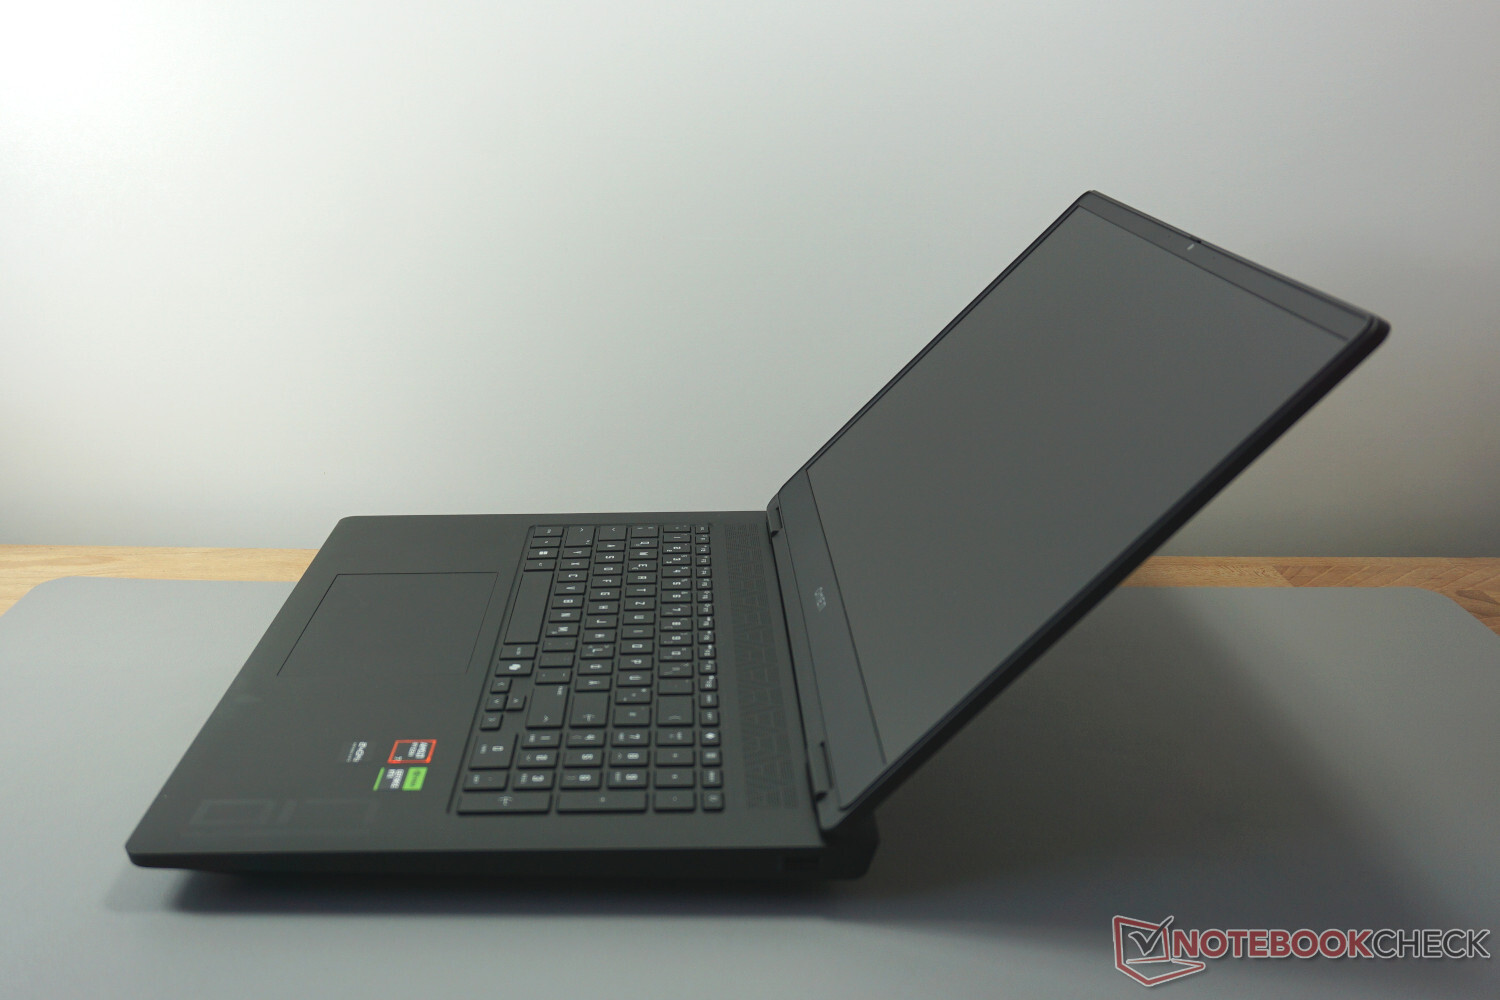
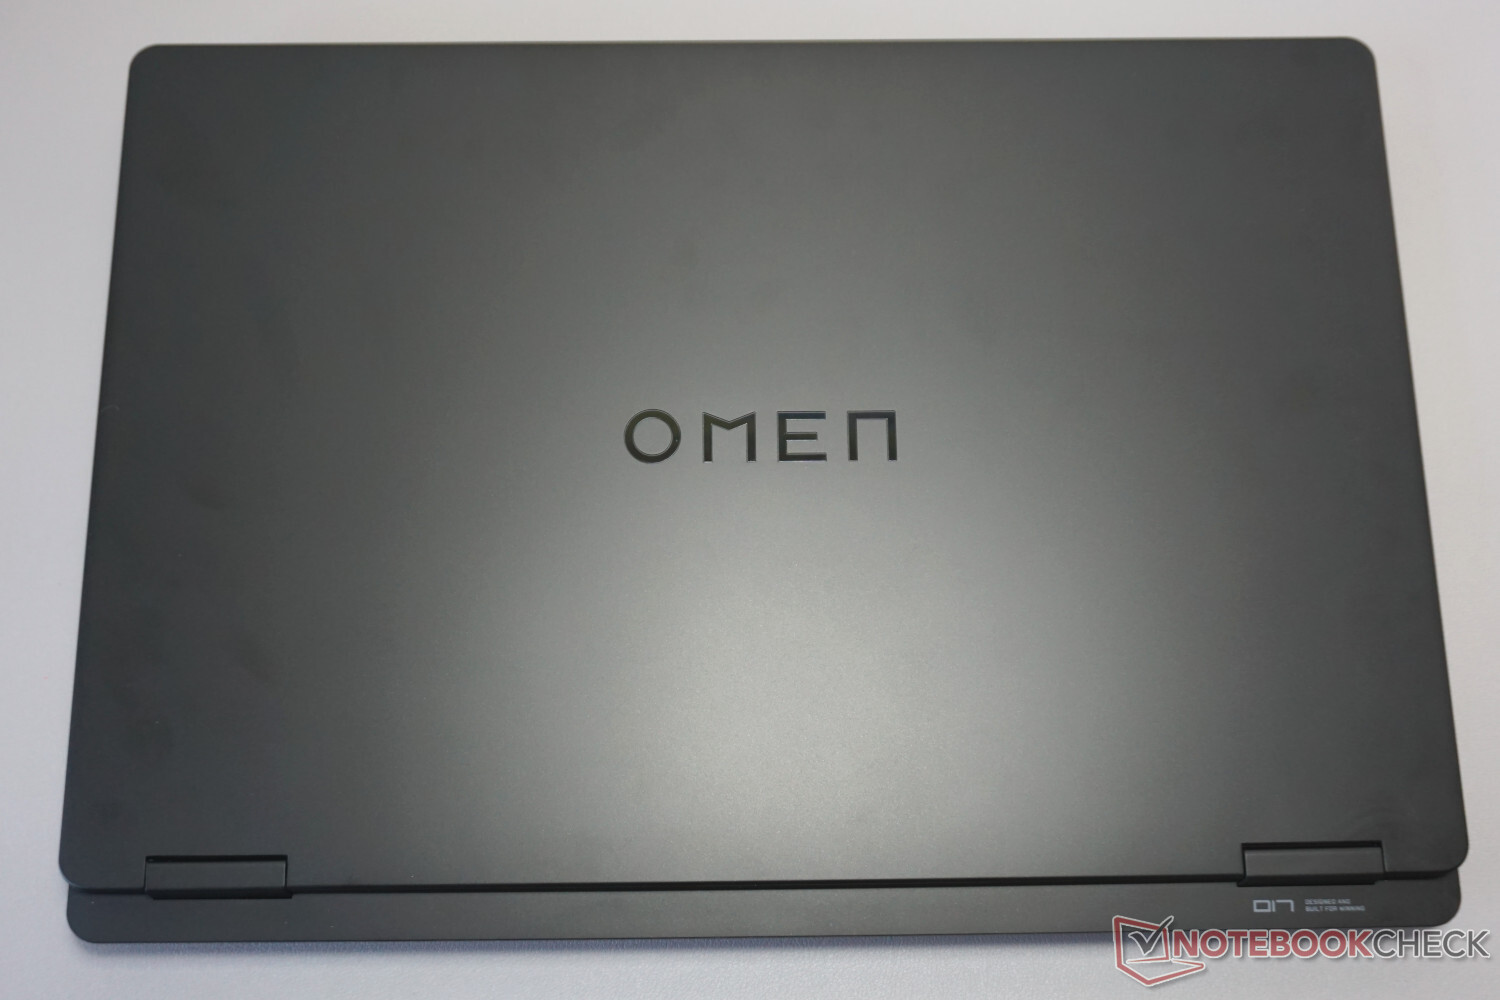
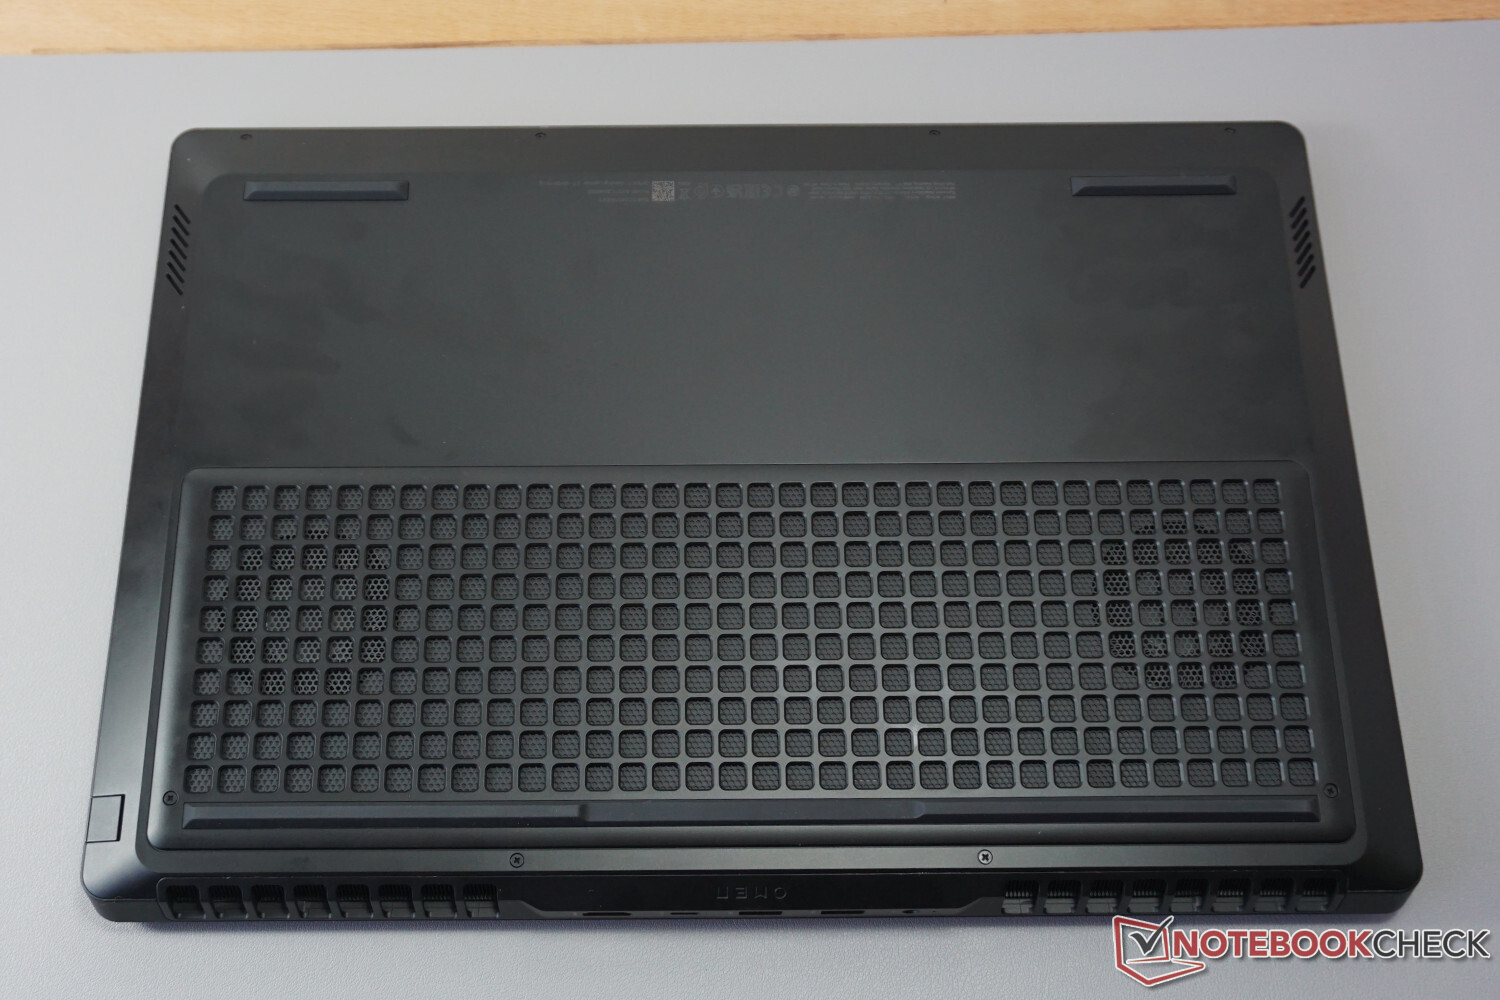
Caso - Um jogador grande e pesado
O gabinete parece quase indefinido. O plástico preto, que também parece ser, predomina por toda parte. Não há destaques visuais, pequenos detalhes ou mesmo efeitos de luz para admirar.
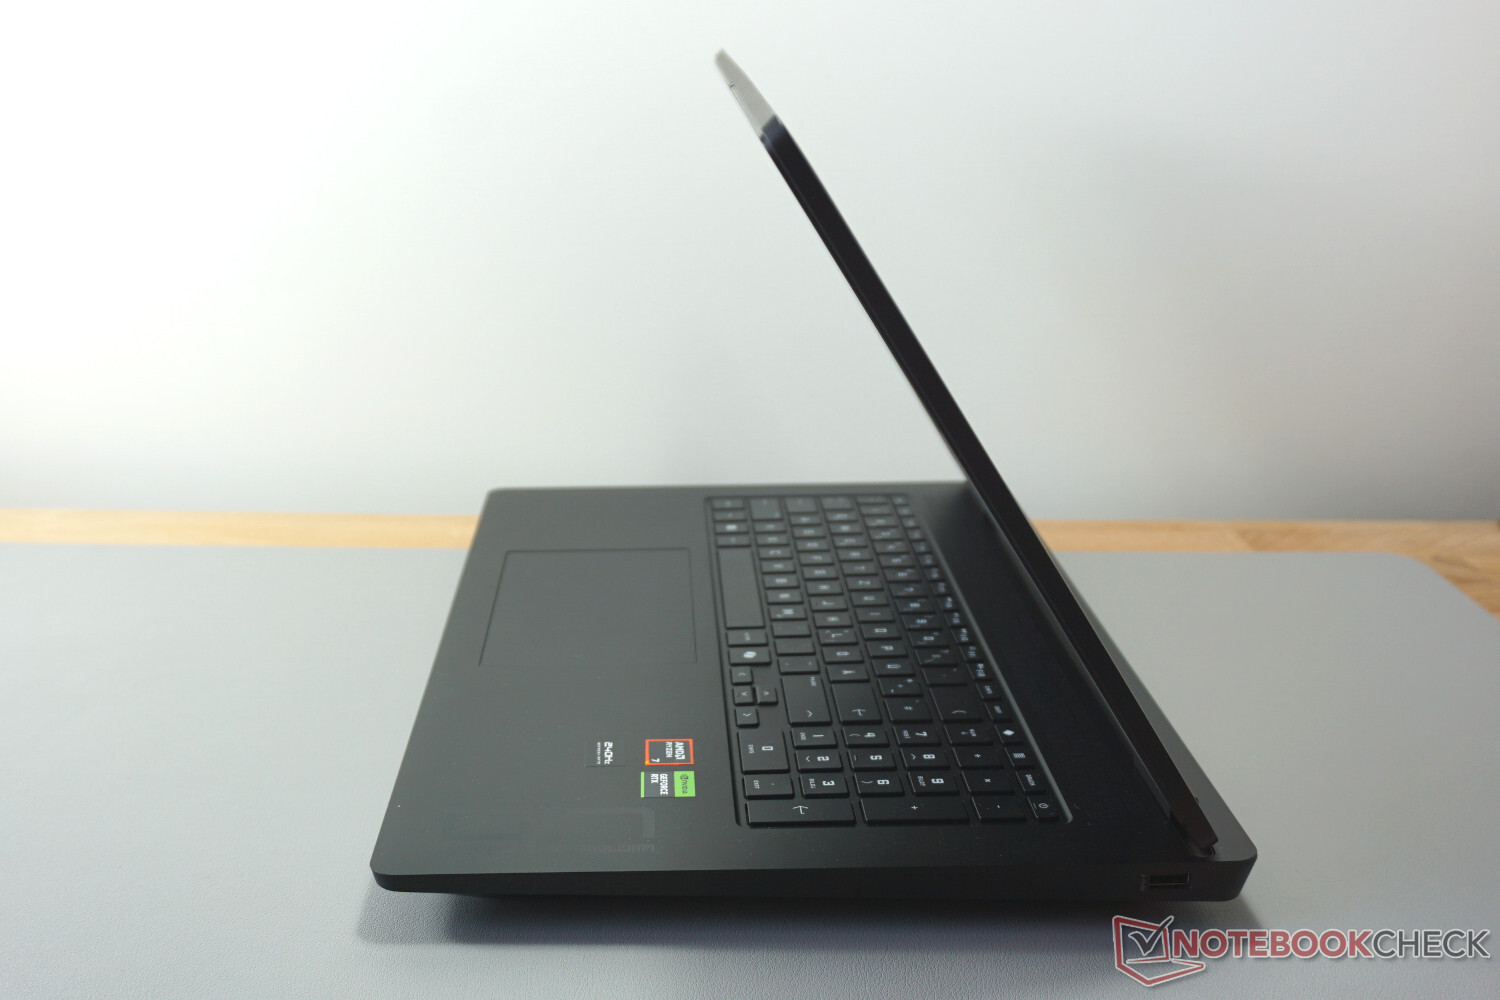
Mas quando o senhor tenta levantar o laptop - ou quando o tira diretamente da caixa, no nosso caso - fica claro que a HP definitivamente não economizou no uso de componentes maciços em seu interior. O peso não está longe da marca de 3 kg (~6,6 lb), embora a base não seja afetada se o senhor levantá-lo apenas em um único canto frontal. Tudo permanece rígido e firme.
As dobradiças da tela oferecem uma impressão semelhante, mas a tampa da tela poderia ter usado um pouco mais de estabilidade, permanecendo bastante flexível sem nenhuma estrutura metálica adicional.
Em termos de tamanho geral, há poucos modelos que são ainda maiores. Uma largura de 40 cm e uma altura de 3 cm, mesmo sem os pés, realmente não parecem ter muita mobilidade. Por outro lado, isso garante bastante espaço para hardware e resfriamento, embora possa ser grande demais para algumas bolsas ou mochilas de laptop.
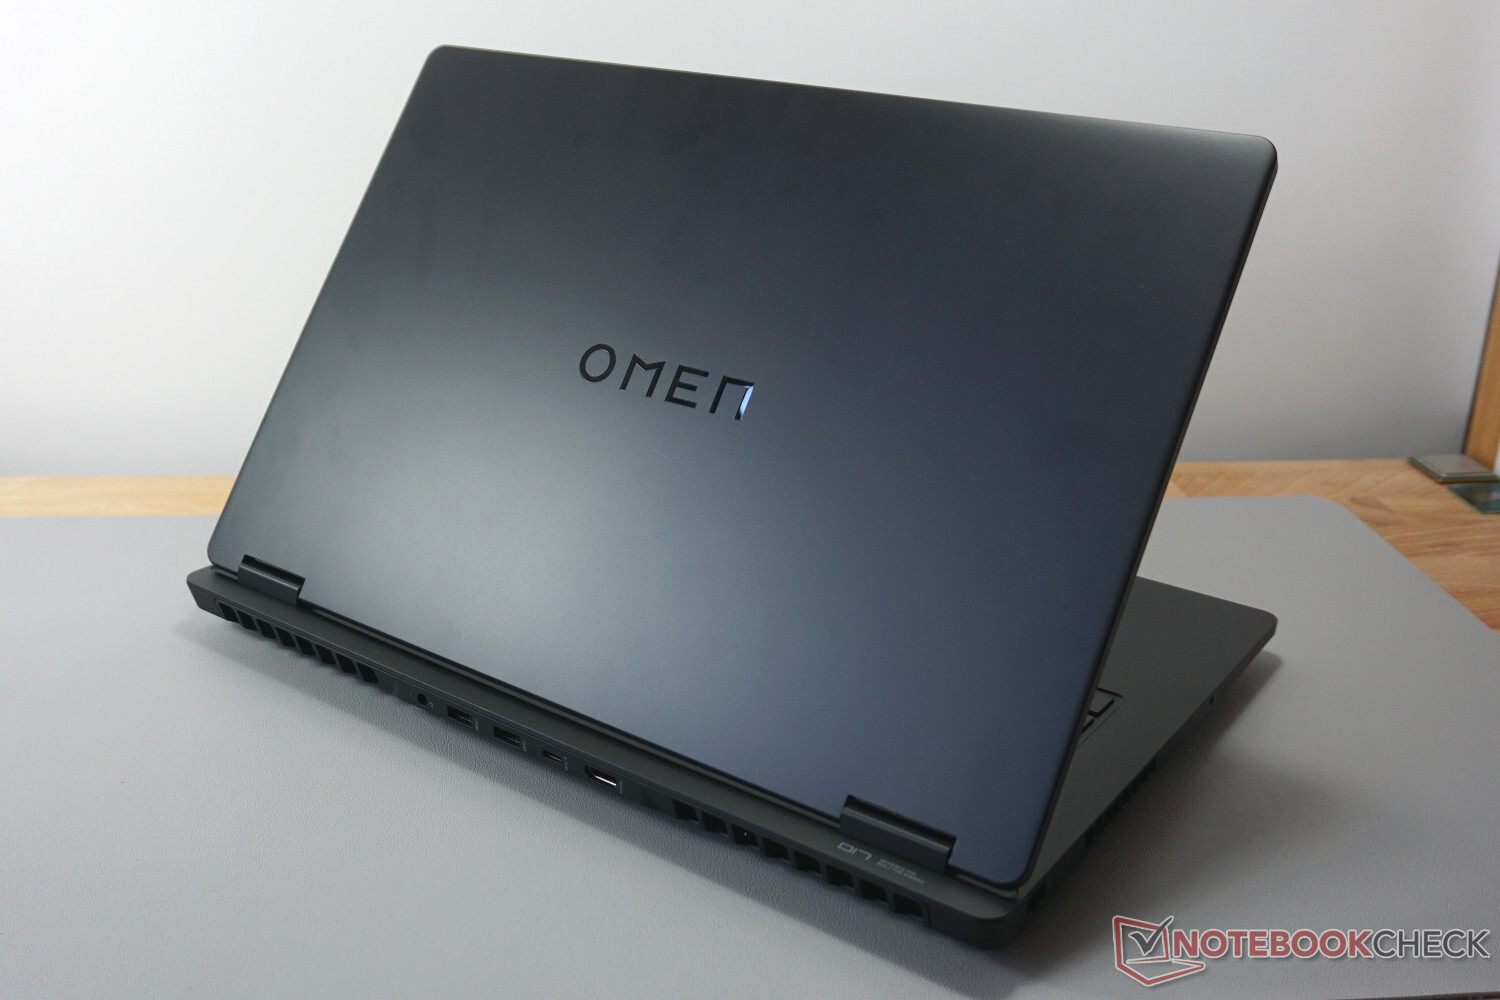
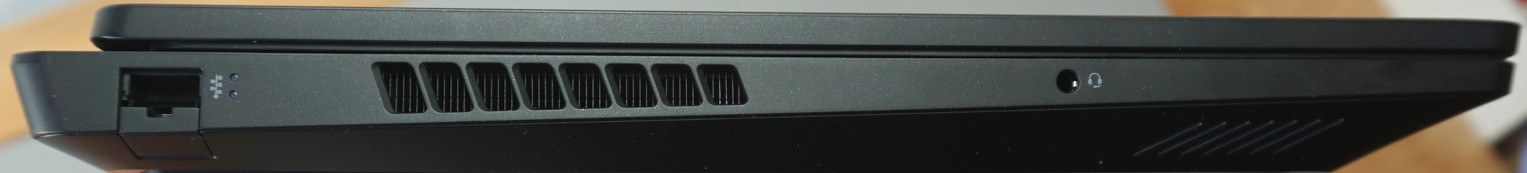
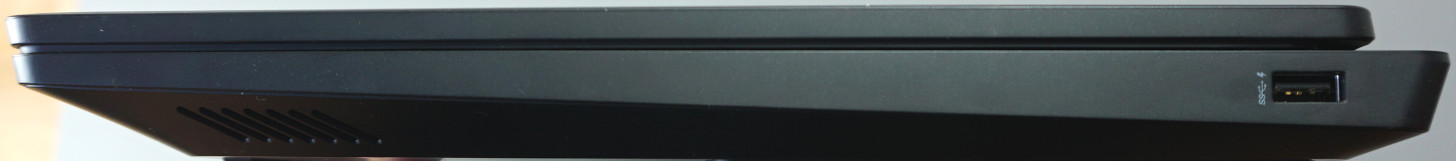
Equipamento de conexão - Omen 17 com poucas áreas para brilhar
Embora houvesse bastante espaço, as portas de conexão são limitadas. E não é só isso, mas elas também são as versões mais lentas. Todas as conexões USB na parte traseira atingem apenas 10 Gbit/s e a da lateral apenas 5 Gbit/s. O USB4 ou TB4 teria sido quatro ou oito vezes mais rápido. Mas pelo menos as portas na parte traseira ainda devem permitir que o senhor jogue muitos jogos a partir de um SSD externo.
Da mesma forma, a porta LAN também atinge apenas 1 Gbit/s, enquanto os concorrentes mais bem equipados, como o Acer Predator Helios Neo vão mais longe, oferecendo 2,5 Gbit/s. A posição da porta no lado esquerdo também não é a ideal e teria sido melhor na parte traseira. Além disso, não há uma terceira porta de vídeo nem um leitor de cartões.
Pelo menos, as saídas de vídeo HDMI e USB-C suportam a exibição de 4K@120Hz, permitindo que aqueles que têm uma TV adequada façam bom uso dela.

Comunicação
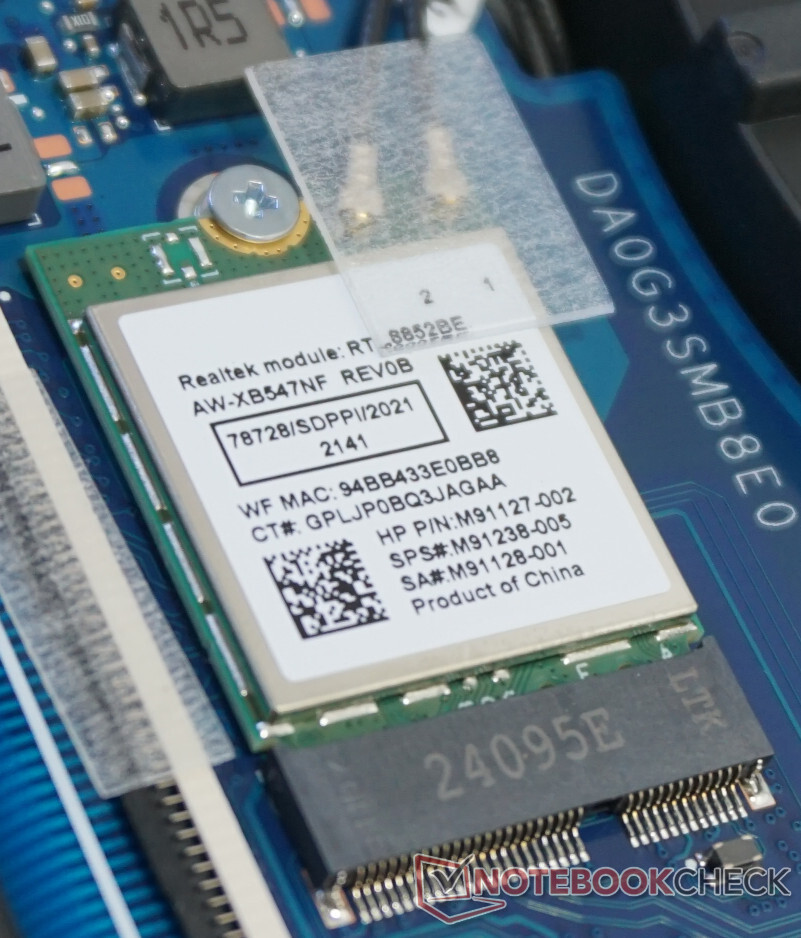
O módulo WLAN funciona bem na medida de suas capacidades. Com quase 1 Gbit/s em condições ideais, é quase tão bom quanto uma conexão com fio. Não houve quedas dignas de menção durante nosso teste.
Embora o módulo Wi-Fi 6 garanta uma conexão estável e confiável, ele não é adequado para a transferência de grandes quantidades de dados.
Webcam
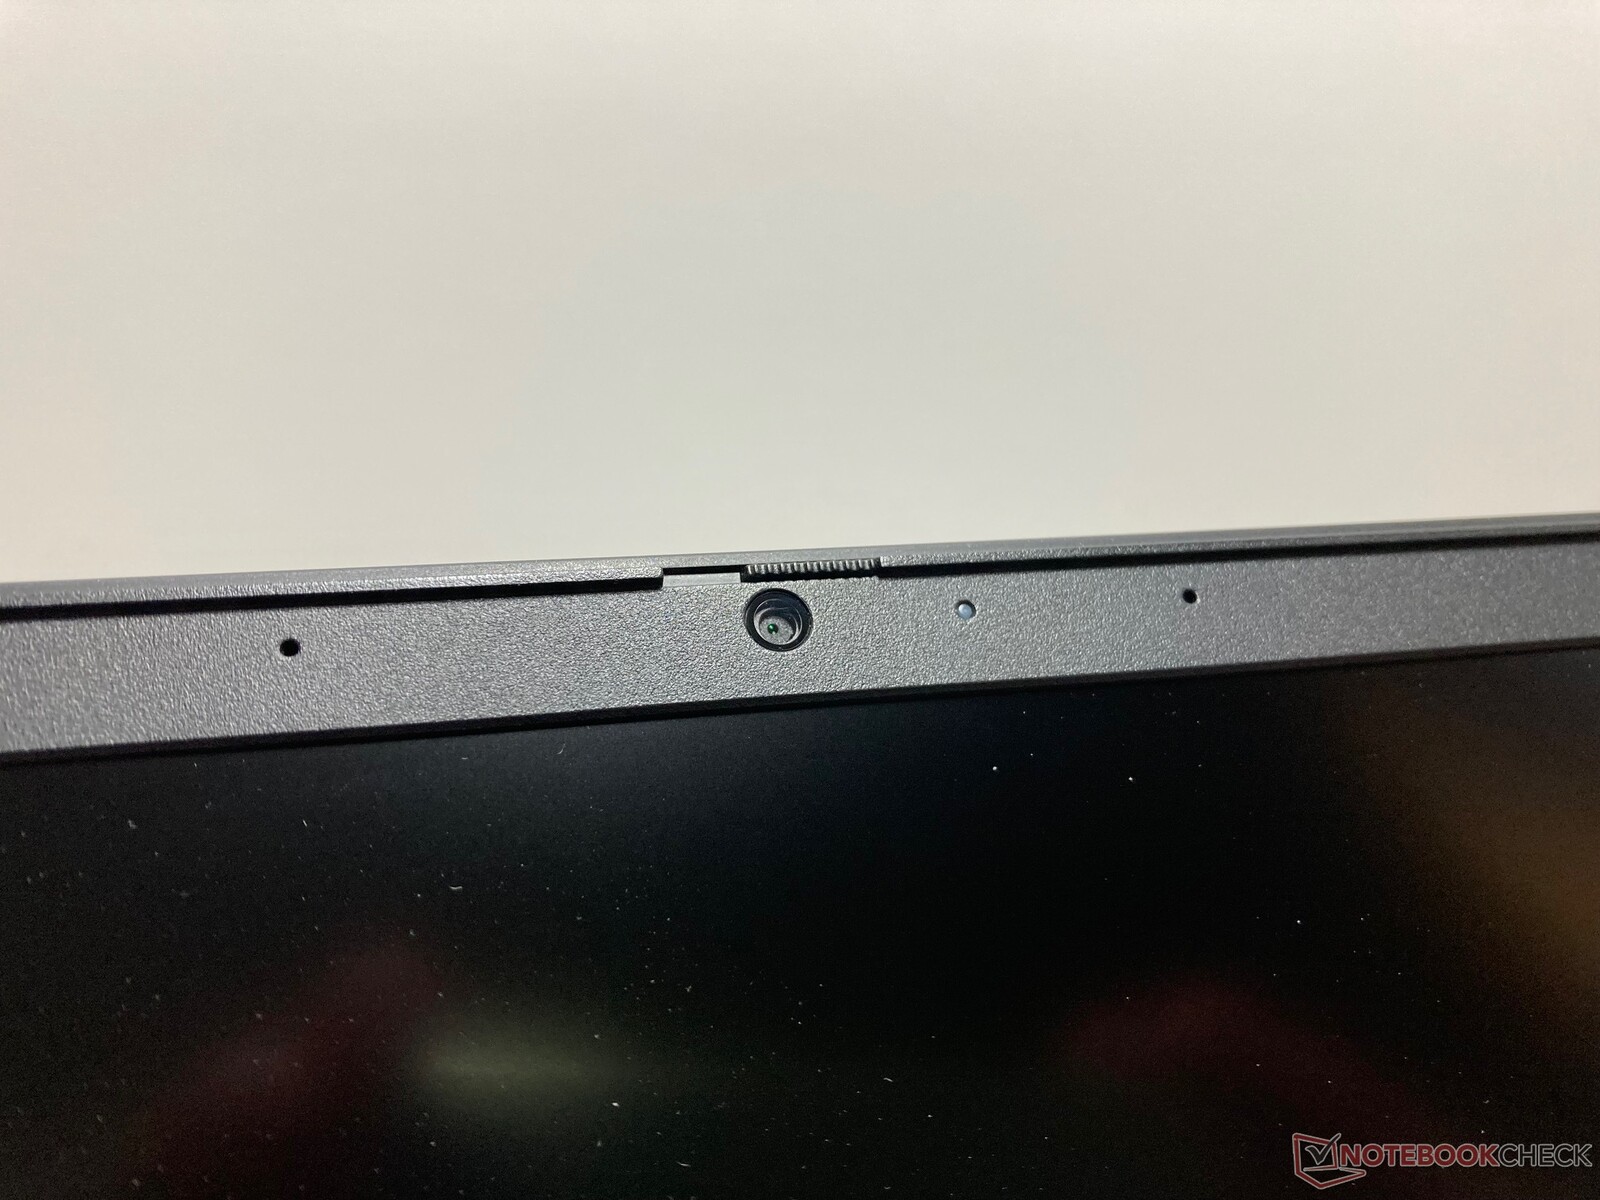
Uma resolução Full-HD decente resulta em imagens detalhadas. Mas isso só se aplica a uma luz suficientemente brilhante na sala. Mesmo uma luz de teto que não seja muito brilhante resulta em uma queda na qualidade da imagem. A câmera não é capaz de lidar com condições de luz fraca. Os detalhes se perdem e a reprodução de cores sofre consideravelmente. A precisão das cores só é convincente para uma câmera alojada na moldura do visor se a luz ao redor for brilhante. Portanto, não podemos recomendar o uso da câmera para mais do que algumas chamadas de vídeo.
Isso é lamentável, pois o microfone tem algum potencial. Embora as gravações soem um pouco metálicas, elas são sempre gravadas no mesmo volume e soam muito claras. O senhor pode até ouvir facilmente as vozes de fora da sala.


Manutenção
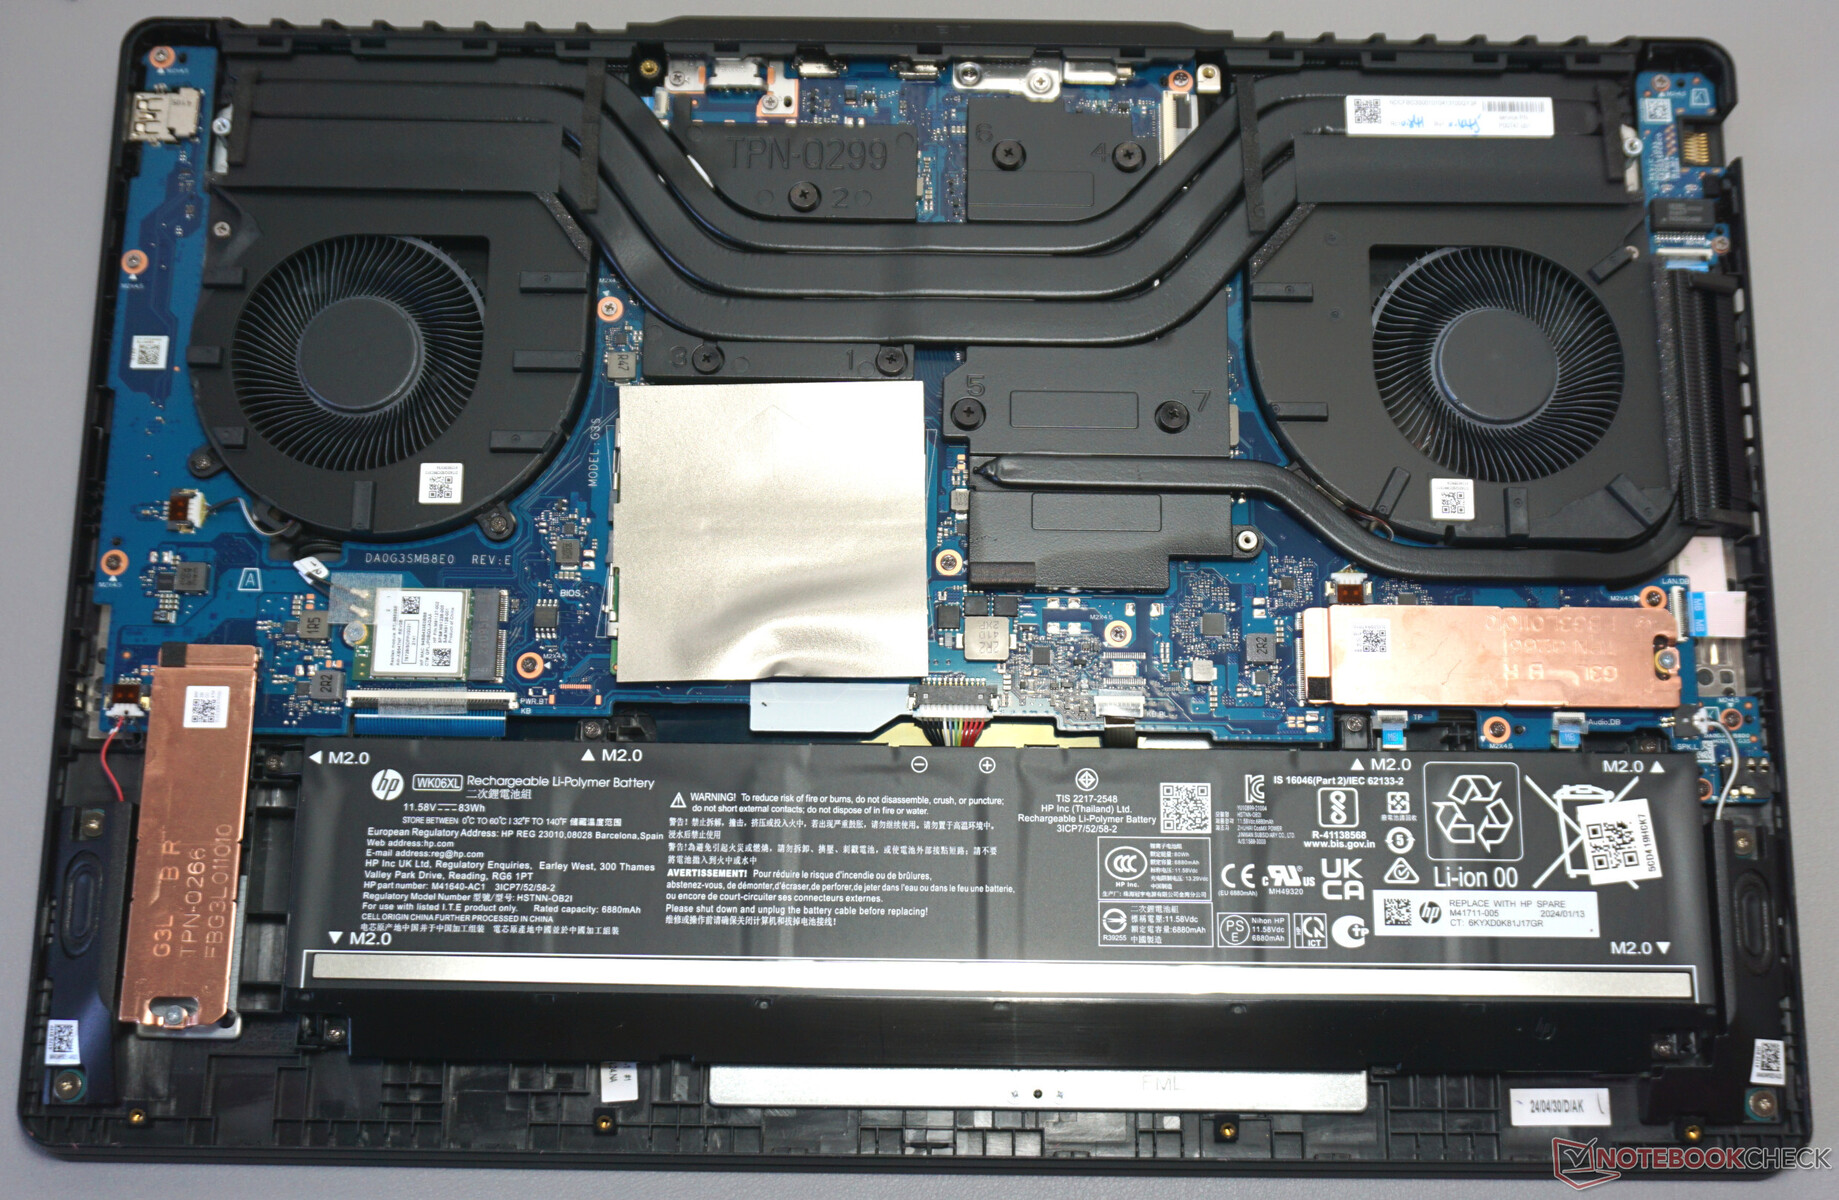
O HP Omen 17 acumula alguns pontos positivos com a facilidade de abertura da parte inferior do gabinete. Depois de remover os oito parafusos Philips comuns, a tampa do gabinete não oferece nenhuma resistência e pode ser facilmente removida sem o uso de força.
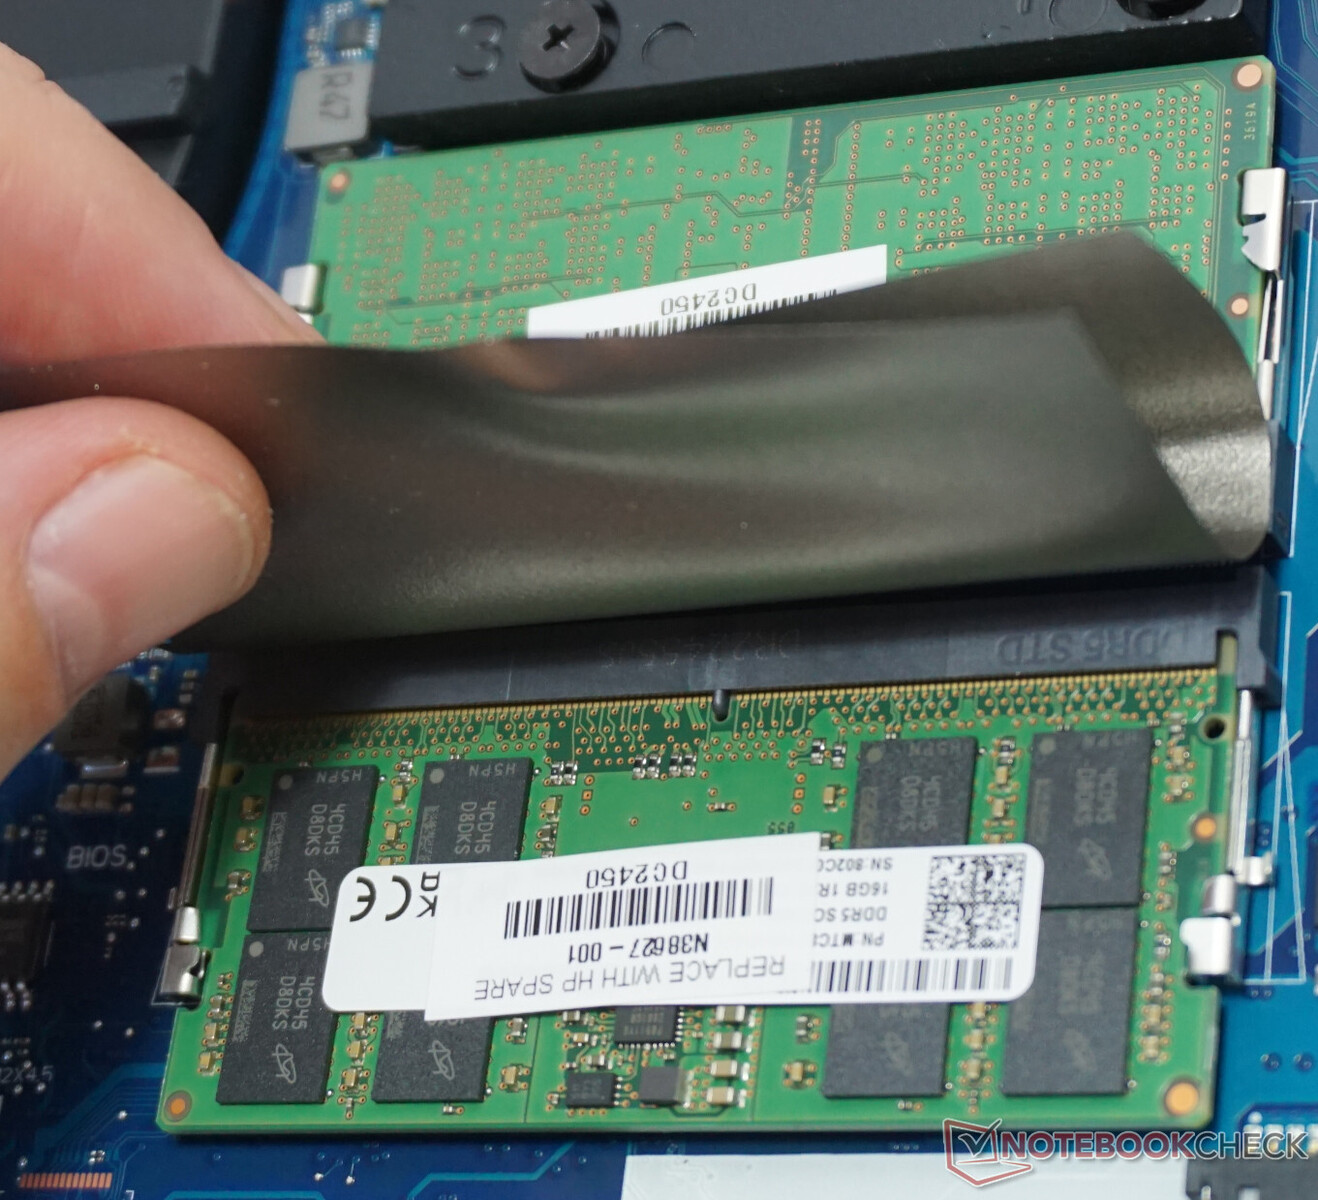
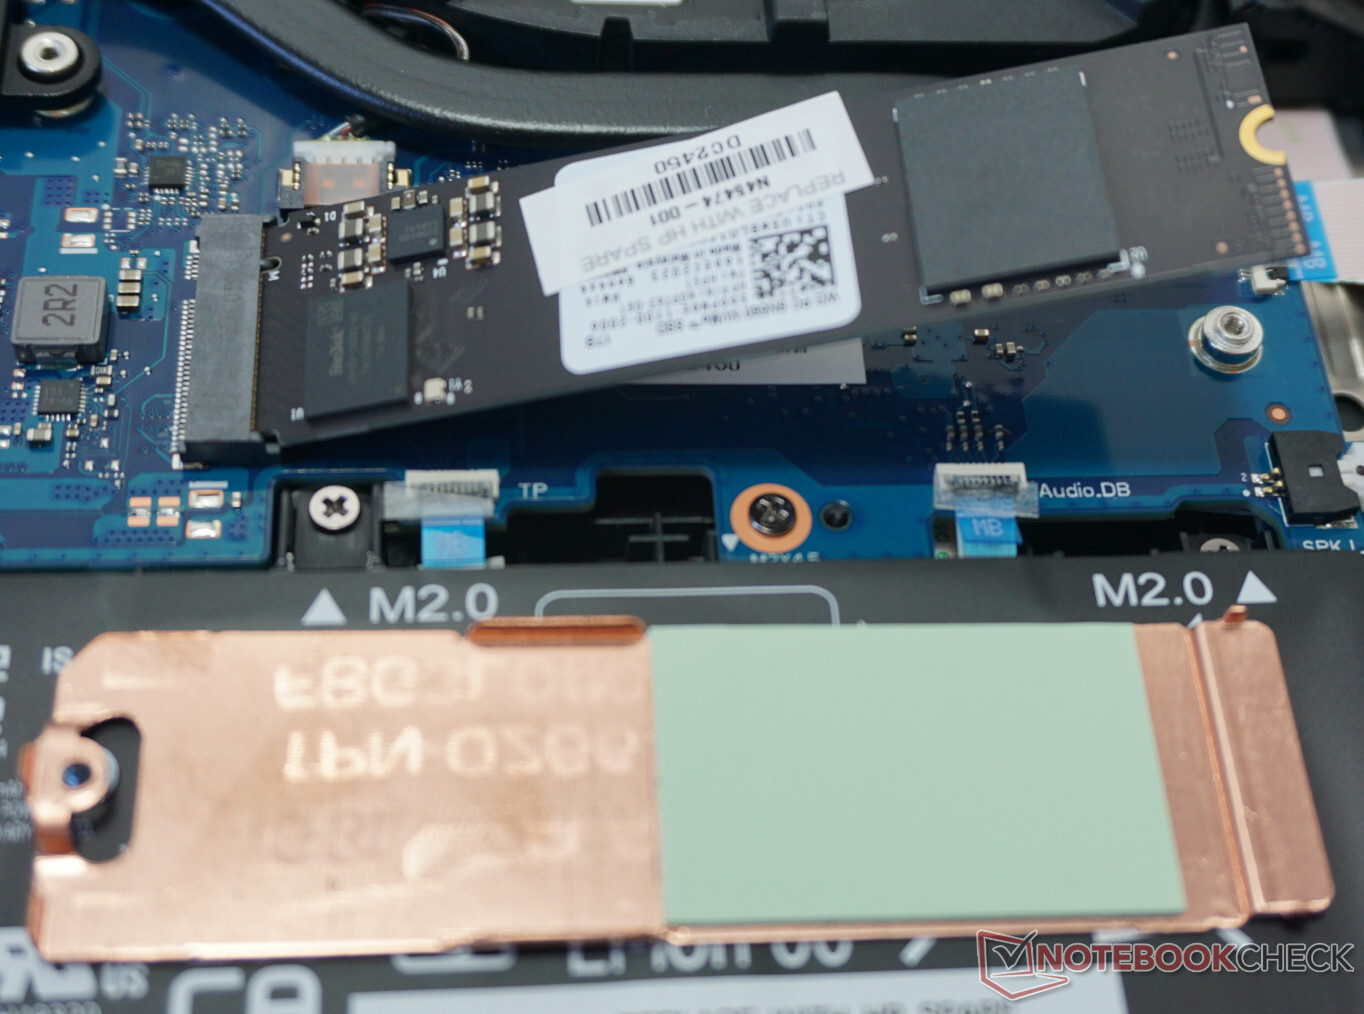
Isso lhe dá acesso para limpar as ventoinhas e substituir todos os componentes importantes. Dois slots de RAM, um módulo WLAN com plugues de antena de fácil acesso, dois slots de SSD e uma bateria que pode ser facilmente removida não são coisas que muitos dos notebooks mais compactos podem oferecer, pelo menos não nessa combinação completa.
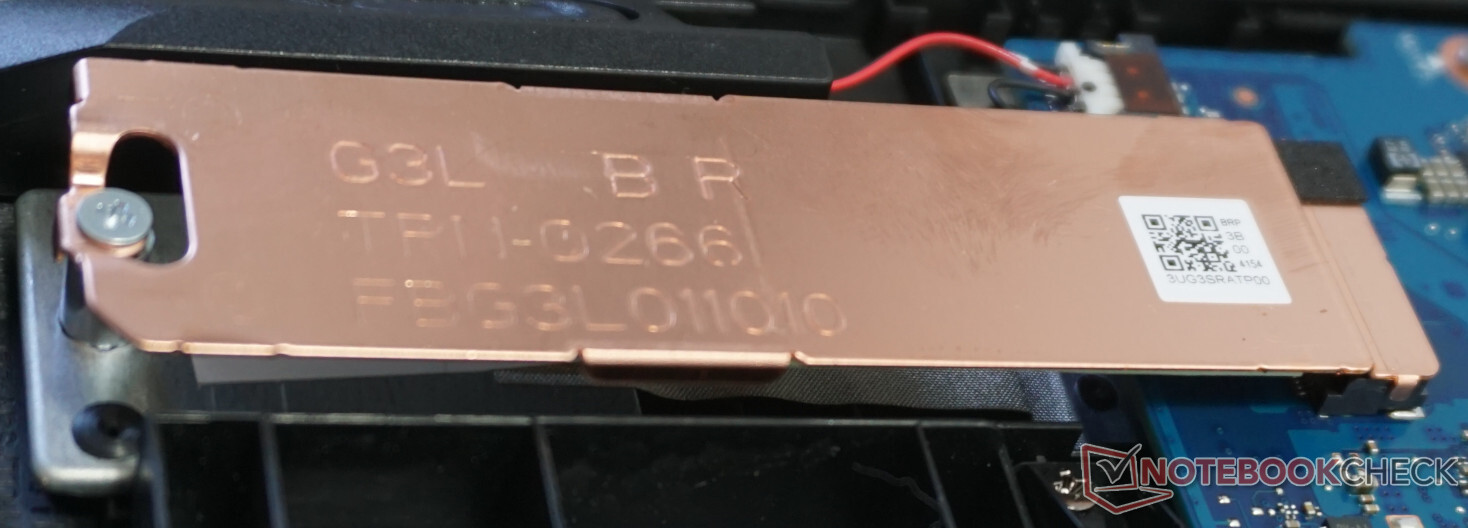
Além disso, há tampas de cobre para os slots de SSD M.2 que, aparentemente, também têm um efeito, como descobriremos mais tarde no teste. Um dos slots ainda está disponível, o que facilita a adição posterior de espaço de armazenamento.
Sustentabilidade
A embalagem é composta principalmente de papelão e papel. Até mesmo a capa protetora do laptop e o teclado são feitos de papel. Apenas o carregador é envolto em uma folha de plástico protetora. Além disso, há também a fácil manutenção do laptop, o que certamente beneficiará a longevidade do Omen 17. Desde a memória de trabalho até a bateria, tudo pode ser substituído.
Além disso, há o consumo moderado de energia com tarefas cotidianas que, na maioria das vezes, fica abaixo de 10 watts. Um típico PC desktop claramente tem uma desvantagem aqui.
E, finalmente, a HP publica um relatório anual de sustentabilidade que mostra as iniciativas do fabricante, que começam com a geração de energia a partir de fontes renováveis e vão até a meta de tratamento igualitário de todos os funcionários em todos os níveis da estrutura da empresa. O senhor pode conhecer os detalhes aqui.
Garantia
Embora a HP conceda uma garantia de dois anos, ela não oferece nenhum extra, como reparo no local. Dependendo do fornecedor, o senhor também poderá reservar algumas opções adicionais de garantia.
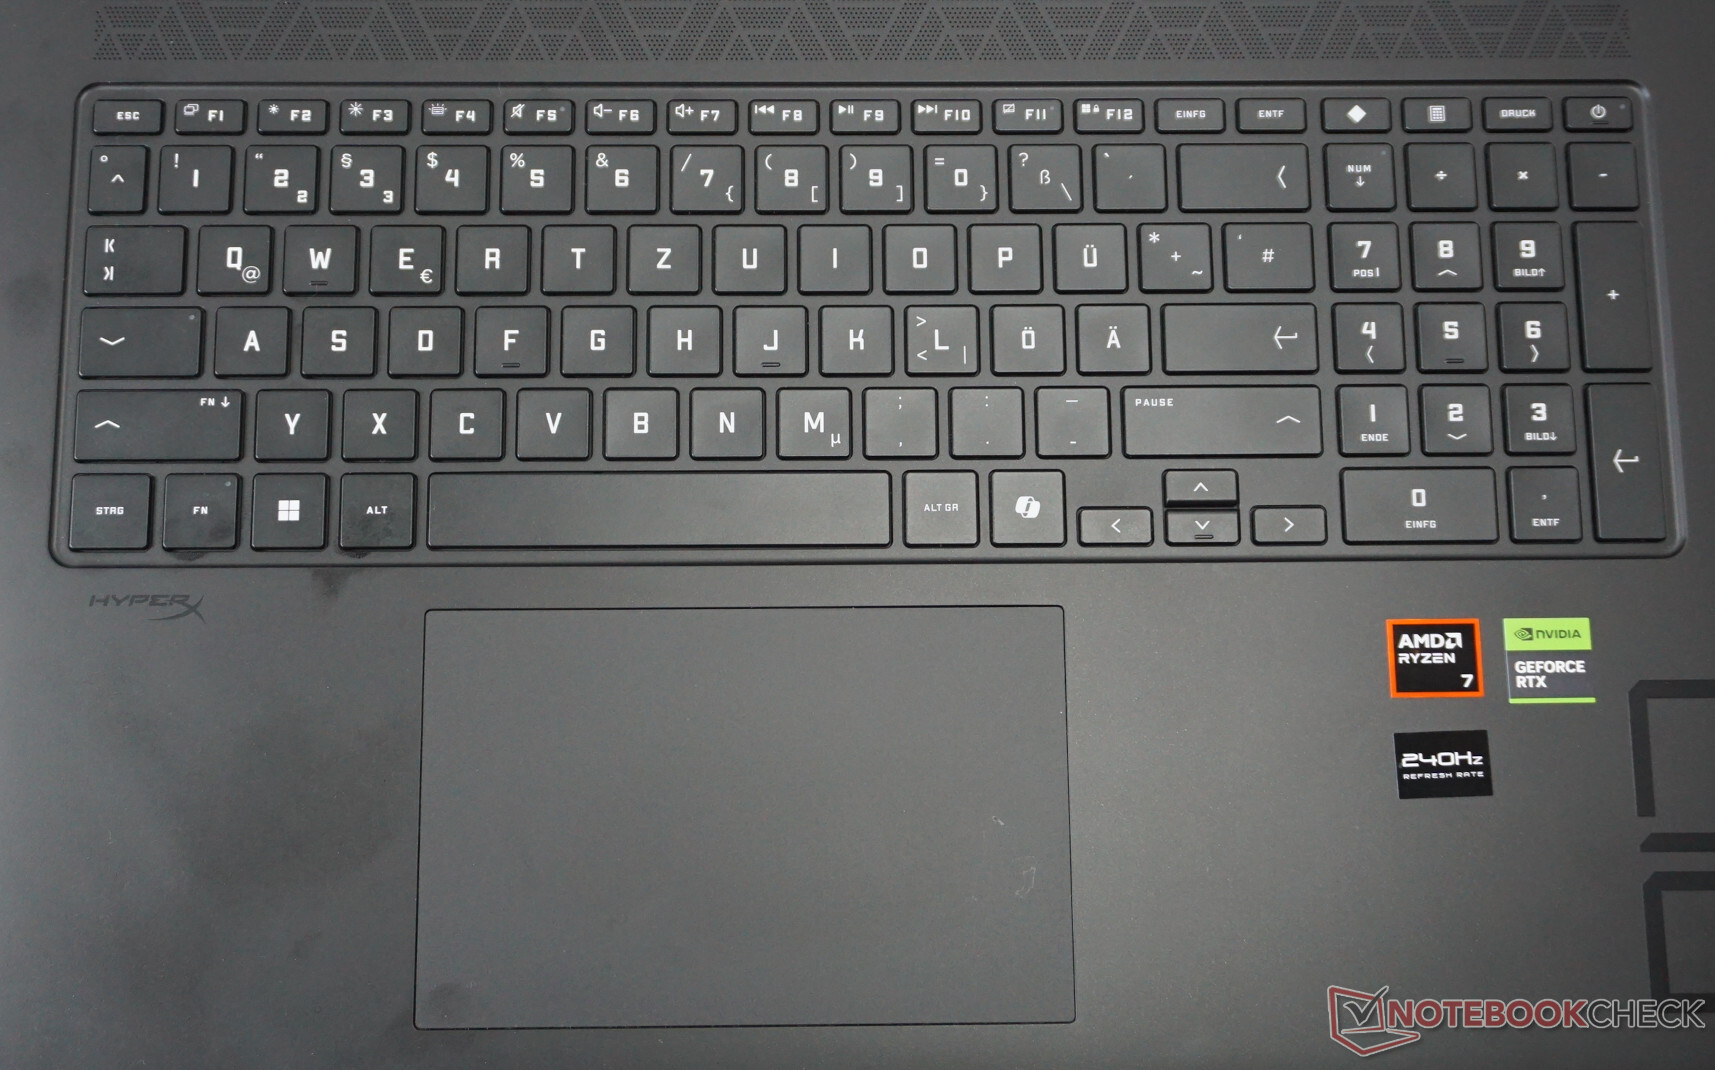
Dispositivos de entrada - O HP Omen 17 oferece apenas a tarifa padrão
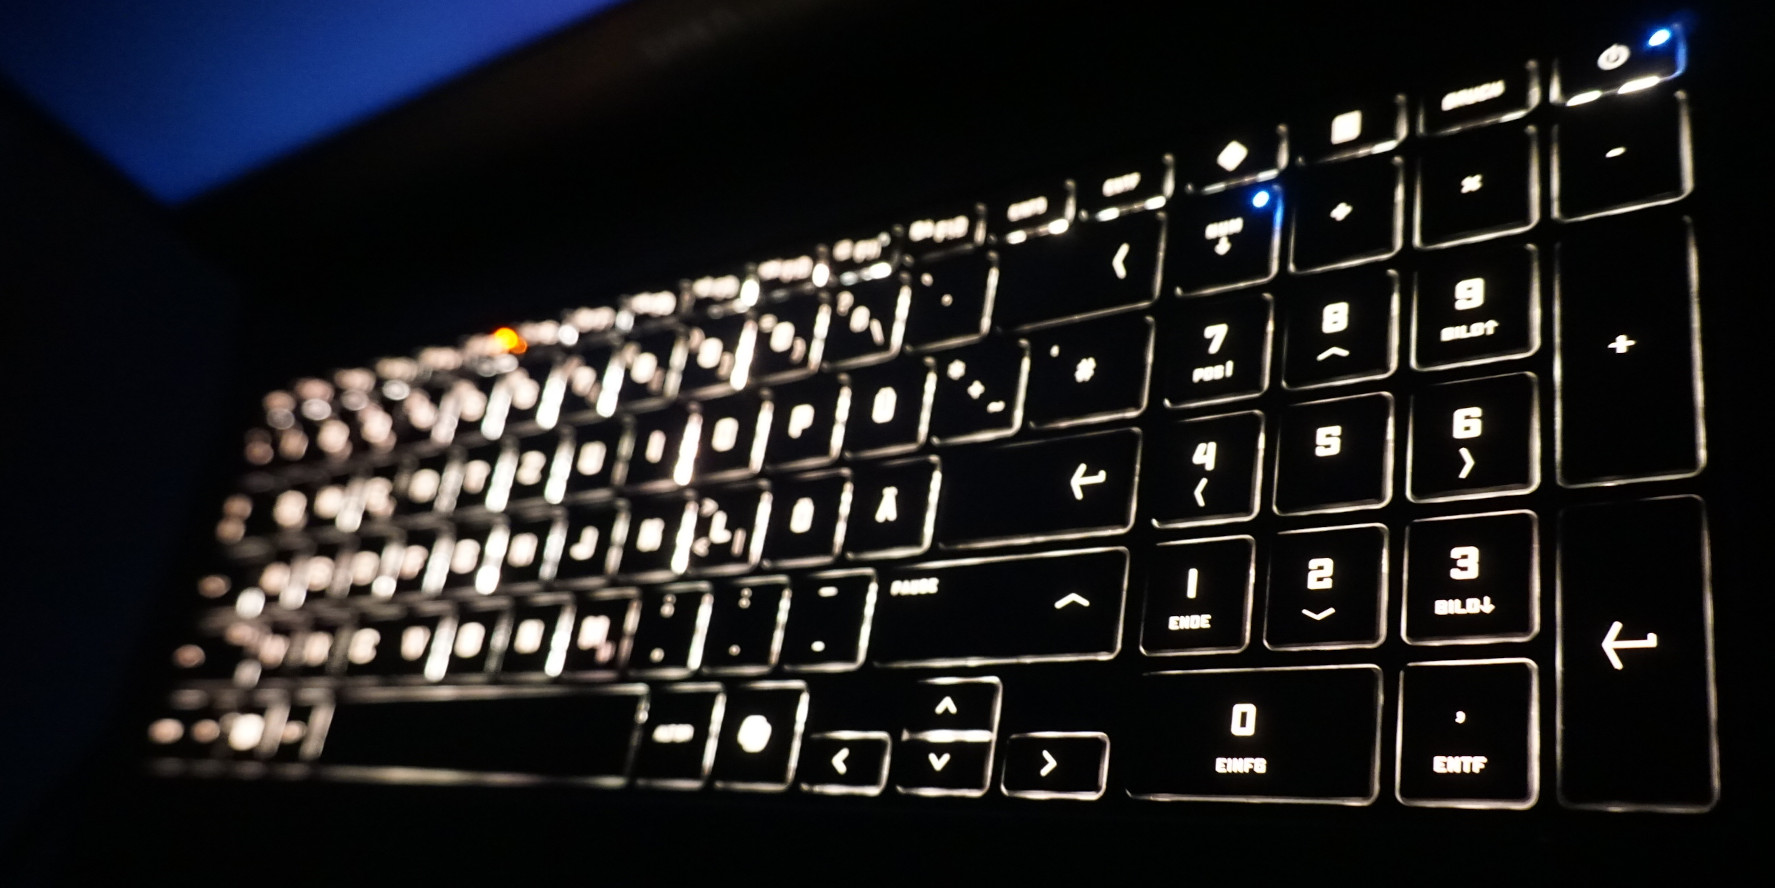
O teclado não parece muito adequado para um laptop para jogos. O curso das teclas é curto e a resistência das teclas é quase imperceptível. Além disso, o teclado não tem a iluminação ajustável individualmente. Embora o senhor possa selecionar praticamente qualquer cor com ajustes finos de brilho, todas as teclas são iluminadas com a mesma cor. Pelo menos, as teclas de seta deveriam ser de tamanho normal.
O touchpad apresenta um quadro semelhante. Embora, com 13 x 8 cm (5,1 x 3,15 pol.), ele tenha um tamanho confortável e também responda com muita precisão, o pressionamento das teclas parece menos bem ajustado. Uma pressão mais forte resulta em um ruído perceptível. Embora seja suficiente para as tarefas cotidianas - o teclado também oferece uma estrutura firme e uma boa experiência de digitação - aqueles que desejam jogar com mais intensidade são quase obrigados a usar dispositivos de entrada adicionais.
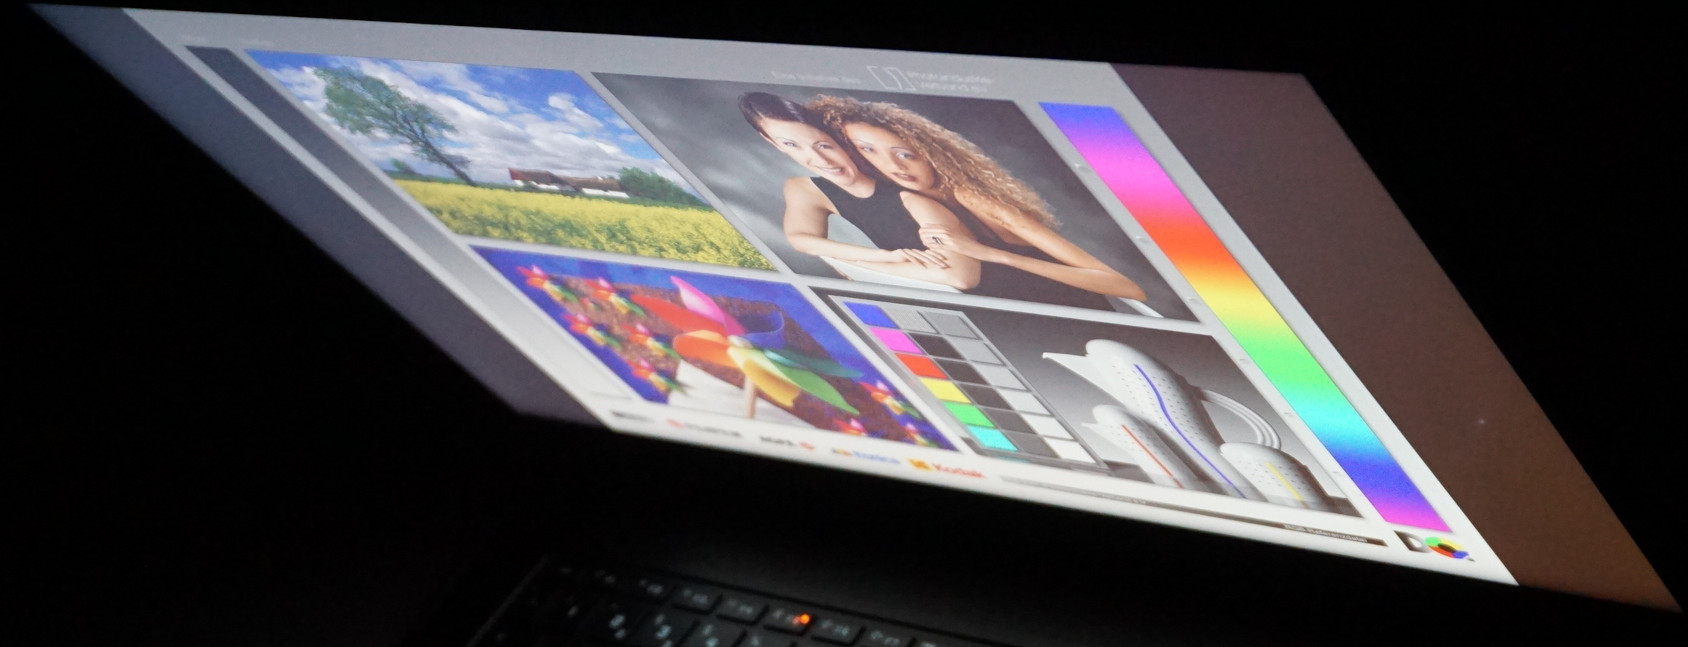
Tela - Bem ajustada ao desempenho de jogo oferecido
Se o senhor pensar no que uma boa tela para jogos em um laptop deve ser capaz de fazer, terá uma visão bastante precisa da tela QHD do HP Omen 17. Combinada com uma diagonal de 17 polegadas, a resolução garante uma imagem nítida e detalhada.
Além de jogos, o formato 16:9 também é adequado para streaming. As cores no painel IPS parecem bastante naturais, e a superfície fosca também evita reflexos incômodos.
A taxa de atualização de 240 Hertz e o espaço de cores suficientemente grande garantem que os vários gêneros de jogos sejam exibidos conforme desejado. Os tempos de resposta em nossas medições também são capazes de acompanhar os dos melhores modelos, atingindo um nível consideravelmente mais alto do que os do Asus TUF Gaming 17da Asus, por exemplo.
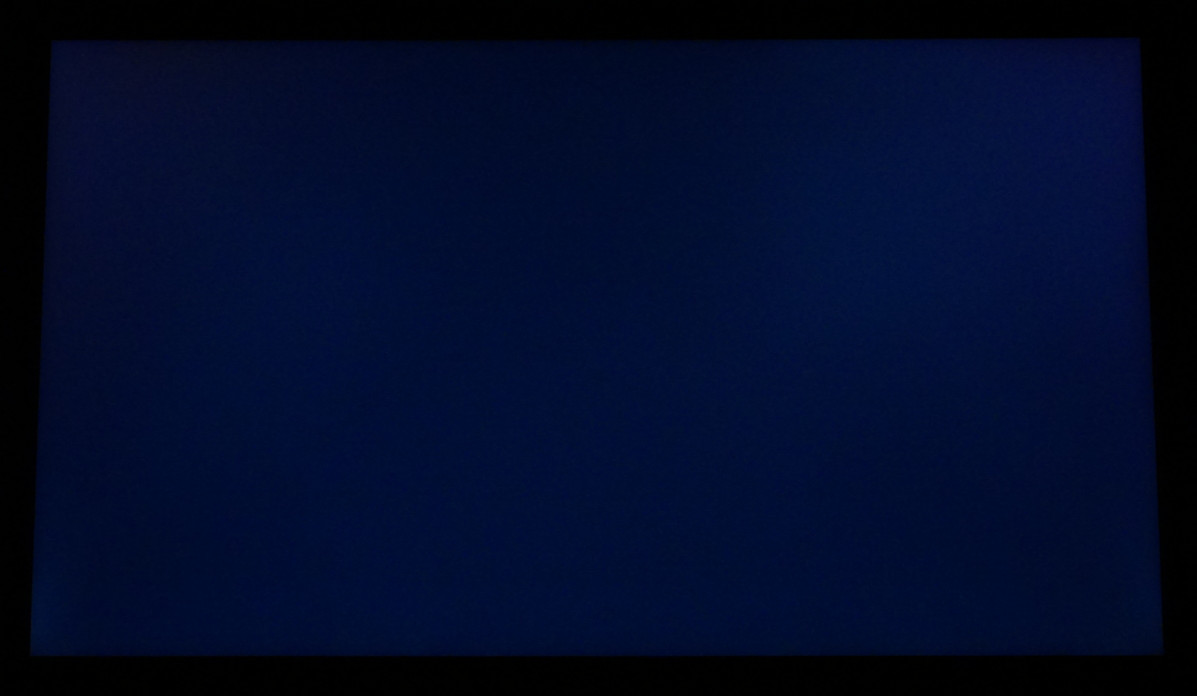
O que é menos impressionante é o contraste e o valor de preto. Mesmo para um painel IPS, em que não esperamos um preto perfeito, a imagem parece brilhante demais com escuridão absoluta. Por outro lado, não conseguimos detectar nenhum sangramento na tela a olho nu, ou apenas muito pouco com exposição longa. Também não observamos nenhuma oscilação da modulação de largura de pulso em nosso teste.
Além disso, a HP também oferece uma versão Full-HD com 144 Hertz, que pode ser uma opção sensata em combinação com uma RTX 4060.
| |||||||||||||||||||||||||
iluminação: 84 %
iluminação com acumulador: 363 cd/m²
Contraste: 955:1 (Preto: 0.38 cd/m²)
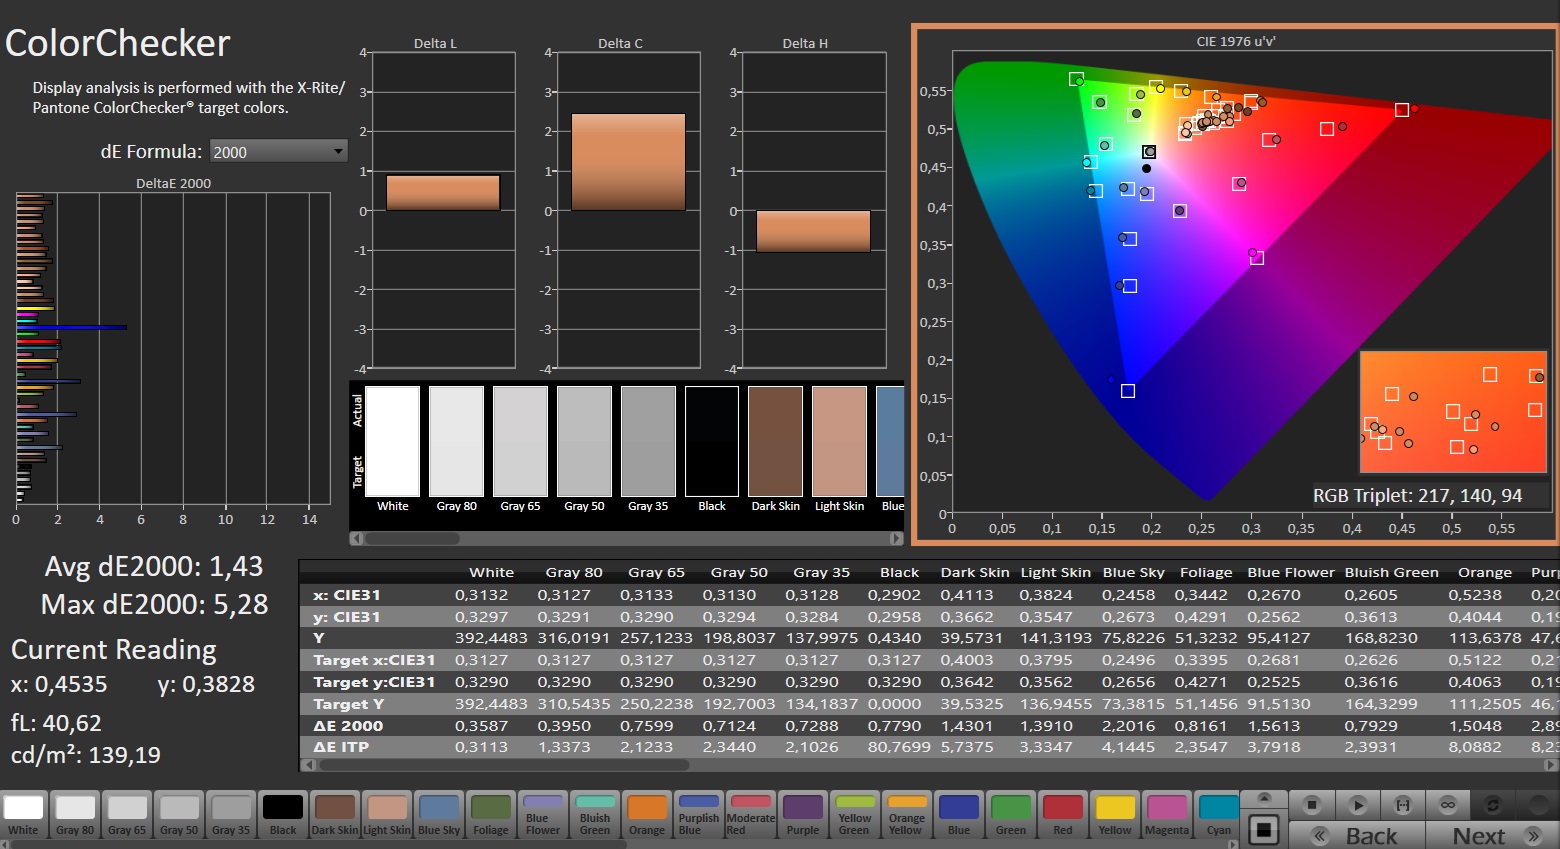
ΔE Color 1.74 | 0.5-29.43 Ø4.87, calibrated: 1.43
ΔE Greyscale 1.3 | 0.5-98 Ø5.1
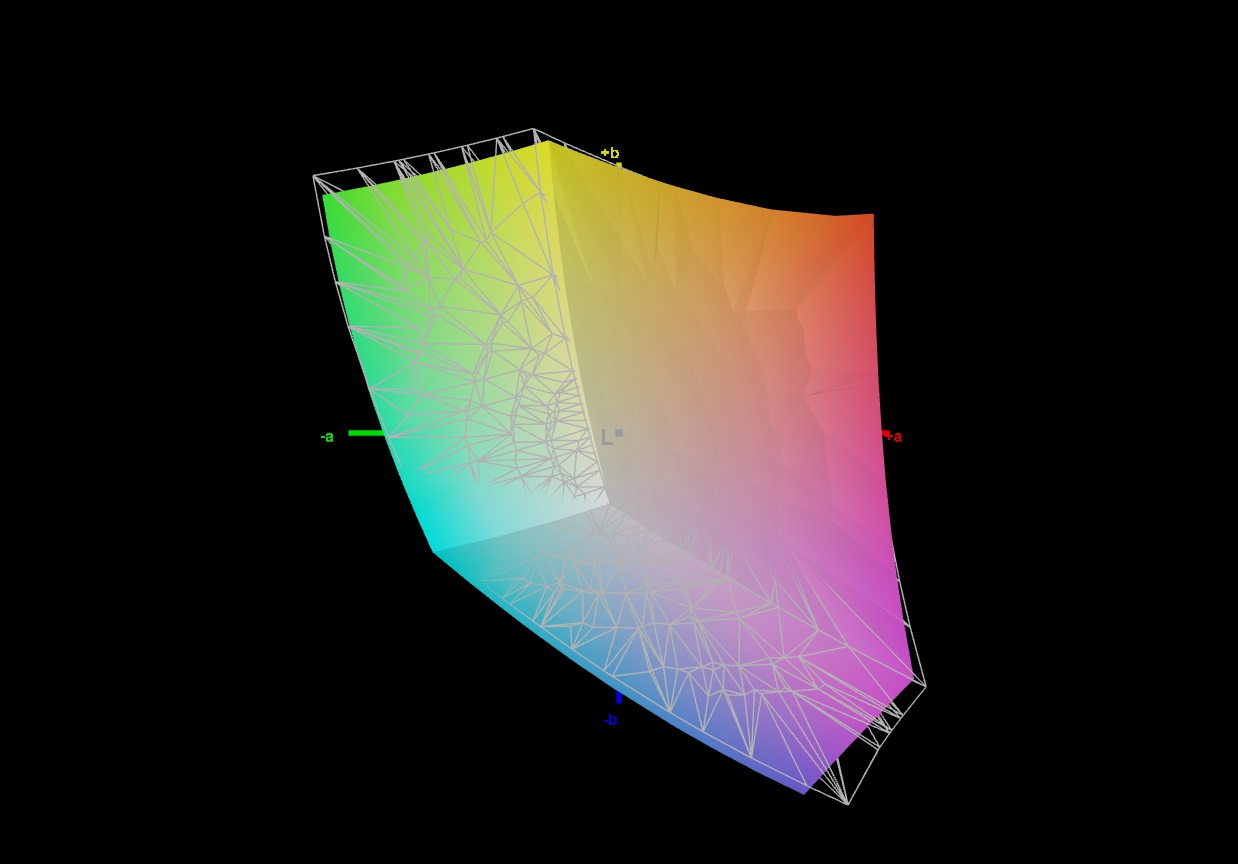
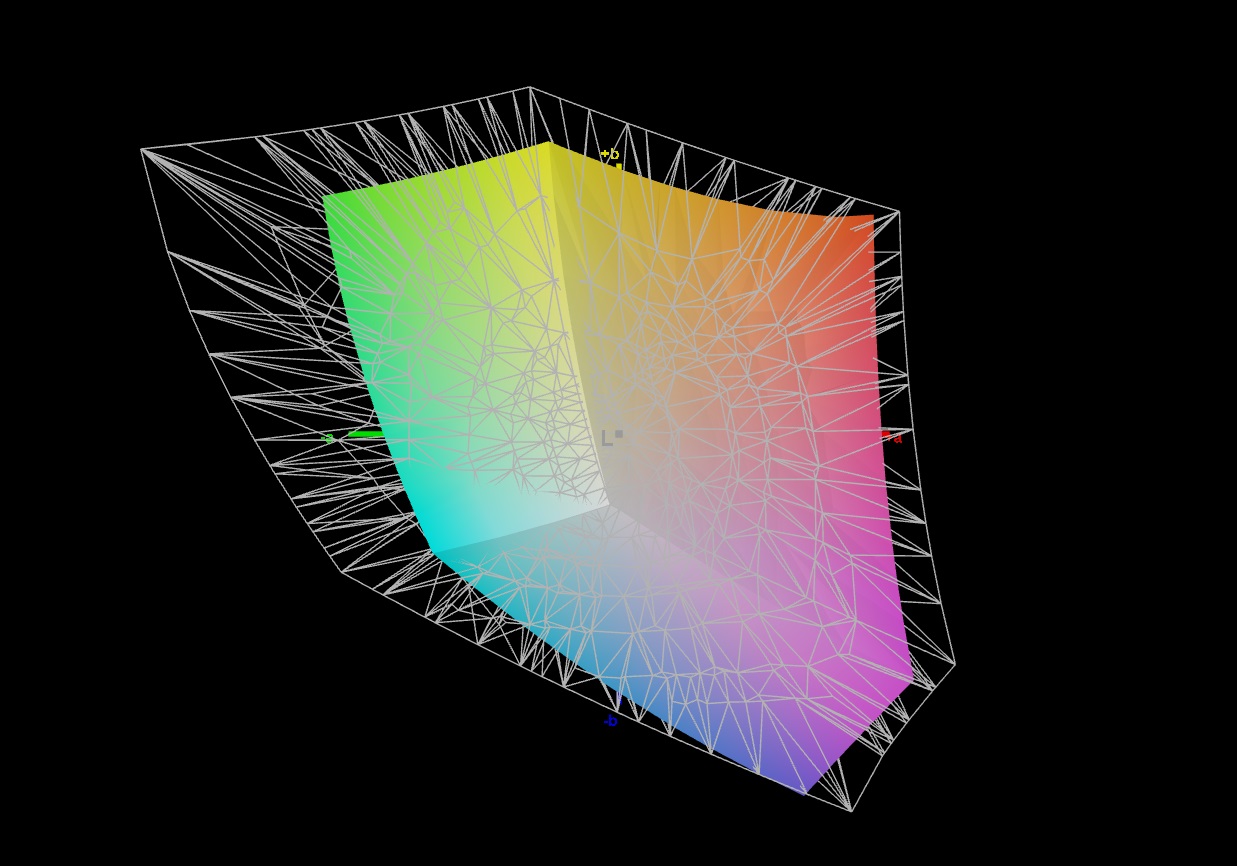
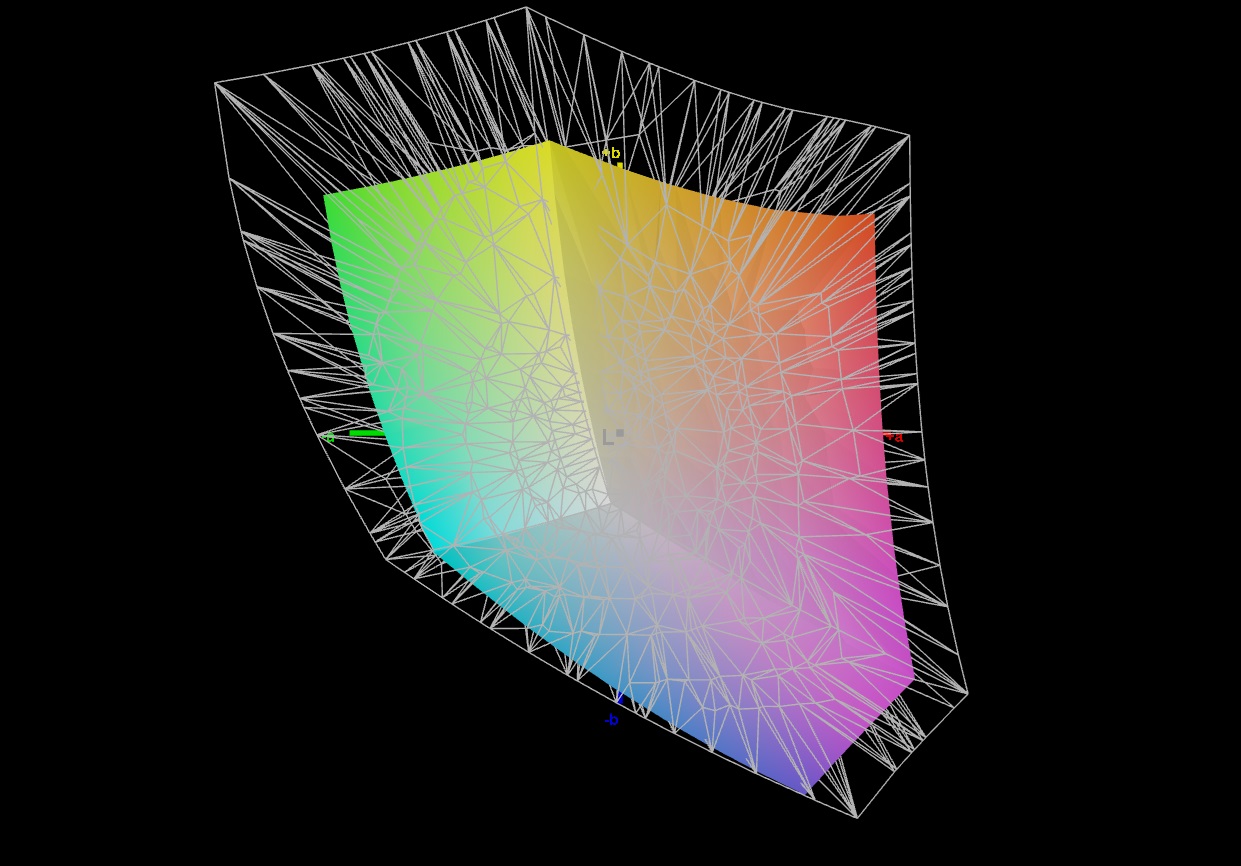
68.1% AdobeRGB 1998 (Argyll 2.2.0 3D)
95.5% sRGB (Argyll 2.2.0 3D)
66.2% Display P3 (Argyll 2.2.0 3D)
Gamma: 2.235
| HP Omen 17-db0079ng BOE0B67, IPS, 2560x1440, 17.3" | Alienware m16 R2 BOE NE16NYH, IPS, 2560x1600, 16" | Asus ROG Strix Scar 16 G634JZR BOE NE160QDM-NM7, Mini LED, 2560x1600, 16" | Acer Predator Helios Neo 16 (2024) Chi Mei N160GME-GTB, LED, 2560x1600, 16" | Asus TUF Gaming A17 FA707XI-NS94 AU Optronics B173HAN04.9, IPS, 1920x1080, 17.3" | Asus TUF Gaming A15 FA507UV AU Optronics B156HAN15.H, IPS, 1920x1080, 15.6" | |
|---|---|---|---|---|---|---|
| Display | 6% | 30% | 26% | -39% | 5% | |
| Display P3 Coverage | 66.2 | 71 7% | 99.8 51% | 95.9 45% | 39.7 -40% | 70.5 6% |
| sRGB Coverage | 95.5 | 100 5% | 100 5% | 99.8 5% | 59.1 -38% | 98.5 3% |
| AdobeRGB 1998 Coverage | 68.1 | 71.4 5% | 90.8 33% | 86.4 27% | 41 -40% | 72.7 7% |
| Response Times | 28% | 20% | 30% | -198% | -148% | |
| Response Time Grey 50% / Grey 80% * | 14.4 ? | 5.7 ? 60% | 5 ? 65% | 5 ? 65% | 39 ? -171% | 31.7 ? -120% |
| Response Time Black / White * | 8.3 ? | 8.7 ? -5% | 10.4 ? -25% | 8.8 ? -6% | 26.9 ? -224% | 22.9 ? -176% |
| PWM Frequency | 2040 ? | |||||
| Screen | 6% | 29% | 7% | -66% | -22% | |
| Brightness middle | 363 | 345.8 -5% | 490 35% | 521 44% | 255.9 -30% | 315 -13% |
| Brightness | 341 | 337 -1% | 487 43% | 506 48% | 248 -27% | 303 -11% |
| Brightness Distribution | 84 | 87 4% | 94 12% | 85 1% | 91 8% | 90 7% |
| Black Level * | 0.38 | 0.3 21% | 0.4 -5% | 0.44 -16% | 0.21 45% | 0.25 34% |
| Contrast | 955 | 1153 21% | 1225 28% | 1184 24% | 1219 28% | 1260 32% |
| Colorchecker dE 2000 * | 1.74 | 1.99 -14% | 1.08 38% | 1.74 -0% | 4.51 -159% | 2.26 -30% |
| Colorchecker dE 2000 max. * | 5.39 | 3.52 35% | 2.38 56% | 3.88 28% | 20.77 -285% | 7.37 -37% |
| Colorchecker dE 2000 calibrated * | 1.43 | 0.62 57% | 0.9 37% | 0.52 64% | 1.82 -27% | 1.03 28% |
| Greyscale dE 2000 * | 1.3 | 2.1 -62% | 1.1 15% | 3 -131% | 3.2 -146% | 4 -208% |
| Gamma | 2.235 98% | 2.32 95% | 2.13 103% | 2.164 102% | 2.08 106% | 2.116 104% |
| CCT | 6346 102% | 6369 102% | 6724 97% | 6816 95% | 6054 107% | 7570 86% |
| Média Total (Programa/Configurações) | 13% /
9% | 26% /
28% | 21% /
14% | -101% /
-79% | -55% /
-34% |
* ... menor é melhor
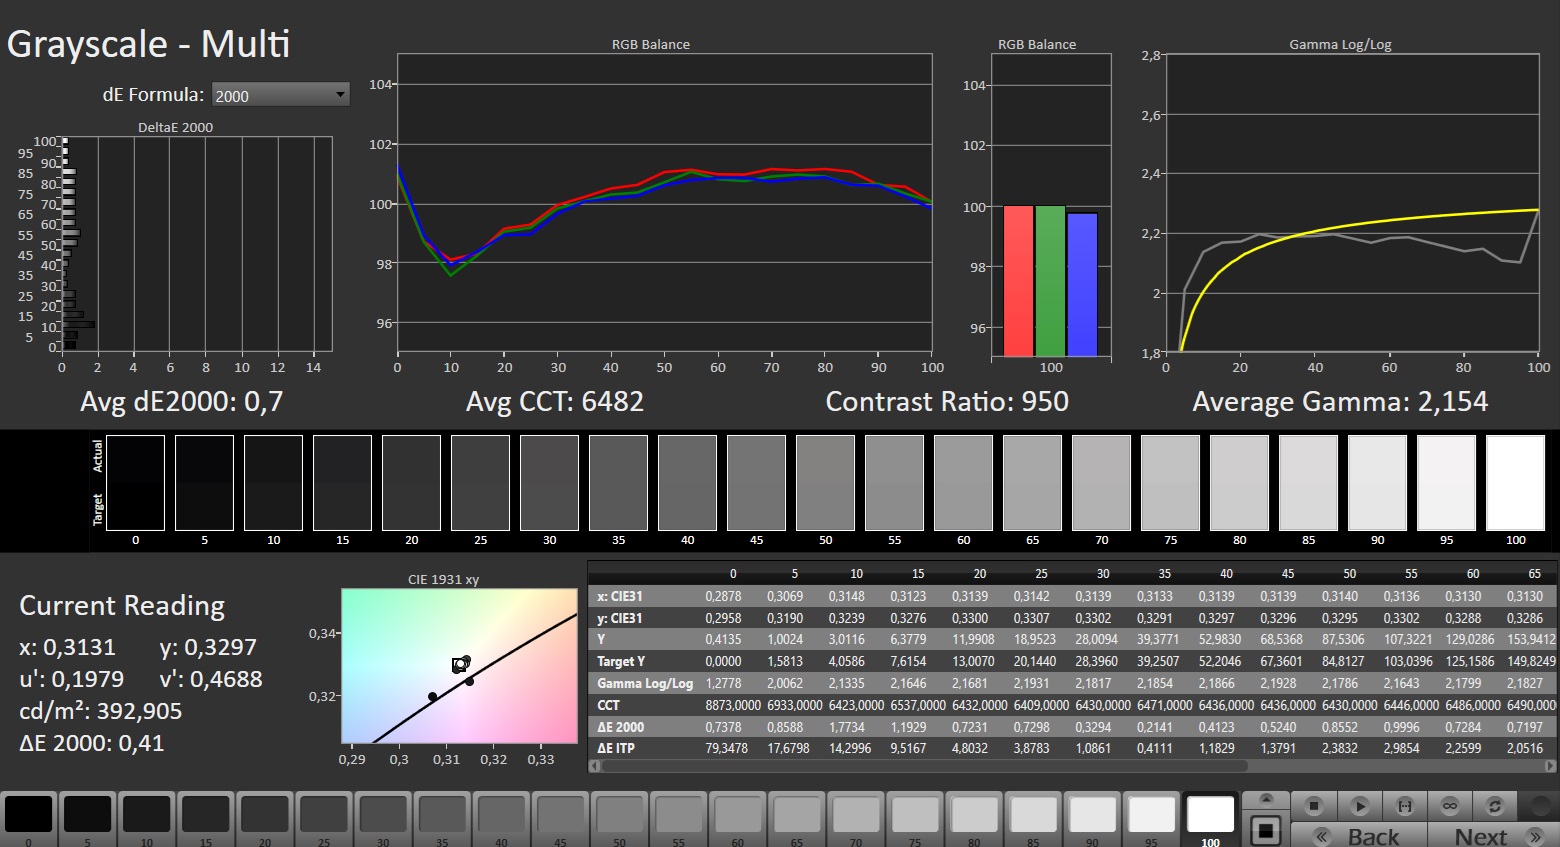
A reprodução de cores é boa, mesmo sem uma calibração adicional. Medimos apenas um desvio maior com a cor azul, que também pode ser percebido a olho nu. Nas outras áreas de cores, incluindo a escala de cinza, a reprodução de cores é quase perfeita no estado de entrega.
Após a calibração, não há mais discrepâncias e a precisão das cores está em um nível alto em todas as áreas.
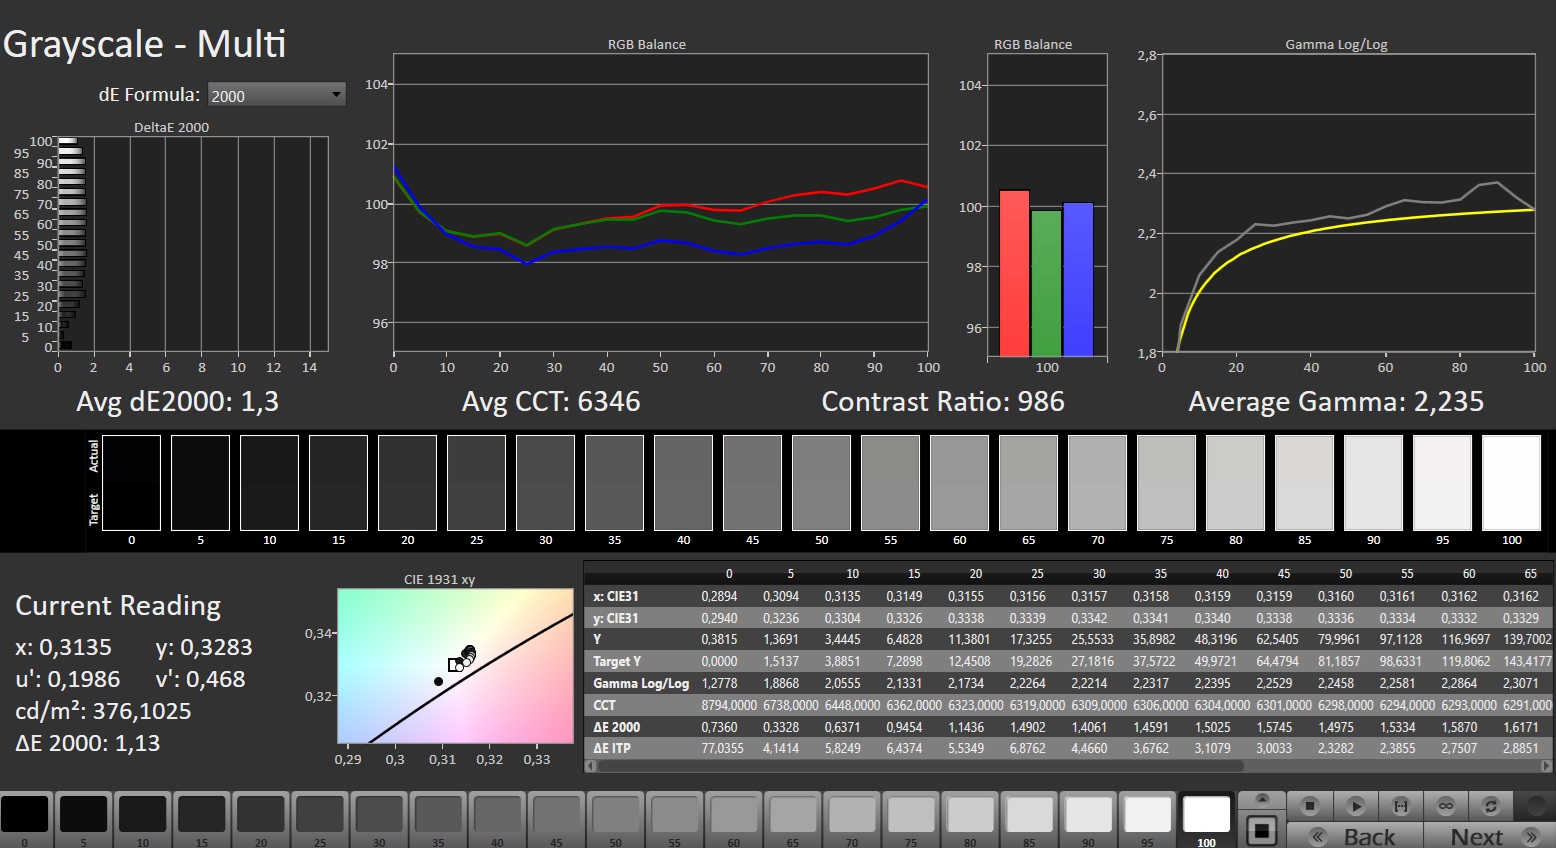
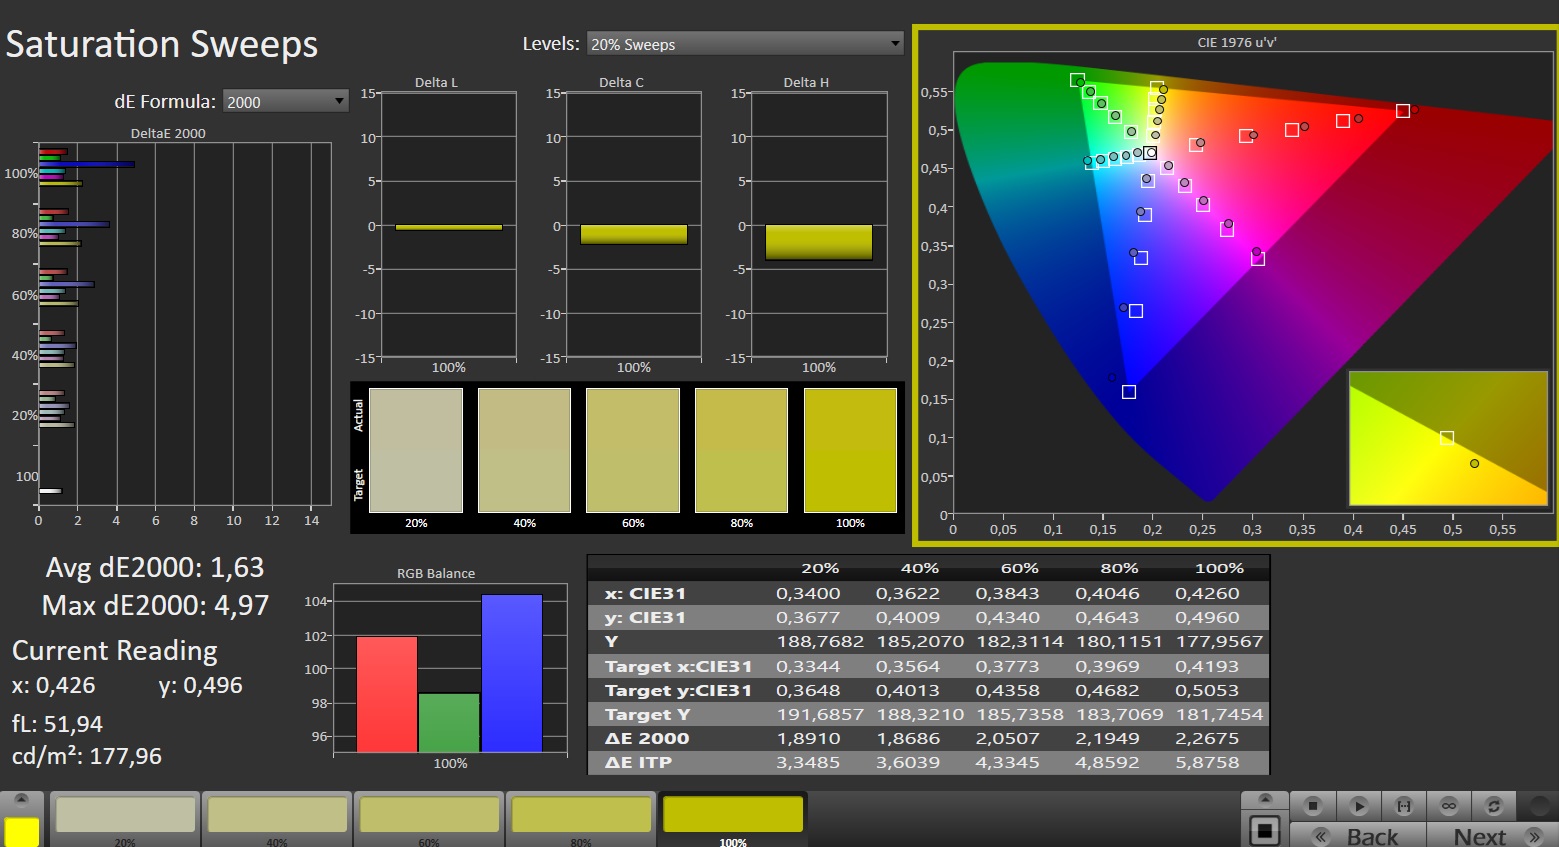
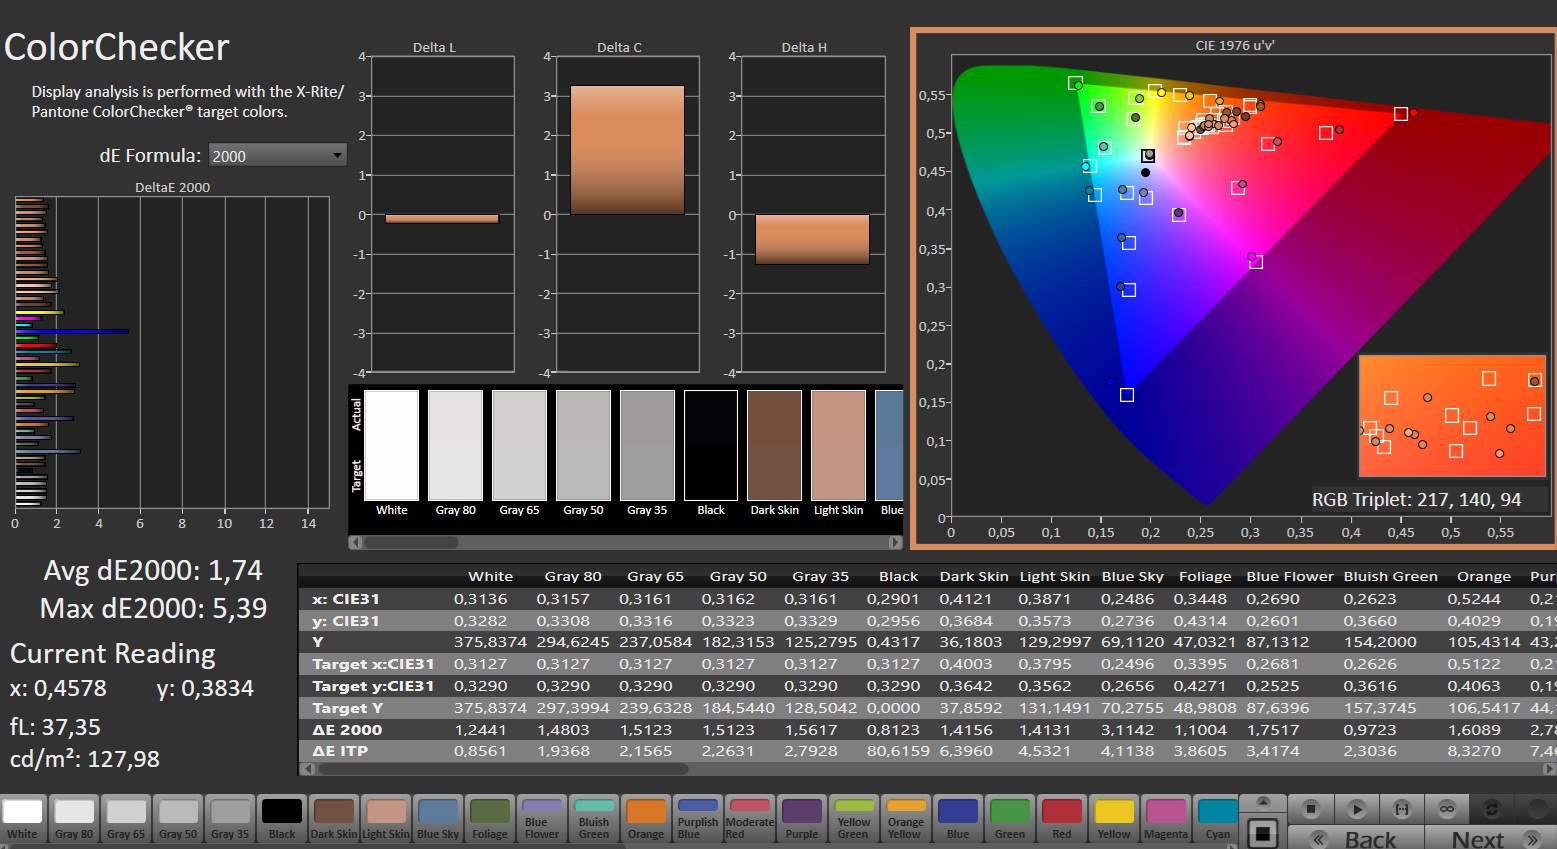
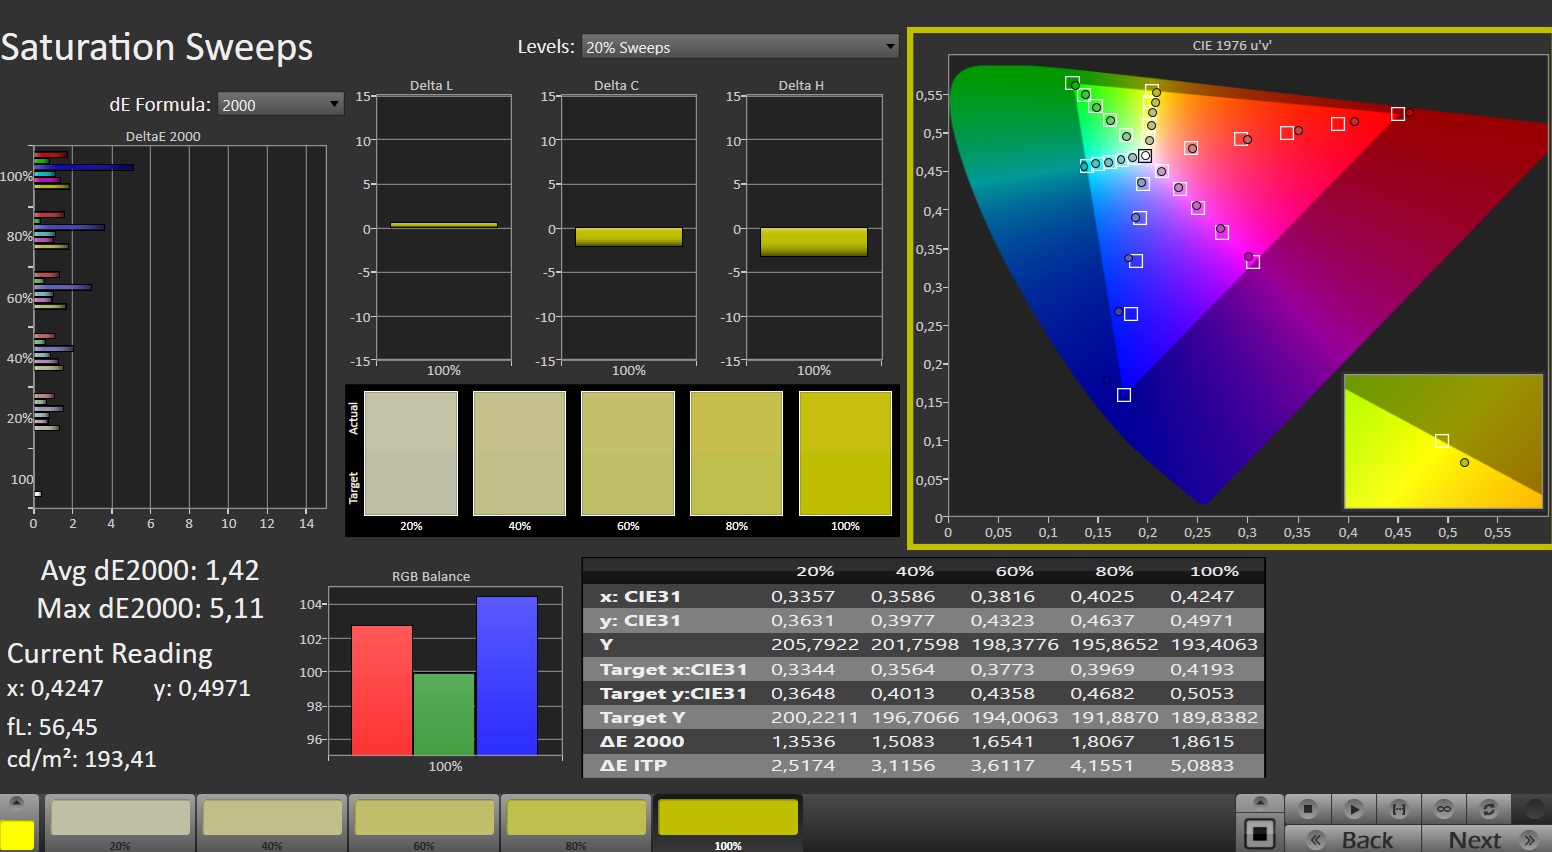
O espaço de cores sRGB, que é recomendado para jogos, não é totalmente coberto. Mas isso não deve ser percebido na prática, e as telas mais simples mostram um terço a menos de cores. No entanto, alguns concorrentes, como o Alienware m16 R2 são capazes de atingir 100% com a mesma tecnologia de painel. Se o senhor quiser fazer o processamento de imagens e vídeos paralelamente, esse monitor seria a melhor opção.
Exibir tempos de resposta
| ↔ Tempo de resposta preto para branco | ||
|---|---|---|
| 8.3 ms ... ascensão ↗ e queda ↘ combinadas | ↗ 3.5 ms ascensão | 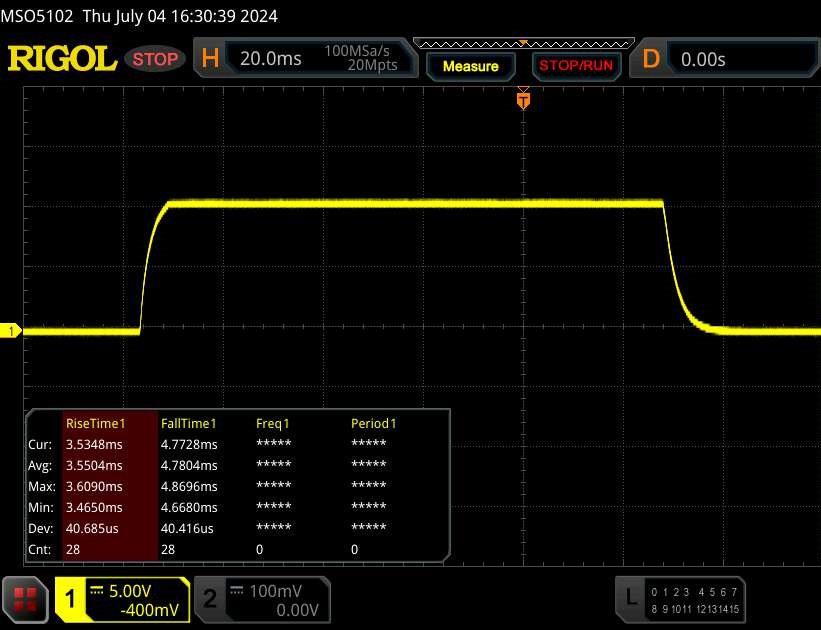 |
| ↘ 4.8 ms queda | ||
| A tela mostra taxas de resposta rápidas em nossos testes e deve ser adequada para jogos. Em comparação, todos os dispositivos testados variam de 0.1 (mínimo) a 240 (máximo) ms. » 21 % de todos os dispositivos são melhores. Isso significa que o tempo de resposta medido é melhor que a média de todos os dispositivos testados (20.8 ms). | ||
| ↔ Tempo de resposta 50% cinza a 80% cinza | ||
| 14.4 ms ... ascensão ↗ e queda ↘ combinadas | ↗ 6.8 ms ascensão | 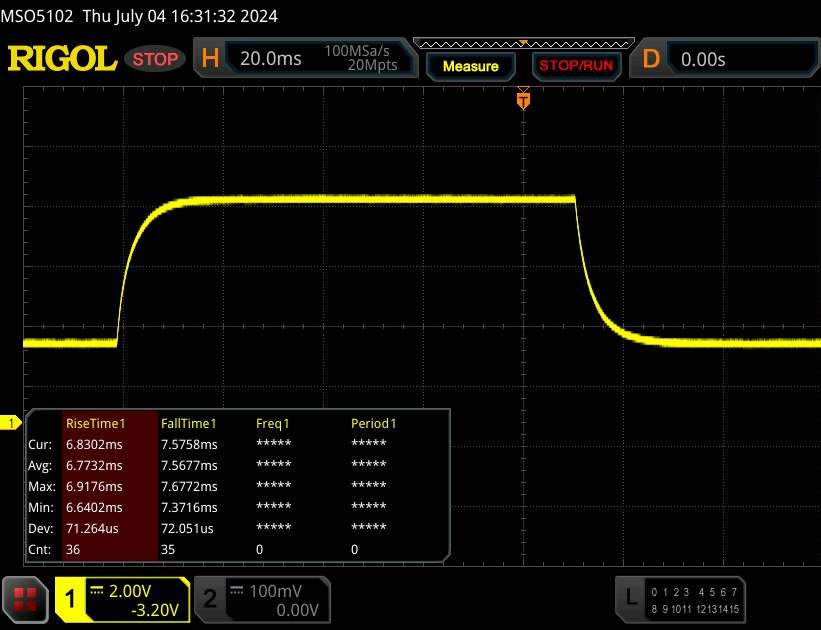 |
| ↘ 7.6 ms queda | ||
| A tela mostra boas taxas de resposta em nossos testes, mas pode ser muito lenta para jogadores competitivos. Em comparação, todos os dispositivos testados variam de 0.165 (mínimo) a 636 (máximo) ms. » 25 % de todos os dispositivos são melhores. Isso significa que o tempo de resposta medido é melhor que a média de todos os dispositivos testados (32.5 ms). | ||
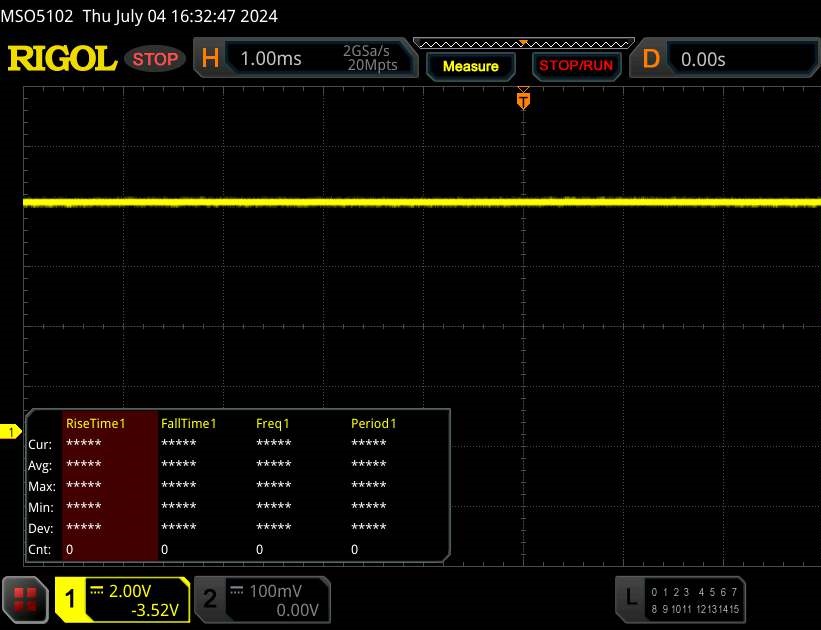
Cintilação da tela / PWM (modulação por largura de pulso)
| Tela tremeluzindo / PWM não detectado | 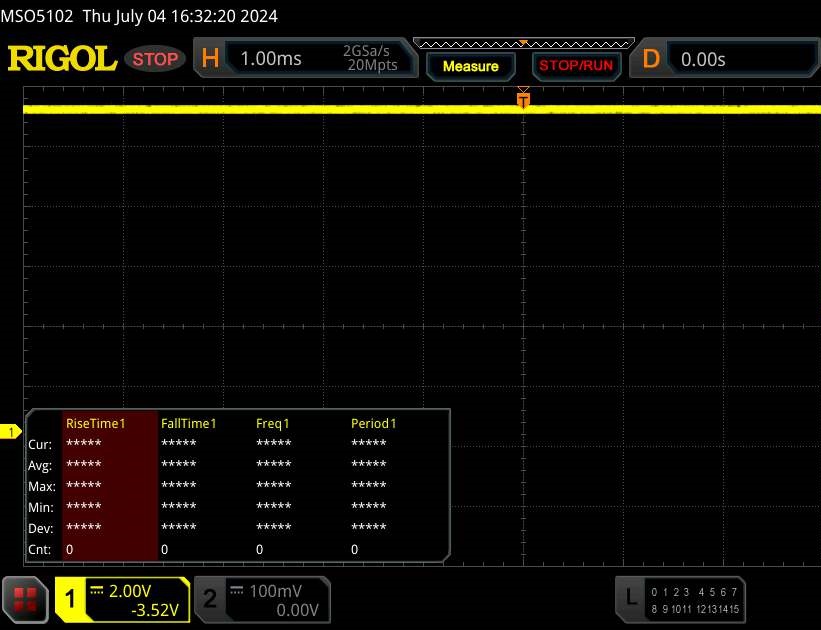 | ||
[pwm_comparison] Em comparação: 53 % de todos os dispositivos testados não usam PWM para escurecer a tela. Se PWM foi detectado, uma média de 8516 (mínimo: 5 - máximo: 343500) Hz foi medida. | |||
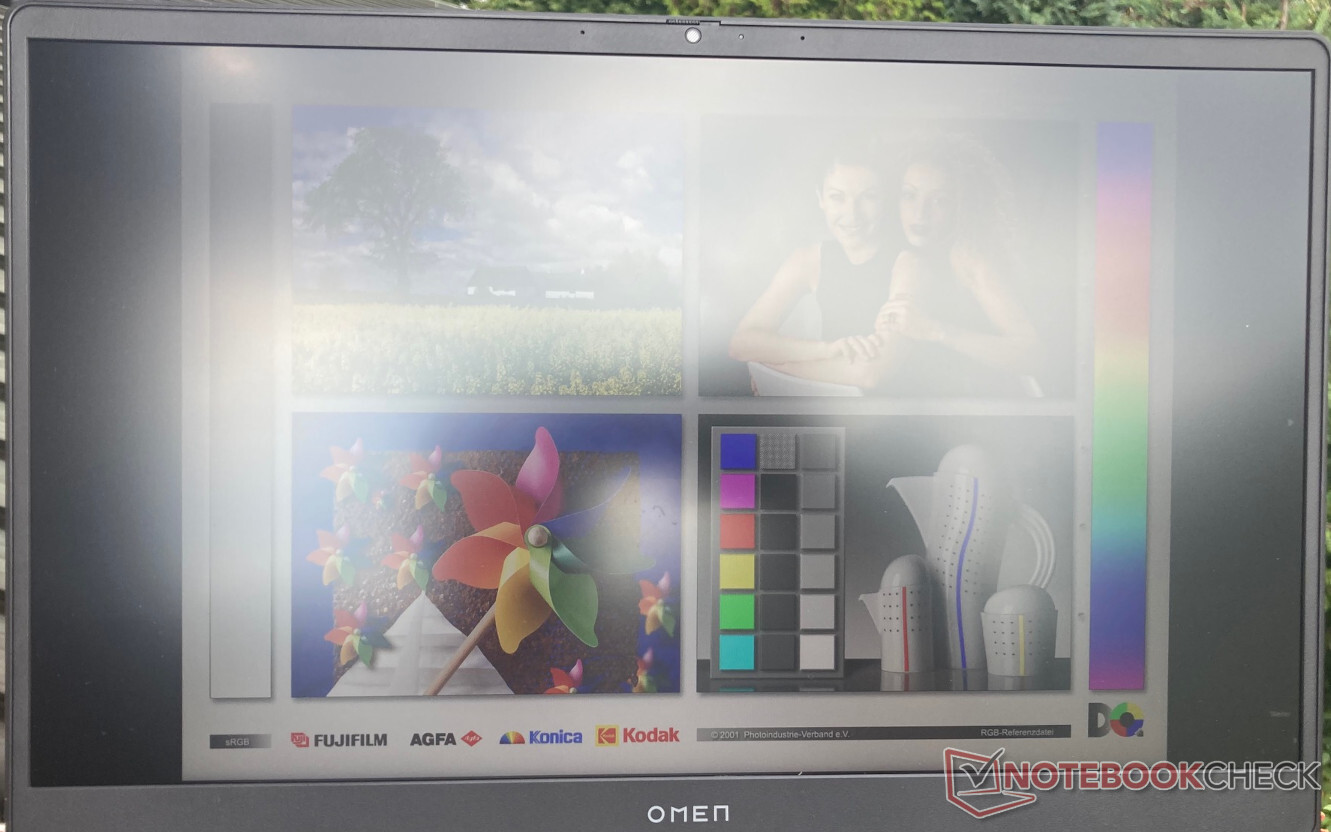
Em ambientes externos, o senhor deve sentar-se na sombra se quiser reconhecer algo na tela. O brilho limitado do Omen 17 significa que até mesmo o brilho de um céu ligeiramente nublado pode limitar sua capacidade de ver qualquer coisa na tela.
Mesmo assim, a imagem parece pálida. As cores não têm vibração em ambientes externos e são cobertas por um véu cinza. Se quiser desfrutar de jogos com esplendor colorido, o senhor terá que jogar em ambientes fechados.

Em contraste com o que normalmente vemos em um painel IPS, o HP Omen com resolução QHD mostra algumas mudanças de cor claramente perceptíveis a partir de ângulos de visão de cerca de 45 graus. Até então, a imagem permanece facilmente reconhecível, e também não notamos nenhuma diminuição no brilho antes desse ponto. Além dos 45 graus, todas as cores apresentam uma leve tonalidade amarela.


Desempenho - O Omen 17 é um laptop para jogos equilibrado
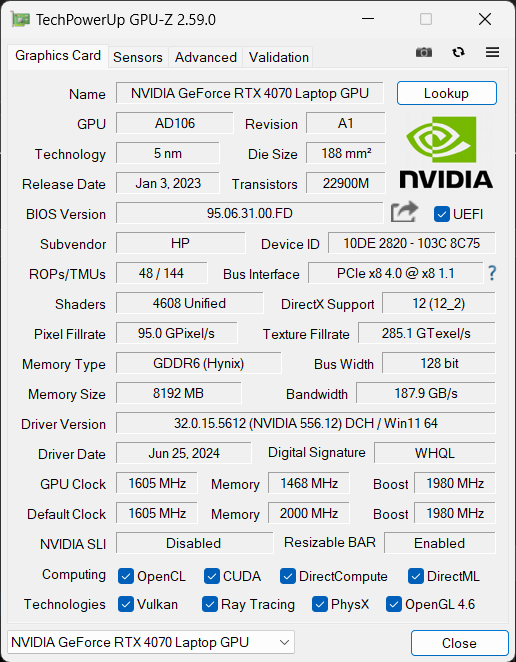
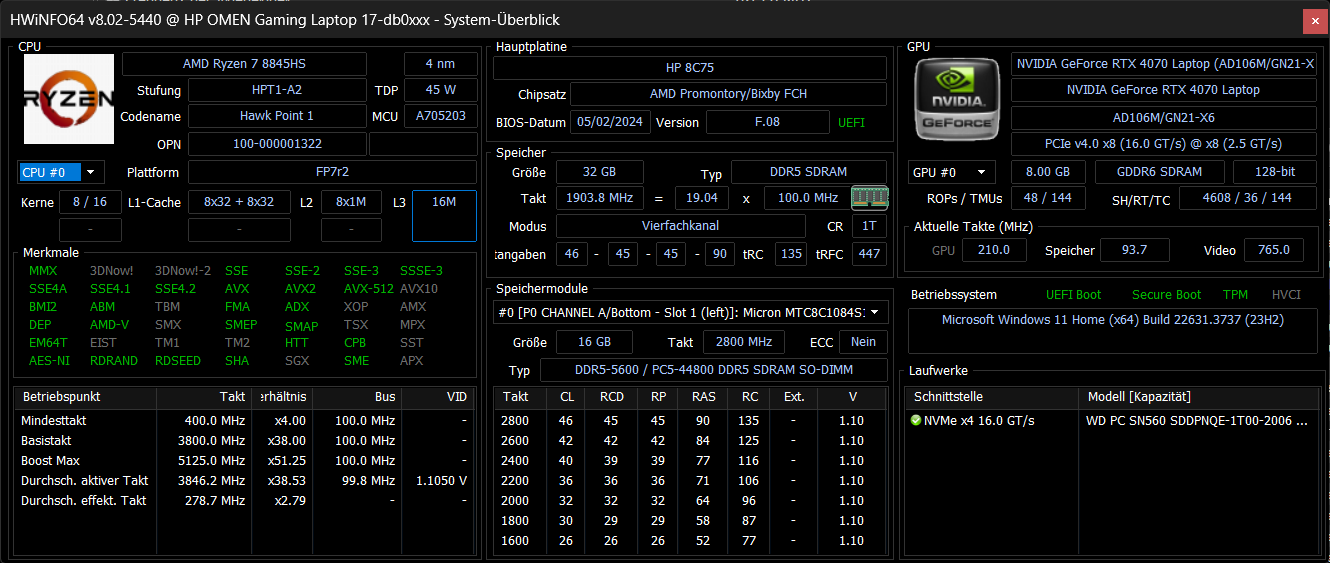
Em termos de recursos de desempenho, nossa unidade de teste com o AMD Ryzen 7 8845HS e Nvidia GeForce RTX 4070 fica no meio do campo de nossos dispositivos de comparação. No entanto, tanto a CPU quanto a GPU têm desempenho ligeiramente abaixo de seu potencial máximo.
O Ryzen 7 funciona constantemente com 65 watts em vez de 70 ou até 80 watts como no Schenker XMG Core 15por exemplo. A GPU também é ligeiramente estrangulada e só consegue usar 120 em vez do máximo possível de 140 watts. Laptops para jogos comparáveis, como o Asus TUF Gaming A17 FA707 conseguem obter um desempenho ligeiramente superior da placa de vídeo, embora isso não tenha apenas vantagens e não necessariamente leve a taxas de quadros visivelmente mais altas.
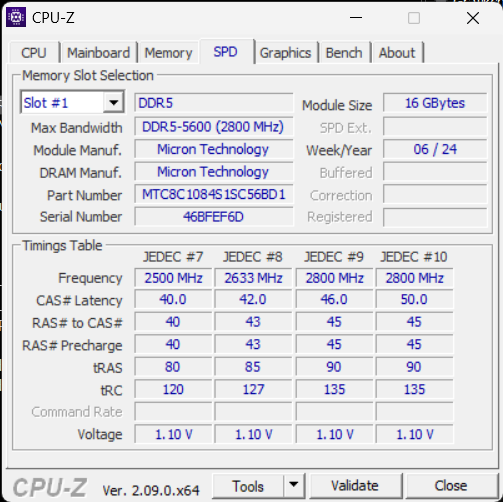
Com 32 Gigabytes de DDR5-5600, o equipamento de RAM também é sólido. Como a memória pode ser substituída facilmente, também é possível expandi-la posteriormente. Nesse nível, não esperamos que o fato de ela ser de apenas 5.600 MHz tenha um efeito limitador.
Uma versão menor do HP Omen 17 com a RTX 4060 também está disponível.
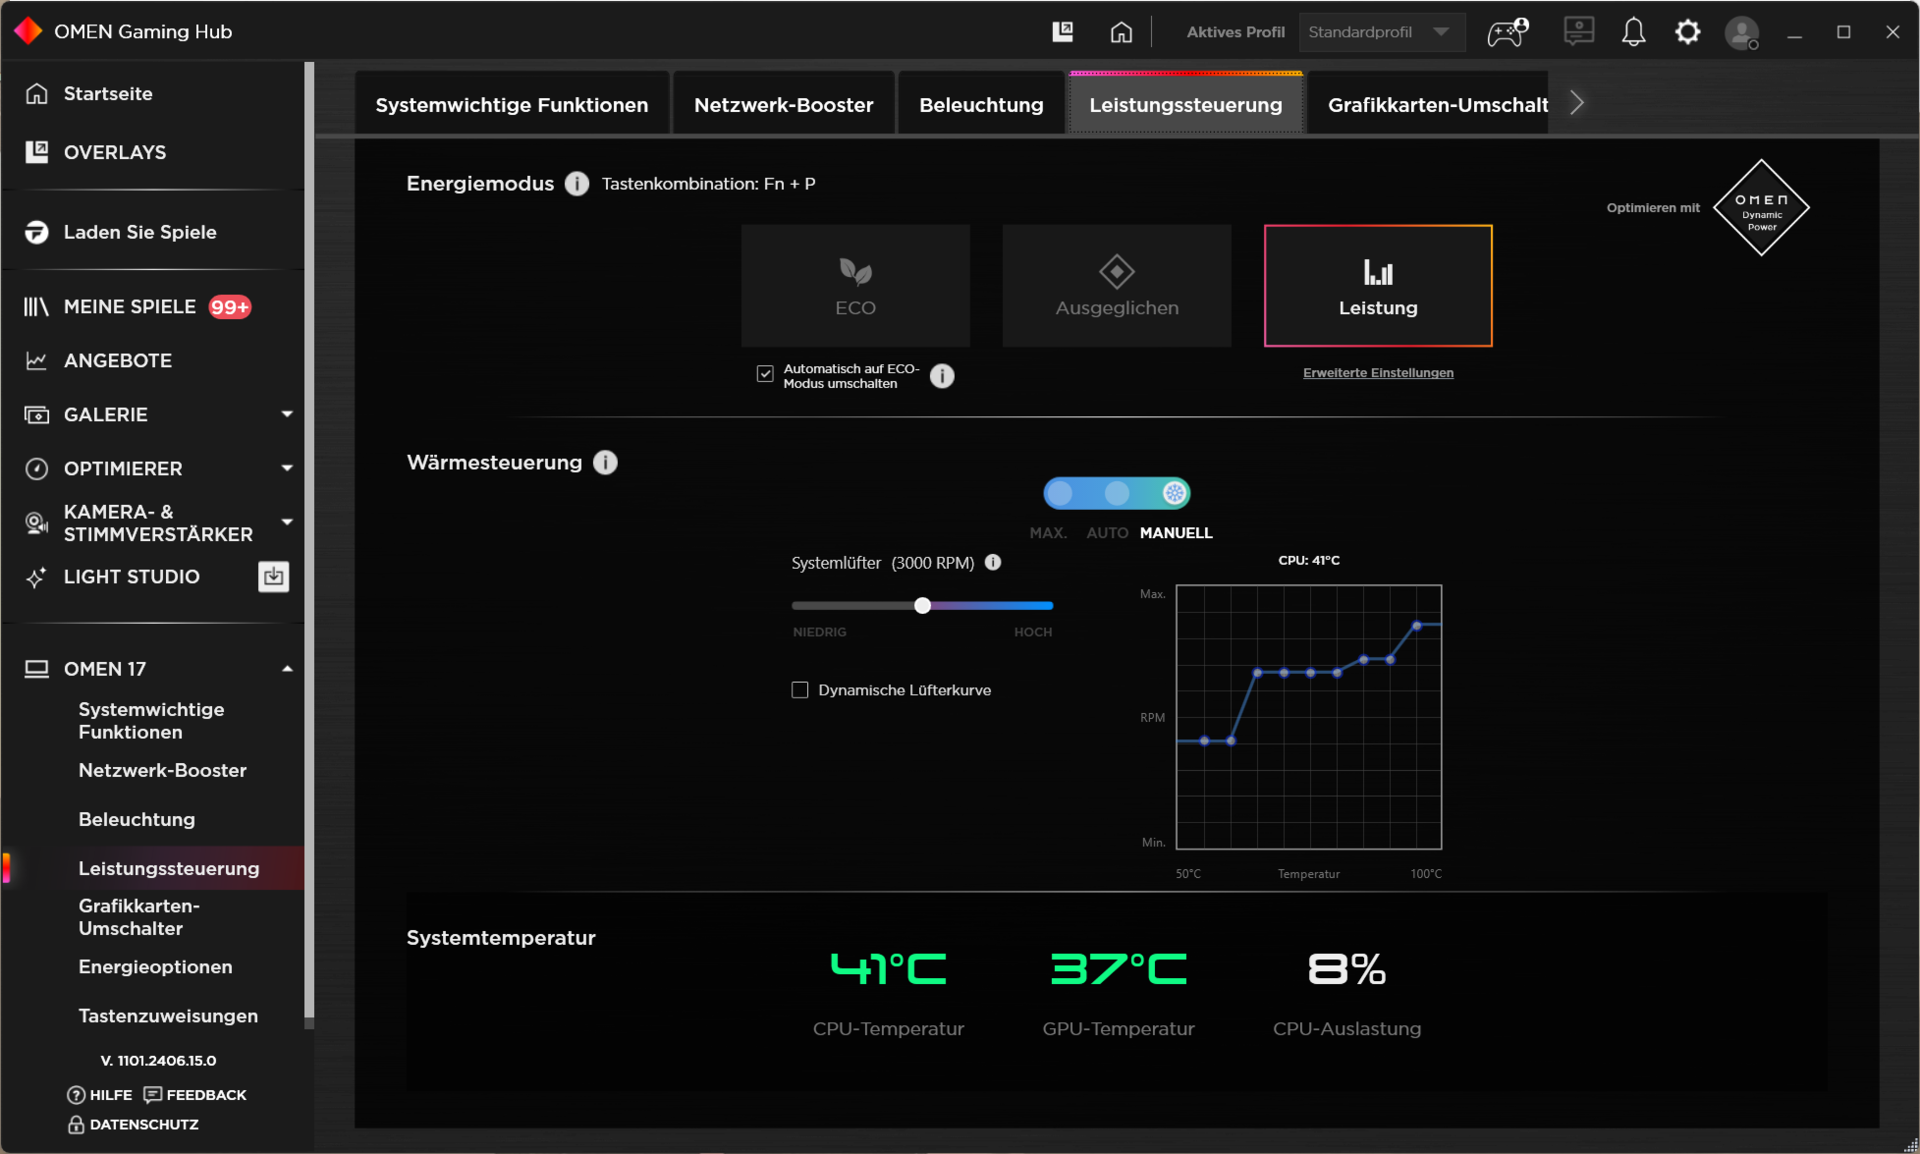
Condições de teste
Três perfis de energia permitem que o senhor ajuste o Omen 17 à maioria dos cenários típicos. O senhor pode descobrir o efeito exato sobre o consumo de energia, o comportamento da ventoinha e o desempenho em jogos na tabela abaixo.
Usamos o perfil "Performance" para nossos benchmarks. Além disso, o senhor pode fazer vários ajustes que têm grande influência sobre o comportamento da ventoinha. Por exemplo, os níveis da ventoinha podem ser ajustados para serem mais potentes ou podem ser reduzidos significativamente, mesmo no nível de desempenho mais alto, o que afetaria o desempenho máximo.
| Perfil de energia | Carga da CPU | Carga da GPU (incluindo aumento de 15 Watt) | Steel Nomad | Cyberpunk 2077 QHD Ultra | ruído máximo da ventoinha |
|---|---|---|---|---|---|
| Eco | 65->35 Watt | 40 Watt | 24.37 FPS | 60 FPS (Lock) | 41 dB(A) |
| Equilibrado | 65->35 Watt | 90 Watt | 25.23 FPS | 75 FPS | 43 dB(A) |
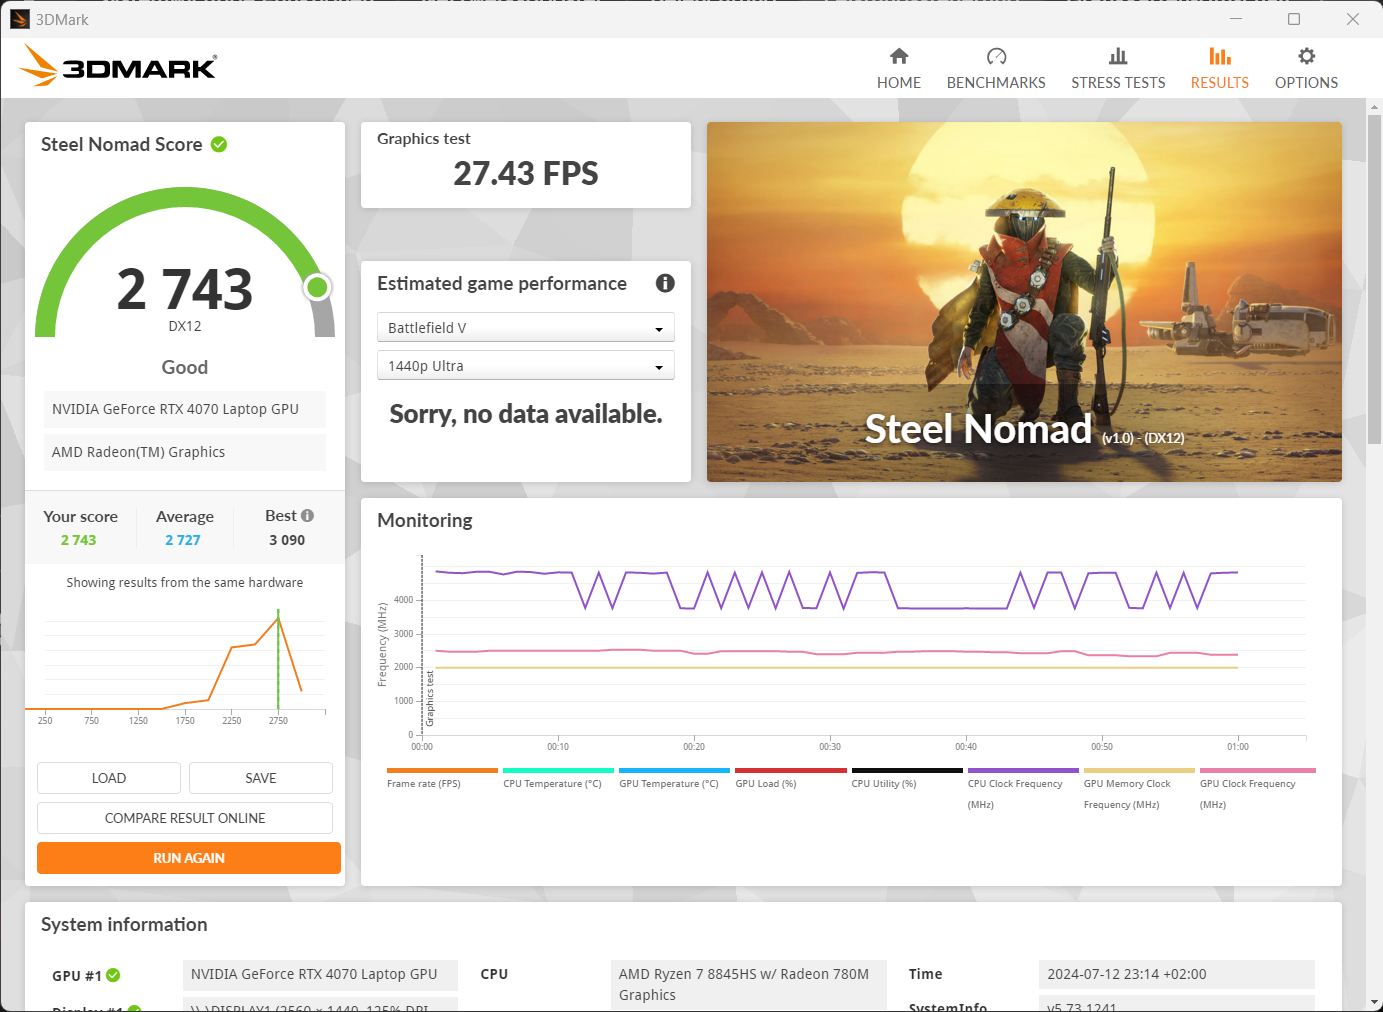
| Desempenho | 100->65 Watt | 120 Watt | 27.43 FPS | 80 FPS | 48 dB(A) |
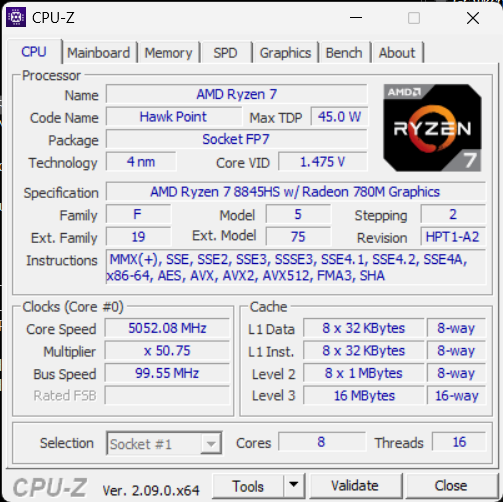
Processador
O AMD Ryzen 7 8845HS é um processador rápido da série Hawk Point que usa a arquitetura Zen 4 e quase atinge o desempenho do AMD Ryzen 9 7940HS da geração anterior. Ele também tem um desempenho quase equivalente ao do Intel Core i7-13700H.
No entanto, os oito núcleos idênticos do Ryzen 7 são capazes de obter repetidamente uma pequena vantagem sobre os seis núcleos de desempenho do i7-13700H, especialmente durante os jogos.
Embora quase sempre possamos observar uma ligeira queda no desempenho constante com os concorrentes, a CPU é capaz de apresentar um desempenho constante em um bom nível aqui.
Os senhores podem encontrar medições adicionais e resultados de testes de vários processadores em nossa Lista de benchmark de CPU.
Cinebench R15 Multi Constant Load Test
Cinebench R23: Multi Core | Single Core
Cinebench R20: CPU (Multi Core) | CPU (Single Core)
Cinebench R15: CPU Multi 64Bit | CPU Single 64Bit
Blender: v2.79 BMW27 CPU
7-Zip 18.03: 7z b 4 | 7z b 4 -mmt1
Geekbench 6.4: Multi-Core | Single-Core
Geekbench 5.5: Multi-Core | Single-Core
HWBOT x265 Benchmark v2.2: 4k Preset
LibreOffice : 20 Documents To PDF
R Benchmark 2.5: Overall mean
| CPU Performance Rating | |
| Asus ROG Strix Scar 16 G634JZR | |
| Acer Predator Helios Neo 16 (2024) | |
| Média da turma Gaming | |
| Asus TUF Gaming A17 FA707XI-NS94 | |
| Asus TUF Gaming A15 FA507UV | |
| Alienware m16 R2 -1! | |
| Média AMD Ryzen 7 8845HS | |
| Tulpar T7 V20.6 | |
| HP Omen 17-db0079ng | |
| Cinebench R23 / Multi Core | |
| Asus ROG Strix Scar 16 G634JZR | |
| Acer Predator Helios Neo 16 (2024) | |
| Média da turma Gaming (5668 - 39652, n=151, últimos 2 anos) | |
| Alienware m16 R2 | |
| Tulpar T7 V20.6 | |
| Asus TUF Gaming A17 FA707XI-NS94 | |
| Asus TUF Gaming A15 FA507UV | |
| HP Omen 17-db0079ng | |
| Média AMD Ryzen 7 8845HS (14895 - 18037, n=12) | |
| Cinebench R23 / Single Core | |
| Asus ROG Strix Scar 16 G634JZR | |
| Acer Predator Helios Neo 16 (2024) | |
| Tulpar T7 V20.6 | |
| Média da turma Gaming (1136 - 2252, n=151, últimos 2 anos) | |
| Asus TUF Gaming A17 FA707XI-NS94 | |
| Asus TUF Gaming A15 FA507UV | |
| Alienware m16 R2 | |
| Média AMD Ryzen 7 8845HS (1623 - 1783, n=12) | |
| HP Omen 17-db0079ng | |
| Cinebench R20 / CPU (Multi Core) | |
| Asus ROG Strix Scar 16 G634JZR | |
| Acer Predator Helios Neo 16 (2024) | |
| Média da turma Gaming (2179 - 15517, n=151, últimos 2 anos) | |
| Alienware m16 R2 | |
| Tulpar T7 V20.6 | |
| Asus TUF Gaming A17 FA707XI-NS94 | |
| Asus TUF Gaming A15 FA507UV | |
| HP Omen 17-db0079ng | |
| Média AMD Ryzen 7 8845HS (5808 - 7026, n=12) | |
| Cinebench R20 / CPU (Single Core) | |
| Asus ROG Strix Scar 16 G634JZR | |
| Acer Predator Helios Neo 16 (2024) | |
| Tulpar T7 V20.6 | |
| Média da turma Gaming (439 - 866, n=151, últimos 2 anos) | |
| Asus TUF Gaming A17 FA707XI-NS94 | |
| Média AMD Ryzen 7 8845HS (673 - 698, n=12) | |
| HP Omen 17-db0079ng | |
| Alienware m16 R2 | |
| Asus TUF Gaming A15 FA507UV | |
| Cinebench R15 / CPU Multi 64Bit | |
| Asus ROG Strix Scar 16 G634JZR | |
| Acer Predator Helios Neo 16 (2024) | |
| Média da turma Gaming (905 - 6074, n=154, últimos 2 anos) | |
| Alienware m16 R2 | |
| Asus TUF Gaming A17 FA707XI-NS94 | |
| Asus TUF Gaming A15 FA507UV | |
| Tulpar T7 V20.6 | |
| HP Omen 17-db0079ng | |
| Média AMD Ryzen 7 8845HS (2342 - 2908, n=12) | |
| Cinebench R15 / CPU Single 64Bit | |
| Asus ROG Strix Scar 16 G634JZR | |
| Acer Predator Helios Neo 16 (2024) | |
| Asus TUF Gaming A17 FA707XI-NS94 | |
| Asus TUF Gaming A15 FA507UV | |
| Tulpar T7 V20.6 | |
| Média da turma Gaming (191.9 - 343, n=151, últimos 2 anos) | |
| Média AMD Ryzen 7 8845HS (269 - 283, n=12) | |
| HP Omen 17-db0079ng | |
| Alienware m16 R2 | |
| Blender / v2.79 BMW27 CPU | |
| Média AMD Ryzen 7 8845HS (179 - 216, n=12) | |
| HP Omen 17-db0079ng | |
| Asus TUF Gaming A17 FA707XI-NS94 | |
| Asus TUF Gaming A15 FA507UV | |
| Média da turma Gaming (81 - 555, n=144, últimos 2 anos) | |
| Tulpar T7 V20.6 | |
| Acer Predator Helios Neo 16 (2024) | |
| Asus ROG Strix Scar 16 G634JZR | |
| 7-Zip 18.03 / 7z b 4 | |
| Asus ROG Strix Scar 16 G634JZR | |
| Acer Predator Helios Neo 16 (2024) | |
| Média da turma Gaming (23795 - 144064, n=149, últimos 2 anos) | |
| Asus TUF Gaming A15 FA507UV | |
| Asus TUF Gaming A17 FA707XI-NS94 | |
| Média AMD Ryzen 7 8845HS (62669 - 74664, n=12) | |
| Alienware m16 R2 | |
| HP Omen 17-db0079ng | |
| Tulpar T7 V20.6 | |
| 7-Zip 18.03 / 7z b 4 -mmt1 | |
| Asus ROG Strix Scar 16 G634JZR | |
| Acer Predator Helios Neo 16 (2024) | |
| Asus TUF Gaming A17 FA707XI-NS94 | |
| Asus TUF Gaming A15 FA507UV | |
| Média AMD Ryzen 7 8845HS (5197 - 6714, n=12) | |
| Média da turma Gaming (4199 - 7573, n=149, últimos 2 anos) | |
| Tulpar T7 V20.6 | |
| HP Omen 17-db0079ng | |
| Alienware m16 R2 | |
| Geekbench 6.4 / Multi-Core | |
| Asus ROG Strix Scar 16 G634JZR | |
| Acer Predator Helios Neo 16 (2024) | |
| Média da turma Gaming (5340 - 21668, n=119, últimos 2 anos) | |
| Média AMD Ryzen 7 8845HS (11073 - 14014, n=16) | |
| HP Omen 17-db0079ng | |
| Alienware m16 R2 | |
| Asus TUF Gaming A15 FA507UV | |
| Asus TUF Gaming A17 FA707XI-NS94 | |
| Tulpar T7 V20.6 | |
| Geekbench 6.4 / Single-Core | |
| Asus ROG Strix Scar 16 G634JZR | |
| Acer Predator Helios Neo 16 (2024) | |
| Asus TUF Gaming A17 FA707XI-NS94 | |
| Asus TUF Gaming A15 FA507UV | |
| Média da turma Gaming (1490 - 3219, n=119, últimos 2 anos) | |
| Média AMD Ryzen 7 8845HS (2510 - 2698, n=14) | |
| Tulpar T7 V20.6 | |
| HP Omen 17-db0079ng | |
| Alienware m16 R2 | |
| Geekbench 5.5 / Multi-Core | |
| Asus ROG Strix Scar 16 G634JZR | |
| Acer Predator Helios Neo 16 (2024) | |
| Média da turma Gaming (4557 - 25855, n=148, últimos 2 anos) | |
| Alienware m16 R2 | |
| Asus TUF Gaming A15 FA507UV | |
| HP Omen 17-db0079ng | |
| Média AMD Ryzen 7 8845HS (11256 - 12726, n=13) | |
| Asus TUF Gaming A17 FA707XI-NS94 | |
| Tulpar T7 V20.6 | |
| Geekbench 5.5 / Single-Core | |
| Asus ROG Strix Scar 16 G634JZR | |
| Acer Predator Helios Neo 16 (2024) | |
| Asus TUF Gaming A17 FA707XI-NS94 | |
| Asus TUF Gaming A15 FA507UV | |
| Média AMD Ryzen 7 8845HS (1765 - 2004, n=13) | |
| Média da turma Gaming (986 - 2423, n=148, últimos 2 anos) | |
| Tulpar T7 V20.6 | |
| HP Omen 17-db0079ng | |
| Alienware m16 R2 | |
| HWBOT x265 Benchmark v2.2 / 4k Preset | |
| Asus ROG Strix Scar 16 G634JZR | |
| Acer Predator Helios Neo 16 (2024) | |
| Média da turma Gaming (6.72 - 42.9, n=148, últimos 2 anos) | |
| Asus TUF Gaming A15 FA507UV | |
| Asus TUF Gaming A17 FA707XI-NS94 | |
| Alienware m16 R2 | |
| Média AMD Ryzen 7 8845HS (18.6 - 22.7, n=12) | |
| HP Omen 17-db0079ng | |
| Tulpar T7 V20.6 | |
| LibreOffice / 20 Documents To PDF | |
| HP Omen 17-db0079ng | |
| Tulpar T7 V20.6 | |
| Média AMD Ryzen 7 8845HS (44.4 - 77, n=12) | |
| Alienware m16 R2 | |
| Asus TUF Gaming A17 FA707XI-NS94 | |
| Asus ROG Strix Scar 16 G634JZR | |
| Média da turma Gaming (19 - 96.6, n=147, últimos 2 anos) | |
| Asus TUF Gaming A15 FA507UV | |
| Acer Predator Helios Neo 16 (2024) | |
| R Benchmark 2.5 / Overall mean | |
| HP Omen 17-db0079ng | |
| Alienware m16 R2 | |
| Média AMD Ryzen 7 8845HS (0.4304 - 0.4935, n=12) | |
| Tulpar T7 V20.6 | |
| Média da turma Gaming (0.3609 - 0.759, n=150, últimos 2 anos) | |
| Asus TUF Gaming A15 FA507UV | |
| Asus TUF Gaming A17 FA707XI-NS94 | |
| Acer Predator Helios Neo 16 (2024) | |
| Asus ROG Strix Scar 16 G634JZR | |
* ... menor é melhor
AIDA64: FP32 Ray-Trace | FPU Julia | CPU SHA3 | CPU Queen | FPU SinJulia | FPU Mandel | CPU AES | CPU ZLib | FP64 Ray-Trace | CPU PhotoWorxx
| Performance Rating | |
| Asus ROG Strix Scar 16 G634JZR | |
| Asus TUF Gaming A15 FA507UV | |
| Asus TUF Gaming A17 FA707XI-NS94 | |
| Acer Predator Helios Neo 16 (2024) | |
| HP Omen 17-db0079ng | |
| Média AMD Ryzen 7 8845HS | |
| Média da turma Gaming | |
| Alienware m16 R2 | |
| Tulpar T7 V20.6 | |
| AIDA64 / FP32 Ray-Trace | |
| Asus TUF Gaming A17 FA707XI-NS94 | |
| Asus TUF Gaming A15 FA507UV | |
| HP Omen 17-db0079ng | |
| Asus ROG Strix Scar 16 G634JZR | |
| Média AMD Ryzen 7 8845HS (23708 - 29544, n=12) | |
| Média da turma Gaming (4986 - 81639, n=147, últimos 2 anos) | |
| Acer Predator Helios Neo 16 (2024) | |
| Alienware m16 R2 | |
| Tulpar T7 V20.6 | |
| AIDA64 / FPU Julia | |
| Asus ROG Strix Scar 16 G634JZR | |
| Asus TUF Gaming A17 FA707XI-NS94 | |
| Asus TUF Gaming A15 FA507UV | |
| HP Omen 17-db0079ng | |
| Média AMD Ryzen 7 8845HS (99659 - 125873, n=12) | |
| Acer Predator Helios Neo 16 (2024) | |
| Média da turma Gaming (25360 - 252486, n=147, últimos 2 anos) | |
| Alienware m16 R2 | |
| Tulpar T7 V20.6 | |
| AIDA64 / CPU SHA3 | |
| Asus ROG Strix Scar 16 G634JZR | |
| Asus TUF Gaming A17 FA707XI-NS94 | |
| Asus TUF Gaming A15 FA507UV | |
| Acer Predator Helios Neo 16 (2024) | |
| Média da turma Gaming (1339 - 10389, n=147, últimos 2 anos) | |
| HP Omen 17-db0079ng | |
| Média AMD Ryzen 7 8845HS (4332 - 5180, n=12) | |
| Alienware m16 R2 | |
| Tulpar T7 V20.6 | |
| AIDA64 / CPU Queen | |
| Acer Predator Helios Neo 16 (2024) | |
| Asus ROG Strix Scar 16 G634JZR | |
| Asus TUF Gaming A15 FA507UV | |
| Asus TUF Gaming A17 FA707XI-NS94 | |
| Média AMD Ryzen 7 8845HS (109458 - 124695, n=12) | |
| HP Omen 17-db0079ng | |
| Média da turma Gaming (50699 - 200651, n=147, últimos 2 anos) | |
| Tulpar T7 V20.6 | |
| Alienware m16 R2 | |
| AIDA64 / FPU SinJulia | |
| Asus ROG Strix Scar 16 G634JZR | |
| Asus TUF Gaming A15 FA507UV | |
| Asus TUF Gaming A17 FA707XI-NS94 | |
| HP Omen 17-db0079ng | |
| Média AMD Ryzen 7 8845HS (14062 - 15519, n=12) | |
| Acer Predator Helios Neo 16 (2024) | |
| Média da turma Gaming (4800 - 32988, n=147, últimos 2 anos) | |
| Tulpar T7 V20.6 | |
| Alienware m16 R2 | |
| AIDA64 / FPU Mandel | |
| Asus TUF Gaming A17 FA707XI-NS94 | |
| Asus TUF Gaming A15 FA507UV | |
| Asus ROG Strix Scar 16 G634JZR | |
| HP Omen 17-db0079ng | |
| Média AMD Ryzen 7 8845HS (53436 - 67367, n=12) | |
| Acer Predator Helios Neo 16 (2024) | |
| Média da turma Gaming (12321 - 134044, n=147, últimos 2 anos) | |
| Alienware m16 R2 | |
| Tulpar T7 V20.6 | |
| AIDA64 / CPU AES | |
| Asus ROG Strix Scar 16 G634JZR | |
| Média da turma Gaming (19065 - 328679, n=147, últimos 2 anos) | |
| Acer Predator Helios Neo 16 (2024) | |
| Média AMD Ryzen 7 8845HS (64515 - 172642, n=12) | |
| Asus TUF Gaming A17 FA707XI-NS94 | |
| Asus TUF Gaming A15 FA507UV | |
| HP Omen 17-db0079ng | |
| Alienware m16 R2 | |
| Tulpar T7 V20.6 | |
| AIDA64 / CPU ZLib | |
| Asus ROG Strix Scar 16 G634JZR | |
| Acer Predator Helios Neo 16 (2024) | |
| Média da turma Gaming (373 - 2531, n=147, últimos 2 anos) | |
| Alienware m16 R2 | |
| Tulpar T7 V20.6 | |
| Asus TUF Gaming A17 FA707XI-NS94 | |
| Asus TUF Gaming A15 FA507UV | |
| HP Omen 17-db0079ng | |
| Média AMD Ryzen 7 8845HS (627 - 1080, n=12) | |
| AIDA64 / FP64 Ray-Trace | |
| Asus TUF Gaming A17 FA707XI-NS94 | |
| Asus TUF Gaming A15 FA507UV | |
| HP Omen 17-db0079ng | |
| Asus ROG Strix Scar 16 G634JZR | |
| Média AMD Ryzen 7 8845HS (12361 - 15911, n=12) | |
| Média da turma Gaming (2540 - 43430, n=147, últimos 2 anos) | |
| Acer Predator Helios Neo 16 (2024) | |
| Alienware m16 R2 | |
| Tulpar T7 V20.6 | |
| AIDA64 / CPU PhotoWorxx | |
| Asus ROG Strix Scar 16 G634JZR | |
| Acer Predator Helios Neo 16 (2024) | |
| HP Omen 17-db0079ng | |
| Média da turma Gaming (10805 - 60161, n=147, últimos 2 anos) | |
| Alienware m16 R2 | |
| Média AMD Ryzen 7 8845HS (33192 - 41668, n=12) | |
| Asus TUF Gaming A15 FA507UV | |
| Asus TUF Gaming A17 FA707XI-NS94 | |
| Tulpar T7 V20.6 | |
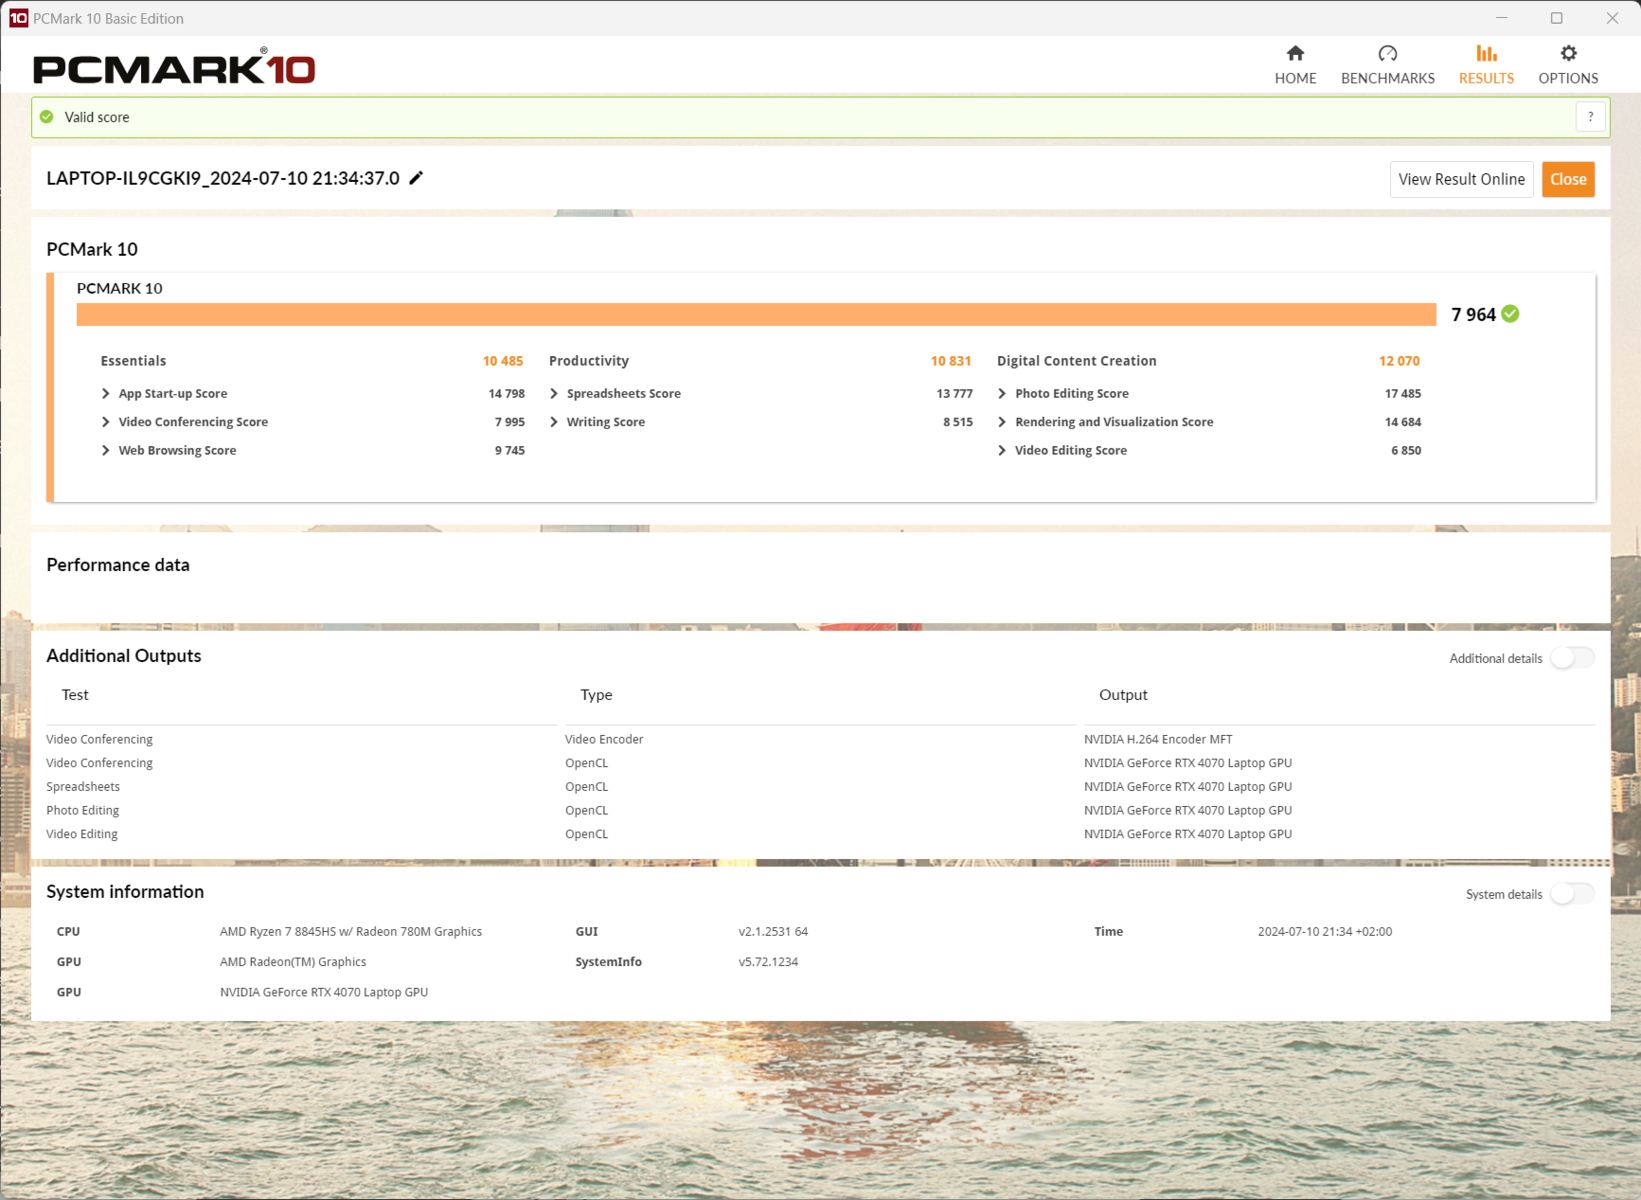
Desempenho do sistema
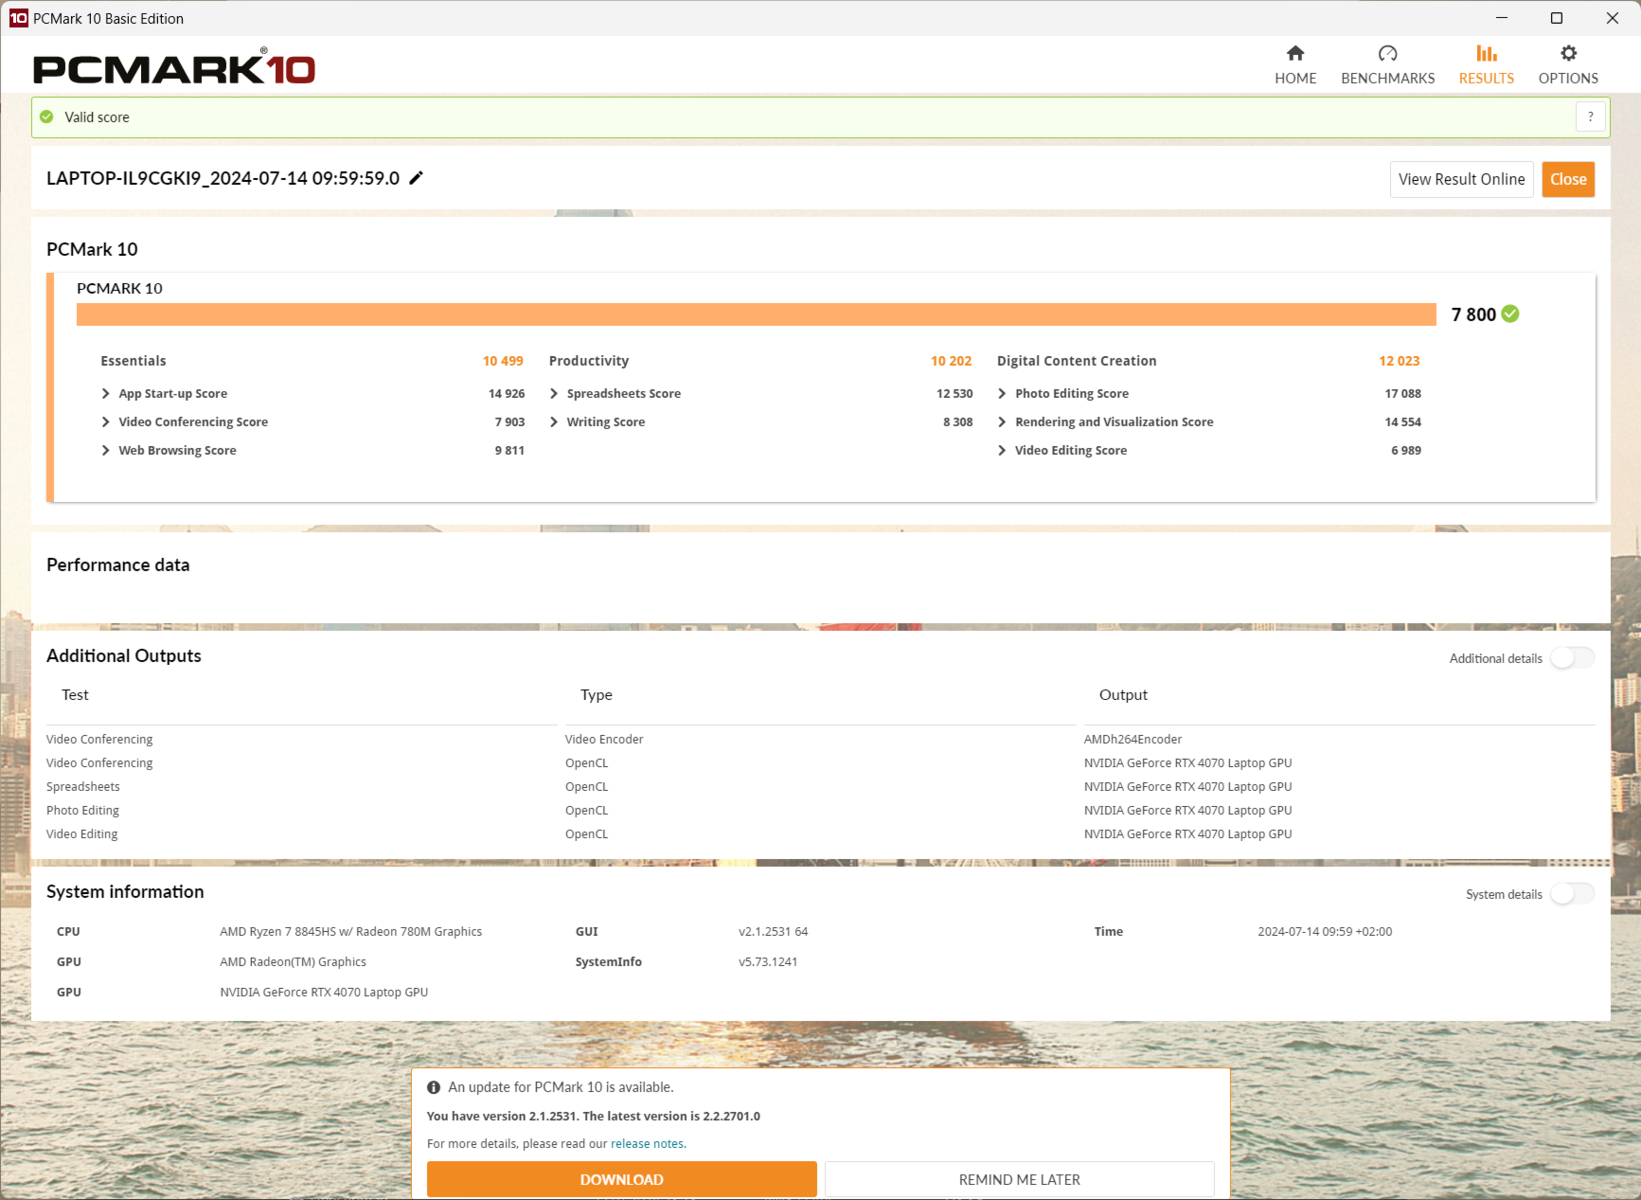
Durante as tarefas cotidianas que avaliamos com o PCMark 10 e alguns outros benchmarks semelhantes, basicamente não há diferença perceptível em relação a sistemas comparáveis. Os valores estão no nível de um Ryzen 7 8845HS configurado com mais potência e no meio do campo dos concorrentes, embora haja apenas uma diferença de 10% entre o valor mais alto e o mais baixo da tabela.
O laptop é responsivo o tempo todo e não apresenta nenhum tempo de espera durante os processos de instalação ou quando vários programas são abertos simultaneamente. Mesmo durante a execução de um jogo exigente, continua sendo possível alternar para outro aplicativo, embora isso raramente seja recomendado.

CrossMark: Overall | Productivity | Creativity | Responsiveness
WebXPRT 3: Overall
WebXPRT 4: Overall
Mozilla Kraken 1.1: Total
| PCMark 10 / Score | |
| Acer Predator Helios Neo 16 (2024) | |
| Asus TUF Gaming A17 FA707XI-NS94 | |
| Asus TUF Gaming A15 FA507UV | |
| Média AMD Ryzen 7 8845HS, NVIDIA GeForce RTX 4070 Laptop GPU (7800 - 8070, n=2) | |
| Média da turma Gaming (5776 - 9852, n=133, últimos 2 anos) | |
| HP Omen 17-db0079ng | |
| Alienware m16 R2 | |
| Asus ROG Strix Scar 16 G634JZR | |
| Tulpar T7 V20.6 | |
| PCMark 10 / Essentials | |
| Acer Predator Helios Neo 16 (2024) | |
| Asus ROG Strix Scar 16 G634JZR | |
| Tulpar T7 V20.6 | |
| Asus TUF Gaming A17 FA707XI-NS94 | |
| Asus TUF Gaming A15 FA507UV | |
| Média da turma Gaming (9057 - 12600, n=133, últimos 2 anos) | |
| Média AMD Ryzen 7 8845HS, NVIDIA GeForce RTX 4070 Laptop GPU (10499 - 10664, n=2) | |
| HP Omen 17-db0079ng | |
| Alienware m16 R2 | |
| PCMark 10 / Productivity | |
| Acer Predator Helios Neo 16 (2024) | |
| Asus TUF Gaming A15 FA507UV | |
| HP Omen 17-db0079ng | |
| Média AMD Ryzen 7 8845HS, NVIDIA GeForce RTX 4070 Laptop GPU (9887 - 10202, n=2) | |
| Média da turma Gaming (6662 - 14612, n=133, últimos 2 anos) | |
| Tulpar T7 V20.6 | |
| Asus TUF Gaming A17 FA707XI-NS94 | |
| Alienware m16 R2 | |
| Asus ROG Strix Scar 16 G634JZR | |
| PCMark 10 / Digital Content Creation | |
| Asus ROG Strix Scar 16 G634JZR | |
| Asus TUF Gaming A17 FA707XI-NS94 | |
| Alienware m16 R2 | |
| Acer Predator Helios Neo 16 (2024) | |
| Média AMD Ryzen 7 8845HS, NVIDIA GeForce RTX 4070 Laptop GPU (12023 - 13528, n=2) | |
| Média da turma Gaming (6807 - 18475, n=133, últimos 2 anos) | |
| Asus TUF Gaming A15 FA507UV | |
| HP Omen 17-db0079ng | |
| Tulpar T7 V20.6 | |
| CrossMark / Overall | |
| Acer Predator Helios Neo 16 (2024) | |
| Asus ROG Strix Scar 16 G634JZR | |
| Média da turma Gaming (1247 - 2344, n=114, últimos 2 anos) | |
| Asus TUF Gaming A15 FA507UV | |
| Asus TUF Gaming A17 FA707XI-NS94 | |
| Alienware m16 R2 | |
| Tulpar T7 V20.6 | |
| Média AMD Ryzen 7 8845HS, NVIDIA GeForce RTX 4070 Laptop GPU (1531 - 1790, n=2) | |
| HP Omen 17-db0079ng | |
| CrossMark / Productivity | |
| Acer Predator Helios Neo 16 (2024) | |
| Asus ROG Strix Scar 16 G634JZR | |
| Média da turma Gaming (1299 - 2204, n=114, últimos 2 anos) | |
| Asus TUF Gaming A15 FA507UV | |
| Asus TUF Gaming A17 FA707XI-NS94 | |
| Tulpar T7 V20.6 | |
| Alienware m16 R2 | |
| Média AMD Ryzen 7 8845HS, NVIDIA GeForce RTX 4070 Laptop GPU (1488 - 1720, n=2) | |
| HP Omen 17-db0079ng | |
| CrossMark / Creativity | |
| Acer Predator Helios Neo 16 (2024) | |
| Asus ROG Strix Scar 16 G634JZR | |
| Média da turma Gaming (1275 - 2660, n=114, últimos 2 anos) | |
| Asus TUF Gaming A17 FA707XI-NS94 | |
| Asus TUF Gaming A15 FA507UV | |
| Alienware m16 R2 | |
| Tulpar T7 V20.6 | |
| Média AMD Ryzen 7 8845HS, NVIDIA GeForce RTX 4070 Laptop GPU (1683 - 1932, n=2) | |
| HP Omen 17-db0079ng | |
| CrossMark / Responsiveness | |
| Acer Predator Helios Neo 16 (2024) | |
| Asus ROG Strix Scar 16 G634JZR | |
| Média da turma Gaming (1030 - 2330, n=114, últimos 2 anos) | |
| Asus TUF Gaming A15 FA507UV | |
| Alienware m16 R2 | |
| Tulpar T7 V20.6 | |
| Asus TUF Gaming A17 FA707XI-NS94 | |
| Média AMD Ryzen 7 8845HS, NVIDIA GeForce RTX 4070 Laptop GPU (1255 - 1603, n=2) | |
| HP Omen 17-db0079ng | |
| WebXPRT 3 / Overall | |
| Acer Predator Helios Neo 16 (2024) | |
| Asus TUF Gaming A17 FA707XI-NS94 | |
| Asus ROG Strix Scar 16 G634JZR | |
| Asus TUF Gaming A15 FA507UV | |
| Média da turma Gaming (215 - 480, n=127, últimos 2 anos) | |
| Alienware m16 R2 | |
| Tulpar T7 V20.6 | |
| Média AMD Ryzen 7 8845HS, NVIDIA GeForce RTX 4070 Laptop GPU (275 - 312, n=2) | |
| HP Omen 17-db0079ng | |
| WebXPRT 4 / Overall | |
| Asus ROG Strix Scar 16 G634JZR | |
| Acer Predator Helios Neo 16 (2024) | |
| Tulpar T7 V20.6 | |
| Asus TUF Gaming A17 FA707XI-NS94 | |
| Média AMD Ryzen 7 8845HS, NVIDIA GeForce RTX 4070 Laptop GPU (n=1) | |
| Média da turma Gaming (176.4 - 335, n=115, últimos 2 anos) | |
| Asus TUF Gaming A15 FA507UV | |
| Alienware m16 R2 | |
| Mozilla Kraken 1.1 / Total | |
| HP Omen 17-db0079ng | |
| Alienware m16 R2 | |
| Média AMD Ryzen 7 8845HS, NVIDIA GeForce RTX 4070 Laptop GPU (500 - 564, n=2) | |
| Asus TUF Gaming A15 FA507UV | |
| Média da turma Gaming (409 - 674, n=139, últimos 2 anos) | |
| Tulpar T7 V20.6 | |
| Asus TUF Gaming A17 FA707XI-NS94 | |
| Acer Predator Helios Neo 16 (2024) | |
| Asus ROG Strix Scar 16 G634JZR | |
* ... menor é melhor
| PCMark 10 Score | 7800 pontos | |
Ajuda | ||
| AIDA64 / Memory Copy | |
| Asus ROG Strix Scar 16 G634JZR | |
| Acer Predator Helios Neo 16 (2024) | |
| HP Omen 17-db0079ng | |
| Média AMD Ryzen 7 8845HS (61459 - 71873, n=12) | |
| Média da turma Gaming (21750 - 97515, n=147, últimos 2 anos) | |
| Alienware m16 R2 | |
| Asus TUF Gaming A15 FA507UV | |
| Asus TUF Gaming A17 FA707XI-NS94 | |
| Tulpar T7 V20.6 | |
| AIDA64 / Memory Read | |
| Asus ROG Strix Scar 16 G634JZR | |
| Acer Predator Helios Neo 16 (2024) | |
| Alienware m16 R2 | |
| Média da turma Gaming (22956 - 102937, n=147, últimos 2 anos) | |
| Asus TUF Gaming A15 FA507UV | |
| Asus TUF Gaming A17 FA707XI-NS94 | |
| HP Omen 17-db0079ng | |
| Média AMD Ryzen 7 8845HS (49866 - 61976, n=12) | |
| Tulpar T7 V20.6 | |
| AIDA64 / Memory Write | |
| HP Omen 17-db0079ng | |
| Média AMD Ryzen 7 8845HS (68425 - 93239, n=12) | |
| Asus TUF Gaming A15 FA507UV | |
| Asus ROG Strix Scar 16 G634JZR | |
| Asus TUF Gaming A17 FA707XI-NS94 | |
| Acer Predator Helios Neo 16 (2024) | |
| Média da turma Gaming (22297 - 108954, n=147, últimos 2 anos) | |
| Alienware m16 R2 | |
| Tulpar T7 V20.6 | |
| AIDA64 / Memory Latency | |
| Alienware m16 R2 | |
| HP Omen 17-db0079ng | |
| Média AMD Ryzen 7 8845HS (82.5 - 117, n=12) | |
| Média da turma Gaming (59.5 - 259, n=147, últimos 2 anos) | |
| Asus TUF Gaming A15 FA507UV | |
| Asus TUF Gaming A17 FA707XI-NS94 | |
| Acer Predator Helios Neo 16 (2024) | |
| Tulpar T7 V20.6 | |
| Asus ROG Strix Scar 16 G634JZR | |
* ... menor é melhor
Latências DPC
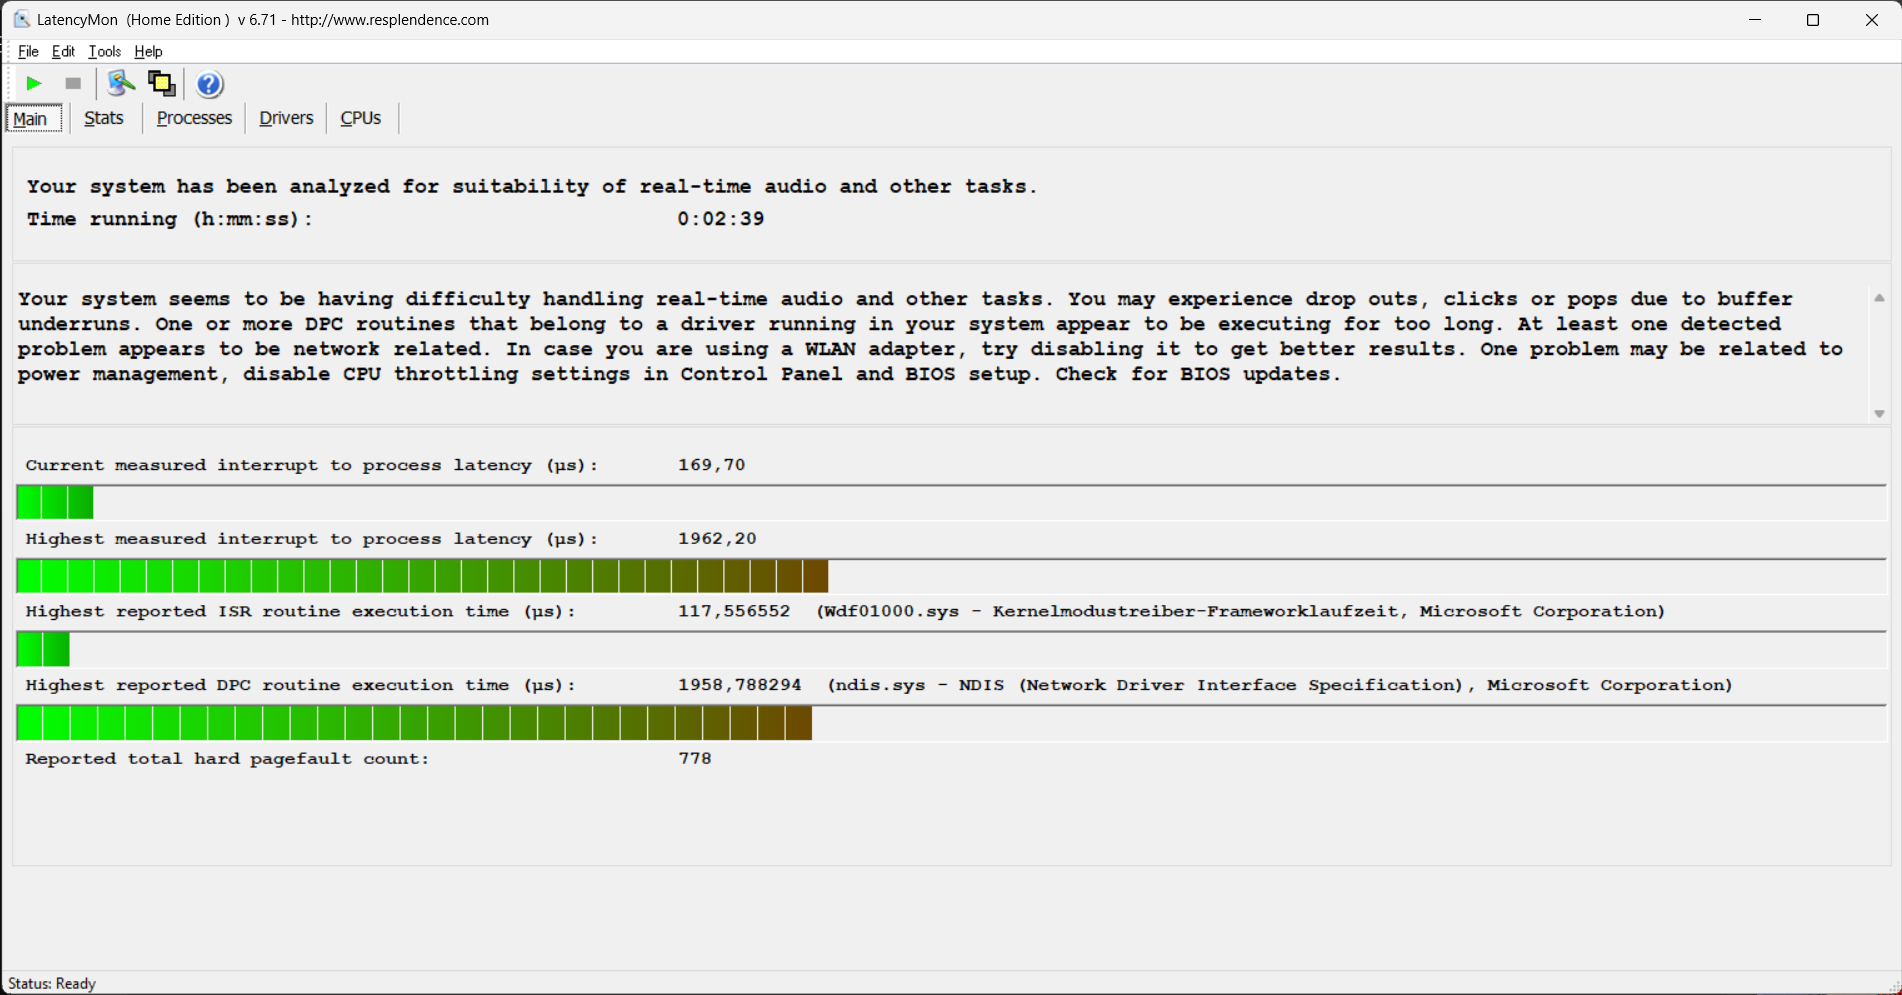
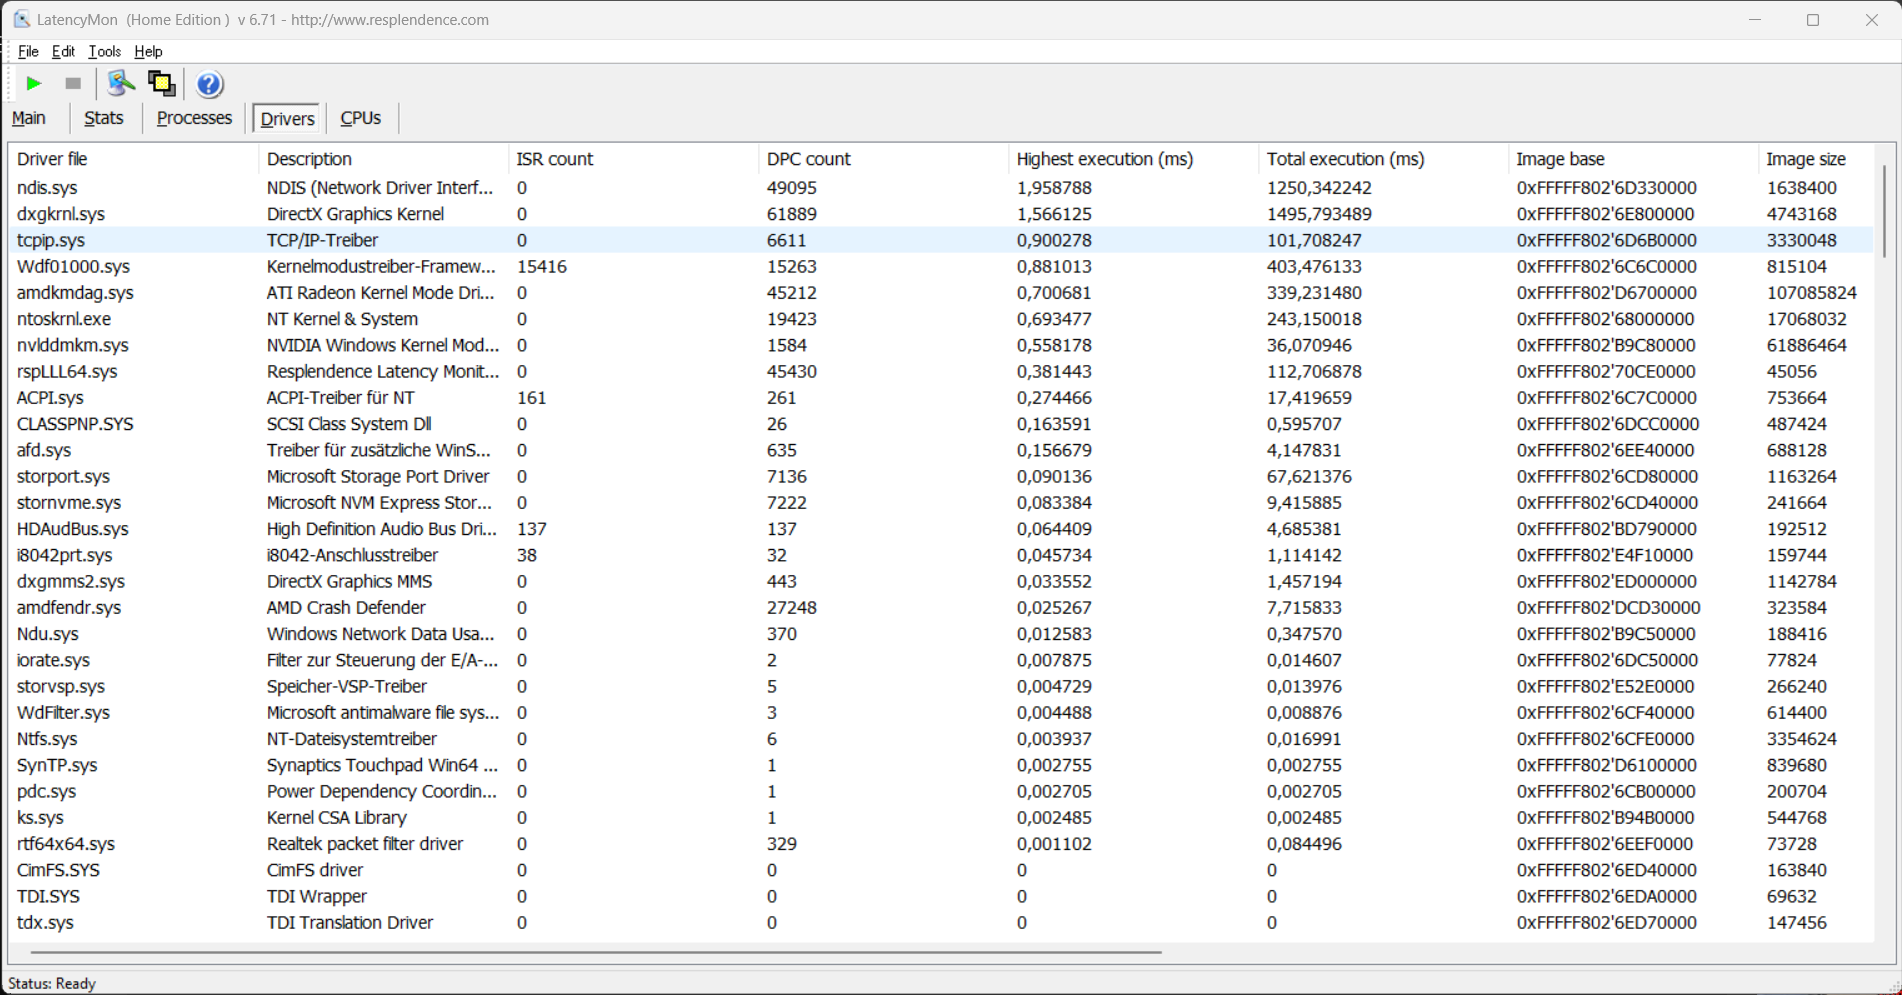
Nossa unidade de teste, em sua configuração atual, não é necessariamente adequada para o processamento de áudio e vídeo em tempo real, pois é preciso esperar algumas pequenas interrupções. Os drivers de rede e o kernel gráfico DirectX impedem um resultado melhor. Com alguns drivers alterados ou uma atualização de software posterior, essa situação pode melhorar ou até piorar.
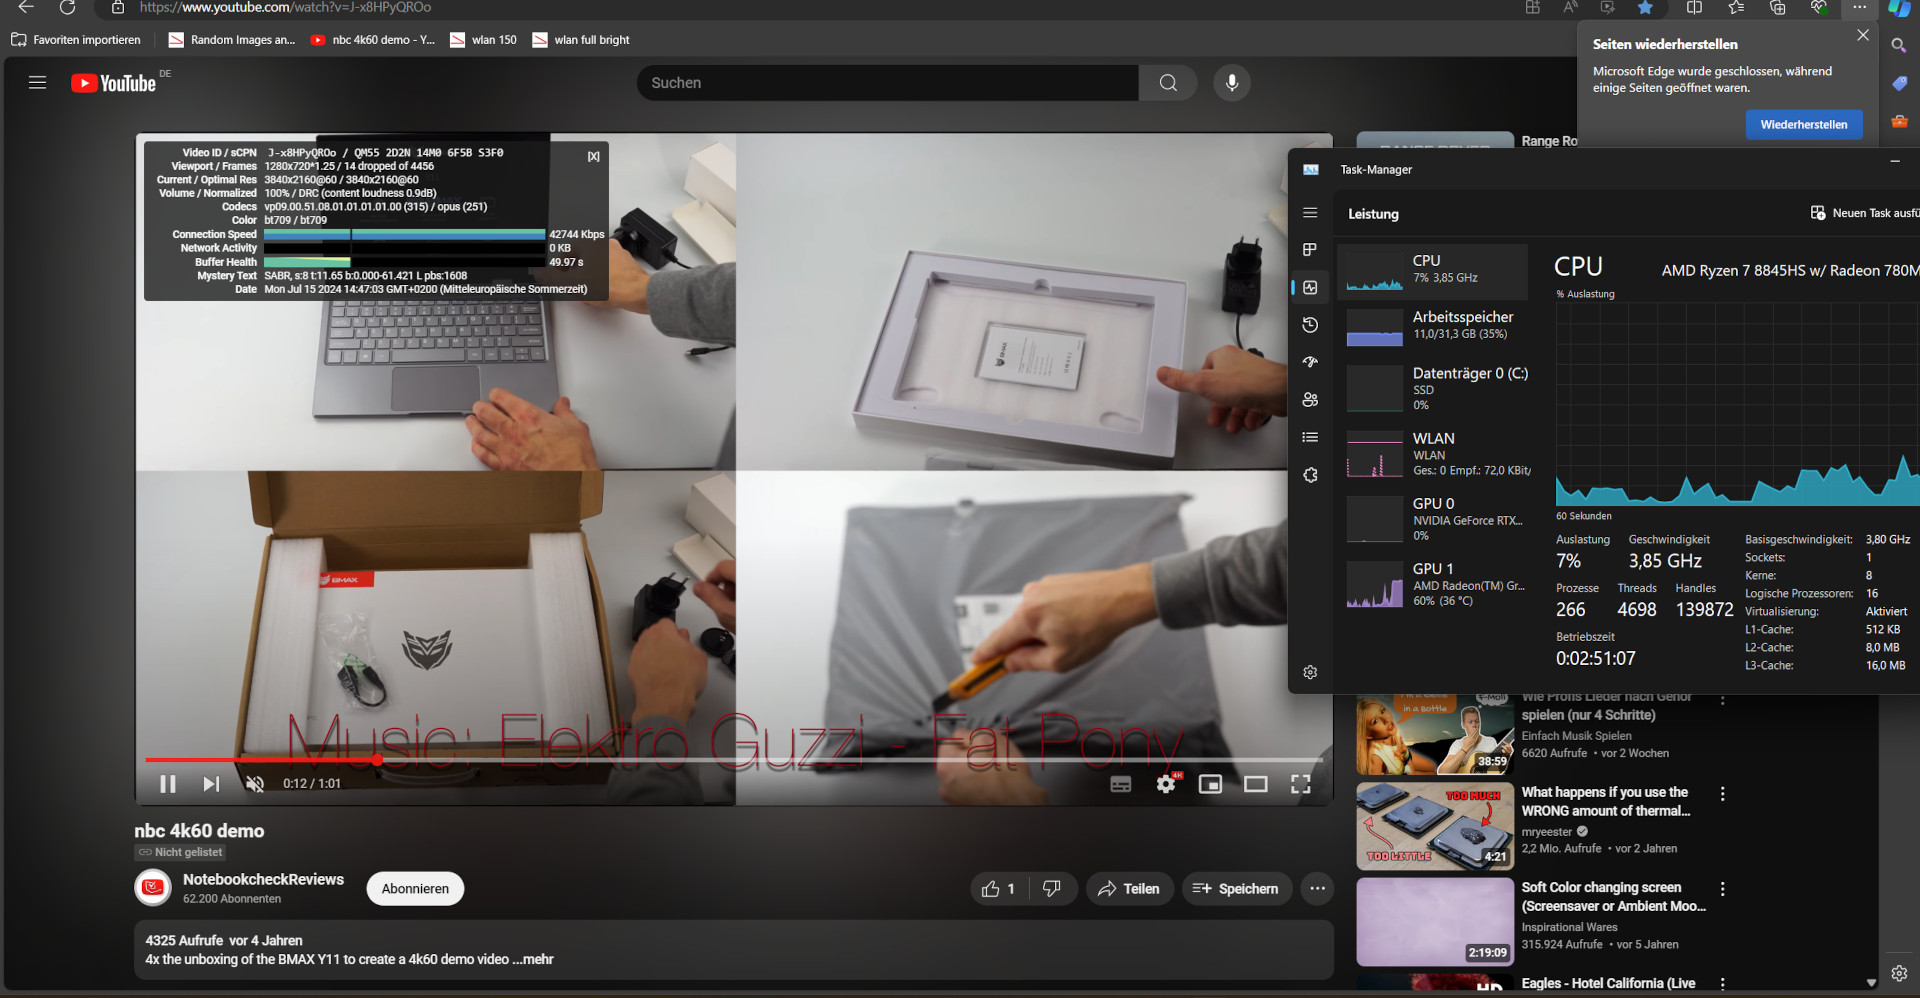
O que se destaca é a alta utilização da iGPU durante a reprodução de um vídeo 4K. Embora uma utilização de 60% ainda seja defensável, isso é quase o dobro da solução gráfica integrada da Intel. E 13 quadros perdidos em um intervalo de tempo de um minuto também não são um resultado ideal.
| DPC Latencies / LatencyMon - interrupt to process latency (max), Web, Youtube, Prime95 | |
| Asus ROG Strix Scar 16 G634JZR | |
| Alienware m16 R2 | |
| HP Omen 17-db0079ng | |
| Asus TUF Gaming A17 FA707XI-NS94 | |
| Acer Predator Helios Neo 16 (2024) | |
| Asus TUF Gaming A15 FA507UV | |
* ... menor é melhor
Solução de armazenamento
O SSD usado aqui definitivamente não atinge as velocidades máximas absolutas. Por exemplo, a solução de armazenamento no Asus ROG Strix Scar 16 é capaz de ter um desempenho 30% melhor em termos de acesso sequencial. Mas isso raramente contribui para um aumento nas taxas de quadros durante os jogos. Podemos observar apenas uma melhoria mínima, se houver, durante multitarefas intensas com muitas tarefas de acesso paralelo.
Por outro lado, o Omen 17 mostra como deve ser o bom resfriamento da SSD. Em contraste com muitos concorrentes com construção semelhante, incluindo o ROG Strix Scar, o desempenho constante permanece permanentemente em um nível bom, mesmo que não excepcional.
O segundo slot para um SSD M.2-NVMe também tem um cooler que já vem pré-instalado. Portanto, se quiser, o senhor pode adicionar uma unidade mais rápida ou, pelo menos, maior aqui.

* ... menor é melhor
Disk Throttling: DiskSpd Read Loop, Queue Depth 8
Placa de vídeo
O HP Omen 17 usa a Nvidia GeForce RTX 4070 da Nvidia. Como alternativa, o senhor também pode comprar uma versão menor com a RTX 4060. A maior das duas é adequada para a tela QHD. Só tivemos que abrir mão das configurações de detalhes máximos com os jogos mais recentes se ainda quiséssemos obter mais de 60 FPS.
A RTX 4070 pode consumir um máximo de 120 watts aqui, o que está abaixo do valor máximo permitido de 140 watts. Mas isso não é muito perceptível, principalmente nos benchmarks sintéticos do 3DMark, e às vezes até observamos o contrário. Por exemplo, o Asus TUF Gaming A17que está melhor equipado no papel com uma RTX 4070 de 140 watts, fica atrás de 9% no geral. No entanto, a distância é menor no desempenho em jogos. Provavelmente, vemos o efeito do HP Omen 17 não precisar de aceleração aqui.
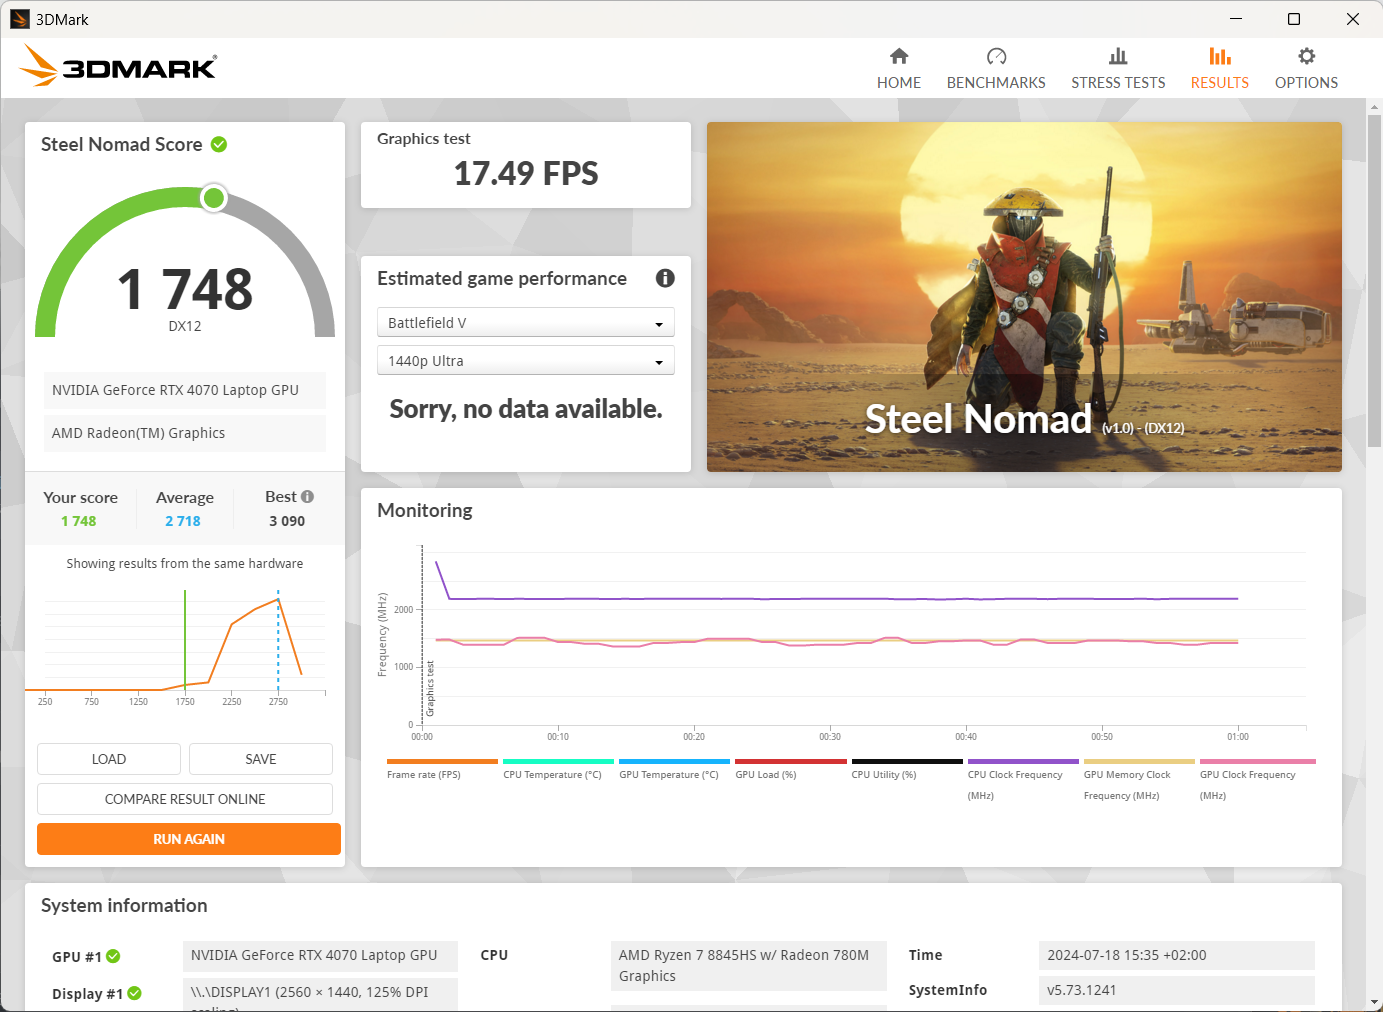
Os valores de energia são ainda mais reduzidos nos outros modos de energia. No modo "Equilibrado", ainda são 90 watts, o que reduz o desempenho em 10%, no máximo. A queda na potência se torna mais acentuada no modo "Eco" e durante a operação com bateria, em que a placa de vídeo só pode consumir 40 watts. Embora os jogos que não são tão complexos permaneçam jogáveis, o senhor deve esperar uma taxa de quadros reduzida em um terço.
O senhor pode encontrar outros benchmarks e testes de jogos em nossa Lista de benchmarks de GPU.
| 3DMark 11 Performance | 35016 pontos | |
| 3DMark Cloud Gate Standard Score | 65355 pontos | |
| 3DMark Fire Strike Score | 27594 pontos | |
| 3DMark Time Spy Score | 12346 pontos | |
| 3DMark Steel Nomad Score | 2743 pontos | |
Ajuda | ||
* ... menor é melhor
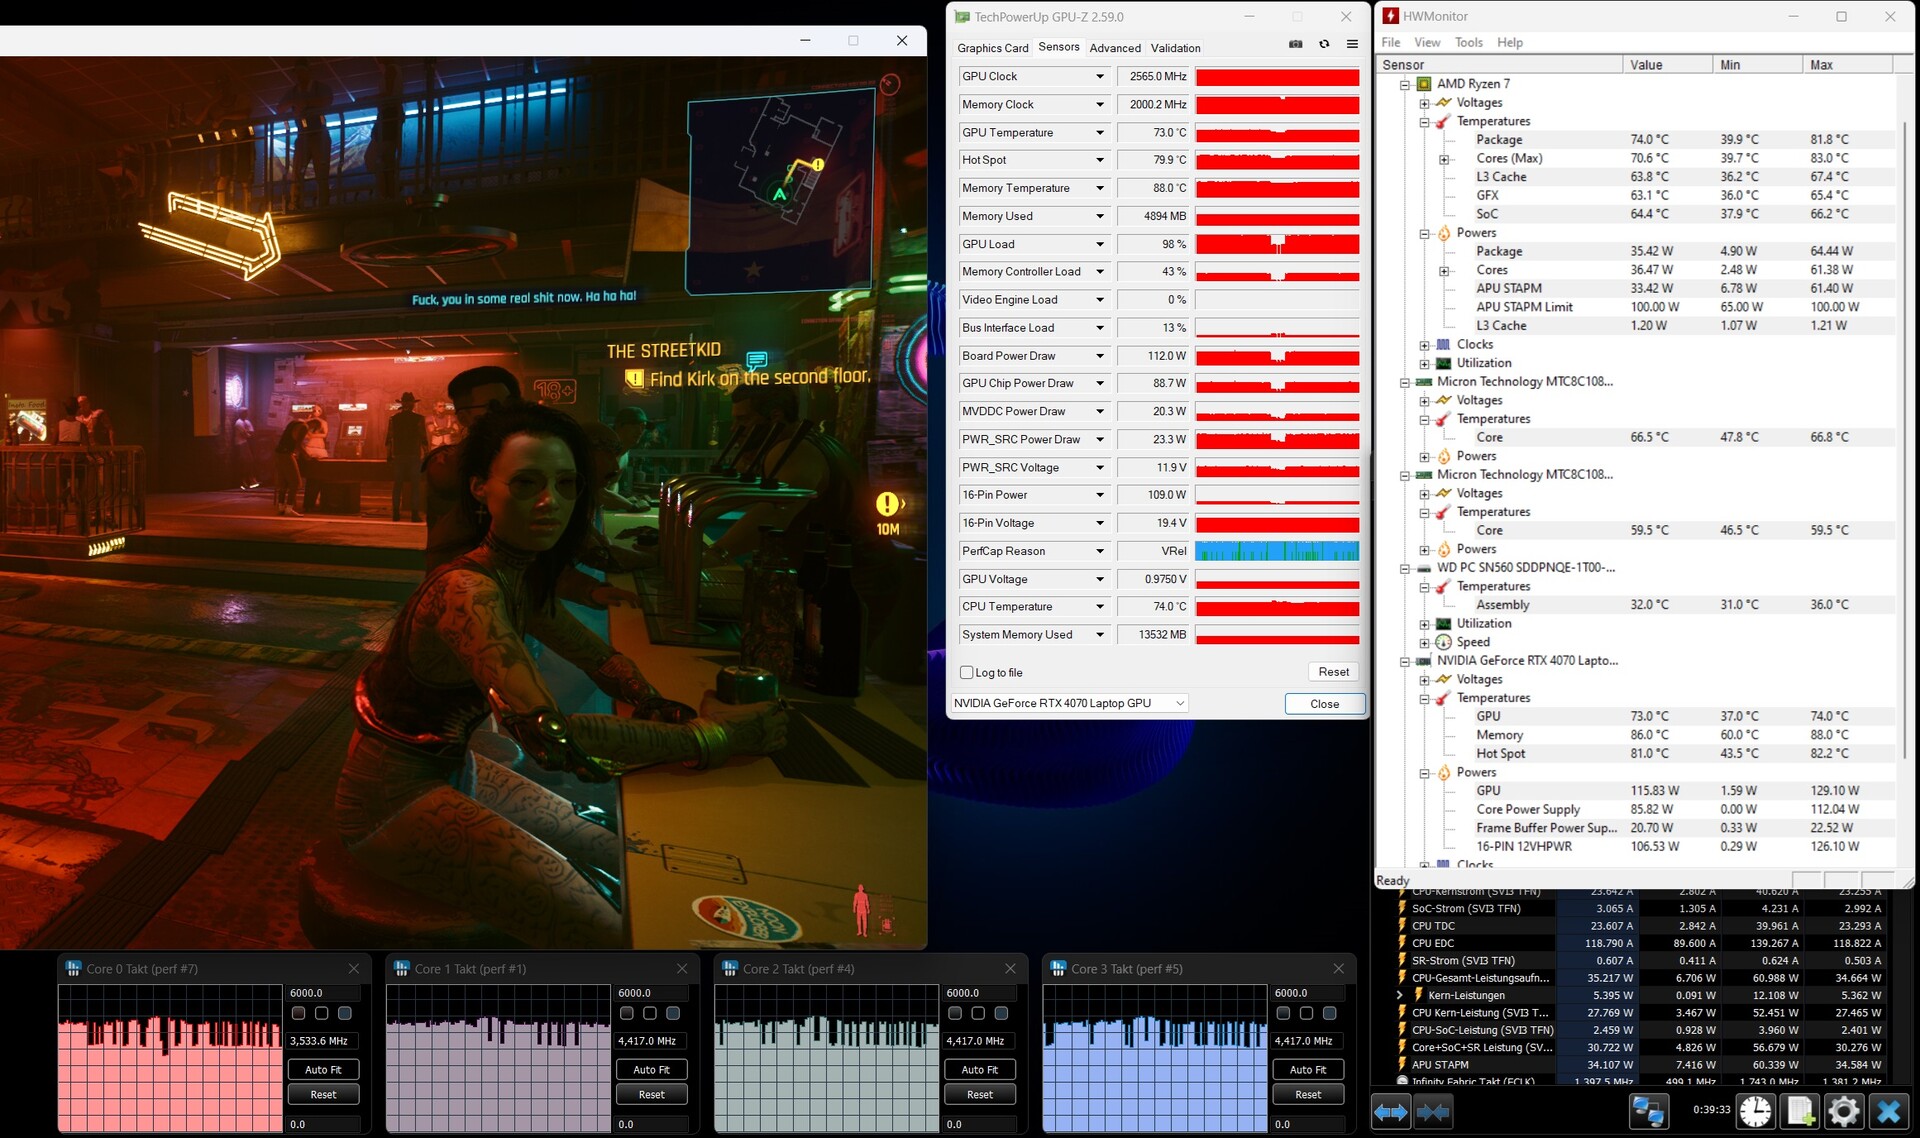
Desempenho em jogos
Com apenas configurações de detalhes altas em vez de máximas, o HP Omen 17 é capaz de ultrapassar com segurança a marca de 100 FPS em resolução Full-HD. Isso também se aplica aos jogos atuais. Em vários jogos, as diferenças em relação a outros notebooks para jogos com a RTX 4070 são de apenas alguns pontos percentuais. A vantagem do Asus TUF Gaming A15 com uma CPU mais rápida, mas apenas uma RTX 4060, é de apenas 4%. Mas os jogos graficamente exigentes, como o Cyberpunk 2077 2.1, são muito mais jogáveis com o Omen 17. No entanto, a GPU menor ainda é capaz de dominar jogos mais antigos ao nível dos olhos.
A diferença entre o modo mais silencioso "Balanced" e o desempenho máximo continua pequena. Mesmo assim, é possível atingir 100 FPS com frequência. Portanto, podemos dizer que, de modo geral, a decisão por um TGP mais baixo não trouxe nenhuma desvantagem séria que valha a pena mencionar nos jogos. Como o desempenho de computação disponível permanece estável, o Omen 17 tem até mesmo uma vantagem em momentos de carga constante.


| GTA V - 1920x1080 Highest Settings possible AA:4xMSAA + FX AF:16x | |
| Asus ROG Strix Scar 16 G634JZR | |
| Acer Predator Helios Neo 16 (2024) | |
| Média da turma Gaming (12.1 - 168.2, n=132, últimos 2 anos) | |
| HP Omen 16 (2024) | |
| Asus ROG Zephyrus M16 GU603Z | |
| Asus TUF Gaming A15 FA507UV | |
| HP Omen 17-db0079ng | |
| HP Omen 16-b0085ng | |
| Cyberpunk 2077 2.2 Phantom Liberty - 1920x1080 Ultra Preset (FSR off) | |
| Asus ROG Strix Scar 16 G634JZR | |
| HP Omen 17-db0079ng | |
| Média da turma Gaming (6.76 - 158, n=90, últimos 2 anos) | |
| Asus TUF Gaming A17 FA707XI-NS94 | |
| HP Omen 16 (2024) | |
| Acer Predator Helios Neo 16 (2024) | |
| Alienware m16 R2 | |
| Asus TUF Gaming A15 FA507UV | |
| F1 23 | |
| 1920x1080 Ultra High Preset AA:T AF:16x | |
| Asus ROG Strix Scar 16 G634JZR | |
| Média da turma Gaming (12.9 - 149.2, n=39, últimos 2 anos) | |
| Média NVIDIA GeForce RTX 4070 Laptop GPU (49.5 - 100, n=14) | |
| 2560x1440 Ultra High Preset AA:T AF:16x | |
| Asus ROG Strix Scar 16 G634JZR | |
| Média da turma Gaming (17 - 144.6, n=30, últimos 2 anos) | |
| Média NVIDIA GeForce RTX 4070 Laptop GPU (35.2 - 49, n=13) | |
| F1 24 | |
| 1920x1080 Ultra High Preset AA:T AF:16x | |
| Média da turma Gaming (54.1 - 148, n=19, últimos 2 anos) | |
| HP Omen 17-db0079ng | |
| Média NVIDIA GeForce RTX 4070 Laptop GPU (58.4 - 78.1, n=9) | |
| Asus TUF Gaming A15 FA507UV | |
| 2560x1440 Ultra High Preset AA:T AF:16x | |
| Média da turma Gaming (36.7 - 100, n=16, últimos 2 anos) | |
| HP Omen 17-db0079ng | |
| Média NVIDIA GeForce RTX 4070 Laptop GPU (36.8 - 50.9, n=9) | |
O teste de carga constante com o Cyberpunk 2077 2.1 também mostra a estabilidade do desempenho do laptop, resultando em uma linha quase perfeitamente reta do início ao fim. Com o consumo de energia reduzido, o Omen 17 não precisa ser acelerado em nenhum momento.
Cyberpunk 2077 Ultra FPS Chart
| baixo | média | alto | ultra | QHD | |
|---|---|---|---|---|---|
| GTA V (2015) | 178.9 | 175.5 | 163.1 | 103.9 | 90.2 |
| Dota 2 Reborn (2015) | 152.5 | 138.8 | 137.3 | 126.3 | |
| Final Fantasy XV Benchmark (2018) | 201 | 155.7 | 117.2 | 88.2 | |
| X-Plane 11.11 (2018) | 128.8 | 115.7 | 89.5 | ||
| Far Cry 5 (2018) | 137 | 123 | 115 | 110 | 108 |
| Strange Brigade (2018) | 318 | 276 | 240 | 213 | 138.3 |
| God of War (2022) | 149 | 129 | 105 | 74 | 60 |
| Hogwarts Legacy (2023) | 103 | 92 | 87 | 76 | 52 |
| Cyberpunk 2077 2.2 Phantom Liberty (2023) | 135.3 | 122 | 102.6 | 88.9 | 54.5 |
| F1 24 (2024) | 205 | 210 | 196.6 | 74.1 | 48.4 |
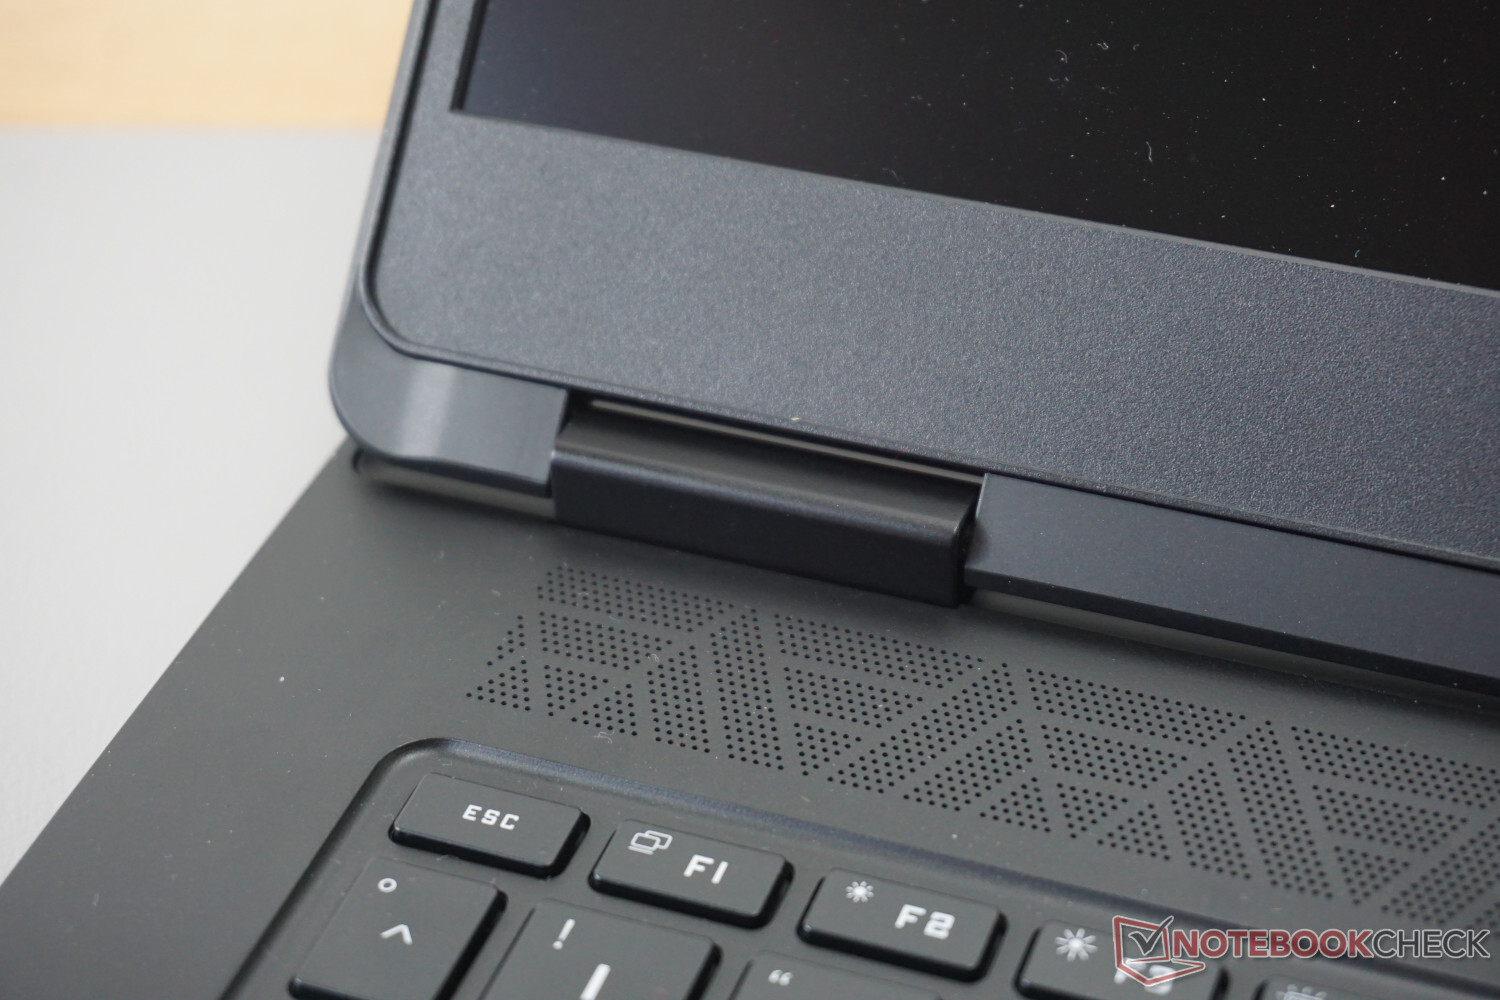
Emissões - Não é um avião a jato
Níveis de ruído
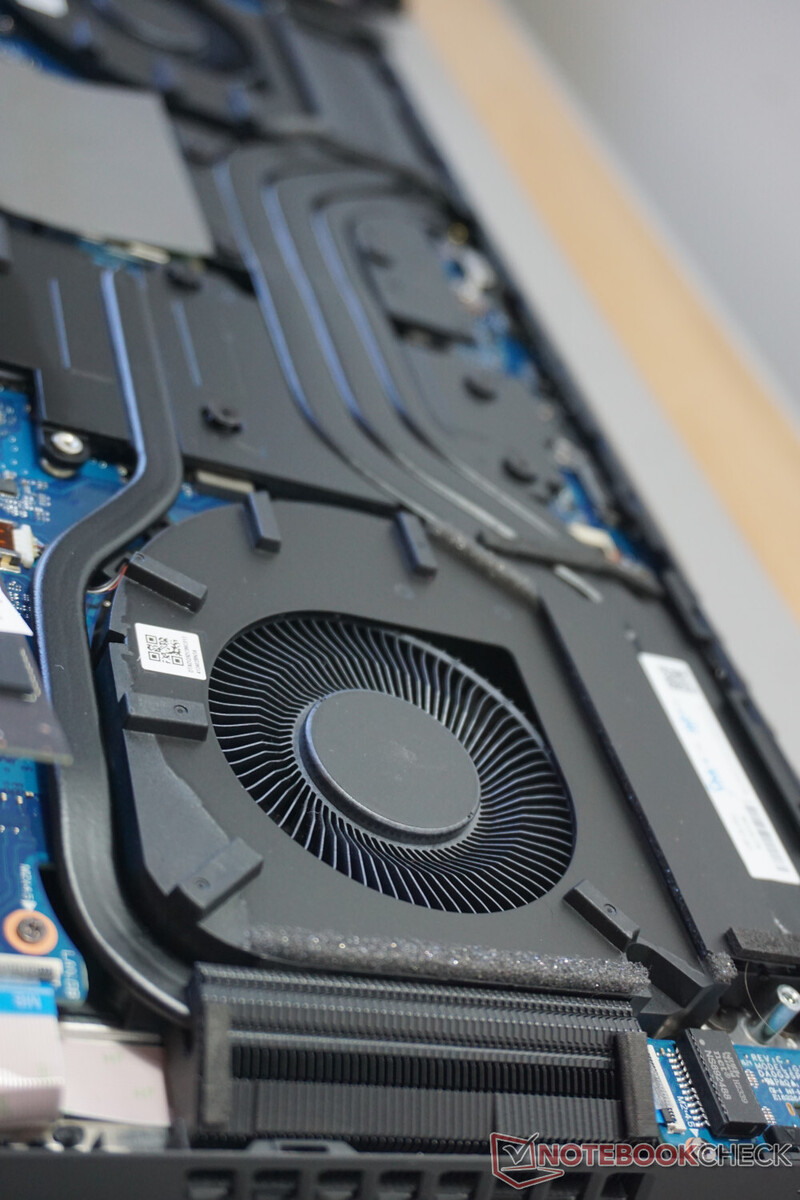
O controle da ventoinha sob carga mostra uma implementação de resfriamento bem-sucedida. Mesmo nos momentos de maior desempenho, o ruído nunca se torna incômodo, embora seja claramente audível. Em contraste com os concorrentes, como o Alienware m16 R2os fones de ouvido não serão absolutamente necessários nesses momentos, embora ainda sejam recomendados.
O Omen 17 se sai ainda melhor no modo "Balanced", que traz apenas algumas pequenas limitações no desempenho. Desde que o jogo seja apenas meio interessante, o senhor dificilmente perceberá o ruído da ventoinha. Além disso, o software incluído permitirá que o senhor faça facilmente outros ajustes na velocidade da ventoinha para reduzir ainda mais o nível de ruído.
Infelizmente, o laptop para jogos nunca fica absolutamente silencioso. Mesmo sem nenhuma carga, as ventoinhas aceleram de tempos em tempos e, embora não atinjam os níveis máximos de velocidade, ainda são bem audíveis. O Omen 17 está longe de atingir temperaturas críticas.
Barulho
| Ocioso |
| 25 / 29 / 33 dB |
| Carga |
| 45 / 52 dB |
 | ||
30 dB silencioso 40 dB(A) audível 50 dB(A) ruidosamente alto |
||
min: | ||
| HP Omen 17-db0079ng NVIDIA GeForce RTX 4070 Laptop GPU, R7 8845HS, WD PC SN560 SDDPNQE-1T00 | Alienware m16 R2 NVIDIA GeForce RTX 4070 Laptop GPU, Ultra 7 155H, Samsung PM9A1 MZVL21T0HCLR | Asus ROG Strix Scar 16 G634JZR NVIDIA GeForce RTX 4080 Laptop GPU, i9-14900HX, SK hynix PC801 HFS002TEJ9X101N | Acer Predator Helios Neo 16 (2024) NVIDIA GeForce RTX 4070 Laptop GPU, i7-14700HX, Samsung PM9A1a MZVL21T0HDLU | Asus TUF Gaming A17 FA707XI-NS94 NVIDIA GeForce RTX 4070 Laptop GPU, R9 7940HS, WD PC SN560 SDDPNQE-1T00 | Asus TUF Gaming A15 FA507UV NVIDIA GeForce RTX 4060 Laptop GPU, R9 8945H, WD PC SN560 SDDPNQE-1T00 | |
|---|---|---|---|---|---|---|
| Noise | 8% | -5% | -3% | -1% | 5% | |
| desligado / ambiente * | 25 | 24.7 1% | 21.07 16% | 25.2 -1% | 27.9 -12% | 25 -0% |
| Idle Minimum * | 25 | 25.3 -1% | 29.75 -19% | 27.8 -11% | 28.5 -14% | 25 -0% |
| Idle Average * | 29 | 25.3 13% | 29.75 -3% | 32 -10% | 29.8 -3% | 27 7% |
| Idle Maximum * | 33 | 25.3 23% | 29.75 10% | 29.6 10% | 29.8 10% | 33 -0% |
| Load Average * | 45 | 31.7 30% | 54.85 -22% | 45.2 -0% | 34.8 23% | 40 11% |
| Cyberpunk 2077 ultra * | 48 | 45 6% | ||||
| Load Maximum * | 52 | 62 -19% | 58 -12% | 55.8 -7% | 57.3 -10% | 46 12% |
| Witcher 3 ultra * | 53.8 | 57.8 | 57.1 |
* ... menor é melhor
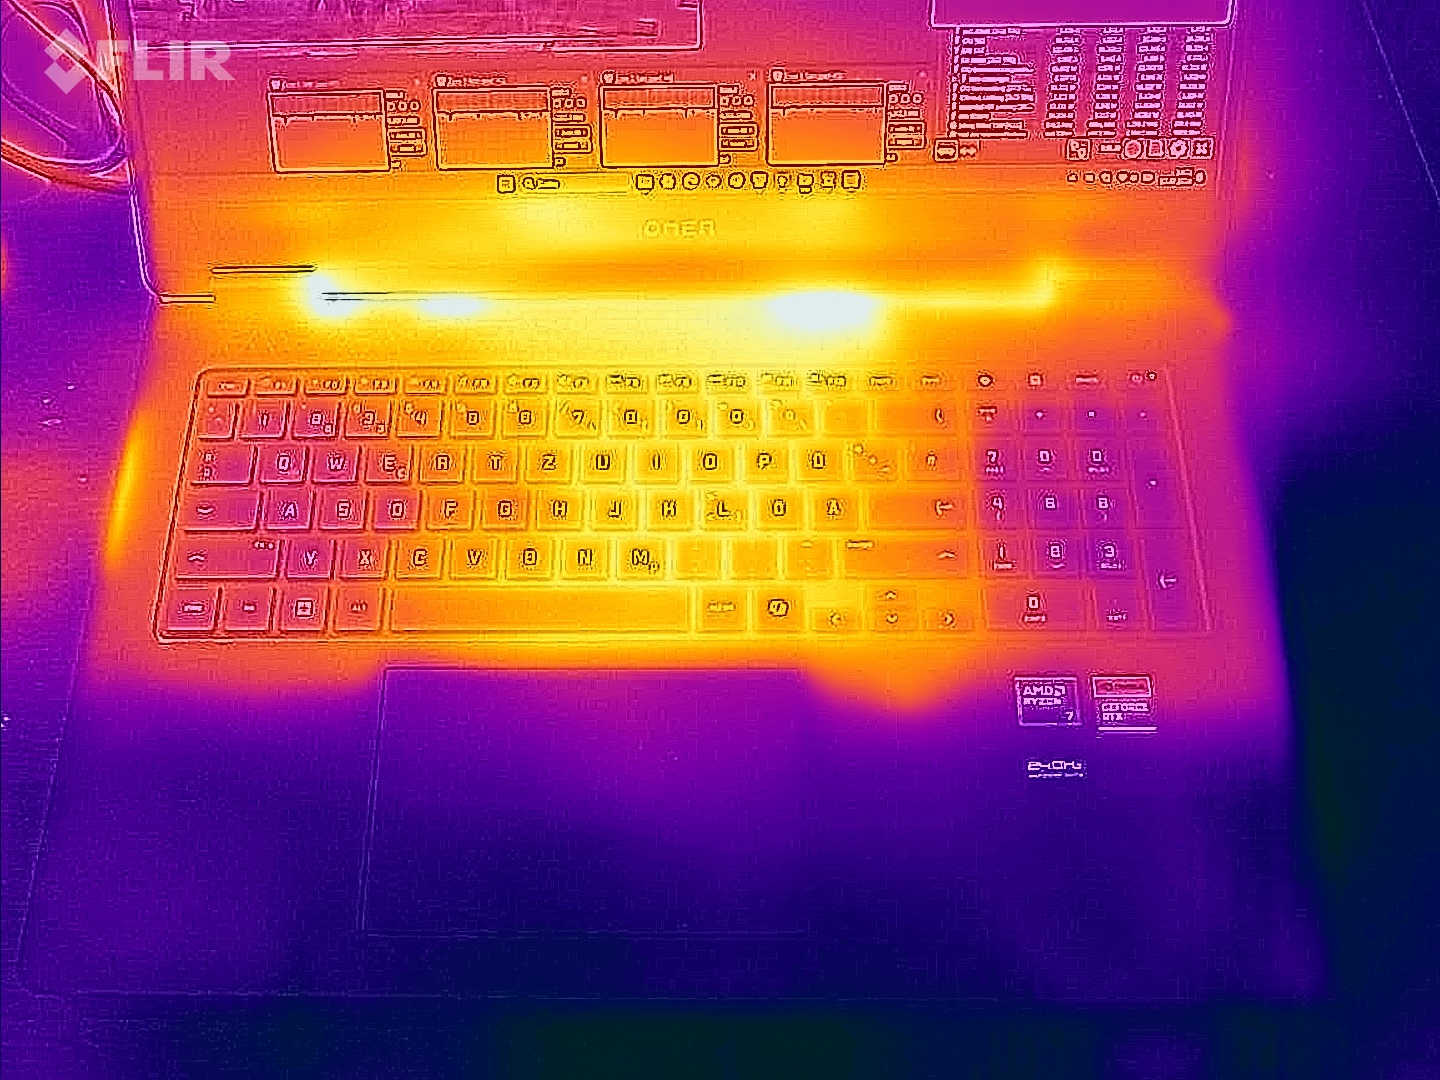
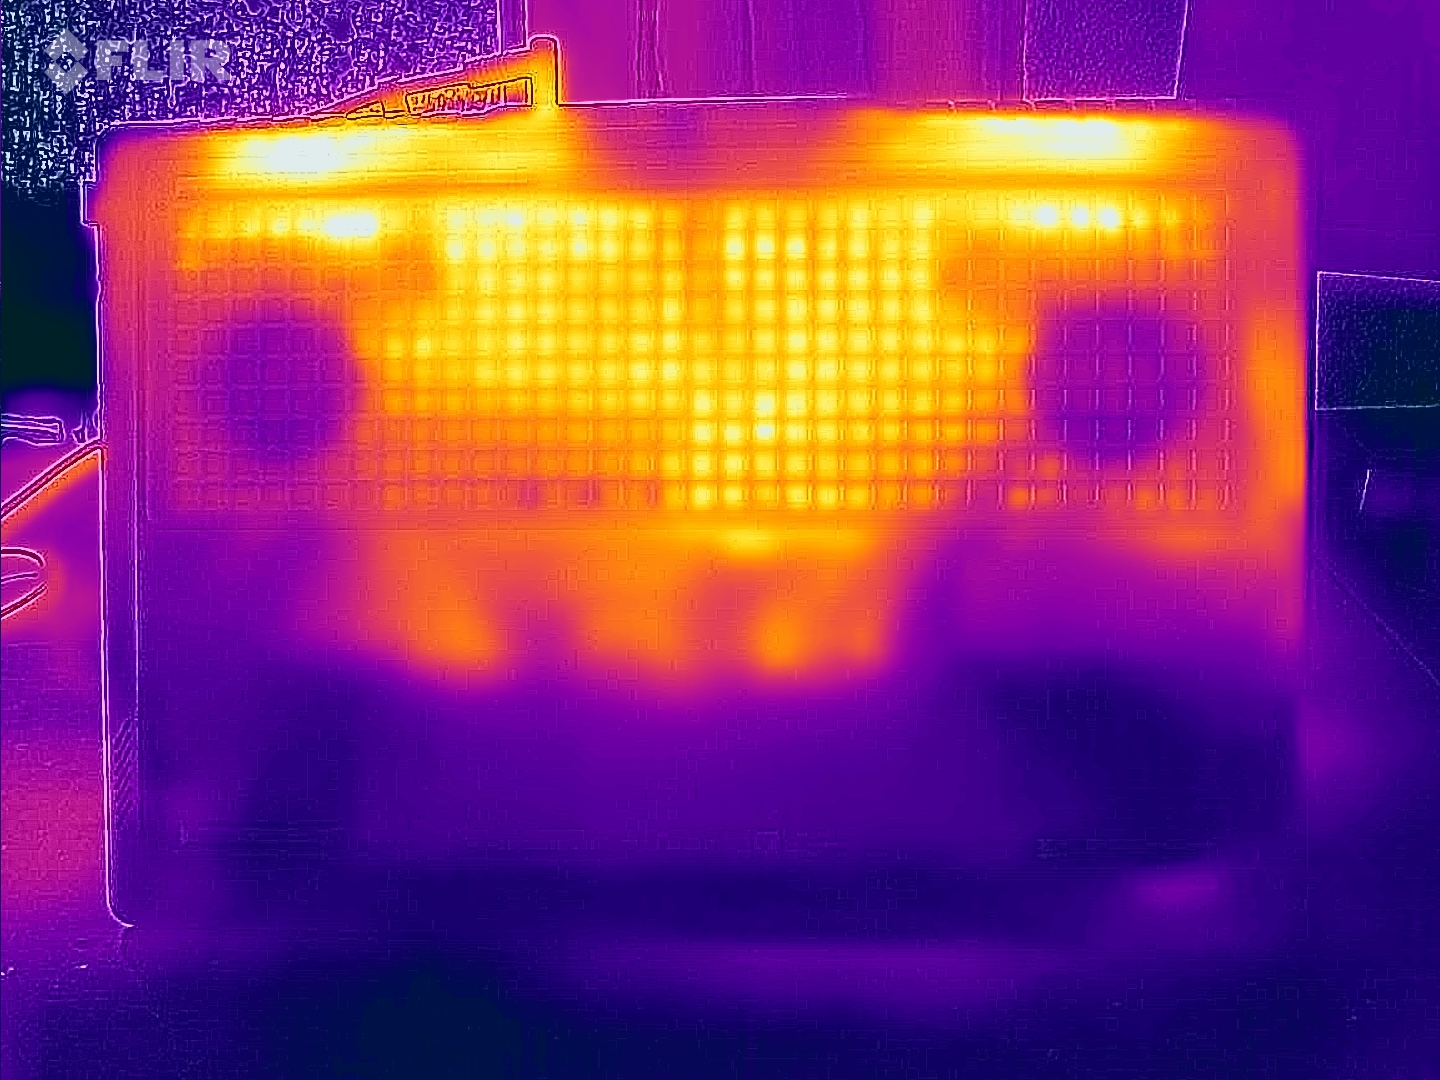
Temperaturas
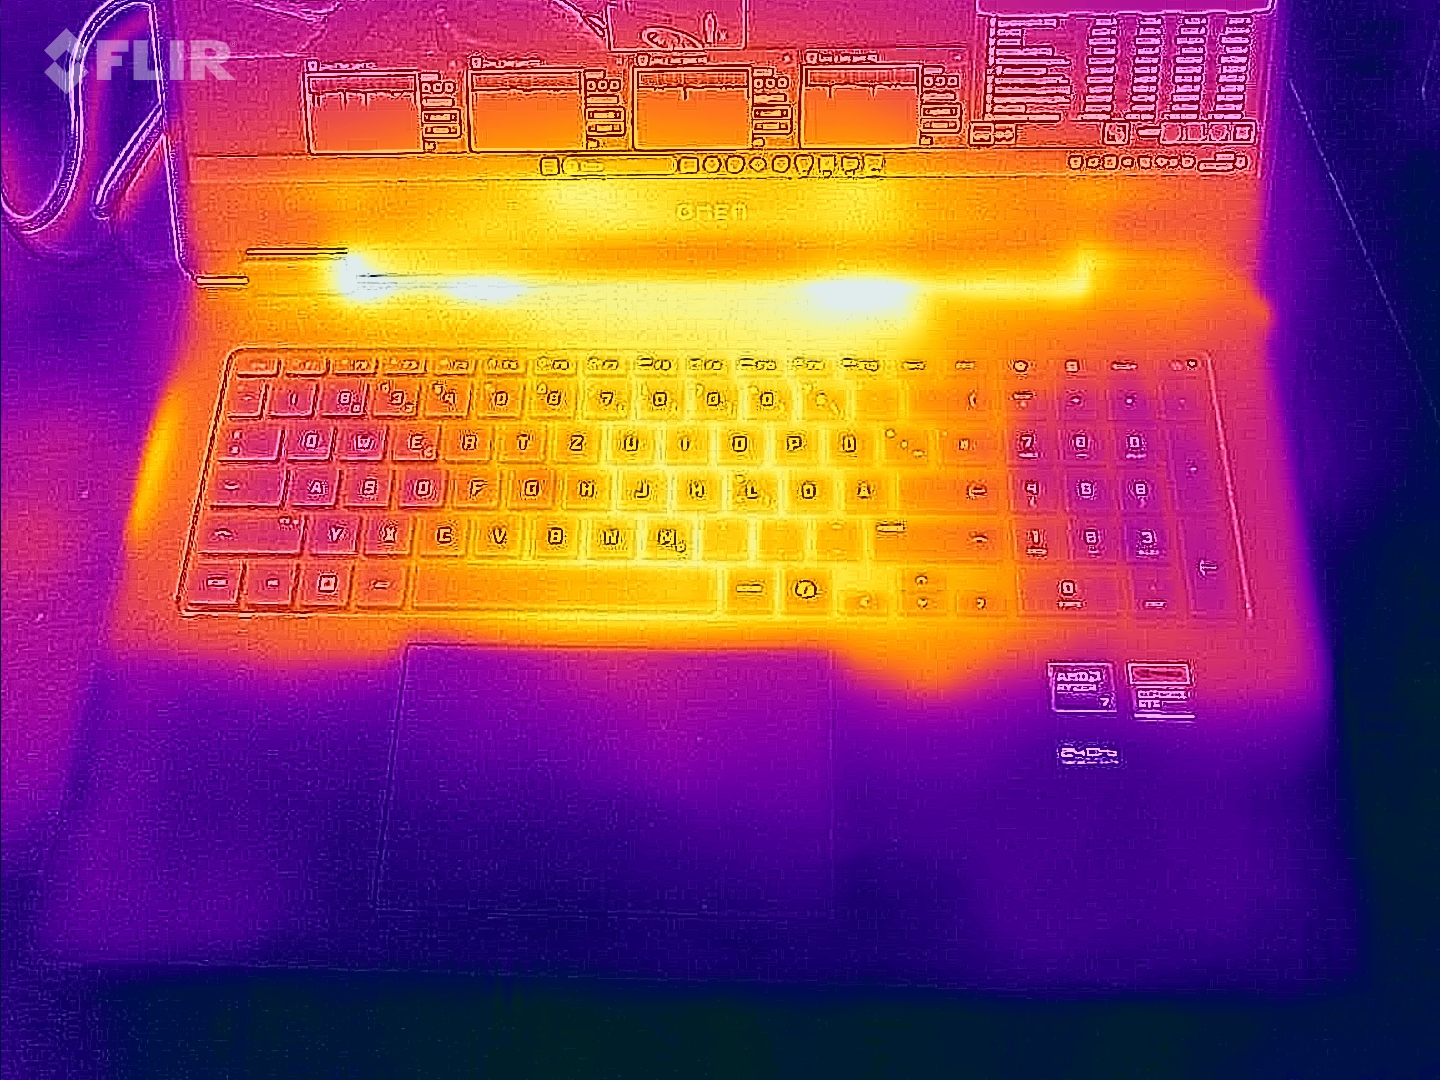
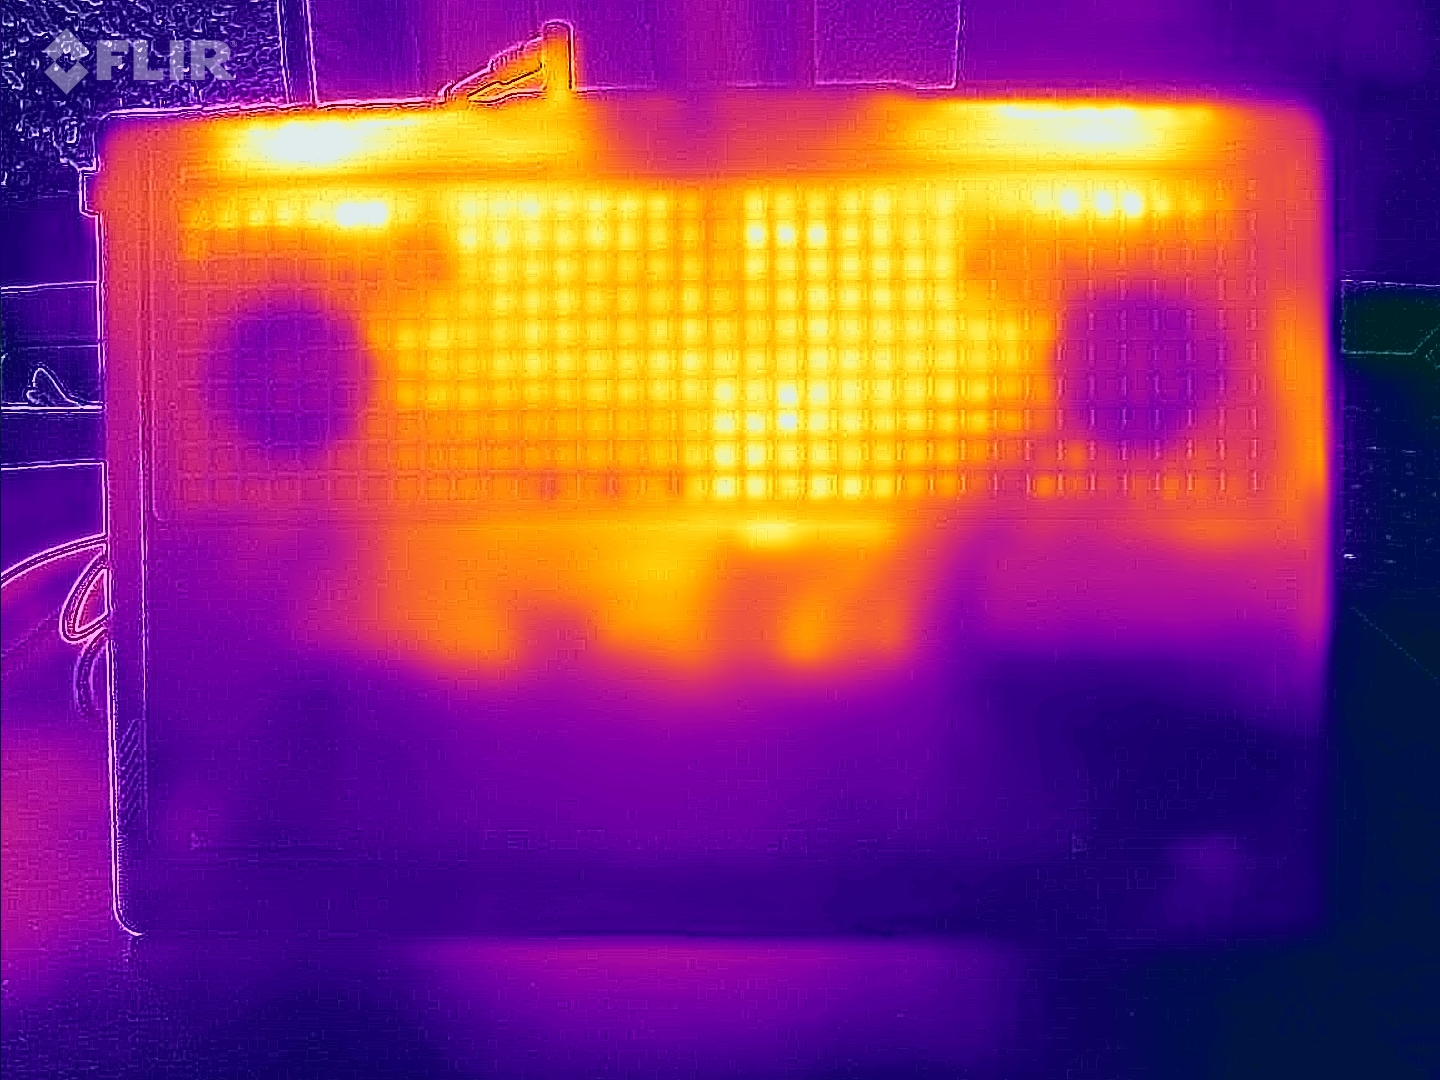
Tanto durante a operação inativa quanto sob carga elevada, o Omen 17 permanece mais frio do que muitos de seus concorrentes. Especialmente os apoios para as mãos quase não esquentam. Na área do teclado, por outro lado, o aumento da temperatura é claramente perceptível durante os jogos. Uma solução externa é recomendada aqui, principalmente porque o teclado integrado não é muito impressionante. Durante tarefas simples, como navegar na Internet ou trabalhar em tarefas de escritório, o dispositivo inteiro permanece frio e confortável de operar. O senhor também pode usá-lo confortavelmente no colo.
(±) A temperatura máxima no lado superior é 44 °C / 111 F, em comparação com a média de 40.4 °C / 105 F , variando de 21.2 a 68.8 °C para a classe Gaming.
(±) A parte inferior aquece até um máximo de 45 °C / 113 F, em comparação com a média de 43.2 °C / 110 F
(+) Em uso inativo, a temperatura média para o lado superior é 25.7 °C / 78 F, em comparação com a média do dispositivo de 33.9 °C / ### class_avg_f### F.
(±) 3: The average temperature for the upper side is 36.1 °C / 97 F, compared to the average of 33.9 °C / 93 F for the class Gaming.
(+) Os apoios para as mãos e o touchpad são mais frios que a temperatura da pele, com um máximo de 28 °C / 82.4 F e, portanto, são frios ao toque.
(±) A temperatura média da área do apoio para as mãos de dispositivos semelhantes foi 28.9 °C / 84 F (+0.9 °C / 1.6 F).
| HP Omen 17-db0079ng AMD Ryzen 7 8845HS, NVIDIA GeForce RTX 4070 Laptop GPU | Alienware m16 R2 Intel Core Ultra 7 155H, NVIDIA GeForce RTX 4070 Laptop GPU | Asus ROG Strix Scar 16 G634JZR Intel Core i9-14900HX, NVIDIA GeForce RTX 4080 Laptop GPU | Acer Predator Helios Neo 16 (2024) Intel Core i7-14700HX, NVIDIA GeForce RTX 4070 Laptop GPU | Asus TUF Gaming A17 FA707XI-NS94 AMD Ryzen 9 7940HS, NVIDIA GeForce RTX 4070 Laptop GPU | Asus TUF Gaming A15 FA507UV AMD Ryzen 9 8945H, NVIDIA GeForce RTX 4060 Laptop GPU | |
|---|---|---|---|---|---|---|
| Heat | -27% | -18% | -23% | 11% | -18% | |
| Maximum Upper Side * | 44 | 44.8 -2% | 47.8 -9% | 58 -32% | 40 9% | 53 -20% |
| Maximum Bottom * | 45 | 48 -7% | 52.2 -16% | 45.2 -0% | 33.6 25% | 46 -2% |
| Idle Upper Side * | 26 | 37.2 -43% | 32.4 -25% | 31.1 -20% | 26.6 -2% | 32 -23% |
| Idle Bottom * | 27 | 42 -56% | 33 -22% | 37.2 -38% | 24.4 10% | 34 -26% |
* ... menor é melhor
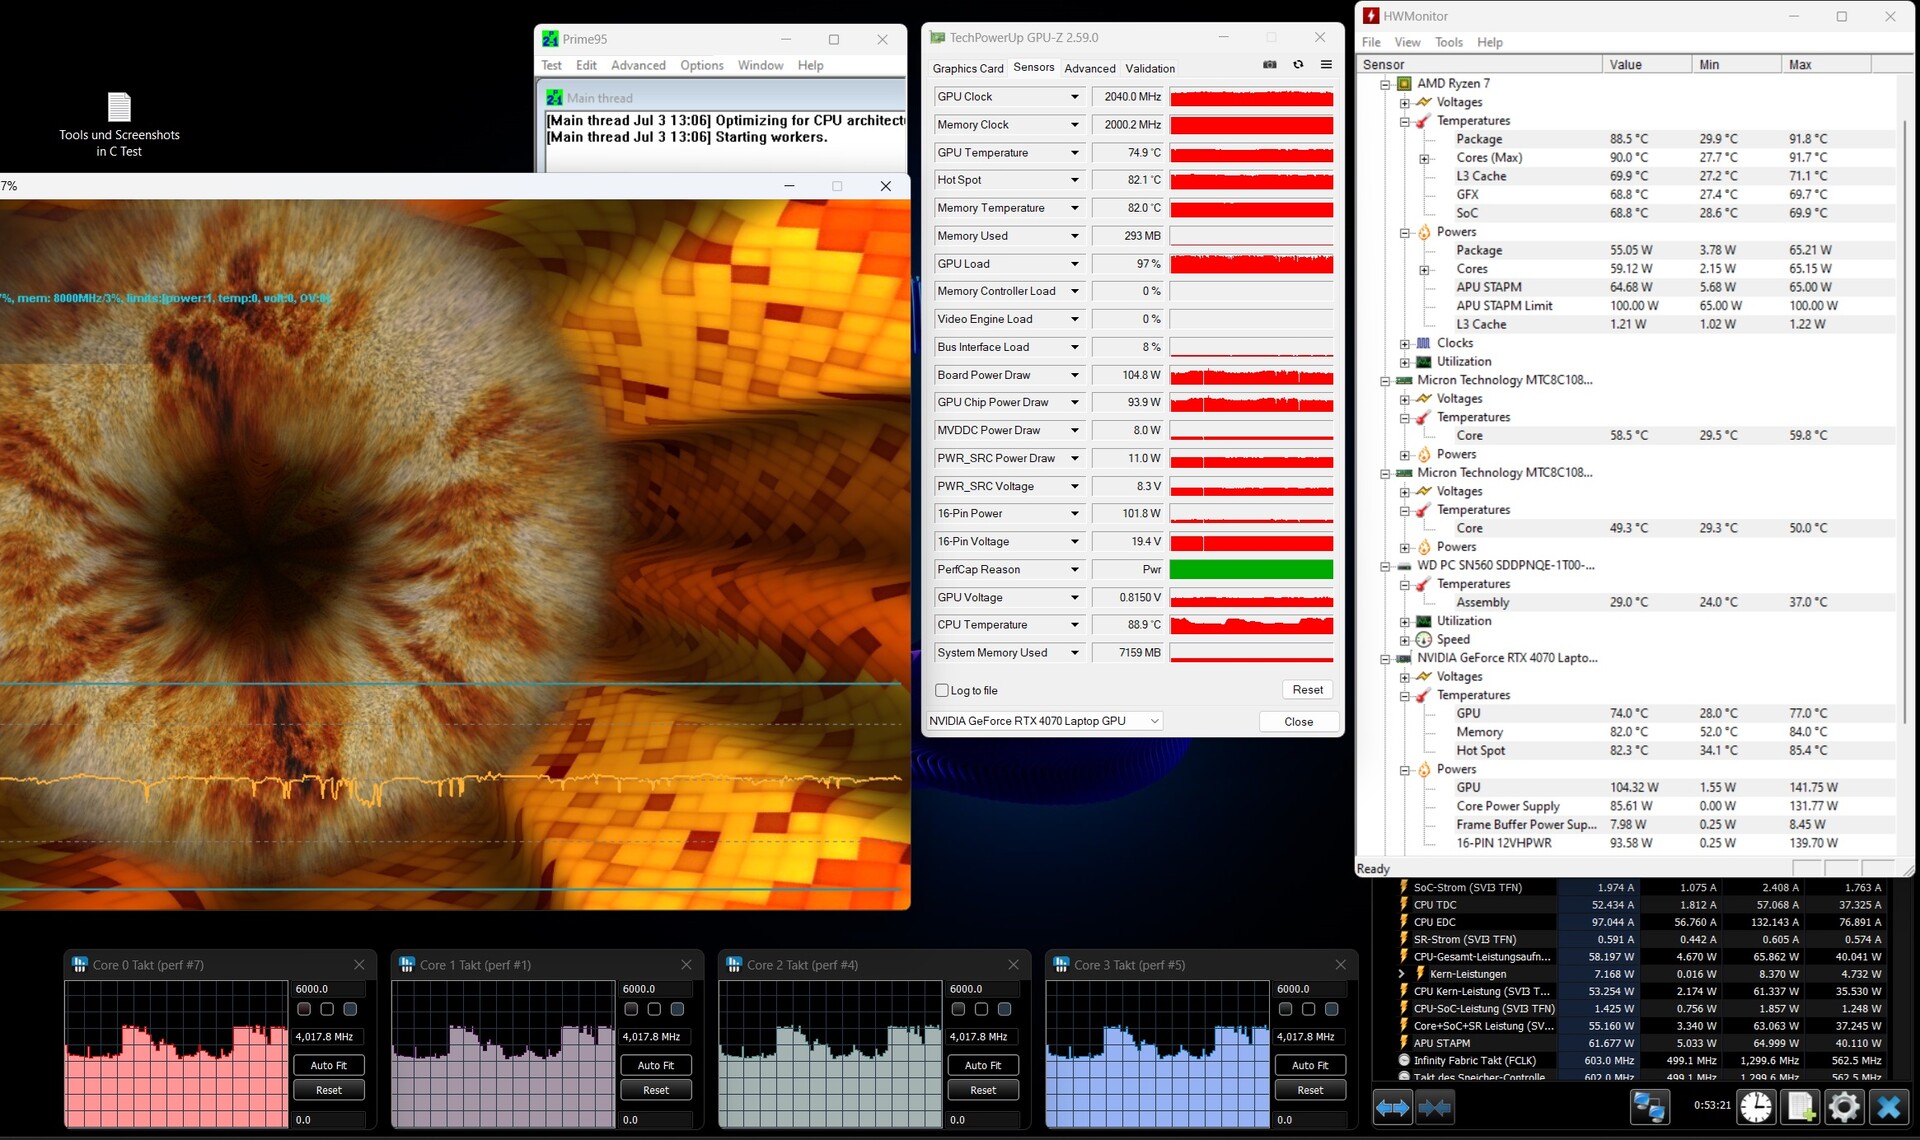
Teste de estresse
Quando a CPU é colocada sob carga total com o Prime95, ela consome constantemente os 65 watts permitidos. Embora esse valor seja menor do que o de alguns concorrentes com a mesma CPU, ele permanece constante por períodos de tempo mais longos. A temperatura do núcleo permanece em um valor aceitável de 80 °C (176 °F) ou menos.
Somente sob carga adicional na placa de vídeo o HP Omen 17 atinge seus limites. Quando ambos os componentes são executados com desempenho total, o consumo de energia permanece em seus valores máximos de 50 watts para a CPU (menos o aumento dinâmico para a GPU) e 120 watts para a placa de vídeo. As temperaturas aumentarão então para quase 90 °C (194 °F) para a CPU e 75 °C (167 °F) para a GPU.
Durante o teste de estresse, a velocidade do clock da CPU permanece em torno de 4.500 MHz, caindo para cerca de 4.000 MHz quando o chip gráfico é adicionado.
Alto-falantes
Os alto-falantes deixam uma impressão muito variada. Os graves médios, que também são usados principalmente em jogos de ação, soam surpreendentemente bons e potentes. As vozes também soam naturais e incluem uma certa profundidade nos detalhes.
Os graves profundos não estão presentes e os médios mais baixos, a faixa das guitarras ou da bateria, são fracos. Também é perceptível que as vozes podem se perder facilmente no fundo, atrás de outros ruídos. Os alto-falantes são bons para jogos, mas nem a transmissão de vídeo nem a audição de música devem ser incluídas nos cenários de uso recomendados para os alto-falantes medíocres.
HP Omen 17-db0079ng análise de áudio
(±) | o volume do alto-falante é médio, mas bom (###valor### dB)
Graves 100 - 315Hz
(-) | quase nenhum baixo - em média 19.1% menor que a mediana
(±) | a linearidade dos graves é média (10.3% delta para a frequência anterior)
Médios 400 - 2.000 Hz
(+) | médios equilibrados - apenas 1.9% longe da mediana
(+) | médios são lineares (4.4% delta para frequência anterior)
Altos 2 - 16 kHz
(+) | agudos equilibrados - apenas 3.8% longe da mediana
(±) | a linearidade dos máximos é média (7.8% delta para frequência anterior)
Geral 100 - 16.000 Hz
(+) | o som geral é linear (14.3% diferença em relação à mediana)
Comparado com a mesma classe
» 25% de todos os dispositivos testados nesta classe foram melhores, 7% semelhantes, 69% piores
» O melhor teve um delta de 6%, a média foi 18%, o pior foi 132%
Comparado com todos os dispositivos testados
» 16% de todos os dispositivos testados foram melhores, 4% semelhantes, 80% piores
» O melhor teve um delta de 4%, a média foi 24%, o pior foi 134%
Apple MacBook Pro 16 2021 M1 Pro análise de áudio
(+) | os alto-falantes podem tocar relativamente alto (###valor### dB)
Graves 100 - 315Hz
(+) | bons graves - apenas 3.8% longe da mediana
(+) | o baixo é linear (5.2% delta para a frequência anterior)
Médios 400 - 2.000 Hz
(+) | médios equilibrados - apenas 1.3% longe da mediana
(+) | médios são lineares (2.1% delta para frequência anterior)
Altos 2 - 16 kHz
(+) | agudos equilibrados - apenas 1.9% longe da mediana
(+) | os máximos são lineares (2.7% delta da frequência anterior)
Geral 100 - 16.000 Hz
(+) | o som geral é linear (4.6% diferença em relação à mediana)
Comparado com a mesma classe
» 0% de todos os dispositivos testados nesta classe foram melhores, 0% semelhantes, 100% piores
» O melhor teve um delta de 5%, a média foi 18%, o pior foi 45%
Comparado com todos os dispositivos testados
» 0% de todos os dispositivos testados foram melhores, 0% semelhantes, 100% piores
» O melhor teve um delta de 4%, a média foi 24%, o pior foi 134%
Gerenciamento de energia - Eficiente para um laptop para jogos
Consumo de energia
O consumo máximo de energia limitado não é muito surpreendente, já que a CPU e a GPU são ligeiramente estranguladas. Medimos um valor máximo de 230 watts, que é quase 10% menor do que o consumo de outros modelos com essa placa de vídeo.
O que é realmente notável, por outro lado, são nossas medições de consumo quando não há carga digna de menção. Em alguns momentos, o Omen 17 consome apenas 50% do que os concorrentes usam. Isso também explica a falta de aquecimento, que quase não é registrado, e a boa duração da bateria.
| desligado | |
| Ocioso | |
| Carga |
|
Key:
min: | |
| HP Omen 17-db0079ng R7 8845HS, NVIDIA GeForce RTX 4070 Laptop GPU | Alienware m16 R2 Ultra 7 155H, NVIDIA GeForce RTX 4070 Laptop GPU | Asus ROG Strix Scar 16 G634JZR i9-14900HX, NVIDIA GeForce RTX 4080 Laptop GPU | Acer Predator Helios Neo 16 (2024) i7-14700HX, NVIDIA GeForce RTX 4070 Laptop GPU | Asus TUF Gaming A17 FA707XI-NS94 R9 7940HS, NVIDIA GeForce RTX 4070 Laptop GPU | Asus TUF Gaming A15 FA507UV R9 8945H, NVIDIA GeForce RTX 4060 Laptop GPU | Média NVIDIA GeForce RTX 4070 Laptop GPU | Média da turma Gaming | |
|---|---|---|---|---|---|---|---|---|
| Power Consumption | -38% | -59% | -122% | -20% | 6% | -46% | -56% | |
| Idle Minimum * | 6 | 8.1 -35% | 10.71 -79% | 26.7 -345% | 6.2 -3% | 7 -17% | 12.8 ? -113% | 13.4 ? -123% |
| Idle Average * | 12 | 13 -8% | 14.75 -23% | 24.4 -103% | 21.8 -82% | 12 -0% | 17.8 ? -48% | 18.9 ? -58% |
| Idle Maximum * | 18 | 40.3 -124% | 30 -67% | 32.7 -82% | 22 -22% | 18 -0% | 24.3 ? -35% | 26.3 ? -46% |
| Load Average * | 71 | 79 -11% | 135 -90% | 122.1 -72% | 59.2 17% | 70 1% | 96.9 ? -36% | 102.7 ? -45% |
| Cyberpunk 2077 ultra * | 197 | 146.8 25% | ||||||
| Cyberpunk 2077 ultra external monitor * | 191.8 | 146.2 24% | ||||||
| Load Maximum * | 228 | 254.9 -12% | 307 -35% | 241 -6% | 247.8 -9% | 206 10% | 221 ? 3% | 244 ? -7% |
| Witcher 3 ultra * | 188.1 | 286 | 190.6 | 189.7 |
* ... menor é melhor
Power Consumption Cyberpunk / Stress Test
Power Consumption With External Monitor
Duração da bateria
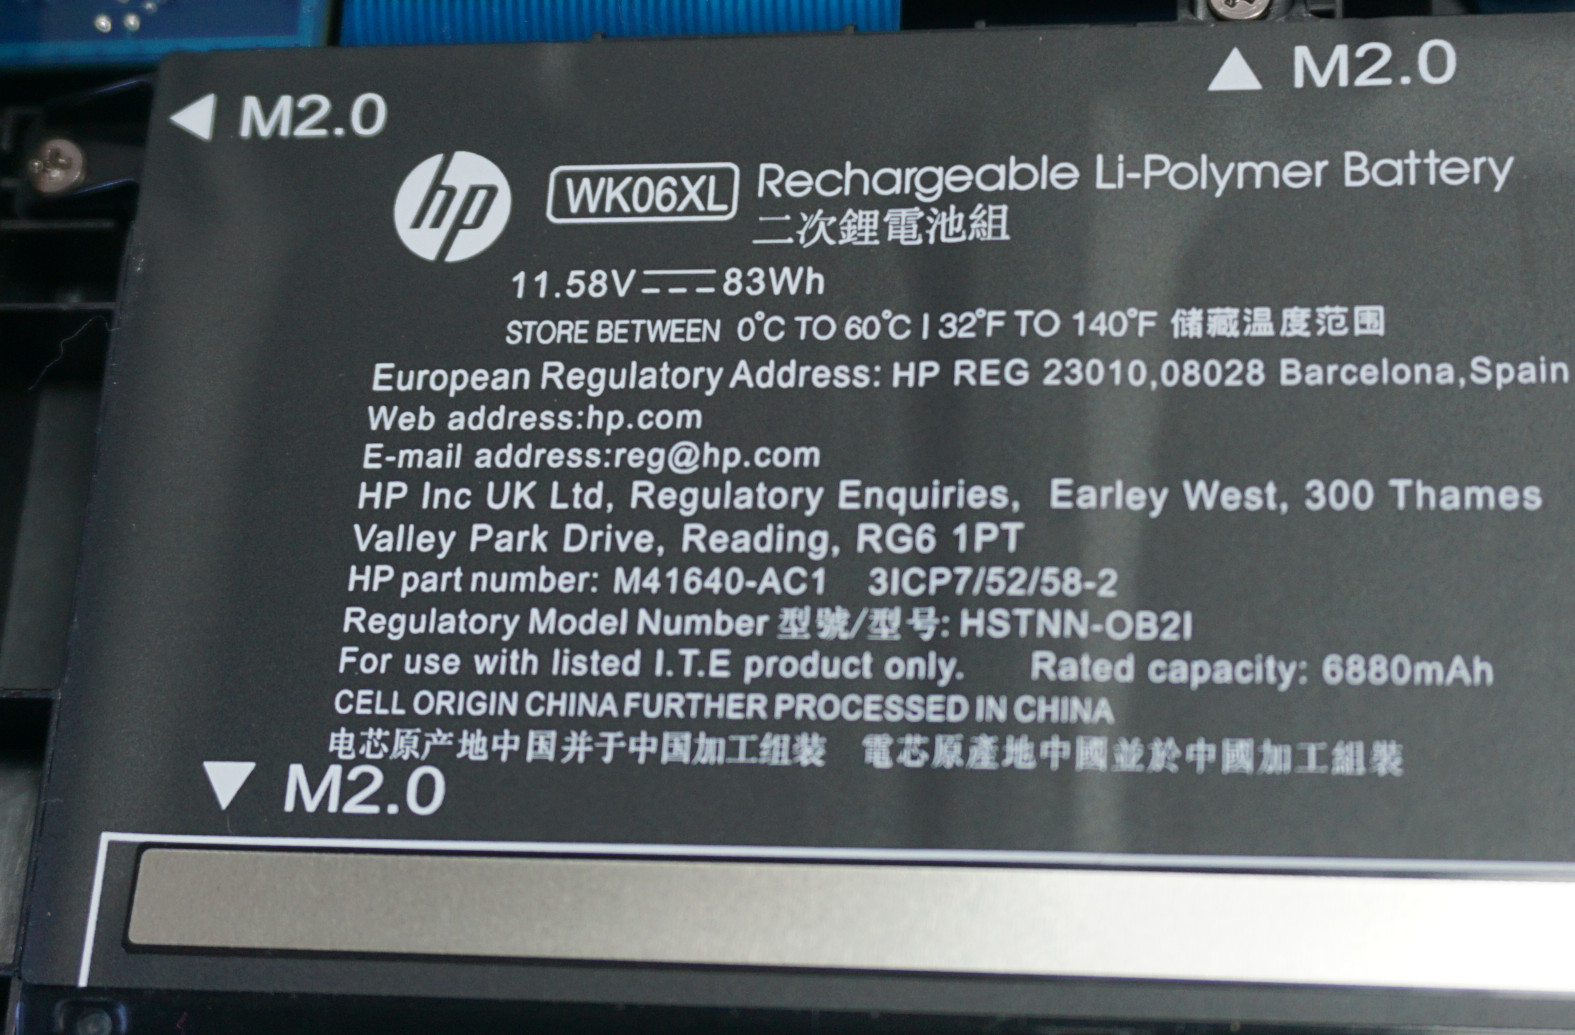
Como esperávamos em função do consumo moderado de energia, a duração da bateria está em um nível alto, considerando o desempenho de computação. Embora com uma capacidade de 83 Wh, a bateria seja menor do que a de outros notebooks para jogos de médio porte, o tempo de execução em nosso teste de navegação na Web é ligeiramente superior a 9 horas. Durante esse teste, o brilho da tela foi reduzido para 150 cd/m², o que normalmente também deve ser suficiente para o trabalho de mesa e, em geral, durante a noite.
Com o brilho máximo, o Omen 17 não é tão eficiente. A tela grande exige o que lhe é devido, resultando na redução da duração da bateria quase pela metade, para apenas 5 horas. A reprodução de vídeos também é menos eficiente. Como também fica evidente durante o streaming de vídeo, os gráficos integrados são usados em uma extensão bastante completa. Mas, pelo menos, a duração da bateria quase atinge a marca de 8 horas.
Embora a duração da bateria possa não ser excelente no geral, ela está em um bom nível para um notebook para jogos.
| HP Omen 17-db0079ng R7 8845HS, NVIDIA GeForce RTX 4070 Laptop GPU, 83 Wh | Alienware m16 R2 Ultra 7 155H, NVIDIA GeForce RTX 4070 Laptop GPU, 90 Wh | Asus ROG Strix Scar 16 G634JZR i9-14900HX, NVIDIA GeForce RTX 4080 Laptop GPU, 90 Wh | Acer Predator Helios Neo 16 (2024) i7-14700HX, NVIDIA GeForce RTX 4070 Laptop GPU, 90.61 Wh | Asus TUF Gaming A17 FA707XI-NS94 R9 7940HS, NVIDIA GeForce RTX 4070 Laptop GPU, 90 Wh | Asus TUF Gaming A15 FA507UV R9 8945H, NVIDIA GeForce RTX 4060 Laptop GPU, 90 Wh | Média da turma Gaming | |
|---|---|---|---|---|---|---|---|
| Duração da bateria | -11% | -11% | -53% | 1% | 29% | -16% | |
| H.264 | 462 | 451 -2% | 242 -48% | 447 ? -3% | |||
| WiFi v1.3 | 544 | 483 -11% | 434 -20% | 227 -58% | 548 1% | 702 29% | 387 ? -29% |
| Cyberpunk 2077 ultra 150cd | 59 | ||||||
| Witcher 3 ultra | 57 | 74.7 ? |
Pro
Contra
Veredicto - O foco em jogos exige alguns compromissos
O HP Omen 17 (2024) é um laptop para jogos puro que não oferece mais do que o equipamento necessário em qualquer lugar. Isso resulta em uma combinação de desempenho de computação elevado para jogos exigentes e um preço aceitável.
A RTX 4070 e o AMD Ryzen 7 da oitava geração combinam bem com a tela QHD, mesmo que sua taxa de atualização de 240 Hertz seja quase impossível de alcançar com os jogos atuais. Infelizmente, o restante das características da tela é insuficiente para lidar também com tarefas como processamento de imagens em alto nível.
Jogos rápidos com um ruído moderado da ventoinha, mas o Omen 17 não oferece muito mais do que isso.
O que também é bem-sucedido é a implementação do sistema de resfriamento. A HP configura a CPU e a GPU para funcionar abaixo de suas capacidades máximas e faz bom uso do espaço dentro de um laptop de 17 polegadas. Mesmo sob a carga mais alta, o ruído do ventilador continua sendo suportável. No modo "Balanced", ele até desaparece no fundo.
Em todas as áreas restantes, há alguns compromissos importantes. As conexões são limitadas e as que estão disponíveis são relativamente lentas. A webcam e os alto-falantes atendem apenas às demandas mais baixas, na melhor das hipóteses. E, por fim, os dispositivos de entrada só são adequados para jogos até certo ponto, de modo que o senhor deve adicionar não apenas o mouse para jogos habitual, mas também um teclado adequado.
Embora os concorrentes com desempenho comparável para jogos geralmente ofereçam o melhor pacote geral, eles também são mais caros. Uma alternativa que não é tão bem equipada e até mesmo tem uma tela mais fraca, mas pelo menos oferece um teclado sólido, é o Asus TUF Gaming A17 F707. E com duas conexões Thunderbolt 4 e uma excelente tela, o Acer Predator Helios Neo 16 é claramente um laptop melhor. Mas se considerarmos apenas o desempenho puro em jogos, nenhum desses dois laptops é significativamente mais rápido, mas apenas muito mais barulhento.
Preço e disponibilidade
O HP Omen 17 (2024) está disponível diretamente na HP a partir de US$ 999. O senhor pode configurar os componentes e nossa configuração testada com uma RTX 4070 e tela QHD custa aproximadamente US$ 1660. A Amazon oferece um modelo com o mesmo processador, mas com a RTX 4050, por aproximadamente US$ 1500.
Observe que atualizamos recentemente nosso sistema de classificação e que os resultados da versão 8 não são mais comparáveis aos da versão 7. O senhor pode encontrar informações adicionais sobre isso aqui.
HP Omen 17-db0079ng
- 07/22/2024 v8
Mario Petzold
 Total Sustainability Score:
 Transparência
A seleção dos dispositivos a serem analisados é feita pela nossa equipe editorial. A amostra de teste foi fornecida ao autor como empréstimo pelo fabricante ou varejista para fins desta revisão. O credor não teve influência nesta revisão, nem o fabricante recebeu uma cópia desta revisão antes da publicação. Não houve obrigação de publicar esta revisão. Nunca aceitamos compensação ou pagamento em troca de nossas avaliações. Como empresa de mídia independente, a Notebookcheck não está sujeita à autoridade de fabricantes, varejistas ou editores.
É assim que o Notebookcheck está testando
Todos os anos, o Notebookcheck analisa de forma independente centenas de laptops e smartphones usando procedimentos padronizados para garantir que todos os resultados sejam comparáveis. Desenvolvemos continuamente nossos métodos de teste há cerca de 20 anos e definimos padrões da indústria no processo. Em nossos laboratórios de teste, equipamentos de medição de alta qualidade são utilizados por técnicos e editores experientes. Esses testes envolvem um processo de validação em vários estágios. Nosso complexo sistema de classificação é baseado em centenas de medições e benchmarks bem fundamentados, o que mantém a objetividade.Price comparison

