

Análise do Asus TUF Gaming A15 (2024): Potência da RTX 4060, preço moderado, bateria de longa duração

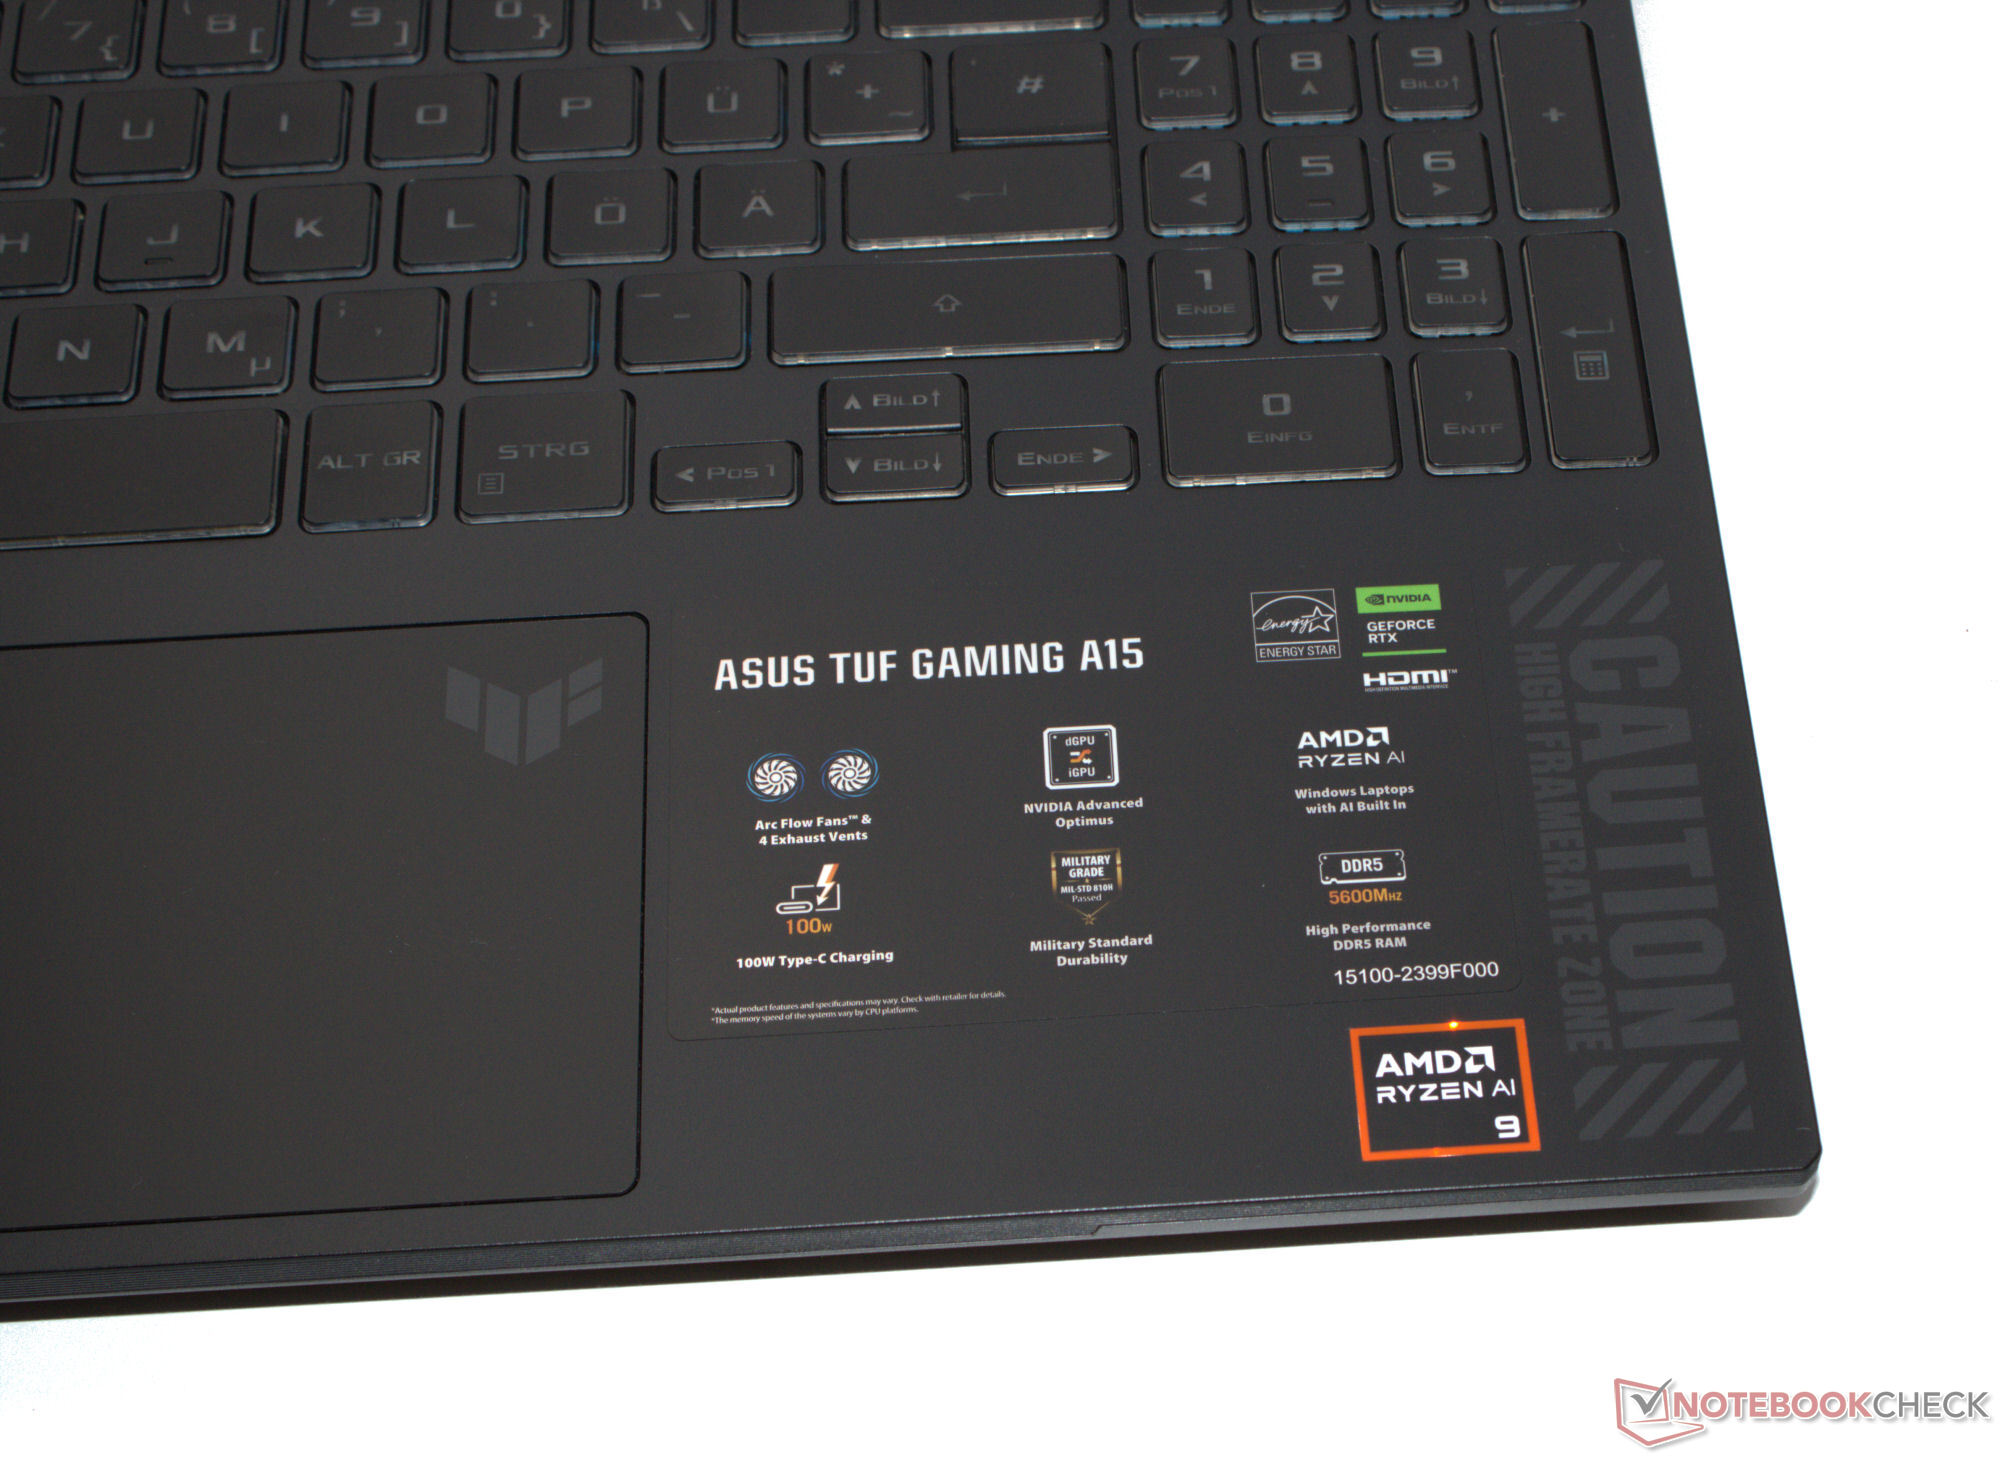
"TUF Gaming" é sinônimo de laptops para jogos na extremidade inferior da escala de preços: Ryzen 9 8945H, GeForce RTX 4060, 16 GB de RAM, um SSD de 512 GB e um preço de cerca de US$ 1.399 formam um laptop para jogos de médio porte acessível. A concorrência pode ser encontrada na forma de dispositivos como o Lenovo LOQ 15IRX9e o Gigabyte G6X 9KG (2024), o Dell G16o XMG Core 15 (M24) e o HP Victus 16 (2024).
Isso é idêntico ao modelo irmão do ano anterior, o A15 que analisamos no ano passado. A principal diferença é a mudança do Ryzen 7000 para o Ryzen 8000.
Possíveis concorrentes em comparação
Avaliação | Versão | Data | Modelo | Peso | Altura | Size | Resolução | Preço |
|---|---|---|---|---|---|---|---|---|
| 80.3 % | v8 | 07/2024 | Asus TUF Gaming A15 FA507UV R9 8945H, NVIDIA GeForce RTX 4060 Laptop GPU | 2.1 kg | 22.4 mm | 15.60" | 1920x1080 | |
| 79 % | v8 | 07/2024 | Lenovo LOQ 15IRX9 i5-13450HX, NVIDIA GeForce RTX 4060 Laptop GPU | 2.4 kg | 23.9 mm | 15.60" | 1920x1080 | |
| 84.3 % v7 (old) | v7 (old) | 05/2024 | HP Victus 16 (2024) i7-14700HX, NVIDIA GeForce RTX 4060 Laptop GPU | 2.4 kg | 23.9 mm | 16.10" | 1920x1080 | |
| 83.2 % v7 (old) | v7 (old) | 03/2024 | Gigabyte G6X 9KG (2024) i7-13650HX, NVIDIA GeForce RTX 4060 Laptop GPU | 2.6 kg | 25.1 mm | 16.00" | 1920x1200 | |
| 83.7 % | v8 | 06/2024 | SCHENKER XMG Core 15 (M24) R7 8845HS, NVIDIA GeForce RTX 4060 Laptop GPU | 2.1 kg | 21.9 mm | 15.30" | 2560x1600 | |
| 85.5 % v7 (old) | v7 (old) | 02/2024 | Dell G16, i7-13650HX, RTX 4060 i7-13650HX, NVIDIA GeForce RTX 4060 Laptop GPU | 2.8 kg | 25.65 mm | 16.00" | 2560x1600 |
Observação: Atualizamos recentemente nosso sistema de classificação e os resultados da versão 8 não são comparáveis aos resultados da versão 7. Mais informações estão disponíveis aqui.
Case e recursos - Asus TUF e USB 4
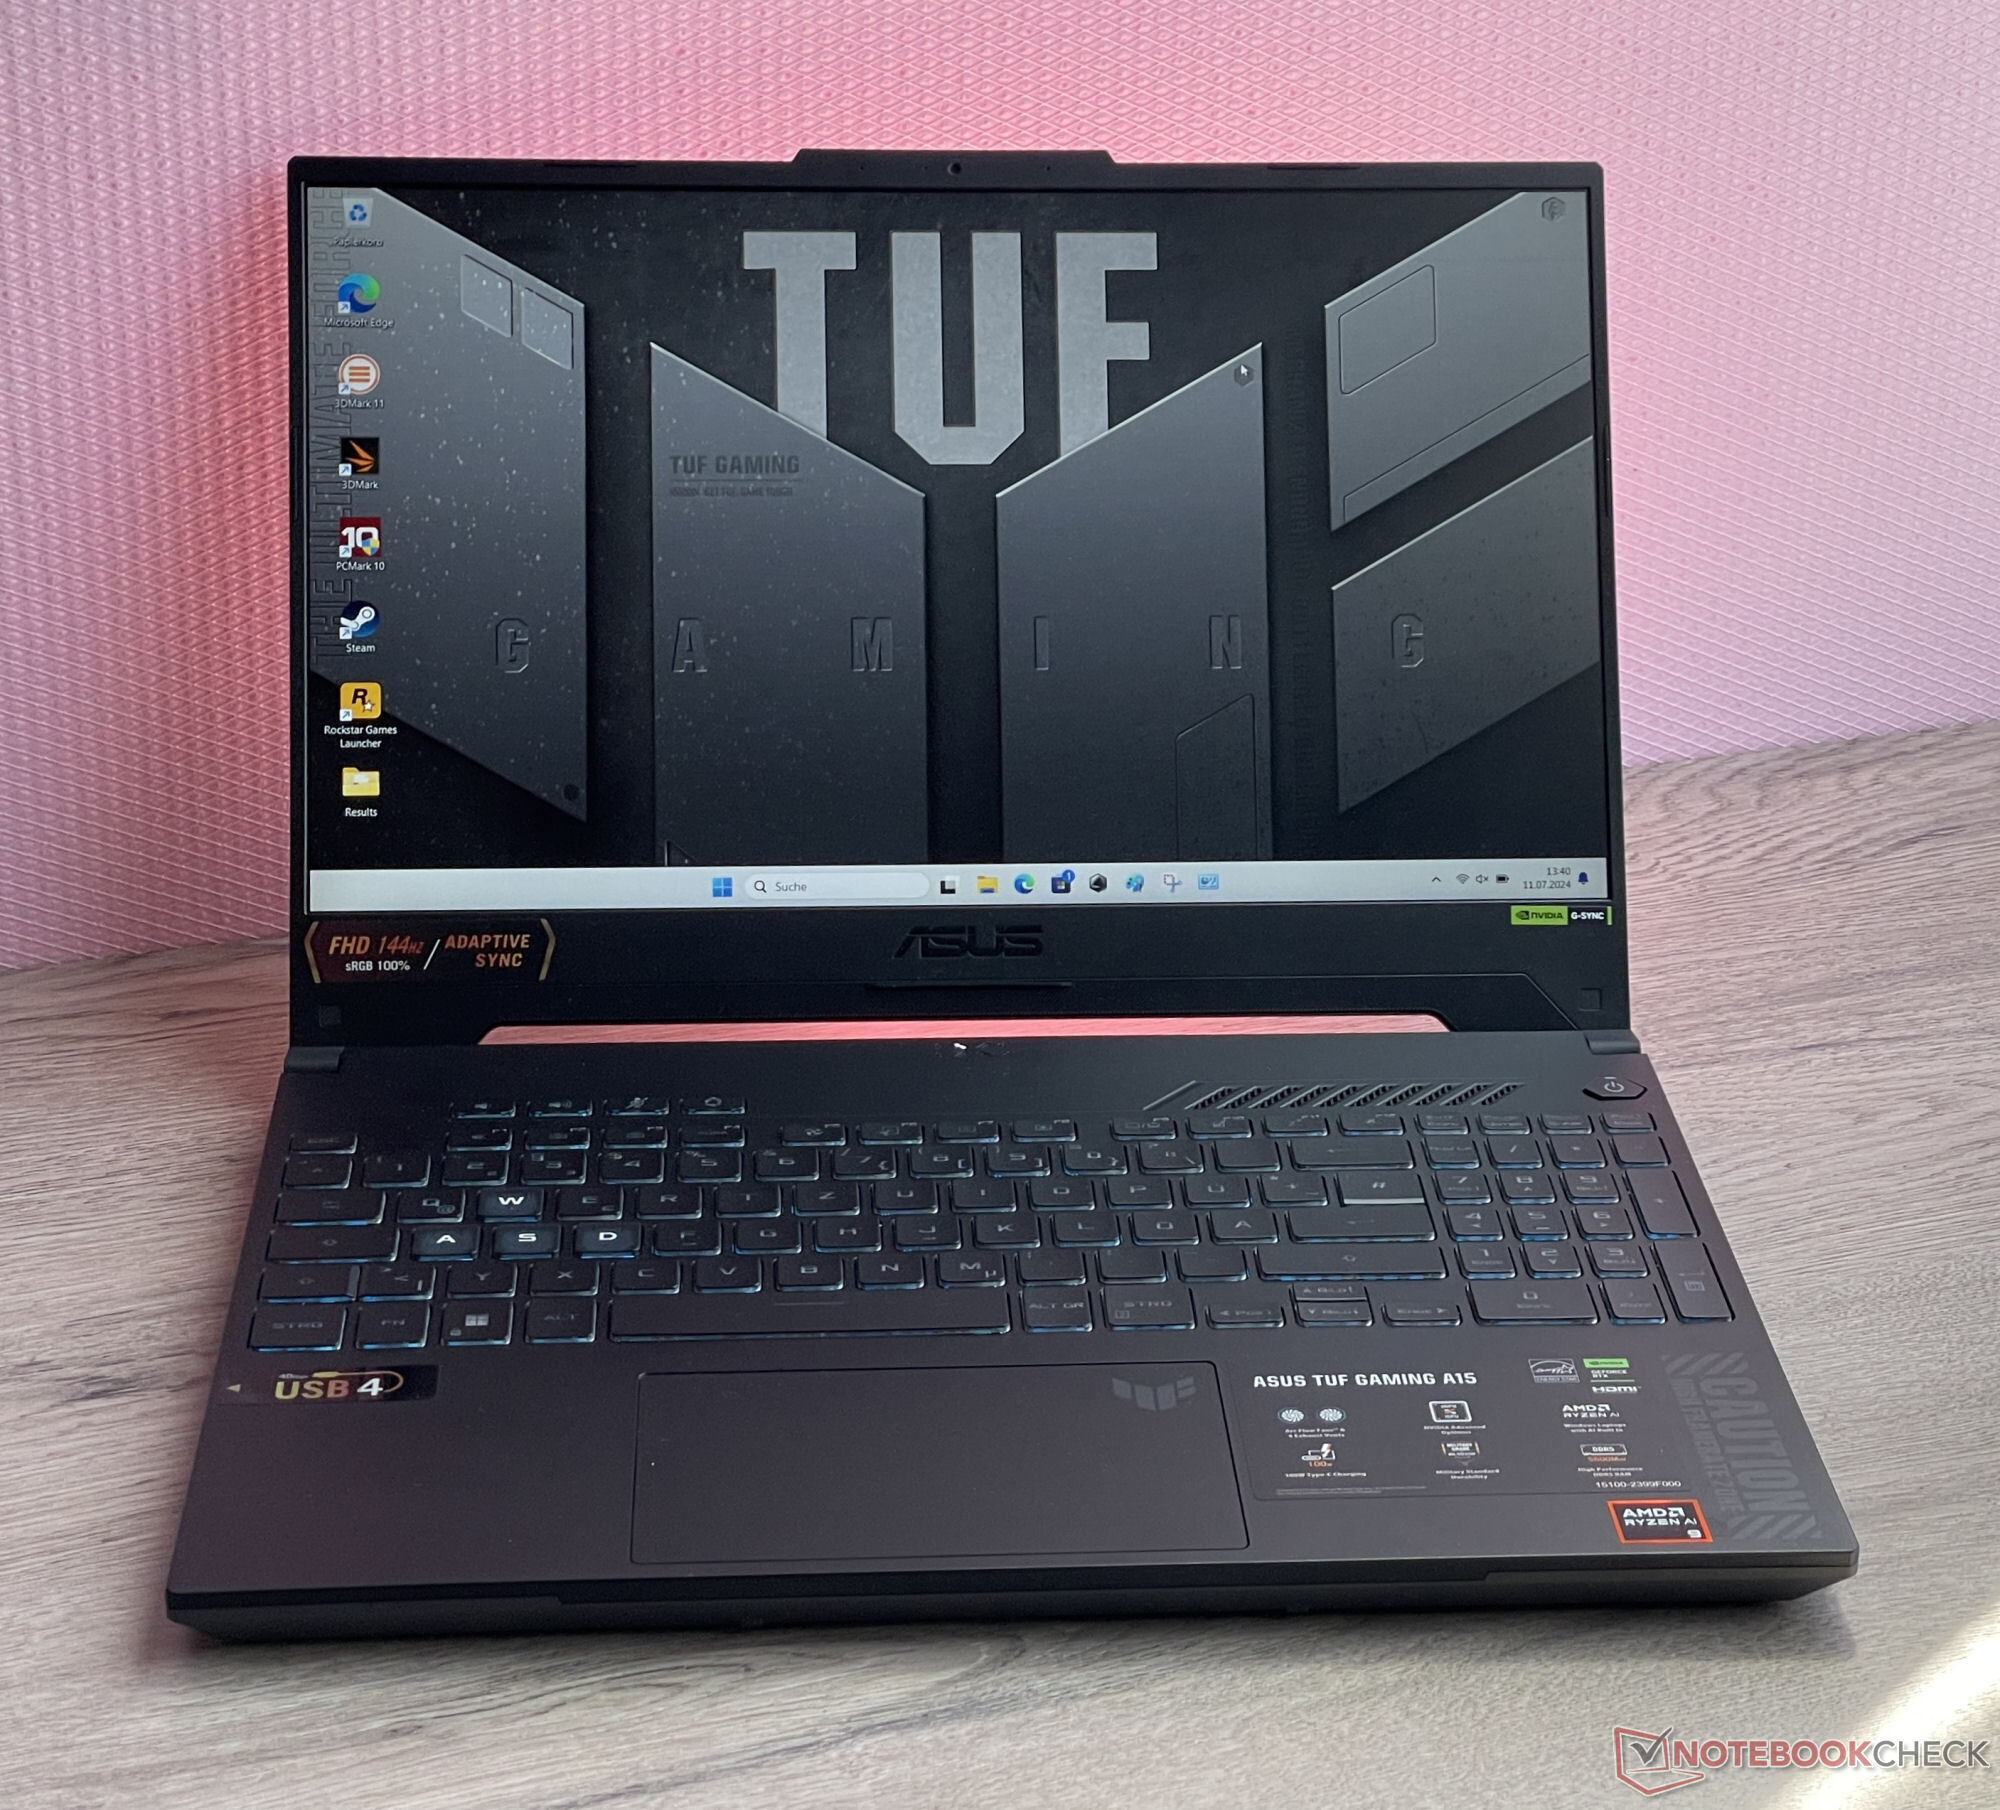
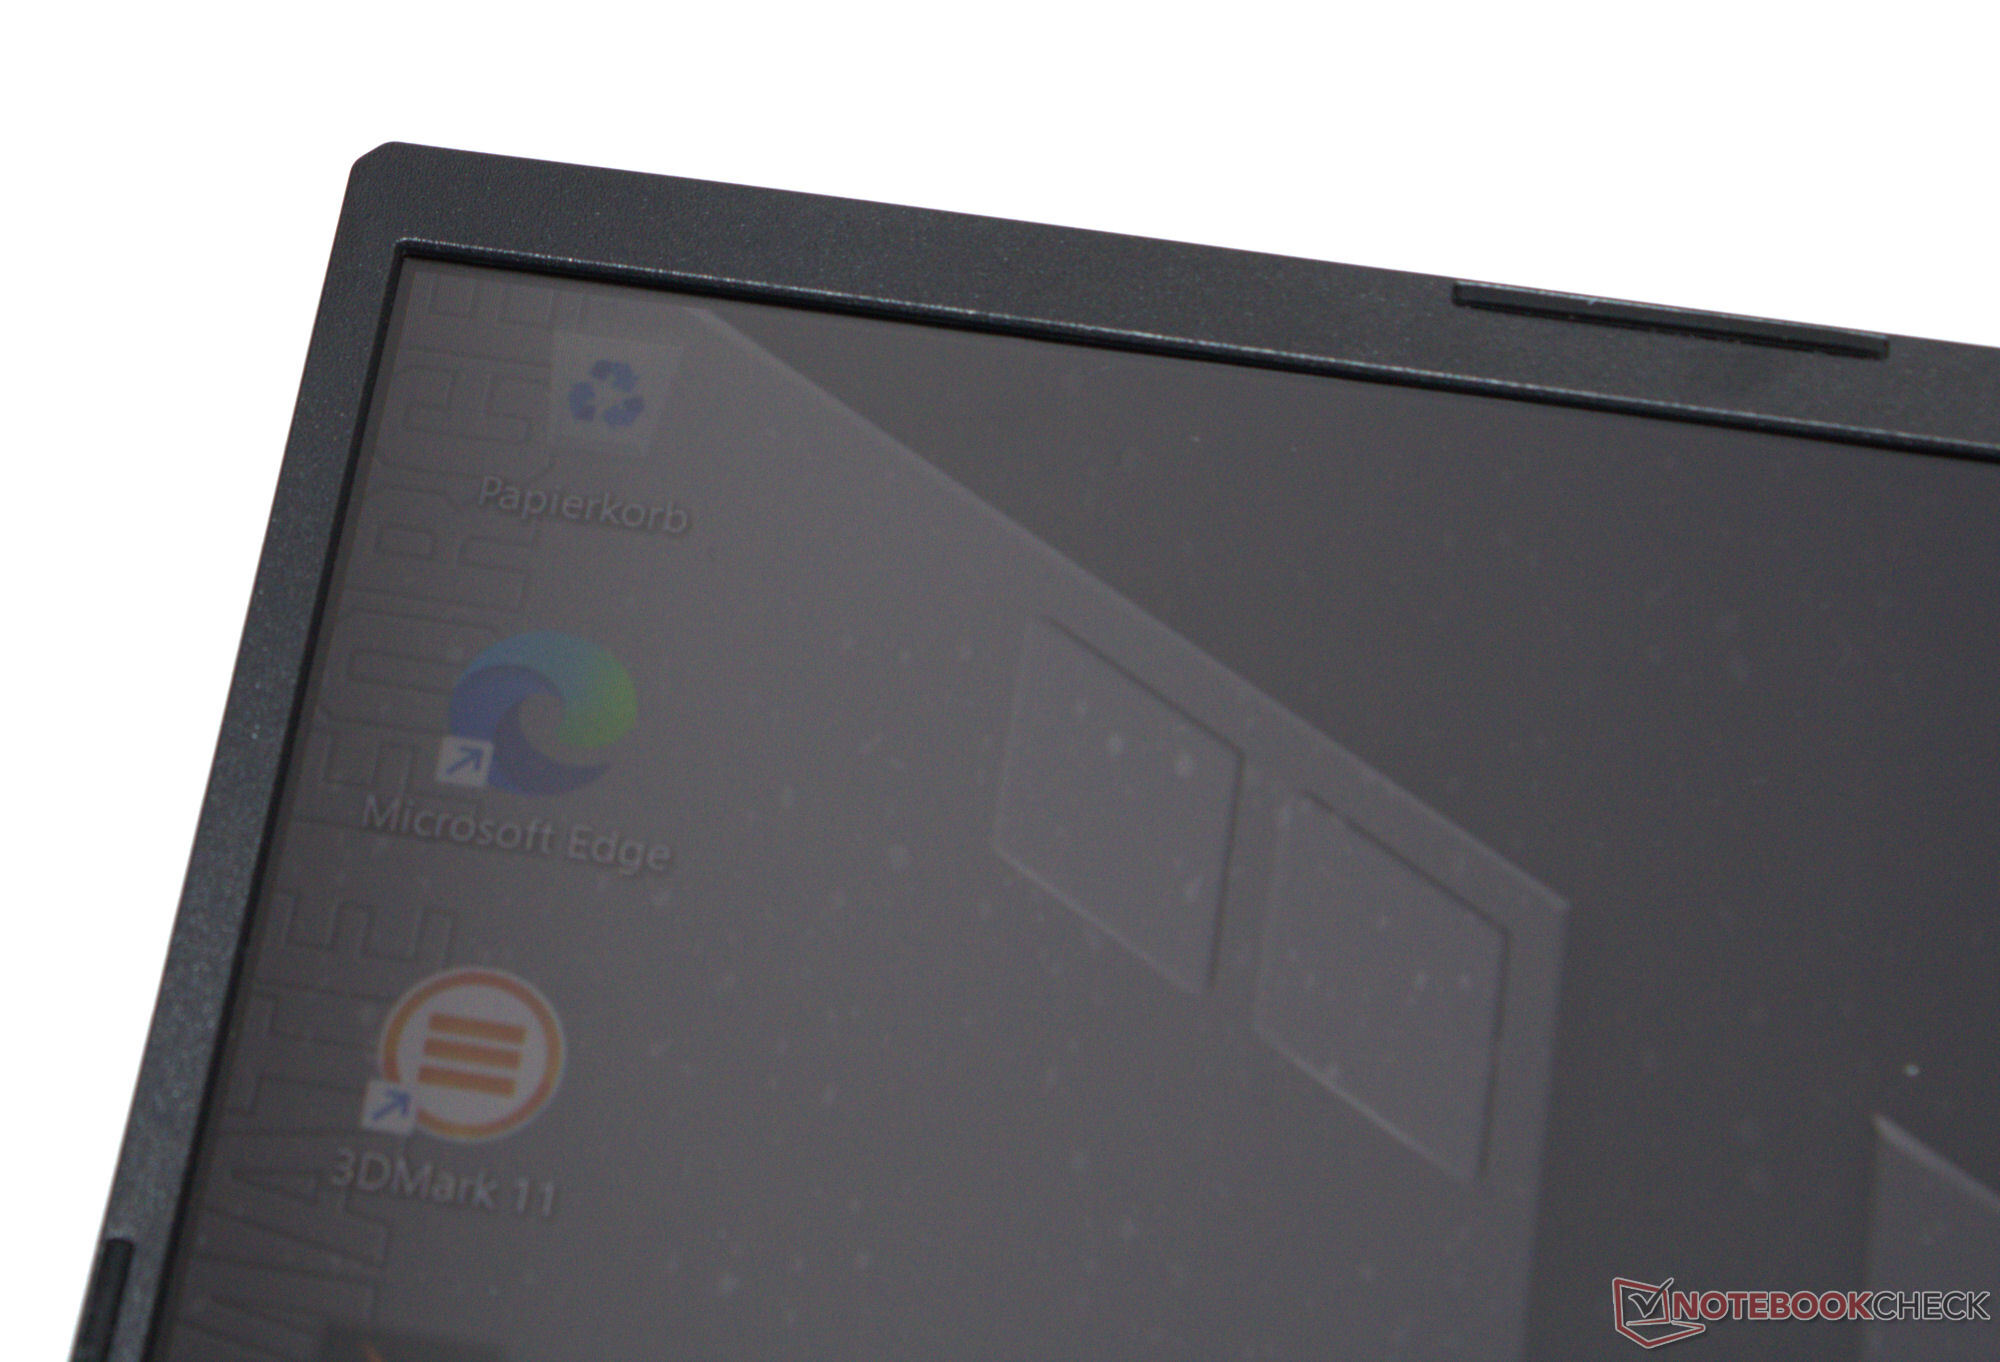
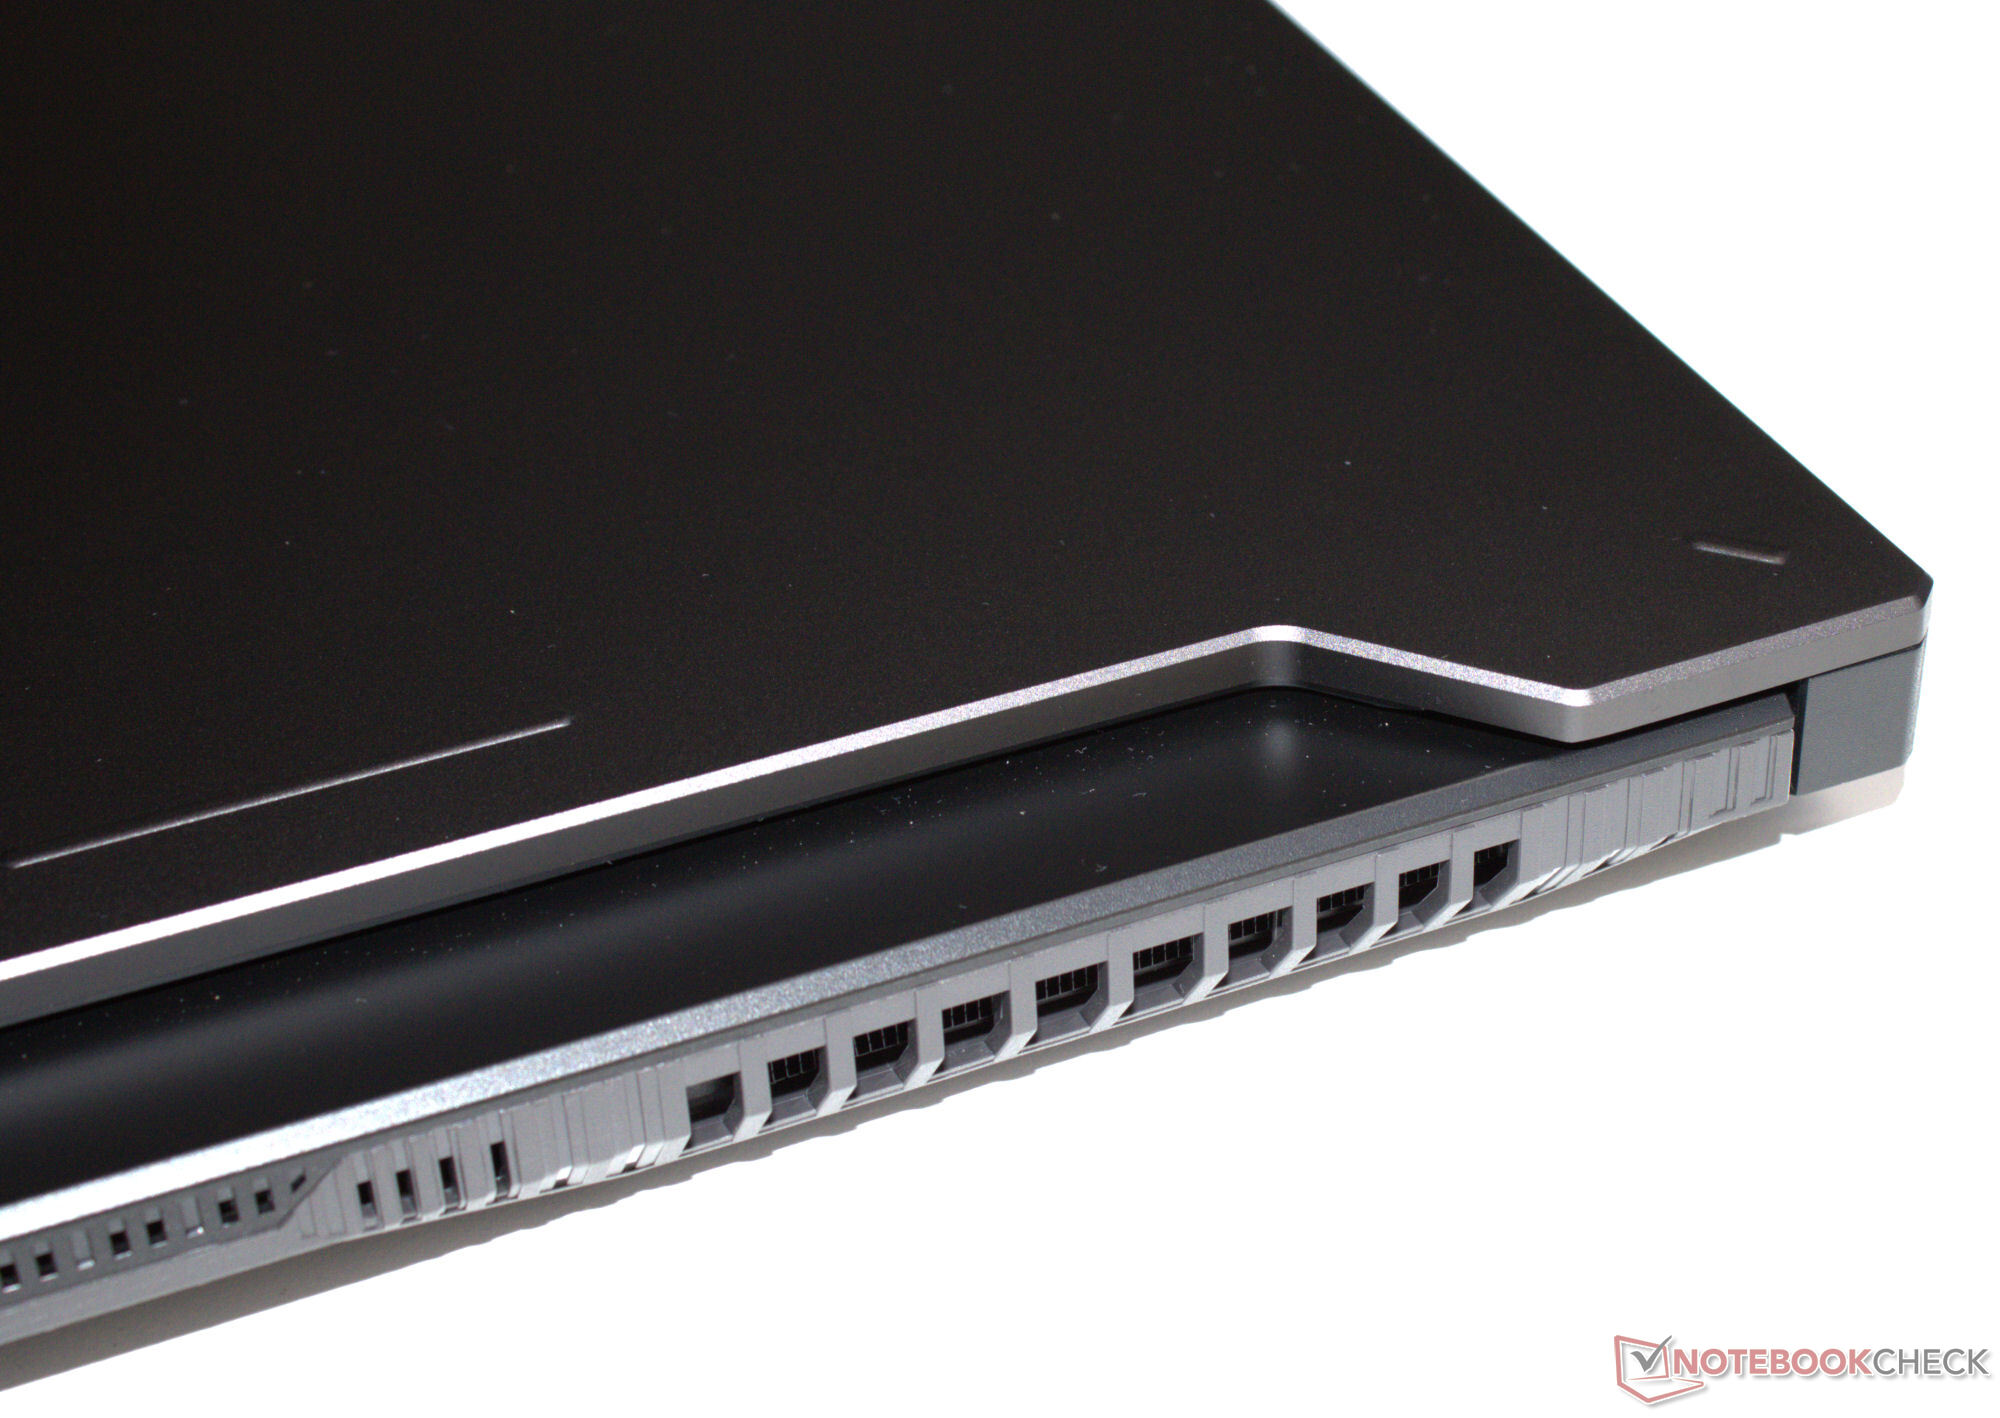
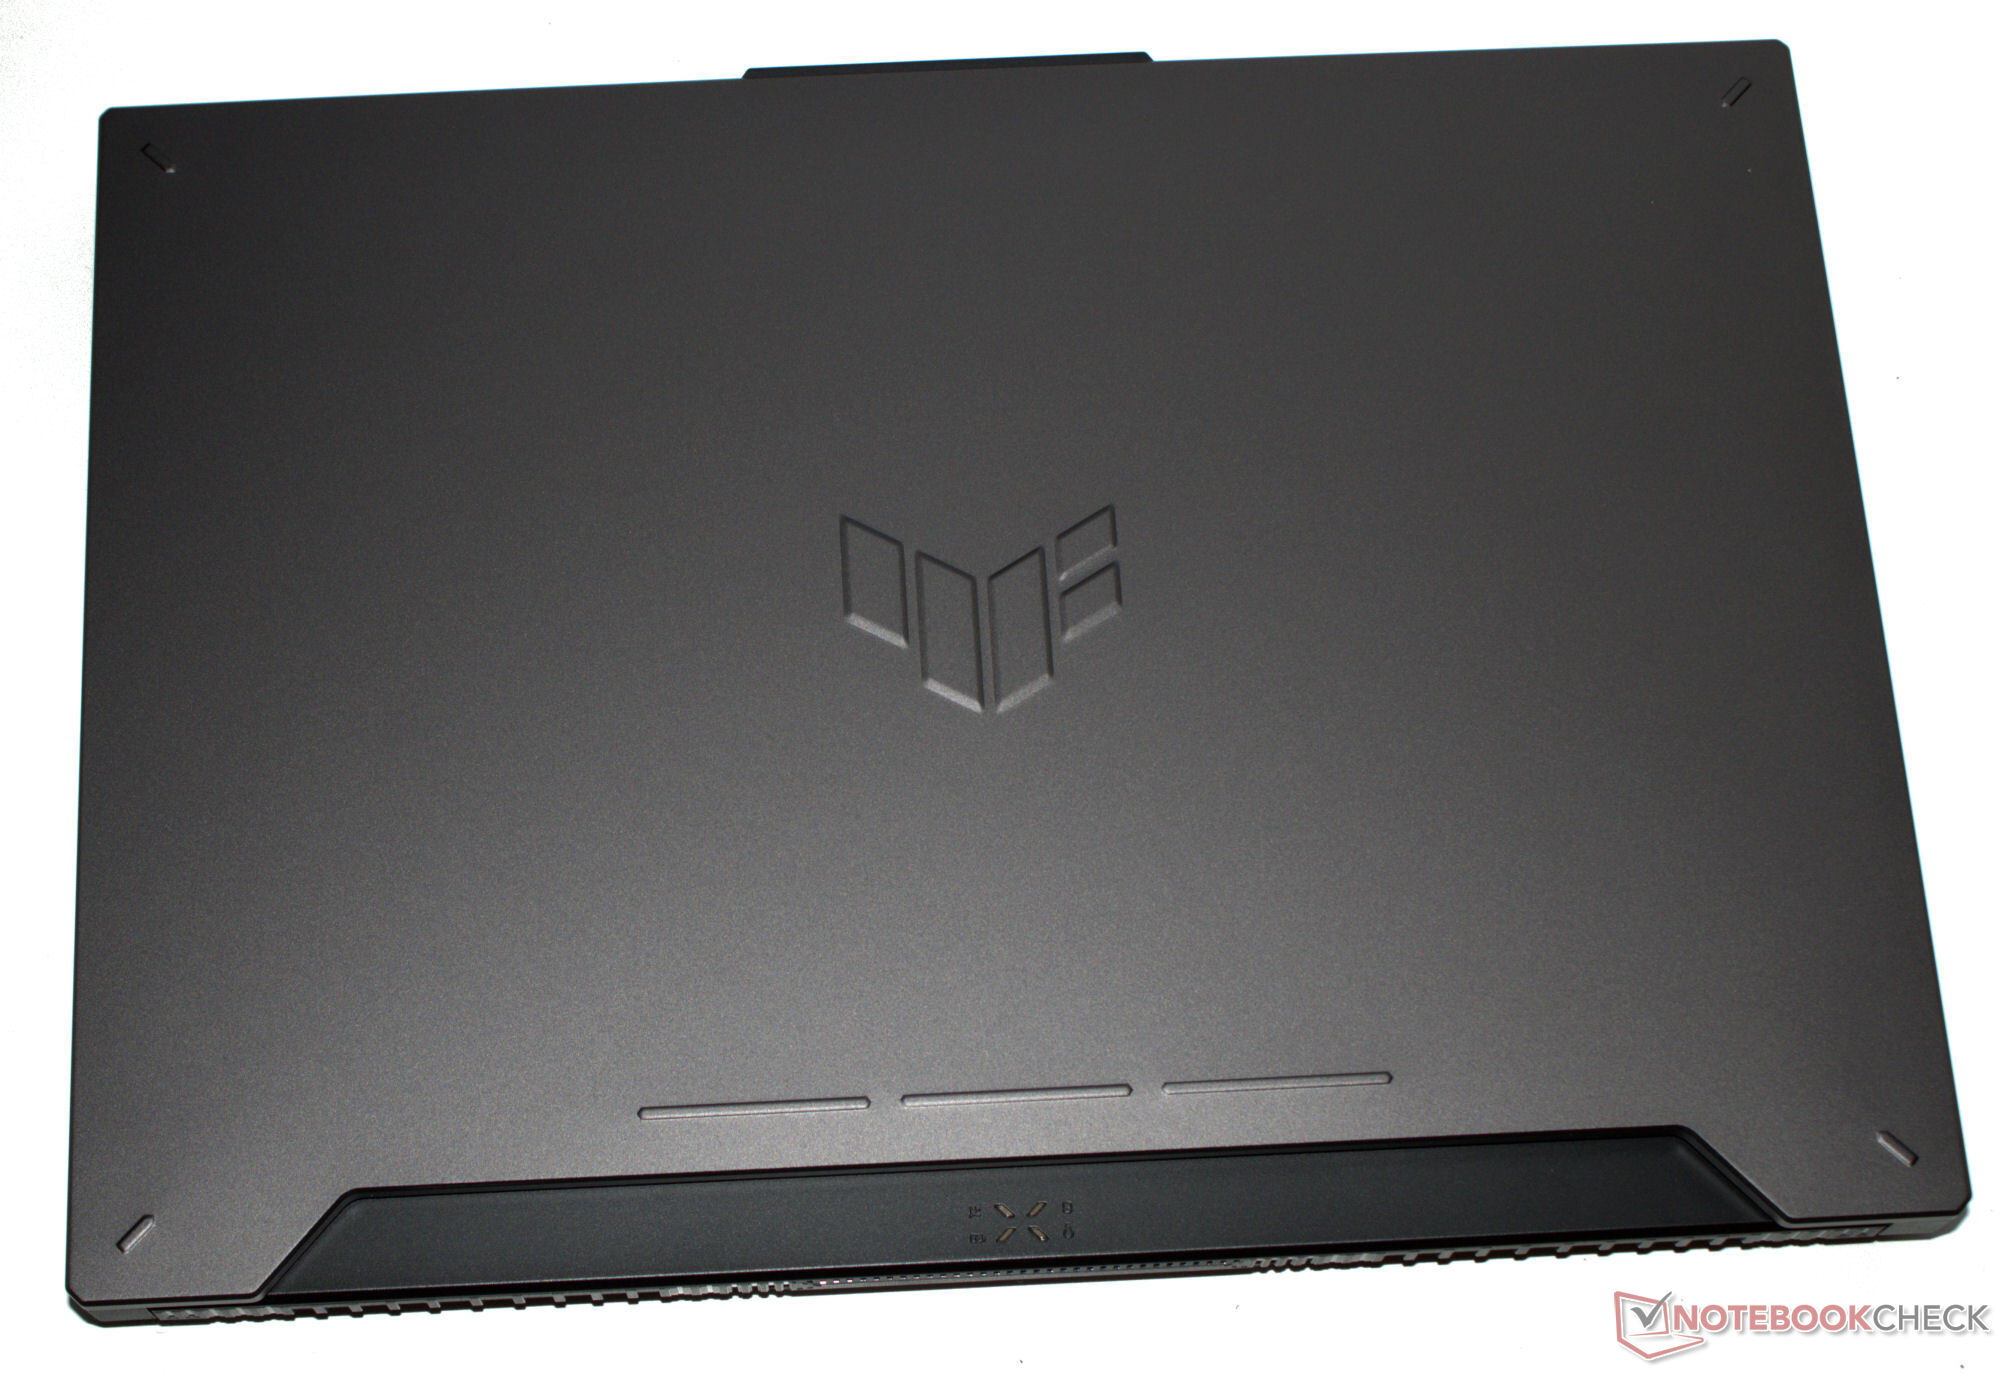
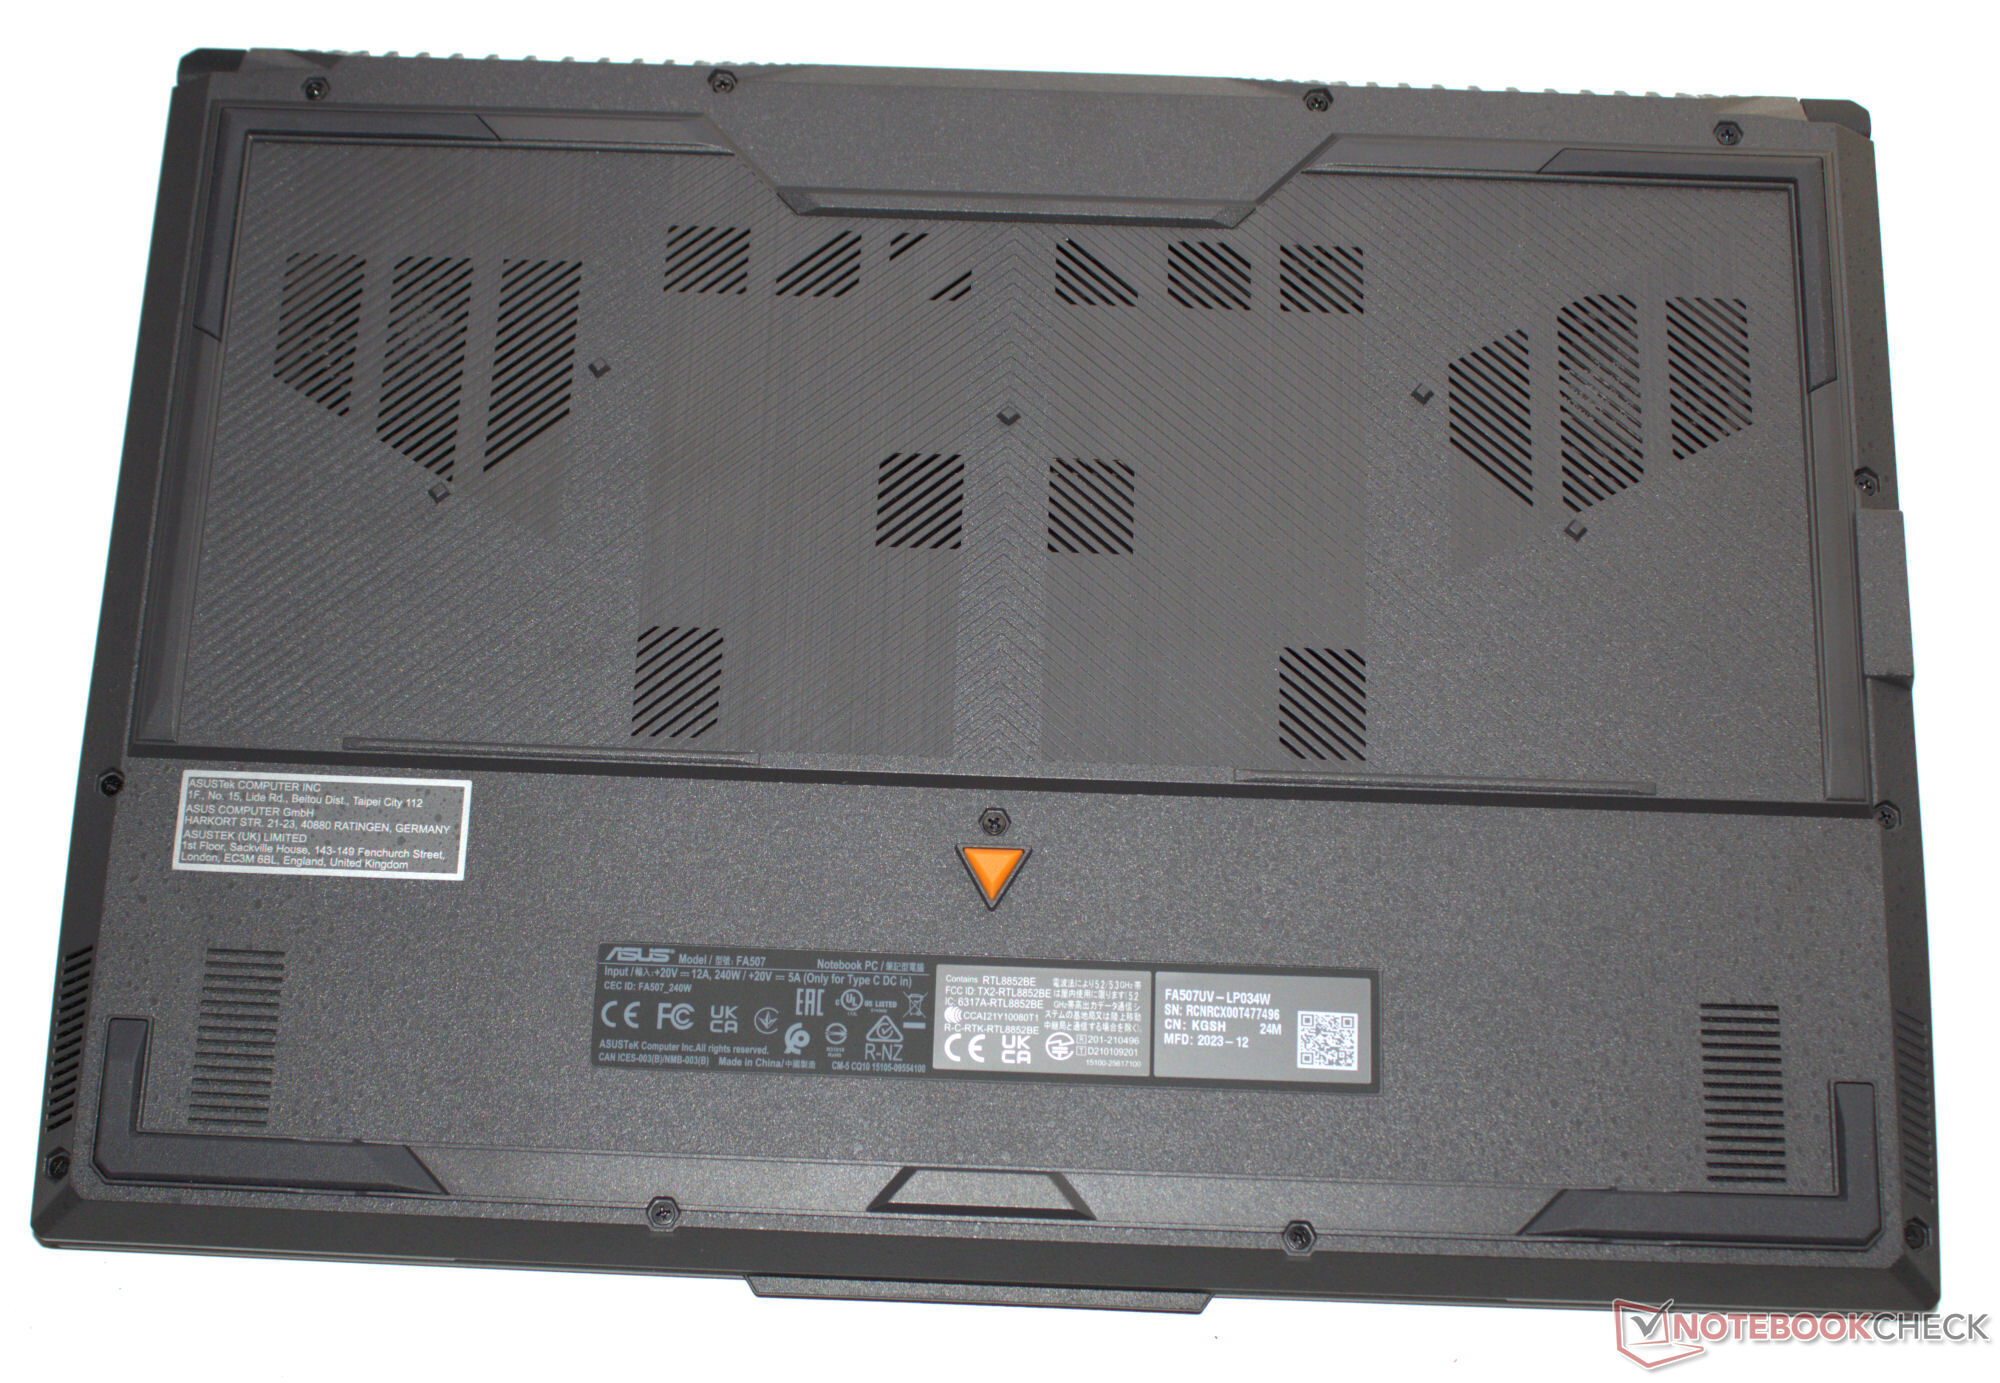
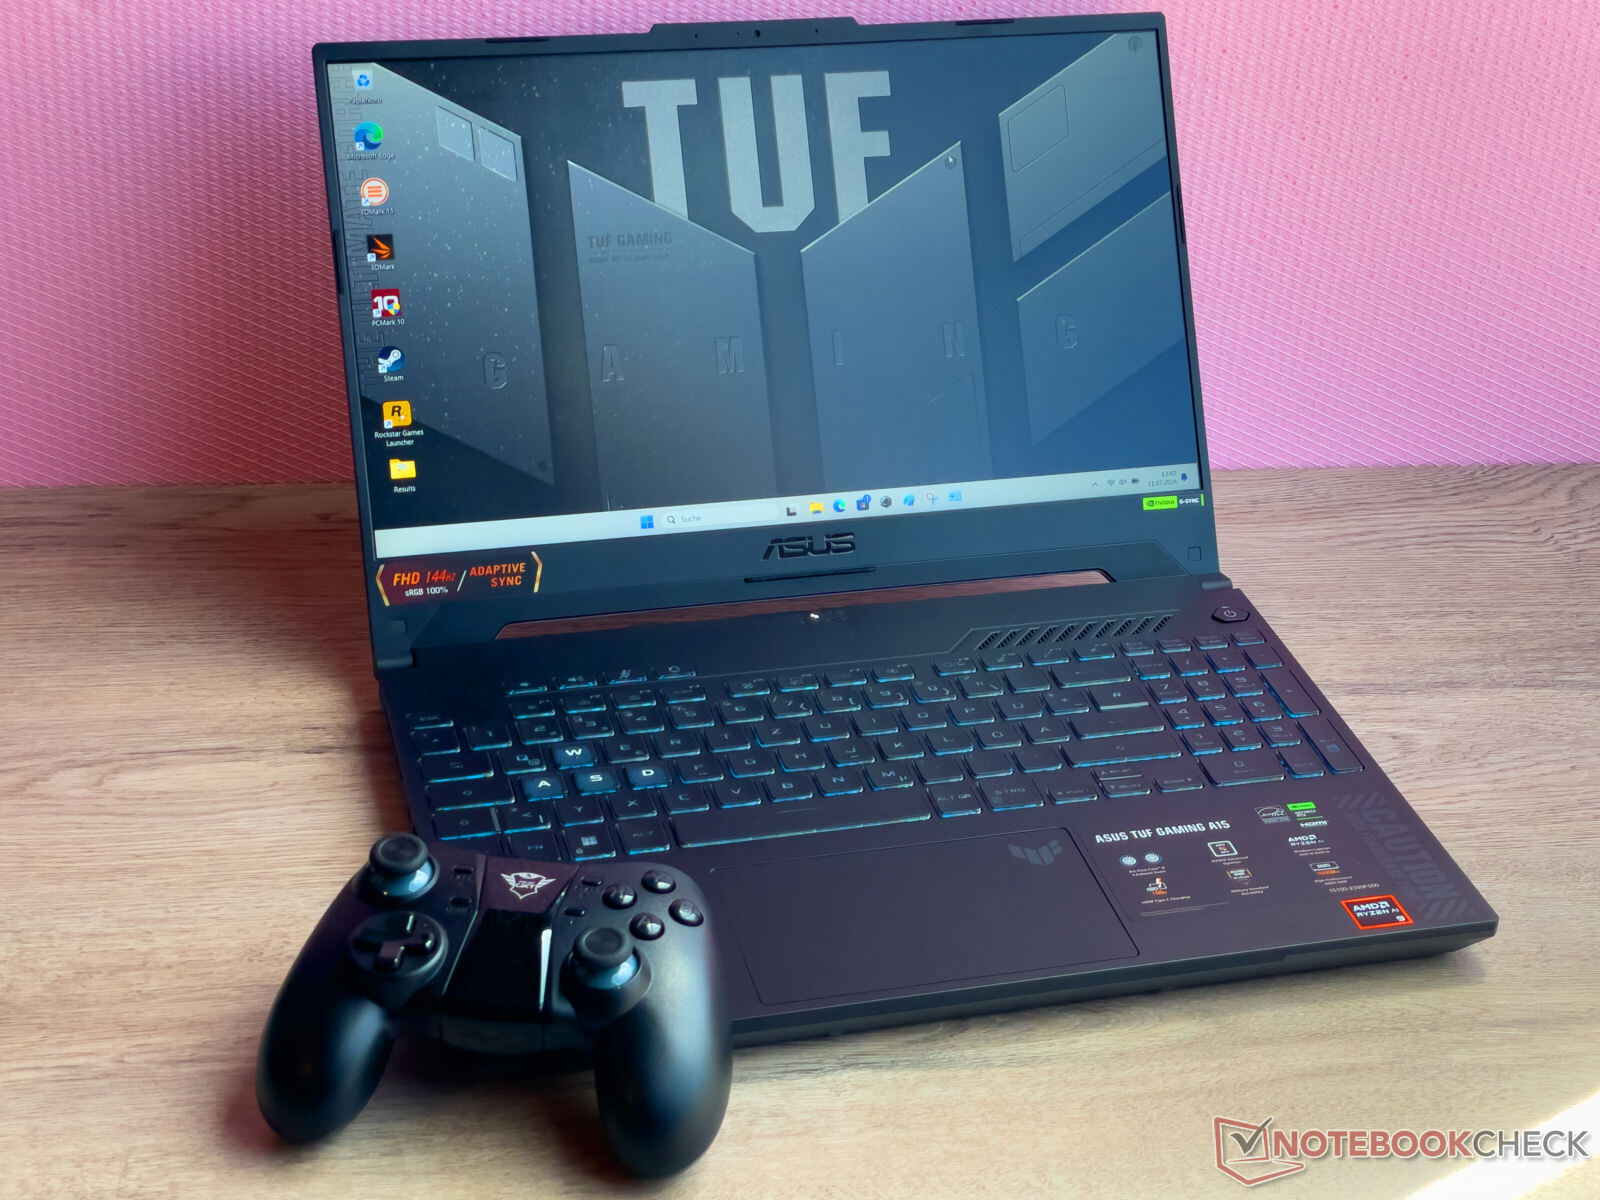
O chassi cinza (Mecha Gray), fosco e com superfície lisa já é conhecido do do A15 do ano passado. Não há problemas de estabilidade e a unidade de base (plástico) e a tampa (traseira de metal) podem ser torcidas dentro de limites aceitáveis. A tampa tem um ângulo de abertura máximo de cerca de 130 graus.
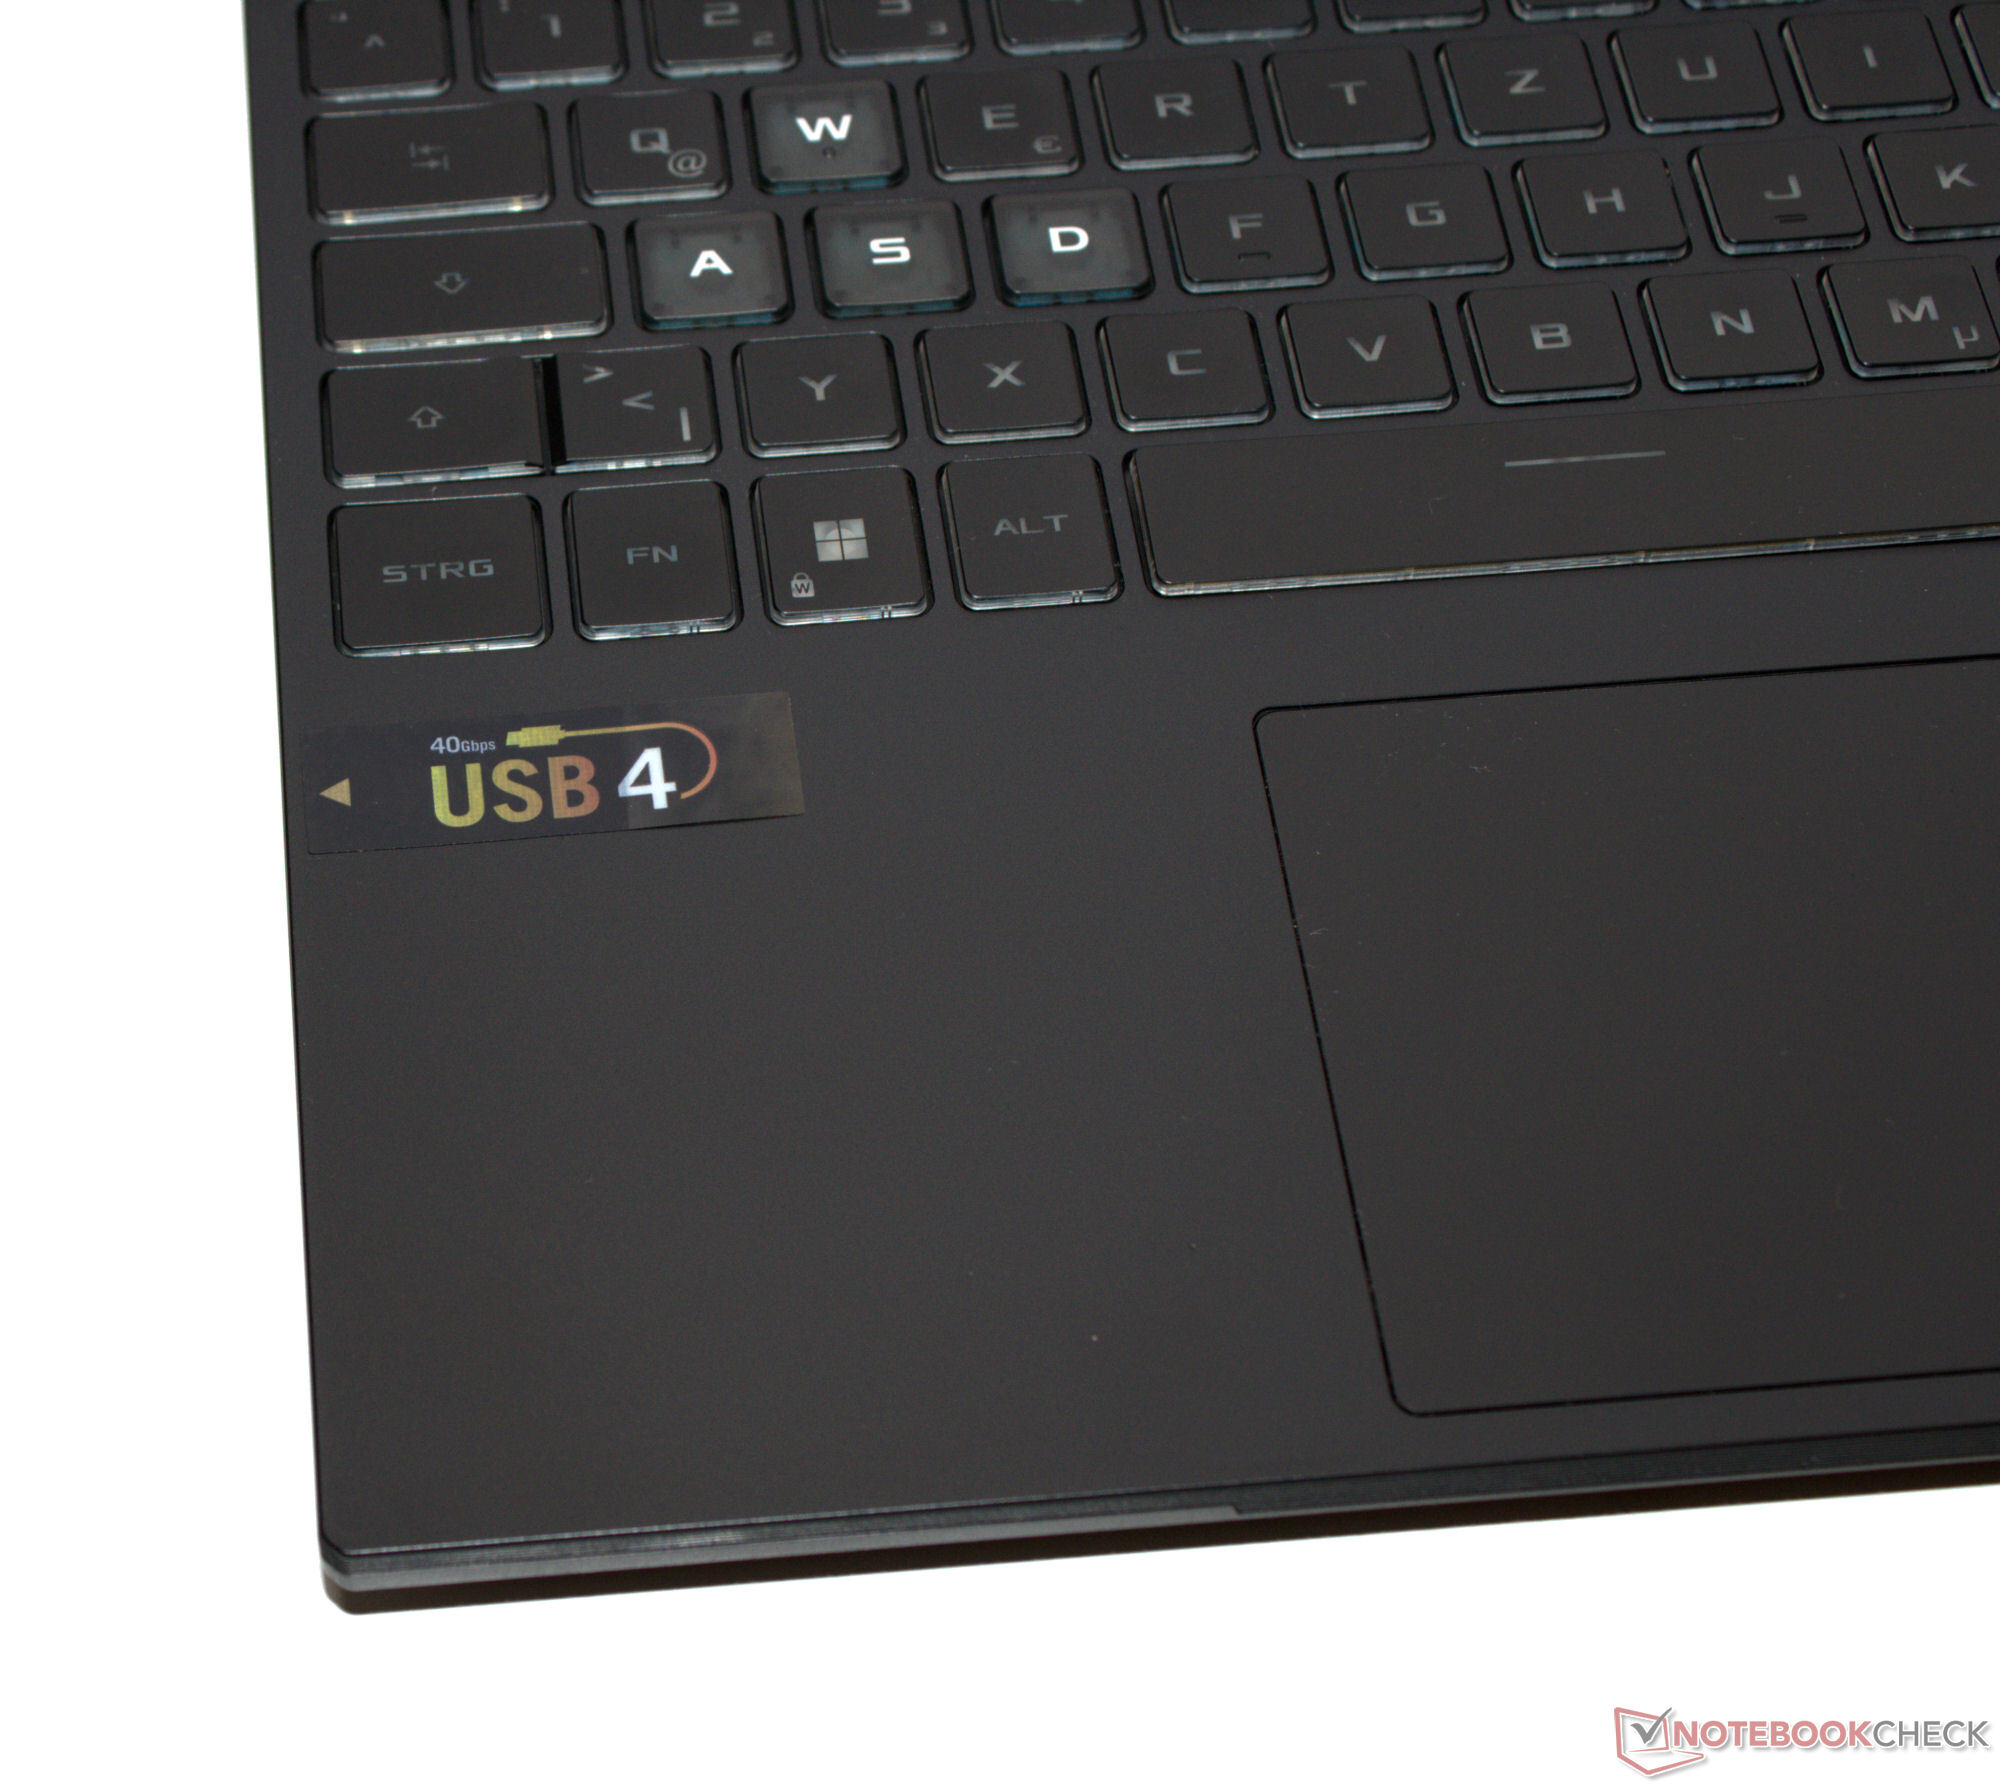
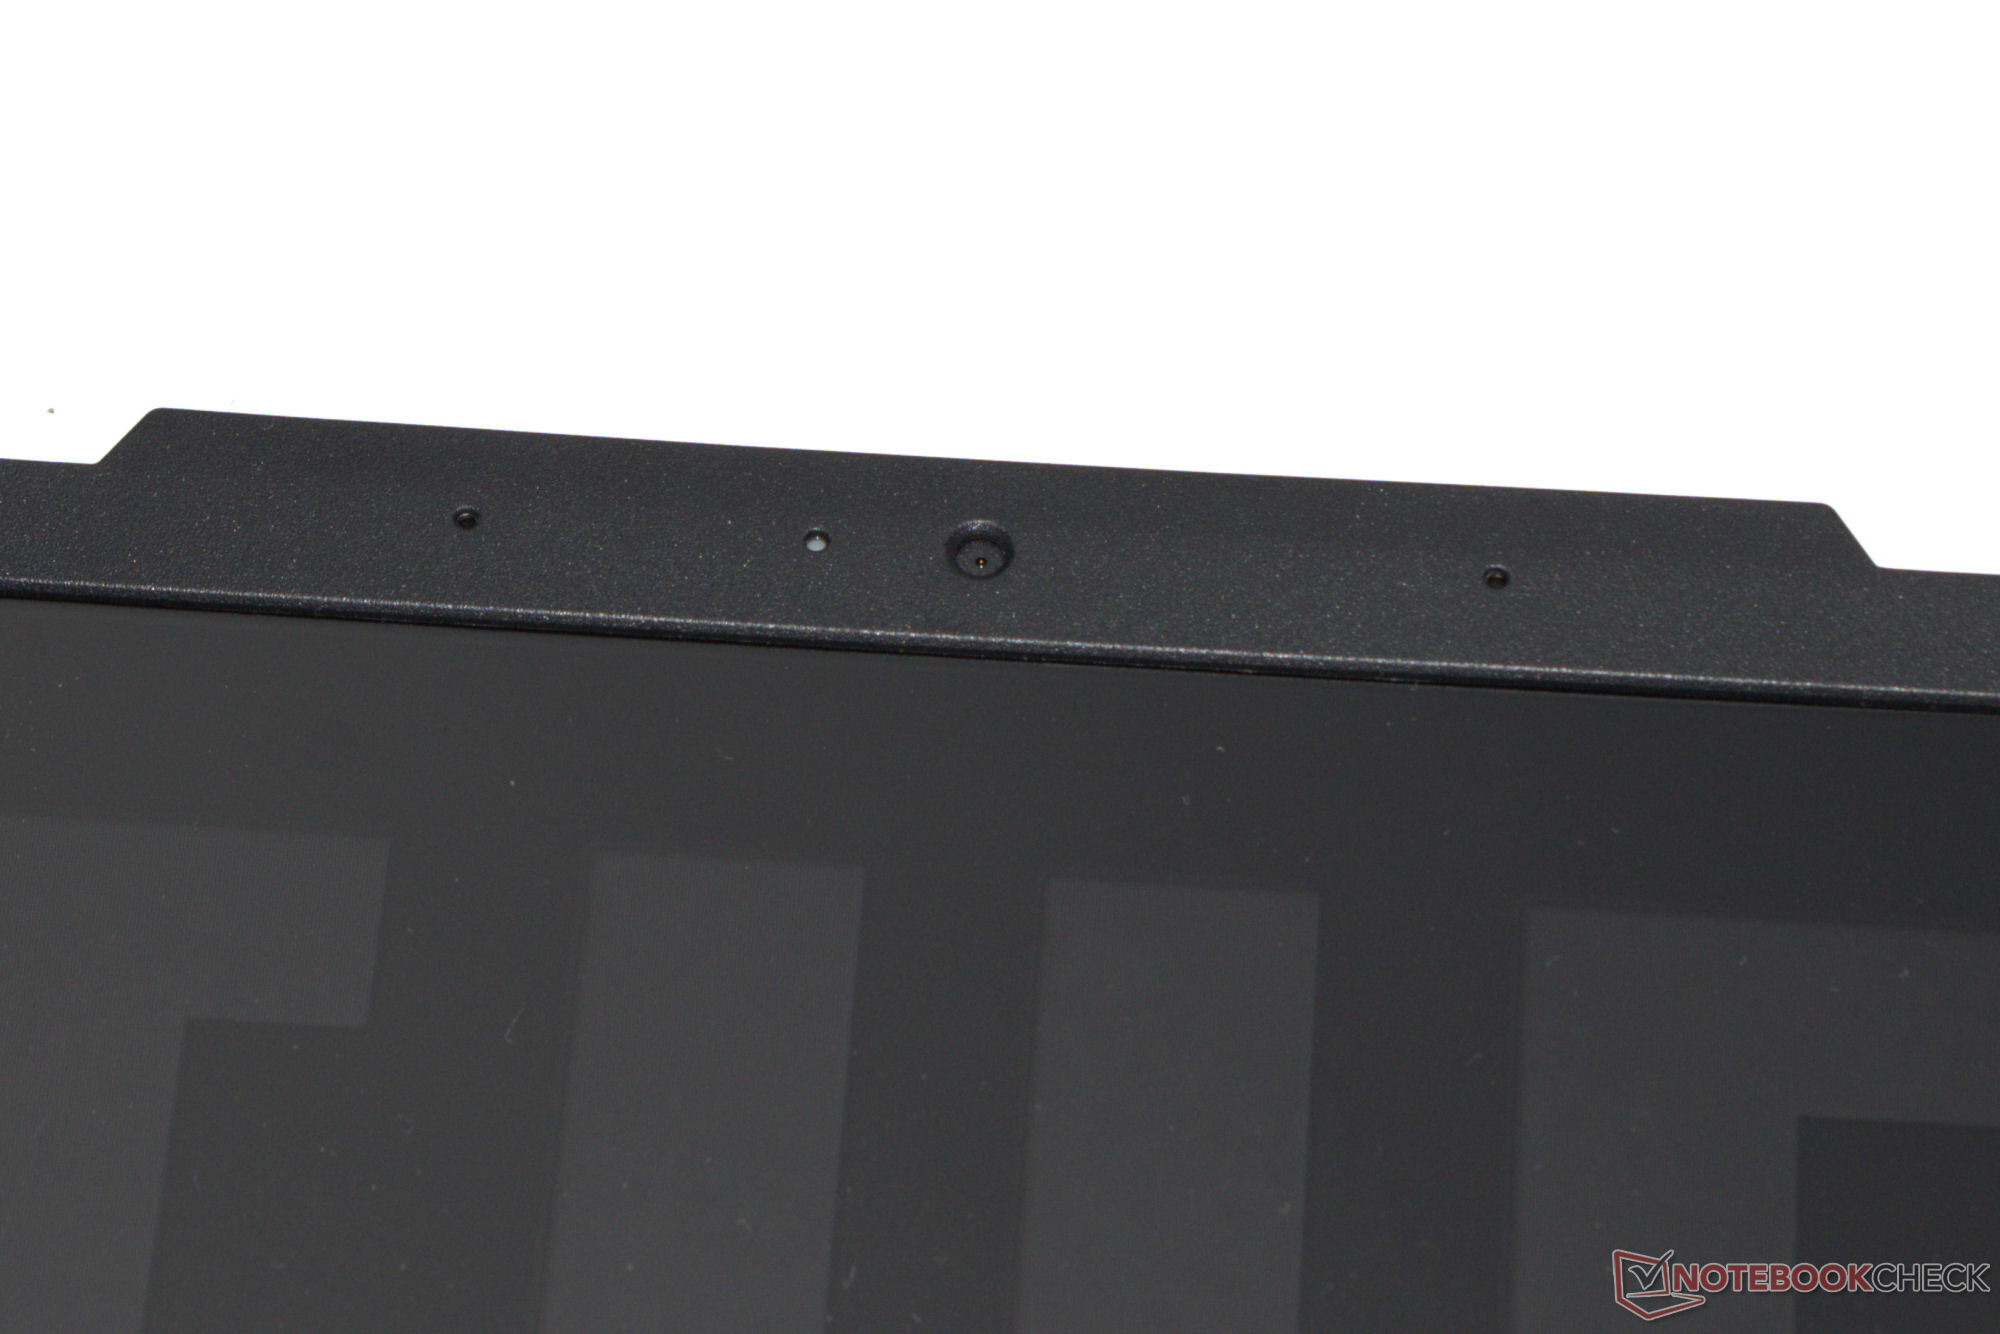
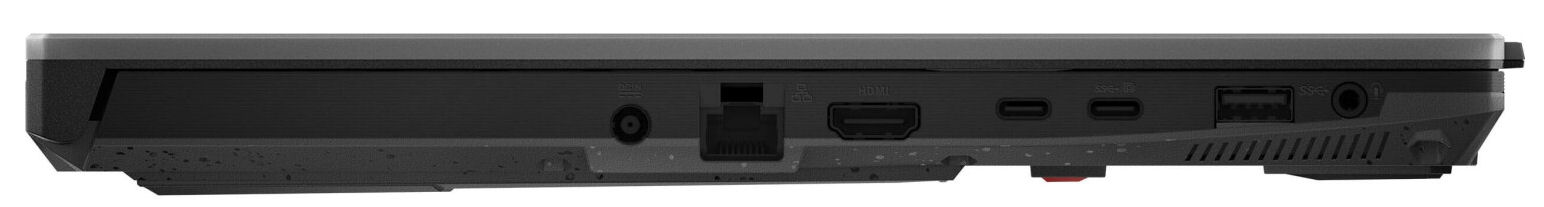
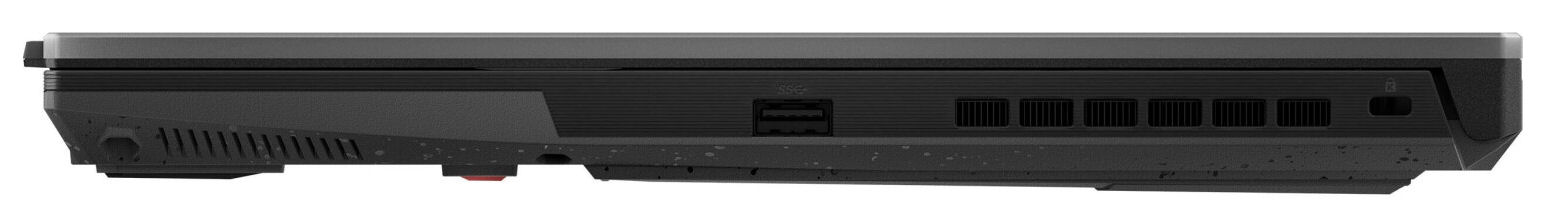
A maioria das portas foi alocada no lado esquerdo do computador. Entre elas estão duas portas USB-A (USB 3.2 Gen 1) e dois conectores USB-C (1x USB 3.2 Gen 2, 1x USB 4). O último suporta DisplayPort Alt Mode e, além disso, a porta USB 3.2 oferece Power Delivery. Isso significa que o TUF tem três saídas de vídeo (1x HDMI, 2x DP). As imagens produzidas pela webcam (0,9 MP, sem obturador) não ganharão nenhum prêmio. O A15 não tem um leitor de cartão de memória.
O computador da Asus se une aos laptops de nível básico que usam o chip RTL8852BE da Realtek (WiFi 6). O chip sem fio oferece velocidades de transferência decentes, mas não alcança seu potencial e não consegue atingir as velocidades vistas no módulo concorrente da Intel. Um controlador Gigabit Ethernet (Realtek RTL8168/8111) é responsável pelas conexões com fio.


Sustentabilidade
Dentro da caixa do laptop, o senhor encontrará principalmente papelão e não muito plástico. O laptop está alojado em uma bolsa de fibra plástica com uma caixa transparente que protege a PSU contra arranhões. Por último, mas não menos importante, há também uma inserção que protege a tela contra arranhões. Em todos os três casos, os plásticos implementados são especificados.
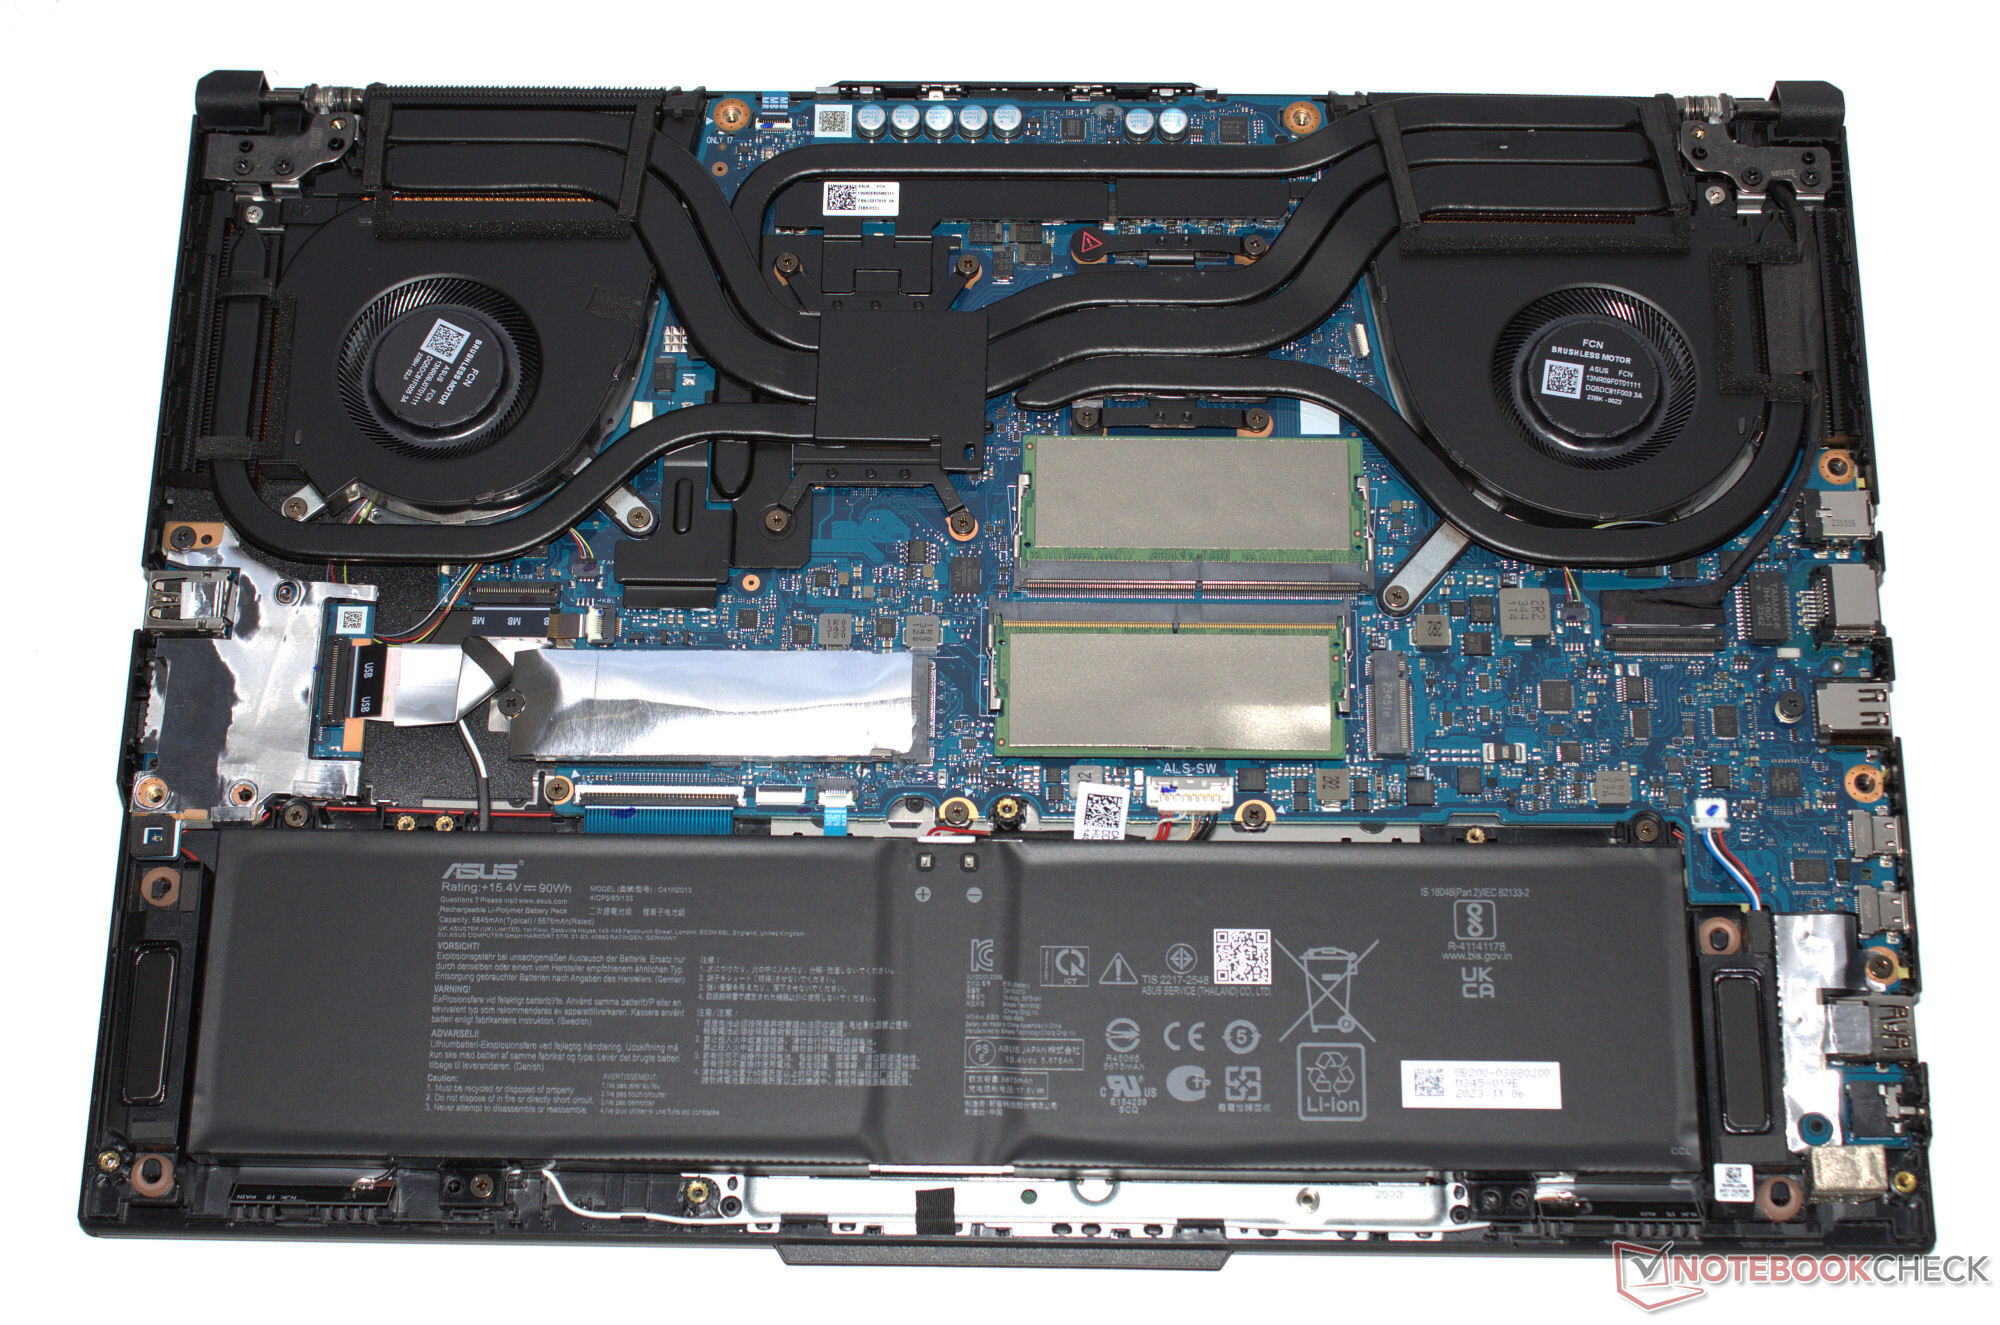
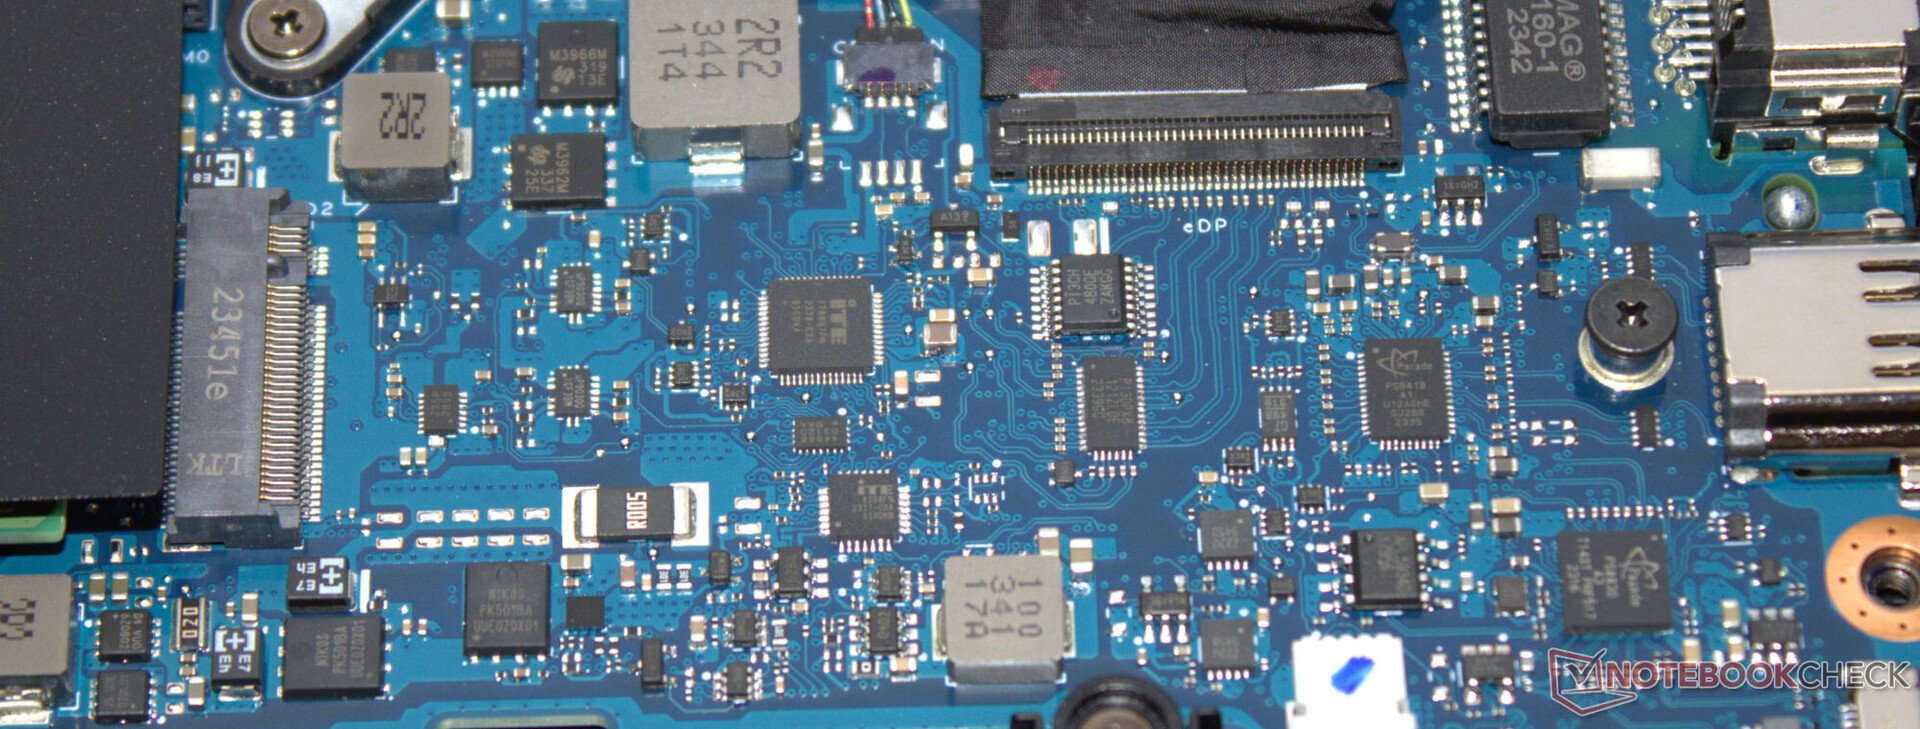
Deve ser fácil realizar reparos graças à placa de base removível - todo o hardware é acessível. Não encontramos nenhuma pasta colada dentro do dispositivo. As atualizações de software não devem ser um problema nos próximos anos. O laptop em si tem um selo EPEAT bronze.
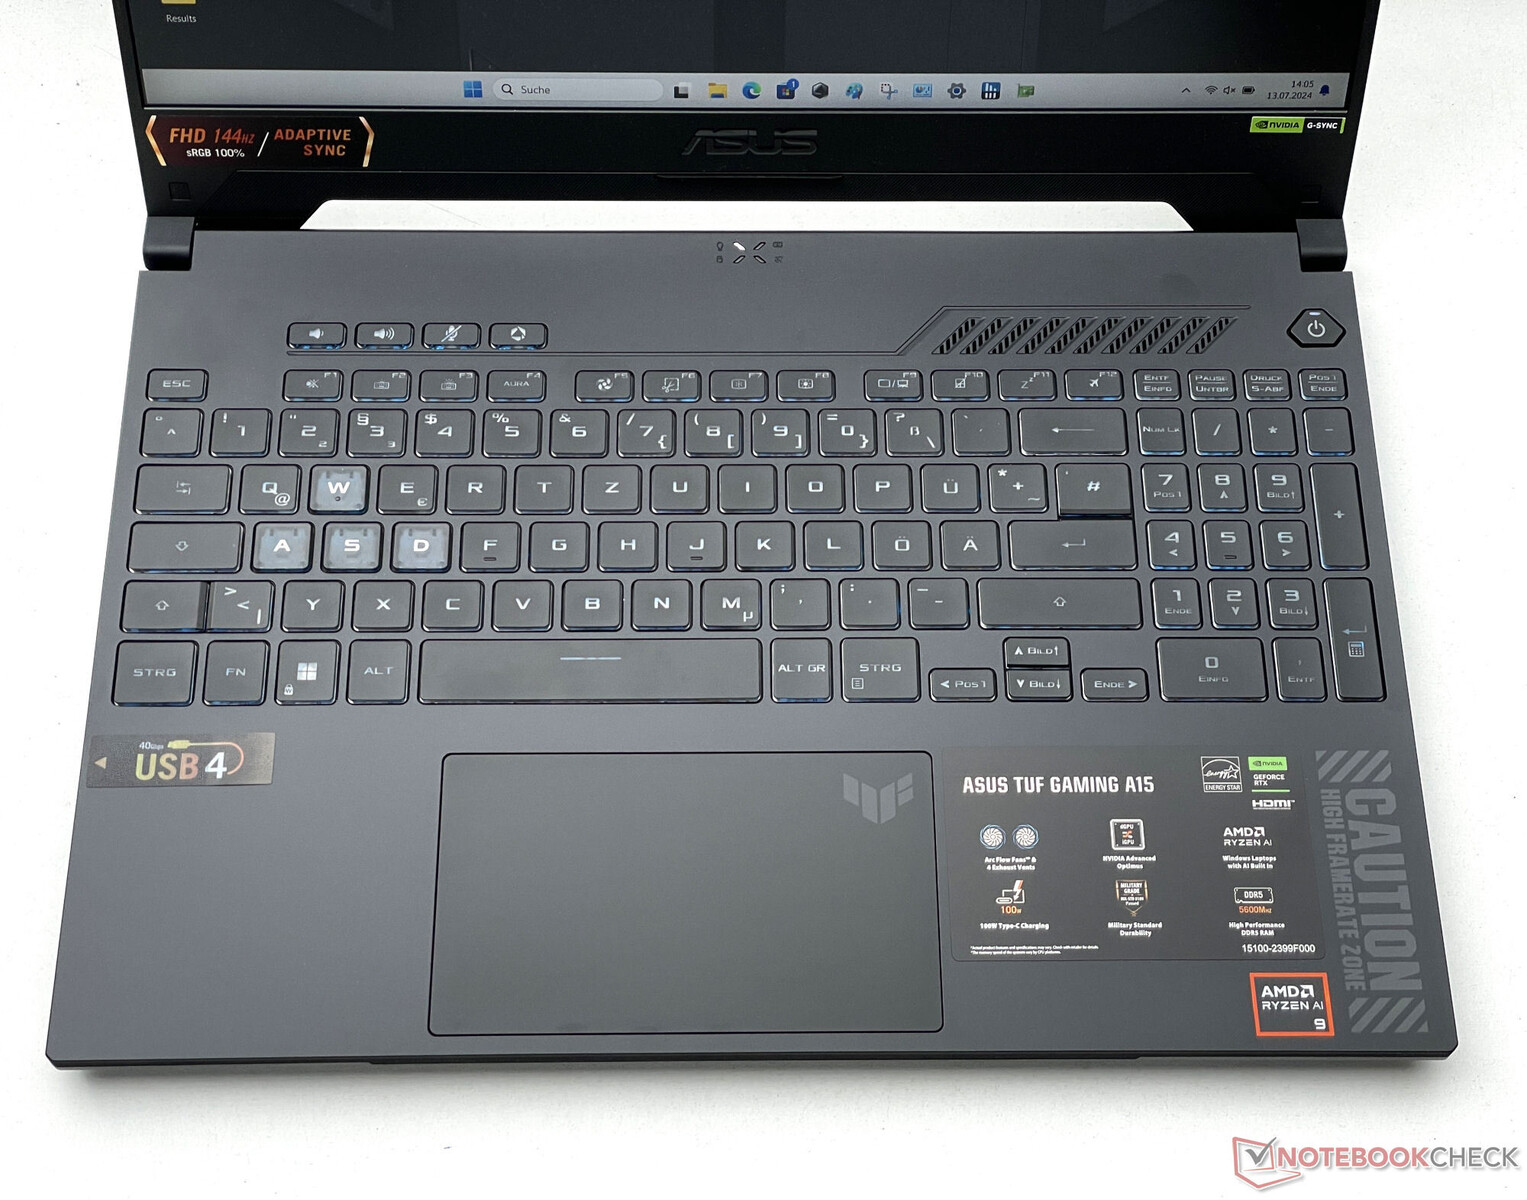
Dispositivos de entrada - O A15 tem pequenas teclas de seta
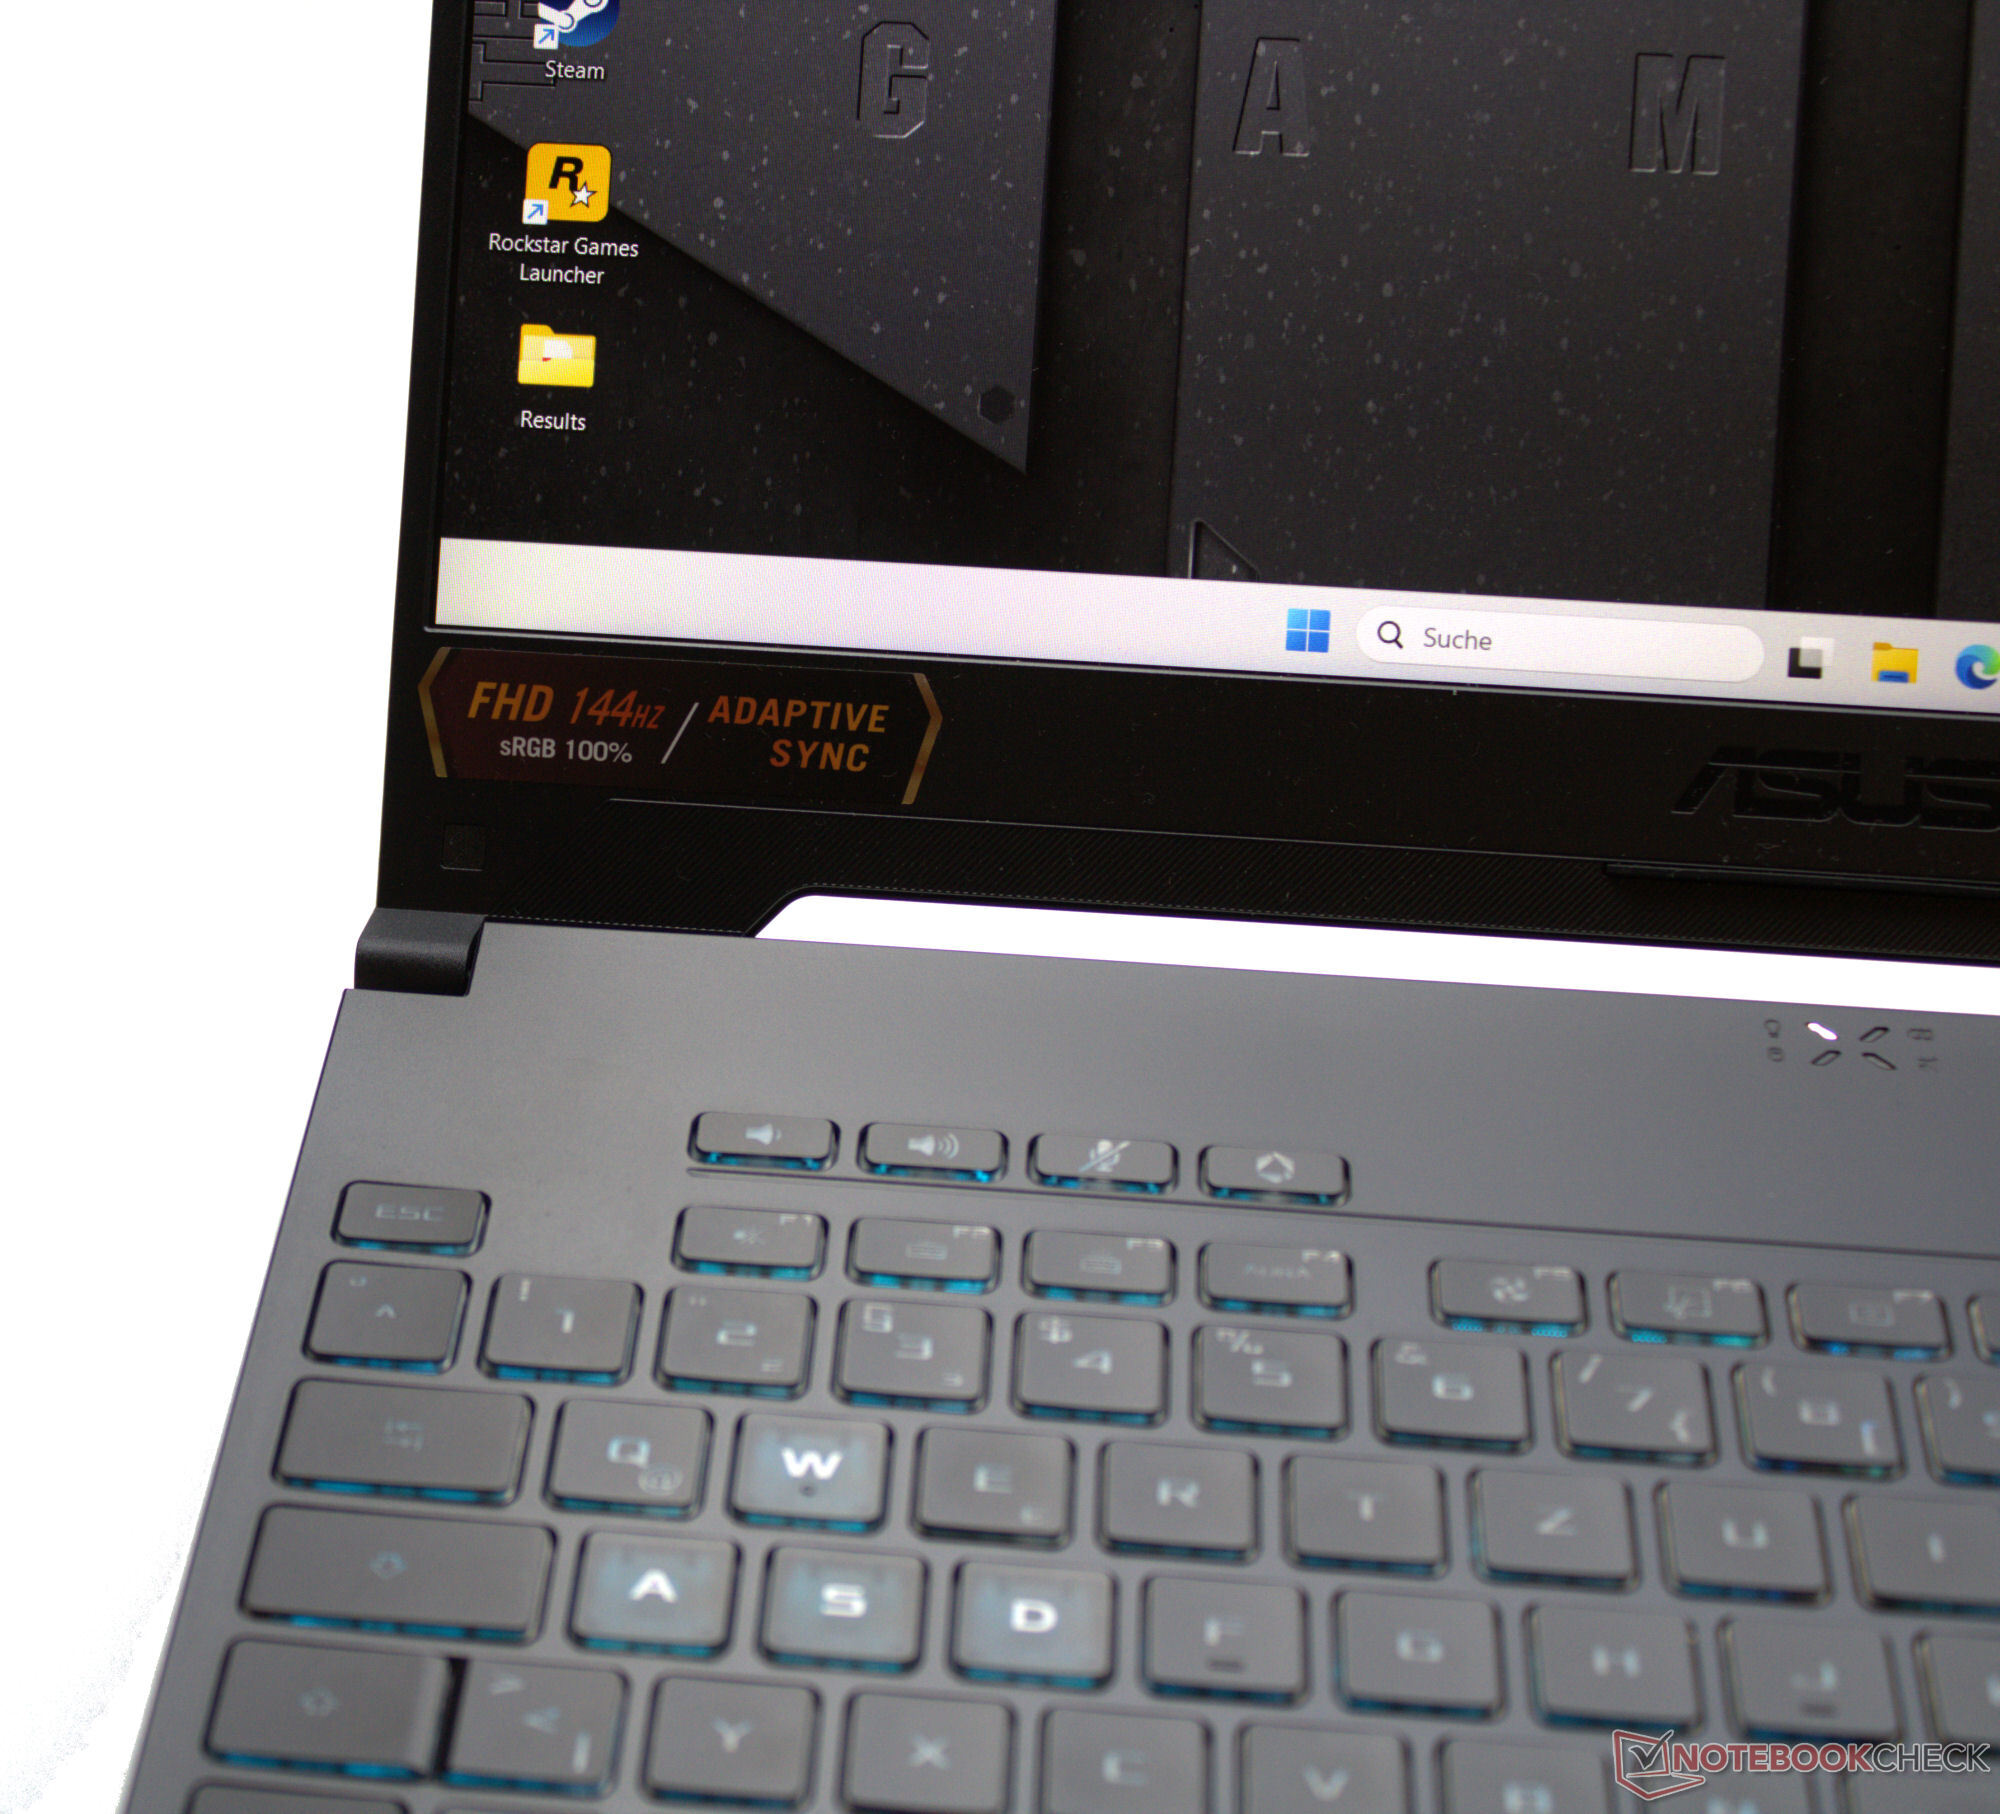
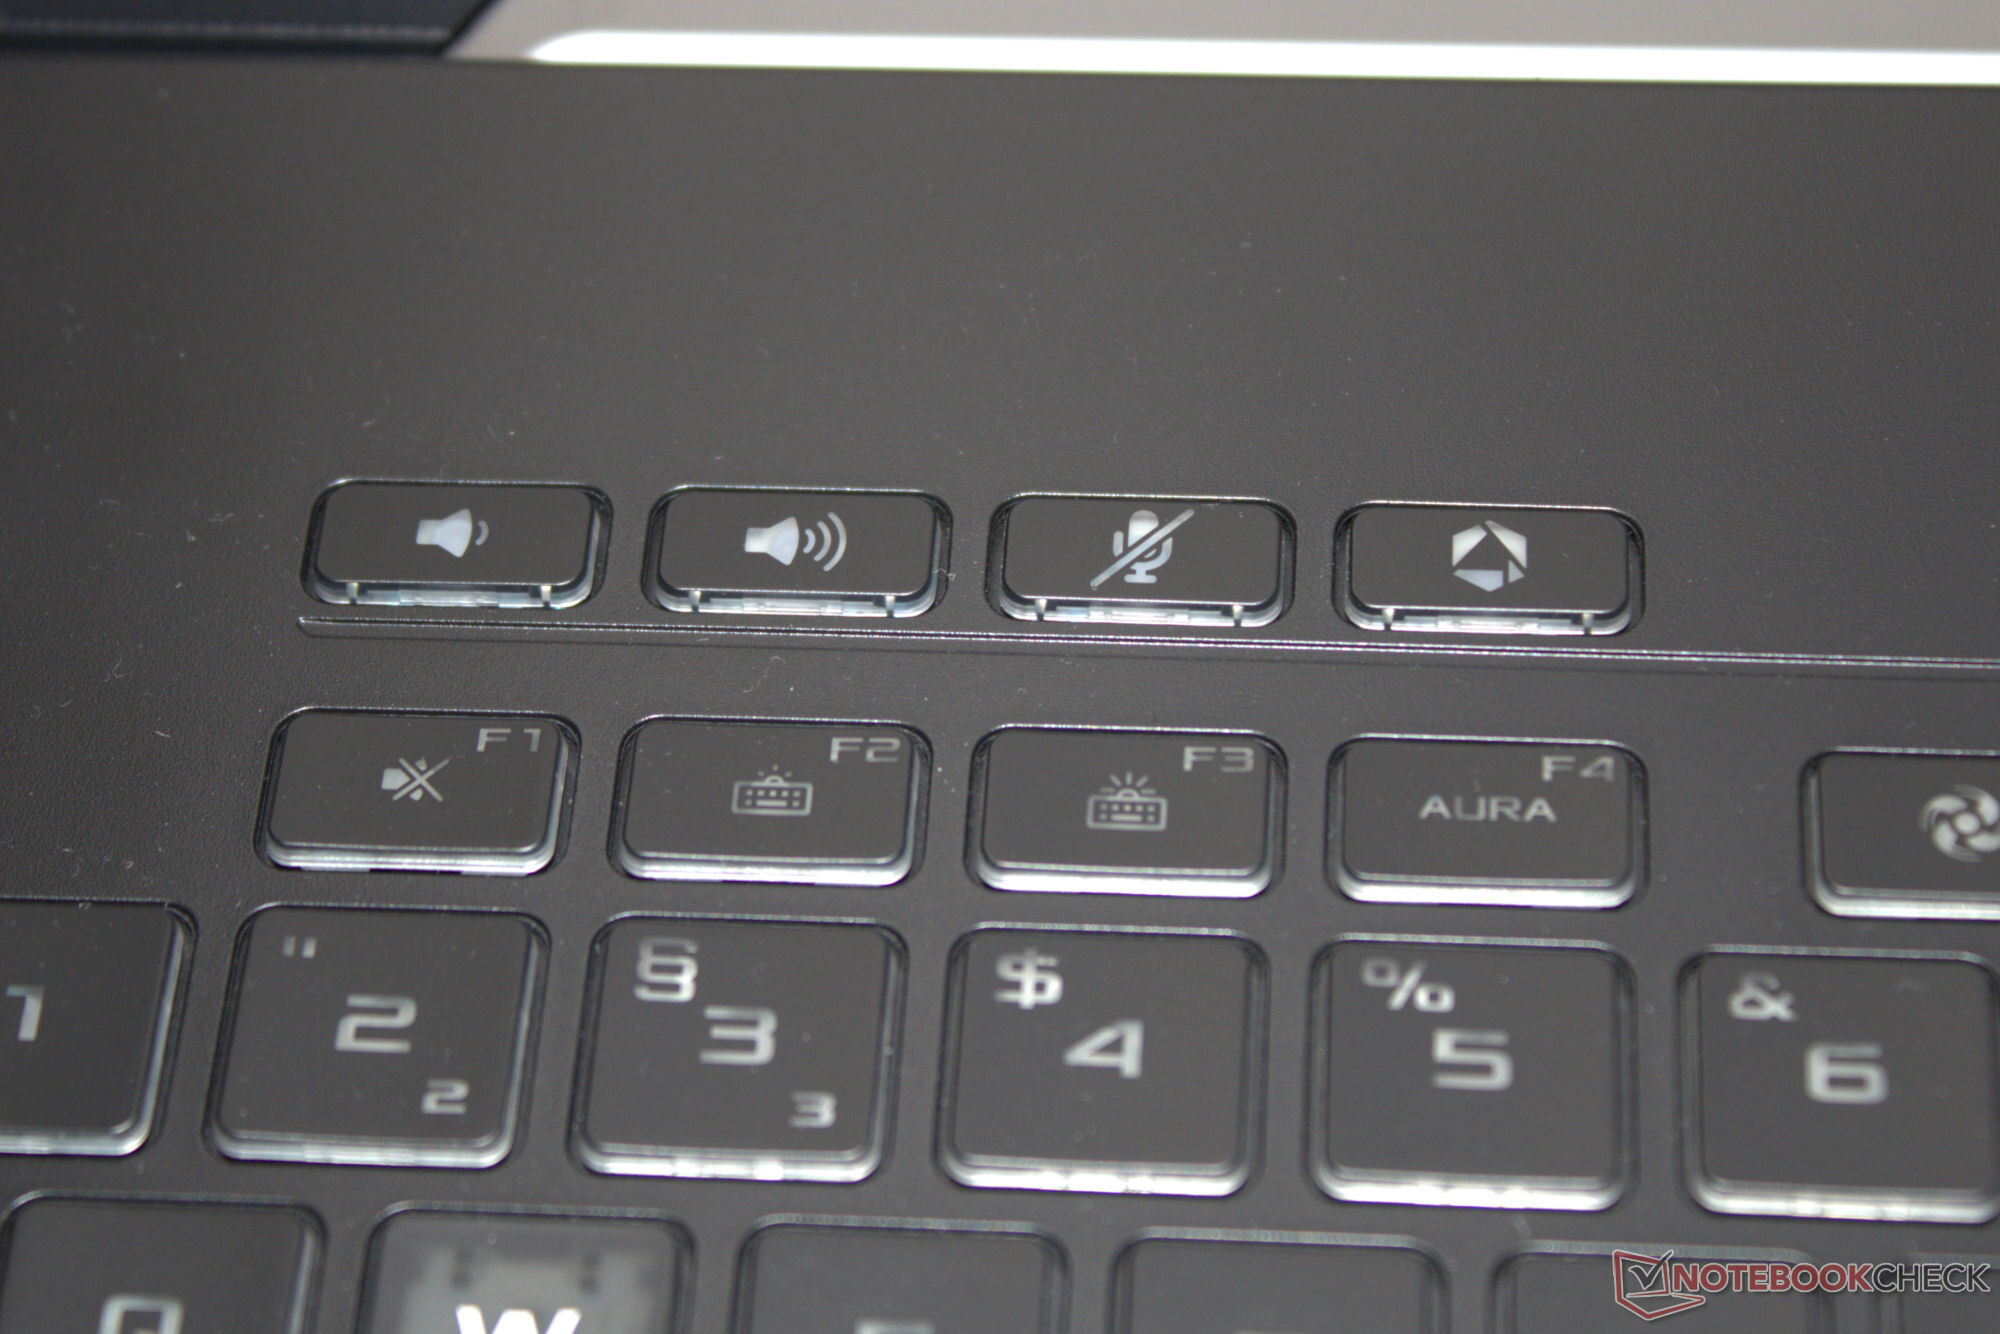
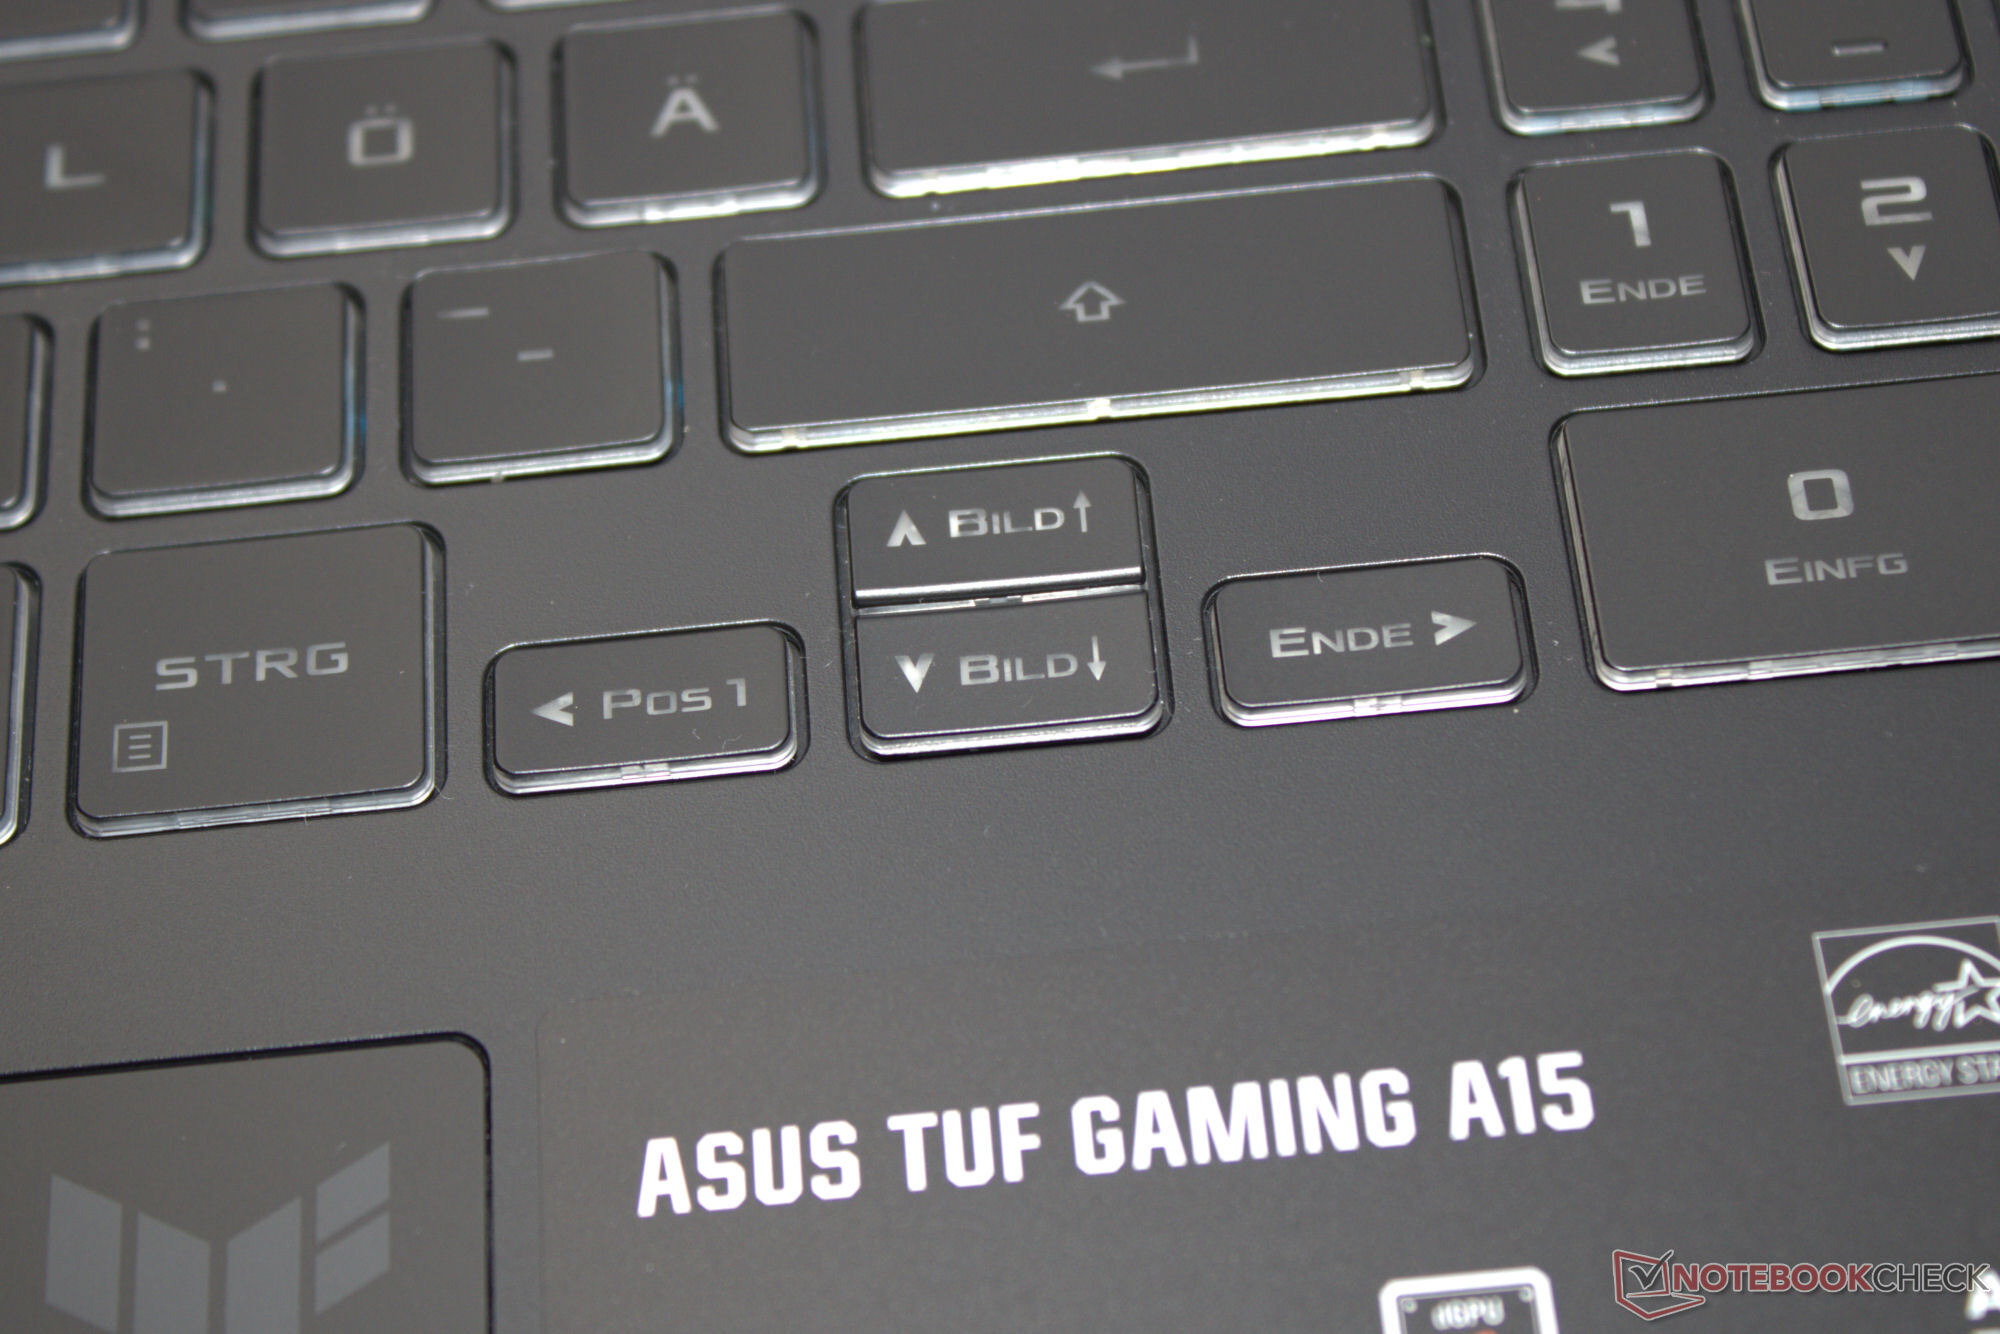
A Asus usa toda a largura do dispositivo para o teclado chiclet retroiluminado (RGB), o que significa que há espaço para um teclado numérico. Suas teclas suaves têm deslocamento médio e um ponto de pressão distinto. A resistência das teclas é razoável. Ao digitar, o teclado não se flexiona. O que se nota é que a tecla de seta e a tecla "Enter" são pequenas e as teclas de controle (W, A, S, D) têm uma cor diferente. O clickpad multitoque (cerca de 13 x 7,7 cm) tem curso curto, um ponto de pressão distinto e serve como um mouse substituto.
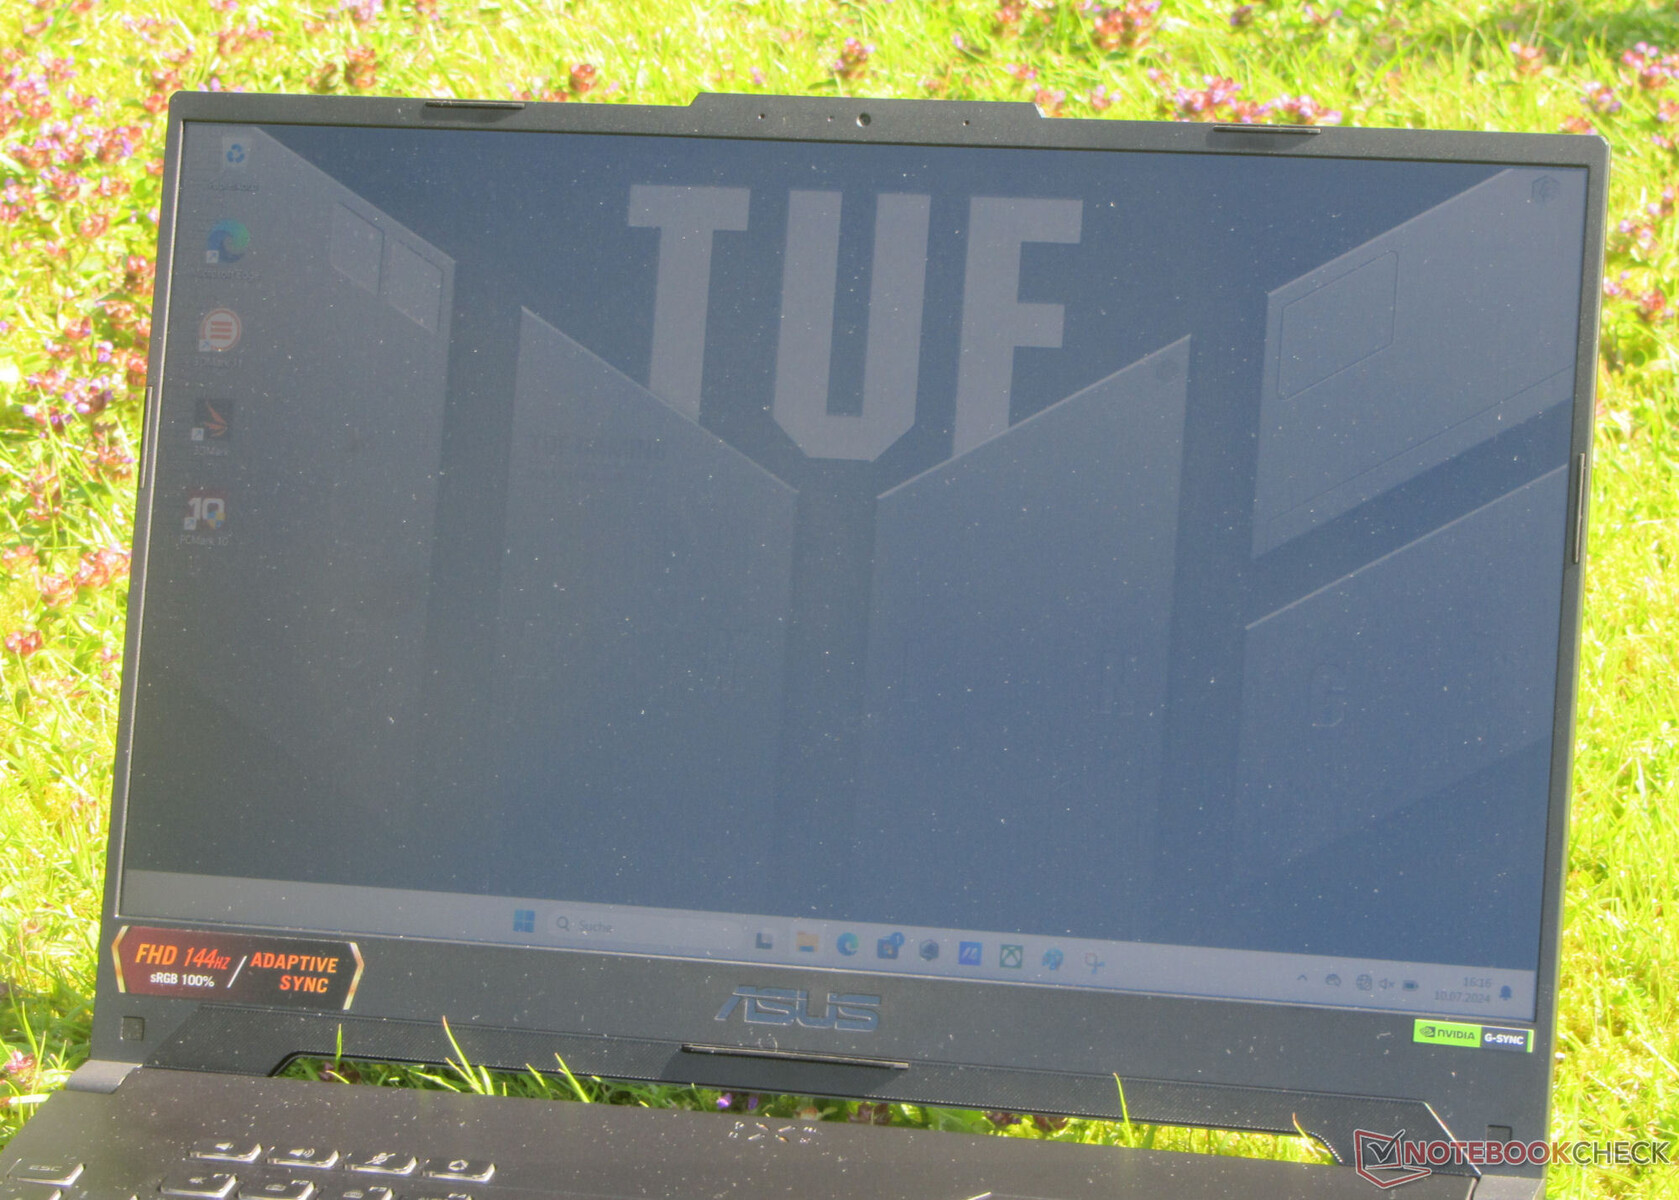
Tela - IPS on board
A Asus equipou o dispositivo com uma tela 16:9, fosca, de 15,6 polegadas (FHD, IPS, 144 Hz, G-Sync) que tem ângulos de visão estáveis. Quando se trata de brilho e contraste, o painel não oferece os melhores números da categoria, mas ainda faz o que deveria e isso o torna predestinado para uso em ambientes internos. A leitura em ambientes externos seria possível em qualquer condição que não fosse a luz solar intensa. Não foi possível detectar nenhuma oscilação de PWM.

| |||||||||||||||||||||||||
iluminação: 90 %
iluminação com acumulador: 315 cd/m²
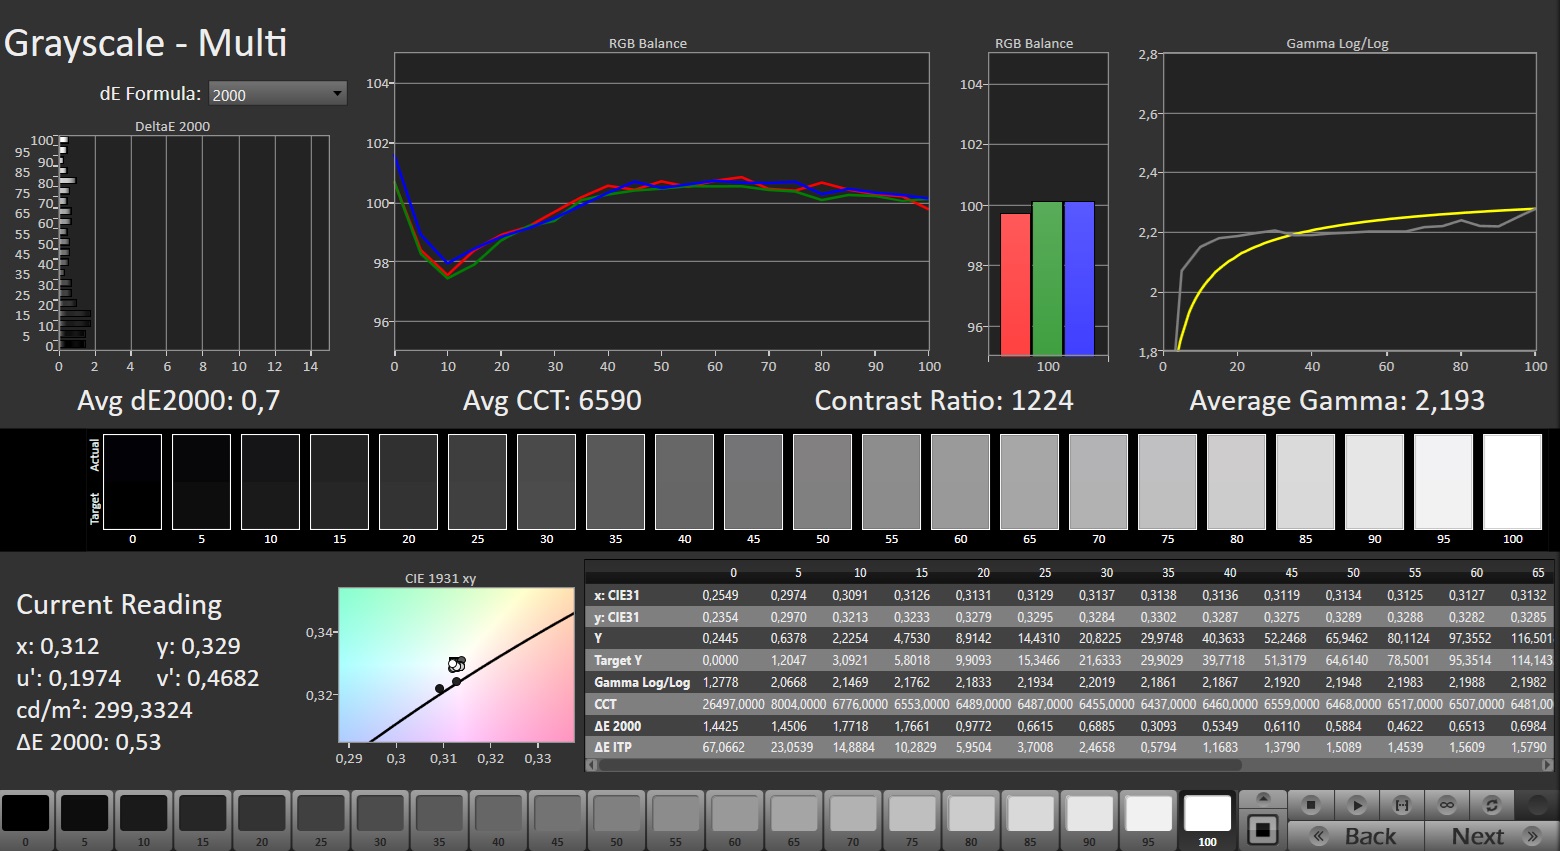
Contraste: 1260:1 (Preto: 0.25 cd/m²)
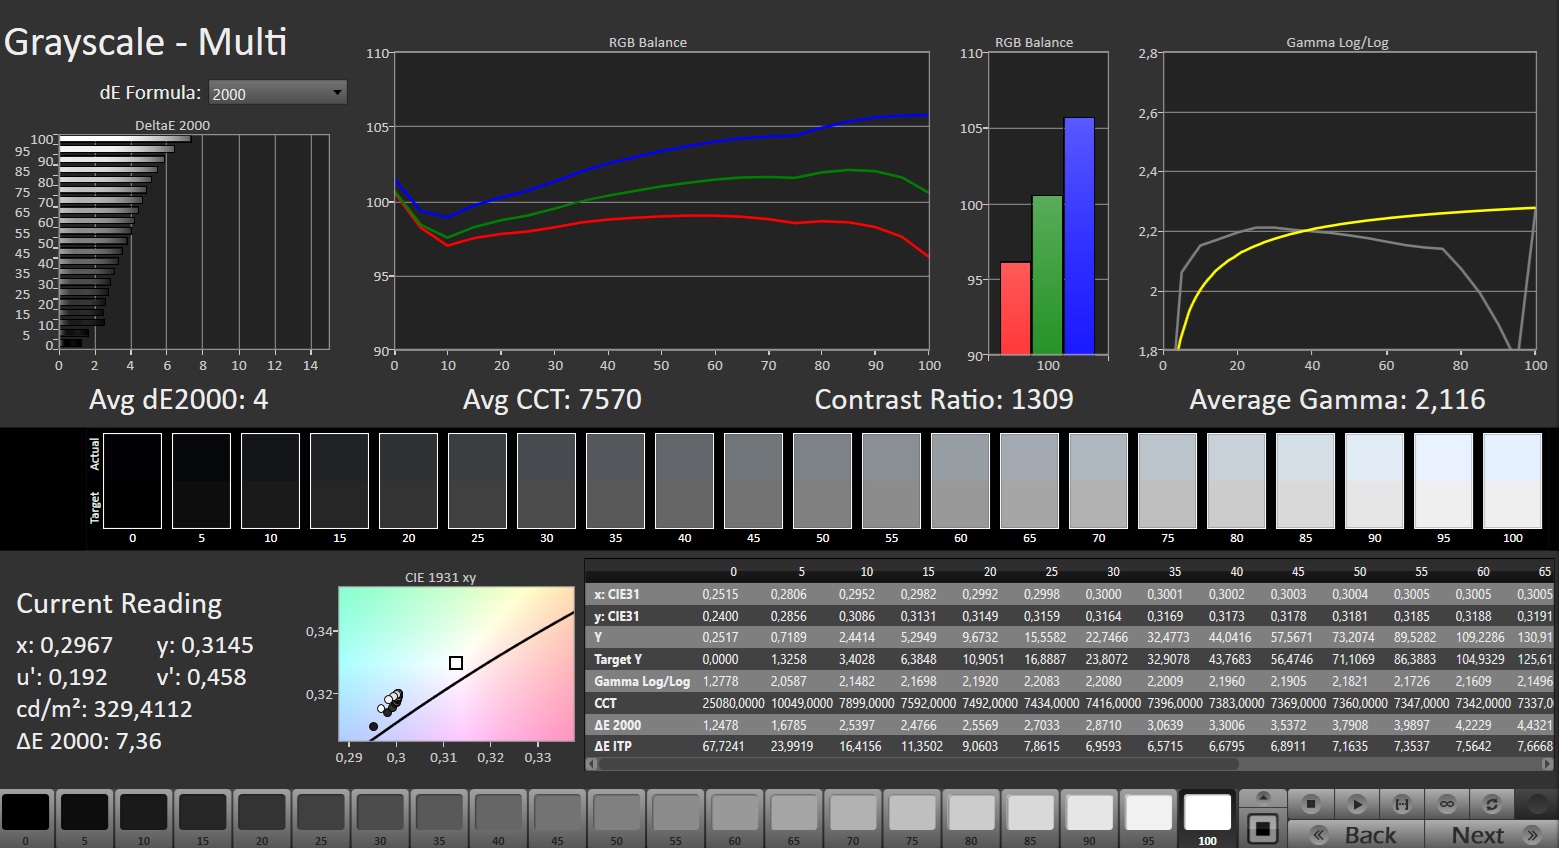
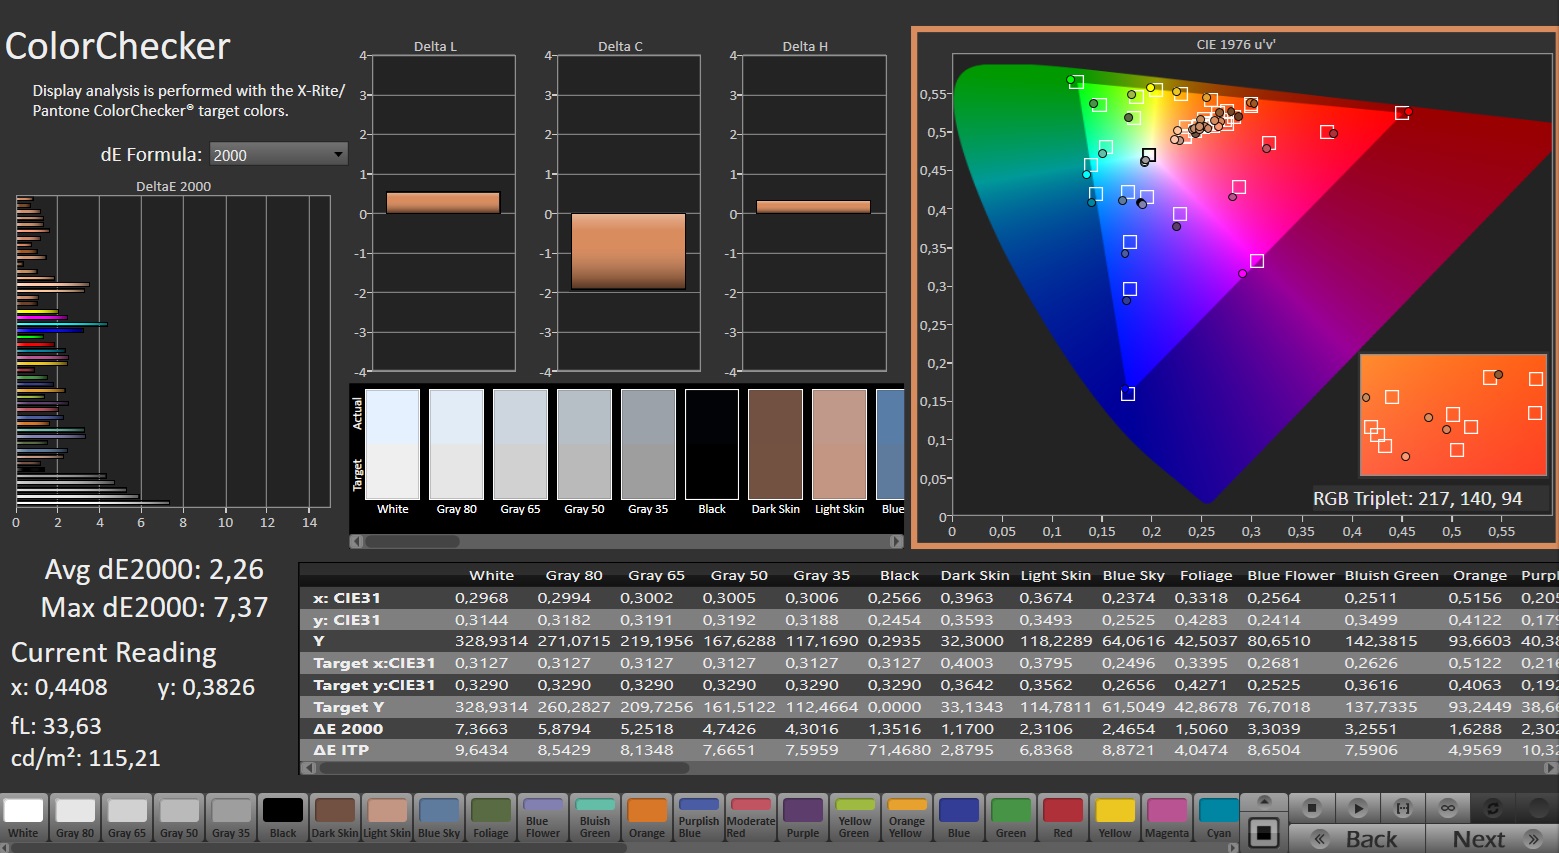
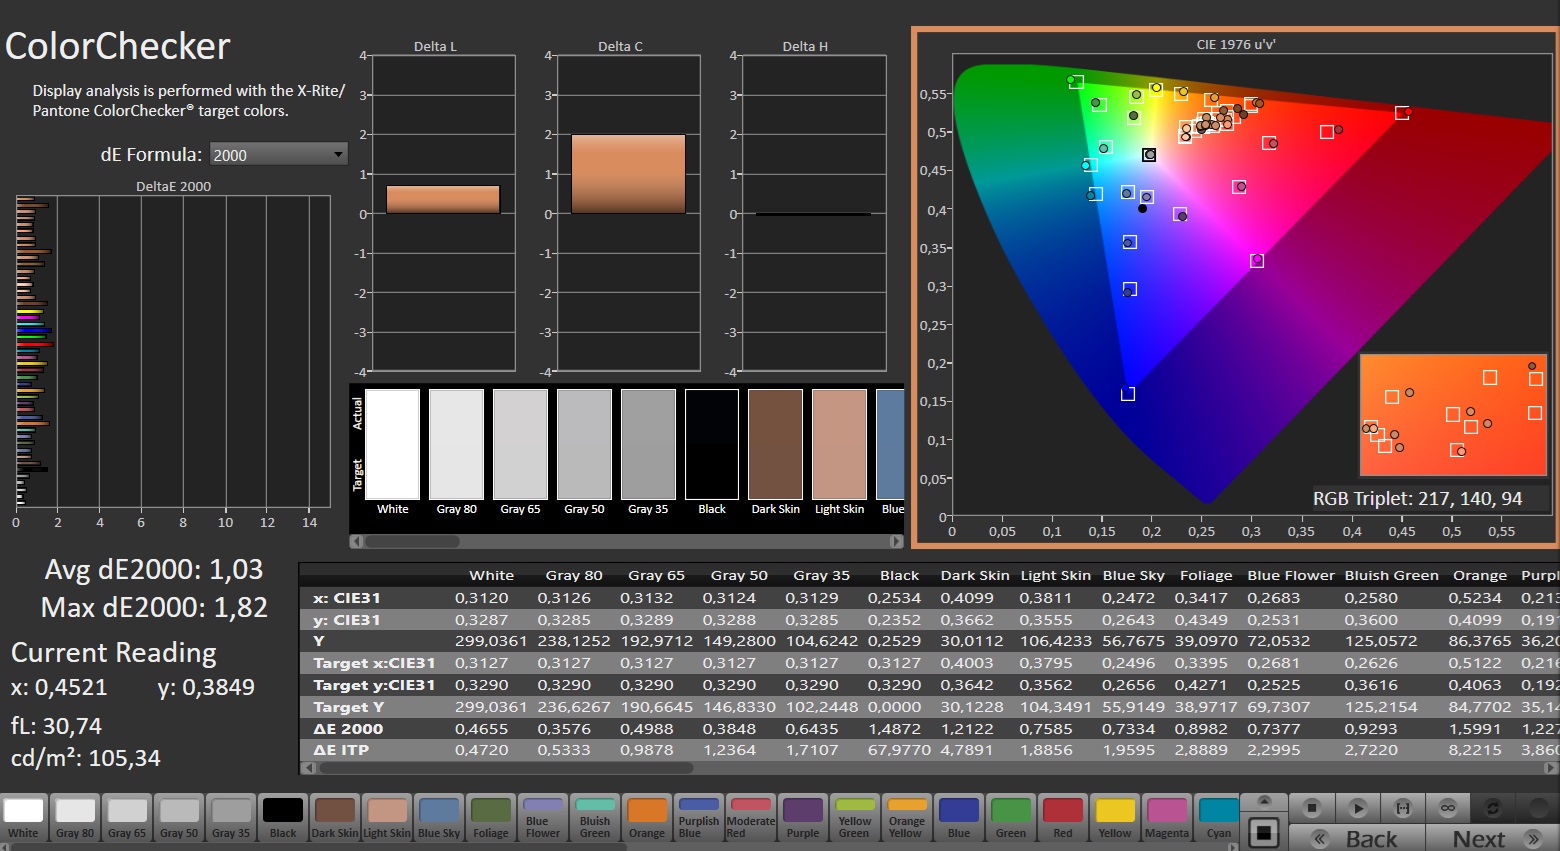
ΔE Color 2.26 | 0.5-29.43 Ø4.87, calibrated: 1.03
ΔE Greyscale 4 | 0.5-98 Ø5.1
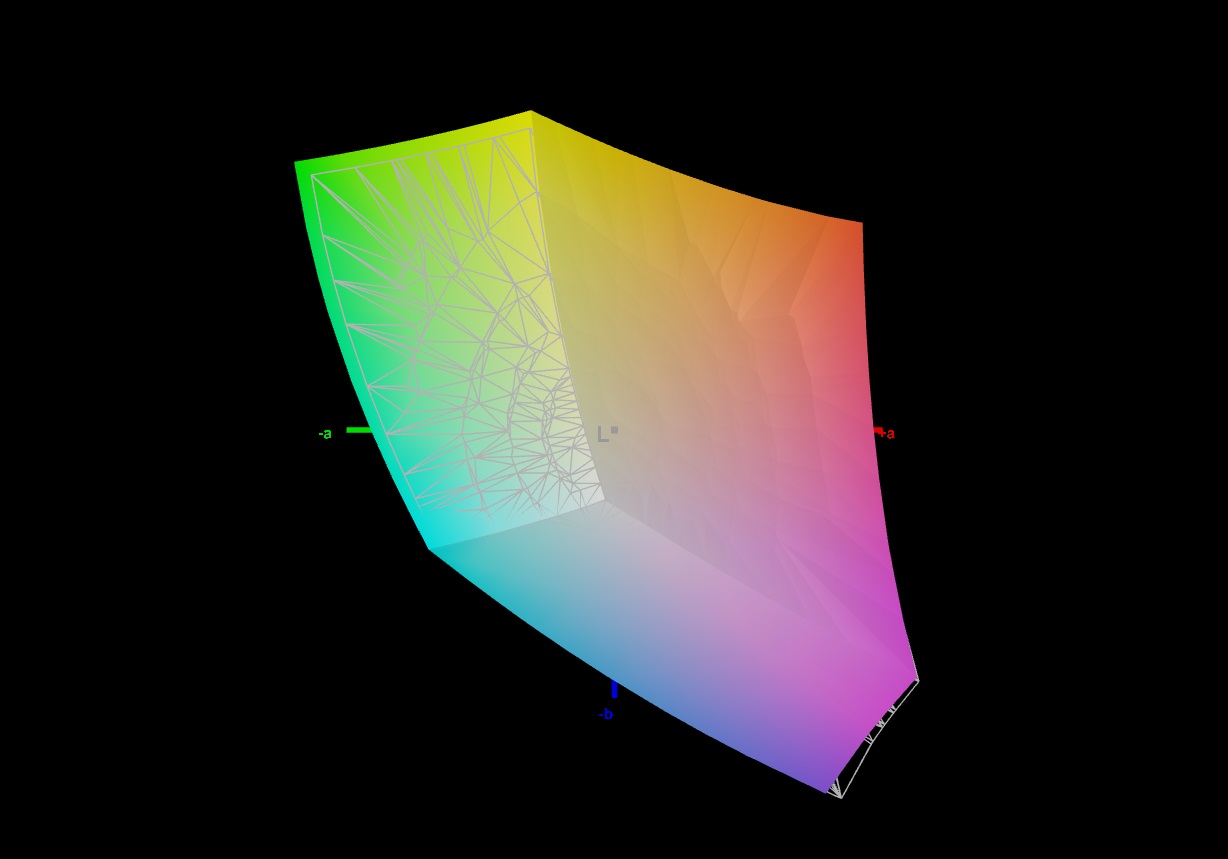
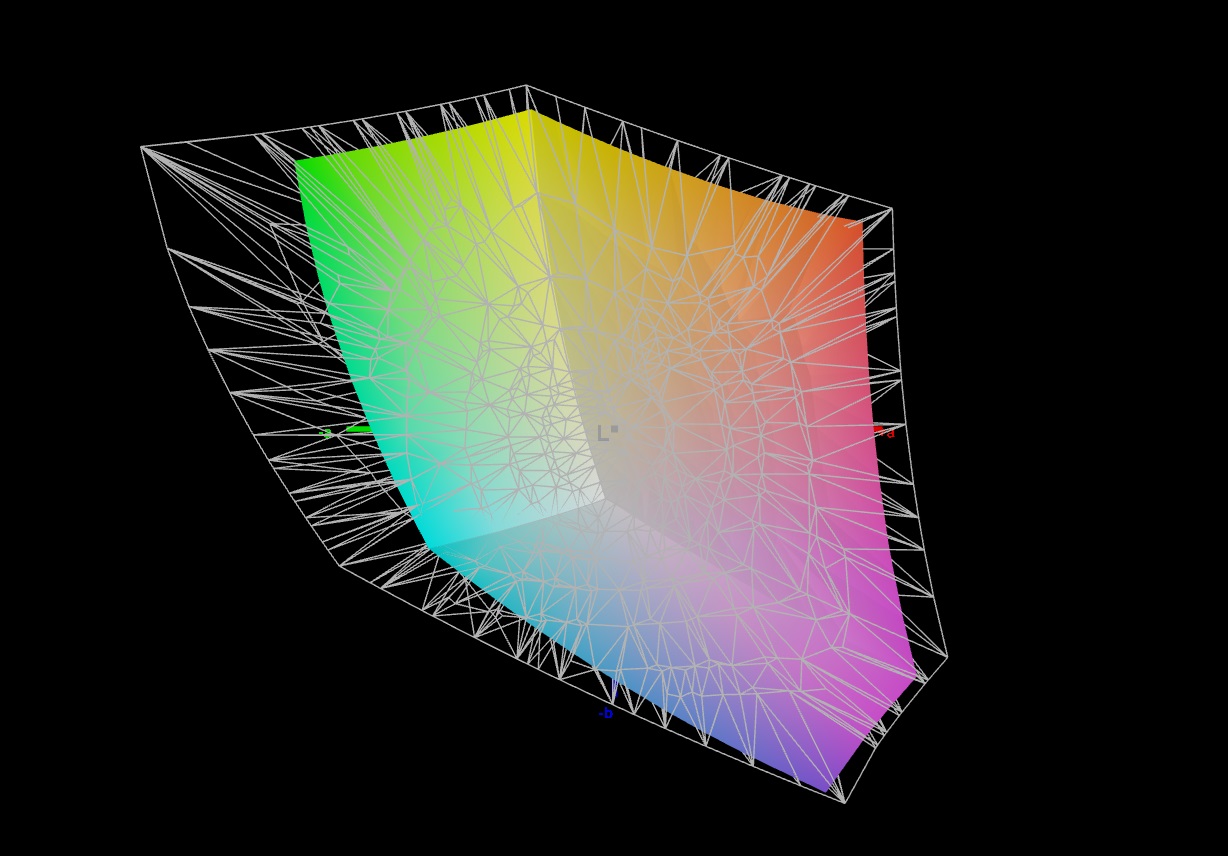
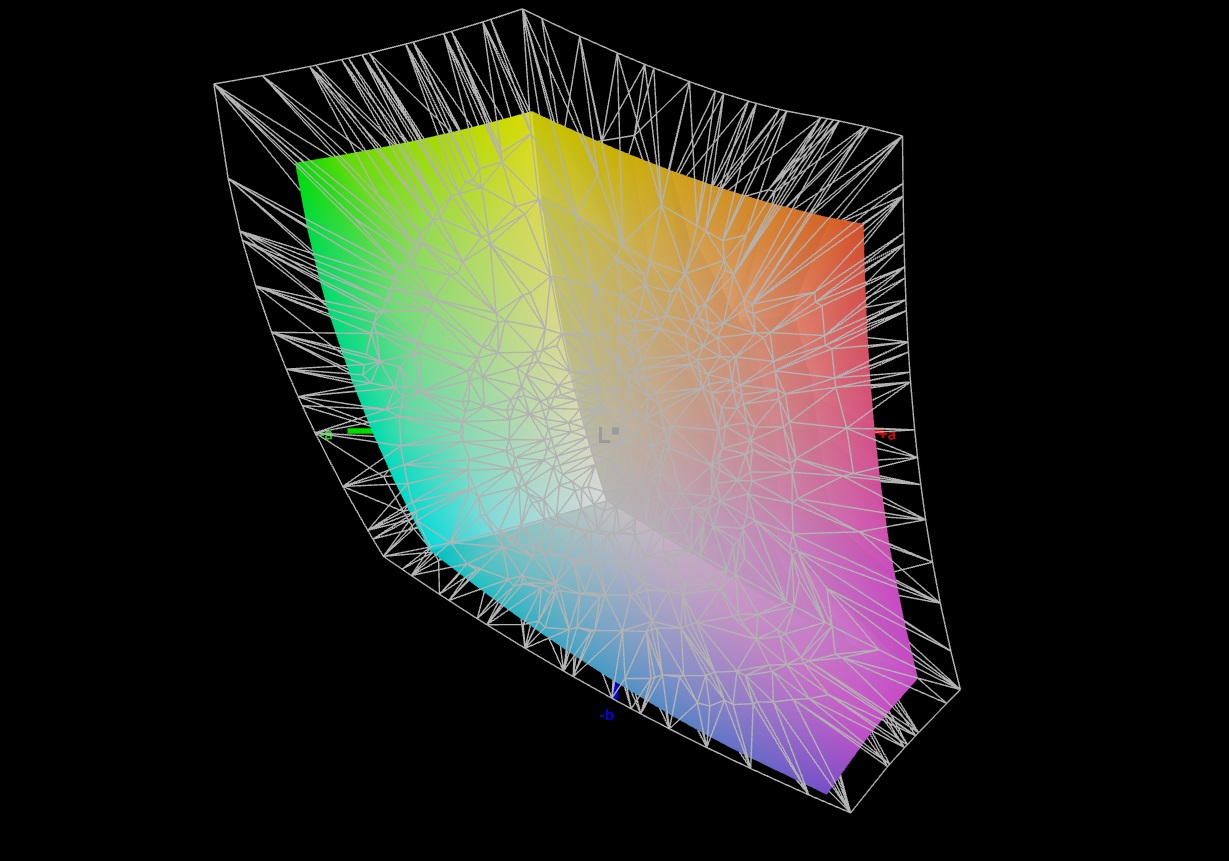
72.7% AdobeRGB 1998 (Argyll 2.2.0 3D)
98.5% sRGB (Argyll 2.2.0 3D)
70.5% Display P3 (Argyll 2.2.0 3D)
Gamma: 2.116
| Asus TUF Gaming A15 FA507UV AU Optronics B156HAN15.H, IPS, 1920x1080, 15.6" | Lenovo LOQ 15IRX9 BOE NJ NE156FHM-NX9, IPS, 1920x1080, 15.6" | HP Victus 16 (2024) Chi Mei CMN163E, IPS, 1920x1080, 16.1" | Gigabyte G6X 9KG (2024) BOE NE160WUM-NX6, IPS, 1920x1200, 16" | SCHENKER XMG Core 15 (M24) BOE NJ NE153QDM-NZ1 (BOE0C8E), IPS, 2560x1600, 15.3" | Dell G16, i7-13650HX, RTX 4060 Chi Mei CMN161D (160GME), IPS, 2560x1600, 16" | Asus TUF A15 FA507 N156HMA-GA1, IPS, 1920x1080, 15.6" | |
|---|---|---|---|---|---|---|---|
| Display | 2% | -40% | -39% | 3% | -3% | -6% | |
| Display P3 Coverage | 70.5 | 73.7 5% | 41.3 -41% | 41.8 -41% | 73.2 4% | 67.5 -4% | 64.9 -8% |
| sRGB Coverage | 98.5 | 99.1 1% | 61.7 -37% | 62.4 -37% | 100 2% | 98.5 0% | 96.5 -2% |
| AdobeRGB 1998 Coverage | 72.7 | 72.6 0% | 42.7 -41% | 43.3 -40% | 74.6 3% | 69.3 -5% | 66.6 -8% |
| Response Times | -16% | 14% | -11% | 65% | 66% | 7% | |
| Response Time Grey 50% / Grey 80% * | 31.7 ? | 42.2 ? -33% | 28.6 ? 10% | 40.5 ? -28% | 9.6 ? 70% | 7.6 ? 76% | 30.4 ? 4% |
| Response Time Black / White * | 22.9 ? | 22.6 ? 1% | 18.7 ? 18% | 21.6 ? 6% | 9.2 ? 60% | 10.4 ? 55% | 20.8 ? 9% |
| PWM Frequency | |||||||
| Screen | 6% | -62% | -54% | 14% | -9% | 18% | |
| Brightness middle | 315 | 306 -3% | 287 -9% | 353 12% | 635 102% | 369 17% | 288 -9% |
| Brightness | 303 | 287 -5% | 288 -5% | 318 5% | 604 99% | 344 14% | 271 -11% |
| Brightness Distribution | 90 | 88 -2% | 86 -4% | 81 -10% | 91 1% | 89 -1% | 91 1% |
| Black Level * | 0.25 | 0.21 16% | 0.19 24% | 0.21 16% | 0.64 -156% | 0.26 -4% | 0.17 32% |
| Contrast | 1260 | 1457 16% | 1511 20% | 1681 33% | 992 -21% | 1419 13% | 1694 34% |
| Colorchecker dE 2000 * | 2.26 | 2.25 -0% | 5.46 -142% | 5.21 -131% | 1.89 16% | 3.04 -35% | 1.9 16% |
| Colorchecker dE 2000 max. * | 7.37 | 4.84 34% | 20.36 -176% | 19.95 -171% | 3.14 57% | 5.56 25% | 3.3 55% |
| Colorchecker dE 2000 calibrated * | 1.03 | 1.45 -41% | 3.52 -242% | 3.61 -250% | 1.14 -11% | 2.35 -128% | 0.9 13% |
| Greyscale dE 2000 * | 4 | 2.4 40% | 4.8 -20% | 3.6 10% | 2.53 37% | 3.38 15% | 2.7 32% |
| Gamma | 2.116 104% | 2.259 97% | 2.108 104% | 2.367 93% | 2.36 93% | 2.47 89% | 2.32 95% |
| CCT | 7570 86% | 6790 96% | 6442 101% | 7138 91% | 6434 101% | 6040 108% | 6535 99% |
| Média Total (Programa/Configurações) | -3% /
2% | -29% /
-46% | -35% /
-45% | 27% /
19% | 18% /
3% | 6% /
11% |
* ... menor é melhor
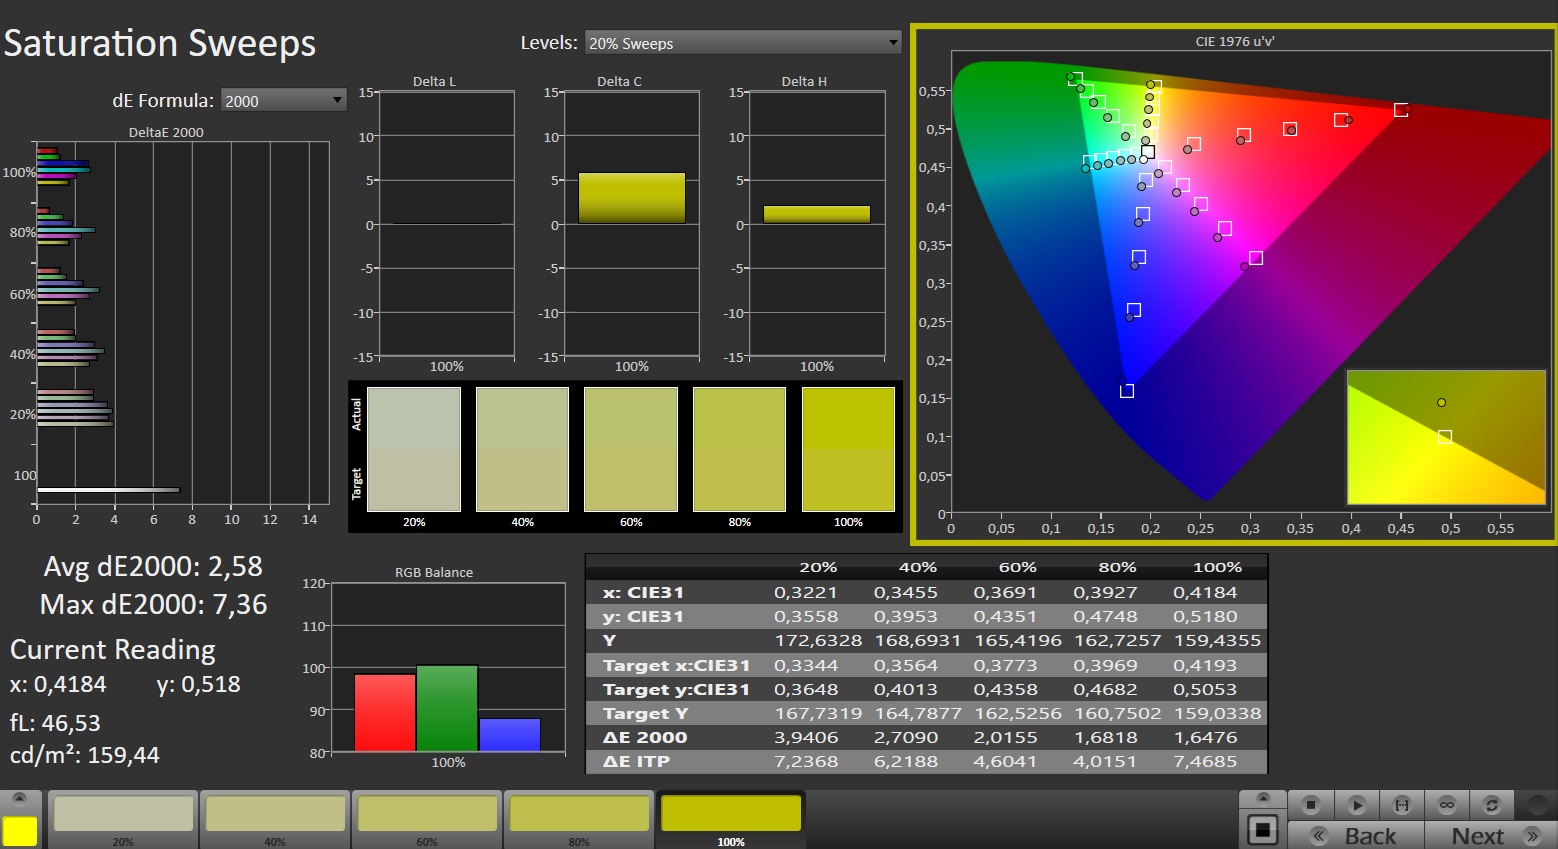
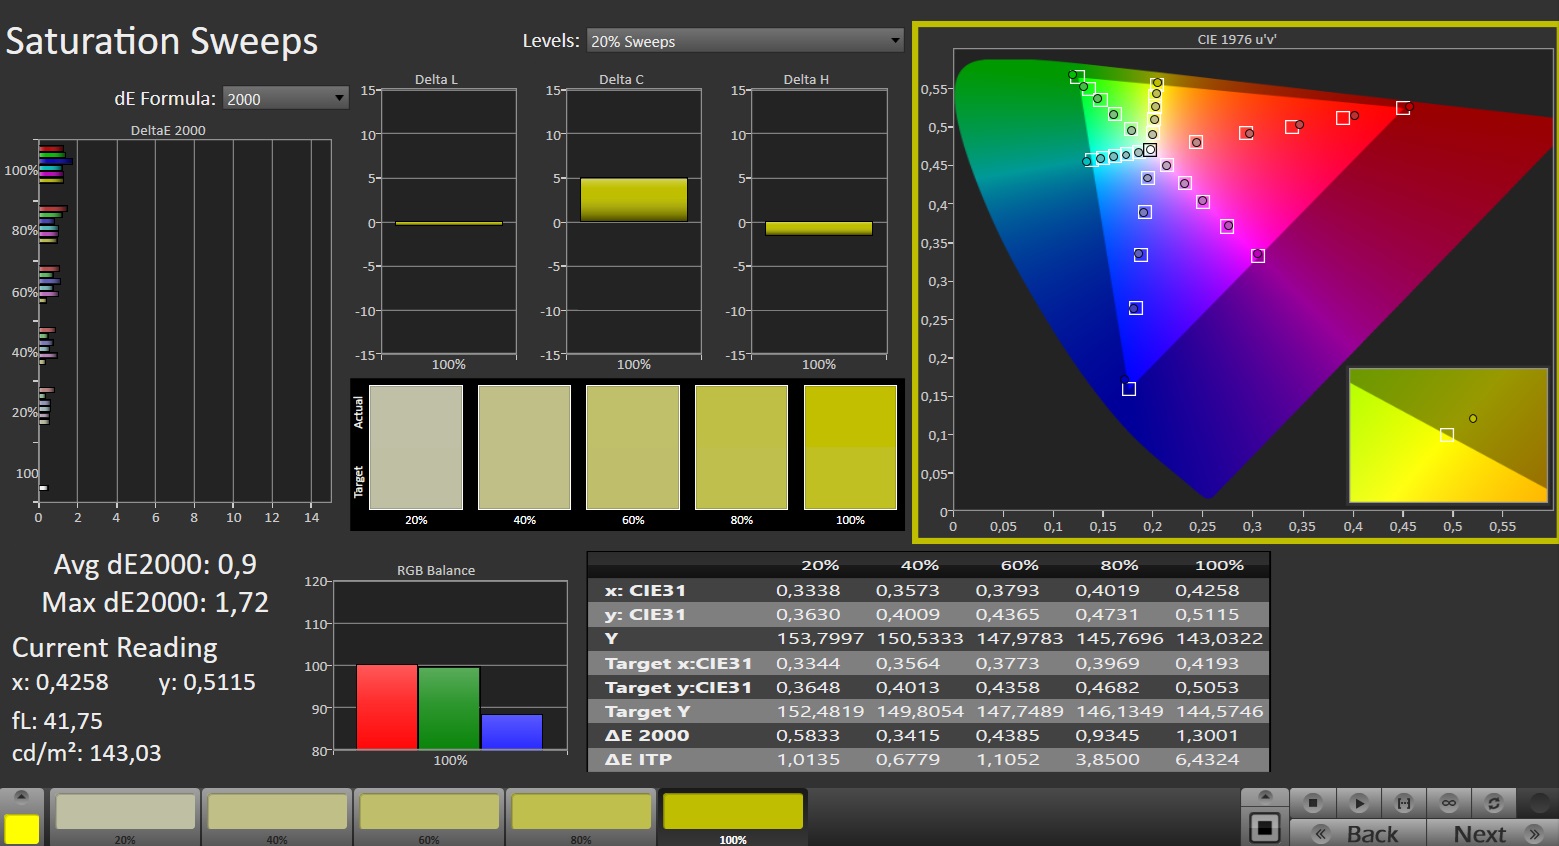
O painel vem pronto para uso com um desvio de cor muito baixo de cerca de 2,26 (meta: DeltaE < 3). Uma calibração reduz esse valor para 1,03. Como é o caso das telas encontradas na maioria dos concorrentes, esse painel cobre o espaço de cores sRGB (quase) completamente, mas não os espaços de cores AdobeRGB e DCI P3.
Exibir tempos de resposta
| ↔ Tempo de resposta preto para branco | ||
|---|---|---|
| 22.9 ms ... ascensão ↗ e queda ↘ combinadas | ↗ 11.7 ms ascensão | 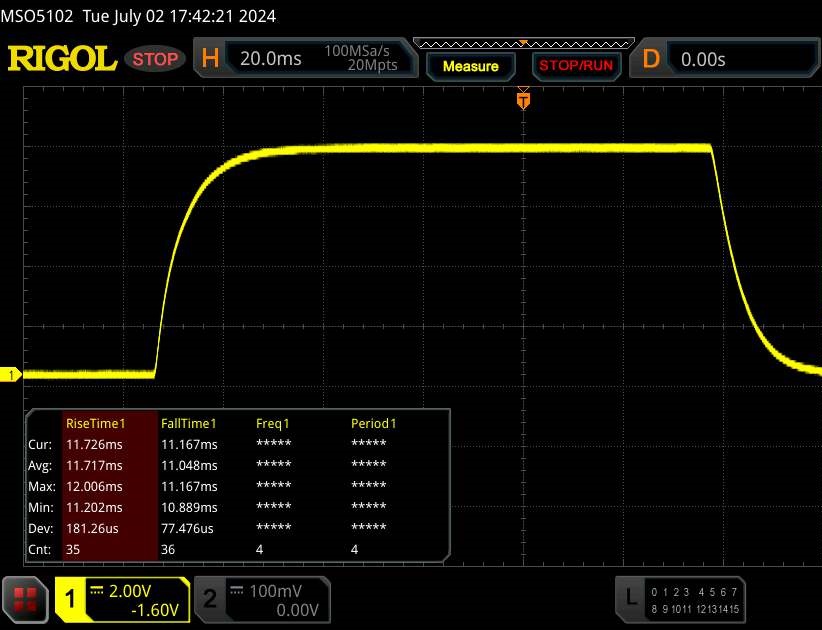 |
| ↘ 11.2 ms queda | ||
| A tela mostra boas taxas de resposta em nossos testes, mas pode ser muito lenta para jogadores competitivos. Em comparação, todos os dispositivos testados variam de 0.1 (mínimo) a 240 (máximo) ms. » 48 % de todos os dispositivos são melhores. Isso significa que o tempo de resposta medido é pior que a média de todos os dispositivos testados (20.8 ms). | ||
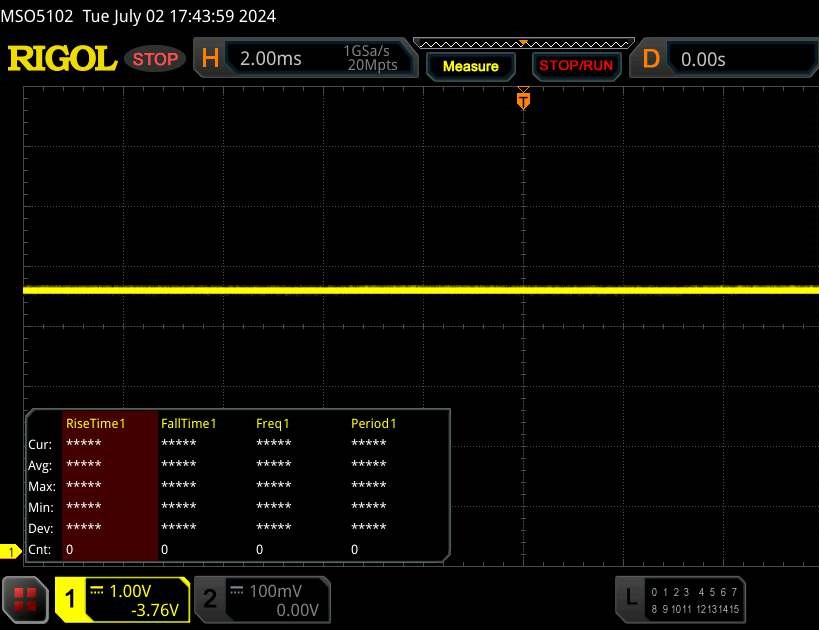
| ↔ Tempo de resposta 50% cinza a 80% cinza | ||
| 31.7 ms ... ascensão ↗ e queda ↘ combinadas | ↗ 14.7 ms ascensão | 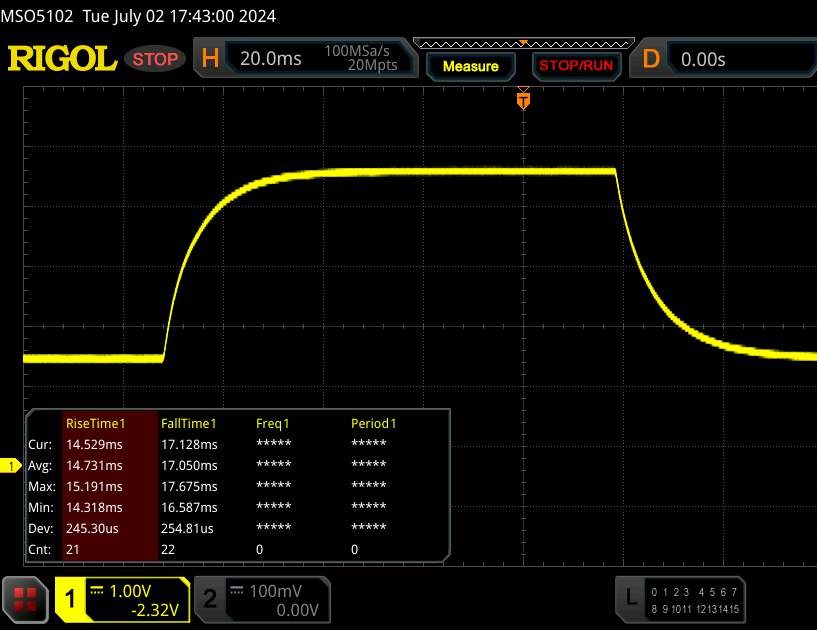 |
| ↘ 17 ms queda | ||
| A tela mostra taxas de resposta lentas em nossos testes e será insatisfatória para os jogadores. Em comparação, todos os dispositivos testados variam de 0.165 (mínimo) a 636 (máximo) ms. » 39 % de todos os dispositivos são melhores. Isso significa que o tempo de resposta medido é semelhante à média de todos os dispositivos testados (32.5 ms). | ||
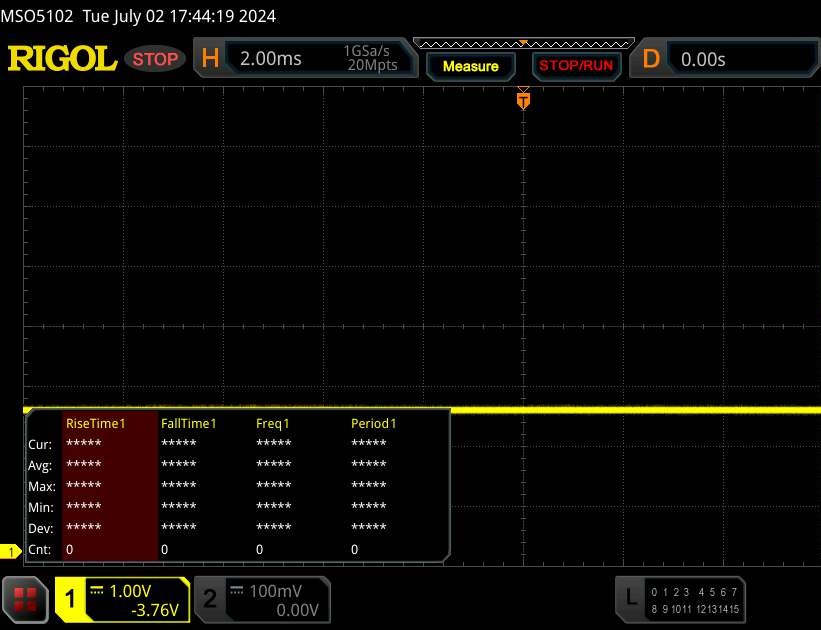
Cintilação da tela / PWM (modulação por largura de pulso)
| Tela tremeluzindo / PWM não detectado | 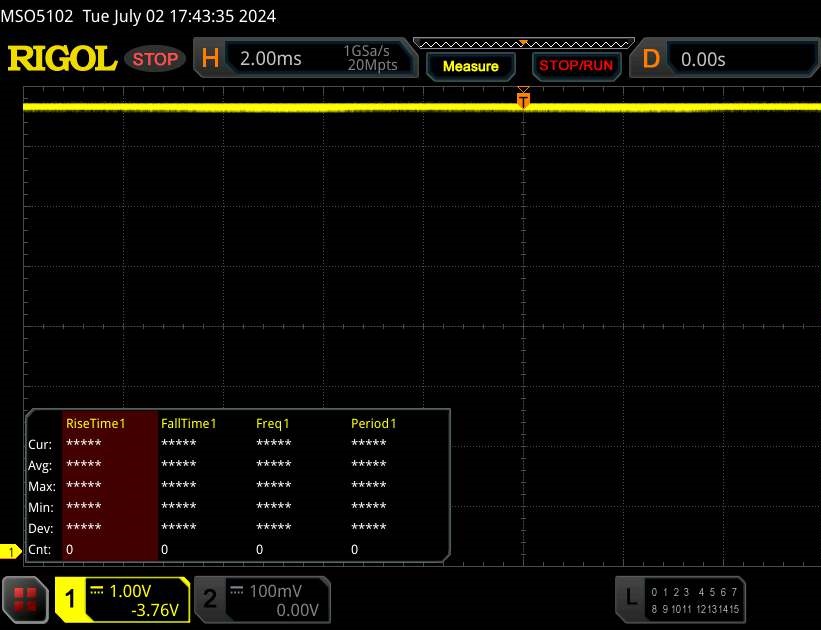 | ||
[pwm_comparison] Em comparação: 53 % de todos os dispositivos testados não usam PWM para escurecer a tela. Se PWM foi detectado, uma média de 8516 (mínimo: 5 - máximo: 343500) Hz foi medida. | |||
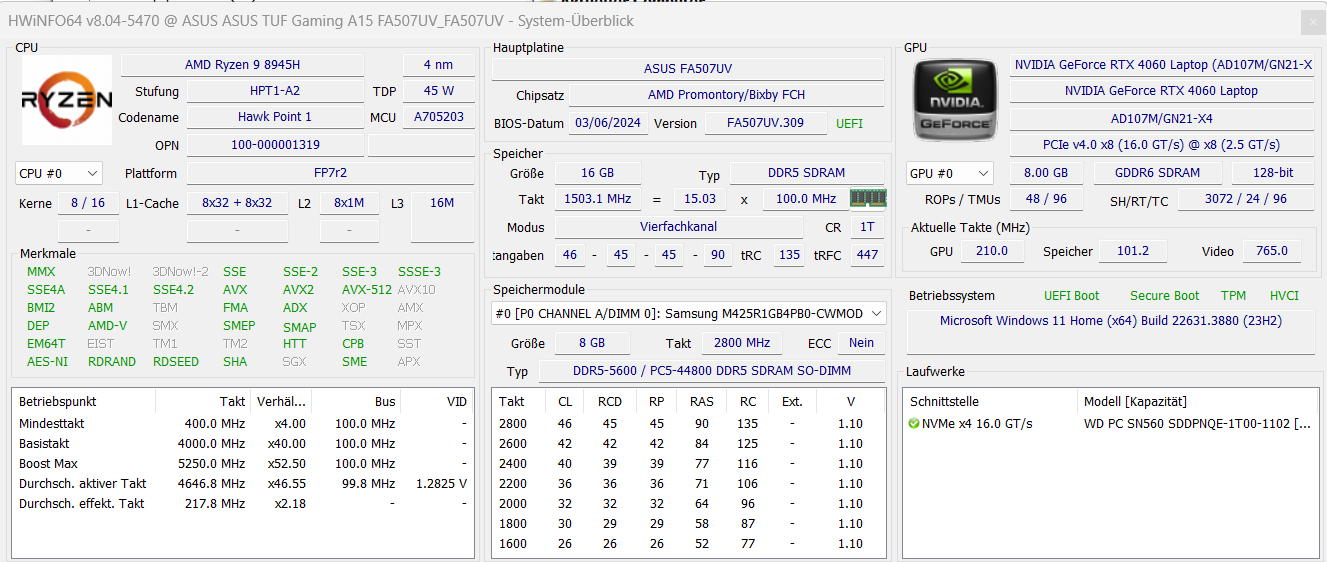
Desempenho - Hawk Point e Ada Lovelace alimentam o computador
Com o TUF Gaming A15 FA507UV, a Asus está oferecendo um laptop para jogos de médio porte no segmento de preço mais baixo. O hardware necessário para as tarefas de computação vem da AMD (Hawk Point, Zen 4) e da Nvidia (Ada Lovelace). O dispositivo analisado custará ao senhor cerca de US$ 1.399.
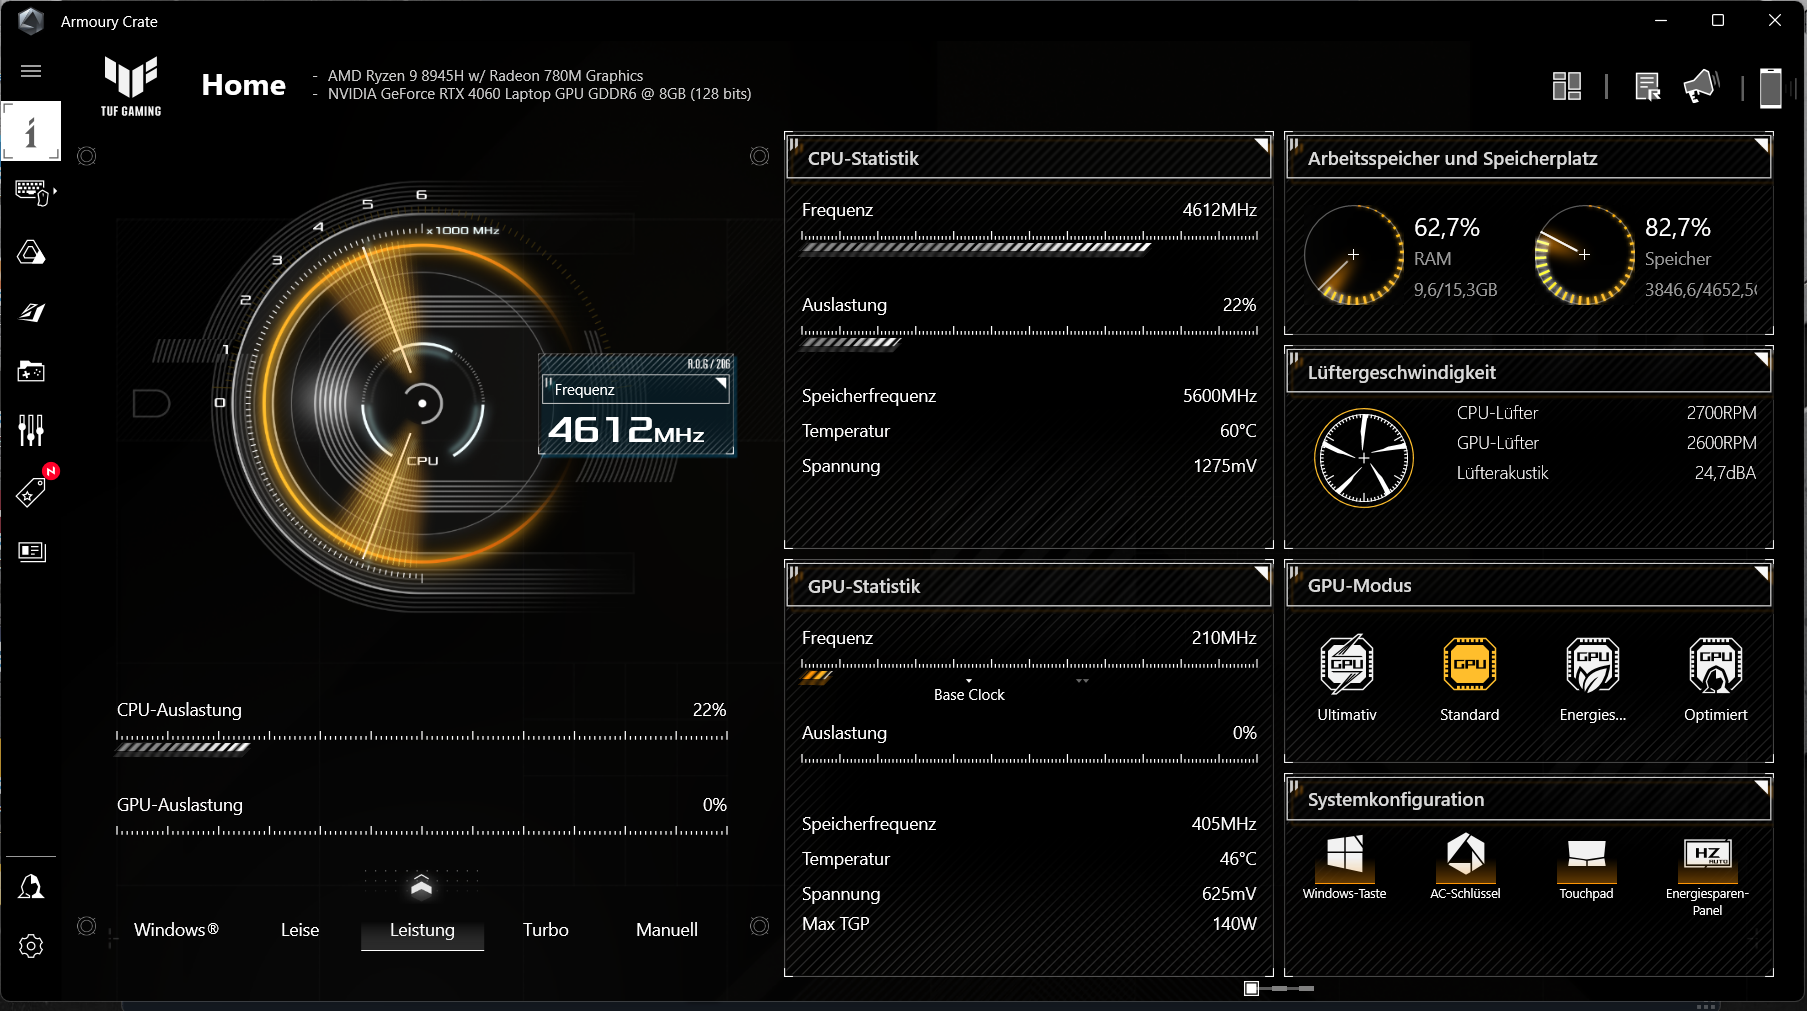
Condições de teste
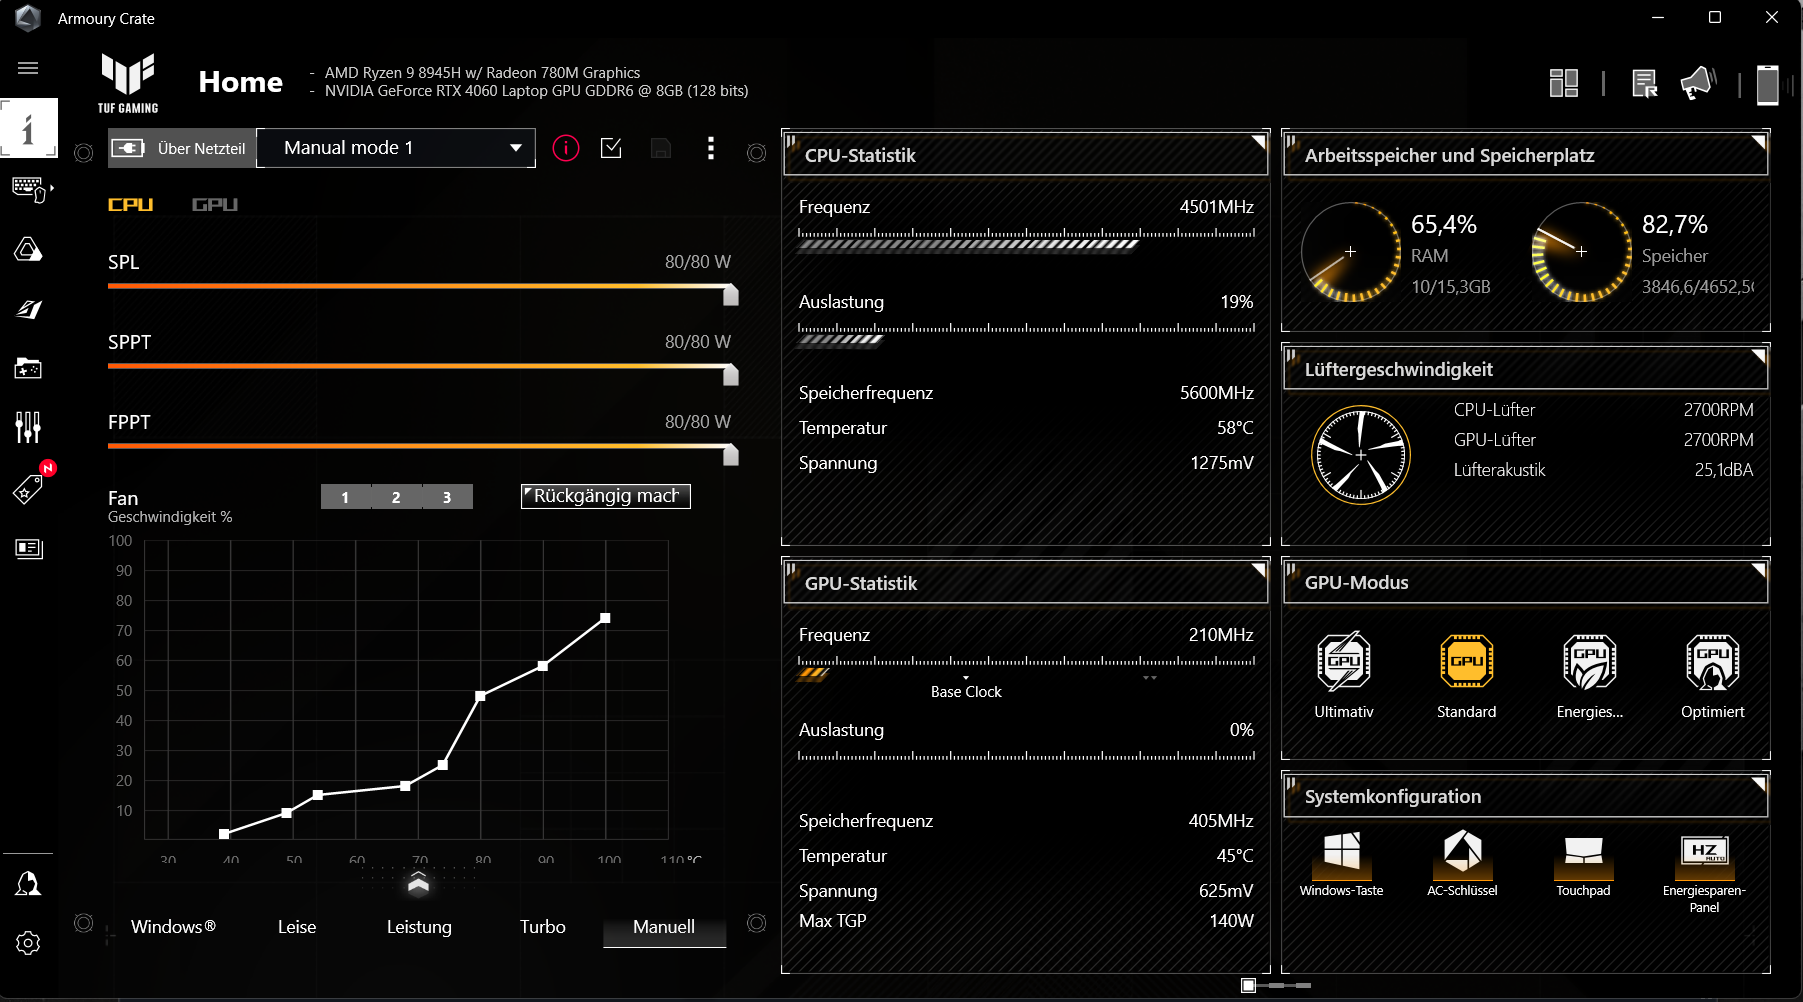
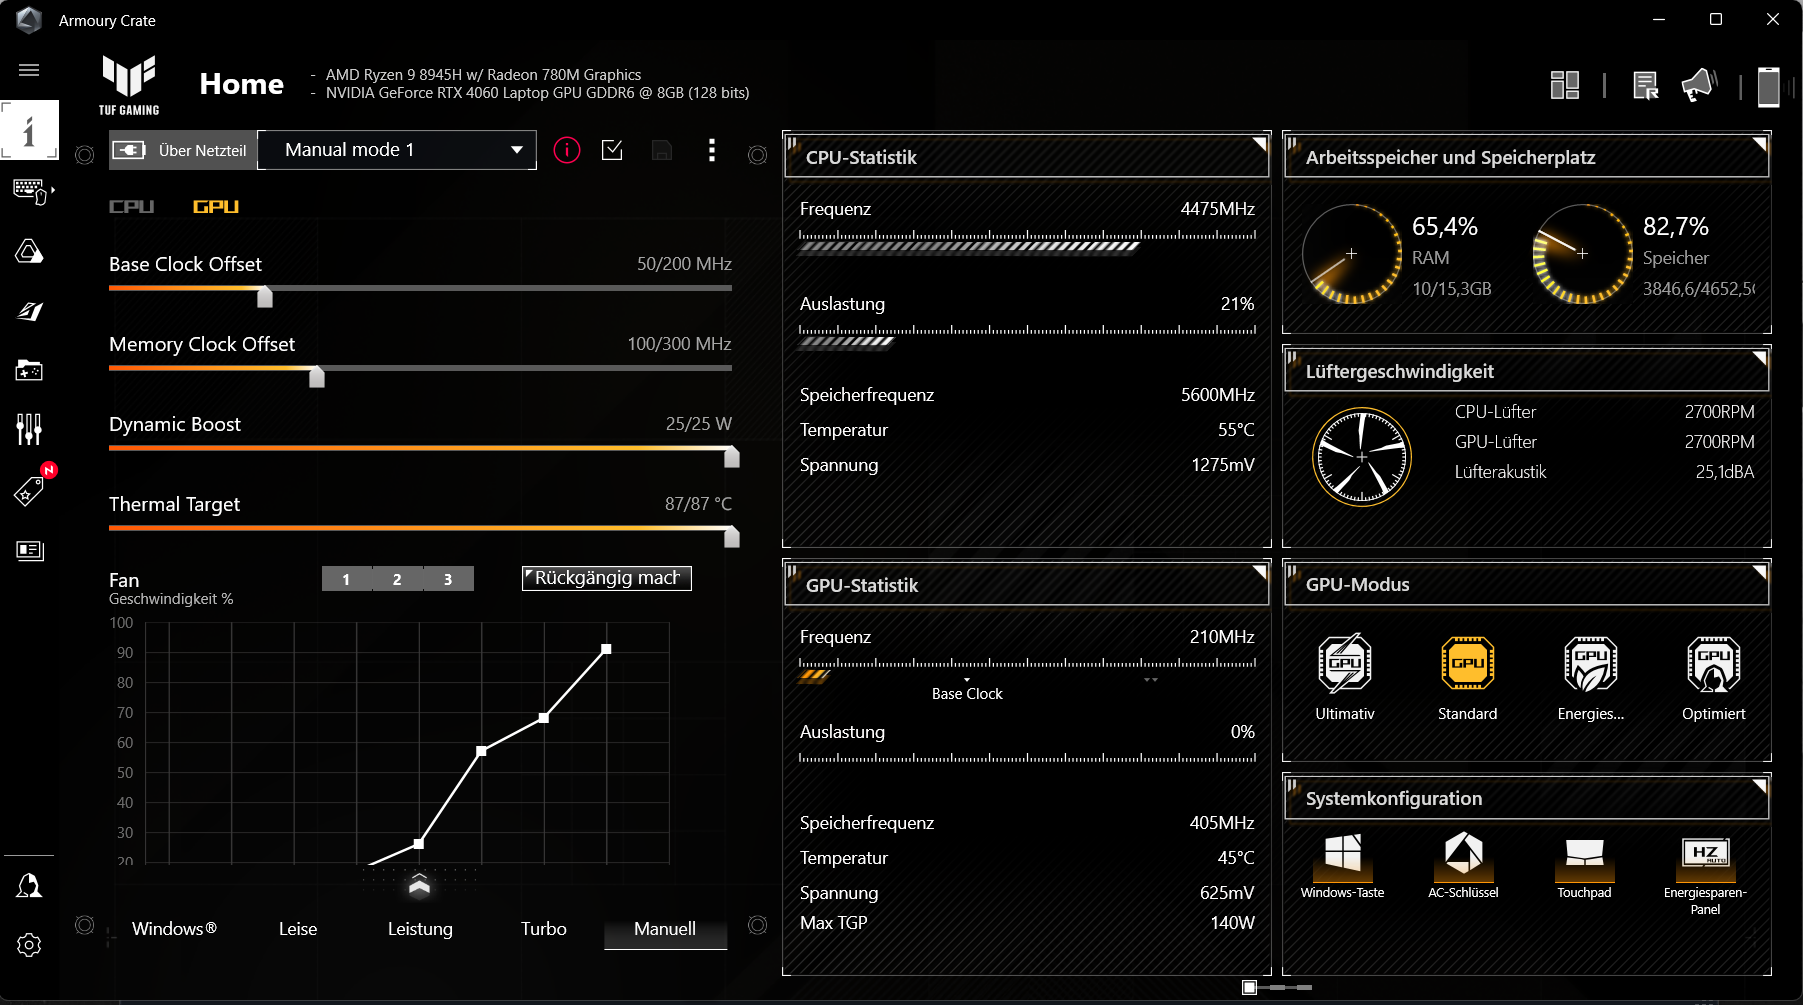
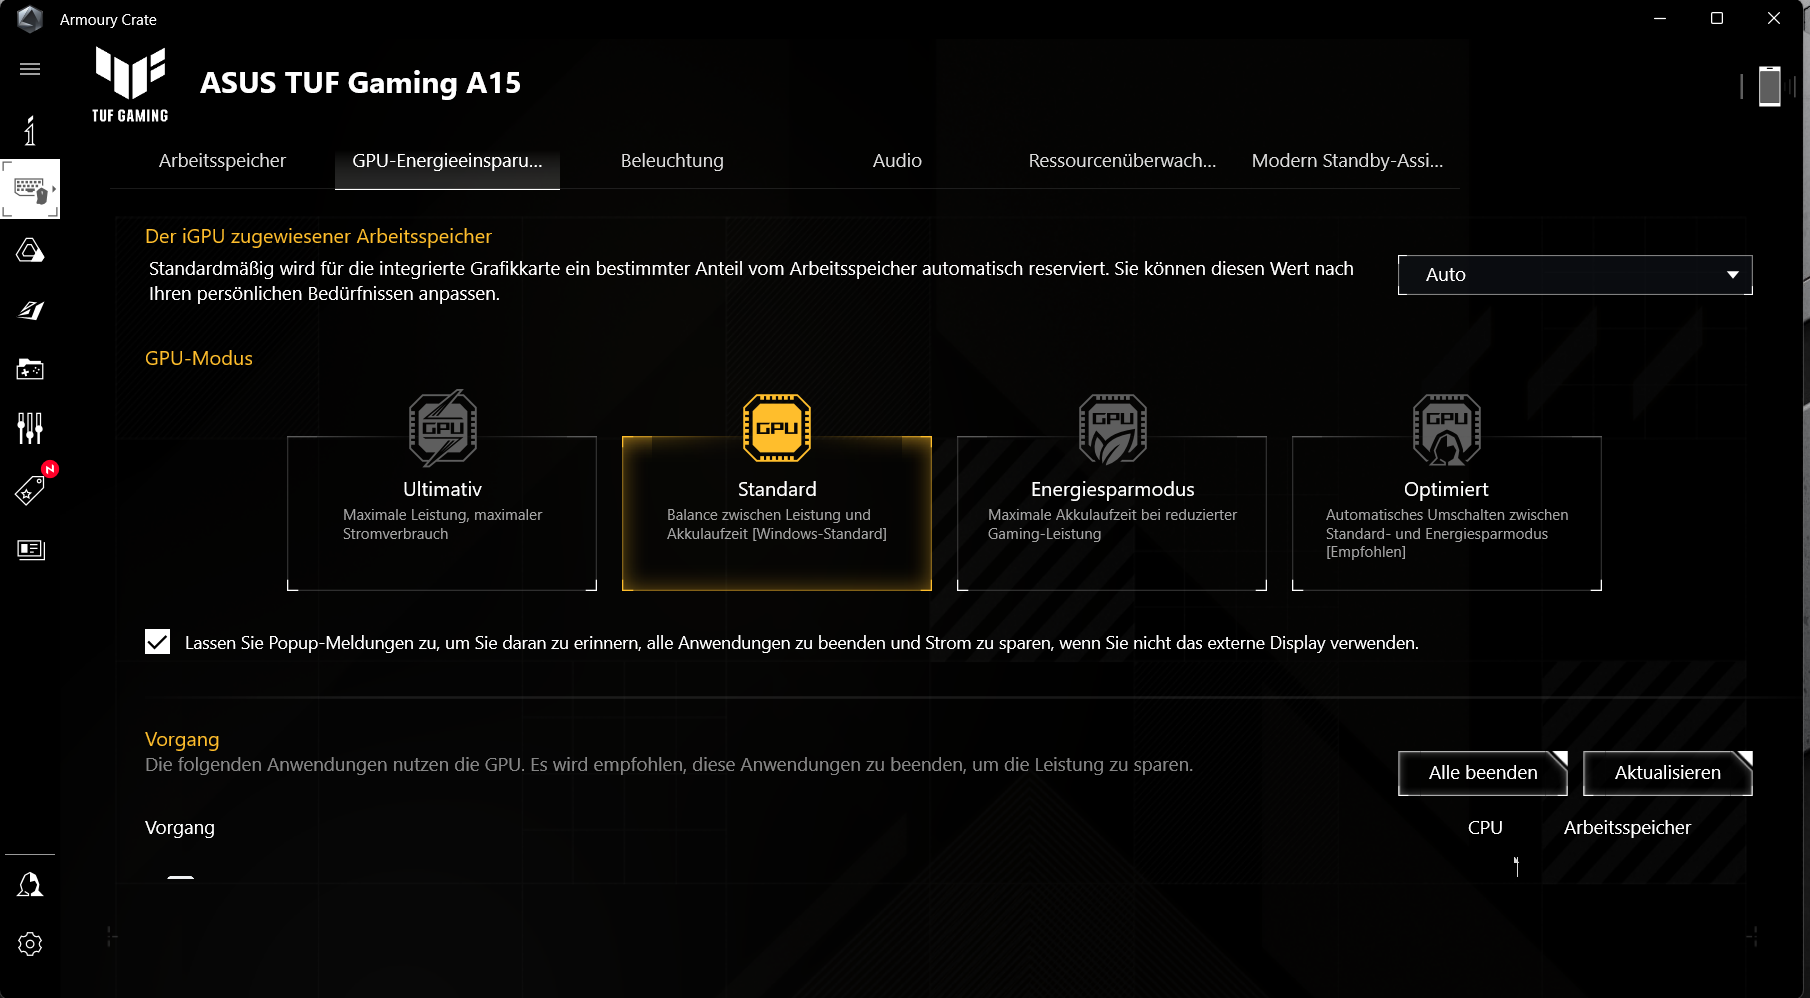
O laptop tem três perfis de desempenho específicos do fabricante (consulte a tabela) que podem ser alternados por meio da combinação de teclas "Fn" + "F5". Usamos os perfis "Performance" (benchmarks) e "Quiet" (teste de bateria). O modo GPU foi definido como "Standard". O centro de controle do laptop ("Armoury Crate") permite definir um perfil personalizado ("Manual"), bem como definir os limites de energia, o aumento dinâmico e as curvas da ventoinha.
| Desempenho | Turbo | Silencioso | |
|---|---|---|---|
| Limite de potência 1 (HWInfo) | 70 watts | 80 watts | 54 watts |
| Limite de potência 2 (HWInfo) | 80 watts | 80 watts | 65 watts |
| Ruído (CP 2077 Phantom) | 45 dB(A) | 56 dB(A) | 41 dB(A) |
| Desempenho (CP 2077 Phantom) | 64fps | 70fps | 56fps |

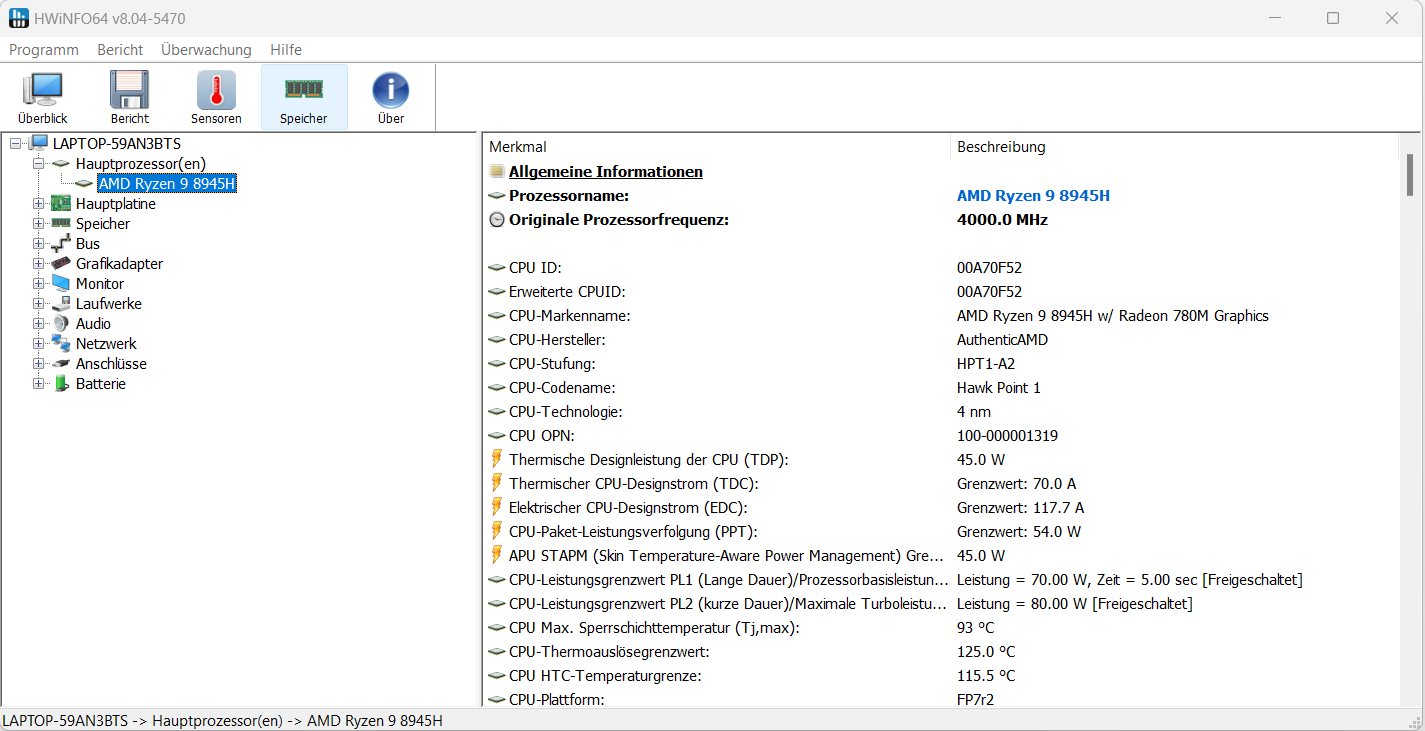
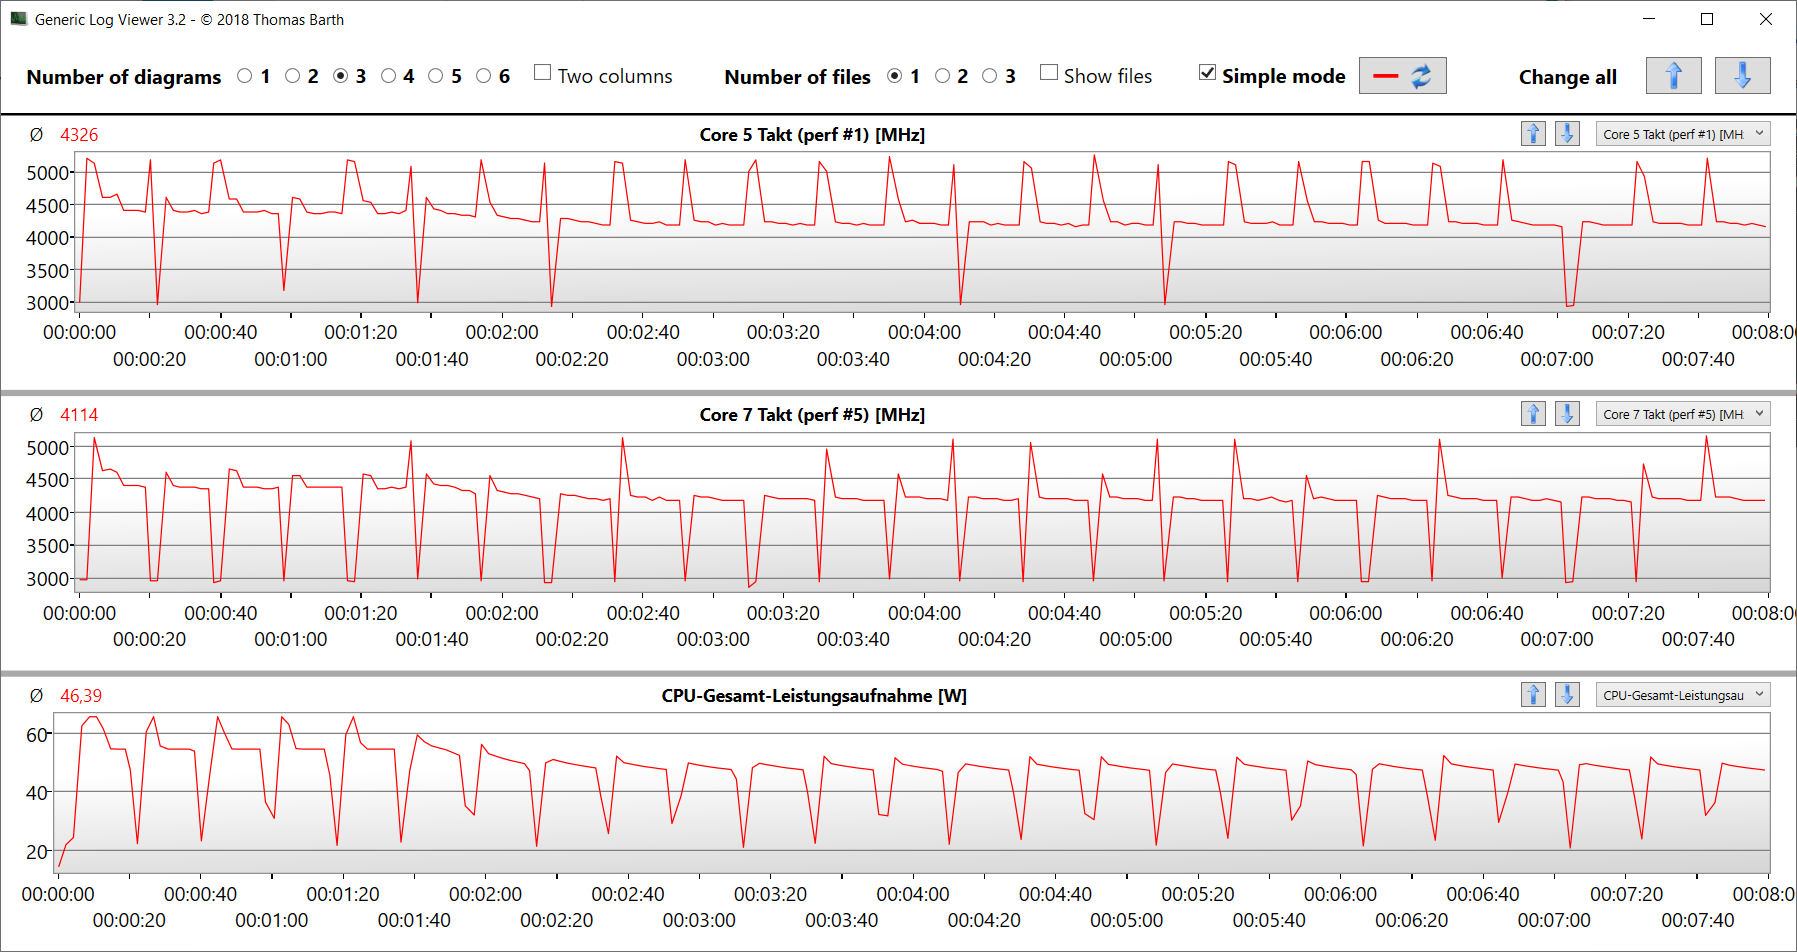
Processador
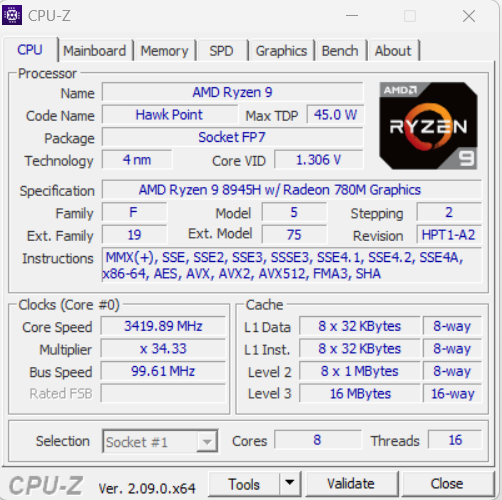
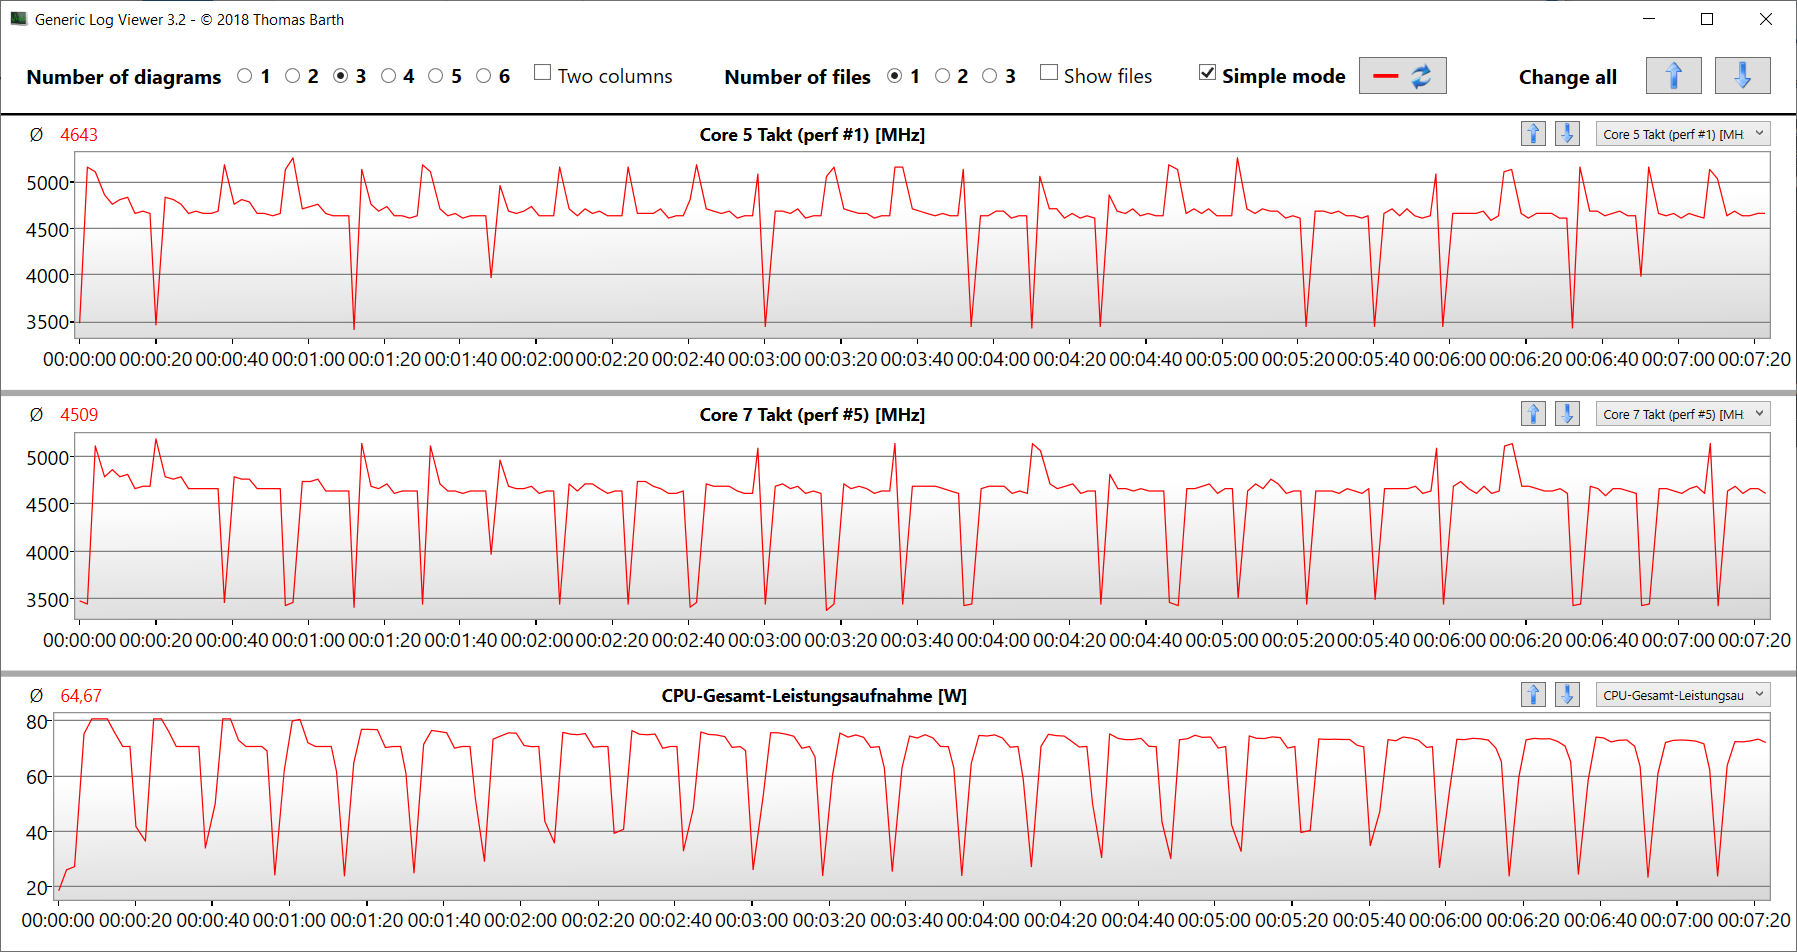
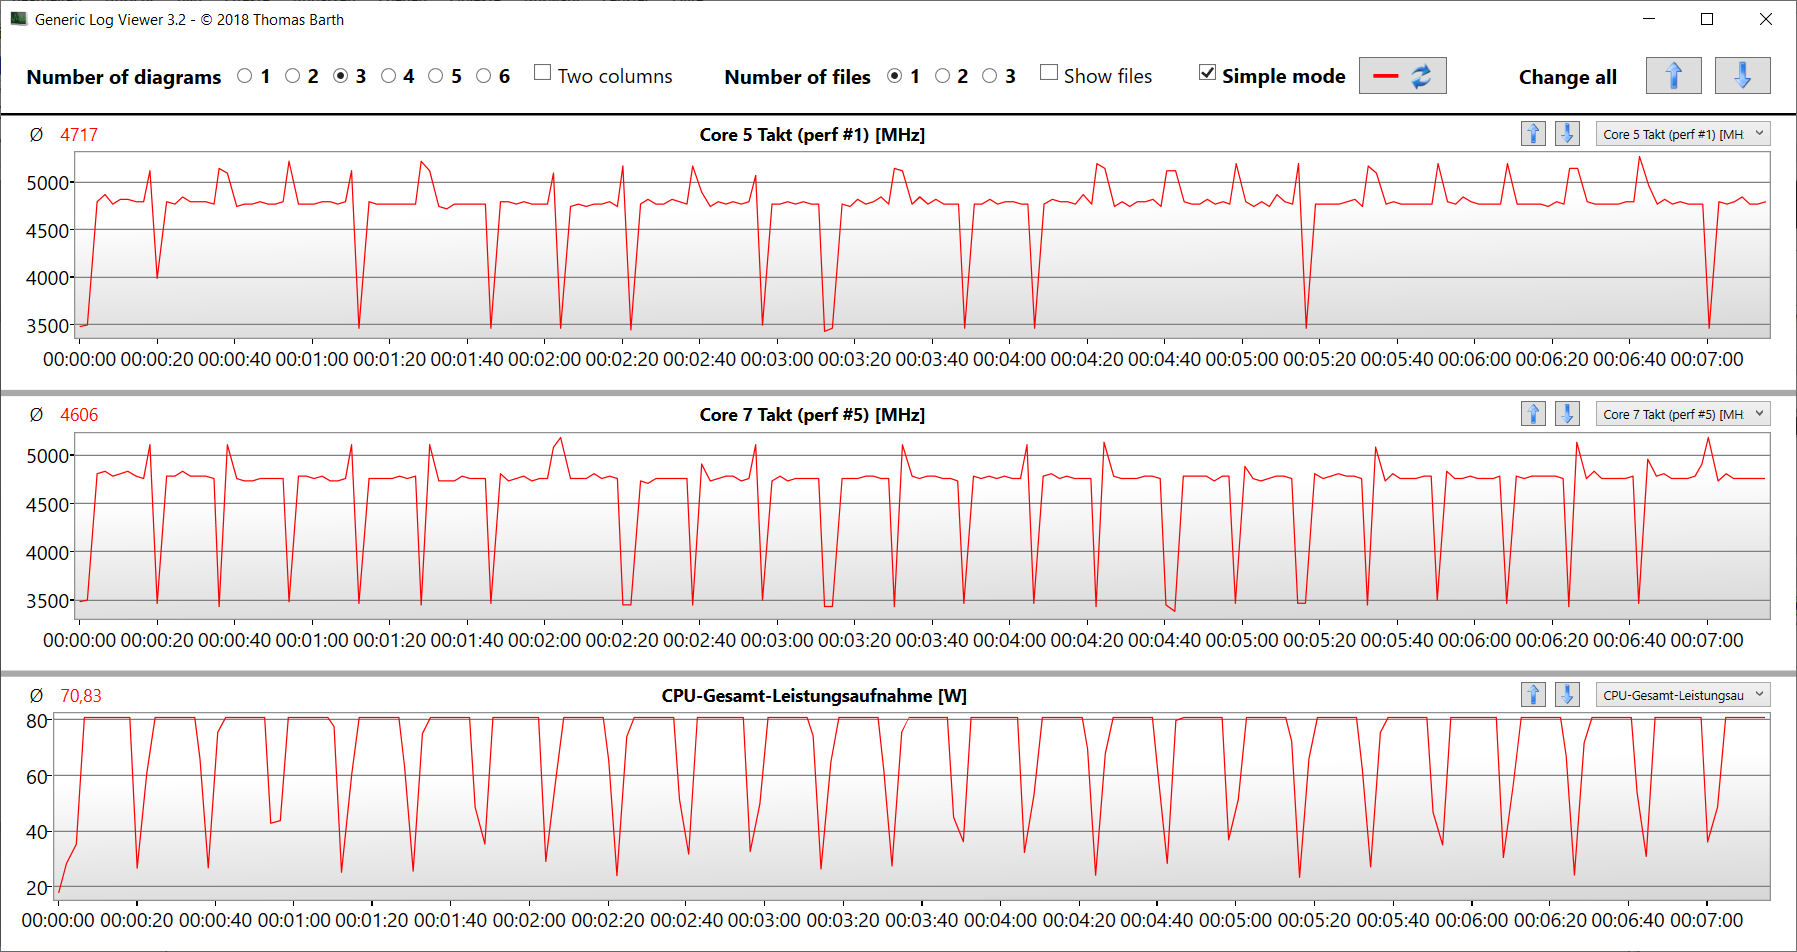
Ryzen 9 8945H (Hawk Point, Zen 4) oferece oito núcleos de CPU com um total de 16 threads a uma velocidade máxima de clock de 5,25 GHz (um núcleo). A CPU responde à carga sustentada de vários threads (loop CB15) com uma velocidade turbo consistentemente alta. O desempenho da CPU varia de acordo com o perfil de energia selecionado e as diferenças são bem pequenas. Os resultados do benchmark estão no mesmo nível de um Ryzen 9 8945HS APU.
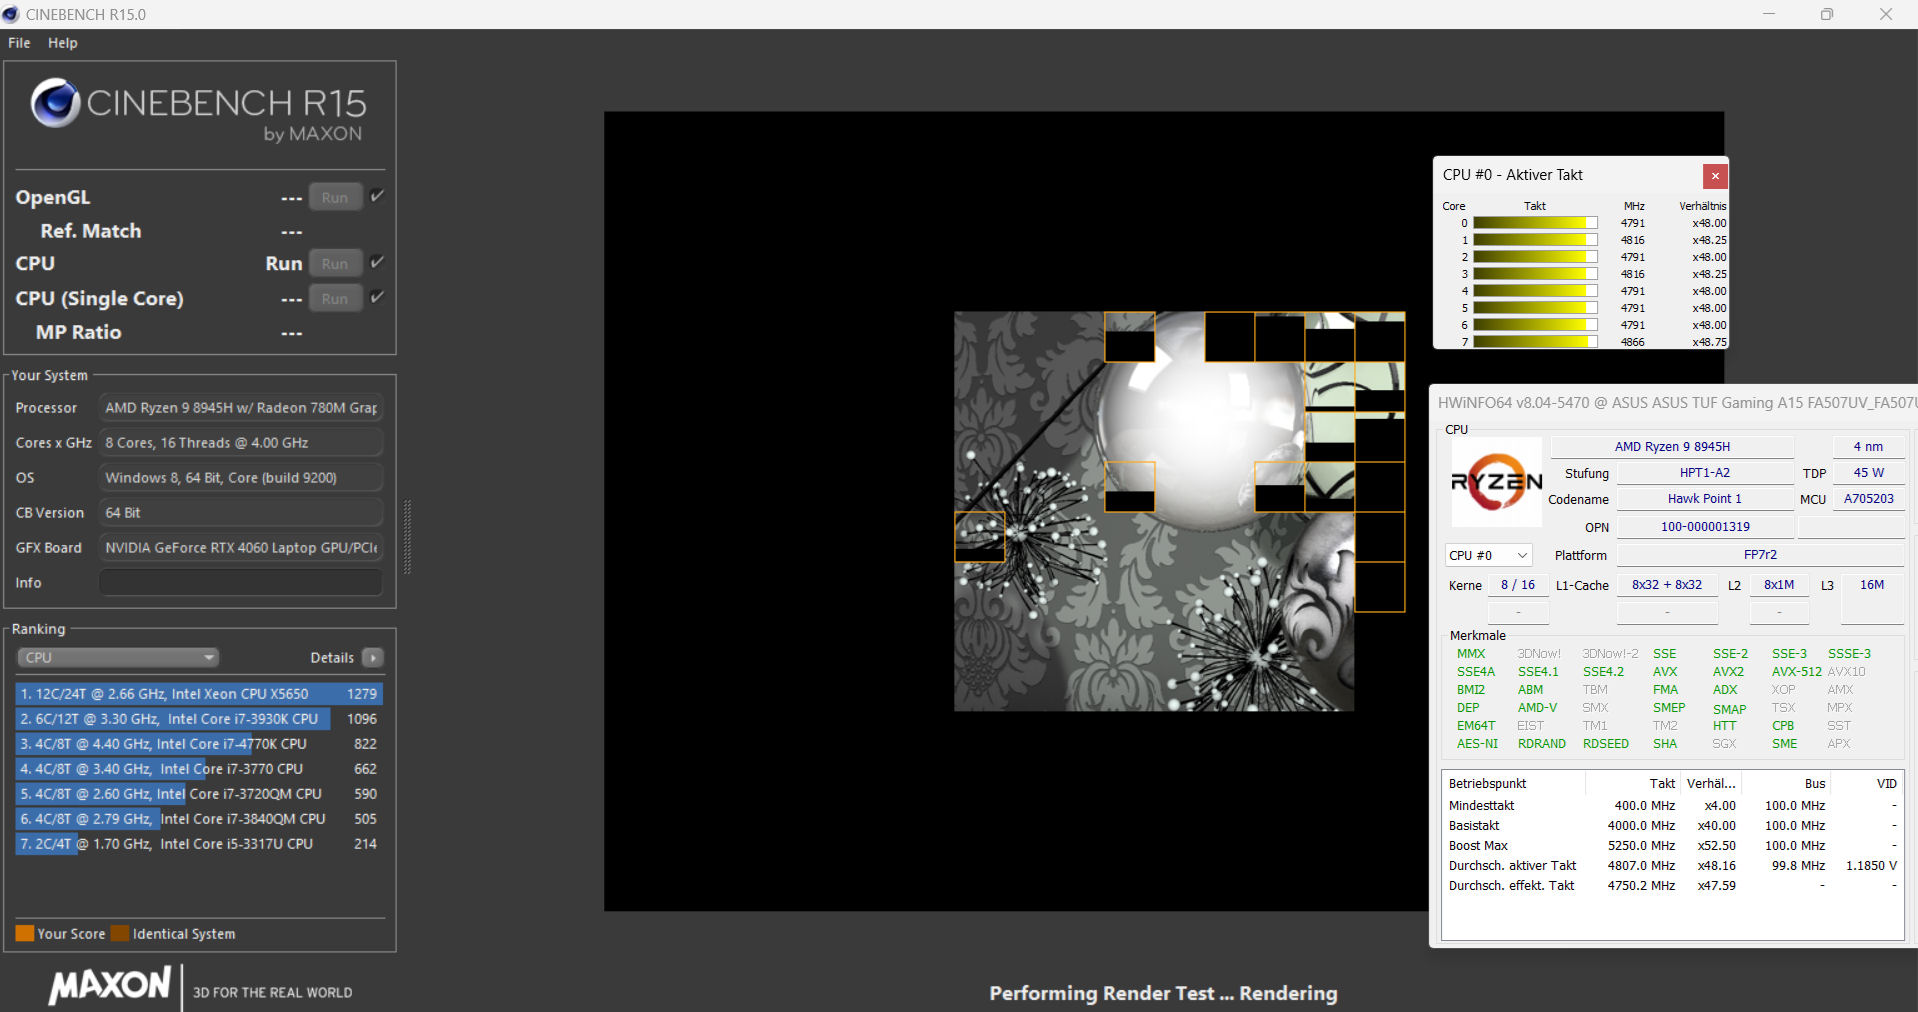
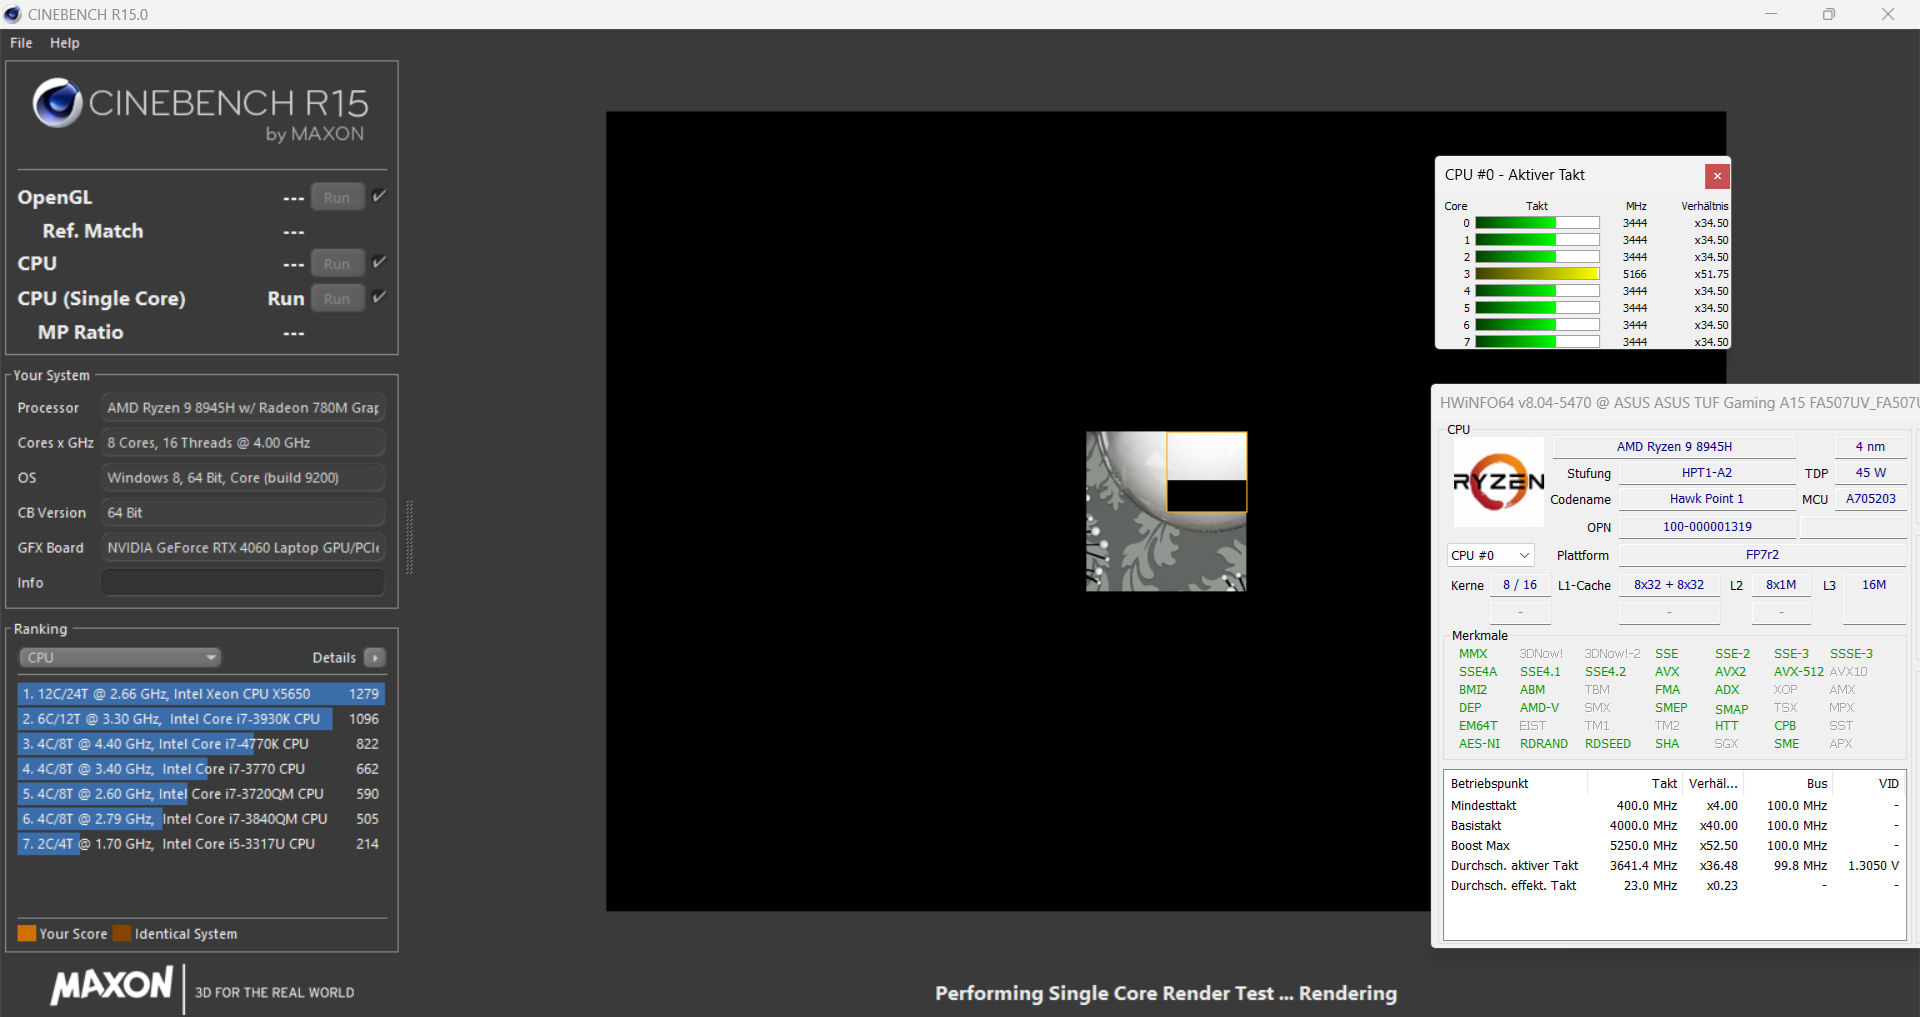
Cinebench R15 Multi Continuous Test
| CPU Performance Rating - Percent | |
| Média da turma Gaming | |
| HP Victus 16 (2024) | |
| SCHENKER XMG Core 15 (M24) | |
| Dell G16, i7-13650HX, RTX 4060 | |
| Asus TUF Gaming A15 FA507UV | |
| Média AMD Ryzen 9 8945H | |
| Asus TUF Gaming A15 FA507UV | |
| Gigabyte G6X 9KG (2024) | |
| Lenovo LOQ 15IRX9 | |
| Asus TUF A15 FA507 -2! | |
| Cinebench R20 | |
| CPU (Multi Core) | |
| HP Victus 16 (2024) | |
| Média da turma Gaming (2179 - 15517, n=151, últimos 2 anos) | |
| Dell G16, i7-13650HX, RTX 4060 | |
| Gigabyte G6X 9KG (2024) | |
| SCHENKER XMG Core 15 (M24) | |
| Asus TUF Gaming A15 FA507UV (Turbo) | |
| Média AMD Ryzen 9 8945H (6859 - 6956, n=2) | |
| Asus TUF Gaming A15 FA507UV | |
| Lenovo LOQ 15IRX9 | |
| Asus TUF A15 FA507 | |
| CPU (Single Core) | |
| Média da turma Gaming (439 - 866, n=151, últimos 2 anos) | |
| Dell G16, i7-13650HX, RTX 4060 | |
| Gigabyte G6X 9KG (2024) | |
| SCHENKER XMG Core 15 (M24) | |
| Asus TUF Gaming A15 FA507UV | |
| Média AMD Ryzen 9 8945H (638 - 670, n=2) | |
| Lenovo LOQ 15IRX9 | |
| HP Victus 16 (2024) | |
| Asus TUF Gaming A15 FA507UV (Turbo) | |
| Asus TUF A15 FA507 | |
| Cinebench R15 | |
| CPU Multi 64Bit | |
| HP Victus 16 (2024) | |
| Média da turma Gaming (905 - 6074, n=154, últimos 2 anos) | |
| Dell G16, i7-13650HX, RTX 4060 | |
| SCHENKER XMG Core 15 (M24) | |
| Gigabyte G6X 9KG (2024) | |
| Asus TUF Gaming A15 FA507UV (Turbo) | |
| Asus TUF Gaming A15 FA507UV | |
| Média AMD Ryzen 9 8945H (2605 - 2819, n=3) | |
| Lenovo LOQ 15IRX9 | |
| Asus TUF A15 FA507 | |
| CPU Single 64Bit | |
| Asus TUF Gaming A15 FA507UV | |
| Média AMD Ryzen 9 8945H (283 - 284, n=2) | |
| Asus TUF Gaming A15 FA507UV (Turbo) | |
| SCHENKER XMG Core 15 (M24) | |
| Média da turma Gaming (191.9 - 343, n=151, últimos 2 anos) | |
| Dell G16, i7-13650HX, RTX 4060 | |
| Gigabyte G6X 9KG (2024) | |
| Asus TUF A15 FA507 | |
| Lenovo LOQ 15IRX9 | |
| HP Victus 16 (2024) | |
| Blender - v2.79 BMW27 CPU | |
| Lenovo LOQ 15IRX9 | |
| Gigabyte G6X 9KG (2024) | |
| Asus TUF A15 FA507 | |
| Asus TUF Gaming A15 FA507UV | |
| Média AMD Ryzen 9 8945H (178 - 182, n=2) | |
| SCHENKER XMG Core 15 (M24) | |
| Asus TUF Gaming A15 FA507UV (Turbo) | |
| Média da turma Gaming (81 - 555, n=144, últimos 2 anos) | |
| HP Victus 16 (2024) | |
| Dell G16, i7-13650HX, RTX 4060 | |
| Geekbench 6.4 | |
| Multi-Core | |
| HP Victus 16 (2024) (6.2.1) | |
| Média da turma Gaming (5340 - 21668, n=119, últimos 2 anos) | |
| SCHENKER XMG Core 15 (M24) (6.2.1) | |
| Dell G16, i7-13650HX, RTX 4060 (6.2.1) | |
| Gigabyte G6X 9KG (2024) (6.2.1) | |
| Lenovo LOQ 15IRX9 (6.2.1) | |
| Asus TUF Gaming A15 FA507UV (6.2.1) | |
| Média AMD Ryzen 9 8945H (12638 - 12662, n=2) | |
| Asus TUF Gaming A15 FA507UV (6.2.1 Turbo) | |
| Single-Core | |
| Asus TUF Gaming A15 FA507UV (6.2.1) | |
| Média AMD Ryzen 9 8945H (2692 - 2711, n=2) | |
| Asus TUF Gaming A15 FA507UV (6.2.1, Turbo) | |
| SCHENKER XMG Core 15 (M24) (6.2.1) | |
| Média da turma Gaming (1490 - 3219, n=119, últimos 2 anos) | |
| Dell G16, i7-13650HX, RTX 4060 (6.2.1) | |
| Gigabyte G6X 9KG (2024) (6.2.1) | |
| Lenovo LOQ 15IRX9 (6.2.1) | |
| HP Victus 16 (2024) (6.2.1) | |
| HWBOT x265 Benchmark v2.2 - 4k Preset | |
| Média da turma Gaming (6.72 - 42.9, n=148, últimos 2 anos) | |
| SCHENKER XMG Core 15 (M24) | |
| Asus TUF Gaming A15 FA507UV (Turbo) | |
| Média AMD Ryzen 9 8945H (21.9 - 22.4, n=2) | |
| HP Victus 16 (2024) | |
| Asus TUF Gaming A15 FA507UV | |
| Dell G16, i7-13650HX, RTX 4060 | |
| Gigabyte G6X 9KG (2024) | |
| Lenovo LOQ 15IRX9 | |
| Asus TUF A15 FA507 | |
| LibreOffice - 20 Documents To PDF | |
| Lenovo LOQ 15IRX9 (6.3.4.2) | |
| HP Victus 16 (2024) (6.3.4.2) | |
| Dell G16, i7-13650HX, RTX 4060 (6.3.4.2) | |
| Asus TUF A15 FA507 | |
| SCHENKER XMG Core 15 (M24) (6.3.4.2) | |
| Média da turma Gaming (19 - 96.6, n=147, últimos 2 anos) | |
| Asus TUF Gaming A15 FA507UV (6.3.4.2) | |
| Média AMD Ryzen 9 8945H (44.2 - 47.5, n=2) | |
| Asus TUF Gaming A15 FA507UV (6.3.4.2, Turbo) | |
| Gigabyte G6X 9KG (2024) (6.3.4.2) | |
* ... menor é melhor
AIDA64: FP32 Ray-Trace | FPU Julia | CPU SHA3 | CPU Queen | FPU SinJulia | FPU Mandel | CPU AES | CPU ZLib | FP64 Ray-Trace | CPU PhotoWorxx
| Performance Rating | |
| Asus TUF Gaming A15 FA507UV | |
| Média AMD Ryzen 9 8945H | |
| SCHENKER XMG Core 15 (M24) | |
| Asus TUF Gaming A15 FA507UV | |
| Média da turma Gaming | |
| Dell G16, i7-13650HX, RTX 4060 | |
| HP Victus 16 (2024) | |
| Asus TUF A15 FA507 | |
| Gigabyte G6X 9KG (2024) | |
| Lenovo LOQ 15IRX9 | |
| AIDA64 / FP32 Ray-Trace | |
| SCHENKER XMG Core 15 (M24) (v6.92.6600) | |
| Asus TUF Gaming A15 FA507UV (v6.92.6600, Turbo) | |
| Média AMD Ryzen 9 8945H (28698 - 29423, n=2) | |
| Asus TUF Gaming A15 FA507UV (v6.92.6600) | |
| Média da turma Gaming (4986 - 81639, n=147, últimos 2 anos) | |
| Dell G16, i7-13650HX, RTX 4060 (v6.92.6600) | |
| HP Victus 16 (2024) (v6.92.6600) | |
| Asus TUF A15 FA507 (v6.85.6300) | |
| Lenovo LOQ 15IRX9 (v6.92.6600) | |
| Gigabyte G6X 9KG (2024) (v6.92.6600) | |
| AIDA64 / FPU Julia | |
| SCHENKER XMG Core 15 (M24) (v6.92.6600) | |
| Asus TUF Gaming A15 FA507UV (v6.92.6600, Turbo) | |
| Média AMD Ryzen 9 8945H (122466 - 125008, n=2) | |
| Asus TUF Gaming A15 FA507UV (v6.92.6600) | |
| Média da turma Gaming (25360 - 252486, n=147, últimos 2 anos) | |
| Asus TUF A15 FA507 (v6.85.6300) | |
| Dell G16, i7-13650HX, RTX 4060 (v6.92.6600) | |
| HP Victus 16 (2024) (v6.92.6600) | |
| Lenovo LOQ 15IRX9 (v6.92.6600) | |
| Gigabyte G6X 9KG (2024) (v6.92.6600) | |
| AIDA64 / CPU SHA3 | |
| Asus TUF Gaming A15 FA507UV (v6.92.6600, Turbo) | |
| SCHENKER XMG Core 15 (M24) (v6.92.6600) | |
| Média AMD Ryzen 9 8945H (5113 - 5209, n=2) | |
| Asus TUF Gaming A15 FA507UV (v6.92.6600) | |
| Média da turma Gaming (1339 - 10389, n=147, últimos 2 anos) | |
| Dell G16, i7-13650HX, RTX 4060 (v6.92.6600) | |
| HP Victus 16 (2024) (v6.92.6600) | |
| Lenovo LOQ 15IRX9 (v6.92.6600) | |
| Asus TUF A15 FA507 (v6.85.6300) | |
| Gigabyte G6X 9KG (2024) (v6.92.6600) | |
| AIDA64 / CPU Queen | |
| HP Victus 16 (2024) (v6.92.6600) | |
| Asus TUF Gaming A15 FA507UV (v6.92.6600) | |
| Média AMD Ryzen 9 8945H (124401 - 125950, n=2) | |
| SCHENKER XMG Core 15 (M24) (v6.92.6600) | |
| Asus TUF Gaming A15 FA507UV (v6.92.6600, Turbo) | |
| Média da turma Gaming (50699 - 200651, n=147, últimos 2 anos) | |
| Gigabyte G6X 9KG (2024) (v6.92.6600) | |
| Dell G16, i7-13650HX, RTX 4060 (v6.92.6600) | |
| Asus TUF A15 FA507 (v6.85.6300) | |
| Lenovo LOQ 15IRX9 (v6.92.6600) | |
| AIDA64 / FPU SinJulia | |
| Asus TUF Gaming A15 FA507UV (v6.92.6600, Turbo) | |
| Média AMD Ryzen 9 8945H (15856 - 15889, n=2) | |
| Asus TUF Gaming A15 FA507UV (v6.92.6600) | |
| SCHENKER XMG Core 15 (M24) (v6.92.6600) | |
| Média da turma Gaming (4800 - 32988, n=147, últimos 2 anos) | |
| Asus TUF A15 FA507 (v6.85.6300) | |
| HP Victus 16 (2024) (v6.92.6600) | |
| Dell G16, i7-13650HX, RTX 4060 (v6.92.6600) | |
| Lenovo LOQ 15IRX9 (v6.92.6600) | |
| Gigabyte G6X 9KG (2024) (v6.92.6600) | |
| AIDA64 / FPU Mandel | |
| SCHENKER XMG Core 15 (M24) (v6.92.6600) | |
| Asus TUF Gaming A15 FA507UV (v6.92.6600, Turbo) | |
| Média AMD Ryzen 9 8945H (65523 - 67020, n=2) | |
| Asus TUF Gaming A15 FA507UV (v6.92.6600) | |
| Asus TUF A15 FA507 (v6.85.6300) | |
| Média da turma Gaming (12321 - 134044, n=147, últimos 2 anos) | |
| Dell G16, i7-13650HX, RTX 4060 (v6.92.6600) | |
| HP Victus 16 (2024) (v6.92.6600) | |
| Lenovo LOQ 15IRX9 (v6.92.6600) | |
| Gigabyte G6X 9KG (2024) (v6.92.6600) | |
| AIDA64 / CPU AES | |
| Média da turma Gaming (19065 - 328679, n=147, últimos 2 anos) | |
| SCHENKER XMG Core 15 (M24) (v6.92.6600) | |
| Asus TUF Gaming A15 FA507UV (v6.92.6600, Turbo) | |
| Média AMD Ryzen 9 8945H (90481 - 91871, n=2) | |
| Asus TUF Gaming A15 FA507UV (v6.92.6600) | |
| Dell G16, i7-13650HX, RTX 4060 (v6.92.6600) | |
| HP Victus 16 (2024) (v6.92.6600) | |
| Lenovo LOQ 15IRX9 (v6.92.6600) | |
| Asus TUF A15 FA507 (v6.85.6300) | |
| Gigabyte G6X 9KG (2024) (v6.92.6600) | |
| AIDA64 / CPU ZLib | |
| Média da turma Gaming (373 - 2531, n=147, últimos 2 anos) | |
| Dell G16, i7-13650HX, RTX 4060 (v6.92.6600) | |
| HP Victus 16 (2024) (v6.92.6600) | |
| Asus TUF Gaming A15 FA507UV (v6.92.6600, Turbo) | |
| Média AMD Ryzen 9 8945H (1150 - 1164, n=2) | |
| Asus TUF Gaming A15 FA507UV (v6.92.6600) | |
| Gigabyte G6X 9KG (2024) (v6.92.6600) | |
| Lenovo LOQ 15IRX9 (v6.92.6600) | |
| SCHENKER XMG Core 15 (M24) (v6.92.6600) | |
| Asus TUF A15 FA507 (v6.85.6300) | |
| AIDA64 / FP64 Ray-Trace | |
| SCHENKER XMG Core 15 (M24) (v6.92.6600) | |
| Asus TUF Gaming A15 FA507UV (v6.92.6600, Turbo) | |
| Média AMD Ryzen 9 8945H (15513 - 15727, n=2) | |
| Asus TUF Gaming A15 FA507UV (v6.92.6600) | |
| Média da turma Gaming (2540 - 43430, n=147, últimos 2 anos) | |
| Dell G16, i7-13650HX, RTX 4060 (v6.92.6600) | |
| HP Victus 16 (2024) (v6.92.6600) | |
| Asus TUF A15 FA507 (v6.85.6300) | |
| Lenovo LOQ 15IRX9 (v6.92.6600) | |
| Gigabyte G6X 9KG (2024) (v6.92.6600) | |
| AIDA64 / CPU PhotoWorxx | |
| SCHENKER XMG Core 15 (M24) (v6.92.6600) | |
| Média da turma Gaming (10805 - 60161, n=147, últimos 2 anos) | |
| HP Victus 16 (2024) (v6.92.6600) | |
| Gigabyte G6X 9KG (2024) (v6.92.6600) | |
| Lenovo LOQ 15IRX9 (v6.92.6600) | |
| Dell G16, i7-13650HX, RTX 4060 (v6.92.6600) | |
| Asus TUF Gaming A15 FA507UV (v6.92.6600) | |
| Média AMD Ryzen 9 8945H (33327 - 33410, n=2) | |
| Asus TUF Gaming A15 FA507UV (v6.92.6600, Turbo) | |
| Asus TUF A15 FA507 (v6.85.6300) | |
Desempenho do sistema
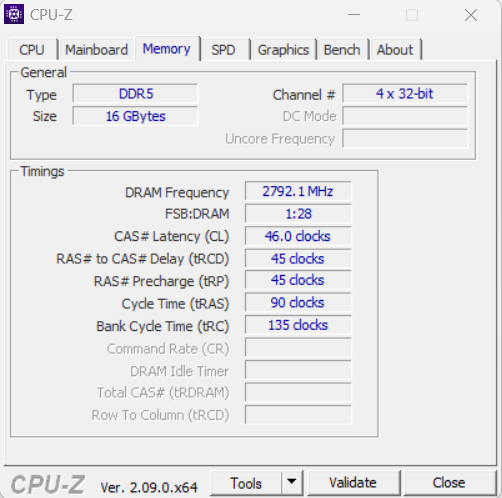
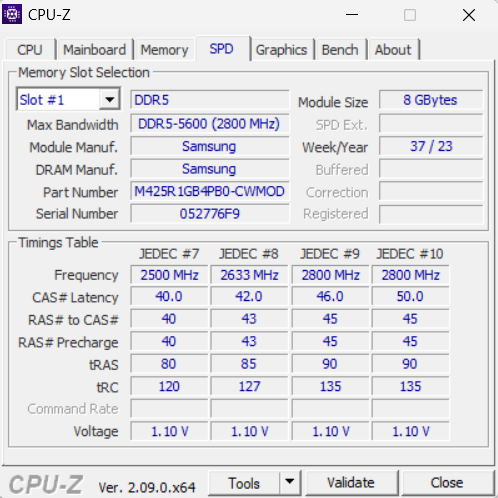
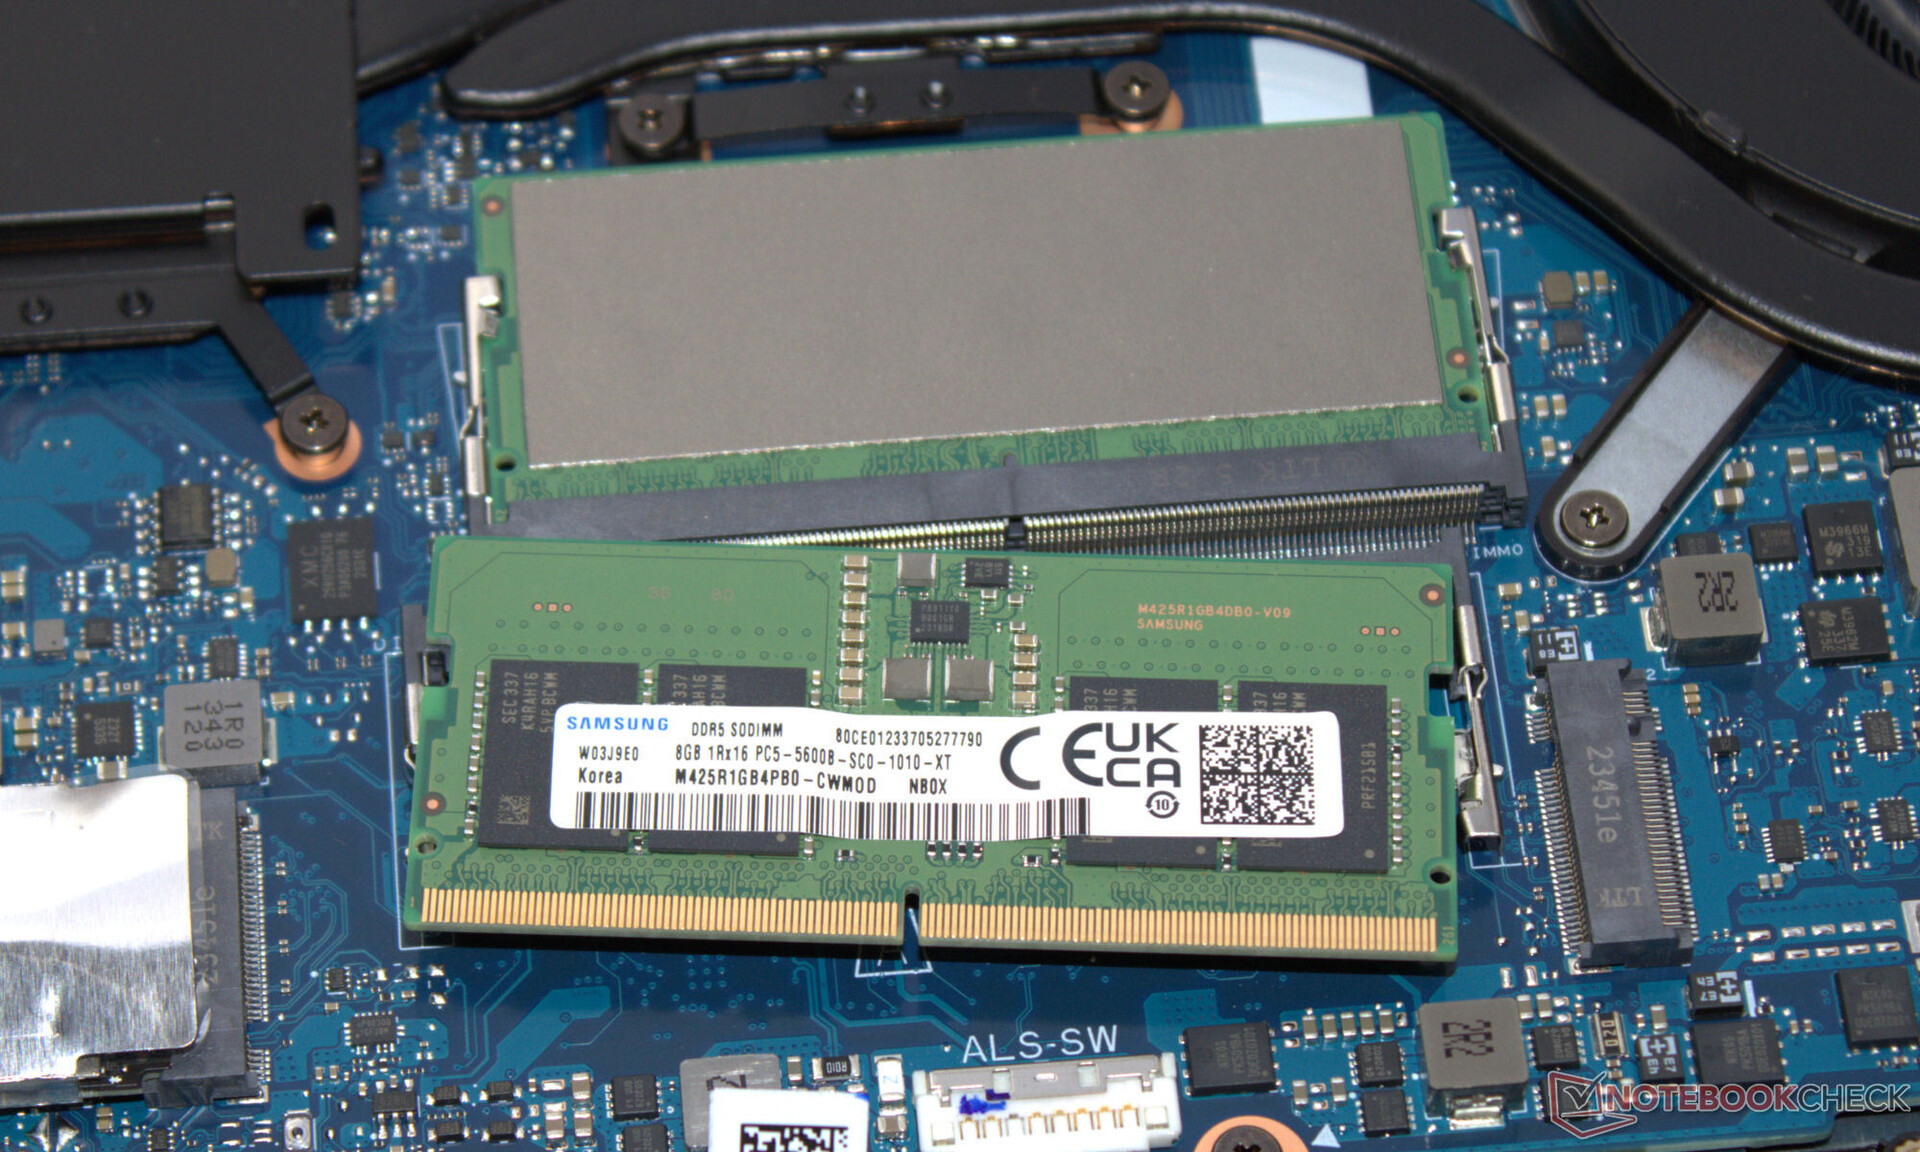
O sistema de funcionamento suave oferece potência suficiente para renderização, streaming e jogos - isso é confirmado pelos bons resultados do PC Mark. As velocidades de transferência da RAM estão em um nível normal para a RAM DDR5 5600.
CrossMark: Overall | Productivity | Creativity | Responsiveness
WebXPRT 3: Overall
WebXPRT 4: Overall
Mozilla Kraken 1.1: Total
| PCMark 10 / Score | |
| SCHENKER XMG Core 15 (M24) | |
| Asus TUF Gaming A15 FA507UV | |
| Média AMD Ryzen 9 8945H, NVIDIA GeForce RTX 4060 Laptop GPU (n=1) | |
| Média da turma Gaming (5776 - 9852, n=133, últimos 2 anos) | |
| Gigabyte G6X 9KG (2024) | |
| HP Victus 16 (2024) | |
| Dell G16, i7-13650HX, RTX 4060 | |
| Asus TUF A15 FA507 | |
| Lenovo LOQ 15IRX9 | |
| PCMark 10 / Essentials | |
| Asus TUF Gaming A15 FA507UV | |
| Média AMD Ryzen 9 8945H, NVIDIA GeForce RTX 4060 Laptop GPU (n=1) | |
| HP Victus 16 (2024) | |
| Média da turma Gaming (9057 - 12600, n=133, últimos 2 anos) | |
| Asus TUF A15 FA507 | |
| Gigabyte G6X 9KG (2024) | |
| SCHENKER XMG Core 15 (M24) | |
| Dell G16, i7-13650HX, RTX 4060 | |
| Lenovo LOQ 15IRX9 | |
| PCMark 10 / Productivity | |
| SCHENKER XMG Core 15 (M24) | |
| Asus TUF Gaming A15 FA507UV | |
| Média AMD Ryzen 9 8945H, NVIDIA GeForce RTX 4060 Laptop GPU (n=1) | |
| Gigabyte G6X 9KG (2024) | |
| Dell G16, i7-13650HX, RTX 4060 | |
| HP Victus 16 (2024) | |
| Média da turma Gaming (6662 - 14612, n=133, últimos 2 anos) | |
| Asus TUF A15 FA507 | |
| Lenovo LOQ 15IRX9 | |
| PCMark 10 / Digital Content Creation | |
| SCHENKER XMG Core 15 (M24) | |
| Média da turma Gaming (6807 - 18475, n=133, últimos 2 anos) | |
| Asus TUF Gaming A15 FA507UV | |
| Média AMD Ryzen 9 8945H, NVIDIA GeForce RTX 4060 Laptop GPU (n=1) | |
| Dell G16, i7-13650HX, RTX 4060 | |
| Gigabyte G6X 9KG (2024) | |
| Lenovo LOQ 15IRX9 | |
| HP Victus 16 (2024) | |
| Asus TUF A15 FA507 | |
| CrossMark / Overall | |
| Gigabyte G6X 9KG (2024) | |
| HP Victus 16 (2024) | |
| Média da turma Gaming (1247 - 2344, n=114, últimos 2 anos) | |
| SCHENKER XMG Core 15 (M24) | |
| Dell G16, i7-13650HX, RTX 4060 | |
| Lenovo LOQ 15IRX9 | |
| Asus TUF Gaming A15 FA507UV | |
| Média AMD Ryzen 9 8945H, NVIDIA GeForce RTX 4060 Laptop GPU (n=1) | |
| Asus TUF A15 FA507 | |
| CrossMark / Productivity | |
| Gigabyte G6X 9KG (2024) | |
| Média da turma Gaming (1299 - 2204, n=114, últimos 2 anos) | |
| SCHENKER XMG Core 15 (M24) | |
| HP Victus 16 (2024) | |
| Asus TUF Gaming A15 FA507UV | |
| Média AMD Ryzen 9 8945H, NVIDIA GeForce RTX 4060 Laptop GPU (n=1) | |
| Dell G16, i7-13650HX, RTX 4060 | |
| Lenovo LOQ 15IRX9 | |
| Asus TUF A15 FA507 | |
| CrossMark / Creativity | |
| HP Victus 16 (2024) | |
| SCHENKER XMG Core 15 (M24) | |
| Média da turma Gaming (1275 - 2660, n=114, últimos 2 anos) | |
| Gigabyte G6X 9KG (2024) | |
| Dell G16, i7-13650HX, RTX 4060 | |
| Asus TUF Gaming A15 FA507UV | |
| Média AMD Ryzen 9 8945H, NVIDIA GeForce RTX 4060 Laptop GPU (n=1) | |
| Lenovo LOQ 15IRX9 | |
| Asus TUF A15 FA507 | |
| CrossMark / Responsiveness | |
| Gigabyte G6X 9KG (2024) | |
| HP Victus 16 (2024) | |
| Lenovo LOQ 15IRX9 | |
| Média da turma Gaming (1030 - 2330, n=114, últimos 2 anos) | |
| Dell G16, i7-13650HX, RTX 4060 | |
| SCHENKER XMG Core 15 (M24) | |
| Asus TUF Gaming A15 FA507UV | |
| Média AMD Ryzen 9 8945H, NVIDIA GeForce RTX 4060 Laptop GPU (n=1) | |
| Asus TUF A15 FA507 | |
| WebXPRT 3 / Overall | |
| Asus TUF Gaming A15 FA507UV | |
| Média AMD Ryzen 9 8945H, NVIDIA GeForce RTX 4060 Laptop GPU (n=1) | |
| SCHENKER XMG Core 15 (M24) | |
| Gigabyte G6X 9KG (2024) | |
| Média da turma Gaming (215 - 480, n=127, últimos 2 anos) | |
| Asus TUF A15 FA507 | |
| HP Victus 16 (2024) | |
| Dell G16, i7-13650HX, RTX 4060 | |
| Lenovo LOQ 15IRX9 | |
| WebXPRT 4 / Overall | |
| Média da turma Gaming (176.4 - 335, n=115, últimos 2 anos) | |
| SCHENKER XMG Core 15 (M24) | |
| Asus TUF Gaming A15 FA507UV | |
| Média AMD Ryzen 9 8945H, NVIDIA GeForce RTX 4060 Laptop GPU (n=1) | |
| Gigabyte G6X 9KG (2024) | |
| HP Victus 16 (2024) | |
| Lenovo LOQ 15IRX9 | |
| Asus TUF A15 FA507 | |
| Mozilla Kraken 1.1 / Total | |
| Asus TUF A15 FA507 | |
| Lenovo LOQ 15IRX9 | |
| HP Victus 16 (2024) | |
| Gigabyte G6X 9KG (2024) | |
| Dell G16, i7-13650HX, RTX 4060 | |
| Asus TUF Gaming A15 FA507UV | |
| Média AMD Ryzen 9 8945H, NVIDIA GeForce RTX 4060 Laptop GPU (n=1) | |
| Média da turma Gaming (409 - 674, n=139, últimos 2 anos) | |
| SCHENKER XMG Core 15 (M24) | |
* ... menor é melhor
| PCMark 10 Score | 7943 pontos | |
Ajuda | ||
| AIDA64 / Memory Copy | |
| SCHENKER XMG Core 15 (M24) | |
| HP Victus 16 (2024) | |
| Média da turma Gaming (21750 - 97515, n=147, últimos 2 anos) | |
| Média AMD Ryzen 9 8945H (61823 - 63192, n=2) | |
| Asus TUF Gaming A15 FA507UV | |
| Gigabyte G6X 9KG (2024) | |
| Dell G16, i7-13650HX, RTX 4060 | |
| Lenovo LOQ 15IRX9 | |
| Asus TUF A15 FA507 | |
| AIDA64 / Memory Read | |
| HP Victus 16 (2024) | |
| Média da turma Gaming (22956 - 102937, n=147, últimos 2 anos) | |
| Gigabyte G6X 9KG (2024) | |
| Lenovo LOQ 15IRX9 | |
| Dell G16, i7-13650HX, RTX 4060 | |
| Média AMD Ryzen 9 8945H (61696 - 61810, n=2) | |
| Asus TUF Gaming A15 FA507UV | |
| SCHENKER XMG Core 15 (M24) | |
| Asus TUF A15 FA507 | |
| AIDA64 / Memory Write | |
| SCHENKER XMG Core 15 (M24) | |
| Média AMD Ryzen 9 8945H (78716 - 79615, n=2) | |
| Asus TUF Gaming A15 FA507UV | |
| Média da turma Gaming (22297 - 108954, n=147, últimos 2 anos) | |
| HP Victus 16 (2024) | |
| Gigabyte G6X 9KG (2024) | |
| Lenovo LOQ 15IRX9 | |
| Dell G16, i7-13650HX, RTX 4060 | |
| Asus TUF A15 FA507 | |
| AIDA64 / Memory Latency | |
| HP Victus 16 (2024) | |
| Média da turma Gaming (59.5 - 259, n=147, últimos 2 anos) | |
| Lenovo LOQ 15IRX9 | |
| Asus TUF Gaming A15 FA507UV | |
| Média AMD Ryzen 9 8945H (92 - 92.6, n=2) | |
| Dell G16, i7-13650HX, RTX 4060 | |
| Gigabyte G6X 9KG (2024) | |
| SCHENKER XMG Core 15 (M24) | |
| Asus TUF A15 FA507 | |
* ... menor é melhor
Latências de DPC
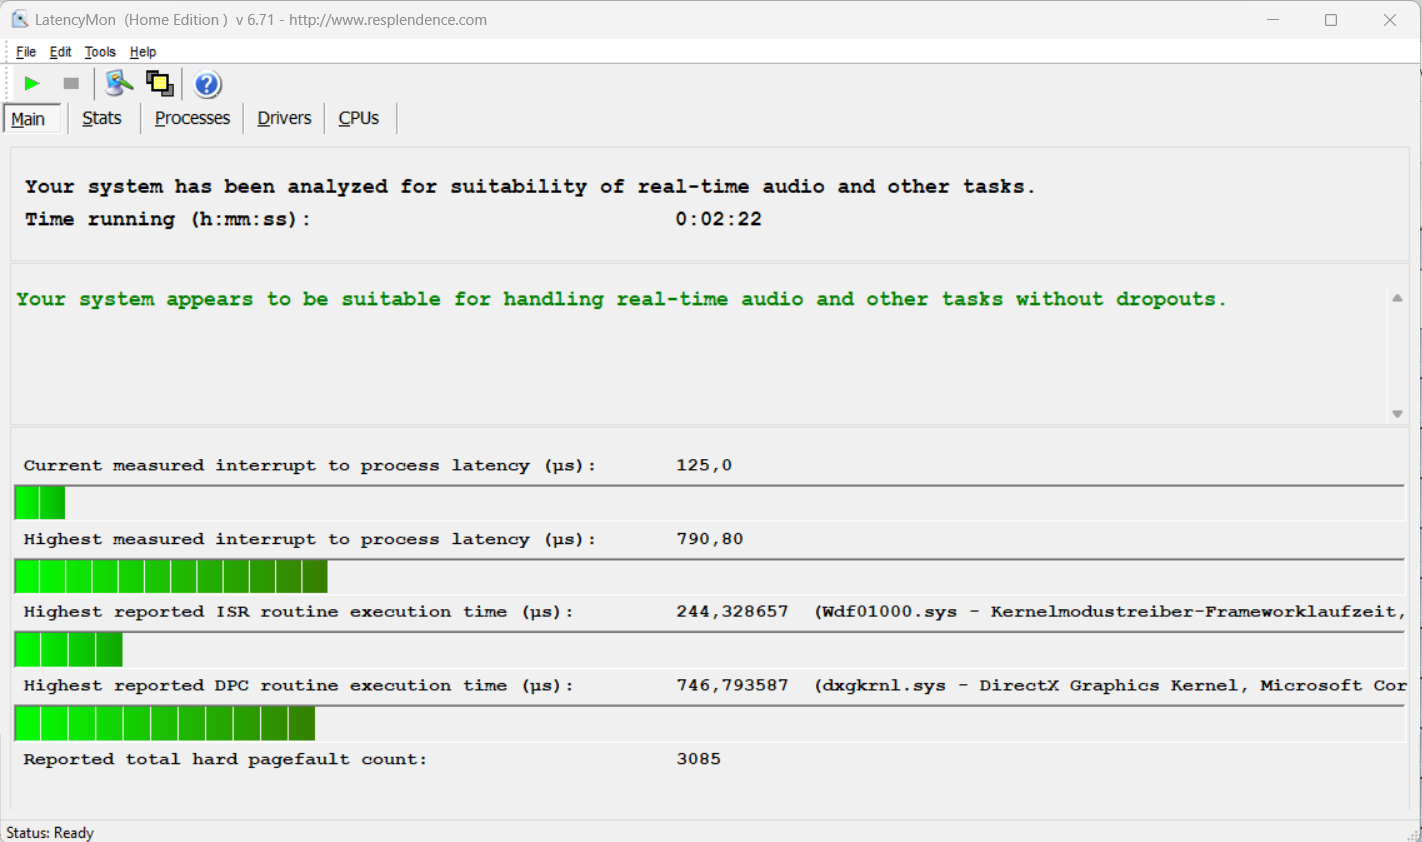
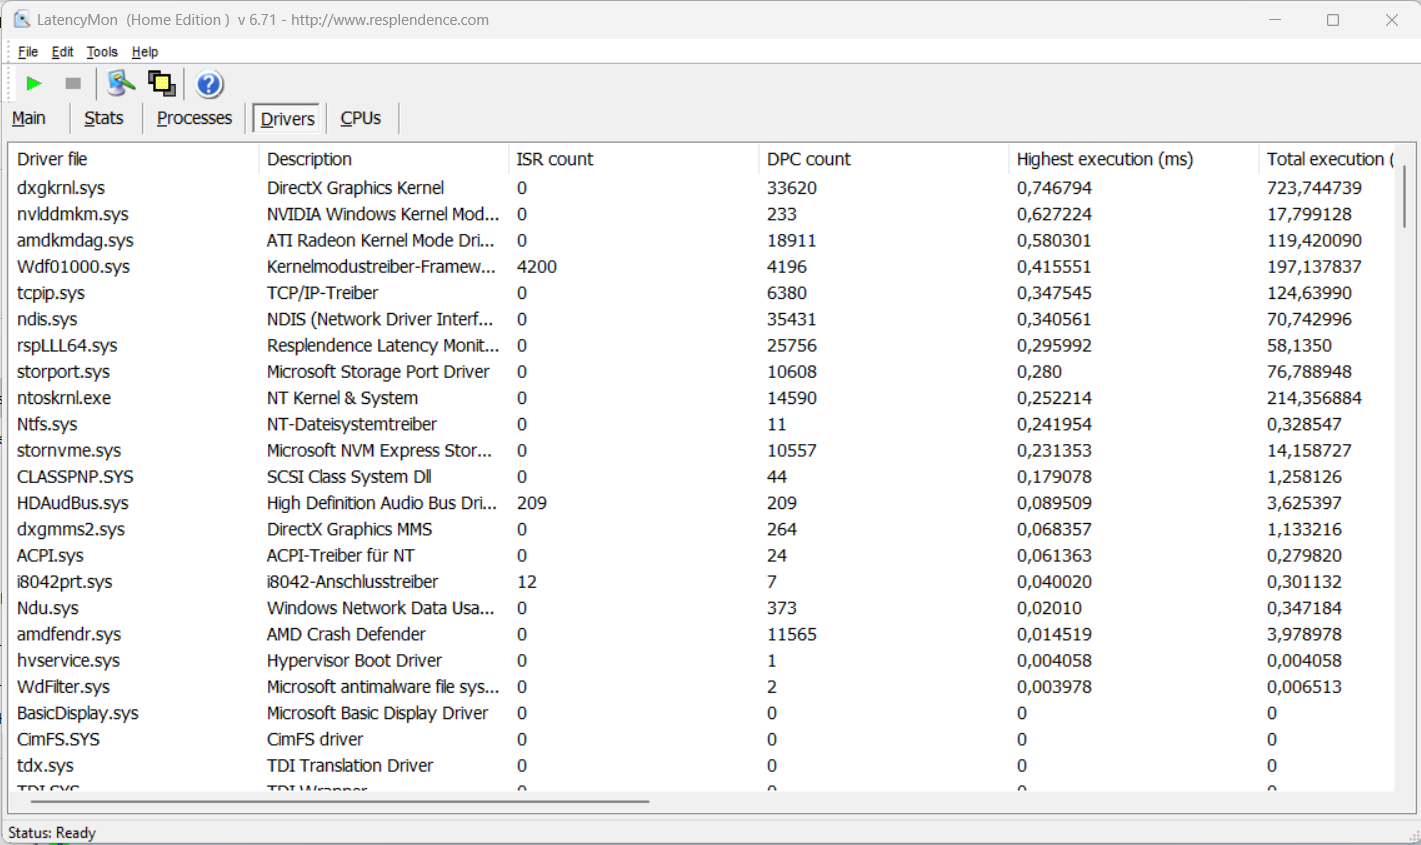
O teste de latência (navegação na Internet, reprodução de vídeo 4k, alta carga do Prime95) não revelou anomalias. O sistema parece ser adequado para a edição de vídeo e áudio em tempo real. Futuras atualizações de software poderão melhorar ou piorar essa área.
| DPC Latencies / LatencyMon - interrupt to process latency (max), Web, Youtube, Prime95 | |
| Gigabyte G6X 9KG (2024) | |
| Lenovo LOQ 15IRX9 | |
| SCHENKER XMG Core 15 (M24) | |
| Dell G16, i7-13650HX, RTX 4060 | |
| HP Victus 16 (2024) | |
| Asus TUF Gaming A15 FA507UV | |
* ... menor é melhor
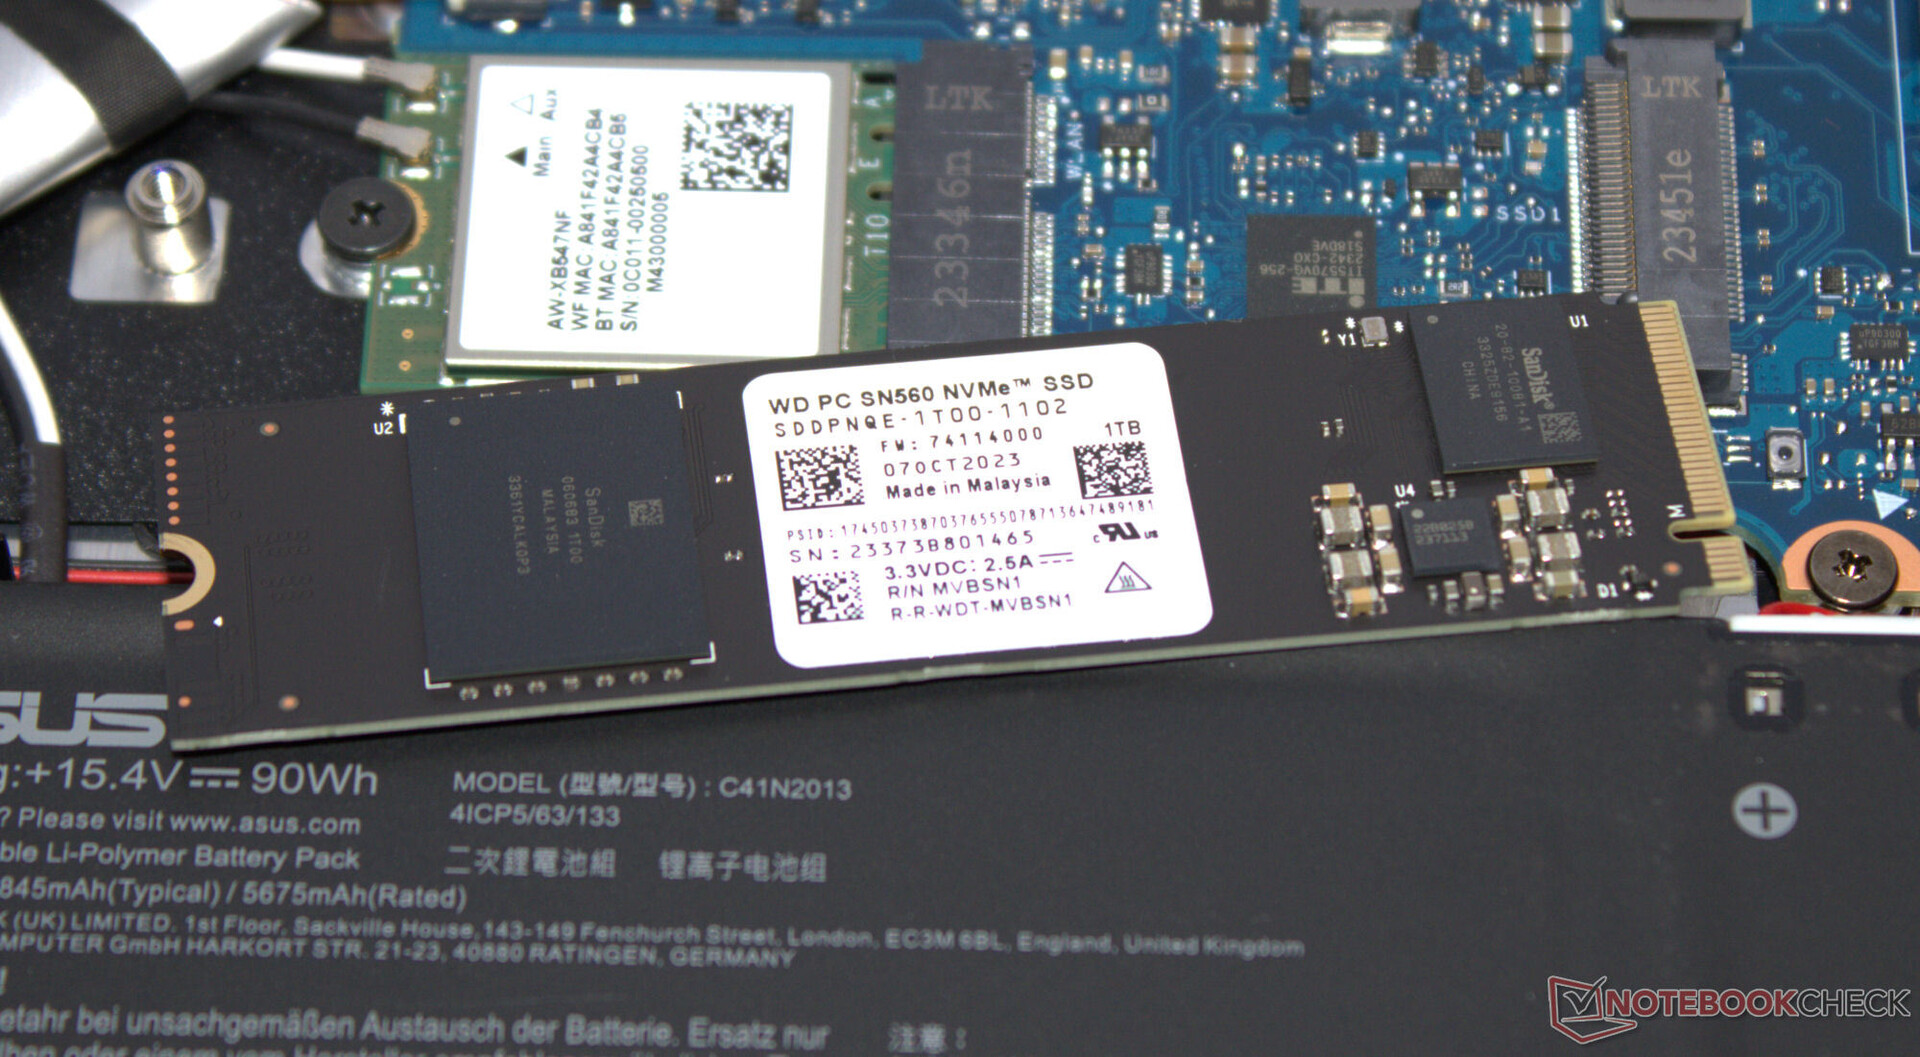
Armazenamento em massa
Dois SSDs PCIe 4 (M.2 2280) podem ser acomodados dentro do A15, um SSD está instalado: O dispositivo de armazenamento Western Digital (1 TB, M.2 2280) oferece boas velocidades de transferência de dados, mas não pertence aos principais modelos de SSD. Nos últimos estágios do loop do DiskSpd, observamos um estrangulamento induzido termicamente.

* ... menor é melhor
Continuous Performance Read: DiskSpd Read Loop, Queue Depth 8
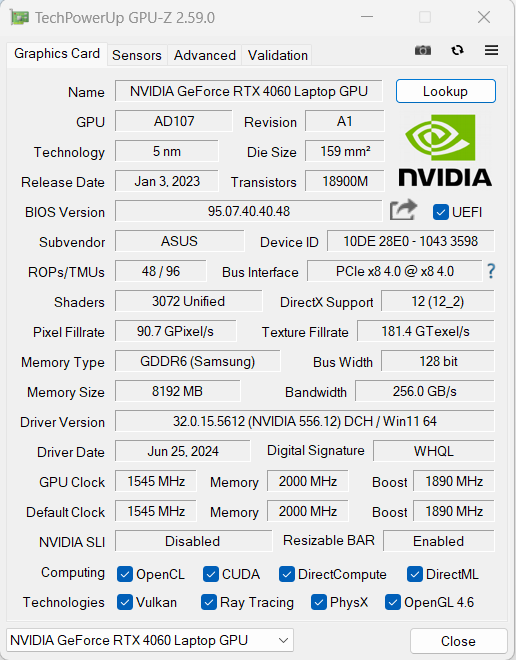
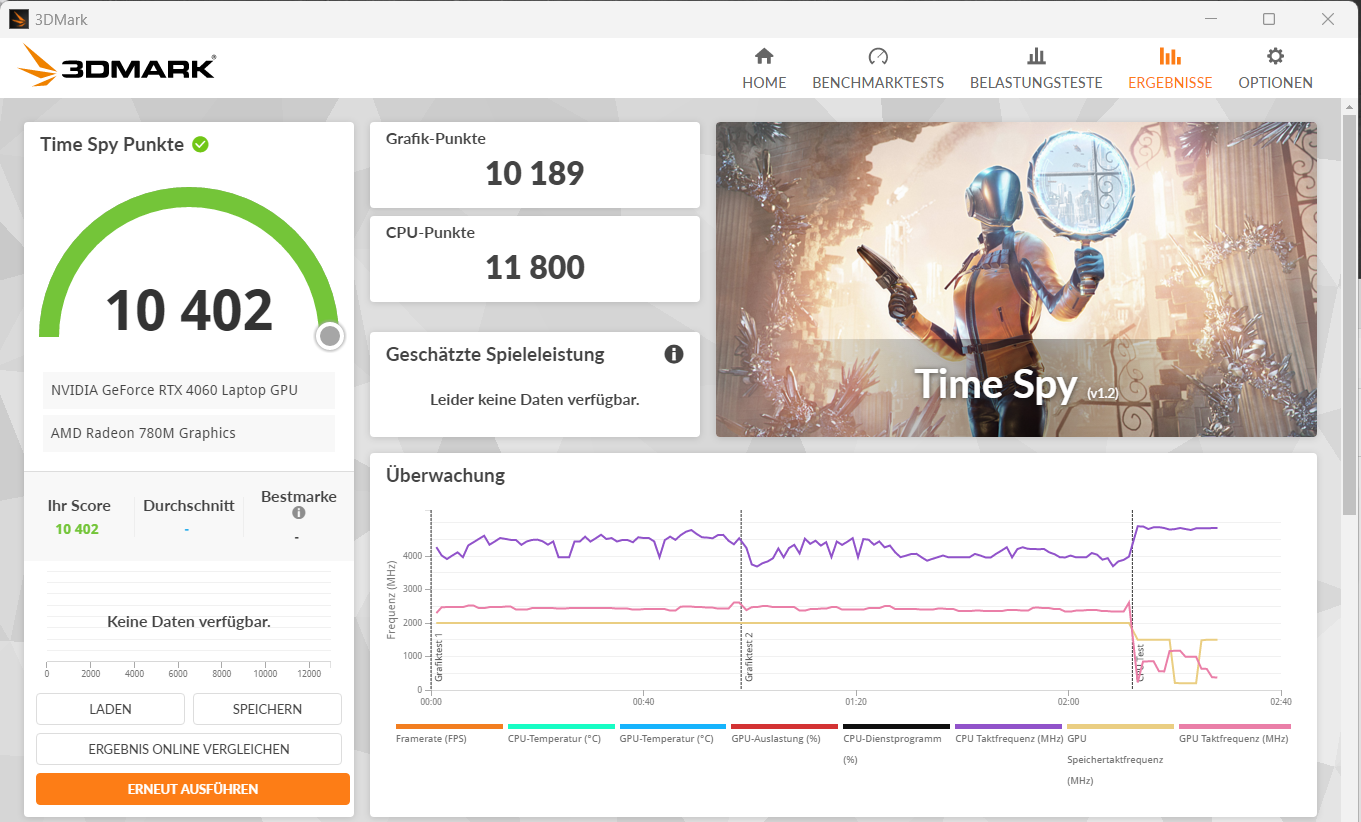
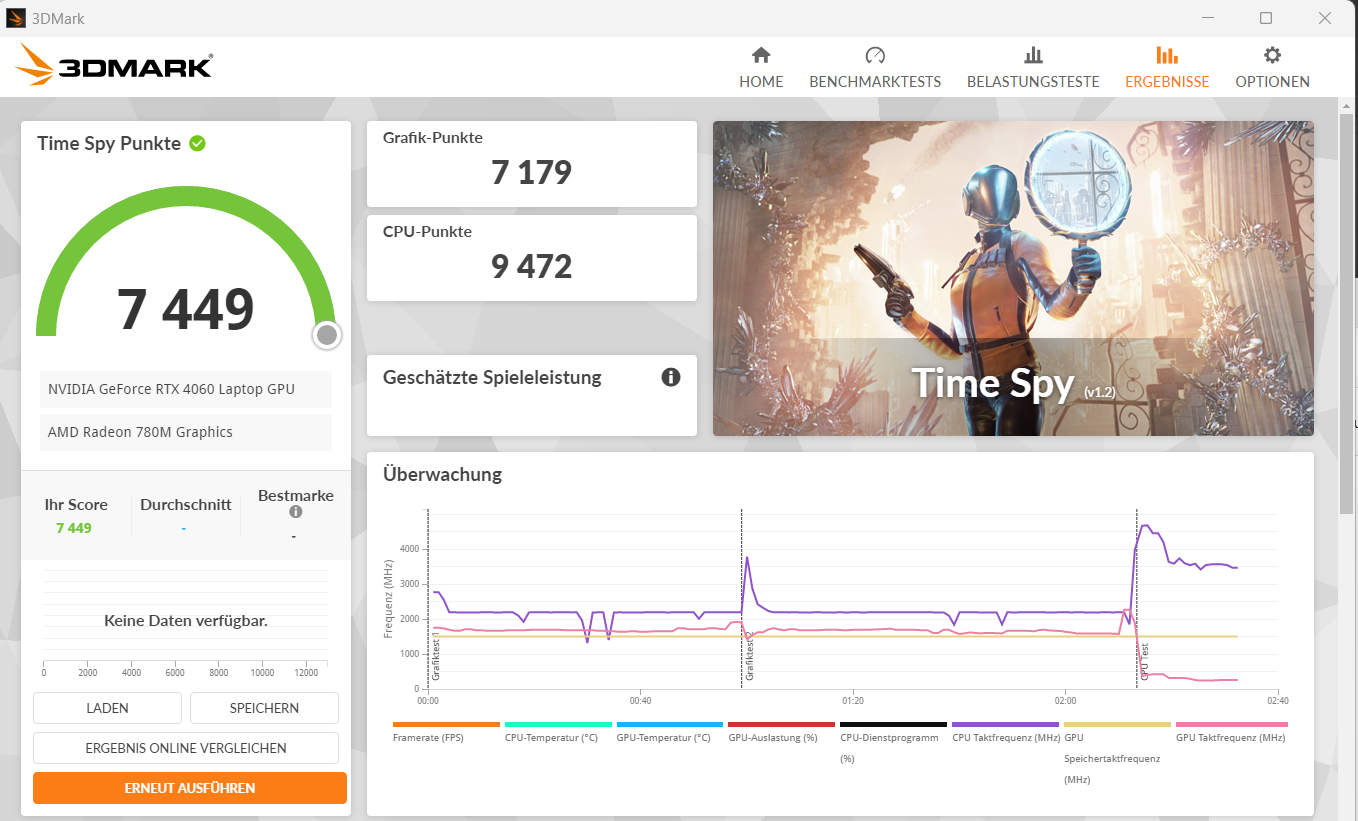
Placa de vídeo
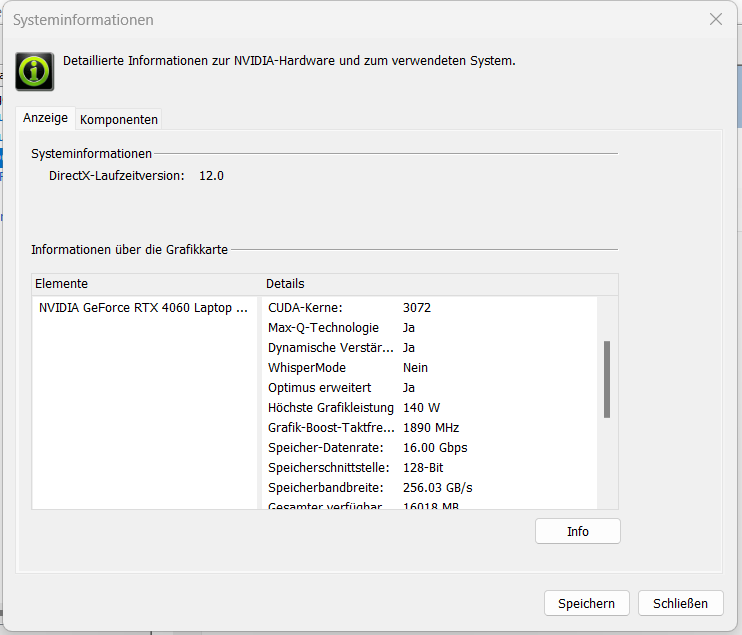
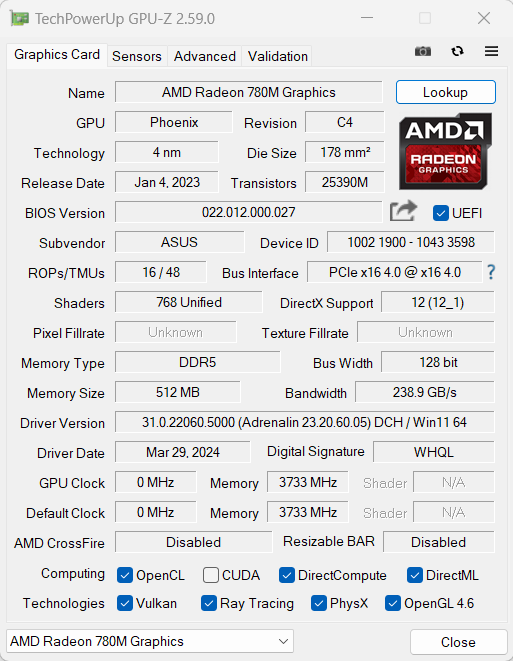
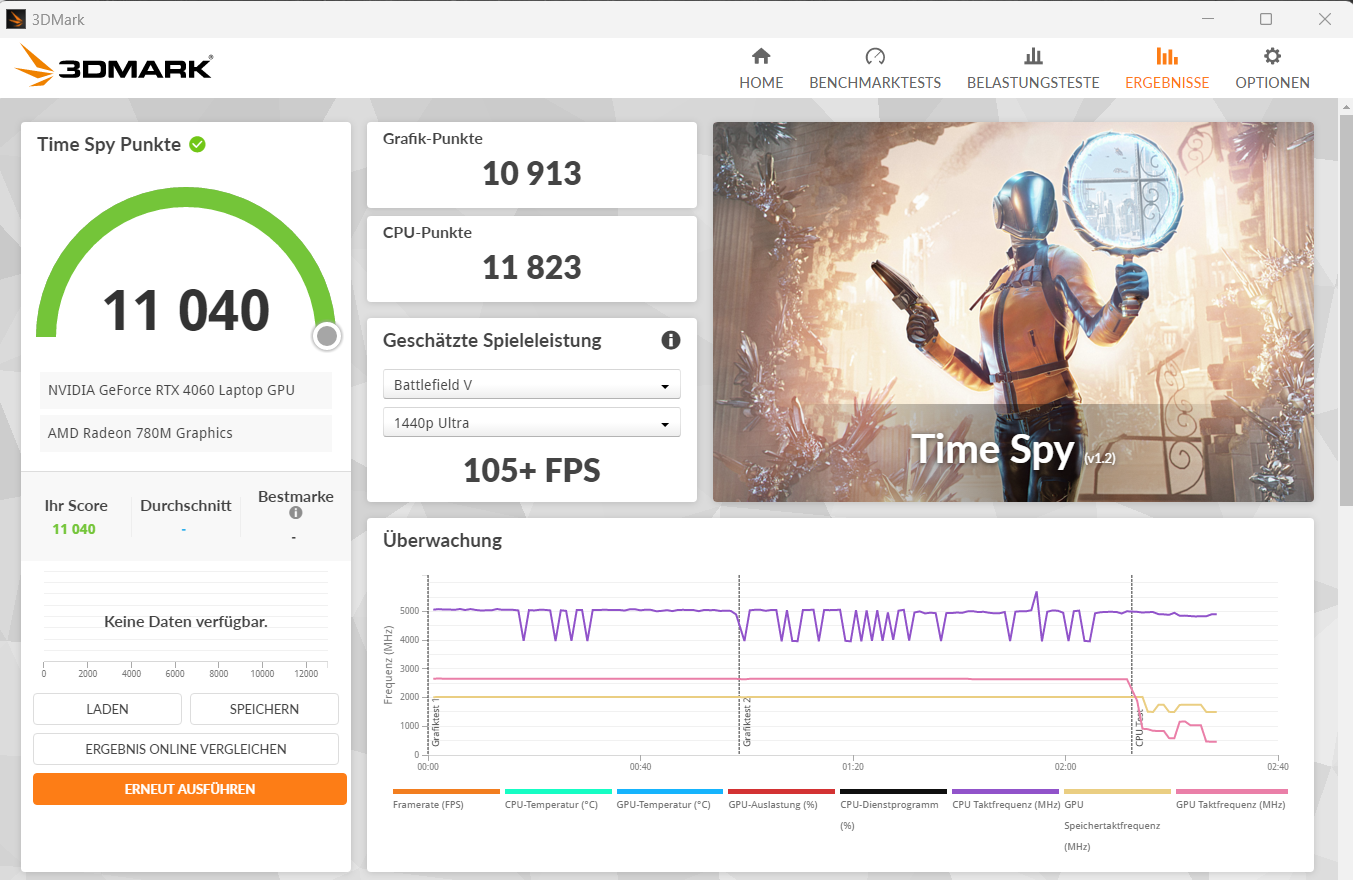
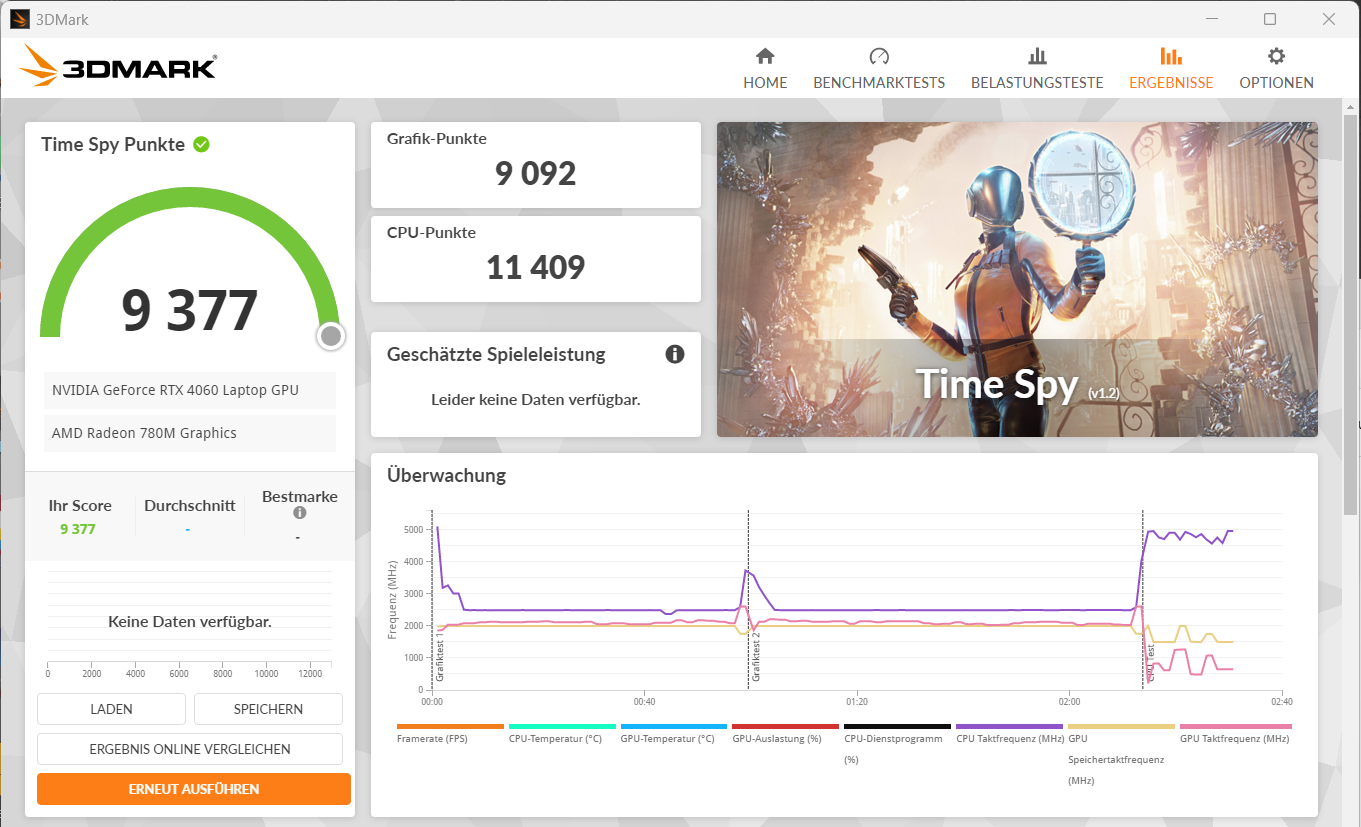
A GeForce RTX 4060 (3.072 shaders, barramento de 128 bits, 8 GB GDDR6, 140 watts) foi projetado para jogos em FHD em configurações altas ou máximas. As pontuações de benchmark e as taxas de quadros estão no mesmo nível da média da RTX 4060 ("Desempenho"). Em alguns casos, o perfil "Turbo" resulta apenas em um aumento mínimo. A troca entre dGPU e Optimus não requer reinicialização: O Optimus avançado é compatível.
| 3DMark Performance Rating - Percent | |
| Média da turma Gaming | |
| SCHENKER XMG Core 15 (M24) | |
| Asus TUF Gaming A15 FA507UV | |
| Asus TUF Gaming A15 FA507UV | |
| Dell G16, i7-13650HX, RTX 4060 | |
| Lenovo LOQ 15IRX9 | |
| Gigabyte G6X 9KG (2024) | |
| HP Victus 16 (2024) | |
| Média NVIDIA GeForce RTX 4060 Laptop GPU | |
| Asus TUF A15 FA507 | |
| 3DMark 11 - 1280x720 Performance GPU | |
| Média da turma Gaming (10741 - 72178, n=143, últimos 2 anos) | |
| SCHENKER XMG Core 15 (M24) | |
| Asus TUF Gaming A15 FA507UV (Turbo) | |
| Asus TUF Gaming A15 FA507UV | |
| Dell G16, i7-13650HX, RTX 4060 | |
| Lenovo LOQ 15IRX9 | |
| Gigabyte G6X 9KG (2024) | |
| HP Victus 16 (2024) | |
| Média NVIDIA GeForce RTX 4060 Laptop GPU (28136 - 38912, n=57) | |
| Asus TUF A15 FA507 | |
| 3DMark | |
| 1920x1080 Fire Strike Graphics | |
| Média da turma Gaming (2913 - 56116, n=155, últimos 2 anos) | |
| SCHENKER XMG Core 15 (M24) | |
| Asus TUF Gaming A15 FA507UV (Turbo) | |
| Asus TUF Gaming A15 FA507UV | |
| Lenovo LOQ 15IRX9 | |
| Gigabyte G6X 9KG (2024) | |
| Dell G16, i7-13650HX, RTX 4060 | |
| HP Victus 16 (2024) | |
| Média NVIDIA GeForce RTX 4060 Laptop GPU (20533 - 29656, n=54) | |
| Asus TUF A15 FA507 | |
| 2560x1440 Time Spy Graphics | |
| Média da turma Gaming (2295 - 24599, n=151, últimos 2 anos) | |
| SCHENKER XMG Core 15 (M24) | |
| Asus TUF Gaming A15 FA507UV (Turbo) | |
| Dell G16, i7-13650HX, RTX 4060 | |
| Asus TUF Gaming A15 FA507UV | |
| Média NVIDIA GeForce RTX 4060 Laptop GPU (7484 - 11451, n=56) | |
| HP Victus 16 (2024) | |
| Gigabyte G6X 9KG (2024) | |
| Lenovo LOQ 15IRX9 | |
| Asus TUF A15 FA507 | |
| 3DMark 06 Standard Score | 55024 pontos | |
| 3DMark 11 Performance | 31639 pontos | |
| 3DMark Fire Strike Score | 25032 pontos | |
| 3DMark Time Spy Score | 10402 pontos | |
| 3DMark Steel Nomad Score | 2200 pontos | |
Ajuda | ||
| Geekbench 6.4 | |
| GPU OpenCL | |
| Média da turma Gaming (4321 - 234213, n=118, últimos 2 anos) | |
| Gigabyte G6X 9KG (2024) (6.2.1) | |
| SCHENKER XMG Core 15 (M24) (6.2.1) | |
| HP Victus 16 (2024) (6.2.1) | |
| Asus TUF Gaming A15 FA507UV (6.2.1 Turbo) | |
| Dell G16, i7-13650HX, RTX 4060 (6.2.1) | |
| Asus TUF Gaming A15 FA507UV (6.2.1) | |
| Lenovo LOQ 15IRX9 (6.2.1) | |
| Média NVIDIA GeForce RTX 4060 Laptop GPU (4321 - 100831, n=40) | |
| GPU Vulkan | |
| SCHENKER XMG Core 15 (M24) (6.2.1) | |
| Asus TUF Gaming A15 FA507UV (6.2.1) | |
| Asus TUF Gaming A15 FA507UV (6.2.1 Turbo) | |
| Gigabyte G6X 9KG (2024) (6.2.1) | |
| Lenovo LOQ 15IRX9 (6.2.1) | |
| HP Victus 16 (2024) (6.2.1) | |
| Média da turma Gaming (4286 - 231659, n=110, últimos 2 anos) | |
| Média NVIDIA GeForce RTX 4060 Laptop GPU (4286 - 101001, n=36) | |
| Dell G16, i7-13650HX, RTX 4060 (6.2.1) | |
| V-Ray Benchmark Next 4.10 | |
| GPU | |
| SCHENKER XMG Core 15 (M24) (v4.10.07 ) | |
| Média da turma Gaming (54 - 1317, n=122, últimos 2 anos) | |
| Asus TUF Gaming A15 FA507UV (v4.10.07, Turbo) | |
| Gigabyte G6X 9KG (2024) (v4.10.07 ) | |
| Asus TUF Gaming A15 FA507UV (v4.10.07 ) | |
| Média NVIDIA GeForce RTX 4060 Laptop GPU (483 - 715, n=46) | |
| HP Victus 16 (2024) (v4.10.07 ) | |
| Lenovo LOQ 15IRX9 (v4.10.07 ) | |
| Asus TUF A15 FA507 (v4.10.07 ) | |
| CPU | |
| HP Victus 16 (2024) (v4.10.07 ) | |
| Média da turma Gaming (5413 - 44129, n=122, últimos 2 anos) | |
| Média NVIDIA GeForce RTX 4060 Laptop GPU (12680 - 32360, n=46) | |
| SCHENKER XMG Core 15 (M24) (v4.10.07 ) | |
| Gigabyte G6X 9KG (2024) (v4.10.07 ) | |
| Asus TUF Gaming A15 FA507UV (v4.10.07, Turbo) | |
| Asus TUF Gaming A15 FA507UV (v4.10.07 ) | |
| Lenovo LOQ 15IRX9 (v4.10.07 ) | |
| Asus TUF A15 FA507 (v4.10.07 ) | |
* ... menor é melhor
| Performance Rating - Percent | |
| Média da turma Gaming | |
| SCHENKER XMG Core 15 (M24) | |
| Dell G16, i7-13650HX, RTX 4060 | |
| Gigabyte G6X 9KG (2024) | |
| Média NVIDIA GeForce RTX 4060 Laptop GPU | |
| HP Victus 16 (2024) | |
| Asus TUF Gaming A15 FA507UV | |
| Asus TUF Gaming A15 FA507UV | |
| Lenovo LOQ 15IRX9 | |
| Asus TUF A15 FA507 -1! | |
| Cyberpunk 2077 2.2 Phantom Liberty - 1920x1080 Ultra Preset (FSR off) | |
| SCHENKER XMG Core 15 (M24) (2.12) | |
| Média da turma Gaming (6.76 - 158, n=90, últimos 2 anos) | |
| Asus TUF Gaming A15 FA507UV (2.12) | |
| Asus TUF Gaming A15 FA507UV (2.12, Turbo) | |
| Média NVIDIA GeForce RTX 4060 Laptop GPU (56.4 - 93.1, n=31) | |
| Lenovo LOQ 15IRX9 (2.02) | |
| Dell G16, i7-13650HX, RTX 4060 (2.11) | |
| Gigabyte G6X 9KG (2024) (2.02) | |
| HP Victus 16 (2024) (2.02) | |
| GTA V - 1920x1080 Highest Settings possible AA:4xMSAA + FX AF:16x | |
| Dell G16, i7-13650HX, RTX 4060 | |
| SCHENKER XMG Core 15 (M24) | |
| Gigabyte G6X 9KG (2024) | |
| Lenovo LOQ 15IRX9 | |
| Média da turma Gaming (12.1 - 168.2, n=132, últimos 2 anos) | |
| HP Victus 16 (2024) | |
| Média NVIDIA GeForce RTX 4060 Laptop GPU (76.9 - 126.3, n=48) | |
| Asus TUF Gaming A15 FA507UV | |
| Asus TUF Gaming A15 FA507UV (Turbo) | |
| Asus TUF A15 FA507 | |
| Final Fantasy XV Benchmark - 1920x1080 High Quality | |
| Média da turma Gaming (19.2 - 201, n=144, últimos 2 anos) | |
| SCHENKER XMG Core 15 (M24) (1.3) | |
| Asus TUF Gaming A15 FA507UV (1.3, Turbo) | |
| Dell G16, i7-13650HX, RTX 4060 (1.3) | |
| Gigabyte G6X 9KG (2024) (1.3) | |
| Asus TUF Gaming A15 FA507UV (1.3) | |
| Lenovo LOQ 15IRX9 (1.3) | |
| HP Victus 16 (2024) (1.3) | |
| Média NVIDIA GeForce RTX 4060 Laptop GPU (75.1 - 109.8, n=51) | |
| Asus TUF A15 FA507 (1.3) | |
| Strange Brigade - 1920x1080 ultra AA:ultra AF:16 | |
| Média da turma Gaming (38.9 - 420, n=140, últimos 2 anos) | |
| SCHENKER XMG Core 15 (M24) (1.47.22.14 D3D12) | |
| Dell G16, i7-13650HX, RTX 4060 (1.47.22.14 D3D12) | |
| Asus TUF Gaming A15 FA507UV (1.47.22.14 D3D12, Turbo) | |
| Asus TUF Gaming A15 FA507UV (1.47.22.14 D3D12) | |
| Lenovo LOQ 15IRX9 (1.47.22.14 D3D12) | |
| Gigabyte G6X 9KG (2024) (1.47.22.14 D3D12) | |
| Média NVIDIA GeForce RTX 4060 Laptop GPU (135.3 - 210, n=50) | |
| HP Victus 16 (2024) (1.47.22.14 D3D12) | |
| Asus TUF A15 FA507 | |
| Dota 2 Reborn - 1920x1080 ultra (3/3) best looking | |
| HP Victus 16 (2024) | |
| Dell G16, i7-13650HX, RTX 4060 | |
| Média da turma Gaming (65.1 - 220, n=148, últimos 2 anos) | |
| Média NVIDIA GeForce RTX 4060 Laptop GPU (115 - 183.8, n=53) | |
| Gigabyte G6X 9KG (2024) | |
| Lenovo LOQ 15IRX9 | |
| Asus TUF Gaming A15 FA507UV | |
| SCHENKER XMG Core 15 (M24) | |
| Asus TUF Gaming A15 FA507UV (Turbo) | |
| Asus TUF A15 FA507 | |
| X-Plane 11.11 - 1920x1080 high (fps_test=3) | |
| Dell G16, i7-13650HX, RTX 4060 | |
| Gigabyte G6X 9KG (2024) | |
| Média da turma Gaming (32.8 - 166.2, n=151, últimos 2 anos) | |
| Média NVIDIA GeForce RTX 4060 Laptop GPU (60.7 - 141.1, n=54) | |
| HP Victus 16 (2024) | |
| SCHENKER XMG Core 15 (M24) | |
| Lenovo LOQ 15IRX9 | |
| Asus TUF Gaming A15 FA507UV | |
| Asus TUF Gaming A15 FA507UV (Turbo) | |
| Asus TUF A15 FA507 | |
| Baldur's Gate 3 - 1920x1080 Ultra Preset | |
| Média da turma Gaming (34.5 - 208, n=57, últimos 2 anos) | |
| SCHENKER XMG Core 15 (M24) | |
| Asus TUF Gaming A15 FA507UV | |
| Média NVIDIA GeForce RTX 4060 Laptop GPU (66.5 - 105.5, n=19) | |
| F1 24 - 1920x1080 Ultra High Preset AA:T AF:16x | |
| Média da turma Gaming (54.1 - 148, n=19, últimos 2 anos) | |
| Média NVIDIA GeForce RTX 4060 Laptop GPU (47.5 - 61.6, n=10) | |
| Asus TUF Gaming A15 FA507UV (1126333) | |
| Lenovo LOQ 15IRX9 (1122588) | |
| The First Descendant - 1920x1080 Ultra Preset | |
| Média NVIDIA GeForce RTX 4060 Laptop GPU (67.6 - 69.4, n=3) | |
| Asus TUF Gaming A15 FA507UV | |
| Média da turma Gaming (15.4 - 80, n=5, últimos 2 anos) | |
| Ghost of Tsushima - 1920x1080 Very High Preset AA:T | |
| Asus TUF Gaming A15 FA507UV | |
| Lenovo LOQ 15IRX9 | |
| Média NVIDIA GeForce RTX 4060 Laptop GPU (55.6 - 63.4, n=5) | |
| Média da turma Gaming (28.5 - 73.7, n=7, últimos 2 anos) | |
| Senua's Saga Hellblade 2 - 1920x1080 High Preset | |
| Média da turma Gaming (38.4 - 78.8, n=6, últimos 2 anos) | |
| Asus TUF Gaming A15 FA507UV | |
| Média NVIDIA GeForce RTX 4060 Laptop GPU (37.6 - 39.5, n=3) | |
| Lenovo LOQ 15IRX9 | |
| Dragon's Dogma 2 - 1920x1080 High Preset | |
| Média da turma Gaming (49.5 - 80, n=8, últimos 2 anos) | |
| HP Victus 16 (2024) | |
| Lenovo LOQ 15IRX9 | |
| Média NVIDIA GeForce RTX 4060 Laptop GPU (57.2 - 67.7, n=5) | |
| Asus TUF Gaming A15 FA507UV | |
Cyberpunk 2077 ultra FPS diagram
| baixo | média | alto | ultra | |
|---|---|---|---|---|
| GTA V (2015) | 182.6 | 177 | 168 | 107.2 |
| Dota 2 Reborn (2015) | 171.5 | 154.9 | 149.3 | 139.5 |
| Final Fantasy XV Benchmark (2018) | 210 | 138.8 | 100.7 | |
| X-Plane 11.11 (2018) | 135.3 | 117.5 | 91.7 | |
| Strange Brigade (2018) | 360 | 263 | 213 | 184.2 |
| Baldur's Gate 3 (2023) | 135 | 107.8 | 95.9 | 93.9 |
| Cyberpunk 2077 2.2 Phantom Liberty (2023) | 122.2 | 96.6 | 82.7 | 76.2 |
| Alone in the Dark (2024) | 159.1 | 150.1 | 143.8 | 126.9 |
| Dragon's Dogma 2 (2024) | 68.1 | 59.9 | ||
| Ghost of Tsushima (2024) | 94.1 | 83.9 | 76.9 | 62.1 |
| Senua's Saga Hellblade 2 (2024) | 66.1 | 55.1 | 39.5 | |
| F1 24 (2024) | 220 | 205 | 169.7 | 56.6 |
| The First Descendant (2024) | 155.5 | 96.8 | 79.1 | 67.6 |
Emissões e energia - Um laptop para jogos com uma duração de bateria muito boa
Emissões de ruído
Não nos surpreendemos nem positiva nem negativamente com a produção de ruído do A15. O Cyberpunk 2077 faz com que o nível de ruído aumente para 45 dB(A) claramente audíveis ("Desempenho") e 56 dB(A) muito altos ("Turbo"). O modo "Quiet" (Silencioso) é responsável por níveis de ruído moderados com taxas de quadros ainda jogáveis. Em situações cotidianas (escritório, Internet), as duas ventoinhas geralmente operam em baixa velocidade e, ocasionalmente, ficam paradas.
Barulho
| Ocioso |
| 25 / 27 / 33 dB |
| Carga |
| 40 / 46 dB |
 | ||
30 dB silencioso 40 dB(A) audível 50 dB(A) ruidosamente alto |
||
min: | ||
| Asus TUF Gaming A15 FA507UV NVIDIA GeForce RTX 4060 Laptop GPU, R9 8945H, WD PC SN560 SDDPNQE-1T00 | Lenovo LOQ 15IRX9 NVIDIA GeForce RTX 4060 Laptop GPU, i5-13450HX, Micron 2400 MTFDKCD1T0QFM | HP Victus 16 (2024) NVIDIA GeForce RTX 4060 Laptop GPU, i7-14700HX, Kioxia XG8 KXG80ZNV512G | Gigabyte G6X 9KG (2024) NVIDIA GeForce RTX 4060 Laptop GPU, i7-13650HX, Gigabyte AG450E1024-SI | SCHENKER XMG Core 15 (M24) NVIDIA GeForce RTX 4060 Laptop GPU, R7 8845HS, Samsung 990 Pro 1 TB | Dell G16, i7-13650HX, RTX 4060 NVIDIA GeForce RTX 4060 Laptop GPU, i7-13650HX, WD PC SN740 SDDPNQD-1T00 | Asus TUF A15 FA507 NVIDIA GeForce RTX 4050 Laptop GPU, R7 7735HS, Micron 2400 MTFDKBA512QFM | |
|---|---|---|---|---|---|---|---|
| Noise | -11% | -6% | -16% | 5% | 12% | 15% | |
| desligado / ambiente * | 25 | 25 -0% | 25 -0% | 26 -4% | 23 8% | 23 8% | 23.3 7% |
| Idle Minimum * | 25 | 26 -4% | 28 -12% | 30 -20% | 23 8% | 23 8% | 23.3 7% |
| Idle Average * | 27 | 34 -26% | 29 -7% | 32 -19% | 23 15% | 23 15% | 23.3 14% |
| Idle Maximum * | 33 | 36 -9% | 33 -0% | 35 -6% | 23 30% | 27.96 15% | 23.3 29% |
| Load Average * | 40 | 48 -20% | 45 -13% | 51 -28% | 38.92 3% | 27.96 30% | 29.6 26% |
| Cyberpunk 2077 ultra * | 45 | 48 -7% | 52.06 -16% | ||||
| Load Maximum * | 46 | 50 -9% | 48 -4% | 54 -17% | 52.09 -13% | 47.89 -4% | 43 7% |
| Witcher 3 ultra * | 43 | 51 | 50.96 | 47.89 | 43 |
* ... menor é melhor
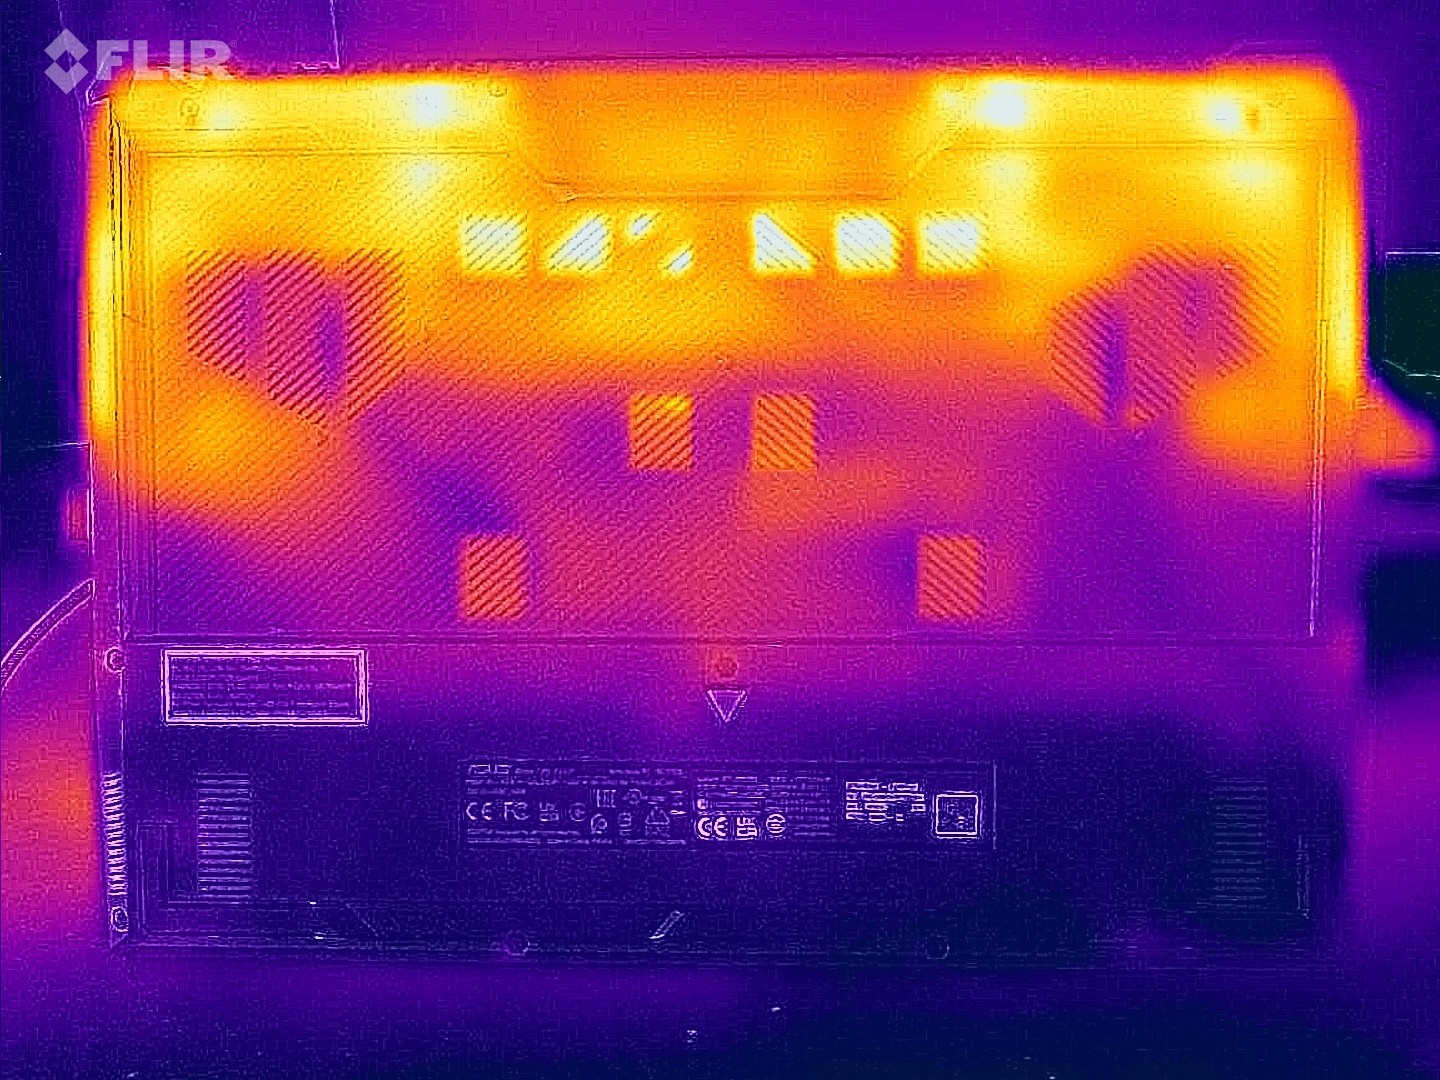
Temperatura
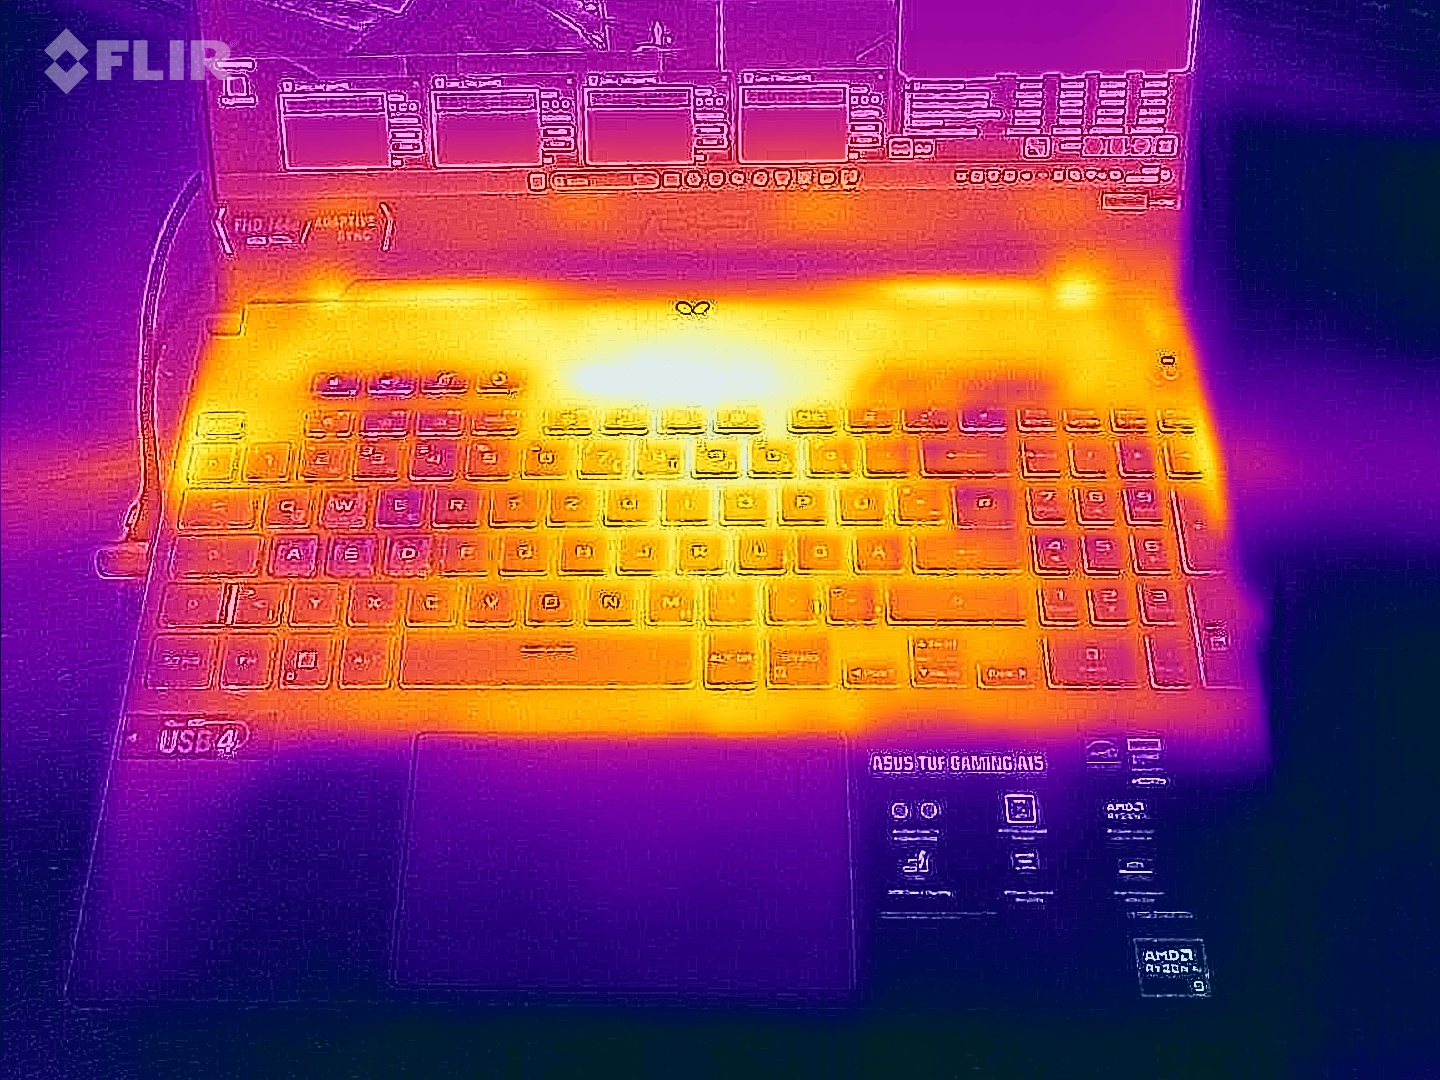
O laptop fica visivelmente quente: O Cyberpunk e o teste de estresse causam temperaturas de mais de 50 graus Celsius em algumas áreas. Nos casos de uso diário (escritório, Internet), são atingidos valores acima da média. As temperaturas do apoio para as mãos estão em um nível moderado.
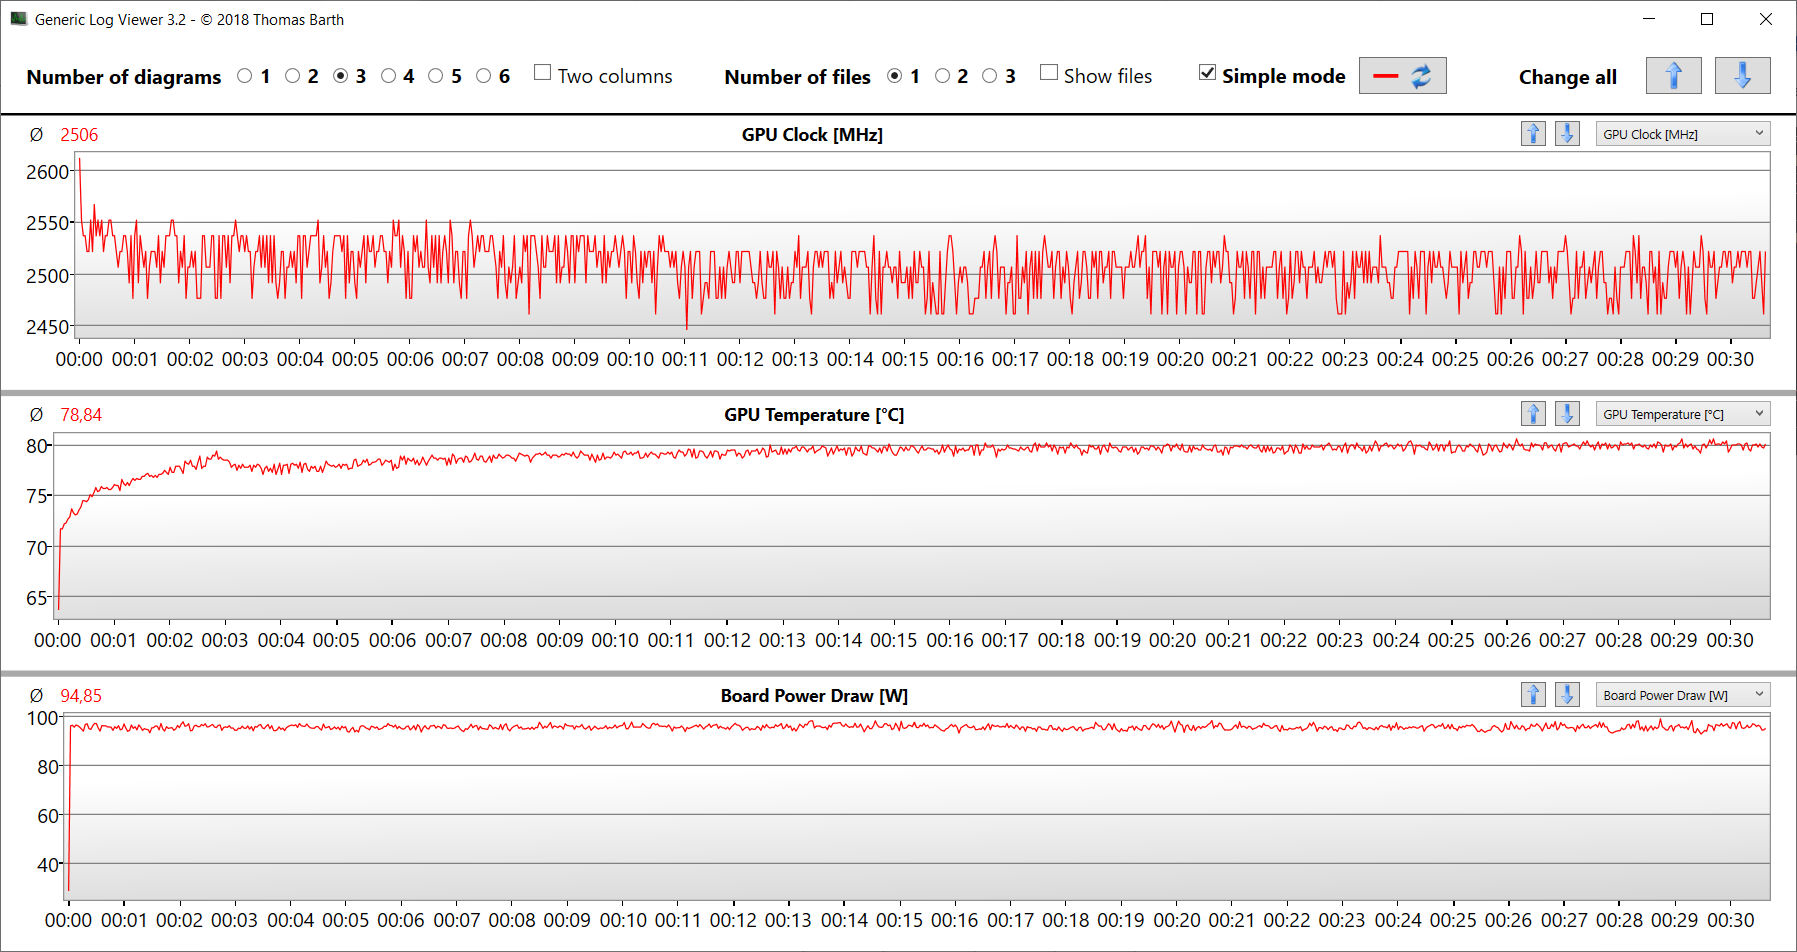
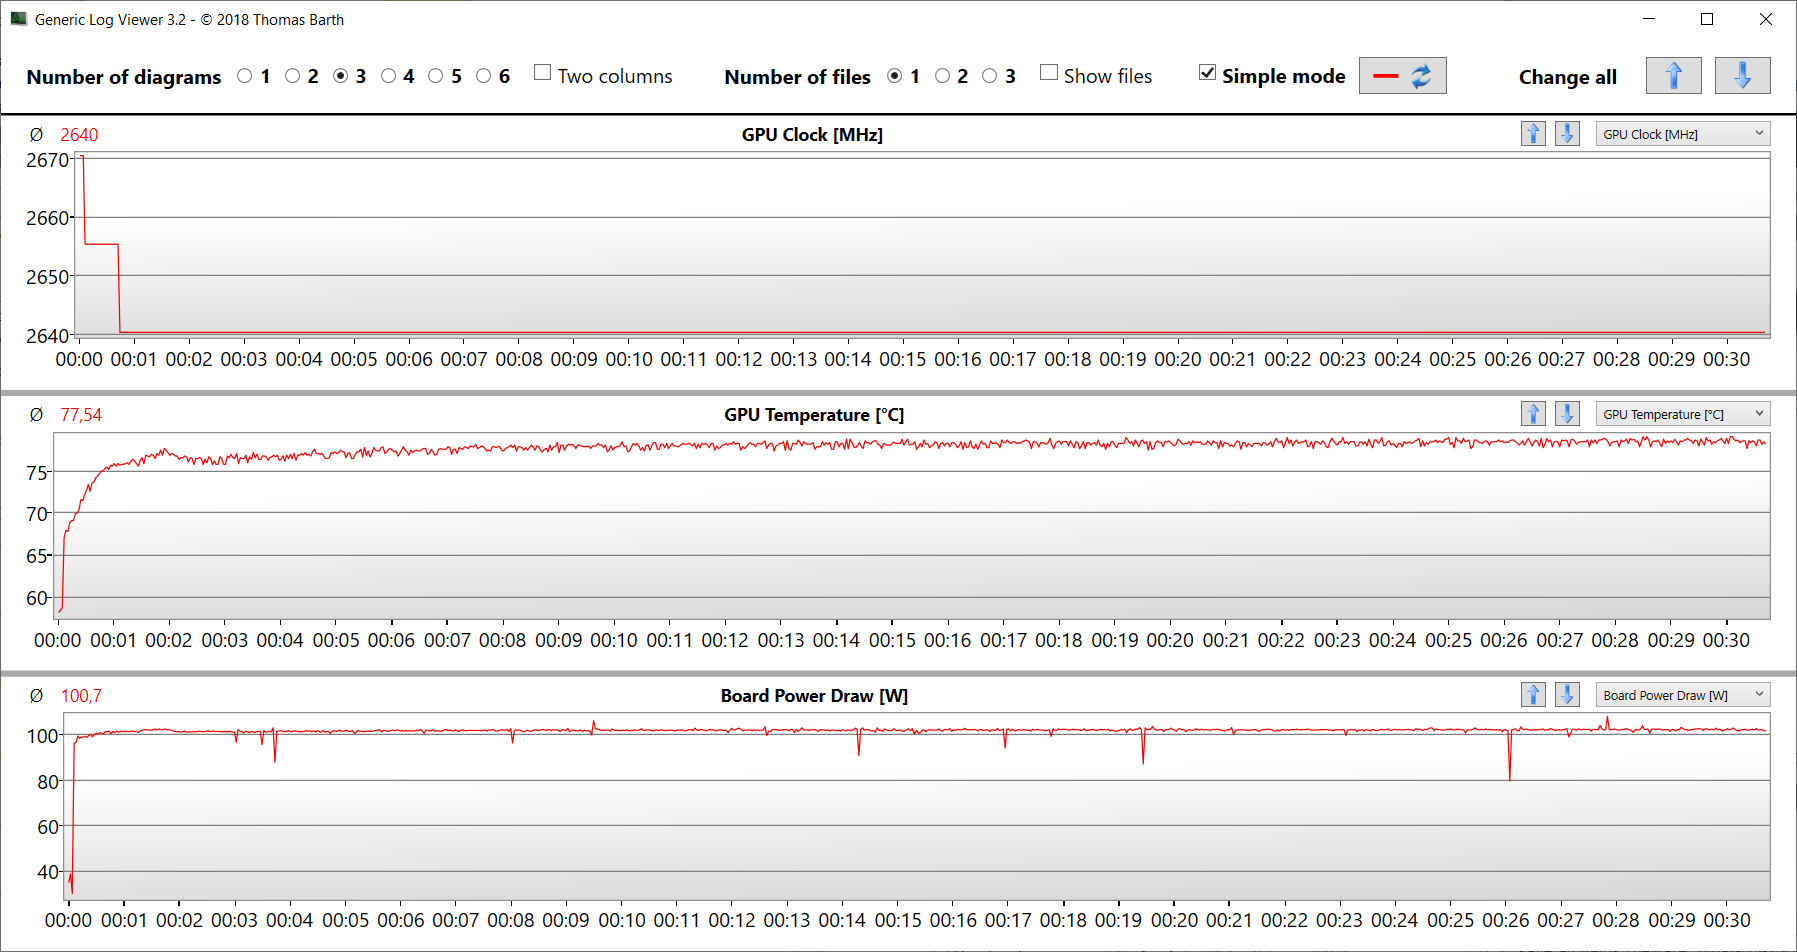
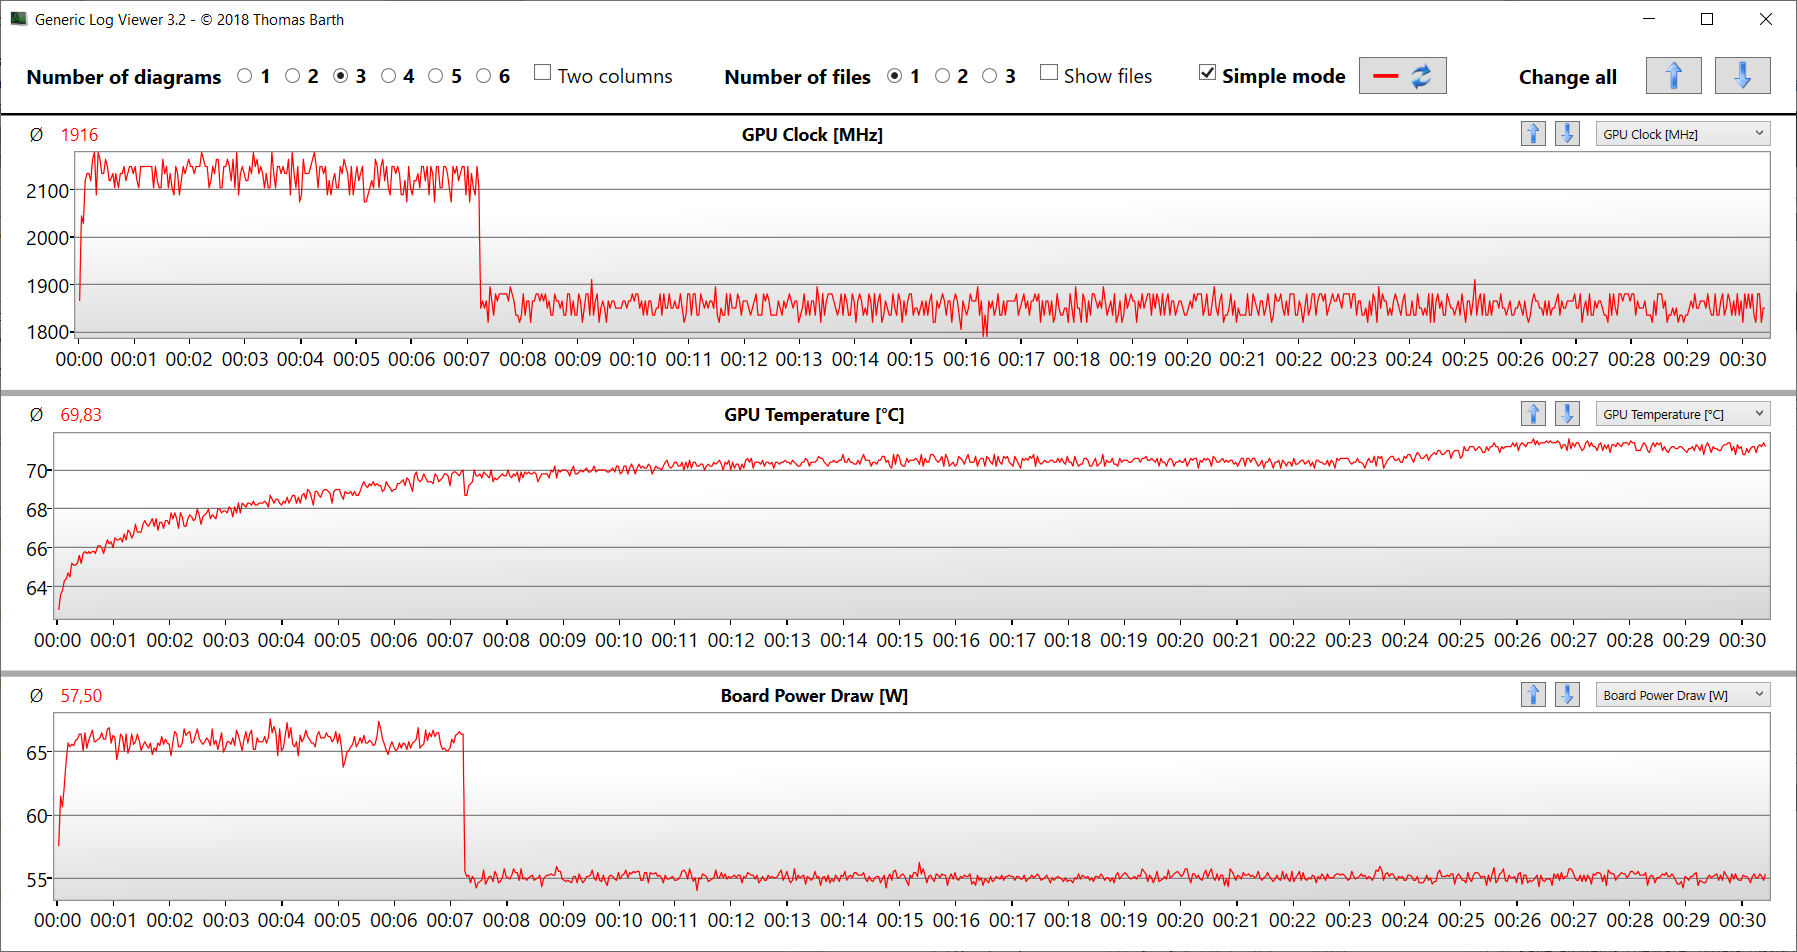
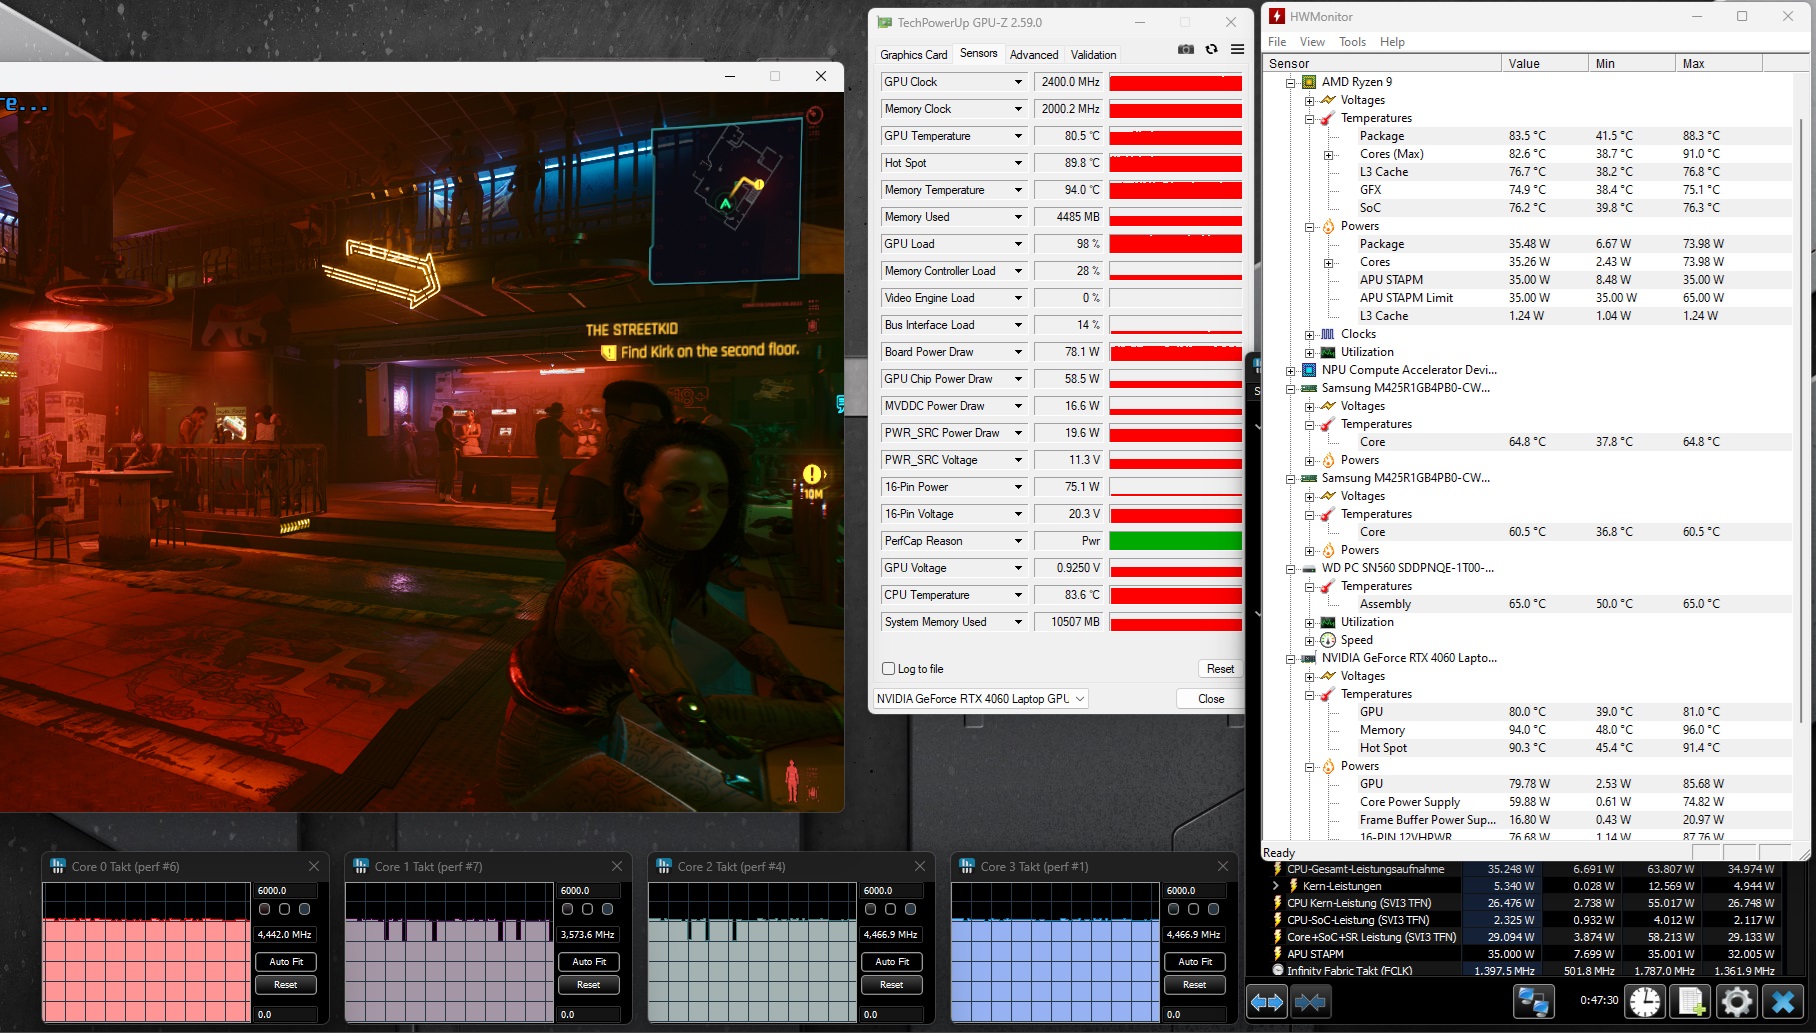
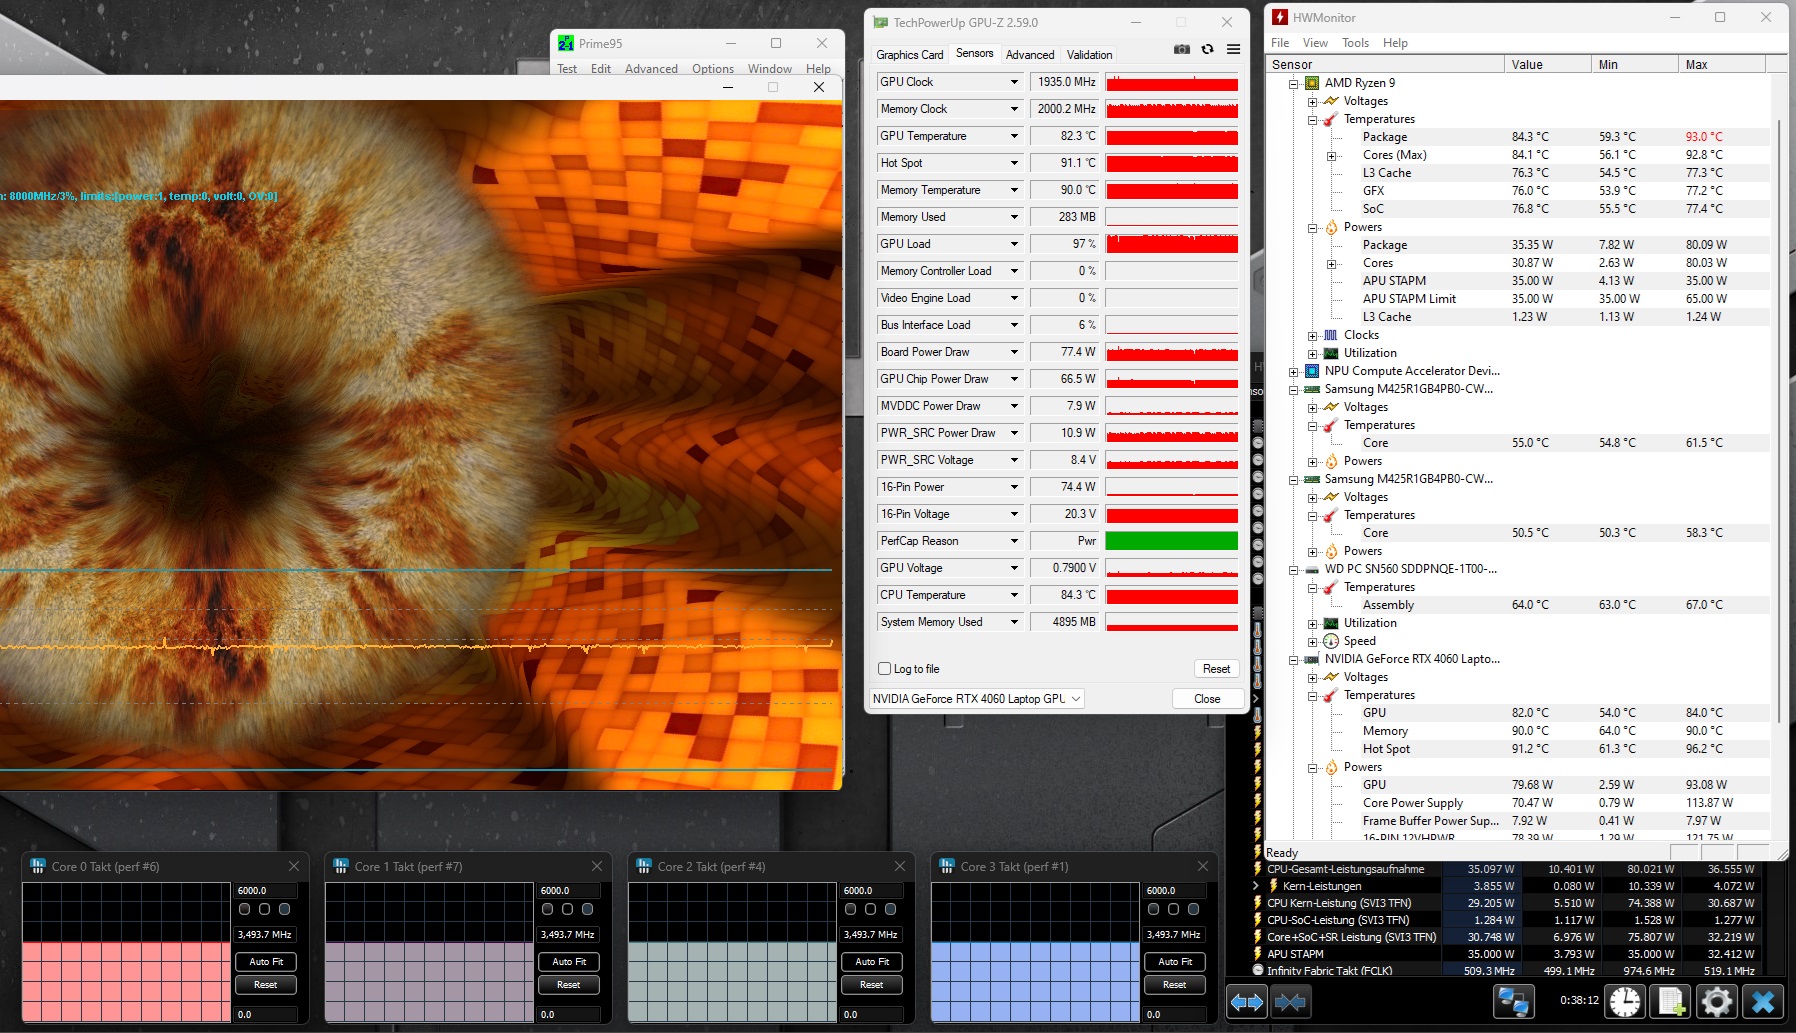
O teste de estresse de cenário extremo (Prime95 e Furmark em operação contínua) verifica a estabilidade do sistema sob carga total. As altas velocidades iniciais do clock da CPU e da GPU caem no primeiro minuto do teste para 3,5 GHz (CPU) e 1,9 GHz (GPU), respectivamente, e continuam a permanecer nesse nível.
(-) A temperatura máxima no lado superior é 53 °C / 127 F, em comparação com a média de 40.4 °C / 105 F , variando de 21.2 a 68.8 °C para a classe Gaming.
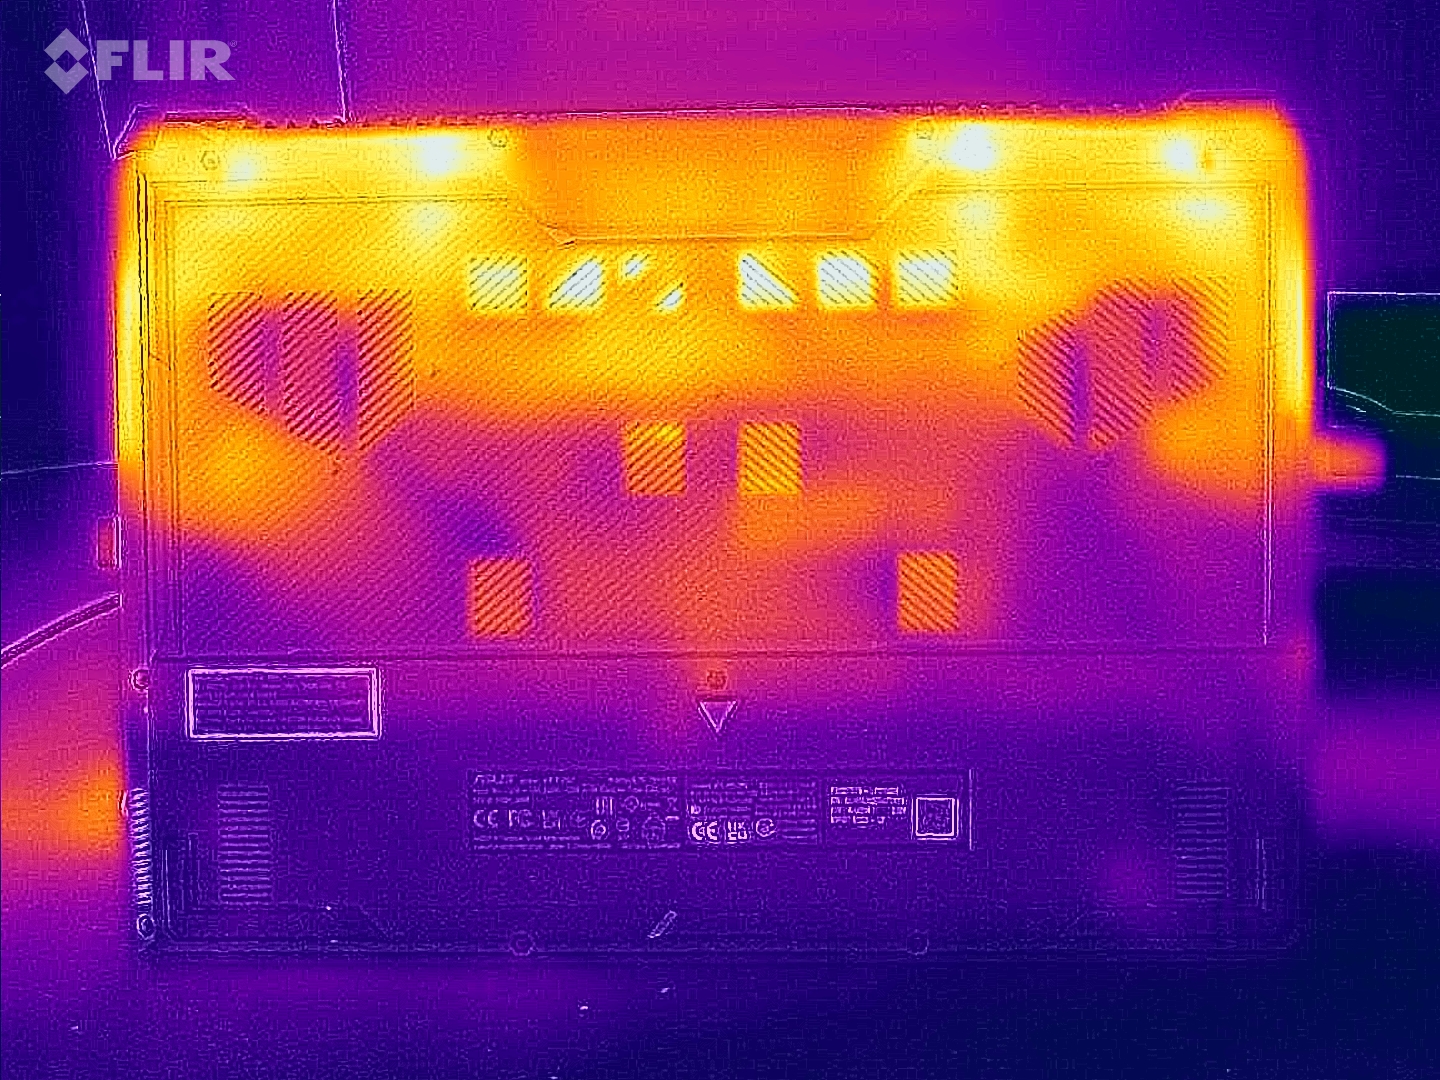
(-) A parte inferior aquece até um máximo de 46 °C / 115 F, em comparação com a média de 43.2 °C / 110 F
(+) Em uso inativo, a temperatura média para o lado superior é 29.9 °C / 86 F, em comparação com a média do dispositivo de 33.9 °C / ### class_avg_f### F.
(-) 3: The average temperature for the upper side is 41.9 °C / 107 F, compared to the average of 33.9 °C / 93 F for the class Gaming.
(+) Os apoios para as mãos e o touchpad estão atingindo a temperatura máxima da pele (35 °C / 95 F) e, portanto, não estão quentes.
(-) A temperatura média da área do apoio para as mãos de dispositivos semelhantes foi 28.9 °C / 84 F (-6.1 °C / -11 F).

| Asus TUF Gaming A15 FA507UV AMD Ryzen 9 8945H, NVIDIA GeForce RTX 4060 Laptop GPU | Lenovo LOQ 15IRX9 Intel Core i5-13450HX, NVIDIA GeForce RTX 4060 Laptop GPU | HP Victus 16 (2024) Intel Core i7-14700HX, NVIDIA GeForce RTX 4060 Laptop GPU | Gigabyte G6X 9KG (2024) Intel Core i7-13650HX, NVIDIA GeForce RTX 4060 Laptop GPU | SCHENKER XMG Core 15 (M24) AMD Ryzen 7 8845HS, NVIDIA GeForce RTX 4060 Laptop GPU | Dell G16, i7-13650HX, RTX 4060 Intel Core i7-13650HX, NVIDIA GeForce RTX 4060 Laptop GPU | Asus TUF A15 FA507 AMD Ryzen 7 7735HS, NVIDIA GeForce RTX 4050 Laptop GPU | |
|---|---|---|---|---|---|---|---|
| Heat | -5% | 11% | 5% | -14% | -8% | 11% | |
| Maximum Upper Side * | 53 | 47 11% | 50 6% | 41 23% | 52 2% | 49 8% | 48.9 8% |
| Maximum Bottom * | 46 | 58 -26% | 50 -9% | 43 7% | 61 -33% | 58 -26% | 44.6 3% |
| Idle Upper Side * | 32 | 32 -0% | 25 22% | 32 -0% | 35 -9% | 35 -9% | 27.1 15% |
| Idle Bottom * | 34 | 36 -6% | 26 24% | 37 -9% | 39 -15% | 35 -3% | 27.5 19% |
* ... menor é melhor
Alto-falantes
Em suma, os alto-falantes estéreo produzem um som decente. Os graves poderiam ser um pouco mais pronunciados.
Asus TUF Gaming A15 FA507UV análise de áudio
(+) | os alto-falantes podem tocar relativamente alto (###valor### dB)
Graves 100 - 315Hz
(±) | graves reduzidos - em média 6.8% menor que a mediana
(±) | a linearidade dos graves é média (7.1% delta para a frequência anterior)
Médios 400 - 2.000 Hz
(±) | médios mais altos - em média 7.8% maior que a mediana
(±) | a linearidade dos médios é média (7% delta para frequência anterior)
Altos 2 - 16 kHz
(+) | agudos equilibrados - apenas 2.4% longe da mediana
(±) | a linearidade dos máximos é média (7.6% delta para frequência anterior)
Geral 100 - 16.000 Hz
(+) | o som geral é linear (13.1% diferença em relação à mediana)
Comparado com a mesma classe
» 17% de todos os dispositivos testados nesta classe foram melhores, 4% semelhantes, 79% piores
» O melhor teve um delta de 6%, a média foi 18%, o pior foi 132%
Comparado com todos os dispositivos testados
» 11% de todos os dispositivos testados foram melhores, 3% semelhantes, 86% piores
» O melhor teve um delta de 4%, a média foi 24%, o pior foi 134%
Lenovo LOQ 15IRX9 análise de áudio
(±) | o volume do alto-falante é médio, mas bom (###valor### dB)
Graves 100 - 315Hz
(±) | graves reduzidos - em média 14.6% menor que a mediana
(±) | a linearidade dos graves é média (9.6% delta para a frequência anterior)
Médios 400 - 2.000 Hz
(+) | médios equilibrados - apenas 2.1% longe da mediana
(+) | médios são lineares (3.6% delta para frequência anterior)
Altos 2 - 16 kHz
(±) | máximos mais altos - em média 5.9% maior que a mediana
(±) | a linearidade dos máximos é média (8.2% delta para frequência anterior)
Geral 100 - 16.000 Hz
(+) | o som geral é linear (14.7% diferença em relação à mediana)
Comparado com a mesma classe
» 27% de todos os dispositivos testados nesta classe foram melhores, 7% semelhantes, 66% piores
» O melhor teve um delta de 6%, a média foi 18%, o pior foi 132%
Comparado com todos os dispositivos testados
» 17% de todos os dispositivos testados foram melhores, 4% semelhantes, 79% piores
» O melhor teve um delta de 4%, a média foi 24%, o pior foi 134%
Consumo de energia
No que diz respeito ao consumo de energia, não há nada de estranho a relatar. Os valores estão em um nível normal para o hardware instalado. O Cyberpunk e, mais tarde, o teste de estresse foram executados com consumo de energia consistente. A PSU (240 watts) tem o tamanho adequado.
| desligado | |
| Ocioso | |
| Carga |
|
Key:
min: | |
Power consumption Cyberpunk / stress test
Power consumption with an extrnal monitor
Duração da bateria
O dispositivo de 15,6 polegadas conseguiu um tempo de execução de 11 horas e 42 minutos em um teste de Wi-Fi no mundo real (imagem da carga ao acessar sites que executam um script) - um número excelente. Isso o coloca no mesmo nível do modelo A15 do ano passado.
Pro
Contra
Veredicto - Um jogo versátil

O foco está nos jogos em FHD, mas a renderização e o streaming também não apresentam problemas para o dispositivo. Ryzen 9 8945H e GeForce RTX 4060 fornecem a potência necessária e ambos os chips podem ser executados em velocidades de clock consistentemente altas. O painel de 15,6 polegadas instalado (FHD, 144 Hz, G-Sync, sRGB) não apresenta pontos fracos graves.
Com o TUF Gaming A15 FA507UV, a Asus forneceu um laptop para jogos FHD completo com uma duração de bateria impressionante.
Em alguns lugares, o computador aquece visivelmente e faz muito barulho. Ao selecionar o modo, o senhor conseguirá um bom compromisso entre desempenho e ruído e a perda de desempenho resultante não é significativa.
O principal destaque do A15 é a excelente duração da bateria: Números reais de quase 12 horas são normalmente reservados para laptops de escritório ou subnotebooks. É possível fornecer energia à bateria por meio de uma PSU USB-C - uma das duas portas USB-C (USB 3.2 Gen 2, USB 4) é compatível com o Power Delivery, o que significa que o senhor não precisa necessariamente carregar a PSU proprietária.
Uma alternativa poderia ser o Lenovo LOQ 15IRX9. Ele oferece um pouco menos de potência de computação, o USB 4 não está integrado e a duração da bateria é consideravelmente pior. No entanto, ele está na frente quando se trata do preço: O LOQ pode ser pode ser seu por apenas US$ 999.
Preço e disponibilidade
O Asus TUF Gaming A15 FA507UV está atualmente (em 17.07.24) disponível por cerca de US$ 1.399 (SSD de 512 GB) na Amazon.
Observação: Atualizamos recentemente nosso sistema de classificação e os resultados da versão 8 não são comparáveis aos resultados da versão 7. Mais informações estão disponíveis aqui.
Asus TUF Gaming A15 FA507UV
- 07/17/2024 v8
Sascha Mölck
 Total Sustainability Score:
 Transparência
A seleção dos dispositivos a serem analisados é feita pela nossa equipe editorial. A amostra de teste foi fornecida ao autor como empréstimo pelo fabricante ou varejista para fins desta revisão. O credor não teve influência nesta revisão, nem o fabricante recebeu uma cópia desta revisão antes da publicação. Não houve obrigação de publicar esta revisão. Nunca aceitamos compensação ou pagamento em troca de nossas avaliações. Como empresa de mídia independente, a Notebookcheck não está sujeita à autoridade de fabricantes, varejistas ou editores.
É assim que o Notebookcheck está testando
Todos os anos, o Notebookcheck analisa de forma independente centenas de laptops e smartphones usando procedimentos padronizados para garantir que todos os resultados sejam comparáveis. Desenvolvemos continuamente nossos métodos de teste há cerca de 20 anos e definimos padrões da indústria no processo. Em nossos laboratórios de teste, equipamentos de medição de alta qualidade são utilizados por técnicos e editores experientes. Esses testes envolvem um processo de validação em vários estágios. Nosso complexo sistema de classificação é baseado em centenas de medições e benchmarks bem fundamentados, o que mantém a objetividade.Price comparison

