

Análise do Lenovo ThinkPad P1 Gen 7: Sem botões TrackPoint, com Nvidia GeForce RTX 4060
P1 com uma pitada de ThinkPad Z.
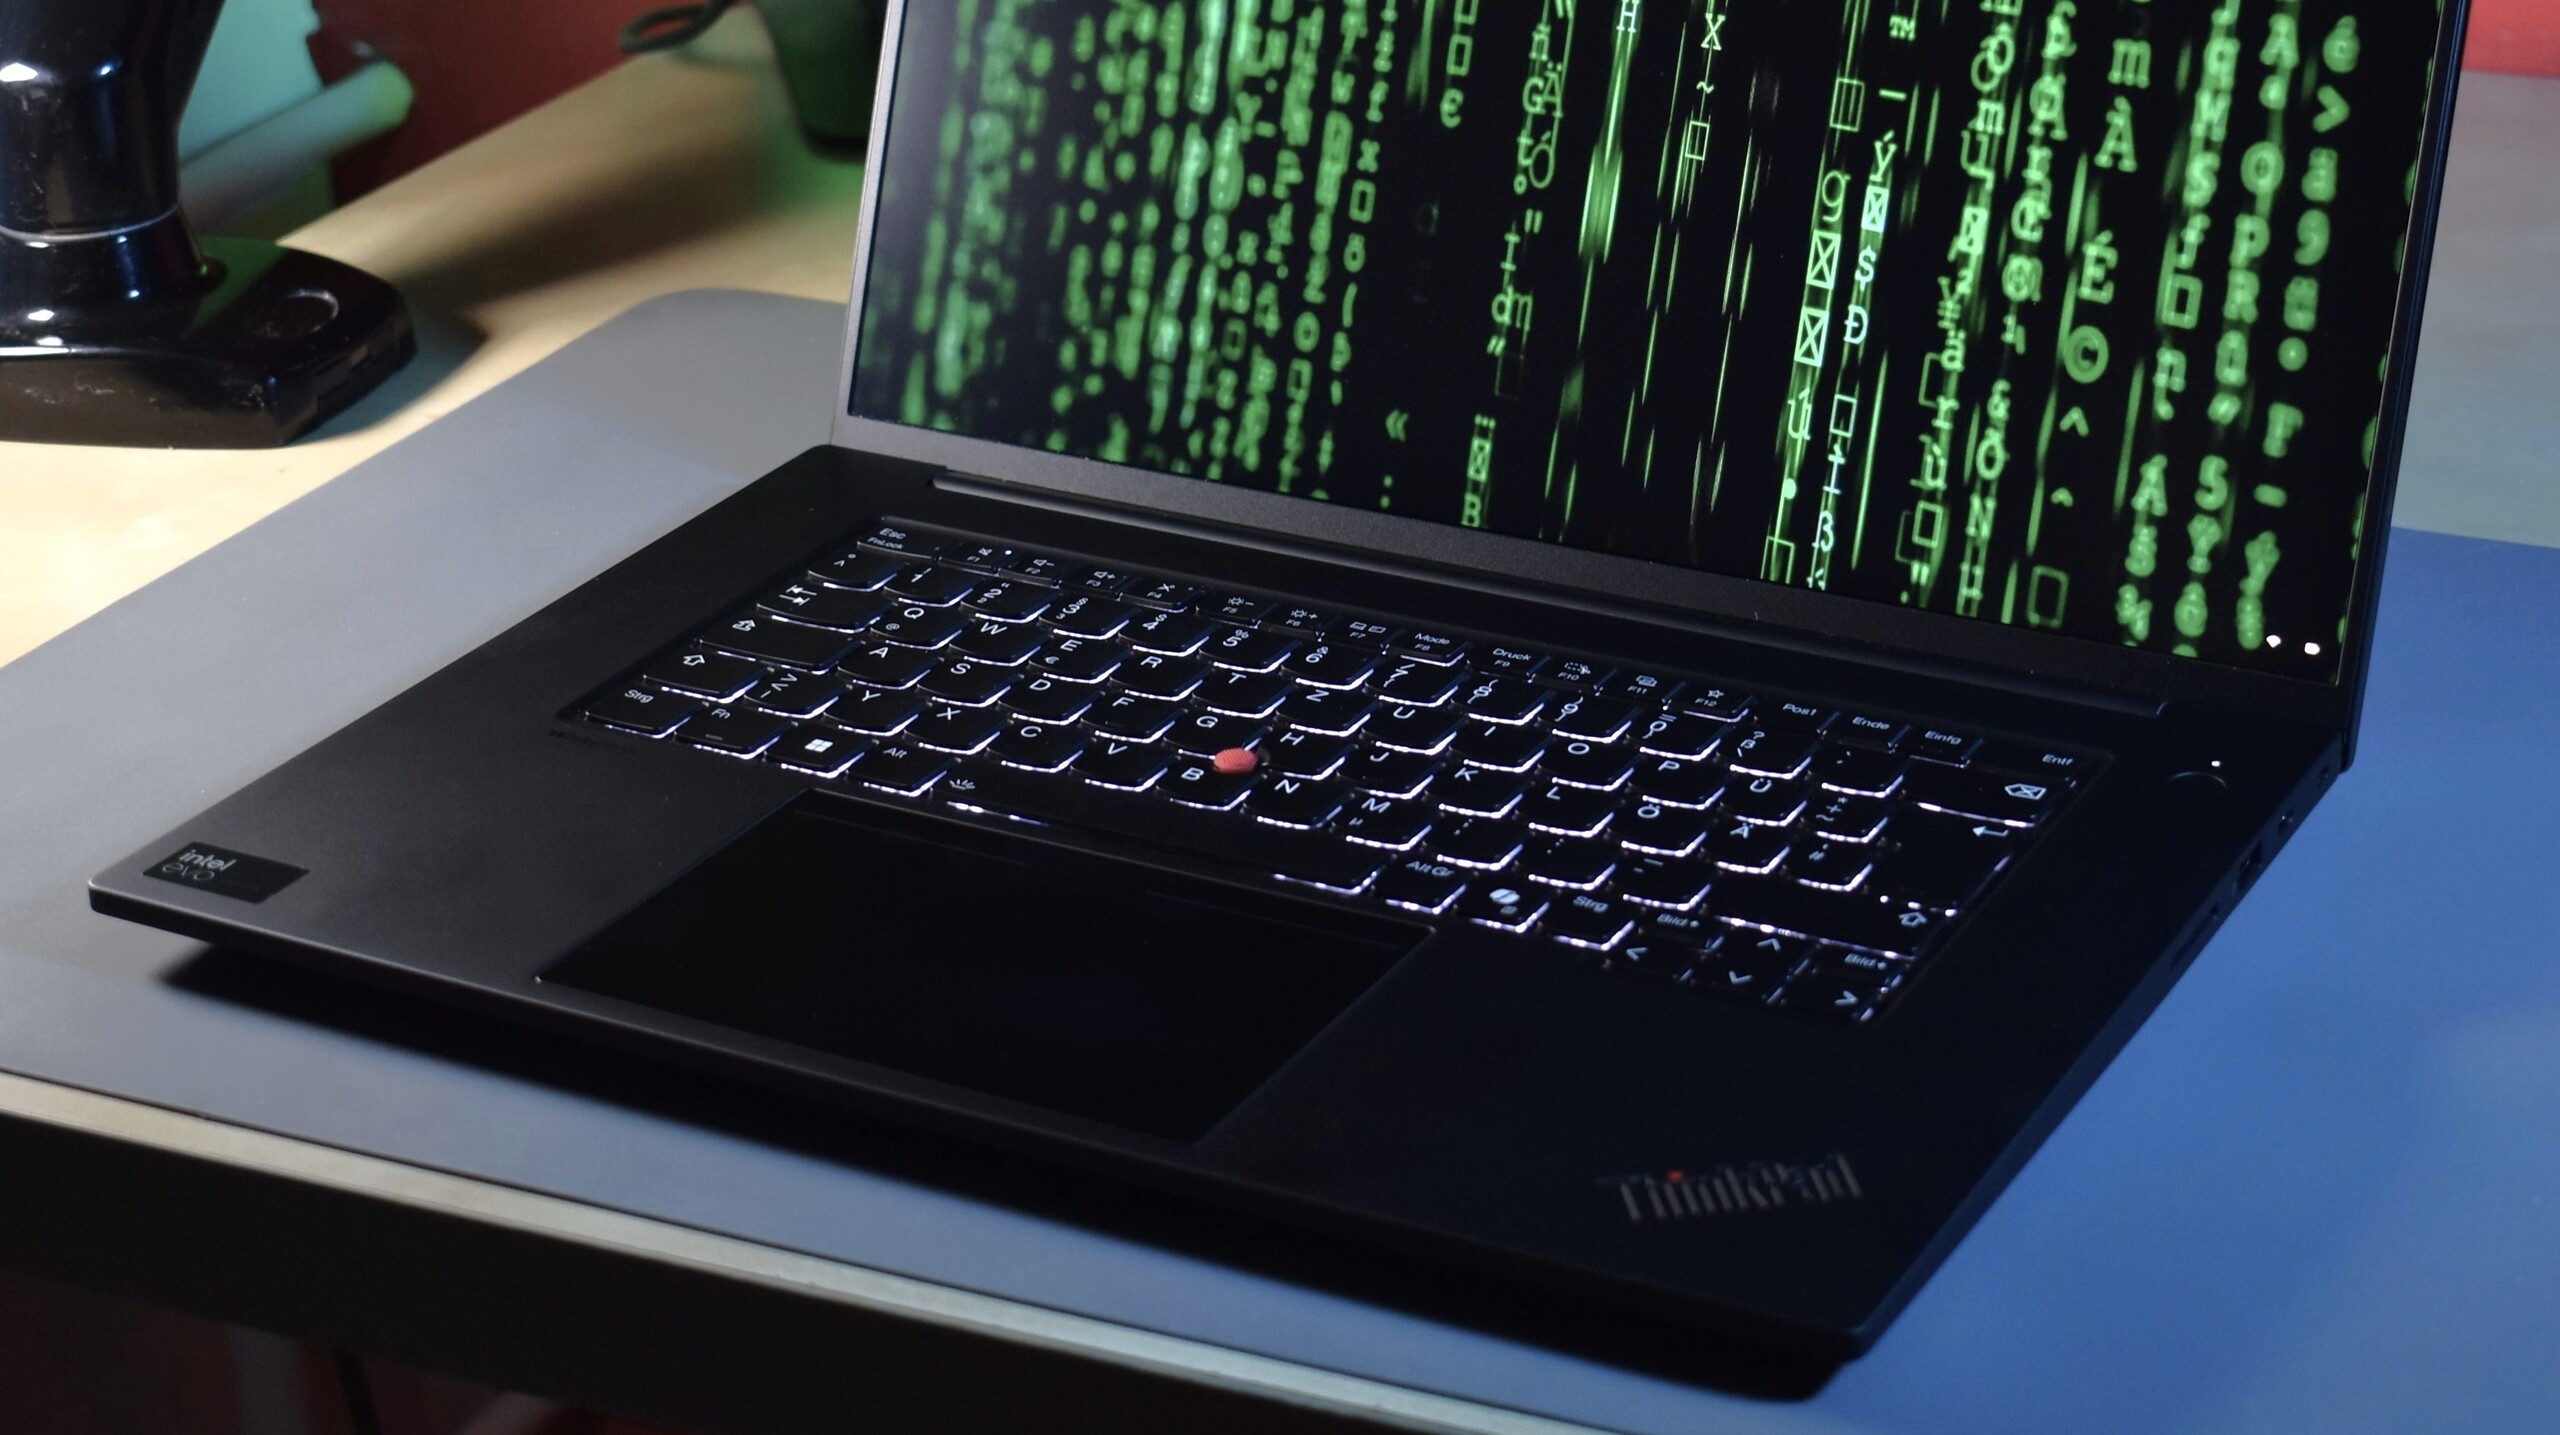
Para o novo Lenovo ThinkPad P1 Gen 7, o novo design é a principal atração. A estação de trabalho de ponta é mais premium, reparável e fácil de usar. Em seu núcleo está o novo touchpad Sensel háptico, que assume com sucesso a função dos botões TrackPoint anteriormente dedicados.Benjamin Herzig, 👁 Benjamin Herzig (traduzido por DeepL / Ninh Duy) Publicado 🇺🇸 🇩🇪 ...
Veredicto: Design moderno, mas menos desempenho da GPU
Na maioria das vezes, os novos modelos de laptop de uma linha preexistente de PCs são meras atualizações de seu antecessor, apenas com processadores mais novos. Esse não é o caso do ThinkPad P1 Gen 7: a Lenovo muda sua estação de trabalho premium em um nível fundamental, desviando o foco do desempenho máximo - as opções de GPU de ponta do antecessor não estão mais disponíveis. Em vez disso, agora há dois slots SSD M.2 2280 em cada variante de modelo, e o novo P1 G7 também adota o novo e inovador tipo de memória LPCAMM2.
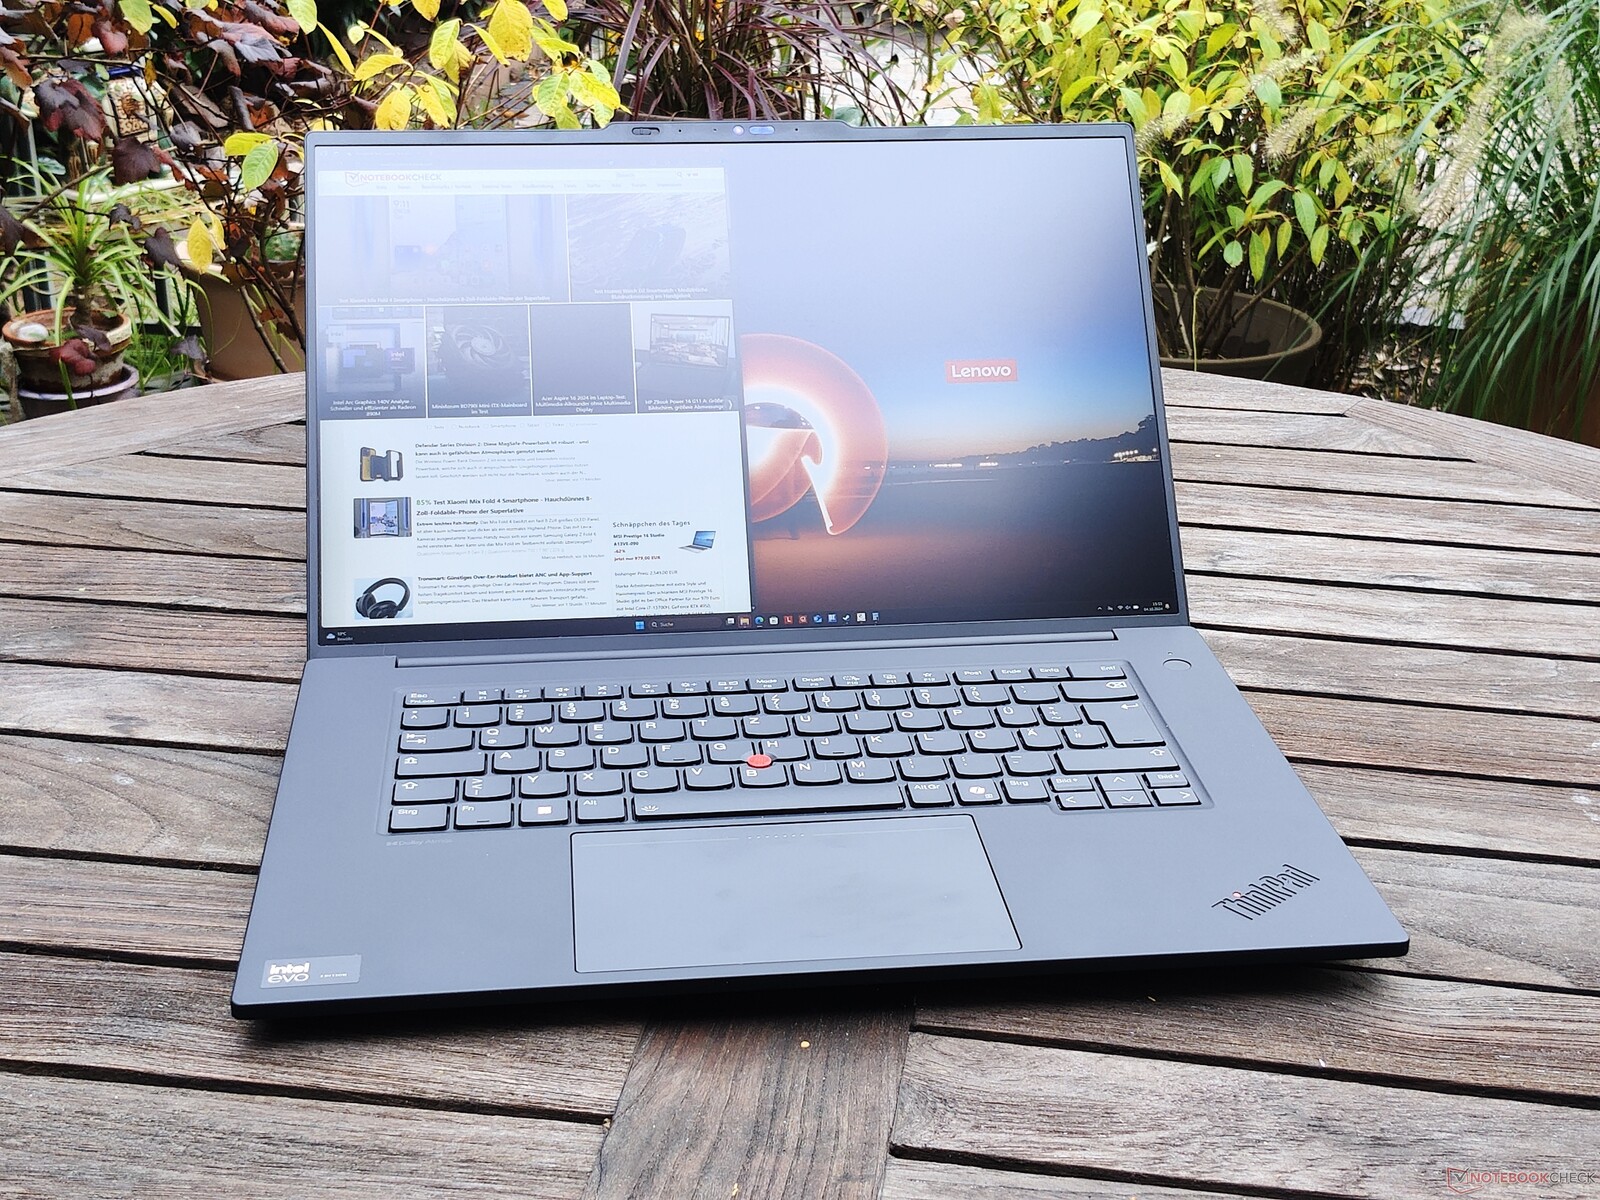
Na parte externa, há muitas sugestões de design do ThinkPad Z16, especialmente com a tampa de alumínio e o grande trackpad háptico, que funciona muito bem. Junto com a moldura da tela mais fina, o design parece mais fresco e moderno, sem perder completamente o charme do design do ThinkPad. A nova plataforma de CPU Meteor Lake não está à altura da Raptor Lake em termos de desempenho de núcleo único, mas a eficiência e a duração da bateria foram melhoradas. No geral, o Lenovo ThinkPad P1 Gen 7 é uma transformação bem realizada para um design mais premium com maior mobilidade em comparação com o antecessor. Para o pacote geral mais arredondado, a Lenovo sacrifica um pouco do desempenho da GPU na extremidade superior, mas isso provavelmente é bom para a maioria dos usuários.
Pro
Contra
Preços e disponibilidade
Em nosso fornecedor de empréstimos Campuspoint, o senhor pode comprar o Lenovo ThinkPad P1 Gen 7 testado por 3.359 euros na Alemanha, com o preço para estudantes em 2.859 euros. A Amazon.com lista uma versão do ThinkPad P1 Gen 7 por US$ 2.548.
Price comparison
Possíveis concorrentes em comparação
Imagem | Modelo / Análises | Preço | Peso | Altura | Tela |
|---|---|---|---|---|---|
1. 83.5%  | Lenovo ThinkPad P1 Gen 7 21KV001SGE Intel Core Ultra 7 155H ⎘ NVIDIA GeForce RTX 4060 Laptop GPU ⎘ 32 GB Memória, 1024 GB SSD | 2 kg | 20.5 mm | 16.00" 2560x1600 189 PPI IPS LED | |
2. 90.1% v7 (old)  | Lenovo ThinkPad P1 G6 21FV001KUS Intel Core i7-13800H ⎘ NVIDIA GeForce RTX 4080 Laptop GPU ⎘ 32 GB Memória, 1024 GB SSD | 1.9 kg | 17.5 mm | 16.00" 3480x2400 264 PPI OLED | |
3. 93.7% v7 (old)  | Apple MacBook Pro 16 2023 M3 Pro Apple M3 Pro 12-Core ⎘ Apple M3 Pro 18-Core GPU ⎘ 18 GB Memória, 512 GB SSD | 2.1 kg | 16.9 mm | 16.20" 3456x2234 254 PPI Mini-LED | |
4. 88.6% v7 (old) 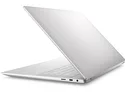 | Dell XPS 16 9640 Intel Core Ultra 7 155H ⎘ NVIDIA GeForce RTX 4070 Laptop GPU ⎘ 32 GB Memória, 1024 GB SSD | 2.3 kg | 18.7 mm | 16.30" 3840x2400 139 PPI OLED | |
5. 88.3% v7 (old)  | Dell Precision 5690 Intel Core Ultra 9 185H ⎘ Nvidia RTX 5000 Ada Generation Laptop GPU ⎘ 32 GB Memória, 2048 GB SSD | 2.3 kg | 22.17 mm | 16.00" 3840x2400 283 PPI OLED |
Índice
- Veredicto: Design moderno, mas menos desempenho da GPU
- Specifications: Core Ultra 7 155H meets GeForce RTX 4060
- Chassi: Alumínio em vez de fibra de carbono para o ThinkPad P1
- Conectividade: A Lenovo substitui o SO-DIMM pelo LPCAMM2
- Dispositivos de entrada: Botões TrackPoint integrados bem realizados pela primeira vez
- Tela: Tela rápida de 165 Hz
- Desempenho: O Meteor Lake substitui o Raptor Lake
- Emissões: O apoio para as mãos do laptop Lenovo permanece frio
- Gerenciamento de energia: Melhor duração da bateria do que o ThinkPad P1 Gen 6
- Classificação geral do Notebookcheck
No ano de 2018, a Lenovo lançou uma série ThinkPad completamente nova: O ThinkPad P1uma estação de trabalho fina e premium, bem como o ThinkPad X1 Extremesua contraparte multimídia. A linha X1 Extreme morreu nesse meio tempo, mas o ThinkPad P1 ainda existe. Com o ThinkPad P1 Gen 7, já temos sete gerações desse dispositivo de ponta. Essa versão mais recente tem muitos recursos novos, já que a Lenovo reformulou o design quase completamente - apenas pela segunda vez na história da série. Juntamente com as CPUs Intel Meteor Lake H, essa é uma combinação muito interessante, que a Lenovo coloca contra o Apple MacBook Pro 16, Dell XPS 16 ou o HP ZBook Studio.
Specifications: Core Ultra 7 155H meets GeForce RTX 4060
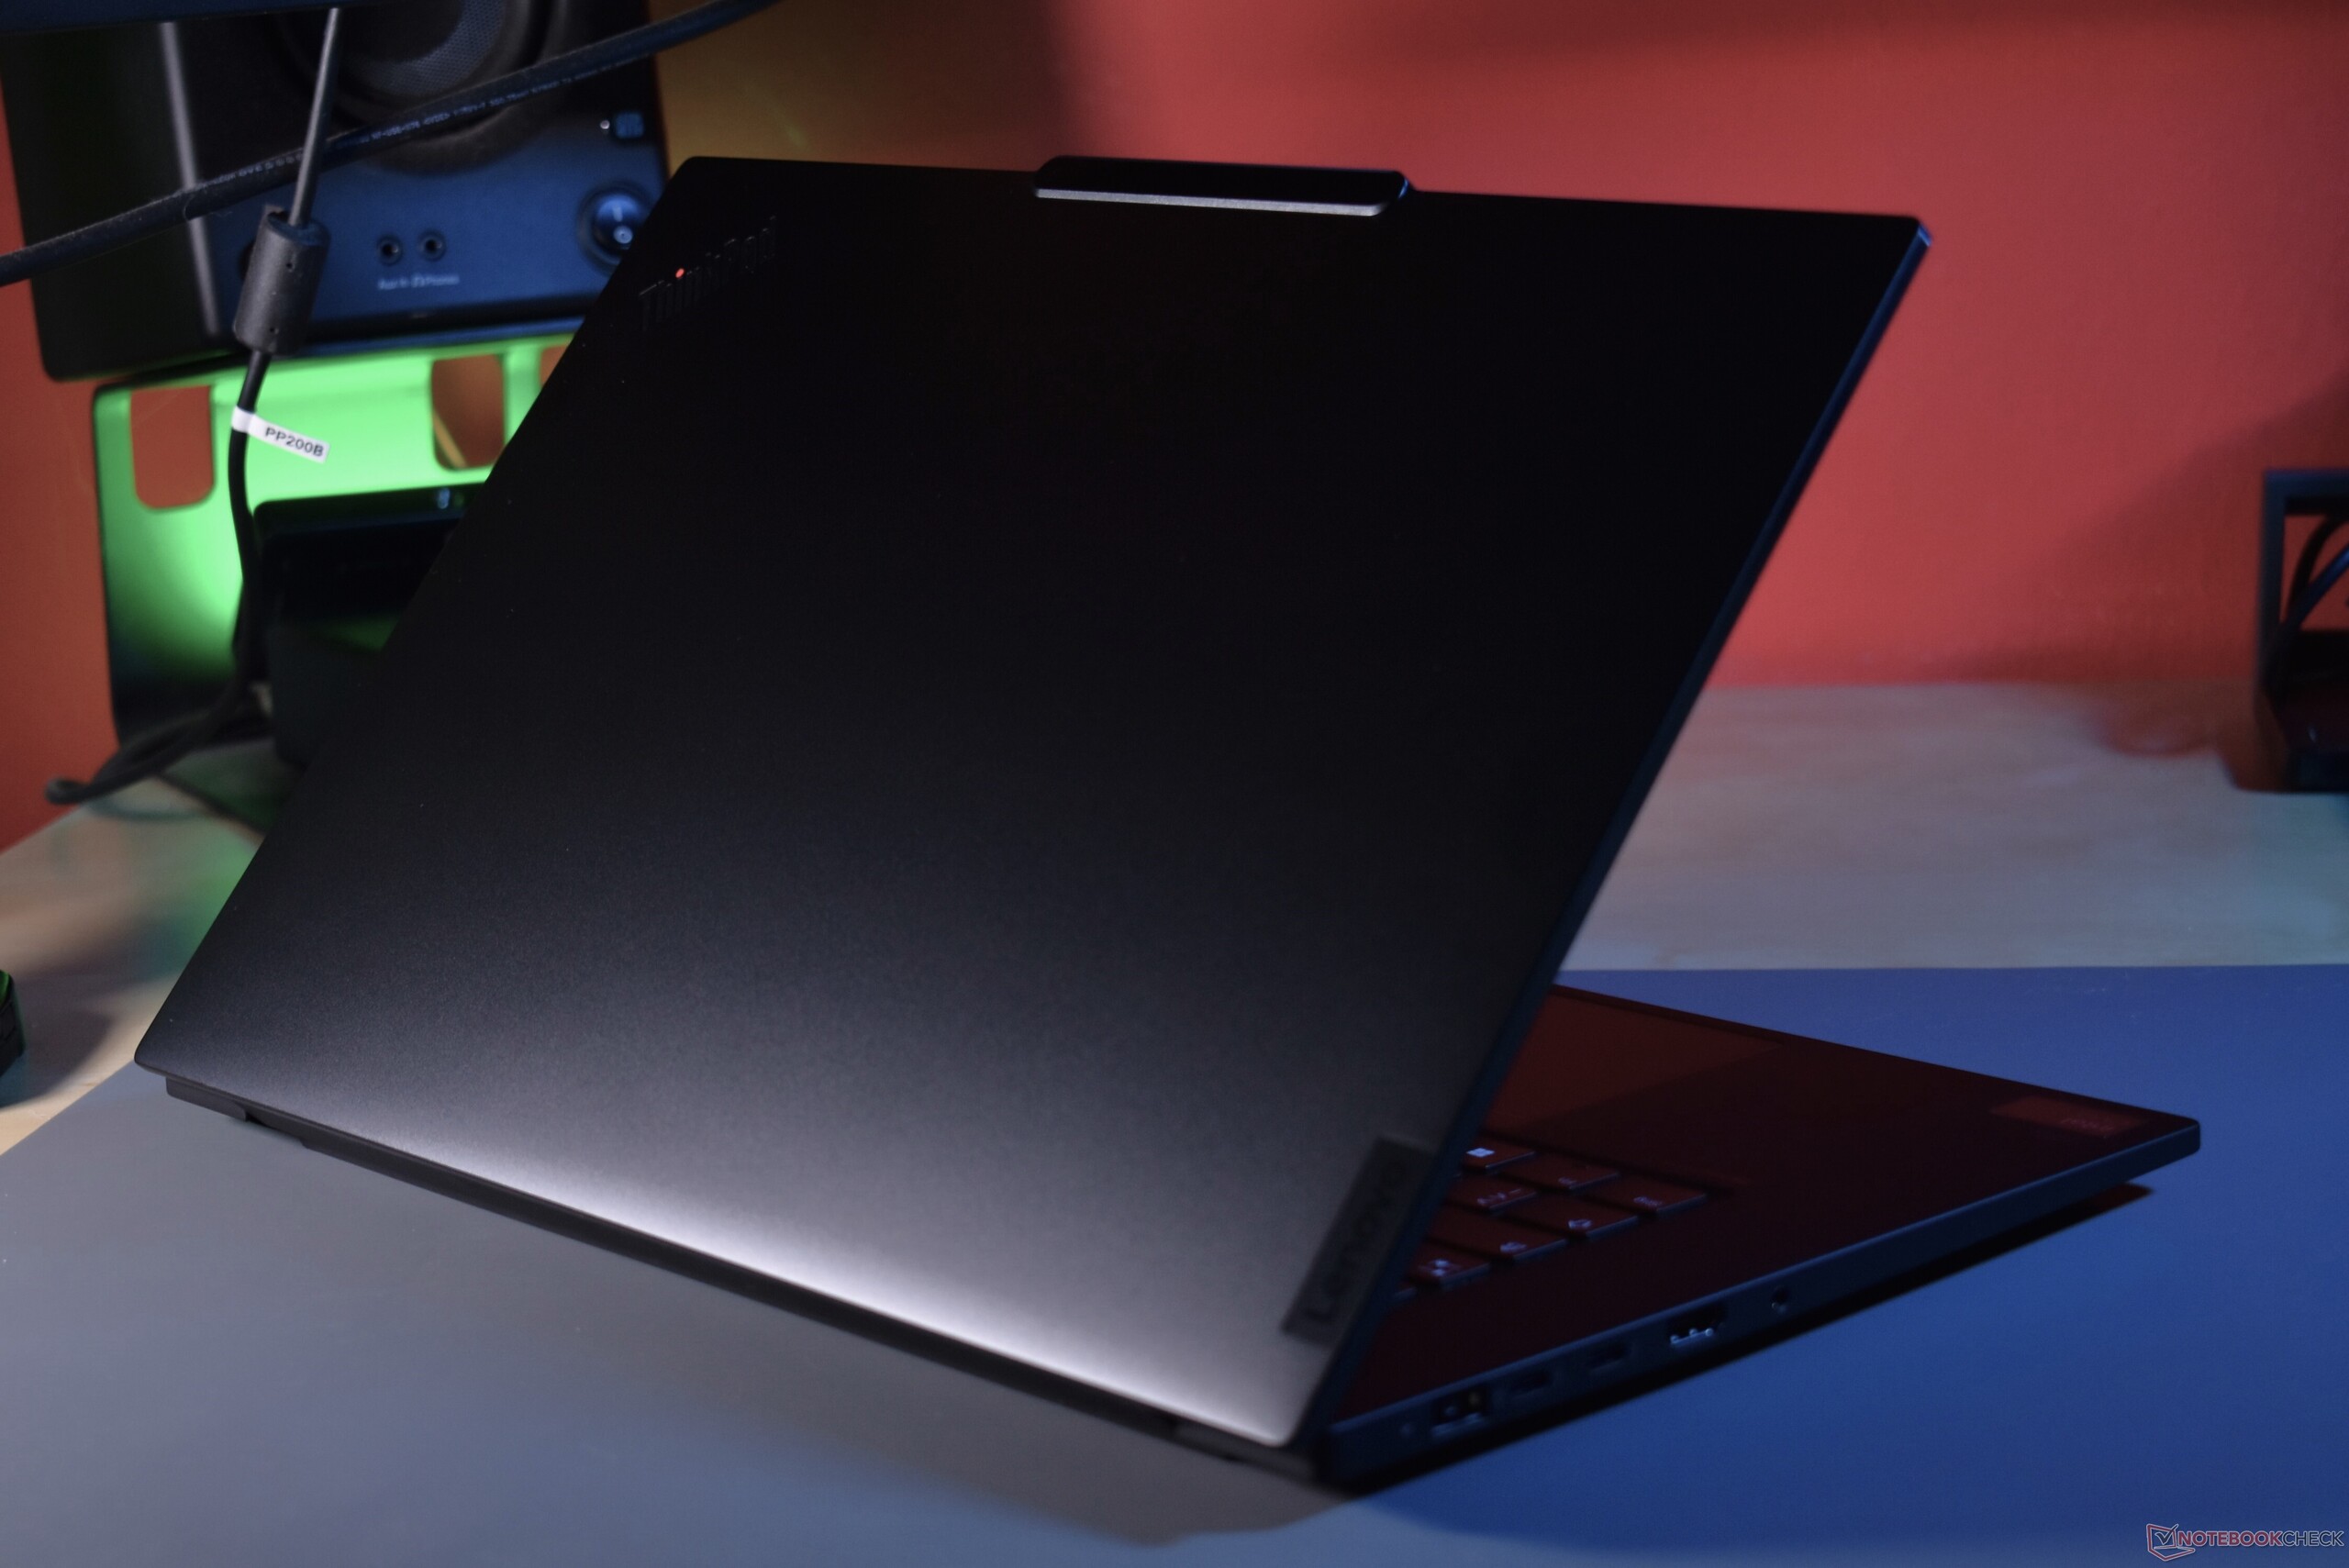
Chassi: Alumínio em vez de fibra de carbono para o ThinkPad P1
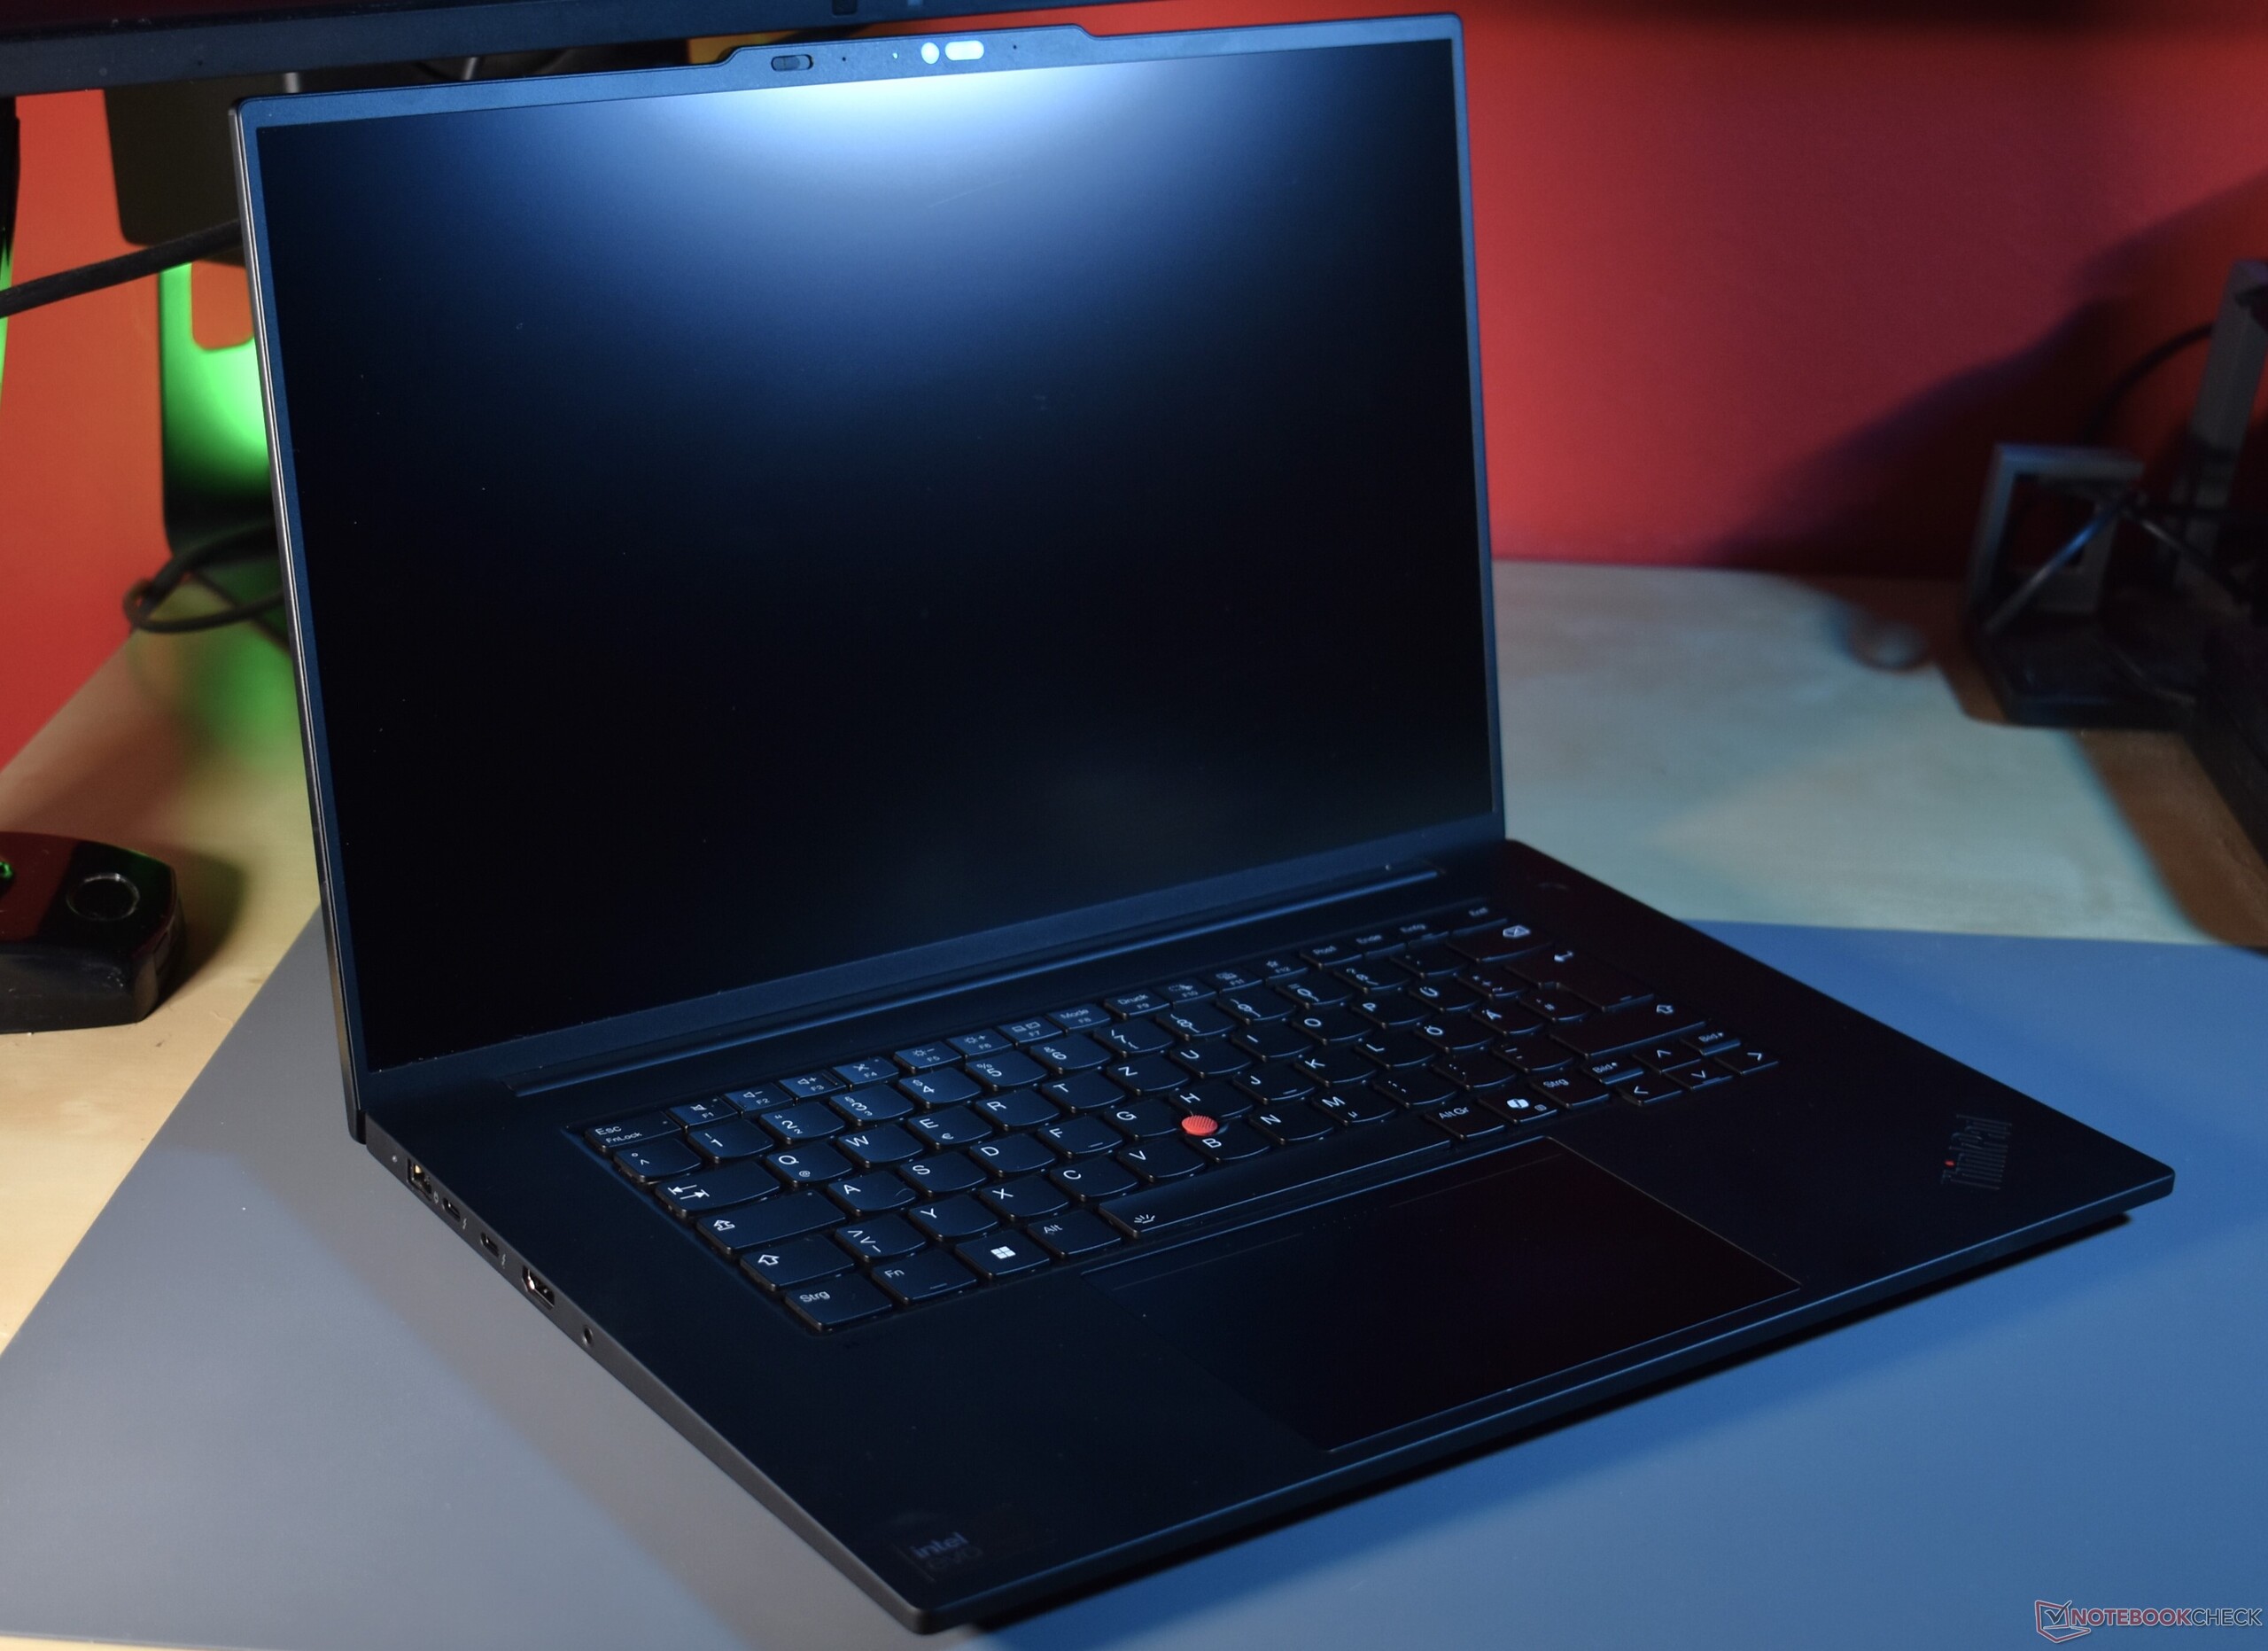
Desde o início, o Lenovo ThinkPad P1 era basicamente um ThinkPad X1 Carbon maior. Ele usava a mesma construção e os mesmos materiais que o Ultrabook menor, apenas um pouco mais grosso e no formato maior de 15,6 ou 16 polegadas (já que o Lenovo ThinkPad P1 Gen 4). Com o ThinkPad P1 Gen 7, a Lenovo rompe com essa regra, pelo menos um pouco. Em vez da clássica tampa superior emborrachada feita de fibra de carbono, a Lenovo agora usa alumínio anodizado preto com lados cortados em diamante. Outras mudanças no design foram adaptadas do ThinkPad X1 Carbon G12como a saliência da câmera. Muito diferente do anterior é também o novo touchpad háptico, que integra os botões TrackPoint - mais sobre isso na seção sobre dispositivos de entrada, mas no geral, podemos dizer que o ThinkPad P1 agora se parece muito mais com o ThinkPad Z16 do que antes. Um componente disso é a moldura da tela muito mais fina. A proporção entre a tela e o corpo aumenta de 81% para 87%.

Em termos de qualidade, o novo design está um nível acima do modelo anterior, o que se deve ao fato de a cobertura da tela de alumínio oferecer mais rigidez. O laptop ThinkPad não pode ser amassado em nenhum lugar e quase não se flexiona. O acabamento é, como esperado de um modelo premium, impecável. Pequena desvantagem: A propensão a manchas da cor preta do ThinkPad ainda permanece, tanto na unidade de base emborrachada quanto na tampa da tela de metal.
A tela pode ser aberta até 180 graus. Dispostas como uma barra larga de peça única, as duas dobradiças são suaves o suficiente para permitir a abertura com uma mão e rígidas o suficiente para impedir que a tela balance. Ao abrir a tampa, a saliência da câmera torna-se um apoio útil.

O peso aumenta um pouco, mas a área de cobertura X/Y fica menor. O peso maior se deve ao material de alumínio mais denso da tampa. Por outro lado, o P1 Gen 7 é notavelmente mais compacto do que o P1 Gen 6, graças à moldura da tela mais fina. Todos os concorrentes são mais pesados. No caso do Dell XPS 16a diferença é substancial.
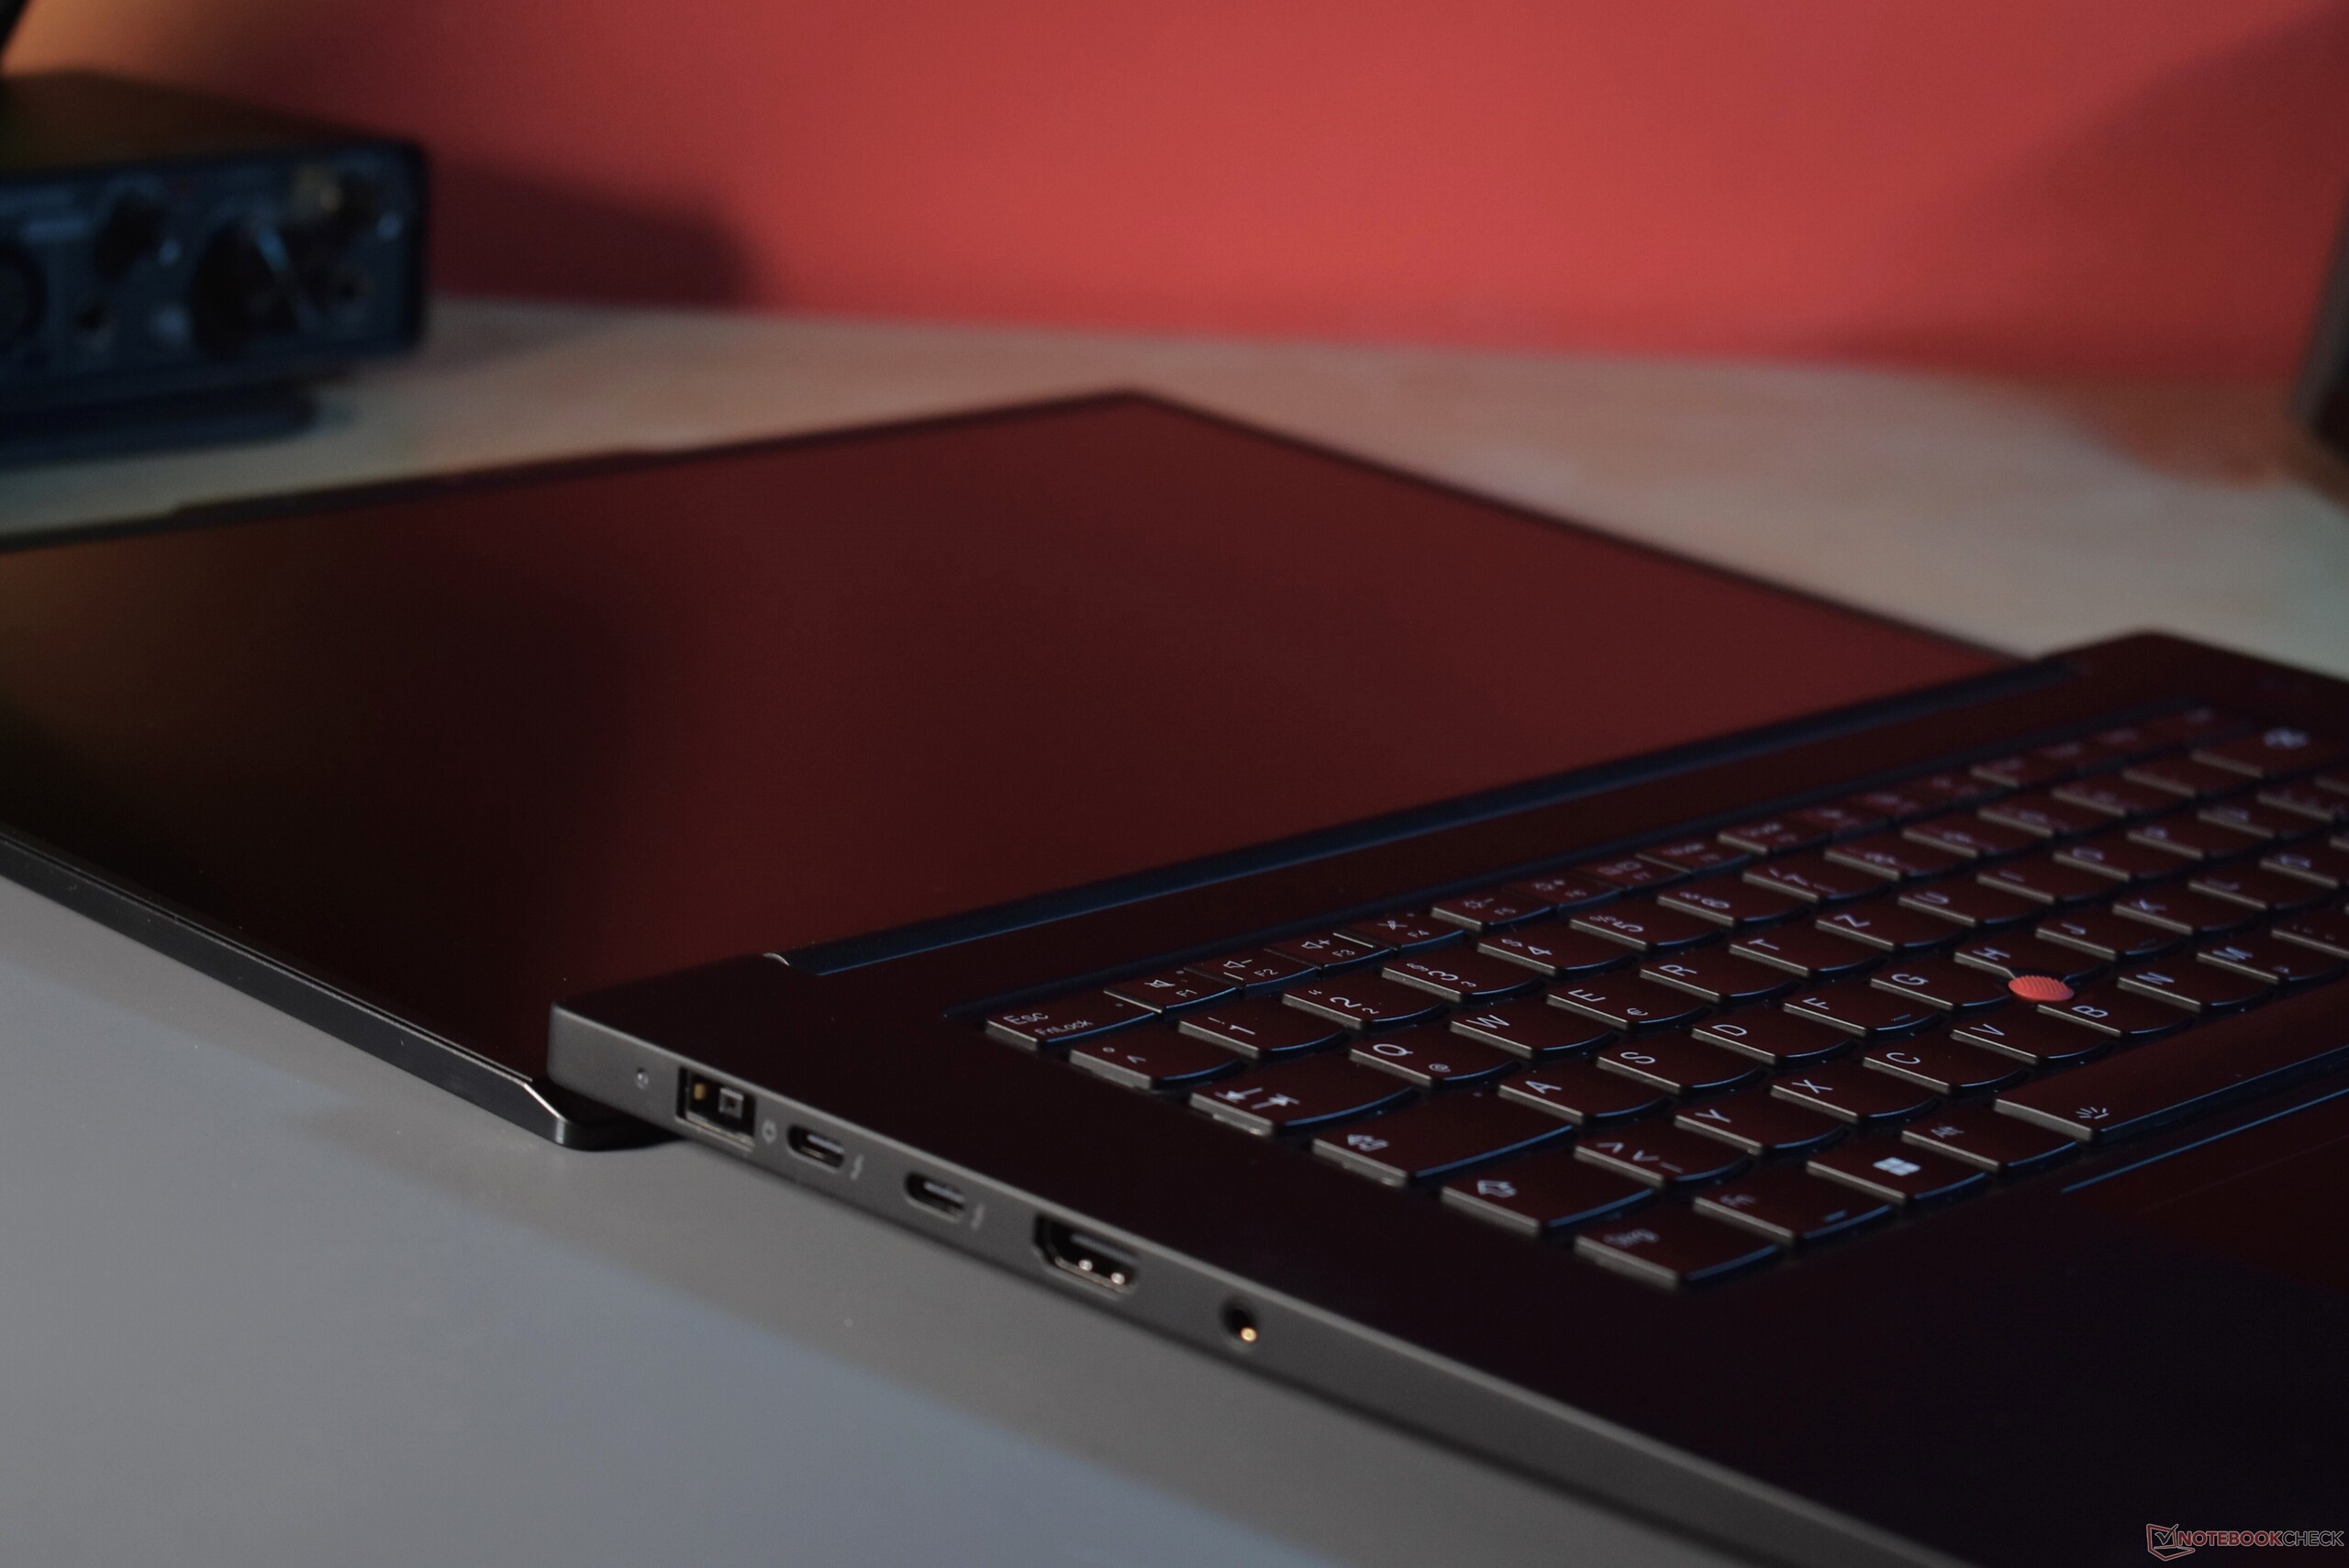
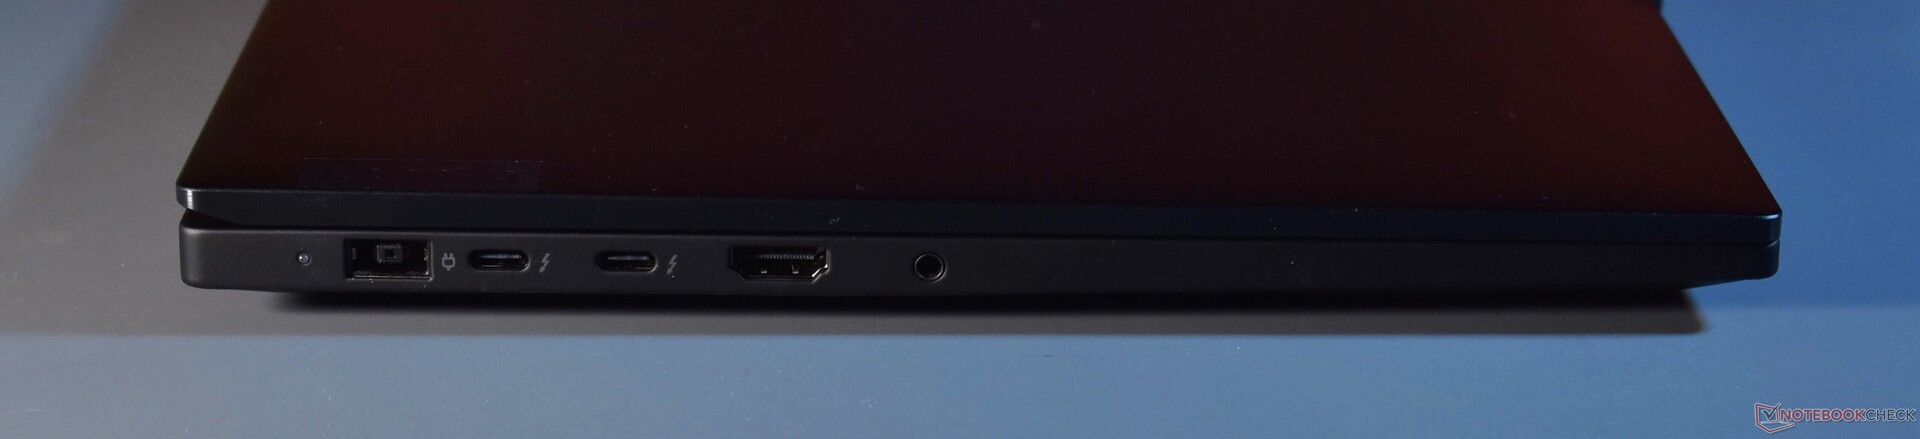
Conectividade: A Lenovo substitui o SO-DIMM pelo LPCAMM2
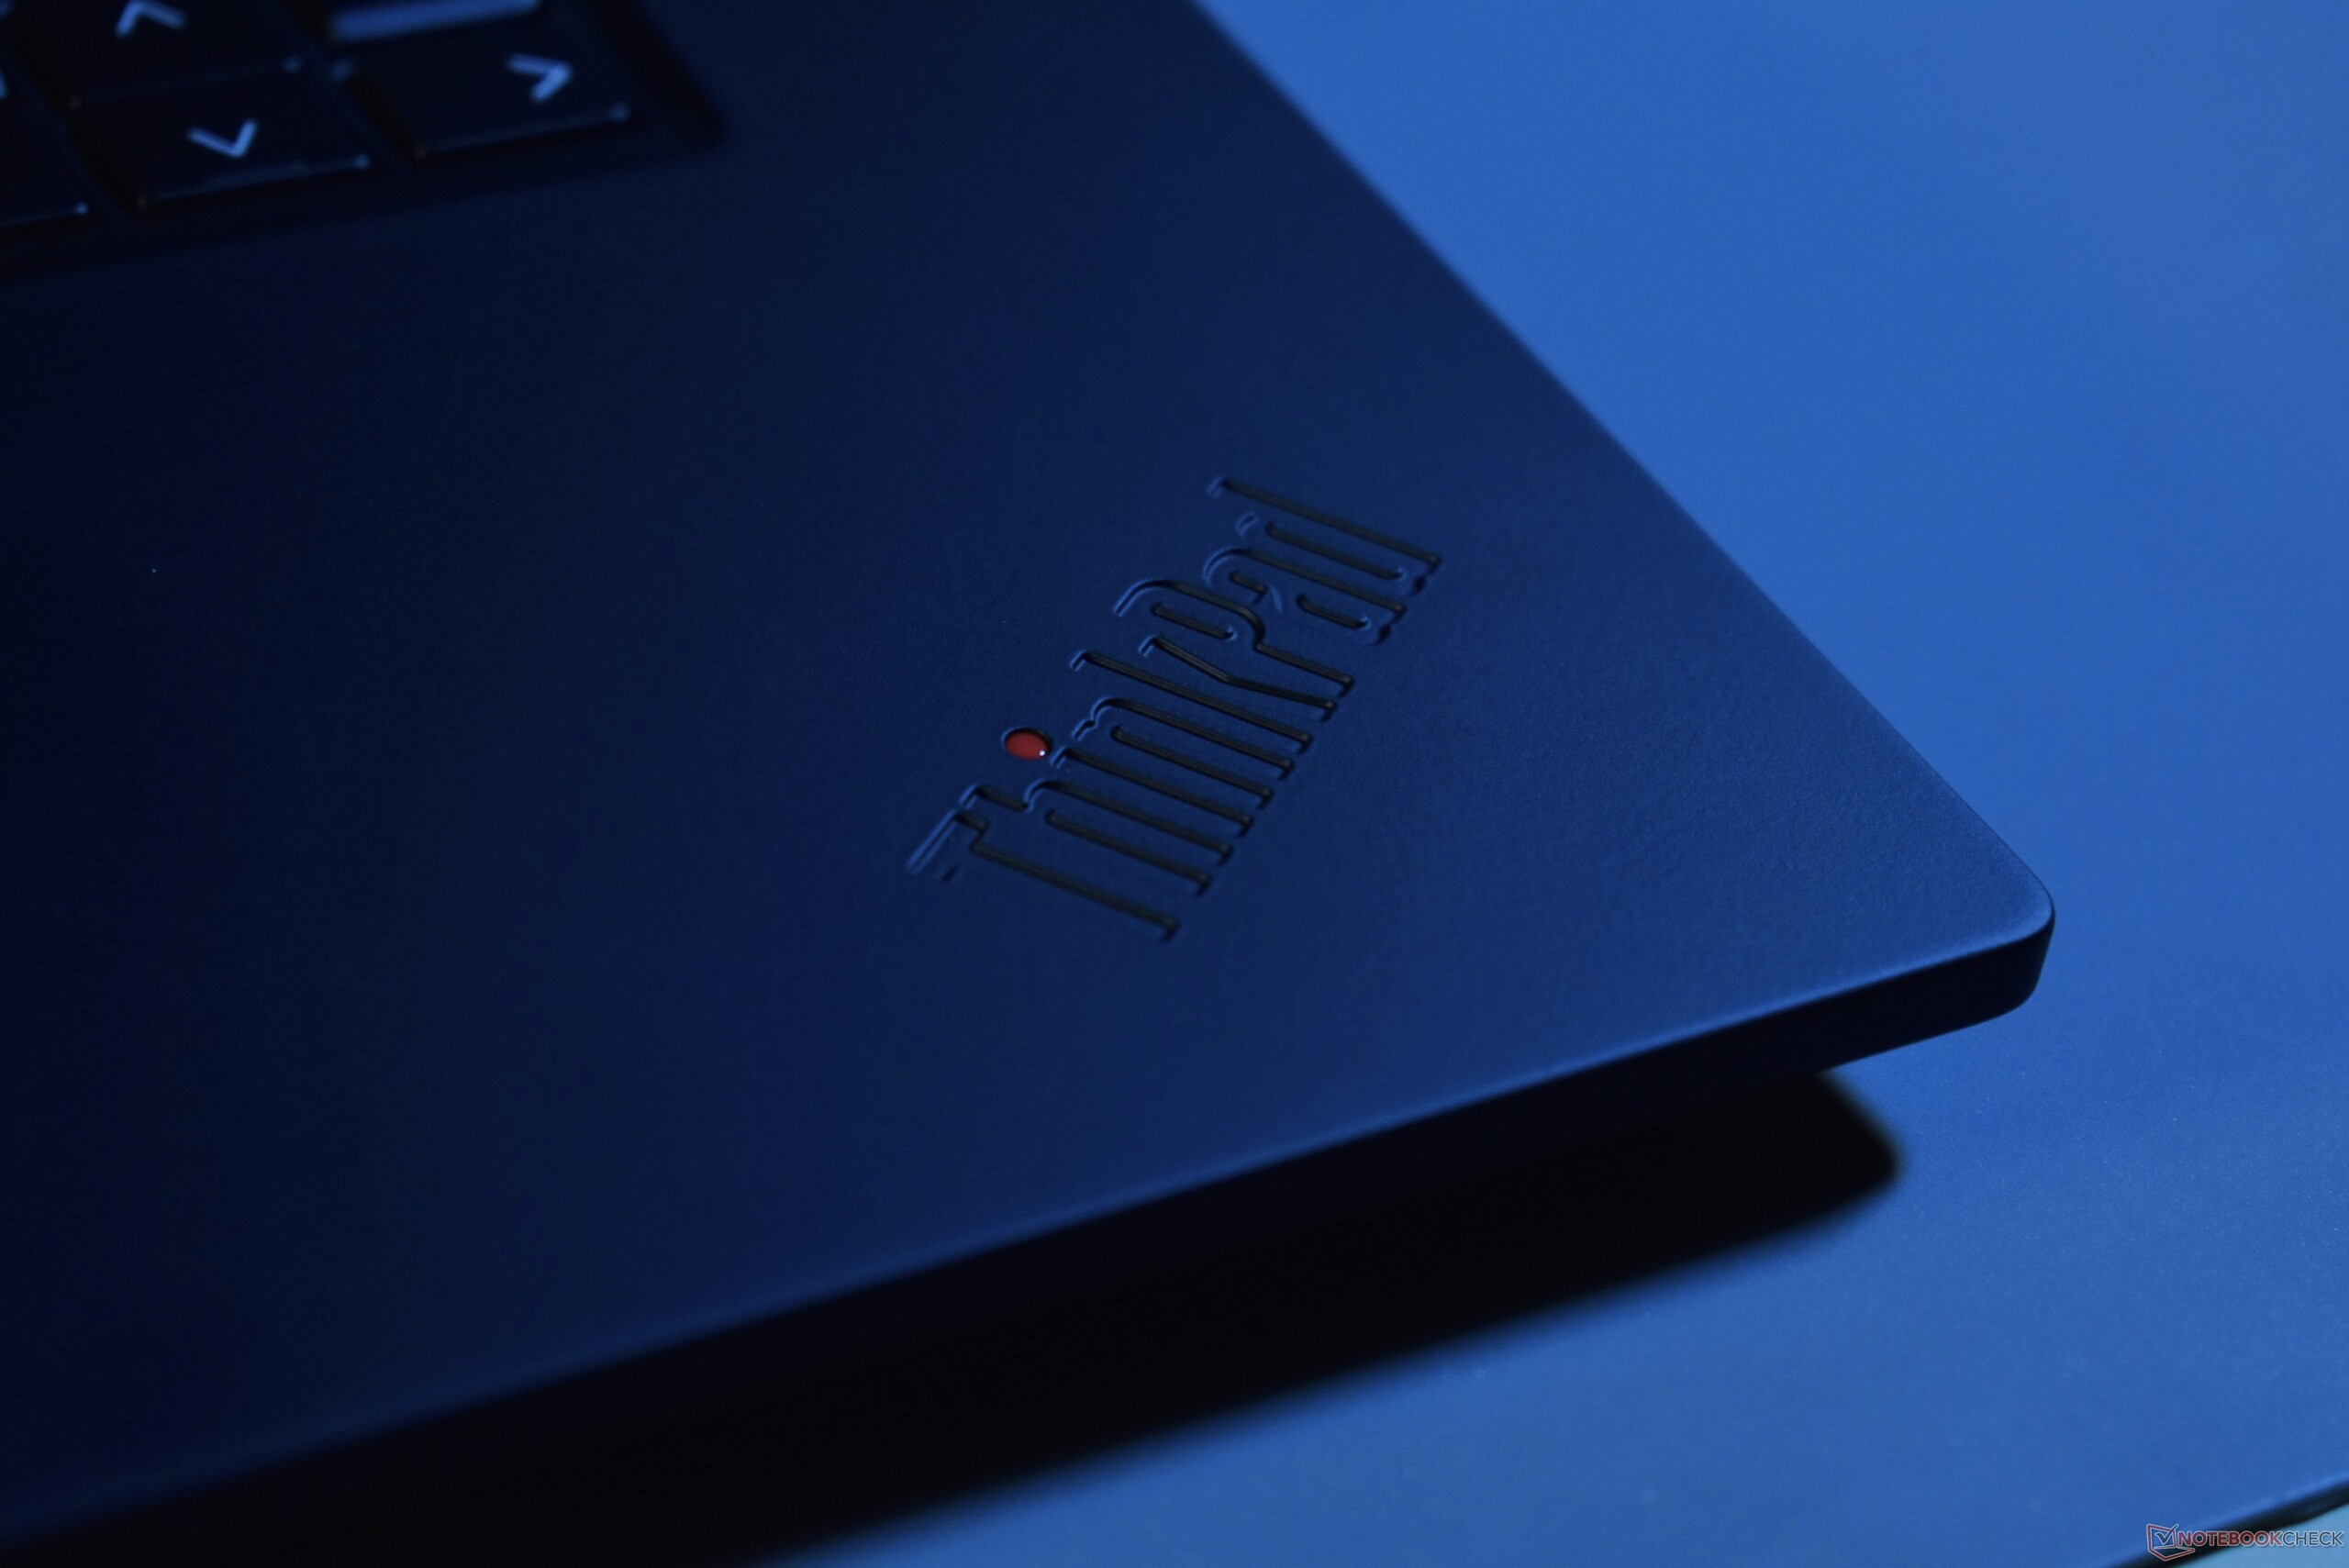
Não há nenhuma grande revolução nas portas, a Lenovo mantém muitos conectores antigos. A única mudança substancial: Uma das duas portas USB-A foi substituída por uma USB-C. Desse tipo, não há três portas, sendo que as duas à esquerda suportam Thunderbolt 4. A nova porta do lado direito é compatível com DisplayPort, pelo menos.
O carregamento é possível com cada uma das portas USB-C, embora também haja um conector de carregamento de ponta Slim dedicado. Com um carregador USB-C de 100 W, o P1 G7 funciona sem problemas. Somente sob carga máxima, o desempenho provavelmente será reduzido. Um carregador de 65 W também pode carregar o P1 - no entanto, o laptop ThinkPad reclamará disso, produzindo uma notificação de que é um "carregador lento".
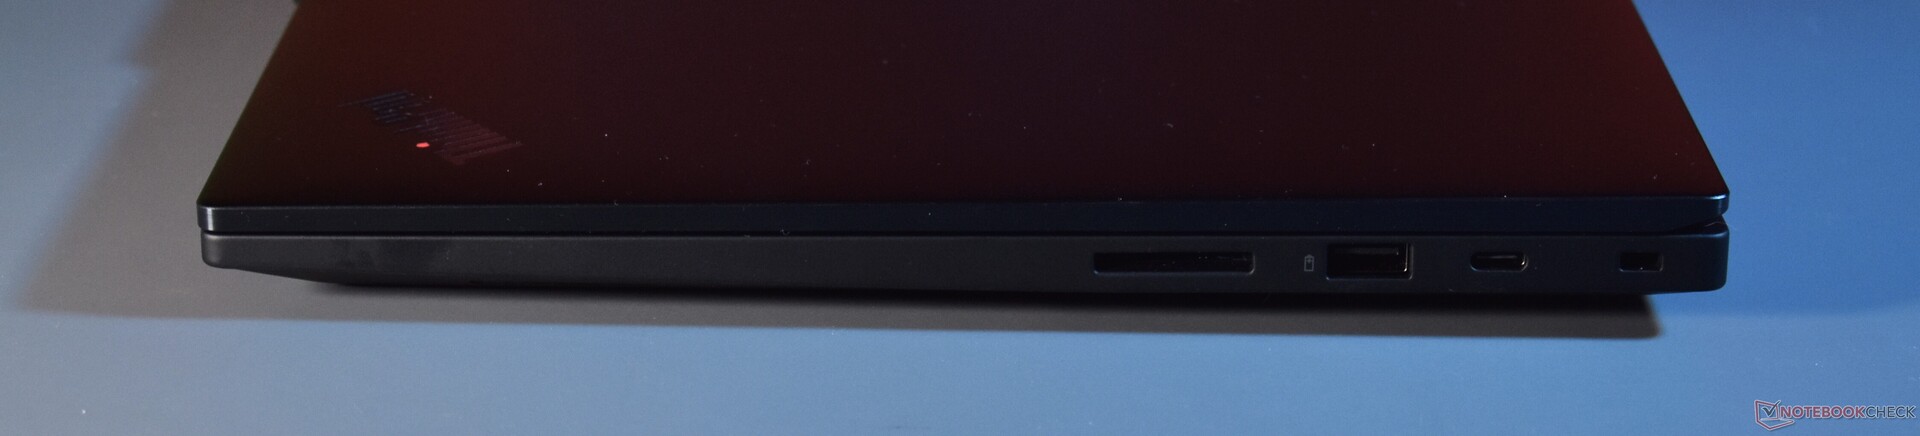
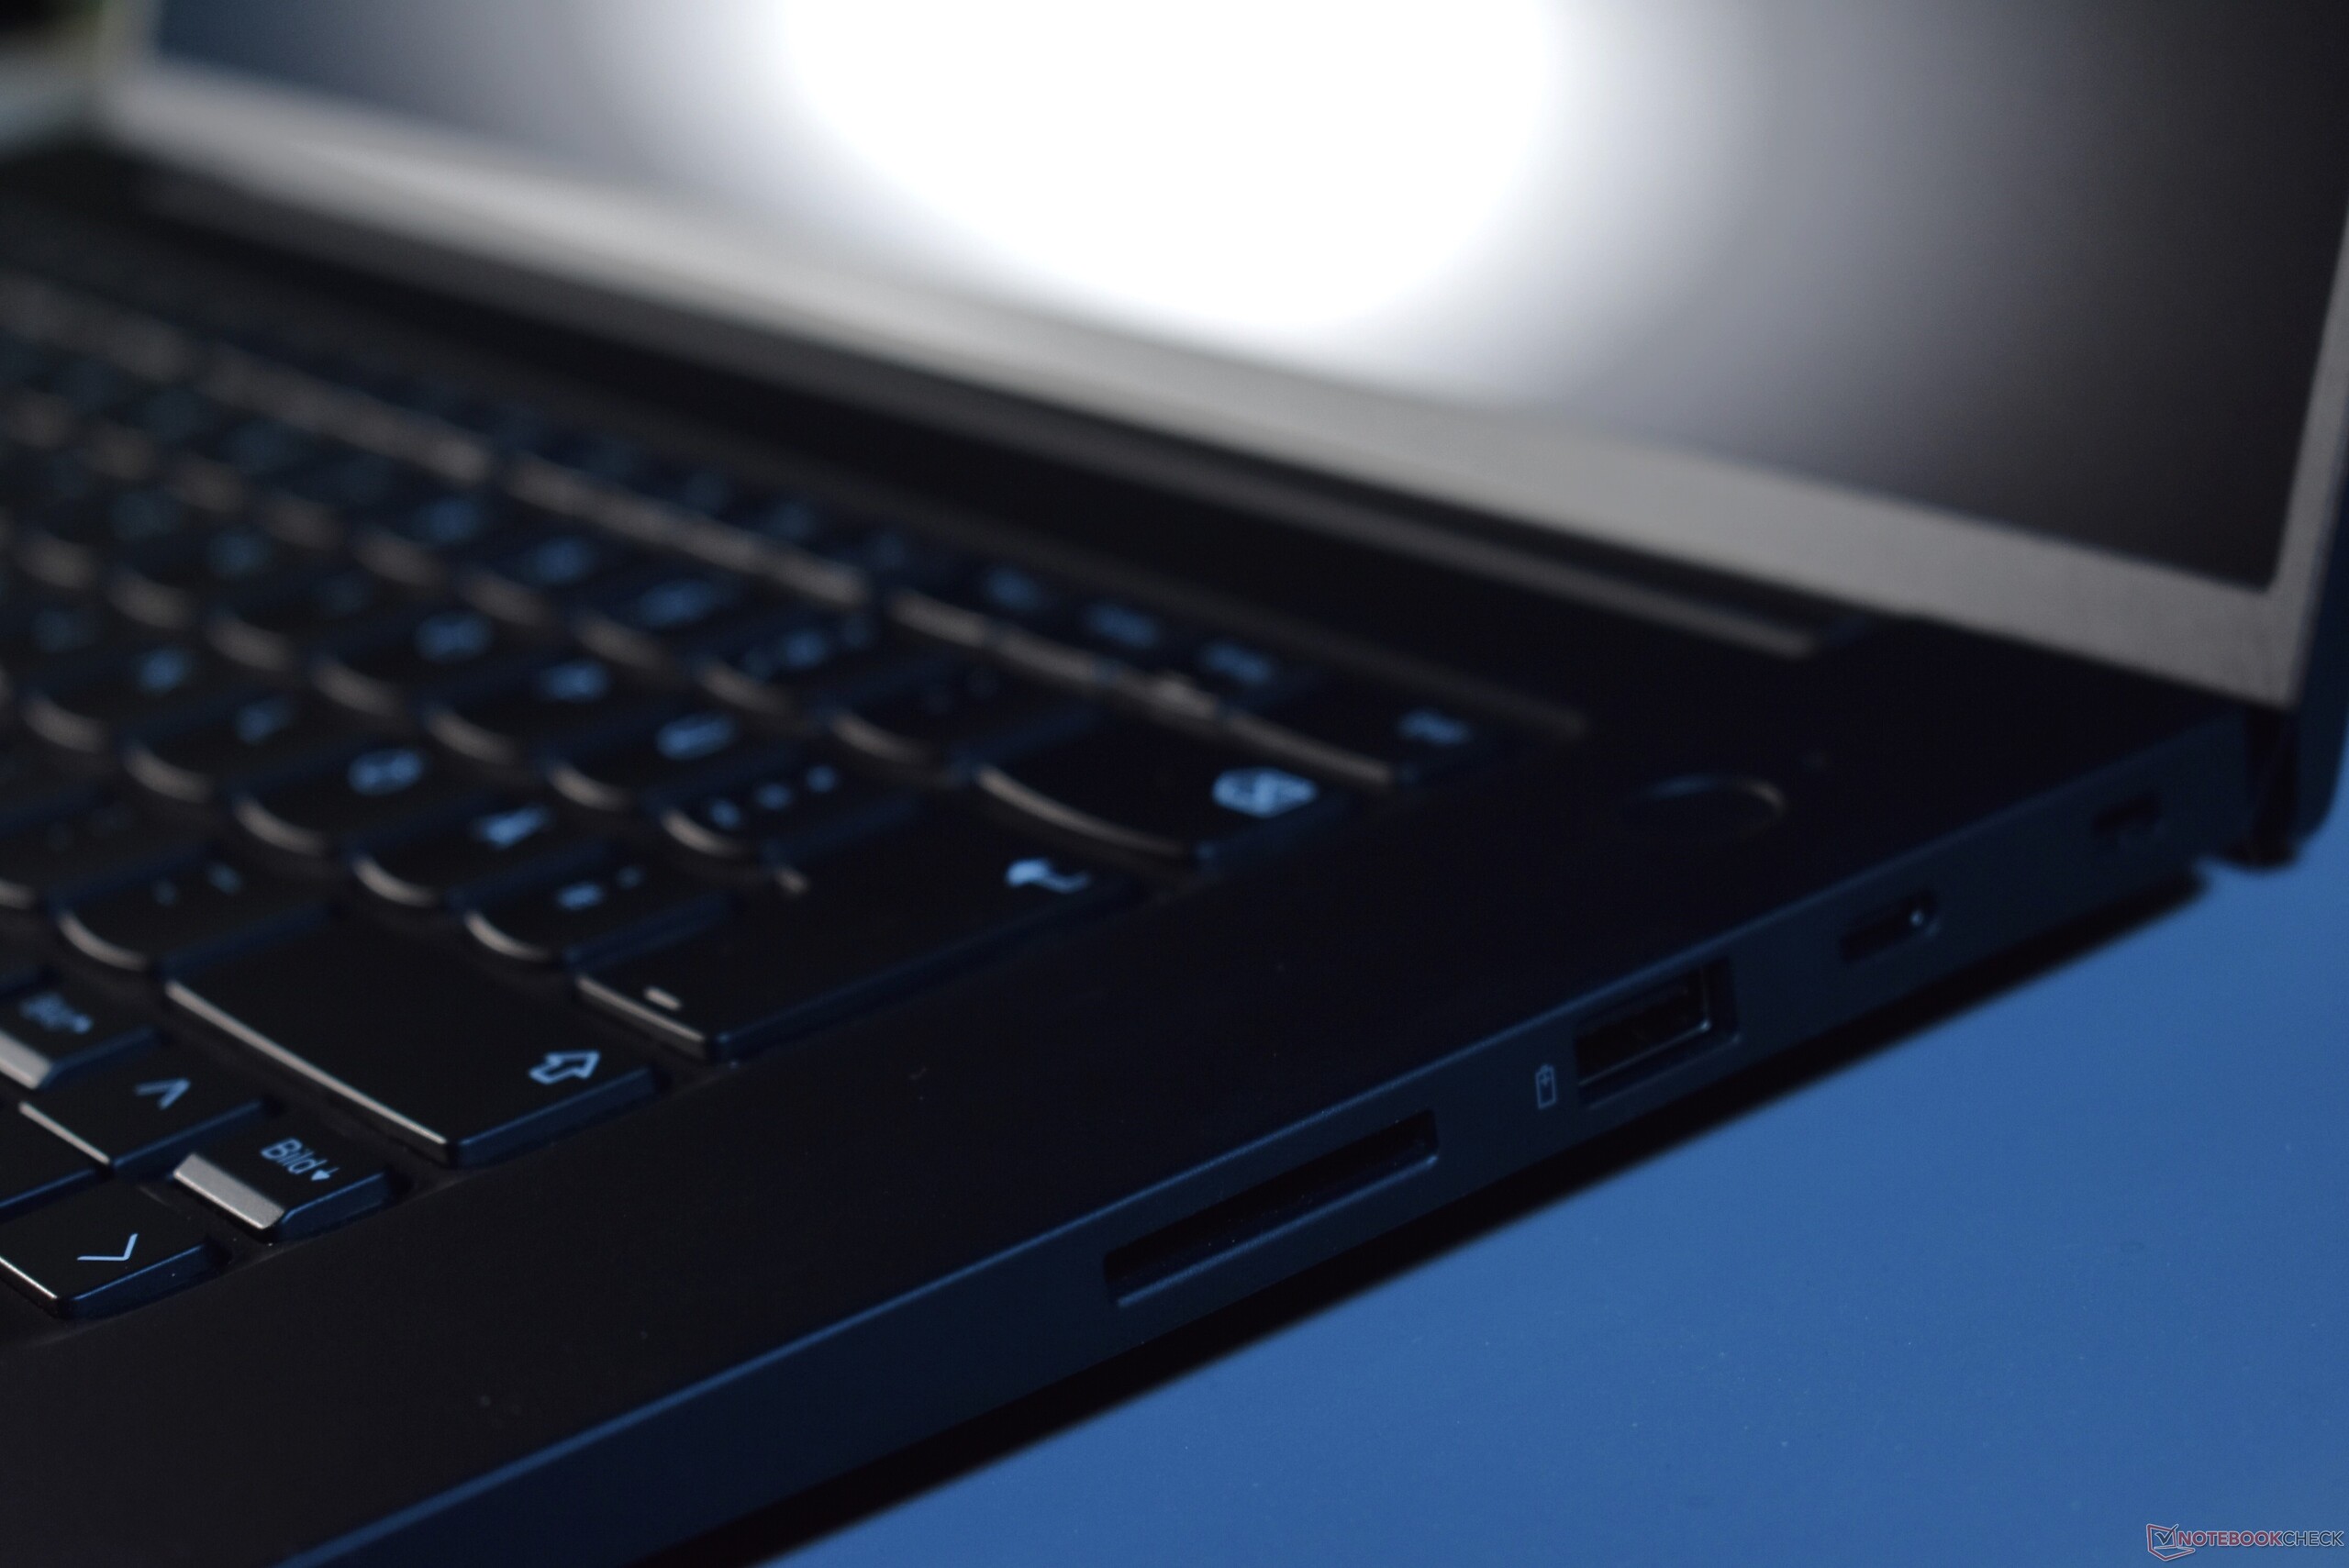
Leitor de cartão SD
Surpreendente: O leitor de cartões do Lenovo ThinkPad P1 Gen 7 pode, mais uma vez, receber cartões SD completamente, tornando-o útil para a expansão permanente do armazenamento. As taxas de transferência, que foram medidas com o cartão de referência Angelbird AV Pro V60, são um pouco decepcionantes. O leitor de cartão SD tem velocidade média.
| SD Card Reader | |
| average JPG Copy Test (av. of 3 runs) | |
| Dell XPS 16 9640 (Angelbird AV Pro V60) | |
| Média da turma Workstation (49.6 - 200, n=12, últimos 2 anos) | |
| Lenovo ThinkPad P1 G6 21FV001KUS (Toshiba Exceria Pro SDXC 64 GB UHS-II) | |
| Lenovo ThinkPad P1 Gen 7 21KV001SGE (AV Pro V60) | |
| maximum AS SSD Seq Read Test (1GB) | |
| Dell XPS 16 9640 (Angelbird AV Pro V60) | |
| Média da turma Workstation (85.1 - 227, n=12, últimos 2 anos) | |
| Lenovo ThinkPad P1 G6 21FV001KUS (Toshiba Exceria Pro SDXC 64 GB UHS-II) | |
| Lenovo ThinkPad P1 Gen 7 21KV001SGE (AV Pro V60) | |
Comunicação
O ThinkPad P1 Gen 7 está preparado para o futuro quando se trata da solução Wi-Fi. A Lenovo coloca uma solução Wi-Fi 7 da Intel, o BE200. Ela produz altas taxas de transferência.
Além do Wi-Fi, essa estação de trabalho ThinkPad oferece apenas Bluetooth 5.4. A Ethernet RJ45 não está presente, nem a WWAN. o 4G ou 5G foi descontinuado da série P1 há alguns anos, e não parece que esse recurso reaparecerá tão cedo.
Webcam
A webcam do Lenovo ThinkPad P1 Gen 7 oferece uma resolução de cinco megapixels. No modelo anterior, essa ainda era uma atualização opcional. A qualidade da webcam é comparativamente boa para um laptop, com imagens bastante nítidas com boa iluminação.


Segurança
Como se trata de um modelo empresarial, o Lenovo ThinkPad P1 Gen 7 oferece a maioria das funções de segurança que os modelos padrão para tarefas de escritório, como a série T, oferecem. Entre esses recursos, encontramos um slot de bloqueio Kensington, um leitor de impressões digitais no botão de energia, bem como um chip dTPM, uma detecção de violação na parte inferior da tampa da base e uma câmera infravermelha para o Windows Hello. Diferente do ThinkPad Z16, a Lenovo oferece ao ThinkPad P1 G7 um obturador físico da câmera para aumentar a privacidade. Não faz parte do pacote um leitor de cartões inteligentes.
Acessórios
A Lenovo diminui um pouco o nível quando se trata do carregador. Em vez de um de 230 W, o P1 G7 inclui apenas um carregador de 170 W, que é mais leve e compacto. Ele ainda é um carregador proprietário com um conector de ponta fina, mas o carregamento USB-C com até 100 W também é possível aqui.
Manutenção
A Lenovo facilita o acesso à parte interna do ThinkPad, pois os seis parafusos que prendem a tampa inferior são fixos, evitando que se percam. Os parafusos usam o padrão de cabeça Philips - não são necessárias ferramentas especiais. Quando os parafusos estiverem soltos, a base poderá ser aberta, começando pela parte de trás, em torno das dobradiças. Os clipes praticamente se abrem sozinhos aqui.
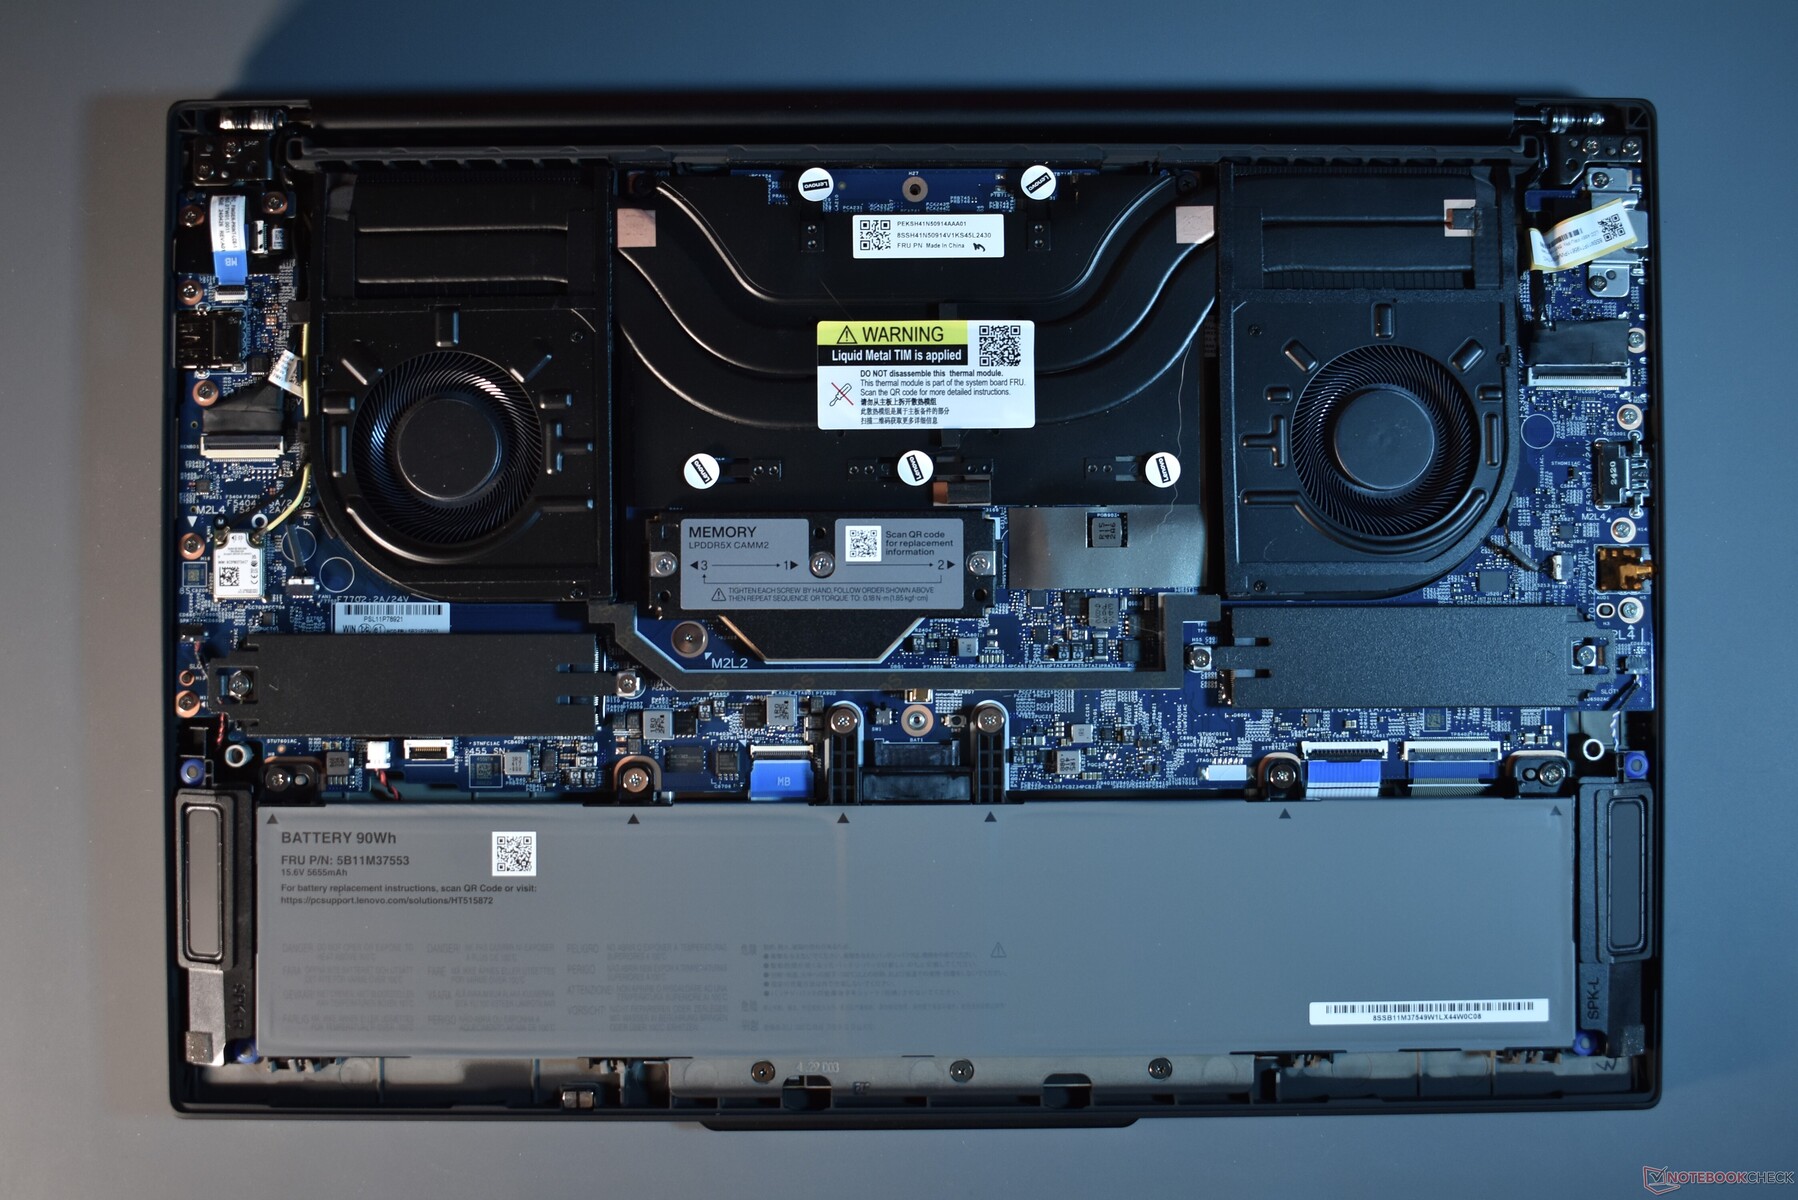
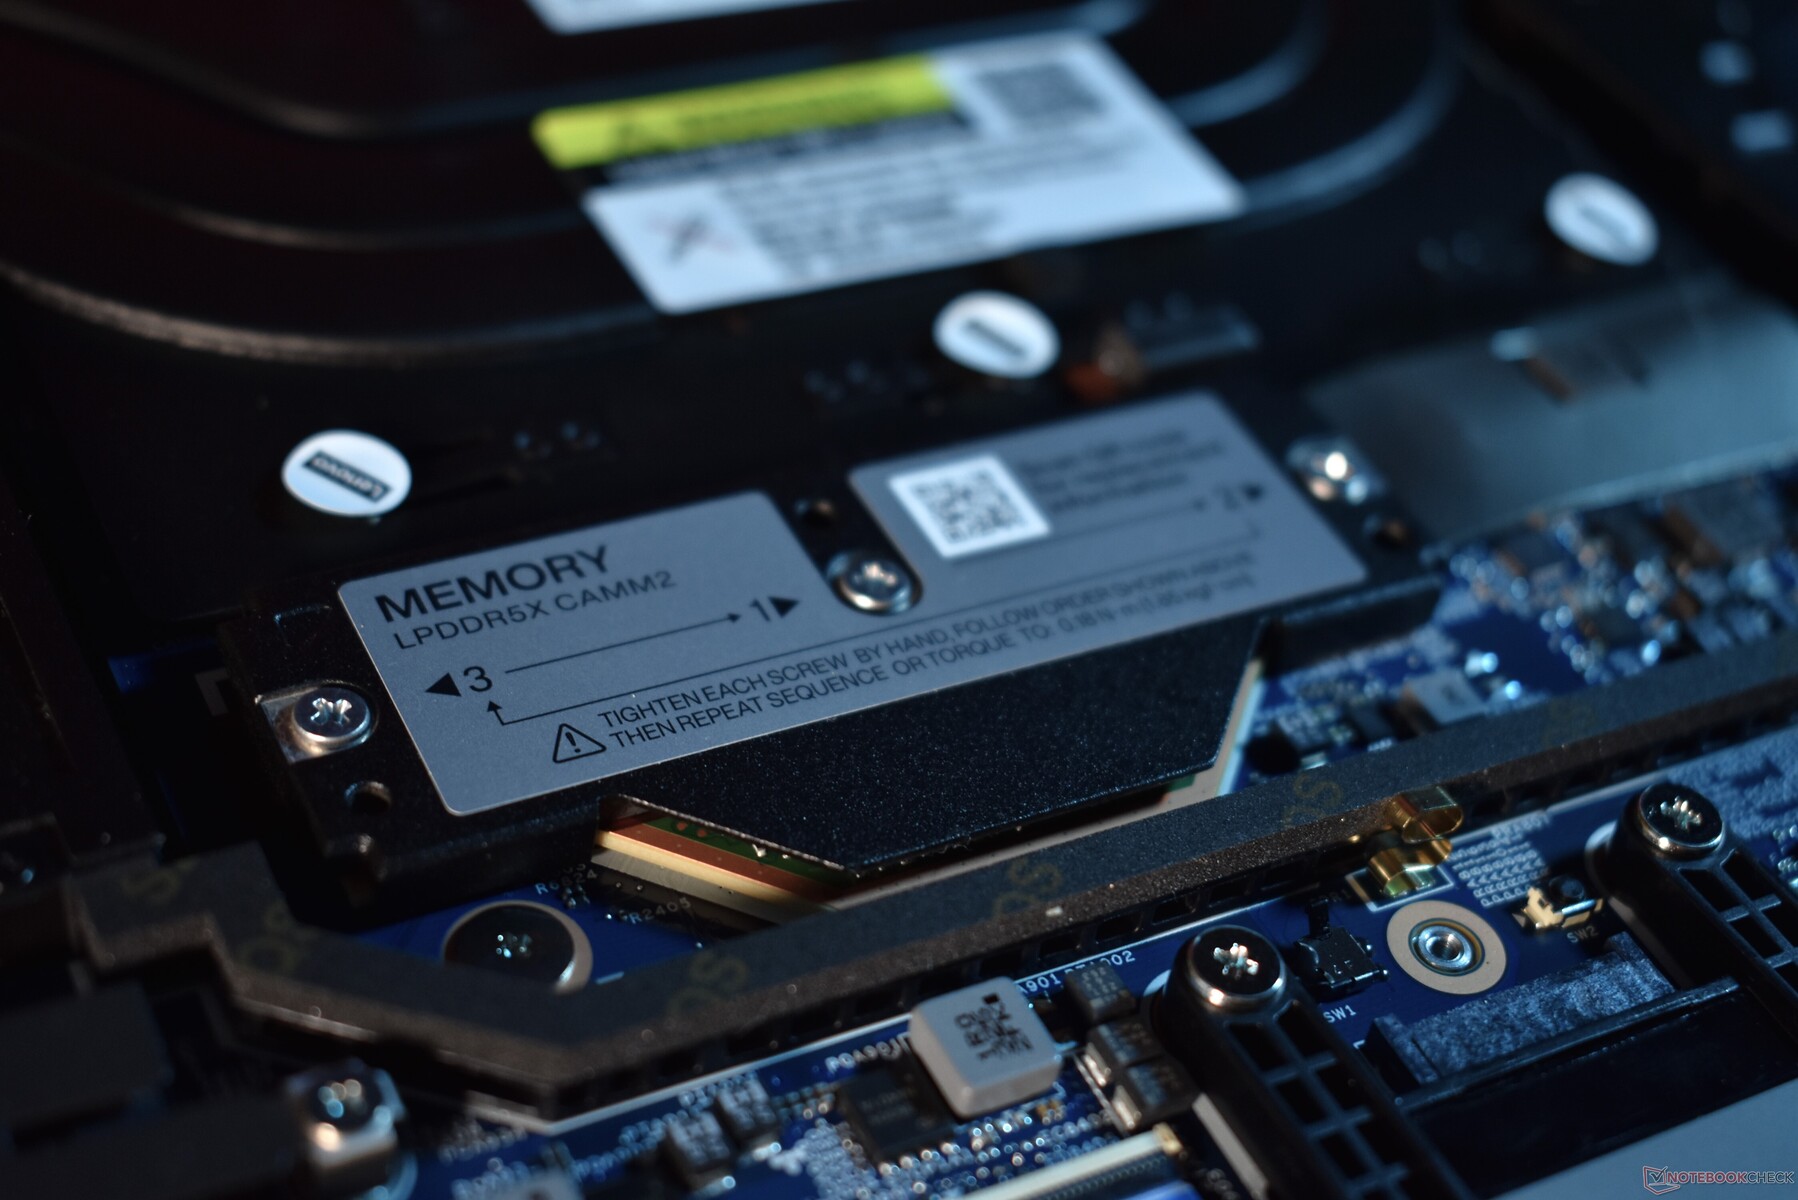
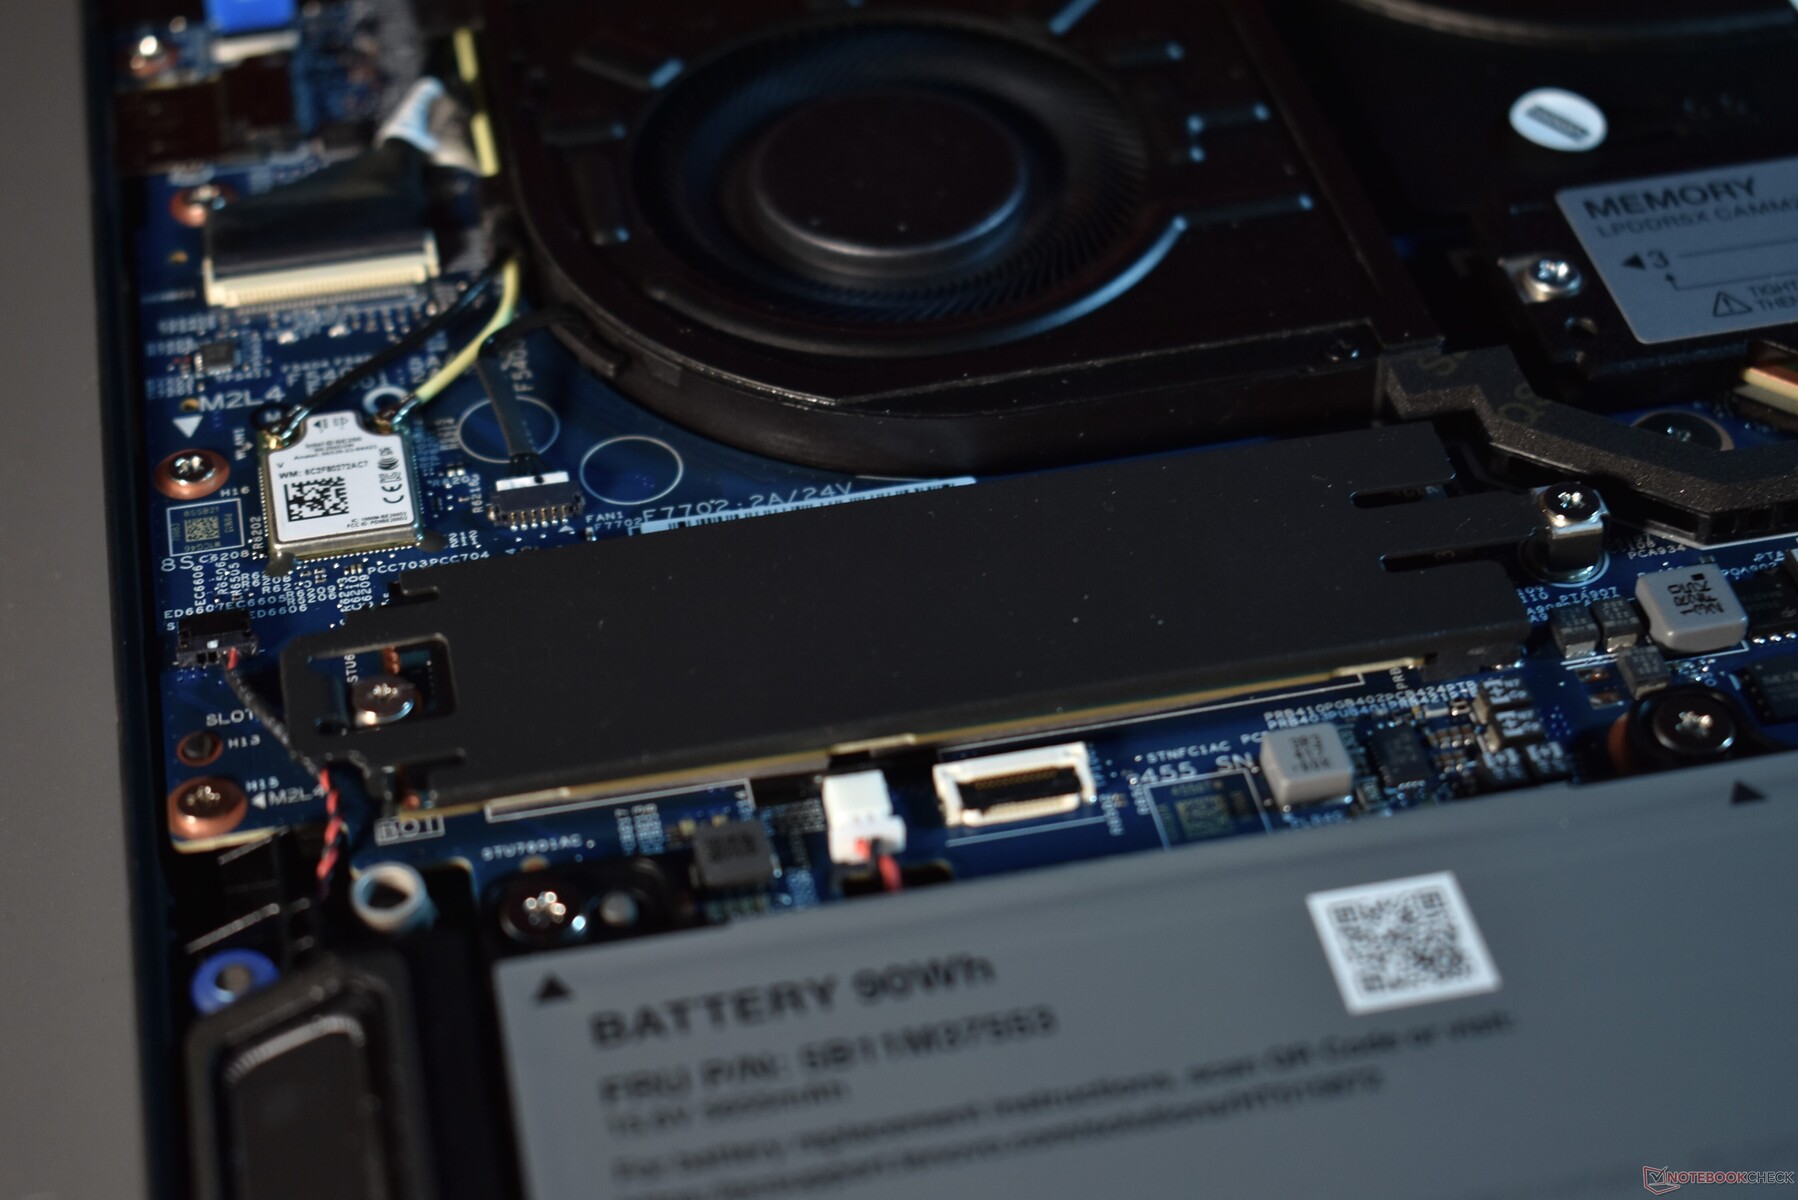
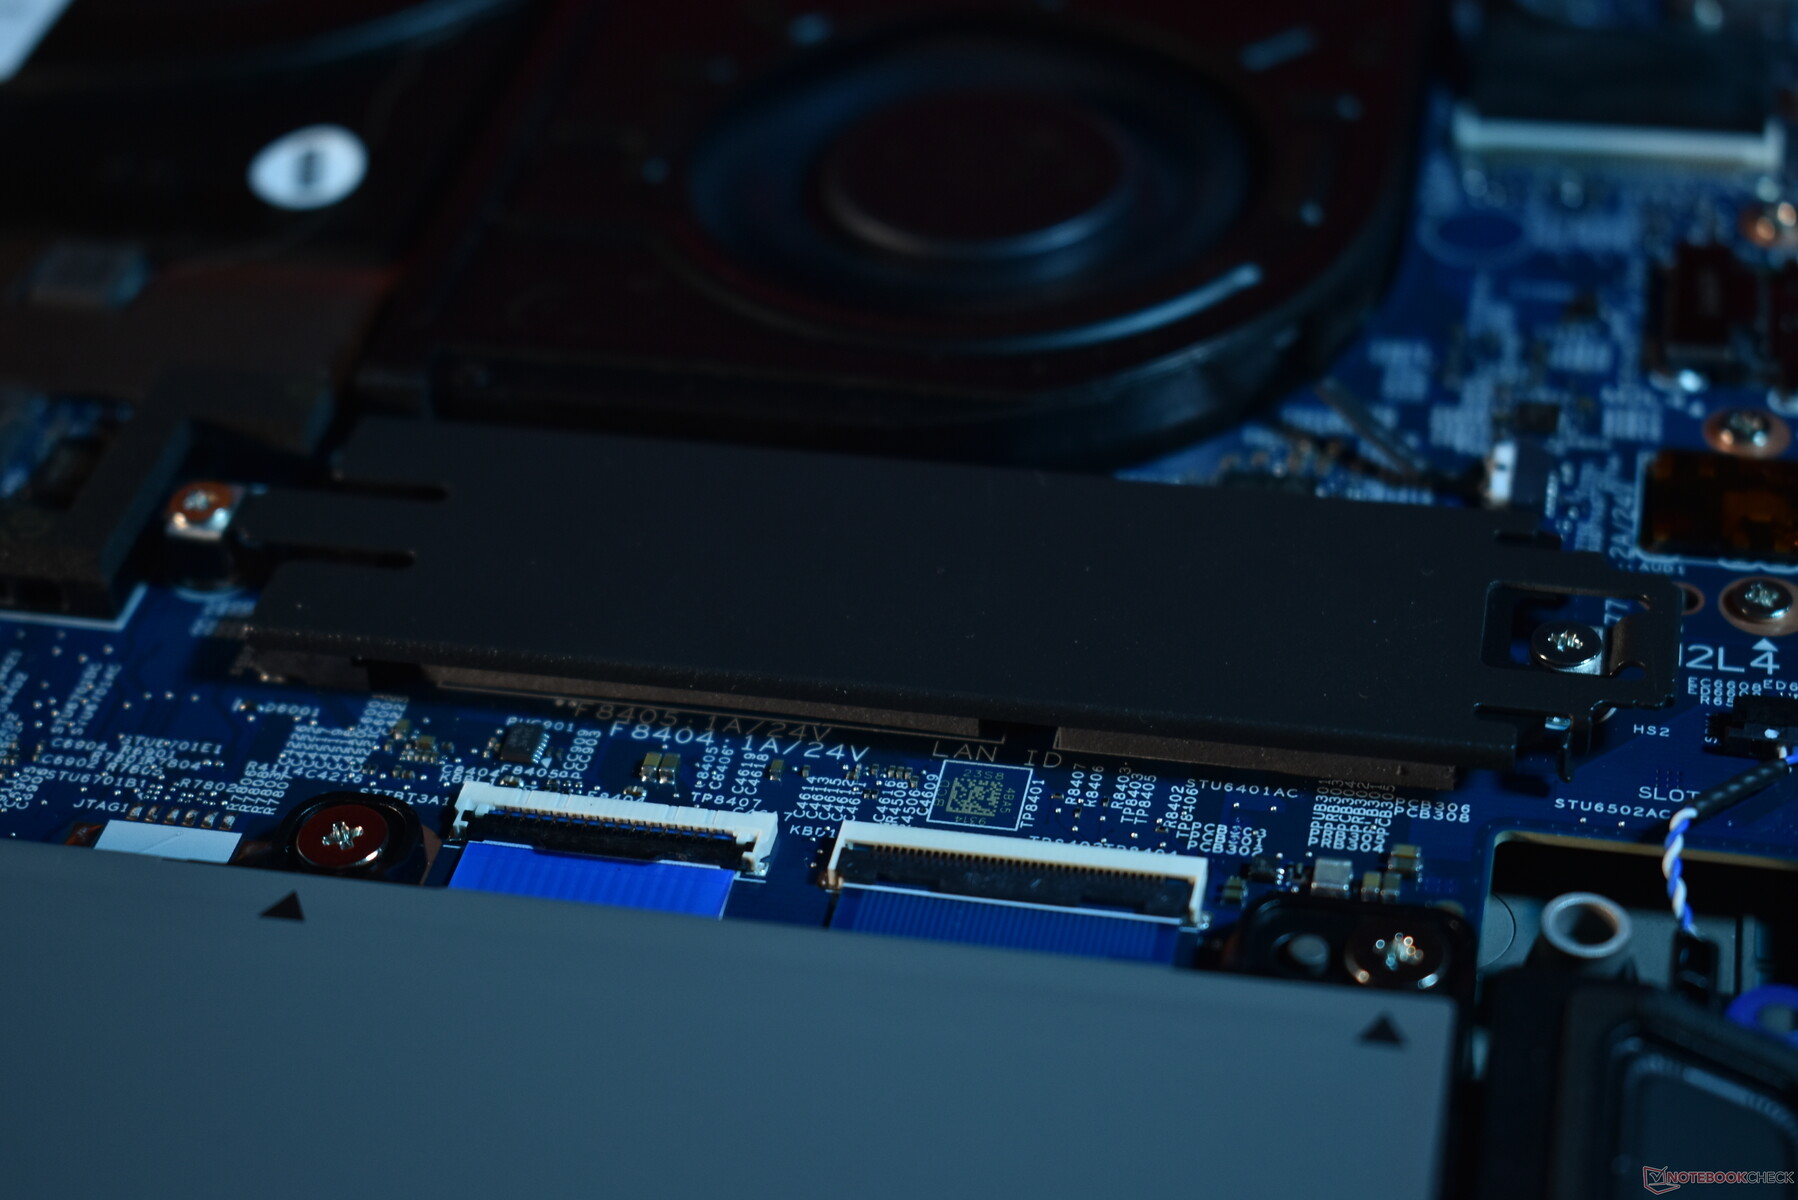
A Lenovo redesenhou completamente os componentes internos. O sistema de resfriamento é um pouco menor que o do antecessor ThinkPad P1 Gen 6. Como ganho, o ThinkPad P1 Gen 7 sempre tem dois slots M.2 2280, o que era apenas o caso das variantes mais fracas do P1 Gen 6. Além disso, os dois slots SO-DIMM não se encontram em nenhum lugar. Em vez disso, a Lenovo coloca um único módulo LPCAMM2 - o Lenovo ThinkPad P1 Gen 7 é o primeiro portátil com esse tipo de memória. O módulo único carrega a memória de baixo consumo, que vem em tamanhos de 16, 32 e 64 GB. O antecessor com memória DDR5 mais ineficiente oferecia até 96 GB, embora os módulos SO-DIMM também ocupassem muito mais espaço. Para remover a memória LPCAMM2, é necessário soltar três parafusos. Um guia sobre como fazer isso está disponível por meio do código QR no módulo de memória.
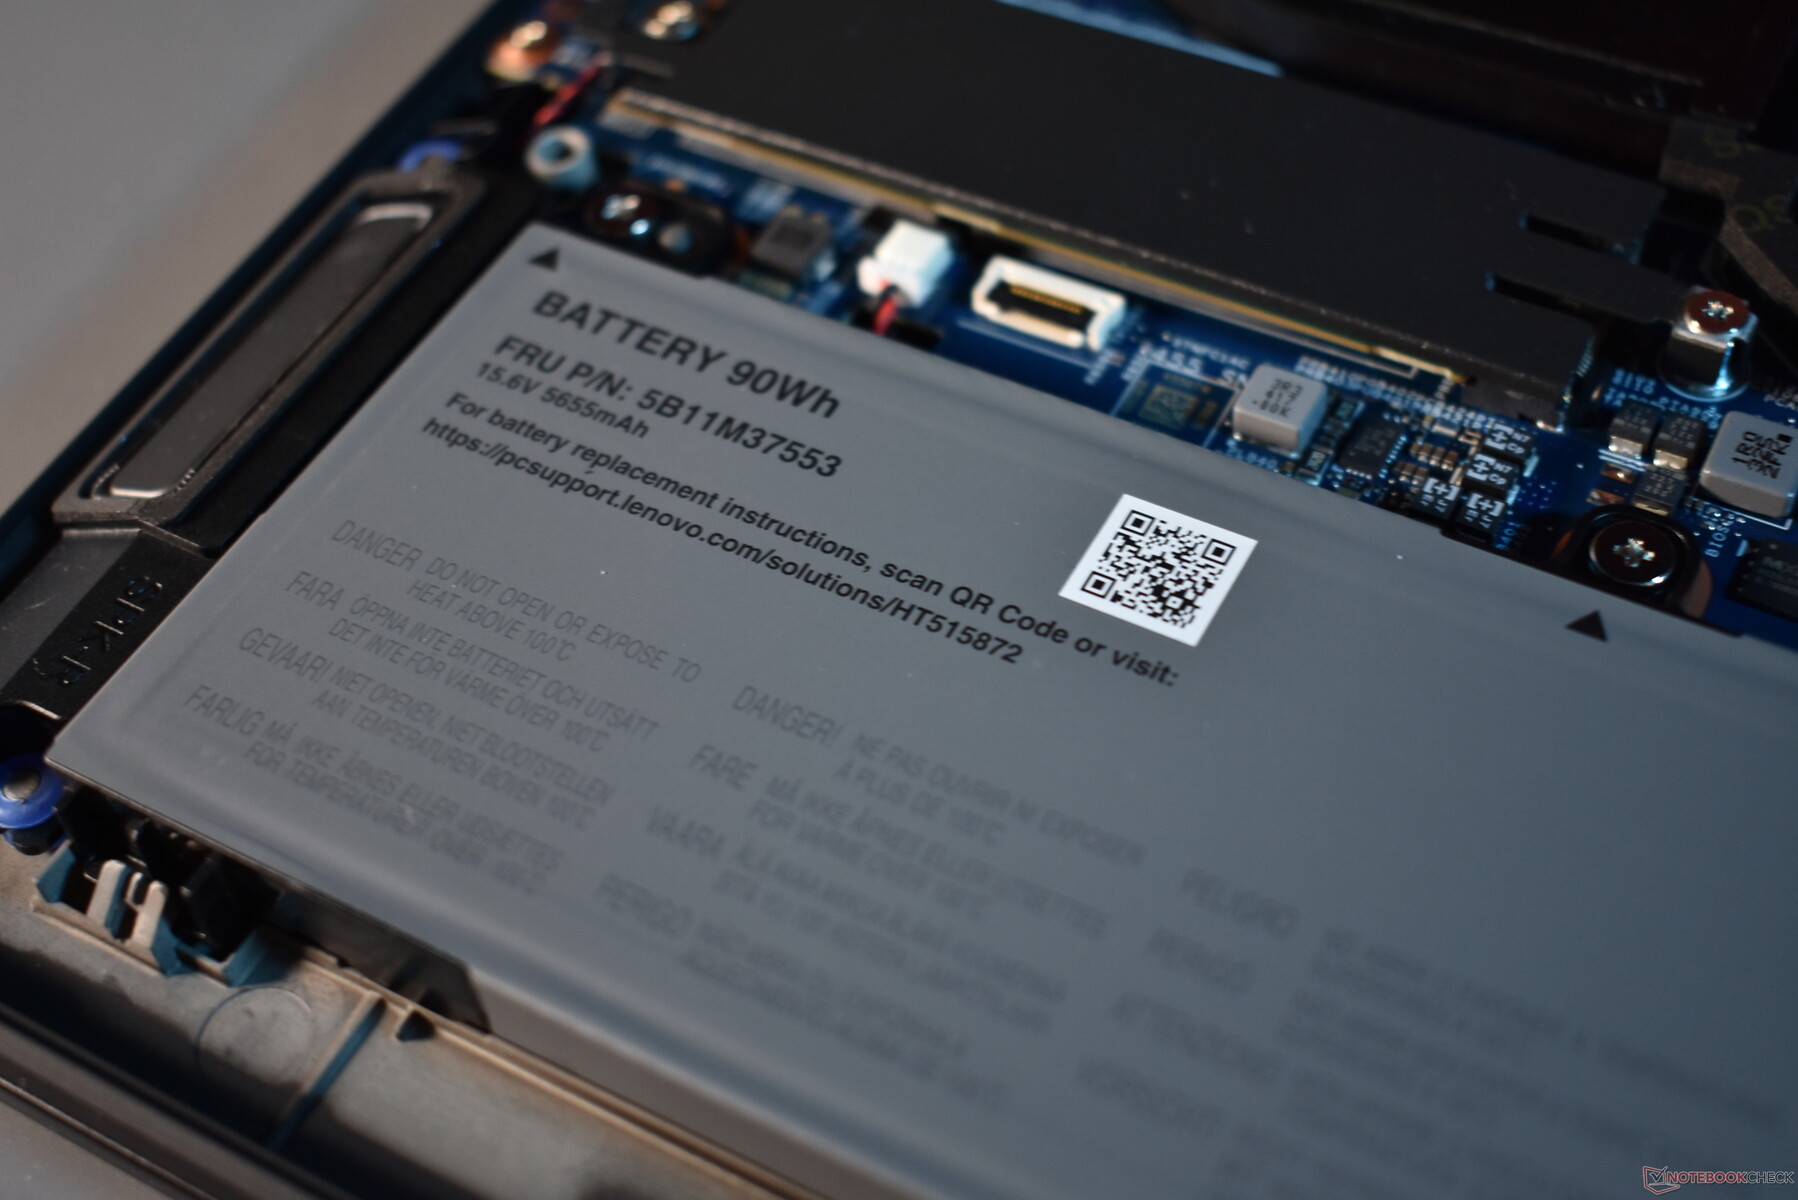
O módulo Wi-Fi está soldado. A WWAN não está presente na linha P1 há algum tempo, portanto não há slot M.2 adicional para isso. É muito fácil trocar a bateria, a Lenovo eliminou o conector de cabo. Em vez disso, a bateria simplesmente se conecta diretamente. Obviamente, ainda é fixada com parafusos. Também há um código QR para um manual aqui. Pela primeira vez com a linha P1, a bateria pode ser trocada pelo usuário inclusive durante o período de garantia, já que agora é uma Unidade Substituível pelo Cliente (CRU).
O teclado não é facilmente substituível, pois toda a unidade básica precisa ser substituída para trocar o teclado. Além disso, o sistema de resfriamento não é mais facilmente acessível - a Lenovo adverte os clientes a não desmontá-lo, devido ao uso de pasta de resfriamento de metal líquido.
Sustentabilidade
A maioria dos notebooks ThinkPad da geração 2024 usa materiais reciclados para partes de sua estrutura externa. Esse não é o caso do ThinkPad P1 Gen 7, apenas algumas peças de plástico, como as teclas, são recicladas. Pelo menos a embalagem do laptop ThinkPad é totalmente compostável. A Lenovo oferece um máximo de cinco anos de garantia, portanto, há também cinco anos de atualizações de software e suporte para peças de reposição. O valor de produção de CO₂ para o ThinkPad P1 G7 é de 214 kg/CO₂ equivalente.
Garantia
Conforme mencionado na seção de sustentabilidade, a garantia máxima chega a cinco anos. Nossa unidade já vem com três anos de serviço padrão no local. Internacionalmente, são três anos de garantia de entrega.
Dispositivos de entrada: Botões TrackPoint integrados bem realizados pela primeira vez
Teclado
A Lenovo reformulou o teclado com luz de fundo de dois níveis do ThinkPad P1 Gen 7 em muitos aspectos.
A distância de deslocamento ainda é a mesma, 1,5 mm. O design das teclas também permanece, mas a Lenovo muda as teclas externas do design em forma de sorriso para um retangular - algo que fizeram na maioria dos ThinkPads há algum tempo. O mesmo acontece com a segunda mudança: A Lenovo usa um teclado um pouco menor pela primeira vez no ThinkPad P1. O novo teclado tem cerca de um centímetro a menos de largura. Isso parece estranho, pois há muito espaço no ThinkPad P1. No entanto, o ThinkPad P1 Gen 6 foi o último notebook ThinkPad da linha com a largura padrão antiga. No final, o argumento do custo foi provavelmente decisivo, pois a fabricação de componentes de hardware especializados tende a ser cara. Ao usar um layout menor, como nos modelos ThinkPad de 14 polegadas, a Lenovo pode compartilhar peças entre as linhas.
Para os usuários europeus com o layout ISO, o novo teclado é irritante, pois as teclas importantes, como os tremas alemães Ü e Ä, são menores - no layout americano do tipo ANSI, com a tecla Enter menor, isso é menos problemático. Outros novos recursos afetam todos os ThinkPads 2024, como as teclas FN/Ctrl trocadas, a tecla Copilot em vez de PrtScr e os marcadores hápticos em teclas importantes como Enter ou as teclas de volume.
No geral, o teclado é excelente. A força de atuação é um pouco maior do que a de outros notebooks ThinkPad, mas gostamos disso. A digitação nesse teclado é quase tão confortável quanto nos ThinkPads mais antigos, apesar da menor distância de deslocamento. Com esse teclado, digitar durante horas é fácil e sem esforço.

Touchpad e TrackPoint
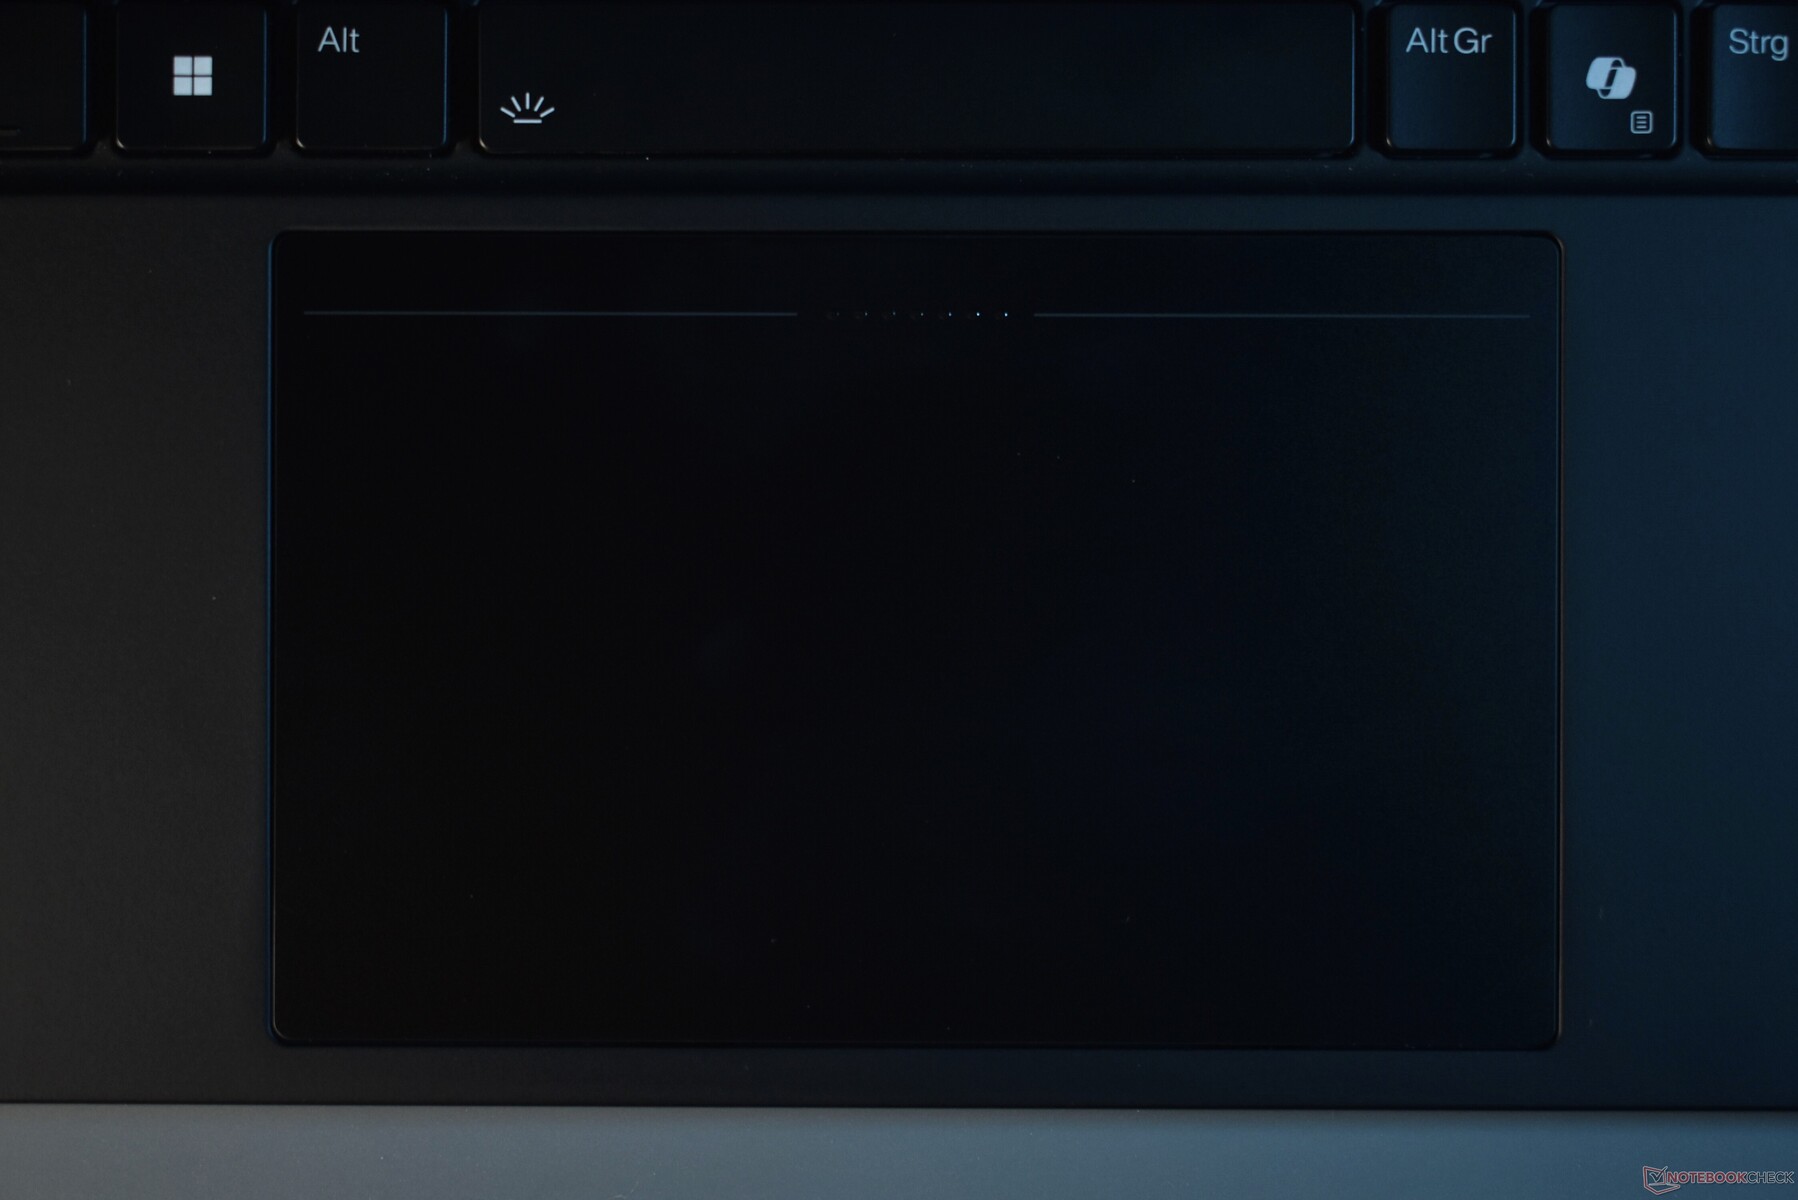
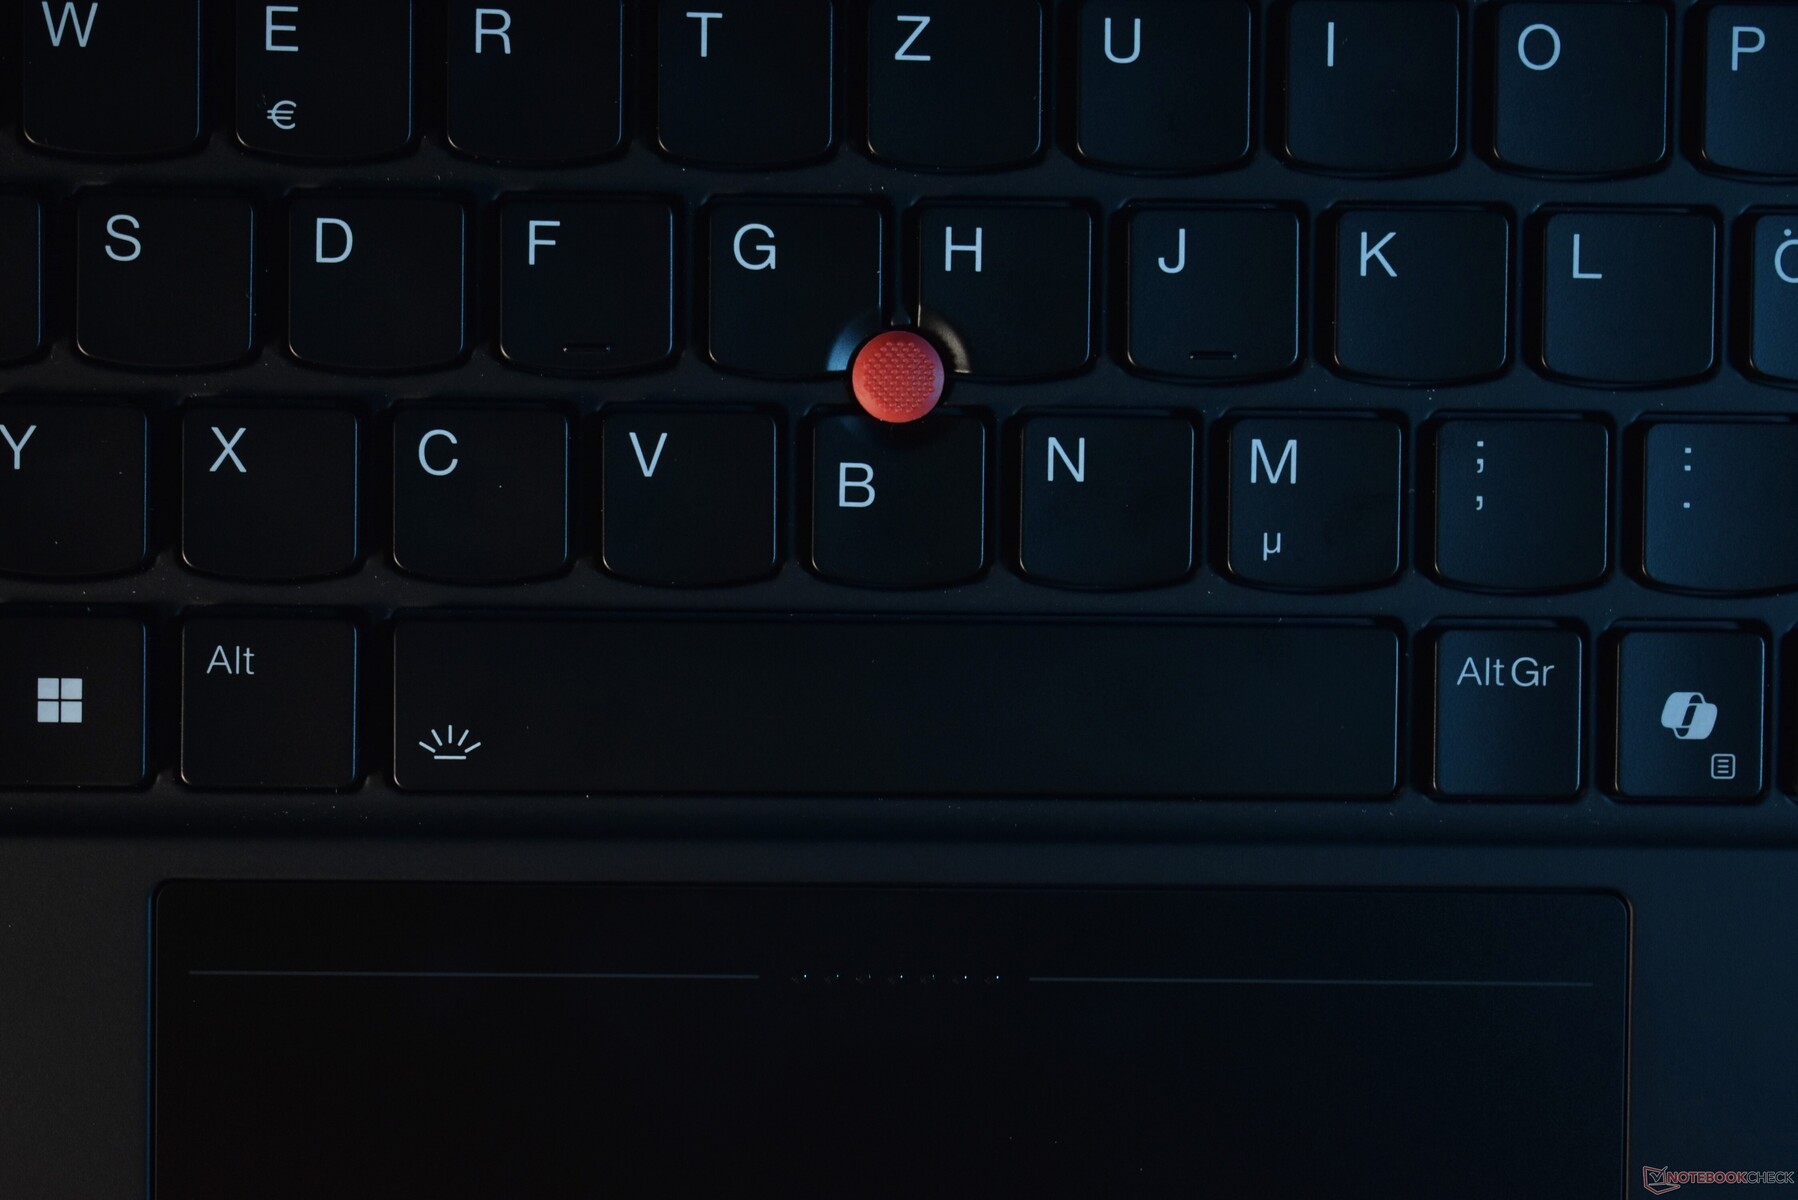
O touchpad é a área em que a Lenovo mais claramente se inspirou no ThinkPad Z16. Em vez da combinação de botões TrackPoint físicos e um clickpad mecânico, como é habitual no ThinkPad P1, a Lenovo coloca um trackpad háptico no ThinkPad P1 Gen 7, fabricado pela Sensel. Integradas na superfície estão as zonas de clique para o ThinkPad TrackPoint - o P1 Gen 7 agora tem botões TrackPoint integrados.
Esse novo design permite que a Lenovo aumente o tamanho do touchpad sem sacrificar completamente a função TrackPoint. Com um tamanho de 13,5 x 8,5 cm, é o maior trackpad da recente geração do ThinkPad. A superfície é de vidro fosco e, como se trata de um clickpad háptico, é possível clicar nele em qualquer lugar. A força do clique pode ser diminuída ou aumentada nas configurações do Windows. O efeito háptico também pode ser completamente desativado. O trackpad é excelente em todos os aspectos entre os ThinkPads, atuando na mais alta liga do mercado de laptops em geral.
Se o TrackPoint vermelho for usado para direcionar o ponteiro do mouse, a parte superior do touchpad substitui os botões dedicados do mouse. Como não há botões separados, os pequenos pontos do botão do meio devem ser usados para orientação. Essa solução ainda não é 100% tão boa quanto os botões dedicados, mas está quase lá. Em comparação com a versão anterior da primeira geração da série ThinkPad Z, o feedback tátil é muito mais suave, tornando-o mais agradável de usar. O sensor de força também funciona muito bem, com raros erros de clique. Observamos apenas um problema: às vezes, o touchpad tende a congelar quando usado com o TrackPoint e quando uma mão repousa sobre a superfície do touchpad. A Sensel nos prometeu que uma atualização de firmware corrigirá esse problema no futuro.
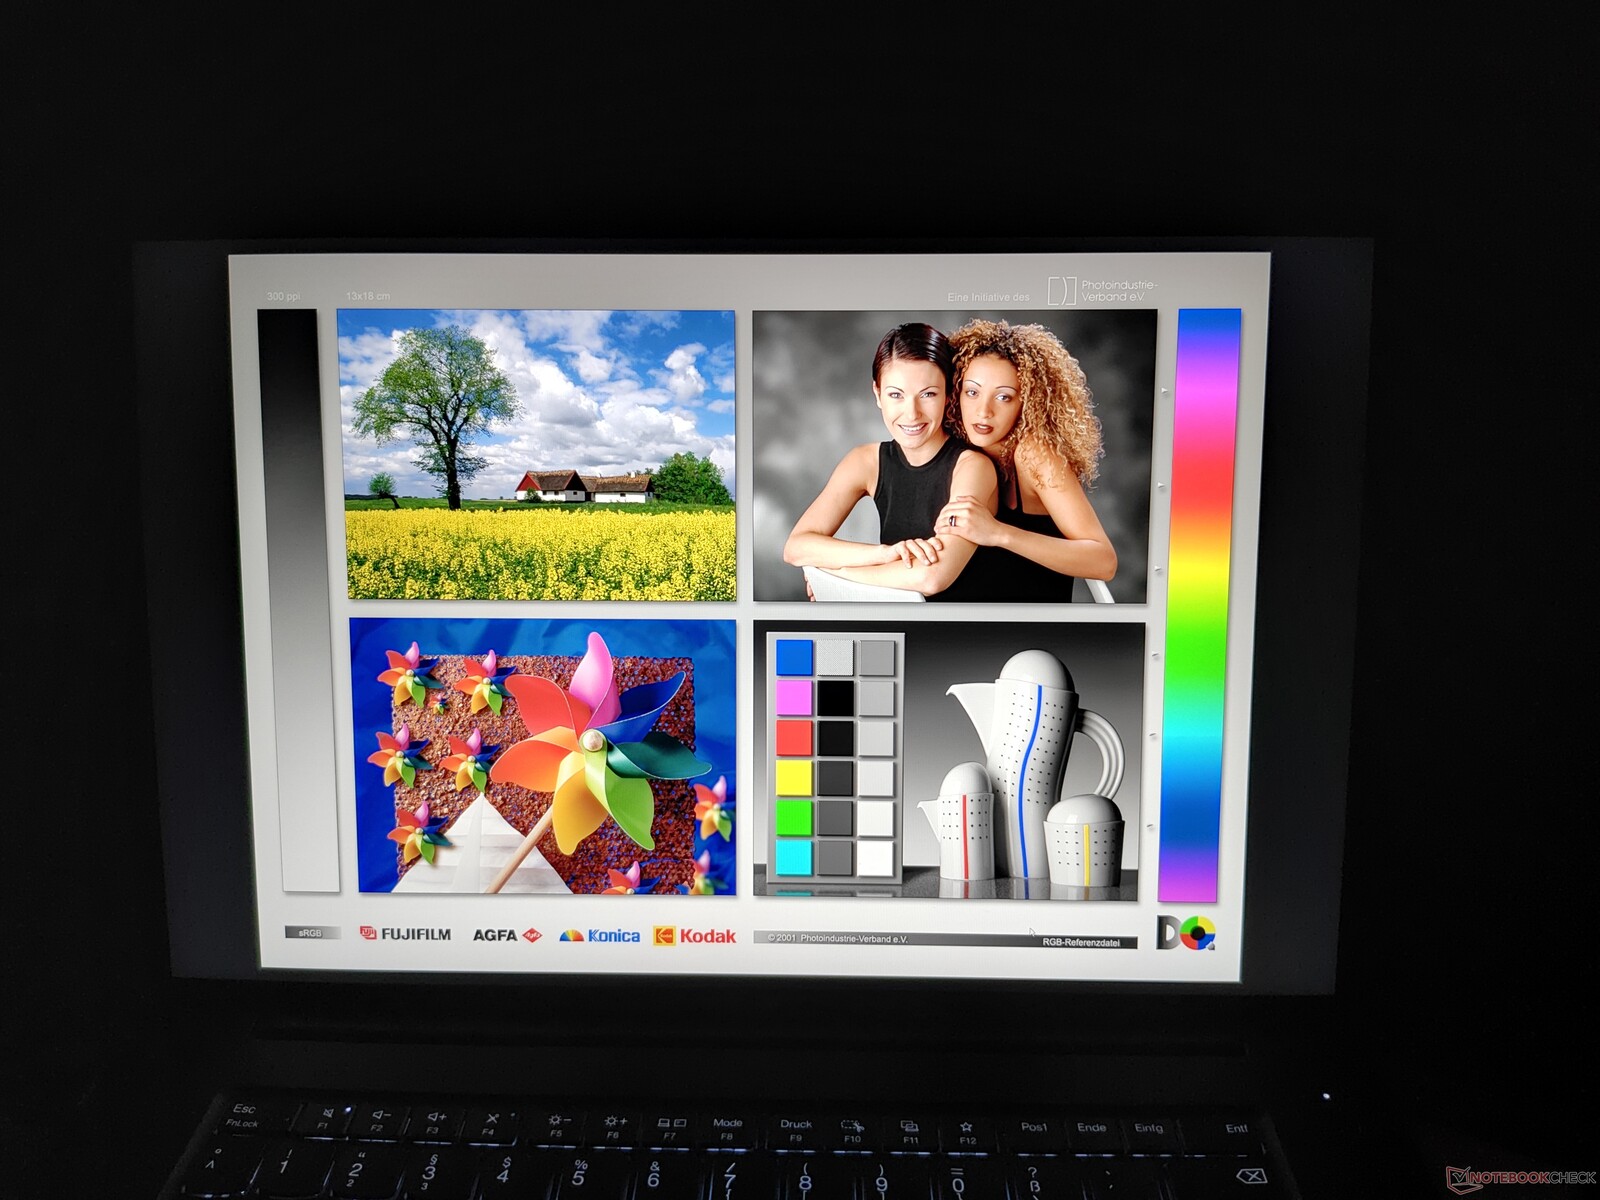
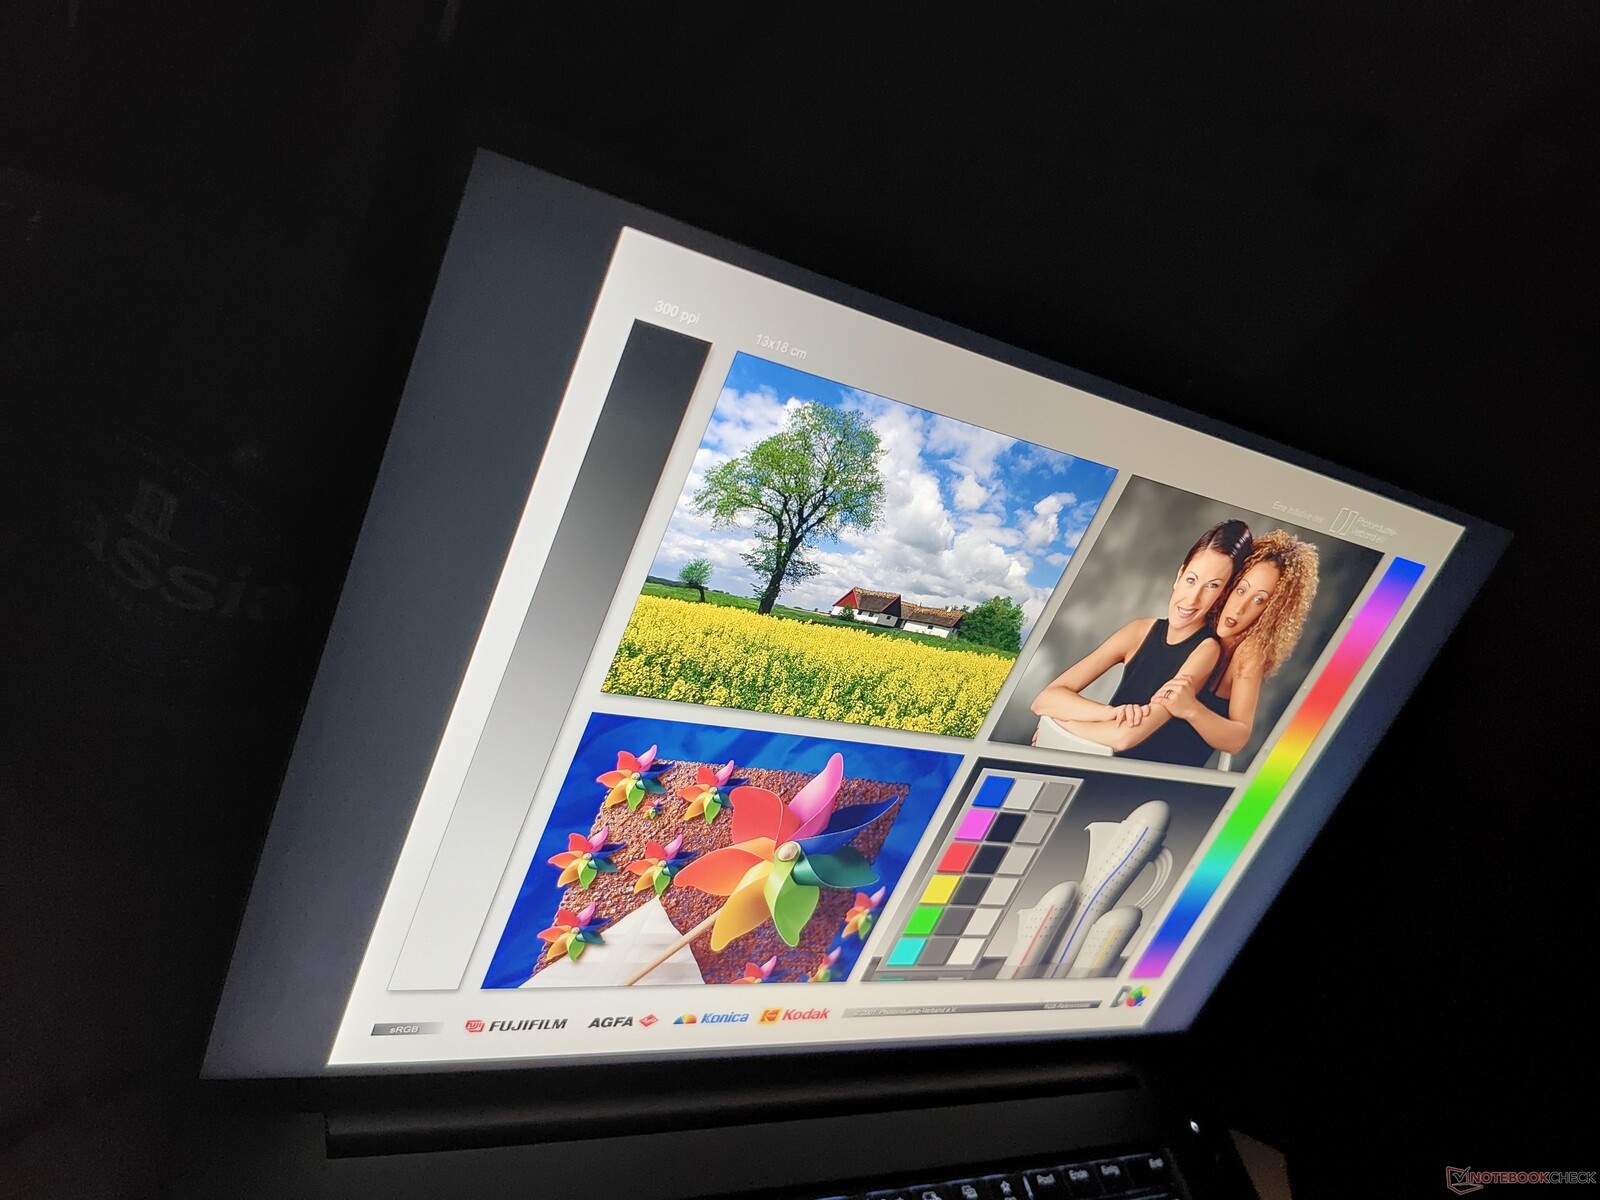
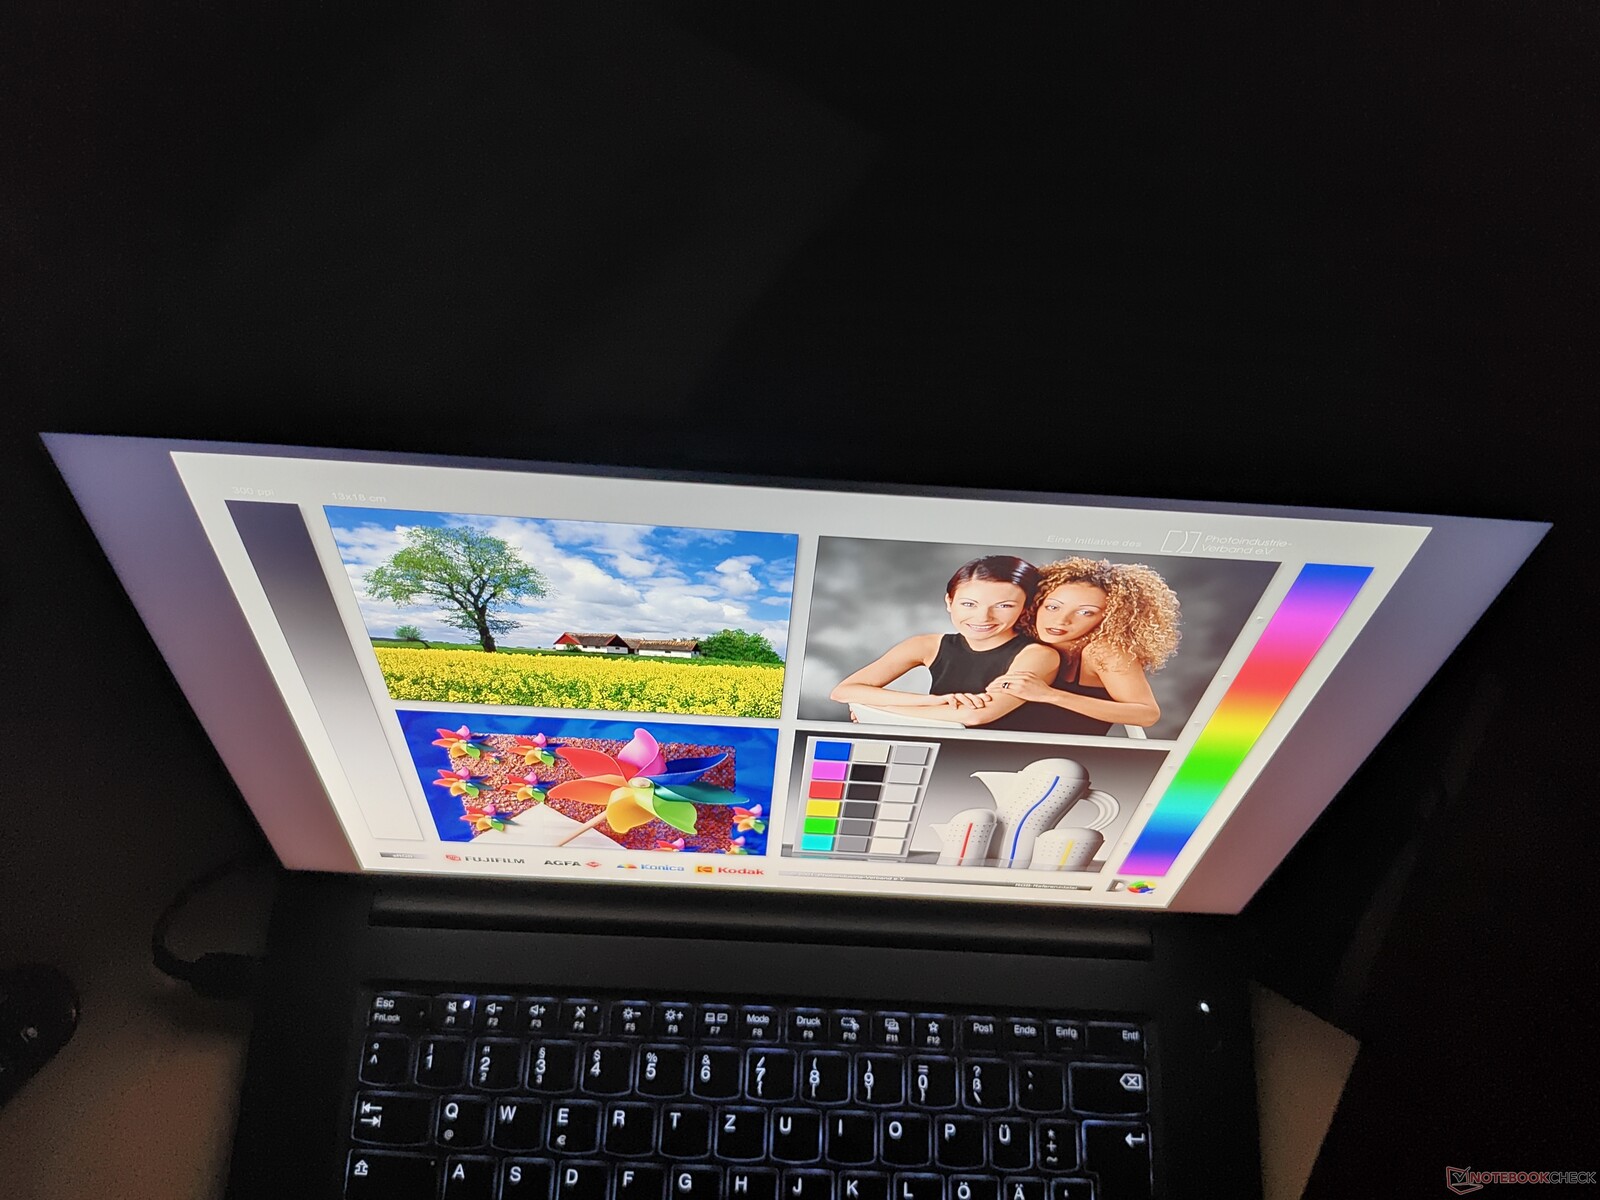
Tela: Tela rápida de 165 Hz
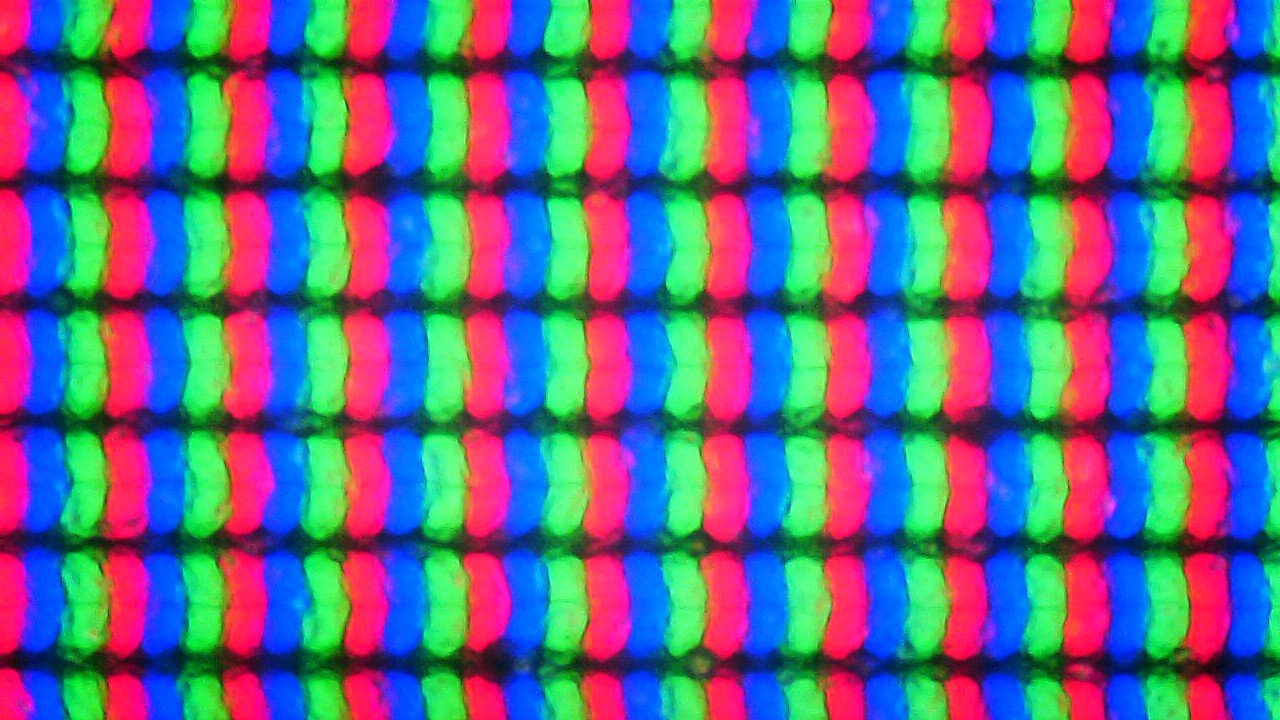
A Lenovo fez ajustes em muitas áreas, mas não nas telas. As opções de tela quase não mudaram, e a única mudança em comparação com o ThinkPad P1 G6 é que a opção de tela básica agora é 100 cd/m² mais brilhante. Todas as telas oferecidas vêm na proporção 16:10 e no formato de 16 polegadas.
- WUXGA (1.920 x 1.200), IPS, 400 cd/m², 100% sRGB, fosco
- WQXGA (2.560 x 1.600), IPS, 500 cd/m², 100 % sRGB, fosco, 165 Hz
- WQUXGA (3.840 x 2.400), OLED, 400 cd/m², 100% DCI-P3, semi-fosco/semi-brilhante, HDR
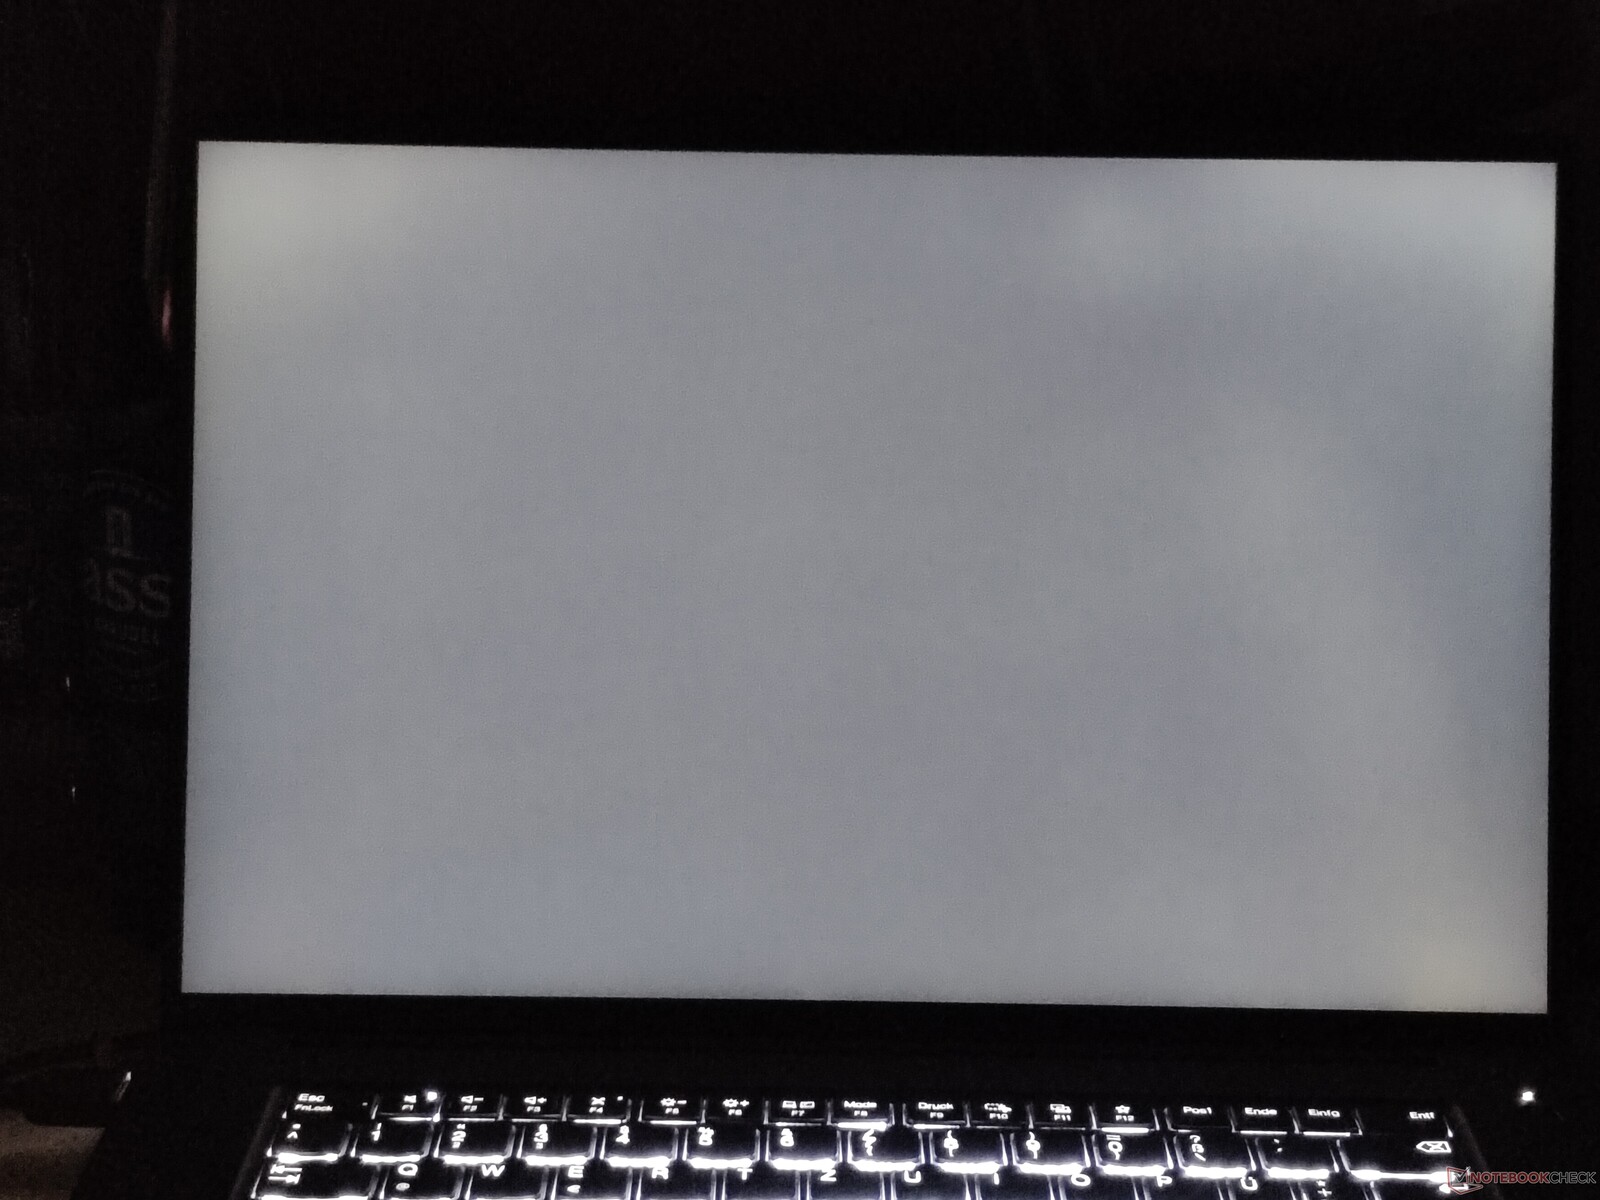
O LCD usado aqui oferece o brilho prometido de 500 cd/m², com um brilho médio medido de 505 cd/m². As telas OLED da concorrência Windows montada são superadas com folga, mas não a tela miniLED do Apple MacBook Pro 16. De modo geral, esse painel não é realmente comparável aos laptops concorrentes que testamos, devido às diferentes tecnologias e resoluções. A variante OLED do ThinkPad P1 Gen 7 seria uma comparação mais adequada. Pelo menos, a taxa de atualização de 165 Hz está um nível acima das demais, embora as telas OLED tenham tempos de resposta melhores. Nesse aspecto, o MacBook não consegue acompanhar. Um ponto positivo: O LCD não tem PWM, diferente dos concorrentes OLED e miniLED.
| |||||||||||||||||||||||||
iluminação: 89 %
iluminação com acumulador: 516 cd/m²
Contraste: 1259:1 (Preto: 0.41 cd/m²)
ΔE Color 3.5 | 0.5-29.43 Ø4.87, calibrated: 1.2
ΔE Greyscale 5.6 | 0.5-98 Ø5.1
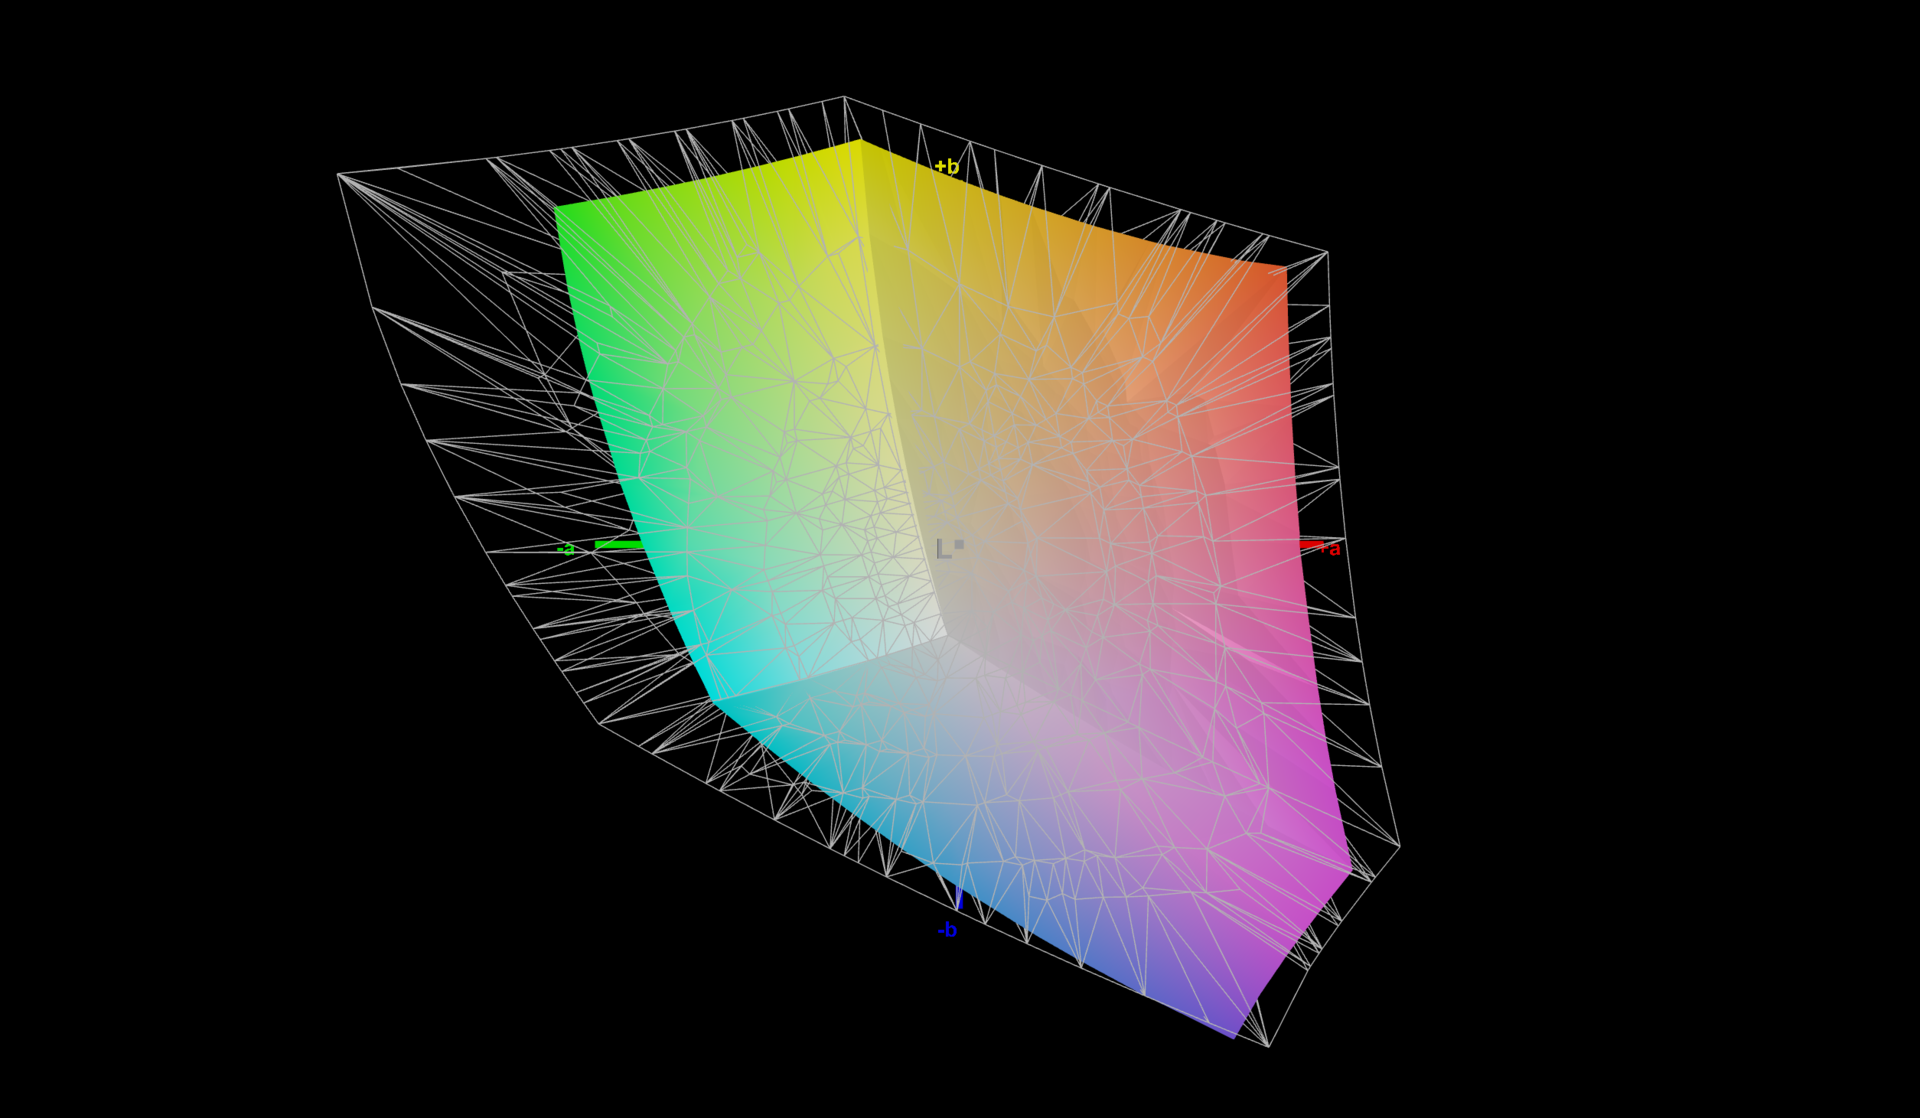
71.8% AdobeRGB 1998 (Argyll 2.2.0 3D)
97.6% sRGB (Argyll 2.2.0 3D)
69.4% Display P3 (Argyll 2.2.0 3D)
Gamma: 2.27
| Lenovo ThinkPad P1 Gen 7 21KV001SGE MNG007DA1-9 , IPS LED, 2560x1600, 16", 165 Hz | Lenovo ThinkPad P1 G6 21FV001KUS Samsung ATNA60YV04-0, OLED, 3480x2400, 16", 60 Hz | Dell XPS 16 9640 SDC4196, OLED, 3840x2400, 16.3", 90 Hz | Dell Precision 5690 Samsung 160YV03, OLED, 3840x2400, 16", 60 Hz | Apple MacBook Pro 16 2023 M3 Max Mini-LED, 3456x2234, 16", 120 Hz | |
|---|---|---|---|---|---|
| Display | 27% | 22% | 27% | 43% | |
| Display P3 Coverage | 69.4 | 99.8 44% | 98.3 42% | 99.8 44% | 99.2 43% |
| sRGB Coverage | 97.6 | 100 2% | 100 2% | 100 2% | |
| AdobeRGB 1998 Coverage | 71.8 | 97.9 36% | 87.8 22% | 96.6 35% | |
| Response Times | 85% | 93% | 85% | -404% | |
| Response Time Grey 50% / Grey 80% * | 11.2 ? | 1.69 ? 85% | 0.82 ? 93% | 1.7 ? 85% | 66.9 ? -497% |
| Response Time Black / White * | 10.6 ? | 1.73 ? 84% | 0.85 ? 92% | 1.7 ? 84% | 43.6 ? -311% |
| PWM Frequency | 60 ? | 360 ? | 60 ? | 14877 | |
| Screen | 28% | 22% | 6% | 41% | |
| Brightness middle | 516 | 375.1 -27% | 366 -29% | 348.1 -33% | 630 22% |
| Brightness | 505 | 379 -25% | 367 -27% | 351 -30% | 604 20% |
| Brightness Distribution | 89 | 98 10% | 96 8% | 97 9% | 94 6% |
| Black Level * | 0.41 | ||||
| Contrast | 1259 | ||||
| Colorchecker dE 2000 * | 3.5 | 1.16 67% | 1.3 63% | 4.18 -19% | 1.2 66% |
| Colorchecker dE 2000 max. * | 8.8 | 2.94 67% | 3.6 59% | 6.68 24% | 2.8 68% |
| Colorchecker dE 2000 calibrated * | 1.2 | 1 17% | 0.97 19% | ||
| Greyscale dE 2000 * | 5.6 | 1.4 75% | 2.2 61% | 1.7 70% | 1.9 66% |
| Gamma | 2.27 97% | 2.2 100% | 2.14 103% | 2.2 100% | 2.29 96% |
| CCT | 6071 107% | 6325 103% | 6680 97% | 6198 105% | 6812 95% |
| Média Total (Programa/Configurações) | 47% /
38% | 46% /
34% | 39% /
24% | -107% /
-57% |
* ... menor é melhor
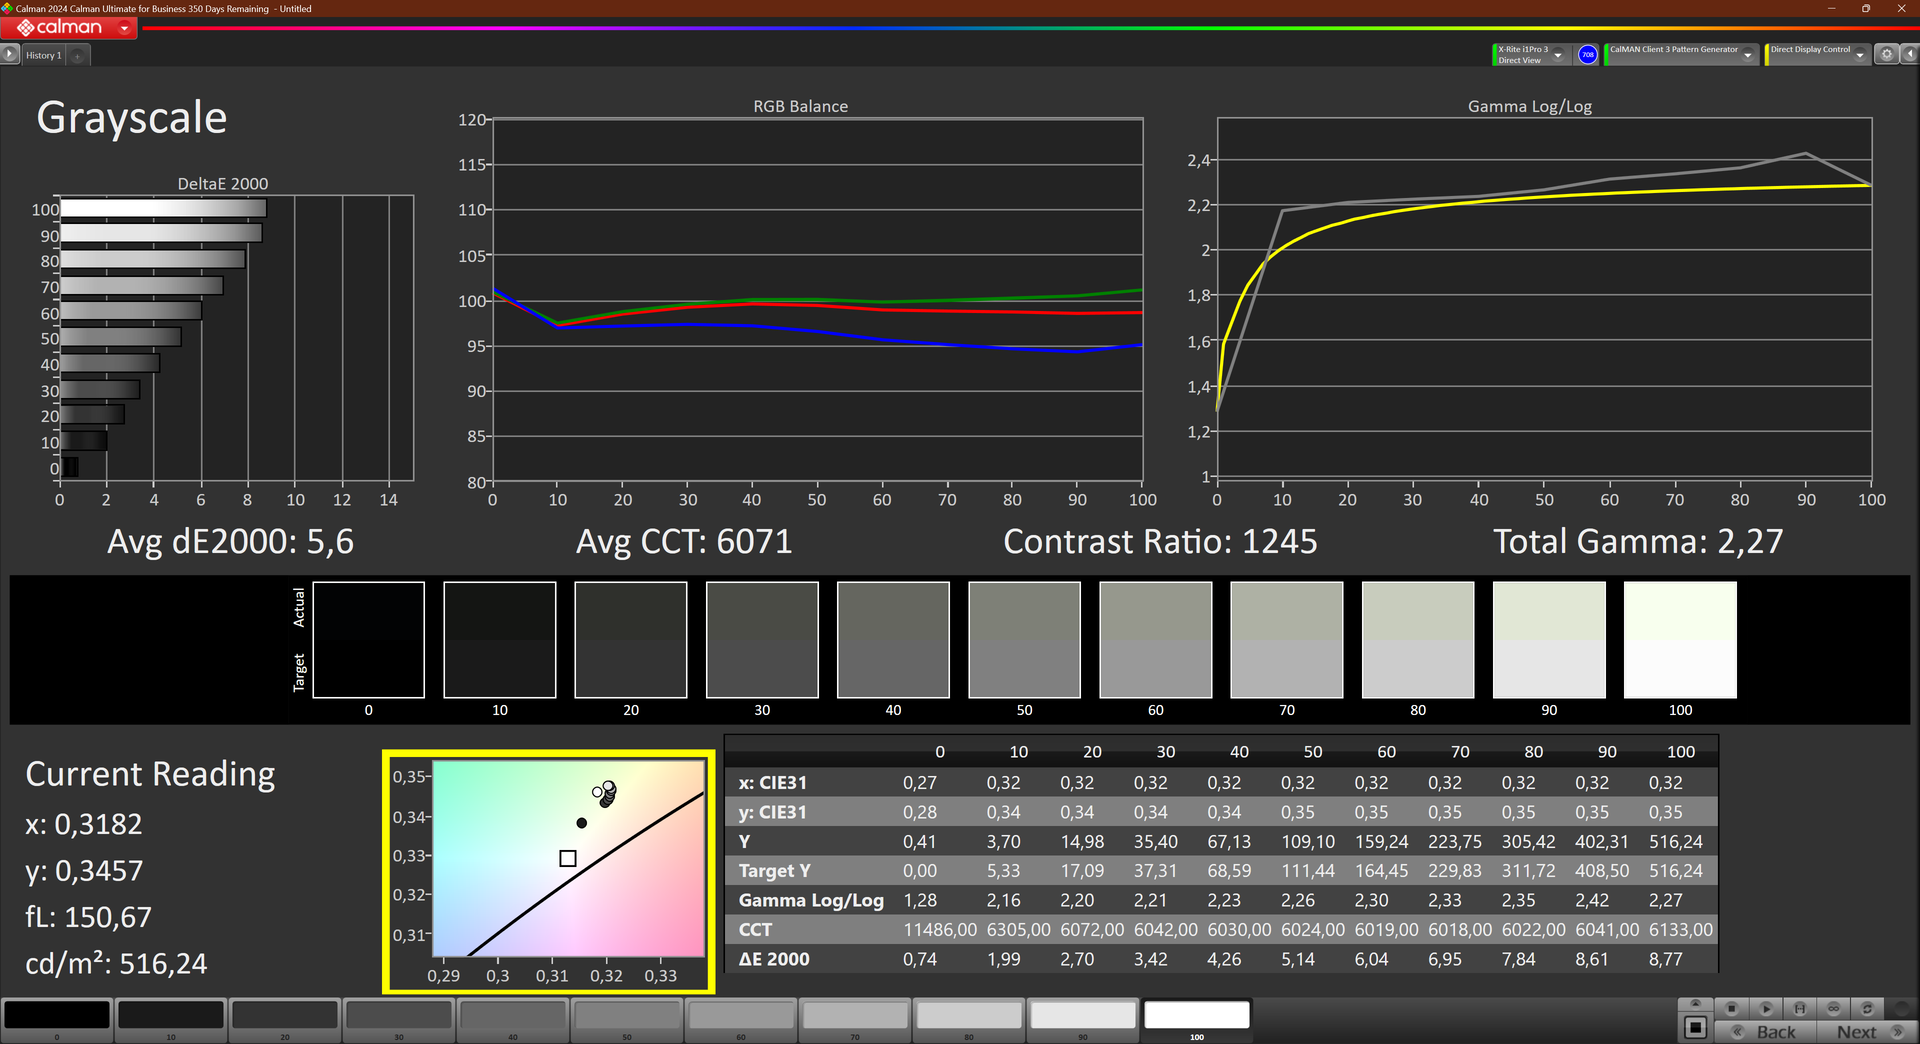
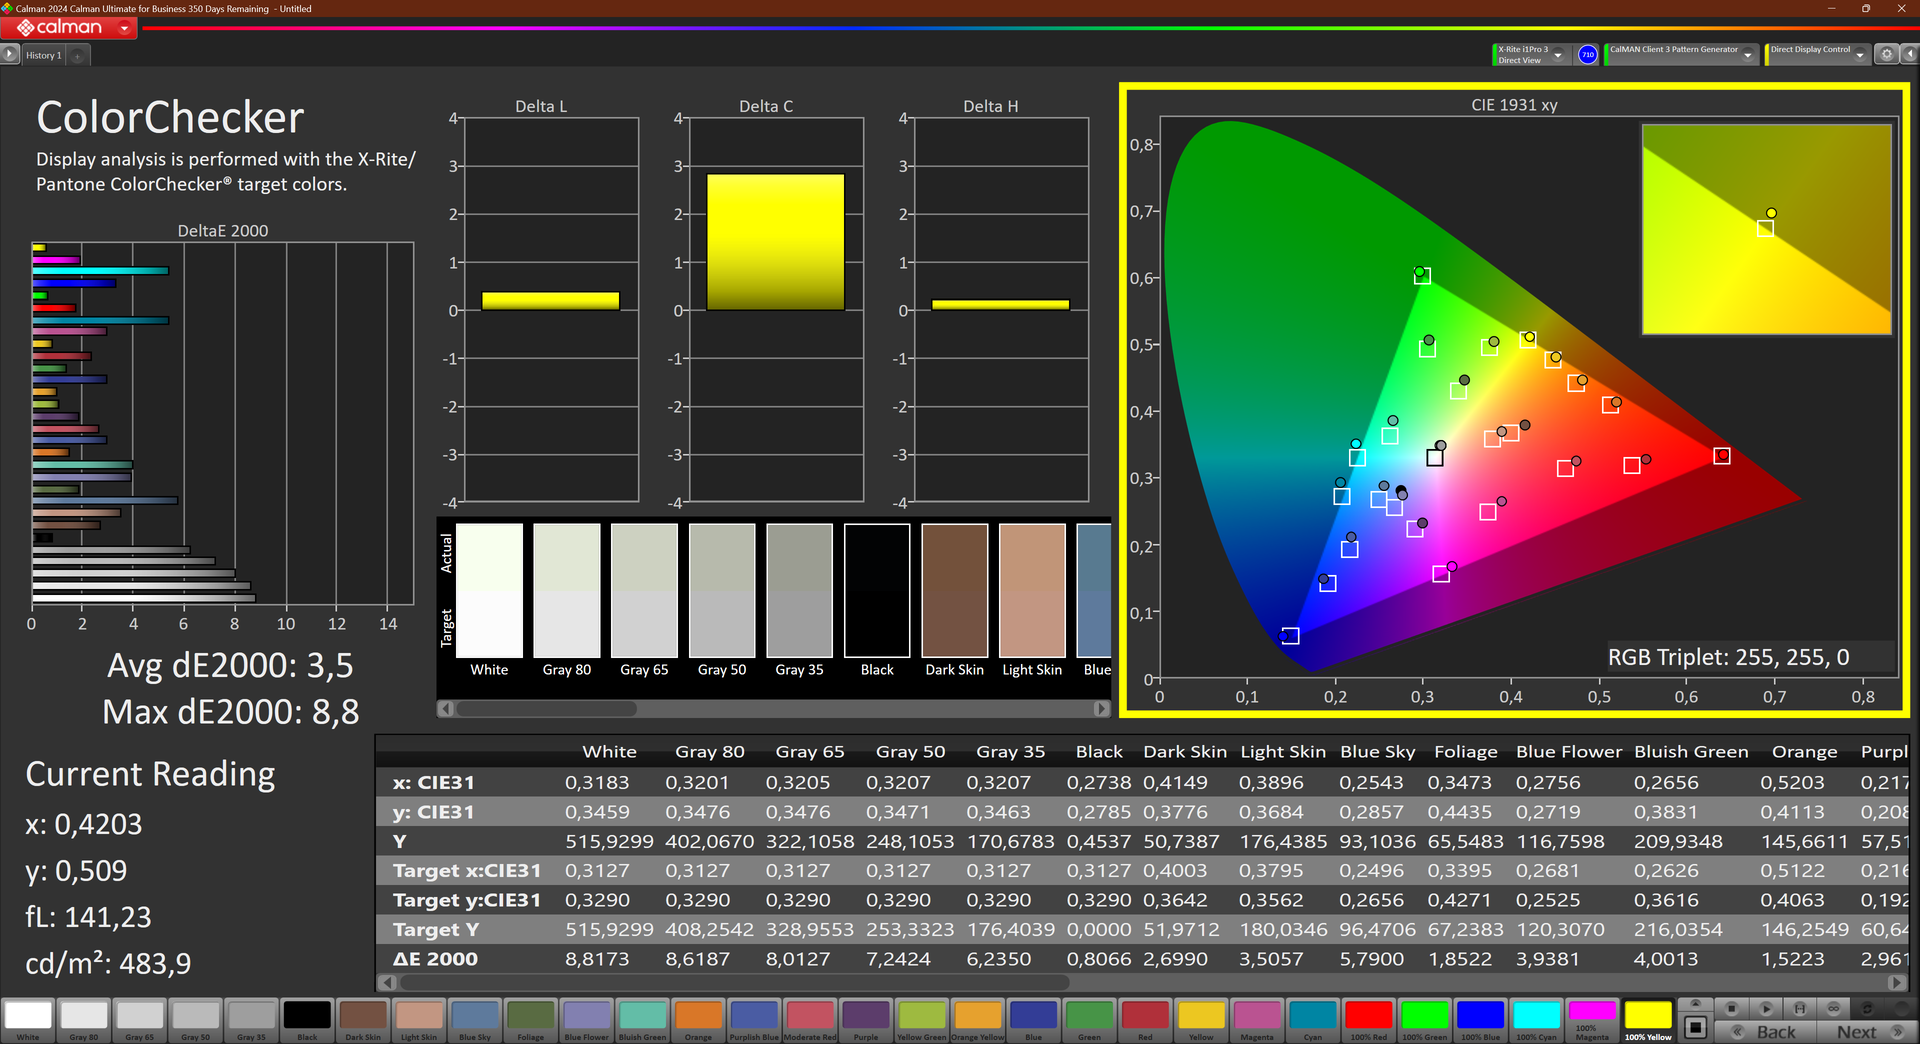
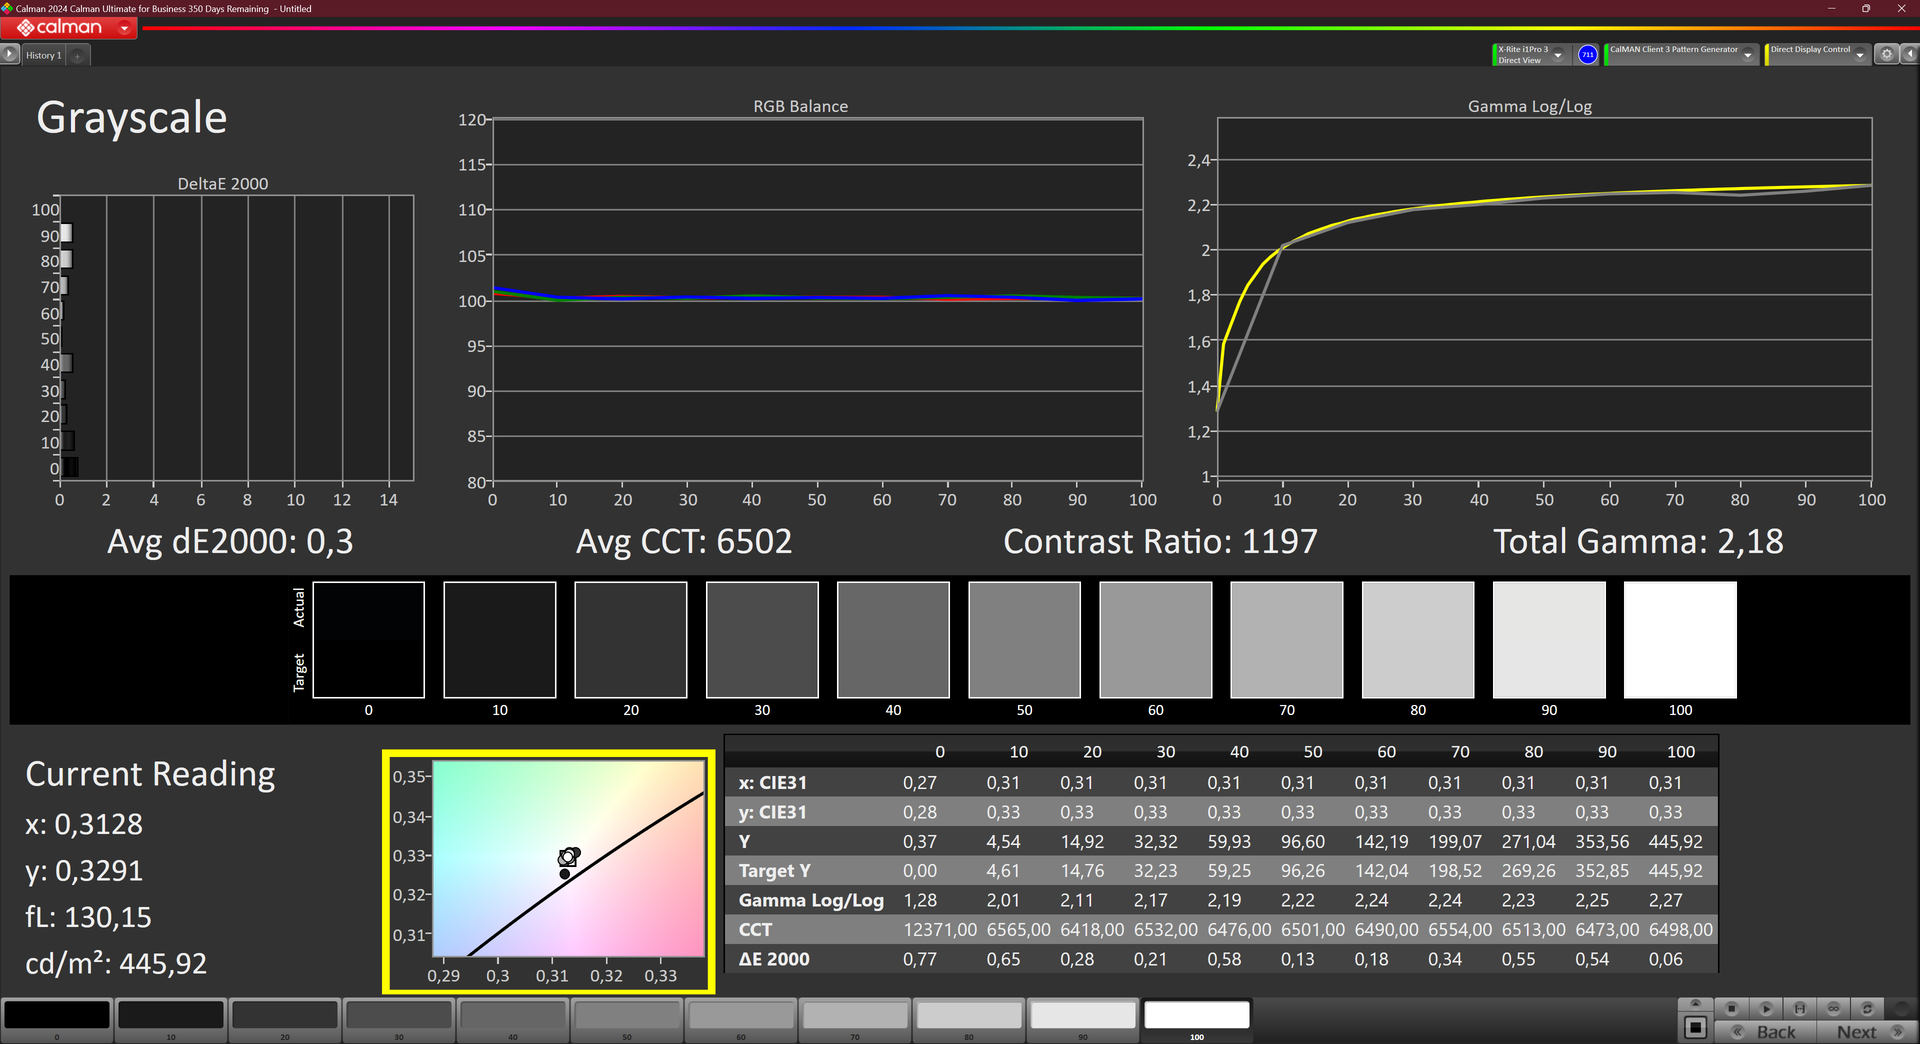

O perfil de cores habilitado de fábrica mostra cores falsas, com os cinzas também muito quentes. Com uma calibração com o X-Rite i1Pro 3, conseguimos corrigir isso. O deltaE do Colorchecker, que nos dá o desvio médio das cores neutras, diminuiu após a calibração de 3,5 para 1,2.
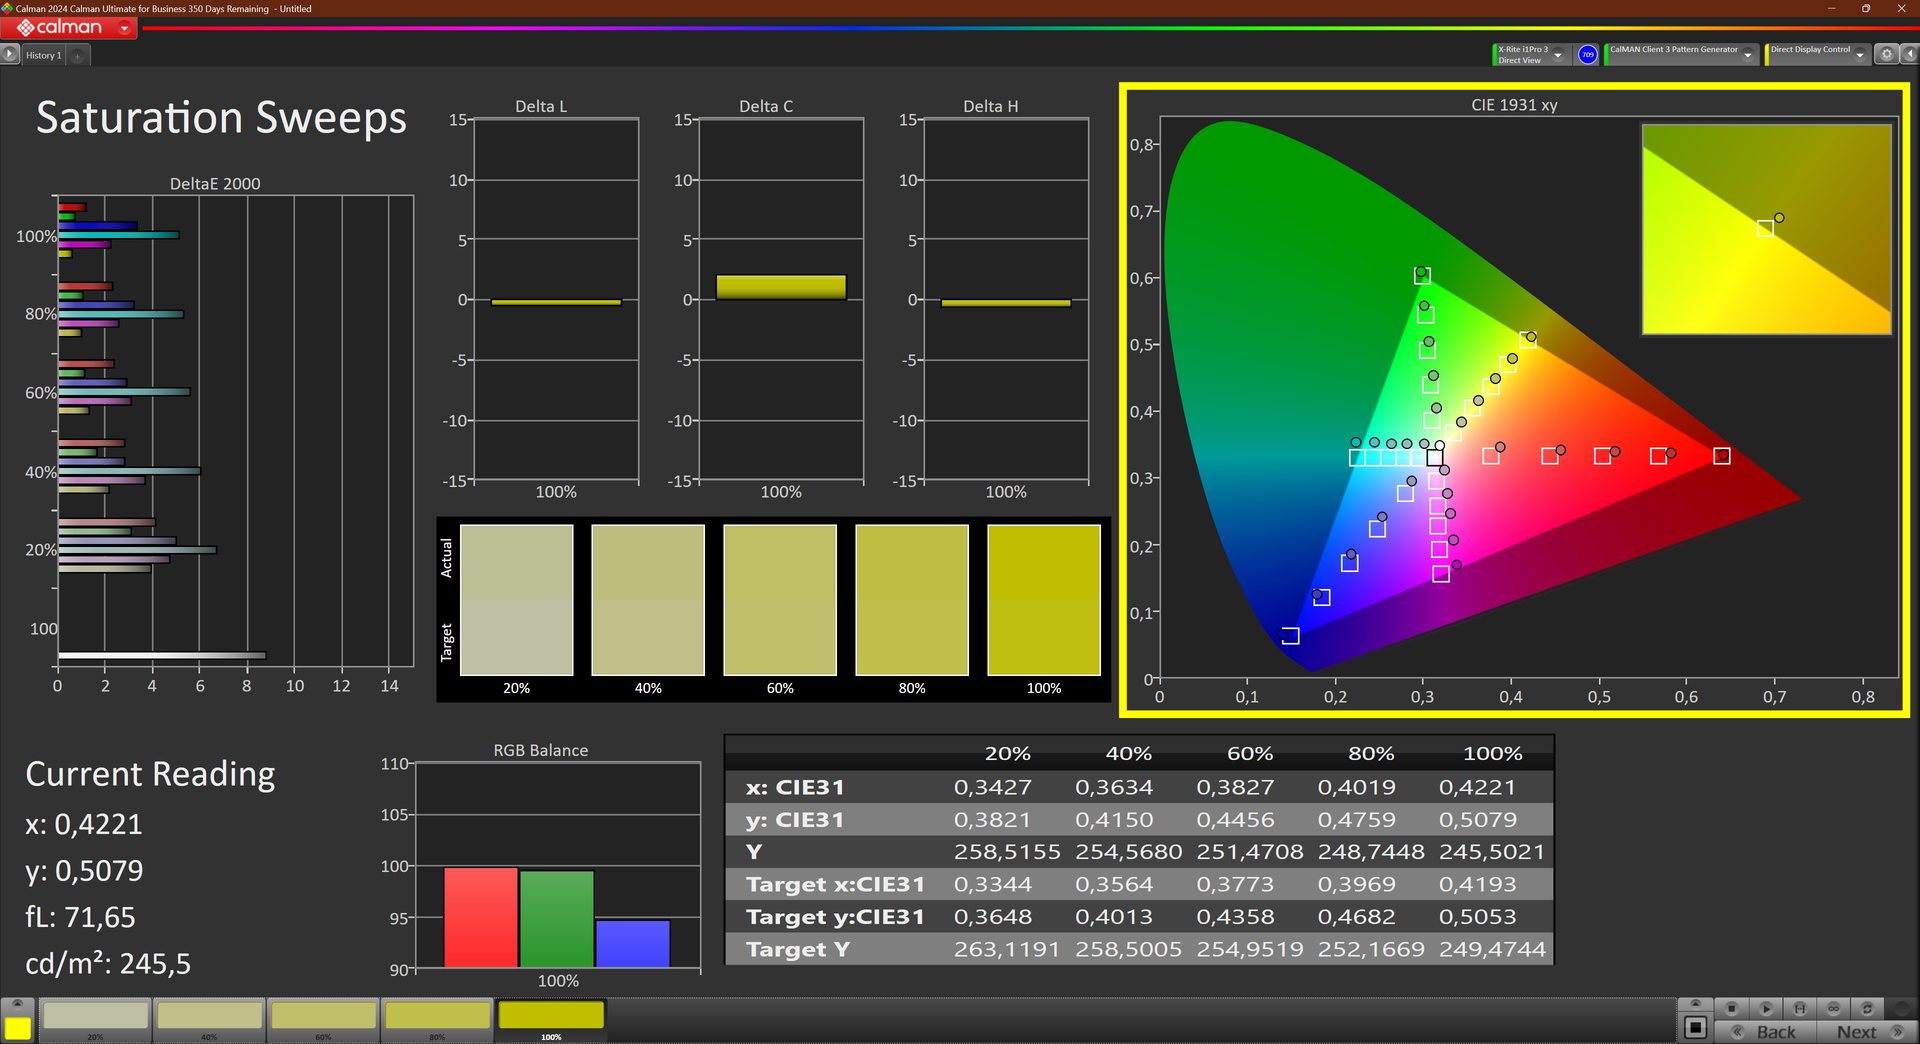
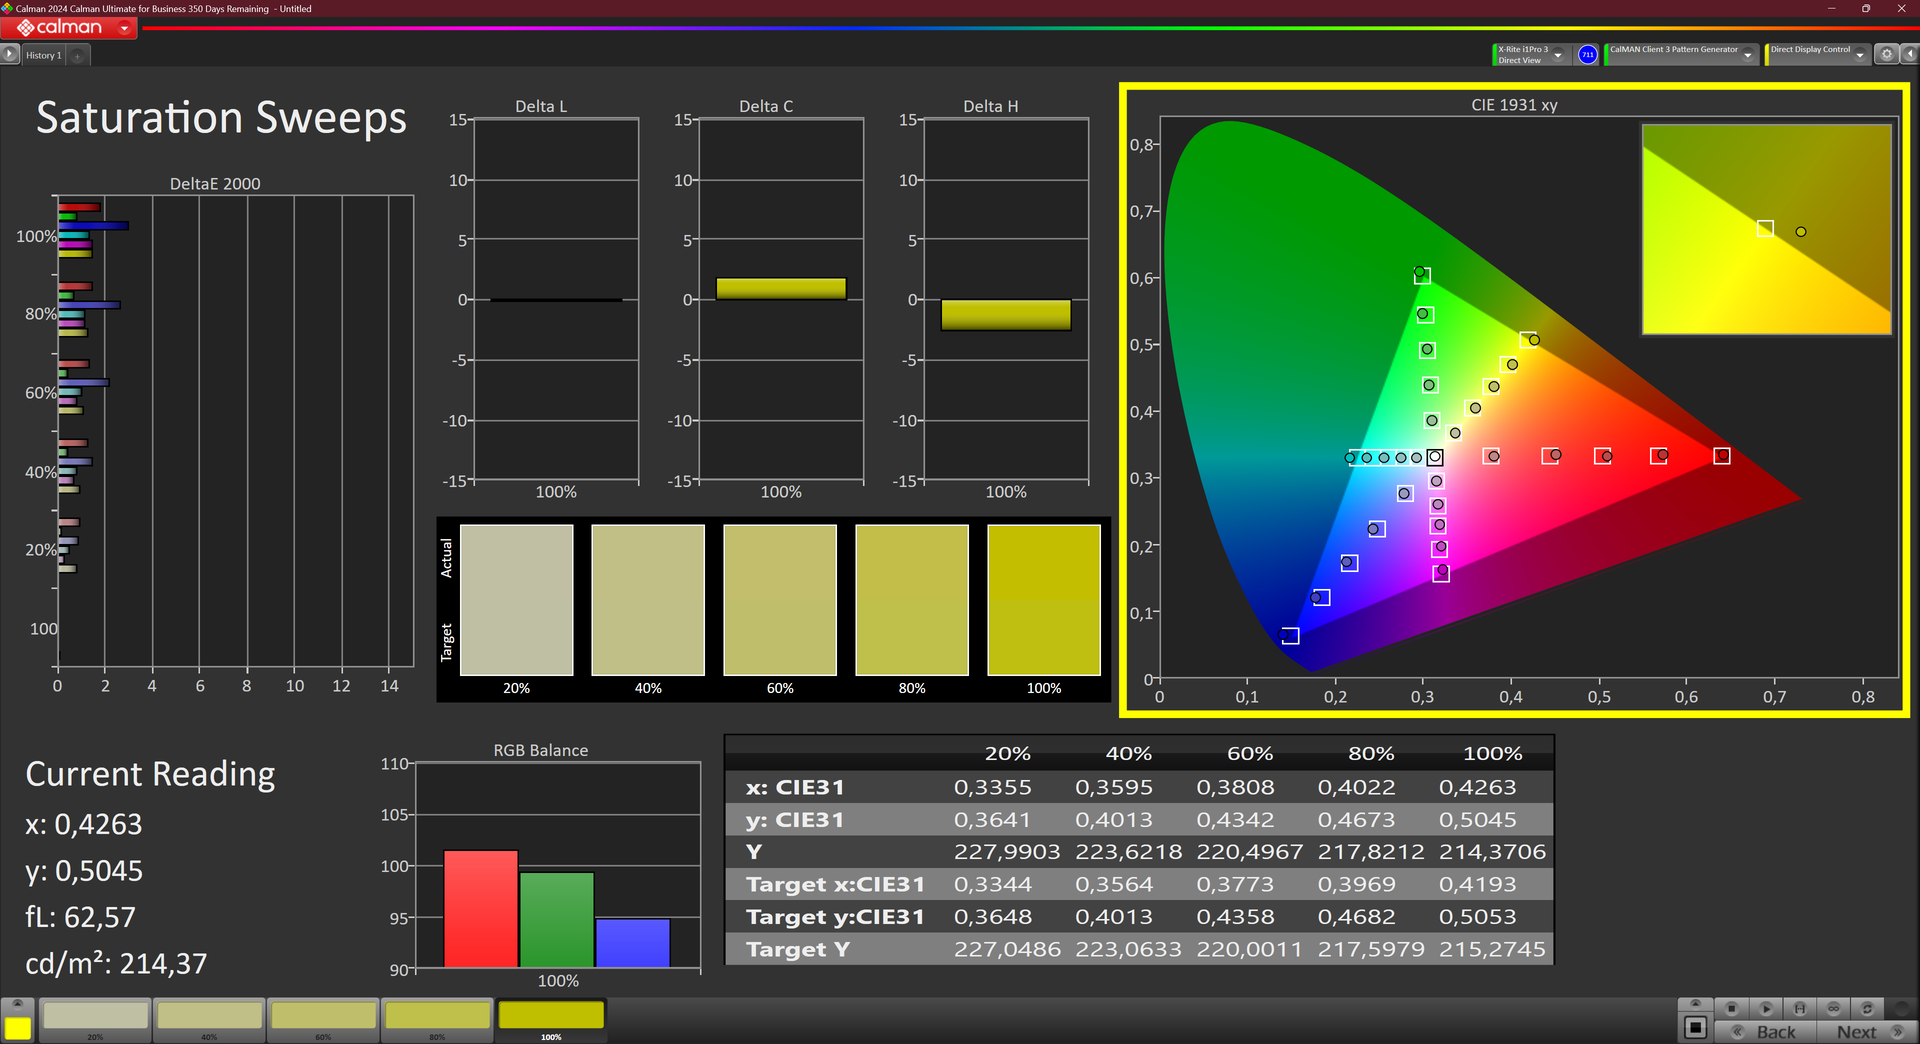
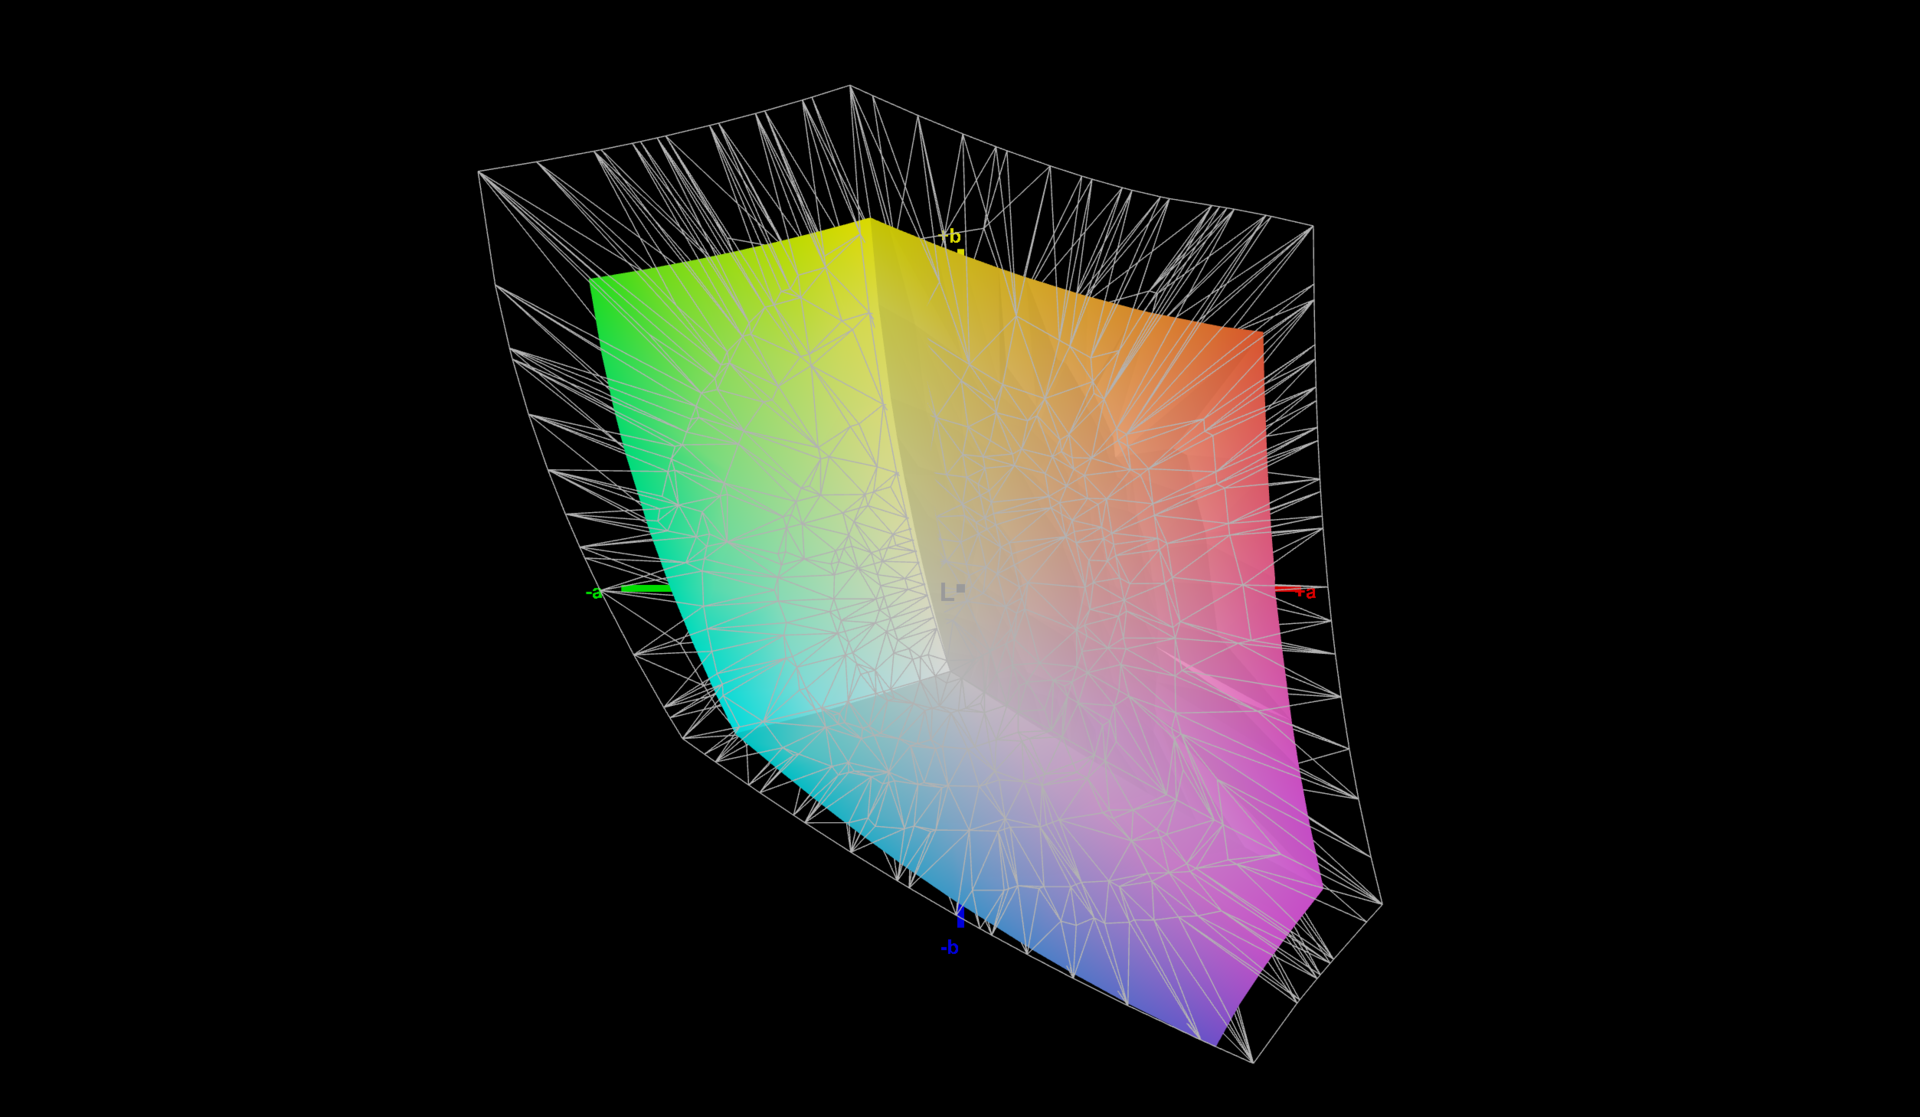
A tela WQXGA do Lenovo ThinkPad P1 Gen 7 cobre 97% da gama de cores sRGB. Isso torna o painel adequado para trabalhos simples com cores. Para qualquer coisa avançada, o painel OLED deve ser a escolha.

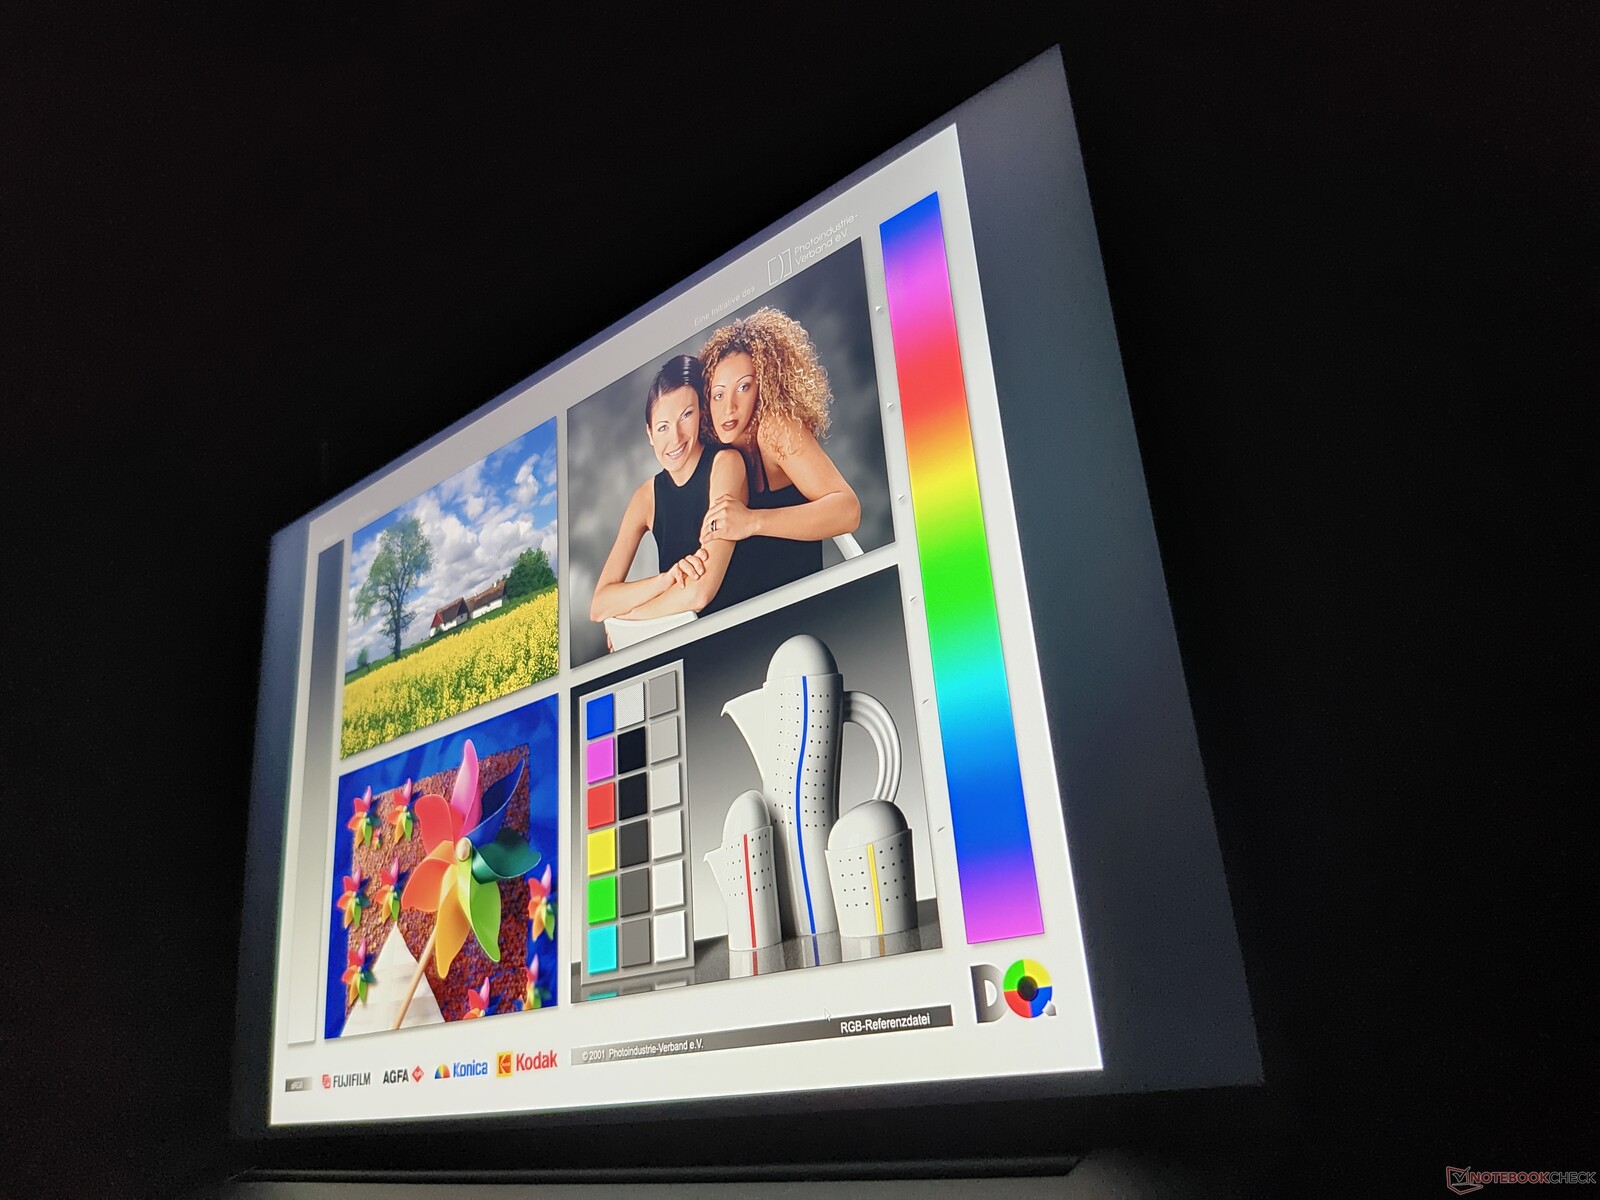
Ao usar o Lenovo ThinkPad P1 Gen 7 em ambientes externos, o alto brilho da tela mantém o conteúdo da tela visível. A superfície fosca da tela também suporta a capacidade de uso em ambientes externos.
Exibir tempos de resposta
| ↔ Tempo de resposta preto para branco | ||
|---|---|---|
| 10.6 ms ... ascensão ↗ e queda ↘ combinadas | ↗ 6.1 ms ascensão | 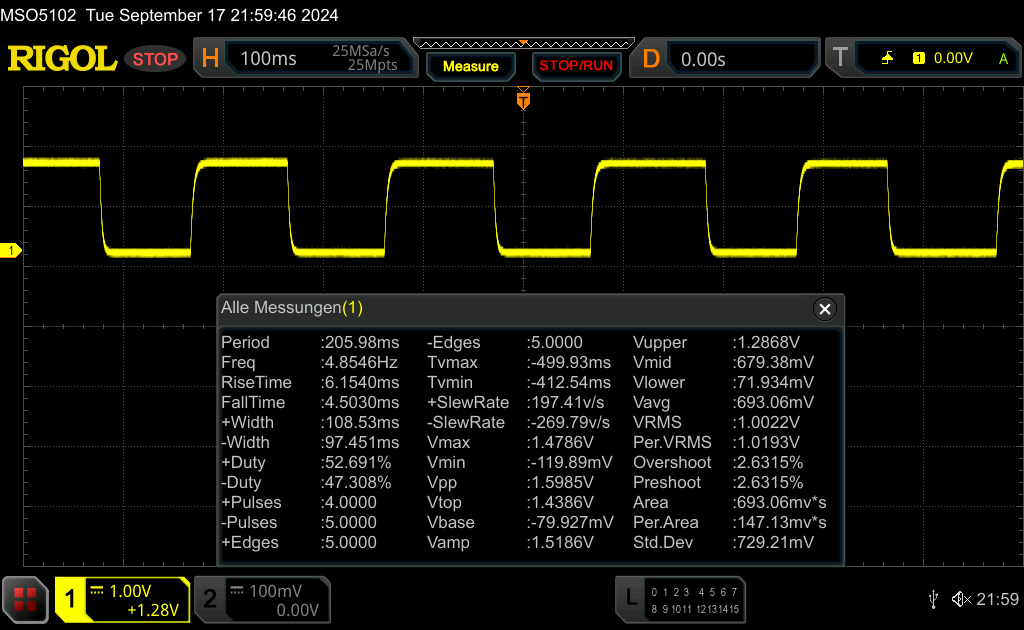 |
| ↘ 4.5 ms queda | ||
| A tela mostra boas taxas de resposta em nossos testes, mas pode ser muito lenta para jogadores competitivos. Em comparação, todos os dispositivos testados variam de 0.1 (mínimo) a 240 (máximo) ms. » 26 % de todos os dispositivos são melhores. Isso significa que o tempo de resposta medido é melhor que a média de todos os dispositivos testados (20.8 ms). | ||
| ↔ Tempo de resposta 50% cinza a 80% cinza | ||
| 11.2 ms ... ascensão ↗ e queda ↘ combinadas | ↗ 5.6 ms ascensão | 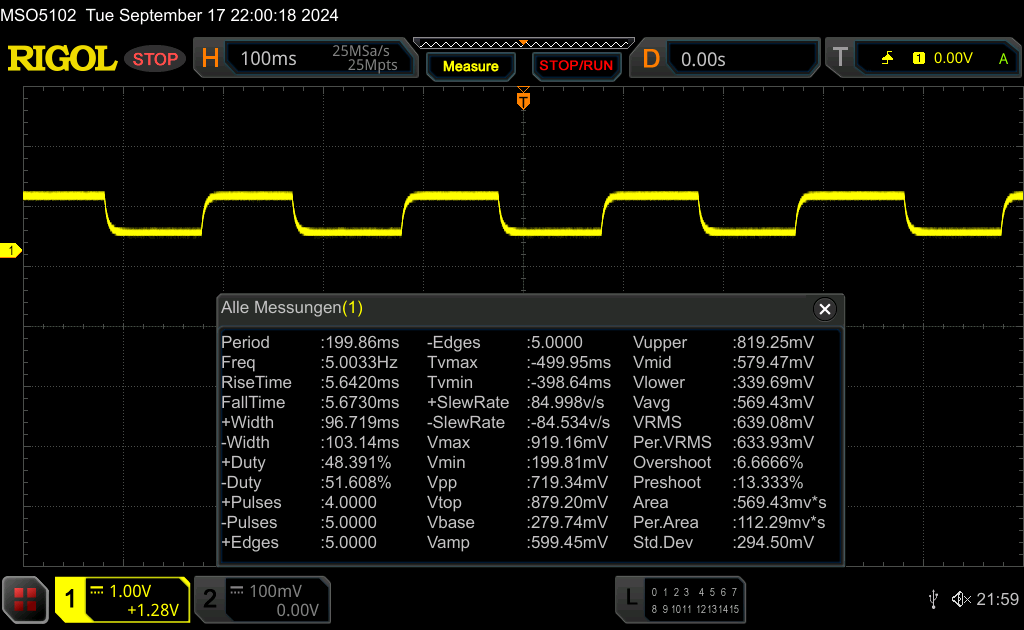 |
| ↘ 5.6 ms queda | ||
| A tela mostra boas taxas de resposta em nossos testes, mas pode ser muito lenta para jogadores competitivos. Em comparação, todos os dispositivos testados variam de 0.165 (mínimo) a 636 (máximo) ms. » 22 % de todos os dispositivos são melhores. Isso significa que o tempo de resposta medido é melhor que a média de todos os dispositivos testados (32.5 ms). | ||
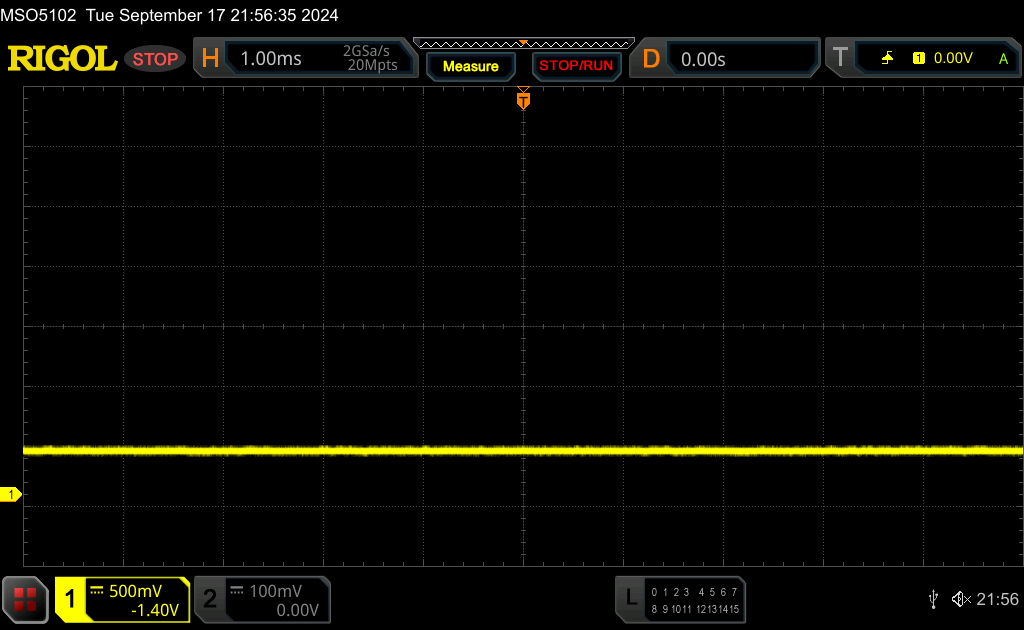
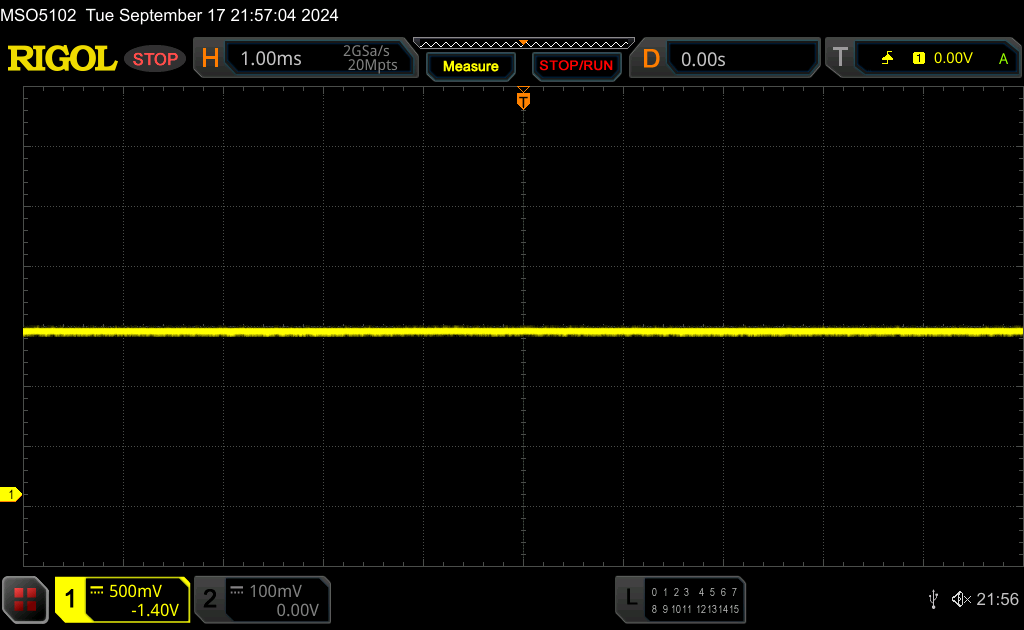
Cintilação da tela / PWM (modulação por largura de pulso)
| Tela tremeluzindo / PWM não detectado |  | ||
[pwm_comparison] Em comparação: 53 % de todos os dispositivos testados não usam PWM para escurecer a tela. Se PWM foi detectado, uma média de 8516 (mínimo: 5 - máximo: 343500) Hz foi medida. | |||
Desempenho: O Meteor Lake substitui o Raptor Lake
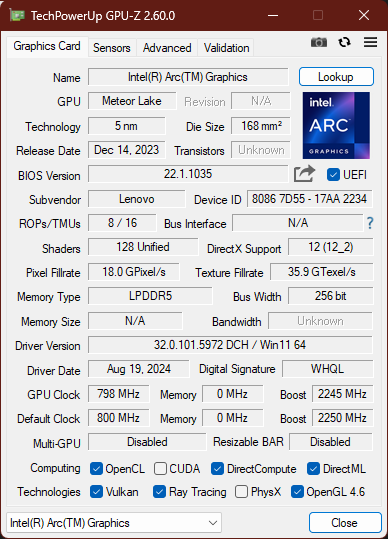
O Lenovo ThinkPad P1 Gen 7 só é oferecido com CPUs Intel, ao contrário do ThinkPad Z16 baseado na AMD. Quatro chips Meteor Lake H estão listados na folha de especificações (Intel Core Ultra 5 135H, Core Ultra 7 155H, Core Ultra 7 165H, Core Ultra 9 185H), todos compatíveis com vPro Enterprise, exceto o 155H. Ainda mais abrangente é a escolha de GPUs, com três chips profissionais Nvidia RTX (RTX 1000 Ada, RTX 2000 Ada, RTX 3000 Ada) e dois chips Nvidia GeForce (GeForce RTX 4060, GeForce RTX 4070). Como alternativa, o P1 G7 também pode ser configurado sem nenhuma dGPU e, nesse caso, o Intel ARC assume o controle.
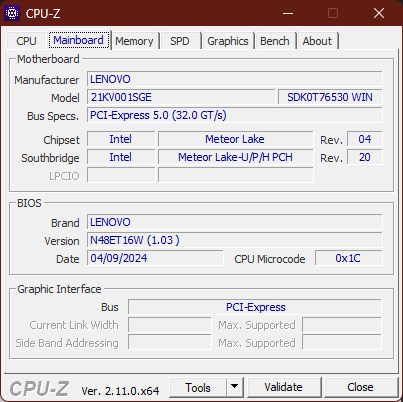
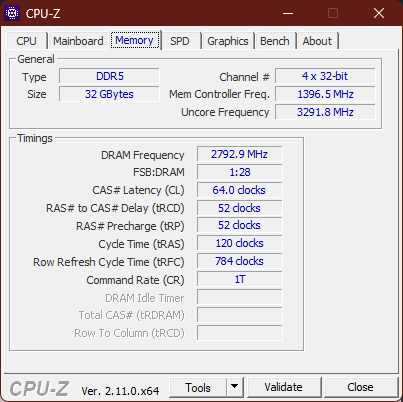
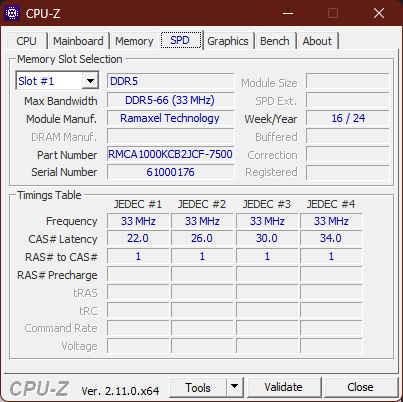
A capacidade da RAM é de 16, 32 ou 64 GB. O único módulo LPCAMM2 traz a rápida memória LPDDR5X-7500 para o ThinkPad P1 G7, substituindo a DDR5-5600 do predecessor - mas sem o suporte ECC, esse recurso desaparece. Os dois SSDs M.2 2280 são conectados via NVMe PCIe 4.0, com o limite máximo de 8 TB (2x 4 TB). Há suporte para RAID 0/1.
Condições de teste
Os três perfis de energia disponíveis podem ser selecionados por meio das configurações do Windows. Eles influenciam as configurações de TDP por meio dos limites de energia - com o Power Limit 1 (PL1) definindo o consumo de energia sob carga sustentada e o PL2 sendo o consumo máximo de energia sob carga de curto prazo.
- Melhor duração da bateria: PL1 25 W / PL2 115 W
- Equilibrado: PL1 50 W / PL2 115 W
- Melhor desempenho: PL1 70 W / PL2 115 W
A tabela a seguir lista a diferença de desempenho entre os diferentes perfis de energia do ThinkPad P1 Gen 7.
| Perfil de energia | PL1 | PL2 | CB R23 Multi | TGP | Time Spy Gráficos | CP 2077 QHD/Ultra | Teste de estresse | Ruído máximo da ventoinha |
|---|---|---|---|---|---|---|---|---|
| Melhor duração da bateria | 25 W | 115 W | 16388 | 45 W | 7150 | 30,3 FPS | CPU: 75 C GPU: 65 C |
43,18 dB(A) |
| Balanceado | 50 W | 115 W | 17111 | 60 W | 8166 | 33,6 FPS | CPU: 100 C GPU: 80 C |
46,17 dB(A) |
| Melhor desempenho | 70 W | 115 W | 18762 | 80 W | 9386 | 39,9 FPS | CPU: 103 C GPU: 88 C |
53,27 dB(a) |
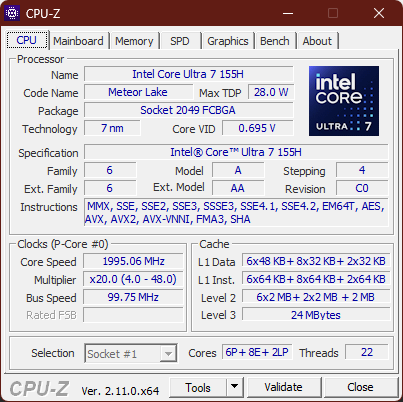
Processador
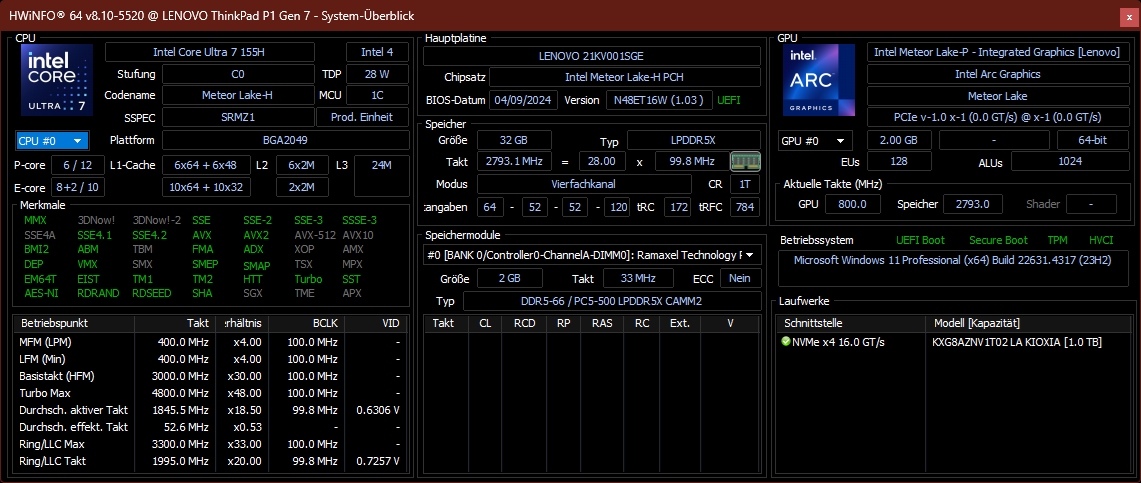
Intel's Core Ultra 7 155H da Intel faz parte da série Meteor Lake H, voltada para o desempenho. O consumo de energia típico fica entre 28 e 45 W, mas, como vimos com o Lenovo ThinkPad P1 Gen 7, é possível que os OEMs estabeleçam um limite muito mais alto. A CPU tem 16 núcleos e 22 threads com hyperthreading, sendo um design 6+8+2 com seis núcleos P grandes, oito núcleos E e dois núcleos E de baixo consumo. Os núcleos têm taxas de clock variadas (núcleos P: 1.4 a 4,8 GHz, núcleos E: 0.9 a 3,9 GHz, núcleos LP E: 0.7 a 2,5 GHz). É possível fazer comparações com outras CPUs com nossa Lista de CPUs.
Os limites de alta potência permitem que o Lenovo ThinkPad P1 Gen 7 eclipse seu antecessor P1 Gen 6 no teste multicore. A estação de trabalho ThinkPad mais recente também oferece esse desempenho sob carga sustentada sem qualquer estrangulamento. Ao executar tarefas de núcleo único, o P1 Gen 7 perde para seu antecessor, já que o Raptor Lake em geral supera o Meteor Lake nessa disciplina - com um consumo de energia maior. De modo geral, o desempenho da CPU do P1 Gen 7 é mais do que útil para uma estação de trabalho moderna e está praticamente no mesmo nível da concorrência da Dell.
No modo de bateria, o desempenho da CPU é ligeiramente reduzido. Medimos uma perda de desempenho de 13%.
Cinebench R15 Multi Dauertest
Cinebench R23: Multi Core | Single Core
Cinebench R20: CPU (Multi Core) | CPU (Single Core)
Cinebench R15: CPU Multi 64Bit | CPU Single 64Bit
Blender: v2.79 BMW27 CPU
7-Zip 18.03: 7z b 4 | 7z b 4 -mmt1
Geekbench 6.4: Multi-Core | Single-Core
Geekbench 5.5: Multi-Core | Single-Core
HWBOT x265 Benchmark v2.2: 4k Preset
LibreOffice : 20 Documents To PDF
R Benchmark 2.5: Overall mean
| CPU Performance Rating | |
| Apple MacBook Pro 16 2023 M3 Pro -8! | |
| Lenovo ThinkPad P1 G6 21FV001KUS | |
| Dell Precision 5690 | |
| Média da turma Workstation | |
| Lenovo ThinkPad P1 Gen 7 21KV001SGE | |
| Dell XPS 16 9640 | |
| HP ZBook Power 16 G11 A | |
| Média Intel Core Ultra 7 155H | |
| Cinebench R23 / Multi Core | |
| Dell Precision 5690 | |
| Lenovo ThinkPad P1 Gen 7 21KV001SGE | |
| Média da turma Workstation (11507 - 30706, n=25, últimos 2 anos) | |
| Dell XPS 16 9640 | |
| Lenovo ThinkPad P1 G6 21FV001KUS | |
| HP ZBook Power 16 G11 A | |
| Apple MacBook Pro 16 2023 M3 Pro | |
| Média Intel Core Ultra 7 155H (9769 - 19007, n=52) | |
| Cinebench R23 / Single Core | |
| Lenovo ThinkPad P1 G6 21FV001KUS | |
| Apple MacBook Pro 16 2023 M3 Pro | |
| Média da turma Workstation (1581 - 2178, n=25, últimos 2 anos) | |
| Dell Precision 5690 | |
| Lenovo ThinkPad P1 Gen 7 21KV001SGE | |
| Dell XPS 16 9640 | |
| HP ZBook Power 16 G11 A | |
| Média Intel Core Ultra 7 155H (1496 - 1815, n=52) | |
| Cinebench R20 / CPU (Multi Core) | |
| Dell Precision 5690 | |
| Lenovo ThinkPad P1 Gen 7 21KV001SGE | |
| Média da turma Workstation (4530 - 11816, n=25, últimos 2 anos) | |
| Dell XPS 16 9640 | |
| Lenovo ThinkPad P1 G6 21FV001KUS | |
| HP ZBook Power 16 G11 A | |
| Média Intel Core Ultra 7 155H (3798 - 7409, n=50) | |
| Cinebench R20 / CPU (Single Core) | |
| Lenovo ThinkPad P1 G6 21FV001KUS | |
| Média da turma Workstation (612 - 827, n=25, últimos 2 anos) | |
| Dell Precision 5690 | |
| Lenovo ThinkPad P1 Gen 7 21KV001SGE | |
| HP ZBook Power 16 G11 A | |
| Dell XPS 16 9640 | |
| Média Intel Core Ultra 7 155H (601 - 696, n=50) | |
| Cinebench R15 / CPU Multi 64Bit | |
| Dell Precision 5690 | |
| Média da turma Workstation (1863 - 4784, n=25, últimos 2 anos) | |
| Lenovo ThinkPad P1 Gen 7 21KV001SGE | |
| Dell XPS 16 9640 | |
| Lenovo ThinkPad P1 G6 21FV001KUS | |
| HP ZBook Power 16 G11 A | |
| Média Intel Core Ultra 7 155H (1932 - 2880, n=56) | |
| Apple MacBook Pro 16 2023 M3 Pro | |
| Cinebench R15 / CPU Single 64Bit | |
| Lenovo ThinkPad P1 G6 21FV001KUS | |
| HP ZBook Power 16 G11 A | |
| Média da turma Workstation (167 - 307, n=25, últimos 2 anos) | |
| Dell Precision 5690 | |
| Lenovo ThinkPad P1 Gen 7 21KV001SGE | |
| Dell XPS 16 9640 | |
| Média Intel Core Ultra 7 155H (99.6 - 268, n=52) | |
| Blender / v2.79 BMW27 CPU | |
| Apple MacBook Pro 16 2023 M3 Pro | |
| Média Intel Core Ultra 7 155H (175 - 381, n=47) | |
| Dell Precision 5690 | |
| HP ZBook Power 16 G11 A | |
| Média da turma Workstation (102 - 270, n=25, últimos 2 anos) | |
| Lenovo ThinkPad P1 G6 21FV001KUS | |
| Dell XPS 16 9640 | |
| Lenovo ThinkPad P1 Gen 7 21KV001SGE | |
| 7-Zip 18.03 / 7z b 4 | |
| Dell Precision 5690 | |
| Média da turma Workstation (51096 - 109760, n=25, últimos 2 anos) | |
| Lenovo ThinkPad P1 G6 21FV001KUS | |
| Lenovo ThinkPad P1 Gen 7 21KV001SGE | |
| Dell XPS 16 9640 | |
| HP ZBook Power 16 G11 A | |
| Média Intel Core Ultra 7 155H (41739 - 70254, n=50) | |
| 7-Zip 18.03 / 7z b 4 -mmt1 | |
| Lenovo ThinkPad P1 G6 21FV001KUS | |
| HP ZBook Power 16 G11 A | |
| Média da turma Workstation (4981 - 6960, n=25, últimos 2 anos) | |
| Lenovo ThinkPad P1 Gen 7 21KV001SGE | |
| Dell XPS 16 9640 | |
| Média Intel Core Ultra 7 155H (4594 - 5621, n=50) | |
| Dell Precision 5690 | |
| Geekbench 6.4 / Multi-Core | |
| Apple MacBook Pro 16 2023 M3 Pro | |
| Dell Precision 5690 | |
| Dell XPS 16 9640 | |
| Média da turma Workstation (10200 - 16855, n=23, últimos 2 anos) | |
| Lenovo ThinkPad P1 Gen 7 21KV001SGE | |
| Lenovo ThinkPad P1 G6 21FV001KUS | |
| HP ZBook Power 16 G11 A | |
| Média Intel Core Ultra 7 155H (7732 - 13656, n=55) | |
| Geekbench 6.4 / Single-Core | |
| Apple MacBook Pro 16 2023 M3 Pro | |
| Lenovo ThinkPad P1 G6 21FV001KUS | |
| HP ZBook Power 16 G11 A | |
| Média da turma Workstation (2352 - 2949, n=23, últimos 2 anos) | |
| Dell Precision 5690 | |
| Dell XPS 16 9640 | |
| Lenovo ThinkPad P1 Gen 7 21KV001SGE | |
| Média Intel Core Ultra 7 155H (1901 - 2473, n=52) | |
| Geekbench 5.5 / Multi-Core | |
| Apple MacBook Pro 16 2023 M3 Pro | |
| Dell Precision 5690 | |
| Dell XPS 16 9640 | |
| Média da turma Workstation (8863 - 19316, n=25, últimos 2 anos) | |
| Lenovo ThinkPad P1 Gen 7 21KV001SGE | |
| Lenovo ThinkPad P1 G6 21FV001KUS | |
| Média Intel Core Ultra 7 155H (10017 - 13556, n=52) | |
| HP ZBook Power 16 G11 A | |
| Geekbench 5.5 / Single-Core | |
| Apple MacBook Pro 16 2023 M3 Pro | |
| Lenovo ThinkPad P1 G6 21FV001KUS | |
| HP ZBook Power 16 G11 A | |
| Média da turma Workstation (1740 - 2095, n=25, últimos 2 anos) | |
| Dell Precision 5690 | |
| Lenovo ThinkPad P1 Gen 7 21KV001SGE | |
| Dell XPS 16 9640 | |
| Média Intel Core Ultra 7 155H (1462 - 1824, n=52) | |
| HWBOT x265 Benchmark v2.2 / 4k Preset | |
| Dell Precision 5690 | |
| Lenovo ThinkPad P1 Gen 7 21KV001SGE | |
| Dell XPS 16 9640 | |
| Média da turma Workstation (14.4 - 33, n=25, últimos 2 anos) | |
| Lenovo ThinkPad P1 G6 21FV001KUS | |
| HP ZBook Power 16 G11 A | |
| Média Intel Core Ultra 7 155H (9.93 - 21.2, n=50) | |
| LibreOffice / 20 Documents To PDF | |
| HP ZBook Power 16 G11 A | |
| Média Intel Core Ultra 7 155H (37.5 - 79.2, n=49) | |
| Média da turma Workstation (36.5 - 56.9, n=25, últimos 2 anos) | |
| Dell XPS 16 9640 | |
| Lenovo ThinkPad P1 G6 21FV001KUS | |
| Lenovo ThinkPad P1 Gen 7 21KV001SGE | |
| Dell Precision 5690 | |
| R Benchmark 2.5 / Overall mean | |
| Dell XPS 16 9640 | |
| Média Intel Core Ultra 7 155H (0.4457 - 0.53, n=49) | |
| Lenovo ThinkPad P1 Gen 7 21KV001SGE | |
| Dell Precision 5690 | |
| HP ZBook Power 16 G11 A | |
| Média da turma Workstation (0.3825 - 0.4888, n=25, últimos 2 anos) | |
| Lenovo ThinkPad P1 G6 21FV001KUS | |
* ... menor é melhor
AIDA64: FP32 Ray-Trace | FPU Julia | CPU SHA3 | CPU Queen | FPU SinJulia | FPU Mandel | CPU AES | CPU ZLib | FP64 Ray-Trace | CPU PhotoWorxx
| Performance Rating | |
| Média da turma Workstation | |
| Dell Precision 5690 | |
| Dell XPS 16 9640 | |
| Lenovo ThinkPad P1 Gen 7 21KV001SGE | |
| Lenovo ThinkPad P1 G6 21FV001KUS | |
| Média Intel Core Ultra 7 155H | |
| AIDA64 / FP32 Ray-Trace | |
| Média da turma Workstation (10658 - 61611, n=25, últimos 2 anos) | |
| Dell Precision 5690 | |
| Lenovo ThinkPad P1 Gen 7 21KV001SGE | |
| Dell XPS 16 9640 | |
| Lenovo ThinkPad P1 G6 21FV001KUS | |
| Média Intel Core Ultra 7 155H (6670 - 18470, n=50) | |
| AIDA64 / FPU Julia | |
| Dell Precision 5690 | |
| Média da turma Workstation (56664 - 183843, n=25, últimos 2 anos) | |
| Lenovo ThinkPad P1 Gen 7 21KV001SGE | |
| Dell XPS 16 9640 | |
| Lenovo ThinkPad P1 G6 21FV001KUS | |
| Média Intel Core Ultra 7 155H (40905 - 93181, n=50) | |
| AIDA64 / CPU SHA3 | |
| Dell Precision 5690 | |
| Média da turma Workstation (2608 - 8341, n=25, últimos 2 anos) | |
| Lenovo ThinkPad P1 Gen 7 21KV001SGE | |
| Dell XPS 16 9640 | |
| Lenovo ThinkPad P1 G6 21FV001KUS | |
| Média Intel Core Ultra 7 155H (1940 - 4436, n=50) | |
| AIDA64 / CPU Queen | |
| Lenovo ThinkPad P1 G6 21FV001KUS | |
| Média da turma Workstation (84022 - 144411, n=25, últimos 2 anos) | |
| Dell Precision 5690 | |
| Lenovo ThinkPad P1 Gen 7 21KV001SGE | |
| Dell XPS 16 9640 | |
| Média Intel Core Ultra 7 155H (64698 - 94181, n=50) | |
| AIDA64 / FPU SinJulia | |
| Média da turma Workstation (7906 - 29343, n=25, últimos 2 anos) | |
| Dell Precision 5690 | |
| Lenovo ThinkPad P1 G6 21FV001KUS | |
| Dell XPS 16 9640 | |
| Lenovo ThinkPad P1 Gen 7 21KV001SGE | |
| Média Intel Core Ultra 7 155H (5639 - 10647, n=50) | |
| AIDA64 / FPU Mandel | |
| Média da turma Workstation (27301 - 97385, n=25, últimos 2 anos) | |
| Dell Precision 5690 | |
| Lenovo ThinkPad P1 Gen 7 21KV001SGE | |
| Dell XPS 16 9640 | |
| Lenovo ThinkPad P1 G6 21FV001KUS | |
| Média Intel Core Ultra 7 155H (18236 - 47685, n=50) | |
| AIDA64 / CPU AES | |
| Dell Precision 5690 | |
| Média da turma Workstation (56077 - 187841, n=25, últimos 2 anos) | |
| Lenovo ThinkPad P1 Gen 7 21KV001SGE | |
| Dell XPS 16 9640 | |
| Lenovo ThinkPad P1 G6 21FV001KUS | |
| Média Intel Core Ultra 7 155H (45713 - 152179, n=50) | |
| AIDA64 / CPU ZLib | |
| Dell Precision 5690 | |
| Lenovo ThinkPad P1 Gen 7 21KV001SGE | |
| Dell XPS 16 9640 | |
| Lenovo ThinkPad P1 G6 21FV001KUS | |
| Média da turma Workstation (742 - 2057, n=25, últimos 2 anos) | |
| Média Intel Core Ultra 7 155H (557 - 1250, n=50) | |
| AIDA64 / FP64 Ray-Trace | |
| Média da turma Workstation (5580 - 32891, n=25, últimos 2 anos) | |
| Dell Precision 5690 | |
| Lenovo ThinkPad P1 Gen 7 21KV001SGE | |
| Lenovo ThinkPad P1 G6 21FV001KUS | |
| Dell XPS 16 9640 | |
| Média Intel Core Ultra 7 155H (3569 - 9802, n=50) | |
| AIDA64 / CPU PhotoWorxx | |
| Dell XPS 16 9640 | |
| Dell Precision 5690 | |
| Média Intel Core Ultra 7 155H (32719 - 54223, n=50) | |
| Média da turma Workstation (24325 - 93684, n=25, últimos 2 anos) | |
| Lenovo ThinkPad P1 Gen 7 21KV001SGE | |
| Lenovo ThinkPad P1 G6 21FV001KUS | |
Desempenho do sistema
Não há nada a reclamar quando se trata do desempenho do sistema. Como é de se esperar de uma unidade tão cara, o Lenovo ThinkPad P1 Gen 7 funciona muito rápido.
Os benchmarks de memória são interessantes: A memória LPCAMM2 é muito mais rápida que a RAM DDR5 do predecessor, mas ainda fica atrás da concorrência soldada da Dell.
CrossMark: Overall | Productivity | Creativity | Responsiveness
WebXPRT 3: Overall
WebXPRT 4: Overall
Mozilla Kraken 1.1: Total
| PCMark 10 / Score | |
| Dell Precision 5690 | |
| Lenovo ThinkPad P1 G6 21FV001KUS | |
| Média da turma Workstation (6336 - 8587, n=25, últimos 2 anos) | |
| Lenovo ThinkPad P1 Gen 7 21KV001SGE | |
| Dell XPS 16 9640 | |
| Média Intel Core Ultra 7 155H, NVIDIA GeForce RTX 4060 Laptop GPU (6751 - 7370, n=5) | |
| PCMark 10 / Essentials | |
| Lenovo ThinkPad P1 G6 21FV001KUS | |
| Dell Precision 5690 | |
| Média da turma Workstation (9647 - 12197, n=25, últimos 2 anos) | |
| Lenovo ThinkPad P1 Gen 7 21KV001SGE | |
| Dell XPS 16 9640 | |
| Média Intel Core Ultra 7 155H, NVIDIA GeForce RTX 4060 Laptop GPU (9476 - 10446, n=5) | |
| PCMark 10 / Productivity | |
| Dell Precision 5690 | |
| Lenovo ThinkPad P1 G6 21FV001KUS | |
| Média da turma Workstation (8829 - 10820, n=25, últimos 2 anos) | |
| Dell XPS 16 9640 | |
| Lenovo ThinkPad P1 Gen 7 21KV001SGE | |
| Média Intel Core Ultra 7 155H, NVIDIA GeForce RTX 4060 Laptop GPU (8079 - 9477, n=5) | |
| PCMark 10 / Digital Content Creation | |
| Lenovo ThinkPad P1 G6 21FV001KUS | |
| Dell Precision 5690 | |
| Lenovo ThinkPad P1 Gen 7 21KV001SGE | |
| Média da turma Workstation (7589 - 15093, n=25, últimos 2 anos) | |
| Média Intel Core Ultra 7 155H, NVIDIA GeForce RTX 4060 Laptop GPU (9811 - 11620, n=5) | |
| Dell XPS 16 9640 | |
| CrossMark / Overall | |
| Apple MacBook Pro 16 2023 M3 Pro | |
| Dell XPS 16 9640 | |
| Lenovo ThinkPad P1 G6 21FV001KUS | |
| Dell Precision 5690 | |
| Média da turma Workstation (1574 - 2037, n=23, últimos 2 anos) | |
| Lenovo ThinkPad P1 Gen 7 21KV001SGE | |
| Média Intel Core Ultra 7 155H, NVIDIA GeForce RTX 4060 Laptop GPU (1540 - 1746, n=5) | |
| CrossMark / Productivity | |
| Apple MacBook Pro 16 2023 M3 Pro | |
| Dell XPS 16 9640 | |
| Dell Precision 5690 | |
| Lenovo ThinkPad P1 G6 21FV001KUS | |
| Média da turma Workstation (1546 - 1902, n=23, últimos 2 anos) | |
| Lenovo ThinkPad P1 Gen 7 21KV001SGE | |
| Média Intel Core Ultra 7 155H, NVIDIA GeForce RTX 4060 Laptop GPU (1436 - 1684, n=5) | |
| CrossMark / Creativity | |
| Apple MacBook Pro 16 2023 M3 Pro | |
| Lenovo ThinkPad P1 G6 21FV001KUS | |
| Dell Precision 5690 | |
| Média da turma Workstation (1655 - 2412, n=23, últimos 2 anos) | |
| Dell XPS 16 9640 | |
| Lenovo ThinkPad P1 Gen 7 21KV001SGE | |
| Média Intel Core Ultra 7 155H, NVIDIA GeForce RTX 4060 Laptop GPU (1811 - 1929, n=5) | |
| CrossMark / Responsiveness | |
| Dell XPS 16 9640 | |
| Dell Precision 5690 | |
| Lenovo ThinkPad P1 G6 21FV001KUS | |
| Média da turma Workstation (1304 - 1730, n=23, últimos 2 anos) | |
| Apple MacBook Pro 16 2023 M3 Pro | |
| Média Intel Core Ultra 7 155H, NVIDIA GeForce RTX 4060 Laptop GPU (1165 - 1631, n=5) | |
| Lenovo ThinkPad P1 Gen 7 21KV001SGE | |
| WebXPRT 3 / Overall | |
| Apple MacBook Pro 16 2023 M3 Pro | |
| Lenovo ThinkPad P1 G6 21FV001KUS | |
| Média da turma Workstation (259 - 415, n=26, últimos 2 anos) | |
| Dell Precision 5690 | |
| Lenovo ThinkPad P1 Gen 7 21KV001SGE | |
| Dell XPS 16 9640 | |
| Média Intel Core Ultra 7 155H, NVIDIA GeForce RTX 4060 Laptop GPU (274 - 290, n=5) | |
| WebXPRT 4 / Overall | |
| Lenovo ThinkPad P1 G6 21FV001KUS | |
| Dell Precision 5690 | |
| Média da turma Workstation (199.4 - 338, n=22, últimos 2 anos) | |
| Lenovo ThinkPad P1 Gen 7 21KV001SGE | |
| Dell XPS 16 9640 | |
| Média Intel Core Ultra 7 155H, NVIDIA GeForce RTX 4060 Laptop GPU (236 - 262, n=5) | |
| Mozilla Kraken 1.1 / Total | |
| Média Intel Core Ultra 7 155H, NVIDIA GeForce RTX 4060 Laptop GPU (519 - 585, n=5) | |
| Lenovo ThinkPad P1 Gen 7 21KV001SGE | |
| Média da turma Workstation (433 - 591, n=26, últimos 2 anos) | |
| Dell Precision 5690 | |
| Lenovo ThinkPad P1 G6 21FV001KUS | |
| Apple MacBook Pro 16 2023 M3 Pro | |
* ... menor é melhor
| PCMark 10 Score | 7370 pontos | |
Ajuda | ||
| AIDA64 / Memory Copy | |
| Dell XPS 16 9640 | |
| Dell Precision 5690 | |
| Média Intel Core Ultra 7 155H (62397 - 96791, n=50) | |
| Média da turma Workstation (34323 - 158632, n=25, últimos 2 anos) | |
| Lenovo ThinkPad P1 Gen 7 21KV001SGE | |
| Lenovo ThinkPad P1 G6 21FV001KUS | |
| AIDA64 / Memory Read | |
| Dell Precision 5690 | |
| Dell XPS 16 9640 | |
| Média Intel Core Ultra 7 155H (60544 - 90647, n=50) | |
| Média da turma Workstation (30787 - 121177, n=25, últimos 2 anos) | |
| Lenovo ThinkPad P1 Gen 7 21KV001SGE | |
| Lenovo ThinkPad P1 G6 21FV001KUS | |
| AIDA64 / Memory Write | |
| Média da turma Workstation (39166 - 212172, n=25, últimos 2 anos) | |
| Dell Precision 5690 | |
| Dell XPS 16 9640 | |
| Média Intel Core Ultra 7 155H (58692 - 93451, n=50) | |
| Lenovo ThinkPad P1 Gen 7 21KV001SGE | |
| Lenovo ThinkPad P1 G6 21FV001KUS | |
| AIDA64 / Memory Latency | |
| Média Intel Core Ultra 7 155H (116.2 - 233, n=50) | |
| Dell Precision 5690 | |
| Dell XPS 16 9640 | |
| Lenovo ThinkPad P1 Gen 7 21KV001SGE | |
| Média da turma Workstation (83.4 - 165.2, n=25, últimos 2 anos) | |
| Lenovo ThinkPad P1 G6 21FV001KUS | |
* ... menor é melhor
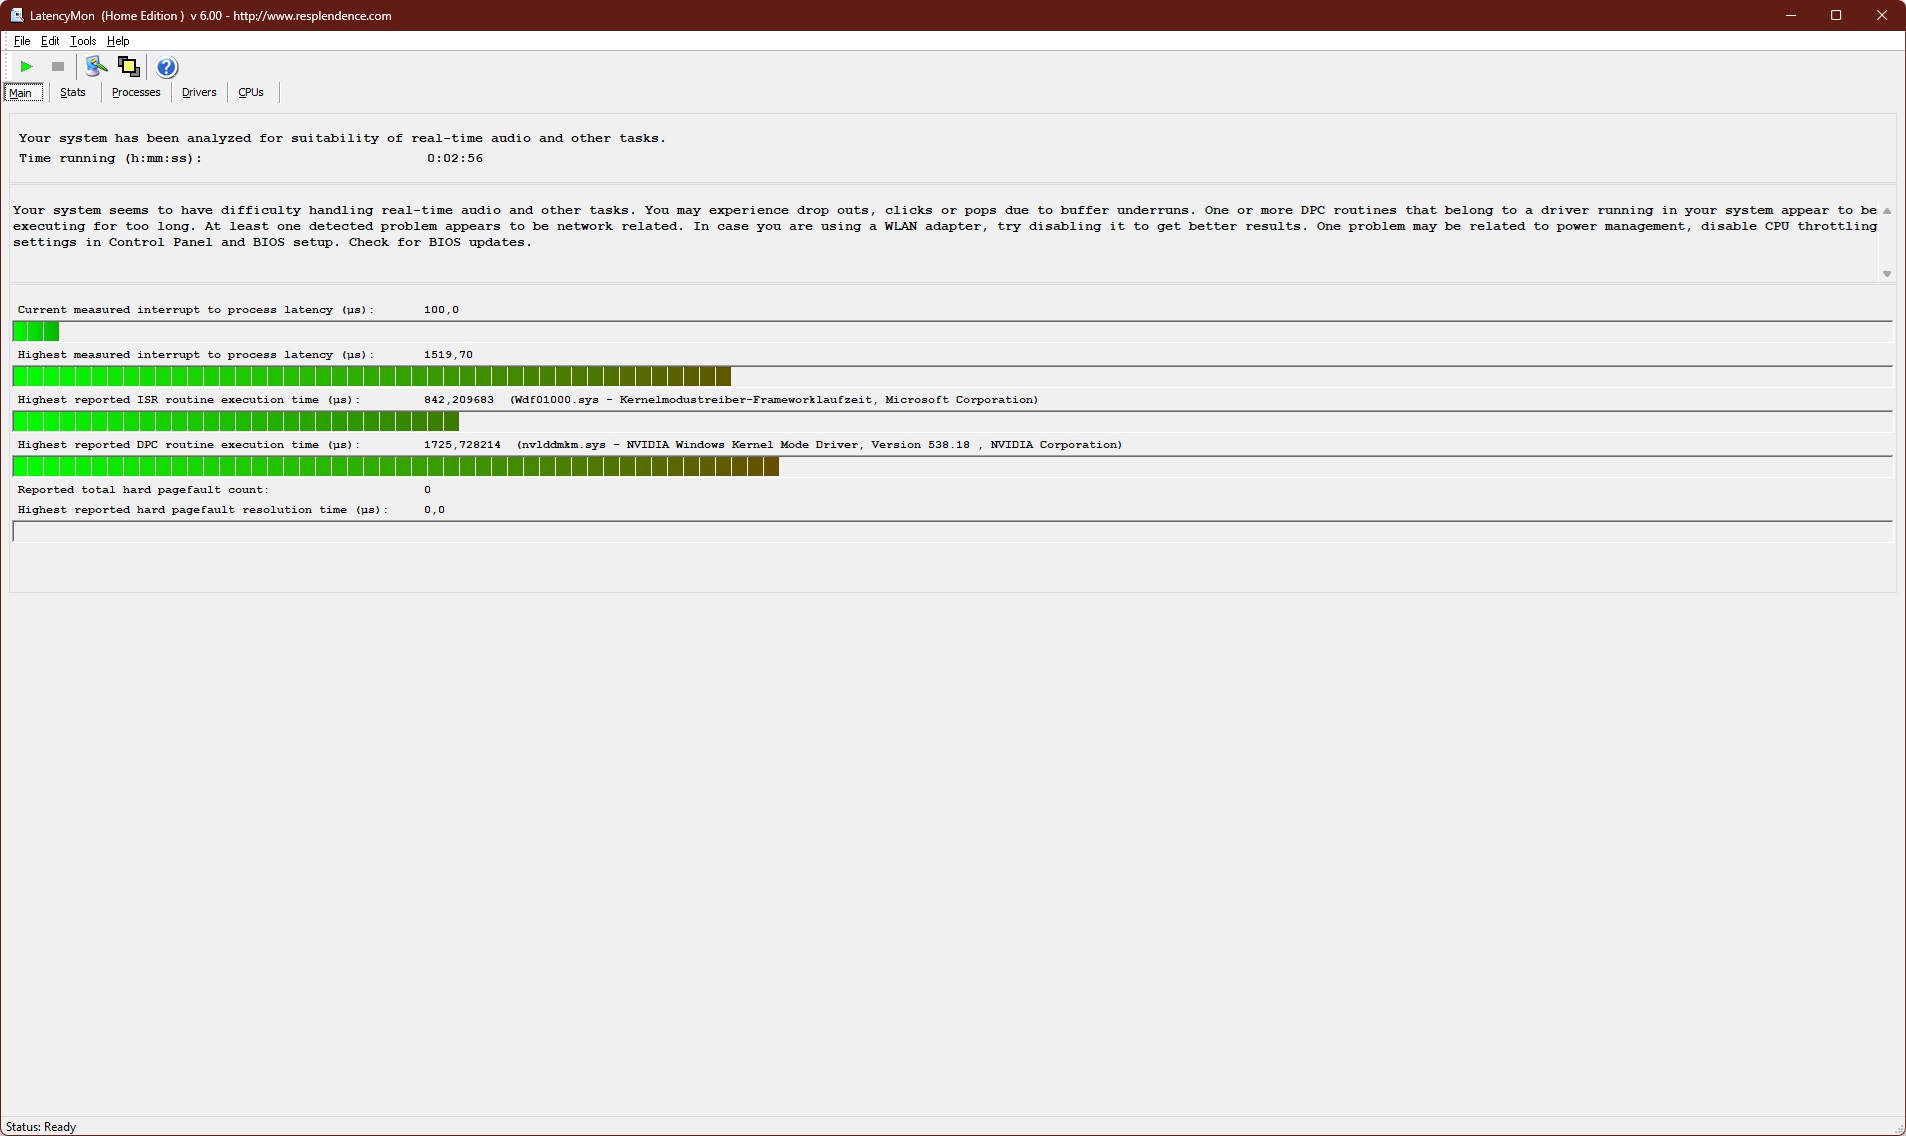
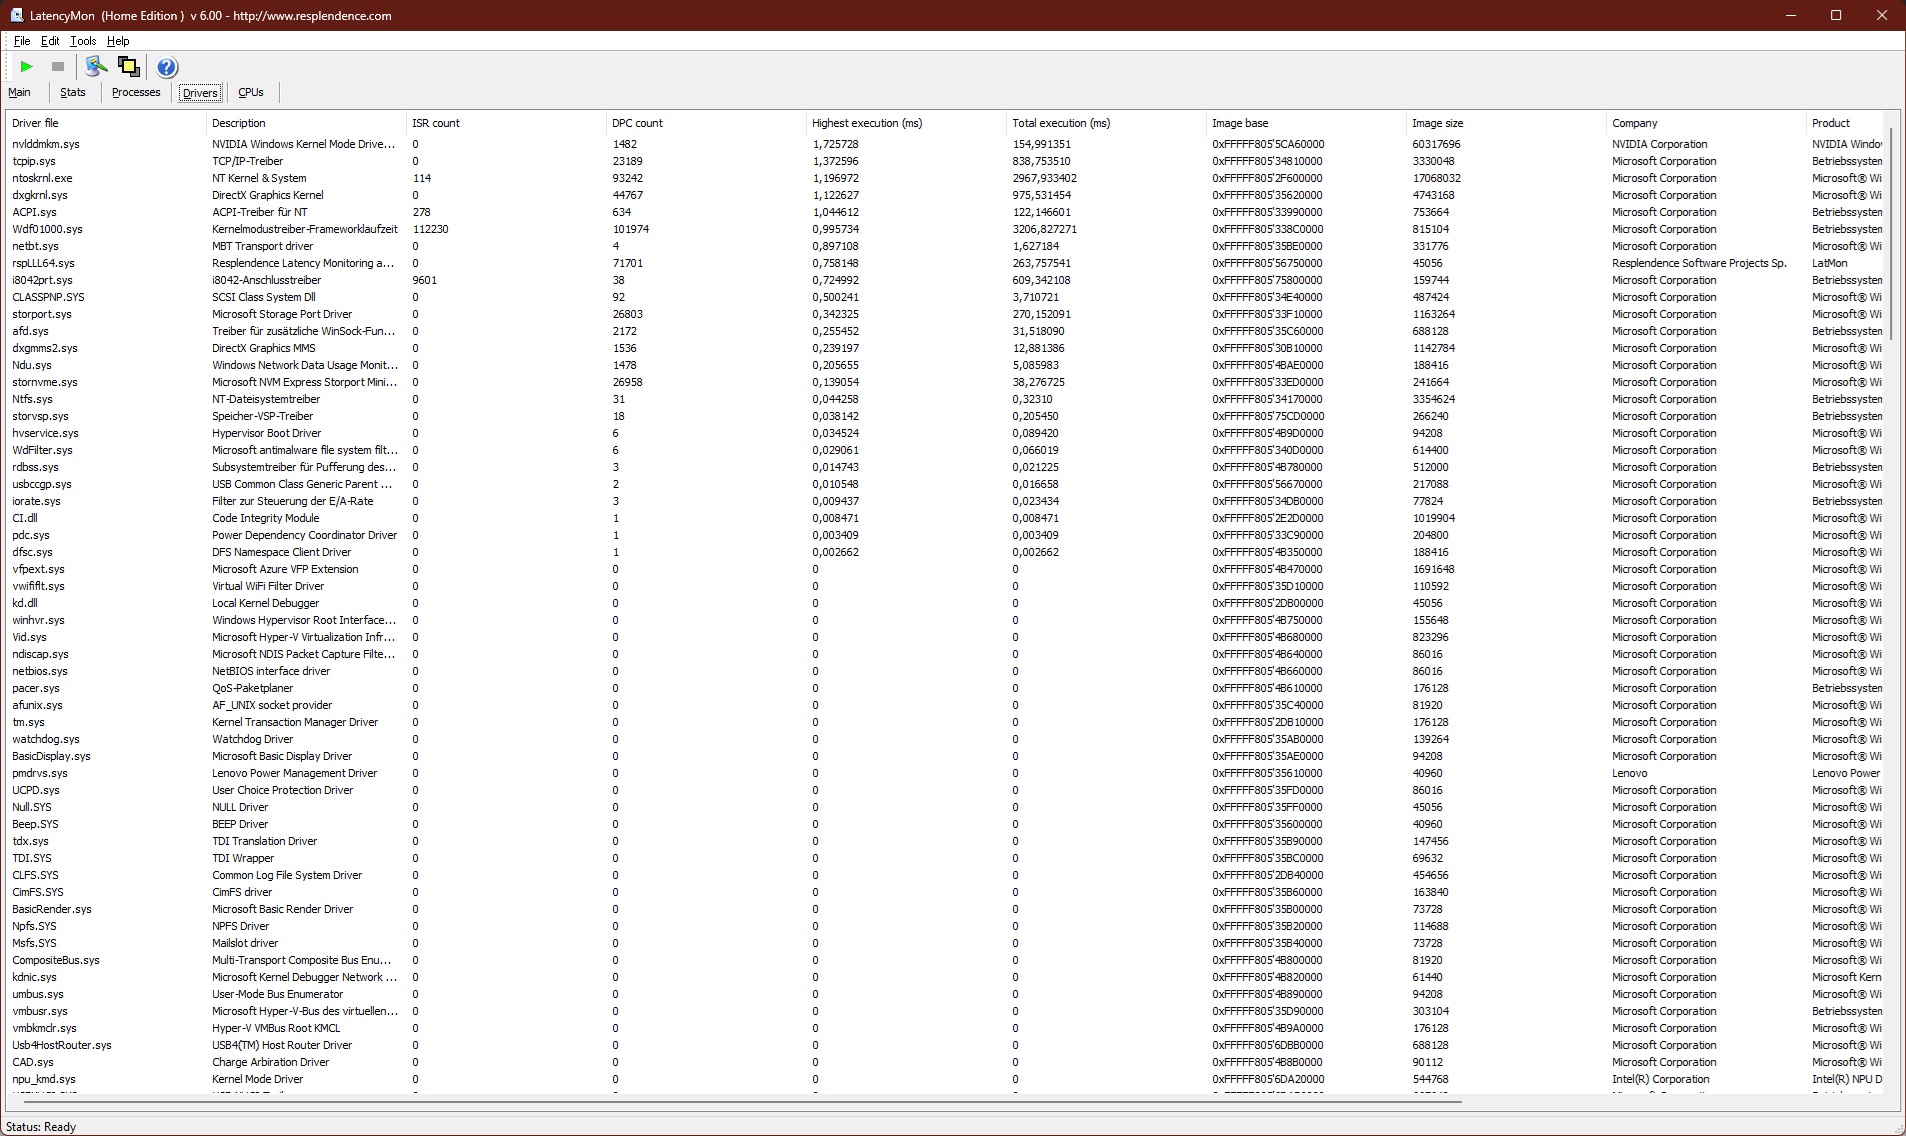
Latência DPC
O ThinkPad P1 G7 da Lenovo parece ter alguns problemas com quedas de sinal induzidas pela latência do DPC. A causa principal parece ser o driver da Nvidia. Quando o ThinkPad é usado com a GPU da Nvidia desativada, o problema pode desaparecer.
| DPC Latencies / LatencyMon - interrupt to process latency (max), Web, Youtube, Prime95 | |
| Lenovo ThinkPad P1 Gen 7 21KV001SGE | |
| Lenovo ThinkPad P1 G6 21FV001KUS | |
| Dell XPS 16 9640 | |
| Dell Precision 5690 | |
* ... menor é melhor
Armazenamento
A Lenovo usa um SSD Kioxia com capacidade de um terabyte. A SSD NVMe PCIe 4.0 não apresenta degradação de desempenho sob carga contínua, mas não é extremamente rápida. No entanto, no uso diário, as diferenças em relação às SSDs da concorrência não serão aparentes.
Conforme mencionado na seção de manutenção: O Lenovo ThinkPad P1 Gen 7 tem dois slots M.2 2280, um dos quais permanece aberto em nossa unidade. Outro SSD pode ser adicionado. O ThinkPad P1 Gen 7 também suporta RAID 0/1.

| Drive Performance Rating - Percent | |
| Dell XPS 16 9640 | |
| Dell Precision 5690 | |
| Média da turma Workstation | |
| Média Kioxia XG8 KXG8AZNV1T02 | |
| Lenovo ThinkPad P1 G6 21FV001KUS | |
| Lenovo ThinkPad P1 Gen 7 21KV001SGE | |
* ... menor é melhor
Sustained performance read: DiskSpd Read Loop, Queue Depth 8
GPU
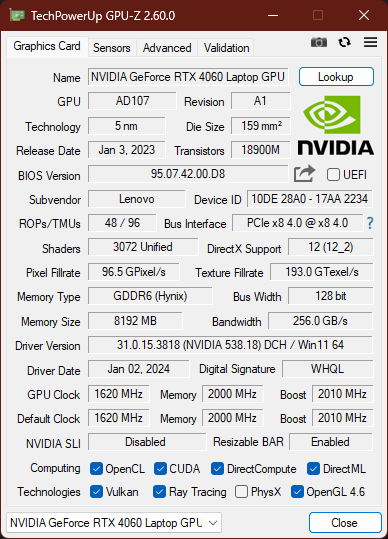
Com o Laptop Nvidia GeForce RTX 4060o Lenovo ThinkPad P1 Gen 7 oferece uma solução de médio porte da série Ada Lovelace. Como alternativa, o GeForce RTX 4070 ou RTX 3000 Ada podem oferecer ainda mais desempenho. As verdadeiras GPUs de ponta, que estavam disponíveis no ThinkPad P1 Gen 6 (RTX 4000 Ada, RTX 5000 Ada, GeForce RTX 4080, GeForce RTX 4090) não podem ser encontrados aqui.
Isso significa que o Lenovo ThinkPad P1 Gen 7 é um downgrade de GPU em comparação com a estação de trabalho ThinkPad mais antiga. Esse downgrade é especialmente aparente quando se trata de VRAM: o P1 G6 oferecia até 16 GB de VRAM, que é reduzido pela metade para 8 GB no P1 Gen 7. Pelo menos, a GeForce RTX 4060 aqui não é lenta. Nos benchmarks 3DMark, ele é quase tão rápido quanto o RTX 4070 no Dell XPS 16. O TGP da GPU fica em 80 W.
É um pouco triste que o ThinkPad P1 Gen 7 não ofereça mais o Advanced Optimus. Com o predecessor, o interruptor MUX no BIOS permitiu uma operação dGPU pura - não é mais possível aqui.
No modo de bateria, o desempenho da GPU é ligeiramente limitado. No 3DMark 11, o Lenovo ThinkPad P1 Gen 7 marcou 25.134 pontos em vez de 32.372, uma redução de 22 por cento.
| 3DMark 11 Performance | 28509 pontos | |
| 3DMark Fire Strike Score | 21488 pontos | |
| 3DMark Time Spy Score | 9572 pontos | |
Ajuda | ||
| SPECviewperf Performance Rating - Percent | |
| Dell Precision 5690 -1! | |
| Lenovo ThinkPad P1 G6 21FV001KUS -1! | |
| Média da turma Workstation | |
| Média NVIDIA GeForce RTX 4060 Laptop GPU -1! | |
| Lenovo ThinkPad P1 Gen 7 21KV001SGE -1! | |
* ... menor é melhor
Desempenho em jogos
Os jogos certamente são possíveis com o P1 Gen 7, mas ele fica abaixo do ThinkPad P1 Gen 8 com seu Nvidia GeForce RTX 4080. Pelo menos nesse aspecto, o ThinkPad P1 Gen 7 pode vencer o Dell XPS 16, apesar de ele ter um RTX 4070. É claro que jogar jogos com o Lenovo ThinkPad P1 Gen 7 é um pouco como dirigir uma Ferrari em uma rua pública - ele é feito para diferentes aplicações.
| Performance Rating - Percent | |
| Lenovo ThinkPad P1 G6 21FV001KUS | |
| Dell Precision 5690 -1! | |
| Lenovo ThinkPad P1 Gen 7 21KV001SGE | |
| Dell XPS 16 9640 | |
| Média da turma Workstation | |
| Apple MacBook Pro 16 2023 M3 Pro -3! | |
| GTA V - 1920x1080 Highest Settings possible AA:4xMSAA + FX AF:16x | |
| Lenovo ThinkPad P1 G6 21FV001KUS | |
| Dell XPS 16 9640 | |
| Lenovo ThinkPad P1 Gen 7 21KV001SGE | |
| Média da turma Workstation (18.3 - 126.7, n=21, últimos 2 anos) | |
| Apple MacBook Pro 16 2023 M3 Pro | |
| Final Fantasy XV Benchmark - 1920x1080 High Quality | |
| Lenovo ThinkPad P1 G6 21FV001KUS | |
| Dell Precision 5690 | |
| Dell XPS 16 9640 | |
| Lenovo ThinkPad P1 Gen 7 21KV001SGE | |
| Média da turma Workstation (21.2 - 174.6, n=25, últimos 2 anos) | |
| Dota 2 Reborn - 1920x1080 ultra (3/3) best looking | |
| Lenovo ThinkPad P1 G6 21FV001KUS | |
| Dell Precision 5690 | |
| Lenovo ThinkPad P1 Gen 7 21KV001SGE | |
| Média da turma Workstation (64.8 - 178.4, n=25, últimos 2 anos) | |
| Dell XPS 16 9640 | |
| X-Plane 11.11 - 1920x1080 high (fps_test=3) | |
| Lenovo ThinkPad P1 G6 21FV001KUS | |
| Dell Precision 5690 | |
| Dell XPS 16 9640 | |
| Dell XPS 16 9640 | |
| Lenovo ThinkPad P1 Gen 7 21KV001SGE | |
| Média da turma Workstation (27.7 - 139.7, n=26, últimos 2 anos) | |
No teste de carga do Cyberpunk , não houve grandes quedas na taxa de quadros.
Cyberpunk 2077 ultra FPS diagram
| baixo | média | alto | ultra | QHD | 4K | |
|---|---|---|---|---|---|---|
| GTA V (2015) | 176.4 | 168 | 162.9 | 97.9 | 77.6 | 73.1 |
| Dota 2 Reborn (2015) | 161.5 | 146.7 | 138.2 | 131.2 | ||
| Final Fantasy XV Benchmark (2018) | 174.2 | 122.7 | 90.3 | 68.1 | ||
| X-Plane 11.11 (2018) | 124.4 | 105.9 | 83.3 | |||
| Far Cry 5 (2018) | 148 | 125 | 118 | 110 | 88 | |
| Baldur's Gate 3 (2023) | 102.8 | 77.5 | 68.7 | 67.4 | 45.2 | |
| Cyberpunk 2077 2.2 Phantom Liberty (2023) | 106.9 | 85.7 | 74.4 | 65.1 | 41 | 16.9 |
| F1 24 (2024) | 190.1 | 175.5 | 142.5 | 47.5 | 31.8 |
Emissões: O apoio para as mãos do laptop Lenovo permanece frio
Ruído
Não se pode esperar que uma unidade otimizada para o desempenho como o Lenovo ThinkPad P1 Gen 7 seja sempre silenciosa. Quando está em marcha lenta, as duas ventoinhas não estão funcionando, mas já ficam muito altas sob carga média (perfil de energia: Equilibrado). Sob carga máxima no teste de estresse (perfil de energia: Melhor desempenho), medimos 53 dB(a) - muito alto, mas normal para um laptop de estação de trabalho. No geral, não chamaríamos o ThinkPad P1 Gen 7 de um notebook muito barulhento. As ventoinhas são barulhentas, mas param de funcionar assim que o sistema volta a ficar em marcha lenta.
O Lenovo ThinkPad P1 Gen 7 não produz nenhum ruído de bobina.
Barulho
| Ocioso |
| 24.7 / 24.7 / 24.7 dB |
| Carga |
| 43.7 / 53.3 dB |
 | ||
30 dB silencioso 40 dB(A) audível 50 dB(A) ruidosamente alto |
||
min: | ||
| Lenovo ThinkPad P1 Gen 7 21KV001SGE NVIDIA GeForce RTX 4060 Laptop GPU, Ultra 7 155H, Kioxia XG8 KXG8AZNV1T02 | Lenovo ThinkPad P1 G6 21FV001KUS NVIDIA GeForce RTX 4080 Laptop GPU, i7-13800H, Kioxia XG8 KXG8AZNV1T02 | Apple MacBook Pro 16 2023 M3 Pro M3 Pro 18-Core GPU, Apple M3 Pro 12-Core, Apple SSD AP0512Z | Dell XPS 16 9640 NVIDIA GeForce RTX 4070 Laptop GPU, Ultra 7 155H, Kioxia XG8 KXG80ZNV1T02 | Dell Precision 5690 NVIDIA RTX 5000 Ada Generation Laptop GPU, Ultra 9 185H, 2x Samsung PM9A1 1TB (RAID 0) | |
|---|---|---|---|---|---|
| Noise | 11% | 8% | 1% | -1% | |
| desligado / ambiente * | 24.7 | 22.5 9% | 24.4 1% | 24.5 1% | 23.4 5% |
| Idle Minimum * | 24.7 | 22.5 9% | 24.4 1% | 24.5 1% | 23.6 4% |
| Idle Average * | 24.7 | 22.5 9% | 24.4 1% | 24.5 1% | 24.9 -1% |
| Idle Maximum * | 24.7 | 22.5 9% | 24.4 1% | 27.5 -11% | 30.9 -25% |
| Load Average * | 43.7 | 28.7 34% | 26.9 38% | 39.6 9% | 40.4 8% |
| Cyberpunk 2077 ultra * | 53.2 | ||||
| Load Maximum * | 53.3 | 54.4 -2% | 50.4 5% | 49.7 7% | 51.9 3% |
| Witcher 3 ultra * | 47.5 | 25.1 | 49.7 | 48.3 |
* ... menor é melhor
Calor
A temperatura máxima do chassi chega a 50 graus Celsius / 123 F. Esse ponto quente fica acima do teclado, uma área que o usuário normalmente não toca. A parte inferior do dispositivo permanece fria, não importa se no teste de estresse ou no teste de jogos Cyberpunk.
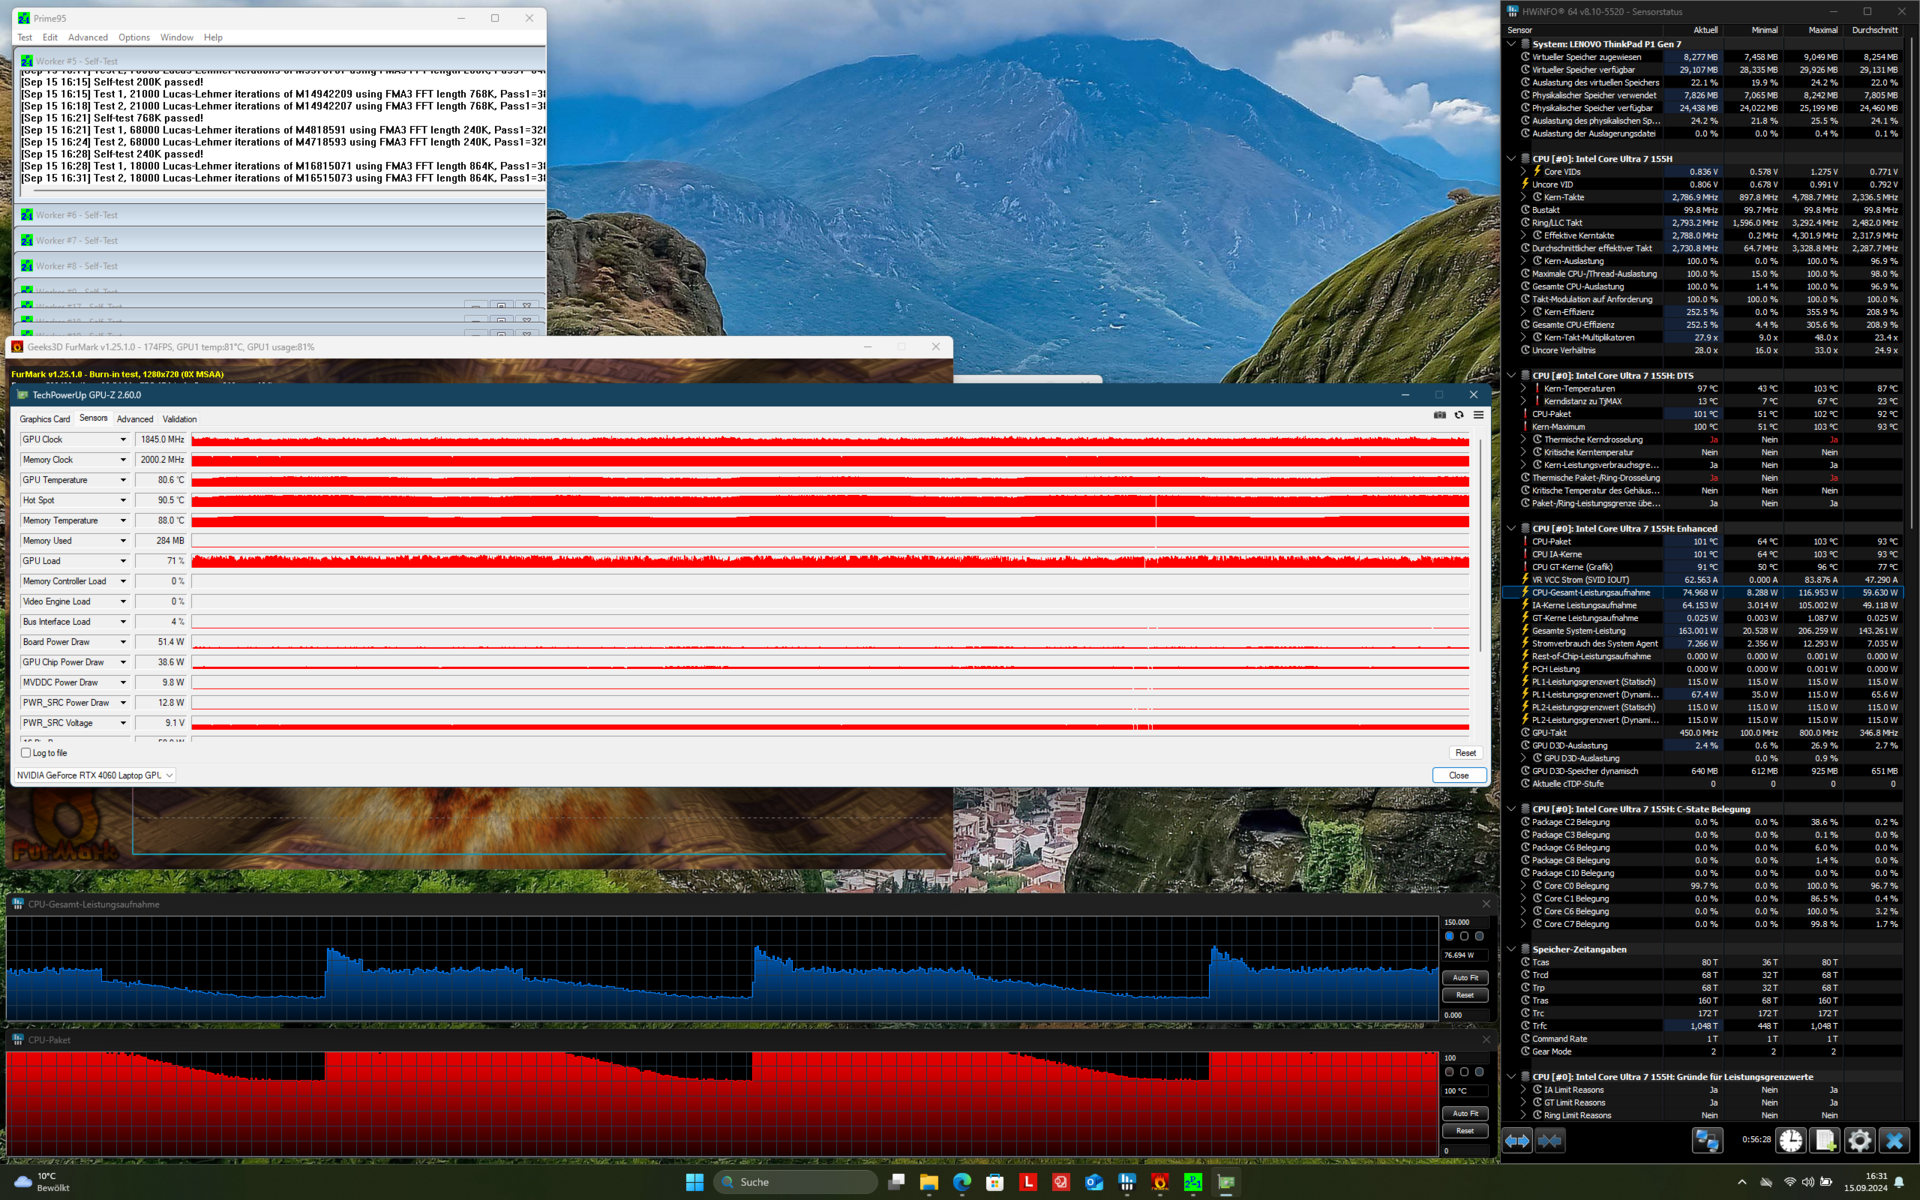
Apesar de ter duas ventoinhas, metal líquido e uma câmara de vapor, o Lenovo ThinkPad P1 Gen 7 não consegue resfriar a CPU e a GPU sem estrangulamento sob carga contínua. Ambos os componentes têm que ser limitados no teste de estresse, com a GPU funcionando a 50 W e a CPU a 70 W. O desempenho da CPU sobe e desce em uma espécie de padrão de "onda".
(-) A temperatura máxima no lado superior é 50.3 °C / 123 F, em comparação com a média de 38.2 °C / 101 F , variando de 22.2 a 69.8 °C para a classe Workstation.
(+) A parte inferior aquece até um máximo de 38 °C / 100 F, em comparação com a média de 41.2 °C / 106 F
(+) Em uso inativo, a temperatura média para o lado superior é 24.9 °C / 77 F, em comparação com a média do dispositivo de 32 °C / ### class_avg_f### F.
(±) 3: The average temperature for the upper side is 32.2 °C / 90 F, compared to the average of 32 °C / 90 F for the class Workstation.
(+) Os apoios para as mãos e o touchpad são mais frios que a temperatura da pele, com um máximo de 30.2 °C / 86.4 F e, portanto, são frios ao toque.
(-) A temperatura média da área do apoio para as mãos de dispositivos semelhantes foi 27.8 °C / 82 F (-2.4 °C / -4.4 F).
| Lenovo ThinkPad P1 Gen 7 21KV001SGE Intel Core Ultra 7 155H, NVIDIA GeForce RTX 4060 Laptop GPU | Lenovo ThinkPad P1 G6 21FV001KUS Intel Core i7-13800H, NVIDIA GeForce RTX 4080 Laptop GPU | Apple MacBook Pro 16 2023 M3 Pro Apple M3 Pro 12-Core, Apple M3 Pro 18-Core GPU | Dell XPS 16 9640 Intel Core Ultra 7 155H, NVIDIA GeForce RTX 4070 Laptop GPU | Dell Precision 5690 Intel Core Ultra 9 185H, Nvidia RTX 5000 Ada Generation Laptop GPU | |
|---|---|---|---|---|---|
| Heat | -14% | 13% | 6% | -1% | |
| Maximum Upper Side * | 50.3 | 42 17% | 38.1 24% | 39.4 22% | 46.6 7% |
| Maximum Bottom * | 38 | 45.2 -19% | 37 3% | 36.9 3% | 33 13% |
| Idle Upper Side * | 28.3 | 33 -17% | 24.2 14% | 28.2 -0% | 32.4 -14% |
| Idle Bottom * | 27.3 | 37 -36% | 24.6 10% | 27.4 -0% | 29.4 -8% |
* ... menor é melhor
Alto-falantes
Em vez de alto-falantes voltados para cima, como o antecessor ThinkPad P1 Gen 6o ThinkPad P1 Gen 7 tem alto-falantes que disparam para baixo. A qualidade dos alto-falantes estéreo ainda é excelente, mesmo que o volume máximo seja um pouco menor em comparação com o modelo do ano passado.
Lenovo ThinkPad P1 Gen 7 21KV001SGE análise de áudio
(±) | o volume do alto-falante é médio, mas bom (###valor### dB)
Graves 100 - 315Hz
(±) | graves reduzidos - em média 6.8% menor que a mediana
(±) | a linearidade dos graves é média (10.3% delta para a frequência anterior)
Médios 400 - 2.000 Hz
(+) | médios equilibrados - apenas 3.4% longe da mediana
(+) | médios são lineares (4.7% delta para frequência anterior)
Altos 2 - 16 kHz
(+) | agudos equilibrados - apenas 3.1% longe da mediana
(+) | os máximos são lineares (6% delta da frequência anterior)
Geral 100 - 16.000 Hz
(+) | o som geral é linear (9.2% diferença em relação à mediana)
Comparado com a mesma classe
» 3% de todos os dispositivos testados nesta classe foram melhores, 2% semelhantes, 94% piores
» O melhor teve um delta de 7%, a média foi 18%, o pior foi 35%
Comparado com todos os dispositivos testados
» 3% de todos os dispositivos testados foram melhores, 1% semelhantes, 97% piores
» O melhor teve um delta de 4%, a média foi 24%, o pior foi 134%
Lenovo ThinkPad P1 G6 21FV001KUS análise de áudio
(+) | os alto-falantes podem tocar relativamente alto (###valor### dB)
Graves 100 - 315Hz
(±) | graves reduzidos - em média 8% menor que a mediana
(±) | a linearidade dos graves é média (10.2% delta para a frequência anterior)
Médios 400 - 2.000 Hz
(±) | médios mais altos - em média 7.7% maior que a mediana
(+) | médios são lineares (4.7% delta para frequência anterior)
Altos 2 - 16 kHz
(+) | agudos equilibrados - apenas 4.2% longe da mediana
(+) | os máximos são lineares (6.2% delta da frequência anterior)
Geral 100 - 16.000 Hz
(+) | o som geral é linear (13.2% diferença em relação à mediana)
Comparado com a mesma classe
» 19% de todos os dispositivos testados nesta classe foram melhores, 6% semelhantes, 75% piores
» O melhor teve um delta de 7%, a média foi 18%, o pior foi 35%
Comparado com todos os dispositivos testados
» 12% de todos os dispositivos testados foram melhores, 3% semelhantes, 86% piores
» O melhor teve um delta de 4%, a média foi 24%, o pior foi 134%
Dell XPS 16 9640 análise de áudio
(+) | os alto-falantes podem tocar relativamente alto (###valor### dB)
Graves 100 - 315Hz
(±) | graves reduzidos - em média 11.2% menor que a mediana
(±) | a linearidade dos graves é média (8.9% delta para a frequência anterior)
Médios 400 - 2.000 Hz
(+) | médios equilibrados - apenas 4.5% longe da mediana
(+) | médios são lineares (3% delta para frequência anterior)
Altos 2 - 16 kHz
(+) | agudos equilibrados - apenas 1.4% longe da mediana
(+) | os máximos são lineares (2% delta da frequência anterior)
Geral 100 - 16.000 Hz
(+) | o som geral é linear (10% diferença em relação à mediana)
Comparado com a mesma classe
» 10% de todos os dispositivos testados nesta classe foram melhores, 1% semelhantes, 89% piores
» O melhor teve um delta de 5%, a média foi 18%, o pior foi 45%
Comparado com todos os dispositivos testados
» 4% de todos os dispositivos testados foram melhores, 1% semelhantes, 95% piores
» O melhor teve um delta de 4%, a média foi 24%, o pior foi 134%
Gerenciamento de energia: Melhor duração da bateria do que o ThinkPad P1 Gen 6
Consumo de energia
O Lenovo ThinkPad P1 Gen 7 tem um consumo de energia ocioso menor do que a concorrência, com exceção do Apple MacBook Pro 16. Nesse sentido, a resolução mais baixa da tela provavelmente compensa, embora a taxa de atualização mais alta de 165 Hz neutralize essa vantagem. De fábrica, a tela é configurada para 165 Hz, a taxa de atualização dinâmica não é suportada.
Sob carga máxima, o laptop ThinkPad consome até 167,5 W, o que está dentro dos limites do carregador de 170 W.
| desligado | |
| Ocioso | |
| Carga |
|
Key:
min: | |
| Lenovo ThinkPad P1 Gen 7 21KV001SGE Ultra 7 155H, NVIDIA GeForce RTX 4060 Laptop GPU, Kioxia XG8 KXG8AZNV1T02, IPS LED, 2560x1600, 16" | Lenovo ThinkPad P1 G6 21FV001KUS i7-13800H, NVIDIA GeForce RTX 4080 Laptop GPU, Kioxia XG8 KXG8AZNV1T02, OLED, 3480x2400, 16" | Apple MacBook Pro 16 2023 M3 Pro Apple M3 Pro 12-Core, M3 Pro 18-Core GPU, Apple SSD AP0512Z, Mini-LED, 3456x2234, 16.2" | Dell XPS 16 9640 Ultra 7 155H, NVIDIA GeForce RTX 4070 Laptop GPU, Kioxia XG8 KXG80ZNV1T02, OLED, 3840x2400, 16.3" | Dell Precision 5690 Ultra 9 185H, NVIDIA RTX 5000 Ada Generation Laptop GPU, 2x Samsung PM9A1 1TB (RAID 0), OLED, 3840x2400, 16" | Média NVIDIA GeForce RTX 4060 Laptop GPU | Média da turma Workstation | |
|---|---|---|---|---|---|---|---|
| Power Consumption | -12% | 15% | 14% | -19% | -29% | -4% | |
| Idle Minimum * | 7.3 | 8 -10% | 4.5 38% | 7.7 -5% | 7.9 -8% | 11.5 ? -58% | 8.43 ? -15% |
| Idle Average * | 12.3 | 9.5 23% | 16.5 -34% | 10.3 16% | 12 2% | 16 ? -30% | 12.4 ? -1% |
| Idle Maximum * | 17.9 | 23.7 -32% | 16.7 7% | 10.6 41% | 28.6 -60% | 20.3 ? -13% | 17.8 ? 1% |
| Load Average * | 78.2 | 97.2 -24% | 60.4 23% | 76.5 2% | 98.8 -26% | 92.9 ? -19% | 88.4 ? -13% |
| Cyberpunk 2077 ultra external monitor * | 117.7 | ||||||
| Cyberpunk 2077 ultra * | 123.5 | ||||||
| Load Maximum * | 167.5 | 197.2 -18% | 102.9 39% | 138.5 17% | 174.8 -4% | 210 ? -25% | 154.1 ? 8% |
| Witcher 3 ultra * | 144 | 52.1 | 126.4 | 144.5 |
* ... menor é melhor
Power consumption Cyberpunk / stress test
Power consumption w/external monitor
Duração da bateria
A capacidade da bateria de 90 Wh permanece inalterada. Ainda assim, a duração da bateria melhorou no teste Wi-Fi (brilho da tela de 150 cd/m²) em comparação com o anterior Lenovo ThinkPad P1 Gen 6. O modelo 2024 atinge aproximadamente dez horas em vez de quatro como o modelo antigo. O uso desse dispositivo em trânsito parece muito mais viável do que com o P1 Gen 6.
| Lenovo ThinkPad P1 Gen 7 21KV001SGE Ultra 7 155H, NVIDIA GeForce RTX 4060 Laptop GPU, 90 Wh | Lenovo ThinkPad P1 G6 21FV001KUS i7-13800H, NVIDIA GeForce RTX 4080 Laptop GPU, 90 Wh | Apple MacBook Pro 16 2023 M3 Pro Apple M3 Pro 12-Core, M3 Pro 18-Core GPU, 99.6 Wh | Dell XPS 16 9640 Ultra 7 155H, NVIDIA GeForce RTX 4070 Laptop GPU, 99.5 Wh | Dell Precision 5690 Ultra 9 185H, NVIDIA RTX 5000 Ada Generation Laptop GPU, 98 Wh | Média da turma Workstation | |
|---|---|---|---|---|---|---|
| Duração da bateria | -58% | 38% | -9% | -8% | -24% | |
| WiFi v1.3 | 595 | 252 -58% | 1204 102% | 629 6% | 549 -8% | 502 ? -16% |
| Load | 114 | 83 -27% | 87 -24% | 77.4 ? -32% |
Classificação geral do Notebookcheck
O Lenovo ThinkPad P1 Gen 7 não utiliza GPUs de última geração e usa dois slots M.2 2280, assim como a nova memória LPCAMM2. O design é parecido com o do ThinkPad Z16, com uma tampa de alumínio e um grande trackpad. Na parte interna, a CPU Meteor Lake melhora a eficiência e a duração da bateria. No geral, esse modelo oferece um design mais premium e maior mobilidade com um desempenho de GPU ligeiramente reduzido.
Transparência
A seleção dos dispositivos a serem analisados é feita pela nossa equipe editorial. A amostra de teste foi fornecida ao autor como empréstimo pelo fabricante ou varejista para fins desta revisão. O credor não teve influência nesta revisão, nem o fabricante recebeu uma cópia desta revisão antes da publicação. Não houve obrigação de publicar esta revisão. Nunca aceitamos compensação ou pagamento em troca de nossas avaliações. Como empresa de mídia independente, a Notebookcheck não está sujeita à autoridade de fabricantes, varejistas ou editores.
É assim que o Notebookcheck está testando
Todos os anos, o Notebookcheck analisa de forma independente centenas de laptops e smartphones usando procedimentos padronizados para garantir que todos os resultados sejam comparáveis. Desenvolvemos continuamente nossos métodos de teste há cerca de 20 anos e definimos padrões da indústria no processo. Em nossos laboratórios de teste, equipamentos de medição de alta qualidade são utilizados por técnicos e editores experientes. Esses testes envolvem um processo de validação em vários estágios. Nosso complexo sistema de classificação é baseado em centenas de medições e benchmarks bem fundamentados, o que mantém a objetividade.
