

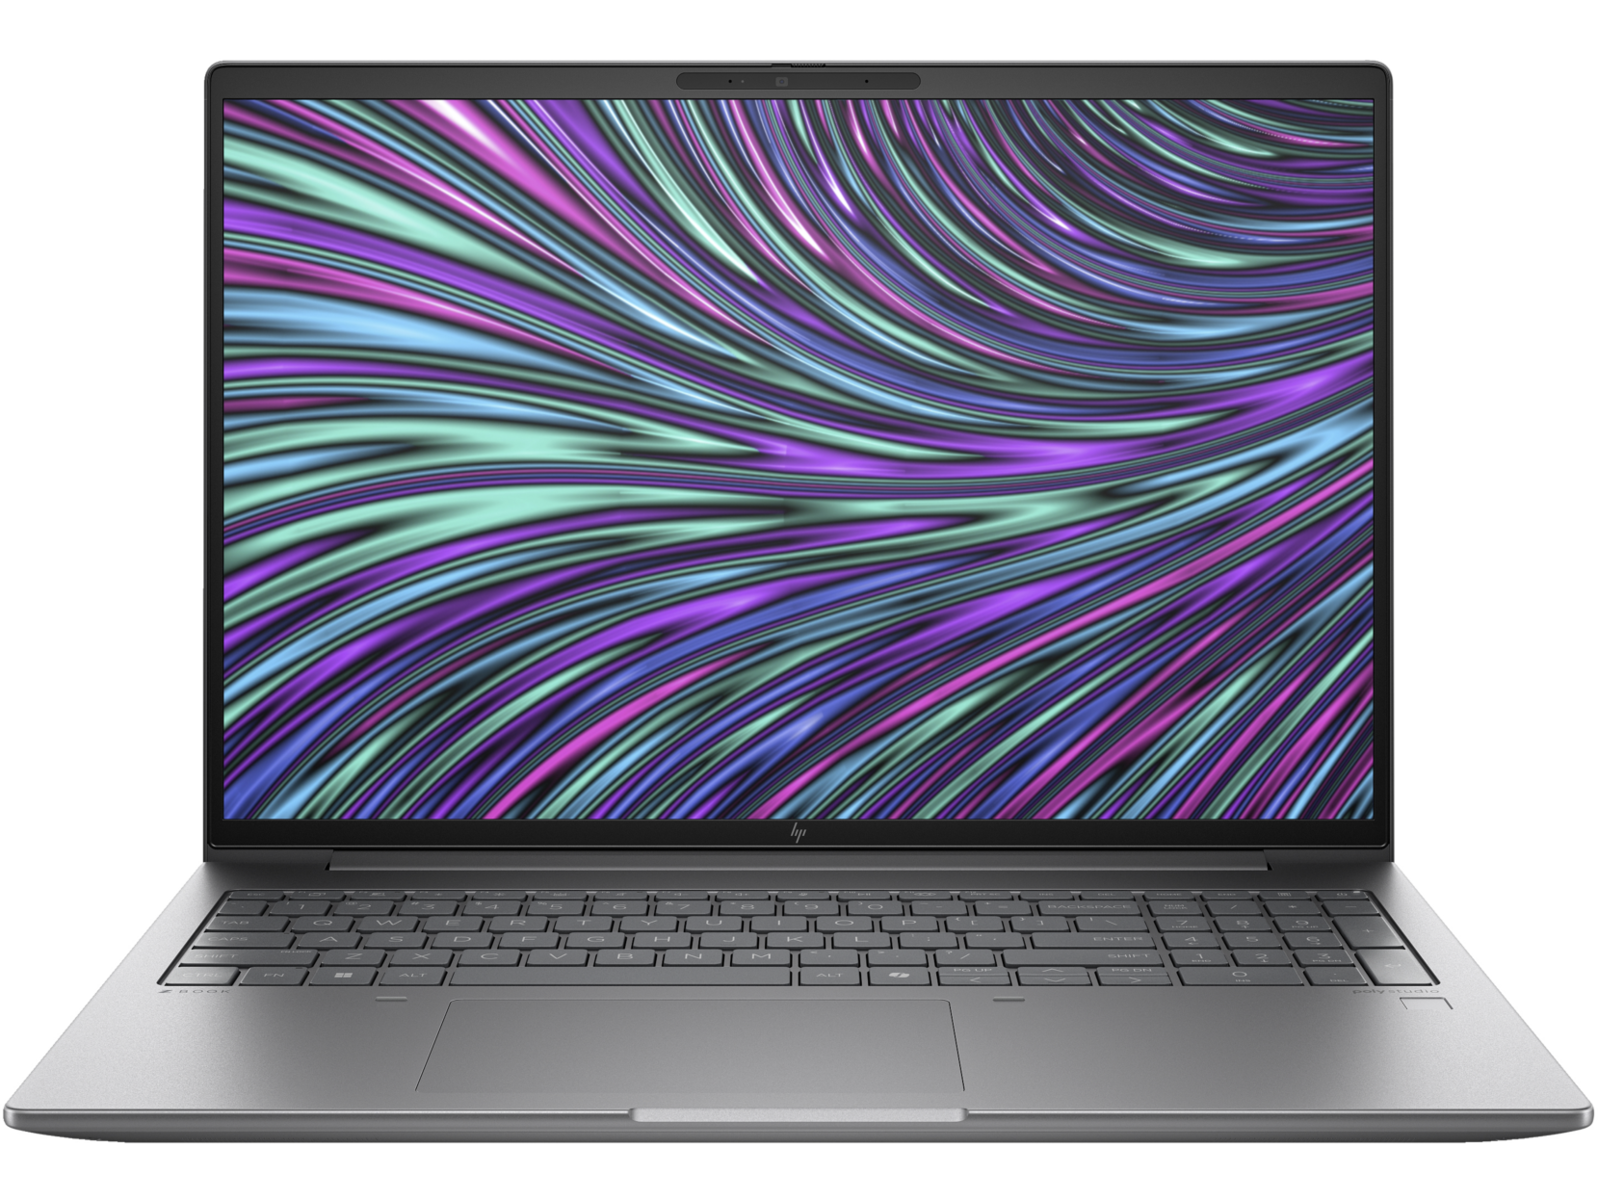
Análise da HP ZBook Power 16 G11 A: Estação de trabalho poderosa com AMD Zen 4

O ZBook Power 16 G11 sucede o antigo ZBook Power 15 G10 com novos processadores internos e novas mudanças externas. Como o próprio nome indica, o ZBook Power 16 G11 moderniza a série ao trocar o antigo formato de 15,6 polegadas por um design de 16 polegadas. Ele fica entre o ZBook Firefly, de gama baixa, e o ZBook Fury, de gama alta, quando se trata de desempenho. Os usuários podem configurar com CPUs Intel Core Ultra Meteor Lake ou CPUs AMD Ryzen Zen 4 e gráficos Nvidia RTX.
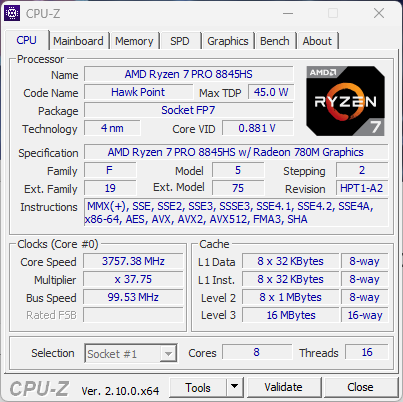
Nossa unidade em análise é uma configuração AMD de ponta (ZBook Power 16 G11 A) com CPU Ryzen 7 8845HS, GPU RTX 2000 Ada e tela IPS 2560 x 1600p de 120 Hz por aproximadamente US$ 2100. As opções são muito variadas, desde o Ryzen 5 8645HS até o Ryzen 9 8945HS com tela de 1200p e gráficos RTX 1000, RTX 2000 ou RTX 3000. Os usuários também podem optar por nenhuma placa de vídeo discreta.
Os concorrentes nesse espaço incluem outras estações de trabalho de 16 polegadas, como a Dell Precision 5690, MSI CreatorPro Z16Pou o Lenovo ThinkPad P16s G2.
Mais análises da HP:
Possíveis concorrentes em comparação
Avaliação | Versão | Data | Modelo | Peso | Altura | Size | Resolução | Preço |
|---|---|---|---|---|---|---|---|---|
| 85.4 % | v8 | 10/2024 | HP ZBook Power 16 G11 A R7 8845HS, NVIDIA RTX 2000 Ada Generation Laptop GPU | 2.2 kg | 22.9 mm | 16.00" | 2560x1600 | |
| 88.9 % v7 (old) | v7 (old) | 12/2023 | HP ZBook Power 15 G10 R7 PRO 7840HS, NVIDIA RTX 2000 Ada Generation Laptop GPU | 2 kg | 22.9 mm | 15.60" | 2560x1440 | |
| 85.9 % | v8 | 08/2024 | HP ZBook Fury 16 G11 i9-14900HX, NVIDIA RTX 3500 Ada Generation Laptop GPU | 2.6 kg | 28.5 mm | 16.00" | 3840x2400 | |
| 83.5 % | v8 | 10/2024 | Lenovo ThinkPad P1 Gen 7 21KV001SGE Ultra 7 155H, NVIDIA GeForce RTX 4060 Laptop GPU | 2 kg | 20.5 mm | 16.00" | 2560x1600 | |
| 88.6 % v7 (old) | v7 (old) | 01/2024 | Lenovo ThinkPad P16s G2 21K9000CGE R7 PRO 7840U, Radeon 780M | 1.8 kg | 24.4 mm | 16.00" | 3840x2400 | |
| 88.3 % v7 (old) | v7 (old) | 05/2024 | Dell Precision 5690 Ultra 9 185H, NVIDIA RTX 5000 Ada Generation Laptop GPU | 2.3 kg | 22.17 mm | 16.00" | 3840x2400 |
Observação: Atualizamos recentemente nosso sistema de classificação e os resultados da versão 8 não são comparáveis aos resultados da versão 7. Mais informações estão disponíveis aqui .
Estojo - Certificado MIL-STD 810
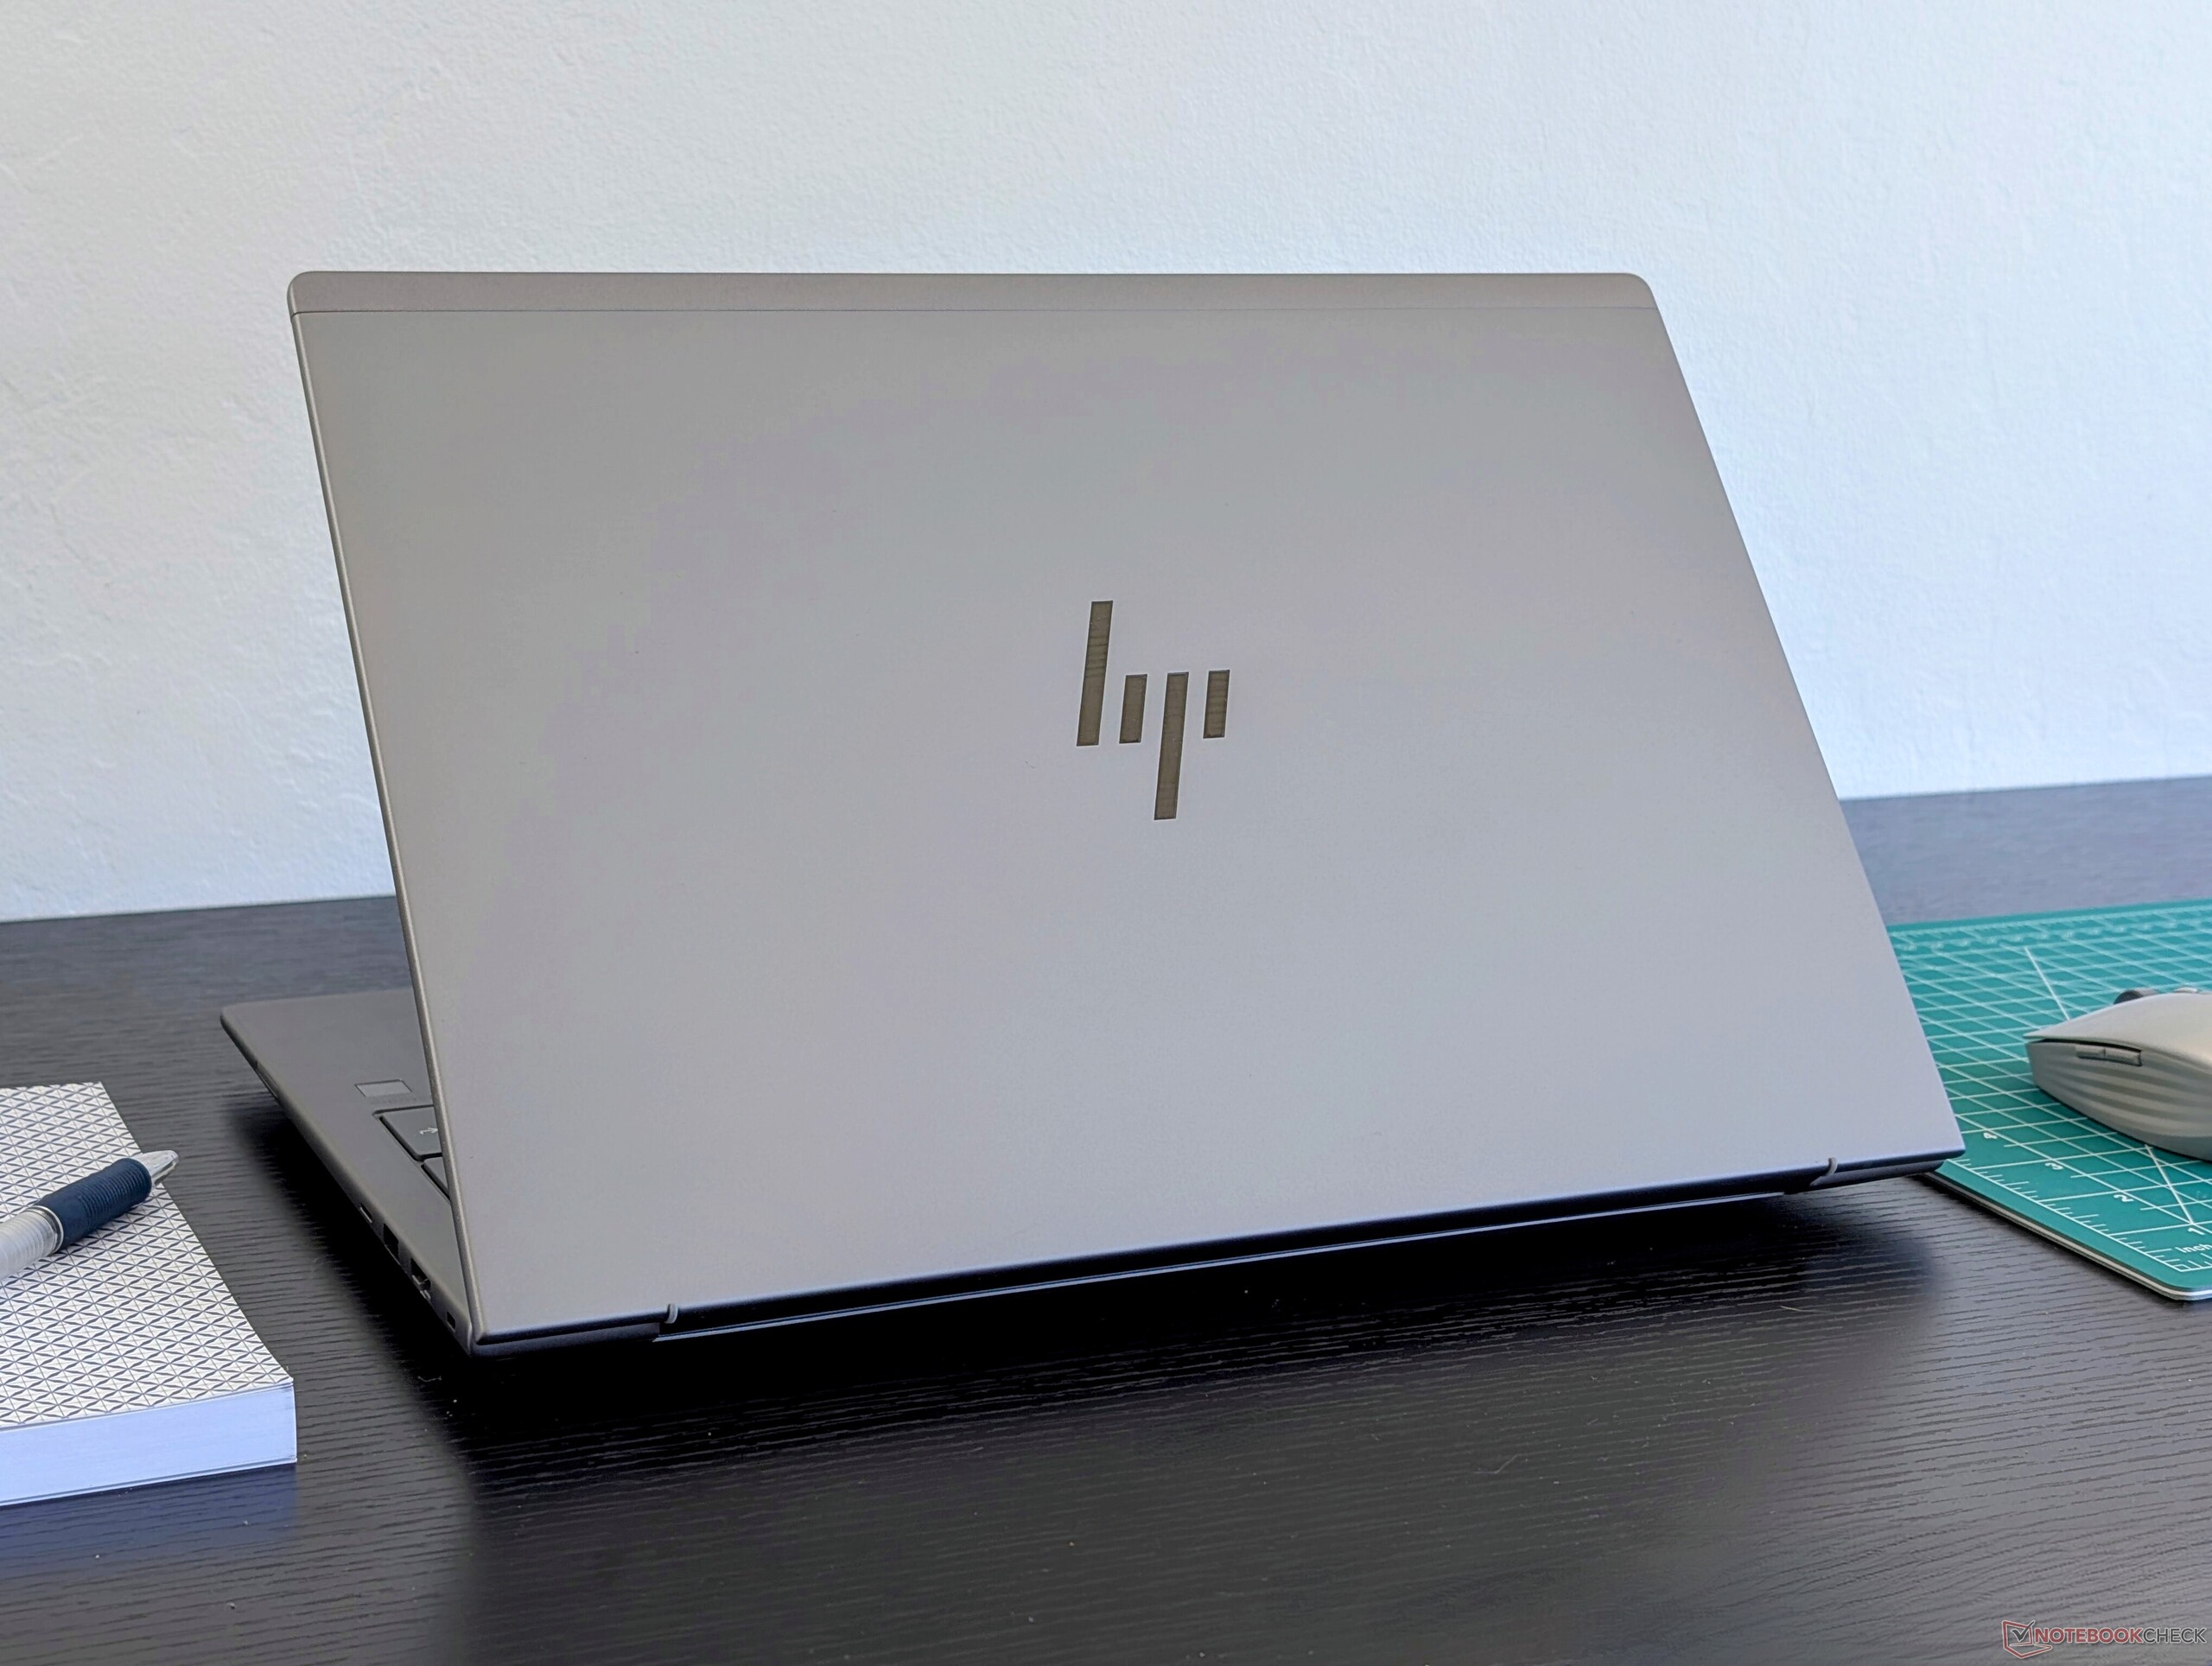
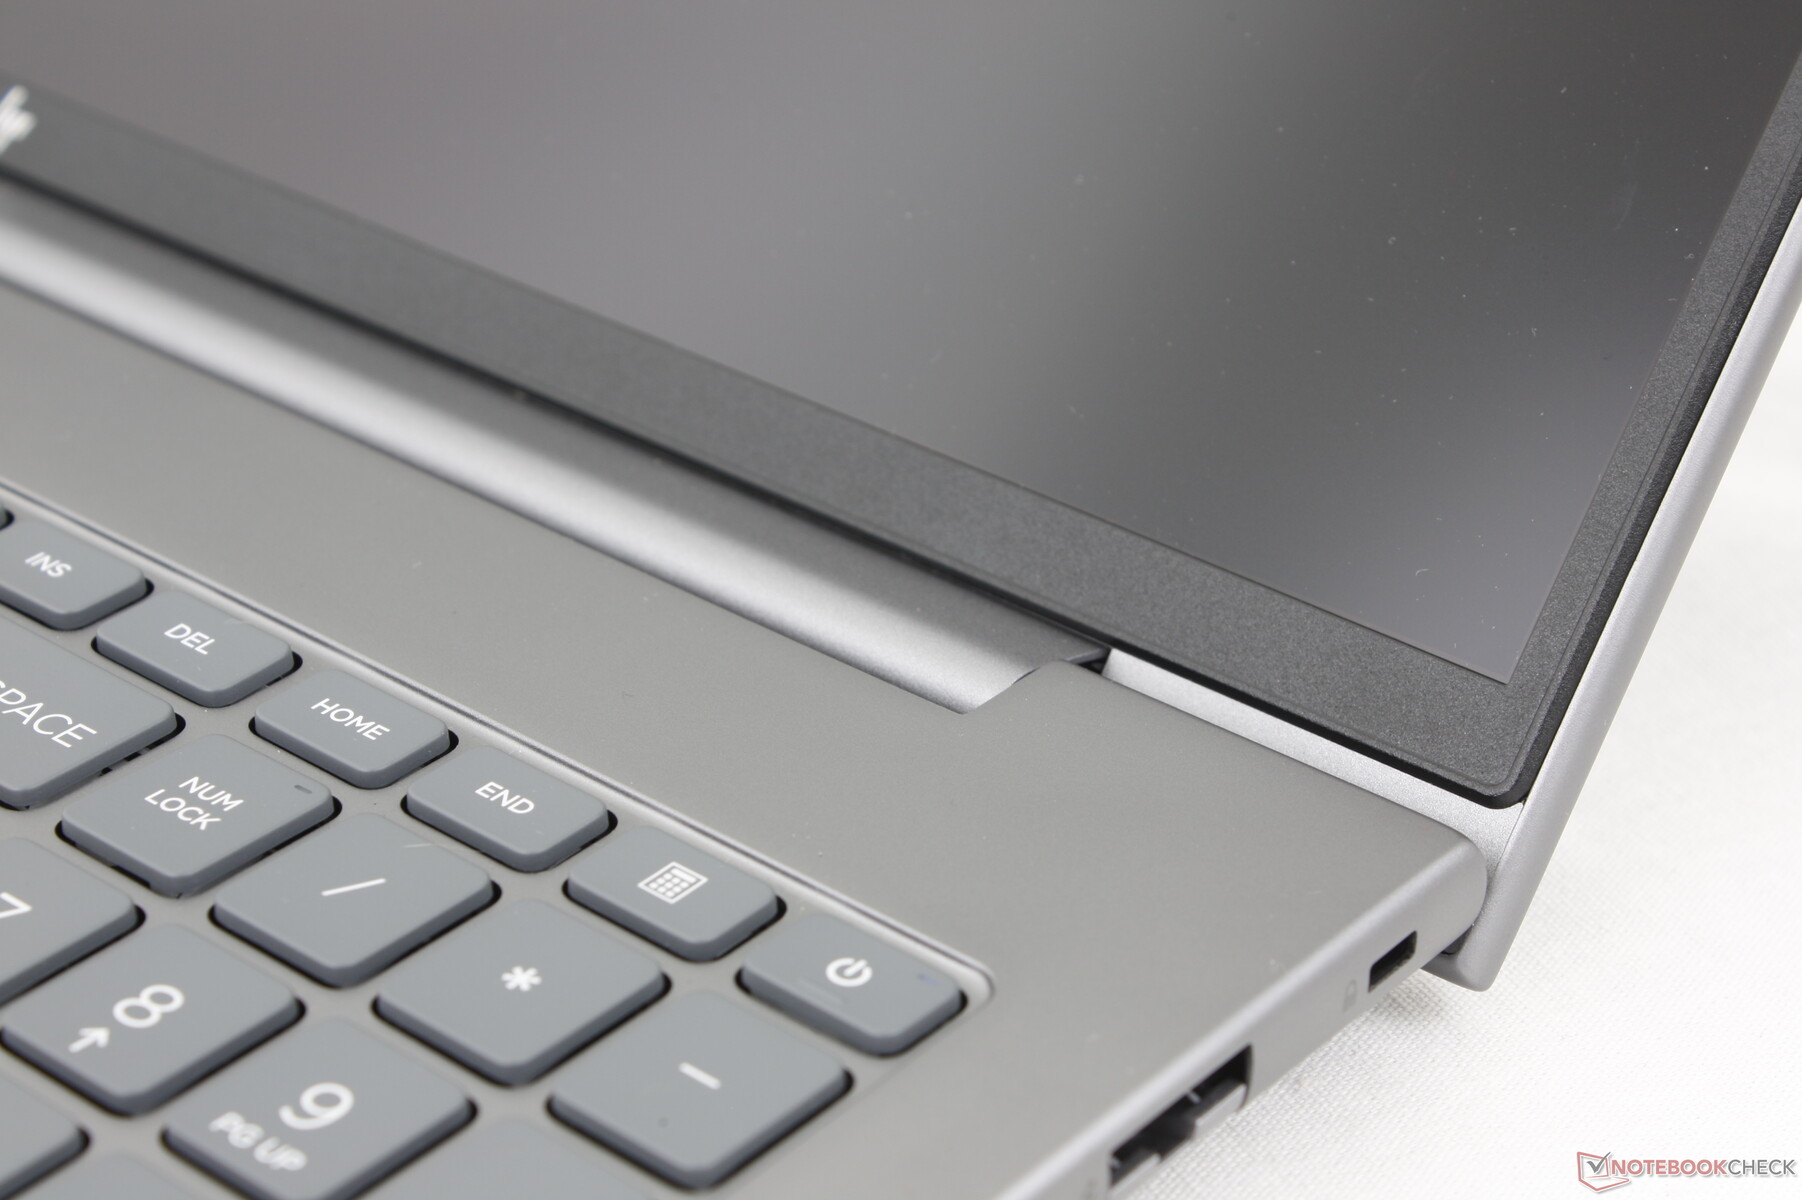
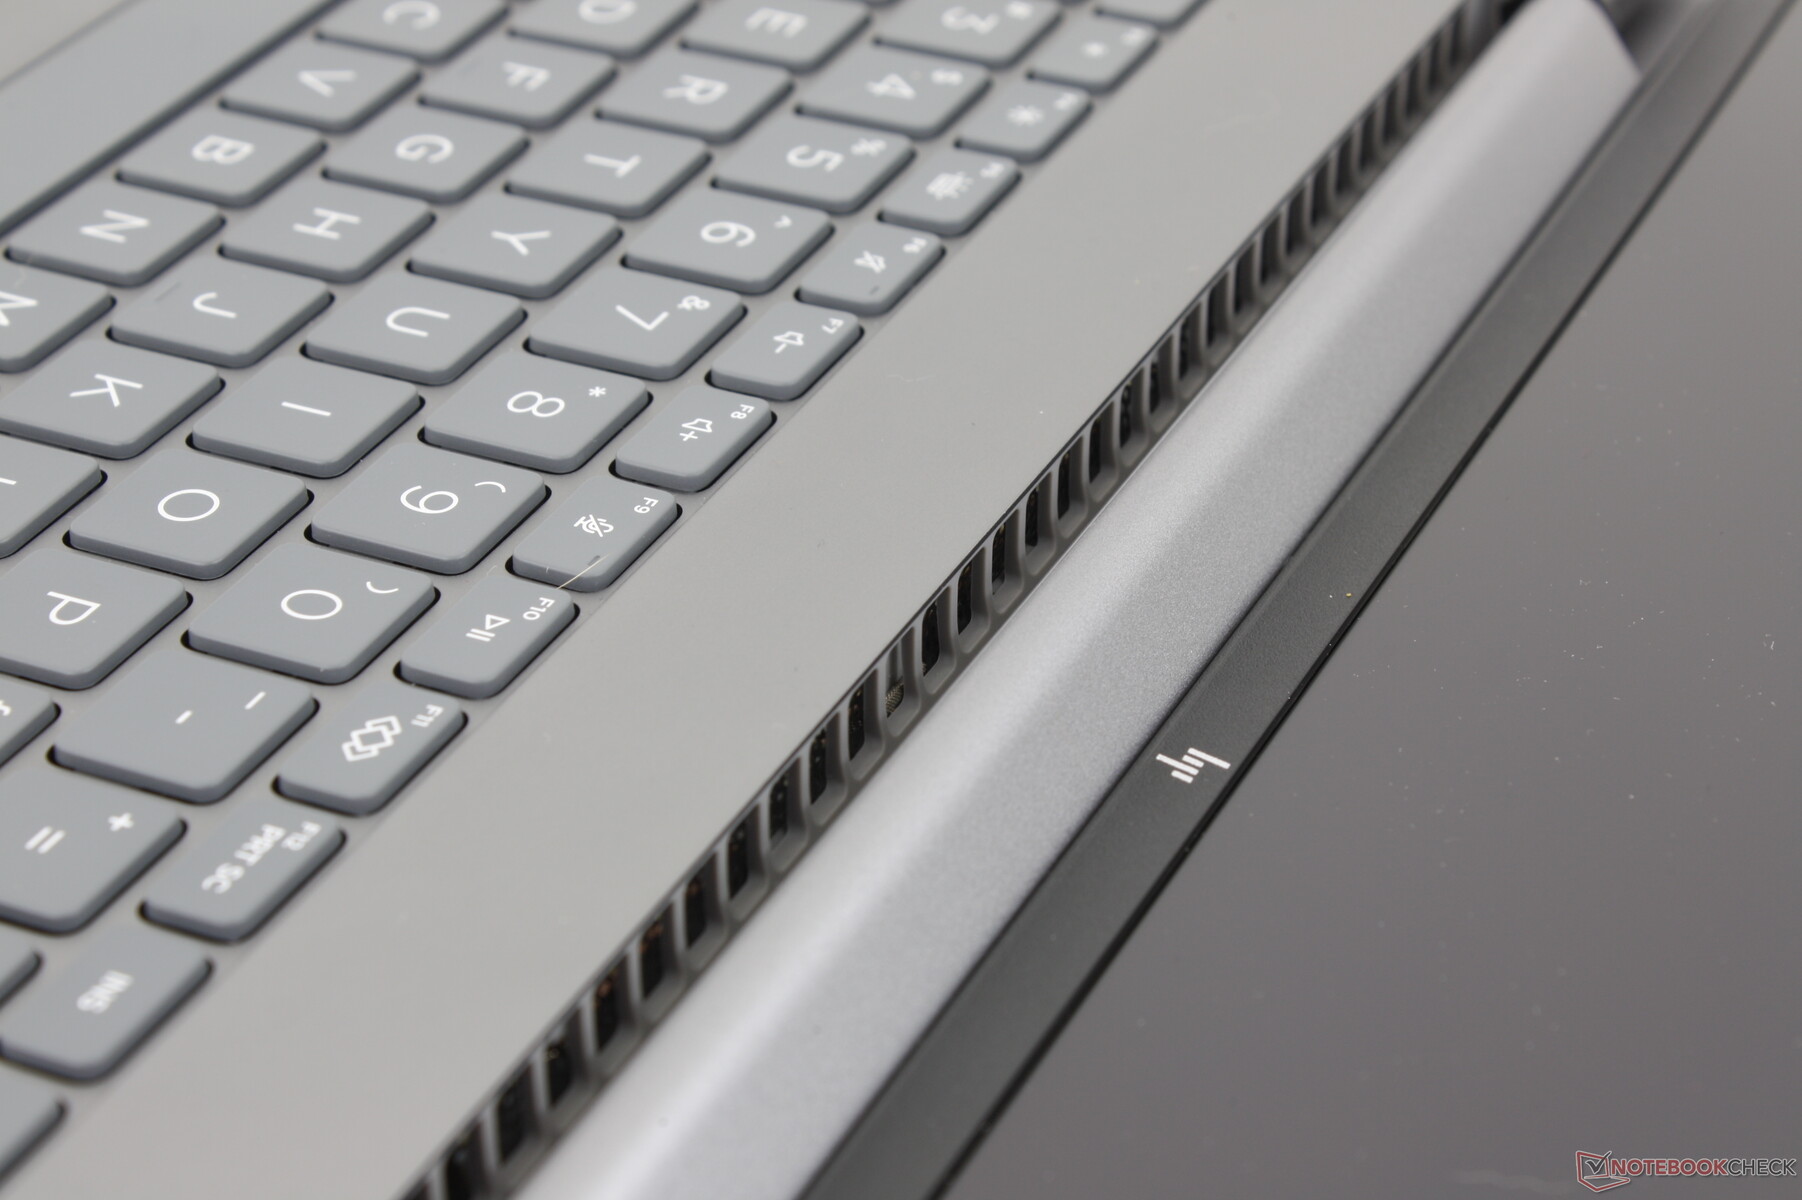
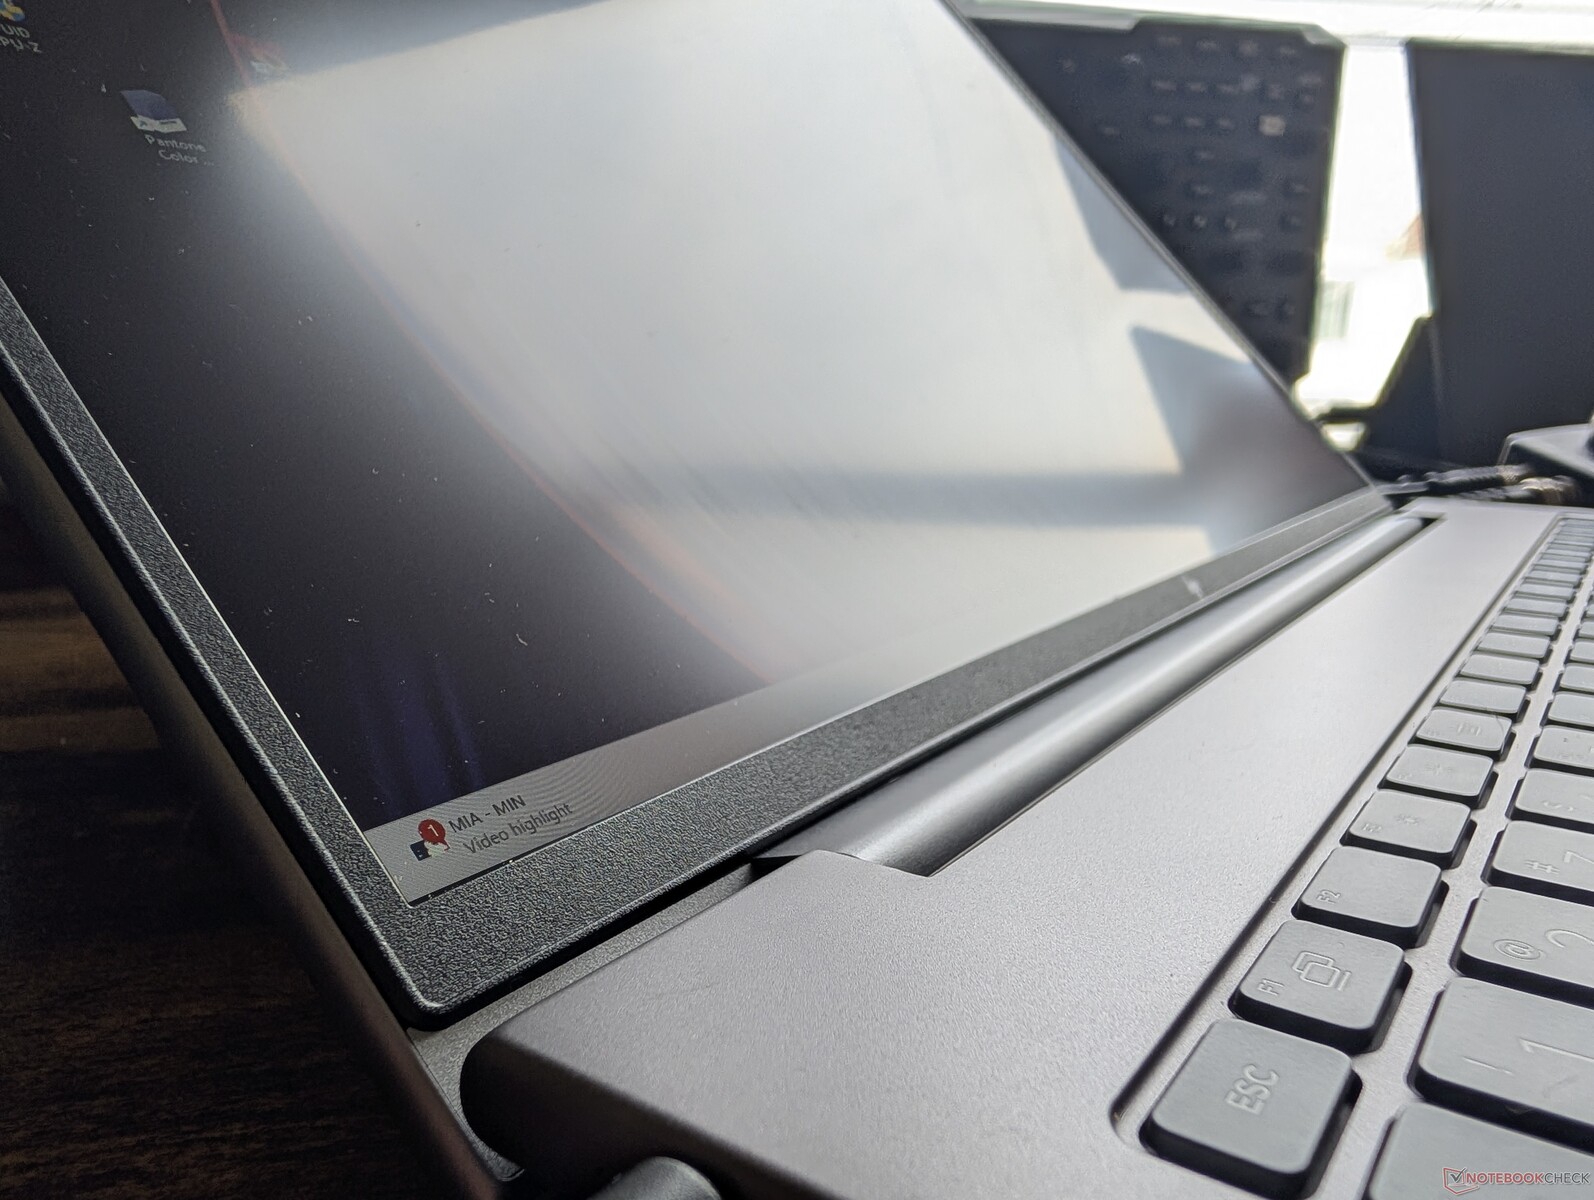
A HP utiliza materiais semelhantes de liga de alumínio cinza em quase todos os seus modelos ZBook para manter a consistência em toda a família. Nesse caso, o ZBook Power 16 G11 apresenta a mesma textura de metal fosco suave do ZBook Power 15 G10, mas com alterações superficiais nas bordas do teclado, no acabamento da tampa externa e no painel inferior.
A rigidez do chassi é excelente, com o mínimo de dobras e depressões ao tentar torcer a base. Entretanto, as dobradiças e a tampa poderiam ser mais rígidas, especialmente porque a tampa pode abrir quase 180 graus, ao contrário do Precision 5690.
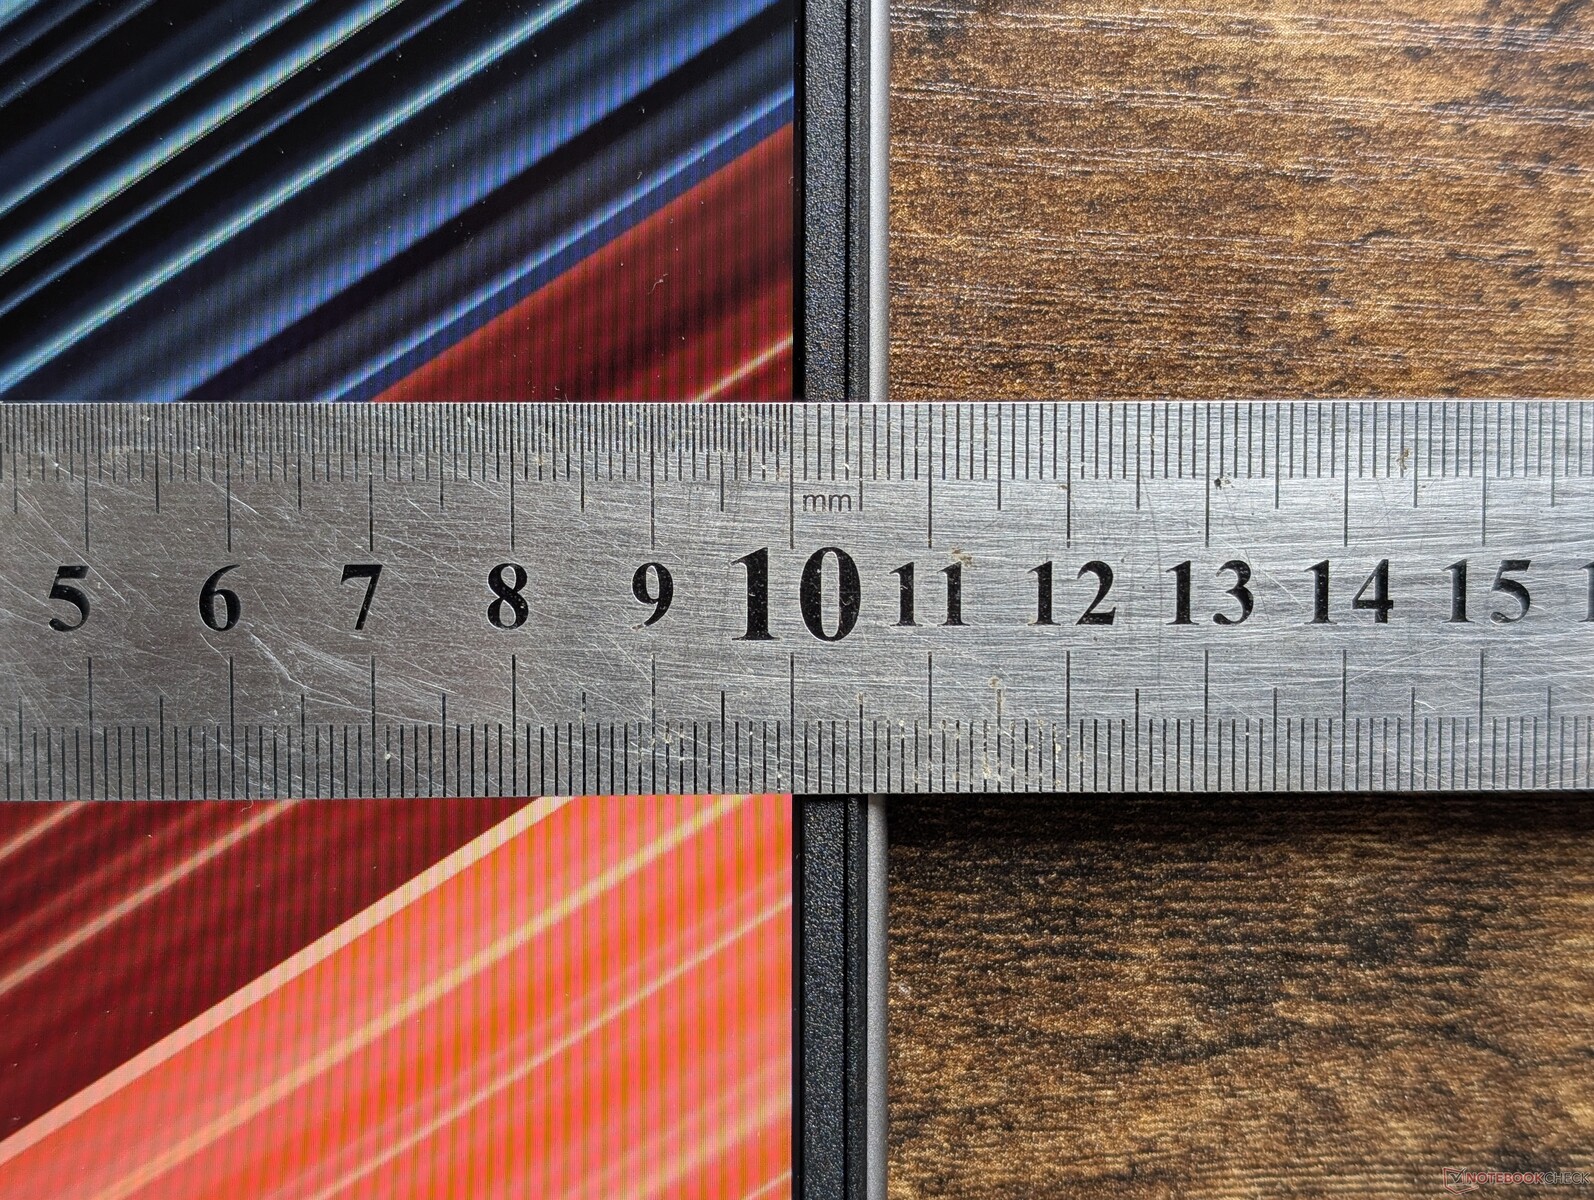
O novo design de 16 polegadas é cerca de 10% mais pesado e 7% maior do que o modelo anterior de 15 polegadas. Notavelmente não é mais fino, o que é uma pena, pois já é mais grosso do que alguns concorrentes, como o ThinkPad P1 Gen 7. O ZBook Fury 16 G11 é ainda mais pesado e mais espesso, mas com opções de CPU e GPU mais rápidas para compensar. A HP oferece o mais fino ZBook Firefly 16 mais fino, caso os usuários queiram uma opção mais portátil.
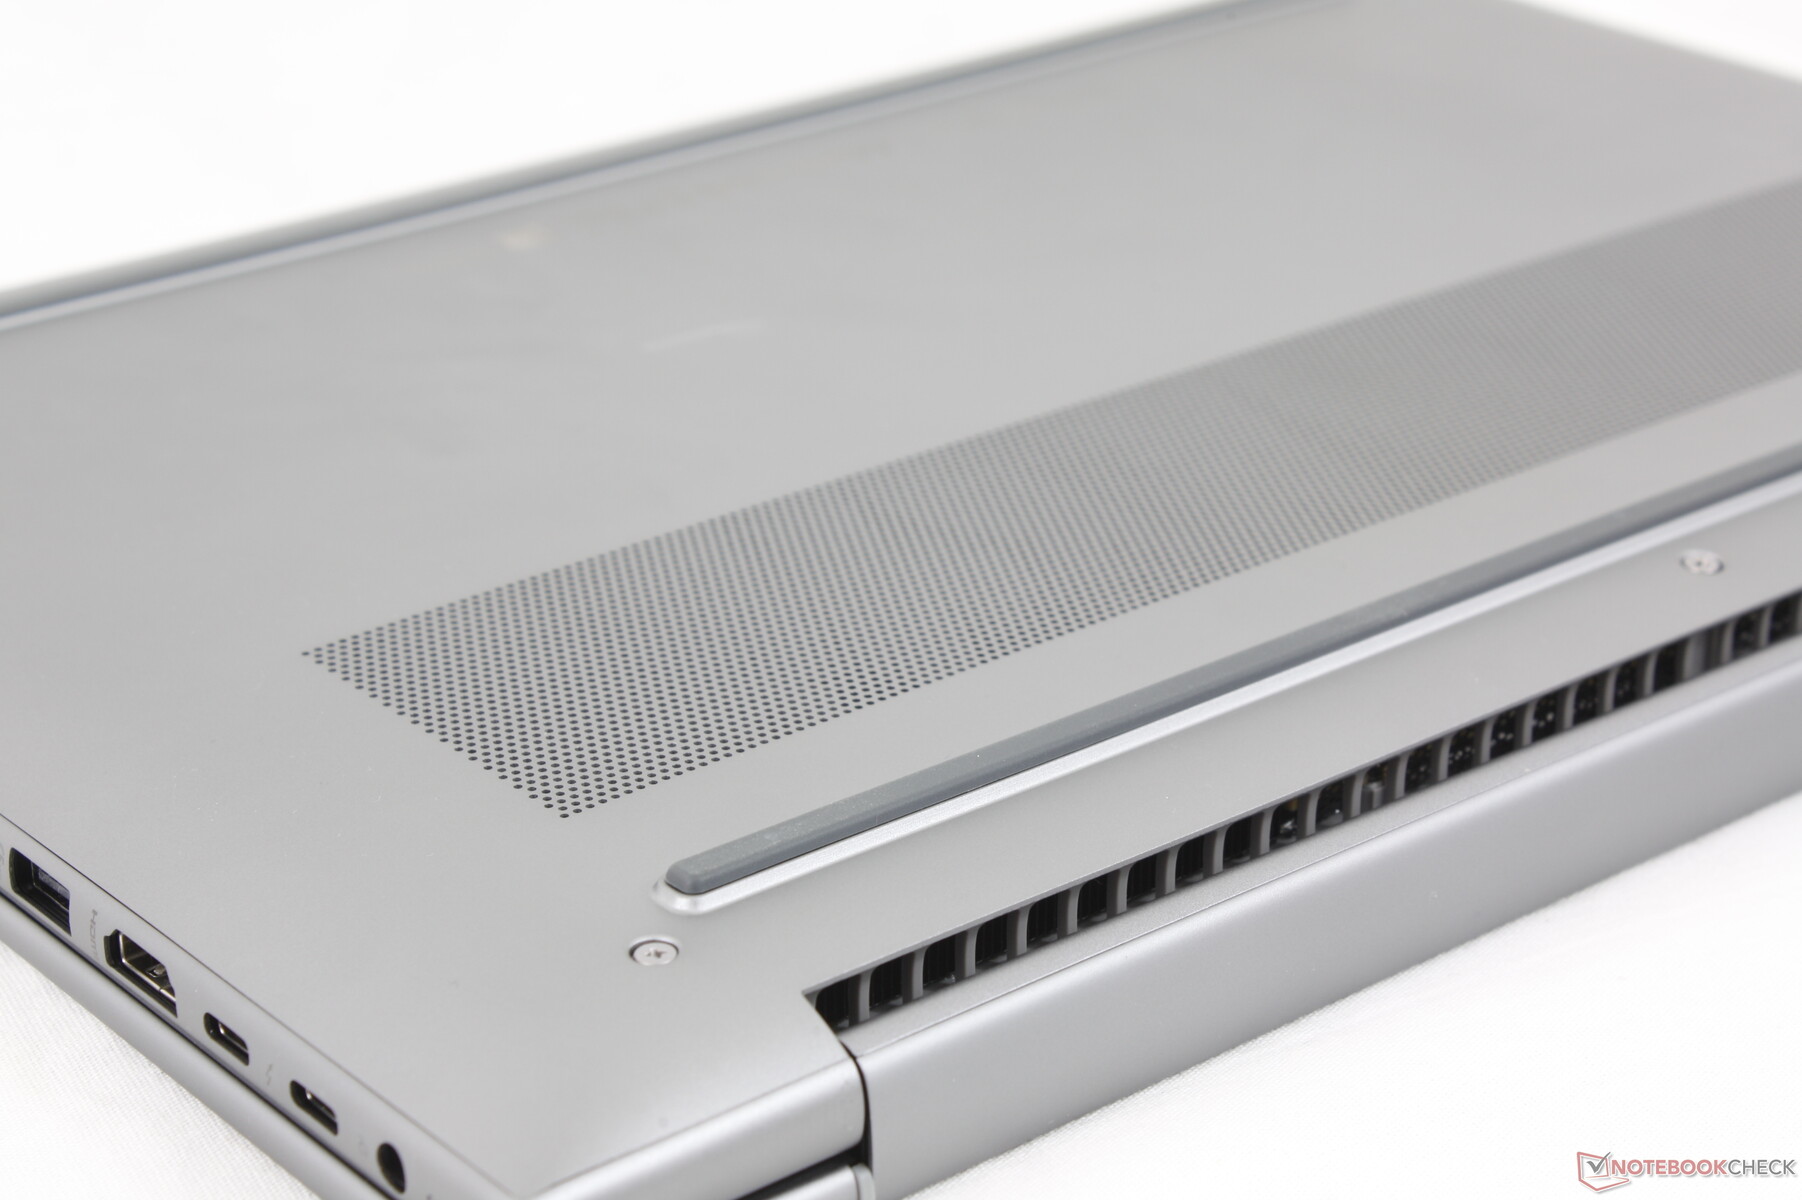
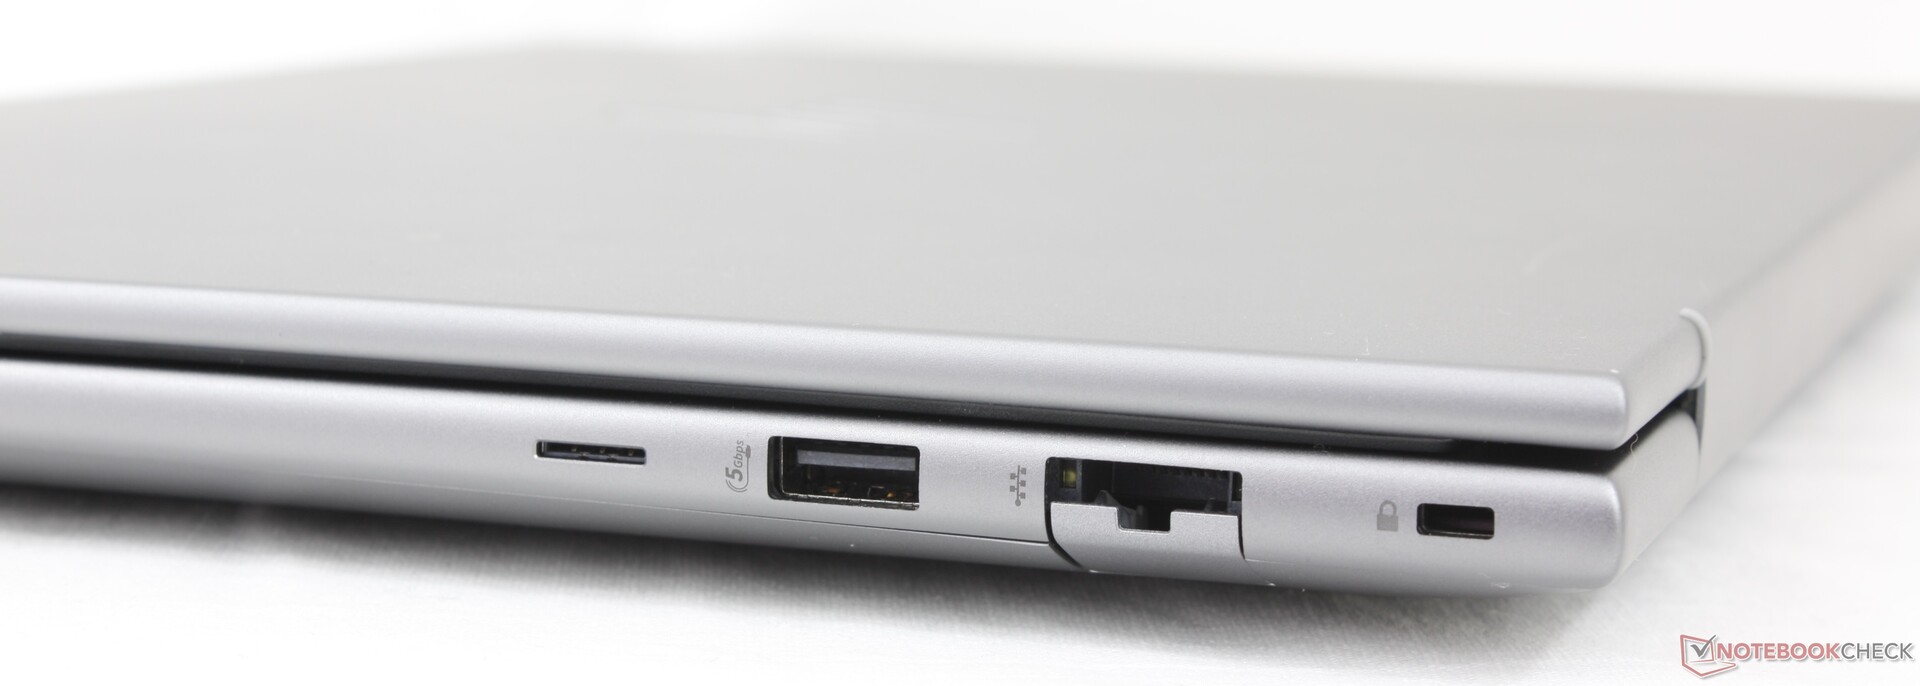
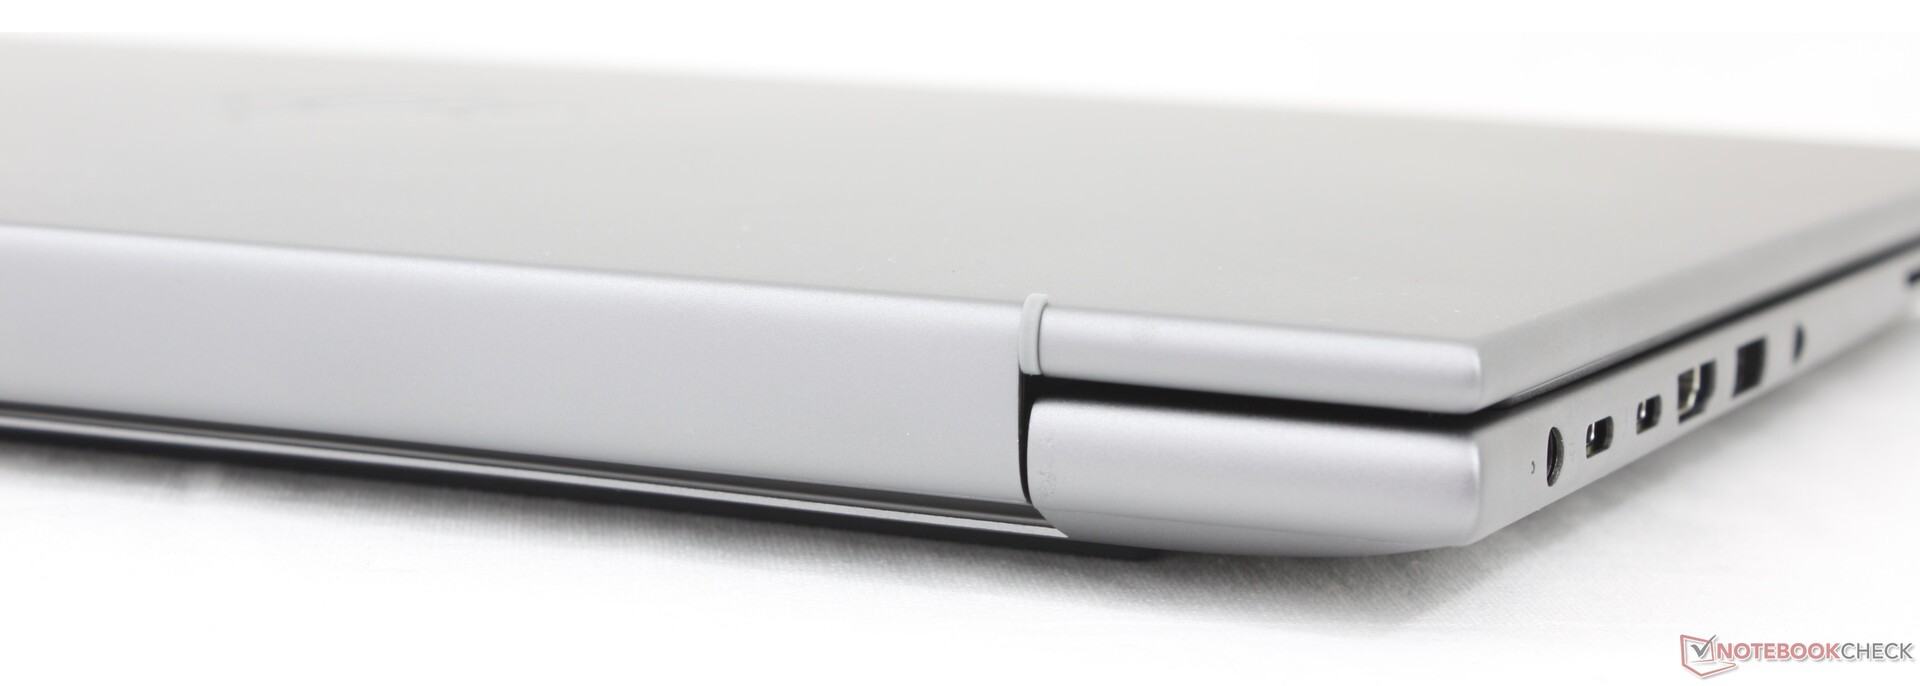
Conectividade - Portas Thunderbolt 4
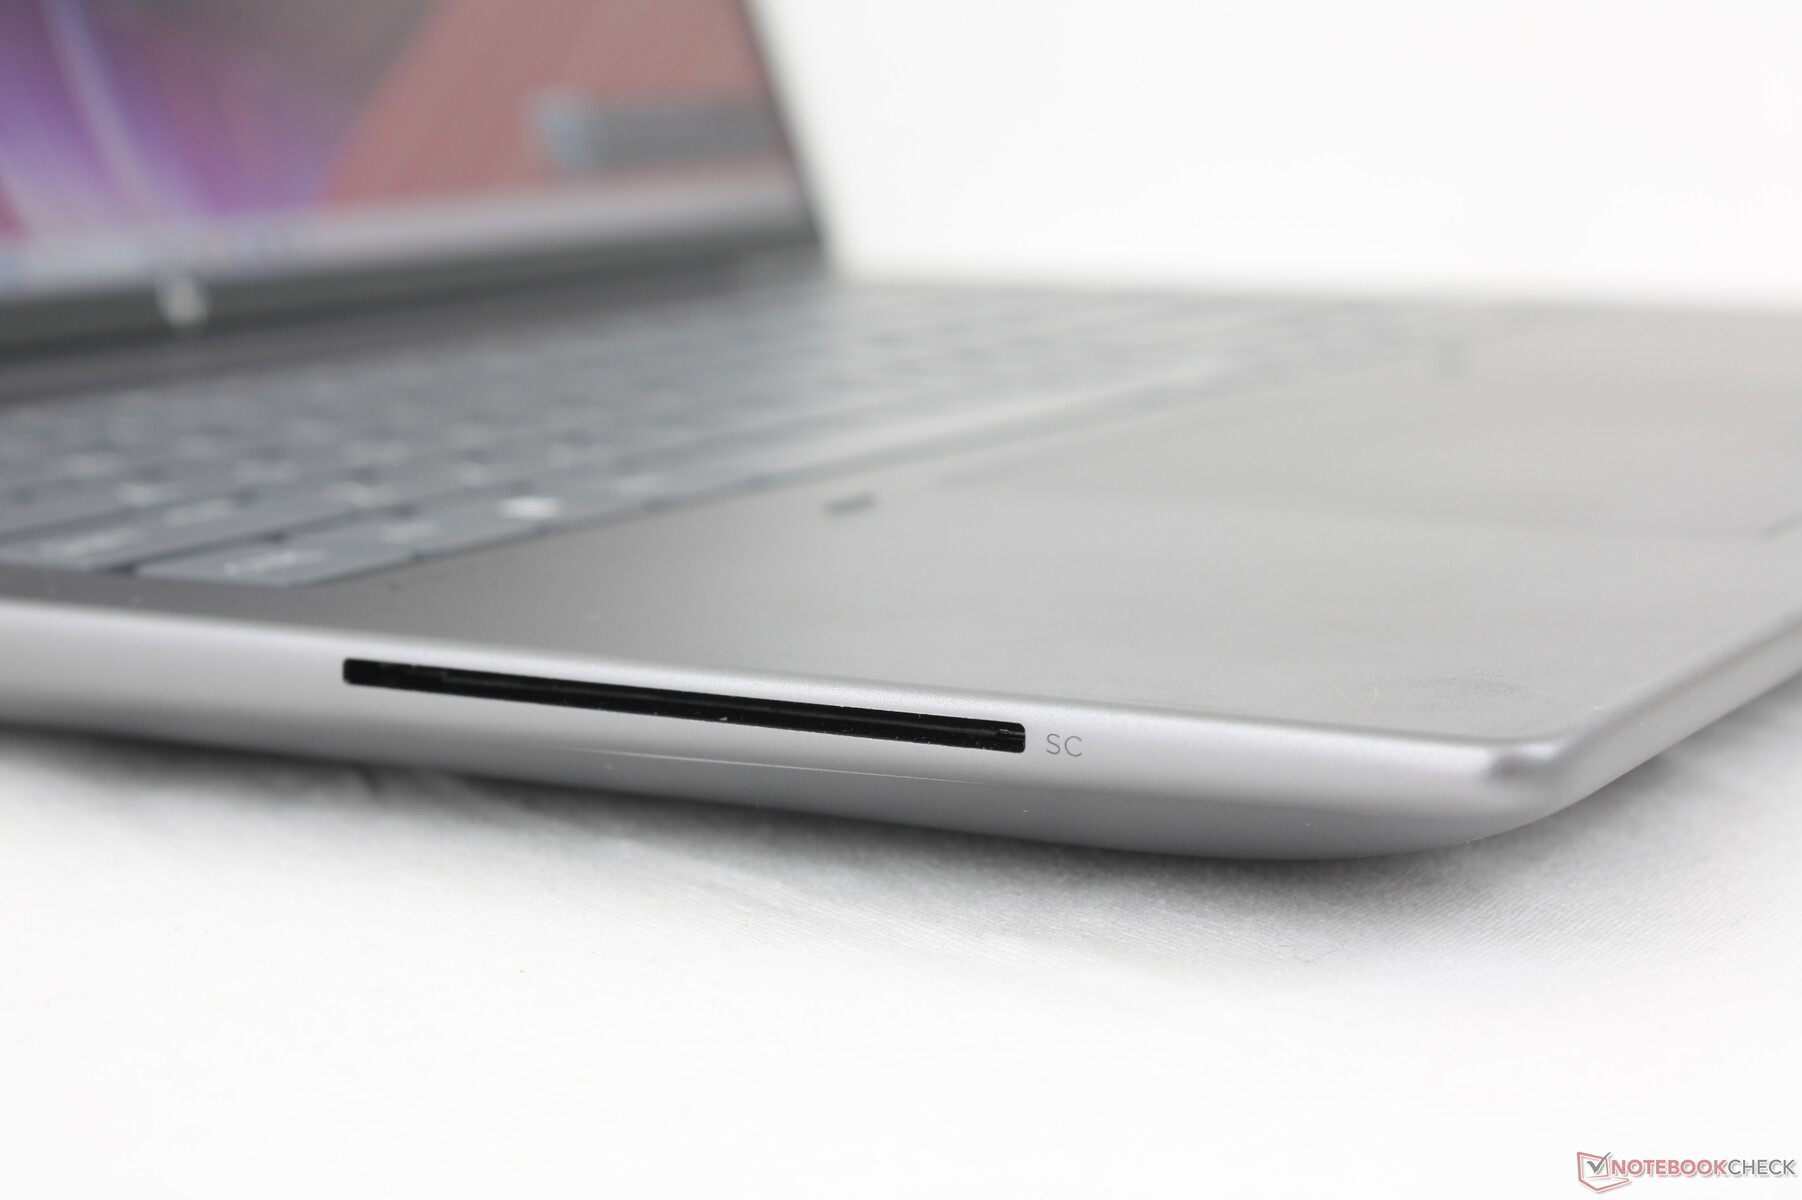
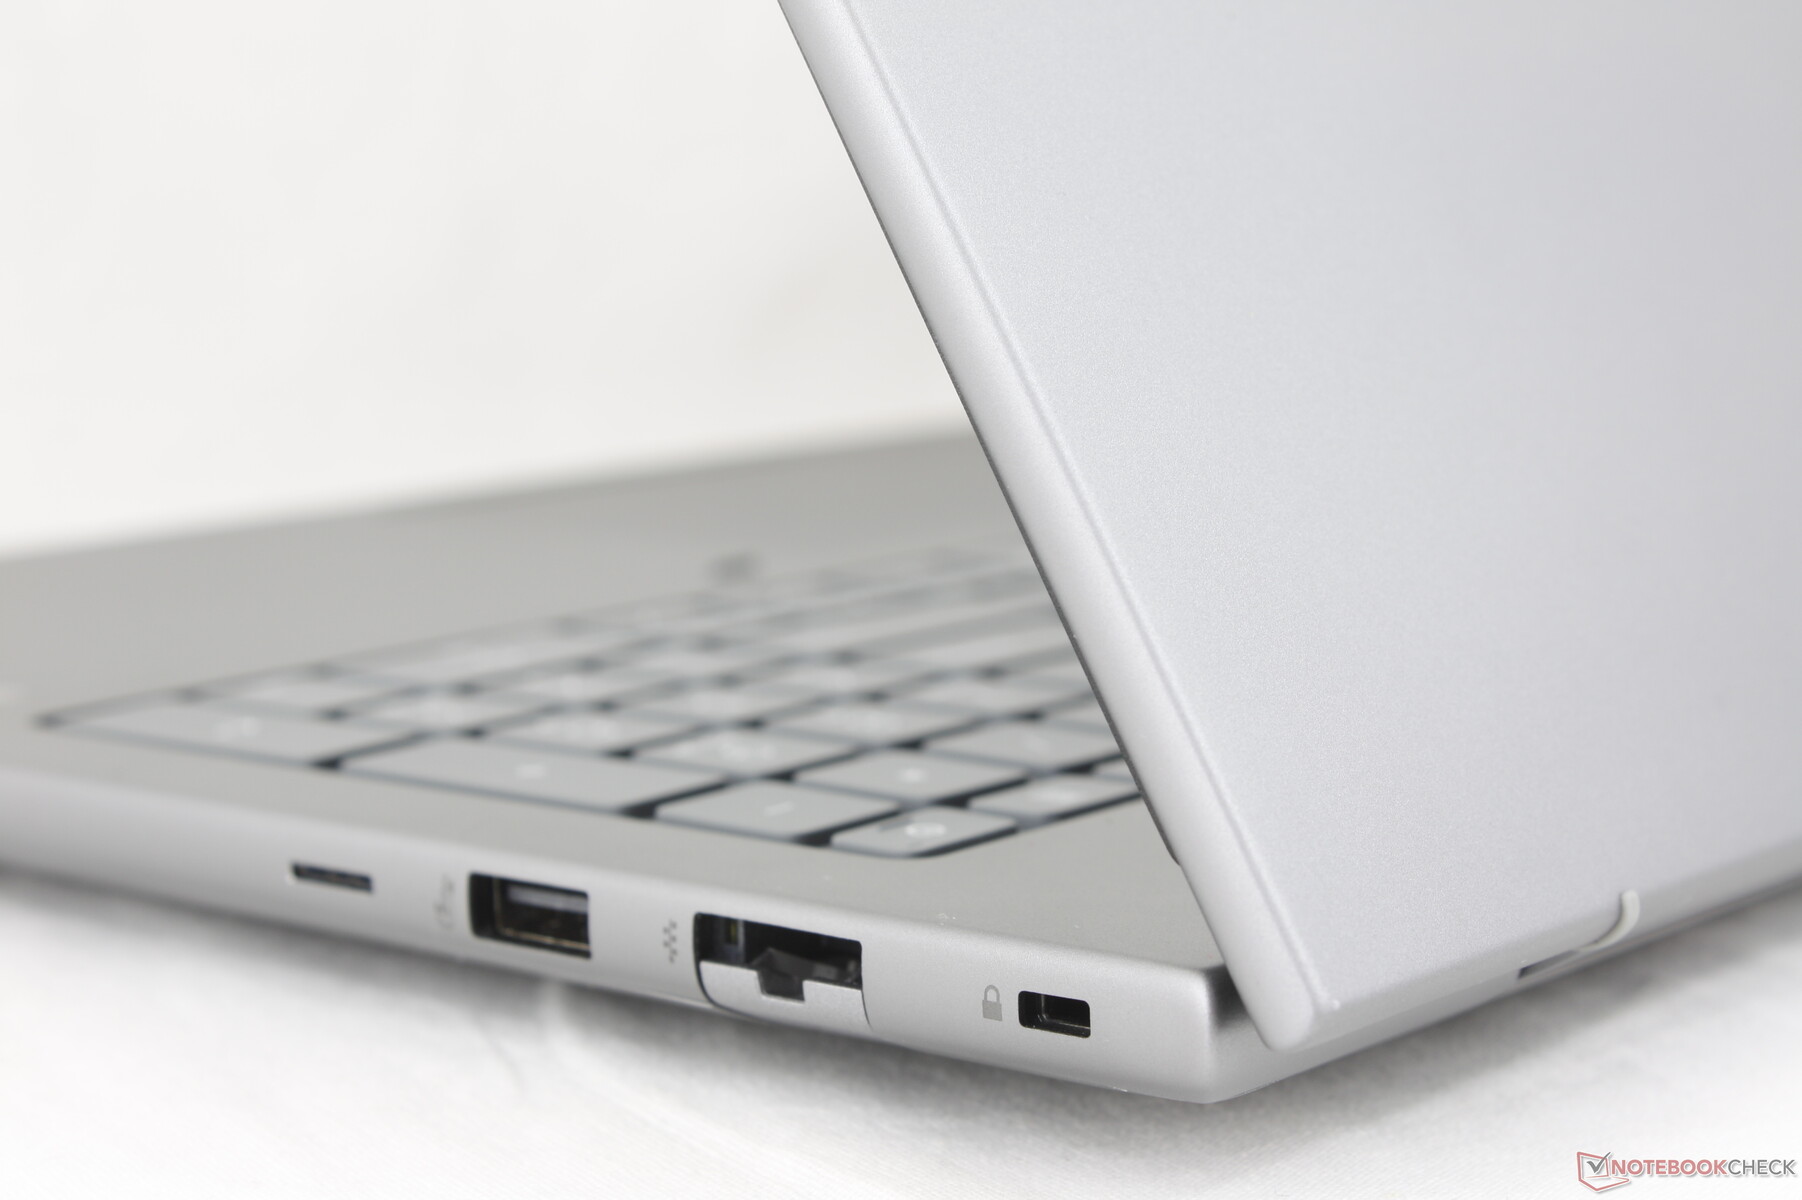
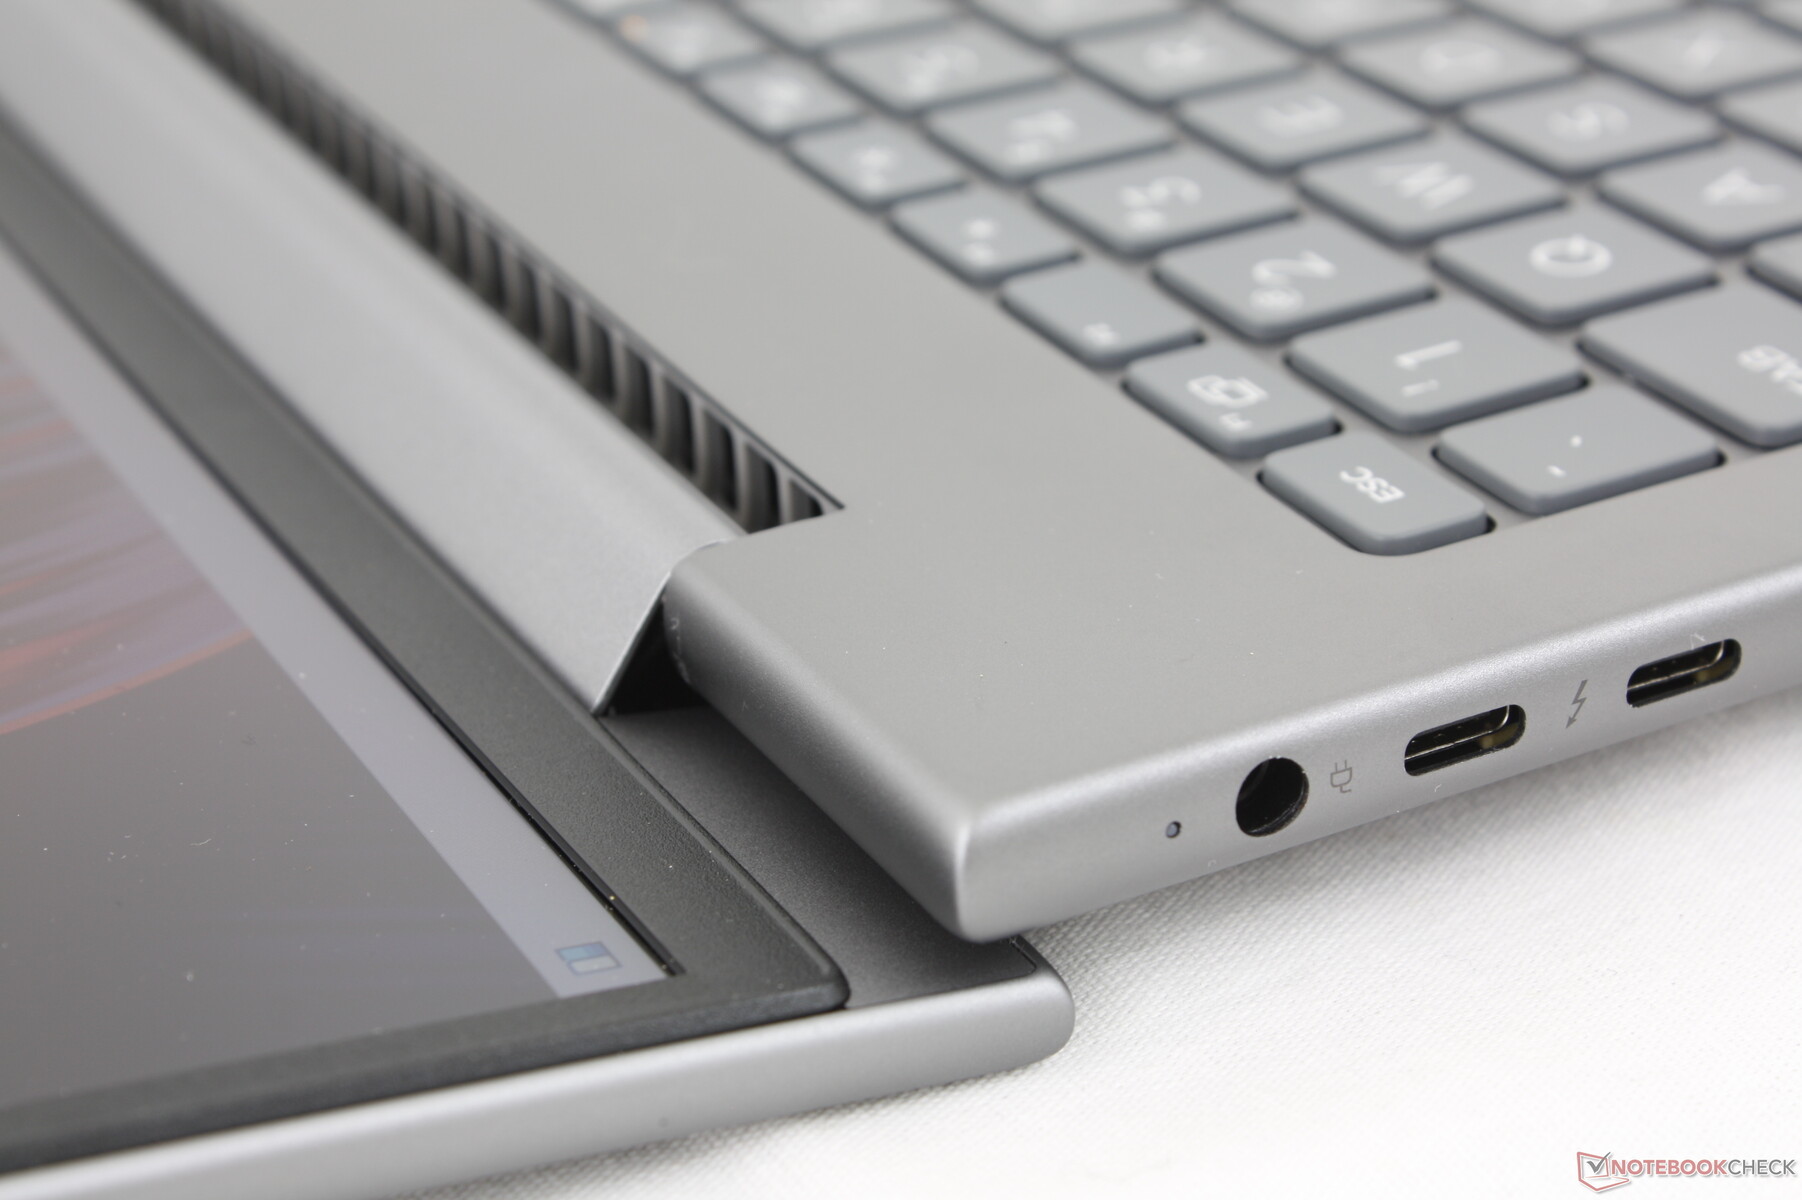
O modelo inclui menos portas USB-A do que no ZBook Power 15 G10 do ano passado. Todo o resto voltou, inclusive o leitor de cartão inteligente e as portas duplas USB-C Thunderbolt 4, embora reorganizadas. As portas ao longo da borda esquerda, em particular, estão muito cheias e poderiam ter sido espalhadas um pouco mais.
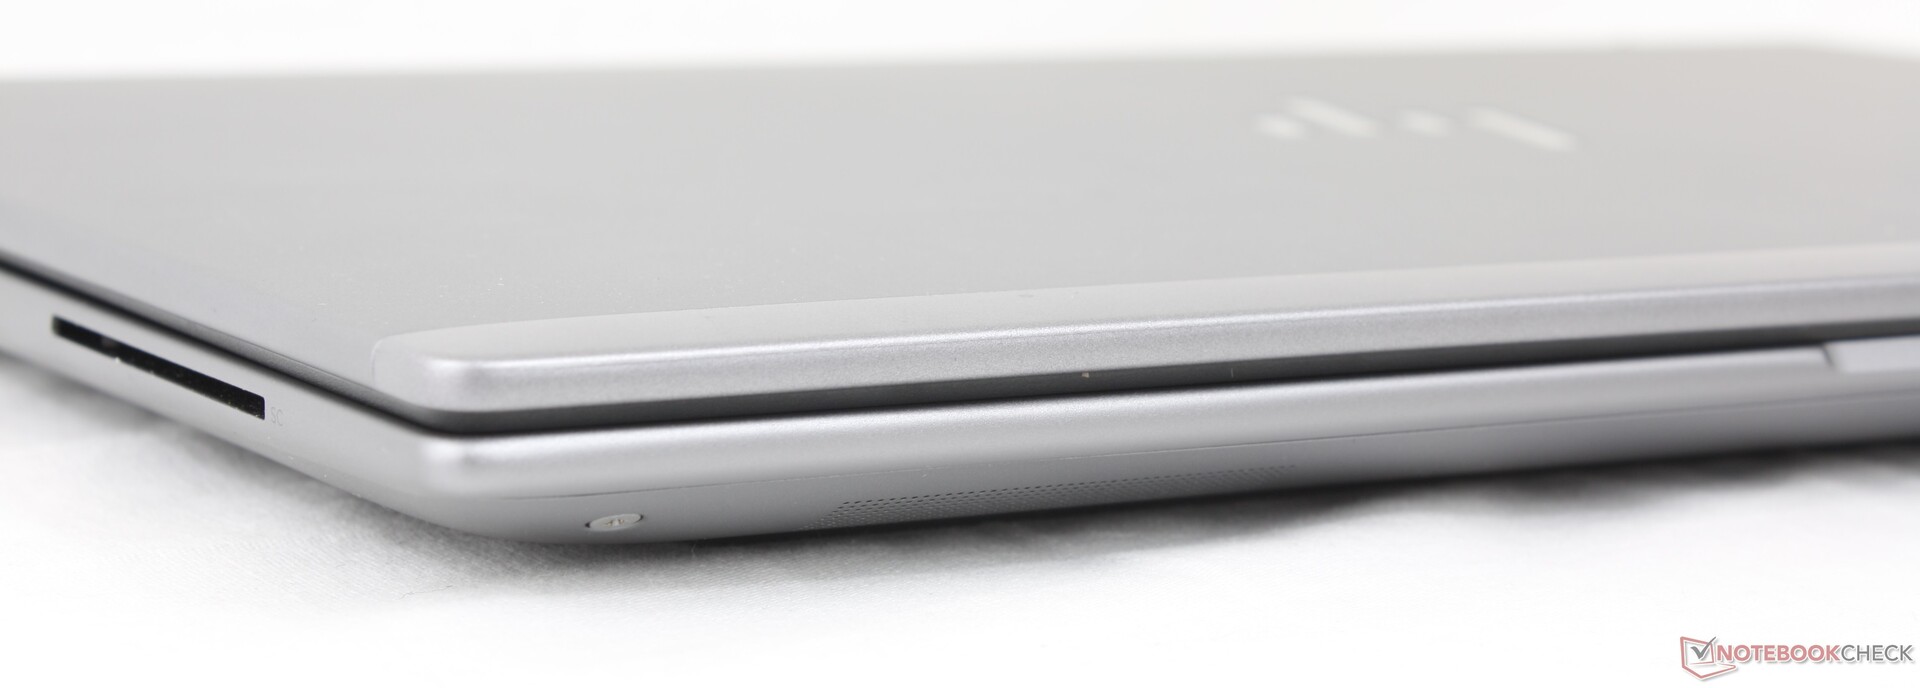

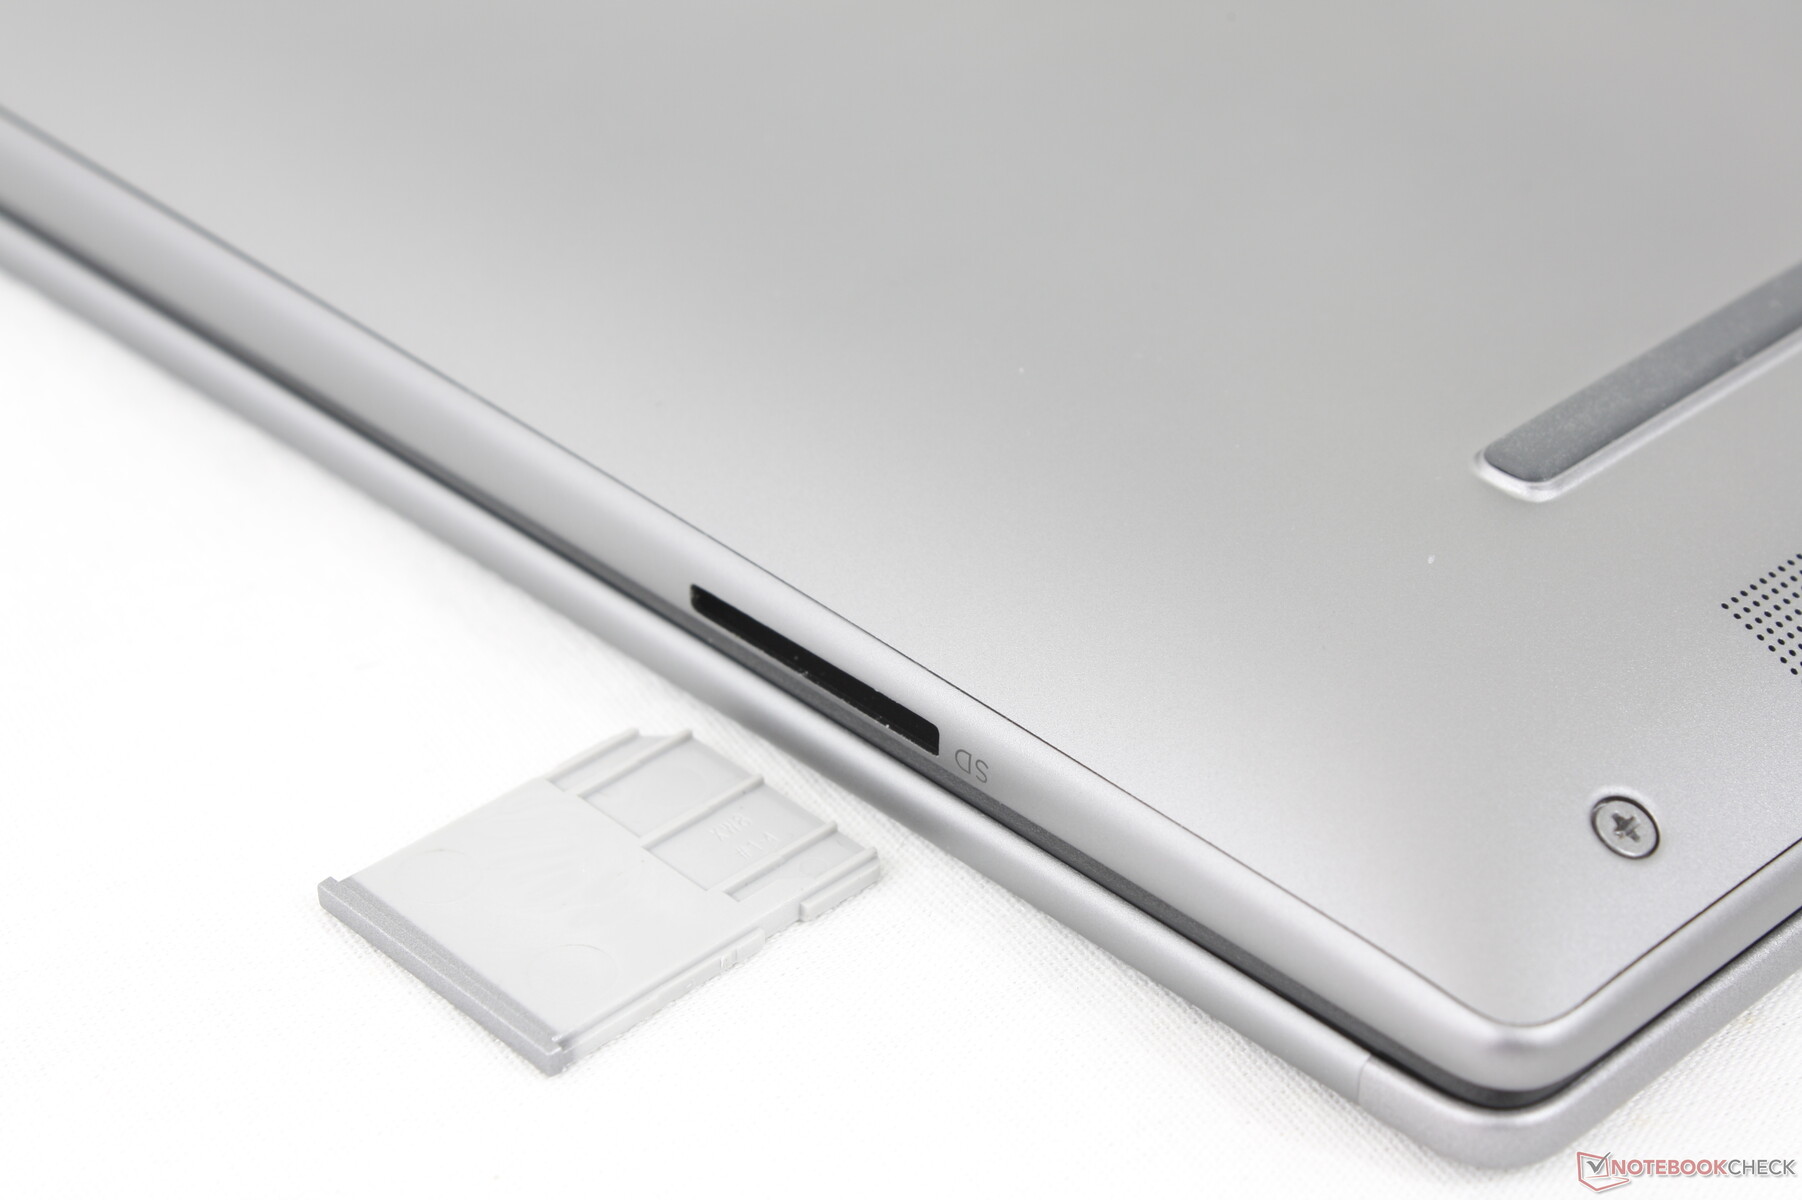
Leitor de cartão SD
O modelo integra um leitor de cartão MicroSD, enquanto esse recurso não existia no ZBook Power 15 G10. As taxas de transferência são muito rápidas; mover 1 GB de fotos do nosso cartão de teste UHS-II leva menos de 6 segundos, em comparação com 12 segundos no ZBook Fury 16 G11 ou no ThinkPad P1 Gen 7.
| SD Card Reader | |
| average JPG Copy Test (av. of 3 runs) | |
| HP ZBook Power 16 G11 A (Toshiba Exceria Pro SDXC 64 GB UHS-II) | |
| HP ZBook Fury 16 G11 (Toshiba Exceria Pro SDXC 64 GB UHS-II) | |
| Lenovo ThinkPad P1 Gen 7 21KV001SGE (AV Pro V60) | |
| maximum AS SSD Seq Read Test (1GB) | |
| HP ZBook Power 16 G11 A (Toshiba Exceria Pro SDXC 64 GB UHS-II) | |
| HP ZBook Fury 16 G11 (Toshiba Exceria Pro SDXC 64 GB UHS-II) | |
| Lenovo ThinkPad P1 Gen 7 21KV001SGE (AV Pro V60) | |
Comunicação
O MediaTek MT7922 vem como padrão para conectividade Wi-Fi 6E e Bluetooth 5.2. As opções Realtek também estão disponíveis, assim como o HP 4000 ou o Qualcomm 9205 para conectividade WAN.
Webcam
Uma webcam de 5 MP é padrão, juntamente com IR e um controle deslizante de obturador físico semelhante ao do ThinkPad P16s G2. O Precision 5690 vem com uma webcam de 2 MP de resolução muito mais baixa.


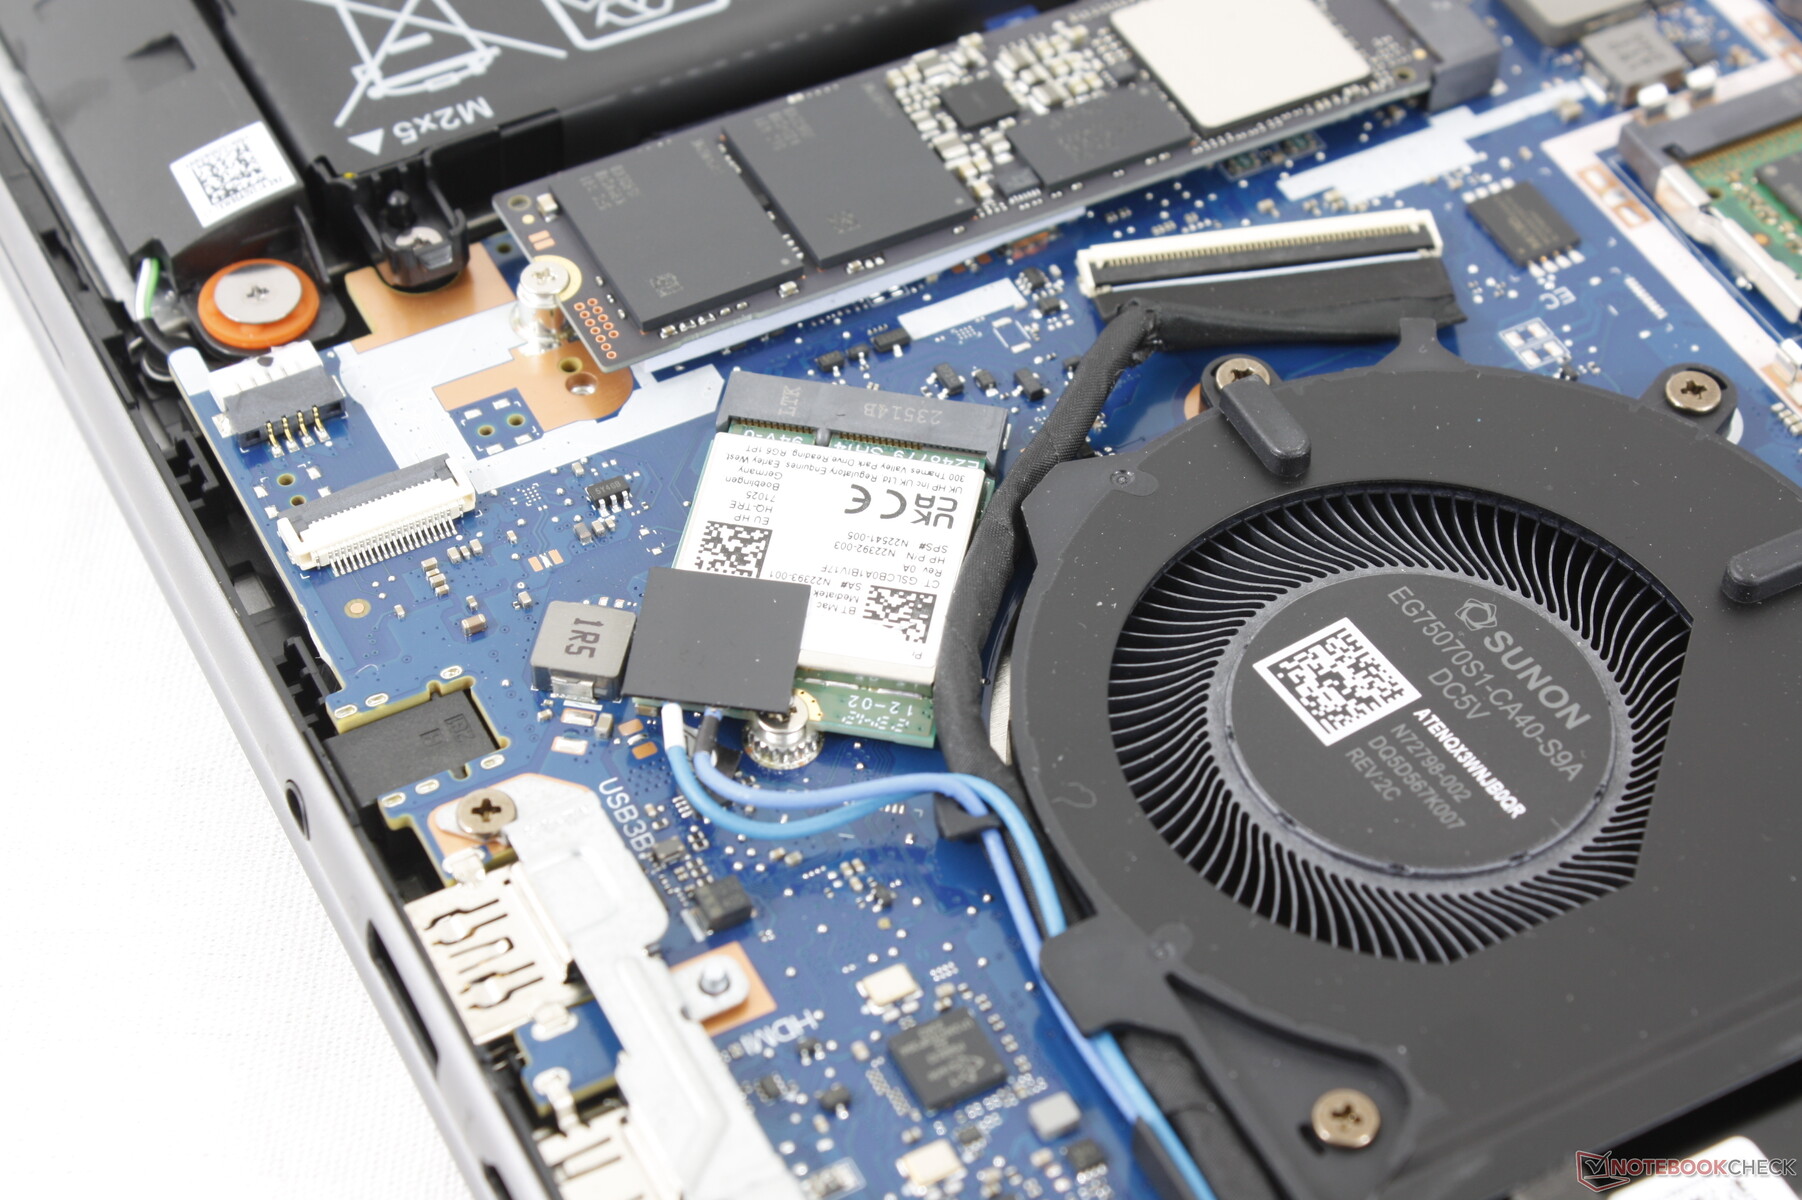
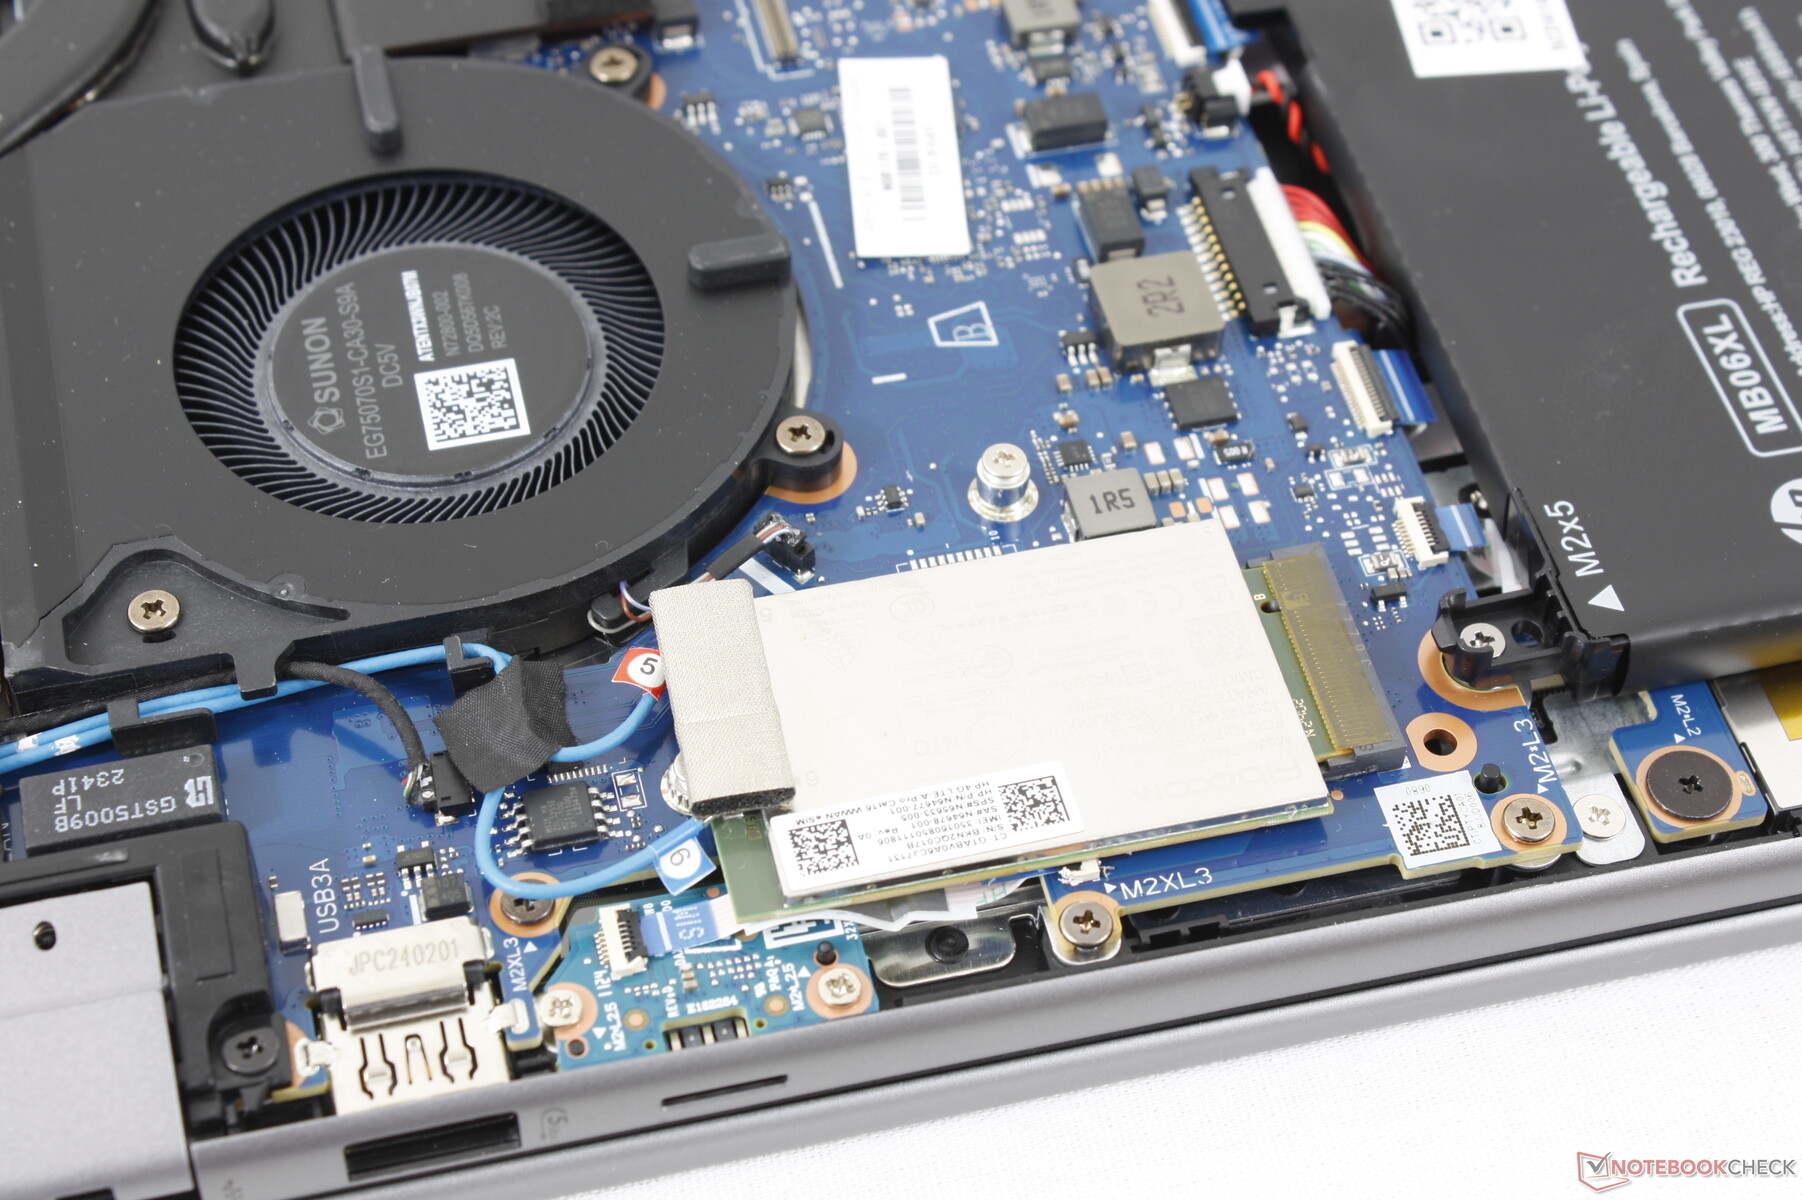
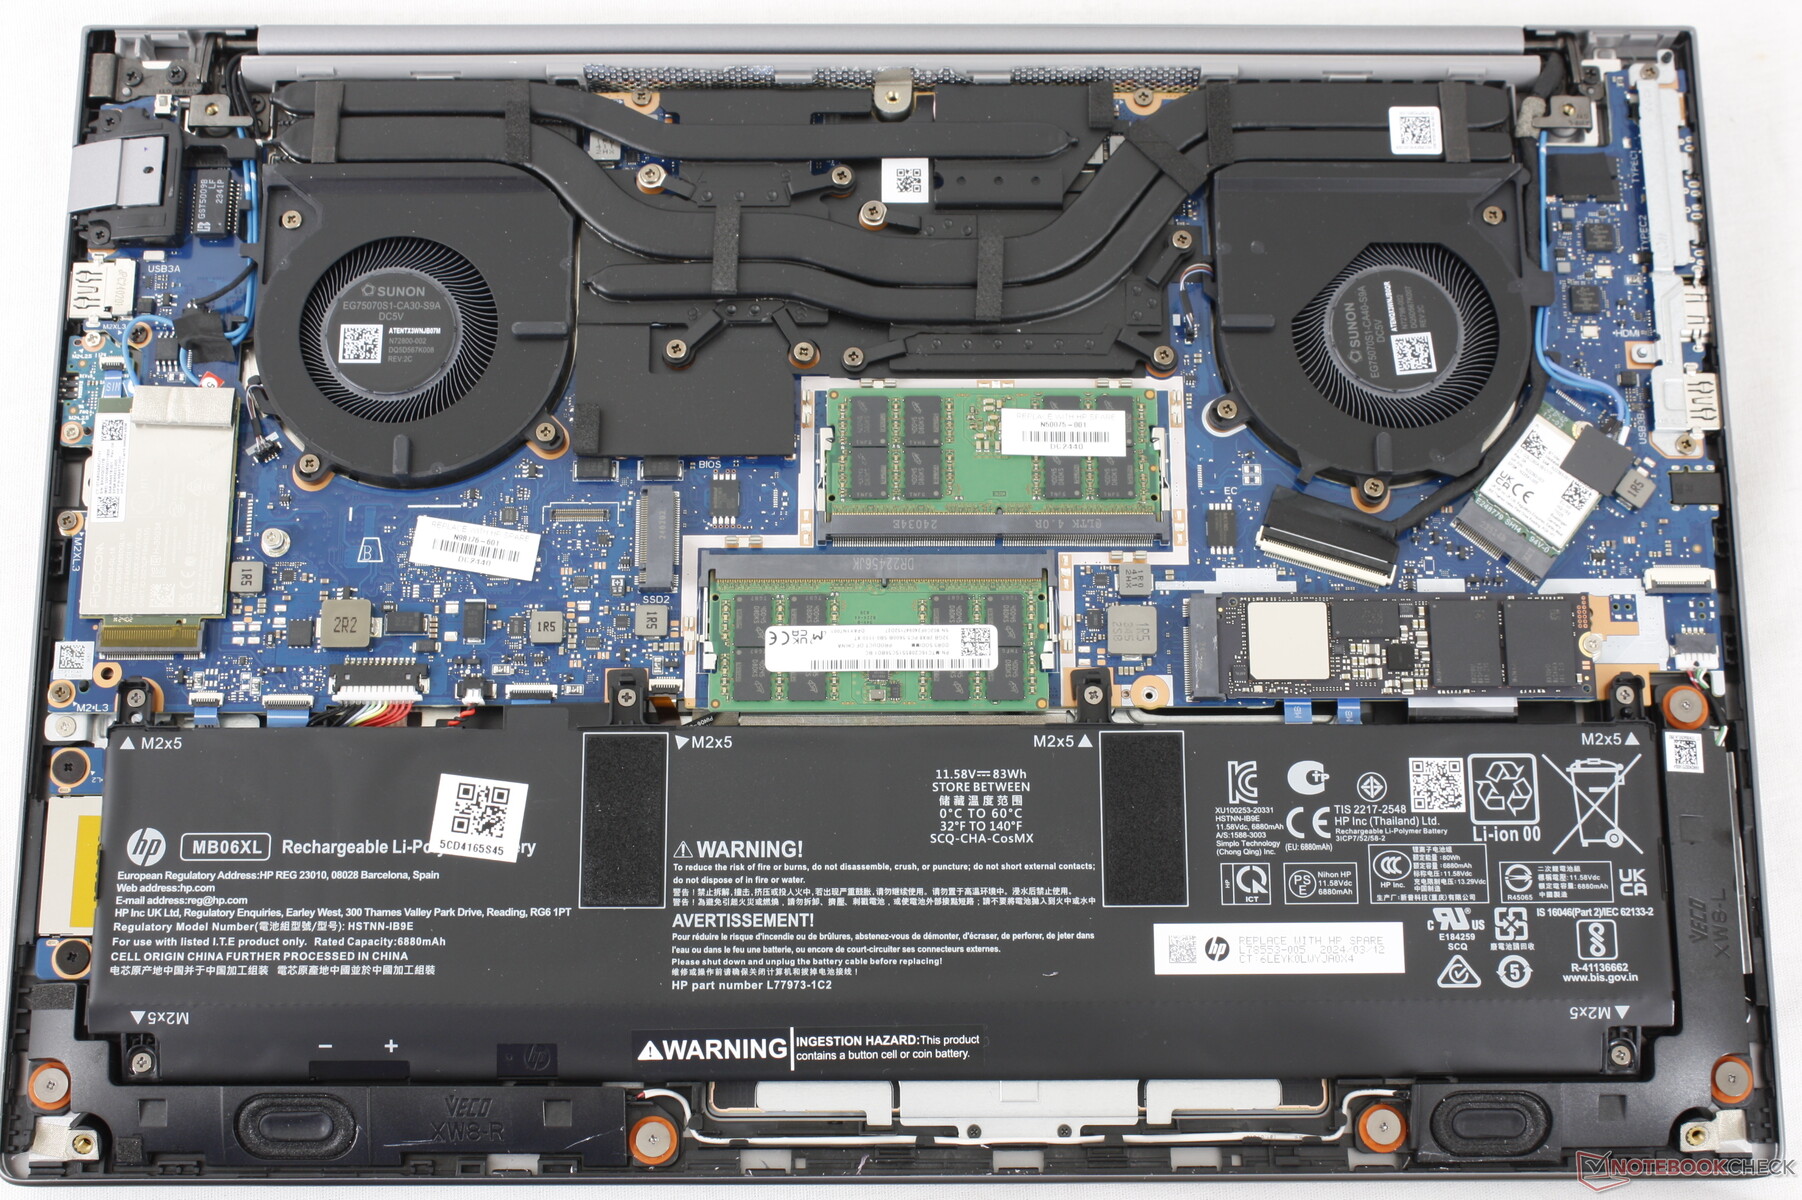
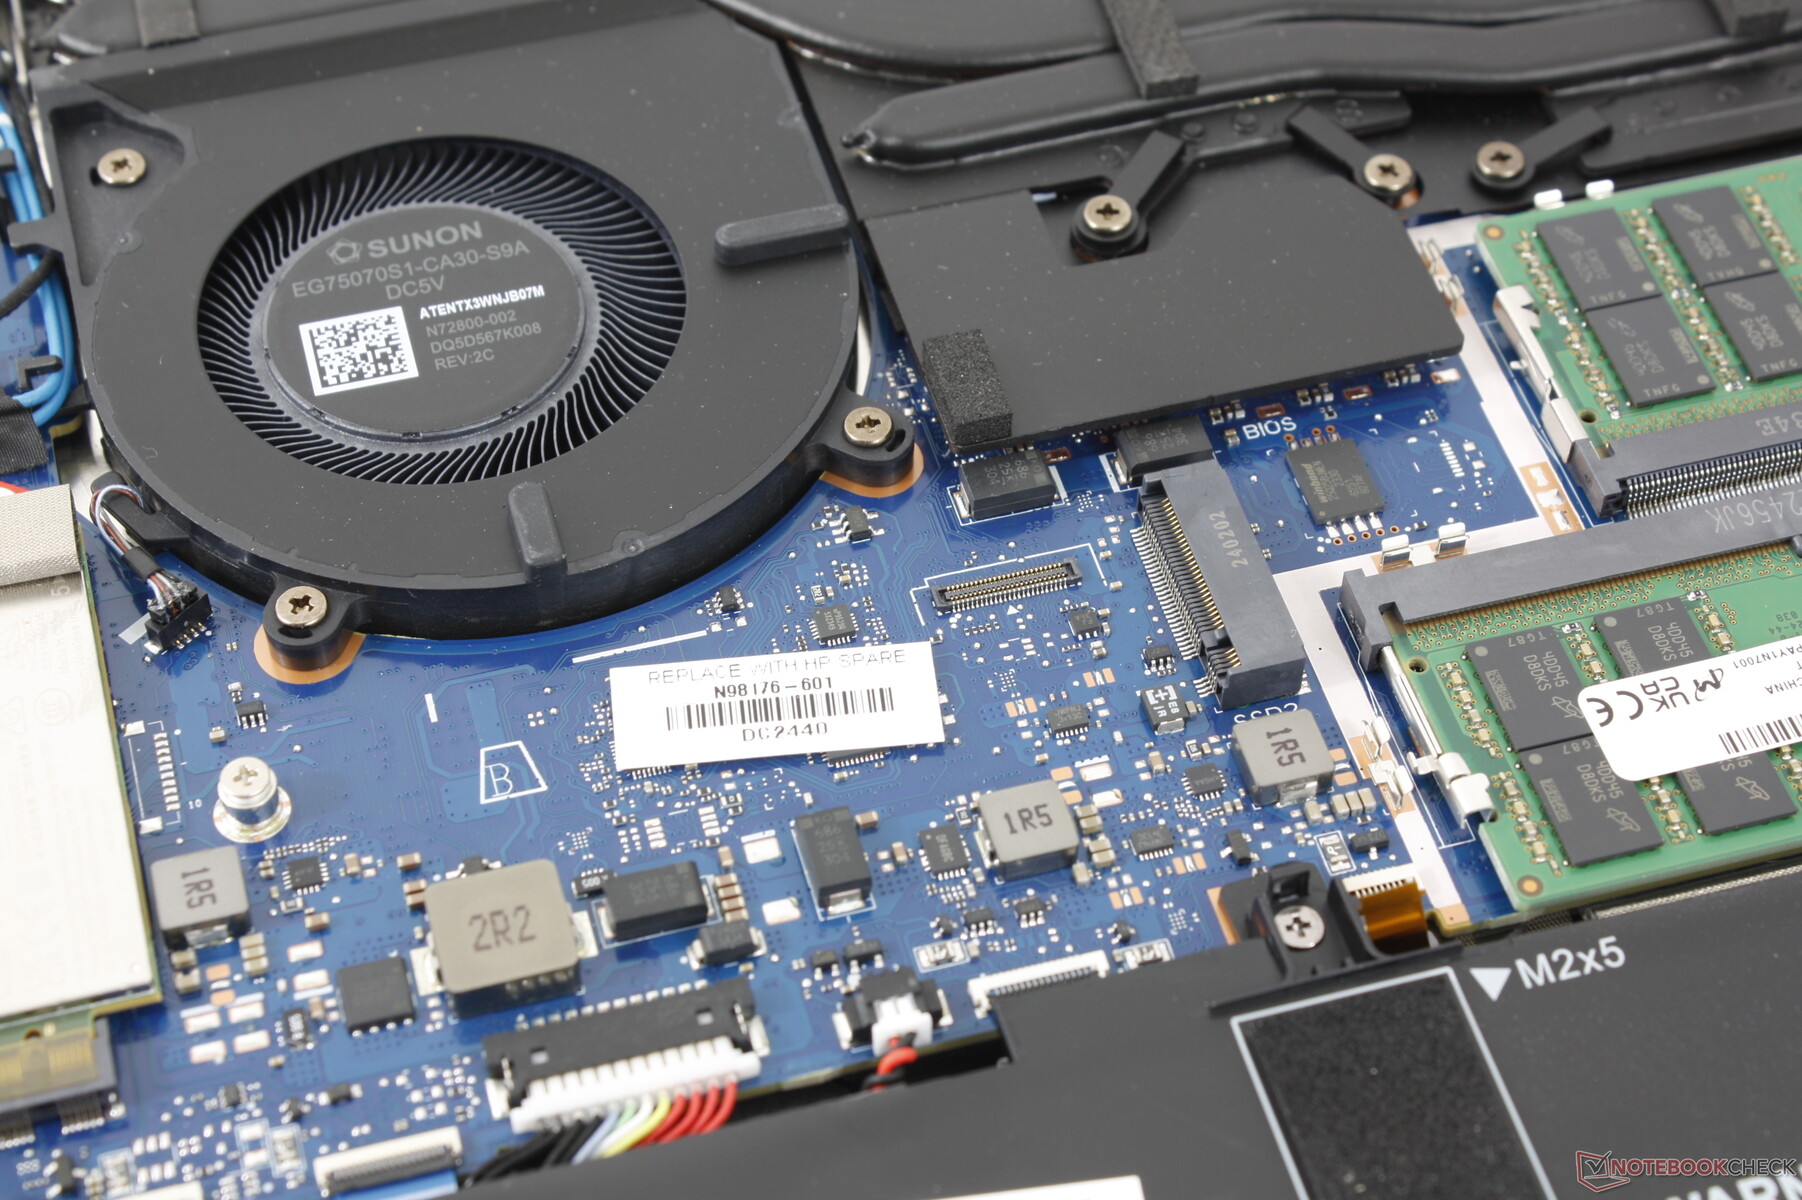
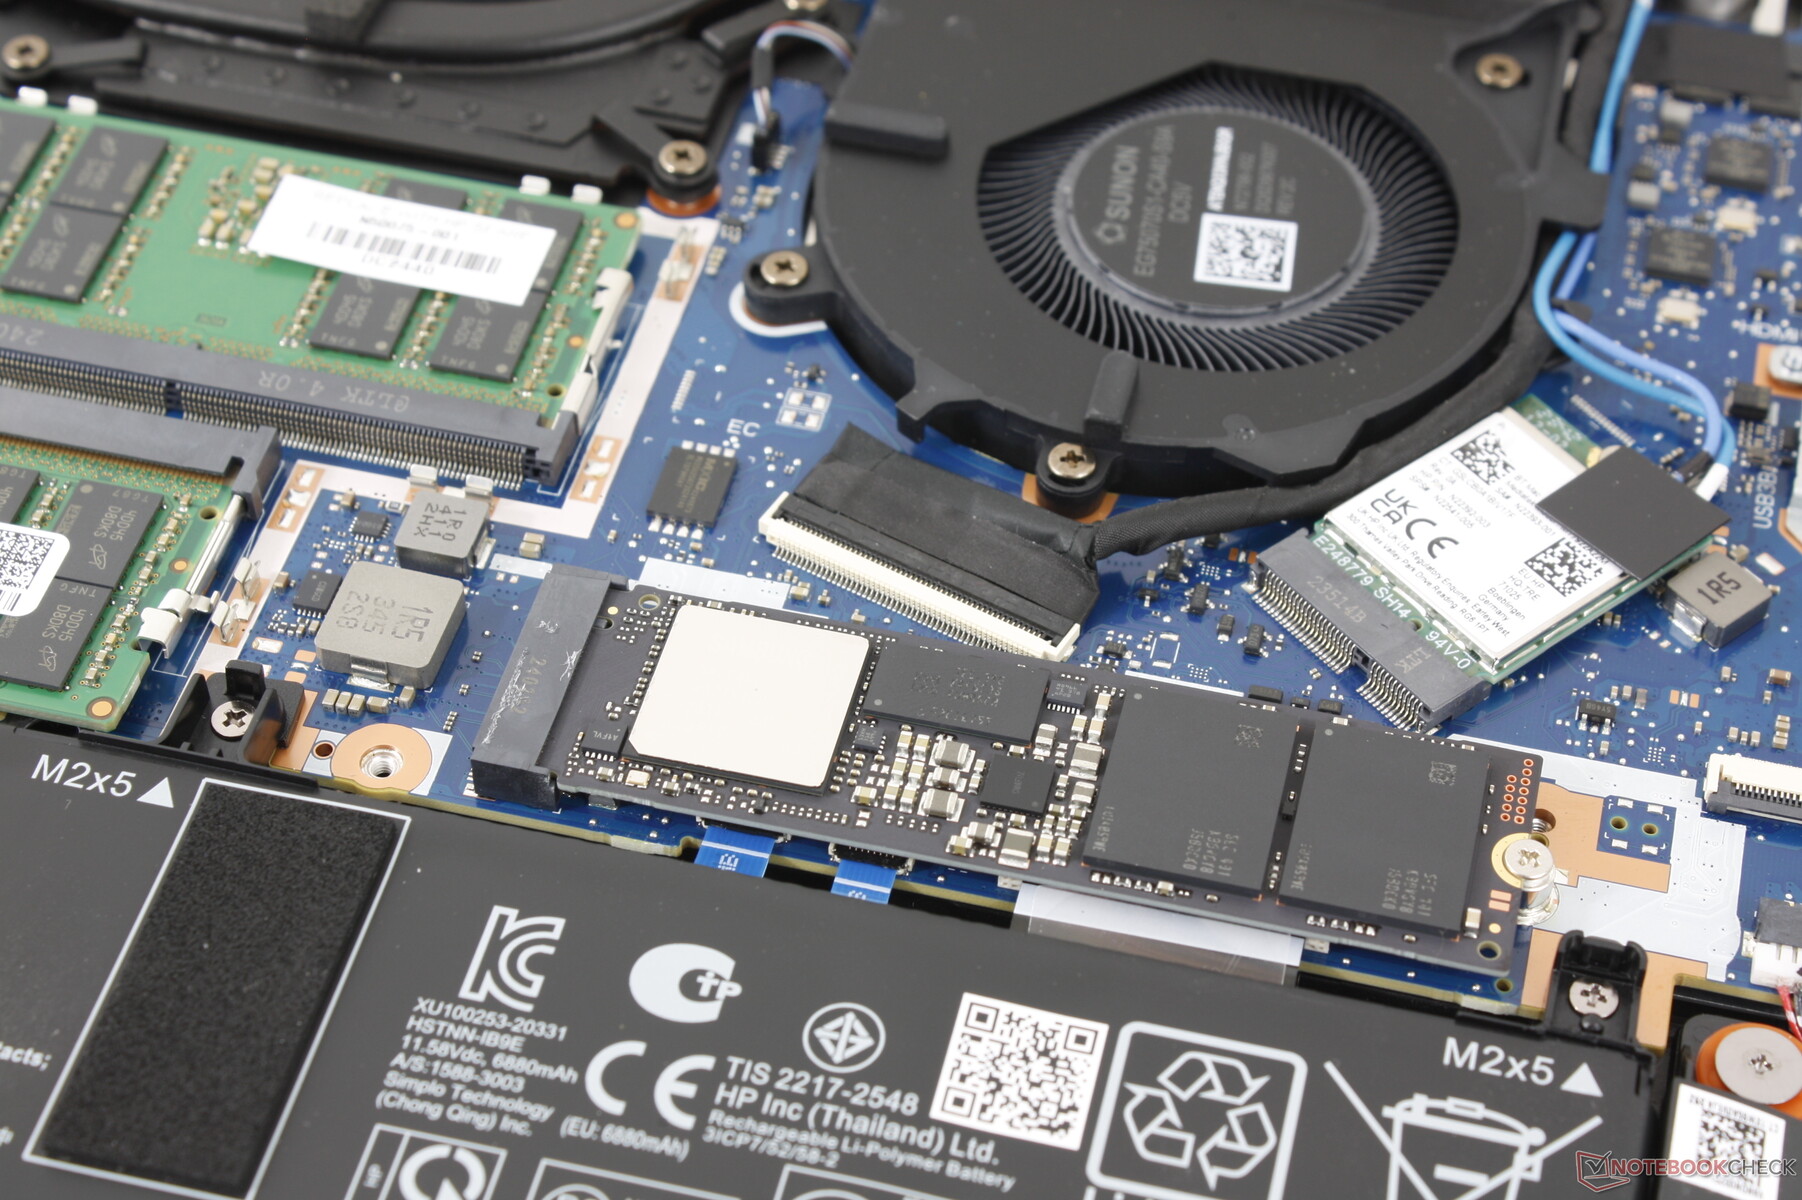
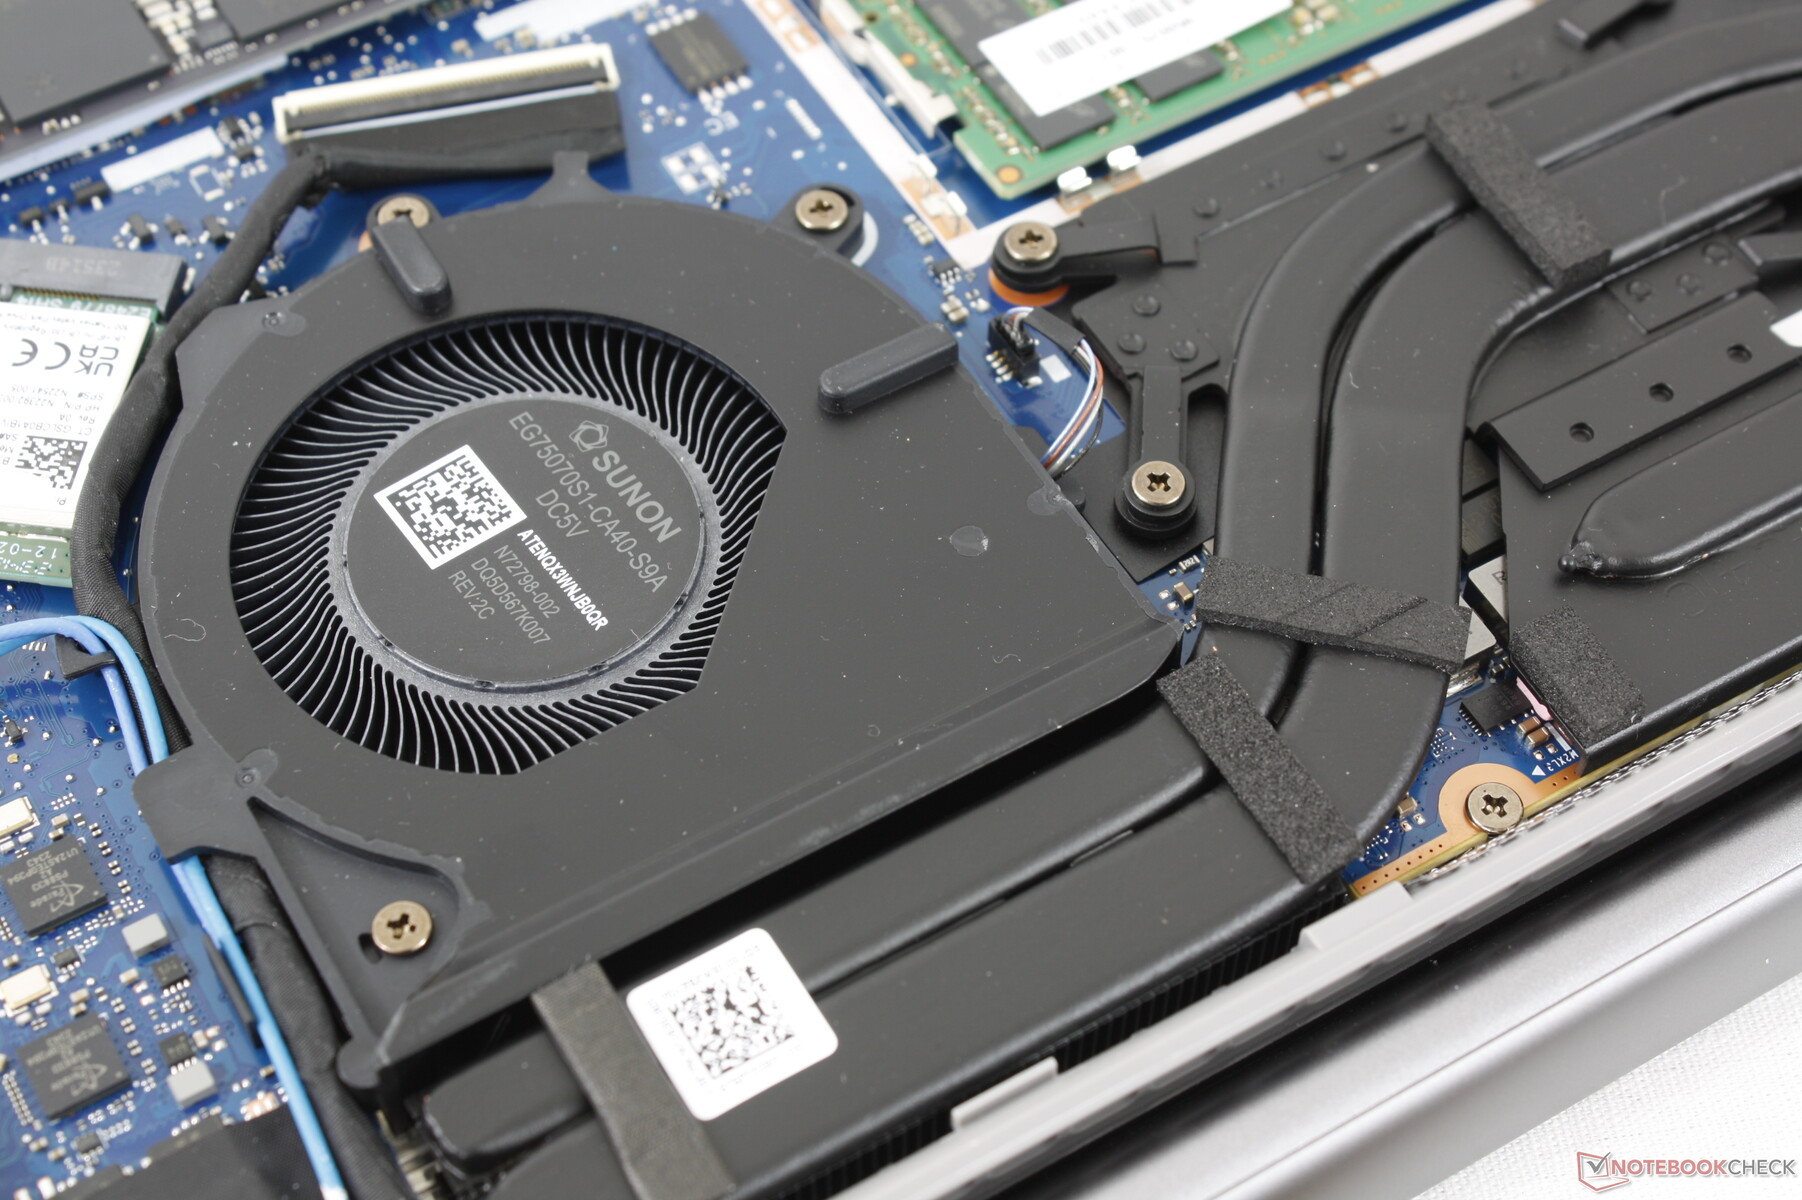
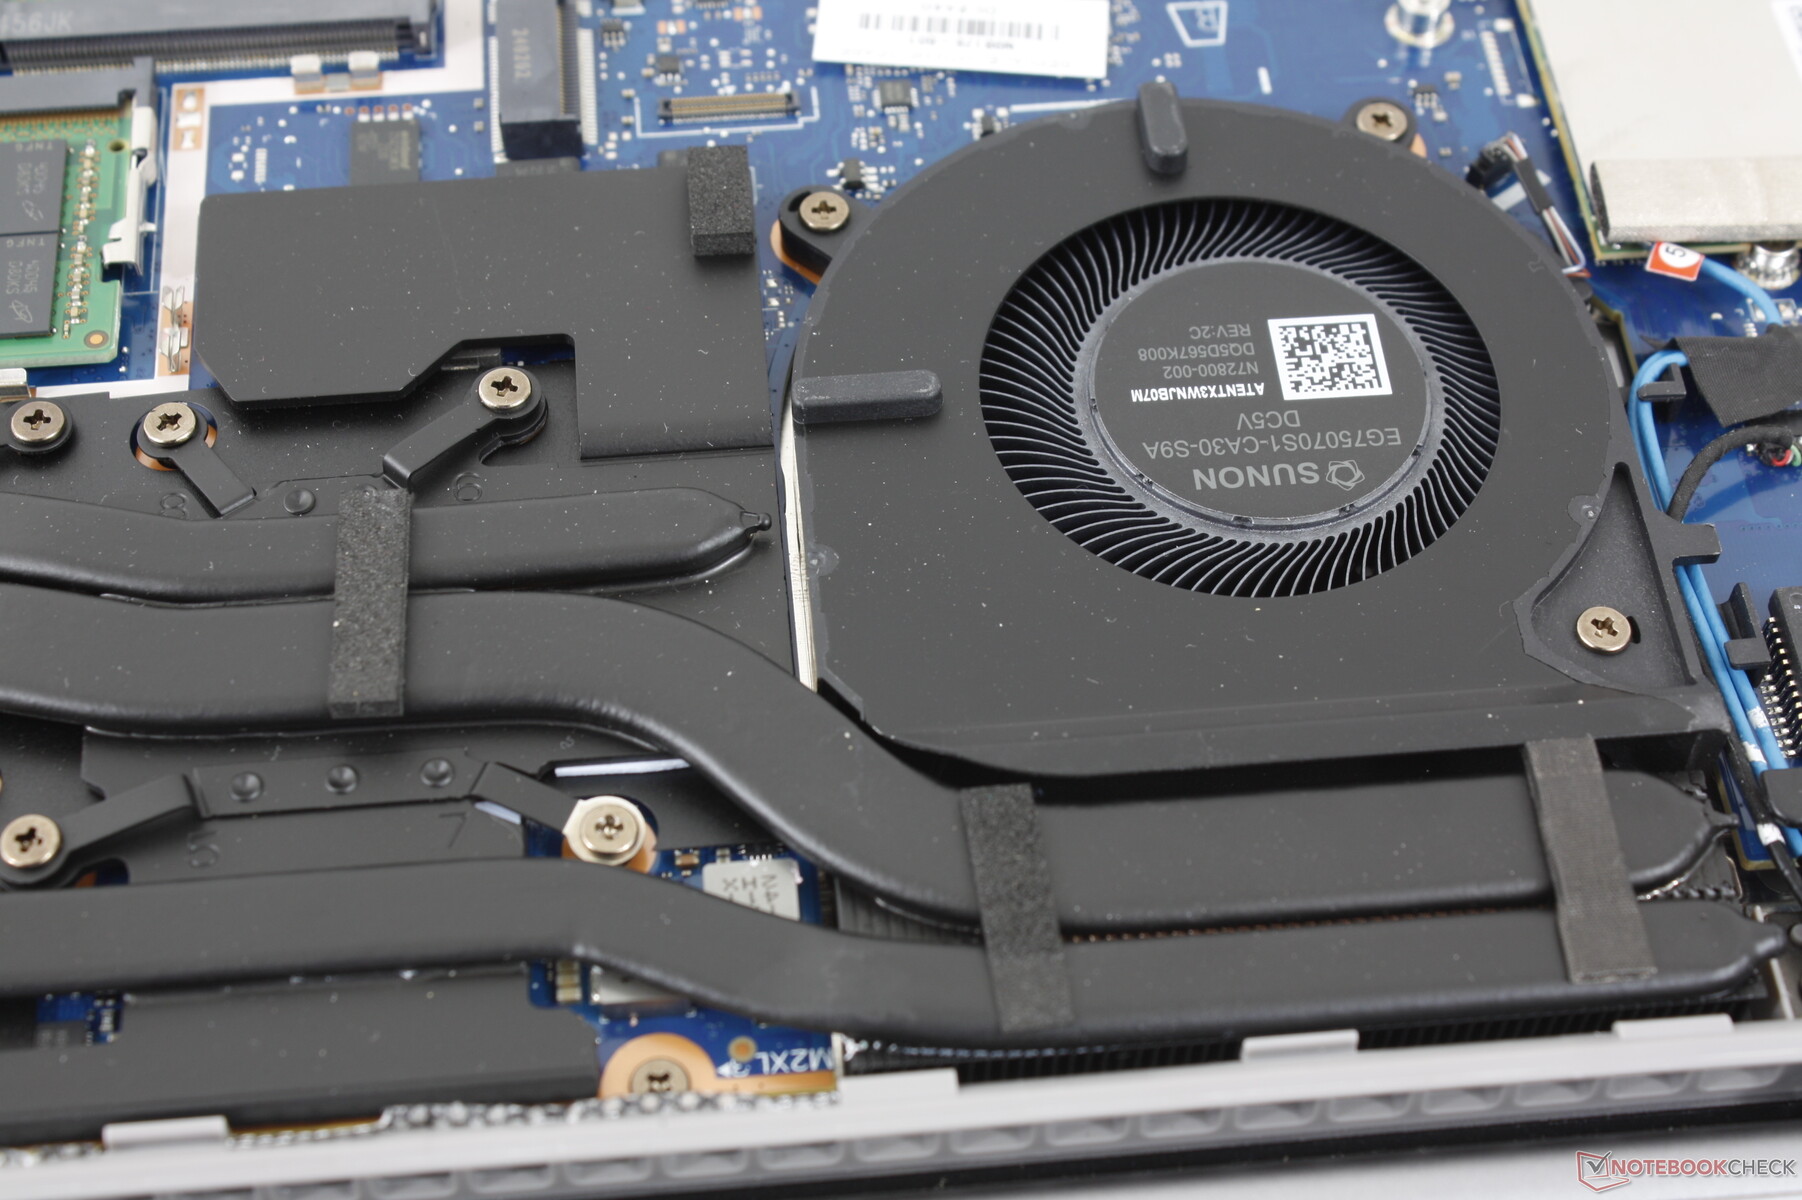
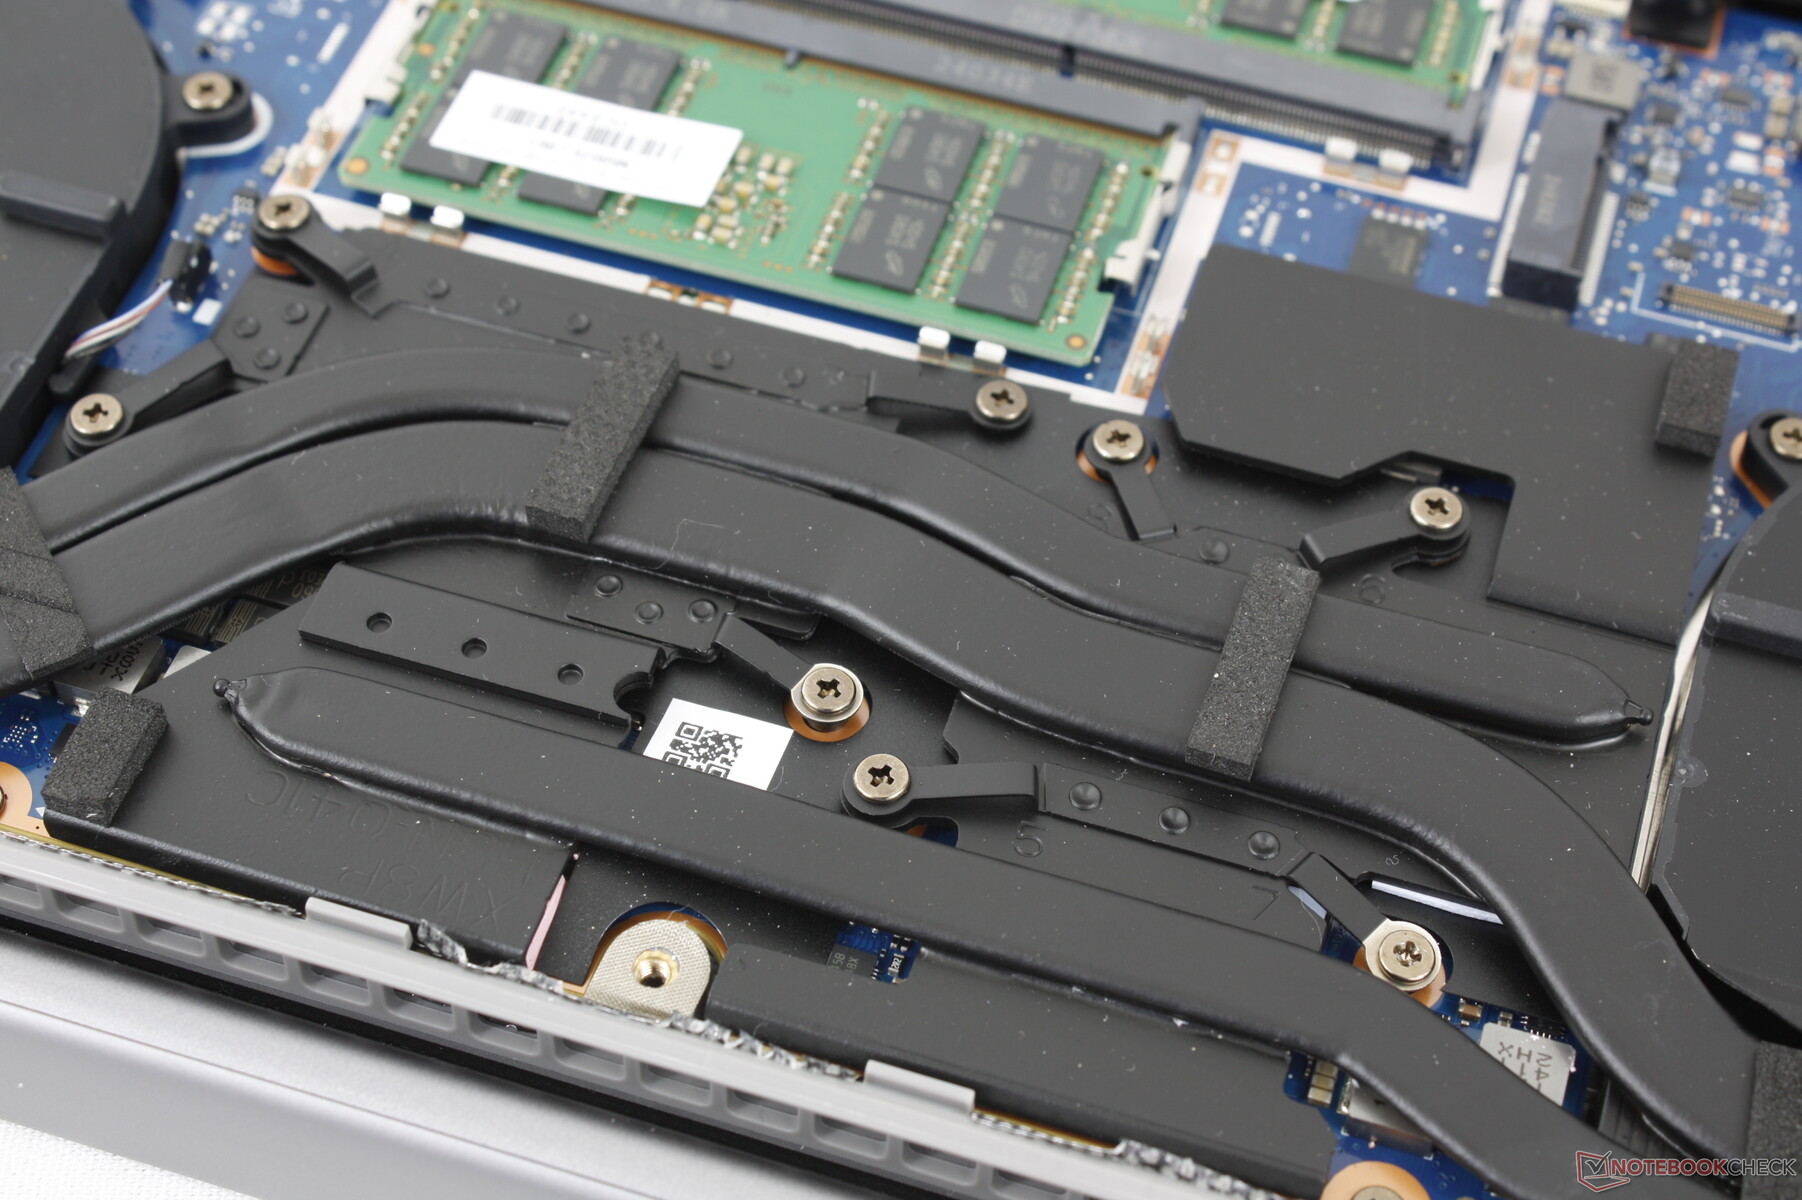
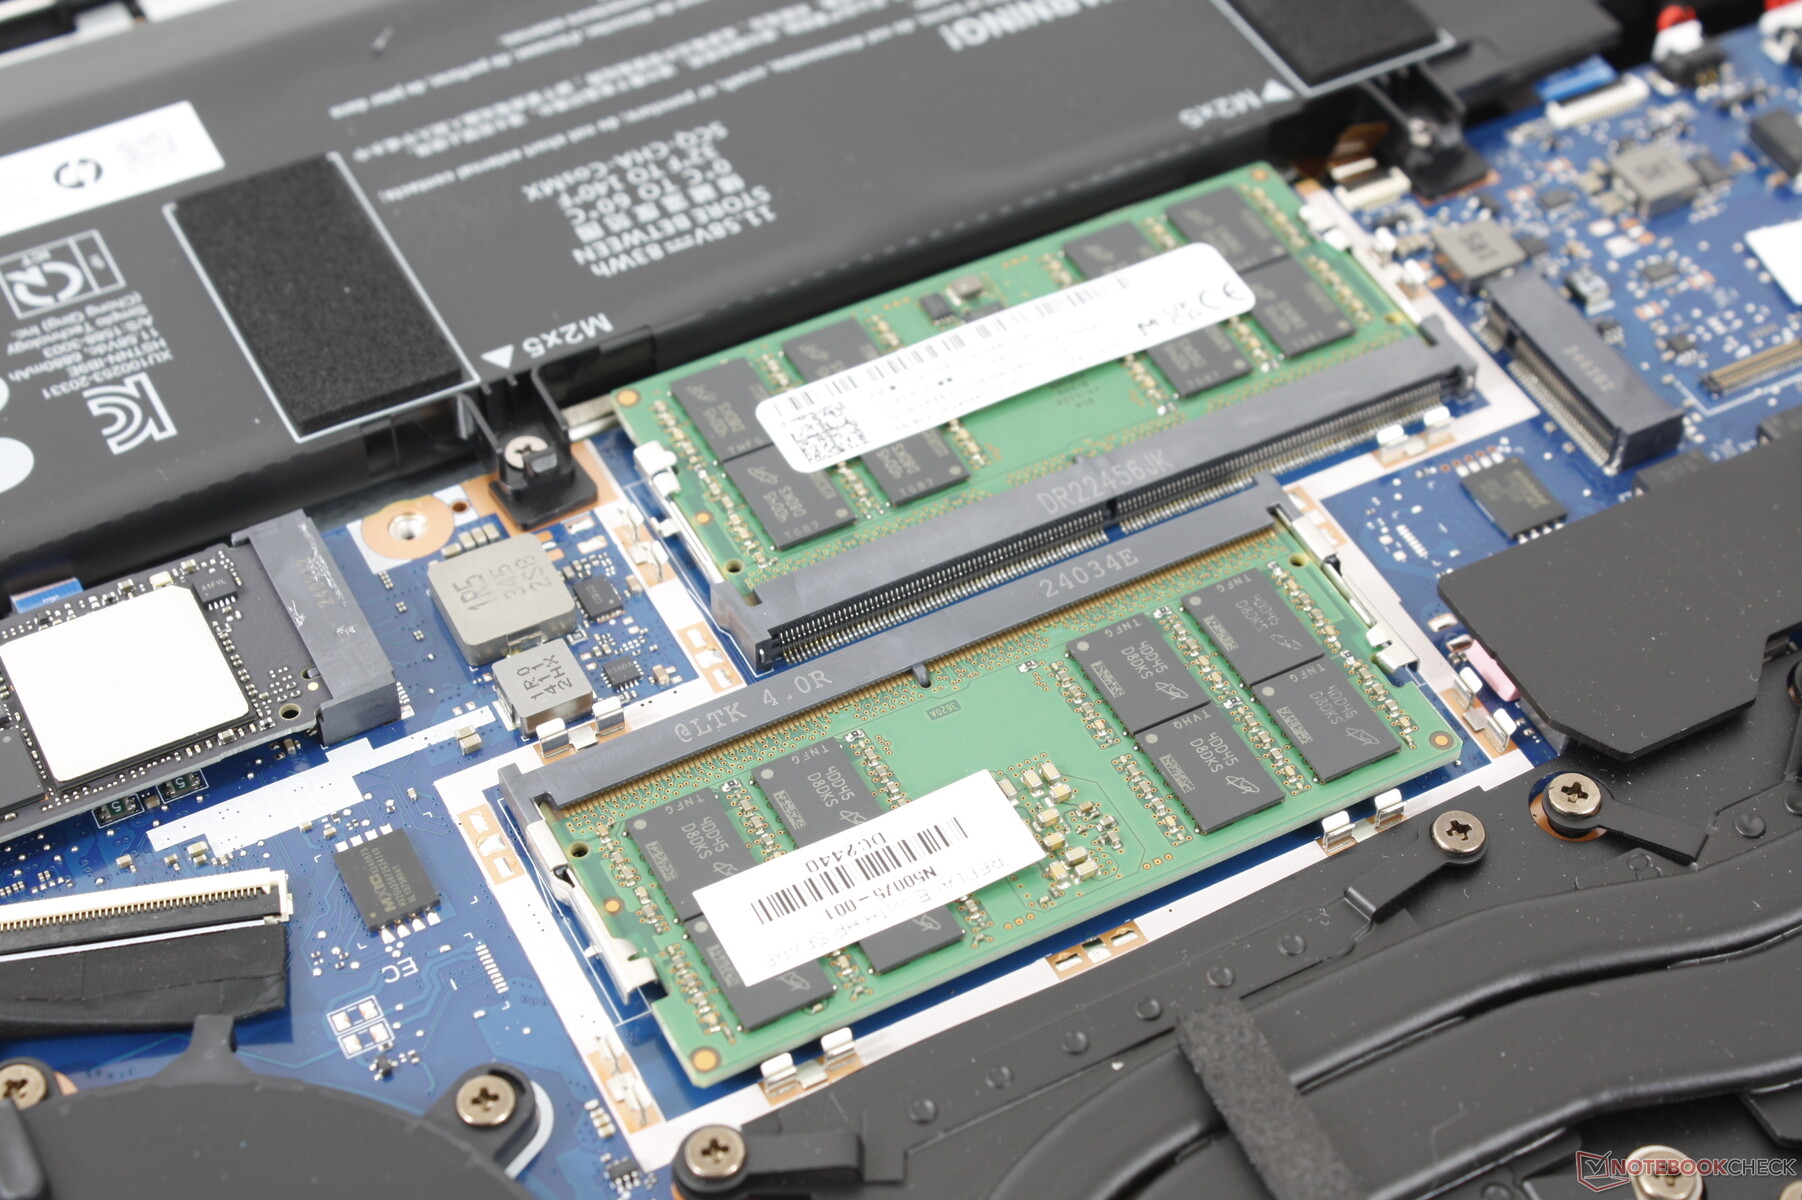
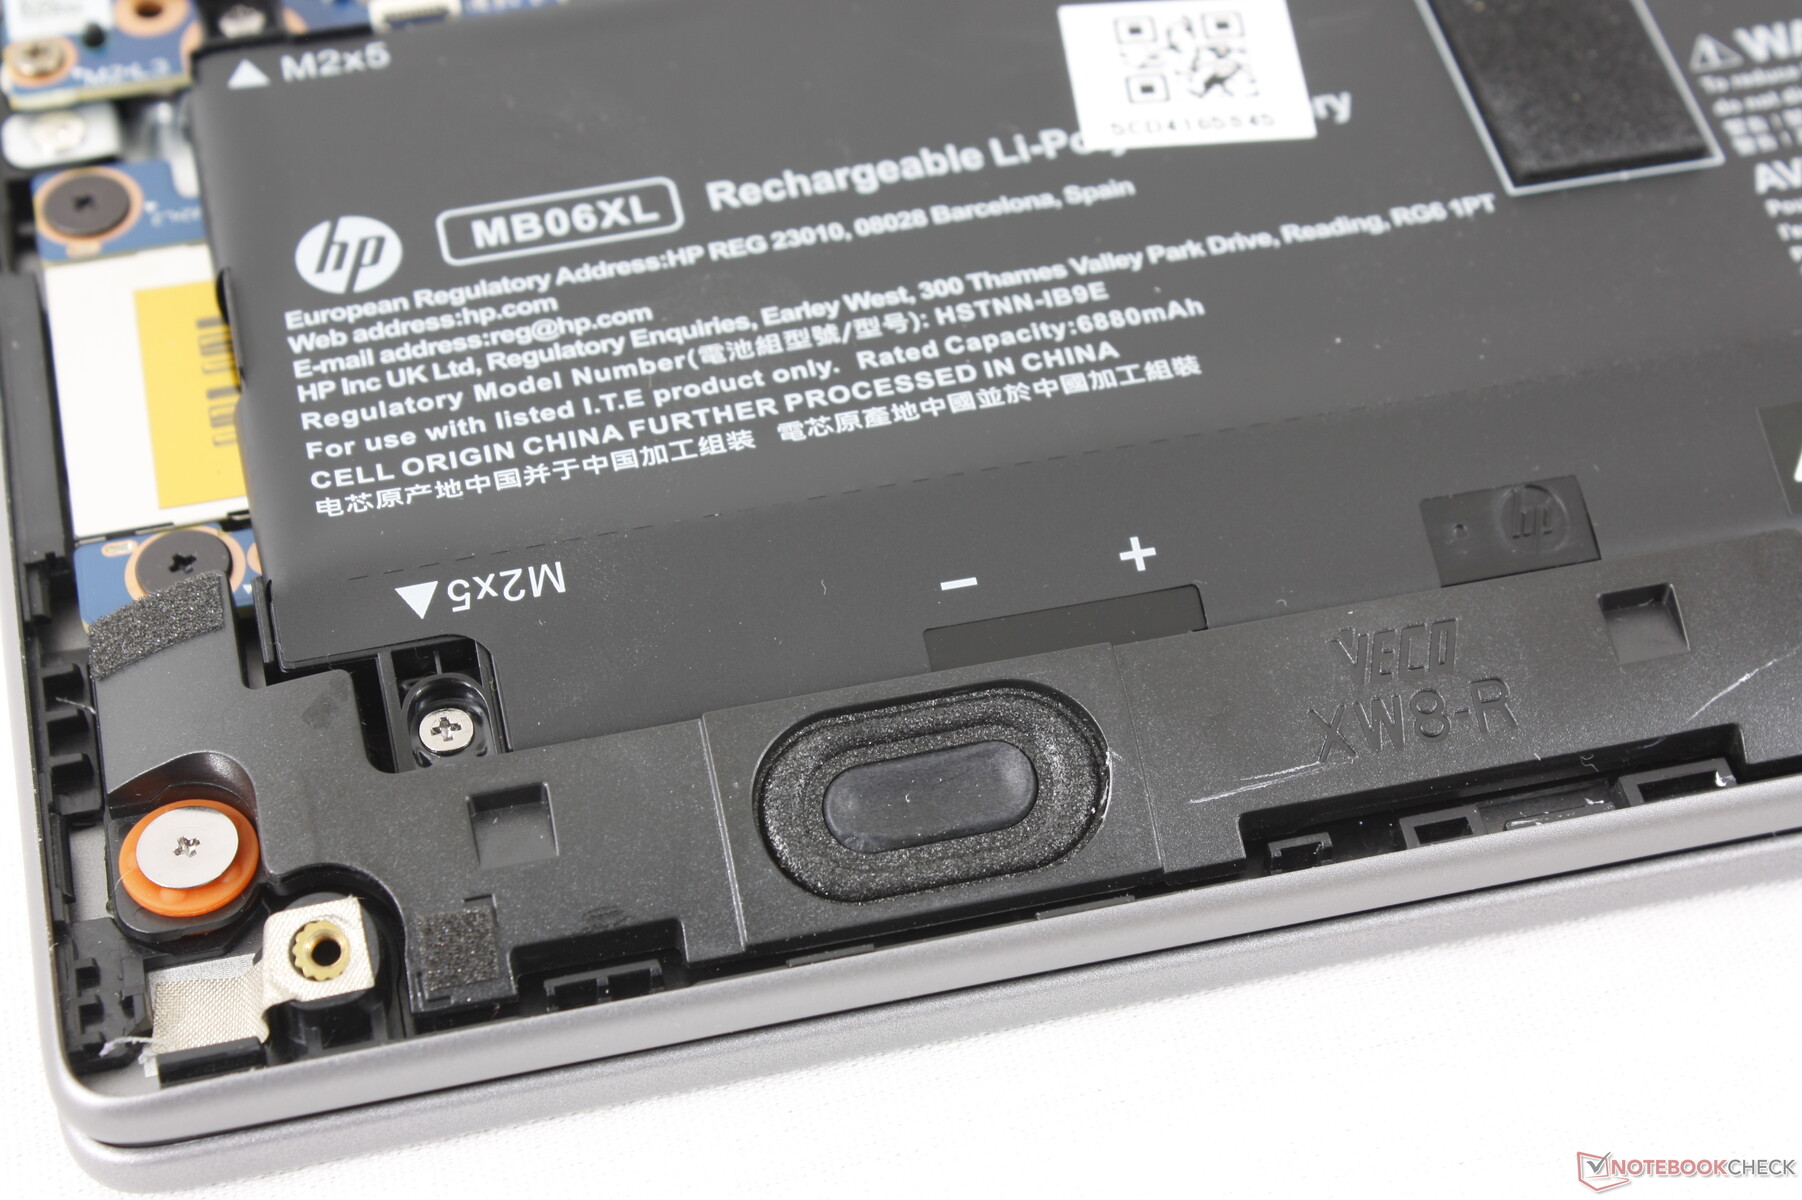
Manutenção
O painel inferior se solta com relativa facilidade com apenas uma chave de fenda Phillips e uma ponta afiada. Os componentes internos foram completamente redesenhados em comparação com o ZBook Power 15 G10, mantendo as mesmas opções atualizáveis, como os dois slots SODIMM, os dois slots SSD PCIe4 x4 NVMe e o módulo WLAN removível. Desta vez, a WAN é uma opção adicional.
Sustentabilidade
A fabricação utiliza baixo teor de halogênio, enquanto a embalagem consiste em polpa de papel moldado e plásticos reciclados feitos de fontes 100% sustentáveis e 60% de fontes pós-consumo, respectivamente.
Acessórios e garantia
Não há extras na caixa para acompanhar o adaptador CA e a documentação. Infelizmente, a garantia limitada padrão é de apenas um ano se for comprada nos EUA, enquanto o ZBook Fury vem com três anos como padrão.
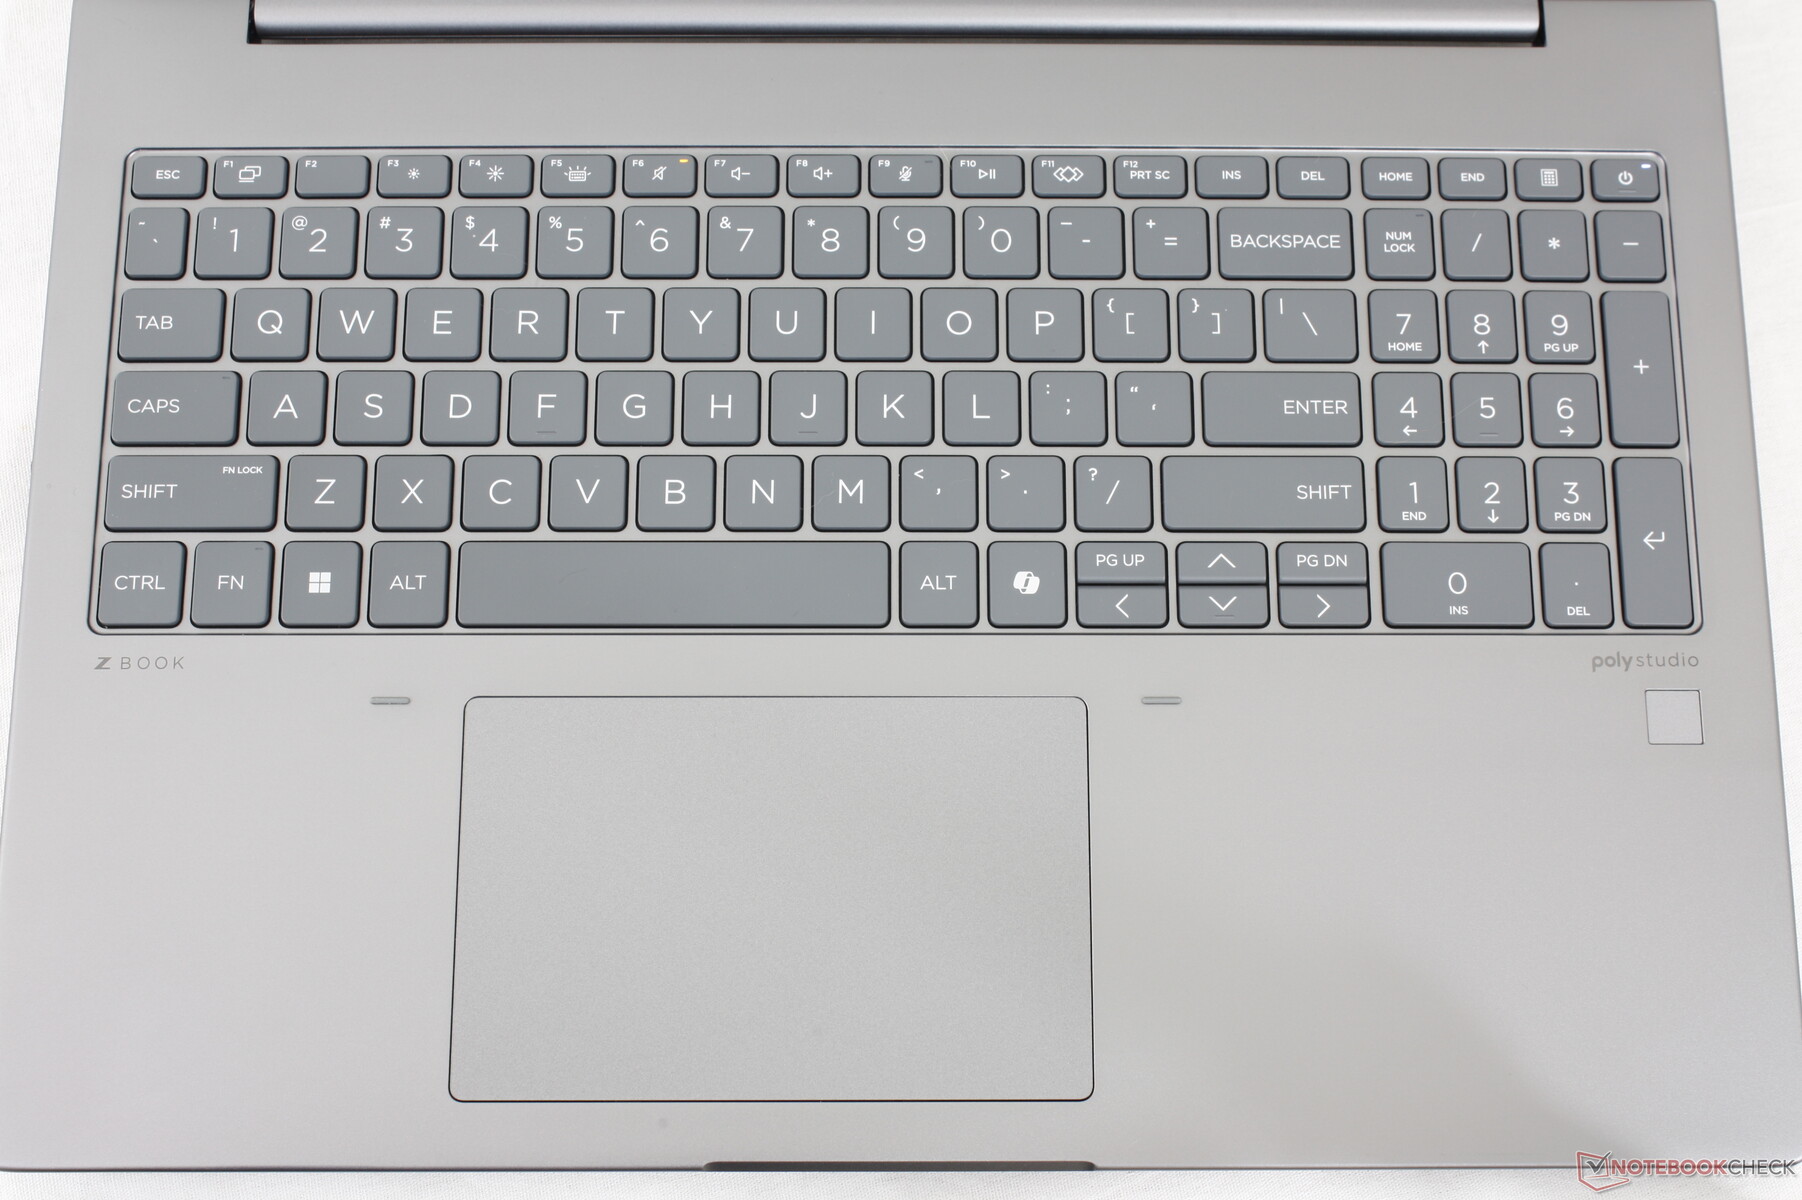
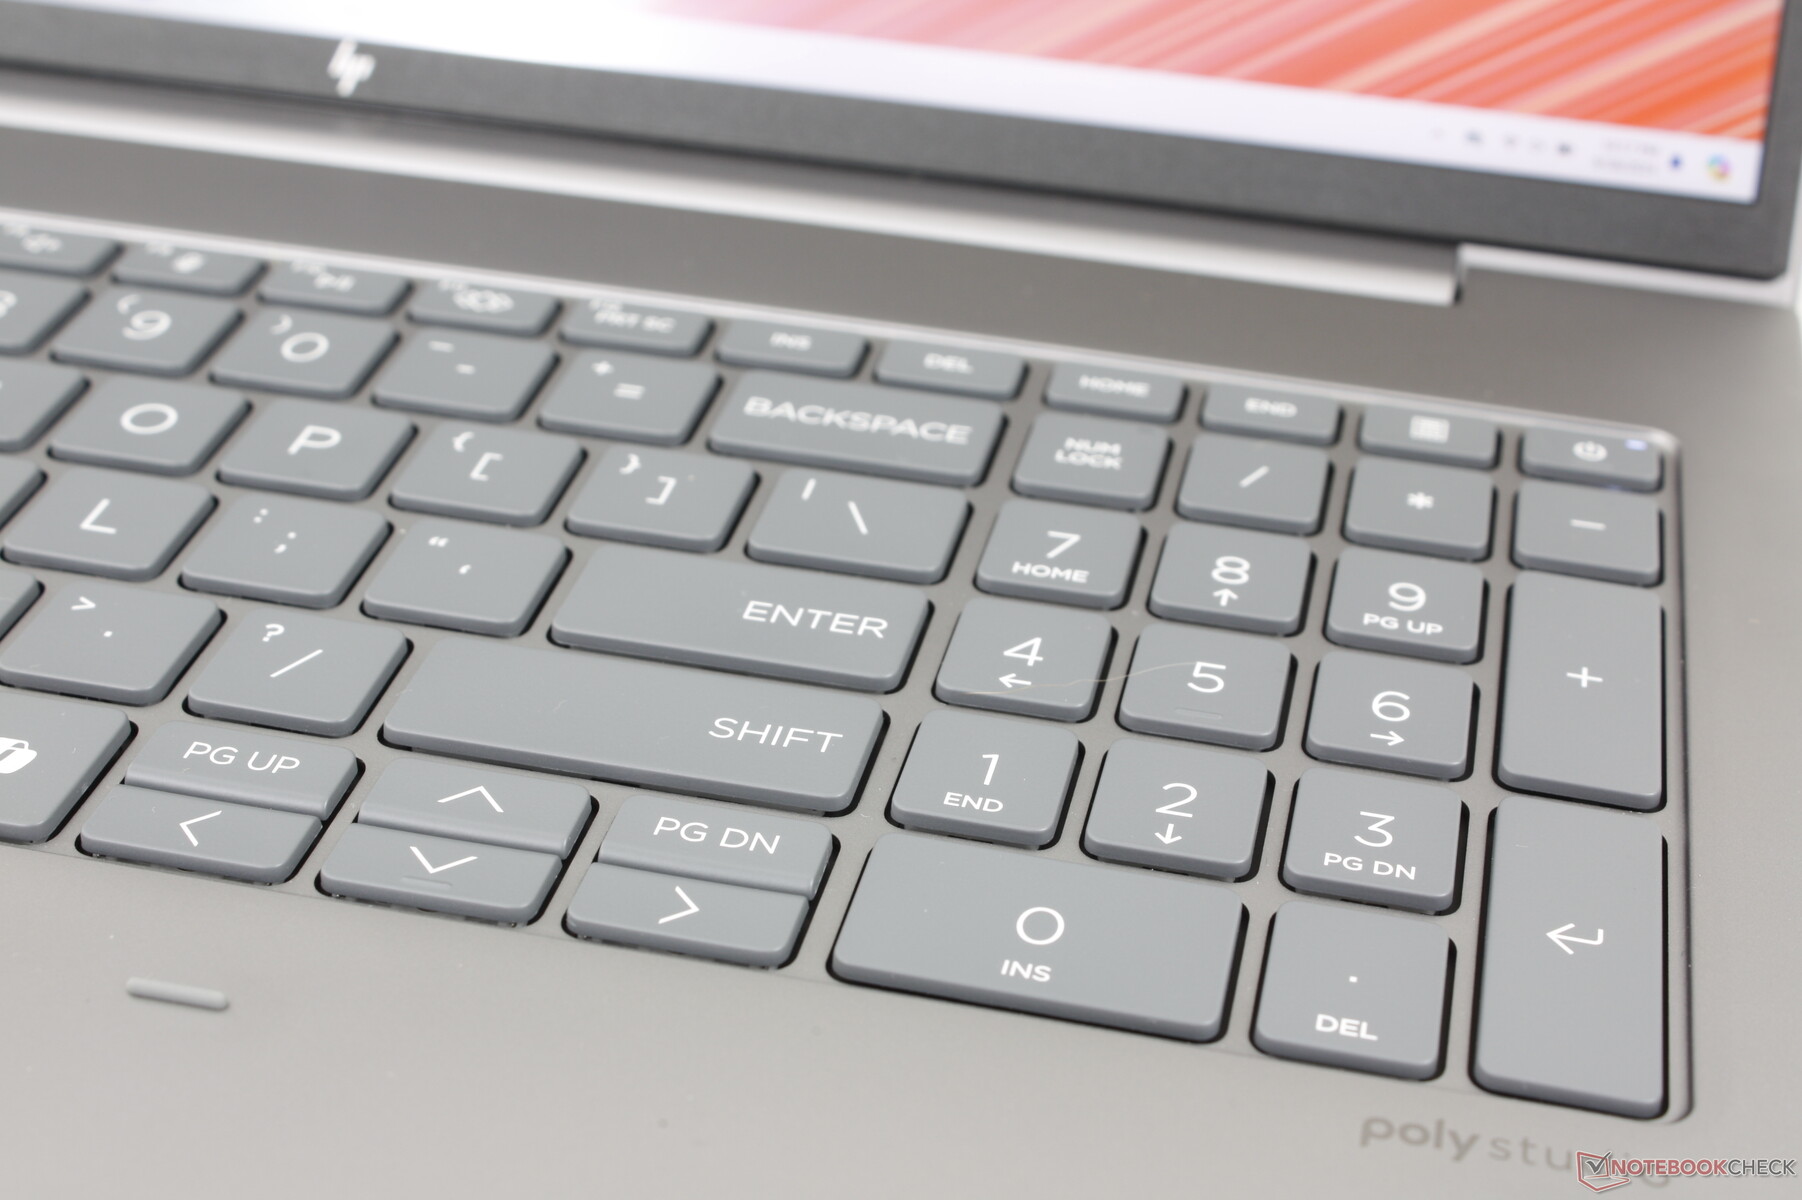
Dispositivos de entrada - Teclas espaçosas
Teclado
A experiência de digitação é semelhante à de um Spectre x360 16 no sentido de que as teclas são firmes, com feedback relativamente nítido, o que as torna confortáveis para digitação. O deslocamento das teclas, em particular, parece mais profundo do que na maioria dos Ultrabooks para evitar o típico feedback superficial ou esponjoso.
O teclado numérico retornou, embora não exista no concorrente Precision 5690. No entanto, suas teclas são um pouco mais estreitas do que as teclas QWERTY principais e, portanto, a resposta é visivelmente mais suave quando pressionadas.
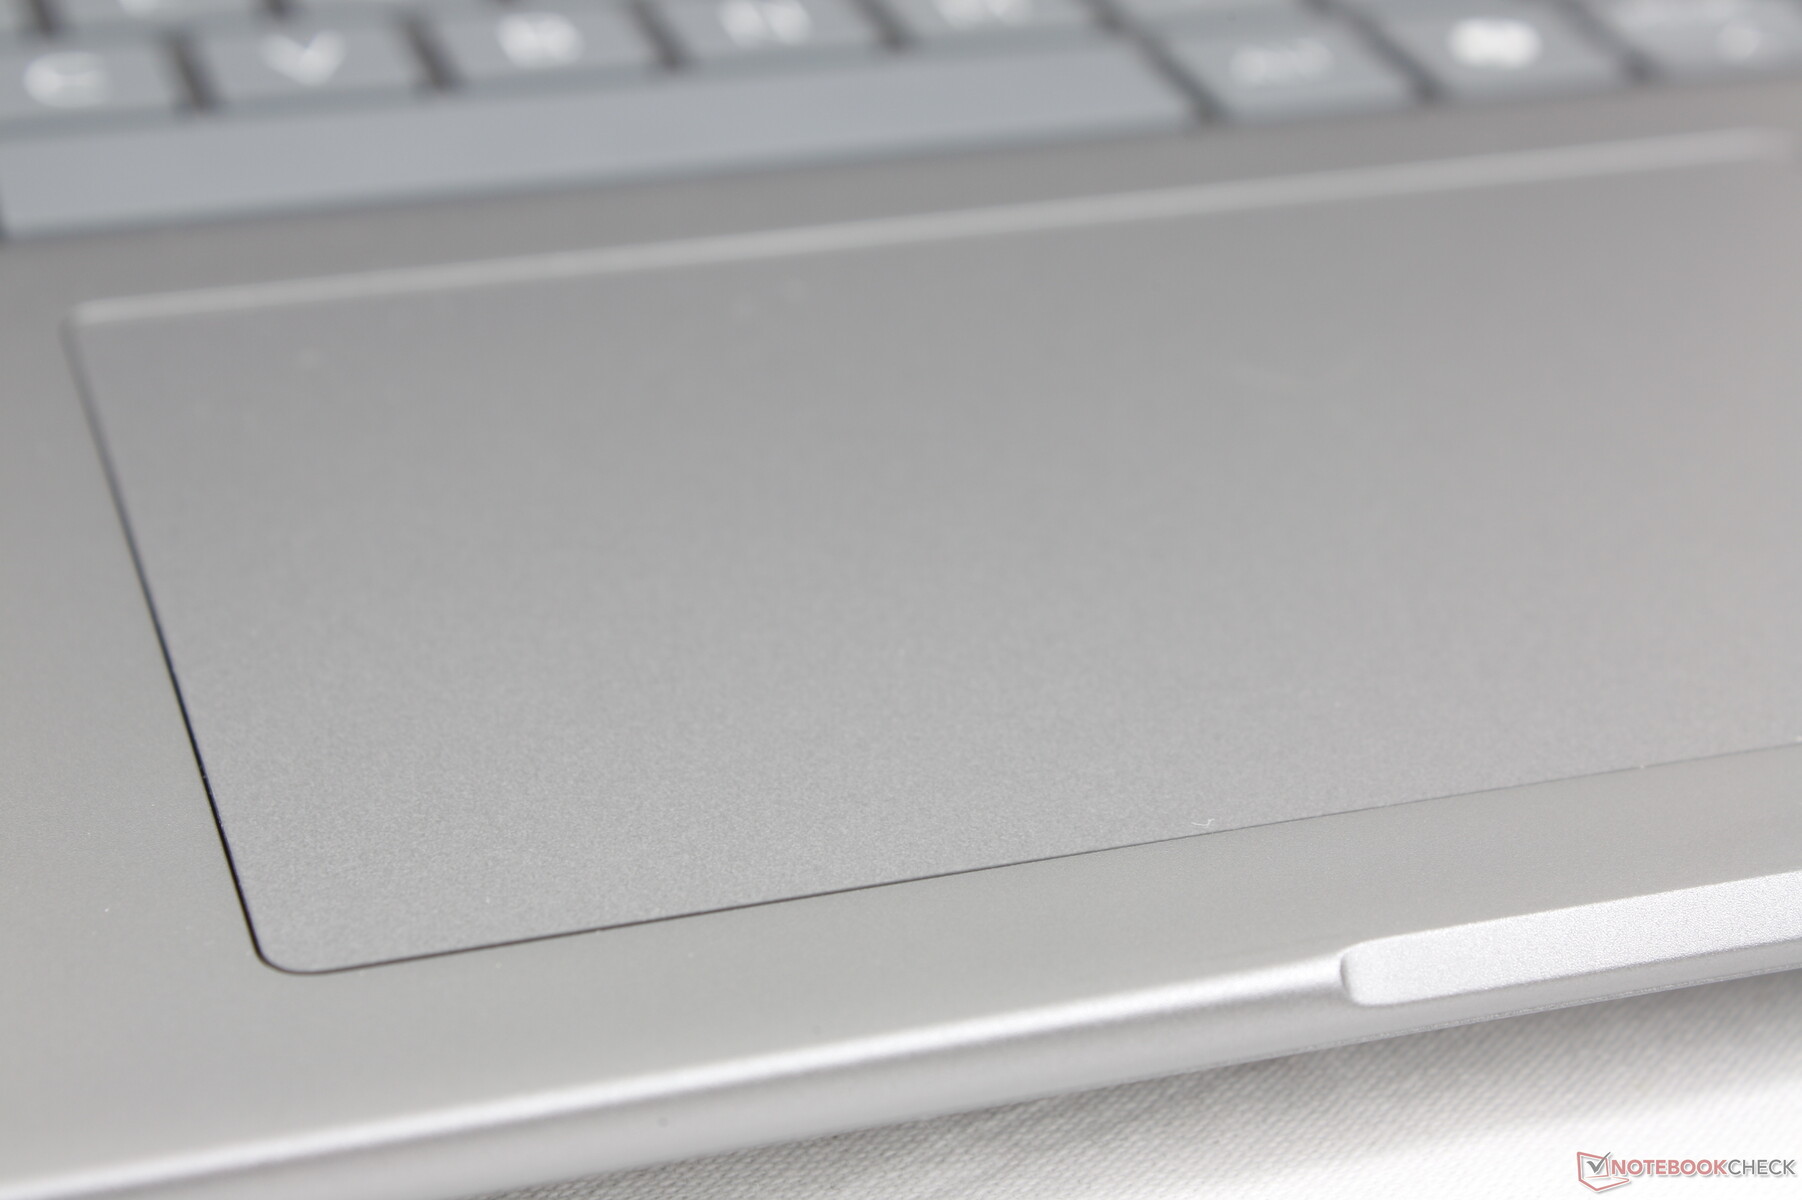
Touchpad
O clickpad é maior do que antes (12,5 x 8 cm vs. 11,5 × 7 cm) para aproveitar o formato maior de 16 polegadas. Ainda não há teclas dedicadas, que estão disponíveis na série ZBook Fury, mais cara. A tração e o feedback são, no entanto, suaves e clicáveis, respectivamente, para serem mais confiáveis do que os clickpads normalmente mais esponjosos da maioria dos laptops de consumo.

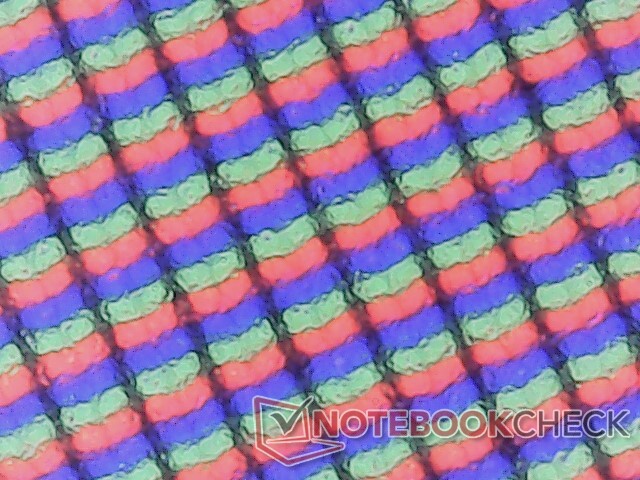
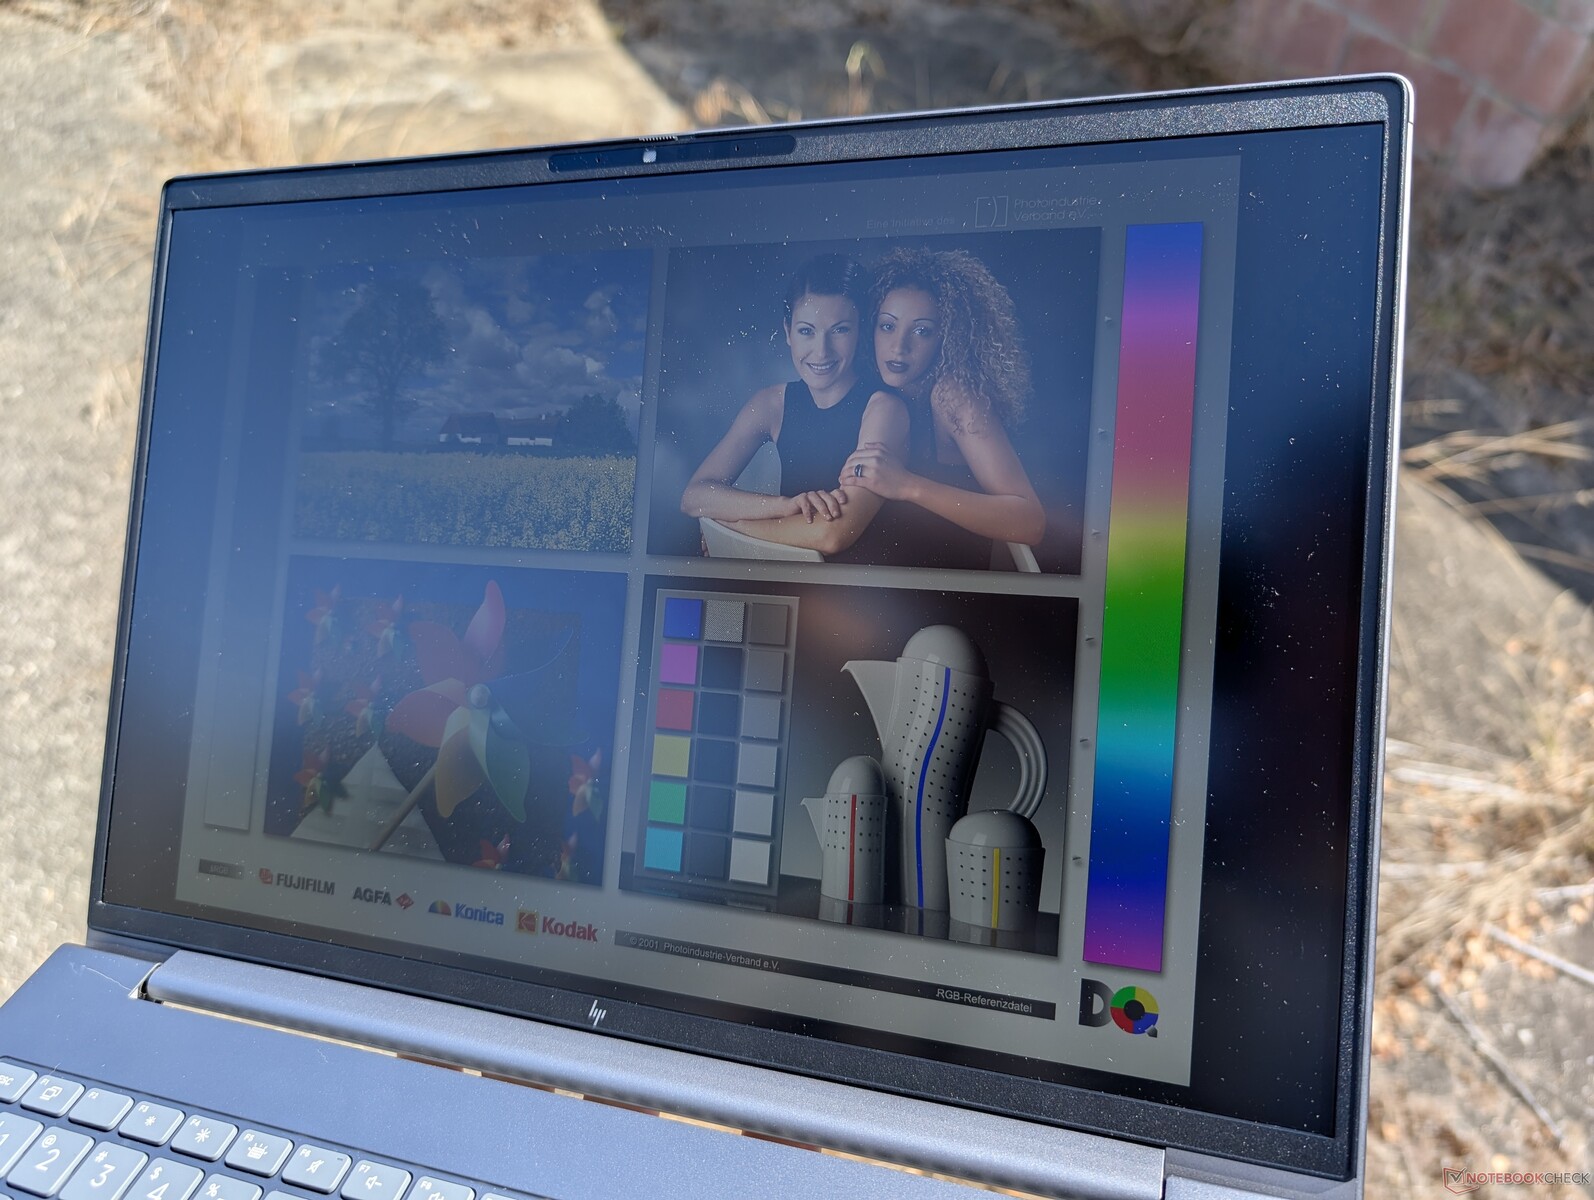
Tela - IPS em toda a linha
Há um total de cinco opções de tela disponíveis, como segue, todas elas somente IPS. Nossa configuração é fornecida com a opção em negrito.
- 1920 x 1200, sem toque, fosco, 250 nits, 45% NTSC, 60 Hz
- 1920 x 1200, sensível ao toque, fosco, 250 nits, 45% NTSC, 60 Hz
- 1920 x 1200, sem toque, fosco, 400 nits, 100 por cento sRGB, 60 Hz
- 1920 x 1200, sem toque, fosco, 1000 nits, 100 por cento sRGB, HP Sure View, 60 Hz
- 2560 x 1600, sem toque, fosco, 400 nits, 100 por cento sRGB, 120 Hz
Se a qualidade da imagem for uma preocupação, os usuários devem ignorar as duas primeiras opções de baixo custo, pois a cobertura de cores seria de apenas 60% do sRGB. O painel superbrilhante de 1.000 nit é digno de nota, pois muitas outras estações de trabalho não oferecem esse recurso, mas infelizmente a opção está vinculada ao Sure View, que limita severamente os ângulos de visão para aumentar a privacidade. Não há opções OLED, HDR ou P3, o que é um pouco decepcionante para uma estação de trabalho de alto desempenho. Os usuários teriam que fazer o upgrade para o HP ZBook Fury 16 G11 ou considerar o ThinkPad P16s G2 para obter esses recursos.

| |||||||||||||||||||||||||
iluminação: 88 %
iluminação com acumulador: 470.7 cd/m²
Contraste: 826:1 (Preto: 0.57 cd/m²)
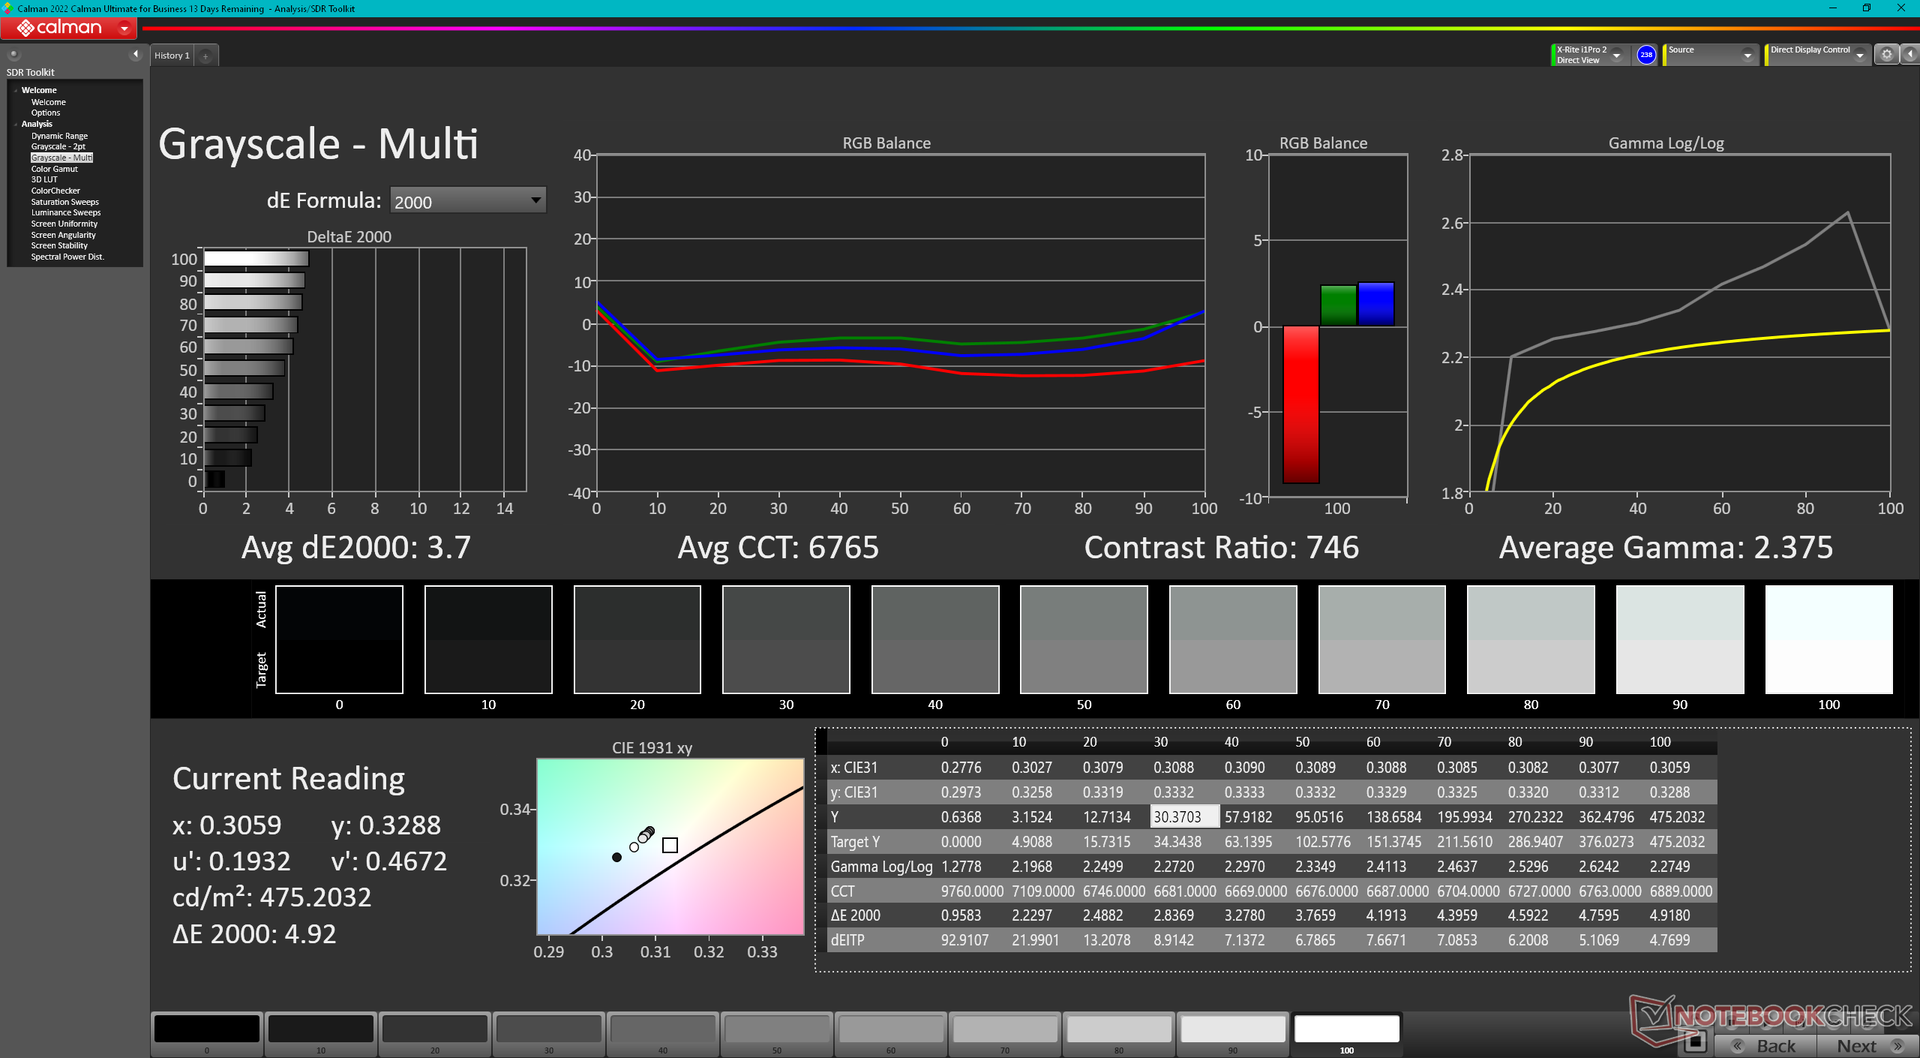
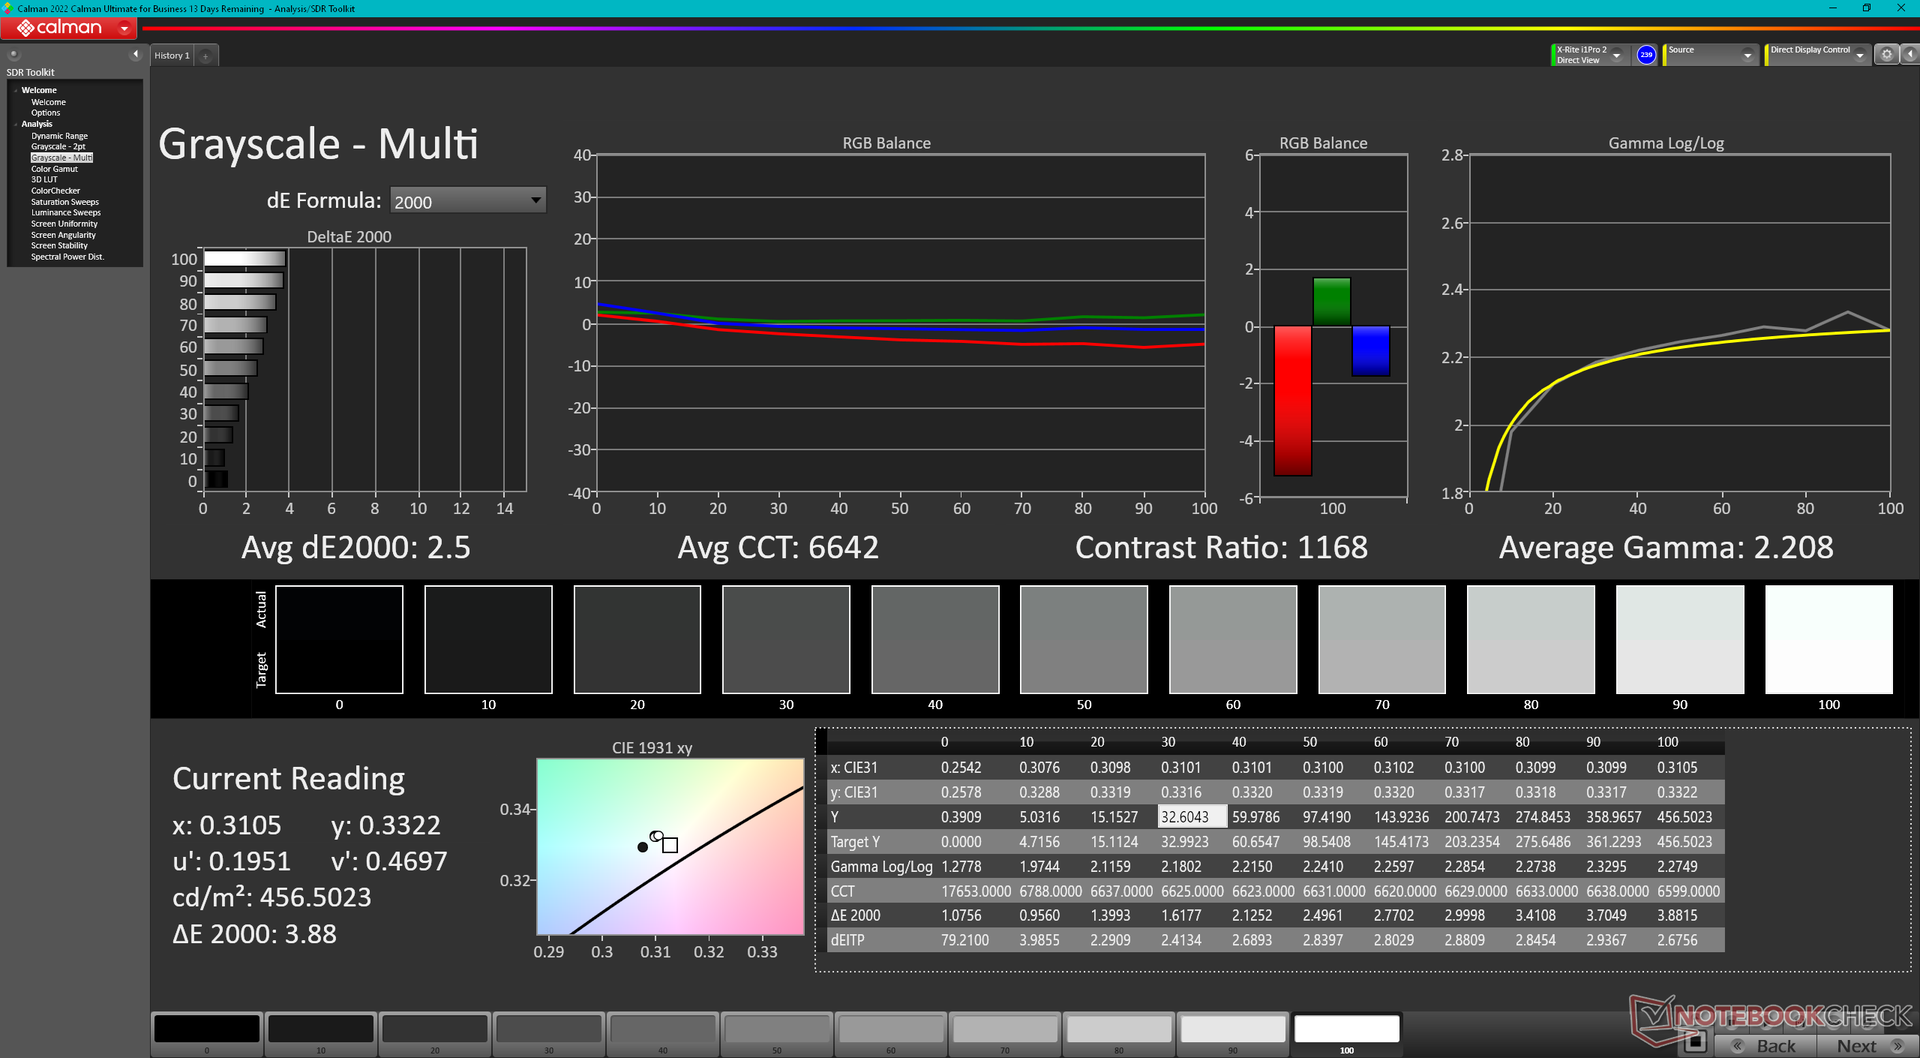
ΔE Color 2.16 | 0.5-29.43 Ø4.87, calibrated: 1.37
ΔE Greyscale 3.7 | 0.5-98 Ø5.1
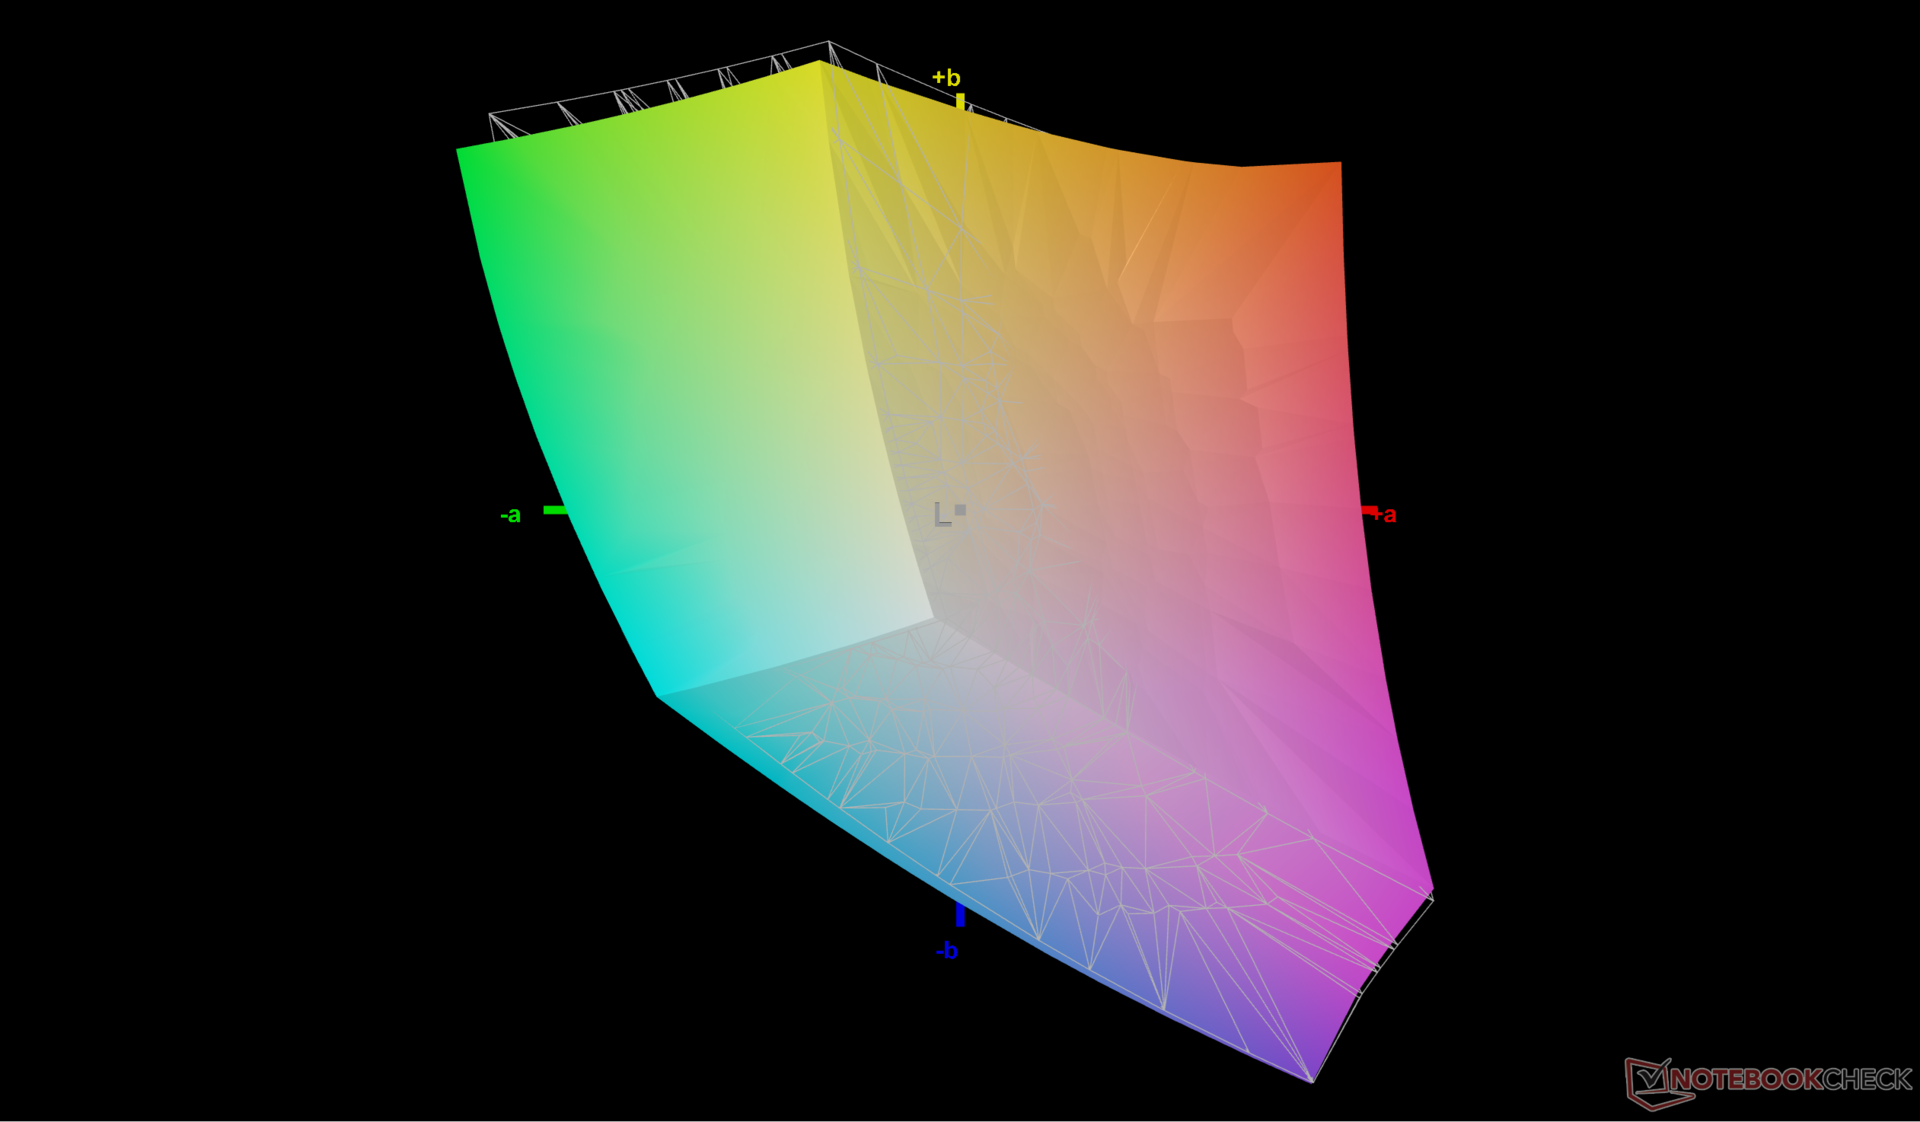
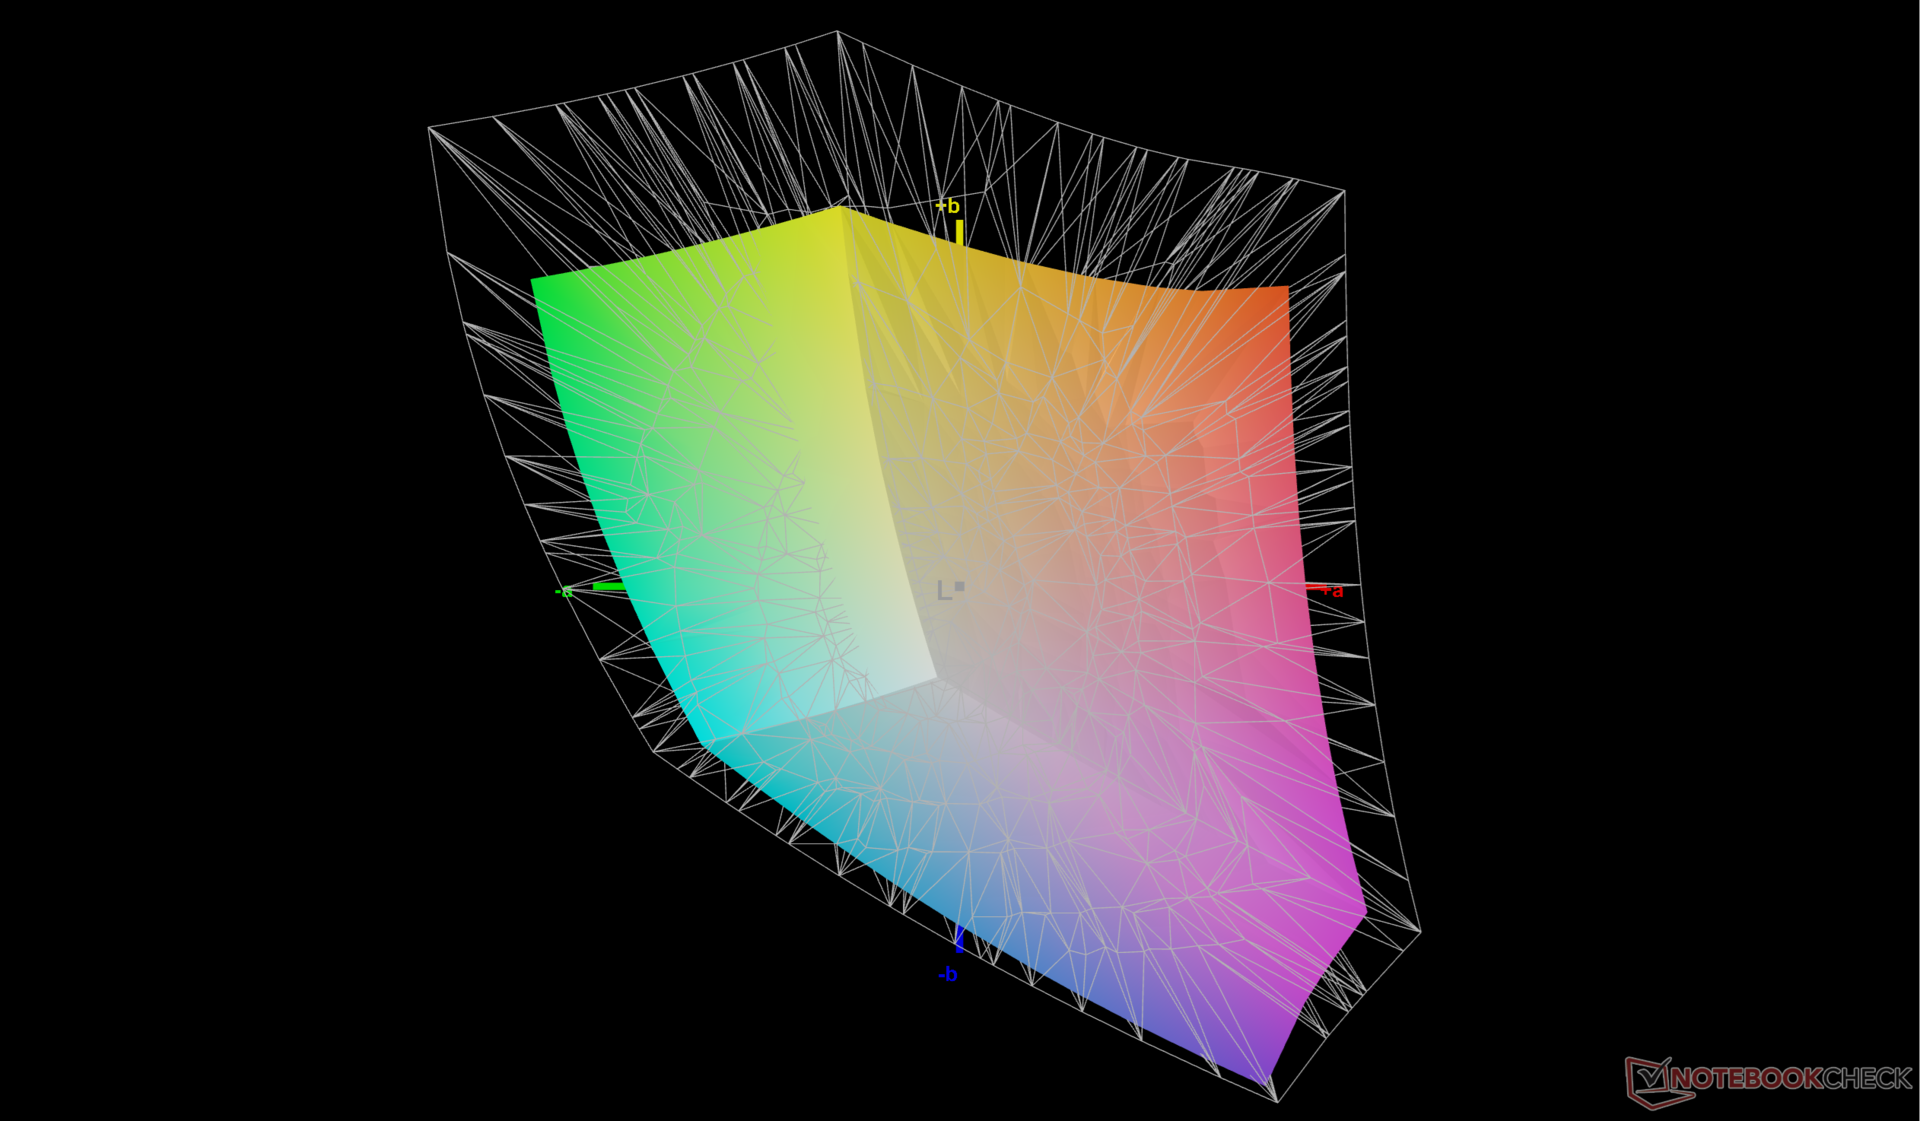
71% AdobeRGB 1998 (Argyll 2.2.0 3D)
97.7% sRGB (Argyll 2.2.0 3D)
69.1% Display P3 (Argyll 2.2.0 3D)
Gamma: 2.38
| HP ZBook Power 16 G11 A AUOA0A9, IPS, 2560x1600, 16", 120 Hz | HP ZBook Power 15 G10 BOE0B6A, IPS, 2560x1440, 15.6", 120 Hz | HP ZBook Fury 16 G11 AUO87A8, IPS, 3840x2400, 16", 120 Hz | Lenovo ThinkPad P1 Gen 7 21KV001SGE MNG007DA1-9 , IPS LED, 2560x1600, 16", 165 Hz | Lenovo ThinkPad P16s G2 21K9000CGE ATNA60YV04-0, OLED, 3840x2400, 16", 60 Hz | Dell Precision 5690 Samsung 160YV03, OLED, 3840x2400, 16", 60 Hz | |
|---|---|---|---|---|---|---|
| Display | -1% | 22% | 0% | 28% | 27% | |
| Display P3 Coverage | 69.1 | 68.2 -1% | 98.4 42% | 69.4 0% | 99.9 45% | 99.8 44% |
| sRGB Coverage | 97.7 | 95.6 -2% | 99.9 2% | 97.6 0% | 100 2% | 100 2% |
| AdobeRGB 1998 Coverage | 71 | 70.5 -1% | 86 21% | 71.8 1% | 96.9 36% | 96.6 36% |
| Response Times | -10% | 8% | -4% | 87% | 84% | |
| Response Time Grey 50% / Grey 80% * | 13.6 ? | 13 ? 4% | 11.4 ? 16% | 11.2 ? 18% | 1.5 ? 89% | 1.7 ? 87% |
| Response Time Black / White * | 8.4 ? | 10.4 ? -24% | 8.4 ? -0% | 10.6 ? -26% | 1.3 ? 85% | 1.7 ? 80% |
| PWM Frequency | 60 | 60 ? | ||||
| Screen | -13% | 5% | -10% | 2% | -14% | |
| Brightness middle | 470.7 | 313.8 -33% | 457.6 -3% | 516 10% | 416 -12% | 348.1 -26% |
| Brightness | 431 | 302 -30% | 466 8% | 505 17% | 421 -2% | 351 -19% |
| Brightness Distribution | 88 | 83 -6% | 83 -6% | 89 1% | 98 11% | 97 10% |
| Black Level * | 0.57 | 0.29 49% | 0.43 25% | 0.41 28% | ||
| Contrast | 826 | 1082 31% | 1064 29% | 1259 52% | ||
| Colorchecker dE 2000 * | 2.16 | 3.27 -51% | 2.78 -29% | 3.5 -62% | 1.3 40% | 4.18 -94% |
| Colorchecker dE 2000 max. * | 4.39 | 7.81 -78% | 5.53 -26% | 8.8 -100% | 2.8 36% | 6.68 -52% |
| Colorchecker dE 2000 calibrated * | 1.37 | 0.56 59% | 1.37 -0% | 1.2 12% | 2.9 -112% | 0.97 29% |
| Greyscale dE 2000 * | 3.7 | 5.9 -59% | 2 46% | 5.6 -51% | 1.8 51% | 1.7 54% |
| Gamma | 2.38 92% | 2.18 101% | 2.28 96% | 2.27 97% | 2.25 98% | 2.2 100% |
| CCT | 6765 96% | 6323 103% | 6806 96% | 6071 107% | 6574 99% | 6198 105% |
| Média Total (Programa/Configurações) | -8% /
-10% | 12% /
9% | -5% /
-7% | 39% /
22% | 32% /
13% |
* ... menor é melhor
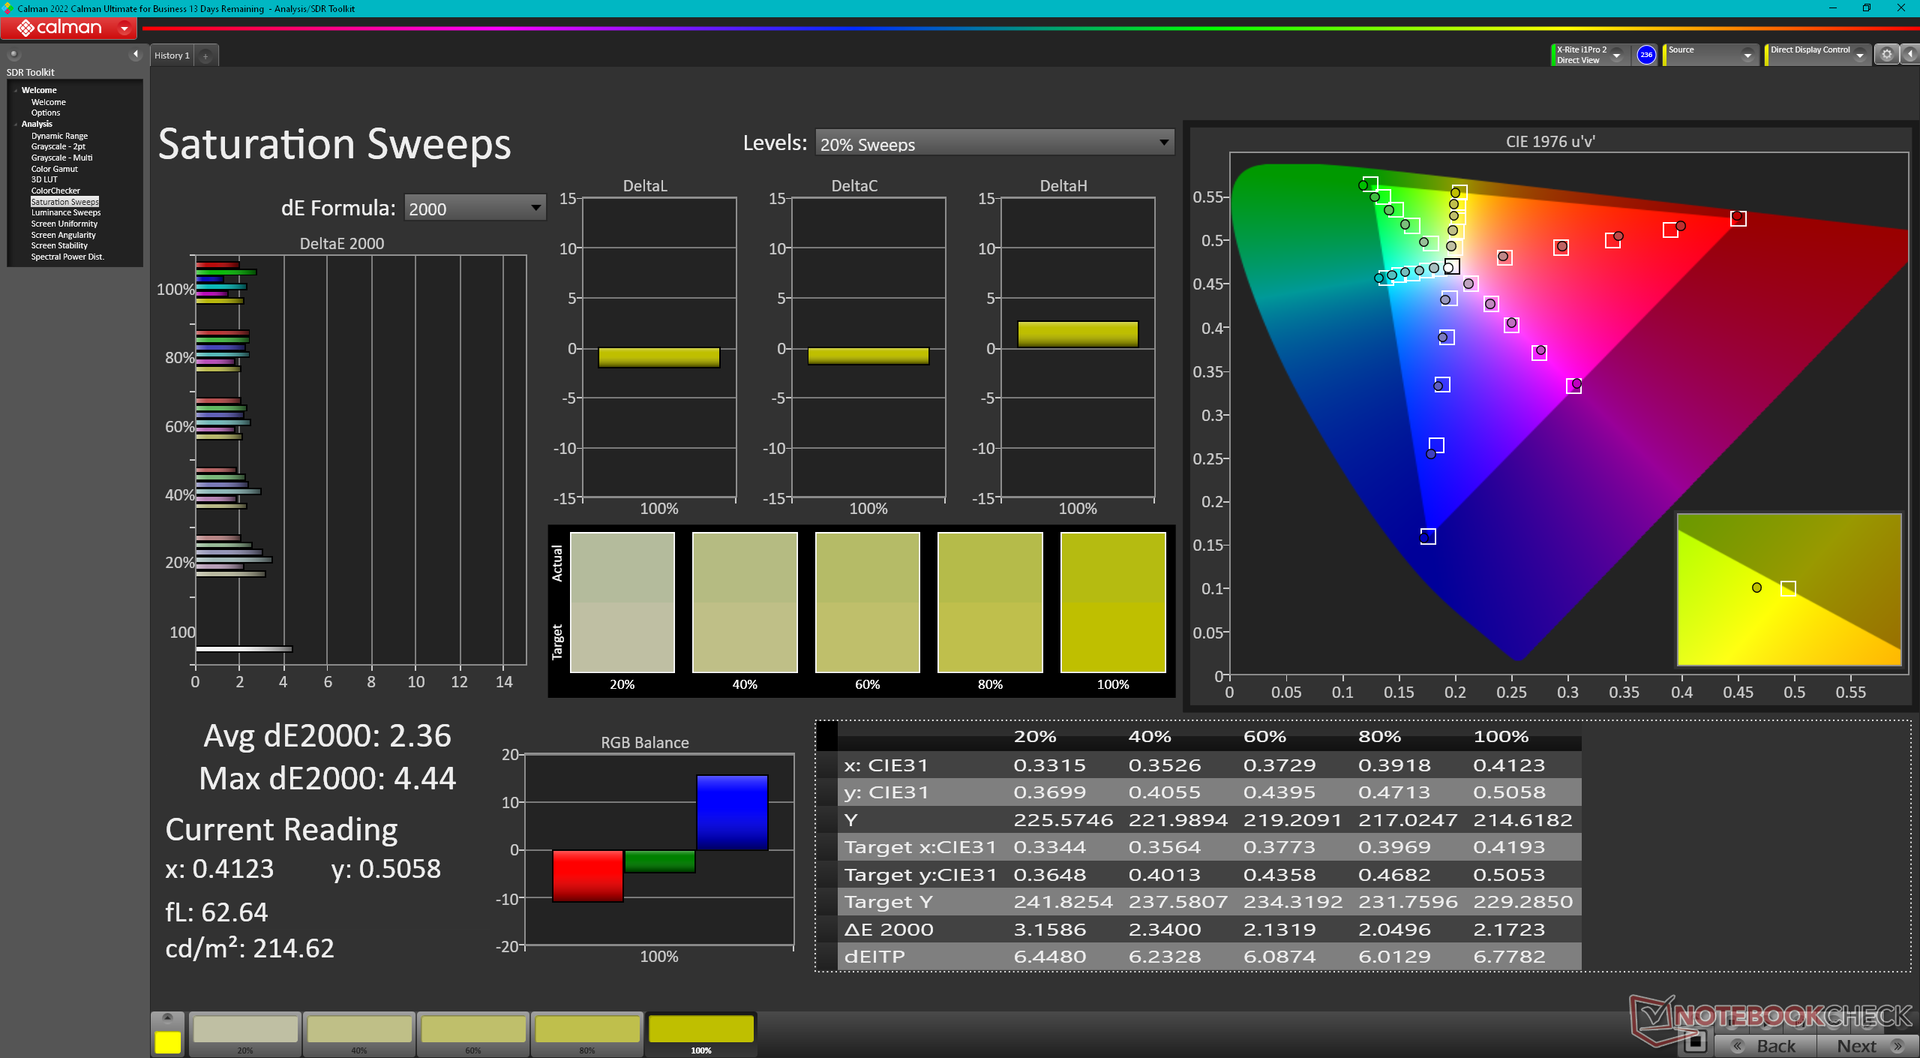
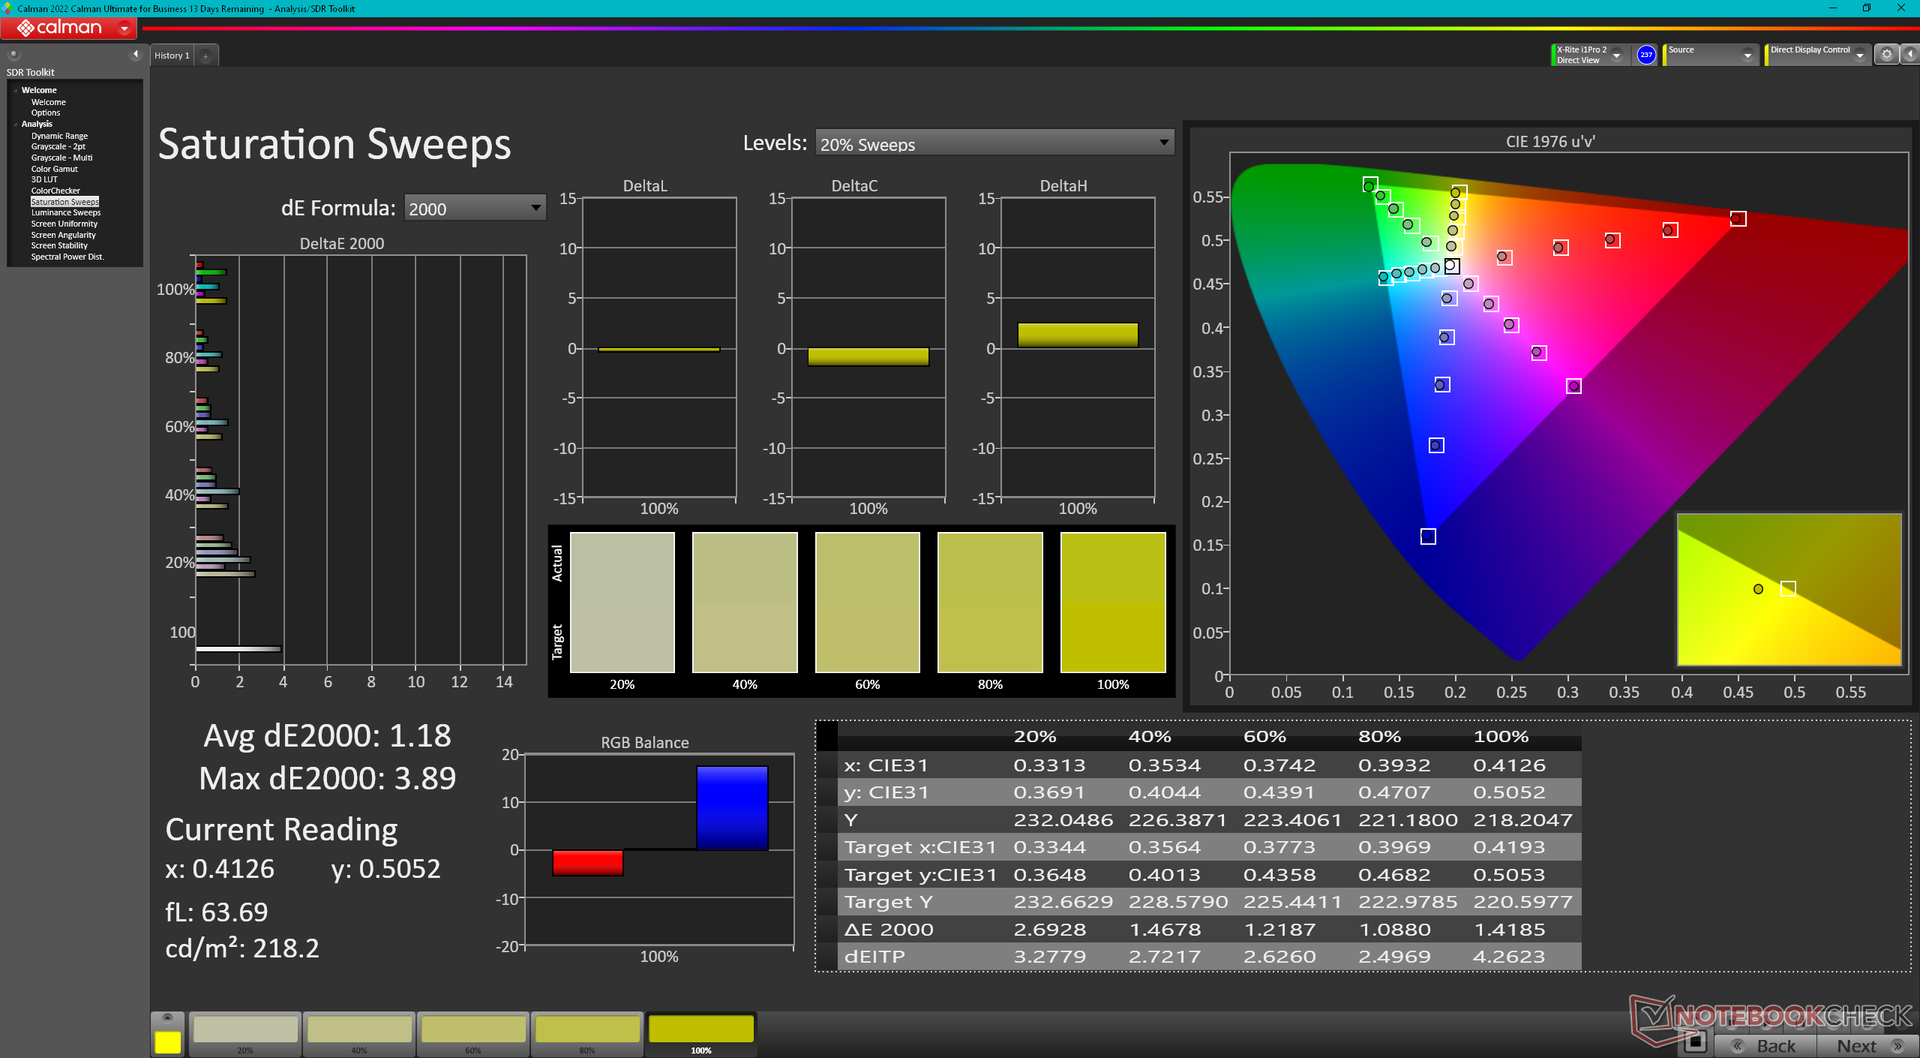
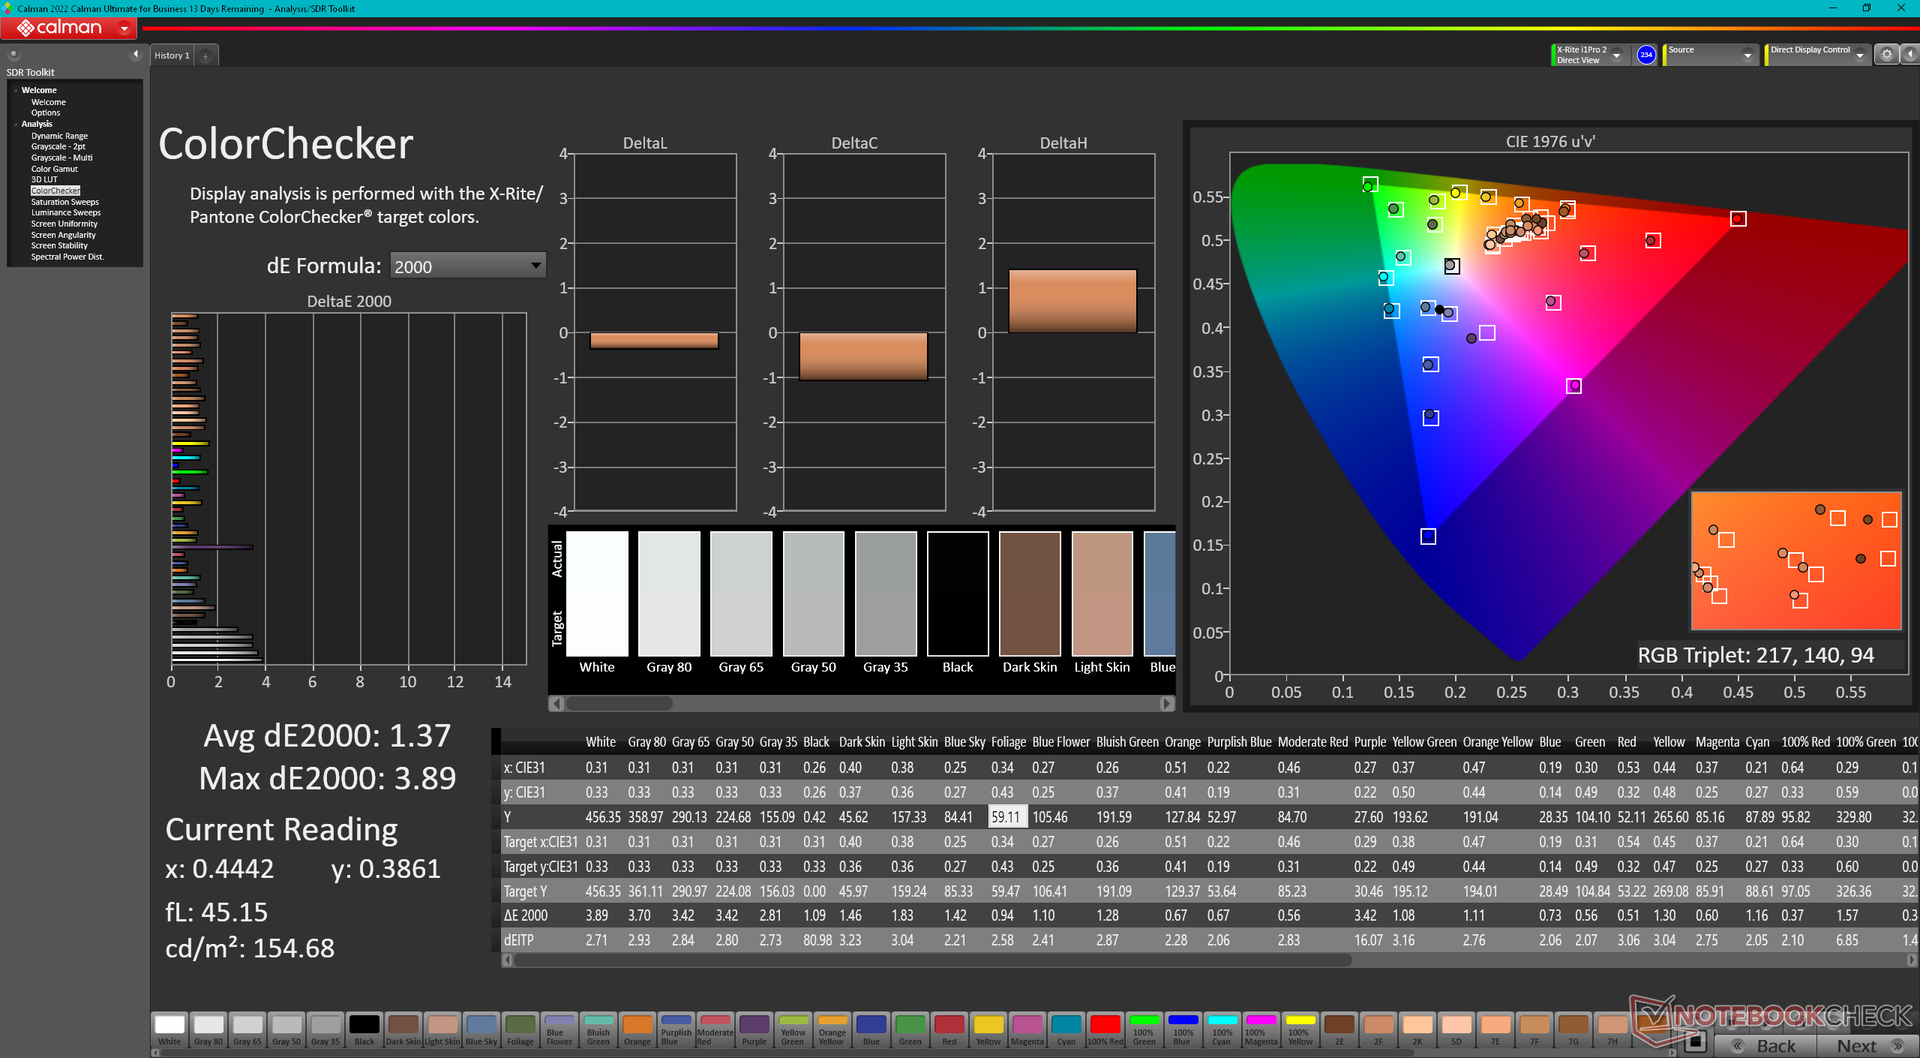
O monitor é decentemente calibrado fora da caixa em relação ao padrão sRGB. Calibrar o painel com nosso colorímetro X-Rite melhoraria ainda mais os valores médios de deltaE de escala de cinza e cor, de 3,7 e 2,16 para apenas 2,5 e 1,37, respectivamente. Nosso perfil ICM calibrado está disponível para download gratuito acima.

Exibir tempos de resposta
| ↔ Tempo de resposta preto para branco | ||
|---|---|---|
| 8.4 ms ... ascensão ↗ e queda ↘ combinadas | ↗ 4.5 ms ascensão | 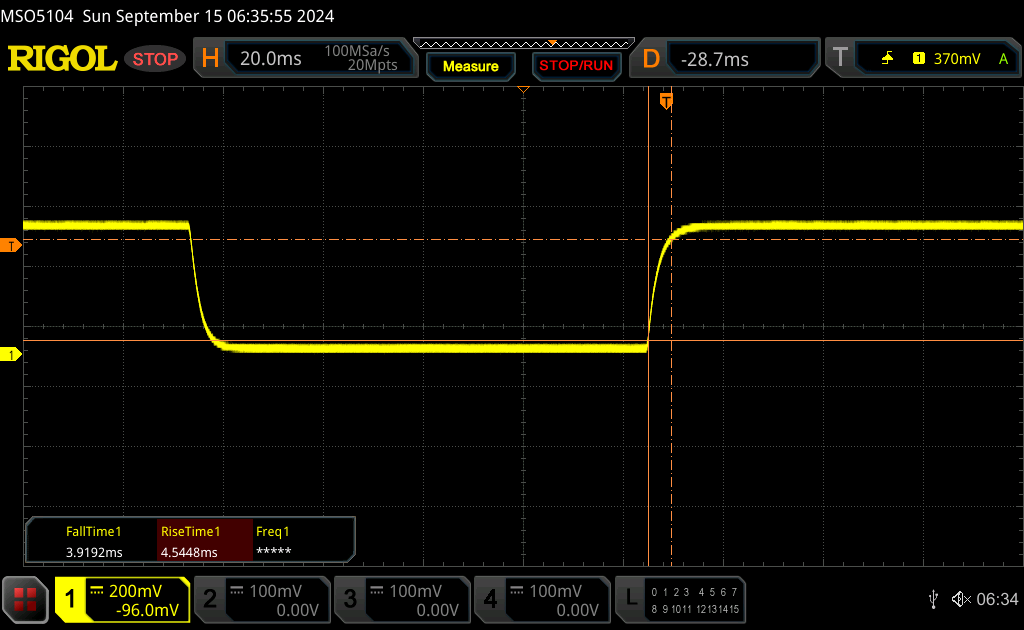 |
| ↘ 3.9 ms queda | ||
| A tela mostra taxas de resposta rápidas em nossos testes e deve ser adequada para jogos. Em comparação, todos os dispositivos testados variam de 0.1 (mínimo) a 240 (máximo) ms. » 21 % de todos os dispositivos são melhores. Isso significa que o tempo de resposta medido é melhor que a média de todos os dispositivos testados (20.8 ms). | ||
| ↔ Tempo de resposta 50% cinza a 80% cinza | ||
| 13.6 ms ... ascensão ↗ e queda ↘ combinadas | ↗ 7.2 ms ascensão | 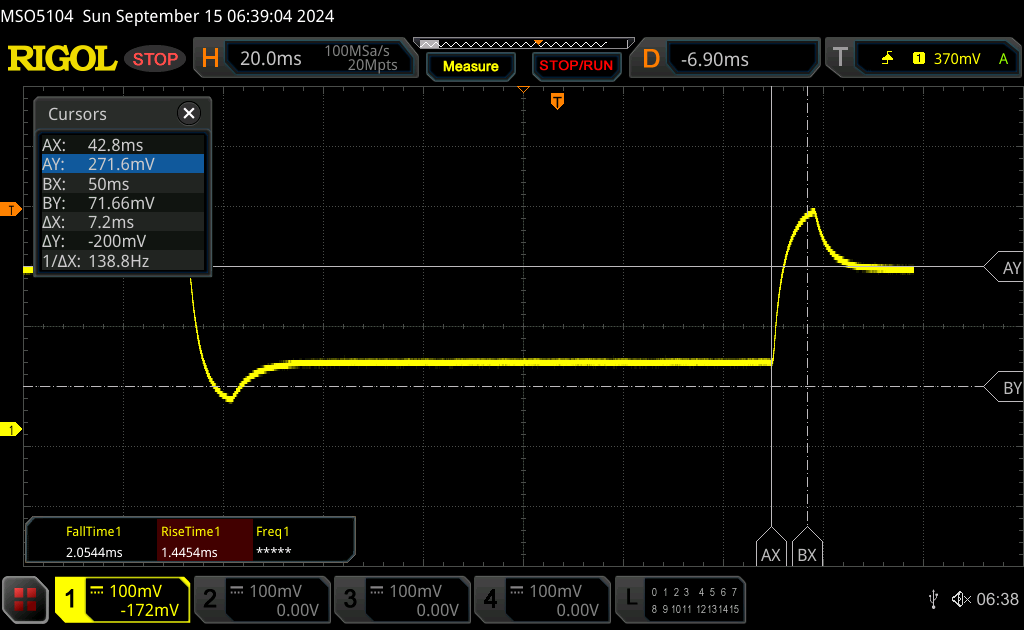 |
| ↘ 6.4 ms queda | ||
| A tela mostra boas taxas de resposta em nossos testes, mas pode ser muito lenta para jogadores competitivos. Em comparação, todos os dispositivos testados variam de 0.165 (mínimo) a 636 (máximo) ms. » 24 % de todos os dispositivos são melhores. Isso significa que o tempo de resposta medido é melhor que a média de todos os dispositivos testados (32.5 ms). | ||
Cintilação da tela / PWM (modulação por largura de pulso)
| Tela tremeluzindo / PWM não detectado | 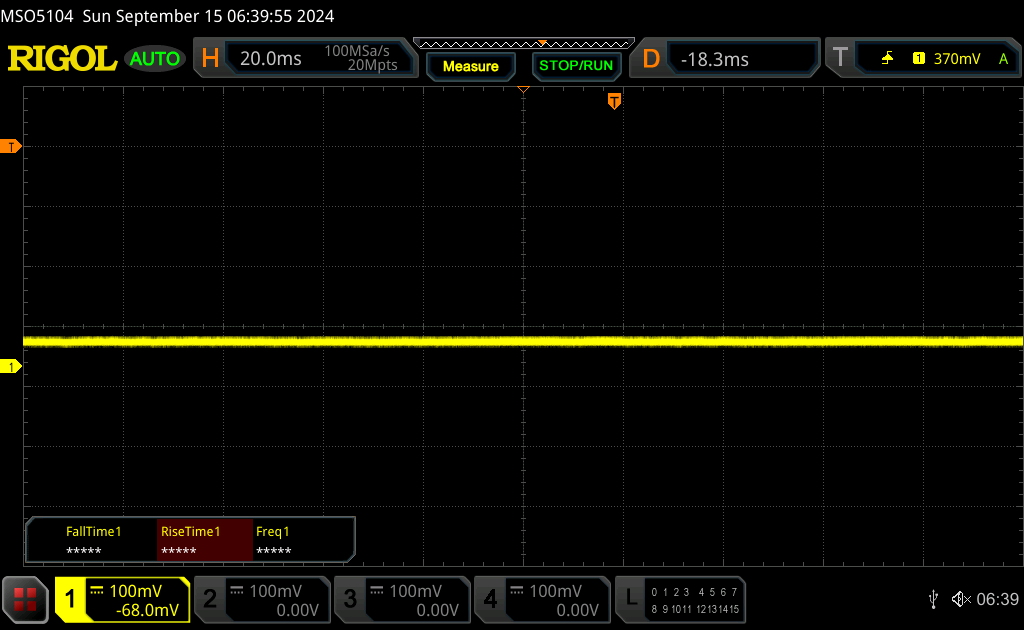 | ||
[pwm_comparison] Em comparação: 53 % de todos os dispositivos testados não usam PWM para escurecer a tela. Se PWM foi detectado, uma média de 8516 (mínimo: 5 - máximo: 343500) Hz foi medida. | |||
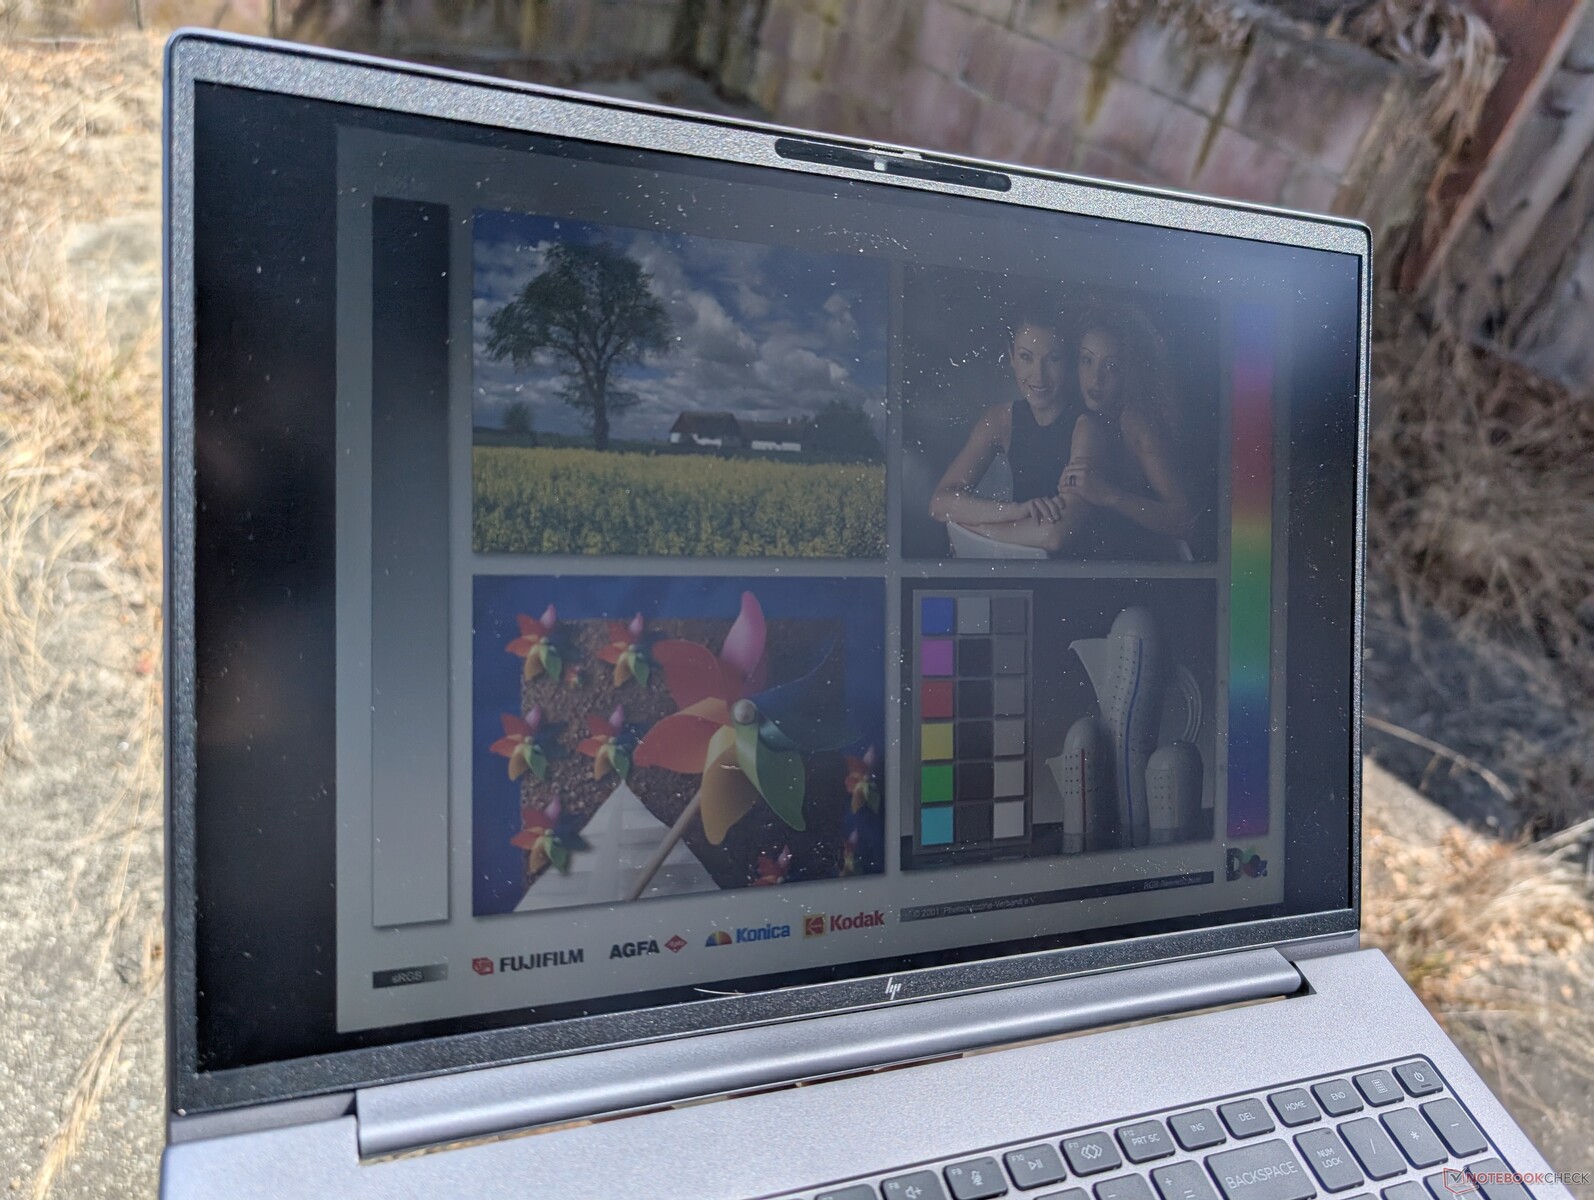
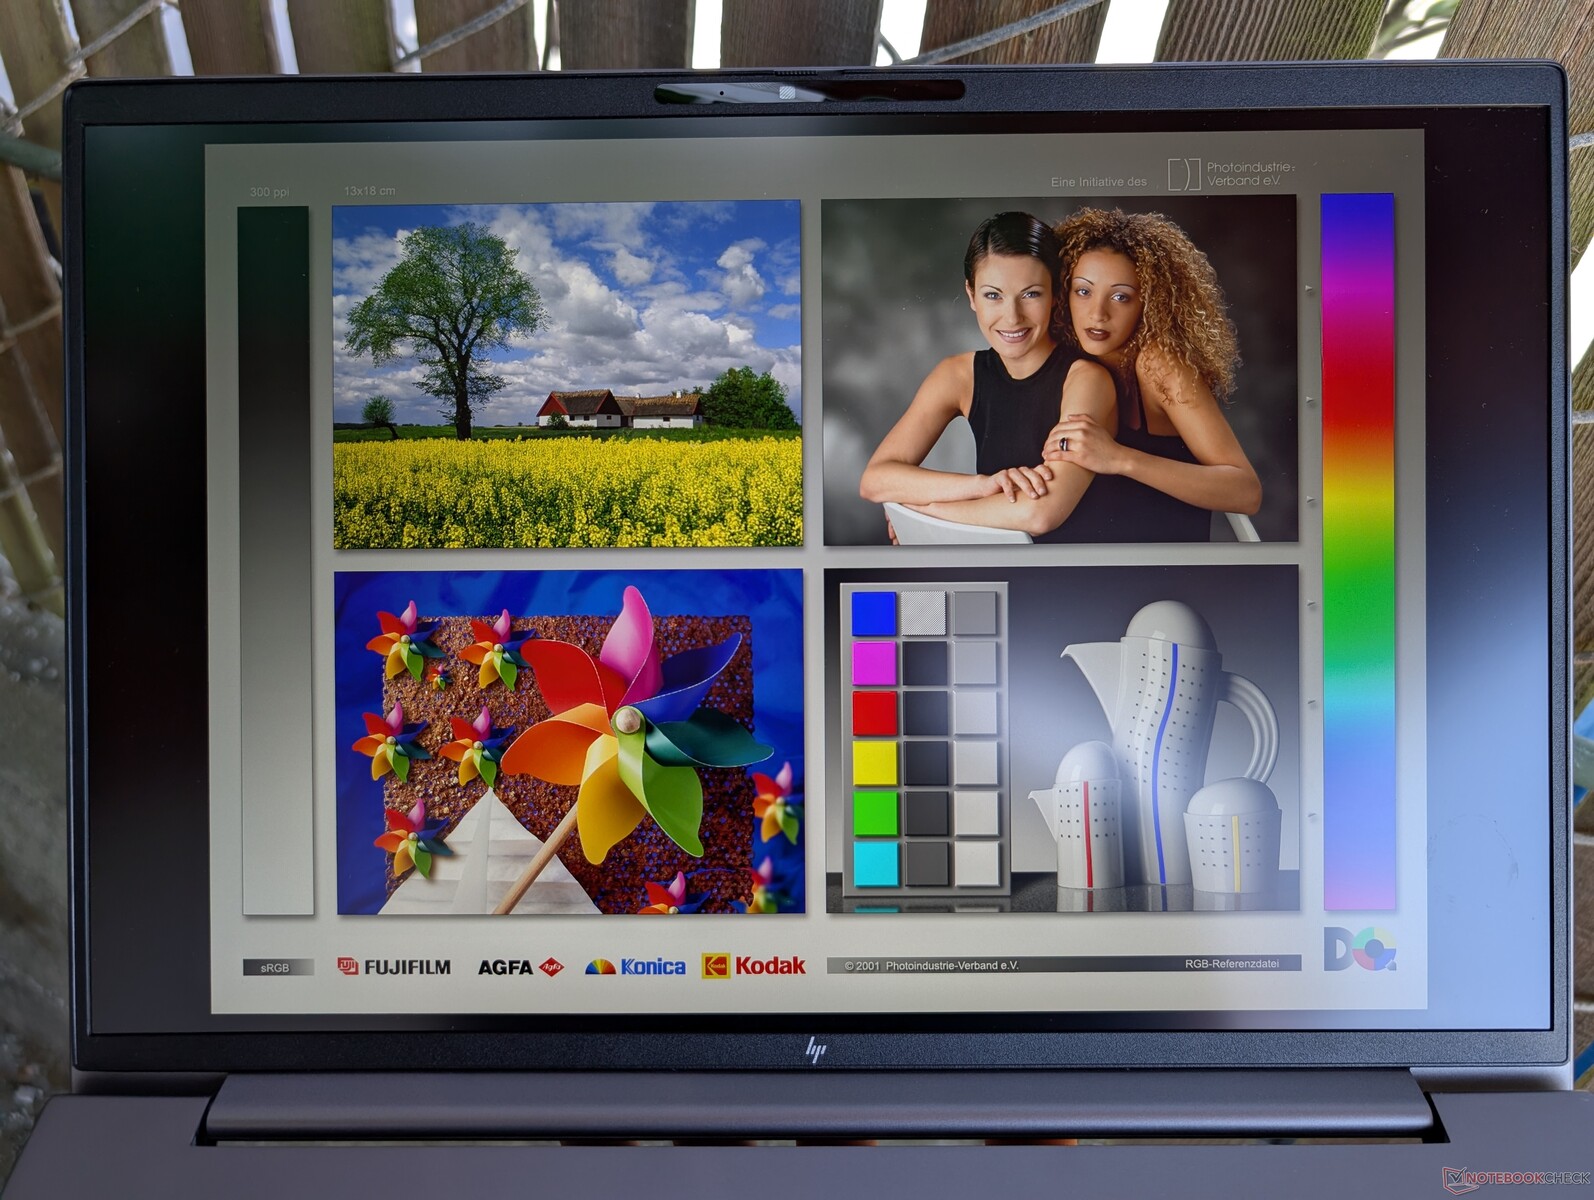
A visibilidade em ambientes externos é decente quando à sombra com o nosso painel de 1600p, mas as opções inferiores serão mais escuras e mais propensas a reflexos. A opção de 1.000 nits deve ser considerada se o senhor trabalha frequentemente em ambientes externos.
Desempenho - Novo Zen 4, mesmo desempenho do Zen 4
Condições de teste
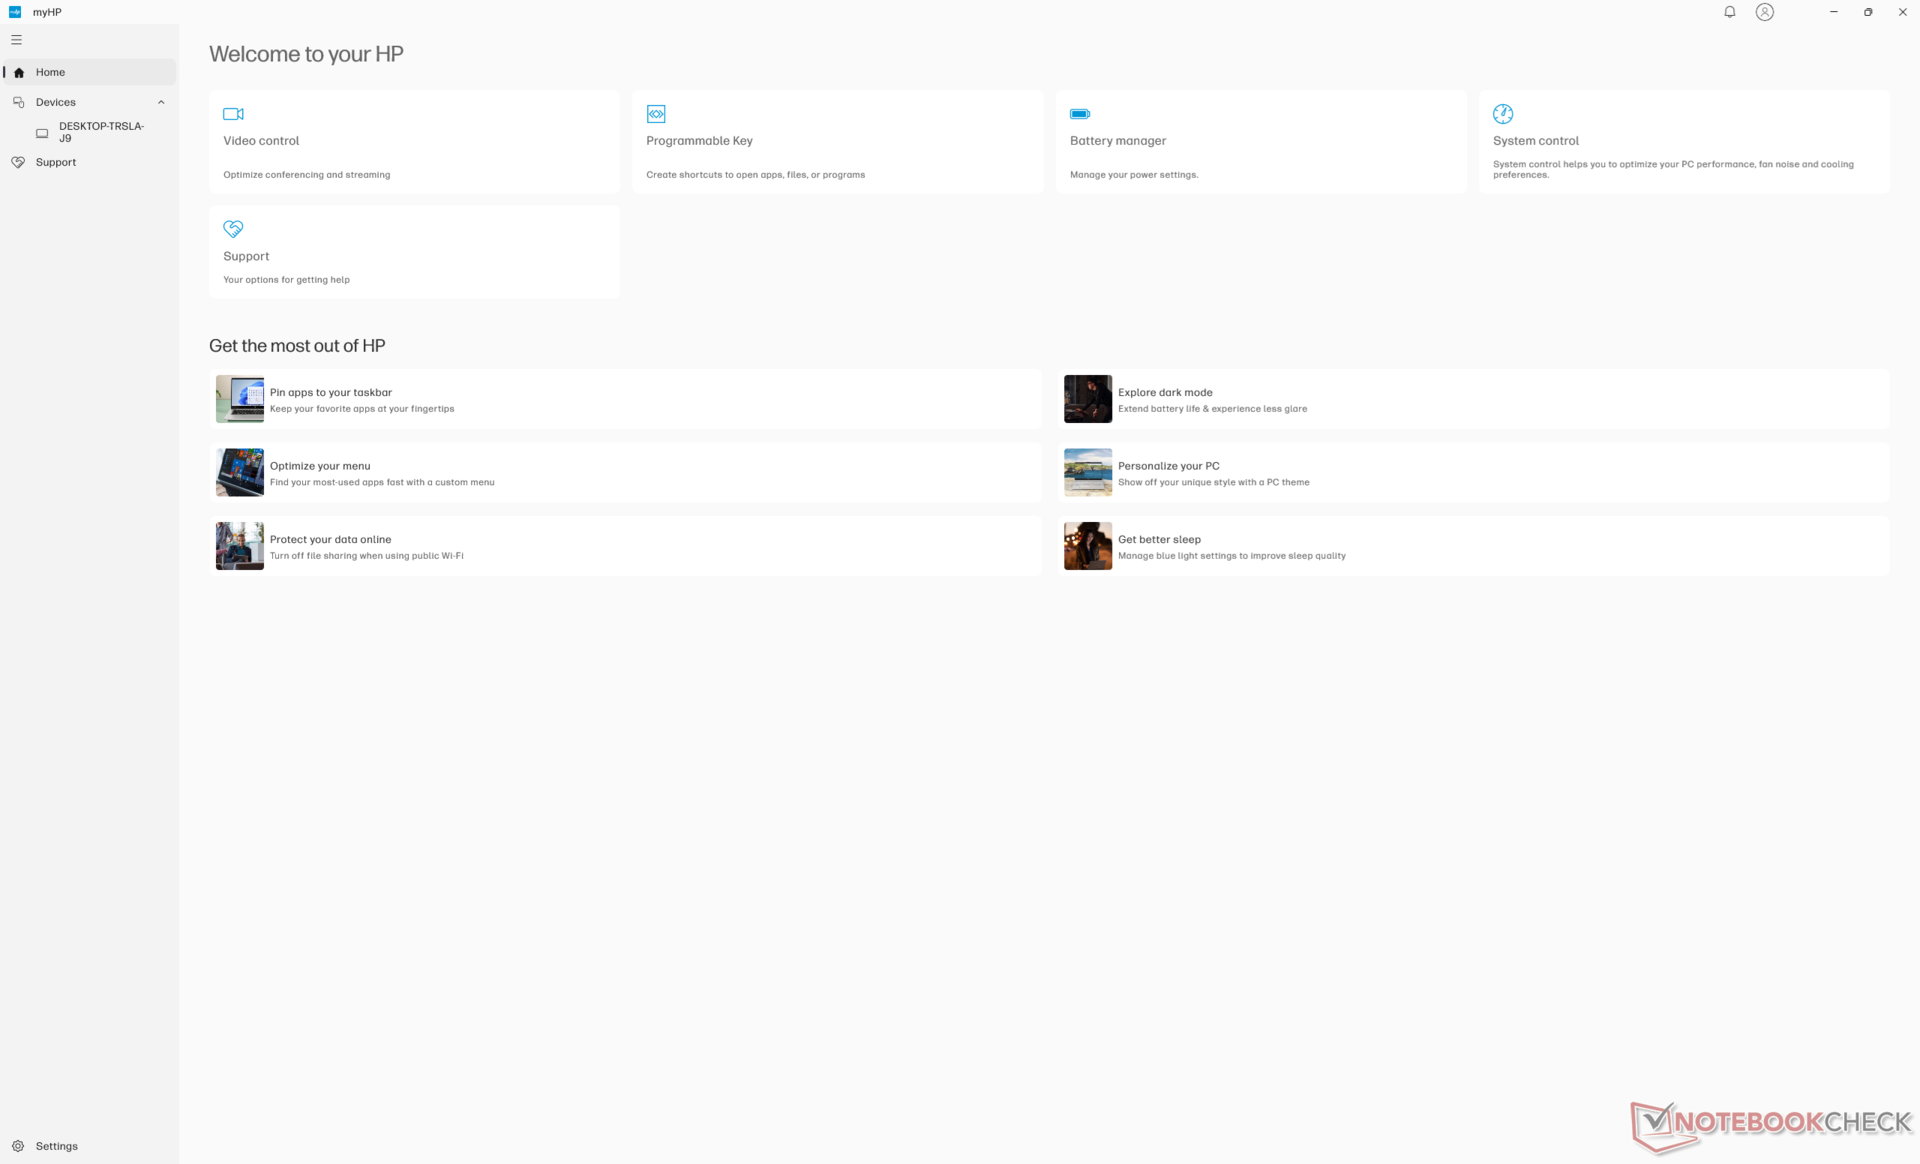
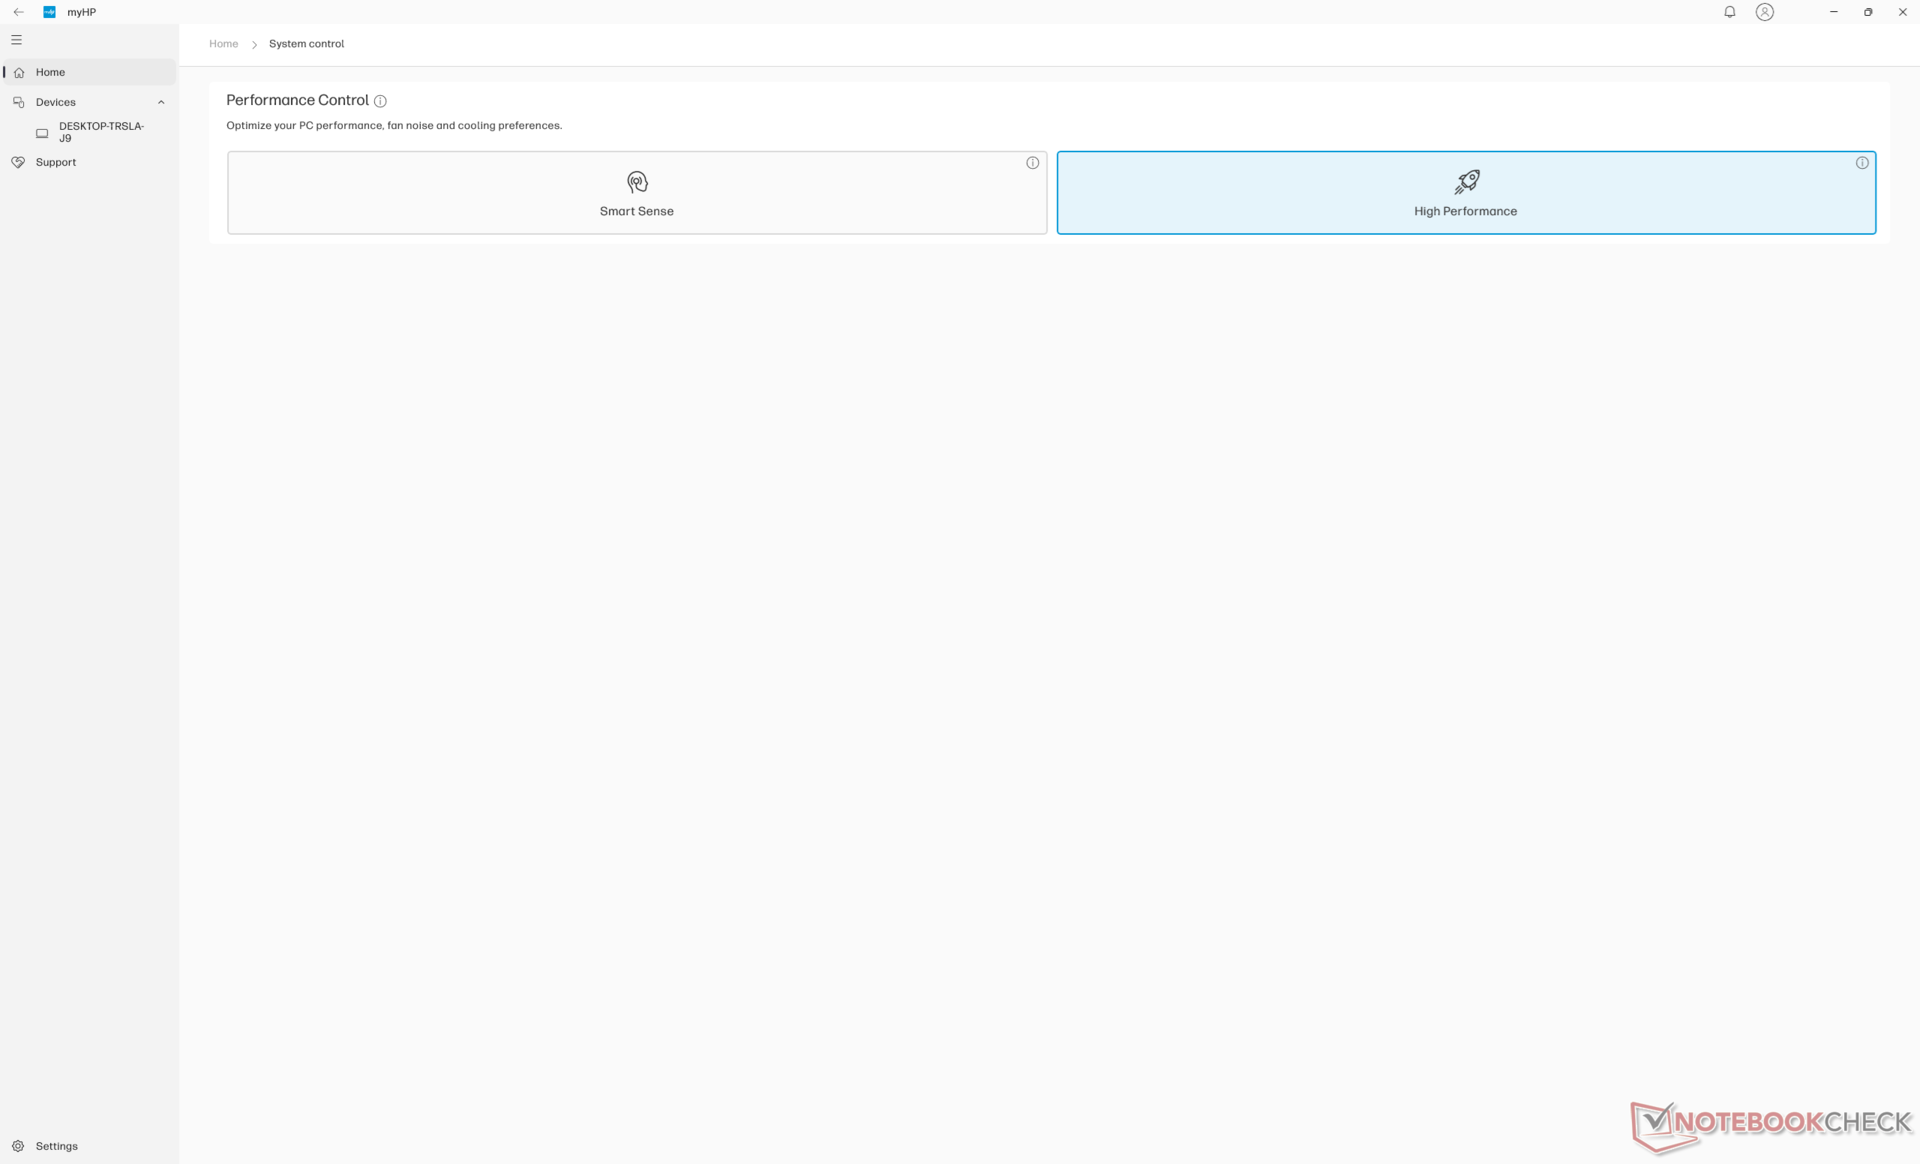
Colocamos o Windows e o MyHP no modo Desempenho antes de executar os benchmarks abaixo. O Optimus 1.0 é compatível.
Processador
O Ryzen 7 8845HS não oferece muito mais do que o Ryzen 7 7840HS que ele substitui no ZBook Power 15 G10 do ano passado ZBook Power 15 G10 do ano passado. Na verdade, os benchmarks colocam os dois processadores lado a lado por apenas alguns pontos percentuais, sendo essencialmente idênticos. Isso pode ser decepcionante para os usuários avançados que esperavam atualizações de desempenho mais significativas na transição de 15 para 16 polegadas. As opções mais rápidas do Raptor Lake-HX estão disponíveis apenas na série ZBook Fury, mais espessa, da HP.
A principal vantagem que o Ryzen 7 8845HS tem sobre o Ryzen 7 7840HS é a aceleração de IA devido à sua NPU integrada. Entretanto, o Co-Pilot+ é incompatível com as CPUs Hawk Point e, portanto, a praticidade da NPU é muito limitada nessa máquina.
Fazer o downgrade para o Ryzen 5 8645HS deverá reduzir o desempenho em 25 a 30 por cento, enquanto o upgrade para o Ryzen 9 8945HS deverá melhorar o desempenho em apenas 5%.
Cinebench R15 Multi Loop
Cinebench R23: Multi Core | Single Core
Cinebench R20: CPU (Multi Core) | CPU (Single Core)
Cinebench R15: CPU Multi 64Bit | CPU Single 64Bit
Blender: v2.79 BMW27 CPU
7-Zip 18.03: 7z b 4 | 7z b 4 -mmt1
Geekbench 6.4: Multi-Core | Single-Core
Geekbench 5.5: Multi-Core | Single-Core
HWBOT x265 Benchmark v2.2: 4k Preset
LibreOffice : 20 Documents To PDF
R Benchmark 2.5: Overall mean
| CPU Performance Rating | |
| HP ZBook Fury 16 G11 | |
| Asus ExpertBook B6 Flip B6602FC2 -2! | |
| Dell Precision 5690 | |
| HP ZBook Fury 16 G9 -2! | |
| HP ZBook Power 15 G10 | |
| Média AMD Ryzen 7 8845HS | |
| HP ZBook Power 16 G11 A | |
| Dell Precision 5000 5490 | |
| MSI CreatorPro Z16P B12UKST -2! | |
| Lenovo ThinkPad P16v G1 AMD | |
| Lenovo ThinkPad P16s G2 21K9000CGE | |
| Lenovo ThinkPad P1 G4-20Y4Z9DVUS -2! | |
| HP ZBook Firefly 16 G9-6B897EA -2! | |
| Cinebench R23 / Multi Core | |
| HP ZBook Fury 16 G11 | |
| Asus ExpertBook B6 Flip B6602FC2 | |
| Dell Precision 5690 | |
| HP ZBook Fury 16 G9 | |
| MSI CreatorPro Z16P B12UKST | |
| Dell Precision 5000 5490 | |
| Média AMD Ryzen 7 8845HS (14895 - 18037, n=12) | |
| HP ZBook Power 16 G11 A | |
| HP ZBook Power 15 G10 | |
| Lenovo ThinkPad P16s G2 21K9000CGE | |
| Lenovo ThinkPad P16v G1 AMD | |
| Lenovo ThinkPad P1 G4-20Y4Z9DVUS | |
| HP ZBook Firefly 16 G9-6B897EA | |
| Cinebench R23 / Single Core | |
| HP ZBook Fury 16 G11 | |
| HP ZBook Fury 16 G9 | |
| Asus ExpertBook B6 Flip B6602FC2 | |
| Dell Precision 5690 | |
| HP ZBook Power 15 G10 | |
| Dell Precision 5000 5490 | |
| HP ZBook Power 16 G11 A | |
| Média AMD Ryzen 7 8845HS (1623 - 1783, n=12) | |
| MSI CreatorPro Z16P B12UKST | |
| Lenovo ThinkPad P16s G2 21K9000CGE | |
| Lenovo ThinkPad P16v G1 AMD | |
| Lenovo ThinkPad P1 G4-20Y4Z9DVUS | |
| HP ZBook Firefly 16 G9-6B897EA | |
| Cinebench R20 / CPU (Multi Core) | |
| HP ZBook Fury 16 G11 | |
| Asus ExpertBook B6 Flip B6602FC2 | |
| Dell Precision 5690 | |
| HP ZBook Fury 16 G9 | |
| MSI CreatorPro Z16P B12UKST | |
| Dell Precision 5000 5490 | |
| HP ZBook Power 16 G11 A | |
| Média AMD Ryzen 7 8845HS (5808 - 7026, n=12) | |
| HP ZBook Power 15 G10 | |
| Lenovo ThinkPad P16s G2 21K9000CGE | |
| Lenovo ThinkPad P16v G1 AMD | |
| Lenovo ThinkPad P1 G4-20Y4Z9DVUS | |
| HP ZBook Firefly 16 G9-6B897EA | |
| Cinebench R20 / CPU (Single Core) | |
| HP ZBook Fury 16 G11 | |
| HP ZBook Fury 16 G9 | |
| Asus ExpertBook B6 Flip B6602FC2 | |
| Dell Precision 5690 | |
| HP ZBook Power 15 G10 | |
| Média AMD Ryzen 7 8845HS (673 - 698, n=12) | |
| HP ZBook Power 16 G11 A | |
| Dell Precision 5000 5490 | |
| MSI CreatorPro Z16P B12UKST | |
| Lenovo ThinkPad P16s G2 21K9000CGE | |
| Lenovo ThinkPad P16v G1 AMD | |
| Lenovo ThinkPad P1 G4-20Y4Z9DVUS | |
| HP ZBook Firefly 16 G9-6B897EA | |
| Cinebench R15 / CPU Multi 64Bit | |
| HP ZBook Fury 16 G11 | |
| Asus ExpertBook B6 Flip B6602FC2 | |
| Dell Precision 5690 | |
| Dell Precision 5000 5490 | |
| HP ZBook Power 16 G11 A | |
| Média AMD Ryzen 7 8845HS (2342 - 2908, n=12) | |
| HP ZBook Power 15 G10 | |
| HP ZBook Fury 16 G9 | |
| Lenovo ThinkPad P16s G2 21K9000CGE | |
| Lenovo ThinkPad P16v G1 AMD | |
| MSI CreatorPro Z16P B12UKST | |
| Lenovo ThinkPad P1 G4-20Y4Z9DVUS | |
| HP ZBook Firefly 16 G9-6B897EA | |
| Cinebench R15 / CPU Single 64Bit | |
| HP ZBook Fury 16 G11 | |
| HP ZBook Power 15 G10 | |
| Média AMD Ryzen 7 8845HS (269 - 283, n=12) | |
| HP ZBook Power 16 G11 A | |
| Asus ExpertBook B6 Flip B6602FC2 | |
| Dell Precision 5690 | |
| Lenovo ThinkPad P16s G2 21K9000CGE | |
| Lenovo ThinkPad P16v G1 AMD | |
| Dell Precision 5000 5490 | |
| MSI CreatorPro Z16P B12UKST | |
| Lenovo ThinkPad P1 G4-20Y4Z9DVUS | |
| HP ZBook Firefly 16 G9-6B897EA | |
| HP ZBook Fury 16 G9 | |
| Blender / v2.79 BMW27 CPU | |
| HP ZBook Firefly 16 G9-6B897EA | |
| Lenovo ThinkPad P1 G4-20Y4Z9DVUS | |
| Lenovo ThinkPad P16s G2 21K9000CGE | |
| Dell Precision 5690 | |
| HP ZBook Power 16 G11 A | |
| Lenovo ThinkPad P16v G1 AMD | |
| Dell Precision 5000 5490 | |
| Média AMD Ryzen 7 8845HS (179 - 216, n=12) | |
| MSI CreatorPro Z16P B12UKST | |
| HP ZBook Power 15 G10 | |
| Asus ExpertBook B6 Flip B6602FC2 | |
| HP ZBook Fury 16 G9 | |
| HP ZBook Fury 16 G11 | |
| 7-Zip 18.03 / 7z b 4 | |
| HP ZBook Fury 16 G11 | |
| HP ZBook Fury 16 G9 | |
| Dell Precision 5690 | |
| Asus ExpertBook B6 Flip B6602FC2 | |
| HP ZBook Power 15 G10 | |
| Média AMD Ryzen 7 8845HS (62669 - 74664, n=12) | |
| Dell Precision 5000 5490 | |
| HP ZBook Power 16 G11 A | |
| MSI CreatorPro Z16P B12UKST | |
| Lenovo ThinkPad P16v G1 AMD | |
| Lenovo ThinkPad P16s G2 21K9000CGE | |
| Lenovo ThinkPad P1 G4-20Y4Z9DVUS | |
| HP ZBook Firefly 16 G9-6B897EA | |
| 7-Zip 18.03 / 7z b 4 -mmt1 | |
| HP ZBook Fury 16 G11 | |
| Lenovo ThinkPad P16v G1 AMD | |
| HP ZBook Power 15 G10 | |
| HP ZBook Power 16 G11 A | |
| Média AMD Ryzen 7 8845HS (5197 - 6714, n=12) | |
| Asus ExpertBook B6 Flip B6602FC2 | |
| HP ZBook Fury 16 G9 | |
| Lenovo ThinkPad P16s G2 21K9000CGE | |
| MSI CreatorPro Z16P B12UKST | |
| Lenovo ThinkPad P1 G4-20Y4Z9DVUS | |
| Dell Precision 5000 5490 | |
| Dell Precision 5690 | |
| HP ZBook Firefly 16 G9-6B897EA | |
| Geekbench 6.4 / Multi-Core | |
| HP ZBook Fury 16 G11 | |
| Dell Precision 5690 | |
| Dell Precision 5000 5490 | |
| HP ZBook Power 15 G10 | |
| Média AMD Ryzen 7 8845HS (11073 - 14014, n=16) | |
| HP ZBook Power 16 G11 A | |
| Lenovo ThinkPad P16s G2 21K9000CGE | |
| Lenovo ThinkPad P16v G1 AMD | |
| Geekbench 6.4 / Single-Core | |
| HP ZBook Fury 16 G11 | |
| HP ZBook Power 15 G10 | |
| Média AMD Ryzen 7 8845HS (2510 - 2698, n=14) | |
| HP ZBook Power 16 G11 A | |
| Lenovo ThinkPad P16v G1 AMD | |
| Dell Precision 5690 | |
| Lenovo ThinkPad P16s G2 21K9000CGE | |
| Dell Precision 5000 5490 | |
| Geekbench 5.5 / Multi-Core | |
| HP ZBook Fury 16 G11 | |
| Asus ExpertBook B6 Flip B6602FC2 | |
| Dell Precision 5690 | |
| HP ZBook Fury 16 G9 | |
| Dell Precision 5000 5490 | |
| MSI CreatorPro Z16P B12UKST | |
| HP ZBook Power 15 G10 | |
| Média AMD Ryzen 7 8845HS (11256 - 12726, n=13) | |
| HP ZBook Power 16 G11 A | |
| Lenovo ThinkPad P16s G2 21K9000CGE | |
| Lenovo ThinkPad P16v G1 AMD | |
| Lenovo ThinkPad P1 G4-20Y4Z9DVUS | |
| HP ZBook Firefly 16 G9-6B897EA | |
| Geekbench 5.5 / Single-Core | |
| HP ZBook Fury 16 G11 | |
| HP ZBook Power 15 G10 | |
| HP ZBook Fury 16 G9 | |
| Média AMD Ryzen 7 8845HS (1765 - 2004, n=13) | |
| HP ZBook Power 16 G11 A | |
| Asus ExpertBook B6 Flip B6602FC2 | |
| Dell Precision 5690 | |
| Lenovo ThinkPad P16v G1 AMD | |
| HP ZBook Firefly 16 G9-6B897EA | |
| MSI CreatorPro Z16P B12UKST | |
| Dell Precision 5000 5490 | |
| Lenovo ThinkPad P16s G2 21K9000CGE | |
| Lenovo ThinkPad P1 G4-20Y4Z9DVUS | |
| HWBOT x265 Benchmark v2.2 / 4k Preset | |
| HP ZBook Fury 16 G11 | |
| Dell Precision 5690 | |
| Asus ExpertBook B6 Flip B6602FC2 | |
| Média AMD Ryzen 7 8845HS (18.6 - 22.7, n=12) | |
| HP ZBook Power 15 G10 | |
| HP ZBook Fury 16 G9 | |
| HP ZBook Power 16 G11 A | |
| MSI CreatorPro Z16P B12UKST | |
| Lenovo ThinkPad P16v G1 AMD | |
| Lenovo ThinkPad P16s G2 21K9000CGE | |
| Dell Precision 5000 5490 | |
| Lenovo ThinkPad P1 G4-20Y4Z9DVUS | |
| HP ZBook Firefly 16 G9-6B897EA | |
| LibreOffice / 20 Documents To PDF | |
| HP ZBook Power 15 G10 | |
| HP ZBook Firefly 16 G9-6B897EA | |
| Lenovo ThinkPad P16s G2 21K9000CGE | |
| HP ZBook Power 16 G11 A | |
| Média AMD Ryzen 7 8845HS (44.4 - 77, n=12) | |
| Lenovo ThinkPad P1 G4-20Y4Z9DVUS | |
| HP ZBook Fury 16 G11 | |
| Lenovo ThinkPad P16v G1 AMD | |
| Dell Precision 5000 5490 | |
| Asus ExpertBook B6 Flip B6602FC2 | |
| Dell Precision 5690 | |
| MSI CreatorPro Z16P B12UKST | |
| HP ZBook Fury 16 G9 | |
| R Benchmark 2.5 / Overall mean | |
| Lenovo ThinkPad P1 G4-20Y4Z9DVUS | |
| HP ZBook Firefly 16 G9-6B897EA | |
| Dell Precision 5000 5490 | |
| Lenovo ThinkPad P16s G2 21K9000CGE | |
| Dell Precision 5690 | |
| MSI CreatorPro Z16P B12UKST | |
| Média AMD Ryzen 7 8845HS (0.4304 - 0.4935, n=12) | |
| Asus ExpertBook B6 Flip B6602FC2 | |
| HP ZBook Power 15 G10 | |
| HP ZBook Power 16 G11 A | |
| Lenovo ThinkPad P16v G1 AMD | |
| HP ZBook Fury 16 G9 | |
| HP ZBook Fury 16 G11 | |
Cinebench R23: Multi Core | Single Core
Cinebench R20: CPU (Multi Core) | CPU (Single Core)
Cinebench R15: CPU Multi 64Bit | CPU Single 64Bit
Blender: v2.79 BMW27 CPU
7-Zip 18.03: 7z b 4 | 7z b 4 -mmt1
Geekbench 6.4: Multi-Core | Single-Core
Geekbench 5.5: Multi-Core | Single-Core
HWBOT x265 Benchmark v2.2: 4k Preset
LibreOffice : 20 Documents To PDF
R Benchmark 2.5: Overall mean
* ... menor é melhor
AIDA64: FP32 Ray-Trace | FPU Julia | CPU SHA3 | CPU Queen | FPU SinJulia | FPU Mandel | CPU AES | CPU ZLib | FP64 Ray-Trace | CPU PhotoWorxx
| Performance Rating | |
| Média AMD Ryzen 7 8845HS | |
| HP ZBook Power 15 G10 | |
| HP ZBook Power 16 G11 A | |
| HP ZBook Fury 16 G11 | |
| Lenovo ThinkPad P16s G2 21K9000CGE | |
| Dell Precision 5690 | |
| Lenovo ThinkPad P1 Gen 7 21KV001SGE | |
| AIDA64 / FP32 Ray-Trace | |
| Média AMD Ryzen 7 8845HS (23708 - 29544, n=12) | |
| HP ZBook Power 15 G10 | |
| HP ZBook Power 16 G11 A | |
| Lenovo ThinkPad P16s G2 21K9000CGE | |
| HP ZBook Fury 16 G11 | |
| Dell Precision 5690 | |
| Lenovo ThinkPad P1 Gen 7 21KV001SGE | |
| AIDA64 / FPU Julia | |
| HP ZBook Power 16 G11 A | |
| Média AMD Ryzen 7 8845HS (99659 - 125873, n=12) | |
| HP ZBook Power 15 G10 | |
| HP ZBook Fury 16 G11 | |
| Lenovo ThinkPad P16s G2 21K9000CGE | |
| Dell Precision 5690 | |
| Lenovo ThinkPad P1 Gen 7 21KV001SGE | |
| AIDA64 / CPU SHA3 | |
| HP ZBook Fury 16 G11 | |
| HP ZBook Power 16 G11 A | |
| Média AMD Ryzen 7 8845HS (4332 - 5180, n=12) | |
| HP ZBook Power 15 G10 | |
| Lenovo ThinkPad P16s G2 21K9000CGE | |
| Dell Precision 5690 | |
| Lenovo ThinkPad P1 Gen 7 21KV001SGE | |
| AIDA64 / CPU Queen | |
| HP ZBook Fury 16 G11 | |
| HP ZBook Power 16 G11 A | |
| Média AMD Ryzen 7 8845HS (109458 - 124695, n=12) | |
| HP ZBook Power 15 G10 | |
| Lenovo ThinkPad P16s G2 21K9000CGE | |
| Dell Precision 5690 | |
| Lenovo ThinkPad P1 Gen 7 21KV001SGE | |
| AIDA64 / FPU SinJulia | |
| Média AMD Ryzen 7 8845HS (14062 - 15519, n=12) | |
| HP ZBook Power 15 G10 | |
| HP ZBook Power 16 G11 A | |
| Lenovo ThinkPad P16s G2 21K9000CGE | |
| HP ZBook Fury 16 G11 | |
| Dell Precision 5690 | |
| Lenovo ThinkPad P1 Gen 7 21KV001SGE | |
| AIDA64 / FPU Mandel | |
| Média AMD Ryzen 7 8845HS (53436 - 67367, n=12) | |
| HP ZBook Power 15 G10 | |
| HP ZBook Power 16 G11 A | |
| Lenovo ThinkPad P16s G2 21K9000CGE | |
| HP ZBook Fury 16 G11 | |
| Dell Precision 5690 | |
| Lenovo ThinkPad P1 Gen 7 21KV001SGE | |
| AIDA64 / CPU AES | |
| HP ZBook Fury 16 G11 | |
| Média AMD Ryzen 7 8845HS (64515 - 172642, n=12) | |
| Dell Precision 5690 | |
| HP ZBook Power 15 G10 | |
| Lenovo ThinkPad P1 Gen 7 21KV001SGE | |
| HP ZBook Power 16 G11 A | |
| Lenovo ThinkPad P16s G2 21K9000CGE | |
| AIDA64 / CPU ZLib | |
| HP ZBook Fury 16 G11 | |
| Dell Precision 5690 | |
| Lenovo ThinkPad P1 Gen 7 21KV001SGE | |
| HP ZBook Power 16 G11 A | |
| HP ZBook Power 15 G10 | |
| Lenovo ThinkPad P16s G2 21K9000CGE | |
| Média AMD Ryzen 7 8845HS (627 - 1080, n=12) | |
| AIDA64 / FP64 Ray-Trace | |
| HP ZBook Power 15 G10 | |
| Média AMD Ryzen 7 8845HS (12361 - 15911, n=12) | |
| HP ZBook Power 16 G11 A | |
| Lenovo ThinkPad P16s G2 21K9000CGE | |
| HP ZBook Fury 16 G11 | |
| Dell Precision 5690 | |
| Lenovo ThinkPad P1 Gen 7 21KV001SGE | |
| AIDA64 / CPU PhotoWorxx | |
| Dell Precision 5690 | |
| HP ZBook Power 15 G10 | |
| Lenovo ThinkPad P1 Gen 7 21KV001SGE | |
| HP ZBook Power 16 G11 A | |
| Média AMD Ryzen 7 8845HS (33192 - 41668, n=12) | |
| Lenovo ThinkPad P16s G2 21K9000CGE | |
| HP ZBook Fury 16 G11 | |
Teste de estresse
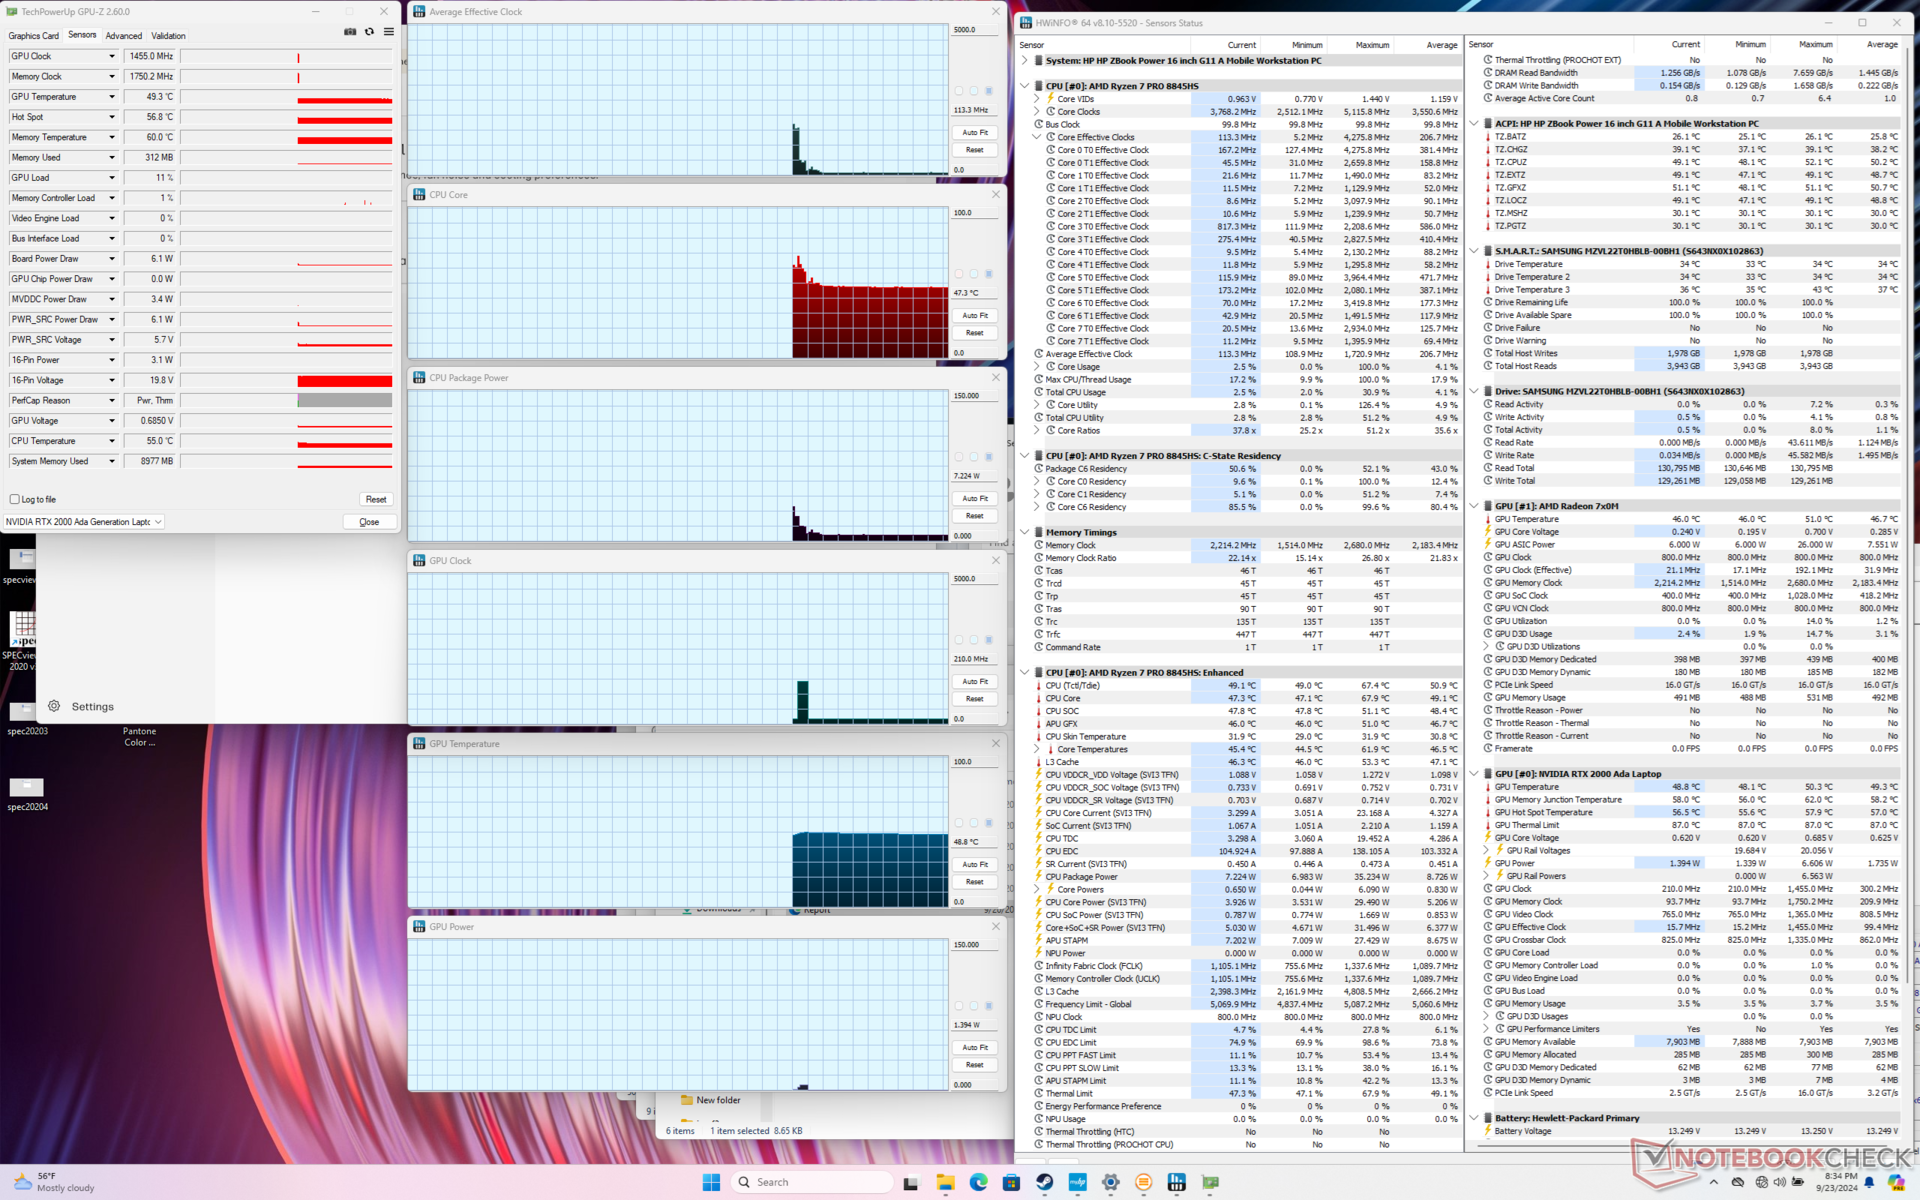
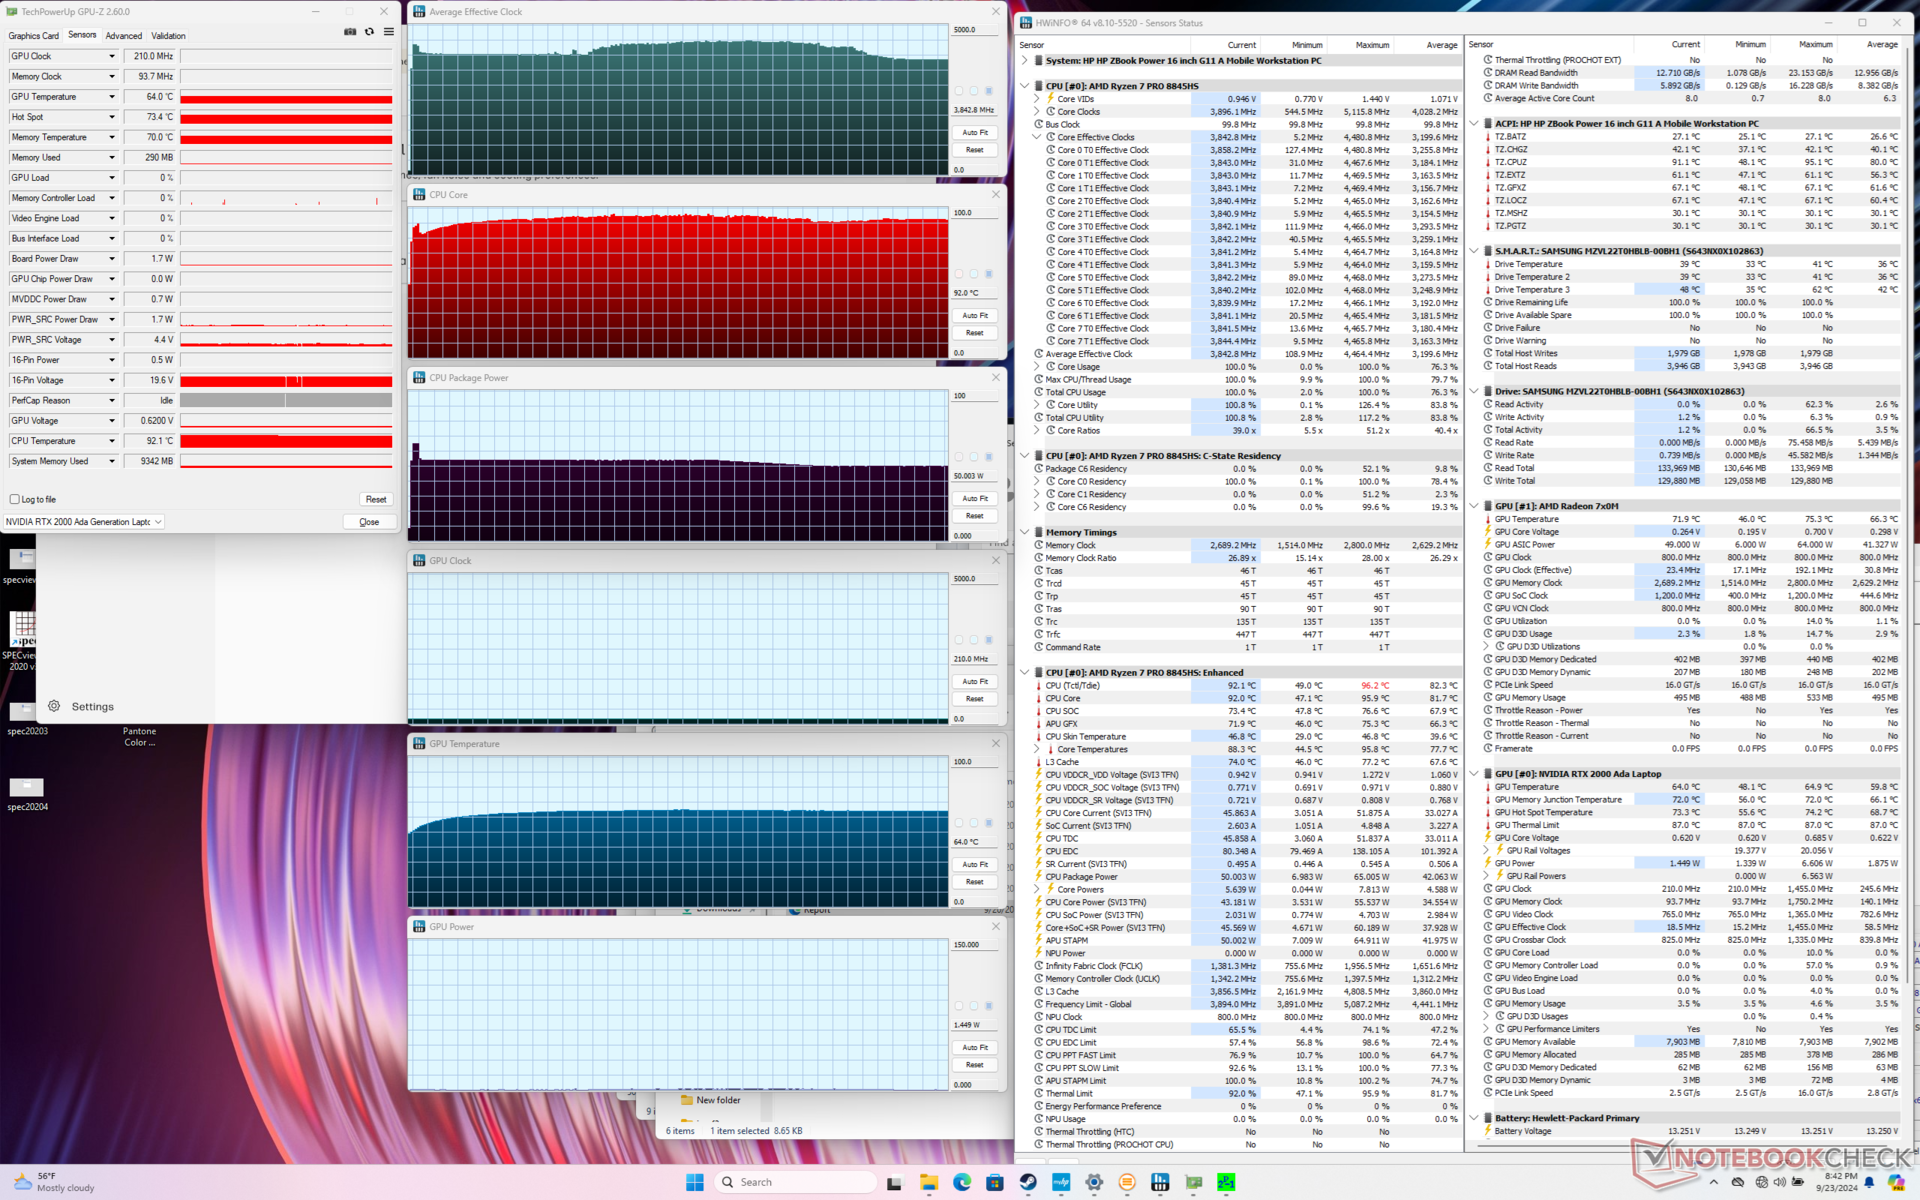
A CPU aumentaria para 4,3 GHz, 65 W e 90 C ao iniciar o estresse do Prime95 antes de cair rapidamente e se estabilizar em 3,8 GHz e 50 W para evitar temperaturas mais altas no núcleo. Os resultados são próximos aos que observamos no ZBook Power 15 G10, se não forem ligeiramente mais quentes em alguns graus.
É interessante notar que a CPU é acelerada mais fortemente para apenas 2,8 GHz ao executar o Prime95 e o FurMark simultaneamente, em vez de 3,8 GHz como no modelo do ano passado. Essa mudança provavelmente melhorou as temperaturas do núcleo; a CPU agora se estabiliza em uma temperatura mais confortável de 66 C em vez dos 99 C do ZBook Power 15 G10.
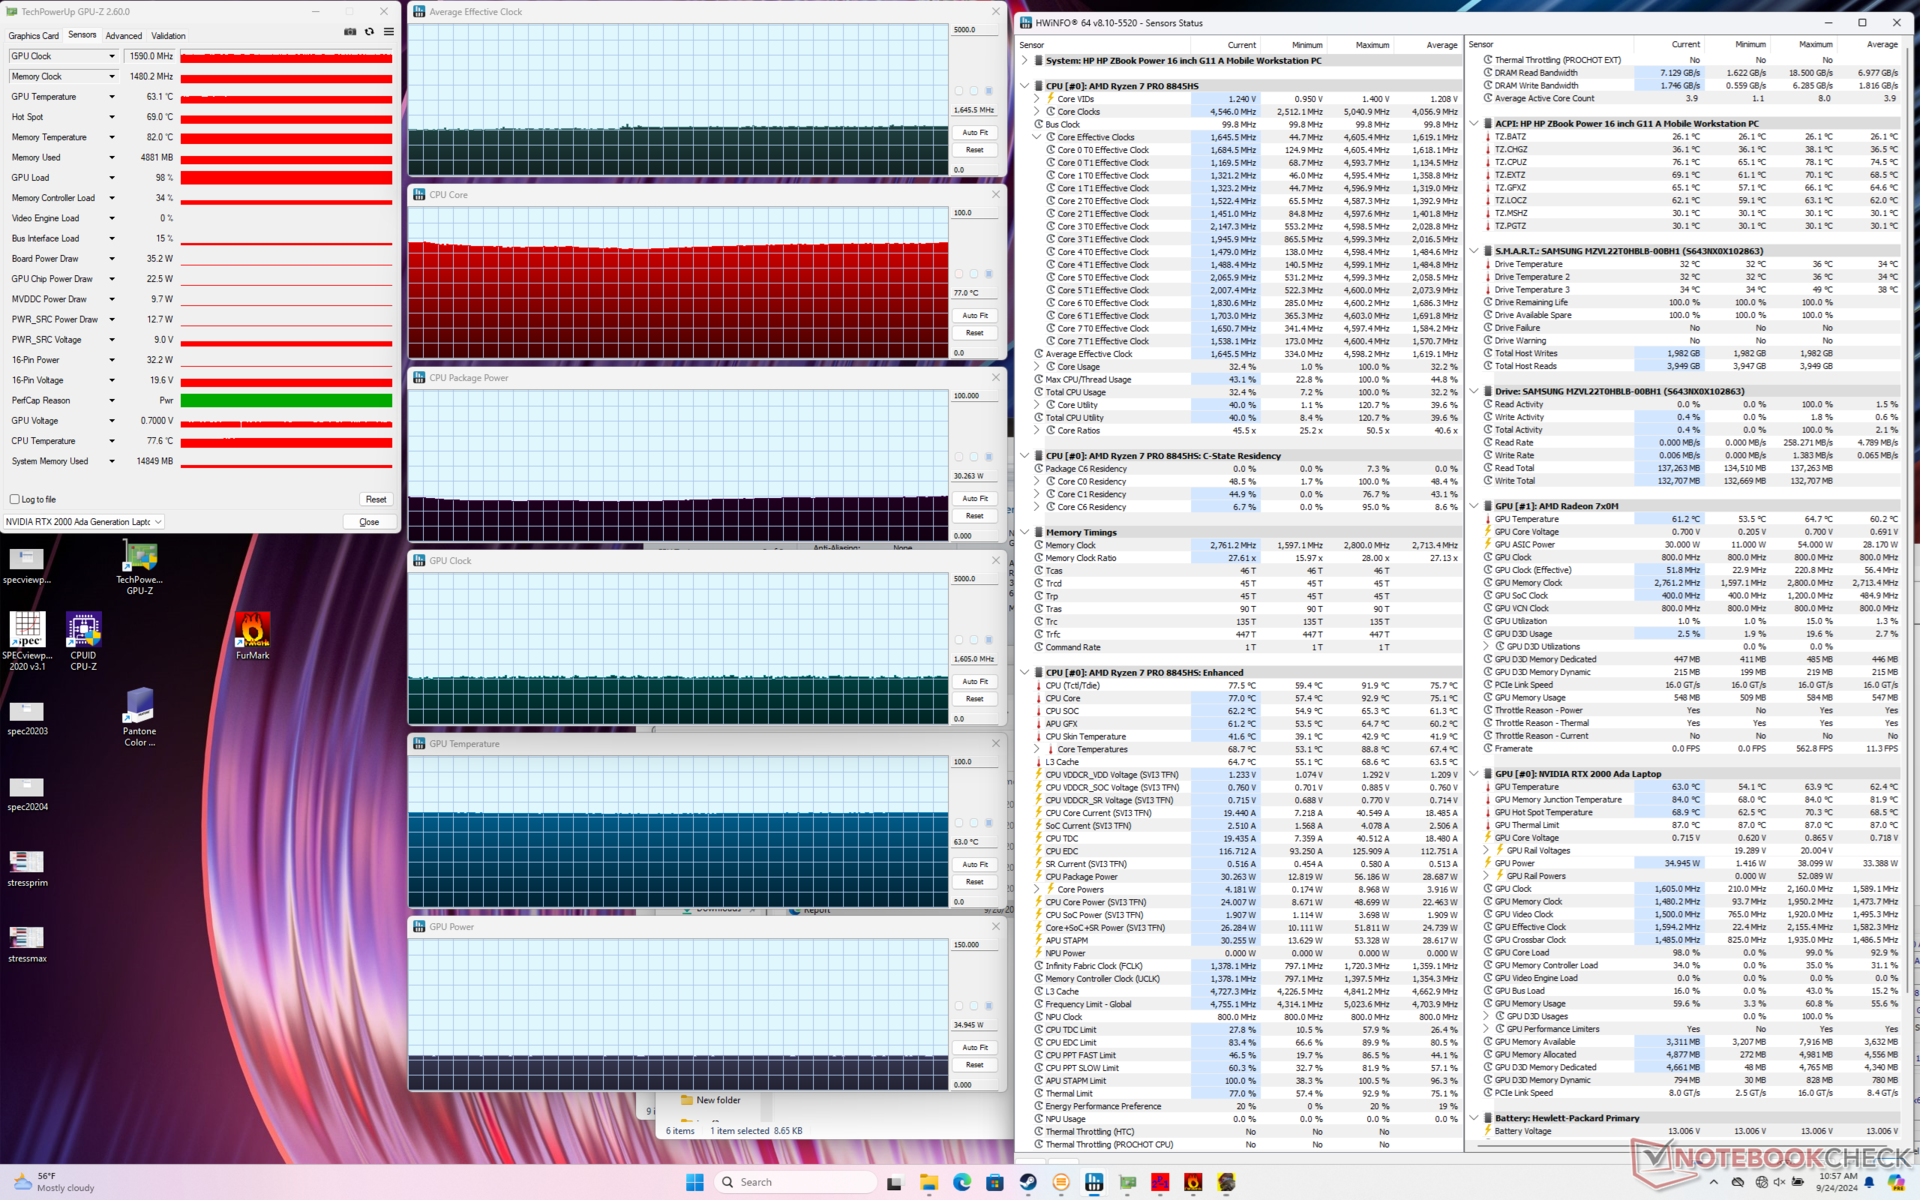
A execução do Cyberpunk 2077 no modo Balanced em vez do modo Performance resulta em temperaturas de núcleo ligeiramente mais baixas e taxas de clock médias ligeiramente mais lentas, conforme mostrado abaixo. O consumo de energia da placa da GPU também cairia de 35 W para 30 W, em comparação com o máximo anunciado de 50 W.
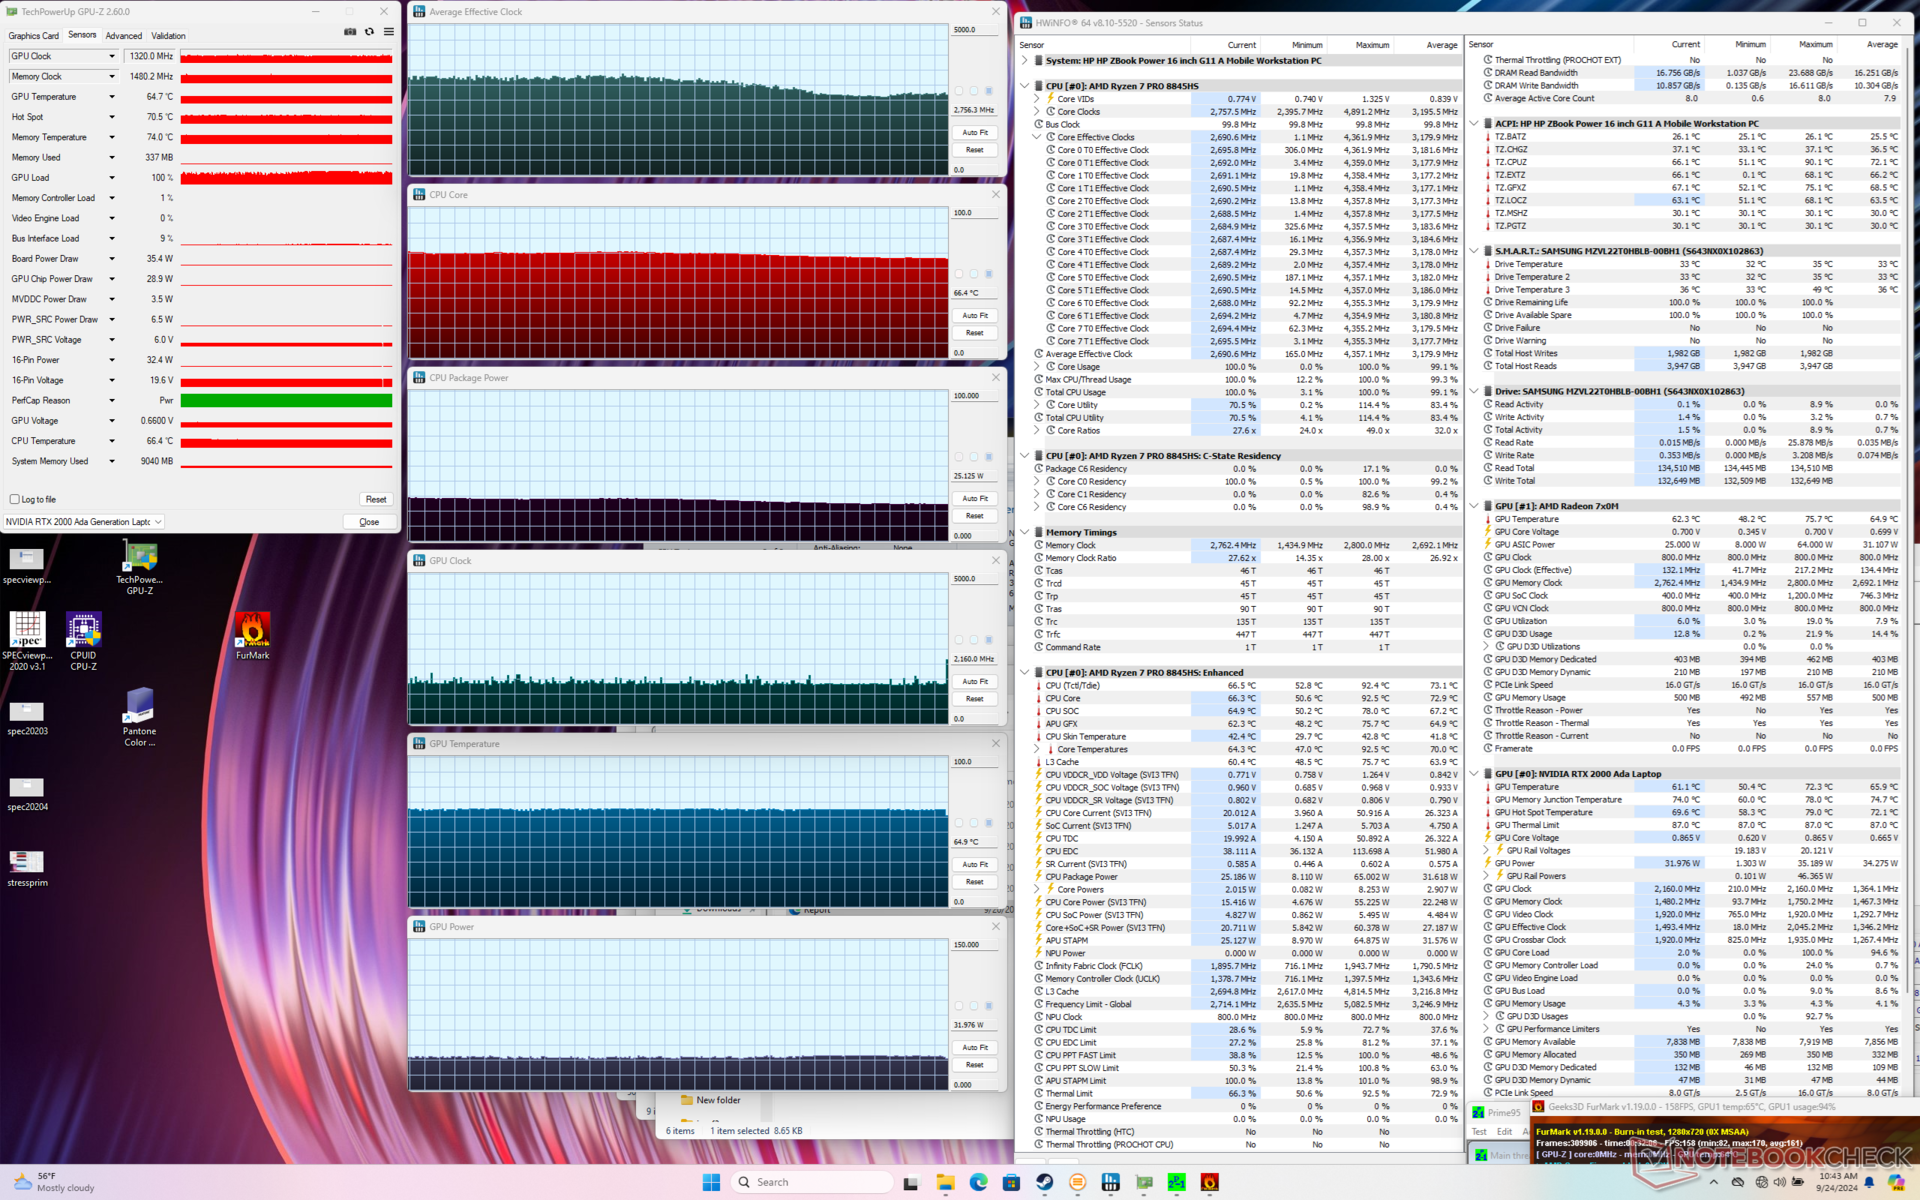
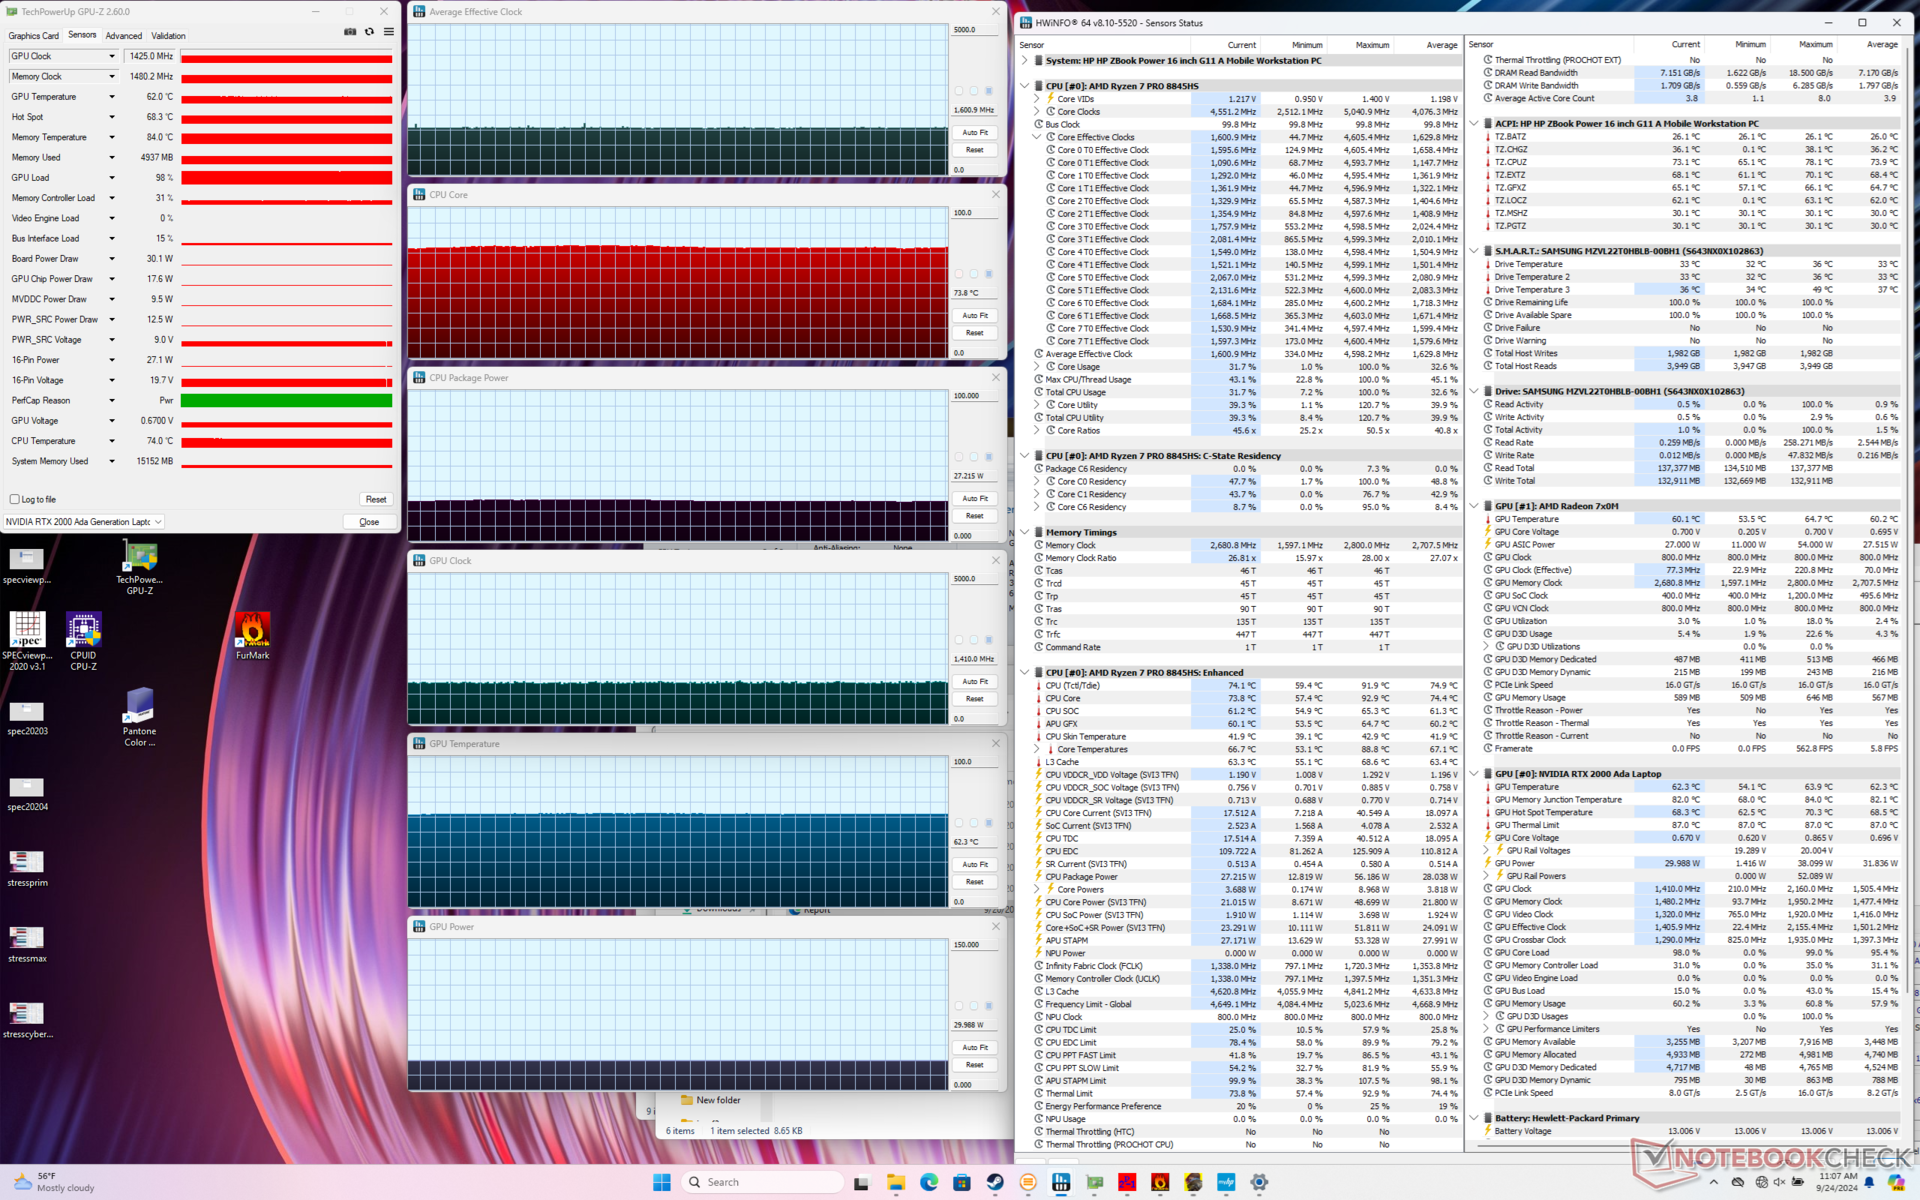
| Clock médio da CPU (GHz) | Clock da GPU (MHz) | Temperatura média da CPU (°C) | Temperatura média da GPU (°C) | |
| Sistema ocioso | -- | -- | 47 | 49 |
| Estresse do Prime95 | 3.9 | -- | 92 | 64 |
| Prime95 + FurMark Stress | 2.8 | 1320 | 66 | 65 |
| Cyberpunk 2077 Stress (Modo balanceado) | 1.6 | 1425 | 74 | 62 |
| Estresse do Cyberpunk 2077 (Modo de desempenho) | 1.7 | 1590 | 77 | 63 |
Desempenho do sistema
Os resultados do PCMark são praticamente idênticos aos que registramos no ZBook Power 15 G10 do ano passado. Isso significa que as cargas tradicionais do dia a dia, como navegação ou edição, não são visivelmente mais rápidas em nosso modelo mais novo. O desempenho da RAM também não melhorou.
Tivemos um problema ao acordar do modo de suspensão em que era necessário um desligamento forçado para retornar ao Windows. Não foi possível reproduzir o problema de forma confiável, mas o fato de ele ter ocorrido em uma estação de trabalho móvel é digno de nota.

CrossMark: Overall | Productivity | Creativity | Responsiveness
WebXPRT 3: Overall
WebXPRT 4: Overall
Mozilla Kraken 1.1: Total
| PCMark 10 / Score | |
| Dell Precision 5690 | |
| HP ZBook Fury 16 G11 | |
| HP ZBook Power 15 G10 | |
| HP ZBook Power 16 G11 A | |
| Média AMD Ryzen 7 8845HS, NVIDIA RTX 2000 Ada Generation Laptop GPU (n=1) | |
| Lenovo ThinkPad P1 Gen 7 21KV001SGE | |
| Lenovo ThinkPad P16s G2 21K9000CGE | |
| PCMark 10 / Essentials | |
| Dell Precision 5690 | |
| HP ZBook Power 15 G10 | |
| HP ZBook Power 16 G11 A | |
| Média AMD Ryzen 7 8845HS, NVIDIA RTX 2000 Ada Generation Laptop GPU (n=1) | |
| Lenovo ThinkPad P1 Gen 7 21KV001SGE | |
| Lenovo ThinkPad P16s G2 21K9000CGE | |
| HP ZBook Fury 16 G11 | |
| PCMark 10 / Productivity | |
| Dell Precision 5690 | |
| HP ZBook Power 15 G10 | |
| HP ZBook Power 16 G11 A | |
| Média AMD Ryzen 7 8845HS, NVIDIA RTX 2000 Ada Generation Laptop GPU (n=1) | |
| HP ZBook Fury 16 G11 | |
| Lenovo ThinkPad P1 Gen 7 21KV001SGE | |
| Lenovo ThinkPad P16s G2 21K9000CGE | |
| PCMark 10 / Digital Content Creation | |
| HP ZBook Fury 16 G11 | |
| Dell Precision 5690 | |
| Lenovo ThinkPad P1 Gen 7 21KV001SGE | |
| HP ZBook Power 15 G10 | |
| HP ZBook Power 16 G11 A | |
| Média AMD Ryzen 7 8845HS, NVIDIA RTX 2000 Ada Generation Laptop GPU (n=1) | |
| Lenovo ThinkPad P16s G2 21K9000CGE | |
| CrossMark / Overall | |
| HP ZBook Fury 16 G11 | |
| Dell Precision 5690 | |
| HP ZBook Power 16 G11 A | |
| Média AMD Ryzen 7 8845HS, NVIDIA RTX 2000 Ada Generation Laptop GPU (n=1) | |
| Lenovo ThinkPad P1 Gen 7 21KV001SGE | |
| HP ZBook Power 15 G10 | |
| Lenovo ThinkPad P16s G2 21K9000CGE | |
| CrossMark / Productivity | |
| HP ZBook Fury 16 G11 | |
| Dell Precision 5690 | |
| HP ZBook Power 16 G11 A | |
| Média AMD Ryzen 7 8845HS, NVIDIA RTX 2000 Ada Generation Laptop GPU (n=1) | |
| Lenovo ThinkPad P1 Gen 7 21KV001SGE | |
| HP ZBook Power 15 G10 | |
| Lenovo ThinkPad P16s G2 21K9000CGE | |
| CrossMark / Creativity | |
| HP ZBook Fury 16 G11 | |
| HP ZBook Power 16 G11 A | |
| Média AMD Ryzen 7 8845HS, NVIDIA RTX 2000 Ada Generation Laptop GPU (n=1) | |
| Dell Precision 5690 | |
| Lenovo ThinkPad P1 Gen 7 21KV001SGE | |
| HP ZBook Power 15 G10 | |
| Lenovo ThinkPad P16s G2 21K9000CGE | |
| CrossMark / Responsiveness | |
| HP ZBook Fury 16 G11 | |
| Dell Precision 5690 | |
| HP ZBook Power 16 G11 A | |
| Média AMD Ryzen 7 8845HS, NVIDIA RTX 2000 Ada Generation Laptop GPU (n=1) | |
| Lenovo ThinkPad P1 Gen 7 21KV001SGE | |
| Lenovo ThinkPad P16s G2 21K9000CGE | |
| HP ZBook Power 15 G10 | |
| WebXPRT 3 / Overall | |
| HP ZBook Fury 16 G11 | |
| HP ZBook Power 15 G10 | |
| HP ZBook Power 16 G11 A | |
| Média AMD Ryzen 7 8845HS, NVIDIA RTX 2000 Ada Generation Laptop GPU (n=1) | |
| Dell Precision 5690 | |
| Lenovo ThinkPad P1 Gen 7 21KV001SGE | |
| Lenovo ThinkPad P16s G2 21K9000CGE | |
| WebXPRT 4 / Overall | |
| HP ZBook Fury 16 G11 | |
| Dell Precision 5690 | |
| Lenovo ThinkPad P1 Gen 7 21KV001SGE | |
| HP ZBook Power 16 G11 A | |
| Média AMD Ryzen 7 8845HS, NVIDIA RTX 2000 Ada Generation Laptop GPU (n=1) | |
| HP ZBook Power 15 G10 | |
| Mozilla Kraken 1.1 / Total | |
| Lenovo ThinkPad P16s G2 21K9000CGE | |
| HP ZBook Power 15 G10 | |
| HP ZBook Power 16 G11 A | |
| Média AMD Ryzen 7 8845HS, NVIDIA RTX 2000 Ada Generation Laptop GPU (n=1) | |
| Lenovo ThinkPad P1 Gen 7 21KV001SGE | |
| Dell Precision 5690 | |
| HP ZBook Fury 16 G11 | |
* ... menor é melhor
| PCMark 10 Score | 7376 pontos | |
Ajuda | ||
| AIDA64 / Memory Copy | |
| Dell Precision 5690 | |
| HP ZBook Power 15 G10 | |
| Média AMD Ryzen 7 8845HS (61459 - 71873, n=12) | |
| Lenovo ThinkPad P16s G2 21K9000CGE | |
| Lenovo ThinkPad P1 Gen 7 21KV001SGE | |
| HP ZBook Power 16 G11 A | |
| HP ZBook Fury 16 G11 | |
| AIDA64 / Memory Read | |
| Dell Precision 5690 | |
| Lenovo ThinkPad P1 Gen 7 21KV001SGE | |
| HP ZBook Power 15 G10 | |
| HP ZBook Power 16 G11 A | |
| HP ZBook Fury 16 G11 | |
| Média AMD Ryzen 7 8845HS (49866 - 61976, n=12) | |
| Lenovo ThinkPad P16s G2 21K9000CGE | |
| AIDA64 / Memory Write | |
| Lenovo ThinkPad P16s G2 21K9000CGE | |
| Média AMD Ryzen 7 8845HS (68425 - 93239, n=12) | |
| HP ZBook Power 15 G10 | |
| HP ZBook Power 16 G11 A | |
| Dell Precision 5690 | |
| Lenovo ThinkPad P1 Gen 7 21KV001SGE | |
| HP ZBook Fury 16 G11 | |
| AIDA64 / Memory Latency | |
| Dell Precision 5690 | |
| Lenovo ThinkPad P1 Gen 7 21KV001SGE | |
| Lenovo ThinkPad P16s G2 21K9000CGE | |
| HP ZBook Power 15 G10 | |
| HP ZBook Power 16 G11 A | |
| Média AMD Ryzen 7 8845HS (82.5 - 117, n=12) | |
| HP ZBook Fury 16 G11 | |
* ... menor é melhor
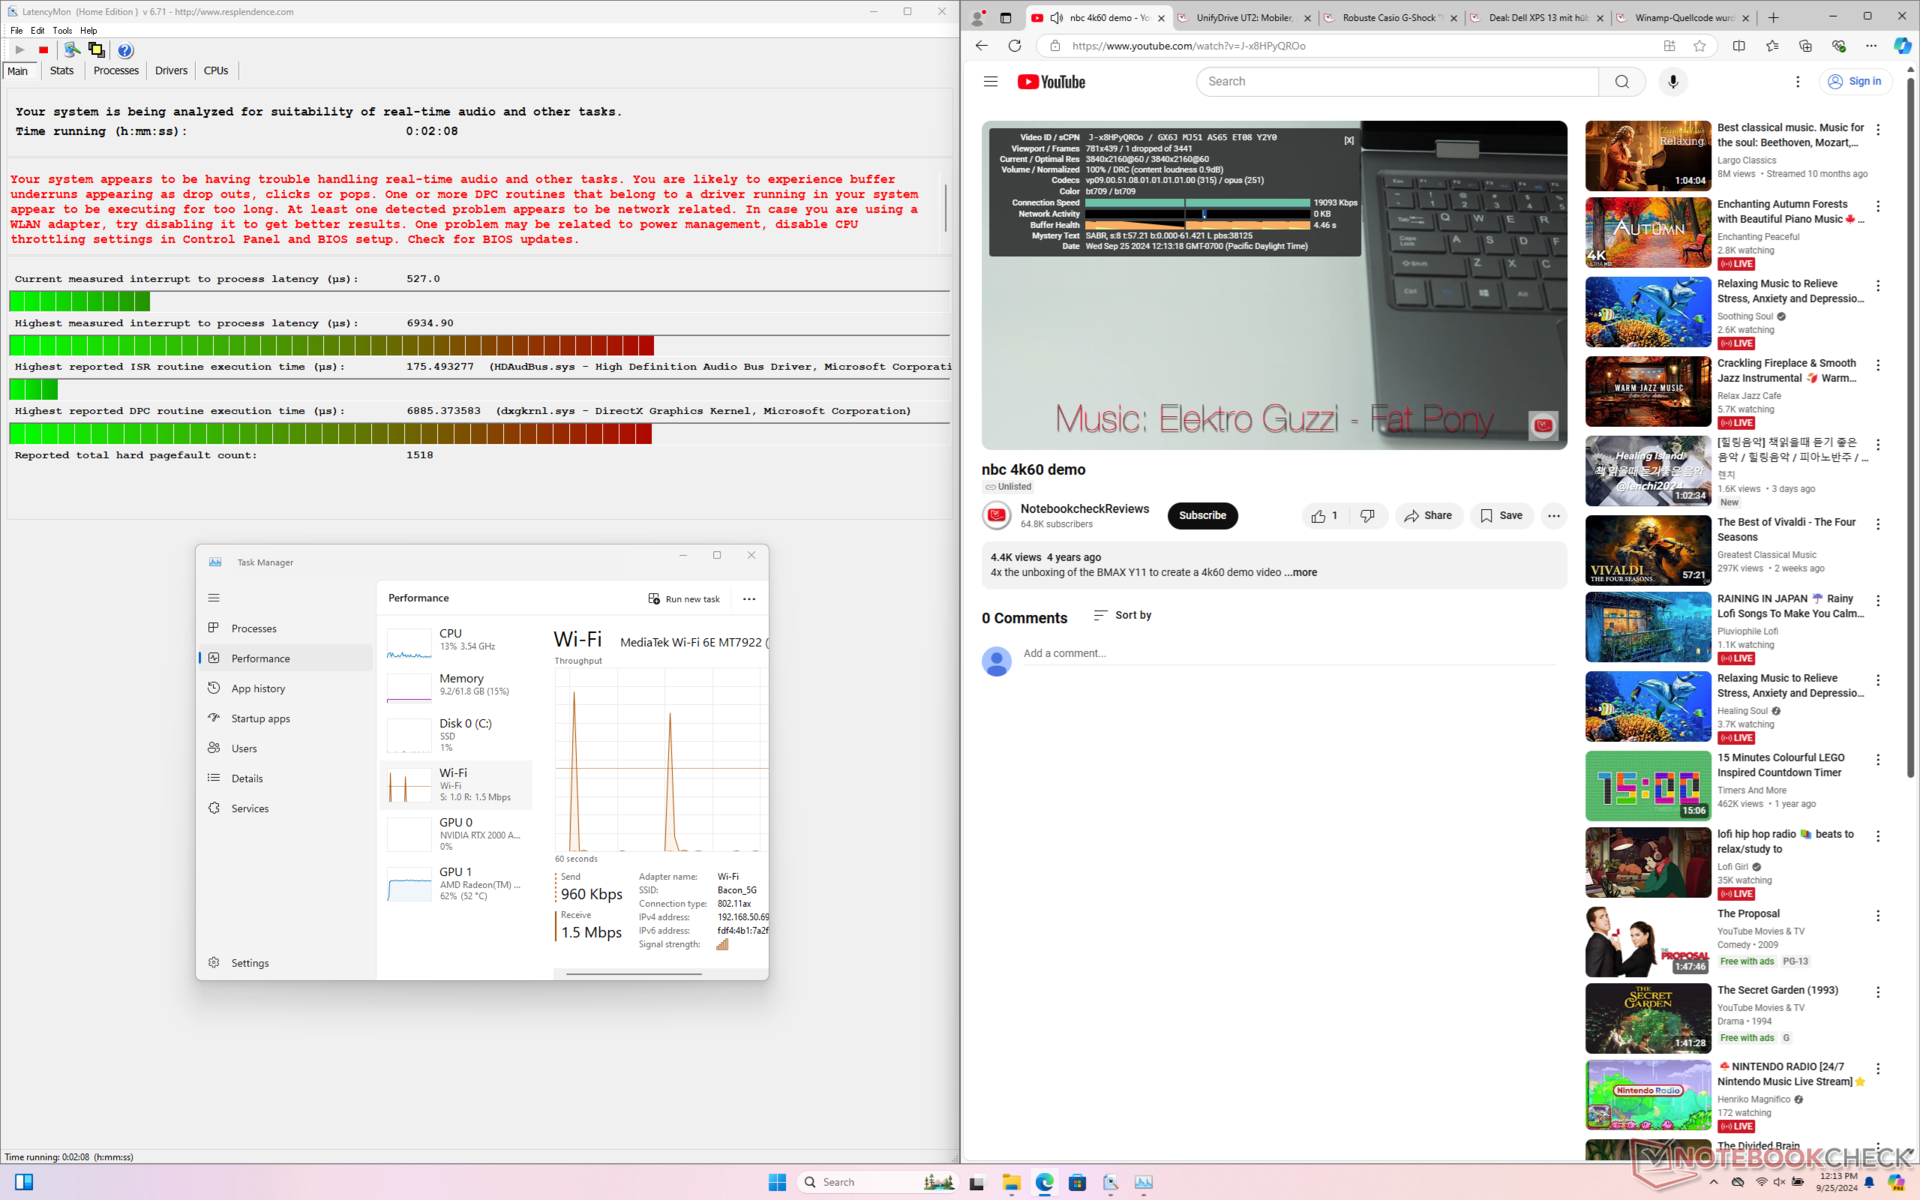
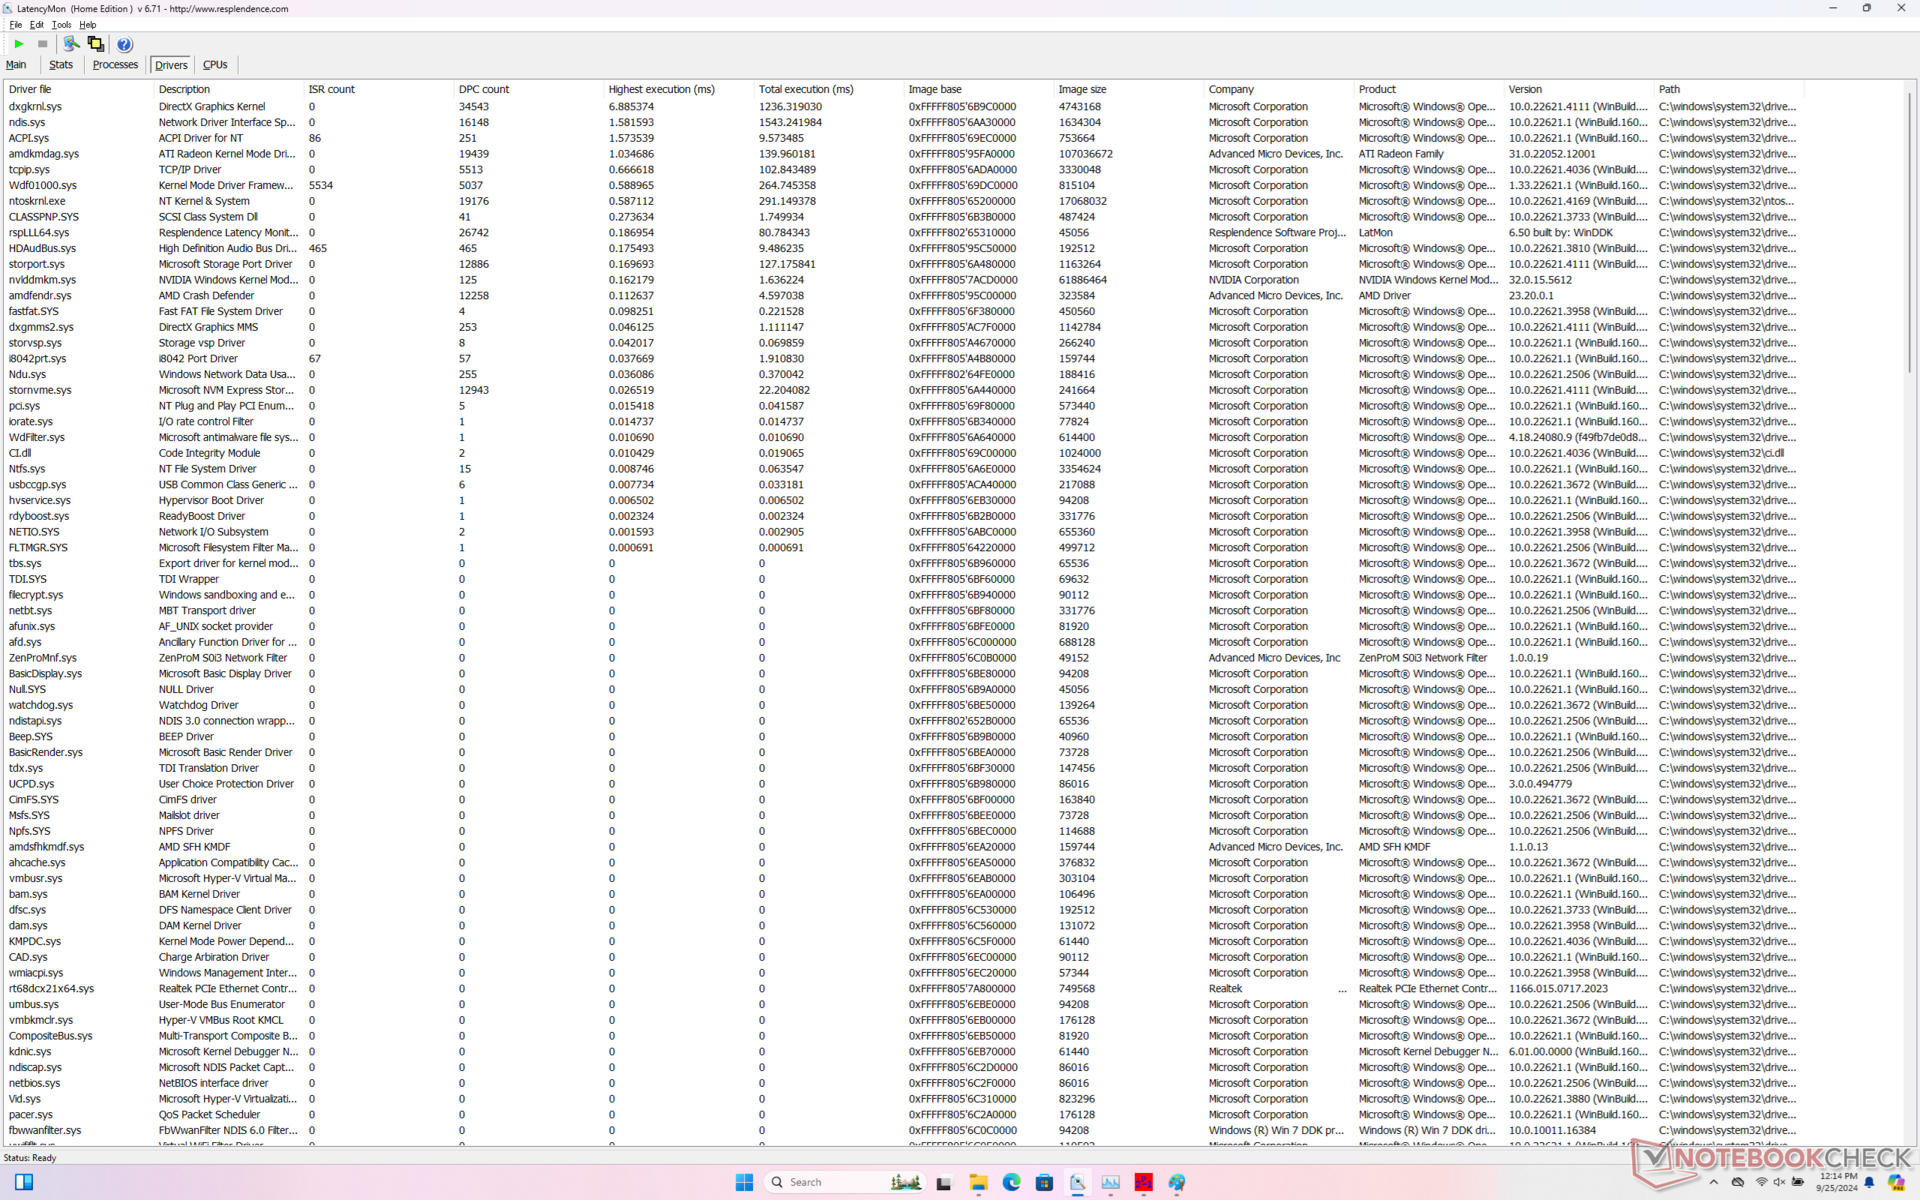
Latência DPC
O LatencyMon revela problemas de DPC relacionados ao HDAudBus.sys, mesmo após vários testes. a reprodução de vídeo 4K a 60 FPS é excelente, com apenas um único quadro perdido registrado durante uma janela de 60 segundos.
| DPC Latencies / LatencyMon - interrupt to process latency (max), Web, Youtube, Prime95 | |
| HP ZBook Fury 16 G11 | |
| HP ZBook Power 16 G11 A | |
| HP ZBook Power 15 G10 | |
| Lenovo ThinkPad P1 Gen 7 21KV001SGE | |
| Lenovo ThinkPad P16s G2 21K9000CGE | |
| Dell Precision 5690 | |
* ... menor é melhor
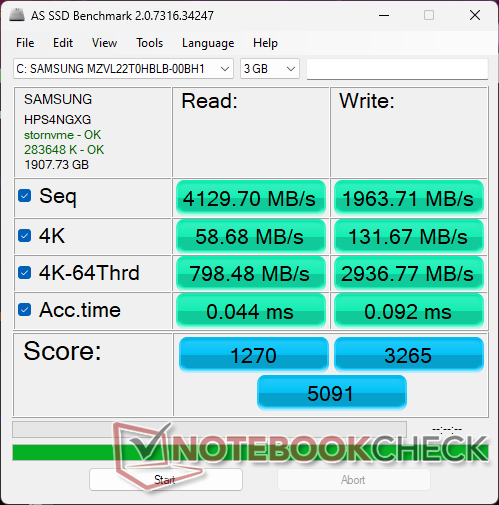
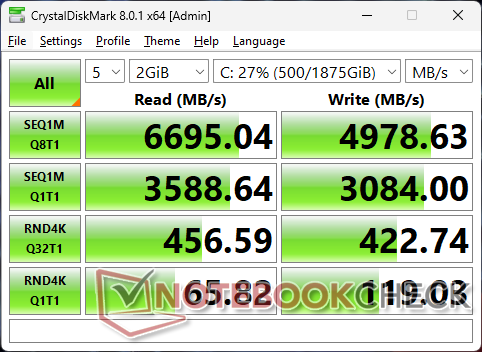
Dispositivos de armazenamento
Nossa unidade de teste é fornecida com um dispositivo de 2 TB Samsung PM9A1 PCIe4 x4 NVMe SSD de 2 TB para taxas de leitura sequencial de até 6700 MB/s. Infelizmente, a unidade foi rapidamente reduzida para a faixa baixa de 2.000 MB/s após apenas alguns minutos de estresse, conforme mostrado pelos resultados do teste de loop do DiskSpd abaixo. Repetimos o teste e os resultados não melhoraram. Isso é decepcionante, pois a unidade WD no antigo ZBook Power 15 G10 não apresentava nenhum problema de estrangulamento. Um dissipador de calor provavelmente teria melhorado o desempenho.

| Drive Performance Rating - Percent | |
| HP ZBook Fury 16 G11 | |
| Dell Precision 5690 | |
| Lenovo ThinkPad P16s G2 21K9000CGE | |
| HP ZBook Power 15 G10 | |
| HP ZBook Power 16 G11 A | |
| Lenovo ThinkPad P1 Gen 7 21KV001SGE | |
* ... menor é melhor
Disk Throttling: DiskSpd Read Loop, Queue Depth 8
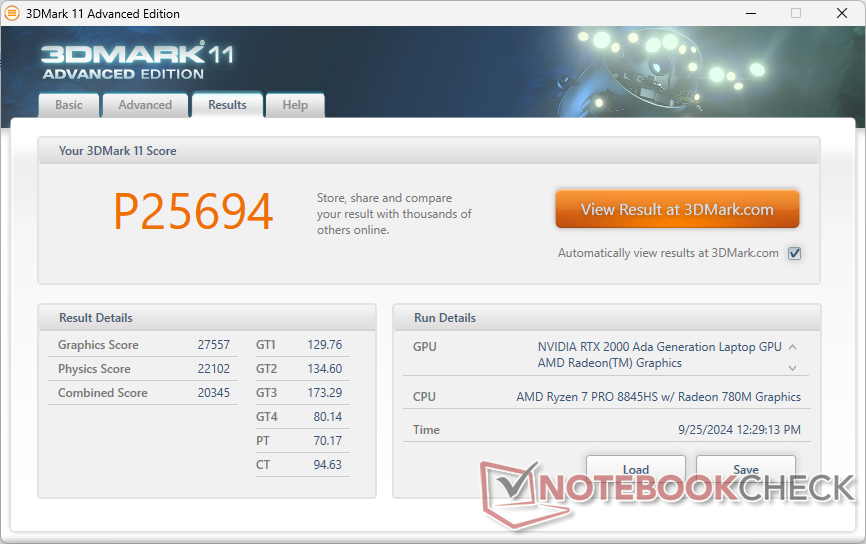
Desempenho da GPU
As opções de GPUs discretas permanecem idênticas às do ZBook Power 15 G10 de 15 polegadas, pois a Nvidia ainda não lançou um sucessor para a série móvel Ada Lovelace. Além disso, a solução de resfriamento não melhorou muito durante a mudança para um formato de 16 polegadas, o que significa que o ZBook Power 16 G11 ainda está limitado ao mesmo teto TGP de 50 W e à RTX 1000 Ada, RTX 2000 Adae RTX 3000 Ada como antes. Os usuários terão que considerar o ZBook Fury 16 series mais espesso para as opções RTX Ada mais avançadas.
A atualização para o RTX 3000 Ada traz aumentos marginais de desempenho, na melhor das hipóteses, com base em nossa experiência com o Dell Precision 5490.
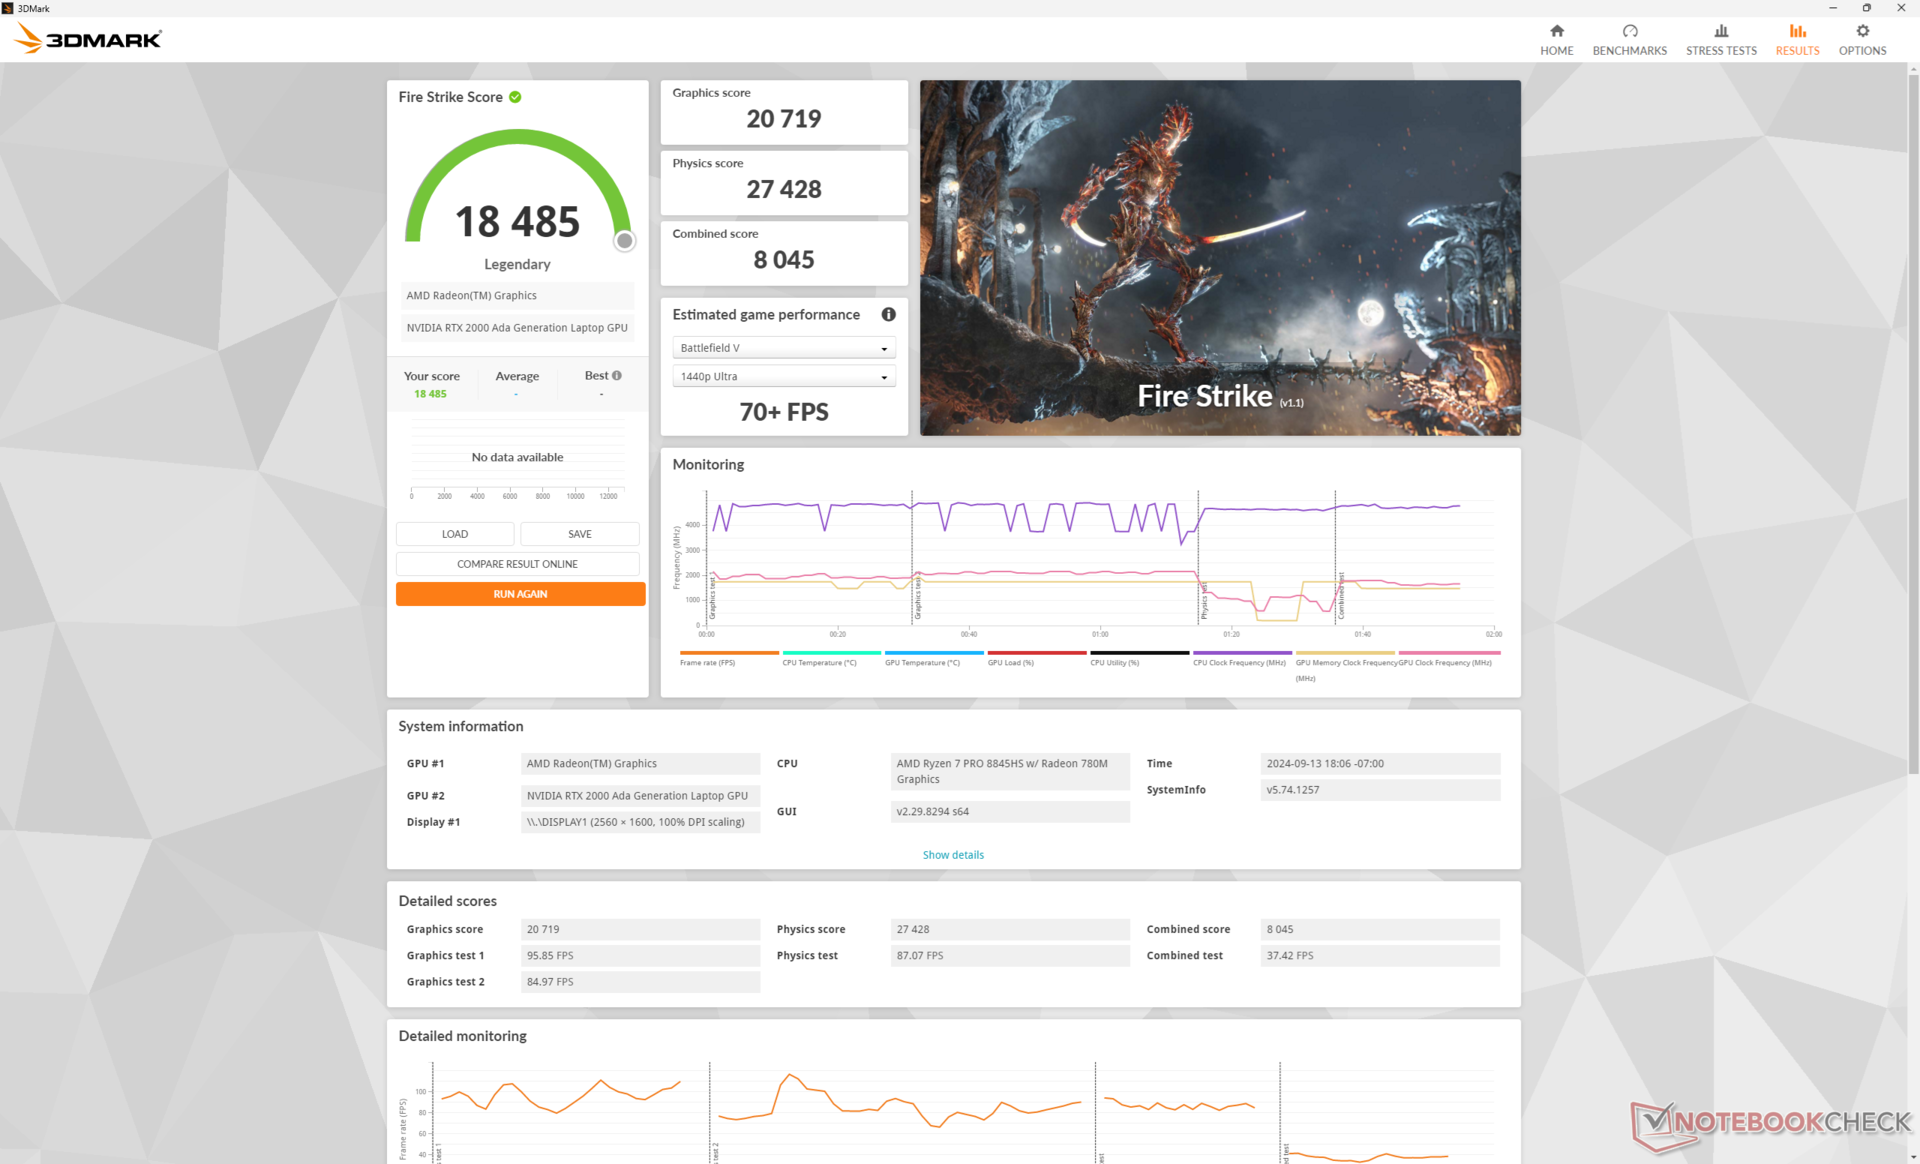
| Perfil de potência | Pontuação de gráficos | Pontuação de física | Pontuação combinada |
| Modo de desempenho | 20719 | 27428 | 8045 |
| Modo equilibrado | 19961 (-4%) | 26363 (-4%) | 7633 (-5%) |
| Energia da bateria | 8108 (-61%) | 6149 (-78%) | 1727 (-79%) |
A execução no modo Balanced em vez do modo Performance afeta ligeiramente o desempenho, conforme mostrado na tabela de resultados do site Fire Strike acima. No entanto, o desempenho da CPU e da GPU é significativamente reduzido se a execução for feita com baterias.
| 3DMark Performance Rating - Percent | |
| Dell Precision 5690 -3! | |
| HP ZBook Fury 16 G11 | |
| HP ZBook Fury 16 G9 -3! | |
| HP ZBook Power 16 G11 A | |
| Média NVIDIA RTX 2000 Ada Generation Laptop GPU | |
| Dell Precision 5000 5490 -3! | |
| MSI CreatorPro Z16P B12UKST -19! | |
| HP ZBook Power 15 G10 -11! | |
| Asus ExpertBook B6 Flip B6602FC2 -19! | |
| Lenovo ThinkPad P16v G1 AMD -18! | |
| Lenovo ThinkPad P1 G4-20Y4Z9DVUS -19! | |
| Lenovo ThinkPad P16s G2 21K9000CGE -19! | |
| HP ZBook Firefly 16 G9-6B897EA -19! | |
| 3DMark 11 Performance | 25694 pontos | |
| 3DMark Cloud Gate Standard Score | 51846 pontos | |
| 3DMark Fire Strike Score | 18485 pontos | |
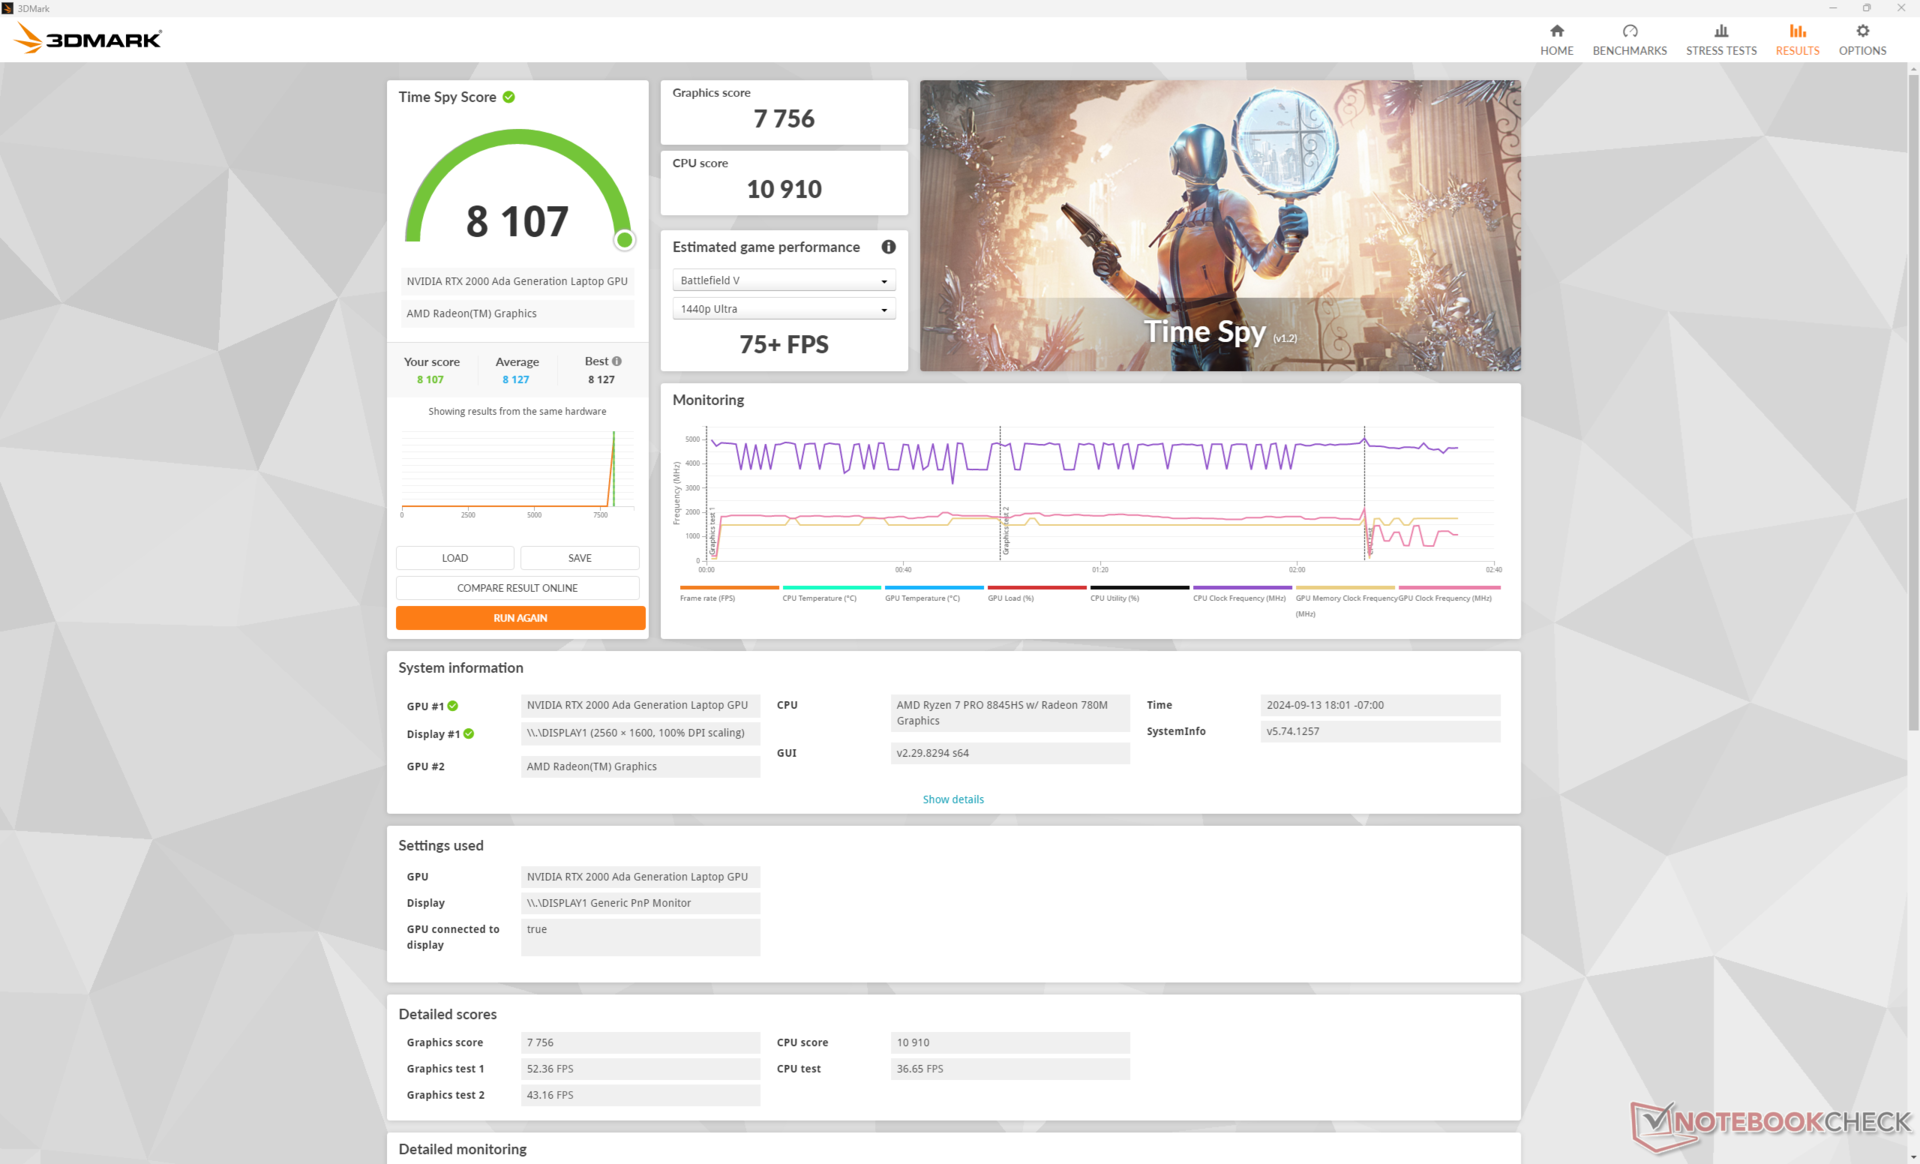
| 3DMark Time Spy Score | 8107 pontos | |
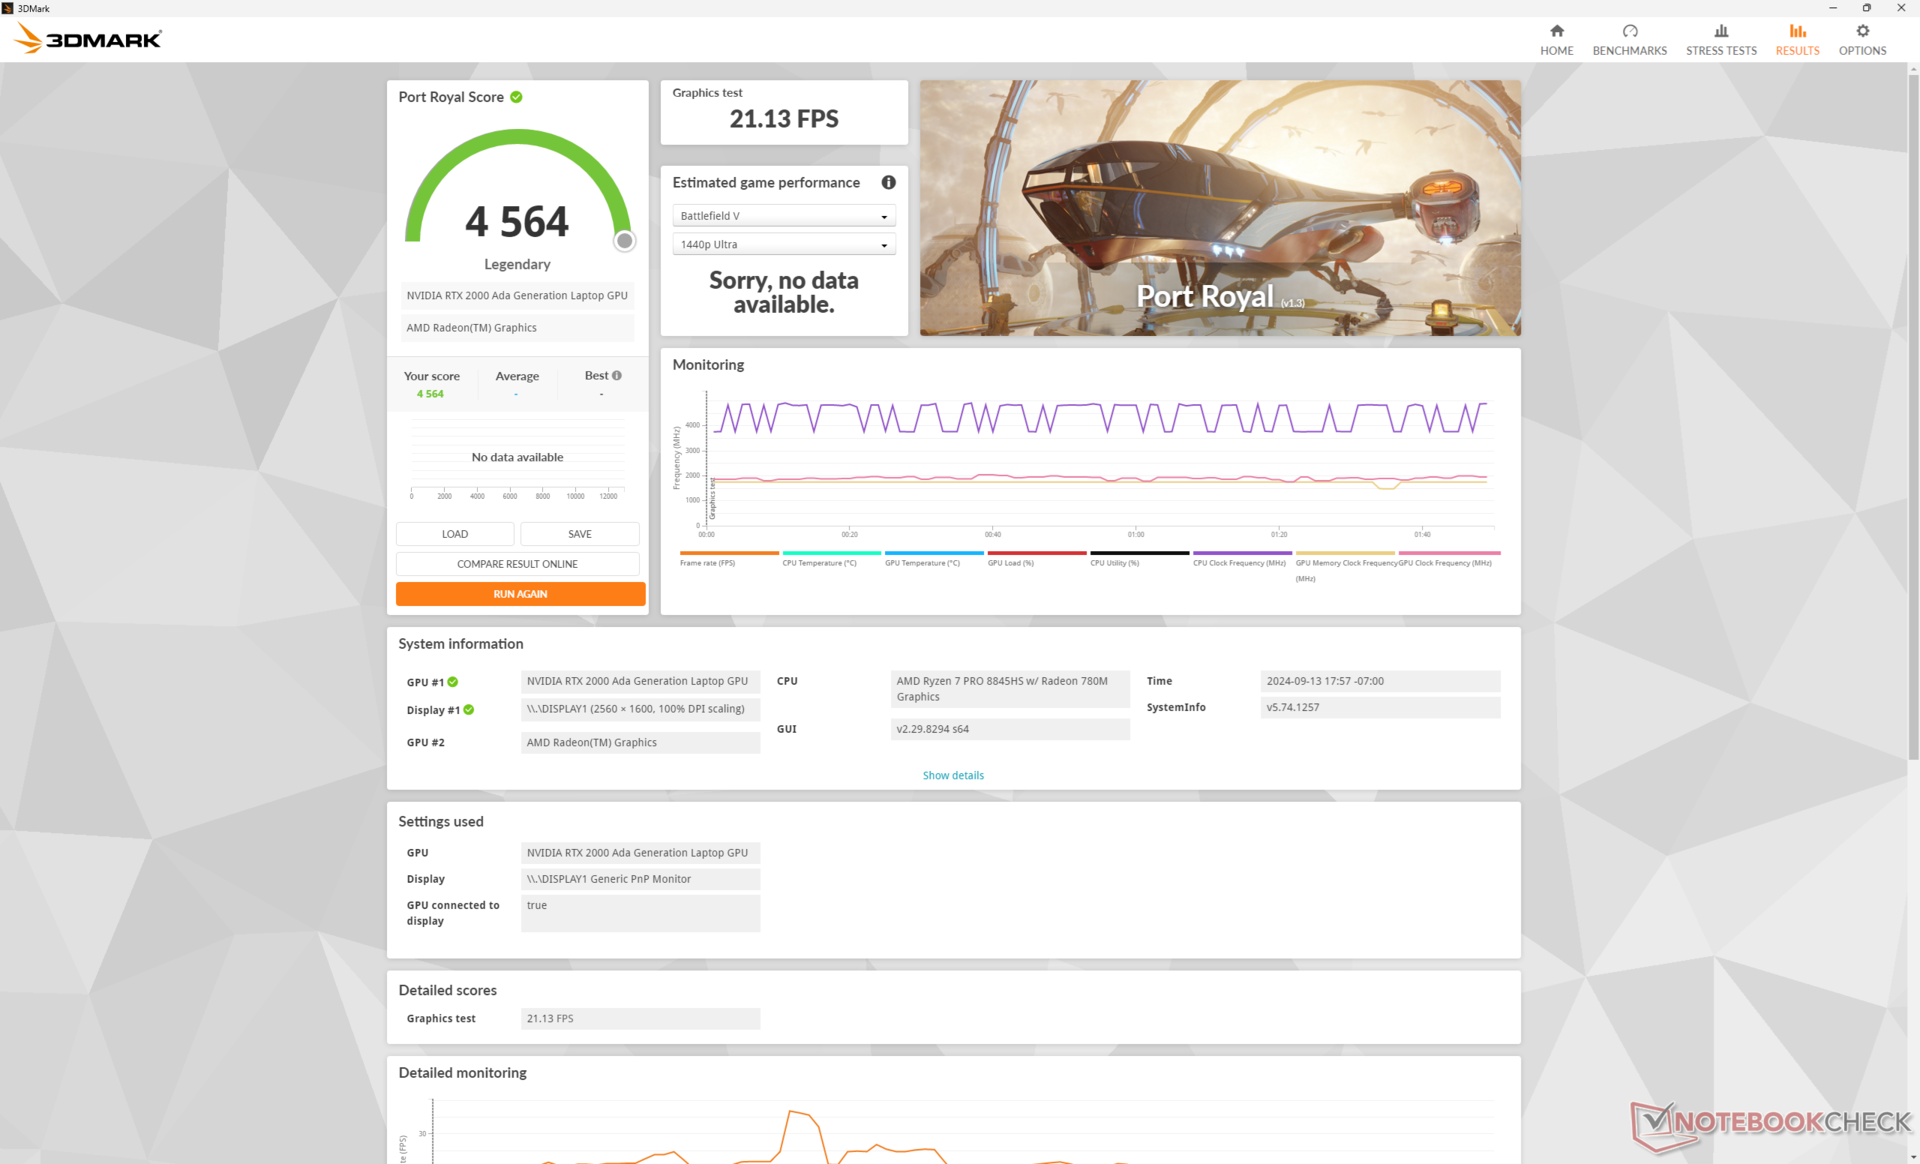
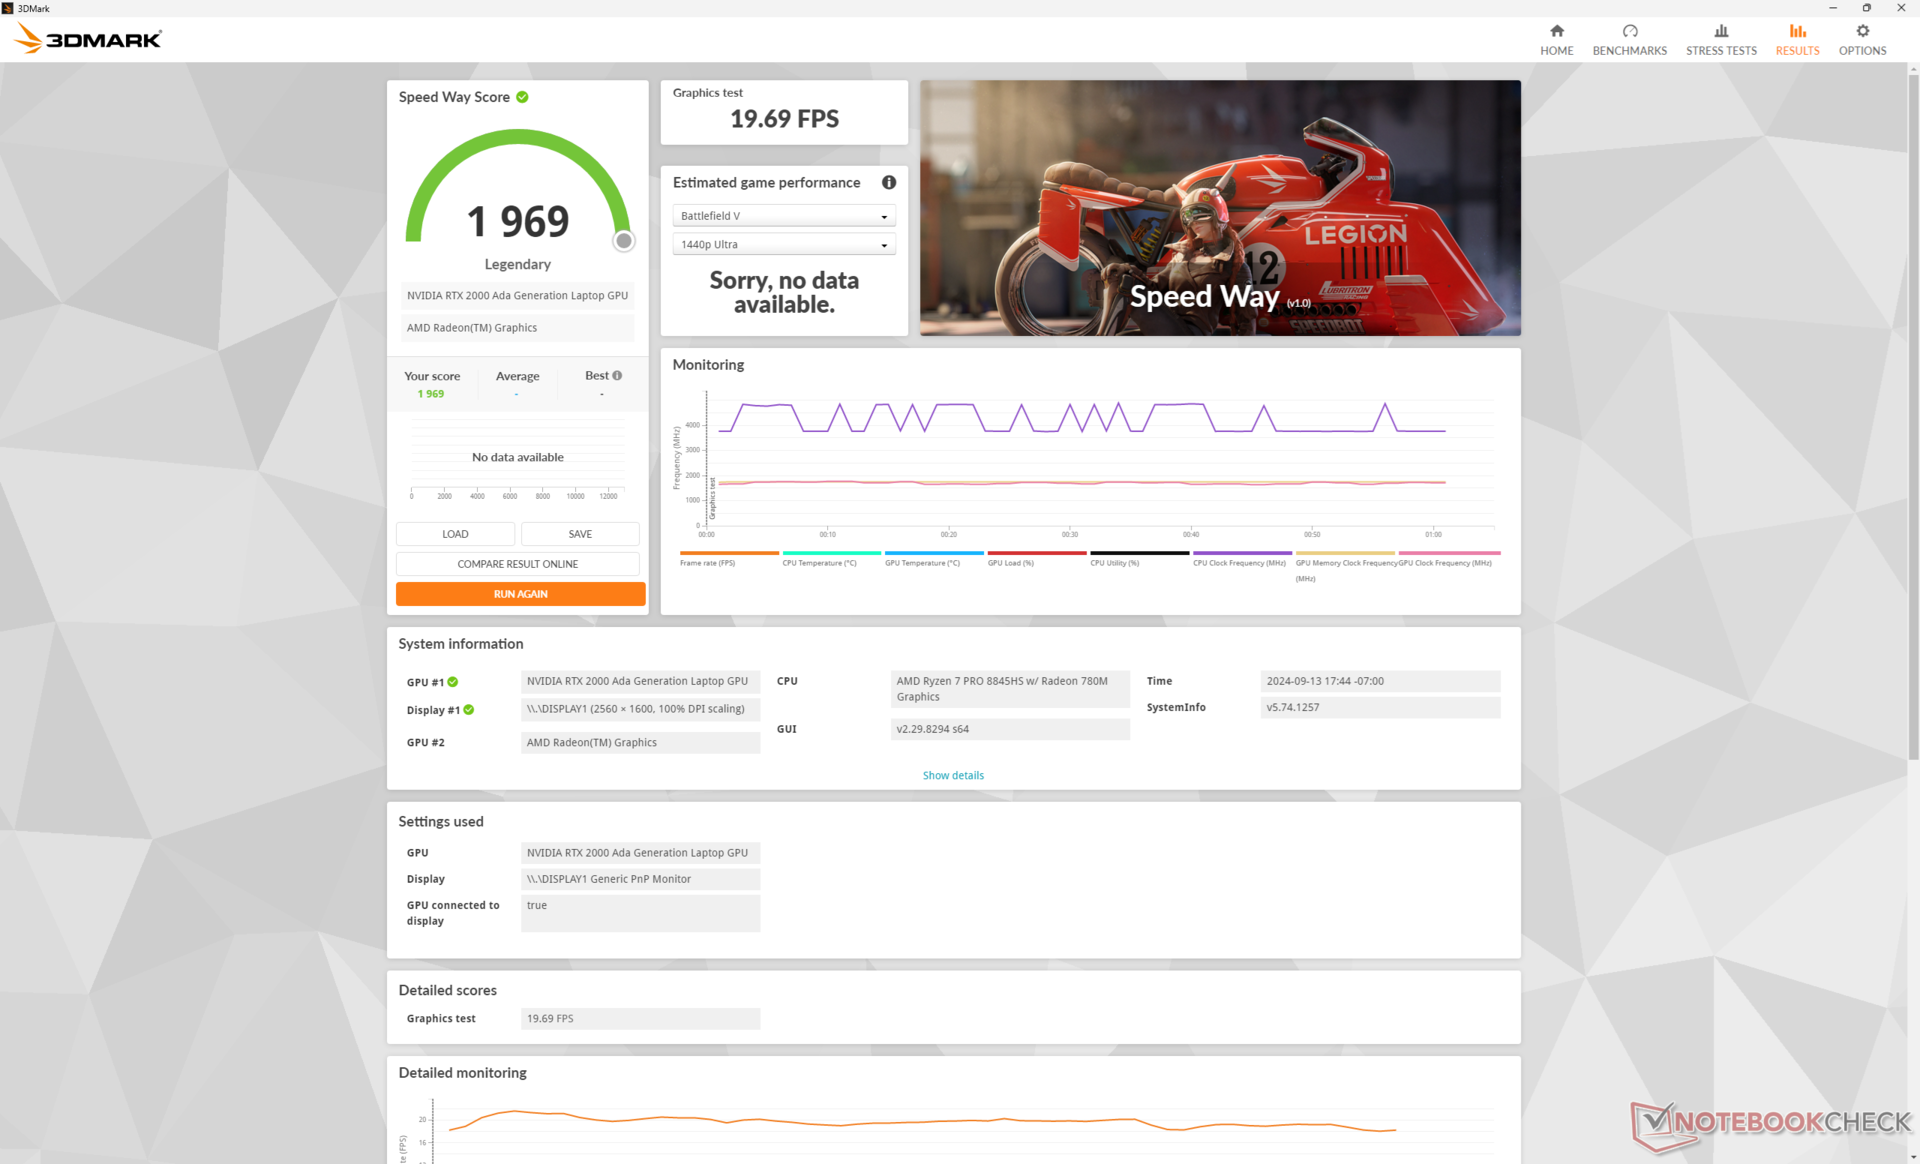
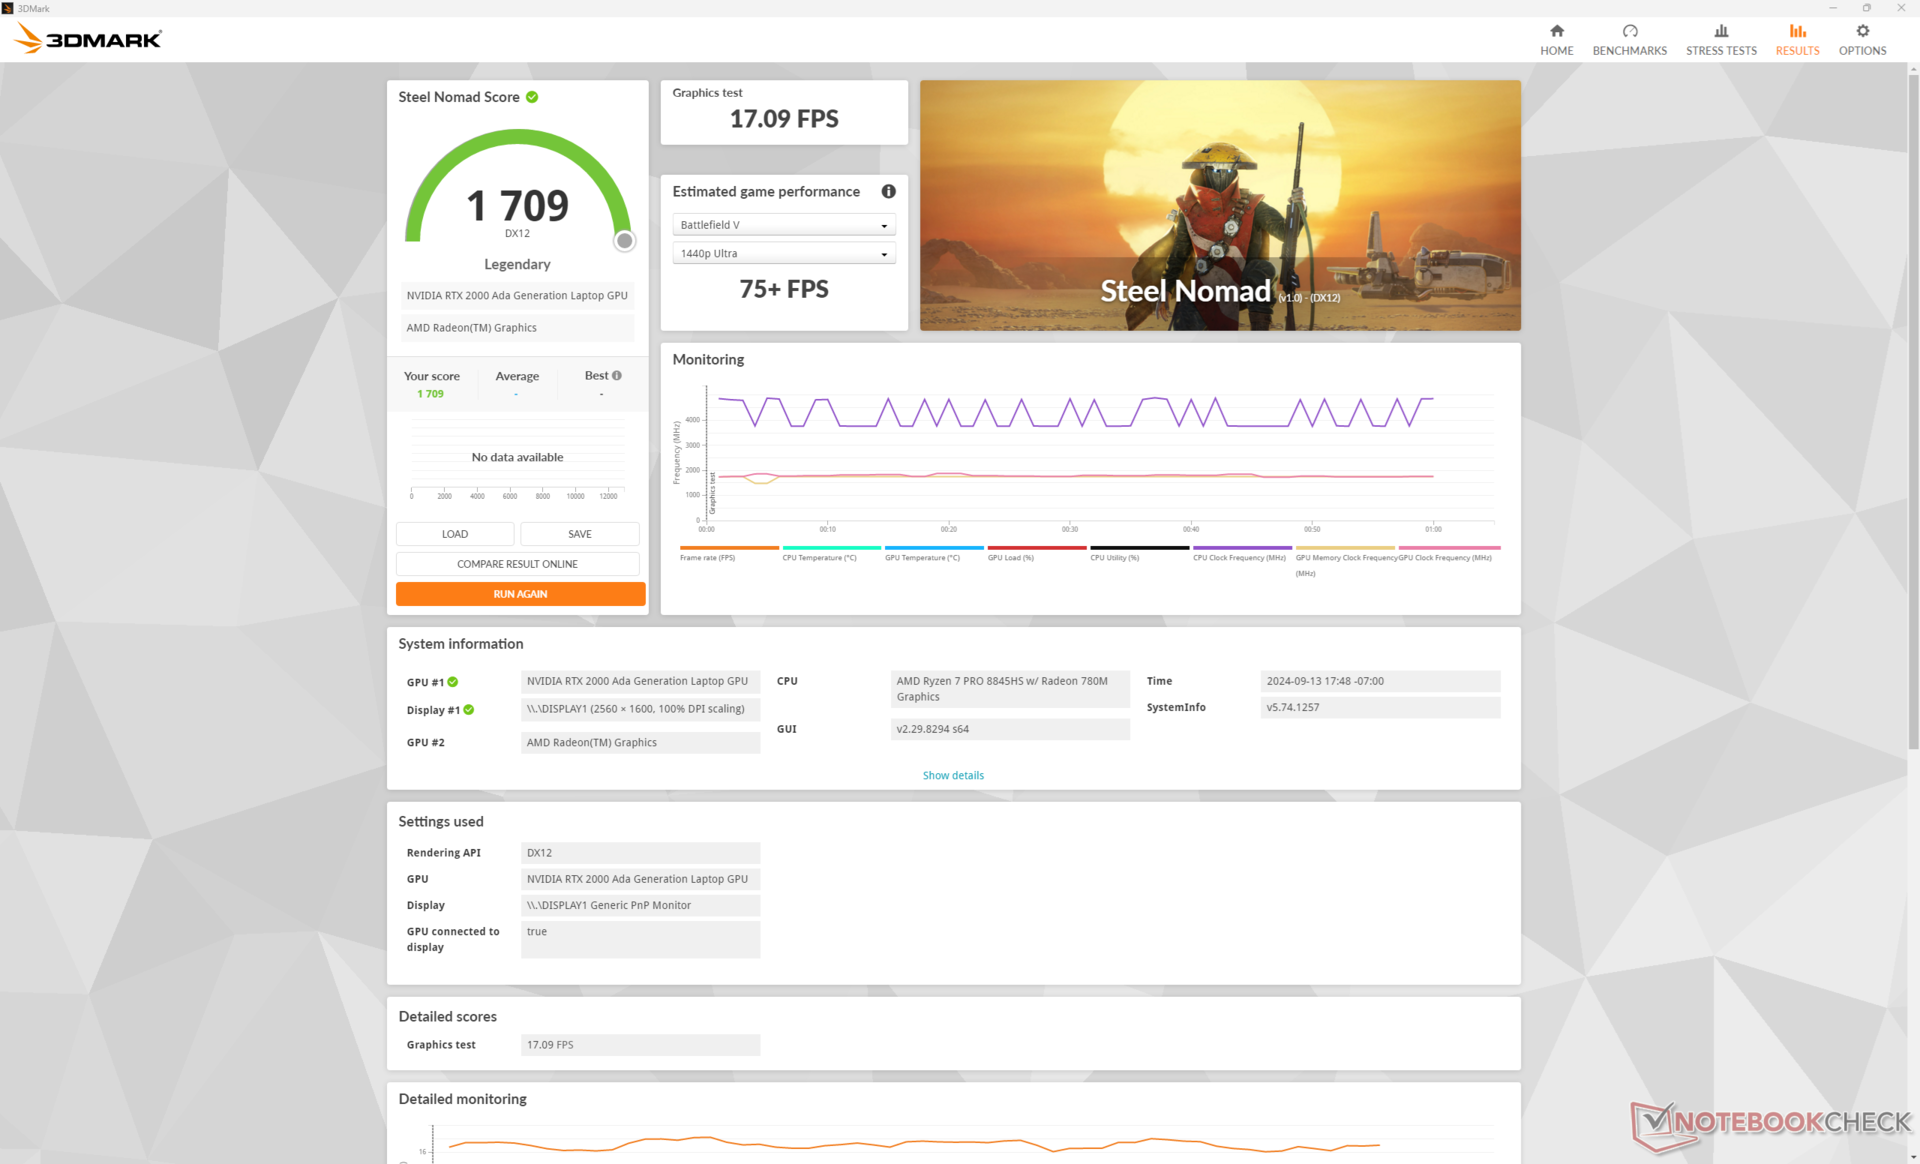
| 3DMark Steel Nomad Score | 1709 pontos | |
Ajuda | ||
* ... menor é melhor
Desempenho em jogos
Embora não seja otimizado para jogos, o RTX 2000 Ada é mais semelhante aos laptops com a GeForce RTX 3060 ou RTX 4060.
| Performance Rating - Percent | |
| HP ZBook Fury 16 G11 | |
| Dell Precision 5690 -1! | |
| HP ZBook Fury 16 G9 -1! | |
| MSI CreatorPro Z16P B12UKST | |
| Asus ExpertBook B6 Flip B6602FC2 | |
| Dell Precision 5000 5490 -1! | |
| HP ZBook Power 16 G11 A | |
| HP ZBook Power 15 G10 | |
| Lenovo ThinkPad P1 G4-20Y4Z9DVUS -3! | |
| Lenovo ThinkPad P16v G1 AMD | |
| HP ZBook Firefly 16 G9-6B897EA | |
| Lenovo ThinkPad P16s G2 21K9000CGE | |
| GTA V - 1920x1080 Highest Settings possible AA:4xMSAA + FX AF:16x | |
| HP ZBook Fury 16 G9 | |
| HP ZBook Fury 16 G11 | |
| MSI CreatorPro Z16P B12UKST | |
| HP ZBook Power 16 G11 A | |
| HP ZBook Power 15 G10 | |
| Asus ExpertBook B6 Flip B6602FC2 | |
| Lenovo ThinkPad P16v G1 AMD | |
| HP ZBook Firefly 16 G9-6B897EA | |
| Lenovo ThinkPad P16s G2 21K9000CGE | |
| Final Fantasy XV Benchmark - 1920x1080 High Quality | |
| Dell Precision 5690 | |
| HP ZBook Fury 16 G11 | |
| HP ZBook Fury 16 G9 | |
| Dell Precision 5000 5490 | |
| HP ZBook Power 15 G10 | |
| HP ZBook Power 16 G11 A | |
| MSI CreatorPro Z16P B12UKST | |
| Asus ExpertBook B6 Flip B6602FC2 | |
| Lenovo ThinkPad P16v G1 AMD | |
| Lenovo ThinkPad P1 G4-20Y4Z9DVUS | |
| Lenovo ThinkPad P16s G2 21K9000CGE | |
| HP ZBook Firefly 16 G9-6B897EA | |
| Dota 2 Reborn - 1920x1080 ultra (3/3) best looking | |
| HP ZBook Fury 16 G11 | |
| HP ZBook Fury 16 G9 | |
| MSI CreatorPro Z16P B12UKST | |
| Asus ExpertBook B6 Flip B6602FC2 | |
| Dell Precision 5690 | |
| HP ZBook Power 15 G10 | |
| Dell Precision 5000 5490 | |
| HP ZBook Power 16 G11 A | |
| Lenovo ThinkPad P16v G1 AMD | |
| Lenovo ThinkPad P1 G4-20Y4Z9DVUS | |
| HP ZBook Firefly 16 G9-6B897EA | |
| Lenovo ThinkPad P16s G2 21K9000CGE | |
Cyberpunk 2077 ultra FPS Chart
| baixo | média | alto | ultra | QHD | |
|---|---|---|---|---|---|
| GTA V (2015) | 180.6 | 162.7 | 90.3 | 63.4 | |
| Dota 2 Reborn (2015) | 145.2 | 142 | 126.1 | 119.9 | |
| Final Fantasy XV Benchmark (2018) | 166.1 | 89.3 | 66.3 | 49.4 | |
| X-Plane 11.11 (2018) | 83.2 | 72.1 | 60.6 | ||
| Far Cry 5 (2018) | 138 | 111 | 104 | 98 | 67 |
| Strange Brigade (2018) | 329 | 187.8 | 158.1 | 138.5 | 99.5 |
| Tiny Tina's Wonderlands (2022) | 139.1 | 115.1 | 80 | 64.4 | 46.3 |
| F1 22 (2022) | 186.6 | 171.1 | 129.1 | 46.2 | 29.8 |
| Baldur's Gate 3 (2023) | 87.1 | 75.7 | 67.6 | 66.1 | 45.6 |
| Cyberpunk 2077 2.2 Phantom Liberty (2023) | 81.1 | 61.4 | 51.7 | 44.8 | 29.7 |
Emissões
Ruído do sistema
Os níveis de ruído e o comportamento do ventilador são semelhantes ao que observamos no modelo do ano passado. O sistema permanece silencioso, com apenas 25,4 dB(A), mesmo depois de executar a primeira cena de benchmarks do 3DMark 06, o que é muito mais silencioso do que os modelos concorrentes, como o ThinkPad P16s G2 ou o Precision 5690 em condições semelhantes.
Lembre-se de que o ruído da ventoinha é visivelmente mais silencioso no modo Balanced; a execução do Cyberpunk 2077 no modo Performance pode chegar a 43 dB(A), em comparação com apenas 37,5 dB(A) no modo Balanced.
Barulho
| Ocioso |
| 23.8 / 24.2 / 24.2 dB |
| Carga |
| 25.4 / 45 dB |
 | ||
30 dB silencioso 40 dB(A) audível 50 dB(A) ruidosamente alto |
||
min: | ||
| HP ZBook Power 16 G11 A NVIDIA RTX 2000 Ada Generation Laptop GPU, R7 8845HS, Samsung PM9A1 MZVL22T0HBLB | HP ZBook Power 15 G10 NVIDIA RTX 2000 Ada Generation Laptop GPU, R7 PRO 7840HS, WDC PC SN810 2TB | HP ZBook Fury 16 G11 NVIDIA RTX 3500 Ada Generation Laptop GPU, i9-14900HX, SK hynix PC801 HFS001TEJ9X101N | Lenovo ThinkPad P1 Gen 7 21KV001SGE NVIDIA GeForce RTX 4060 Laptop GPU, Ultra 7 155H, Kioxia XG8 KXG8AZNV1T02 | Lenovo ThinkPad P16s G2 21K9000CGE Radeon 780M, R7 PRO 7840U, SK hynix PC801 HFS001TEJ9X162N | Dell Precision 5690 NVIDIA RTX 5000 Ada Generation Laptop GPU, Ultra 9 185H, 2x Samsung PM9A1 1TB (RAID 0) | |
|---|---|---|---|---|---|---|
| Noise | -3% | -15% | -18% | -3% | -17% | |
| desligado / ambiente * | 23.5 | 24.2 -3% | 23.2 1% | 24.7 -5% | 22.6 4% | 23.4 -0% |
| Idle Minimum * | 23.8 | 24.4 -3% | 23.2 3% | 24.7 -4% | 22.6 5% | 23.6 1% |
| Idle Average * | 24.2 | 24.4 -1% | 23.2 4% | 24.7 -2% | 22.6 7% | 24.9 -3% |
| Idle Maximum * | 24.2 | 24.4 -1% | 29.5 -22% | 24.7 -2% | 22.6 7% | 30.9 -28% |
| Load Average * | 25.4 | 27.4 -8% | 43 -69% | 43.7 -72% | 37.8 -49% | 40.4 -59% |
| Cyberpunk 2077 ultra * | 43 | 48.2 -12% | 53.2 -24% | |||
| Load Maximum * | 45 | 46.8 -4% | 48.2 -7% | 53.3 -18% | 40.5 10% | 51.9 -15% |
| Witcher 3 ultra * | 43.3 | 40.3 | 48.3 |
* ... menor é melhor
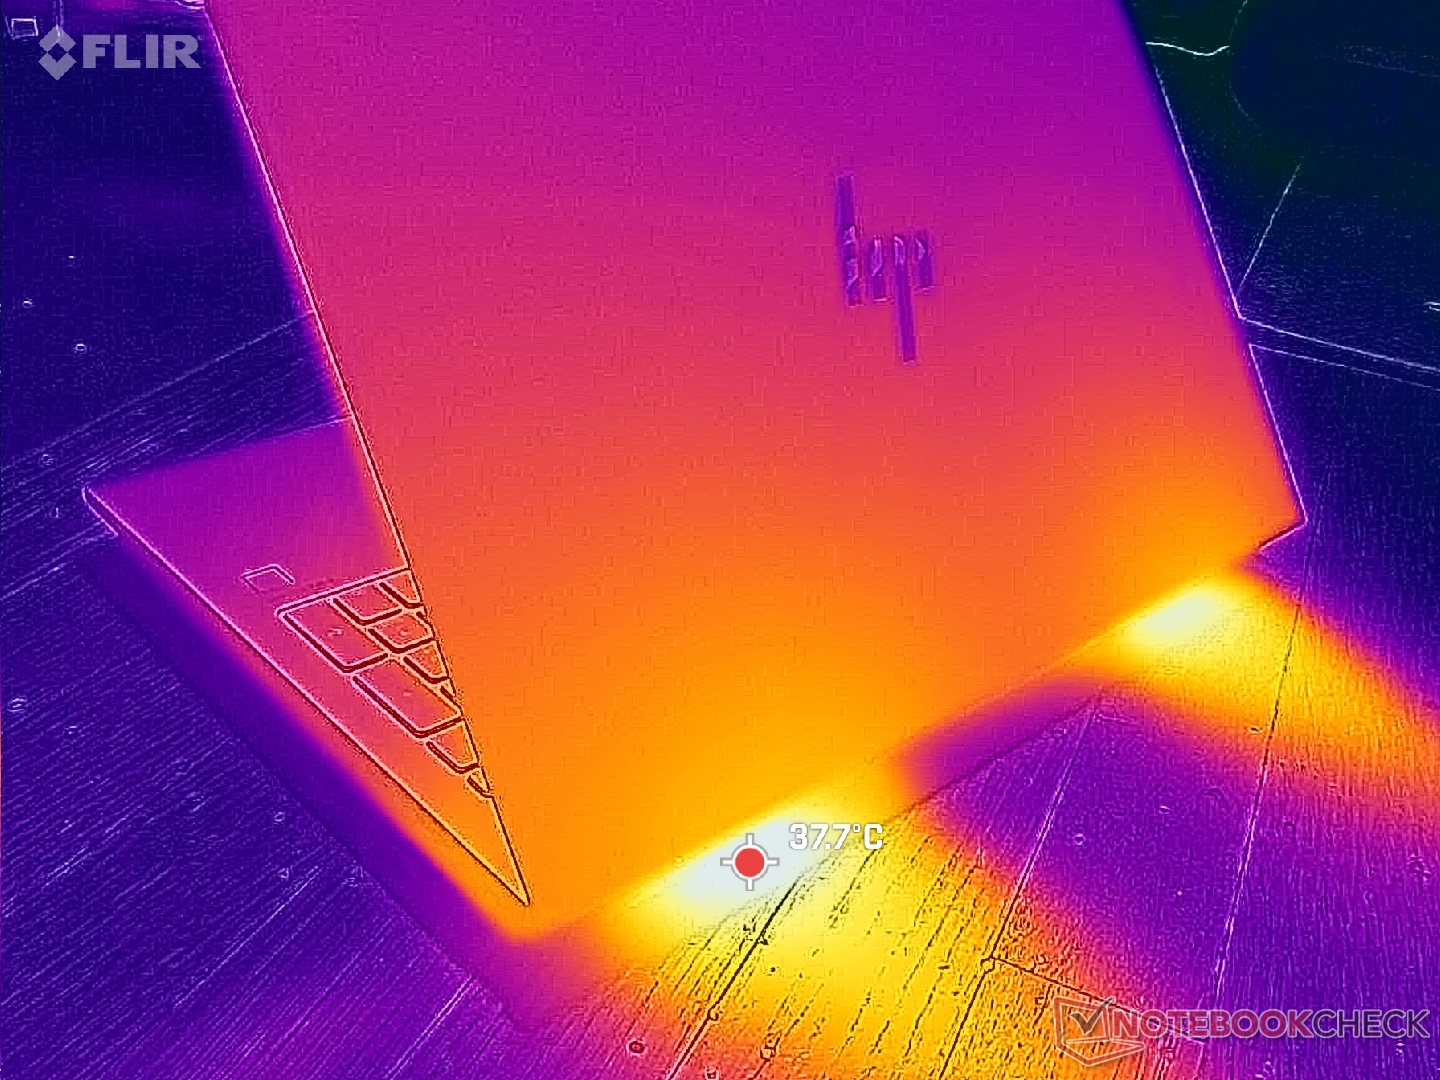
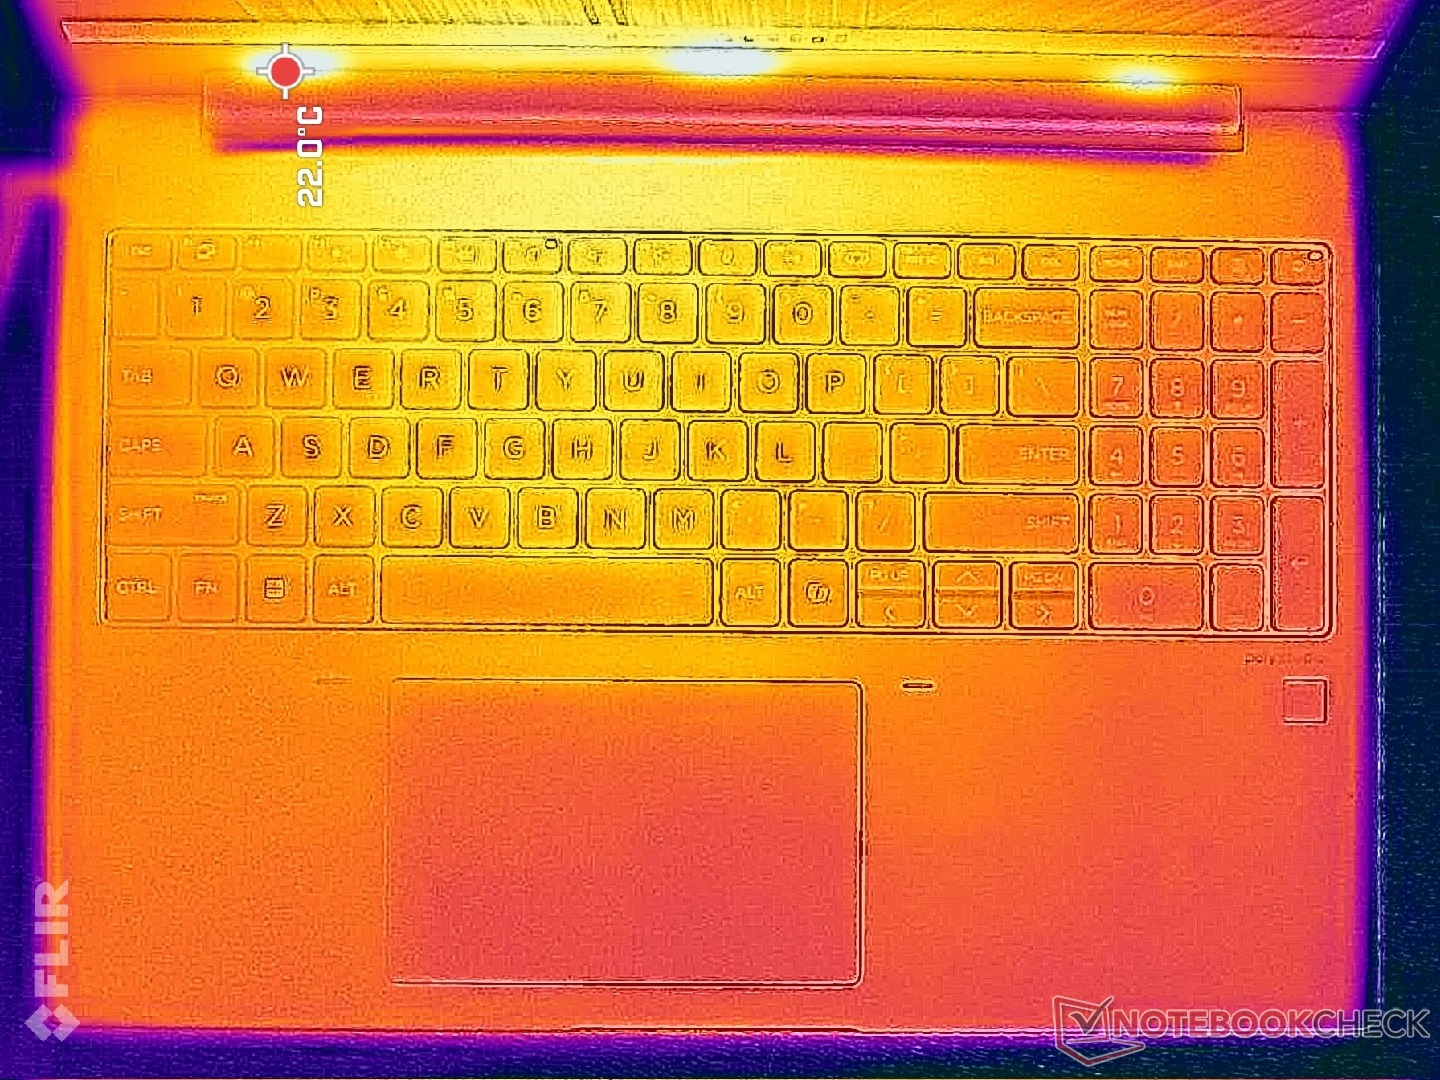
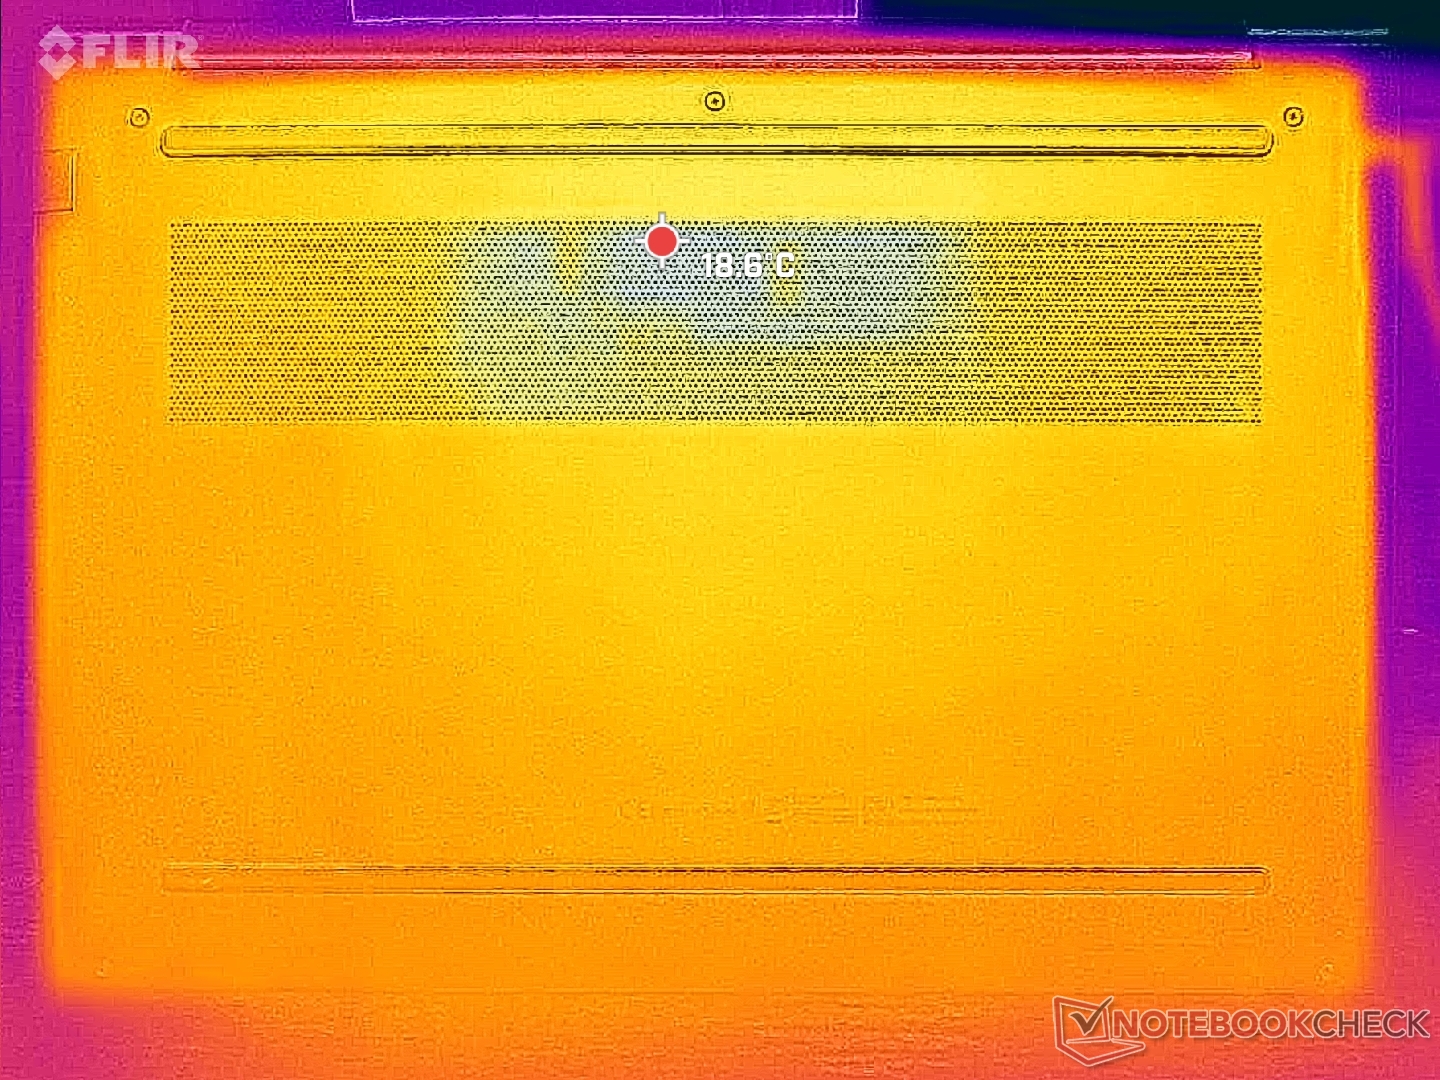
Temperatura
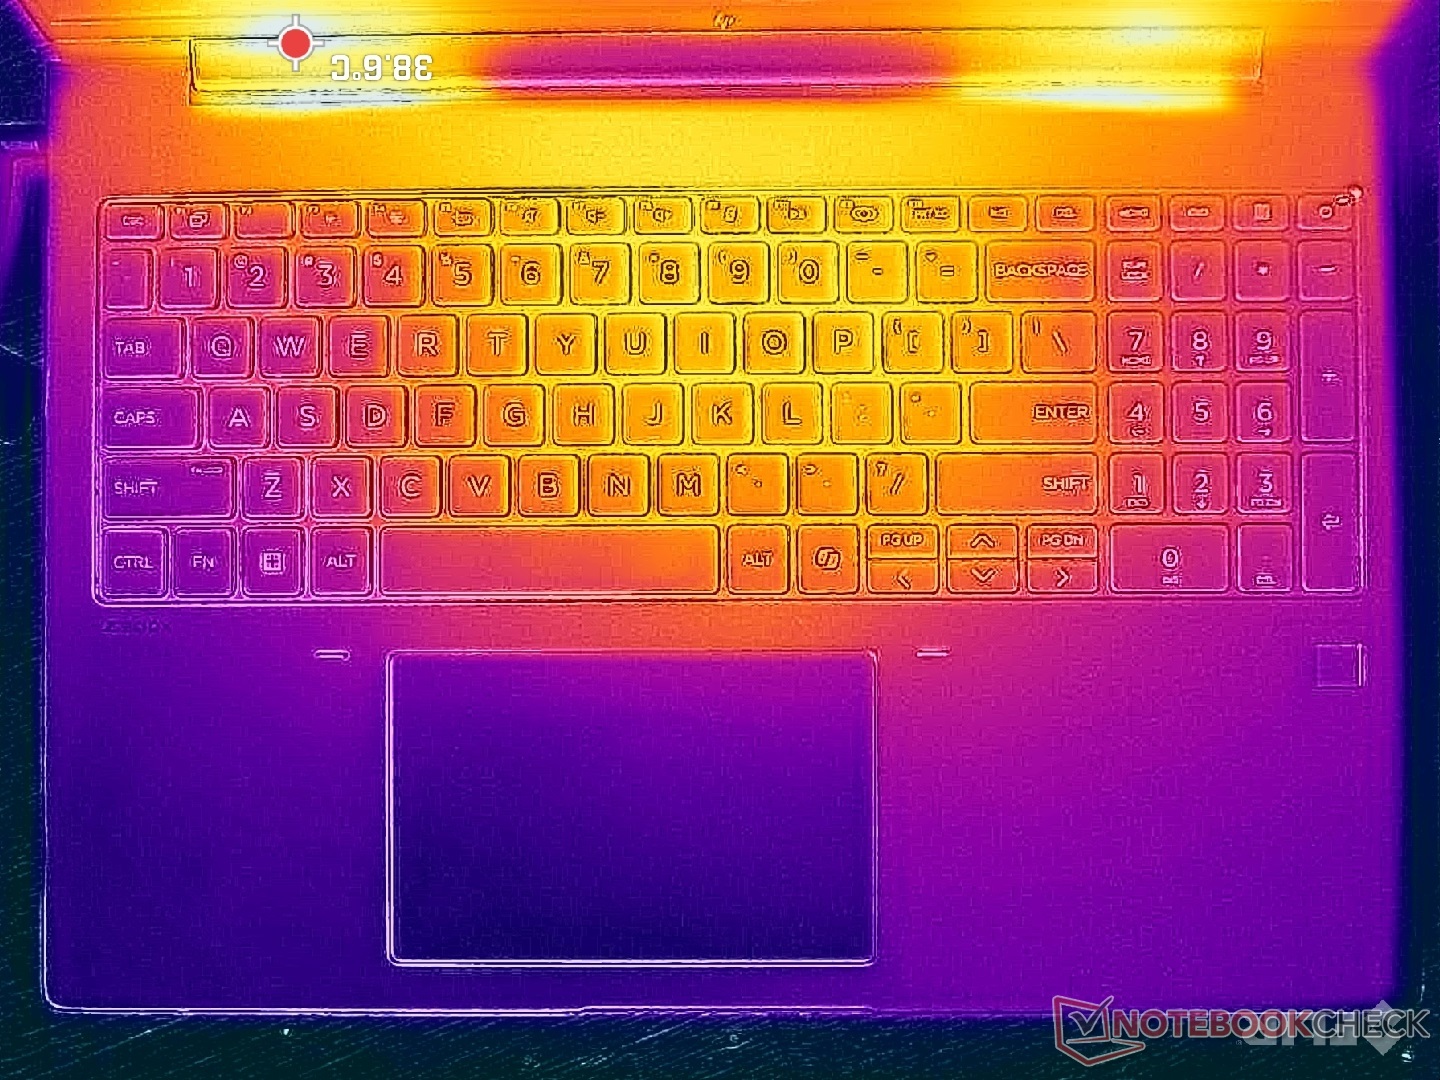
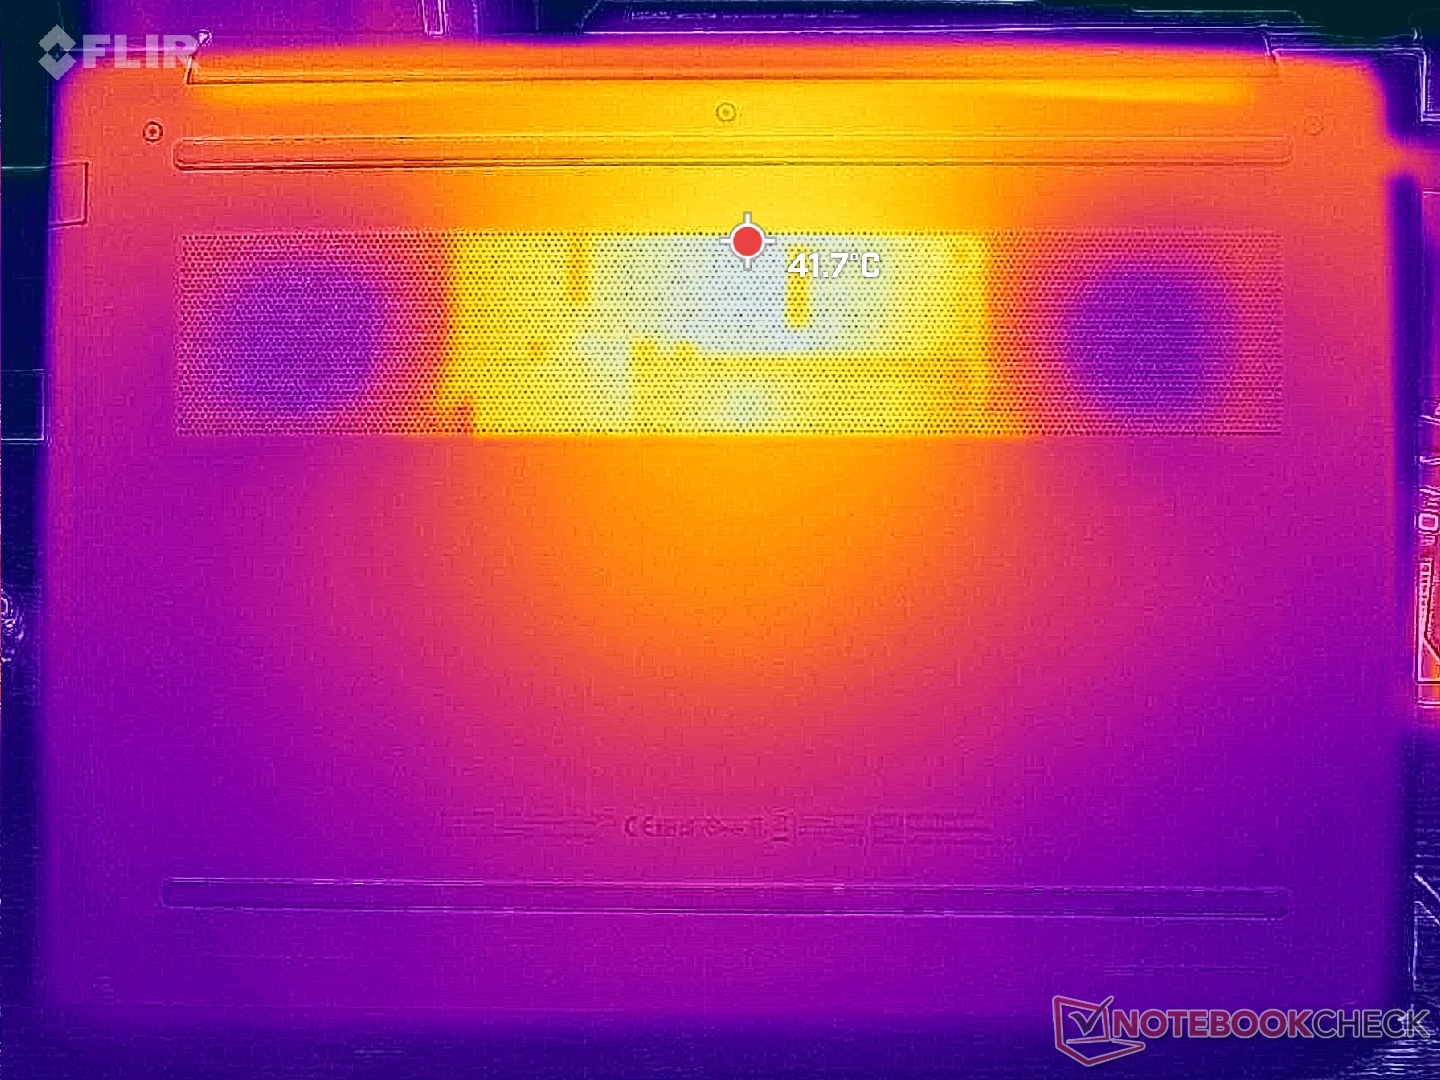
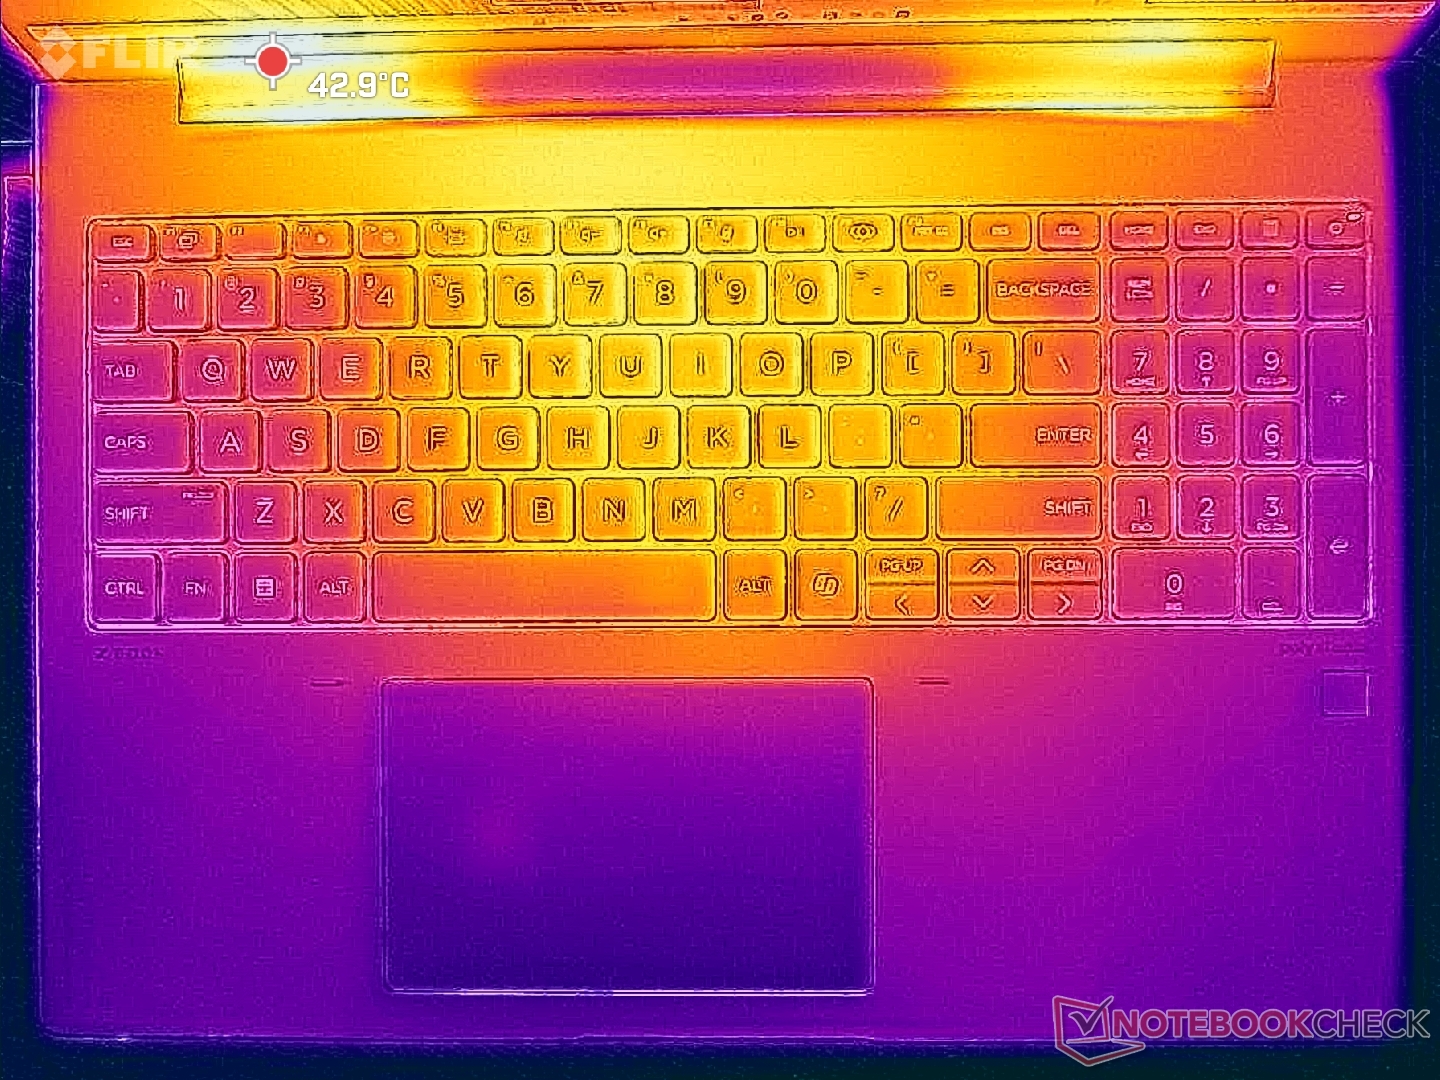
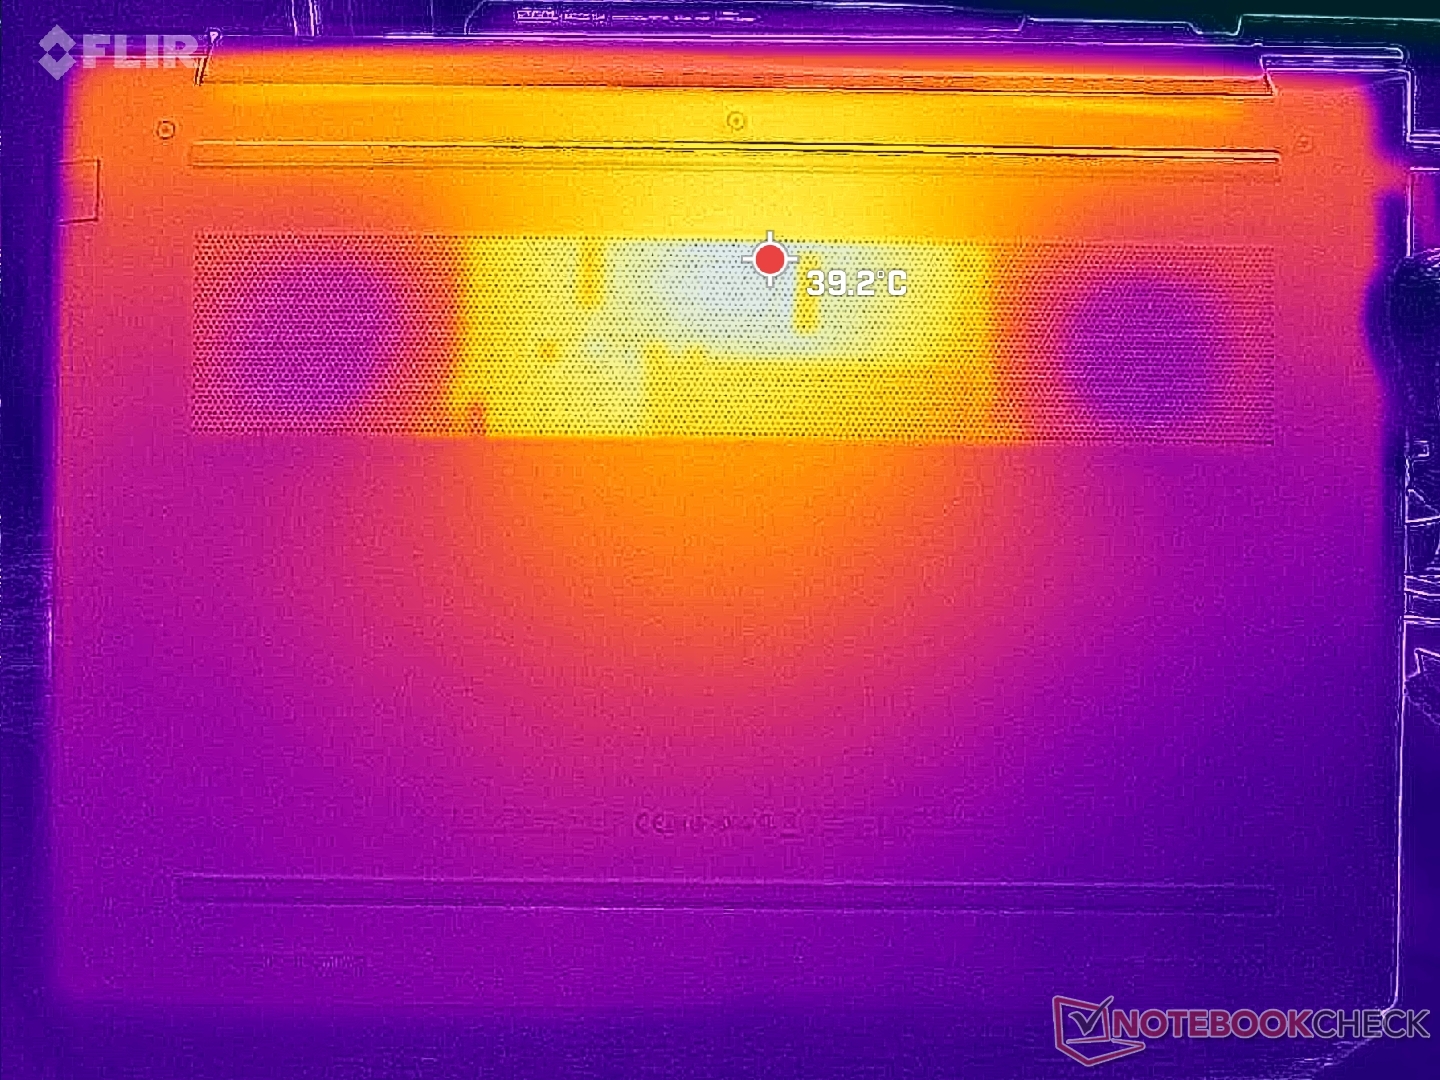
As temperaturas da superfície são geralmente mais baixas em nosso novo formato de 16 polegadas, especialmente em relação à tampa inferior. Os pontos quentes na parte inferior atingem apenas 41 °C ao executar cargas exigentes, em comparação com 48 °C no antigo ZBook Power 15 G10. O ponto quente no centro do teclado também atinge 41 °C, enquanto os apoios para as mãos e as laterais permanecem mais frios e confortáveis para as palmas das mãos e os dedos.
Quando comparado com o mais potente Precision 5690mais potente, a unidade da Dell é ainda mais quente no teclado e mais fria na superfície inferior.
(±) A temperatura máxima no lado superior é 40.6 °C / 105 F, em comparação com a média de 38.2 °C / 101 F , variando de 22.2 a 69.8 °C para a classe Workstation.
(±) A parte inferior aquece até um máximo de 40.6 °C / 105 F, em comparação com a média de 41.2 °C / 106 F
(+) Em uso inativo, a temperatura média para o lado superior é 24.6 °C / 76 F, em comparação com a média do dispositivo de 32 °C / ### class_avg_f### F.
(+) 3: The average temperature for the upper side is 30.1 °C / 86 F, compared to the average of 32 °C / 90 F for the class Workstation.
(+) Os apoios para as mãos e o touchpad são mais frios que a temperatura da pele, com um máximo de 27.2 °C / 81 F e, portanto, são frios ao toque.
(±) A temperatura média da área do apoio para as mãos de dispositivos semelhantes foi 27.8 °C / 82 F (+0.6 °C / 1 F).
| HP ZBook Power 16 G11 A AMD Ryzen 7 8845HS, NVIDIA RTX 2000 Ada Generation Laptop GPU | HP ZBook Power 15 G10 AMD Ryzen 7 PRO 7840HS, NVIDIA RTX 2000 Ada Generation Laptop GPU | HP ZBook Fury 16 G11 Intel Core i9-14900HX, NVIDIA RTX 3500 Ada Generation Laptop GPU | Lenovo ThinkPad P1 Gen 7 21KV001SGE Intel Core Ultra 7 155H, NVIDIA GeForce RTX 4060 Laptop GPU | Lenovo ThinkPad P16s G2 21K9000CGE AMD Ryzen 7 PRO 7840U, AMD Radeon 780M | Dell Precision 5690 Intel Core Ultra 9 185H, Nvidia RTX 5000 Ada Generation Laptop GPU | |
|---|---|---|---|---|---|---|
| Heat | -7% | -26% | -8% | -9% | -8% | |
| Maximum Upper Side * | 40.6 | 42.4 -4% | 42.2 -4% | 50.3 -24% | 42.7 -5% | 46.6 -15% |
| Maximum Bottom * | 40.6 | 47.8 -18% | 48 -18% | 38 6% | 47.2 -16% | 33 19% |
| Idle Upper Side * | 26 | 26.8 -3% | 37 -42% | 28.3 -9% | 27.8 -7% | 32.4 -25% |
| Idle Bottom * | 26.6 | 27.2 -2% | 36.8 -38% | 27.3 -3% | 28.4 -7% | 29.4 -11% |
* ... menor é melhor
Alto-falantes
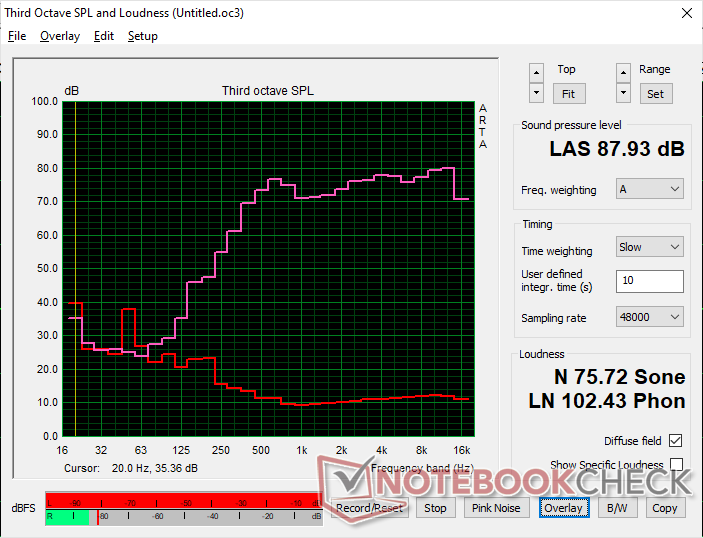
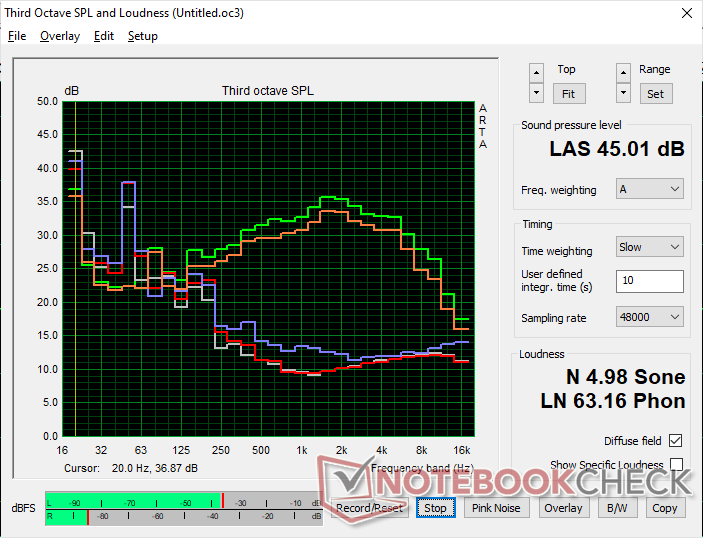
HP ZBook Power 16 G11 A análise de áudio
(+) | os alto-falantes podem tocar relativamente alto (###valor### dB)
Graves 100 - 315Hz
(-) | quase nenhum baixo - em média 28.1% menor que a mediana
(±) | a linearidade dos graves é média (9% delta para a frequência anterior)
Médios 400 - 2.000 Hz
(+) | médios equilibrados - apenas 1.9% longe da mediana
(+) | médios são lineares (4.8% delta para frequência anterior)
Altos 2 - 16 kHz
(+) | agudos equilibrados - apenas 3.6% longe da mediana
(+) | os máximos são lineares (2.4% delta da frequência anterior)
Geral 100 - 16.000 Hz
(±) | a linearidade do som geral é média (15.1% diferença em relação à mediana)
Comparado com a mesma classe
» 29% de todos os dispositivos testados nesta classe foram melhores, 7% semelhantes, 63% piores
» O melhor teve um delta de 7%, a média foi 18%, o pior foi 35%
Comparado com todos os dispositivos testados
» 19% de todos os dispositivos testados foram melhores, 4% semelhantes, 77% piores
» O melhor teve um delta de 4%, a média foi 24%, o pior foi 134%
Apple MacBook Pro 16 2021 M1 Pro análise de áudio
(+) | os alto-falantes podem tocar relativamente alto (###valor### dB)
Graves 100 - 315Hz
(+) | bons graves - apenas 3.8% longe da mediana
(+) | o baixo é linear (5.2% delta para a frequência anterior)
Médios 400 - 2.000 Hz
(+) | médios equilibrados - apenas 1.3% longe da mediana
(+) | médios são lineares (2.1% delta para frequência anterior)
Altos 2 - 16 kHz
(+) | agudos equilibrados - apenas 1.9% longe da mediana
(+) | os máximos são lineares (2.7% delta da frequência anterior)
Geral 100 - 16.000 Hz
(+) | o som geral é linear (4.6% diferença em relação à mediana)
Comparado com a mesma classe
» 0% de todos os dispositivos testados nesta classe foram melhores, 0% semelhantes, 100% piores
» O melhor teve um delta de 5%, a média foi 18%, o pior foi 45%
Comparado com todos os dispositivos testados
» 0% de todos os dispositivos testados foram melhores, 0% semelhantes, 100% piores
» O melhor teve um delta de 4%, a média foi 24%, o pior foi 134%
Gerenciamento de energia
Consumo de energia
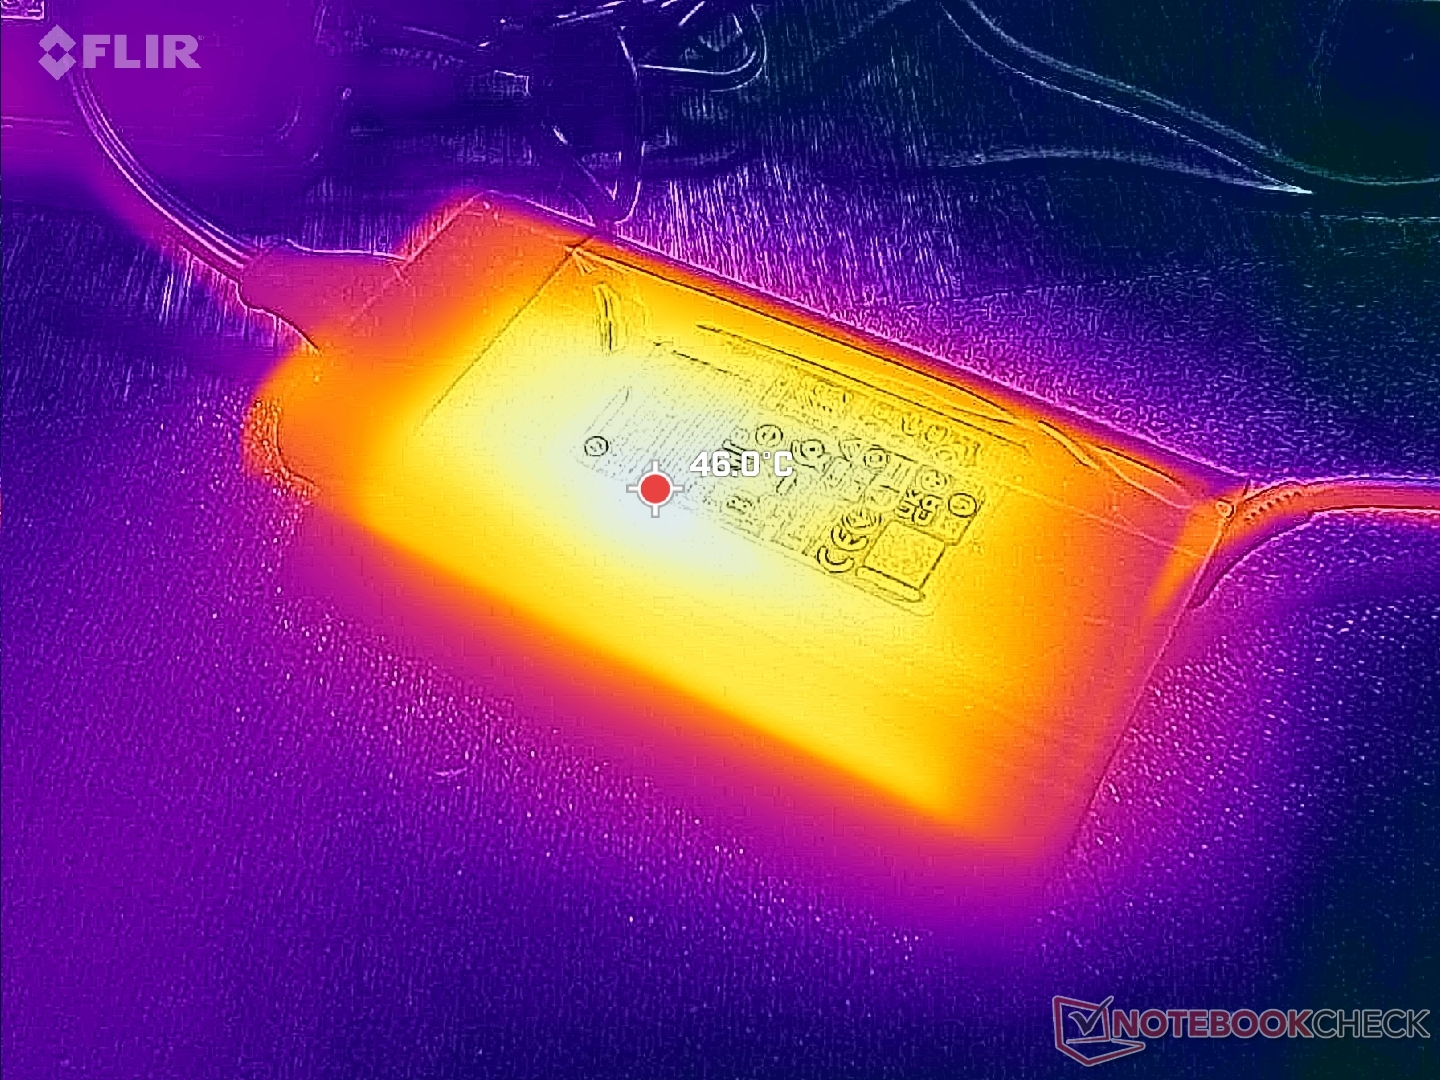
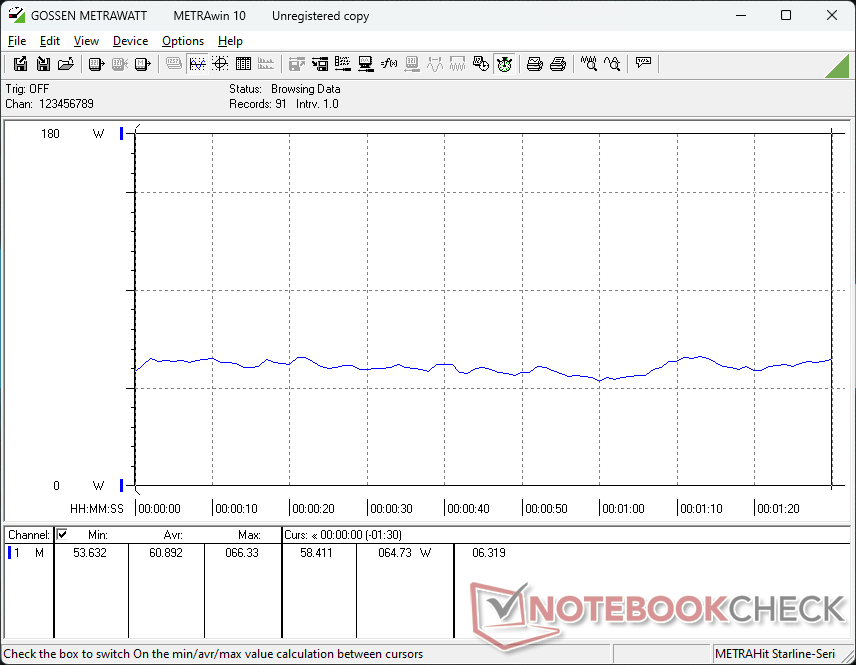
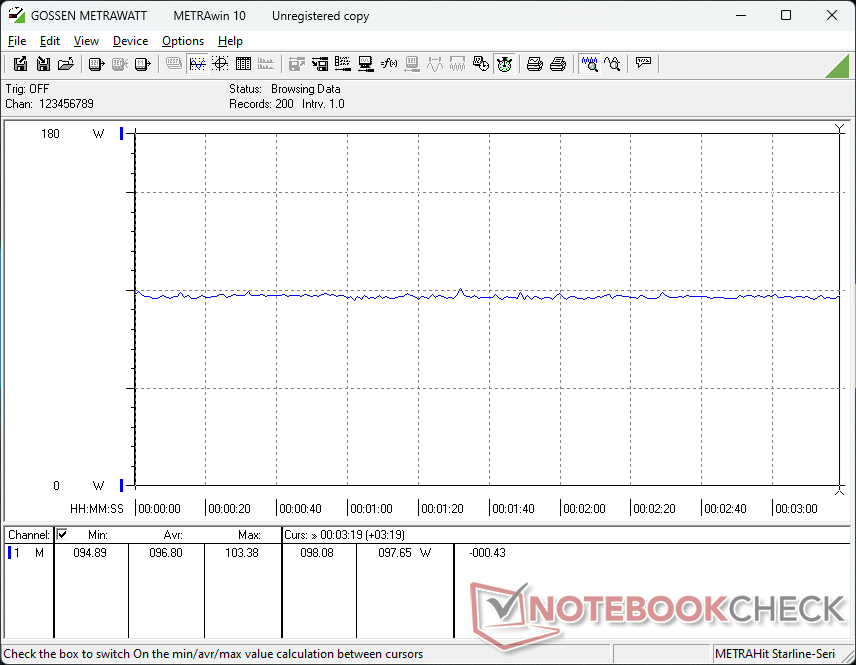
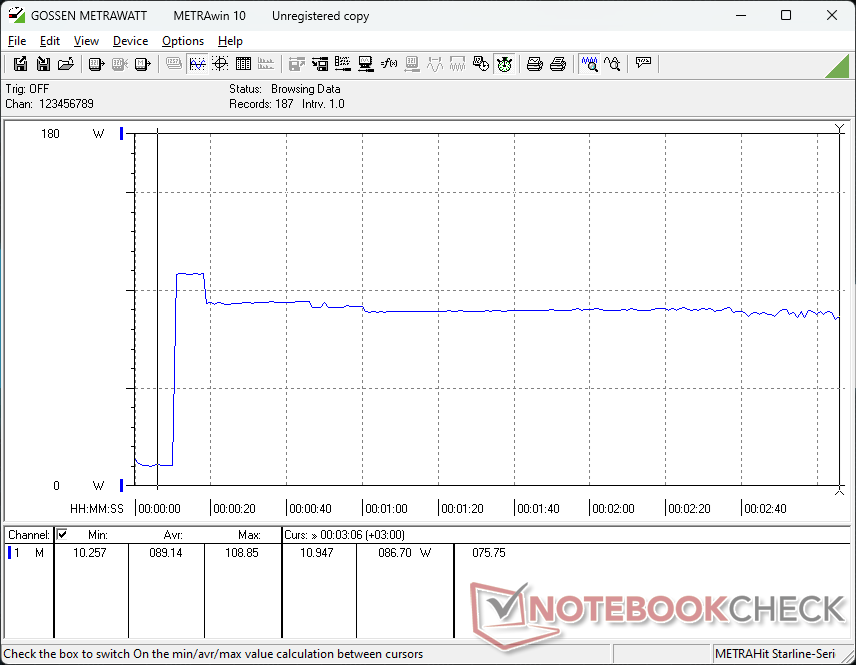
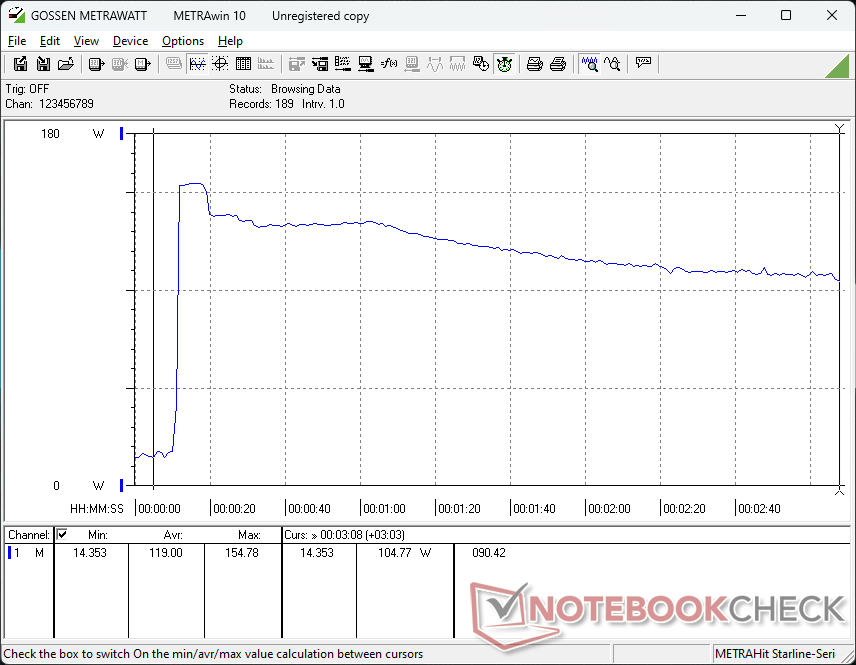
Os níveis de consumo e o comportamento são semelhantes ao que observamos no ZBook Power 15 G10, o que não é surpreendente, já que o envelope de potência permanece o mesmo entre eles. Talvez a diferença mais notável esteja relacionada ao menor consumo de cerca de 25 W ao executar o Prime95 e o FurMark simultaneamente. Isso pode ser atribuído à aceleração mais intensa para resfriar as temperaturas do núcleo ao executar essas cargas, conforme mencionado na seção Teste de estresse acima.
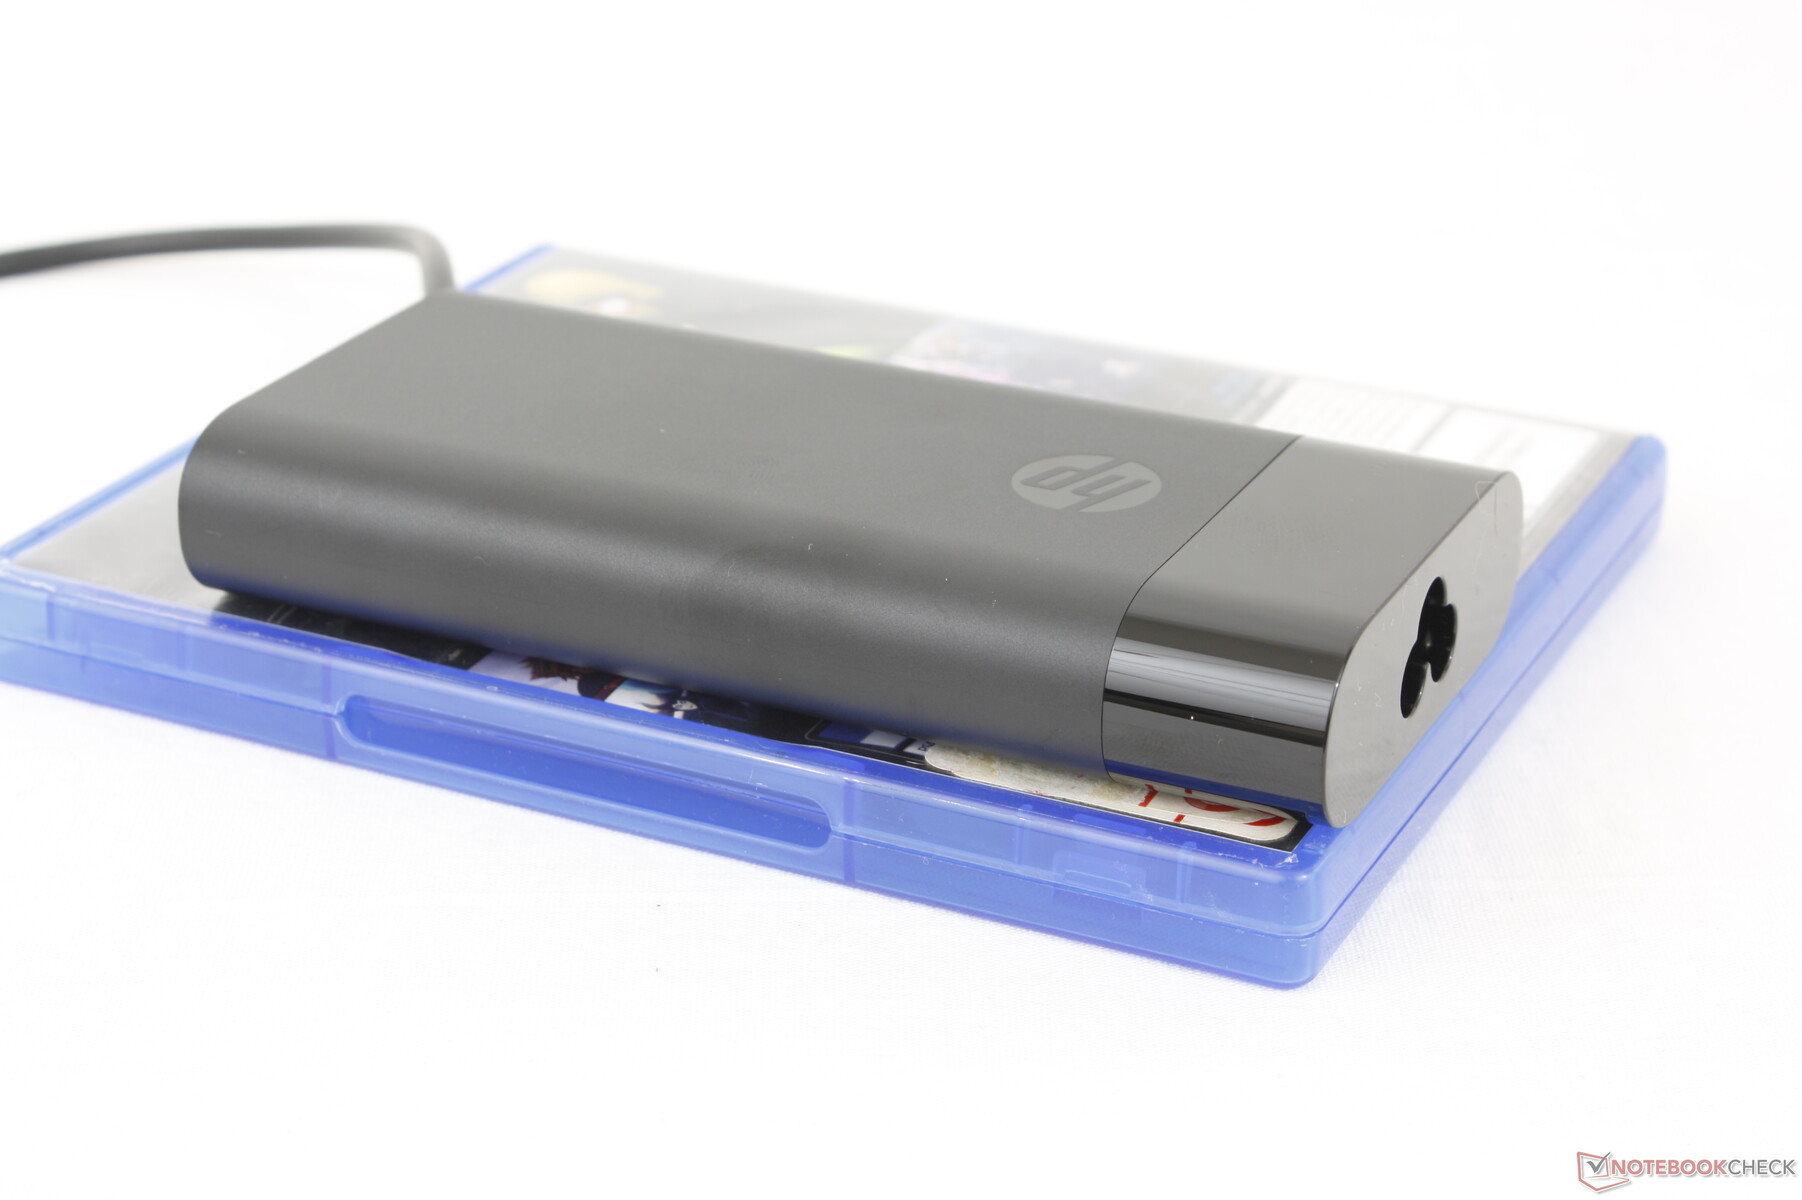
Conseguimos registrar um consumo máximo temporário de 155 W com o adaptador CA de 150 W de tamanho médio (~13,8 x 6,5 x 2,2 cm).
| desligado | |
| Ocioso | |
| Carga |
|
Key:
min: | |
| HP ZBook Power 16 G11 A R7 8845HS, NVIDIA RTX 2000 Ada Generation Laptop GPU, Samsung PM9A1 MZVL22T0HBLB, IPS, 2560x1600, 16" | HP ZBook Power 15 G10 R7 PRO 7840HS, NVIDIA RTX 2000 Ada Generation Laptop GPU, WDC PC SN810 2TB, IPS, 2560x1440, 15.6" | HP ZBook Fury 16 G11 i9-14900HX, NVIDIA RTX 3500 Ada Generation Laptop GPU, SK hynix PC801 HFS001TEJ9X101N, IPS, 3840x2400, 16" | Lenovo ThinkPad P1 Gen 7 21KV001SGE Ultra 7 155H, NVIDIA GeForce RTX 4060 Laptop GPU, Kioxia XG8 KXG8AZNV1T02, IPS LED, 2560x1600, 16" | Lenovo ThinkPad P16s G2 21K9000CGE R7 PRO 7840U, Radeon 780M, SK hynix PC801 HFS001TEJ9X162N, OLED, 3840x2400, 16" | Dell Precision 5690 Ultra 9 185H, NVIDIA RTX 5000 Ada Generation Laptop GPU, 2x Samsung PM9A1 1TB (RAID 0), OLED, 3840x2400, 16" | |
|---|---|---|---|---|---|---|
| Power Consumption | -13% | -80% | -35% | 20% | -67% | |
| Idle Minimum * | 4.6 | 5.3 -15% | 8.6 -87% | 7.3 -59% | 6.1 -33% | 7.9 -72% |
| Idle Average * | 10 | 9.9 1% | 14.8 -48% | 12.3 -23% | 6.5 35% | 12 -20% |
| Idle Maximum * | 10.6 | 16.7 -58% | 15.7 -48% | 17.9 -69% | 7 34% | 28.6 -170% |
| Load Average * | 60.9 | 61.3 -1% | 129.4 -112% | 78.2 -28% | 56.6 7% | 98.8 -62% |
| Cyberpunk 2077 ultra external monitor * | 92.8 | 192.6 -108% | 117.7 -27% | |||
| Cyberpunk 2077 ultra * | 96.8 | 199.4 -106% | 123.5 -28% | |||
| Load Maximum * | 154.8 | 145.3 6% | 236.1 -53% | 167.5 -8% | 68.3 56% | 174.8 -13% |
| Witcher 3 ultra * | 87.9 | 61.2 | 144.5 |
* ... menor é melhor
Power Consumption Cyberpunk / Stress Test
Power Consumption external Monitor
Duração da bateria
A capacidade da bateria não mudou em relação ao ZBook Power 15 G10 do ano passado, apesar das atualizações do fator de forma. Talvez por coincidência, os tempos de execução permanecem praticamente os mesmos, com pouco mais de 9,5 horas de navegação em WLAN no mundo real antes do desligamento automático.
O carregamento da capacidade vazia até a capacidade total é relativamente rápido, com menos de 70 minutos. O carregamento via USB-C é suportado, embora em velocidades mais lentas.
| HP ZBook Power 16 G11 A R7 8845HS, NVIDIA RTX 2000 Ada Generation Laptop GPU, 83 Wh | HP ZBook Power 15 G10 R7 PRO 7840HS, NVIDIA RTX 2000 Ada Generation Laptop GPU, 83 Wh | HP ZBook Fury 16 G11 i9-14900HX, NVIDIA RTX 3500 Ada Generation Laptop GPU, 95 Wh | Lenovo ThinkPad P1 Gen 7 21KV001SGE Ultra 7 155H, NVIDIA GeForce RTX 4060 Laptop GPU, 90 Wh | Lenovo ThinkPad P16s G2 21K9000CGE R7 PRO 7840U, Radeon 780M, 84 Wh | Dell Precision 5690 Ultra 9 185H, NVIDIA RTX 5000 Ada Generation Laptop GPU, 98 Wh | |
|---|---|---|---|---|---|---|
| Duração da bateria | 3% | -31% | 7% | -1% | -6% | |
| Reader / Idle | 1566 | |||||
| WiFi v1.3 | 582 | 601 3% | 402 -31% | 595 2% | 635 9% | 549 -6% |
| Load | 103 | 114 11% | 92 -11% | |||
| H.264 | 797 |
Pro
Contra
Veredicto - Tela maior, mas com o mesmo desempenho
O ZBook Power 16 G11 substitui a série ZBook Power 15 com um design maior e mais pesado de 16 polegadas. Pode-se supor que o formato maior leva a um desempenho mais rápido, mas infelizmente não é esse o caso. As novas CPUs Hawk Point não oferecem muito mais do que as opções Phoenix do ano passado, enquanto as opções de GPU são exatamente as mesmas até os tetos TGP. O redesenho do chassi foi a oportunidade que a HP teve para atualizar a solução de resfriamento e obter mais desempenho dos processadores, mas supomos que o fabricante não quis invadir muito o território do ZBook Fury de gama alta.
As opções de tela também são um pouco decepcionantes para uma estação de trabalho. Além da opção exclusiva de 1000 nits, não há nenhum recurso digno de nota, como OLED, cores P3 ou resolução 4K. Esses painéis teriam tornado o tamanho maior da tela muito mais atraente do que a versão anterior de 15,6 polegadas. Em vez disso, os usuários estão limitados a 2K e IPS.
O ZBook Power 16 G11 não oferece muito mais do que seu antecessor, além do tamanho maior da tela de 16 polegadas. O desempenho e os recursos são praticamente os mesmos entre os dois modelos.
O HP ainda é uma estação de trabalho de médio porte forte, apesar da falta de atualizações de desempenho e de novos recursos. O desempenho da CPU ainda é visivelmente mais rápido do que o do ThinkPad P16s G2 que é limitado a CPUs da série Ryzen-U e é mais barato que o popular Dell Precision 5690 quando configurado com a mesma GPU. No entanto, se o senhor já possui um ZBook Power 15 G10, a versão mais pesada de 16 polegadas pode parecer um passo em falso.
Preço e disponibilidade
A HP agora está enviando o ZBook Power 16 G11 A a partir de US$ 1140 na configuração básica do Ryzen 5 e iGPU. Nossa configuração de análise com CPU Ryzen 7, GPU RTX 2000 Ada e tela 1600p é vendida por cerca de US$ 2.000.
Observação: Atualizamos recentemente nosso sistema de classificação e os resultados da versão 8 não são comparáveis aos resultados da versão 7. Mais informações estão disponíveis aqui .
HP ZBook Power 16 G11 A
- 09/30/2024 v8
Allen Ngo
 Total Sustainability Score:
 Transparência
A seleção dos dispositivos a serem analisados é feita pela nossa equipe editorial. A amostra de teste foi fornecida ao autor como empréstimo pelo fabricante ou varejista para fins desta revisão. O credor não teve influência nesta revisão, nem o fabricante recebeu uma cópia desta revisão antes da publicação. Não houve obrigação de publicar esta revisão. Nunca aceitamos compensação ou pagamento em troca de nossas avaliações. Como empresa de mídia independente, a Notebookcheck não está sujeita à autoridade de fabricantes, varejistas ou editores.
É assim que o Notebookcheck está testando
Todos os anos, o Notebookcheck analisa de forma independente centenas de laptops e smartphones usando procedimentos padronizados para garantir que todos os resultados sejam comparáveis. Desenvolvemos continuamente nossos métodos de teste há cerca de 20 anos e definimos padrões da indústria no processo. Em nossos laboratórios de teste, equipamentos de medição de alta qualidade são utilizados por técnicos e editores experientes. Esses testes envolvem um processo de validação em vários estágios. Nosso complexo sistema de classificação é baseado em centenas de medições e benchmarks bem fundamentados, o que mantém a objetividade.Price comparison

