

Análise do mini PC Beelink GTI12 Ultra EX Docking Station: Mais econômico do que o esperado

Uma das principais reclamações sobre os mini PCs da Beelink até agora é que todos eles vêm apenas com gráficos integrados. Embora a mais recente série GTI Ultra não aborde isso diretamente, ainda é a primeira incursão da Beelink no suporte oficial a eGPUs por meio da EX Docking Station para atrair usuários avançados ou jogadores.
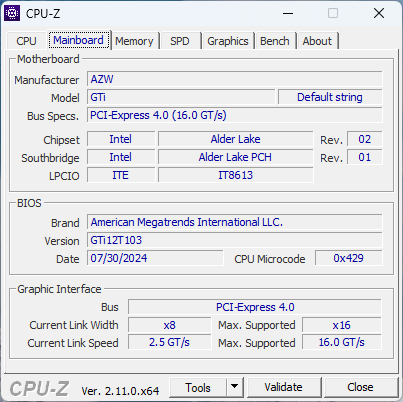
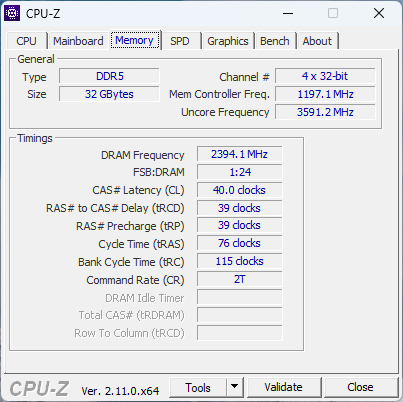
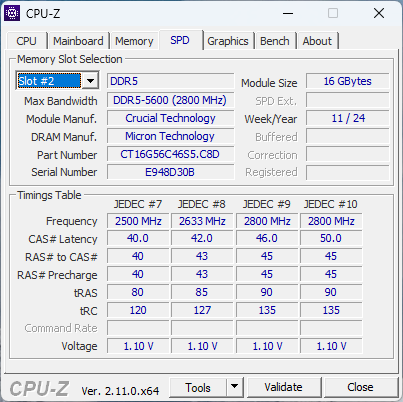
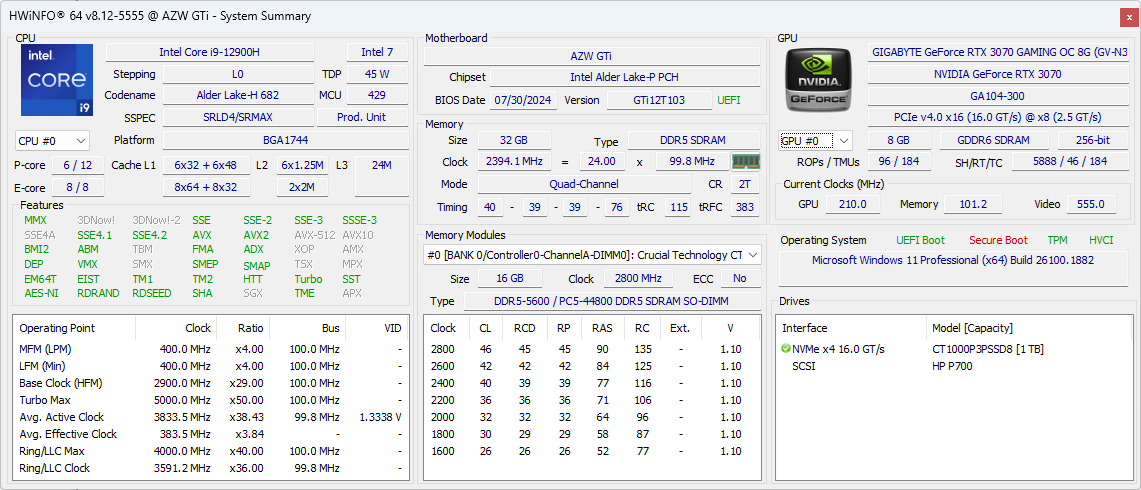
Nossa unidade de teste é o GTI12 Ultra equipado com o Core i9-12900H, SSD de 1 TB e 32 GB de RAM DDR5-5600 por aproximadamente US$ 740 quando combinado com a EX Docking Station. As CPUs Meteor Lake mais recentes estão disponíveis com o nome de modelo GTI14 Ultra, que é visualmente idêntico ao GTI12 Ultra.
Adquirimos uma GPU pessoal Gigabyte GeForce RTX 3070 para testar a docking station EX, mas a dock em si pode suportar GPUs de até RTX 4090 com 600 W no máximo.
Mais análises da Beelink:
Possíveis concorrentes em comparação
Avaliação | Versão | Data | Modelo | Peso | Altura | Size | Resolução | Preço |
|---|---|---|---|---|---|---|---|---|
| 76.5 % | v8 | 10/2024 | Beelink GTI12 Ultra EX Docking Station i9-12900H, NVIDIA GeForce RTX 3070 | 1.3 kg | 55.8 mm | x | ||
| 76.7 % | v8 | 10/2024 | Minisforum MS-A1 Ryzen 7 8700G, Radeon 780M | 1.7 kg | 48 mm | x | ||
| 67.3 % | v8 | 09/2024 | GMK NucBox K9 Ultra 5 125H, Arc 7-Core | 528 g | 47 mm | x | ||
| 74.7 % | v8 | 08/2024 | Asus NUC 14 Pro Ultra 5 125H, Arc 7-Core | 525 g | 37 mm | x | ||
| 78.4 % | v8 | 08/2024 | Geekom AX8 Pro R9 8945HS, Radeon 780M | 548 g | 37 mm | x | ||
| 86 % | v8 | 08/2024 | Asus ROG NUC 14-90AS0051 Ultra 9 185H, NVIDIA GeForce RTX 4070 Laptop GPU | 2.6 kg | 50 mm | x |
Caso
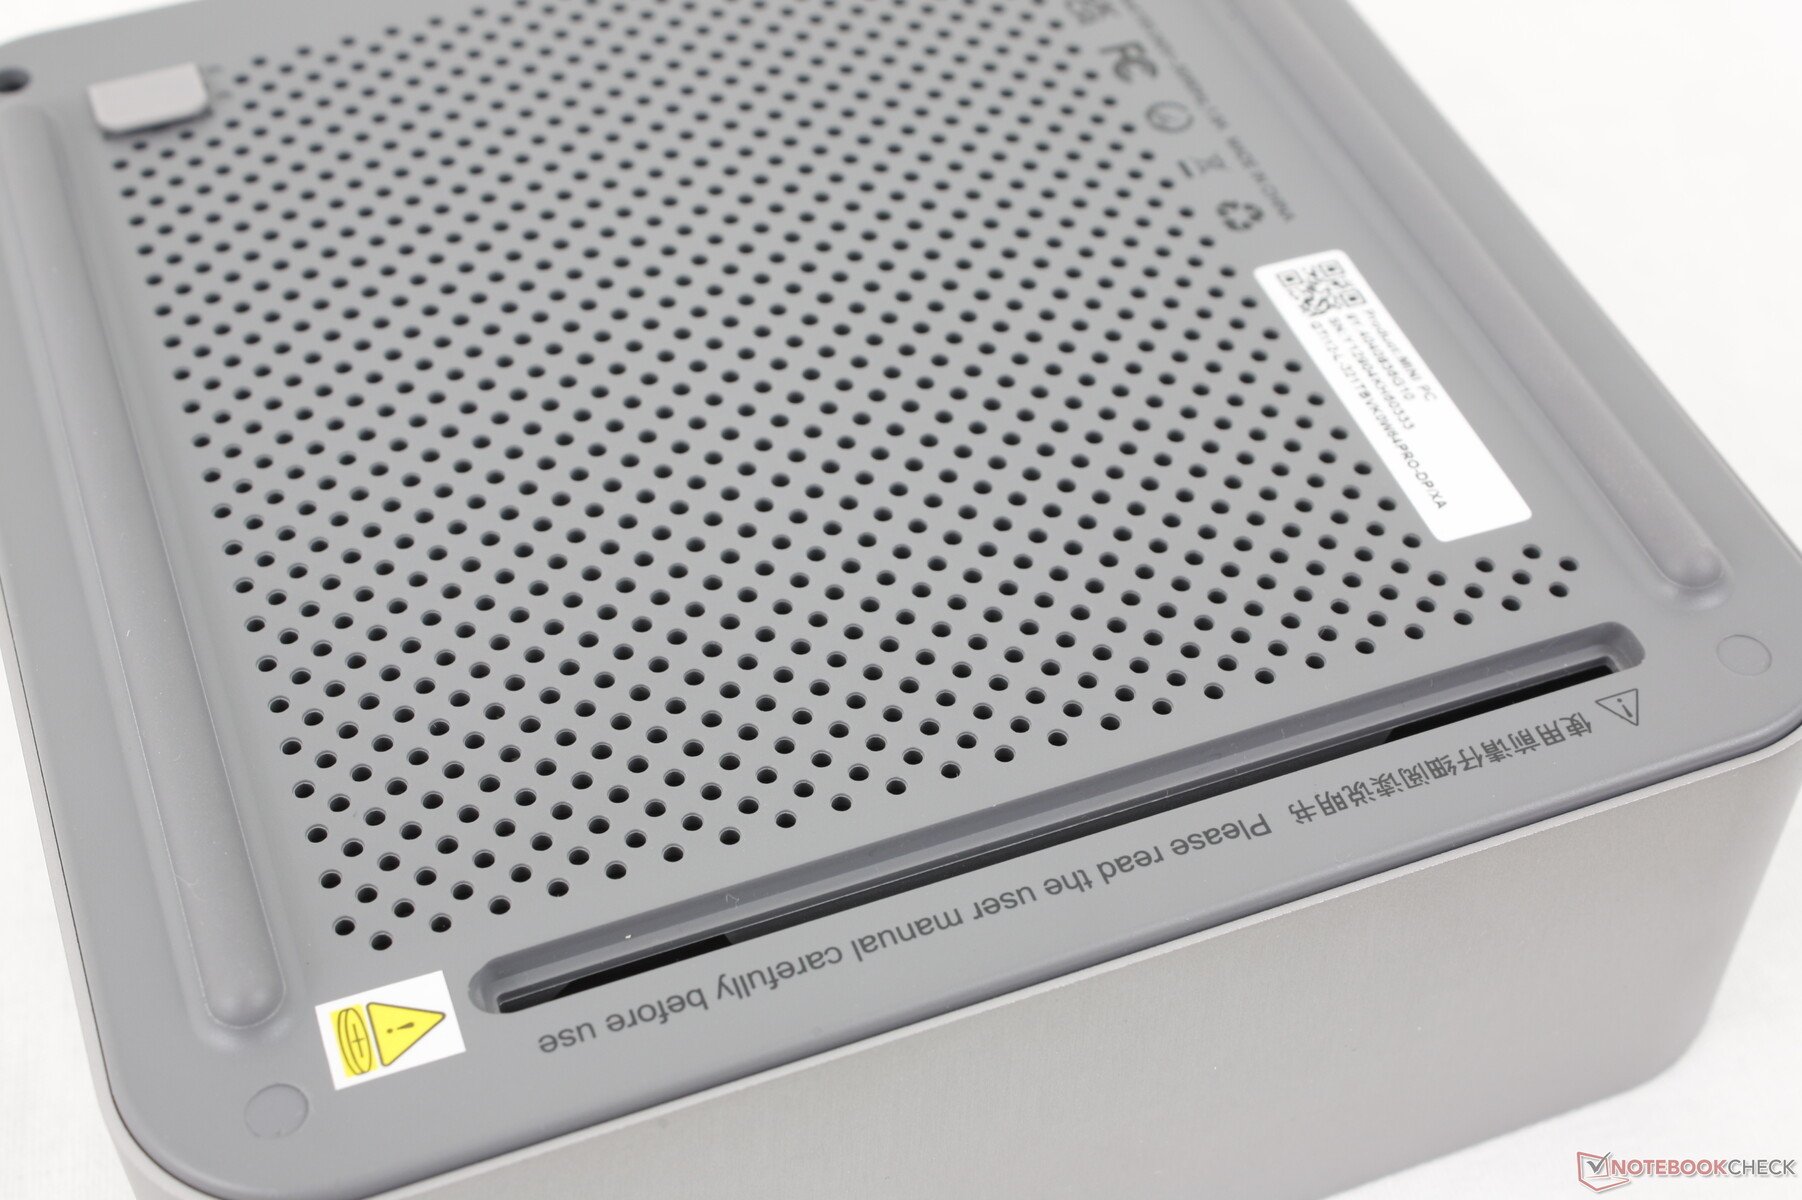
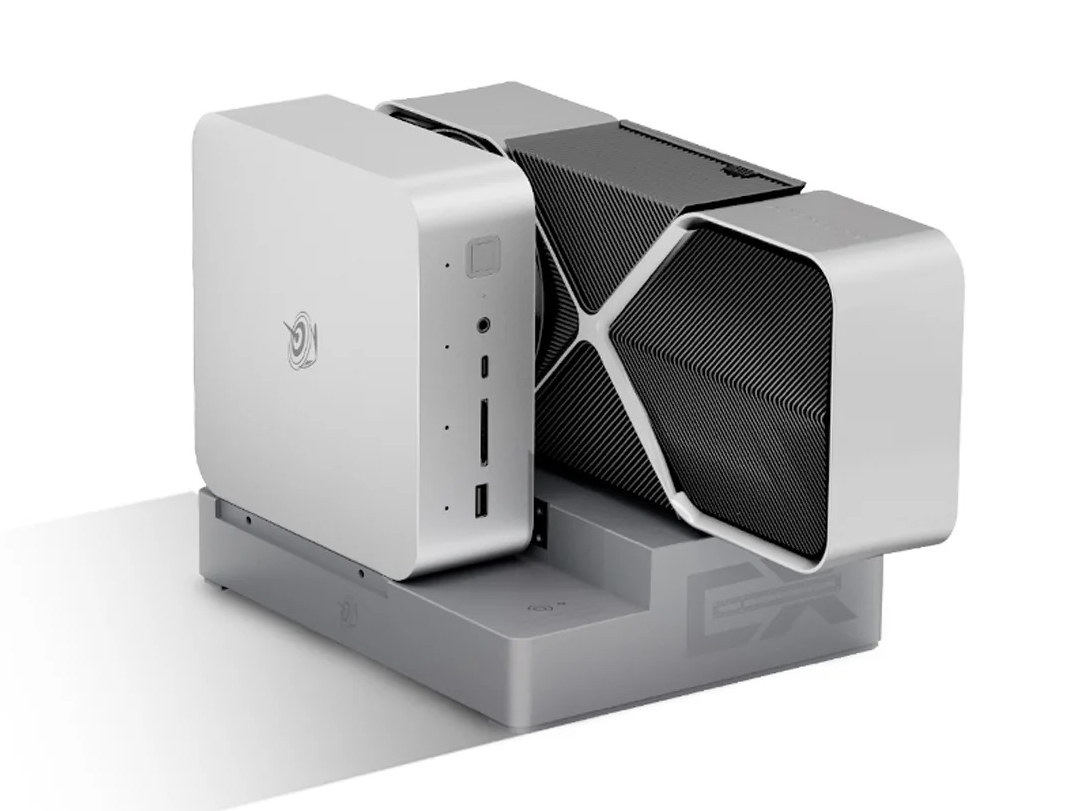
O GTI12 Ultra é essencialmente uma versão ampliada do SER8 utilizando os mesmos materiais de chassi de metal, fundo de plástico e acabamento fosco liso. No entanto, internamente, os dois modelos são muito diferentes, pois o GTI12 Ultra integra uma PSU de 145 W em vez de depender de uma fonte de alimentação externa. Ele também integra dois alto-falantes para ser um dos poucos minicomputadores com áudio integrado e uma PSU.
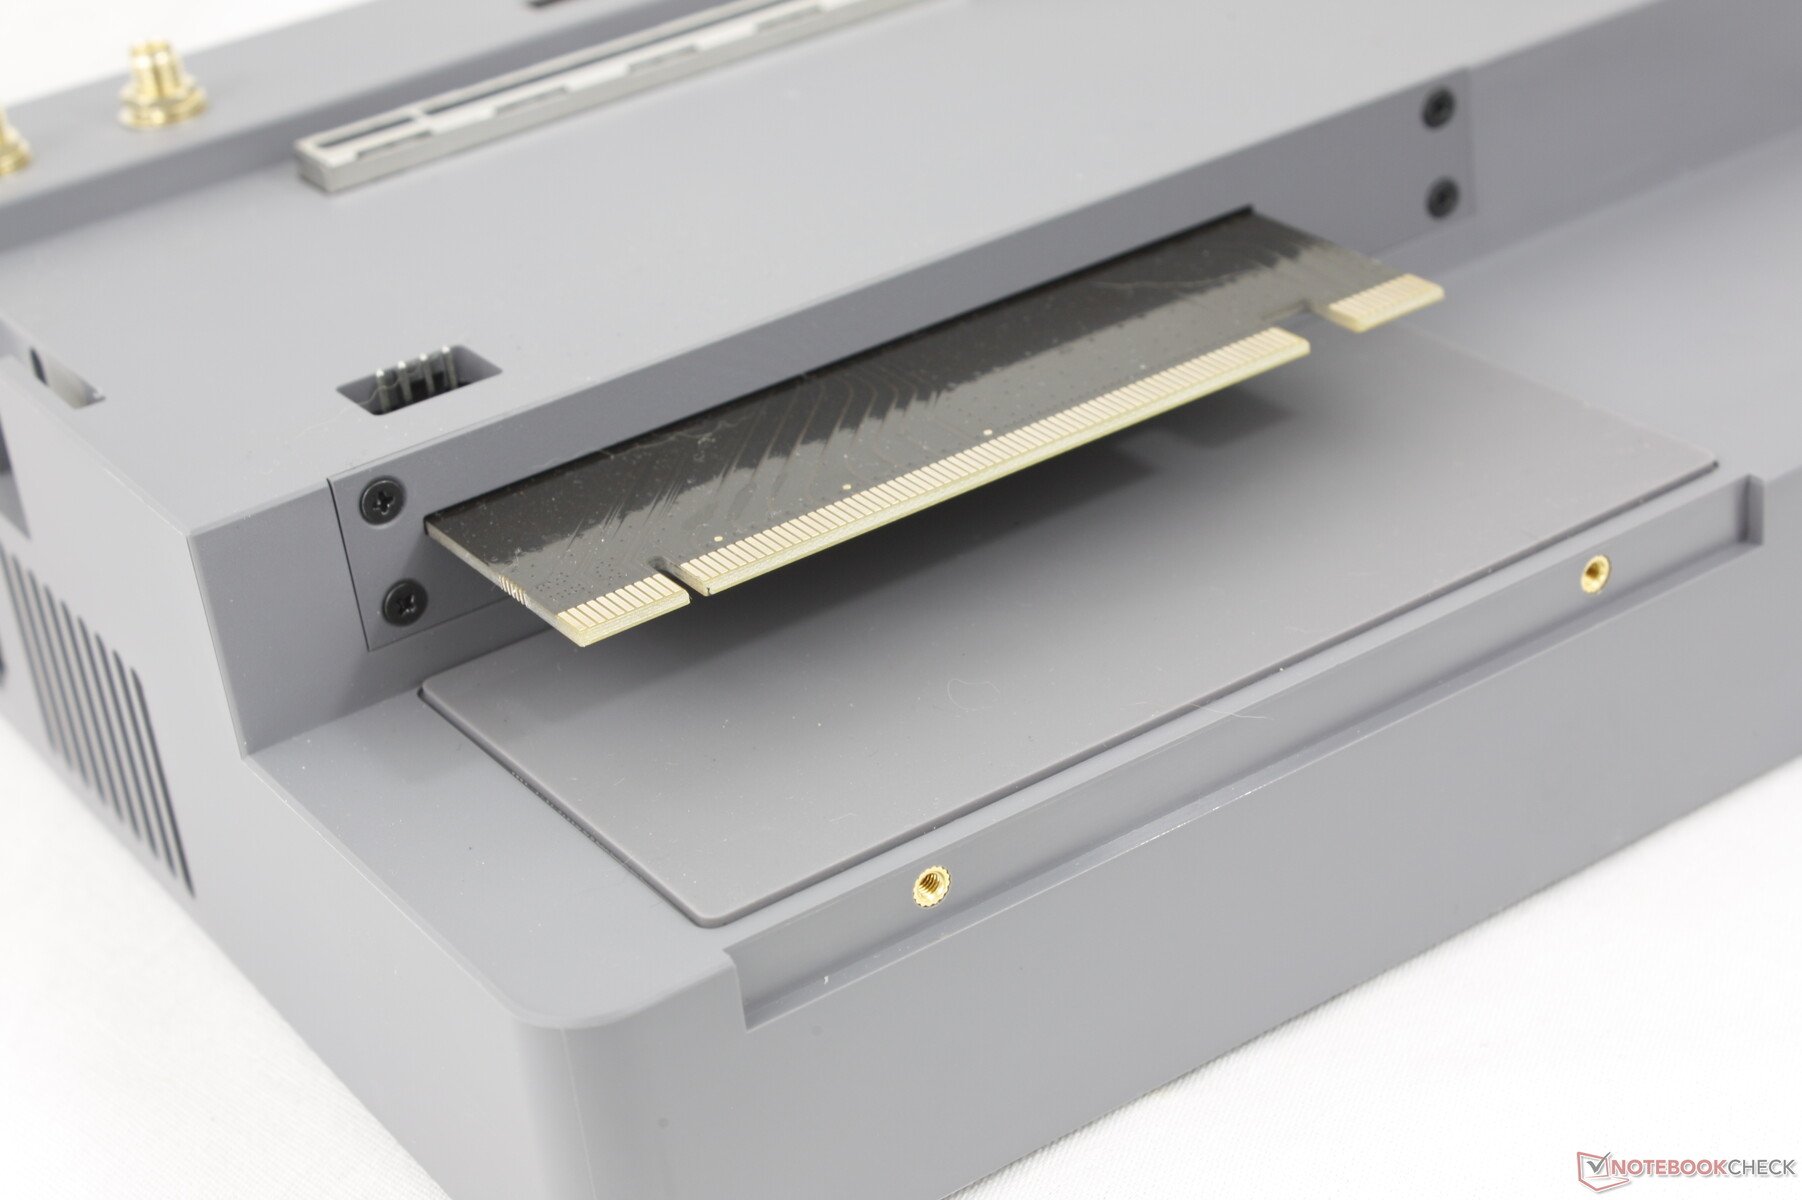
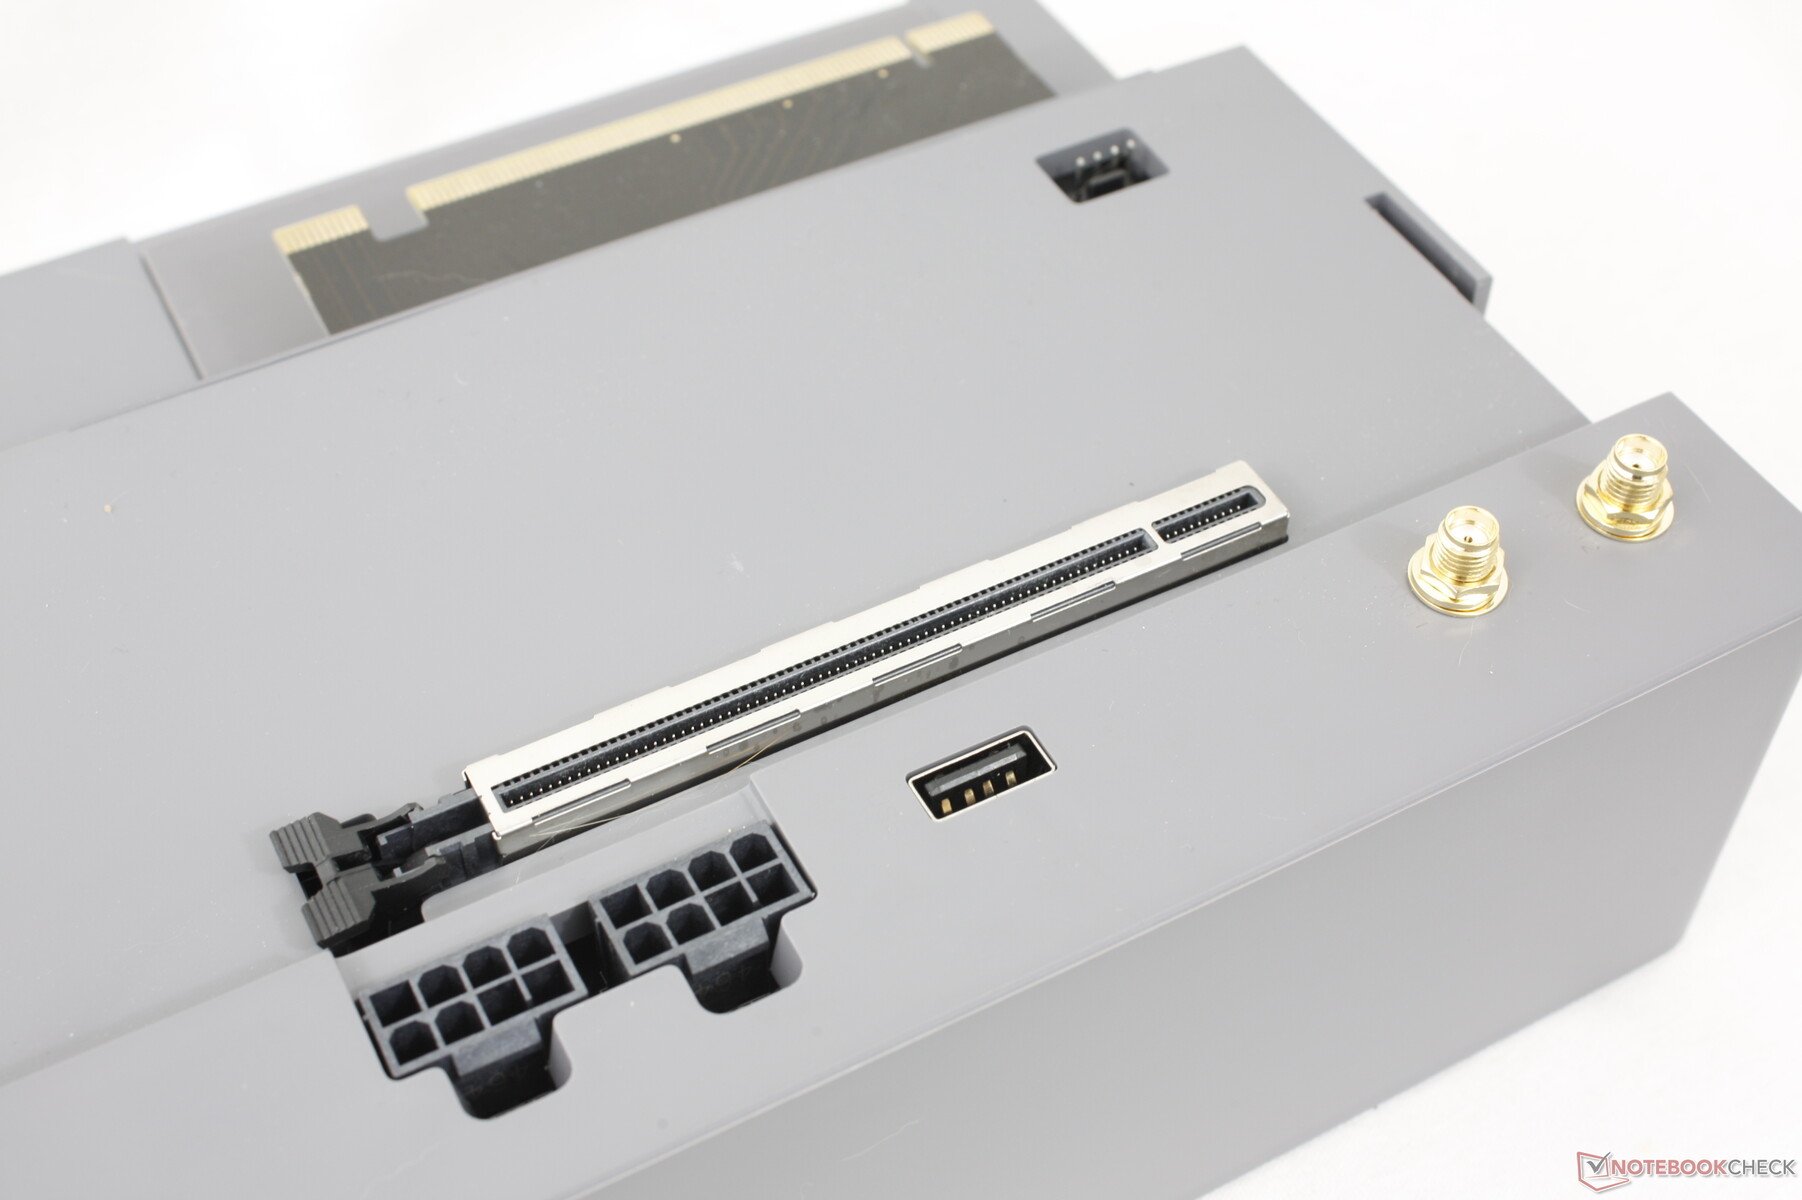
Outro recurso exclusivo é o slot PCI x8 na parte inferior da unidade para conexão com a EX Docking Station, conforme mostrado na imagem abaixo. Gostamos do fato de o conector não ser proprietário, como no caso do Asus ROG XG Mobile.
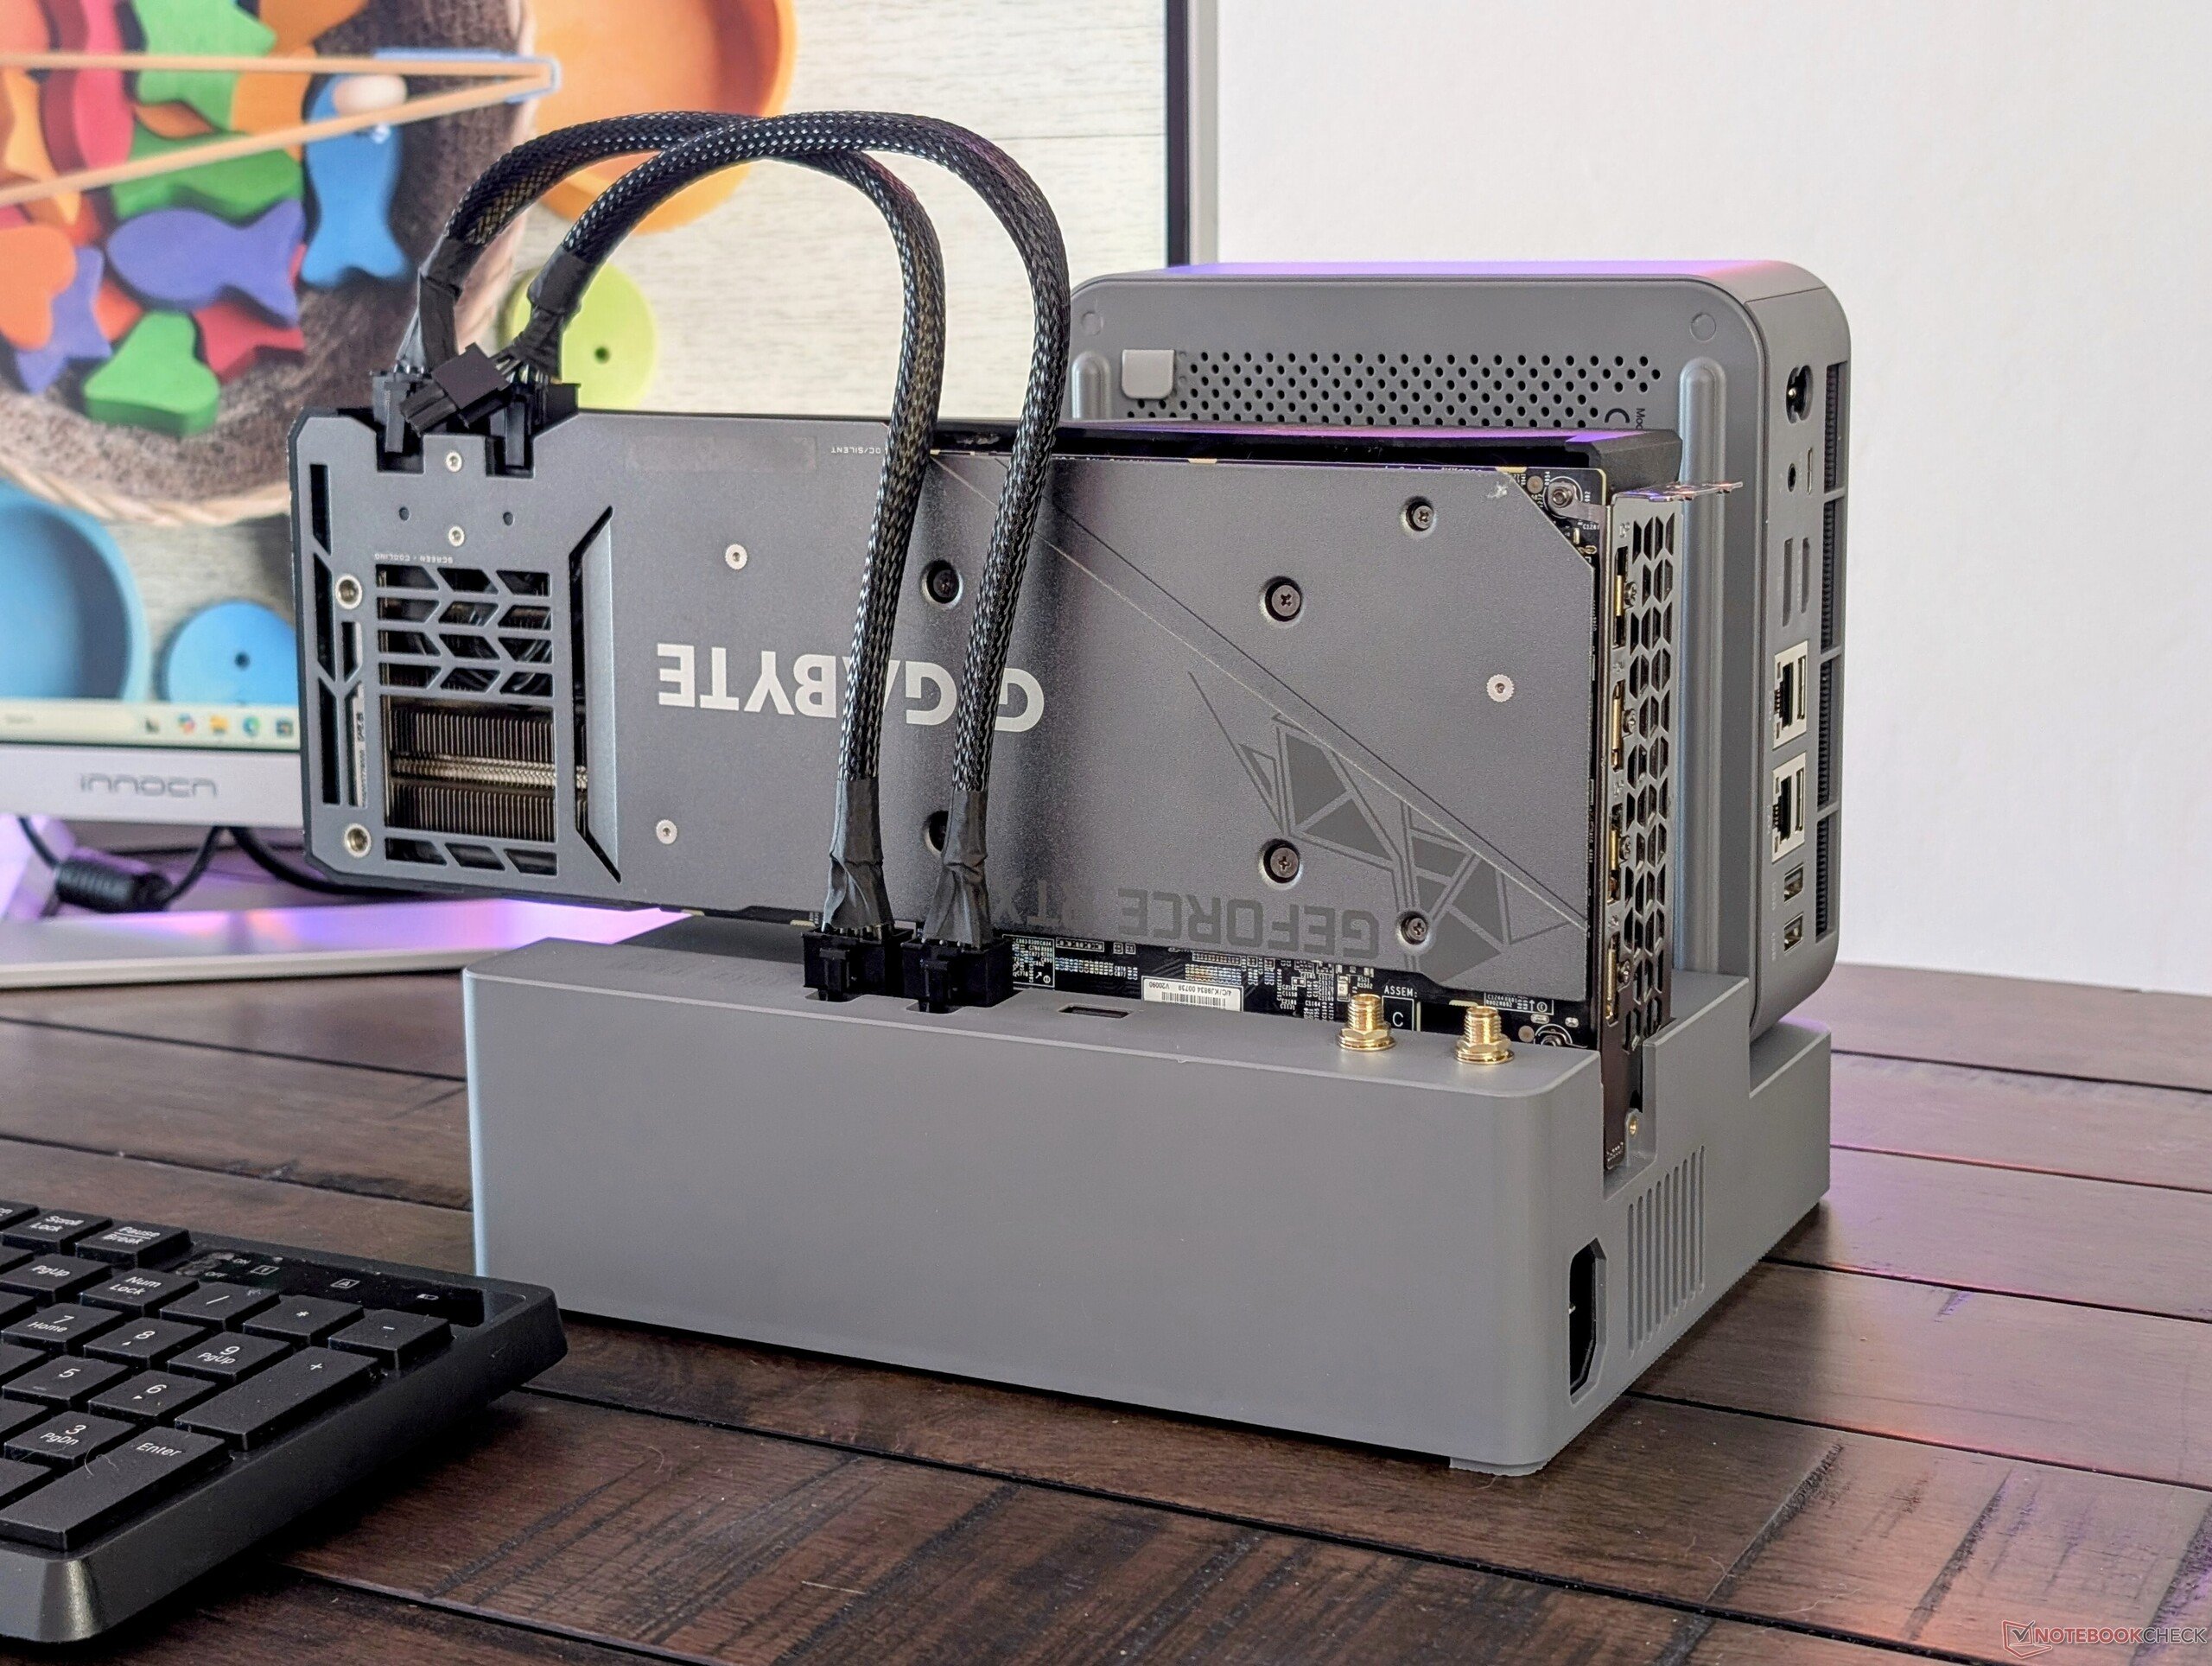
A unidade é significativamente maior e mais pesada do que a maioria dos outros mini PCs com gráficos integrados devido às características exclusivas mencionadas acima.
| Mini PC | Estação de acoplamento EX | Mini PC + Estação de acoplamento EX |
| 1316 g | 1419 g | 2735 g |

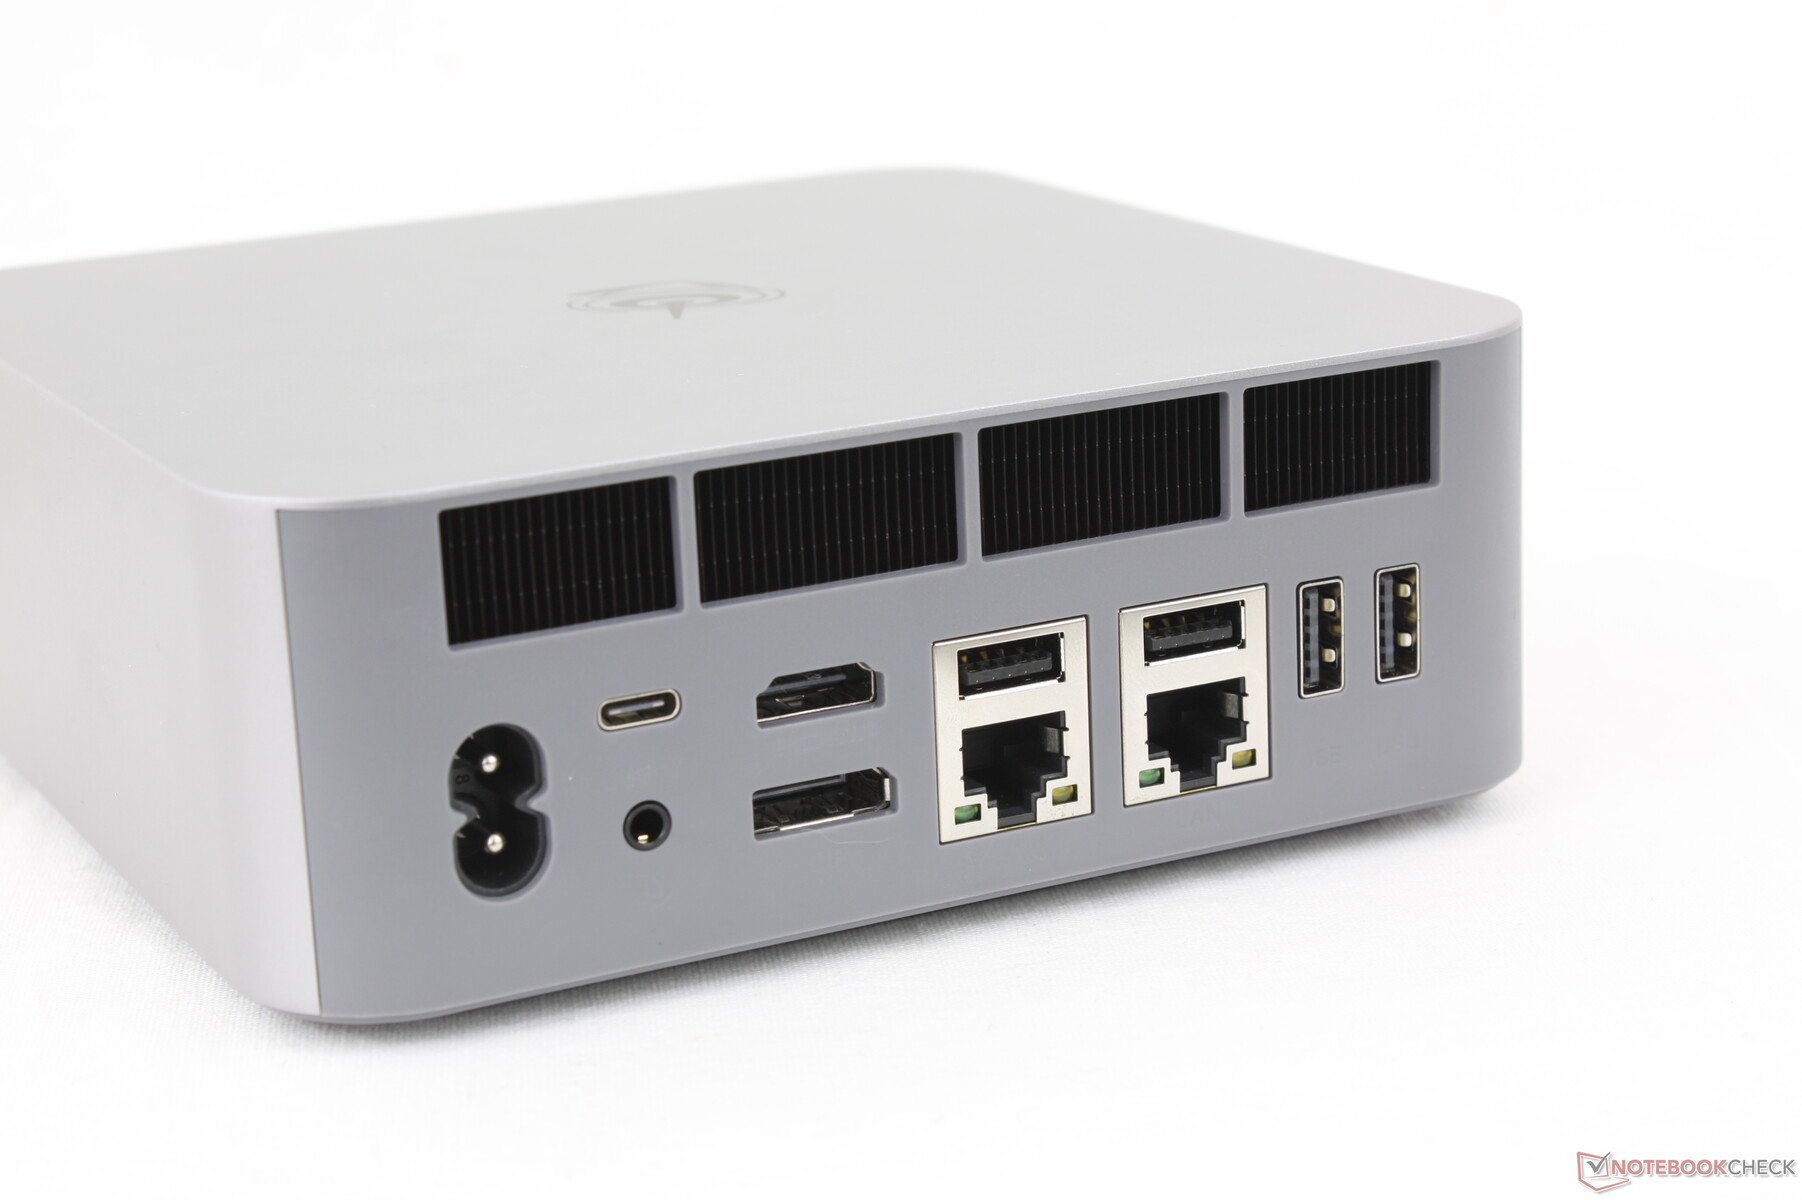
Conectividade
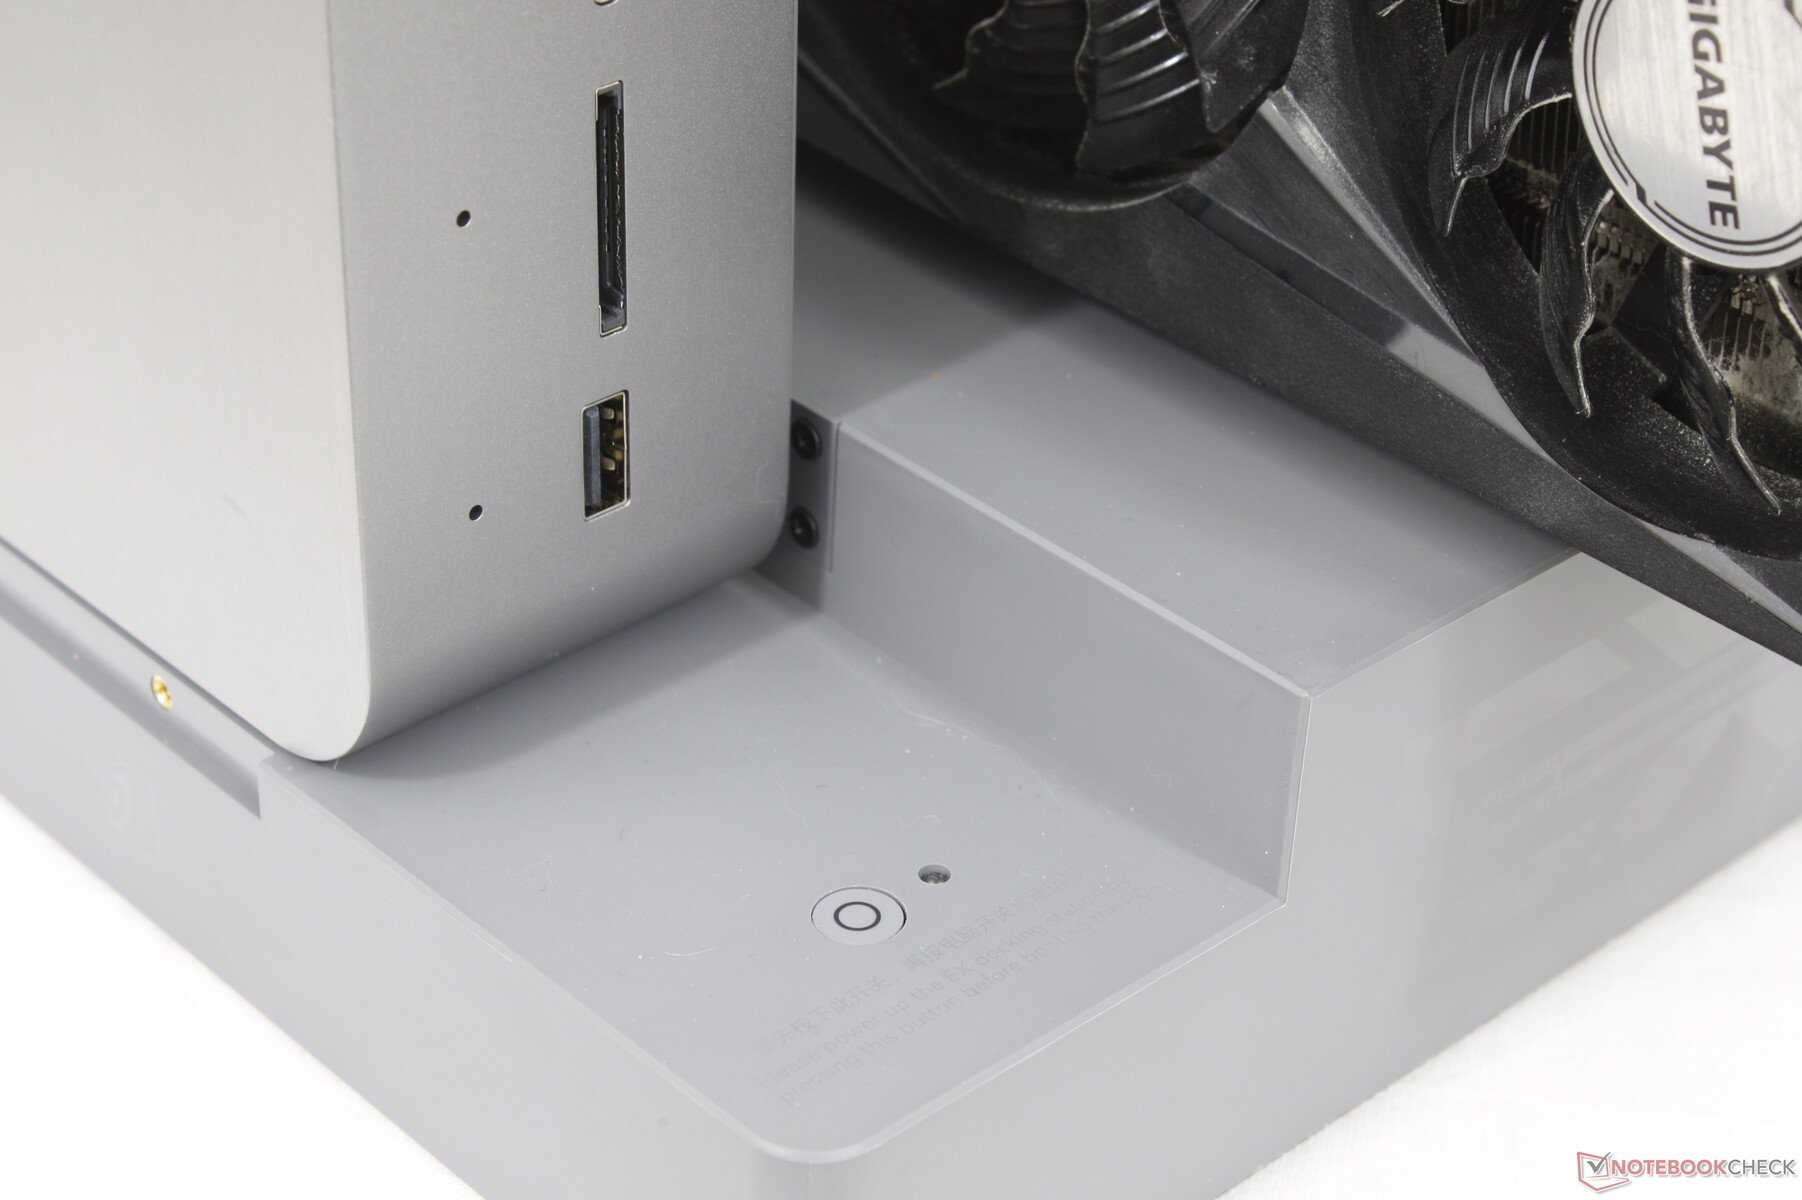
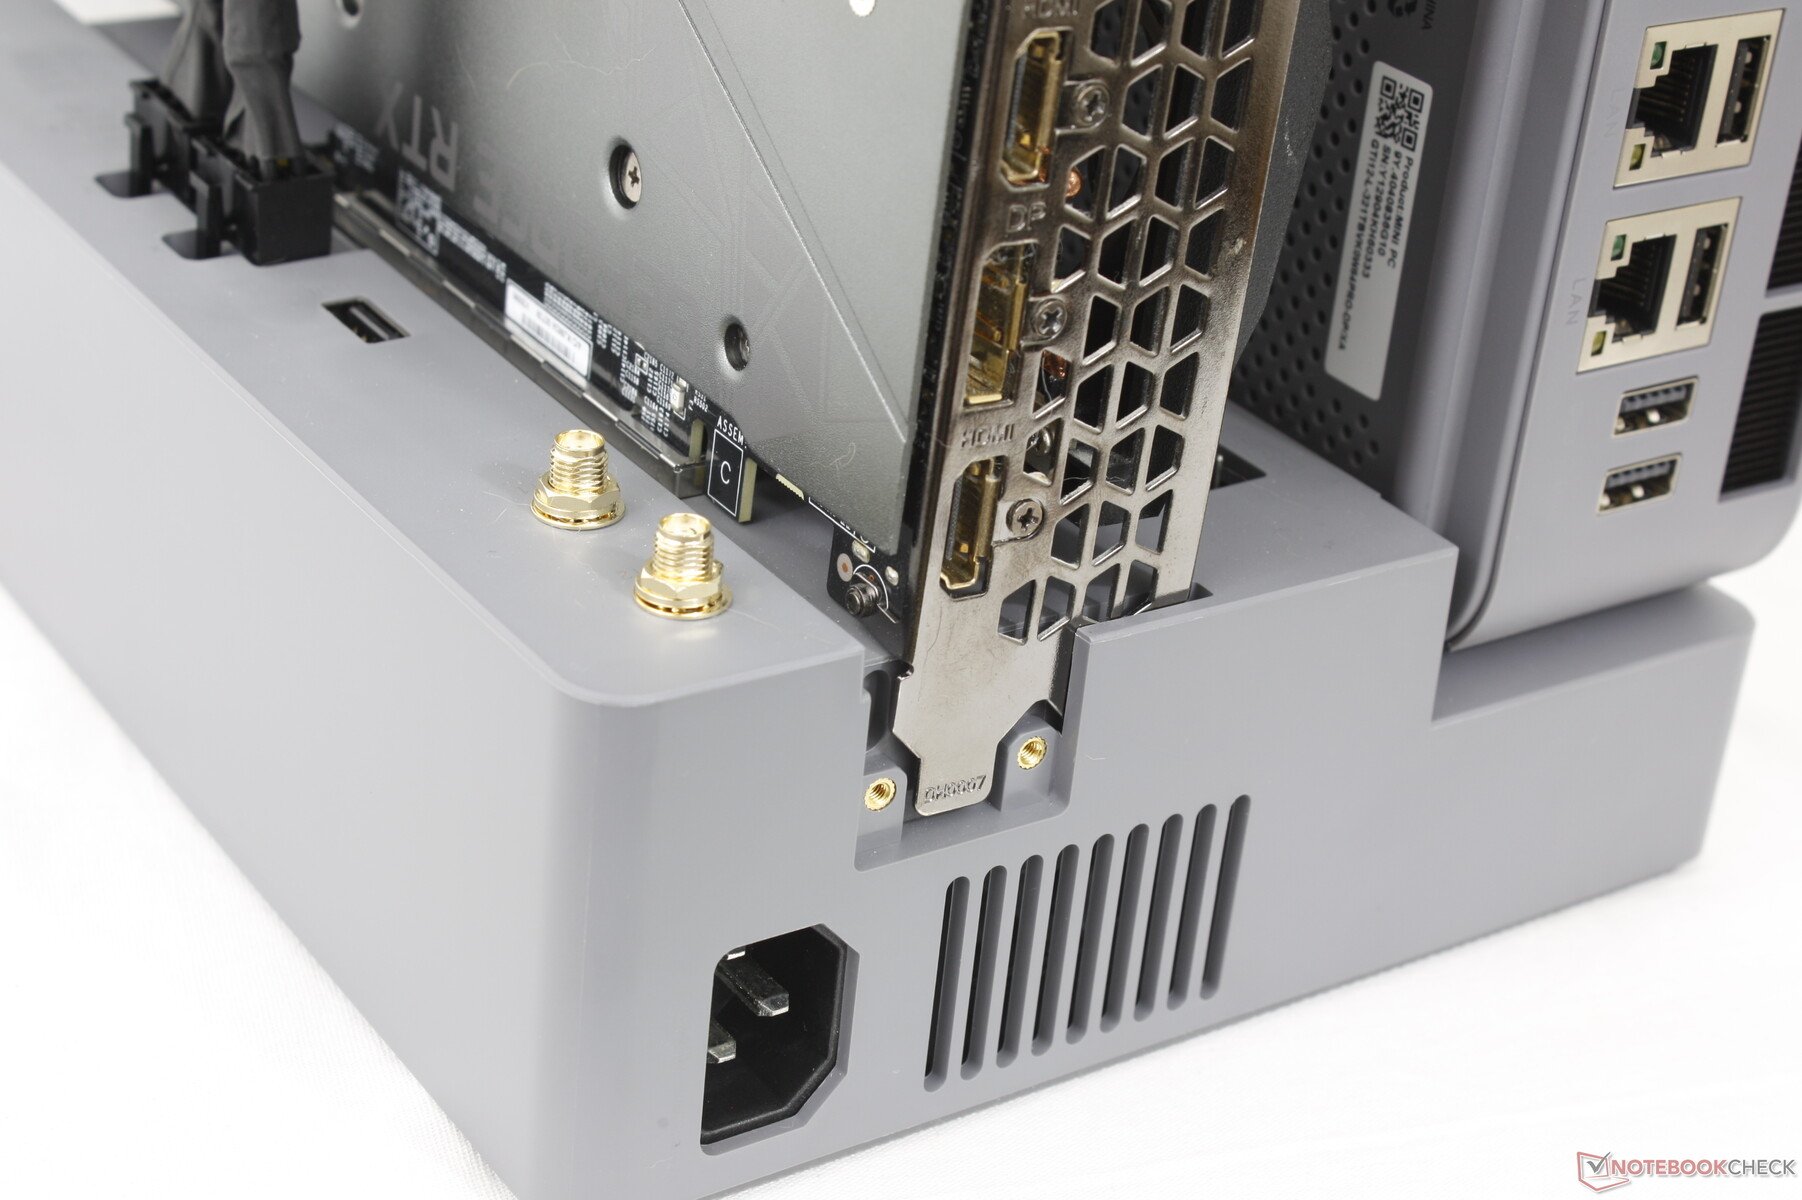
As opções de portas são maiores do que as oferecidas pelo SER8 e por muitos outros mini PCs do tamanho do NUC, já que o GTI12 Ultra é tão grande. O modelo integra um leitor de cartão SD juntamente com portas USB-A adicionais e portas RJ-45.
Não há trava Kensington.

Leitor de cartão SD
| SD Card Reader | |
| average JPG Copy Test (av. of 3 runs) | |
| Asus ROG NUC 14-90AS0051 (AV Pro SD microSD 128 GB V60) | |
| Beelink GTI12 Ultra EX Docking Station (Toshiba Exceria Pro SDXC 64 GB UHS-II) | |
| maximum AS SSD Seq Read Test (1GB) | |
| Asus ROG NUC 14-90AS0051 (AV Pro SD microSD 128 GB V60) | |
| Beelink GTI12 Ultra EX Docking Station (Toshiba Exceria Pro SDXC 64 GB UHS-II) | |
Comunicação
O Wi-Fi 6E e o Wi-Fi 7 não são suportados, provavelmente para economizar nos custos.
| Networking | |
| iperf3 transmit AXE11000 | |
| Asus NUC 14 Pro | |
| Beelink GTI12 Ultra EX Docking Station | |
| Asus ROG NUC 14-90AS0051 | |
| Geekom AX8 Pro | |
| Minisforum MS-A1 | |
| GMK NucBox K9 | |
| iperf3 receive AXE11000 | |
| Asus NUC 14 Pro | |
| Beelink GTI12 Ultra EX Docking Station | |
| Geekom AX8 Pro | |
| Asus ROG NUC 14-90AS0051 | |
| Minisforum MS-A1 | |
| GMK NucBox K9 | |
| iperf3 transmit AXE11000 6GHz | |
| Geekom AX8 Pro | |
| Asus ROG NUC 14-90AS0051 | |
| Minisforum MS-A1 | |
| Asus NUC 14 Pro | |
| iperf3 receive AXE11000 6GHz | |
| Minisforum MS-A1 | |
| Asus ROG NUC 14-90AS0051 | |
| Asus NUC 14 Pro | |
| Geekom AX8 Pro | |
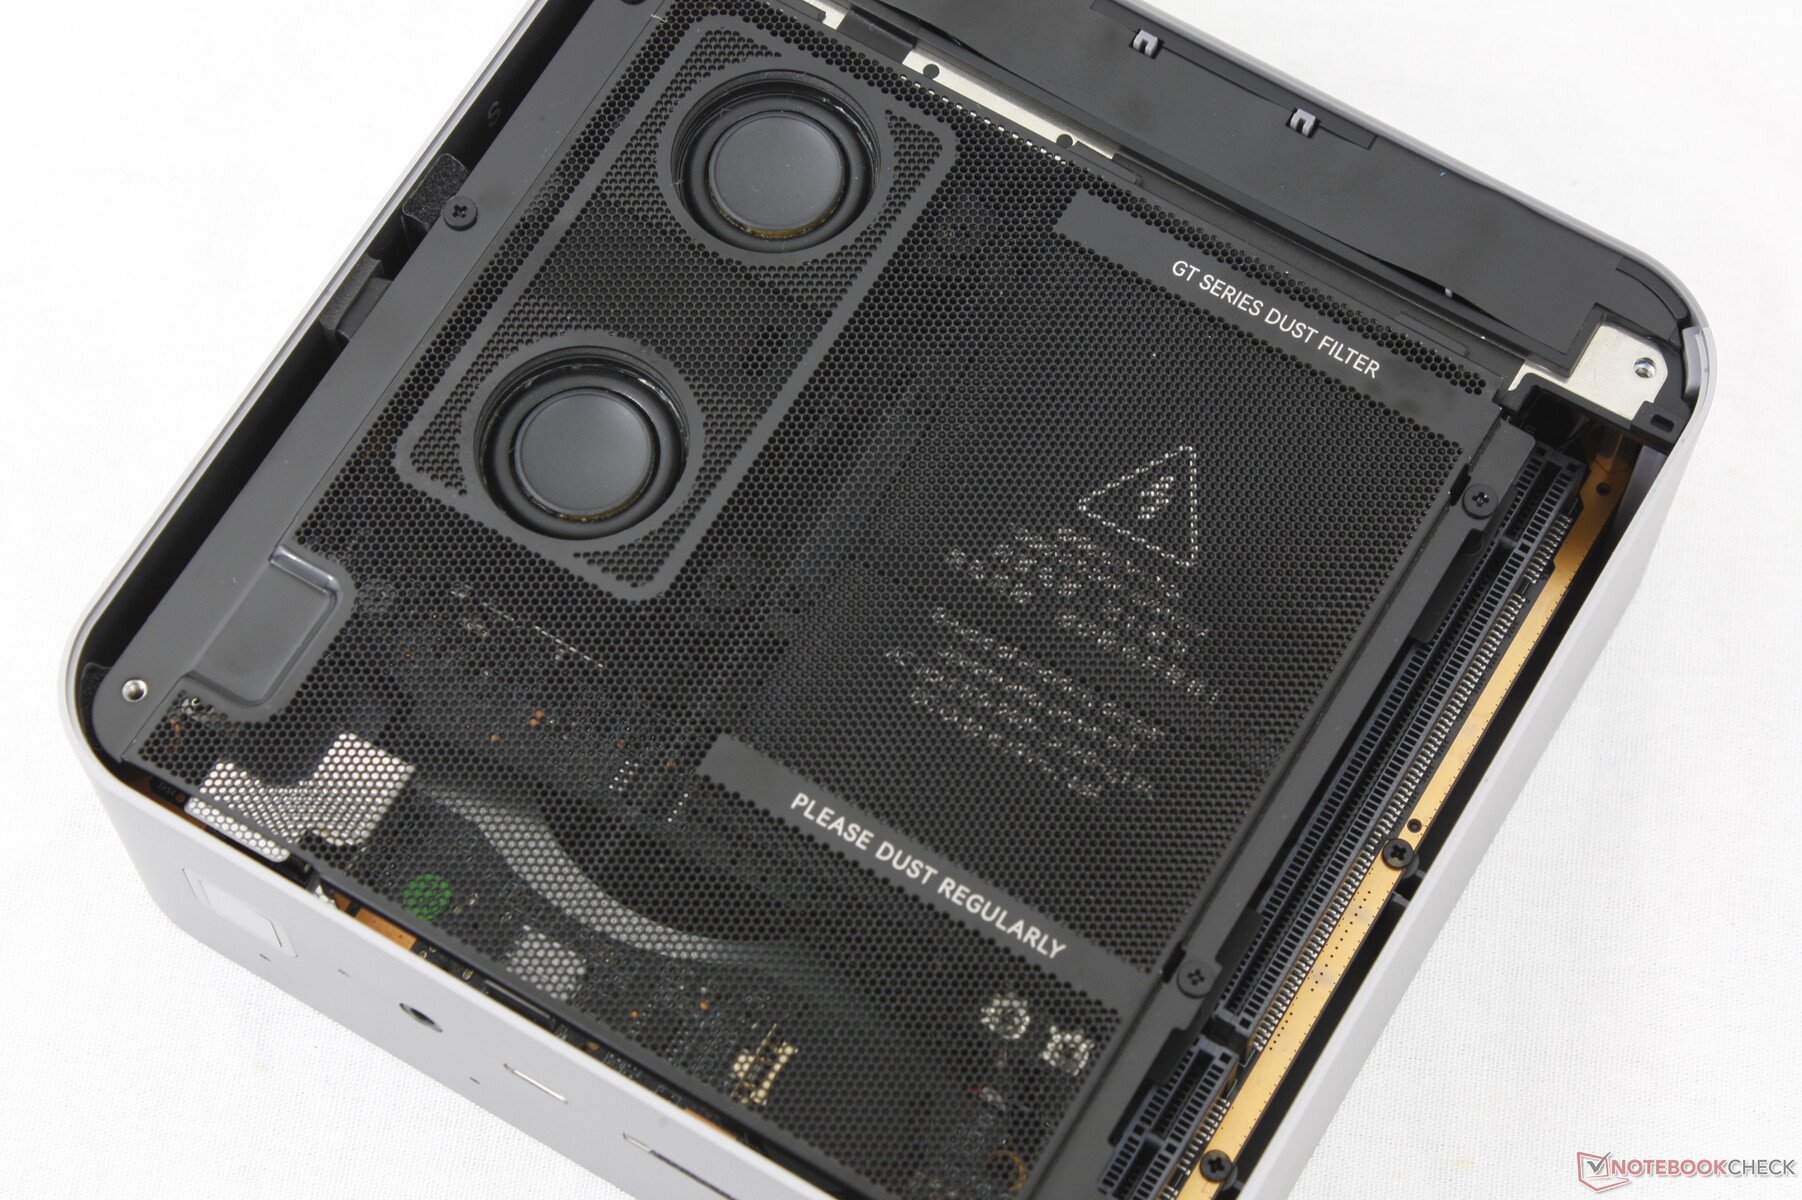
Manutenção
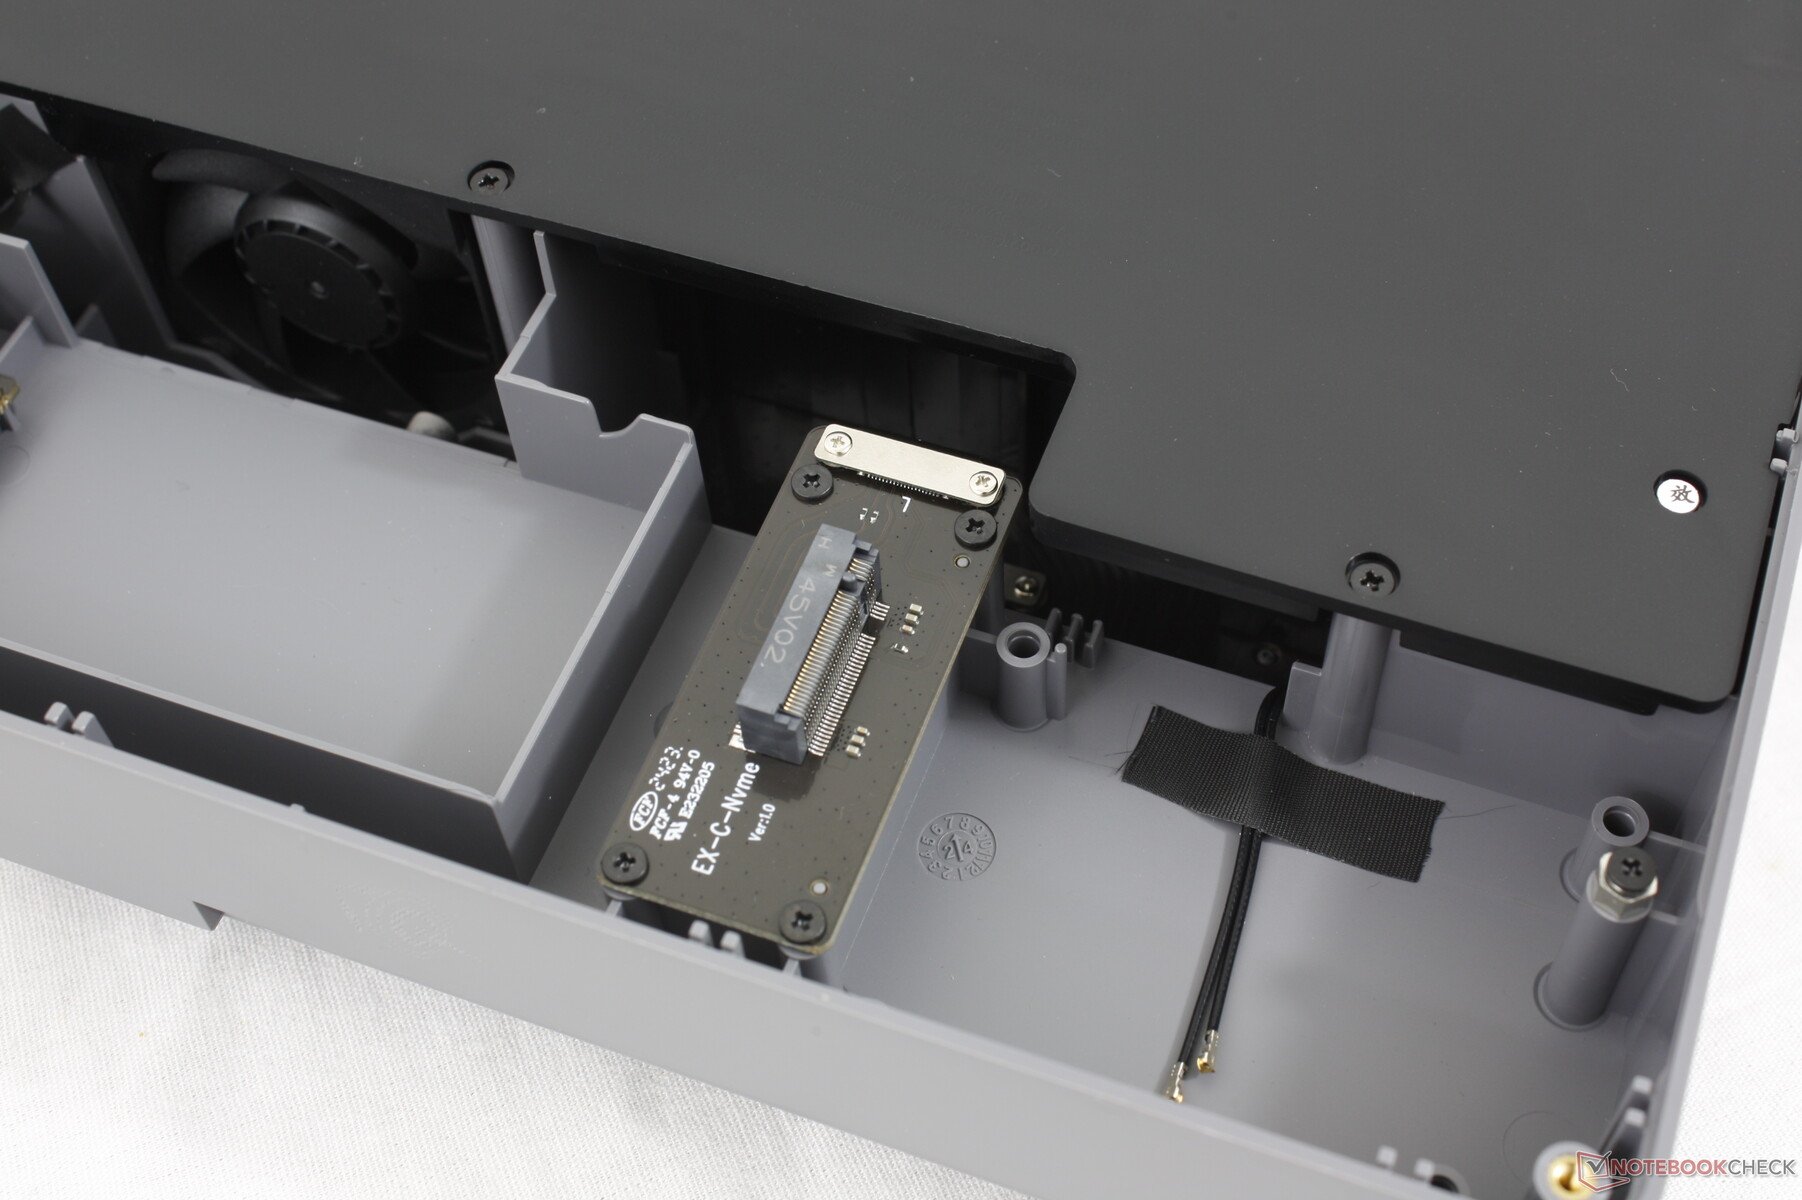
A manutenção do GTI12 Ultra é muito mais difícil quando comparada à de seus irmãos menores, pois ele tem mais peças integradas que não são encontradas em outros modelos. Os alto-falantes, o filtro de poeira e a PSU integrada ficam sobre a placa-mãe e cada um deles tem parafusos de tamanhos diferentes, o que torna a manutenção ainda mais complicada.
Sustentabilidade
A Beelink não anuncia nenhuma medida de sustentabilidade adotada para fabricar o GTI12. A embalagem é composta principalmente de papel, com alguns invólucros de LDPE e plástico.
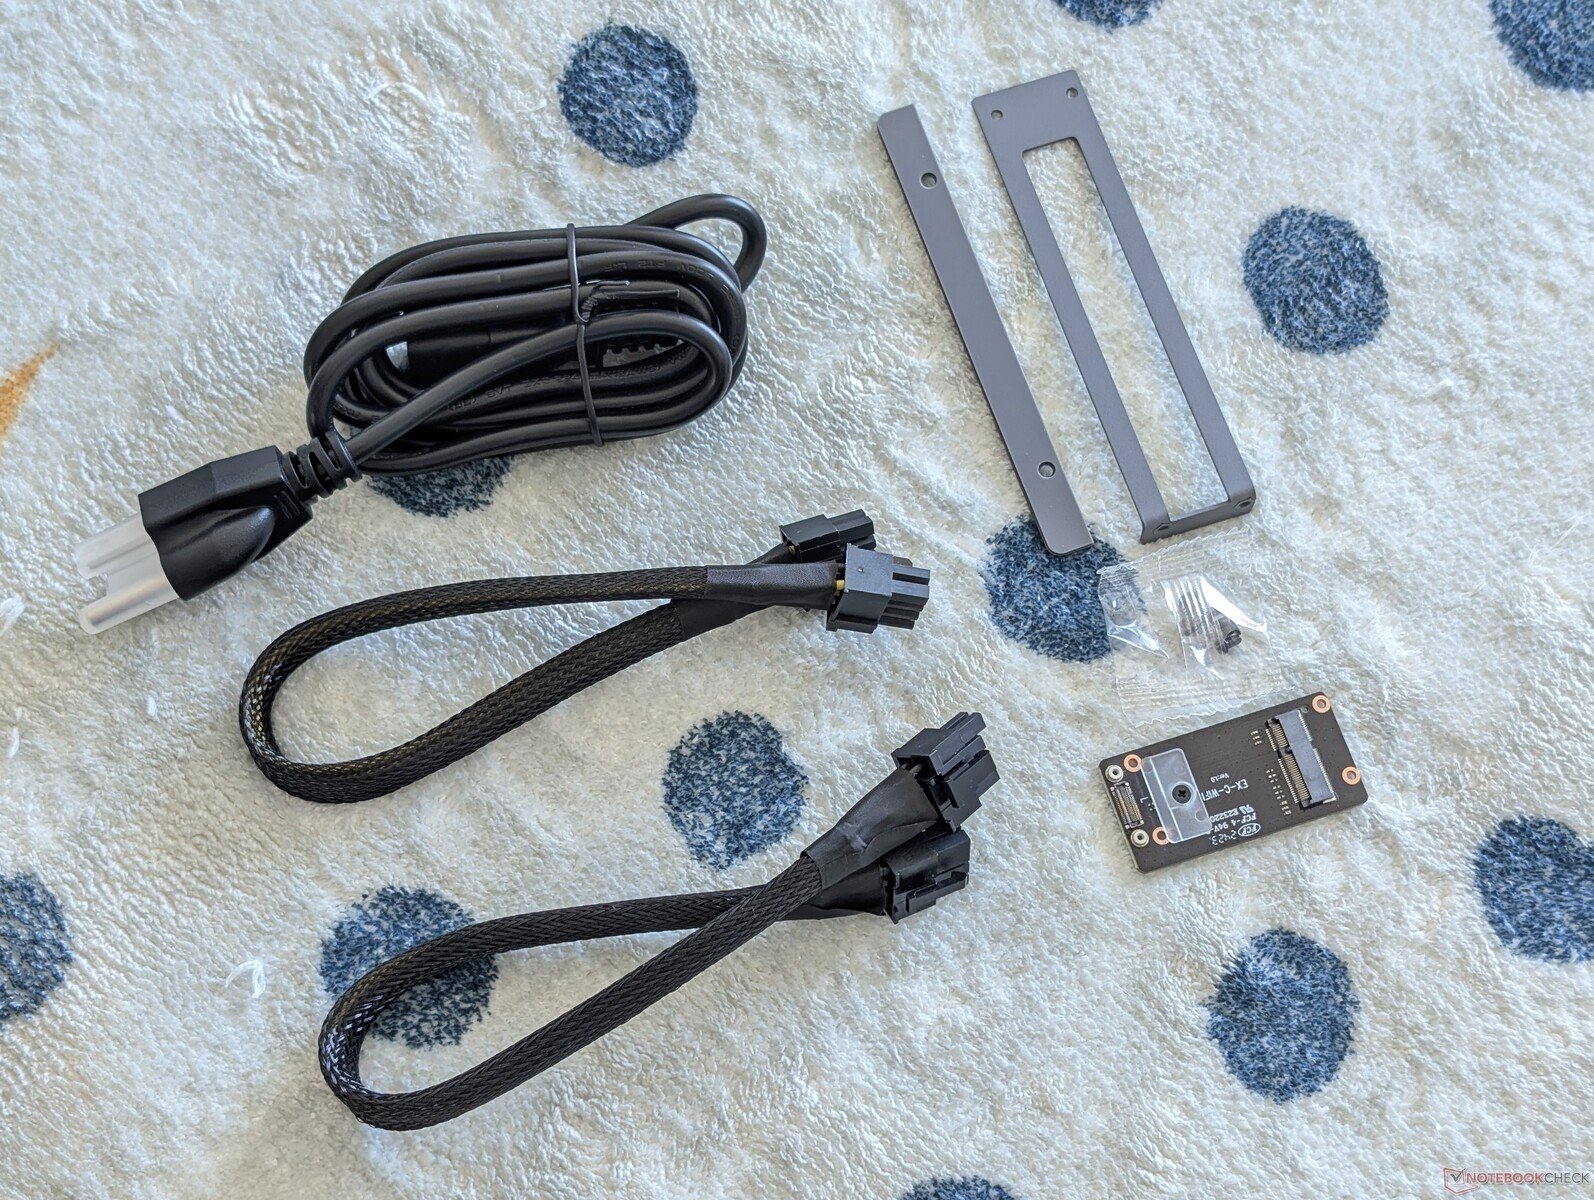
Acessórios e garantia
A dock EX inclui dois cabos de alimentação de 6+2 pinos e duas pequenas placas para fixar a GPU e o mini PC na dock. O slot e a antena Wi-Fi M.2 são opcionais para quem deseja instalar um módulo WLAN na estação de acoplamento em vez de dentro do mini PC. Praticamente todos os mini PCs vêm com WLAN integrada e, portanto, esse recurso específico do dock pode ser ignorado pela maioria dos usuários.
Desempenho
Condições de teste
Colocamos o Windows no modo Desempenho antes de executar os benchmarks abaixo.
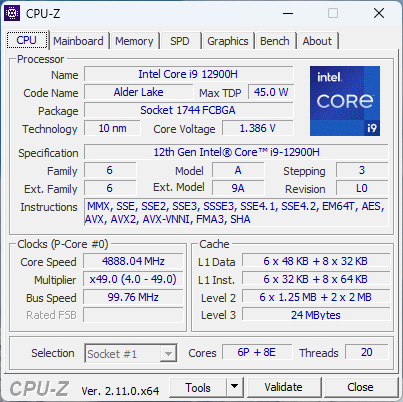
Processador
O Core i9-12900H está duas a três gerações atrás da atual série Raptor Lake-R e os resultados de benchmark refletem isso. O mais novo Core i9-14900HXmais recente, por exemplo, oferece quase o dobro do desempenho multi-thread em relação à nossa unidade Beelink. Até mesmo mini PCs mais baratos, como o Beelink SER7 podem oferecer um desempenho de processador quase idêntico.
As opções mais recentes do processador Meteor Lake Core Ultra estão disponíveis para esse modelo chamado GTI14.
Cinebench R15 Multi Loop
Cinebench R23: Multi Core | Single Core
Cinebench R20: CPU (Multi Core) | CPU (Single Core)
Cinebench R15: CPU Multi 64Bit | CPU Single 64Bit
Blender: v2.79 BMW27 CPU
7-Zip 18.03: 7z b 4 | 7z b 4 -mmt1
Geekbench 6.4: Multi-Core | Single-Core
Geekbench 5.5: Multi-Core | Single-Core
HWBOT x265 Benchmark v2.2: 4k Preset
LibreOffice : 20 Documents To PDF
R Benchmark 2.5: Overall mean
* ... menor é melhor
AIDA64: FP32 Ray-Trace | FPU Julia | CPU SHA3 | CPU Queen | FPU SinJulia | FPU Mandel | CPU AES | CPU ZLib | FP64 Ray-Trace | CPU PhotoWorxx
| Performance Rating | |
| Minisforum MS-A1 | |
| Geekom AX8 Pro | |
| Asus ROG NUC 14-90AS0051 | |
| Beelink GTI12 Ultra EX Docking Station | |
| Asus NUC 14 Pro | |
| Média Intel Core i9-12900H | |
| GMK NucBox K9 | |
| AIDA64 / FP32 Ray-Trace | |
| Minisforum MS-A1 | |
| Geekom AX8 Pro | |
| Asus ROG NUC 14-90AS0051 | |
| Beelink GTI12 Ultra EX Docking Station | |
| Asus NUC 14 Pro | |
| Média Intel Core i9-12900H (4074 - 18289, n=28) | |
| GMK NucBox K9 | |
| AIDA64 / FPU Julia | |
| Minisforum MS-A1 | |
| Geekom AX8 Pro | |
| Asus ROG NUC 14-90AS0051 | |
| Beelink GTI12 Ultra EX Docking Station | |
| Asus NUC 14 Pro | |
| GMK NucBox K9 | |
| Média Intel Core i9-12900H (22307 - 93236, n=28) | |
| AIDA64 / CPU SHA3 | |
| Minisforum MS-A1 | |
| Geekom AX8 Pro | |
| Asus ROG NUC 14-90AS0051 | |
| Beelink GTI12 Ultra EX Docking Station | |
| Asus NUC 14 Pro | |
| Média Intel Core i9-12900H (1378 - 4215, n=28) | |
| GMK NucBox K9 | |
| AIDA64 / CPU Queen | |
| Minisforum MS-A1 | |
| Geekom AX8 Pro | |
| Média Intel Core i9-12900H (78172 - 111241, n=28) | |
| Beelink GTI12 Ultra EX Docking Station | |
| Asus ROG NUC 14-90AS0051 | |
| Asus NUC 14 Pro | |
| GMK NucBox K9 | |
| AIDA64 / FPU SinJulia | |
| Minisforum MS-A1 | |
| Geekom AX8 Pro | |
| Asus ROG NUC 14-90AS0051 | |
| Beelink GTI12 Ultra EX Docking Station | |
| Média Intel Core i9-12900H (5709 - 10410, n=28) | |
| Asus NUC 14 Pro | |
| GMK NucBox K9 | |
| AIDA64 / FPU Mandel | |
| Minisforum MS-A1 | |
| Geekom AX8 Pro | |
| Asus ROG NUC 14-90AS0051 | |
| Beelink GTI12 Ultra EX Docking Station | |
| Asus NUC 14 Pro | |
| Média Intel Core i9-12900H (11257 - 45581, n=28) | |
| GMK NucBox K9 | |
| AIDA64 / CPU AES | |
| Minisforum MS-A1 | |
| Geekom AX8 Pro | |
| GMK NucBox K9 | |
| Asus ROG NUC 14-90AS0051 | |
| Média Intel Core i9-12900H (31935 - 151546, n=28) | |
| Beelink GTI12 Ultra EX Docking Station | |
| Asus NUC 14 Pro | |
| AIDA64 / CPU ZLib | |
| Asus ROG NUC 14-90AS0051 | |
| Minisforum MS-A1 | |
| Beelink GTI12 Ultra EX Docking Station | |
| Geekom AX8 Pro | |
| Asus NUC 14 Pro | |
| Média Intel Core i9-12900H (449 - 1193, n=28) | |
| GMK NucBox K9 | |
| AIDA64 / FP64 Ray-Trace | |
| Minisforum MS-A1 | |
| Geekom AX8 Pro | |
| Asus ROG NUC 14-90AS0051 | |
| Beelink GTI12 Ultra EX Docking Station | |
| Asus NUC 14 Pro | |
| Média Intel Core i9-12900H (2235 - 10511, n=28) | |
| GMK NucBox K9 | |
| AIDA64 / CPU PhotoWorxx | |
| Asus NUC 14 Pro | |
| GMK NucBox K9 | |
| Asus ROG NUC 14-90AS0051 | |
| Beelink GTI12 Ultra EX Docking Station | |
| Minisforum MS-A1 | |
| Geekom AX8 Pro | |
| Média Intel Core i9-12900H (20960 - 48269, n=29) | |
Desempenho do sistema
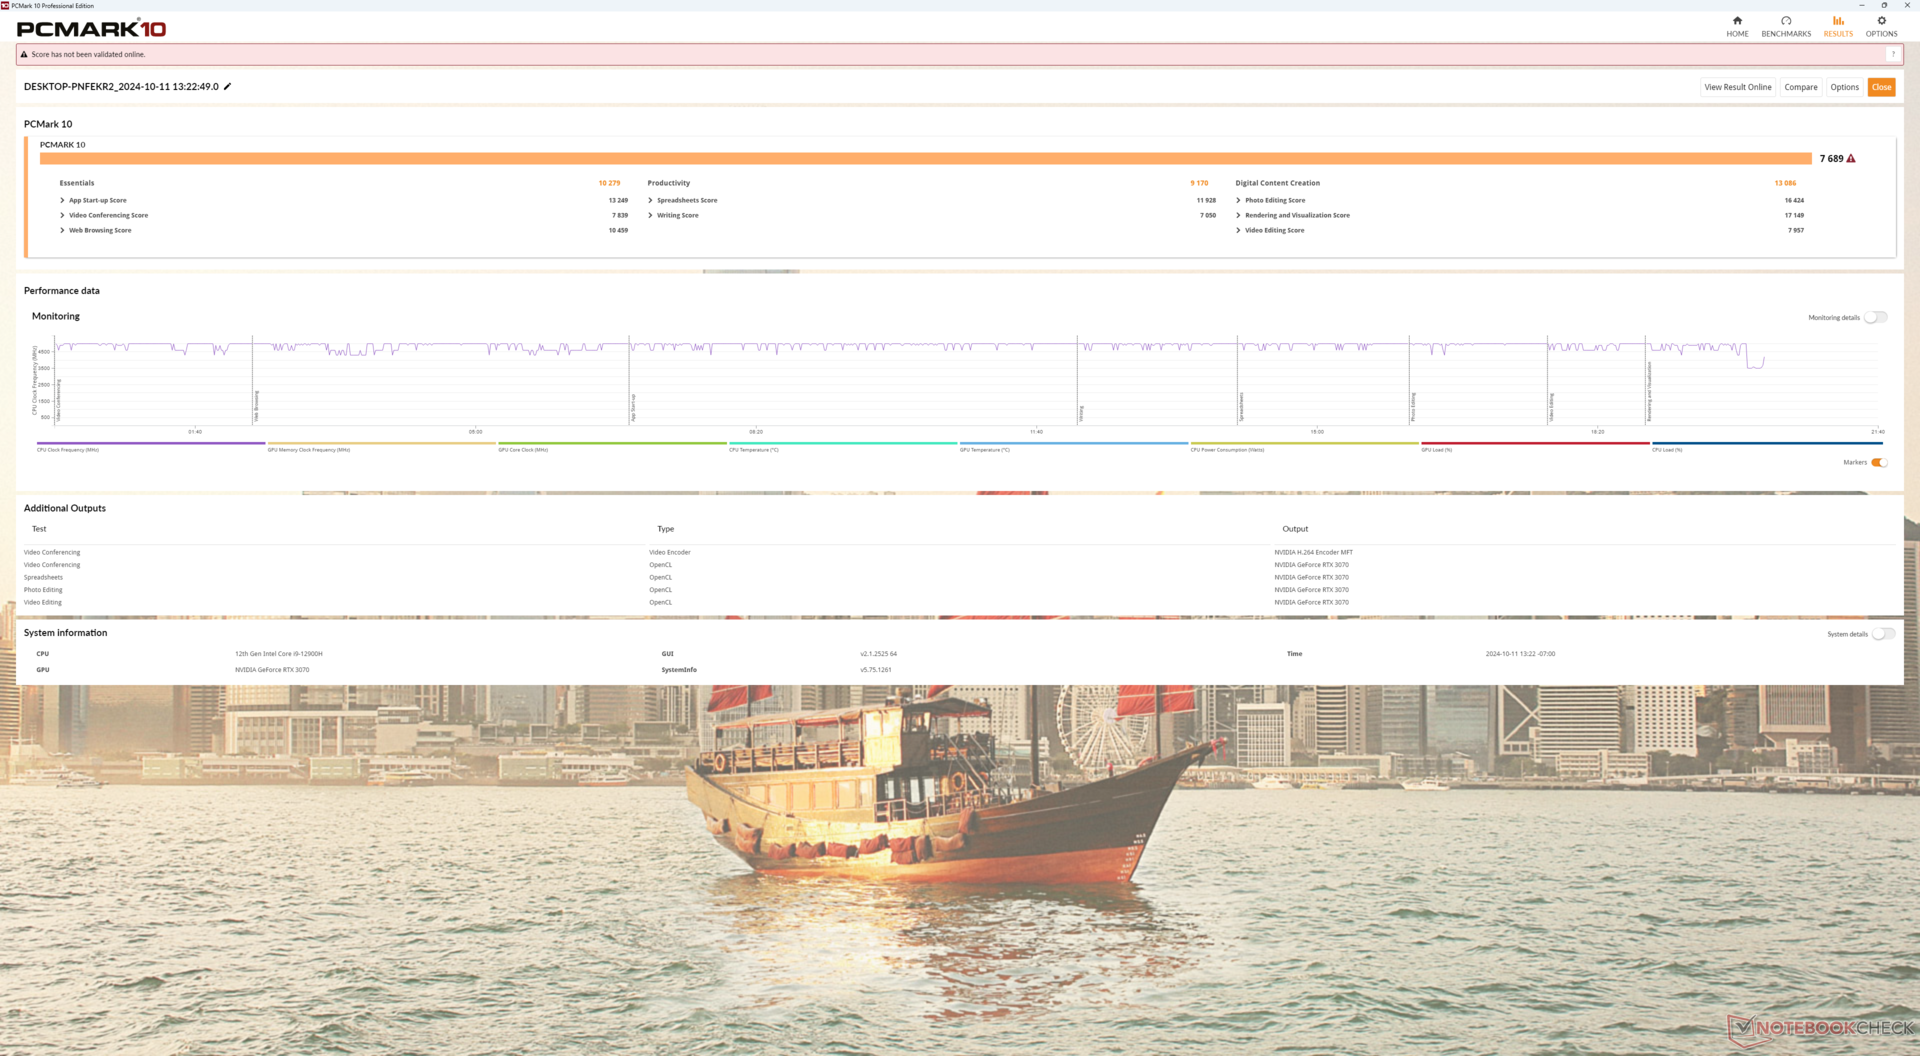
Os resultados do PCMark são comparáveis aos de laptops e outros mini PCs com gráficos discretos, incluindo o Asus ROG NUC 14. No entanto, nossa pontuação de produtividade é relativamente baixa, provavelmente devido à CPU Intel de 12ª geração mais antiga.
CrossMark: Overall | Productivity | Creativity | Responsiveness
WebXPRT 3: Overall
WebXPRT 4: Overall
Mozilla Kraken 1.1: Total
* ... menor é melhor
| PCMark 10 Score | 7689 pontos | |
Ajuda | ||
| AIDA64 / Memory Copy | |
| Asus ROG NUC 14-90AS0051 | |
| Asus NUC 14 Pro | |
| Geekom AX8 Pro | |
| GMK NucBox K9 | |
| Minisforum MS-A1 | |
| Beelink GTI12 Ultra EX Docking Station | |
| Média Intel Core i9-12900H (34438 - 74264, n=28) | |
| AIDA64 / Memory Read | |
| Asus NUC 14 Pro | |
| Asus ROG NUC 14-90AS0051 | |
| GMK NucBox K9 | |
| Beelink GTI12 Ultra EX Docking Station | |
| Média Intel Core i9-12900H (36365 - 74642, n=28) | |
| Geekom AX8 Pro | |
| Minisforum MS-A1 | |
| AIDA64 / Memory Write | |
| Geekom AX8 Pro | |
| Minisforum MS-A1 | |
| Asus NUC 14 Pro | |
| GMK NucBox K9 | |
| Asus ROG NUC 14-90AS0051 | |
| Beelink GTI12 Ultra EX Docking Station | |
| Média Intel Core i9-12900H (32276 - 67858, n=28) | |
| AIDA64 / Memory Latency | |
| Asus ROG NUC 14-90AS0051 | |
| GMK NucBox K9 | |
| Asus NUC 14 Pro | |
| Geekom AX8 Pro | |
| Beelink GTI12 Ultra EX Docking Station | |
| Minisforum MS-A1 | |
| Média Intel Core i9-12900H (74.7 - 118.1, n=27) | |
* ... menor é melhor
Latência DPC
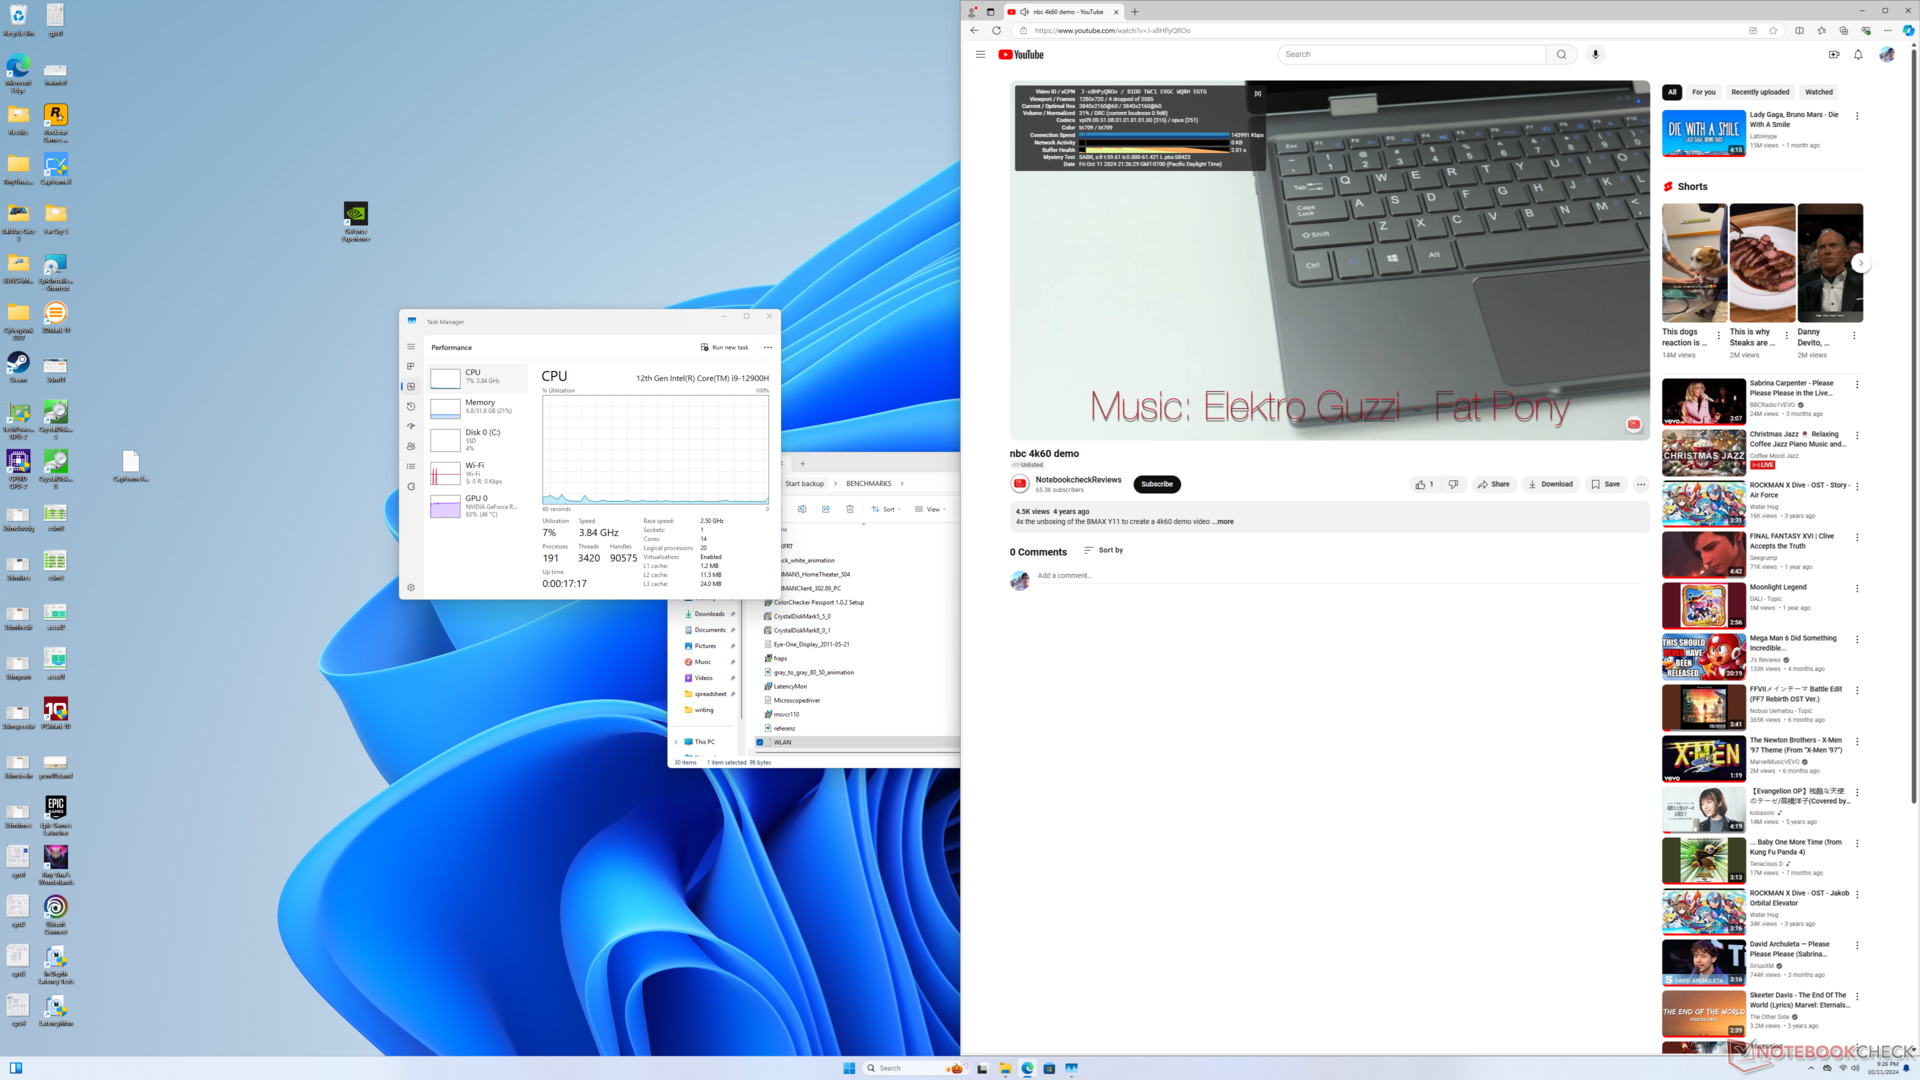
a reprodução de vídeo 4K a 60 FPS é quase perfeita. Estranhamente, sempre há alguns quadros pulados imediatamente após pressionar o botão Play, o que normalmente não ocorre em outros PCs. Caso contrário, não há quadros pulados durante o restante do vídeo de teste.
O LatencyMon é incompatível com a versão atual do sistema.
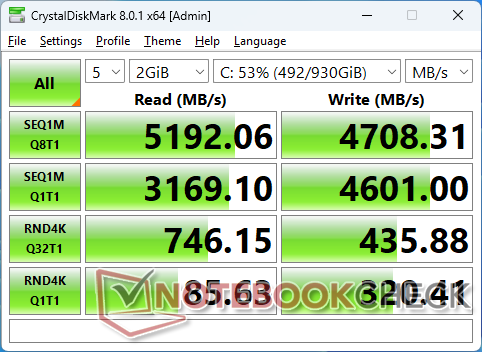
Dispositivos de armazenamento
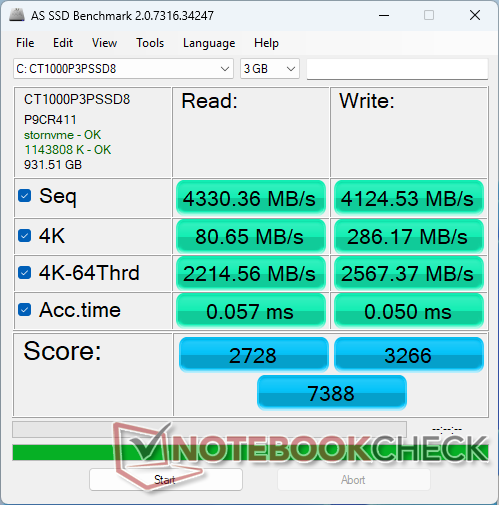
Nossa unidade vem com um SSD Crucial P3 Plus de 1 TB Crucial P3 Plus SSD. As taxas máximas de transferência atingem 5200 MB/s antes de cair para 4800 MB/s após alguns minutos de estresse. O Samsung PM9A1a mais rápido no Asus NUC 14 pode sustentar 6700 MB/s em comparação.

| Drive Performance Rating - Percent | |
| Beelink GTI12 Ultra EX Docking Station | |
| GMK NucBox K9 | |
| Minisforum MS-A1 | |
| Geekom AX8 Pro | |
| Asus ROG NUC 14-90AS0051 | |
| Asus NUC 14 Pro | |
* ... menor é melhor
Disk Throttling: DiskSpd Read Loop, Queue Depth 8
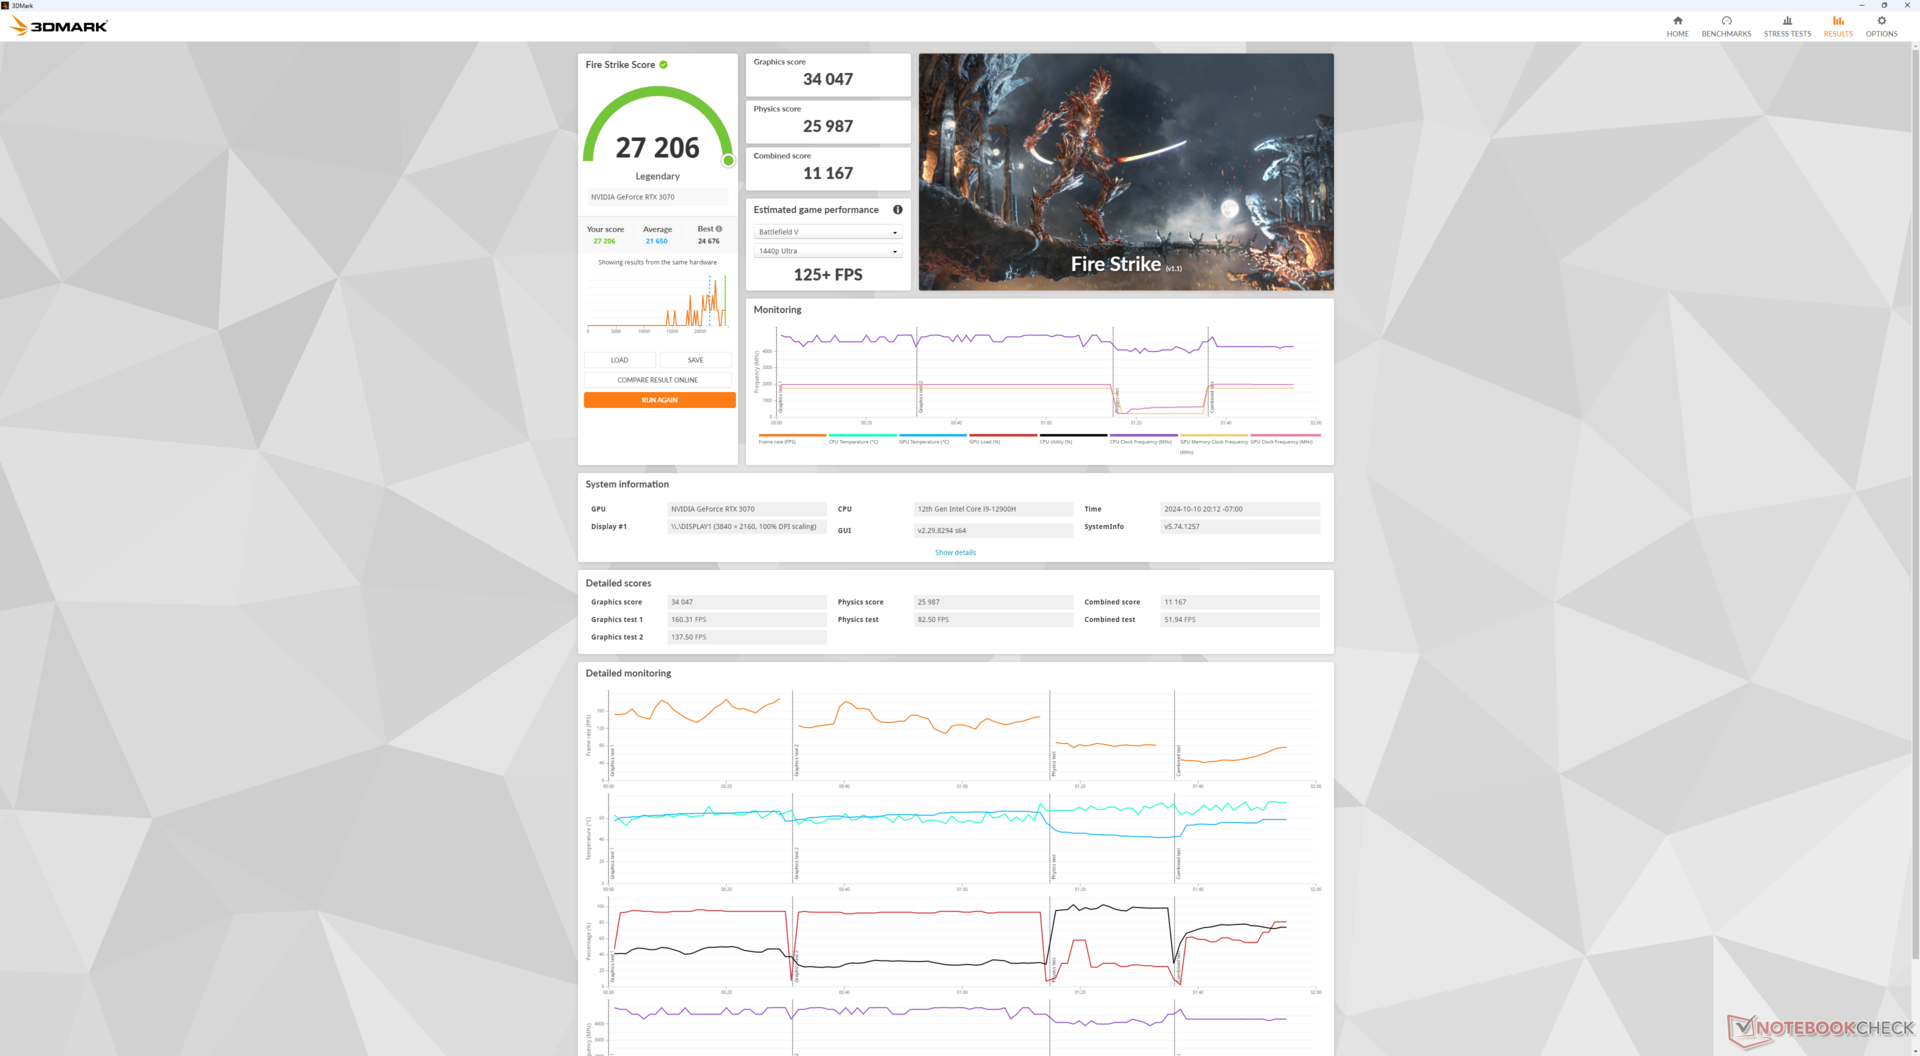
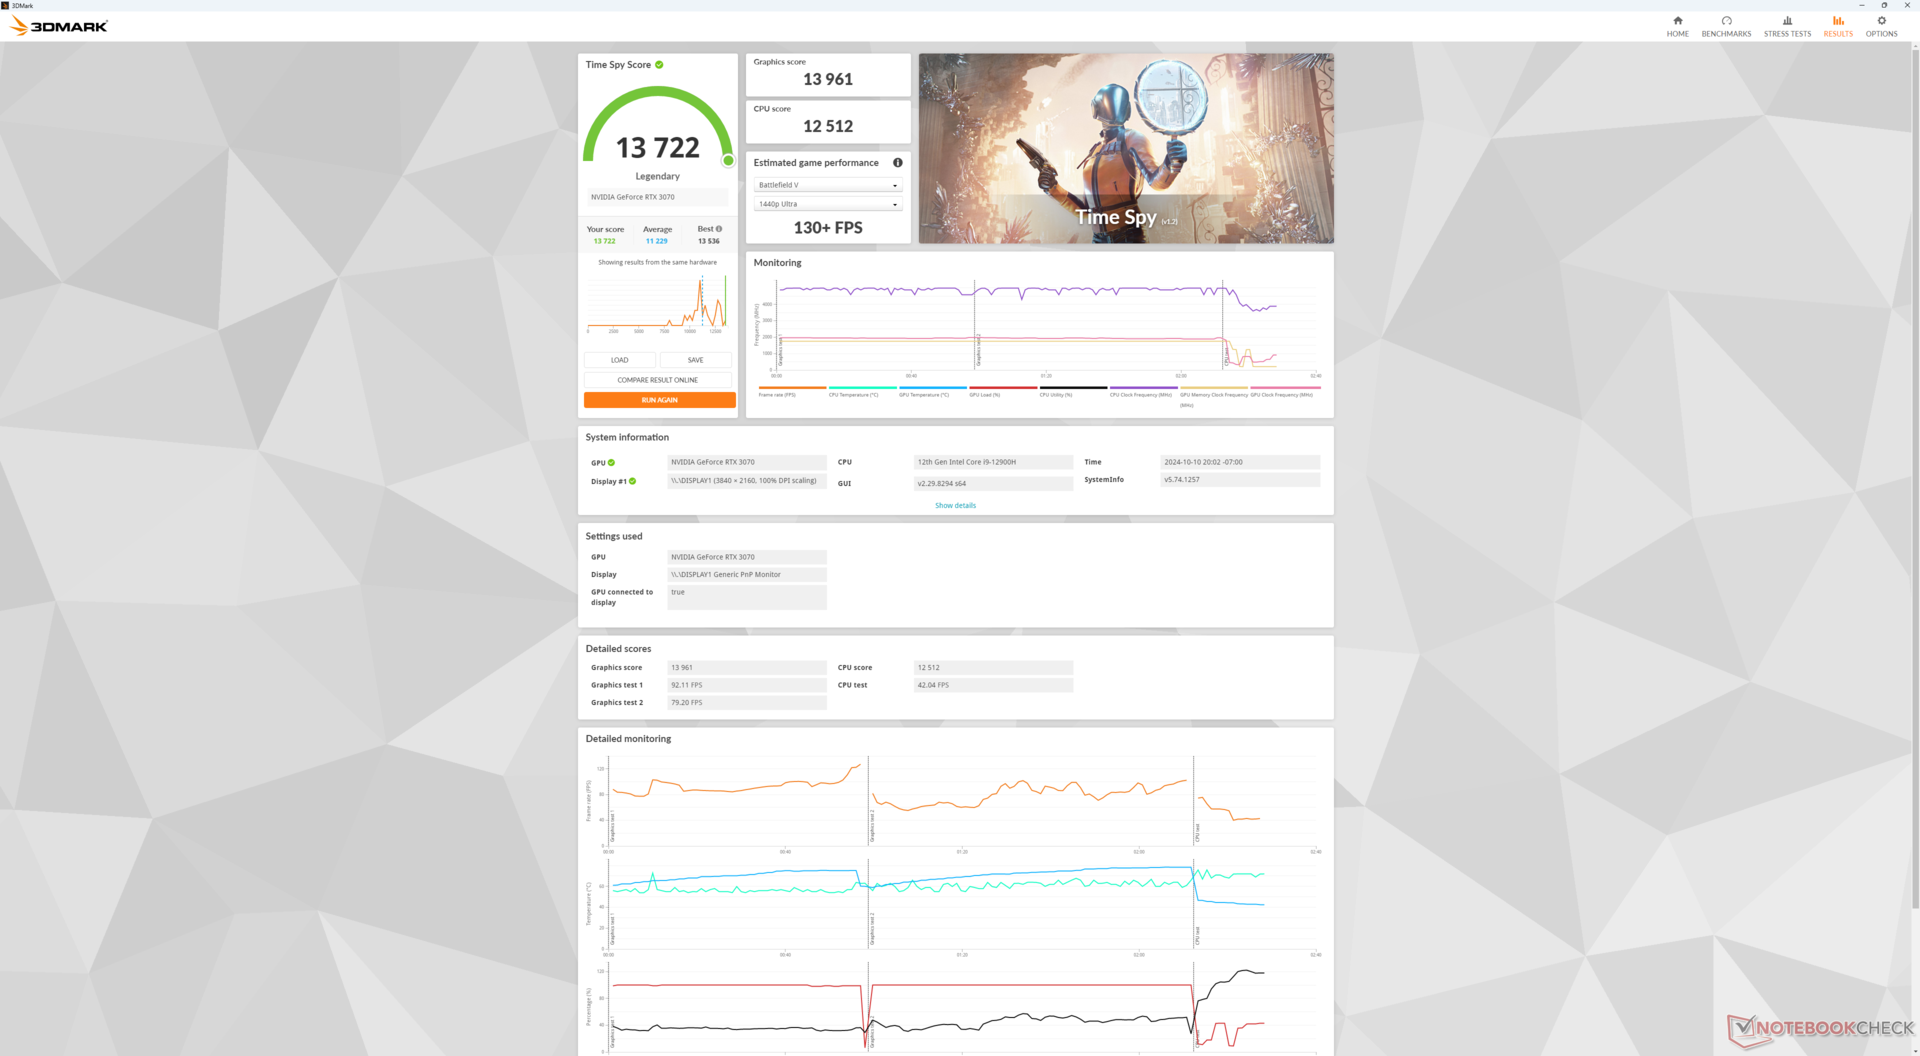
Desempenho da GPU
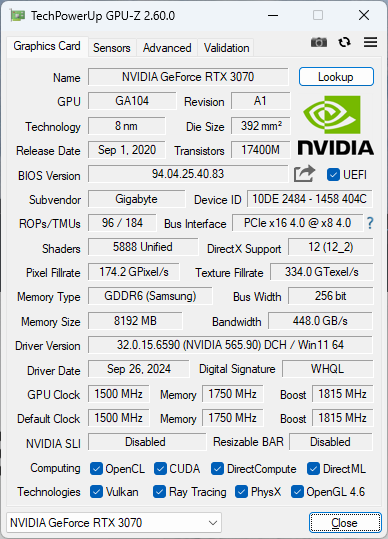
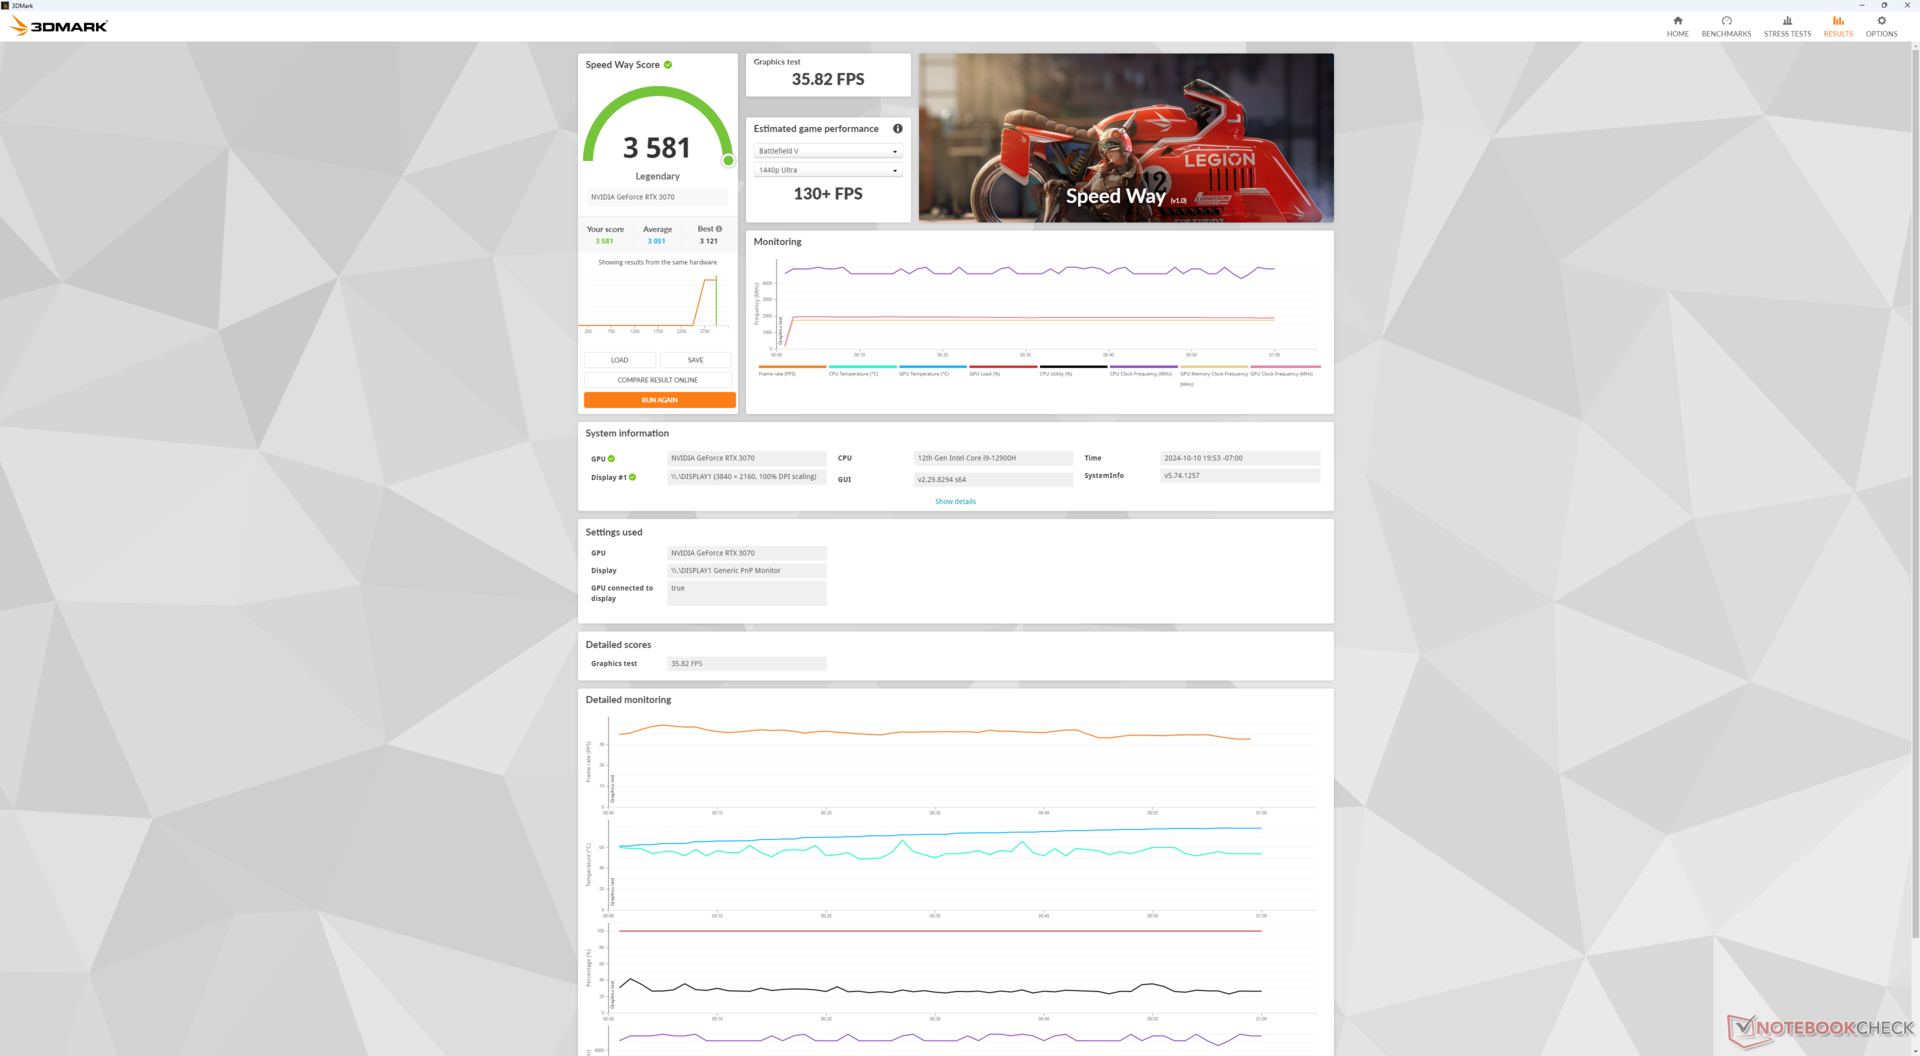
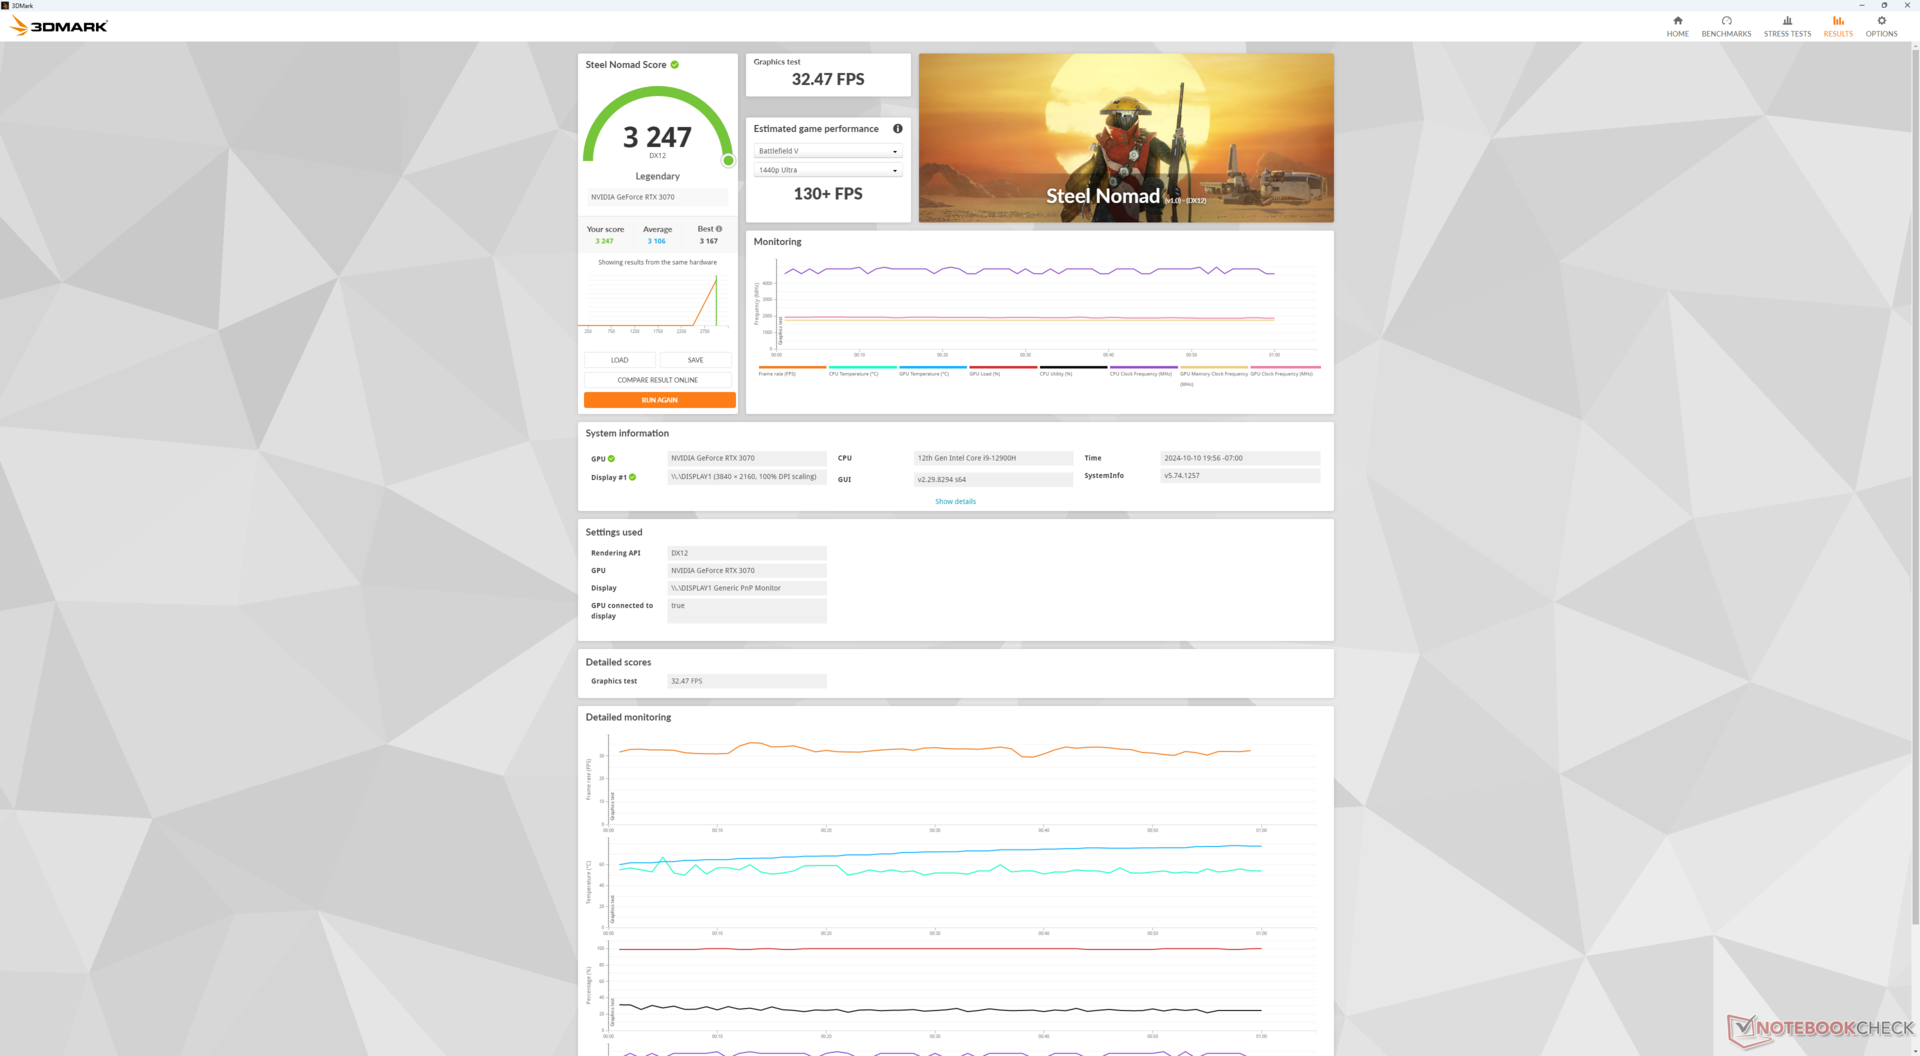
A GeForce RTX 3070 foi testado exaustivamente e, portanto, seu desempenho não oferece surpresas. Em vez disso, estamos interessados em qualquer déficit de desempenho que nosso RTX 3070 acoplado possa ter em relação a um PC desktop "adequado" com o RTX 3070. Nesse caso, o desempenho está essencialmente no mesmo nível do nosso PC desktop RTX 3070 de referência ou até mesmo um pouco mais rápido em alguns pontos percentuais para não mostrar perdas tangíveis de desempenho. Obviamente, os resultados podem variar se o senhor instalar GPUs muito mais rápidas, como a RTX 4090, em que a interface PCIe x8 pode se tornar um fator mais limitante.
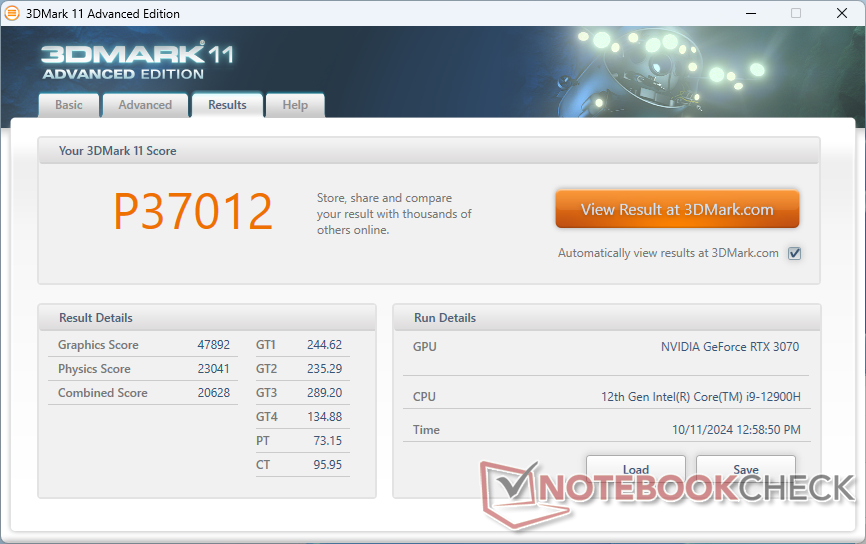
| 3DMark 11 Performance | 37012 pontos | |
| 3DMark Cloud Gate Standard Score | 57634 pontos | |
| 3DMark Fire Strike Score | 27206 pontos | |
| 3DMark Time Spy Score | 13722 pontos | |
| 3DMark Steel Nomad Score | 3247 pontos | |
Ajuda | ||
* ... menor é melhor
Desempenho em jogos
Apesar de ser uma GPU com quatro anos de idade (!), o desktop GeForce RTX 3070 ainda é potente, especialmente quando comparado a laptops para jogos em que os envelopes de energia são muito menores. Nossa GTI12 Ultra e a eGPU de sua escolha podem superar com folga os laptops com a GeForce RTX 4070, como a Maingear ML-16 MK2 para ficar mais alinhado com a rTX 4080 móvel. Observe que isso é feito antes de contabilizar qualquer método de upscaling DLSS e, portanto, a série RTX 40 móvel ainda pode funcionar melhor se o título for compatível com DLSS 3.
| GTA V - 1920x1080 Highest Settings possible AA:4xMSAA + FX AF:16x | |
| Lenovo Legion 9 16IRX9, RTX 4090 | |
| Acemagic M2A | |
| Beelink GTI12 Ultra EX Docking Station | |
| Acemagic Tank03 | |
| Asus TUF Gaming A14 FA401WV-WB94 | |
| MSI GeForce RTX 3070 Ventus 3X | |
| Asus ROG NUC 14-90AS0051 | |
| Minisforum G7 PT | |
| Lenovo IdeaPad Pro 5 16IMH G9 RTX 4050 | |
| Cyberpunk 2077 2.2 Phantom Liberty - 1920x1080 Ultra Preset (FSR off) | |
| Lenovo Legion 9 16IRX9, RTX 4090 | |
| Beelink GTI12 Ultra EX Docking Station | |
| Minisforum G7 PT | |
| Asus ROG NUC 14-90AS0051 | |
| Acemagic M2A | |
| Acemagic Tank03 | |
| Asus TUF Gaming A14 FA401WV-WB94 | |
| Lenovo IdeaPad Pro 5 16IMH G9 RTX 4050 | |
Cyberpunk 2077 ultra FPS Chart
| baixo | média | alto | ultra | QHD | 4K | |
|---|---|---|---|---|---|---|
| GTA V (2015) | 184.3 | 178.9 | 176.5 | 111.3 | 108.8 | 129 |
| Dota 2 Reborn (2015) | 175.9 | 162 | 158.5 | 149.3 | 144.3 | |
| Final Fantasy XV Benchmark (2018) | 209 | 184.8 | 138.7 | 104.9 | 61.5 | |
| X-Plane 11.11 (2018) | 118.2 | 106.1 | 89.5 | 79.4 | ||
| Far Cry 5 (2018) | 170 | 154 | 148 | 142 | 130 | 75 |
| Strange Brigade (2018) | 459 | 339 | 280 | 245 | 181.1 | 104.6 |
| Tiny Tina's Wonderlands (2022) | 268.9 | 216.7 | 154.9 | 122.6 | 87.1 | 48.9 |
| F1 22 (2022) | 282 | 277 | 264 | 91.8 | 58.8 | 28.8 |
| Baldur's Gate 3 (2023) | 174.5 | 152.6 | 137.1 | 132.9 | 93.5 | 49.7 |
| Cyberpunk 2077 2.2 Phantom Liberty (2023) | 148.5 | 133.9 | 115.3 | 102.2 | 65.7 | 29.9 |
Emissões
Ruído do sistema
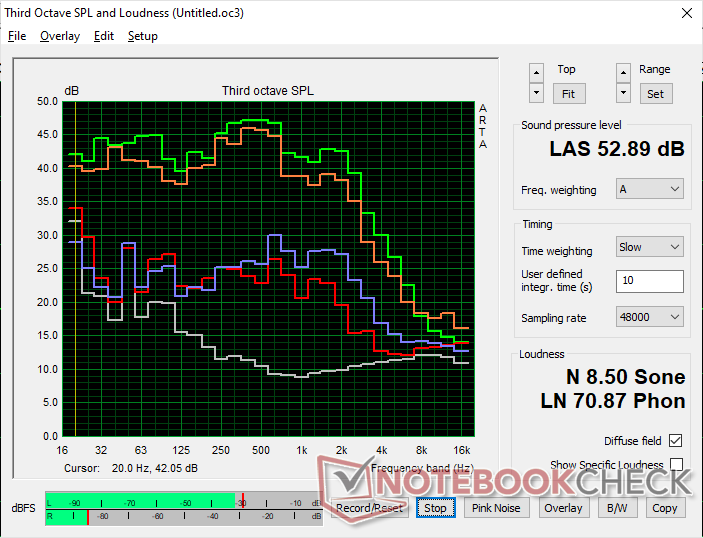
O ruído da ventoinha está sempre presente, pois a ventoinha interna da PSU no dock EX está sempre ativa, mesmo que as ventoinhas do mini PC e da GPU estejam inativas. Em geral, os níveis de ruído são mais altos do que na maioria dos outros minicomputadores, considerando a mesma distância de gravação de 15 cm, mas a curva de ruído é mais ampla e não tão acentuada como a que estamos acostumados. As frequências de dB mais baixas são menos intrusivas e mais toleráveis do que as ventoinhas geralmente mais agudas e altas dos laptops para jogos.
Barulho
| Ocioso |
| 32.7 / 32.7 / 35.3 dB |
| Carga |
| 36.8 / 52.9 dB |
 | ||
30 dB silencioso 40 dB(A) audível 50 dB(A) ruidosamente alto |
||
min: | ||
| Beelink GTI12 Ultra EX Docking Station NVIDIA GeForce RTX 3070, i9-12900H, Crucial P3 Plus CT1000P3PSSD8 | Minisforum MS-A1 Radeon 780M, Ryzen 7 8700G, Kingston OM8PGP41024Q-A0 | GMK NucBox K9 Arc 7-Core, Ultra 5 125H, MasonSemi 1TB MC7000 | Asus NUC 14 Pro Arc 7-Core, Ultra 5 125H, Kingston KC3000 2048G SKC3000D2048G | Geekom AX8 Pro Radeon 780M, R9 8945HS, Acer N7000 2 TB | Asus ROG NUC 14-90AS0051 NVIDIA GeForce RTX 4070 Laptop GPU, Ultra 9 185H, Samsung PM9A1a MZVL21T0HDLU | |
|---|---|---|---|---|---|---|
| Noise | 1% | 2% | 9% | 5% | 15% | |
| desligado / ambiente * | 22.8 | 24.8 -9% | 23 -1% | 24 -5% | 24.9 -9% | 24.9 -9% |
| Idle Minimum * | 32.7 | 33.9 -4% | 29.8 9% | 26 20% | 24.9 24% | 24.9 24% |
| Idle Average * | 32.7 | 34 -4% | 35.7 -9% | 26.2 20% | 24.9 24% | 24.9 24% |
| Idle Maximum * | 35.3 | 34 4% | 35.7 -1% | 26.2 26% | 24.9 29% | 24.9 29% |
| Load Average * | 36.8 | 41.1 -12% | 41.9 -14% | 42.4 -15% | 50.1 -36% | 37.9 -3% |
| Cyberpunk 2077 ultra * | 50.3 | 42.2 16% | 43.8 13% | 47.7 5% | 50 1% | 38.3 24% |
| Load Maximum * | 52.9 | 46.2 13% | 44 17% | 47.8 10% | 50.2 5% | 44.2 16% |
* ... menor é melhor
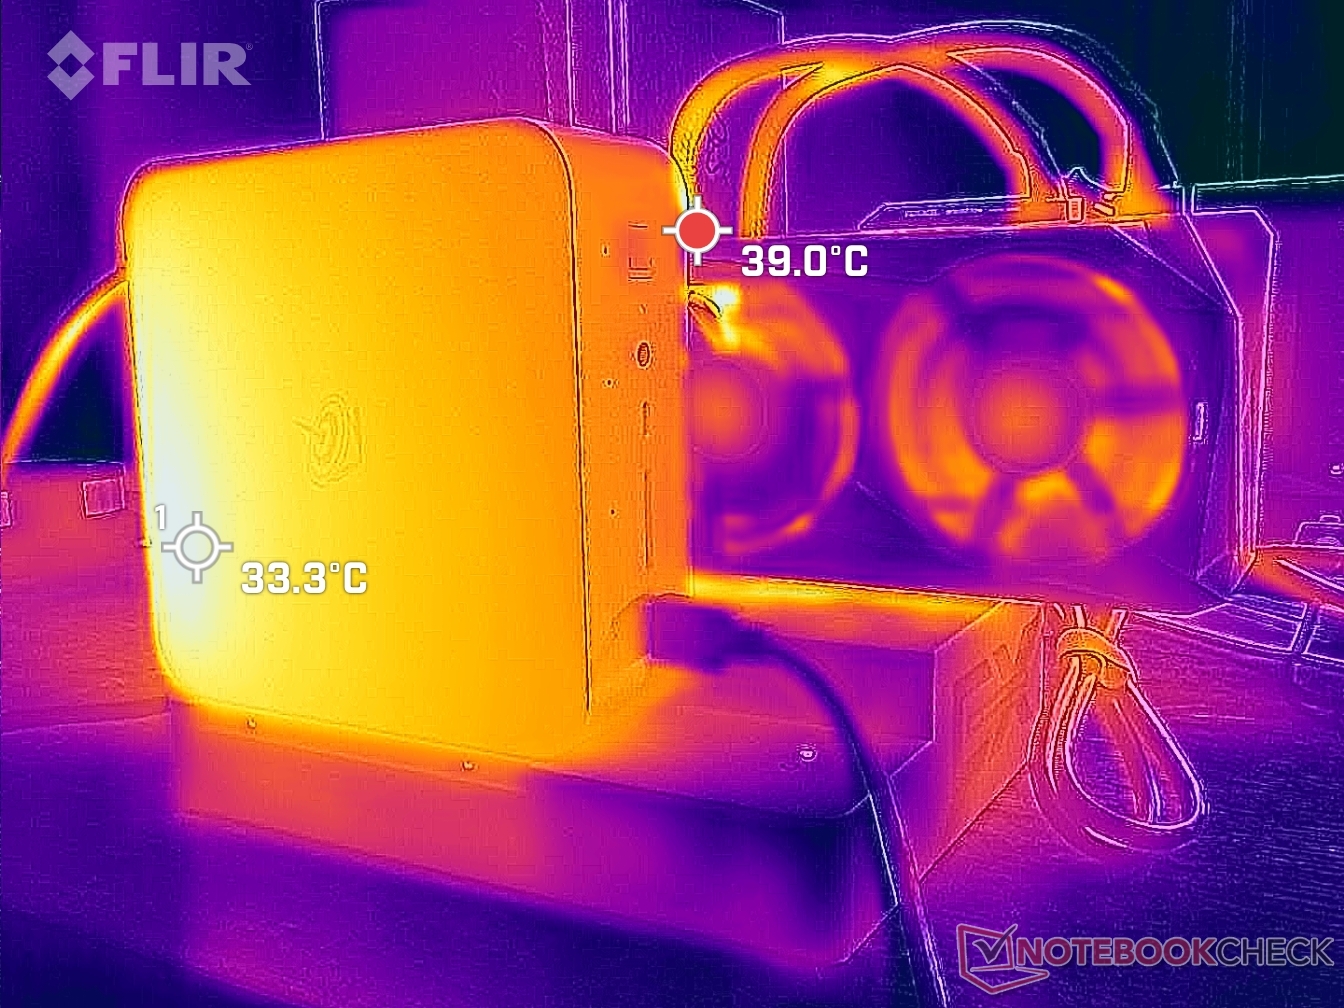
Temperatura
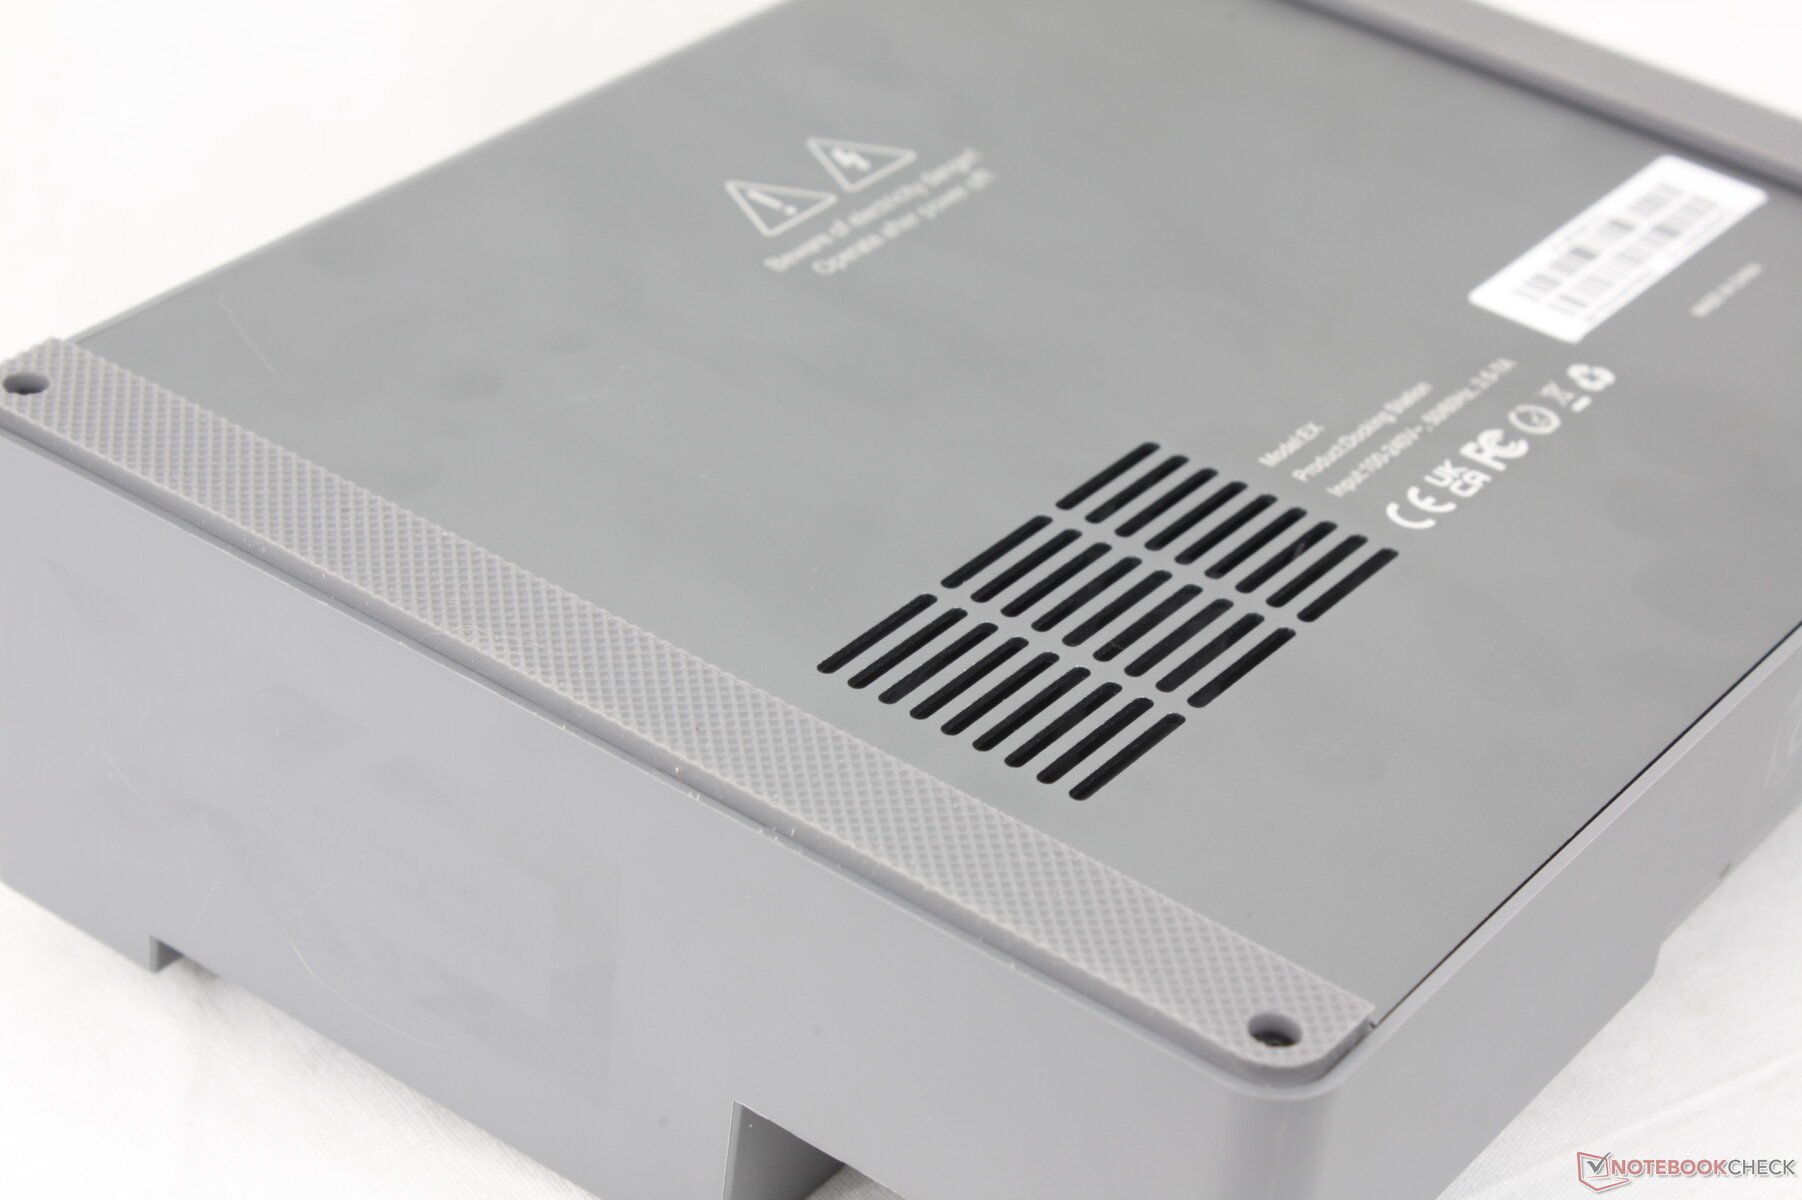
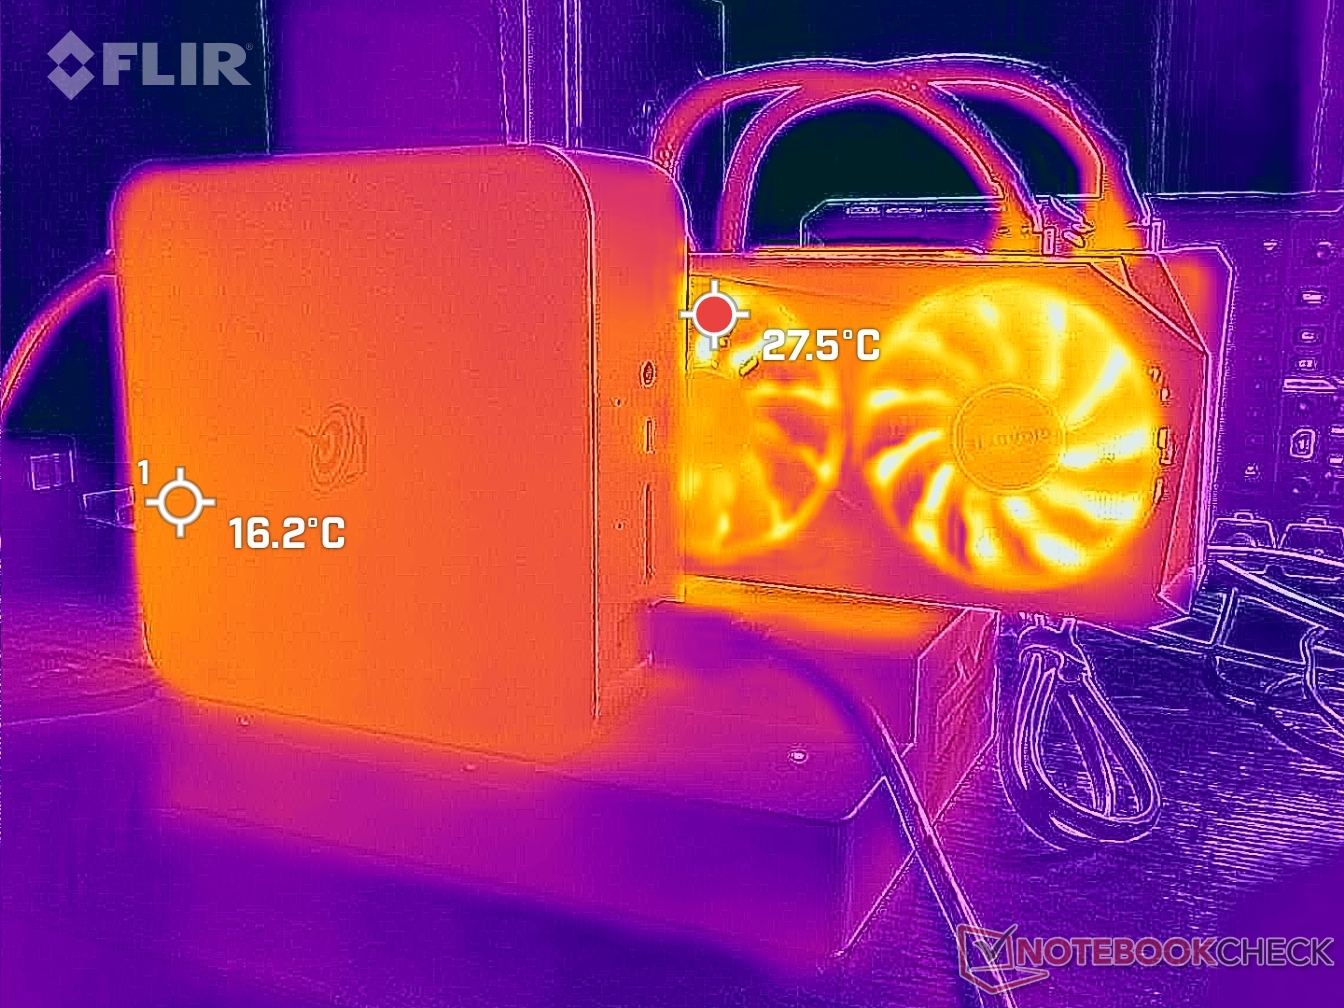
A superfície superior do minicomputador pode atingir cerca de 34 °C durante os jogos ou mais de 41 °C quando a CPU está sendo utilizada em 100%, o que o torna mais quente do que muitos outros minicomputadores. Isso ocorre principalmente porque a unidade integra toda a PSU dentro do chassi e não inclui grades de ventilação nas laterais.
Teste de estresse
A CPU aumentaria para 3,2 GHz e 69 W ao iniciar o estresse do Prime95. No entanto, após cerca de um a dois minutos, ela cairia para 2,9 GHz e 61 W para manter uma temperatura central razoável de 78 C. Infelizmente, o Turbo Boost máximo não é indefinido, apesar do tamanho grande do chassi, mas pelo menos a queda no desempenho é relativamente pequena.
A temperatura do núcleo se estabilizaria em 83 °C durante os jogos, o que é mais quente do que o esperado para um mini PC.
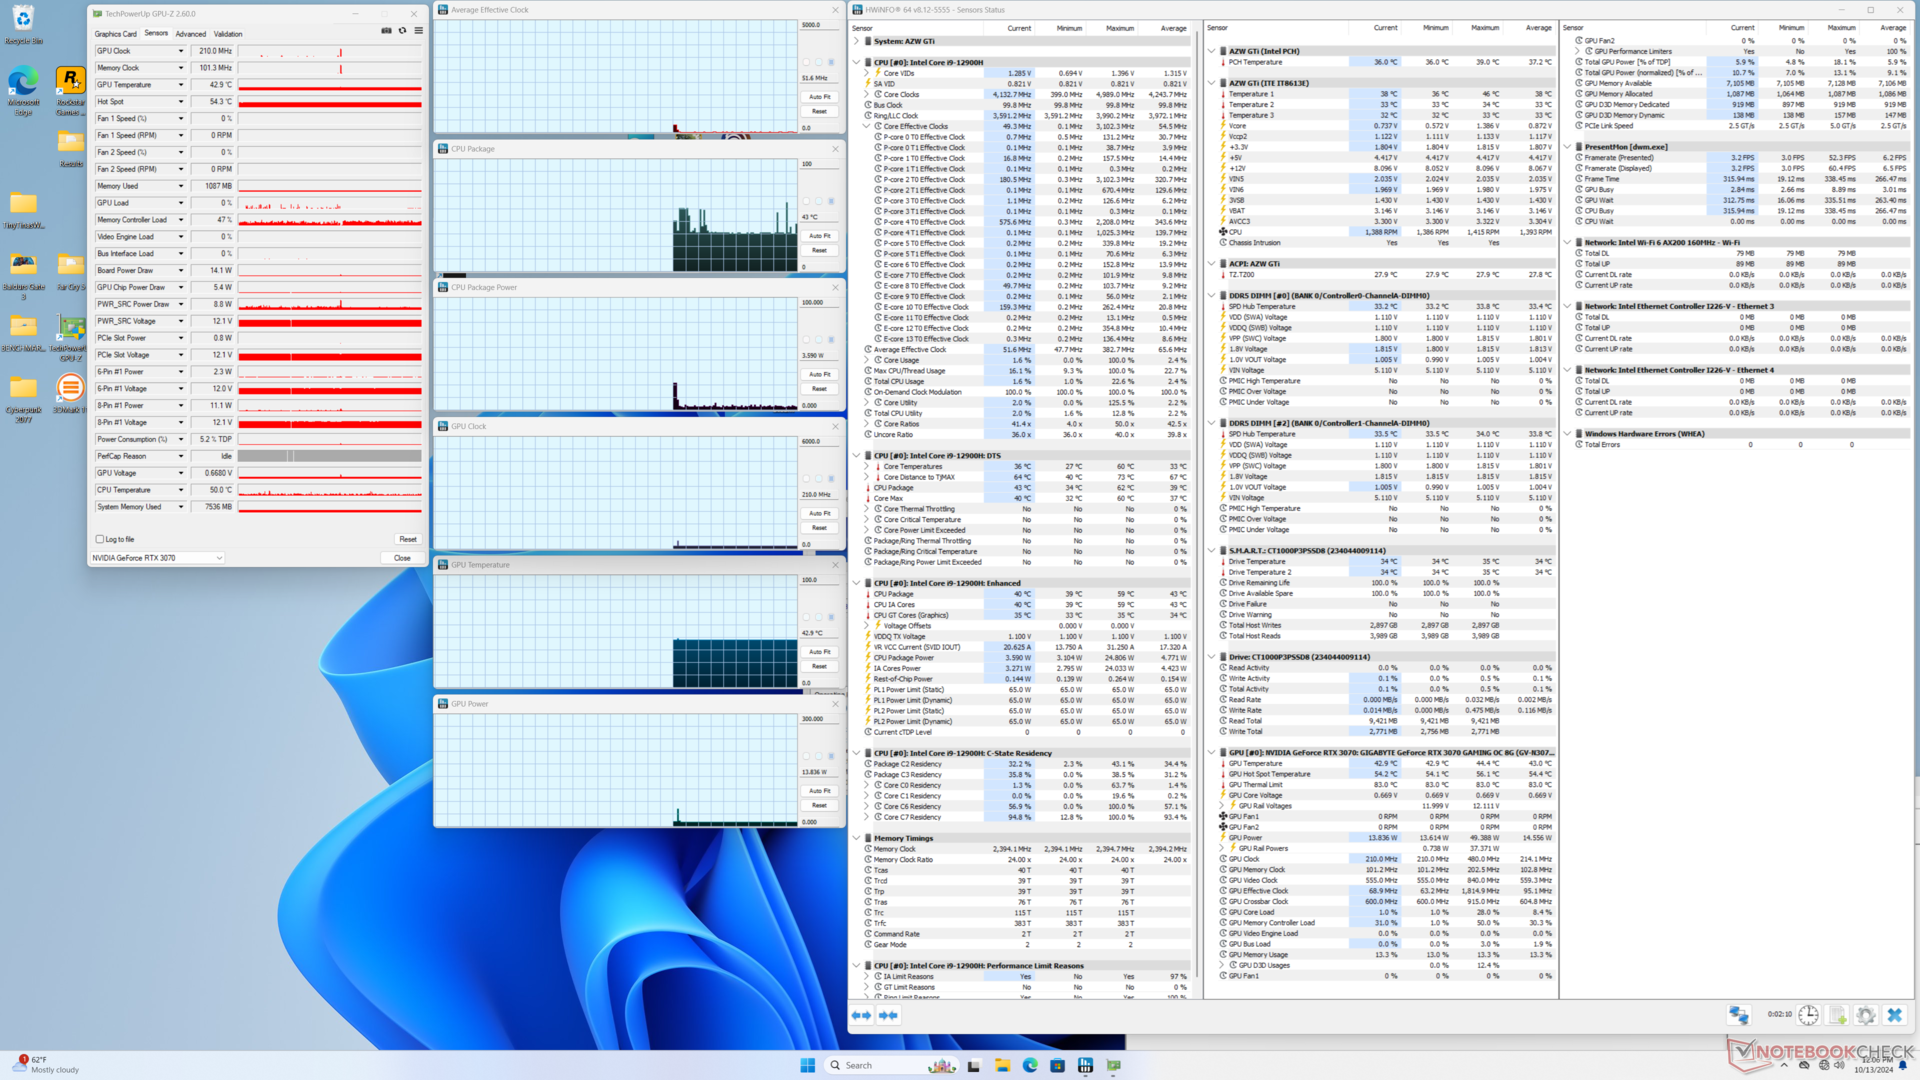
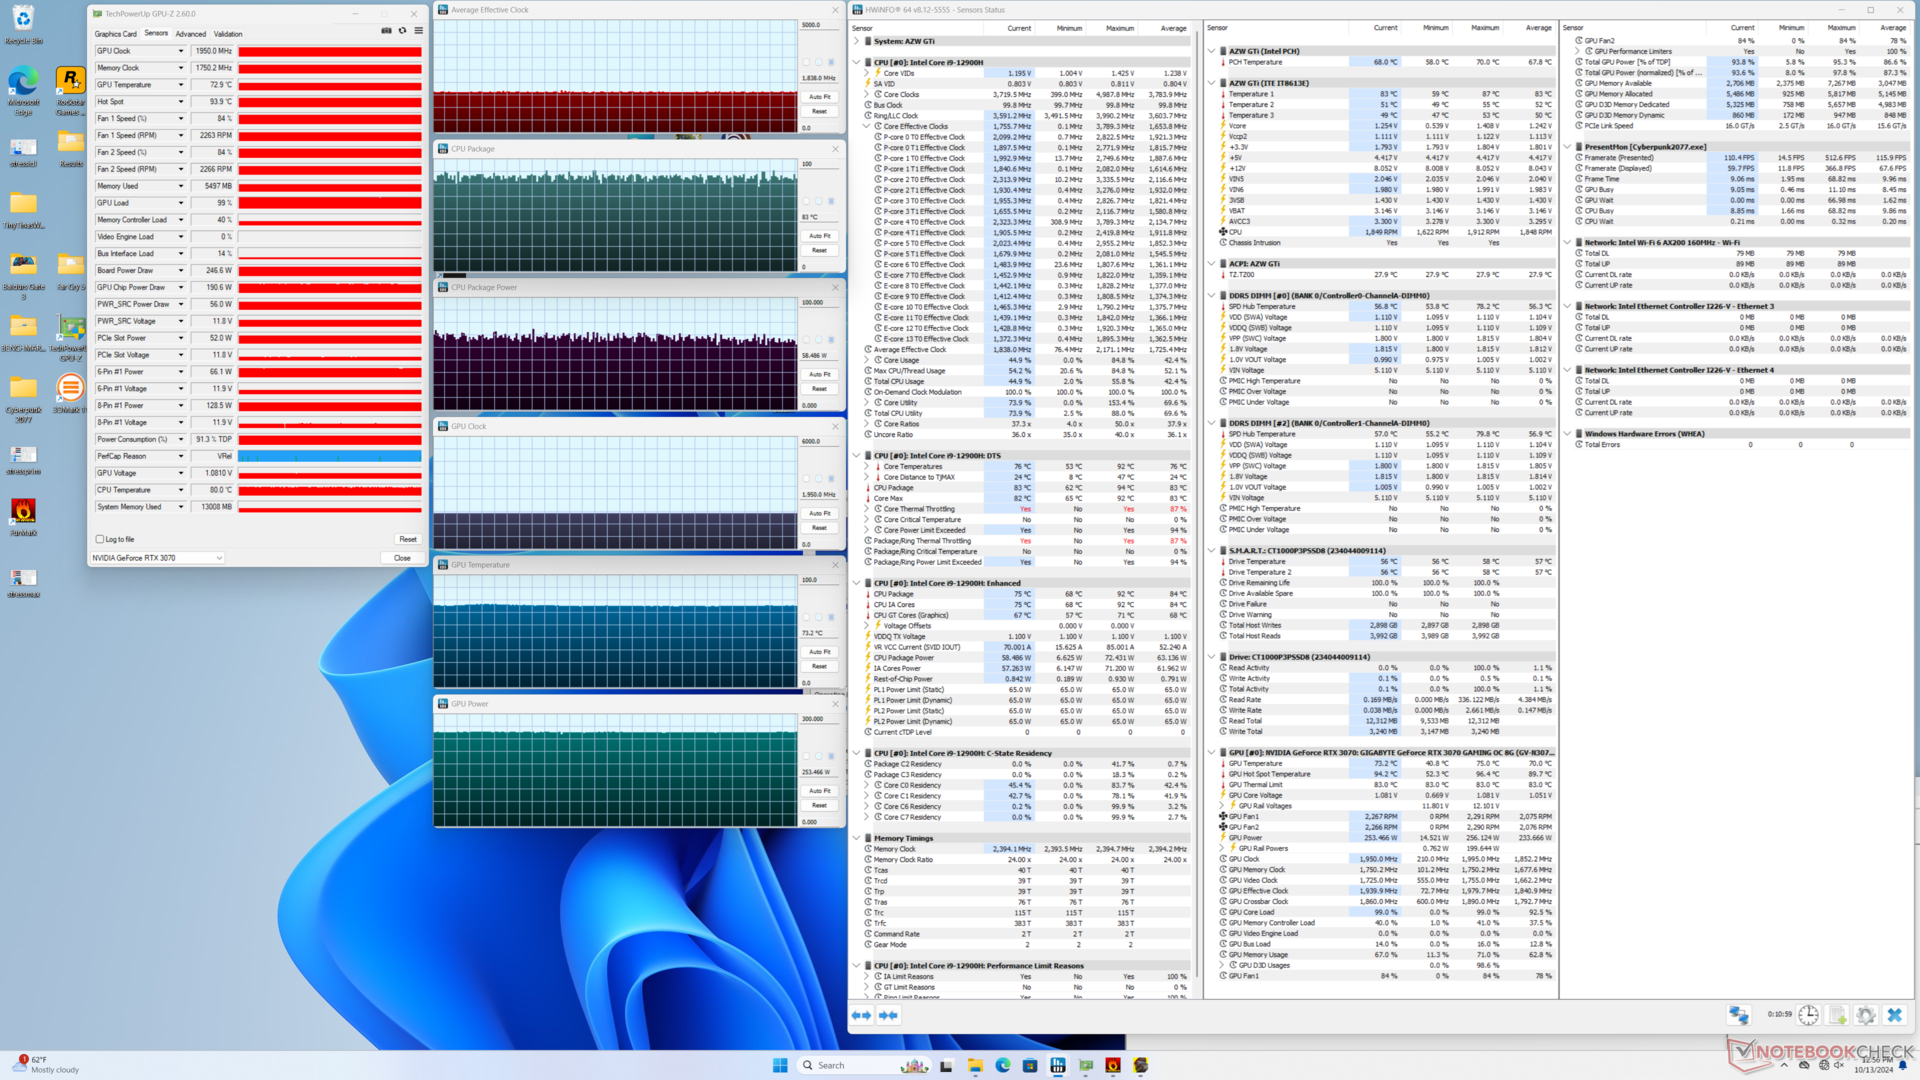
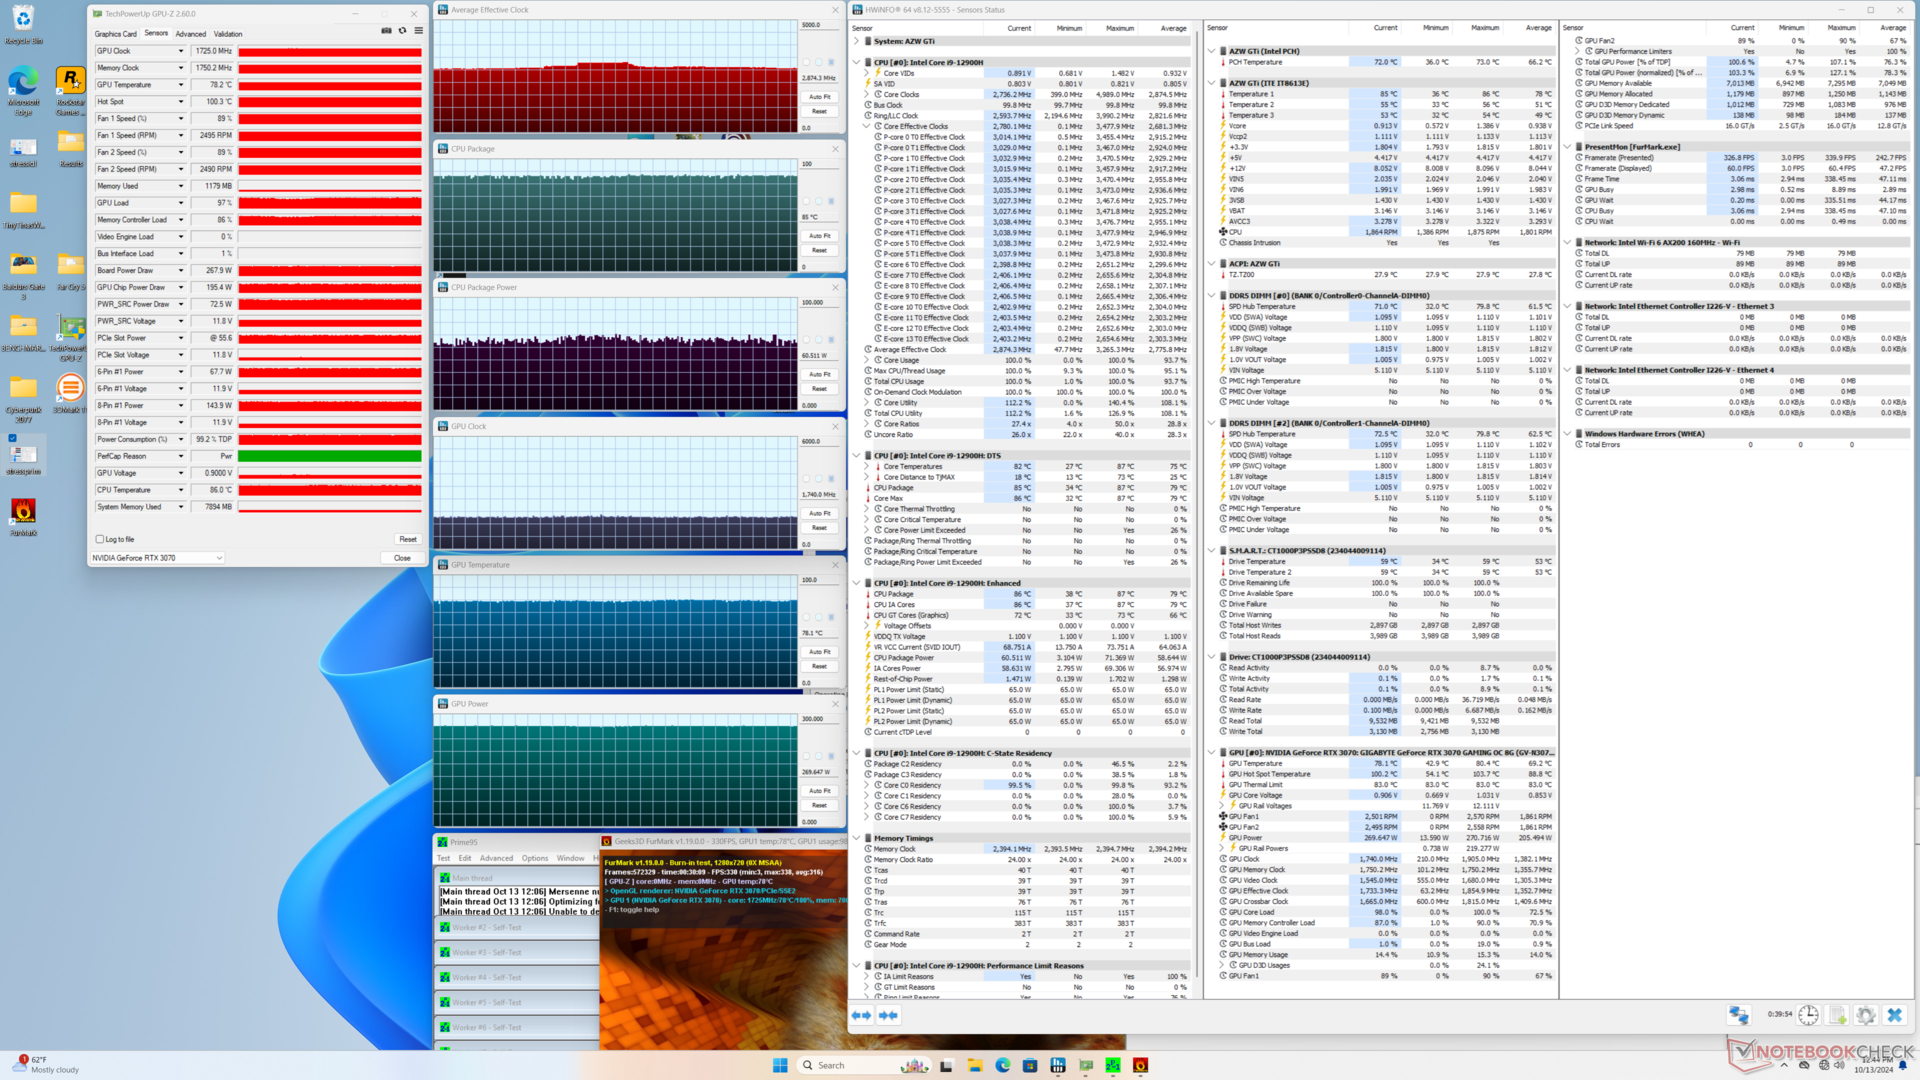
| Clock médio da CPU (GHz) | Clock da GPU (MHz) | Temperatura média da CPU (°C) | Temperatura média da GPU (°C) | |
| Sistema ocioso | -- | -- | 40 | 43 |
| Estresse do Prime95 | 2.9 | -- | 78 | 43 |
| Prime95 + FurMark Stress | 2.9 | 1725 | 85 | 78 |
| Cyberpunk 2077 Stress | 1.8 | 1950 | 83 | 73 |
Alto-falantes
Os alto-falantes internos não são muito altos nem impressionantes, muito parecido com o que experimentamos no recente Bosgame. Eles são mais adequados para funções auxiliares, como conferências ou salas pequenas, onde a qualidade do áudio não é tão importante. Os alto-falantes externos adequados ainda são recomendados para qualquer tipo de reprodução de multimídia.
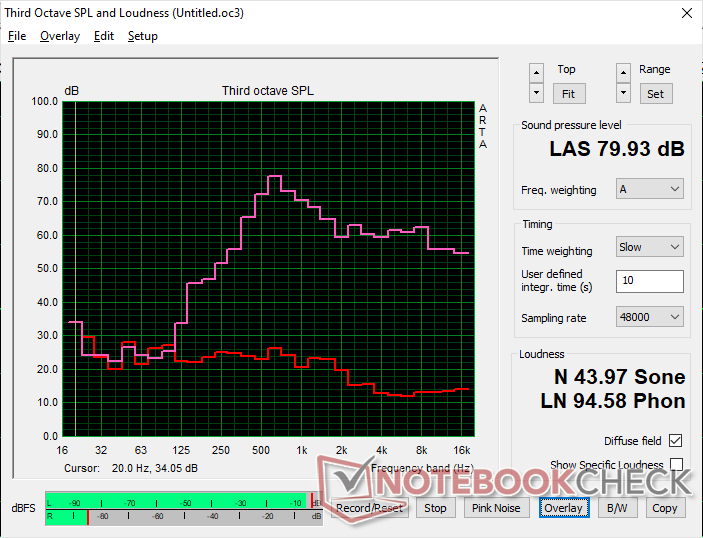
Beelink GTI12 Ultra EX Docking Station análise de áudio
(±) | o volume do alto-falante é médio, mas bom (###valor### dB)
Graves 100 - 315Hz
(-) | quase nenhum baixo - em média 17.1% menor que a mediana
(±) | a linearidade dos graves é média (14.3% delta para a frequência anterior)
Médios 400 - 2.000 Hz
(±) | médios mais altos - em média 8.9% maior que a mediana
(±) | a linearidade dos médios é média (13% delta para frequência anterior)
Altos 2 - 16 kHz
(+) | agudos equilibrados - apenas 1.7% longe da mediana
(+) | os máximos são lineares (6.7% delta da frequência anterior)
Geral 100 - 16.000 Hz
(±) | a linearidade do som geral é média (24.2% diferença em relação à mediana)
Comparado com a mesma classe
» 58% de todos os dispositivos testados nesta classe foram melhores, 11% semelhantes, 32% piores
» O melhor teve um delta de 13%, a média foi 25%, o pior foi 64%
Comparado com todos os dispositivos testados
» 71% de todos os dispositivos testados foram melhores, 6% semelhantes, 23% piores
» O melhor teve um delta de 4%, a média foi 24%, o pior foi 134%
Apple MacBook Pro 16 2021 M1 Pro análise de áudio
(+) | os alto-falantes podem tocar relativamente alto (###valor### dB)
Graves 100 - 315Hz
(+) | bons graves - apenas 3.8% longe da mediana
(+) | o baixo é linear (5.2% delta para a frequência anterior)
Médios 400 - 2.000 Hz
(+) | médios equilibrados - apenas 1.3% longe da mediana
(+) | médios são lineares (2.1% delta para frequência anterior)
Altos 2 - 16 kHz
(+) | agudos equilibrados - apenas 1.9% longe da mediana
(+) | os máximos são lineares (2.7% delta da frequência anterior)
Geral 100 - 16.000 Hz
(+) | o som geral é linear (4.6% diferença em relação à mediana)
Comparado com a mesma classe
» 0% de todos os dispositivos testados nesta classe foram melhores, 0% semelhantes, 100% piores
» O melhor teve um delta de 5%, a média foi 18%, o pior foi 45%
Comparado com todos os dispositivos testados
» 0% de todos os dispositivos testados foram melhores, 0% semelhantes, 100% piores
» O melhor teve um delta de 4%, a média foi 24%, o pior foi 134%
Gerenciamento de energia
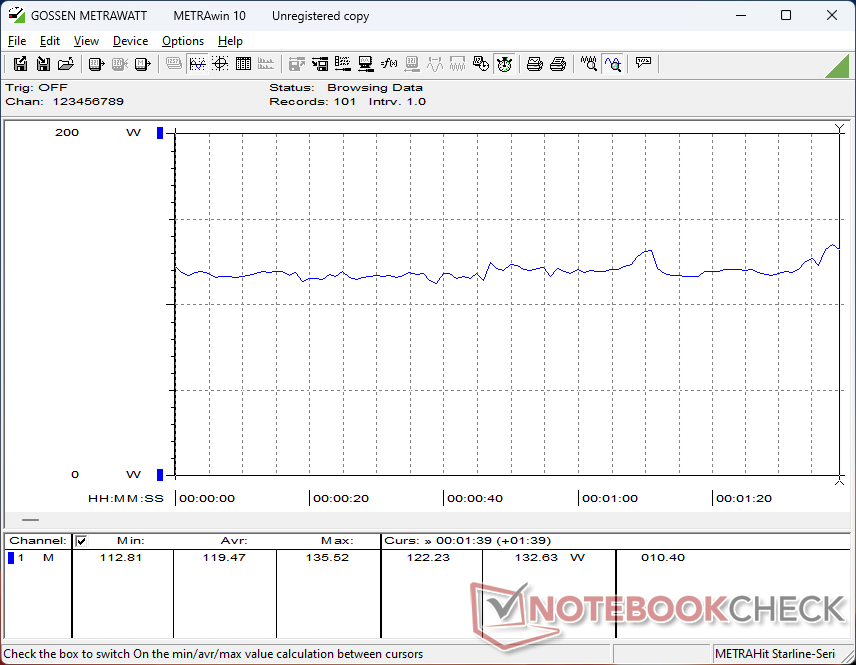
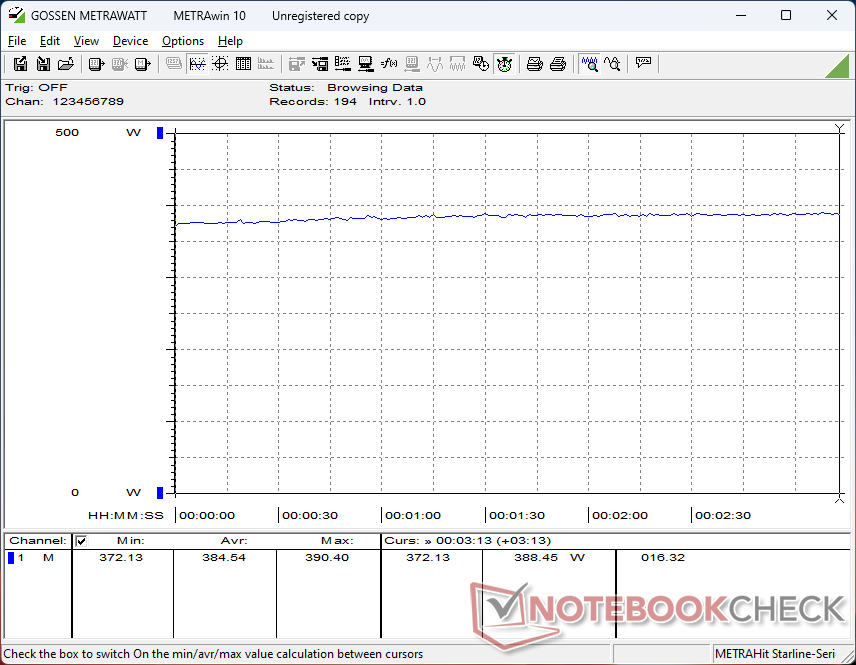
Consumo de energia
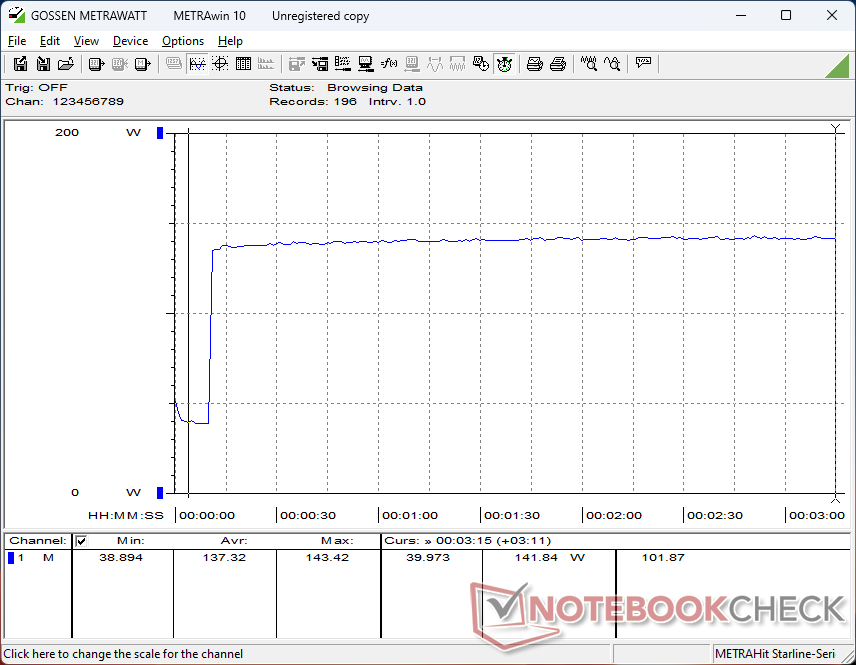
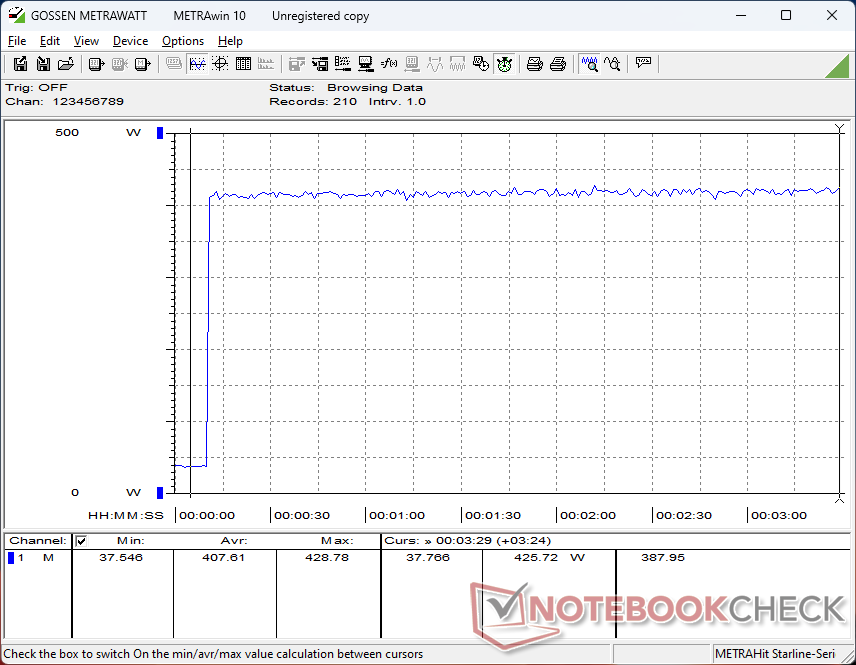
Espera-se que o GTI12 Ultra e a docking station EX sejam muito mais exigentes do que outros mini PCs, incluindo o Asus ROG NUC 14 e sua própria solução de docking RTX 4070. A marcha lenta no desktop já consome duas vezes mais energia do que na maioria dos laptops, enquanto os jogos podem exigir mais de 380 W, em comparação com 336 W no MSI Titan 18 HX que é um dos laptops para jogos mais rápidos disponíveis atualmente.
Como mencionado acima, tanto o GTI12 Ultra quanto o dock EX não têm fonte de alimentação externa, ao contrário da maioria dos outros mini PCs e laptops.
| desligado | |
| Ocioso | |
| Carga |
|
Key:
min: | |
| Beelink GTI12 Ultra EX Docking Station i9-12900H, NVIDIA GeForce RTX 3070, Crucial P3 Plus CT1000P3PSSD8, , x, | Minisforum MS-A1 Ryzen 7 8700G, Radeon 780M, Kingston OM8PGP41024Q-A0, , x, | GMK NucBox K9 Ultra 5 125H, Arc 7-Core, MasonSemi 1TB MC7000, , x, | Asus NUC 14 Pro Ultra 5 125H, Arc 7-Core, Kingston KC3000 2048G SKC3000D2048G, , x, | Geekom AX8 Pro R9 8945HS, Radeon 780M, Acer N7000 2 TB, , x, | Asus ROG NUC 14-90AS0051 Ultra 9 185H, NVIDIA GeForce RTX 4070 Laptop GPU, Samsung PM9A1a MZVL21T0HDLU, , x, | |
|---|---|---|---|---|---|---|
| Power Consumption | 62% | 72% | 74% | 60% | 47% | |
| Idle Minimum * | 35.9 | 8.8 75% | 10.9 70% | 5.1 86% | 14 61% | 10.6 70% |
| Idle Average * | 35.9 | 12.6 65% | 11 69% | 6.4 82% | 15.9 56% | 14.8 59% |
| Idle Maximum * | 36 | 14 61% | 11.4 68% | 14.7 59% | 19.5 46% | 27.5 24% |
| Load Average * | 119.5 | 93.2 22% | 52.8 56% | 55.5 54% | 76.4 36% | 84.6 29% |
| Cyberpunk 2077 ultra external monitor * | 384 | 102.1 73% | 57.1 85% | 59.1 85% | 54.3 86% | 171.4 55% |
| Load Maximum * | 422.9 | 105.4 75% | 72.2 83% | 103.3 76% | 99.1 77% | 244 42% |
* ... menor é melhor
Power Consumption Cyberpunk / Stress Test
Power Consumption external Monitor
Pro
Contra
Veredicto - Excelente qualidade de construção pelo preço
O GTI12 Ultra faz jus ao seu nome "Ultra" com seu design de chassi ampliado e recursos adicionais em relação à série Beelink GTI ou SER normal. A PSU integrada, em particular, é algo que gostaríamos que se tornasse a norma, já que alguns blocos de energia podem ser quase tão grandes quanto os próprios minicomputadores. O design e a qualidade do chassi também são de primeira linha, assim como no SER8.
A principal desvantagem se torna óbvia sempre que o senhor precisa fazer a manutenção da unidade. Os alto-falantes e a PSU devem ser removidos primeiro para acessar o SSD M.2 e os slots de RAM e, portanto, o processo é mais inconveniente do que na maioria dos outros mini PCs. Ele também funciona mais quente do que gostaríamos, apesar de ser visivelmente maior e mais pesado do que outros da categoria. O leitor SD integrado muito lento também é um tapa na cara dos criadores de conteúdo, especialmente porque o modelo é comercializado como um minicomputador de ponta.
Quanto à estação de acoplamento EX, é um design robusto, embora deselegante, com seus cabos de alimentação expostos e conexões de antena, mesmo que o senhor decida não utilizar nenhum dos recursos de WLAN da estação. O design "ao ar livre" da EX atrairá mais poeira e cabelos visíveis em comparação com uma solução de eGPU em caixa, como a Aorus Gaming Box em que os pré-filtros geralmente estão embutidos. O EX também não é ideal para exibir a placa de vídeo, pois a GPU deve ser instalada voltada para o minicomputador, e não para longe dele.
O GTI12 Ultra e a docking station EX são surpreendentemente econômicos, considerando a qualidade de construção e a concorrência.
A remoção do recurso Wi-Fi raramente usado do EX ou a troca por mais portas poderia reduzir ainda mais o tamanho e o preço do dock.
Preço e disponibilidade
Atualmente, a Beelink está enviando o GTI12 Ultra com SSD de 1 TB, 32 GB de RAM e docking station EX como um pacote por apenas US$ 738. As opções mais recentes de CPU Meteor Lake estão disponíveis a partir de US$ 200 a mais.
Beelink GTI12 Ultra EX Docking Station
- 10/21/2024 v8
Allen Ngo
 Total Sustainability Score:
 Transparência
A seleção dos dispositivos a serem analisados é feita pela nossa equipe editorial. A amostra de teste foi fornecida ao autor como empréstimo pelo fabricante ou varejista para fins desta revisão. O credor não teve influência nesta revisão, nem o fabricante recebeu uma cópia desta revisão antes da publicação. Não houve obrigação de publicar esta revisão. Nunca aceitamos compensação ou pagamento em troca de nossas avaliações. Como empresa de mídia independente, a Notebookcheck não está sujeita à autoridade de fabricantes, varejistas ou editores.
É assim que o Notebookcheck está testando
Todos os anos, o Notebookcheck analisa de forma independente centenas de laptops e smartphones usando procedimentos padronizados para garantir que todos os resultados sejam comparáveis. Desenvolvemos continuamente nossos métodos de teste há cerca de 20 anos e definimos padrões da indústria no processo. Em nossos laboratórios de teste, equipamentos de medição de alta qualidade são utilizados por técnicos e editores experientes. Esses testes envolvem um processo de validação em vários estágios. Nosso complexo sistema de classificação é baseado em centenas de medições e benchmarks bem fundamentados, o que mantém a objetividade.Price comparison

