

Análise do MSI Raider 18 HX A14V: Desempenho de Titã sem o preço de Titã
")
Os laptops para jogos maiores, de 18 polegadas, estão voltando à tona, já que a linha continua a se expandir constantemente. A MSI já oferece a experiência de jogos "definitiva" de 18 polegadas com o Titan 18 HXmas este último modelo Raider 18 HX está um nível abaixo em termos de recursos para diminuir a barreira de entrada.
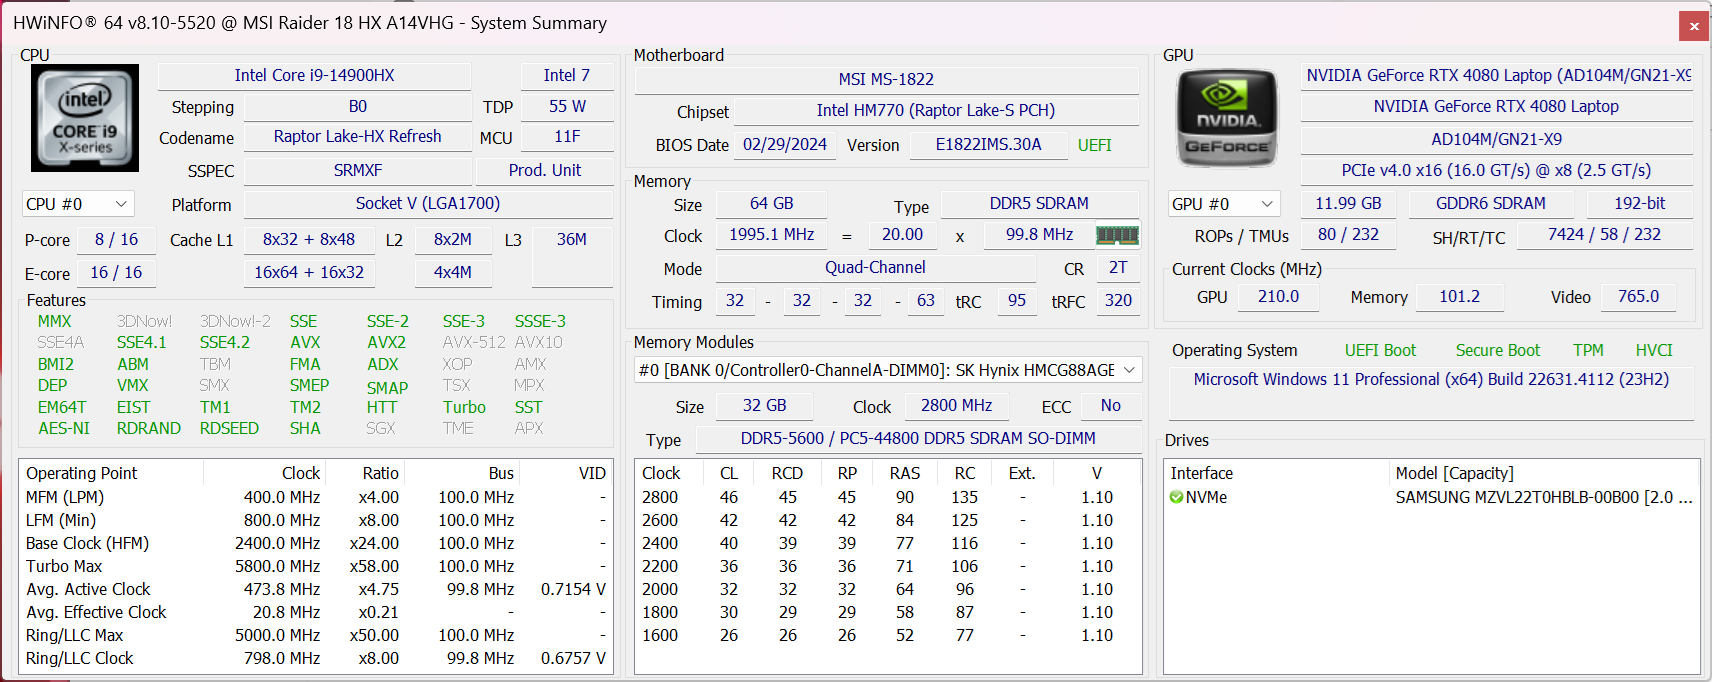
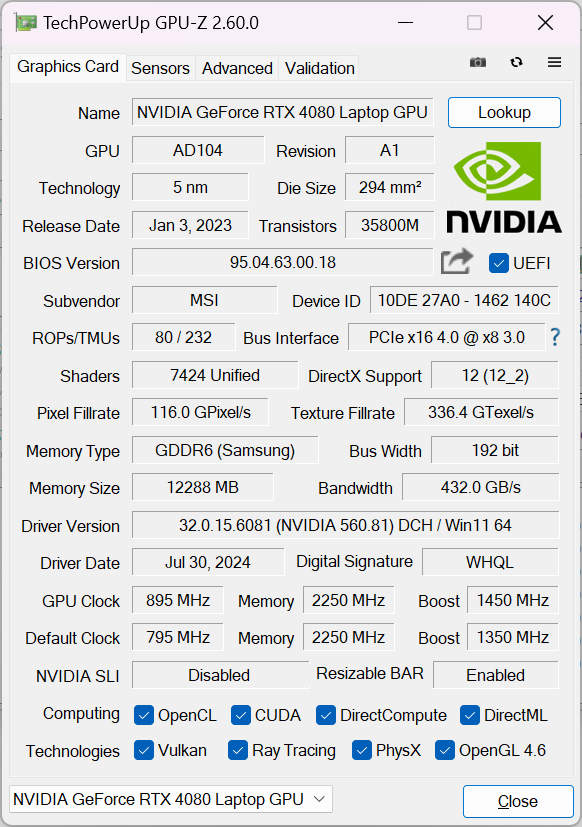
Nossa unidade de teste é uma configuração intermediária com CPU Raptor Lake-R Core i9-14900HX, GPU GeForce RTX 4080 de 175 W e tela Mini-LED de 3840 x 2400 120 Hz por aproximadamente US$ 3200 no varejo. Outras SKUs incluem o Zen 4 Ryzen 9 7945HX, RTX 4070, RTX 4090 ou tela IPS QHD+ 2560 x 1600 240 Hz.
Os concorrentes do Raider 18 HX incluem outros notebooks para jogos de 18 polegadas, como o Razer Blade 18, Alienware m18 R2ou Asus ROG Strix G18.
Mais análises da MSI:
Possíveis concorrentes em comparação
Avaliação | Versão | Data | Modelo | Peso | Altura | Size | Resolução | Preço |
|---|---|---|---|---|---|---|---|---|
| 84.7 % | v8 | 09/2024 | MSI Raider 18 HX A14V i9-14900HX, NVIDIA GeForce RTX 4080 Laptop GPU | 3.6 kg | 32 mm | 18.00" | 3840x2400 | |
| 90.5 % v7 (old) | v7 (old) | 05/2024 | Razer Blade 18 2024 RZ09-0509 i9-14900HX, NVIDIA GeForce RTX 4090 Laptop GPU | 3.1 kg | 21.9 mm | 18.00" | 2560x1600 | |
| 89.5 % v7 (old) | v7 (old) | 03/2024 | Alienware m18 R2 i9-14900HX, NVIDIA GeForce RTX 4090 Laptop GPU | 4 kg | 26.7 mm | 18.00" | 2560x1600 | |
| 88.8 % v7 (old) | v7 (old) | 01/2024 | MSI Titan 18 HX A14VIG i9-14900HX, NVIDIA GeForce RTX 4090 Laptop GPU | 3.6 kg | 32.1 mm | 18.00" | 3840x2400 | |
| 87.4 % v7 (old) | v7 (old) | 03/2023 | Asus ROG Strix G18 G814JI i7-13650HX, NVIDIA GeForce RTX 4070 Laptop GPU | 3 kg | 31 mm | 18.00" | 2560x1600 | |
| 87.1 % v7 (old) | v7 (old) | 03/2024 | Acer Predator Helios 18 PH18-72-98MW i9-14900HX, NVIDIA GeForce RTX 4090 Laptop GPU | 3.3 kg | 29.5 mm | 18.00" | 2560x1600 |
Observação: Atualizamos recentemente nosso sistema de classificação e os resultados da versão 8 não são comparáveis aos resultados da versão 7. Mais informações estão disponíveis aqui .
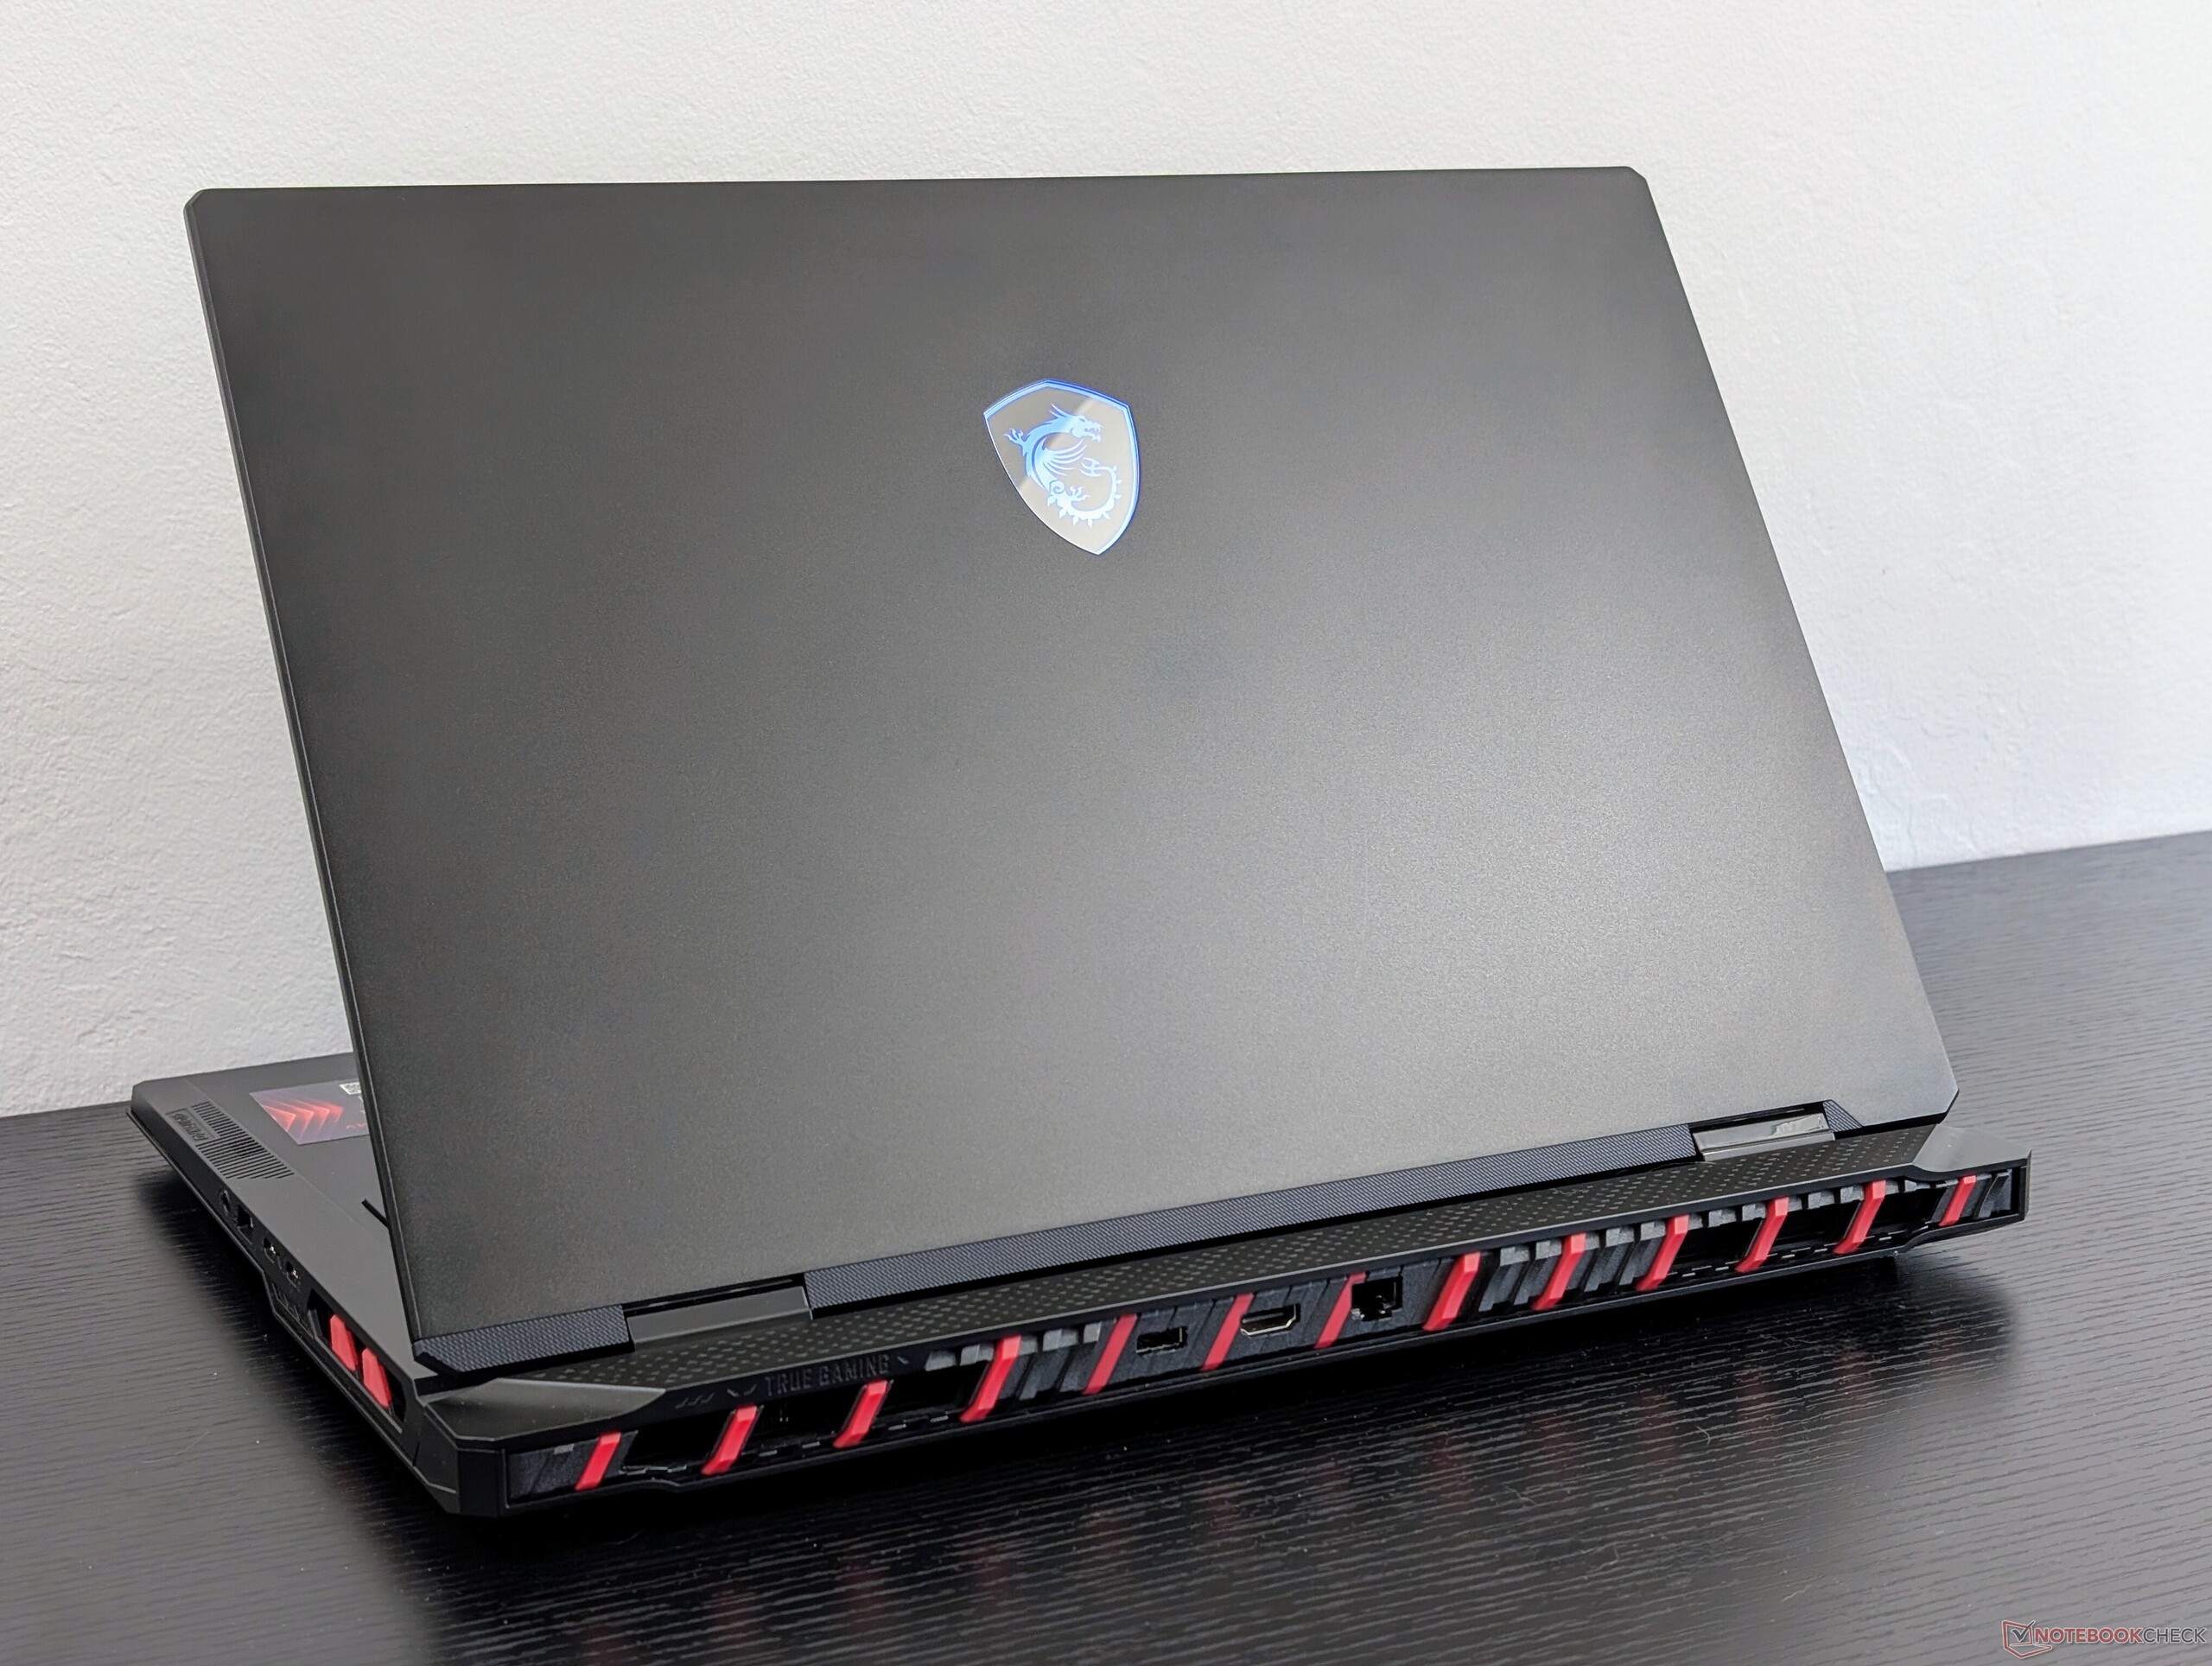
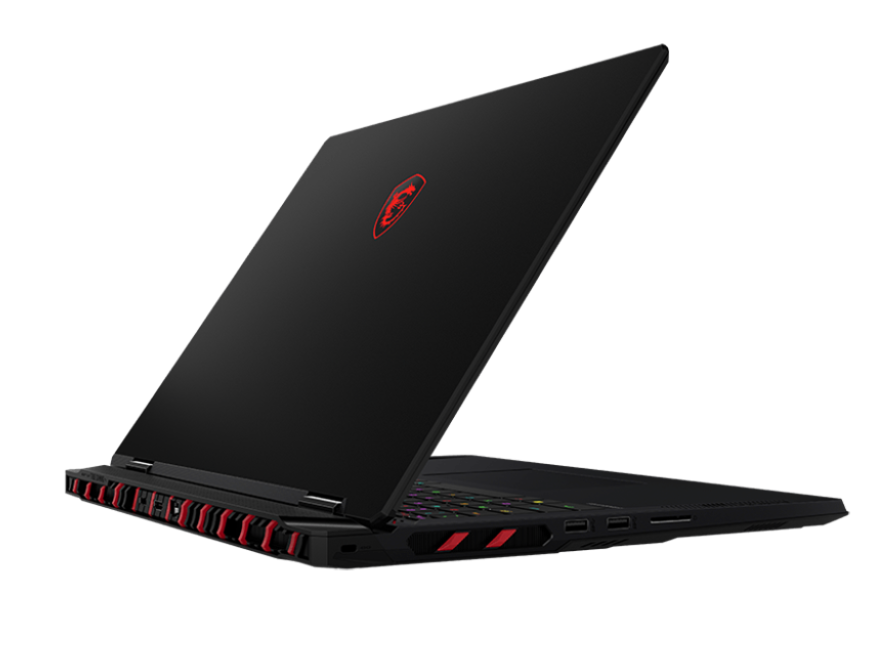
Caso - Do dragão azul ao vermelho
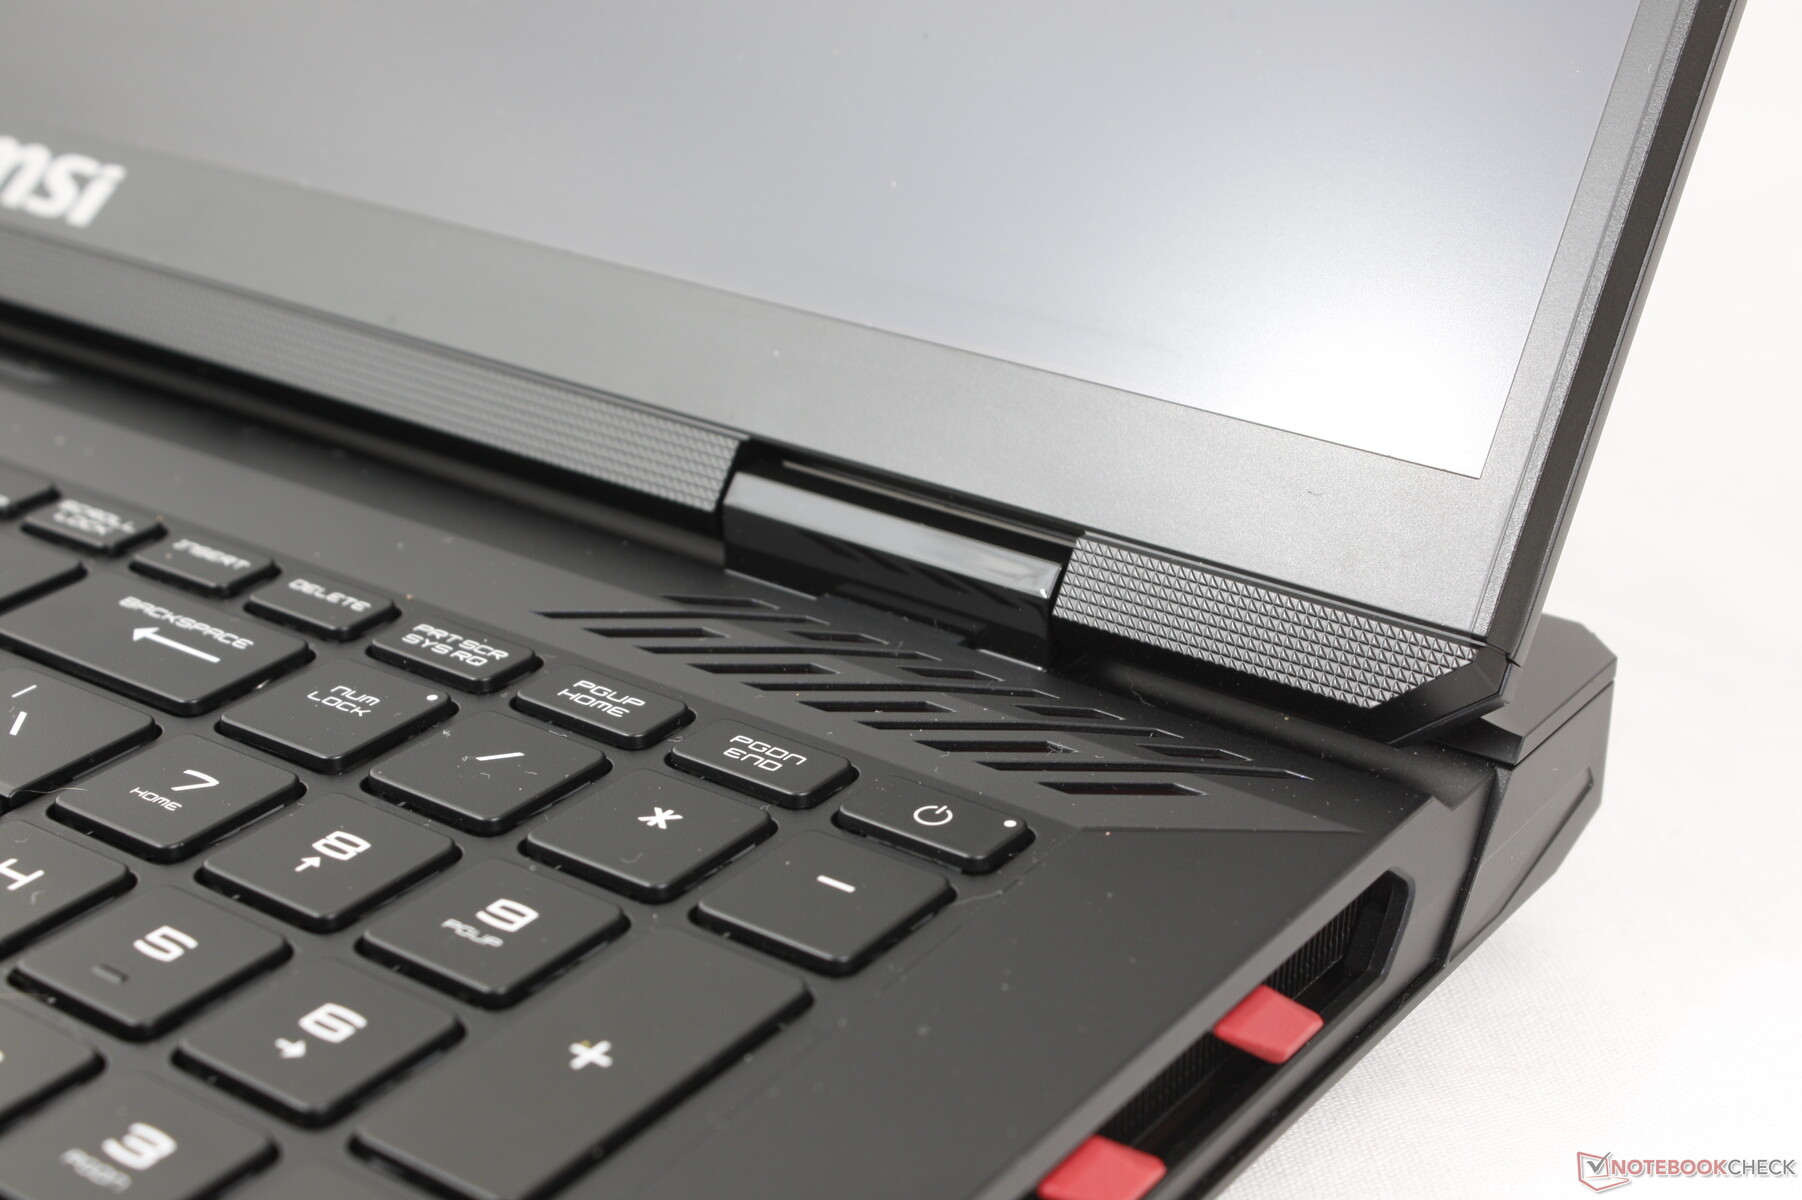
O chassi é um derivado do Titan 18 HX. Os acentos vermelhos do Titan são azuis no novo Raider e a maioria das superfícies é preta em vez de cinza ou prata para uma aparência geral mais escura. A MSI também adicionou uma barra de LED ao longo da borda frontal do sistema, enquanto isso não existia no Titan. As mudanças são em grande parte estéticas e, portanto, o Raider ainda parece tão forte quanto seu irmão mais caro, já que os materiais subjacentes e o esqueleto são os mesmos.
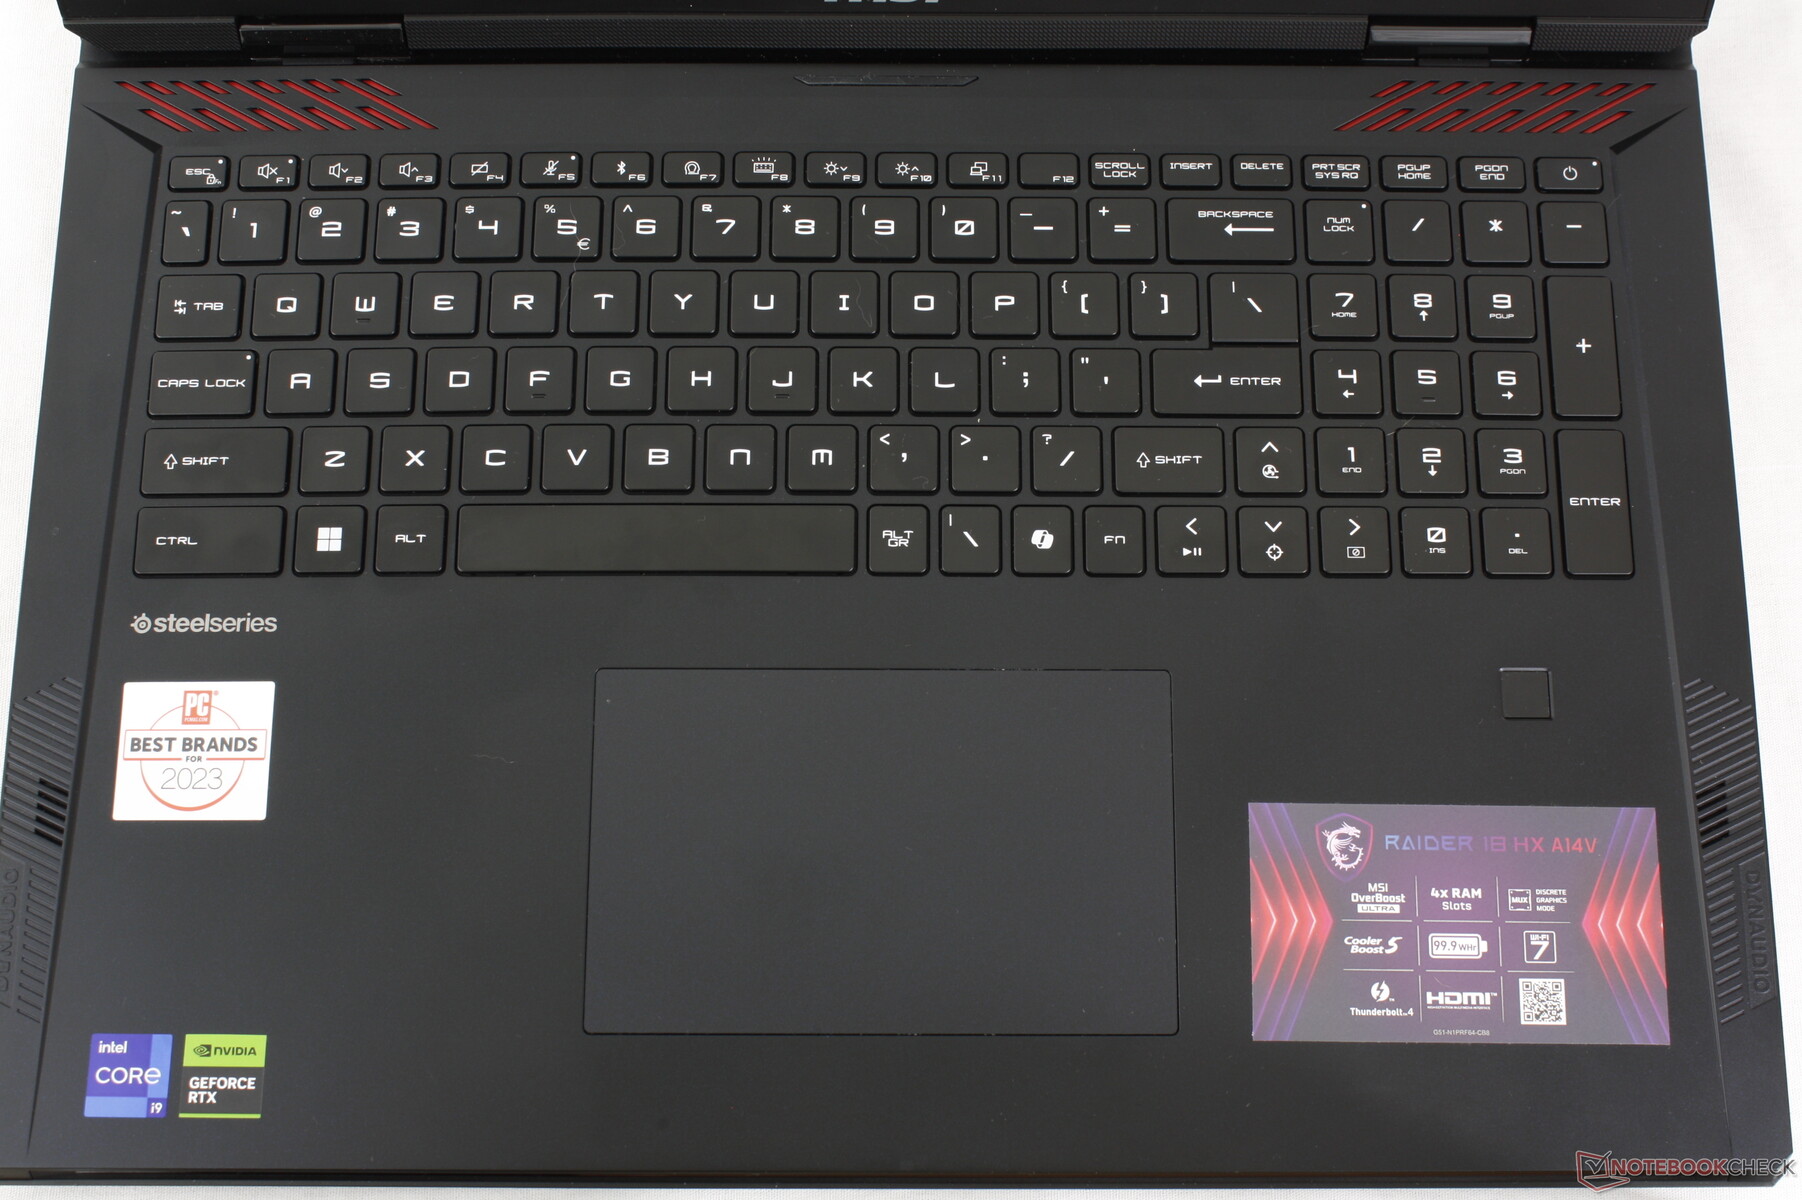
Talvez a diferença visual mais notável entre o Raider 18 HX e o Titan 18 HX seja o deck do teclado redesenhado. Enquanto o Titan 18 HX tem uma plataforma mais plana com um painel de vidro sofisticado que se estende pelos apoios para as mãos e pelo clickpad, o Raider adota uma abordagem mais tradicional, sem vidro e apenas com um clickpad básico.
As dimensões e o peso são essencialmente idênticos aos do Titan 18 HX, apesar de todas as diferenças externas entre eles. Portanto, o modelo está no meio do pacote no que diz respeito à portabilidade, já que alternativas como o Alienware m18 R2 são mais pesadas e maiores, enquanto o ROG Strix G18 ou o Blade 18 são muito mais leves.
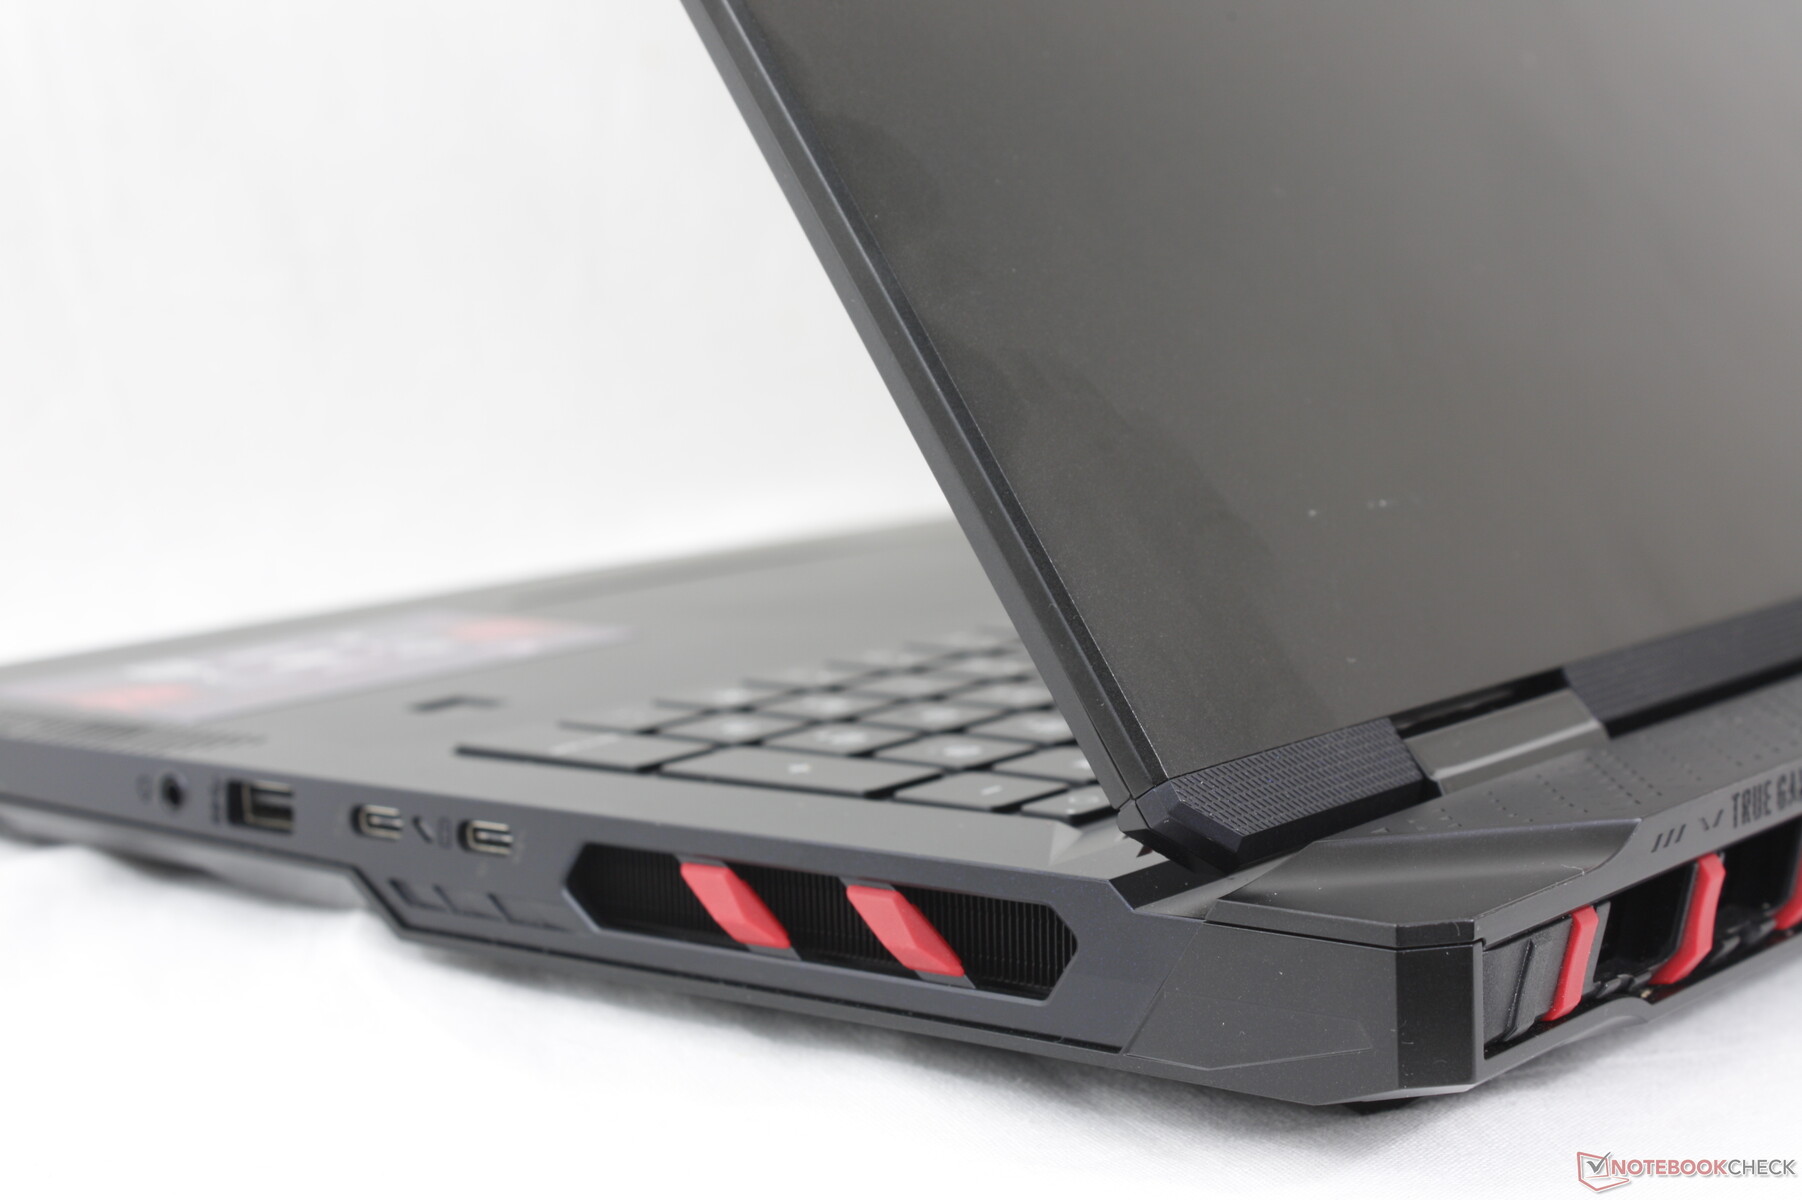
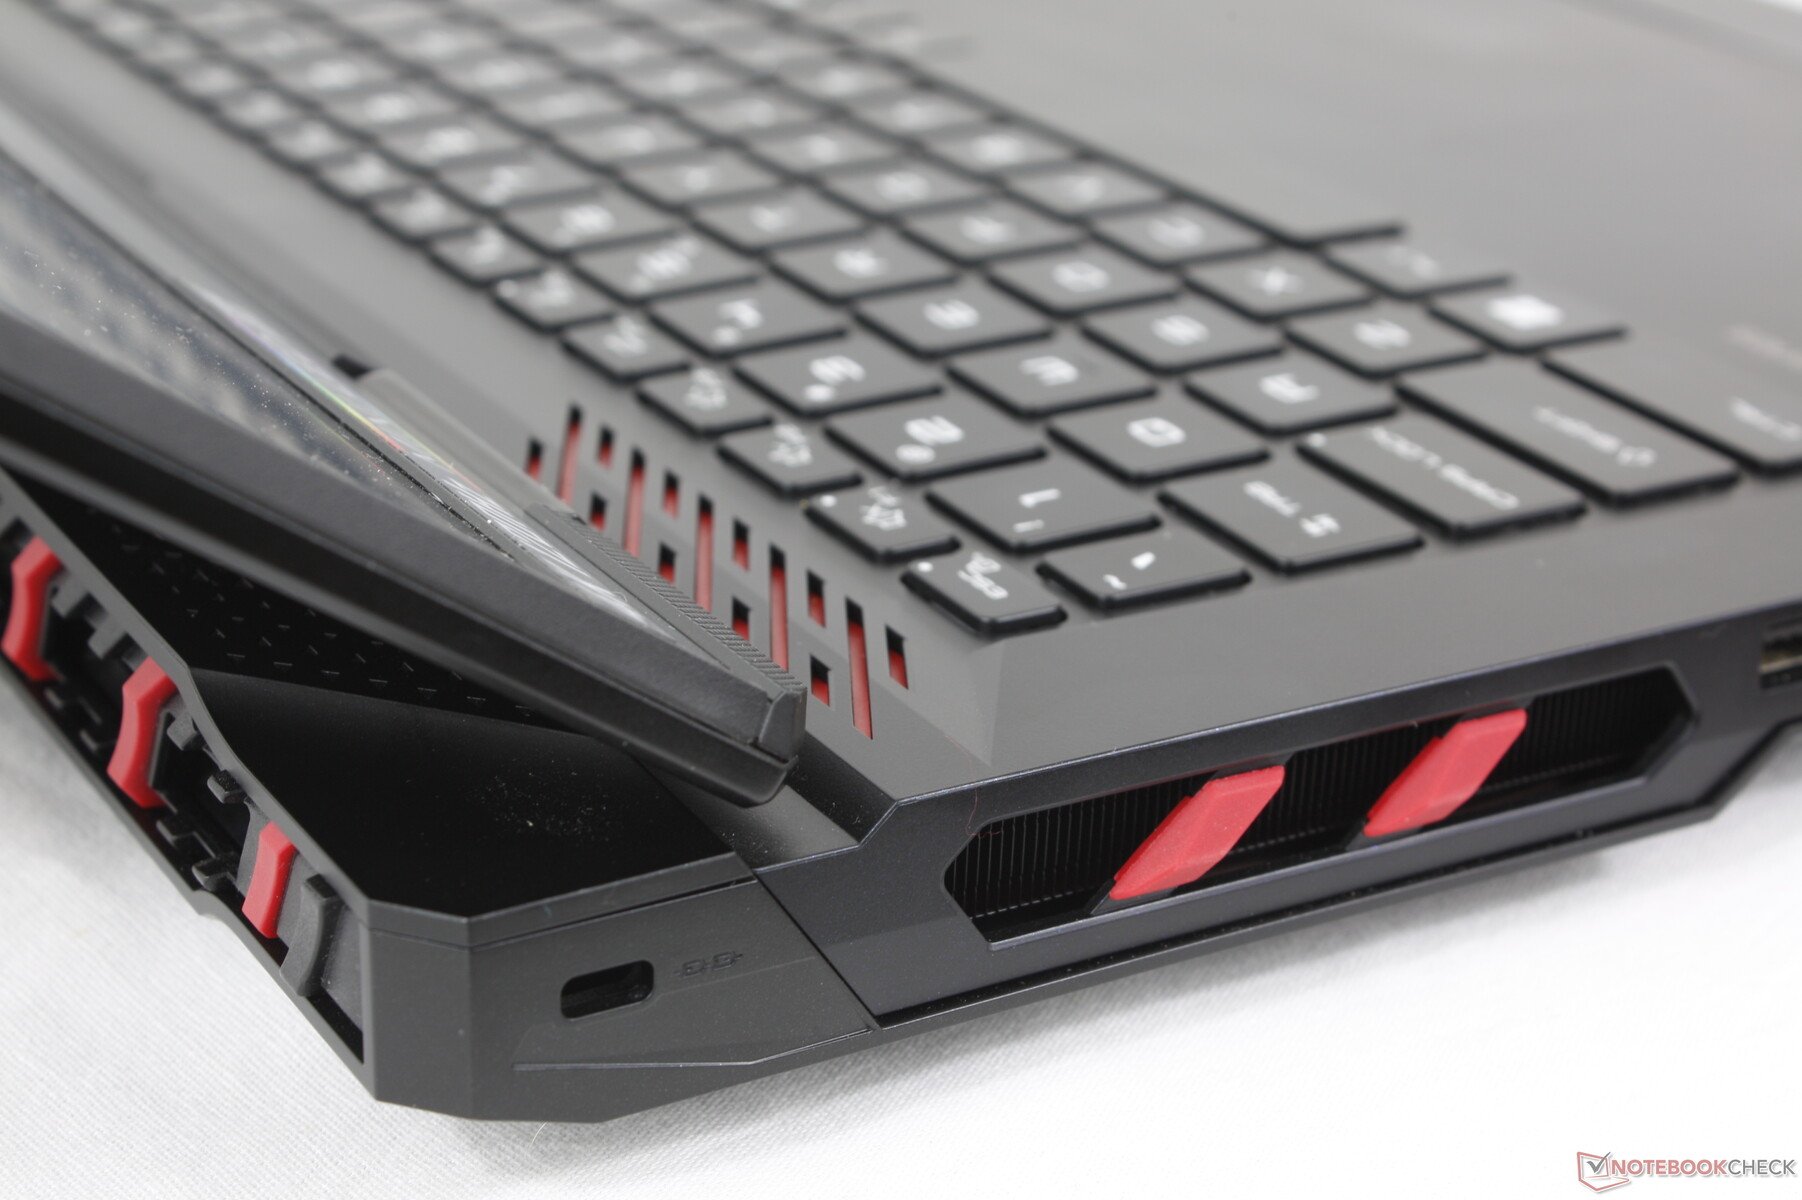
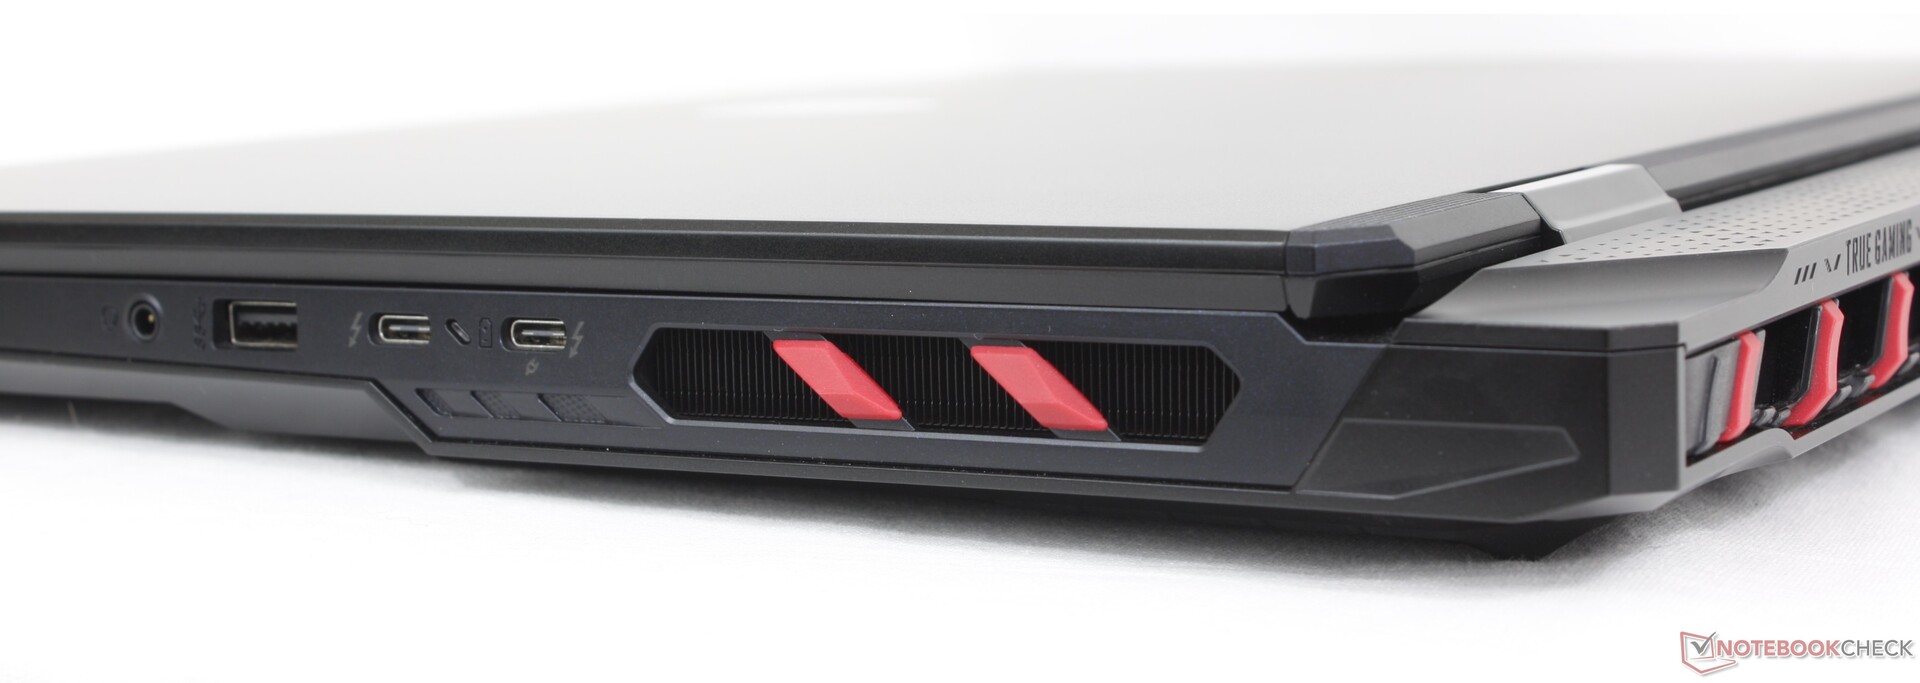
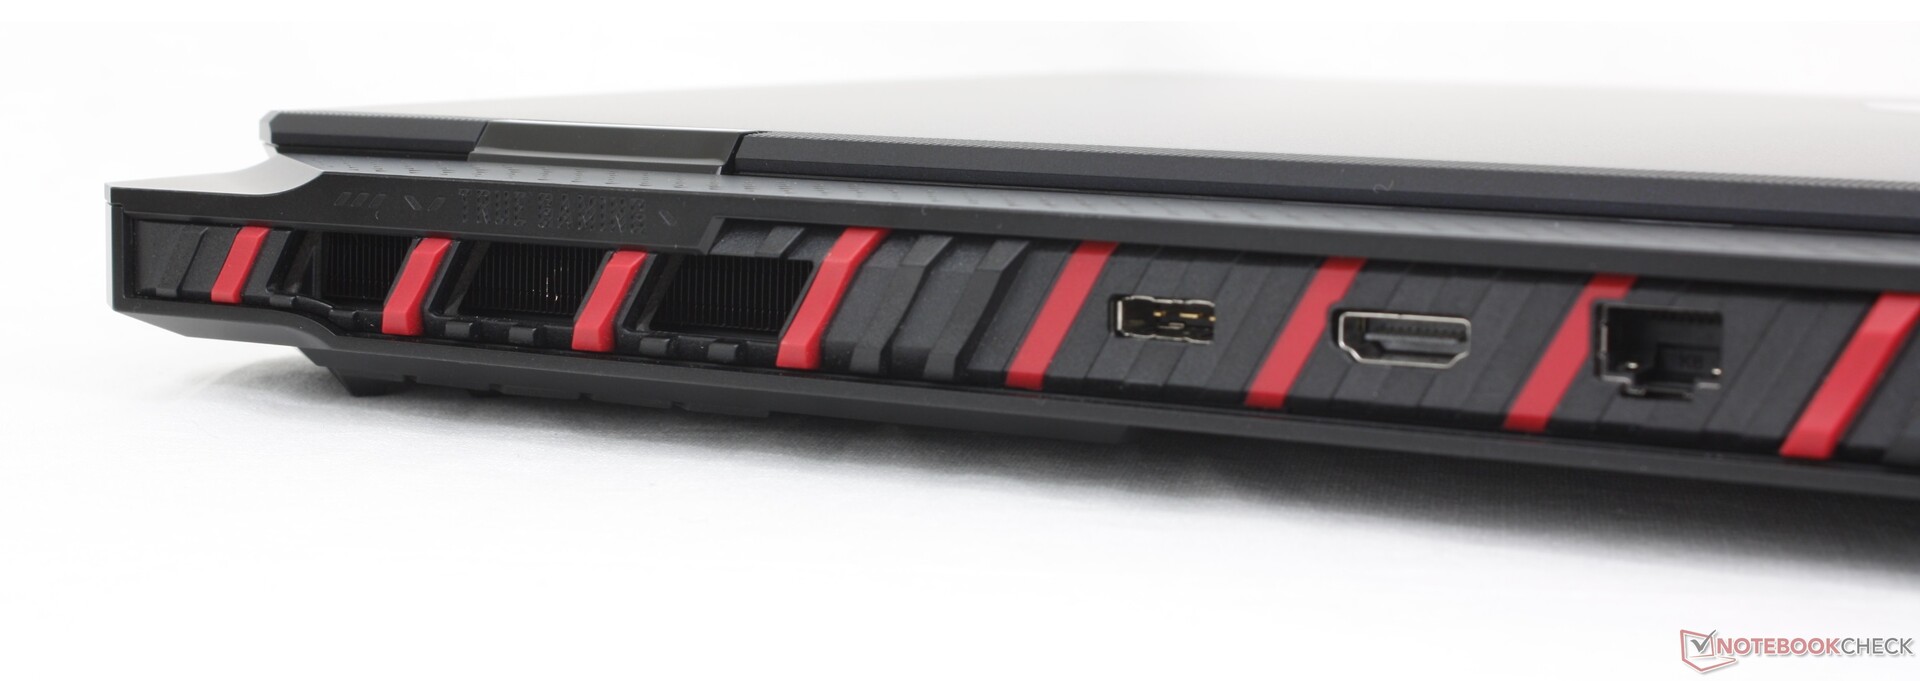
Conectividade
As portas e o posicionamento são idênticos aos da Titan 18 HX, o que é uma grande dica sobre o que esperar por baixo do capô. As opções integradas são comparáveis às que o senhor encontrará no Blade 18 ou no ROG Strix G18, embora em arranjos muito diferentes.
Lembre-se de que apenas uma das duas portas USB-C é compatível com Power Delivery. Por outro lado, ambas são compatíveis com DisplayPort.

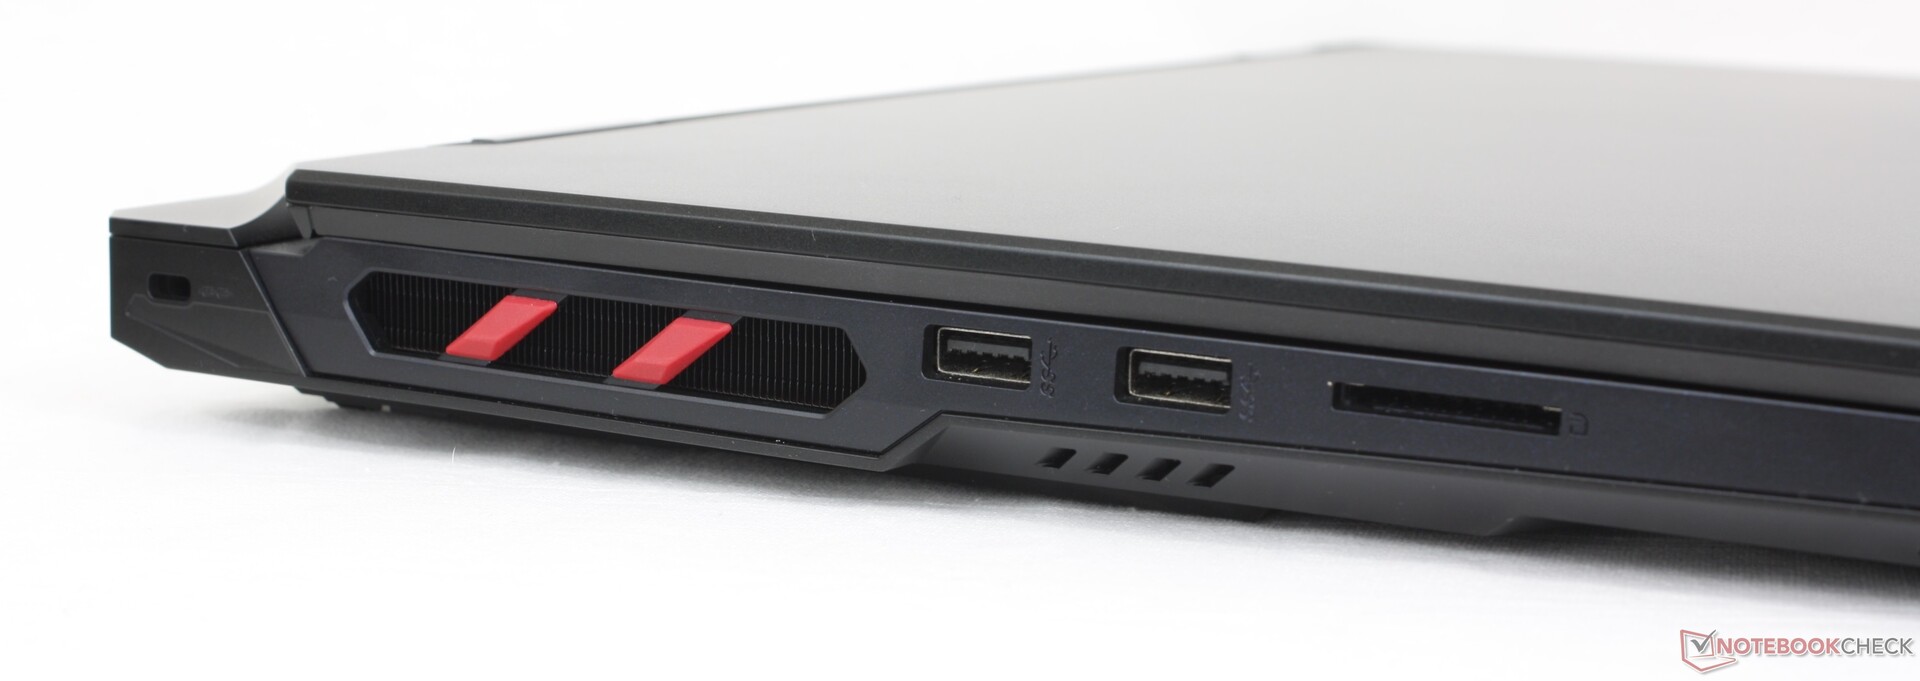
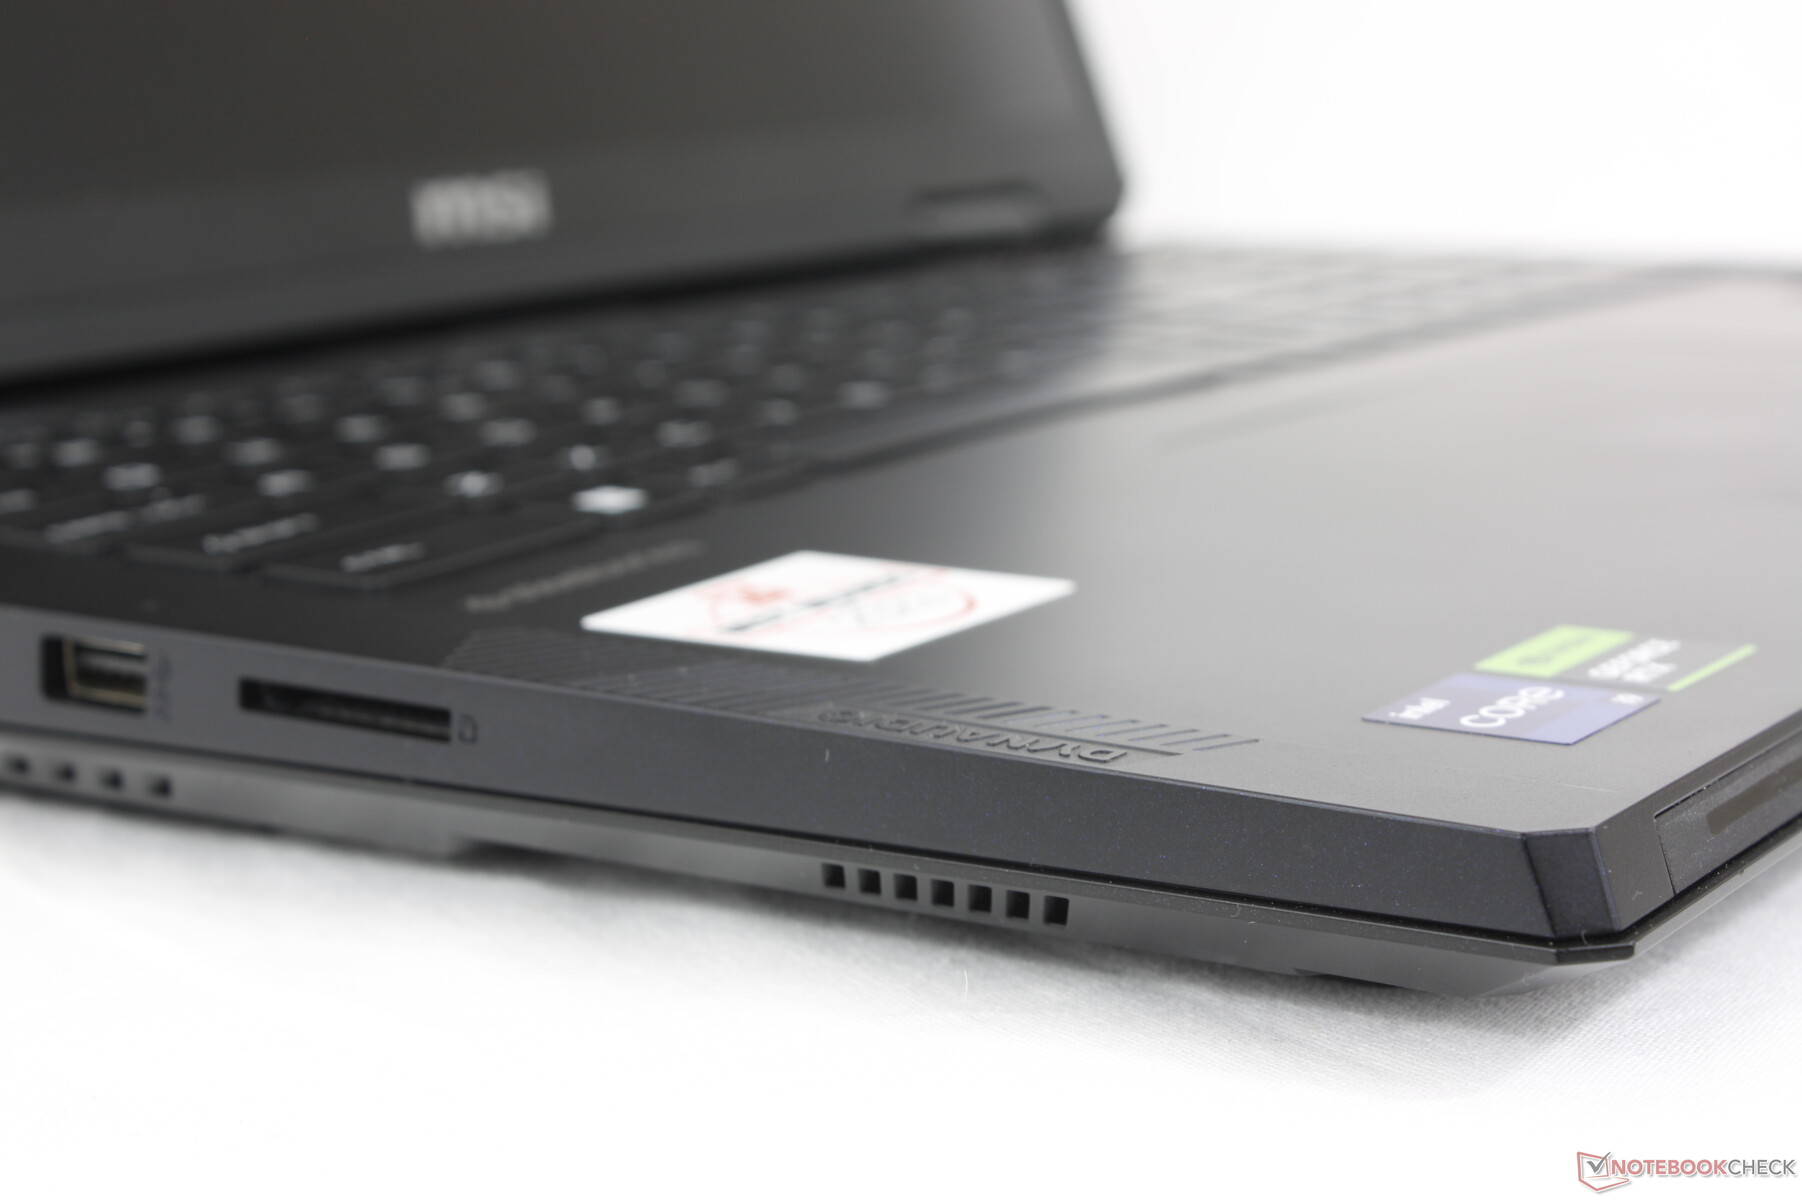
Leitor de cartão SD
Com cerca de 90 MB/s, o leitor SD integrado é decente, mas lento em relação ao alto preço do Raider 18 HX. Os leitores de cartão SD do Razer Blade 18 ou do Alienware m18 R2por exemplo, são duas vezes mais rápidos em comparação.
| SD Card Reader | |
| average JPG Copy Test (av. of 3 runs) | |
| Alienware m18 R2 (Toshiba Exceria Pro SDXC 64 GB UHS-II) | |
| Razer Blade 18 2024 RZ09-0509 (Toshiba Exceria Pro SDXC 64 GB UHS-II) | |
| Acer Predator Helios 18 PH18-72-98MW (AV PRO microSD 128 GB V60) | |
| MSI Raider 18 HX A14V (Toshiba Exceria Pro SDXC 64 GB UHS-II) | |
| MSI Titan 18 HX A14VIG (Toshiba Exceria Pro SDXC 64 GB UHS-II) | |
| maximum AS SSD Seq Read Test (1GB) | |
| Razer Blade 18 2024 RZ09-0509 (Toshiba Exceria Pro SDXC 64 GB UHS-II) | |
| Alienware m18 R2 (Toshiba Exceria Pro SDXC 64 GB UHS-II) | |
| MSI Titan 18 HX A14VIG (Toshiba Exceria Pro SDXC 64 GB UHS-II) | |
| MSI Raider 18 HX A14V (Toshiba Exceria Pro SDXC 64 GB UHS-II) | |
| Acer Predator Helios 18 PH18-72-98MW (AV PRO microSD 128 GB V60) | |
Comunicação
O Killer BE1750x vem com conectividade padrão Wi-Fi 7 e Bluetooth 5.4. As taxas de transferência são estáveis e confiáveis quando emparelhado com nosso roteador de teste Wi-Fi 6E.
Webcam
Uma webcam de 2 MP com IR e obturador físico é padrão, assim como no Titan 18 HX. Curiosamente, a câmera também apresentaria problemas de brilho semelhantes.


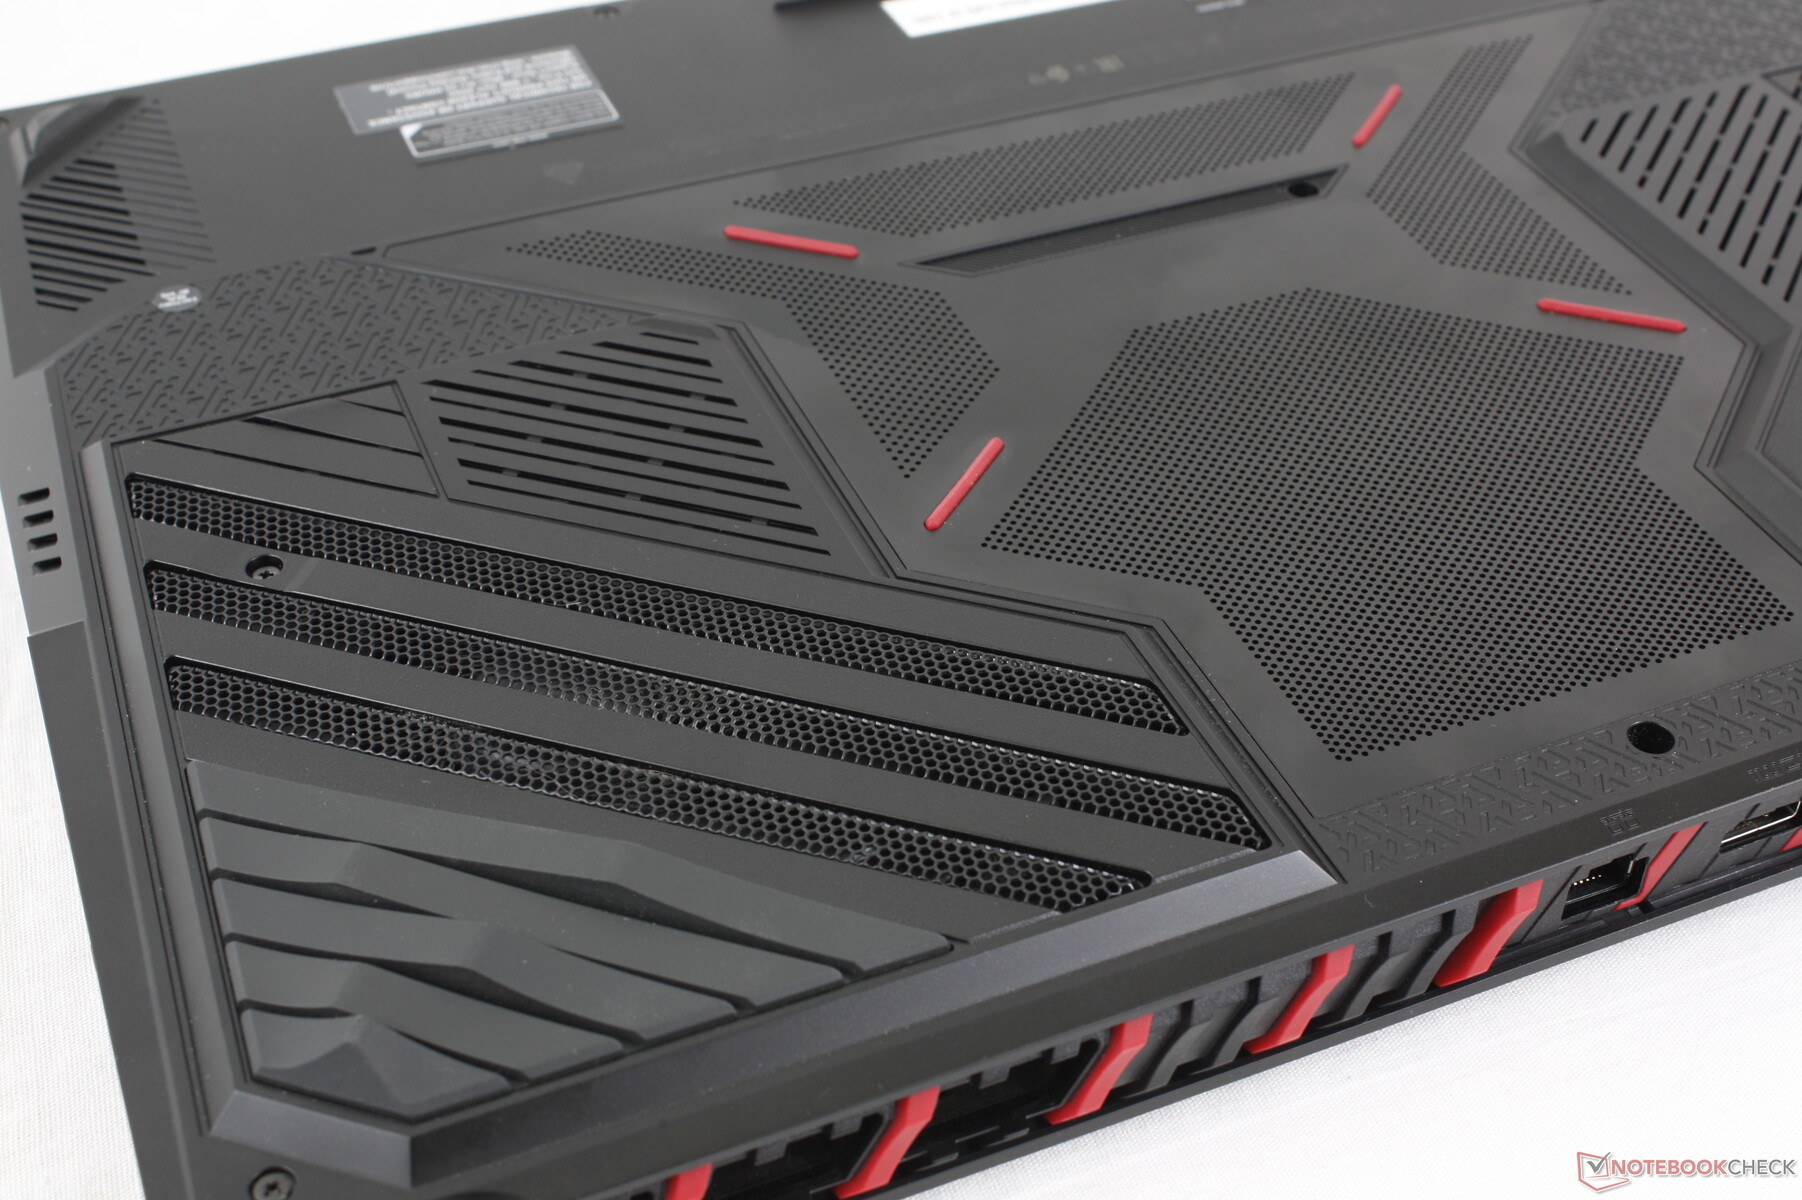
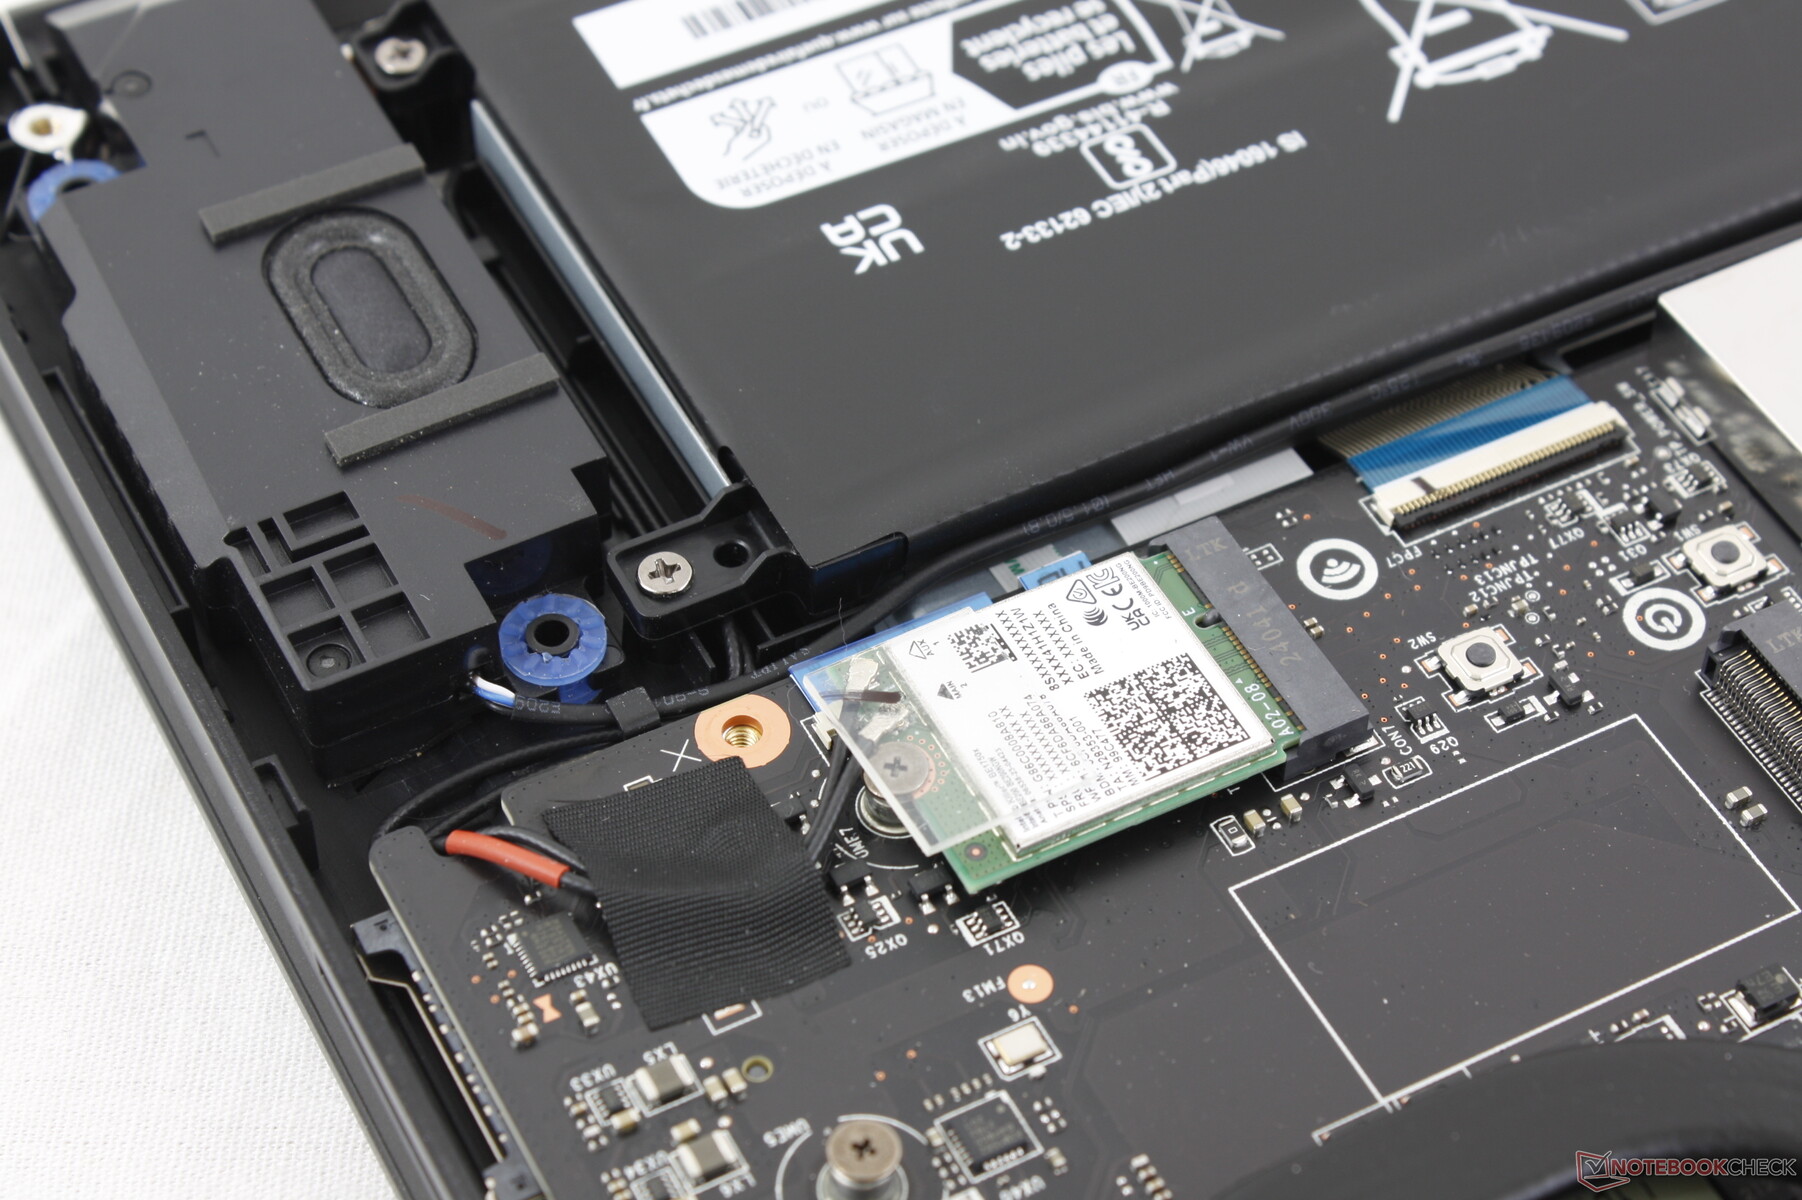
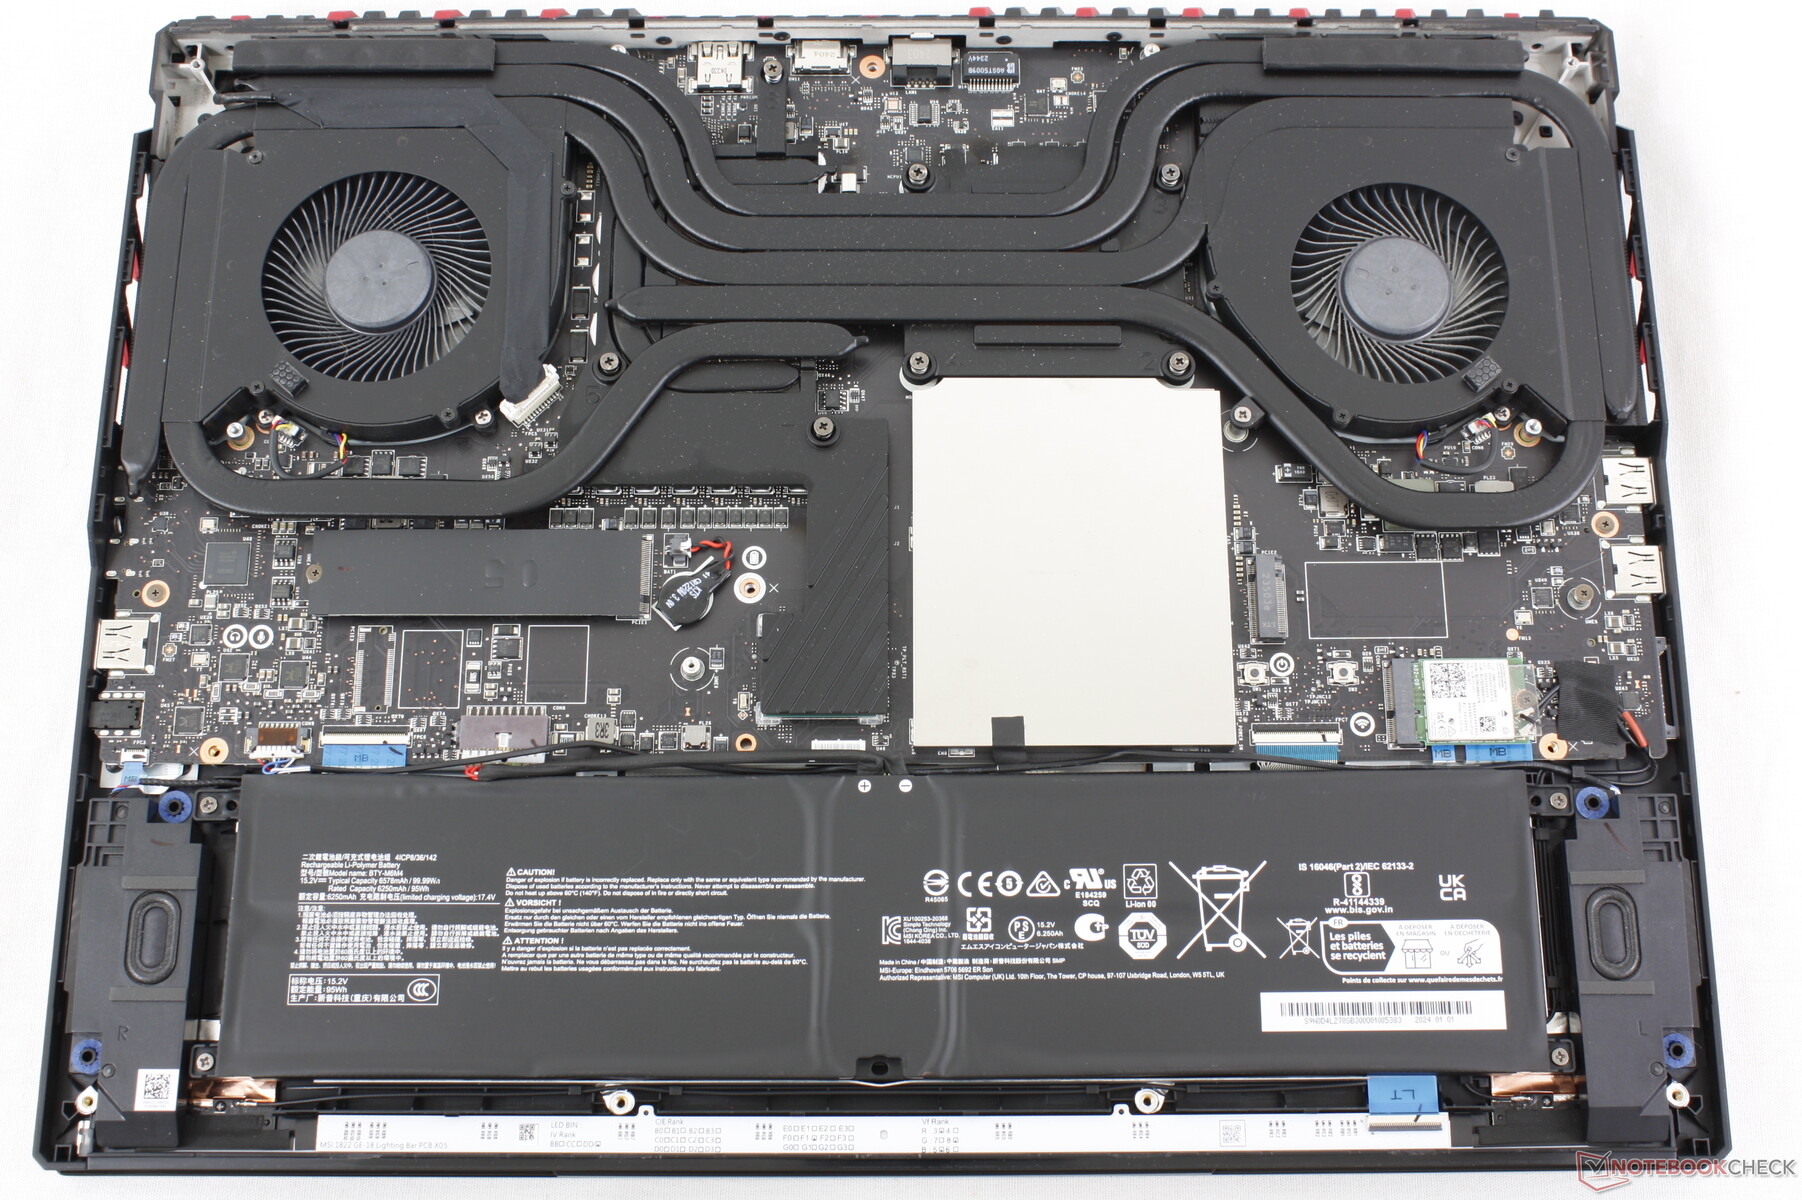
Manutenção
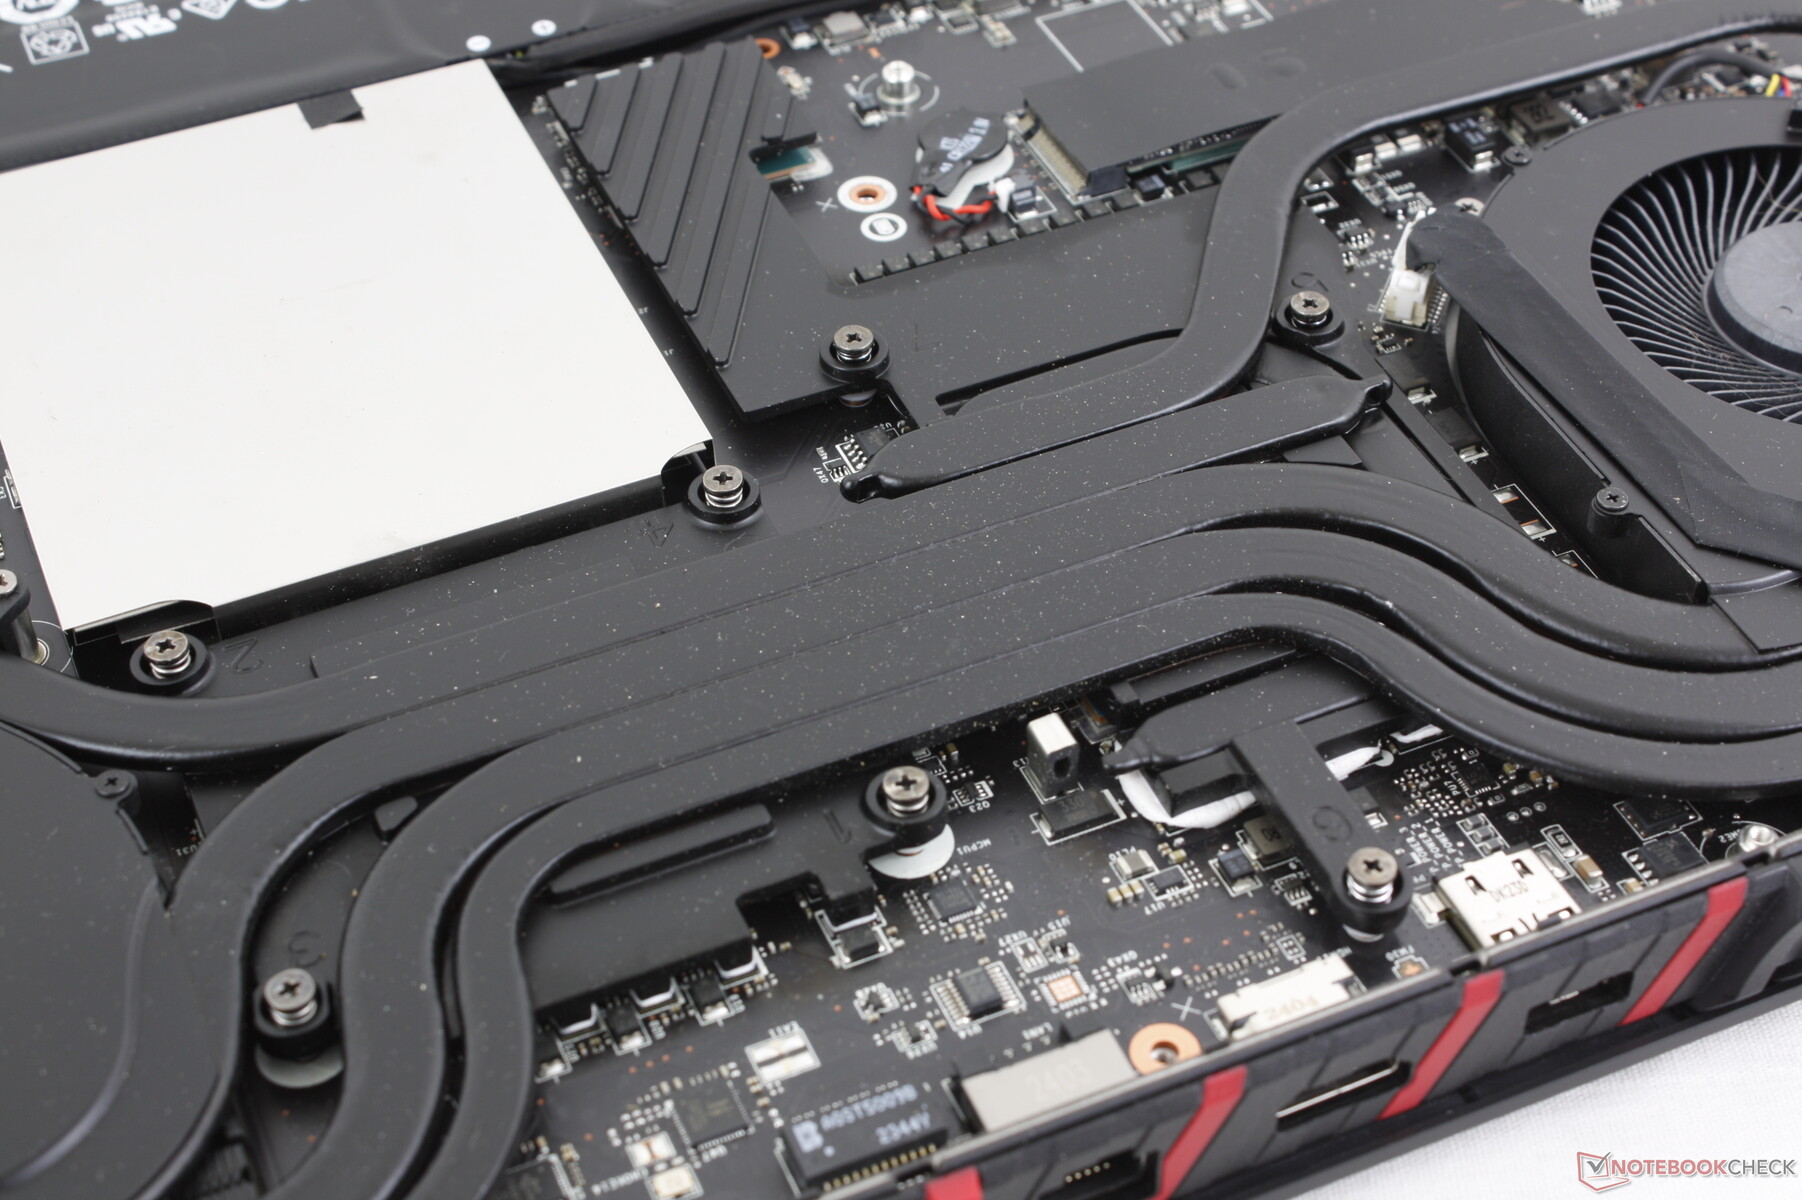
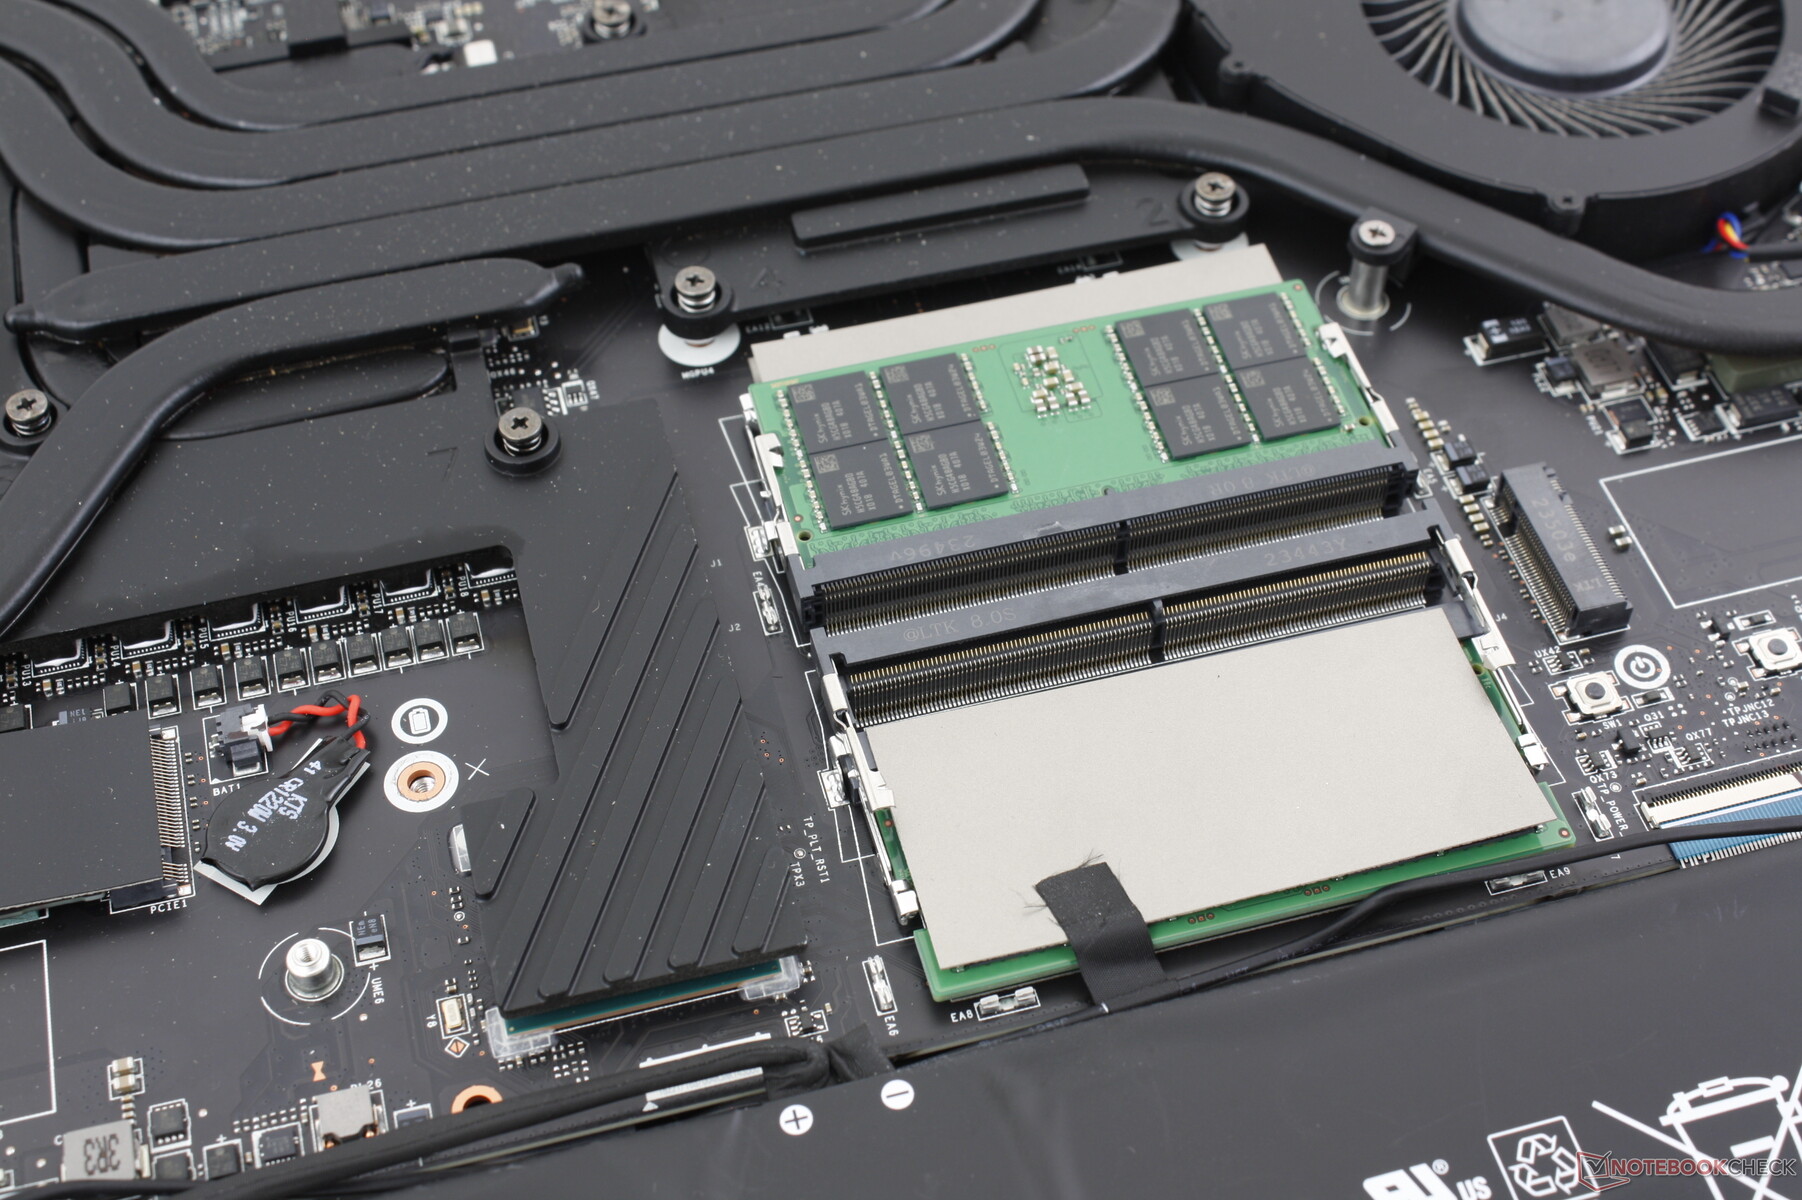
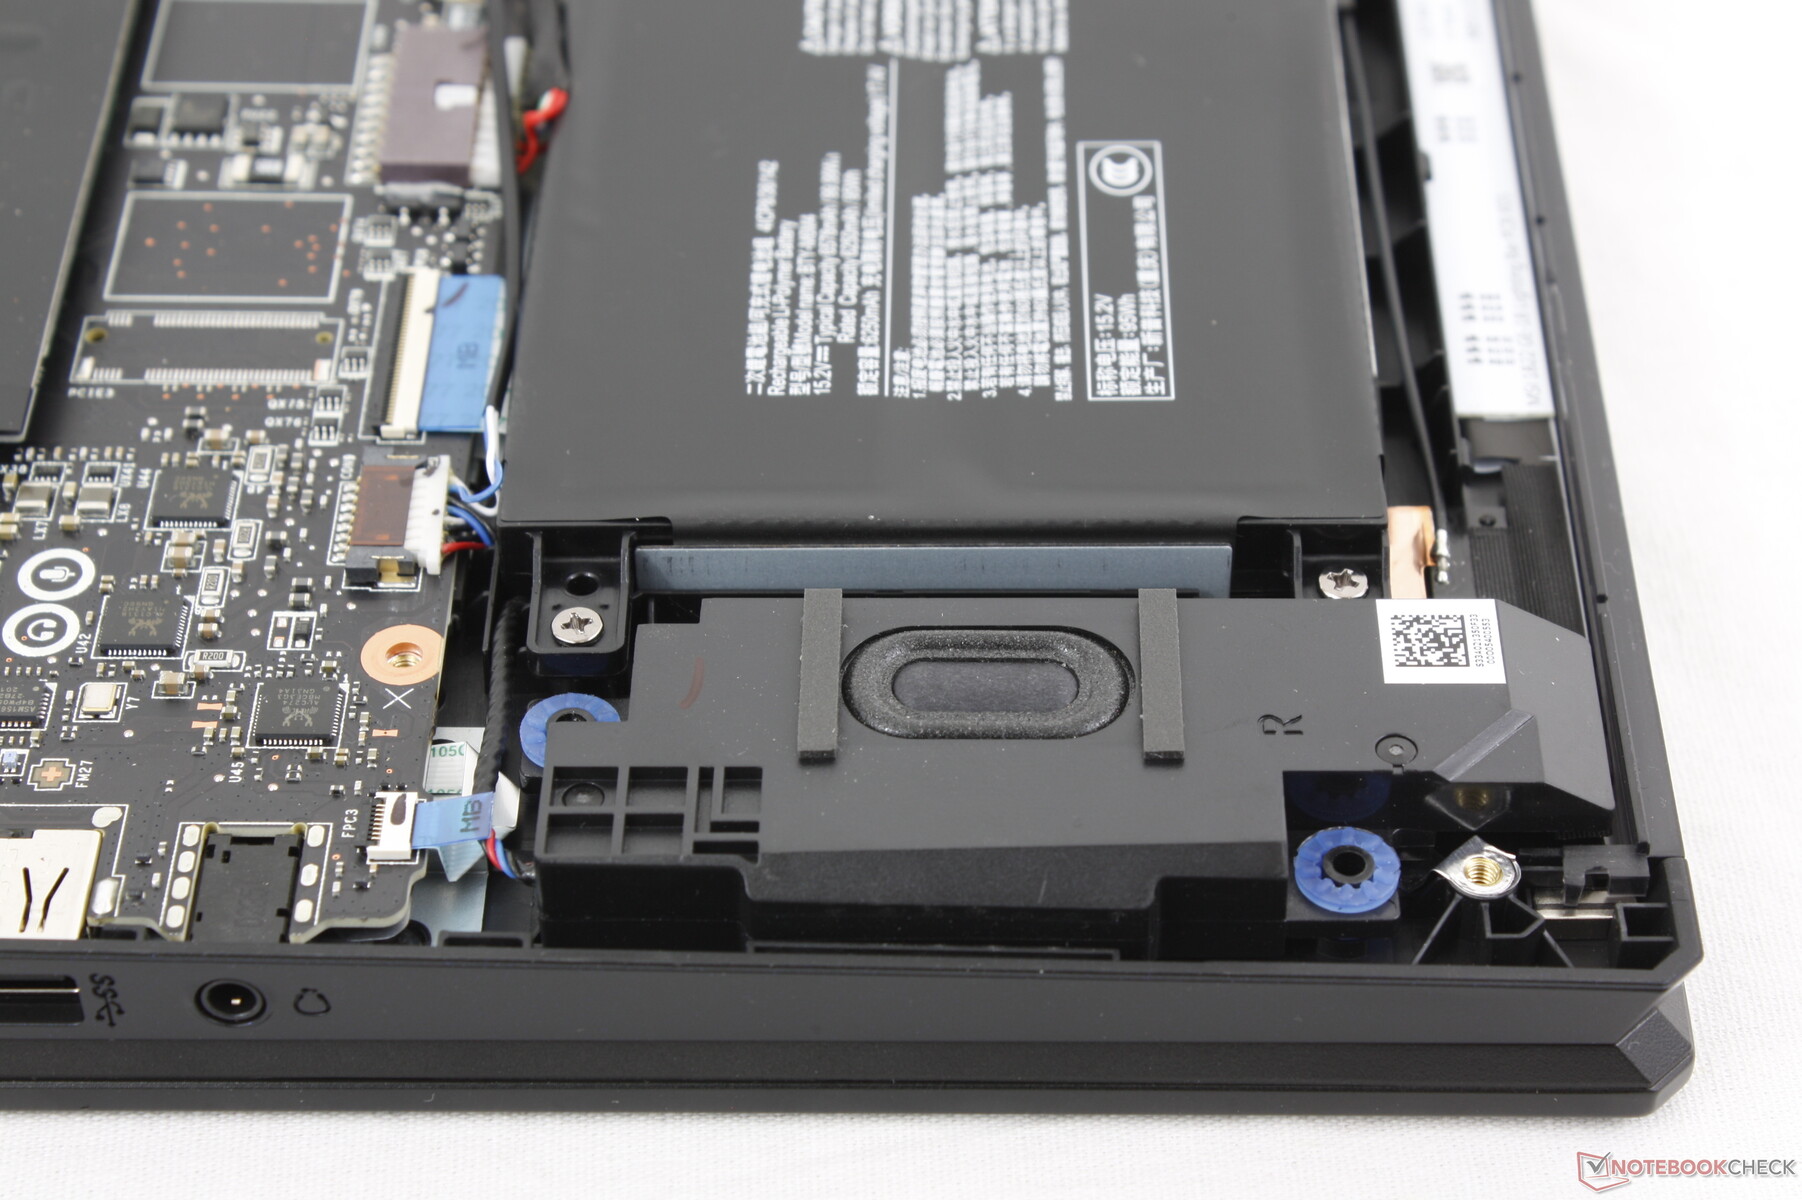
O painel inferior é fixado por 12 parafusos Phillips para uma remoção relativamente fácil. No entanto, a MSI continua sendo um dos poucos fabricantes com um adesivo anti-violação cobrindo um dos parafusos que deve ser quebrado até mesmo para atualizações simples, como RAM ou armazenamento.
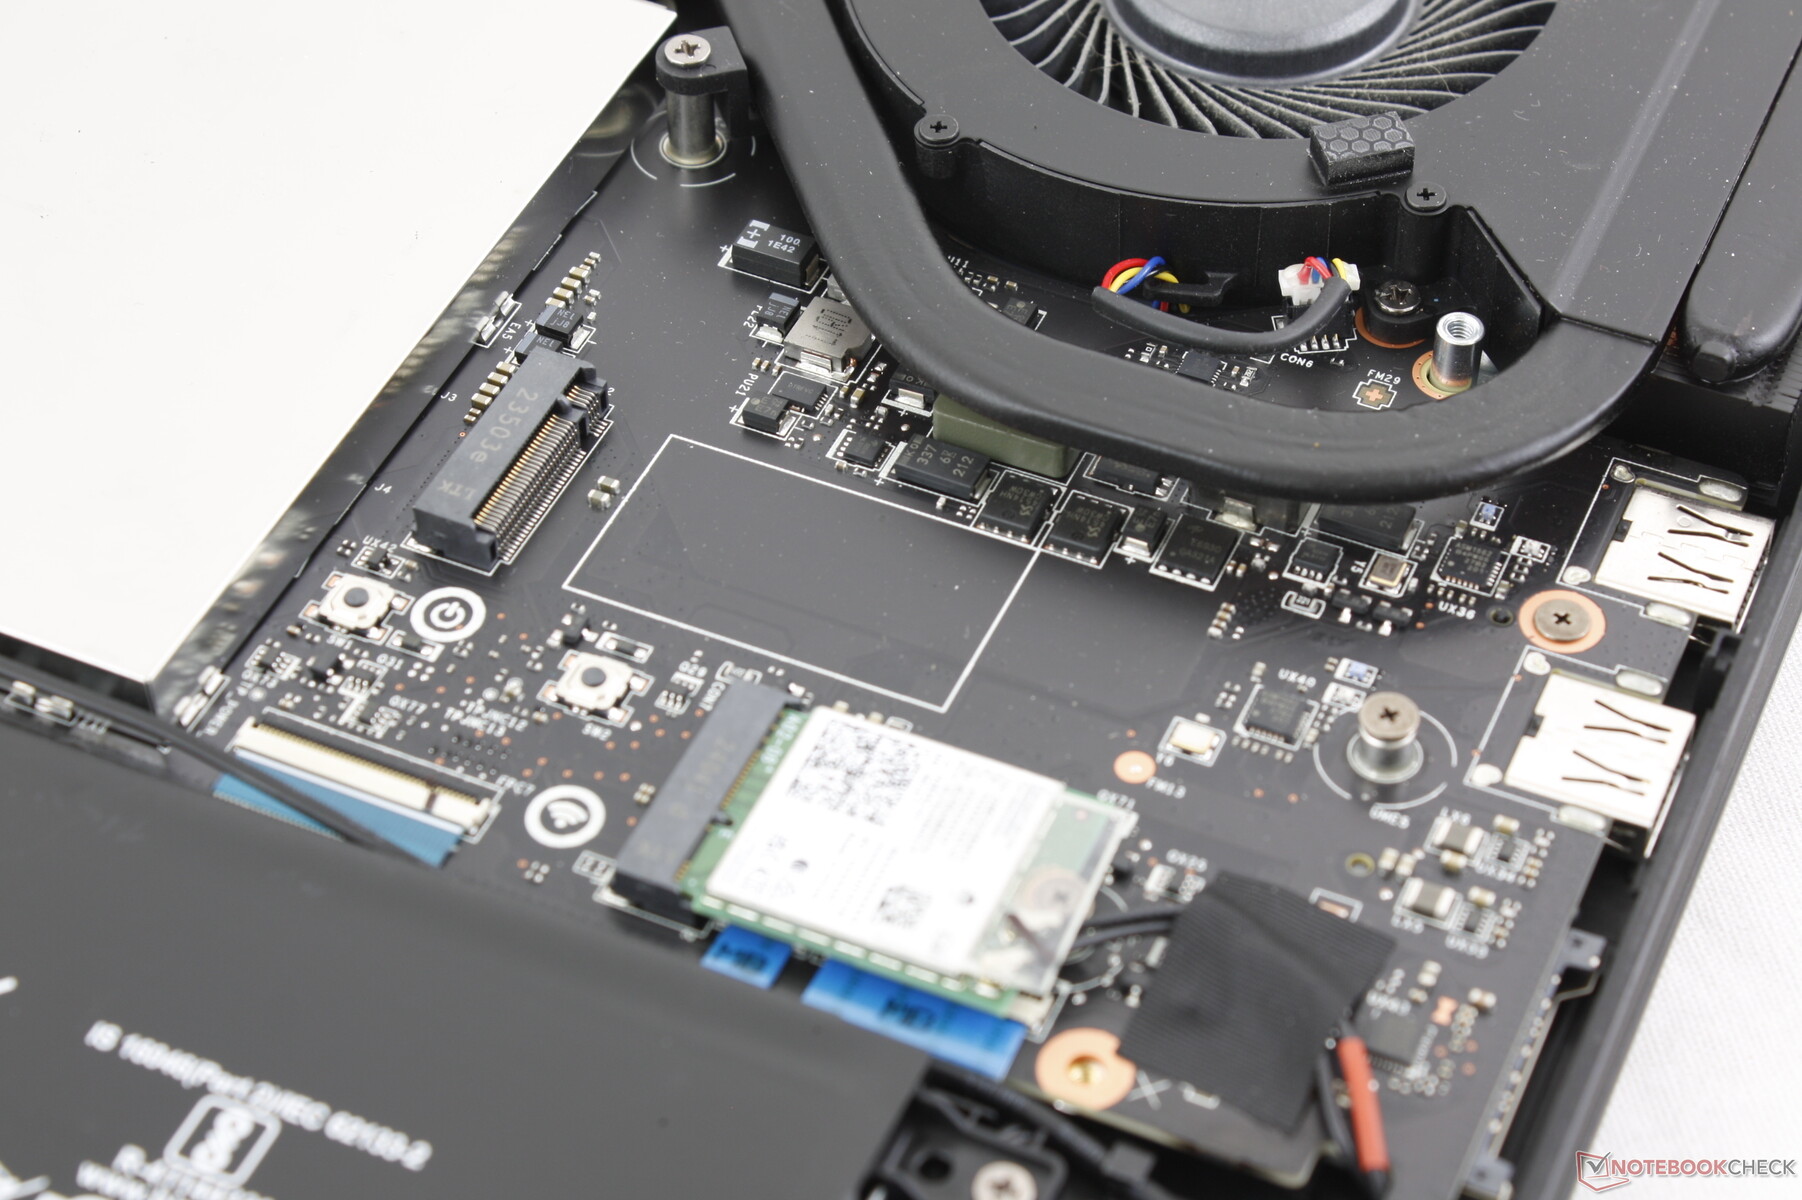
O Raider 18 HX compartilha muitos dos mesmos componentes internos que o Titan 18 HX. Os usuários têm acesso a dois slots para SSD M.2 2280 e quatro slots para SODIMM DDR5. Observe que o terceiro slot de SSD M.2 foi removido desse modelo; os usuários devem fazer upgrade para o Titan 18 HX para obter esse recurso.

Sustentabilidade
A embalagem é totalmente reciclável e quase toda de papelão, com apenas um pouco de plástico para o manual do usuário. Entretanto, não há informações sobre nenhum material reciclado usado durante a fabricação do sistema.
Acessórios e garantia
Não há extras na caixa além do adaptador CA e da documentação. Os modelos Raider mais antigos eram enviados com um pano de limpeza de veludo, mas esse parece não ser mais o caso.
A garantia limitada de um ano do fabricante se aplica se o produto for comprado nos EUA.
Dispositivos de entrada - mais familiares do que sofisticados
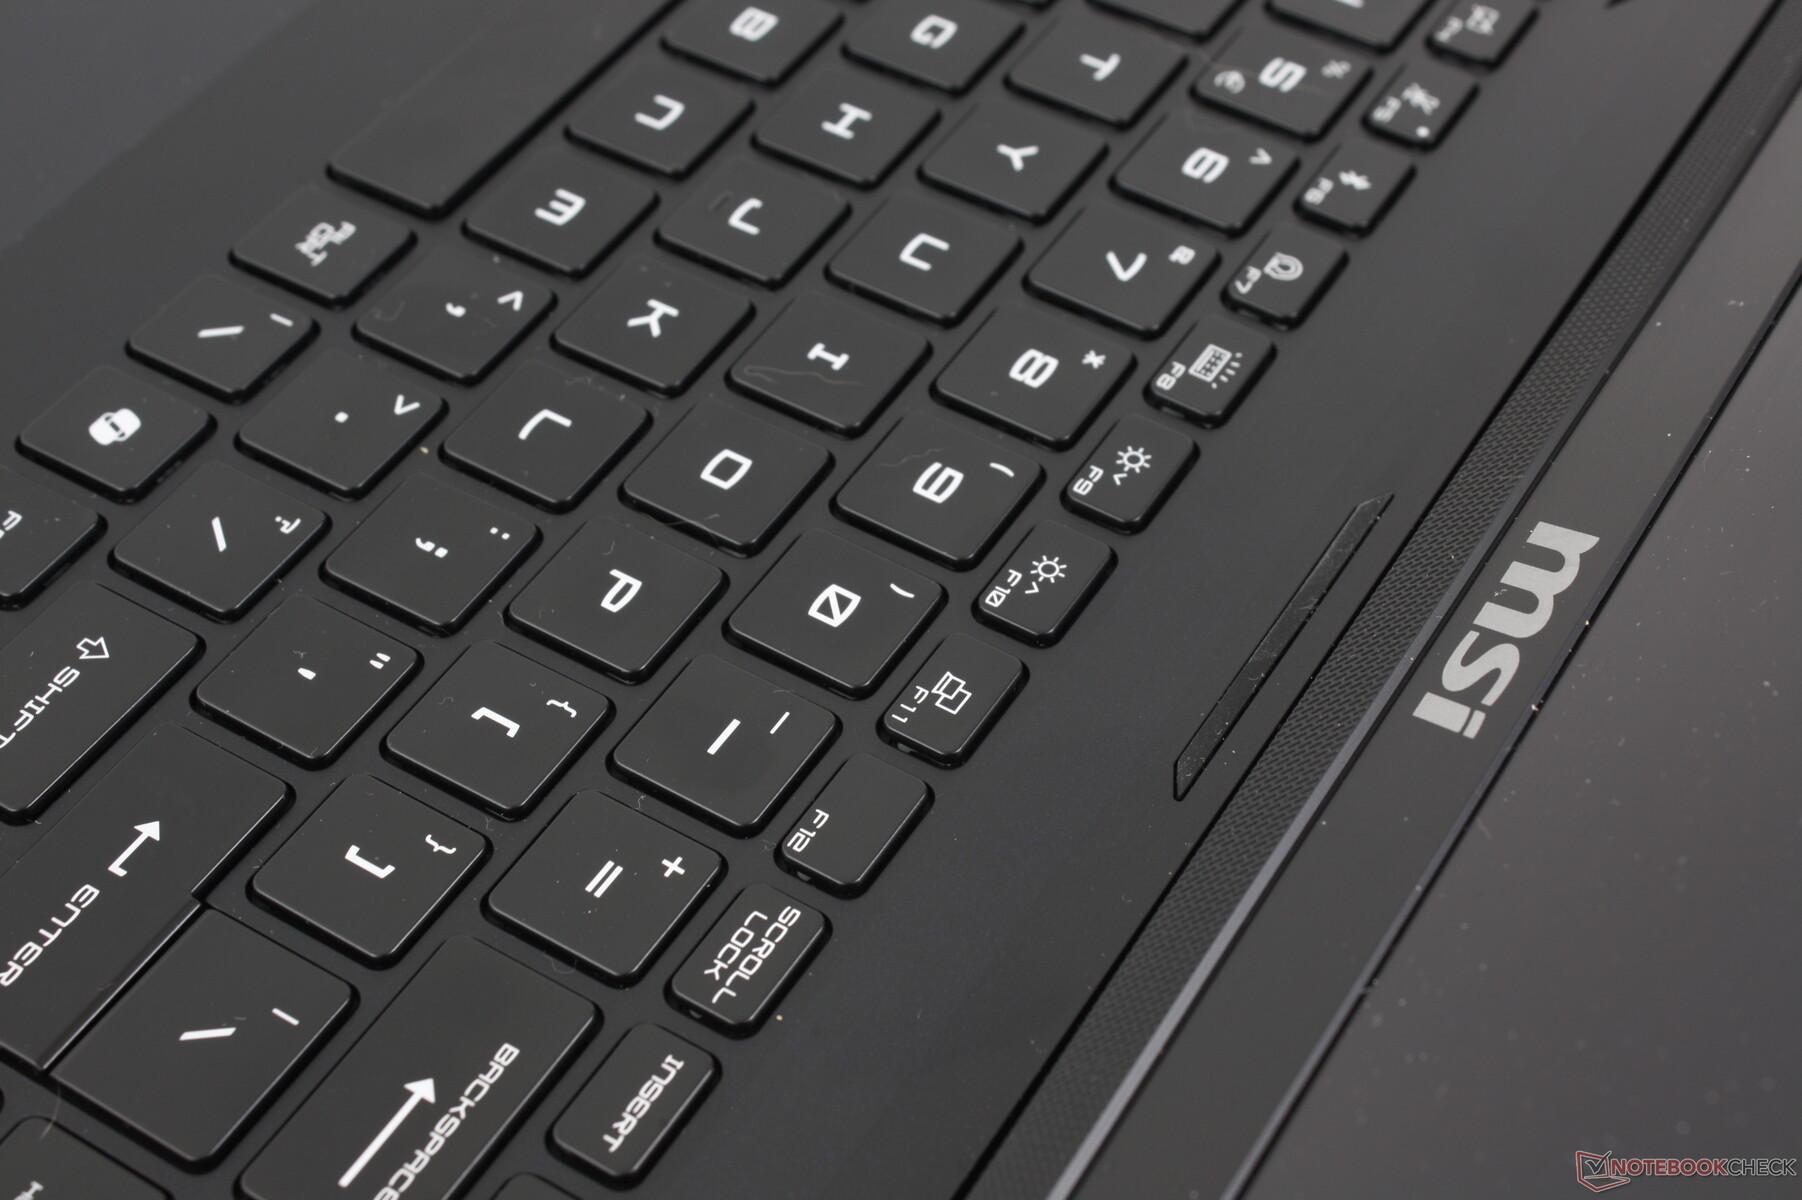
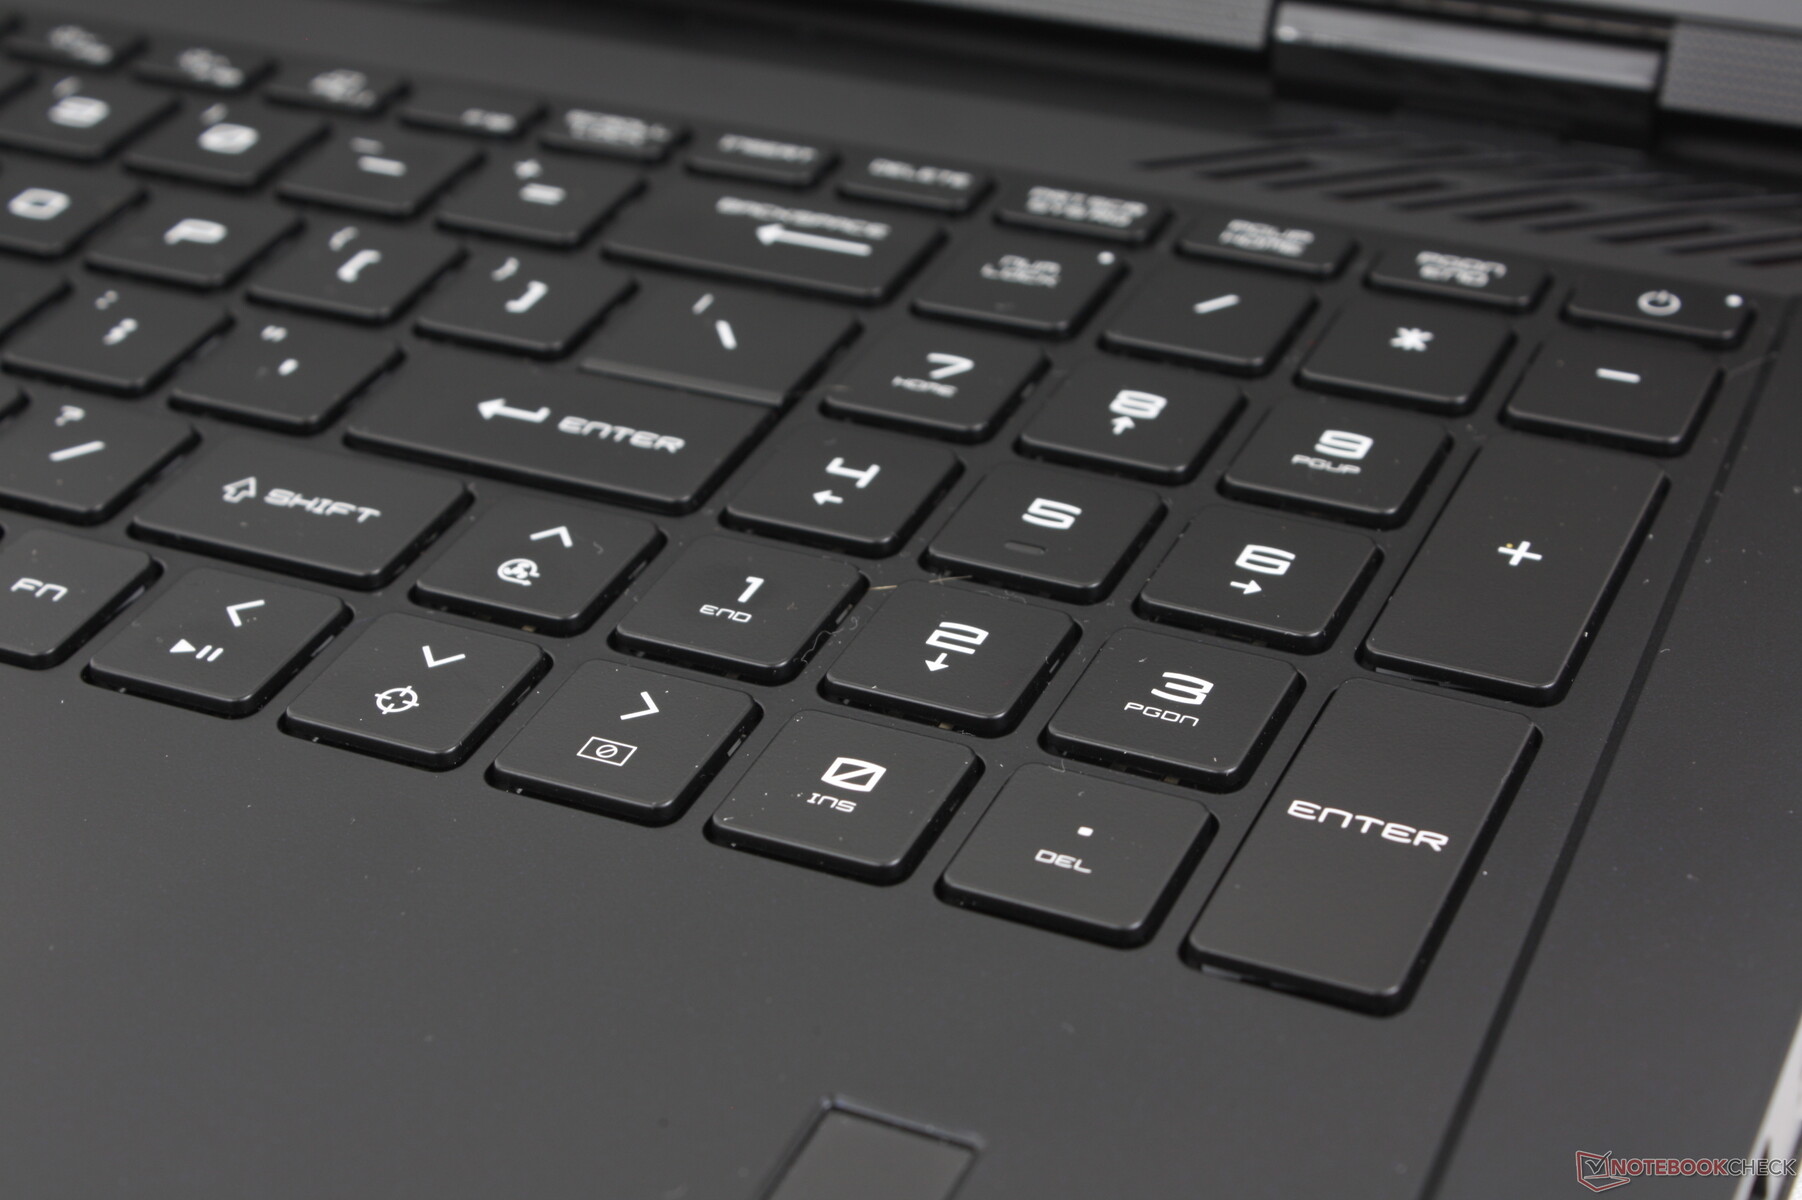
Teclado
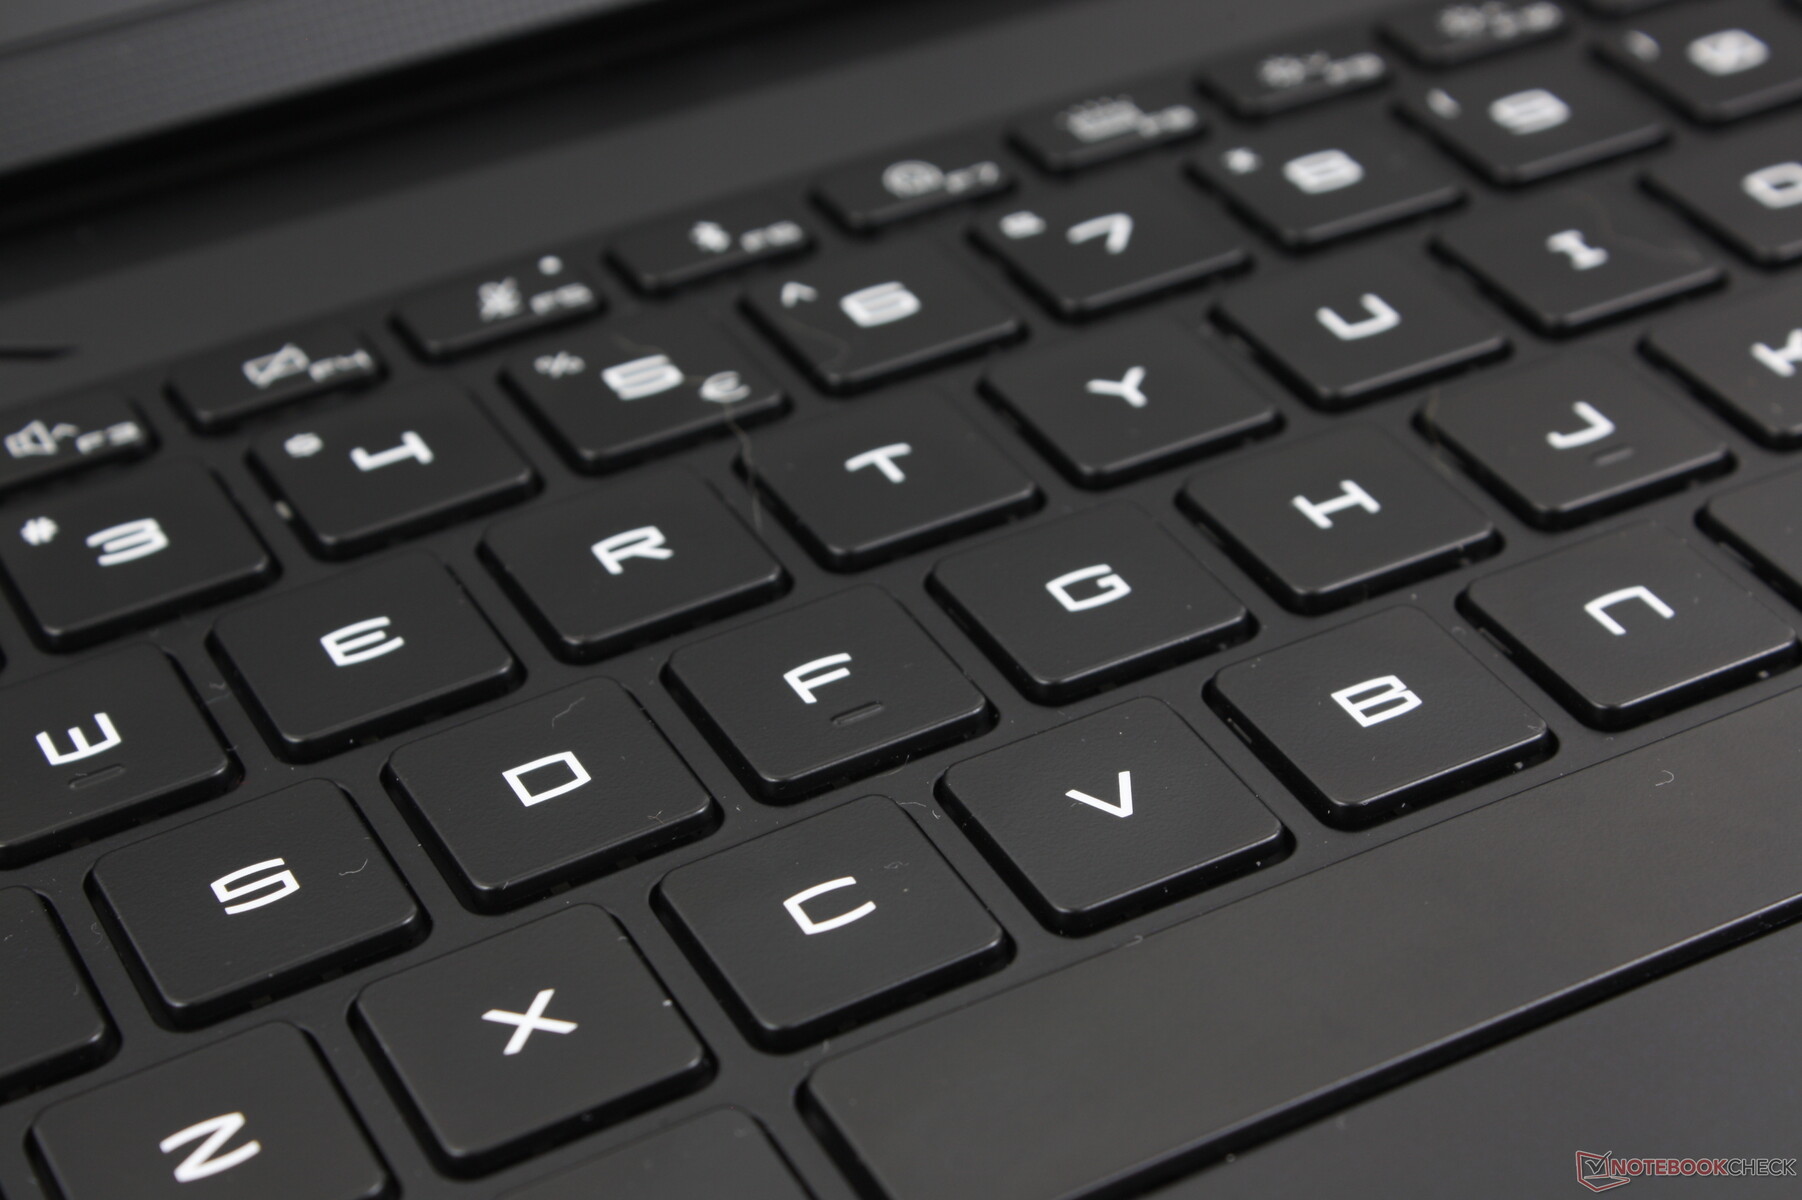
O teclado é visualmente idêntico ao do Titan 18 HX, mas com uma diferença muito importante: A falta de opções mecânicas CherryMX. Portanto, a digitação no Raider 18 HX é mais parecida com a digitação em teclados de laptop mais tradicionais, como o MSI Stealth 16 ou modelos Raider da geração anterior. O feedback não é nem de longe tão firme ou clicável, mas o ruído mais suave pode ser preferível para ambientes como salas de conferência, salas de aula, bibliotecas ou dormitórios.
Gostamos especialmente do teclado numérico e das teclas de seta de tamanho normal, pois geralmente são mais estreitos e menores do que as teclas QWERTY principais da maioria dos outros laptops. Portanto, o trabalho com planilhas é mais confortável no Raider 18 HX do que no Blade 18 ou no ROG Strix G18.
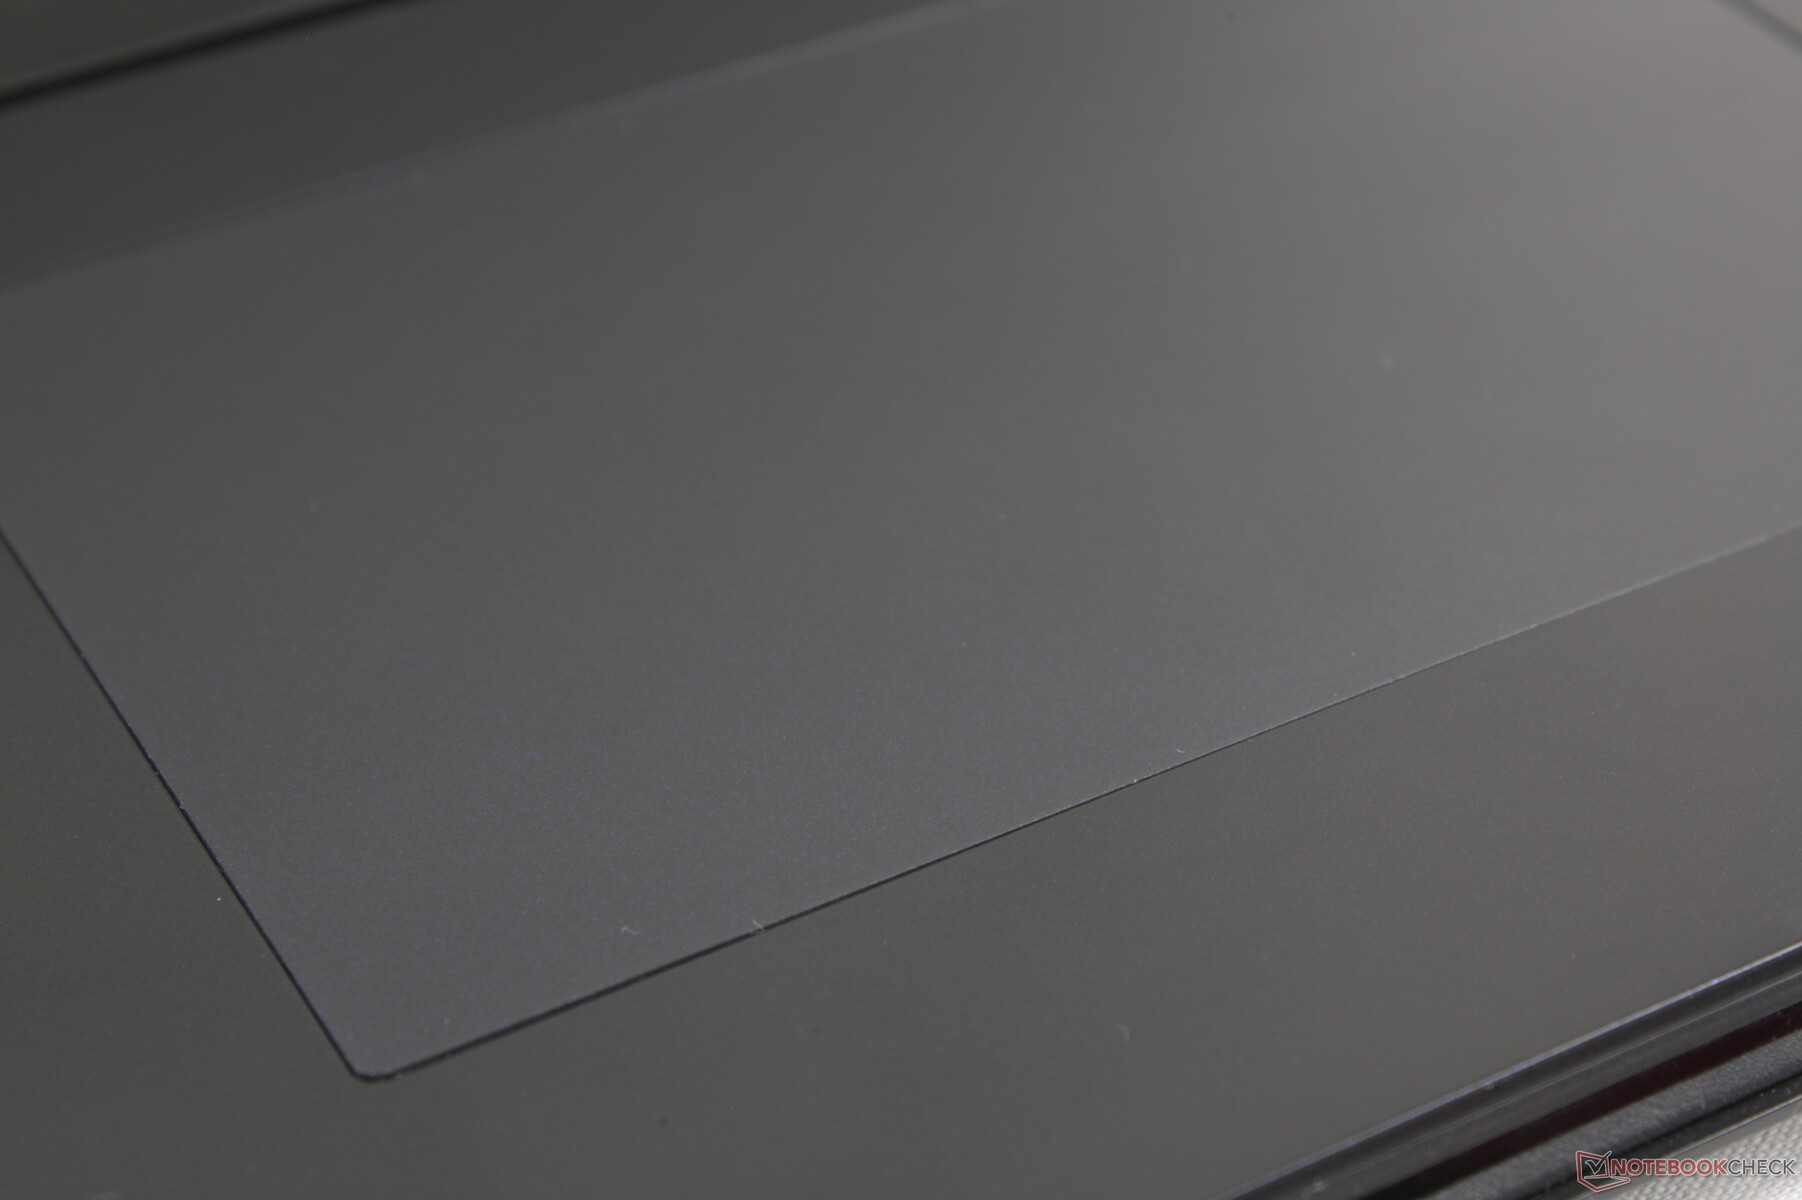
Touchpad
Ao contrário do sofisticado clickpad sem bordas iluminado por LED do Titan 18 HX, o Raider 18 HX utiliza um clickpad tradicional para proporcionar uma sensação mais familiar. O tamanho permanece exatamente o mesmo (13 x 8,2 cm) e é indiscutivelmente mais confortável de usar, pois não está tentando ser algo novo ou corrigir um problema que não existia. A tração é extremamente suave, com apenas um pouco de aderência em velocidades mais lentas para garantir a precisão.
Infelizmente, pressionar para baixo para inserir um clique ainda é superficial e suave, com feedback insatisfatório. Teria sido preferível um clique mais forte e firme ou até mesmo o retorno das teclas dedicadas do mouse, pois o teclado é bastante espaçoso.
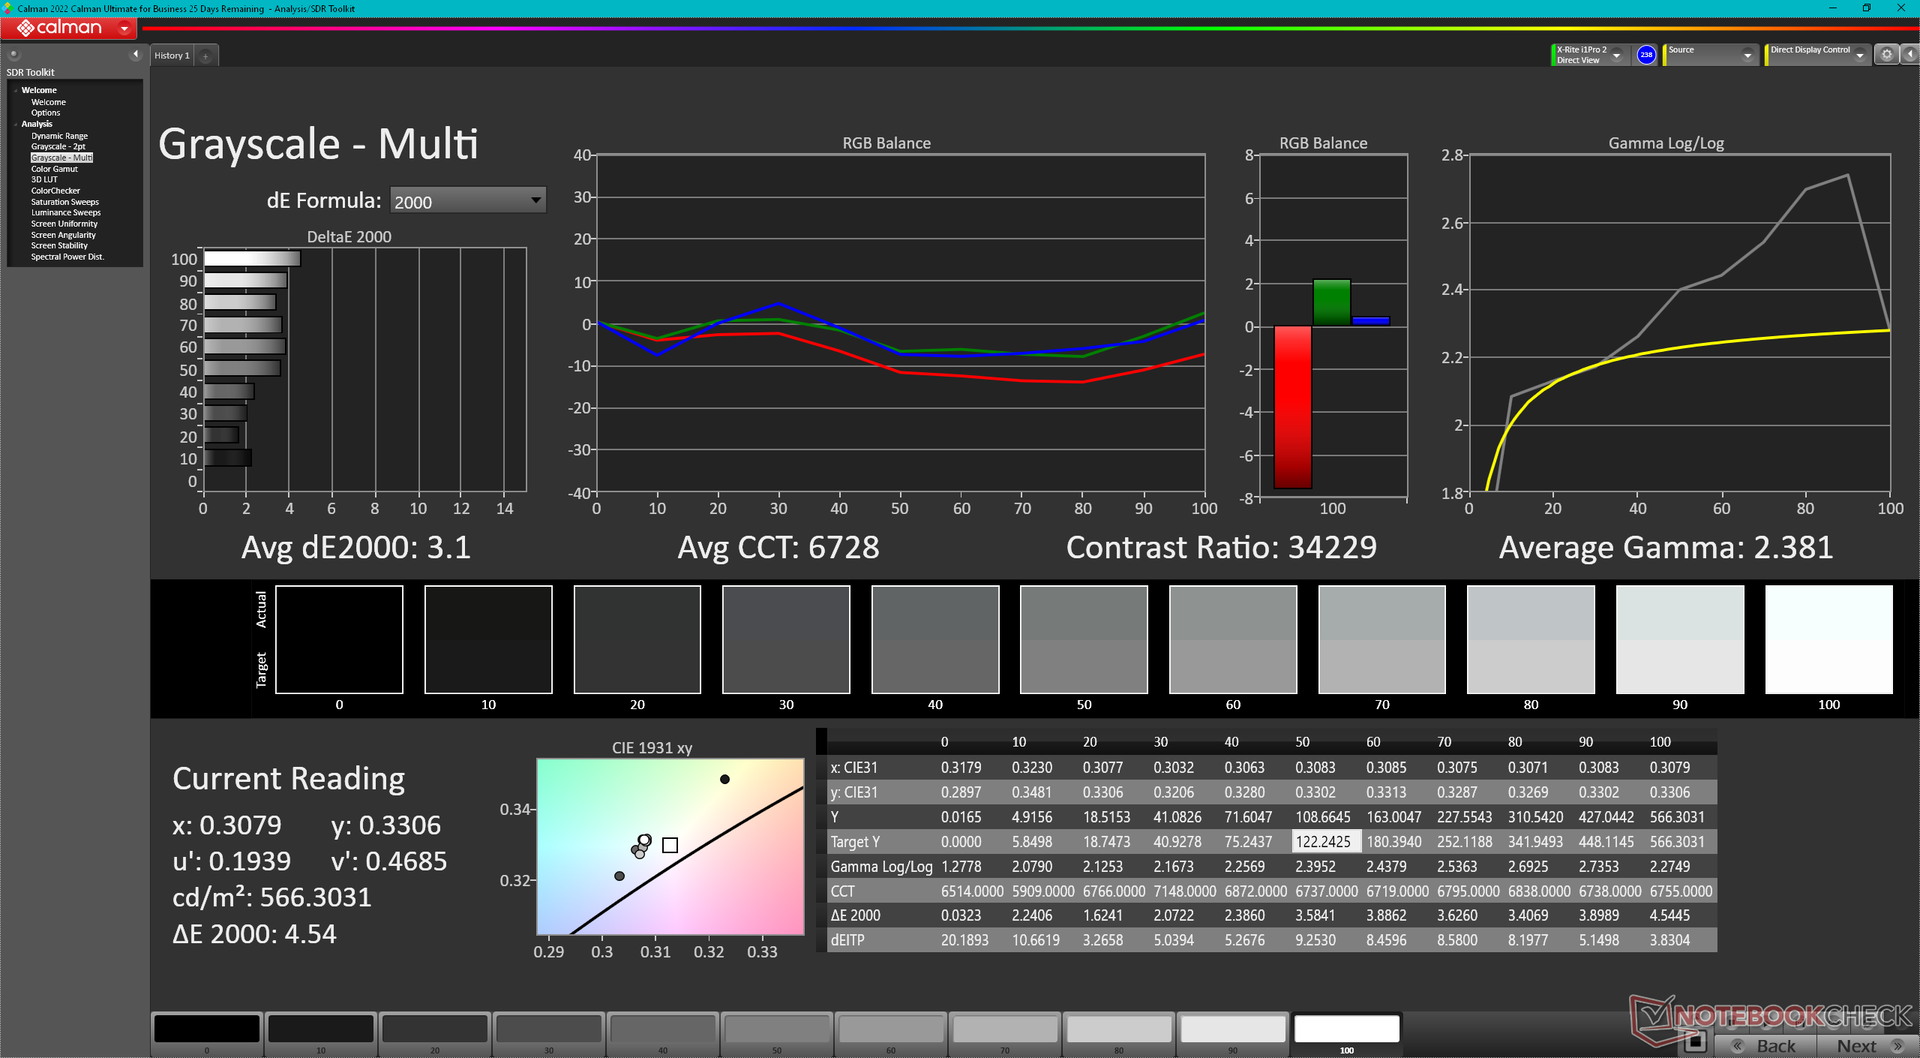
Tela - Experiência Titan 18 HX por menos
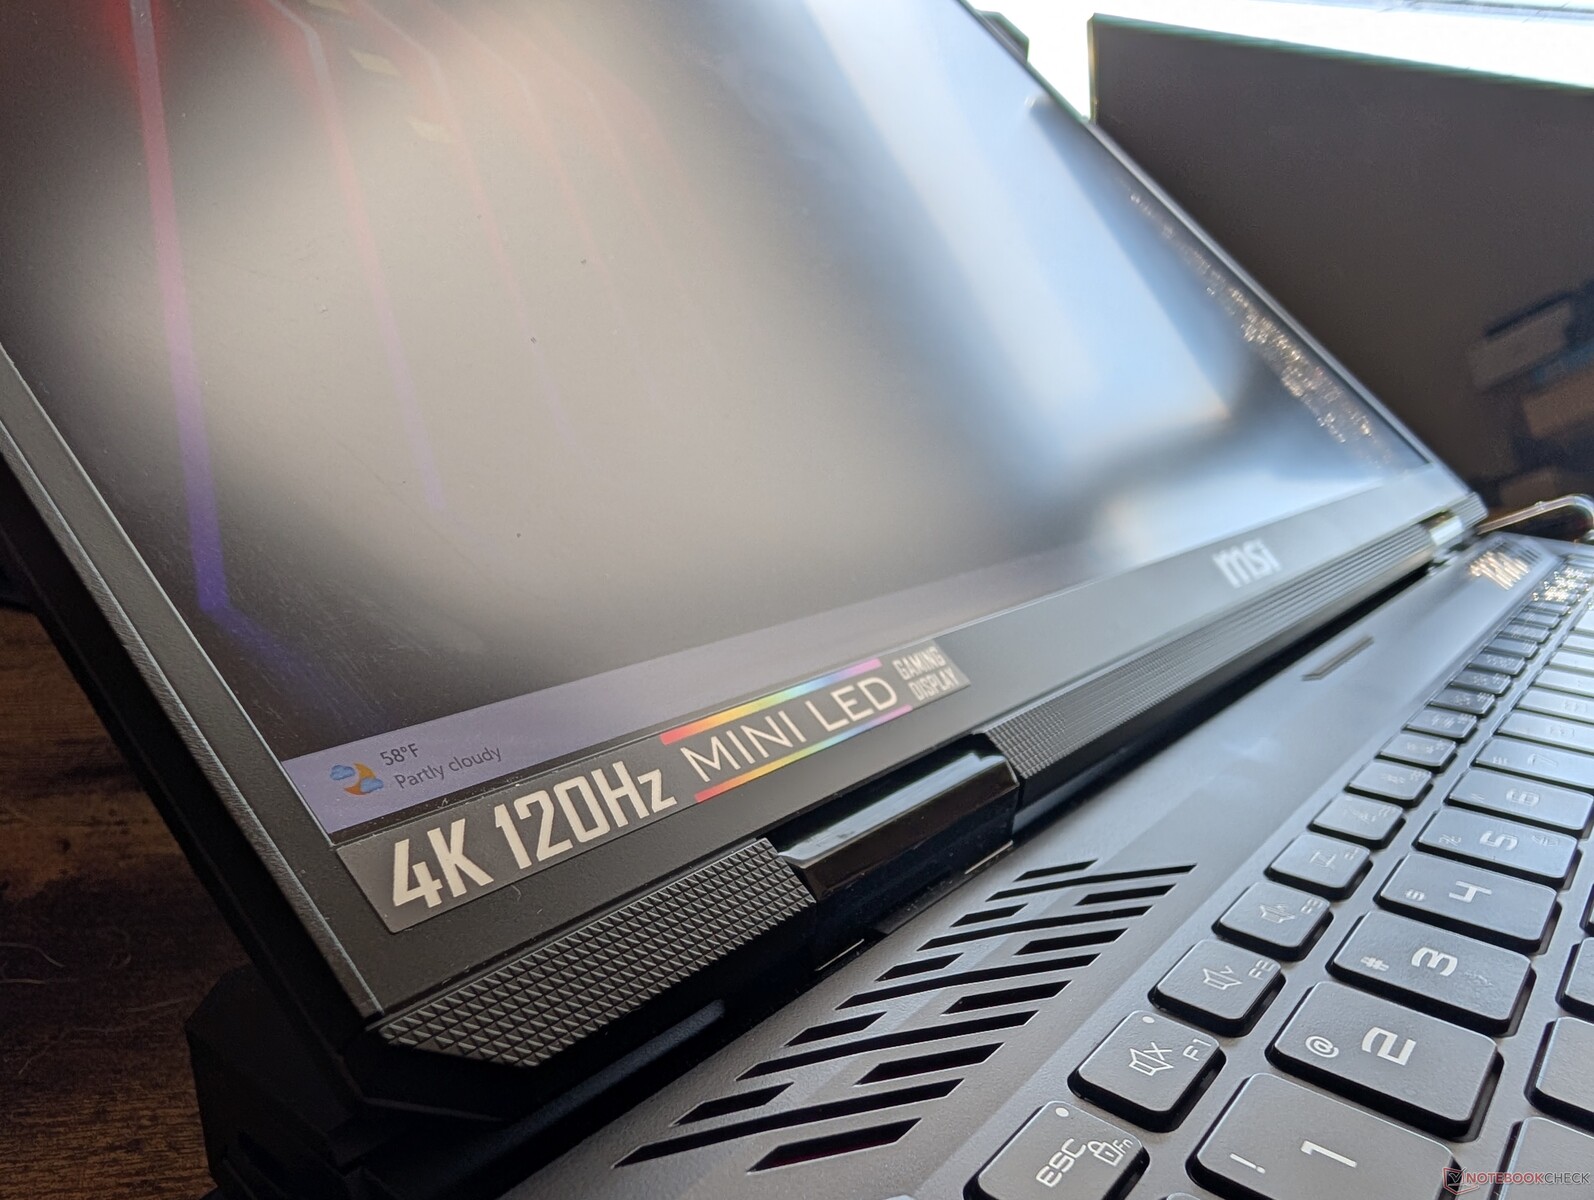
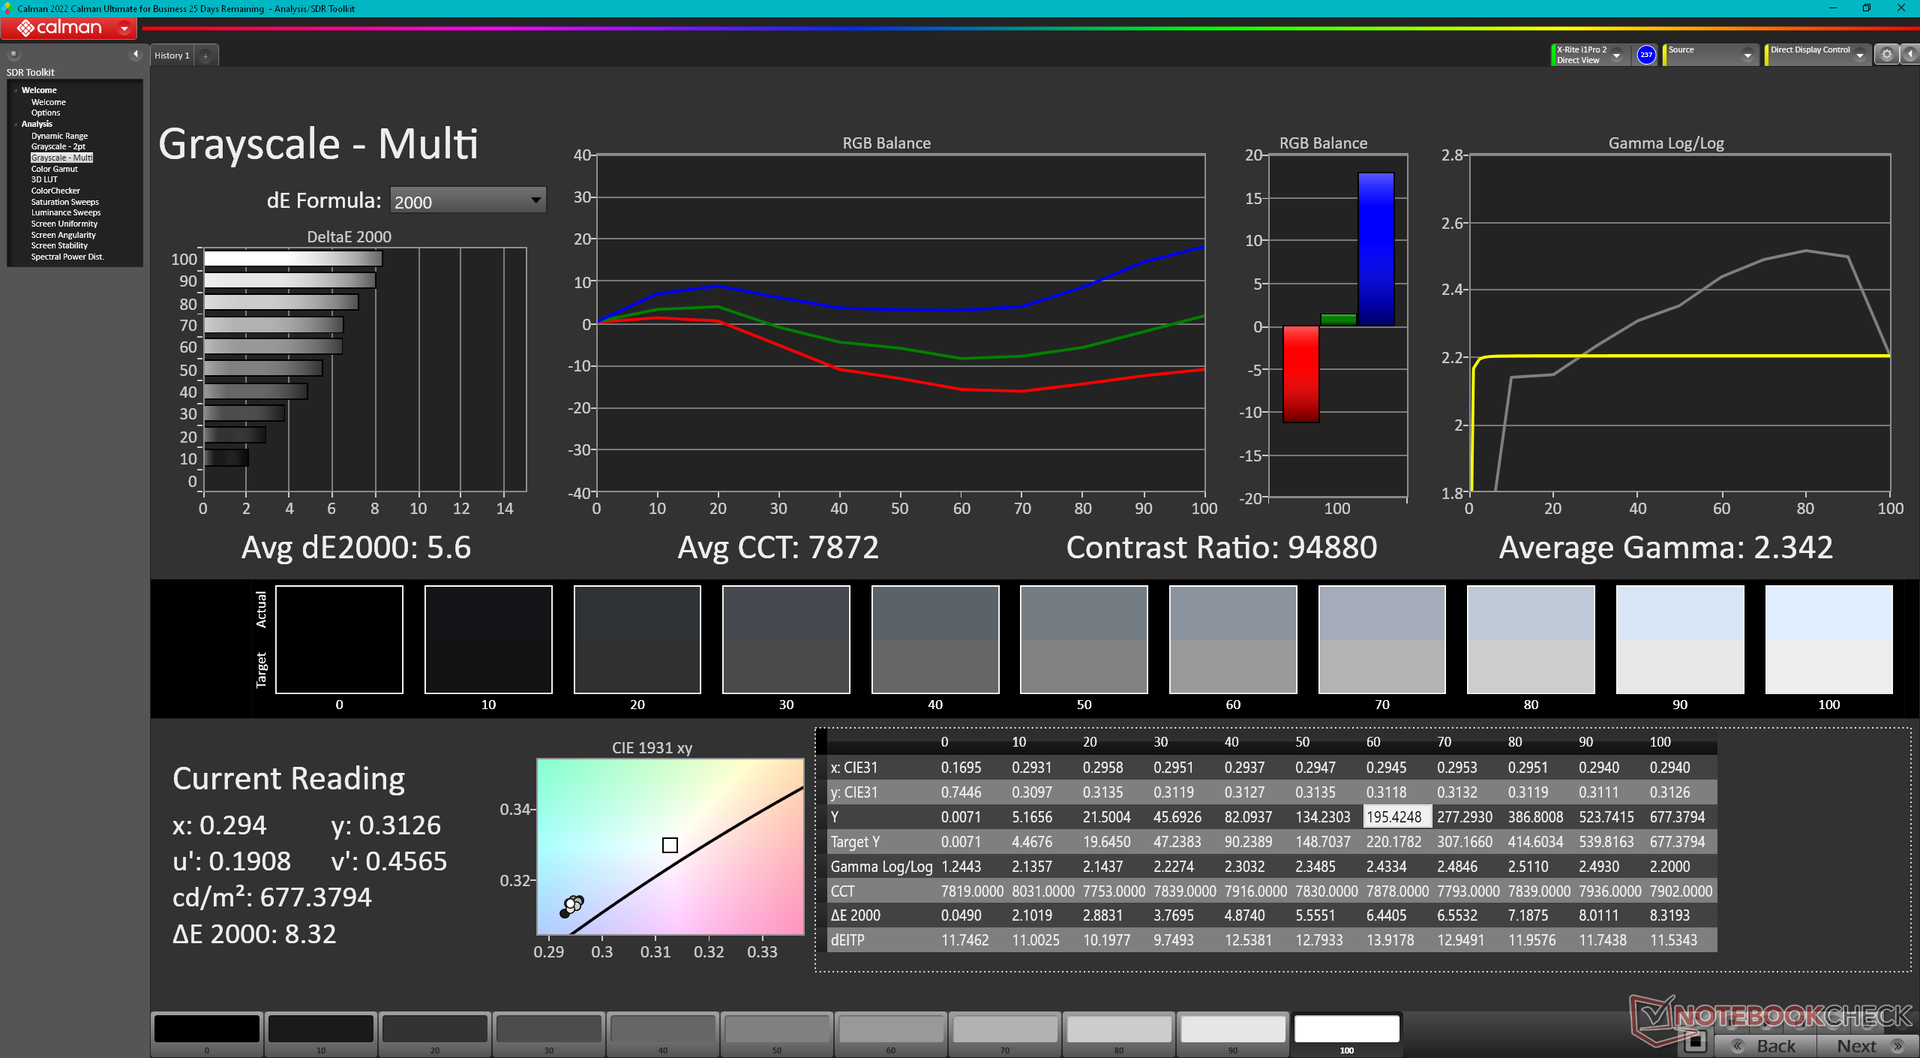
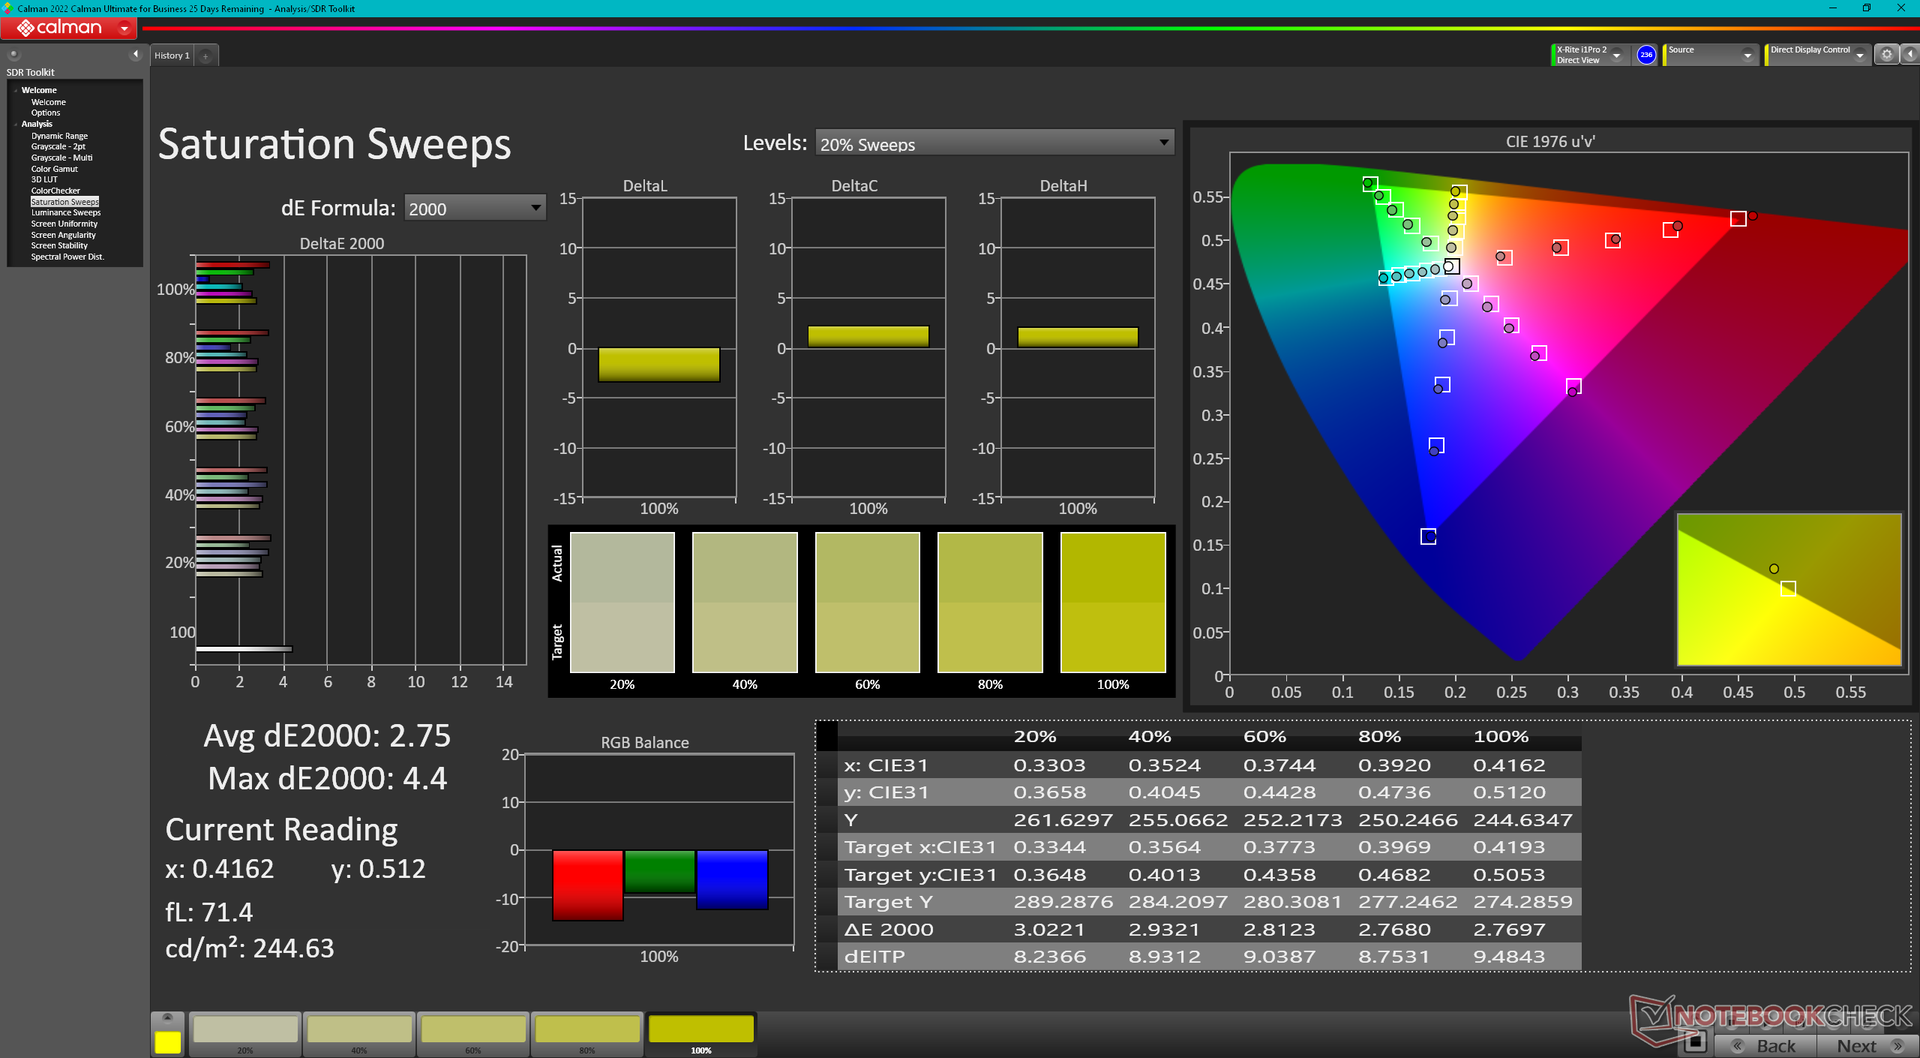
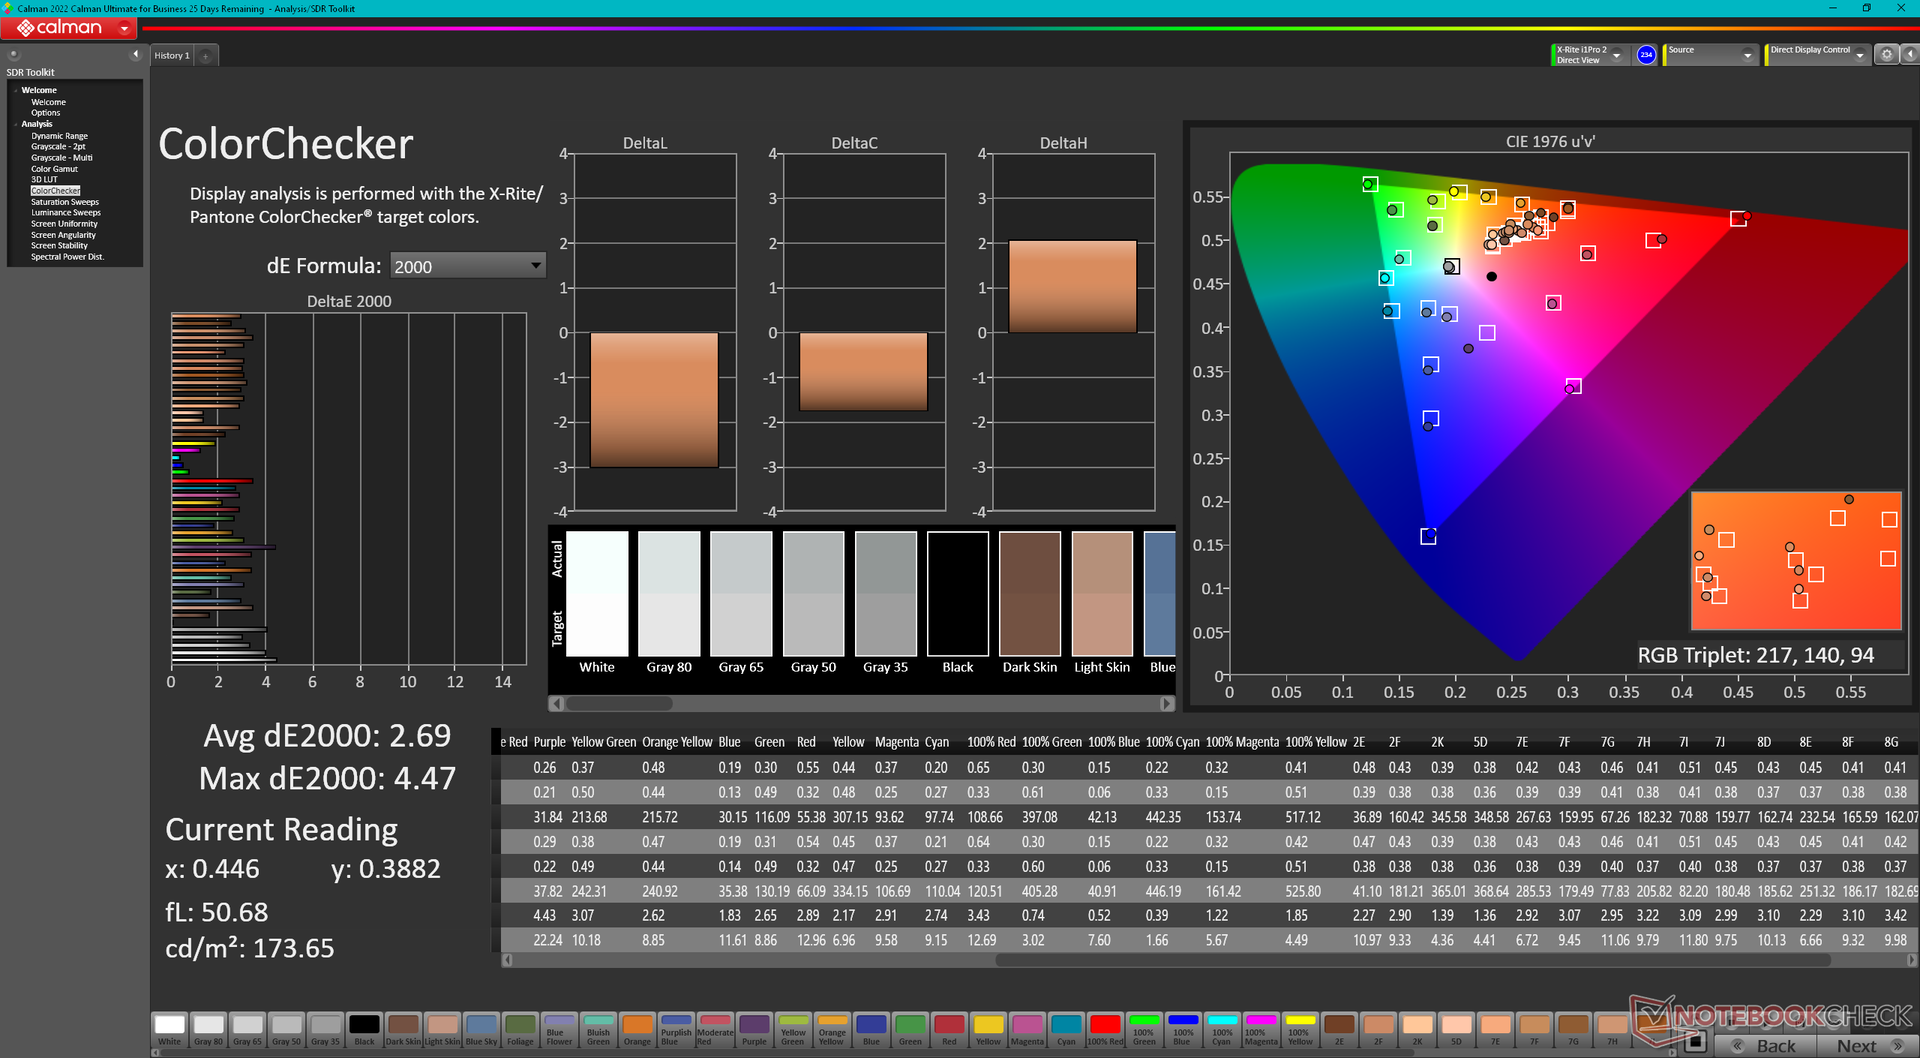
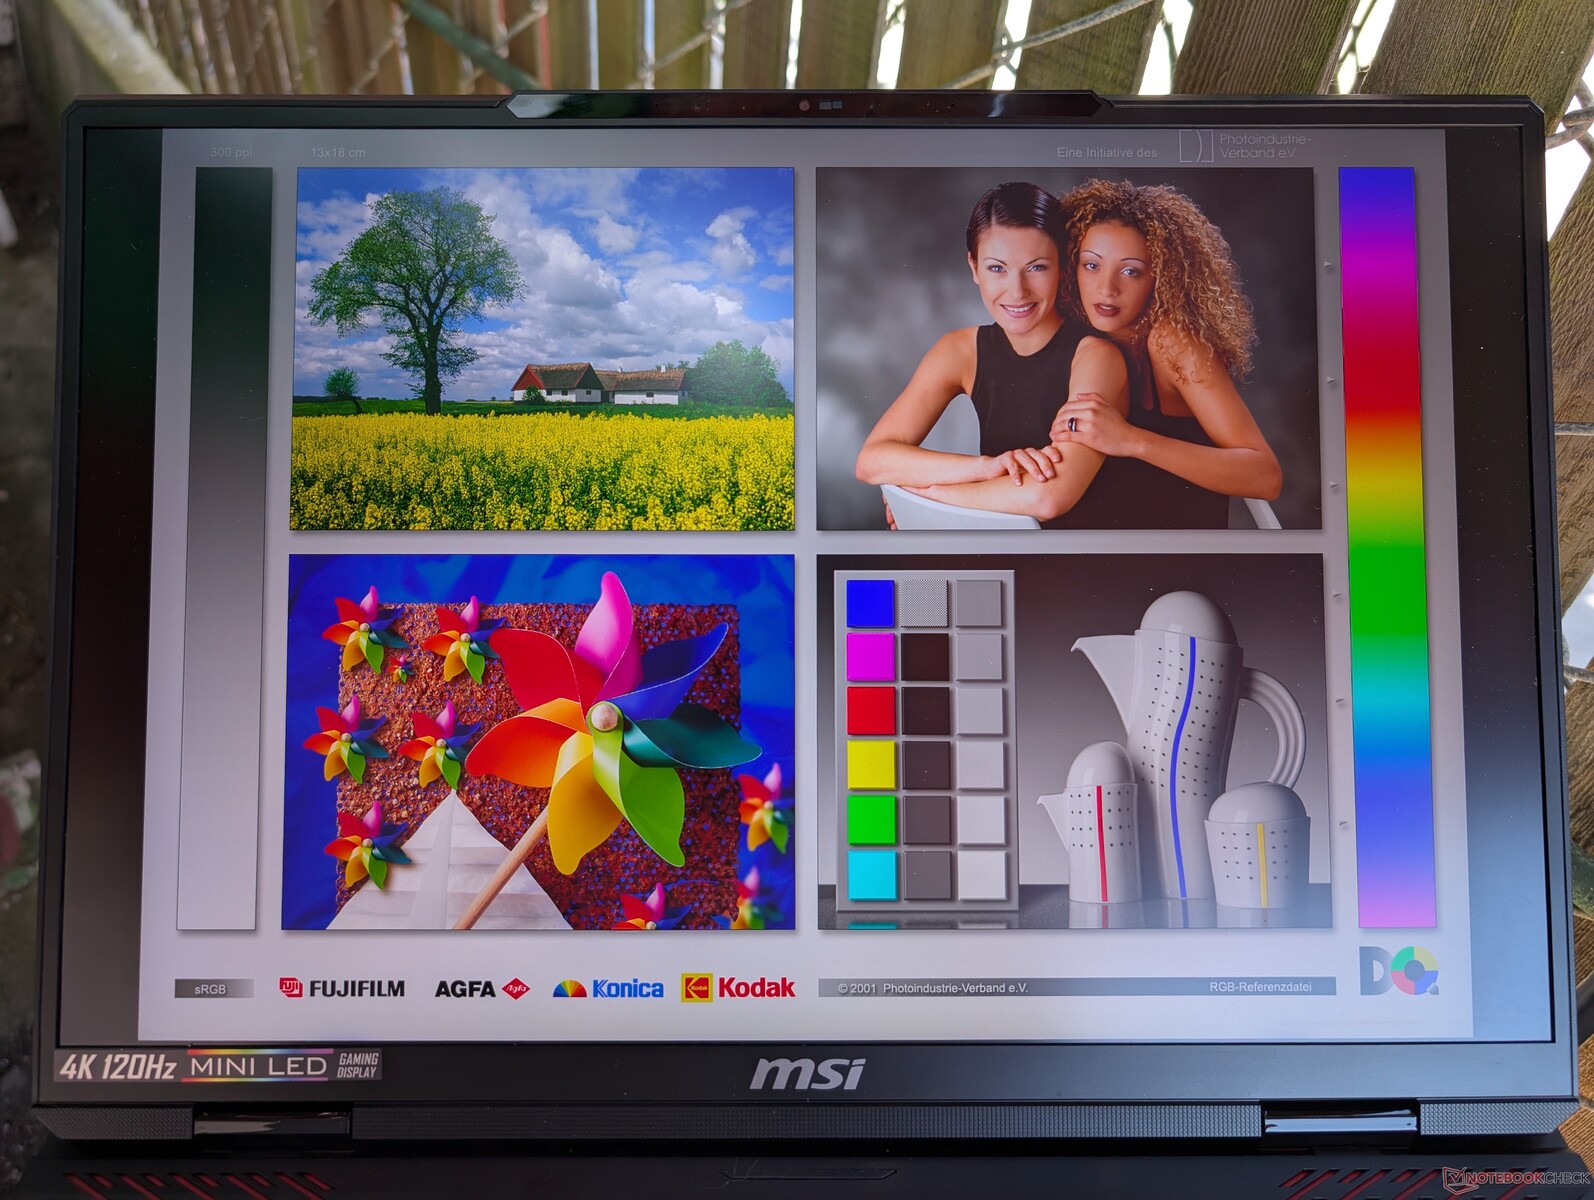
O Raider 18 HX vem com exatamente o mesmo painel mini-LED AU Optronics B180ZAN01.0 de 120 Hz encontrado no Titan 18 HX para uma experiência de visualização praticamente idêntica. O brilho máximo chega a quase 600 nits quando o HDR está desligado ou 935 nits quando o HDR está ligado. Quando comparado ao IPS ou OLED, o mini-LED proporciona uma melhor experiência de visualização HDR, pois é capaz de atingir níveis de brilho mais altos do que qualquer um dos dois, ao custo de um maior consumo de energia. Os laptops IPS ou OLED normalmente suportam HDR600 na melhor das hipóteses, enquanto os painéis mini-LED geralmente prometem HDR1000.
| |||||||||||||||||||||||||
iluminação: 94 %
iluminação com acumulador: 392.2 cd/m²
Contraste: ∞:1 (Preto: 0 cd/m²)
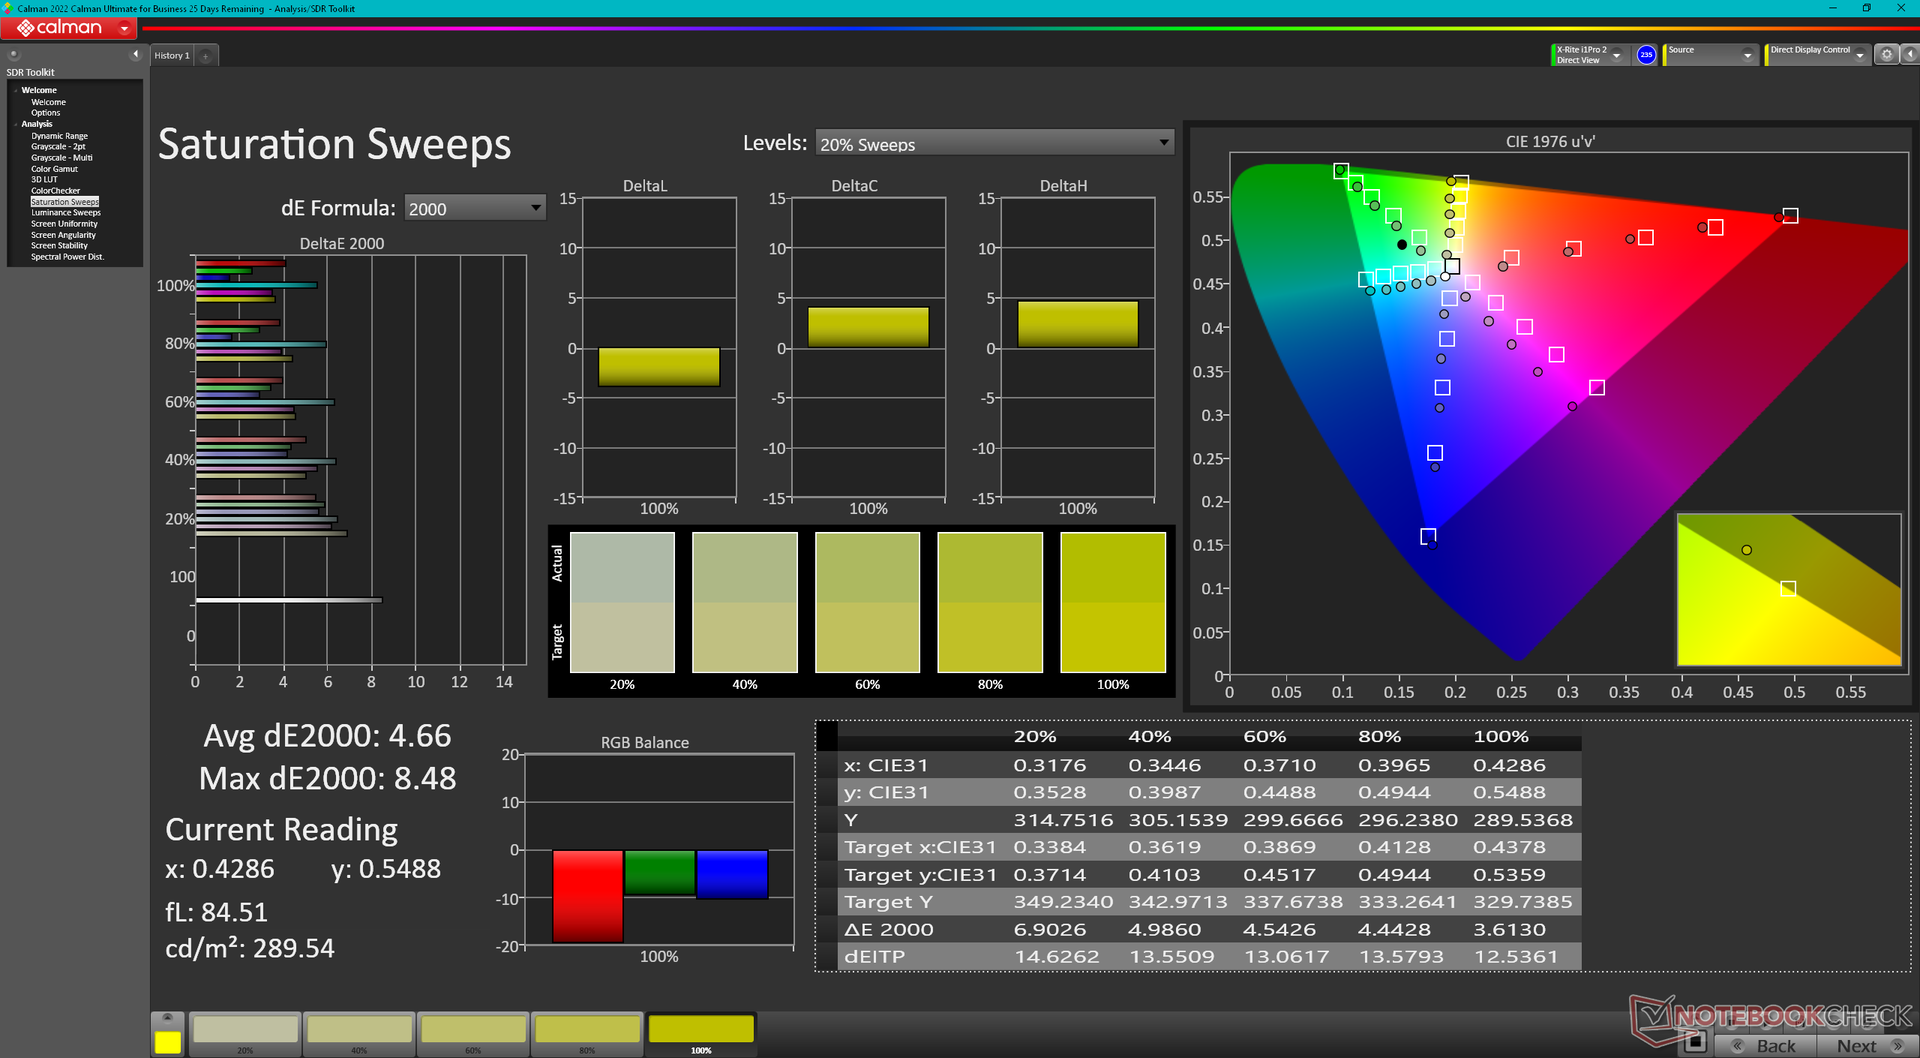
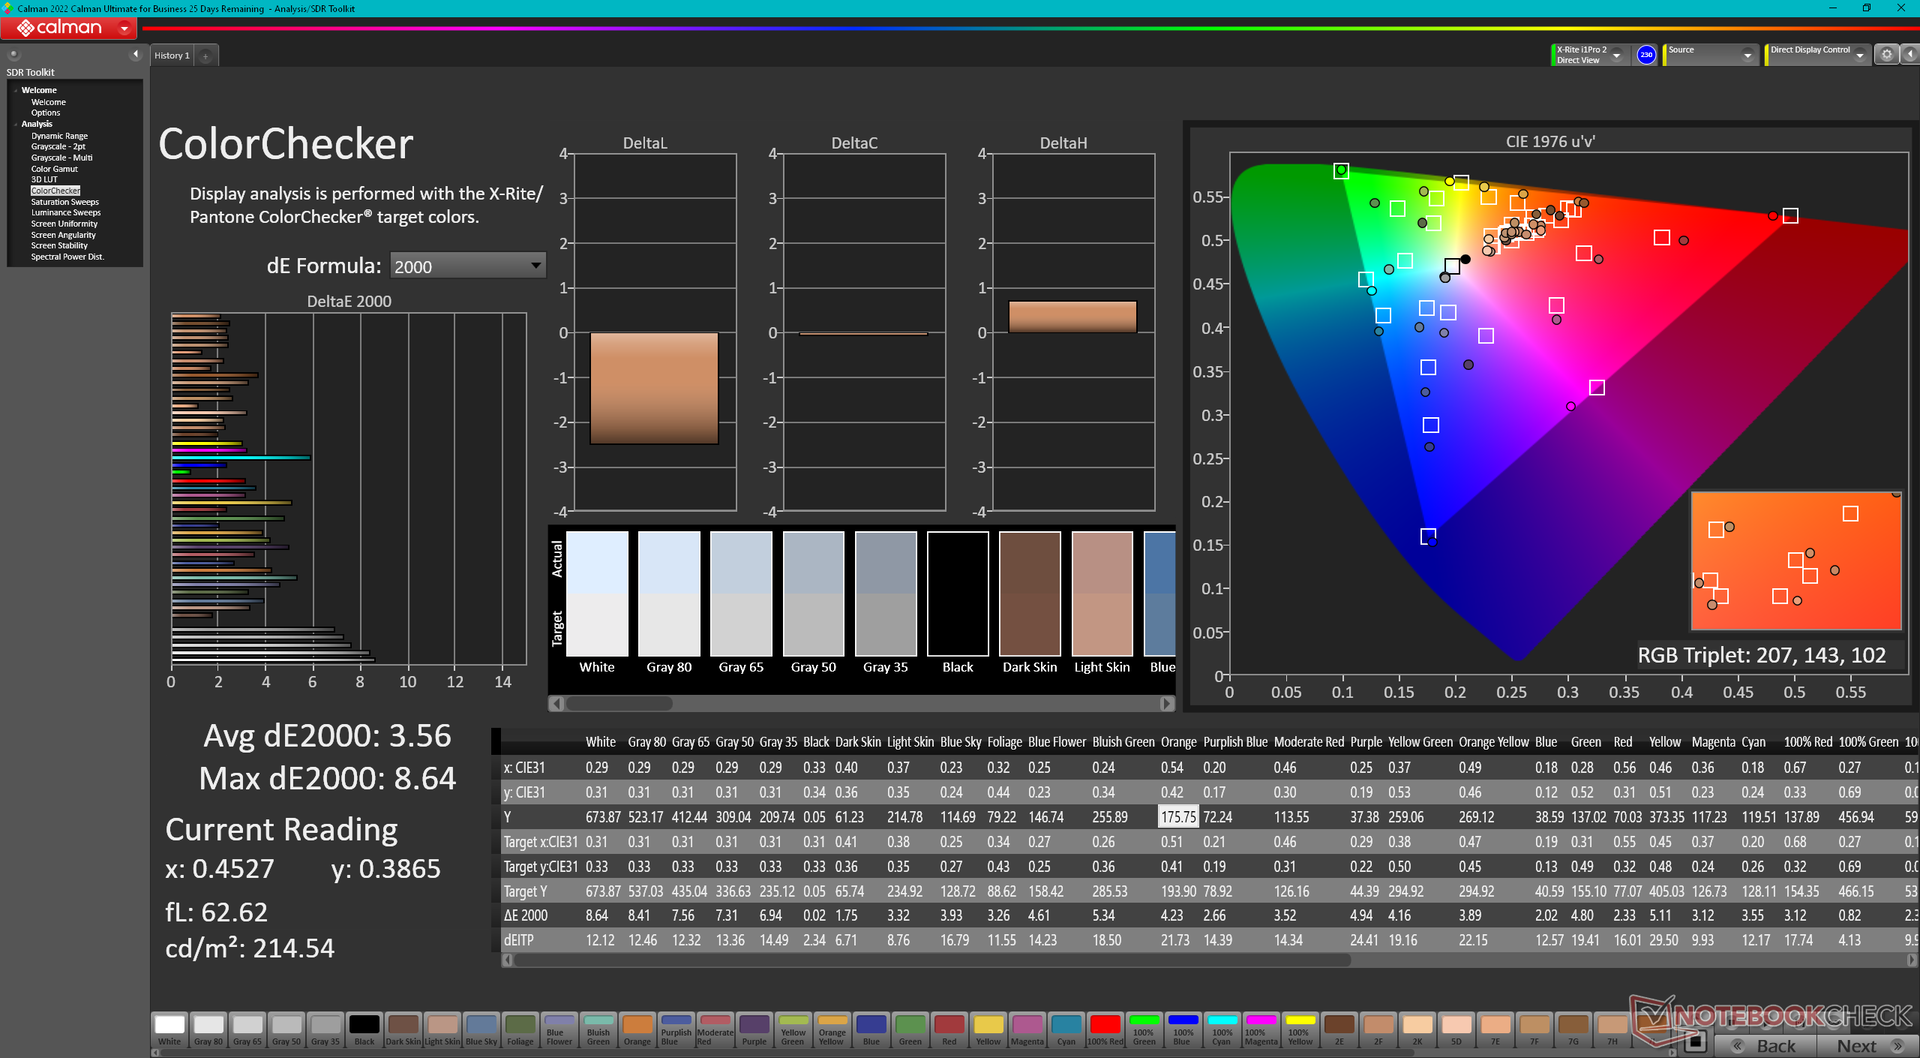
ΔE Color 3.56 | 0.5-29.43 Ø4.87, calibrated: 2.69
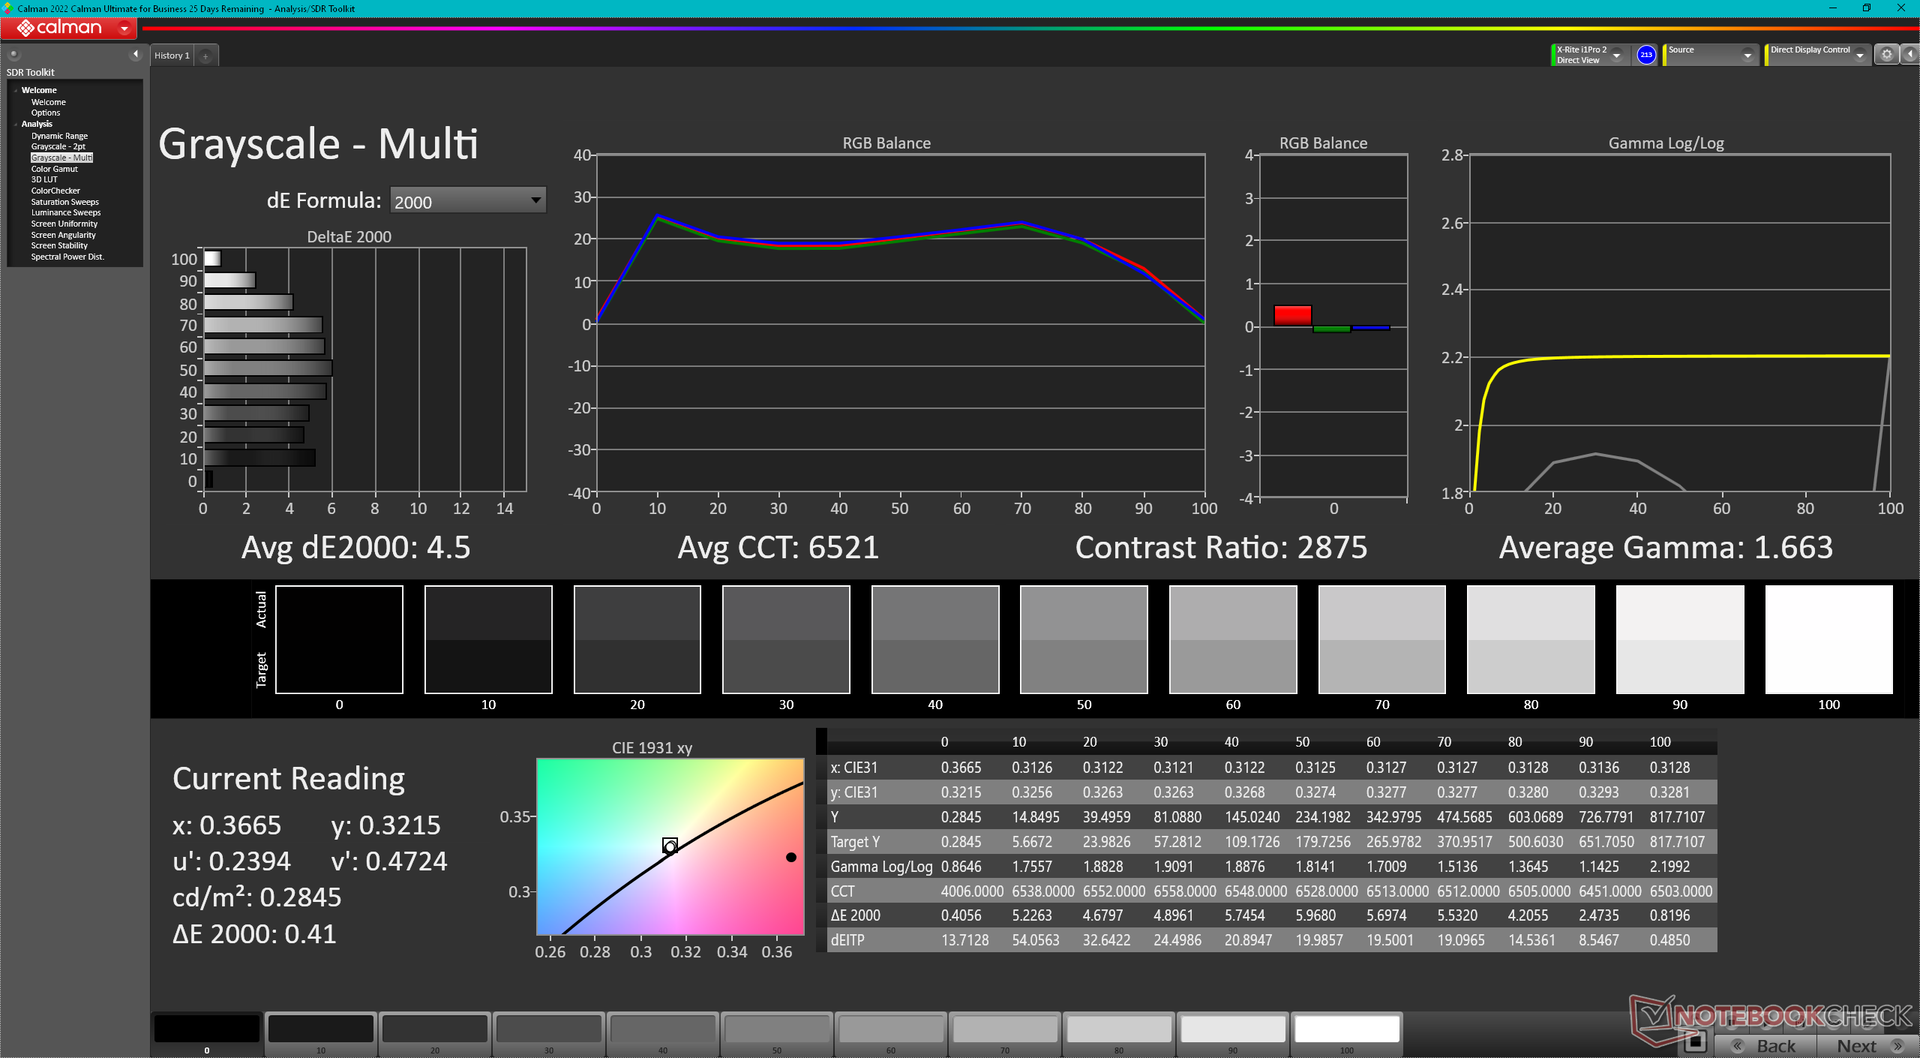
ΔE Greyscale 5.6 | 0.5-98 Ø5.1
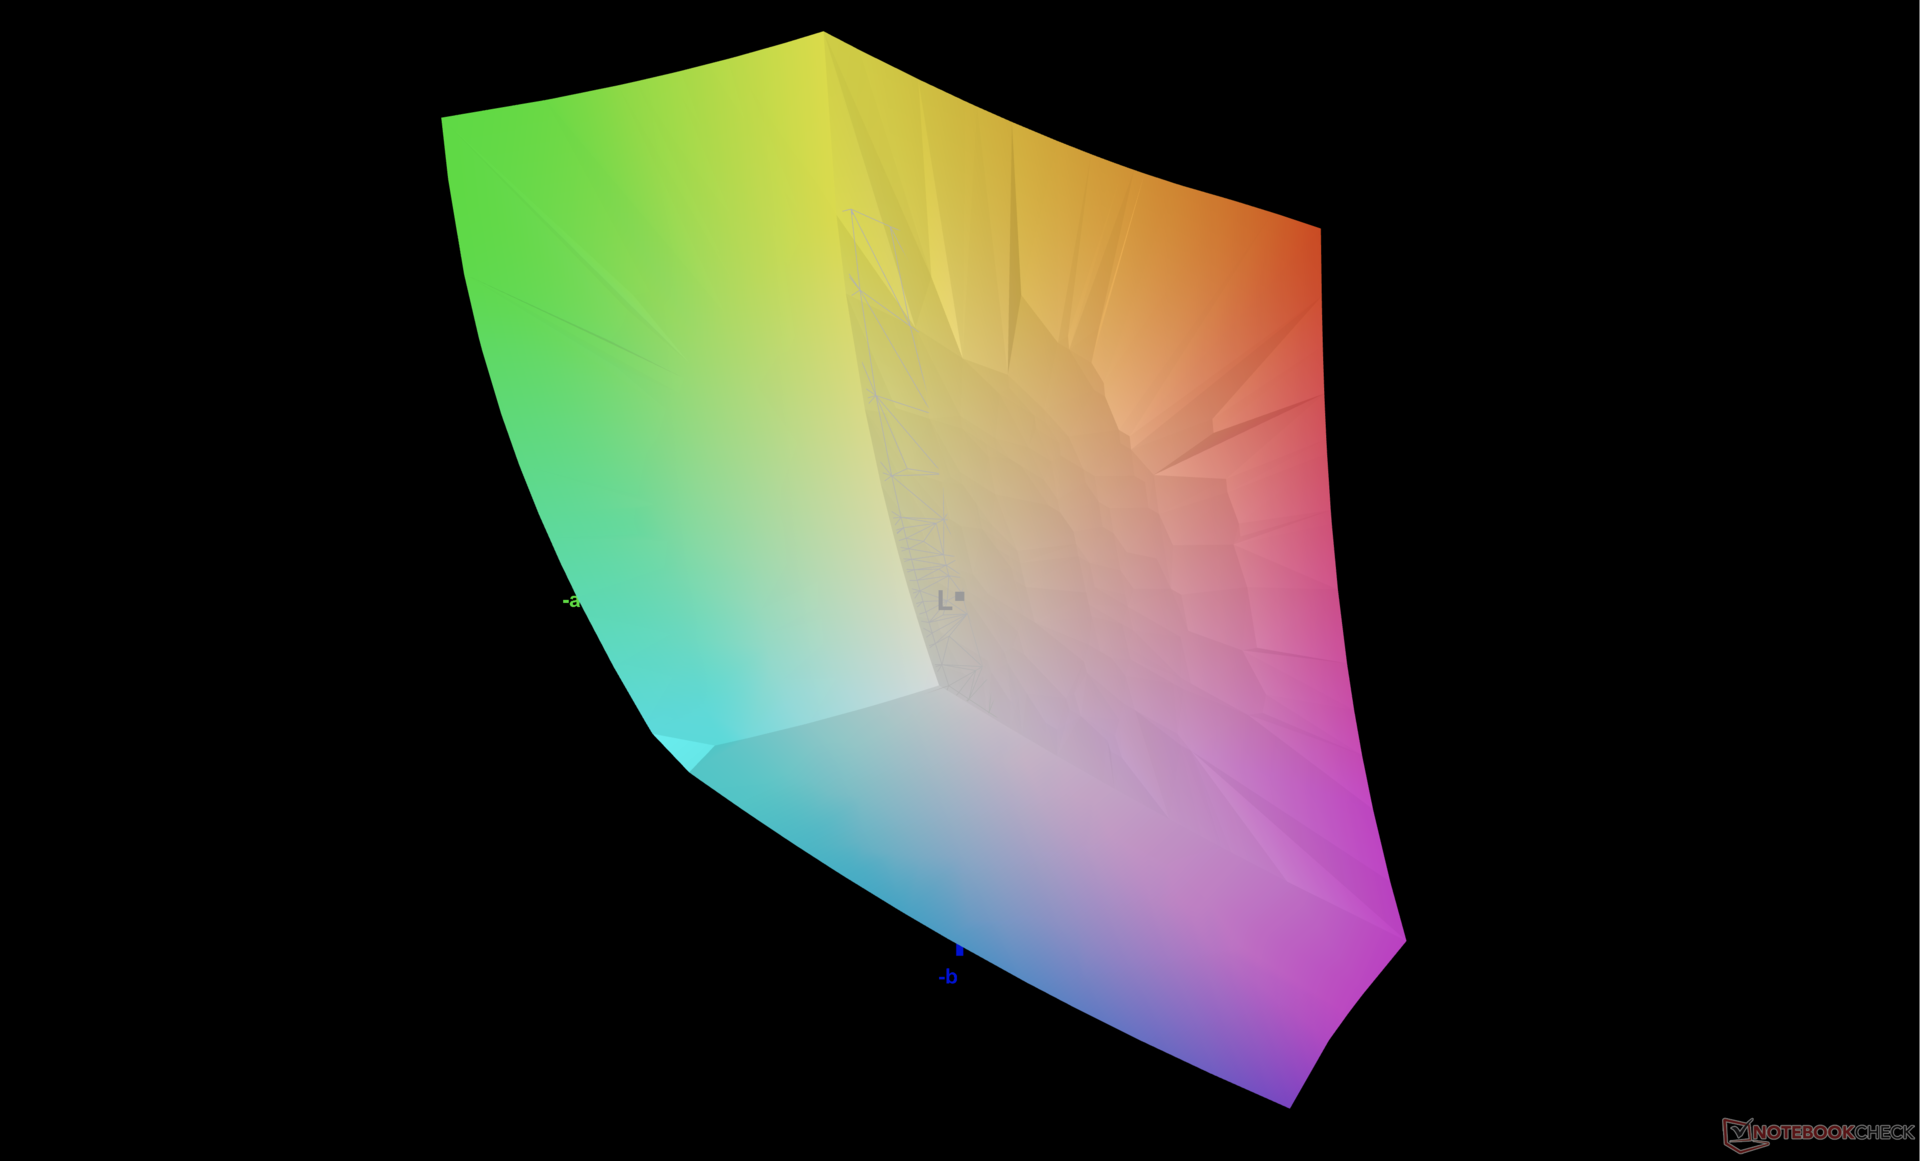
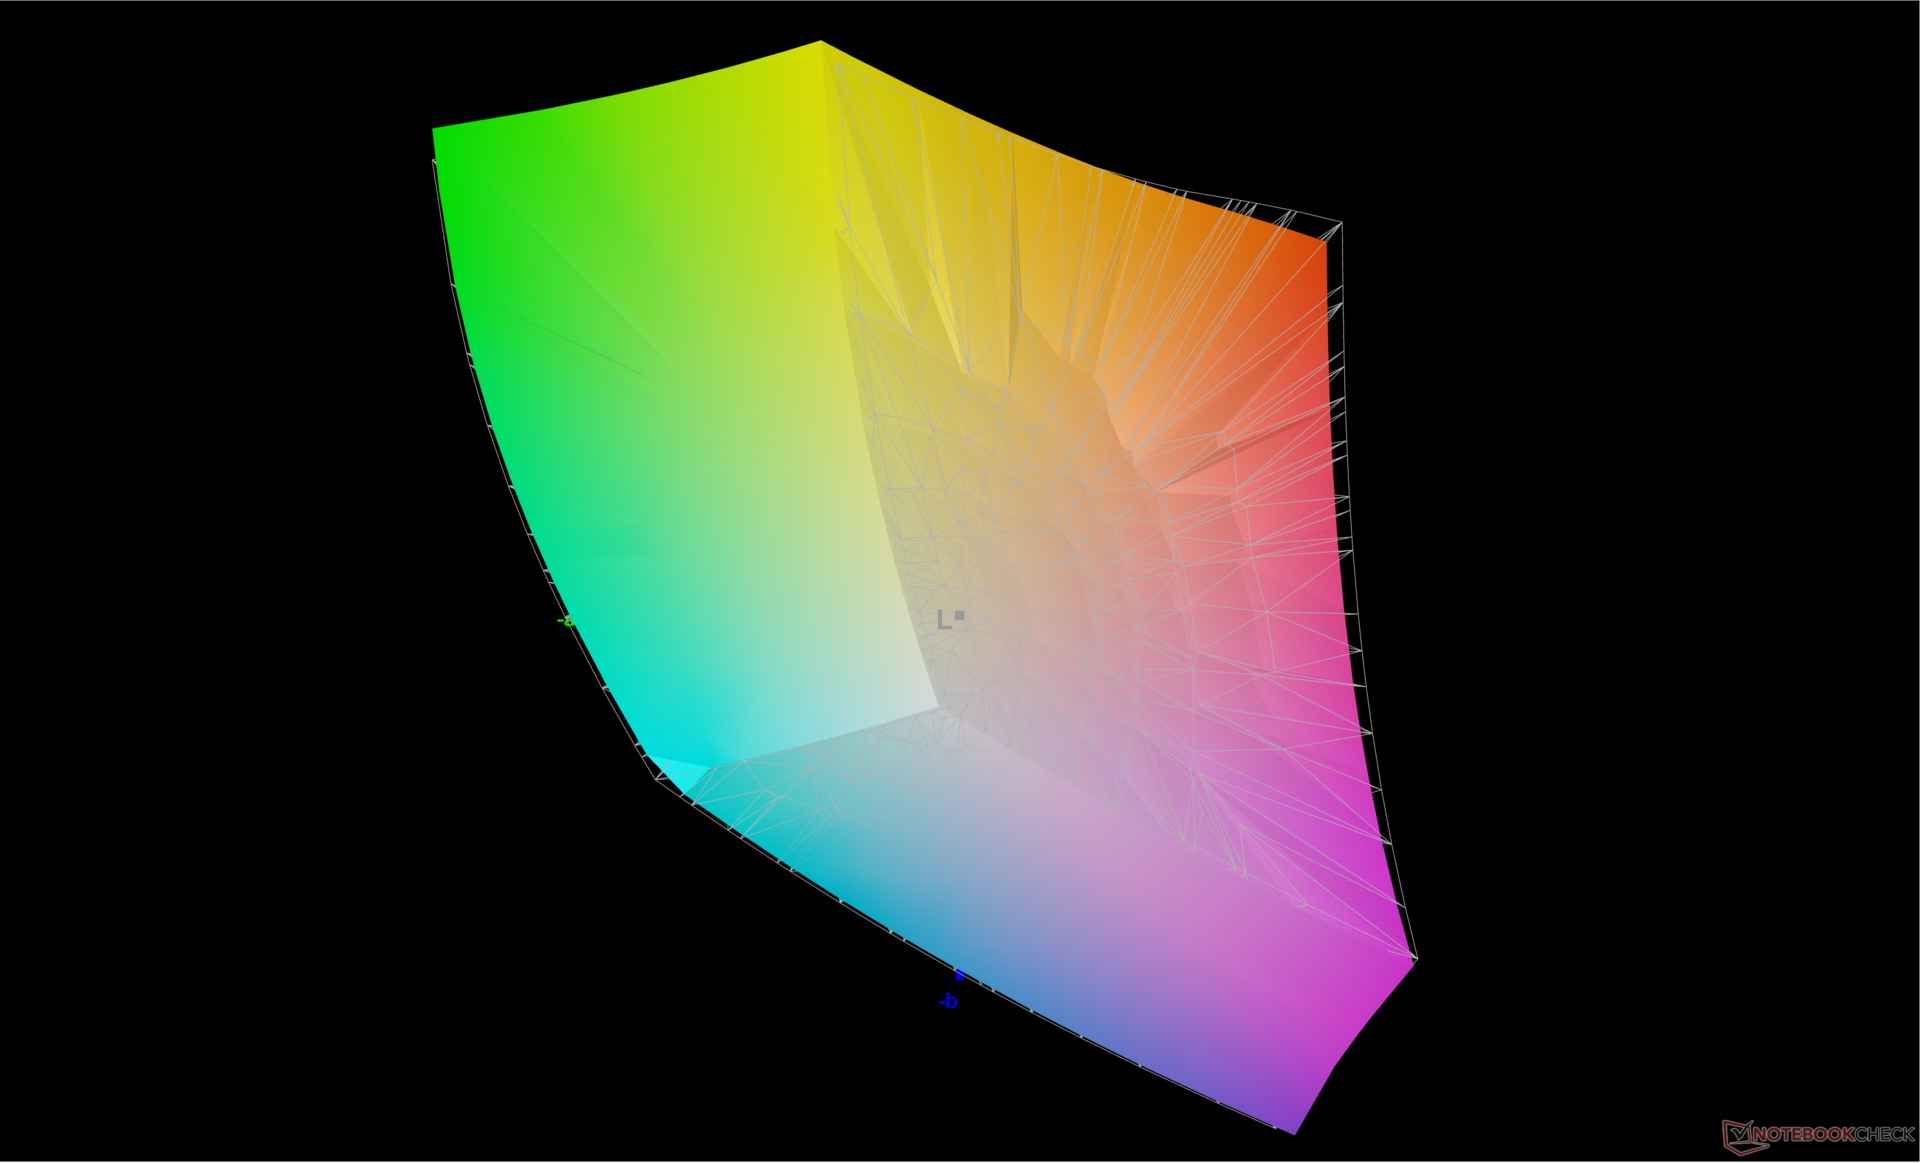
84.8% AdobeRGB 1998 (Argyll 2.2.0 3D)
99.9% sRGB (Argyll 2.2.0 3D)
96.6% Display P3 (Argyll 2.2.0 3D)
Gamma: 2.34
| MSI Raider 18 HX A14V AU Optronics B180ZAN1.0, Mini-LED, 3840x2400, 18", 120 Hz | Razer Blade 18 2024 RZ09-0509 BOE NE180QDM-NM1, Mini-LED, 2560x1600, 18", 300 Hz | Alienware m18 R2 BOE NE18NZ1, IPS, 2560x1600, 18", 165 Hz | MSI Titan 18 HX A14VIG AU Optronics B180ZAN01.0, Mini-LED, 3840x2400, 18", 120 Hz | Asus ROG Strix G18 G814JI NE180QDM-NZ2 (BOE0B35), IPS, 2560x1600, 18", 240 Hz | Acer Predator Helios 18 PH18-72-98MW B180QAN01.2 (AUO45A8), Mini-LED, 2560x1600, 18", 250 Hz | |
|---|---|---|---|---|---|---|
| Display | 1% | 2% | 1% | 1% | 4% | |
| Display P3 Coverage | 96.6 | 99 2% | 97.8 1% | 98.1 2% | 98.1 2% | 99.7 3% |
| sRGB Coverage | 99.9 | 100 0% | 99.5 0% | 99.8 0% | 99.9 0% | 100 0% |
| AdobeRGB 1998 Coverage | 84.8 | 86.9 2% | 88.9 5% | 86.2 2% | 85.6 1% | 91.6 8% |
| Response Times | 341% | 68% | 3% | 67% | 62% | |
| Response Time Grey 50% / Grey 80% * | 10.4 ? | 7.6 ? 27% | 5.3 ? 49% | 8.6 ? 17% | 5.6 ? 46% | 8 ? 23% |
| Response Time Black / White * | 75.8 ? | 14 ? 82% | 10.4 ? 86% | 81.8 ? -8% | 9 ? 88% | 17.6 ? 77% |
| PWM Frequency | 2606.2 ? | 26444 ? 915% | 2592 ? -1% | 4832 ? 85% | ||
| Screen | 29% | 8% | 2% | 23% | 24% | |
| Brightness middle | 575.7 | 605.4 5% | 271.8 -53% | 467.5 -19% | 471 -18% | 722 25% |
| Brightness | 574 | 600 5% | 275 -52% | 459 -20% | 422 -26% | 724 26% |
| Brightness Distribution | 94 | 97 3% | 78 -17% | 90 -4% | 83 -12% | 93 -1% |
| Black Level * | 0.62 | 0.27 | 0.47 | 0.04 | ||
| Colorchecker dE 2000 * | 3.56 | 1.53 57% | 2.48 30% | 3.77 -6% | 2.05 42% | 3.4 4% |
| Colorchecker dE 2000 max. * | 8.64 | 4.15 52% | 5.59 35% | 6.12 29% | 4.15 52% | 5.32 38% |
| Colorchecker dE 2000 calibrated * | 2.69 | 0.56 79% | 2.94 -9% | 0.8 70% | 1.6 41% | |
| Greyscale dE 2000 * | 5.6 | 2.6 54% | 3.7 34% | 3.2 43% | 2.8 50% | 3.8 32% |
| Gamma | 2.34 94% | 2.22 99% | 2.2 100% | 2.43 91% | 2.204 100% | 2.383 92% |
| CCT | 7872 83% | 6843 95% | 6355 102% | 6478 100% | 7122 91% | 7051 92% |
| Contrast | 976 | 1007 | 1002 | 18050 | ||
| Média Total (Programa/Configurações) | 124% /
100% | 26% /
16% | 2% /
2% | 30% /
25% | 30% /
28% |
* ... menor é melhor
A temperatura da cor quando definida como Display P3 e HDR desativado é bastante fria em 7872. A ativação do HDR desativa automaticamente qualquer configuração MSI TrueColor, mas a temperatura da cor também se torna automaticamente mais quente em 6521 para cores mais precisas. A MSI não anuncia a calibração de fábrica para este modelo Raider.
Exibir tempos de resposta
| ↔ Tempo de resposta preto para branco | ||
|---|---|---|
| 75.8 ms ... ascensão ↗ e queda ↘ combinadas | ↗ 71 ms ascensão | 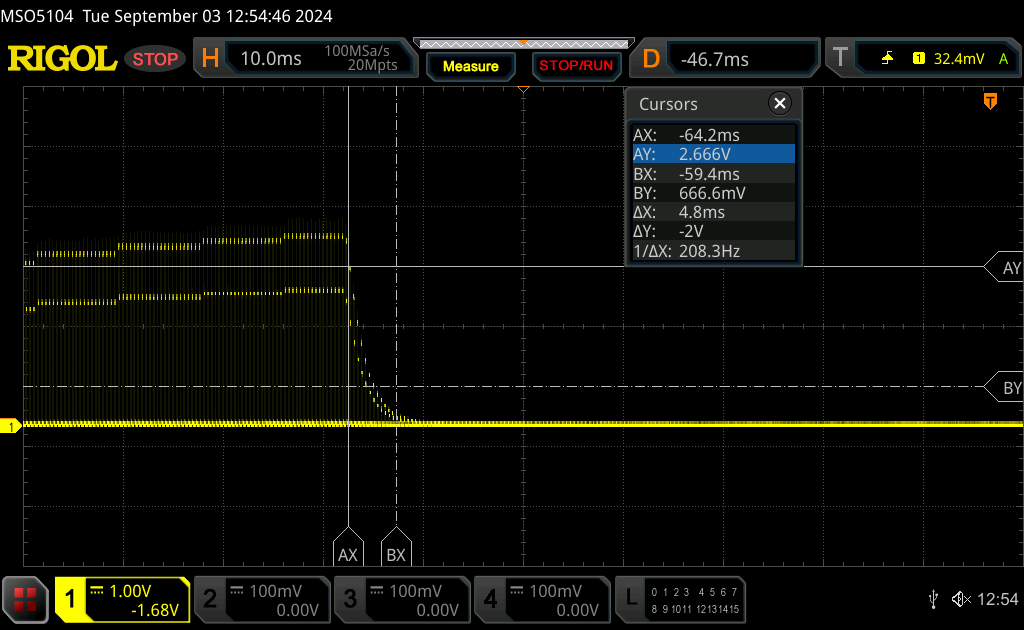 |
| ↘ 4.8 ms queda | ||
| A tela mostra taxas de resposta lentas em nossos testes e será insatisfatória para os jogadores. Em comparação, todos os dispositivos testados variam de 0.1 (mínimo) a 240 (máximo) ms. » 100 % de todos os dispositivos são melhores. Isso significa que o tempo de resposta medido é pior que a média de todos os dispositivos testados (20.7 ms). | ||
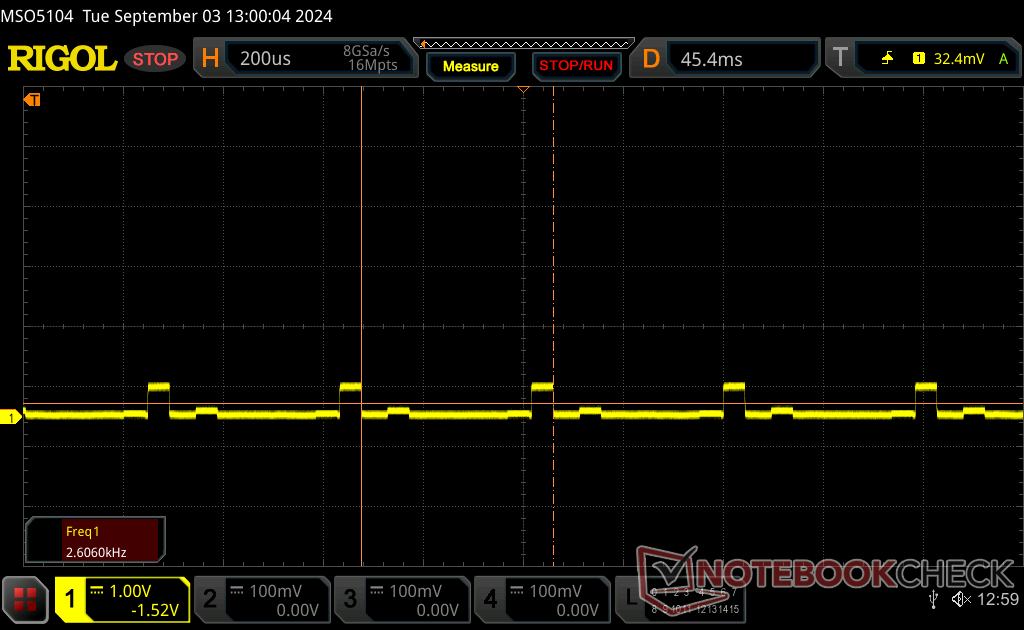
| ↔ Tempo de resposta 50% cinza a 80% cinza | ||
| 10.4 ms ... ascensão ↗ e queda ↘ combinadas | ↗ 4.8 ms ascensão | 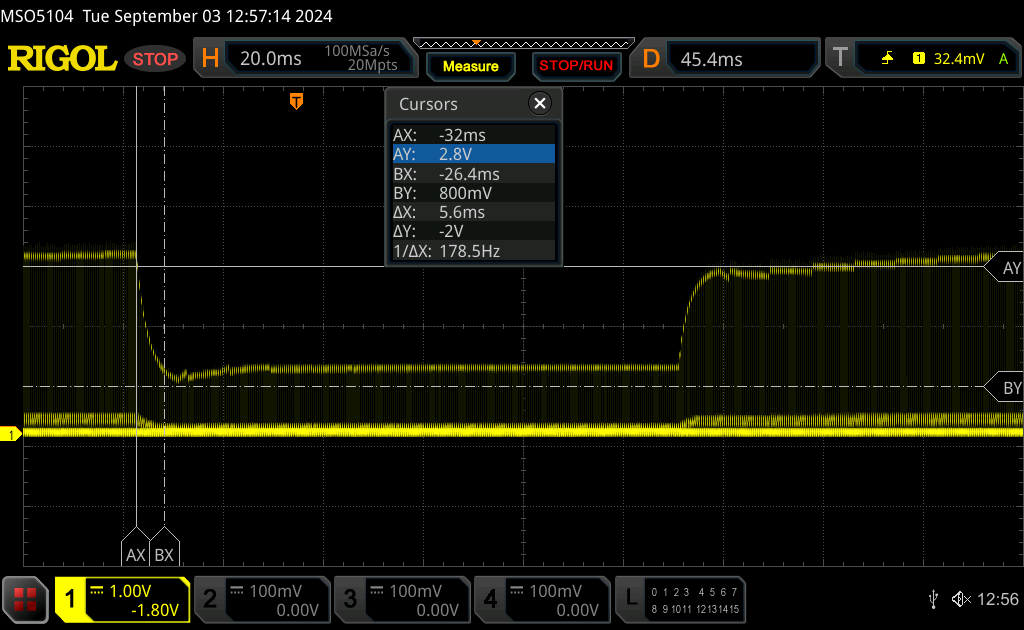 |
| ↘ 5.6 ms queda | ||
| A tela mostra boas taxas de resposta em nossos testes, mas pode ser muito lenta para jogadores competitivos. Em comparação, todos os dispositivos testados variam de 0.165 (mínimo) a 636 (máximo) ms. » 21 % de todos os dispositivos são melhores. Isso significa que o tempo de resposta medido é melhor que a média de todos os dispositivos testados (32.5 ms). | ||
Cintilação da tela / PWM (modulação por largura de pulso)
| Tela tremeluzindo/PWM detectado | 2606.2 Hz Amplitude: 90 % | ≤ 100 % configuração de brilho | 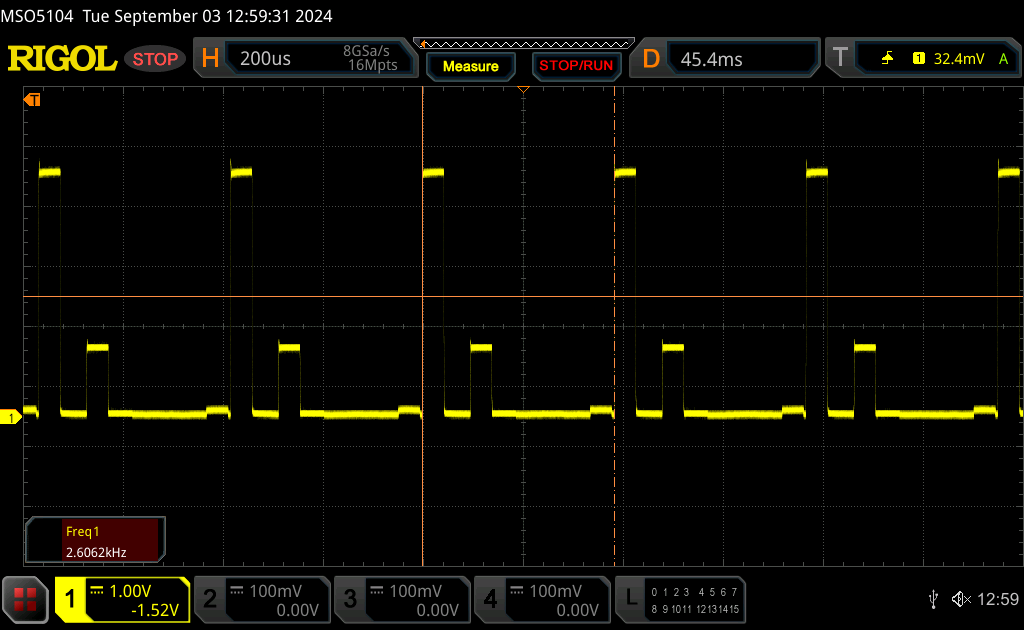 |
A luz de fundo da tela pisca em 2606.2 Hz (pior caso, por exemplo, utilizando PWM) Cintilação detectada em uma configuração de brilho de 100 % e abaixo. Não deve haver cintilação ou PWM acima desta configuração de brilho. A frequência de 2606.2 Hz é bastante alta, então a maioria dos usuários sensíveis ao PWM não deve notar nenhuma oscilação. [pwm_comparison] Em comparação: 53 % de todos os dispositivos testados não usam PWM para escurecer a tela. Se PWM foi detectado, uma média de 8492 (mínimo: 5 - máximo: 343500) Hz foi medida. | |||


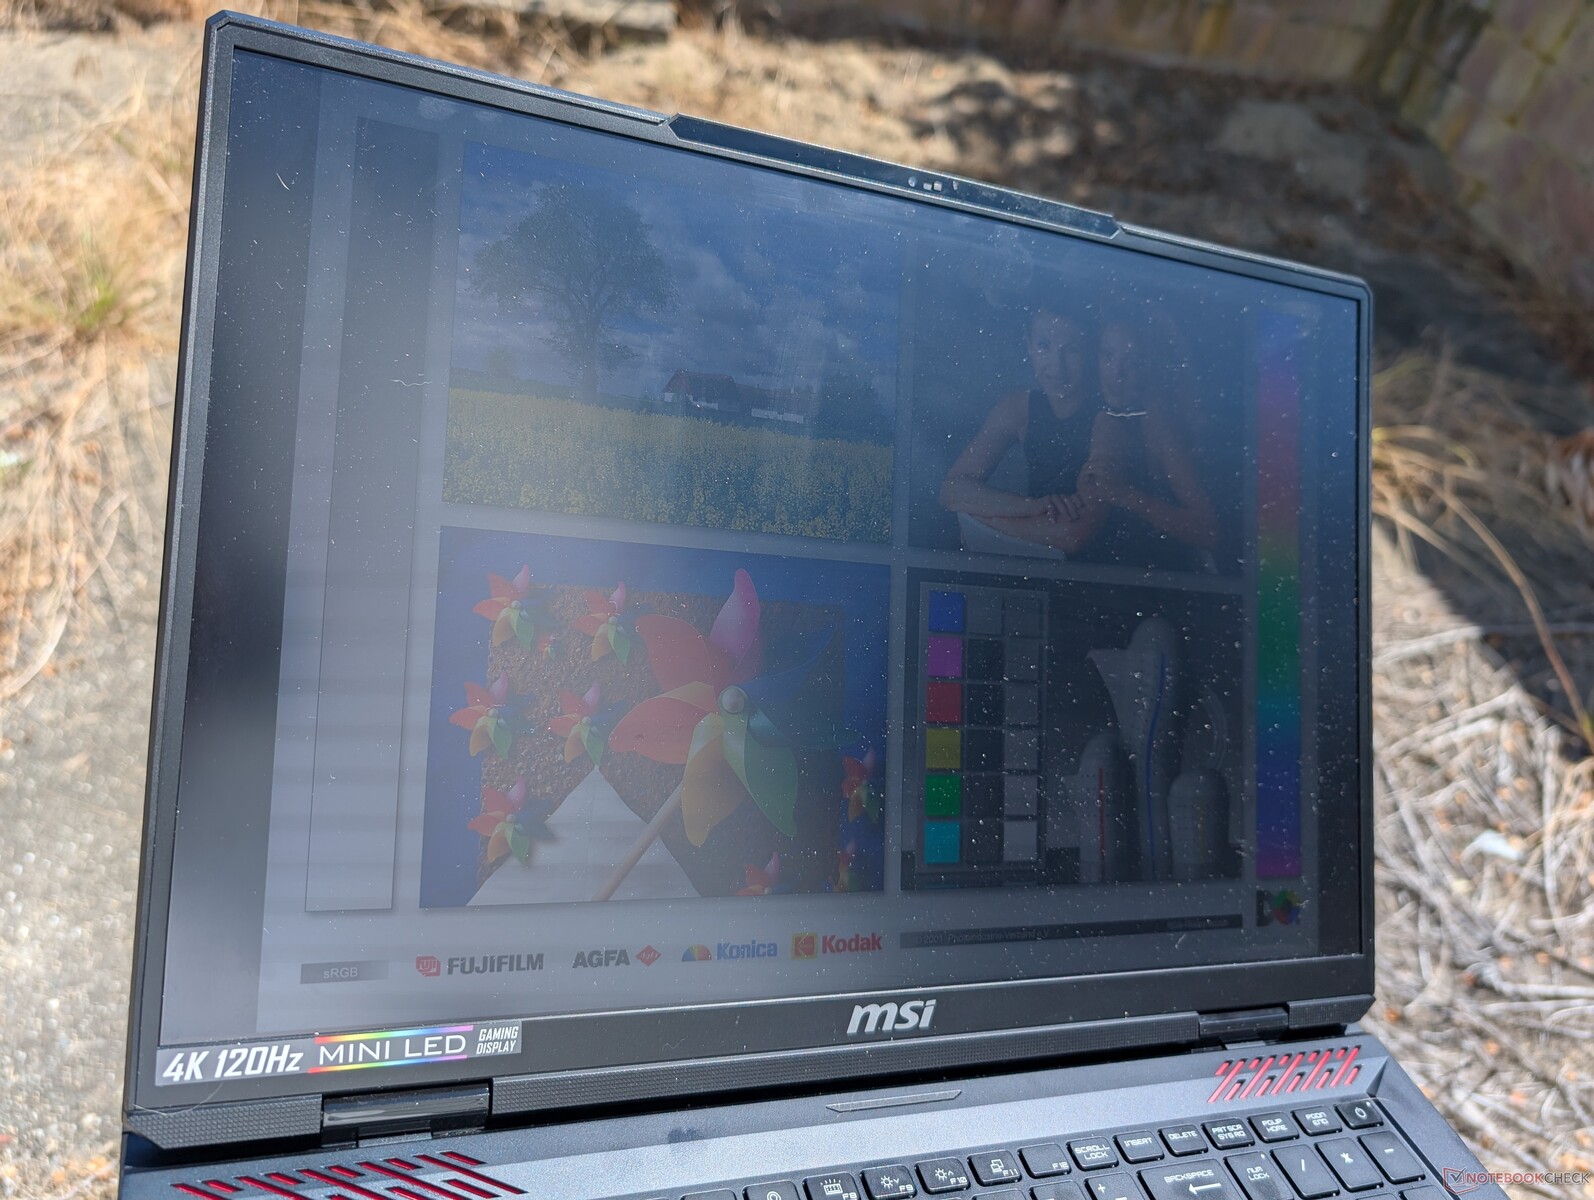
A visibilidade externa é apenas decente sob a sombra e não tão boa sob a luz do sol. O funcionamento com a bateria reduz o brilho máximo para apenas 392 nits e o Windows HDR é automaticamente desativado.
Desempenho - Novo nome da CPU, mesmo desempenho da CPU
Condições de teste
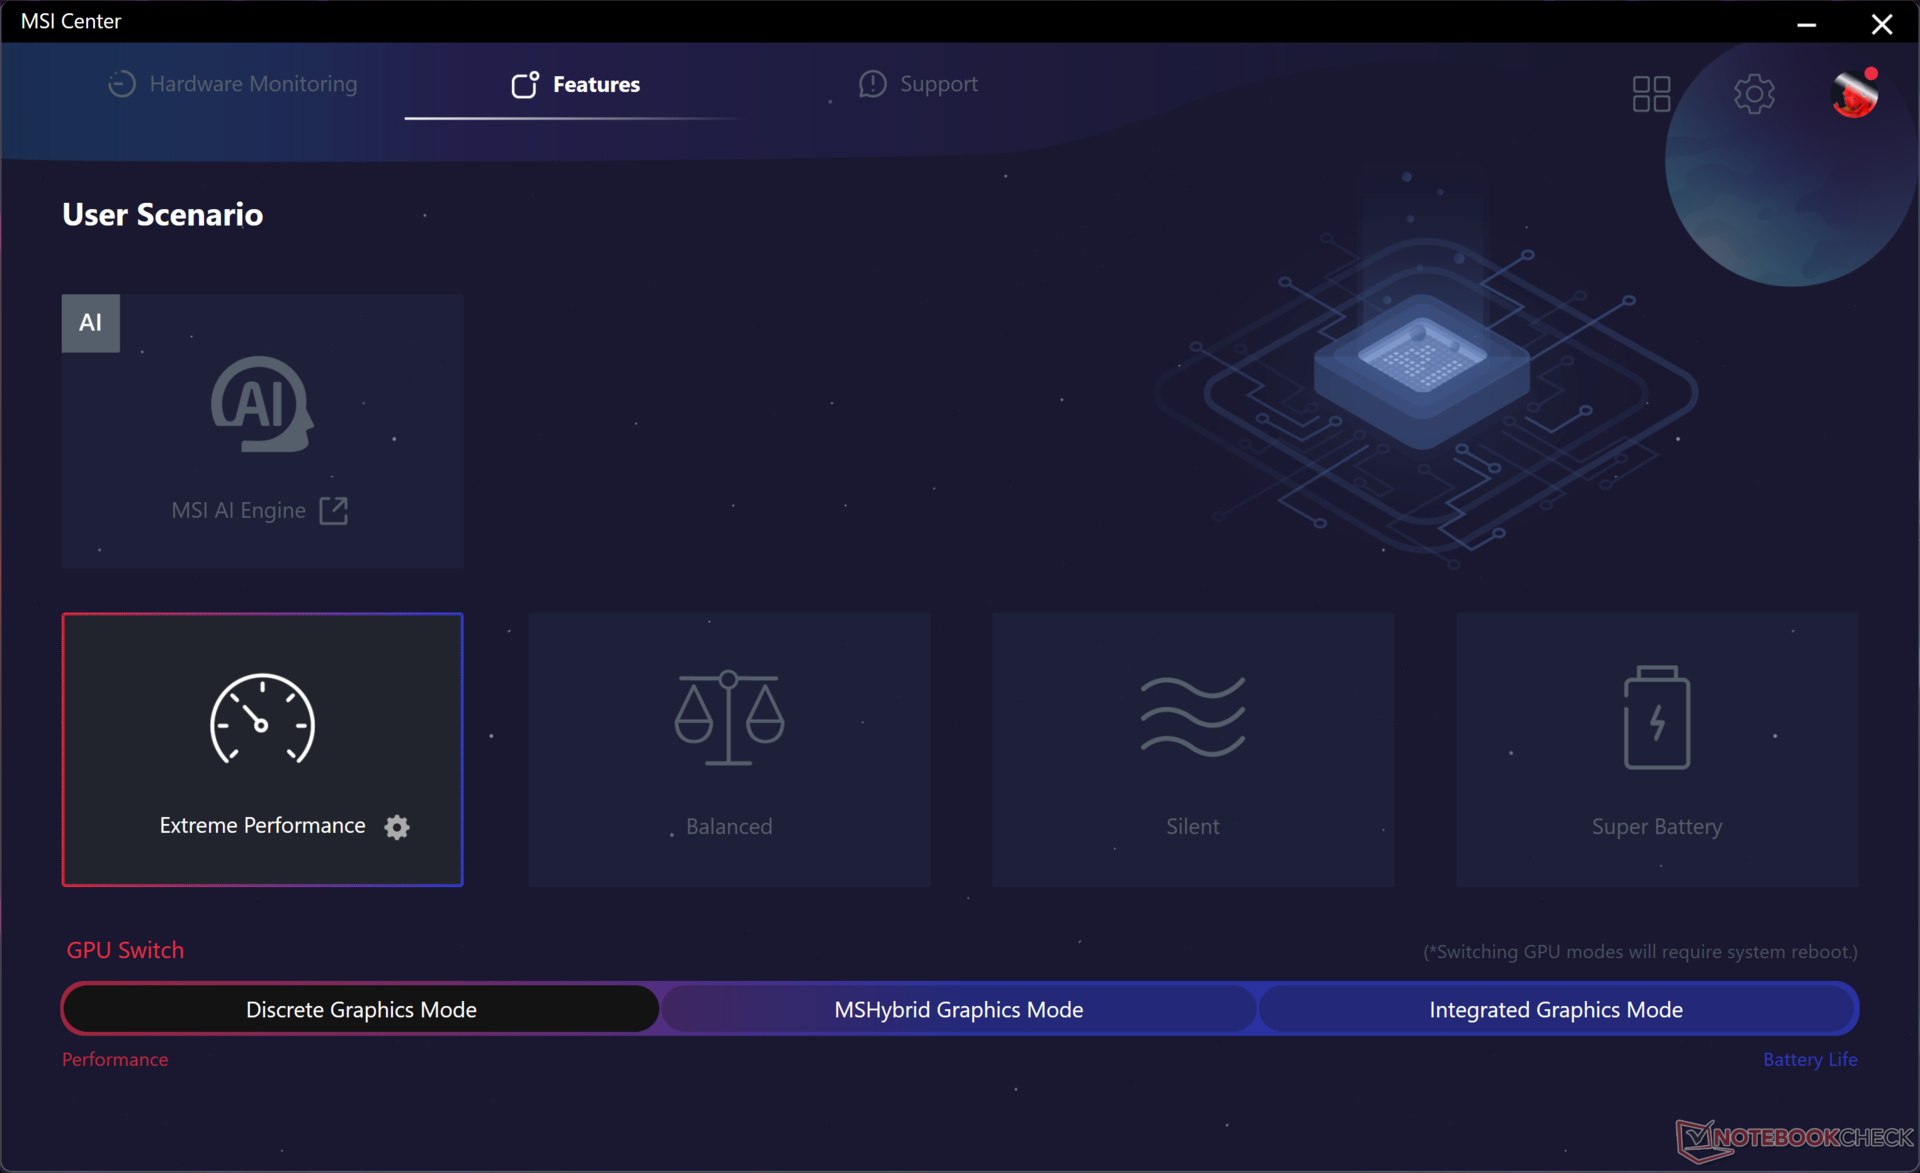
Definimos a GPU para o modo de gráficos discretos, o Windows para o modo Desempenho e o MSI Center para o modo Desempenho extremo antes de executar os benchmarks abaixo. O modo Cooler Boost (ou seja, modo de ventilador máximo) é outra configuração no modo Extreme Performance, mas essa opção geralmente não é necessária para o desempenho máximo, conforme nossas descobertas mostrarão. Isso é consistente com nossa experiência em outros notebooks MSI que apresentam o mesmo recurso Cooler Boost.
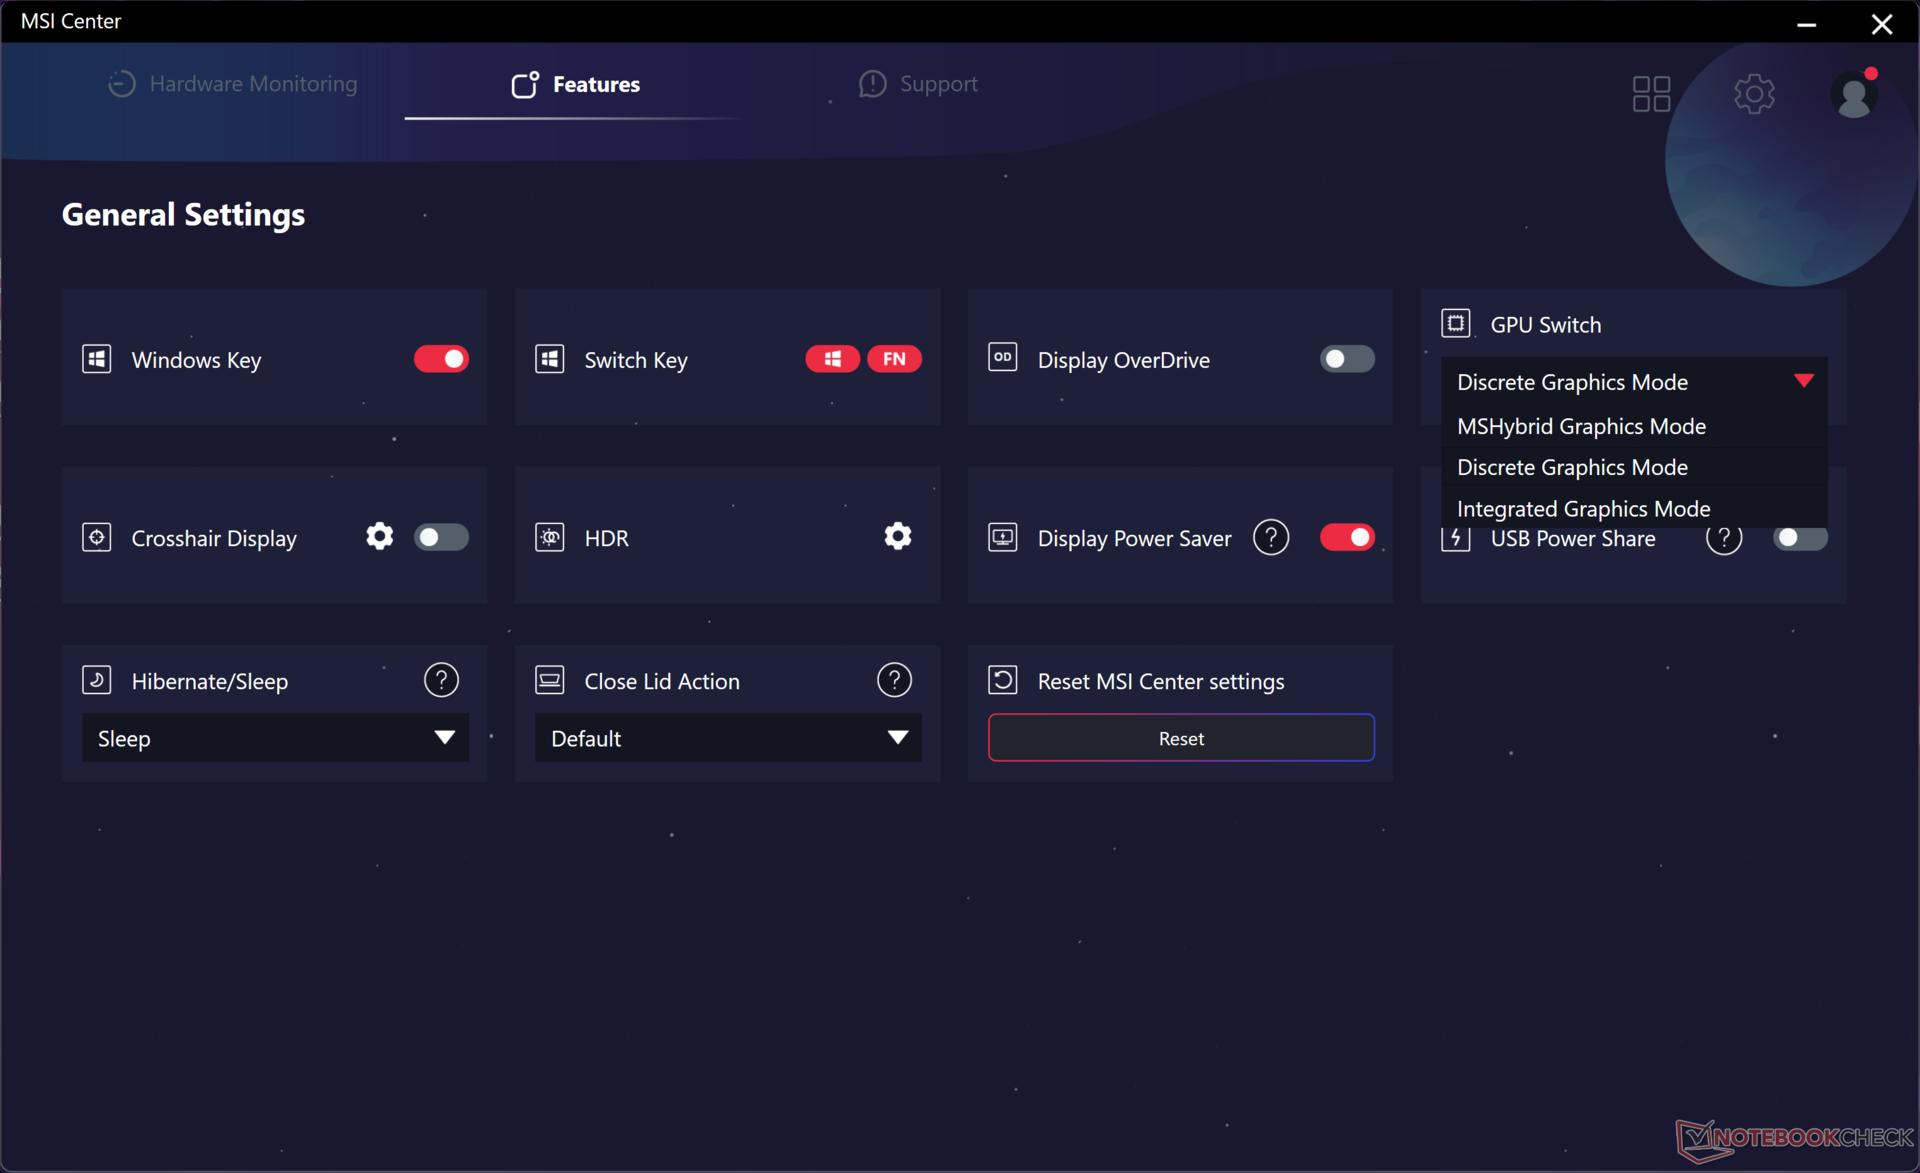
O MUX é suportado para alternar entre os modos dGPU, iGPU e MSHybrid, mas o Advanced Optimus não é como no Titan 18 HX. De fato, uma das principais desvantagens do painel mini-LED 4K é a falta de suporte ao G-Sync.
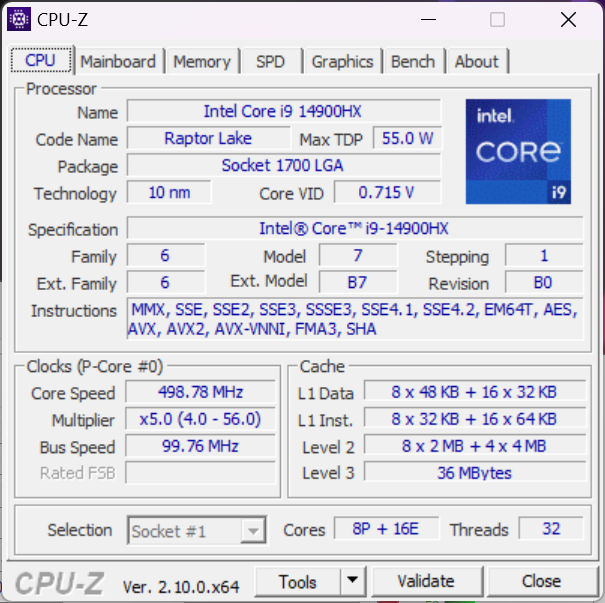
Processador
O Core i9-14900HX é apenas uma reformulação do Core i9-13900HX e, portanto, oferece apenas benefícios marginais, na melhor das hipóteses. Mesmo assim, ele continua sendo uma das CPUs mais rápidas disponíveis em laptops quando se trata de métricas de desempenho tradicionais, como CineBench ou renderização do Blender. A CPU complementa o Meteor Lake Core Ultra 9 185H que troca um pouco do desempenho bruto por uma NPU integrada para acelerar as tarefas de IA.
A sustentabilidade do desempenho é excelente, sem grandes quedas nas taxas de clock quando estressado, ao contrário do que observamos no Acer Predator Helios 18 equipado com a mesma CPU Core i9-14900HX.
Mudando para o processador baseado em AMD Ryzen 9 7945HX com base na AMD deve aumentar o desempenho multi-thread em cerca de 10 a 15%, enquanto o desempenho single-thread é afetado em 10 a 15%.
Cinebench R15 Multi Loop
Cinebench R23: Multi Core | Single Core
Cinebench R20: CPU (Multi Core) | CPU (Single Core)
Cinebench R15: CPU Multi 64Bit | CPU Single 64Bit
Blender: v2.79 BMW27 CPU
7-Zip 18.03: 7z b 4 | 7z b 4 -mmt1
Geekbench 6.4: Multi-Core | Single-Core
Geekbench 5.5: Multi-Core | Single-Core
HWBOT x265 Benchmark v2.2: 4k Preset
LibreOffice : 20 Documents To PDF
R Benchmark 2.5: Overall mean
* ... menor é melhor
AIDA64: FP32 Ray-Trace | FPU Julia | CPU SHA3 | CPU Queen | FPU SinJulia | FPU Mandel | CPU AES | CPU ZLib | FP64 Ray-Trace | CPU PhotoWorxx
| Performance Rating | |
| Alienware m18 R2 | |
| MSI Titan 18 HX A14VIG | |
| MSI Raider 18 HX A14V | |
| Média Intel Core i9-14900HX | |
| Razer Blade 18 2024 RZ09-0509 | |
| Acer Predator Helios 18 PH18-72-98MW | |
| Asus ROG Strix G18 G814JI | |
| AIDA64 / FP32 Ray-Trace | |
| MSI Titan 18 HX A14VIG | |
| Alienware m18 R2 | |
| MSI Raider 18 HX A14V | |
| Razer Blade 18 2024 RZ09-0509 | |
| Média Intel Core i9-14900HX (13098 - 33474, n=36) | |
| Acer Predator Helios 18 PH18-72-98MW | |
| Asus ROG Strix G18 G814JI | |
| AIDA64 / FPU Julia | |
| MSI Titan 18 HX A14VIG | |
| Alienware m18 R2 | |
| MSI Raider 18 HX A14V | |
| Razer Blade 18 2024 RZ09-0509 | |
| Média Intel Core i9-14900HX (67573 - 166040, n=36) | |
| Acer Predator Helios 18 PH18-72-98MW | |
| Asus ROG Strix G18 G814JI | |
| AIDA64 / CPU SHA3 | |
| MSI Titan 18 HX A14VIG | |
| Alienware m18 R2 | |
| MSI Raider 18 HX A14V | |
| Razer Blade 18 2024 RZ09-0509 | |
| Média Intel Core i9-14900HX (3589 - 7979, n=36) | |
| Acer Predator Helios 18 PH18-72-98MW | |
| Asus ROG Strix G18 G814JI | |
| AIDA64 / CPU Queen | |
| MSI Titan 18 HX A14VIG | |
| MSI Raider 18 HX A14V | |
| Alienware m18 R2 | |
| Acer Predator Helios 18 PH18-72-98MW | |
| Média Intel Core i9-14900HX (118405 - 148966, n=36) | |
| Razer Blade 18 2024 RZ09-0509 | |
| Asus ROG Strix G18 G814JI | |
| AIDA64 / FPU SinJulia | |
| MSI Titan 18 HX A14VIG | |
| MSI Raider 18 HX A14V | |
| Alienware m18 R2 | |
| Razer Blade 18 2024 RZ09-0509 | |
| Média Intel Core i9-14900HX (10475 - 18517, n=36) | |
| Acer Predator Helios 18 PH18-72-98MW | |
| Asus ROG Strix G18 G814JI | |
| AIDA64 / FPU Mandel | |
| Alienware m18 R2 | |
| MSI Titan 18 HX A14VIG | |
| MSI Raider 18 HX A14V | |
| Razer Blade 18 2024 RZ09-0509 | |
| Média Intel Core i9-14900HX (32543 - 83662, n=36) | |
| Acer Predator Helios 18 PH18-72-98MW | |
| Asus ROG Strix G18 G814JI | |
| AIDA64 / CPU AES | |
| Média Intel Core i9-14900HX (86964 - 241777, n=36) | |
| MSI Titan 18 HX A14VIG | |
| Alienware m18 R2 | |
| MSI Raider 18 HX A14V | |
| Razer Blade 18 2024 RZ09-0509 | |
| Acer Predator Helios 18 PH18-72-98MW | |
| Asus ROG Strix G18 G814JI | |
| AIDA64 / CPU ZLib | |
| MSI Titan 18 HX A14VIG | |
| Alienware m18 R2 | |
| MSI Raider 18 HX A14V | |
| Razer Blade 18 2024 RZ09-0509 | |
| Média Intel Core i9-14900HX (1054 - 2292, n=36) | |
| Acer Predator Helios 18 PH18-72-98MW | |
| Asus ROG Strix G18 G814JI | |
| AIDA64 / FP64 Ray-Trace | |
| Alienware m18 R2 | |
| MSI Titan 18 HX A14VIG | |
| MSI Raider 18 HX A14V | |
| Razer Blade 18 2024 RZ09-0509 | |
| Média Intel Core i9-14900HX (6809 - 18349, n=36) | |
| Acer Predator Helios 18 PH18-72-98MW | |
| Asus ROG Strix G18 G814JI | |
| AIDA64 / CPU PhotoWorxx | |
| Alienware m18 R2 | |
| Razer Blade 18 2024 RZ09-0509 | |
| Acer Predator Helios 18 PH18-72-98MW | |
| Média Intel Core i9-14900HX (23903 - 54702, n=36) | |
| Asus ROG Strix G18 G814JI | |
| MSI Raider 18 HX A14V | |
| MSI Titan 18 HX A14VIG | |
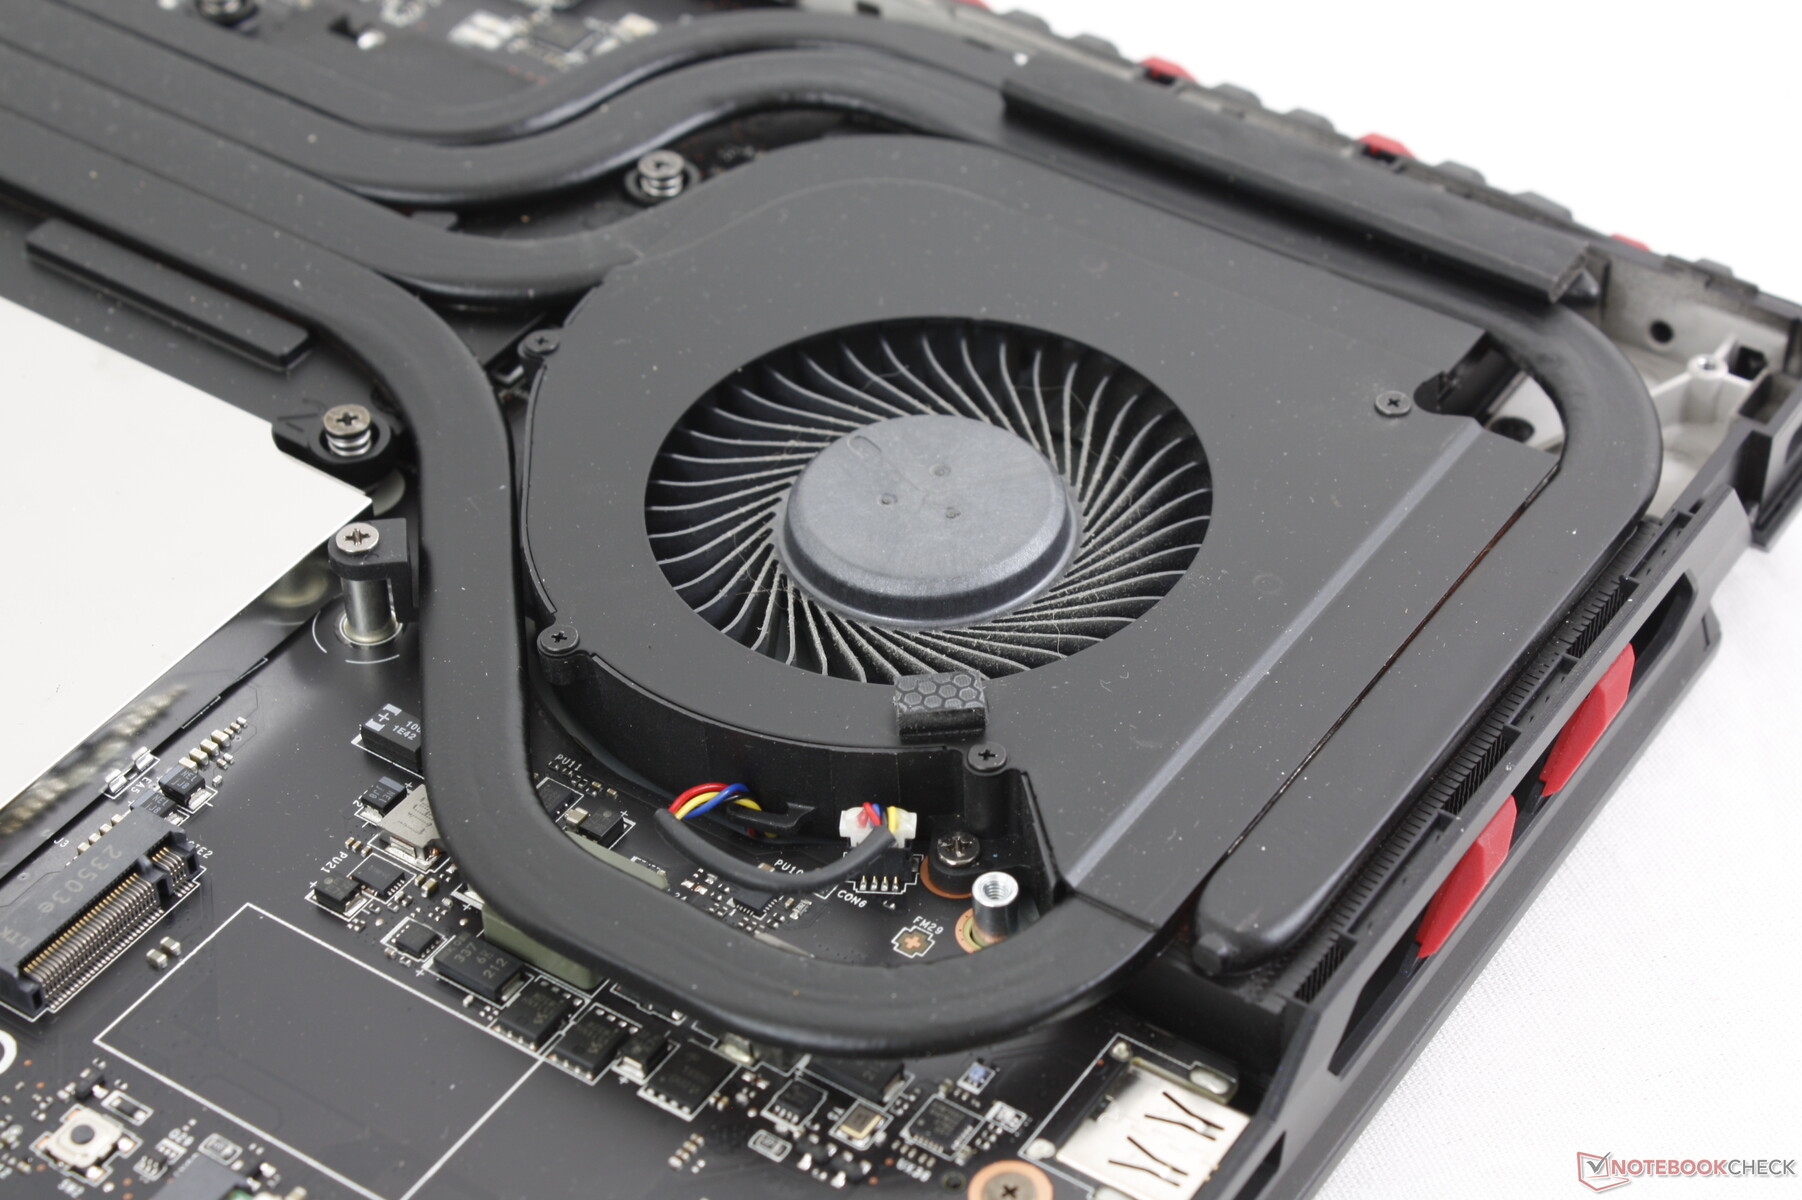
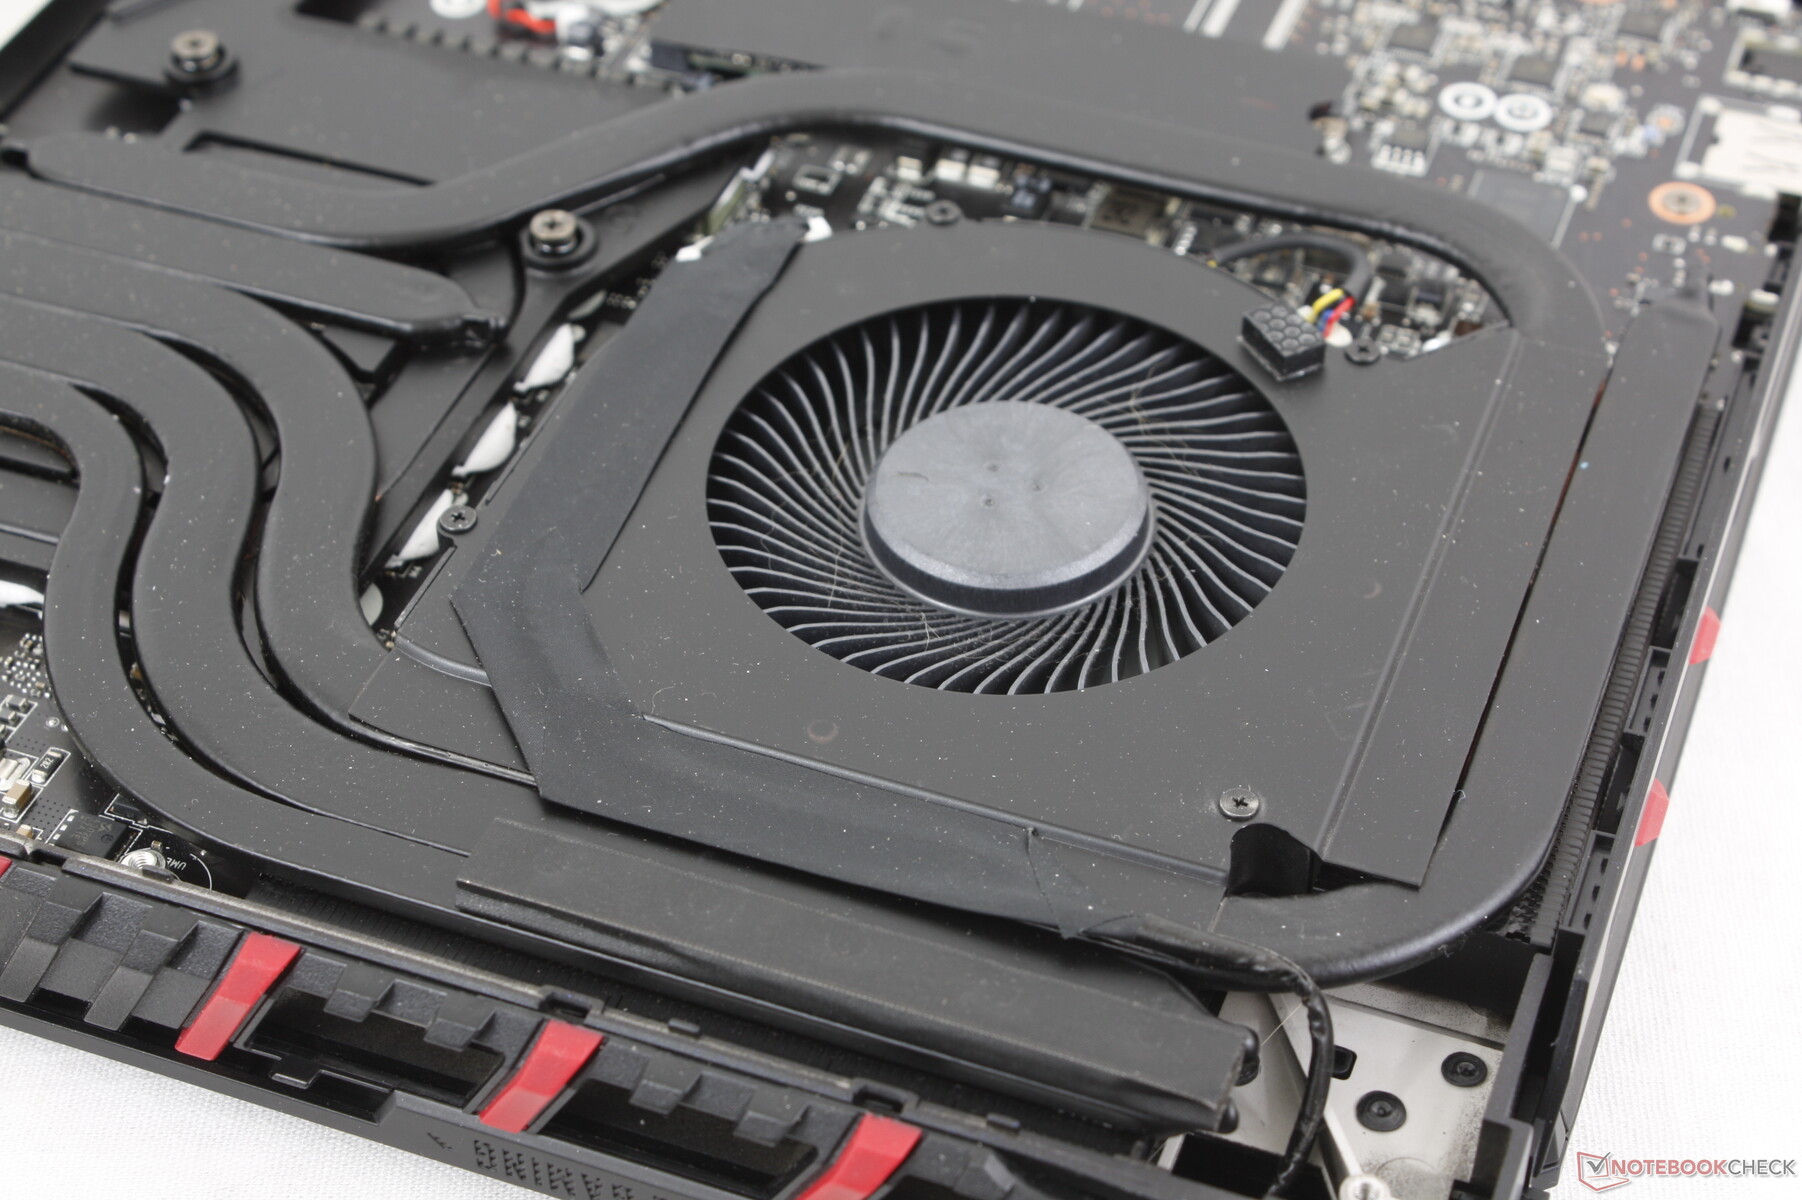
Teste de estresse
A CPU aumentaria para 4 GHz, 86 C e 145 W ao iniciar o estresse do Prime95, sem grandes quedas nas taxas de clock ou no desempenho ao longo do tempo. O chassi grande e a solução de resfriamento podem extrair mais desempenho do Core i9-14900HX em comparação com sistemas menores com o mesmo processador, como o RedMagic Titan 16 Pro que apresenta uma aceleração bastante forte.
A execução no modo Extreme Performance com o Cooler Boost ativado não oferece benefícios tangíveis de desempenho em comparação com o Cooler Boost desativado em jogos. As taxas de clock da GPU, as taxas de clock da memória e o consumo de energia da placa ao executar o Cyberpunk 2077 se estabilizariam em 2550 MHz, 2250 MHz e 159 W, respectivamente, entre as duas configurações. As temperaturas do núcleo são ligeiramente mais baixas em alguns graus C com o Cooler Boost ativado, pois o ruído da ventoinha é mais alto, mas essa é a única vantagem notável.
A redução para o modo Balanced reduz as taxas de clock da GPU e o consumo de energia da placa para 2295 MHz e 150 W, respectivamente, que são apenas marginalmente mais lentos do que o modo Extreme Performance. Os deltas de desempenho entre os modos Balanced e Extreme Performance são, portanto, menores do que se poderia esperar.
As temperaturas da GPU são mais altas do que no Razer Blade 18 em até 9 °C durante os jogos, embora nosso MSI seja o sistema mais espesso e mais pesado.
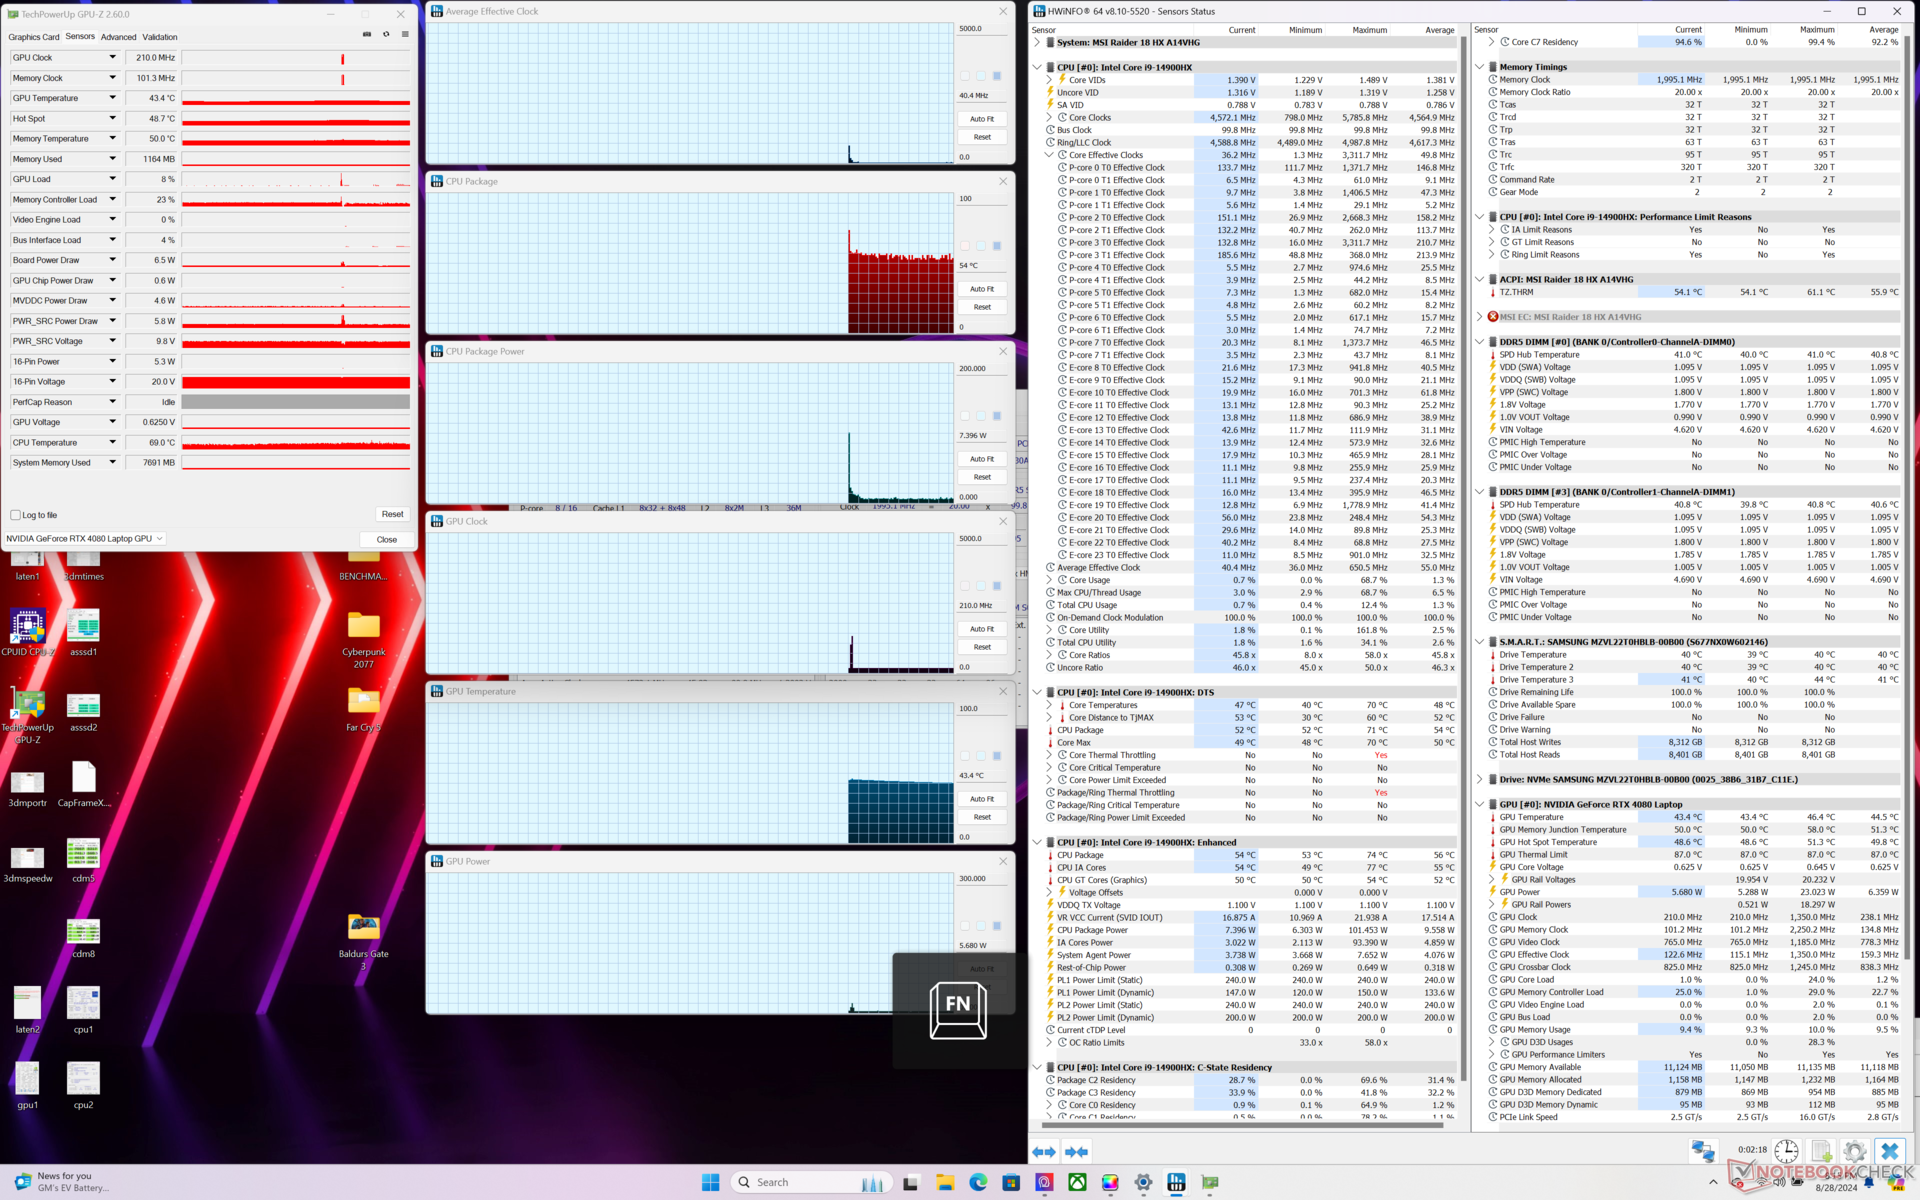

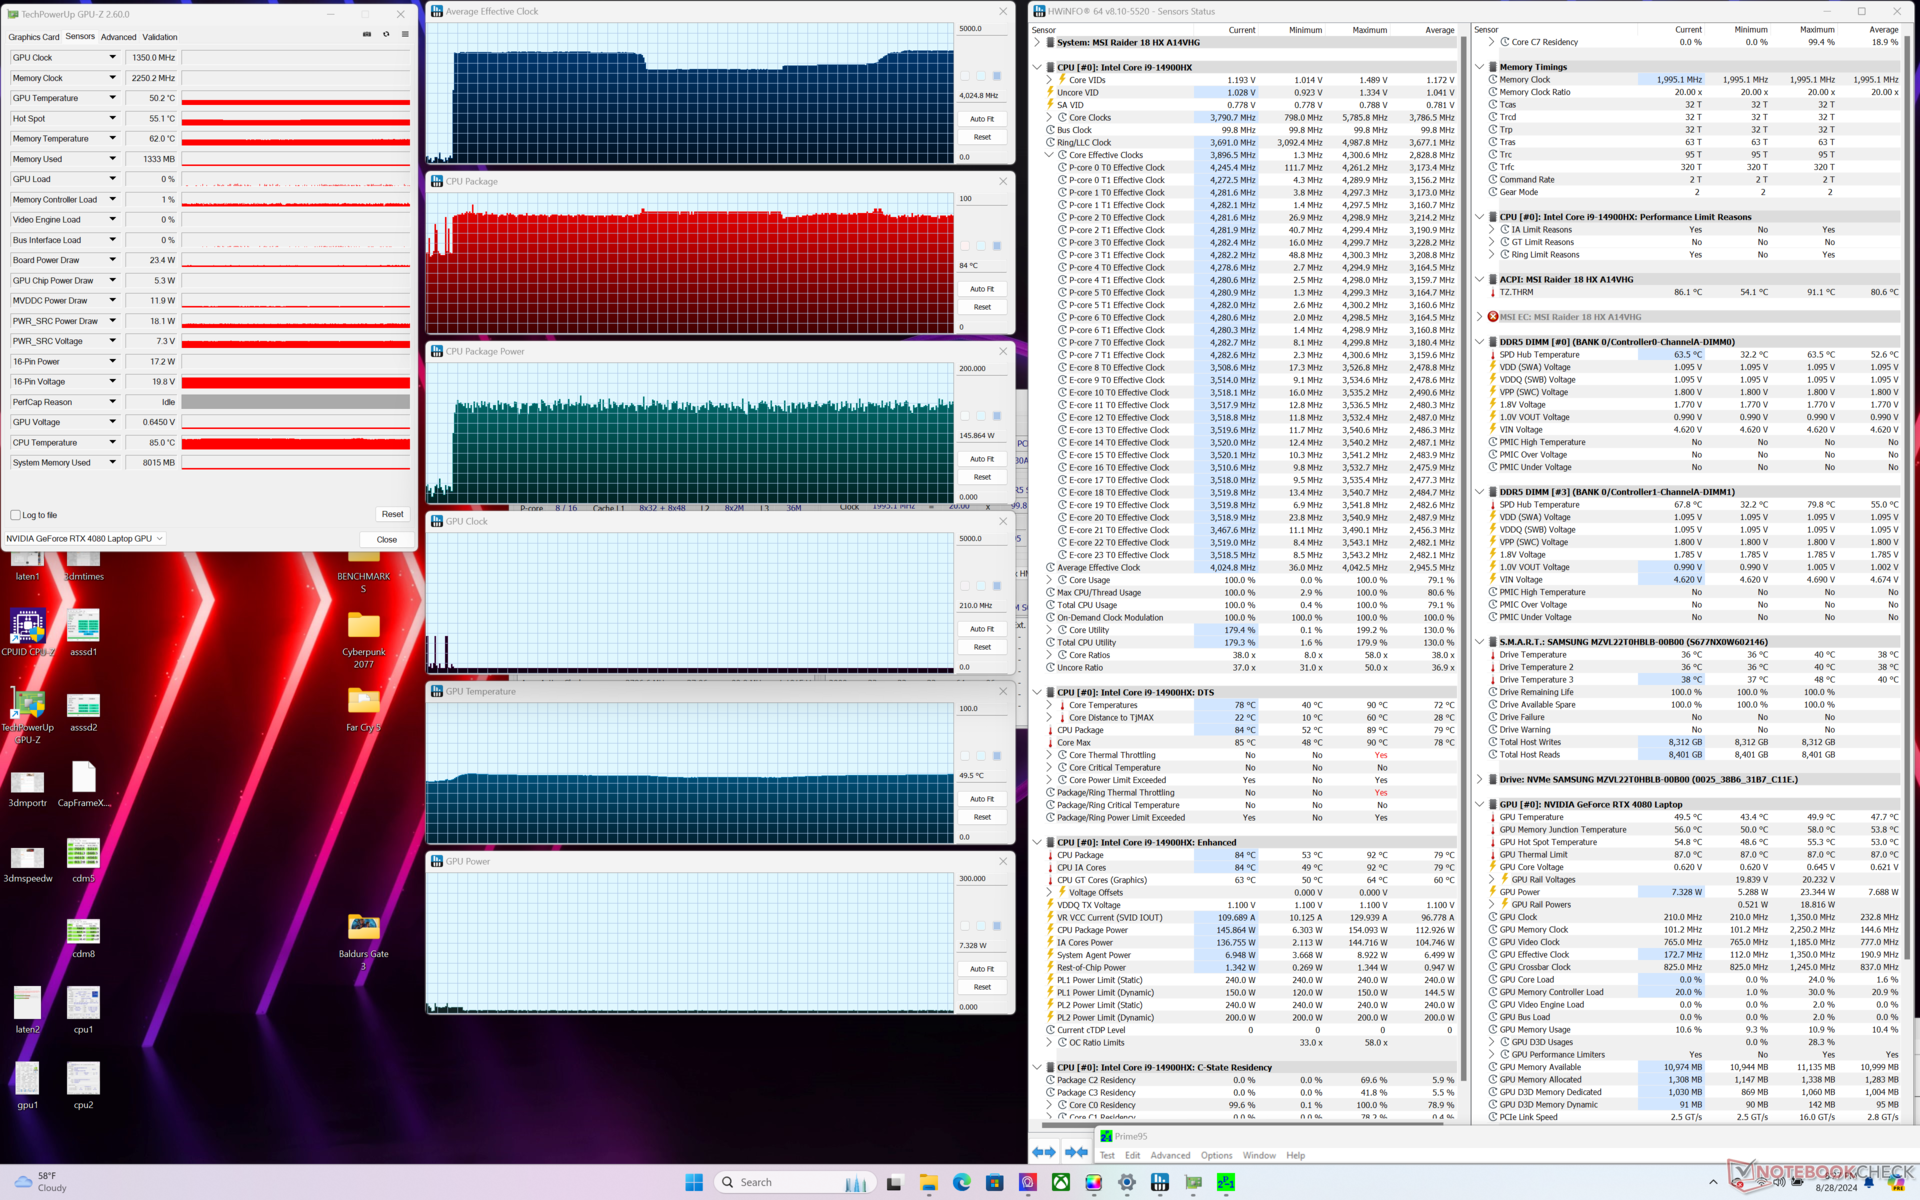
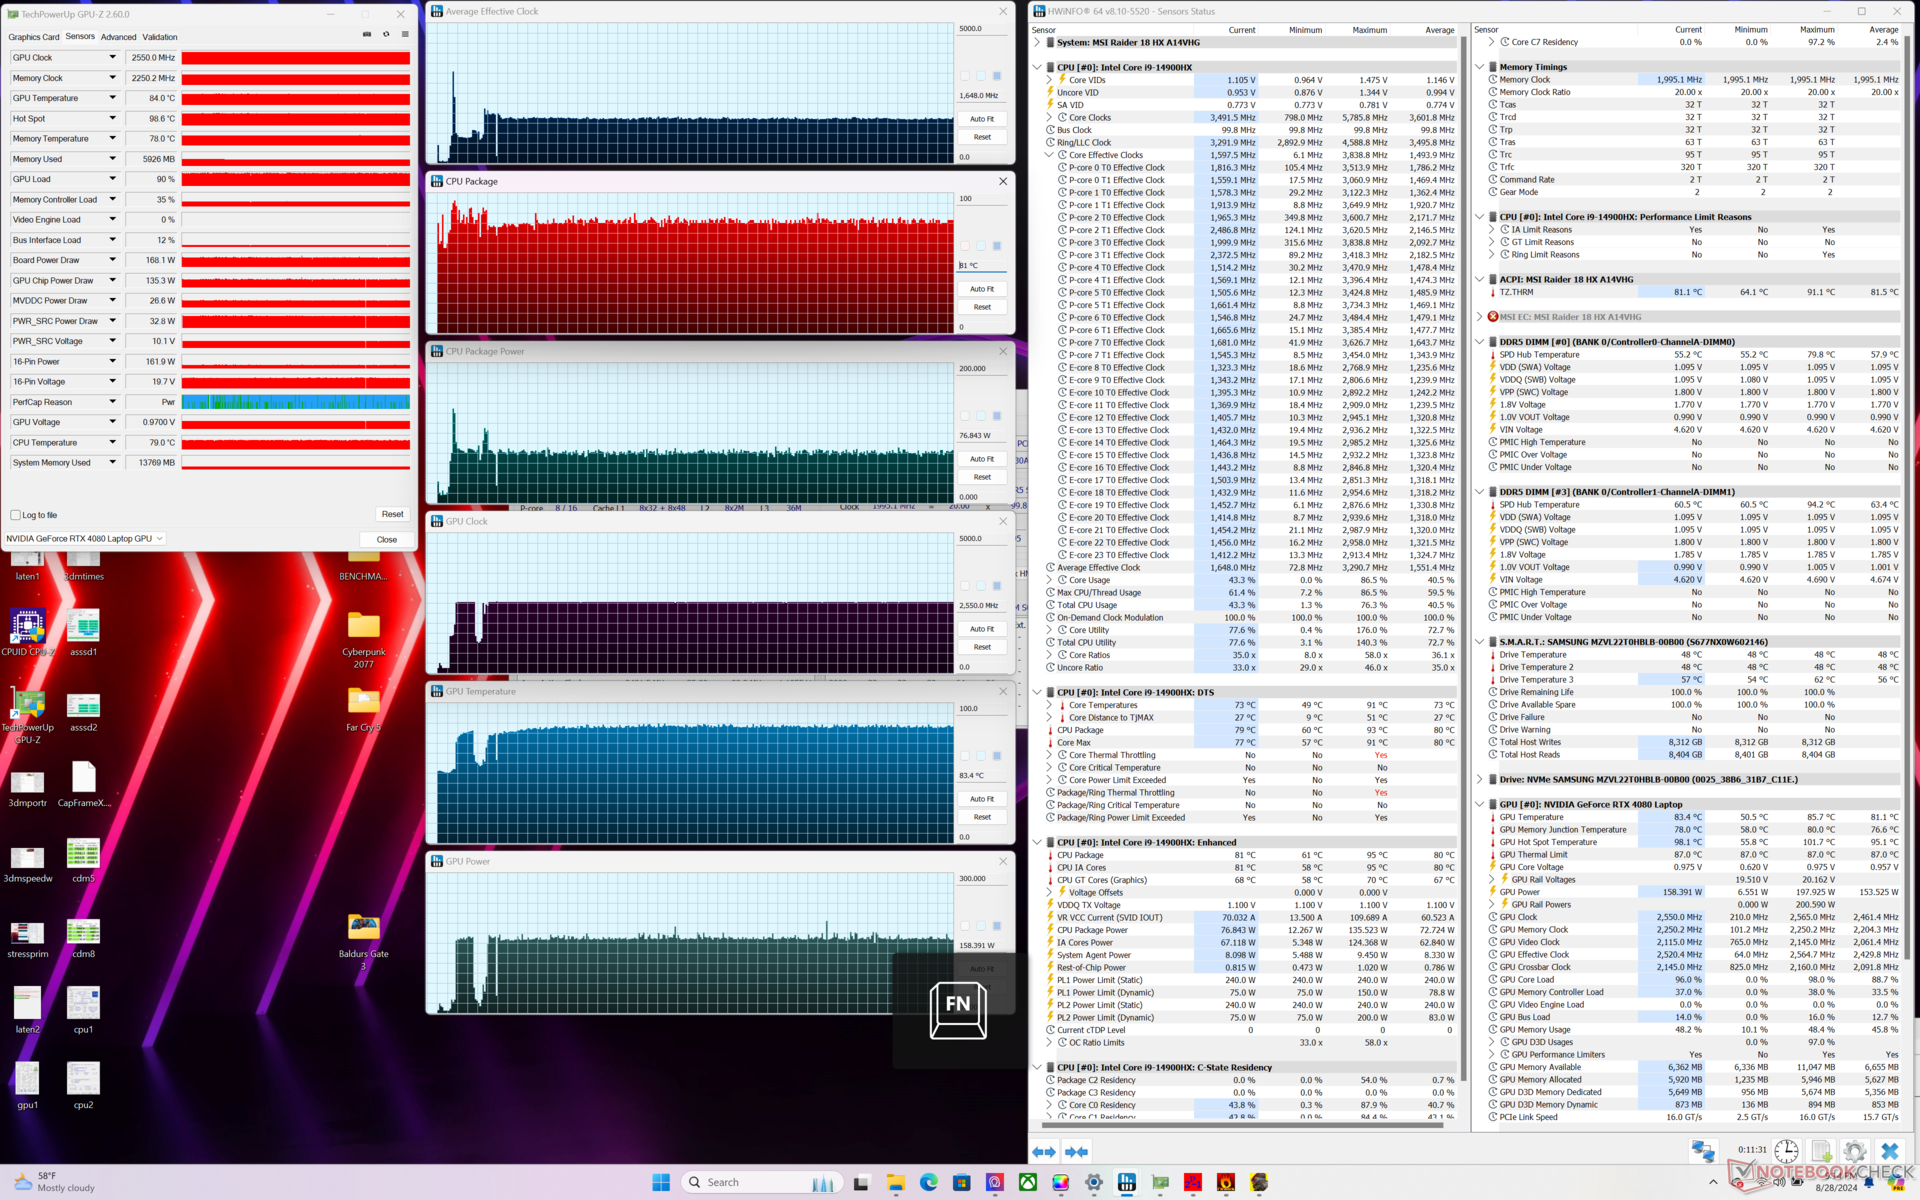
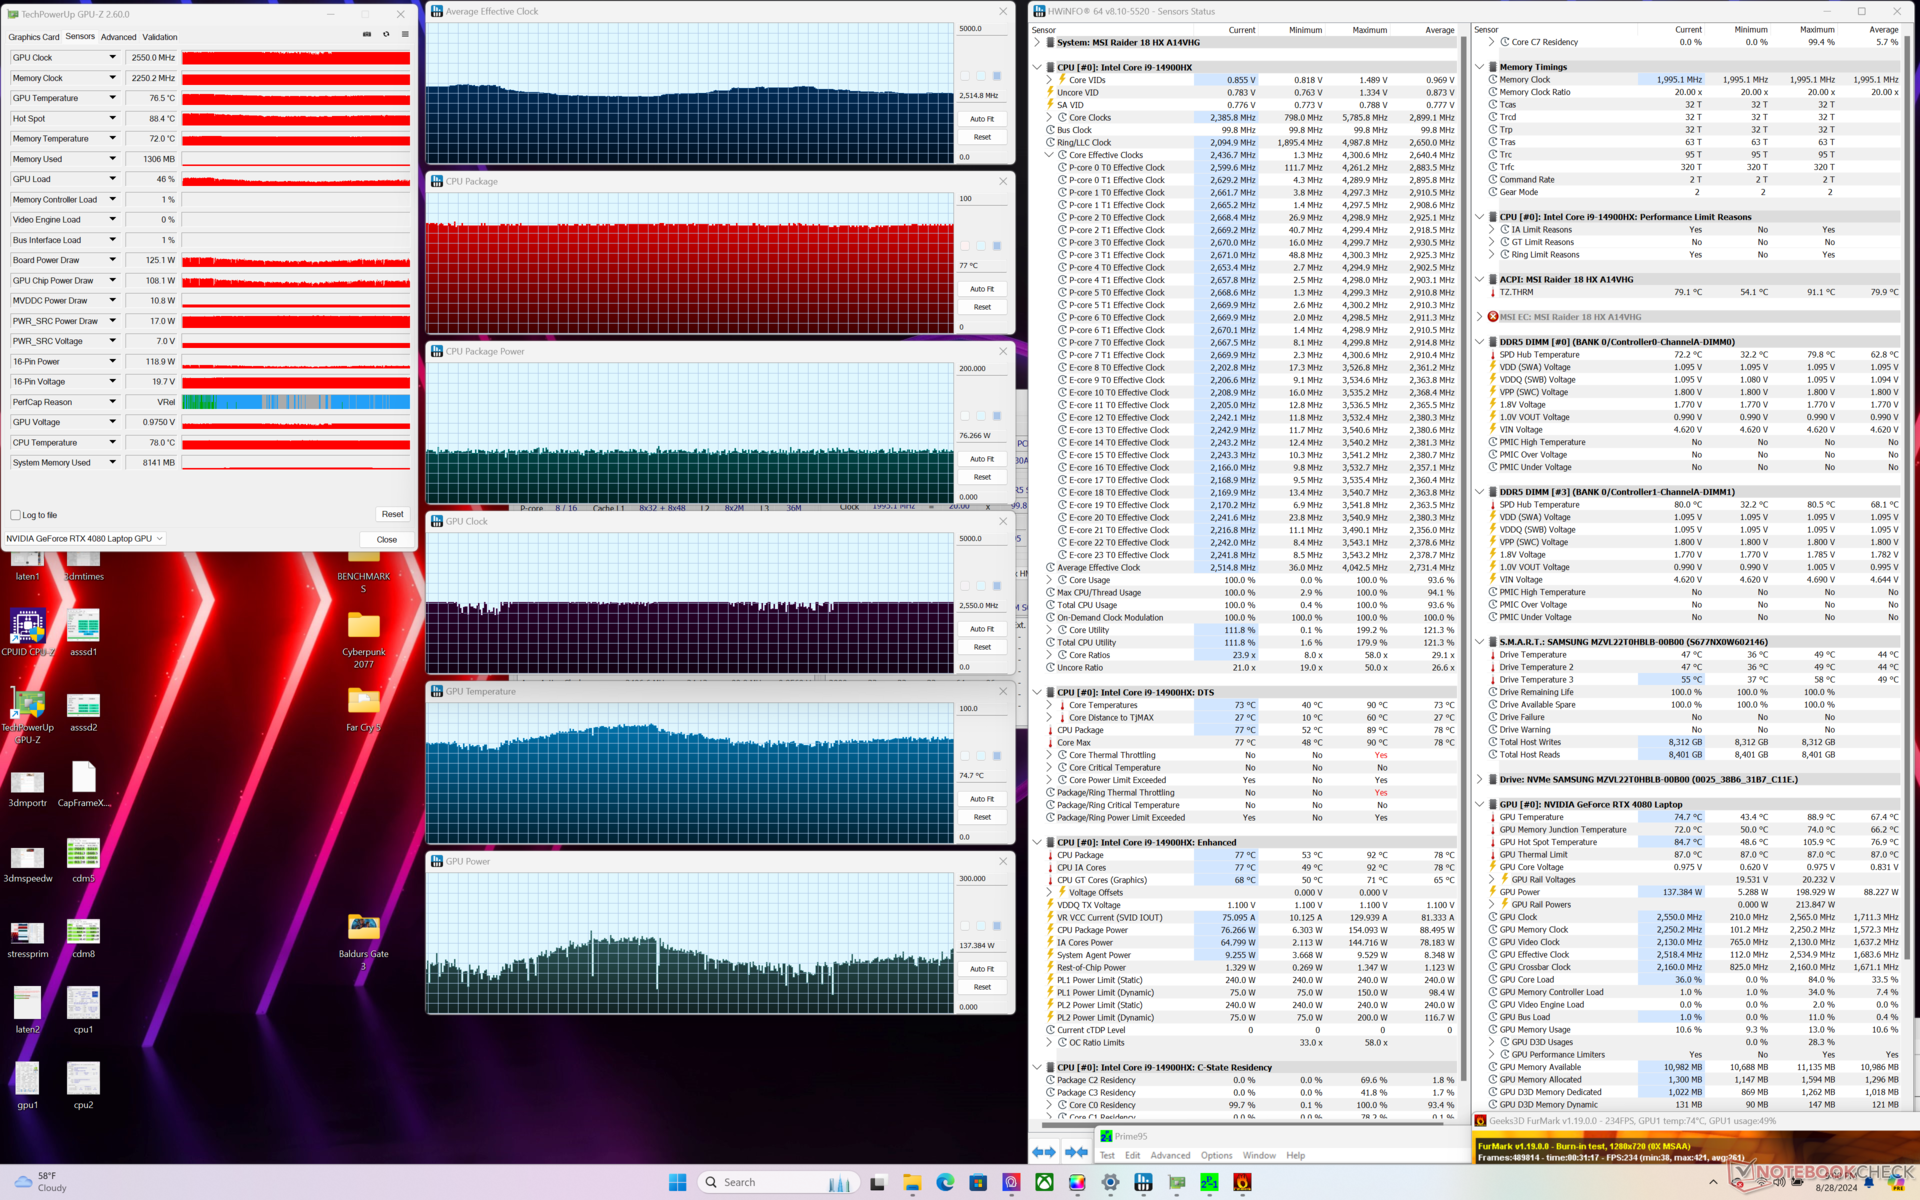
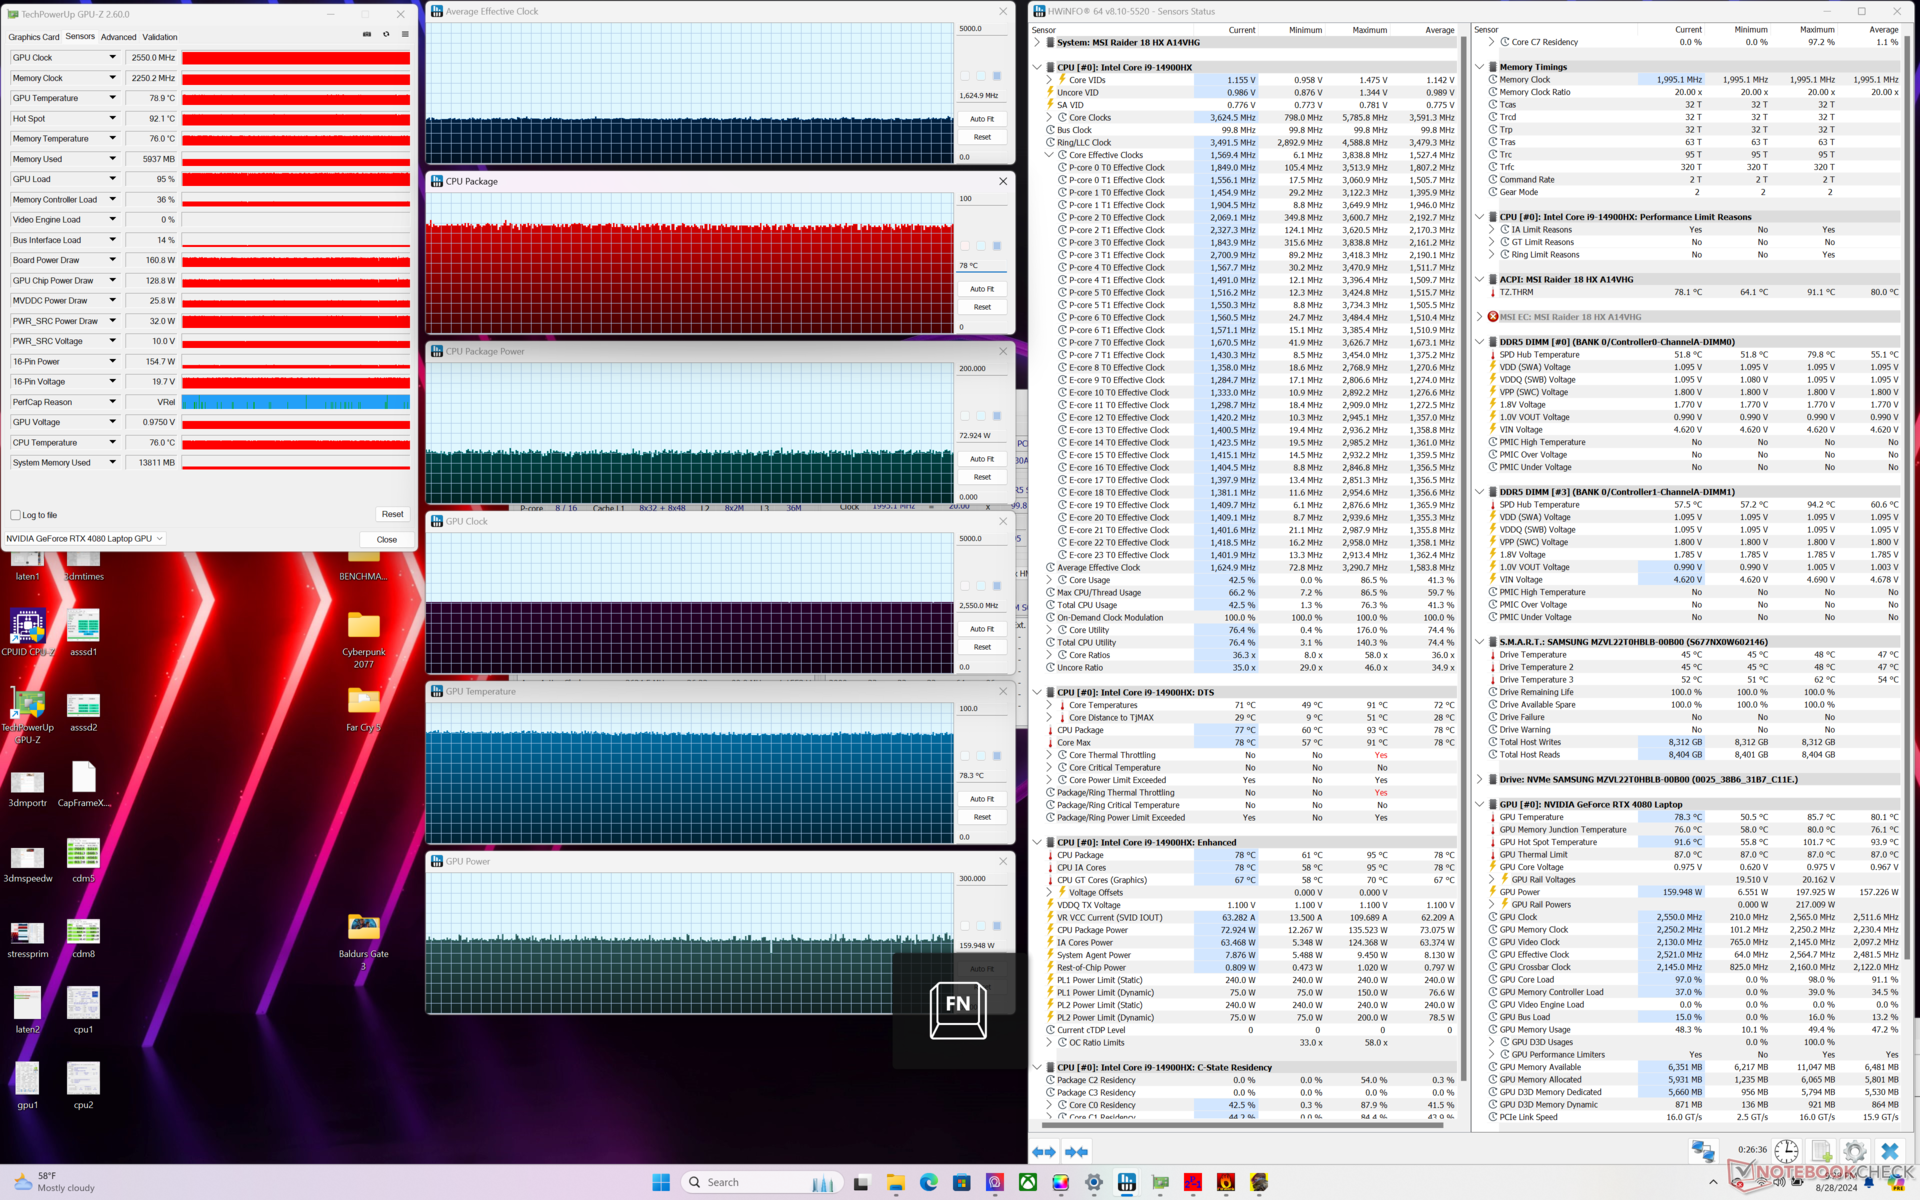
| Clock médio da CPU (GHz) | Clock da GPU (MHz) | Temperatura média da CPU (°C) | Temperatura média da GPU (°C) | |
| Sistema ocioso | -- | -- | 54 | 43 |
| Estresse do Prime95 | 4.0 | -- | 84 | 50 |
| Prime95 + FurMark Stress | 2.5 | 2550 | 77 | 75 |
| Cyberpunk 2077 Stress (Modo equilibrado) | 1.5 | 2295 | 78 | 85 |
| Cyberpunk 2077 Stress (Extreme Performance w/ Cooler Boost off) | 1.7 | 2550 | 81 | 83 |
| Cyberpunk 2077 Stress (Extreme Performance w/ Cooler Boost on) | 1.6 | 2550 | 78 | 78 |
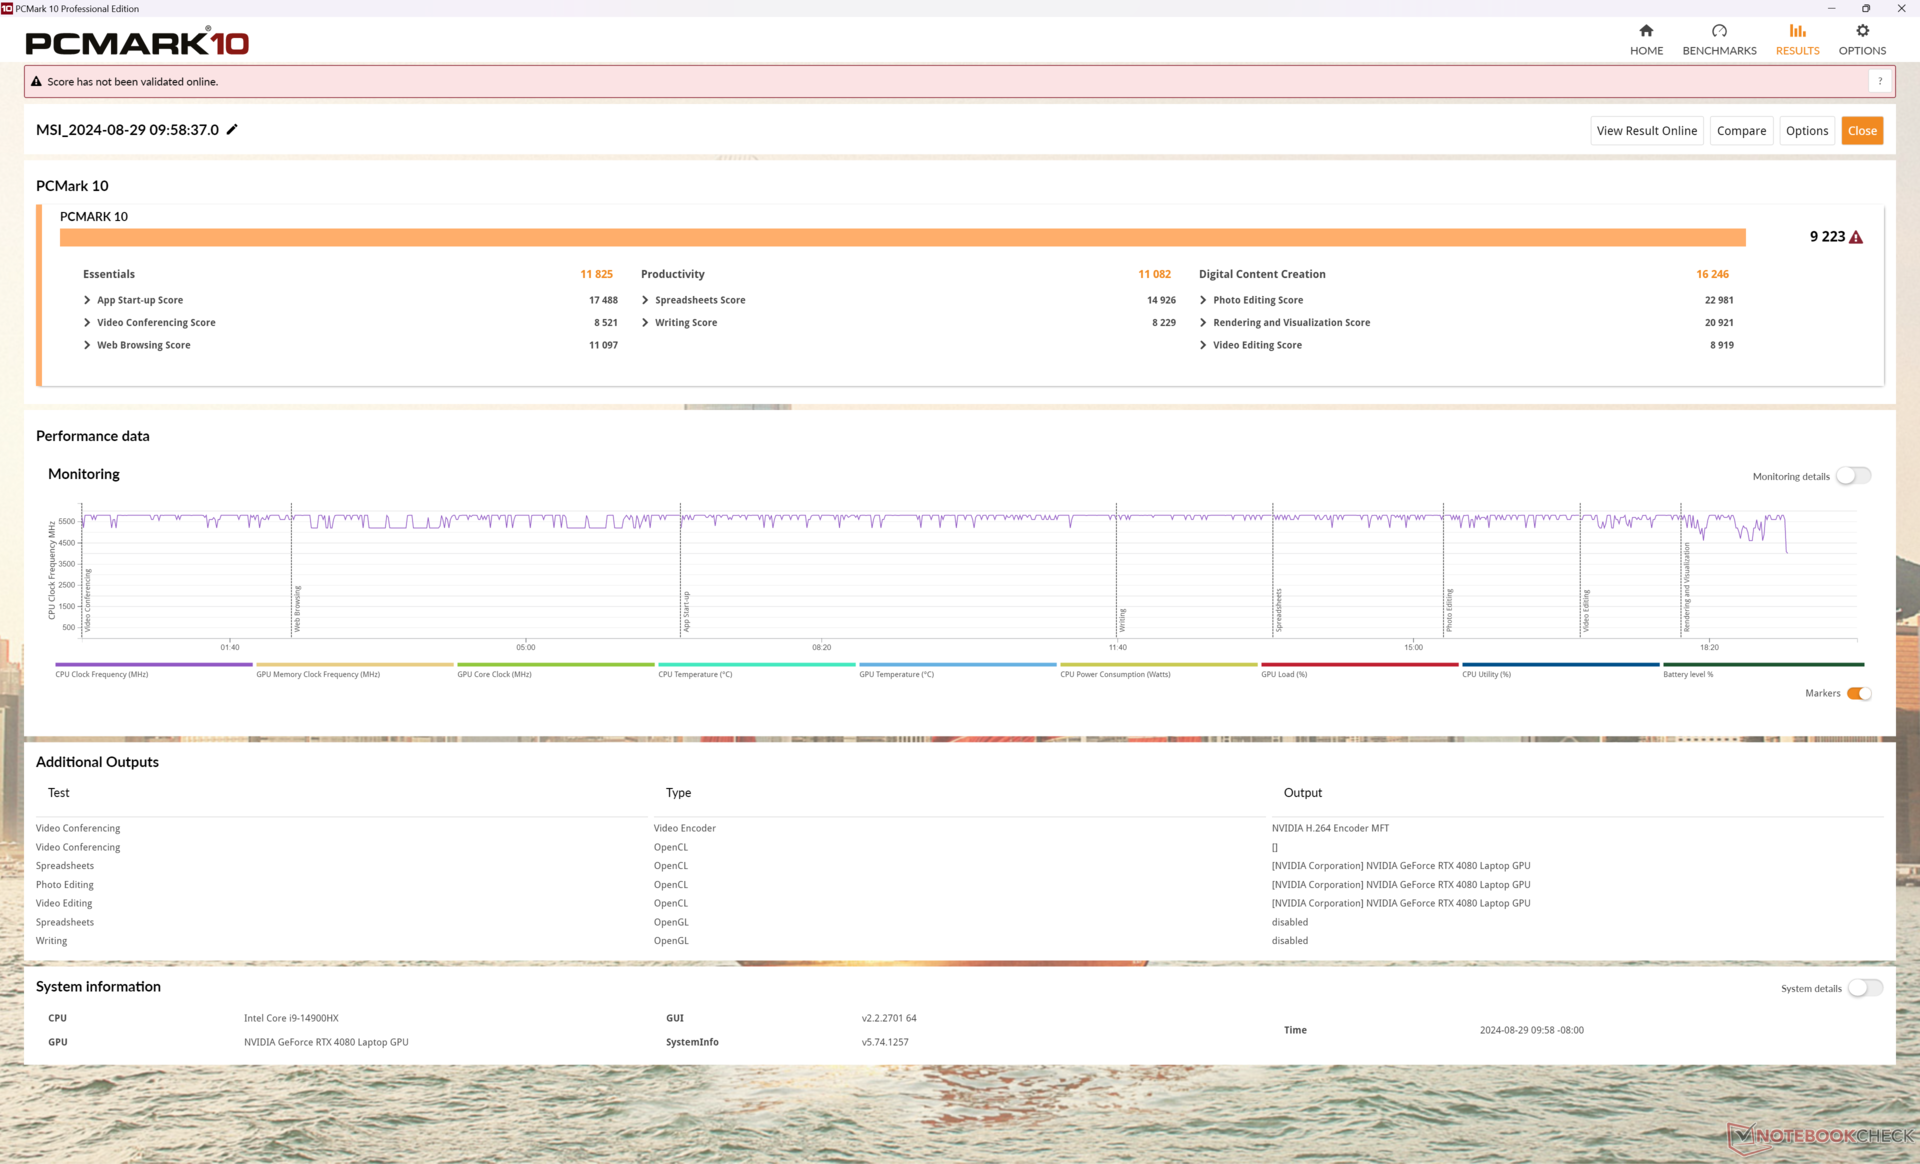
Desempenho do sistema
As pontuações do PCMark 10 são comparáveis às do MSI Titan 18 HX para mostrar que as tarefas cotidianas não são realmente mais lentas no Raider 18 HX, embora ele seja essencialmente um Titan com um tom mais baixo.
Tivemos problemas estranhos de login com nossa unidade de teste ao alternar entre os modos dGPU e iGPU, o que nos forçou a redefinir o PIN todas as vezes.
CrossMark: Overall | Productivity | Creativity | Responsiveness
WebXPRT 3: Overall
WebXPRT 4: Overall
Mozilla Kraken 1.1: Total
| PCMark 10 / Score | |
| Alienware m18 R2 | |
| MSI Raider 18 HX A14V | |
| MSI Titan 18 HX A14VIG | |
| Razer Blade 18 2024 RZ09-0509 | |
| Média Intel Core i9-14900HX, NVIDIA GeForce RTX 4080 Laptop GPU (7703 - 9223, n=7) | |
| Acer Predator Helios 18 PH18-72-98MW | |
| Asus ROG Strix G18 G814JI | |
| PCMark 10 / Essentials | |
| MSI Raider 18 HX A14V | |
| Média Intel Core i9-14900HX, NVIDIA GeForce RTX 4080 Laptop GPU (11255 - 12600, n=7) | |
| MSI Titan 18 HX A14VIG | |
| Alienware m18 R2 | |
| Razer Blade 18 2024 RZ09-0509 | |
| Acer Predator Helios 18 PH18-72-98MW | |
| Asus ROG Strix G18 G814JI | |
| PCMark 10 / Productivity | |
| Alienware m18 R2 | |
| MSI Raider 18 HX A14V | |
| Média Intel Core i9-14900HX, NVIDIA GeForce RTX 4080 Laptop GPU (6662 - 11410, n=7) | |
| MSI Titan 18 HX A14VIG | |
| Razer Blade 18 2024 RZ09-0509 | |
| Acer Predator Helios 18 PH18-72-98MW | |
| Asus ROG Strix G18 G814JI | |
| PCMark 10 / Digital Content Creation | |
| MSI Titan 18 HX A14VIG | |
| Alienware m18 R2 | |
| MSI Raider 18 HX A14V | |
| Razer Blade 18 2024 RZ09-0509 | |
| Média Intel Core i9-14900HX, NVIDIA GeForce RTX 4080 Laptop GPU (14211 - 16246, n=7) | |
| Acer Predator Helios 18 PH18-72-98MW | |
| Asus ROG Strix G18 G814JI | |
| CrossMark / Overall | |
| Média Intel Core i9-14900HX, NVIDIA GeForce RTX 4080 Laptop GPU (1992 - 2334, n=7) | |
| MSI Raider 18 HX A14V | |
| Alienware m18 R2 | |
| Razer Blade 18 2024 RZ09-0509 | |
| MSI Titan 18 HX A14VIG | |
| CrossMark / Productivity | |
| Média Intel Core i9-14900HX, NVIDIA GeForce RTX 4080 Laptop GPU (1812 - 2204, n=7) | |
| MSI Raider 18 HX A14V | |
| Razer Blade 18 2024 RZ09-0509 | |
| Alienware m18 R2 | |
| MSI Titan 18 HX A14VIG | |
| CrossMark / Creativity | |
| Média Intel Core i9-14900HX, NVIDIA GeForce RTX 4080 Laptop GPU (2327 - 2500, n=7) | |
| Alienware m18 R2 | |
| MSI Raider 18 HX A14V | |
| Razer Blade 18 2024 RZ09-0509 | |
| MSI Titan 18 HX A14VIG | |
| CrossMark / Responsiveness | |
| Média Intel Core i9-14900HX, NVIDIA GeForce RTX 4080 Laptop GPU (1520 - 2254, n=7) | |
| MSI Raider 18 HX A14V | |
| Alienware m18 R2 | |
| Razer Blade 18 2024 RZ09-0509 | |
| MSI Titan 18 HX A14VIG | |
| WebXPRT 3 / Overall | |
| Razer Blade 18 2024 RZ09-0509 | |
| MSI Raider 18 HX A14V | |
| Média Intel Core i9-14900HX, NVIDIA GeForce RTX 4080 Laptop GPU (310 - 345, n=7) | |
| MSI Titan 18 HX A14VIG | |
| Alienware m18 R2 | |
| Asus ROG Strix G18 G814JI | |
| Asus ROG Strix G18 G814JI | |
| WebXPRT 4 / Overall | |
| MSI Raider 18 HX A14V | |
| Média Intel Core i9-14900HX, NVIDIA GeForce RTX 4080 Laptop GPU (300 - 321, n=7) | |
| Alienware m18 R2 | |
| MSI Titan 18 HX A14VIG | |
| Asus ROG Strix G18 G814JI | |
| Asus ROG Strix G18 G814JI | |
| Mozilla Kraken 1.1 / Total | |
| Asus ROG Strix G18 G814JI | |
| Asus ROG Strix G18 G814JI | |
| MSI Titan 18 HX A14VIG | |
| Razer Blade 18 2024 RZ09-0509 | |
| MSI Raider 18 HX A14V | |
| Acer Predator Helios 18 PH18-72-98MW | |
| Média Intel Core i9-14900HX, NVIDIA GeForce RTX 4080 Laptop GPU (437 - 446, n=7) | |
| Alienware m18 R2 | |
* ... menor é melhor
| PCMark 10 Score | 9223 pontos | |
Ajuda | ||
| AIDA64 / Memory Copy | |
| Alienware m18 R2 | |
| Acer Predator Helios 18 PH18-72-98MW | |
| Razer Blade 18 2024 RZ09-0509 | |
| Média Intel Core i9-14900HX (38028 - 83392, n=36) | |
| MSI Raider 18 HX A14V | |
| Asus ROG Strix G18 G814JI | |
| MSI Titan 18 HX A14VIG | |
| AIDA64 / Memory Read | |
| Alienware m18 R2 | |
| Acer Predator Helios 18 PH18-72-98MW | |
| Razer Blade 18 2024 RZ09-0509 | |
| Média Intel Core i9-14900HX (43306 - 87568, n=36) | |
| Asus ROG Strix G18 G814JI | |
| MSI Raider 18 HX A14V | |
| MSI Titan 18 HX A14VIG | |
| AIDA64 / Memory Write | |
| Alienware m18 R2 | |
| Média Intel Core i9-14900HX (37146 - 80589, n=36) | |
| Acer Predator Helios 18 PH18-72-98MW | |
| Razer Blade 18 2024 RZ09-0509 | |
| MSI Raider 18 HX A14V | |
| Asus ROG Strix G18 G814JI | |
| MSI Titan 18 HX A14VIG | |
| AIDA64 / Memory Latency | |
| MSI Titan 18 HX A14VIG | |
| MSI Raider 18 HX A14V | |
| Razer Blade 18 2024 RZ09-0509 | |
| Alienware m18 R2 | |
| Média Intel Core i9-14900HX (76.1 - 105, n=36) | |
| Asus ROG Strix G18 G814JI | |
| Acer Predator Helios 18 PH18-72-98MW | |
* ... menor é melhor
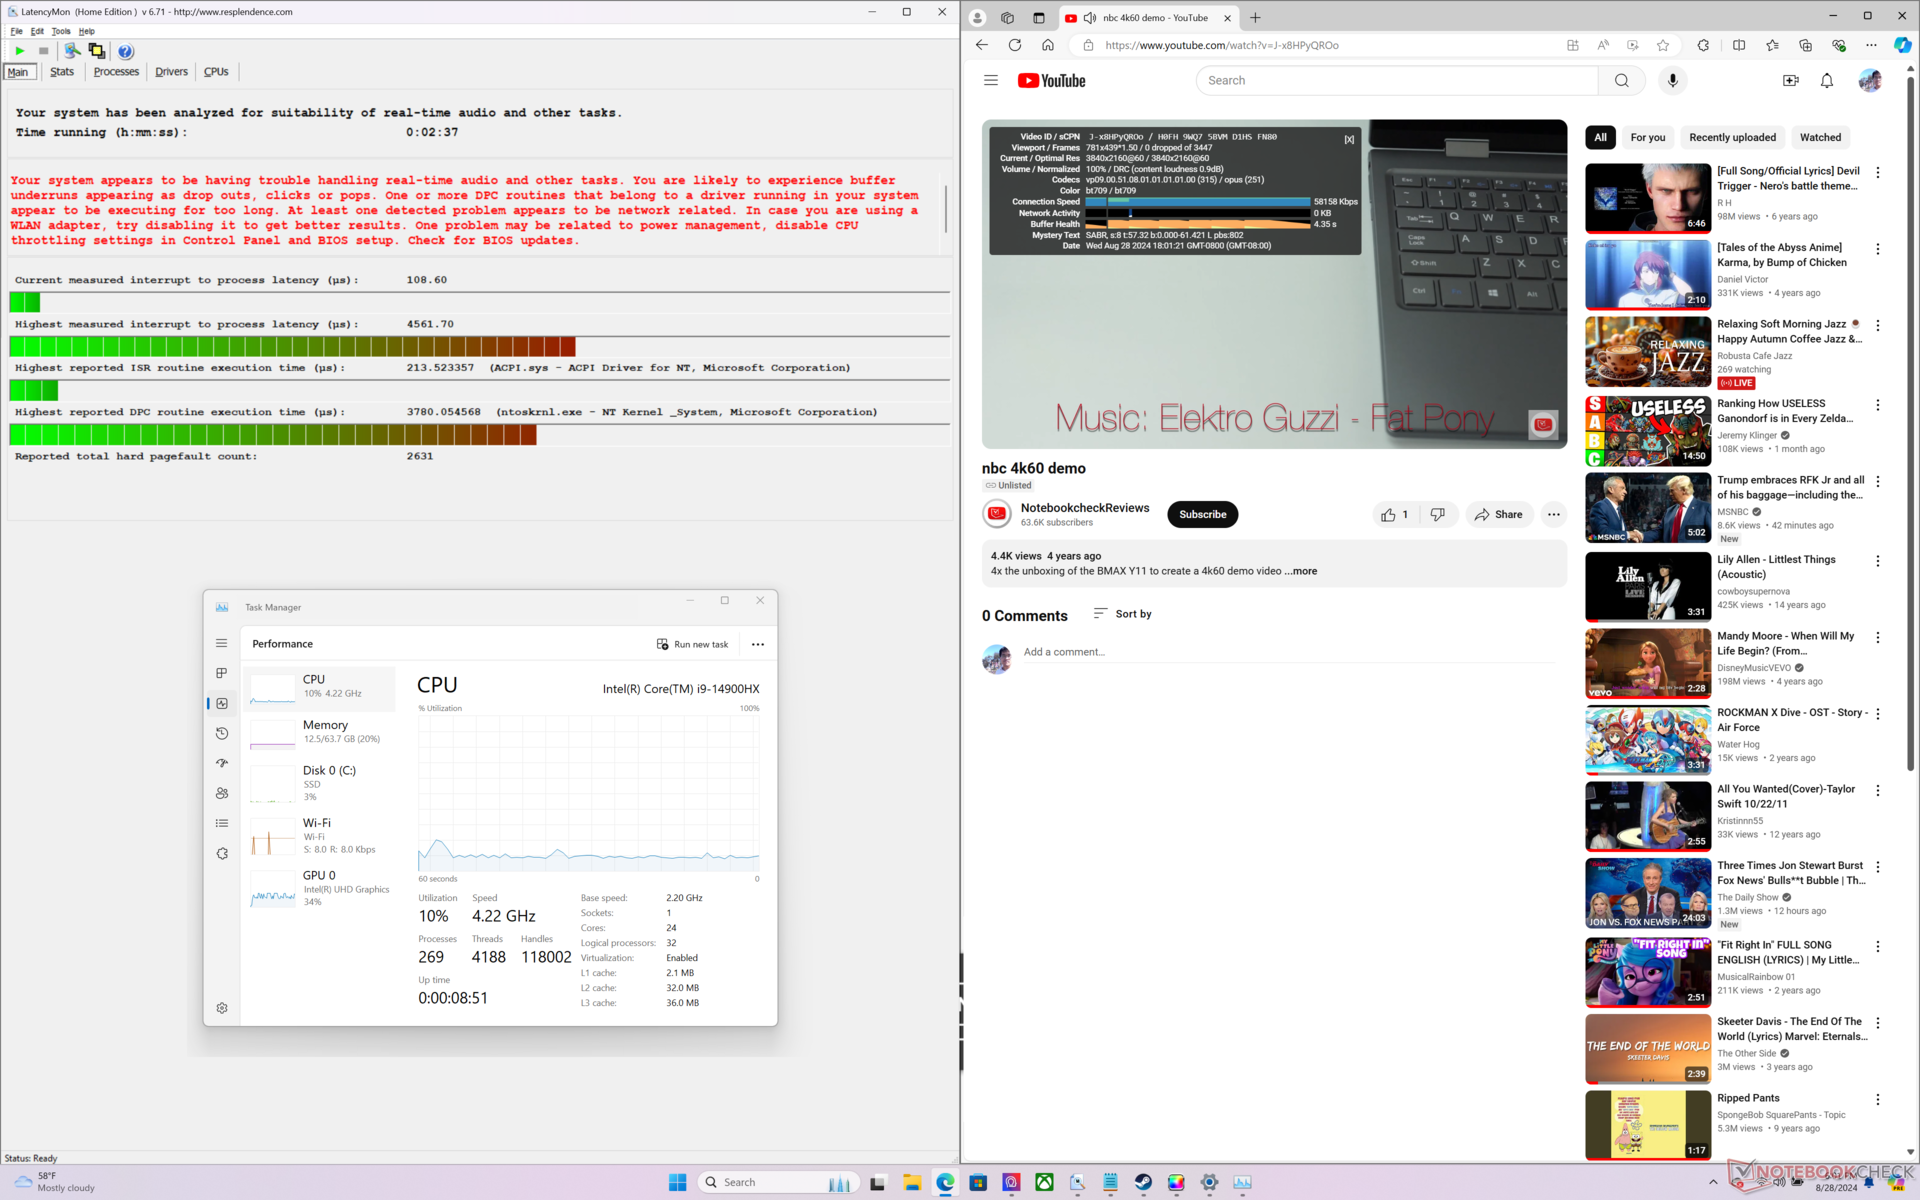
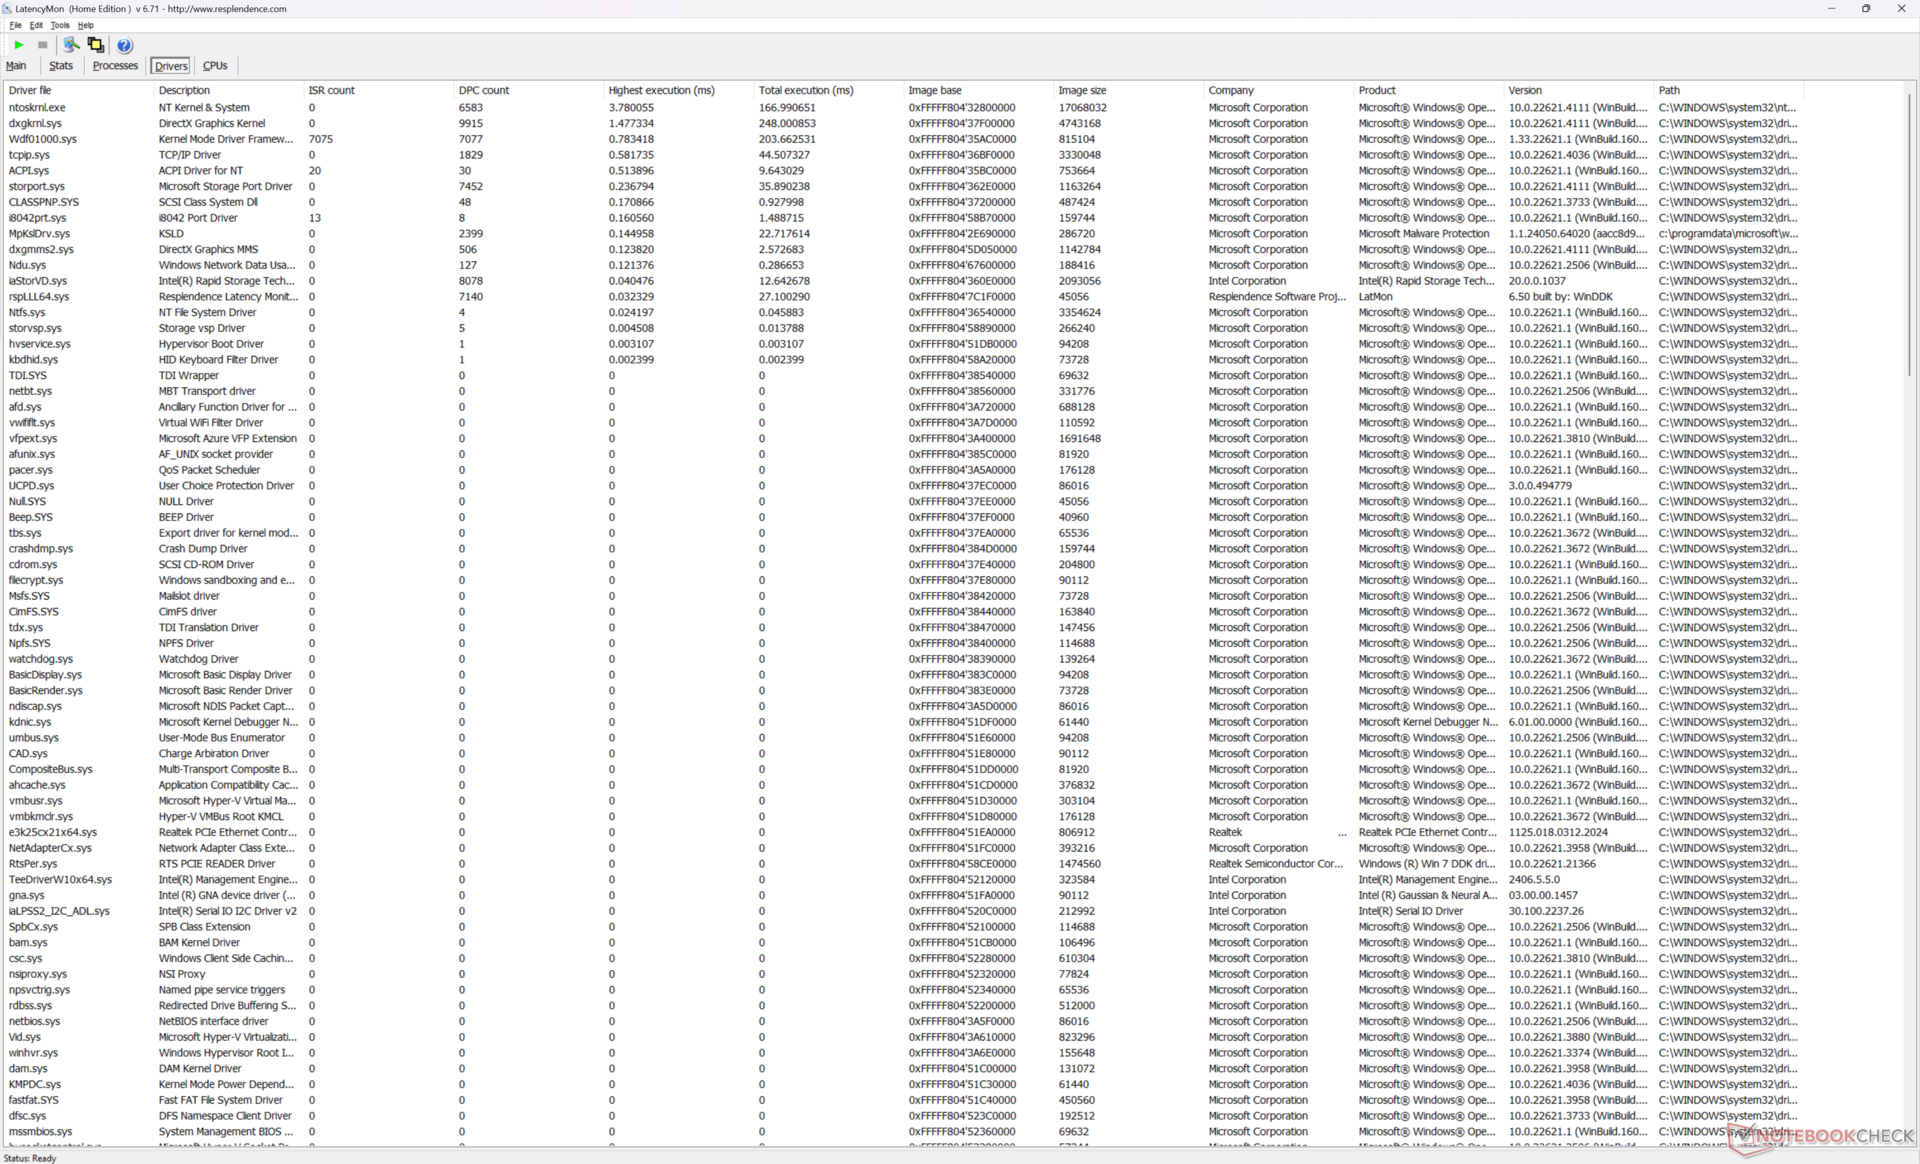
Latência DPC
O LatencyMon revela problemas de DPC ao abrir várias guias de nossa página inicial, mesmo quando configurado para o modo iGPU. a reprodução de vídeo 4K a 60 FPS é perfeita, sem registro de queda de quadros.
| DPC Latencies / LatencyMon - interrupt to process latency (max), Web, Youtube, Prime95 | |
| MSI Raider 18 HX A14V | |
| Acer Predator Helios 18 PH18-72-98MW | |
| Alienware m18 R2 | |
| MSI Titan 18 HX A14VIG | |
| Razer Blade 18 2024 RZ09-0509 | |
| Asus ROG Strix G18 G814JI | |
* ... menor é melhor
Dispositivos de armazenamento
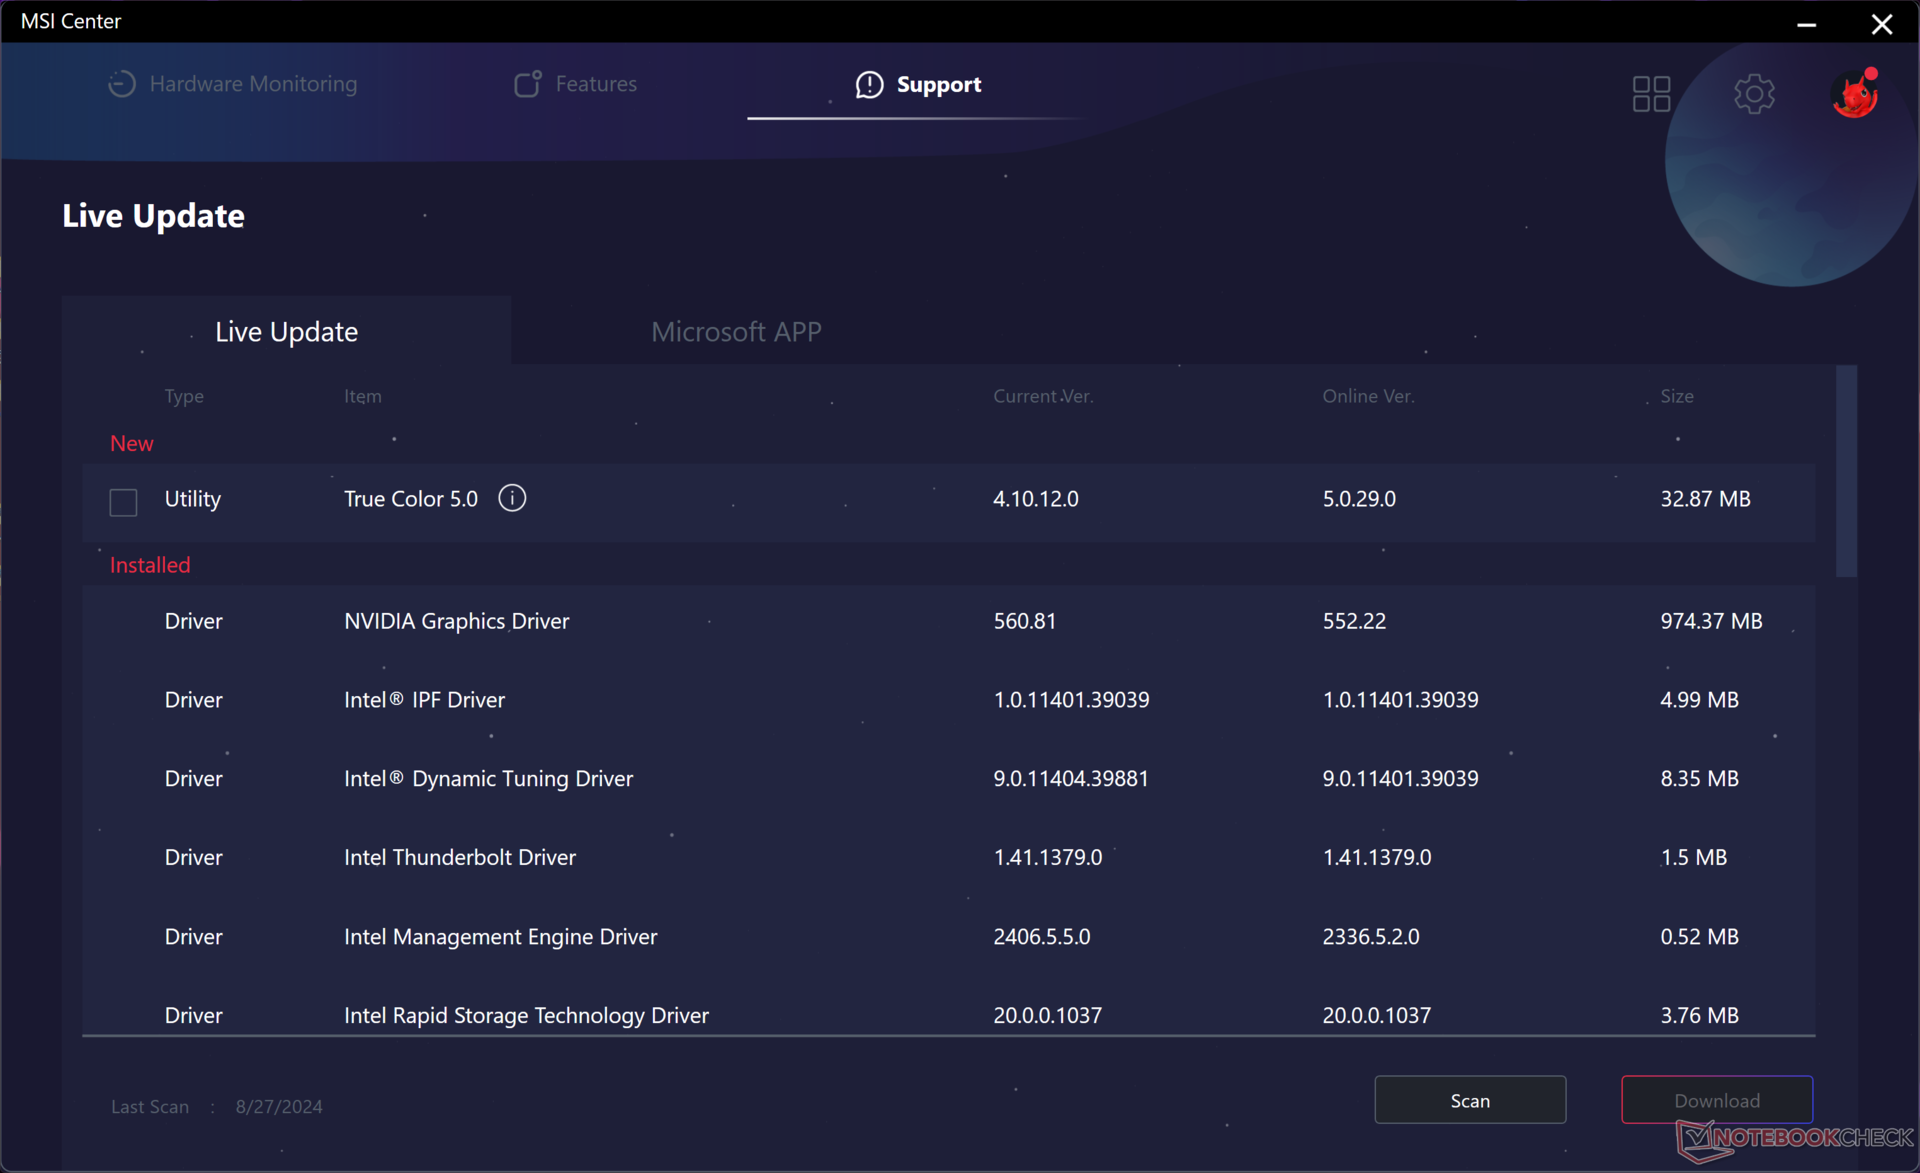
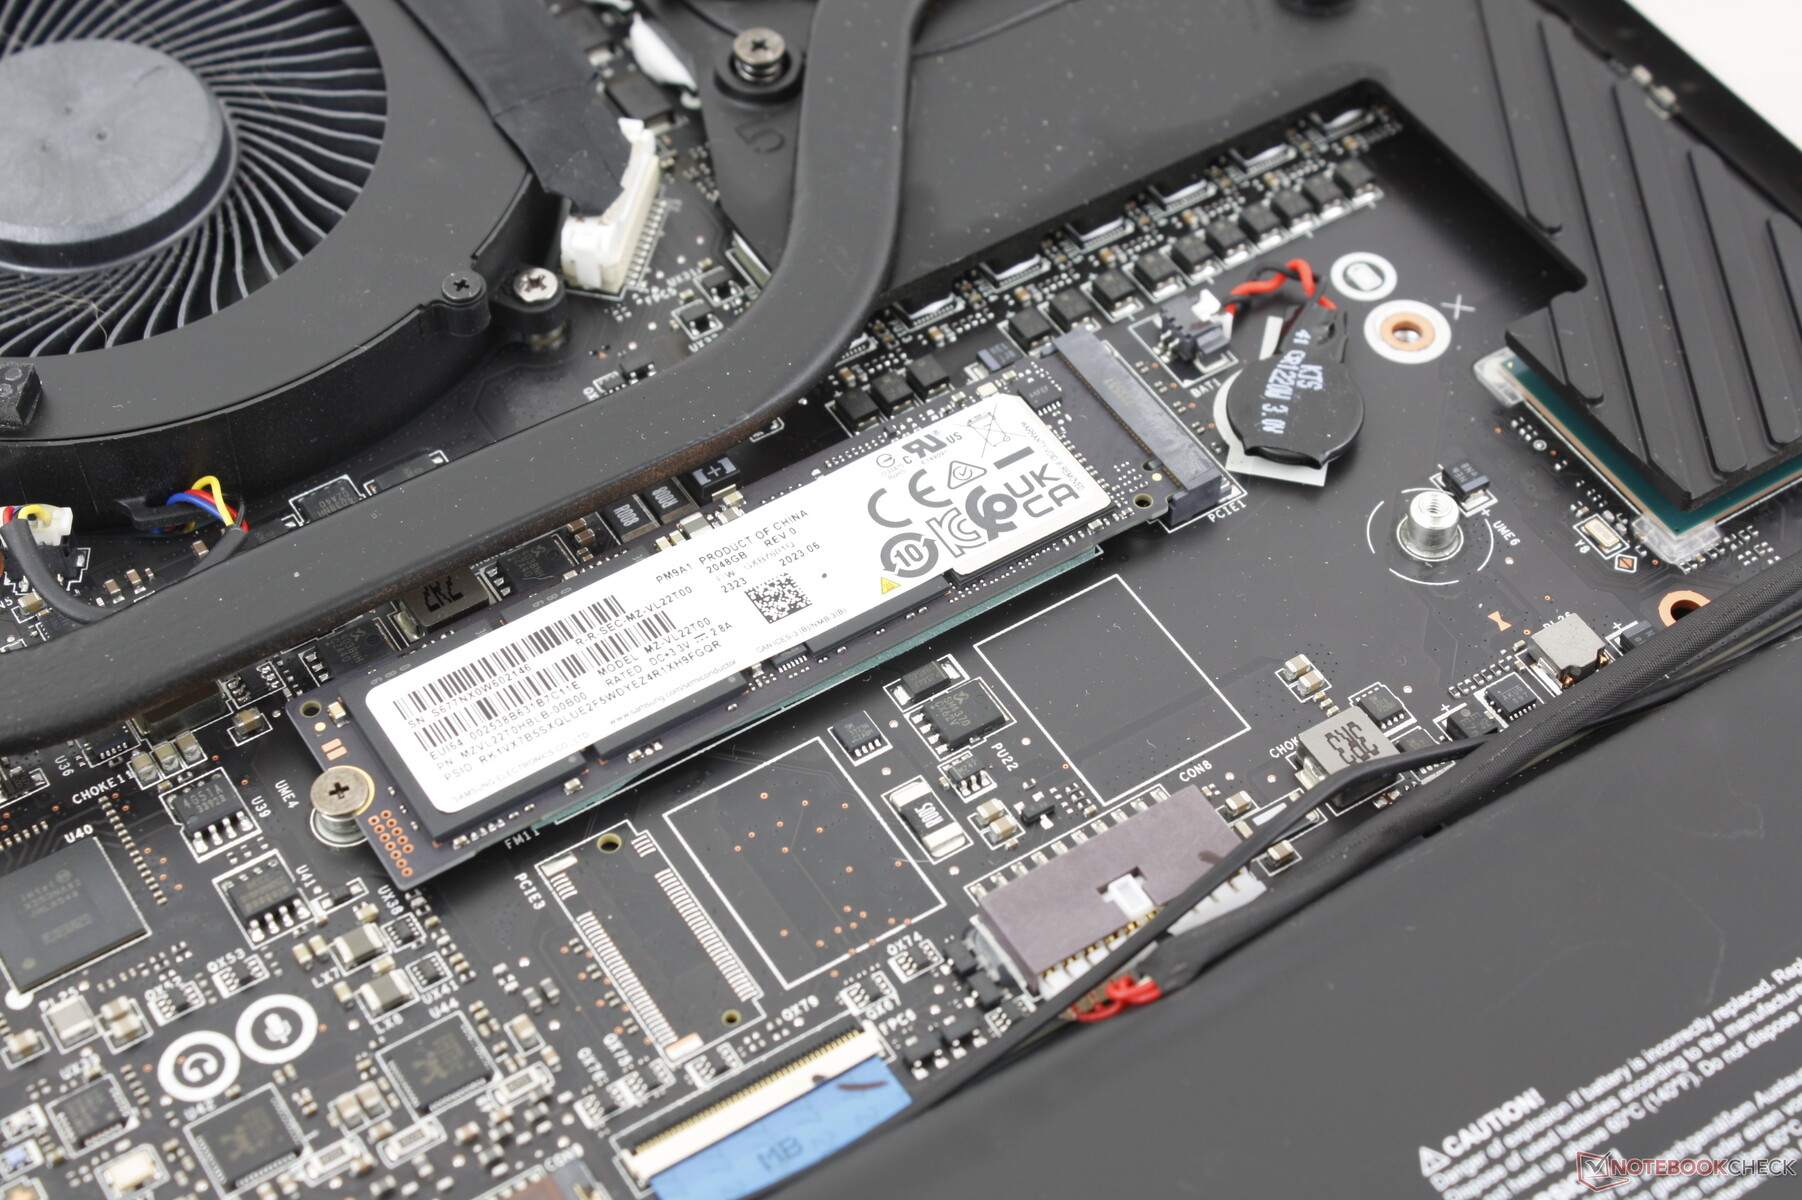
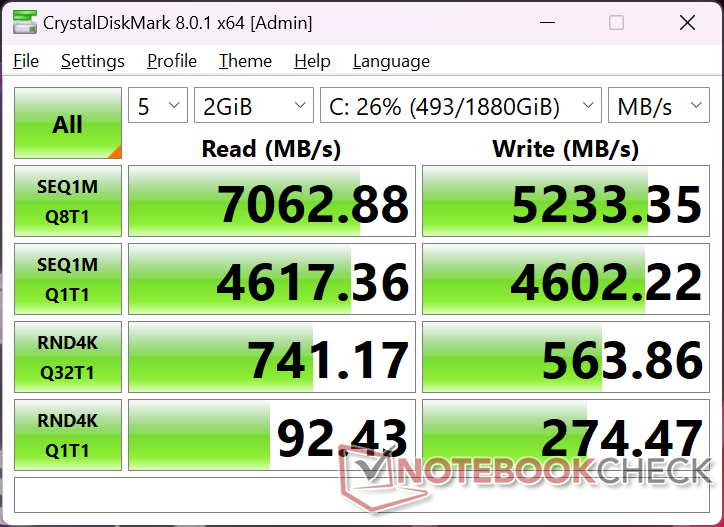
Nossa unidade é fornecida com o Samsung PM9A1a MZVL22T0HDLB SSD PCIe4 comumente encontrado em laptops de ponta. As taxas de transferência são estáveis em cerca de 7.000 MB/s, mesmo quando estressadas, e podem ser ainda mais rápidas se forem configuradas com uma unidade PCIe5. No entanto, a falta de um dissipador de calor incluído pode significar que as unidades PCIe5 têm maior probabilidade de sofrerem aceleração.


| Drive Performance Rating - Percent | |
| Alienware m18 R2 | |
| MSI Raider 18 HX A14V | |
| Acer Predator Helios 18 PH18-72-98MW | |
| MSI Titan 18 HX A14VIG | |
| Razer Blade 18 2024 RZ09-0509 | |
| Asus ROG Strix G18 G814JI | |
* ... menor é melhor
Disk Throttling: DiskSpd Read Loop, Queue Depth 8
Desempenho da GPU - Gráficos TGP de 175 W
Ao contrário dos laptops mais finos que podem ser fornecidos com gráficos mais fracos de 80 W GeForce RTX 4080o Raider 18 HX maior vem com uma versão mais potente de 175 W (150 W + 25 W de aumento dinâmico). O desempenho é cerca de 5% mais rápido do que o laptop médio em nosso banco de dados com a mesma GPU enquanto a atualização para a RTX 4090 aumentará o desempenho em mais 10%.
Lembre-se de que o desempenho geral ainda é de 30% a 35% mais lento do que a versão para desktop da versão para desktop da GeForce RTX 4080 mesmo que a versão móvel tenha o mesmo nome. Portanto, nosso RTX 4080 móvel está mais próximo, em termos de desempenho, do rTX 4070 para desktop.
| Perfil de potência | Pontuação gráfica | Pontuação de física | Pontuação combinada |
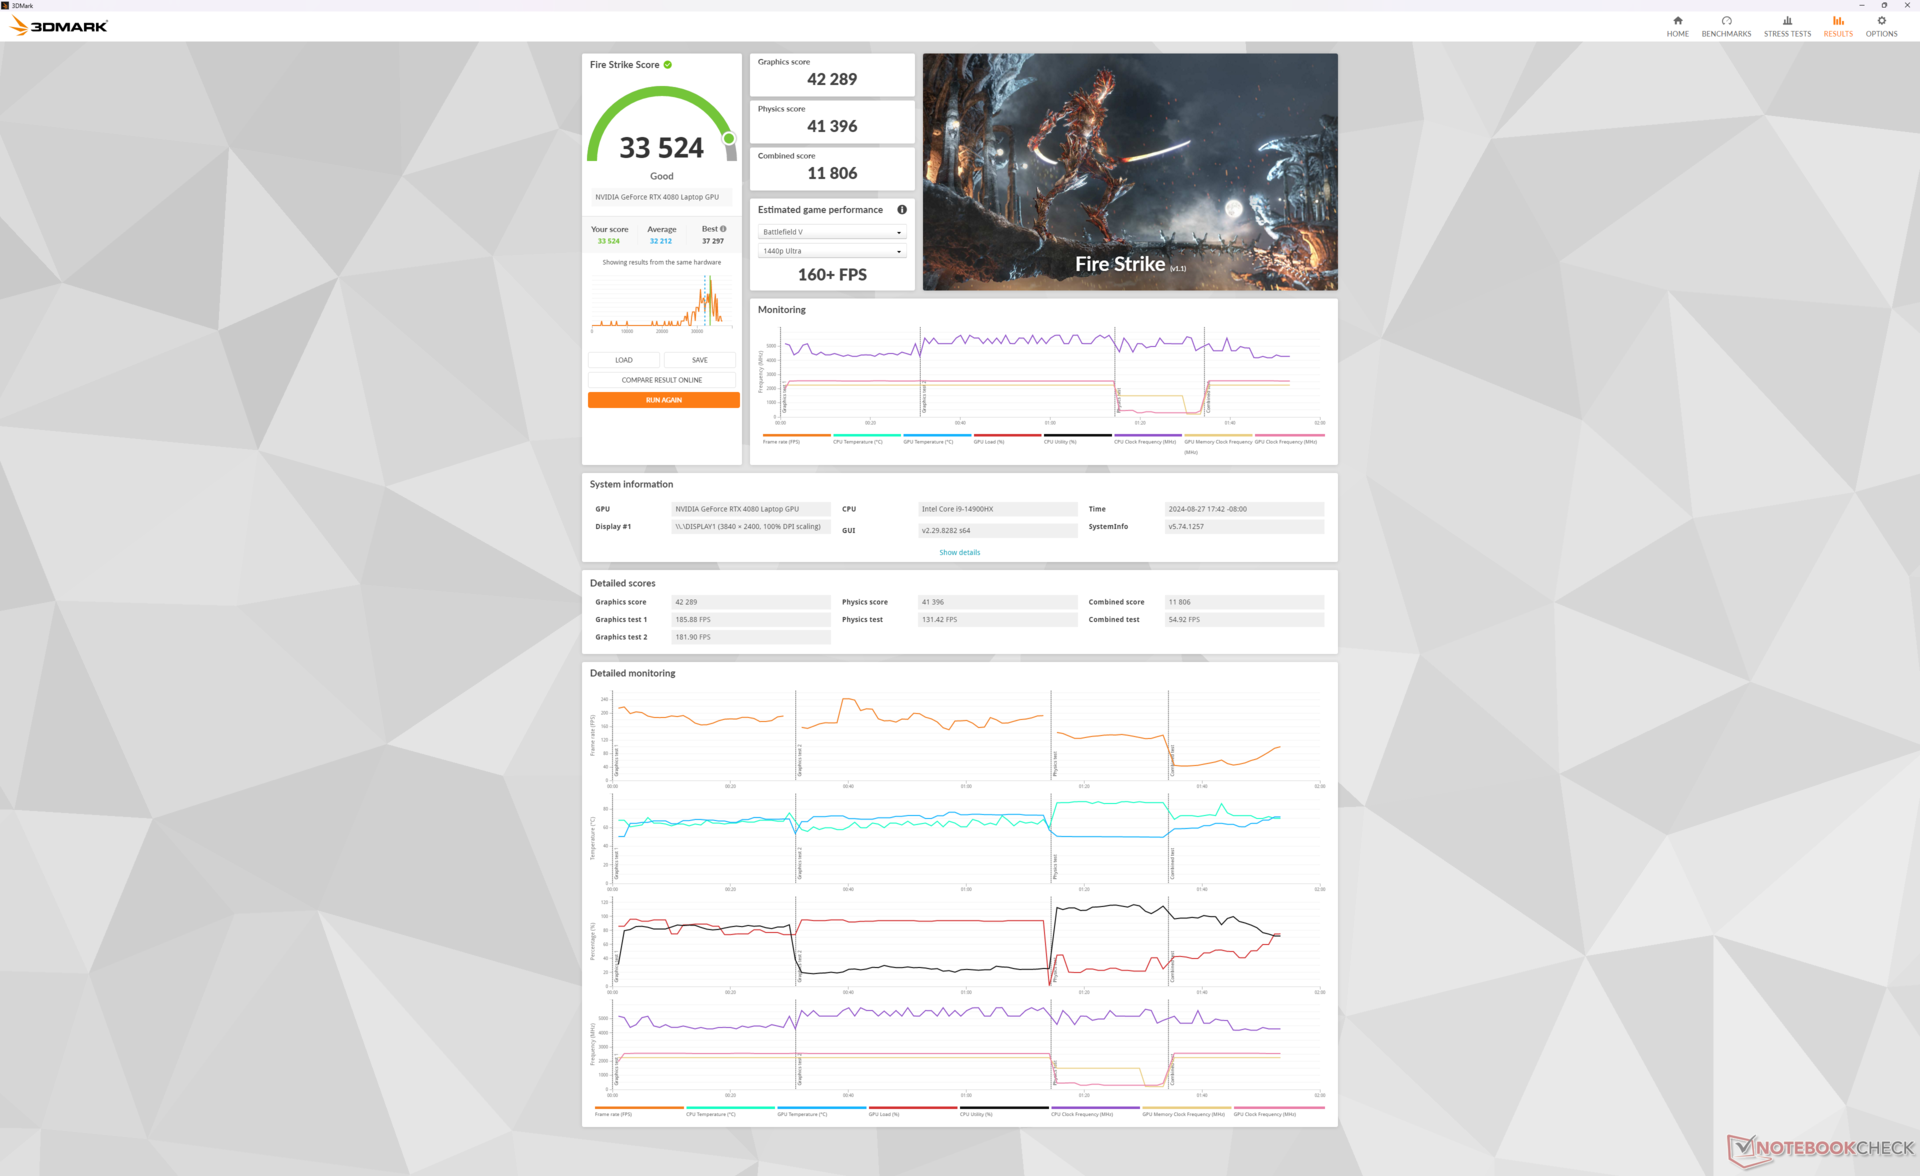
| Desempenho extremo (Cooler Boost ativado) | 42289 | 41396 | 11806 |
| Desempenho extremo (Cooler Boost desligado) | 41778 (-1%) | 40723 (-2%) | 11968 (-1%) |
| Modo equilibrado | 41673 (-2%) | 41013 (-1%) | 10404 (-12%) |
| Energia da bateria | 21731 (-49%) | 17988 (-57%) | 5809 (-51%) |
A redução do modo Extreme Performance para o modo Balanced afeta apenas ligeiramente o desempenho, o que se alinha com as observações do teste de estresse acima. A ativação do Cooler Boost também faz pouca diferença, exceto pela redução das temperaturas do núcleo, aumentando significativamente o ruído da ventoinha.
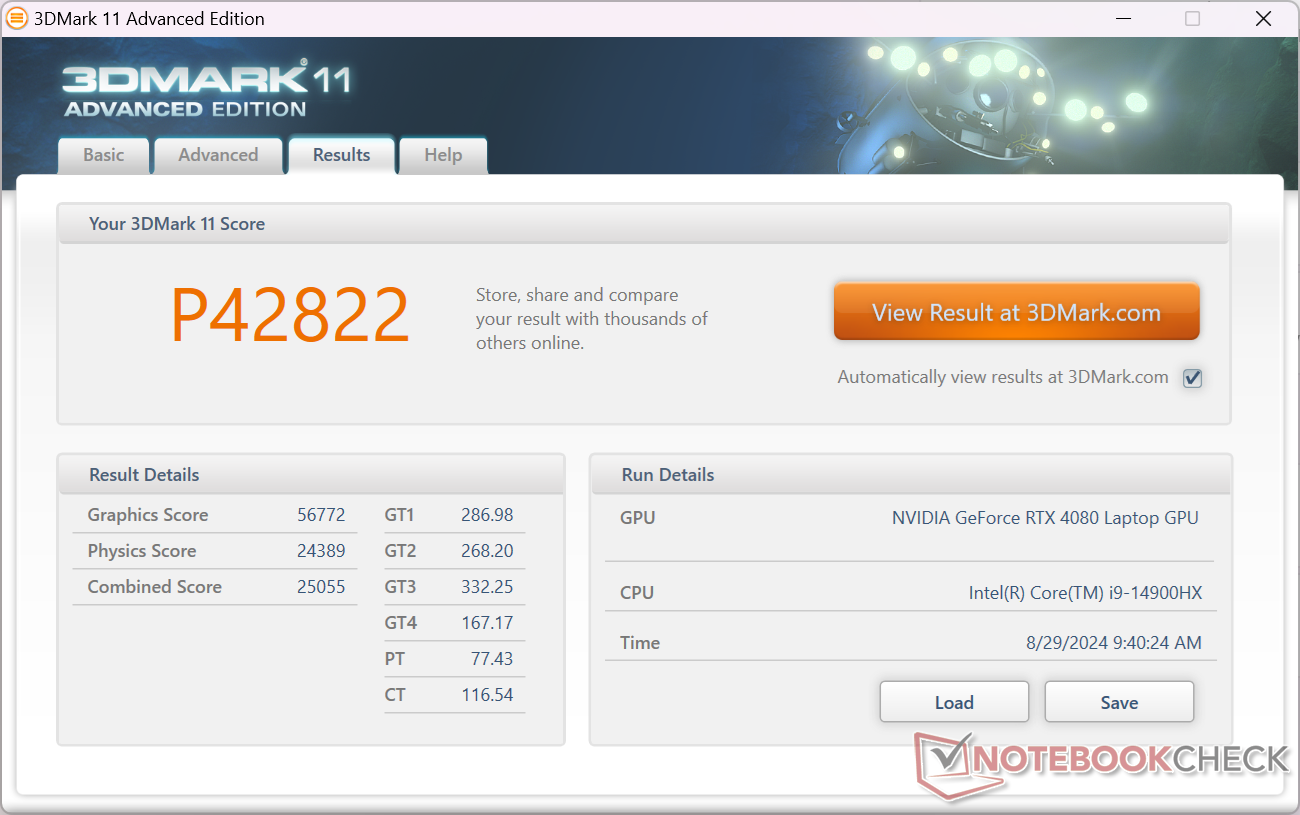
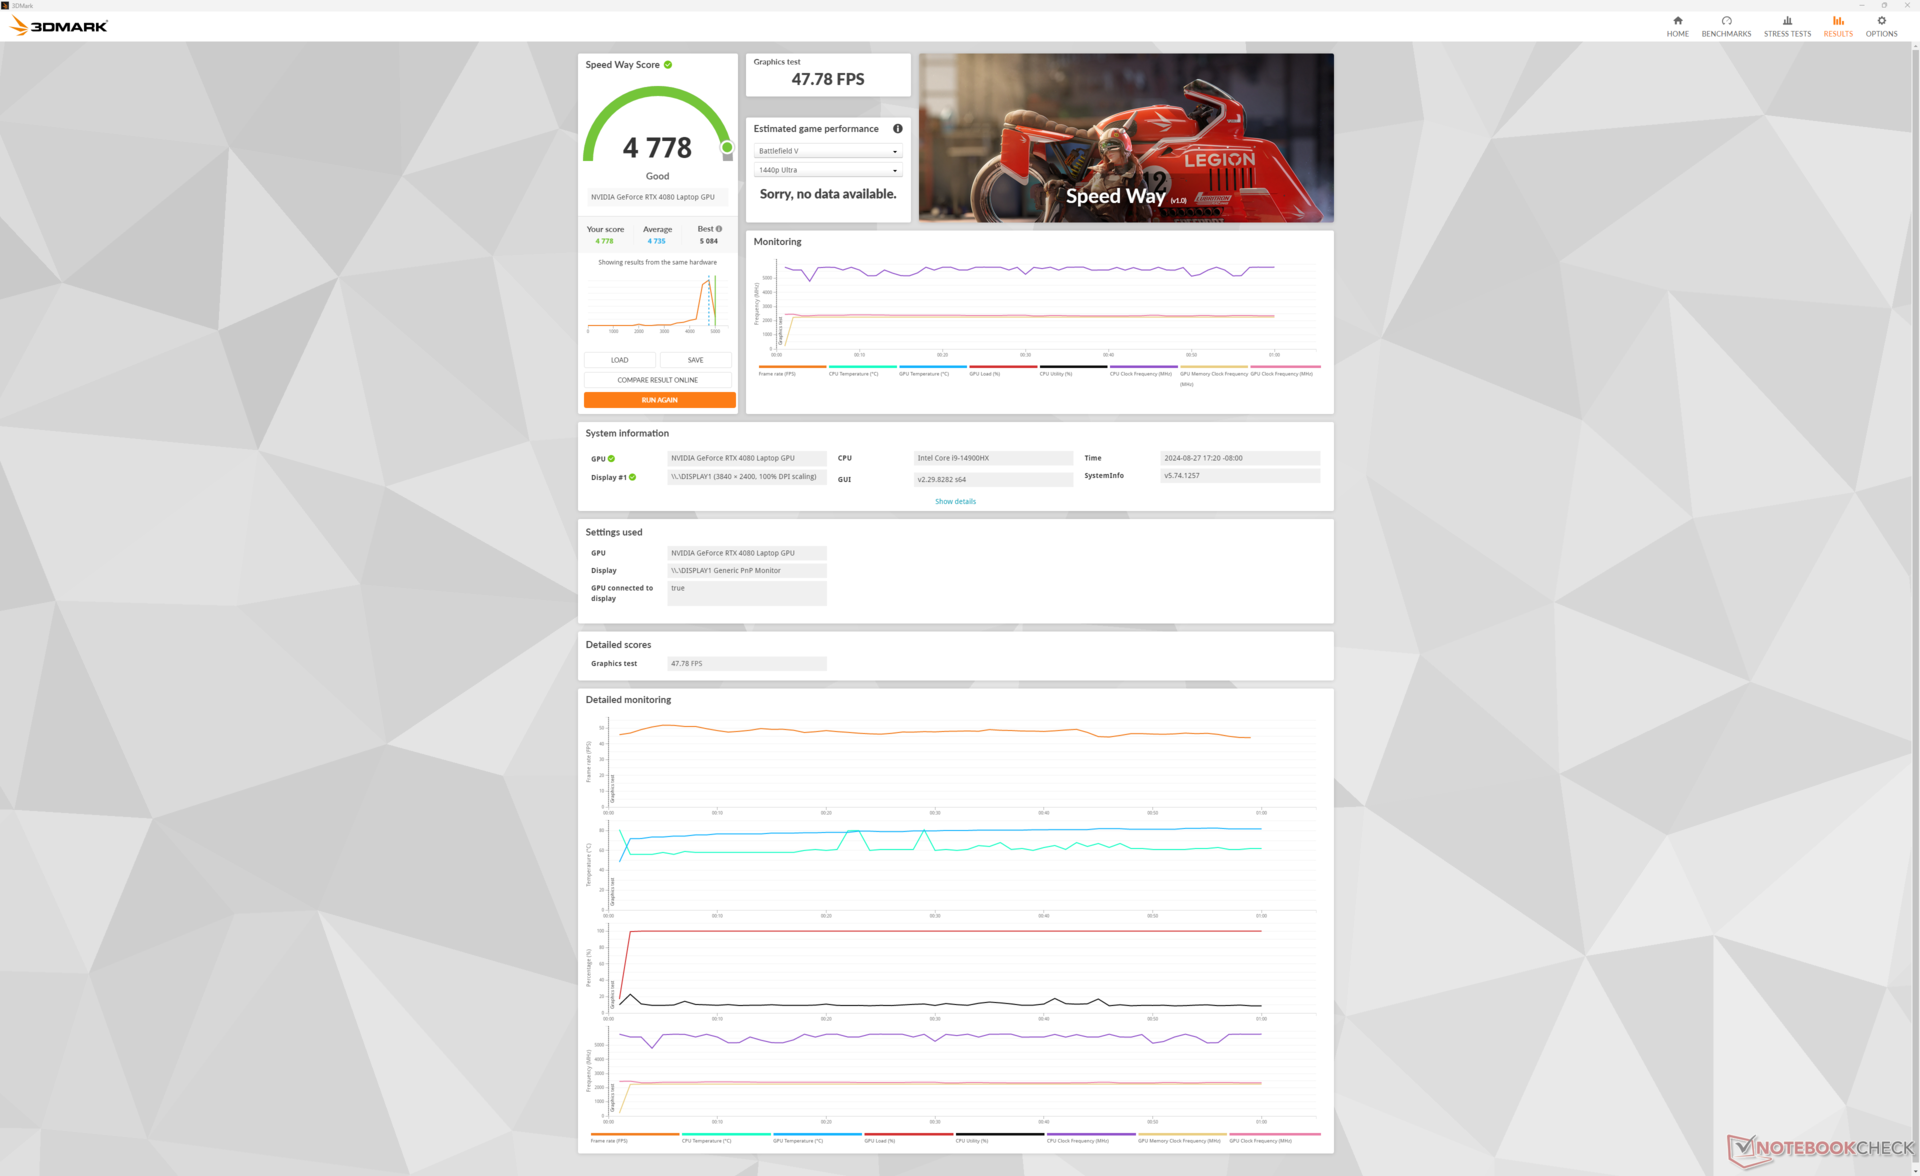
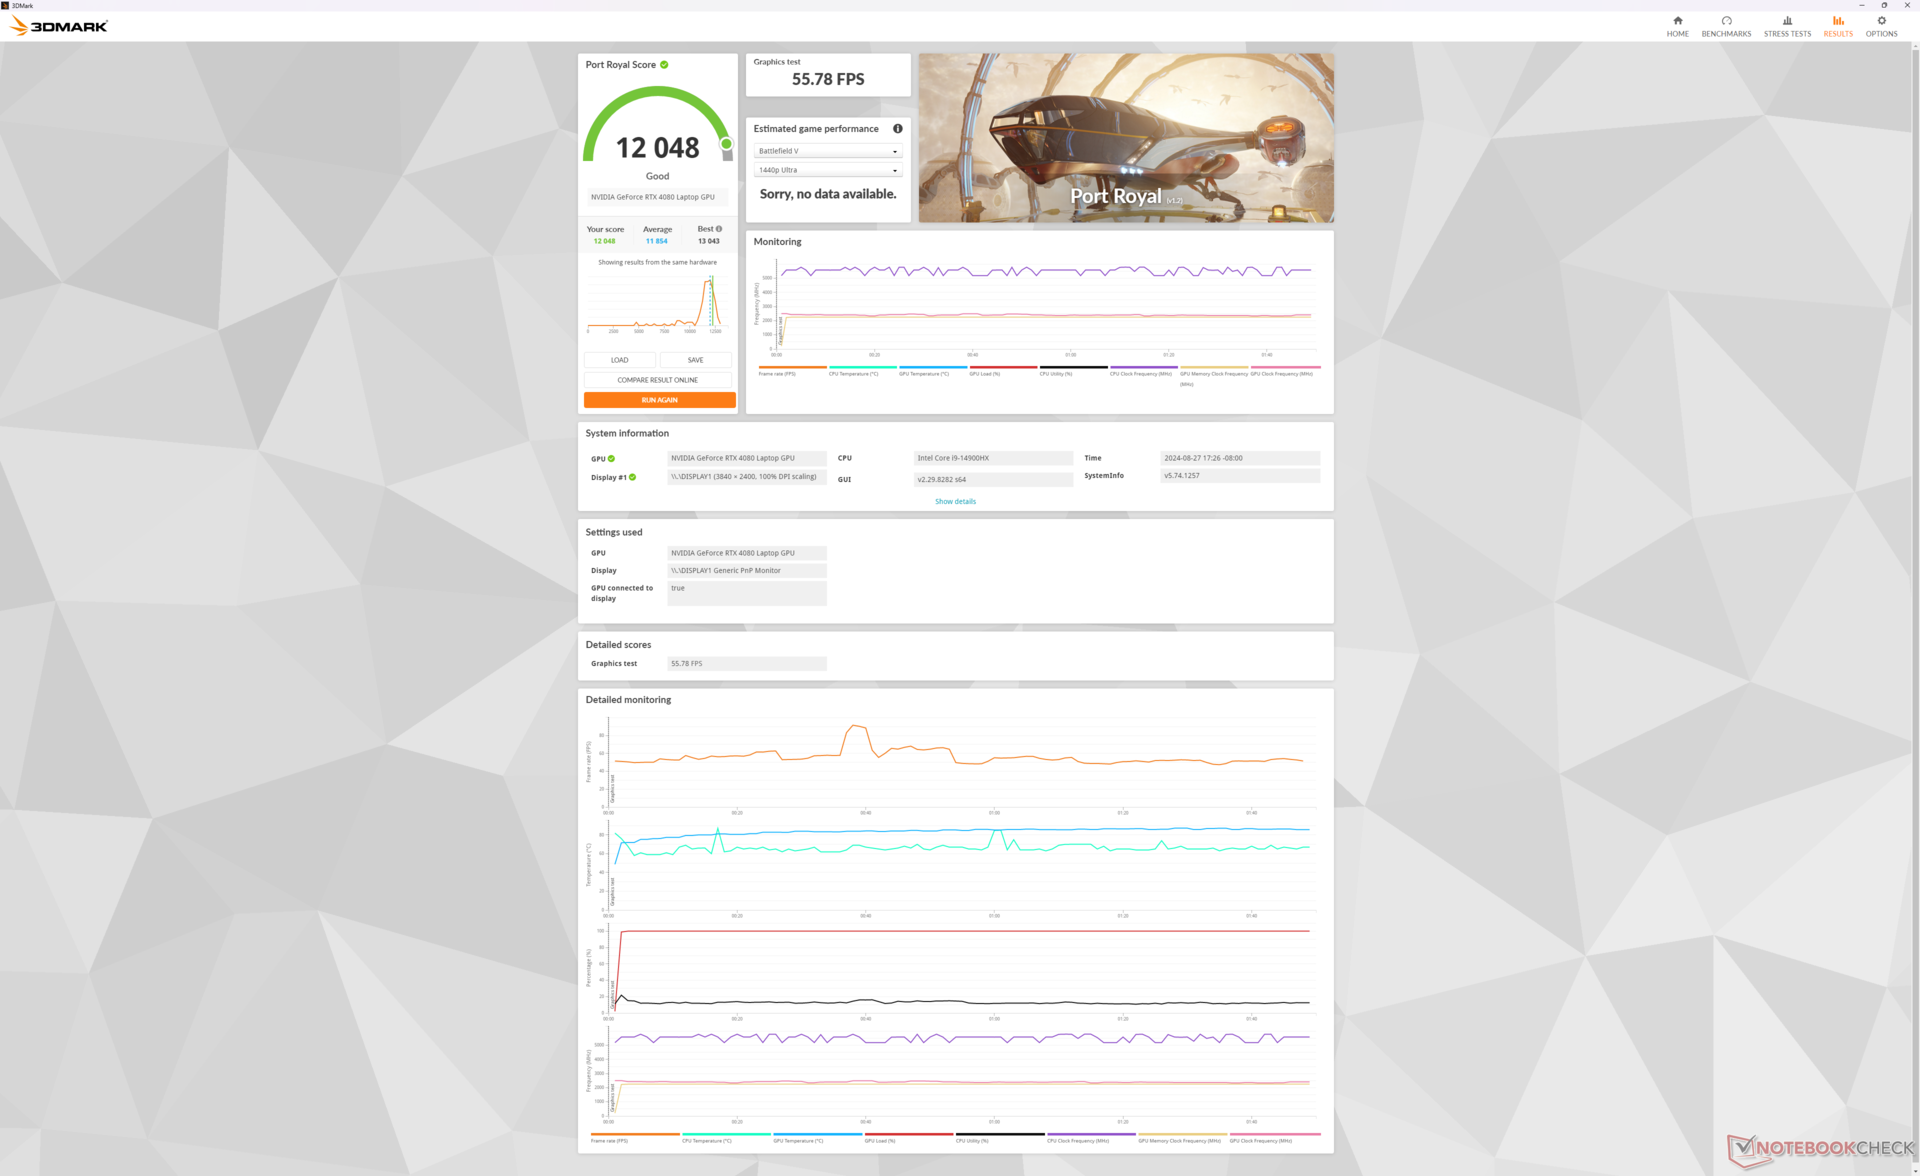

| 3DMark 11 Performance | 42822 pontos | |
| 3DMark Fire Strike Score | 33524 pontos | |
| 3DMark Time Spy Score | 18608 pontos | |
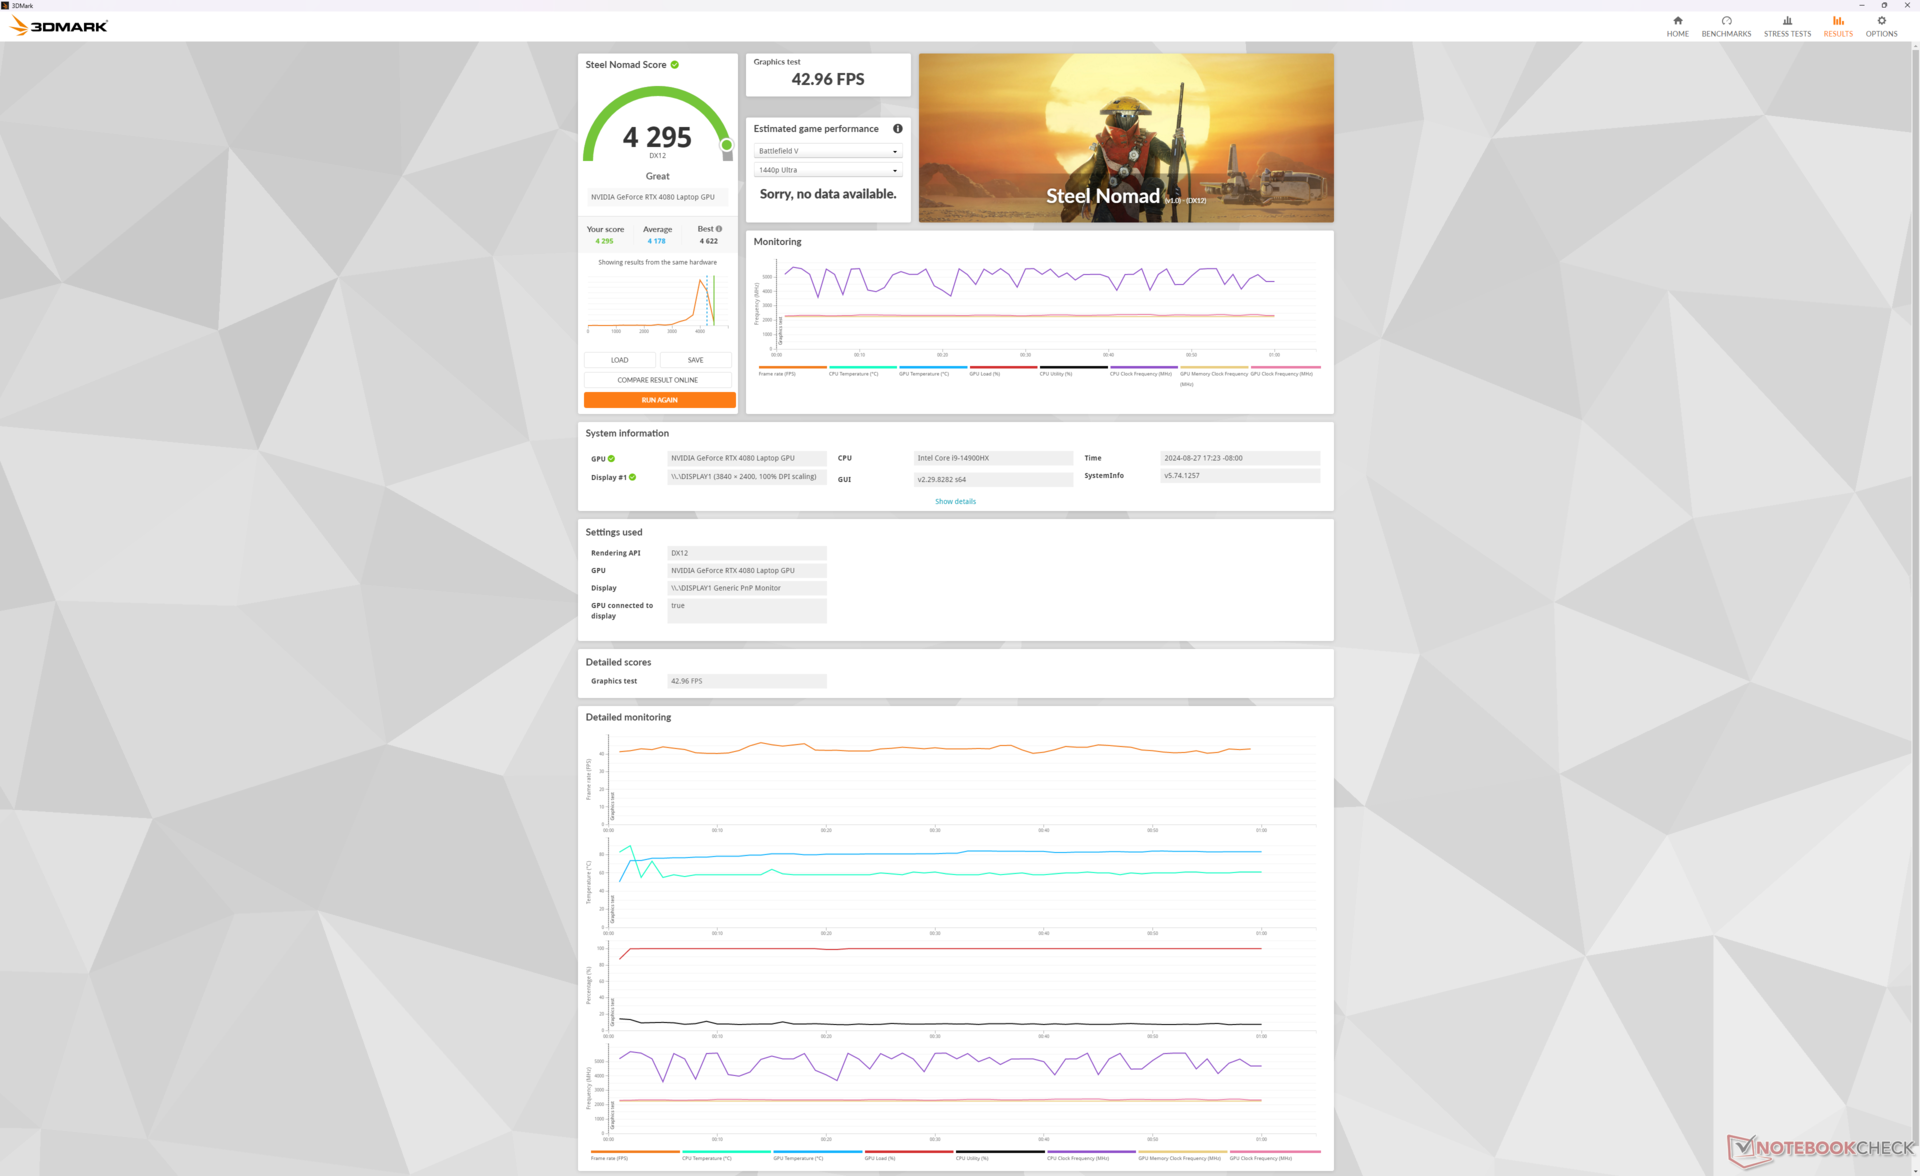
| 3DMark Steel Nomad Score | 4295 pontos | |
Ajuda | ||
* ... menor é melhor
Desempenho em jogos
Os títulos modernos funcionam decentemente bem na resolução 4K UHD+ nativa. O DLSS é recomendado ao executar títulos mais exigentes, como Cyberpunk 2077, para aumentar as taxas de quadros para mais perto de 60 FPS.
Estranhamente, o Baldur's Gate 3 não foi iniciado em nossa unidade, mesmo após várias reinicializações do sistema nos modos DX11 ou DX12.
| Performance Rating - Percent | |
| Alienware m18 R2 | |
| MSI Titan 18 HX A14VIG | |
| MSI Raider 18 HX A14V | |
| Razer Blade 18 2024 RZ09-0509 -1! | |
| Acer Predator Helios 18 PH18-72-98MW | |
| Asus ROG Strix G18 G814JI | |
| GTA V - 1920x1080 Highest Settings possible AA:4xMSAA + FX AF:16x | |
| MSI Raider 18 HX A14V | |
| MSI Titan 18 HX A14VIG | |
| Alienware m18 R2 | |
| Acer Predator Helios 18 PH18-72-98MW | |
| Razer Blade 18 2024 RZ09-0509 | |
| Asus ROG Strix G18 G814JI | |
| Final Fantasy XV Benchmark - 1920x1080 High Quality | |
| Alienware m18 R2 | |
| MSI Titan 18 HX A14VIG | |
| MSI Raider 18 HX A14V | |
| Acer Predator Helios 18 PH18-72-98MW | |
| Razer Blade 18 2024 RZ09-0509 | |
| Asus ROG Strix G18 G814JI | |
| Strange Brigade - 1920x1080 ultra AA:ultra AF:16 | |
| MSI Titan 18 HX A14VIG | |
| Alienware m18 R2 | |
| MSI Raider 18 HX A14V | |
| Razer Blade 18 2024 RZ09-0509 | |
| Acer Predator Helios 18 PH18-72-98MW | |
| Asus ROG Strix G18 G814JI | |
| Dota 2 Reborn - 1920x1080 ultra (3/3) best looking | |
| Acer Predator Helios 18 PH18-72-98MW | |
| MSI Titan 18 HX A14VIG | |
| MSI Raider 18 HX A14V | |
| Alienware m18 R2 | |
| Razer Blade 18 2024 RZ09-0509 | |
| Asus ROG Strix G18 G814JI | |
| X-Plane 11.11 - 1920x1080 high (fps_test=3) | |
| MSI Raider 18 HX A14V | |
| Alienware m18 R2 | |
| Razer Blade 18 2024 RZ09-0509 | |
| MSI Titan 18 HX A14VIG | |
| Acer Predator Helios 18 PH18-72-98MW | |
| Asus ROG Strix G18 G814JI | |
| Far Cry 5 - 1920x1080 Ultra Preset AA:T | |
| Alienware m18 R2 | |
| MSI Titan 18 HX A14VIG | |
| MSI Raider 18 HX A14V | |
| Asus ROG Strix G18 G814JI | |
| Acer Predator Helios 18 PH18-72-98MW | |
| Tiny Tina's Wonderlands | |
| 1920x1080 High Preset (DX12) | |
| Alienware m18 R2 | |
| MSI Raider 18 HX A14V | |
| Média NVIDIA GeForce RTX 4080 Laptop GPU (166.7 - 213, n=6) | |
| 1920x1080 Badass Preset (DX12) | |
| Alienware m18 R2 | |
| MSI Raider 18 HX A14V | |
| Alienware m18 R1 AMD | |
| Média NVIDIA GeForce RTX 4080 Laptop GPU (112.9 - 167.1, n=9) | |
| 2560x1440 Badass Preset (DX12) | |
| Alienware m18 R2 | |
| MSI Raider 18 HX A14V | |
| Alienware m18 R1 AMD | |
| Média NVIDIA GeForce RTX 4080 Laptop GPU (85 - 114.8, n=9) | |
| 3840x2160 Badass Preset (DX12) | |
| Alienware m18 R2 | |
| MSI Raider 18 HX A14V | |
| Alienware m18 R1 AMD | |
| Média NVIDIA GeForce RTX 4080 Laptop GPU (46.4 - 60.9, n=9) | |
Cyberpunk 2077 ultra FPS Chart
| baixo | média | alto | ultra | QHD | 4K | |
|---|---|---|---|---|---|---|
| GTA V (2015) | 185.1 | 183.8 | 181.6 | 143.4 | 134.6 | 158.3 |
| Dota 2 Reborn (2015) | 218 | 193.1 | 184.6 | 172.5 | 166.4 | |
| Final Fantasy XV Benchmark (2018) | 223 | 212 | 177 | 141.8 | 78.6 | |
| X-Plane 11.11 (2018) | 199 | 178.5 | 143.5 | 119.3 | ||
| Far Cry 5 (2018) | 173 | 163 | 151 | 149 | 96 | |
| Strange Brigade (2018) | 504 | 408 | 378 | 349 | 246 | 122.6 |
| Tiny Tina's Wonderlands (2022) | 352.5 | 292.6 | 203.3 | 159.4 | 111.2 | 60.9 |
| F1 22 (2022) | 305 | 299 | 271 | 121.2 | 77.8 | 39.8 |
| Cyberpunk 2077 2.2 Phantom Liberty (2023) | 150.6 | 150 | 140.7 | 125.5 | 82.5 | 35.1 |
Emissões - Silencioso quando em marcha lenta, alto quando em jogos
Ruído do sistema
O ruído e o comportamento da ventoinha são semelhantes aos da Titan 18 HX apesar das diferenças entre as soluções de resfriamento. As ventoinhas tendem a pulsar mesmo quando o usuário navega na Web no modo balanceado ou no modo silencioso, como no Titan, mas o aumento do ruído não é tão acentuado a ponto de causar distração.
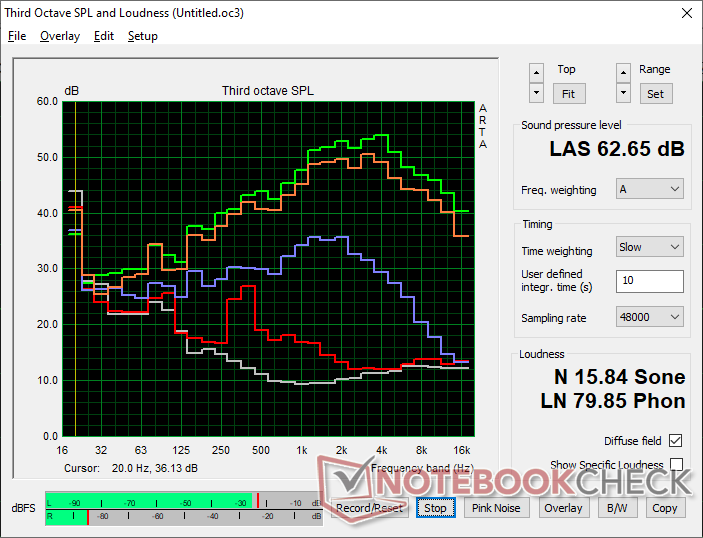
O MSI Center afeta diretamente a experiência de jogo, pois o ruído da ventoinha está intimamente ligado ao perfil de energia selecionado. A execução do Cyberpunk 2077 no modo Balanced, no modo Extreme Performance com Cooler Boost desativado e no modo Extreme Performance com Cooler Boost ativado resultaria em um ruído estável da ventoinha de 52,8 dB(A), 59,4 dB(A) e 62,7 dB(A), respectivamente. A diferença de ruído entre os modos Balanced e Extreme Performance é significativa, embora o déficit de desempenho entre eles seja pequeno, o que significa que o modo Balanced é recomendado para a maioria dos cenários de jogos. Portanto, o Cooler Boost é útil principalmente para overclocking manual, já que, de outra forma, não oferece grandes benefícios para os jogos quando está nas configurações padrão.
A faixa de 50 dB(A) de baixa a média durante os jogos é mais semelhante à do Blade 18 ou do Alienware m18 R2. Recomenda-se o uso de fones de ouvido, especialmente se estiver jogando no modo Extreme Performance.
Barulho
| Ocioso |
| 28.6 / 28.6 / 31.3 dB |
| Carga |
| 44.1 / 62.7 dB |
 | ||
30 dB silencioso 40 dB(A) audível 50 dB(A) ruidosamente alto |
||
min: | ||
| MSI Raider 18 HX A14V NVIDIA GeForce RTX 4080 Laptop GPU, i9-14900HX, Samsung PM9A1 MZVL22T0HBLB | Razer Blade 18 2024 RZ09-0509 NVIDIA GeForce RTX 4090 Laptop GPU, i9-14900HX | Alienware m18 R2 NVIDIA GeForce RTX 4090 Laptop GPU, i9-14900HX, SK Hynix PC811 HFS002TEM9X152N | MSI Titan 18 HX A14VIG NVIDIA GeForce RTX 4090 Laptop GPU, i9-14900HX, 2x Samsung PM9A1a MZVL22T0HDLB (RAID 0) | Asus ROG Strix G18 G814JI NVIDIA GeForce RTX 4070 Laptop GPU, i7-13650HX, Micron 2400 MTFDKBA1T0QFM | Acer Predator Helios 18 PH18-72-98MW NVIDIA GeForce RTX 4090 Laptop GPU, i9-14900HX, 2x SK Hynix HFS001TEJ9X115N (RAID 0) | |
|---|---|---|---|---|---|---|
| Noise | 7% | 11% | 10% | 8% | -12% | |
| desligado / ambiente * | 23.3 | 23.4 -0% | 23.6 -1% | 22.8 2% | 25 -7% | 25 -7% |
| Idle Minimum * | 28.6 | 23.9 16% | 23.8 17% | 23.8 17% | 26 9% | 30 -5% |
| Idle Average * | 28.6 | 28.2 1% | 26.1 9% | 23.8 17% | 28 2% | 36 -26% |
| Idle Maximum * | 31.3 | 29 7% | 31.5 -1% | 28 11% | 29 7% | 44 -41% |
| Load Average * | 44.1 | 36.8 17% | 31.5 29% | 38 14% | 41 7% | 48 -9% |
| Cyberpunk 2077 ultra * | 59.4 | |||||
| Load Maximum * | 62.7 | 61.1 3% | 56.6 10% | 62.8 -0% | 46 27% | 51 19% |
| Witcher 3 ultra * | 54.1 | 52.1 | 57.3 | 44 | 49 |
* ... menor é melhor
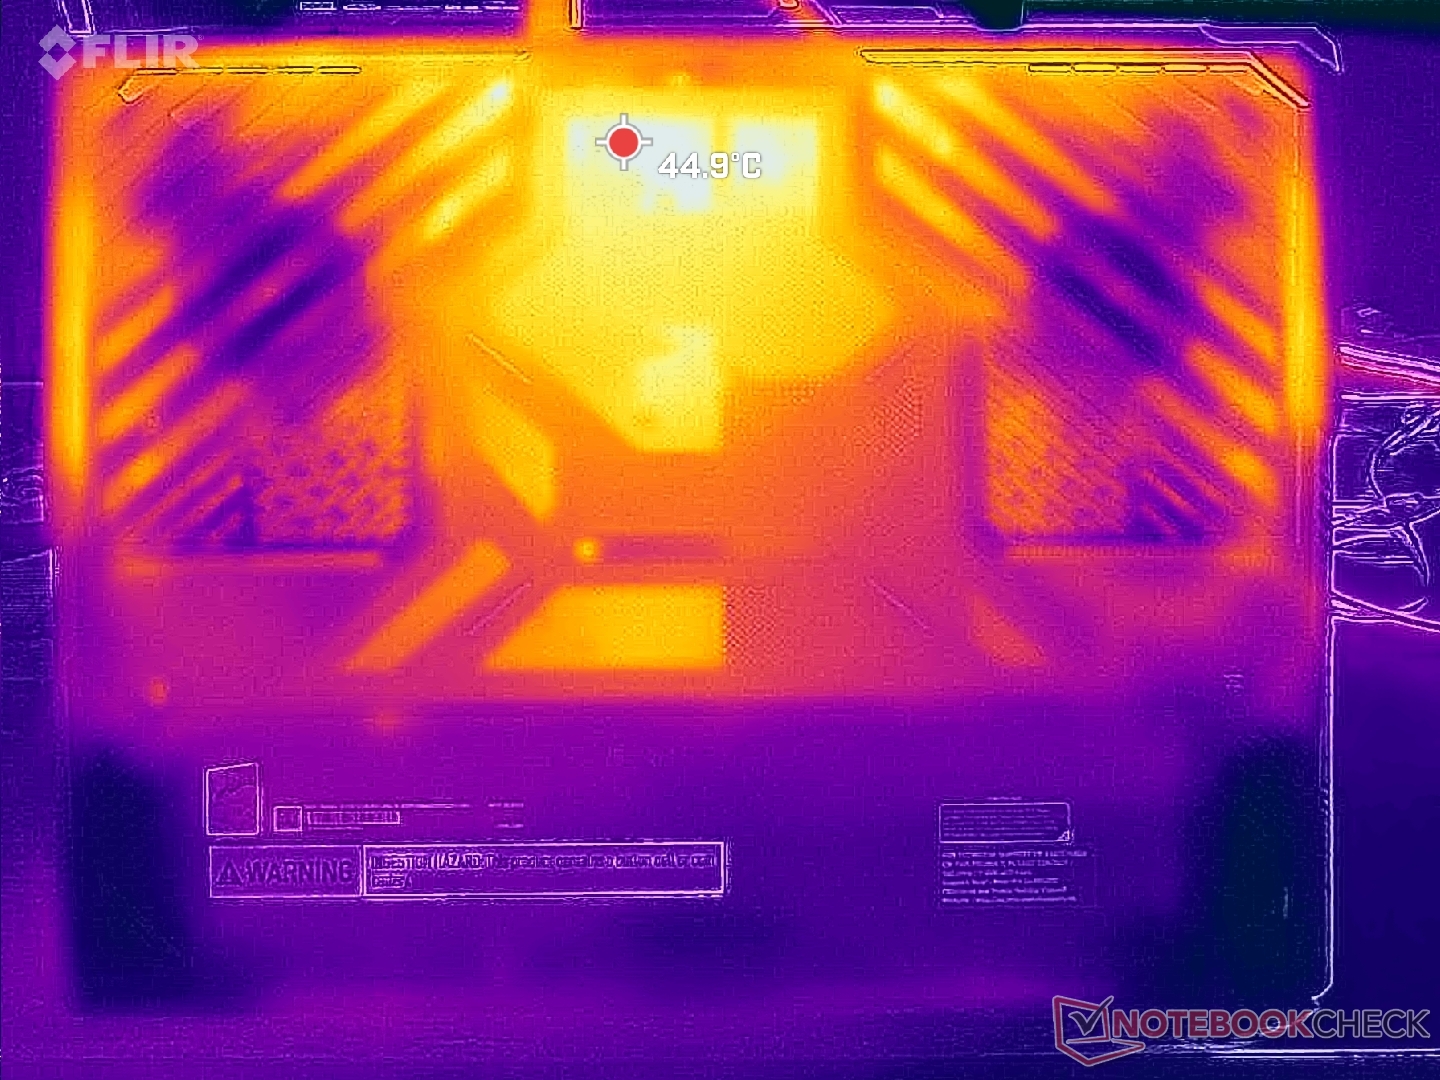
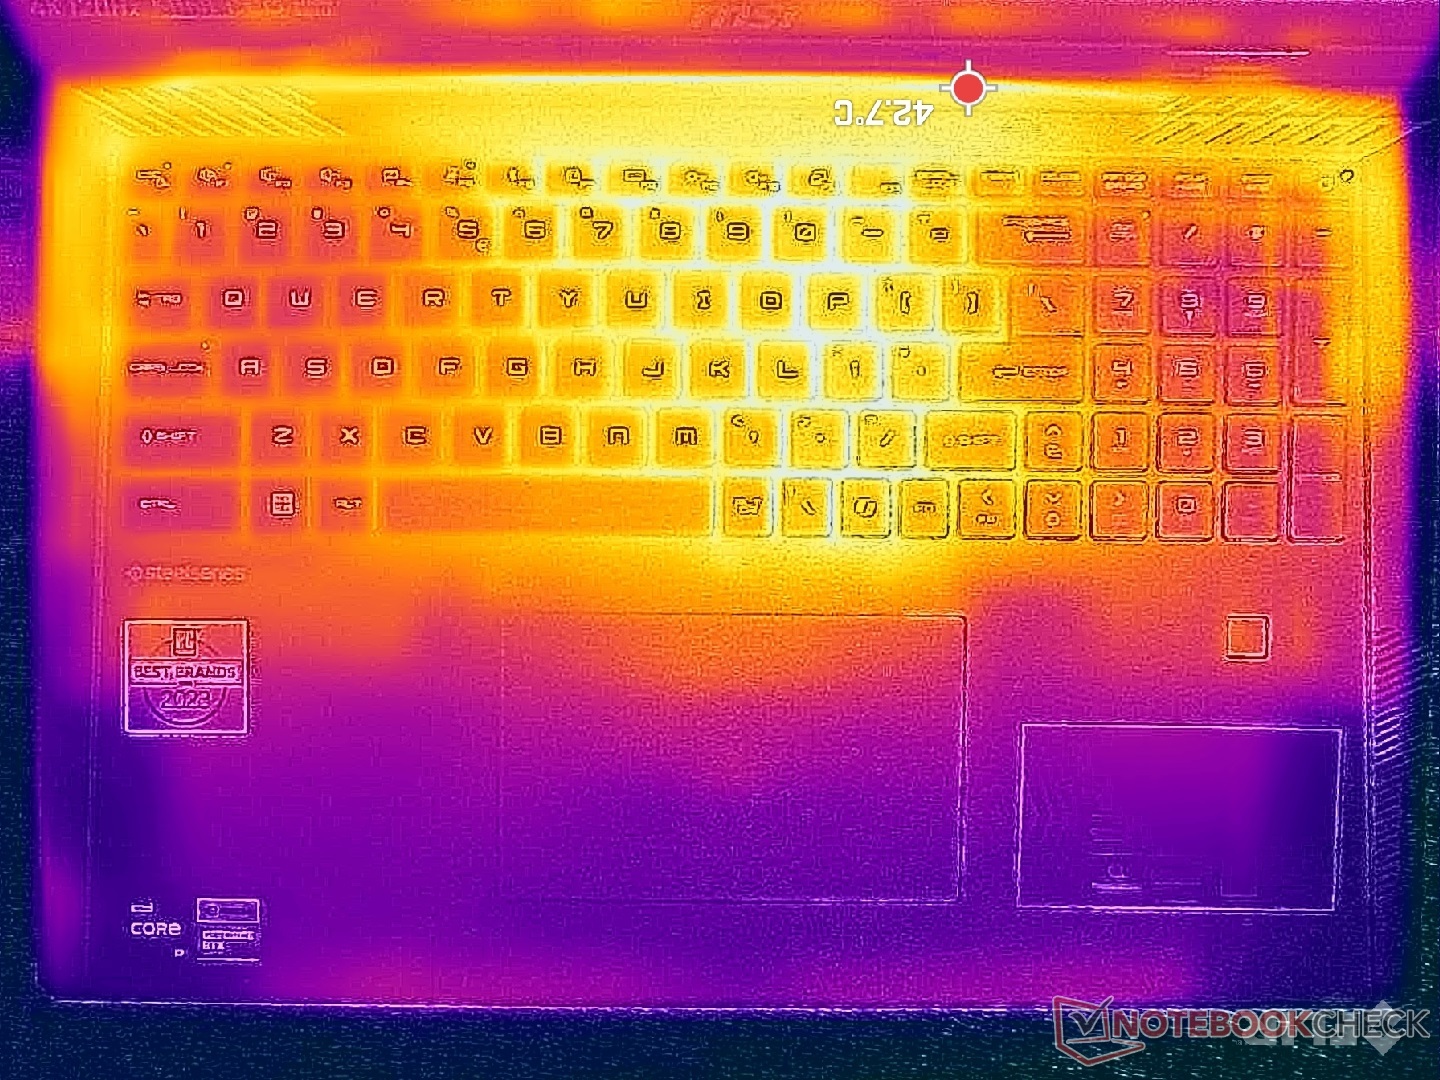
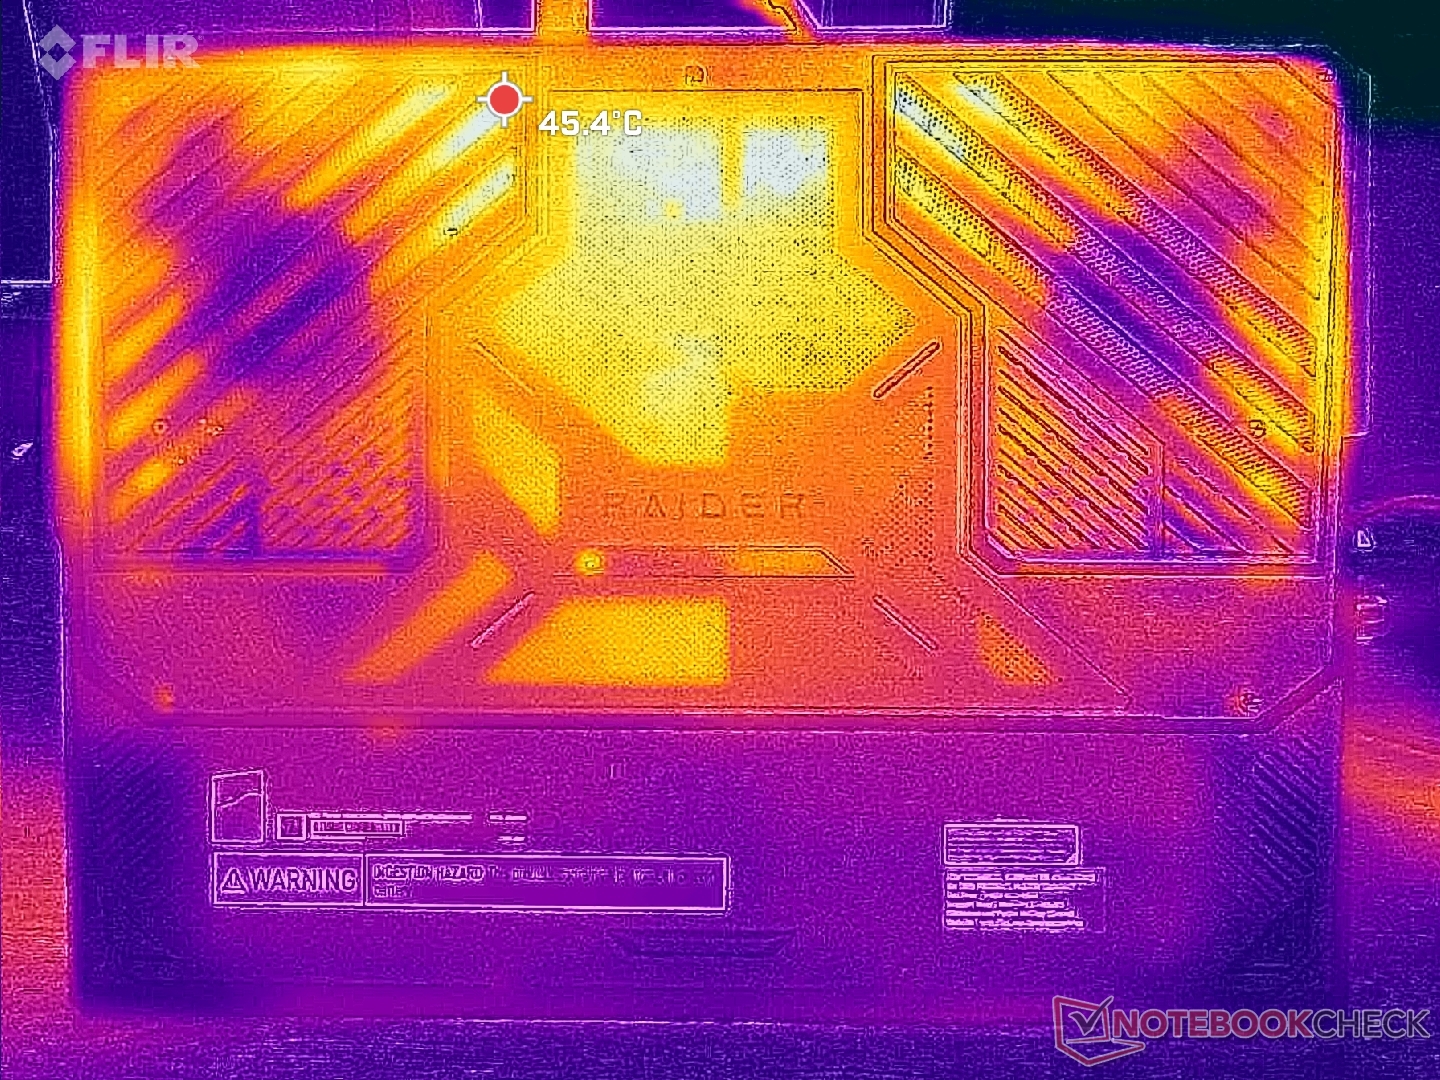
Temperatura
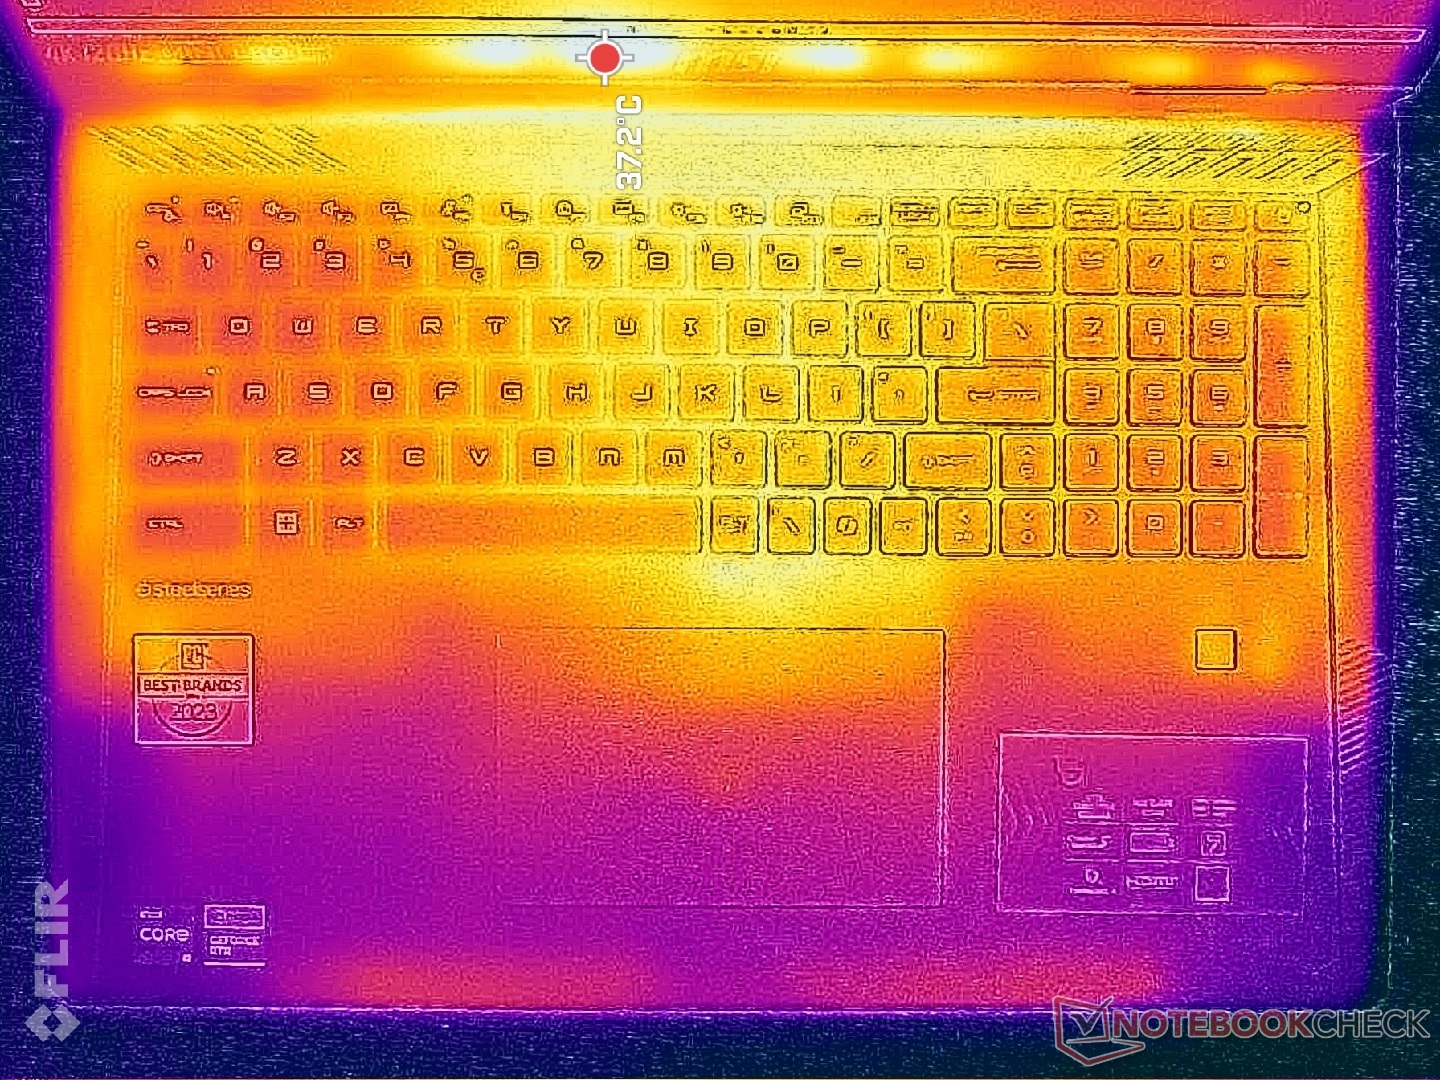
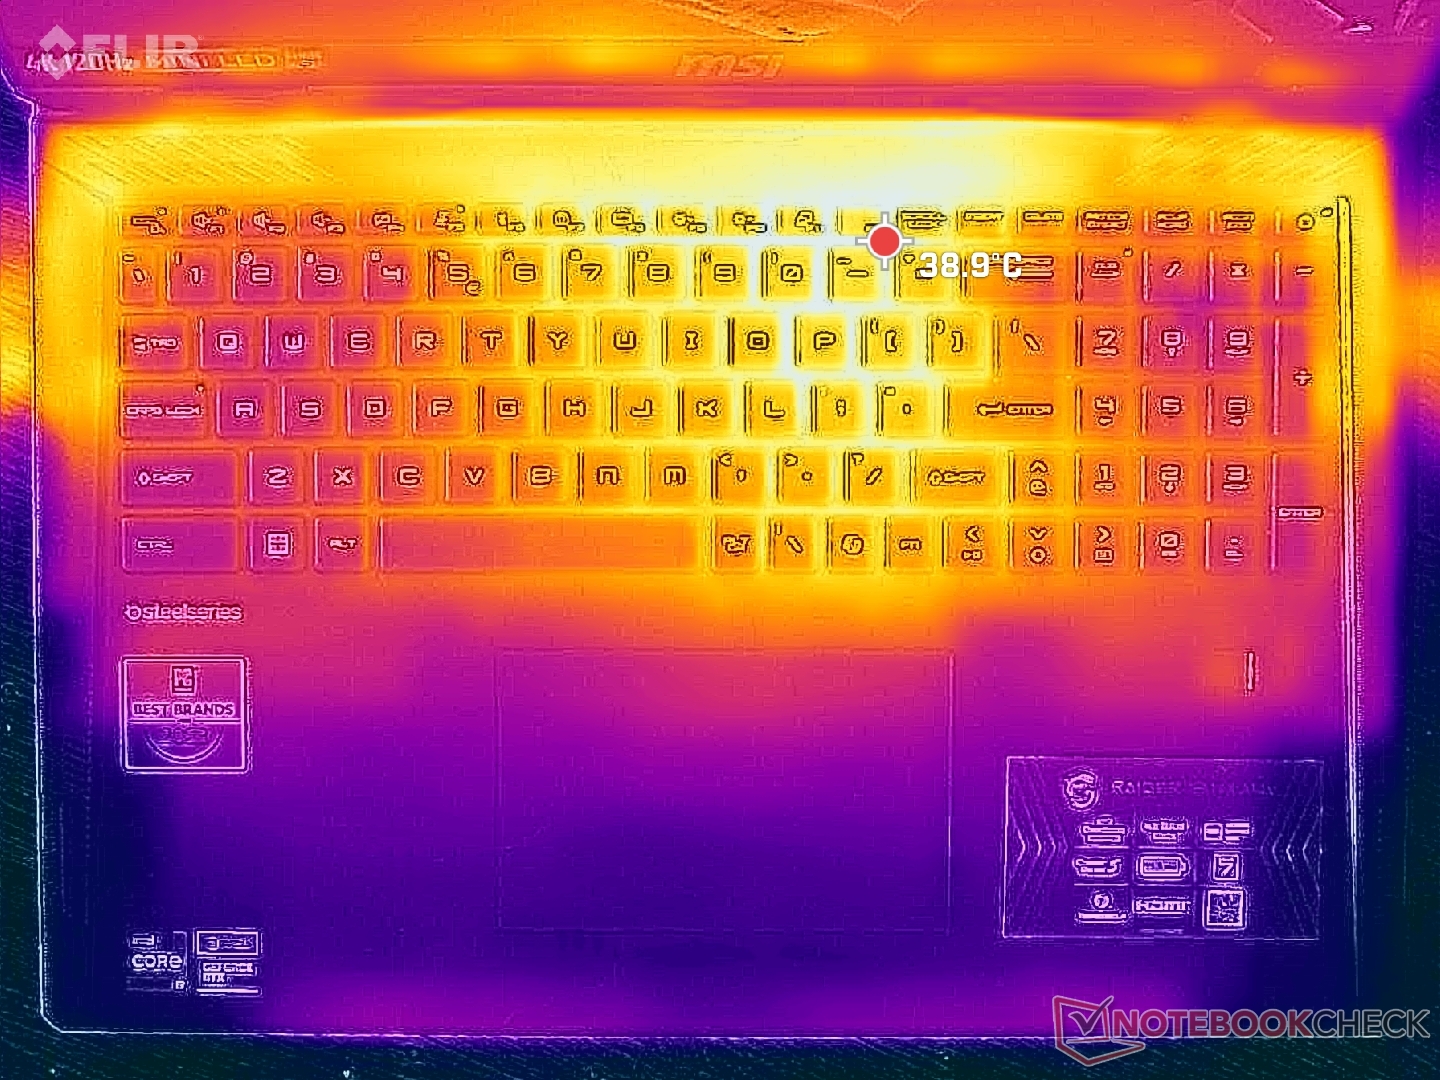
Os pontos quentes podem chegar a pouco mais de 40 °C durante os jogos, assim como no Titan 18 HX. As áreas mais quentes ficam no centro do teclado e, portanto, as teclas WASD, o teclado numérico e os apoios para as mãos permaneceriam muito mais frios e confortáveis para a pele.
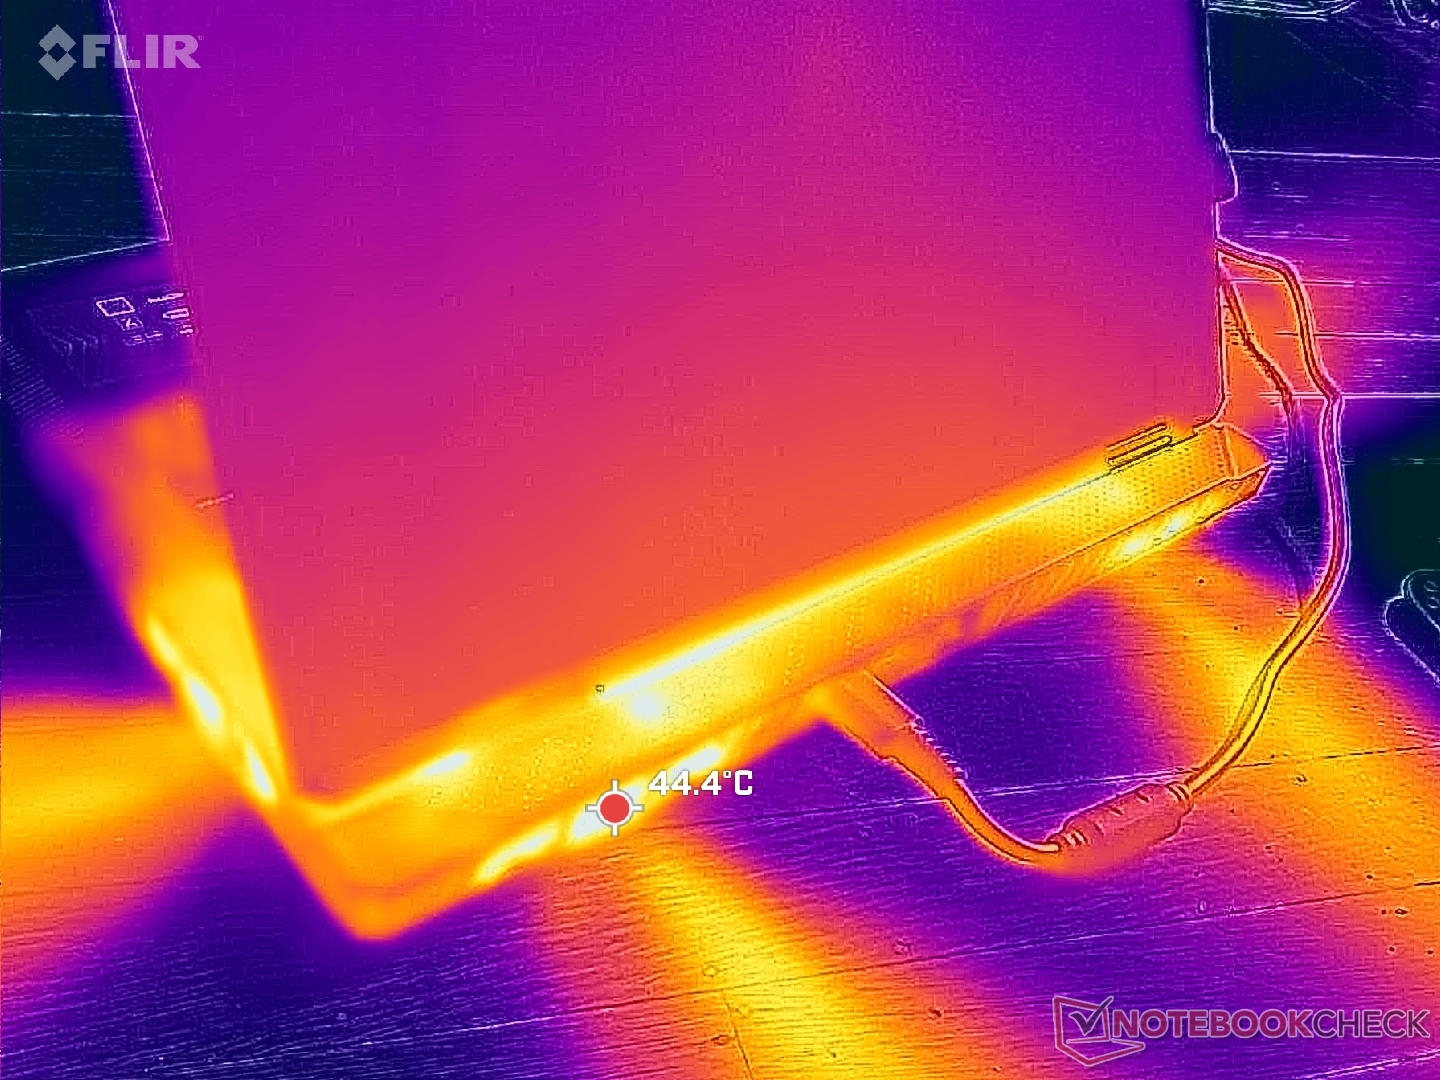
(±) A temperatura máxima no lado superior é 40.8 °C / 105 F, em comparação com a média de 40.4 °C / 105 F , variando de 21.2 a 68.8 °C para a classe Gaming.
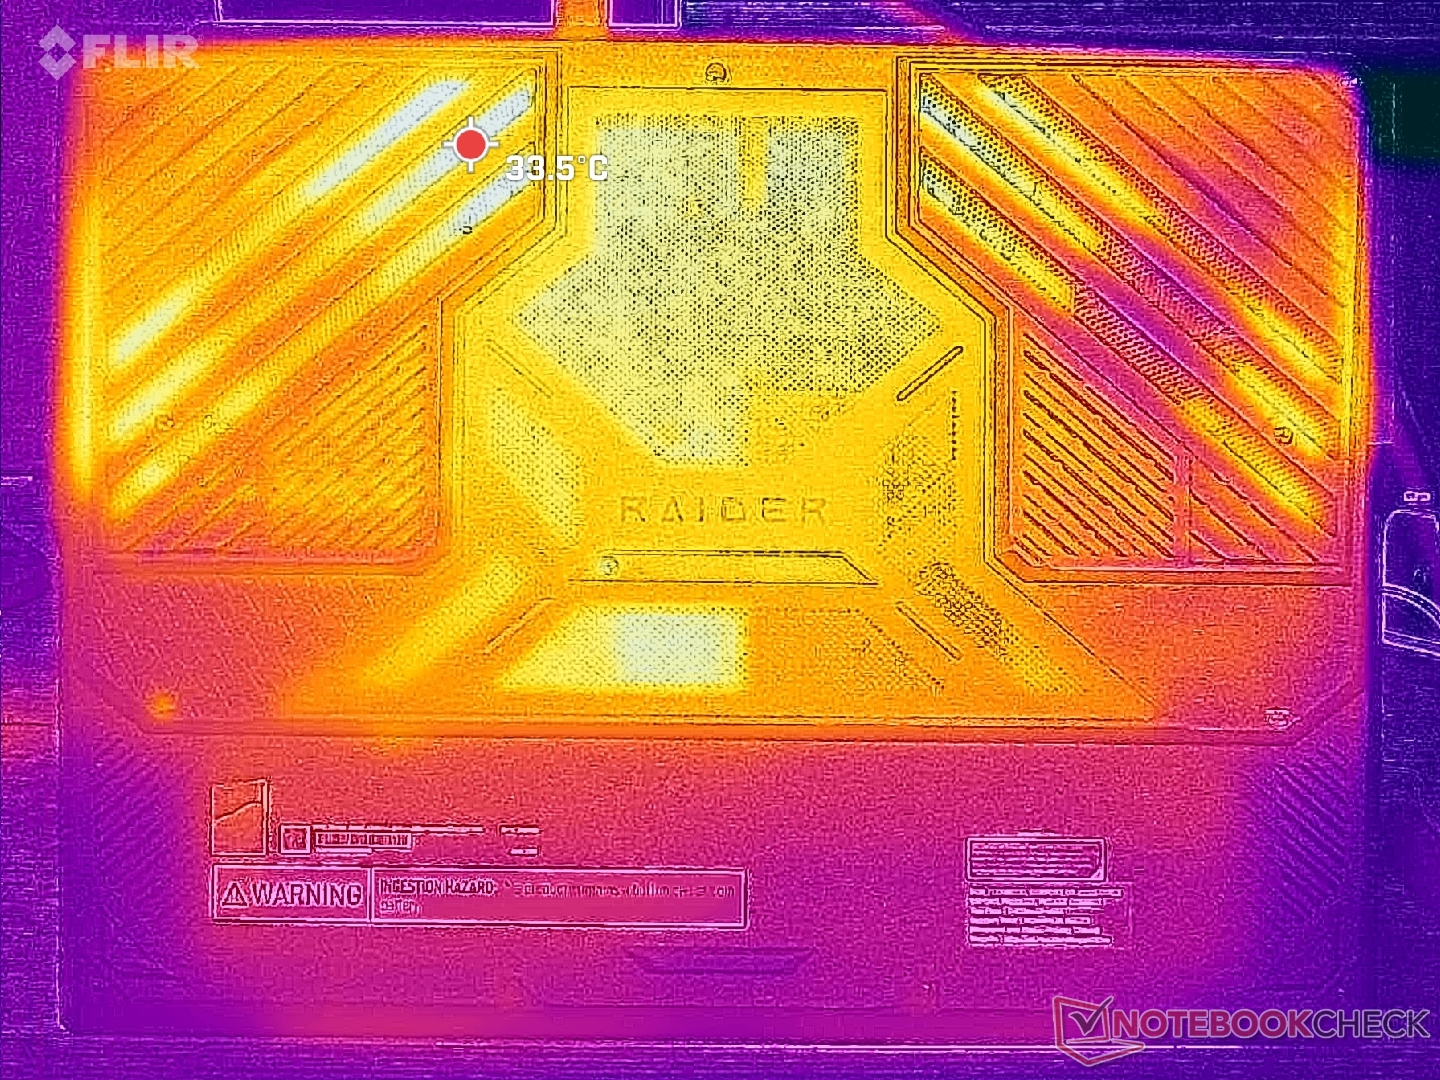
(±) A parte inferior aquece até um máximo de 43.4 °C / 110 F, em comparação com a média de 43.2 °C / 110 F
(±) Em uso inativo, a temperatura média para o lado superior é 33.7 °C / 93 F, em comparação com a média do dispositivo de 33.9 °C / ### class_avg_f### F.
(±) 3: The average temperature for the upper side is 34.4 °C / 94 F, compared to the average of 33.9 °C / 93 F for the class Gaming.
(+) Os apoios para as mãos e o touchpad estão atingindo a temperatura máxima da pele (32.6 °C / 90.7 F) e, portanto, não estão quentes.
(-) A temperatura média da área do apoio para as mãos de dispositivos semelhantes foi 28.9 °C / 84 F (-3.7 °C / -6.7 F).
| MSI Raider 18 HX A14V Intel Core i9-14900HX, NVIDIA GeForce RTX 4080 Laptop GPU | Razer Blade 18 2024 RZ09-0509 Intel Core i9-14900HX, NVIDIA GeForce RTX 4090 Laptop GPU | Alienware m18 R2 Intel Core i9-14900HX, NVIDIA GeForce RTX 4090 Laptop GPU | MSI Titan 18 HX A14VIG Intel Core i9-14900HX, NVIDIA GeForce RTX 4090 Laptop GPU | Asus ROG Strix G18 G814JI Intel Core i7-13650HX, NVIDIA GeForce RTX 4070 Laptop GPU | Acer Predator Helios 18 PH18-72-98MW Intel Core i9-14900HX, NVIDIA GeForce RTX 4090 Laptop GPU | |
|---|---|---|---|---|---|---|
| Heat | -1% | -5% | 6% | 5% | -6% | |
| Maximum Upper Side * | 40.8 | 43.2 -6% | 41.2 -1% | 37.8 7% | 45 -10% | 43 -5% |
| Maximum Bottom * | 43.4 | 42.6 2% | 34.6 20% | 37.6 13% | 47 -8% | 59 -36% |
| Idle Upper Side * | 36.4 | 36 1% | 42.8 -18% | 34.8 4% | 28 23% | 32 12% |
| Idle Bottom * | 36.4 | 36.4 -0% | 43.6 -20% | 36 1% | 31 15% | 34 7% |
* ... menor é melhor
Alto-falantes
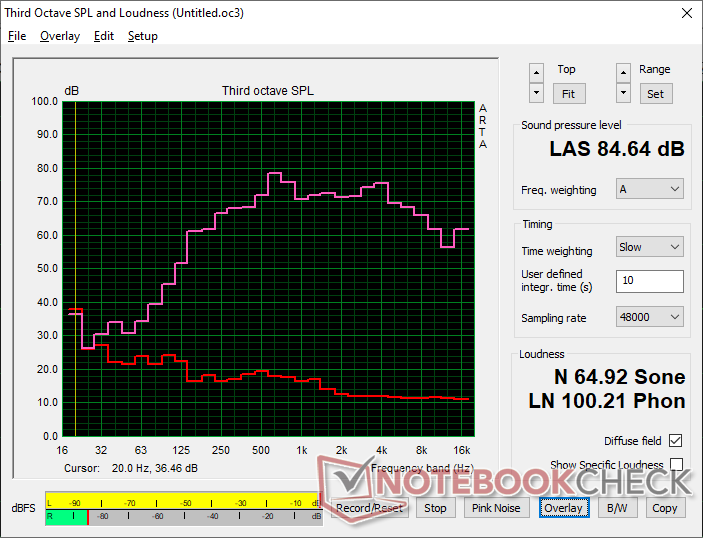
MSI Raider 18 HX A14V análise de áudio
(+) | os alto-falantes podem tocar relativamente alto (###valor### dB)
Graves 100 - 315Hz
(±) | graves reduzidos - em média 9.2% menor que a mediana
(±) | a linearidade dos graves é média (9.2% delta para a frequência anterior)
Médios 400 - 2.000 Hz
(+) | médios equilibrados - apenas 4.3% longe da mediana
(+) | médios são lineares (5.1% delta para frequência anterior)
Altos 2 - 16 kHz
(+) | agudos equilibrados - apenas 3.8% longe da mediana
(+) | os máximos são lineares (4.9% delta da frequência anterior)
Geral 100 - 16.000 Hz
(+) | o som geral é linear (11.9% diferença em relação à mediana)
Comparado com a mesma classe
» 11% de todos os dispositivos testados nesta classe foram melhores, 4% semelhantes, 85% piores
» O melhor teve um delta de 6%, a média foi 18%, o pior foi 132%
Comparado com todos os dispositivos testados
» 8% de todos os dispositivos testados foram melhores, 2% semelhantes, 90% piores
» O melhor teve um delta de 4%, a média foi 24%, o pior foi 134%
Apple MacBook Pro 16 2021 M1 Pro análise de áudio
(+) | os alto-falantes podem tocar relativamente alto (###valor### dB)
Graves 100 - 315Hz
(+) | bons graves - apenas 3.8% longe da mediana
(+) | o baixo é linear (5.2% delta para a frequência anterior)
Médios 400 - 2.000 Hz
(+) | médios equilibrados - apenas 1.3% longe da mediana
(+) | médios são lineares (2.1% delta para frequência anterior)
Altos 2 - 16 kHz
(+) | agudos equilibrados - apenas 1.9% longe da mediana
(+) | os máximos são lineares (2.7% delta da frequência anterior)
Geral 100 - 16.000 Hz
(+) | o som geral é linear (4.6% diferença em relação à mediana)
Comparado com a mesma classe
» 0% de todos os dispositivos testados nesta classe foram melhores, 0% semelhantes, 100% piores
» O melhor teve um delta de 5%, a média foi 18%, o pior foi 45%
Comparado com todos os dispositivos testados
» 0% de todos os dispositivos testados foram melhores, 0% semelhantes, 100% piores
» O melhor teve um delta de 4%, a média foi 24%, o pior foi 134%
Gerenciamento de energia
Consumo de energia
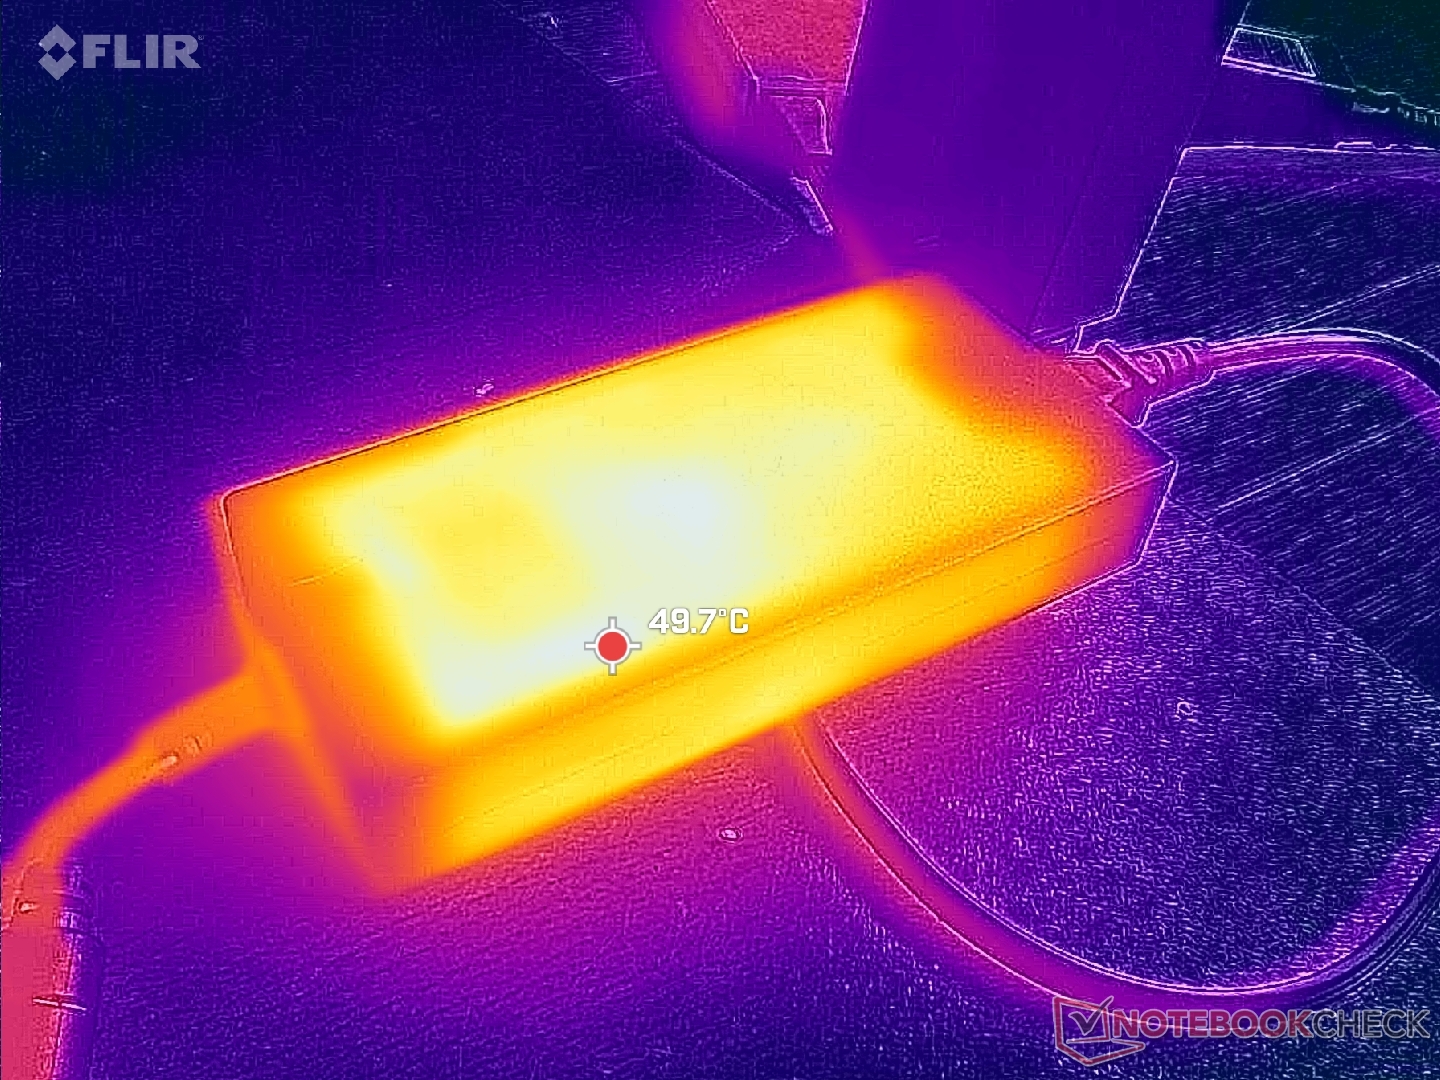
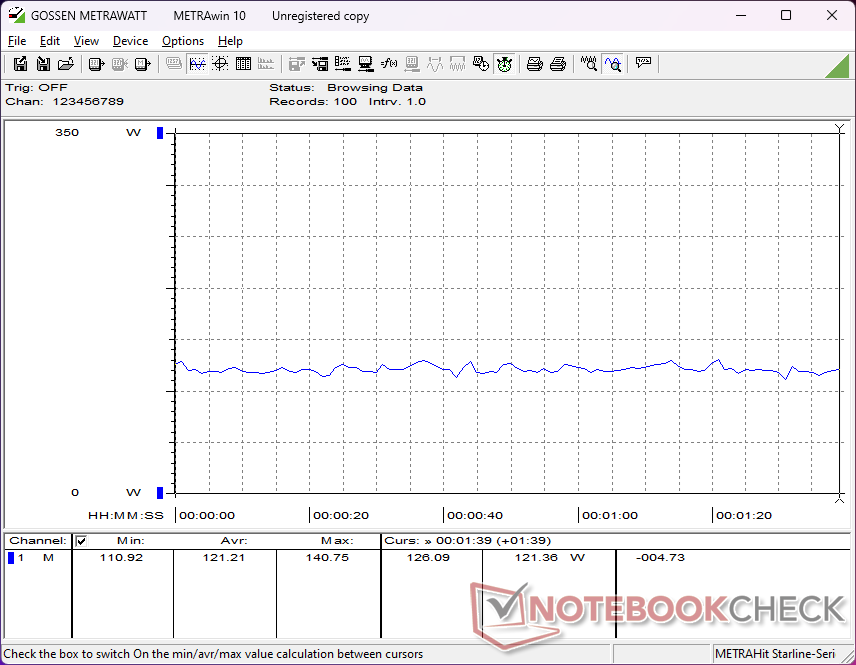
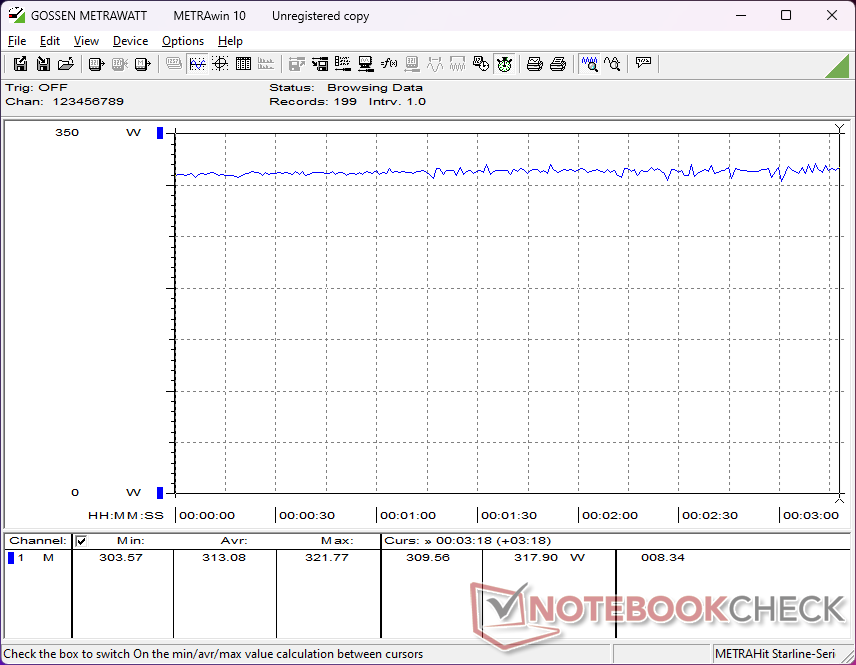
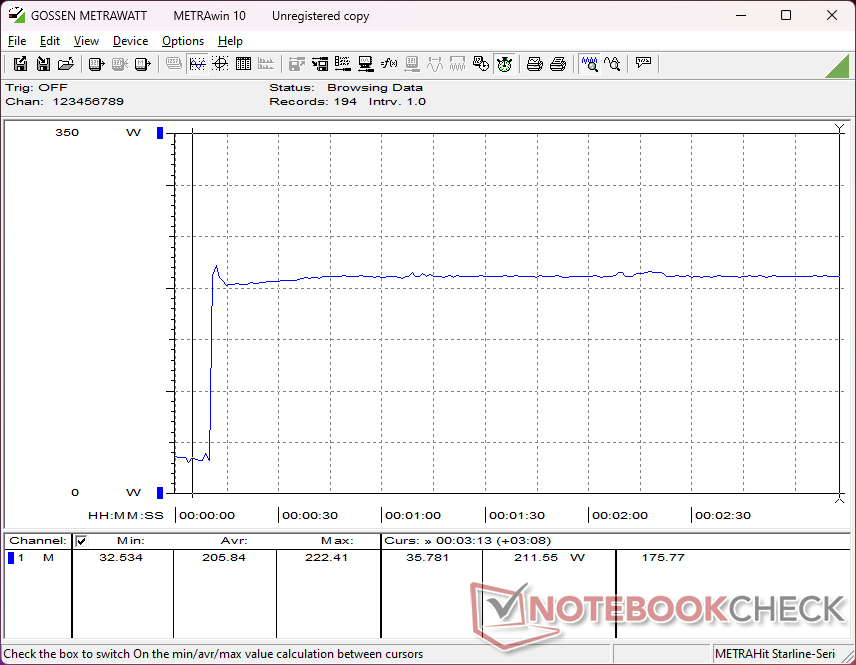
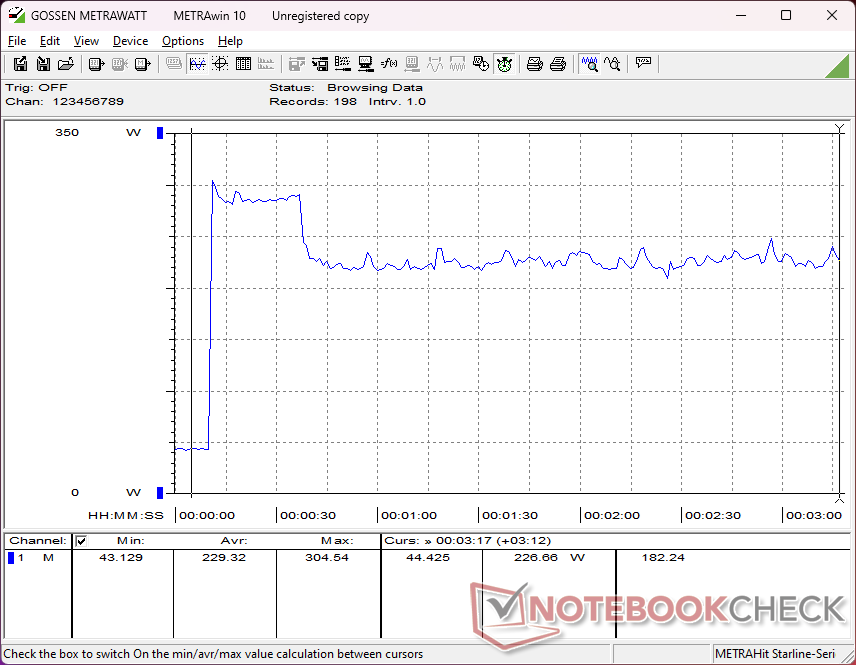
O consumo geral é muito alto, como é de se esperar de um DTR de 18 polegadas equipado com um exigente painel mini-LED 4K. Ocioso no desktop consome entre 27 W e 48 W, dependendo da configuração de brilho, da configuração da GPU e da configuração do perfil de energia. Os jogos exigiriam pouco mais de 300 W, em comparação com apenas 220 W no Acer Predator Helios 18.
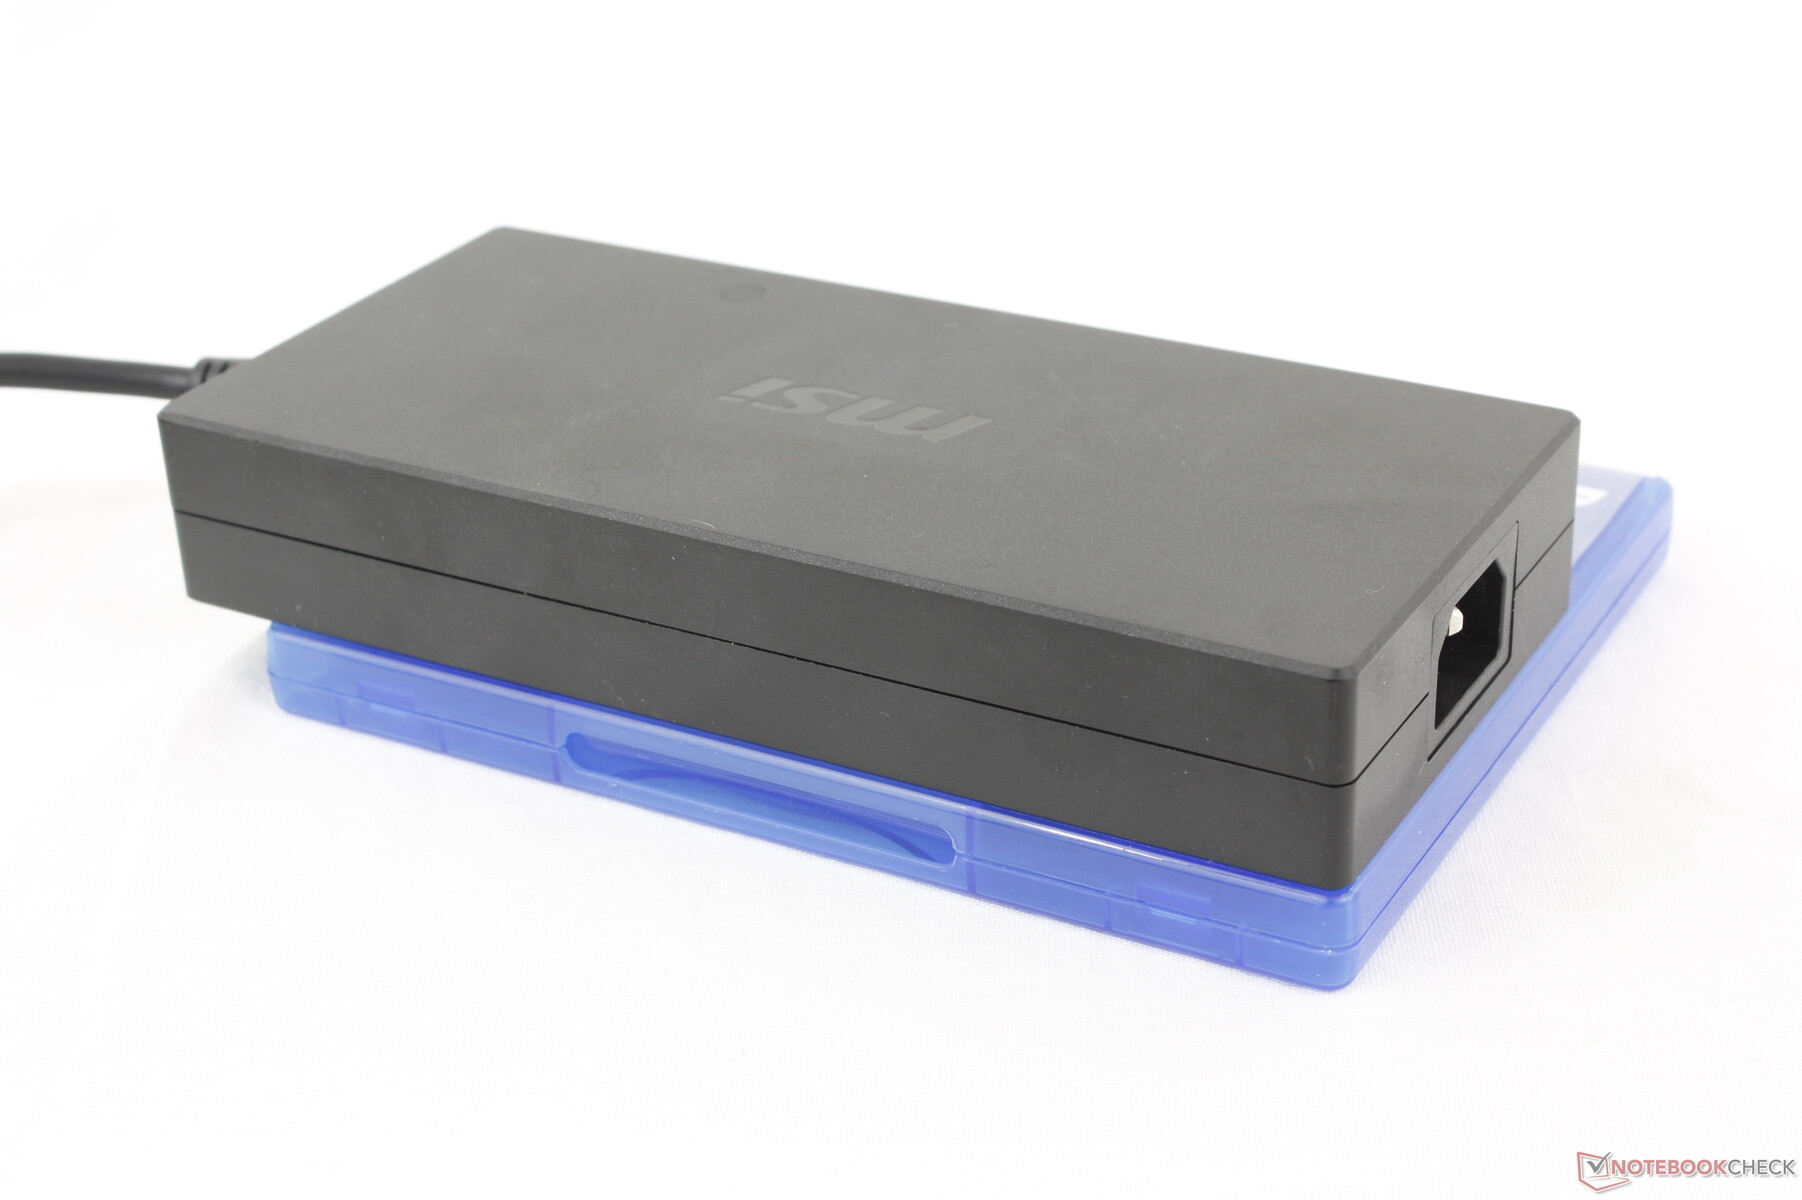
Conseguimos registrar um consumo de até 322 W com o grande adaptador CA de 330 W. Quando comparado ao adaptador CA de 400 W para o Titan 18 HX, o de 330 W é um pouco menor (~18,4 x 8,4 x 3,1 cm vs. ~18,8 x 8,8 x 3,2 cm). O consumo ao executar tarefas com uso intensivo de CPU é geralmente menor no Raider 18 HX, embora ele venha com a mesma CPU do Titan 18 HX, o que se alinha com o desempenho ligeiramente mais lento da CPU, conforme registrado na seção CineBench acima.
| desligado | |
| Ocioso | |
| Carga |
|
Key:
min: | |
| MSI Raider 18 HX A14V i9-14900HX, NVIDIA GeForce RTX 4080 Laptop GPU, Samsung PM9A1 MZVL22T0HBLB, Mini-LED, 3840x2400, 18" | Razer Blade 18 2024 RZ09-0509 i9-14900HX, NVIDIA GeForce RTX 4090 Laptop GPU, , Mini-LED, 2560x1600, 18" | Alienware m18 R2 i9-14900HX, NVIDIA GeForce RTX 4090 Laptop GPU, SK Hynix PC811 HFS002TEM9X152N, IPS, 2560x1600, 18" | MSI Titan 18 HX A14VIG i9-14900HX, NVIDIA GeForce RTX 4090 Laptop GPU, 2x Samsung PM9A1a MZVL22T0HDLB (RAID 0), Mini-LED, 3840x2400, 18" | Asus ROG Strix G18 G814JI i7-13650HX, NVIDIA GeForce RTX 4070 Laptop GPU, Micron 2400 MTFDKBA1T0QFM, IPS, 2560x1600, 18" | Acer Predator Helios 18 PH18-72-98MW i9-14900HX, NVIDIA GeForce RTX 4090 Laptop GPU, 2x SK Hynix HFS001TEJ9X115N (RAID 0), Mini-LED, 2560x1600, 18" | |
|---|---|---|---|---|---|---|
| Power Consumption | -2% | 8% | 5% | 42% | -2% | |
| Idle Minimum * | 27.7 | 25.4 8% | 10.6 62% | 13.2 52% | 8 71% | 31 -12% |
| Idle Average * | 38.3 | 37.7 2% | 20.9 45% | 25.4 34% | 15 61% | 35 9% |
| Idle Maximum * | 47.1 | 57.9 -23% | 40 15% | 53.5 -14% | 26 45% | 43 9% |
| Load Average * | 121.2 | 128.4 -6% | 201.1 -66% | 151.4 -25% | 102 16% | 144 -19% |
| Cyberpunk 2077 ultra * | 313 | |||||
| Cyberpunk 2077 ultra external monitor * | 306 | |||||
| Load Maximum * | 321.8 | 297.9 7% | 378.9 -18% | 395.2 -23% | 267 17% | 318 1% |
| Witcher 3 ultra * | 273.1 | 358 | 336 | 178.6 | 228 |
* ... menor é melhor
Power Consumption Cyberpunk / Stress Test
Power Consumption external Monitor
Duração da bateria
Os tempos de execução são curtos devido ao hardware exigente. Conseguimos registrar pouco mais de 3 horas de uso de WLAN no mundo real, mesmo quando configurado no modo Battery Saver e no modo iGPU, enquanto o ROG Strix G18 pode durar mais que o dobro do tempo com sua tela IPS. A capacidade da bateria já está em seu máximo legal de 99,9 Wh.
O carregamento da capacidade vazia até a capacidade total leva quase 2,5 horas, o que é um pouco mais longo do que na maioria dos outros notebooks. O carregamento com adaptadores CA USB-C de terceiros será ainda mais lento.
| MSI Raider 18 HX A14V i9-14900HX, NVIDIA GeForce RTX 4080 Laptop GPU, 99.9 Wh | Razer Blade 18 2024 RZ09-0509 i9-14900HX, NVIDIA GeForce RTX 4090 Laptop GPU, 91.7 Wh | Alienware m18 R2 i9-14900HX, NVIDIA GeForce RTX 4090 Laptop GPU, 97 Wh | MSI Titan 18 HX A14VIG i9-14900HX, NVIDIA GeForce RTX 4090 Laptop GPU, 99.9 Wh | Asus ROG Strix G18 G814JI i7-13650HX, NVIDIA GeForce RTX 4070 Laptop GPU, 90 Wh | Acer Predator Helios 18 PH18-72-98MW i9-14900HX, NVIDIA GeForce RTX 4090 Laptop GPU, 90 Wh | |
|---|---|---|---|---|---|---|
| Duração da bateria | 20% | 46% | 19% | 101% | -10% | |
| Reader / Idle | 264 | 395 50% | 353 34% | 702 166% | ||
| WiFi v1.3 | 198 | 263 33% | 290 46% | 252 27% | 484 144% | 192 -3% |
| Load | 76 | 58 -24% | 72 -5% | 71 -7% | 64 -16% |
Pro
Contra
Veredicto - Um Titã no Coração
Quando analisamos o Titan 18 HX no início deste ano, elogiamos seu desempenho, mas ficamos chocados ao saber do preço pedido de mais de US$ 5.000. O fato de a CPU e a GPU não serem efetivamente novas só tornou o modelo muito menos atraente. O Raider 18 HX aborda o preço exorbitantemente alto do Titan 18 HX cortando a gordura e mantendo as mesmas opções de CPU, GPU e tela. Os proprietários do Raider perdem o clickpad retroiluminado, o resfriamento por câmara de vapor, as teclas mecânicas e o suporte a SSD M.2 terciário, mas é fácil abrir mão desses recursos de luxo quando a experiência de jogo entre o Raider e o Titan é exatamente a mesma. Na verdade, pode-se argumentar que o Raider é mais confortável de usar, pois seu clickpad tradicional e o teclado com membrana são mais familiares do que a abordagem atípica do Titan.
O Raider 18 HX extrai todo o desempenho possível da CPU Core i9 e da GPU de 175 W, mesmo que tenha que ser maior, mais pesado e, muitas vezes, mais barulhento do que muitos de seus concorrentes.
Quando comparado a outros notebooks para jogos de 18 polegadas, o Raider 18 HX oferece uma experiência de digitação mais espaçosa e quatro slots SODIMM, enquanto alternativas como o Blade 18 ou o ROG Strix G18 não têm teclado numérico ou suportam apenas dois módulos SODIMM. No entanto, o sistema da MSI ainda é visivelmente maior e mais pesado do que a maioria dos concorrentes e não é necessariamente mais silencioso para compensar isso. O desempenho da CPU e da GPU pode ser ligeiramente mais rápido, mas muitos usuários podem não perceber na prática. Nesse caso, o senhor terá que valorizar a facilidade de manutenção e as opções de mini-LED 4K do Raider para justificar seu peso.
Preço e disponibilidade
O MSI Raider 18 HX, conforme configurado em nossa análise, já está disponível na Amazon por US$ 3190. Alternativamente, a versão IPS também está disponível por US$ 3290.
Observação: Atualizamos recentemente nosso sistema de classificação e os resultados da versão 8 não são comparáveis aos resultados da versão 7. Mais informações estão disponíveis aqui .
MSI Raider 18 HX A14V
- 09/03/2024 v8
Allen Ngo
 Total Sustainability Score:
 Transparência
A seleção dos dispositivos a serem analisados é feita pela nossa equipe editorial. A amostra de teste foi fornecida ao autor como empréstimo pelo fabricante ou varejista para fins desta revisão. O credor não teve influência nesta revisão, nem o fabricante recebeu uma cópia desta revisão antes da publicação. Não houve obrigação de publicar esta revisão. Nunca aceitamos compensação ou pagamento em troca de nossas avaliações. Como empresa de mídia independente, a Notebookcheck não está sujeita à autoridade de fabricantes, varejistas ou editores.
É assim que o Notebookcheck está testando
Todos os anos, o Notebookcheck analisa de forma independente centenas de laptops e smartphones usando procedimentos padronizados para garantir que todos os resultados sejam comparáveis. Desenvolvemos continuamente nossos métodos de teste há cerca de 20 anos e definimos padrões da indústria no processo. Em nossos laboratórios de teste, equipamentos de medição de alta qualidade são utilizados por técnicos e editores experientes. Esses testes envolvem um processo de validação em vários estágios. Nosso complexo sistema de classificação é baseado em centenas de medições e benchmarks bem fundamentados, o que mantém a objetividade.Price comparison

