Análise do MSI Claw - O dispositivo portátil para jogos com um processador Intel Core Ultra decepciona
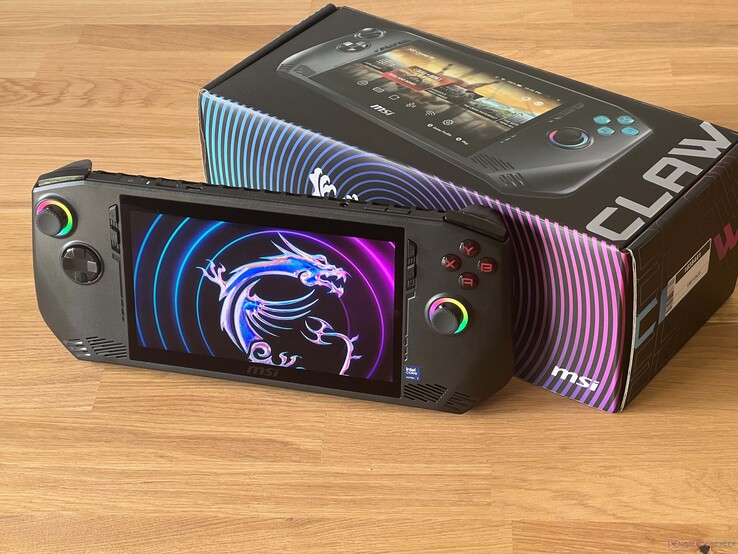
Atualmente, os dispositivos portáteis para jogos estão na moda e todos os grandes fabricantes estão tentando entrar na onda. A MSI não é exceção, embora tenha chegado ao mercado bastante tarde com seu novo Claw e, em contraste com a maioria de seus concorrentes, que apresentam um processador AMD, a MSI optou por um modelo Intel Core Ultra. Também está equipado com uma tela IPS de 7 polegadas e joysticks e gatilhos de efeito Hall.
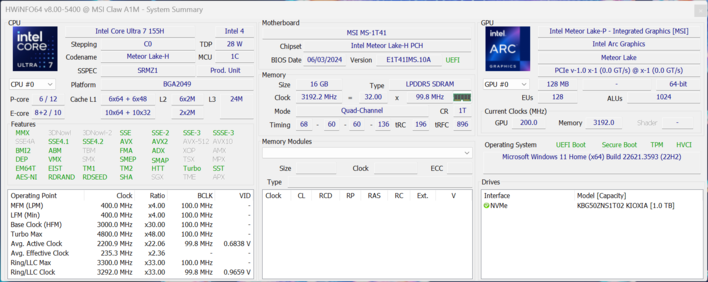
Atualmente, a MSI tem dois modelos em oferta: O Claw A1M-036, que vem com o Core Ultra 5 135H16 GB de RAM e um SSD de 512 GB, e o Claw A1M-059 com o mais potente Core Ultra 7 155Hmais potente, 16 GB de RAM e um SSD de 1 TB por US$ 899, que é o modelo que estamos testando.
Possíveis concorrentes em comparação
Avaliação | Data | Modelo | Peso | Altura | Size | Resolução | Preço |
|---|---|---|---|---|---|---|---|
| 77.4 % | 06/2024 | MSI Claw Ultra 7 155H, Arc 8-Core | 672 g | 33 mm | 7.00" | 1920x1080 | |
| 88.9 % v7 (old) | 02/2024 | Valve Steam Deck 1 TB OLED Steam Deck OLED APU, Radeon Radeon Steam Deck 8CU | 640 g | 49 mm | 7.40" | 1280x800 | |
| 66.3 % | 01/2024 | Lenovo Legion Go Z1 Extreme, Radeon 780M | 845 g | 41 mm | 8.80" | 2560x1600 | |
| 87.5 % v7 (old) | 05/2023 | Asus ROG Ally Z1 Extreme Z1 Extreme, Radeon 780M | 611 g | 21.22 mm | 7.00" | 1920x1080 | |
| 84.9 % v7 (old) | 01/2024 | ONEXPLAYER 2 Pro AR18 R7 7840U, Radeon 780M | 876 g | 43 mm | 8.40" | 2560x1600 | |
| 85.2 % v7 (old) | 01/2024 | Ayaneo Kun R7 7840U, Radeon 780M | 942 g | 22 mm | 8.40" | 2560x1600 |
Os Top 10
» Os Top 10 Portáteis Multimídia
» Os Top 10 Portáteis de Jogos
» Os Top 10 Portáteis Leves para Jogos
» Os Top 10 Portáteis Acessíveis de Escritório/Empresariais
» Os Top 10 Portáteis Premium de Escritório/Empresariais
» Os Top 10 dos Portáteis Workstation
» Os Top 10 Subportáteis
» Os Top 10 Ultrabooks
» Os Top 10 Conversíveis
» Os Top 10 Tablets
» Os Top 10 Smartphones
» A melhores Telas de Portáteis Analisadas Pela Notebookcheck
» Top 10 dos portáteis abaixo dos 500 Euros da Notebookcheck
» Top 10 dos Portáteis abaixo dos 300 Euros
Estojo - The Claw com joysticks e botões iluminados
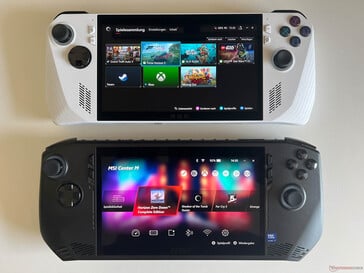
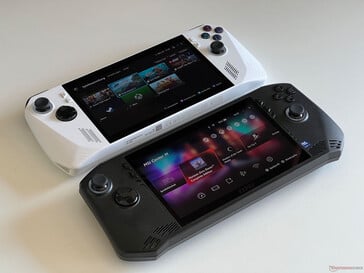
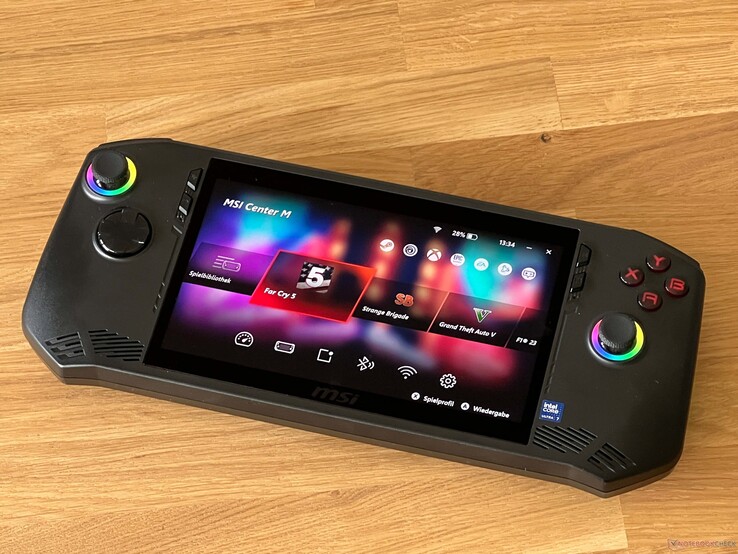
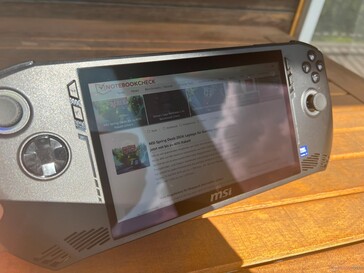
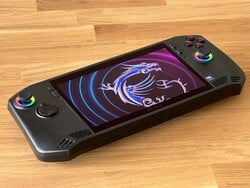
O MSI Claw é um dispositivo portátil típico para jogos, como o ROG Ally da Asus que, em comparação com o Lenovo Legion Go por exemplo, não possui controles removíveis. O MSI Claw usa uma caixa de plástico preto com superfícies lisas - somente a parte traseira tem muitas grades de ventilador. Em geral, a construção é boa, mas o dispositivo pode emitir alguns ruídos de rangidos. As marcas de impressões digitais, por outro lado, não são um grande problema. Os dois anéis ao redor dos joysticks, bem como os botões do lado direito, podem ser iluminados adicionalmente. As bordas pretas largas incomodam um pouco (especialmente na parte superior e inferior da tela), embora a boa impressão seja reforçada pelo uso de material adicional.
As bordas do ROG Ally, por exemplo, são igualmente largas, mas, por sua vez, o gabinete é um pouco mais estreito acima e abaixo da tela. Em suma, o MSI Claw é um pouco maior e suas alças têm formato diferente. Como resultado, a ergonomia é melhor e o usuário pode segurar o dispositivo com mais facilidade, principalmente com mãos maiores, o que resulta em um pouco mais de conforto do que o ROG Ally.
Pesando 672 gramas, o MSI Claw é um dos dispositivos portáteis mais leves no campo de comparação e, mesmo ao usá-lo por longos períodos, o senhor não deverá ter problemas com o peso. Com as alças incluídas, a espessura da caixa é de cerca de 3,4 cm. A fonte de alimentação de 65 watts incluída pesa 341 gramas.
Conectividade - Thunderbolt 4
A MSI instalou uma porta USB-C na parte superior do dispositivo que também suporta Thunderbolt 4. Gostaríamos de ter visto uma segunda conexão USB para conectar rapidamente SSDs externos ou pendrives, por exemplo. Isso é especialmente importante quando o dispositivo está conectado à rede elétrica ou alimentado com um monitor externo. Realizamos parte do nosso teste com o gamer conectado a um monitor externo e funcionou muito bem, desde que a tela suporte o fornecimento de energia via USB-C. Ele não tem webcam, mas o botão liga/desliga também pode ser usado como um scanner de impressões digitais.
Leitor de cartão SD
O senhor pode expandir o armazenamento do dispositivo inserindo um cartão microSD no slot na parte superior. Em nosso teste usando nosso cartão de referência (Angelbird AV Pro V60), as taxas de transferência do leitor de cartão de mais de 200 MB/s foram muito boas e, mesmo ao copiar arquivos de imagem do cartão, ainda medimos cerca de 120 MB/s.
| SD Card Reader | |
| average JPG Copy Test (av. of 3 runs) | |
| ONEXPLAYER 2 Pro AR18 (Angelbird AV PRO microSD) | |
| Lenovo Legion Go | |
| Ayaneo Kun | |
| Asus ROG Ally Z1 Extreme (Angelbird AV Pro V60) | |
| MSI Claw (Angelbird AV Pro V60) | |
| Média da turma Handheld / UMPC (20.9 - 201, n=14, últimos 2 anos) | |
| Valve Steam Deck 1 TB OLED | |
| maximum AS SSD Seq Read Test (1GB) | |
| Asus ROG Ally Z1 Extreme (Angelbird AV Pro V60) | |
| ONEXPLAYER 2 Pro AR18 (Angelbird AV PRO microSD) | |
| MSI Claw (Angelbird AV Pro V60) | |
| Ayaneo Kun | |
| Média da turma Handheld / UMPC (74.7 - 260, n=13, últimos 2 anos) | |
| Lenovo Legion Go | |
Comunicação
A MSI equipou o computador de mão Claw com o Killer BE1750x BE200NGW, um módulo Wi-Fi 7 moderno, o que significa que o dispositivo está preparado para as mais novas redes WLAN. Ainda não usamos um roteador Wi-Fi 7 correspondente em nossos testes, mas seu desempenho usando nosso roteador de referência da Asus ainda era muito bom e estável, embora não conseguisse se equiparar ao de laptops maiores. No uso diário, não notamos problemas com a qualidade do sinal e o download de jogos grandes não demorou muito.
| Networking | |
| MSI Claw | |
| iperf3 transmit AXE11000 | |
| iperf3 receive AXE11000 | |
| Valve Steam Deck 1 TB OLED | |
| iperf3 transmit AXE11000 | |
| iperf3 receive AXE11000 | |
| iperf3 transmit AXE11000 6GHz | |
| iperf3 receive AXE11000 6GHz | |
| Lenovo Legion Go | |
| iperf3 transmit AXE11000 | |
| iperf3 receive AXE11000 | |
| iperf3 transmit AXE11000 6GHz | |
| iperf3 receive AXE11000 6GHz | |
| Asus ROG Ally Z1 Extreme | |
| iperf3 transmit AXE11000 | |
| iperf3 receive AXE11000 | |
| ONEXPLAYER 2 Pro AR18 | |
| iperf3 transmit AXE11000 | |
| iperf3 receive AXE11000 | |
| iperf3 transmit AXE11000 6GHz | |
| iperf3 receive AXE11000 6GHz | |
| Ayaneo Kun | |
| iperf3 transmit AXE11000 | |
| iperf3 receive AXE11000 | |
| iperf3 transmit AXE11000 6GHz | |
| iperf3 receive AXE11000 6GHz | |
Manutenção
A parte traseira é fixada por um total de seis parafusos Phillips. Como é comum nos dispositivos MSI, um parafuso é coberto por um adesivo com as palavras Factory Seal (selo de fábrica). O uso adequado não anula a garantia do computador de mão, mas como nosso dispositivo de teste é um dispositivo de loja, não queríamos danificar o selo. Para substituir o pequeno SSD M.2 2230, a bateria e toda a unidade de resfriamento devem ser removidas, o que torna necessário reaplicar a pasta térmica quando o senhor o monta novamente.
Dispositivos de entrada e operação
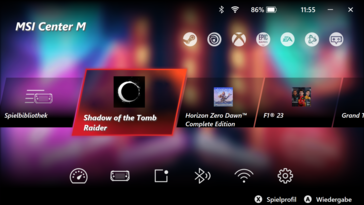
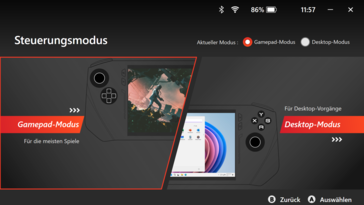
Seus principais métodos de entrada são o capacitivo do dispositivo, bem como os controles do "gamepad", como os dois joysticks, o D-pad e os botões adicionais. A tela sensível ao toque em si funciona perfeitamente, mas usar o Windows apenas com uma tela sensível ao toque (especialmente uma pequena) ainda é muito cansativo e a configuração inicial não é muito divertida. O ideal é que o senhor tenha um monitor disponível que forneça energia ao dispositivo e ao qual um mouse e um teclado também possam ser conectados diretamente. Assim que o senhor terminar de usar o Windows, tudo gira em torno do software do fabricante - nesse caso, o MSI Center M. O iniciador pode ser iniciado automaticamente quando o dispositivo é inicializado e as alterações em todas as configurações podem ser feitas aqui. Além disso, todos os serviços de jogos importantes, como Steam, UPlay, XBox, Epic, EA e Battlenet, já estão integrados, o que facilita muito a instalação de jogos. Há também um menu rápido, que pode ser exibido a qualquer momento e pode ser usado para alterar rapidamente as configurações mais importantes (perfil de energia, brilho, conexão Wi-Fi). O menu também é altamente personalizável e, de modo geral, o software Center-M funciona perfeitamente e parece ser muito bem desenvolvido. Apenas o monitoramento em tempo real (três modos diferentes) está vinculado ao canto superior esquerdo e a exibição de FPS não funcionou em nenhum dos jogos que testamos.
A MSI usa sticks e gatilhos analógicos com efeito Hall, portanto, não haverá problemas com o desvio do stick. Os botões são um pouco mais barulhentos no total em comparação com o ROG Ally e o ruído alto quando os gatilhos retornam à posição original pode ser um pouco irritante. Entretanto, não notamos nenhum problema funcional ao jogar.
Tela - IPS de 7 polegadas com taxa de atualização de 120 Hz
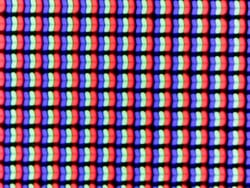
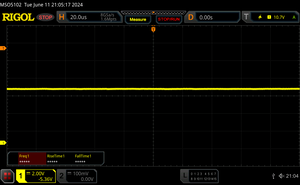
A tela IPS 16:9 de 7 polegadas apresenta uma resolução de 1.920 x 1.080 pixels. Sua taxa de atualização é de 120 Hz, mas, ao contrário do ROG Ally, o Claw não suporta uma taxa de atualização variável. No geral, a tela causa uma boa impressão, embora as superfícies brilhantes tendam a parecer ligeiramente granuladas. Seus tempos de resposta são bons e rápidos e notamos apenas um leve sangramento da luz de fundo com brilho total - além disso, não há oscilação de PWM.
Medimos um brilho máximo de 483 cd/m² e uma média de 461 cd/m². Seu nível de preto é de 0,32 cd/m², o que resulta em uma relação de contraste máxima muito boa de quase 1.500:1.
| |||||||||||||||||||||||||
iluminação: 88 %
Contraste: 1491:1 (Preto: 0.32 cd/m²)
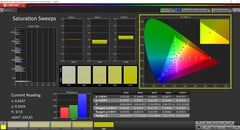
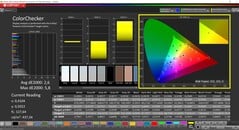
ΔE Color 2.6 | 0.5-29.43 Ø4.87, calibrated: 1.5
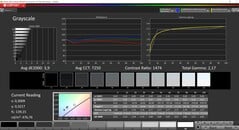
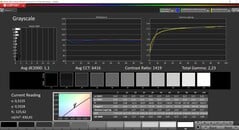
ΔE Greyscale 3.9 | 0.5-98 Ø5.1
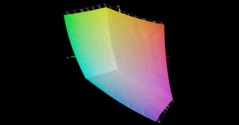
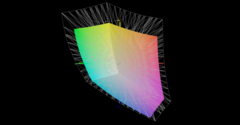
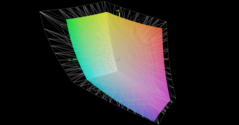
69.4% AdobeRGB 1998 (Argyll 2.2.0 3D)
94.4% sRGB (Argyll 2.2.0 3D)
67% Display P3 (Argyll 2.2.0 3D)
Gamma: 2.17
| MSI Claw TL070FVXS02-0, IPS, 1920x1080, 7" | Valve Steam Deck 1 TB OLED ANX7530 U, OLED, 1280x800, 7.4" | Lenovo Legion Go Legion Go Display, IPS, 2560x1600, 8.8" | Asus ROG Ally Z1 Extreme TL070FVSX01-0, IPS, 1920x1080, 7" | ONEXPLAYER 2 Pro AR18 FLQ8423-24L0, IPS, 2560x1600, 8.4" | Ayaneo Kun Ayaneo 2K, IPS, 2560x1600, 8.4" | |
|---|---|---|---|---|---|---|
| Display | 31% | 24% | -2% | 20% | 25% | |
| Display P3 Coverage | 67 | 99.6 49% | 92.1 37% | 65.6 -2% | 91.9 37% | 93.52 40% |
| sRGB Coverage | 94.4 | 100 6% | 99.56 5% | 92.1 -2% | 99.3 5% | 99.4 5% |
| AdobeRGB 1998 Coverage | 69.4 | 96.1 38% | 90.09 30% | 67.9 -2% | 81.6 18% | 91.2 31% |
| Response Times | -17% | -122% | -3% | -211% | -154% | |
| Response Time Grey 50% / Grey 80% * | 9.2 ? | 9 ? 2% | 20.8 ? -126% | 10.5 ? -14% | 25.5 ? -177% | 24.2 ? -163% |
| Response Time Black / White * | 6.6 ? | 9 ? -36% | 14.4 ? -118% | 6 ? 9% | 22.73 ? -244% | 16.2 ? -145% |
| PWM Frequency | 360 ? | 700 | 20000 | |||
| Screen | 147% | -37% | -17% | -14% | -20% | |
| Brightness middle | 477 | 485 2% | 411 -14% | 513 8% | 318 -33% | 680 43% |
| Brightness | 461 | 482 5% | 413 -10% | 474 3% | 287 -38% | 678 47% |
| Brightness Distribution | 88 | 98 11% | 80 -9% | 84 -5% | 48 -45% | 91 3% |
| Black Level * | 0.32 | 0.03 91% | 0.42 -31% | 0.38 -19% | 0.1118 65% | 0.5 -56% |
| Contrast | 1491 | 16167 984% | 979 -34% | 1350 -9% | 2844 91% | 1360 -9% |
| Colorchecker dE 2000 * | 2.6 | 2 23% | 5.94 -128% | 3.7 -42% | 4.81 -85% | 4 -54% |
| Colorchecker dE 2000 max. * | 5.8 | 5 14% | 10.56 -82% | 8.3 -43% | 6.93 -19% | 9 -55% |
| Colorchecker dE 2000 calibrated * | 1.5 | 2.95 -97% | 1.53 -2% | 1 33% | ||
| Greyscale dE 2000 * | 3.9 | 2 49% | 0.92 76% | 5.1 -31% | 6.12 -57% | 9 -131% |
| Gamma | 2.17 101% | 2 110% | 1.93 114% | 2.14 103% | 2.003 110% | 2 110% |
| CCT | 7250 90% | 6336 103% | 8064 81% | 7732 84% | 7707 84% | 7188 90% |
| Média Total (Programa/Configurações) | 54% /
95% | -45% /
-36% | -7% /
-11% | -68% /
-35% | -50% /
-29% |
* ... menor é melhor
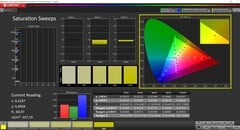
A MSI não oferece nenhum perfil de cor e, durante nossa análise com o software profissional CalMAN (X-Rite i1 Pro 2), o painel mostrou um leve tom azulado em conexão com uma temperatura de cor muito fria. Seus desvios de cor, por outro lado, são aceitáveis. A MSI usa essas configurações para obter um brilho mais alto. Com nossa calibração (o perfil está disponível para download gratuito mais acima), conseguimos melhorar sua escala de cinza em particular, tornando sua projeção de cor uma coisa do passado - mas seu brilho máximo era então quase 50 cd/m² menor. O espaço de cores sRGB é coberto em 95% e, teoricamente, o senhor poderia até mesmo editar imagens no dispositivo, mas esse obviamente não é um cenário de uso realista para um dispositivo portátil para jogos.
Exibir tempos de resposta
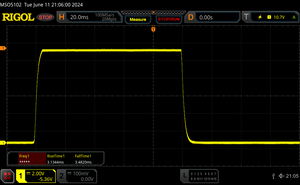
| ↔ Tempo de resposta preto para branco | ||
|---|---|---|
| 6.6 ms ... ascensão ↗ e queda ↘ combinadas | ↗ 3.1 ms ascensão | |
| ↘ 3.5 ms queda | ||
| A tela mostra taxas de resposta muito rápidas em nossos testes e deve ser muito adequada para jogos em ritmo acelerado. Em comparação, todos os dispositivos testados variam de 0.1 (mínimo) a 240 (máximo) ms. » 18 % de todos os dispositivos são melhores. Isso significa que o tempo de resposta medido é melhor que a média de todos os dispositivos testados (20.7 ms). | ||
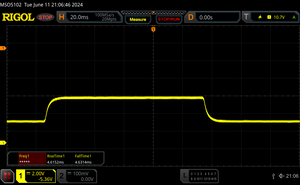
| ↔ Tempo de resposta 50% cinza a 80% cinza | ||
| 9.2 ms ... ascensão ↗ e queda ↘ combinadas | ↗ 4.6 ms ascensão | |
| ↘ 4.6 ms queda | ||
| A tela mostra taxas de resposta rápidas em nossos testes e deve ser adequada para jogos. Em comparação, todos os dispositivos testados variam de 0.165 (mínimo) a 636 (máximo) ms. » 20 % de todos os dispositivos são melhores. Isso significa que o tempo de resposta medido é melhor que a média de todos os dispositivos testados (32.5 ms). | ||
Cintilação da tela / PWM (modulação por largura de pulso)
| Tela tremeluzindo / PWM não detectado | |||
[pwm_comparison] Em comparação: 53 % de todos os dispositivos testados não usam PWM para escurecer a tela. Se PWM foi detectado, uma média de 8488 (mínimo: 5 - máximo: 343500) Hz foi medida. | |||
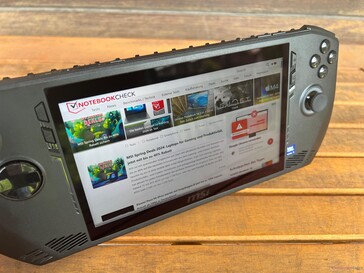
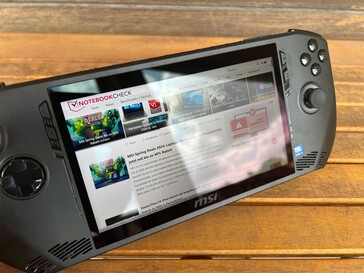
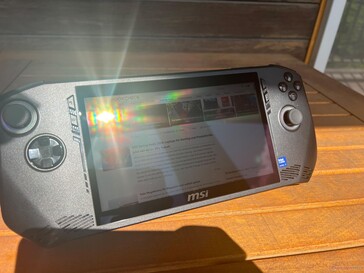
É claro que os reflexos na tela sensível ao toque brilhante são esperados e, em dias muito claros, fica um pouco difícil usar o dispositivo. Entretanto, na maioria dos casos, o senhor deve conseguir encontrar uma posição que funcione. Não há problemas quando se trata dos ângulos de visão.
Desempenho - Intel Core Ultra e 16 GB de RAM
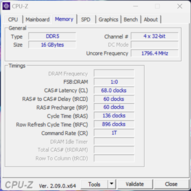
Como mencionado anteriormente, o senhor pode obter o dispositivo portátil para jogos MSI Claw com o Core Ultra 7 155H ou o Core Ultra 5 135H, mais fraco, sendo que o último também vem com uma iGPU um pouco mais fraca. Ambos os modelos são equipados com 16 GB de RAM e não há opção de atribuir manualmente a VRAM.
Condições de teste
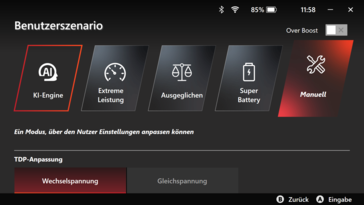
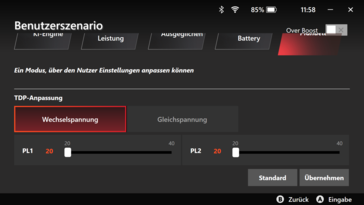
A MSI oferece vários perfis de energia, sendo que o modo AI Engine está ativo por padrão. Isso deve selecionar automaticamente as melhores configurações de acordo com o cenário de carga e também usamos esse modo para os seguintes benchmarks e testes. Listamos os valores de TDP e desempenho dos vários perfis na tabela a seguir.
| Perfil de energia | TDP rede elétrica | TDP bateria | CB R23 multi | Time Spy gráficos | Cyberpunk 2077 1080p Low | emissões máximas de ruído da ventoinha |
|---|---|---|---|---|---|---|
| Super Battery | 20 watts | 20 watts | 7.270 pontos | 2.581 pontos | 23,3 fps | 36,6 dB(A) |
| Balanceada | 35 watts | 30 watts | 12.523 pontos | 3.517 pontos | 31fps | 45,5 dB(A) |
| AI | 45 -> 43 watts | 35 watts | 14.463 pontos | 3.491 pontos | 31fps | 45,5 dB(A) |
| Desempenho extremo | 45 -> 43 watts | 35 watts | 14.550 pontos | 4.461 pontos | 31fps | 48,5 dB(A) |
Processador - Core Ultra 7 155H
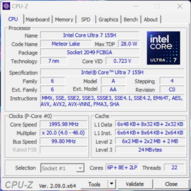
O Core Ultra 7 155H da atual geração Meteor Lake da Intel é usado em muitos laptops no momento. Seu desempenho no MSI Claw também é estável e, em geral, decente, embora o processador Intel simplesmente exija mais energia do que outros dispositivos portáteis da AMD para oferecer um desempenho comparável, o que, obviamente, não é ideal para um dispositivo portátil. Além disso, sua unidade de resfriamento tem muito trabalho a fazer, mas falaremos mais sobre isso na seção de emissões um pouco mais tarde. Durante a operação com bateria, o processador pode consumir no máximo 35 watts, razão pela qual o desempenho de vários núcleos é cerca de 14% menor nesse caso. Outros benchmarks de CPU podem ser encontrados em nossa seção de tecnologia.
Cinebench R15 Multi continuous test
Cinebench R23: Multi Core | Single Core
Cinebench R20: CPU (Multi Core) | CPU (Single Core)
Cinebench R15: CPU Multi 64Bit | CPU Single 64Bit
Blender: v2.79 BMW27 CPU
7-Zip 18.03: 7z b 4 | 7z b 4 -mmt1
Geekbench 6.4: Multi-Core | Single-Core
Geekbench 5.5: Multi-Core | Single-Core
HWBOT x265 Benchmark v2.2: 4k Preset
LibreOffice : 20 Documents To PDF
R Benchmark 2.5: Overall mean
| CPU Performance Rating | |
| Asus ROG Ally Z1 Extreme | |
| Lenovo Legion Go -2! | |
| Média Intel Core Ultra 7 155H | |
| MSI Claw | |
| Ayaneo Kun | |
| ONEXPLAYER 2 Pro AR18 | |
| Média da turma Handheld / UMPC | |
| Valve Steam Deck 1 TB OLED -6! | |
| Cinebench R23 / Multi Core | |
| Ayaneo Kun | |
| Média Intel Core Ultra 7 155H (9769 - 19007, n=52) | |
| Asus ROG Ally Z1 Extreme | |
| MSI Claw | |
| ONEXPLAYER 2 Pro AR18 | |
| Lenovo Legion Go | |
| Média da turma Handheld / UMPC (3984 - 16841, n=17, últimos 2 anos) | |
| Valve Steam Deck 1 TB OLED | |
| Cinebench R23 / Single Core | |
| Asus ROG Ally Z1 Extreme | |
| MSI Claw | |
| Lenovo Legion Go | |
| ONEXPLAYER 2 Pro AR18 | |
| Média Intel Core Ultra 7 155H (1496 - 1815, n=52) | |
| Média da turma Handheld / UMPC (1088 - 2006, n=16, últimos 2 anos) | |
| Ayaneo Kun | |
| Cinebench R20 / CPU (Multi Core) | |
| Ayaneo Kun | |
| Asus ROG Ally Z1 Extreme | |
| Média Intel Core Ultra 7 155H (3798 - 7409, n=50) | |
| ONEXPLAYER 2 Pro AR18 | |
| Lenovo Legion Go | |
| MSI Claw | |
| Média da turma Handheld / UMPC (1521 - 6577, n=15, últimos 2 anos) | |
| Valve Steam Deck 1 TB OLED | |
| Cinebench R20 / CPU (Single Core) | |
| Asus ROG Ally Z1 Extreme | |
| MSI Claw | |
| ONEXPLAYER 2 Pro AR18 | |
| Lenovo Legion Go | |
| Média Intel Core Ultra 7 155H (601 - 696, n=50) | |
| Média da turma Handheld / UMPC (357 - 787, n=15, últimos 2 anos) | |
| Ayaneo Kun | |
| Valve Steam Deck 1 TB OLED | |
| Cinebench R15 / CPU Multi 64Bit | |
| Média Intel Core Ultra 7 155H (1932 - 2880, n=56) | |
| Ayaneo Kun | |
| Asus ROG Ally Z1 Extreme | |
| ONEXPLAYER 2 Pro AR18 | |
| Lenovo Legion Go | |
| MSI Claw | |
| Média da turma Handheld / UMPC (689 - 2533, n=15, últimos 2 anos) | |
| Valve Steam Deck 1 TB OLED | |
| Cinebench R15 / CPU Single 64Bit | |
| Asus ROG Ally Z1 Extreme | |
| Lenovo Legion Go | |
| ONEXPLAYER 2 Pro AR18 | |
| MSI Claw | |
| Média da turma Handheld / UMPC (155.1 - 304, n=14, últimos 2 anos) | |
| Média Intel Core Ultra 7 155H (99.6 - 268, n=52) | |
| Ayaneo Kun | |
| Blender / v2.79 BMW27 CPU | |
| Média da turma Handheld / UMPC (189 - 588, n=13, últimos 2 anos) | |
| MSI Claw | |
| ONEXPLAYER 2 Pro AR18 | |
| Média Intel Core Ultra 7 155H (175 - 381, n=47) | |
| Asus ROG Ally Z1 Extreme | |
| Ayaneo Kun | |
| 7-Zip 18.03 / 7z b 4 | |
| Asus ROG Ally Z1 Extreme | |
| Ayaneo Kun | |
| Média Intel Core Ultra 7 155H (41739 - 70254, n=50) | |
| Lenovo Legion Go | |
| ONEXPLAYER 2 Pro AR18 | |
| MSI Claw | |
| Média da turma Handheld / UMPC (19684 - 66618, n=14, últimos 2 anos) | |
| Valve Steam Deck 1 TB OLED | |
| 7-Zip 18.03 / 7z b 4 -mmt1 | |
| Asus ROG Ally Z1 Extreme | |
| ONEXPLAYER 2 Pro AR18 | |
| Ayaneo Kun | |
| Média Intel Core Ultra 7 155H (4594 - 5621, n=50) | |
| MSI Claw | |
| Média da turma Handheld / UMPC (3653 - 6143, n=14, últimos 2 anos) | |
| Valve Steam Deck 1 TB OLED | |
| Geekbench 6.4 / Multi-Core | |
| Média Intel Core Ultra 7 155H (7732 - 13656, n=55) | |
| Asus ROG Ally Z1 Extreme | |
| Lenovo Legion Go | |
| Lenovo Legion Go | |
| MSI Claw | |
| Média da turma Handheld / UMPC (4587 - 13426, n=16, últimos 2 anos) | |
| Ayaneo Kun | |
| ONEXPLAYER 2 Pro AR18 | |
| Valve Steam Deck 1 TB OLED | |
| Geekbench 6.4 / Single-Core | |
| Lenovo Legion Go | |
| Lenovo Legion Go | |
| Asus ROG Ally Z1 Extreme | |
| MSI Claw | |
| Média Intel Core Ultra 7 155H (1901 - 2473, n=52) | |
| Média da turma Handheld / UMPC (1348 - 2904, n=16, últimos 2 anos) | |
| ONEXPLAYER 2 Pro AR18 | |
| Ayaneo Kun | |
| Valve Steam Deck 1 TB OLED | |
| Geekbench 5.5 / Multi-Core | |
| Média Intel Core Ultra 7 155H (10017 - 13556, n=52) | |
| Asus ROG Ally Z1 Extreme | |
| MSI Claw | |
| Lenovo Legion Go | |
| Lenovo Legion Go | |
| Média da turma Handheld / UMPC (3932 - 11975, n=16, últimos 2 anos) | |
| Ayaneo Kun | |
| ONEXPLAYER 2 Pro AR18 | |
| Valve Steam Deck 1 TB OLED | |
| Geekbench 5.5 / Single-Core | |
| Asus ROG Ally Z1 Extreme | |
| Lenovo Legion Go | |
| Lenovo Legion Go | |
| MSI Claw | |
| Média Intel Core Ultra 7 155H (1462 - 1824, n=52) | |
| Média da turma Handheld / UMPC (875 - 2134, n=16, últimos 2 anos) | |
| ONEXPLAYER 2 Pro AR18 | |
| Valve Steam Deck 1 TB OLED | |
| Ayaneo Kun | |
| HWBOT x265 Benchmark v2.2 / 4k Preset | |
| Ayaneo Kun | |
| Asus ROG Ally Z1 Extreme | |
| Média Intel Core Ultra 7 155H (9.93 - 21.2, n=50) | |
| Lenovo Legion Go | |
| ONEXPLAYER 2 Pro AR18 | |
| Média da turma Handheld / UMPC (7.07 - 20.8, n=14, últimos 2 anos) | |
| MSI Claw | |
| LibreOffice / 20 Documents To PDF | |
| ONEXPLAYER 2 Pro AR18 | |
| Média da turma Handheld / UMPC (41.1 - 92.8, n=14, últimos 2 anos) | |
| Ayaneo Kun | |
| Lenovo Legion Go | |
| Média Intel Core Ultra 7 155H (37.5 - 79.2, n=49) | |
| MSI Claw | |
| Asus ROG Ally Z1 Extreme | |
| R Benchmark 2.5 / Overall mean | |
| Média da turma Handheld / UMPC (0.4167 - 0.756, n=15, últimos 2 anos) | |
| Ayaneo Kun | |
| Ayaneo Kun | |
| Média Intel Core Ultra 7 155H (0.4457 - 0.53, n=49) | |
| ONEXPLAYER 2 Pro AR18 | |
| MSI Claw | |
| Lenovo Legion Go | |
| Asus ROG Ally Z1 Extreme | |
* ... menor é melhor
AIDA64: FP32 Ray-Trace | FPU Julia | CPU SHA3 | CPU Queen | FPU SinJulia | FPU Mandel | CPU AES | CPU ZLib | FP64 Ray-Trace | CPU PhotoWorxx
| Performance Rating | |
| Ayaneo Kun | |
| Asus ROG Ally Z1 Extreme | |
| ONEXPLAYER 2 Pro AR18 | |
| Lenovo Legion Go | |
| Média da turma Handheld / UMPC | |
| Média Intel Core Ultra 7 155H | |
| MSI Claw | |
| AIDA64 / FP32 Ray-Trace | |
| Ayaneo Kun | |
| Ayaneo Kun | |
| Asus ROG Ally Z1 Extreme | |
| ONEXPLAYER 2 Pro AR18 | |
| Lenovo Legion Go | |
| Média da turma Handheld / UMPC (6990 - 26450, n=15, últimos 2 anos) | |
| Média Intel Core Ultra 7 155H (6670 - 18470, n=50) | |
| MSI Claw | |
| AIDA64 / FPU Julia | |
| Ayaneo Kun | |
| Ayaneo Kun | |
| Asus ROG Ally Z1 Extreme | |
| ONEXPLAYER 2 Pro AR18 | |
| Lenovo Legion Go | |
| Média da turma Handheld / UMPC (42932 - 109745, n=15, últimos 2 anos) | |
| Média Intel Core Ultra 7 155H (40905 - 93181, n=50) | |
| MSI Claw | |
| AIDA64 / CPU SHA3 | |
| Ayaneo Kun | |
| Ayaneo Kun | |
| Asus ROG Ally Z1 Extreme | |
| ONEXPLAYER 2 Pro AR18 | |
| Lenovo Legion Go | |
| Média da turma Handheld / UMPC (1403 - 4847, n=15, últimos 2 anos) | |
| Média Intel Core Ultra 7 155H (1940 - 4436, n=50) | |
| MSI Claw | |
| AIDA64 / CPU Queen | |
| Ayaneo Kun | |
| Ayaneo Kun | |
| Asus ROG Ally Z1 Extreme | |
| ONEXPLAYER 2 Pro AR18 | |
| Lenovo Legion Go | |
| Média Intel Core Ultra 7 155H (64698 - 94181, n=50) | |
| Média da turma Handheld / UMPC (41744 - 114294, n=15, últimos 2 anos) | |
| MSI Claw | |
| AIDA64 / FPU SinJulia | |
| Ayaneo Kun | |
| Ayaneo Kun | |
| Asus ROG Ally Z1 Extreme | |
| ONEXPLAYER 2 Pro AR18 | |
| Lenovo Legion Go | |
| Média da turma Handheld / UMPC (4425 - 16980, n=15, últimos 2 anos) | |
| Média Intel Core Ultra 7 155H (5639 - 10647, n=50) | |
| MSI Claw | |
| AIDA64 / FPU Mandel | |
| Ayaneo Kun | |
| Ayaneo Kun | |
| Asus ROG Ally Z1 Extreme | |
| ONEXPLAYER 2 Pro AR18 | |
| Lenovo Legion Go | |
| Média da turma Handheld / UMPC (23380 - 58482, n=15, últimos 2 anos) | |
| Média Intel Core Ultra 7 155H (18236 - 47685, n=50) | |
| MSI Claw | |
| AIDA64 / CPU AES | |
| Ayaneo Kun | |
| Ayaneo Kun | |
| ONEXPLAYER 2 Pro AR18 | |
| Média da turma Handheld / UMPC (21547 - 166333, n=15, últimos 2 anos) | |
| Média Intel Core Ultra 7 155H (45713 - 152179, n=50) | |
| Asus ROG Ally Z1 Extreme | |
| MSI Claw | |
| Lenovo Legion Go | |
| AIDA64 / CPU ZLib | |
| Ayaneo Kun | |
| Ayaneo Kun | |
| Asus ROG Ally Z1 Extreme | |
| Média Intel Core Ultra 7 155H (557 - 1250, n=50) | |
| ONEXPLAYER 2 Pro AR18 | |
| Média da turma Handheld / UMPC (356 - 1112, n=15, últimos 2 anos) | |
| MSI Claw | |
| Lenovo Legion Go | |
| AIDA64 / FP64 Ray-Trace | |
| Ayaneo Kun | |
| Ayaneo Kun | |
| Asus ROG Ally Z1 Extreme | |
| ONEXPLAYER 2 Pro AR18 | |
| Lenovo Legion Go | |
| Média da turma Handheld / UMPC (3766 - 14181, n=15, últimos 2 anos) | |
| Média Intel Core Ultra 7 155H (3569 - 9802, n=50) | |
| MSI Claw | |
| AIDA64 / CPU PhotoWorxx | |
| MSI Claw | |
| Média Intel Core Ultra 7 155H (32719 - 54223, n=50) | |
| Média da turma Handheld / UMPC (19472 - 54726, n=15, últimos 2 anos) | |
| Asus ROG Ally Z1 Extreme | |
| Lenovo Legion Go | |
| Ayaneo Kun | |
| Ayaneo Kun | |
| ONEXPLAYER 2 Pro AR18 | |
Desempenho do sistema
Com exceção da operação de toque do Windows, que ainda é incômoda, o MSI Claw é um dispositivo rápido com componentes modernos. Também não tivemos problemas com travamentos ou outras limitações durante nosso teste. Além disso, não houve gargalos durante os testes sintéticos.
CrossMark: Overall | Productivity | Creativity | Responsiveness
WebXPRT 3: Overall
WebXPRT 4: Overall
Mozilla Kraken 1.1: Total
| PCMark 10 / Score | |
| Asus ROG Ally Z1 Extreme | |
| Média Intel Core Ultra 7 155H, Intel Arc 8-Core iGPU (4809 - 7529, n=34) | |
| MSI Claw | |
| Lenovo Legion Go | |
| Média da turma Handheld / UMPC (5219 - 7471, n=15, últimos 2 anos) | |
| Ayaneo Kun | |
| ONEXPLAYER 2 Pro AR18 | |
| PCMark 10 / Essentials | |
| Média Intel Core Ultra 7 155H, Intel Arc 8-Core iGPU (7605 - 11289, n=34) | |
| Asus ROG Ally Z1 Extreme | |
| Lenovo Legion Go | |
| Média da turma Handheld / UMPC (8427 - 11262, n=15, últimos 2 anos) | |
| MSI Claw | |
| Ayaneo Kun | |
| ONEXPLAYER 2 Pro AR18 | |
| PCMark 10 / Productivity | |
| Asus ROG Ally Z1 Extreme | |
| Lenovo Legion Go | |
| Média Intel Core Ultra 7 155H, Intel Arc 8-Core iGPU (6042 - 10591, n=34) | |
| Média da turma Handheld / UMPC (7213 - 10031, n=15, últimos 2 anos) | |
| MSI Claw | |
| Ayaneo Kun | |
| ONEXPLAYER 2 Pro AR18 | |
| PCMark 10 / Digital Content Creation | |
| MSI Claw | |
| Ayaneo Kun | |
| Média Intel Core Ultra 7 155H, Intel Arc 8-Core iGPU (4985 - 10709, n=34) | |
| Asus ROG Ally Z1 Extreme | |
| Média da turma Handheld / UMPC (6350 - 10026, n=15, últimos 2 anos) | |
| ONEXPLAYER 2 Pro AR18 | |
| Lenovo Legion Go | |
| CrossMark / Overall | |
| Asus ROG Ally Z1 Extreme | |
| MSI Claw | |
| Média Intel Core Ultra 7 155H, Intel Arc 8-Core iGPU (1366 - 1903, n=34) | |
| Média da turma Handheld / UMPC (840 - 1847, n=13, últimos 2 anos) | |
| Ayaneo Kun | |
| ONEXPLAYER 2 Pro AR18 | |
| Valve Steam Deck 1 TB OLED | |
| CrossMark / Productivity | |
| Asus ROG Ally Z1 Extreme | |
| MSI Claw | |
| Média Intel Core Ultra 7 155H, Intel Arc 8-Core iGPU (1291 - 1798, n=33) | |
| Média da turma Handheld / UMPC (874 - 1719, n=13, últimos 2 anos) | |
| Ayaneo Kun | |
| ONEXPLAYER 2 Pro AR18 | |
| Valve Steam Deck 1 TB OLED | |
| CrossMark / Creativity | |
| Asus ROG Ally Z1 Extreme | |
| Média Intel Core Ultra 7 155H, Intel Arc 8-Core iGPU (1519 - 1929, n=33) | |
| MSI Claw | |
| Média da turma Handheld / UMPC (808 - 2077, n=13, últimos 2 anos) | |
| ONEXPLAYER 2 Pro AR18 | |
| Ayaneo Kun | |
| Valve Steam Deck 1 TB OLED | |
| CrossMark / Responsiveness | |
| MSI Claw | |
| Ayaneo Kun | |
| Asus ROG Ally Z1 Extreme | |
| Média Intel Core Ultra 7 155H, Intel Arc 8-Core iGPU (939 - 1802, n=33) | |
| ONEXPLAYER 2 Pro AR18 | |
| Média da turma Handheld / UMPC (759 - 1610, n=13, últimos 2 anos) | |
| Valve Steam Deck 1 TB OLED | |
| WebXPRT 3 / Overall | |
| Asus ROG Ally Z1 Extreme | |
| Lenovo Legion Go | |
| Média Intel Core Ultra 7 155H, Intel Arc 8-Core iGPU (252 - 299, n=34) | |
| MSI Claw | |
| Média da turma Handheld / UMPC (188.4 - 323, n=15, últimos 2 anos) | |
| ONEXPLAYER 2 Pro AR18 | |
| Ayaneo Kun | |
| Ayaneo Kun | |
| WebXPRT 4 / Overall | |
| Asus ROG Ally Z1 Extreme | |
| MSI Claw | |
| Média Intel Core Ultra 7 155H, Intel Arc 8-Core iGPU (166.4 - 309, n=29) | |
| Média da turma Handheld / UMPC (107 - 291, n=12, últimos 2 anos) | |
| Ayaneo Kun | |
| Valve Steam Deck 1 TB OLED | |
| Mozilla Kraken 1.1 / Total | |
| Ayaneo Kun | |
| Ayaneo Kun | |
| Média da turma Handheld / UMPC (428 - 895, n=15, últimos 2 anos) | |
| Lenovo Legion Go | |
| Média Intel Core Ultra 7 155H, Intel Arc 8-Core iGPU (517 - 614, n=35) | |
| MSI Claw | |
| ONEXPLAYER 2 Pro AR18 | |
* ... menor é melhor
| PCMark 10 Score | 6504 pontos | |
Ajuda | ||
| AIDA64 / Memory Copy | |
| Asus ROG Ally Z1 Extreme | |
| Média Intel Core Ultra 7 155H (62397 - 96791, n=50) | |
| MSI Claw | |
| Lenovo Legion Go | |
| Média da turma Handheld / UMPC (32617 - 107929, n=16, últimos 2 anos) | |
| Ayaneo Kun | |
| Ayaneo Kun | |
| ONEXPLAYER 2 Pro AR18 | |
| Valve Steam Deck 1 TB OLED | |
| AIDA64 / Memory Read | |
| MSI Claw | |
| Média Intel Core Ultra 7 155H (60544 - 90647, n=50) | |
| Média da turma Handheld / UMPC (25380 - 100208, n=15, últimos 2 anos) | |
| Lenovo Legion Go | |
| Asus ROG Ally Z1 Extreme | |
| Ayaneo Kun | |
| ONEXPLAYER 2 Pro AR18 | |
| Valve Steam Deck 1 TB OLED | |
| AIDA64 / Memory Write | |
| Lenovo Legion Go | |
| Asus ROG Ally Z1 Extreme | |
| Média da turma Handheld / UMPC (25596 - 117883, n=17, últimos 2 anos) | |
| MSI Claw | |
| Média Intel Core Ultra 7 155H (58692 - 93451, n=50) | |
| Ayaneo Kun | |
| Ayaneo Kun | |
| Ayaneo Kun | |
| ONEXPLAYER 2 Pro AR18 | |
| Valve Steam Deck 1 TB OLED | |
| AIDA64 / Memory Latency | |
| Média Intel Core Ultra 7 155H (116.2 - 233, n=50) | |
| MSI Claw | |
| Ayaneo Kun | |
| Ayaneo Kun | |
| ONEXPLAYER 2 Pro AR18 | |
| Média da turma Handheld / UMPC (99.8 - 147.6, n=16, últimos 2 anos) | |
| Lenovo Legion Go | |
| Asus ROG Ally Z1 Extreme | |
| Valve Steam Deck 1 TB OLED | |
* ... menor é melhor
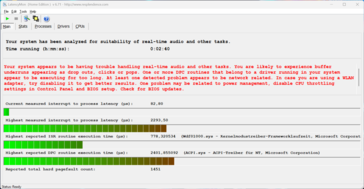
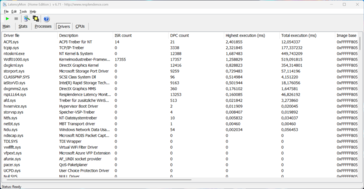
Latências de DPC
| DPC Latencies / LatencyMon - interrupt to process latency (max), Web, Youtube, Prime95 | |
| MSI Claw | |
| Asus ROG Ally Z1 Extreme | |
| ONEXPLAYER 2 Pro AR18 | |
| Ayaneo Kun | |
* ... menor é melhor
Dispositivo de armazenamento
O Claw é equipado com um SSD compacto M.2 2230 - no nosso caso, um da Kioxia (BG5) - que oferece uma capacidade de armazenamento de 1 TB, sendo que os usuários têm 871 GB livres para usar após a primeira inicialização do dispositivo. Embora seja um SSD PCIe 4.0, suas taxas máximas de transferência estão listadas apenas como sendo de 3,5 GB/s, na melhor das hipóteses, e nossos resultados de benchmark mostraram, em sua maioria, valores em torno da marca de 3 GB/s também. Ainda assim, isso é totalmente suficiente para um dispositivo portátil para jogos e, mesmo sob períodos mais longos de carga, não notamos nenhuma queda no desempenho. Outros benchmarks de SSD podem ser encontrados aqui.
| Drive Performance Rating - Percent | |
| ONEXPLAYER 2 Pro AR18 -11! | |
| Ayaneo Kun | |
| Lenovo Legion Go | |
| Média da turma Handheld / UMPC | |
| MSI Claw | |
| Média Kioxia BG5 KBG50ZNS1T02 | |
| Valve Steam Deck 1 TB OLED -11! | |
| Asus ROG Ally Z1 Extreme | |
* ... menor é melhor
Reading continuous performance: DiskSpd Read Loop, Queue Depth 8
Placa de vídeo
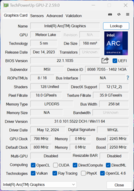
Nosso dispositivo de teste com o Intel Core Ultra 7 155H apresenta a rápida IGPU Arc Graphics com 8 núcleos Xe que podem atingir uma taxa de clock máxima de 2,25 GHz. Nos testes sintéticos do 3DMark, a Intel conseguiu melhorar consideravelmente seu desempenho em comparação com o antigo Iris Xe Graphics G7 e a Radeon 780M da AMD também foi derrotada por pouco. A iGPU está muito bem equipada para tarefas cotidianas, como a reprodução de vídeos de alta resolução.
O desempenho gráfico do dispositivo permanece estável durante o uso da bateria, bem como sob carga contínua. Outros benchmarks de GPU podem ser encontrados aqui.
| 3DMark 11 Performance | 12271 pontos | |
| 3DMark Fire Strike Score | 7988 pontos | |
| 3DMark Time Spy Score | 3829 pontos | |
Ajuda | ||
* ... menor é melhor
Desempenho em jogos
Agora é hora de falar sobre o desempenho do computador de mão em jogos. Nesse aspecto, o MSI Claw não conseguiu repetir os bons resultados da GPU nos testes sintéticos e, em vez disso, ficou atrás da concorrência da AMD em quase todos os jogos. Só foi capaz de superar o Steam Deck. Isso significa que, em sua resolução nativa de 1080p, só é possível jogar muitos jogos com detalhes médios a altos e jogos exigentes, como Cyberpunk 2077 ou Baldurs Gate 3 são difíceis de executar sem o uso da tecnologia de upscaling - mesmo com configurações de detalhes baixos. Além disso, o driver da Intel oferece menos recursos em comparação com o software da AMD (por exemplo, Frame Generation) para melhorar ainda mais o desempenho ou a qualidade da representação.
| Performance Rating - Percent | |
| Lenovo Legion Go | |
| Asus ROG Ally Z1 Extreme | |
| Ayaneo Kun | |
| ONEXPLAYER 2 Pro AR18 | |
| MSI Claw -1! | |
| Média da turma Handheld / UMPC | |
| Valve Steam Deck 1 TB OLED -3! | |
| The Witcher 3 - 1920x1080 Ultra Graphics & Postprocessing (HBAO+) | |
| Ayaneo Kun | |
| ONEXPLAYER 2 Pro AR18 | |
| Lenovo Legion Go | |
| Asus ROG Ally Z1 Extreme | |
| Média da turma Handheld / UMPC (17.5 - 33.9, n=11, últimos 2 anos) | |
| MSI Claw | |
| GTA V - 1920x1080 Highest Settings possible AA:4xMSAA + FX AF:16x | |
| Ayaneo Kun | |
| Ayaneo Kun | |
| Asus ROG Ally Z1 Extreme | |
| ONEXPLAYER 2 Pro AR18 | |
| Lenovo Legion Go | |
| Média da turma Handheld / UMPC (14 - 32.8, n=16, últimos 2 anos) | |
| Valve Steam Deck 1 TB OLED | |
| Final Fantasy XV Benchmark - 1920x1080 High Quality | |
| Ayaneo Kun | |
| ONEXPLAYER 2 Pro AR18 | |
| Asus ROG Ally Z1 Extreme | |
| Lenovo Legion Go | |
| Média da turma Handheld / UMPC (18.4 - 34.4, n=18, últimos 2 anos) | |
| MSI Claw | |
| Valve Steam Deck 1 TB OLED | |
| Strange Brigade - 1920x1080 ultra AA:ultra AF:16 | |
| Ayaneo Kun | |
| ONEXPLAYER 2 Pro AR18 | |
| Asus ROG Ally Z1 Extreme | |
| MSI Claw | |
| Média da turma Handheld / UMPC (30 - 56.1, n=18, últimos 2 anos) | |
| Lenovo Legion Go | |
| Valve Steam Deck 1 TB OLED | |
| Dota 2 Reborn - 1920x1080 ultra (3/3) best looking | |
| Lenovo Legion Go | |
| Asus ROG Ally Z1 Extreme | |
| Média da turma Handheld / UMPC (30.8 - 85, n=18, últimos 2 anos) | |
| MSI Claw | |
| ONEXPLAYER 2 Pro AR18 | |
| Ayaneo Kun | |
| Ayaneo Kun | |
| X-Plane 11.11 - 1920x1080 high (fps_test=3) | |
| MSI Claw | |
| Lenovo Legion Go | |
| Média da turma Handheld / UMPC (24.5 - 50.5, n=18, últimos 2 anos) | |
| Asus ROG Ally Z1 Extreme | |
| ONEXPLAYER 2 Pro AR18 | |
| Ayaneo Kun | |
| Ayaneo Kun | |
| Cyberpunk 2077 2.2 Phantom Liberty | |
| 1920x1080 Ultra Preset (FSR off) | |
| Média da turma Handheld / UMPC (11.5 - 28.5, n=13, últimos 2 anos) | |
| Asus ROG Ally Z1 Extreme | |
| Média Intel Arc 8-Core iGPU (13 - 24.7, n=26) | |
| MSI Claw | |
| 1920x1080 High Preset (FSR off) | |
| Lenovo Legion Go | |
| Ayaneo Kun | |
| Ayaneo Kun | |
| Asus ROG Ally Z1 Extreme | |
| Média da turma Handheld / UMPC (13.8 - 31.4, n=19, últimos 2 anos) | |
| ONEXPLAYER 2 Pro AR18 | |
| MSI Claw | |
| Média Intel Arc 8-Core iGPU (7.3 - 27.6, n=34) | |
| Valve Steam Deck 1 TB OLED | |
Witcher 3 FPS diagram
Nosso loop do Cyberpunk 2077 mostra que o desempenho de jogos do computador de mão da MSI permanece constante sob períodos mais longos de carga. Além disso, testamos seu desempenho em jogos usando os vários perfis de energia e resumimos nossas descobertas na tabela a seguir. O modo eficiente Super Battery é adequado para jogos mais antigos ou menos exigentes - caso contrário, seu desempenho não é suficiente.
| Jogo (1080p) | Super Battery | Balanced | AI | Extreme Performance |
|---|---|---|---|---|
| Witcher 3 (Ultra) | 20.7fps | 25.8fps | 25.6fps | 25.6fps |
| Far Cry 5 (Ultra) | 28fps | 32fps | 34fps | 33fps |
| Shadow of the Tomb Raider (Ultra) | 23fps | 27fps | 27fps | 26fps |
| GTA V (High) | 34.2fps | 40.8fps | 39.6fps | 39.6fps |
| Cyberpunk 2077 (Baixo) | 23.3fps | 31fps | 30.9fps | 31.1fps |
| Baldurs Gate 3 (Baixo) | 28.7fps | 33.1fps | 31.7fps | 33.3fps |
| baixo | média | alto | ultra | |
|---|---|---|---|---|
| GTA V (2015) | 158.1 | 147.9 | 39.6 | |
| The Witcher 3 (2015) | 135 | 51 | 25.6 | |
| Dota 2 Reborn (2015) | 98.6 | 84.1 | 67.4 | 63.6 |
| Final Fantasy XV Benchmark (2018) | 58.5 | 35.9 | 25.4 | |
| X-Plane 11.11 (2018) | 51.6 | 45.1 | 38.9 | |
| Far Cry 5 (2018) | 67 | 40 | 37 | 34 |
| Strange Brigade (2018) | 163 | 71 | 59 | 46 |
| Shadow of the Tomb Raider (2018) | 69 | 33 | 31 | 27 |
| F1 23 (2023) | 64.4 | 59.4 | 41.2 | |
| Baldur's Gate 3 (2023) | 31.7 | 24.8 | 20.7 | 20.3 |
| Cyberpunk 2077 2.2 Phantom Liberty (2023) | 30.9 | 25.3 | 21.9 | 19.8 |
| Horizon Forbidden West (2024) | 52 | 34 | 29 | 25 |
Emissões - Fãs irritantes
Emissões de ruído
A unidade de resfriamento composta por duas ventoinhas consegue manter os altos limites de energia do processador Intel, mas o resultado é um computador portátil para jogos com ventoinhas que funcionam praticamente de forma constante, mesmo quando se usa o modo mais eficiente. É relativamente raro que as ventoinhas sejam realmente desativadas e, normalmente, há sempre um ruído sibilante, mesmo quando o computador de mão está em marcha lenta. A situação fica ainda pior sob carga e o MSI Claw é um dos dispositivos mais barulhentos. Medimos 45-48 dB(A) durante os jogos e ainda um pouco abaixo de 37 dB(A) ao usar o modo Super Battery mais eficiente (TDP de 20 watts).
| Perfil de energia | Cyberpunk 2077 Phantom Liberty | Teste de estresse | operação máxima da bateria |
|---|---|---|---|
| Super Battery | 36,6 dB(A) | 36,6 dB(A) | 36,6 dB(A) |
| Balanceada | 45,5 dB(A) | 45,5 dB(A) | 45,5 dB(A) |
| AI | 45,5 dB(A) | 45,5 dB(A) | 45,5 dB(A) |
| Desempenho extremo | 48,5 dB(A) | 48,5 dB(A) | 46,3 dB(A) |
Barulho
| Ocioso |
| 25.7 / 31.7 / 31.7 dB |
| Carga |
| 36.6 / 45.5 dB |
 | ||
30 dB silencioso 40 dB(A) audível 50 dB(A) ruidosamente alto |
||
min: | ||
| MSI Claw Arc 8-Core, Ultra 7 155H, Kioxia BG5 KBG50ZNS1T02 | Valve Steam Deck 1 TB OLED Radeon Radeon Steam Deck 8CU, Steam Deck OLED APU, Phison ESMP001TKB5C3 | Lenovo Legion Go Radeon 780M, Z1 Extreme, WD PC SN740 512GB SDDPMQD-512G-1101 | Asus ROG Ally Z1 Extreme Radeon 780M, Z1 Extreme, Micron 2400 MTFDKBK512QFM | ONEXPLAYER 2 Pro AR18 Radeon 780M, R7 7840U | Ayaneo Kun Radeon 780M, R7 7840U, Phison M.2 2280 E18 4000GB | |
|---|---|---|---|---|---|---|
| Noise | 12% | 15% | 11% | 9% | 1% | |
| desligado / ambiente * | 25.7 | 24.7 4% | 23 11% | 23.3 9% | 24.4 5% | |
| Idle Minimum * | 25.7 | 25 3% | 23 11% | 23.3 9% | 24.4 5% | 25.31 2% |
| Idle Average * | 31.7 | 25 21% | 23 27% | 23.3 26% | 24.4 23% | 25.31 20% |
| Idle Maximum * | 31.7 | 25 21% | 25 21% | 27.3 14% | 30.6 3% | 34.5 -9% |
| Load Average * | 36.6 | 31.3 14% | 37 -1% | 39.2 -7% | 36 2% | 34.9 5% |
| Cyberpunk 2077 ultra * | 45.5 | |||||
| Load Maximum * | 45.5 | 40.8 10% | 37 19% | 39.2 14% | 39.3 14% | 50.78 -12% |
| Witcher 3 ultra * | 46 | 39.2 |
* ... menor é melhor
Temperatura
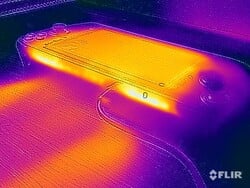
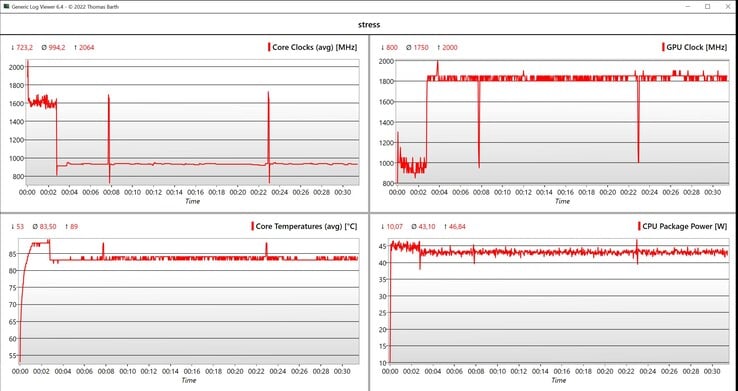
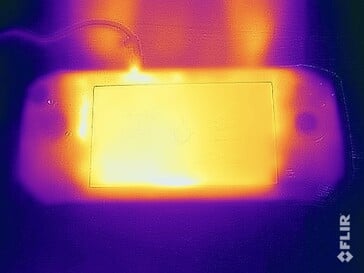
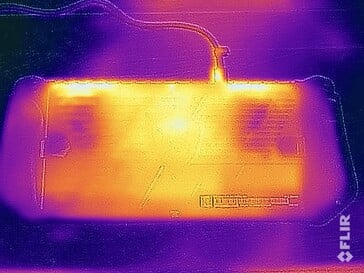
A área central do Claw esquenta consideravelmente, mas isso não importa, pois as alças permanecem sempre frescas e não notamos nenhuma restrição ao jogar. As saídas do ventilador estão localizadas na parte superior e, portanto, não atrapalham. Durante o teste de estresse, o processador operou brevemente a 45 watts e depois se estabilizou em 43 watts.
(±) A temperatura máxima no lado superior é 41.8 °C / 107 F, em comparação com a média de 38.4 °C / 101 F , variando de 26.6 a 55 °C para a classe Handheld / UMPC.
(+) A parte inferior aquece até um máximo de 35.9 °C / 97 F, em comparação com a média de 38 °C / 100 F
(+) Em uso inativo, a temperatura média para o lado superior é 30.9 °C / 88 F, em comparação com a média do dispositivo de 31.6 °C / ### class_avg_f### F.
(-) 3: The average temperature for the upper side is 39.9 °C / 104 F, compared to the average of 31.6 °C / 89 F for the class Handheld / UMPC.
(-) Os apoios para as mãos e o touchpad podem ficar muito quentes ao toque, com um máximo de 41.8 °C / 107.2 F.
(-) A temperatura média da área do apoio para as mãos de dispositivos semelhantes foi 30.5 °C / 86.9 F (-11.3 °C / -20.3 F).
Alto-falantes
Os dois alto-falantes estéreo na parte frontal fazem um bom trabalho e são bem altos. No entanto, ainda é difícil bloquear o ruído constante da ventoinha ao jogar. O som é nítido, mas falta um pouco de força, o que também acontece com os outros dispositivos portáteis. O ROG Ally está em um nível comparável, mas o Steam Deck OLED da Valve tem um desempenho um pouco melhor.
MSI Claw análise de áudio
(+) | os alto-falantes podem tocar relativamente alto (###valor### dB)
Graves 100 - 315Hz
(-) | quase nenhum baixo - em média 17.2% menor que a mediana
(±) | a linearidade dos graves é média (9.2% delta para a frequência anterior)
Médios 400 - 2.000 Hz
(+) | médios equilibrados - apenas 4.3% longe da mediana
(+) | médios são lineares (4.3% delta para frequência anterior)
Altos 2 - 16 kHz
(+) | agudos equilibrados - apenas 3.7% longe da mediana
(+) | os máximos são lineares (4.5% delta da frequência anterior)
Geral 100 - 16.000 Hz
(+) | o som geral é linear (14.9% diferença em relação à mediana)
Comparado com a mesma classe
» 17% de todos os dispositivos testados nesta classe foram melhores, 11% semelhantes, 72% piores
» O melhor teve um delta de 12%, a média foi 18%, o pior foi 23%
Comparado com todos os dispositivos testados
» 18% de todos os dispositivos testados foram melhores, 4% semelhantes, 78% piores
» O melhor teve um delta de 4%, a média foi 24%, o pior foi 134%
Asus ROG Ally Z1 Extreme análise de áudio
(+) | os alto-falantes podem tocar relativamente alto (###valor### dB)
Graves 100 - 315Hz
(-) | quase nenhum baixo - em média 15.5% menor que a mediana
(±) | a linearidade dos graves é média (8.4% delta para a frequência anterior)
Médios 400 - 2.000 Hz
(+) | médios equilibrados - apenas 3.1% longe da mediana
(+) | médios são lineares (3% delta para frequência anterior)
Altos 2 - 16 kHz
(+) | agudos equilibrados - apenas 1.9% longe da mediana
(+) | os máximos são lineares (2.3% delta da frequência anterior)
Geral 100 - 16.000 Hz
(+) | o som geral é linear (13.5% diferença em relação à mediana)
Comparado com a mesma classe
» 25% de todos os dispositivos testados nesta classe foram melhores, 5% semelhantes, 71% piores
» O melhor teve um delta de 5%, a média foi 18%, o pior foi 45%
Comparado com todos os dispositivos testados
» 13% de todos os dispositivos testados foram melhores, 4% semelhantes, 84% piores
» O melhor teve um delta de 4%, a média foi 24%, o pior foi 134%
Lenovo Legion Go análise de áudio
(±) | o volume do alto-falante é médio, mas bom (###valor### dB)
Graves 100 - 315Hz
(-) | quase nenhum baixo - em média 16.4% menor que a mediana
(±) | a linearidade dos graves é média (8.1% delta para a frequência anterior)
Médios 400 - 2.000 Hz
(±) | médios mais altos - em média 5.2% maior que a mediana
(+) | médios são lineares (6% delta para frequência anterior)
Altos 2 - 16 kHz
(±) | máximos mais altos - em média 5.7% maior que a mediana
(±) | a linearidade dos máximos é média (9.7% delta para frequência anterior)
Geral 100 - 16.000 Hz
(±) | a linearidade do som geral é média (22.7% diferença em relação à mediana)
Comparado com a mesma classe
» 89% de todos os dispositivos testados nesta classe foram melhores, 6% semelhantes, 6% piores
» O melhor teve um delta de 12%, a média foi 18%, o pior foi 23%
Comparado com todos os dispositivos testados
» 65% de todos os dispositivos testados foram melhores, 6% semelhantes, 30% piores
» O melhor teve um delta de 4%, a média foi 24%, o pior foi 134%
Valve Steam Deck 1 TB OLED análise de áudio
(+) | os alto-falantes podem tocar relativamente alto (###valor### dB)
Graves 100 - 315Hz
(-) | quase nenhum baixo - em média 22% menor que a mediana
(±) | a linearidade dos graves é média (14.7% delta para a frequência anterior)
Médios 400 - 2.000 Hz
(+) | médios equilibrados - apenas 1% longe da mediana
(+) | médios são lineares (2.1% delta para frequência anterior)
Altos 2 - 16 kHz
(+) | agudos equilibrados - apenas 1.9% longe da mediana
(+) | os máximos são lineares (6.1% delta da frequência anterior)
Geral 100 - 16.000 Hz
(+) | o som geral é linear (12.9% diferença em relação à mediana)
Comparado com a mesma classe
» 6% de todos os dispositivos testados nesta classe foram melhores, 6% semelhantes, 89% piores
» O melhor teve um delta de 12%, a média foi 18%, o pior foi 23%
Comparado com todos os dispositivos testados
» 11% de todos os dispositivos testados foram melhores, 3% semelhantes, 87% piores
» O melhor teve um delta de 4%, a média foi 24%, o pior foi 134%
Gerenciamento de energia - Bateria de curta duração
Consumo de energia
O computador de mão para jogos da MSI não é particularmente eficiente. Com brilho total, o dispositivo de teste já consome 12 watts quando está ocioso. Durante o teste de estresse, ele atingiu apenas 65 watts momentaneamente antes de se equilibrar em cerca de 54 watts após vários segundos. Durante os jogos, ele também atinge cerca de 55 watts, portanto, a fonte de alimentação de 65 watts incluída é suficientemente potente.
| desligado | |
| Ocioso | |
| Carga |
|
Key:
min: | |
| MSI Claw Ultra 7 155H, Arc 8-Core, Kioxia BG5 KBG50ZNS1T02, IPS, 1920x1080, 7" | Valve Steam Deck 1 TB OLED Steam Deck OLED APU, Radeon Radeon Steam Deck 8CU, Phison ESMP001TKB5C3, OLED, 1280x800, 7.4" | Lenovo Legion Go Z1 Extreme, Radeon 780M, WD PC SN740 512GB SDDPMQD-512G-1101, IPS, 2560x1600, 8.8" | Asus ROG Ally Z1 Extreme Z1 Extreme, Radeon 780M, Micron 2400 MTFDKBK512QFM, IPS, 1920x1080, 7" | ONEXPLAYER 2 Pro AR18 R7 7840U, Radeon 780M, , IPS, 2560x1600, 8.4" | Ayaneo Kun R7 7840U, Radeon 780M, Phison M.2 2280 E18 4000GB, IPS, 2560x1600, 8.4" | Média Intel Arc 8-Core iGPU | Média da turma Handheld / UMPC | |
|---|---|---|---|---|---|---|---|---|
| Power Consumption | 42% | -13% | 26% | 16% | -58% | 5% | 10% | |
| Idle Minimum * | 7.8 | 4.5 42% | 11.5 -47% | 4.2 46% | 6.66 15% | 14 -79% | 5.34 ? 32% | 7.38 ? 5% |
| Idle Average * | 11.5 | 7.21 37% | 12 -4% | 6.1 47% | 7.11 38% | 17.56 -53% | 8.54 ? 26% | 9.43 ? 18% |
| Idle Maximum * | 11.8 | 9.66 18% | 17.4 -47% | 6.3 47% | 11.7 1% | 27 -129% | 11.9 ? -1% | 12.9 ? -9% |
| Load Average * | 53.1 | 22.86 57% | 45 15% | 56.6 -7% | 46.708 12% | 38.1 28% | 54 ? -2% | 40 ? 25% |
| Cyberpunk 2077 ultra * | 54.4 | |||||||
| Load Maximum * | 64.6 | 27.8 57% | 54 16% | 67.2 -4% | 56.7 12% | 101 -56% | 84.9 ? -31% | 57.3 ? 11% |
| Witcher 3 ultra * | 42.6 | 64.1 | 53.1 | 83.5 |
* ... menor é melhor
Power consumption Witcher 3 / stress test
Tempos de execução
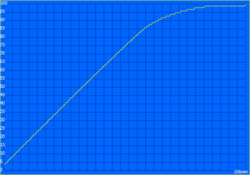
A MSI instalou uma bateria de 53 Wh no dispositivo, por isso, obviamente, realizamos nossos testes normais de bateria. Durante o teste de WLAN, os dois concorrentes ainda estavam no mesmo nível, mas no teste de vídeo, o computador de mão Claw teve que admitir a derrota para o ROG Ally com a bateria significativamente menor. Muito mais importante, por outro lado, é a duração da bateria ao jogar e, aqui, o teste terminou após cerca de 80 minutos ao jogar títulos AAA. O senhor pode jogar um pouco mais usando o modo Super Battery (TDP de 20 watts), mas aí terá que reduzir ainda mais a resolução e os detalhes, e jogos como Cyberpunk 2077 não funcionam mais sem problemas, mesmo em 1080p com poucos detalhes. Para emuladores, por outro lado, gostaríamos de poder reduzir manualmente o TDP ainda mais para possibilitar tempos de execução de várias horas. São necessários 106 minutos para carregar totalmente o dispositivo com ele ligado; 80% está disponível novamente após cerca de uma hora.
| MSI Claw Ultra 7 155H, Arc 8-Core, 53 Wh | Valve Steam Deck 1 TB OLED Steam Deck OLED APU, Radeon Radeon Steam Deck 8CU, 50 Wh | Lenovo Legion Go Z1 Extreme, Radeon 780M, 49.2 Wh | Asus ROG Ally Z1 Extreme Z1 Extreme, Radeon 780M, 40 Wh | ONEXPLAYER 2 Pro AR18 R7 7840U, Radeon 780M, 65 Wh | Ayaneo Kun R7 7840U, Radeon 780M, 75 Wh | Média da turma Handheld / UMPC | |
|---|---|---|---|---|---|---|---|
| Duração da bateria | 20% | -23% | 4% | 39% | -3% | 15% | |
| H.264 | 527 | 568 8% | 629 ? 19% | ||||
| WiFi v1.3 | 466 | 559 20% | 358 -23% | 465 0% | 648 39% | 602 29% | 575 ? 23% |
| Cyberpunk 2077 ultra 150cd | 76 | ||||||
| Load | 76 | 50 -34% | 79.3 ? 4% | ||||
| Witcher 3 ultra | 57 | 72 | 101 | 86.5 ? |
Pro
Contra
Veredicto - O MSI Claw sofre com o processador Intel Meteor Lake
O dispositivo portátil para jogos MSI Claw não foi capaz de nos impressionar durante nosso teste completo. Em geral, seu conceito é semelhante ao do Asus ROG Ally com sua tela de 7 polegadas, que foi lançado há mais de um ano. No entanto, a MSI não optou por um chip da AMD - em vez disso, ela conta com um processador Intel Meteor Lake. Isso traz alguns problemas e mostra por que outros fabricantes não seguiram o mesmo caminho. Apesar do consumo de energia mais alto, o desempenho em jogos é um pouco pior do que em outros dispositivos portáteis da AMD e, ao mesmo tempo, a unidade de resfriamento tem seu trabalho dificultado. As ventoinhas estão praticamente sempre ativas e, no total, o Claw é um dos dispositivos portáteis mais barulhentos do mercado.
Em outros campos, como os joysticks/botões e o software de jogos, por outro lado, o MSI Claw nos deixou uma boa impressão. Sua tela é boa no geral - mesmo que gostaríamos de ter visto uma taxa de atualização variável. Além disso, uma conexão USB adicional teria sido benéfica. Em teoria, o SSD M.2 2230 pode ser trocado, mas, para isso, seria necessário desmontar todo o gabinete e, ao montá-lo novamente, seria preciso reaplicar uma nova pasta térmica.
O dispositivo portátil para jogos MSI Claw demonstra de forma impressionante que as CPUs Intel atuais não são adequadas para dispositivos portáteis para jogos. Devido ao seu desempenho mais fraco para jogos em comparação com a concorrência da AMD, bem como ao seu preço mais alto, o computador de mão Intel não merece nossa recomendação.
Parece que a MSI já identificou esse problema e, apenas três meses após o lançamento do Claw, já anunciou seu sucessorque será equipado com uma tela maior em combinação com um processador Intel Lunar Lake mais eficiente e uma iGPU mais rápida. No entanto, ainda levará alguns meses até que esse modelo seja lançado.
Devido ao seu alto preço de mais de US$ 800, não faz sentido algum optar pelo computador de mão Claw. O maior Legion Go custa apenas US$ 750 (com o SSD menor) e até mesmo o ROG Ally já pode ser encontrado por menos de US$ 700. Além disso, seu sucessor, o ROG Ally X-já está sendo lançado no próximo mês e contará com melhorias significativas (gabinete mais confortável, bateria de 80 Wh, SSD M.2 2280 de 1 TB, 24 GB de RAM, 2x USB) por pouco menos de US$ 1.000. O mais recente Steam Deck OLED com um SSD de 1 TB também é muito mais barato, custando cerca de US$ 630.
Observação: atualizamos nosso sistema de classificação e os resultados da versão 8 não são comparáveis aos resultados da versão 7.
Preço e disponibilidade
Atualmente, nossa configuração de teste do MSI Claw, mas com um SSD de 512 GB, pode ser adquirida na Amazon por um preço reduzido de US$ 649.
MSI Claw
- 06/19/2024 v8
Andreas Osthoff
Transparência
A seleção dos dispositivos a serem analisados é feita pela nossa equipe editorial. A amostra de teste foi fornecida ao autor como empréstimo pelo fabricante ou varejista para fins desta revisão. O credor não teve influência nesta revisão, nem o fabricante recebeu uma cópia desta revisão antes da publicação. Não houve obrigação de publicar esta revisão. Nunca aceitamos compensação ou pagamento em troca de nossas avaliações. Como empresa de mídia independente, a Notebookcheck não está sujeita à autoridade de fabricantes, varejistas ou editores.
É assim que o Notebookcheck está testando
Todos os anos, o Notebookcheck analisa de forma independente centenas de laptops e smartphones usando procedimentos padronizados para garantir que todos os resultados sejam comparáveis. Desenvolvemos continuamente nossos métodos de teste há cerca de 20 anos e definimos padrões da indústria no processo. Em nossos laboratórios de teste, equipamentos de medição de alta qualidade são utilizados por técnicos e editores experientes. Esses testes envolvem um processo de validação em vários estágios. Nosso complexo sistema de classificação é baseado em centenas de medições e benchmarks bem fundamentados, o que mantém a objetividade.


