

Análise do RedMagic Titan 16 Pro: Um laptop para jogos feito por um fabricante de smartphones

Os visitantes regulares deste site talvez já estejam familiarizados com a marca "RedMagic" do segmento de smartphones para jogos (por exemplo, o Nubia RedMagic 9 Pro). O RedMagic Titan 16 Pro é a primeira incursão da Nubia no mundo dos laptops para jogos. Sua folha de dados não traz surpresas: A Core i9-14900HX é combinado com uma GeForce RTX 4060. Isso é acompanhado por uma tela de 16 polegadas com proporção 16:10, Thunderbolt 4, RAM DDR5 e 2 slots de SSD.
Resta saber se a Nubia conseguirá enfrentar a concorrência já bem estabelecida. O Titan concorre com os seguintes dispositivos: O Lenovo Legion Pro 5 16IRX9, HP Victus 16 (2024), Acer Predator Helios Neo 16 (2024), XMG Pro 16 Studio (Mid 24) e o Gigabyte G6X 9KG (2024).
Possíveis concorrentes em comparação
Avaliação | Versão | Data | Modelo | Peso | Altura | Size | Resolução | Preço |
|---|---|---|---|---|---|---|---|---|
| 81.2 % | v8 | 08/2024 | Nubia RedMagic Titan 16 Pro i9-14900HX, NVIDIA GeForce RTX 4060 Laptop GPU | 2.4 kg | 23.9 mm | 16.00" | 2560x1600 | |
| 82.3 % | v8 | 07/2024 | Lenovo Legion Pro 5 16IRX9 G9 i7-14700HX, NVIDIA GeForce RTX 4060 Laptop GPU | 2.5 kg | 26.55 mm | 16.00" | 2560x1600 | |
| 84.3 % v7 (old) | v7 (old) | 05/2024 | HP Victus 16 (2024) i7-14700HX, NVIDIA GeForce RTX 4060 Laptop GPU | 2.4 kg | 23.9 mm | 16.10" | 1920x1080 | |
| 86.8 % v7 (old) | v7 (old) | 05/2024 | Acer Predator Helios Neo 16 (2024) i7-14700HX, NVIDIA GeForce RTX 4070 Laptop GPU | 2.6 kg | 25.95 mm | 16.00" | 2560x1600 | |
| 81.2 % | v8 | 07/2024 | SCHENKER XMG Pro 16 Studio (Mid 24) i9-14900HX, NVIDIA GeForce RTX 4070 Laptop GPU | 2.3 kg | 19.9 mm | 16.00" | 2560x1600 | |
| 83.2 % v7 (old) | v7 (old) | 03/2024 | Gigabyte G6X 9KG (2024) i7-13650HX, NVIDIA GeForce RTX 4060 Laptop GPU | 2.6 kg | 25.1 mm | 16.00" | 1920x1200 |
Observação: Atualizamos recentemente nosso sistema de classificação e os resultados da versão 8 não são comparáveis aos resultados da versão 7. Mais informações estão disponíveis aqui.
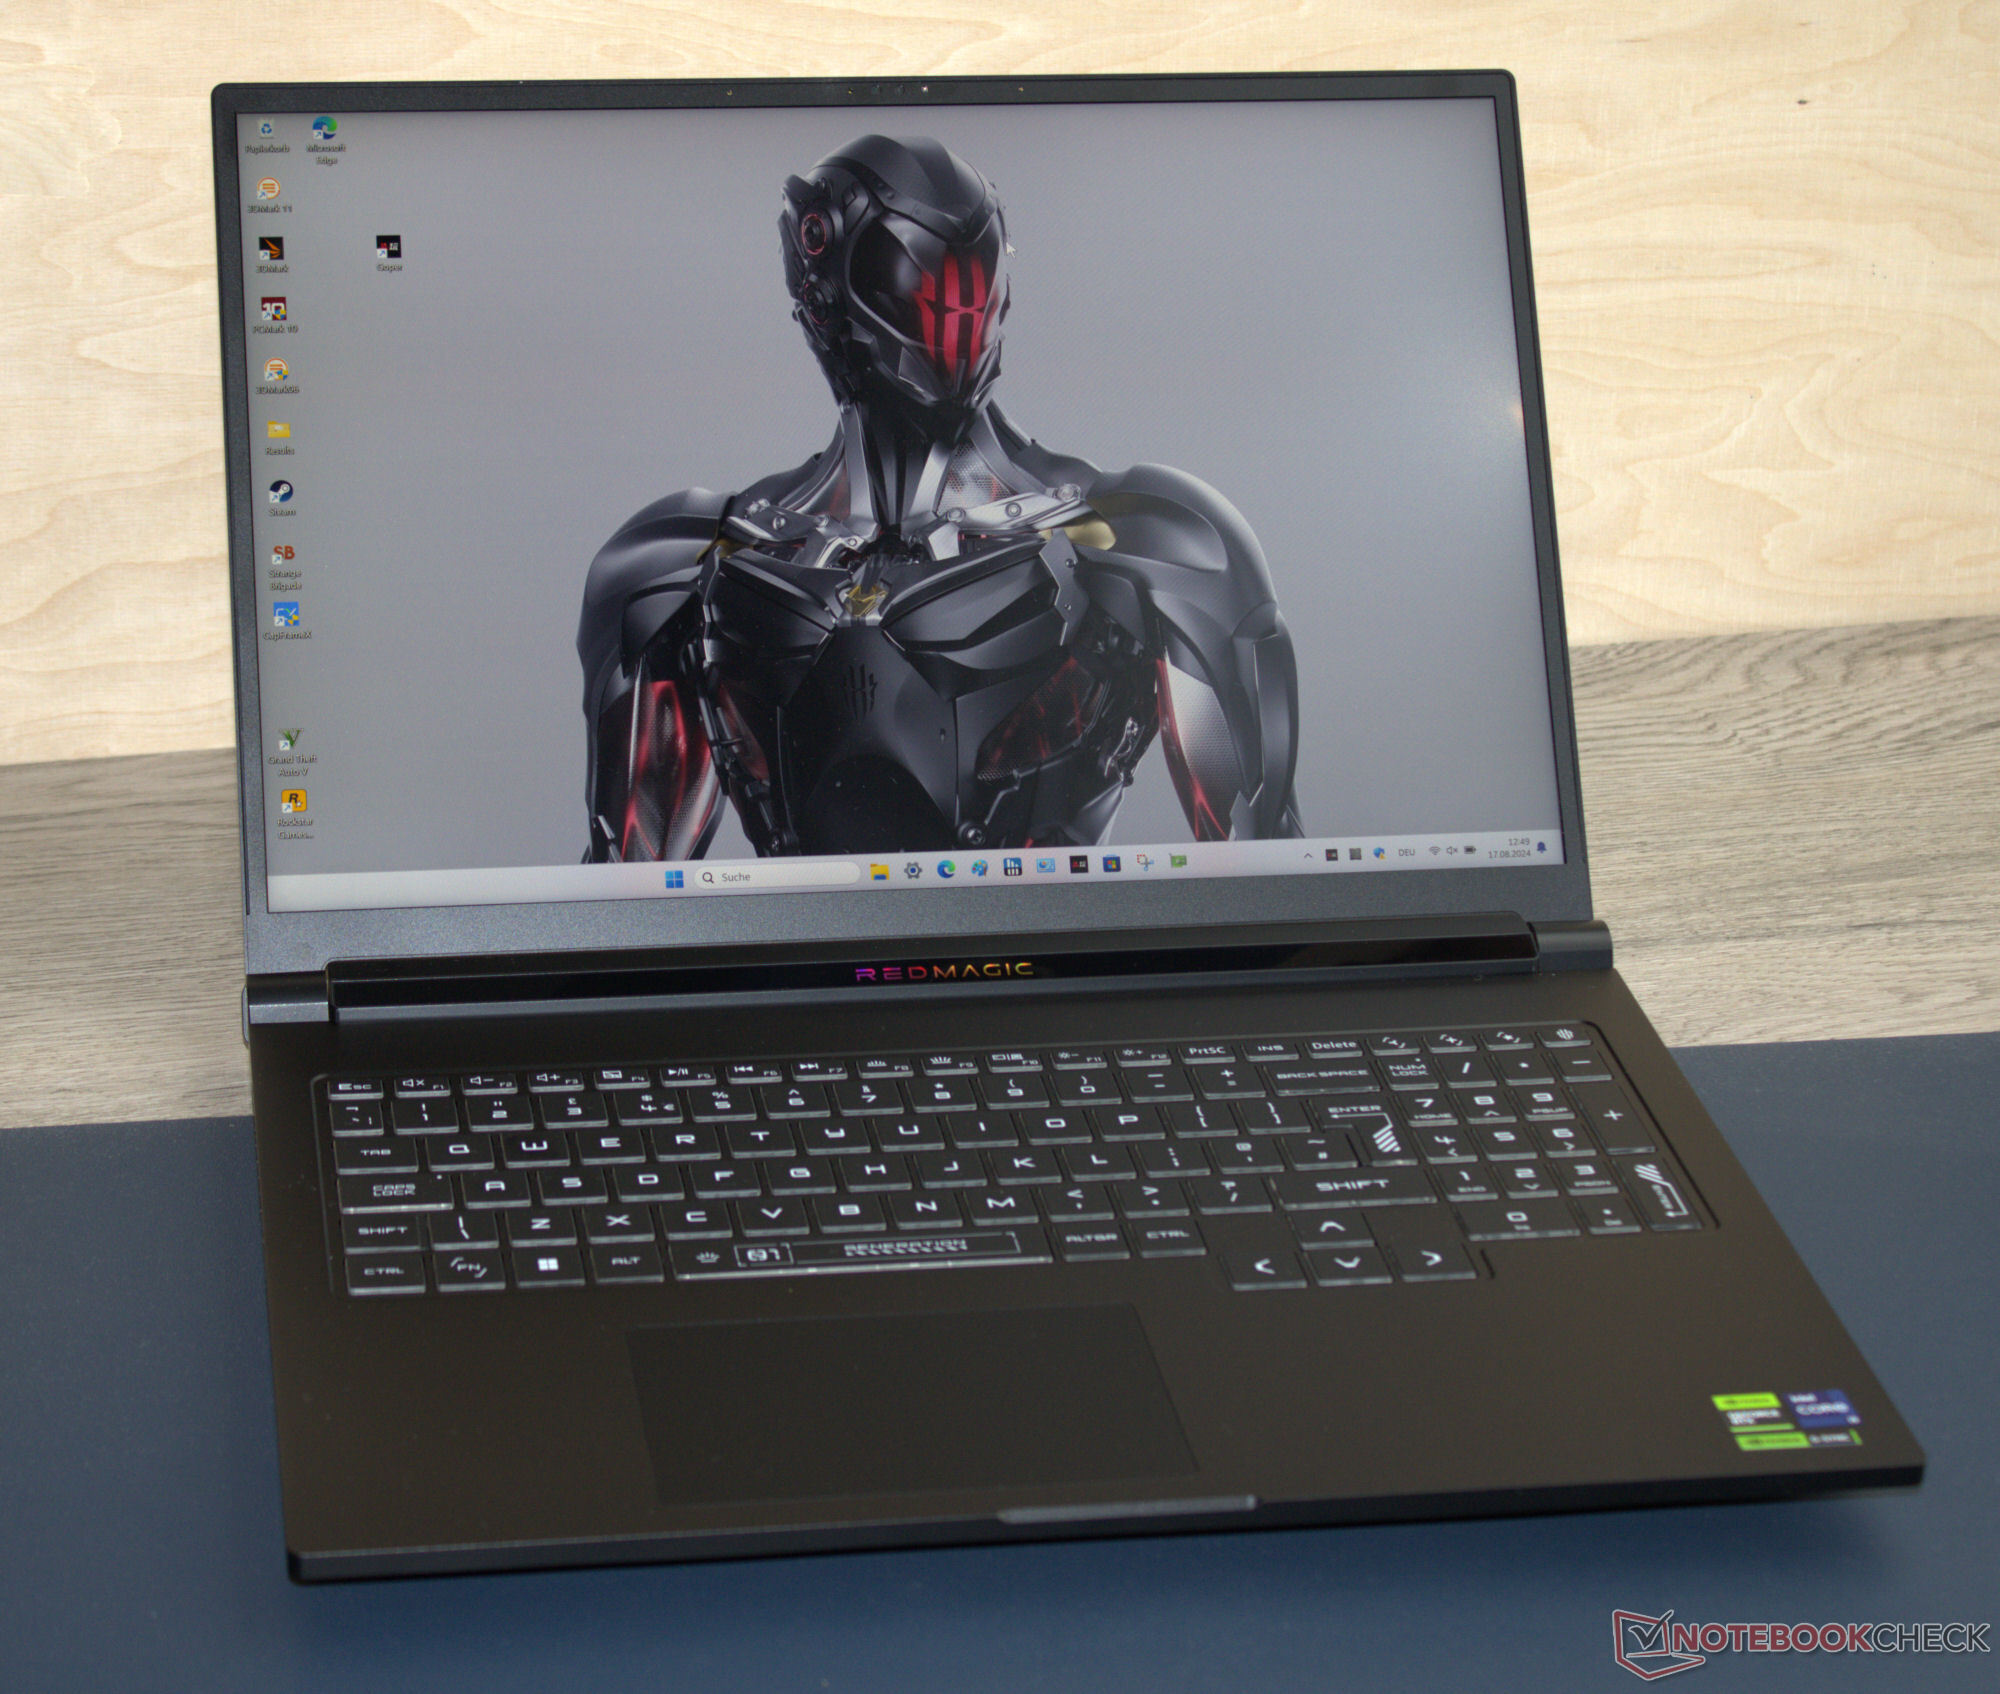
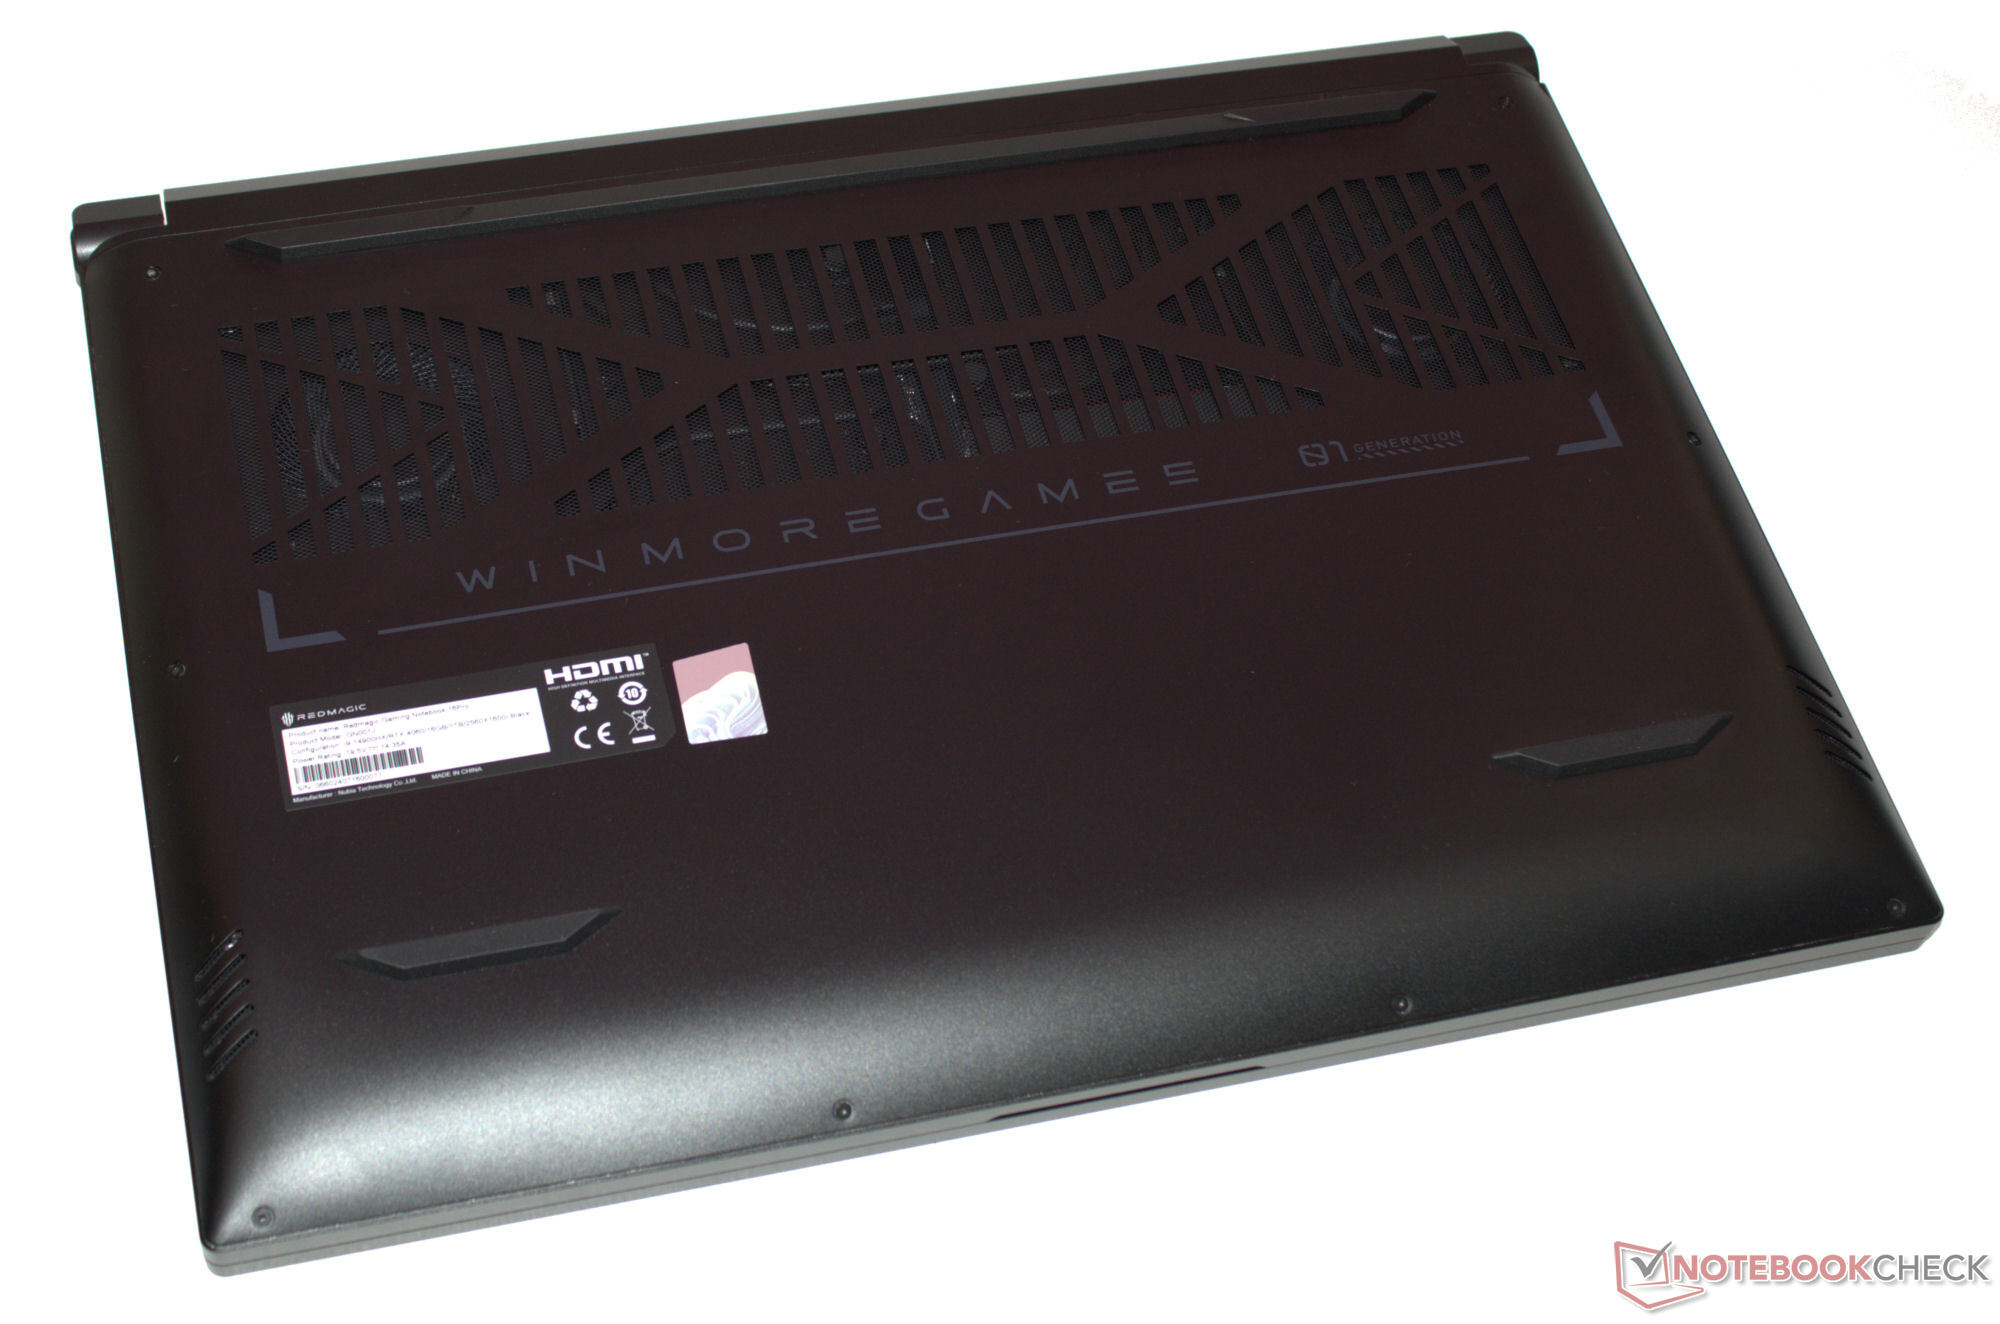
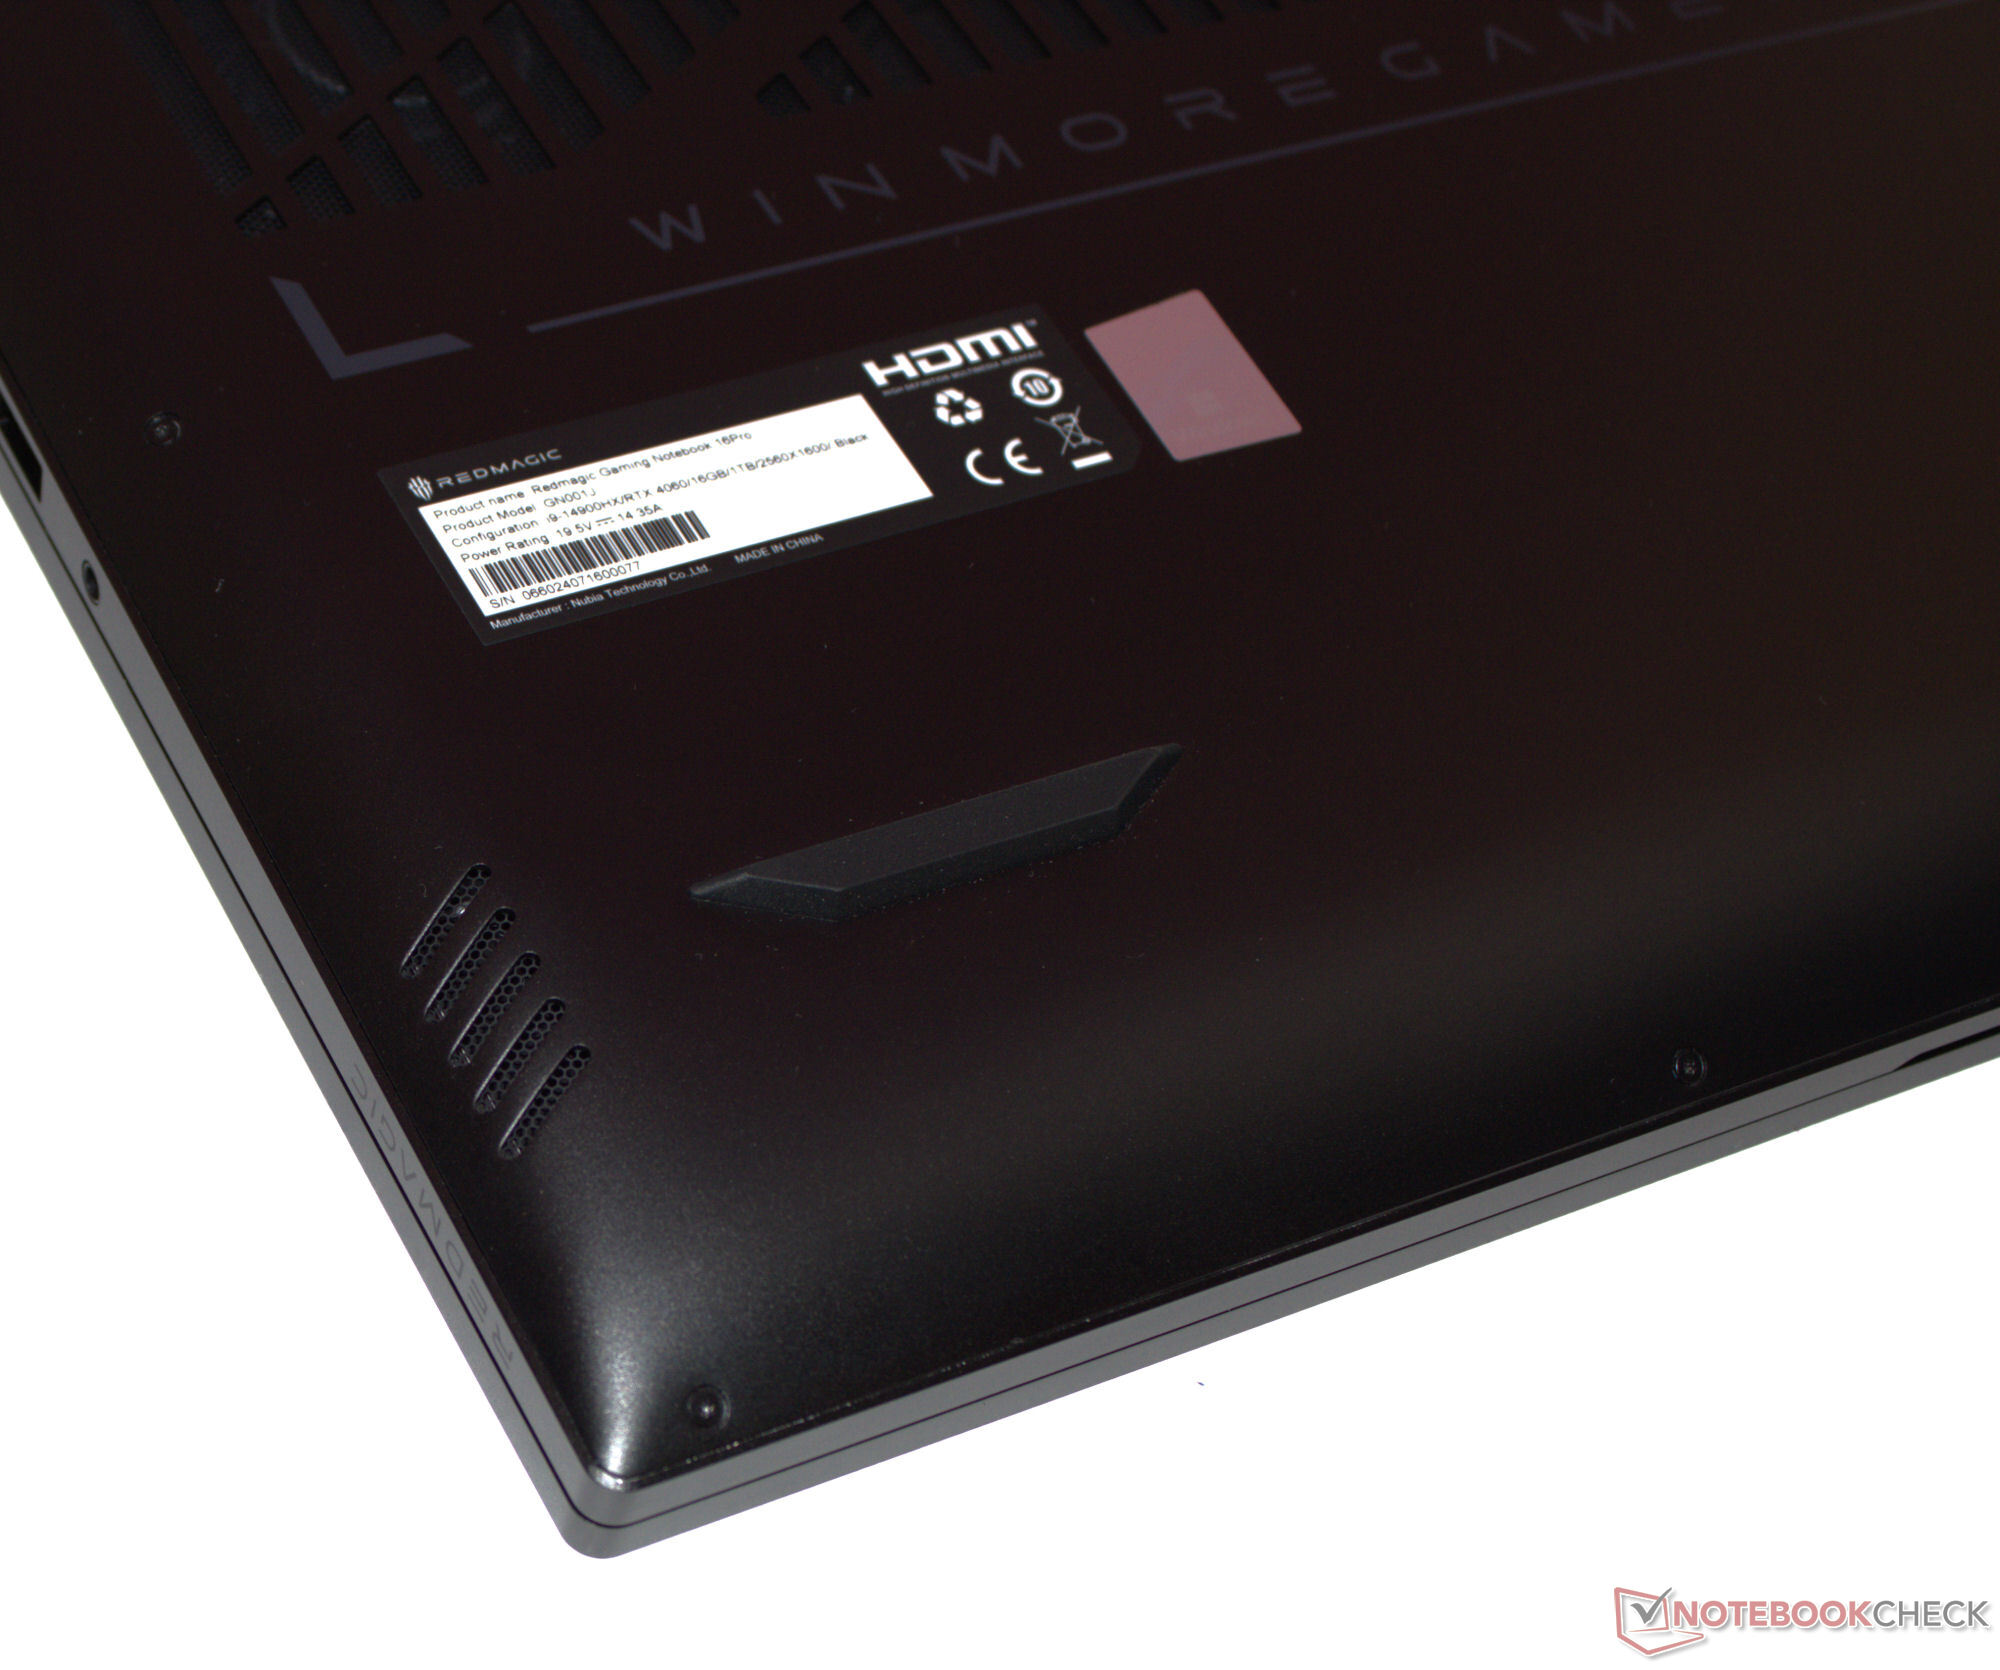
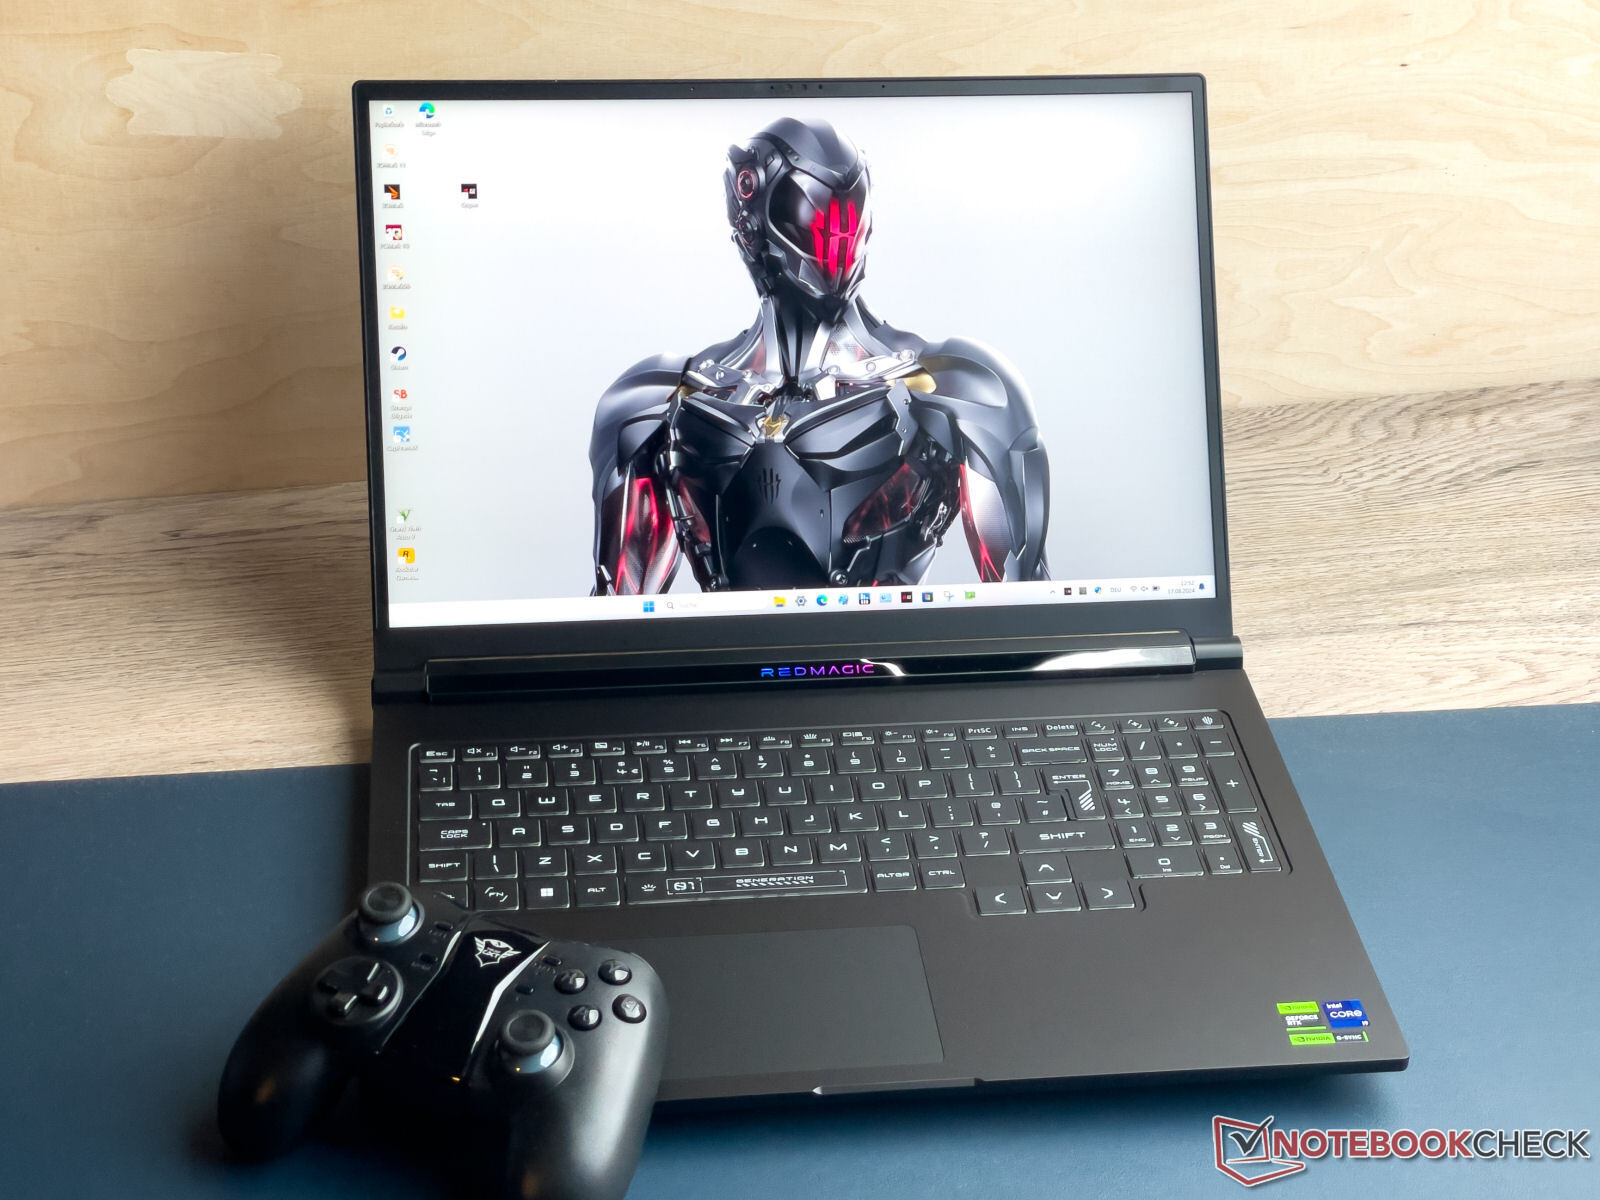
Gabinete - A Nubia optou por um gabinete de alumínio
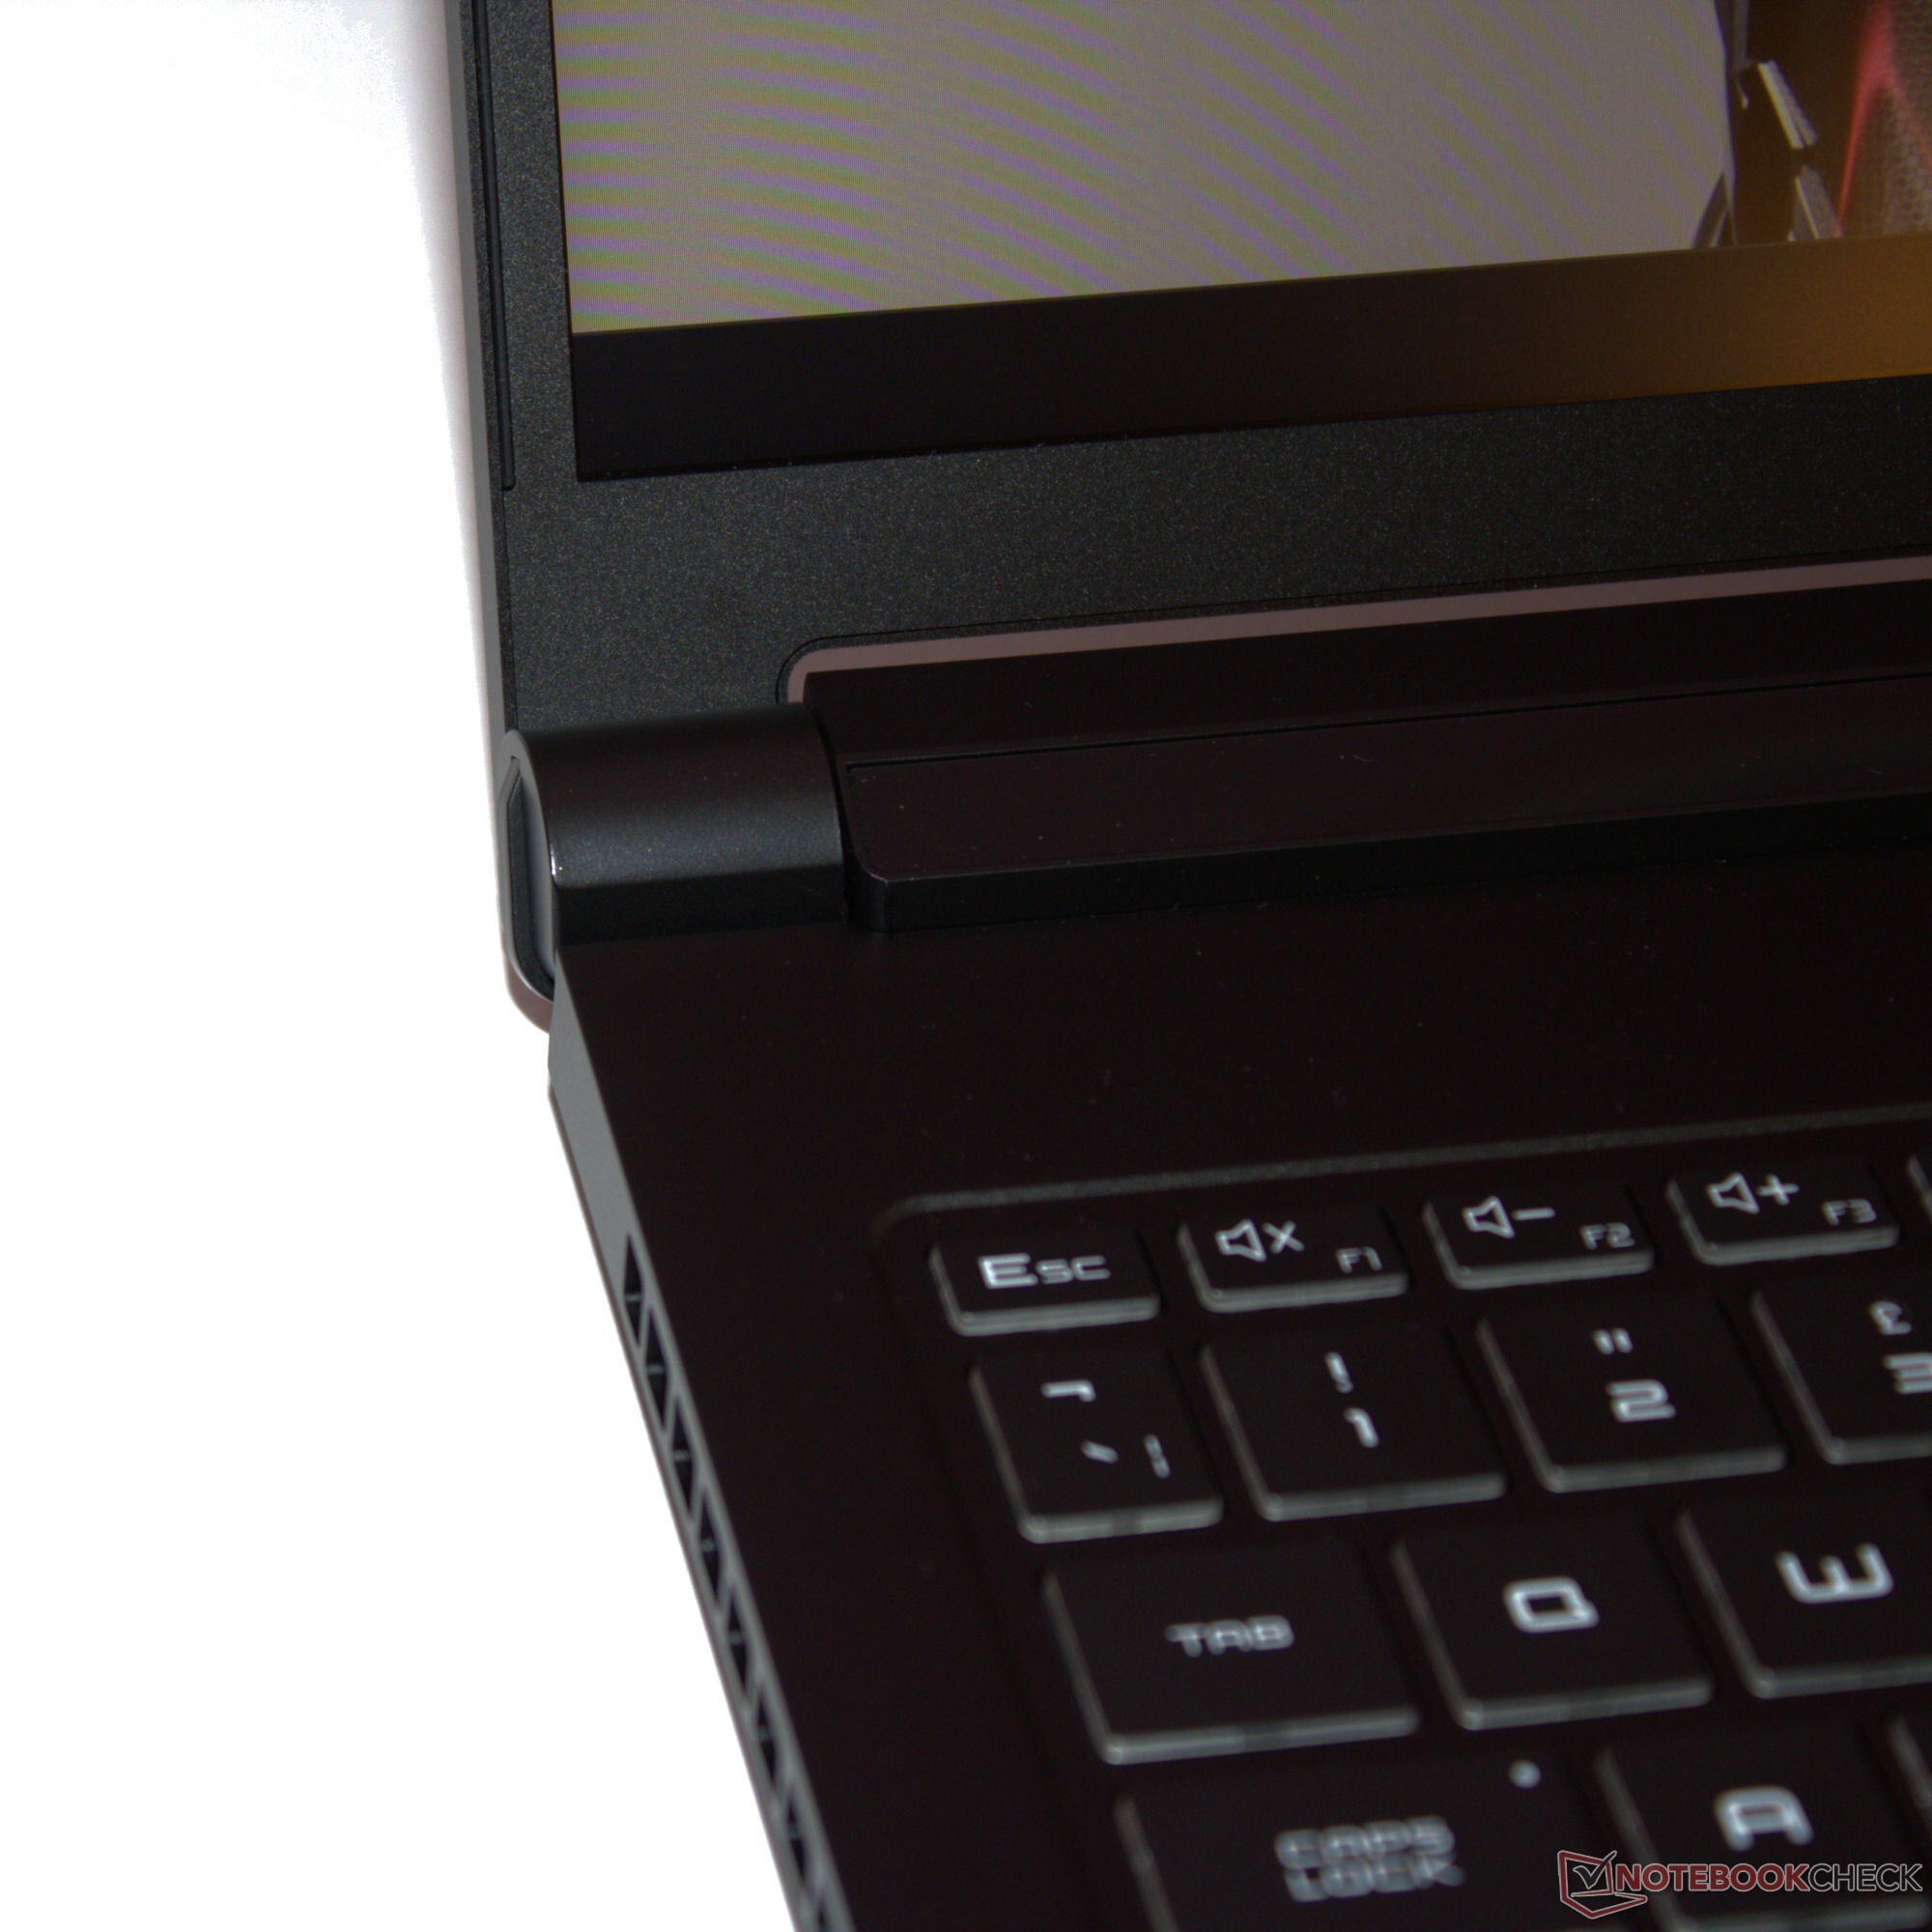
O senhor deve manter sempre um pano de limpeza por perto: As superfícies do gabinete preto fosco são muito sensíveis a marcas de impressões digitais. A unidade de base e a tampa do gabinete de alumínio só podem ser torcidas um pouco e não encontramos nenhum erro de construção. Aplicar pressão na parte traseira da tampa não resulta em nenhuma alteração na imagem. As dobradiças bem apertadas mantêm a tampa firmemente na posição e ela oscila apenas um pouco. Seu ângulo máximo de abertura é de 130 graus e o senhor pode abri-la com uma mão.
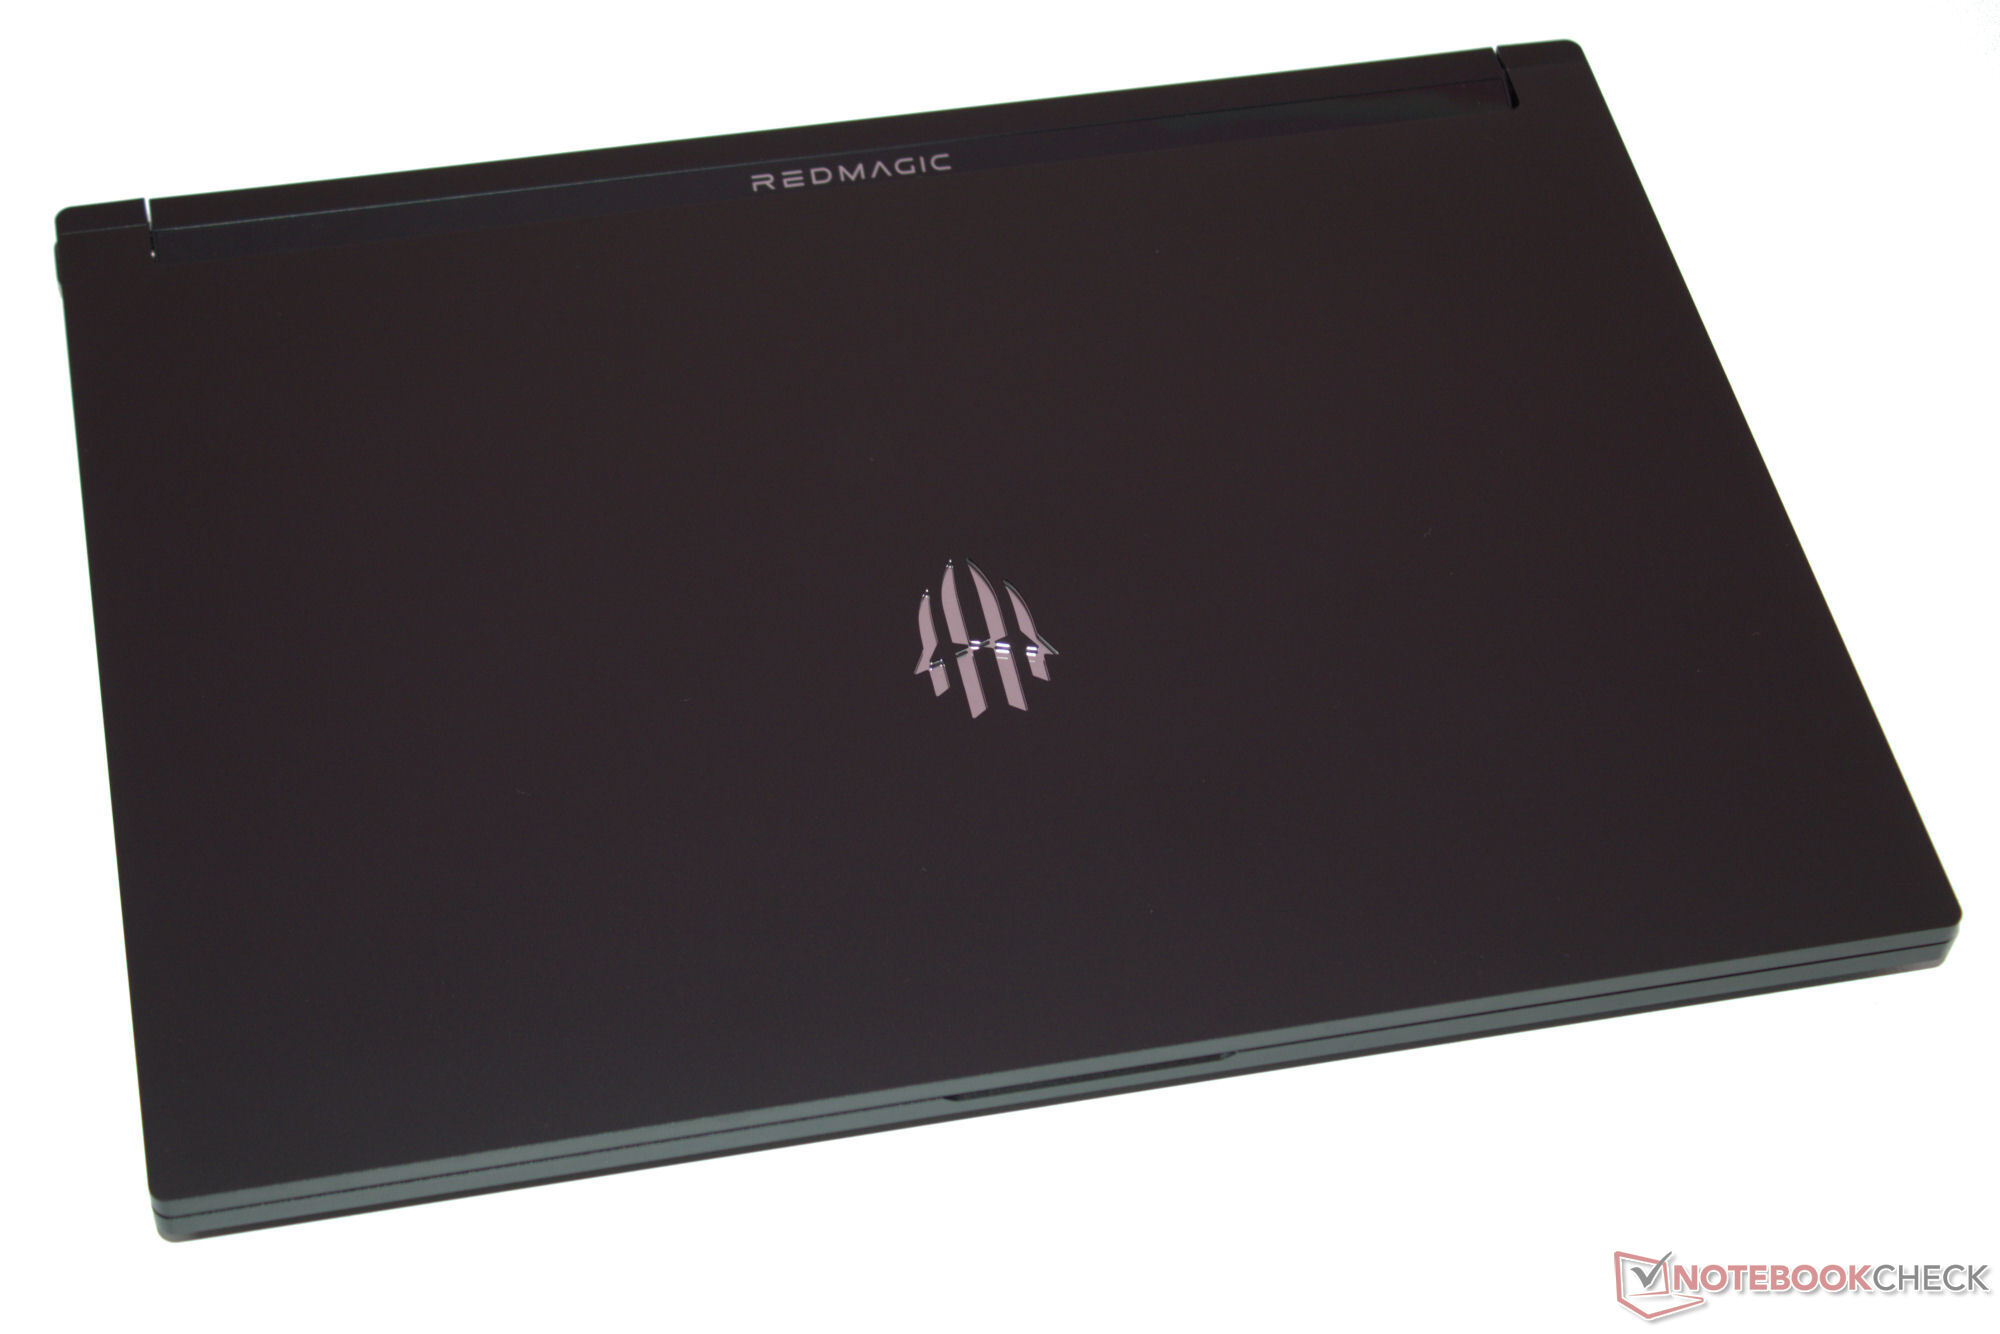
Junto com o teclado retroiluminado do laptop, dois elementos de LED trazem um pouco de cor à mistura: As letras RedMagic na tampa da dobradiça e o logotipo na tampa brilham em todas as cores do arco-íris. Todos os elementos podem ser controlados individualmente. A inscrição também serve como indicador de bateria: uma luz vermelha piscando indica um nível baixo de carga.
Dentro do campo de comparação, o Titan prova ser um dos dispositivos mais compactos e leves. Mesmo assim, as diferenças em relação à concorrência são muito pequenas.
Conectividade - O Titan possui Thunderbolt 4
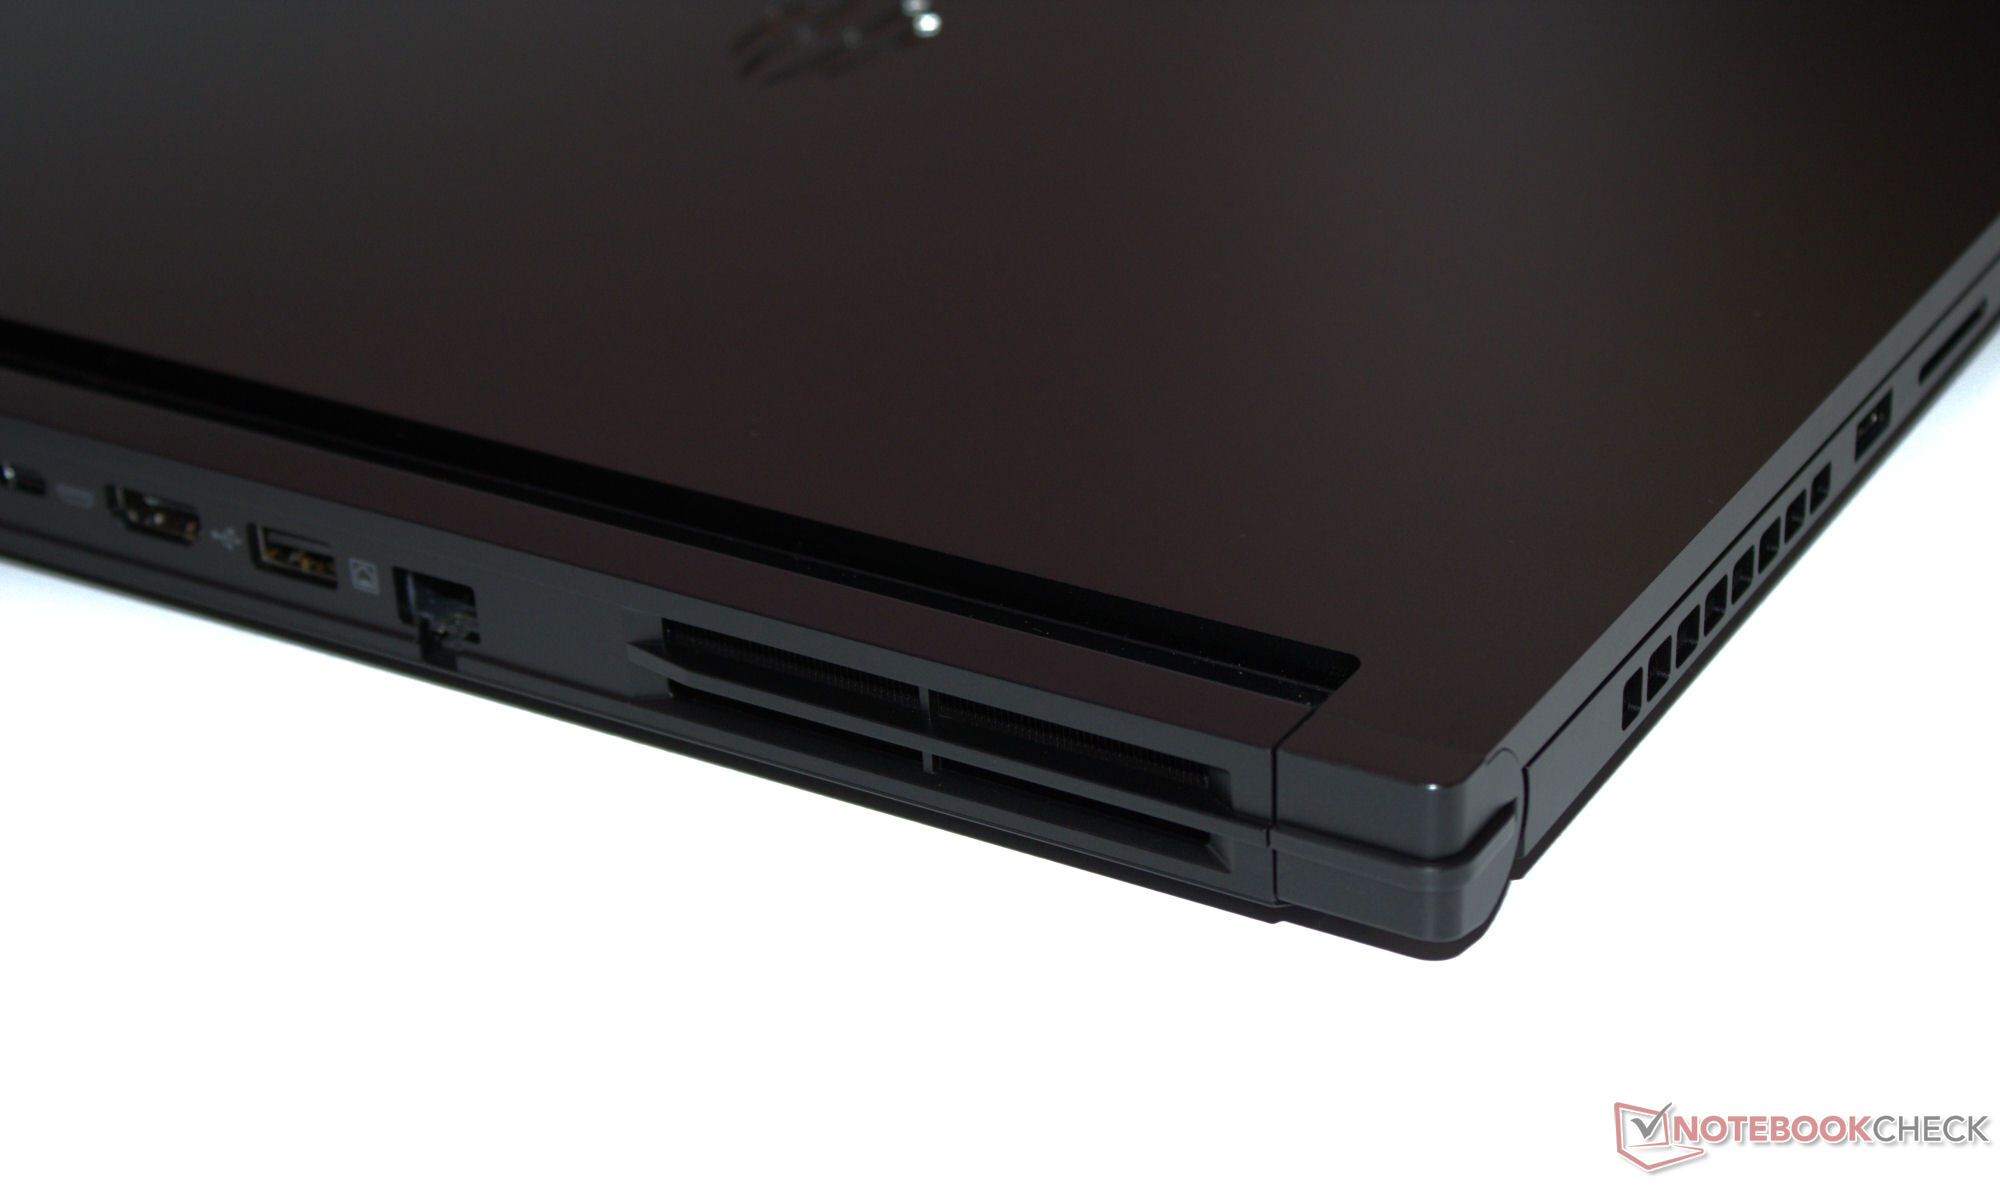
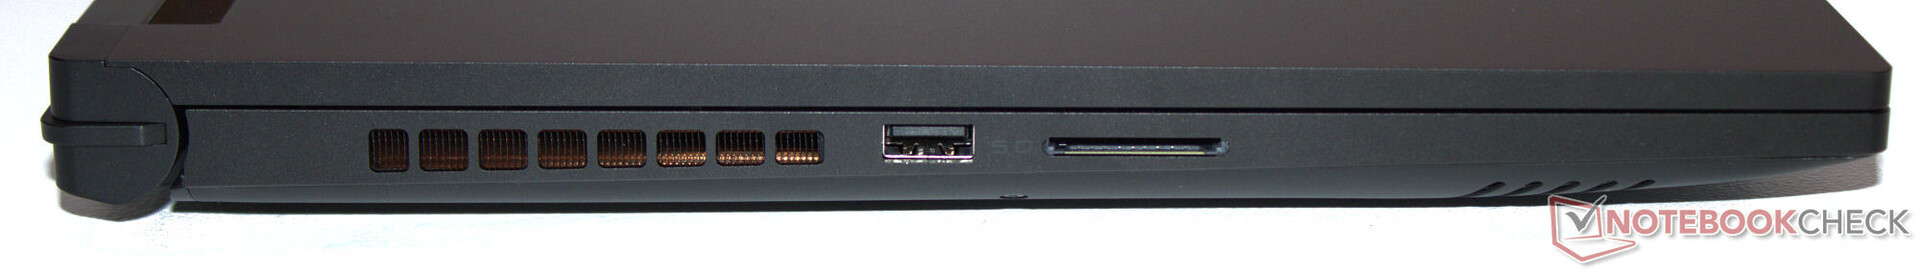
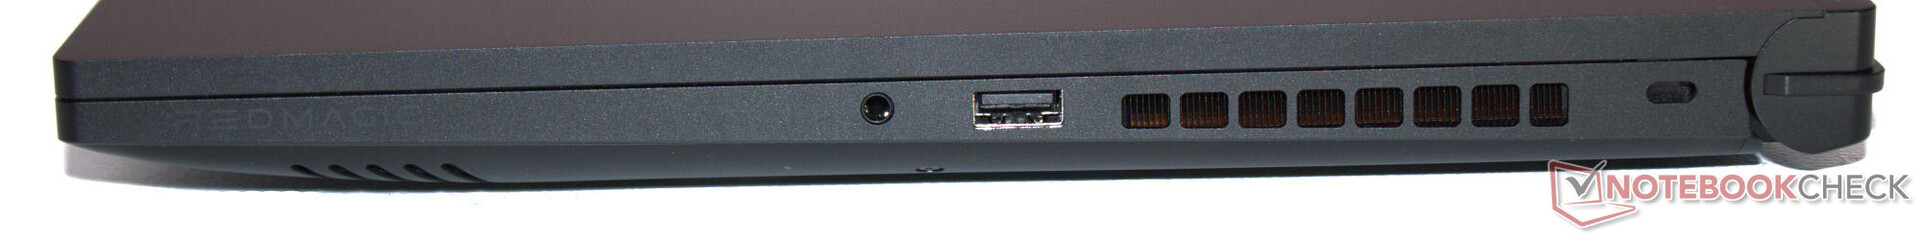
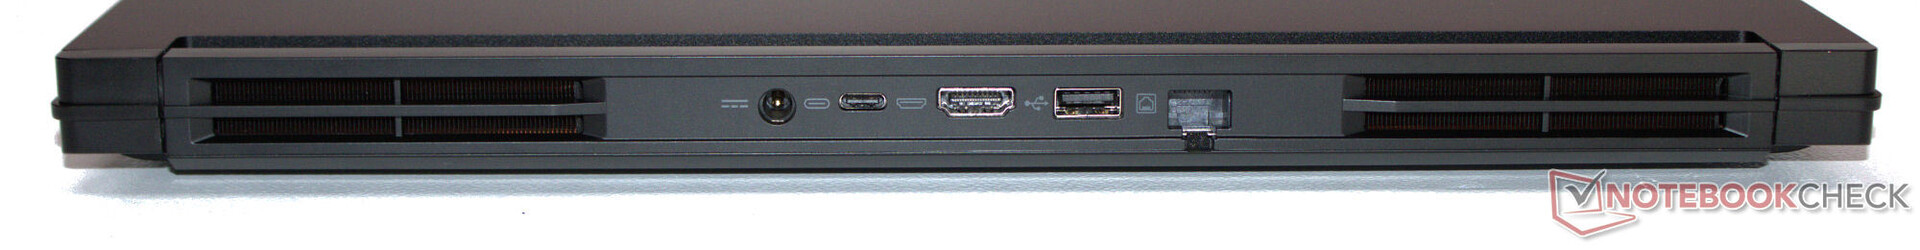
O Titan está equipado com três portas USB-A (2x USB 3.2 Gen 2, 1x USB 3.2 Gen 1), bem como uma porta USB-C (Thunderbolt 4). A última suporta Power Delivery e modo DP Alt. Ele tem um total de duas saídas de vídeo (1x HDMI, 1x DP). Um conector de áudio e uma porta ethernet (1 GBit/s) completam o pacote total.
As saídas de vídeo, o soquete de rede e a conexão de energia estão todos localizados na parte traseira do dispositivo, de modo que os cabos correspondentes não devem atrapalhar o usuário durante o uso. Um ponto positivo é que há uma porta USB-A nos lados esquerdo e direito do laptop.
Leitor de cartão SD
O leitor de cartão SD (cartão de referência: AV PRO microSD 128 GB V60) não é um dos mais rápidos de seu tipo, mas oferece taxas de dados sólidas na faixa médio-rápida. Comparando isso com os valores do Blade 16 (2024) prova que taxas de transferência significativamente mais altas poderiam ser possíveis.
| SD Card Reader | |
| average JPG Copy Test (av. of 3 runs) | |
| Razer Blade 16 2024, RTX 4090 | |
| Média da turma Gaming (19 - 197.3, n=68, últimos 2 anos) | |
| SCHENKER XMG Pro 16 Studio (Mid 24) (AV PRO microSD 128 GB V60) | |
| Nubia RedMagic Titan 16 Pro (AV PRO microSD 128 GB V60) | |
| Acer Predator Helios Neo 16 (2024) (AV PRO microSD 128 GB V60) | |
| maximum AS SSD Seq Read Test (1GB) | |
| Razer Blade 16 2024, RTX 4090 | |
| Média da turma Gaming (25.8 - 263, n=67, últimos 2 anos) | |
| SCHENKER XMG Pro 16 Studio (Mid 24) (AV PRO microSD 128 GB V60) | |
| Nubia RedMagic Titan 16 Pro (AV PRO microSD 128 GB V60) | |
| Acer Predator Helios Neo 16 (2024) (AV PRO microSD 128 GB V60) | |
Comunicação
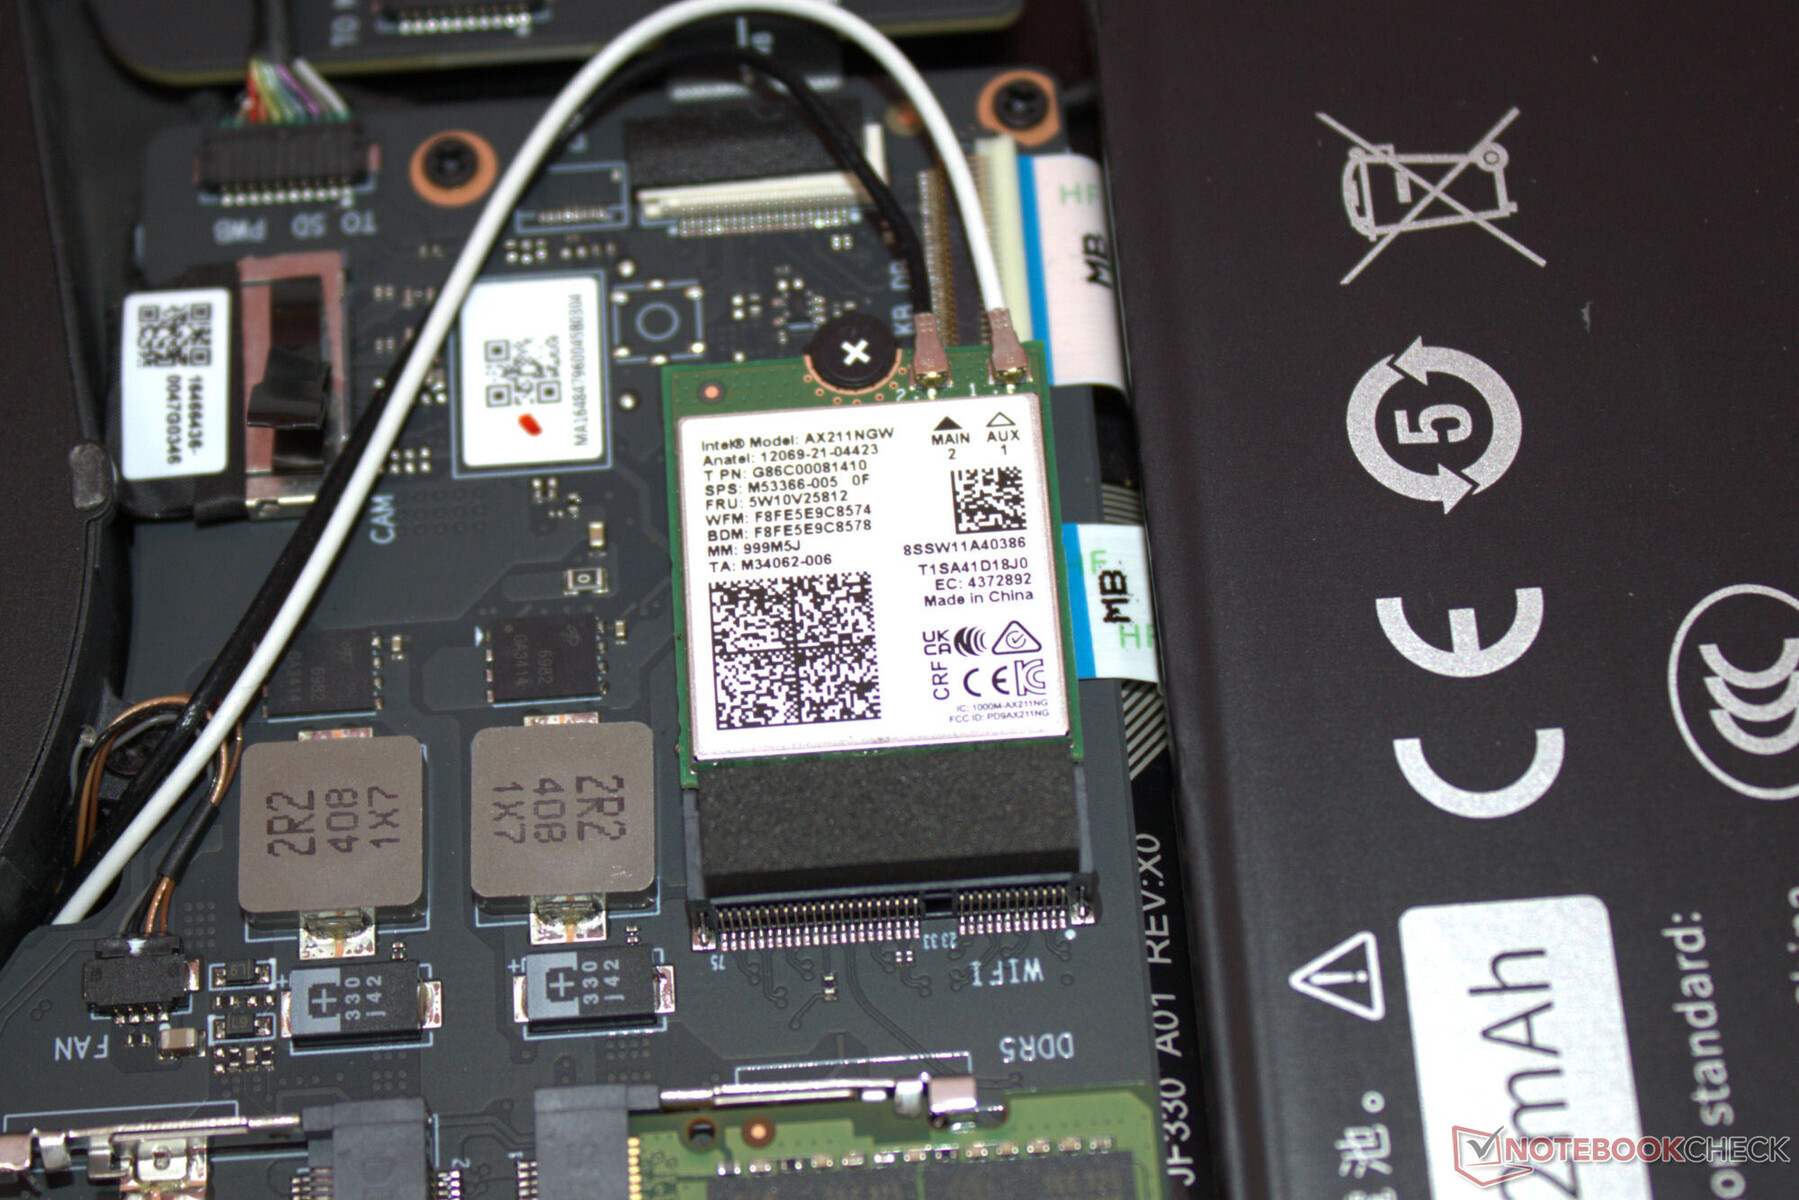
Não há surpresas quando se trata de suas opções de rede: As conexões com fio são gerenciadas por um controlador Gigabit Ethernet estabelecido (RTL8168/8111, 1 GBit/s) da Realtek. O chip WiFi 6E da Intel (AX211) oferece taxas de dados boas a muito boas em condições ideais (nenhum dispositivo WiFi nas proximidades, distância curta entre o laptop e o servidor).
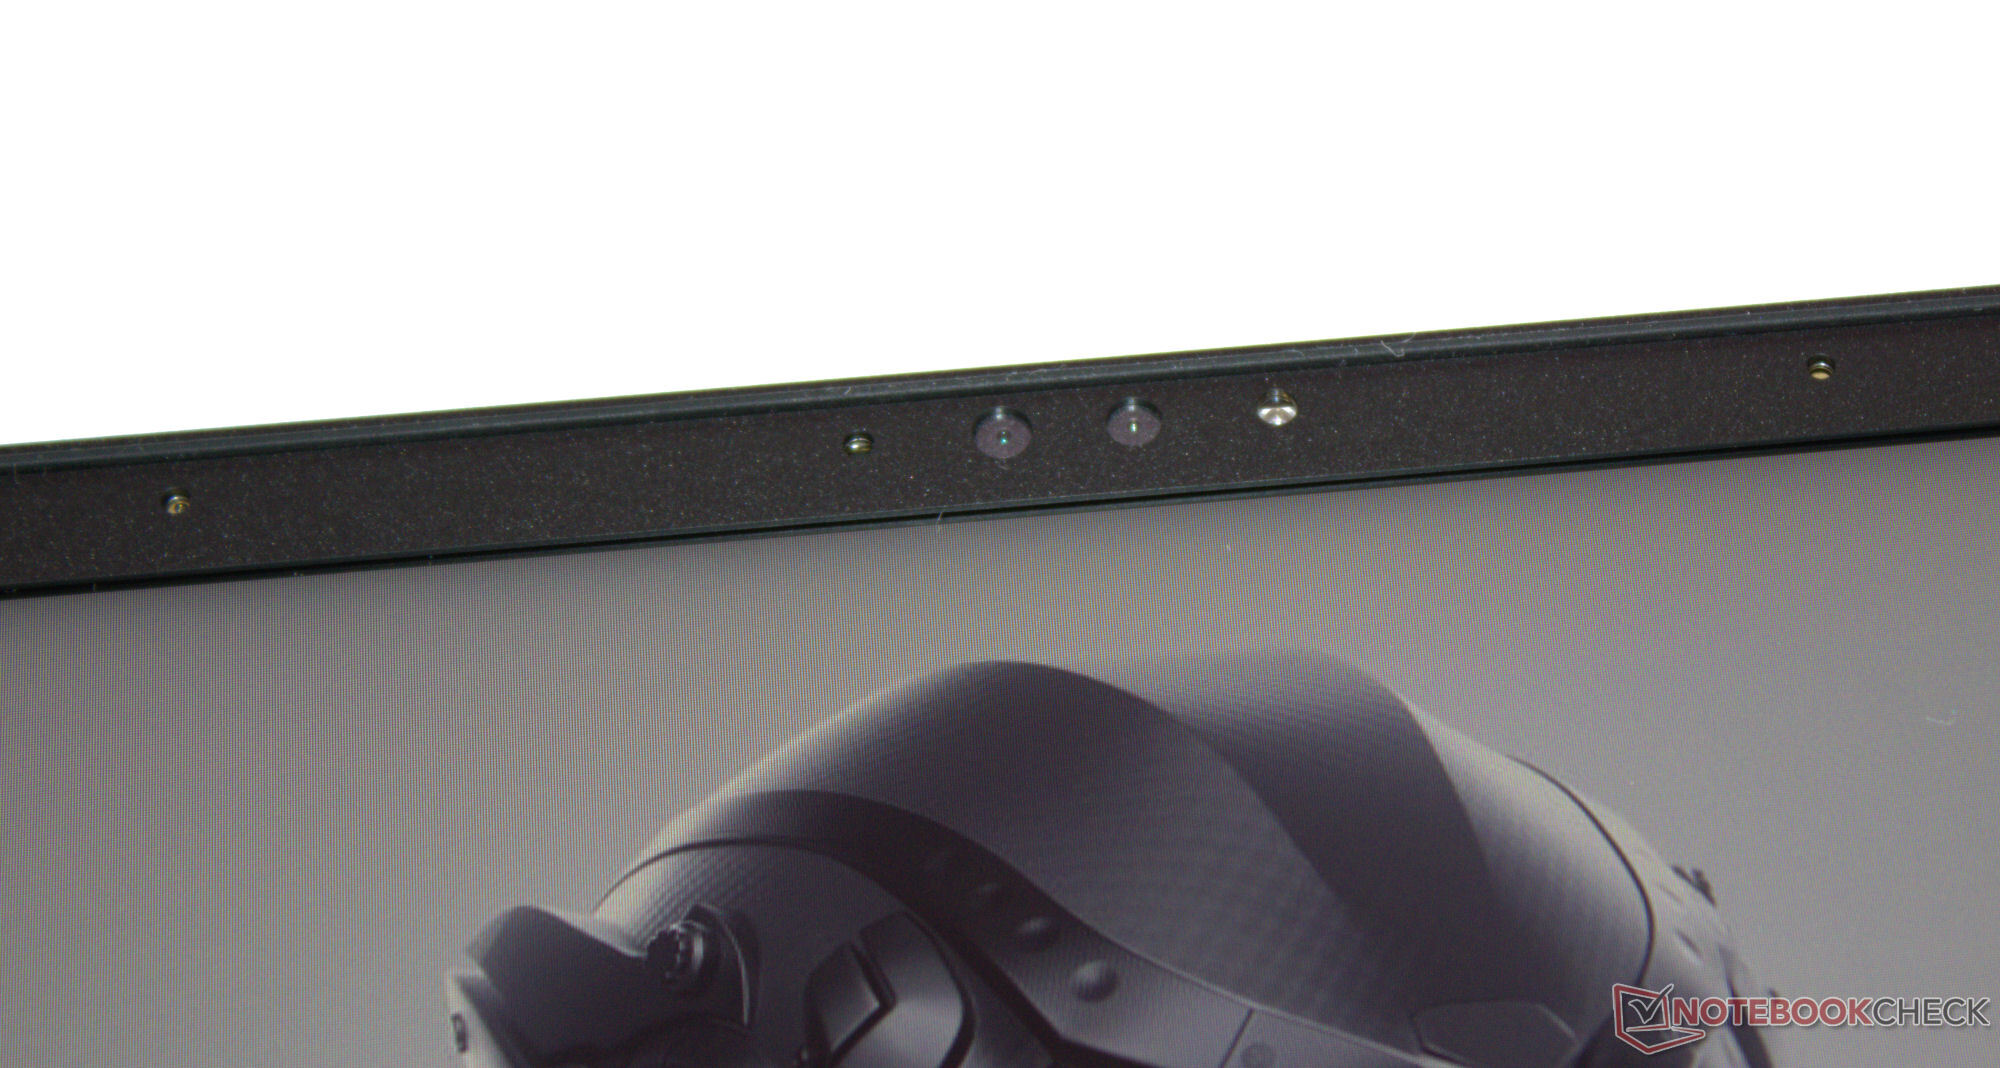
Webcam
A webcam (2,1 MP) é padrão, incluindo suporte para o Windows Hello. A câmera não possui uma tampa mecânica nem um botão físico para ligar/desligar.


Acessórios
Além dos documentos habituais (guia de início rápido e informações sobre garantia), nenhum acessório adicional está incluído no laptop.
Manutenção
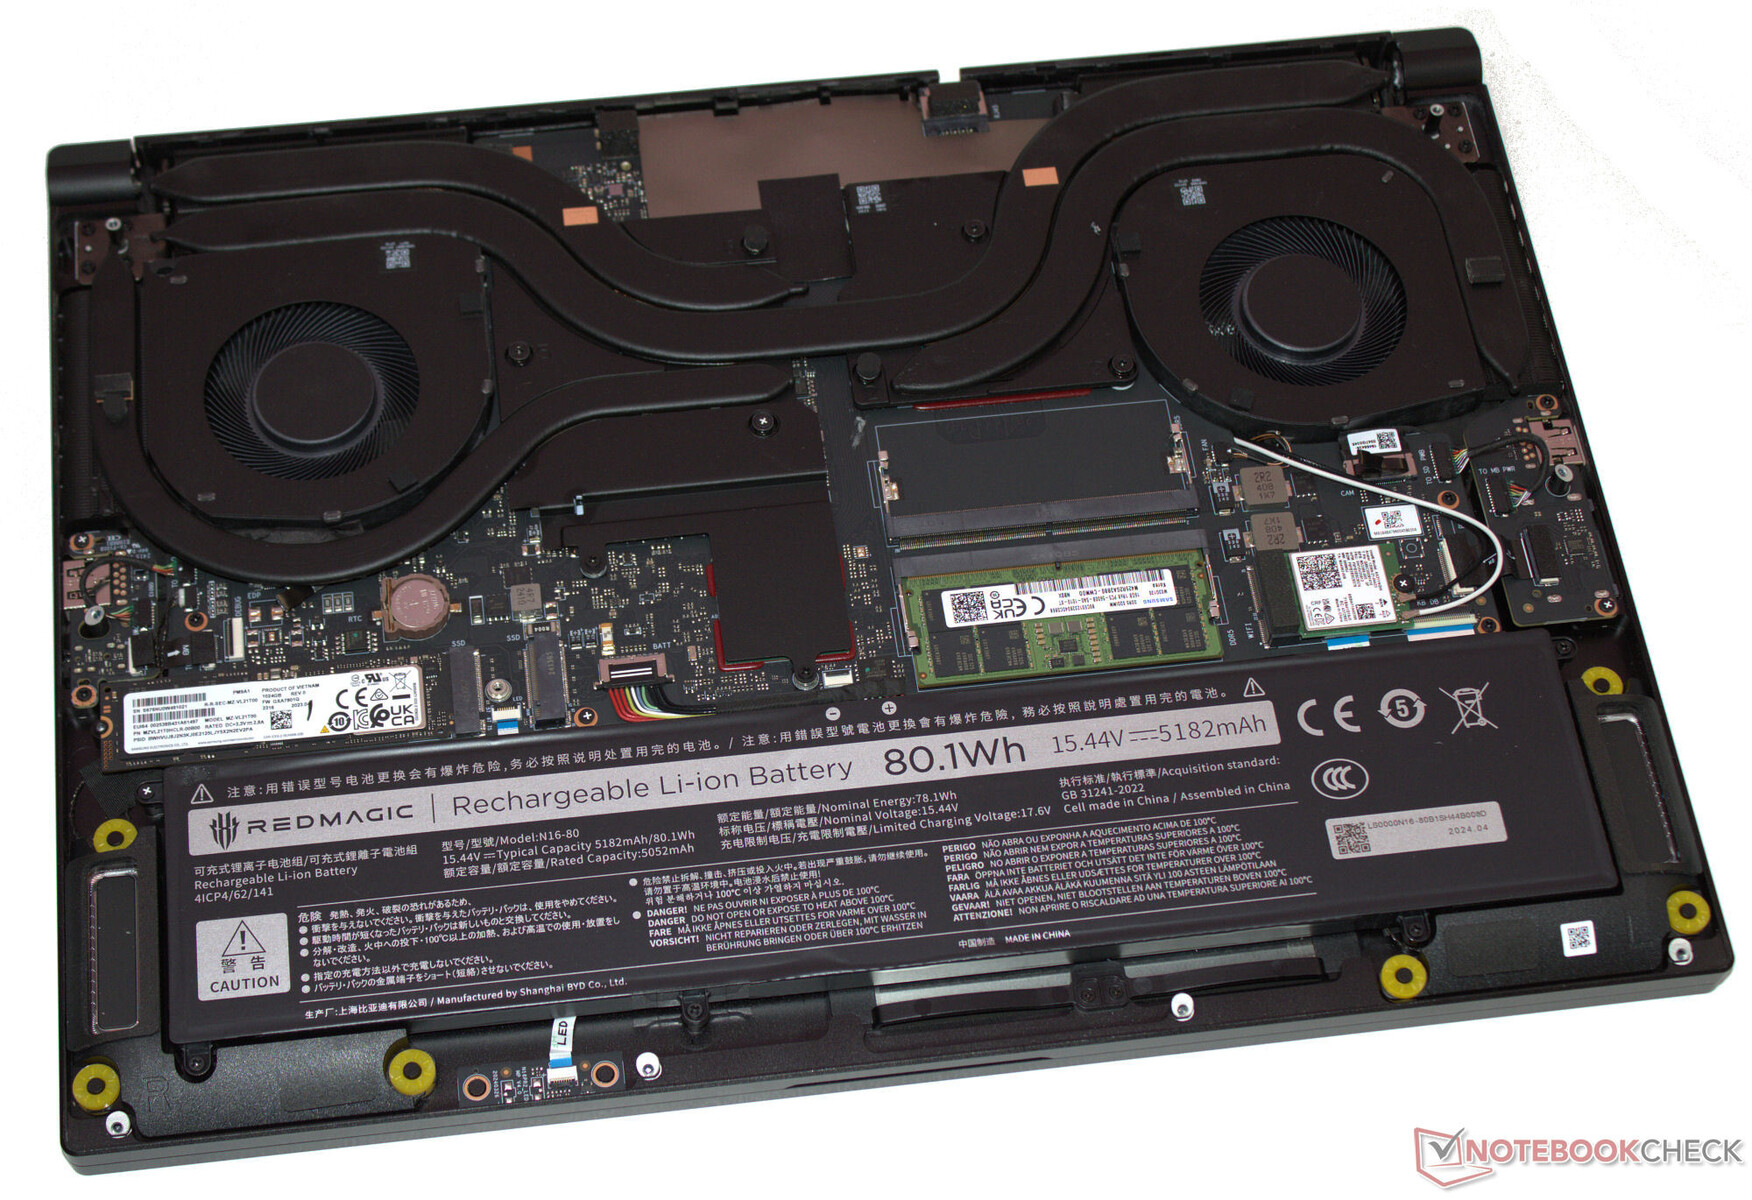
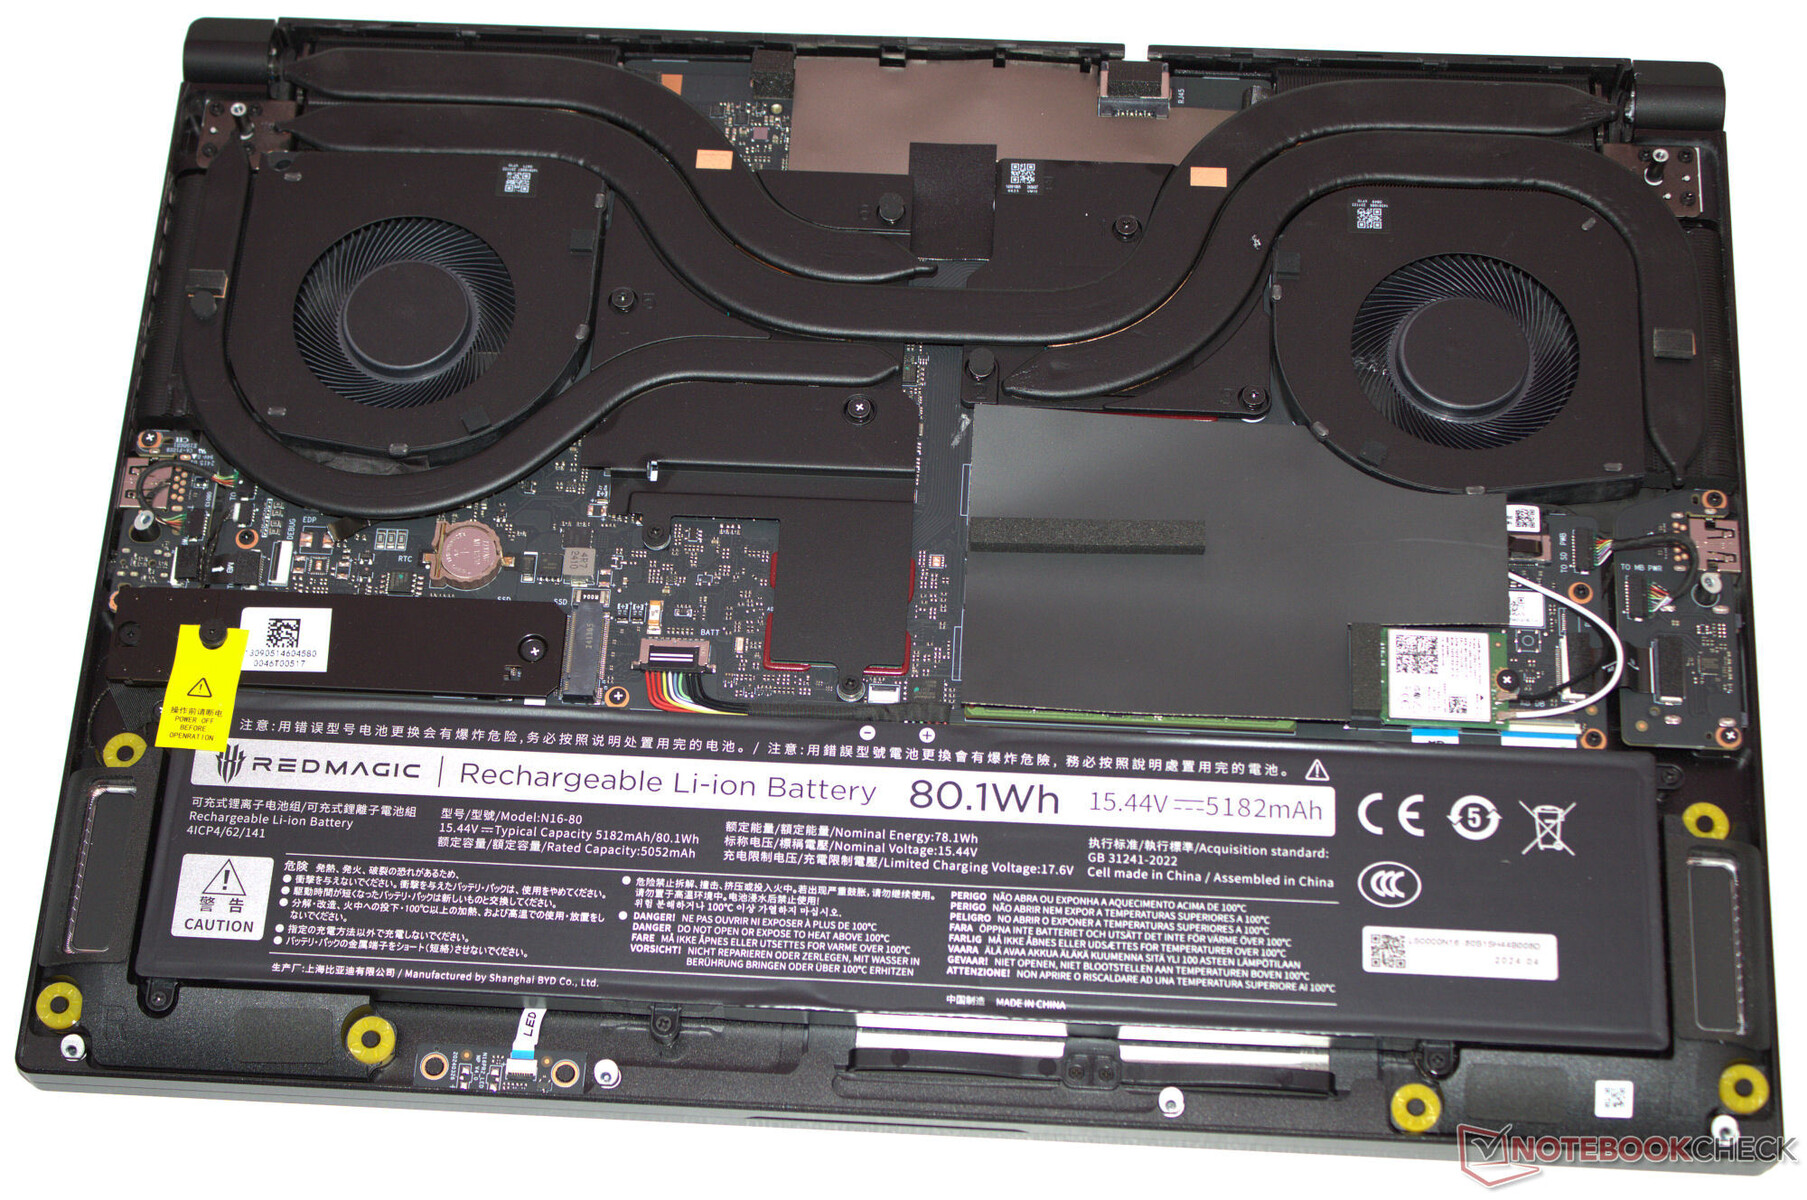
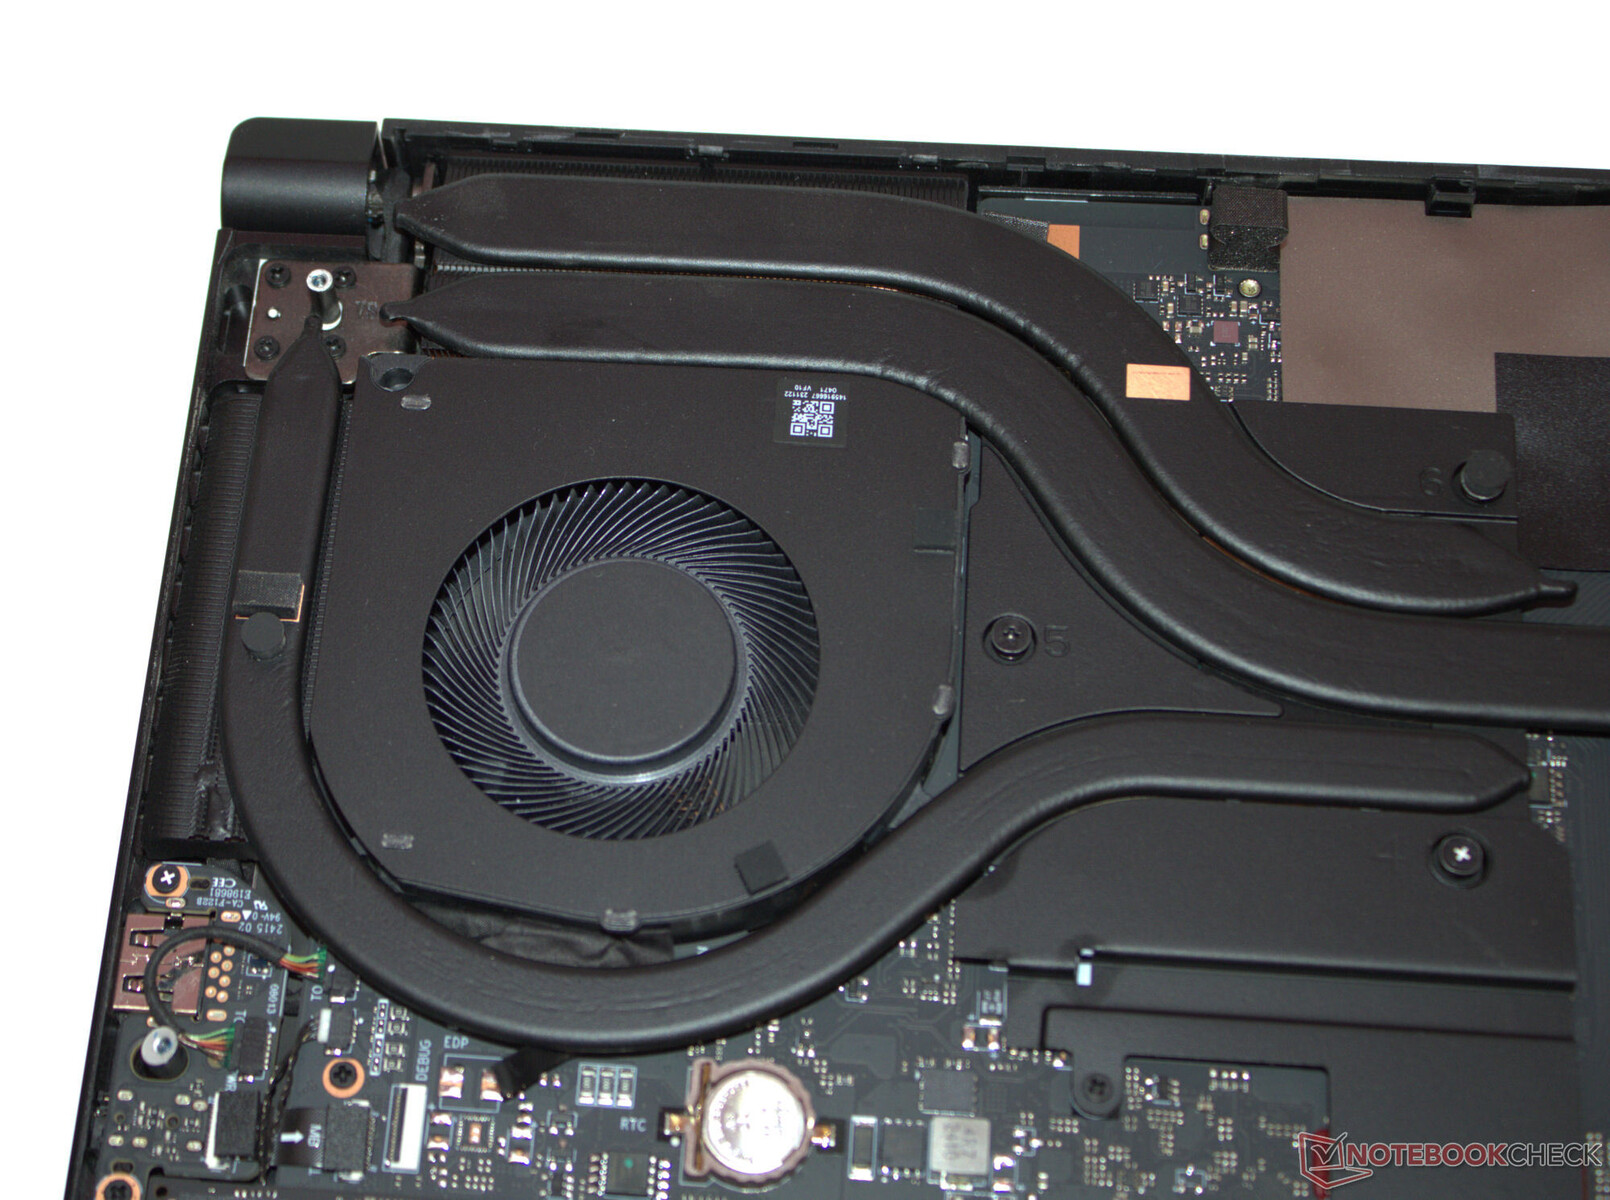
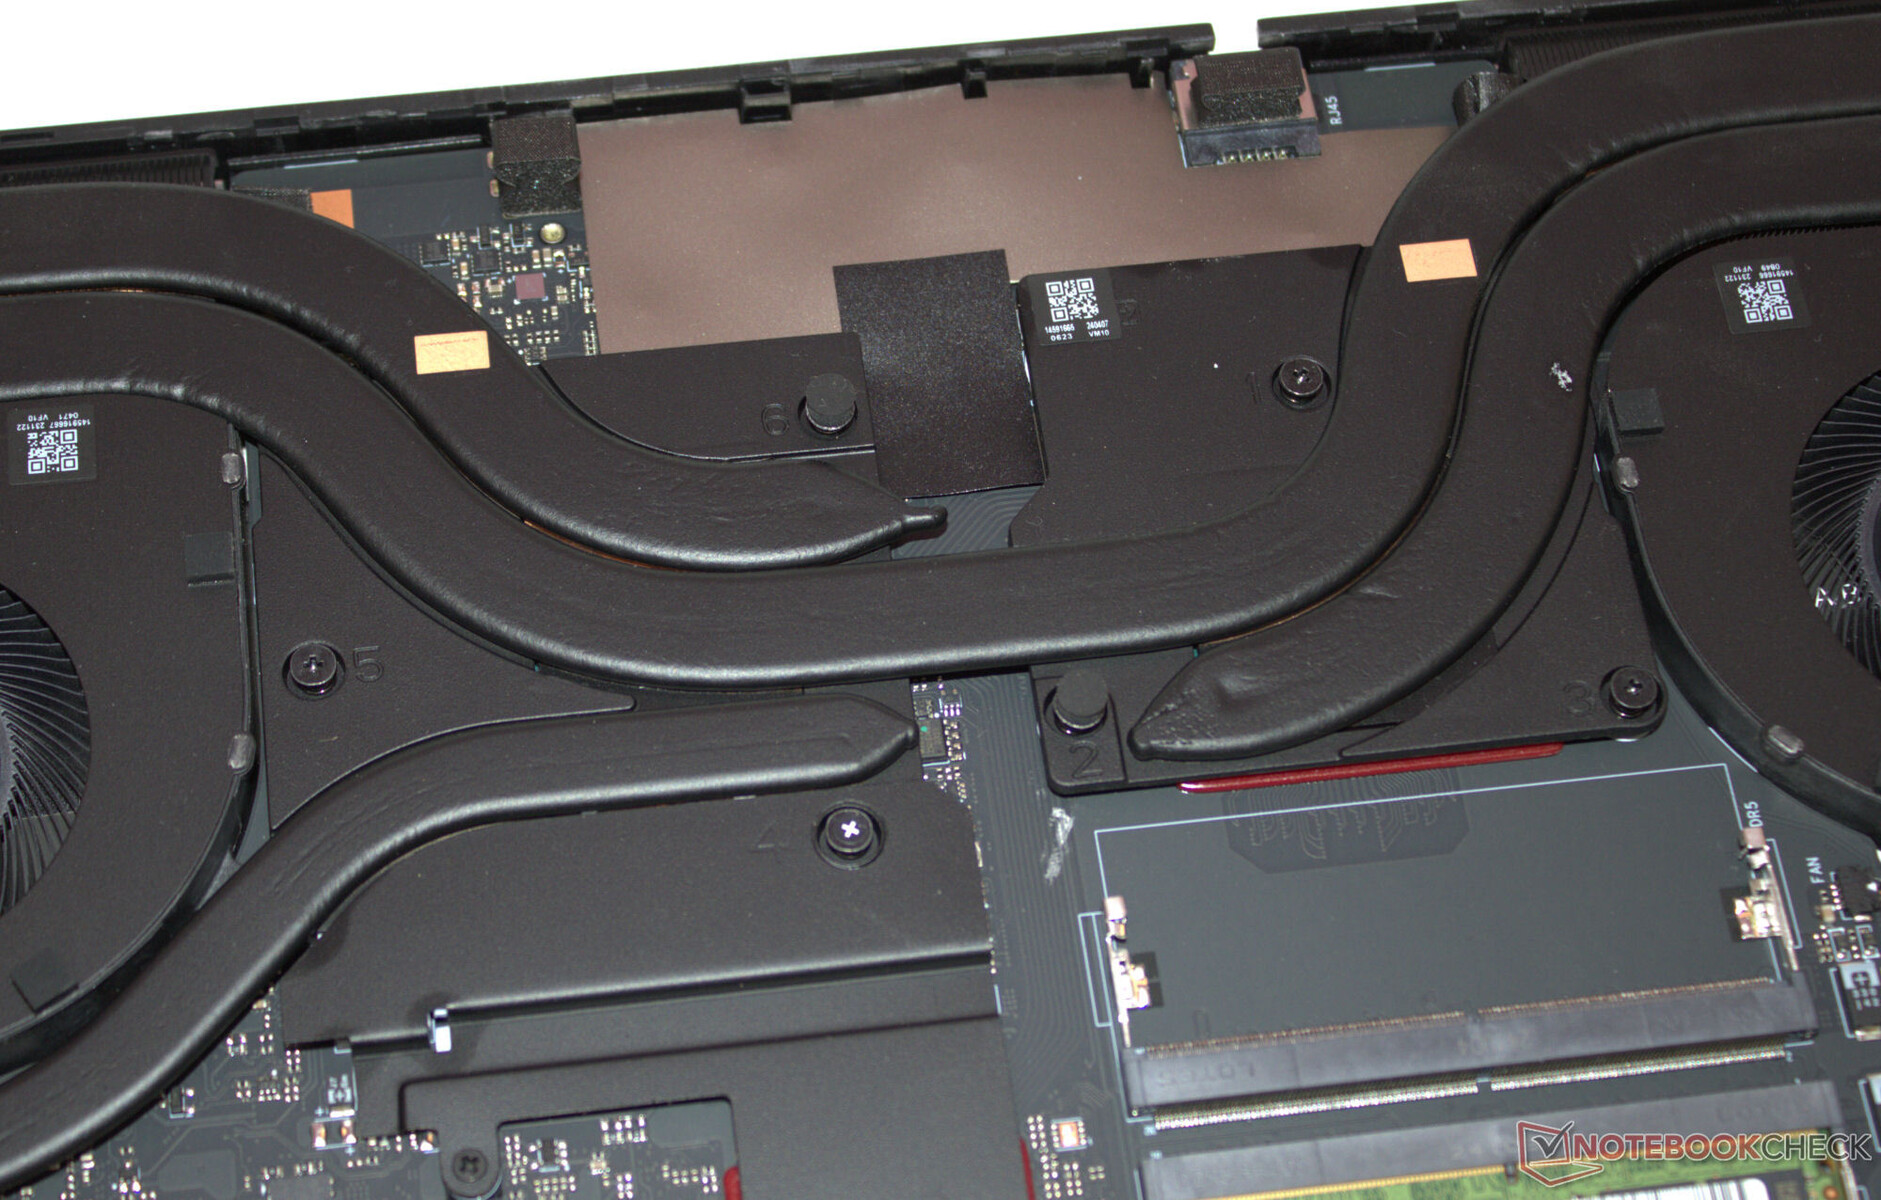
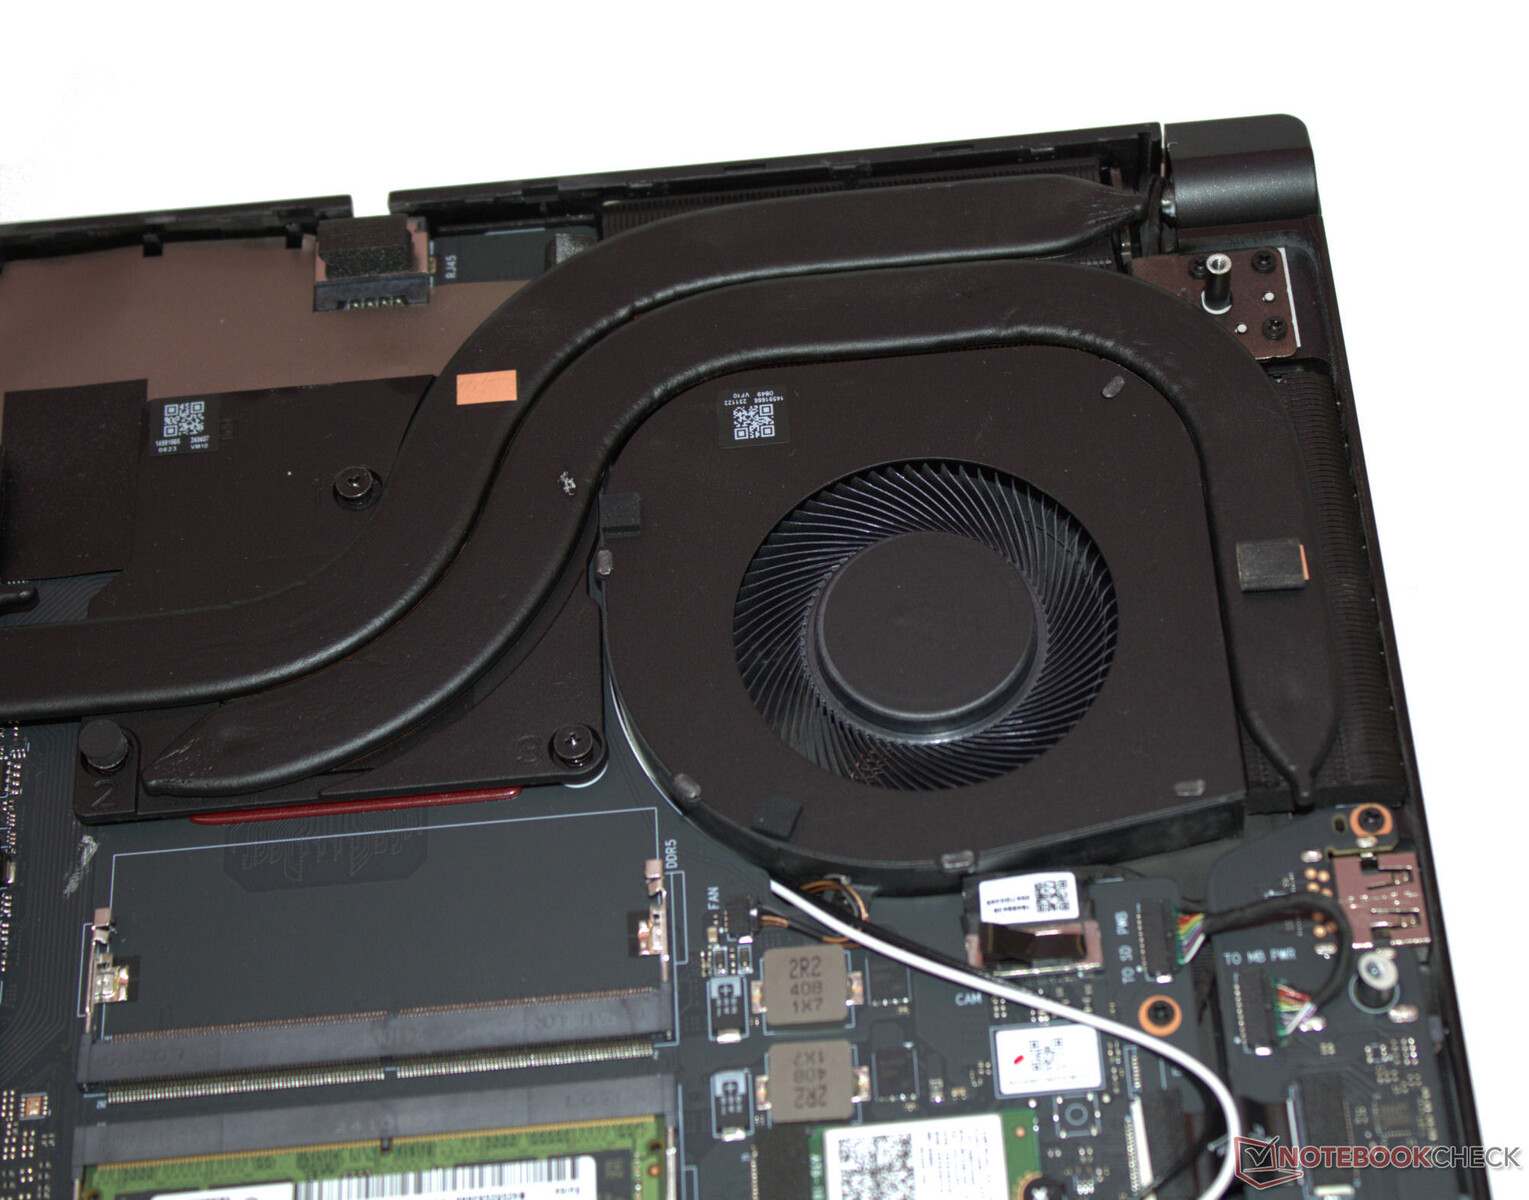
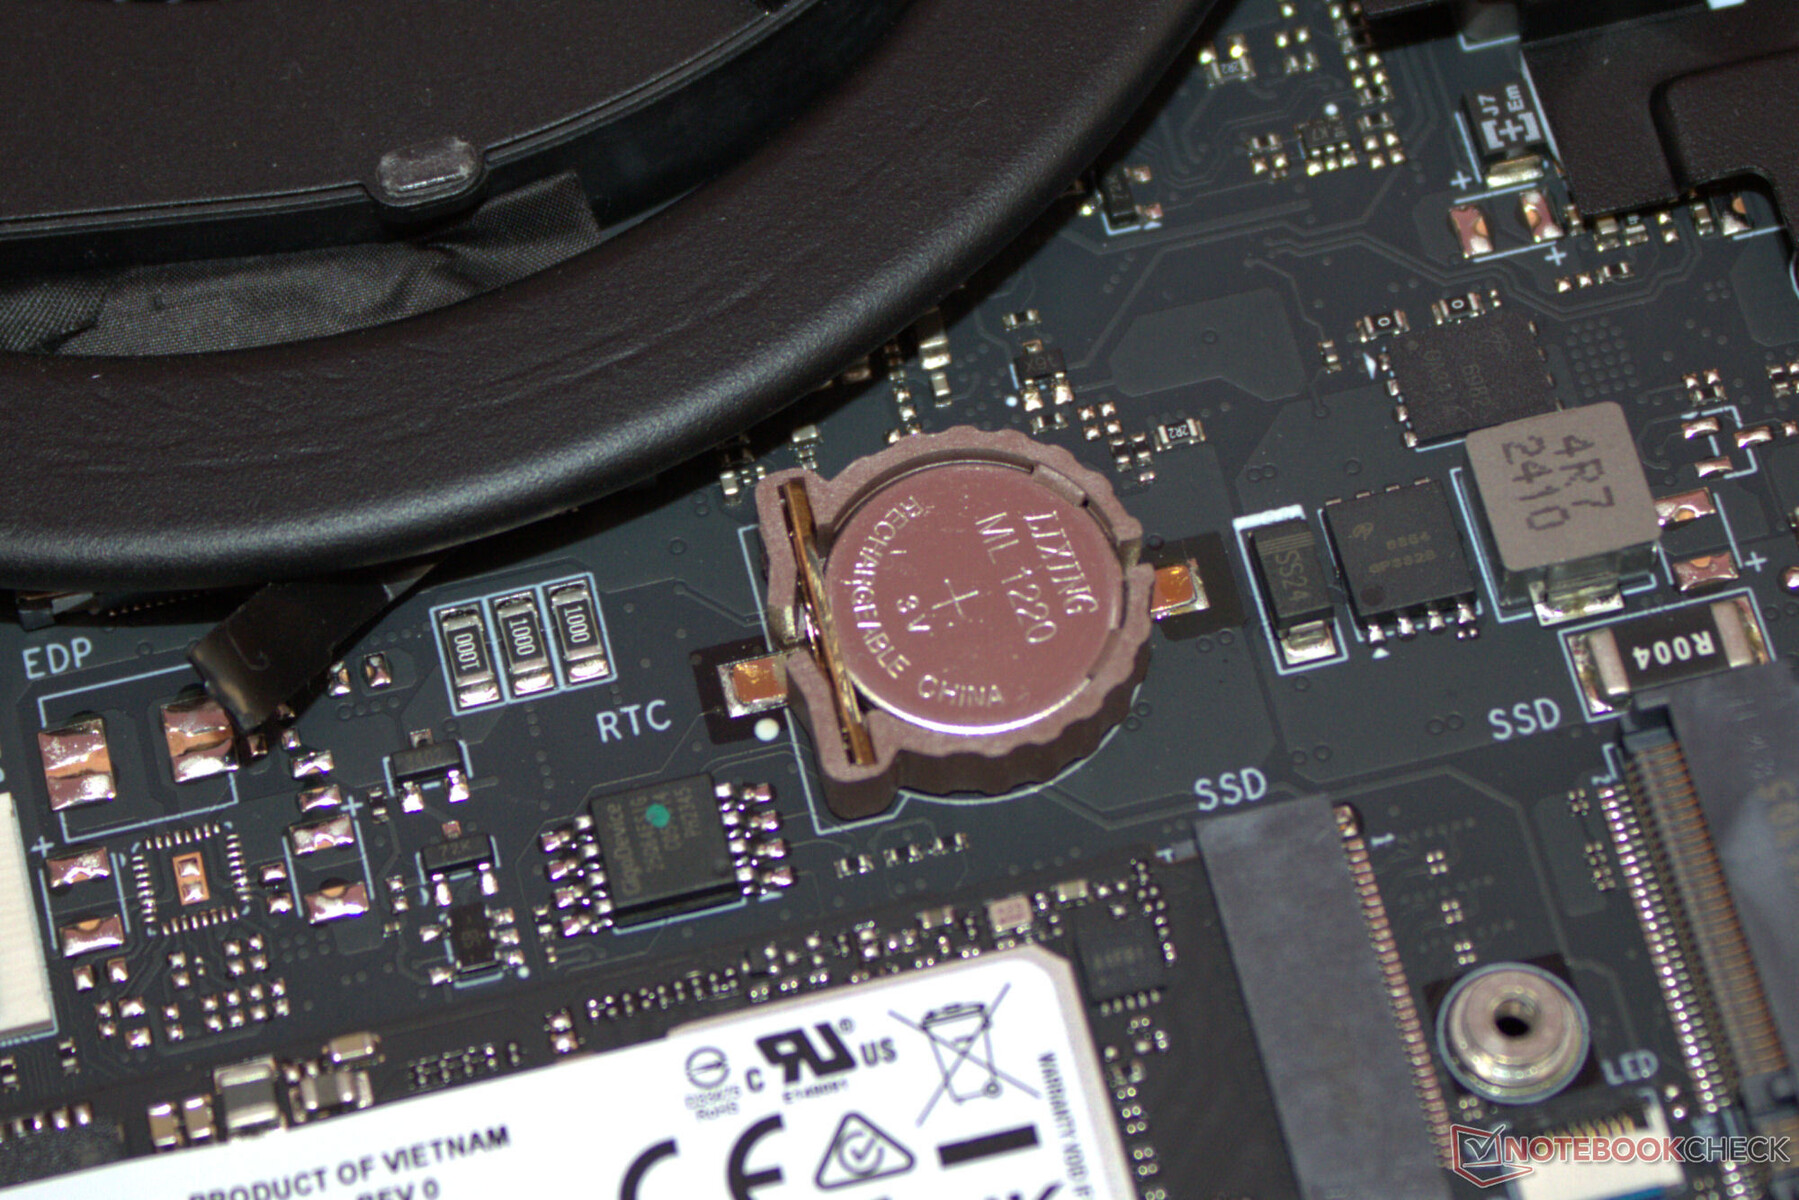
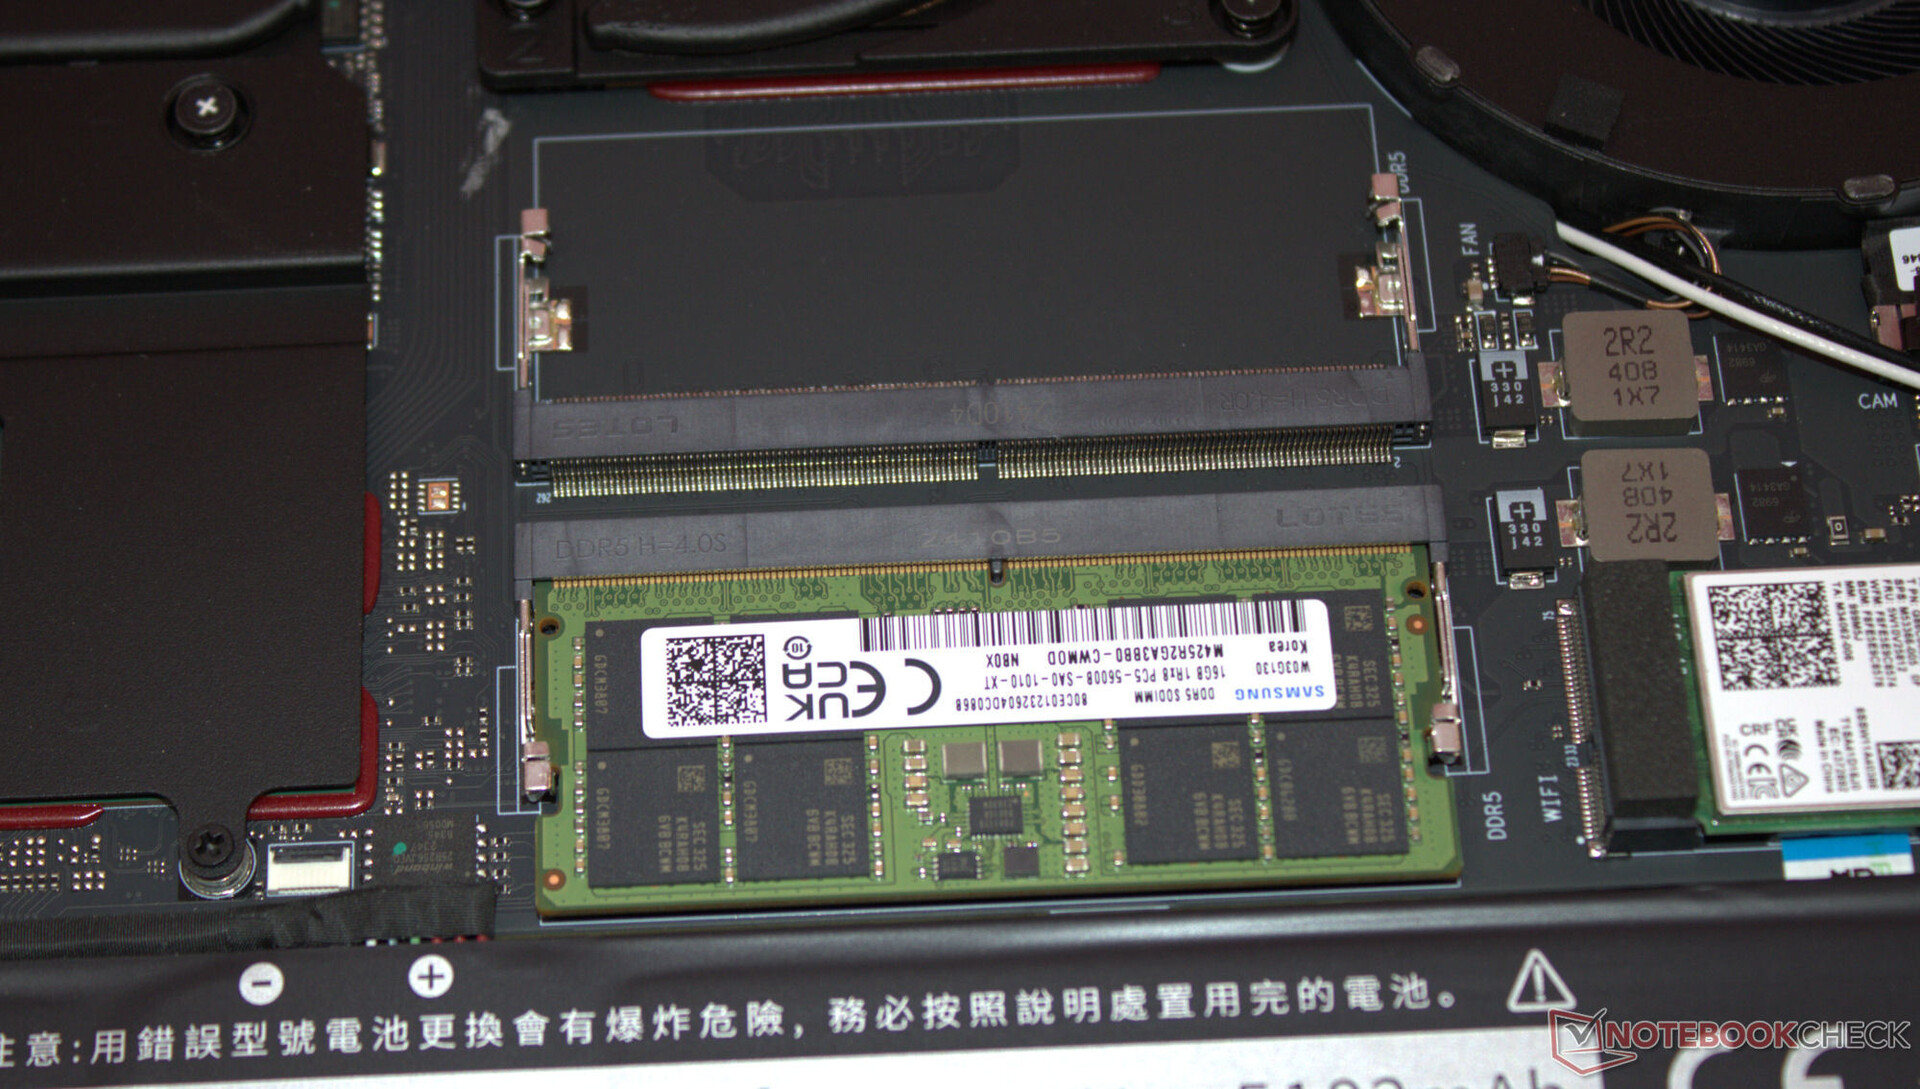
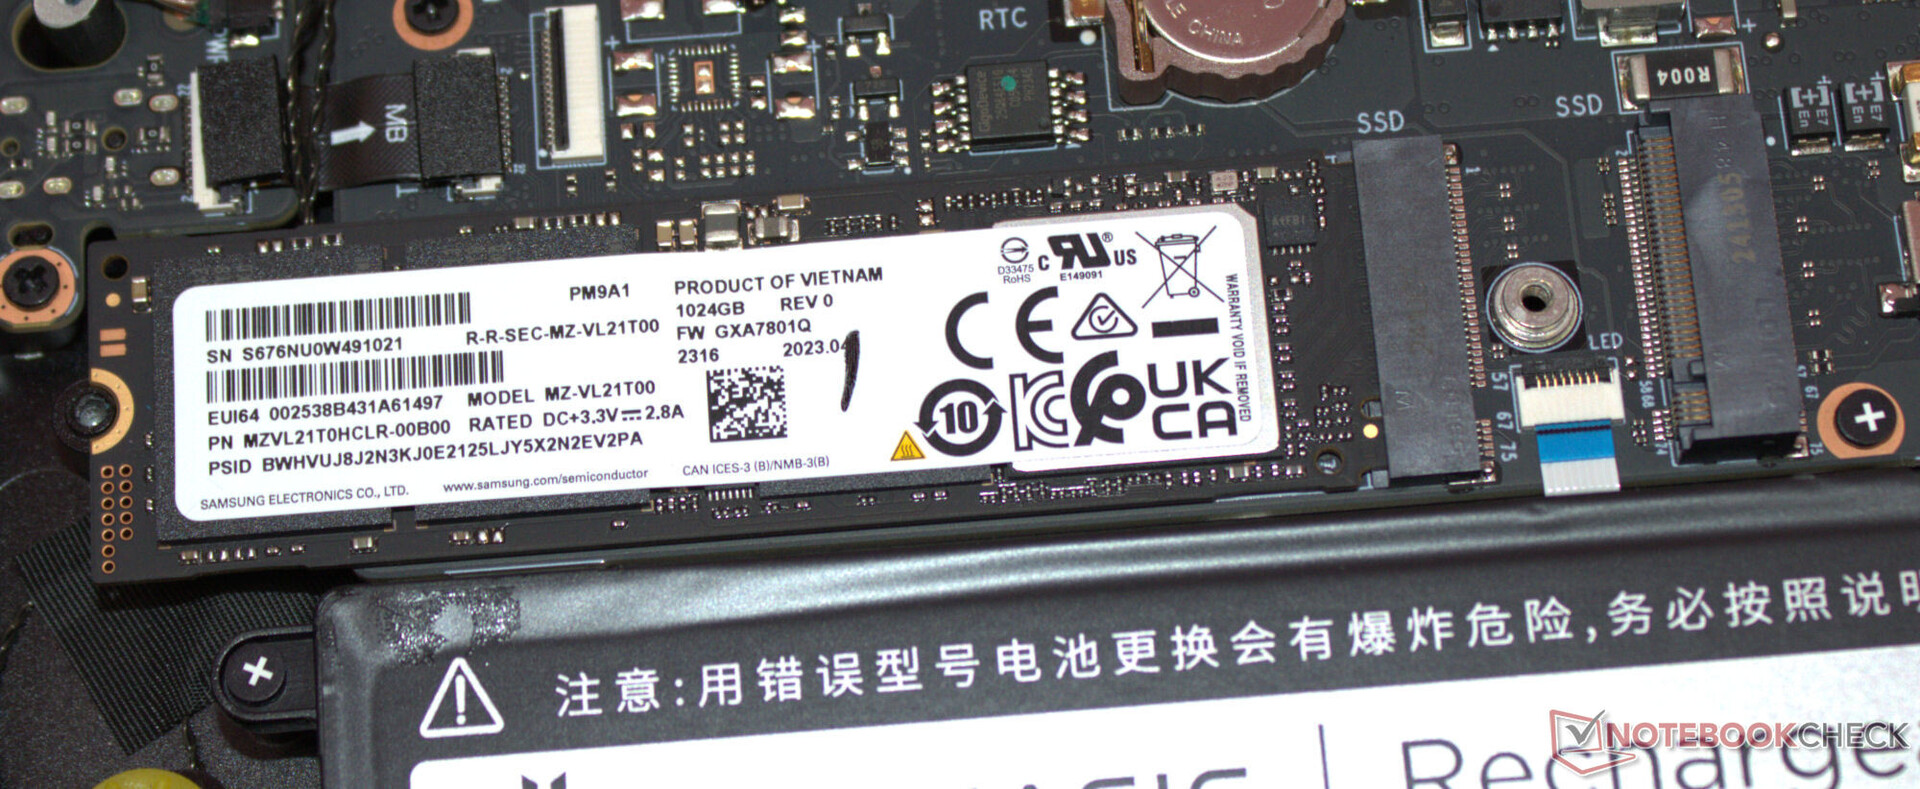
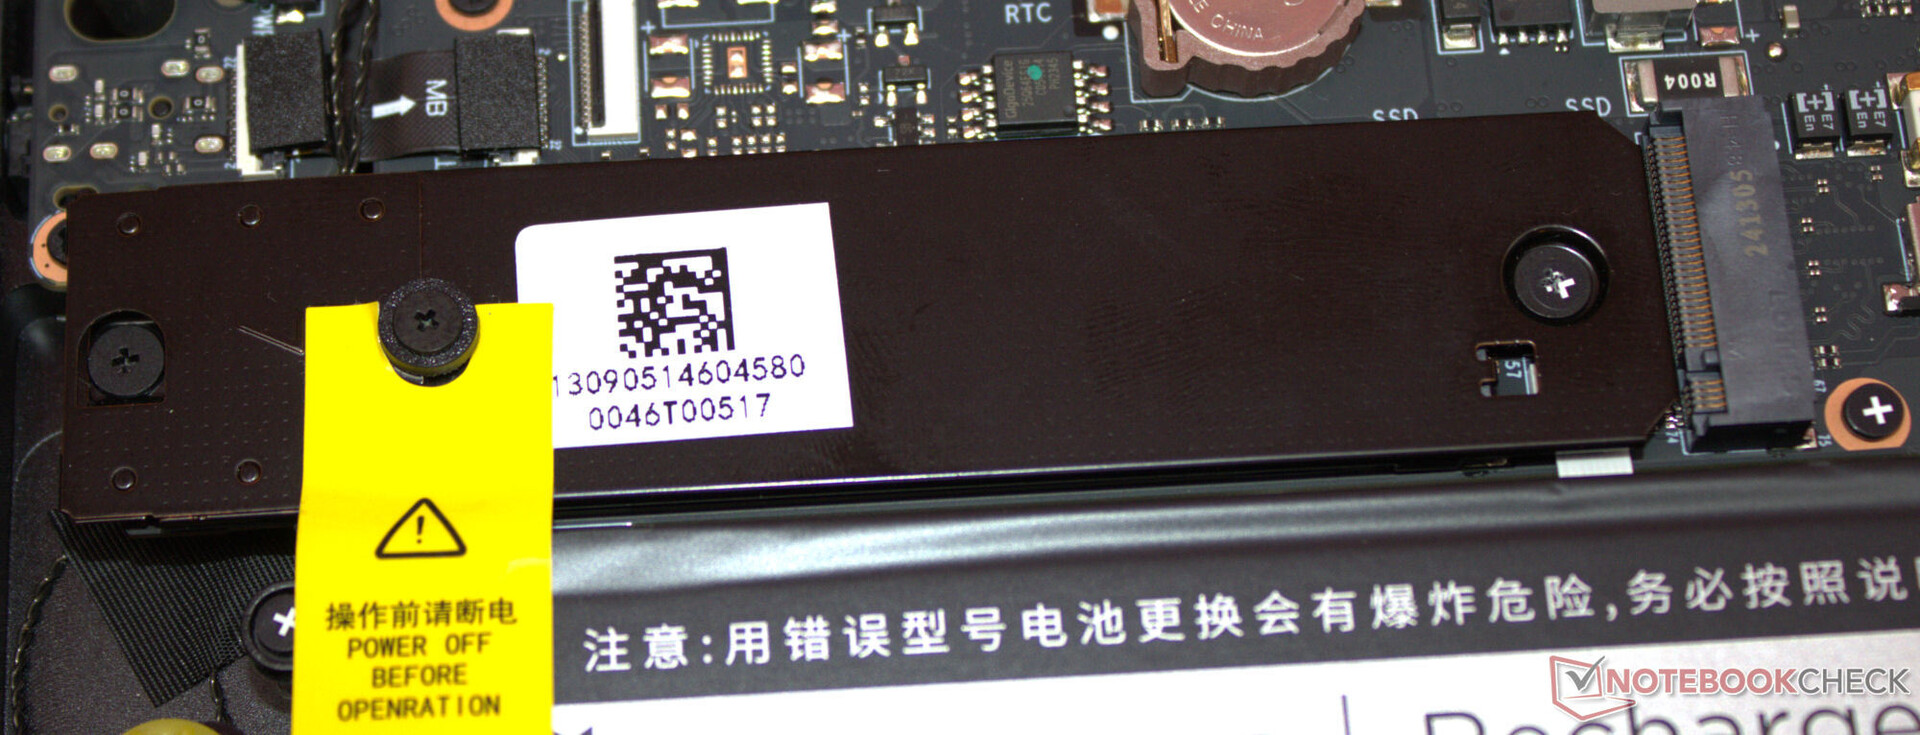
Depois de remover todos os parafusos na parte inferior do gabinete, a parte inferior do gabinete pode ser removida com a ajuda de uma espátula ou espátula plana. Em seguida, o senhor pode acessar os bancos de memória (dos quais um está ocupado), SSD (PCIe 4, M.2-2280), segundo slot SSD (PCIe 4, M.2-2280), módulo WLAN, bateria do BIOS, ventiladores e a bateria.
Sustentabilidade
Muito papelão, pouco plástico: o laptop é envolto em uma película, enquanto um tapete de espuma fina protege a parte superior do dispositivo. O guia de início rápido impresso está em um saco plástico. Uma placa de base removível possibilita reparos no laptop - todo o hardware é acessível. As atualizações de software não devem ser um problema nos próximos anos - afinal, o Windows 11 é usado como seu sistema operacional.
Ainda não se sabe como a Nubia lidará com o fornecimento de peças de reposição e suporte para seu próprio software. No momento do teste, ainda não havia uma área de download para o Titan no site da Nubia.
Garantia
Não podemos fornecer nenhuma informação sobre a garantia do laptop - é provável que seja de cerca de 12 meses, o que é padrão nos Estados Unidos. Consideramos improvável a existência de garantias estendidas.
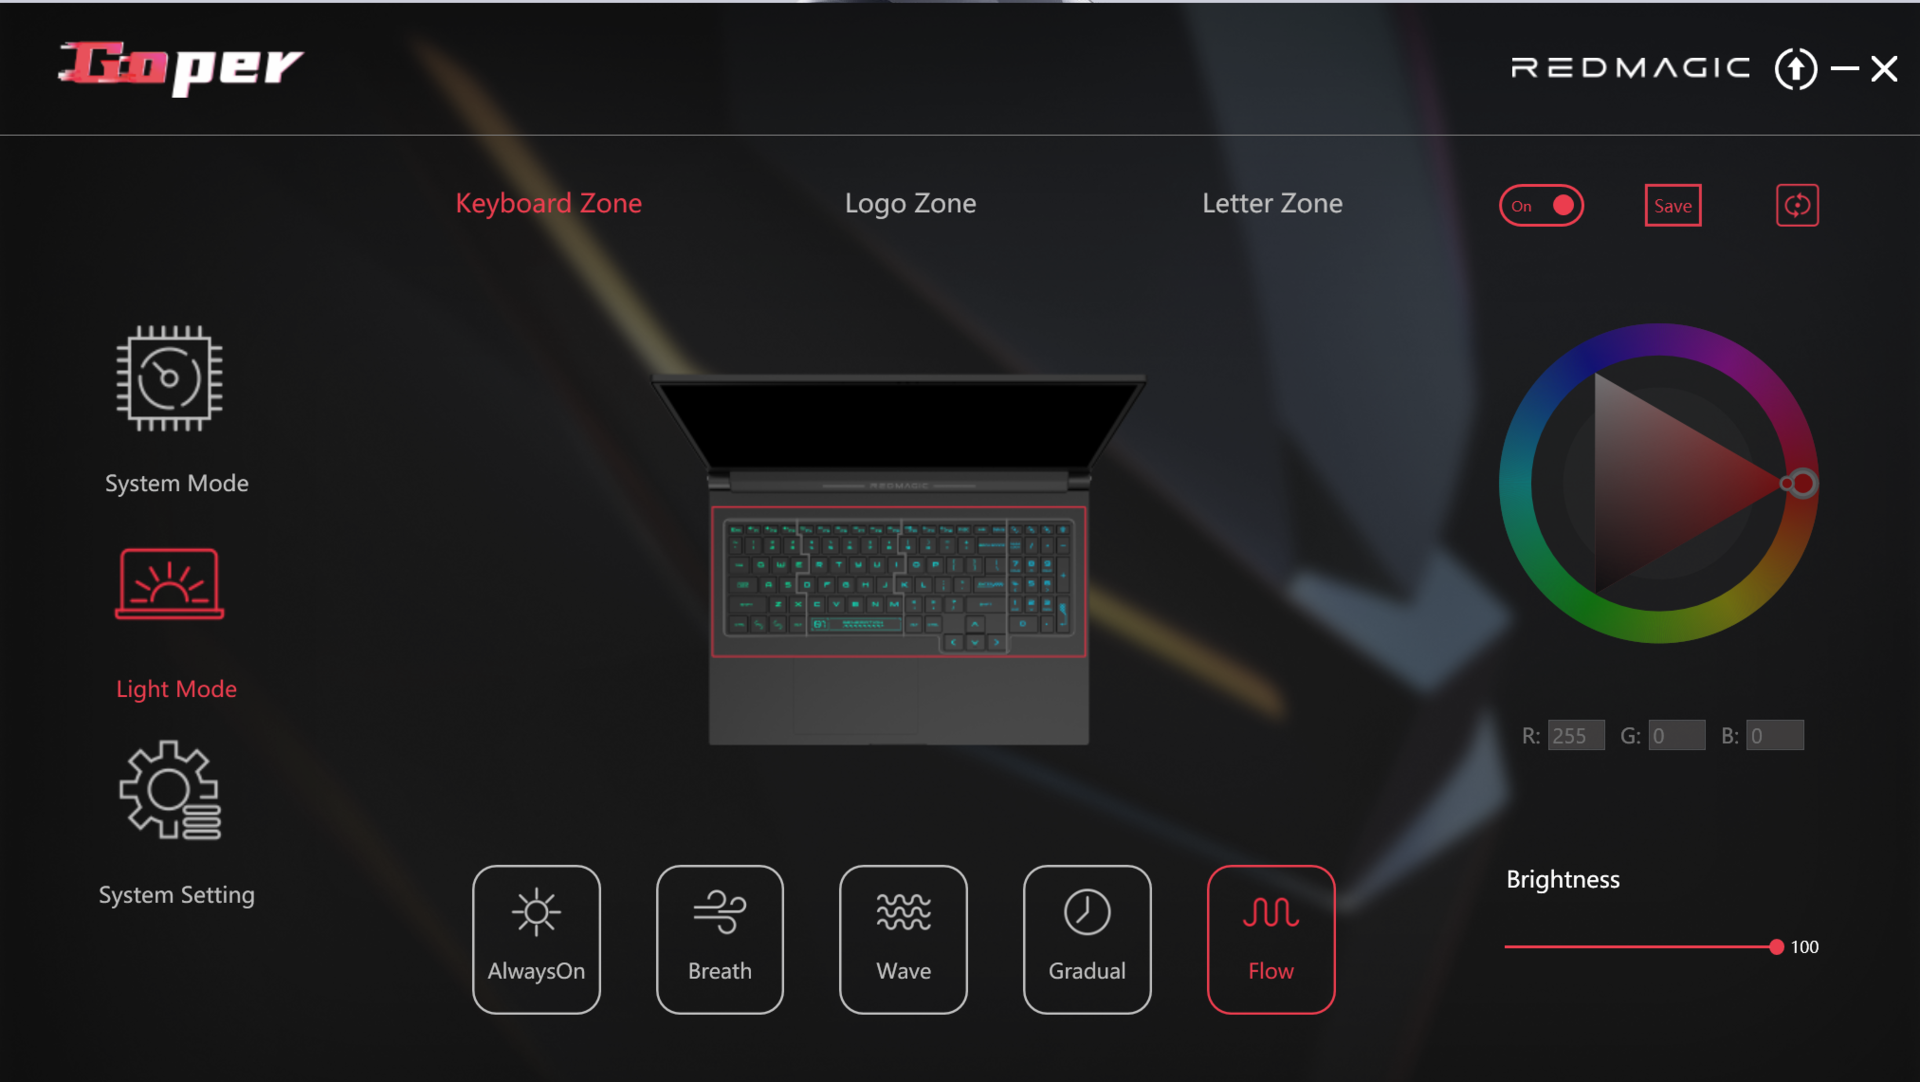
Dispositivos de entrada - O laptop RedMagic com iluminação RGB
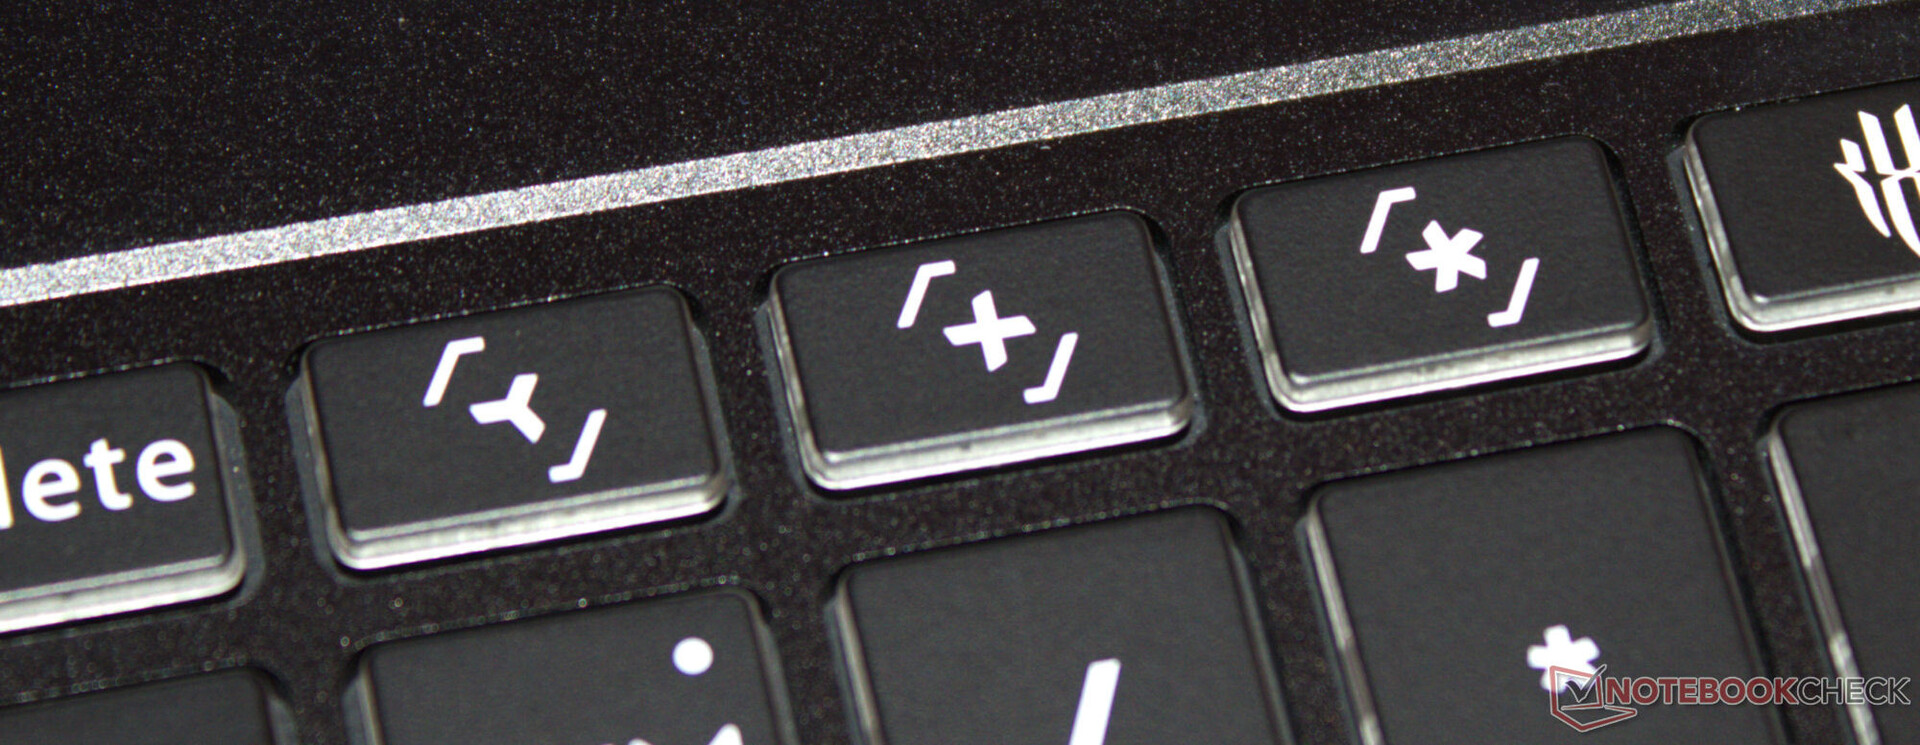
Teclado
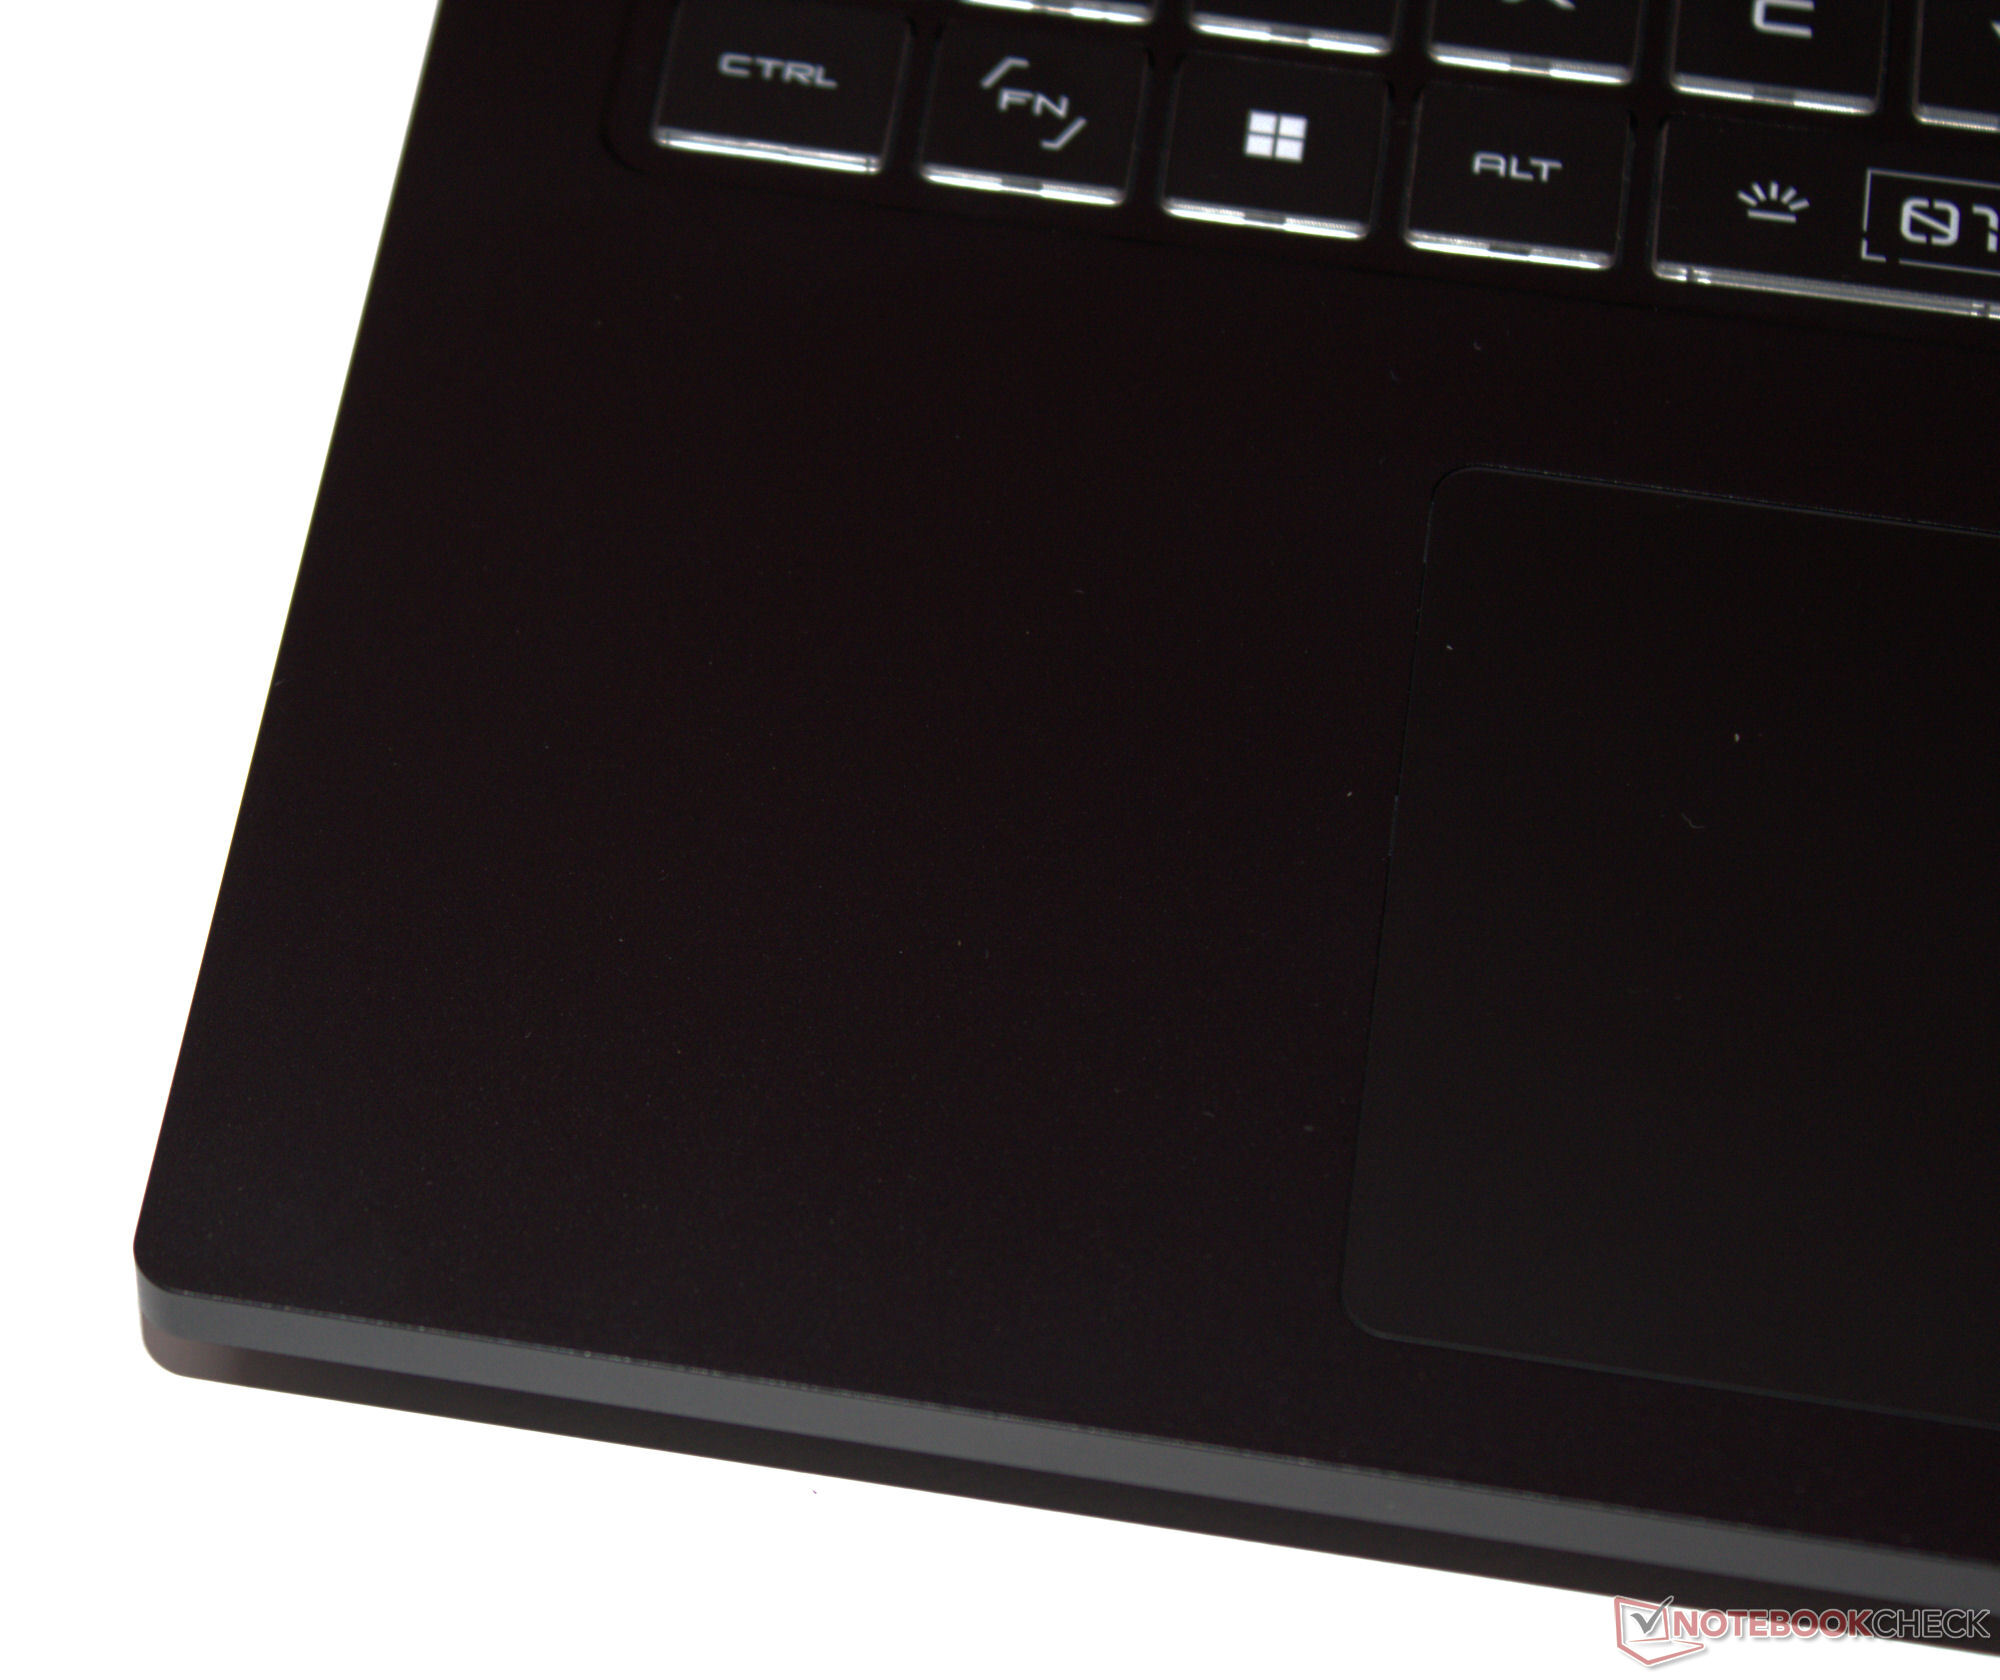
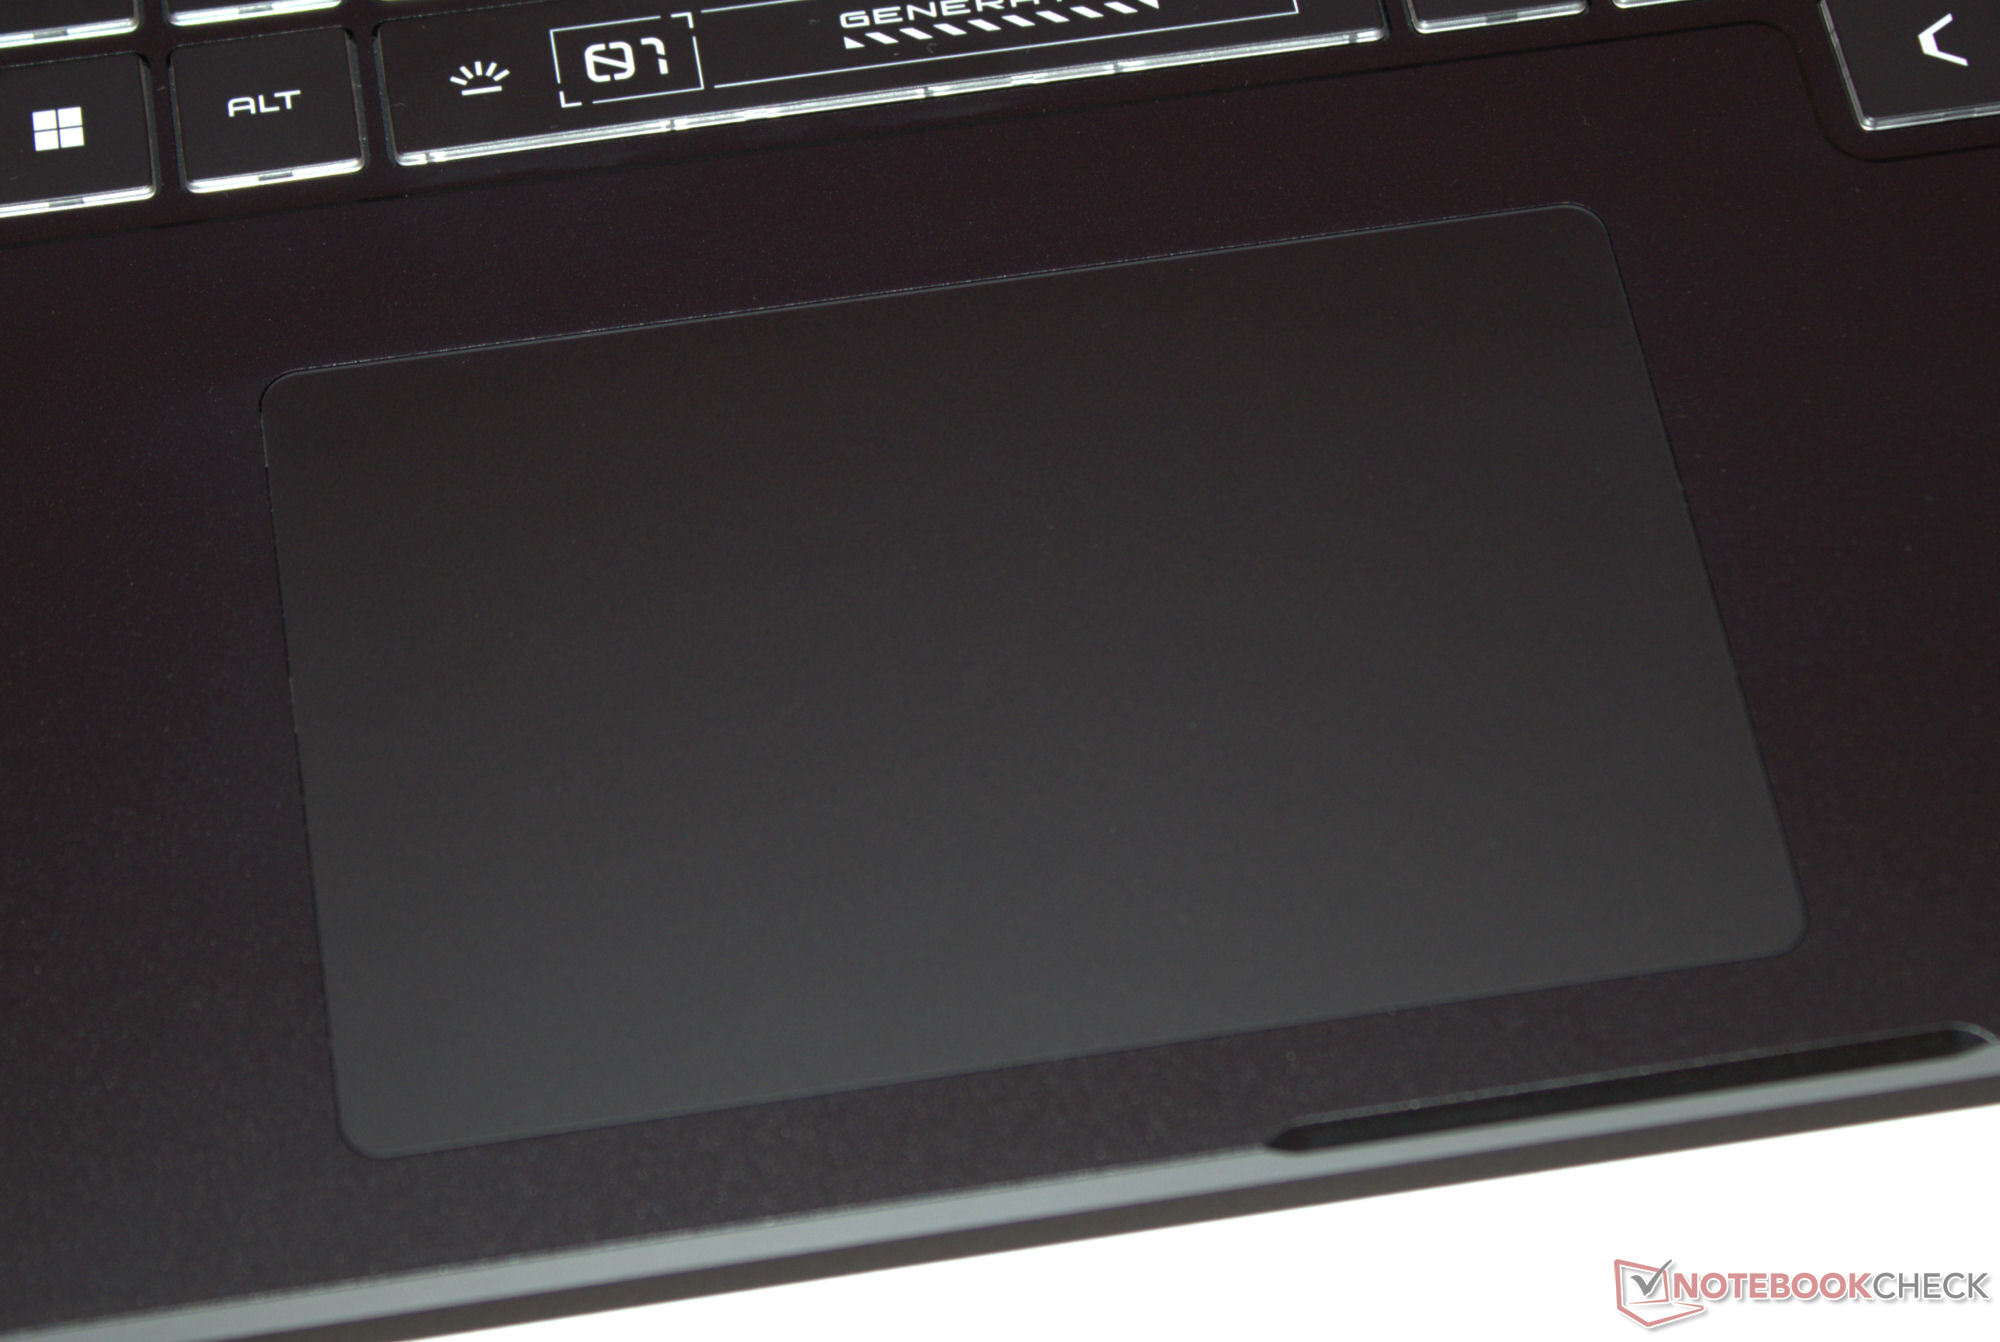
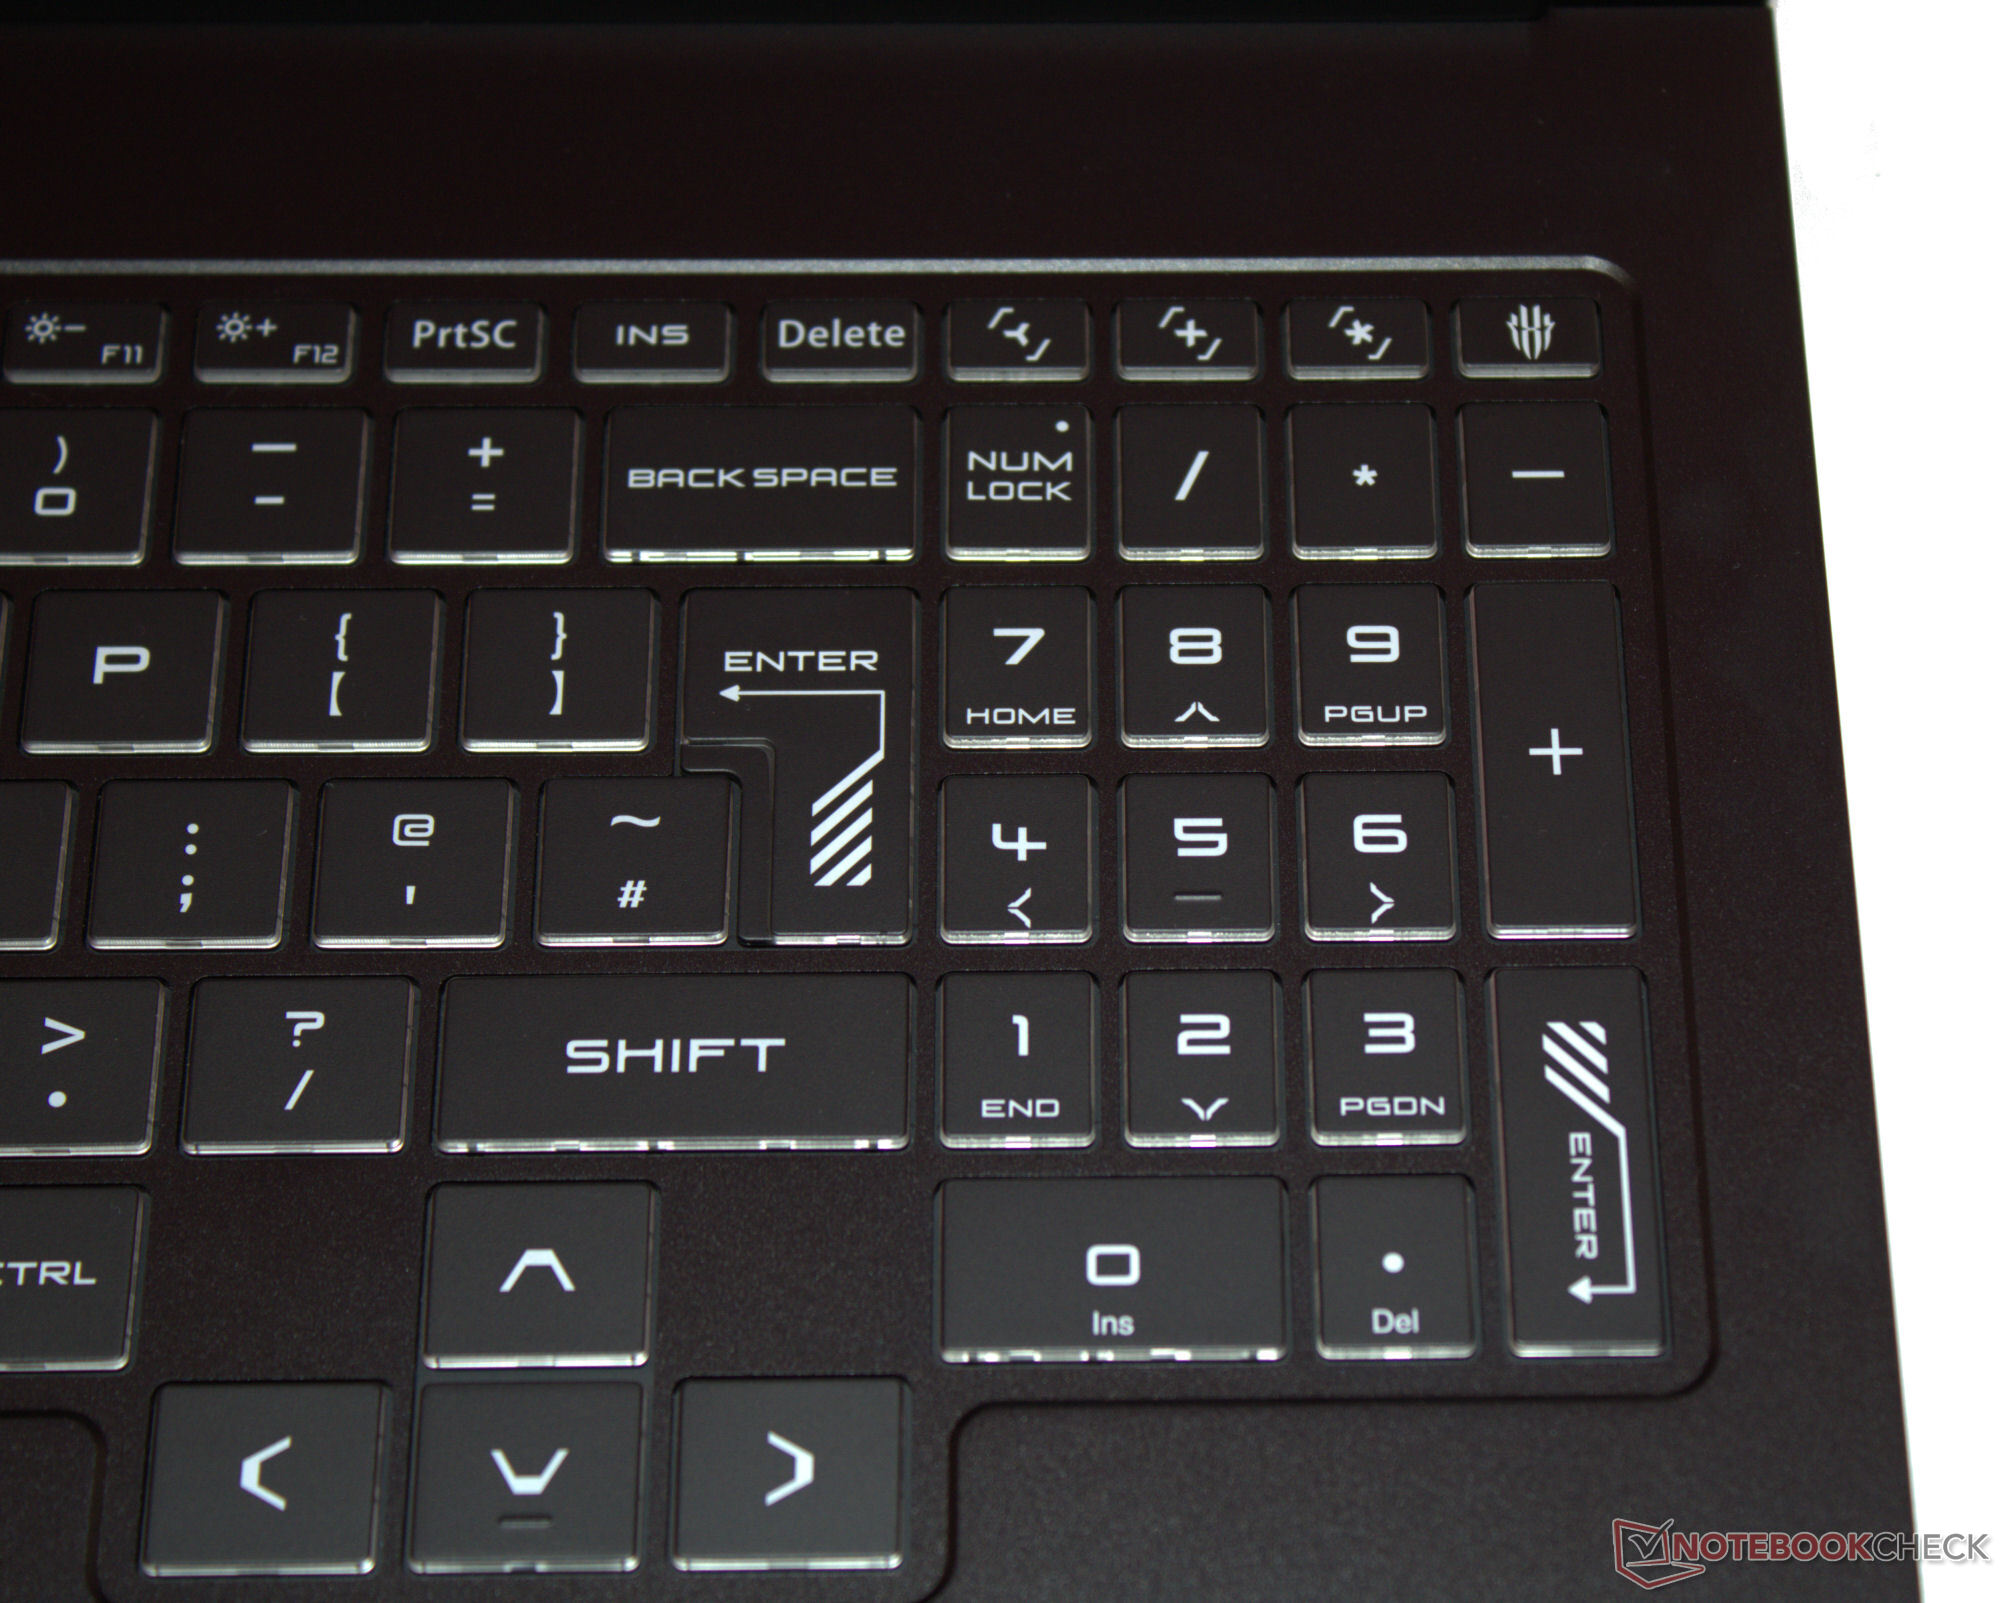
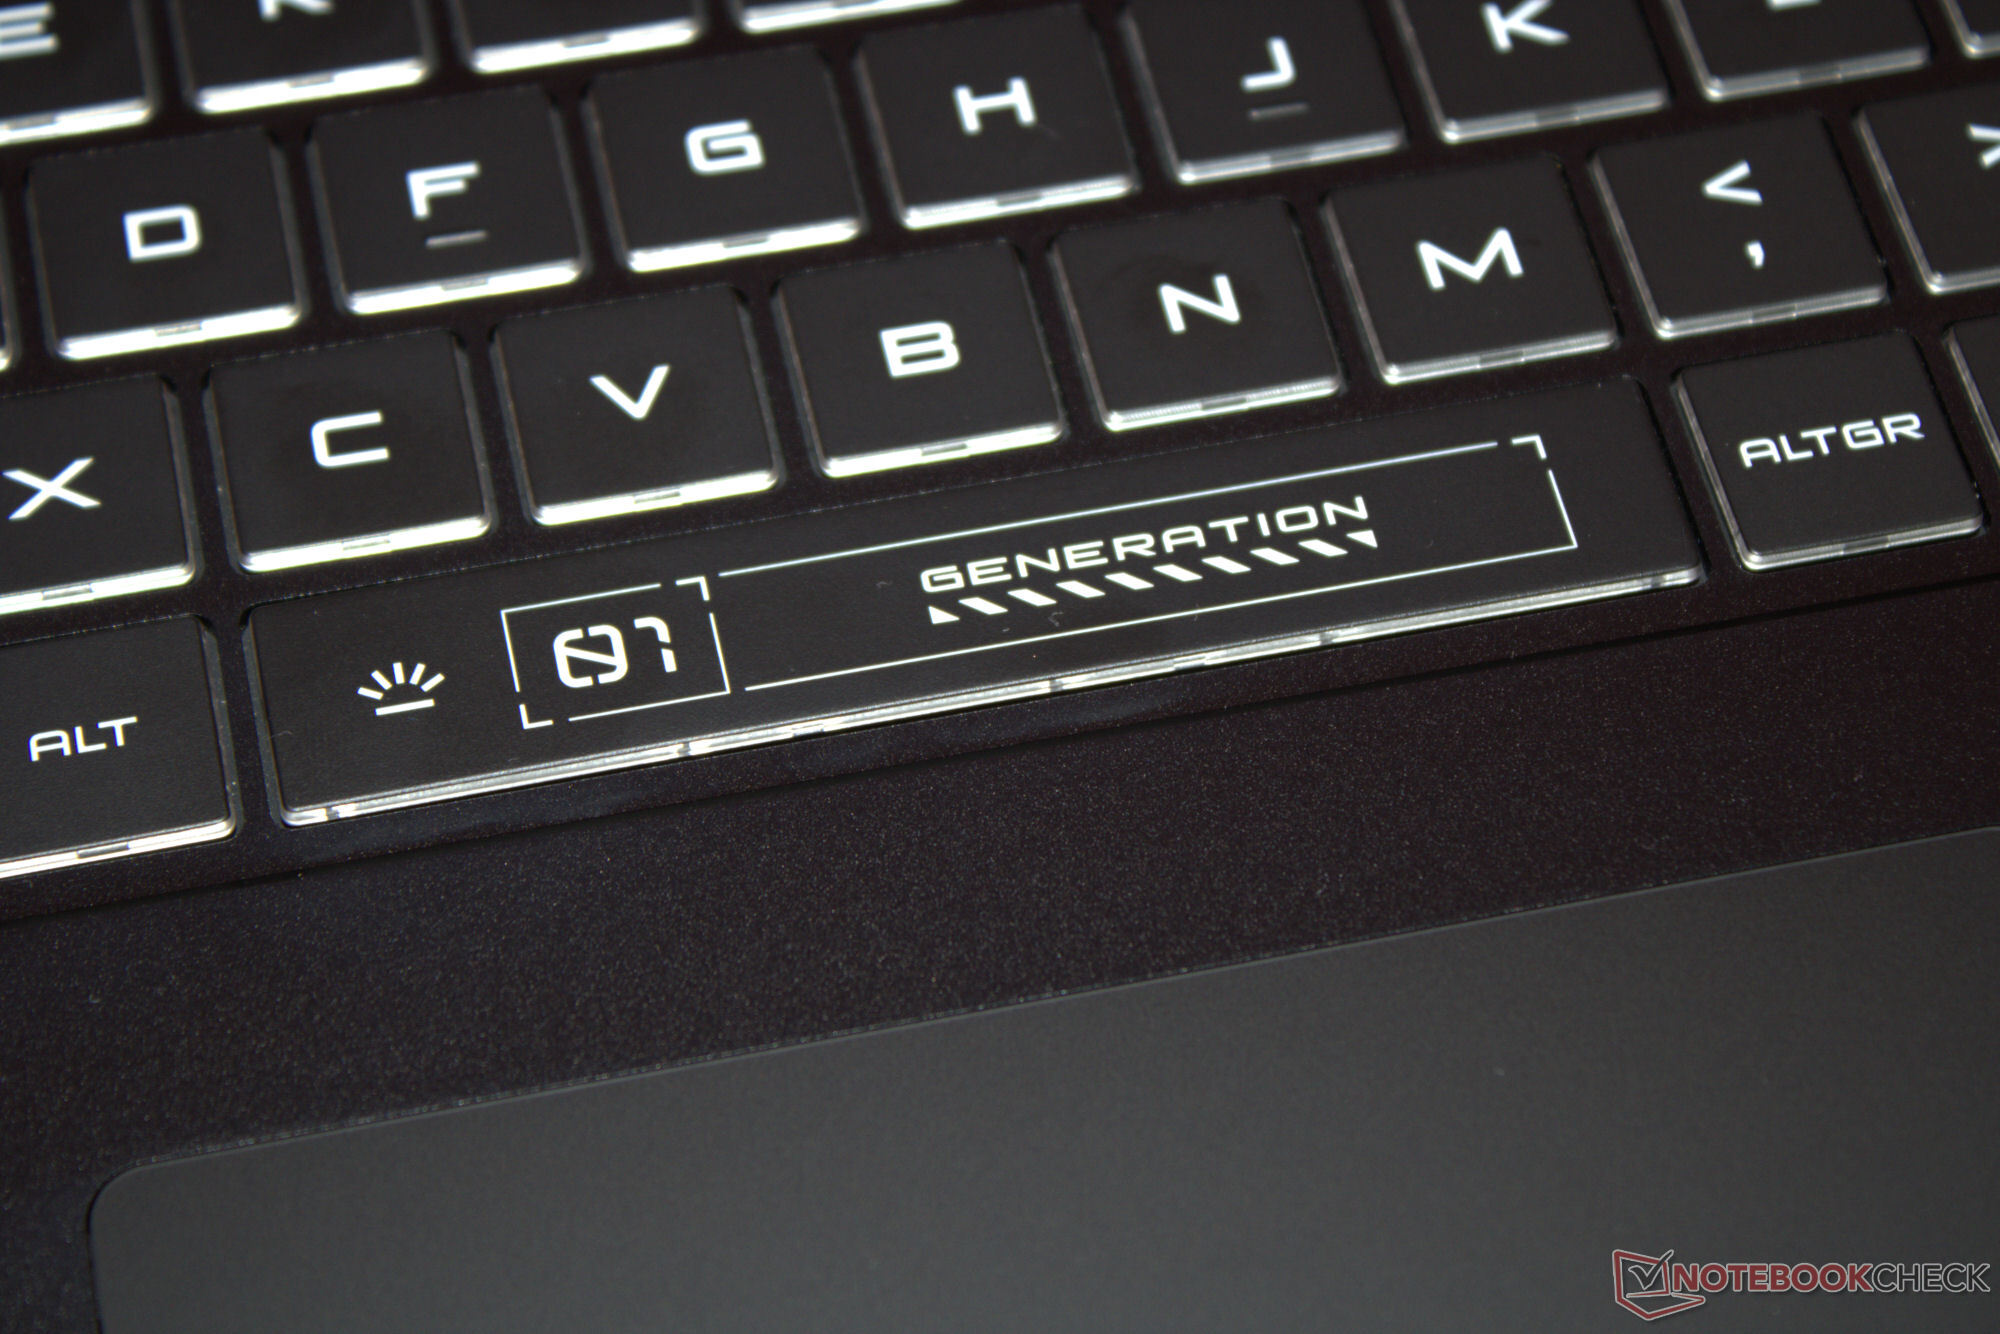
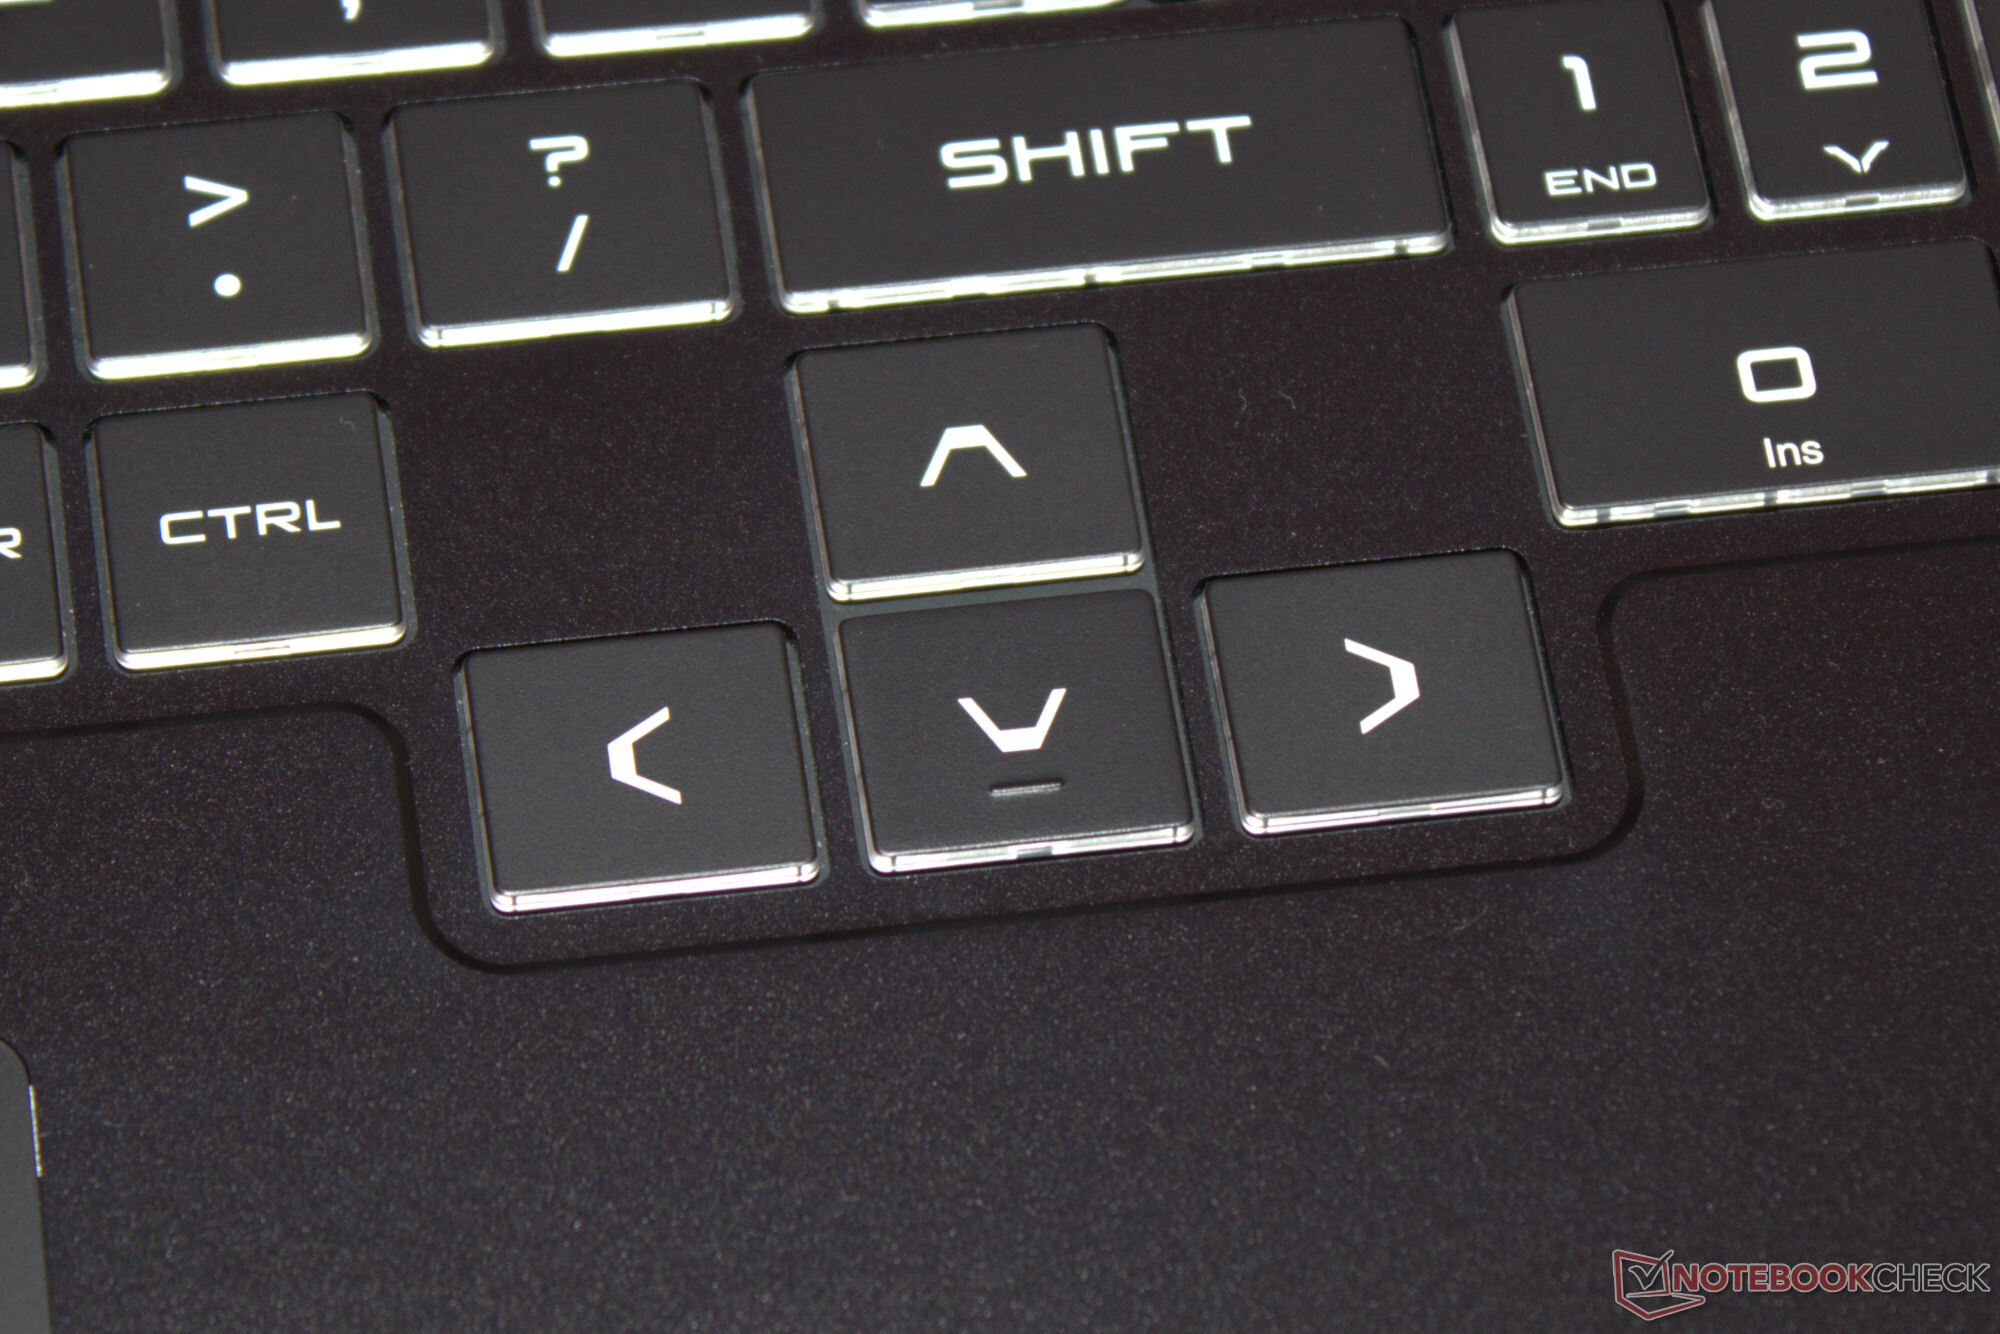
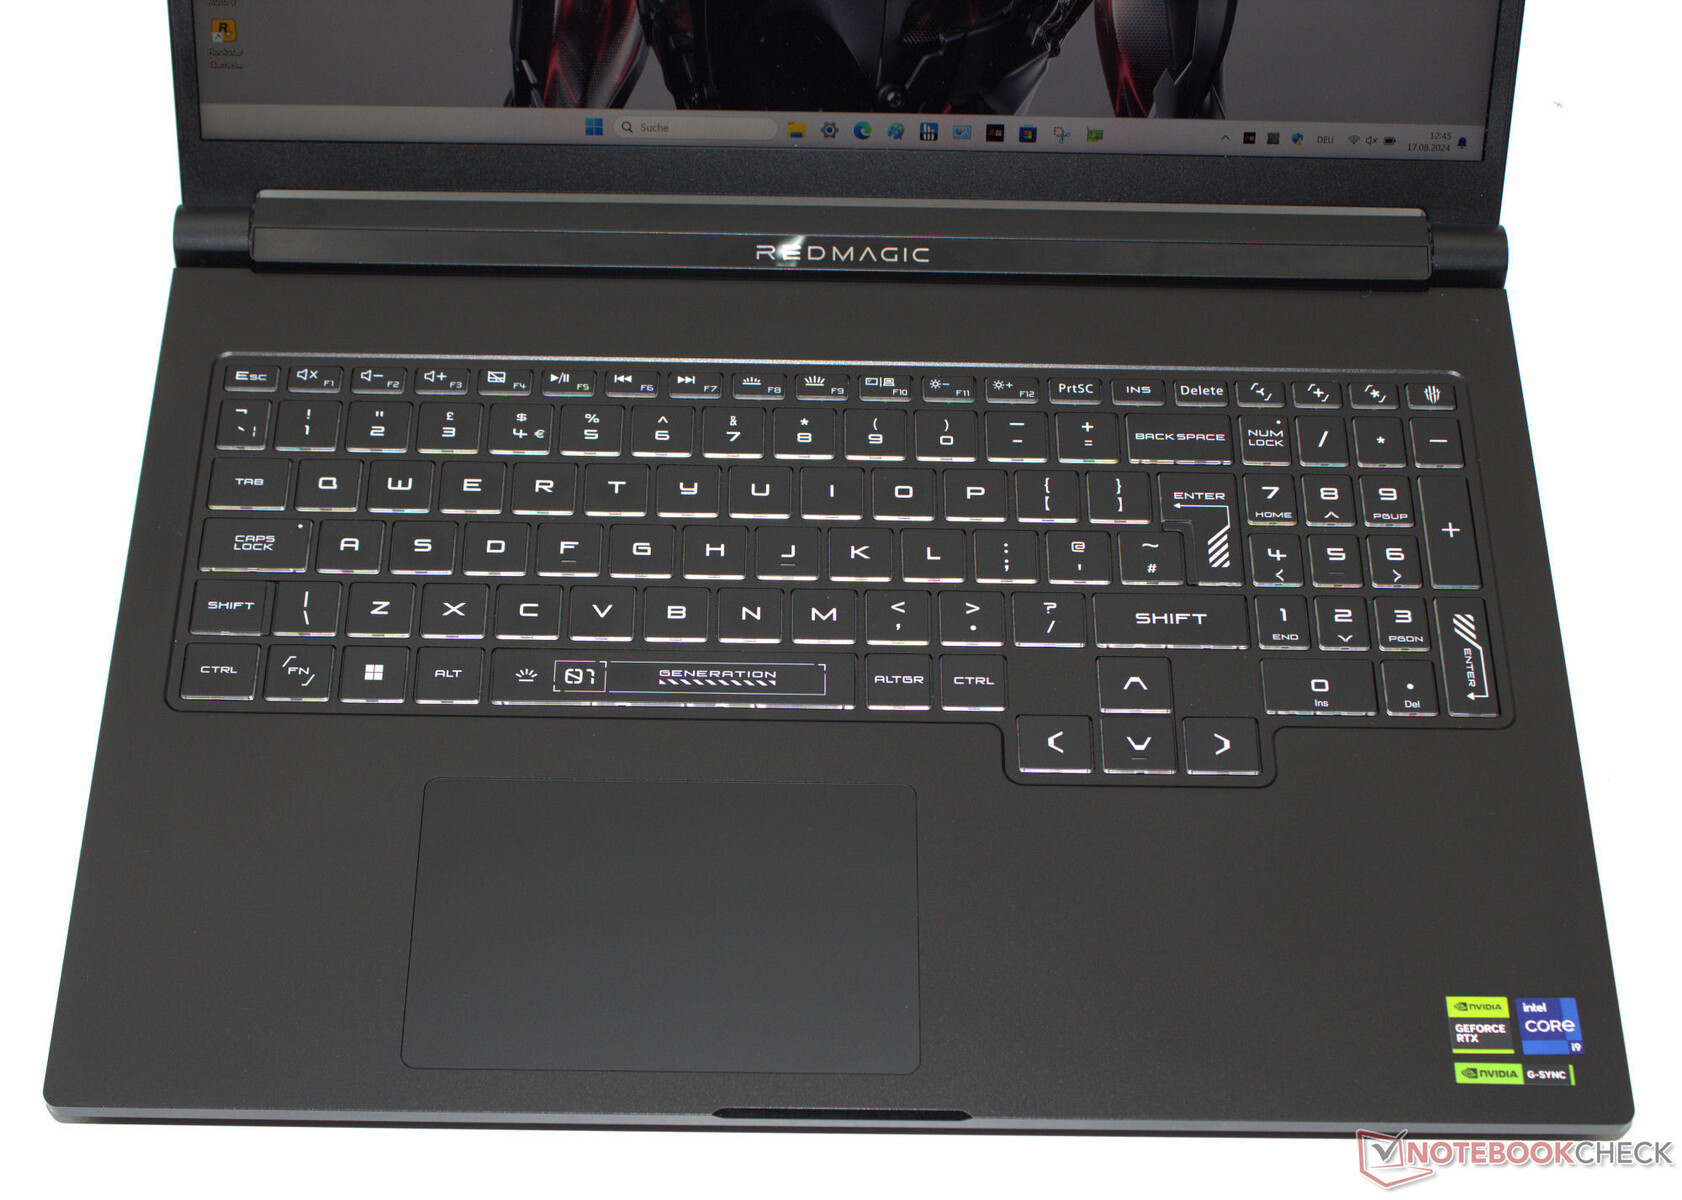
A Nubia optou por um teclado chiclet que inclui um teclado numérico. As teclas com iluminação uniforme têm um curso curto e um ponto de pressão claro. O teclado não cede ao digitar. Um ponto positivo é que as teclas de seta deslocadas são de tamanho normal. A iluminação de fundo RGB é dividida em quatro zonas e o nosso dispositivo de teste tem um layout de teclado QWERTY. Não sabemos dizer se o fabricante oferece layouts localizados.
Touchpad
Um clickpad multitoque (aprox. 11,7 x 7,5 cm) com uma superfície de vidro serve como substituto do mouse. Ele tem um curso curto e um ponto de pressão claro. O pad pode ser desativado, se necessário.
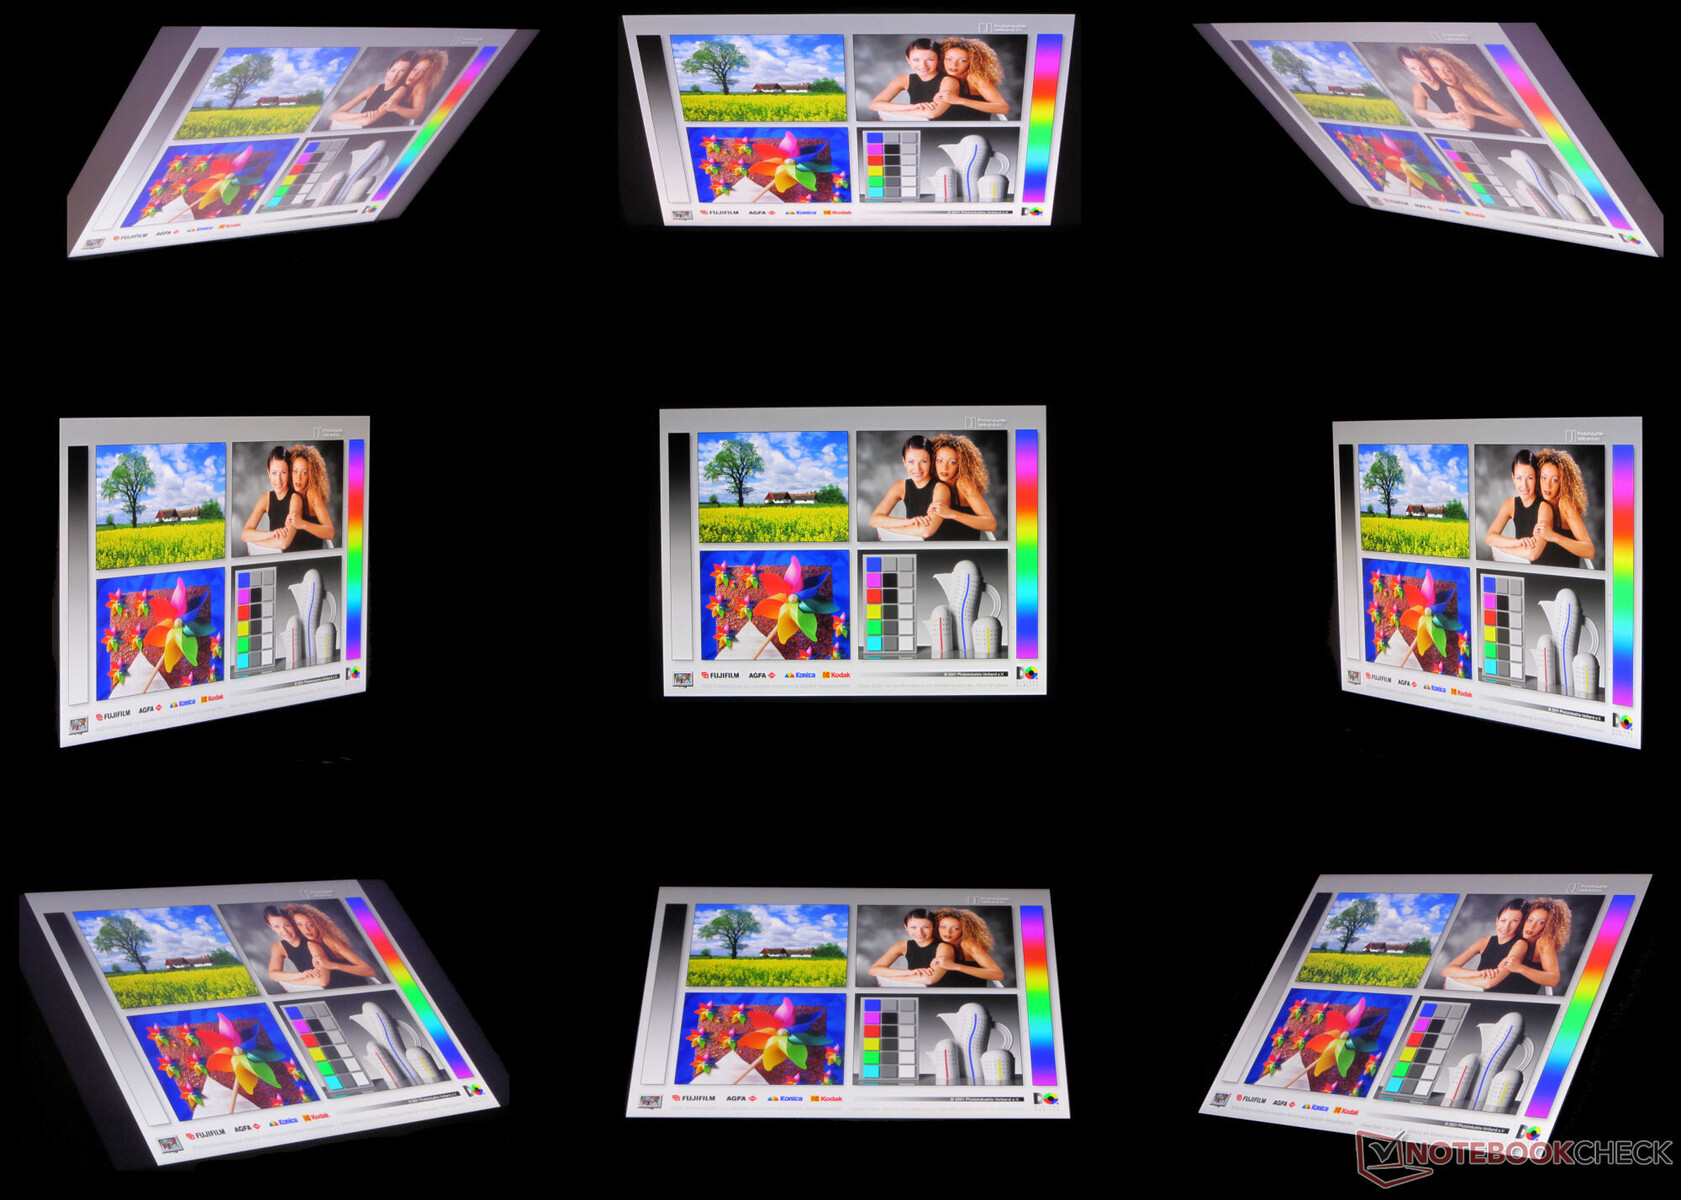
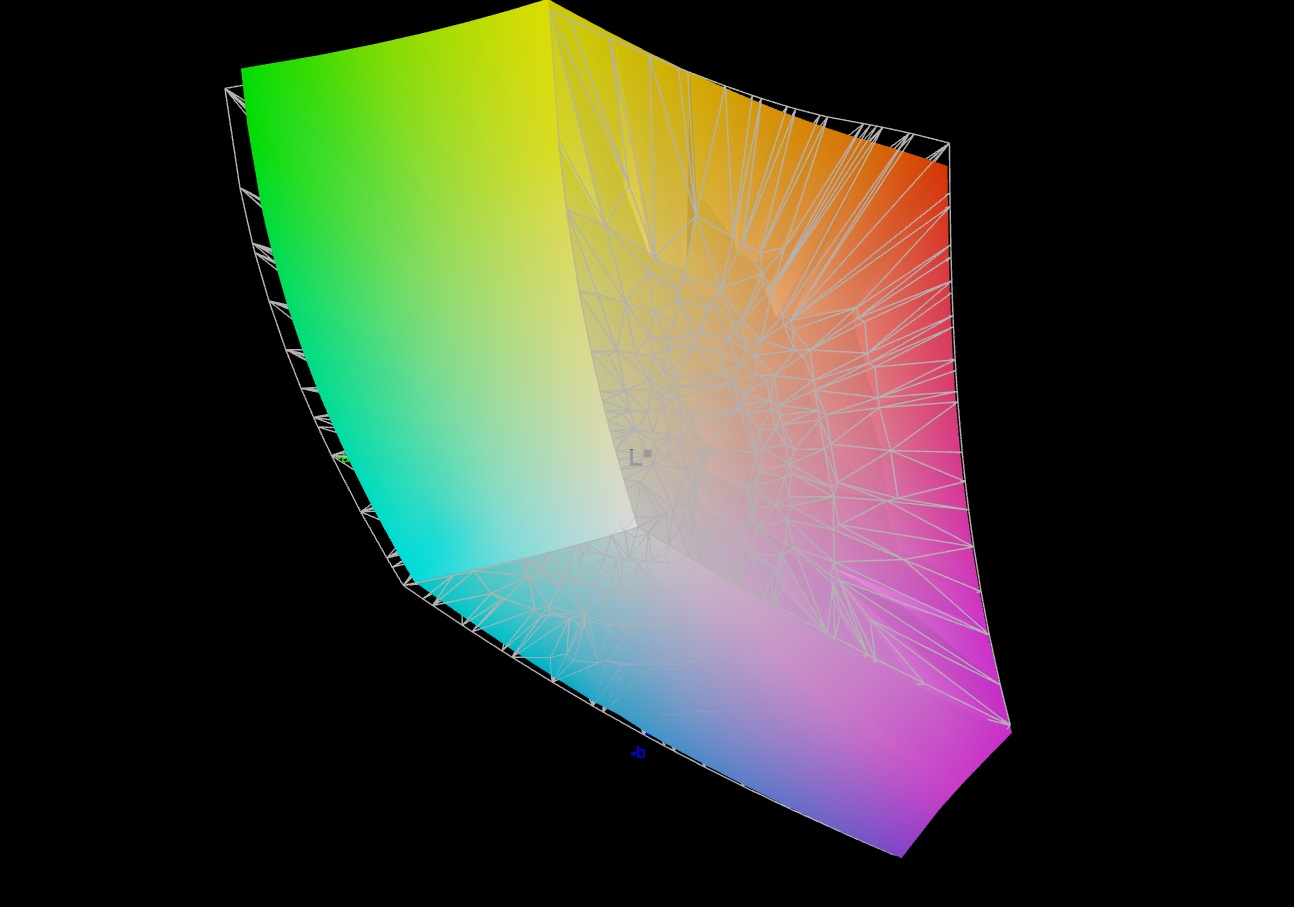
Tela - Um painel IPS com cobertura DCI-P3
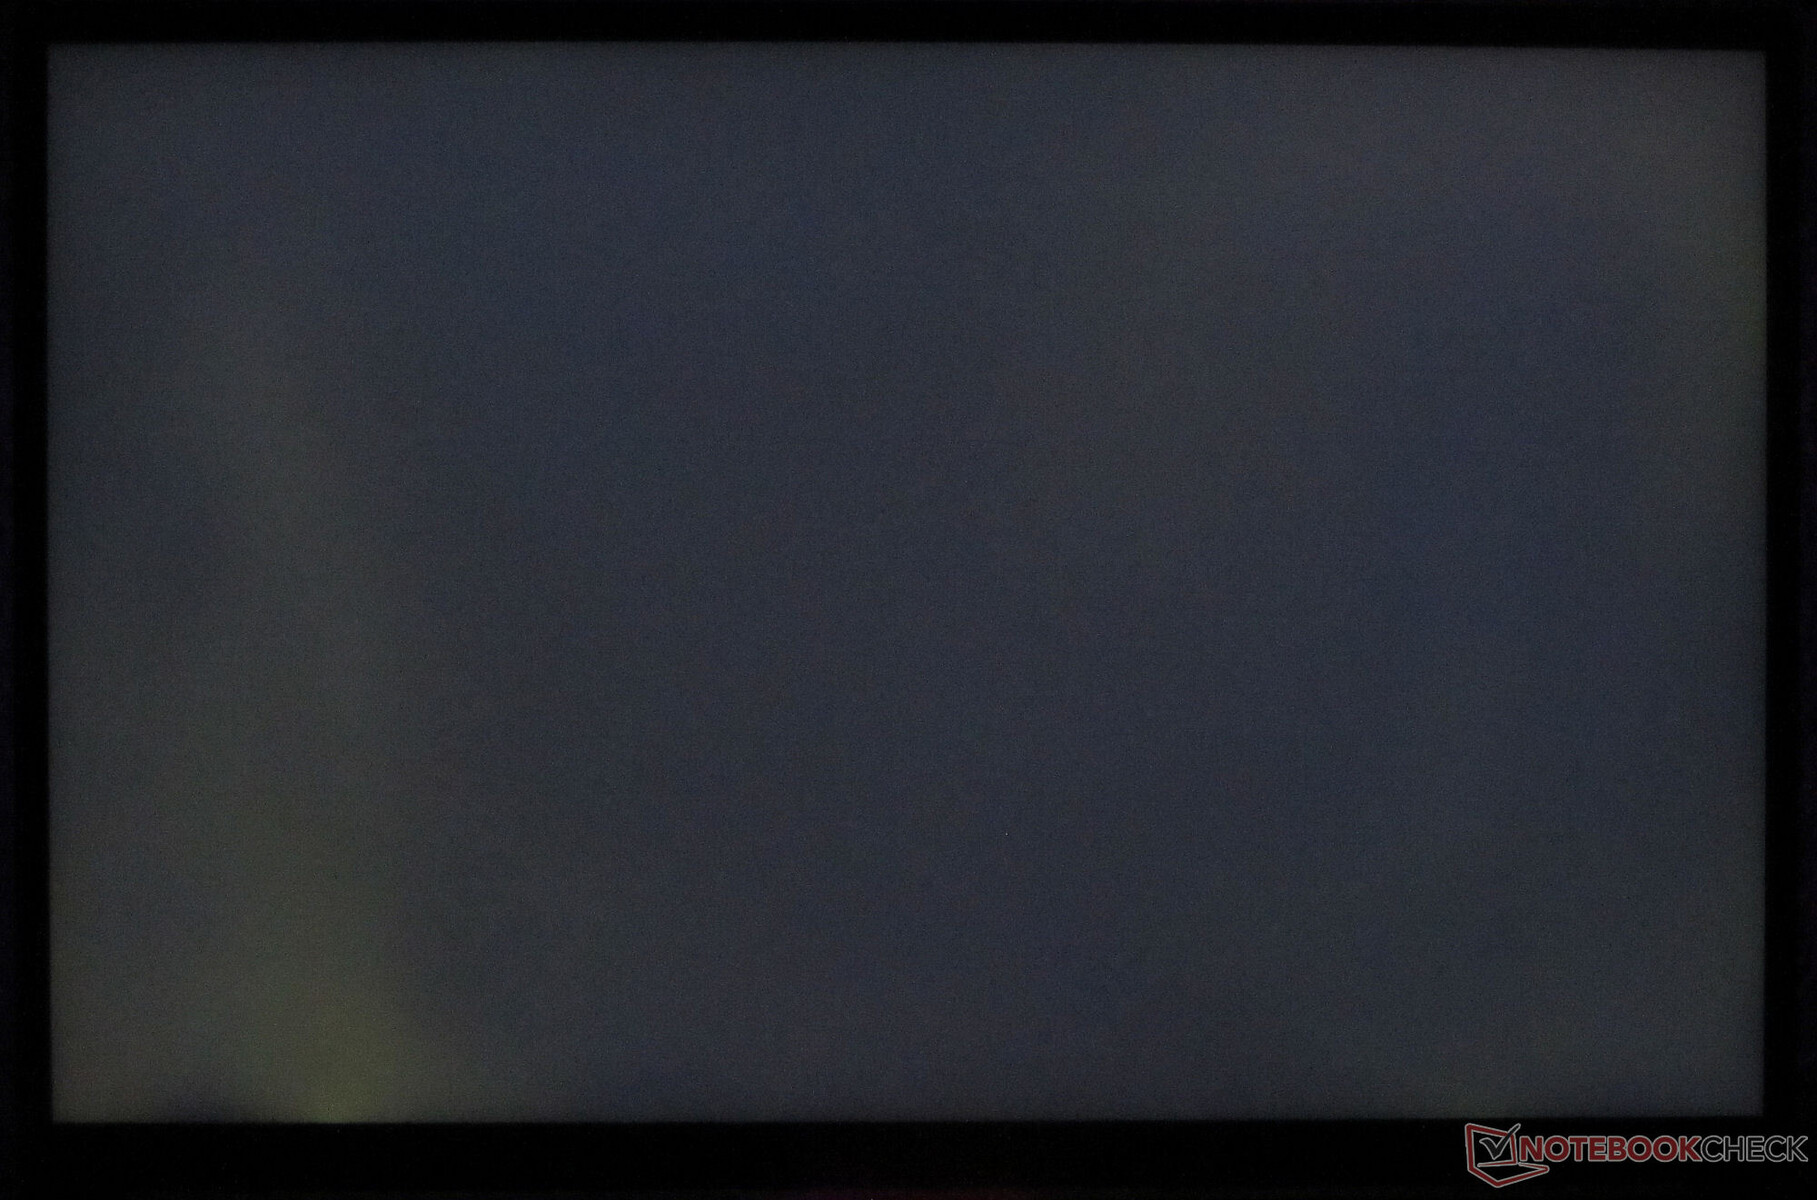
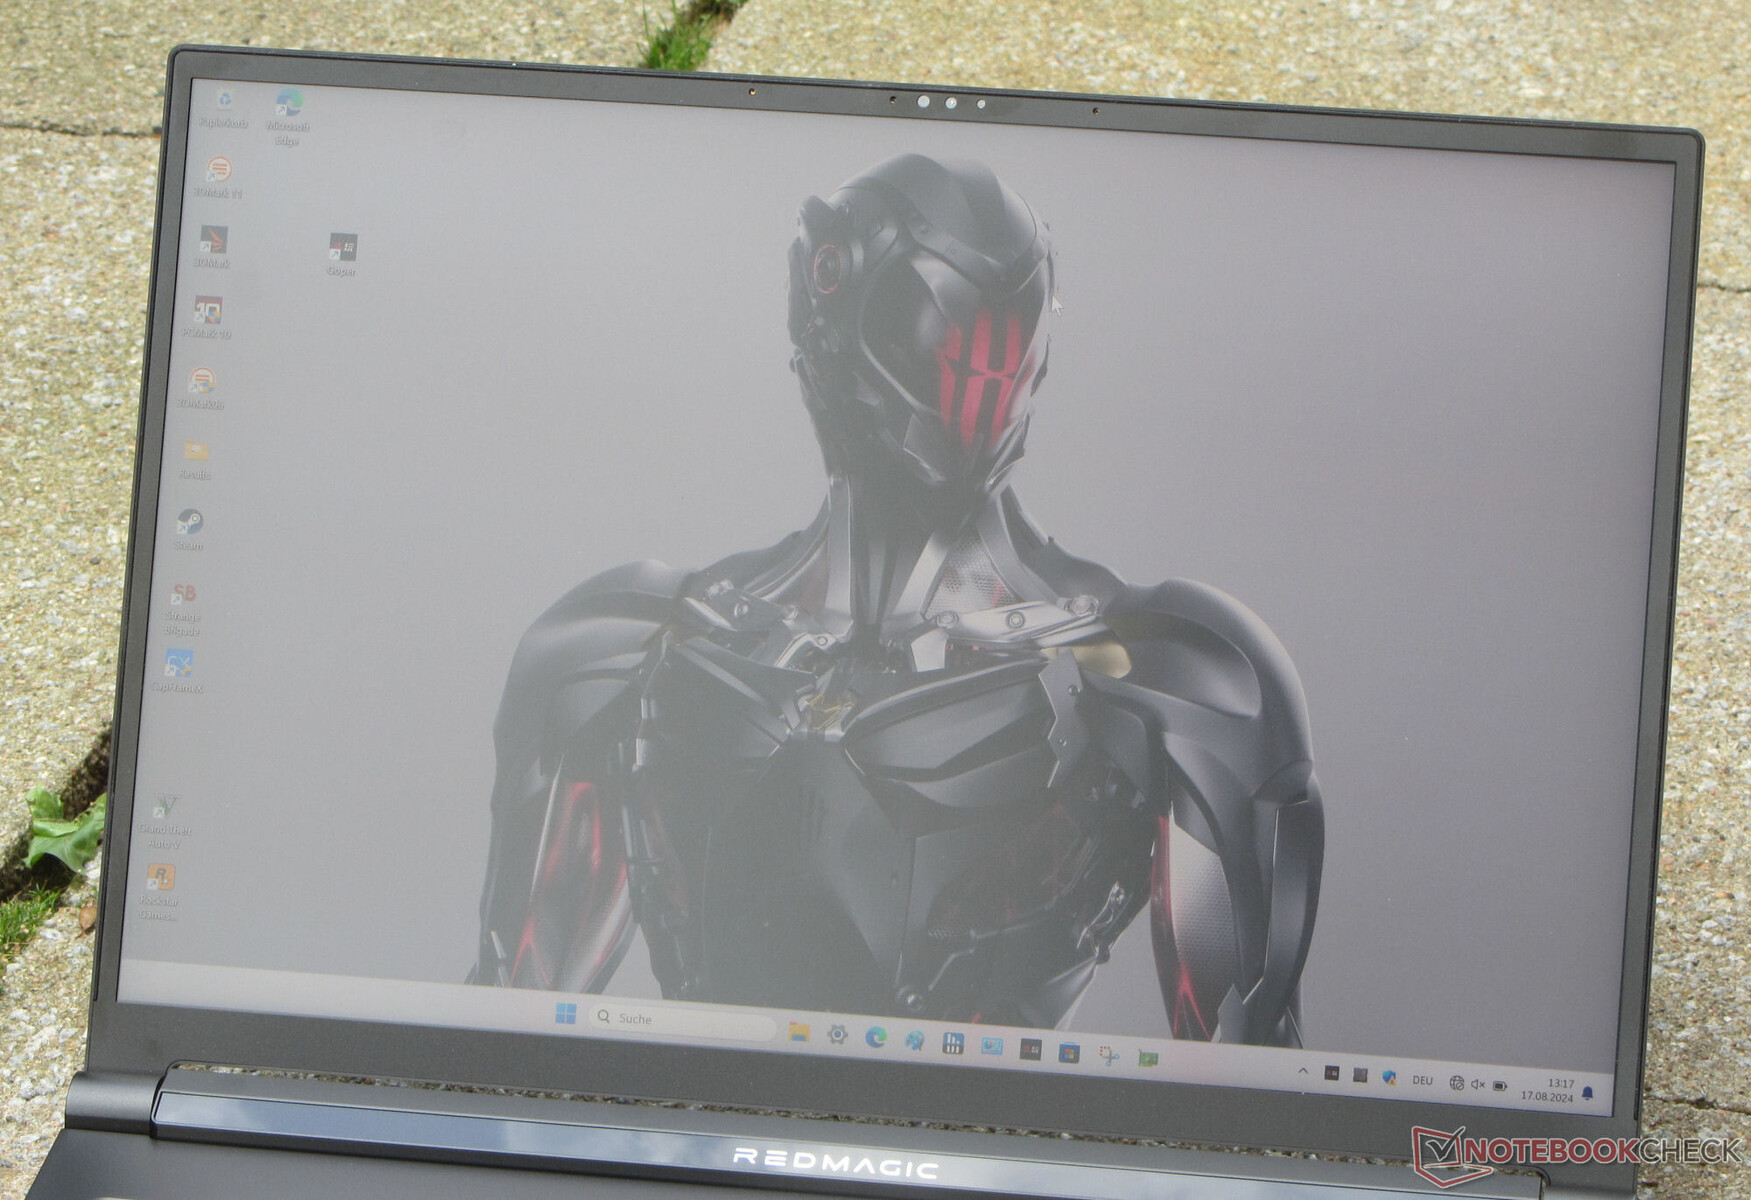
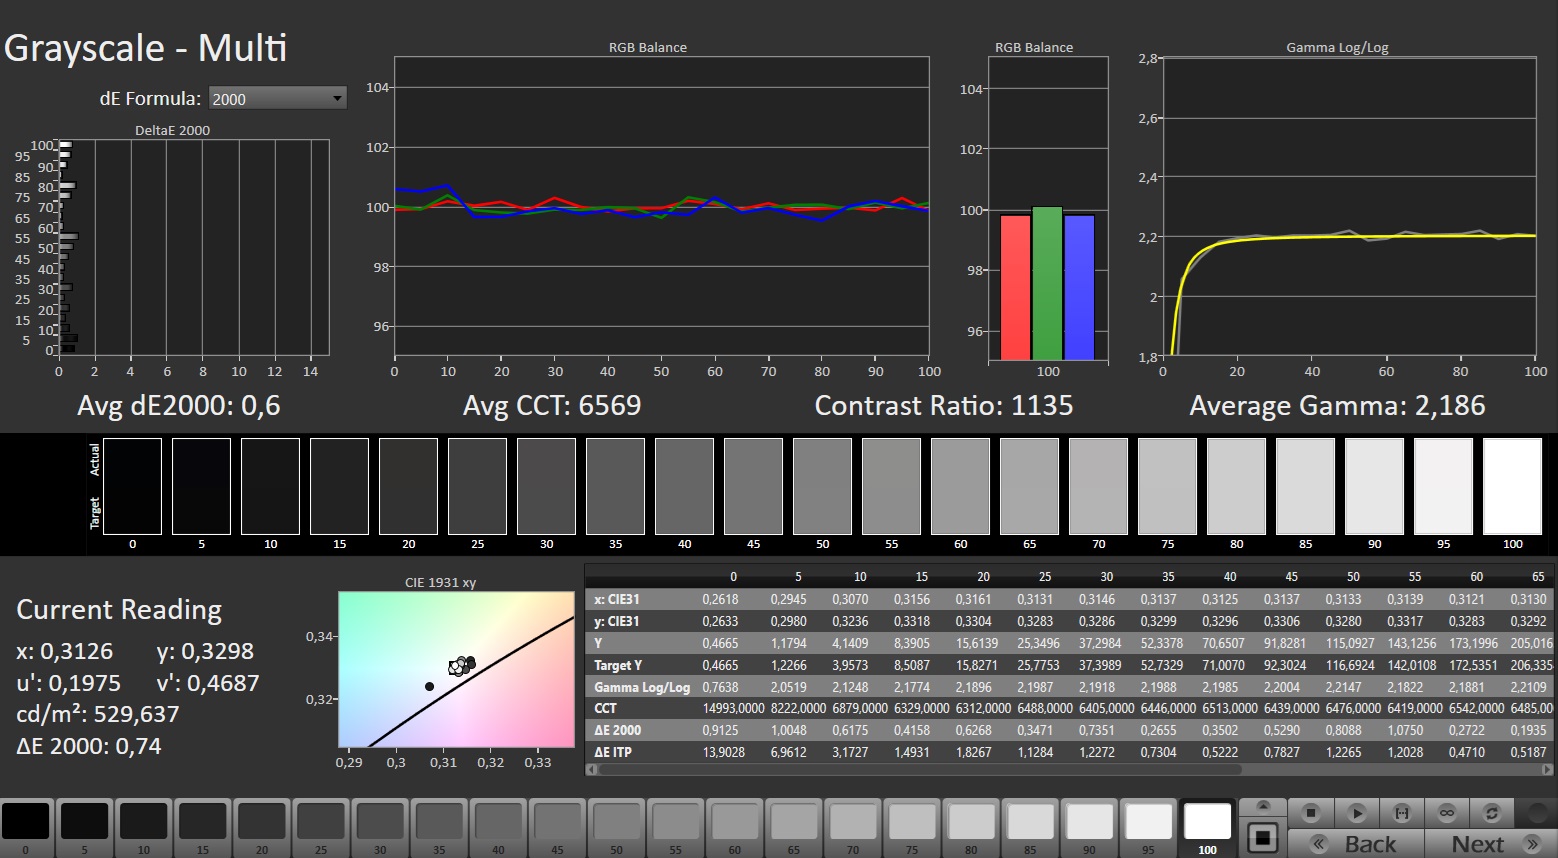
Parece que a proporção de aspecto 16:10, favorável ao trabalho, já se estabeleceu, pois a maioria dos notebooks no campo de comparação tem telas com essa proporção - incluindo o Titan. A Nubia equipou seu laptop com uma tela IPS fosca e estável no ângulo de visão (2.560 x 1.600 pixels) com uma diagonal de 16 polegadas. O painel é superbrilhante e seu contraste atinge o valor desejado. É perfeitamente possível ler na tela em ambientes externos. Um ponto positivo é que o painel de 240 Hz não mostra sinais de oscilação de PWM e suporta G-Sync. Não há telas alternativas disponíveis.
| |||||||||||||||||||||||||
iluminação: 86 %
iluminação com acumulador: 543 cd/m²
Contraste: 1065:1 (Preto: 0.51 cd/m²)
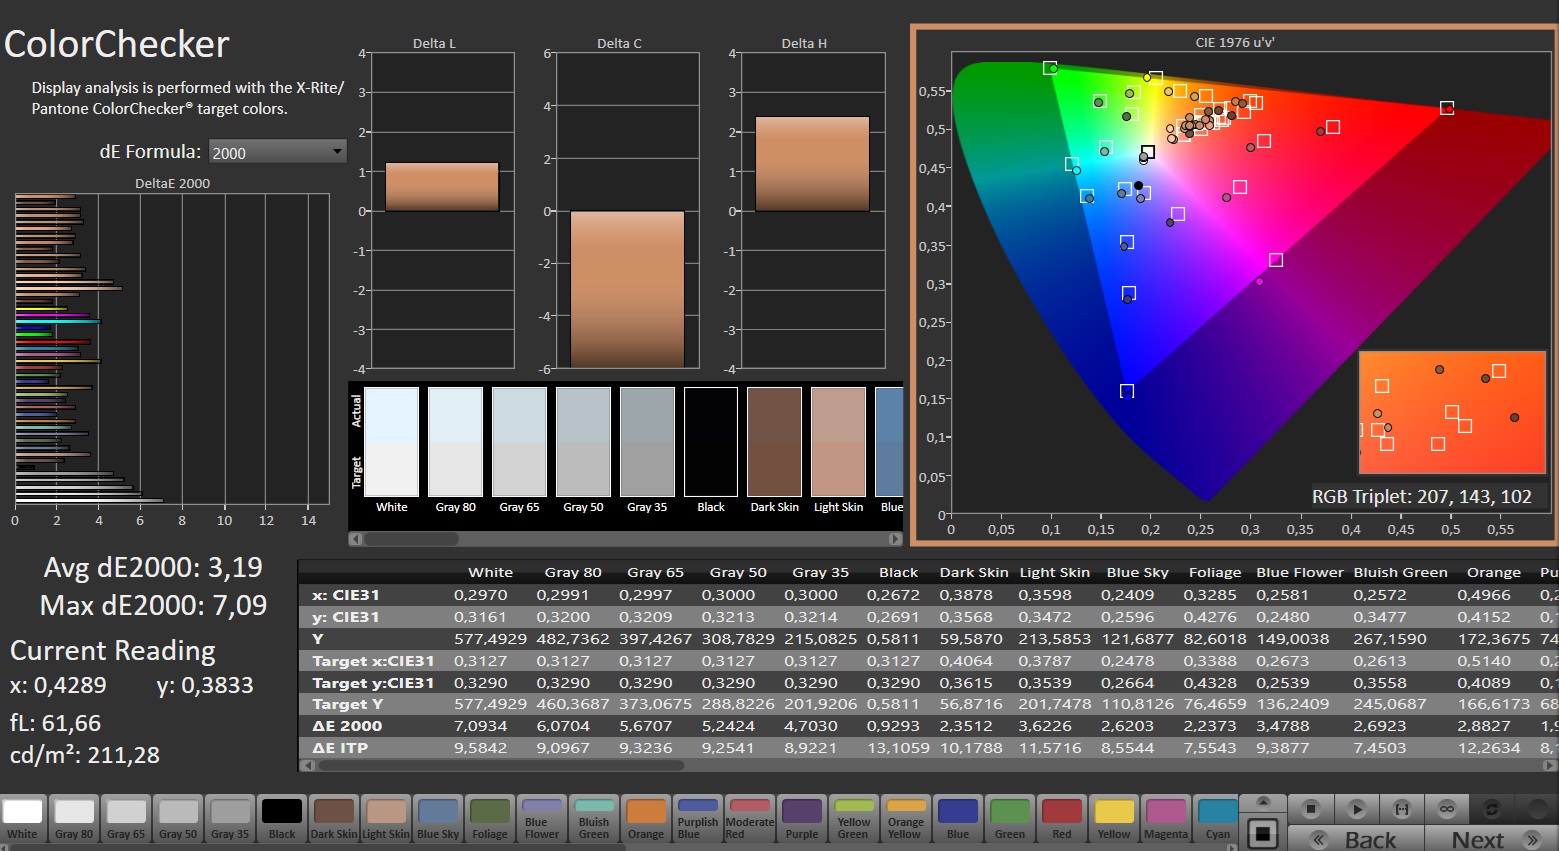
ΔE Color 3.19 | 0.5-29.43 Ø4.87, calibrated: 0.69
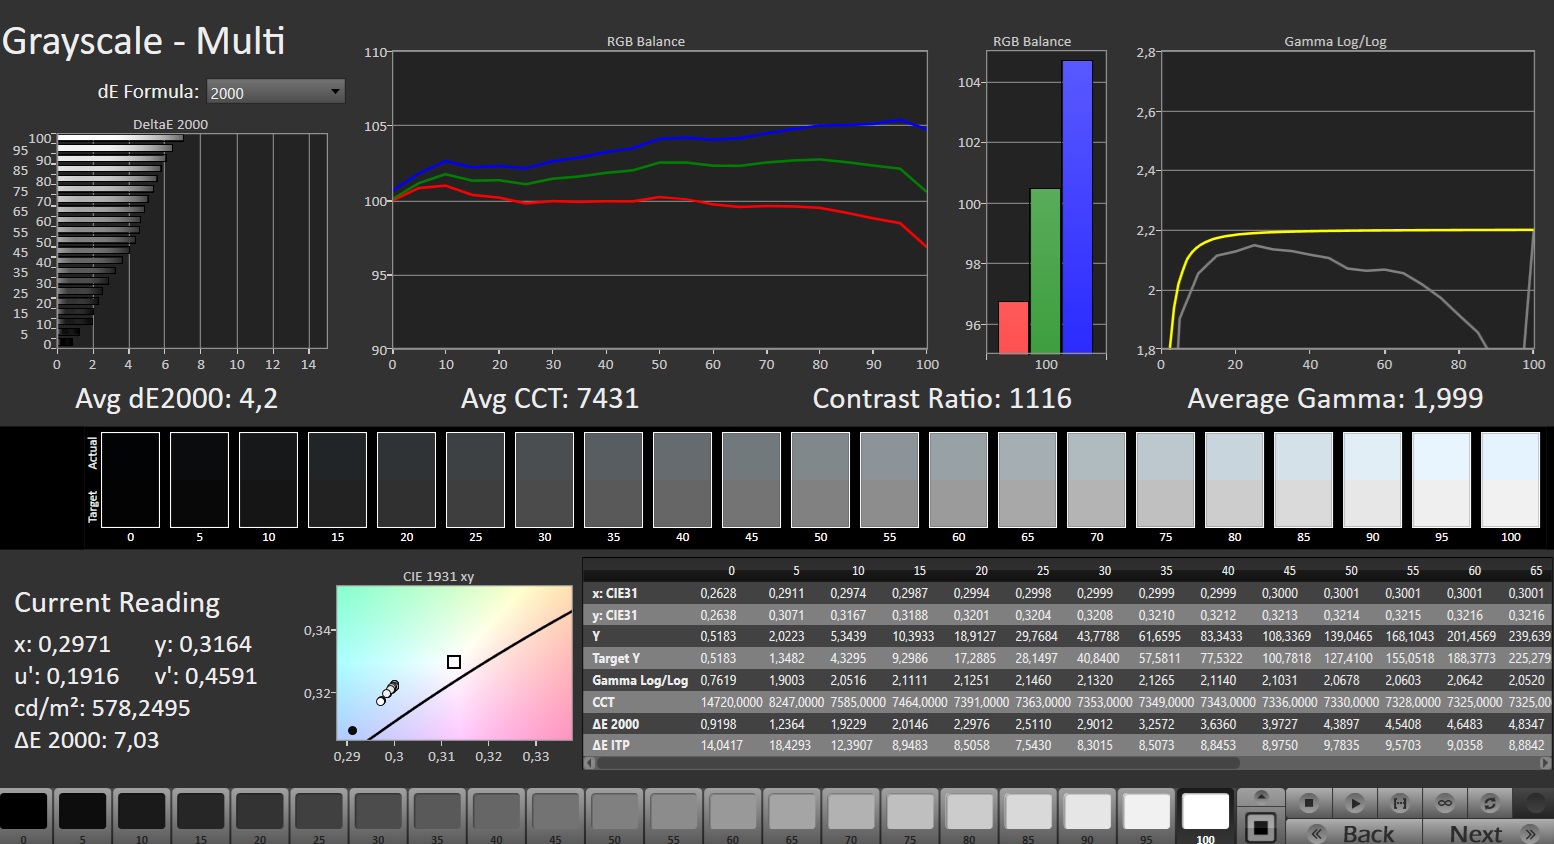
ΔE Greyscale 4.2 | 0.5-98 Ø5.1
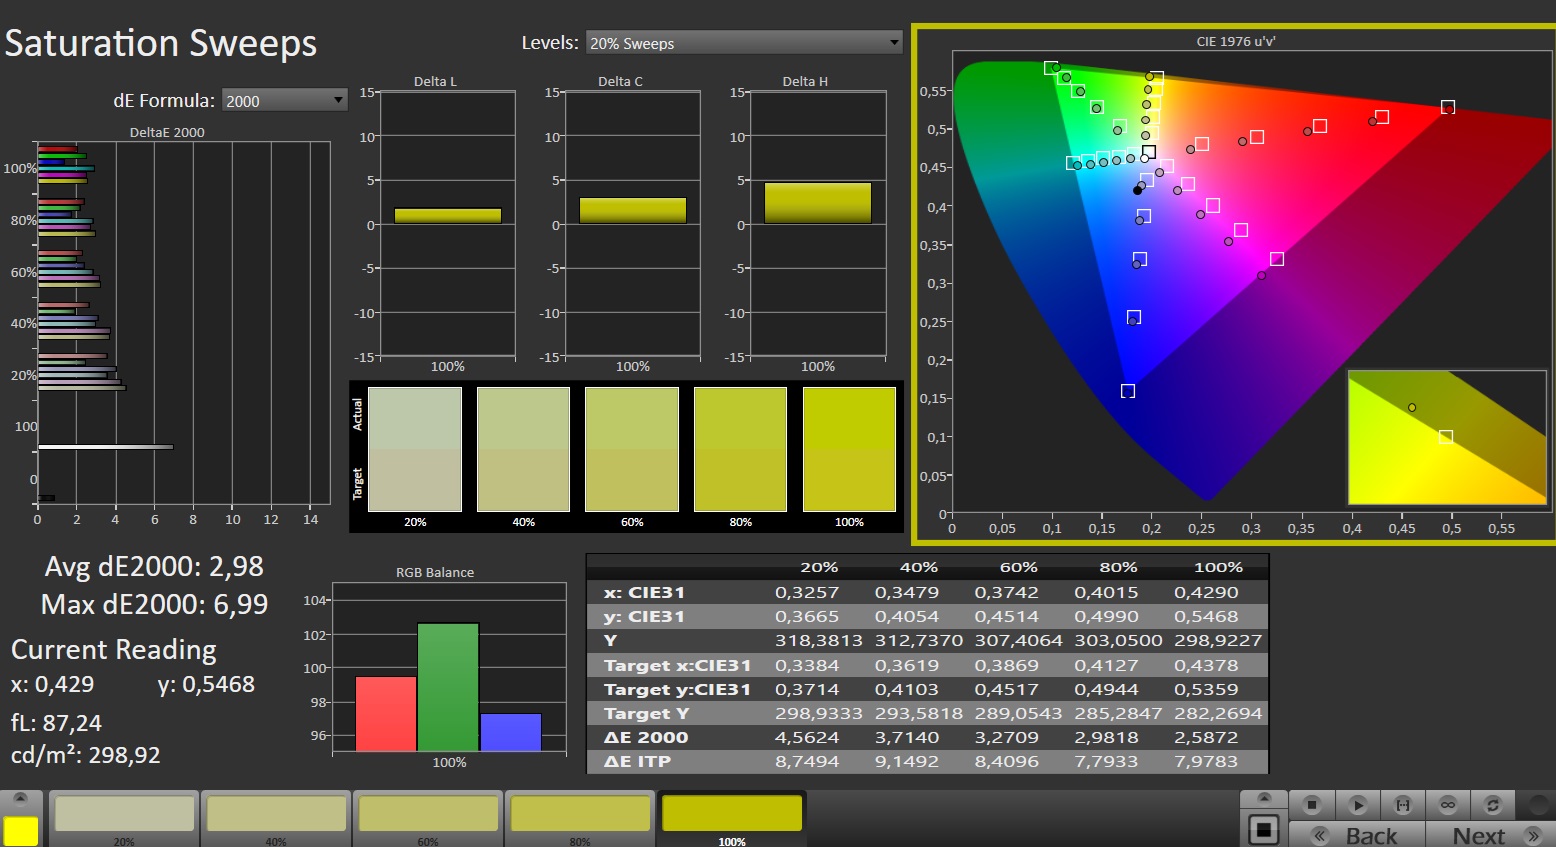
84.1% AdobeRGB 1998 (Argyll 2.2.0 3D)
100% sRGB (Argyll 2.2.0 3D)
96.3% Display P3 (Argyll 2.2.0 3D)
Gamma: 1.999
| Nubia RedMagic Titan 16 Pro BOE CQ NE160QDM-NZ2, IPS, 2560x1600, 16", 240 Hz | Lenovo Legion Pro 5 16IRX9 G9 BOE NE160QDM-NZB, IPS, 2560x1600, 16", 240 Hz | HP Victus 16 (2024) Chi Mei CMN163E, IPS, 1920x1080, 16.1", 144 Hz | Acer Predator Helios Neo 16 (2024) Chi Mei N160GME-GTB, LED, 2560x1600, 16", 240 Hz | SCHENKER XMG Pro 16 Studio (Mid 24) BOE CQ NE160QDM-NZ1, IPS, 2560x1600, 16", 240 Hz | Gigabyte G6X 9KG (2024) BOE NE160WUM-NX6, IPS, 1920x1200, 16", 165 Hz | |
|---|---|---|---|---|---|---|
| Display | 2% | -48% | 1% | -15% | -48% | |
| Display P3 Coverage | 96.3 | 99.22 3% | 41.3 -57% | 95.9 0% | 68.8 -29% | 41.8 -57% |
| sRGB Coverage | 100 | 99.93 0% | 61.7 -38% | 99.8 0% | 99.5 0% | 62.4 -38% |
| AdobeRGB 1998 Coverage | 84.1 | 87.81 4% | 42.7 -49% | 86.4 3% | 70.8 -16% | 43.3 -49% |
| Response Times | -54% | -454% | -52% | -126% | -635% | |
| Response Time Grey 50% / Grey 80% * | 3.9 ? | 4.8 ? -23% | 28.6 ? -633% | 5 ? -28% | 12.7 ? -226% | 40.5 ? -938% |
| Response Time Black / White * | 5 ? | 9.2 ? -84% | 18.7 ? -274% | 8.8 ? -76% | 6.3 ? -26% | 21.6 ? -332% |
| PWM Frequency | ||||||
| Screen | 4% | -74% | 18% | -2% | -68% | |
| Brightness middle | 543 | 518 -5% | 287 -47% | 521 -4% | 416 -23% | 353 -35% |
| Brightness | 516 | 491 -5% | 288 -44% | 506 -2% | 392 -24% | 318 -38% |
| Brightness Distribution | 86 | 90 5% | 86 0% | 85 -1% | 86 0% | 81 -6% |
| Black Level * | 0.51 | 0.36 29% | 0.19 63% | 0.44 14% | 0.38 25% | 0.21 59% |
| Contrast | 1065 | 1439 35% | 1511 42% | 1184 11% | 1095 3% | 1681 58% |
| Colorchecker dE 2000 * | 3.19 | 4.32 -35% | 5.46 -71% | 1.74 45% | 2.33 27% | 5.21 -63% |
| Colorchecker dE 2000 max. * | 7.09 | 6.37 10% | 20.36 -187% | 3.88 45% | 6.07 14% | 19.95 -181% |
| Colorchecker dE 2000 calibrated * | 0.69 | 0.75 -9% | 3.52 -410% | 0.52 25% | 1.02 -48% | 3.61 -423% |
| Greyscale dE 2000 * | 4.2 | 3.66 13% | 4.8 -14% | 3 29% | 3.7 12% | 3.6 14% |
| Gamma | 1.999 110% | 2.19 100% | 2.108 104% | 2.164 102% | 2.161 102% | 2.367 93% |
| CCT | 7431 87% | 6841 95% | 6442 101% | 6816 95% | 7102 92% | 7138 91% |
| Média Total (Programa/Configurações) | -16% /
-4% | -192% /
-123% | -11% /
4% | -48% /
-22% | -250% /
-145% |
* ... menor é melhor
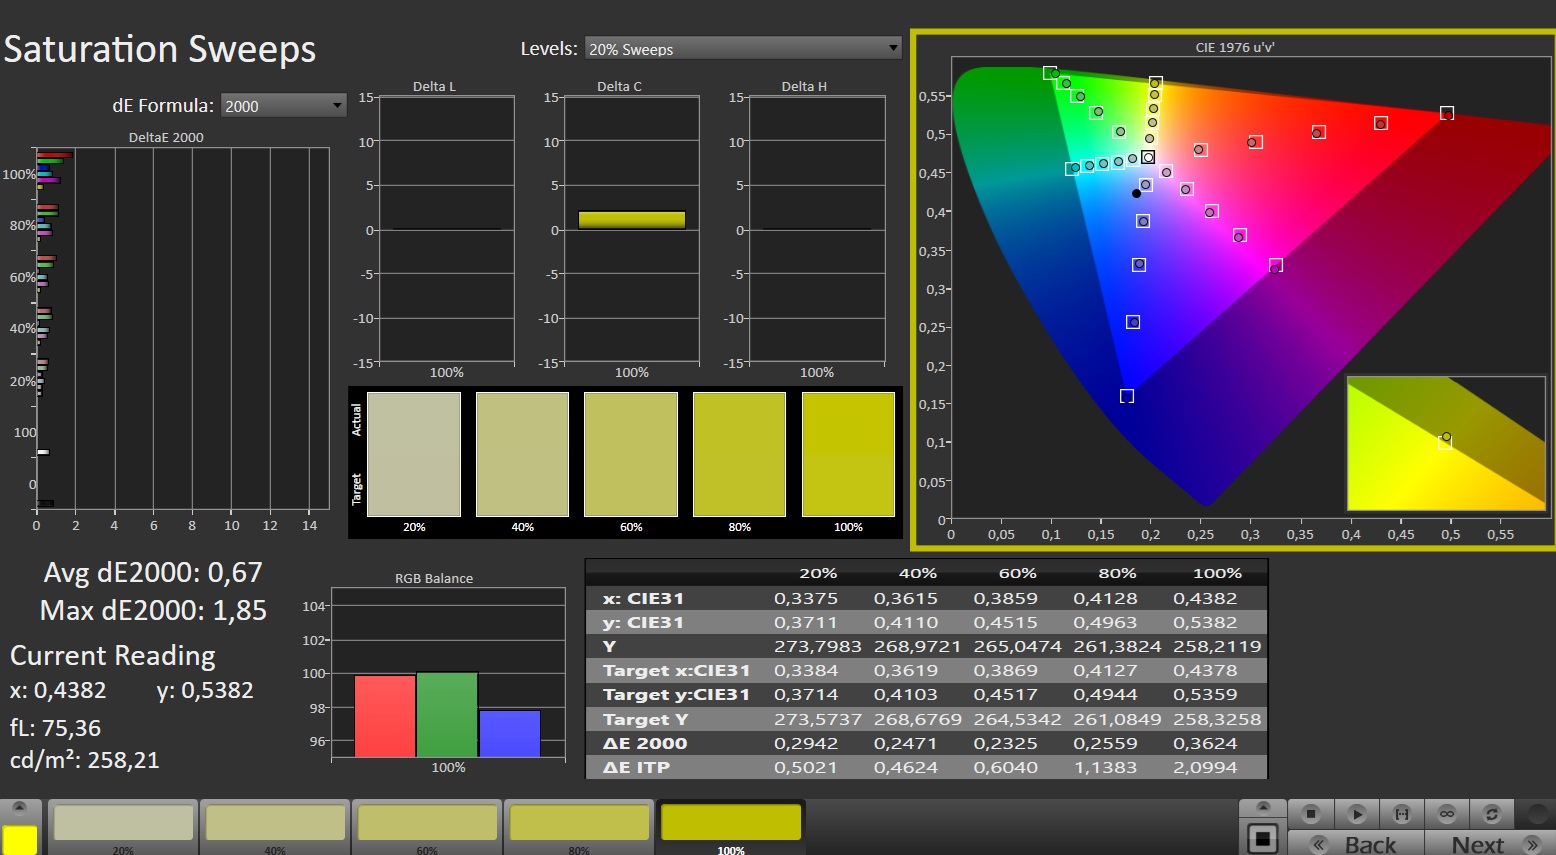
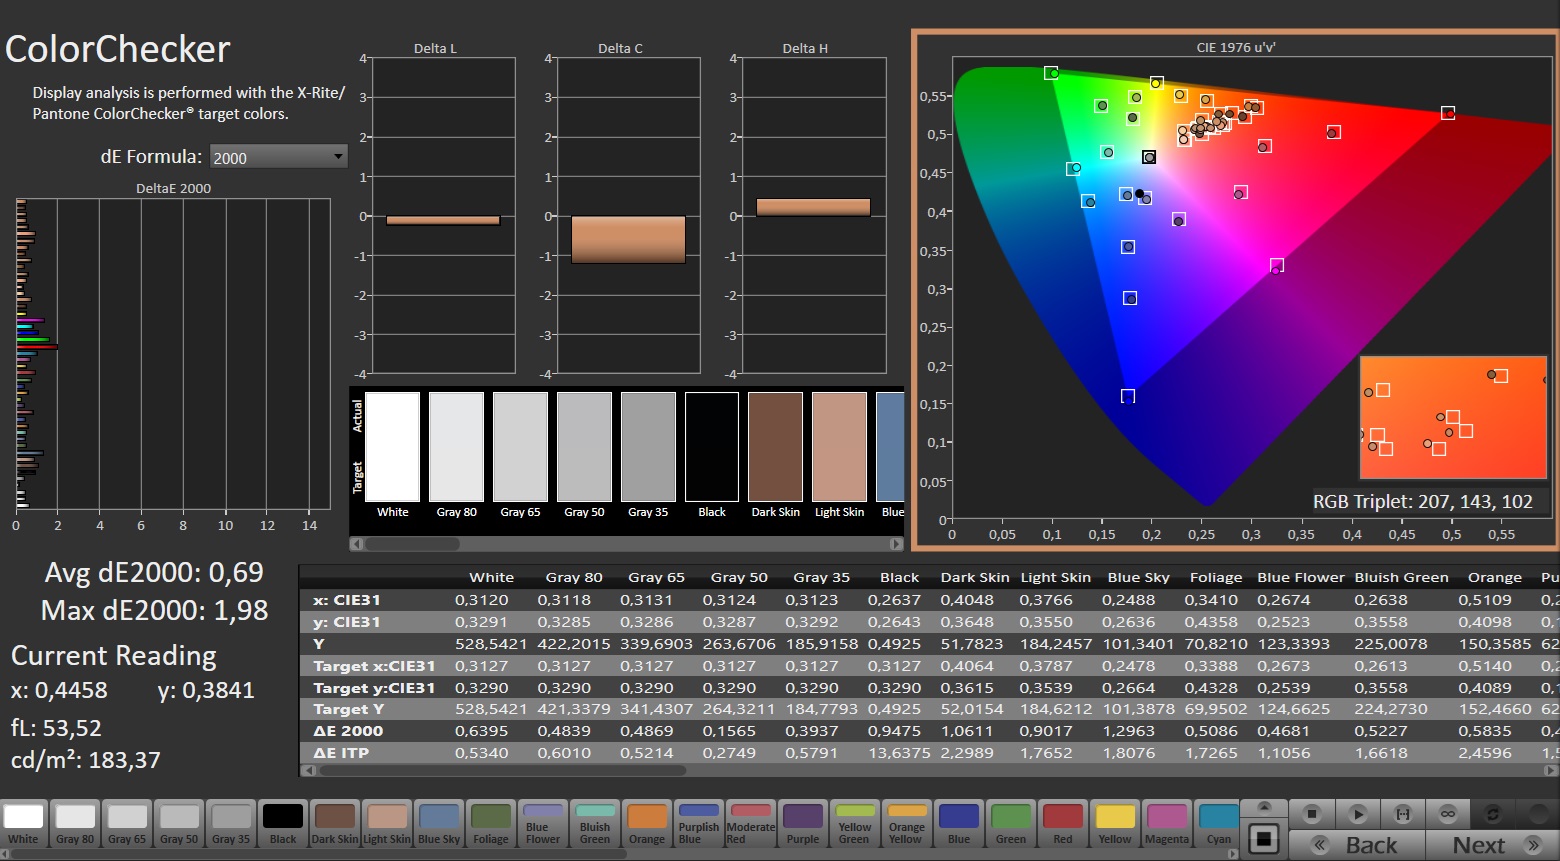
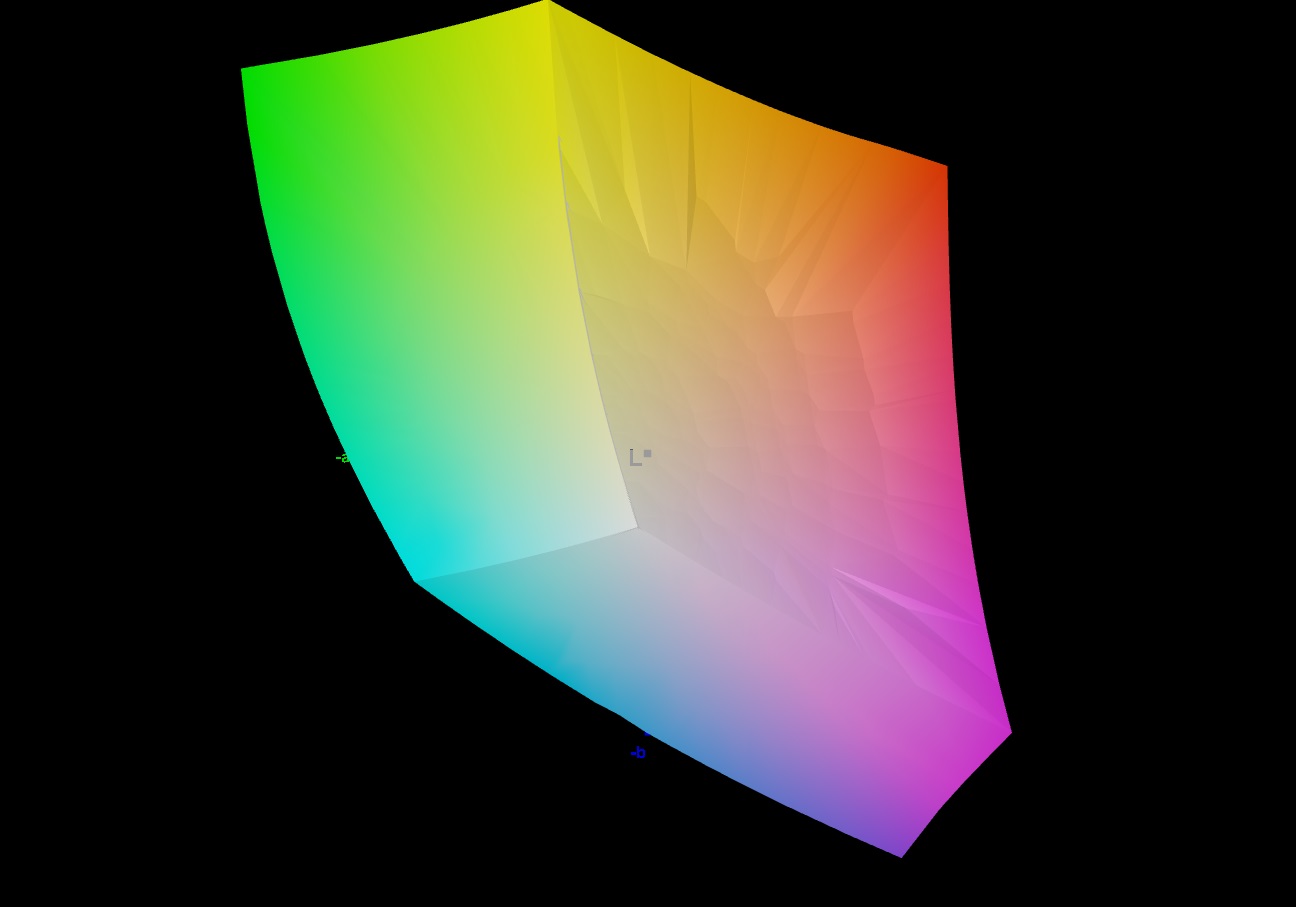
O painel cobre os espaços de cores sRGB e DCI-P3 completamente ou quase completamente, mas não o espaço AdobeRGB - isso é semelhante às telas da maioria dos concorrentes. Sua reprodução de cores decente, logo que sai da caixa, pode ser aumentada para a faixa muito boa com a realização de uma calibração: Então, o desvio de cor cai de 3,19 para 0,69 (meta: DeltaE < 3). Ao mesmo tempo, sua representação em escala de cinza parece muito mais equilibrada.
Nosso perfil de cores pode ser baixado e usado gratuitamente. Um link pode ser encontrado na caixa de informações da tela.

Exibir tempos de resposta
| ↔ Tempo de resposta preto para branco | ||
|---|---|---|
| 5 ms ... ascensão ↗ e queda ↘ combinadas | ↗ 1.2 ms ascensão | 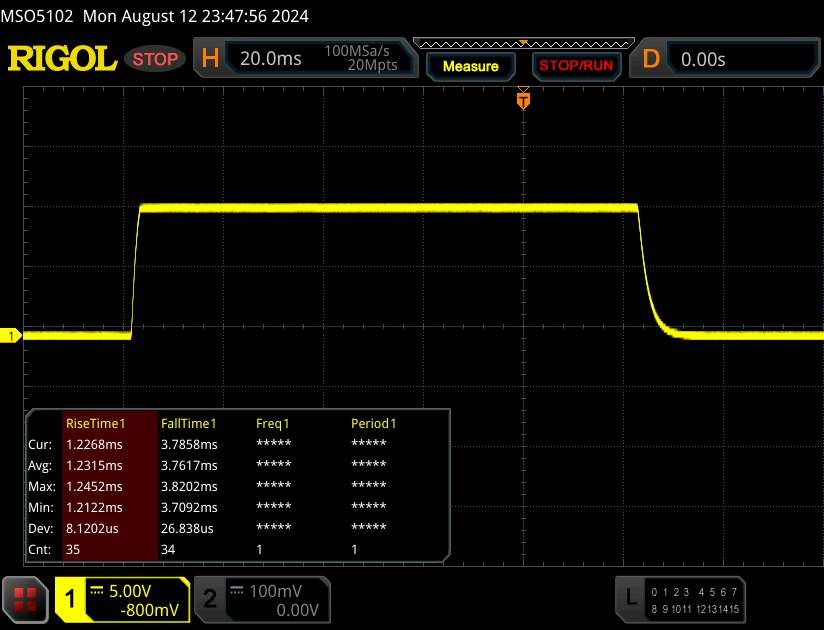 |
| ↘ 3.8 ms queda | ||
| A tela mostra taxas de resposta muito rápidas em nossos testes e deve ser muito adequada para jogos em ritmo acelerado. Em comparação, todos os dispositivos testados variam de 0.1 (mínimo) a 240 (máximo) ms. » 15 % de todos os dispositivos são melhores. Isso significa que o tempo de resposta medido é melhor que a média de todos os dispositivos testados (20.8 ms). | ||
| ↔ Tempo de resposta 50% cinza a 80% cinza | ||
| 3.9 ms ... ascensão ↗ e queda ↘ combinadas | ↗ 1.7 ms ascensão | 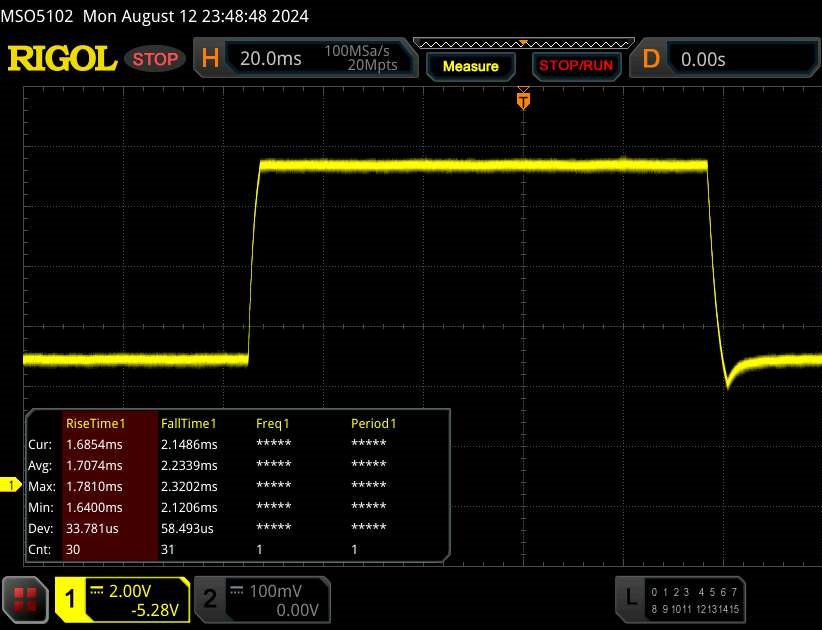 |
| ↘ 2.2 ms queda | ||
| A tela mostra taxas de resposta muito rápidas em nossos testes e deve ser muito adequada para jogos em ritmo acelerado. Em comparação, todos os dispositivos testados variam de 0.165 (mínimo) a 636 (máximo) ms. » 12 % de todos os dispositivos são melhores. Isso significa que o tempo de resposta medido é melhor que a média de todos os dispositivos testados (32.5 ms). | ||
Cintilação da tela / PWM (modulação por largura de pulso)
| Tela tremeluzindo / PWM não detectado | 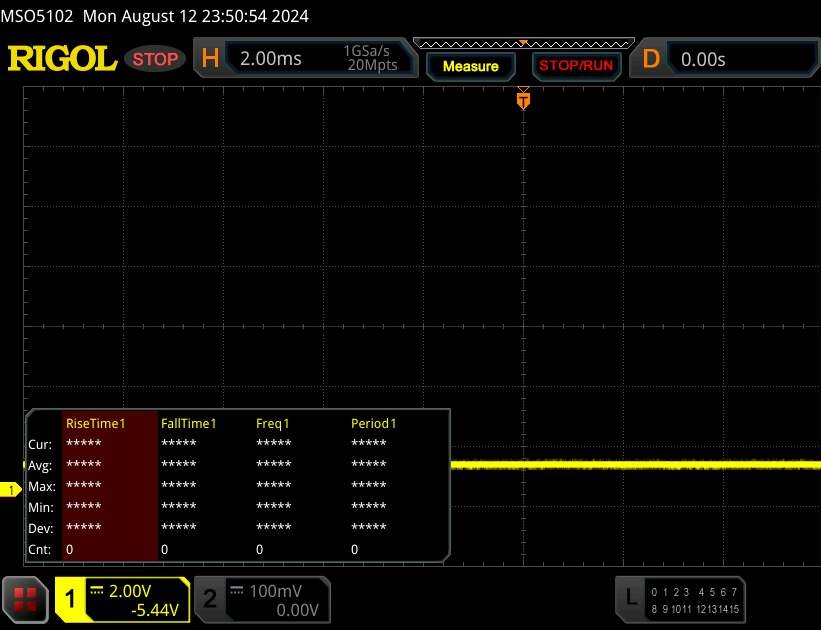 | ||
[pwm_comparison] Em comparação: 53 % de todos os dispositivos testados não usam PWM para escurecer a tela. Se PWM foi detectado, uma média de 8516 (mínimo: 5 - máximo: 343500) Hz foi medida. | |||
Desempenho - Raptor Lake e Ada Lovelace alimentam o laptop
A Titan 16 Pro é voltada para gamers e criadores, sendo que o foco provavelmente está no primeiro. A Core i9-14900HX e uma GeForce RTX 4060 alimentam o laptop. Seu MRSP é de US$ 1.699. A Nubia oferece variantes adicionais desse dispositivo, mas elas ainda não podem ser encontradas globalmente.
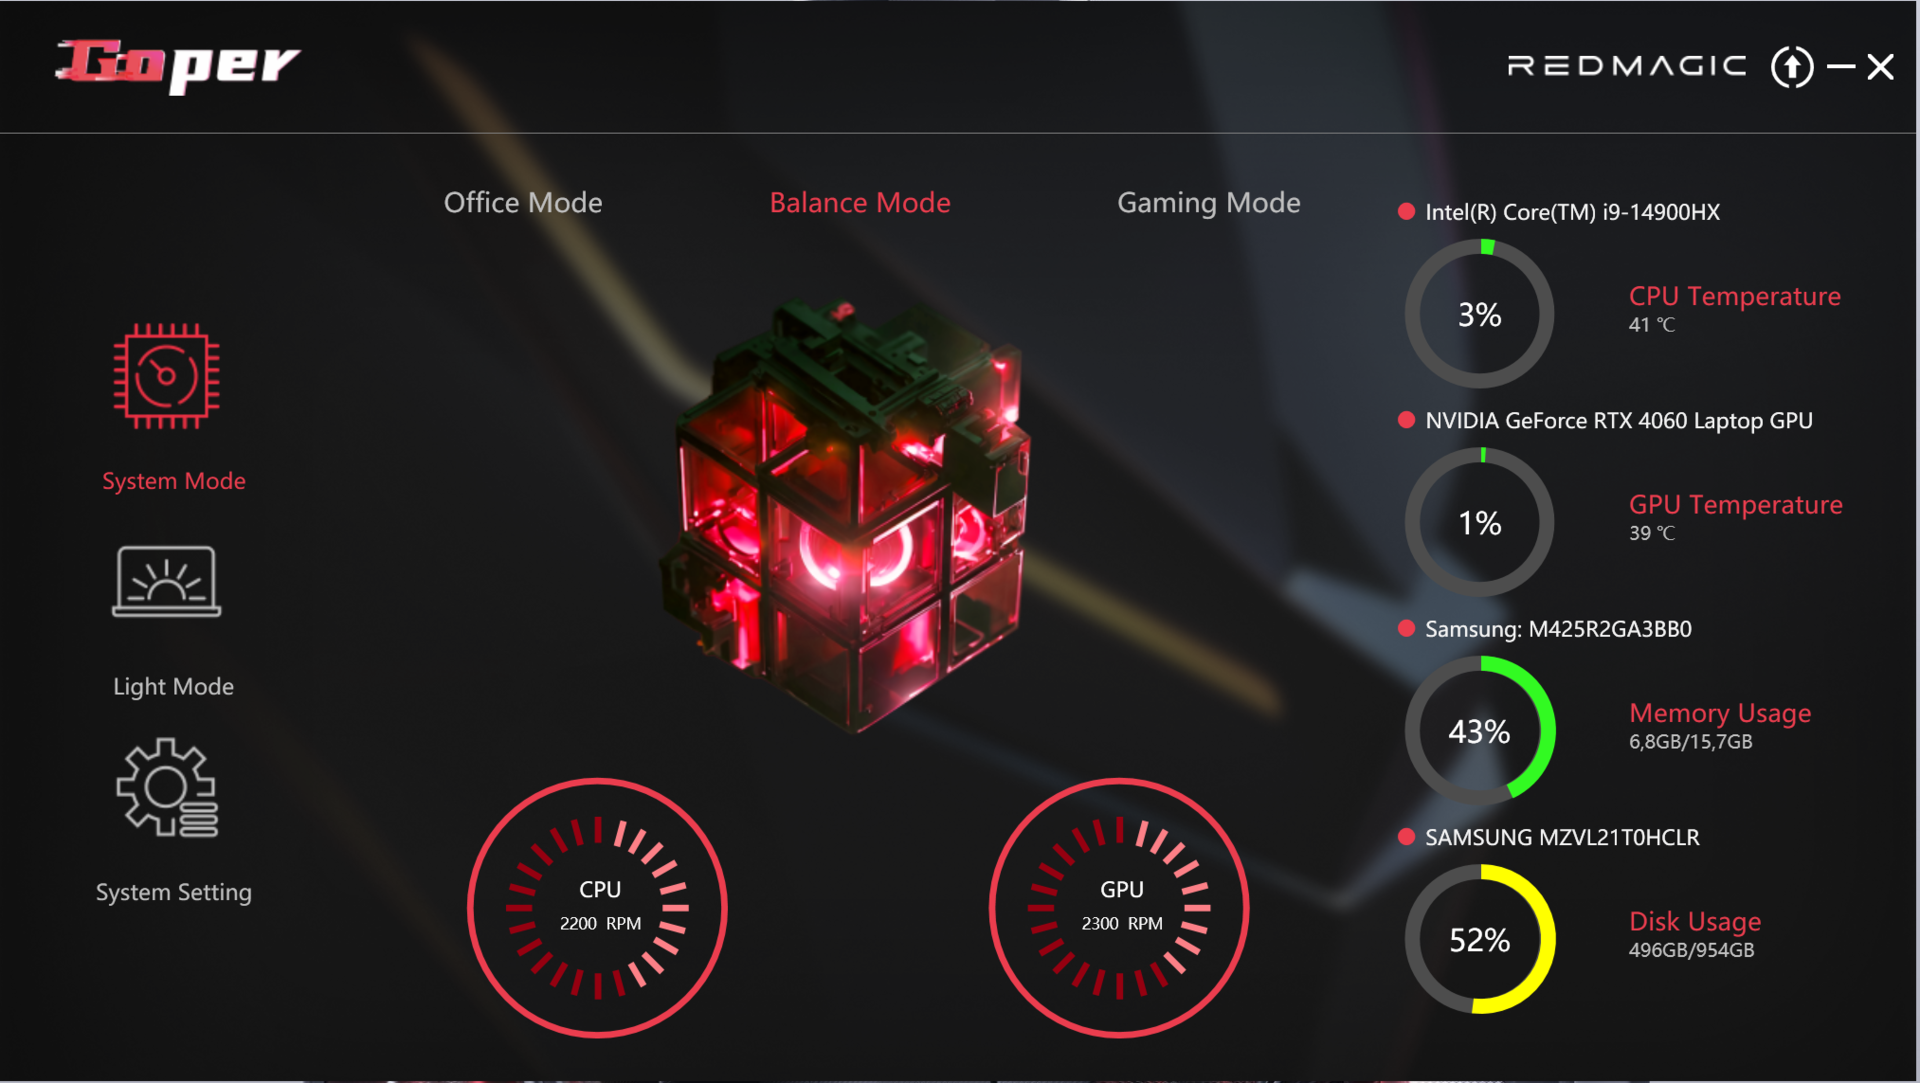
Condições de teste
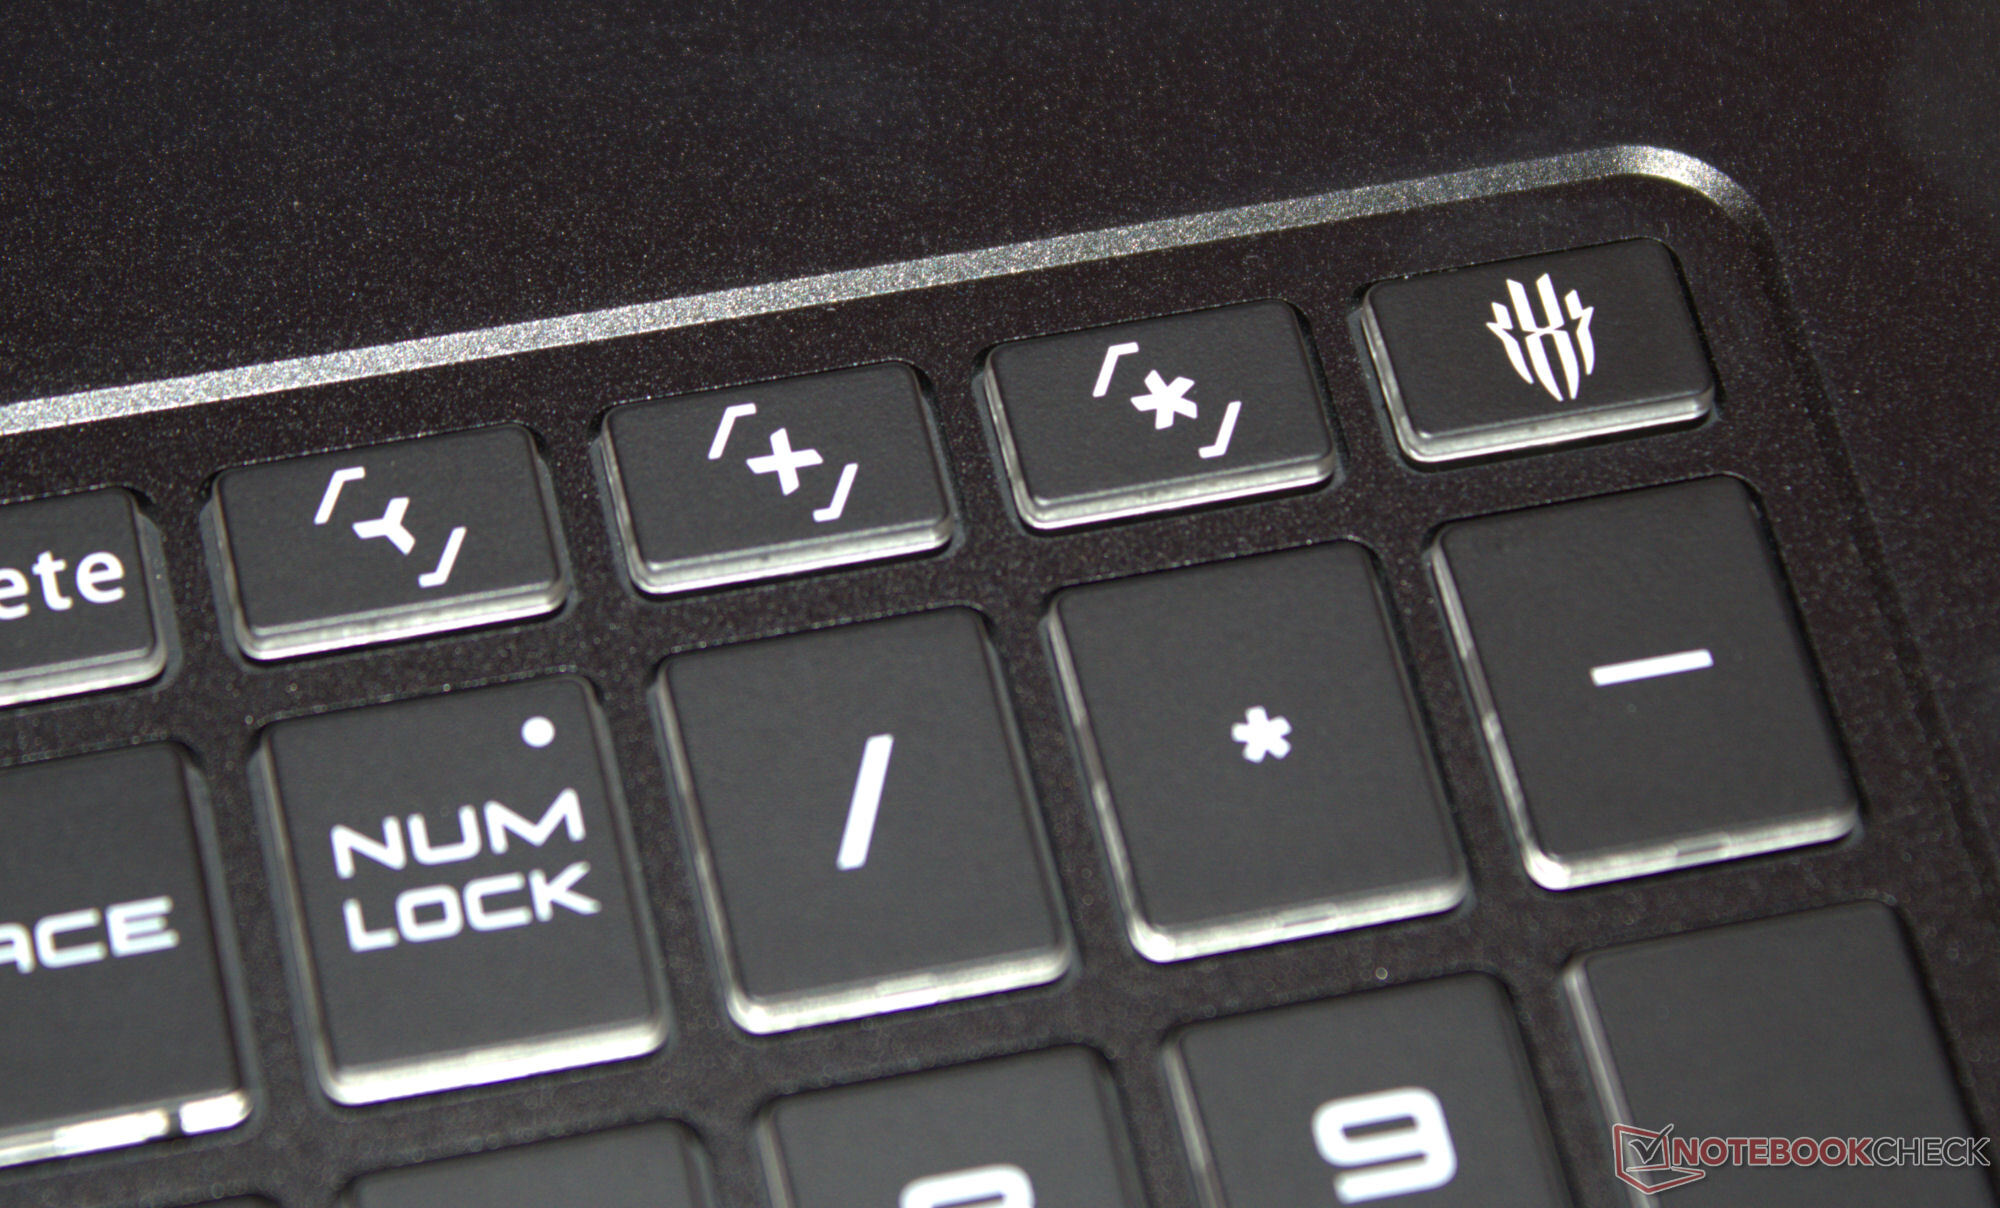
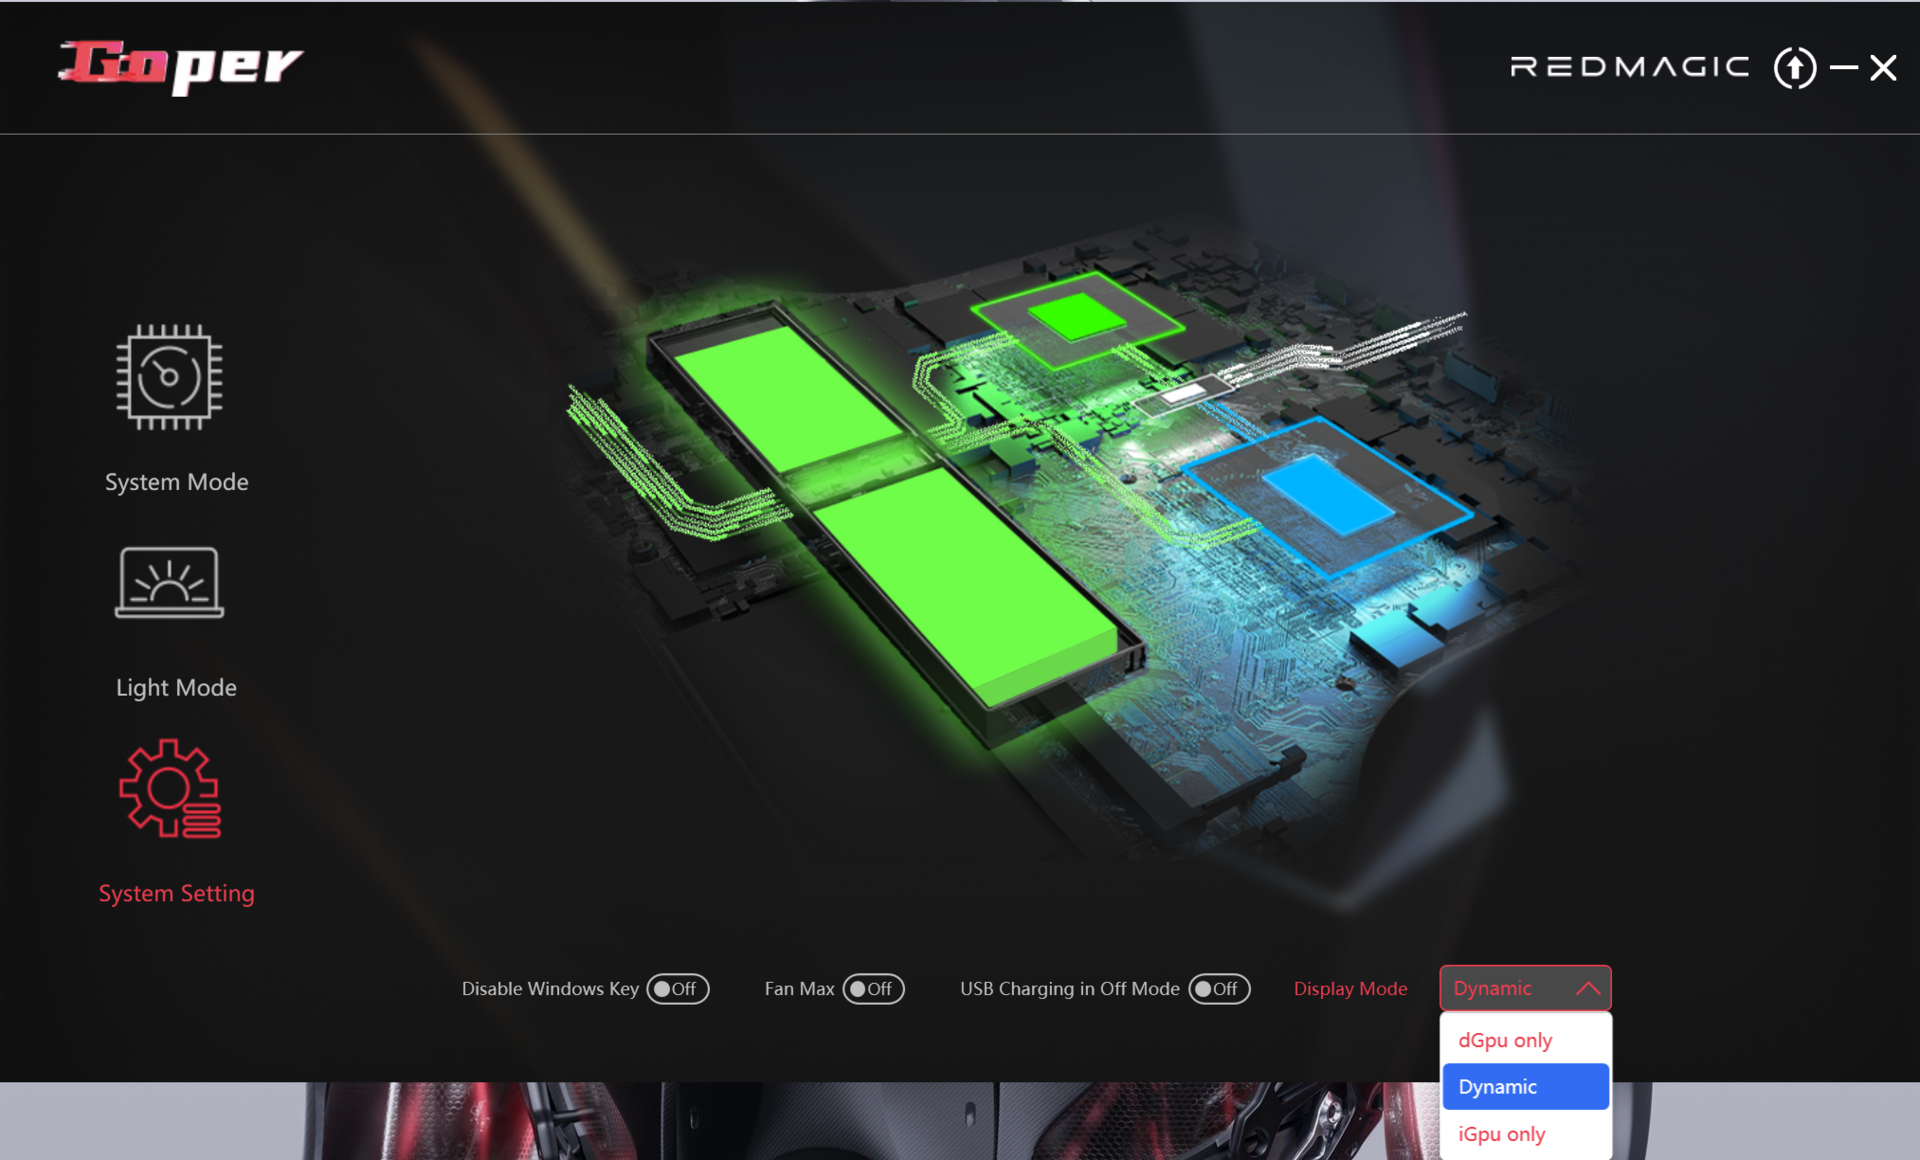
Três perfis de desempenho específicos do fabricante (consulte a tabela) estão disponíveis para escolha. O modo balanceado (benchmarks) e o modo escritório (testes de bateria) foram usados durante nosso teste. O modo GPU foi definido como dinâmico (= Optimus). Cada perfil pode ser acessado diretamente por meio de uma tecla separada na linha superior do teclado numérico. Como alternativa, é possível alterá-los por meio do aplicativo Goper (centro de controle do laptop).
| Modo balanceado | Modo de jogo | Modo de escritório | |
|---|---|---|---|
| Limite de energia 1 (HWInfo) | 45 watts | 100 watts | 35 watts |
| Limite de energia 2 (HWInfo) | 140 watts | 140 watts | 140 watts |
| Ruído (Cyberpunk 2077) | 50 dB(A) | 53 dB(A) | 47 dB(A) |
| Desempenho (Cyberpunk 2077) | 66 fps | 66 fps | 60 fps |
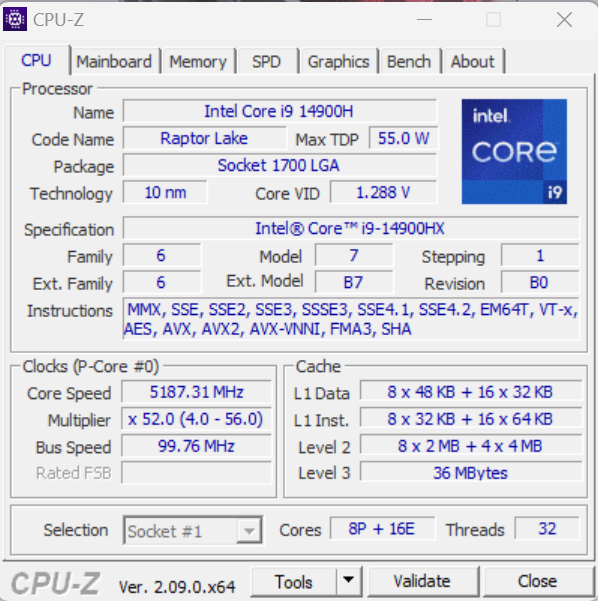
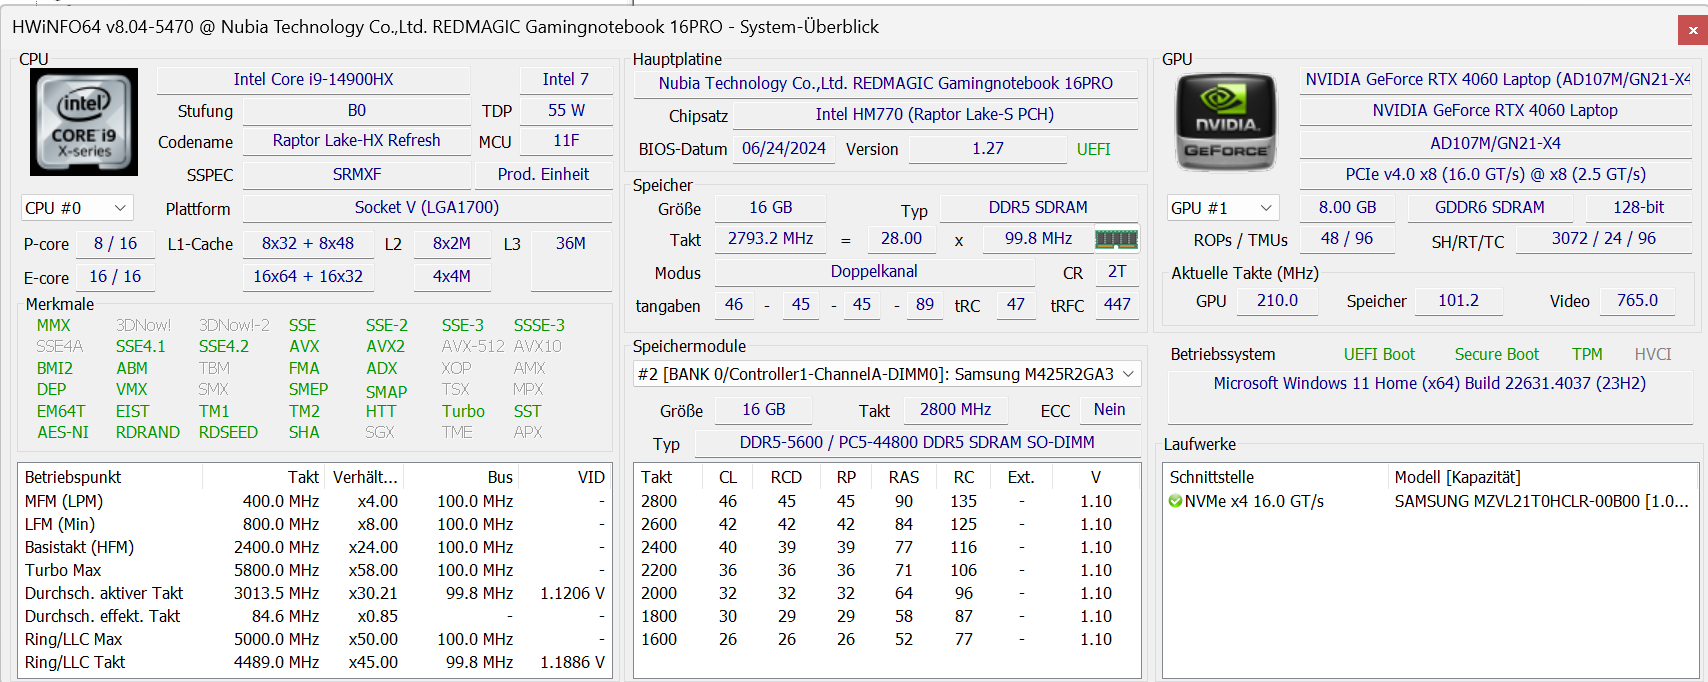
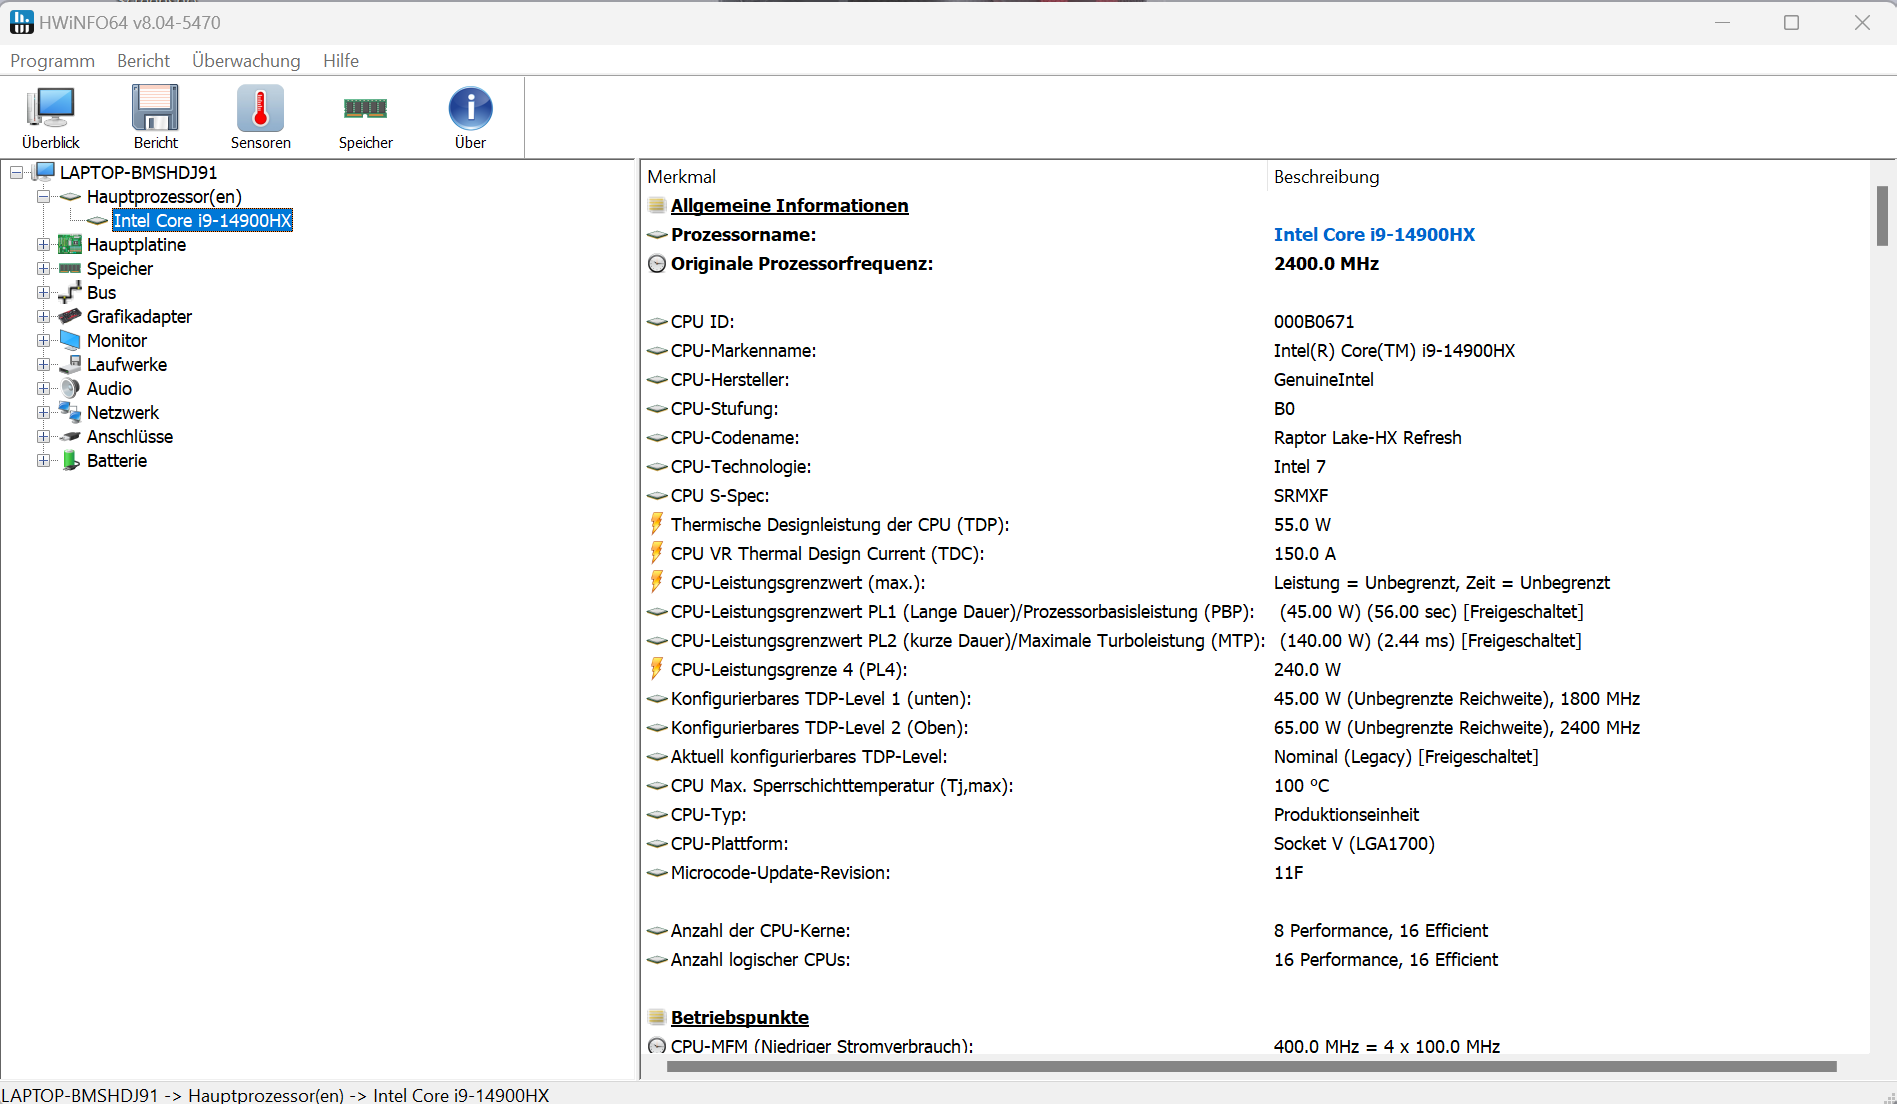
Processador
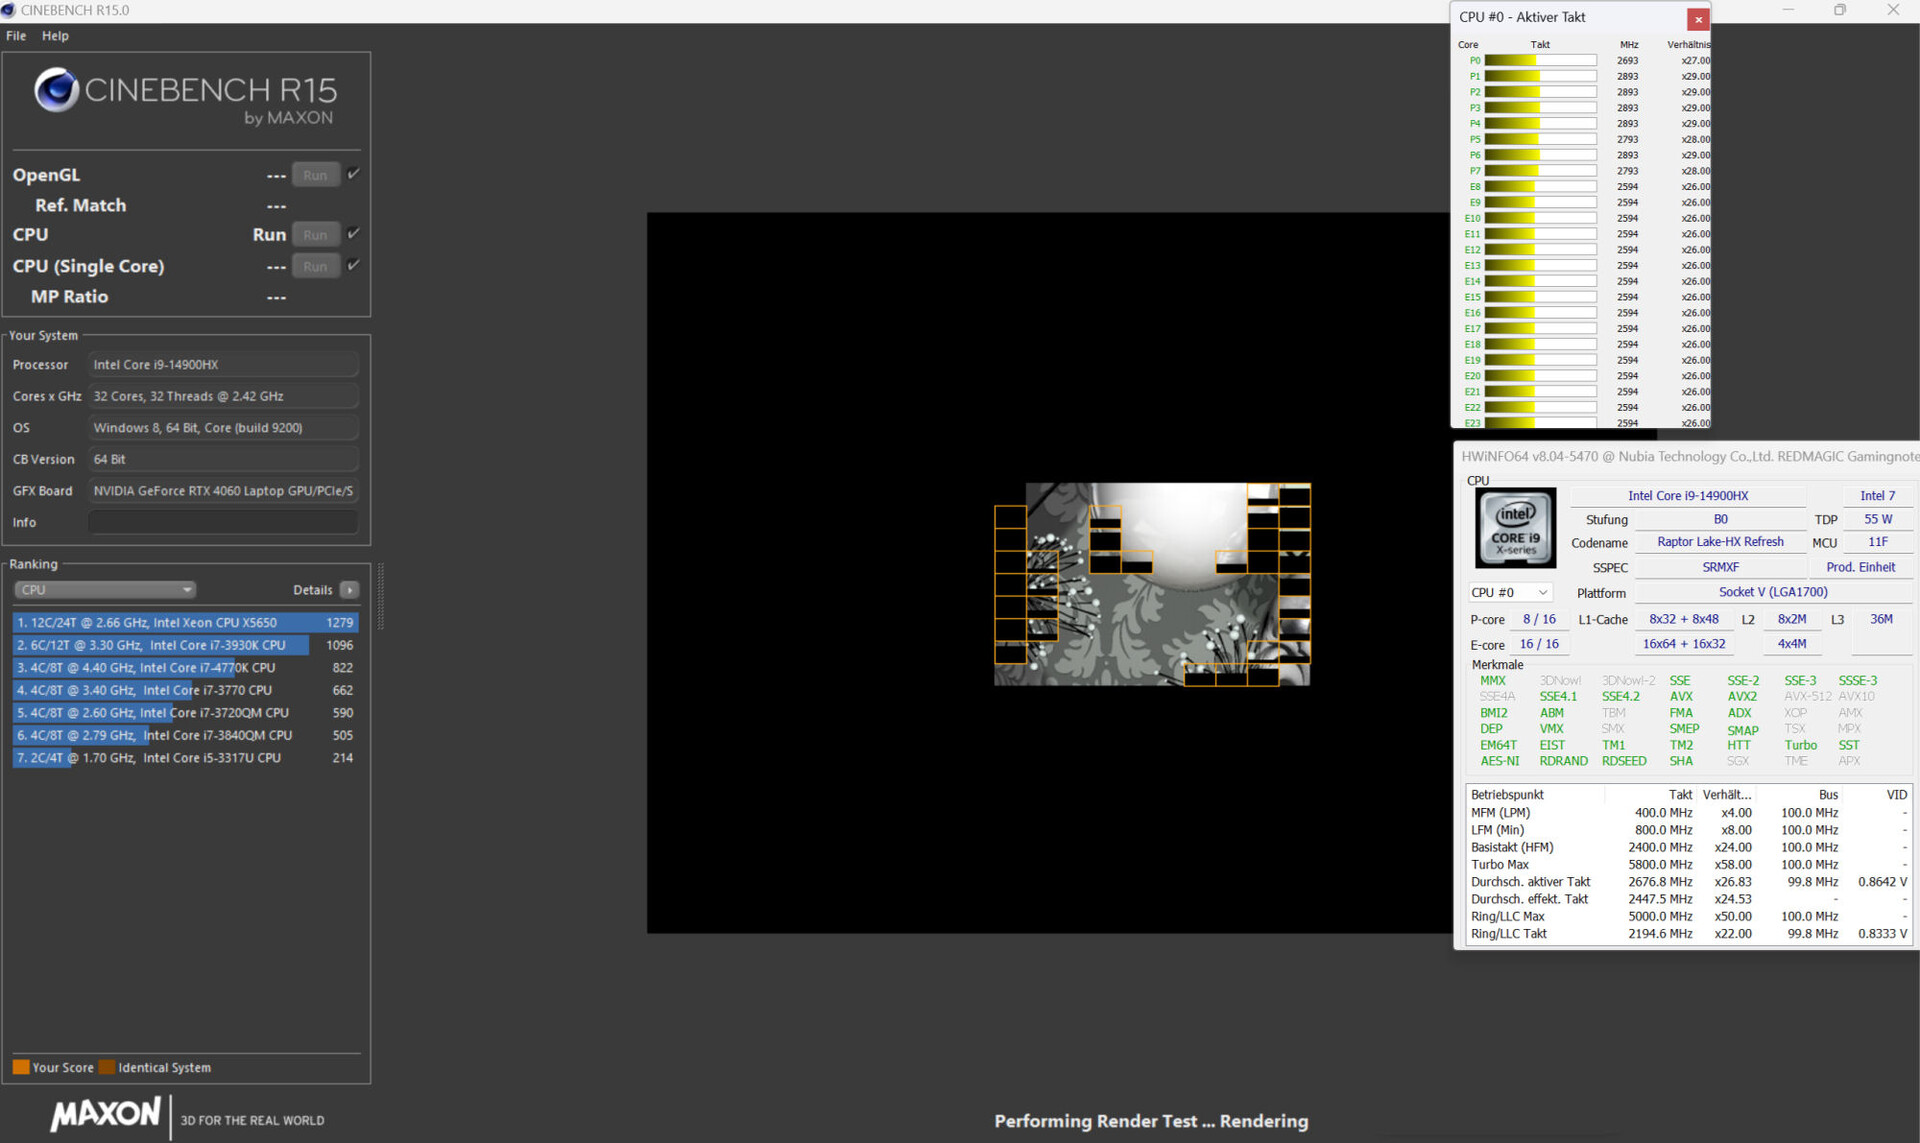
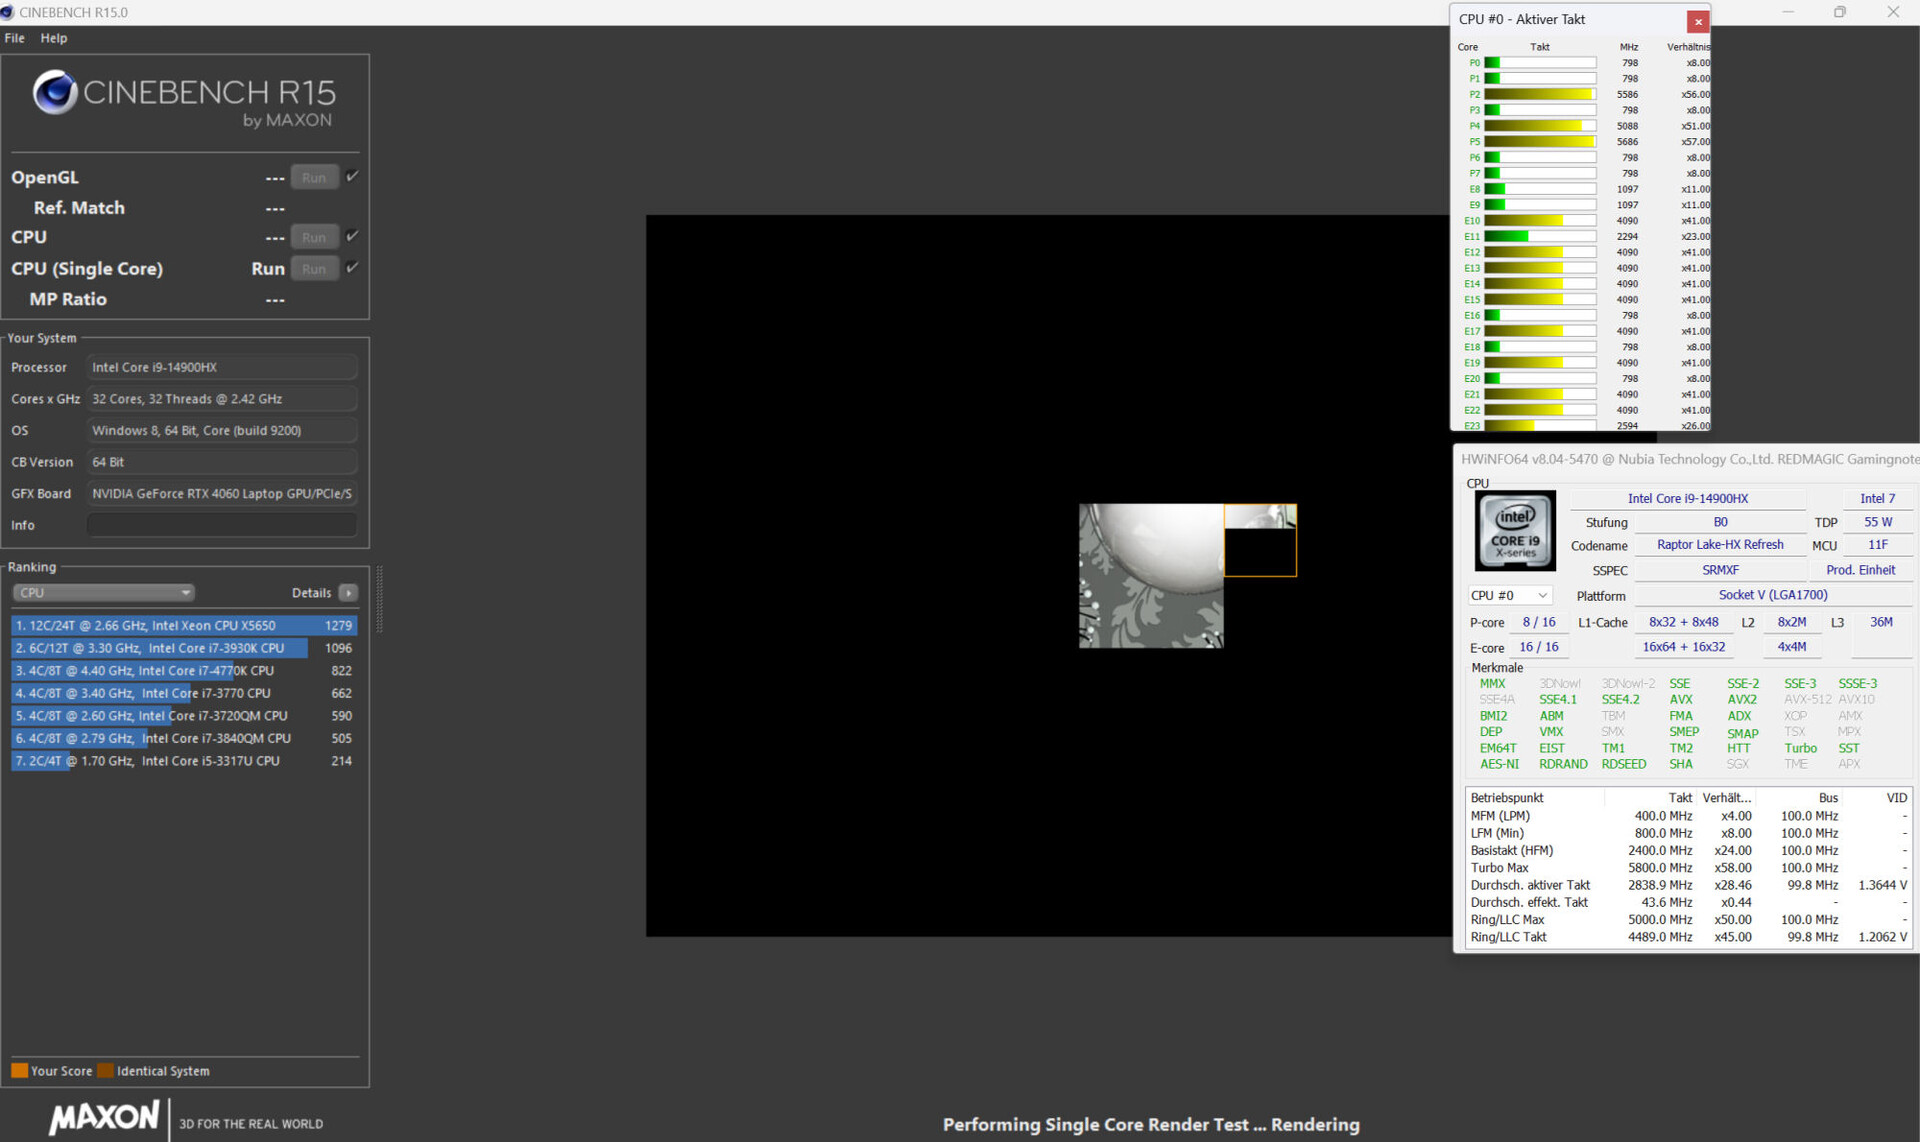
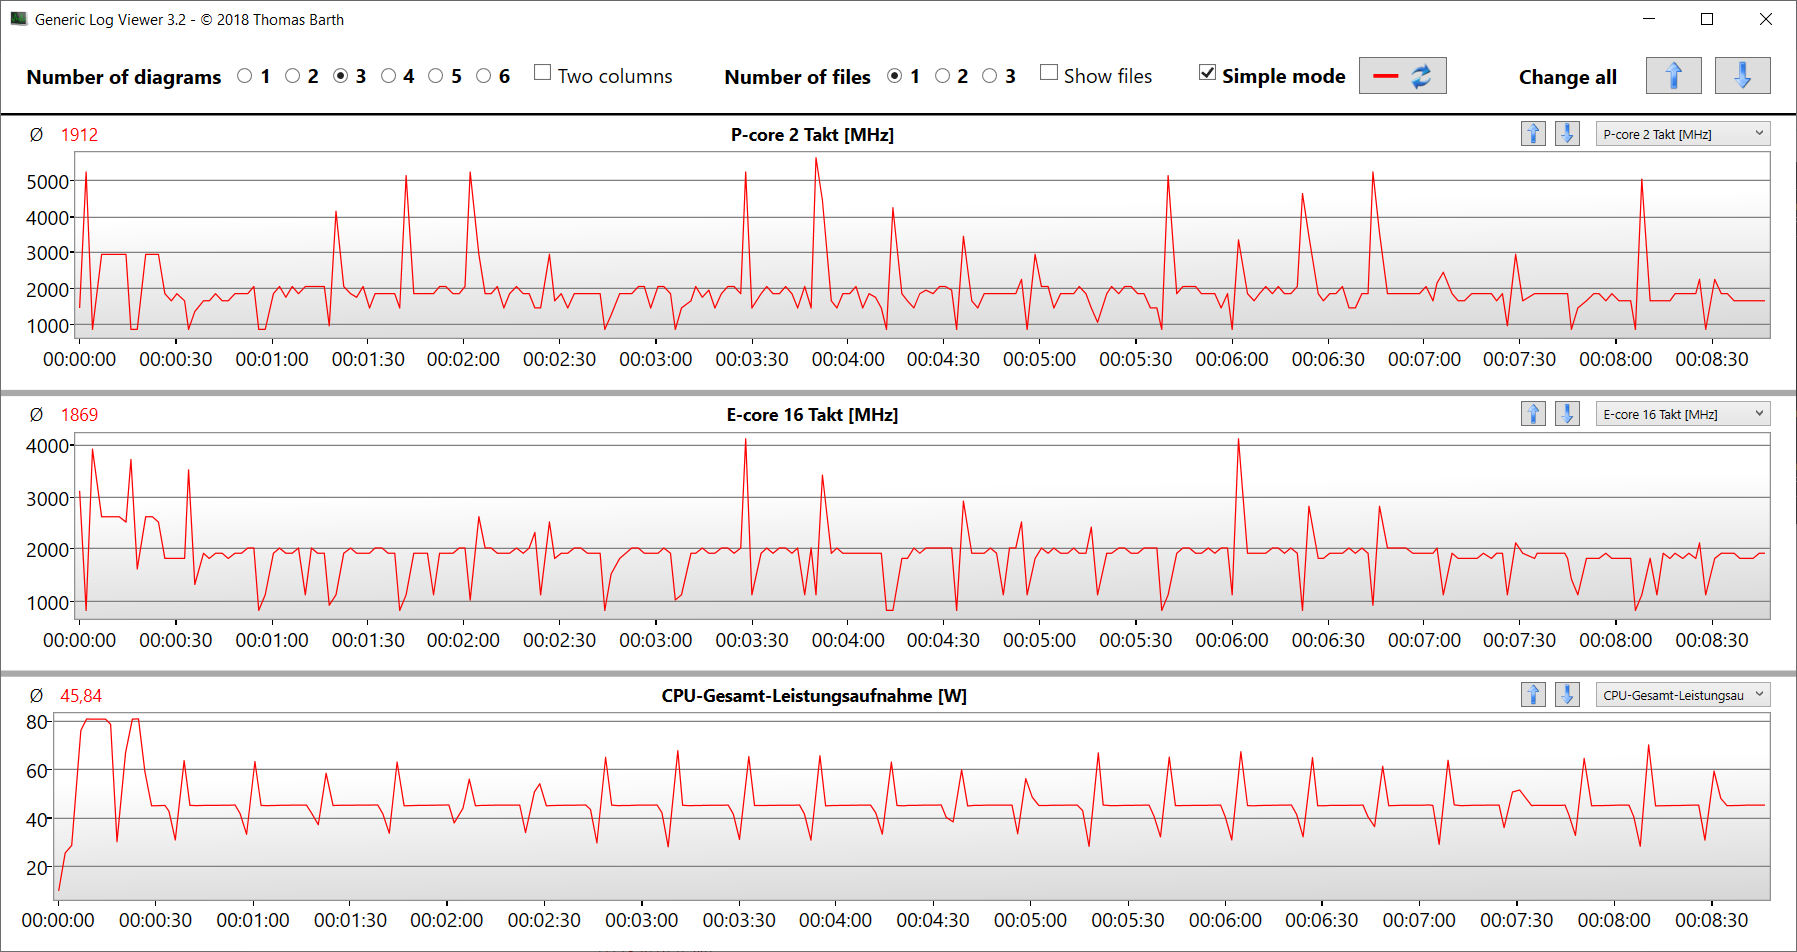
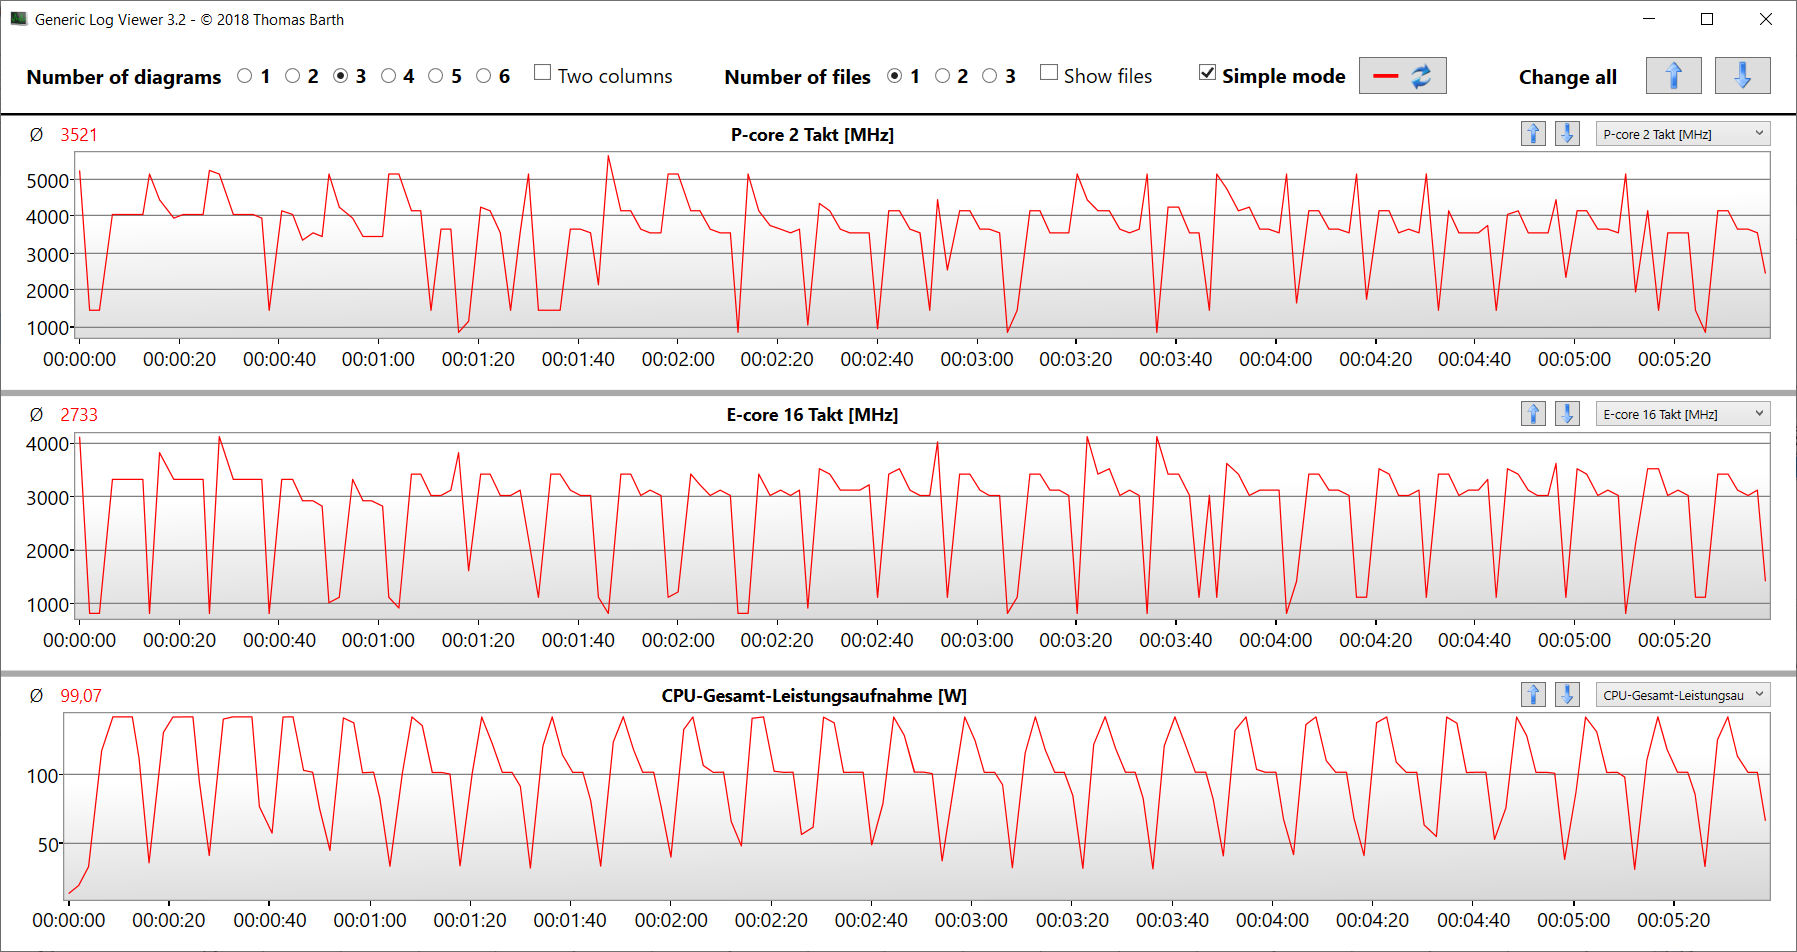
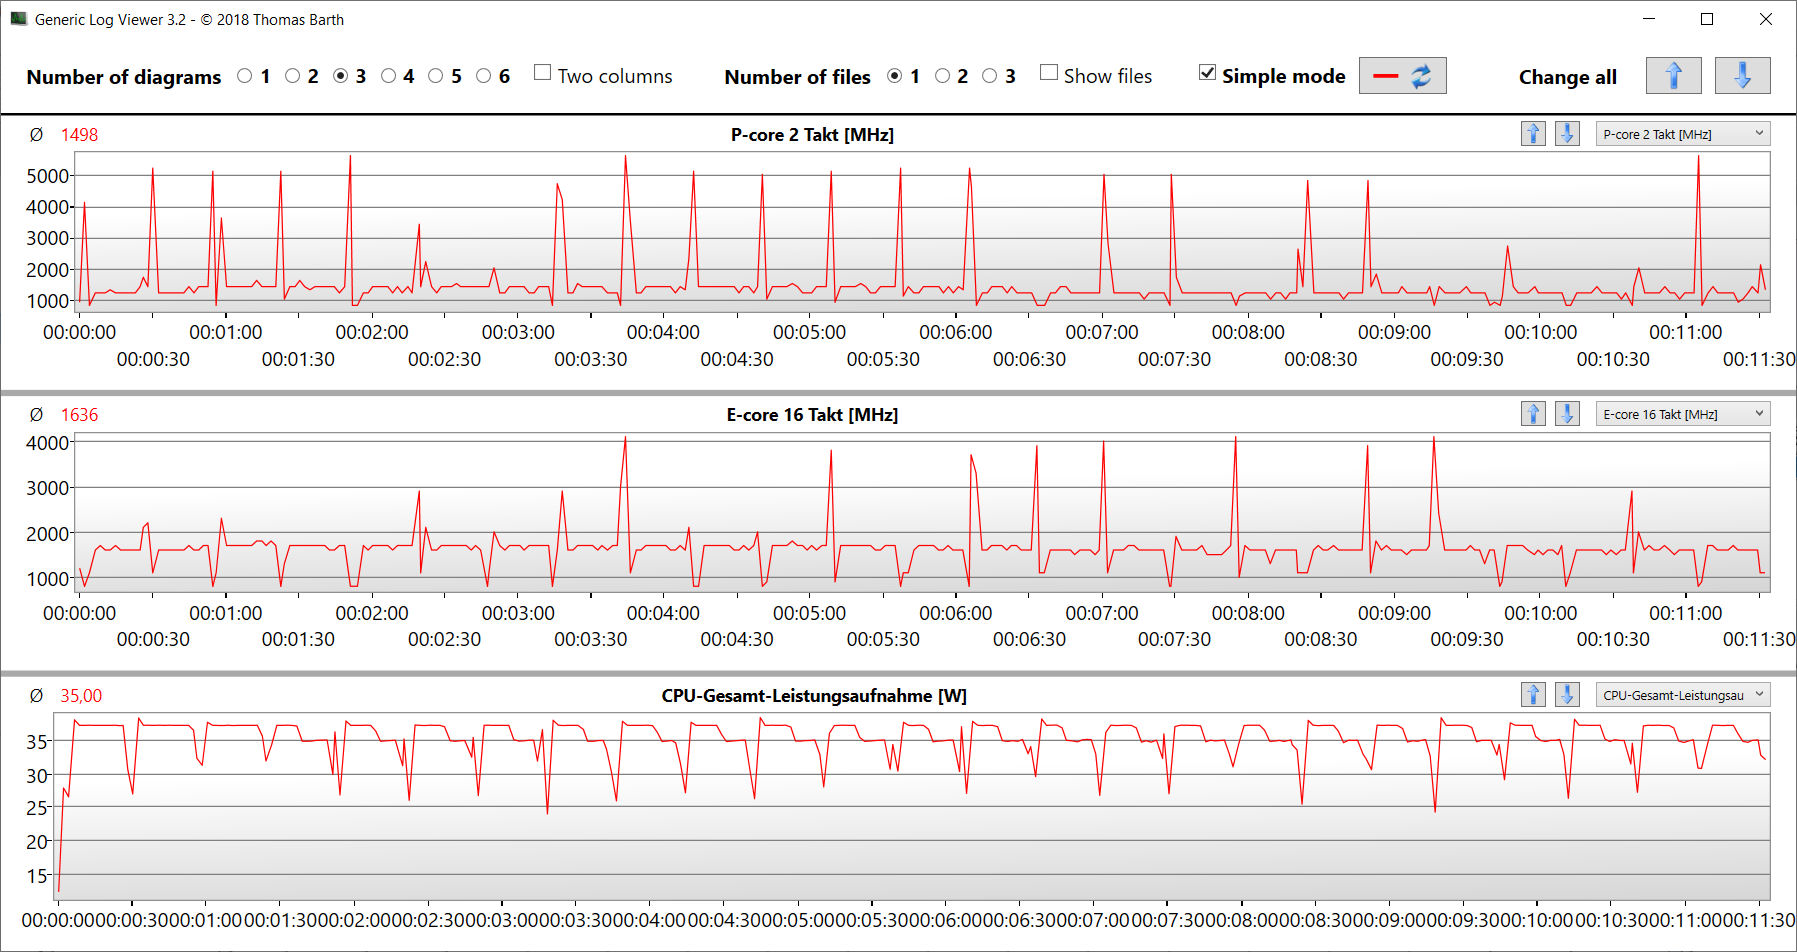
O Titan tem apenas uma opção de CPU disponível, ou seja, o Core i9-14900HX (Raptor Lake). Seus 24 núcleos de CPU (8P + 16E = 32 threads) atingem taxas de clock máximas de 5,8 GHz (P) e 4,1 GHz (E). A carga contínua de vários threads (loop CB15) fez com que o clock da CPU caísse significativamente da primeira à terceira execução. Depois disso, foi mantido um nível razoavelmente constante. O perfil do modo de jogo garante um nível de desempenho significativamente maior.
Os três modos de energia proporcionam um desempenho single-thread muito semelhante, aproximadamente no mesmo nível da média da CPU. Seu desempenho multi-thread difere muito mais: Somente o modo de jogos resultou em valores no nível da média da CPU durante nosso teste, enquanto os outros dois modos foram significativamente inferiores.
Mais informações sobre o Core i9 podem ser encontradas em nosso artigo de análise.
Cinebench R15 Multi continuous test
| CPU Performance Rating - Percent | |
| Média Intel Core i9-14900HX | |
| Lenovo Legion Pro 5 16IRX9 G9 | |
| Nubia RedMagic Titan 16 Pro | |
| SCHENKER XMG Pro 16 Studio (Mid 24) | |
| Acer Predator Helios Neo 16 (2024) | |
| Nubia RedMagic Titan 16 Pro | |
| Média da turma Gaming | |
| HP Victus 16 (2024) | |
| Gigabyte G6X 9KG (2024) | |
| Cinebench R20 | |
| CPU (Multi Core) | |
| Nubia RedMagic Titan 16 Pro (Gaming Mode) | |
| Média Intel Core i9-14900HX (6579 - 13832, n=37) | |
| Lenovo Legion Pro 5 16IRX9 G9 | |
| SCHENKER XMG Pro 16 Studio (Mid 24) | |
| HP Victus 16 (2024) | |
| Acer Predator Helios Neo 16 (2024) | |
| Média da turma Gaming (2179 - 15517, n=151, últimos 2 anos) | |
| Gigabyte G6X 9KG (2024) | |
| Nubia RedMagic Titan 16 Pro | |
| CPU (Single Core) | |
| Nubia RedMagic Titan 16 Pro | |
| Média Intel Core i9-14900HX (657 - 859, n=37) | |
| Lenovo Legion Pro 5 16IRX9 G9 | |
| Nubia RedMagic Titan 16 Pro (Gaming Mode) | |
| Acer Predator Helios Neo 16 (2024) | |
| SCHENKER XMG Pro 16 Studio (Mid 24) | |
| Média da turma Gaming (439 - 866, n=151, últimos 2 anos) | |
| Gigabyte G6X 9KG (2024) | |
| HP Victus 16 (2024) | |
| Cinebench R15 | |
| CPU Multi 64Bit | |
| Nubia RedMagic Titan 16 Pro (Gaming Mode) | |
| Média Intel Core i9-14900HX (3263 - 5589, n=38) | |
| SCHENKER XMG Pro 16 Studio (Mid 24) | |
| Lenovo Legion Pro 5 16IRX9 G9 | |
| HP Victus 16 (2024) | |
| Acer Predator Helios Neo 16 (2024) | |
| Nubia RedMagic Titan 16 Pro | |
| Média da turma Gaming (905 - 6074, n=154, últimos 2 anos) | |
| Gigabyte G6X 9KG (2024) | |
| CPU Single 64Bit | |
| Nubia RedMagic Titan 16 Pro | |
| Nubia RedMagic Titan 16 Pro (Gaming Mode) | |
| Média Intel Core i9-14900HX (247 - 323, n=37) | |
| Lenovo Legion Pro 5 16IRX9 G9 | |
| Acer Predator Helios Neo 16 (2024) | |
| SCHENKER XMG Pro 16 Studio (Mid 24) | |
| Média da turma Gaming (191.9 - 343, n=151, últimos 2 anos) | |
| Gigabyte G6X 9KG (2024) | |
| HP Victus 16 (2024) | |
| Blender - v2.79 BMW27 CPU | |
| Gigabyte G6X 9KG (2024) | |
| Nubia RedMagic Titan 16 Pro | |
| Média da turma Gaming (81 - 555, n=144, últimos 2 anos) | |
| HP Victus 16 (2024) | |
| Acer Predator Helios Neo 16 (2024) | |
| SCHENKER XMG Pro 16 Studio (Mid 24) | |
| Nubia RedMagic Titan 16 Pro (Gaming Mode) | |
| Lenovo Legion Pro 5 16IRX9 G9 | |
| Média Intel Core i9-14900HX (91 - 206, n=37) | |
| Geekbench 6.4 | |
| Multi-Core | |
| Lenovo Legion Pro 5 16IRX9 G9 (6.2.1) | |
| Média Intel Core i9-14900HX (13158 - 19665, n=37) | |
| Acer Predator Helios Neo 16 (2024) (6.2.1) | |
| SCHENKER XMG Pro 16 Studio (Mid 24) (6.2.1) | |
| HP Victus 16 (2024) (6.2.1) | |
| Nubia RedMagic Titan 16 Pro (6.2.1, Gaming Mode) | |
| Média da turma Gaming (5340 - 21668, n=119, últimos 2 anos) | |
| Gigabyte G6X 9KG (2024) (6.2.1) | |
| Nubia RedMagic Titan 16 Pro (6.2.1) | |
| Single-Core | |
| Nubia RedMagic Titan 16 Pro (6.2.1) | |
| Nubia RedMagic Titan 16 Pro (6.2.1, Gaming Mode) | |
| Acer Predator Helios Neo 16 (2024) (6.2.1) | |
| Média Intel Core i9-14900HX (2419 - 3129, n=37) | |
| Lenovo Legion Pro 5 16IRX9 G9 (6.2.1) | |
| SCHENKER XMG Pro 16 Studio (Mid 24) (6.2.1) | |
| Média da turma Gaming (1490 - 3219, n=119, últimos 2 anos) | |
| Gigabyte G6X 9KG (2024) (6.2.1) | |
| HP Victus 16 (2024) (6.2.1) | |
| HWBOT x265 Benchmark v2.2 - 4k Preset | |
| Nubia RedMagic Titan 16 Pro (Gaming Mode) | |
| Média Intel Core i9-14900HX (16.8 - 38.9, n=37) | |
| Lenovo Legion Pro 5 16IRX9 G9 | |
| SCHENKER XMG Pro 16 Studio (Mid 24) | |
| Acer Predator Helios Neo 16 (2024) | |
| Média da turma Gaming (6.72 - 42.9, n=148, últimos 2 anos) | |
| HP Victus 16 (2024) | |
| Gigabyte G6X 9KG (2024) | |
| Nubia RedMagic Titan 16 Pro | |
| LibreOffice - 20 Documents To PDF | |
| HP Victus 16 (2024) (6.3.4.2) | |
| Lenovo Legion Pro 5 16IRX9 G9 (6.3.4.2) | |
| Média da turma Gaming (19 - 96.6, n=147, últimos 2 anos) | |
| SCHENKER XMG Pro 16 Studio (Mid 24) (6.3.4.2) | |
| Média Intel Core i9-14900HX (19 - 85.1, n=37) | |
| Acer Predator Helios Neo 16 (2024) (6.3.4.2) | |
| Nubia RedMagic Titan 16 Pro (6.3.4.2, Gaming Mode) | |
| Gigabyte G6X 9KG (2024) (6.3.4.2) | |
| Nubia RedMagic Titan 16 Pro (6.3.4.2) | |
| R Benchmark 2.5 - Overall mean | |
| HP Victus 16 (2024) | |
| Média da turma Gaming (0.3609 - 0.759, n=150, últimos 2 anos) | |
| Gigabyte G6X 9KG (2024) | |
| SCHENKER XMG Pro 16 Studio (Mid 24) | |
| Lenovo Legion Pro 5 16IRX9 G9 | |
| Média Intel Core i9-14900HX (0.3604 - 0.4859, n=37) | |
| Acer Predator Helios Neo 16 (2024) | |
| Nubia RedMagic Titan 16 Pro | |
| Nubia RedMagic Titan 16 Pro (Gaming Mode) | |
* ... menor é melhor
AIDA64: FP32 Ray-Trace | FPU Julia | CPU SHA3 | CPU Queen | FPU SinJulia | FPU Mandel | CPU AES | CPU ZLib | FP64 Ray-Trace | CPU PhotoWorxx
| Performance Rating | |
| Média Intel Core i9-14900HX | |
| Nubia RedMagic Titan 16 Pro | |
| Lenovo Legion Pro 5 16IRX9 G9 | |
| SCHENKER XMG Pro 16 Studio (Mid 24) | |
| Acer Predator Helios Neo 16 (2024) | |
| Média da turma Gaming | |
| HP Victus 16 (2024) | |
| Nubia RedMagic Titan 16 Pro | |
| Gigabyte G6X 9KG (2024) | |
| AIDA64 / FP32 Ray-Trace | |
| Média Intel Core i9-14900HX (13098 - 33474, n=36) | |
| Nubia RedMagic Titan 16 Pro (v6.92.6600, Gaming Mode) | |
| Lenovo Legion Pro 5 16IRX9 G9 (v6.92.6600) | |
| Média da turma Gaming (4986 - 81639, n=147, últimos 2 anos) | |
| Acer Predator Helios Neo 16 (2024) (v6.92.6600) | |
| SCHENKER XMG Pro 16 Studio (Mid 24) (v6.92.6600) | |
| HP Victus 16 (2024) (v6.92.6600) | |
| Gigabyte G6X 9KG (2024) (v6.92.6600) | |
| Nubia RedMagic Titan 16 Pro (v6.92.6600) | |
| AIDA64 / FPU Julia | |
| Média Intel Core i9-14900HX (67573 - 166040, n=36) | |
| Nubia RedMagic Titan 16 Pro (v6.92.6600, Gaming Mode) | |
| Lenovo Legion Pro 5 16IRX9 G9 (v6.92.6600) | |
| SCHENKER XMG Pro 16 Studio (Mid 24) (v6.92.6600) | |
| Acer Predator Helios Neo 16 (2024) (v6.92.6600) | |
| Média da turma Gaming (25360 - 252486, n=147, últimos 2 anos) | |
| HP Victus 16 (2024) (v6.92.6600) | |
| Gigabyte G6X 9KG (2024) (v6.92.6600) | |
| Nubia RedMagic Titan 16 Pro (v6.92.6600) | |
| AIDA64 / CPU SHA3 | |
| Nubia RedMagic Titan 16 Pro (v6.92.6600, Gaming Mode) | |
| Média Intel Core i9-14900HX (3589 - 7979, n=36) | |
| SCHENKER XMG Pro 16 Studio (Mid 24) (v6.92.6600) | |
| Lenovo Legion Pro 5 16IRX9 G9 (v6.92.6600) | |
| Acer Predator Helios Neo 16 (2024) (v6.92.6600) | |
| Média da turma Gaming (1339 - 10389, n=147, últimos 2 anos) | |
| HP Victus 16 (2024) (v6.92.6600) | |
| Nubia RedMagic Titan 16 Pro (v6.92.6600) | |
| Gigabyte G6X 9KG (2024) (v6.92.6600) | |
| AIDA64 / CPU Queen | |
| Lenovo Legion Pro 5 16IRX9 G9 (v6.92.6600) | |
| Acer Predator Helios Neo 16 (2024) (v6.92.6600) | |
| Nubia RedMagic Titan 16 Pro (v6.92.6600, Gaming Mode) | |
| Média Intel Core i9-14900HX (118405 - 148966, n=36) | |
| SCHENKER XMG Pro 16 Studio (Mid 24) (v6.92.6600) | |
| HP Victus 16 (2024) (v6.92.6600) | |
| Nubia RedMagic Titan 16 Pro (v6.92.6600) | |
| Média da turma Gaming (50699 - 200651, n=147, últimos 2 anos) | |
| Gigabyte G6X 9KG (2024) (v6.92.6600) | |
| AIDA64 / FPU SinJulia | |
| Nubia RedMagic Titan 16 Pro (v6.92.6600, Gaming Mode) | |
| Média Intel Core i9-14900HX (10475 - 18517, n=36) | |
| Lenovo Legion Pro 5 16IRX9 G9 (v6.92.6600) | |
| SCHENKER XMG Pro 16 Studio (Mid 24) (v6.92.6600) | |
| Acer Predator Helios Neo 16 (2024) (v6.92.6600) | |
| Média da turma Gaming (4800 - 32988, n=147, últimos 2 anos) | |
| HP Victus 16 (2024) (v6.92.6600) | |
| Nubia RedMagic Titan 16 Pro (v6.92.6600) | |
| Gigabyte G6X 9KG (2024) (v6.92.6600) | |
| AIDA64 / FPU Mandel | |
| Média Intel Core i9-14900HX (32543 - 83662, n=36) | |
| Nubia RedMagic Titan 16 Pro (v6.92.6600, Gaming Mode) | |
| Lenovo Legion Pro 5 16IRX9 G9 (v6.92.6600) | |
| Acer Predator Helios Neo 16 (2024) (v6.92.6600) | |
| Média da turma Gaming (12321 - 134044, n=147, últimos 2 anos) | |
| SCHENKER XMG Pro 16 Studio (Mid 24) (v6.92.6600) | |
| HP Victus 16 (2024) (v6.92.6600) | |
| Gigabyte G6X 9KG (2024) (v6.92.6600) | |
| Nubia RedMagic Titan 16 Pro | |
| AIDA64 / CPU AES | |
| Nubia RedMagic Titan 16 Pro (v6.92.6600, Gaming Mode) | |
| Média Intel Core i9-14900HX (86964 - 241777, n=36) | |
| Nubia RedMagic Titan 16 Pro (v6.92.6600) | |
| Lenovo Legion Pro 5 16IRX9 G9 (v6.92.6600) | |
| SCHENKER XMG Pro 16 Studio (Mid 24) (v6.92.6600) | |
| Média da turma Gaming (19065 - 328679, n=147, últimos 2 anos) | |
| Acer Predator Helios Neo 16 (2024) (v6.92.6600) | |
| HP Victus 16 (2024) (v6.92.6600) | |
| Gigabyte G6X 9KG (2024) (v6.92.6600) | |
| AIDA64 / CPU ZLib | |
| Nubia RedMagic Titan 16 Pro (v6.92.6600, Gaming Mode) | |
| Média Intel Core i9-14900HX (1054 - 2292, n=36) | |
| Lenovo Legion Pro 5 16IRX9 G9 (v6.92.6600) | |
| SCHENKER XMG Pro 16 Studio (Mid 24) (v6.92.6600) | |
| Acer Predator Helios Neo 16 (2024) (v6.92.6600) | |
| Média da turma Gaming (373 - 2531, n=147, últimos 2 anos) | |
| HP Victus 16 (2024) (v6.92.6600) | |
| Gigabyte G6X 9KG (2024) (v6.92.6600) | |
| Nubia RedMagic Titan 16 Pro (v6.92.6600) | |
| AIDA64 / FP64 Ray-Trace | |
| Média Intel Core i9-14900HX (6809 - 18349, n=36) | |
| Lenovo Legion Pro 5 16IRX9 G9 (v6.92.6600) | |
| Nubia RedMagic Titan 16 Pro (v6.92.6600, Gaming Mode) | |
| Média da turma Gaming (2540 - 43430, n=147, últimos 2 anos) | |
| SCHENKER XMG Pro 16 Studio (Mid 24) (v6.92.6600) | |
| Acer Predator Helios Neo 16 (2024) (v6.92.6600) | |
| HP Victus 16 (2024) (v6.92.6600) | |
| Gigabyte G6X 9KG (2024) (v6.92.6600) | |
| Nubia RedMagic Titan 16 Pro (v6.92.6600) | |
| AIDA64 / CPU PhotoWorxx | |
| Lenovo Legion Pro 5 16IRX9 G9 (v6.92.6600) | |
| SCHENKER XMG Pro 16 Studio (Mid 24) (v6.92.6600) | |
| Média Intel Core i9-14900HX (23903 - 54702, n=36) | |
| Acer Predator Helios Neo 16 (2024) (v6.92.6600) | |
| Média da turma Gaming (10805 - 60161, n=147, últimos 2 anos) | |
| HP Victus 16 (2024) (v6.92.6600) | |
| Gigabyte G6X 9KG (2024) (v6.92.6600) | |
| Nubia RedMagic Titan 16 Pro (v6.92.6600) | |
| Nubia RedMagic Titan 16 Pro (v6.92.6600, Gaming Mode) | |
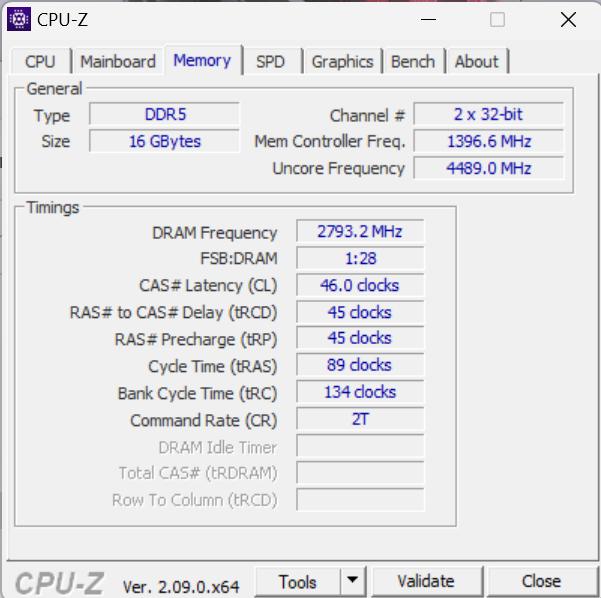
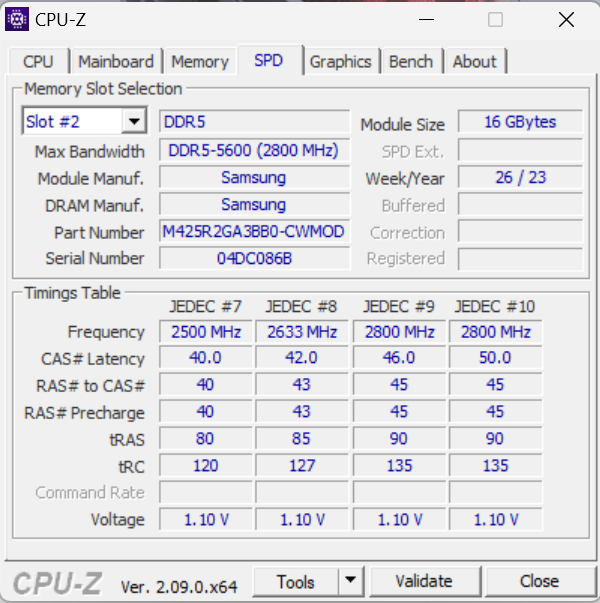
Desempenho do sistema
O sistema de funcionamento suave fornece potência suficiente para aplicativos exigentes, como jogos, renderização e streaming. Entretanto, parte de sua capacidade de computação permanece sem uso, pois a RAM (16 GB, DDR5-5600) funciona apenas no modo de canal único - as baixas taxas de transferência de memória do laptop em comparação com a concorrência confirmam isso. A instalação de um segundo módulo de memória (= modo de canal duplo ativo) seria uma solução para isso.
CrossMark: Overall | Productivity | Creativity | Responsiveness
WebXPRT 3: Overall
WebXPRT 4: Overall
Mozilla Kraken 1.1: Total
| PCMark 10 / Score | |
| Acer Predator Helios Neo 16 (2024) | |
| Lenovo Legion Pro 5 16IRX9 G9 | |
| SCHENKER XMG Pro 16 Studio (Mid 24) | |
| Média Intel Core i9-14900HX, NVIDIA GeForce RTX 4060 Laptop GPU (7830 - 8322, n=2) | |
| Nubia RedMagic Titan 16 Pro | |
| Média da turma Gaming (5776 - 9852, n=133, últimos 2 anos) | |
| Gigabyte G6X 9KG (2024) | |
| HP Victus 16 (2024) | |
| PCMark 10 / Essentials | |
| Acer Predator Helios Neo 16 (2024) | |
| Média Intel Core i9-14900HX, NVIDIA GeForce RTX 4060 Laptop GPU (11022 - 11413, n=2) | |
| Lenovo Legion Pro 5 16IRX9 G9 | |
| Nubia RedMagic Titan 16 Pro | |
| HP Victus 16 (2024) | |
| Média da turma Gaming (9057 - 12600, n=133, últimos 2 anos) | |
| SCHENKER XMG Pro 16 Studio (Mid 24) | |
| Gigabyte G6X 9KG (2024) | |
| PCMark 10 / Productivity | |
| SCHENKER XMG Pro 16 Studio (Mid 24) | |
| Acer Predator Helios Neo 16 (2024) | |
| Gigabyte G6X 9KG (2024) | |
| Média Intel Core i9-14900HX, NVIDIA GeForce RTX 4060 Laptop GPU (9776 - 10558, n=2) | |
| HP Victus 16 (2024) | |
| Média da turma Gaming (6662 - 14612, n=133, últimos 2 anos) | |
| Lenovo Legion Pro 5 16IRX9 G9 | |
| Nubia RedMagic Titan 16 Pro | |
| PCMark 10 / Digital Content Creation | |
| Lenovo Legion Pro 5 16IRX9 G9 | |
| Acer Predator Helios Neo 16 (2024) | |
| Média Intel Core i9-14900HX, NVIDIA GeForce RTX 4060 Laptop GPU (12091 - 12979, n=2) | |
| SCHENKER XMG Pro 16 Studio (Mid 24) | |
| Média da turma Gaming (6807 - 18475, n=133, últimos 2 anos) | |
| Nubia RedMagic Titan 16 Pro | |
| Gigabyte G6X 9KG (2024) | |
| HP Victus 16 (2024) | |
| CrossMark / Overall | |
| Acer Predator Helios Neo 16 (2024) | |
| Média Intel Core i9-14900HX, NVIDIA GeForce RTX 4060 Laptop GPU (2103 - 2184, n=2) | |
| Lenovo Legion Pro 5 16IRX9 G9 | |
| Nubia RedMagic Titan 16 Pro | |
| SCHENKER XMG Pro 16 Studio (Mid 24) | |
| Gigabyte G6X 9KG (2024) | |
| HP Victus 16 (2024) | |
| Média da turma Gaming (1247 - 2344, n=114, últimos 2 anos) | |
| CrossMark / Productivity | |
| Acer Predator Helios Neo 16 (2024) | |
| Nubia RedMagic Titan 16 Pro | |
| Média Intel Core i9-14900HX, NVIDIA GeForce RTX 4060 Laptop GPU (2040 - 2042, n=2) | |
| Lenovo Legion Pro 5 16IRX9 G9 | |
| SCHENKER XMG Pro 16 Studio (Mid 24) | |
| Gigabyte G6X 9KG (2024) | |
| Média da turma Gaming (1299 - 2204, n=114, últimos 2 anos) | |
| HP Victus 16 (2024) | |
| CrossMark / Creativity | |
| Acer Predator Helios Neo 16 (2024) | |
| Lenovo Legion Pro 5 16IRX9 G9 | |
| SCHENKER XMG Pro 16 Studio (Mid 24) | |
| Média Intel Core i9-14900HX, NVIDIA GeForce RTX 4060 Laptop GPU (2240 - 2472, n=2) | |
| Nubia RedMagic Titan 16 Pro | |
| HP Victus 16 (2024) | |
| Média da turma Gaming (1275 - 2660, n=114, últimos 2 anos) | |
| Gigabyte G6X 9KG (2024) | |
| CrossMark / Responsiveness | |
| Acer Predator Helios Neo 16 (2024) | |
| Gigabyte G6X 9KG (2024) | |
| Nubia RedMagic Titan 16 Pro | |
| Lenovo Legion Pro 5 16IRX9 G9 | |
| Média Intel Core i9-14900HX, NVIDIA GeForce RTX 4060 Laptop GPU (1849 - 1899, n=2) | |
| HP Victus 16 (2024) | |
| SCHENKER XMG Pro 16 Studio (Mid 24) | |
| Média da turma Gaming (1030 - 2330, n=114, últimos 2 anos) | |
| WebXPRT 3 / Overall | |
| Média Intel Core i9-14900HX, NVIDIA GeForce RTX 4060 Laptop GPU (329 - 339, n=2) | |
| Nubia RedMagic Titan 16 Pro | |
| Acer Predator Helios Neo 16 (2024) | |
| SCHENKER XMG Pro 16 Studio (Mid 24) | |
| Gigabyte G6X 9KG (2024) | |
| Lenovo Legion Pro 5 16IRX9 G9 | |
| Média da turma Gaming (215 - 480, n=127, últimos 2 anos) | |
| HP Victus 16 (2024) | |
| WebXPRT 4 / Overall | |
| Média Intel Core i9-14900HX, NVIDIA GeForce RTX 4060 Laptop GPU (309 - 319, n=2) | |
| Nubia RedMagic Titan 16 Pro | |
| Acer Predator Helios Neo 16 (2024) | |
| SCHENKER XMG Pro 16 Studio (Mid 24) | |
| Lenovo Legion Pro 5 16IRX9 G9 | |
| Média da turma Gaming (176.4 - 335, n=115, últimos 2 anos) | |
| Gigabyte G6X 9KG (2024) | |
| HP Victus 16 (2024) | |
| Mozilla Kraken 1.1 / Total | |
| HP Victus 16 (2024) | |
| Gigabyte G6X 9KG (2024) | |
| Média da turma Gaming (409 - 674, n=139, últimos 2 anos) | |
| Lenovo Legion Pro 5 16IRX9 G9 | |
| SCHENKER XMG Pro 16 Studio (Mid 24) | |
| Acer Predator Helios Neo 16 (2024) | |
| Nubia RedMagic Titan 16 Pro | |
| Média Intel Core i9-14900HX, NVIDIA GeForce RTX 4060 Laptop GPU (430 - 439, n=2) | |
* ... menor é melhor
| PCMark 10 Score | 7830 pontos | |
Ajuda | ||
| AIDA64 / Memory Copy | |
| SCHENKER XMG Pro 16 Studio (Mid 24) | |
| Lenovo Legion Pro 5 16IRX9 G9 | |
| Acer Predator Helios Neo 16 (2024) | |
| Média Intel Core i9-14900HX (38028 - 83392, n=36) | |
| HP Victus 16 (2024) | |
| Média da turma Gaming (21750 - 97515, n=147, últimos 2 anos) | |
| Gigabyte G6X 9KG (2024) | |
| Nubia RedMagic Titan 16 Pro | |
| AIDA64 / Memory Read | |
| Lenovo Legion Pro 5 16IRX9 G9 | |
| SCHENKER XMG Pro 16 Studio (Mid 24) | |
| Acer Predator Helios Neo 16 (2024) | |
| Média Intel Core i9-14900HX (43306 - 87568, n=36) | |
| HP Victus 16 (2024) | |
| Média da turma Gaming (22956 - 102937, n=147, últimos 2 anos) | |
| Gigabyte G6X 9KG (2024) | |
| Nubia RedMagic Titan 16 Pro | |
| AIDA64 / Memory Write | |
| Lenovo Legion Pro 5 16IRX9 G9 | |
| SCHENKER XMG Pro 16 Studio (Mid 24) | |
| Média Intel Core i9-14900HX (37146 - 80589, n=36) | |
| Acer Predator Helios Neo 16 (2024) | |
| Média da turma Gaming (22297 - 108954, n=147, últimos 2 anos) | |
| HP Victus 16 (2024) | |
| Gigabyte G6X 9KG (2024) | |
| Nubia RedMagic Titan 16 Pro | |
| AIDA64 / Memory Latency | |
| HP Victus 16 (2024) | |
| Média da turma Gaming (59.5 - 259, n=147, últimos 2 anos) | |
| Acer Predator Helios Neo 16 (2024) | |
| Gigabyte G6X 9KG (2024) | |
| Média Intel Core i9-14900HX (76.1 - 105, n=36) | |
| SCHENKER XMG Pro 16 Studio (Mid 24) | |
| Lenovo Legion Pro 5 16IRX9 G9 | |
| Nubia RedMagic Titan 16 Pro | |
* ... menor é melhor
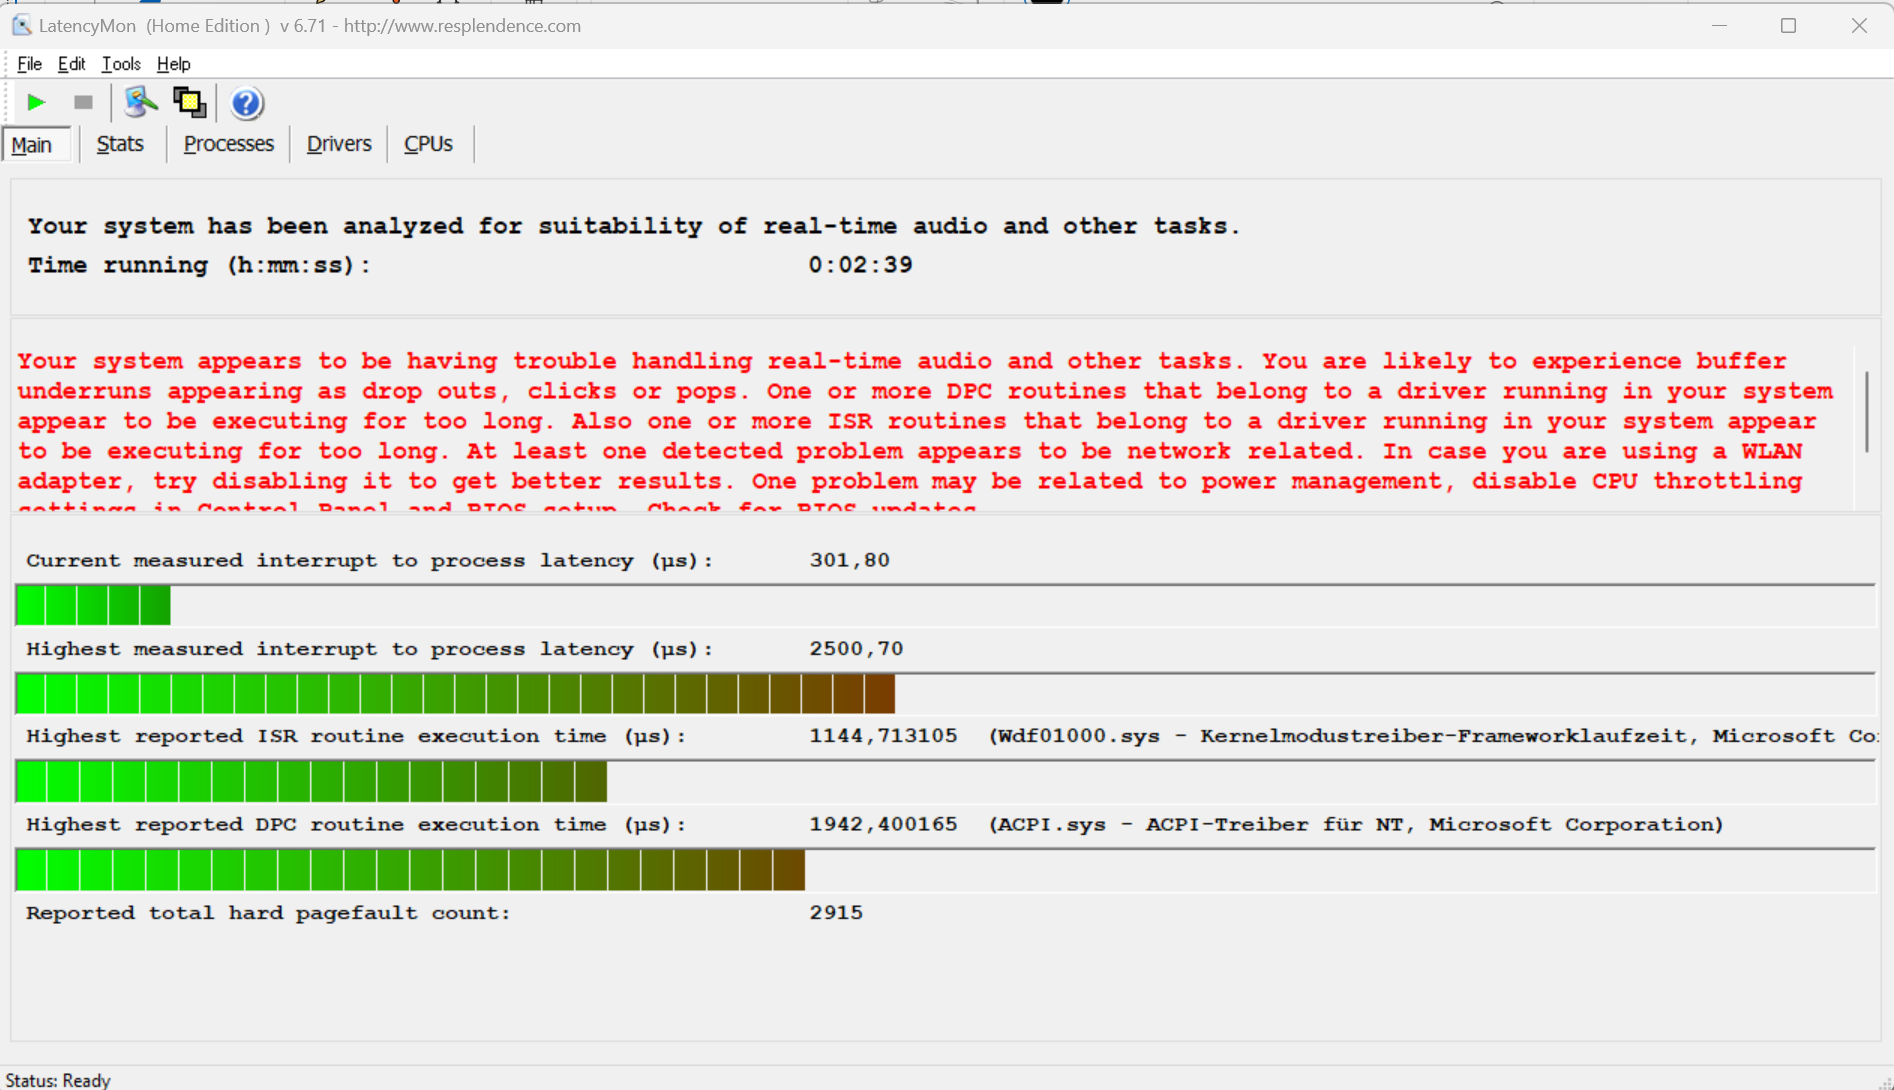
Latências de DPC
As altas latências impedem a edição de vídeo e áudio em tempo real. Futuras atualizações de software podem levar a melhorias ou até mesmo a deteriorações.
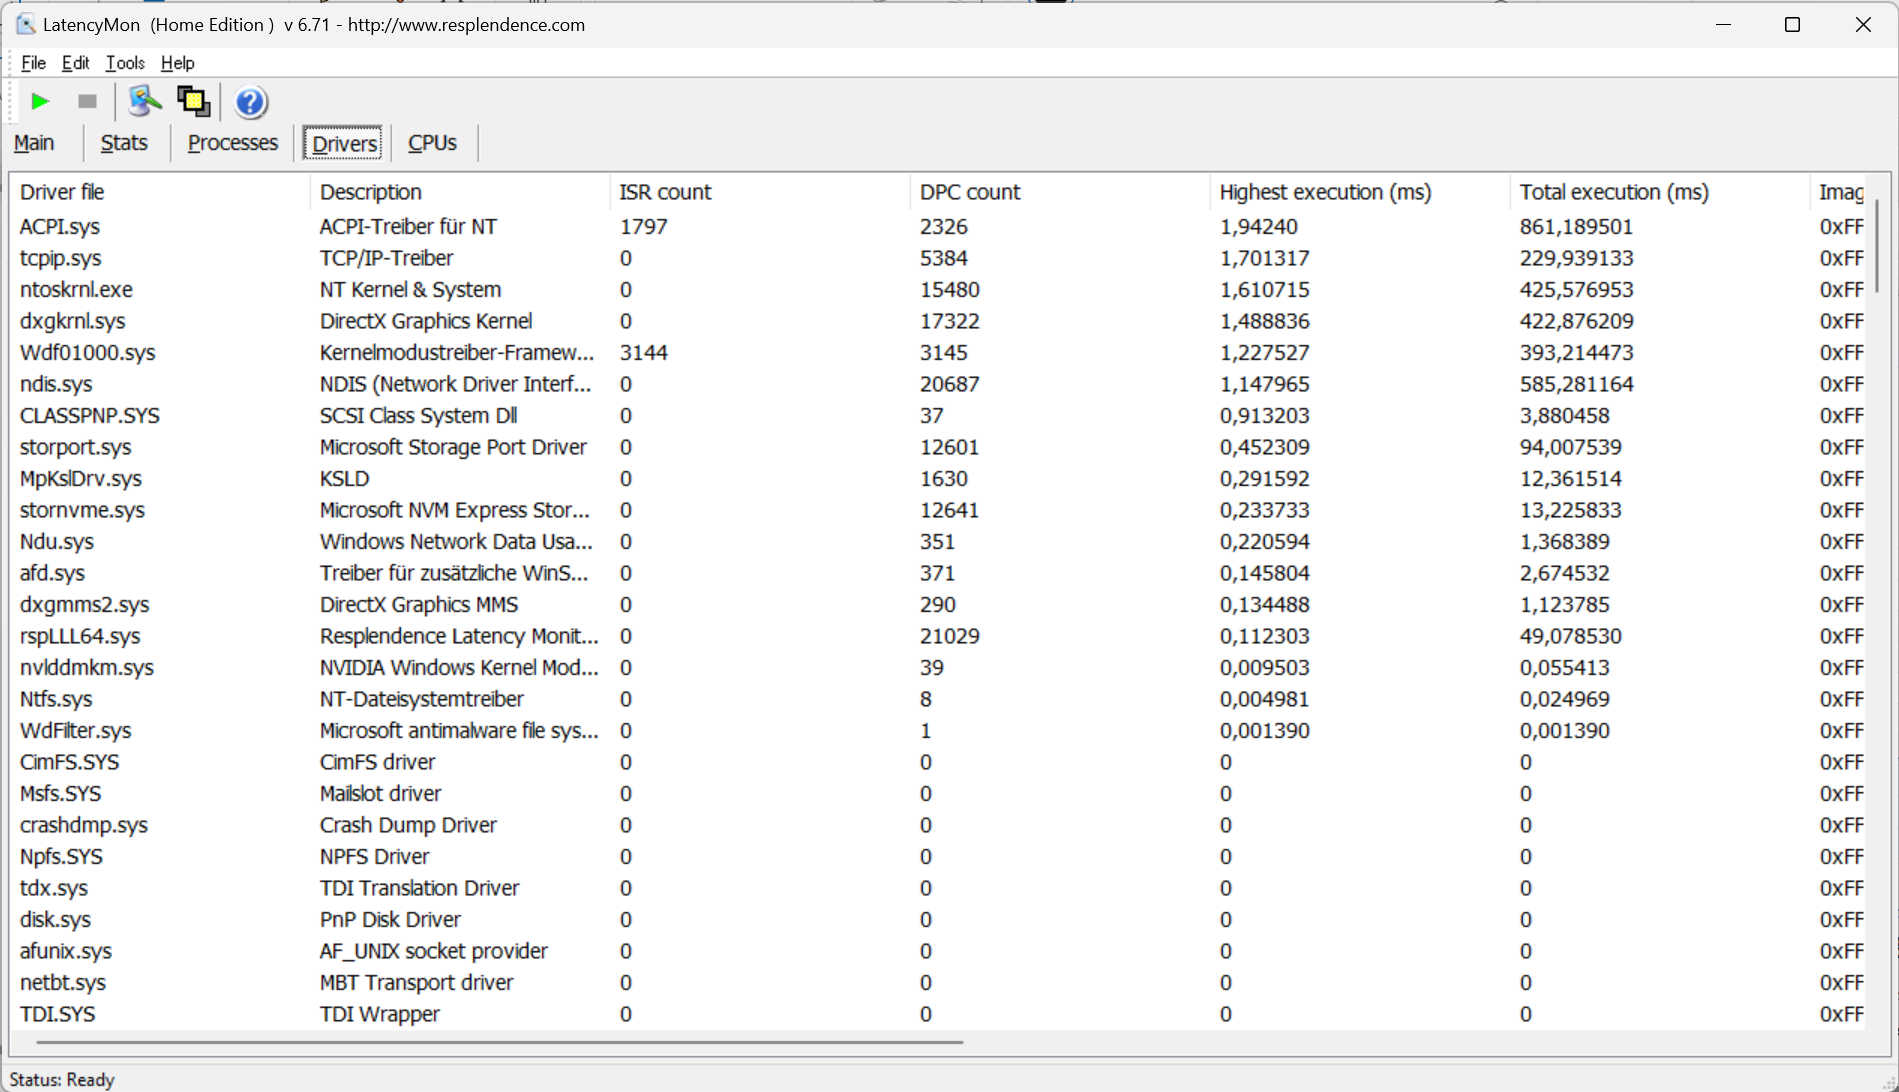
| DPC Latencies / LatencyMon - interrupt to process latency (max), Web, Youtube, Prime95 | |
| Nubia RedMagic Titan 16 Pro | |
| Gigabyte G6X 9KG (2024) | |
| SCHENKER XMG Pro 16 Studio (Mid 24) | |
| Acer Predator Helios Neo 16 (2024) | |
| Lenovo Legion Pro 5 16IRX9 G9 | |
| HP Victus 16 (2024) | |
* ... menor é melhor
Dispositivos de armazenamento
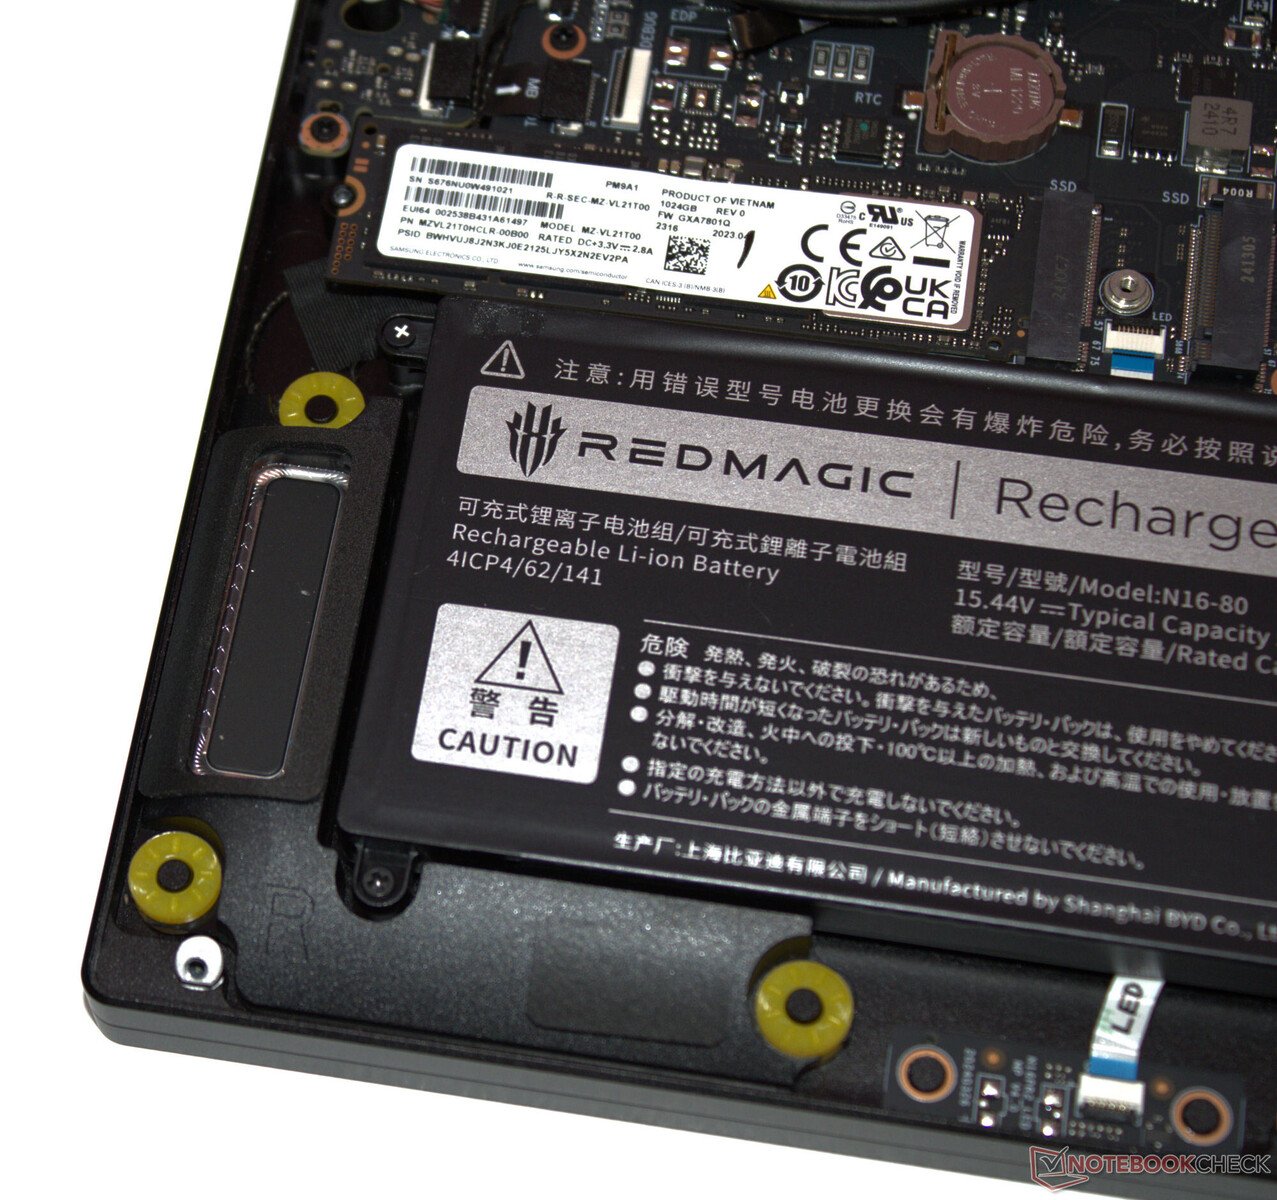
O SSD PCIe 4 (M.2-2280) da Samsung oferece uma capacidade de armazenamento de 1 TB e proporciona taxas de dados muito boas. Pontos positivos: Não observamos nenhum estrangulamento induzido termicamente. O laptop tem espaço para um segundo SSD PCIe 4.

* ... menor é melhor
Reading continuous performance: DiskSpd Read Loop, Queue Depth 8
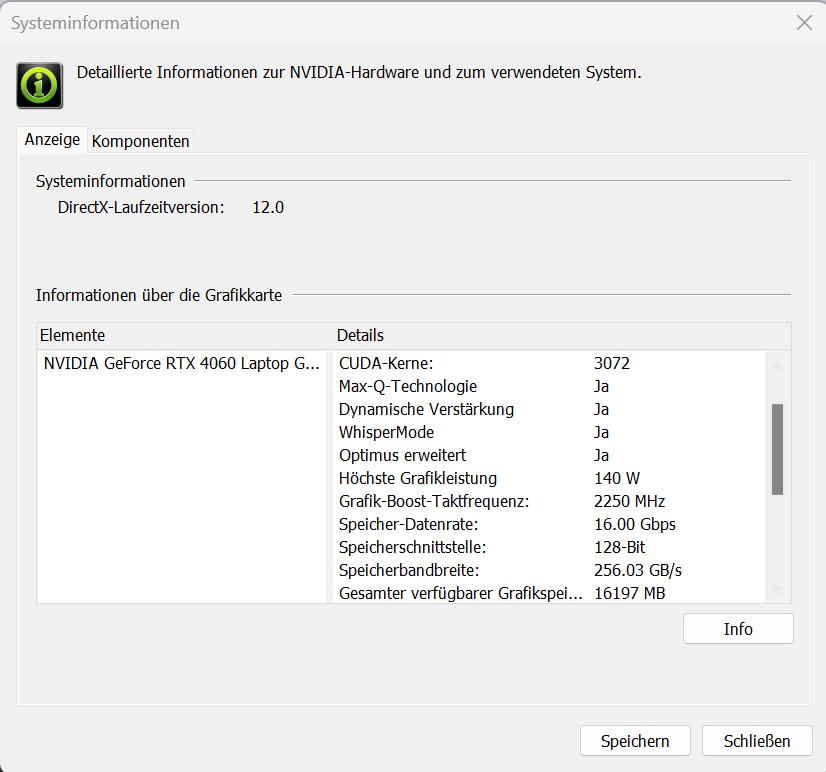
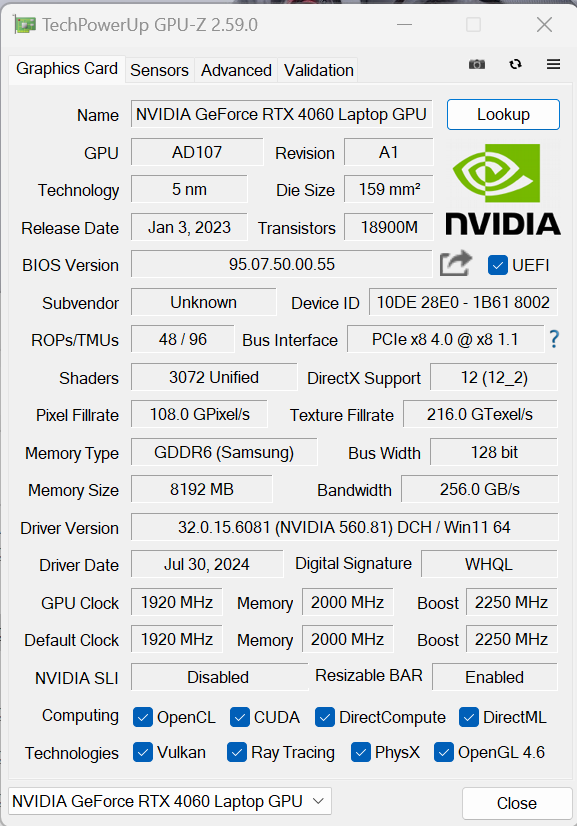
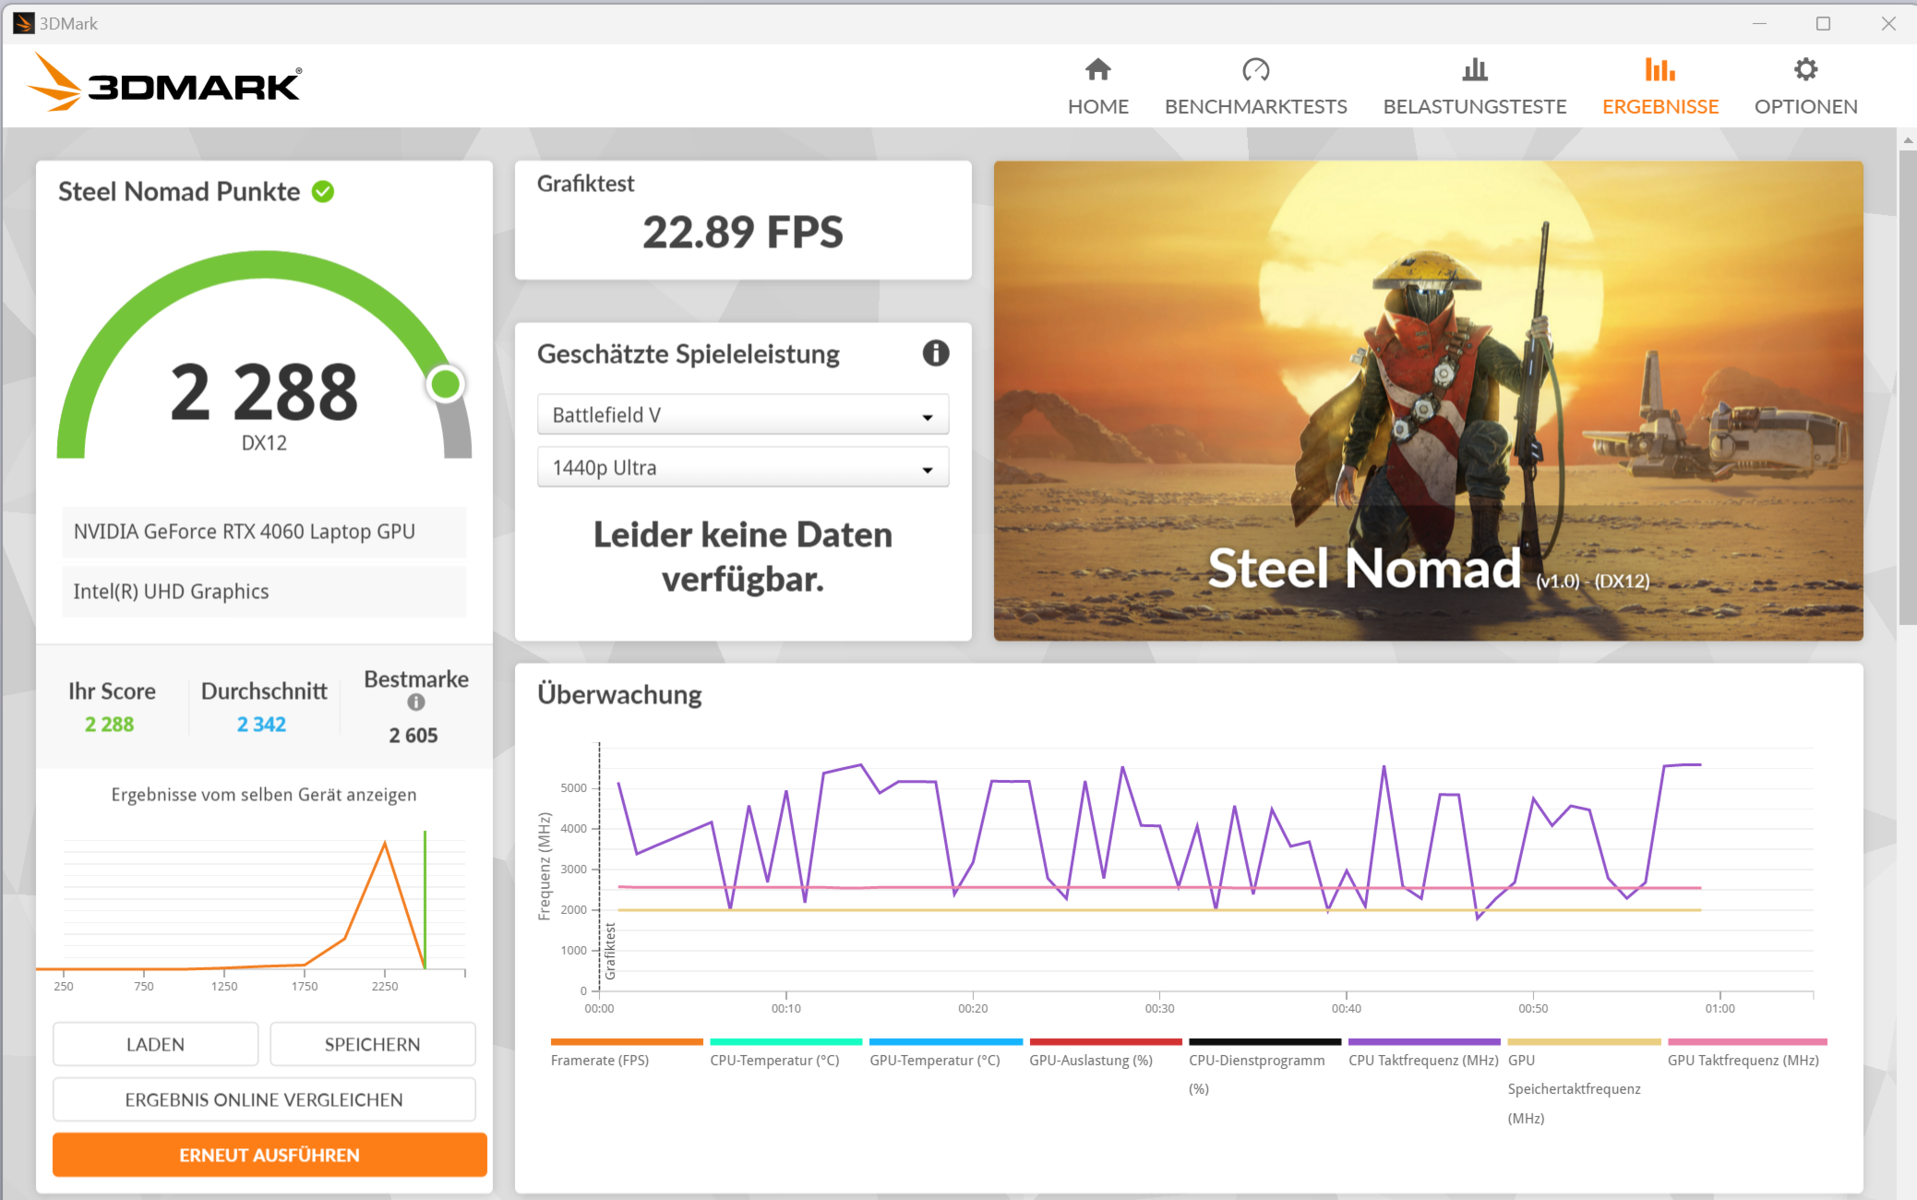
Placa de vídeo
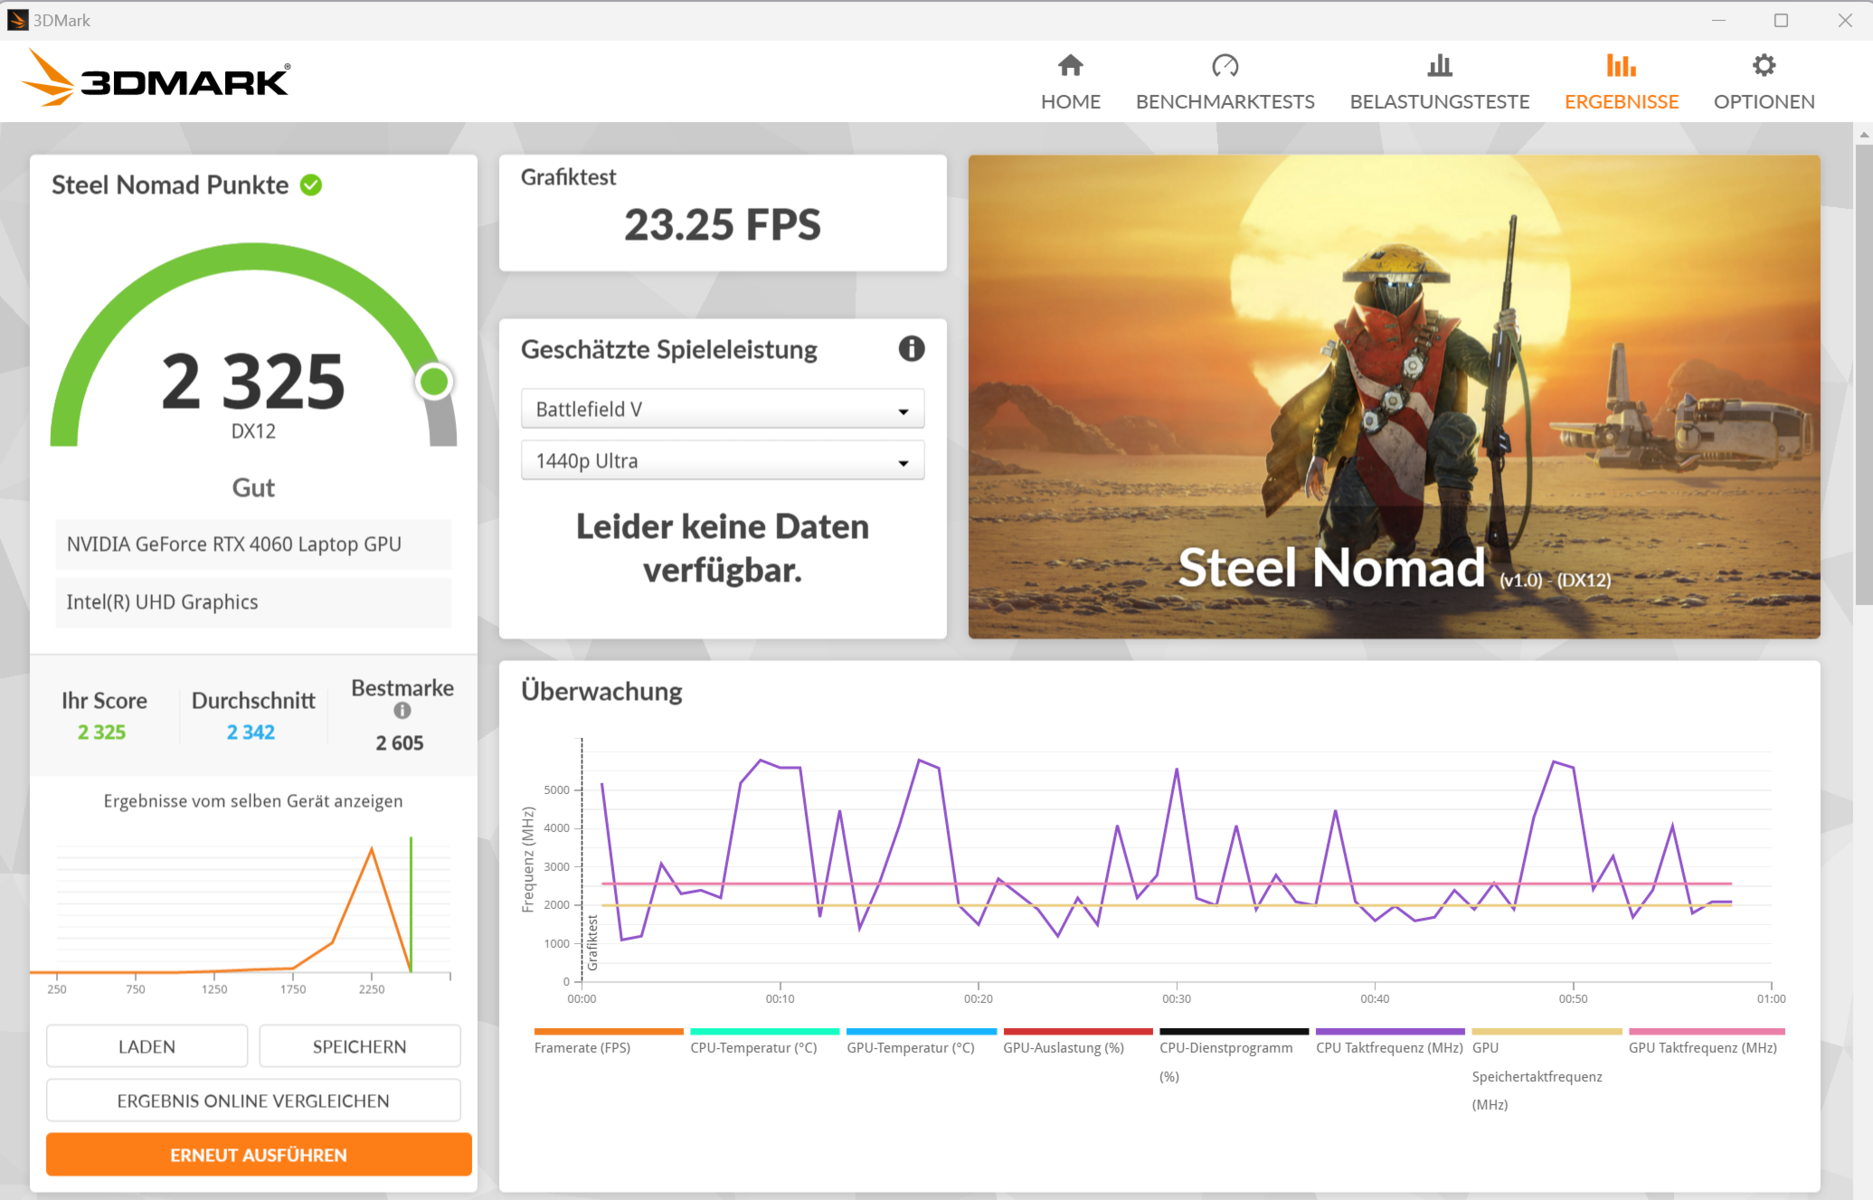
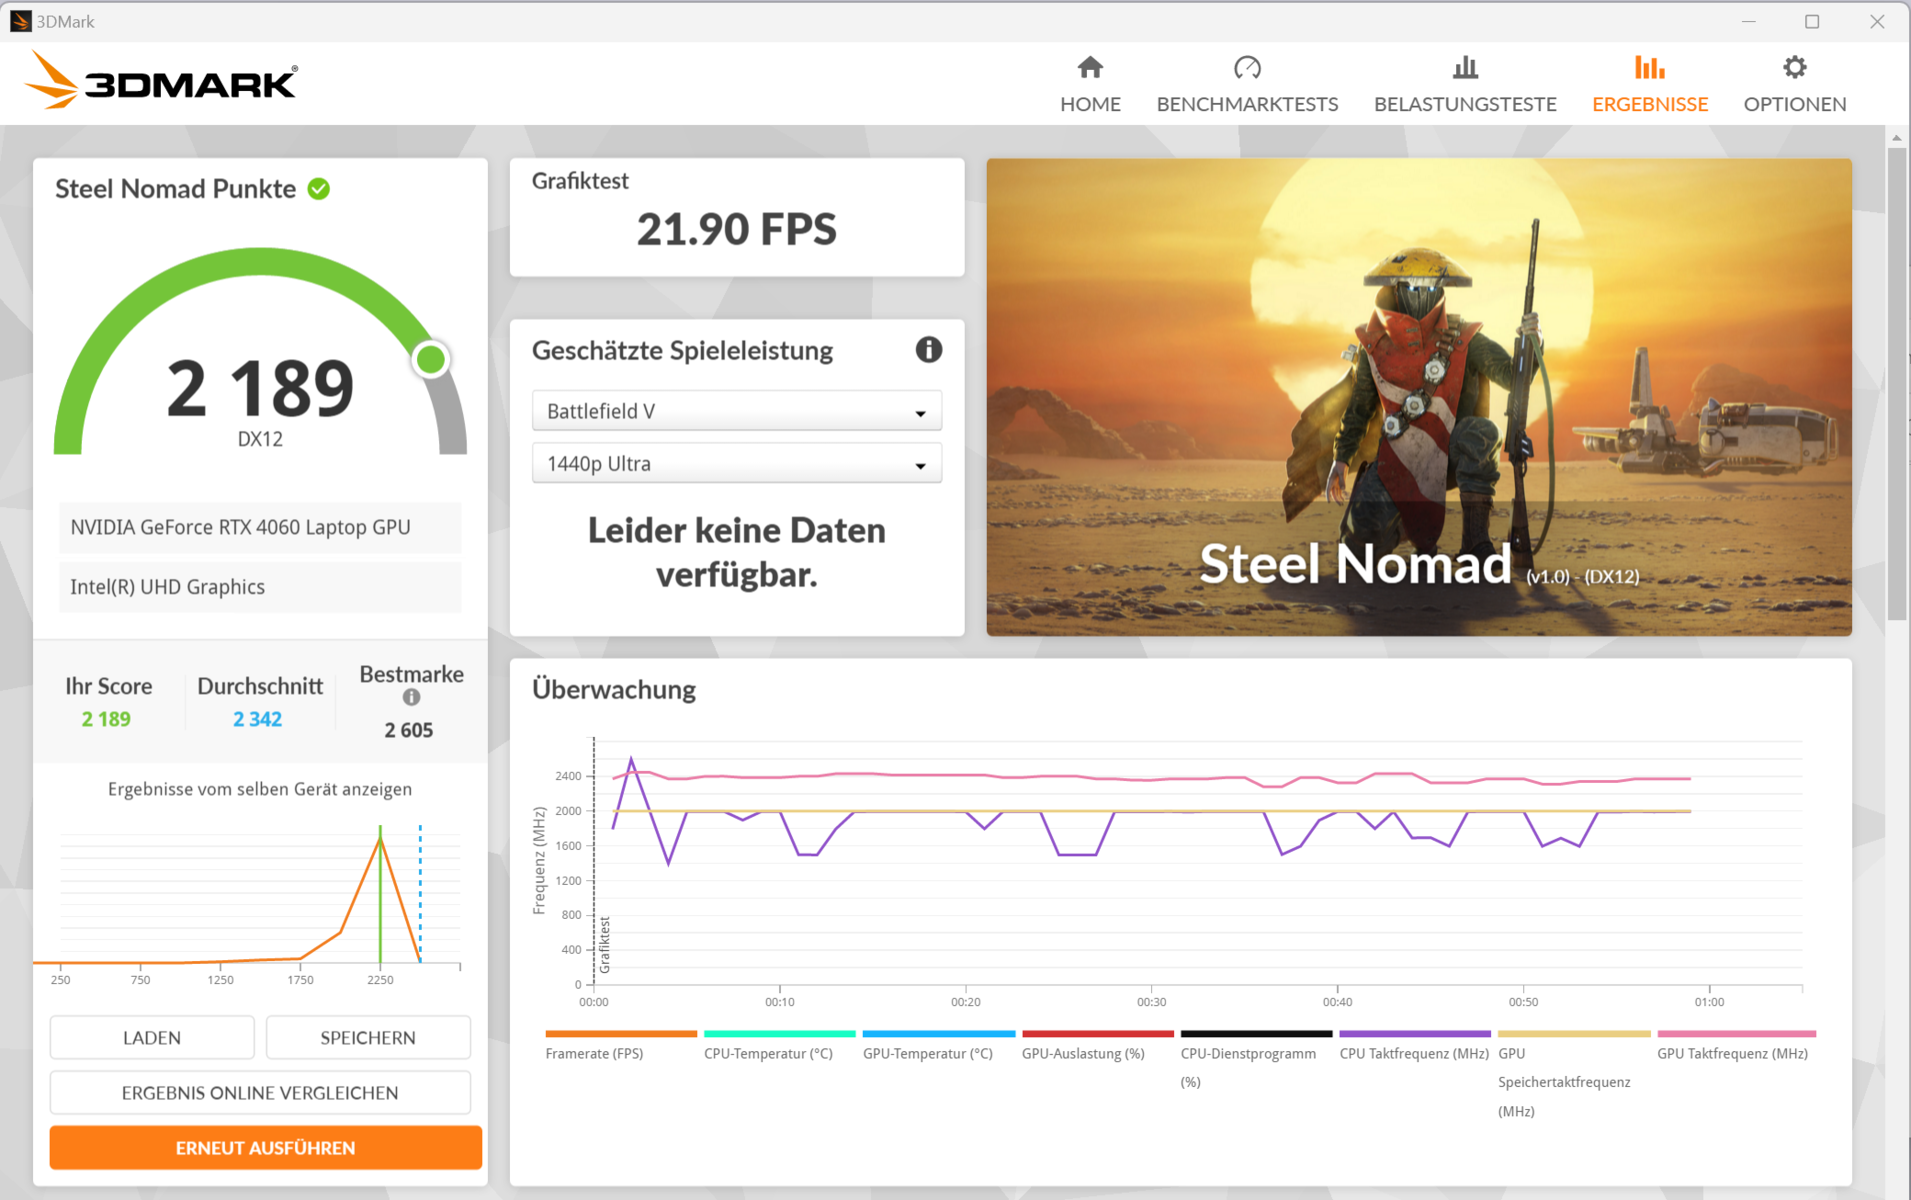
A GeForce RTX 4060 (3.072 shaders, barramento de 128 bits, 8 GB GDDR6) é atualmente uma GPU para jogos de médio porte (inferior). A Nubia concede a ela um TGP máximo de 140 watts - mais não é possível. Seus resultados de benchmark estão ligeiramente acima da média da RTX-4060( modobalanceado ). O modo de jogo não resulta em um aumento. A alternância entre dGPU e Optimus não requer reinicialização - o Optimus avançado é suportado.

| 3DMark Performance Rating - Percent | |
| Acer Predator Helios Neo 16 (2024) | |
| Média da turma Gaming | |
| SCHENKER XMG Pro 16 Studio (Mid 24) | |
| Lenovo Legion Pro 5 16IRX9 G9 | |
| Nubia RedMagic Titan 16 Pro | |
| Nubia RedMagic Titan 16 Pro | |
| Gigabyte G6X 9KG (2024) | |
| HP Victus 16 (2024) | |
| Média NVIDIA GeForce RTX 4060 Laptop GPU | |
| 3DMark 11 - 1280x720 Performance GPU | |
| Acer Predator Helios Neo 16 (2024) | |
| Média da turma Gaming (10741 - 72178, n=143, últimos 2 anos) | |
| SCHENKER XMG Pro 16 Studio (Mid 24) | |
| Lenovo Legion Pro 5 16IRX9 G9 | |
| Nubia RedMagic Titan 16 Pro (Gaming Mode) | |
| Nubia RedMagic Titan 16 Pro | |
| Gigabyte G6X 9KG (2024) | |
| HP Victus 16 (2024) | |
| Média NVIDIA GeForce RTX 4060 Laptop GPU (28136 - 38912, n=57) | |
| 3DMark | |
| 1920x1080 Fire Strike Graphics | |
| Acer Predator Helios Neo 16 (2024) | |
| Média da turma Gaming (2913 - 56116, n=155, últimos 2 anos) | |
| SCHENKER XMG Pro 16 Studio (Mid 24) | |
| Lenovo Legion Pro 5 16IRX9 G9 | |
| Gigabyte G6X 9KG (2024) | |
| HP Victus 16 (2024) | |
| Nubia RedMagic Titan 16 Pro (Gaming Mode) | |
| Nubia RedMagic Titan 16 Pro | |
| Média NVIDIA GeForce RTX 4060 Laptop GPU (20533 - 29656, n=54) | |
| 2560x1440 Time Spy Graphics | |
| Acer Predator Helios Neo 16 (2024) | |
| Média da turma Gaming (2295 - 24599, n=151, últimos 2 anos) | |
| SCHENKER XMG Pro 16 Studio (Mid 24) | |
| Lenovo Legion Pro 5 16IRX9 G9 | |
| Nubia RedMagic Titan 16 Pro (Gaming Mode) | |
| Nubia RedMagic Titan 16 Pro | |
| Média NVIDIA GeForce RTX 4060 Laptop GPU (7484 - 11451, n=56) | |
| HP Victus 16 (2024) | |
| Gigabyte G6X 9KG (2024) | |
| 3DMark 06 Standard Score | 55770 pontos | |
| 3DMark 11 Performance | 28427 pontos | |
| 3DMark Fire Strike Score | 22307 pontos | |
| 3DMark Time Spy Score | 10789 pontos | |
| 3DMark Steel Nomad Score | 2288 pontos | |
Ajuda | ||
| Geekbench 6.4 | |
| GPU OpenCL | |
| Acer Predator Helios Neo 16 (2024) (6.2.1) | |
| Média da turma Gaming (4321 - 234213, n=118, últimos 2 anos) | |
| SCHENKER XMG Pro 16 Studio (Mid 24) (6.2.1) | |
| Nubia RedMagic Titan 16 Pro (6.2.1, Gaming Mode) | |
| Nubia RedMagic Titan 16 Pro (6.2.1) | |
| Gigabyte G6X 9KG (2024) (6.2.1) | |
| HP Victus 16 (2024) (6.2.1) | |
| Média NVIDIA GeForce RTX 4060 Laptop GPU (4321 - 100831, n=40) | |
| Lenovo Legion Pro 5 16IRX9 G9 (6.2.1) | |
| GPU Vulkan | |
| SCHENKER XMG Pro 16 Studio (Mid 24) (6.2.1) | |
| Nubia RedMagic Titan 16 Pro (6.2.1, Gaming Mode) | |
| Gigabyte G6X 9KG (2024) (6.2.1) | |
| Acer Predator Helios Neo 16 (2024) (6.2.1) | |
| HP Victus 16 (2024) (6.2.1) | |
| Média da turma Gaming (4286 - 231659, n=110, últimos 2 anos) | |
| Nubia RedMagic Titan 16 Pro (6.2.1) | |
| Lenovo Legion Pro 5 16IRX9 G9 (6.2.1) | |
| Média NVIDIA GeForce RTX 4060 Laptop GPU (4286 - 101001, n=36) | |
| V-Ray Benchmark Next 4.10 | |
| GPU | |
| Média da turma Gaming (54 - 1317, n=122, últimos 2 anos) | |
| Lenovo Legion Pro 5 16IRX9 G9 (v4.10.07 ) | |
| Acer Predator Helios Neo 16 (2024) (v4.10.07 ) | |
| Gigabyte G6X 9KG (2024) (v4.10.07 ) | |
| Nubia RedMagic Titan 16 Pro (v4.10.07 ) | |
| Nubia RedMagic Titan 16 Pro (v4.10.07, Gaming Mode ) | |
| Média NVIDIA GeForce RTX 4060 Laptop GPU (483 - 715, n=46) | |
| HP Victus 16 (2024) (v4.10.07 ) | |
| SCHENKER XMG Pro 16 Studio (Mid 24) (v4.10.07 ) | |
| CPU | |
| Nubia RedMagic Titan 16 Pro (v4.10.07, Gaming Mode) | |
| Lenovo Legion Pro 5 16IRX9 G9 (v4.10.07 ) | |
| SCHENKER XMG Pro 16 Studio (Mid 24) (v4.10.07 ) | |
| Acer Predator Helios Neo 16 (2024) (v4.10.07 ) | |
| HP Victus 16 (2024) (v4.10.07 ) | |
| Média da turma Gaming (5413 - 44129, n=122, últimos 2 anos) | |
| Média NVIDIA GeForce RTX 4060 Laptop GPU (12680 - 32360, n=46) | |
| Gigabyte G6X 9KG (2024) (v4.10.07 ) | |
| Nubia RedMagic Titan 16 Pro (v4.10.07 ) | |
* ... menor é melhor
Desempenho em jogos
A Titan foi projetada para jogos QHD em configurações altas ou máximas. O hardware instalado gera taxas de quadros ligeiramente acima da média da RTX 4060( modobalanceado ). O modo de jogo resulta em uma vantagem ao executar jogos que se beneficiam do desempenho superior da CPU, como o Dota 2 Reborn e o X-Plane 11. Fora isso, o desempenho gráfico é idêntico.
| Cyberpunk 2077 2.2 Phantom Liberty - 1920x1080 Ultra Preset (FSR off) | |
| Média da turma Gaming (6.76 - 158, n=90, últimos 2 anos) | |
| Acer Predator Helios Neo 16 (2024) (2.02) | |
| SCHENKER XMG Pro 16 Studio (Mid 24) (2.12) | |
| Lenovo Legion Pro 5 16IRX9 G9 (2.12) | |
| Nubia RedMagic Titan 16 Pro (2.12, Gaming Mode) | |
| Nubia RedMagic Titan 16 Pro (2.12) | |
| Média NVIDIA GeForce RTX 4060 Laptop GPU (56.4 - 93.1, n=31) | |
| Gigabyte G6X 9KG (2024) (2.02) | |
| HP Victus 16 (2024) (2.02) | |
| Final Fantasy XV Benchmark - 1920x1080 High Quality | |
| Acer Predator Helios Neo 16 (2024) (1.3) | |
| SCHENKER XMG Pro 16 Studio (Mid 24) (1.3) | |
| Média da turma Gaming (19.2 - 201, n=144, últimos 2 anos) | |
| Lenovo Legion Pro 5 16IRX9 G9 (1.3) | |
| Nubia RedMagic Titan 16 Pro (1.3) | |
| Nubia RedMagic Titan 16 Pro (1.3, Gaming Mode ) | |
| Gigabyte G6X 9KG (2024) (1.3) | |
| HP Victus 16 (2024) (1.3) | |
| Média NVIDIA GeForce RTX 4060 Laptop GPU (75.1 - 109.8, n=51) | |
| Strange Brigade - 1920x1080 ultra AA:ultra AF:16 | |
| Média da turma Gaming (38.9 - 420, n=140, últimos 2 anos) | |
| Acer Predator Helios Neo 16 (2024) (1.47.22.14 D3D12) | |
| SCHENKER XMG Pro 16 Studio (Mid 24) (1.47.22.14 D3D12) | |
| Lenovo Legion Pro 5 16IRX9 G9 (1.47.22.14 D3D12) | |
| Nubia RedMagic Titan 16 Pro (1.47.22.14 D3D12, Gaming Mode ) | |
| Nubia RedMagic Titan 16 Pro (1.47.22.14 D3D12) | |
| Gigabyte G6X 9KG (2024) (1.47.22.14 D3D12) | |
| Média NVIDIA GeForce RTX 4060 Laptop GPU (135.3 - 210, n=50) | |
| HP Victus 16 (2024) (1.47.22.14 D3D12) | |
| Dota 2 Reborn - 1920x1080 ultra (3/3) best looking | |
| Lenovo Legion Pro 5 16IRX9 G9 | |
| Acer Predator Helios Neo 16 (2024) | |
| Nubia RedMagic Titan 16 Pro (Gaming Mode) | |
| SCHENKER XMG Pro 16 Studio (Mid 24) | |
| HP Victus 16 (2024) | |
| Média da turma Gaming (65.1 - 220, n=148, últimos 2 anos) | |
| Nubia RedMagic Titan 16 Pro | |
| Média NVIDIA GeForce RTX 4060 Laptop GPU (115 - 183.8, n=53) | |
| Gigabyte G6X 9KG (2024) | |
| X-Plane 11.11 - 1920x1080 high (fps_test=3) | |
| Nubia RedMagic Titan 16 Pro (Gaming Mode) | |
| Lenovo Legion Pro 5 16IRX9 G9 | |
| Acer Predator Helios Neo 16 (2024) | |
| SCHENKER XMG Pro 16 Studio (Mid 24) | |
| Nubia RedMagic Titan 16 Pro | |
| Gigabyte G6X 9KG (2024) | |
| Média da turma Gaming (32.8 - 166.2, n=151, últimos 2 anos) | |
| Média NVIDIA GeForce RTX 4060 Laptop GPU (60.7 - 141.1, n=54) | |
| HP Victus 16 (2024) | |
| Once Human | |
| 1920x1080 Very High Preset | |
| Nubia RedMagic Titan 16 Pro | |
| Média NVIDIA GeForce RTX 4060 Laptop GPU (88.7 - 94.2, n=2) | |
| Média da turma Gaming (14.2 - 94.2, n=2, últimos 2 anos) | |
| 2560x1440 Very High Preset | |
| Nubia RedMagic Titan 16 Pro | |
| Média da turma Gaming (n=1últimos 2 anos) | |
| Média NVIDIA GeForce RTX 4060 Laptop GPU (59.1 - 62.3, n=2) | |
| 2560x1440 Very High Preset + Quality FSR | |
| Nubia RedMagic Titan 16 Pro | |
| Média NVIDIA GeForce RTX 4060 Laptop GPU (n=1) | |
| Média da turma Gaming (n=1últimos 2 anos) | |
| F1 24 | |
| 1920x1080 Ultra High Preset AA:T AF:16x | |
| Média da turma Gaming (54.1 - 148, n=19, últimos 2 anos) | |
| SCHENKER XMG Pro 16 Studio (Mid 24) | |
| Lenovo Legion Pro 5 16IRX9 G9 | |
| Nubia RedMagic Titan 16 Pro | |
| Média NVIDIA GeForce RTX 4060 Laptop GPU (47.5 - 61.6, n=10) | |
| 2560x1440 Ultra High Preset AA:T AF:16x | |
| Média da turma Gaming (36.7 - 100, n=16, últimos 2 anos) | |
| SCHENKER XMG Pro 16 Studio (Mid 24) | |
| Nubia RedMagic Titan 16 Pro | |
| Média NVIDIA GeForce RTX 4060 Laptop GPU (24.3 - 38.8, n=6) | |
| 2560x1440 Ultra High Preset + Quality DLSS AF:16x | |
| Média da turma Gaming (59.2 - 150.4, n=12, últimos 2 anos) | |
| SCHENKER XMG Pro 16 Studio (Mid 24) | |
| Nubia RedMagic Titan 16 Pro | |
| Média NVIDIA GeForce RTX 4060 Laptop GPU (48.6 - 61, n=3) | |
| Ghost of Tsushima | |
| 1920x1080 Very High Preset AA:T | |
| SCHENKER XMG Pro 16 Studio (Mid 24) | |
| Nubia RedMagic Titan 16 Pro | |
| Média NVIDIA GeForce RTX 4060 Laptop GPU (55.6 - 63.4, n=5) | |
| Média da turma Gaming (28.5 - 73.7, n=7, últimos 2 anos) | |
| 2560x1440 Very High Preset AA:T | |
| SCHENKER XMG Pro 16 Studio (Mid 24) | |
| Nubia RedMagic Titan 16 Pro | |
| Média NVIDIA GeForce RTX 4060 Laptop GPU (41.1 - 47.7, n=3) | |
| Média da turma Gaming (22.7 - 56.1, n=5, últimos 2 anos) | |
| 2560x1440 Very High Preset + Quality DLSS | |
| SCHENKER XMG Pro 16 Studio (Mid 24) | |
| Média da turma Gaming (63.6 - 74.2, n=3, últimos 2 anos) | |
| Nubia RedMagic Titan 16 Pro | |
| Média NVIDIA GeForce RTX 4060 Laptop GPU (n=1) | |
| The First Descendant | |
| 1920x1080 Ultra Preset | |
| SCHENKER XMG Pro 16 Studio (Mid 24) | |
| Nubia RedMagic Titan 16 Pro | |
| Média NVIDIA GeForce RTX 4060 Laptop GPU (67.6 - 69.4, n=3) | |
| Média da turma Gaming (15.4 - 80, n=5, últimos 2 anos) | |
| 2560x1440 Ultra Preset | |
| SCHENKER XMG Pro 16 Studio (Mid 24) | |
| Média da turma Gaming (43.7 - 51.2, n=3, últimos 2 anos) | |
| Nubia RedMagic Titan 16 Pro | |
| Média NVIDIA GeForce RTX 4060 Laptop GPU (43.5 - 43.7, n=2) | |
| 2560x1440 Ultra Preset + Ultra Ray Tracing + DLSS Quality | |
| SCHENKER XMG Pro 16 Studio (Mid 24) | |
| Média da turma Gaming (43.3 - 51.8, n=2, últimos 2 anos) | |
| Nubia RedMagic Titan 16 Pro | |
| Média NVIDIA GeForce RTX 4060 Laptop GPU (n=1) | |
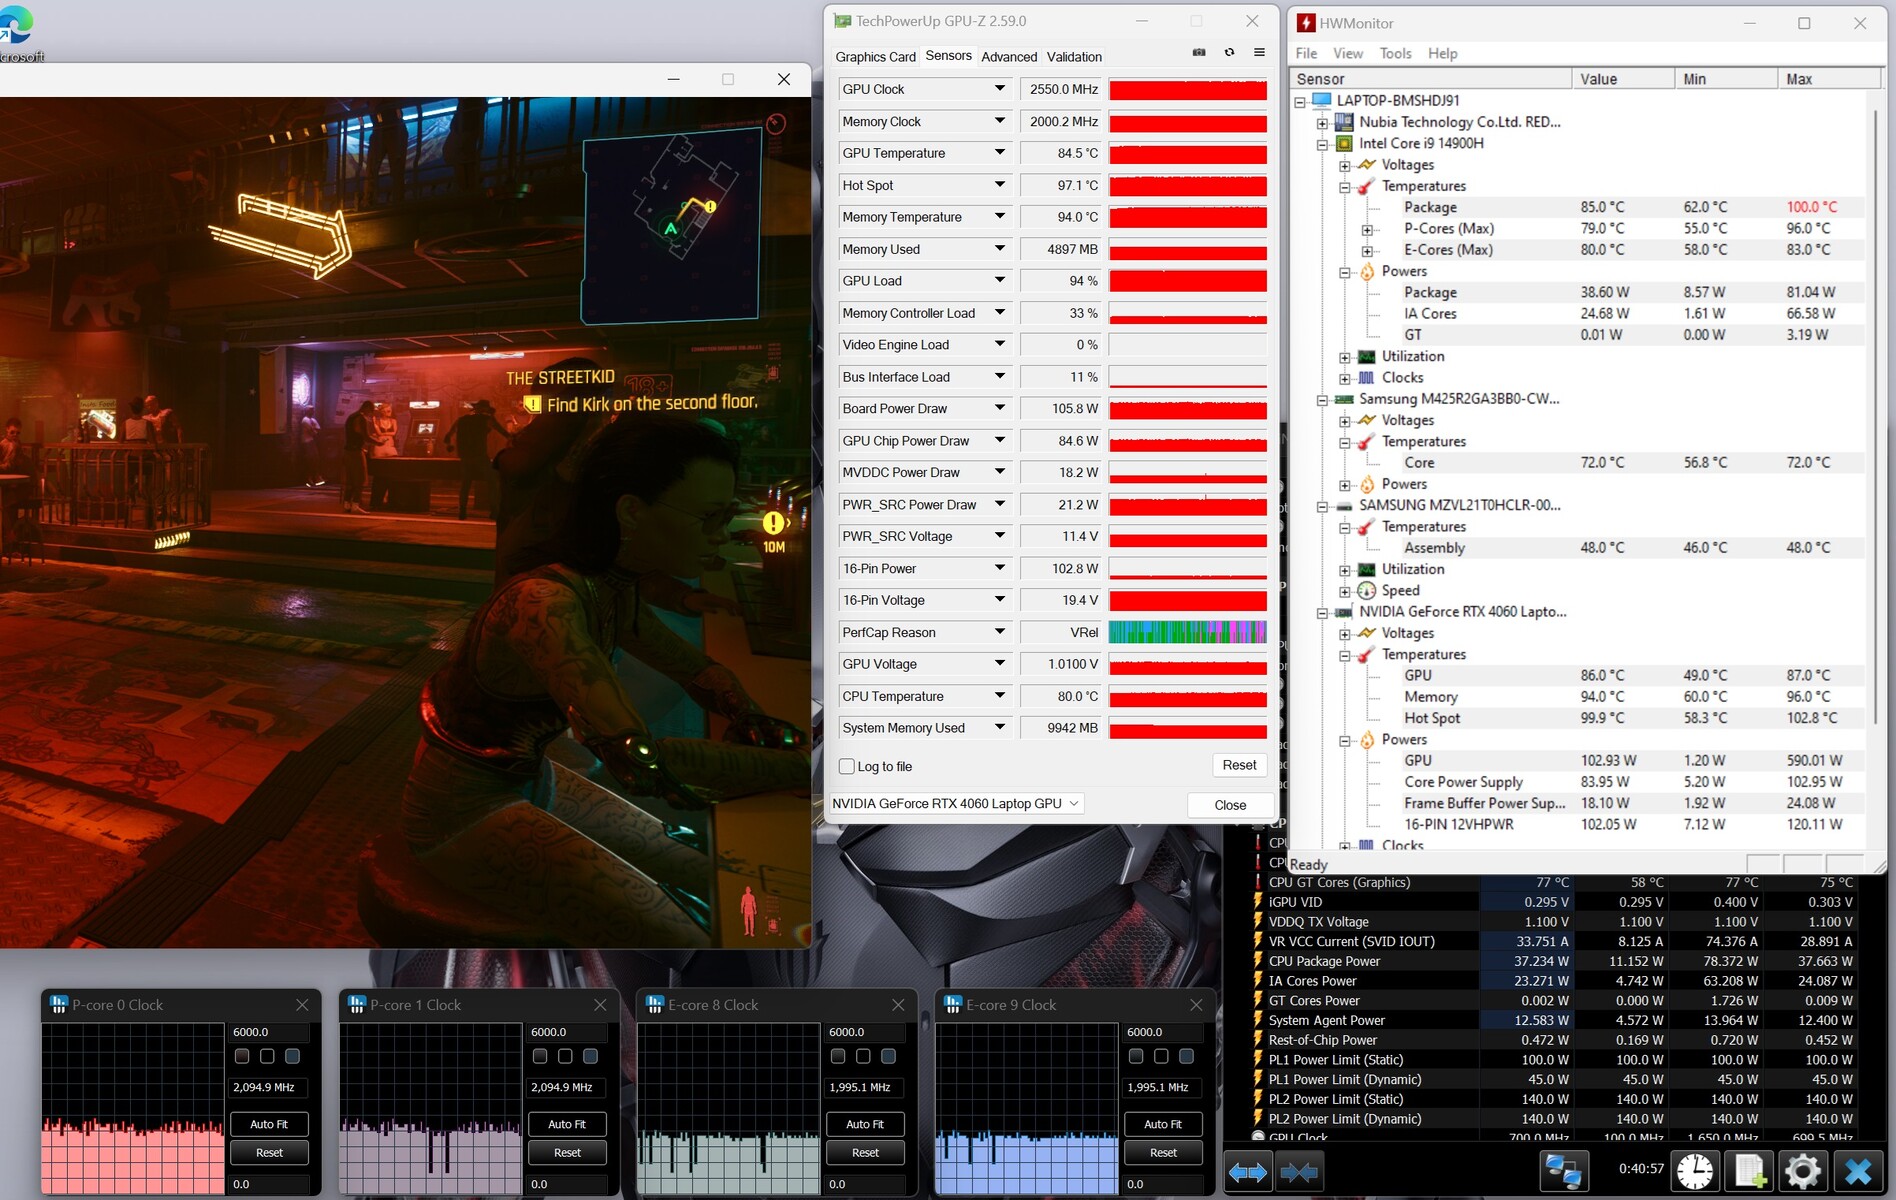
O Cyberpunk 2077 Phantom Liberty apresentou taxas de quadros ligeiramente flutuantes em um nível razoavelmente estável durante nosso teste de 30 minutos (configurações máximas, FHD). Não notamos nenhuma queda perceptível no desempenho.
Cyberpunk 2077 ultra FPS diagram
| baixo | média | alto | ultra | QHD DLSS | QHD FSR | QHD | |
|---|---|---|---|---|---|---|---|
| GTA V (2015) | 186.1 | 184 | 177.7 | 118.4 | 89.3 | ||
| Dota 2 Reborn (2015) | 206 | 170.9 | 160.2 | 146.9 | |||
| Final Fantasy XV Benchmark (2018) | 199.7 | 146 | 105.4 | 76.9 | |||
| X-Plane 11.11 (2018) | 167 | 142.8 | 117.2 | ||||
| Strange Brigade (2018) | 480 | 277 | 219 | 189.2 | 126.9 | ||
| Baldur's Gate 3 (2023) | 140.3 | 110.8 | 97.5 | 96.5 | 65.9 | ||
| Cyberpunk 2077 2.2 Phantom Liberty (2023) | 121.4 | 101.1 | 86.2 | 74.7 | 46.9 | ||
| Dragon's Dogma 2 (2024) | 71.9 | 67.7 | 52.9 | ||||
| Ghost of Tsushima (2024) | 91.3 | 86.8 | 78.2 | 63.4 | 63.6 | 47.7 | |
| F1 24 (2024) | 243 | 225 | 175.8 | 58.8 | 36.7 | ||
| The First Descendant (2024) | 159 | 100.9 | 80.6 | 69.4 | 43.7 | ||
| Once Human (2024) | 164.8 | 132.9 | 108.3 | 94.2 | 76.5 | 62.3 |
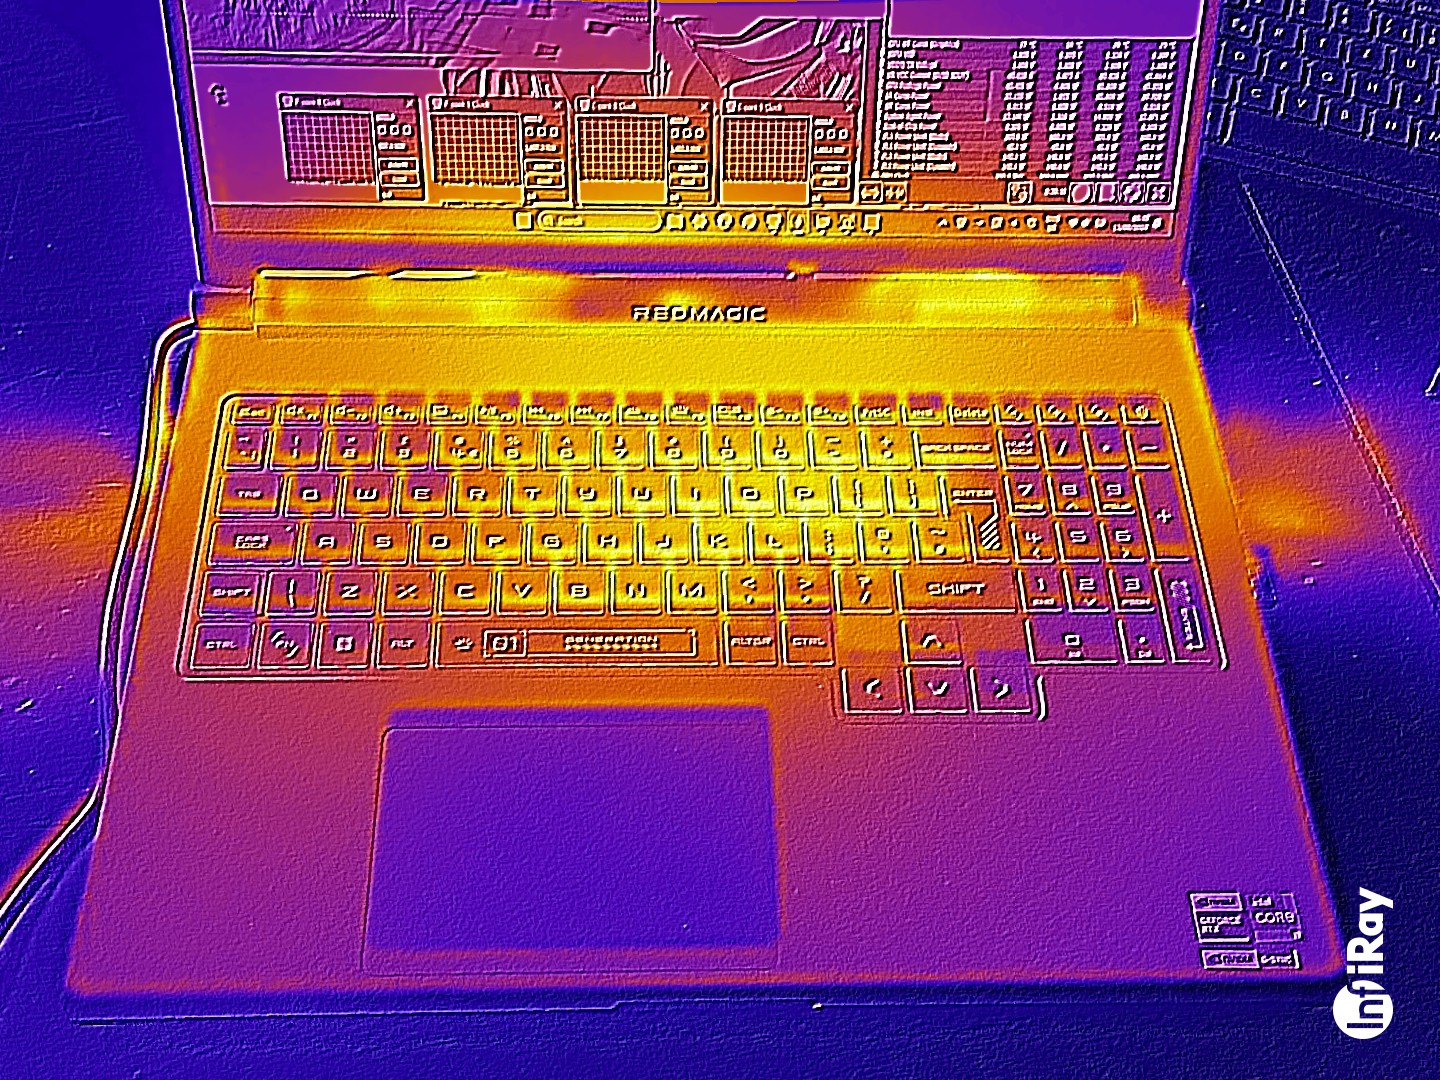
Emissões - muito alto, muito quente
Emissões de ruído
O Titan não é, de forma alguma, um laptop que funciona silenciosamente. Mesmo no modo inativo, as duas ventoinhas são constantemente ouvidas. O Cyberpunk fez com que o nível subisse para 50 dB(A)( modobalanceado ) ou 53 dB(A)( modode jogo ). O modo escritório resultou em um valor apenas um pouco mais moderado de 47 dB(A). As ventoinhas são mais silenciosas no modo de bateria e, ocasionalmente, ficam paradas.
Barulho
| Ocioso |
| 35 / 36 / 40 dB |
| Carga |
| 49 / 52 dB |
 | ||
30 dB silencioso 40 dB(A) audível 50 dB(A) ruidosamente alto |
||
min: | ||
| Nubia RedMagic Titan 16 Pro NVIDIA GeForce RTX 4060 Laptop GPU, i9-14900HX, Samsung PM9A1 MZVL21T0HCLR | Lenovo Legion Pro 5 16IRX9 G9 NVIDIA GeForce RTX 4060 Laptop GPU, i7-14700HX, Samsung PM9A1 MZVL21T0HCLR | HP Victus 16 (2024) NVIDIA GeForce RTX 4060 Laptop GPU, i7-14700HX, Kioxia XG8 KXG80ZNV512G | Acer Predator Helios Neo 16 (2024) NVIDIA GeForce RTX 4070 Laptop GPU, i7-14700HX, Samsung PM9A1a MZVL21T0HDLU | SCHENKER XMG Pro 16 Studio (Mid 24) NVIDIA GeForce RTX 4070 Laptop GPU, i9-14900HX, Samsung 990 Pro 1 TB | Gigabyte G6X 9KG (2024) NVIDIA GeForce RTX 4060 Laptop GPU, i7-13650HX, Gigabyte AG450E1024-SI | |
|---|---|---|---|---|---|---|
| Noise | 17% | 13% | 10% | 5% | 5% | |
| desligado / ambiente * | 26 | 23 12% | 25 4% | 25.2 3% | 25 4% | 26 -0% |
| Idle Minimum * | 35 | 23 34% | 28 20% | 27.8 21% | 28 20% | 30 14% |
| Idle Average * | 36 | 23 36% | 29 19% | 32 11% | 31 14% | 32 11% |
| Idle Maximum * | 40 | 25 37% | 33 17% | 29.6 26% | 35 12% | 35 12% |
| Load Average * | 49 | 45.18 8% | 45 8% | 45.2 8% | 52 -6% | 51 -4% |
| Cyberpunk 2077 ultra * | 50 | 52.69 -5% | 53 -6% | |||
| Load Maximum * | 52 | 53.13 -2% | 48 8% | 55.8 -7% | 52 -0% | 54 -4% |
| Witcher 3 ultra * | 43 | 51 |
* ... menor é melhor
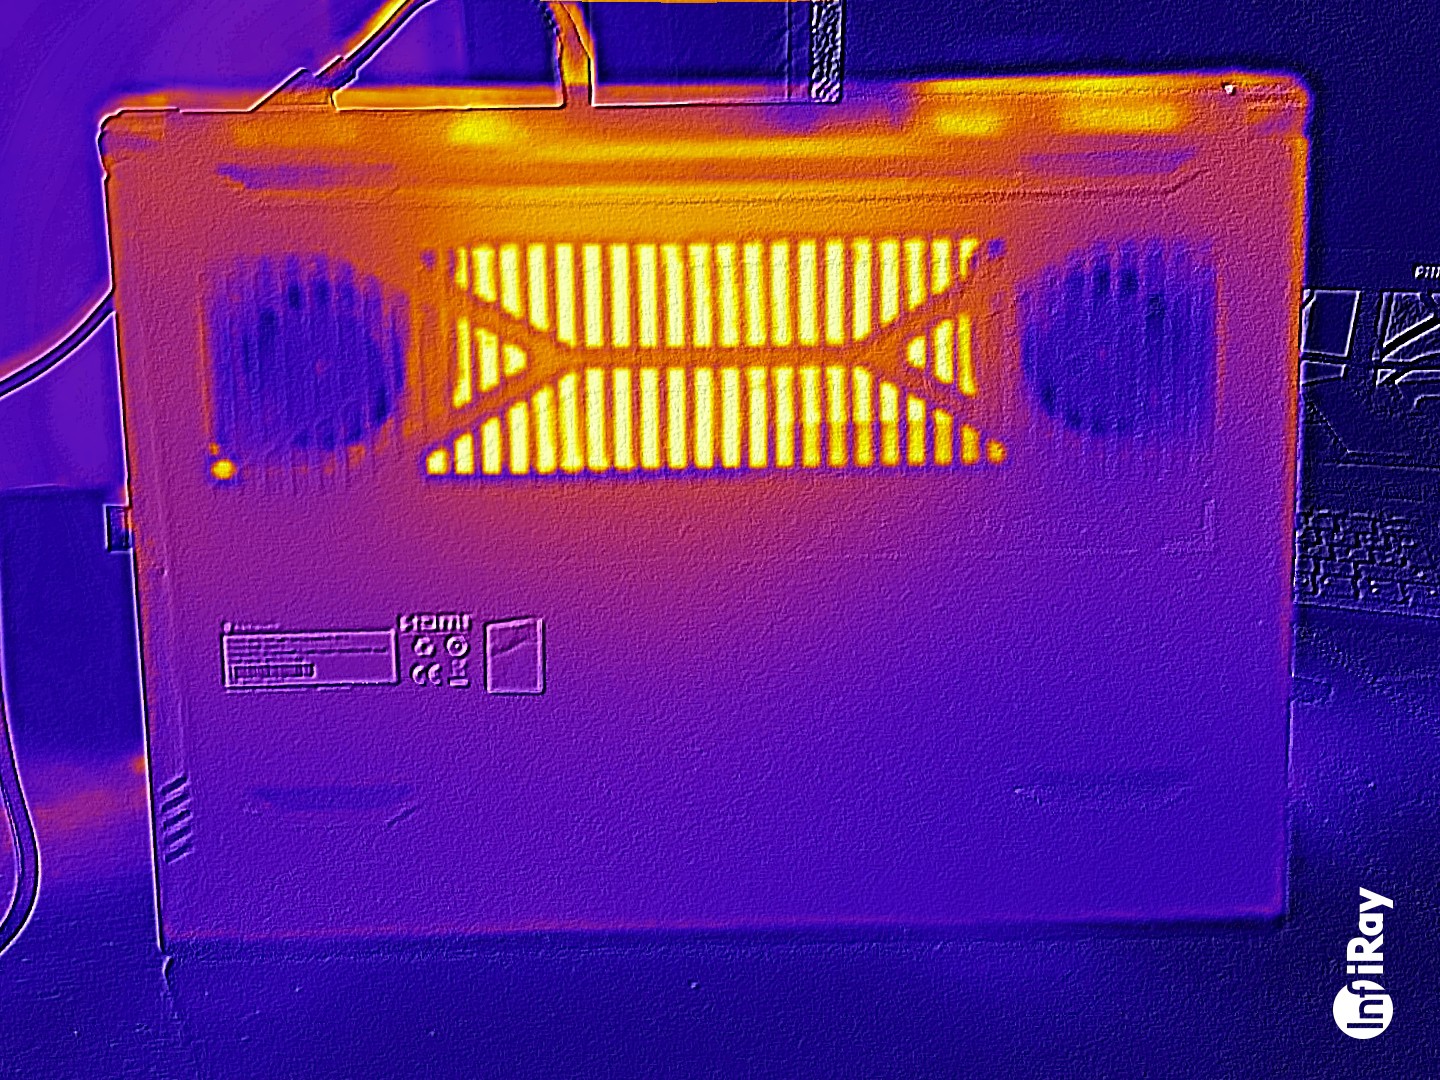
Temperatura
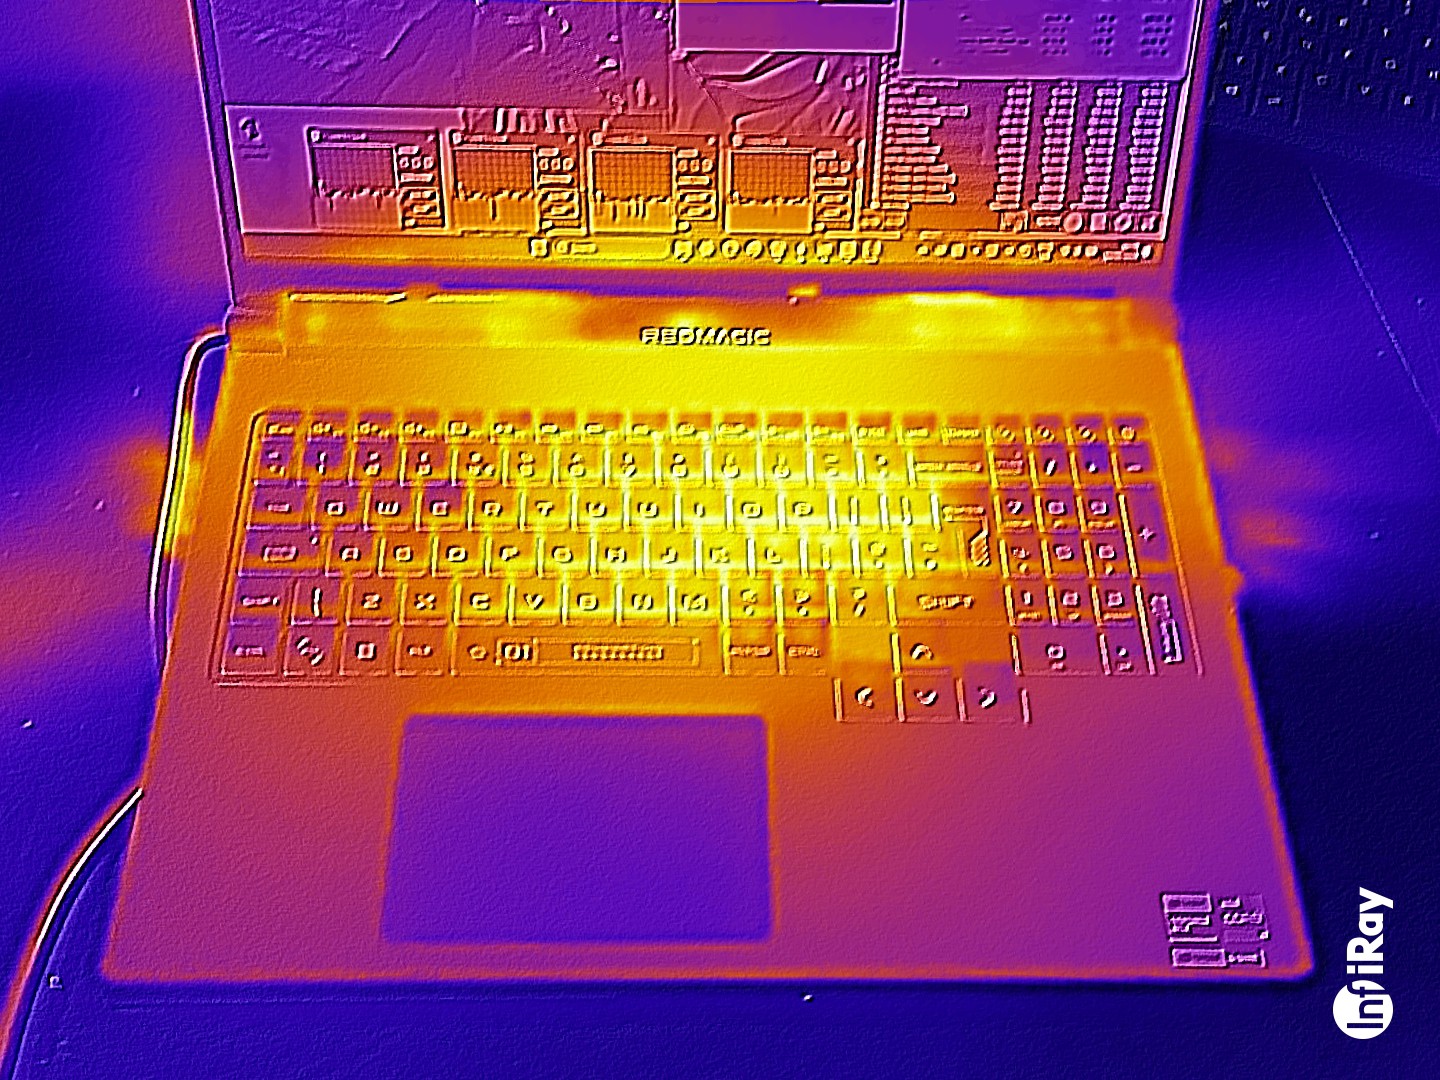
O laptop aquece consideravelmente sob carga: O Cyberpunk 2077 e o teste de estresse causaram temperaturas acima de 50 graus Celsius em determinados pontos. As temperaturas do apoio para as mãos às vezes eram quase muito altas. Também observamos valores acima da média no modo inativo.
(-) A temperatura máxima no lado superior é 50 °C / 122 F, em comparação com a média de 40.4 °C / 105 F , variando de 21.2 a 68.8 °C para a classe Gaming.
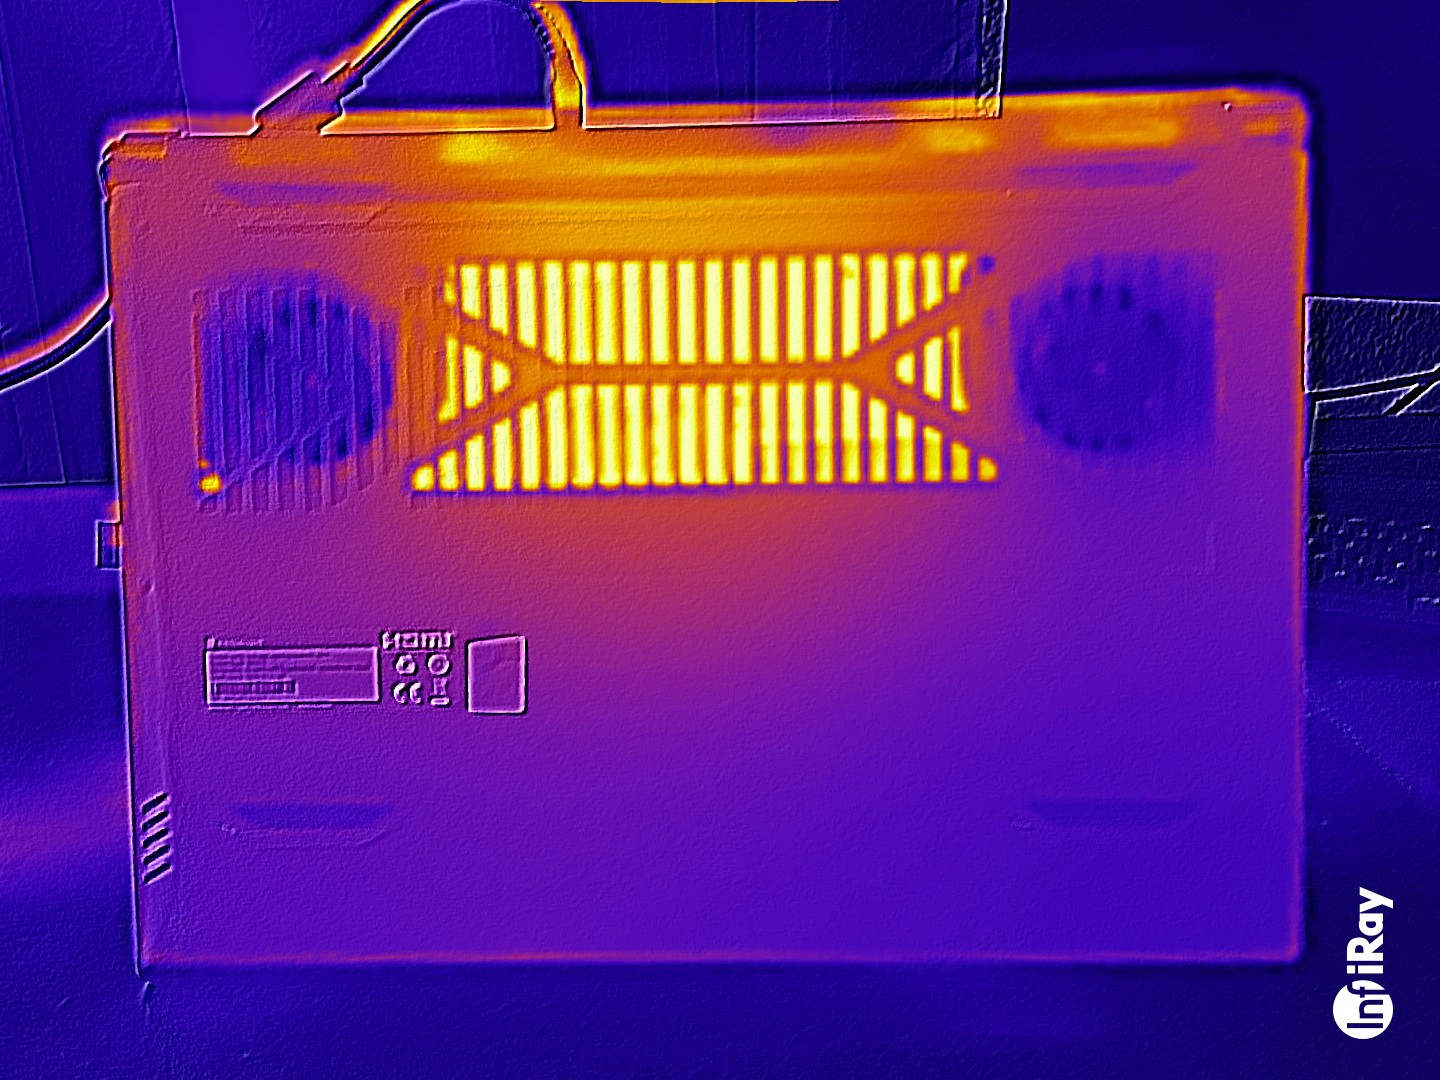
(-) A parte inferior aquece até um máximo de 58 °C / 136 F, em comparação com a média de 43.2 °C / 110 F
(+) Em uso inativo, a temperatura média para o lado superior é 30.4 °C / 87 F, em comparação com a média do dispositivo de 33.9 °C / ### class_avg_f### F.
(-) 3: The average temperature for the upper side is 45.1 °C / 113 F, compared to the average of 33.9 °C / 93 F for the class Gaming.
(-) Os apoios para as mãos e o touchpad podem ficar muito quentes ao toque, com um máximo de 40 °C / 104 F.
(-) A temperatura média da área do apoio para as mãos de dispositivos semelhantes foi 28.9 °C / 84 F (-11.1 °C / -20 F).
| Nubia RedMagic Titan 16 Pro Intel Core i9-14900HX, NVIDIA GeForce RTX 4060 Laptop GPU | Lenovo Legion Pro 5 16IRX9 G9 Intel Core i7-14700HX, NVIDIA GeForce RTX 4060 Laptop GPU | HP Victus 16 (2024) Intel Core i7-14700HX, NVIDIA GeForce RTX 4060 Laptop GPU | Acer Predator Helios Neo 16 (2024) Intel Core i7-14700HX, NVIDIA GeForce RTX 4070 Laptop GPU | SCHENKER XMG Pro 16 Studio (Mid 24) Intel Core i9-14900HX, NVIDIA GeForce RTX 4070 Laptop GPU | Gigabyte G6X 9KG (2024) Intel Core i7-13650HX, NVIDIA GeForce RTX 4060 Laptop GPU | |
|---|---|---|---|---|---|---|
| Heat | -9% | 13% | -3% | -13% | 6% | |
| Maximum Upper Side * | 50 | 50 -0% | 50 -0% | 58 -16% | 51 -2% | 41 18% |
| Maximum Bottom * | 58 | 57 2% | 50 14% | 45.2 22% | 66 -14% | 43 26% |
| Idle Upper Side * | 31 | 36 -16% | 25 19% | 31.1 -0% | 35 -13% | 32 -3% |
| Idle Bottom * | 32 | 39 -22% | 26 19% | 37.2 -16% | 39 -22% | 37 -16% |
* ... menor é melhor
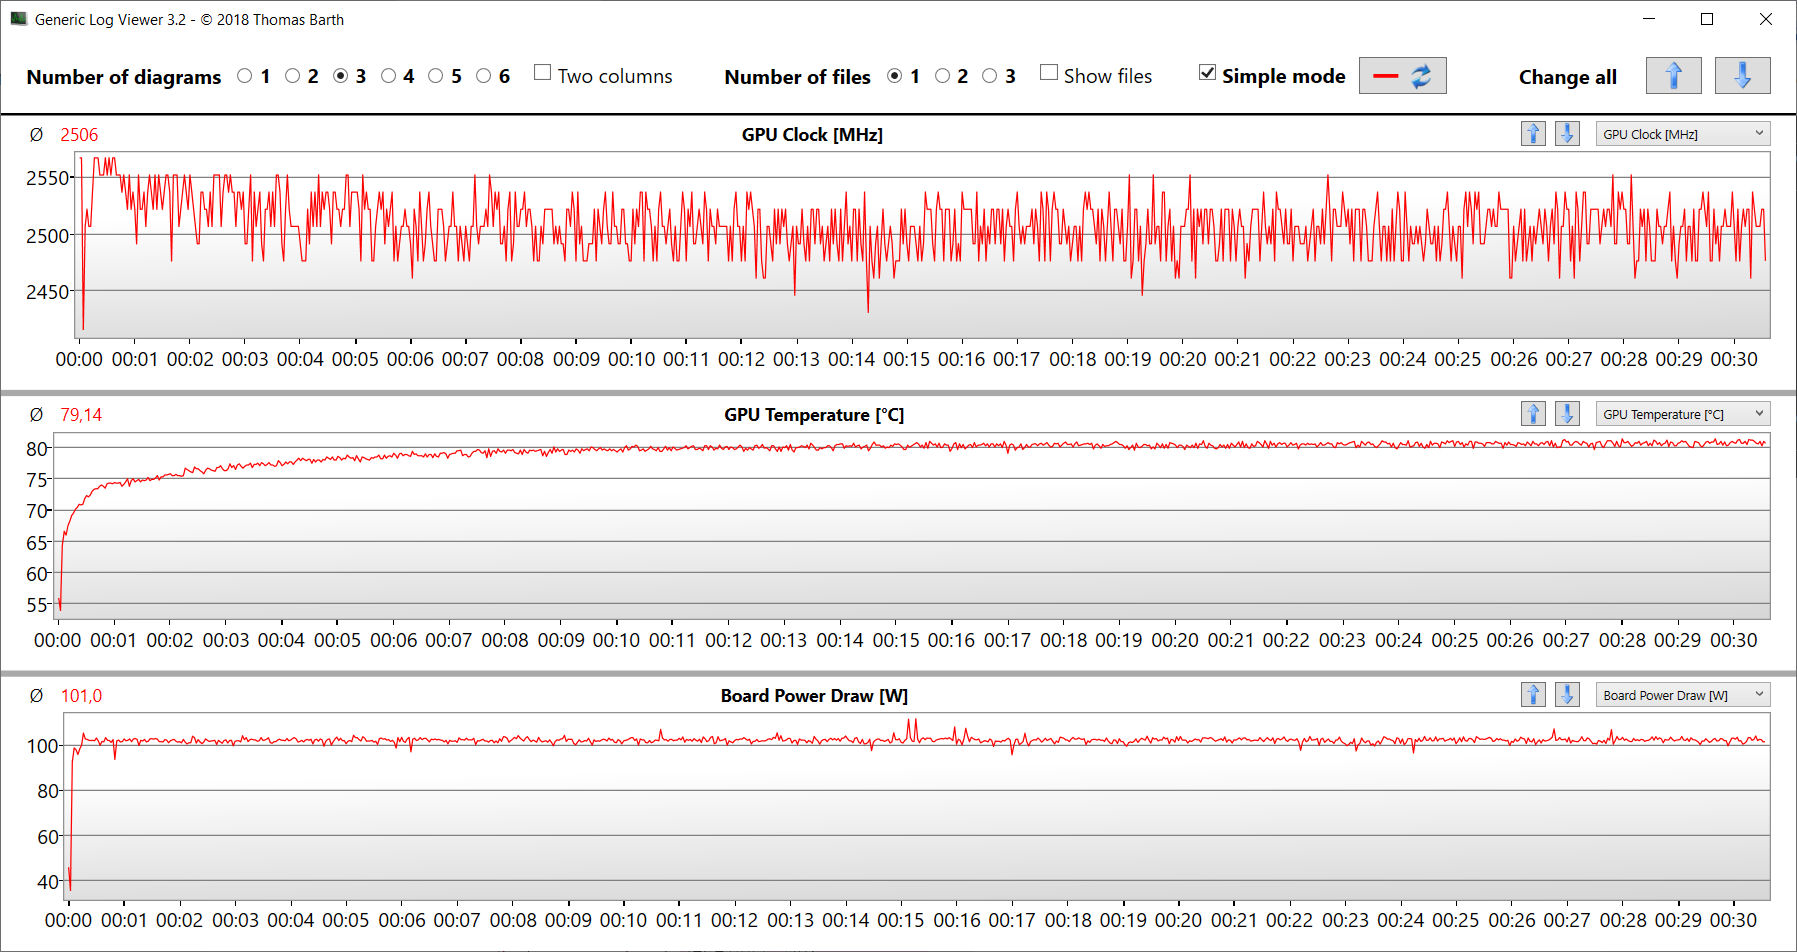
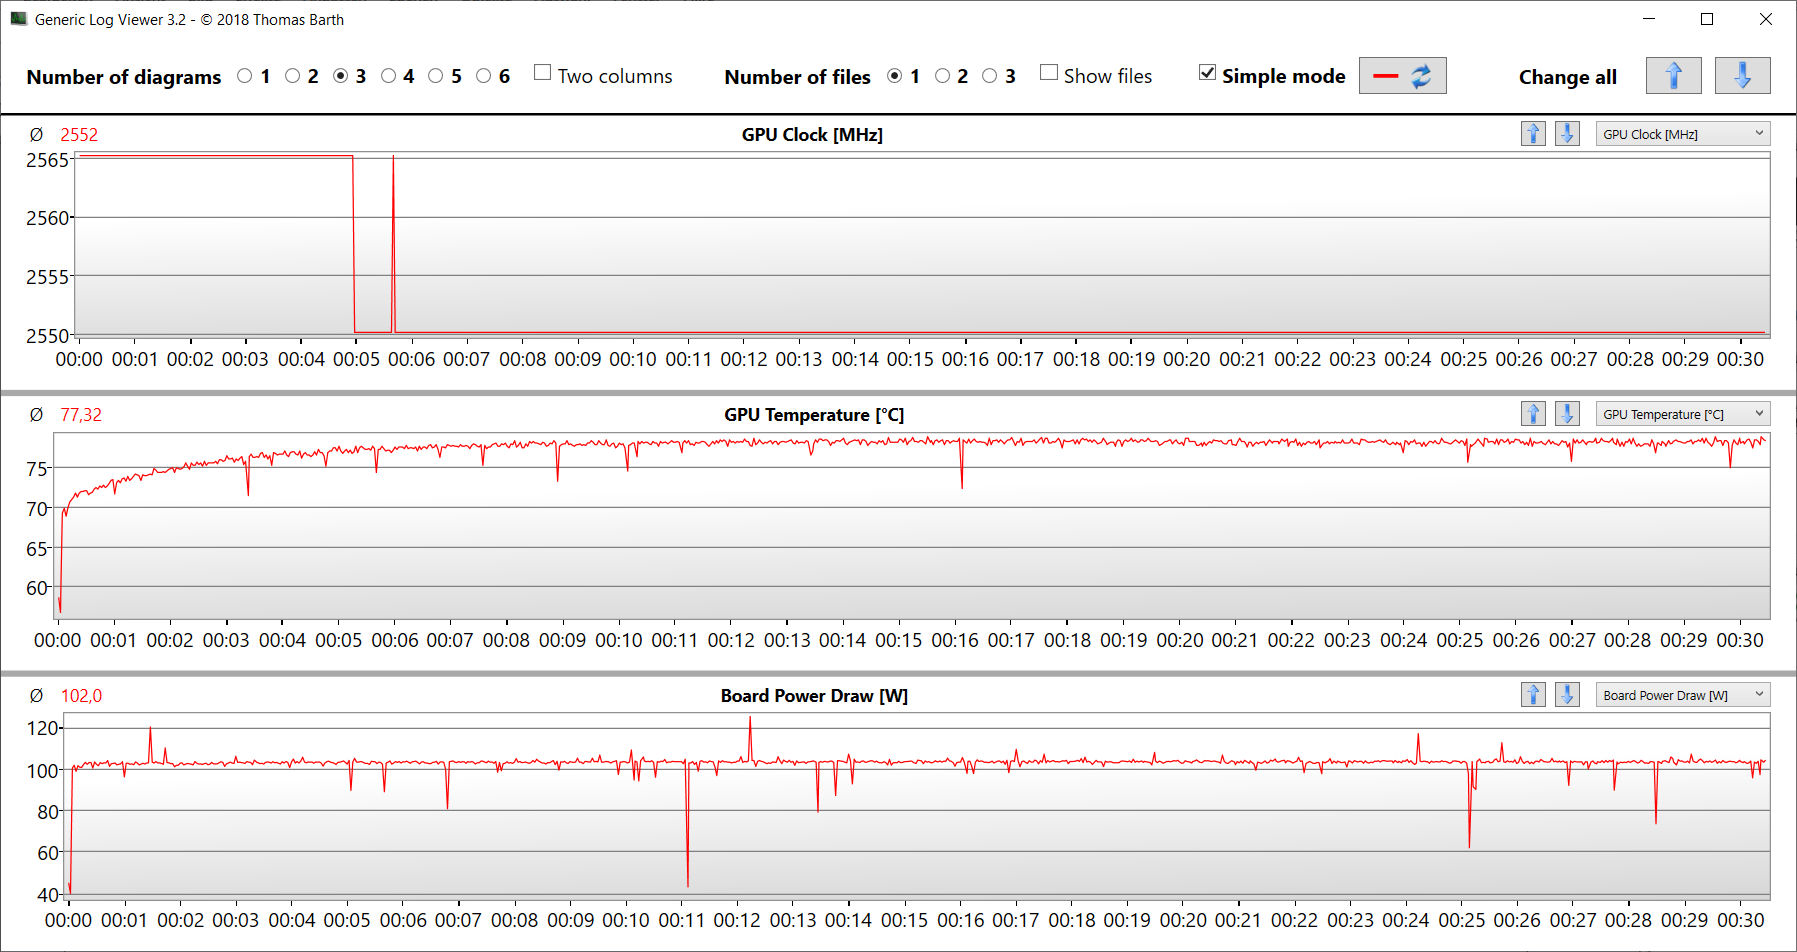
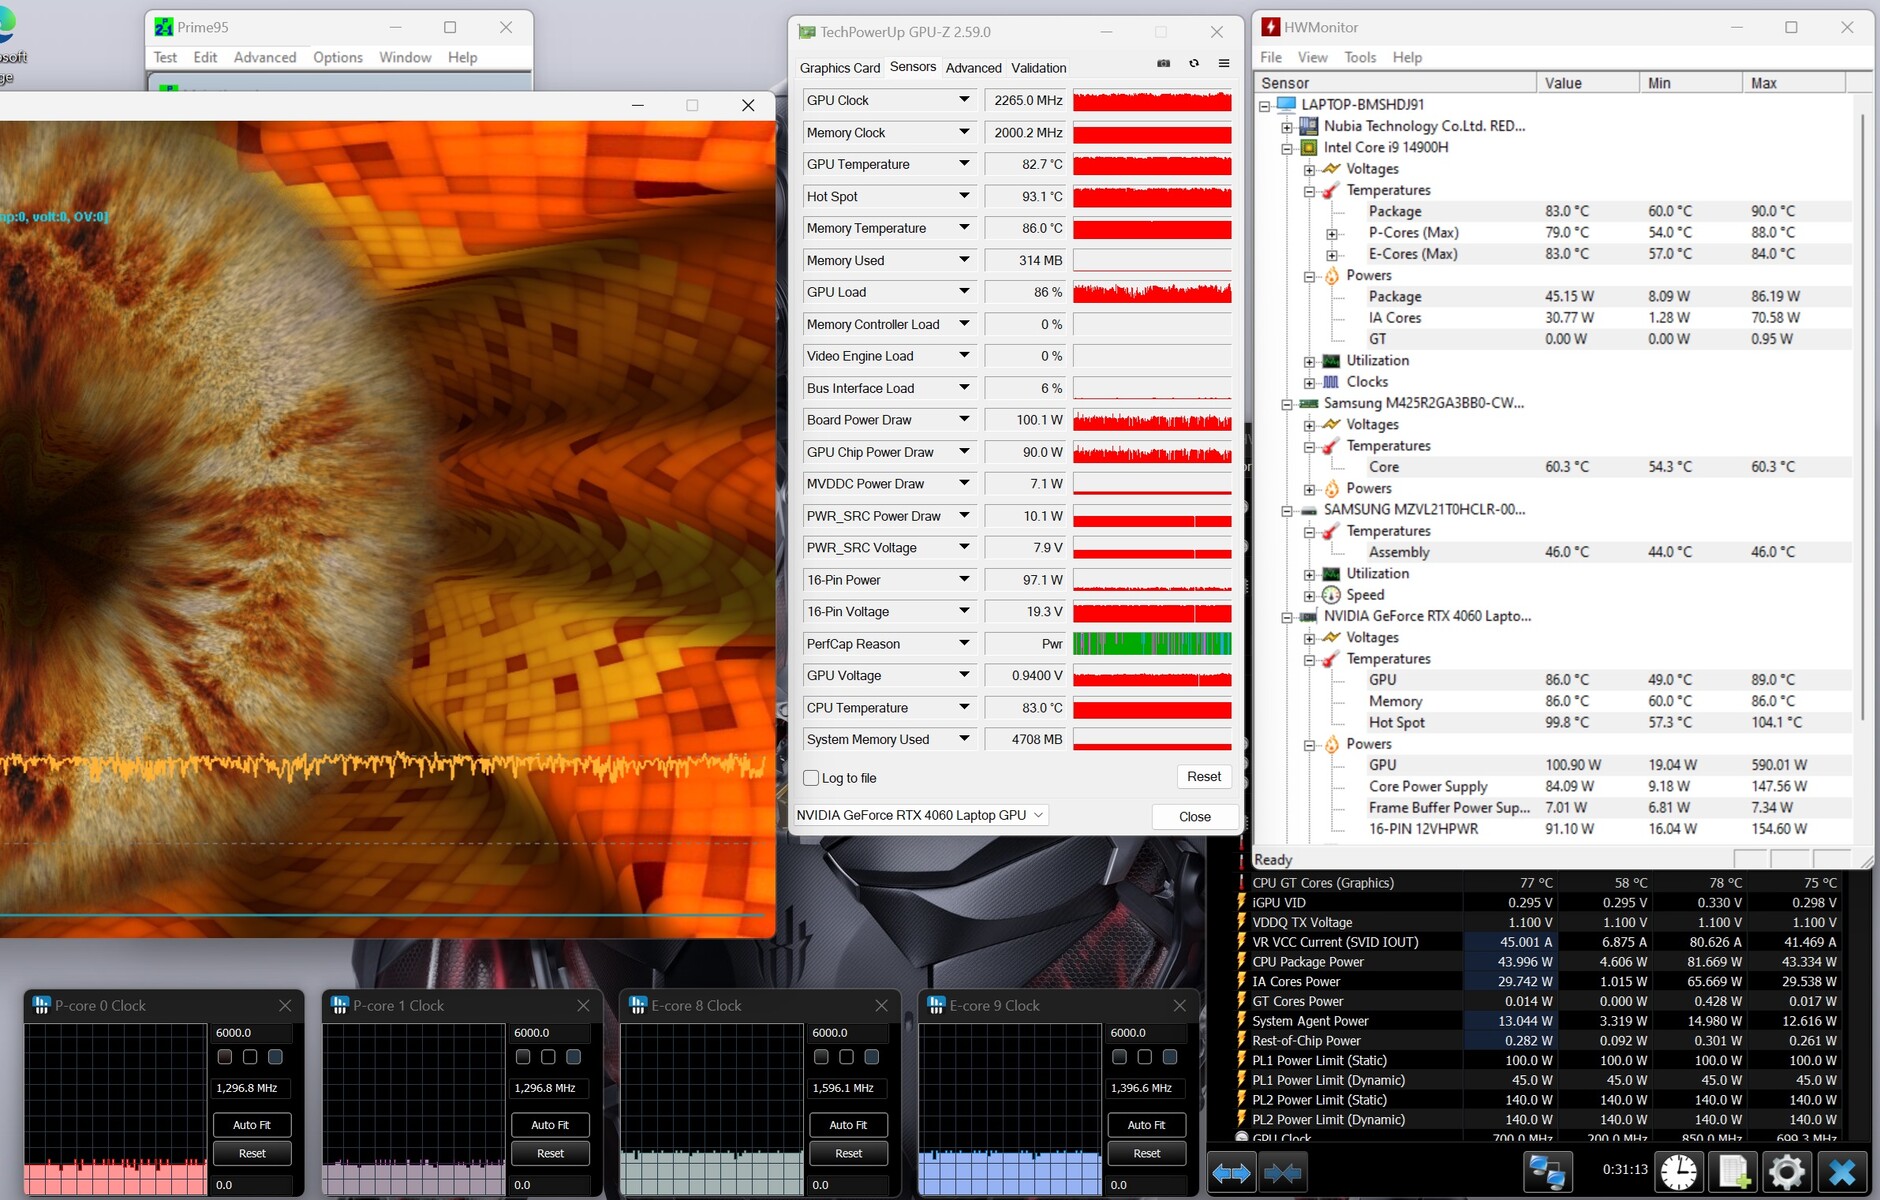
Teste de estresse
O cenário de teste de estresse extremo (Prime95 e Furmark em operação contínua) verificou a estabilidade do sistema sob carga total. A CPU operou com altas taxas de clock no início do teste, mas depois foi reduzida para valores abaixo de 2 GHz. A GPU funcionou com potência máxima.
Alto-falantes
Os alto-falantes estéreo produzem um som bastante decente no geral. Os graves poderiam ser um pouco mais pronunciados.
Nubia RedMagic Titan 16 Pro análise de áudio
(+) | os alto-falantes podem tocar relativamente alto (###valor### dB)
Graves 100 - 315Hz
(±) | graves reduzidos - em média 14.3% menor que a mediana
(±) | a linearidade dos graves é média (11.3% delta para a frequência anterior)
Médios 400 - 2.000 Hz
(+) | médios equilibrados - apenas 1.8% longe da mediana
(+) | médios são lineares (4.9% delta para frequência anterior)
Altos 2 - 16 kHz
(+) | agudos equilibrados - apenas 2.7% longe da mediana
(+) | os máximos são lineares (5.4% delta da frequência anterior)
Geral 100 - 16.000 Hz
(+) | o som geral é linear (11.5% diferença em relação à mediana)
Comparado com a mesma classe
» 9% de todos os dispositivos testados nesta classe foram melhores, 3% semelhantes, 88% piores
» O melhor teve um delta de 6%, a média foi 18%, o pior foi 132%
Comparado com todos os dispositivos testados
» 6% de todos os dispositivos testados foram melhores, 2% semelhantes, 92% piores
» O melhor teve um delta de 4%, a média foi 24%, o pior foi 134%
Lenovo Legion Pro 5 16IRX9 G9 análise de áudio
(±) | o volume do alto-falante é médio, mas bom (###valor### dB)
Graves 100 - 315Hz
(-) | quase nenhum baixo - em média 18.3% menor que a mediana
(±) | a linearidade dos graves é média (12% delta para a frequência anterior)
Médios 400 - 2.000 Hz
(±) | médios mais altos - em média 6.9% maior que a mediana
(+) | médios são lineares (4.9% delta para frequência anterior)
Altos 2 - 16 kHz
(+) | agudos equilibrados - apenas 4.5% longe da mediana
(±) | a linearidade dos máximos é média (9.5% delta para frequência anterior)
Geral 100 - 16.000 Hz
(±) | a linearidade do som geral é média (21.6% diferença em relação à mediana)
Comparado com a mesma classe
» 76% de todos os dispositivos testados nesta classe foram melhores, 5% semelhantes, 19% piores
» O melhor teve um delta de 6%, a média foi 18%, o pior foi 132%
Comparado com todos os dispositivos testados
» 58% de todos os dispositivos testados foram melhores, 7% semelhantes, 34% piores
» O melhor teve um delta de 4%, a média foi 24%, o pior foi 134%
Gerenciamento de energia - O Titan 16 oferece tempos de execução medíocres
Consumo de energia
Seu consumo de energia é normal para o hardware instalado. O Cyberpunk 2077 e o teste de estresse foram executados com consumo de energia constante. A fonte de alimentação (280 watts) é suficiente.
| desligado | |
| Ocioso | |
| Carga |
|
Key:
min: | |
| Nubia RedMagic Titan 16 Pro i9-14900HX, NVIDIA GeForce RTX 4060 Laptop GPU | Lenovo Legion Pro 5 16IRX9 G9 i7-14700HX, NVIDIA GeForce RTX 4060 Laptop GPU | HP Victus 16 (2024) i7-14700HX, NVIDIA GeForce RTX 4060 Laptop GPU | Acer Predator Helios Neo 16 (2024) i7-14700HX, NVIDIA GeForce RTX 4070 Laptop GPU | SCHENKER XMG Pro 16 Studio (Mid 24) i9-14900HX, NVIDIA GeForce RTX 4070 Laptop GPU | Gigabyte G6X 9KG (2024) i7-13650HX, NVIDIA GeForce RTX 4060 Laptop GPU | Média NVIDIA GeForce RTX 4060 Laptop GPU | Média da turma Gaming | |
|---|---|---|---|---|---|---|---|---|
| Power Consumption | -4% | 16% | -23% | -35% | 17% | 21% | 7% | |
| Idle Minimum * | 16 | 13.7 14% | 9 44% | 26.7 -67% | 31 -94% | 12 25% | 11.5 ? 28% | 13.4 ? 16% |
| Idle Average * | 19 | 17.7 7% | 15 21% | 24.4 -28% | 33 -74% | 13 32% | 16 ? 16% | 18.9 ? 1% |
| Idle Maximum * | 27 | 18.5 31% | 23 15% | 32.7 -21% | 41 -52% | 27 -0% | 20.3 ? 25% | 26.3 ? 3% |
| Load Average * | 123 | 124 -1% | 123 -0% | 122.1 1% | 114 7% | 105 15% | 92.9 ? 24% | 102.7 ? 17% |
| Cyberpunk 2077 ultra external monitor * | 174.2 | 224 -29% | 196.8 -13% | |||||
| Cyberpunk 2077 ultra * | 184.3 | 229 -24% | 218 -18% | |||||
| Load Maximum * | 240 | 297 -24% | 241 -0% | 241 -0% | 250 -4% | 210 12% | 210 ? 12% | 244 ? -2% |
| Witcher 3 ultra * | 143.7 | 190.6 | 167.8 |
* ... menor é melhor
Power consumption Cyberpunk / stress test
Power consumption with external monitor
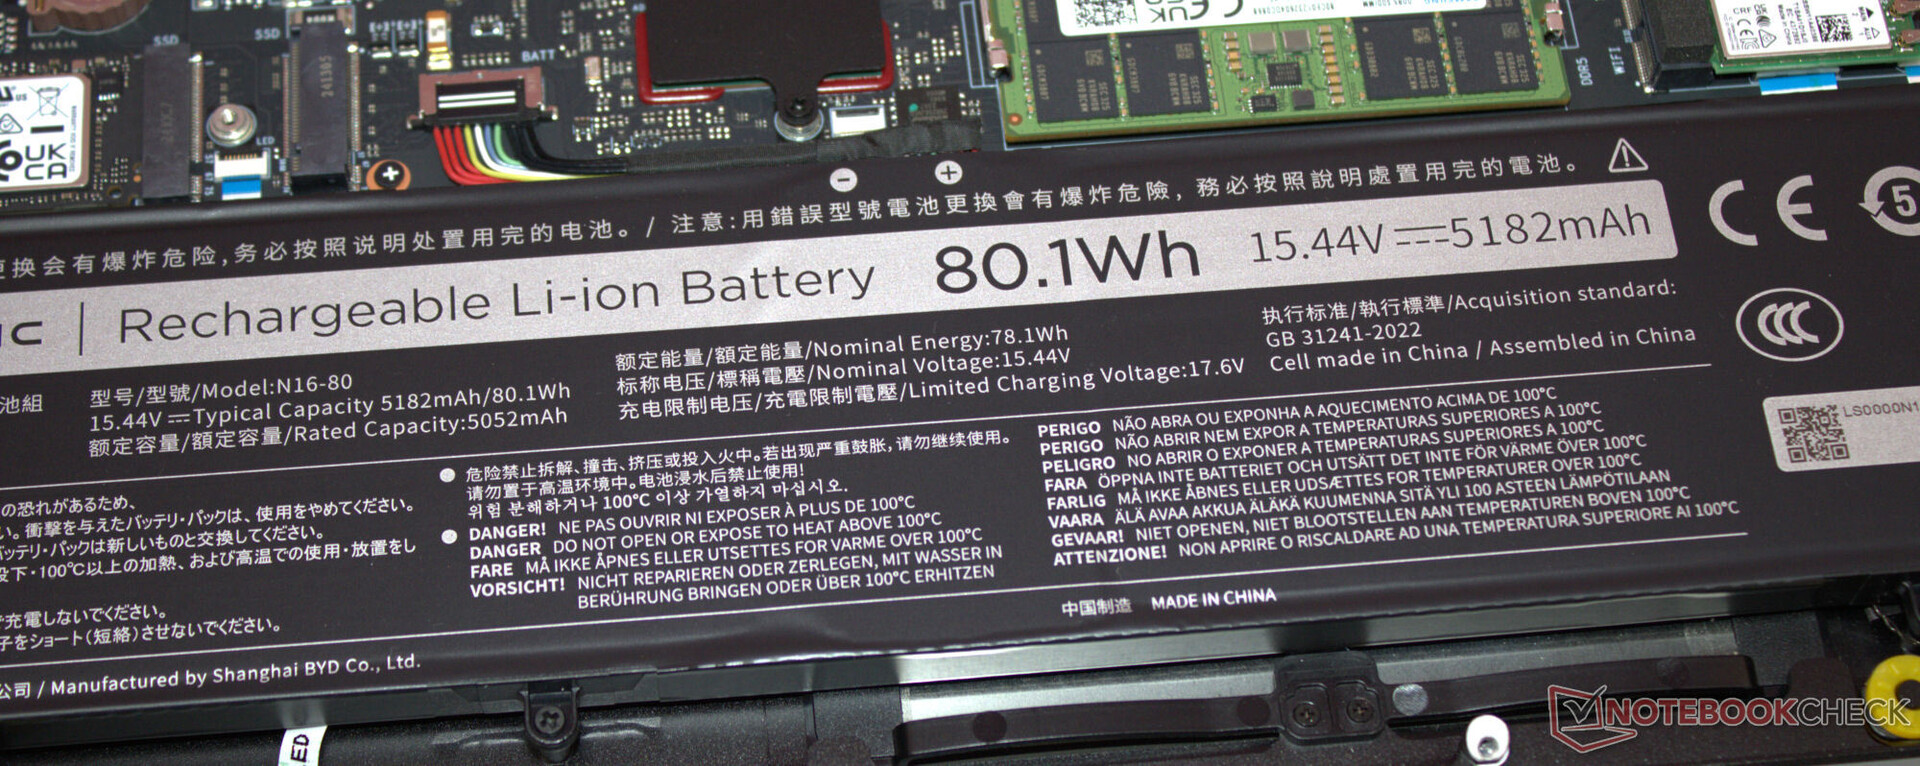
Tempos de execução
O dispositivo de 16 polegadas alcançou tempos de execução de 4:40 h durante o teste de WiFi (acesso a sites usando um script) e 5:16 h durante o teste de vídeo (curta-metragem Big Buck Bunny (codificação H.264, FHD) em loop) - valores não muito bons. Alguns de seus concorrentes funcionam por muito mais tempo.
| Nubia RedMagic Titan 16 Pro i9-14900HX, NVIDIA GeForce RTX 4060 Laptop GPU, 80.1 Wh | Lenovo Legion Pro 5 16IRX9 G9 i7-14700HX, NVIDIA GeForce RTX 4060 Laptop GPU, 80 Wh | HP Victus 16 (2024) i7-14700HX, NVIDIA GeForce RTX 4060 Laptop GPU, 83 Wh | Acer Predator Helios Neo 16 (2024) i7-14700HX, NVIDIA GeForce RTX 4070 Laptop GPU, 90.61 Wh | SCHENKER XMG Pro 16 Studio (Mid 24) i9-14900HX, NVIDIA GeForce RTX 4070 Laptop GPU, 73 Wh | Gigabyte G6X 9KG (2024) i7-13650HX, NVIDIA GeForce RTX 4060 Laptop GPU, 73 Wh | Média da turma Gaming | |
|---|---|---|---|---|---|---|---|
| Duração da bateria | 16% | 83% | -16% | 20% | 69% | 28% | |
| Reader / Idle | 481 | 356 -26% | 585 ? 22% | ||||
| H.264 | 316 | 312 -1% | 242 -23% | 447 ? 41% | |||
| WiFi v1.3 | 280 | 308 10% | 511 83% | 227 -19% | 337 20% | 474 69% | 387 ? 38% |
| Load | 76 | 105 38% | 79 4% | 84.5 ? 11% |
Pro
Contra
Veredicto - Há espaço para melhorias
A Core i9-14900HX e uma GeForce RTX 4060 garantem jogos QHD em configurações altas ou máximas. O hardware instalado não é usado em todo o seu potencial, pois a RAM é executada no modo de canal único. Recomenda-se a instalação de um segundo módulo de memória.
O produto de estreia da Nubia faz o que foi projetado para fazer: Trazer jogos para a tela sem problemas. Mas a concorrência não precisa exatamente de um motivo para ter medo.
Seus valores de emissão são extremamente decepcionantes: O laptop produz (muito) ruído em toda a faixa de carga - além disso, ele esquenta muito. Por outro lado, sua tela IPS brilhante e de cores reais (16 polegadas, 2.560 x 1.600 pixels, 240 Hz, G-Sync, DCI-P3) com uma proporção de 16:10 favorável ao trabalho nos deixou uma boa impressão.
A duração da bateria do laptop não vai impressionar ninguém. O senhor esperaria (um pouco) mais de um notebook para jogos com uma bateria de 80 Wh. Pelo menos a porta USB-C instalada (Thunderbolt 4) suporta o Power Delivery (e o modo DP Alt). Isso significa que o senhor não precisa necessariamente levar sempre consigo a volumosa fonte de alimentação proprietária.
Um fato que o senhor deve considerar antes de comprar o dispositivo: Ao contrário de fabricantes estabelecidos, como Acer, Lenovo ou HP, a Nubia não tem presença global. Como resultado, não é possível estimar qual será a situação em relação ao fornecimento de peças de reposição, suporte e reparos.
Seu preço de US$ 1.699 certamente não é favorável ao laptop: Por exemplo, uma configuração quase idêntica do Acer Predator Helios Neo 16 (com exceção da memória RAM, que é de 32 GB em vez de 16 GB) custa atualmente apenas US$ 1.350. Outra alternativa poderia ser o XMG Pro 16 Studio (Mid 24). O preço de uma versão comparável desse dispositivo é de cerca de US$ 2.000 (com Windows 11) ou US$ 1.950 (sem o Windows como sistema operacional).
Preço e disponibilidade
O Nubia RedMagic Titan 16 Pro está disponível a partir de 29/08/2024 e pode ser adquirido por US$ 1.699 na loja RedMagic do site https://eu.redmagic.gg/de/pages/redmagic-titan-16-pro-launch.
Observação: Atualizamos recentemente nosso sistema de classificação e os resultados da versão 8 não são comparáveis aos resultados da versão 7. Mais informações estão disponíveis em aqui.
Nubia RedMagic Titan 16 Pro
- 08/21/2024 v8
Sascha Mölck
 Total Sustainability Score:
 Transparência
A seleção dos dispositivos a serem analisados é feita pela nossa equipe editorial. A amostra de teste foi fornecida ao autor como empréstimo pelo fabricante ou varejista para fins desta revisão. O credor não teve influência nesta revisão, nem o fabricante recebeu uma cópia desta revisão antes da publicação. Não houve obrigação de publicar esta revisão. Nunca aceitamos compensação ou pagamento em troca de nossas avaliações. Como empresa de mídia independente, a Notebookcheck não está sujeita à autoridade de fabricantes, varejistas ou editores.
É assim que o Notebookcheck está testando
Todos os anos, o Notebookcheck analisa de forma independente centenas de laptops e smartphones usando procedimentos padronizados para garantir que todos os resultados sejam comparáveis. Desenvolvemos continuamente nossos métodos de teste há cerca de 20 anos e definimos padrões da indústria no processo. Em nossos laboratórios de teste, equipamentos de medição de alta qualidade são utilizados por técnicos e editores experientes. Esses testes envolvem um processo de validação em vários estágios. Nosso complexo sistema de classificação é baseado em centenas de medições e benchmarks bem fundamentados, o que mantém a objetividade.Price comparison

