

Análise do XMG Pro 16 Studio (Mid 24): Core i9 e RTX 4070 para gamers e criadores
O prazer do criador?
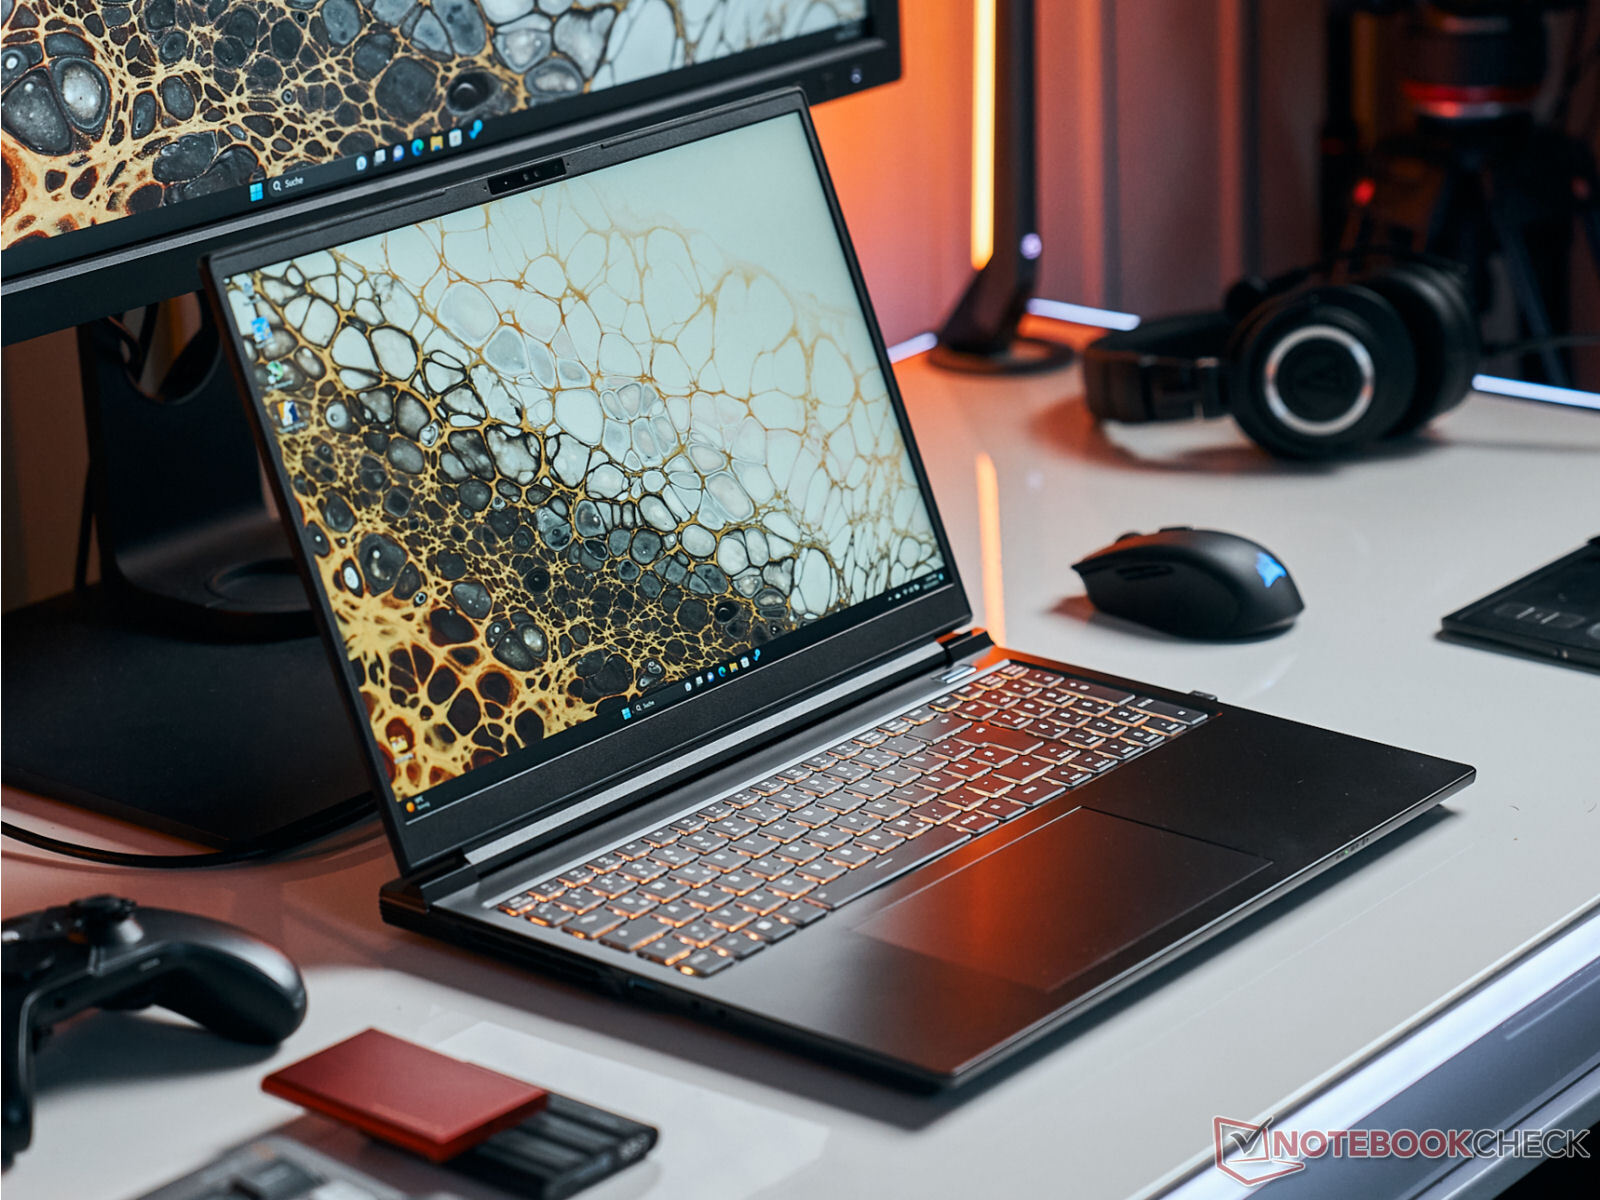
Os criadores de conteúdo e os gamers constituem o mercado-alvo do XMG Pro 16 Studio: A Schenker montou uma oferta que consiste em um processador Core i9, RTX 4070, porta Thunderbolt 4 e uma tela 16:10 (QHD+, 240Hz, sRGB). Supostamente, um bom resfriamento é garantido pelo uso de uma câmara de vapor.Sascha Mölck, 👁 Florian Glaser (traduzido por DeepL / Ninh Duy) Publicado 🇺🇸 🇩🇪 ...
O XMG Pro 16 Studio (Mid 24) é voltado para gamers e criadores. O hardware correspondente está a bordo: Um Core i9-14900HX, GeForce RTX 4070, bem como uma tela calibrada (X-Rite) de 16 polegadas com uma proporção de 16:10. Um barebone (PE60SNE-S) do fabricante Clevo serve como base para isso. Esse é o sucessor do XMG Pro 16 (meados de 23) que, visualmente, tem a mesma aparência. Os concorrentes incluem o Lenovo Legion Pro 5 16IRX9, Acer Predator Helios Neo 16 (2024), Lenovo Legion 7 16 G9 e o Aorus 16X (2024).
Possíveis concorrentes em comparação
Avaliação | Versão | Data | Modelo | Peso | Altura | Size | Resolução | Preço |
|---|---|---|---|---|---|---|---|---|
| 81.2 % | v8 | 07/2024 | SCHENKER XMG Pro 16 Studio (Mid 24) i9-14900HX, NVIDIA GeForce RTX 4070 Laptop GPU | 2.3 kg | 19.9 mm | 16.00" | 2560x1600 | |
| 86.8 % v7 (old) | v7 (old) | 05/2024 | Acer Predator Helios Neo 16 (2024) i7-14700HX, NVIDIA GeForce RTX 4070 Laptop GPU | 2.6 kg | 25.95 mm | 16.00" | 2560x1600 | |
| 89.3 % v7 (old) | v7 (old) | 04/2024 | Lenovo Legion Pro 5 16IRX9 i9-14900HX, NVIDIA GeForce RTX 4070 Laptop GPU | 2.5 kg | 26.95 mm | 16.00" | 2560x1600 | |
| 87.4 % v7 (old) | v7 (old) | 04/2024 | Aorus 16X 2024 i9-14900HX, NVIDIA GeForce RTX 4070 Laptop GPU | 2.3 kg | 20 mm | 16.00" | 2560x1600 | |
| 90.8 % v7 (old) | v7 (old) | 04/2024 | Lenovo Legion 7 16 IRX G9 i9-14900HX, NVIDIA GeForce RTX 4070 Laptop GPU | 2.3 kg | 19.8 mm | 16.00" | 3200x2000 |
Observação: Atualizamos recentemente nosso sistema de classificação e os resultados da versão 8 não são comparáveis aos resultados da versão 7. Mais informações estão disponíveis aqui.
Case e conectividade - Schenker usa um barebone da Clevo
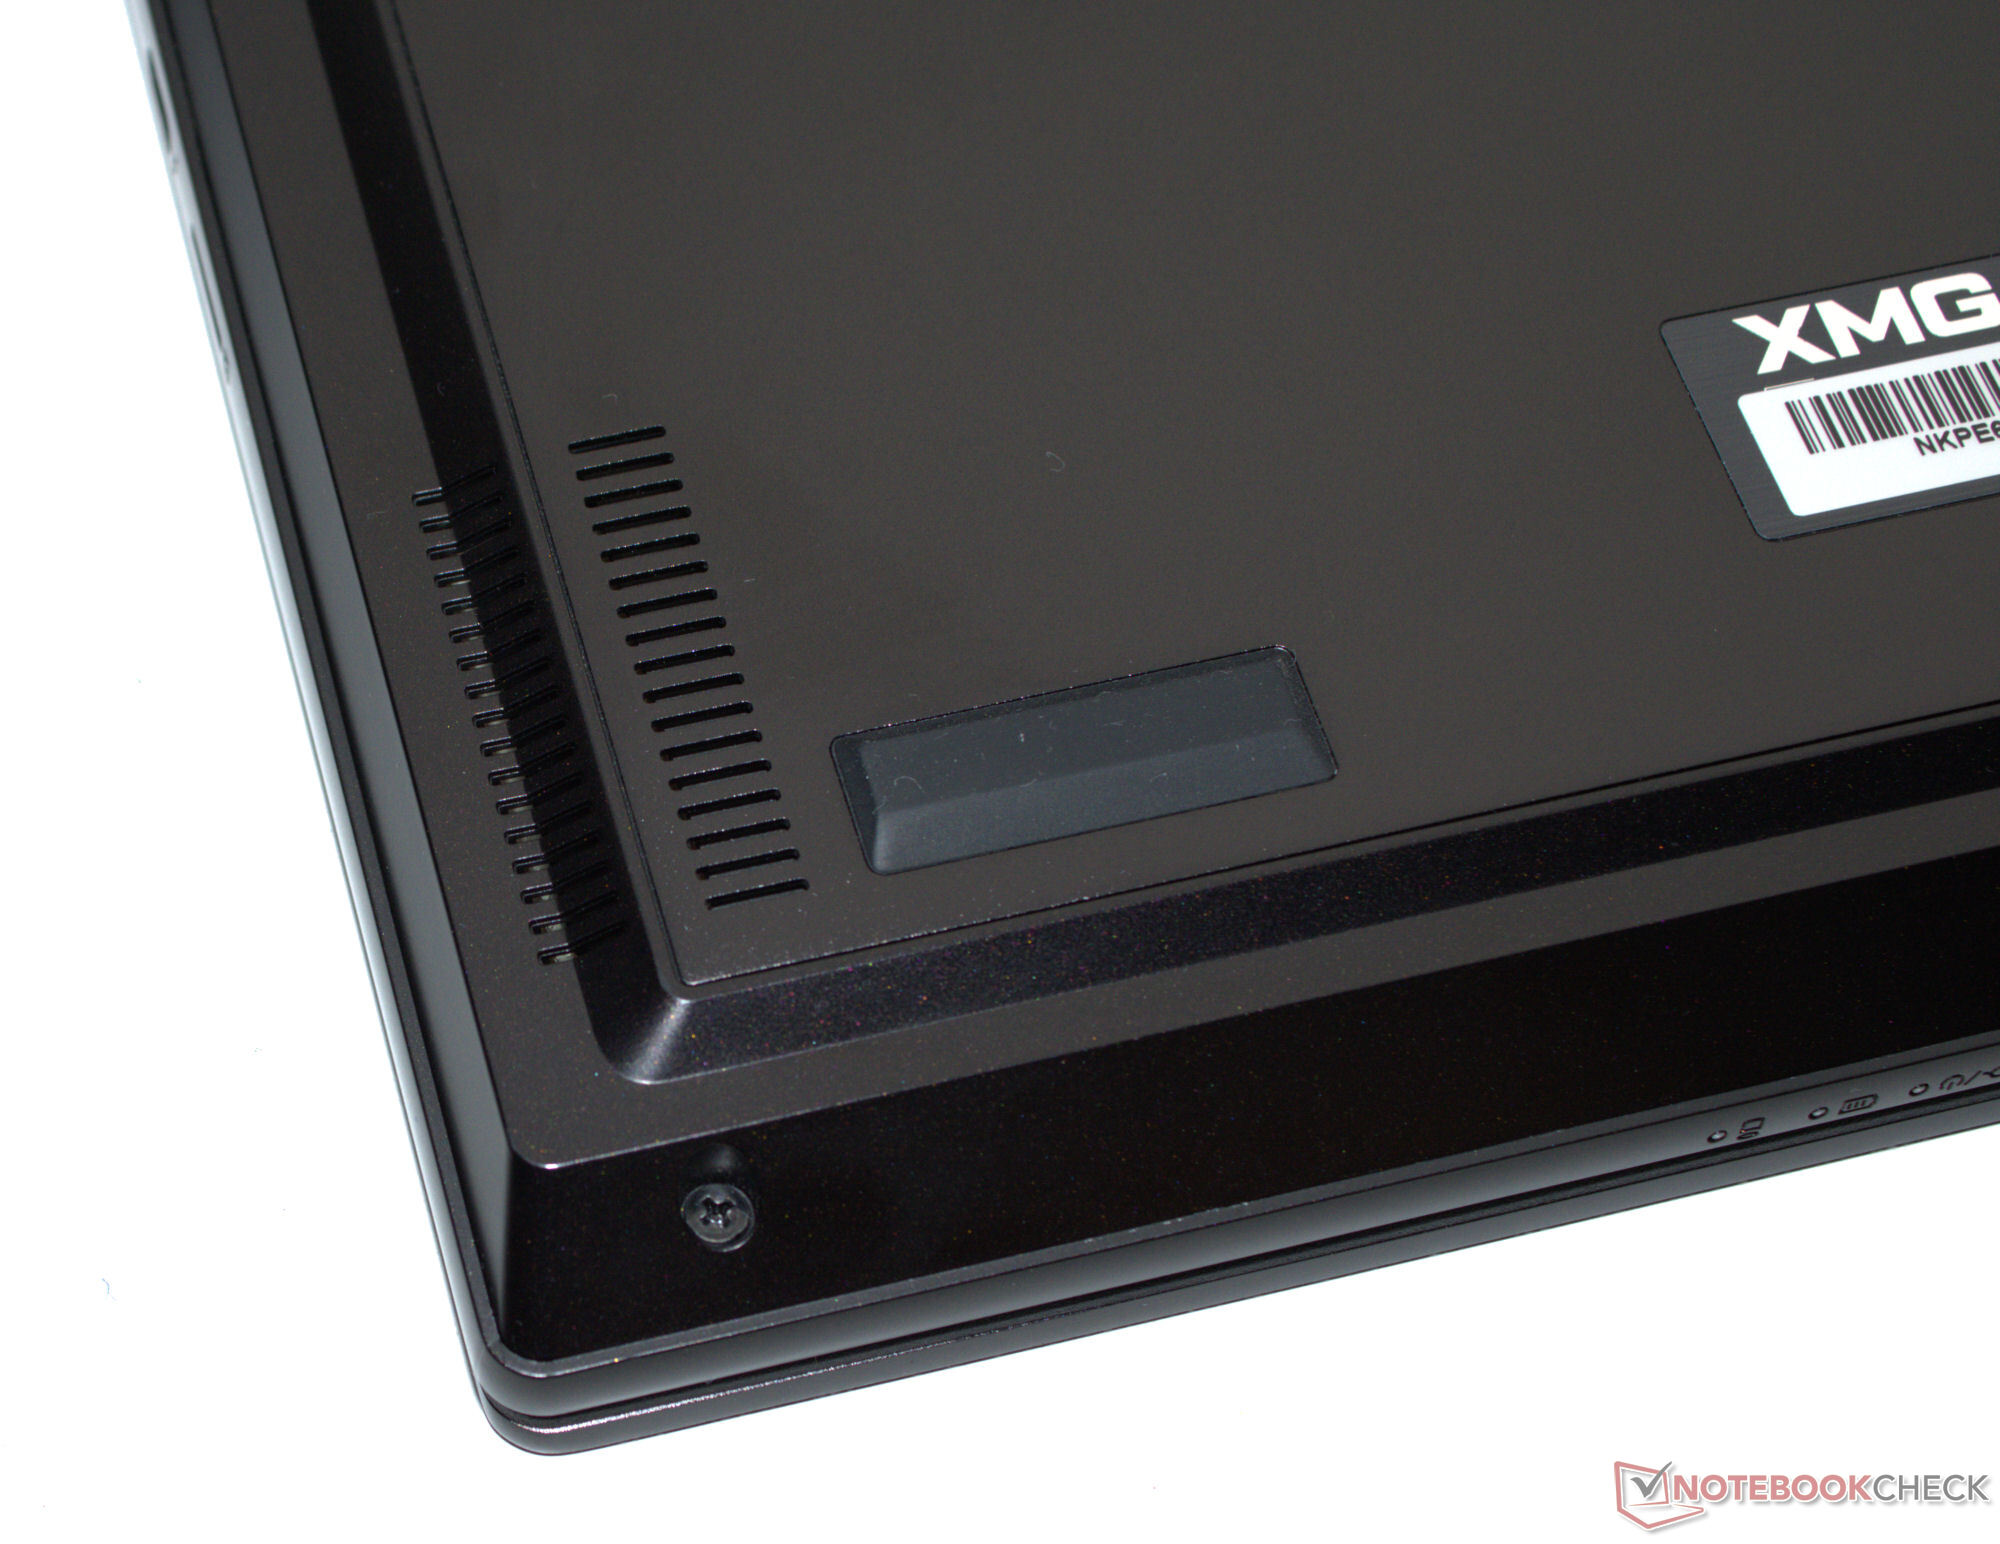
Por fora, nada mudou: o Pro 16 mais recente usa o mesmo gabinete de alumínio preto fosco do modelo do ano passado modelo do ano passado-se o senhor considerar apenas a caixa externa. A unidade de base e a tampa podem ser ligeiramente torcidas, mas sua qualidade de construção é boa. O senhor procurará em vão por faixas de LED em um gabinete de aparência tão séria. O ângulo máximo de abertura da tampa é de 130 graus.
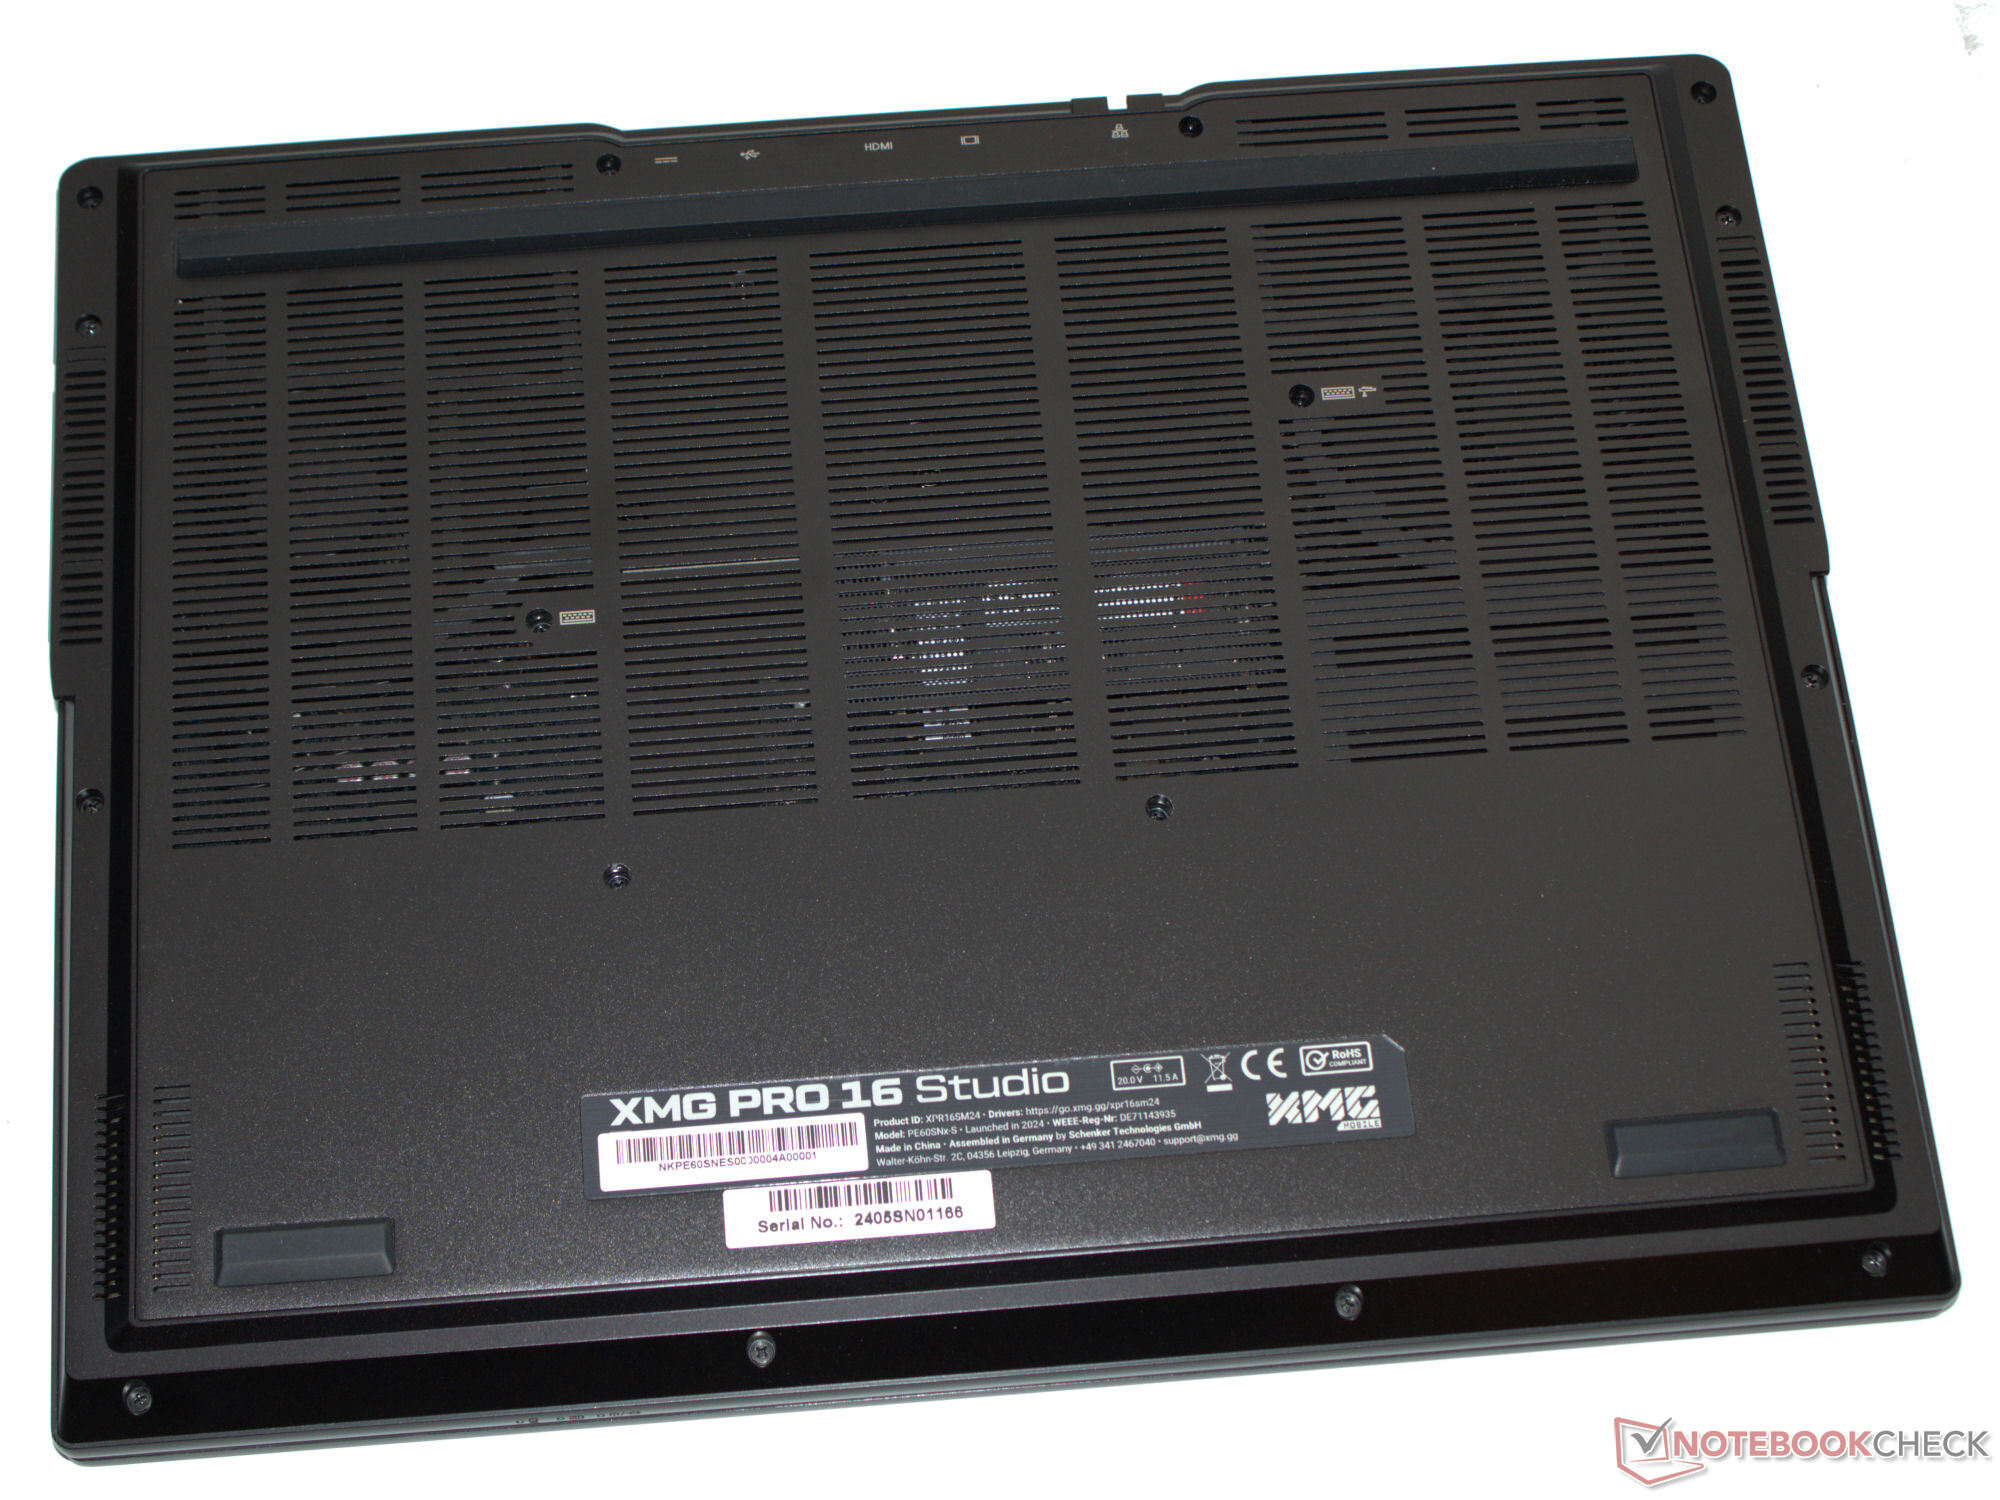
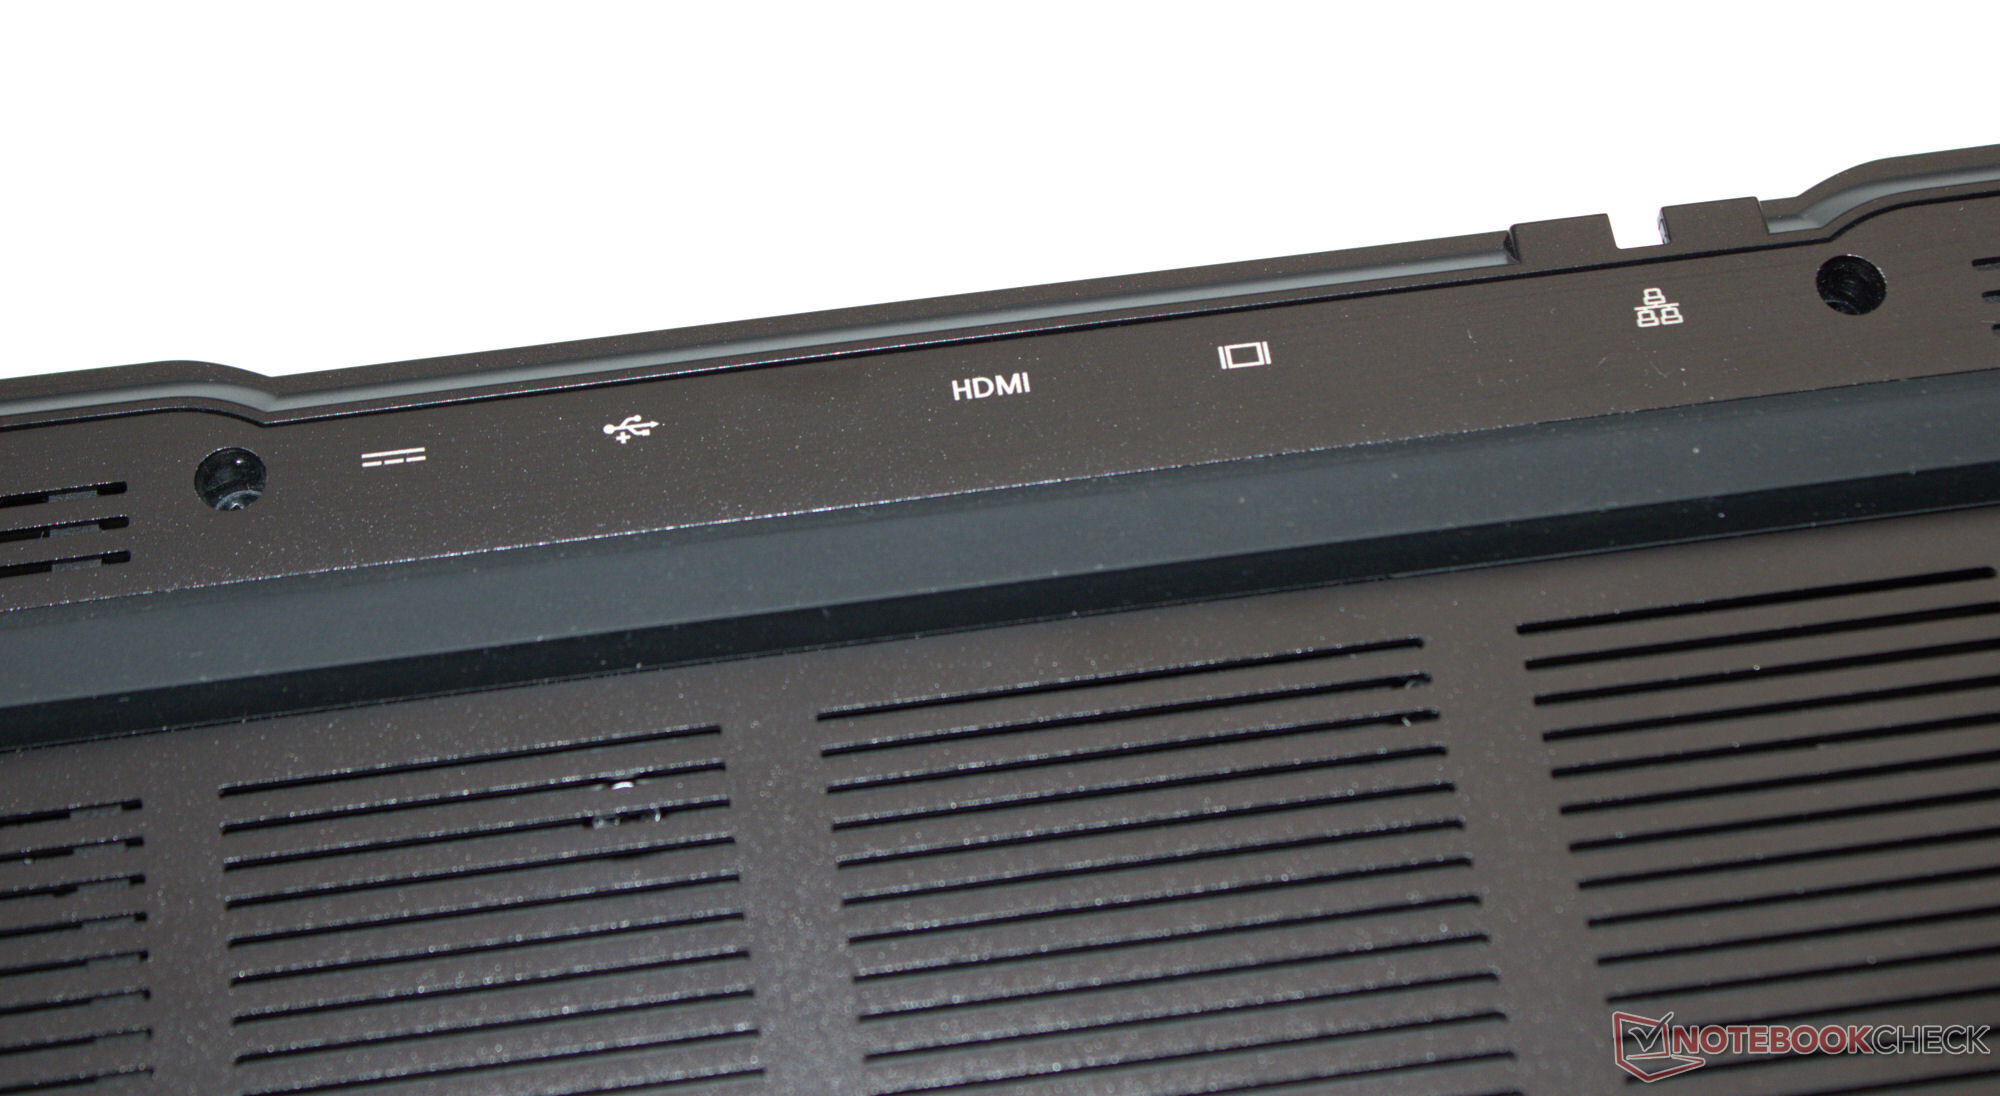
Duas portas USB-A (USB 3.2 Gen 1), duas portas USB-C (1x USB 3.2 Gen 2, 1x TB 4/USB 4), bem como três saídas de vídeo devem ser suficientes para a maioria dos usuários - na pior das hipóteses, talvez seja necessário usar uma docking station. O Power Delivery é suportado graças à porta TB4. A porta Gigabit Ethernet permite taxas de dados de até 2,5 Gbit/s.
Em condições ideais (sem dispositivos WiFi nas proximidades, curta distância entre o laptop e o PC servidor), o chip WiFi-6E da Intel (AX211) produz taxas de dados boas a muito boas. A webcam FHD (2,1 MP, sem cobertura) não tira nenhuma foto surpreendente. O leitor de cartão MicroSD (cartão de referência: AV PRO microSD 128 GB V60) tem velocidade média.


| SD Card Reader | |
| average JPG Copy Test (av. of 3 runs) | |
| Aorus 16X 2024 (AV PRO microSD 128 GB V60) | |
| Média da turma Gaming (19 - 197.3, n=68, últimos 2 anos) | |
| SCHENKER XMG Pro 16 Studio (Mid 23) (AV PRO microSD 128 GB V60) | |
| SCHENKER XMG Pro 16 Studio (Mid 24) (AV PRO microSD 128 GB V60) | |
| Lenovo Legion 7 16 IRX G9 (Angelbird AV Pro V60) | |
| Acer Predator Helios Neo 16 (2024) (AV PRO microSD 128 GB V60) | |
| maximum AS SSD Seq Read Test (1GB) | |
| Aorus 16X 2024 (AV PRO microSD 128 GB V60) | |
| Média da turma Gaming (25.8 - 263, n=67, últimos 2 anos) | |
| SCHENKER XMG Pro 16 Studio (Mid 23) (AV PRO microSD 128 GB V60) | |
| Lenovo Legion 7 16 IRX G9 (Angelbird AV Pro V60) | |
| SCHENKER XMG Pro 16 Studio (Mid 24) (AV PRO microSD 128 GB V60) | |
| Acer Predator Helios Neo 16 (2024) (AV PRO microSD 128 GB V60) | |

 NVIDIA GeForce RTX 4070 Laptop GPU, i9-14900HX, Samsung 990 Pro 1 TB")
 NVIDIA GeForce RTX 4070 Laptop GPU, i9-14900HX, Samsung 990 Pro 1 TB")
Sustentabilidade
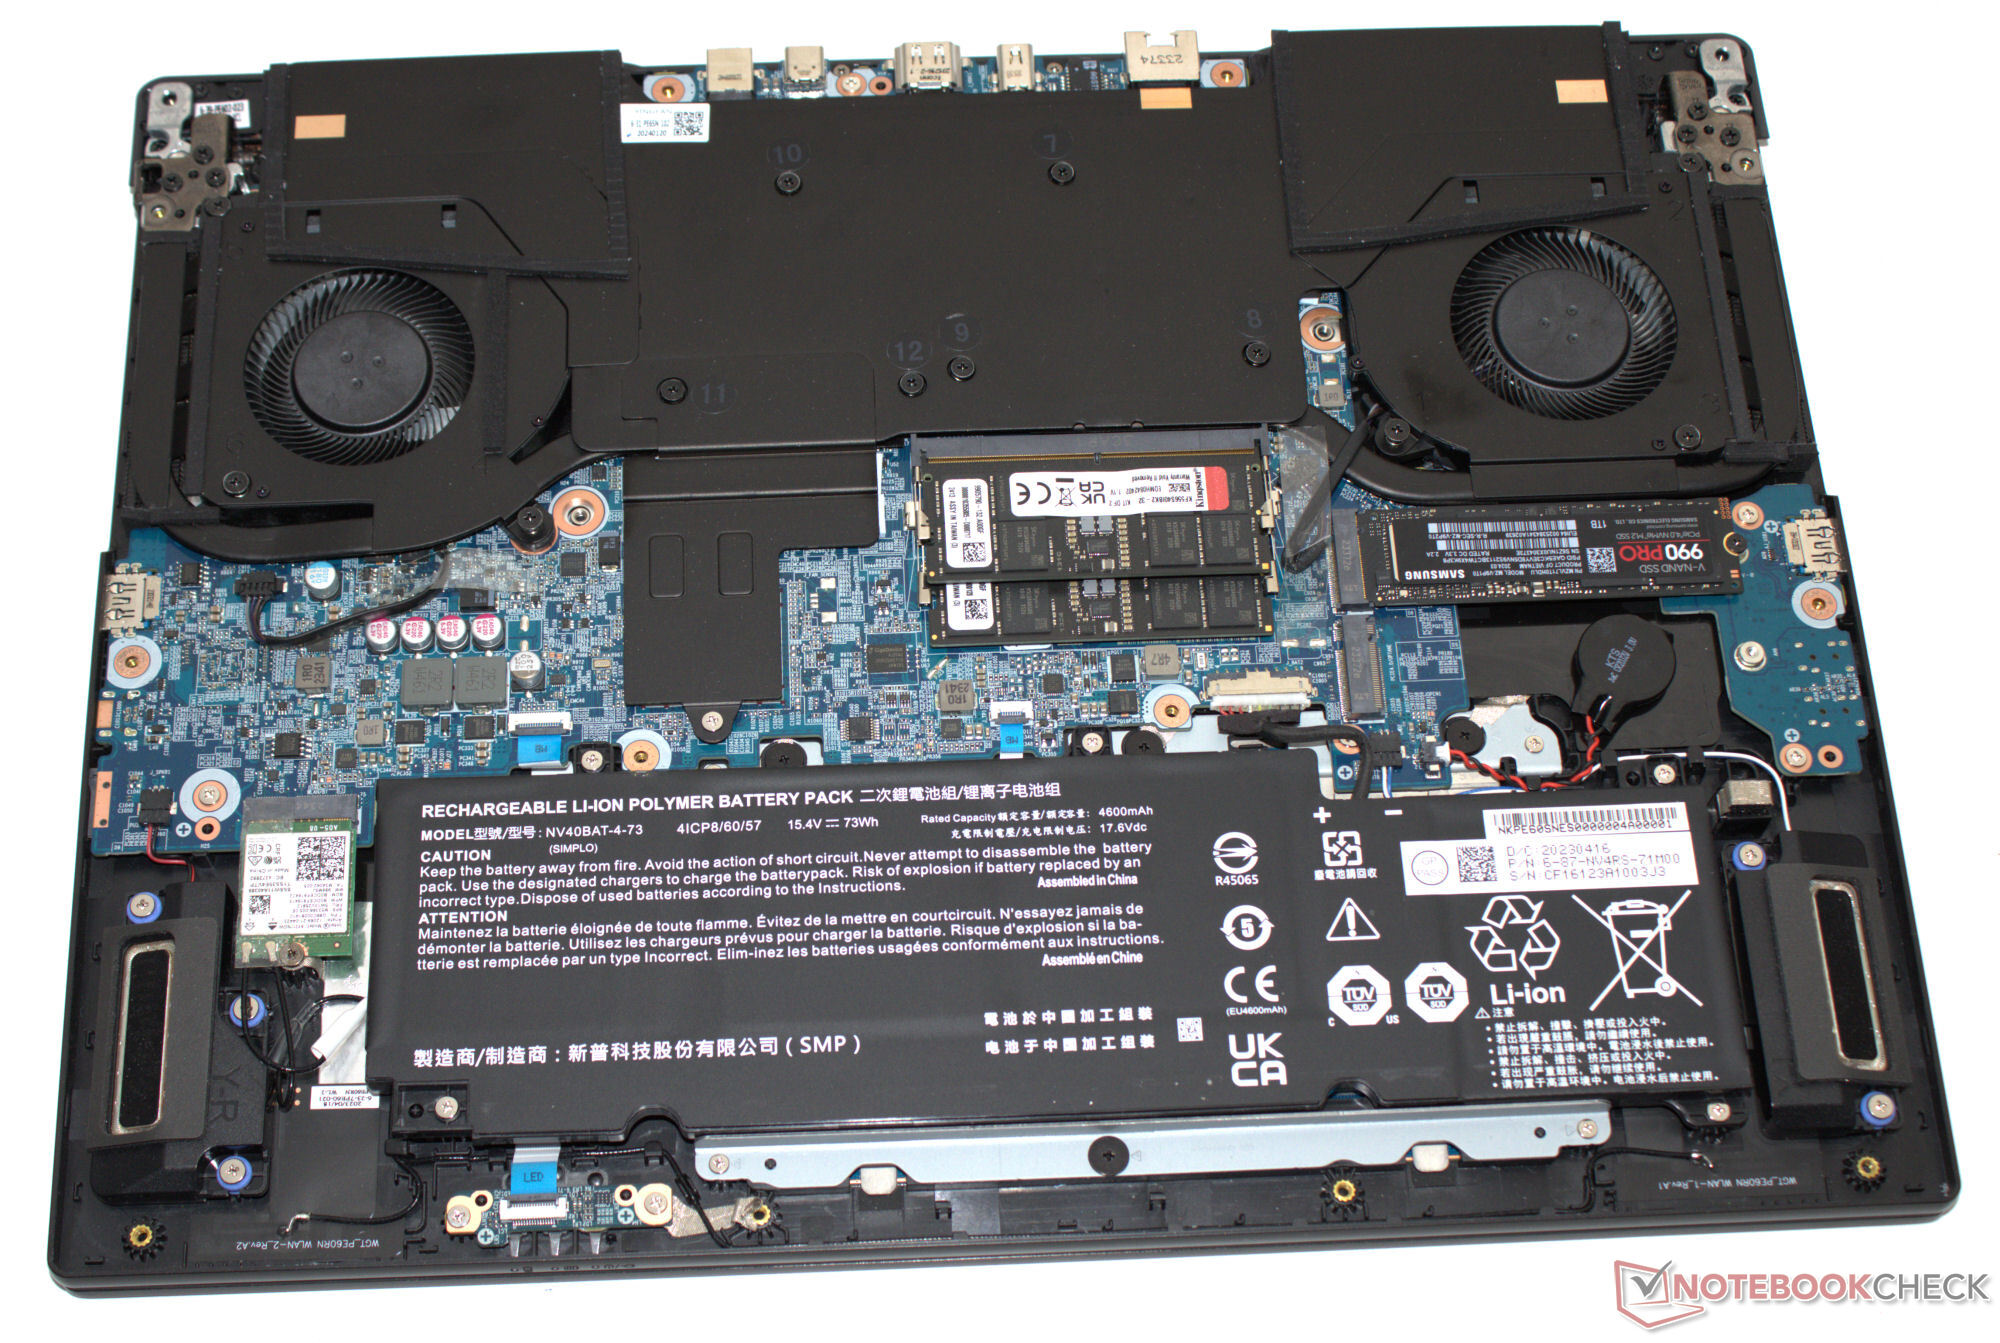
O laptop e os acessórios são protegidos por todos os tipos de capas de plástico (suporte de espuma, filme, bolsa). Os nomes dos plásticos usados estão impressos nelas. Exceção: A capa de filme transparente na tampa não tem as informações correspondentes. O hardware do dispositivo pode ser acessado após a remoção da placa de base, para que o senhor possa realizar trabalhos de manutenção e reparo. As atualizações de software devem ser garantidas para os próximos anos.
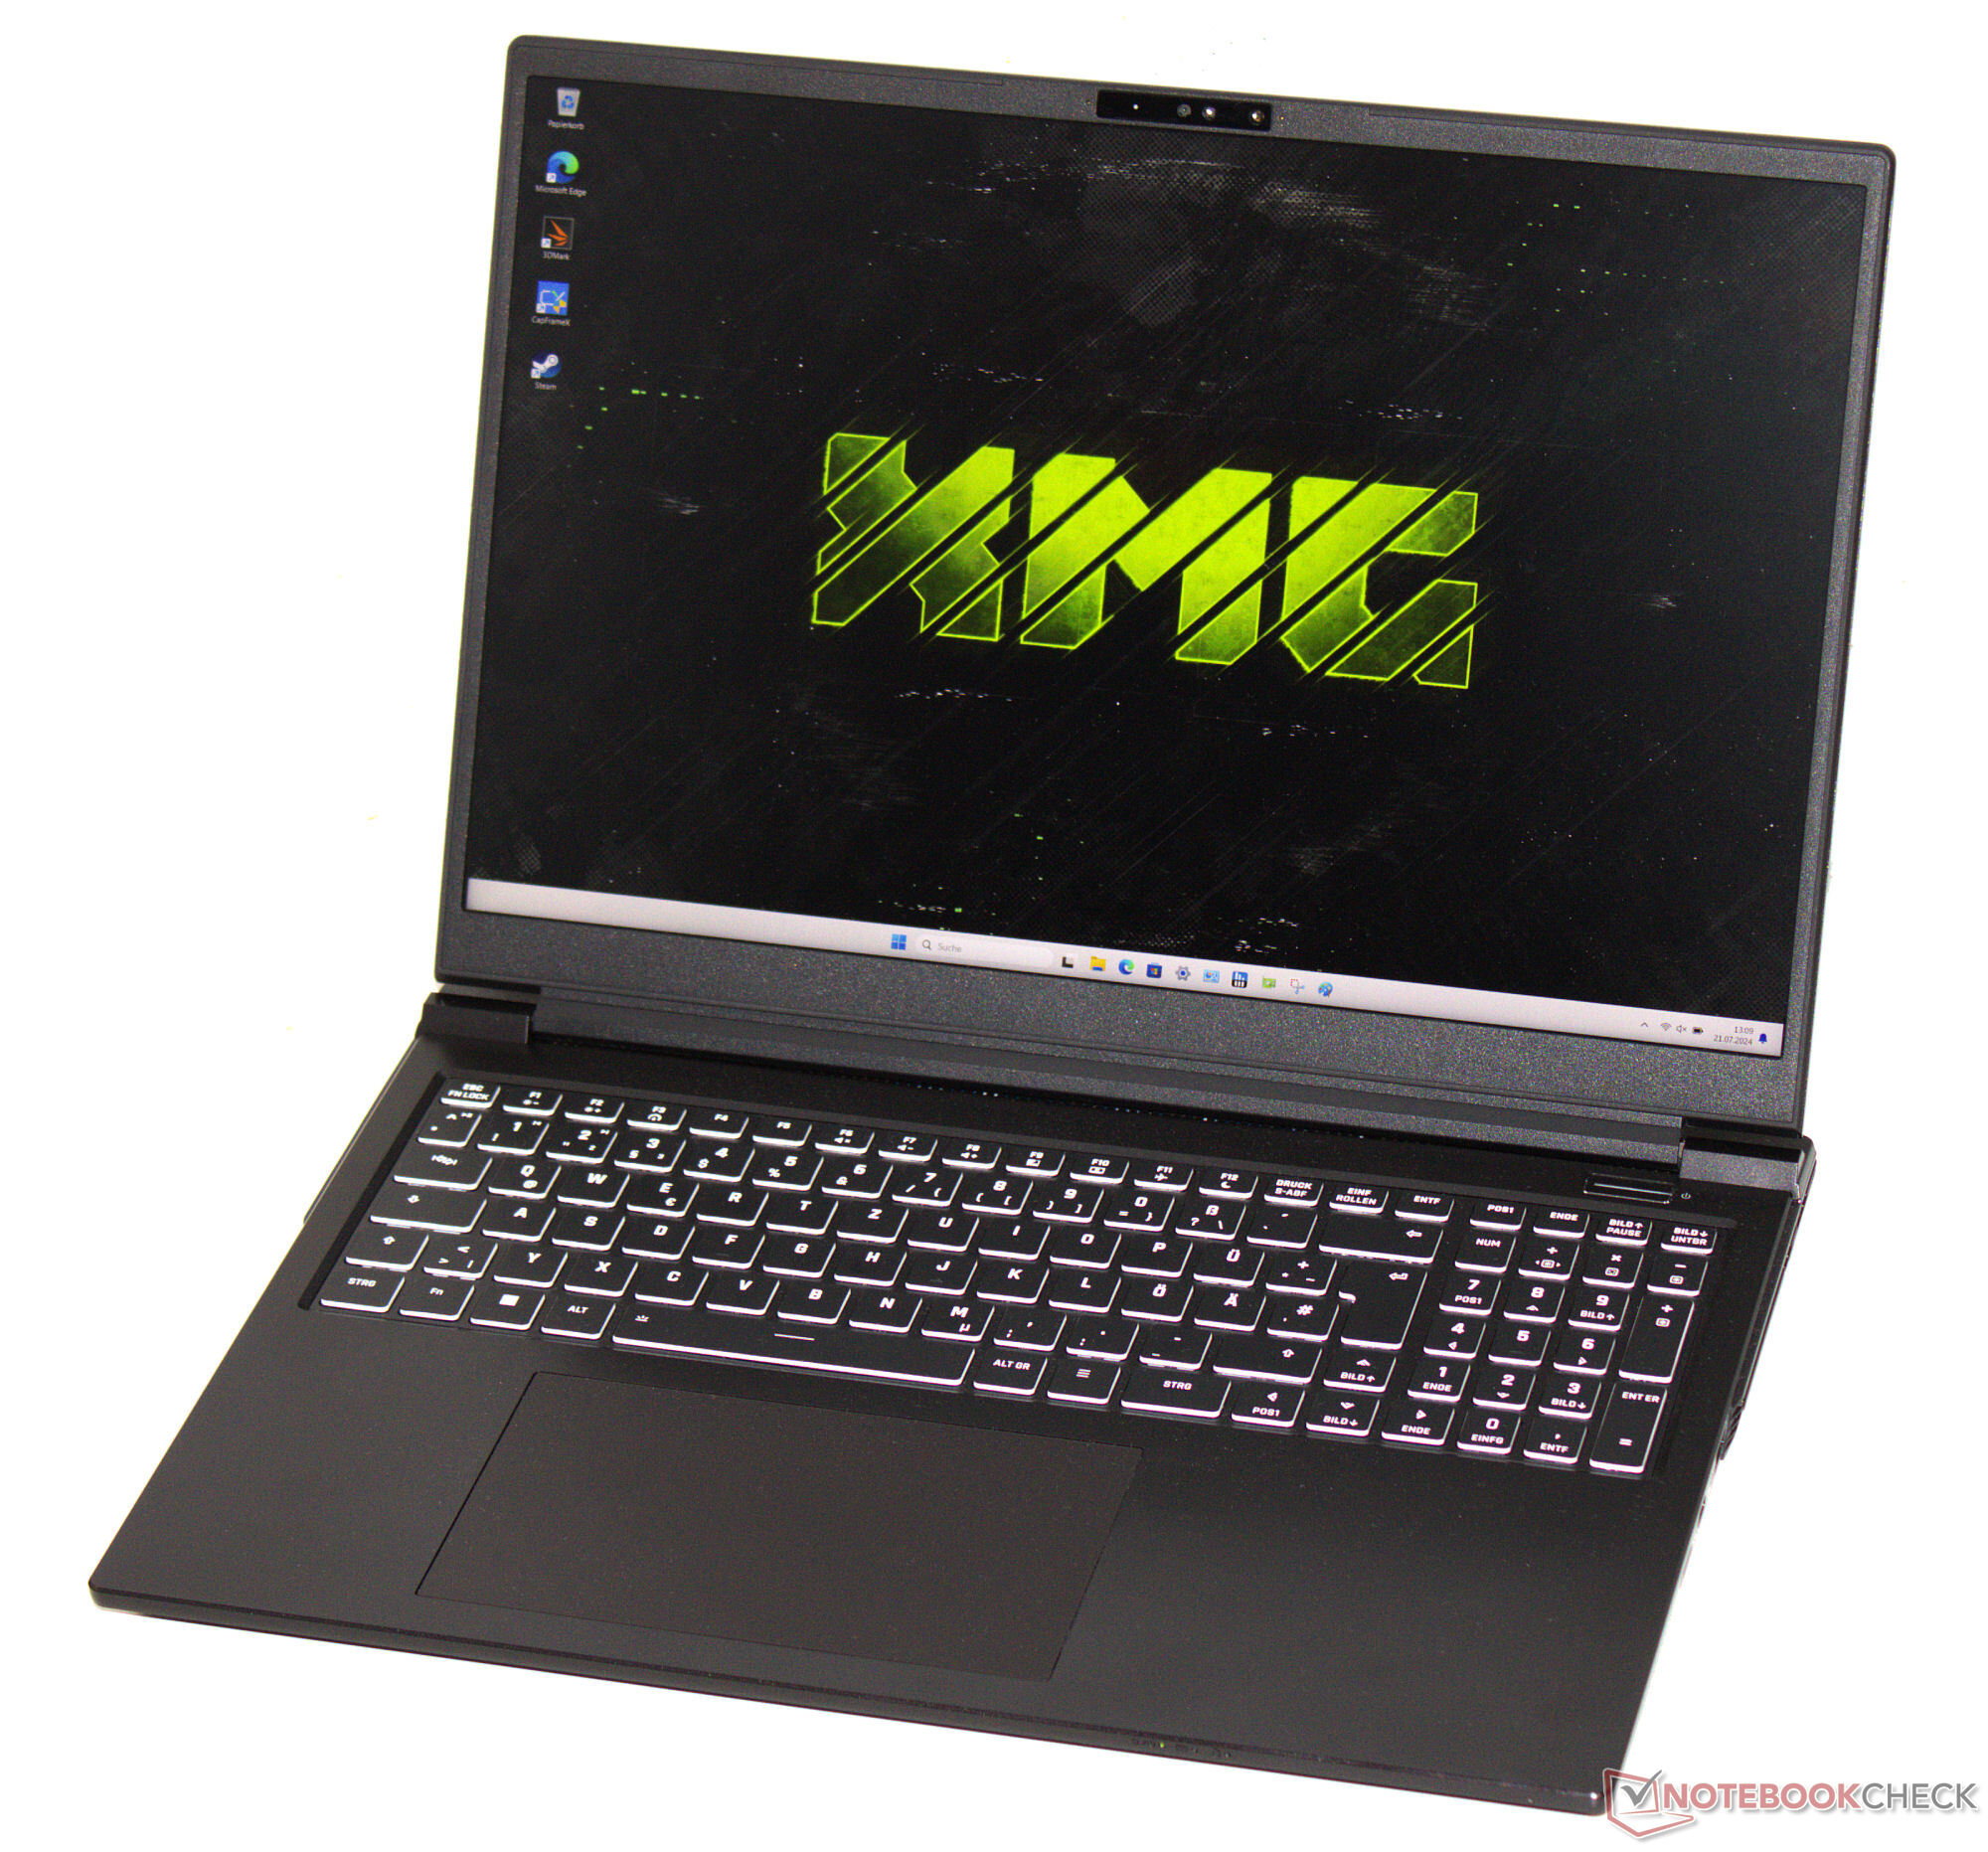
Dispositivos de entrada - O laptop XMG com um teclado intercambiável
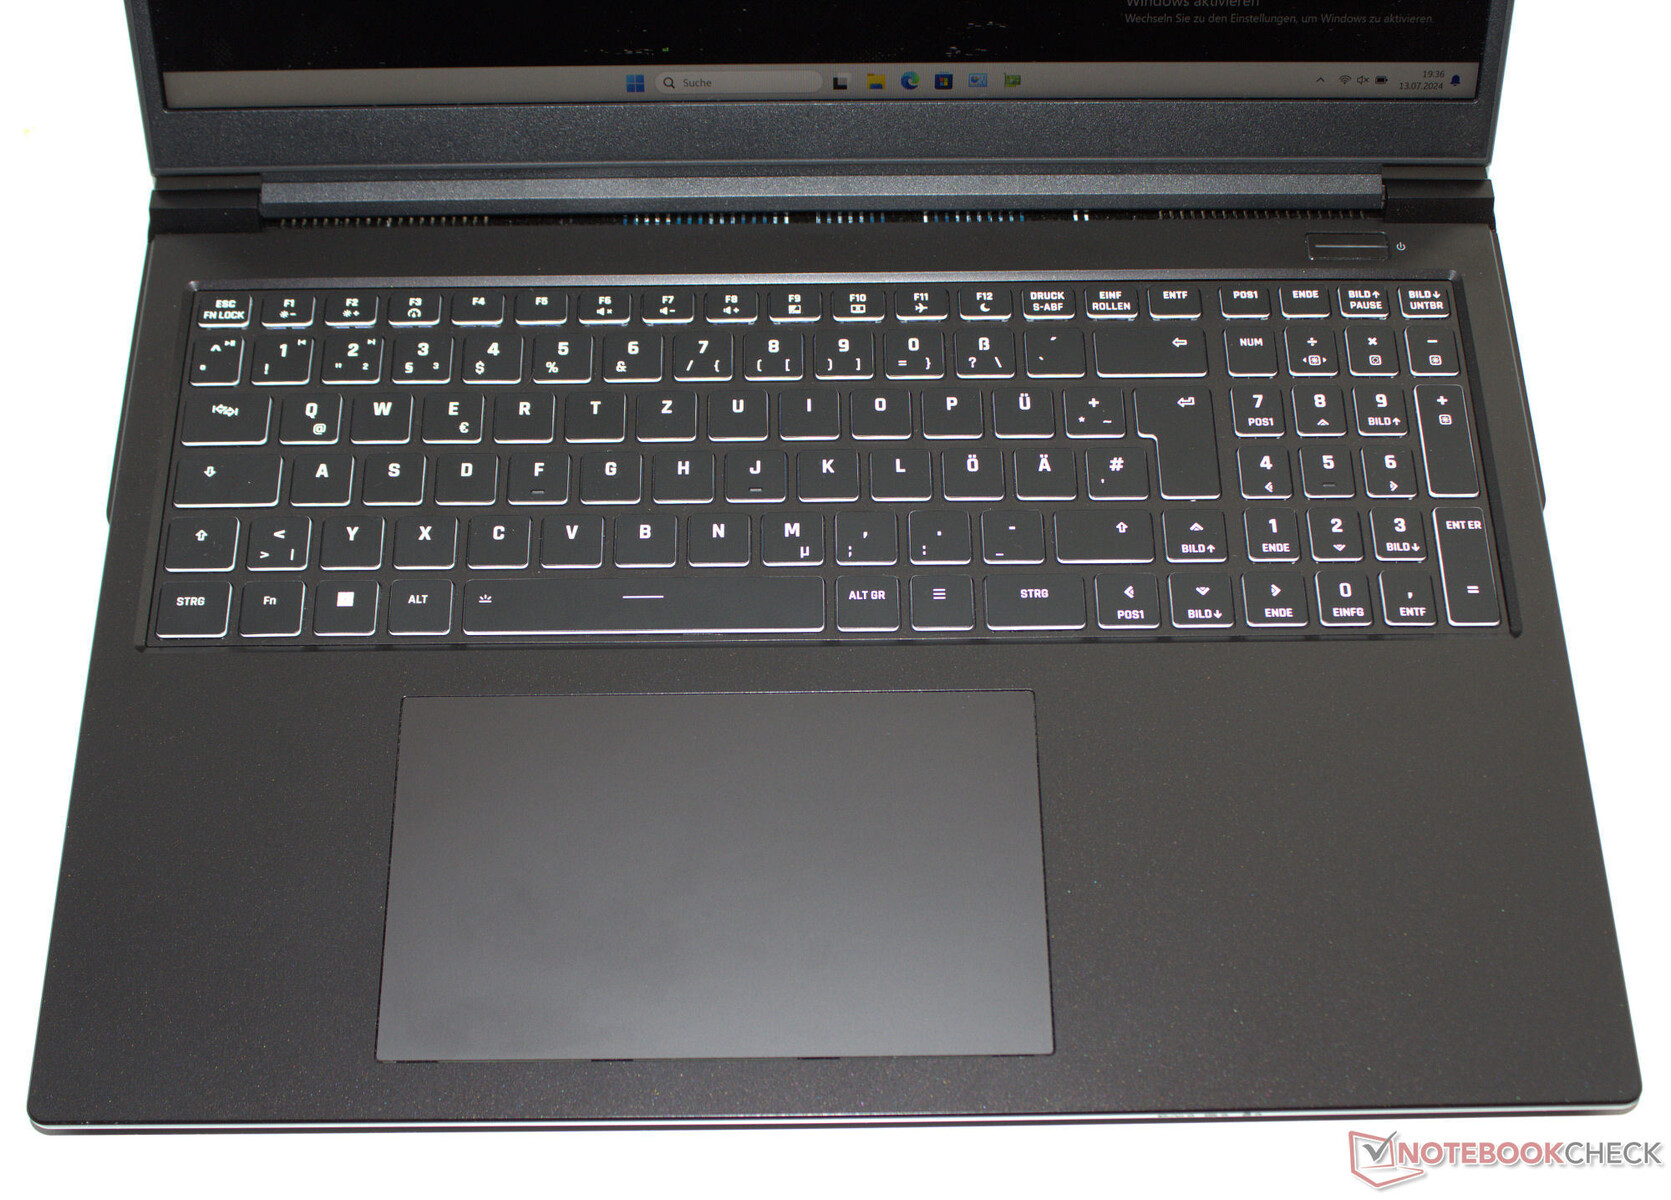
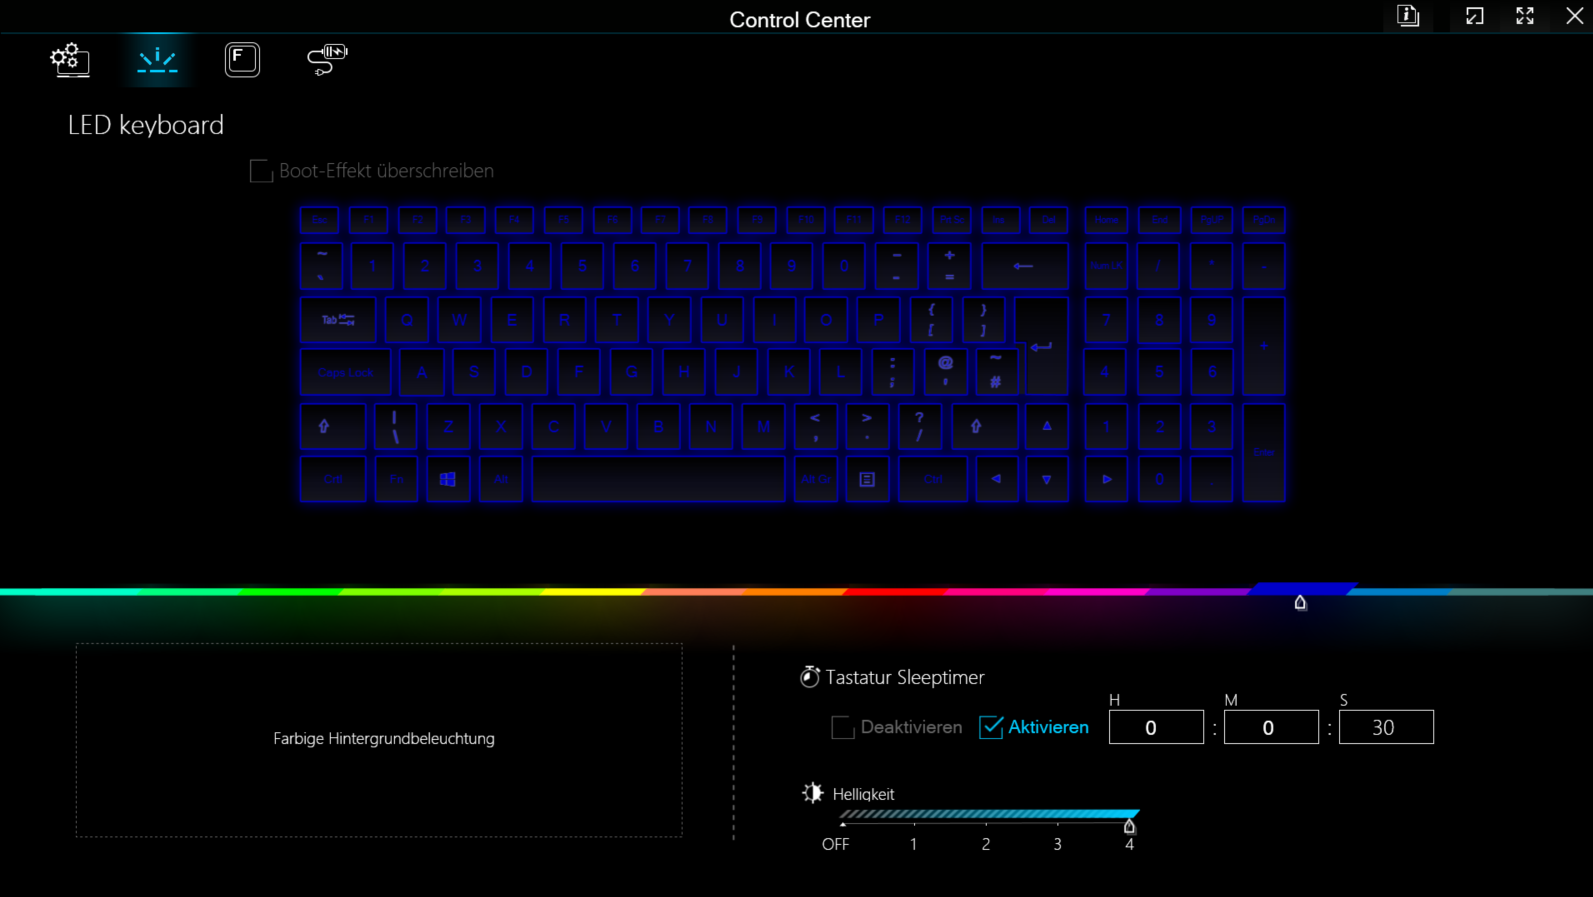
Geralmente, essa é a regra com a Schenker, e uma exceção quando se trata de outros fabricantes: O teclado chiclet retroiluminado (RGB, quatro níveis) poderia ser facilmente substituído, pois é mantido no lugar apenas por dois parafusos (e alguns clipes). Suas teclas planas e suaves têm um curso médio e um ponto de pressão claro. Sua resistência poderia ser mais nítida, mas isso é uma questão de gosto. Uma leve flexão do teclado não deve atrapalhar o senhor no uso diário. Pontos positivos: As quatro teclas de seta são de tamanho normal. Um clickpad multitoque de tamanho generoso (15,1 x 9,1 cm) é usado para controlar o ponteiro do mouse.
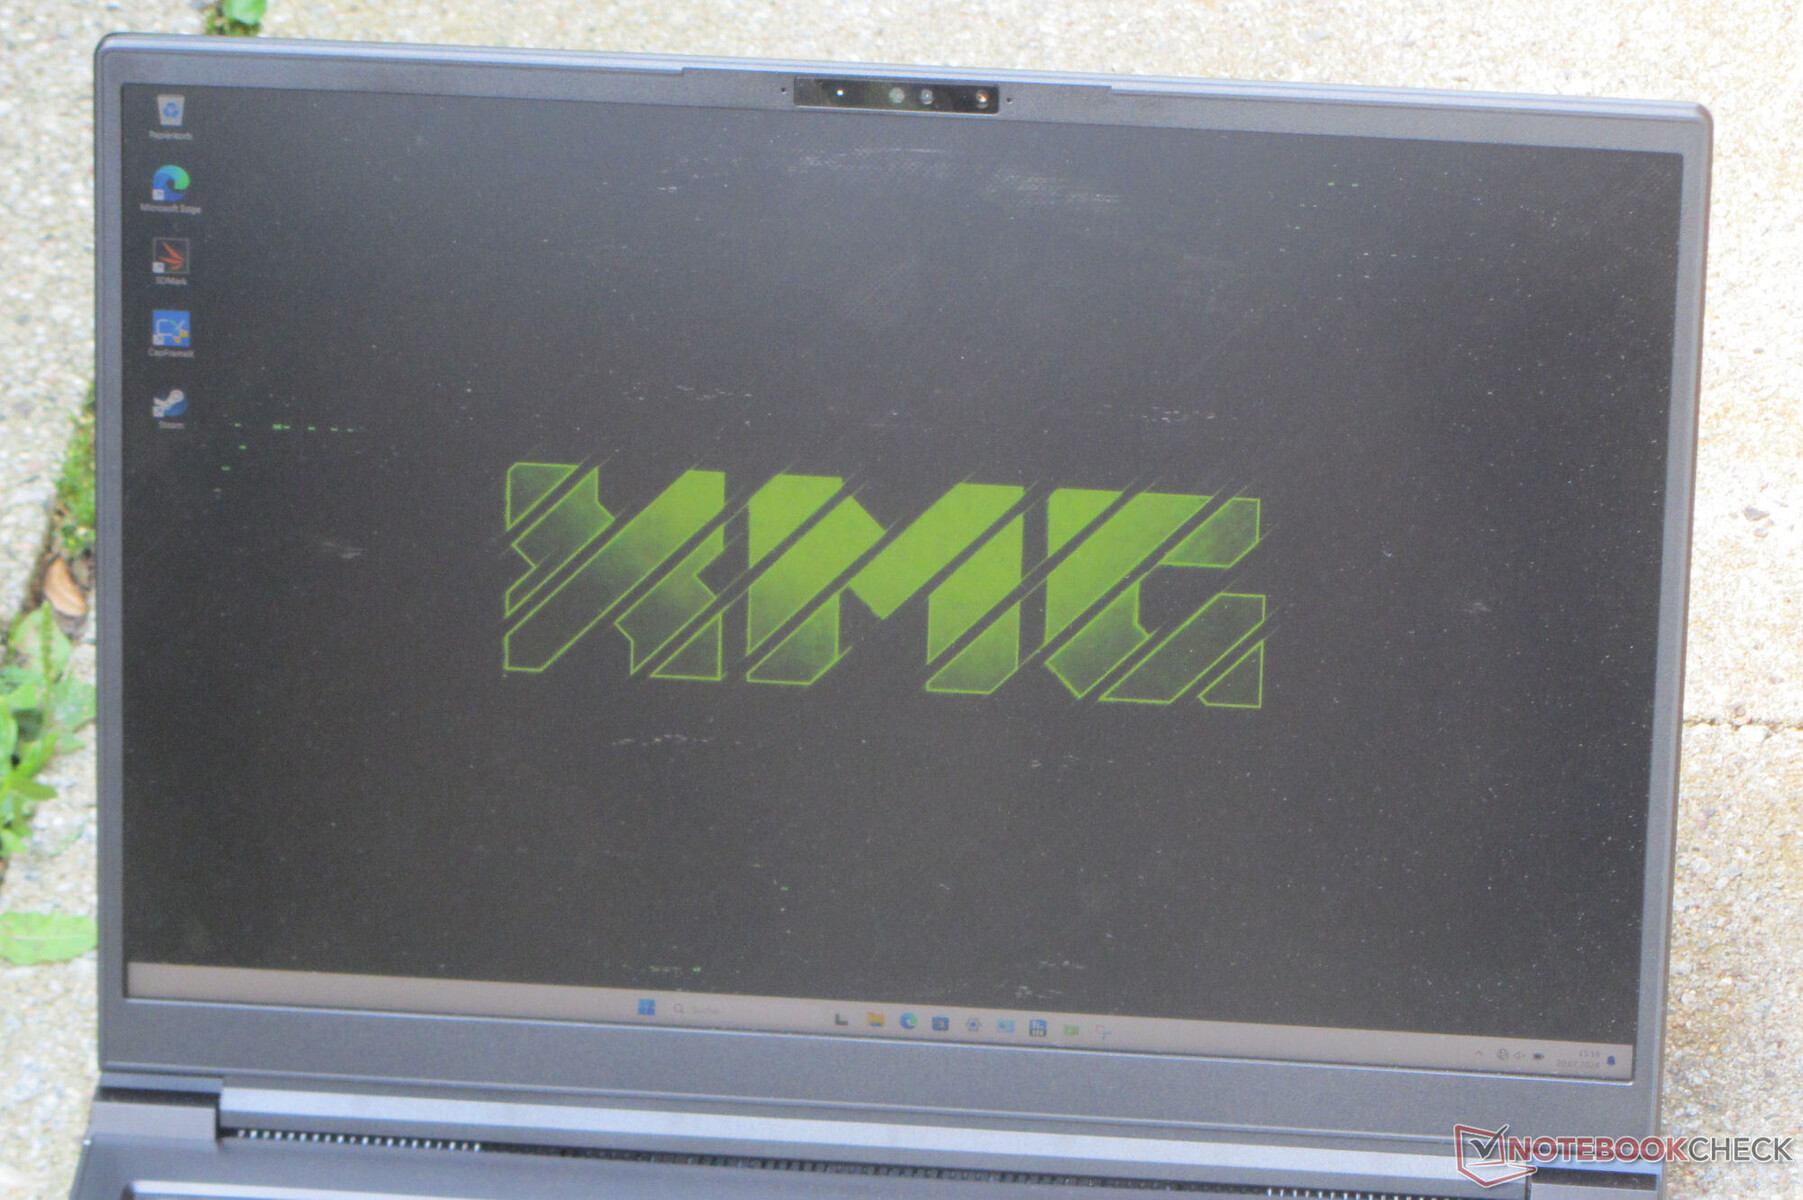
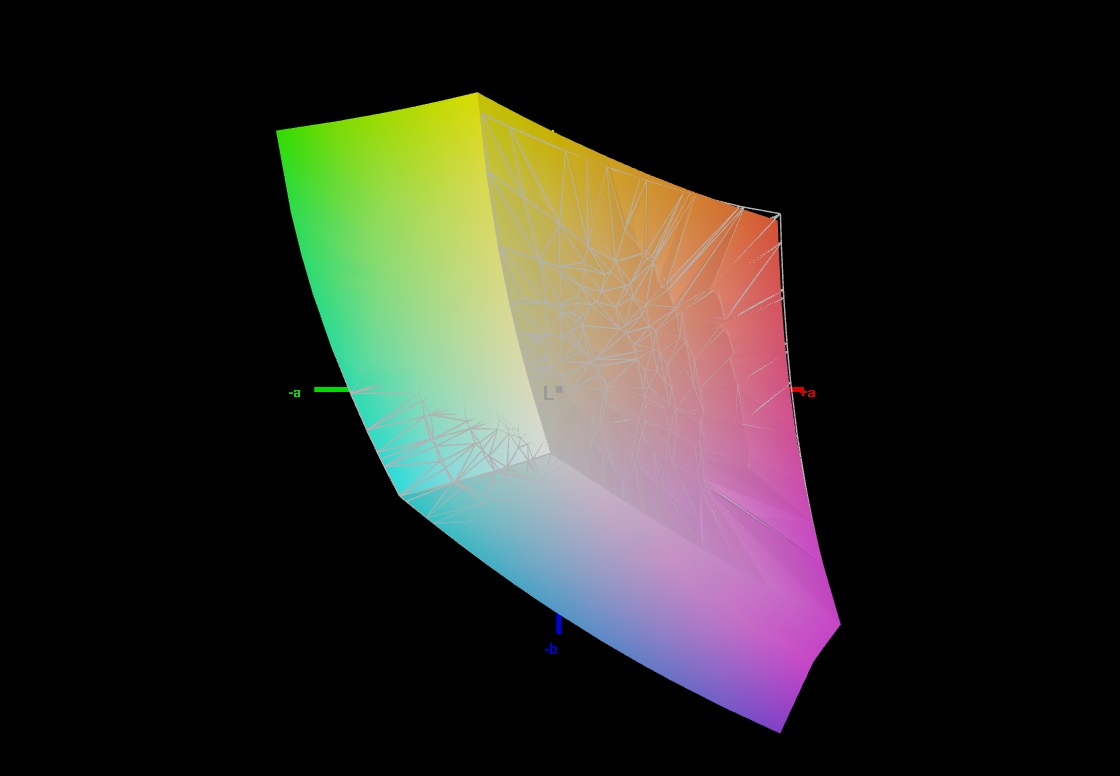
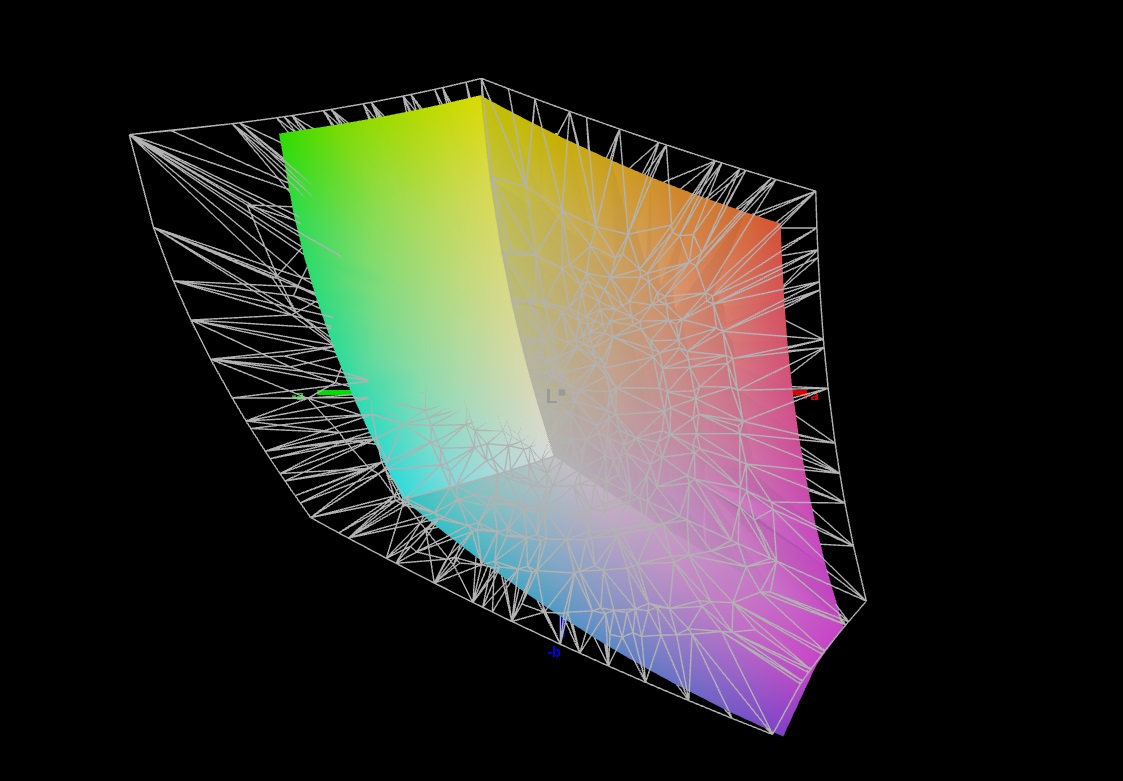
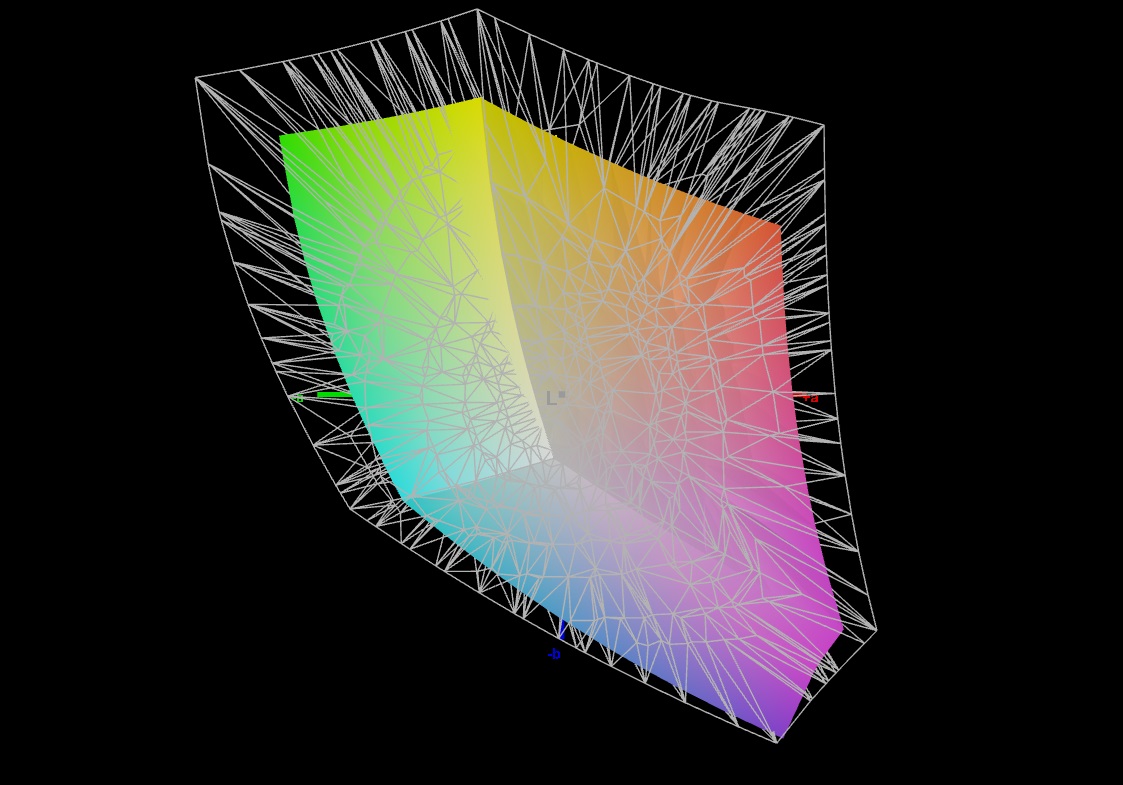
Tela - 16:10, IPS, sRGB
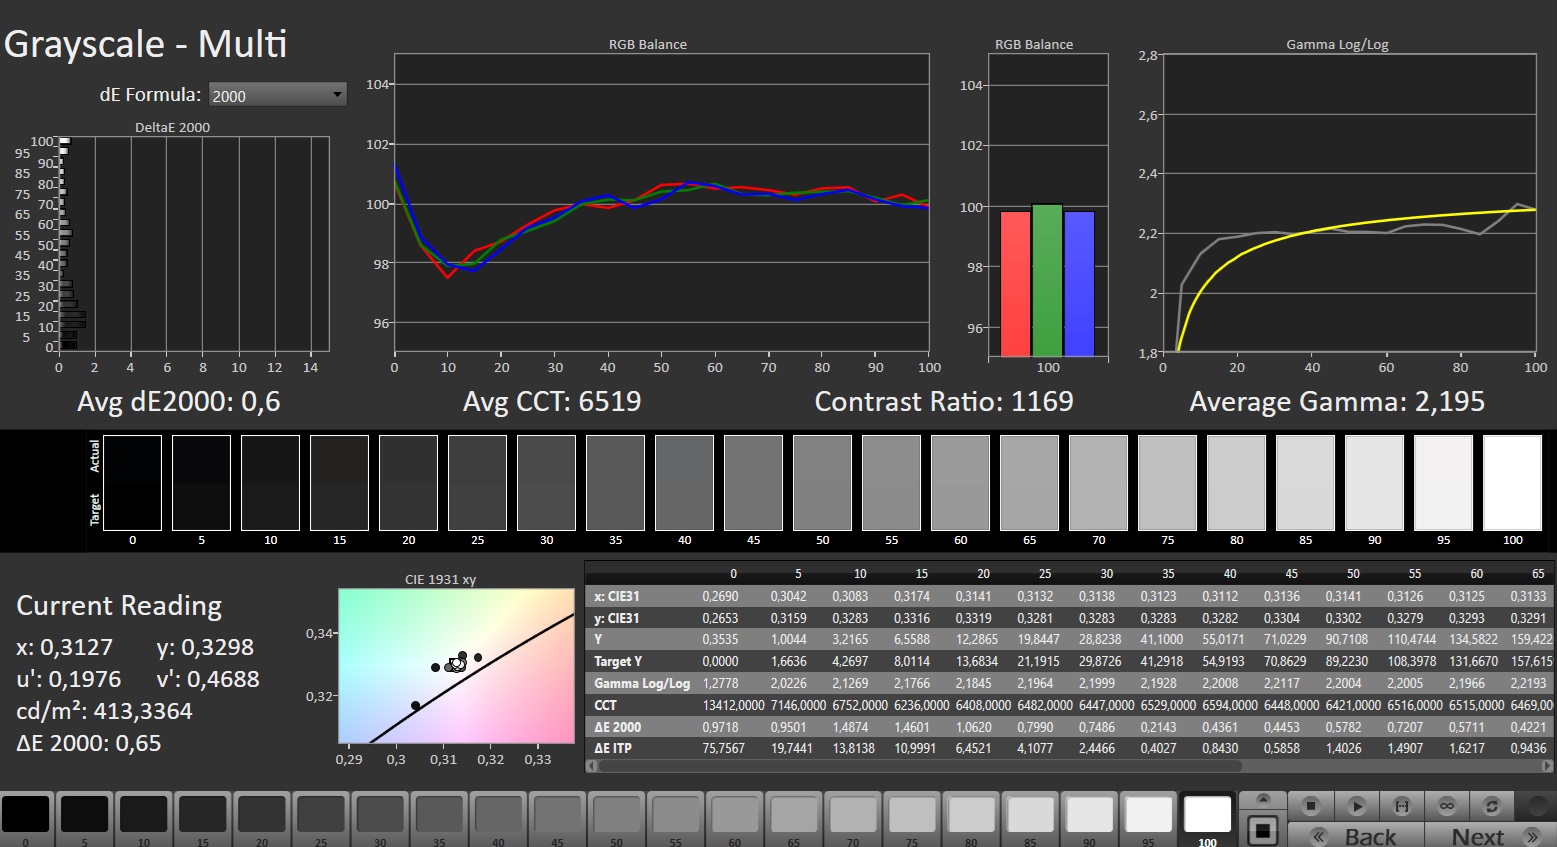
A tela de 16 polegadas (2.560 x 1.600 pixels) com proporção de 16:10 é familiar: O laptop usa o mesmo painel IPS da BOE que já foi usado na versão versão 2023 do Pro 16. No entanto, ele se beneficia de um brilho máximo ligeiramente maior. No geral, os valores da tela que medimos são suficientes para uso em ambientes internos. A leitura ao ar livre deve ser possível, desde que o sol não seja muito forte. Positivo: O painel responsivo de 240 Hz não apresenta oscilação de PWM. Não há opções alternativas de tela disponíveis.
| |||||||||||||||||||||||||
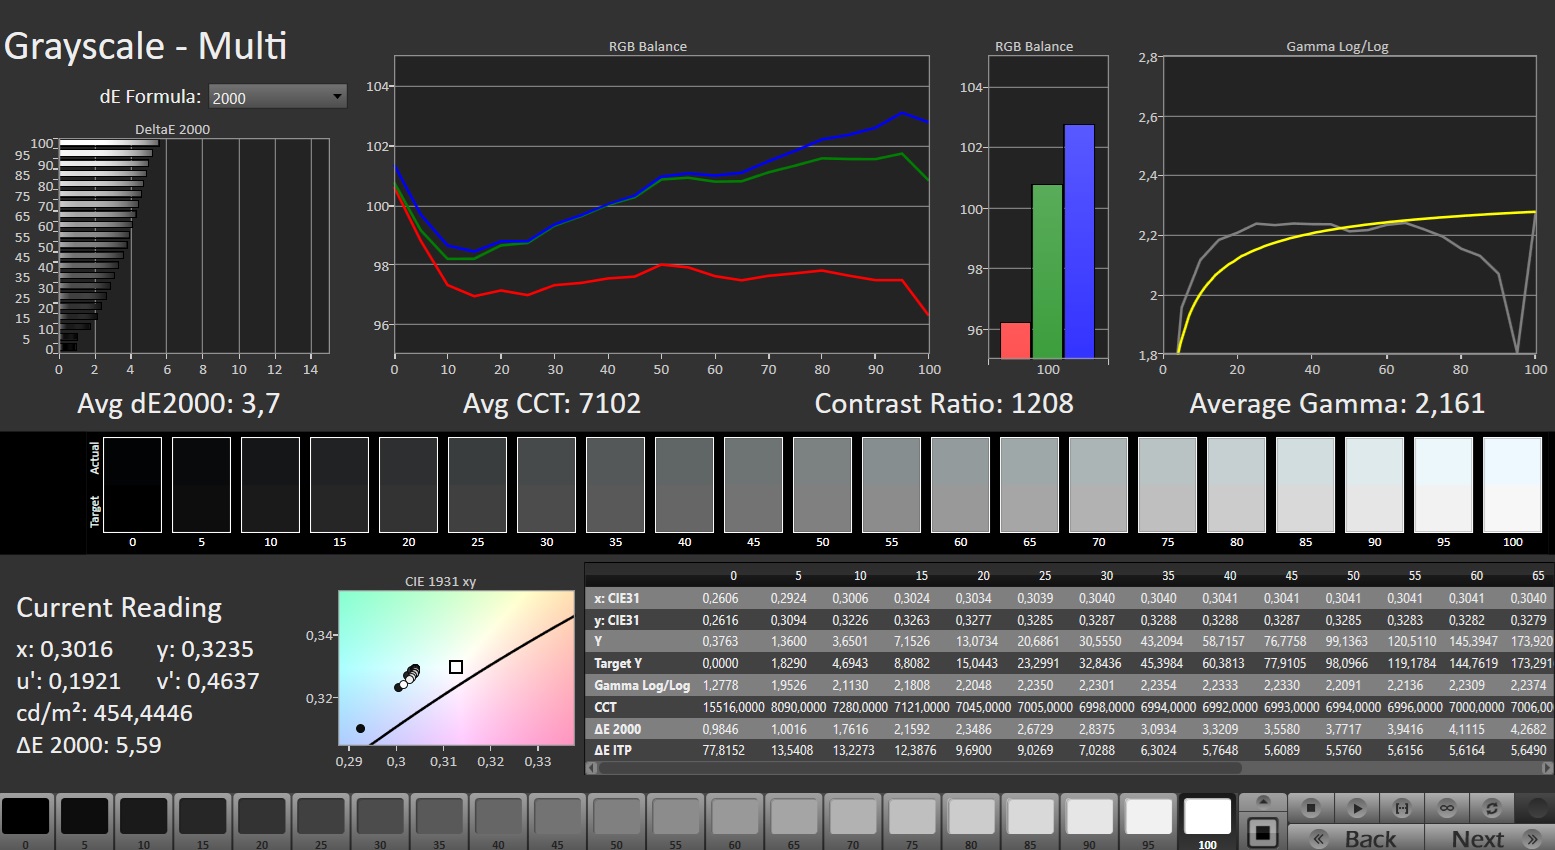
iluminação: 86 %
iluminação com acumulador: 416 cd/m²
Contraste: 1095:1 (Preto: 0.38 cd/m²)
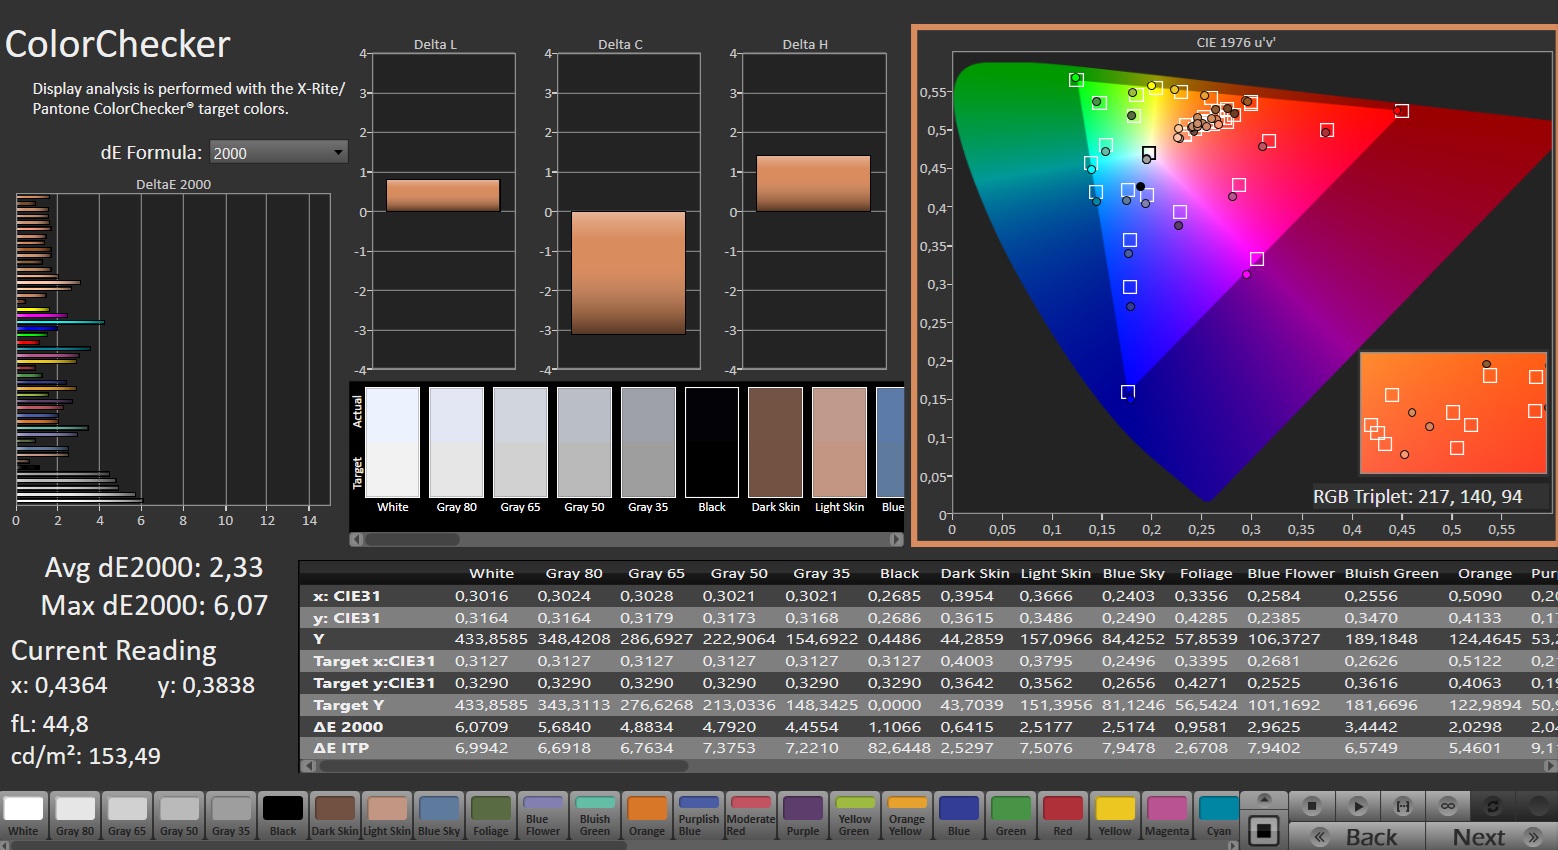
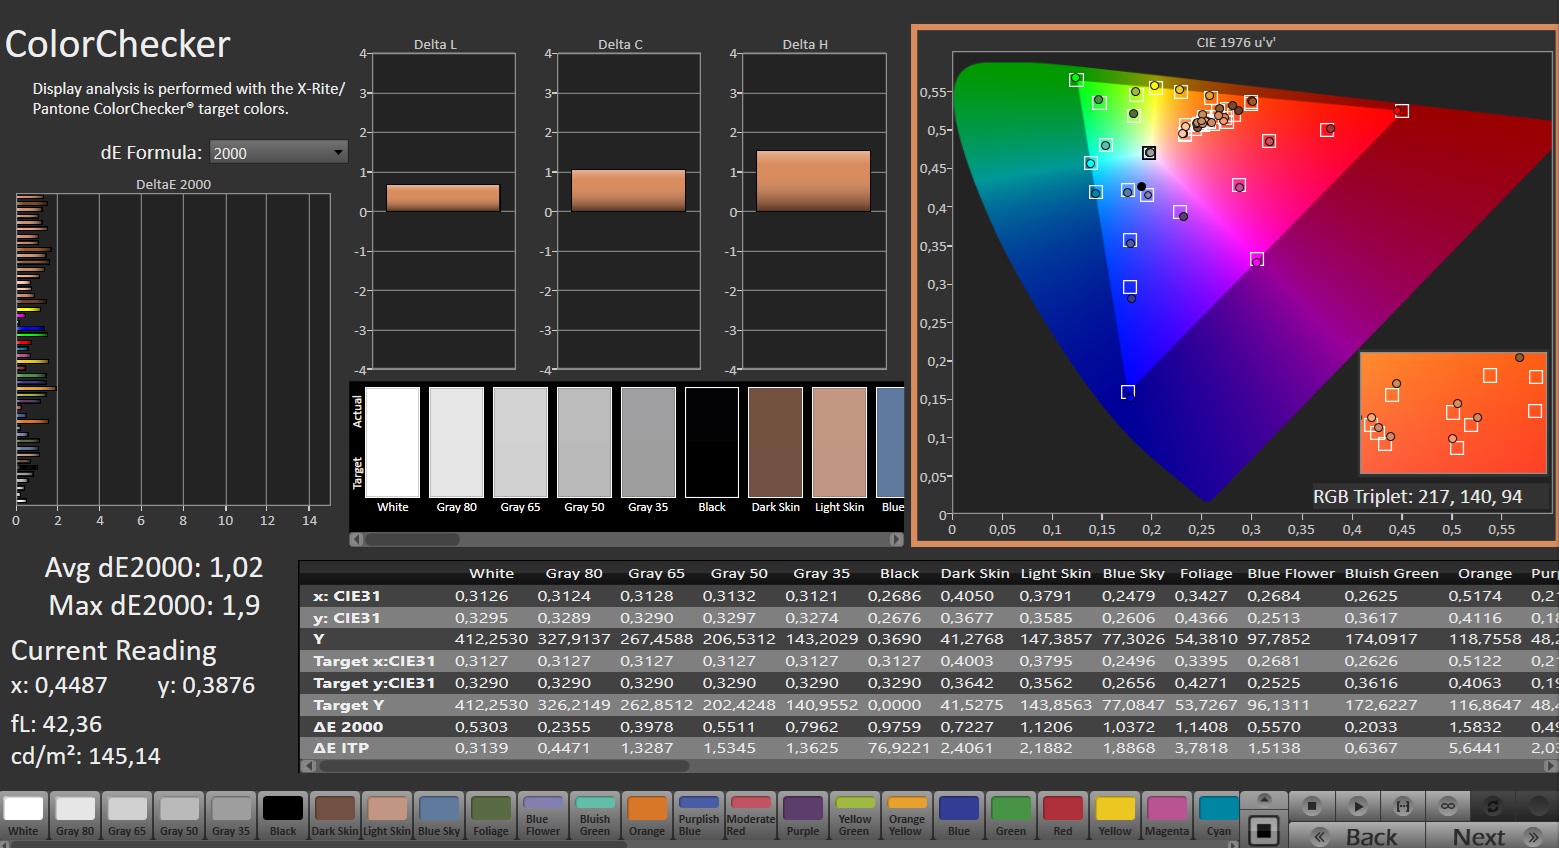
ΔE Color 2.33 | 0.5-29.43 Ø4.87, calibrated: 1.02
ΔE Greyscale 3.7 | 0.5-98 Ø5.1
70.8% AdobeRGB 1998 (Argyll 2.2.0 3D)
99.5% sRGB (Argyll 2.2.0 3D)
68.8% Display P3 (Argyll 2.2.0 3D)
Gamma: 2.161
| SCHENKER XMG Pro 16 Studio (Mid 24) BOE CQ NE160QDM-NZ1, IPS, 2560x1600, 16" | Acer Predator Helios Neo 16 (2024) Chi Mei N160GME-GTB, LED, 2560x1600, 16" | Lenovo Legion Pro 5 16IRX9 BOE NE160QDM-NYC, IPS, 2560x1600, 16" | Aorus 16X 2024 BOE CQ NE160QDM-NY1, IPS, 2560x1600, 16" | SCHENKER XMG Pro 16 Studio (Mid 23) BOE CQ NE160QDM-NZ1, IPS, 2560x1600, 16" | Lenovo Legion 7 16 IRX G9 MNG007ZA1-2, IPS, 3200x2000, 16" | |
|---|---|---|---|---|---|---|
| Display | 20% | 0% | -2% | -0% | 21% | |
| Display P3 Coverage | 68.8 | 95.9 39% | 69.3 1% | 67.2 -2% | 69.4 1% | 95 38% |
| sRGB Coverage | 99.5 | 99.8 0% | 99.4 0% | 96.7 -3% | 98.2 -1% | 100 1% |
| AdobeRGB 1998 Coverage | 70.8 | 86.4 22% | 70.1 -1% | 69.3 -2% | 70.1 -1% | 87.2 23% |
| Response Times | 11% | -18% | 28% | -9% | -14% | |
| Response Time Grey 50% / Grey 80% * | 12.7 ? | 5 ? 61% | 11.9 ? 6% | 7.5 ? 41% | 12.2 ? 4% | 14.4 ? -13% |
| Response Time Black / White * | 6.3 ? | 8.8 ? -40% | 8.9 ? -41% | 5.4 ? 14% | 7.7 ? -22% | 7.2 ? -14% |
| PWM Frequency | ||||||
| Screen | 19% | 20% | 4% | -5% | 23% | |
| Brightness middle | 416 | 521 25% | 384 -8% | 542 30% | 349 -16% | 412 -1% |
| Brightness | 392 | 506 29% | 366 -7% | 504 29% | 348 -11% | 396 1% |
| Brightness Distribution | 86 | 85 -1% | 91 6% | 86 0% | 93 8% | 89 3% |
| Black Level * | 0.38 | 0.44 -16% | 0.35 8% | 0.45 -18% | 0.32 16% | 0.43 -13% |
| Contrast | 1095 | 1184 8% | 1097 0% | 1204 10% | 1091 0% | 958 -13% |
| Colorchecker dE 2000 * | 2.33 | 1.74 25% | 0.97 58% | 2.73 -17% | 1.98 15% | 0.9 61% |
| Colorchecker dE 2000 max. * | 6.07 | 3.88 36% | 3.57 41% | 5.29 13% | 7.56 -25% | 2 67% |
| Colorchecker dE 2000 calibrated * | 1.02 | 0.52 49% | 0.77 25% | 1.32 -29% | 1.45 -42% | 0.6 41% |
| Greyscale dE 2000 * | 3.7 | 3 19% | 1.5 59% | 2.9 22% | 3.3 11% | 1.4 62% |
| Gamma | 2.161 102% | 2.164 102% | 2.24 98% | 2.192 100% | 2.137 103% | 2.23 99% |
| CCT | 7102 92% | 6816 95% | 6709 97% | 6173 105% | 6672 97% | 6731 97% |
| Média Total (Programa/Configurações) | 17% /
18% | 1% /
11% | 10% /
6% | -5% /
-5% | 10% /
17% |
* ... menor é melhor
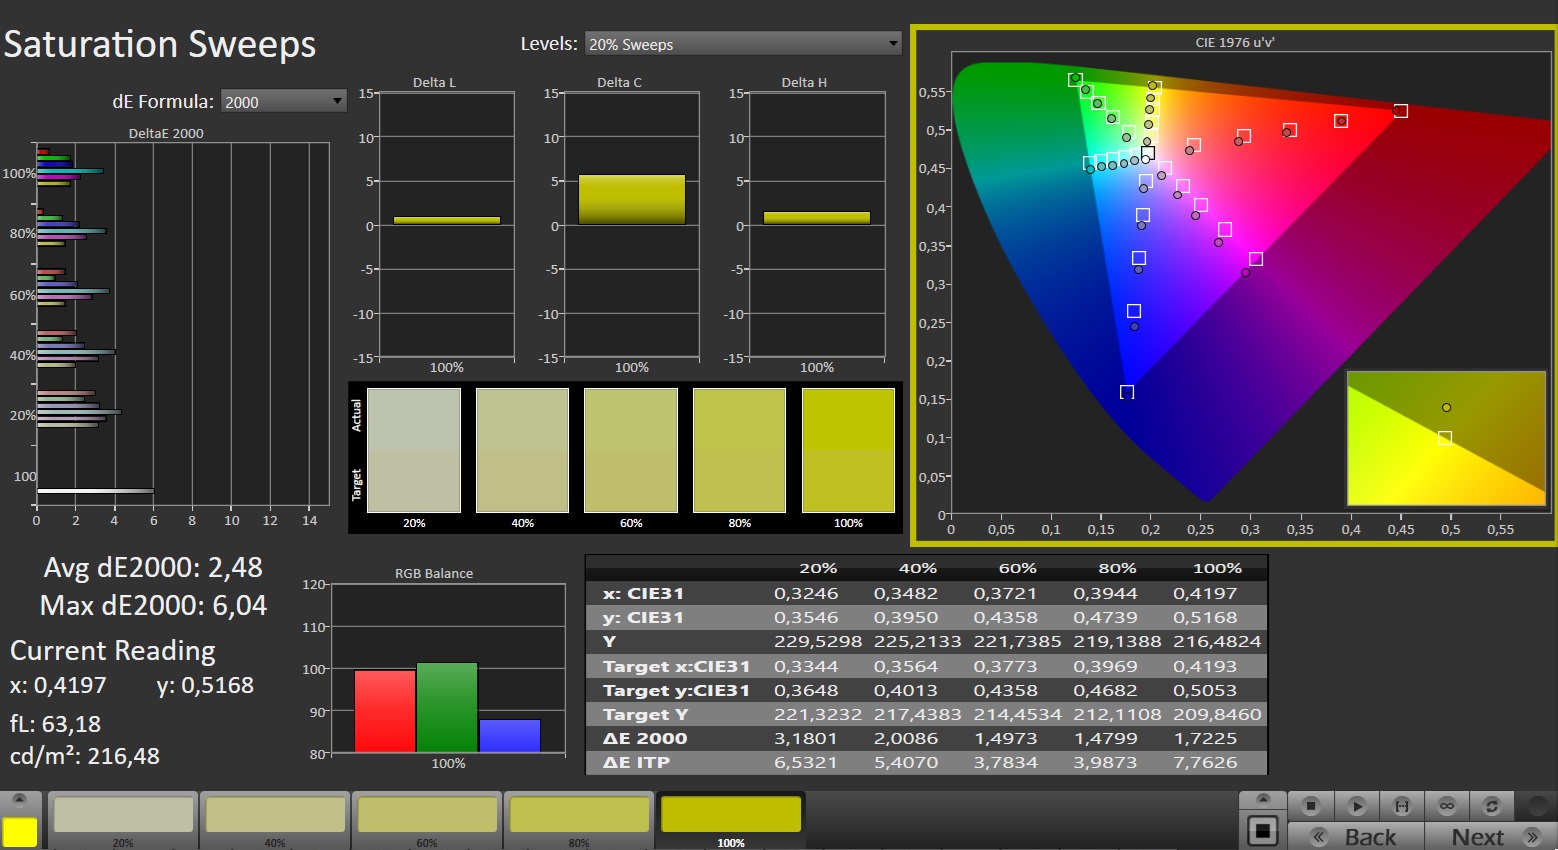
A cobertura do espaço de cores do painel instalado é decepcionante. Somente o espaço sRGB pode ser reproduzido - não os espaços AdobeRGB e DCI-P3. No entanto, isso não é diferente das telas da maioria dos concorrentes. No entanto, a tela de um laptop que é comercializado como uma "estação de trabalho profissional para criação de conteúdo" deveria realmente oferecer a gama completa. Sua reprodução de cores parece melhor: Um leve desvio de 2,26 (meta: DeltaE < 3) poderia ser reduzido para 1,03 com a realização de uma calibração.
Exibir tempos de resposta
| ↔ Tempo de resposta preto para branco | ||
|---|---|---|
| 6.3 ms ... ascensão ↗ e queda ↘ combinadas | ↗ 2.5 ms ascensão | 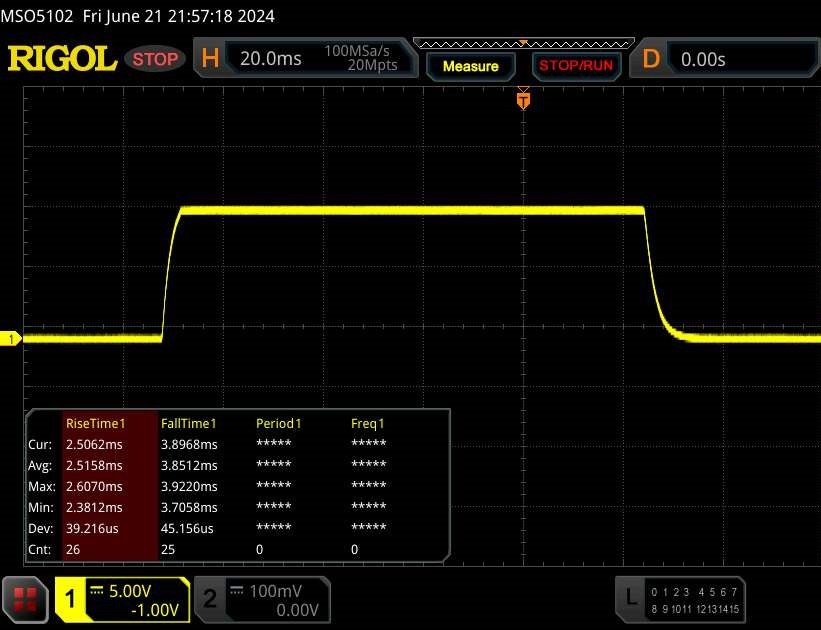 |
| ↘ 3.8 ms queda | ||
| A tela mostra taxas de resposta muito rápidas em nossos testes e deve ser muito adequada para jogos em ritmo acelerado. Em comparação, todos os dispositivos testados variam de 0.1 (mínimo) a 240 (máximo) ms. » 17 % de todos os dispositivos são melhores. Isso significa que o tempo de resposta medido é melhor que a média de todos os dispositivos testados (20.8 ms). | ||
| ↔ Tempo de resposta 50% cinza a 80% cinza | ||
| 12.7 ms ... ascensão ↗ e queda ↘ combinadas | ↗ 6 ms ascensão | 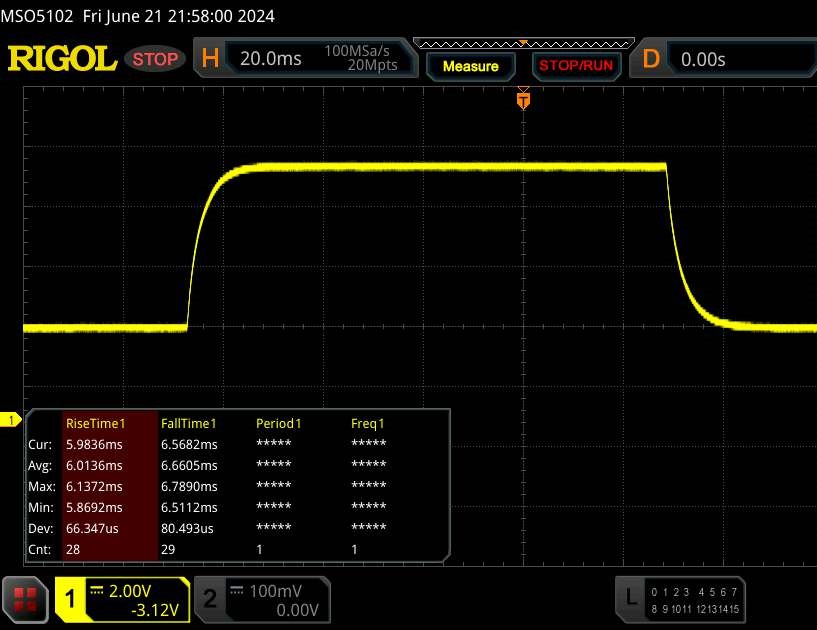 |
| ↘ 6.7 ms queda | ||
| A tela mostra boas taxas de resposta em nossos testes, mas pode ser muito lenta para jogadores competitivos. Em comparação, todos os dispositivos testados variam de 0.165 (mínimo) a 636 (máximo) ms. » 23 % de todos os dispositivos são melhores. Isso significa que o tempo de resposta medido é melhor que a média de todos os dispositivos testados (32.5 ms). | ||
Cintilação da tela / PWM (modulação por largura de pulso)
| Tela tremeluzindo / PWM não detectado |  | ||
[pwm_comparison] Em comparação: 53 % de todos os dispositivos testados não usam PWM para escurecer a tela. Se PWM foi detectado, uma média de 8516 (mínimo: 5 - máximo: 343500) Hz foi medida. | |||
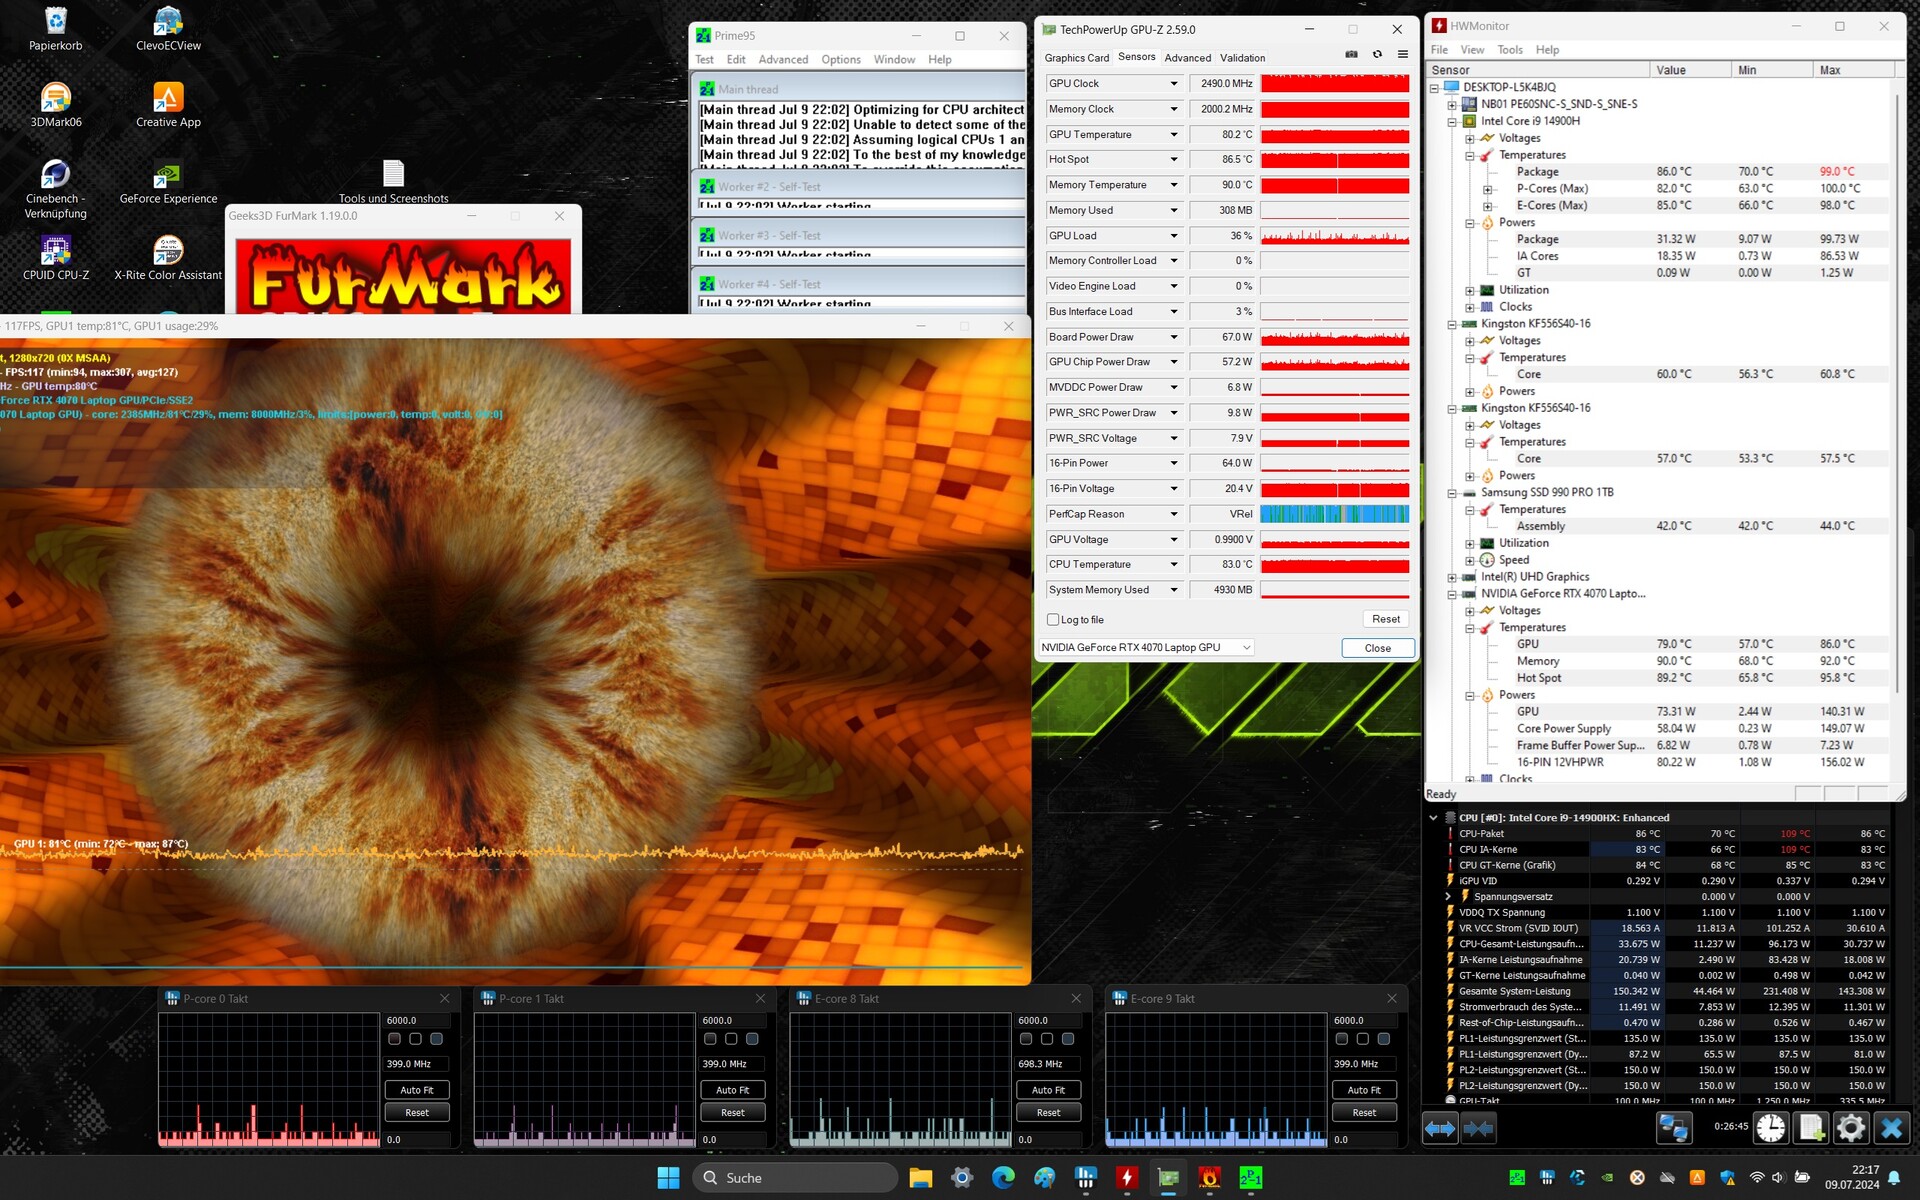
Desempenho - Raptor Lake Refresh substitui o Raptor Lake
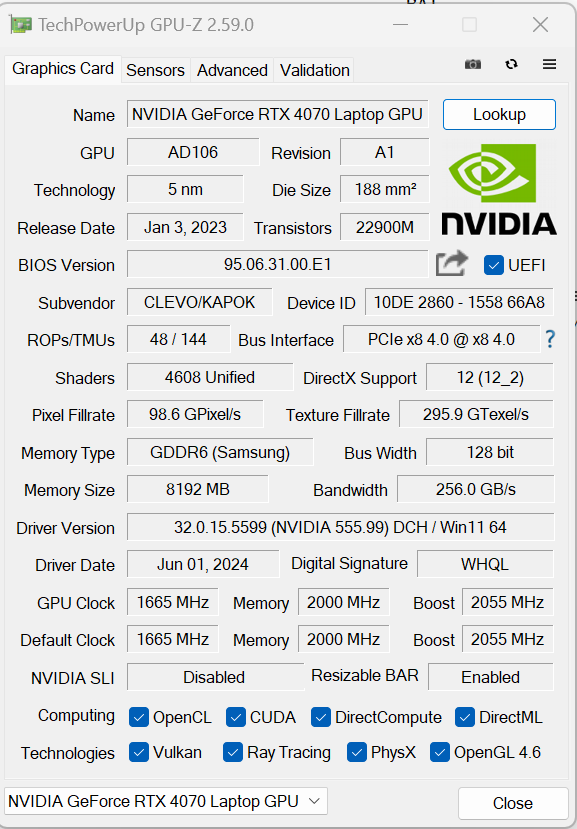
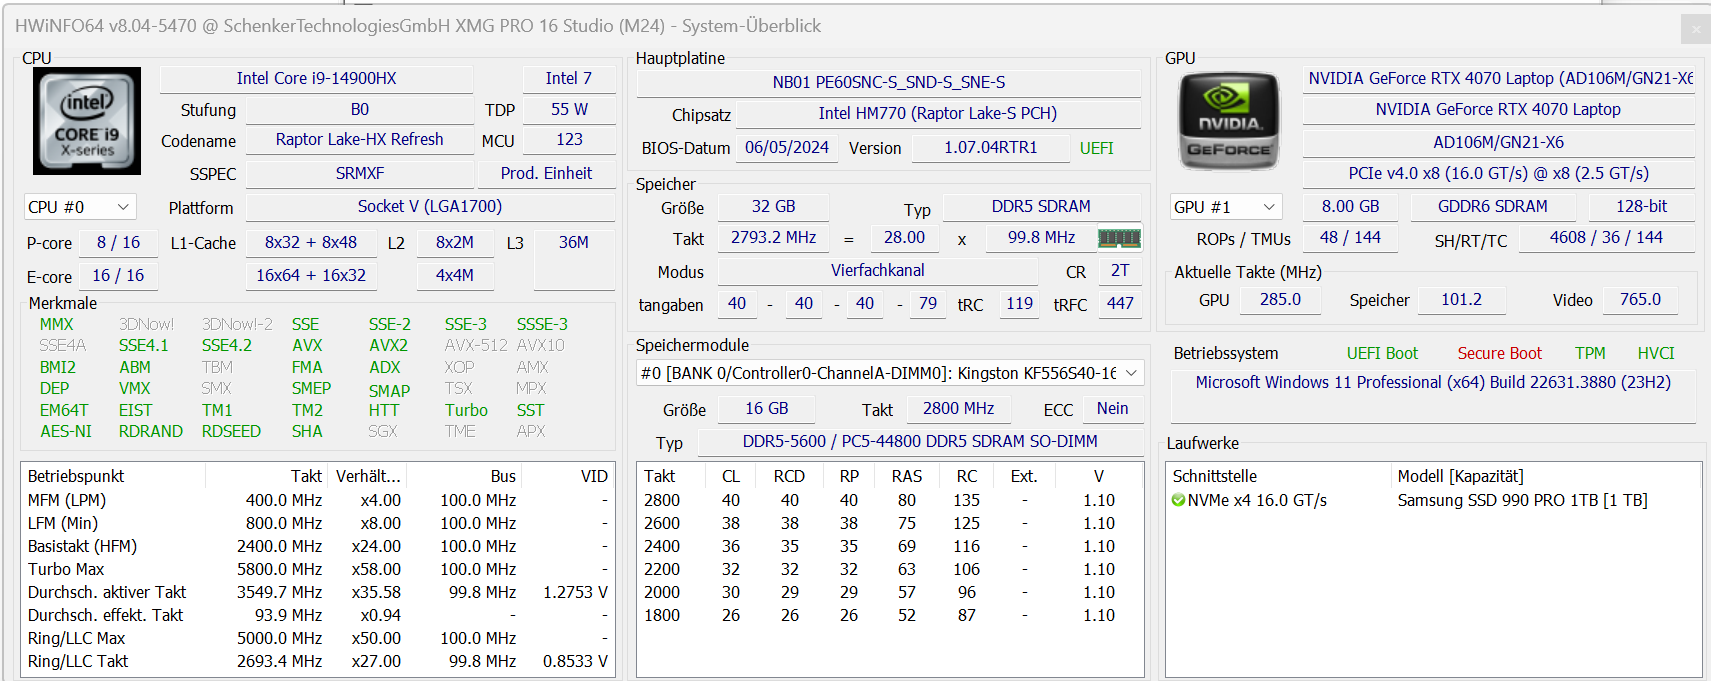
O XMG Pro 16 Studio (Mid 24), descrito pela Schenker como um "laptop de criação de conteúdo", é voltado para gamers e criadores. Todos os modelos apresentam um Core i9-14900HX e a seleção de GPU disponível inclui uma RTX 4060 e uma RTX 4070 - nosso dispositivo de teste está equipado com uma RTX 4070. Essa variante está disponível por cerca de US$ 2.500. Os preços começam em cerca de US$ 1.800.
Condições de teste
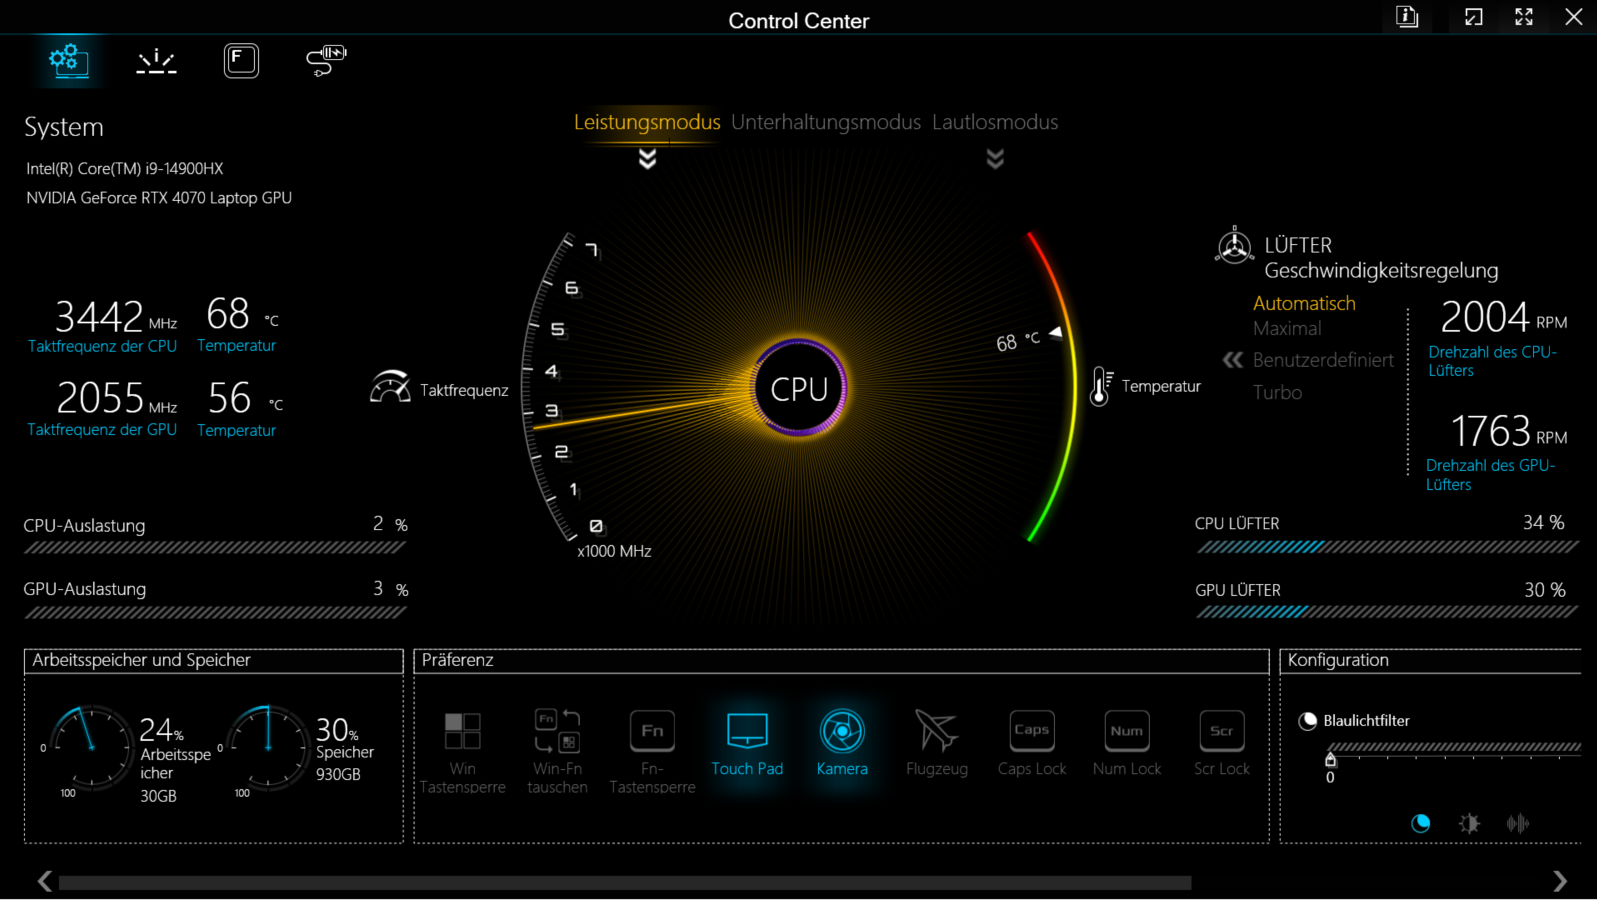
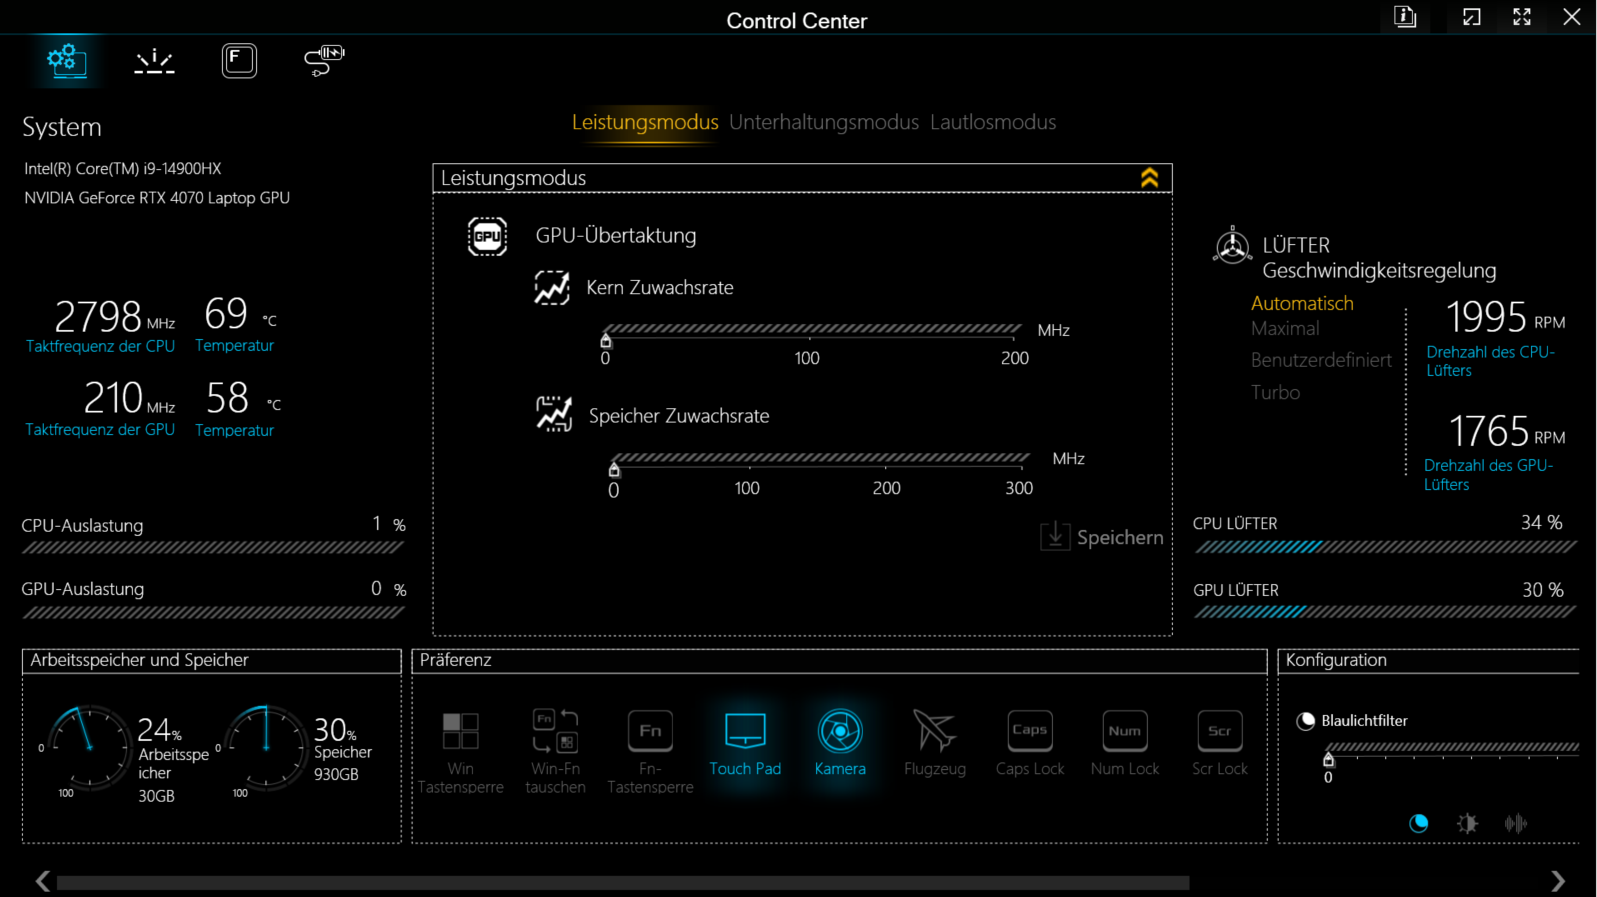
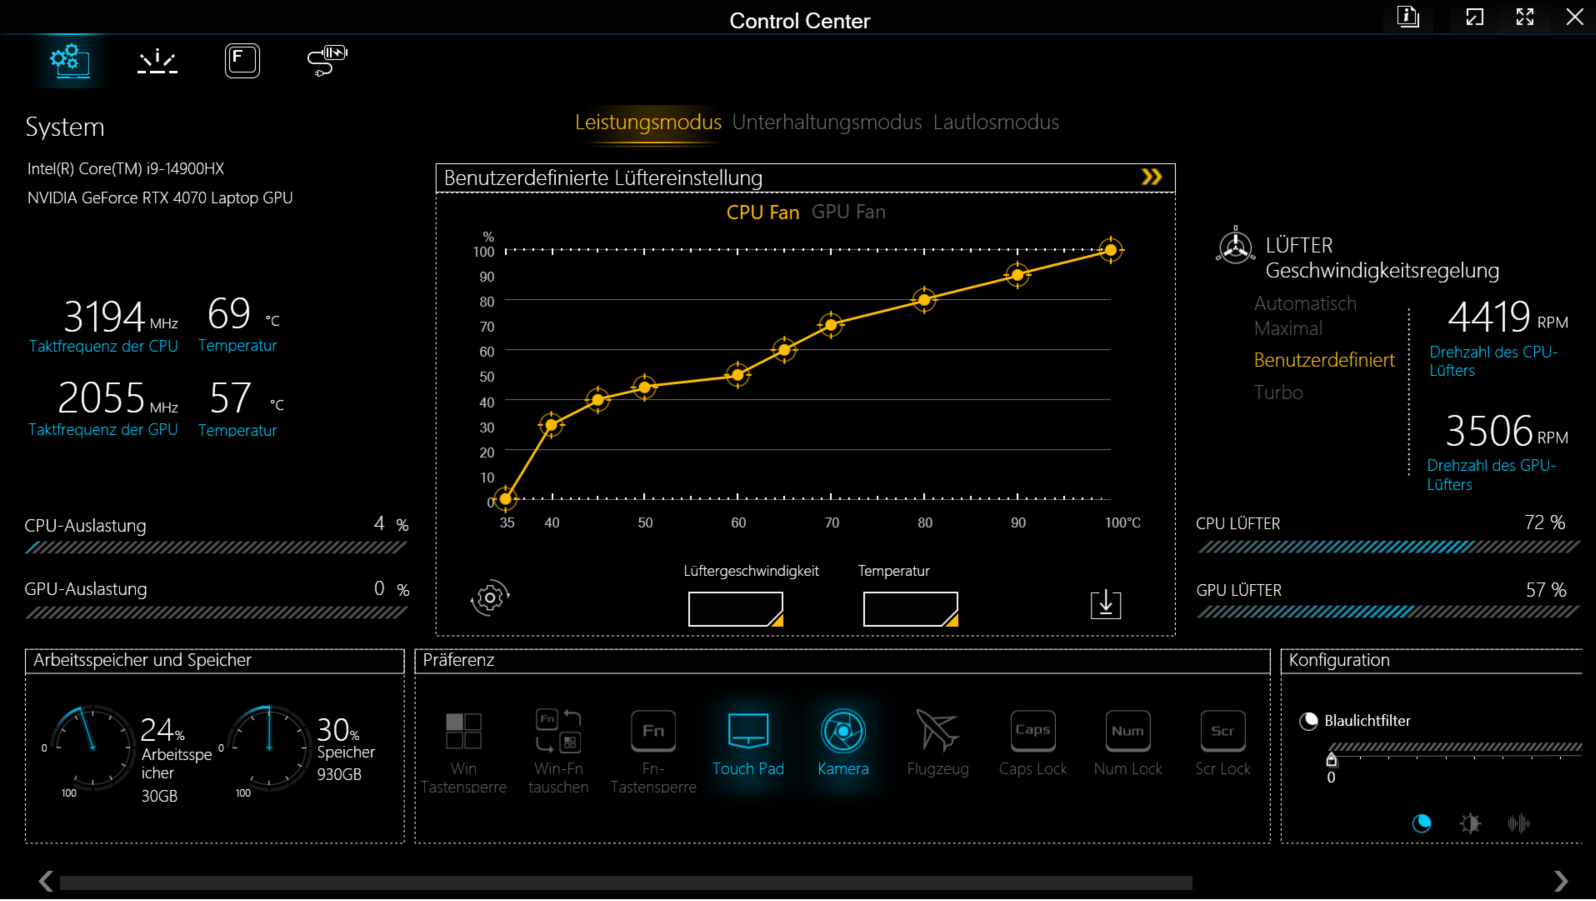
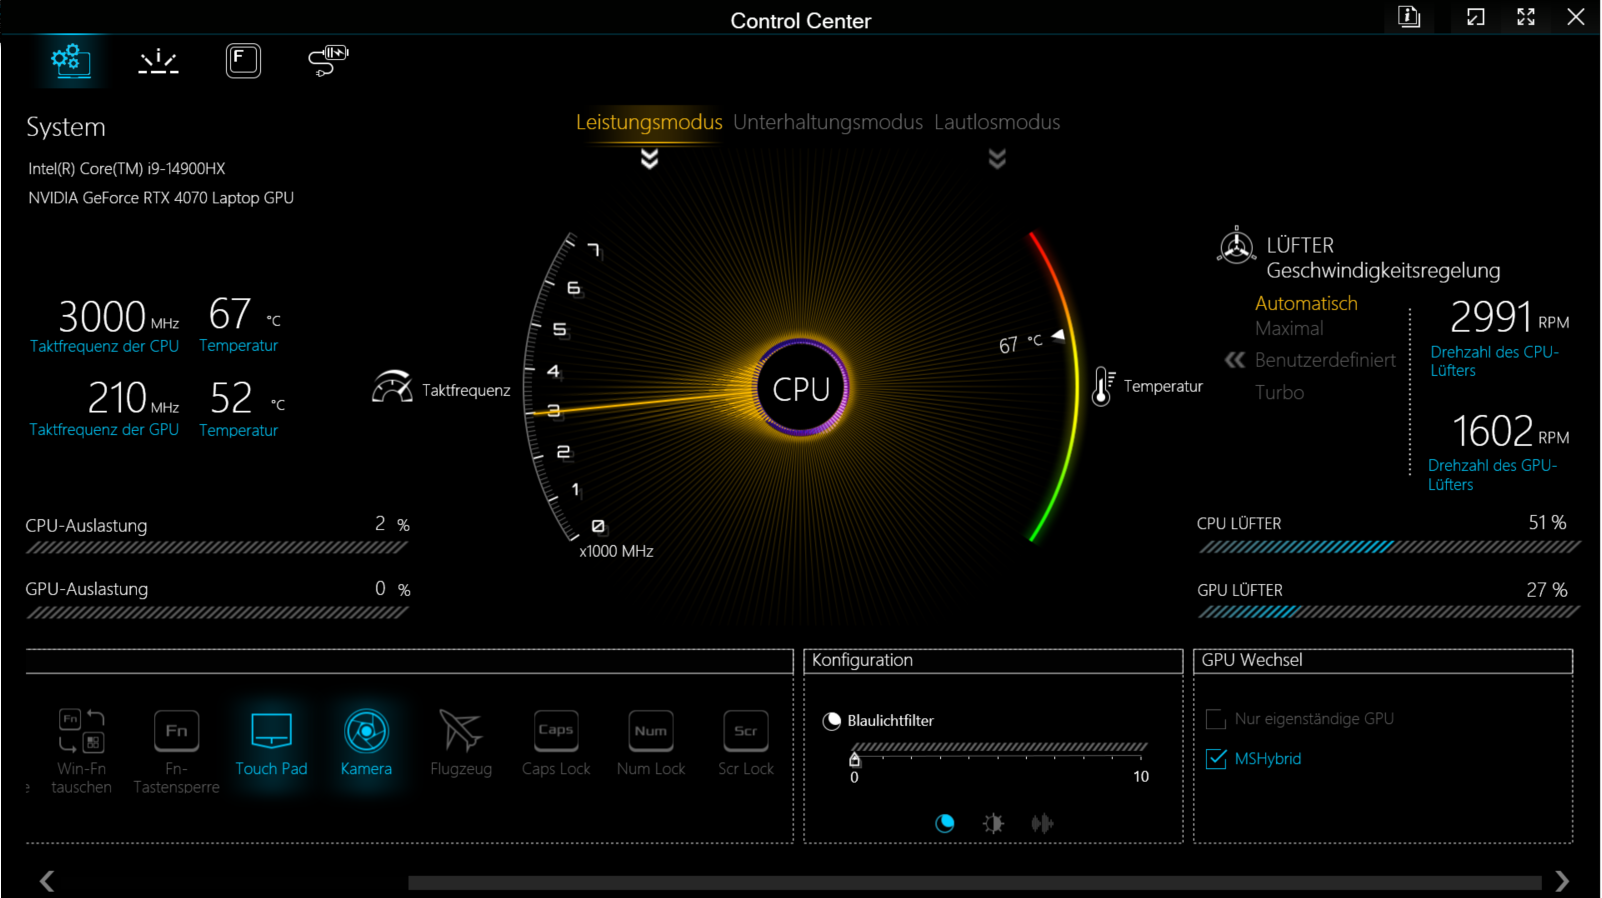
Há uma opção de três modos de desempenho específicos do fabricante (consulte a tabela), que podem ser alternados usando o software Control Center (o centro de controle do laptop). Usamos os modos de desempenho (benchmarks) e silencioso (testes de bateria). O Optimus estava ativo.
| Modo de desempenho | Modo de entretenimento | Modo silencioso (dGPU desligada) | |
|---|---|---|---|
| Limite de energia 1 (HWInfo) | 135 watts | 55 watts | 25 watts |
| Limite de energia 2 (HWInfo) | 150 watts | 135 watts | 35 watts |
| Ruído (CP 2077 Phantom) | 53 dB (A) | 49 dB (A) | - |
| Desempenho (CP 2077 Phantom) | 78 fps | 73 fps | - |
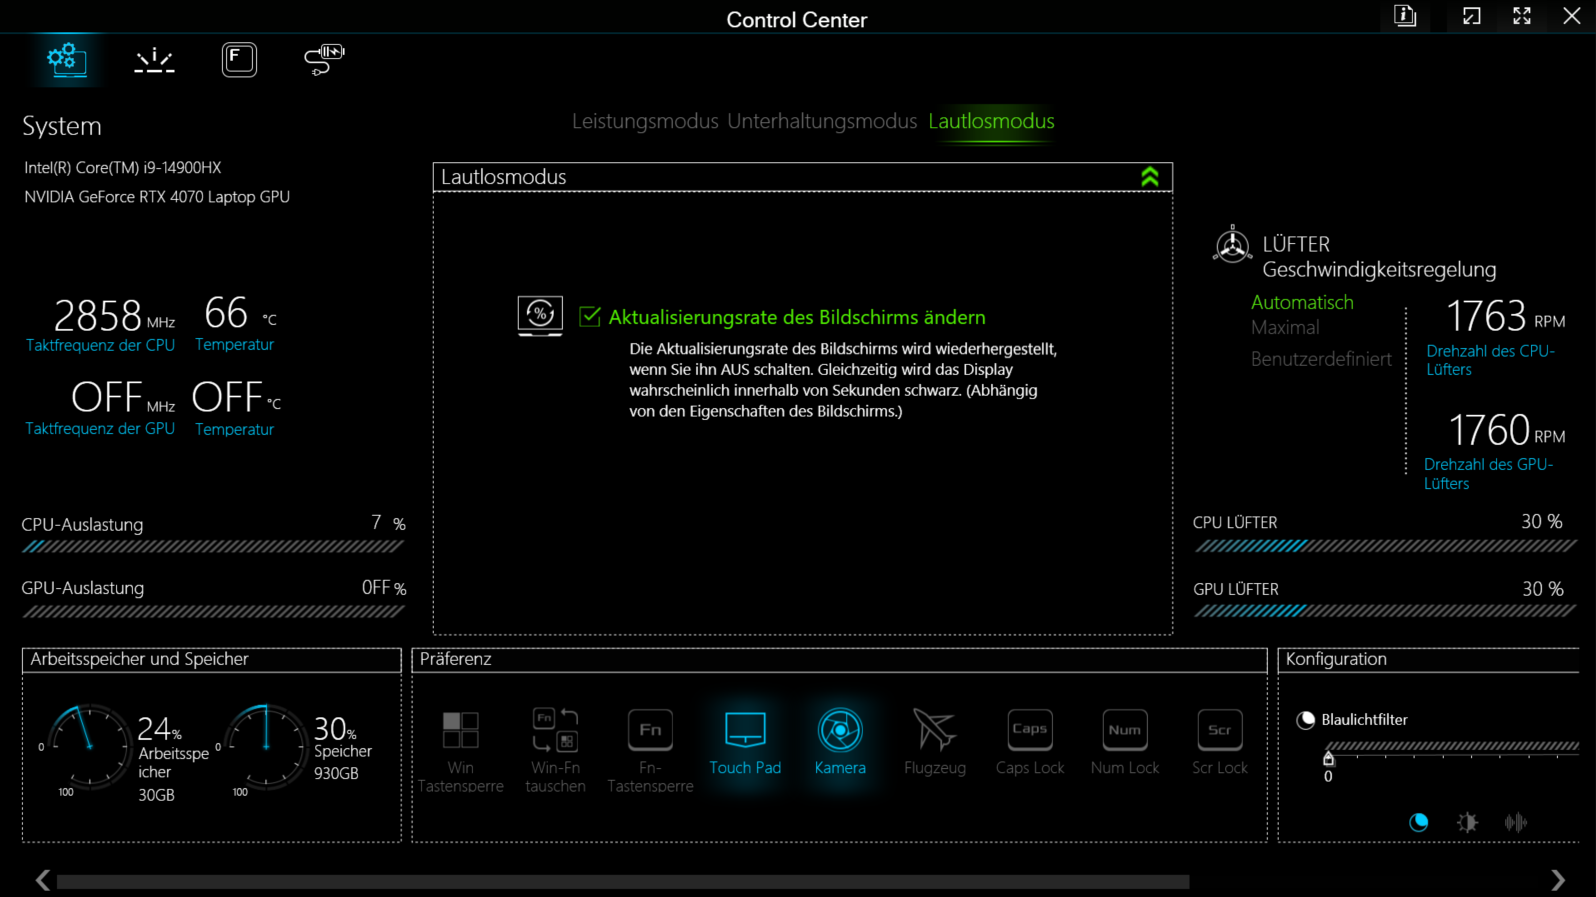
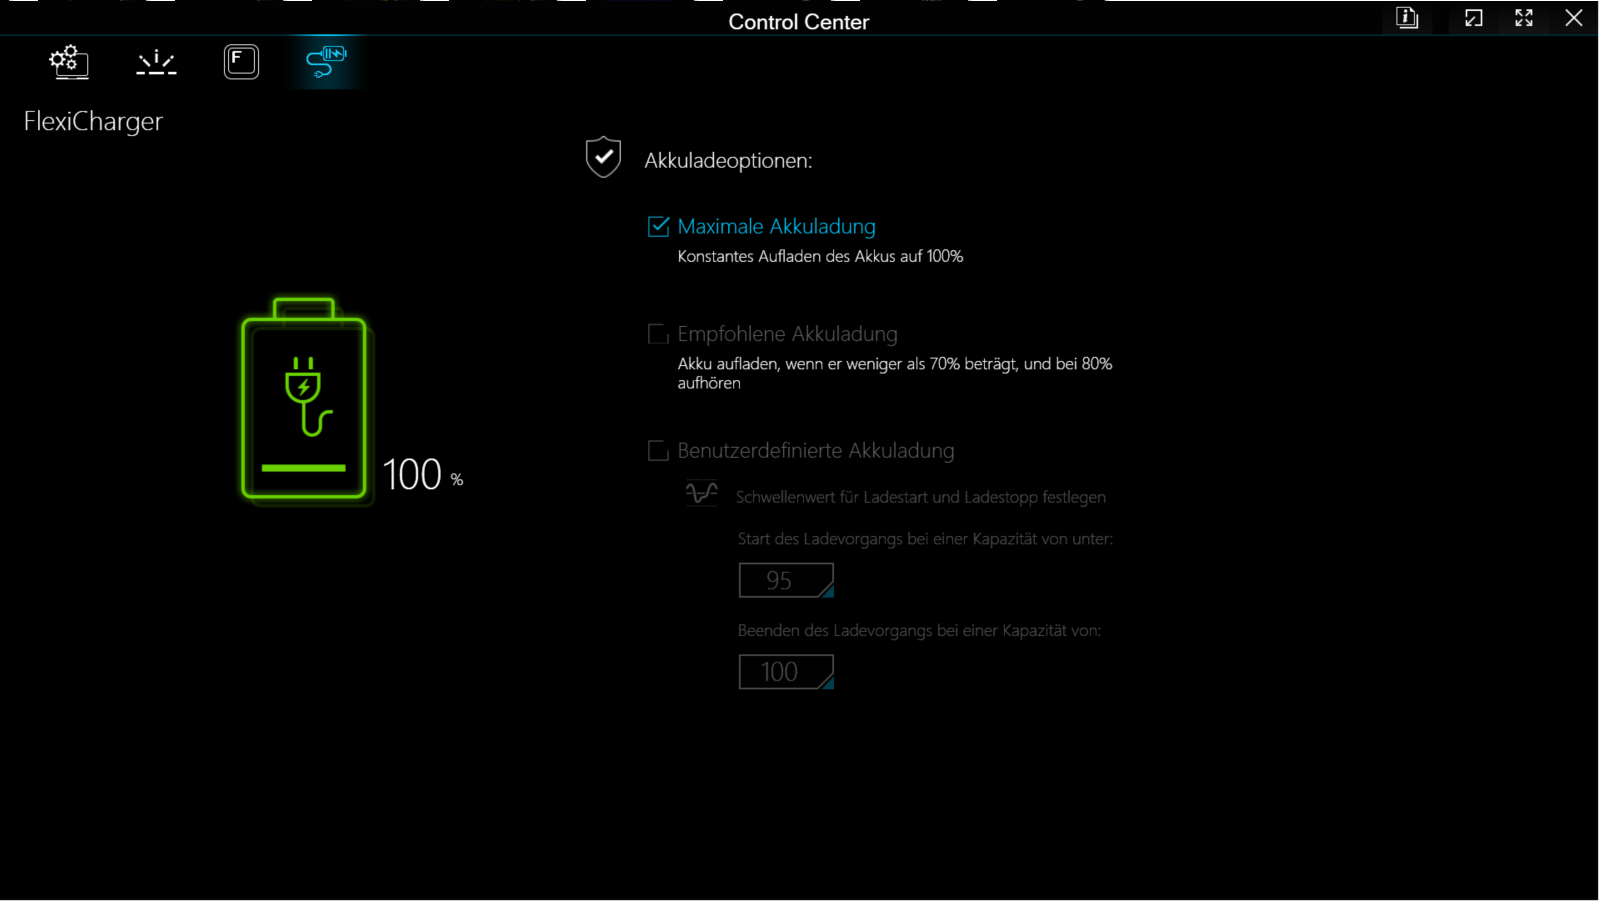
Problemas com o modo de entretenimento
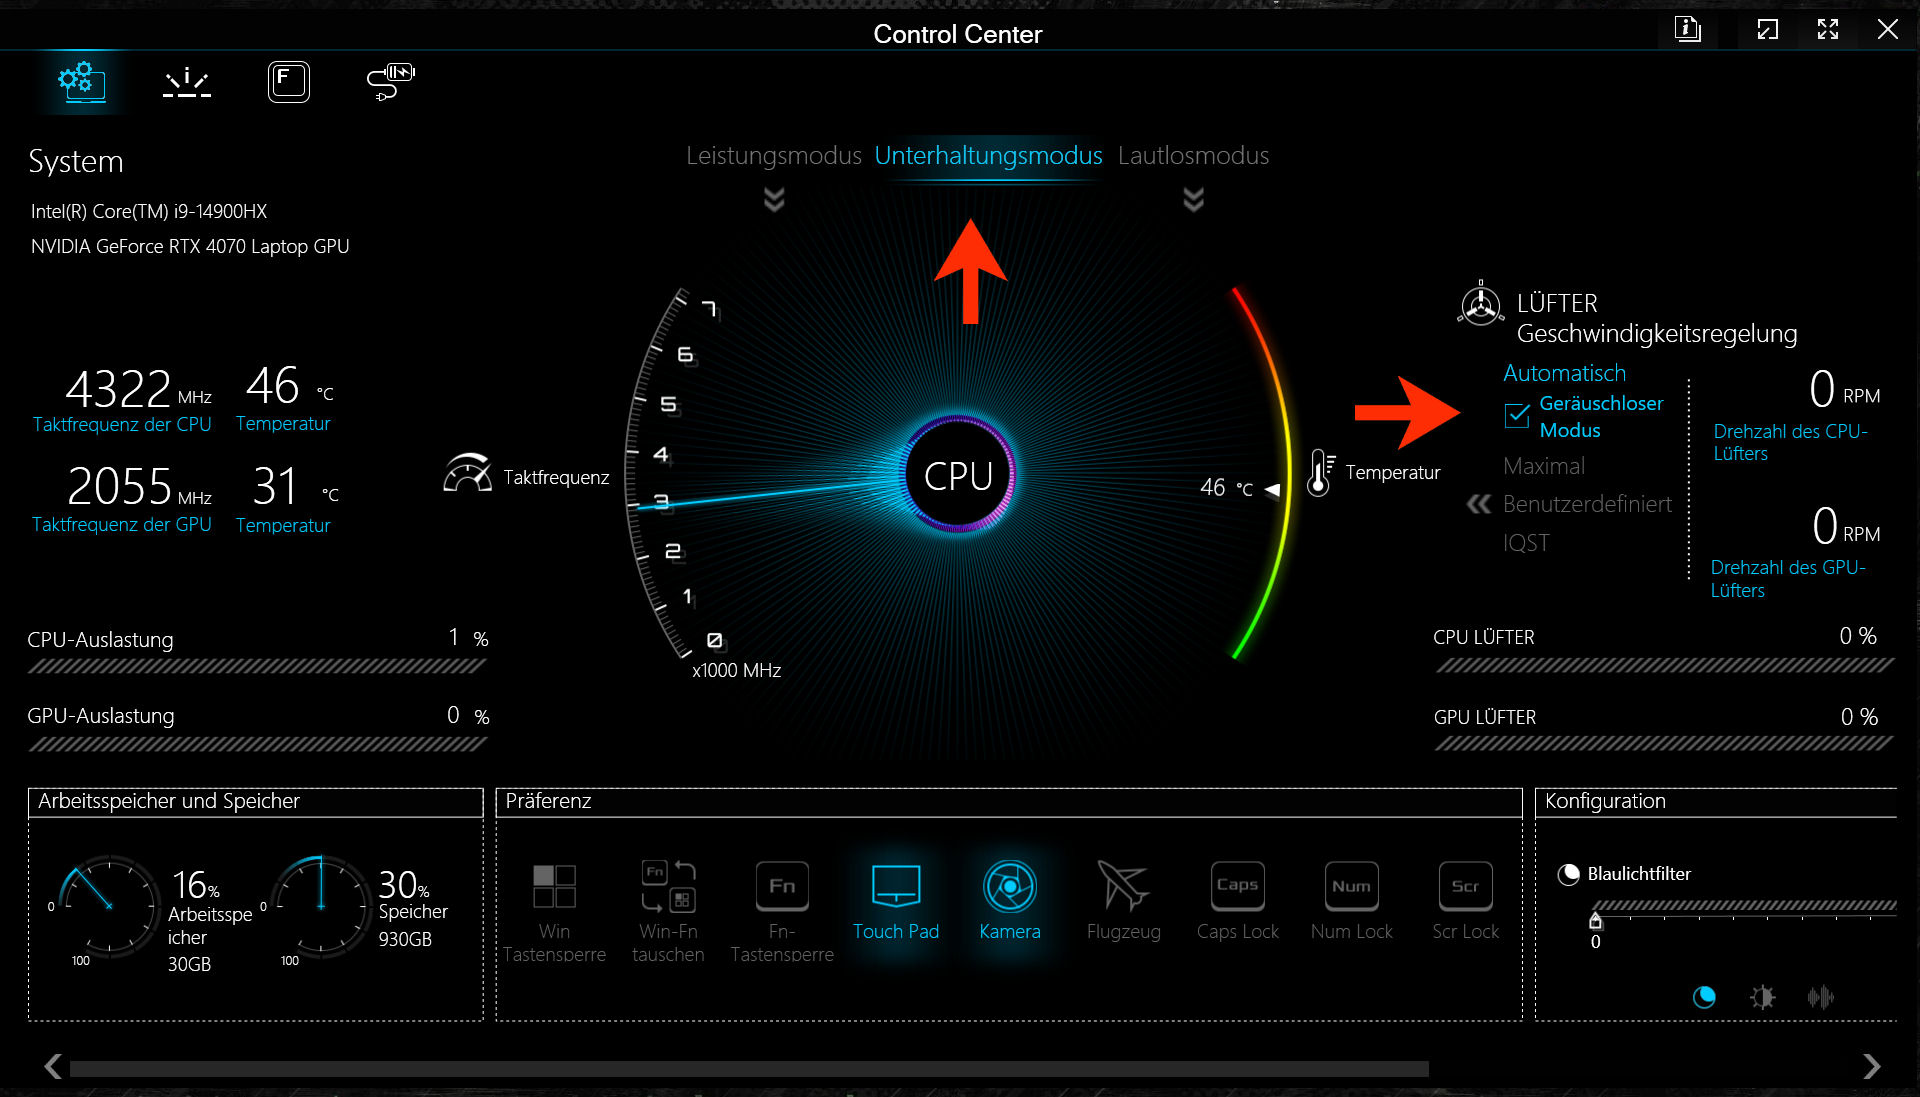
O perfil de "entretenimento" causou flutuações significativas no desempenho durante nosso teste. Por isso, não o utilizamos. Durante o teste, Schenker conseguiu descobrir uma maneira de contornar o problema: ativando a opção de ventilador "modo silencioso" no Control Center. Espera-se que uma futura atualização do BIOS corrija esse erro.
Processador
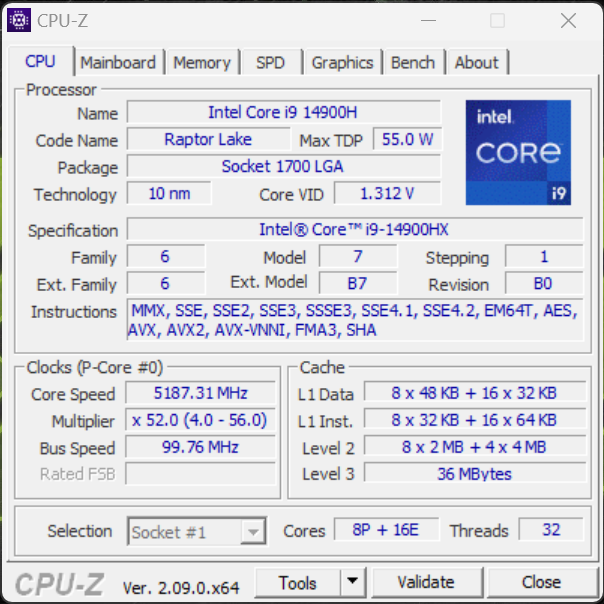
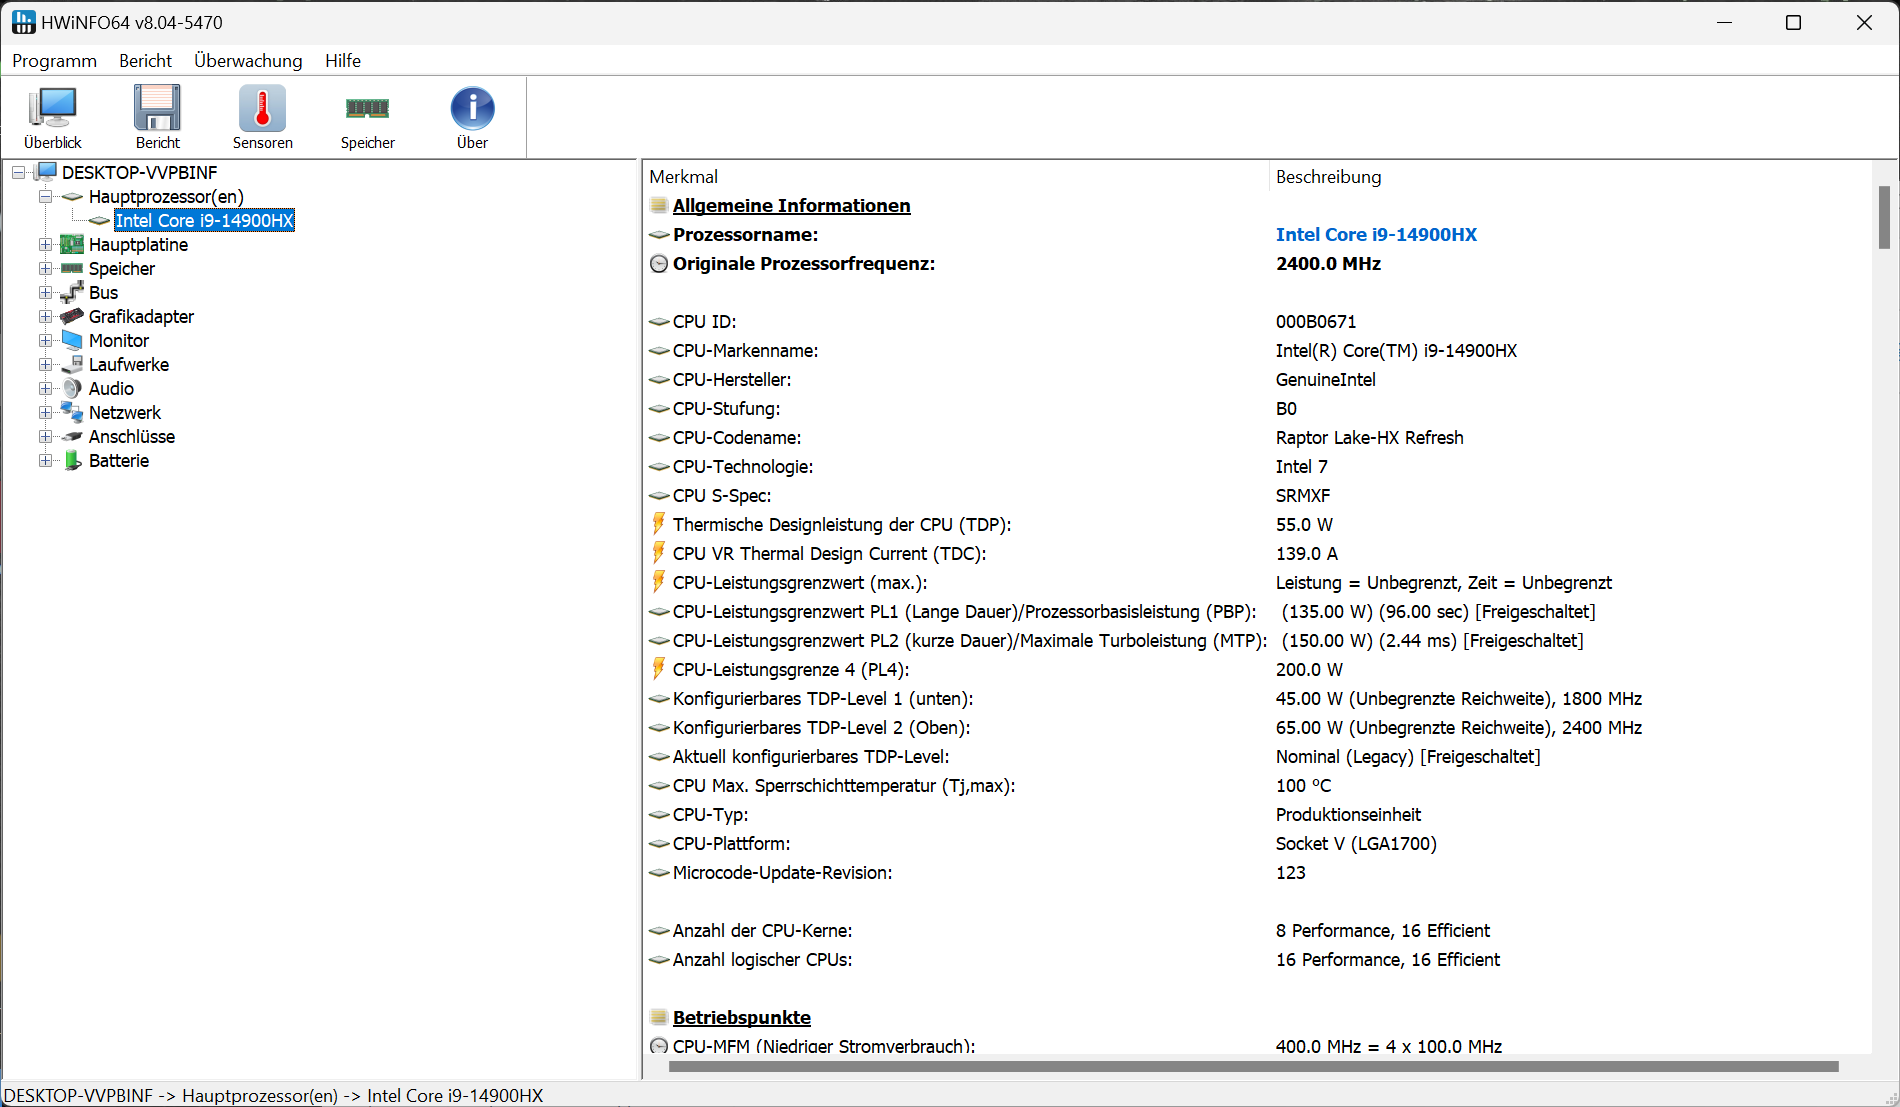
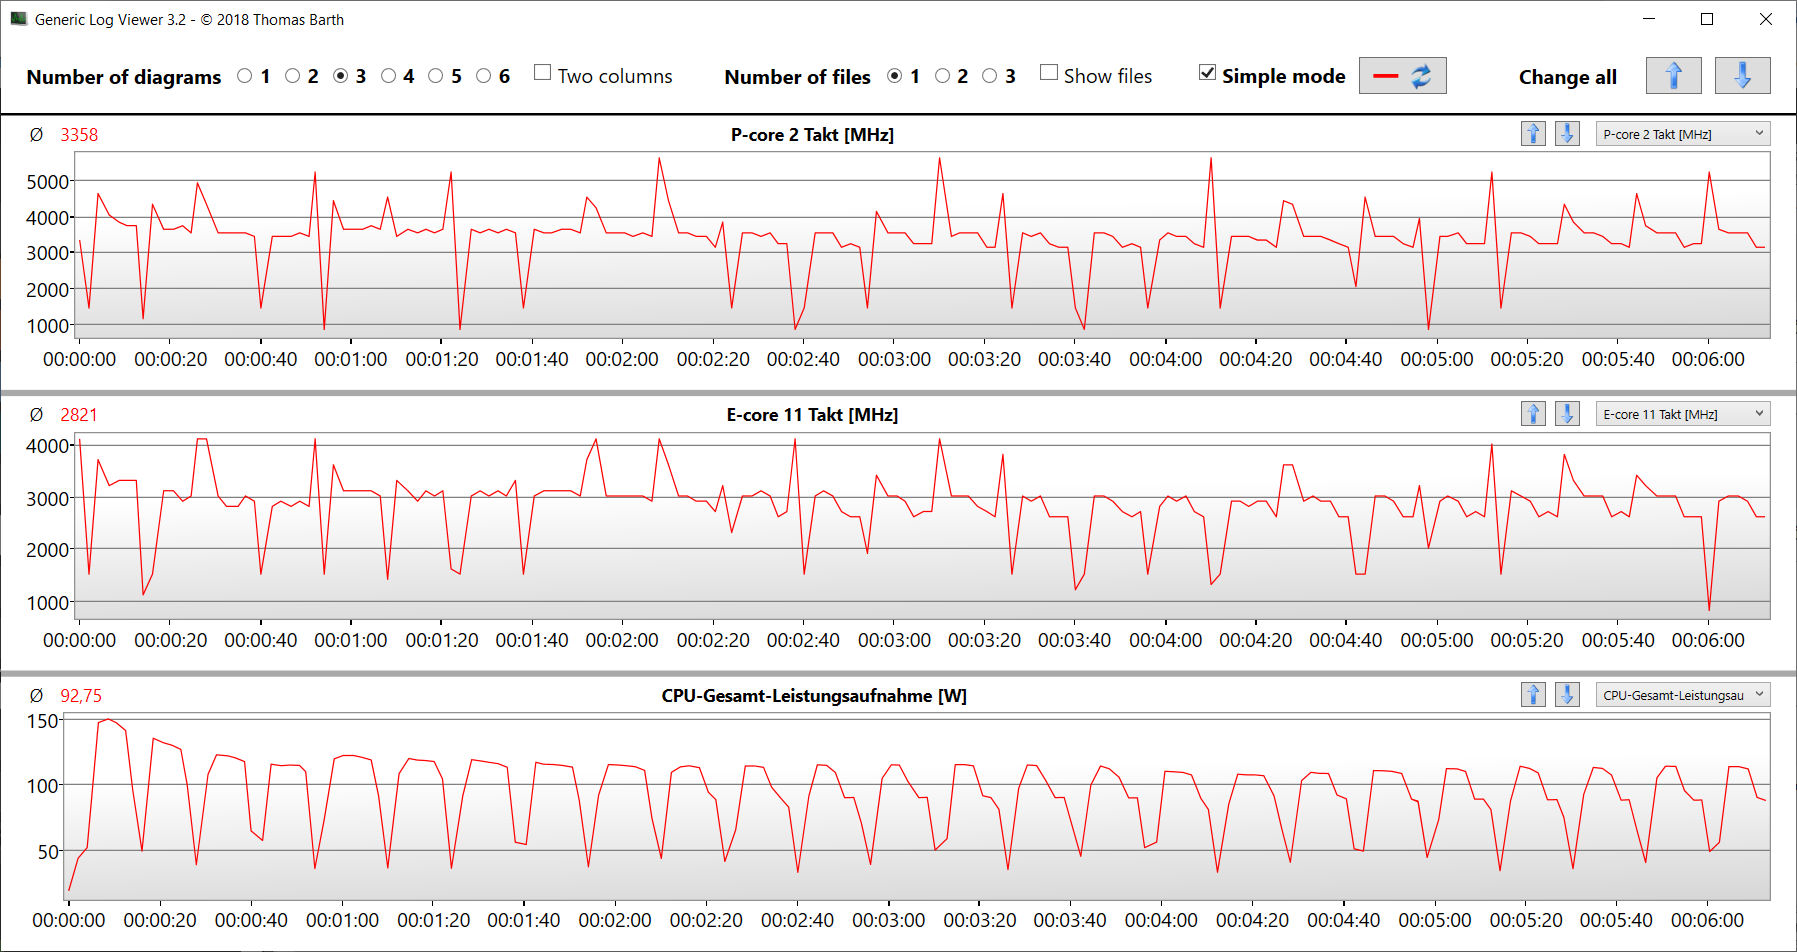
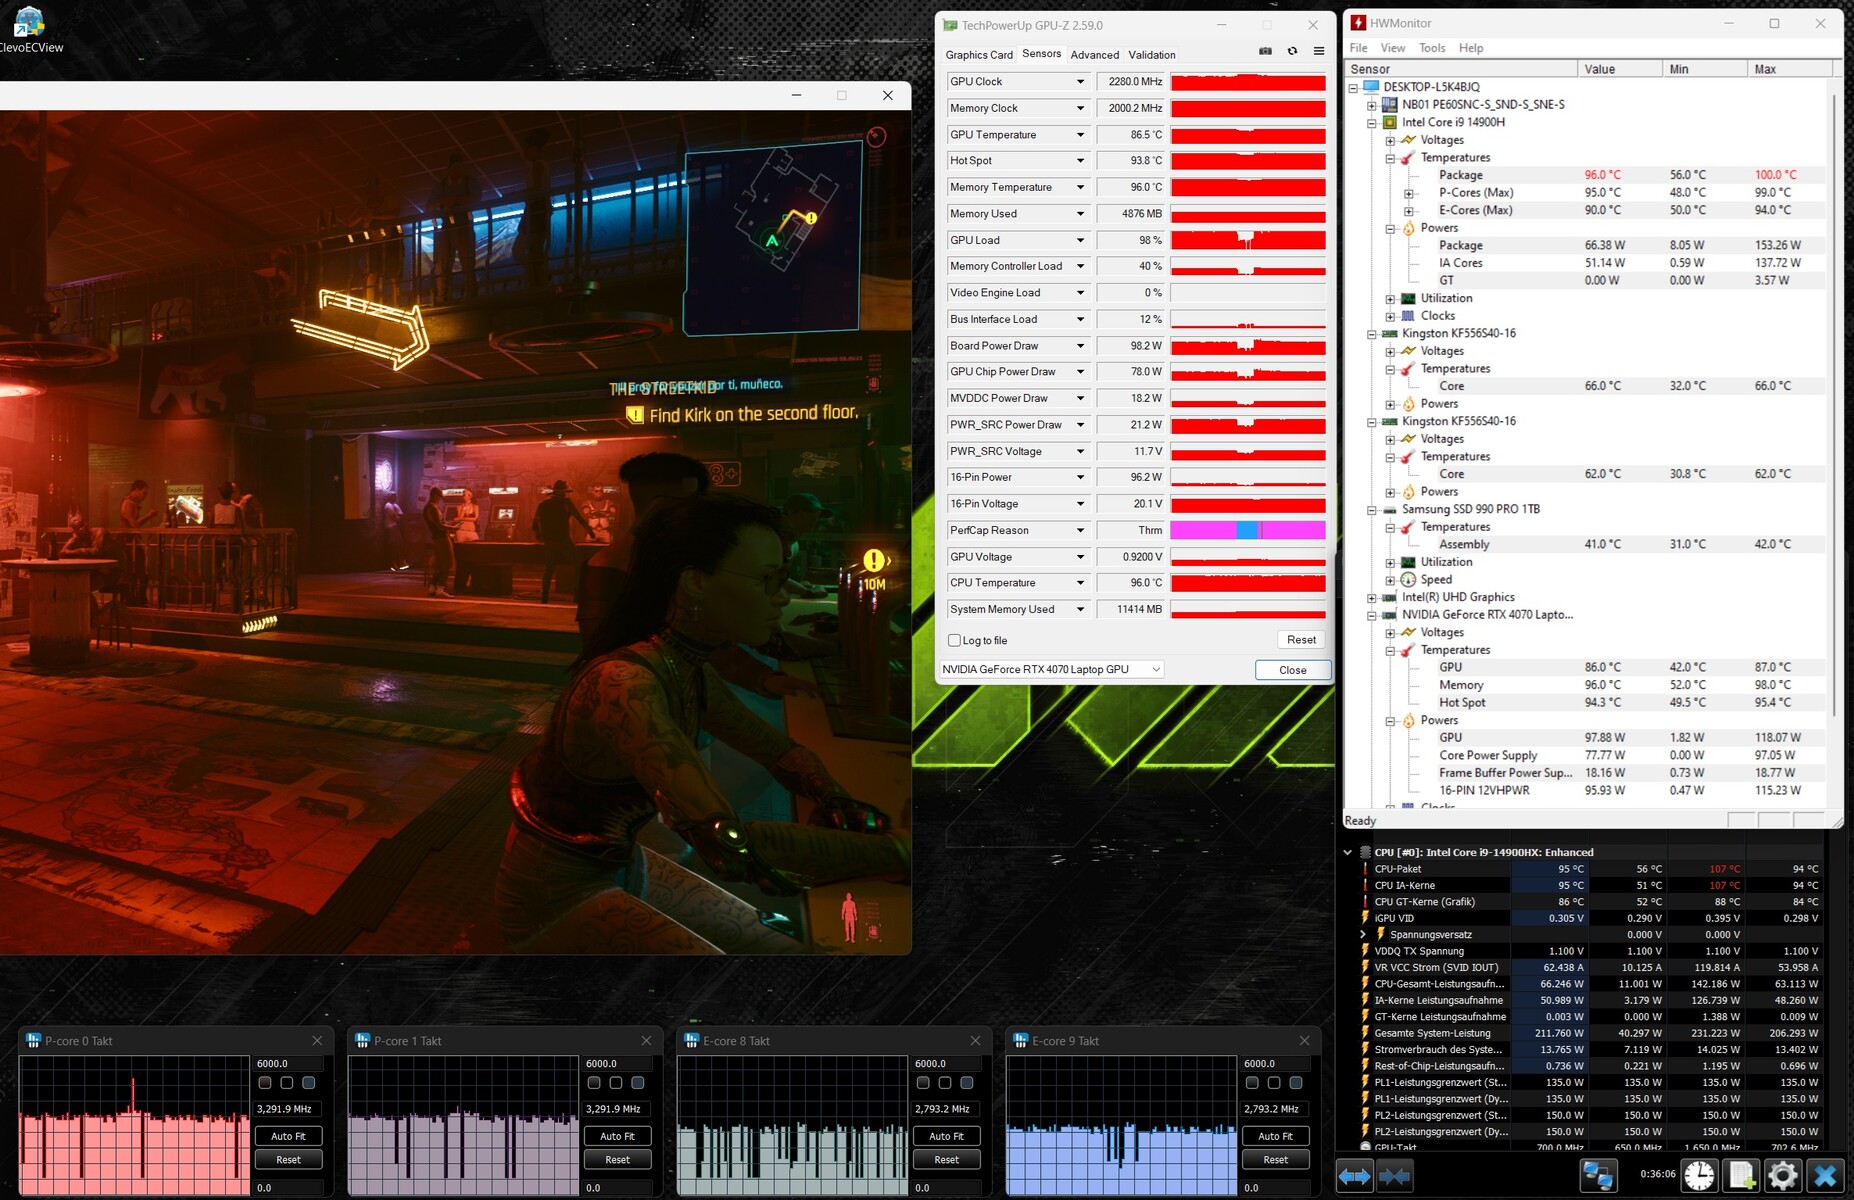
O Core i9-14900HX (Raptor Lake) é usado em todas as variantes de configuração do Pro 16. Seus 24 núcleos (8P + 16E) podem processar um total de 32 threads. Uma surpresa: Mesmo quando o modo de desempenho está ativo, o processador não pode trabalhar com potência máxima o tempo todo. A carga contínua de vários threads (CB15 Loop) fez com que o clock da CPU caísse significativamente da primeira à quinta execução. Depois disso, a curva se estabilizou. Seus resultados de benchmark estão abaixo da média anterior da CPU.
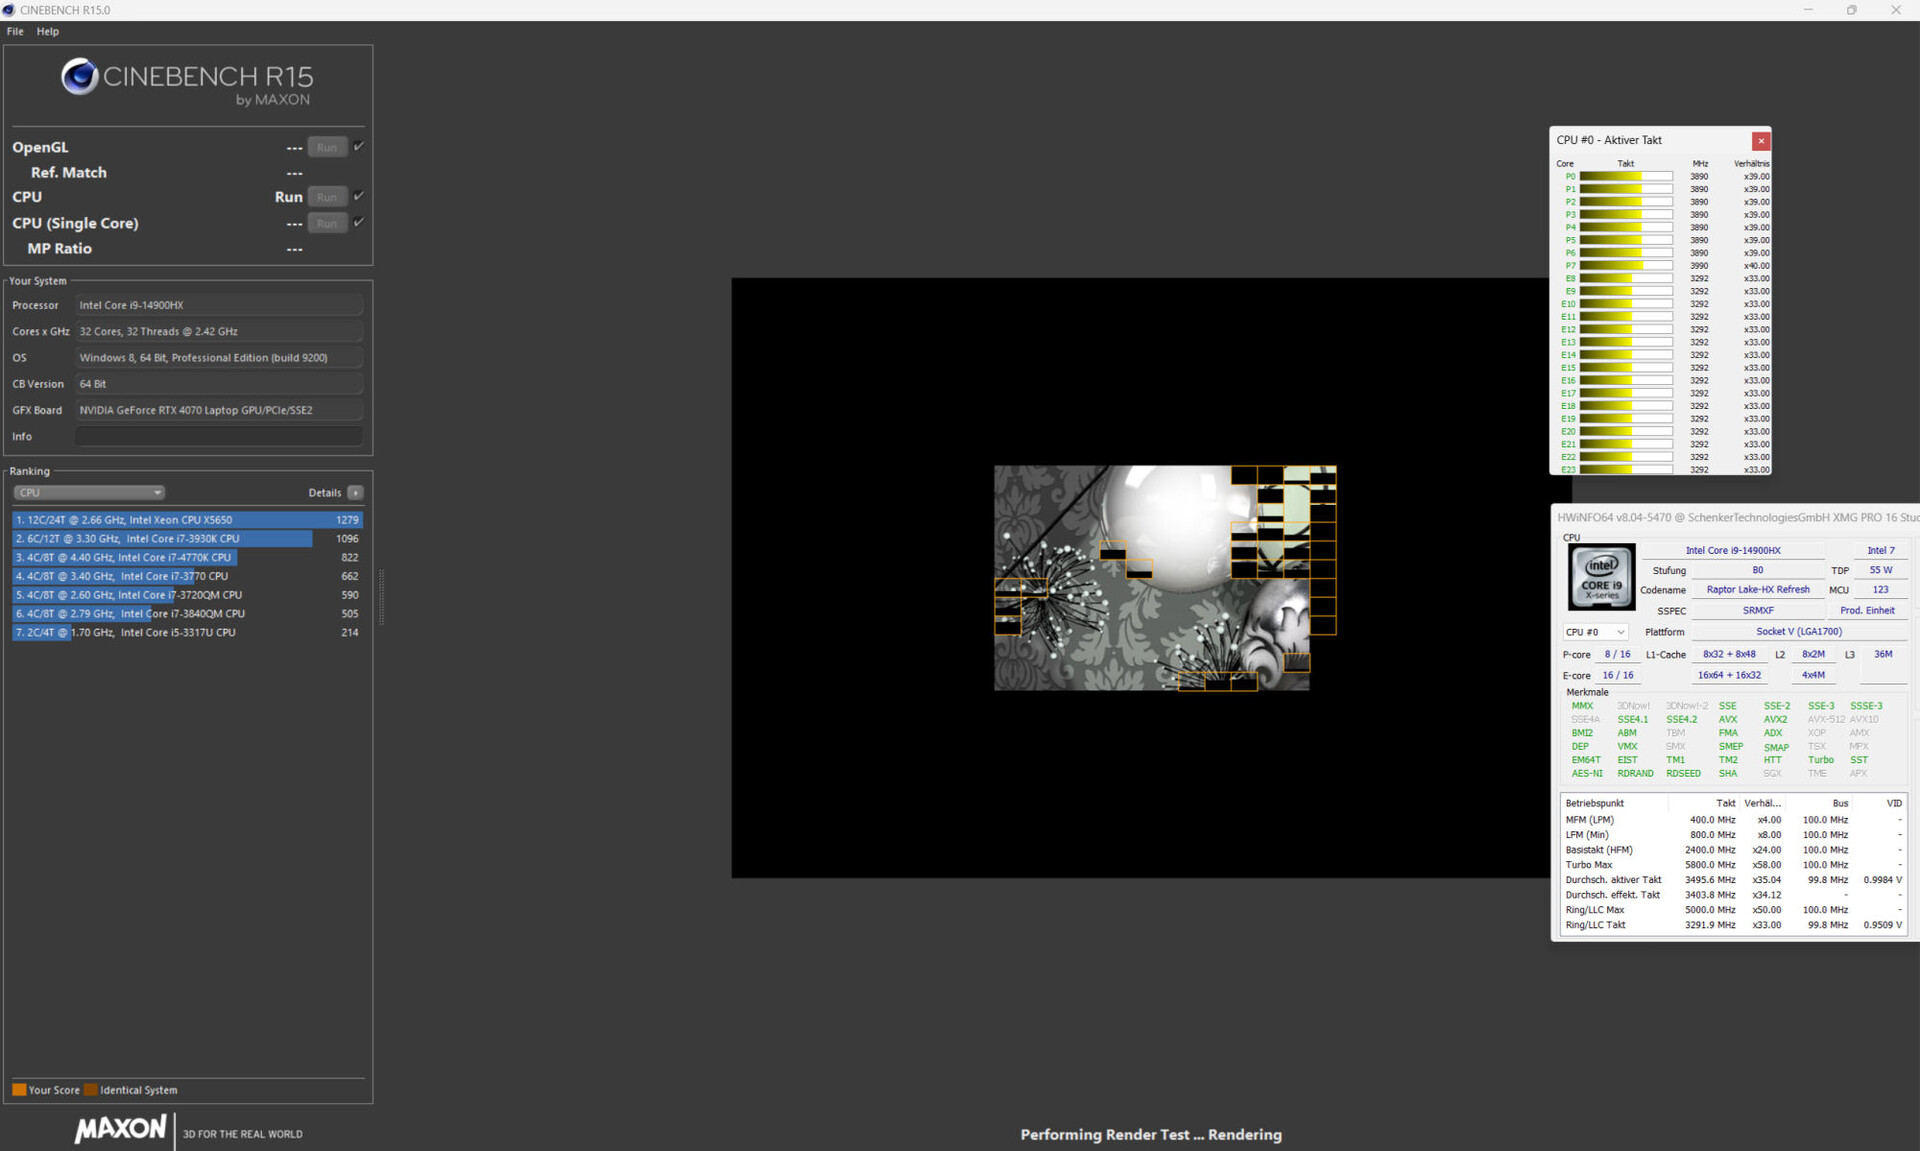
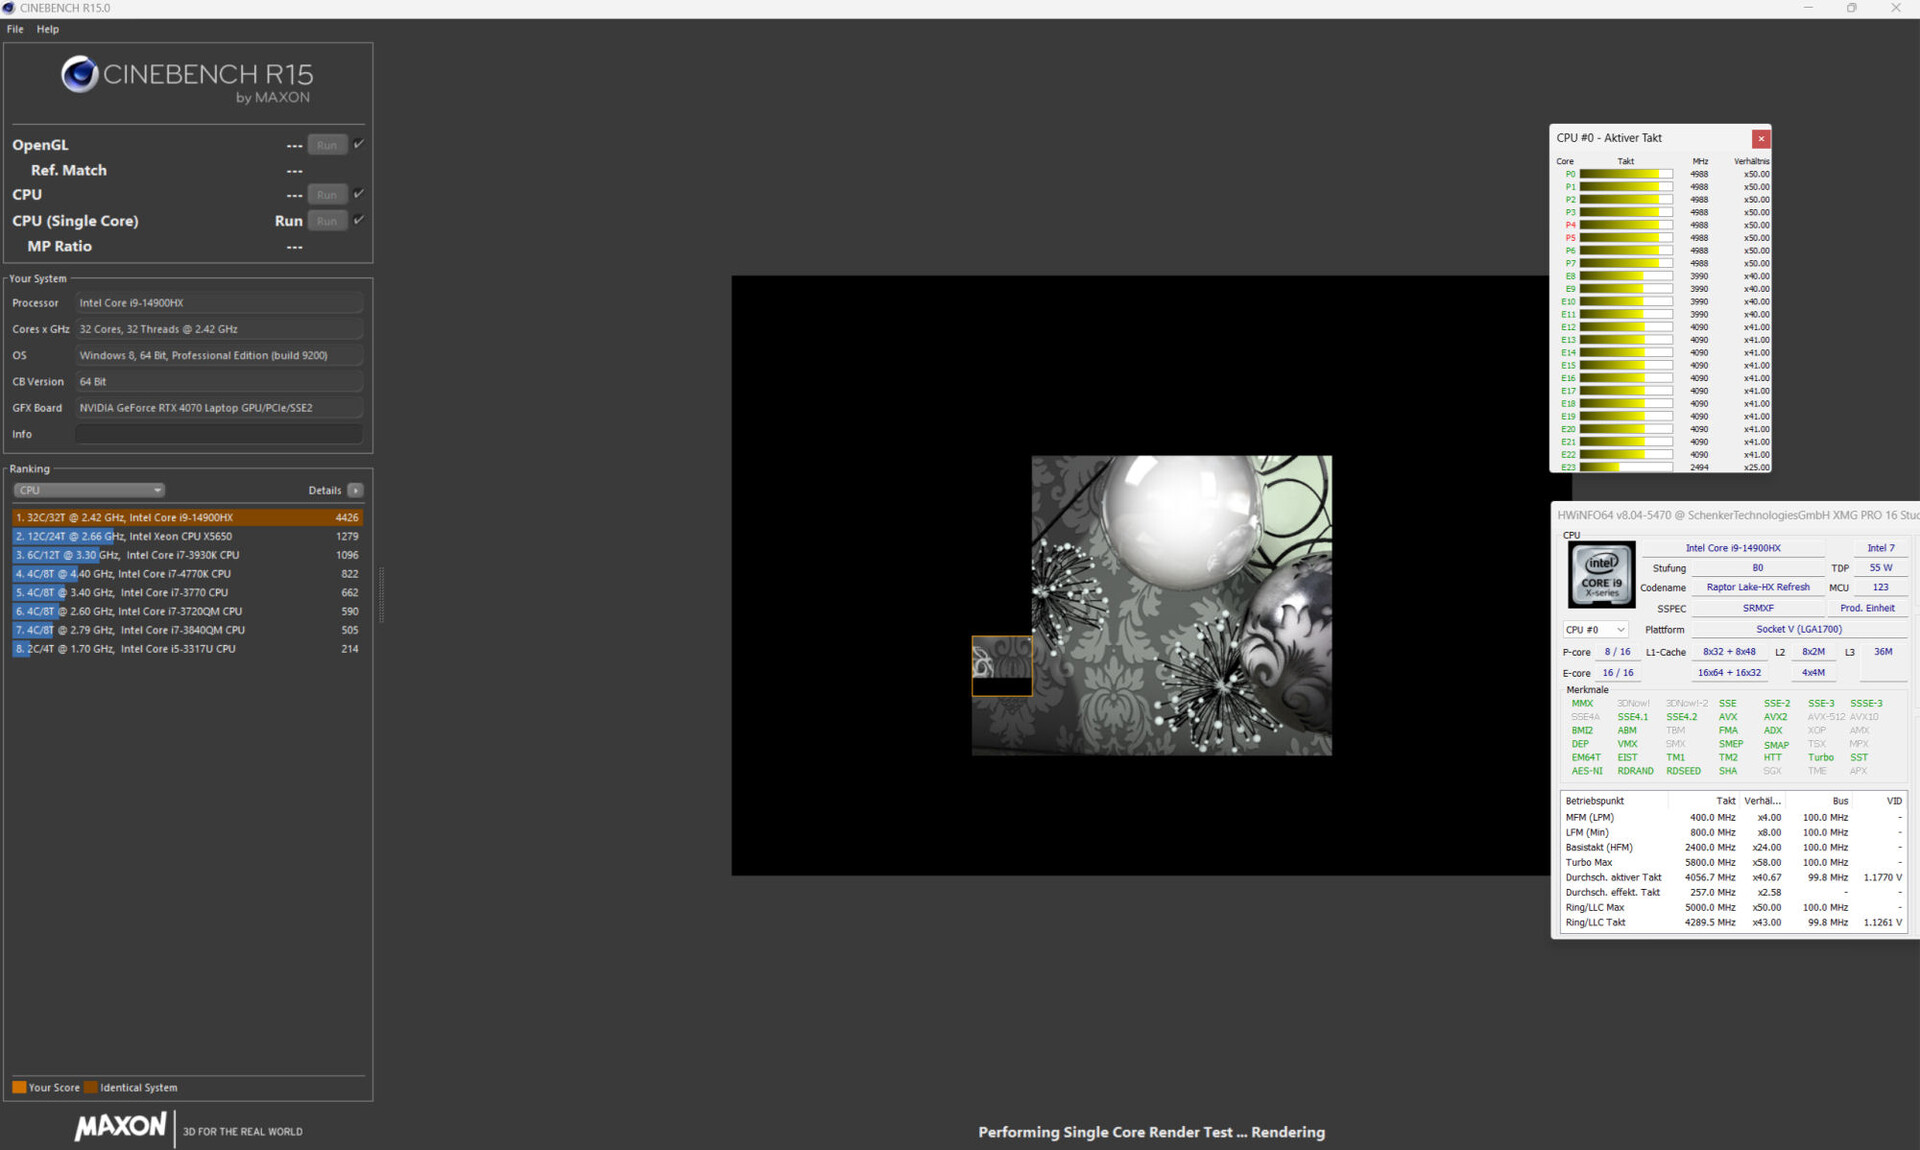
Cinebench R15 Multi continuous test
* ... menor é melhor
AIDA64: FP32 Ray-Trace | FPU Julia | CPU SHA3 | CPU Queen | FPU SinJulia | FPU Mandel | CPU AES | CPU ZLib | FP64 Ray-Trace | CPU PhotoWorxx
| Performance Rating | |
| Lenovo Legion Pro 5 16IRX9 | |
| Média Intel Core i9-14900HX | |
| Aorus 16X 2024 | |
| Lenovo Legion 7 16 IRX G9 | |
| SCHENKER XMG Pro 16 Studio (Mid 24) | |
| Acer Predator Helios Neo 16 (2024) | |
| Média da turma Gaming | |
| SCHENKER XMG Pro 16 Studio (Mid 23) | |
| AIDA64 / FP32 Ray-Trace | |
| Lenovo Legion 7 16 IRX G9 | |
| Lenovo Legion Pro 5 16IRX9 | |
| Média Intel Core i9-14900HX (13098 - 33474, n=36) | |
| Aorus 16X 2024 | |
| Média da turma Gaming (4986 - 81639, n=147, últimos 2 anos) | |
| Acer Predator Helios Neo 16 (2024) | |
| SCHENKER XMG Pro 16 Studio (Mid 24) | |
| SCHENKER XMG Pro 16 Studio (Mid 23) | |
| AIDA64 / FPU Julia | |
| Lenovo Legion Pro 5 16IRX9 | |
| Média Intel Core i9-14900HX (67573 - 166040, n=36) | |
| Lenovo Legion 7 16 IRX G9 | |
| Aorus 16X 2024 | |
| SCHENKER XMG Pro 16 Studio (Mid 24) | |
| Acer Predator Helios Neo 16 (2024) | |
| Média da turma Gaming (25360 - 252486, n=147, últimos 2 anos) | |
| SCHENKER XMG Pro 16 Studio (Mid 23) | |
| AIDA64 / CPU SHA3 | |
| Lenovo Legion Pro 5 16IRX9 | |
| Média Intel Core i9-14900HX (3589 - 7979, n=36) | |
| Aorus 16X 2024 | |
| Lenovo Legion 7 16 IRX G9 | |
| SCHENKER XMG Pro 16 Studio (Mid 24) | |
| Acer Predator Helios Neo 16 (2024) | |
| Média da turma Gaming (1339 - 10389, n=147, últimos 2 anos) | |
| SCHENKER XMG Pro 16 Studio (Mid 23) | |
| AIDA64 / CPU Queen | |
| Acer Predator Helios Neo 16 (2024) | |
| Lenovo Legion Pro 5 16IRX9 | |
| Lenovo Legion 7 16 IRX G9 | |
| Aorus 16X 2024 | |
| Média Intel Core i9-14900HX (118405 - 148966, n=36) | |
| SCHENKER XMG Pro 16 Studio (Mid 24) | |
| Média da turma Gaming (50699 - 200651, n=147, últimos 2 anos) | |
| SCHENKER XMG Pro 16 Studio (Mid 23) | |
| AIDA64 / FPU SinJulia | |
| Lenovo Legion Pro 5 16IRX9 | |
| Média Intel Core i9-14900HX (10475 - 18517, n=36) | |
| Aorus 16X 2024 | |
| Lenovo Legion 7 16 IRX G9 | |
| SCHENKER XMG Pro 16 Studio (Mid 24) | |
| Acer Predator Helios Neo 16 (2024) | |
| Média da turma Gaming (4800 - 32988, n=147, últimos 2 anos) | |
| SCHENKER XMG Pro 16 Studio (Mid 23) | |
| AIDA64 / FPU Mandel | |
| Lenovo Legion Pro 5 16IRX9 | |
| Média Intel Core i9-14900HX (32543 - 83662, n=36) | |
| Aorus 16X 2024 | |
| Acer Predator Helios Neo 16 (2024) | |
| Média da turma Gaming (12321 - 134044, n=147, últimos 2 anos) | |
| SCHENKER XMG Pro 16 Studio (Mid 24) | |
| Lenovo Legion 7 16 IRX G9 | |
| SCHENKER XMG Pro 16 Studio (Mid 23) | |
| AIDA64 / CPU AES | |
| SCHENKER XMG Pro 16 Studio (Mid 23) | |
| Média Intel Core i9-14900HX (86964 - 241777, n=36) | |
| Lenovo Legion Pro 5 16IRX9 | |
| Aorus 16X 2024 | |
| Lenovo Legion 7 16 IRX G9 | |
| SCHENKER XMG Pro 16 Studio (Mid 24) | |
| Média da turma Gaming (19065 - 328679, n=147, últimos 2 anos) | |
| Acer Predator Helios Neo 16 (2024) | |
| AIDA64 / CPU ZLib | |
| Lenovo Legion Pro 5 16IRX9 | |
| Média Intel Core i9-14900HX (1054 - 2292, n=36) | |
| Aorus 16X 2024 | |
| SCHENKER XMG Pro 16 Studio (Mid 24) | |
| Lenovo Legion 7 16 IRX G9 | |
| Acer Predator Helios Neo 16 (2024) | |
| Média da turma Gaming (373 - 2531, n=147, últimos 2 anos) | |
| SCHENKER XMG Pro 16 Studio (Mid 23) | |
| AIDA64 / FP64 Ray-Trace | |
| Lenovo Legion Pro 5 16IRX9 | |
| Média Intel Core i9-14900HX (6809 - 18349, n=36) | |
| Lenovo Legion 7 16 IRX G9 | |
| Aorus 16X 2024 | |
| Média da turma Gaming (2540 - 43430, n=147, últimos 2 anos) | |
| SCHENKER XMG Pro 16 Studio (Mid 24) | |
| Acer Predator Helios Neo 16 (2024) | |
| SCHENKER XMG Pro 16 Studio (Mid 23) | |
| AIDA64 / CPU PhotoWorxx | |
| Lenovo Legion Pro 5 16IRX9 | |
| Aorus 16X 2024 | |
| SCHENKER XMG Pro 16 Studio (Mid 24) | |
| Lenovo Legion 7 16 IRX G9 | |
| SCHENKER XMG Pro 16 Studio (Mid 23) | |
| Média Intel Core i9-14900HX (23903 - 54702, n=36) | |
| Acer Predator Helios Neo 16 (2024) | |
| Média da turma Gaming (10805 - 60161, n=147, últimos 2 anos) | |
Desempenho do sistema
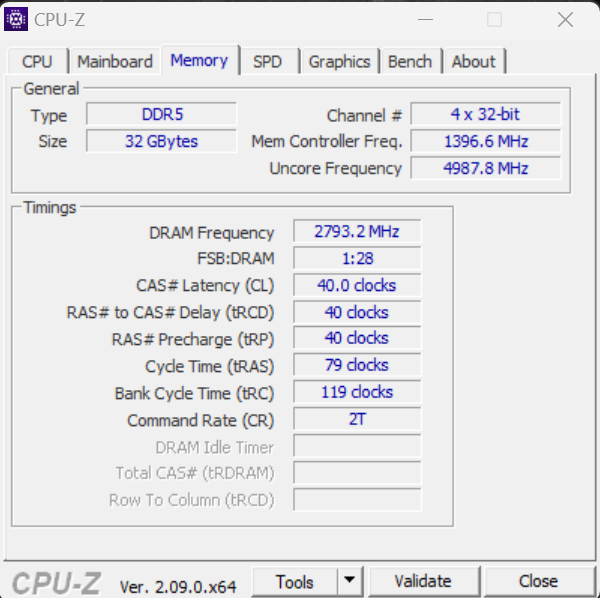
O sistema de funcionamento suave oferece desempenho suficiente para jogos, renderização e streaming, mas o hardware instalado não é capaz de estabelecer novos recordes. As taxas de transferência da RAM estão em um nível normal para a RAM DDR5-5600.

CrossMark: Overall | Productivity | Creativity | Responsiveness
WebXPRT 3: Overall
WebXPRT 4: Overall
Mozilla Kraken 1.1: Total
| PCMark 10 / Score | |
| Lenovo Legion Pro 5 16IRX9 | |
| Aorus 16X 2024 | |
| Acer Predator Helios Neo 16 (2024) | |
| Média Intel Core i9-14900HX, NVIDIA GeForce RTX 4070 Laptop GPU (7768 - 8550, n=8) | |
| SCHENKER XMG Pro 16 Studio (Mid 24) | |
| Lenovo Legion 7 16 IRX G9 | |
| SCHENKER XMG Pro 16 Studio (Mid 23) | |
| Média da turma Gaming (5776 - 9852, n=133, últimos 2 anos) | |
| PCMark 10 / Essentials | |
| SCHENKER XMG Pro 16 Studio (Mid 23) | |
| Acer Predator Helios Neo 16 (2024) | |
| Lenovo Legion Pro 5 16IRX9 | |
| Aorus 16X 2024 | |
| Lenovo Legion 7 16 IRX G9 | |
| Média Intel Core i9-14900HX, NVIDIA GeForce RTX 4070 Laptop GPU (10104 - 11815, n=8) | |
| Média da turma Gaming (9057 - 12600, n=133, últimos 2 anos) | |
| SCHENKER XMG Pro 16 Studio (Mid 24) | |
| PCMark 10 / Productivity | |
| Aorus 16X 2024 | |
| SCHENKER XMG Pro 16 Studio (Mid 24) | |
| Média Intel Core i9-14900HX, NVIDIA GeForce RTX 4070 Laptop GPU (9577 - 11103, n=8) | |
| SCHENKER XMG Pro 16 Studio (Mid 23) | |
| Acer Predator Helios Neo 16 (2024) | |
| Lenovo Legion Pro 5 16IRX9 | |
| Média da turma Gaming (6662 - 14612, n=133, últimos 2 anos) | |
| Lenovo Legion 7 16 IRX G9 | |
| PCMark 10 / Digital Content Creation | |
| Lenovo Legion Pro 5 16IRX9 | |
| Lenovo Legion 7 16 IRX G9 | |
| Média Intel Core i9-14900HX, NVIDIA GeForce RTX 4070 Laptop GPU (12114 - 14827, n=8) | |
| Aorus 16X 2024 | |
| Acer Predator Helios Neo 16 (2024) | |
| SCHENKER XMG Pro 16 Studio (Mid 24) | |
| Média da turma Gaming (6807 - 18475, n=133, últimos 2 anos) | |
| SCHENKER XMG Pro 16 Studio (Mid 23) | |
| CrossMark / Overall | |
| Aorus 16X 2024 | |
| Lenovo Legion 7 16 IRX G9 | |
| Acer Predator Helios Neo 16 (2024) | |
| Média Intel Core i9-14900HX, NVIDIA GeForce RTX 4070 Laptop GPU (2002 - 2312, n=7) | |
| SCHENKER XMG Pro 16 Studio (Mid 24) | |
| Lenovo Legion Pro 5 16IRX9 | |
| SCHENKER XMG Pro 16 Studio (Mid 23) | |
| Média da turma Gaming (1247 - 2344, n=114, últimos 2 anos) | |
| CrossMark / Productivity | |
| Aorus 16X 2024 | |
| Lenovo Legion 7 16 IRX G9 | |
| Acer Predator Helios Neo 16 (2024) | |
| Média Intel Core i9-14900HX, NVIDIA GeForce RTX 4070 Laptop GPU (1827 - 2191, n=7) | |
| SCHENKER XMG Pro 16 Studio (Mid 24) | |
| SCHENKER XMG Pro 16 Studio (Mid 23) | |
| Lenovo Legion Pro 5 16IRX9 | |
| Média da turma Gaming (1299 - 2204, n=114, últimos 2 anos) | |
| CrossMark / Creativity | |
| Aorus 16X 2024 | |
| Acer Predator Helios Neo 16 (2024) | |
| Lenovo Legion 7 16 IRX G9 | |
| SCHENKER XMG Pro 16 Studio (Mid 24) | |
| Média Intel Core i9-14900HX, NVIDIA GeForce RTX 4070 Laptop GPU (2258 - 2458, n=7) | |
| Lenovo Legion Pro 5 16IRX9 | |
| Média da turma Gaming (1275 - 2660, n=114, últimos 2 anos) | |
| SCHENKER XMG Pro 16 Studio (Mid 23) | |
| CrossMark / Responsiveness | |
| Lenovo Legion 7 16 IRX G9 | |
| Aorus 16X 2024 | |
| Média Intel Core i9-14900HX, NVIDIA GeForce RTX 4070 Laptop GPU (1734 - 2330, n=7) | |
| Acer Predator Helios Neo 16 (2024) | |
| SCHENKER XMG Pro 16 Studio (Mid 23) | |
| Lenovo Legion Pro 5 16IRX9 | |
| SCHENKER XMG Pro 16 Studio (Mid 24) | |
| Média da turma Gaming (1030 - 2330, n=114, últimos 2 anos) | |
| WebXPRT 3 / Overall | |
| Lenovo Legion 7 16 IRX G9 | |
| Aorus 16X 2024 | |
| Acer Predator Helios Neo 16 (2024) | |
| Lenovo Legion Pro 5 16IRX9 | |
| Média Intel Core i9-14900HX, NVIDIA GeForce RTX 4070 Laptop GPU (269 - 342, n=8) | |
| SCHENKER XMG Pro 16 Studio (Mid 23) | |
| SCHENKER XMG Pro 16 Studio (Mid 24) | |
| Média da turma Gaming (215 - 480, n=127, últimos 2 anos) | |
| WebXPRT 4 / Overall | |
| Acer Predator Helios Neo 16 (2024) | |
| SCHENKER XMG Pro 16 Studio (Mid 24) | |
| Média Intel Core i9-14900HX, NVIDIA GeForce RTX 4070 Laptop GPU (291 - 304, n=6) | |
| Lenovo Legion 7 16 IRX G9 | |
| Lenovo Legion Pro 5 16IRX9 | |
| Média da turma Gaming (176.4 - 335, n=115, últimos 2 anos) | |
| Mozilla Kraken 1.1 / Total | |
| SCHENKER XMG Pro 16 Studio (Mid 23) | |
| Média da turma Gaming (409 - 674, n=139, últimos 2 anos) | |
| SCHENKER XMG Pro 16 Studio (Mid 24) | |
| Lenovo Legion Pro 5 16IRX9 | |
| Média Intel Core i9-14900HX, NVIDIA GeForce RTX 4070 Laptop GPU (431 - 469, n=8) | |
| Acer Predator Helios Neo 16 (2024) | |
| Lenovo Legion 7 16 IRX G9 | |
| Aorus 16X 2024 | |
* ... menor é melhor
| PCMark 10 Score | 8166 pontos | |
Ajuda | ||
| AIDA64 / Memory Copy | |
| Lenovo Legion Pro 5 16IRX9 | |
| Lenovo Legion 7 16 IRX G9 | |
| Aorus 16X 2024 | |
| SCHENKER XMG Pro 16 Studio (Mid 24) | |
| Acer Predator Helios Neo 16 (2024) | |
| Média Intel Core i9-14900HX (38028 - 83392, n=36) | |
| SCHENKER XMG Pro 16 Studio (Mid 23) | |
| Média da turma Gaming (21750 - 97515, n=147, últimos 2 anos) | |
| AIDA64 / Memory Read | |
| Aorus 16X 2024 | |
| Lenovo Legion Pro 5 16IRX9 | |
| Lenovo Legion 7 16 IRX G9 | |
| SCHENKER XMG Pro 16 Studio (Mid 24) | |
| Acer Predator Helios Neo 16 (2024) | |
| Média Intel Core i9-14900HX (43306 - 87568, n=36) | |
| SCHENKER XMG Pro 16 Studio (Mid 23) | |
| Média da turma Gaming (22956 - 102937, n=147, últimos 2 anos) | |
| AIDA64 / Memory Write | |
| Aorus 16X 2024 | |
| Lenovo Legion Pro 5 16IRX9 | |
| Lenovo Legion 7 16 IRX G9 | |
| SCHENKER XMG Pro 16 Studio (Mid 24) | |
| Média Intel Core i9-14900HX (37146 - 80589, n=36) | |
| SCHENKER XMG Pro 16 Studio (Mid 23) | |
| Acer Predator Helios Neo 16 (2024) | |
| Média da turma Gaming (22297 - 108954, n=147, últimos 2 anos) | |
| AIDA64 / Memory Latency | |
| Média da turma Gaming (59.5 - 259, n=147, últimos 2 anos) | |
| Acer Predator Helios Neo 16 (2024) | |
| SCHENKER XMG Pro 16 Studio (Mid 23) | |
| Média Intel Core i9-14900HX (76.1 - 105, n=36) | |
| SCHENKER XMG Pro 16 Studio (Mid 24) | |
| Lenovo Legion 7 16 IRX G9 | |
| Lenovo Legion Pro 5 16IRX9 | |
| Aorus 16X 2024 | |
* ... menor é melhor
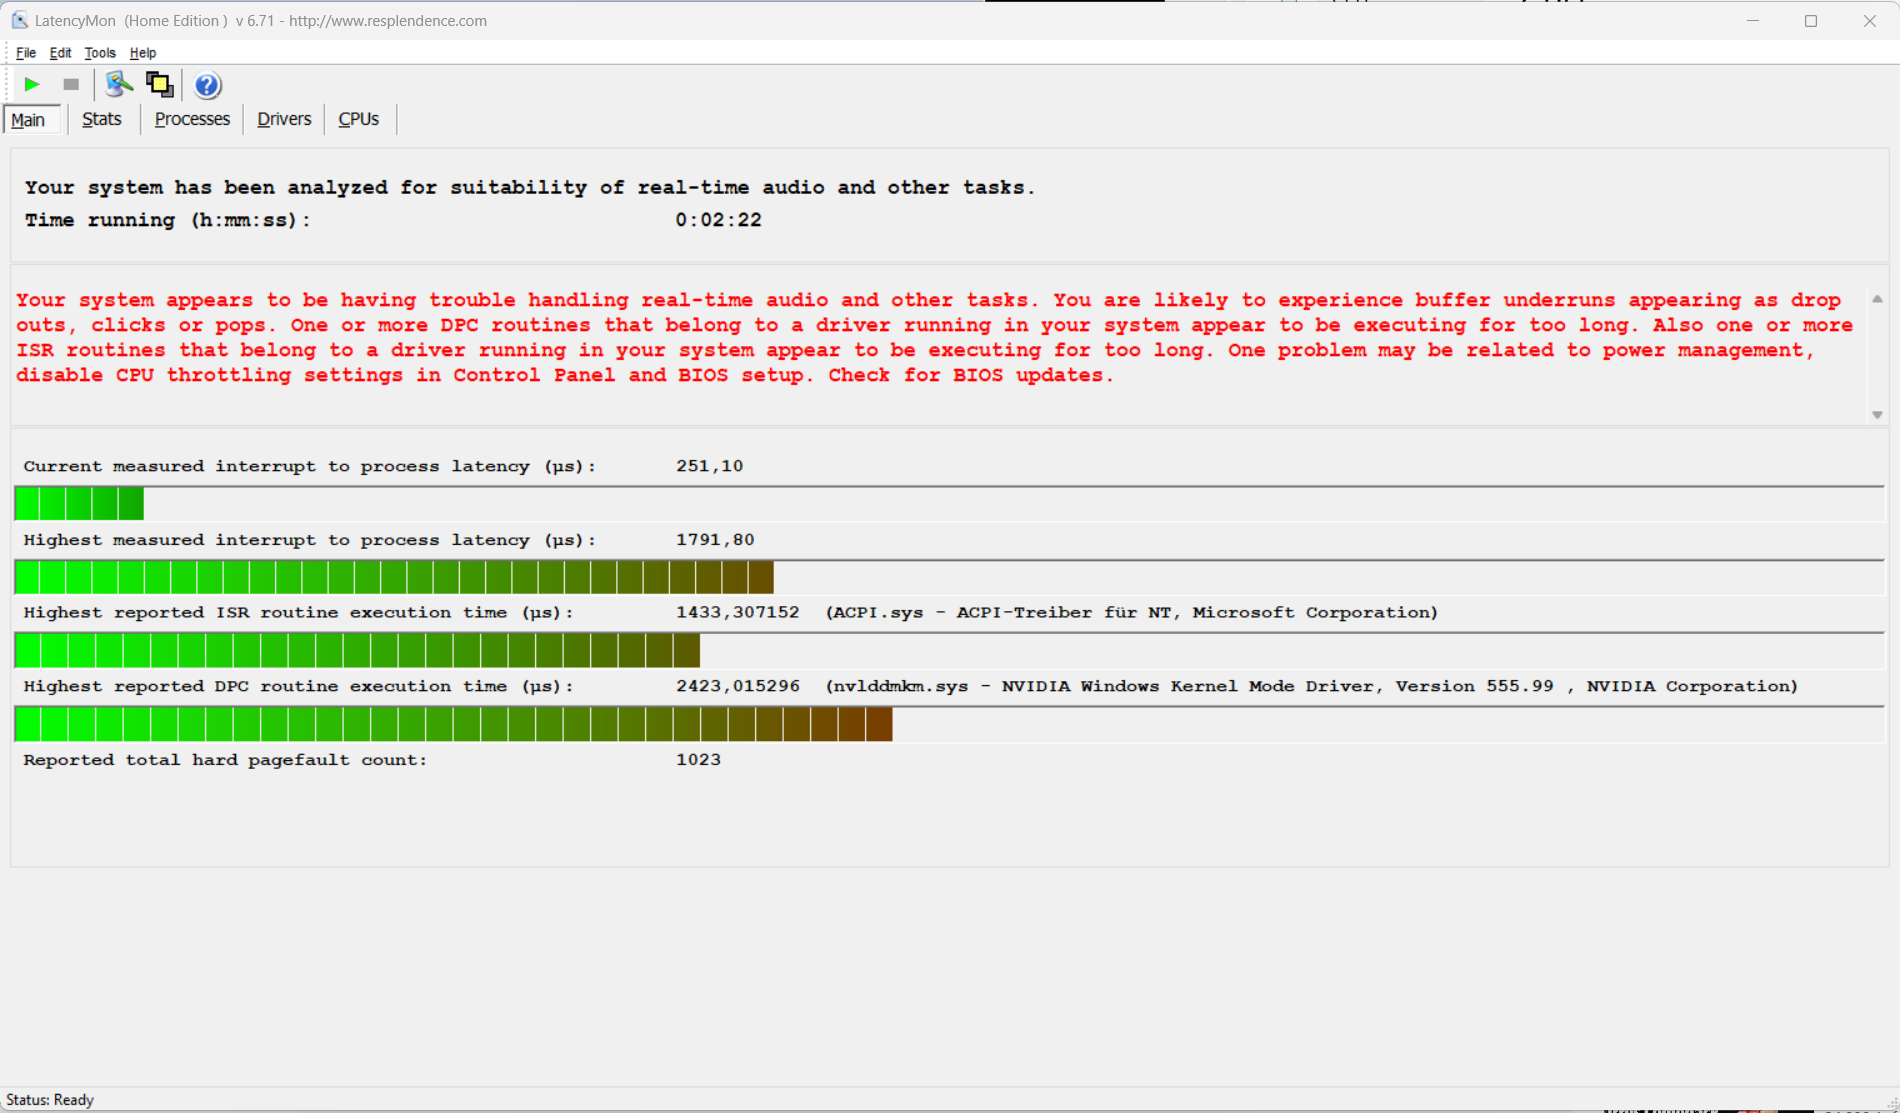
Latências de DPC
Devido às latências relativamente altas do laptop, não se pretende fazer edição de vídeo e áudio em tempo real. Entretanto, futuras atualizações de software podem levar a mudanças nesse aspecto.
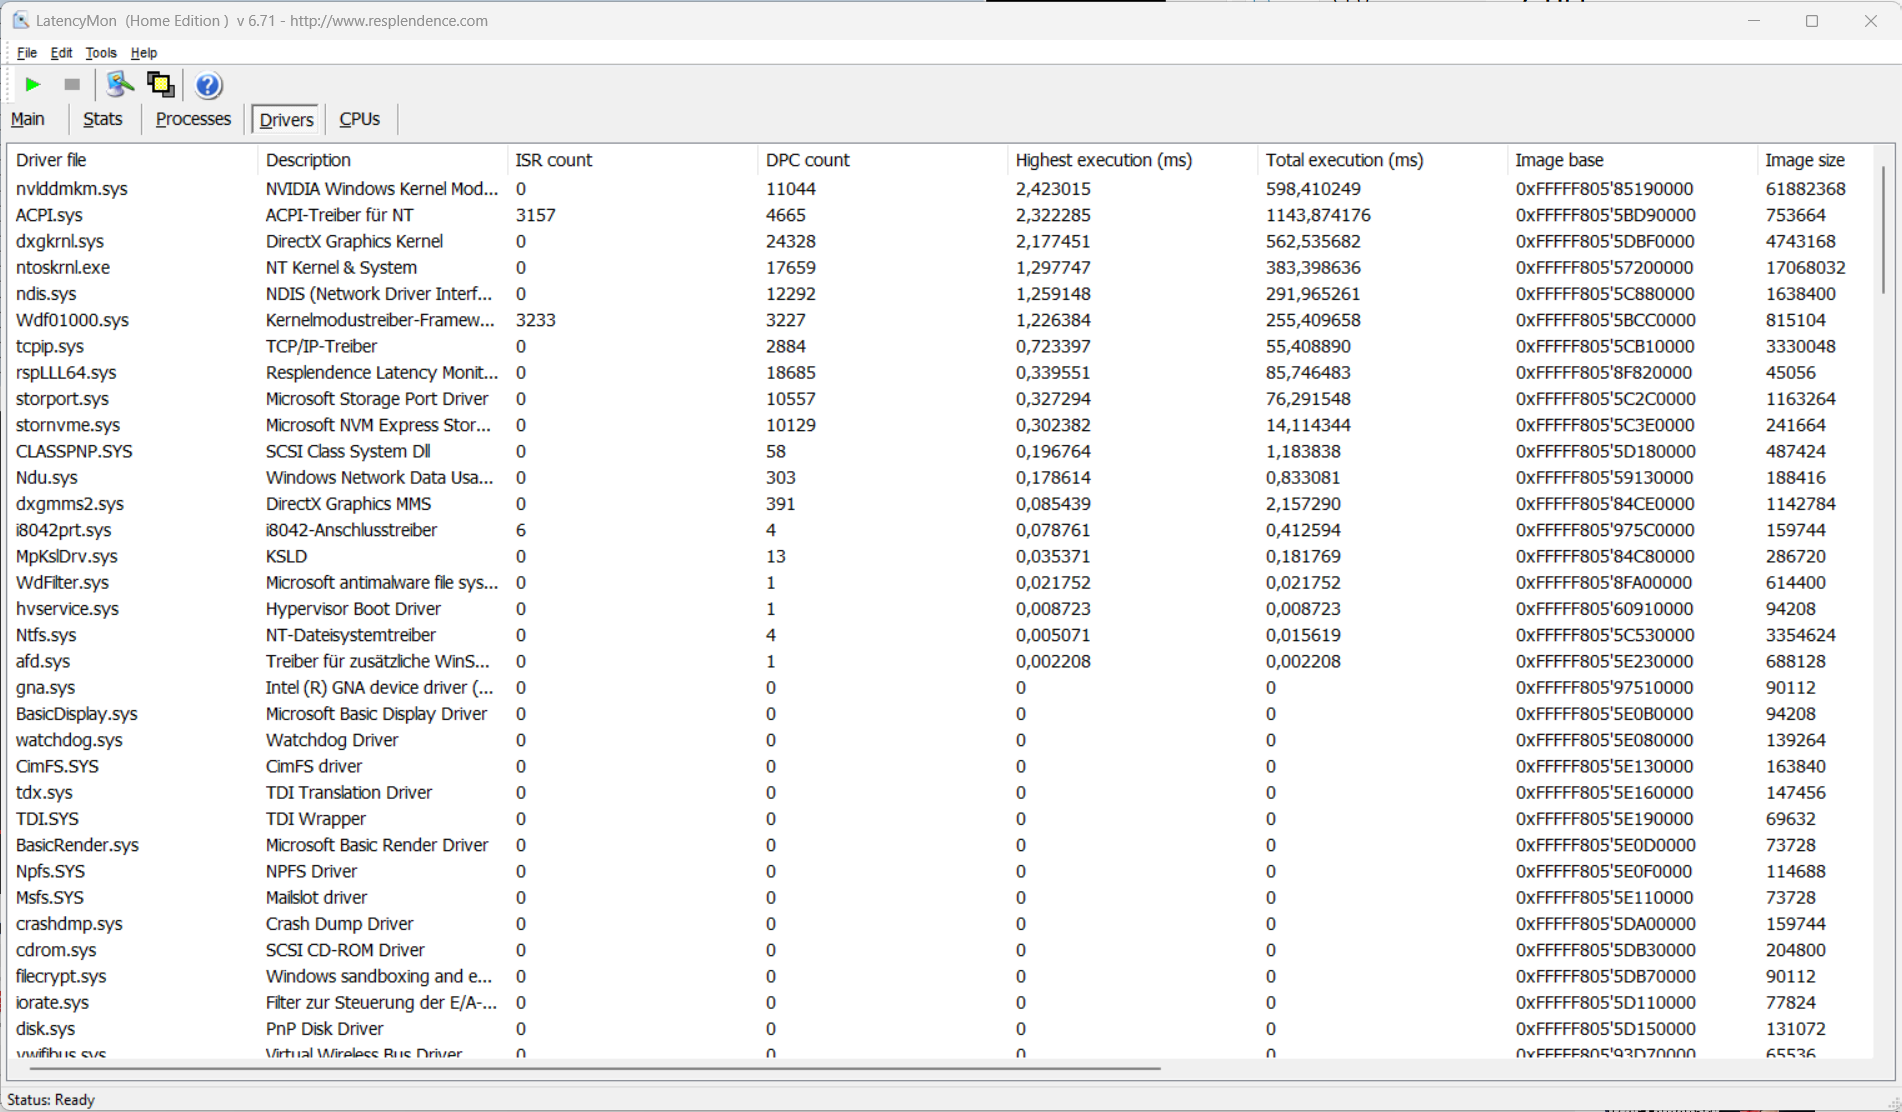
| DPC Latencies / LatencyMon - interrupt to process latency (max), Web, Youtube, Prime95 | |
| SCHENKER XMG Pro 16 Studio (Mid 23) | |
| SCHENKER XMG Pro 16 Studio (Mid 24) | |
| Lenovo Legion 7 16 IRX G9 | |
| Acer Predator Helios Neo 16 (2024) | |
| Aorus 16X 2024 | |
| Lenovo Legion Pro 5 16IRX9 | |
* ... menor é melhor
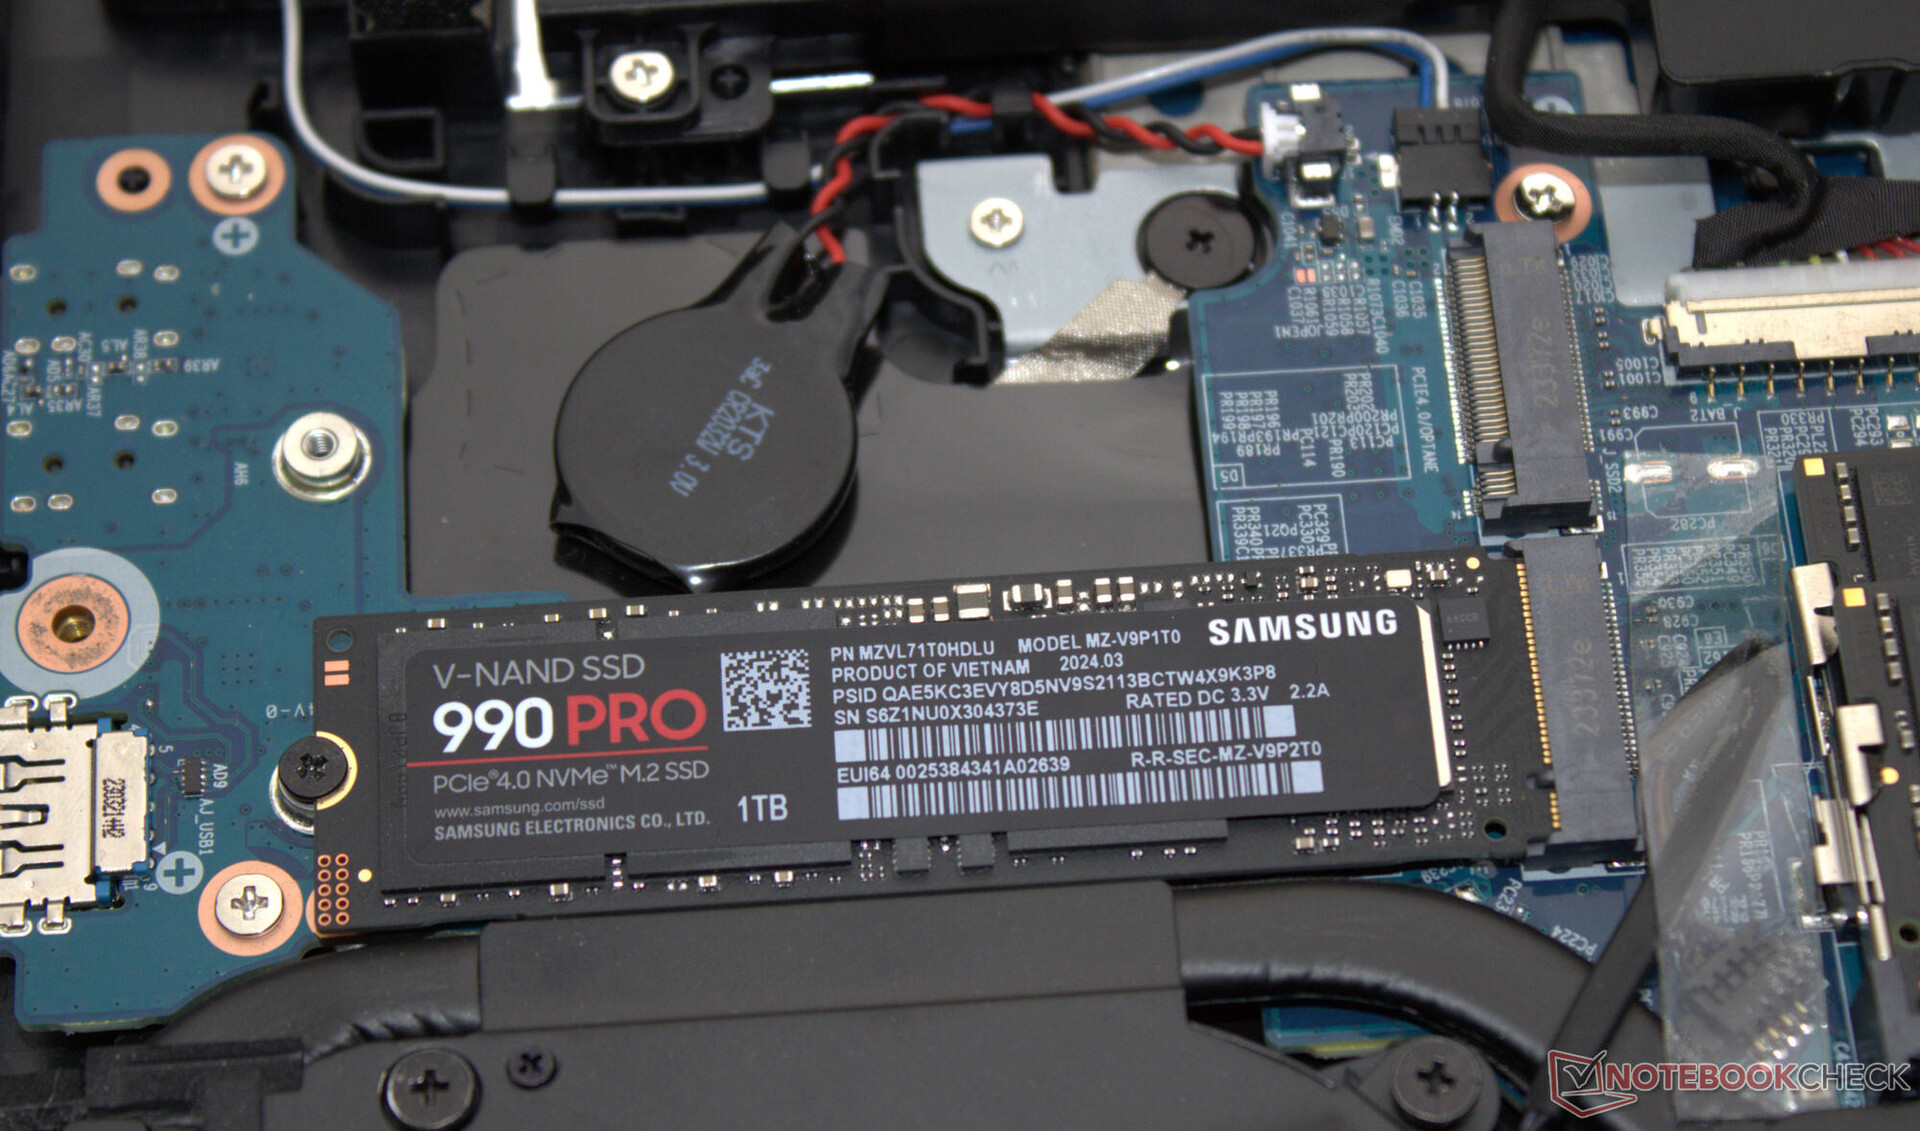
Dispositivos de armazenamento
A loja on-line da Schenker tem uma variedade de SSDs para o senhor escolher - nosso dispositivo de teste apresenta um modelo extremamente rápido (1 TB, PCIe 4, M.2-2280) da Samsung. Pontos positivos: Não houve estrangulamento induzido por calor. O laptop pode acomodar até dois SSDs PCIe 4 (M.2-2280). Há suporte para RAID-0/1.

* ... menor é melhor
Reading continuous performance: DiskSpd Read Loop, Queue Depth 8
Placa de vídeo
Os jogos em QHD com configurações altas ou máximas não são problema para a GeForce RTX 4070 (TGP: 140 watts): Ela oferece taxas de quadros (e resultados de benchmark) ligeiramente acima da média da GPU. Um pouco apertado para os requisitos atuais: A GPU tem apenas 8 GB de VRAM (GDDR6) à sua disposição. A alternância entre dGPU e Optimus requer uma reinicialização.
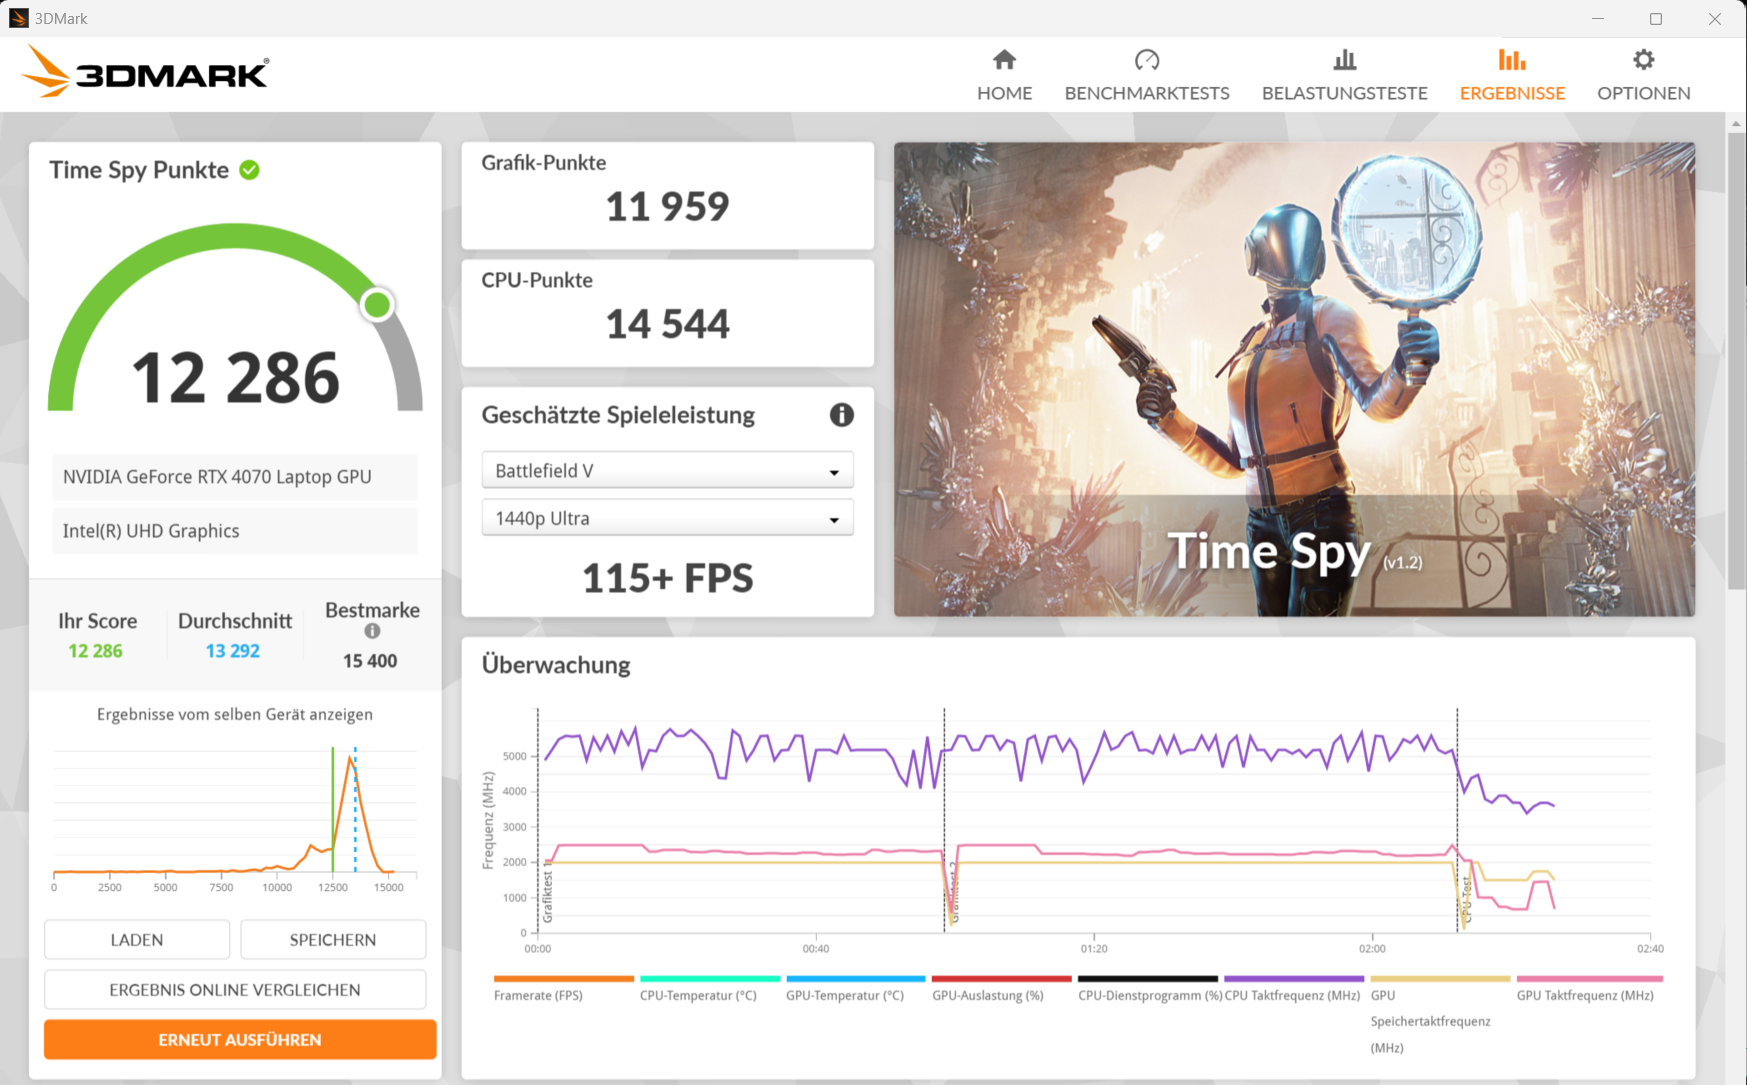

| 3DMark 11 Performance | 34173 pontos | |
| 3DMark Fire Strike Score | 23584 pontos | |
| 3DMark Time Spy Score | 12286 pontos | |
| 3DMark Steel Nomad Score | 2598 pontos | |
Ajuda | ||
* ... menor é melhor
| Cyberpunk 2077 2.2 Phantom Liberty - 1920x1080 Ultra Preset (FSR off) | |
| Média da turma Gaming (6.76 - 158, n=90, últimos 2 anos) | |
| SCHENKER XMG Pro 16 Studio (Mid 23) | |
| Lenovo Legion Pro 5 16IRX9 | |
| Lenovo Legion 7 16 IRX G9 | |
| Acer Predator Helios Neo 16 (2024) | |
| SCHENKER XMG Pro 16 Studio (Mid 24) | |
| Média NVIDIA GeForce RTX 4070 Laptop GPU (30.7 - 90.7, n=38) | |
| Aorus 16X 2024 | |
| GTA V - 1920x1080 Highest Settings possible AA:4xMSAA + FX AF:16x | |
| Acer Predator Helios Neo 16 (2024) | |
| Lenovo Legion Pro 5 16IRX9 | |
| SCHENKER XMG Pro 16 Studio (Mid 24) | |
| SCHENKER XMG Pro 16 Studio (Mid 23) | |
| Lenovo Legion 7 16 IRX G9 | |
| Média da turma Gaming (12.1 - 168.2, n=132, últimos 2 anos) | |
| Média NVIDIA GeForce RTX 4070 Laptop GPU (48.3 - 141.6, n=62) | |
| Aorus 16X 2024 | |
| Dragon's Dogma 2 | |
| 1920x1080 High Preset | |
| SCHENKER XMG Pro 16 Studio (Mid 24) | |
| Média NVIDIA GeForce RTX 4070 Laptop GPU (61.3 - 80, n=5) | |
| Média da turma Gaming (49.5 - 80, n=8, últimos 2 anos) | |
| 2560x1440 High Preset | |
| SCHENKER XMG Pro 16 Studio (Mid 24) | |
| Média NVIDIA GeForce RTX 4070 Laptop GPU (47.7 - 61.3, n=5) | |
| Média da turma Gaming (34.6 - 61.3, n=5, últimos 2 anos) | |
| Senua's Saga Hellblade 2 | |
| 1920x1080 High Preset | |
| Média da turma Gaming (38.4 - 78.8, n=6, últimos 2 anos) | |
| SCHENKER XMG Pro 16 Studio (Mid 24) | |
| Média NVIDIA GeForce RTX 4070 Laptop GPU (34.3 - 51.2, n=4) | |
| 2560x1440 High Preset | |
| Média da turma Gaming (27.1 - 57.3, n=4, últimos 2 anos) | |
| SCHENKER XMG Pro 16 Studio (Mid 24) | |
| Média NVIDIA GeForce RTX 4070 Laptop GPU (23.7 - 33.3, n=4) | |
| 2560x1440 High Preset + Quality DLSS | |
| Média da turma Gaming (42.2 - 83.1, n=3, últimos 2 anos) | |
| SCHENKER XMG Pro 16 Studio (Mid 24) | |
| Média NVIDIA GeForce RTX 4070 Laptop GPU (42.2 - 47.8, n=2) | |
| Ghost of Tsushima | |
| 1920x1080 Very High Preset AA:T | |
| SCHENKER XMG Pro 16 Studio (Mid 24) | |
| Média NVIDIA GeForce RTX 4070 Laptop GPU (55.3 - 73.7, n=5) | |
| Média da turma Gaming (28.5 - 73.7, n=7, últimos 2 anos) | |
| 2560x1440 Very High Preset AA:T | |
| SCHENKER XMG Pro 16 Studio (Mid 24) | |
| Média NVIDIA GeForce RTX 4070 Laptop GPU (43.6 - 56.1, n=5) | |
| Média da turma Gaming (22.7 - 56.1, n=5, últimos 2 anos) | |
| 2560x1440 Very High Preset + Quality DLSS | |
| SCHENKER XMG Pro 16 Studio (Mid 24) | |
| Média da turma Gaming (63.6 - 74.2, n=3, últimos 2 anos) | |
| Média NVIDIA GeForce RTX 4070 Laptop GPU (57 - 74.2, n=3) | |
| The First Descendant | |
| 1920x1080 Ultra Preset | |
| SCHENKER XMG Pro 16 Studio (Mid 24) | |
| Média NVIDIA GeForce RTX 4070 Laptop GPU (73.7 - 83.6, n=5) | |
| Média da turma Gaming (15.4 - 80, n=5, últimos 2 anos) | |
| 2560x1440 Ultra Preset | |
| SCHENKER XMG Pro 16 Studio (Mid 24) | |
| Média NVIDIA GeForce RTX 4070 Laptop GPU (48.2 - 52.5, n=5) | |
| Média da turma Gaming (43.7 - 51.2, n=3, últimos 2 anos) | |
| 2560x1440 Ultra Preset + Ultra Ray Tracing + DLSS Quality | |
| SCHENKER XMG Pro 16 Studio (Mid 24) | |
| Média NVIDIA GeForce RTX 4070 Laptop GPU (48.6 - 51.8, n=2) | |
| Média da turma Gaming (43.3 - 51.8, n=2, últimos 2 anos) | |
| F1 24 | |
| 1920x1080 Ultra High Preset AA:T AF:16x | |
| Média da turma Gaming (54.1 - 148, n=19, últimos 2 anos) | |
| SCHENKER XMG Pro 16 Studio (Mid 24) | |
| Média NVIDIA GeForce RTX 4070 Laptop GPU (58.4 - 78.1, n=9) | |
| 2560x1440 Ultra High Preset AA:T AF:16x | |
| Média da turma Gaming (36.7 - 100, n=16, últimos 2 anos) | |
| SCHENKER XMG Pro 16 Studio (Mid 24) | |
| Média NVIDIA GeForce RTX 4070 Laptop GPU (36.8 - 50.9, n=9) | |
| 2560x1440 Ultra High Preset + Quality DLSS AF:16x | |
| Média da turma Gaming (59.2 - 150.4, n=12, últimos 2 anos) | |
| SCHENKER XMG Pro 16 Studio (Mid 24) | |
| Média NVIDIA GeForce RTX 4070 Laptop GPU (57 - 73.9, n=6) | |
Cyberpunk 2077 ultra FPS diagram
| baixo | média | alto | ultra | QHD DLSS | QHD | |
|---|---|---|---|---|---|---|
| GTA V (2015) | 186.7 | 184.9 | 180.9 | 126 | 95.9 | |
| Dota 2 Reborn (2015) | 231 | 196.2 | 181.6 | 160.8 | ||
| Final Fantasy XV Benchmark (2018) | 214 | 163.6 | 119.7 | 86.8 | ||
| X-Plane 11.11 (2018) | 178 | 147.3 | 119.5 | |||
| Strange Brigade (2018) | 457 | 297 | 236 | 206 | 135.9 | |
| Baldur's Gate 3 (2023) | 171.8 | 132 | 115.3 | 111.8 | 77.2 | |
| Cyberpunk 2077 2.2 Phantom Liberty (2023) | 126.3 | 112.1 | 95.5 | 82.5 | 48.6 | |
| Dragon's Dogma 2 (2024) | 81 | 70.4 | 58.5 | |||
| Ghost of Tsushima (2024) | 114.9 | 102.8 | 93 | 73.7 | 74.2 | 56.1 |
| Senua's Saga Hellblade 2 (2024) | 78.3 | 64.9 | 51.2 | 47.8 | 33.3 | |
| F1 24 (2024) | 239 | 238 | 203 | 70.4 | 45.1 | |
| The First Descendant (2024) | 171 | 110.9 | 91.3 | 80 | 51.2 |
Emissões e potência - O XMG Pro com alto consumo de energia
Emissões de ruído
O Cyberpunk 2077 aumenta as emissões de ruído do laptop para até 53 dB(A)( modode desempenho ), enquanto o perfil de entretenimento produz valores um pouco mais moderados. O modo silencioso não é adequado para jogos, pois a dGPU está desligada. O nível de ruído do dispositivo é menor em marcha lenta e durante o uso diário (escritório, Internet): As ventoinhas não aceleram excessivamente e, ocasionalmente, ficam paradas. Às vezes, um estalo eletrônico pode ser ouvido de dentro do laptop.
Barulho
| Ocioso |
| 28 / 31 / 35 dB |
| Carga |
| 52 / 52 dB |
 | ||
30 dB silencioso 40 dB(A) audível 50 dB(A) ruidosamente alto |
||
min: | ||
| SCHENKER XMG Pro 16 Studio (Mid 24) NVIDIA GeForce RTX 4070 Laptop GPU, i9-14900HX, Samsung 990 Pro 1 TB | Acer Predator Helios Neo 16 (2024) NVIDIA GeForce RTX 4070 Laptop GPU, i7-14700HX, Samsung PM9A1a MZVL21T0HDLU | Lenovo Legion Pro 5 16IRX9 NVIDIA GeForce RTX 4070 Laptop GPU, i9-14900HX, Samsung PM9A1 MZVL21T0HCLR | Aorus 16X 2024 NVIDIA GeForce RTX 4070 Laptop GPU, i9-14900HX, Gigabyte AG450E1024-SI | SCHENKER XMG Pro 16 Studio (Mid 23) NVIDIA GeForce RTX 4070 Laptop GPU, i9-13900H, Samsung 990 Pro 1 TB | Lenovo Legion 7 16 IRX G9 NVIDIA GeForce RTX 4070 Laptop GPU, i9-14900HX, SK Hynix HFS001TEJ9X115N | |
|---|---|---|---|---|---|---|
| Noise | 3% | 10% | -3% | 7% | 16% | |
| desligado / ambiente * | 25 | 25.2 -1% | 23.9 4% | 26 -4% | 25 -0% | 24.5 2% |
| Idle Minimum * | 28 | 27.8 1% | 24.3 13% | 26 7% | 26 7% | 24.5 12% |
| Idle Average * | 31 | 32 -3% | 24.3 22% | 32 -3% | 29 6% | 24.5 21% |
| Idle Maximum * | 35 | 29.6 15% | 28.9 17% | 38 -9% | 34 3% | 24.5 30% |
| Load Average * | 52 | 45.2 13% | 45.8 12% | 54 -4% | 43 17% | 34.8 33% |
| Cyberpunk 2077 ultra * | 53 | |||||
| Load Maximum * | 52 | 55.8 -7% | 56.6 -9% | 55 -6% | 48 8% | 54.1 -4% |
| Witcher 3 ultra * | 51 | 50 | 48 | 54.1 |
* ... menor é melhor
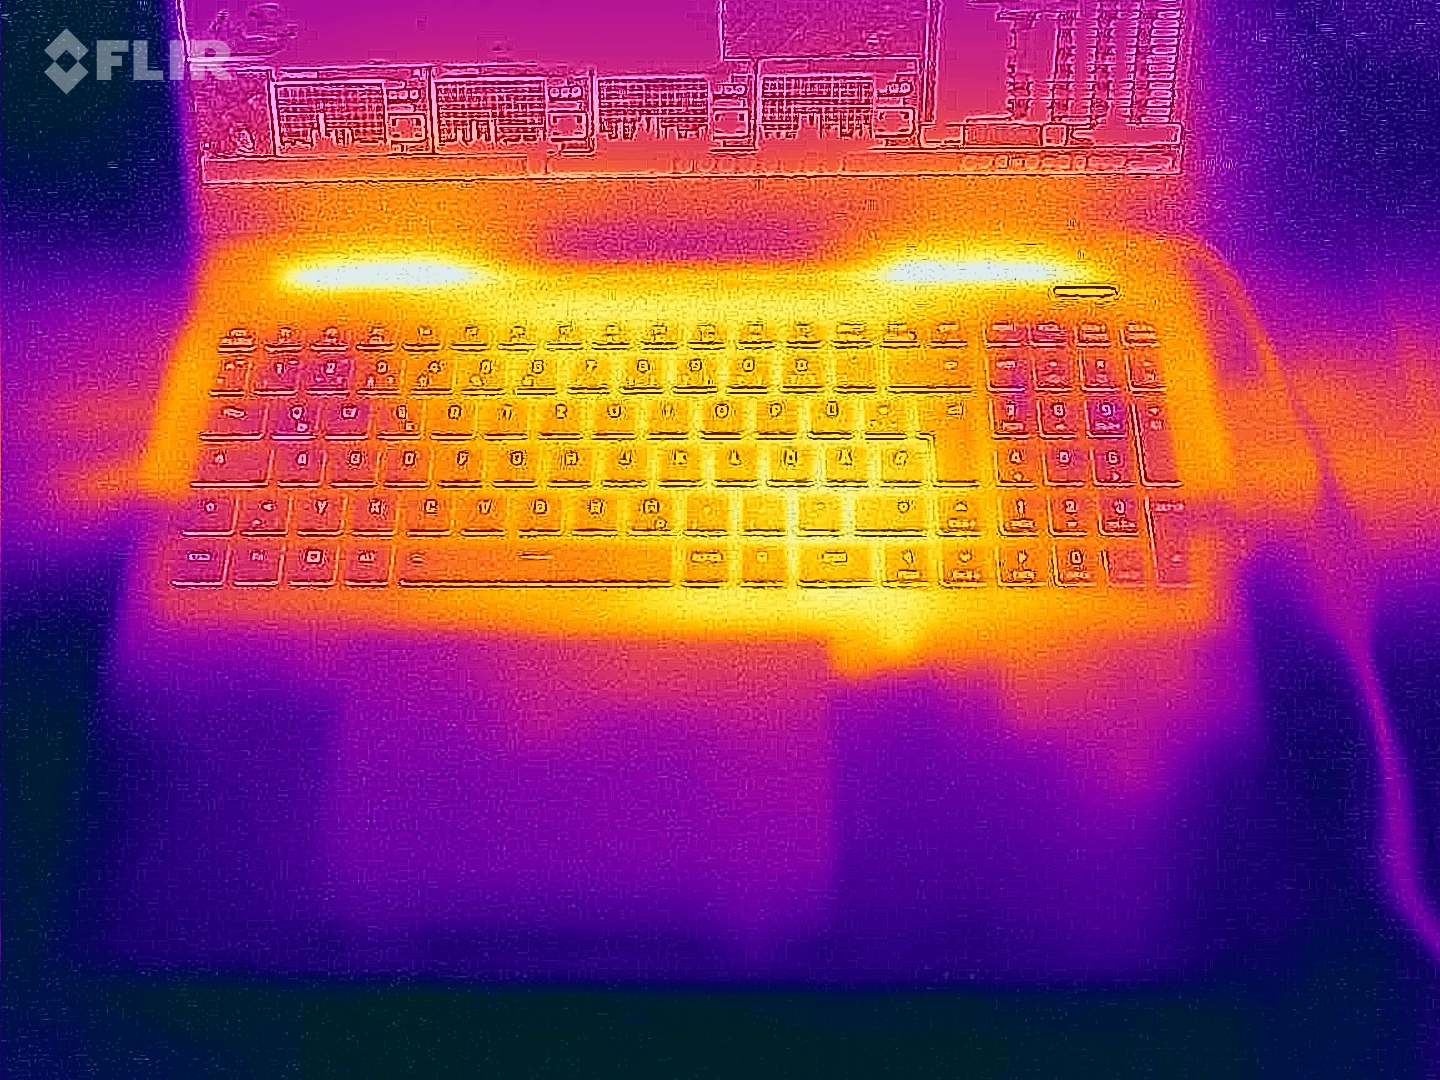
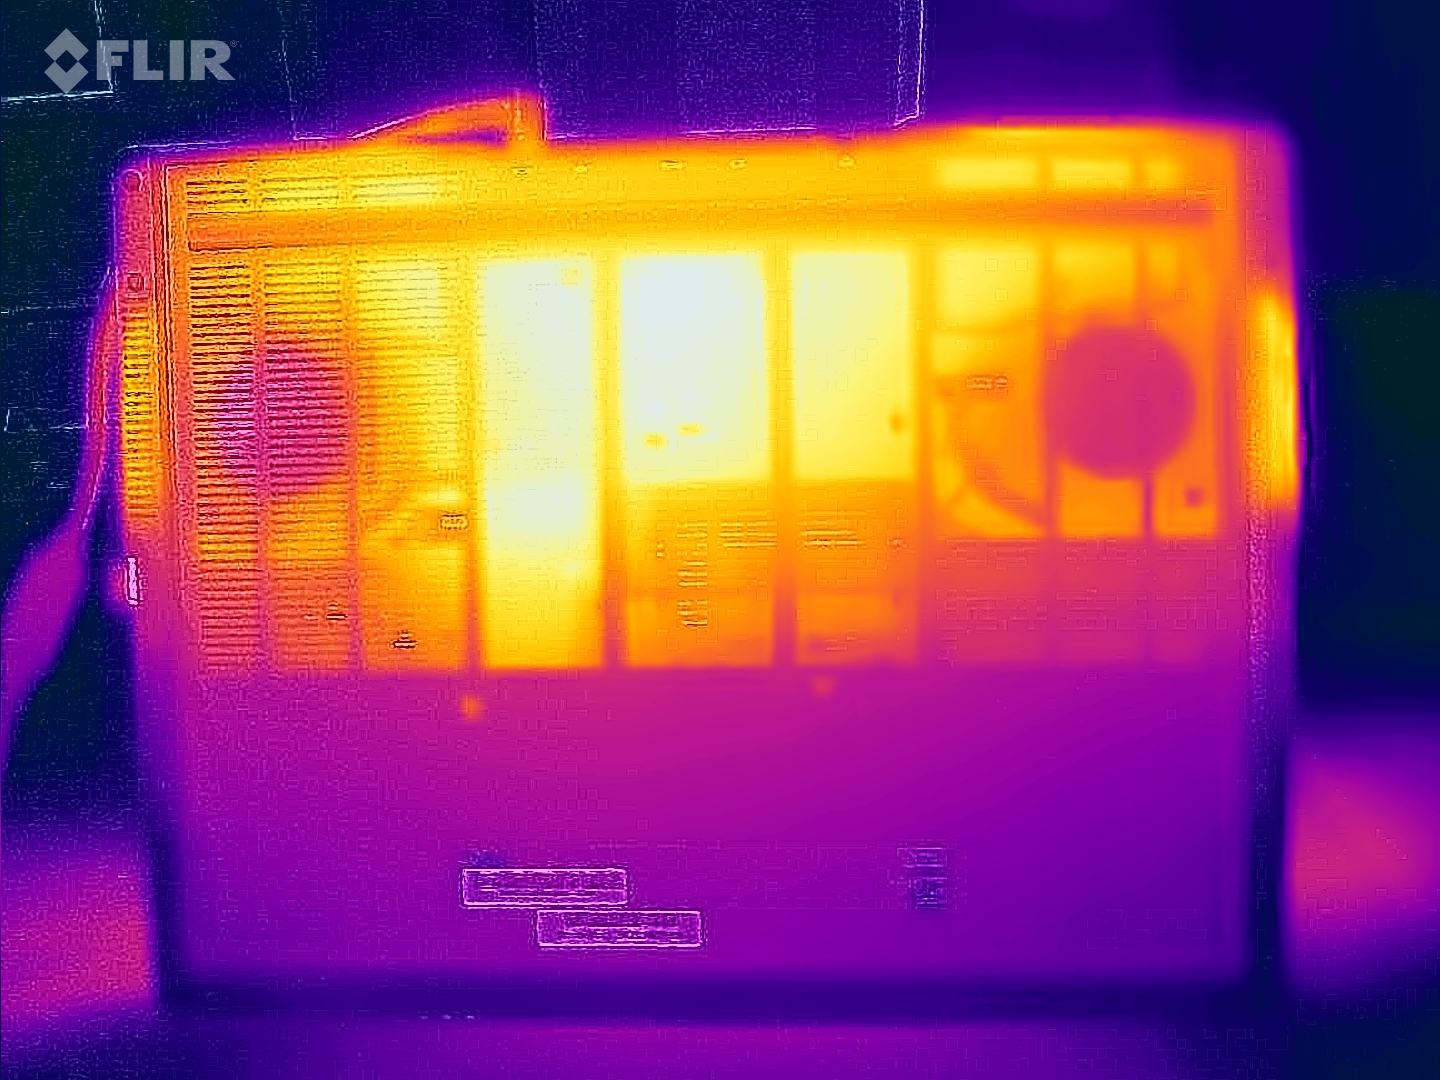
Temperatura
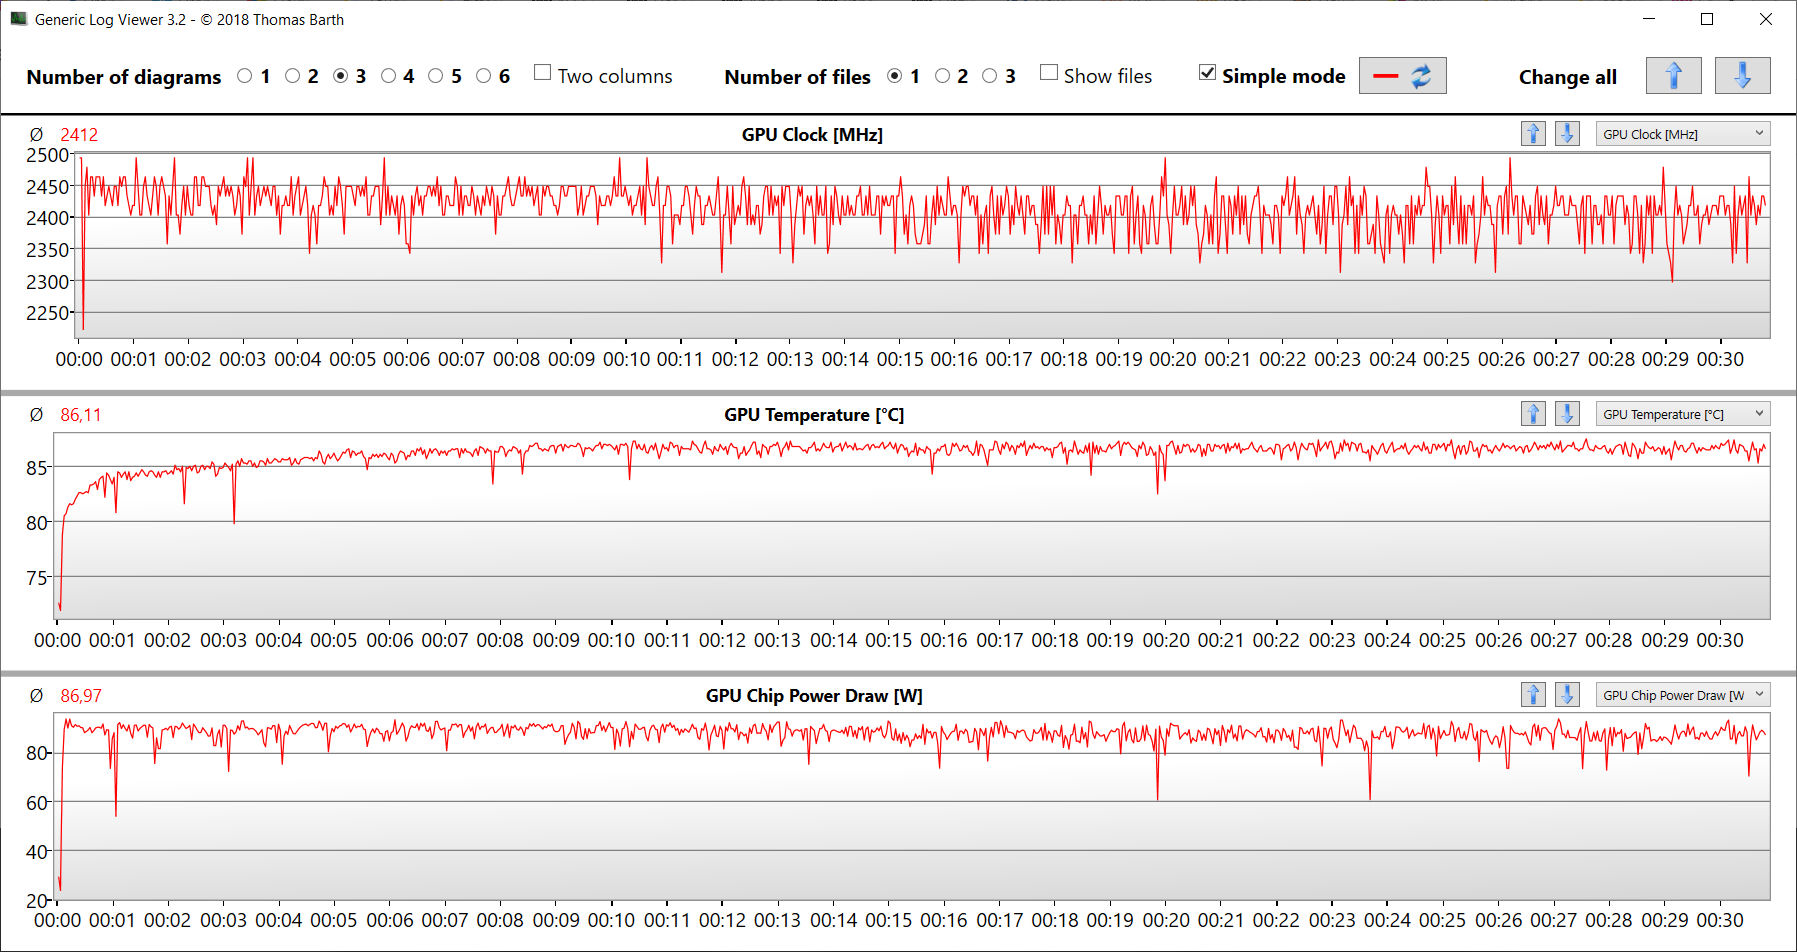
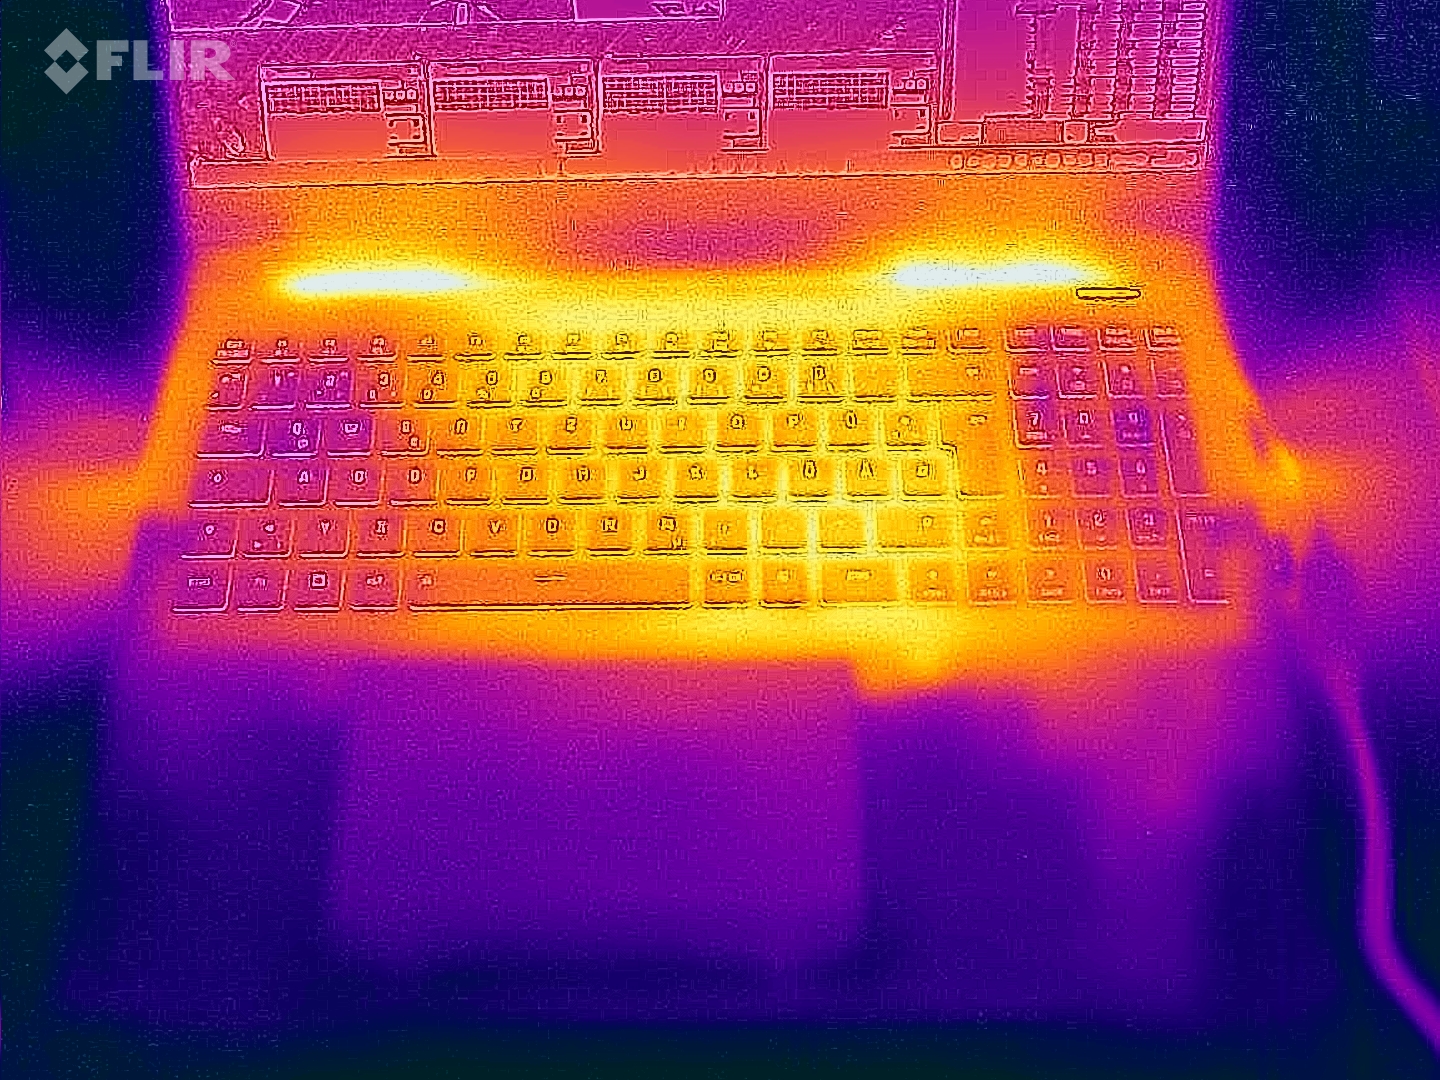
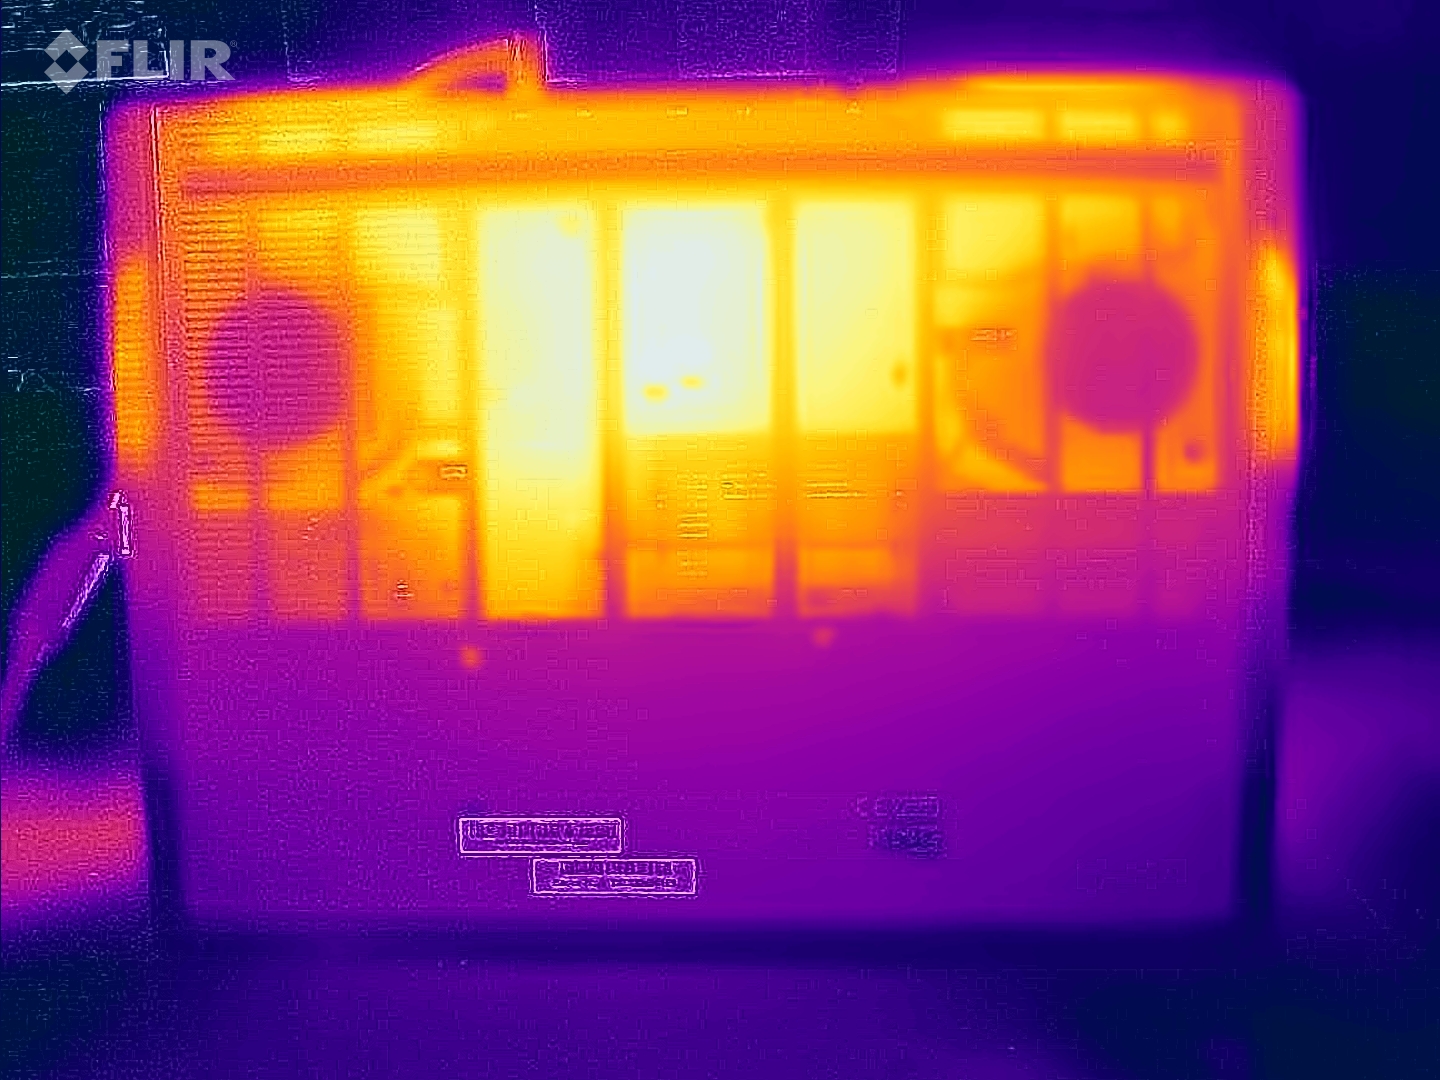
O laptop aquece visivelmente: O Cyberpunk e os testes de estresse resultaram em temperaturas acima de 60 graus Celsius em determinados pontos. Valores acima da média também podem ser alcançados durante o uso diário (escritório, Internet). As temperaturas do apoio para as mãos não são tão ruins.
O cenário de teste de estresse extremo (Prime95 e Furmark em operação contínua) verifica a estabilidade do sistema sob carga total. As prioridades do dispositivo estão claramente distribuídas: Enquanto a GPU trabalhava com potência máxima, o clock da CPU (400 MHz a 2 GHz) estava abaixo do clock base.
(-) A temperatura máxima no lado superior é 51 °C / 124 F, em comparação com a média de 40.4 °C / 105 F , variando de 21.2 a 68.8 °C para a classe Gaming.
(-) A parte inferior aquece até um máximo de 66 °C / 151 F, em comparação com a média de 43.2 °C / 110 F
(±) Em uso inativo, a temperatura média para o lado superior é 32.3 °C / 90 F, em comparação com a média do dispositivo de 33.9 °C / ### class_avg_f### F.
(-) 3: The average temperature for the upper side is 42.2 °C / 108 F, compared to the average of 33.9 °C / 93 F for the class Gaming.
(+) Os apoios para as mãos e o touchpad são mais frios que a temperatura da pele, com um máximo de 31 °C / 87.8 F e, portanto, são frios ao toque.
(-) A temperatura média da área do apoio para as mãos de dispositivos semelhantes foi 28.9 °C / 84 F (-2.1 °C / -3.8 F).
| SCHENKER XMG Pro 16 Studio (Mid 24) Intel Core i9-14900HX, NVIDIA GeForce RTX 4070 Laptop GPU | Acer Predator Helios Neo 16 (2024) Intel Core i7-14700HX, NVIDIA GeForce RTX 4070 Laptop GPU | Lenovo Legion Pro 5 16IRX9 Intel Core i9-14900HX, NVIDIA GeForce RTX 4070 Laptop GPU | Aorus 16X 2024 Intel Core i9-14900HX, NVIDIA GeForce RTX 4070 Laptop GPU | SCHENKER XMG Pro 16 Studio (Mid 23) Intel Core i9-13900H, NVIDIA GeForce RTX 4070 Laptop GPU | Lenovo Legion 7 16 IRX G9 Intel Core i9-14900HX, NVIDIA GeForce RTX 4070 Laptop GPU | |
|---|---|---|---|---|---|---|
| Heat | 9% | 11% | 14% | 2% | 22% | |
| Maximum Upper Side * | 51 | 58 -14% | 43.8 14% | 41 20% | 55 -8% | 43.7 14% |
| Maximum Bottom * | 66 | 45.2 32% | 55.4 16% | 41 38% | 66 -0% | 42.9 35% |
| Idle Upper Side * | 35 | 31.1 11% | 32.8 6% | 37 -6% | 33 6% | 29.1 17% |
| Idle Bottom * | 39 | 37.2 5% | 36 8% | 38 3% | 35 10% | 30.6 22% |
* ... menor é melhor
Alto-falantes
Há uma clara falta de graves. Por outro lado, os alto-falantes estéreo produzem um som aceitável. Seu nível máximo poderia ser um pouco mais alto.
SCHENKER XMG Pro 16 Studio (Mid 24) análise de áudio
(±) | o volume do alto-falante é médio, mas bom (###valor### dB)
Graves 100 - 315Hz
(-) | quase nenhum baixo - em média 15.1% menor que a mediana
(±) | a linearidade dos graves é média (13.6% delta para a frequência anterior)
Médios 400 - 2.000 Hz
(±) | médios mais altos - em média 5.3% maior que a mediana
(+) | médios são lineares (4.4% delta para frequência anterior)
Altos 2 - 16 kHz
(+) | agudos equilibrados - apenas 4.4% longe da mediana
(+) | os máximos são lineares (4.9% delta da frequência anterior)
Geral 100 - 16.000 Hz
(±) | a linearidade do som geral é média (17.7% diferença em relação à mediana)
Comparado com a mesma classe
» 50% de todos os dispositivos testados nesta classe foram melhores, 10% semelhantes, 40% piores
» O melhor teve um delta de 6%, a média foi 18%, o pior foi 132%
Comparado com todos os dispositivos testados
» 33% de todos os dispositivos testados foram melhores, 8% semelhantes, 59% piores
» O melhor teve um delta de 4%, a média foi 24%, o pior foi 134%
Lenovo Legion Pro 5 16IRX9 análise de áudio
(±) | o volume do alto-falante é médio, mas bom (###valor### dB)
Graves 100 - 315Hz
(-) | quase nenhum baixo - em média 19% menor que a mediana
(±) | a linearidade dos graves é média (10.1% delta para a frequência anterior)
Médios 400 - 2.000 Hz
(+) | médios equilibrados - apenas 4.7% longe da mediana
(+) | médios são lineares (5.7% delta para frequência anterior)
Altos 2 - 16 kHz
(+) | agudos equilibrados - apenas 3.3% longe da mediana
(+) | os máximos são lineares (5.6% delta da frequência anterior)
Geral 100 - 16.000 Hz
(±) | a linearidade do som geral é média (17.2% diferença em relação à mediana)
Comparado com a mesma classe
» 45% de todos os dispositivos testados nesta classe foram melhores, 11% semelhantes, 44% piores
» O melhor teve um delta de 6%, a média foi 18%, o pior foi 132%
Comparado com todos os dispositivos testados
» 29% de todos os dispositivos testados foram melhores, 8% semelhantes, 63% piores
» O melhor teve um delta de 4%, a média foi 24%, o pior foi 134%
Consumo de energia
No modo inativo, o consumo de energia do laptop é muito alto, significativamente mais alto do que o modelo predecessor equipado de forma semelhante. O Cyberpunk e os testes de estresse foram executados com um consumo de energia ligeiramente decrescente e constantemente flutuante. A fonte de alimentação de 230 watts ainda tem tamanho suficiente. Os picos de carga de curto prazo, como no início do teste de estresse, não são um problema para ela.
| desligado | |
| Ocioso | |
| Carga |
|
Key:
min: | |
| SCHENKER XMG Pro 16 Studio (Mid 24) NVIDIA GeForce RTX 4070 Laptop GPU, i9-14900HX, Samsung 990 Pro 1 TB | Acer Predator Helios Neo 16 (2024) NVIDIA GeForce RTX 4070 Laptop GPU, i7-14700HX, Samsung PM9A1a MZVL21T0HDLU | Lenovo Legion Pro 5 16IRX9 NVIDIA GeForce RTX 4070 Laptop GPU, i9-14900HX, Samsung PM9A1 MZVL21T0HCLR | Aorus 16X 2024 NVIDIA GeForce RTX 4070 Laptop GPU, i9-14900HX, Gigabyte AG450E1024-SI | SCHENKER XMG Pro 16 Studio (Mid 23) NVIDIA GeForce RTX 4070 Laptop GPU, i9-13900H, Samsung 990 Pro 1 TB | |
|---|---|---|---|---|---|
| Power Consumption | 11% | 23% | 22% | 43% | |
| Idle Minimum * | 31 | 26.7 14% | 12.5 60% | 13 58% | 8 74% |
| Idle Average * | 33 | 24.4 26% | 24.6 25% | 18 45% | 12 64% |
| Idle Maximum * | 41 | 32.7 20% | 24.8 40% | 35 15% | 23 44% |
| Load Average * | 114 | 122.1 -7% | 109.6 4% | 138 -21% | 94 18% |
| Cyberpunk 2077 ultra * | 218 | ||||
| Cyberpunk 2077 ultra external monitor * | 196.8 | ||||
| Load Maximum * | 250 | 241 4% | 284.9 -14% | 222 11% | 215 14% |
| Witcher 3 ultra * | 190.6 | 218 | 172.6 | 181.5 |
* ... menor é melhor
Power consumption Cyberpunk / stress test
Power consumption with external monitor
Tempos de execução
O Pro 16 também requer mais energia do que seu antecessor sob carga baixa no modo de bateria. Como resultado, ele atingiu um tempo de execução de 5:37 horas durante o teste de WiFi (mapeando a carga ao acessar sites usando um script). Isso o deixa uma boa hora atrás de seu antecessor-que tinha a mesma capacidade de bateria de 73 Wh.
Pro
Contra
Veredicto - Uma potência com problemas
O foco do Pro 16 está na potência permanentemente alta da GPU com valores de desempenho ligeiramente acima da média da GPU. A CPU já tem que ter calma depois de um curto período de tempo - o CB15 Loop revelou isso.
O XMG Pro 16 Studio (Mid 24) pode ser atribuído ao departamento de manutenção de modelos. Além da mudança de Raptor Lake para Raptor Lake Refresh, o laptop não apresenta novos recursos significativos.
O ruído e o desenvolvimento de calor do dispositivo, bem como seu consumo de energia no modo inativo, são todos (muito) altos. Com relação ao consumo intenso de energia do laptop, não podemos descartar que nossa amostra de teste tenha um defeito. Seus tempos de execução são decentes.
Seu painel 16:10 instalado (16 polegadas, 2.560 x 1.600 pixels, sRGB, IPS, 240 Hz) é bom, mas não possui o espaço de cores DCI-P3, que é um pré-requisito para um laptop para criadores. O dispositivo ainda pode acomodar dois SSDs PCIe 4 e há suporte para RAID 0/1. Uma porta TB-4 oferece opções de expansão (GPU externa, docking) e suporta Power Delivery.
Uma alternativa poderia ser o Aorus 16X (2024). Ele pode obter um pouco mais de potência de computação com a mesma CPU, apresenta uma tela muito mais brilhante (incluindo Dolby Vision) - além disso, apresenta melhores tempos de execução.
Preço e disponibilidade
O novo XMG Pro 16 Studio (Mid 24) pode ser configurado e encomendado pelo site bestware.comcom o dispositivo de teste atual custando cerca de US$ 2.500.
Observação: Atualizamos recentemente nosso sistema de classificação e os resultados da versão 8 não são comparáveis aos resultados da versão 7. Mais informações estão disponíveis aqui.
SCHENKER XMG Pro 16 Studio (Mid 24)
- 07/23/2024 v8
Sascha Mölck
 Total Sustainability Score:
 Transparência
A seleção dos dispositivos a serem analisados é feita pela nossa equipe editorial. A amostra de teste foi fornecida ao autor como empréstimo pelo fabricante ou varejista para fins desta revisão. O credor não teve influência nesta revisão, nem o fabricante recebeu uma cópia desta revisão antes da publicação. Não houve obrigação de publicar esta revisão. Nunca aceitamos compensação ou pagamento em troca de nossas avaliações. Como empresa de mídia independente, a Notebookcheck não está sujeita à autoridade de fabricantes, varejistas ou editores.
É assim que o Notebookcheck está testando
Todos os anos, o Notebookcheck analisa de forma independente centenas de laptops e smartphones usando procedimentos padronizados para garantir que todos os resultados sejam comparáveis. Desenvolvemos continuamente nossos métodos de teste há cerca de 20 anos e definimos padrões da indústria no processo. Em nossos laboratórios de teste, equipamentos de medição de alta qualidade são utilizados por técnicos e editores experientes. Esses testes envolvem um processo de validação em vários estágios. Nosso complexo sistema de classificação é baseado em centenas de medições e benchmarks bem fundamentados, o que mantém a objetividade.Price comparison

