

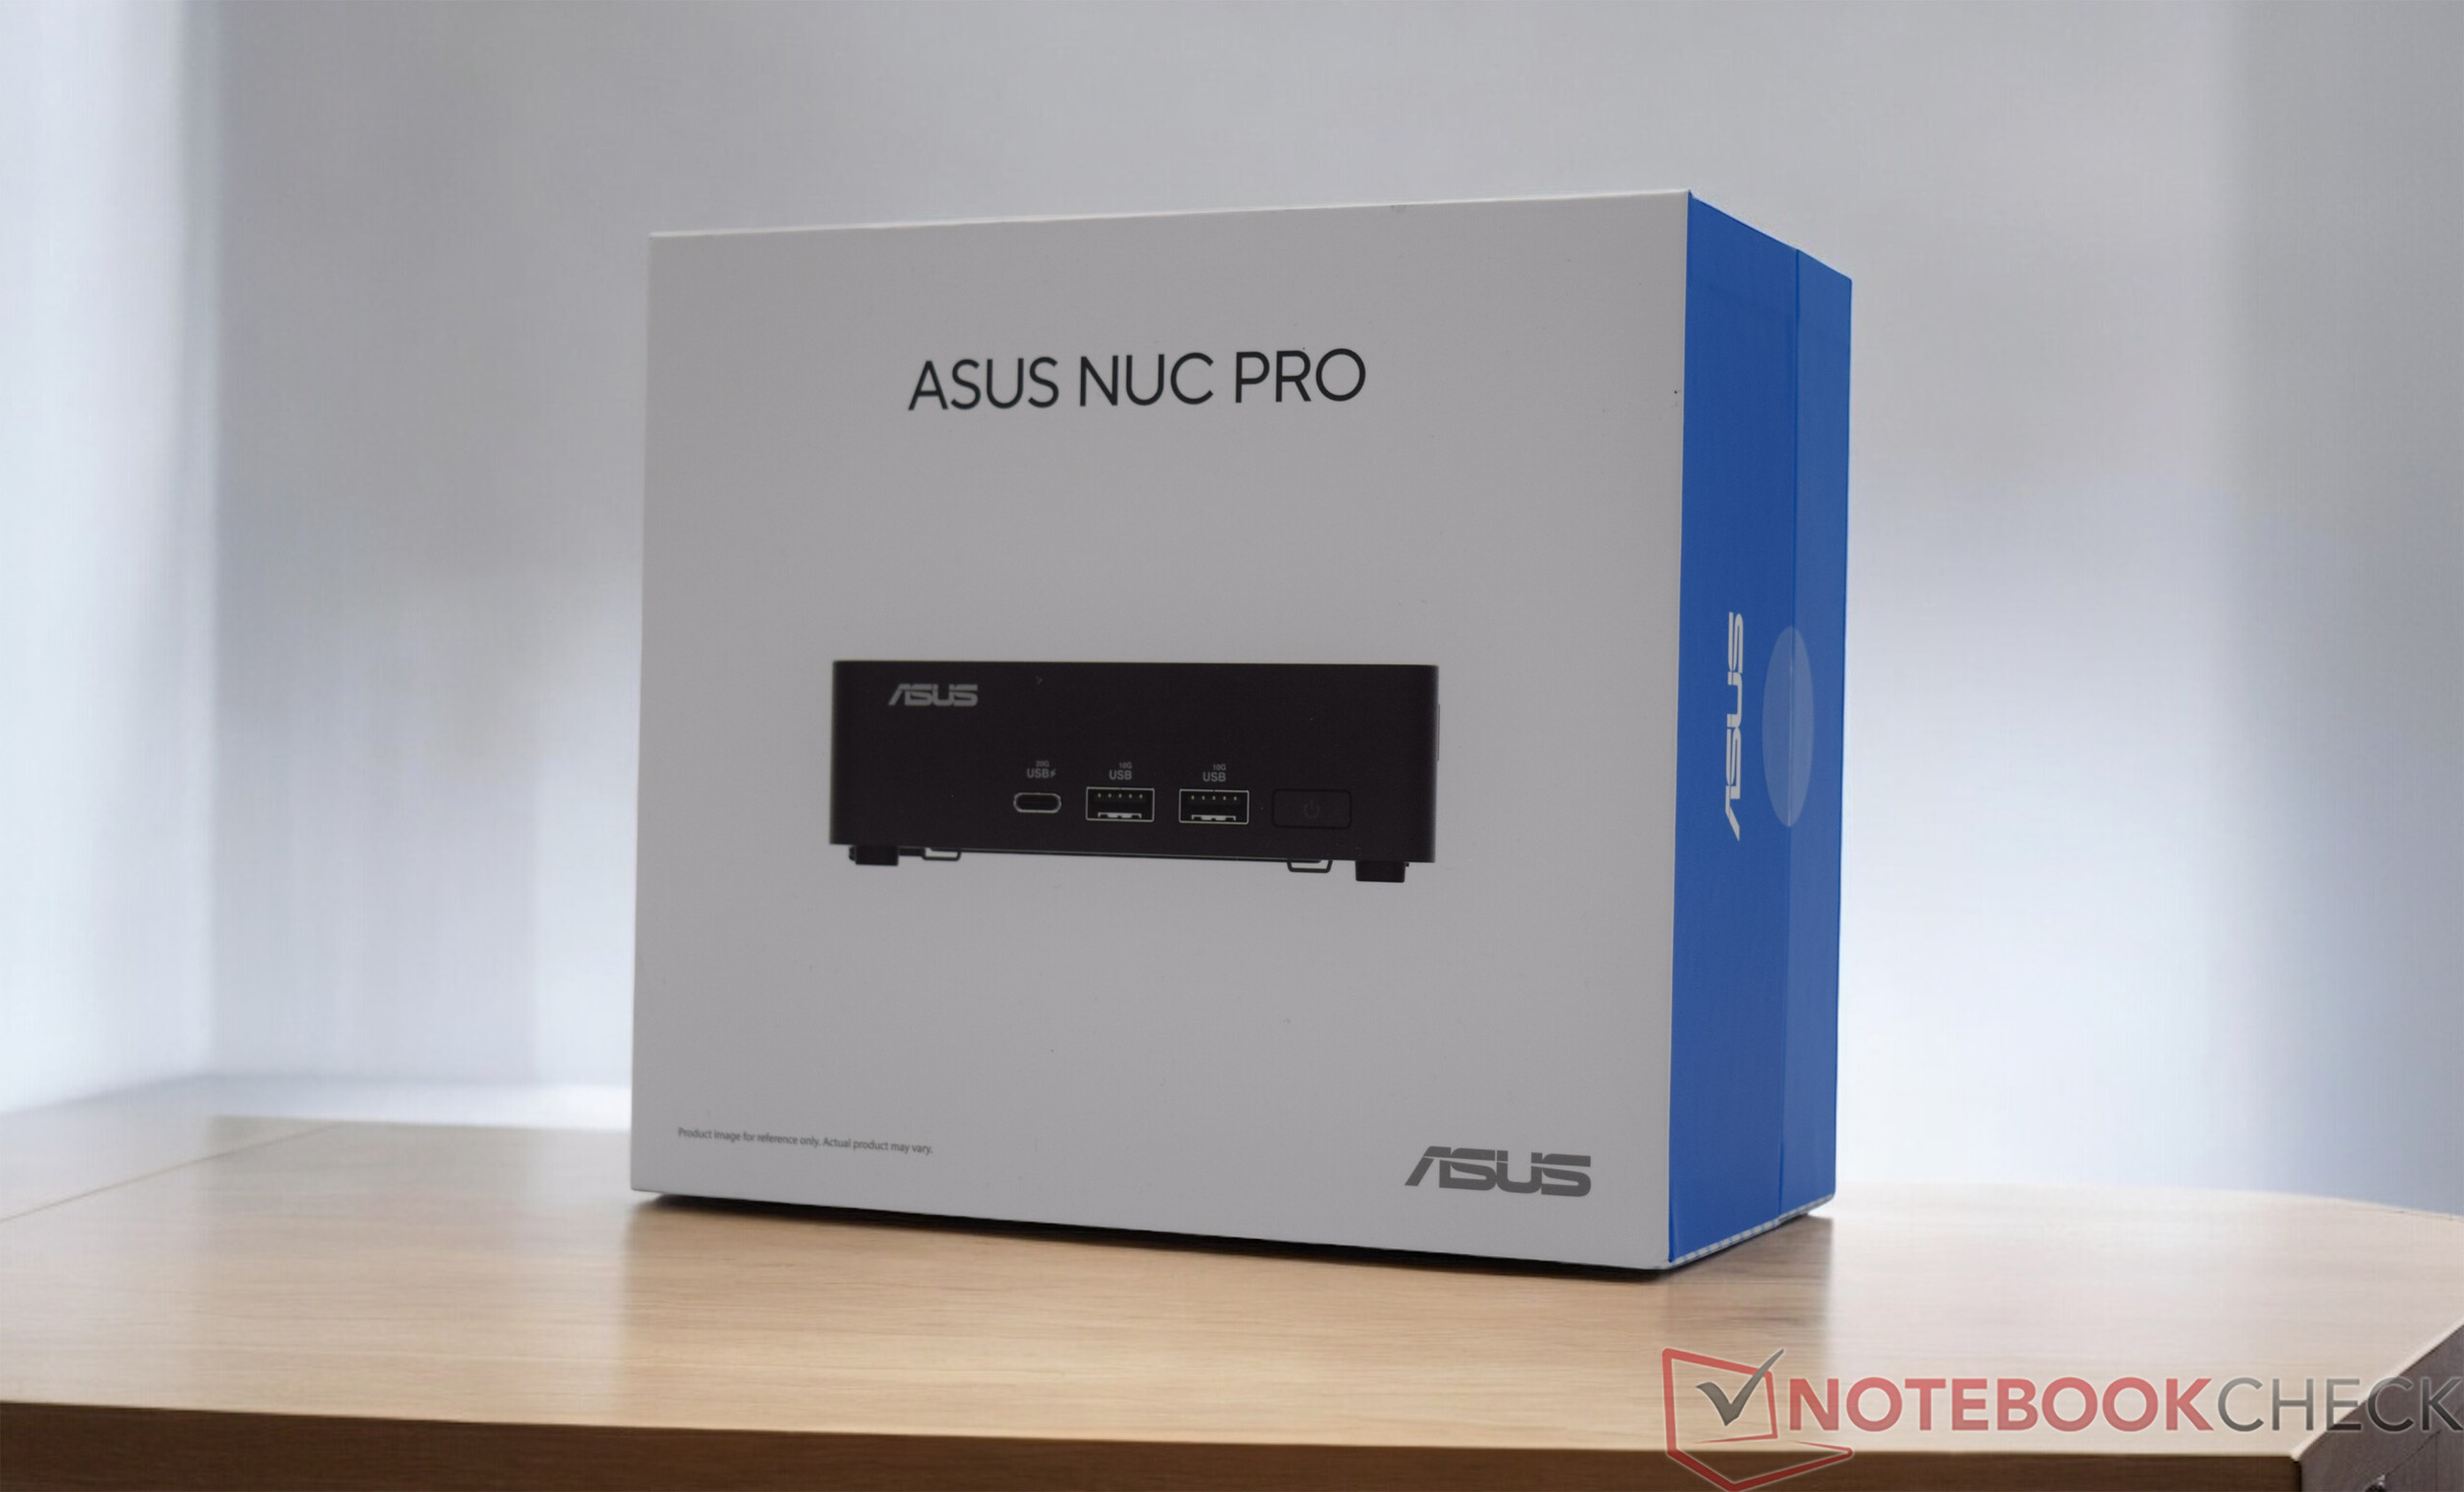
A série NUC (Next Unit of Computing), antes lançada pela Intel, foi assumida pela Asus. A Asus agora está oferecendo os modelos familiares no mesmo estilo, embora dispositivos mais novos também estejam sendo introduzidos. Com base no Intel Meteor Lake, as máquinas de computação compactas recebem mais potência e, acima de tudo, se beneficiam da iGPU revisada com arquitetura Arc. O Asus NUC 14 Pro está disponível com diferentes processadores e, como de costume, em uma versão plana e um pouco mais grossa, que oferece espaço adicional para uma unidade de 2,5 polegadas. Testamos o Asus NUC 14 Pro na opção slim com um processador Intel Core Ultra 5 125H. O dispositivo chegou até nós como um barebone, o que significa que tivemos que instalar a RAM e o SSD antes do teste. O sistema operacional também não está incluído no escopo da entrega. O senhor terá que colocar um pouco mais de 500 euros na mesa para a nossa amostra de teste. Em comparação com seus concorrentes, isso é muito quando o senhor considera que há custos adicionais devido à opção barebone. Em comparação com as outras marcas, a Asus é mais conhecida e oferece melhor suporte.
Os concorrentes com os quais comparamos o Asus NUC 14 Pro estão listados na tabela a seguir.
Possíveis concorrentes em comparação
Avaliação | Versão | Data | Modelo | Peso | Altura | Preço |
|---|---|---|---|---|---|---|
| 74.7 % | v8 | 08/2024 | Asus NUC 14 Pro Ultra 5 125H, Arc 7-Core | 525 g | 37 mm | |
| 78 % | v8 | 07/2024 | Geekom AE7 R9 7940HS, Radeon 780M | 578 g | 49.2 mm | |
| 74.5 % | v8 | 07/2024 | Minisforum UH125 Pro Ultra 5 125H, Arc 7-Core | 797 g | 49 mm | |
| 73.7 % | v8 | Aoostar GEM10 R7 6800H, Radeon 680M | 525 g | 60 mm | ||
| 83.4 % v7 (old) | v7 (old) | 04/2024 | Acemagic F2A Ultra 7 155H, Arc 8-Core | 768 g | 57 mm | |
| 81.2 % v7 (old) | v7 (old) | 10/2023 | Geekom A5 R7 5800H, Vega 8 | 555 g | 49.2 mm |
Observação: Atualizamos nosso sistema de classificação e os resultados da versão 8 não são comparáveis aos resultados da versão 7 , disponíveis aqui.

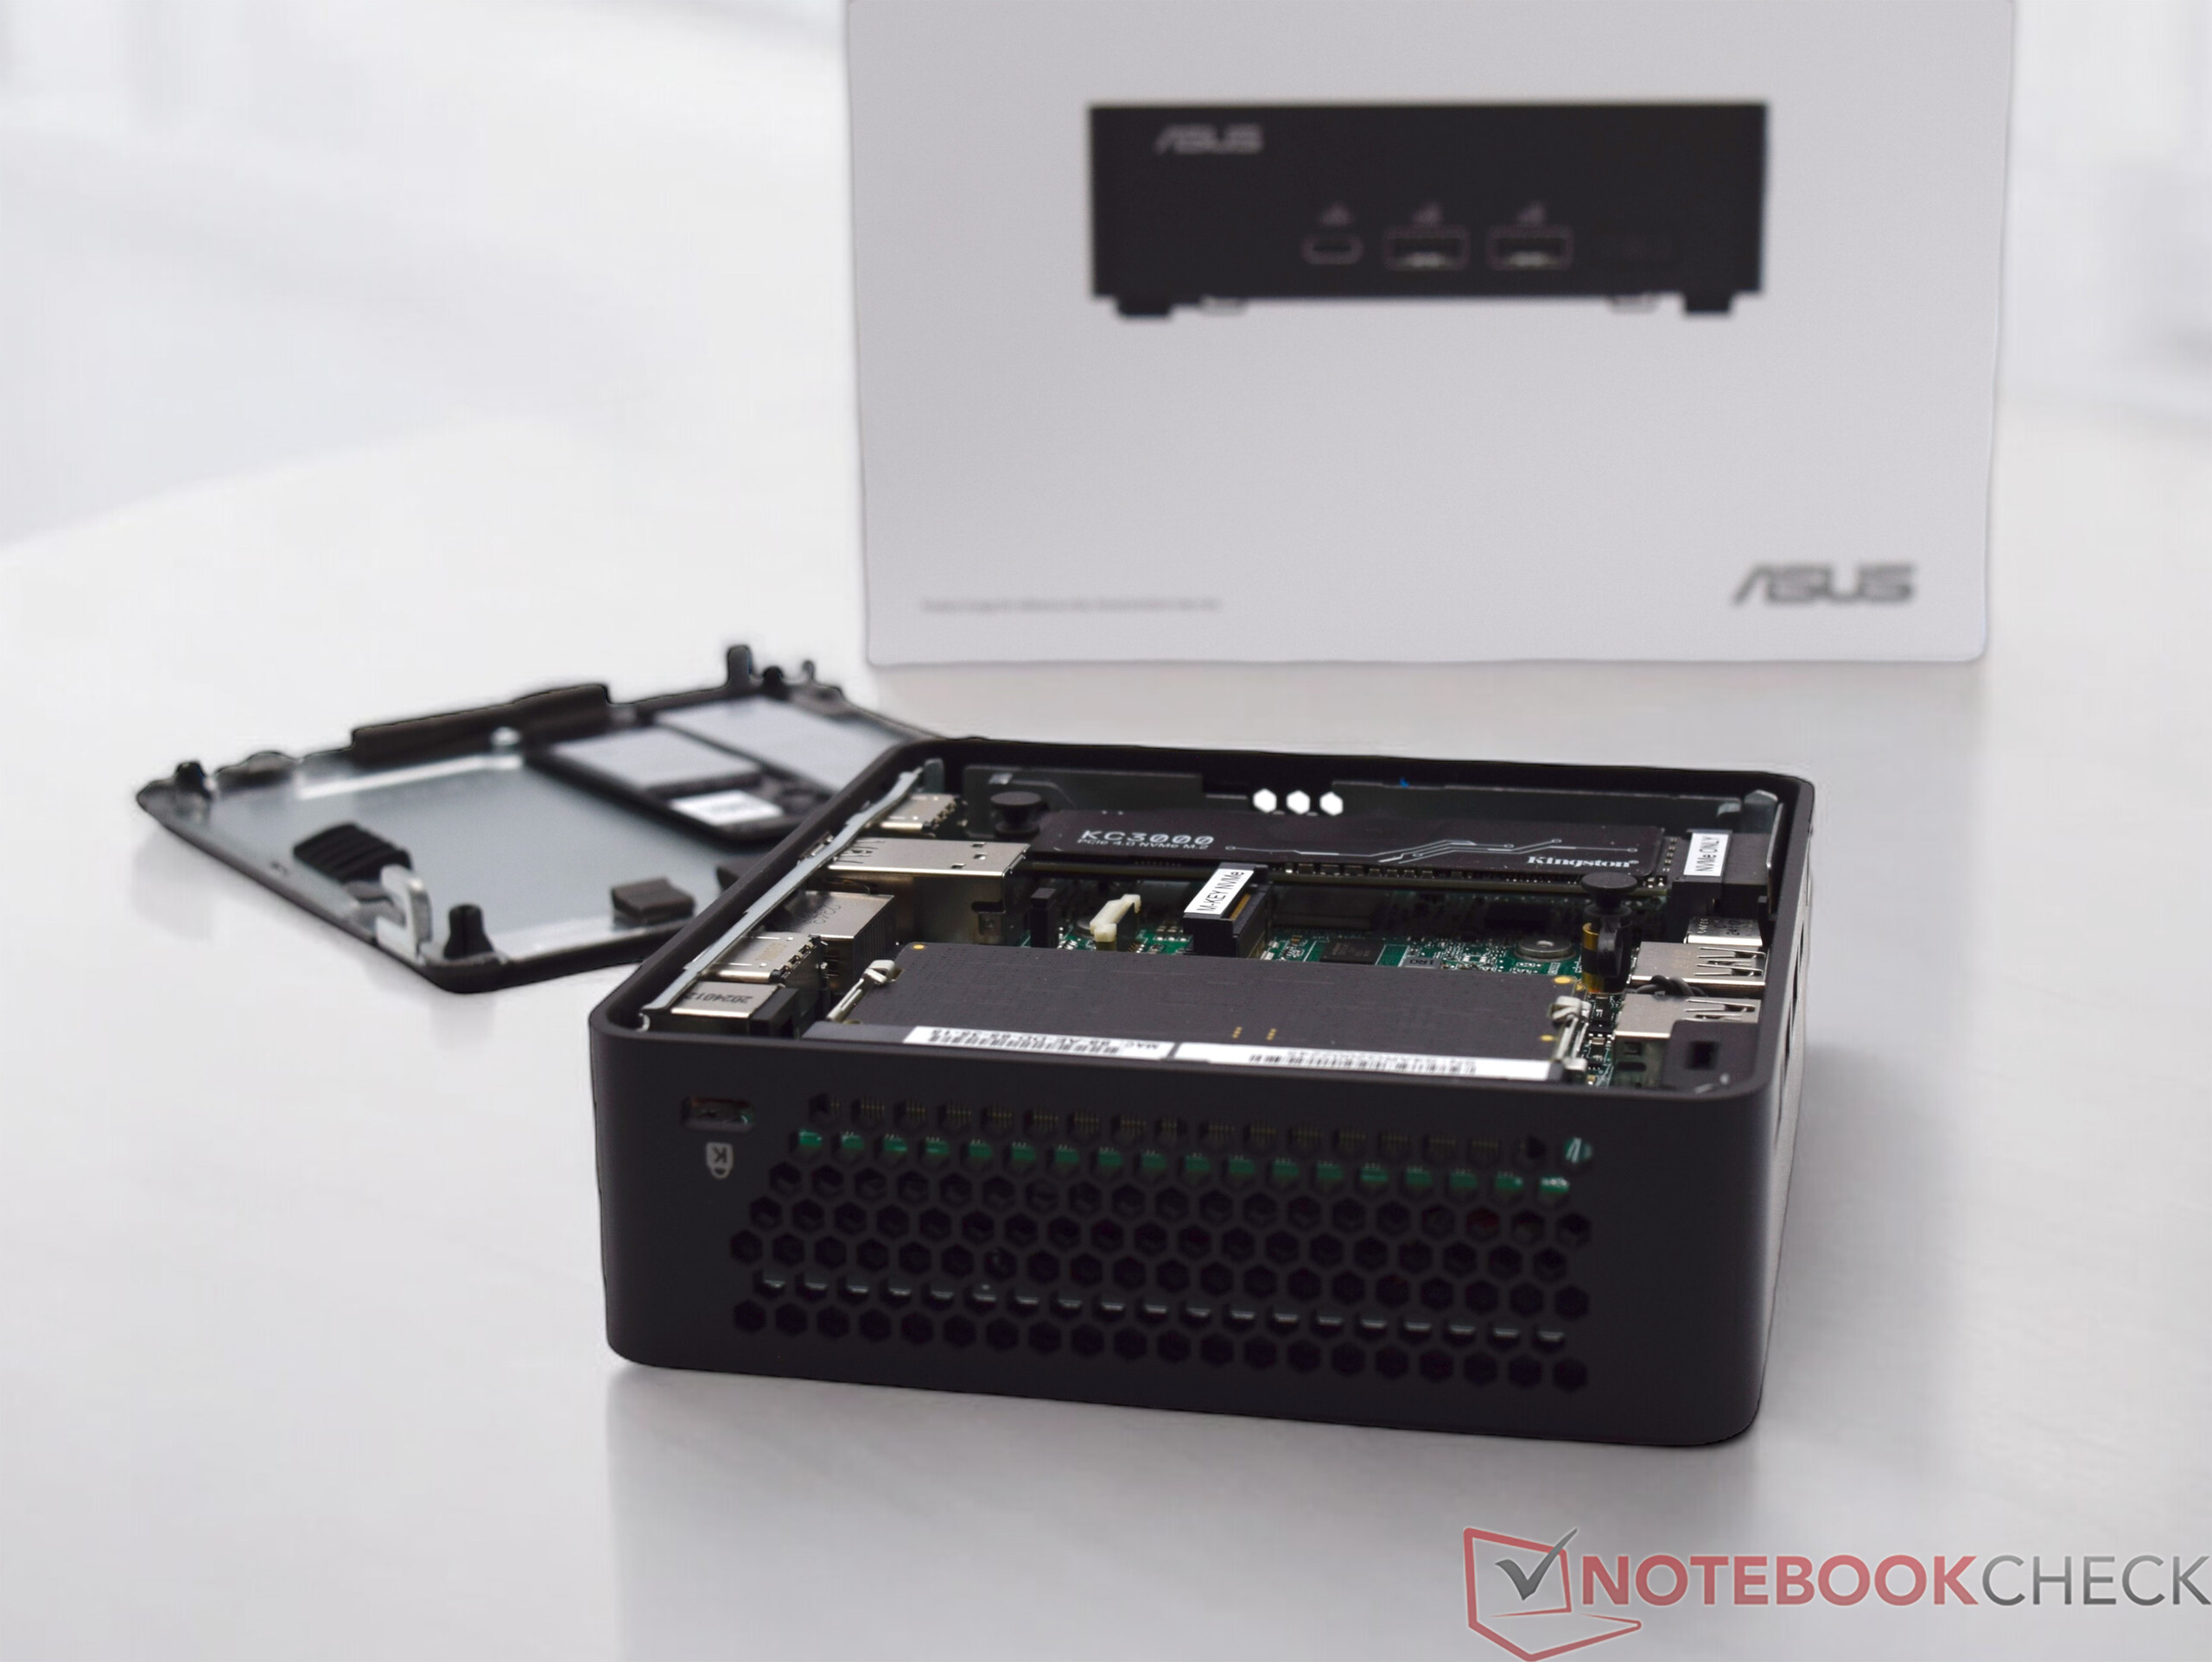

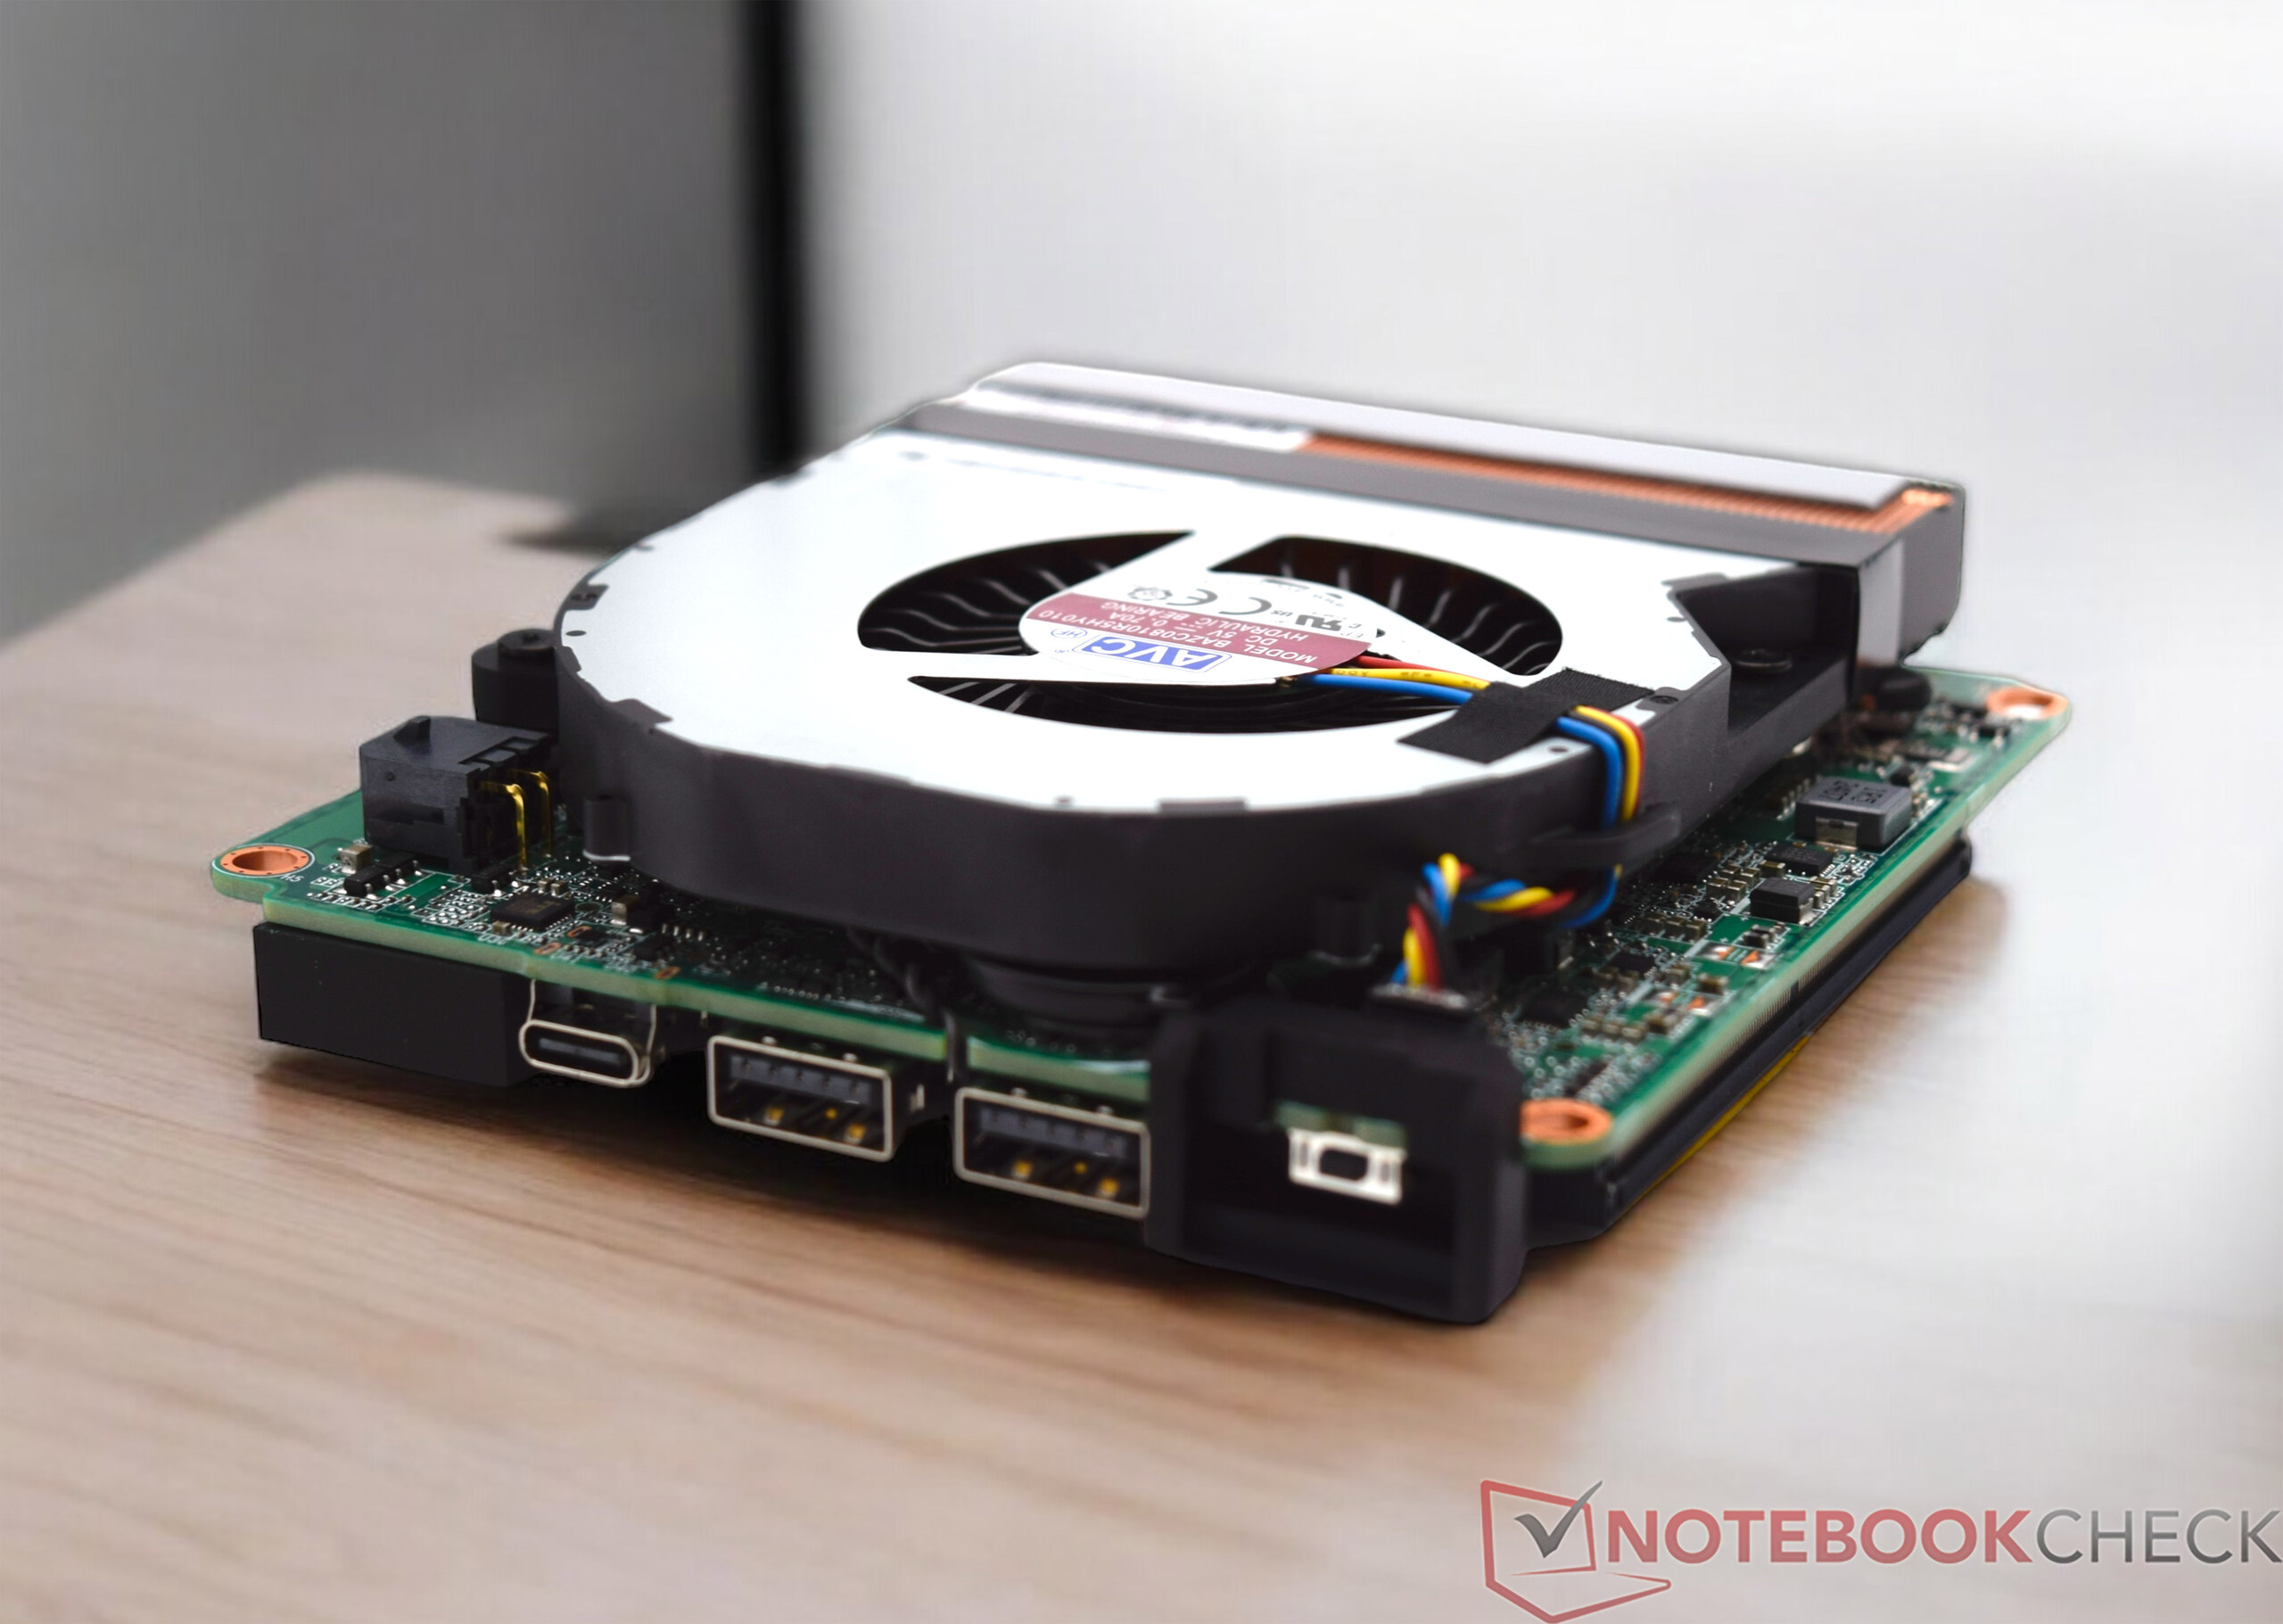
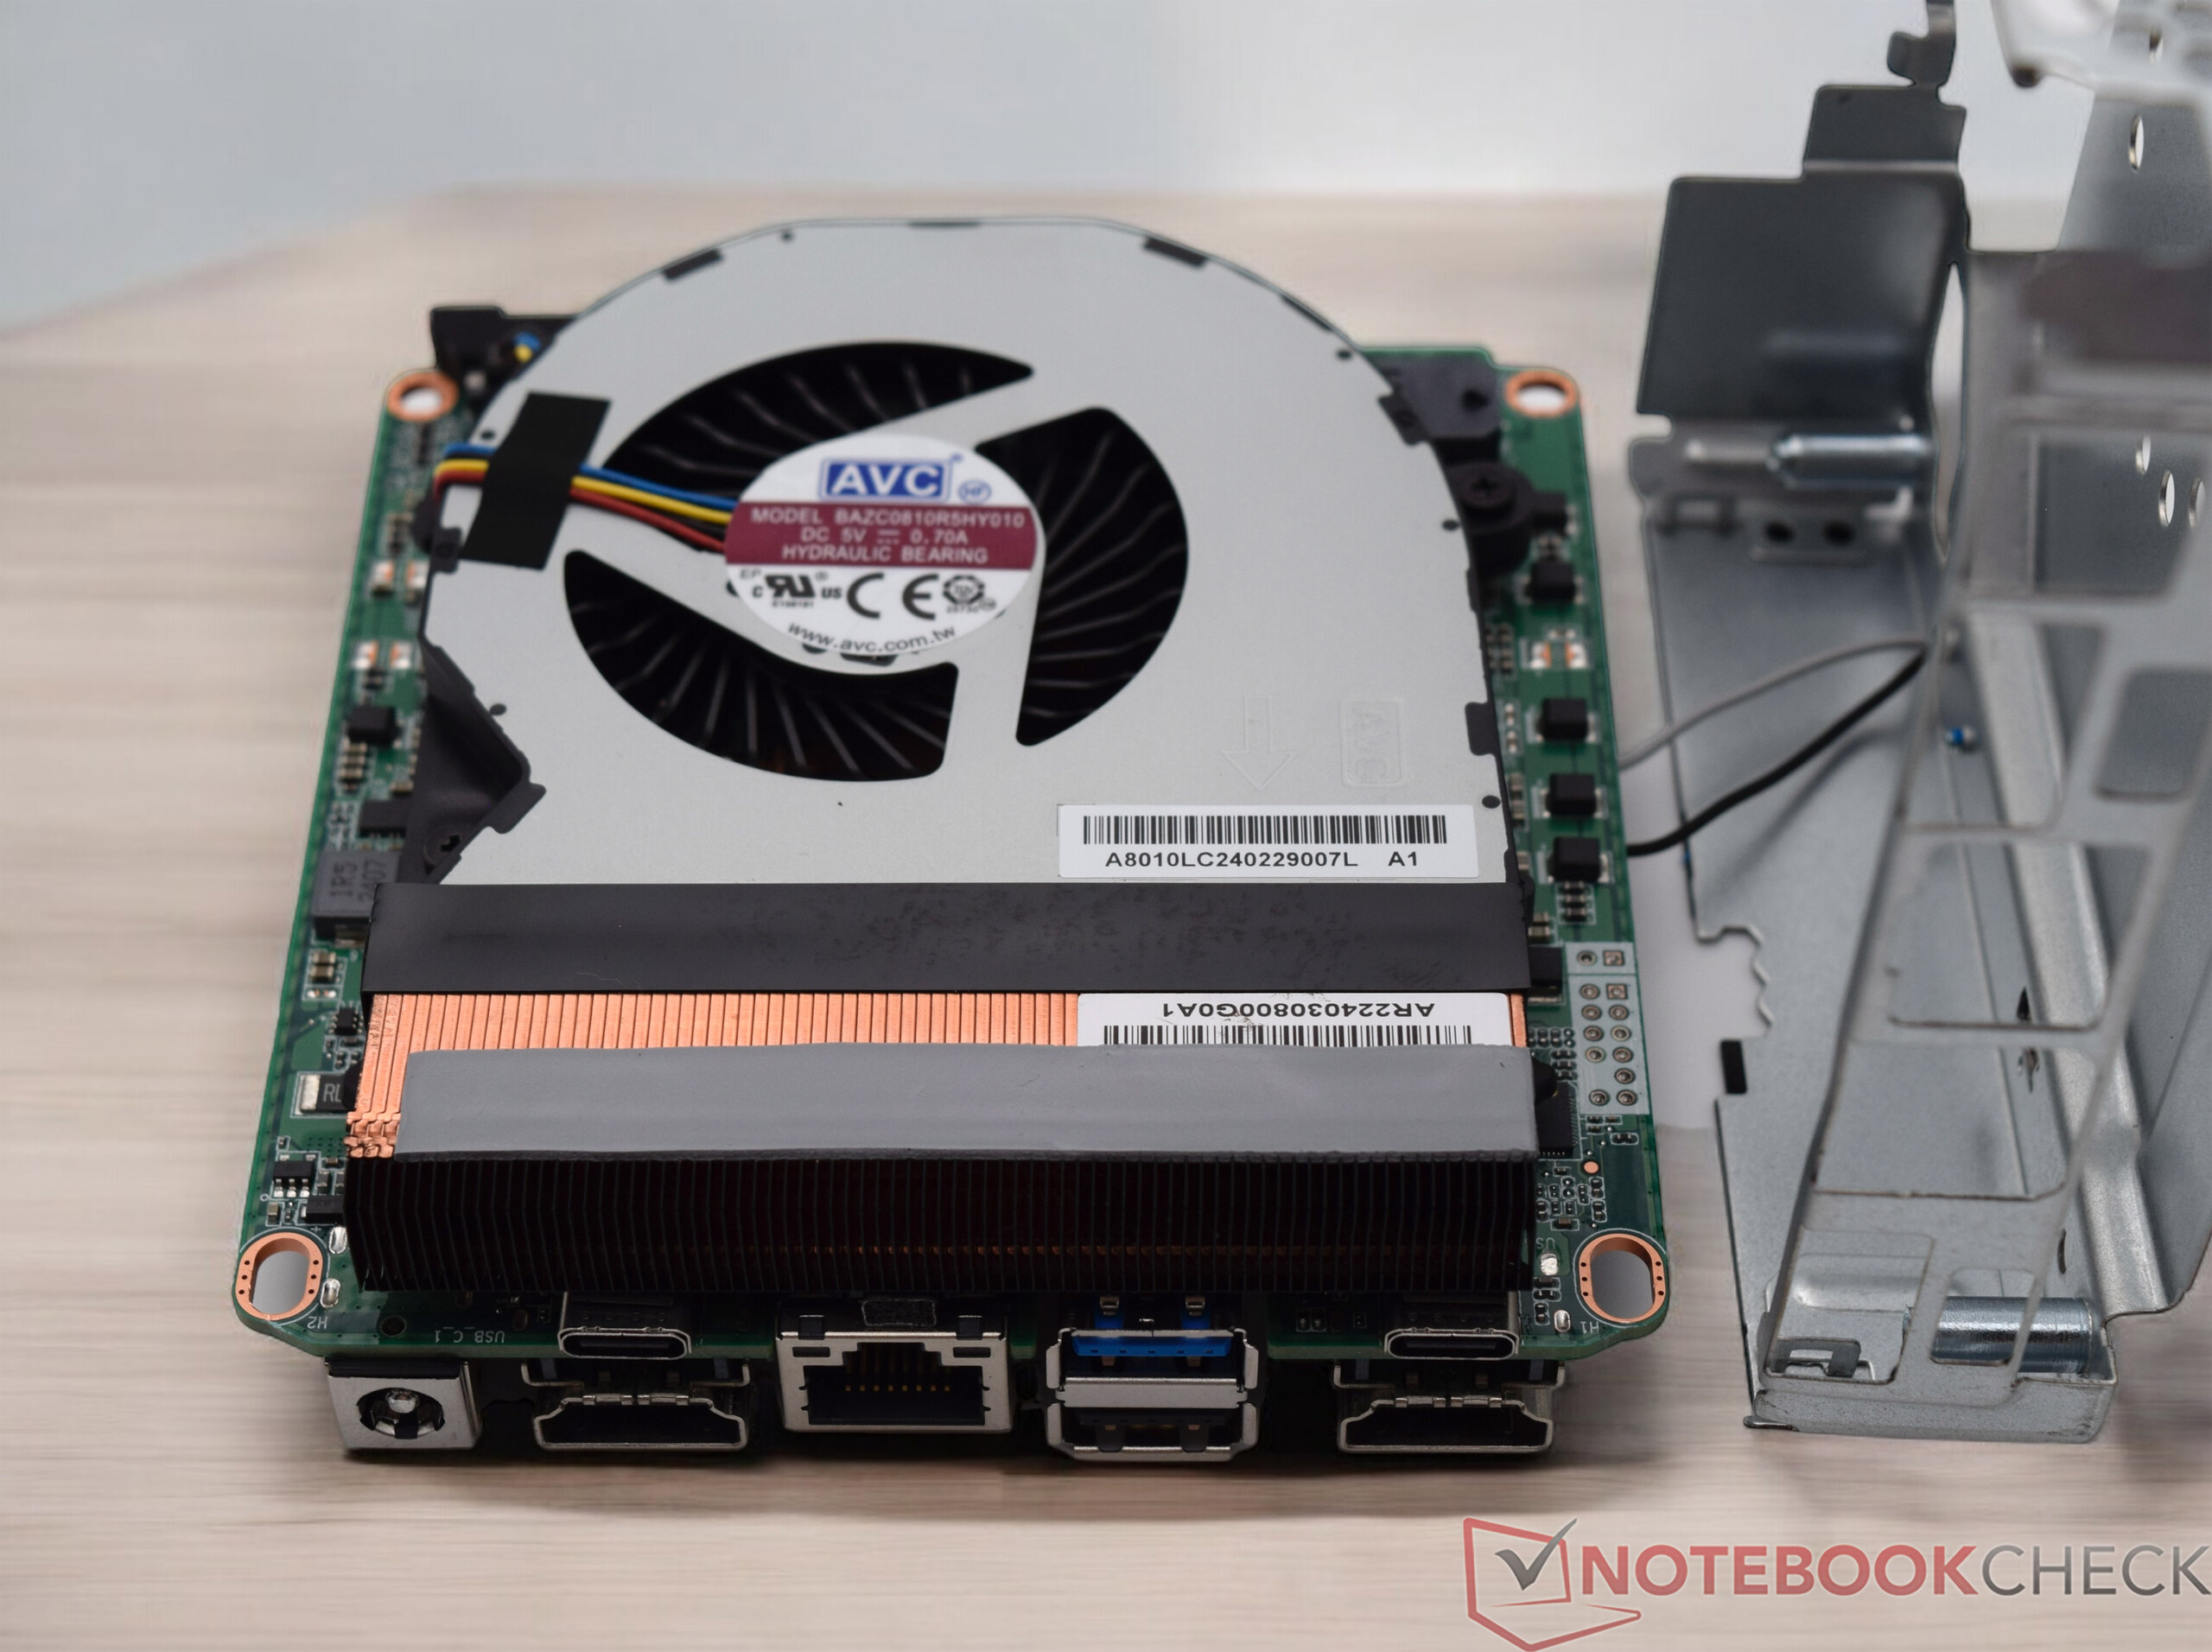
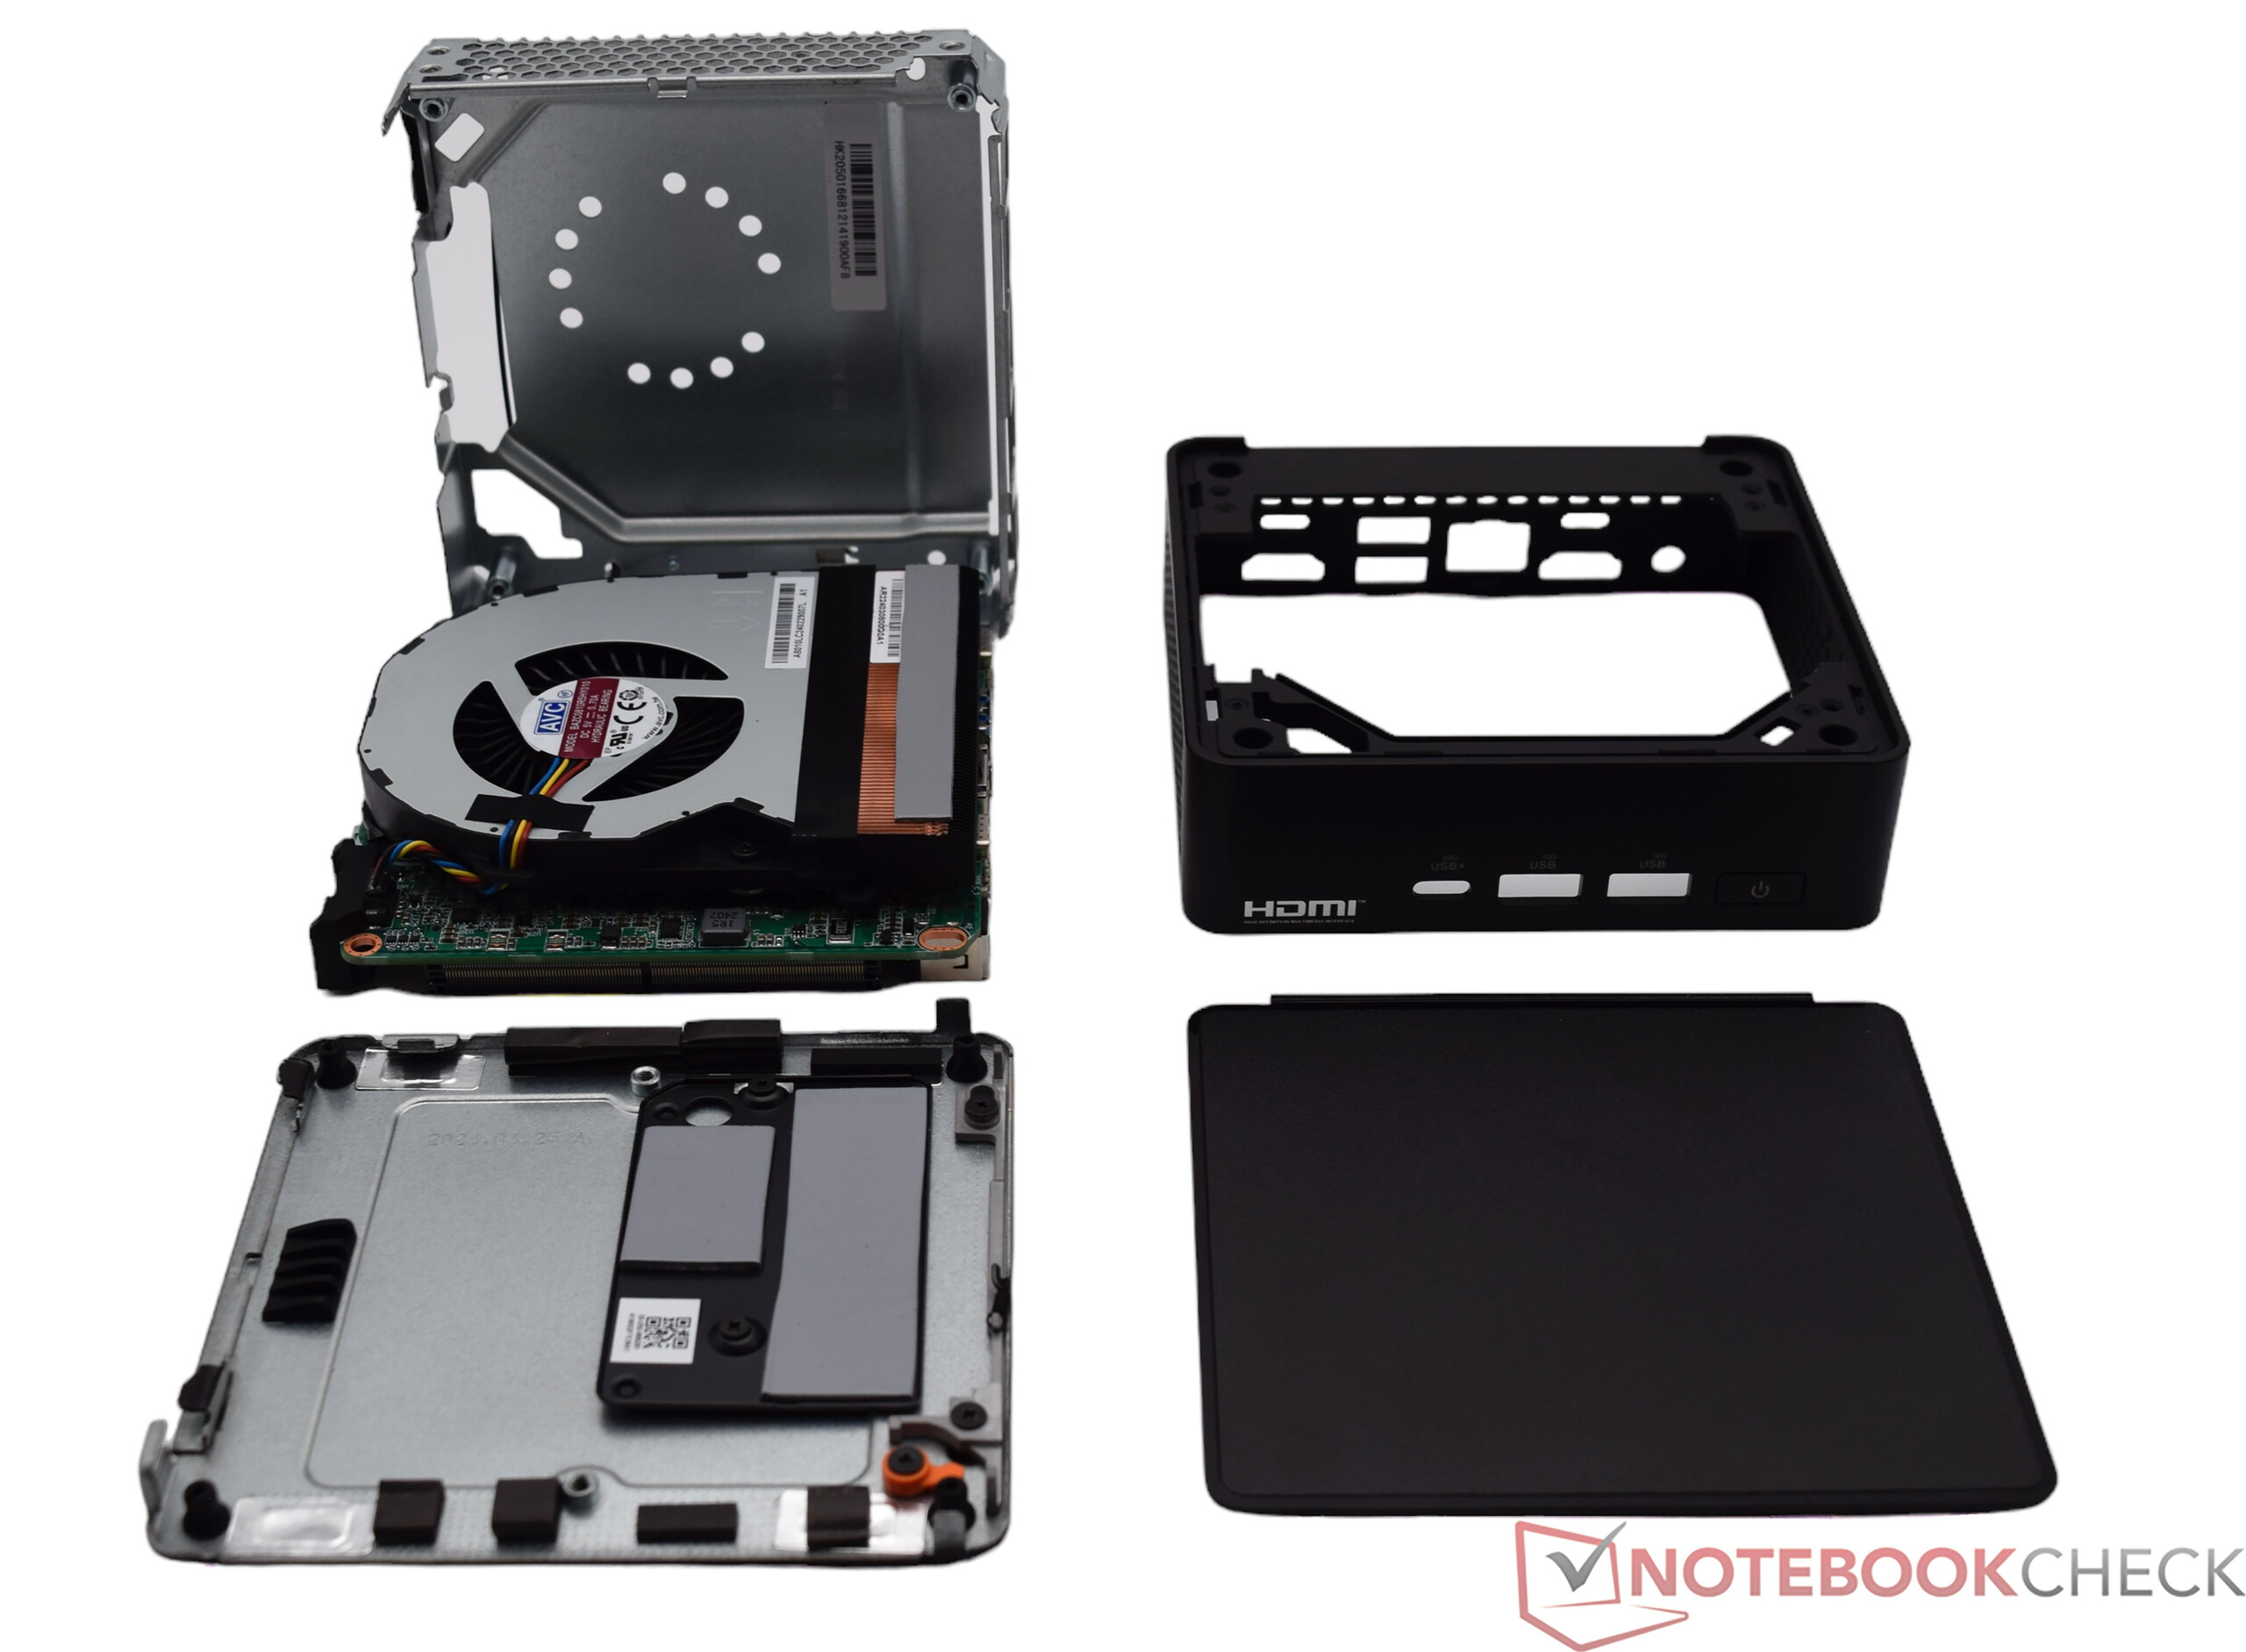
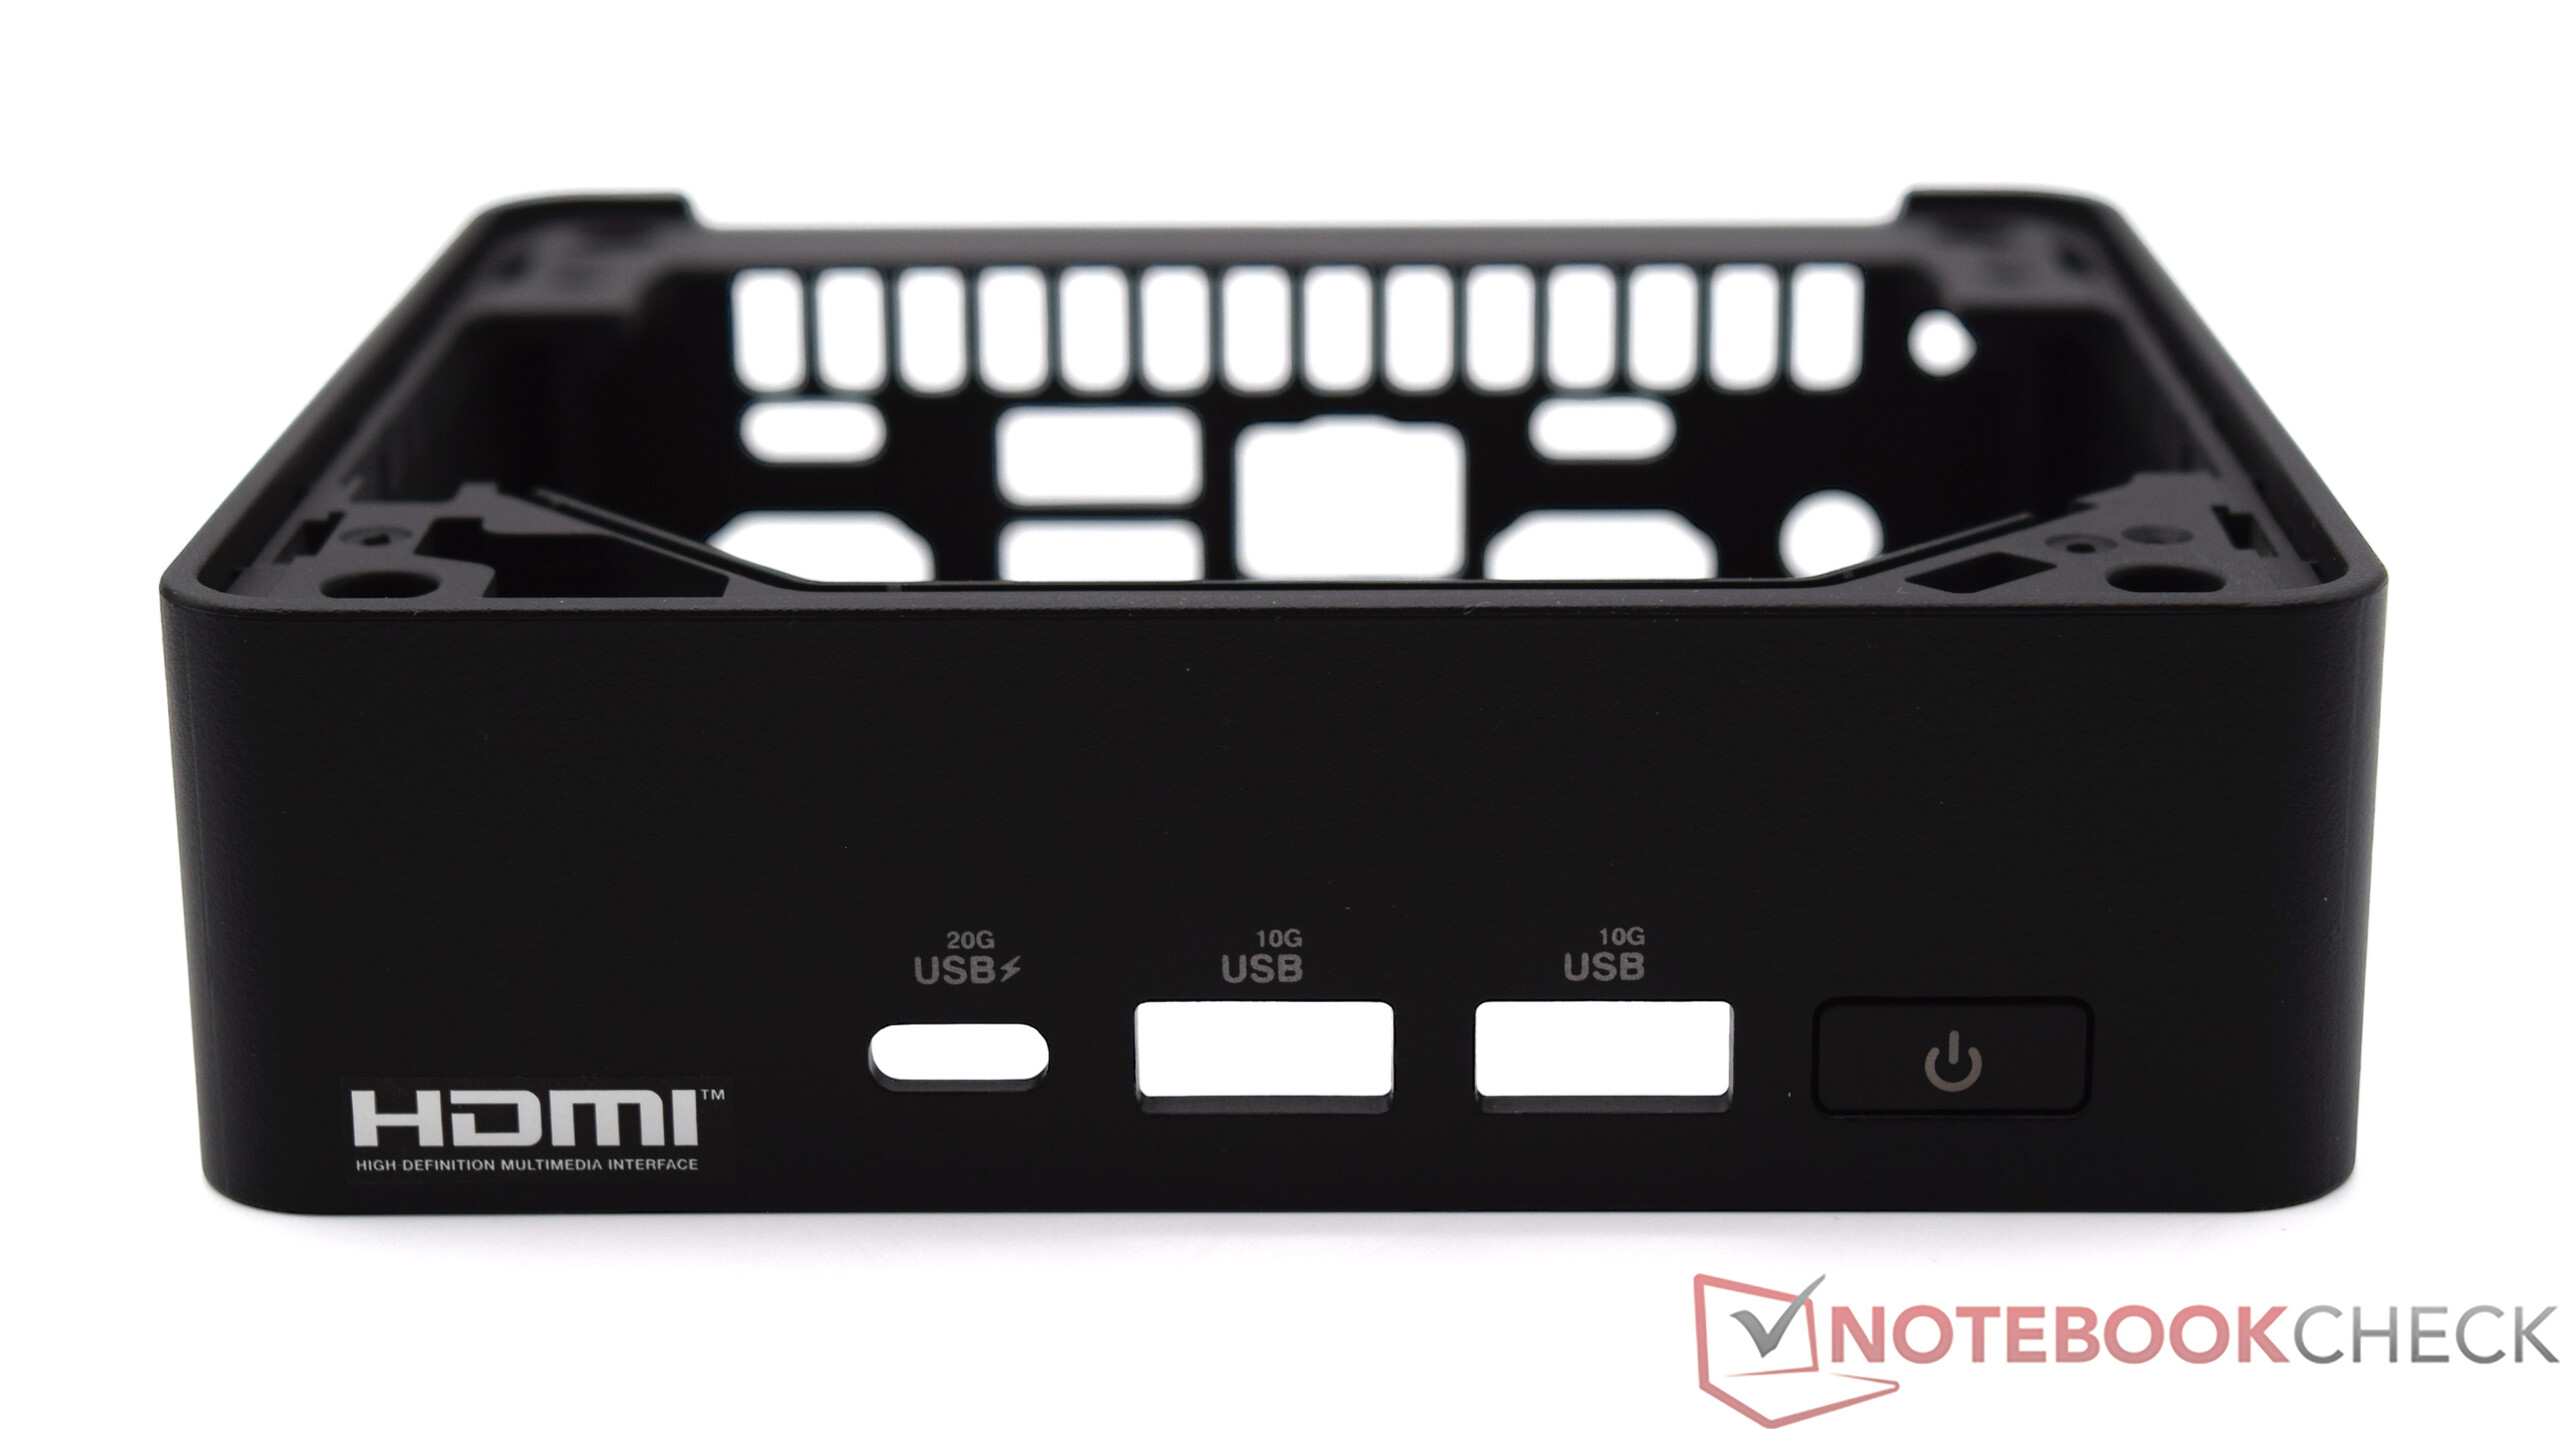
Caixa - A caixa de plástico preta cobre a gaiola de metal
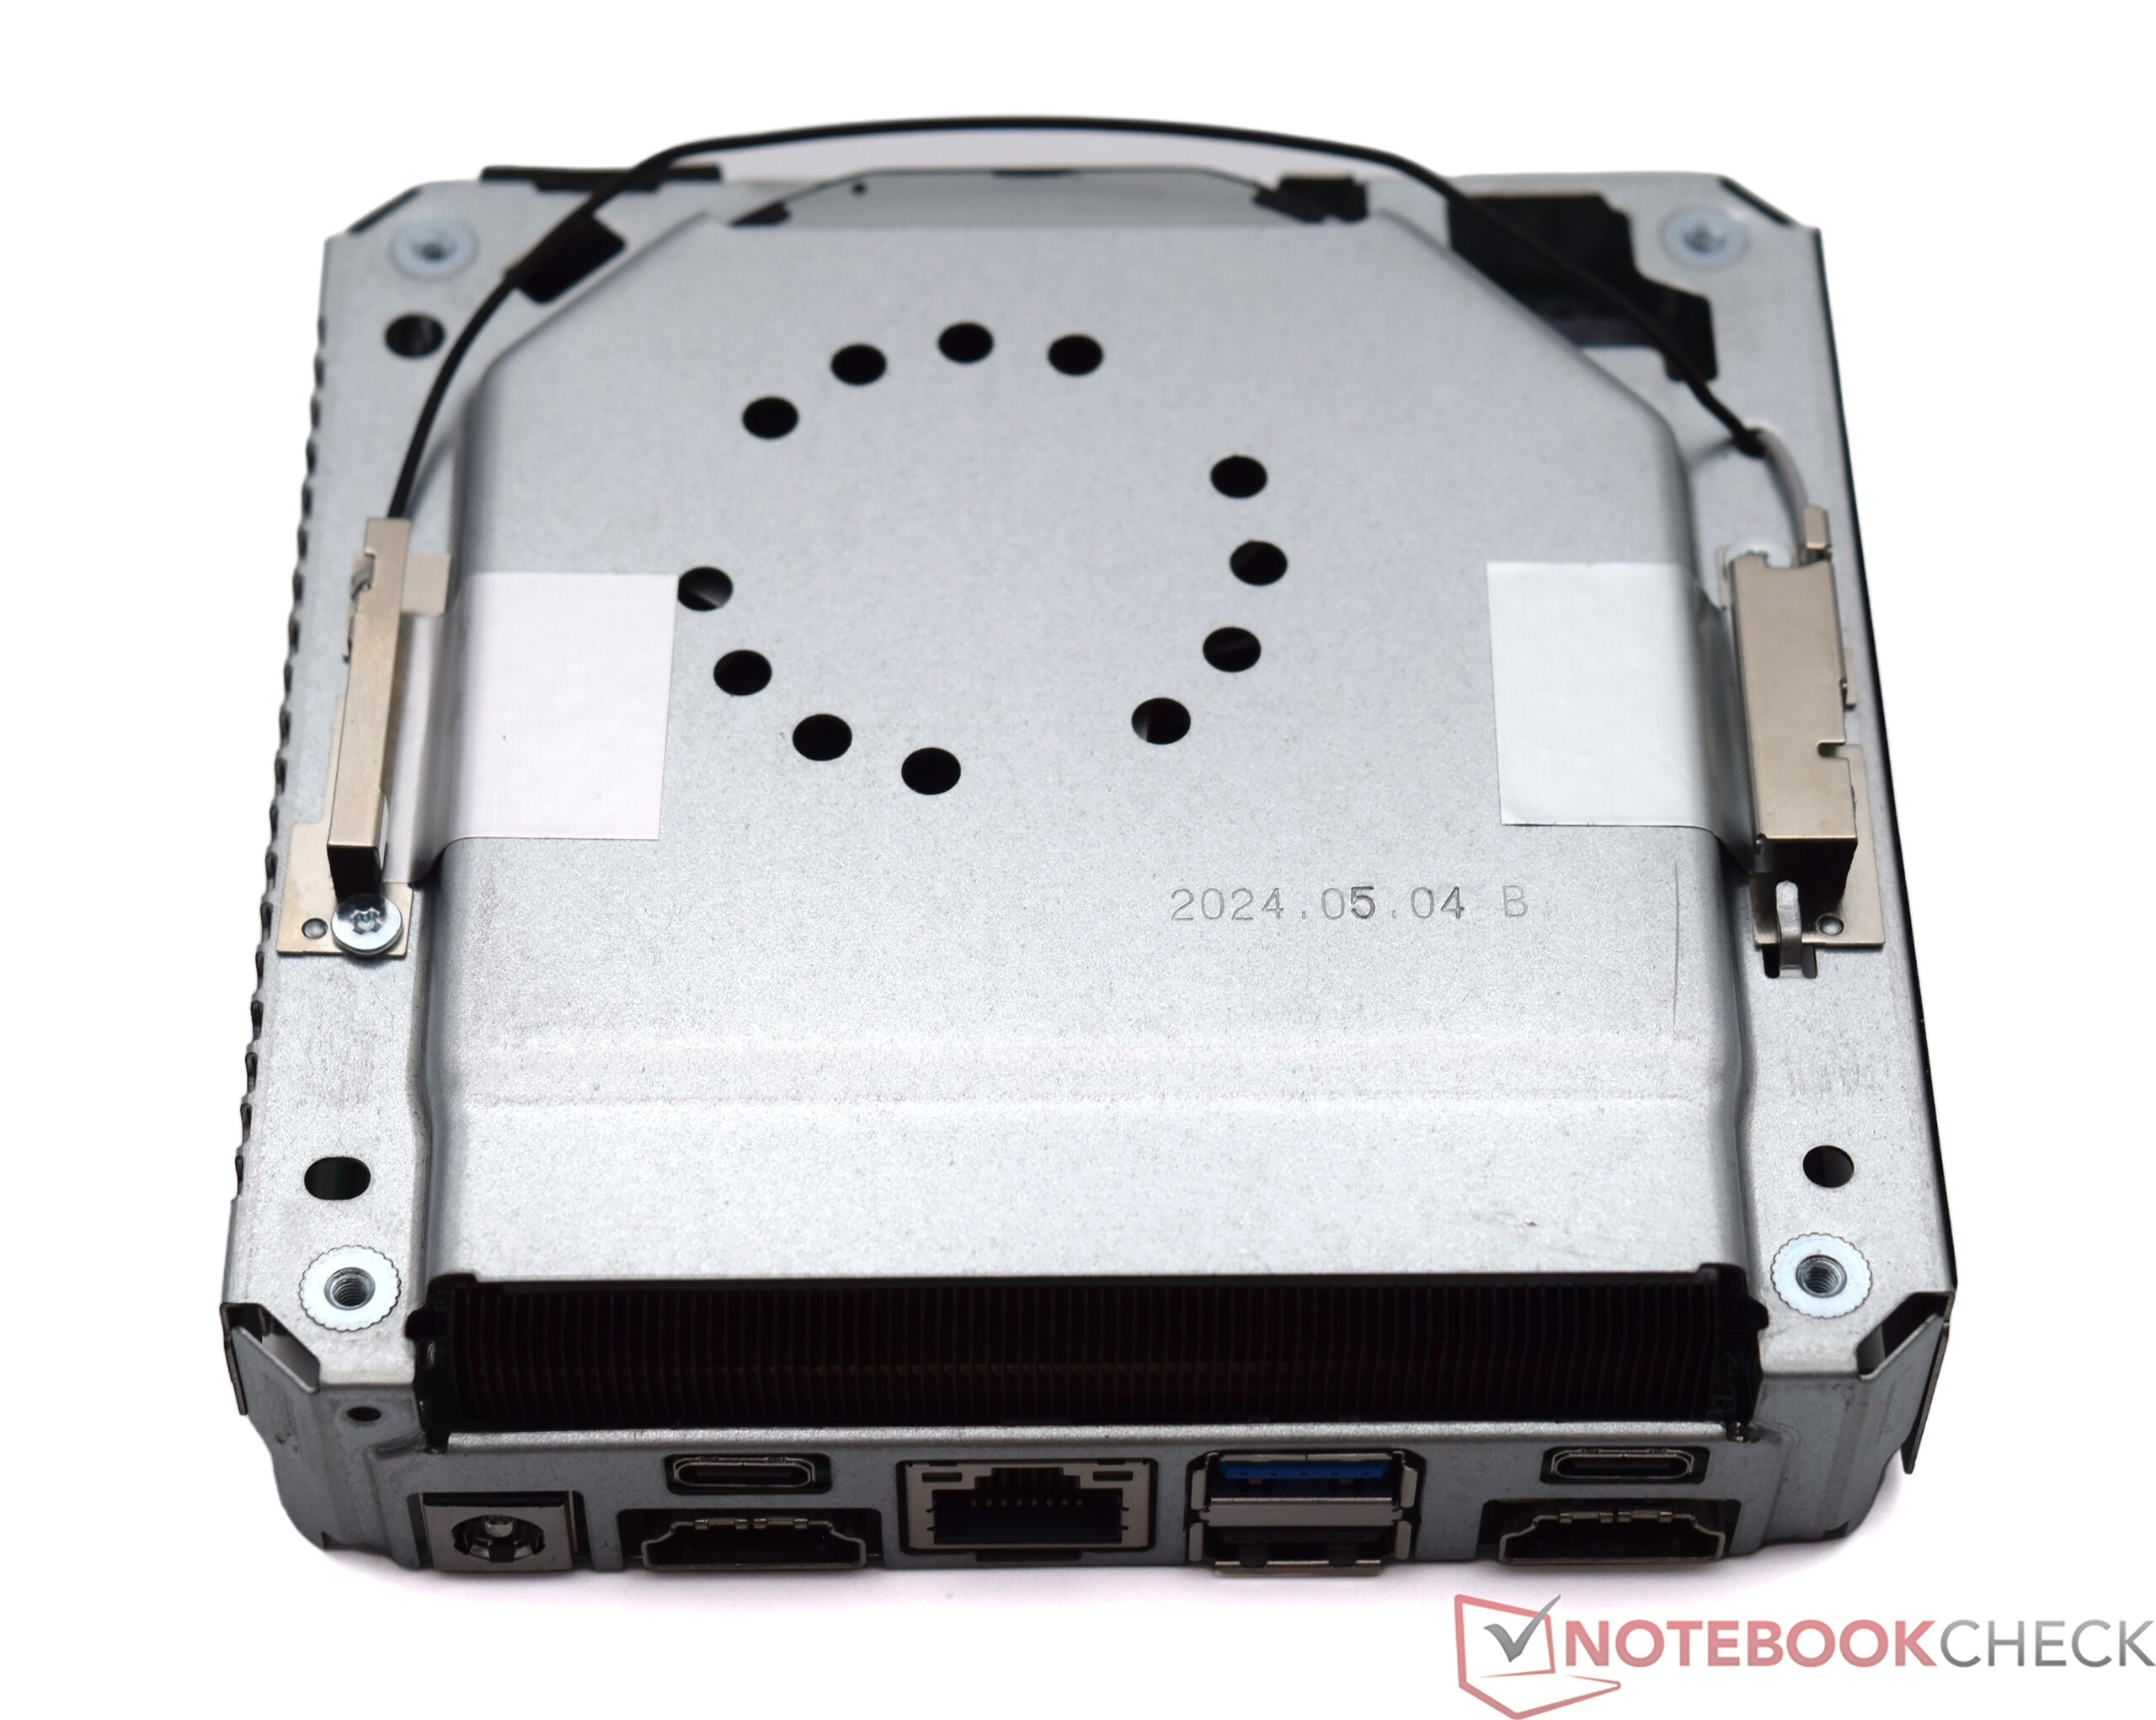
Visualmente, o Asus NUC 14 Pro lembra o Intel NUC 12 Pro Kit embora o design tenha sido ligeiramente revisado. No entanto, a escolha dos materiais é a mesma. O conceito básico também não mudou, pois o plástico preto esconde uma estrutura metálica resistente. Do ponto de vista tátil, o Asus NUC 14 Pro é inferior aos Mini PCs, que contam com uma estrutura de alumínio. Como um atrativo visual, o dispositivo da Asus também não é convincente se isso for importante para o senhor. No entanto, o acabamento não é motivo de crítica. A parte inferior, por outro lado, foi redesenhada e inclui uma trava mecânica para abrir o dispositivo sem ferramentas. A versão slim, que testamos aqui, tem um design bem plano com uma altura de 37 milímetros. Com uma área de cobertura quase quadrada de 11,7 x 11,2 centímetros, o dispositivo ocupa pouco espaço na mesa. O suporte VESA fornecido também permite que ele seja montado em um monitor.
Equipamentos
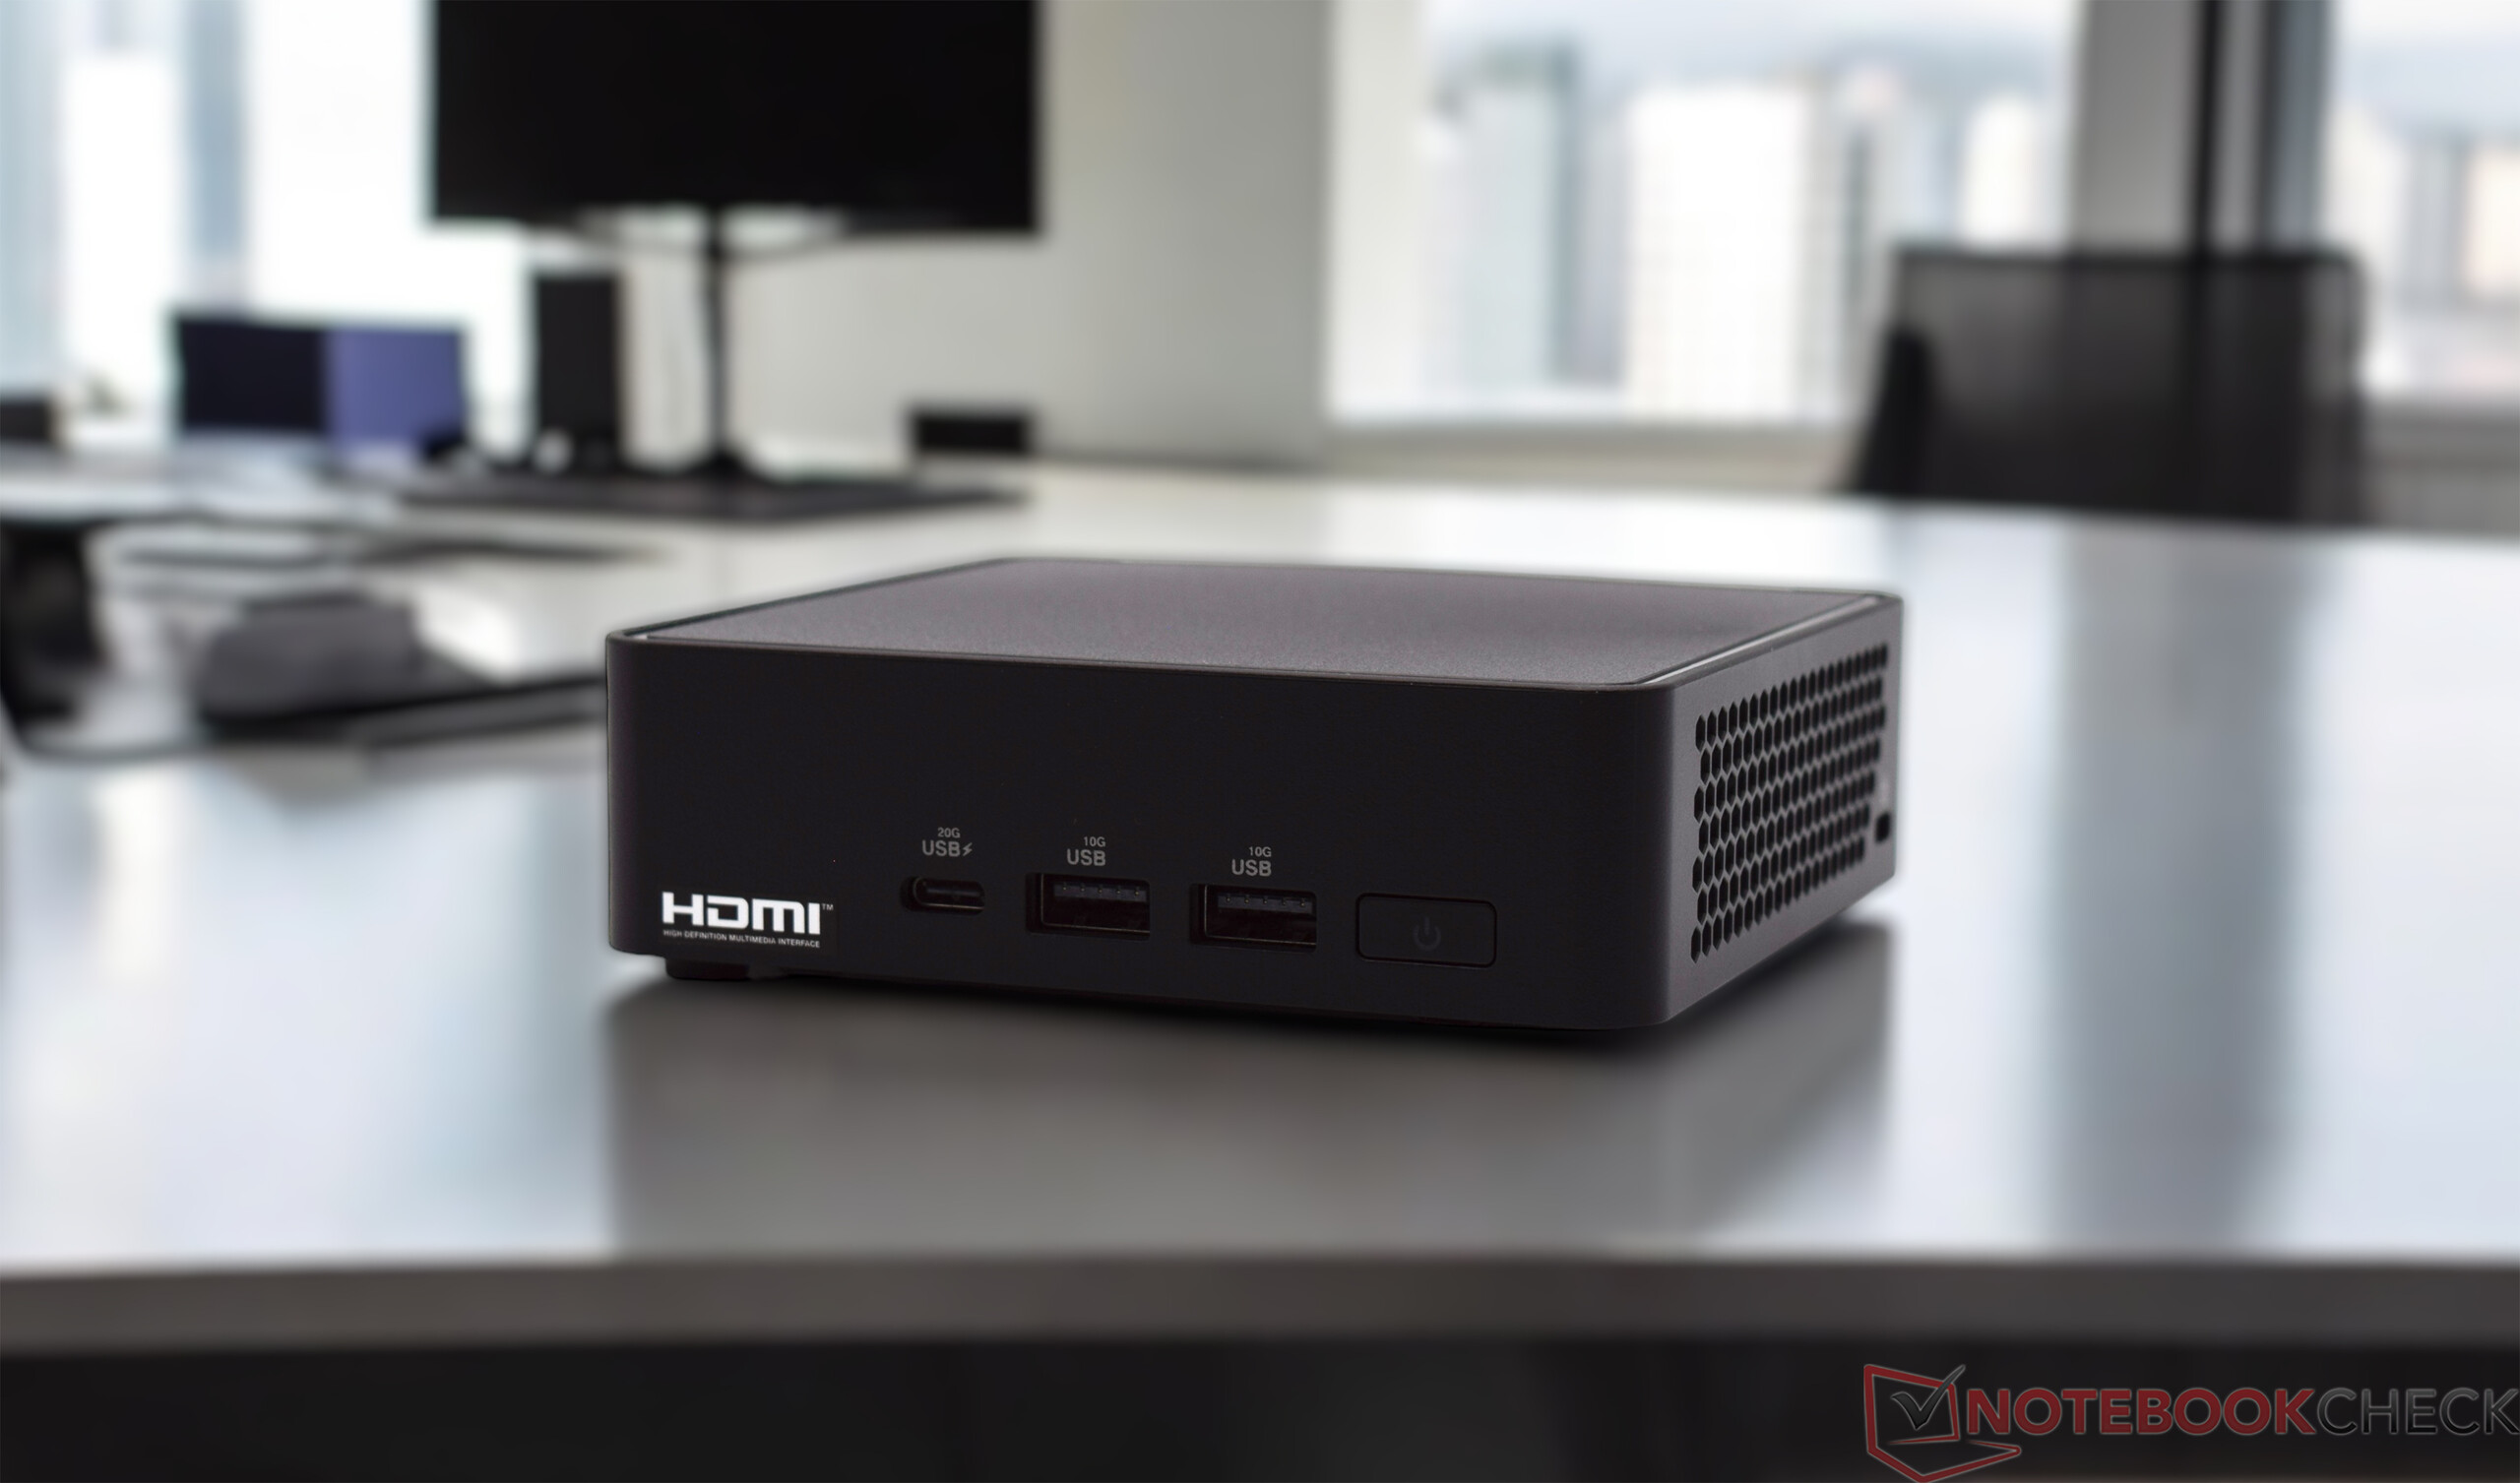
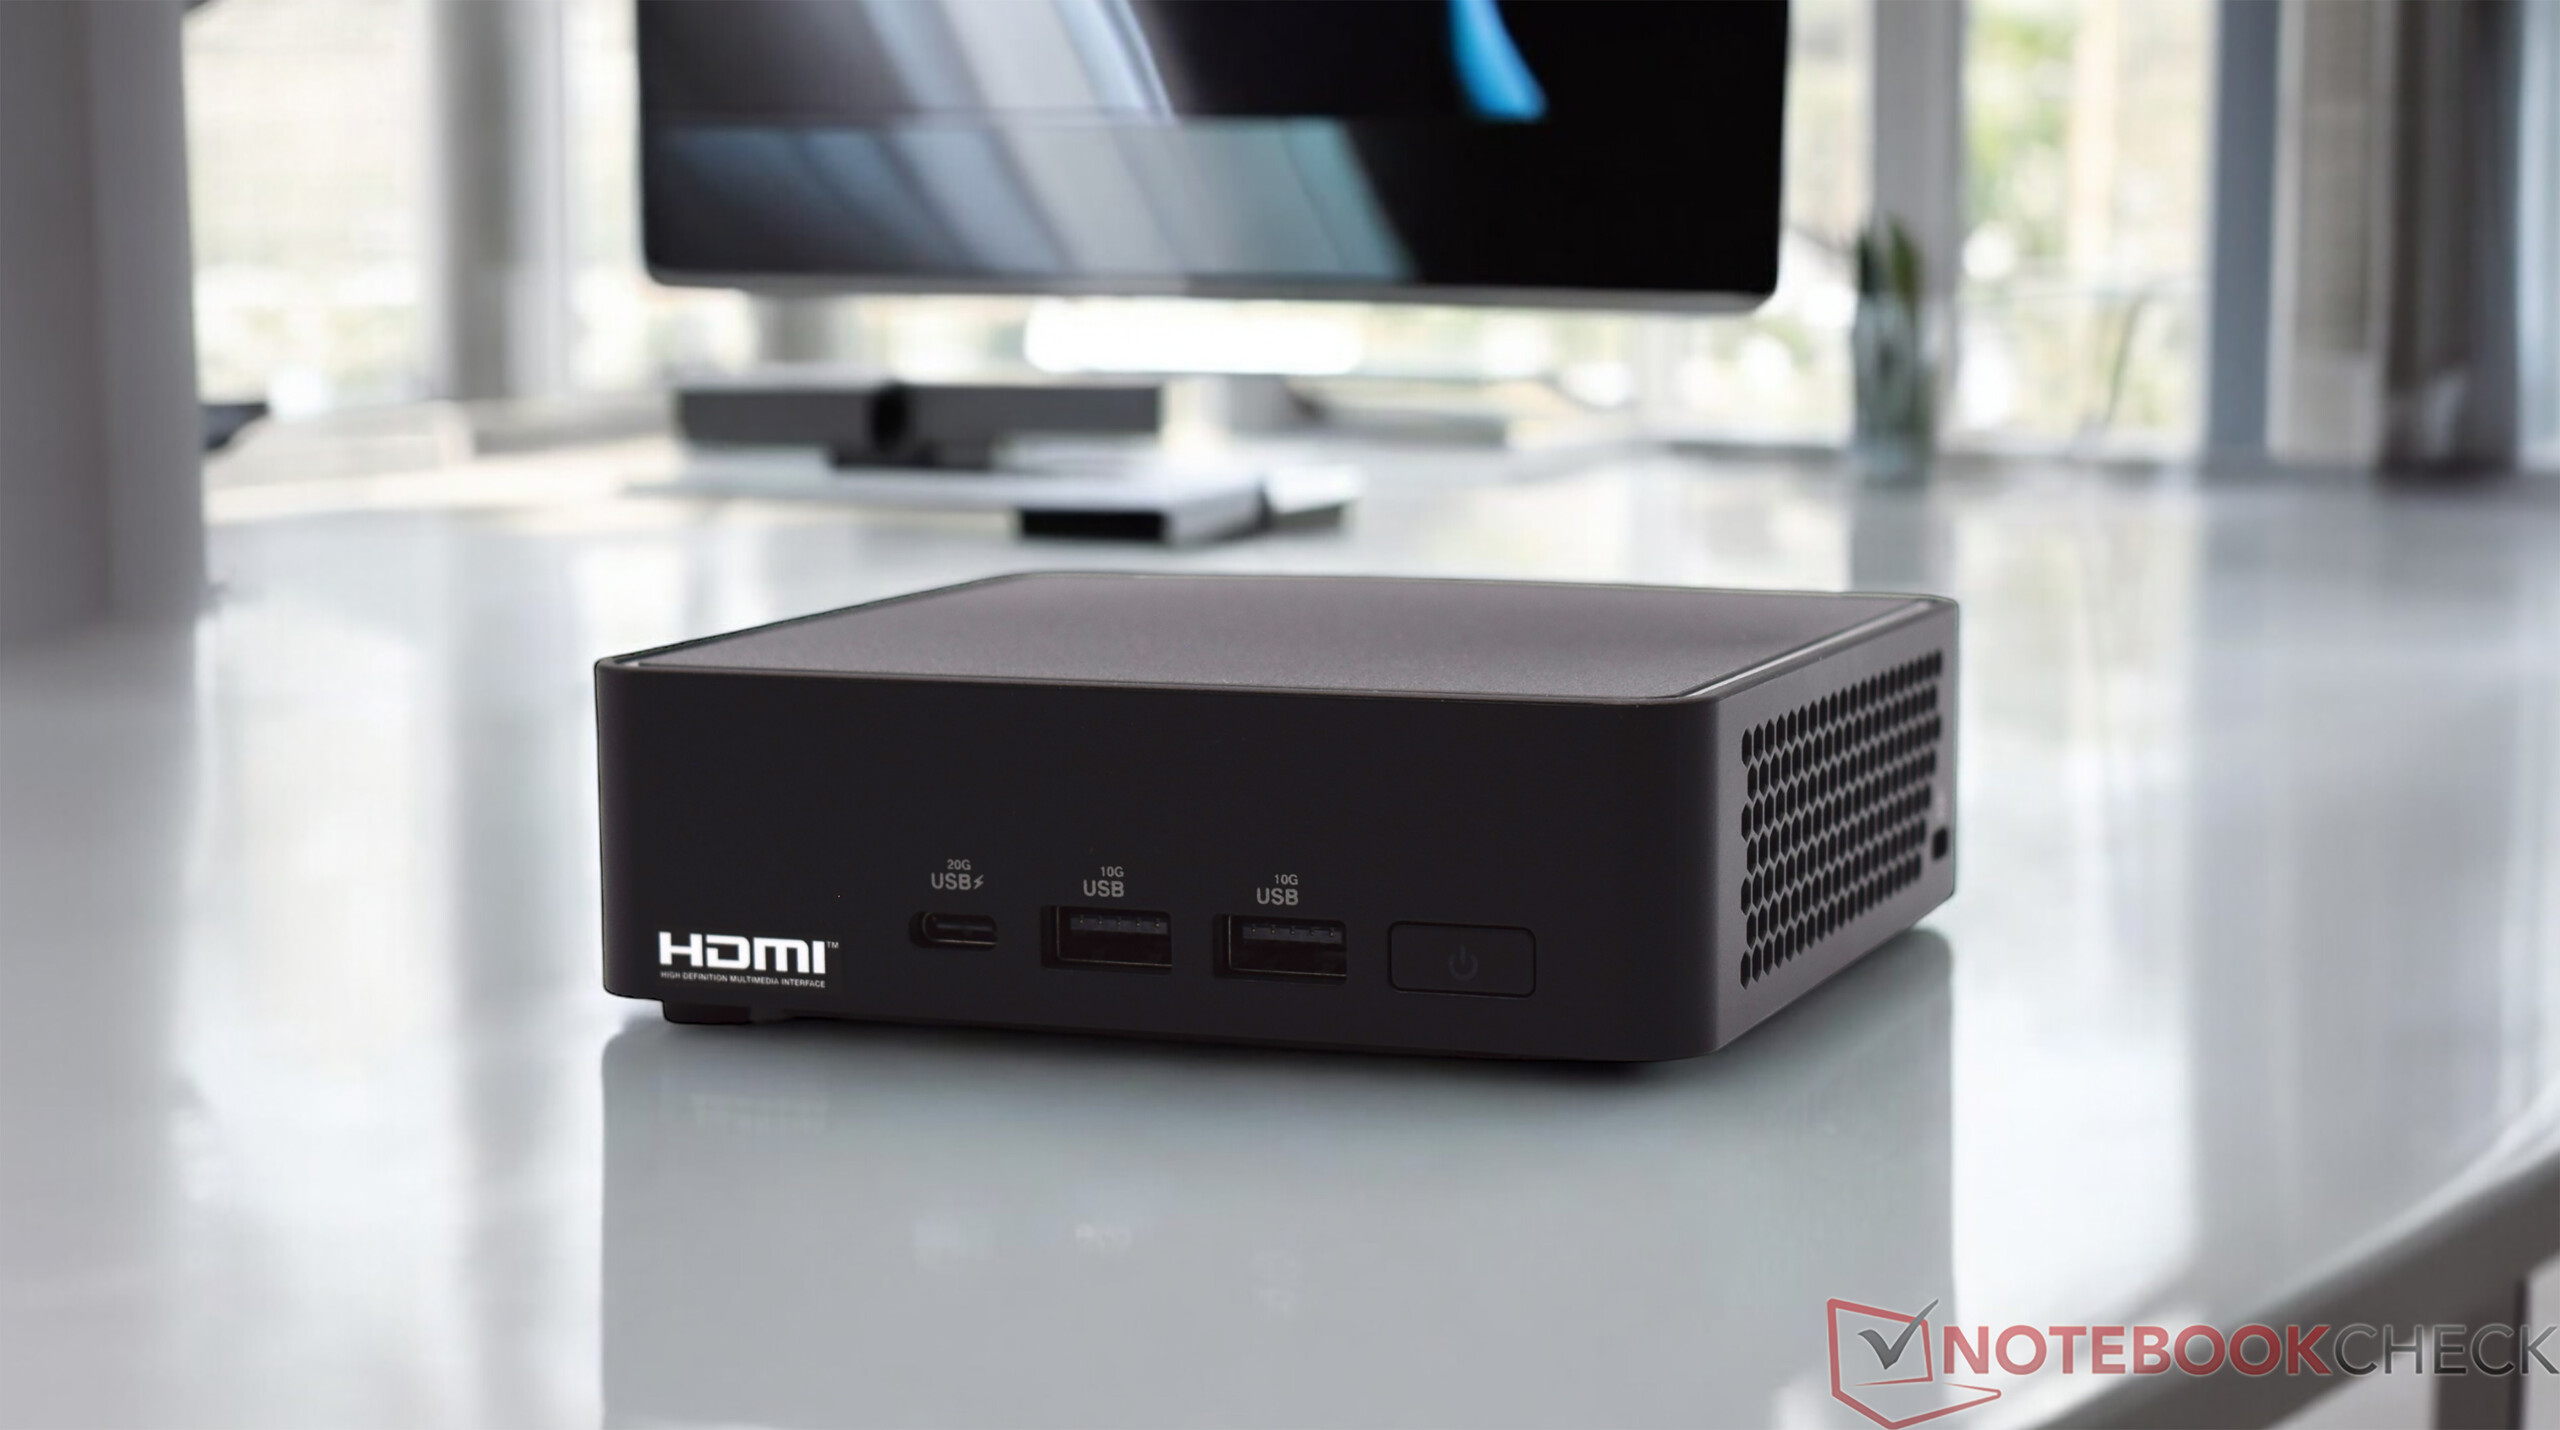
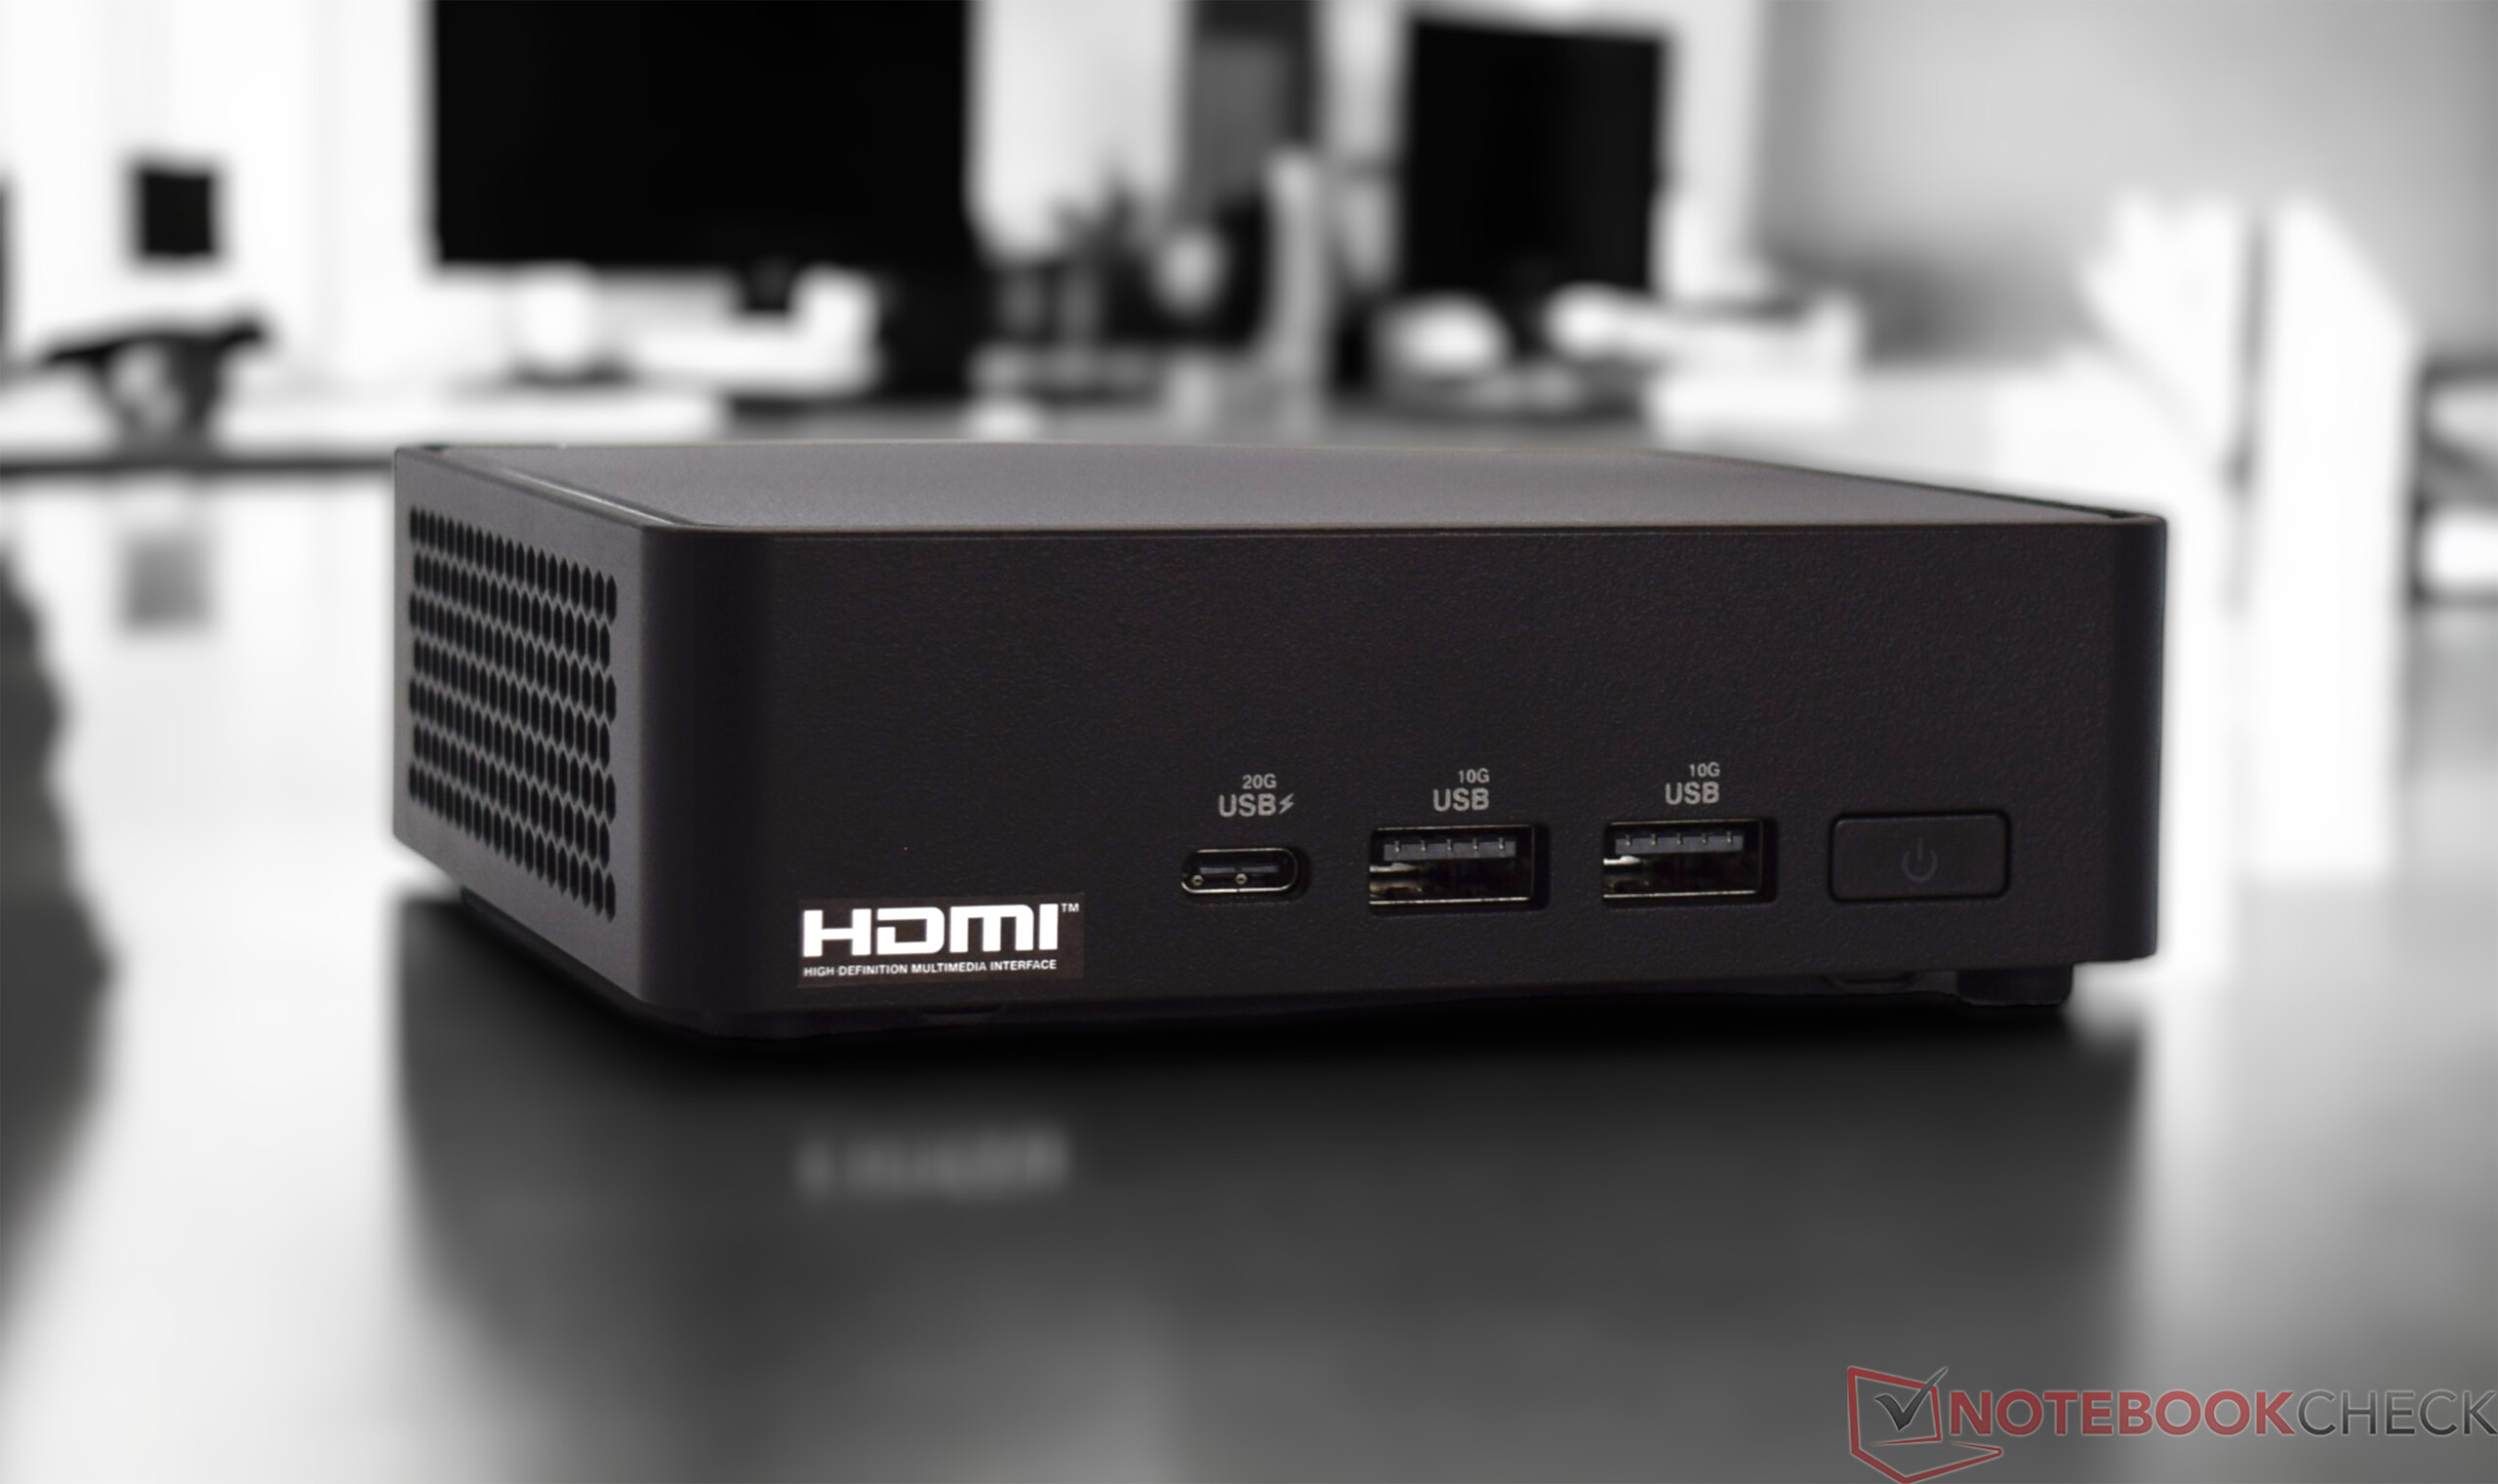
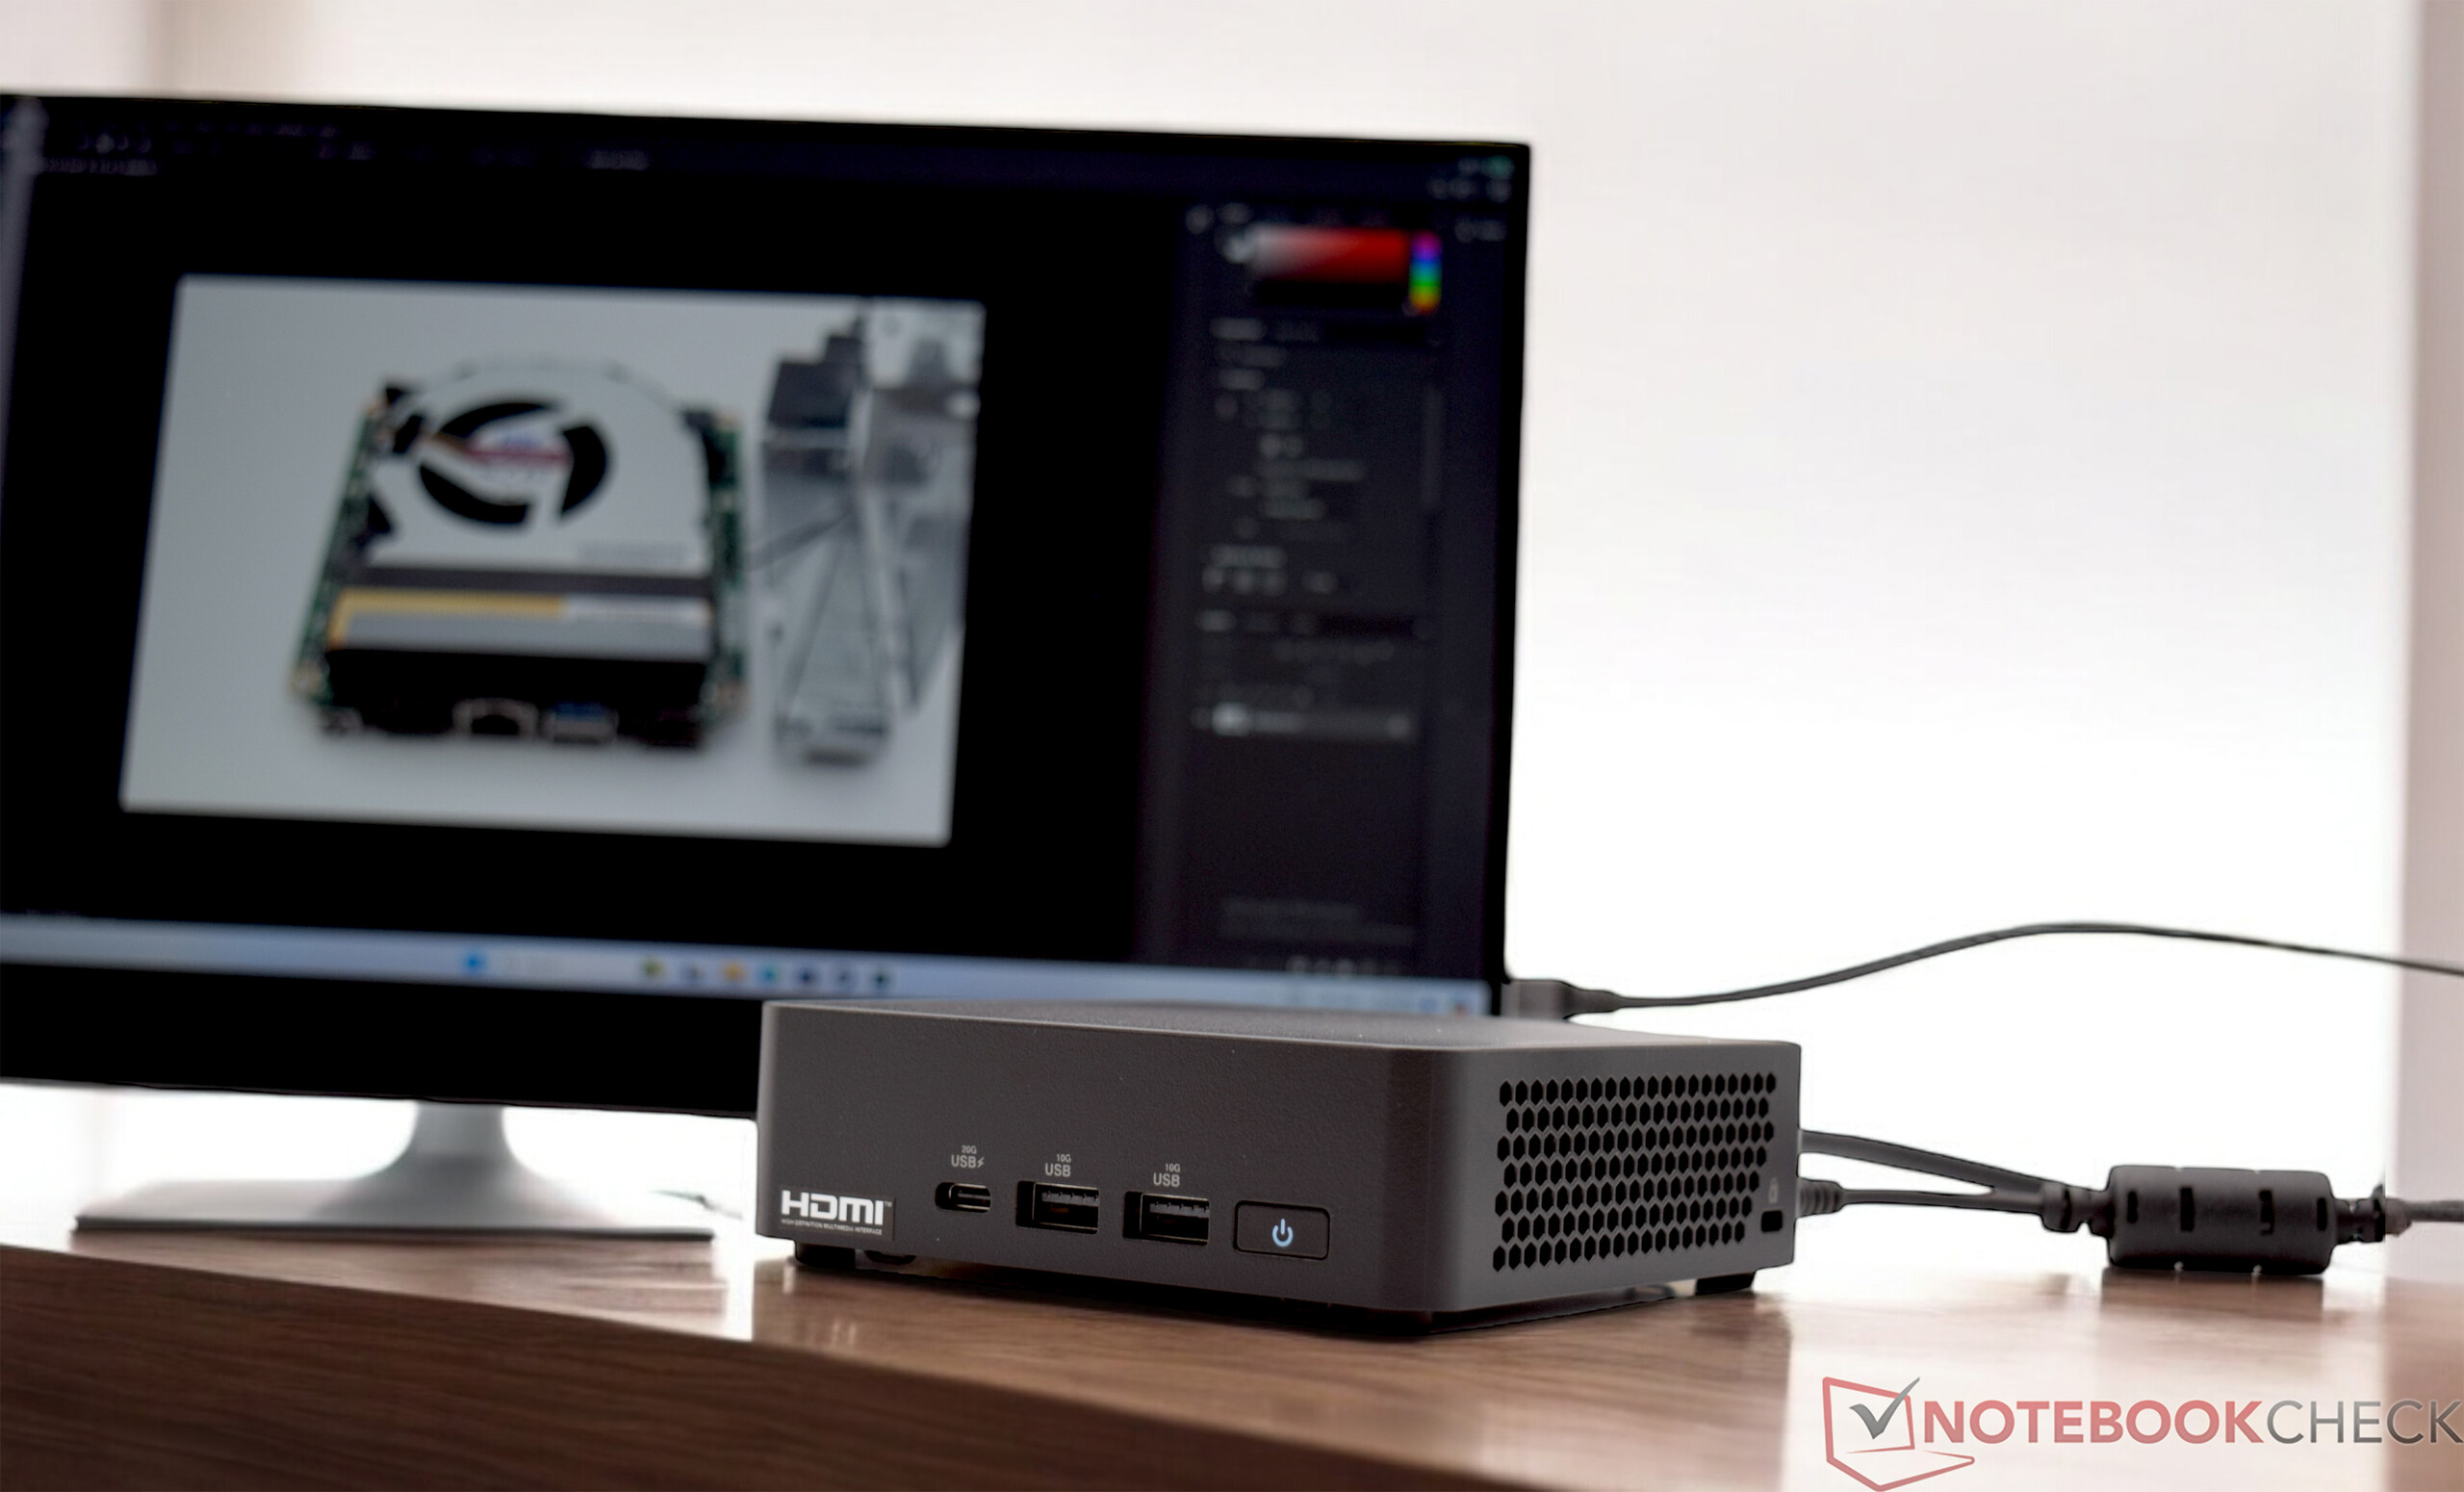
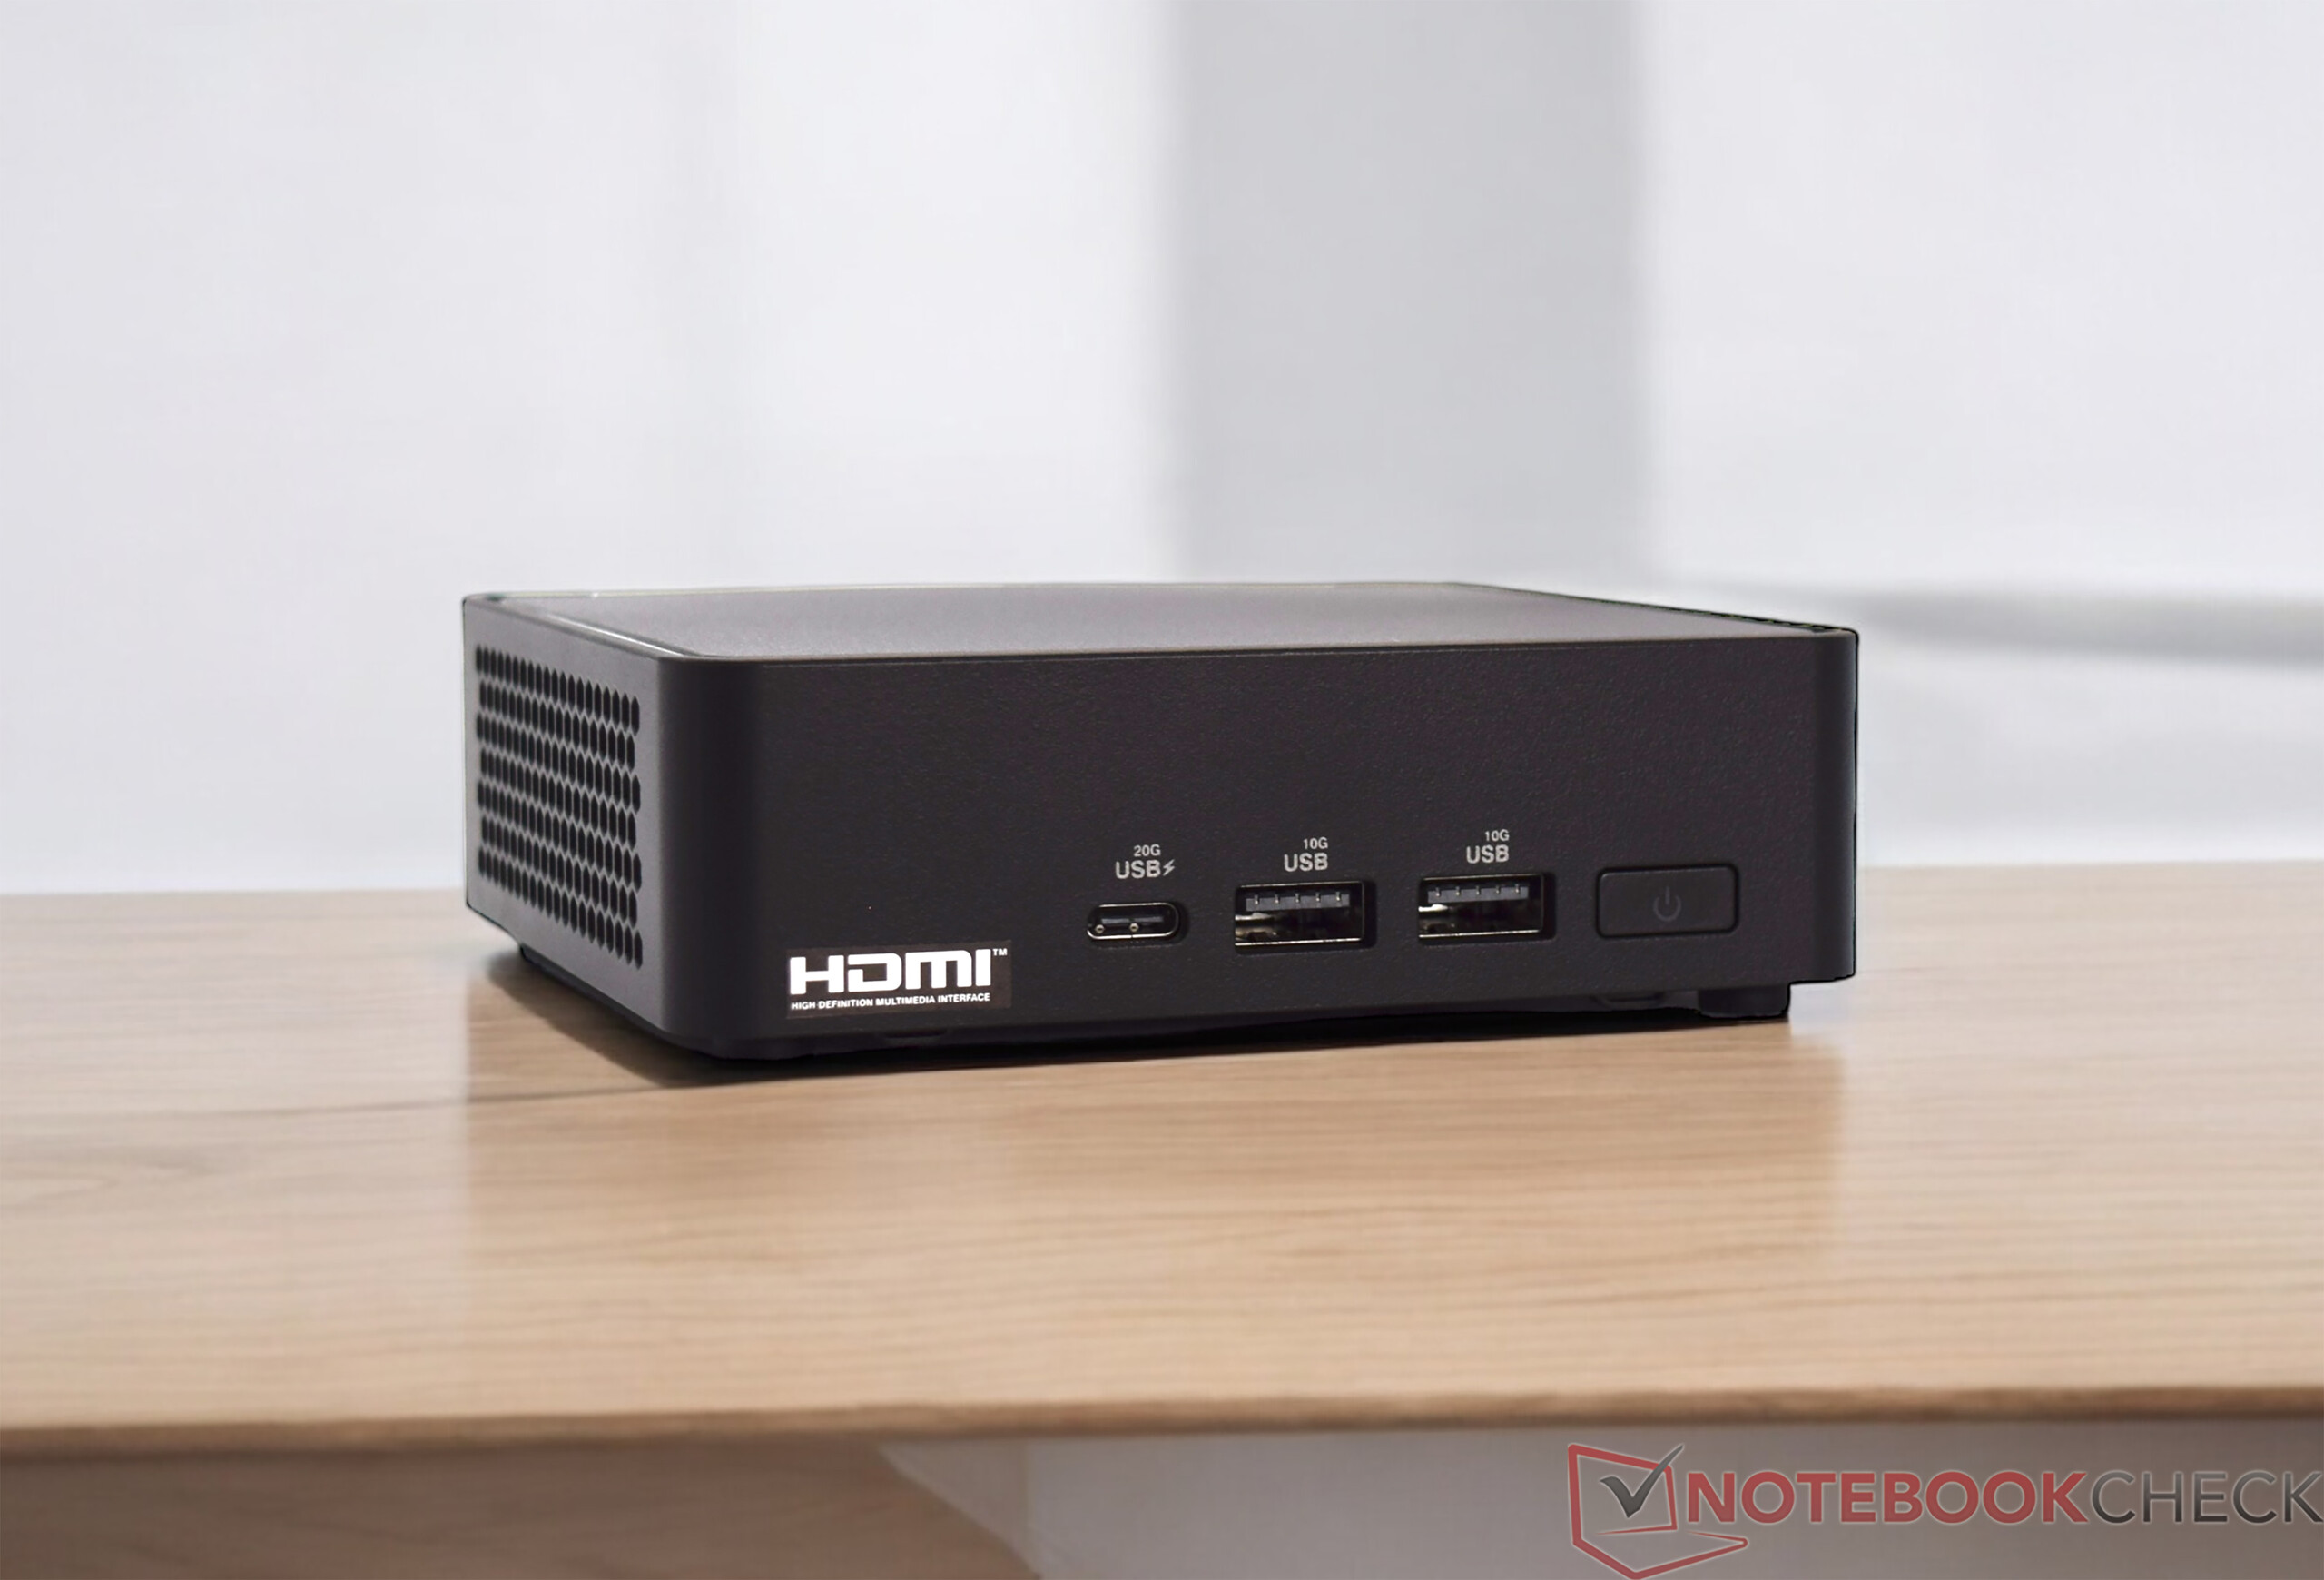
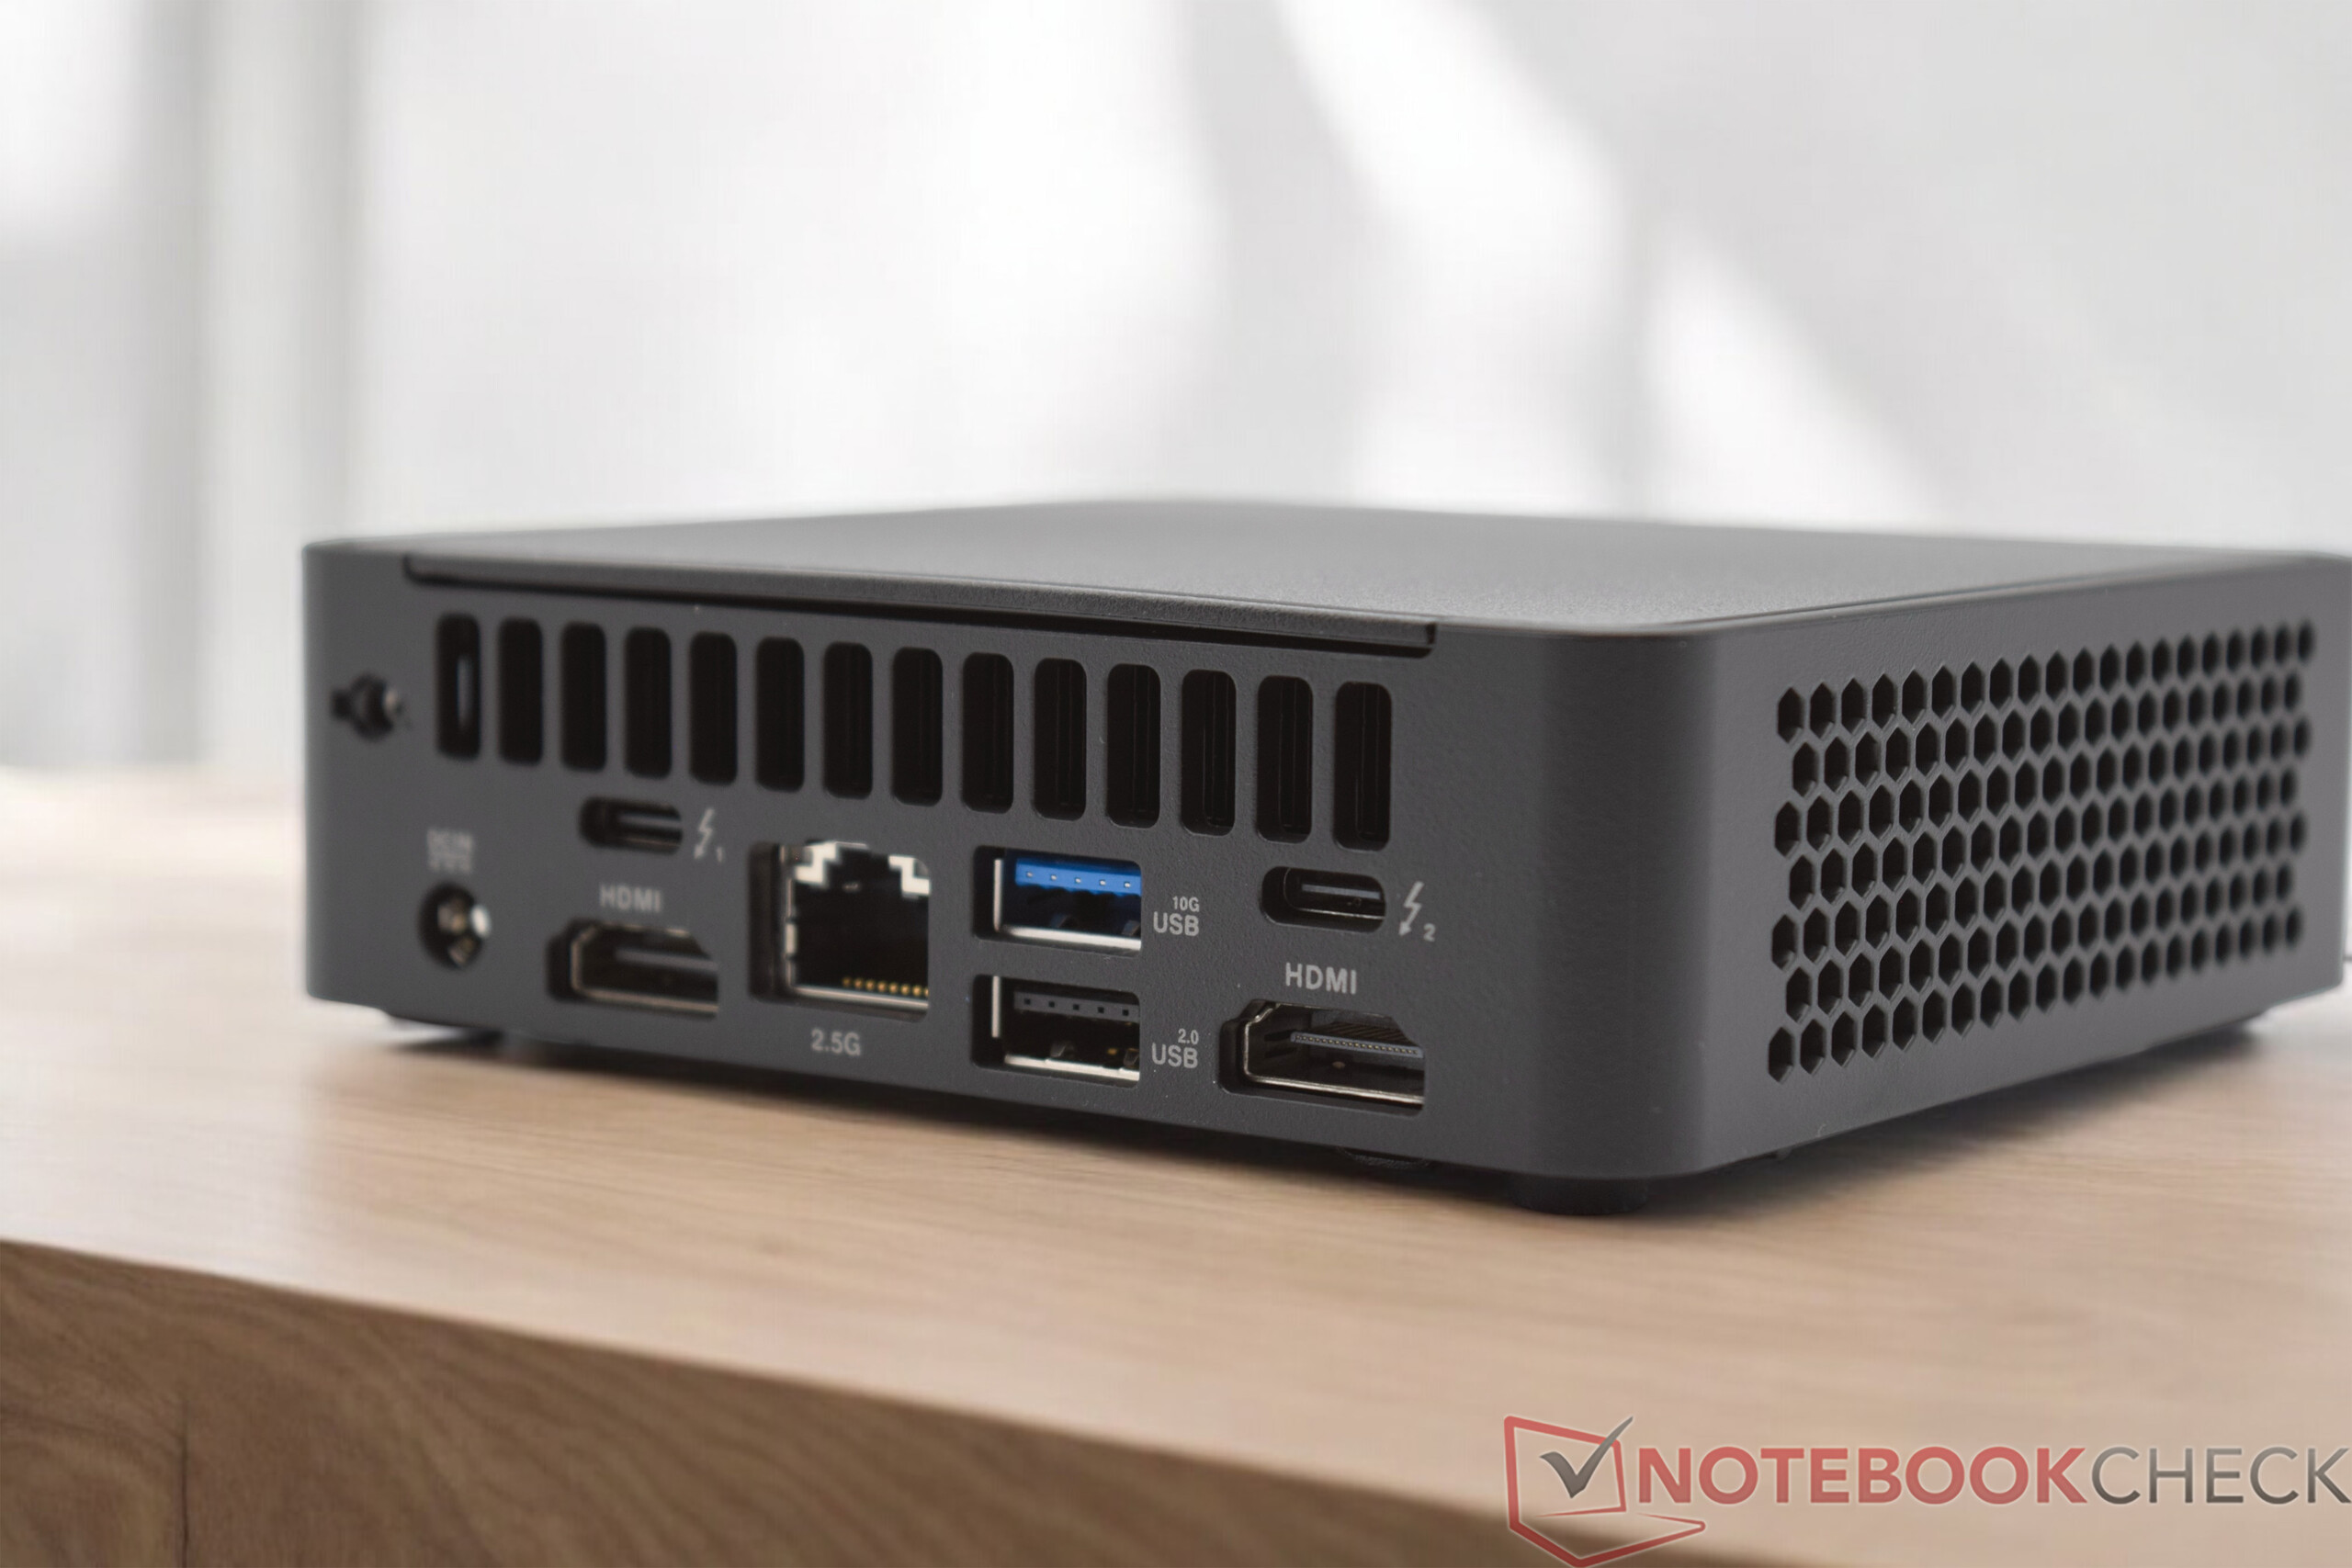
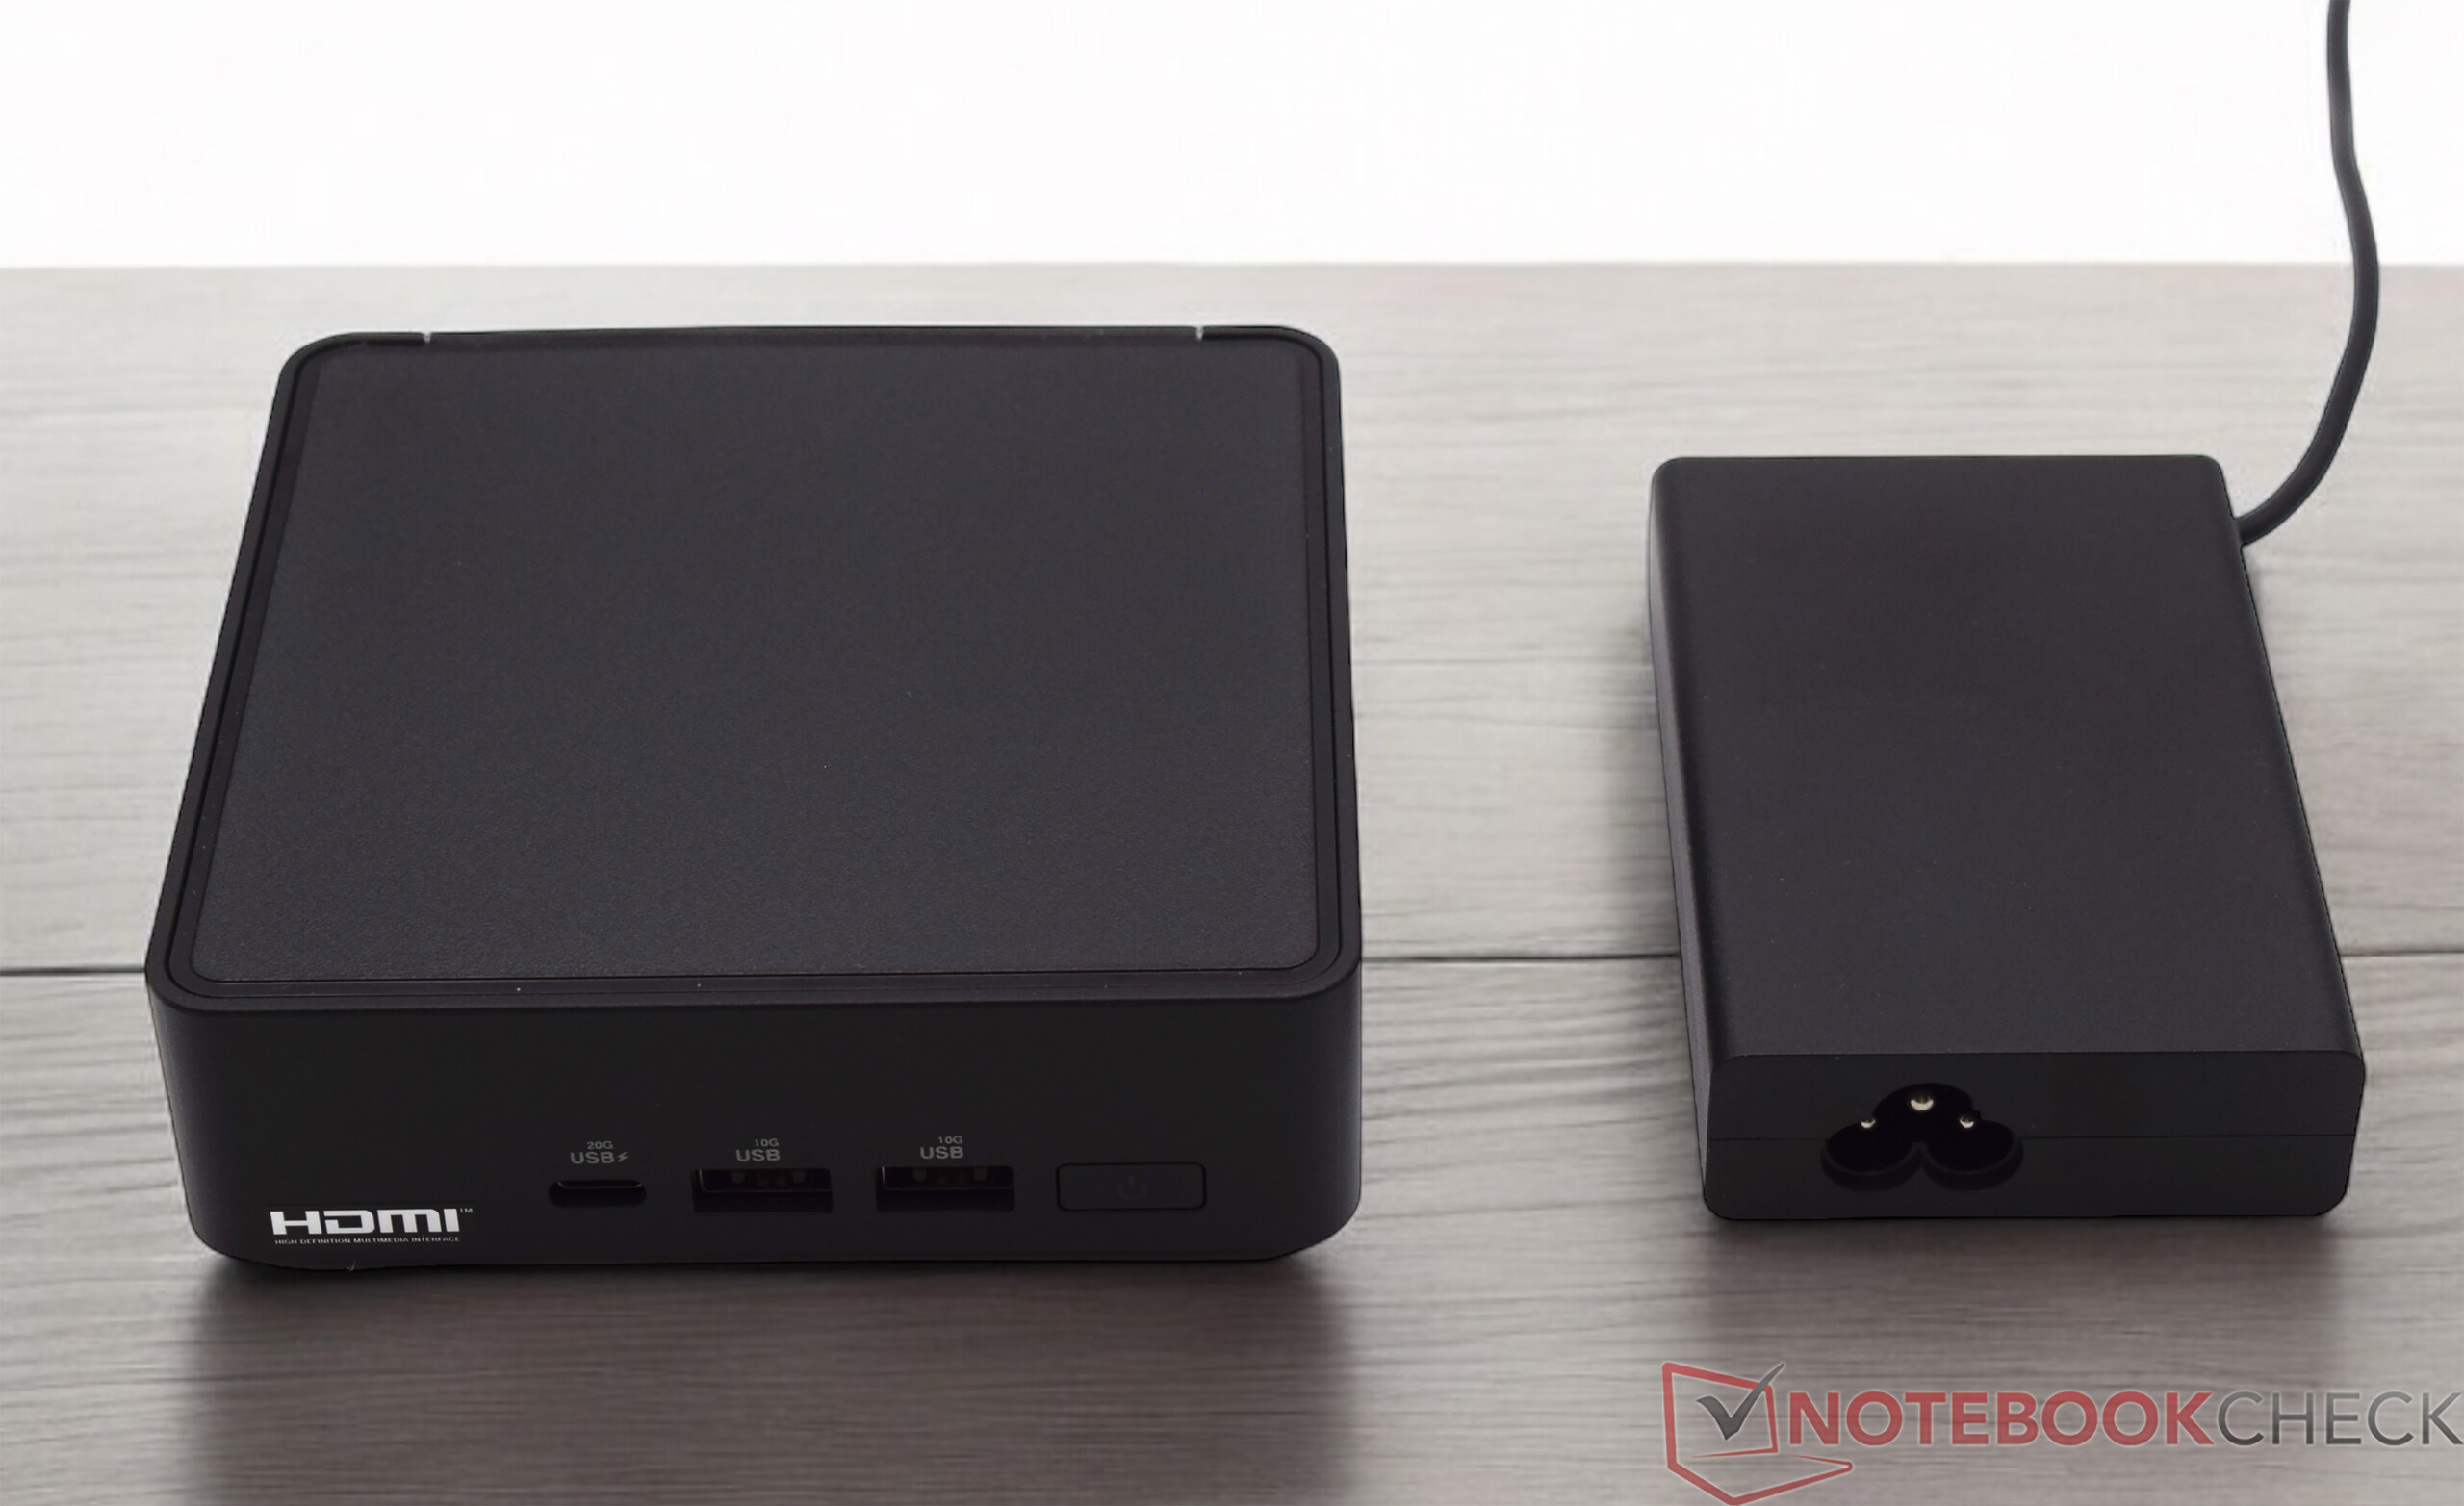
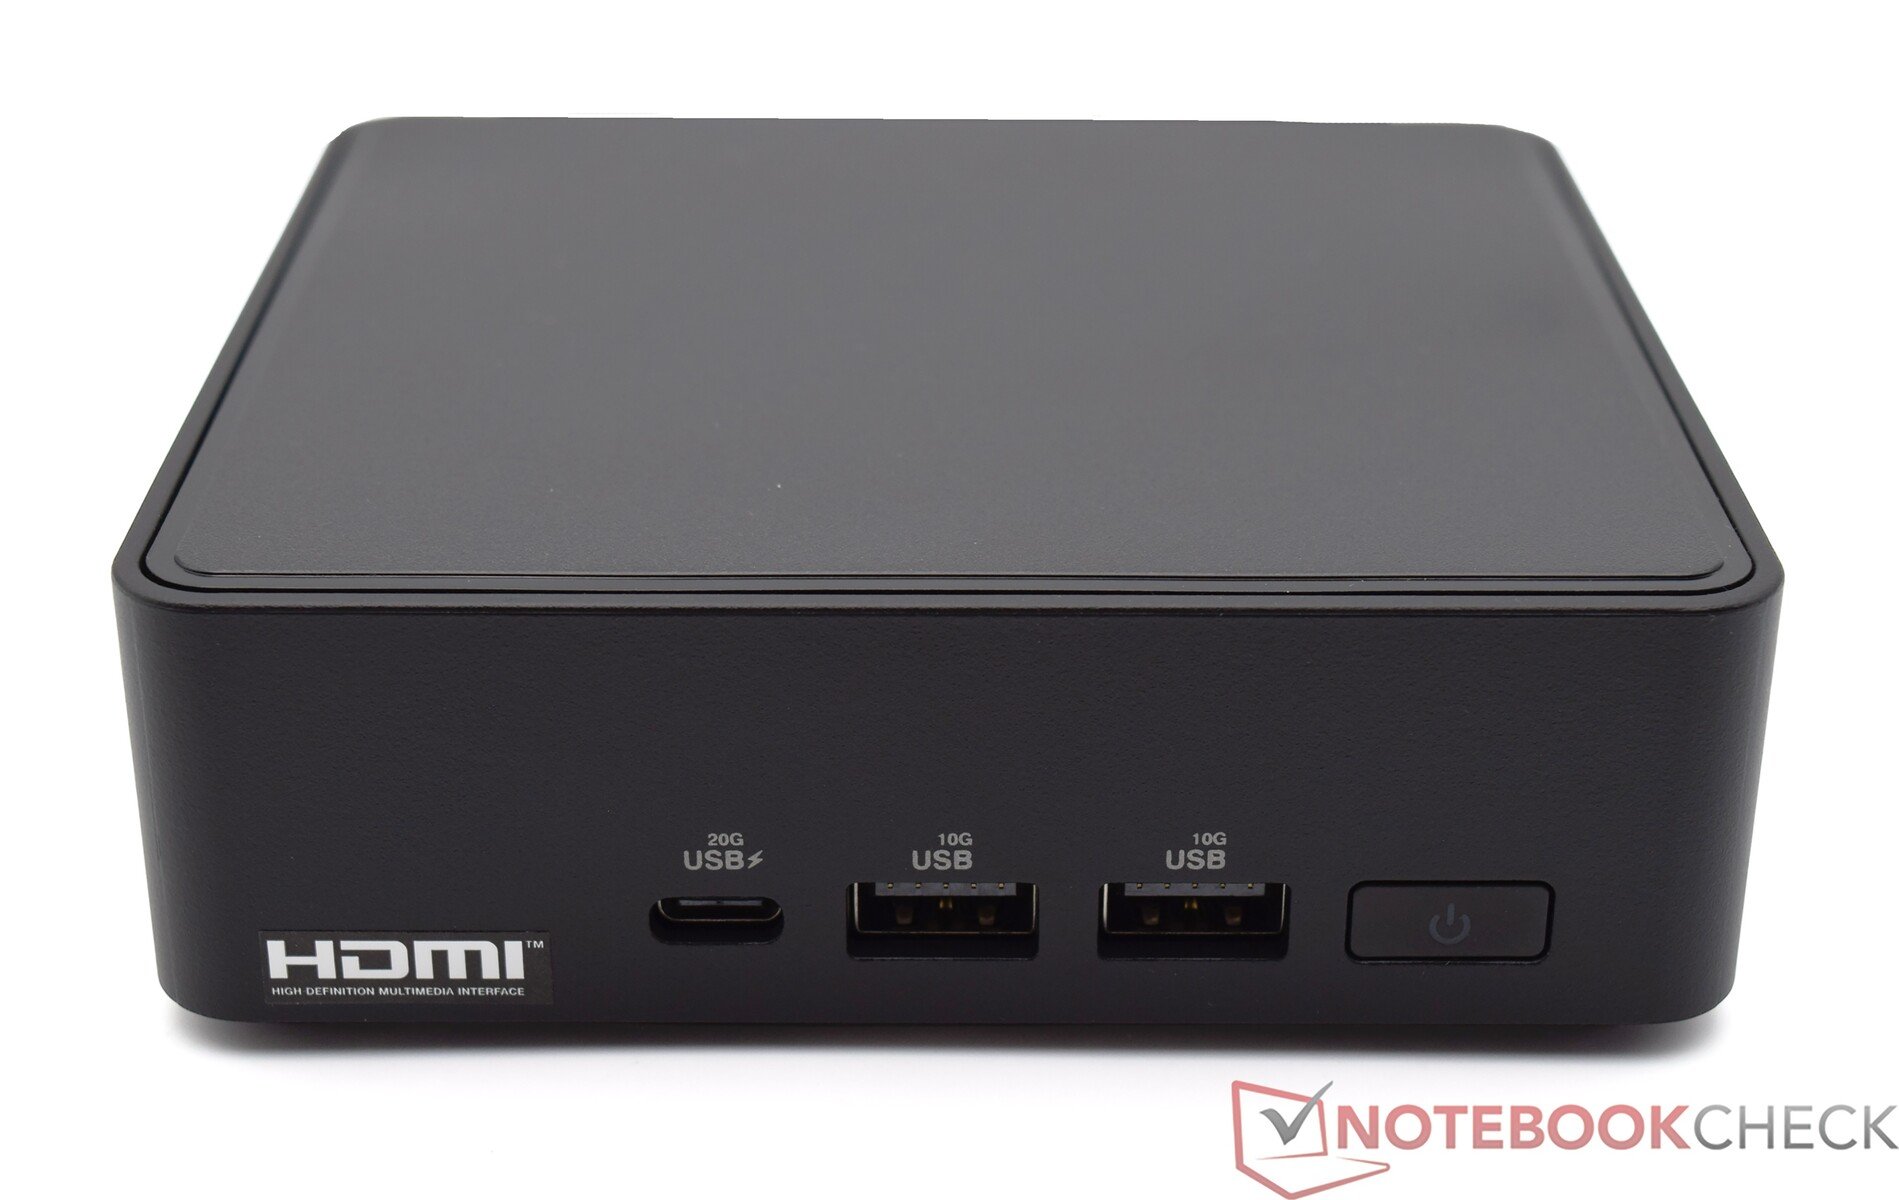
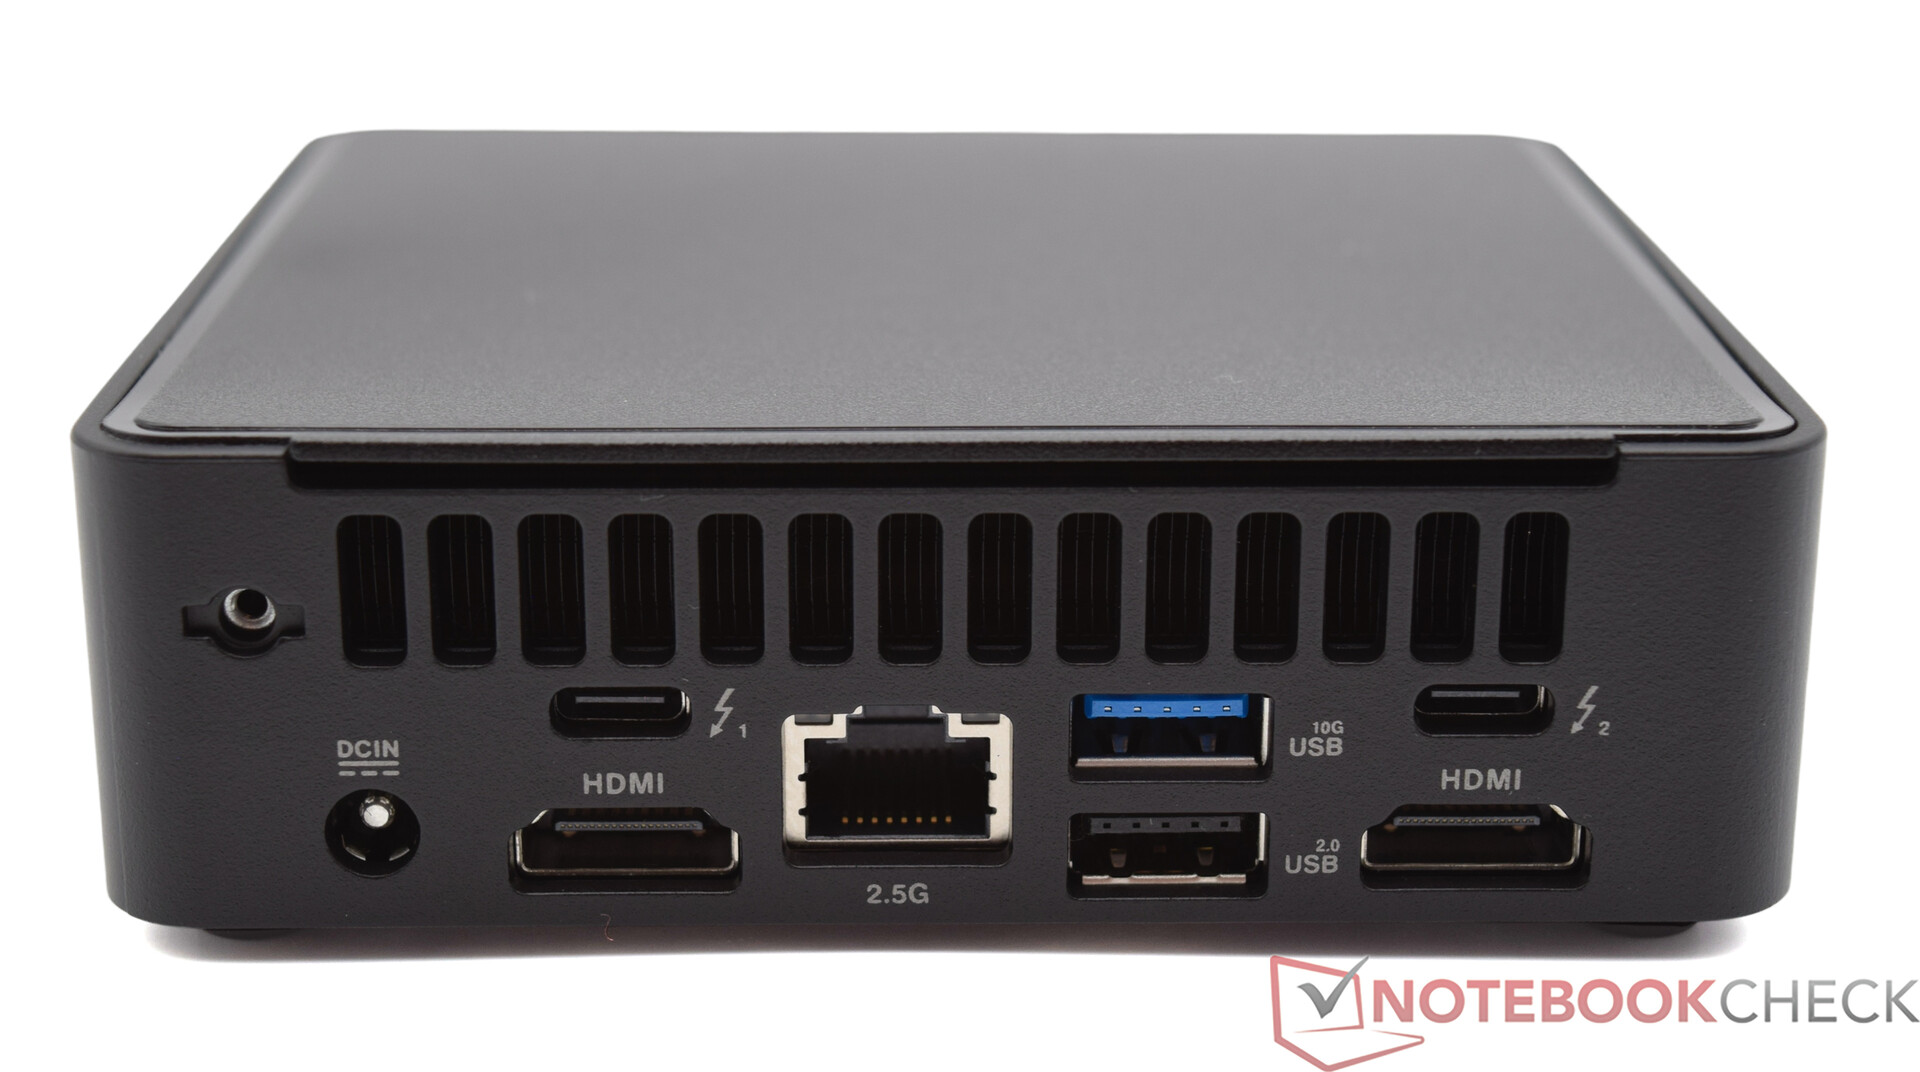
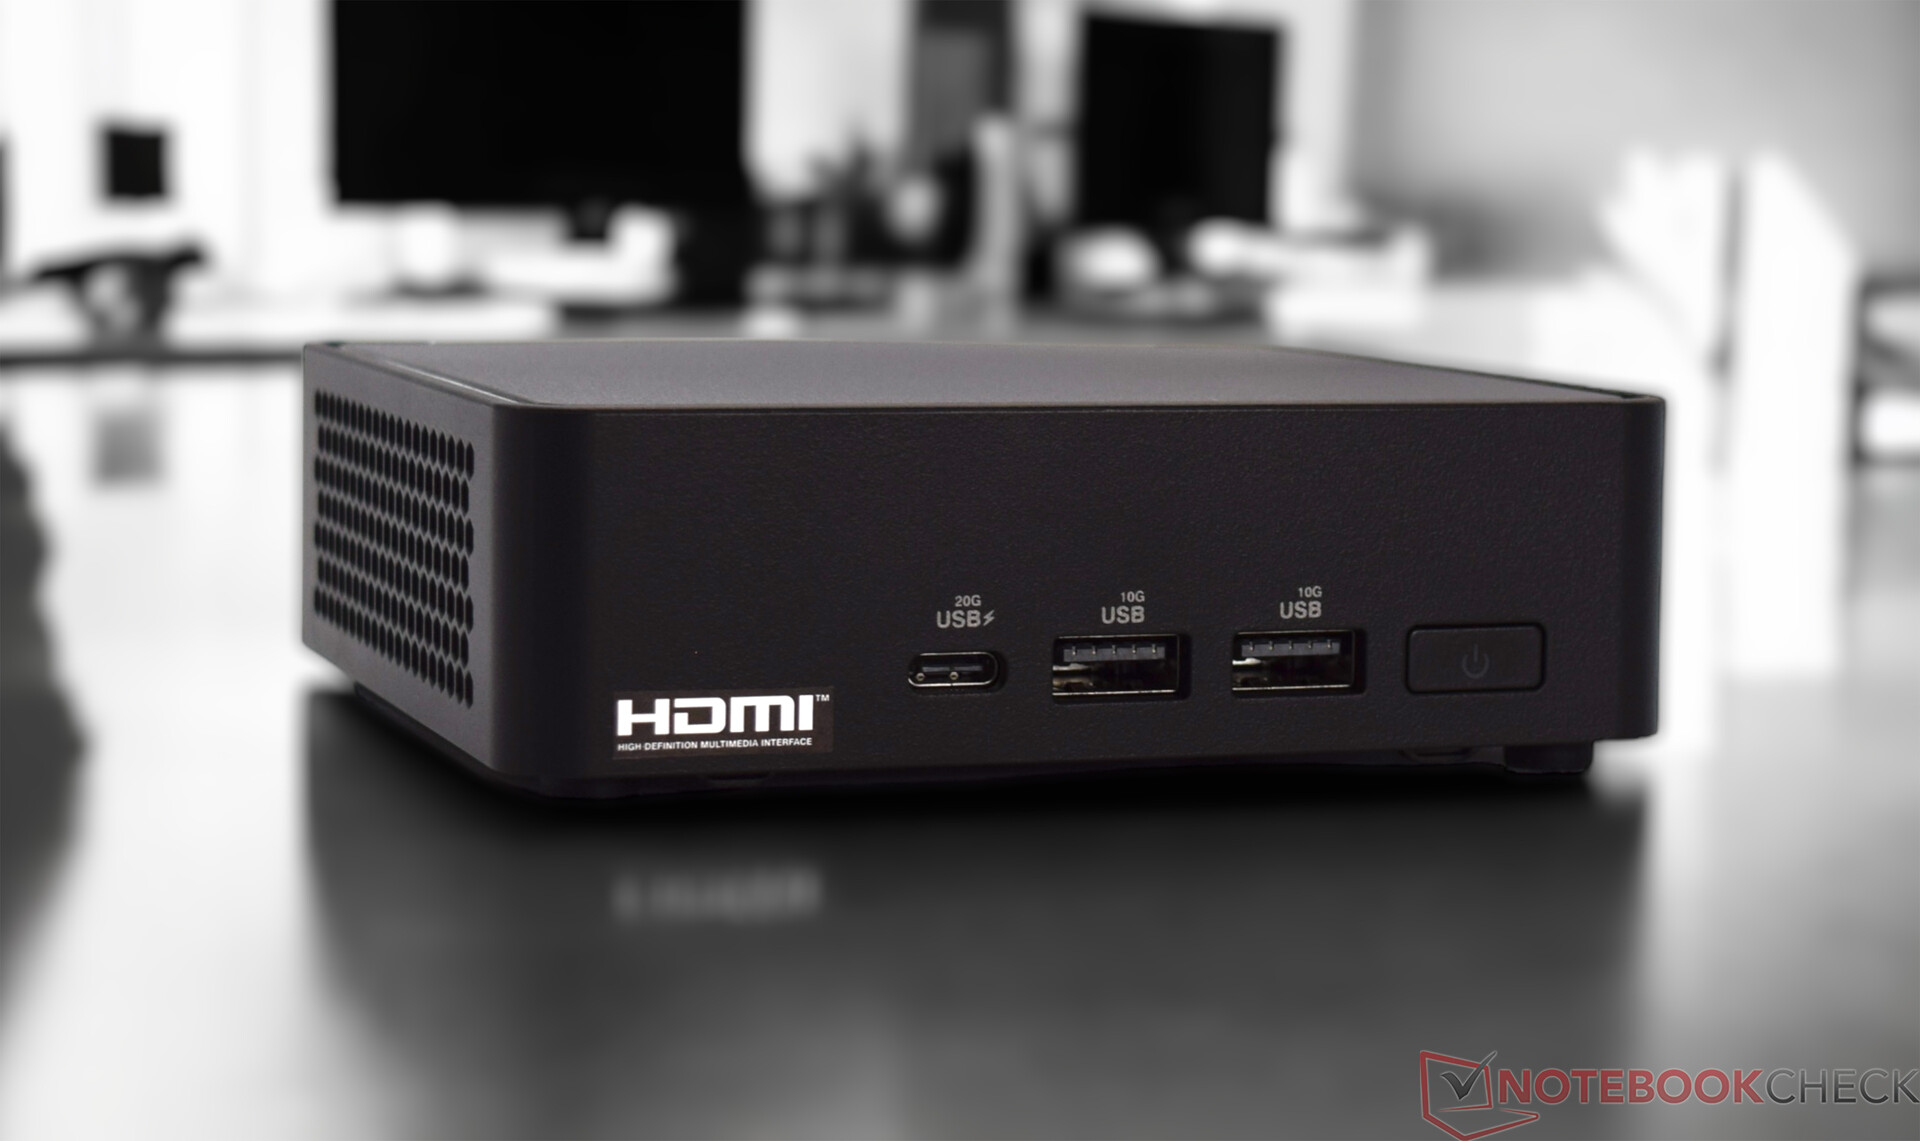
O Mini PC Asus NUC 14 Pro oferece muitas interfaces apesar de seu design compacto. Há um total de seis portas USB, quatro das quais são soquetes Tipo A amplamente usados e duas outras são soquetes Tipo C. Os últimos também oferecem suporte total a Thunderbolt. Isso diferencia o Asus NUC 14 Pro de outros mini PCs, que geralmente oferecem apenas portas USB 4 simples ou portas Type-C convencionais. Há também duas portas HDMI e uma conexão de rede 2,5G.
Comunicação
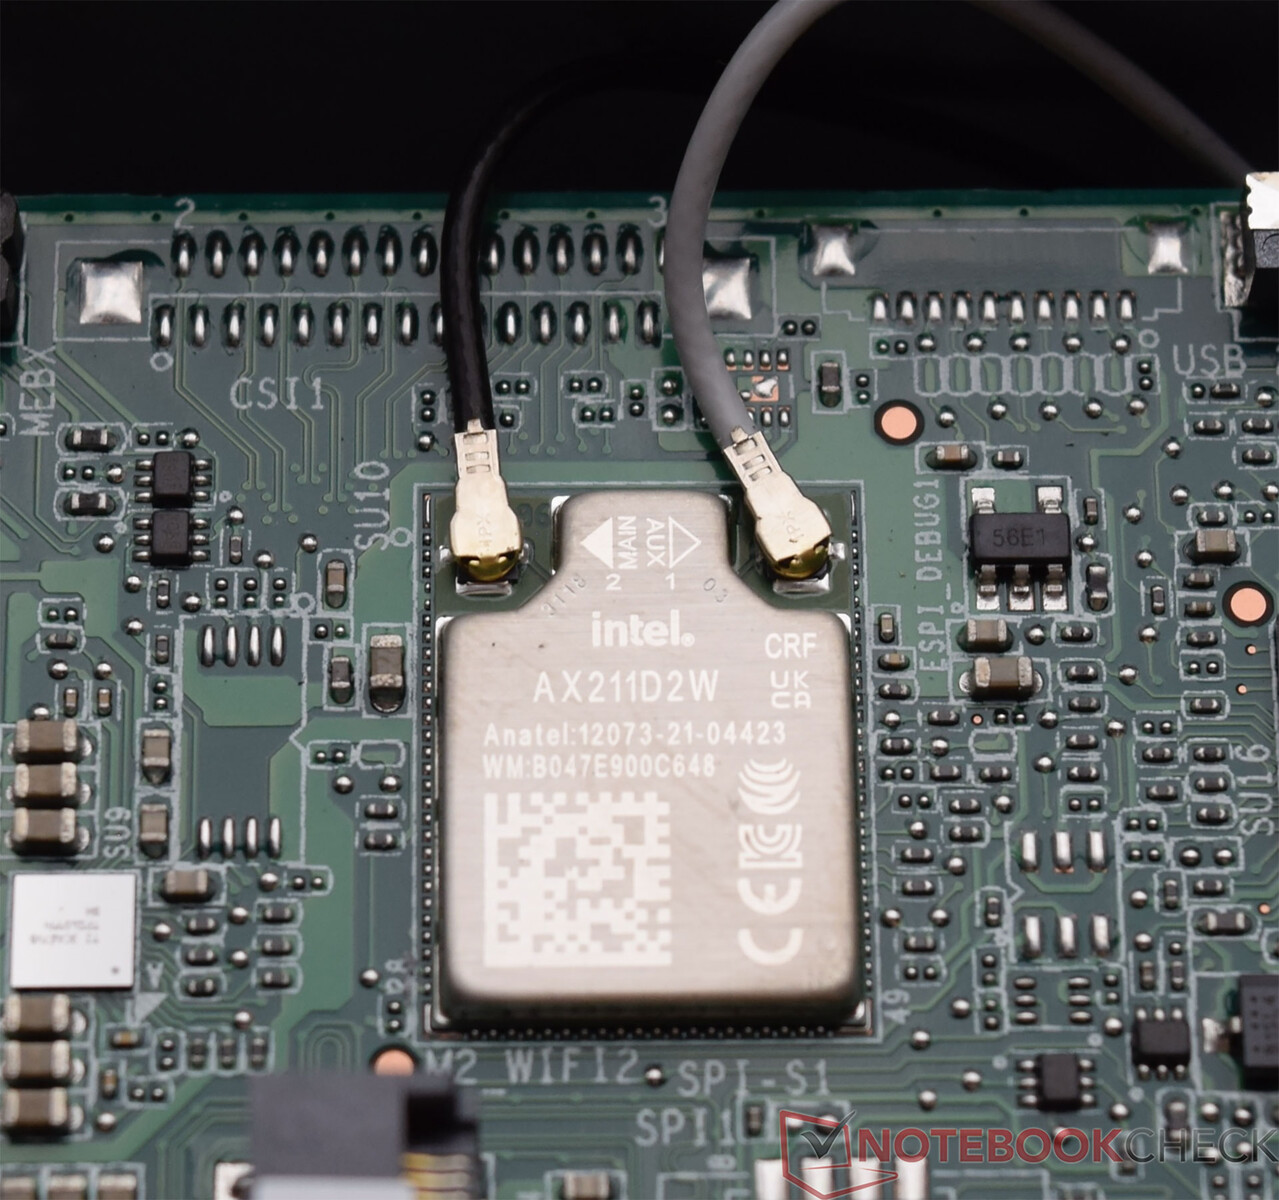
A Asus equipa o NUC 14 Pro com o módulo Intel Wi-Fi 6E AX211, que oferece excelentes resultados no teste. Em combinação com o roteador ASUS ROG Rapture GT-AXE11000, documentamos resultados consistentemente melhores do que com os dispositivos de comparação.
| Networking | |
| iperf3 receive AXE11000 6GHz | |
| Acemagic F2A | |
| Minisforum UH125 Pro | |
| Asus NUC 14 Pro | |
| Geekom AE7 | |
| Média Intel Wi-Fi 6E AX211 (700 - 1857, n=217) | |
| Média da turma Mini PC (684 - 1806, n=56, últimos 2 anos) | |
| iperf3 transmit AXE11000 6GHz | |
| Geekom AE7 | |
| Acemagic F2A | |
| Minisforum UH125 Pro | |
| Asus NUC 14 Pro | |
| Média Intel Wi-Fi 6E AX211 (385 - 1851, n=217) | |
| Média da turma Mini PC (394 - 1800, n=56, últimos 2 anos) | |
| iperf3 receive AXE11000 | |
| Média Intel Wi-Fi 6E AX211 (582 - 1890, n=251) | |
| Asus NUC 14 Pro | |
| Média da turma Mini PC (267 - 1796, n=108, últimos 2 anos) | |
| Geekom A5 | |
| Minisforum UH125 Pro | |
| Acemagic F2A | |
| Geekom AE7 | |
| Aoostar GEM10 | |
| iperf3 transmit AXE11000 | |
| Asus NUC 14 Pro | |
| Média Intel Wi-Fi 6E AX211 (64 - 1921, n=251) | |
| Média da turma Mini PC (251 - 1776, n=108, últimos 2 anos) | |
| Geekom A5 | |
| Minisforum UH125 Pro | |
| Acemagic F2A | |
| Geekom AE7 | |
| Aoostar GEM10 | |
Acessórios
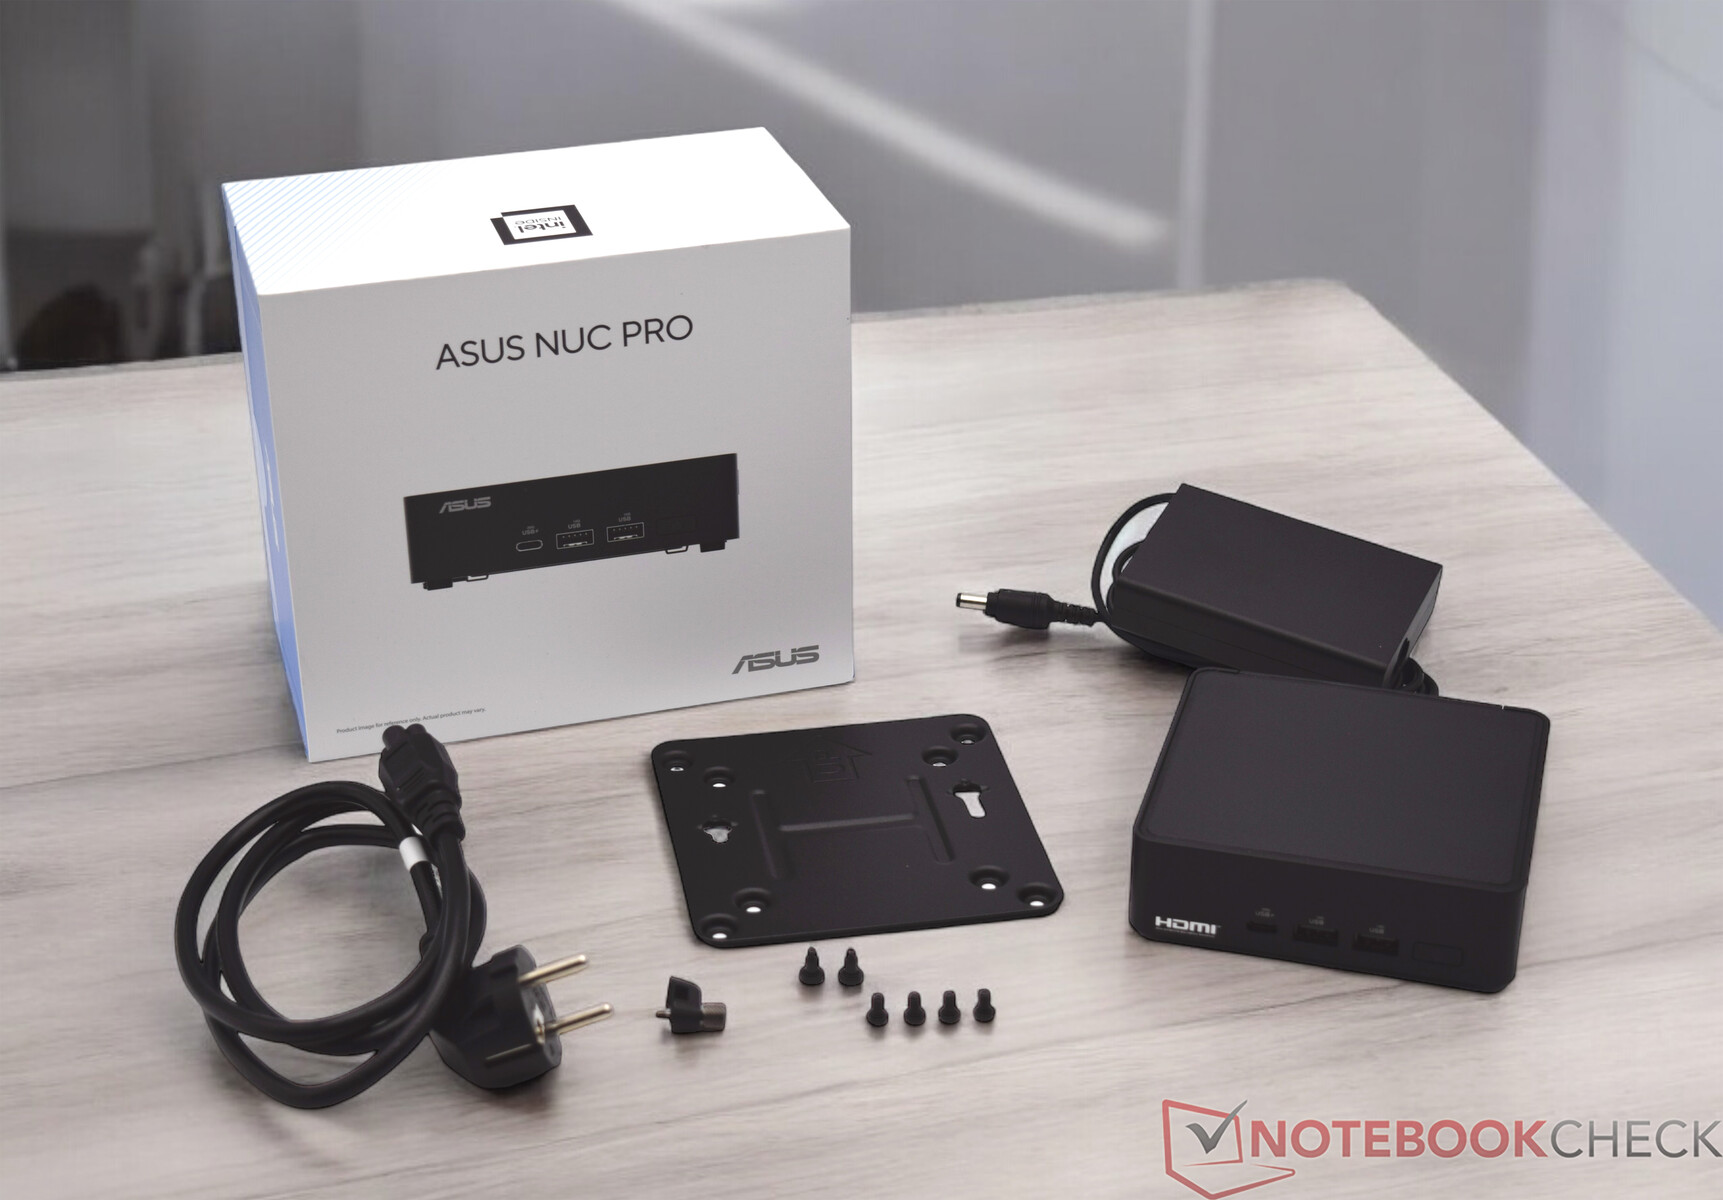
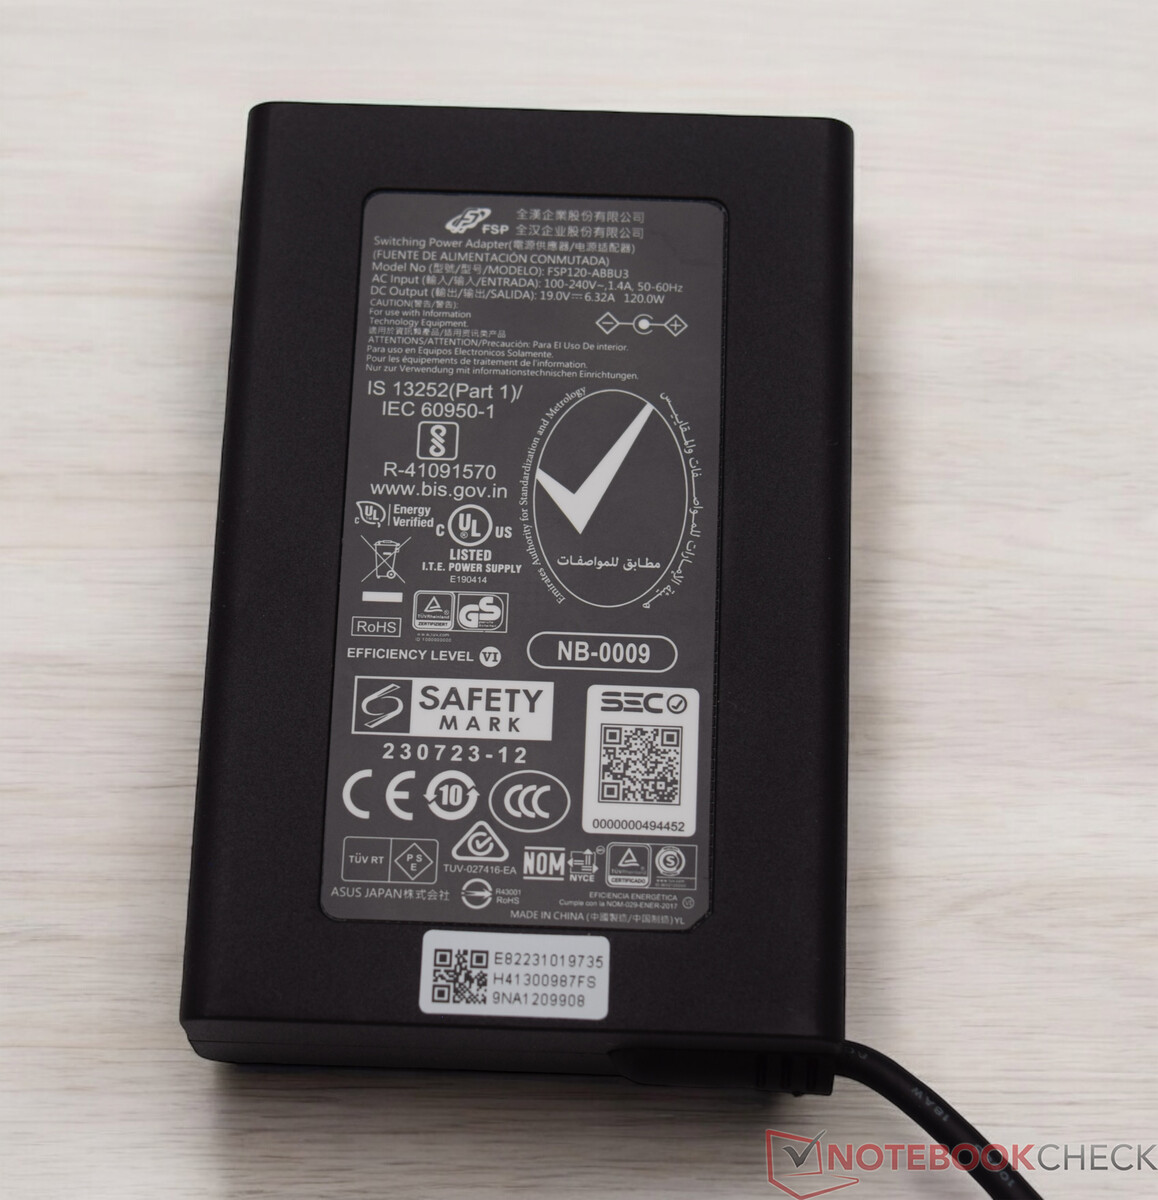
O Asus NUC 14 Pro é fornecido com uma fonte de alimentação de 120 watts e um suporte VESA com material de montagem. O fabricante não inclui nenhum outro acessório, como teclado ou mouse.
Manutenção
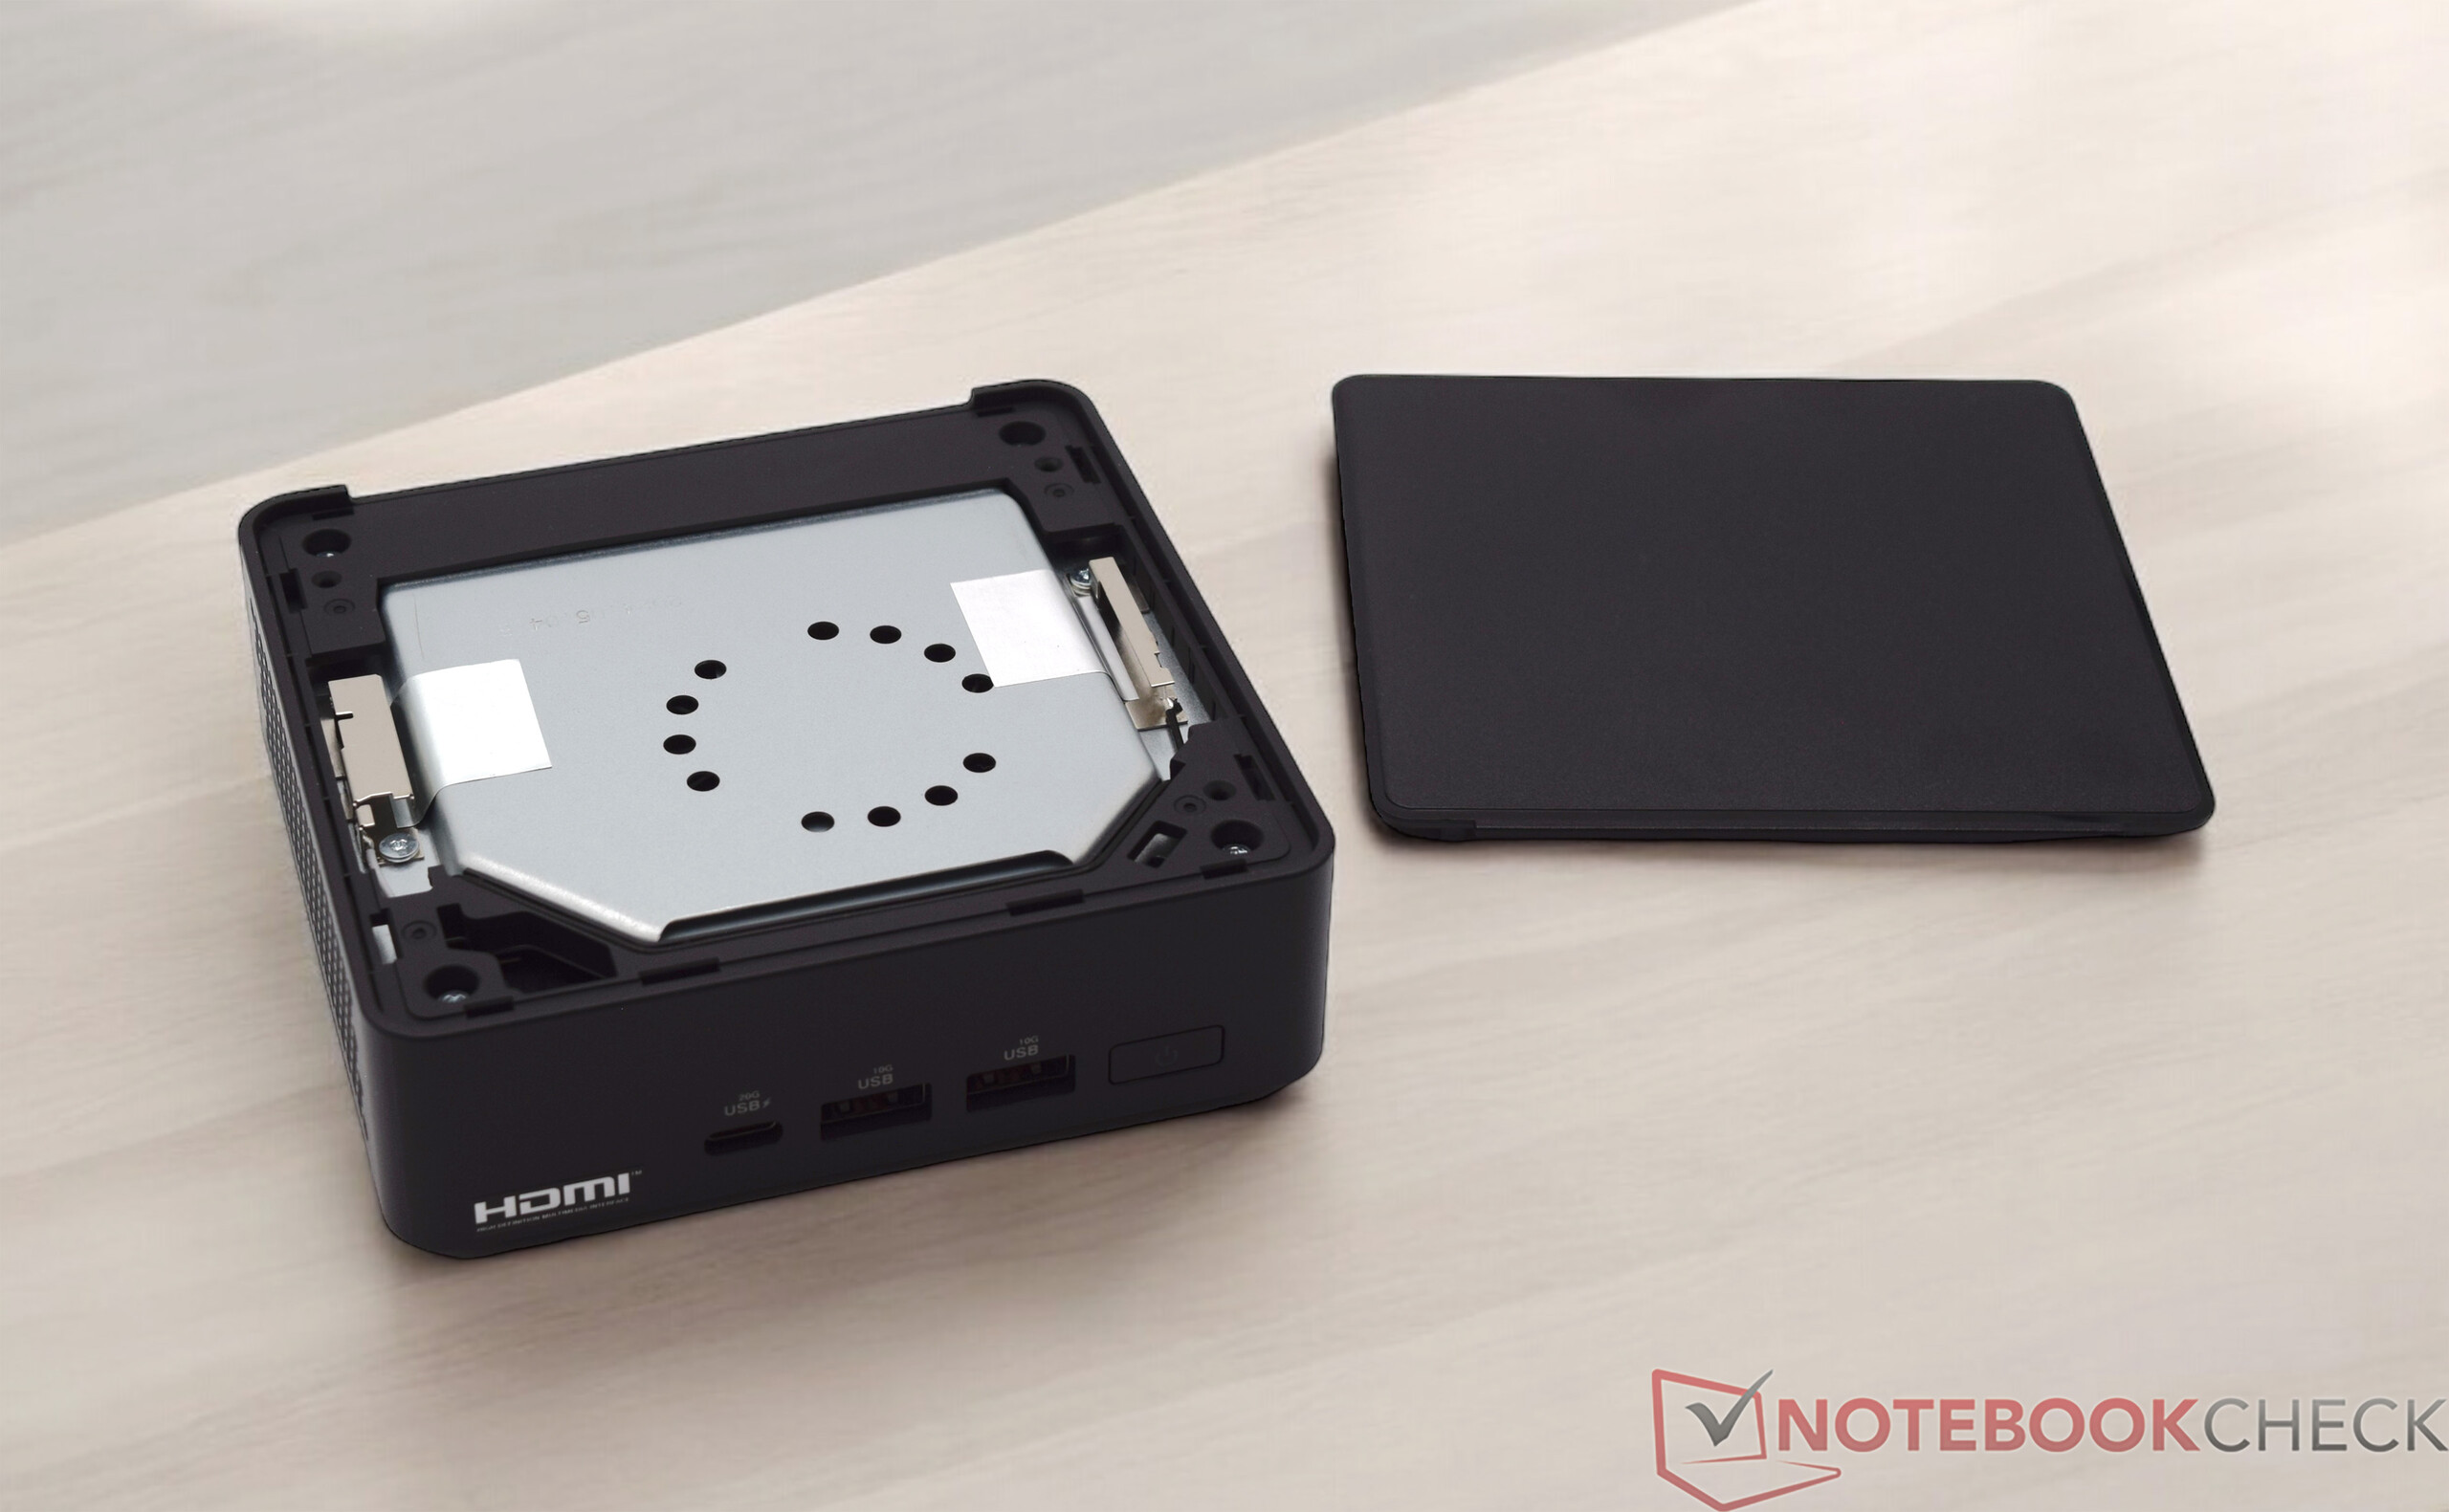
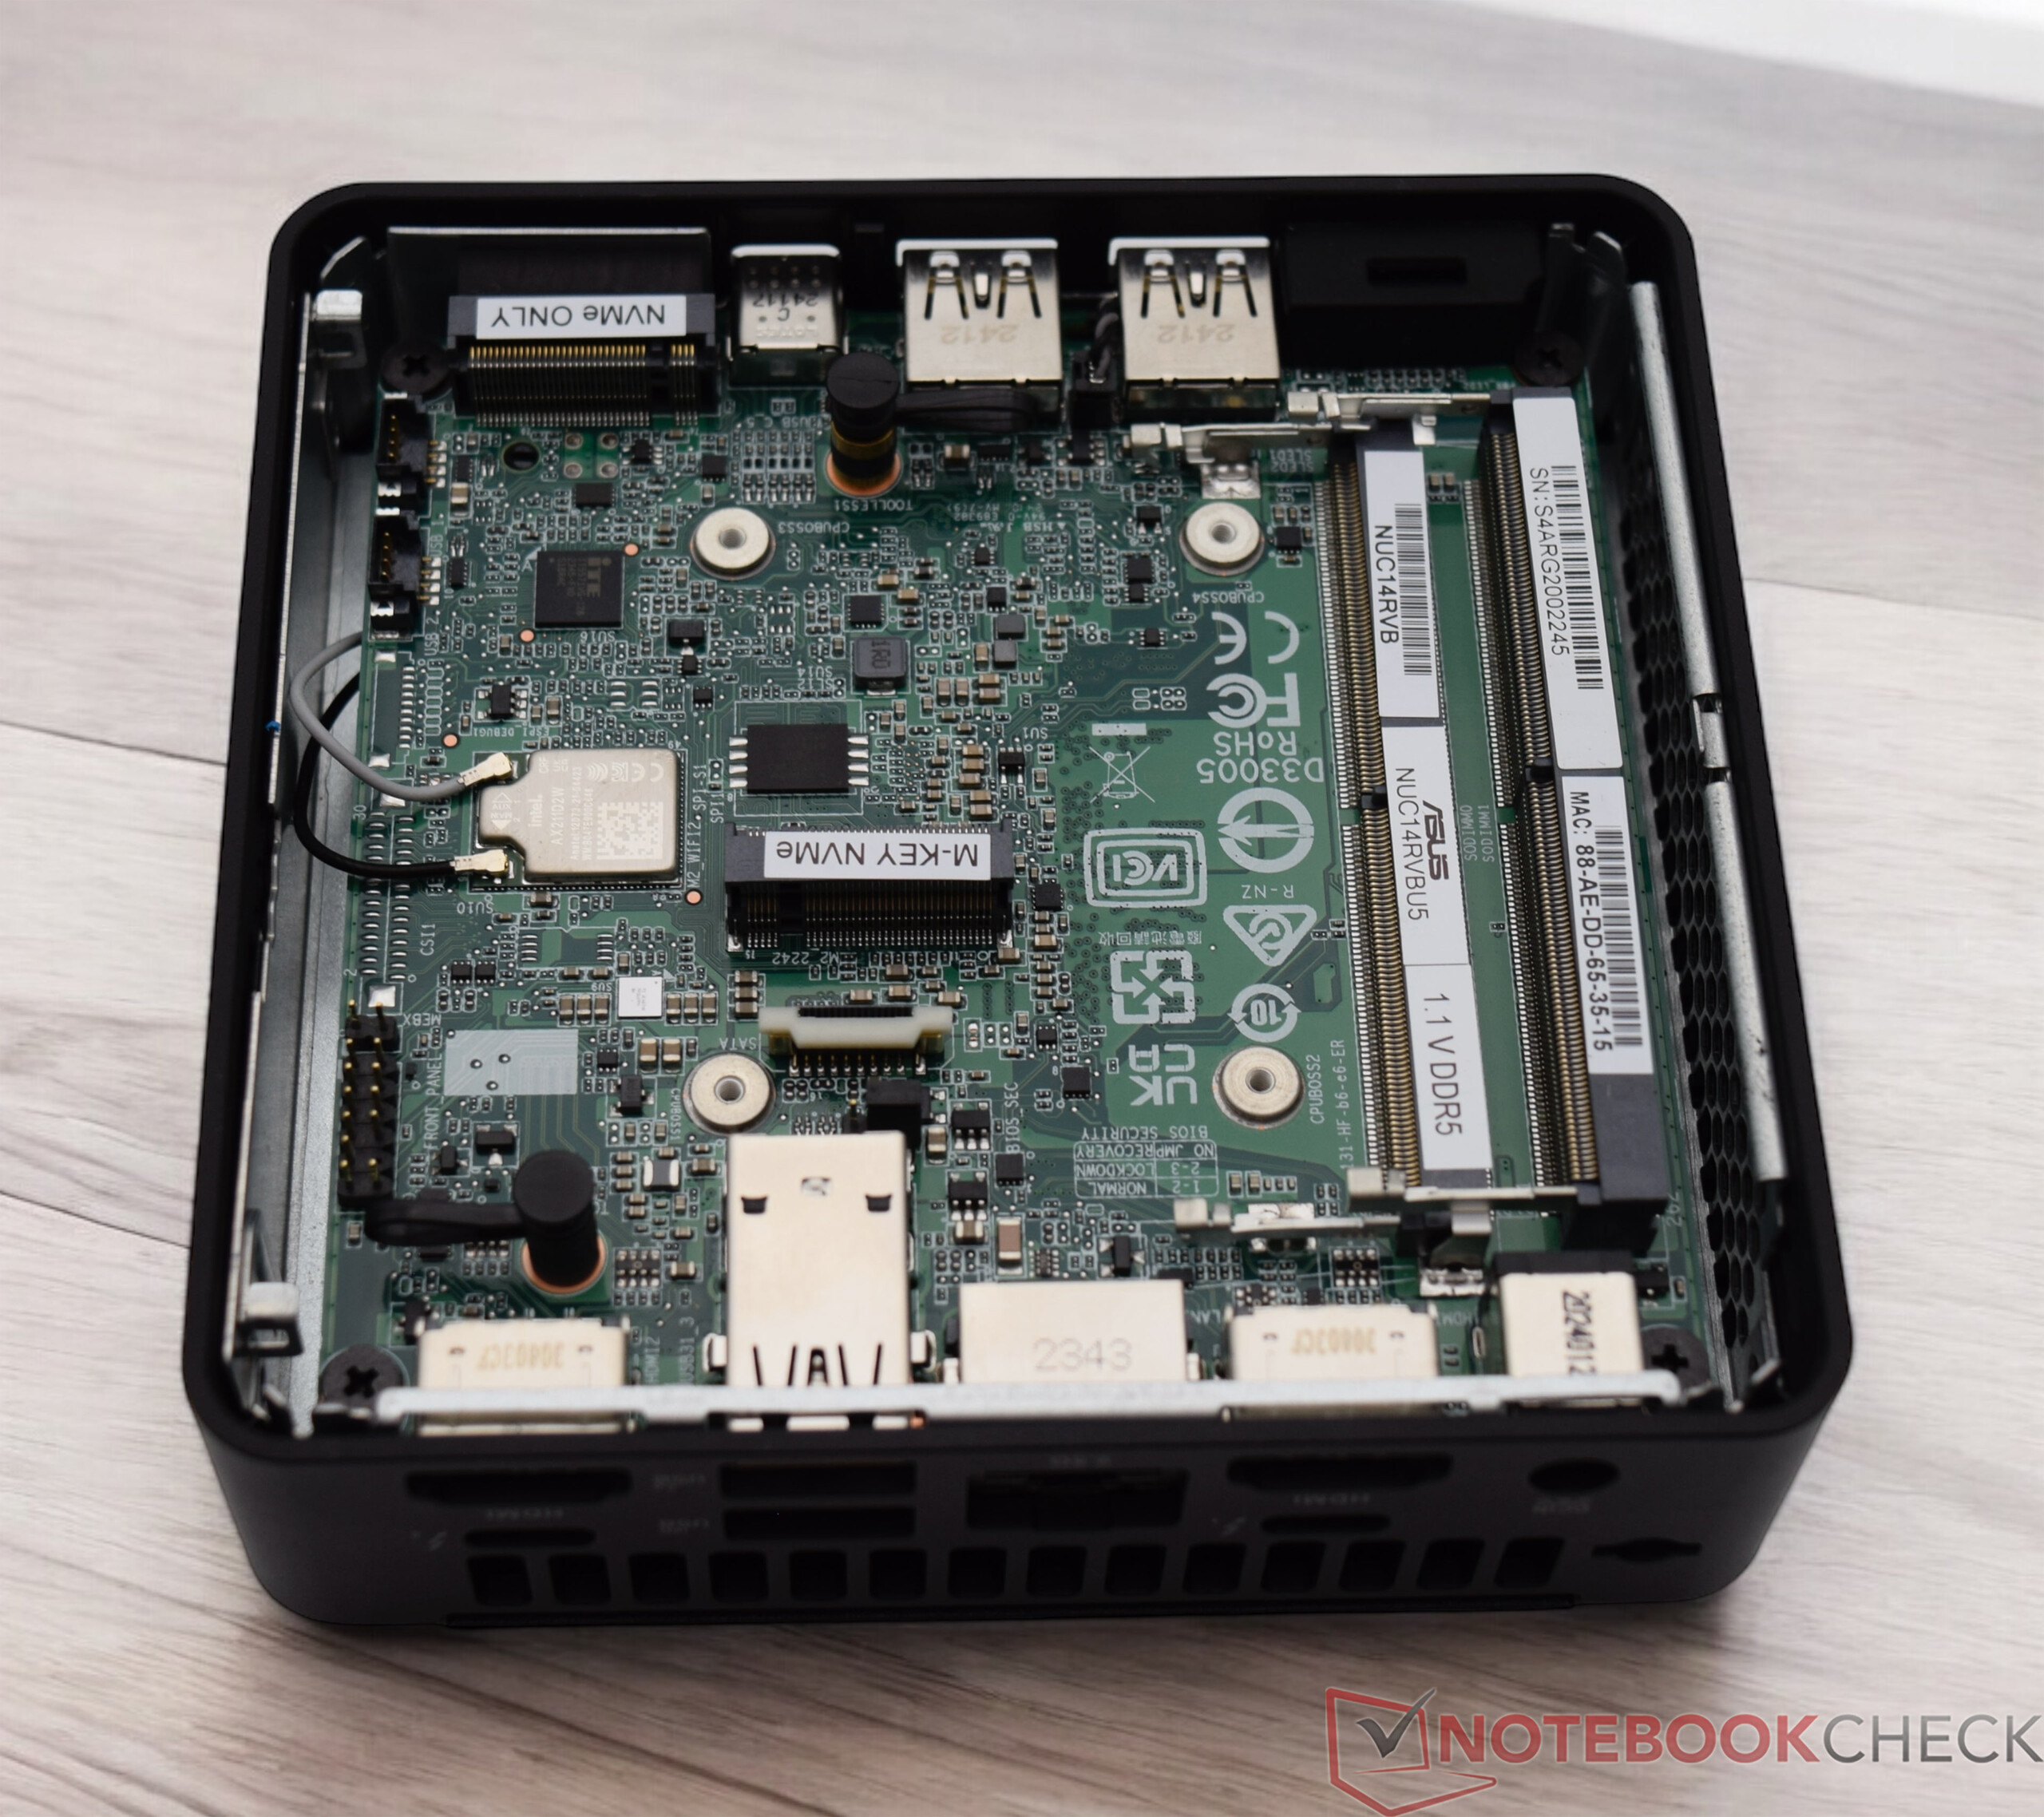
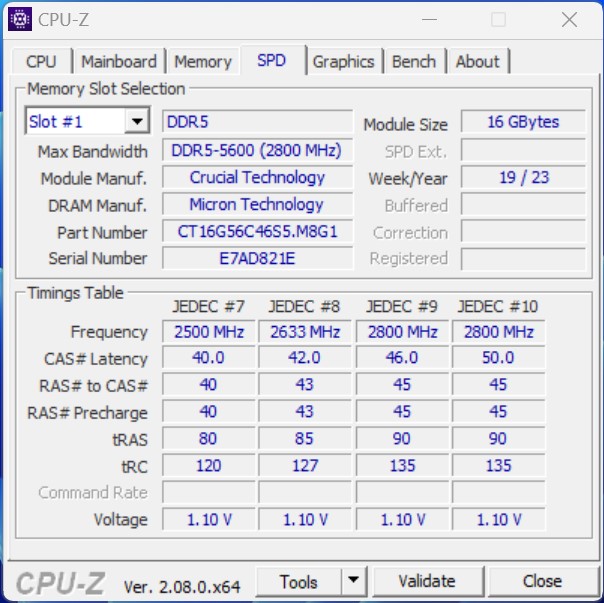
Recebemos o Asus NUC 14 Pro na versão barebone, o que significa que a RAM, o SSD e o sistema operacional não estão incluídos no escopo da entrega. Como resultado, é importante que o usuário possa abrir facilmente o dispositivo para instalar os componentes que faltam. Com o Asus NUC 14 Pro, a placa de base pode ser removida facilmente e sem ferramentas. O fabricante integrou uma pequena trava mecânica que torna isso possível: A RAM e o SSD podem ser instalados rapidamente e, em seguida, o mini PC está pronto para a primeira inicialização. Dois SSDs podem ser instalados no dispositivo e dois slots SO-DIMM são fornecidos para a RAM. Para uma operação ideal, os dois slots SO-DIMM devem estar ocupados.
Sustentabilidade
O Asus NUC 14 Pro é um mini PC muito compacto, que apresenta vantagens significativas em termos de consumo de energia em comparação com um PC de mesa convencional. O dispositivo é entregue em uma caixa pequena, que não é excessivamente grande. O mini PC em si é feito principalmente de metal e plástico. Não sabemos se materiais especialmente reciclados são usados no processo de produção. A Asus recebe elogios pelo período de garantia de três anos.
Desempenho
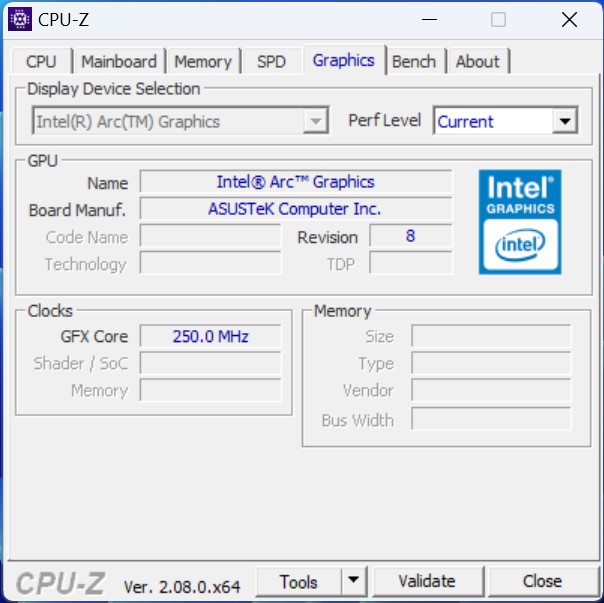
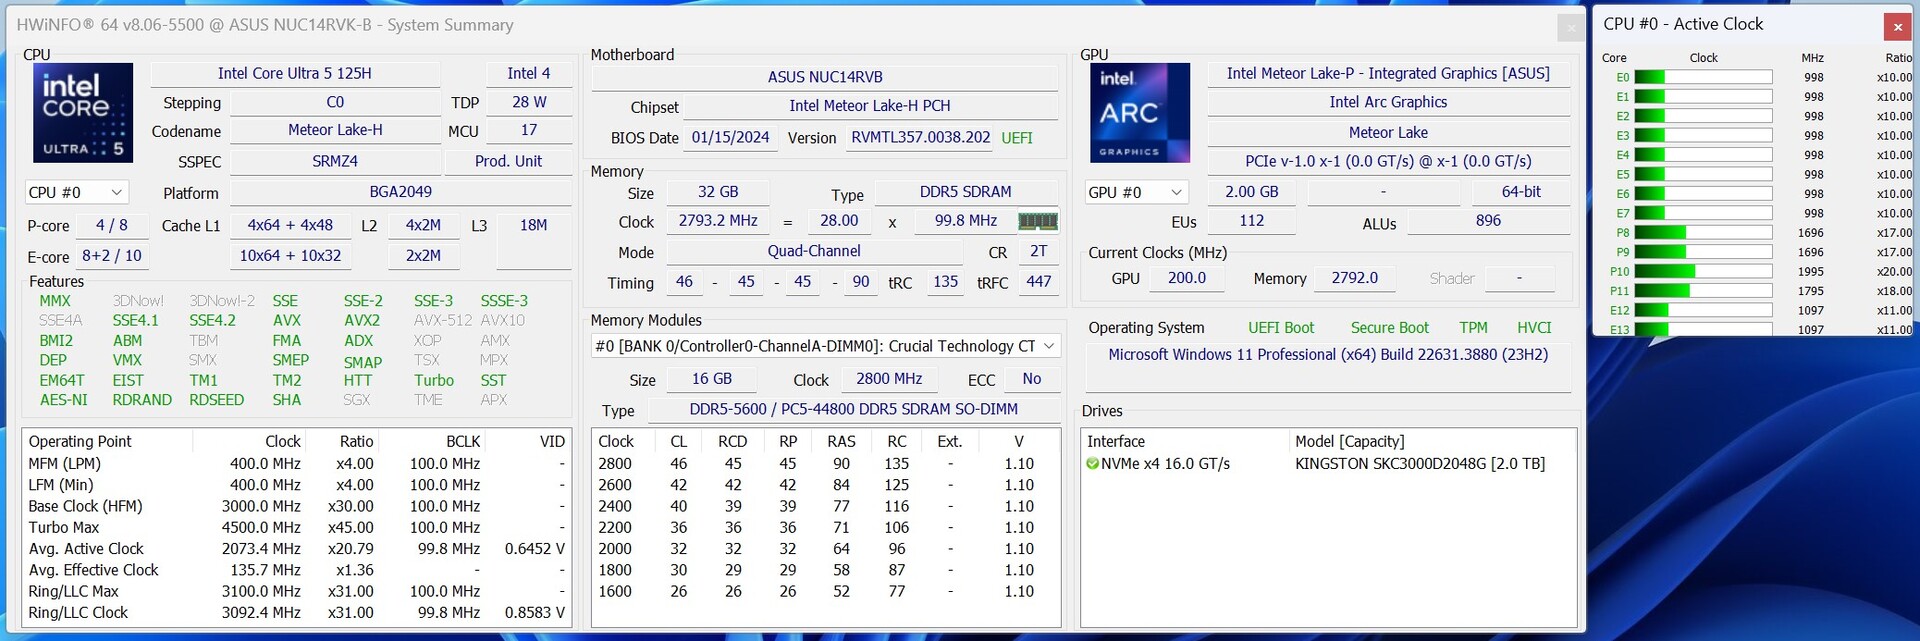
O Intel Core Ultra 5 125H é um SoC de médio porte sólido e potente da série Meteor Lake da Intel. O grande número de núcleos de computação física que o SoC traz consigo garante um bom desempenho multi-thread. O SoC Meteor Lake também tem uma iGPU revisada, que oferece um desempenho visivelmente maior do que as desatualizadas iGPUs Intel Iris Xe da série anterior, baseadas na arquitetura Arc. O Asus NUC 14 Pro também está disponível com um Intel Core 3 100U um pouco mais fraco, bem como uma variante um pouco mais potente com o SoC Intel Core Ultra 7.
Condições de teste
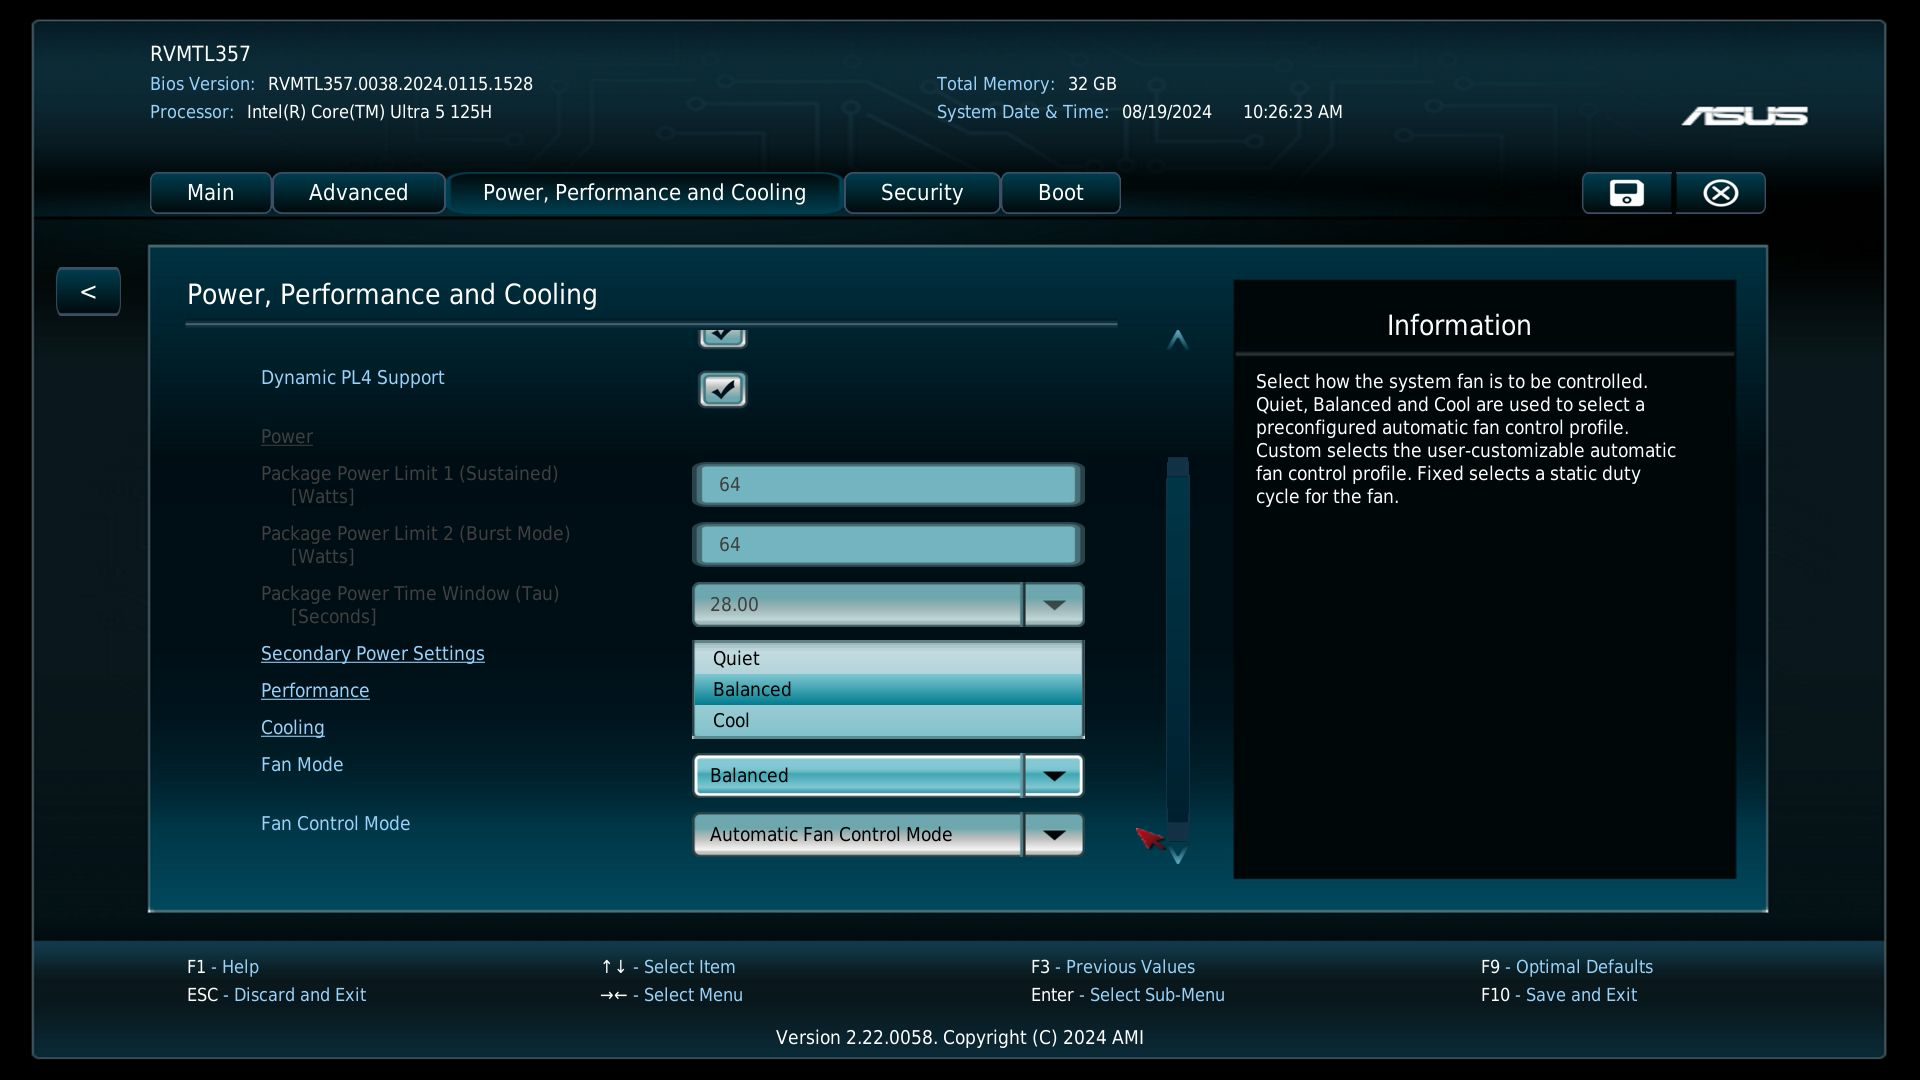
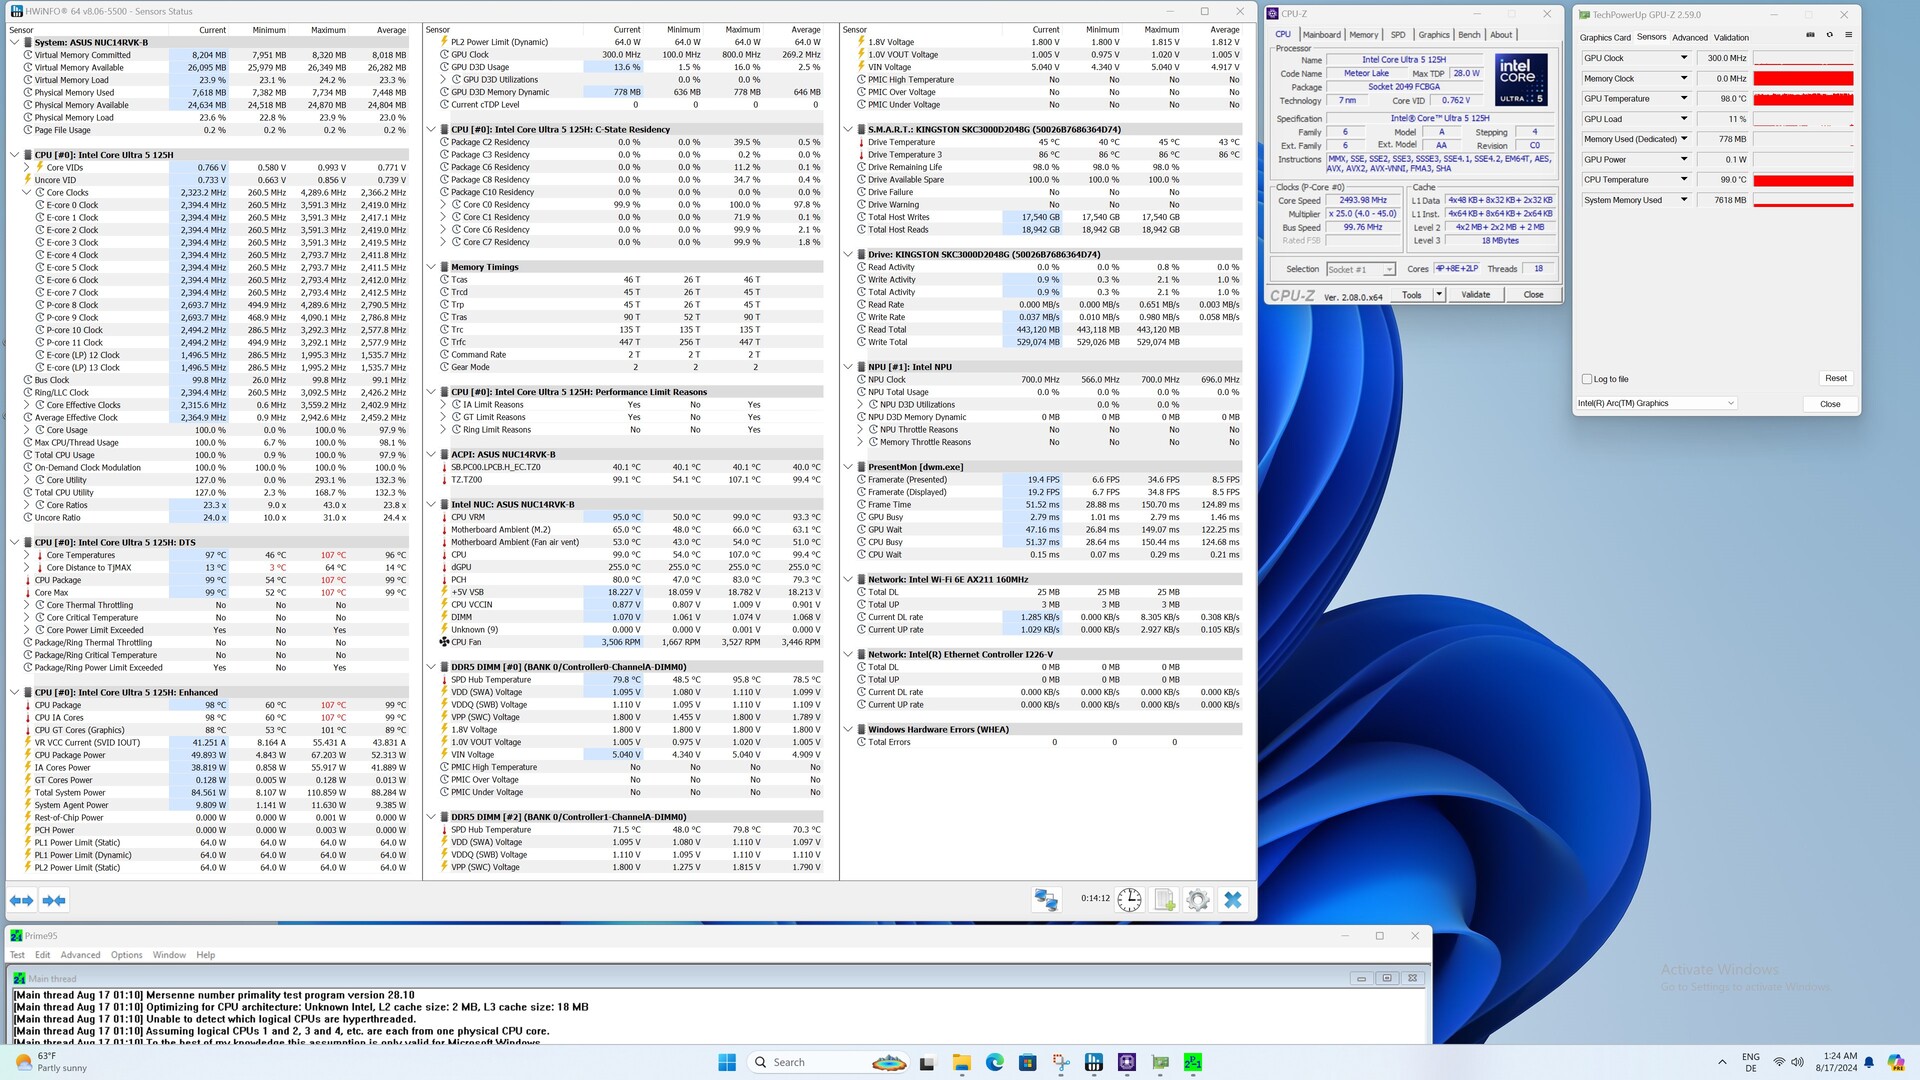
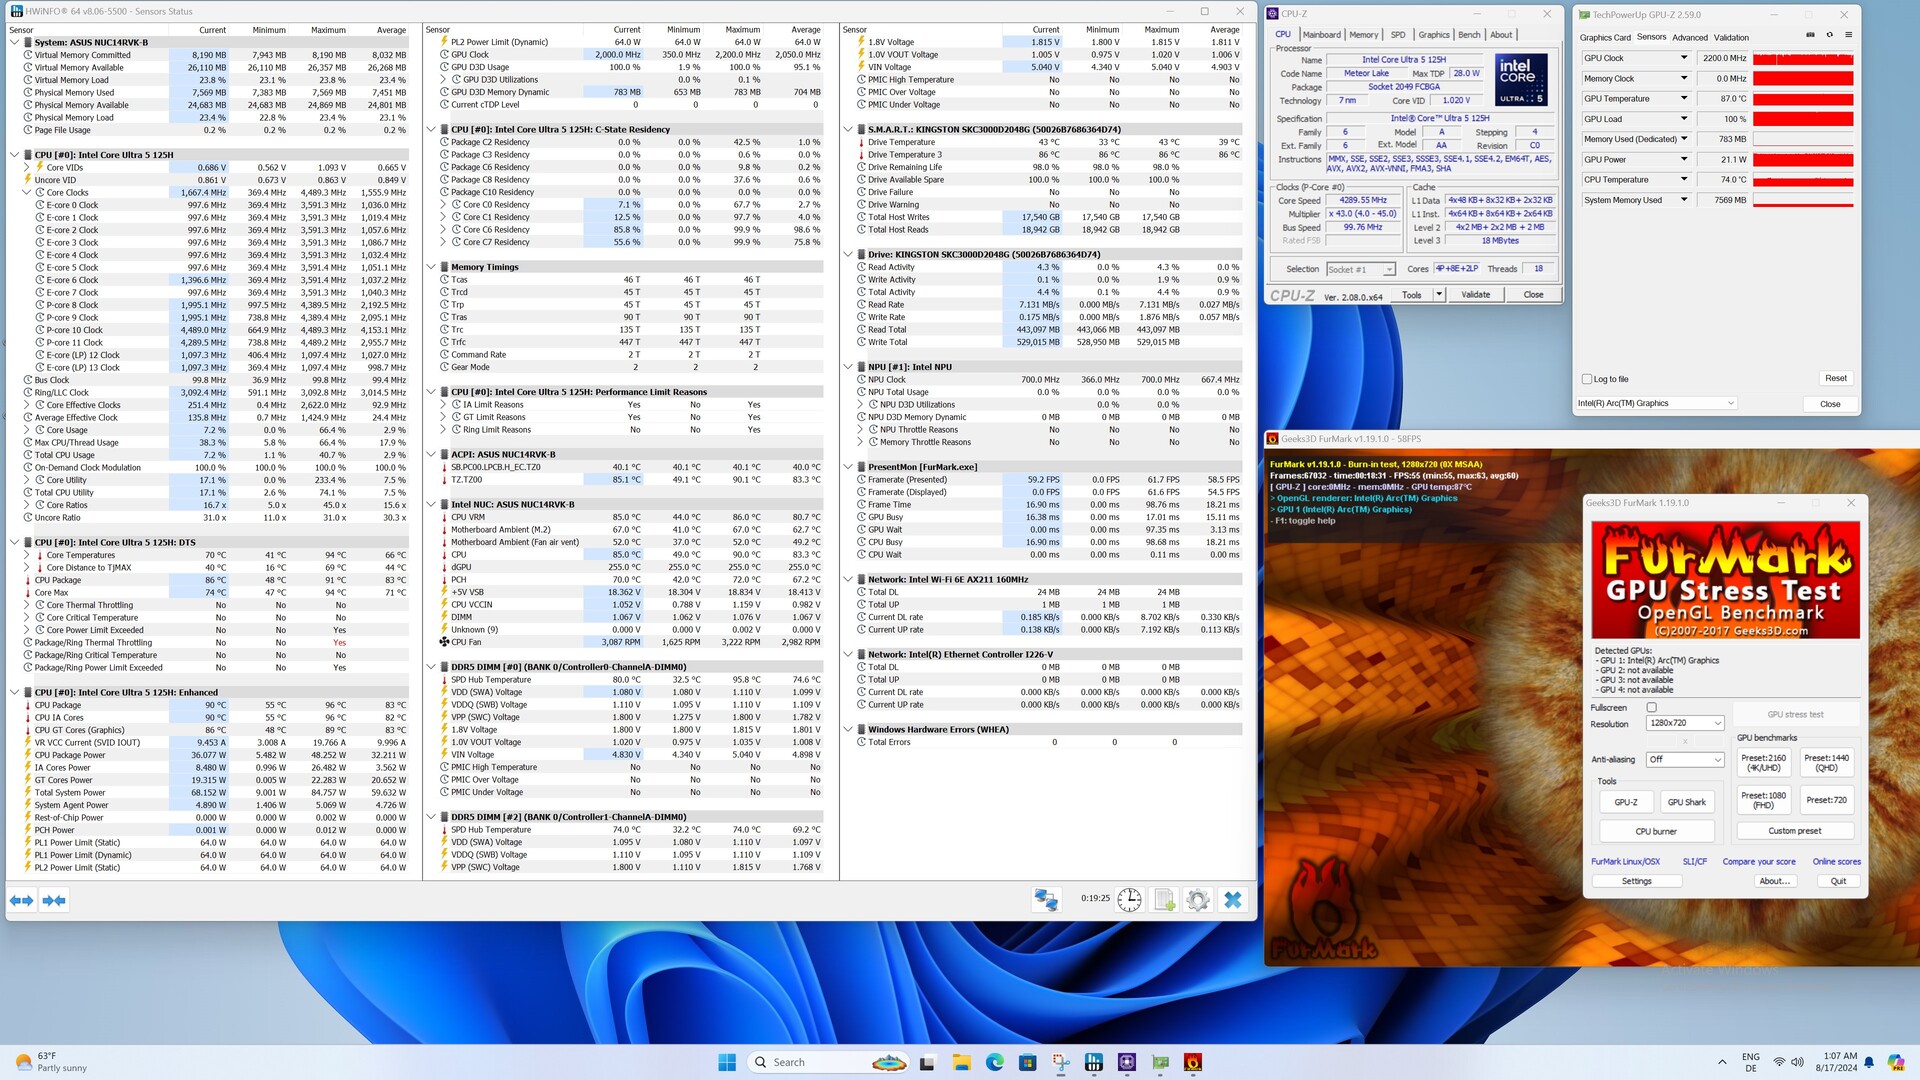
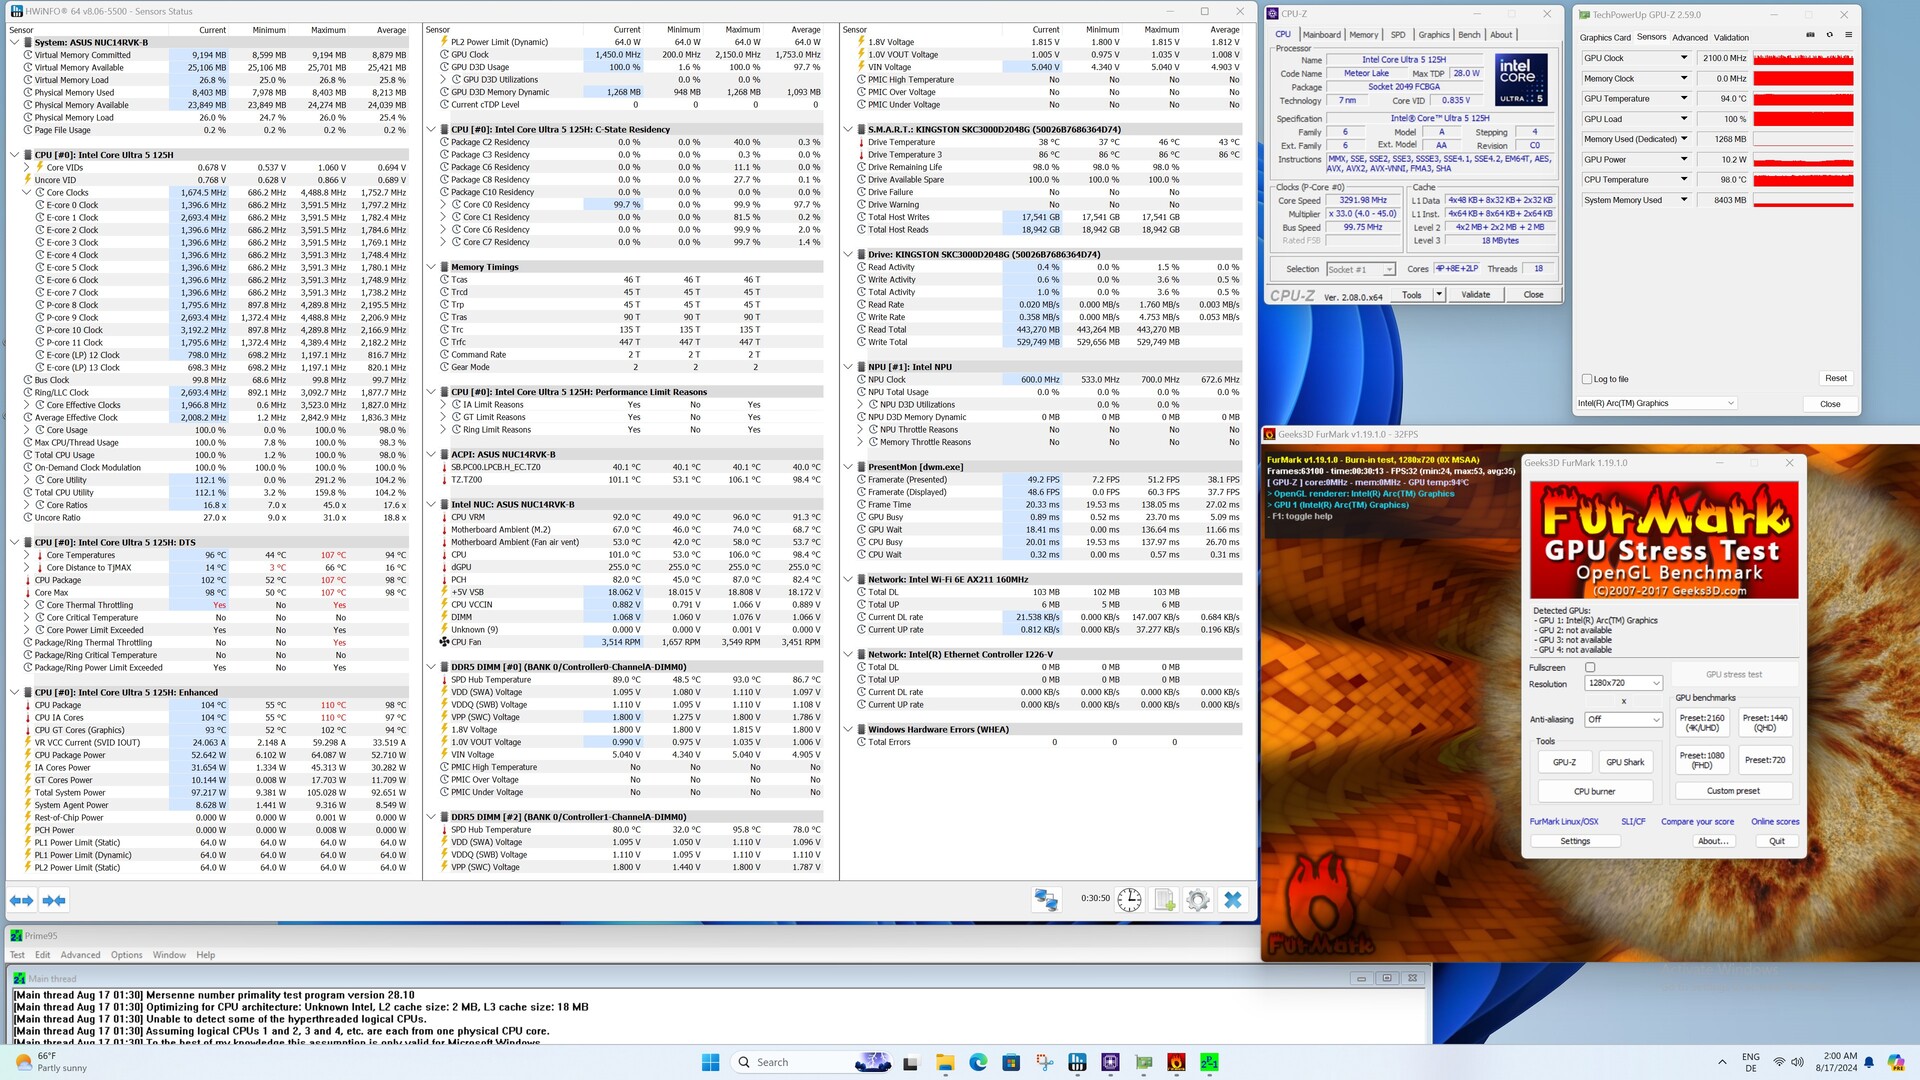
Realizamos todos os testes de desempenho com o perfil de energia Balanced
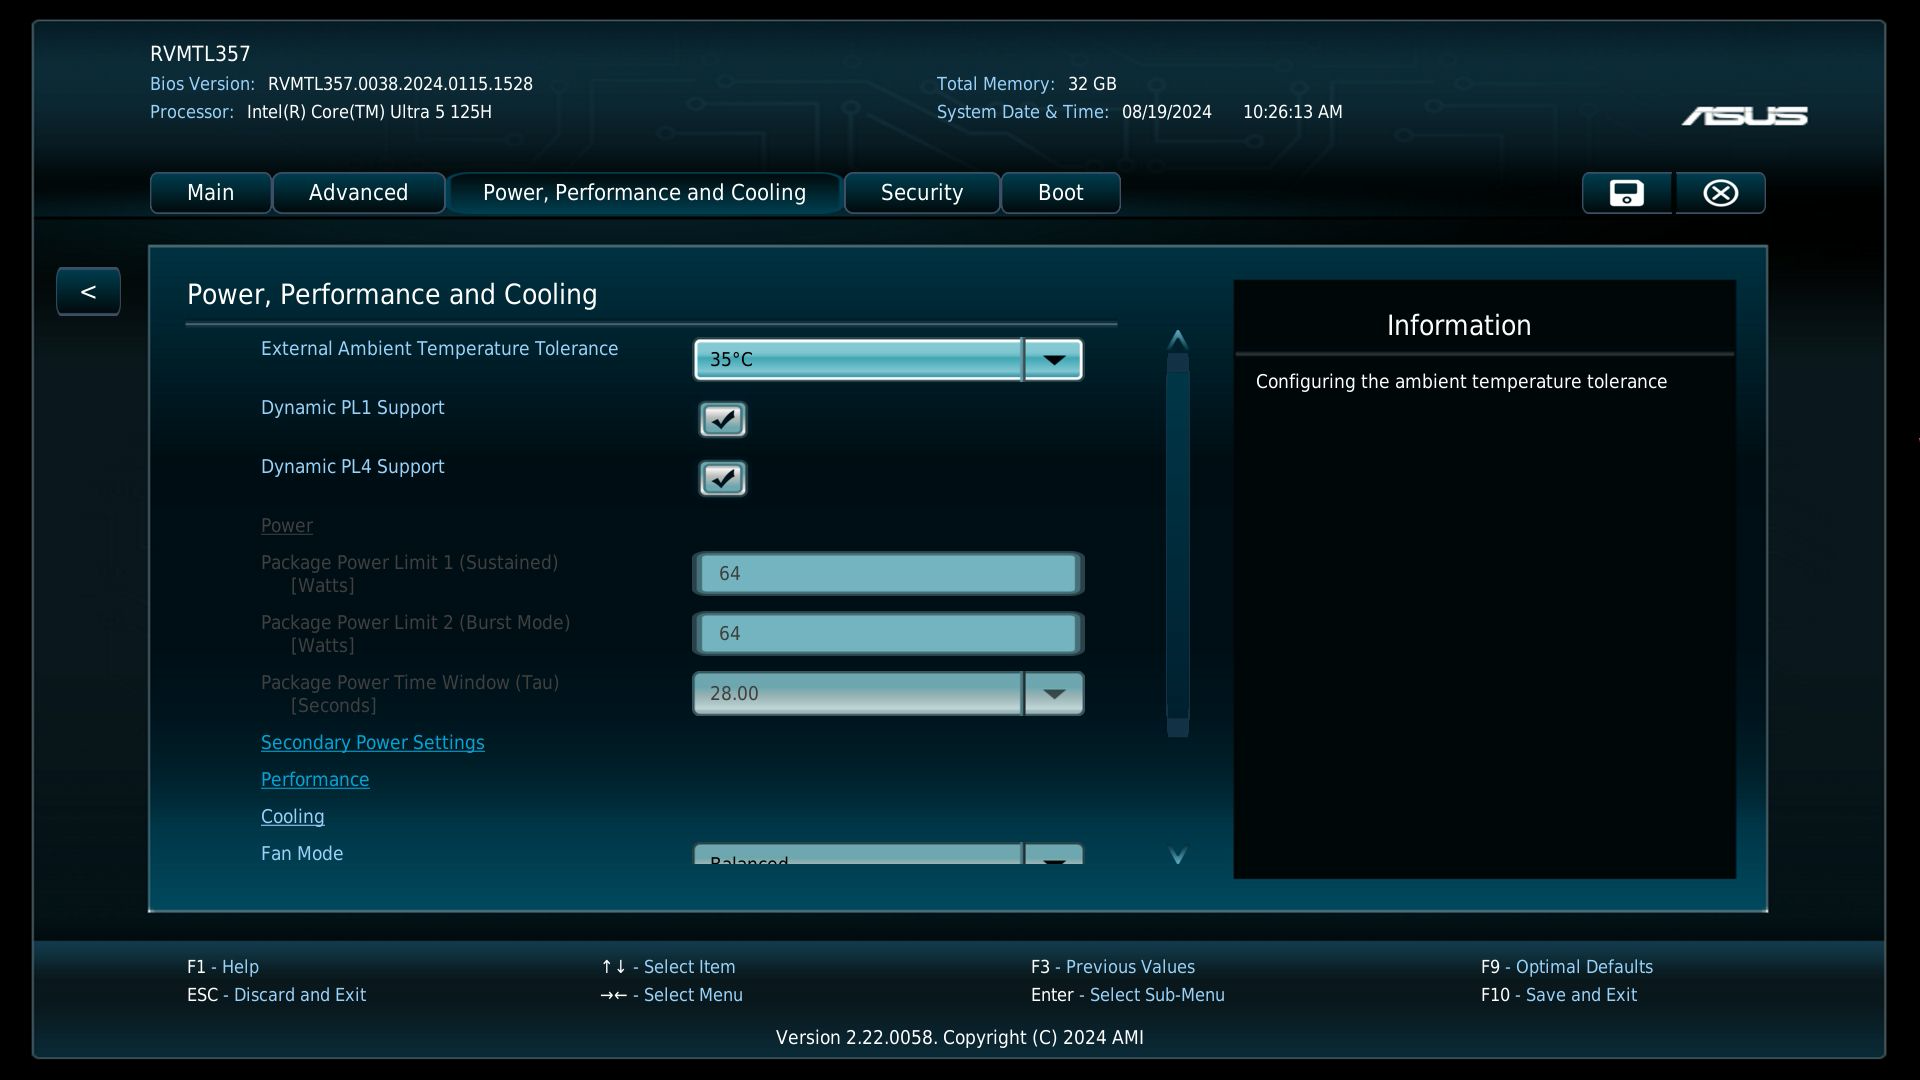
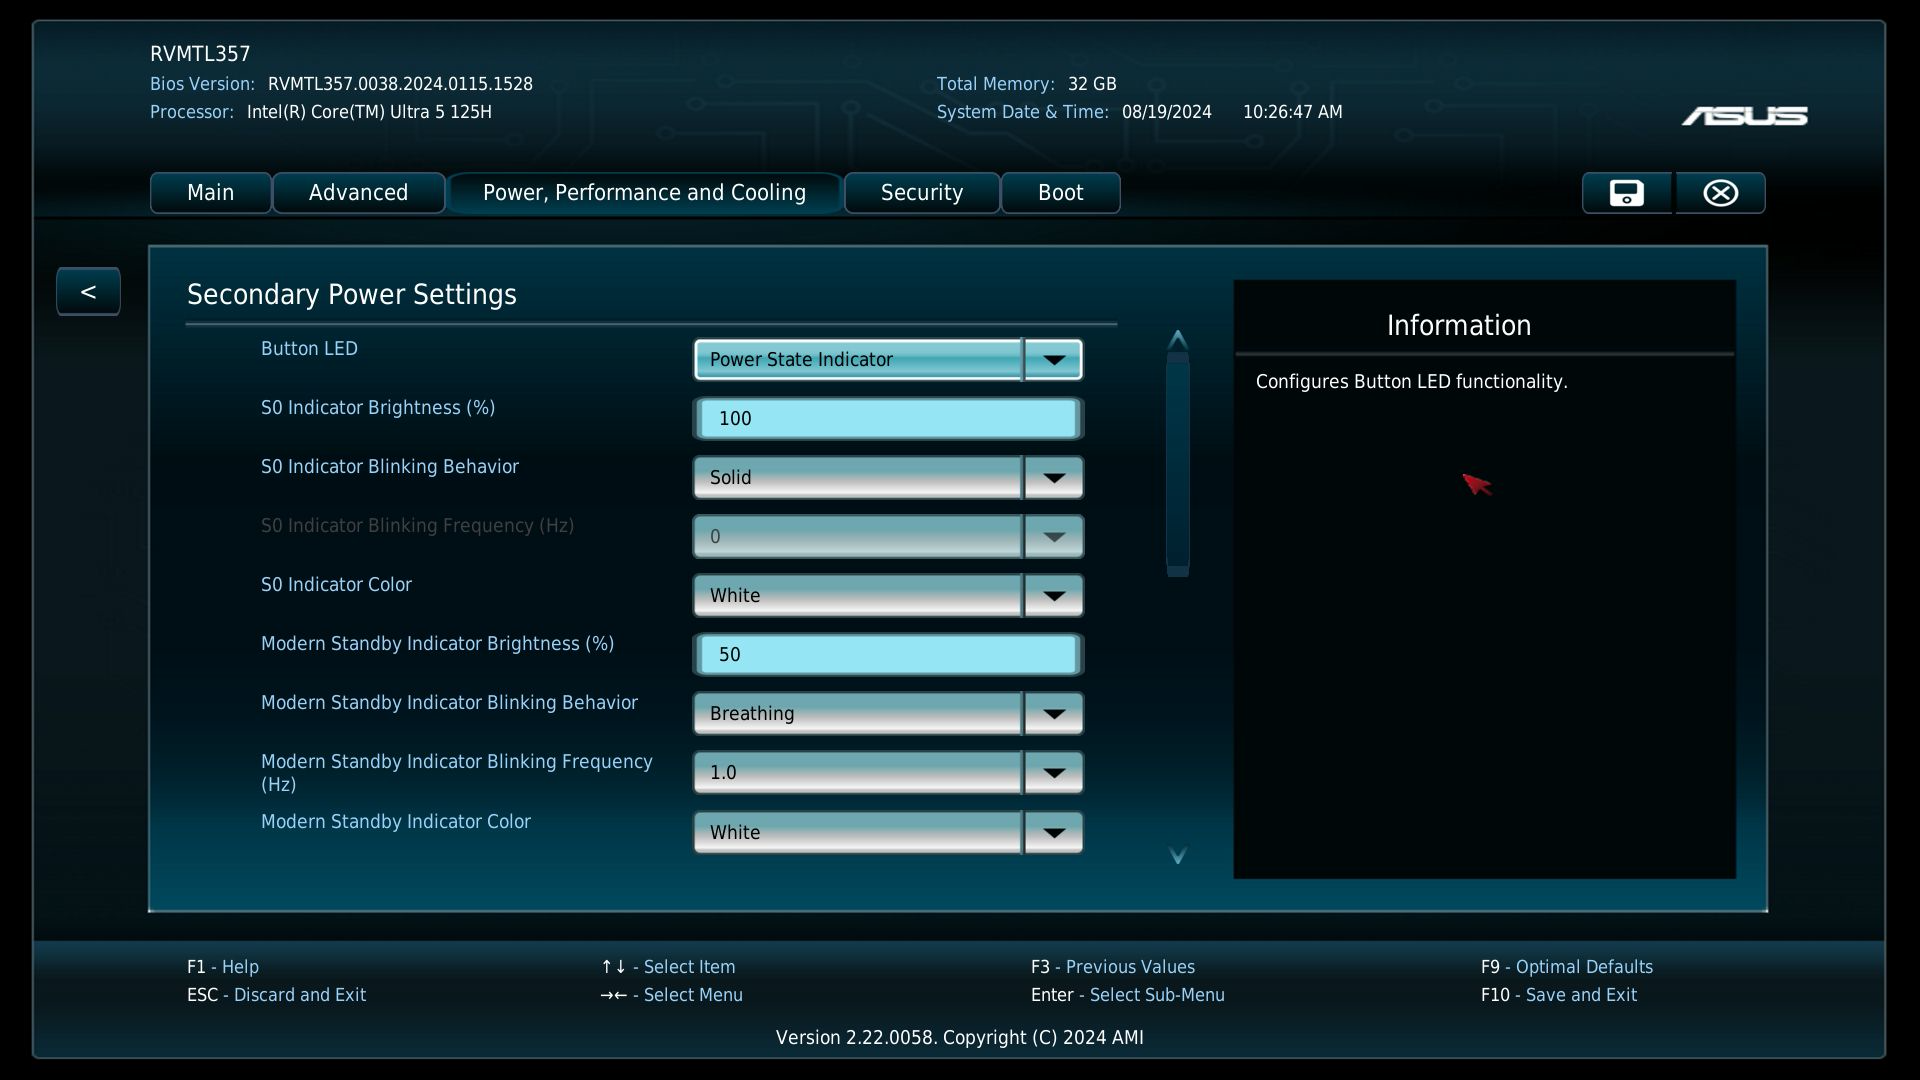
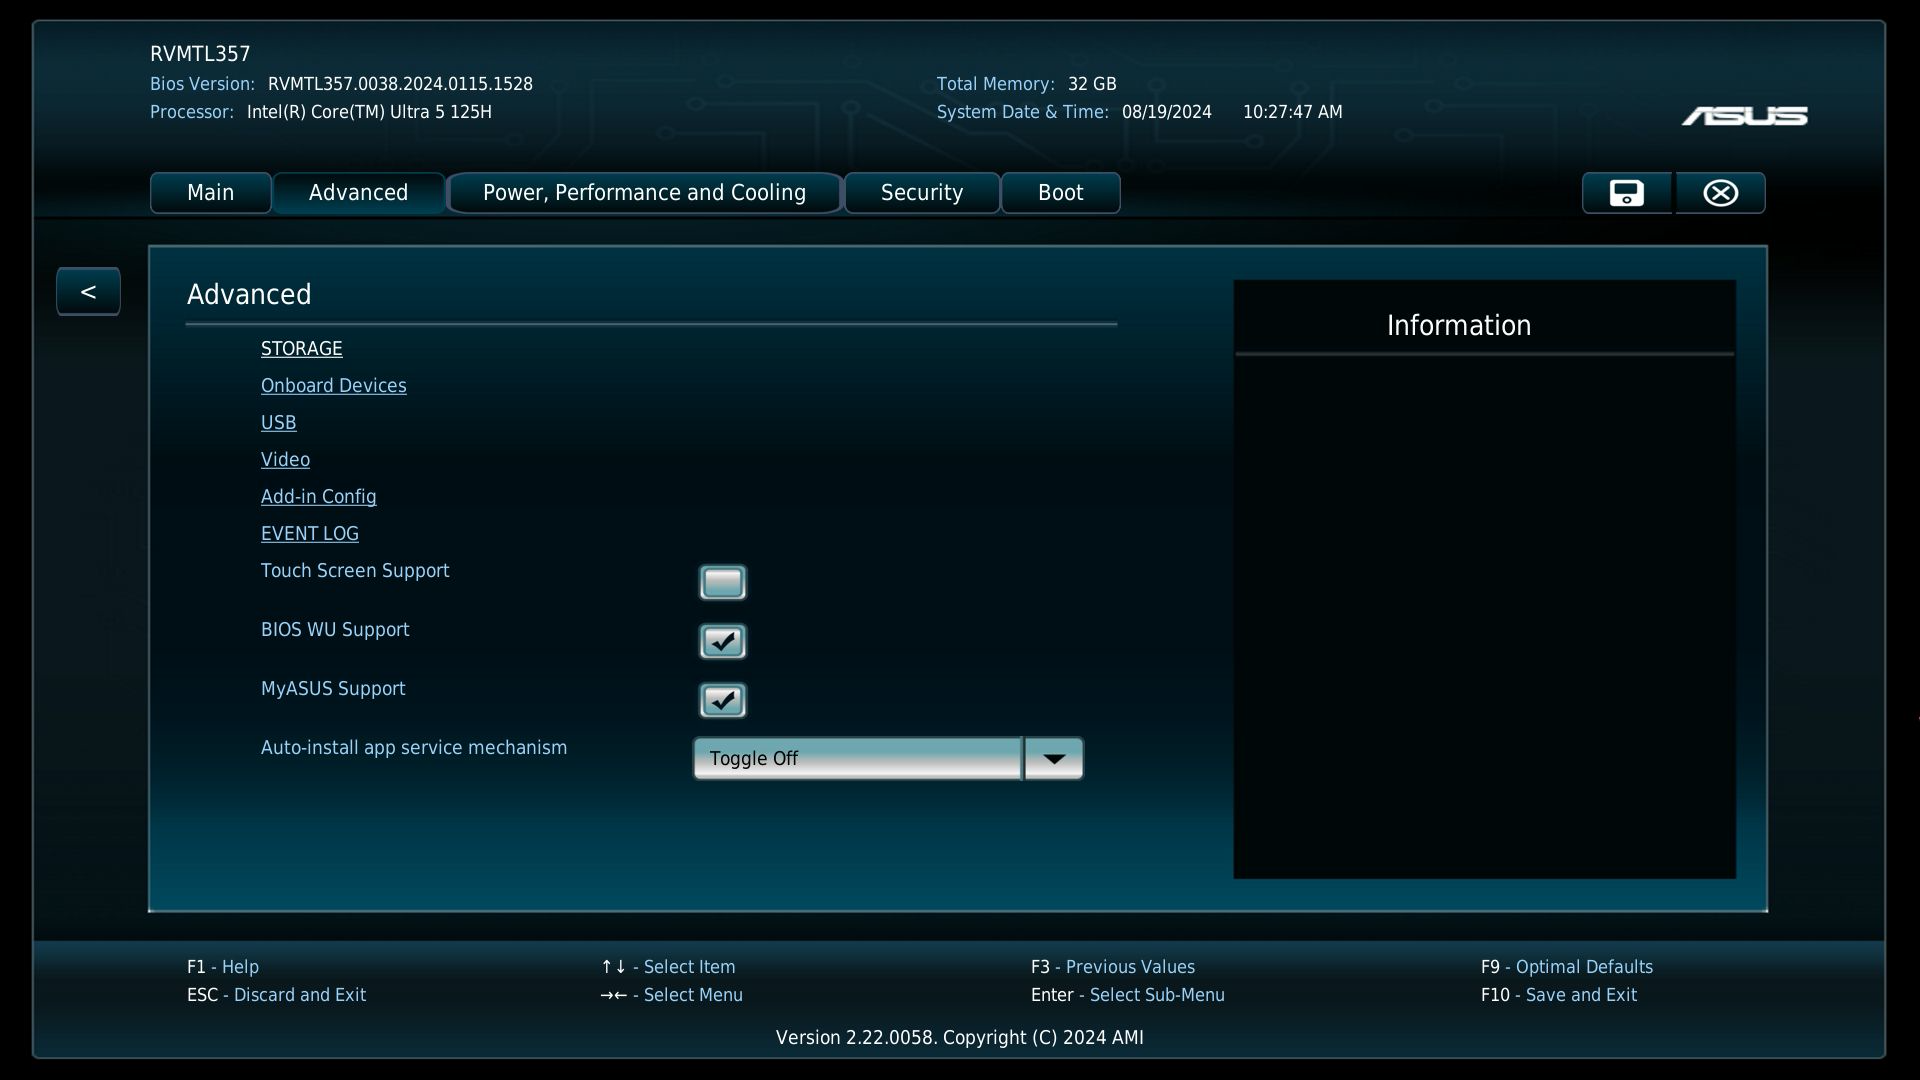
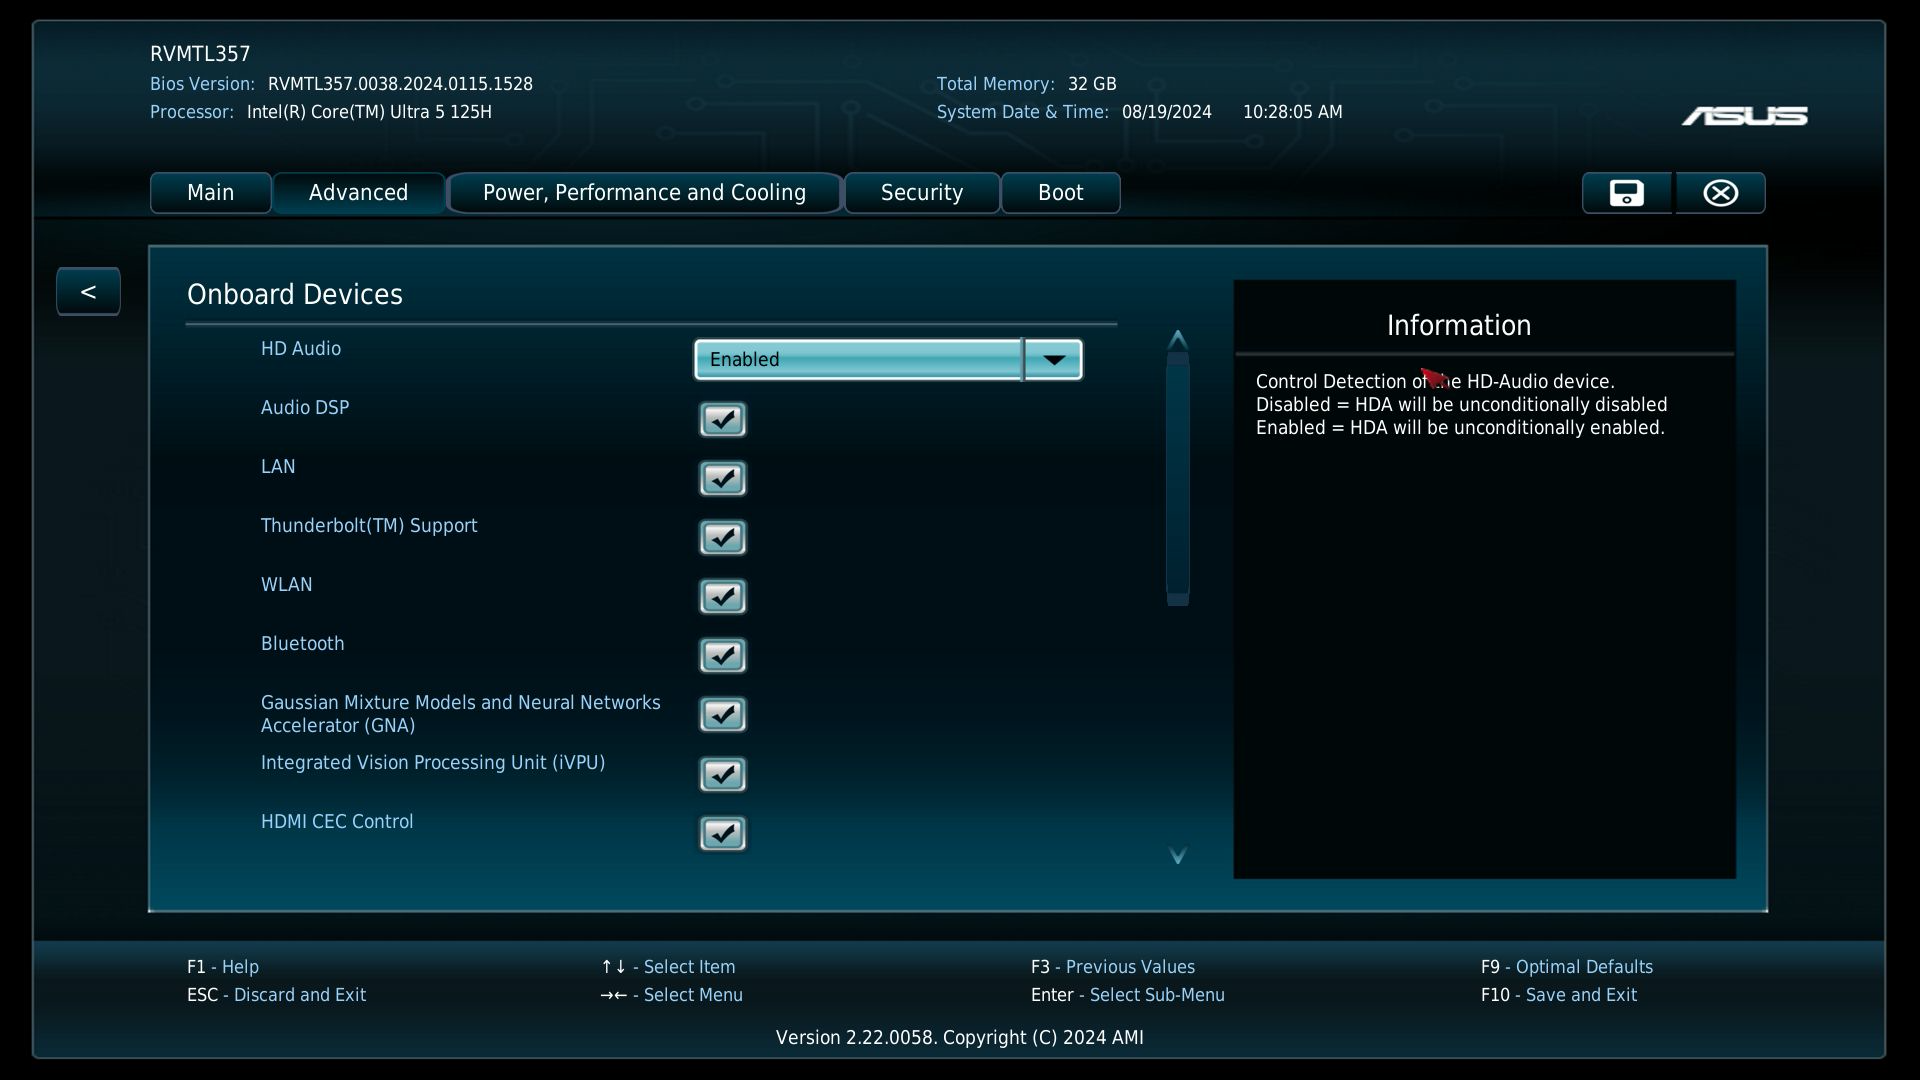
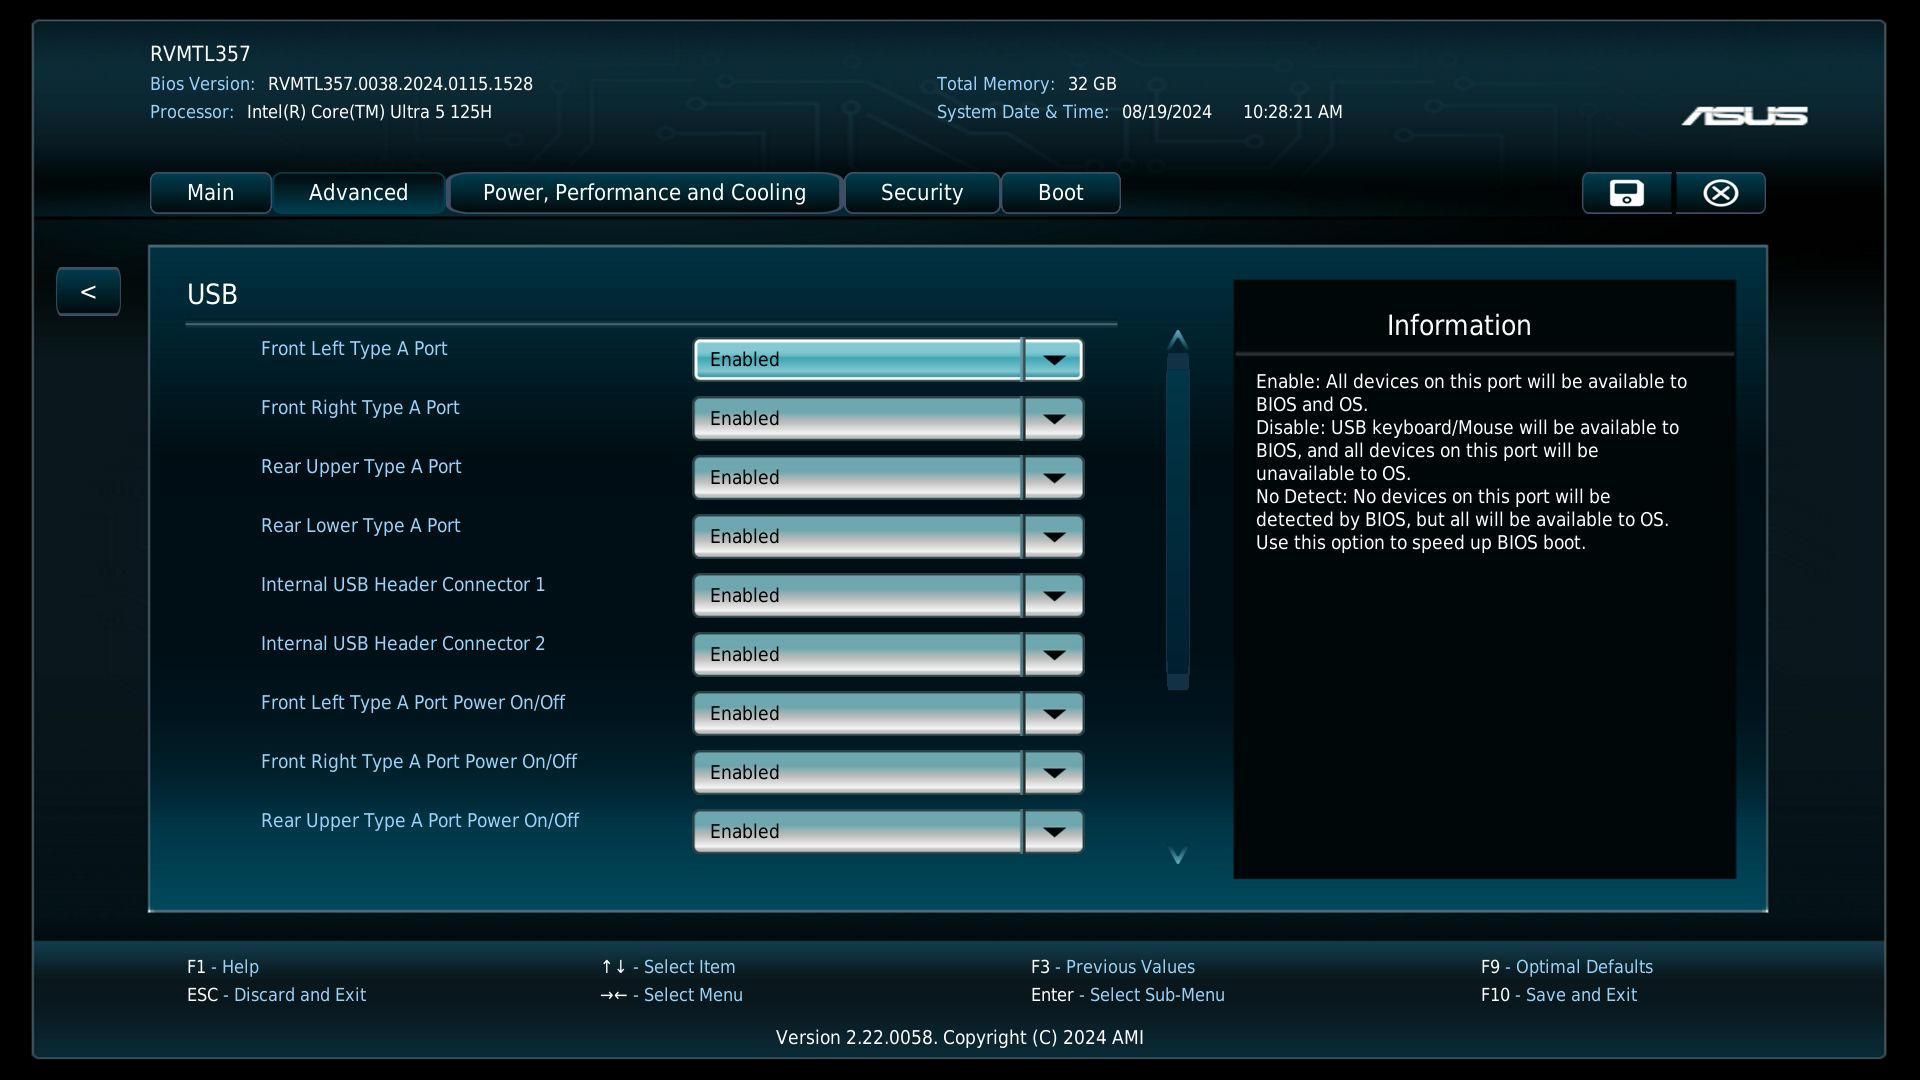
. Não alteramos o desempenho do SoC e o deixamos em seu estado padrão de acordo com as configurações do BIOS (Balanced). As configurações do BIOS são muito abrangentes. Em comparação com os Mini-PCs da Geekom, Minisforum ou Acemagic, a Asus está claramente à frente aqui. Além do consumo de energia da CPU, as portas USB individuais podem até ser desativadas.
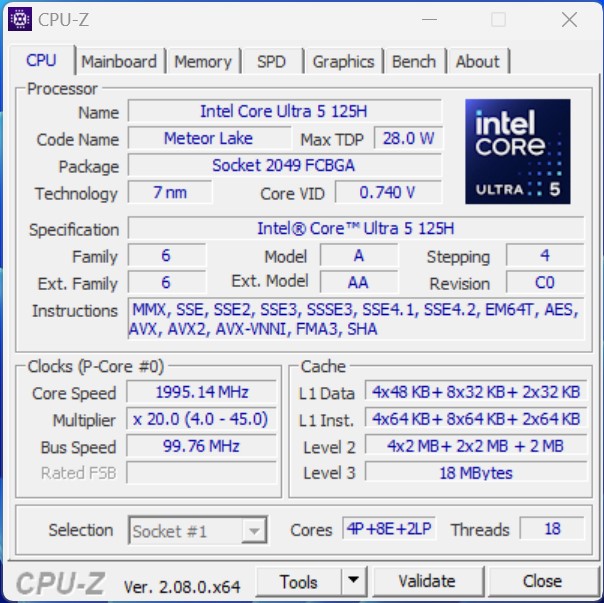
Processador
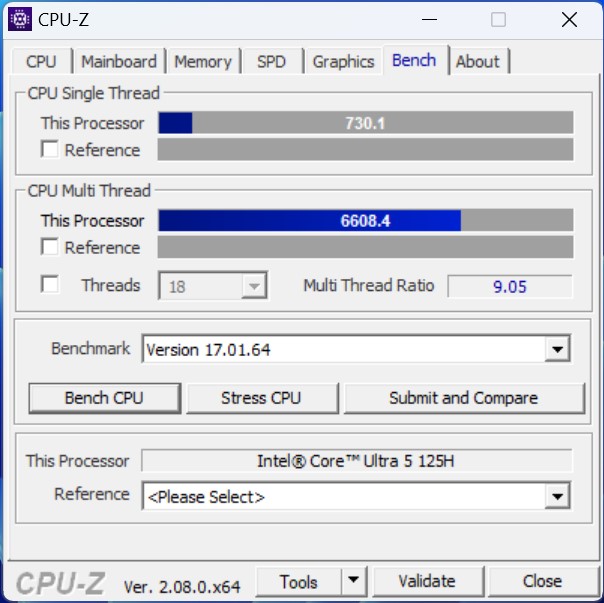
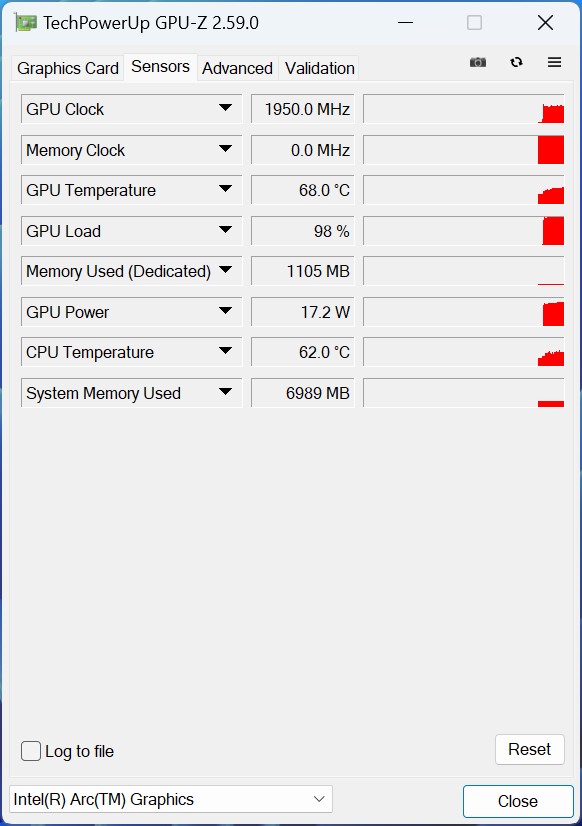
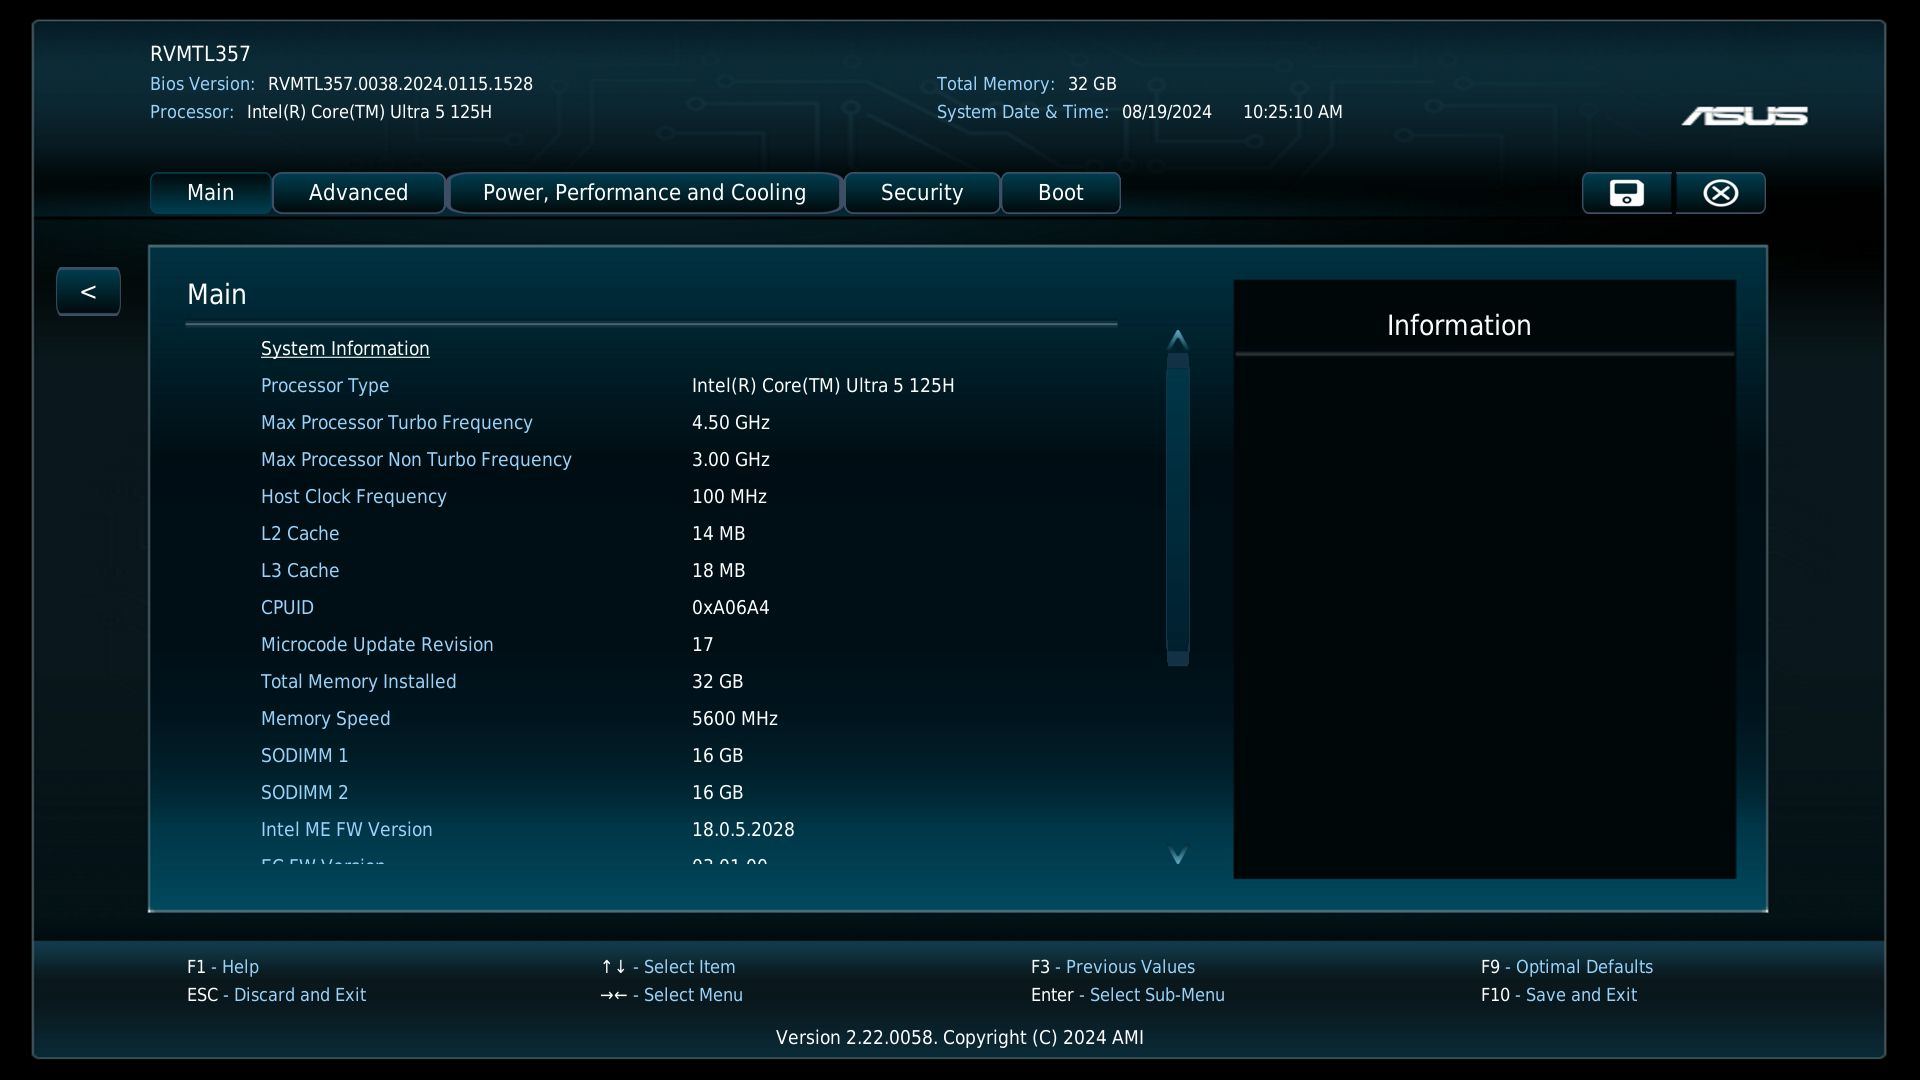
No nosso caso, o Asus NUC 14 Pro é alimentado por um Intel Core Ultra 5 125H. 14 núcleos com um total de 18 threads garantem uma alta velocidade de trabalho, o que coloca nossa amostra de teste em um bom terceiro lugar. O limite de energia do processador é de 64 watts e é atingido repetidamente por períodos curtos. Em cenários de carga mais longos, o SoC só é estrangulado devido a temperaturas excessivas. Essas temperaturas são superiores a 100 °C sob carga e não são incomuns. A Asus não parece estar diminuindo a velocidade do SoC da Intel ainda mais aqui, pois o SoC é especificado com uma temperatura operacional máxima de 110 °C de acordo com as especificações. Uma comparação direta com o Minisforum UH125 Pro é vencida por nossa amostra de teste da Asus. Nos testes individuais, o Asus NUC 14 Pro tem uma pequena vantagem com um desempenho de núcleo único consistentemente melhor.
Para obter mais comparações e benchmarks, consulte nossa Tabela de comparação de CPU.

| Performance Rating - Percent | |
| Geekom AE7 | |
| Acemagic F2A | |
| Asus NUC 14 Pro | |
| Aoostar GEM10 | |
| Minisforum UH125 Pro | |
| Geekom A5 | |
| Cinebench 2024 | |
| CPU Multi Core | |
| Acemagic F2A | |
| Geekom AE7 | |
| Asus NUC 14 Pro | |
| Minisforum UH125 Pro | |
| Aoostar GEM10 | |
| Geekom A5 | |
| CPU Single Core | |
| Geekom AE7 | |
| Acemagic F2A | |
| Asus NUC 14 Pro | |
| Minisforum UH125 Pro | |
| Aoostar GEM10 | |
| Geekom A5 | |
| Cinebench R23 | |
| Multi Core | |
| Acemagic F2A | |
| Geekom AE7 | |
| Minisforum UH125 Pro | |
| Asus NUC 14 Pro | |
| Aoostar GEM10 | |
| Geekom A5 | |
| Single Core | |
| Geekom AE7 | |
| Acemagic F2A | |
| Asus NUC 14 Pro | |
| Minisforum UH125 Pro | |
| Aoostar GEM10 | |
| Geekom A5 | |
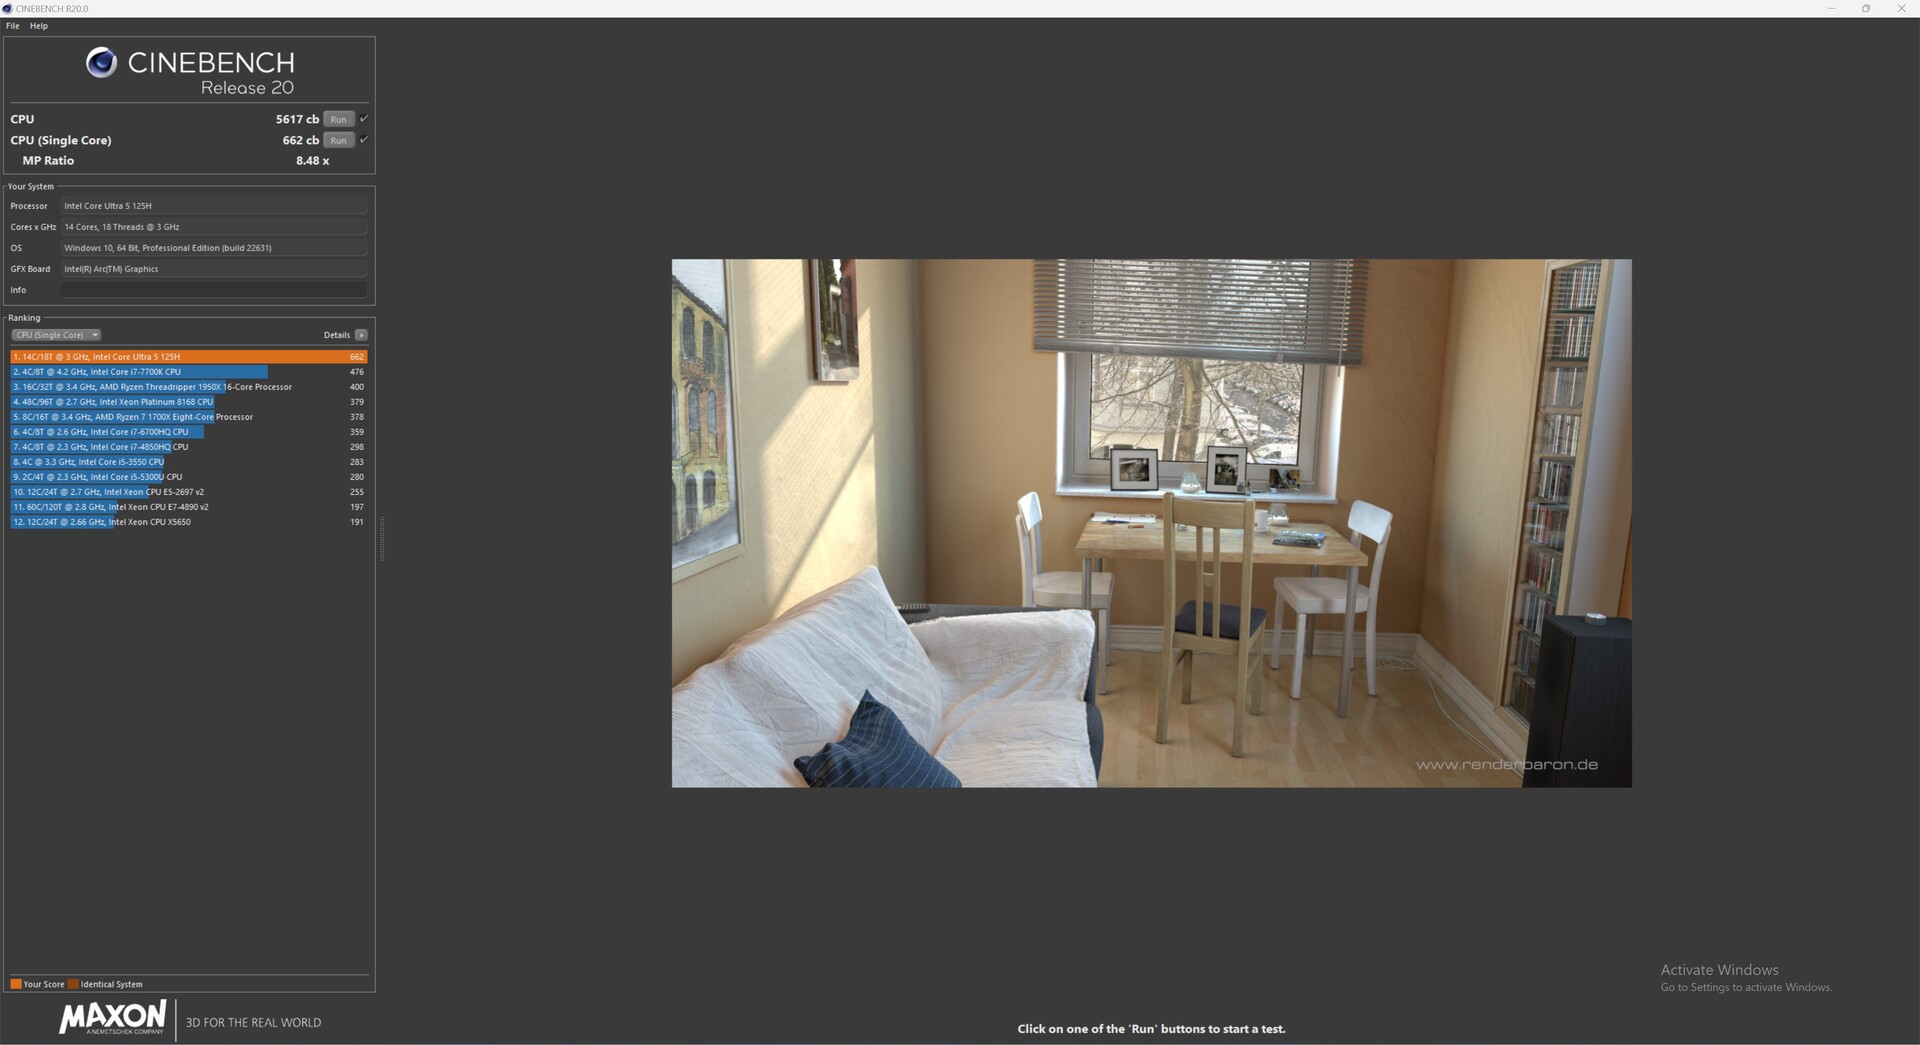
| Cinebench R20 | |
| CPU (Single Core) | |
| Geekom AE7 | |
| Acemagic F2A | |
| Minisforum UH125 Pro | |
| Asus NUC 14 Pro | |
| Aoostar GEM10 | |
| Geekom A5 | |
| CPU (Multi Core) | |
| Acemagic F2A | |
| Geekom AE7 | |
| Minisforum UH125 Pro | |
| Asus NUC 14 Pro | |
| Aoostar GEM10 | |
| Geekom A5 | |
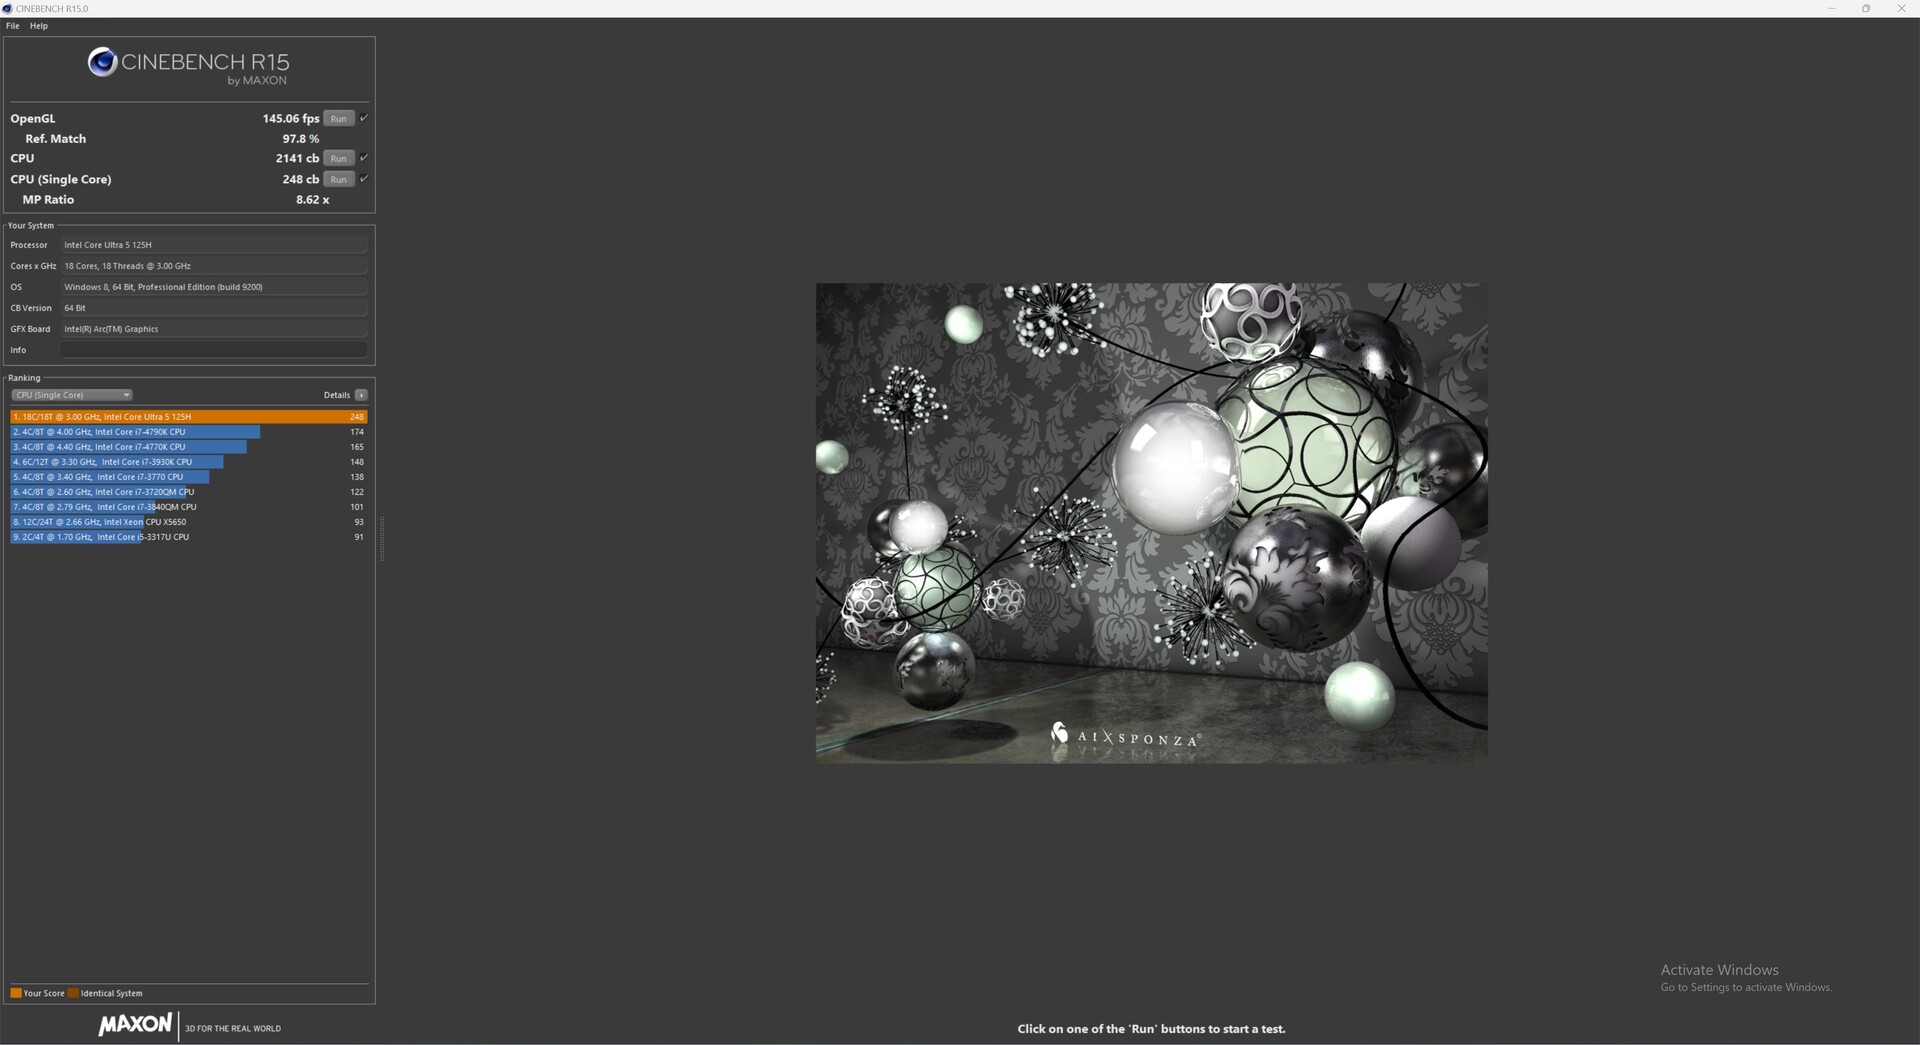
| Cinebench R15 | |
| CPU Single 64Bit | |
| Geekom AE7 | |
| Acemagic F2A | |
| Asus NUC 14 Pro | |
| Aoostar GEM10 | |
| Minisforum UH125 Pro | |
| Geekom A5 | |
| CPU Multi 64Bit | |
| Acemagic F2A | |
| Geekom AE7 | |
| Minisforum UH125 Pro | |
| Asus NUC 14 Pro | |
| Aoostar GEM10 | |
| Geekom A5 | |
| Cinebench R11.5 | |
| CPU Single 64Bit | |
| Geekom AE7 | |
| Acemagic F2A | |
| Asus NUC 14 Pro | |
| Aoostar GEM10 | |
| Minisforum UH125 Pro | |
| Geekom A5 | |
| CPU Multi 64Bit | |
| Acemagic F2A | |
| Geekom AE7 | |
| Minisforum UH125 Pro | |
| Asus NUC 14 Pro | |
| Aoostar GEM10 | |
| Geekom A5 | |
| Cinebench R10 | |
| Rendering Single CPUs 64Bit | |
| Geekom AE7 | |
| Acemagic F2A | |
| Asus NUC 14 Pro | |
| Minisforum UH125 Pro | |
| Aoostar GEM10 | |
| Geekom A5 | |
| Rendering Multiple CPUs 64Bit | |
| Acemagic F2A | |
| Geekom AE7 | |
| Minisforum UH125 Pro | |
| Asus NUC 14 Pro | |
| Aoostar GEM10 | |
| Geekom A5 | |
| Blender - v2.79 BMW27 CPU | |
| Geekom A5 | |
| Aoostar GEM10 | |
| Minisforum UH125 Pro | |
| Asus NUC 14 Pro | |
| Geekom AE7 | |
| Acemagic F2A | |
| wPrime 2.10 | |
| 32m | |
| Minisforum UH125 Pro | |
| Asus NUC 14 Pro | |
| Geekom A5 | |
| Aoostar GEM10 | |
| Acemagic F2A | |
| Geekom AE7 | |
| 1024m | |
| Minisforum UH125 Pro | |
| Asus NUC 14 Pro | |
| Acemagic F2A | |
| Geekom A5 | |
| Aoostar GEM10 | |
| Geekom AE7 | |
| X264 HD Benchmark 4.0 | |
| Pass 1 | |
| Acemagic F2A | |
| Asus NUC 14 Pro | |
| Minisforum UH125 Pro | |
| Geekom AE7 | |
| Aoostar GEM10 | |
| Geekom A5 | |
| Pass 2 | |
| Acemagic F2A | |
| Geekom AE7 | |
| Minisforum UH125 Pro | |
| Asus NUC 14 Pro | |
| Aoostar GEM10 | |
| Geekom A5 | |
| WinRAR - Result | |
| Acemagic F2A | |
| Geekom AE7 | |
| Geekom A5 | |
| Asus NUC 14 Pro | |
| Aoostar GEM10 | |
| Minisforum UH125 Pro | |
| TrueCrypt | |
| AES Mean 100MB | |
| Geekom AE7 | |
| Aoostar GEM10 | |
| Geekom A5 | |
| Acemagic F2A | |
| Minisforum UH125 Pro | |
| Asus NUC 14 Pro | |
| Twofish Mean 100MB | |
| Geekom AE7 | |
| Aoostar GEM10 | |
| Acemagic F2A | |
| Geekom A5 | |
| Minisforum UH125 Pro | |
| Asus NUC 14 Pro | |
| Serpent Mean 100MB | |
| Geekom AE7 | |
| Aoostar GEM10 | |
| Geekom A5 | |
| Acemagic F2A | |
| Asus NUC 14 Pro | |
| Minisforum UH125 Pro | |
| Geekbench 5.5 | |
| Multi-Core | |
| Acemagic F2A | |
| Geekom AE7 | |
| Asus NUC 14 Pro | |
| Minisforum UH125 Pro | |
| Aoostar GEM10 | |
| Geekom A5 | |
| Single-Core | |
| Geekom AE7 | |
| Acemagic F2A | |
| Asus NUC 14 Pro | |
| Minisforum UH125 Pro | |
| Aoostar GEM10 | |
| Geekom A5 | |
| Geekbench 5.0 | |
| 5.0 Multi-Core | |
| Acemagic F2A | |
| Geekom AE7 | |
| Asus NUC 14 Pro | |
| Minisforum UH125 Pro | |
| Aoostar GEM10 | |
| Geekom A5 | |
| 5.0 Single-Core | |
| Geekom AE7 | |
| Acemagic F2A | |
| Asus NUC 14 Pro | |
| Minisforum UH125 Pro | |
| Aoostar GEM10 | |
| Geekom A5 | |
| Geekbench 4.4 | |
| 64 Bit Single-Core Score | |
| Geekom AE7 | |
| Asus NUC 14 Pro | |
| Acemagic F2A | |
| Minisforum UH125 Pro | |
| Aoostar GEM10 | |
| Geekom A5 | |
| 64 Bit Multi-Core Score | |
| Geekom AE7 | |
| Acemagic F2A | |
| Asus NUC 14 Pro | |
| Minisforum UH125 Pro | |
| Aoostar GEM10 | |
| Geekom A5 | |
| 3DMark 11 - 1280x720 Performance Physics | |
| Geekom AE7 | |
| Acemagic F2A | |
| Asus NUC 14 Pro | |
| Minisforum UH125 Pro | |
| Geekom A5 | |
| Aoostar GEM10 | |
| 7-Zip 18.03 | |
| 7z b 4 | |
| Geekom AE7 | |
| Acemagic F2A | |
| Aoostar GEM10 | |
| Geekom A5 | |
| Minisforum UH125 Pro | |
| Asus NUC 14 Pro | |
| 7z b 4 -mmt1 | |
| Geekom AE7 | |
| Aoostar GEM10 | |
| Geekom A5 | |
| Acemagic F2A | |
| Asus NUC 14 Pro | |
| Minisforum UH125 Pro | |
| HWBOT x265 Benchmark v2.2 - 4k Preset | |
| Geekom AE7 | |
| Acemagic F2A | |
| Minisforum UH125 Pro | |
| Asus NUC 14 Pro | |
| Aoostar GEM10 | |
| Geekom A5 | |
| R Benchmark 2.5 - Overall mean | |
| Geekom A5 | |
| Aoostar GEM10 | |
| Minisforum UH125 Pro | |
| Asus NUC 14 Pro | |
| Acemagic F2A | |
| Geekom AE7 | |
| LibreOffice - 20 Documents To PDF | |
| Minisforum UH125 Pro | |
| Asus NUC 14 Pro | |
| Geekom A5 | |
| Geekom AE7 | |
| Aoostar GEM10 | |
| Acemagic F2A | |
| WebXPRT 3 - Overall | |
| Geekom AE7 | |
| Acemagic F2A | |
| Aoostar GEM10 | |
| Geekom A5 | |
| Minisforum UH125 Pro | |
| Asus NUC 14 Pro | |
| Mozilla Kraken 1.1 - Total | |
| Geekom A5 | |
| Minisforum UH125 Pro | |
| Aoostar GEM10 | |
| Asus NUC 14 Pro | |
| Acemagic F2A | |
| Geekom AE7 | |
| 3DMark | |
| 1920x1080 Fire Strike Physics | |
| Geekom AE7 | |
| Acemagic F2A | |
| Aoostar GEM10 | |
| Asus NUC 14 Pro | |
| Geekom A5 | |
| Minisforum UH125 Pro | |
| 2560x1440 Time Spy CPU | |
| Geekom AE7 | |
| Acemagic F2A | |
| Minisforum UH125 Pro | |
| Asus NUC 14 Pro | |
| Geekom A5 | |
| Aoostar GEM10 | |
| Super Pi mod 1.5 XS 1M - 1M | |
| Geekom A5 | |
| Aoostar GEM10 | |
| Minisforum UH125 Pro | |
| Asus NUC 14 Pro | |
| Acemagic F2A | |
| Geekom AE7 | |
| Super Pi mod 1.5 XS 2M - 2M | |
| Geekom A5 | |
| Aoostar GEM10 | |
| Geekom AE7 | |
| Minisforum UH125 Pro | |
| Asus NUC 14 Pro | |
| Acemagic F2A | |
| Super Pi Mod 1.5 XS 32M - 32M | |
| Aoostar GEM10 | |
| Geekom AE7 | |
| Geekom A5 | |
| Minisforum UH125 Pro | |
| Acemagic F2A | |
| Asus NUC 14 Pro | |
| Affinity Photo 2 - Combined (Multi CPU) | |
| Acemagic F2A | |
| Geekom AE7 | |
| Minisforum UH125 Pro | |
| Asus NUC 14 Pro | |
| Aoostar GEM10 | |
| Geekom A5 | |
* ... menor é melhor
AIDA64: FP32 Ray-Trace | FPU Julia | CPU SHA3 | CPU Queen | FPU SinJulia | FPU Mandel | CPU AES | CPU ZLib | FP64 Ray-Trace | CPU PhotoWorxx
| Performance Rating | |
| Geekom AE7 | |
| Acemagic F2A | |
| Aoostar GEM10 | |
| Minisforum UH125 Pro | |
| Asus NUC 14 Pro | |
| Geekom A5 | |
| Média da turma Mini PC | |
| AIDA64 / FP32 Ray-Trace | |
| Geekom AE7 | |
| Acemagic F2A | |
| Média da turma Mini PC (764 - 51004, n=116, últimos 2 anos) | |
| Aoostar GEM10 | |
| Minisforum UH125 Pro | |
| Asus NUC 14 Pro | |
| Geekom A5 | |
| AIDA64 / FPU Julia | |
| Geekom AE7 | |
| Acemagic F2A | |
| Aoostar GEM10 | |
| Geekom A5 | |
| Minisforum UH125 Pro | |
| Média da turma Mini PC (4140 - 214250, n=116, últimos 2 anos) | |
| Asus NUC 14 Pro | |
| AIDA64 / CPU SHA3 | |
| Geekom AE7 | |
| Acemagic F2A | |
| Minisforum UH125 Pro | |
| Asus NUC 14 Pro | |
| Média da turma Mini PC (290 - 9399, n=116, últimos 2 anos) | |
| Aoostar GEM10 | |
| Geekom A5 | |
| AIDA64 / CPU Queen | |
| Geekom AE7 | |
| Aoostar GEM10 | |
| Geekom A5 | |
| Acemagic F2A | |
| Média da turma Mini PC (8172 - 184747, n=116, últimos 2 anos) | |
| Asus NUC 14 Pro | |
| Minisforum UH125 Pro | |
| AIDA64 / FPU SinJulia | |
| Geekom AE7 | |
| Aoostar GEM10 | |
| Geekom A5 | |
| Acemagic F2A | |
| Média da turma Mini PC (408 - 29064, n=116, últimos 2 anos) | |
| Asus NUC 14 Pro | |
| Minisforum UH125 Pro | |
| AIDA64 / FPU Mandel | |
| Geekom AE7 | |
| Aoostar GEM10 | |
| Acemagic F2A | |
| Geekom A5 | |
| Média da turma Mini PC (2088 - 113499, n=116, últimos 2 anos) | |
| Minisforum UH125 Pro | |
| Asus NUC 14 Pro | |
| AIDA64 / CPU AES | |
| Geekom AE7 | |
| Acemagic F2A | |
| Aoostar GEM10 | |
| Geekom A5 | |
| Média da turma Mini PC (3691 - 325960, n=116, últimos 2 anos) | |
| Minisforum UH125 Pro | |
| Asus NUC 14 Pro | |
| AIDA64 / CPU ZLib | |
| Acemagic F2A | |
| Geekom AE7 | |
| Minisforum UH125 Pro | |
| Asus NUC 14 Pro | |
| Média da turma Mini PC (76.7 - 2039, n=116, últimos 2 anos) | |
| Aoostar GEM10 | |
| Geekom A5 | |
| AIDA64 / FP64 Ray-Trace | |
| Geekom AE7 | |
| Acemagic F2A | |
| Média da turma Mini PC (432 - 26952, n=116, últimos 2 anos) | |
| Aoostar GEM10 | |
| Minisforum UH125 Pro | |
| Asus NUC 14 Pro | |
| Geekom A5 | |
| AIDA64 / CPU PhotoWorxx | |
| Asus NUC 14 Pro | |
| Minisforum UH125 Pro | |
| Geekom AE7 | |
| Acemagic F2A | |
| Média da turma Mini PC (5296 - 51727, n=116, últimos 2 anos) | |
| Aoostar GEM10 | |
| Geekom A5 | |
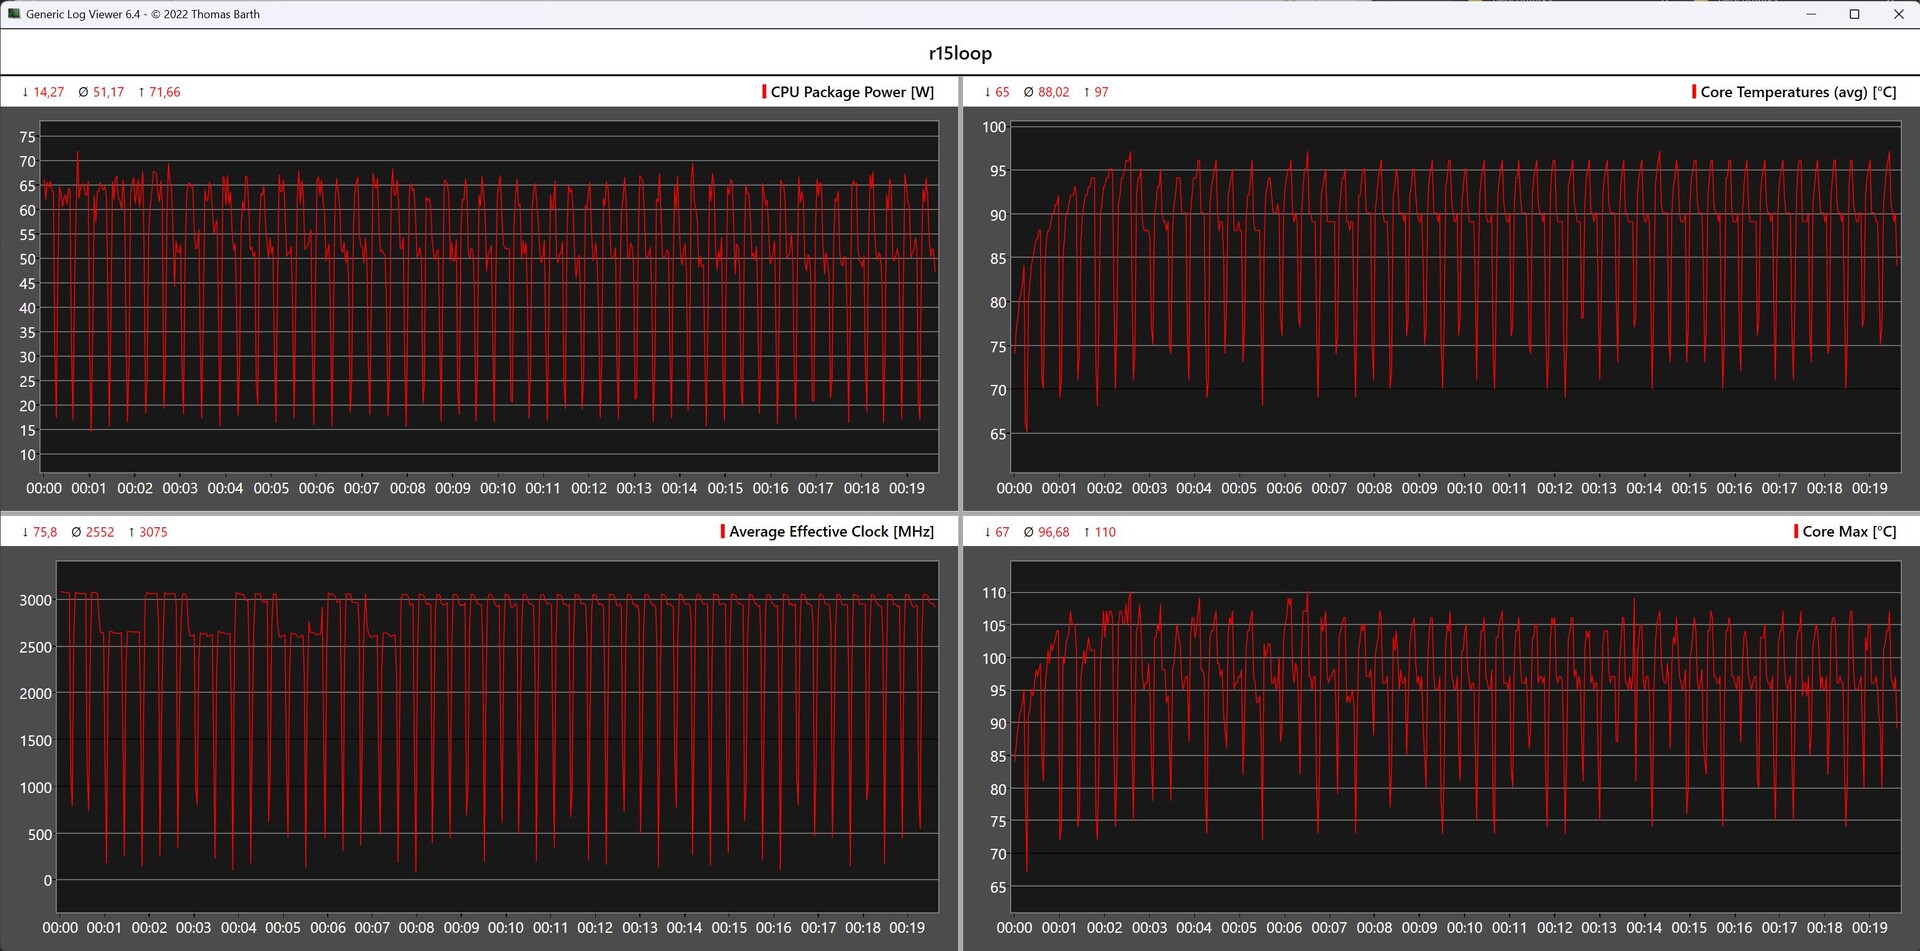
Cinebench R15 Multi loop
Infelizmente, o Asus NUC 14 Pro não consegue manter seu desempenho ligeiramente melhor da CPU no loop contínuo do Cinebench R15 em comparação com o Minisforum UH125 Pro. As temperaturas mais altas da CPU causam repetidamente quedas de desempenho de curto prazo, razão pela qual os resultados não são muito consistentes. Com uma média de 2.021 pontos, o Asus NUC 14 Pro não consegue superar o Minisforum UH125 Pro.
Desempenho do sistema
O desempenho do sistema reflete exatamente o que é possível com o Intel Core Ultra 5 125H. Baseado no mesmo SoC, o Minisforum UH125 Pro é o principal concorrente e oferece um desempenho semelhante ao do Asus NUC 14 Pro. Subjetivamente, o Asus NUC 14 Pro oferece excelente desempenho cotidiano e nossa amostra de teste pode garantir o segundo lugar nos testes de RAM.
| PCMark 10 / Score | |
| Geekom AE7, AMD Ryzen 9 7940HS | |
| Acemagic F2A, Intel Core Ultra 7 155H | |
| Aoostar GEM10, AMD Ryzen 7 6800H | |
| Asus NUC 14 Pro, Intel Core Ultra 5 125H | |
| Minisforum UH125 Pro, Intel Core Ultra 5 125H | |
| Geekom A5, AMD Ryzen 7 5800H | |
| PCMark 10 / Essentials | |
| Acemagic F2A, Intel Core Ultra 7 155H | |
| Geekom AE7, AMD Ryzen 9 7940HS | |
| Aoostar GEM10, AMD Ryzen 7 6800H | |
| Geekom A5, AMD Ryzen 7 5800H | |
| Asus NUC 14 Pro, Intel Core Ultra 5 125H | |
| Minisforum UH125 Pro, Intel Core Ultra 5 125H | |
| PCMark 10 / Productivity | |
| Geekom AE7, AMD Ryzen 9 7940HS | |
| Aoostar GEM10, AMD Ryzen 7 6800H | |
| Geekom A5, AMD Ryzen 7 5800H | |
| Acemagic F2A, Intel Core Ultra 7 155H | |
| Minisforum UH125 Pro, Intel Core Ultra 5 125H | |
| Asus NUC 14 Pro, Intel Core Ultra 5 125H | |
| CrossMark / Overall | |
| Geekom AE7, AMD Ryzen 9 7940HS | |
| Acemagic F2A, Intel Core Ultra 7 155H | |
| Aoostar GEM10, AMD Ryzen 7 6800H | |
| Minisforum UH125 Pro, Intel Core Ultra 5 125H | |
| Asus NUC 14 Pro, Intel Core Ultra 5 125H | |
| Geekom A5, AMD Ryzen 7 5800H | |
| CrossMark / Responsiveness | |
| Acemagic F2A, Intel Core Ultra 7 155H | |
| Aoostar GEM10, AMD Ryzen 7 6800H | |
| Geekom AE7, AMD Ryzen 9 7940HS | |
| Minisforum UH125 Pro, Intel Core Ultra 5 125H | |
| Geekom A5, AMD Ryzen 7 5800H | |
| Asus NUC 14 Pro, Intel Core Ultra 5 125H | |
| CrossMark / Creativity | |
| Geekom AE7, AMD Ryzen 9 7940HS | |
| Acemagic F2A, Intel Core Ultra 7 155H | |
| Asus NUC 14 Pro, Intel Core Ultra 5 125H | |
| Aoostar GEM10, AMD Ryzen 7 6800H | |
| Minisforum UH125 Pro, Intel Core Ultra 5 125H | |
| Geekom A5, AMD Ryzen 7 5800H | |
| CrossMark / Productivity | |
| Geekom AE7, AMD Ryzen 9 7940HS | |
| Acemagic F2A, Intel Core Ultra 7 155H | |
| Aoostar GEM10, AMD Ryzen 7 6800H | |
| Minisforum UH125 Pro, Intel Core Ultra 5 125H | |
| Asus NUC 14 Pro, Intel Core Ultra 5 125H | |
| Geekom A5, AMD Ryzen 7 5800H | |
| AIDA64 / Memory Copy | |
| Minisforum UH125 Pro | |
| Asus NUC 14 Pro | |
| Geekom AE7 | |
| Acemagic F2A | |
| Aoostar GEM10 | |
| Média da turma Mini PC (8377 - 89287, n=116, últimos 2 anos) | |
| Geekom A5 | |
| AIDA64 / Memory Read | |
| Asus NUC 14 Pro | |
| Minisforum UH125 Pro | |
| Acemagic F2A | |
| Geekom AE7 | |
| Média da turma Mini PC (8974 - 100086, n=116, últimos 2 anos) | |
| Geekom A5 | |
| Aoostar GEM10 | |
| AIDA64 / Memory Write | |
| Geekom AE7 | |
| Asus NUC 14 Pro | |
| Minisforum UH125 Pro | |
| Acemagic F2A | |
| Média da turma Mini PC (8762 - 100538, n=116, últimos 2 anos) | |
| Aoostar GEM10 | |
| Geekom A5 | |
| AIDA64 / Memory Latency | |
| Minisforum UH125 Pro | |
| Acemagic F2A | |
| Asus NUC 14 Pro | |
| Aoostar GEM10 | |
| Média da turma Mini PC (44.9 - 184.8, n=116, últimos 2 anos) | |
| Geekom AE7 | |
| Geekom A5 | |
* ... menor é melhor
| UL Procyon for Windows | |
| Overall Score Integer NPU | |
| Asus NUC 14 Pro | |
| Minisforum UH125 Pro | |
| Acemagic F2A | |
| Overall Score Integer GPU | |
| Asus NUC 14 Pro | |
| Acemagic F2A | |
| Minisforum UH125 Pro | |
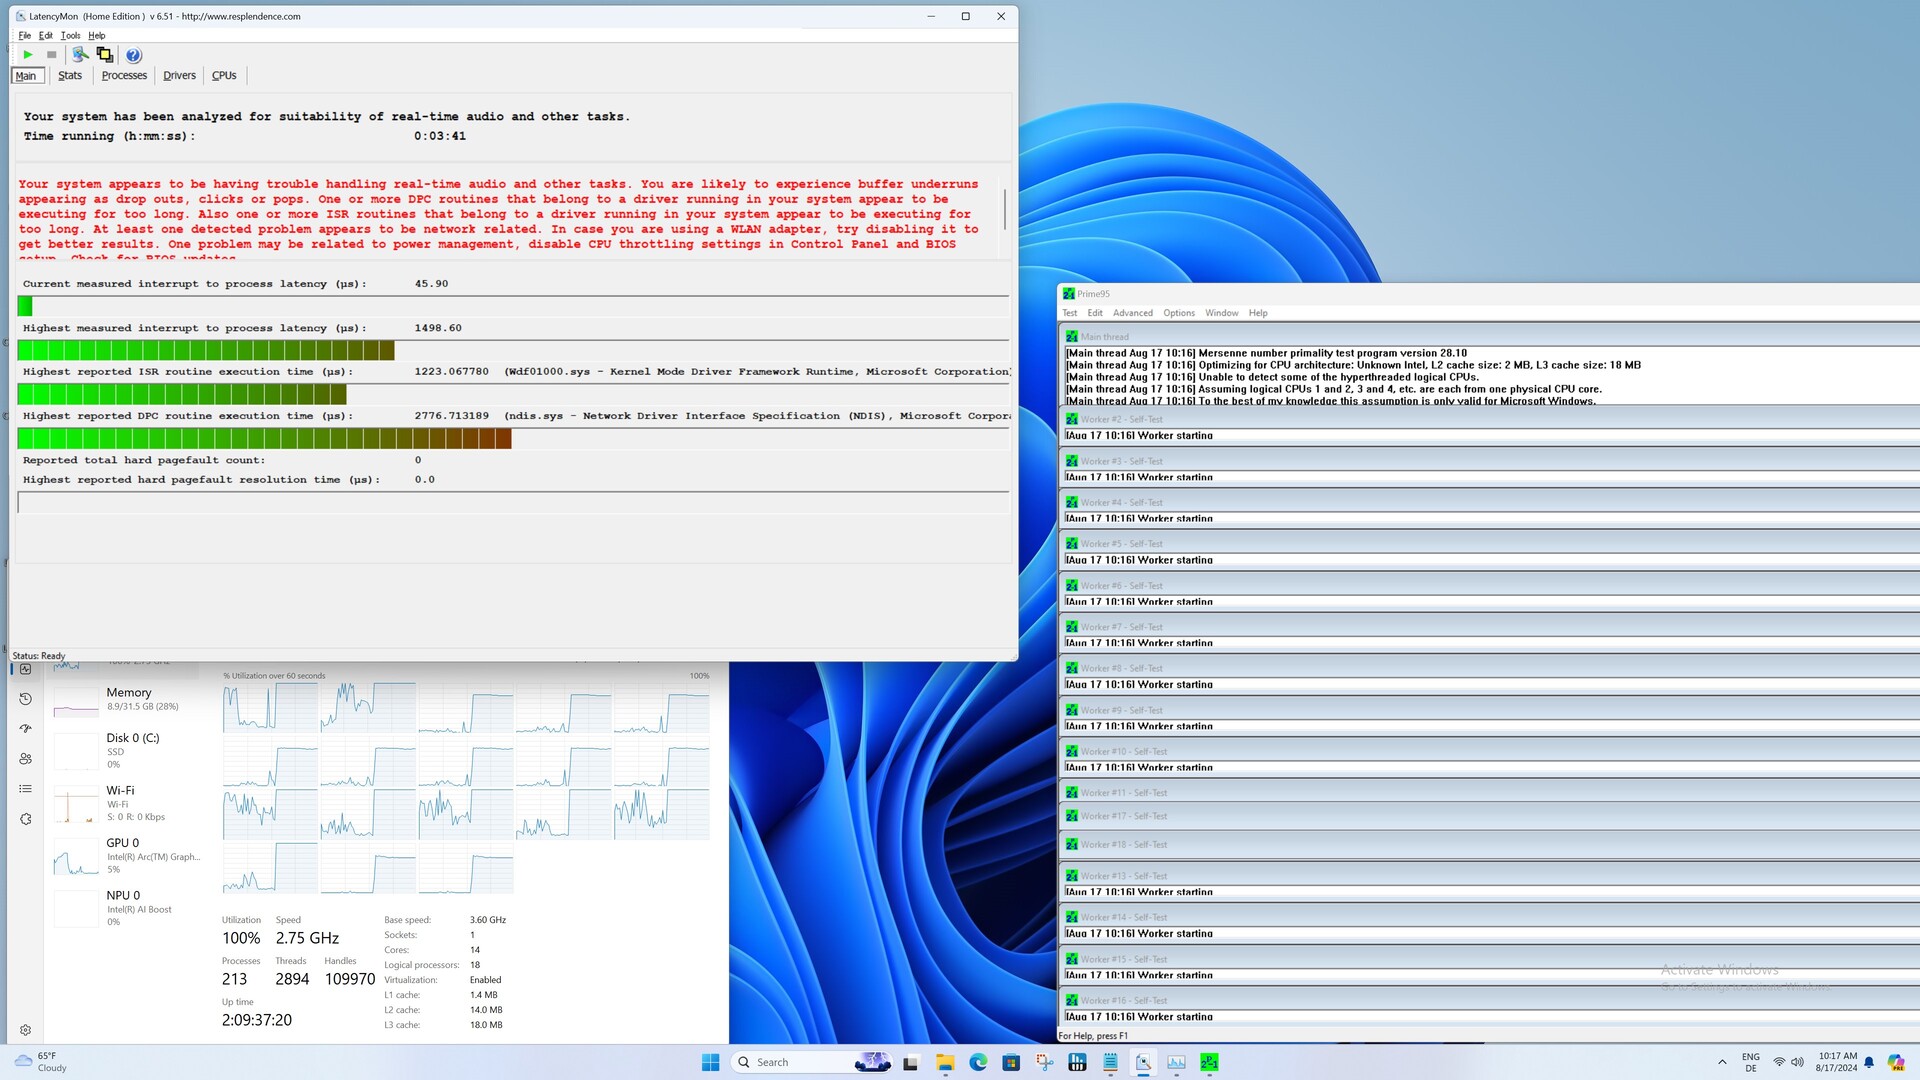
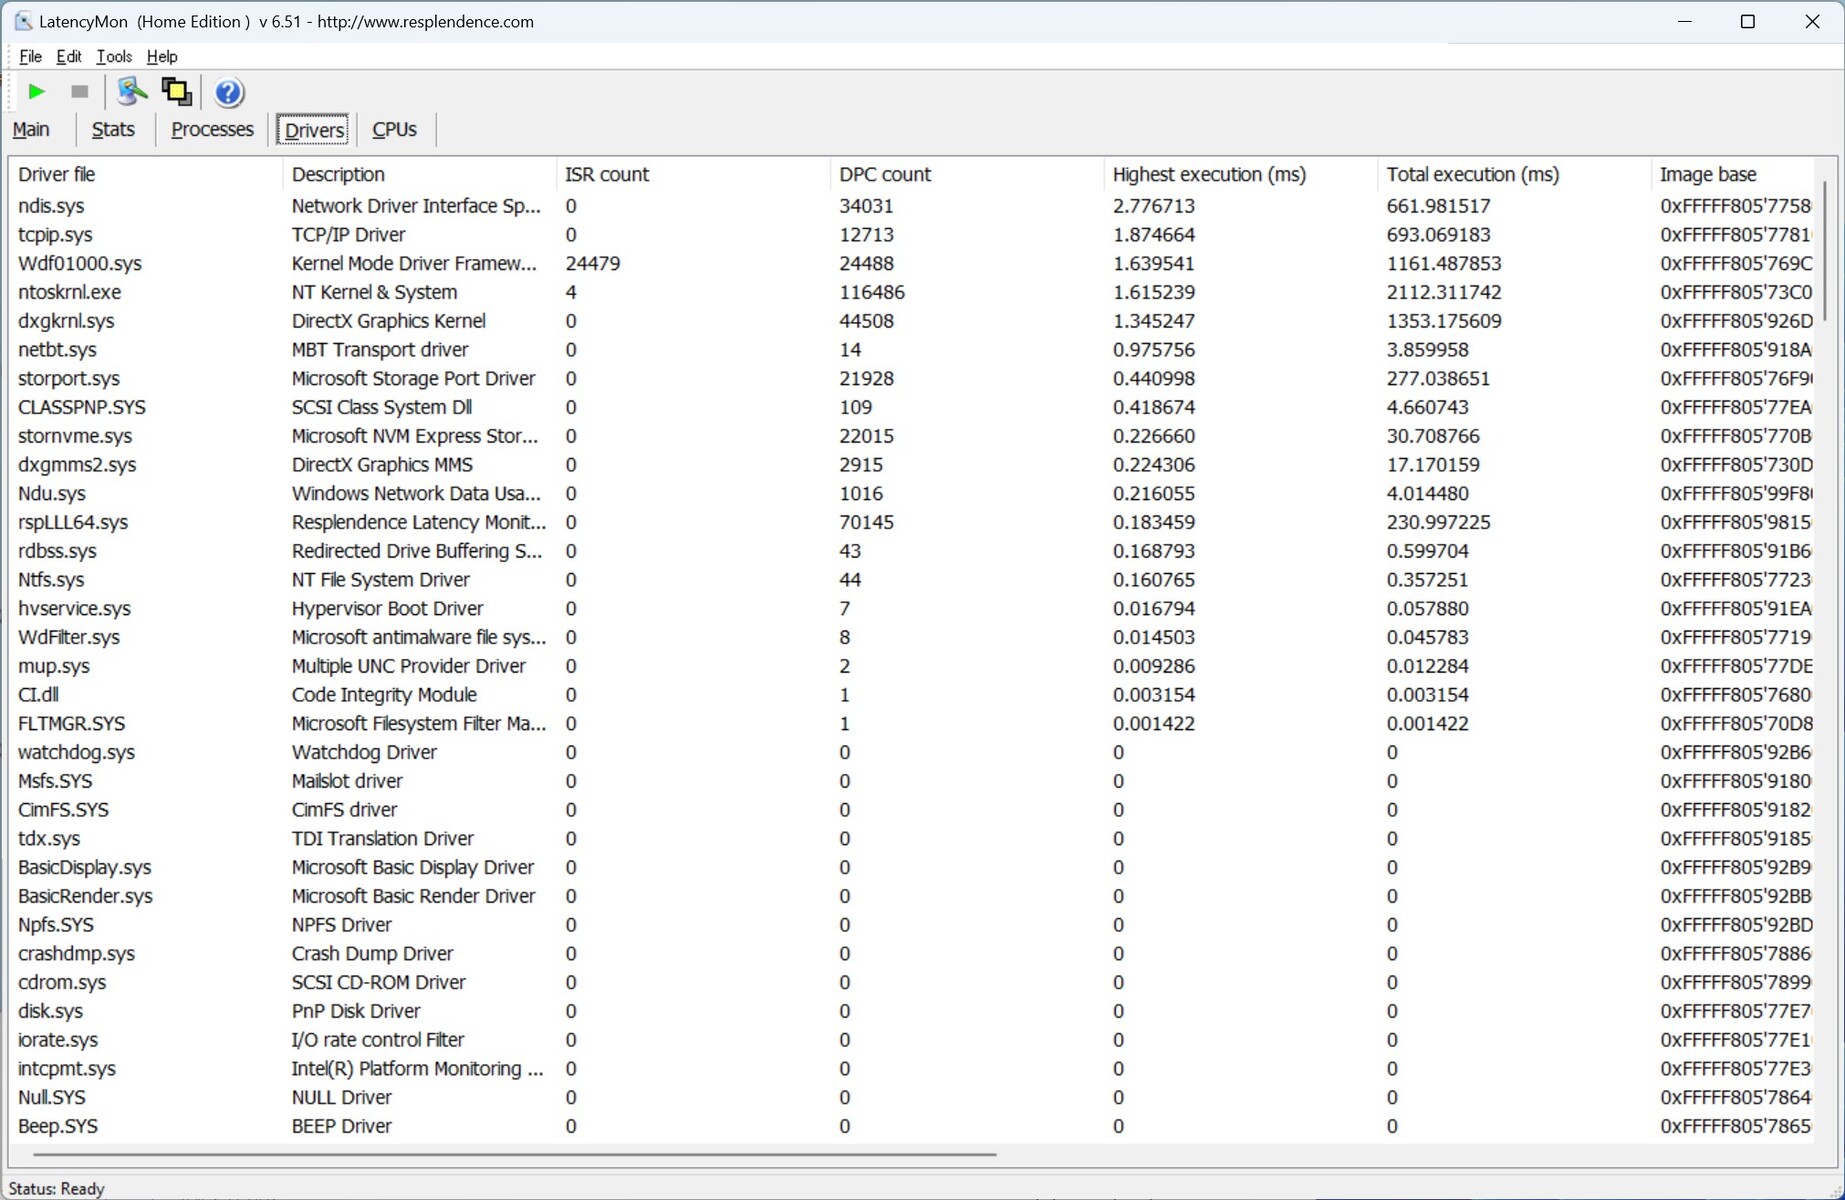
Latências de DPC
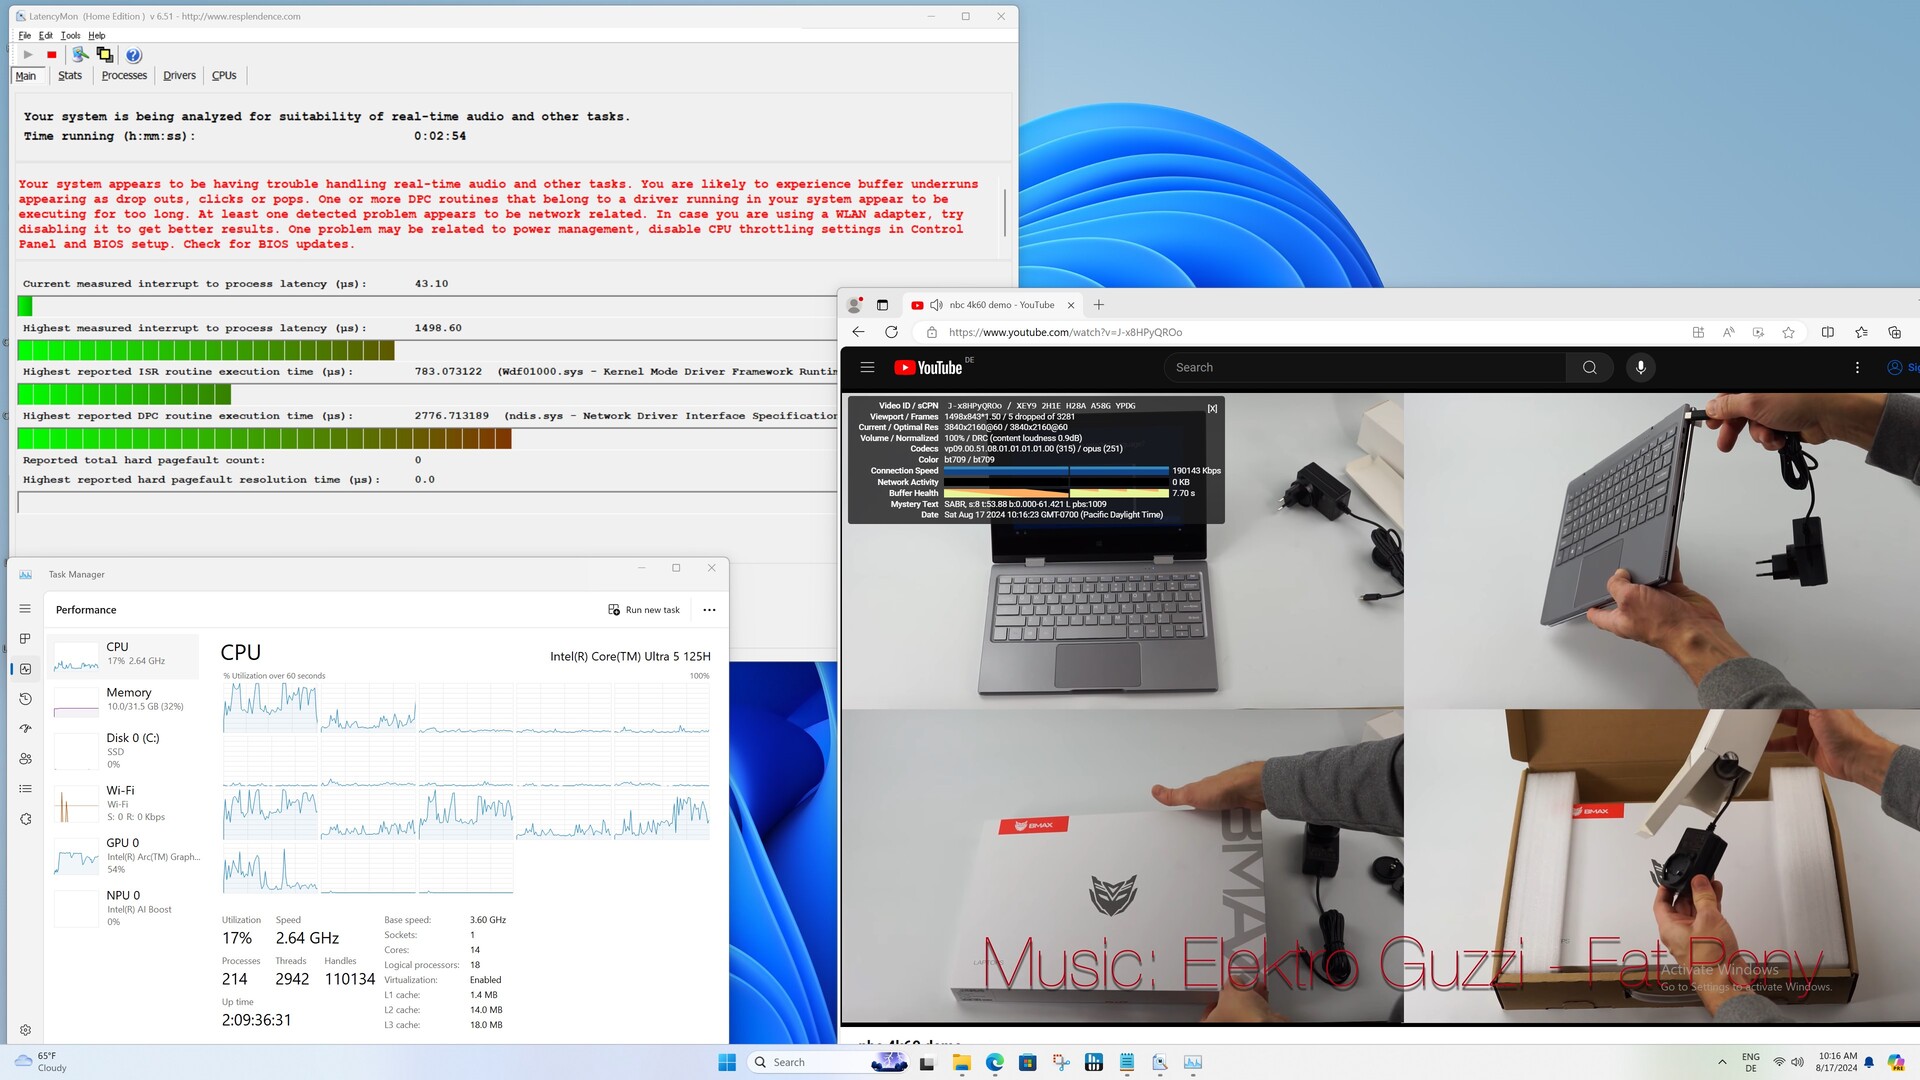
As latências DPC do Asus NUC 14 Pro não são convincentes. Mesmo ao simplesmente navegar na Internet, vemos valores altos, que se deterioram ainda mais ao reproduzir o vídeo de teste 4K. Futuras atualizações do BIOS ou do driver podem garantir melhorias aqui no futuro.
| DPC Latencies / LatencyMon - interrupt to process latency (max), Web, Youtube, Prime95 | |
| Asus NUC 14 Pro | |
| Acemagic F2A | |
| Geekom AE7 | |
| Minisforum UH125 Pro | |
| Geekom A5 | |
| Aoostar GEM10 | |
* ... menor é melhor
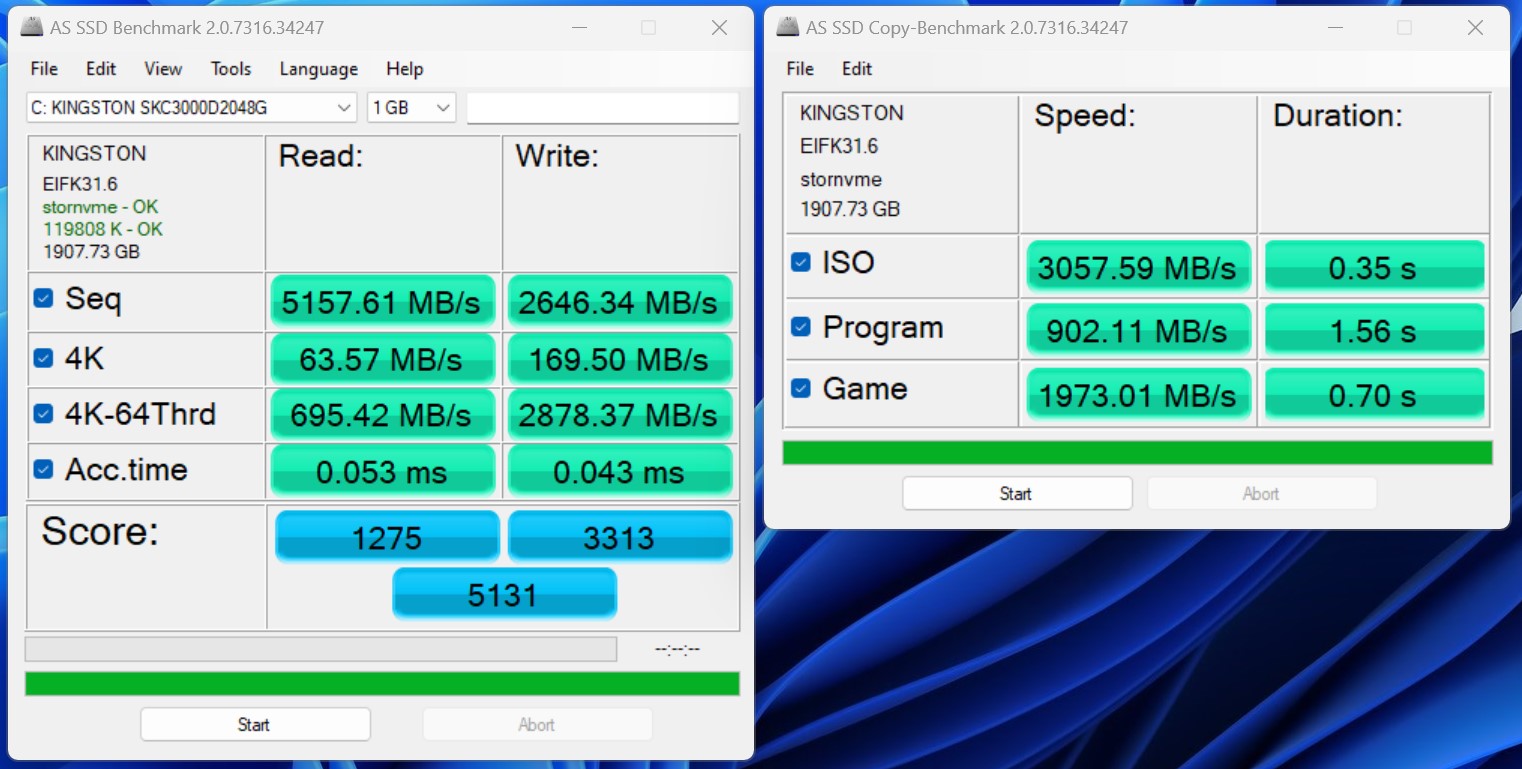
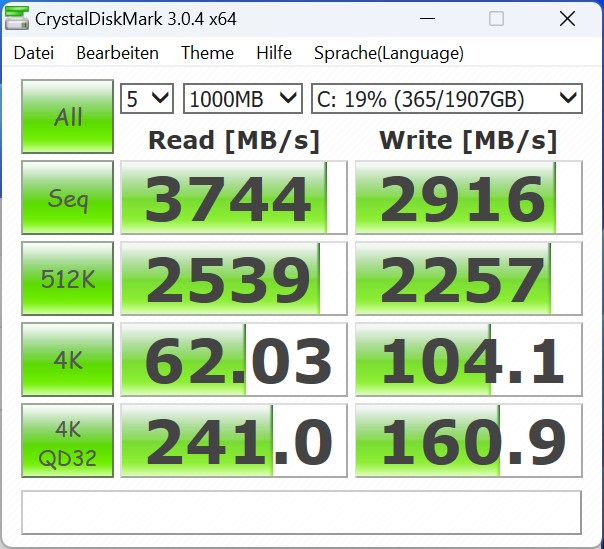
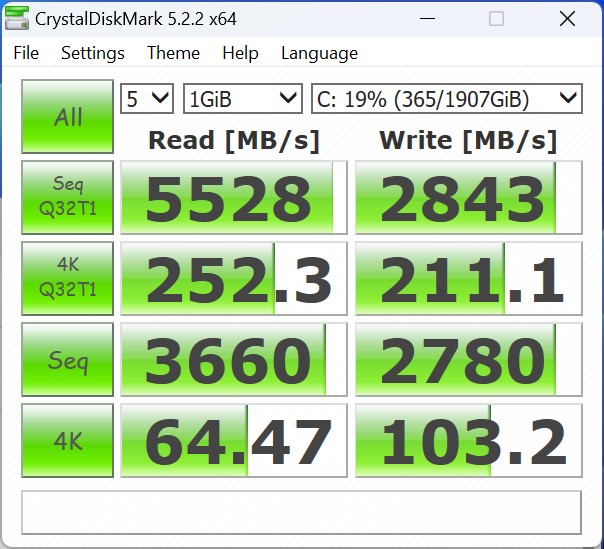
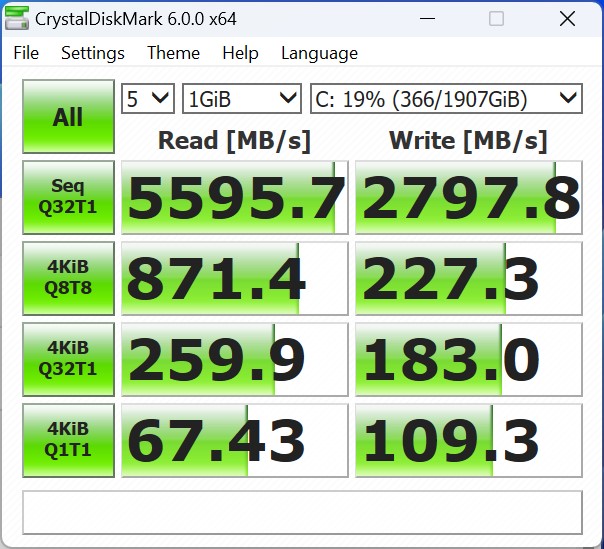
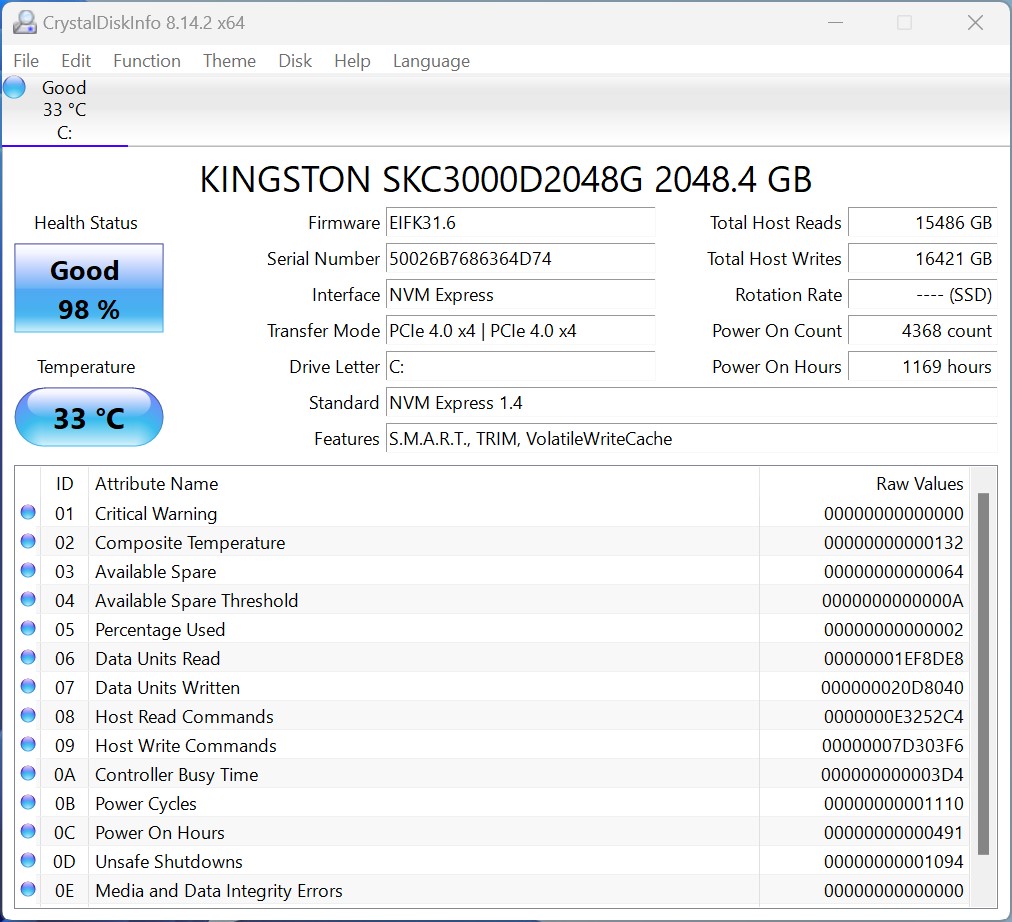
Armazenamento em massa
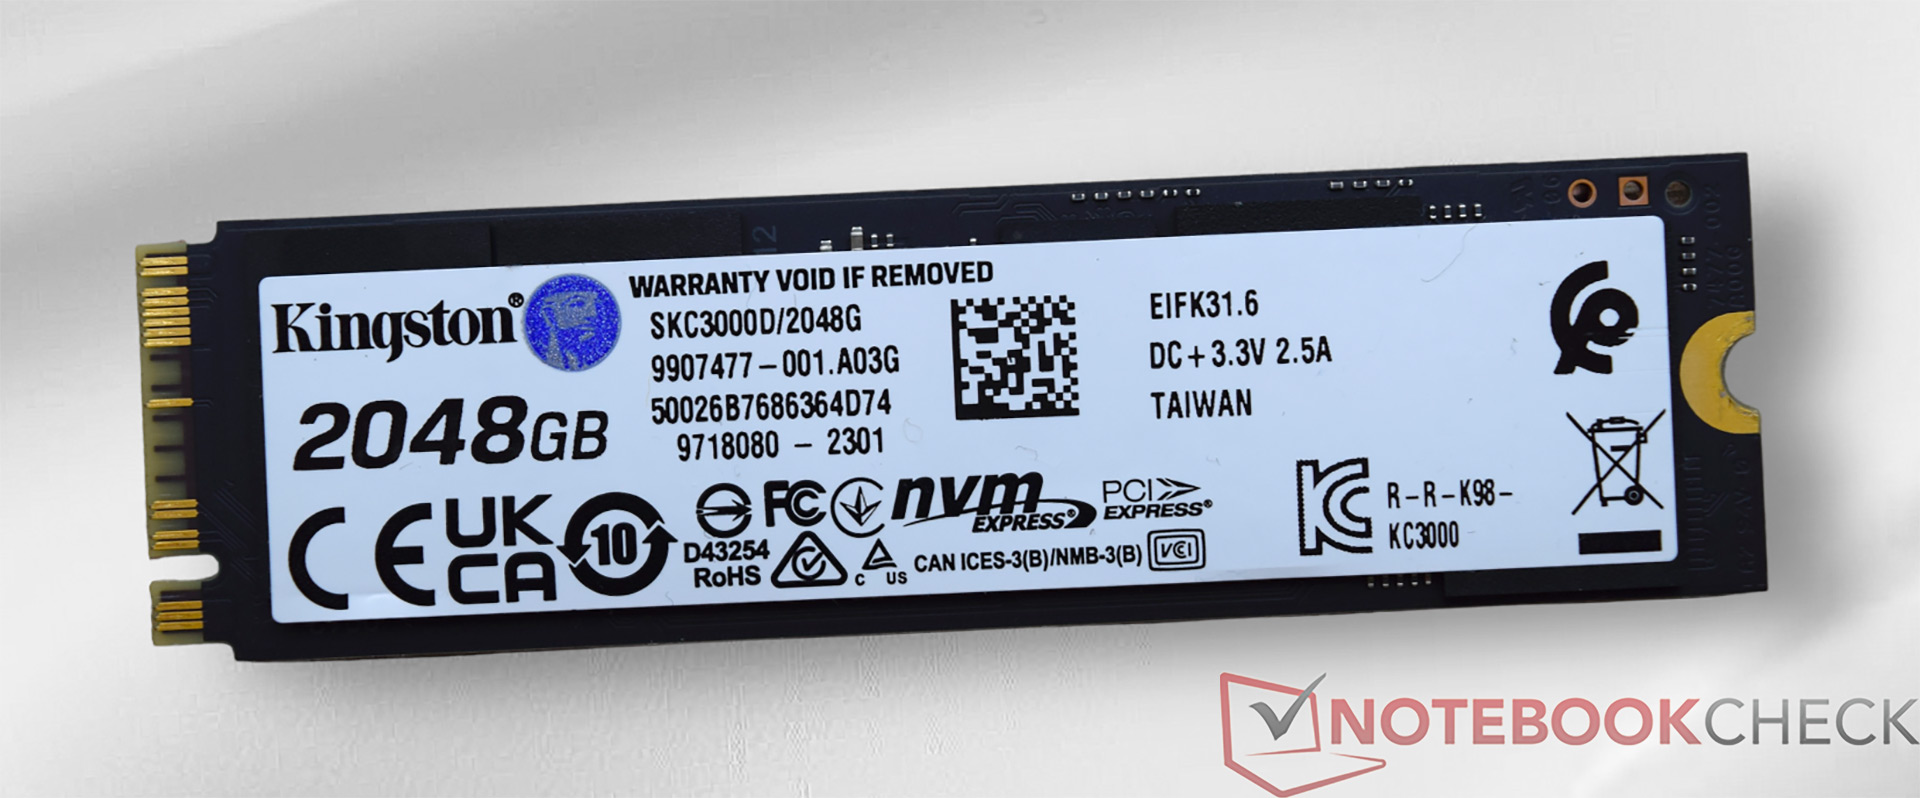
Equipamos o dispositivo de teste com um SSD KC3000 da Kingston. O desempenho teórico do SSD não pode ser alcançado na prática. No entanto, registramos resultados comparativamente bons, o que significou um bom terceiro lugar geral. Pequenos problemas podem ser observados no teste de estresse: Em combinação com o Kingston SC3000 usado, o desempenho de leitura não pode ser mantido permanentemente no mesmo nível.
Para mais comparações e benchmarks, dê uma olhada na nossa tabela de comparação Laptop SSD & HDD Benchmarks .

| Drive Performance Rating - Percent | |
| Aoostar GEM10 | |
| Geekom AE7 | |
| Asus NUC 14 Pro | |
| Média da turma Mini PC | |
| Minisforum UH125 Pro | |
| Acemagic F2A | |
| Geekom A5 | |
* ... menor é melhor
Continuous read: DiskSpd Read Loop, Queue Depth 8
Placa de vídeo
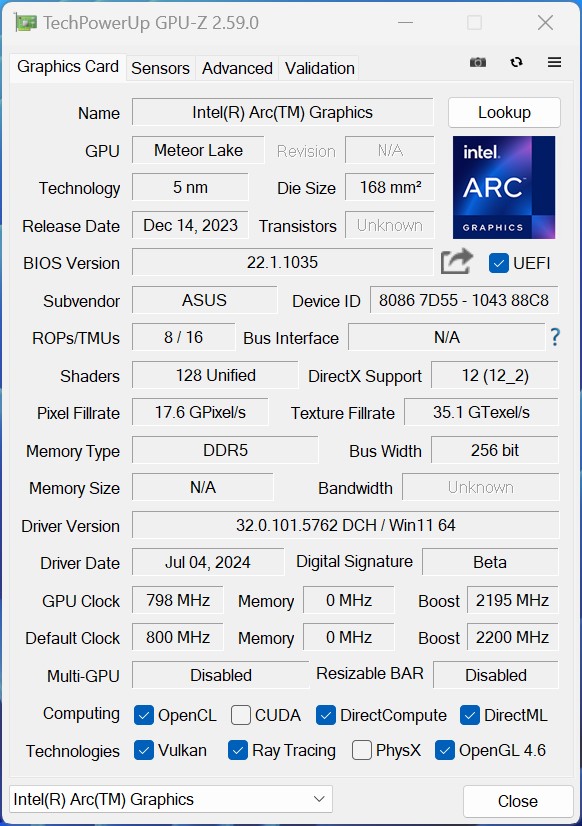
O desempenho 3D do Asus NUC 14 Pro é visivelmente melhor do que o antigo Intel Iris Xe G7 com 96 EUs devido à arquitetura Intel Arc revisada. No entanto, o Intel Arc de 7 núcleos não consegue acompanhar a AMD Radeon 780M. No entanto, o Asus NUC 14 Pro oferece um desempenho excepcional, já que nossa amostra de teste vence a comparação com o Acemagic F2A em vários testes.
Outras comparações e benchmarks podem ser encontrados em nossa tabela de comparação de GPU Mobile Graphics Cards - Benchmark List .
| 3DMark Performance Rating - Percent | |
| Geekom AE7 | |
| Asus NUC 14 Pro | |
| Acemagic F2A | |
| Aoostar GEM10 | |
| Minisforum UH125 Pro | |
| Geekom A5 | |
| 3DMark 11 - 1280x720 Performance GPU | |
| Geekom AE7 | |
| Acemagic F2A | |
| Asus NUC 14 Pro | |
| Aoostar GEM10 | |
| Minisforum UH125 Pro | |
| Geekom A5 | |
| 3DMark | |
| 2560x1440 Time Spy Graphics | |
| Acemagic F2A | |
| Asus NUC 14 Pro | |
| Geekom AE7 | |
| Minisforum UH125 Pro | |
| Aoostar GEM10 | |
| Geekom A5 | |
| 1920x1080 Fire Strike Graphics | |
| Geekom AE7 | |
| Asus NUC 14 Pro | |
| Acemagic F2A | |
| Aoostar GEM10 | |
| Minisforum UH125 Pro | |
| Geekom A5 | |
| Unigine Heaven 4.0 | |
| Extreme Preset OpenGL | |
| Aoostar GEM10 | |
| Asus NUC 14 Pro | |
| Geekom AE7 | |
| Acemagic F2A | |
| Minisforum UH125 Pro | |
| Geekom A5 | |
| Extreme Preset DX11 | |
| Geekom AE7 | |
| Aoostar GEM10 | |
| Asus NUC 14 Pro | |
| Acemagic F2A | |
| Minisforum UH125 Pro | |
| Geekom A5 | |
| Unigine Valley 1.0 | |
| 1920x1080 Extreme HD DirectX AA:x8 | |
| Geekom AE7 | |
| Aoostar GEM10 | |
| Asus NUC 14 Pro | |
| Acemagic F2A | |
| Minisforum UH125 Pro | |
| Geekom A5 | |
| 1920x1080 Extreme HD Preset OpenGL AA:x8 | |
| Aoostar GEM10 | |
| Asus NUC 14 Pro | |
| Geekom AE7 | |
| Acemagic F2A | |
| Minisforum UH125 Pro | |
| Geekom A5 | |
| Unigine Superposition | |
| 1280x720 720p Low | |
| Geekom AE7 | |
| Aoostar GEM10 | |
| Asus NUC 14 Pro | |
| Acemagic F2A | |
| Minisforum UH125 Pro | |
| Geekom A5 | |
| 1920x1080 1080p High | |
| Geekom AE7 | |
| Asus NUC 14 Pro | |
| Acemagic F2A | |
| Aoostar GEM10 | |
| Minisforum UH125 Pro | |
| Geekom A5 | |
| 1920x1080 1080p Extreme | |
| Asus NUC 14 Pro | |
| Acemagic F2A | |
| Geekom AE7 | |
| Minisforum UH125 Pro | |
| Aoostar GEM10 | |
| Geekom A5 | |
| ComputeMark v2.1 | |
| 1024x600 Normal, Score | |
| Geekom AE7 | |
| Acemagic F2A | |
| Aoostar GEM10 | |
| Asus NUC 14 Pro | |
| Minisforum UH125 Pro | |
| Geekom A5 | |
| 1024x600 Normal, Fluid 3DTex | |
| Asus NUC 14 Pro | |
| Geekom AE7 | |
| Minisforum UH125 Pro | |
| Acemagic F2A | |
| Aoostar GEM10 | |
| Geekom A5 | |
| 1024x600 Normal, Fluid 2DTexArr | |
| Geekom AE7 | |
| Asus NUC 14 Pro | |
| Aoostar GEM10 | |
| Minisforum UH125 Pro | |
| Acemagic F2A | |
| Geekom A5 | |
| 1024x600 Normal, Mandel Vector | |
| Geekom AE7 | |
| Acemagic F2A | |
| Aoostar GEM10 | |
| Asus NUC 14 Pro | |
| Minisforum UH125 Pro | |
| Geekom A5 | |
| 1024x600 Normal, Mandel Scalar | |
| Geekom AE7 | |
| Aoostar GEM10 | |
| Acemagic F2A | |
| Asus NUC 14 Pro | |
| Minisforum UH125 Pro | |
| Geekom A5 | |
| 1024x600 Normal, QJuliaRayTrace | |
| Geekom AE7 | |
| Acemagic F2A | |
| Asus NUC 14 Pro | |
| Aoostar GEM10 | |
| Minisforum UH125 Pro | |
| Geekom A5 | |
| LuxMark v2.0 64Bit | |
| Room GPUs-only | |
| Geekom AE7 | |
| Asus NUC 14 Pro | |
| Minisforum UH125 Pro | |
| Geekom A5 | |
| Aoostar GEM10 | |
| Acemagic F2A | |
| Sala GPUs-only | |
| Asus NUC 14 Pro | |
| Minisforum UH125 Pro | |
| Acemagic F2A | |
| Geekom AE7 | |
| Geekom A5 | |
| Aoostar GEM10 | |
| Affinity Photo 2 - Combined (Single / Multi GPU) | |
| Minisforum UH125 Pro | |
| Asus NUC 14 Pro | |
| Acemagic F2A | |
| Aoostar GEM10 | |
| Geekom AE7 | |
| Geekom A5 | |
| Asus NUC 14 Pro, Intel Arc 7-Core iGPU Ultra 5 125H | Geekom AE7, AMD Radeon 780M R9 7940HS | Minisforum UH125 Pro, Intel Arc 7-Core iGPU Ultra 5 125H | Aoostar GEM10, AMD Radeon 680M R7 6800H | Acemagic F2A, Intel Arc 8-Core iGPU Ultra 7 155H | Geekom A5, AMD Radeon RX Vega 8 (Ryzen 4000/5000) R7 5800H | Média da turma Mini PC | |
|---|---|---|---|---|---|---|---|
| SPECviewperf 2020 | 236% | -8% | 217% | 1% | 83% | 149% | |
| 3840x2160 Medical (medical-03) | 5.87 | 12.7 116% | 4.8 -18% | 10.7 82% | 5.05 -14% | 4.82 -18% | 7.95 ? 35% |
| 3840x2160 Energy (energy-03) | 3.81 | 14.4 278% | 3.38 -11% | 10.6 178% | 4.61 21% | 5.33 40% | 11.4 ? 199% |
| 3840x2160 Creo (creo-03) | 15.3 | 30.2 97% | 15.4 1% | 32 109% | 17.9 17% | 19.1 25% | 30.1 ? 97% |
| 3840x2160 CATIA (catia-06) | 10.4 | 23.7 128% | 9.7 -7% | 22.8 119% | 10 -4% | 13.1 26% | 18.3 ? 76% |
| 3840x2160 3ds Max (3dsmax-07) | 14.5 | 20.7 43% | 13.2 -9% | 18.9 30% | 12.9 -11% | 11.3 -22% | 22.1 ? 52% |
| 3840x2160 Siemens NX (snx-04) | 5.82 | 61.3 953% | 5.54 -5% | 61.4 955% | 5.7 -2% | 38 553% | 36.3 ? 524% |
| 3840x2160 Maya (maya-06) | 34.7 | 47.4 37% | 32.8 -5% | 49.7 43% | 35.4 2% | 25.8 -26% | 56.6 ? 63% |
| 3DMark 05 Standard | 48550 pontos | |
| 3DMark 06 Standard Score | 40475 pontos | |
| 3DMark Vantage P Result | 39395 pontos | |
| 3DMark 11 Performance | 11870 pontos | |
| 3DMark Ice Storm Standard Score | 126152 pontos | |
| 3DMark Cloud Gate Standard Score | 29960 pontos | |
| 3DMark Fire Strike Score | 7302 pontos | |
| 3DMark Fire Strike Extreme Score | 3819 pontos | |
| 3DMark Time Spy Score | 3540 pontos | |
| 3DMark Steel Nomad Score | 699 pontos | |
| 3DMark Steel Nomad Light Score | 2798 pontos | |
Ajuda | ||
Desempenho em jogos
O Asus NUC 14 Pro só é adequado para jogos modernos até certo ponto. No entanto, em comparação com o Intel Iris Xe G7 mais antigo com 96 EUs, o desempenho em jogos pode melhorar sensivelmente. A Intel perde o duelo com a iGPU da AMD mais claramente do que nos testes sintéticos em termos de desempenho 3D. Para classificar melhor o desempenho da iGPU, consultamos nossa Lista de jogos de GPU.
| GTA V | |
| 1024x768 Lowest Settings possible | |
| Geekom AE7 | |
| Acemagic F2A | |
| Asus NUC 14 Pro | |
| Aoostar GEM10 | |
| Geekom A5 | |
| Minisforum UH125 Pro | |
| 1920x1080 High/On (Advanced Graphics Off) AA:2xMSAA + FX AF:8x | |
| Geekom AE7 | |
| Aoostar GEM10 | |
| Asus NUC 14 Pro | |
| Minisforum UH125 Pro | |
| Geekom A5 | |
| Acemagic F2A | |
| Dota 2 Reborn | |
| 1280x720 min (0/3) fastest | |
| Geekom AE7 | |
| Geekom A5 | |
| Aoostar GEM10 | |
| Acemagic F2A | |
| Asus NUC 14 Pro | |
| Minisforum UH125 Pro | |
| 1920x1080 high (2/3) | |
| Geekom AE7 | |
| Aoostar GEM10 | |
| Acemagic F2A | |
| Asus NUC 14 Pro | |
| Minisforum UH125 Pro | |
| Geekom A5 | |
| Cyberpunk 2077 2.2 Phantom Liberty | |
| 1920x1080 Low Preset (FSR off) | |
| Geekom AE7 | |
| Aoostar GEM10 | |
| Asus NUC 14 Pro | |
| Acemagic F2A | |
| Minisforum UH125 Pro | |
| Geekom A5 | |
| 1920x1080 High Preset (FSR off) | |
| Geekom AE7 | |
| Asus NUC 14 Pro | |
| Aoostar GEM10 | |
| Minisforum UH125 Pro | |
| Acemagic F2A | |
| Geekom A5 | |
| Baldur's Gate 3 | |
| 1280x720 Low Preset | |
| Geekom AE7 | |
| Asus NUC 14 Pro | |
| Aoostar GEM10 | |
| Minisforum UH125 Pro | |
| Geekom A5 | |
| 1920x1080 High Preset | |
| Geekom AE7 | |
| Aoostar GEM10 | |
| Asus NUC 14 Pro | |
| Minisforum UH125 Pro | |
| Geekom A5 | |
| F1 24 | |
| 1920x1080 Low Preset AA:T AF:16x | |
| Geekom AE7 | |
| Aoostar GEM10 | |
| Asus NUC 14 Pro | |
| Minisforum UH125 Pro | |
| Geekom A5 | |
| 1920x1080 High Preset AA:T AF:16x | |
| Geekom AE7 | |
| Aoostar GEM10 | |
| Asus NUC 14 Pro | |
| Minisforum UH125 Pro | |
| Geekom A5 | |
FPS chart
| baixo | média | alto | ultra | |
|---|---|---|---|---|
| GTA V (2015) | 156.3 | 148.8 | 39.9 | 16.6 |
| Dota 2 Reborn (2015) | 97.1 | 79.2 | 75.9 | 72.9 |
| Final Fantasy XV Benchmark (2018) | 60.6 | 35.4 | 25.3 | |
| X-Plane 11.11 (2018) | 47.5 | 38.5 | 32.9 | |
| Baldur's Gate 3 (2023) | 33.5 | 25.9 | 22.4 | 21.5 |
| Cyberpunk 2077 2.2 Phantom Liberty (2023) | 30.1 | 25.2 | 21.7 | 19.6 |
| F1 24 (2024) | 66.2 | 57.6 | 43.4 |
Verificação de desempenho do Asus NUC 14 Pro com uma Nvidia GeForce RTX 3060 Ti
O desempenho 3D pode ser visivelmente aprimorado com uma placa de vídeo externa. No entanto, os aceleradores 3D externos só podem ser conectados via USB-C. Sem influenciar a classificação geral, realizamos alguns testes em combinação com o Razer Core X e uma placa de vídeo da Nvidia GeForce RTX 3060 Ti. Observamos uma melhora consistente no desempenho 3D e até mesmo jogos modernos podem ser jogados sem problemas. Em comparação com o Minisforum UH125 Proo Asus NUC 14 Pro oferece um desempenho idêntico.
| Performance Rating - Percent | |
| Geekom XT13 Pro (Nvidia GeForce RTX 3060 Ti FE) | |
| Geekom AX8 Pro (Nvidia GeForce RTX 3060 Ti FE) | |
| Asus NUC 14 Pro (Nvidia GeForce RTX 3060 Ti FE) | |
| Minisforum UH125 Pro (Nvidia GeForce RTX 3060 Ti FE) | |
| 3DMark 11 - 1280x720 Performance GPU | |
| Geekom AX8 Pro (Nvidia GeForce RTX 3060 Ti FE) | |
| Geekom XT13 Pro (Nvidia GeForce RTX 3060 Ti FE) | |
| Minisforum UH125 Pro (Nvidia GeForce RTX 3060 Ti FE) | |
| Asus NUC 14 Pro (Nvidia GeForce RTX 3060 Ti FE) | |
| 3DMark | |
| 2560x1440 Time Spy Graphics | |
| Geekom AX8 Pro (Nvidia GeForce RTX 3060 Ti FE) | |
| Geekom XT13 Pro (Nvidia GeForce RTX 3060 Ti FE) | |
| Minisforum UH125 Pro (Nvidia GeForce RTX 3060 Ti FE) | |
| Asus NUC 14 Pro (Nvidia GeForce RTX 3060 Ti FE) | |
| 1920x1080 Fire Strike Graphics | |
| Geekom AX8 Pro (Nvidia GeForce RTX 3060 Ti FE) | |
| Geekom XT13 Pro (Nvidia GeForce RTX 3060 Ti FE) | |
| Minisforum UH125 Pro (Nvidia GeForce RTX 3060 Ti FE) | |
| Asus NUC 14 Pro (Nvidia GeForce RTX 3060 Ti FE) | |
| 3840x2160 Fire Strike Ultra Graphics | |
| Geekom AX8 Pro (Nvidia GeForce RTX 3060 Ti FE) | |
| Geekom XT13 Pro (Nvidia GeForce RTX 3060 Ti FE) | |
| Asus NUC 14 Pro (Nvidia GeForce RTX 3060 Ti FE) | |
| Minisforum UH125 Pro (Nvidia GeForce RTX 3060 Ti FE) | |
| Unigine Superposition | |
| 1280x720 720p Low | |
| Geekom AX8 Pro (Nvidia GeForce RTX 3060 Ti FE) | |
| Geekom XT13 Pro (Nvidia GeForce RTX 3060 Ti FE) | |
| Asus NUC 14 Pro (Nvidia GeForce RTX 3060 Ti FE) | |
| Minisforum UH125 Pro (Nvidia GeForce RTX 3060 Ti FE) | |
| 1920x1080 1080p High | |
| Geekom AX8 Pro (Nvidia GeForce RTX 3060 Ti FE) | |
| Geekom XT13 Pro (Nvidia GeForce RTX 3060 Ti FE) | |
| Asus NUC 14 Pro (Nvidia GeForce RTX 3060 Ti FE) | |
| Minisforum UH125 Pro (Nvidia GeForce RTX 3060 Ti FE) | |
| 1920x1080 1080p Extreme | |
| Geekom AX8 Pro (Nvidia GeForce RTX 3060 Ti FE) | |
| Asus NUC 14 Pro (Nvidia GeForce RTX 3060 Ti FE) | |
| Geekom XT13 Pro (Nvidia GeForce RTX 3060 Ti FE) | |
| Minisforum UH125 Pro (Nvidia GeForce RTX 3060 Ti FE) | |
| 3840x2160 4k Optimized | |
| Geekom XT13 Pro (Nvidia GeForce RTX 3060 Ti FE) | |
| Asus NUC 14 Pro (Nvidia GeForce RTX 3060 Ti FE) | |
| Geekom AX8 Pro (Nvidia GeForce RTX 3060 Ti FE) | |
| Minisforum UH125 Pro (Nvidia GeForce RTX 3060 Ti FE) | |
| 7680x4320 8k Optimized | |
| Geekom XT13 Pro (Nvidia GeForce RTX 3060 Ti FE) | |
| Geekom AX8 Pro (Nvidia GeForce RTX 3060 Ti FE) | |
| Minisforum UH125 Pro (Nvidia GeForce RTX 3060 Ti FE) | |
| Asus NUC 14 Pro (Nvidia GeForce RTX 3060 Ti FE) | |
| Unigine Valley 1.0 | |
| 1920x1080 Extreme HD DirectX AA:x8 | |
| Geekom XT13 Pro (Nvidia GeForce RTX 3060 Ti FE) | |
| Geekom AX8 Pro (Nvidia GeForce RTX 3060 Ti FE) | |
| Asus NUC 14 Pro (Nvidia GeForce RTX 3060 Ti FE) | |
| Minisforum UH125 Pro (Nvidia GeForce RTX 3060 Ti FE) | |
| 1920x1080 Extreme HD Preset OpenGL AA:x8 | |
| Geekom XT13 Pro (Nvidia GeForce RTX 3060 Ti FE) | |
| Geekom AX8 Pro (Nvidia GeForce RTX 3060 Ti FE) | |
| Asus NUC 14 Pro (Nvidia GeForce RTX 3060 Ti FE) | |
| Minisforum UH125 Pro (Nvidia GeForce RTX 3060 Ti FE) | |
| Unigine Heaven 4.0 | |
| Extreme Preset OpenGL | |
| Geekom AX8 Pro (Nvidia GeForce RTX 3060 Ti FE) | |
| Geekom XT13 Pro (Nvidia GeForce RTX 3060 Ti FE) | |
| Asus NUC 14 Pro (Nvidia GeForce RTX 3060 Ti FE) | |
| Minisforum UH125 Pro (Nvidia GeForce RTX 3060 Ti FE) | |
| Extreme Preset DX11 | |
| Geekom XT13 Pro (Nvidia GeForce RTX 3060 Ti FE) | |
| Geekom AX8 Pro (Nvidia GeForce RTX 3060 Ti FE) | |
| Minisforum UH125 Pro (Nvidia GeForce RTX 3060 Ti FE) | |
| Asus NUC 14 Pro (Nvidia GeForce RTX 3060 Ti FE) | |
| ComputeMark v2.1 | |
| 1024x600 Normal, Score | |
| Geekom XT13 Pro (Nvidia GeForce RTX 3060 Ti FE) | |
| Asus NUC 14 Pro (Nvidia GeForce RTX 3060 Ti FE) | |
| Minisforum UH125 Pro (Nvidia GeForce RTX 3060 Ti FE) | |
| Geekom AX8 Pro (Nvidia GeForce RTX 3060 Ti FE) | |
| 1024x600 Normal, Fluid 3DTex | |
| Minisforum UH125 Pro (Nvidia GeForce RTX 3060 Ti FE) | |
| Geekom AX8 Pro (Nvidia GeForce RTX 3060 Ti FE) | |
| Geekom XT13 Pro (Nvidia GeForce RTX 3060 Ti FE) | |
| Asus NUC 14 Pro (Nvidia GeForce RTX 3060 Ti FE) | |
| 1024x600 Normal, Fluid 2DTexArr | |
| Minisforum UH125 Pro (Nvidia GeForce RTX 3060 Ti FE) | |
| Geekom AX8 Pro (Nvidia GeForce RTX 3060 Ti FE) | |
| Geekom XT13 Pro (Nvidia GeForce RTX 3060 Ti FE) | |
| Asus NUC 14 Pro (Nvidia GeForce RTX 3060 Ti FE) | |
| 1024x600 Normal, Mandel Vector | |
| Geekom XT13 Pro (Nvidia GeForce RTX 3060 Ti FE) | |
| Asus NUC 14 Pro (Nvidia GeForce RTX 3060 Ti FE) | |
| Minisforum UH125 Pro (Nvidia GeForce RTX 3060 Ti FE) | |
| Geekom AX8 Pro (Nvidia GeForce RTX 3060 Ti FE) | |
| 1024x600 Normal, Mandel Scalar | |
| Geekom XT13 Pro (Nvidia GeForce RTX 3060 Ti FE) | |
| Asus NUC 14 Pro (Nvidia GeForce RTX 3060 Ti FE) | |
| Minisforum UH125 Pro (Nvidia GeForce RTX 3060 Ti FE) | |
| Geekom AX8 Pro (Nvidia GeForce RTX 3060 Ti FE) | |
| 1024x600 Normal, QJuliaRayTrace | |
| Geekom XT13 Pro (Nvidia GeForce RTX 3060 Ti FE) | |
| Asus NUC 14 Pro (Nvidia GeForce RTX 3060 Ti FE) | |
| Minisforum UH125 Pro (Nvidia GeForce RTX 3060 Ti FE) | |
| Geekom AX8 Pro (Nvidia GeForce RTX 3060 Ti FE) | |
| Performance Rating - Percent | |
| Geekom AX8 Pro (Nvidia GeForce RTX 3060 Ti FE) | |
| Geekom XT13 Pro (Nvidia GeForce RTX 3060 Ti FE) | |
| Minisforum UH125 Pro (Nvidia GeForce RTX 3060 Ti FE) | |
| Asus NUC 14 Pro (Nvidia GeForce RTX 3060 Ti FE) | |
| Cyberpunk 2077 2.2 Phantom Liberty | |
| 1280x720 Low Preset (FSR off) | |
| Geekom AX8 Pro (Nvidia GeForce RTX 3060 Ti FE) | |
| Geekom XT13 Pro (Nvidia GeForce RTX 3060 Ti FE) | |
| Asus NUC 14 Pro (Nvidia GeForce RTX 3060 Ti FE) | |
| Minisforum UH125 Pro (Nvidia GeForce RTX 3060 Ti FE) | |
| 1920x1080 Medium Preset (FSR off) | |
| Geekom AX8 Pro (Nvidia GeForce RTX 3060 Ti FE) | |
| Geekom XT13 Pro (Nvidia GeForce RTX 3060 Ti FE) | |
| Minisforum UH125 Pro (Nvidia GeForce RTX 3060 Ti FE) | |
| Asus NUC 14 Pro (Nvidia GeForce RTX 3060 Ti FE) | |
| 1920x1080 Ultra Preset (FSR off) | |
| Geekom XT13 Pro (Nvidia GeForce RTX 3060 Ti FE) | |
| Geekom AX8 Pro (Nvidia GeForce RTX 3060 Ti FE) | |
| Minisforum UH125 Pro (Nvidia GeForce RTX 3060 Ti FE) | |
| Asus NUC 14 Pro (Nvidia GeForce RTX 3060 Ti FE) | |
| Baldur's Gate 3 | |
| 1920x1080 Low Preset | |
| Geekom XT13 Pro (Nvidia GeForce RTX 3060 Ti FE) | |
| Asus NUC 14 Pro (Nvidia GeForce RTX 3060 Ti FE) | |
| Geekom AX8 Pro (Nvidia GeForce RTX 3060 Ti FE) | |
| Minisforum UH125 Pro (Nvidia GeForce RTX 3060 Ti FE) | |
| 1920x1080 Medium Preset | |
| Geekom XT13 Pro (Nvidia GeForce RTX 3060 Ti FE) | |
| Geekom AX8 Pro (Nvidia GeForce RTX 3060 Ti FE) | |
| Minisforum UH125 Pro (Nvidia GeForce RTX 3060 Ti FE) | |
| Asus NUC 14 Pro (Nvidia GeForce RTX 3060 Ti FE) | |
| 1920x1080 Ultra Preset | |
| Geekom XT13 Pro (Nvidia GeForce RTX 3060 Ti FE) | |
| Geekom AX8 Pro (Nvidia GeForce RTX 3060 Ti FE) | |
| Minisforum UH125 Pro (Nvidia GeForce RTX 3060 Ti FE) | |
| Asus NUC 14 Pro (Nvidia GeForce RTX 3060 Ti FE) | |
| F1 24 | |
| 1920x1080 Low Preset AA:T AF:16x | |
| Geekom AX8 Pro (Nvidia GeForce RTX 3060 Ti FE) | |
| Geekom XT13 Pro (Nvidia GeForce RTX 3060 Ti FE) | |
| Asus NUC 14 Pro (Nvidia GeForce RTX 3060 Ti FE) | |
| Minisforum UH125 Pro (Nvidia GeForce RTX 3060 Ti FE) | |
| 1920x1080 Medium Preset AA:T AF:16x | |
| Geekom AX8 Pro (Nvidia GeForce RTX 3060 Ti FE) | |
| Geekom XT13 Pro (Nvidia GeForce RTX 3060 Ti FE) | |
| Asus NUC 14 Pro (Nvidia GeForce RTX 3060 Ti FE) | |
| Minisforum UH125 Pro (Nvidia GeForce RTX 3060 Ti FE) | |
| 1920x1080 High Preset AA:T AF:16x | |
| Geekom AX8 Pro (Nvidia GeForce RTX 3060 Ti FE) | |
| Geekom XT13 Pro (Nvidia GeForce RTX 3060 Ti FE) | |
| Asus NUC 14 Pro (Nvidia GeForce RTX 3060 Ti FE) | |
| Minisforum UH125 Pro (Nvidia GeForce RTX 3060 Ti FE) | |
| Asus NUC 14 Pro (Nvidia GeForce RTX 3060 Ti FE), Ultra 5 125H | Minisforum UH125 Pro (Nvidia GeForce RTX 3060 Ti FE), Ultra 5 125H | Geekom AX8 Pro (Nvidia GeForce RTX 3060 Ti FE), R9 8945HS | Geekom XT13 Pro (Nvidia GeForce RTX 3060 Ti FE), i9-13900H | Média da turma Mini PC | |
|---|---|---|---|---|---|
| SPECviewperf 2020 | 290% | 126% | 304% | 300% | 149% |
| 3840x2160 Medical (medical-03) | 13 121% | 10.9 86% | 13 121% | 13 121% | 7.95 ? 35% |
| 3840x2160 Energy (energy-03) | 20.9 449% | 17.8 367% | 21 451% | 20.9 449% | 11.4 ? 199% |
| 3840x2160 Creo (creo-03) | 68.3 346% | 26.6 74% | 77.2 405% | 74.2 385% | 30.1 ? 97% |
| 3840x2160 CATIA (catia-06) | 37.3 259% | 23.6 127% | 39.2 277% | 39.4 279% | 18.3 ? 76% |
| 3840x2160 3ds Max (3dsmax-07) | 46.5 221% | 28.7 98% | 46.1 218% | 47.2 226% | 22.1 ? 52% |
| 3840x2160 Siemens NX (snx-04) | 16.2 178% | 11.4 96% | 16.7 187% | 16.5 184% | 36.3 ? 524% |
| 3840x2160 Maya (maya-06) | 193 456% | 47.5 37% | 198 471% | 194 459% | 56.6 ? 63% |
| baixo | média | alto | ultra | QHD | 4K | |
|---|---|---|---|---|---|---|
| GTA V (2015) | 178.7 | 174 | 162.9 | 100.6 | 90 | 102.6 |
| Dota 2 Reborn (2015) | 159 | 138.8 | 131 | 122.6 | 104.3 | |
| Final Fantasy XV Benchmark (2018) | 163.8 | 141 | 97.3 | 75.6 | 47.4 | |
| X-Plane 11.11 (2018) | 119.6 | 107.5 | 83.7 | 71.7 | ||
| Baldur's Gate 3 (2023) | 111.6 | 86 | 72.8 | 72.1 | 57.5 | 36.4 |
| Cyberpunk 2077 2.2 Phantom Liberty (2023) | 72.4 | 69.8 | 63.7 | 58.3 | 43.5 | 22.2 |
| F1 24 (2024) | 75.3 | 71.7 | 59.5 | 41.1 | 35.7 | 16.9 |
Emissões
Emissões de ruído
O Asus NUC 14 Pro é muito silencioso na maior parte do tempo. Entretanto, a ventoinha também funciona no modo inativo, portanto, a operação não é silenciosa. Sob carga média, registramos um nível de pressão sonora de 42,4 dB(A). O Minisforum UH125 Pro e o Aoostar GEM10 estão mais ou menos no mesmo nível. Com carga máxima, nossa amostra de teste atinge 47,8 dB(A). Isso significa que o Asus NUC 14 Pro é claramente audível, embora a percepção subjetiva do nível de ruído seja um pouco menor.
Barulho
| Ocioso |
| 26 / 26.2 / 26.2 dB |
| Carga |
| 42.4 / 47.8 dB |
 | ||
30 dB silencioso 40 dB(A) audível 50 dB(A) ruidosamente alto |
||
min: | ||
| Asus NUC 14 Pro Ultra 5 125H, Arc 7-Core | Geekom AE7 R9 7940HS, Radeon 780M | Minisforum UH125 Pro Ultra 5 125H, Arc 7-Core | Aoostar GEM10 R7 6800H, Radeon 680M | Acemagic F2A Ultra 7 155H, Arc 8-Core | Geekom A5 R7 5800H, Vega 8 | |
|---|---|---|---|---|---|---|
| Noise | -4% | -12% | -13% | -2% | -7% | |
| desligado / ambiente * | 24 | 24.4 -2% | 24.8 -3% | 24.3 -1% | 24.9 -4% | 25 -4% |
| Idle Minimum * | 26 | 24.9 4% | 35 -35% | 36.5 -40% | 25.4 2% | 28.2 -8% |
| Idle Average * | 26.2 | 25 5% | 35 -34% | 36.6 -40% | 25.7 2% | 28.2 -8% |
| Idle Maximum * | 26.2 | 25 5% | 35 -34% | 36.6 -40% | 25.7 2% | 28.2 -8% |
| Load Average * | 42.4 | 52 -23% | 42.2 -0% | 41.7 2% | 47.8 -13% | 47.8 -13% |
| Cyberpunk 2077 ultra * | 47.7 | 52 -9% | 40.8 14% | 40.3 16% | ||
| Load Maximum * | 47.8 | 51.4 -8% | 43.9 8% | 40.8 15% | 49 -3% | 47.4 1% |
| Witcher 3 ultra * | 40.18 | 45.23 |
* ... menor é melhor
Temperatura
O gabinete do Asus NUC 14 Pro aquece consideravelmente em locais sob carga. Registramos um máximo de 55,1 °C na parte superior. Não há anormalidades perceptíveis no modo inativo. Alcançamos facilmente valores acima da marca de 100 °C para o SoC no teste de estresse. De acordo com a Intel, o Intel Core Ultra 5 125H foi projetado para uma temperatura operacional de até 110 °C. Conseguimos isso no teste de estresse, embora o consumo de energia tenha sido reduzido para cerca de 50 watts como resultado. O sistema de resfriamento não é capaz de dissipar permanentemente os 64 watts definidos como PL1 e PL2.
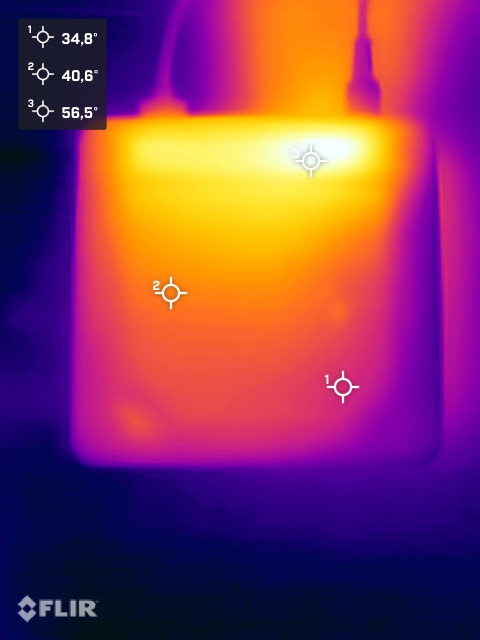
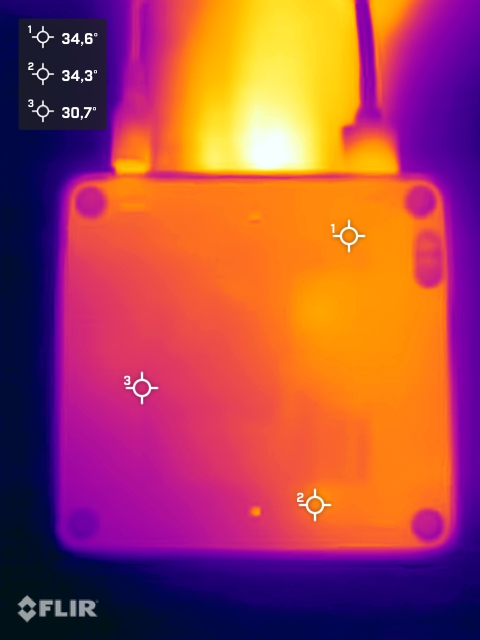
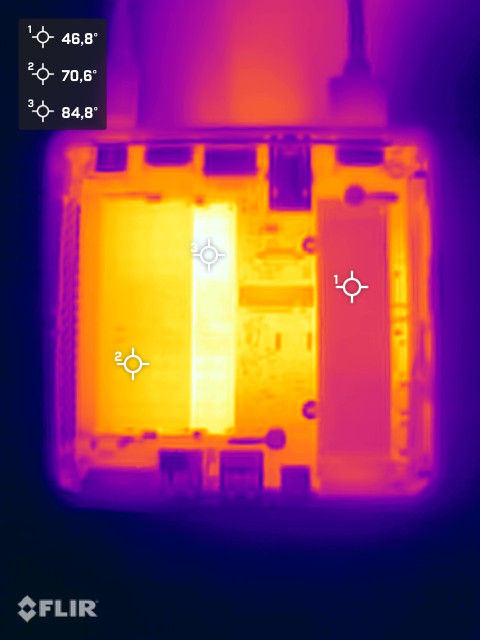
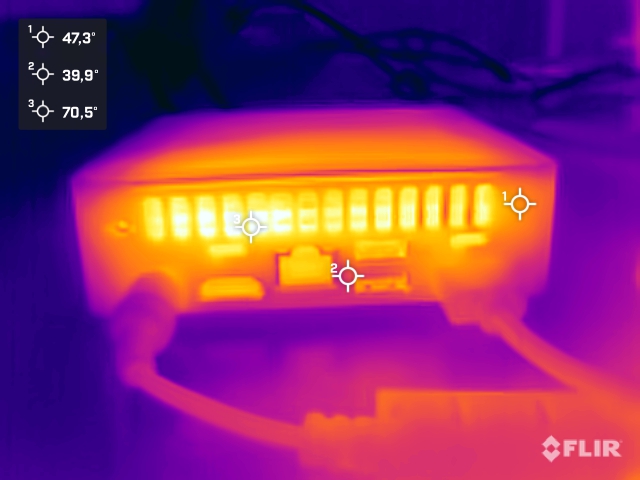
(-) A temperatura máxima no lado superior é 55.1 °C / 131 F, em comparação com a média de 35.8 °C / 96 F , variando de 21.6 a 69.5 °C para a classe Mini PC.
(+) A parte inferior aquece até um máximo de 39.3 °C / 103 F, em comparação com a média de 36.1 °C / 97 F
(+) Em uso inativo, a temperatura média para o lado superior é 30.8 °C / 87 F, em comparação com a média do dispositivo de 32.3 °C / ### class_avg_f### F.
Consumo de energia
A Asus tem o consumo de energia do NUC 14 Pro relativamente bem sob controle. Sob carga média, nossa amostra de teste requer apenas 55,5 watts, o que é um pouco mais do que o Miniforum UH125 Pro. O motivo disso é o limite de energia um pouco mais alto que a Asus impõe ao SoC. Registramos brevemente 103,3 watts, com os quais a fonte de alimentação de 120 watts consegue lidar facilmente.

| desligado | |
| Ocioso | |
| Carga |
|
Key:
min: | |
| Asus NUC 14 Pro Ultra 5 125H, Arc 7-Core | Geekom AE7 R9 7940HS, Radeon 780M | Minisforum UH125 Pro Ultra 5 125H, Arc 7-Core | Aoostar GEM10 R7 6800H, Radeon 680M | Acemagic F2A Ultra 7 155H, Arc 8-Core | Geekom A5 R7 5800H, Vega 8 | Média Intel Arc 7-Core iGPU | Média da turma Mini PC | |
|---|---|---|---|---|---|---|---|---|
| Power Consumption | 3% | -38% | -11% | -29% | -3% | -6% | -34% | |
| Idle Minimum * | 5.1 | 4.5 12% | 11.9 -133% | 7.3 -43% | 9.1 -78% | 6.9 -35% | 6.88 ? -35% | 9.52 ? -87% |
| Idle Average * | 6.4 | 4.7 27% | 14.6 -128% | 8.7 -36% | 10.3 -61% | 7.9 -23% | 9.02 ? -41% | 11.6 ? -81% |
| Idle Maximum * | 14.7 | 8.1 45% | 15.4 -5% | 10.4 29% | 14.4 2% | 8.9 39% | 12.2 ? 17% | 14.9 ? -1% |
| Load Average * | 55.5 | 81.8 -47% | 48.3 13% | 67.2 -21% | 54.9 1% | 60.8 -10% | 51.4 ? 7% | 58.8 ? -6% |
| Cyberpunk 2077 ultra external monitor * | 59.1 | 71.2 -20% | 52.7 11% | 58.8 1% | ||||
| Load Maximum * | 103.3 | 100.3 3% | 89.8 13% | 101.6 2% | 110.4 -7% | 89.7 13% | 78.3 ? 24% | 99.7 ? 3% |
* ... menor é melhor
Efficiency
| Performance Rating - Percent | |
| Geekom AE7 | |
| Minisforum UH125 Pro | |
| Asus NUC 14 Pro | |
| Acemagic F2A | |
| Power Consumption | |
| Cinebench R23 Multi Power Efficiency - external Monitor | |
| Geekom AE7 | |
| Acemagic F2A | |
| Minisforum UH125 Pro | |
| Asus NUC 14 Pro | |
| Cinebench R23 Single Power Efficiency - external Monitor | |
| Asus NUC 14 Pro | |
| Geekom AE7 | |
| Minisforum UH125 Pro | |
| Acemagic F2A | |
| Cinebench R15 Multi Efficiency (external Monitor) | |
| Geekom AE7 | |
| Minisforum UH125 Pro | |
| Acemagic F2A | |
| Asus NUC 14 Pro | |
Power consumtion with the external monitor
Power consumtion with the external monitor
Pro
Contra
Veredicto - Mini PC empresarial com amplas opções de BIOS
Os conhecidos mini PCs NUC, que antes eram comercializados diretamente pela Intel, agora estão sendo continuados pela Asus da mesma forma. Com base nos processadores Meteor Lake, os PCs compactos obtêm um notável aumento de desempenho em termos de desempenho 3D.
Não houve muita mudança em termos de design em comparação com os conhecidos mini PCs NUC. Seria desejável um gabinete todo em metal, pois o Asus NUC 14 Pro é inferior a alguns de seus concorrentes nesse aspecto. Em termos de dimensões, o mini PC é menor do que muitos outros dispositivos. Infelizmente, esse design leva a um compromisso que todos os fabricantes têm que fazer. O desempenho do SoC deve ser dissipado de forma confiável. Na verdade, o Asus NUC 14 Pro consegue fazer isso muito bem se não houver cargas contínuas. A Asus ultrapassa o limite de temperatura do Intel Core Ultra 5 125H o que certamente fará alguns usuários começarem a suar. Em princípio, os processadores foram projetados para essas faixas de temperatura. Enquanto isso, o BIOS oferece muitas opções que também influenciam o limite de temperatura do processador. Um limite pode ser definido manualmente aqui. Entretanto, deve-se esperar um desempenho ligeiramente inferior. A excelente conectividade deve ser enfatizada positivamente: há muitas portas USB e duas portas Thunderbolt 4 a bordo. Wi-Fi rápido e LAN 2,5G também estão incluídos.
O Asus NUC 14 Pro é um poderoso mini PC NUC. A conectividade é melhor do que a da maioria dos concorrentes e as amplas opções de BIOS também são um verdadeiro ponto de venda.
O preço do Asus NUC 14 Pro não é totalmente fora do comum. A 510 euros, o dispositivo barebone certamente não é uma pechincha. Entretanto, seus concorrentes podem facilmente custar mais de 700 euros, incluindo SSD, RAM e sistema operacional. Como dica de preço e desempenho, o Aoostar GEM10 já está disponível por 459 dólares americanos.
Observação: Atualizamos recentemente nosso sistema de classificação e os resultados da versão 8 não são comparáveis aos resultados da versão 7. Mais informações podem ser encontradas aqui.
Preço e disponibilidade
O Asus NUC 14 Pro está disponível em várias configurações. O mini PC com Intel Core Ultra 5 125H está atualmente disponível por 500 euros. Nosso dispositivo de teste está listado em Alternate e Notebooksbilliger. A opção Tall com o mesmo SoC oferece espaço adicional para um suporte de dados de 2,5 polegadas e também pode ser encomendada na Alternate ou na Notebooksbilliger. O preço aqui é de cerca de 520 euros.
Asus NUC 14 Pro
- 08/26/2024 v8
Sebastian Bade
 Total Sustainability Score:
 Transparência
A seleção dos dispositivos a serem analisados é feita pela nossa equipe editorial. A amostra de teste foi fornecida ao autor como empréstimo pelo fabricante ou varejista para fins desta revisão. O credor não teve influência nesta revisão, nem o fabricante recebeu uma cópia desta revisão antes da publicação. Não houve obrigação de publicar esta revisão. Nunca aceitamos compensação ou pagamento em troca de nossas avaliações. Como empresa de mídia independente, a Notebookcheck não está sujeita à autoridade de fabricantes, varejistas ou editores.
É assim que o Notebookcheck está testando
Todos os anos, o Notebookcheck analisa de forma independente centenas de laptops e smartphones usando procedimentos padronizados para garantir que todos os resultados sejam comparáveis. Desenvolvemos continuamente nossos métodos de teste há cerca de 20 anos e definimos padrões da indústria no processo. Em nossos laboratórios de teste, equipamentos de medição de alta qualidade são utilizados por técnicos e editores experientes. Esses testes envolvem um processo de validação em vários estágios. Nosso complexo sistema de classificação é baseado em centenas de medições e benchmarks bem fundamentados, o que mantém a objetividade.Price comparison
