

Análise do laptop Maingear ML-16 MK2: GeForce Desempenho da RTX 4070 por um preço decente

Assim como a Schenker ou a Eurocom, a Maingear é uma revendedora de laptops de marca branca de alto desempenho projetados para atrair gamers e profissionais. Essa abordagem contrasta com a de fabricantes de PCs mais conhecidos, como Dell, Lenovo ou HP, que projetam seus laptops internamente. O modelo mais recente da Maingear é o ML-16 MK2, equipado com a mais recente CPU Intel Meteor Lake e GPU Nvidia.
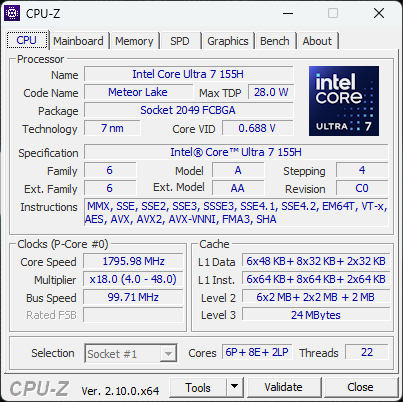
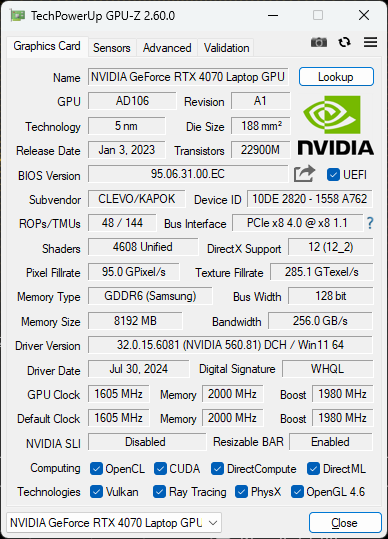
Nossa unidade de teste foi totalmente configurada com o Core Ultra 7 155H, 105 W GeForce RTX 4070 e tela IPS 1600p de 240 Hz por aproximadamente US$ 2.000. SKUs menores vêm com o RTX 4060, mas a CPU e a tela permanecem fixas.
Os concorrentes do ML-16 MK2 incluem outros notebooks para jogos ultrafinos de 16 polegadas, como o Razer Blade 16, Alienware x16 R2, Asus ROG Zephyrus G16ou o Lenovo Legion Pro 7 16.
Mais análises da Maingear:
Possíveis concorrentes em comparação
Avaliação | Versão | Data | Modelo | Peso | Altura | Size | Resolução | Preço |
|---|---|---|---|---|---|---|---|---|
| 80.9 % | v8 | 09/2024 | Maingear ML-16 MK2 Ultra 7 155H, NVIDIA GeForce RTX 4070 Laptop GPU | 2.1 kg | 19.9 mm | 16.00" | 2560x1600 | |
| 85.9 % | v8 | 08/2024 | Asus ROG Zephyrus G16 GA605WV Ryzen AI 9 HX 370, NVIDIA GeForce RTX 4060 Laptop GPU | 1.8 kg | 17.2 mm | 16.00" | 2560x1600 | |
| 84.3 % v7 (old) | v7 (old) | 05/2024 | HP Victus 16 (2024) i7-14700HX, NVIDIA GeForce RTX 4060 Laptop GPU | 2.4 kg | 23.9 mm | 16.10" | 1920x1080 | |
| 88.4 % v7 (old) | v7 (old) | 05/2024 | Alienware x16 R2 P120F Ultra 9 185H, NVIDIA GeForce RTX 4080 Laptop GPU | 2.7 kg | 18.57 mm | 16.00" | 2560x1600 | |
| 89.3 % v7 (old) | v7 (old) | 04/2024 | Lenovo Legion Pro 5 16IRX9 i9-14900HX, NVIDIA GeForce RTX 4070 Laptop GPU | 2.5 kg | 26.95 mm | 16.00" | 2560x1600 | |
| 91.1 % v7 (old) | v7 (old) | 02/2024 | Razer Blade 16 2024, RTX 4090 i9-14900HX, NVIDIA GeForce RTX 4090 Laptop GPU | 2.5 kg | 22 mm | 16.00" | 2560x1600 |
Observação: Atualizamos recentemente nosso sistema de classificação e os resultados da versão 8 não são comparáveis aos resultados da versão 7. Mais informações estão disponíveis aqui .
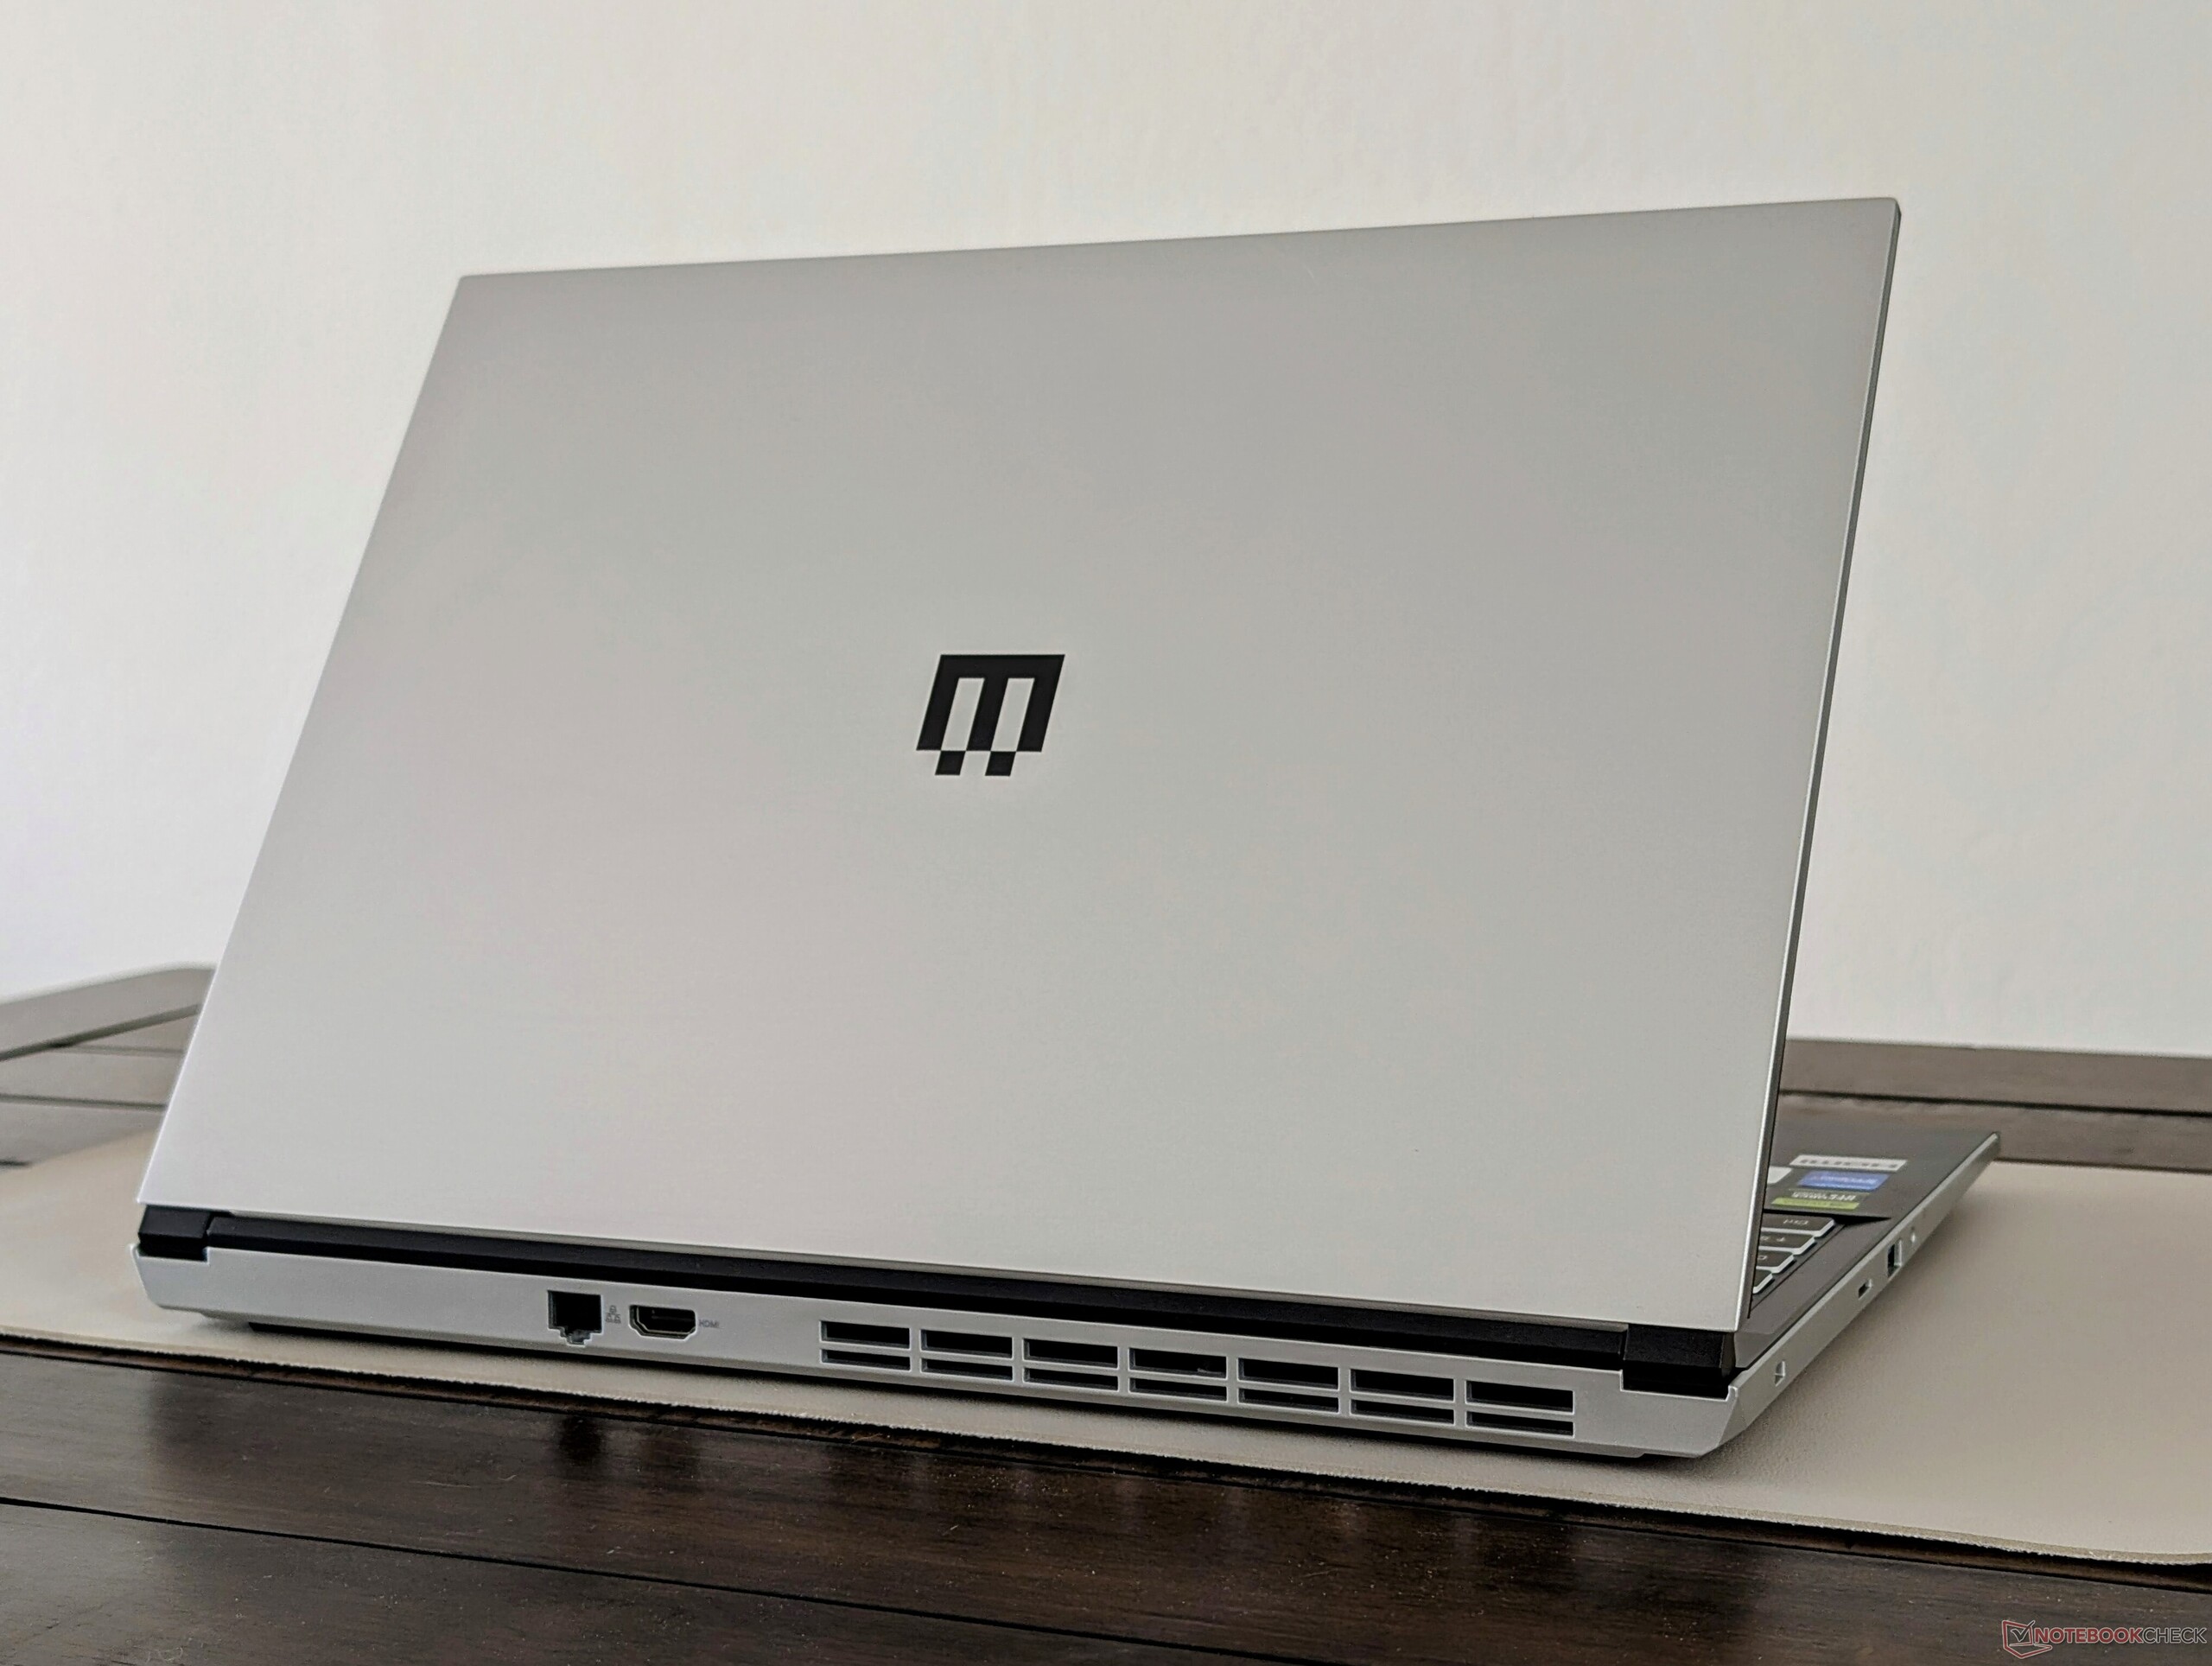
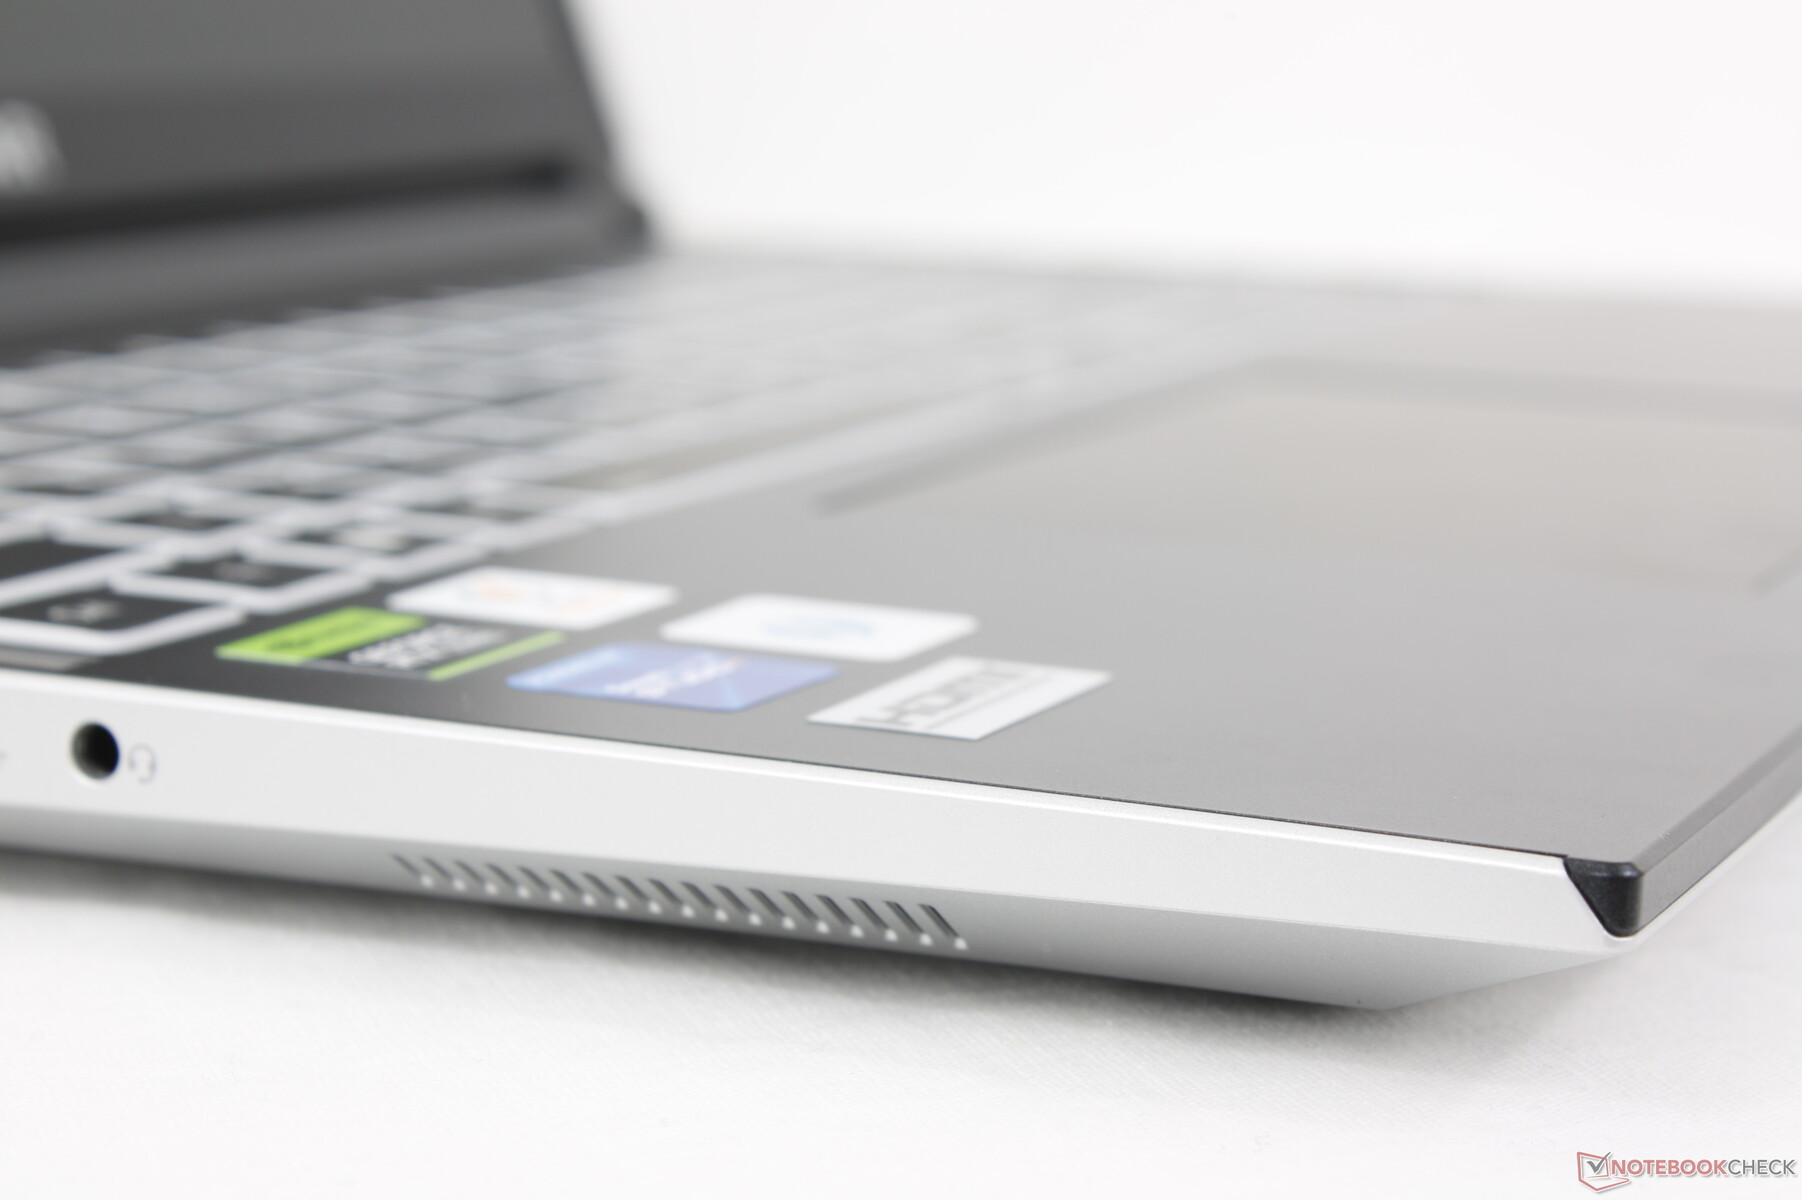
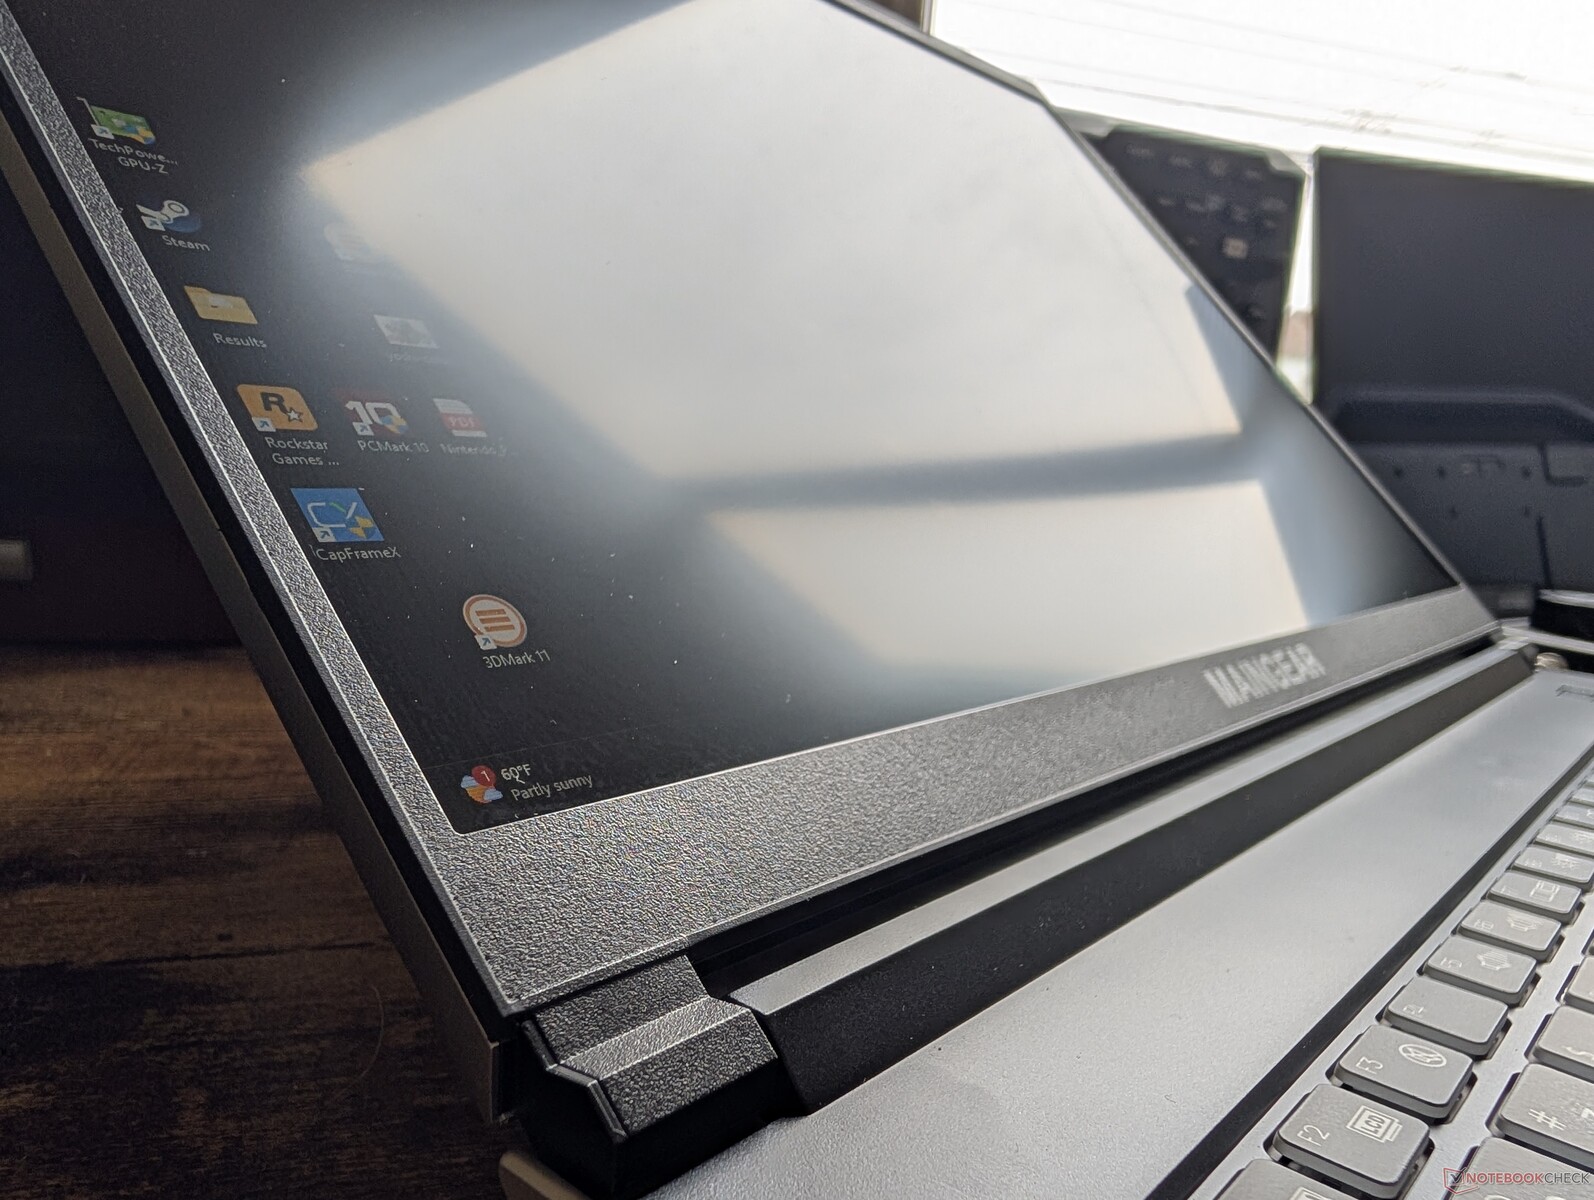
Case - Fino e afiado
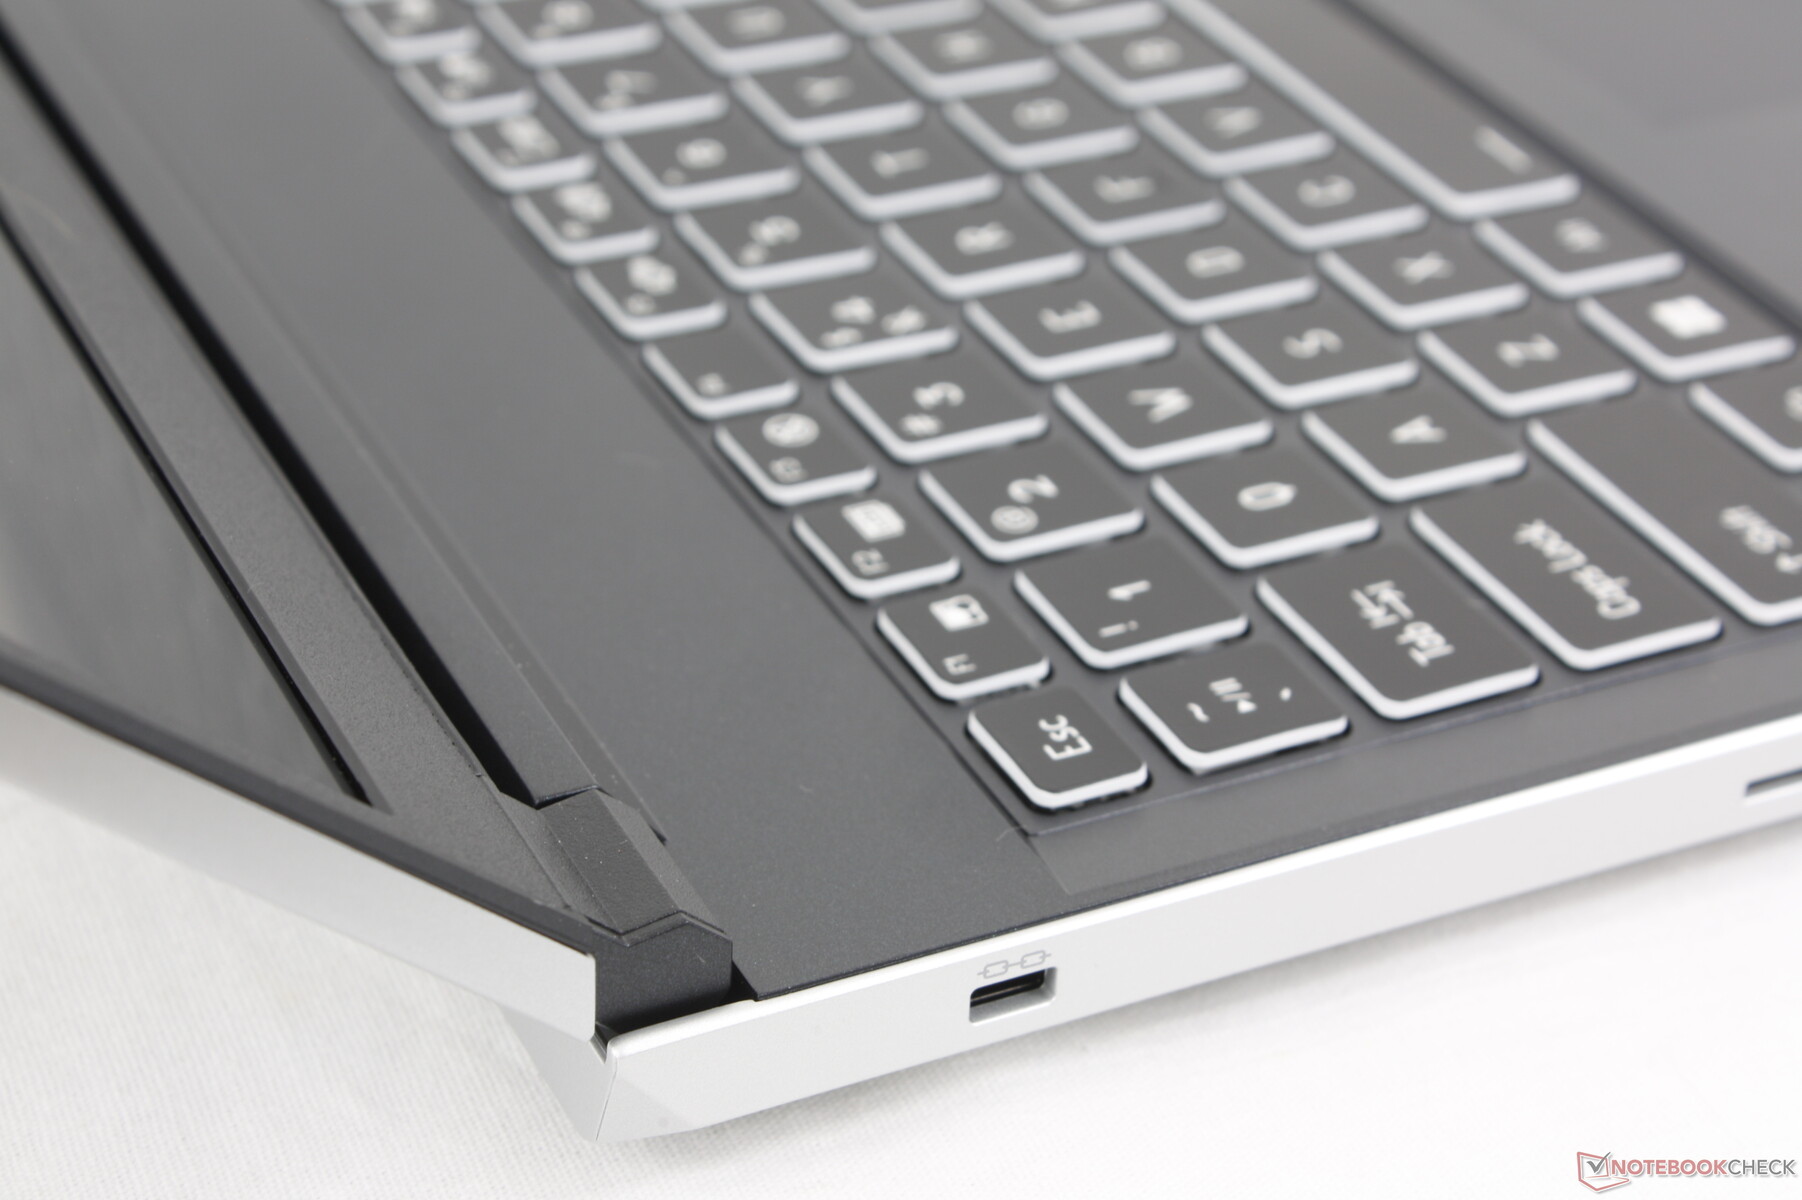
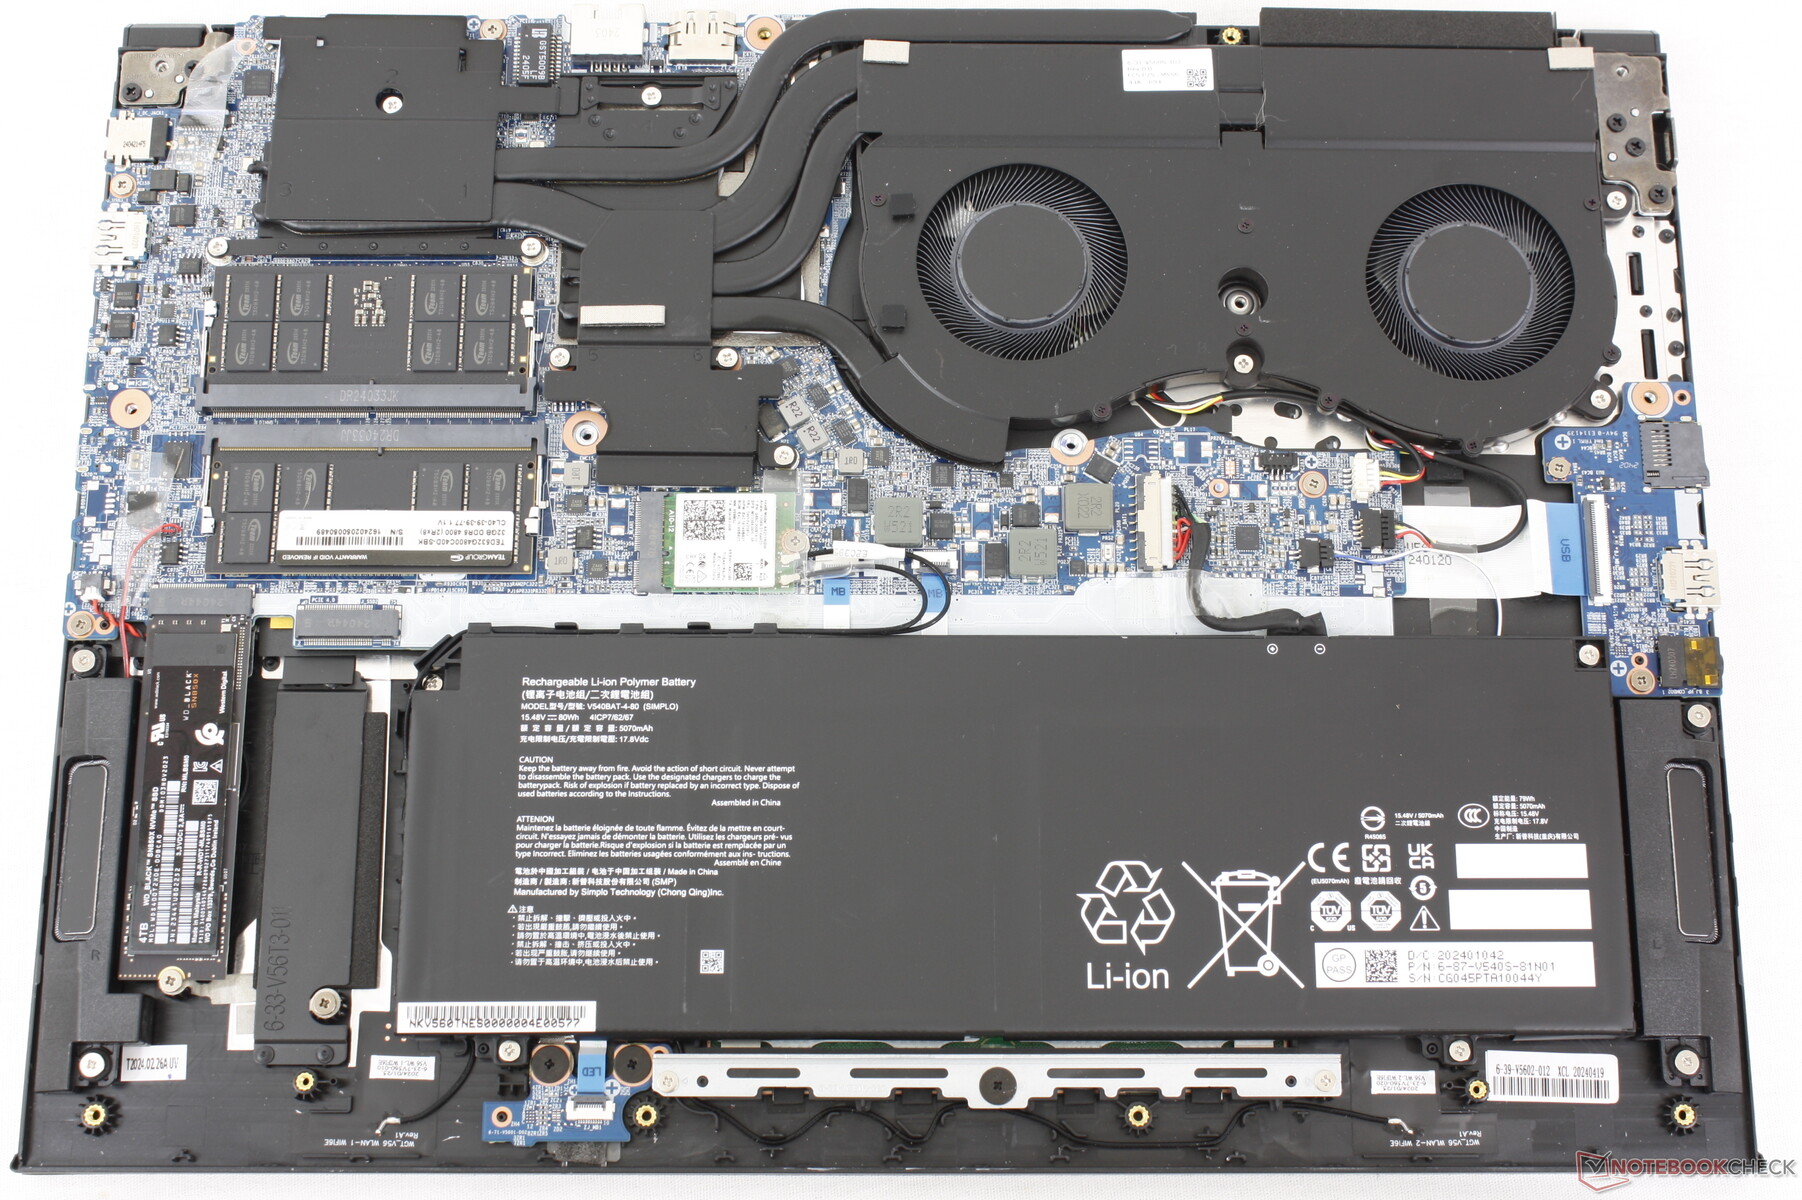
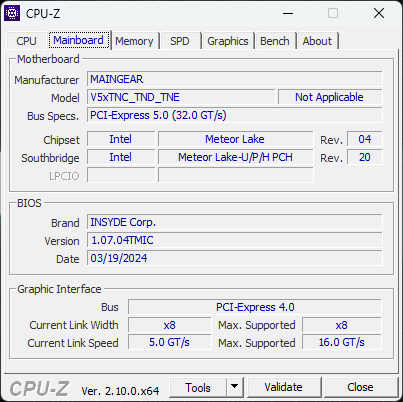
O chassi pode ser rastreado até o Clevo (V560TNE-S) com base no fabricante de origem. Ele é composto principalmente de alumínio metálico para a tampa externa e a parte inferior, enquanto o deck preto do teclado é de plástico. As duas cores contrastantes funcionam bem juntas para ajudar a distinguir visualmente o modelo do habitual laptop para jogos totalmente preto ou branco fosco.
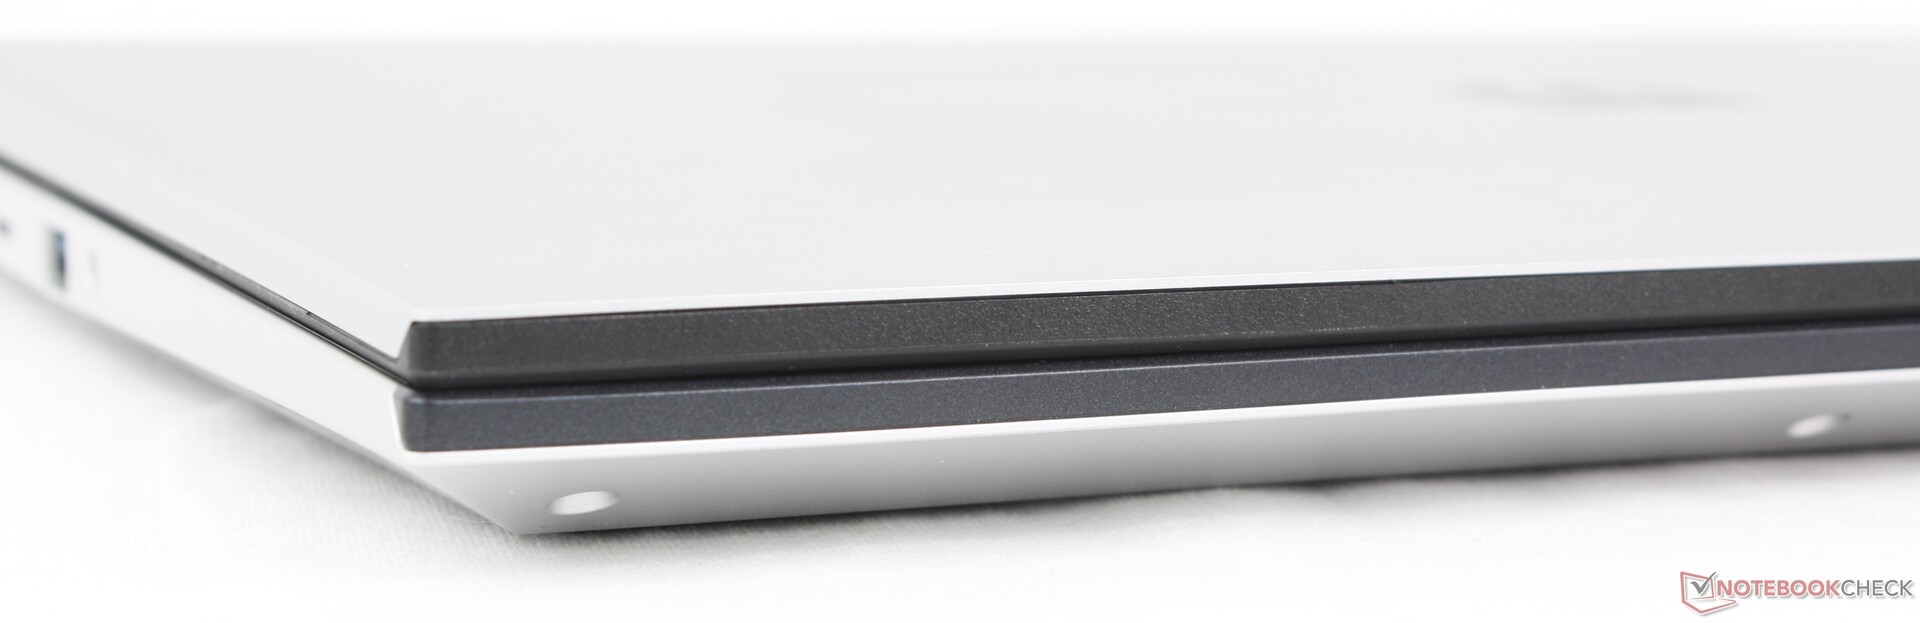
A qualidade do chassi, entretanto, não reflete o alto preço pedido. As superfícies se deformam com mais facilidade e não parecem tão rígidas quanto as de concorrentes como o Razer Blade 16 ou o Alienware x16 R2. Por exemplo, ao pressionar o centro do teclado ou a tampa externa com um dedo, as superfícies ficam visivelmente deprimidas. A tampa também oscila mais facilmente ao ajustar os ângulos. O senhor deverá ter mais cuidado ao manusear o ML-16 MK2 ou poderá danificar as pequenas dobradiças.
O peso e a espessura são mais leves e mais finos do que os principais concorrentes, incluindo o Blade 16 ou o Lenovo Legion Pro 5 16IRX9. O Asus ROG Zephyrus G16 é ainda mais fino e mais leve do que o nosso Maingear, mas também é vendido por centenas de dólares a mais.
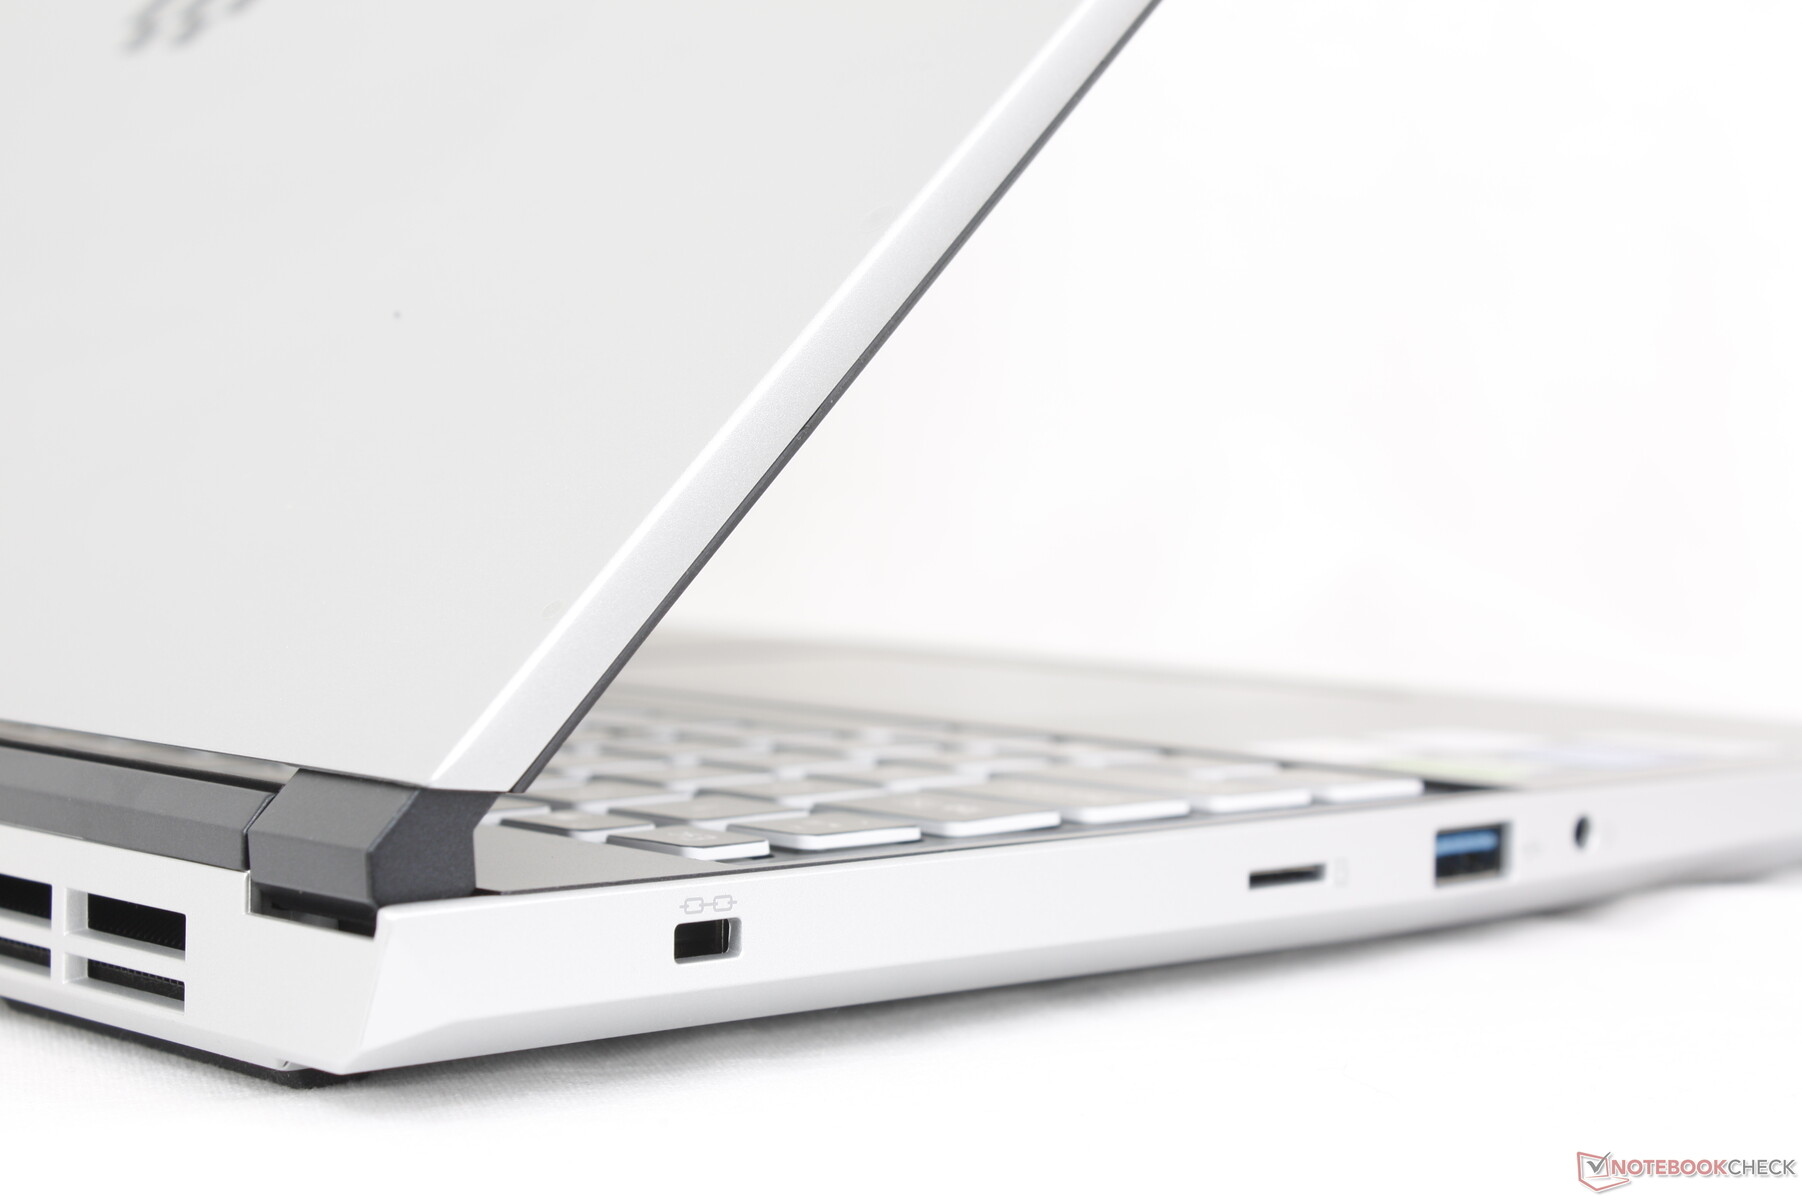
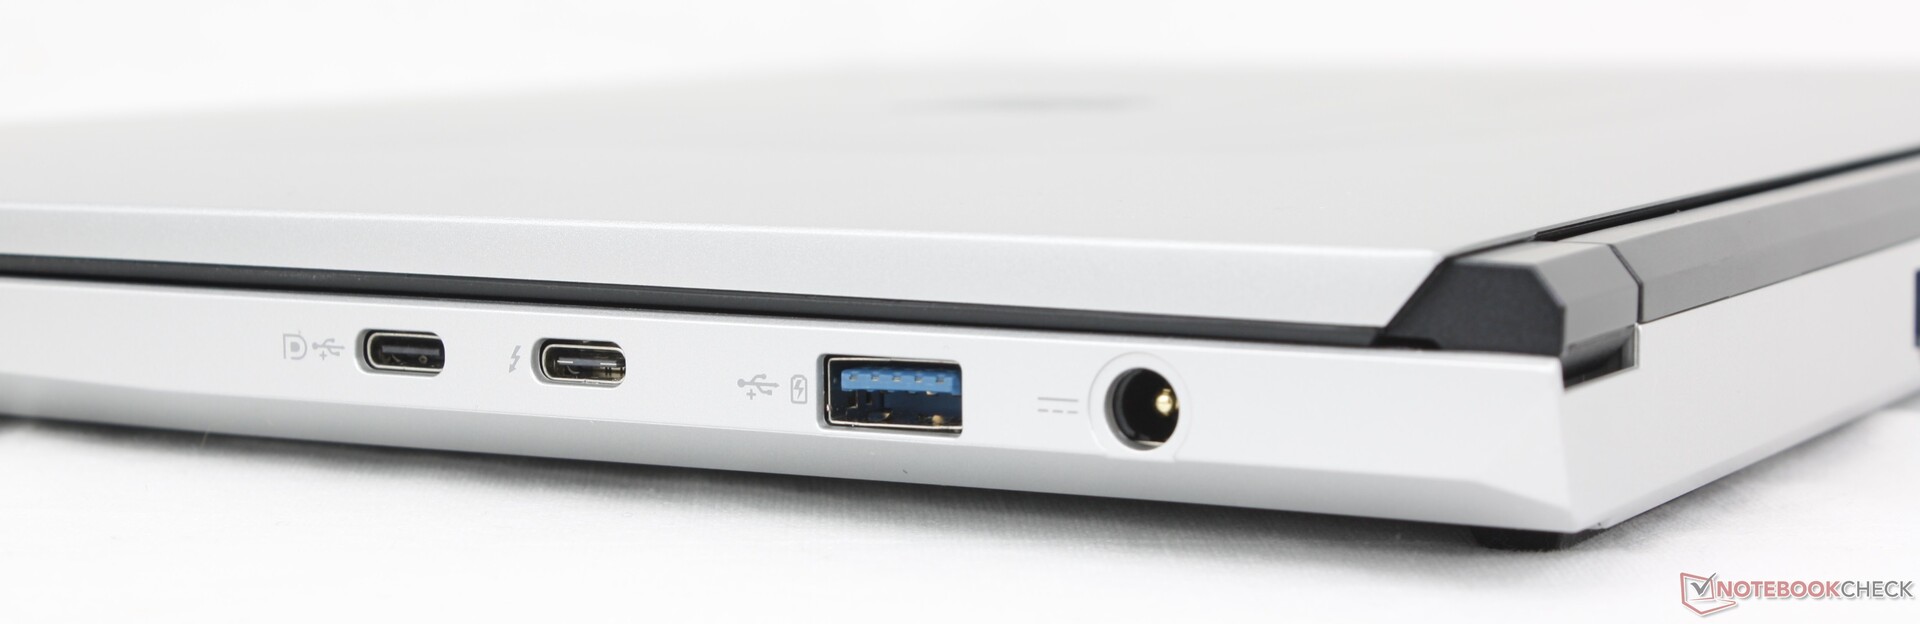
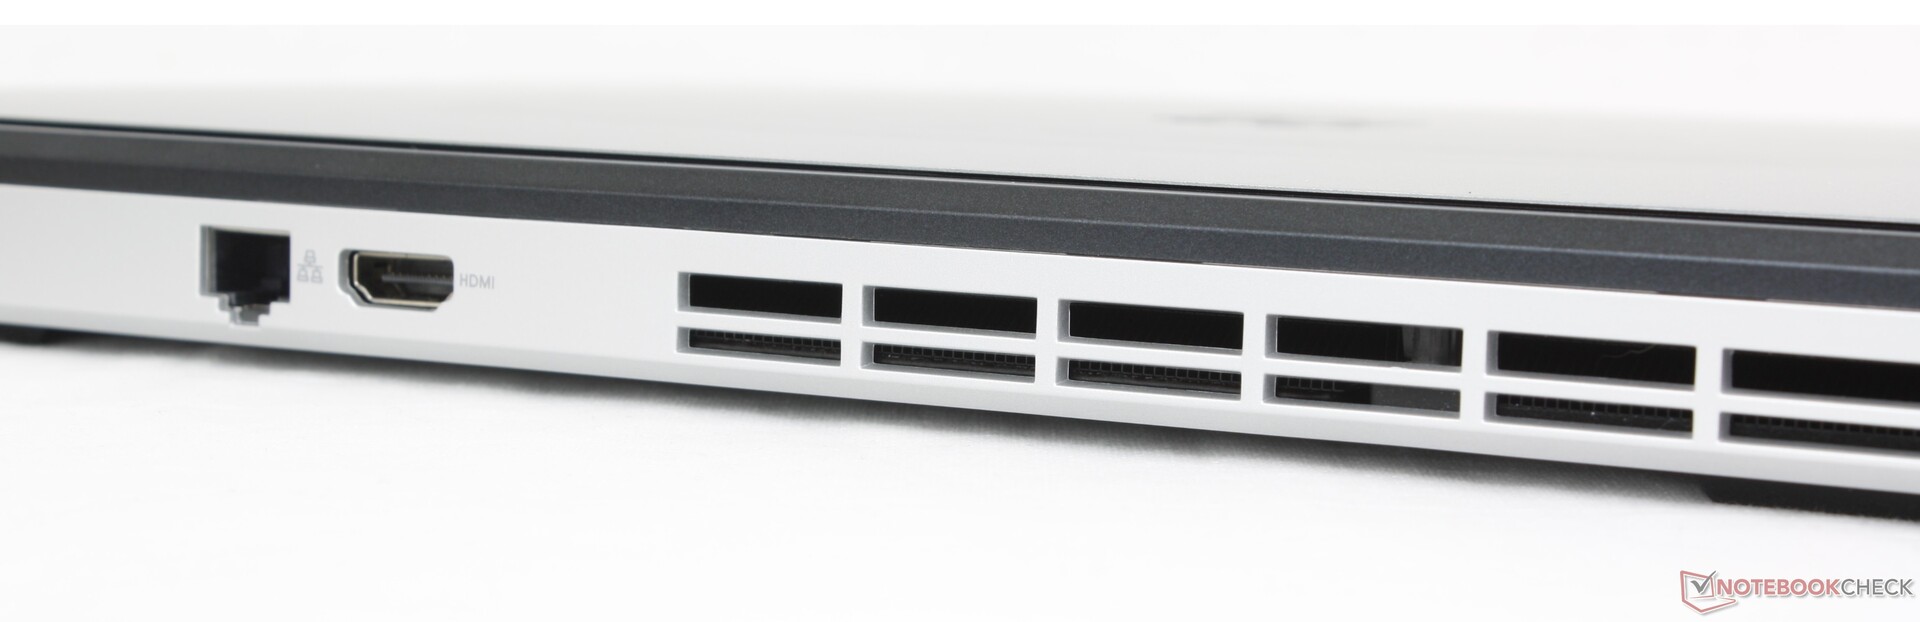
Conectividade
As portas são abundantes, embora faltem algumas. O Blade 16, por exemplo, inclui mais portas USB-A, enquanto o Alienware x16 R2 inclui uma mini-DisplayPort. O posicionamento das portas é bom e não está muito lotado, ao contrário do sistema Alienware mencionado anteriormente.
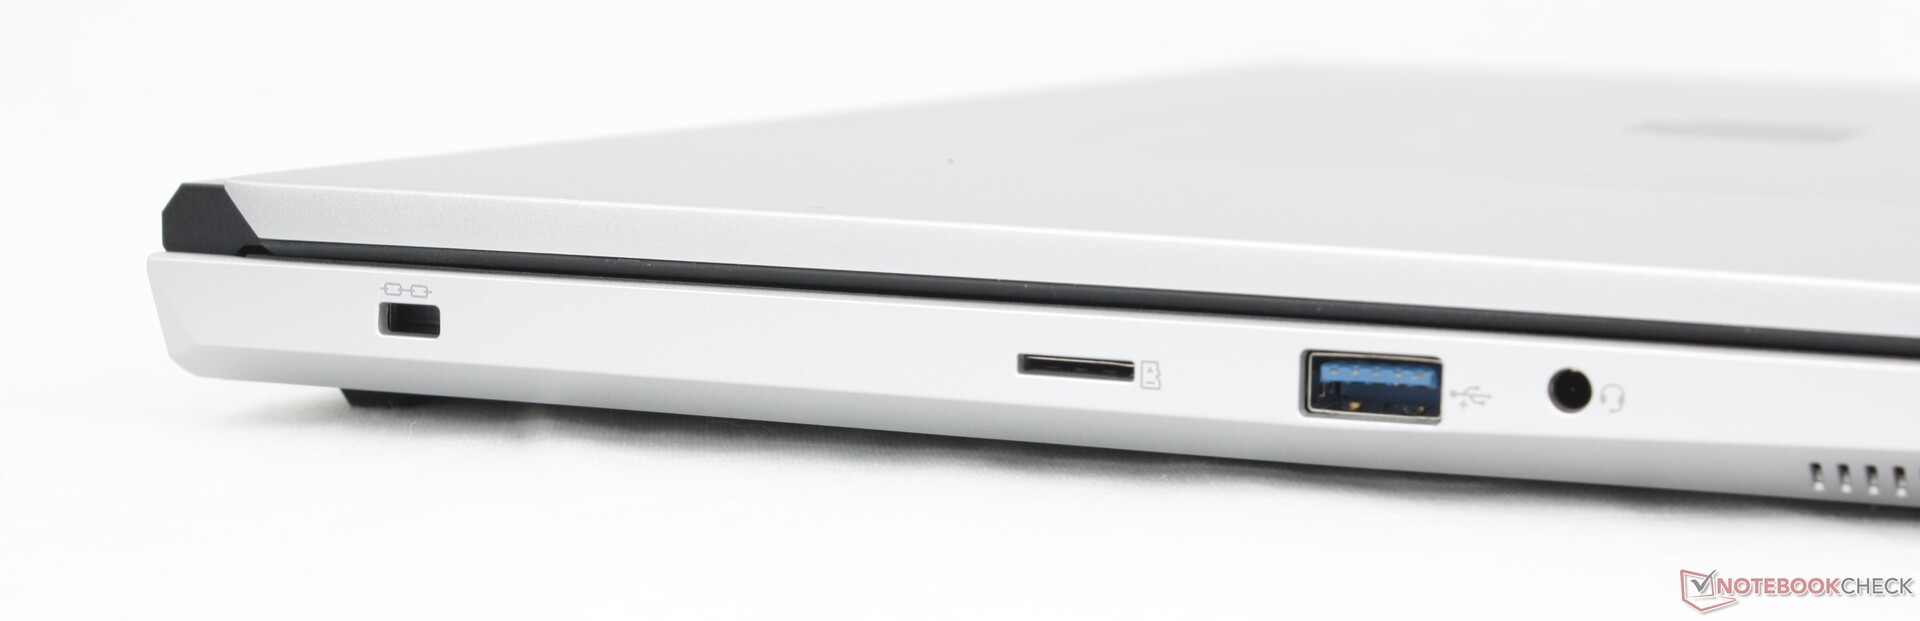
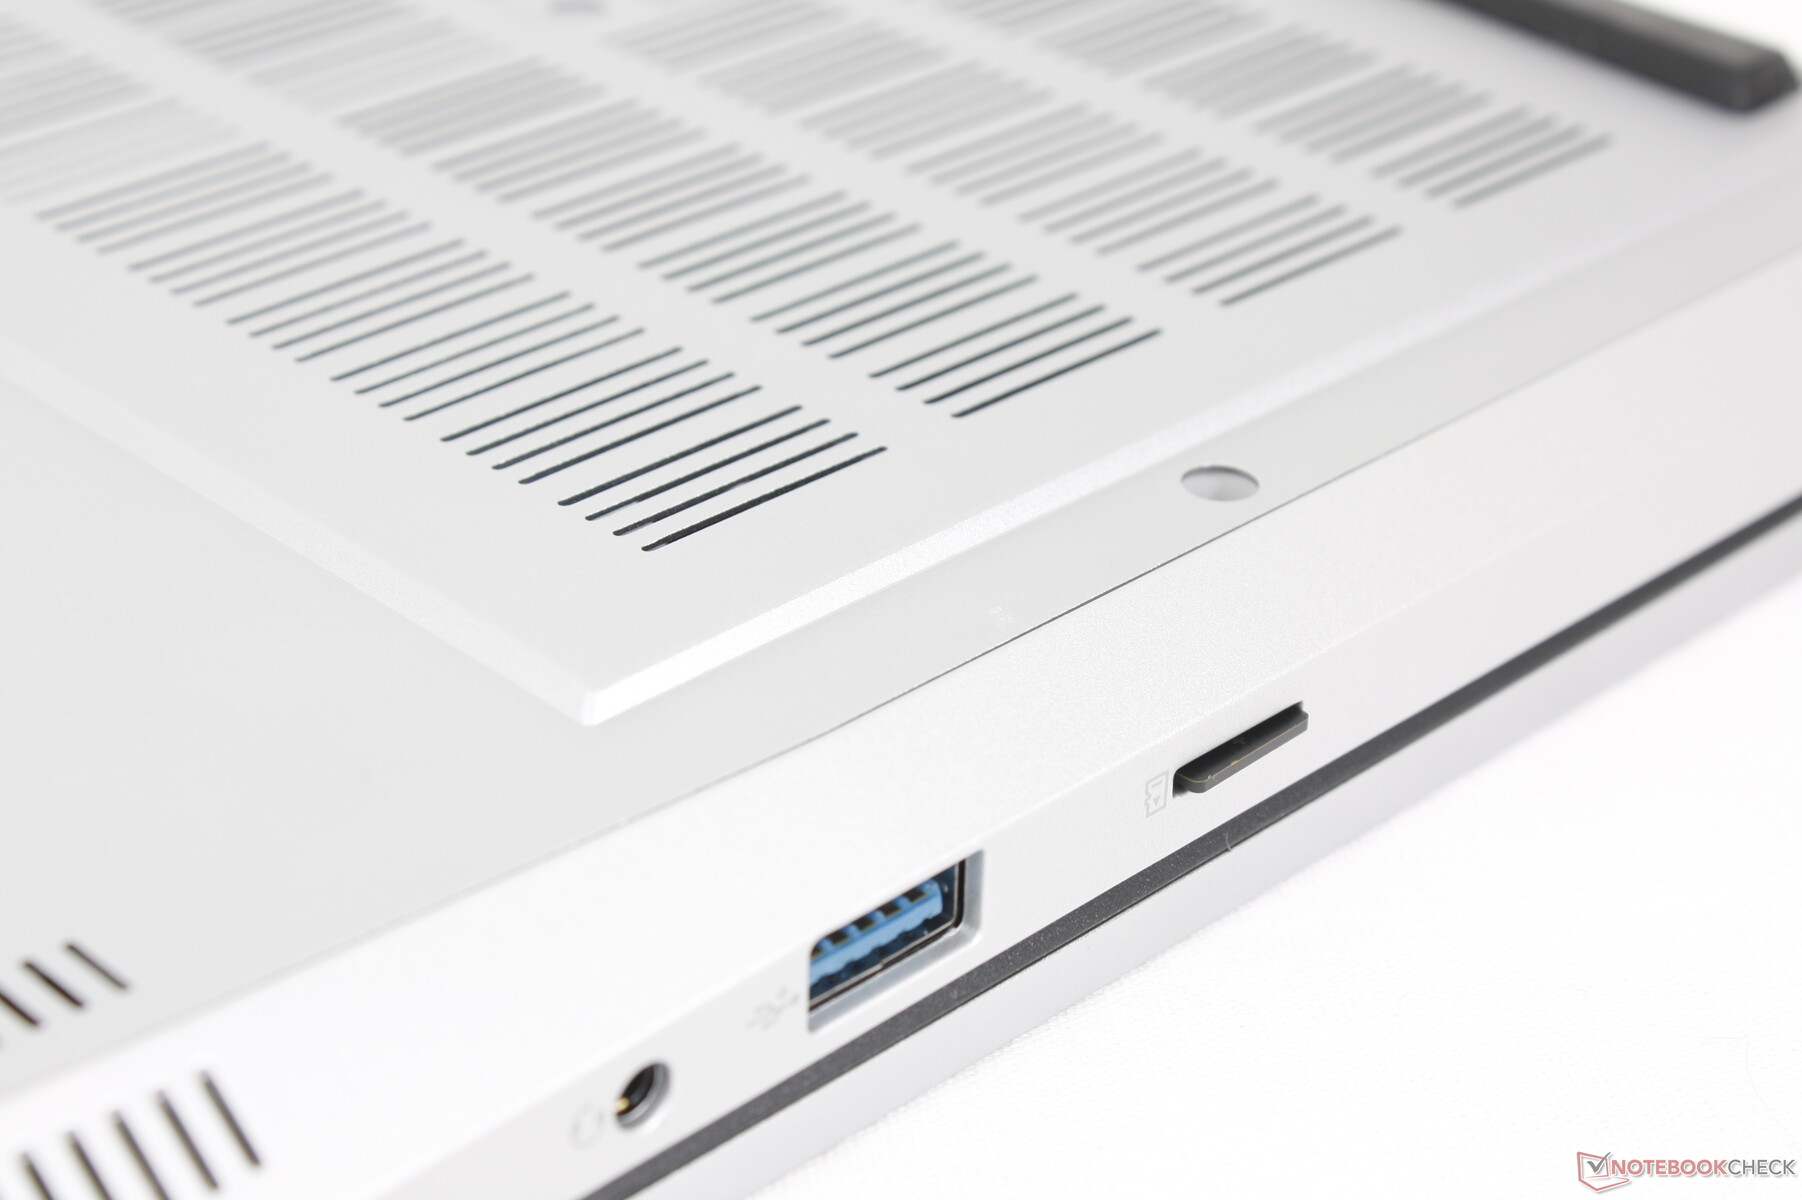
Leitor de cartão SD
Embora apreciemos ter um pequeno leitor de MicroSD em vez de nenhum leitor de SD, o leitor aqui é lento, especialmente para um laptop para jogos de 16 polegadas. A transferência de 1 GB de fotos do nosso cartão de teste UHS-II leva cerca de 25 segundos, em comparação com apenas 6 segundos no Blade 16.
| SD Card Reader | |
| average JPG Copy Test (av. of 3 runs) | |
| Razer Blade 16 2024, RTX 4090 | |
| Alienware x16 R2 P120F (AV PRO microSD 128 GB V60) | |
| Maingear ML-16 MK2 (AV PRO microSD 128 GB V60) | |
| maximum AS SSD Seq Read Test (1GB) | |
| Alienware x16 R2 P120F (AV PRO microSD 128 GB V60) | |
| Razer Blade 16 2024, RTX 4090 | |
| Maingear ML-16 MK2 (AV PRO microSD 128 GB V60) | |
Comunicação
O Intel AX211 vem com conectividade padrão Wi-Fi 6E e Bluetooth 5.3. Tivemos taxas de transferência estáveis e nenhum problema quando emparelhado com nosso roteador de teste AXE11000.
Webcam
Uma webcam de 2 MP com infravermelho e um obturador eletrônico é padrão para ser comparável aos rivais.


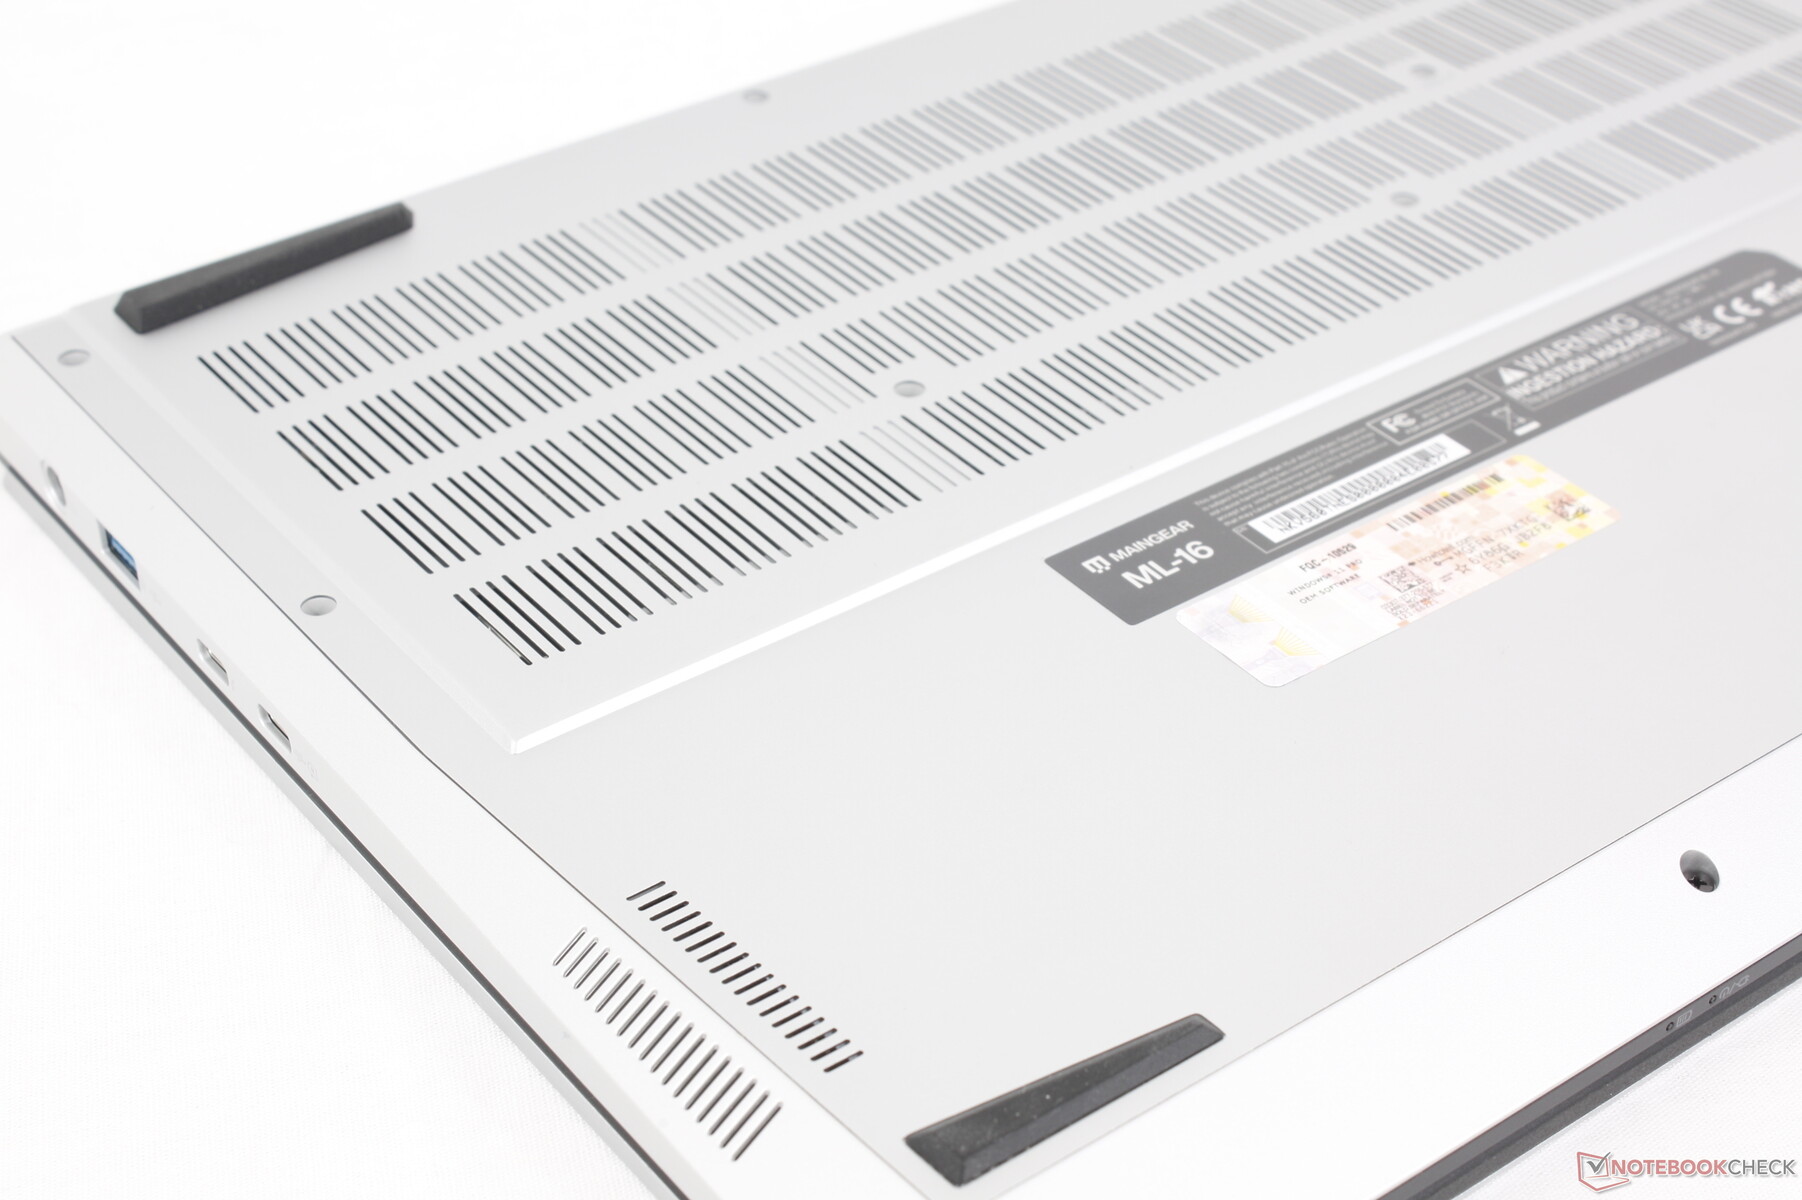
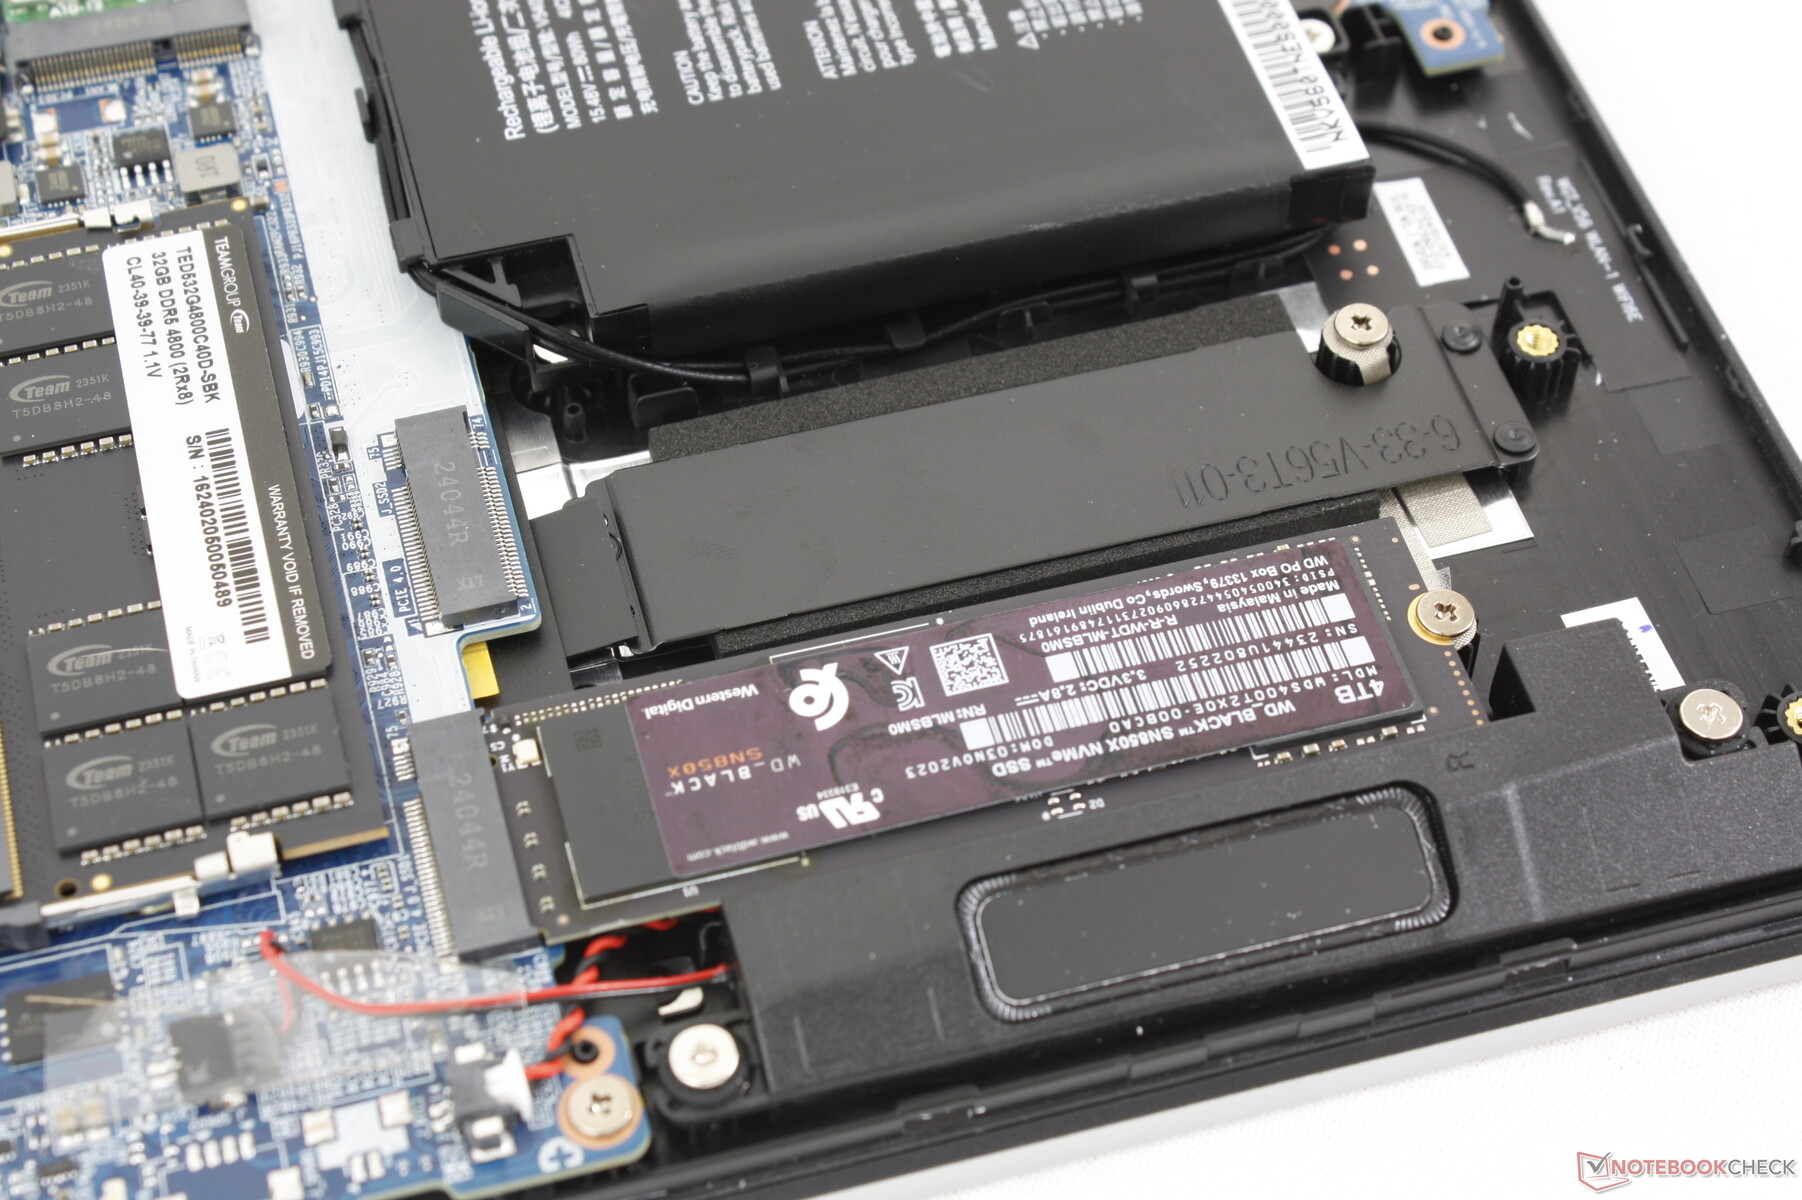
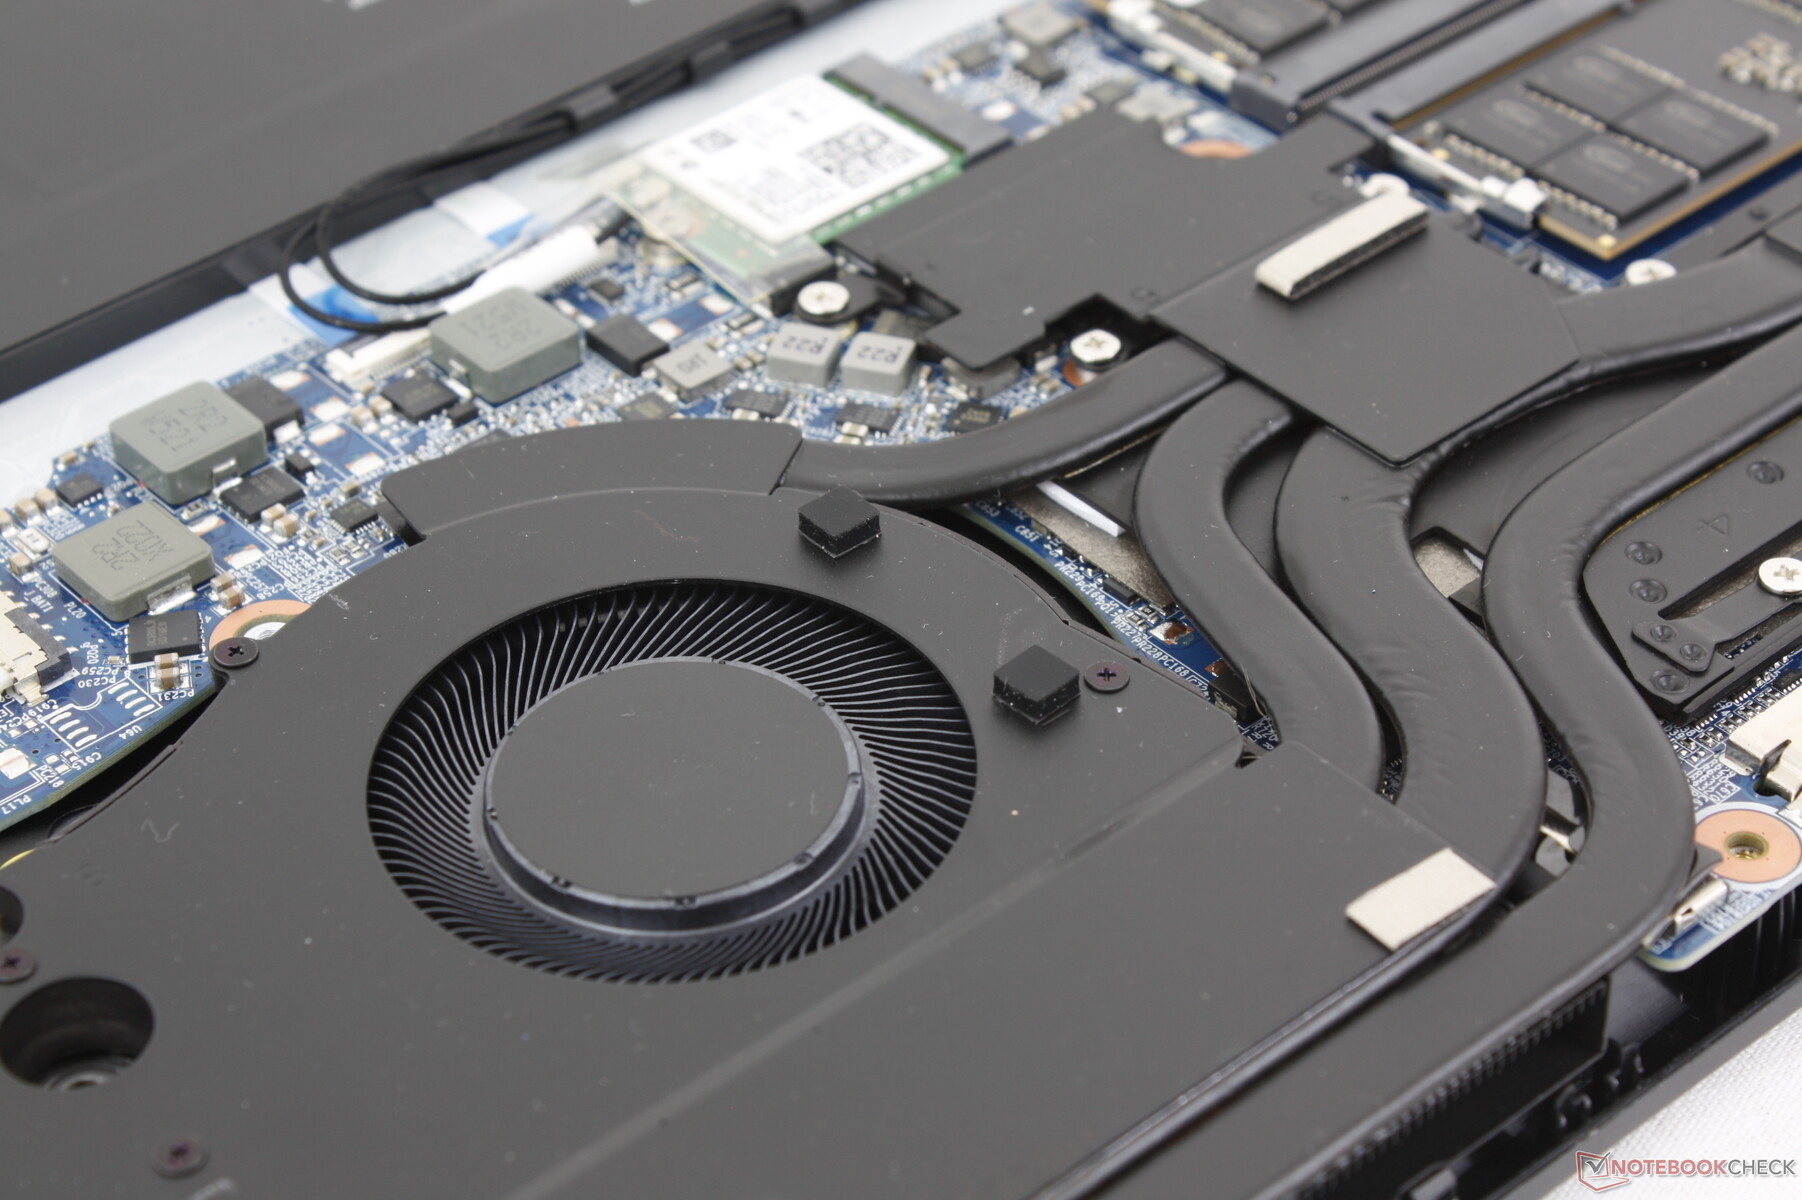
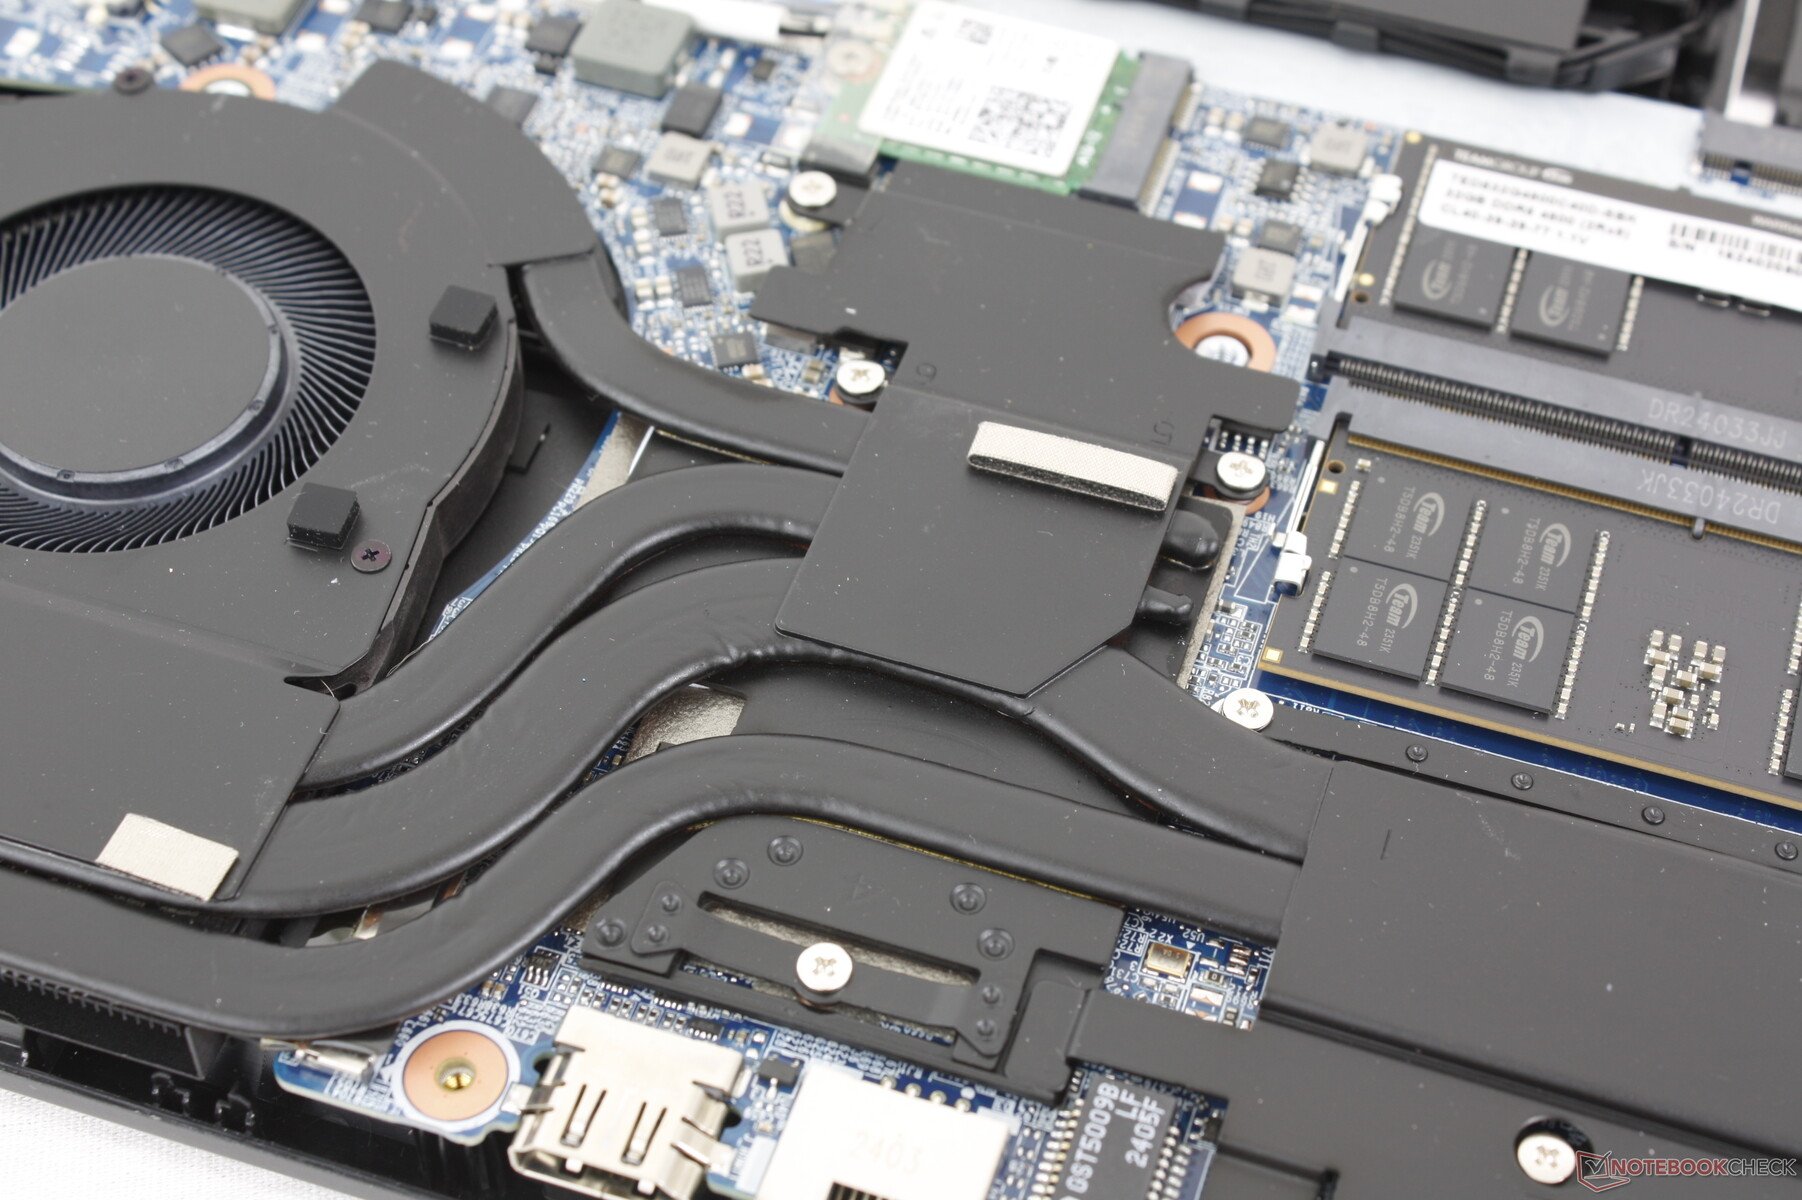
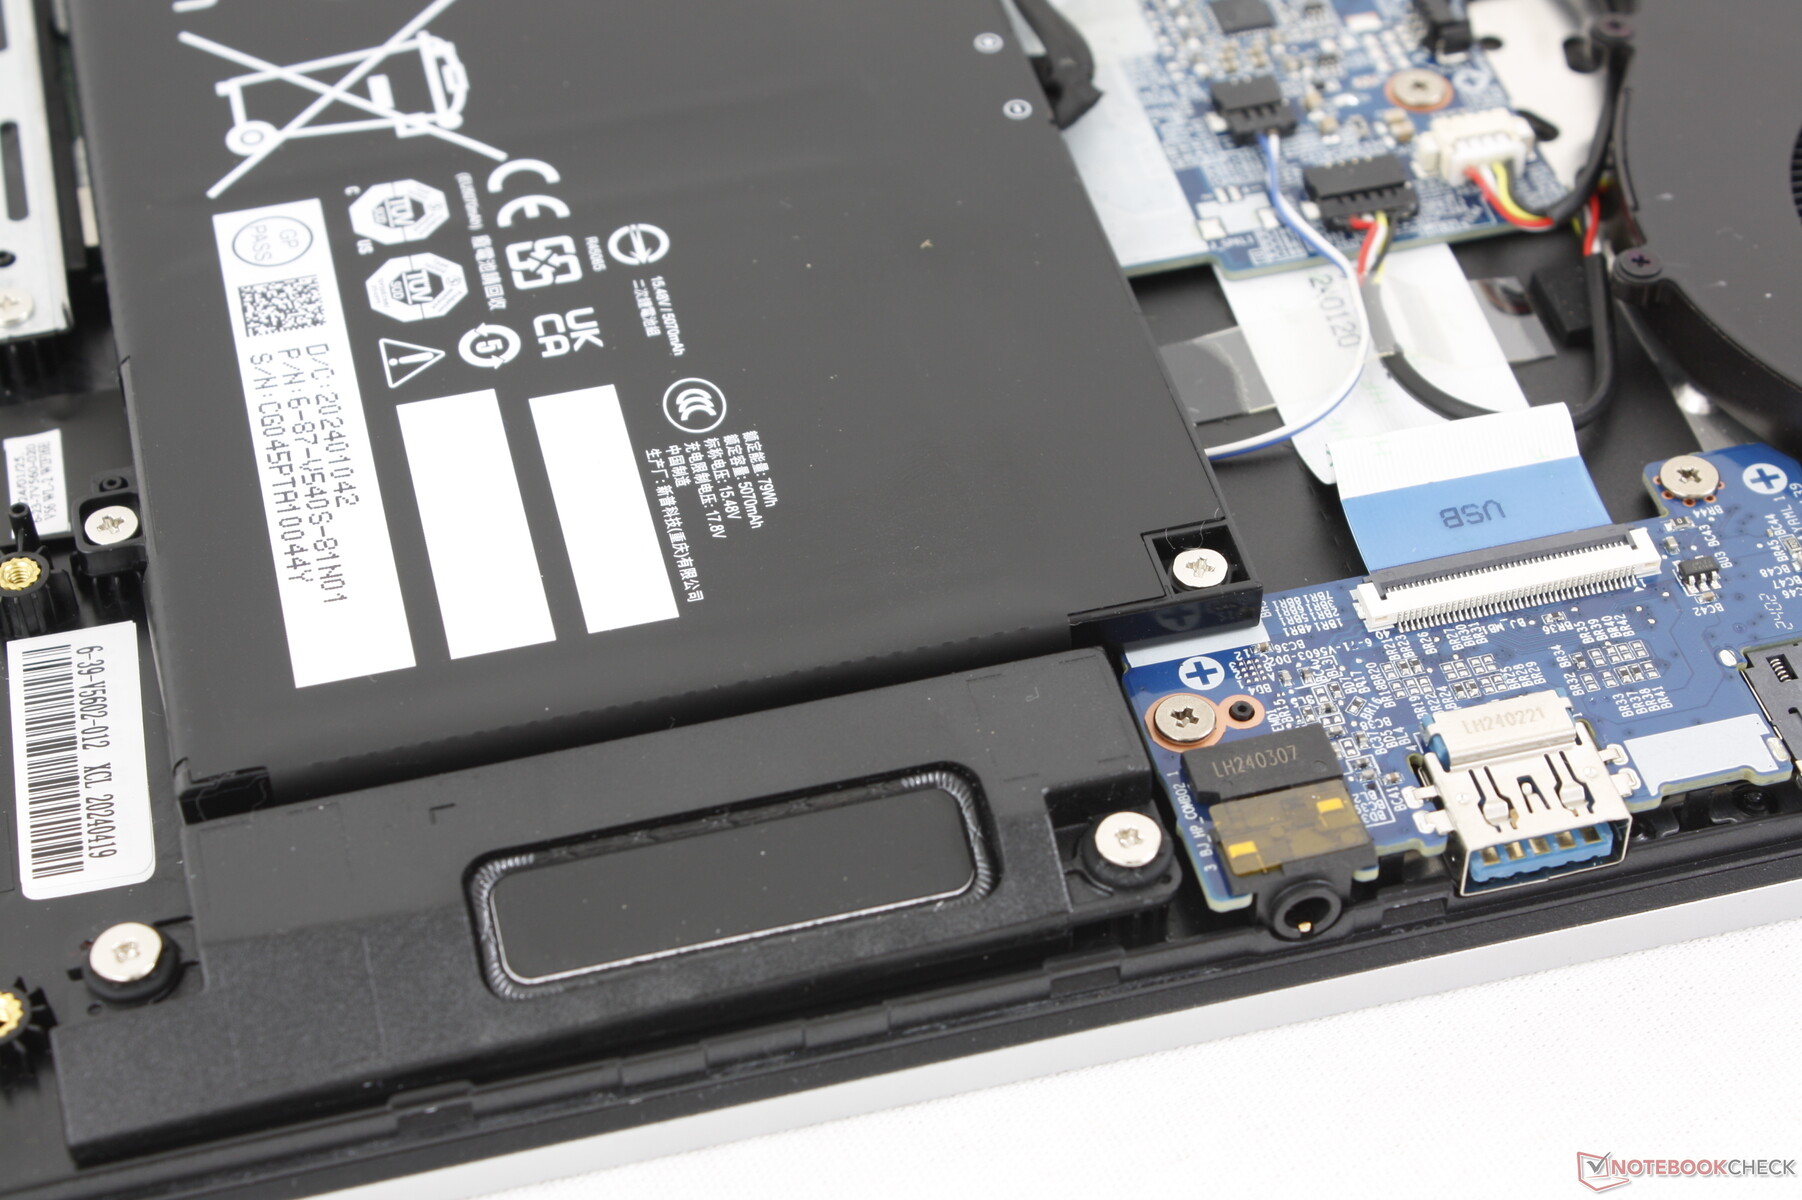
Manutenção
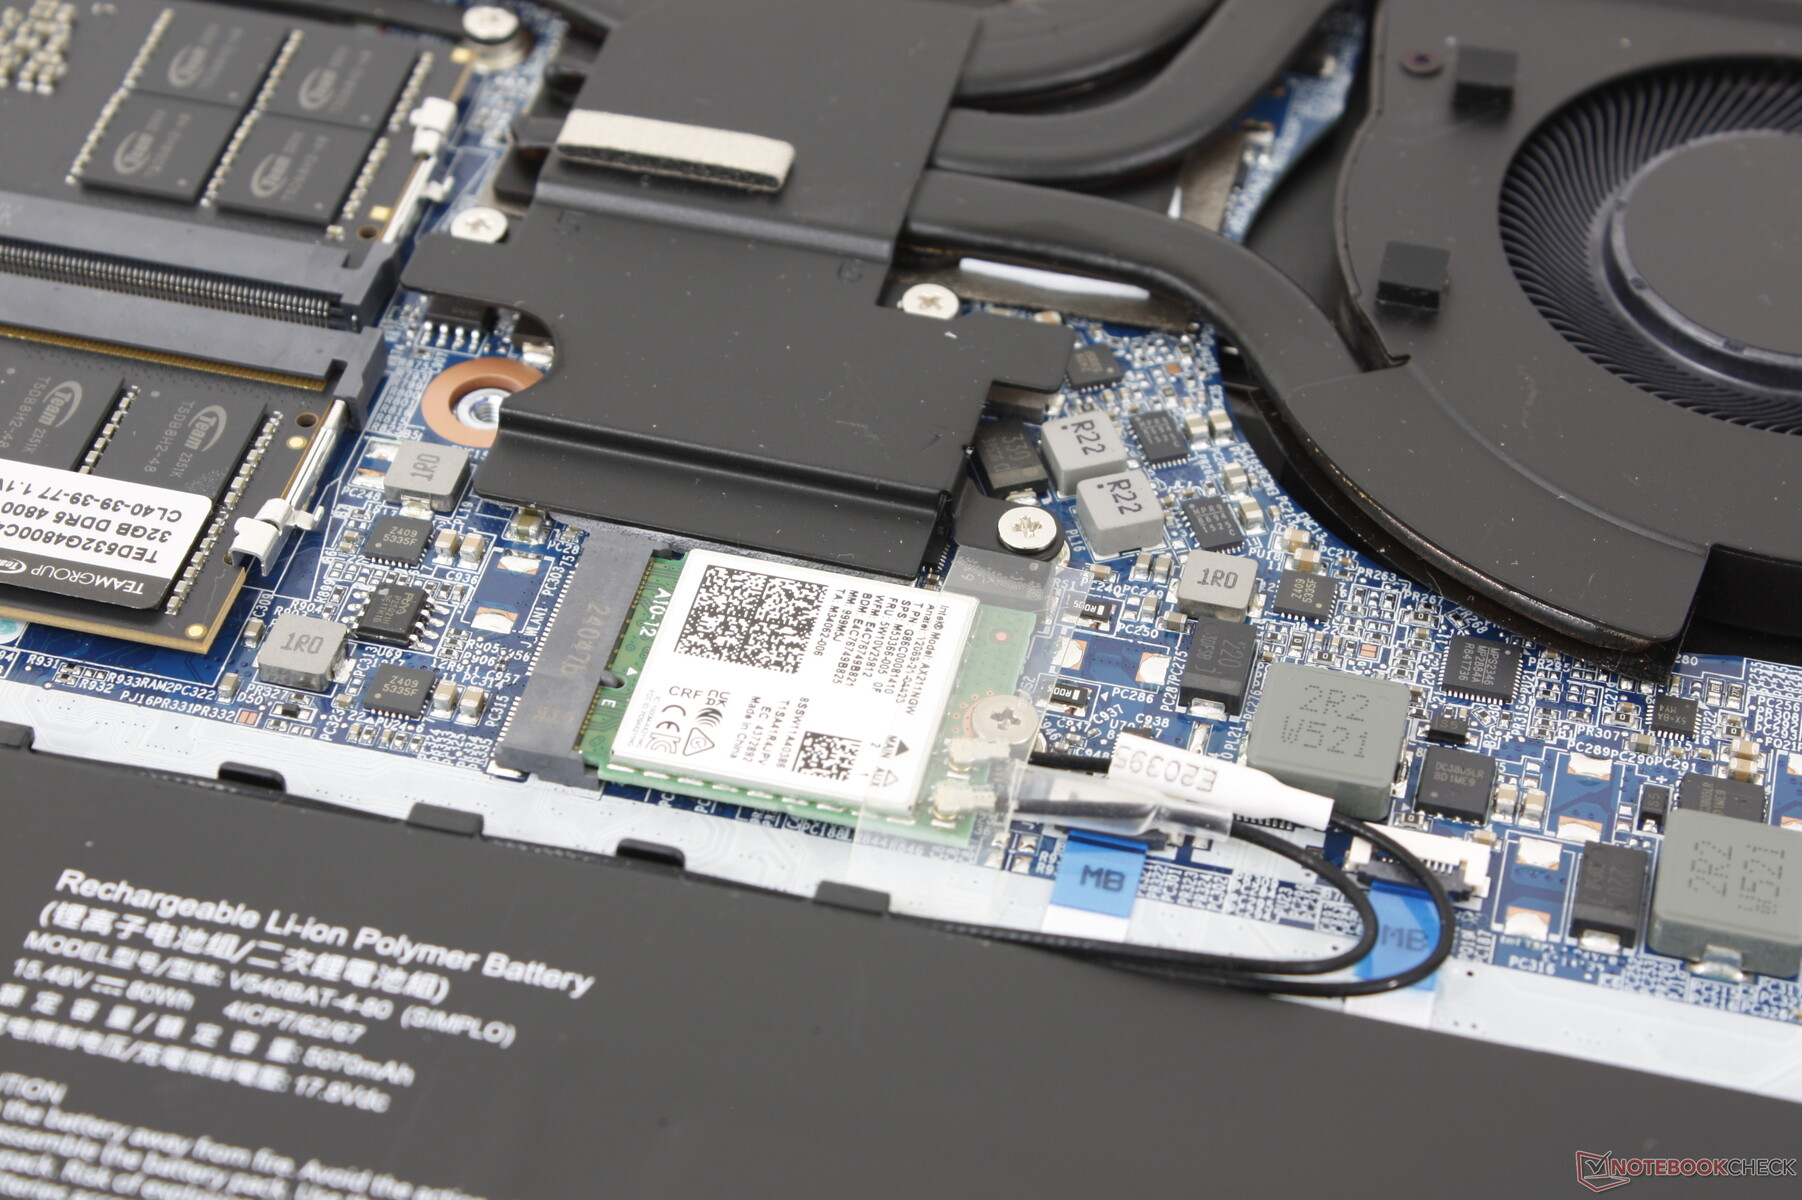
O painel inferior requer um pouco de paciência para ser removido, pois está preso por 13 parafusos Phillips. Em compensação, ele se solta sem muita resistência para facilitar o acesso aos dois compartimentos M.2 PCIe4 x4 2280, aos dois slots SODIMM, à bateria e ao módulo WLAN removível. Essas opções são comparáveis às do Razer Blade 16 e são melhores do que as do Alienware x16 R2 que não tem nenhuma RAM atualizável pelo usuário.
Sustentabilidade
A Maingear não anuncia nenhum material reciclado usado na fabricação do laptop.
A embalagem consiste em papelão, invólucro de plástico e LDPE não reciclável.
Acessórios e garantia
Não há extras na caixa além do adaptador CA e da documentação. A garantia limitada de um ano do fabricante se aplica se o produto for comprado nos EUA.
Dispositivos de entrada
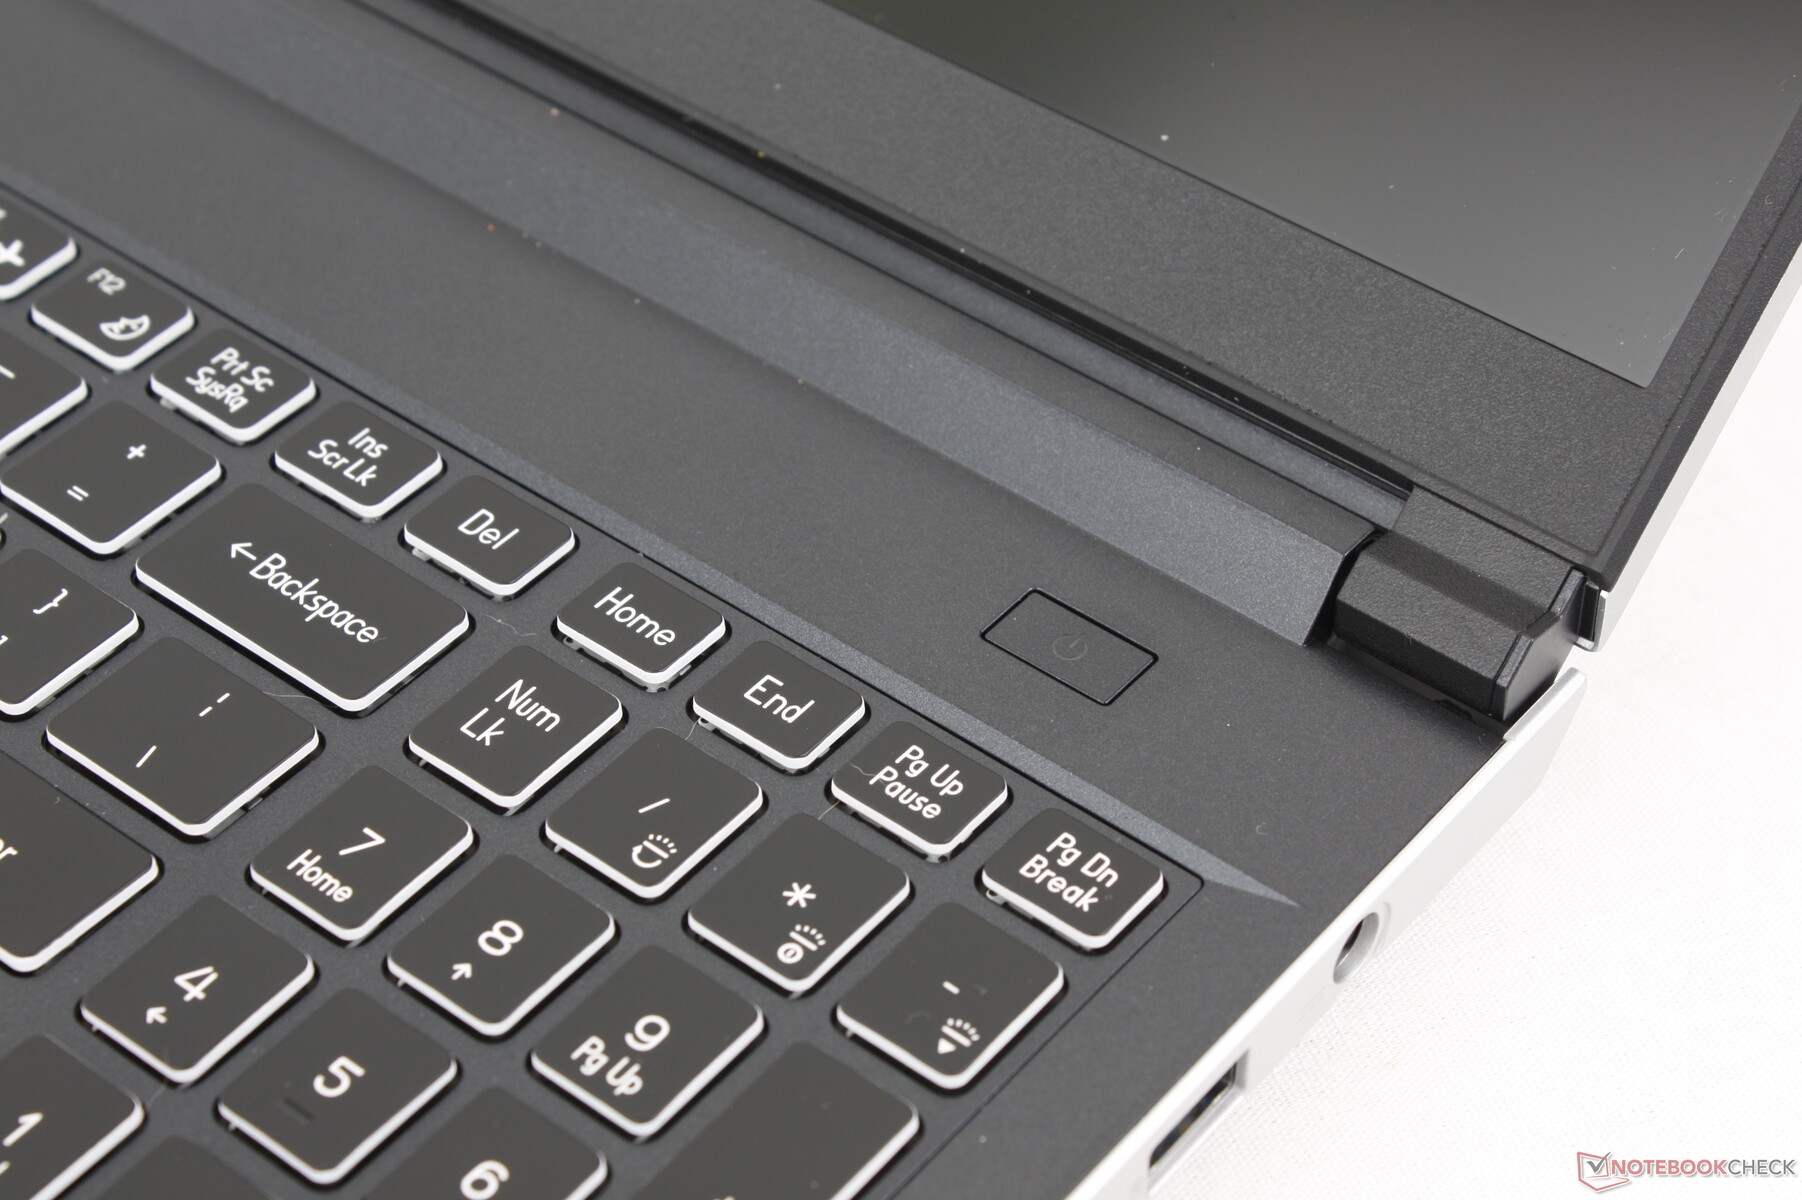
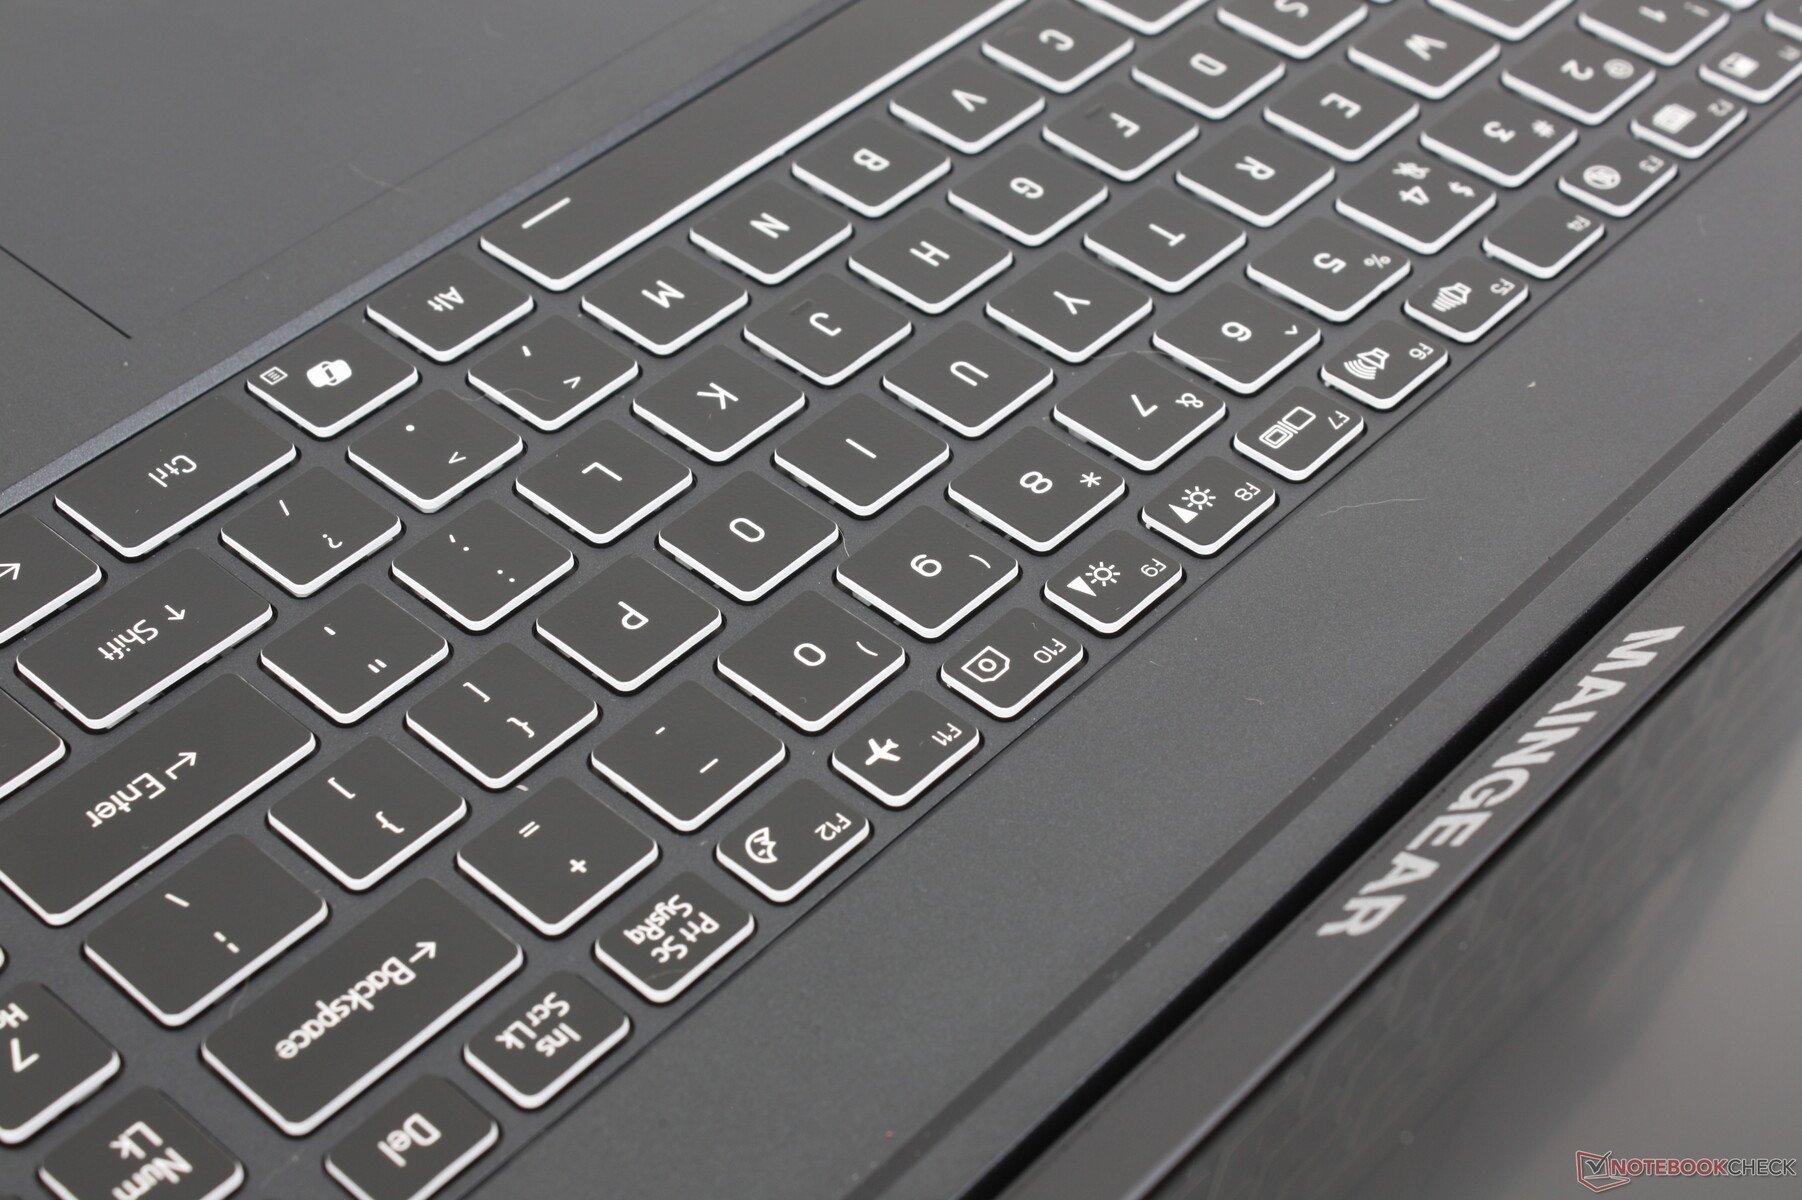
Teclado
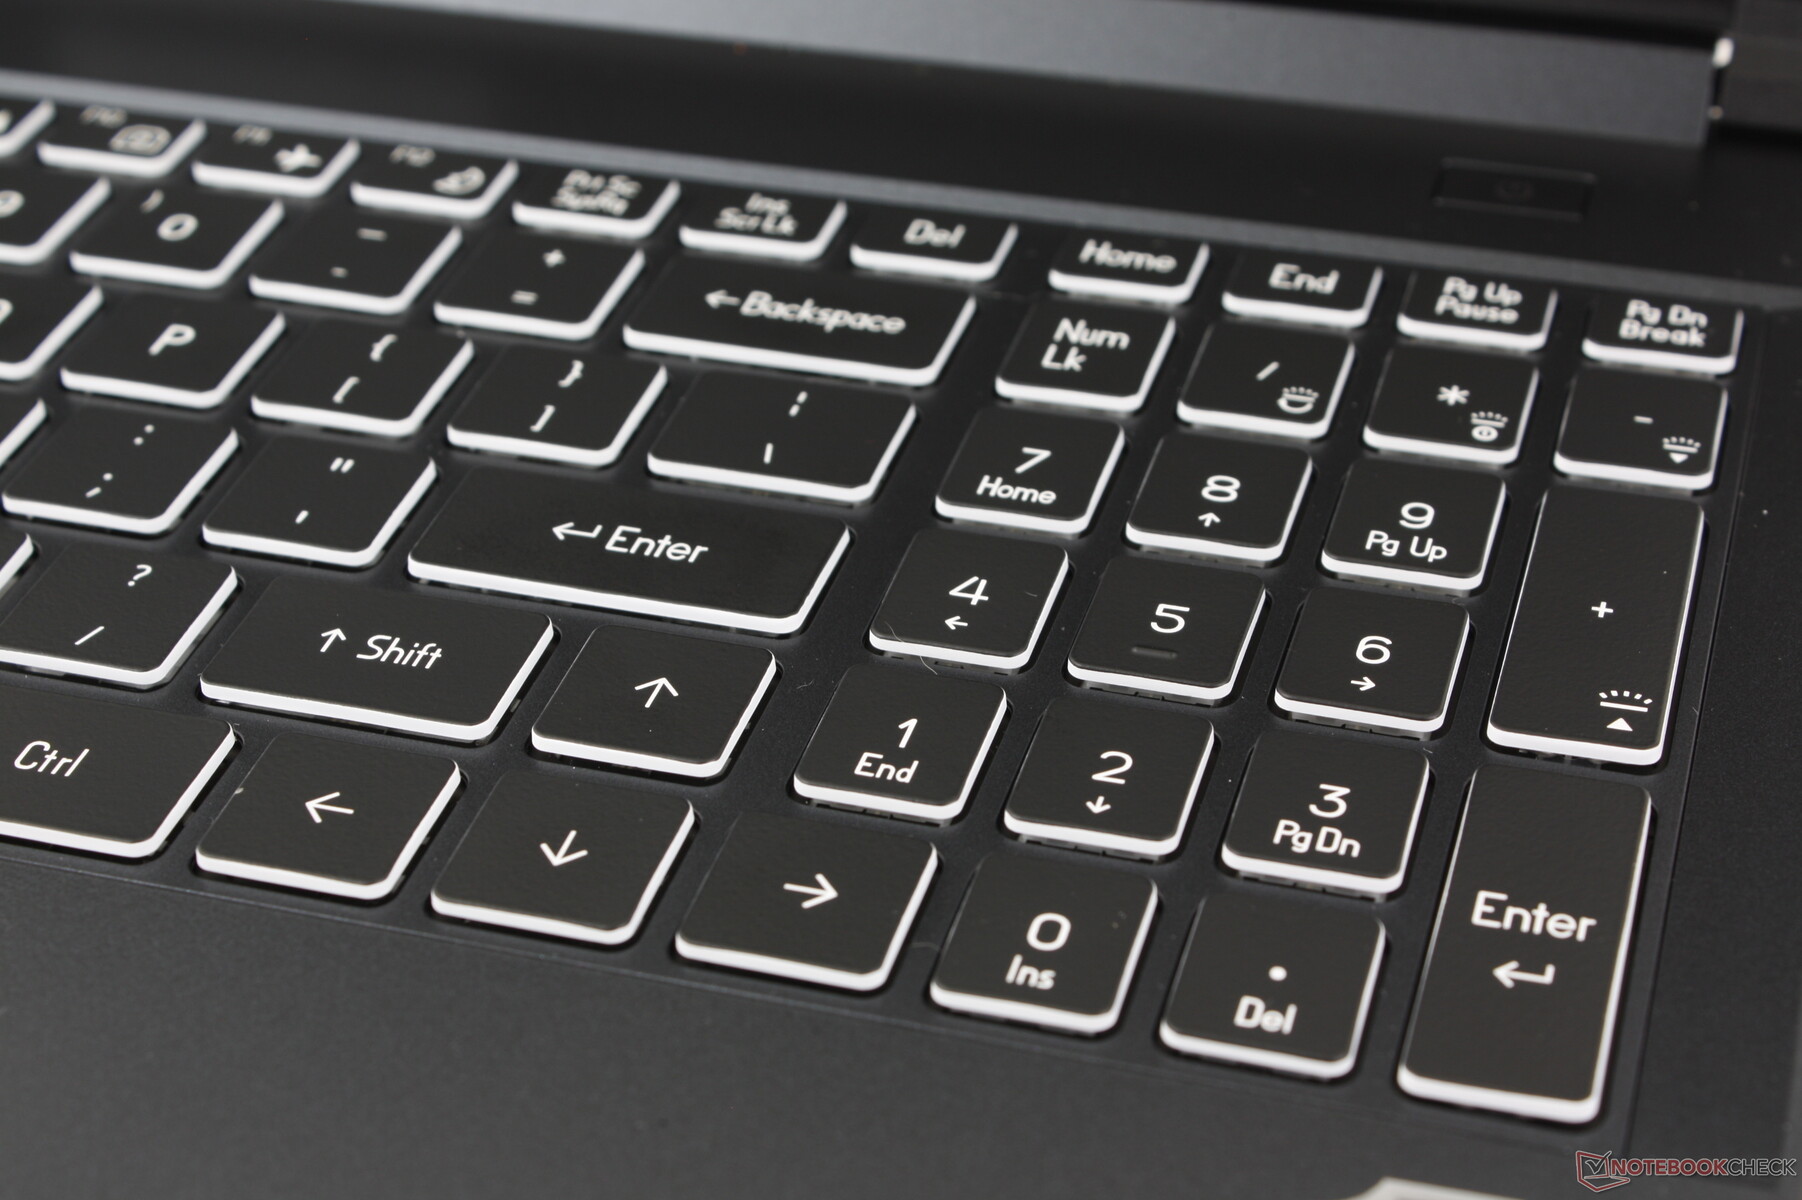
A experiência de digitação é mais barulhenta do que na maioria dos outros laptops devido ao ruído agudo das teclas QWERTY principais. O barulho alto normalmente significa um feedback mais firme e mais satisfatório, mas esse não é o caso do ML-16 MK2, pois o deslocamento ainda é superficial e o feedback suave não corresponde ao nível de ruído agudo. Os teclados do Legion Pro 5 16 ou do Victus 16 que, em comparação, parecem mais familiares e mais fáceis de se acostumar.
Uma luz de fundo RGB de zona única é padrão, sem opções de RGB por tecla ou mesmo de zona quádrupla.
Touchpad
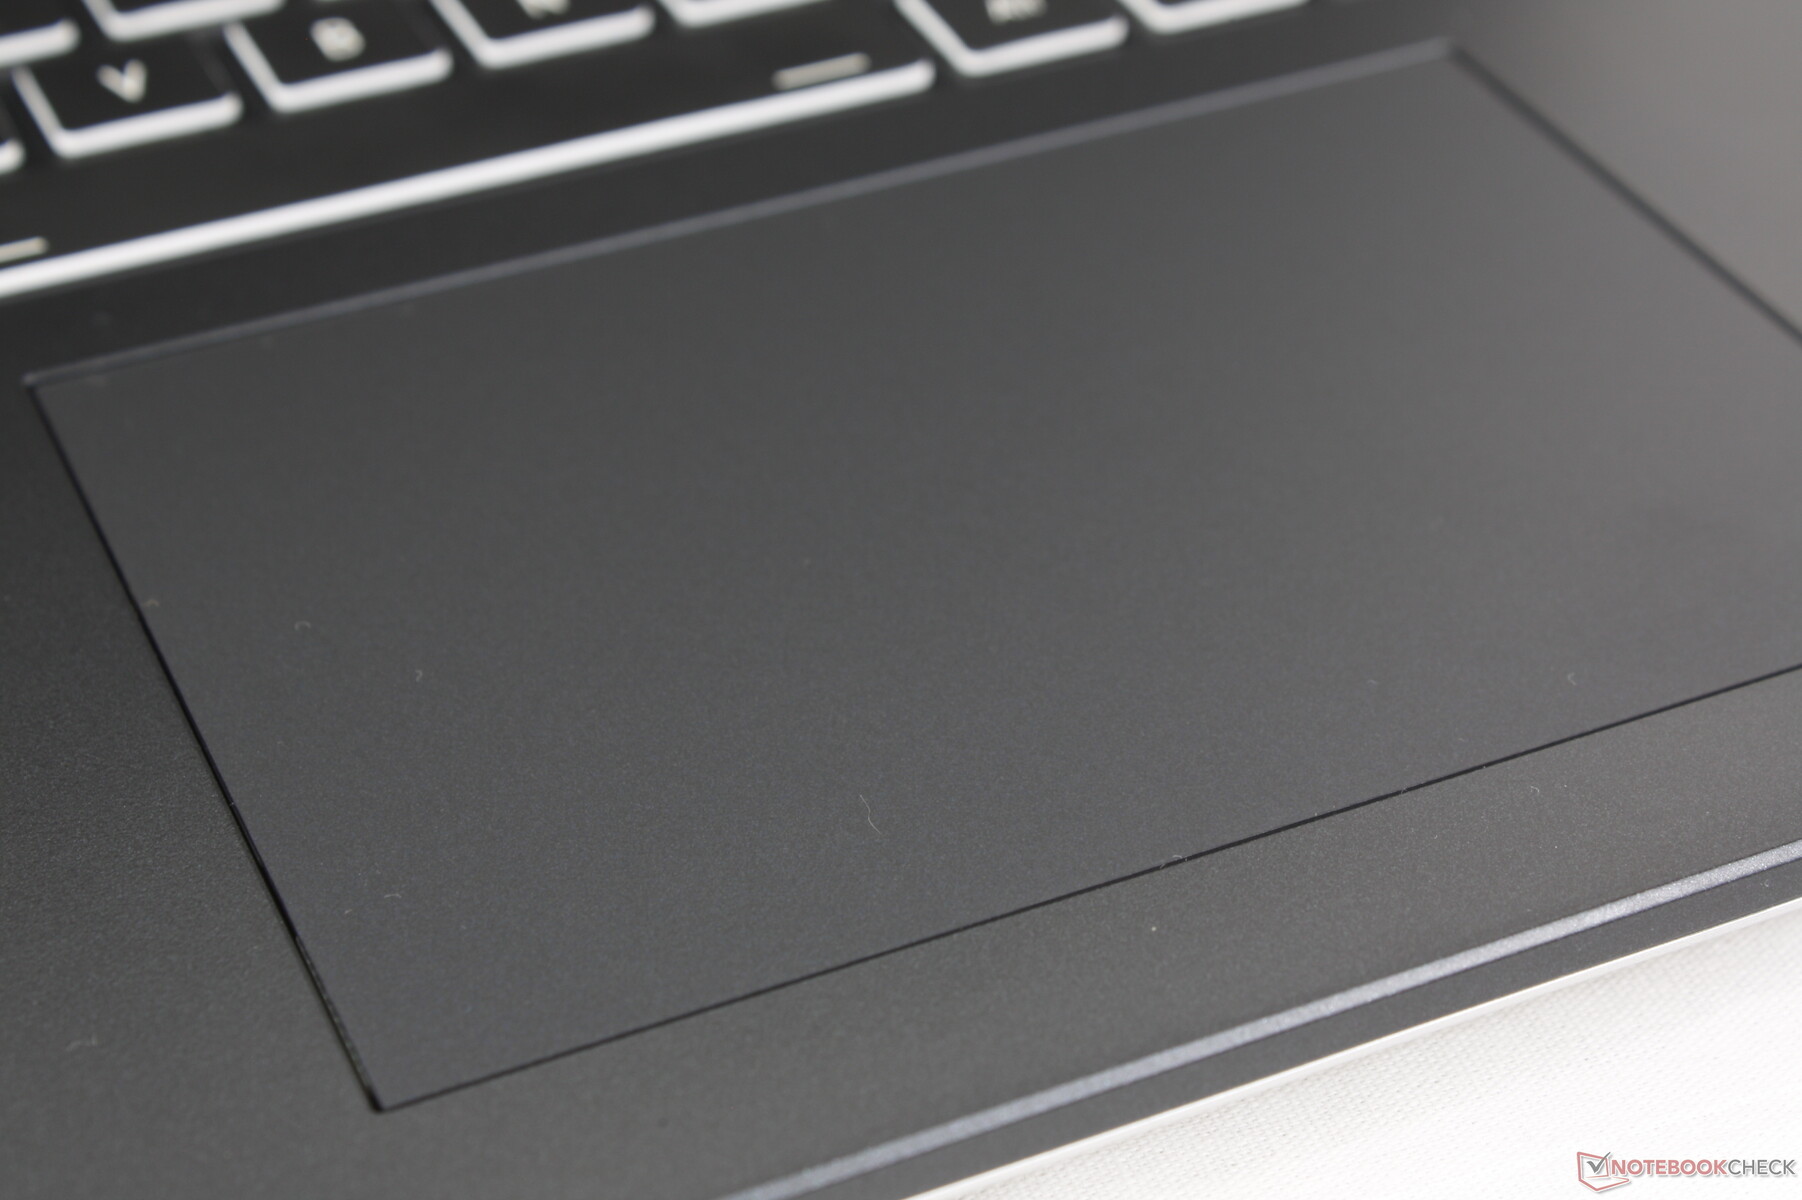
O clickpad (12,2 x 8,3 cm) é menor do que o do Blade 16 (17 x 9,7 cm), mas maior do que o do Legion Pro 5 16IRX9 (12 x 7,5 cm). Ele é espaçoso e tem um feedback firme e sonoro quando pressionado. No entanto, o deslizamento é quase suave demais, especialmente em velocidades mais baixas, o que dificulta os cliques precisos ou as ações de arrastar e soltar. Em comparação, o dedo tende a grudar quando se move em velocidades mais lentas na maioria dos outros laptops para ajudar na precisão.


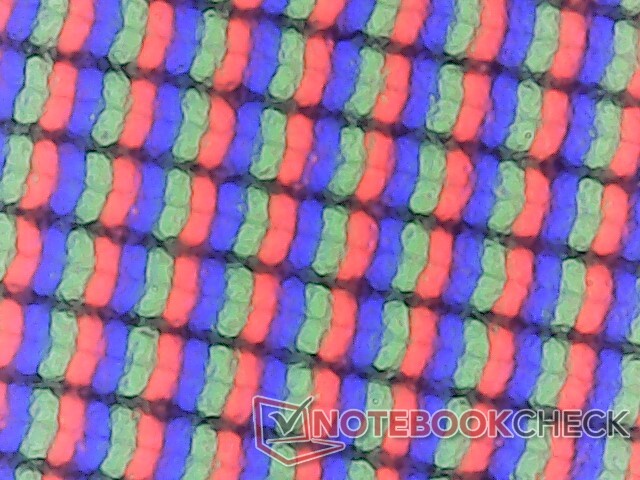
Tela - IPS para jogos
O ML-16 MK2 é o primeiro modelo em nosso banco de dados a ser fornecido com o painel IPS de 240 Hz TL160ADMP11-0. Ele é comparável ao painel BOE B160QAN do Alienware x16 R2 em termos de taxa de atualização, taxa de contraste e resolução, mas não consegue se igualar à tela da Dell no que diz respeito à reprodução de cores ou aos tempos de resposta. Como resultado, o monitor ML-16 MK2 pode ser considerado de médio porte, o que ainda é muito adequado para jogos e para a maioria das edições gráficas amadoras.
Recursos mais avançados, como G-Sync ou HDR, não são suportados.

| |||||||||||||||||||||||||
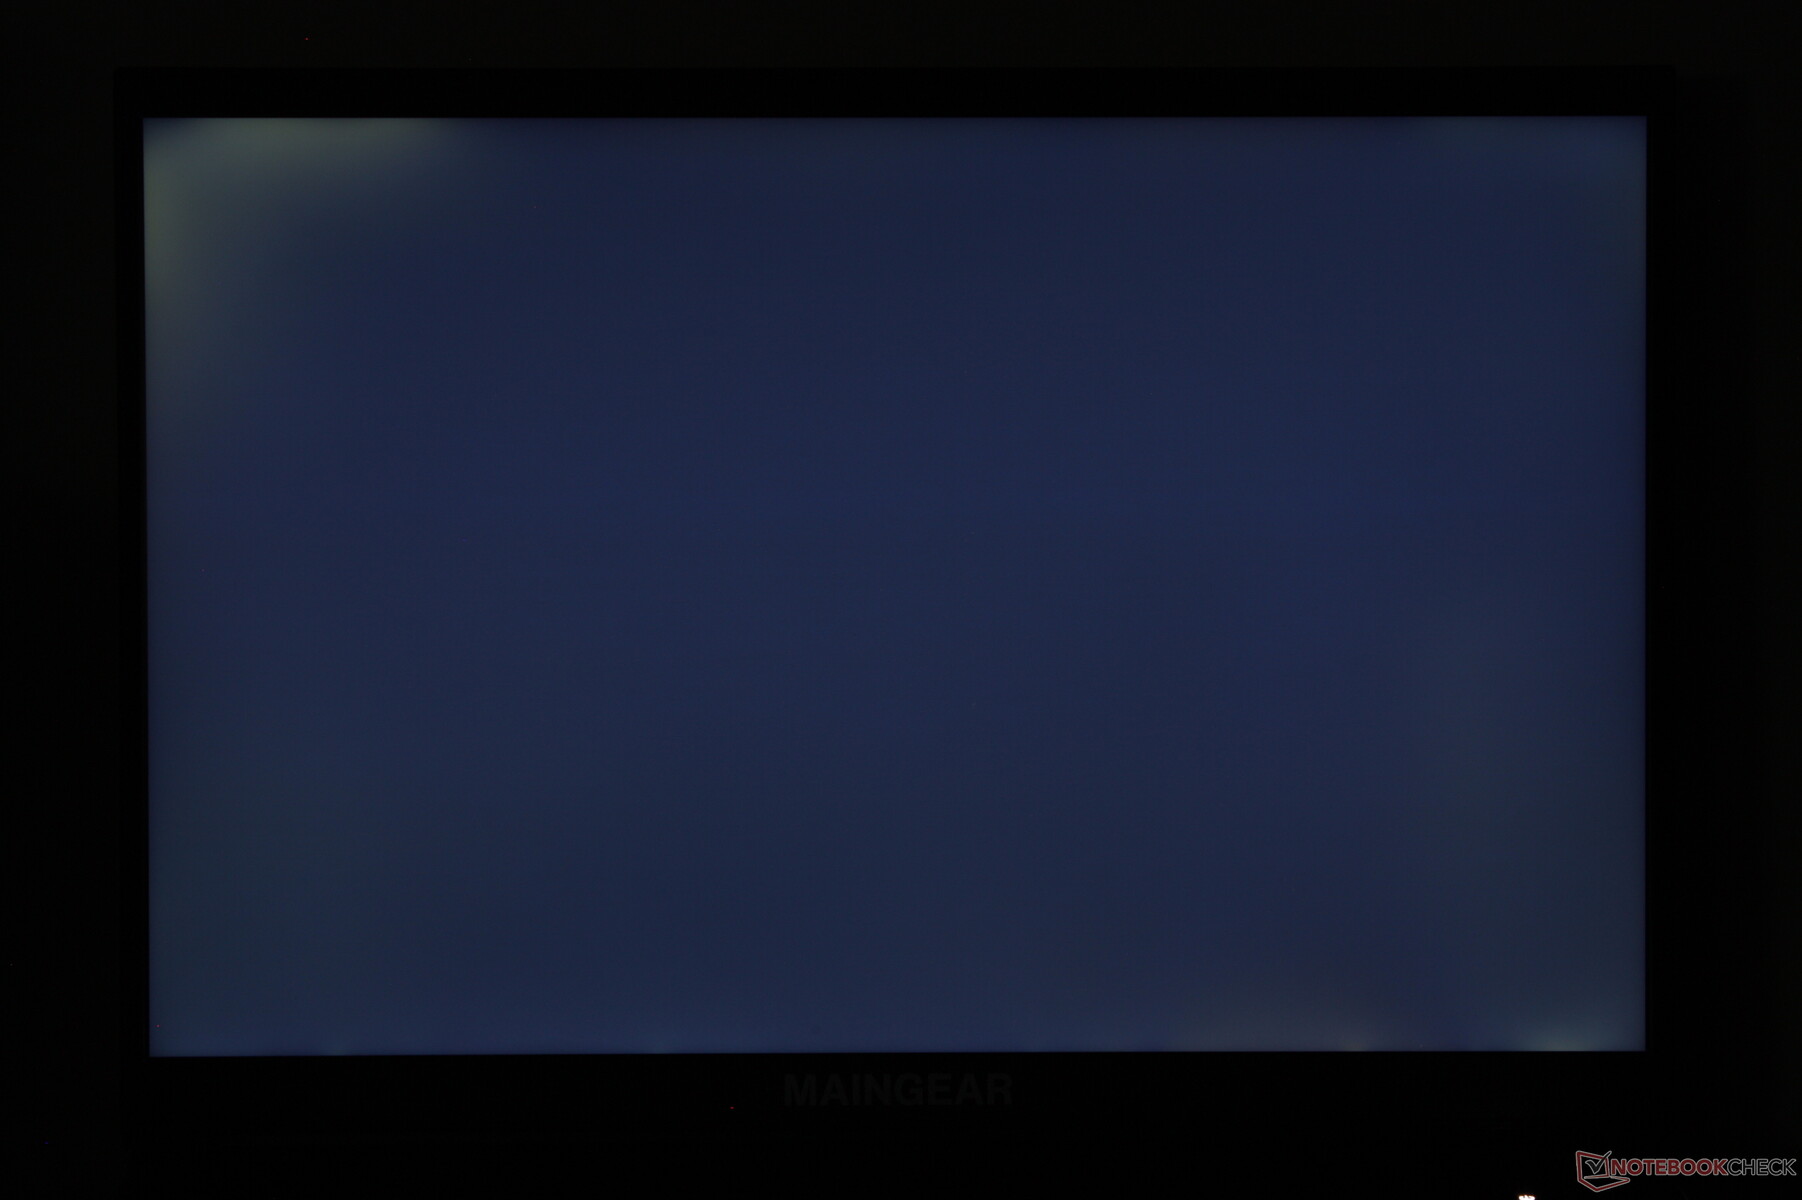
iluminação: 90 %
iluminação com acumulador: 518.2 cd/m²
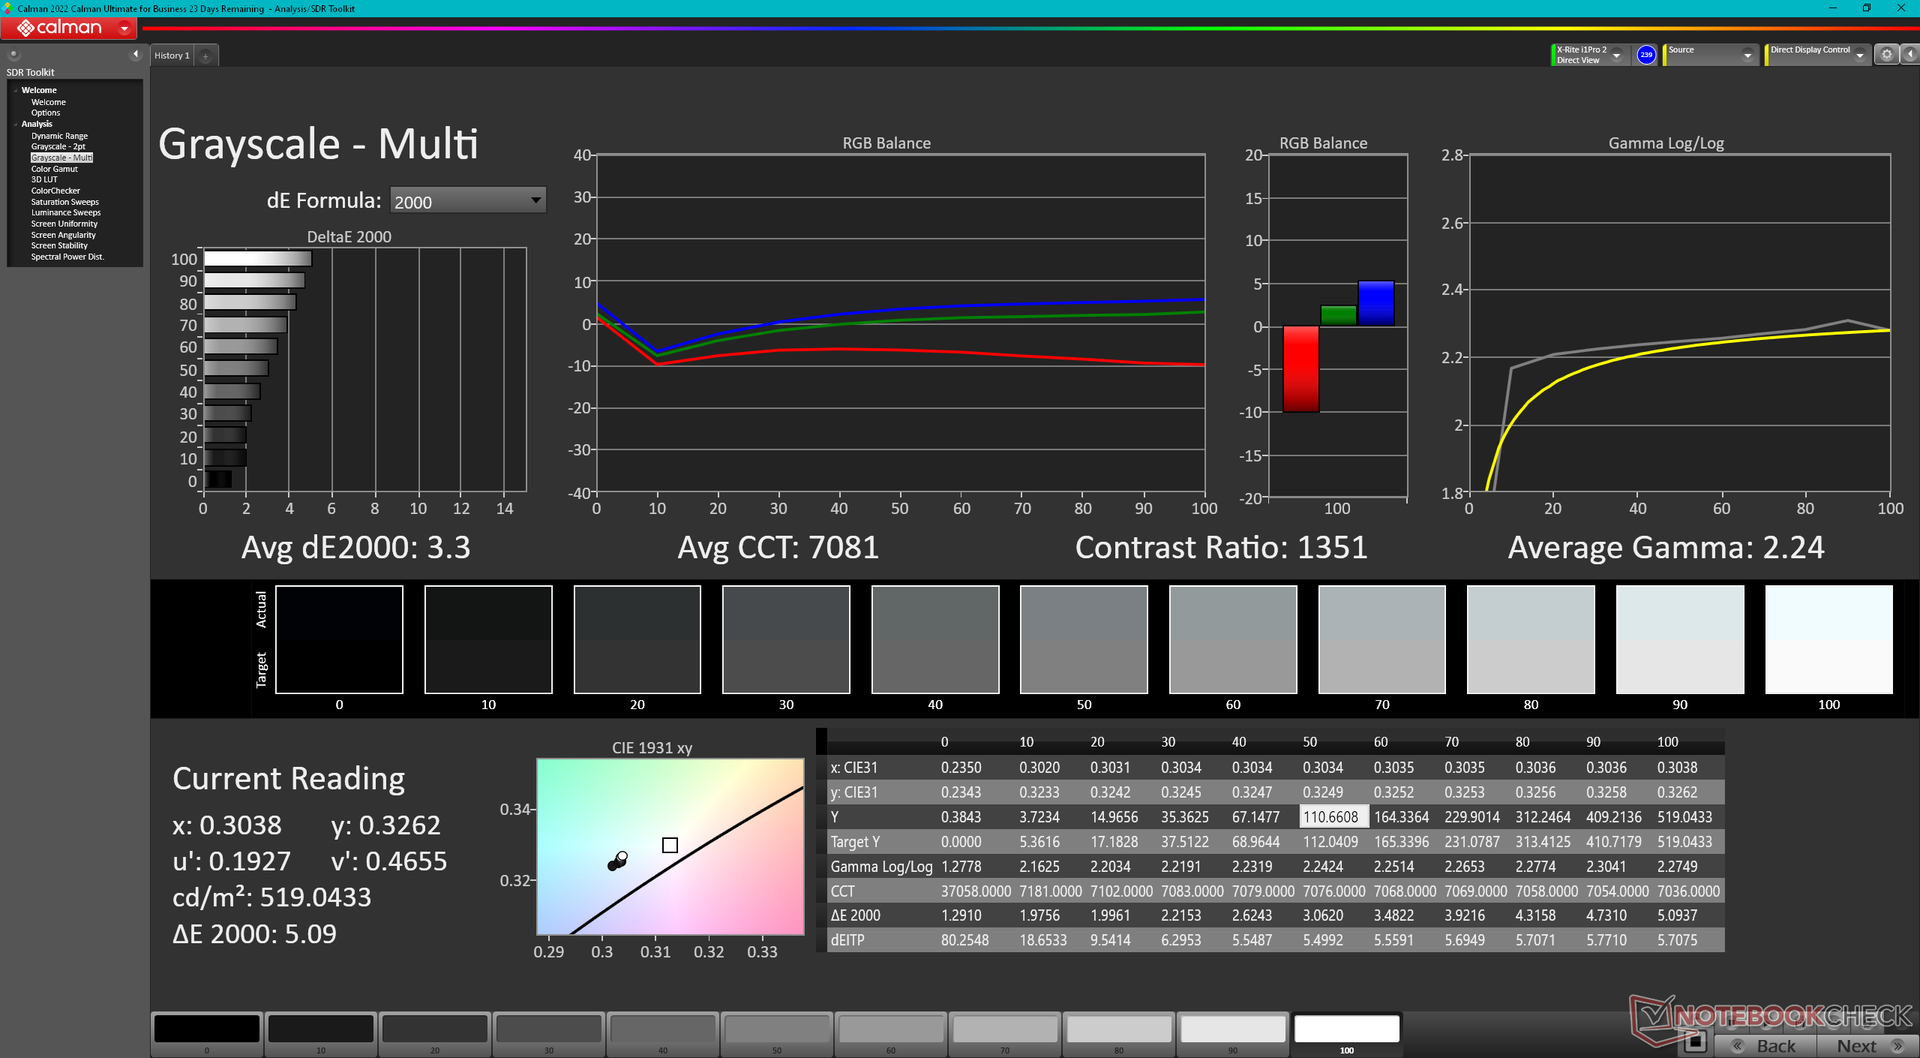
Contraste: 1296:1 (Preto: 0.4 cd/m²)
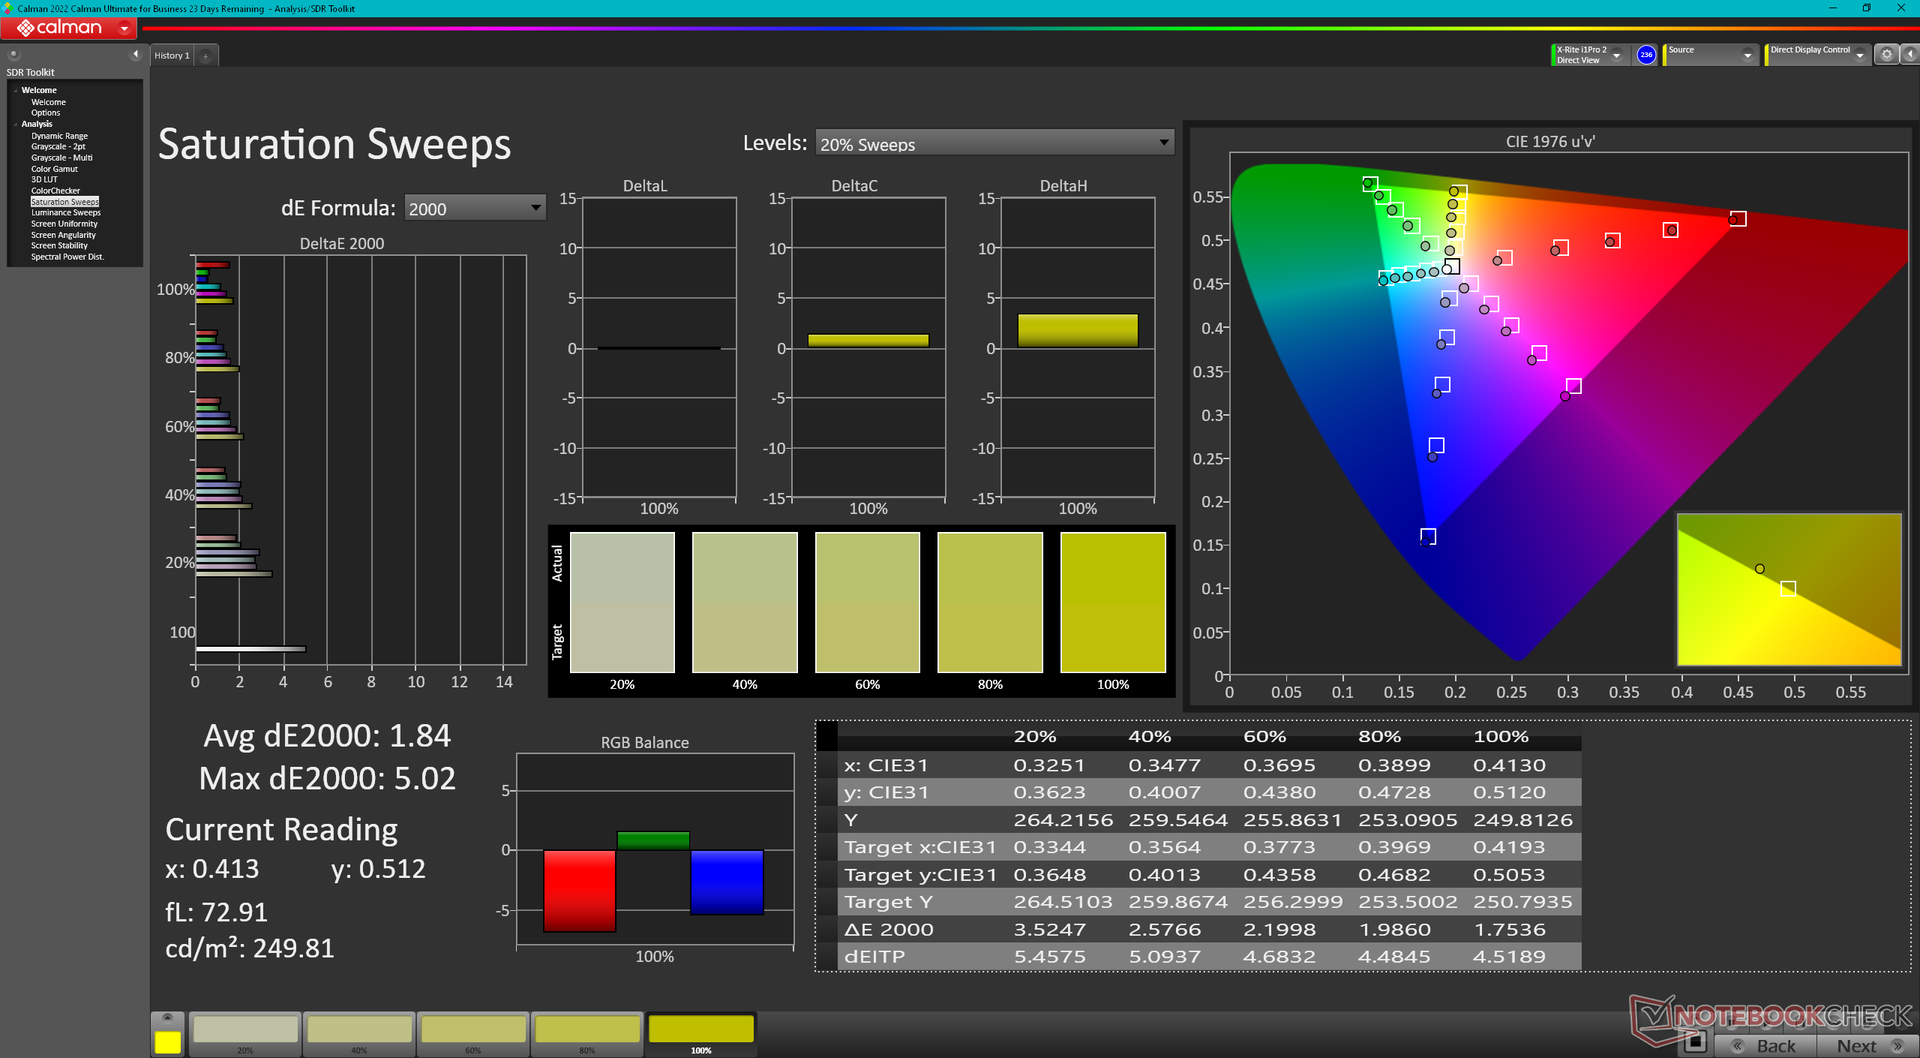
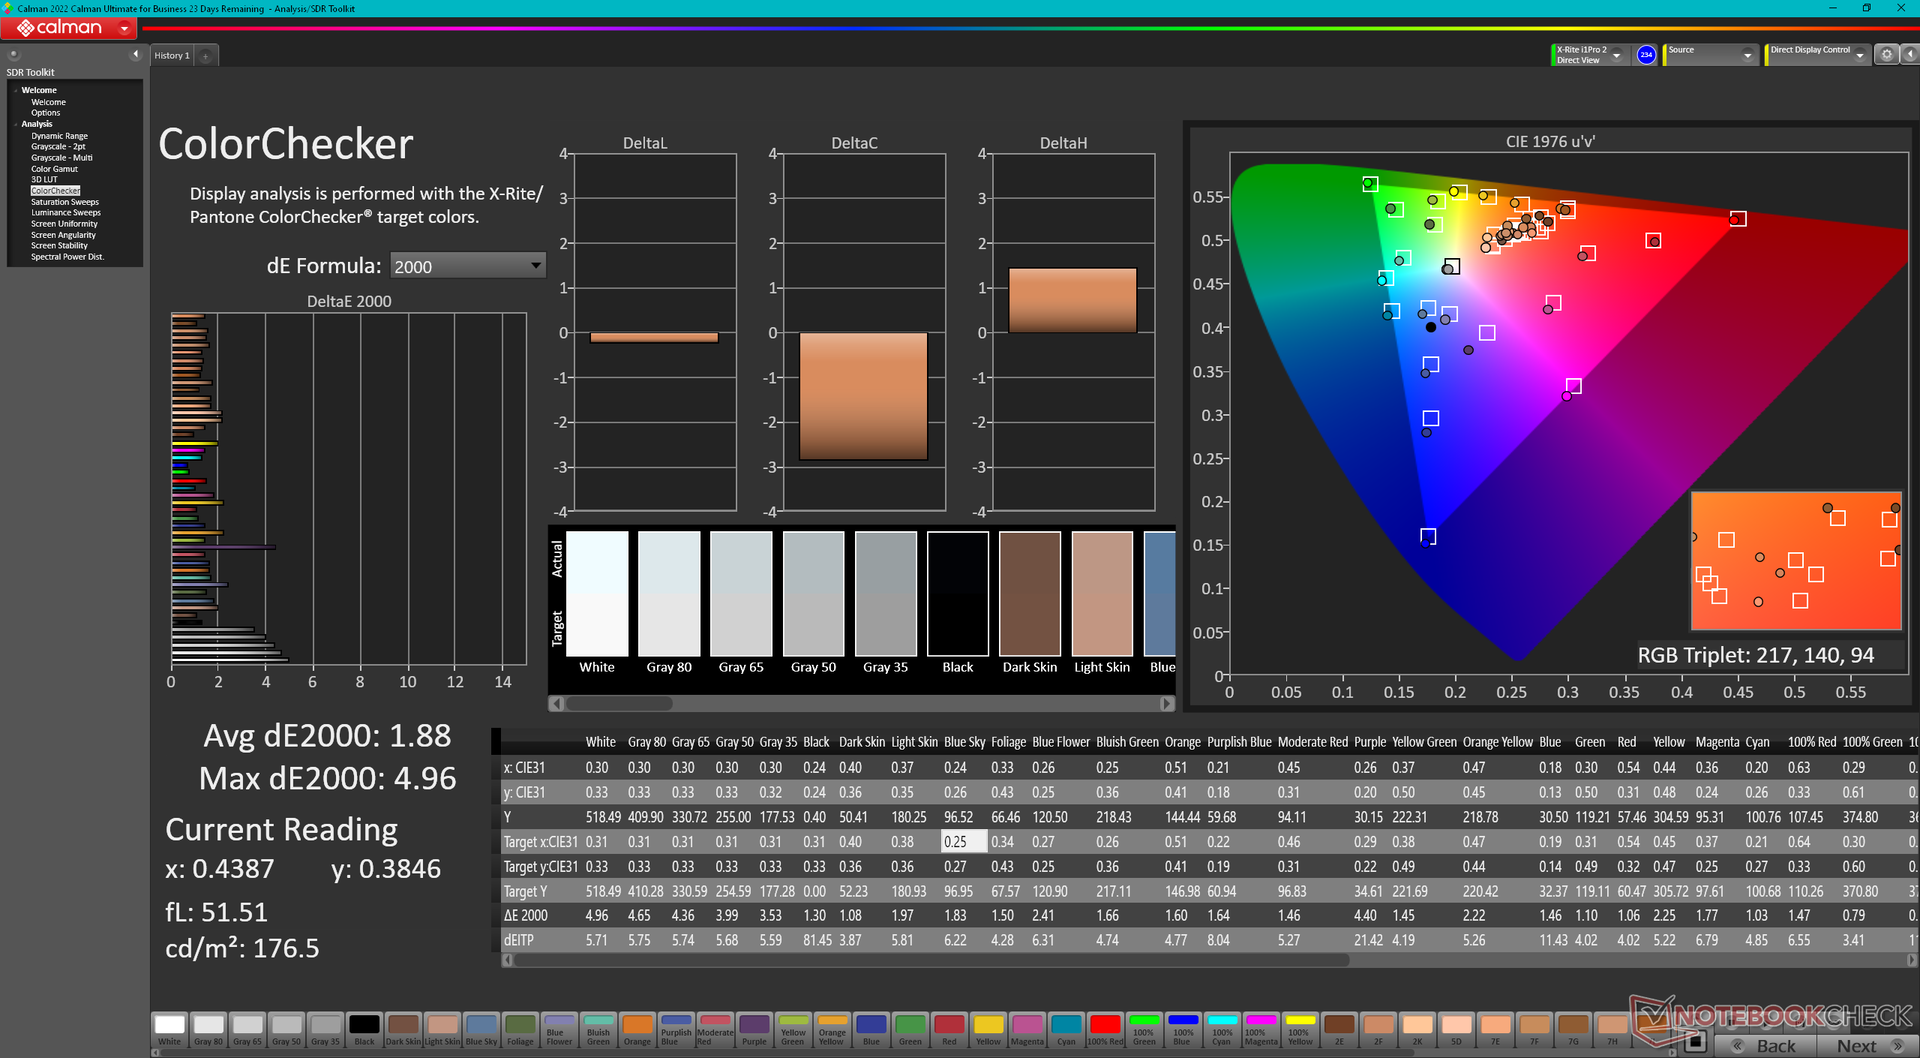
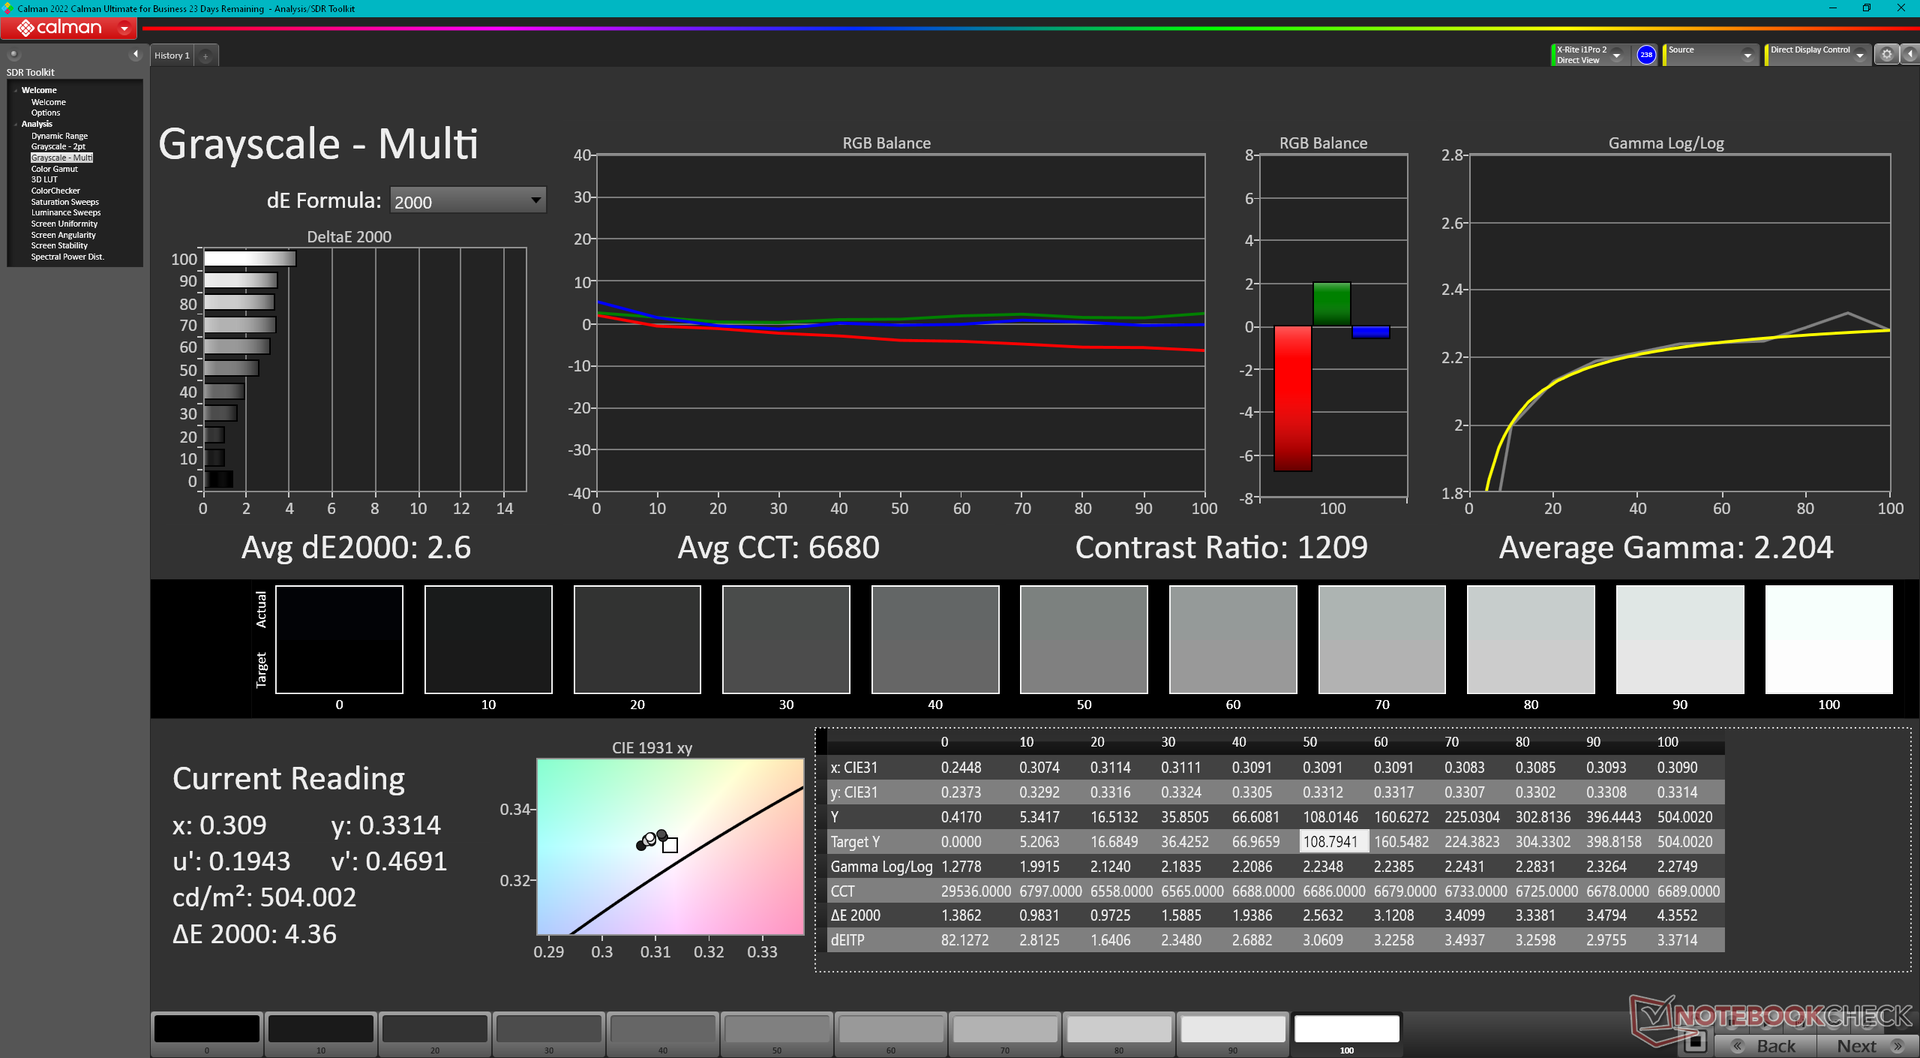
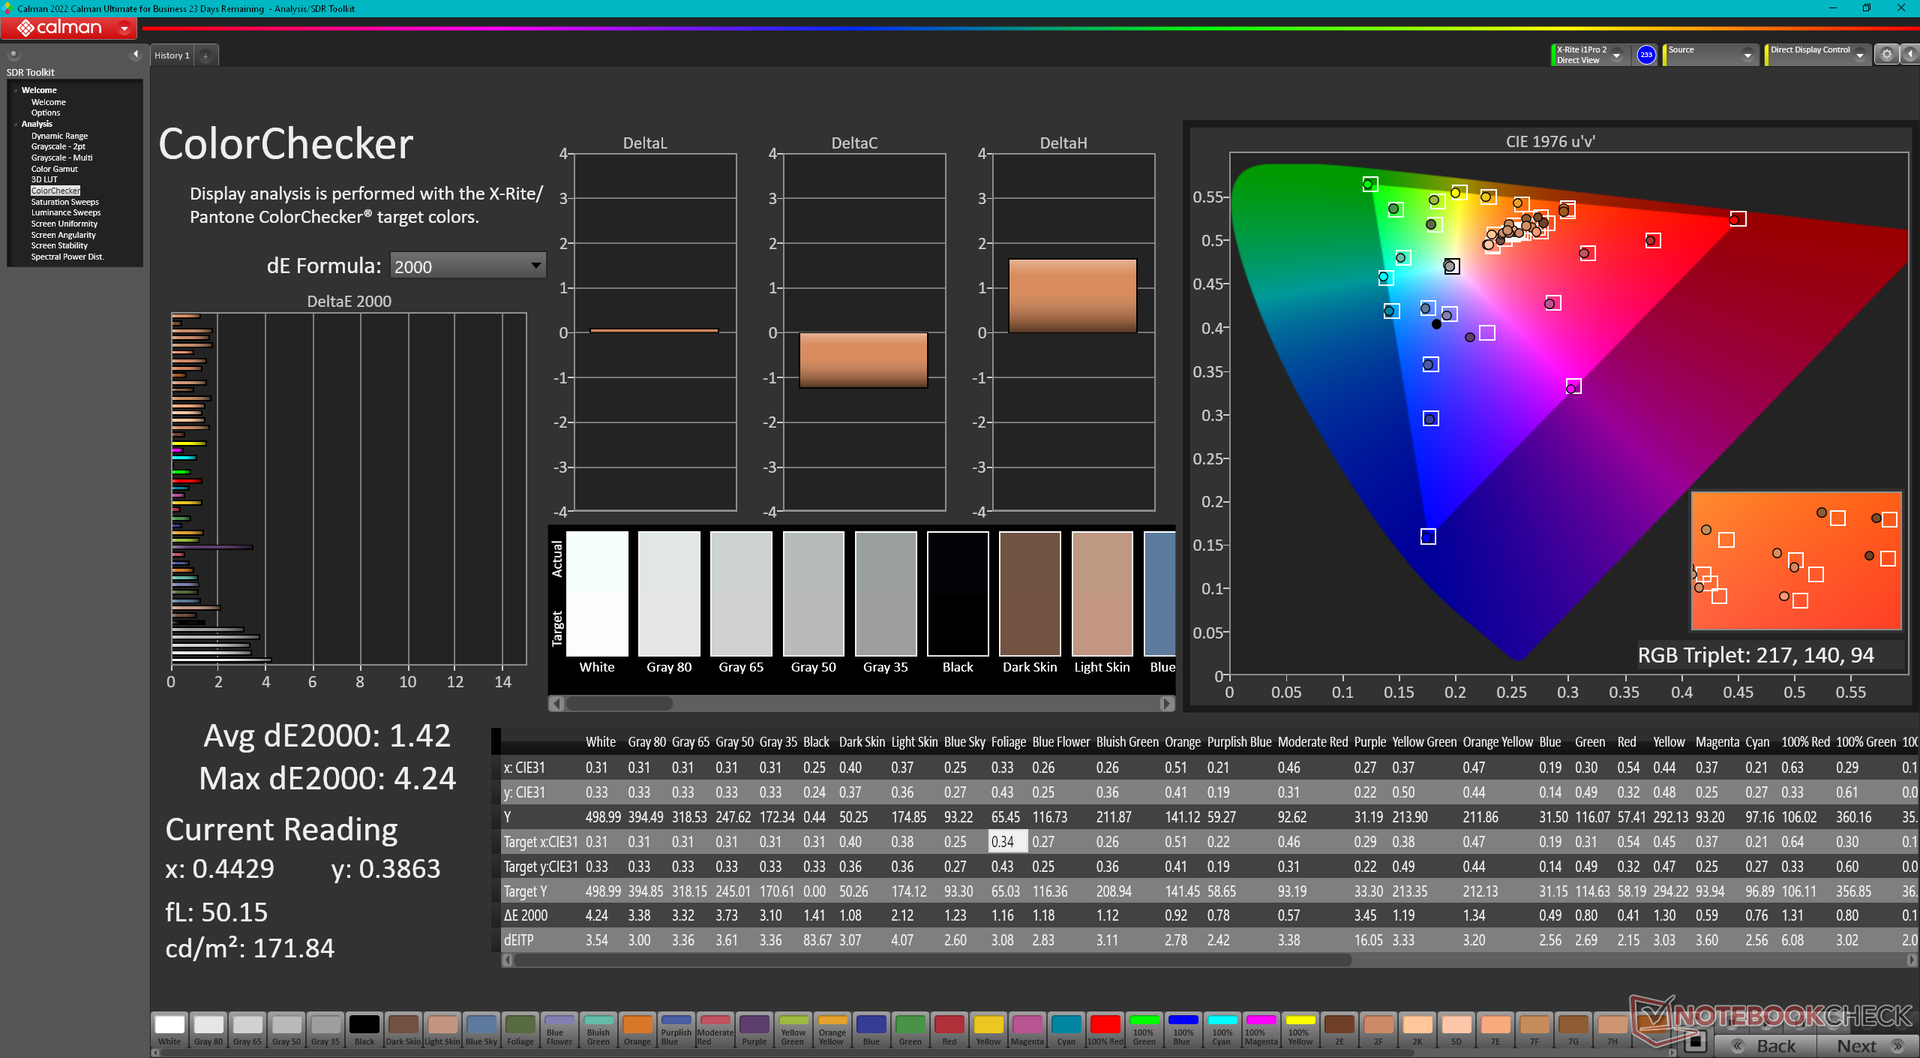
ΔE Color 1.88 | 0.5-29.43 Ø4.87, calibrated: 1.42
ΔE Greyscale 3.3 | 0.5-98 Ø5.1
69.2% AdobeRGB 1998 (Argyll 2.2.0 3D)
98.2% sRGB (Argyll 2.2.0 3D)
67.3% Display P3 (Argyll 2.2.0 3D)
Gamma: 2.24
| Maingear ML-16 MK2 TL160ADMP11-0, IPS, 2560x1600, 16", 240 Hz | Asus ROG Zephyrus G16 GA605WV ATNA60DL04-0, OLED, 2560x1600, 16", 240 Hz | HP Victus 16 (2024) Chi Mei CMN163E, IPS, 1920x1080, 16.1", 144 Hz | Alienware x16 R2 P120F BOE B160QAN, IPS, 2560x1600, 16", 240 Hz | Lenovo Legion Pro 5 16IRX9 BOE NE160QDM-NYC, IPS, 2560x1600, 16", 165 Hz | Razer Blade 16 2024, RTX 4090 Samsung SDC41AB (ATNA60DL03-0), OLED, 2560x1600, 16", 240 Hz | |
|---|---|---|---|---|---|---|
| Display | 30% | -38% | 25% | 2% | 29% | |
| Display P3 Coverage | 67.3 | 99.9 48% | 41.3 -39% | 98.3 46% | 69.3 3% | 99.1 47% |
| sRGB Coverage | 98.2 | 100 2% | 61.7 -37% | 100 2% | 99.4 1% | 99.9 2% |
| AdobeRGB 1998 Coverage | 69.2 | 96.9 40% | 42.7 -38% | 88.8 28% | 70.1 1% | 95.6 38% |
| Response Times | 98% | -117% | 42% | 4% | 97% | |
| Response Time Grey 50% / Grey 80% * | 12.5 ? | 0.22 ? 98% | 28.6 ? -129% | 3.9 ? 69% | 11.9 ? 5% | 0.24 ? 98% |
| Response Time Black / White * | 9.1 ? | 0.25 ? 97% | 18.7 ? -105% | 7.8 ? 14% | 8.9 ? 2% | 0.4 ? 96% |
| PWM Frequency | 960 | 960 | ||||
| Screen | 11% | -79% | -3% | 14% | 193% | |
| Brightness middle | 518.2 | 416 -20% | 287 -45% | 348.4 -33% | 384 -26% | 418 -19% |
| Brightness | 487 | 418 -14% | 288 -41% | 340 -30% | 366 -25% | 420 -14% |
| Brightness Distribution | 90 | 96 7% | 86 -4% | 90 0% | 91 1% | 98 9% |
| Black Level * | 0.4 | 0.19 52% | 0.33 17% | 0.35 12% | 0.02 95% | |
| Contrast | 1296 | 1511 17% | 1056 -19% | 1097 -15% | 20900 1513% | |
| Colorchecker dE 2000 * | 1.88 | 1.6 15% | 5.46 -190% | 2.68 -43% | 0.97 48% | 1.07 43% |
| Colorchecker dE 2000 max. * | 4.96 | 2.1 58% | 20.36 -310% | 4.14 17% | 3.57 28% | 4.04 19% |
| Colorchecker dE 2000 calibrated * | 1.42 | 3.52 -148% | 0.42 70% | 0.77 46% | 1.07 25% | |
| Greyscale dE 2000 * | 3.3 | 2.7 18% | 4.8 -45% | 3.4 -3% | 1.5 55% | 1.12 66% |
| Gamma | 2.24 98% | 2.16 102% | 2.108 104% | 2.41 91% | 2.24 98% | 2.29 96% |
| CCT | 7081 92% | 6331 103% | 6442 101% | 6083 107% | 6709 97% | 6417 101% |
| Média Total (Programa/Configurações) | 46% /
32% | -78% /
-76% | 21% /
10% | 7% /
10% | 106% /
144% |
* ... menor é melhor
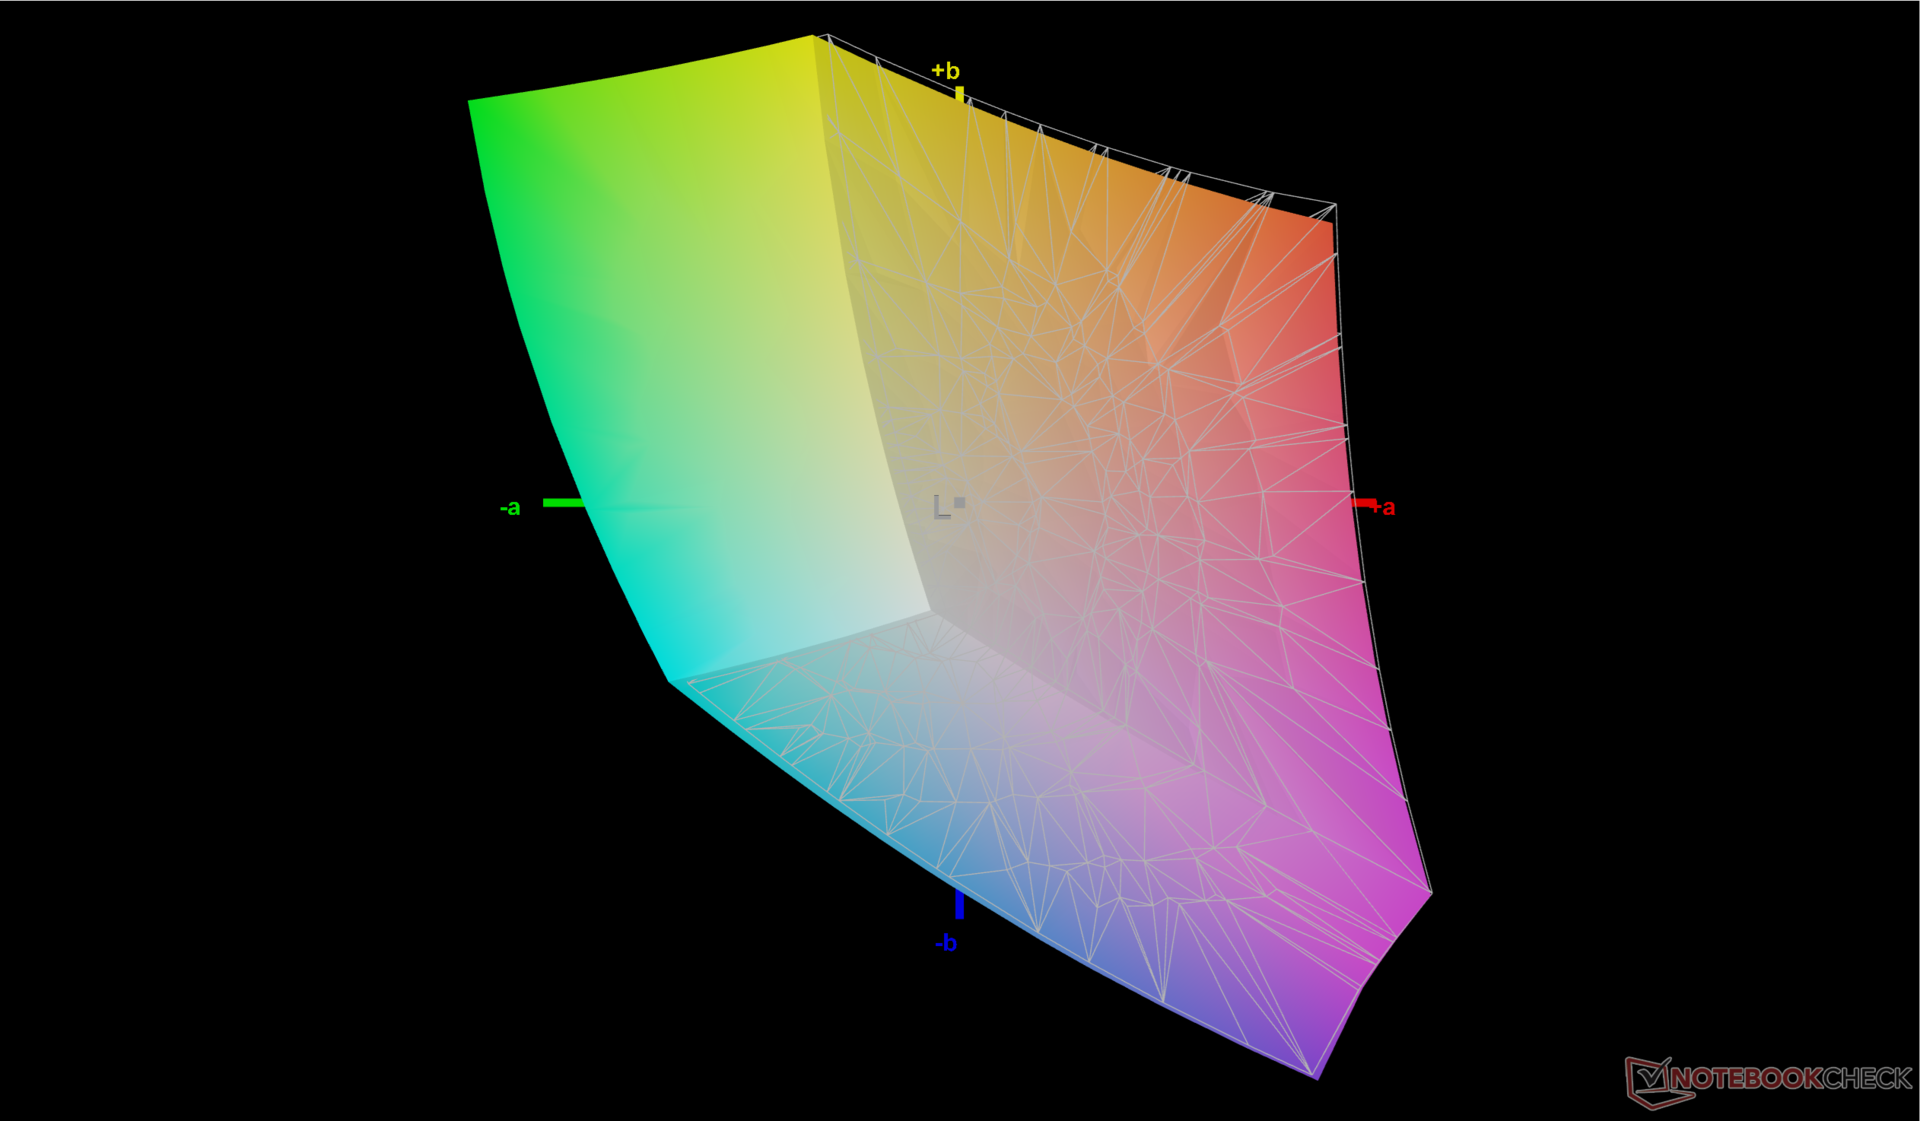
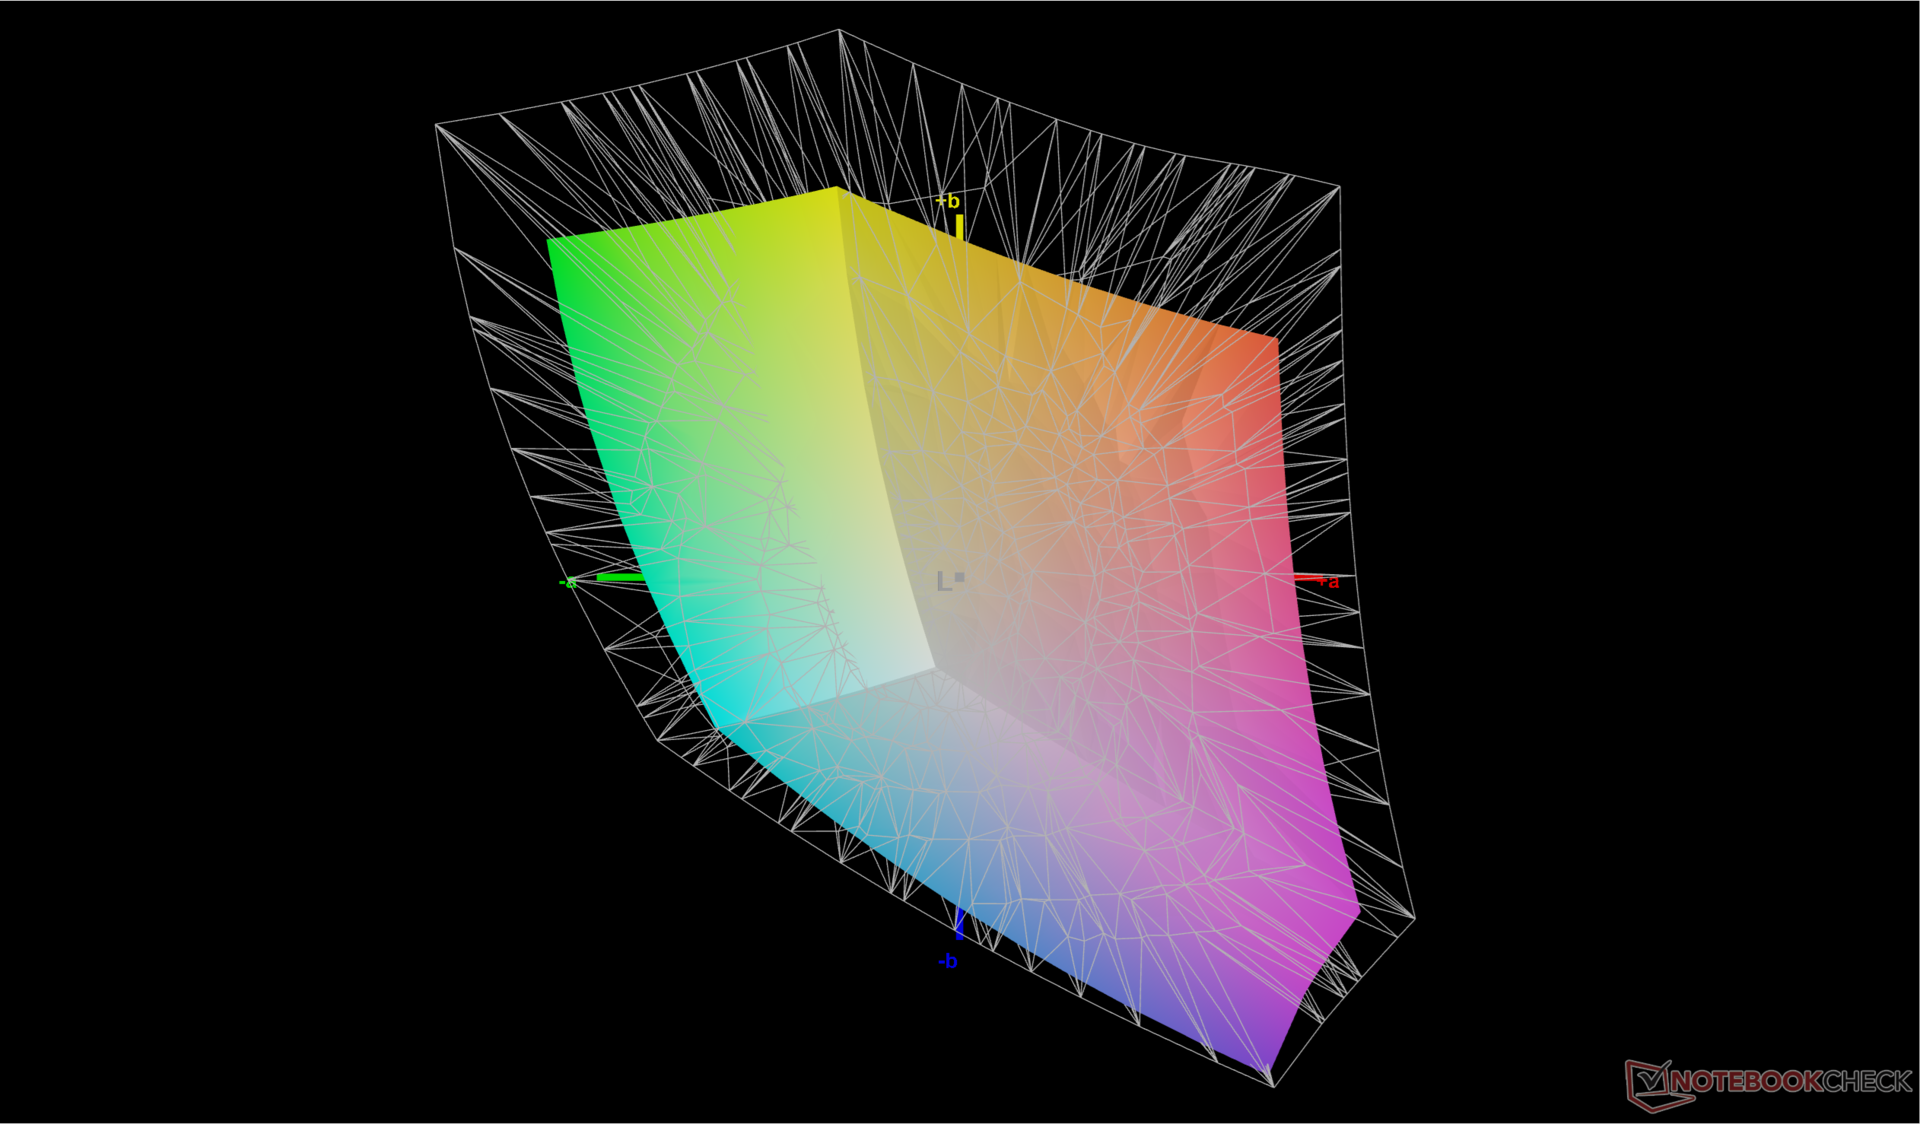
Embora a tela não tenha sido calibrada na fábrica, os valores DeltaE médios de escala de cinza e de cores são muito bons, com 3,3 e 1,8, respectivamente. A temperatura da cor é um pouco fria demais, quase 7100, mas a calibração com nosso colorímetro X-Rite resolve esse problema e melhora um pouco os valores médios do deltaE. Os usuários podem aplicar gratuitamente nosso perfil ICM calibrado acima.

Exibir tempos de resposta
| ↔ Tempo de resposta preto para branco | ||
|---|---|---|
| 9.1 ms ... ascensão ↗ e queda ↘ combinadas | ↗ 5 ms ascensão | 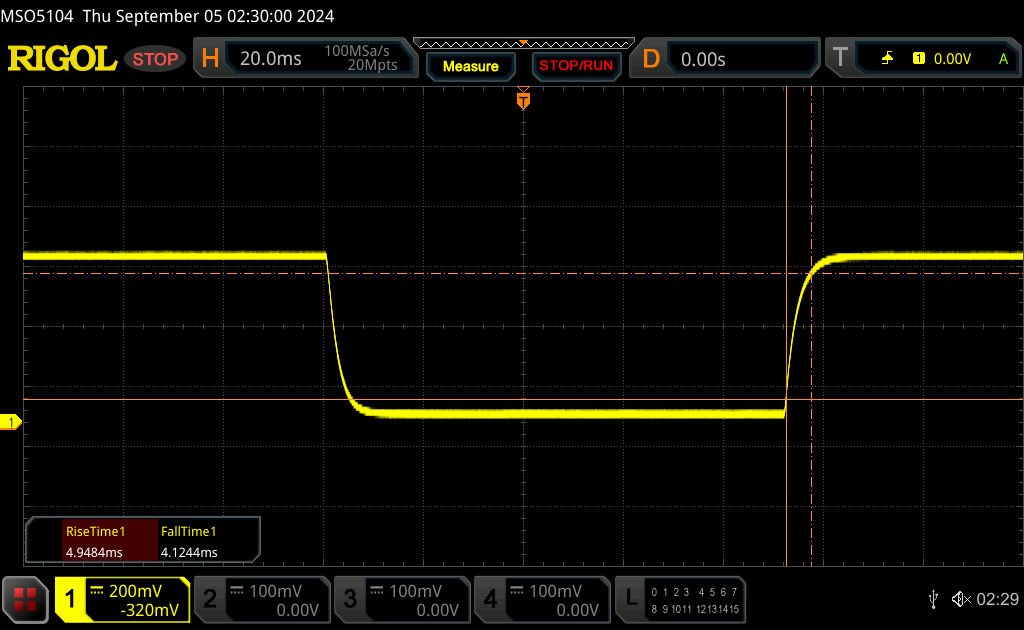 |
| ↘ 4.1 ms queda | ||
| A tela mostra taxas de resposta rápidas em nossos testes e deve ser adequada para jogos. Em comparação, todos os dispositivos testados variam de 0.1 (mínimo) a 240 (máximo) ms. » 23 % de todos os dispositivos são melhores. Isso significa que o tempo de resposta medido é melhor que a média de todos os dispositivos testados (20.8 ms). | ||
| ↔ Tempo de resposta 50% cinza a 80% cinza | ||
| 12.5 ms ... ascensão ↗ e queda ↘ combinadas | ↗ 5.6 ms ascensão | 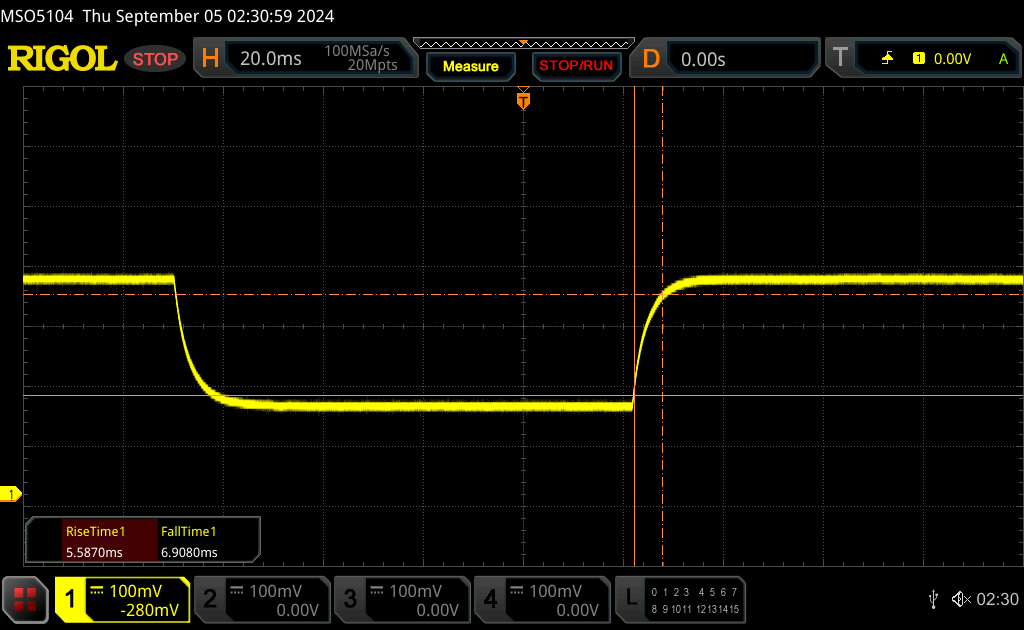 |
| ↘ 6.9 ms queda | ||
| A tela mostra boas taxas de resposta em nossos testes, mas pode ser muito lenta para jogadores competitivos. Em comparação, todos os dispositivos testados variam de 0.165 (mínimo) a 636 (máximo) ms. » 23 % de todos os dispositivos são melhores. Isso significa que o tempo de resposta medido é melhor que a média de todos os dispositivos testados (32.5 ms). | ||
Cintilação da tela / PWM (modulação por largura de pulso)
| Tela tremeluzindo / PWM não detectado |  | ||
[pwm_comparison] Em comparação: 53 % de todos os dispositivos testados não usam PWM para escurecer a tela. Se PWM foi detectado, uma média de 8516 (mínimo: 5 - máximo: 343500) Hz foi medida. | |||
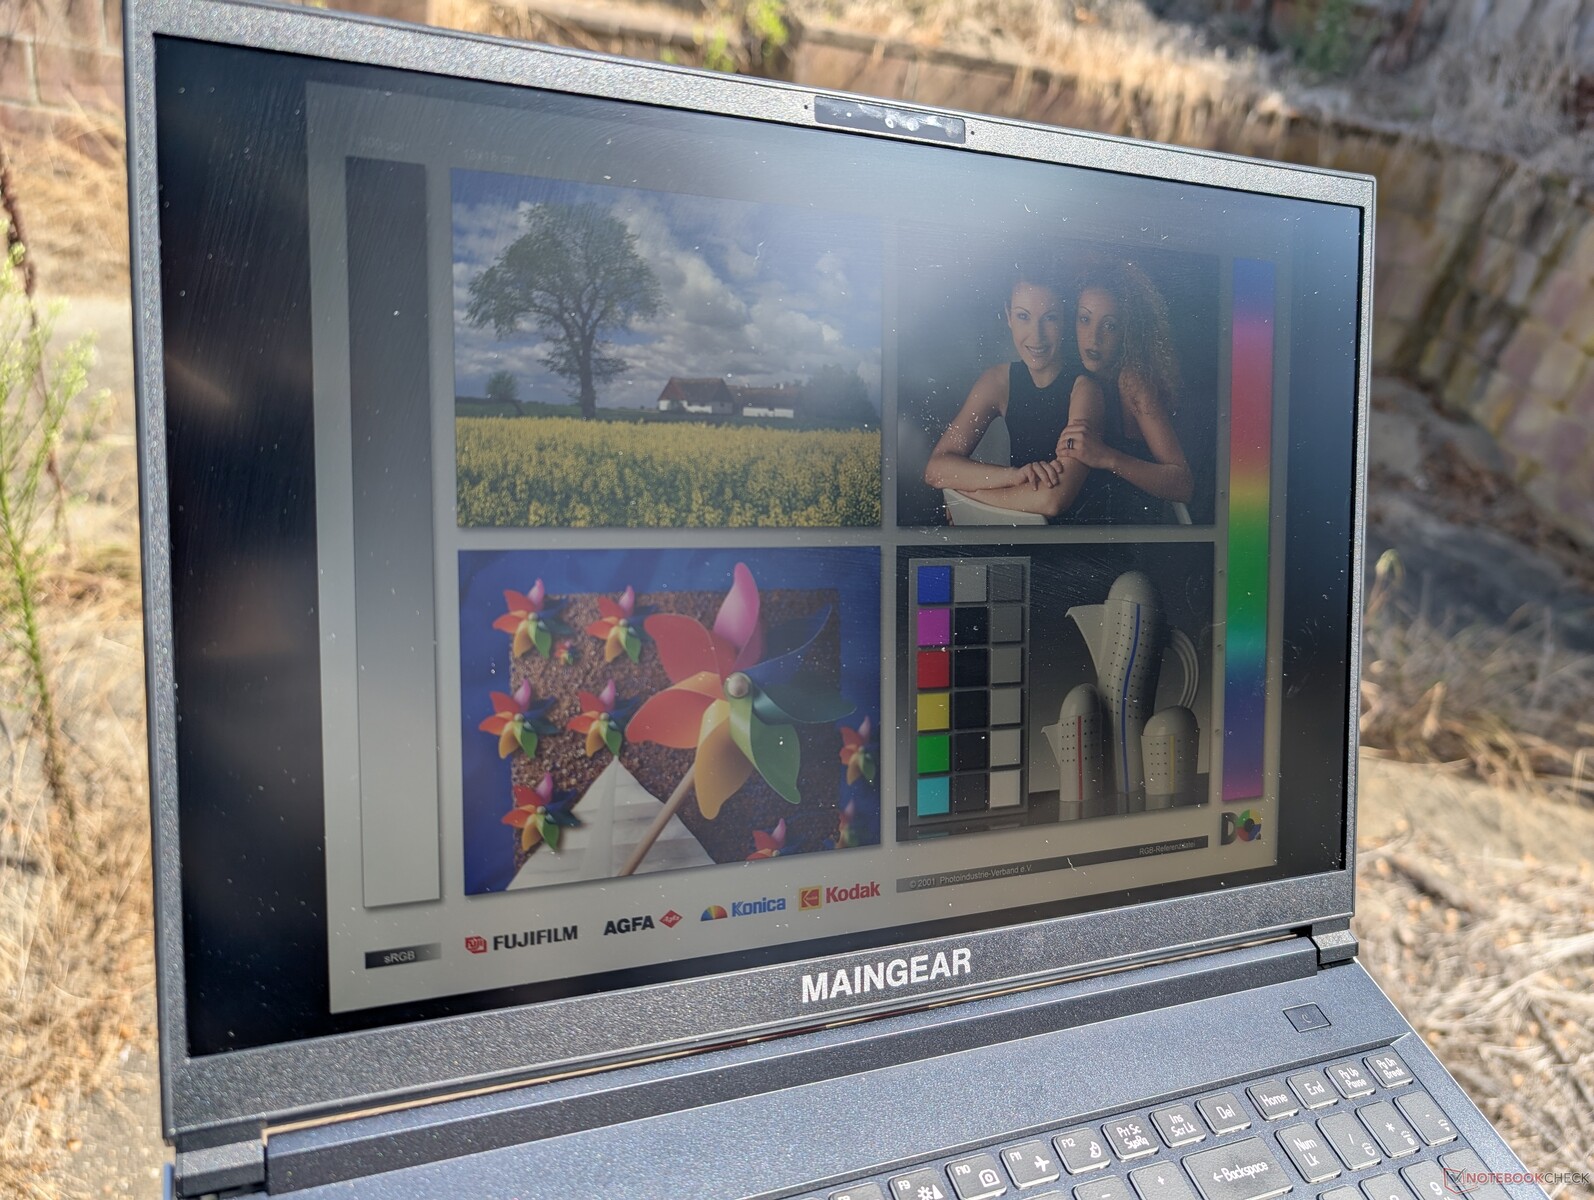
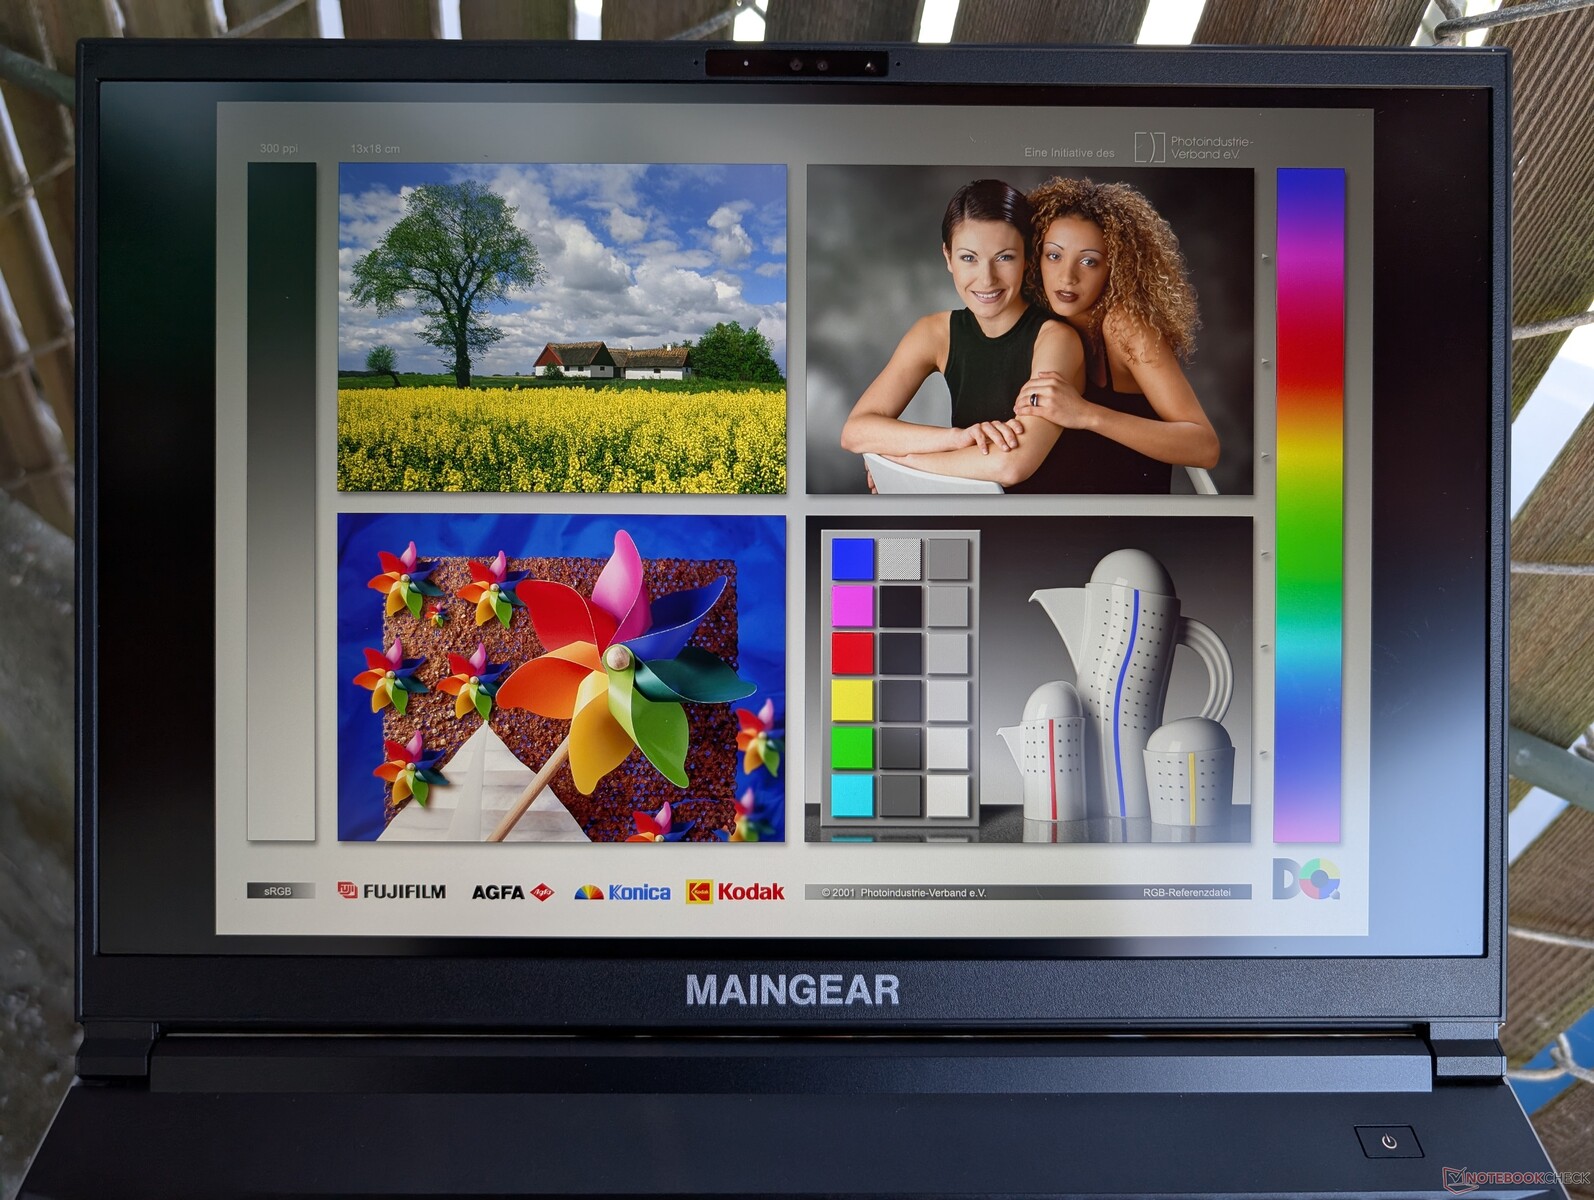
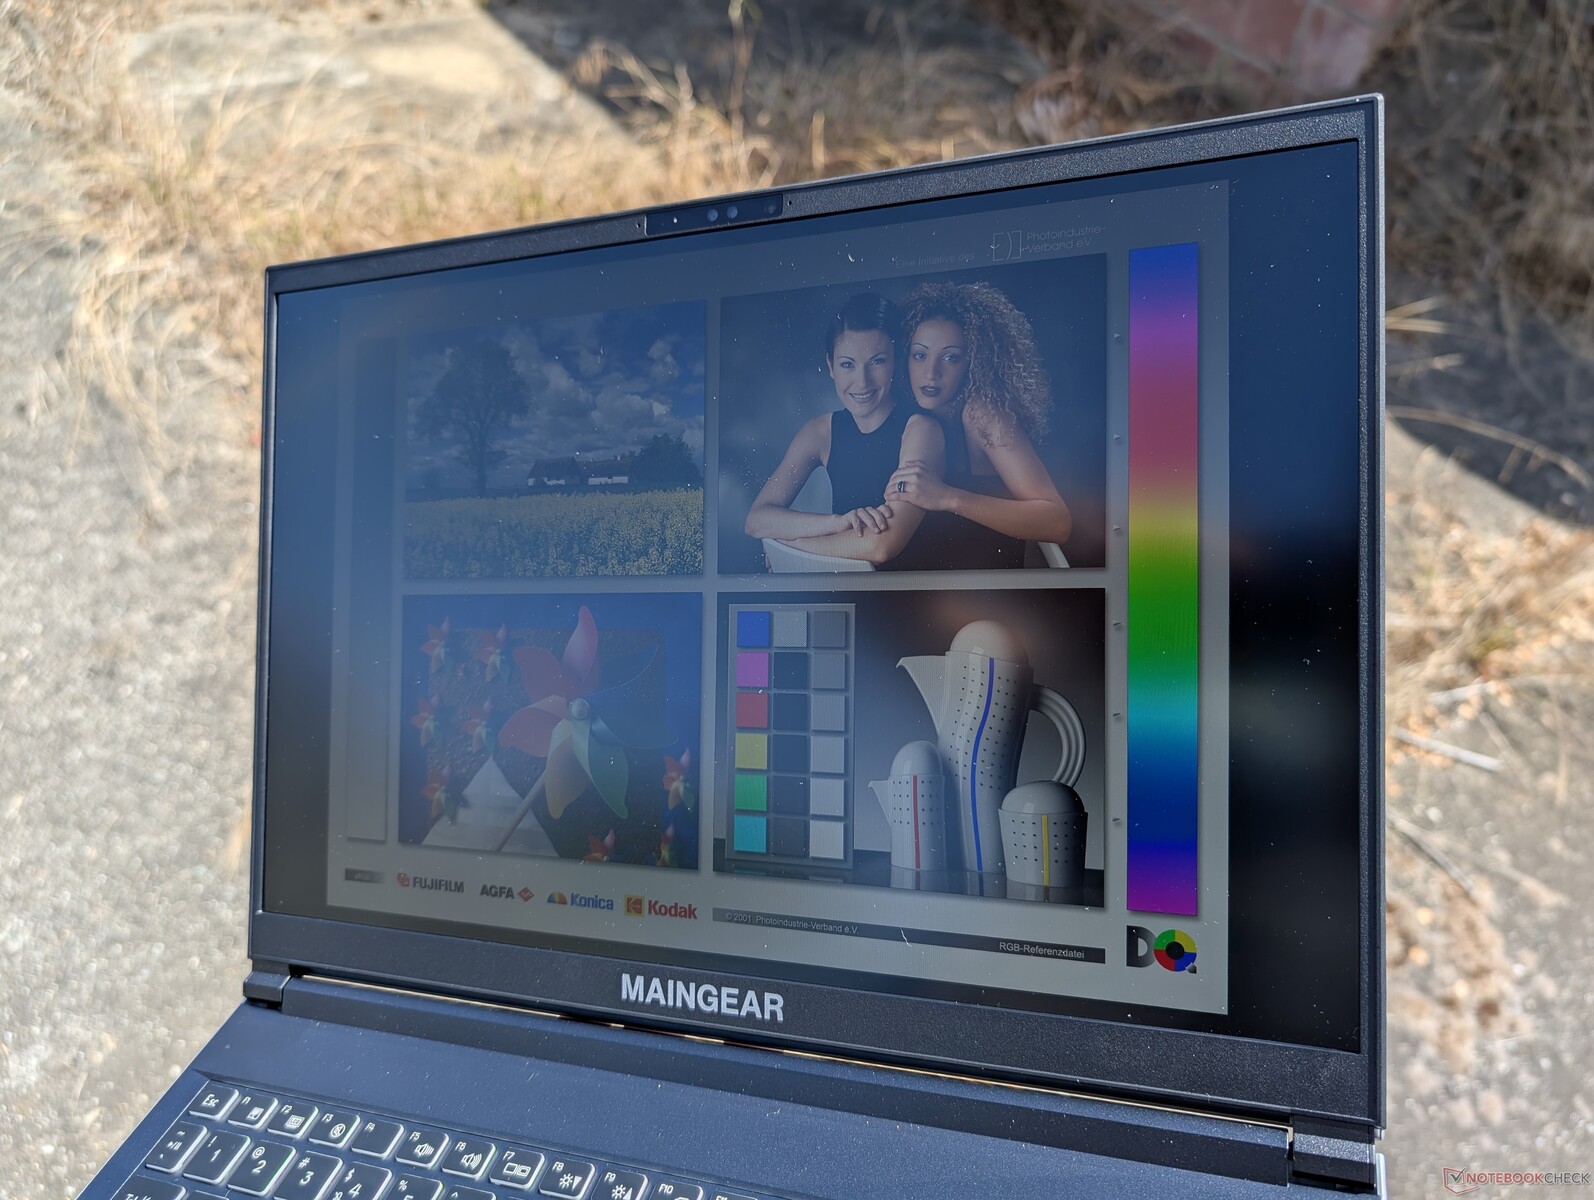
A visibilidade em ambientes externos é melhor do que a maioria dos outros notebooks para jogos de 16 polegadas devido à luz de fundo relativamente brilhante de 500 nit. O Victus 16alienware x16 R2 e Blade 16, por exemplo, atingem apenas 400 nits ou mesmo apenas 300 nits para serem visivelmente mais escuros. Mesmo assim, o senhor deve evitar a luz solar direta para preservar as cores o máximo possível.

Desempenho - Atualização do Meteor Lake em vez do Raptor Lake
Condições de teste
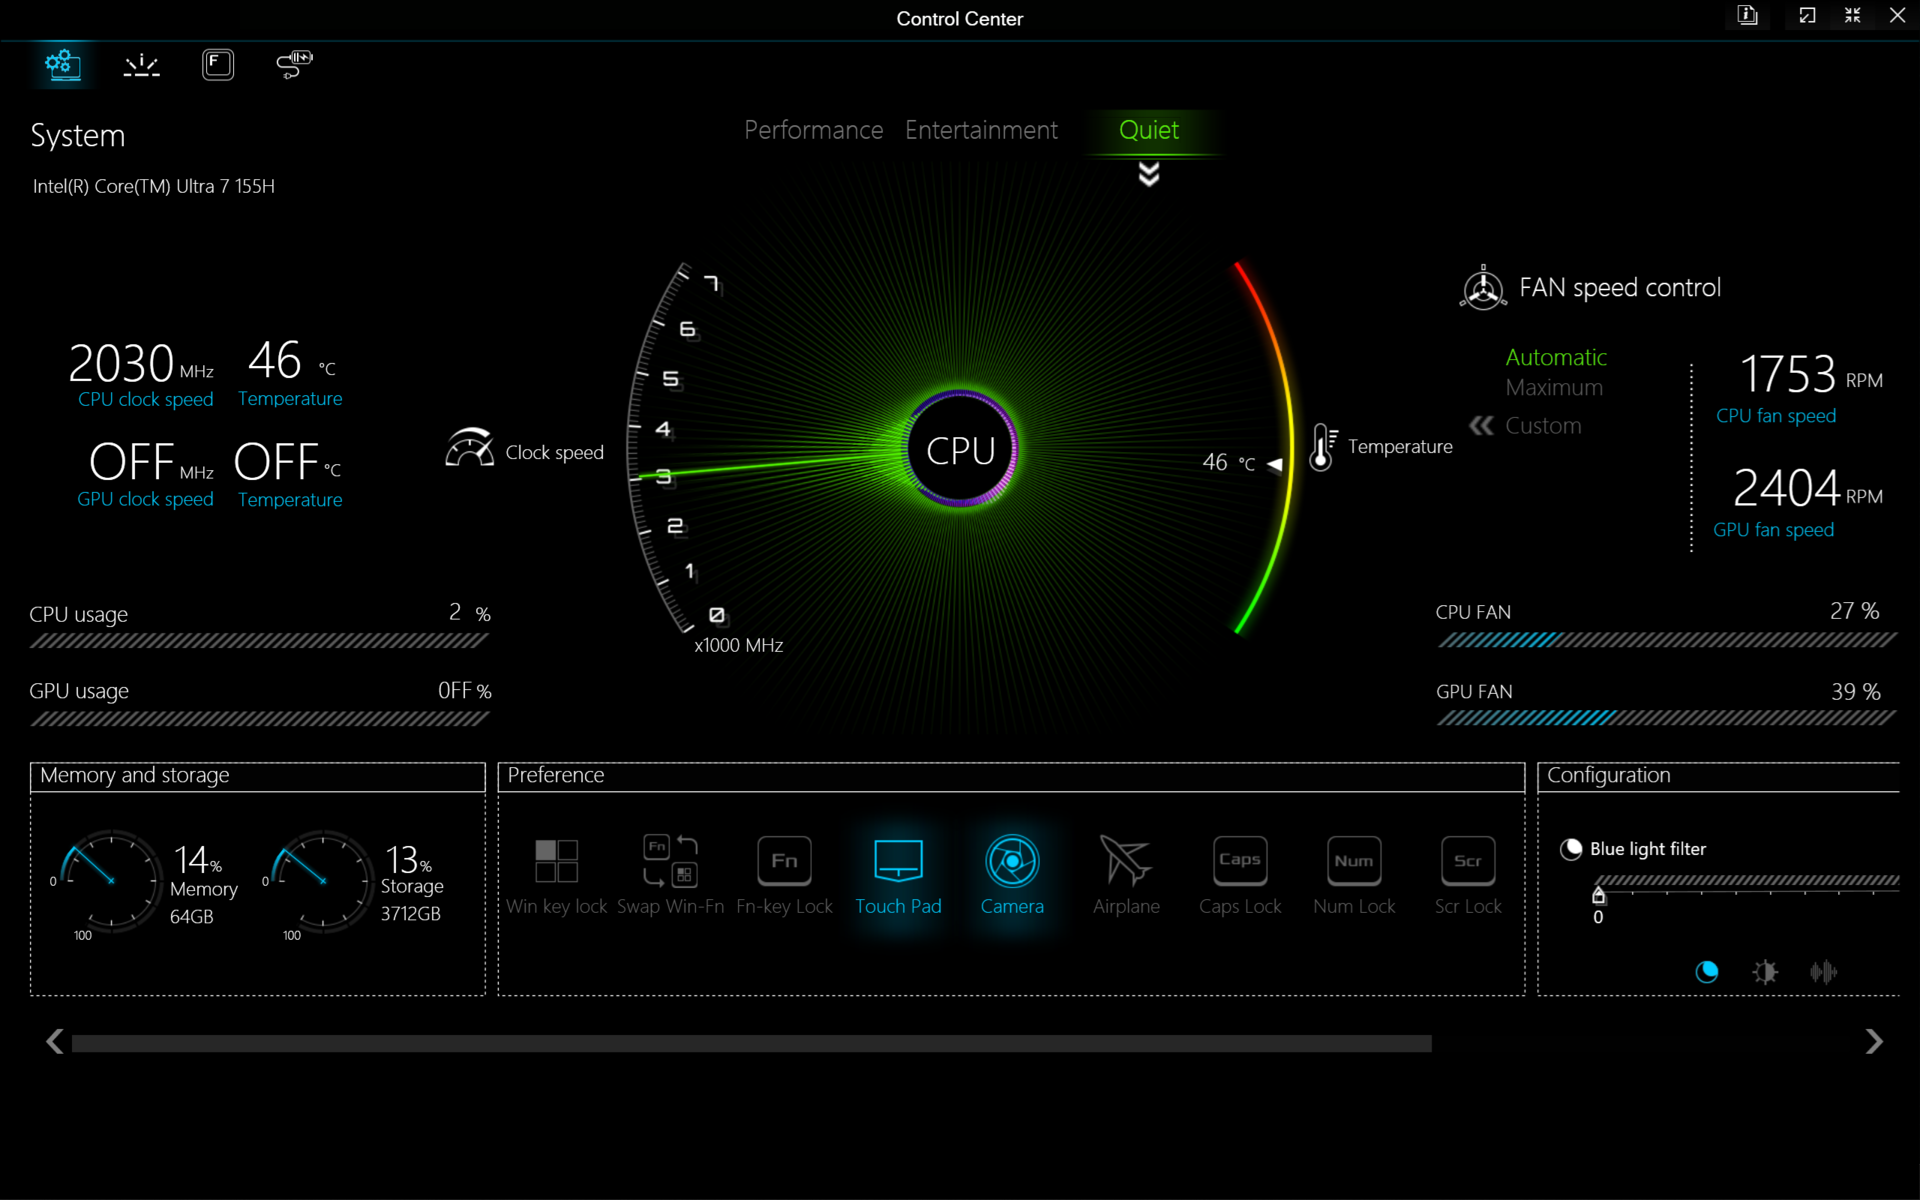
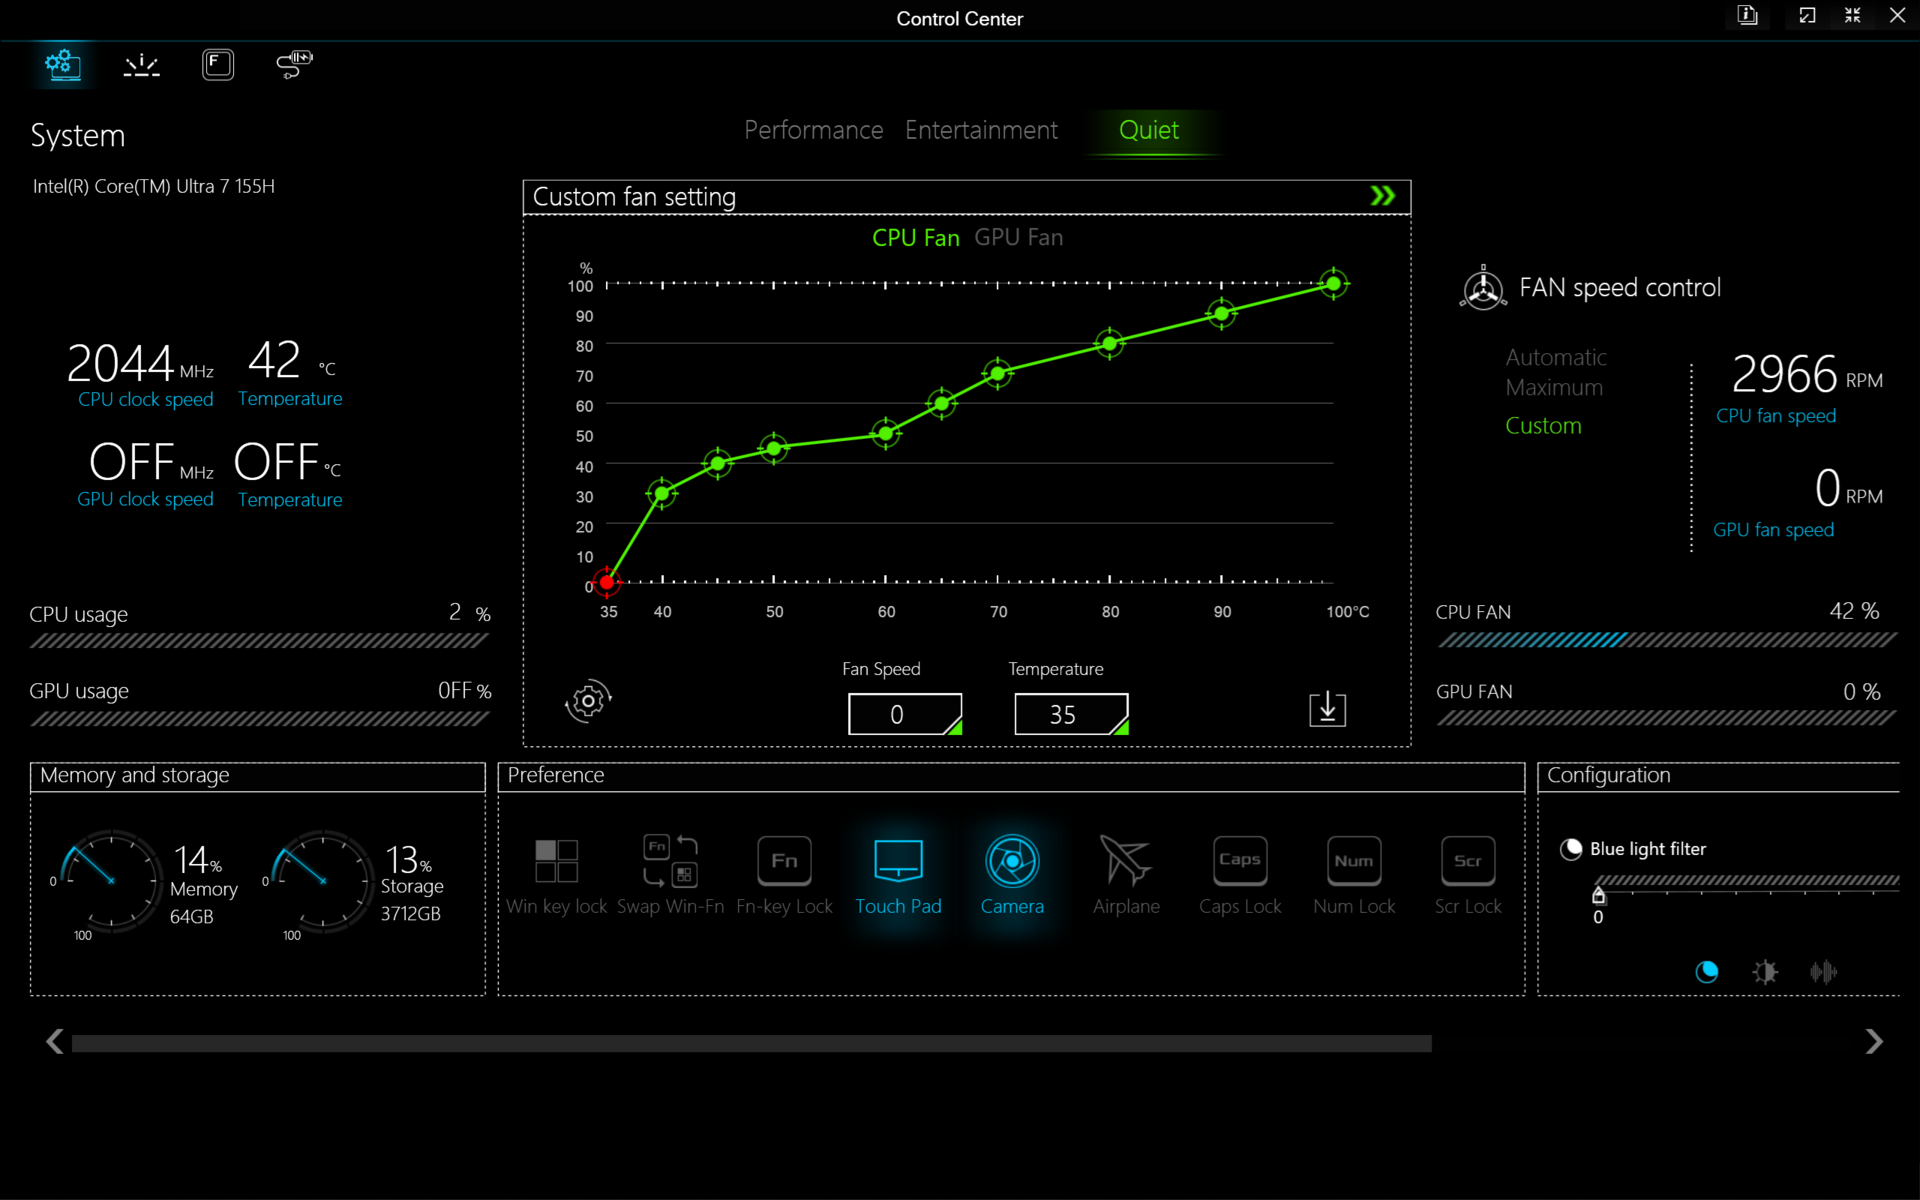
Definimos o Windows e o Control Center para o modo Performance antes de executar os benchmarks abaixo. Os proprietários devem se familiarizar com o software Control Center pré-instalado, pois ele é o centro de ajuste dos principais recursos, incluindo o comportamento da ventoinha, o obturador eletrônico da câmera, as teclas RGB e a chave MUX manual da GPU. Observe que este último está irritantemente oculto em um submenu que requer cliques adicionais para ser acessado.
Somente o Optimus e o MUX padrão são suportados, sem o Optimus avançado. Portanto, é necessário reiniciar o computador ao alternar entre os modos dGPU e MSHybrid.

Processador
O Core Ultra 7 155H sucede o Core i7-13700Hmas o aumento de desempenho é relativamente marginal, de apenas 5 a 15%. Isso se deve ao fato de a nova plataforma Meteor Lake reservar grande parte do espaço de sua matriz para a nova NPU integrada e, portanto, os benefícios do desempenho bruto ficaram em segundo plano este ano. O Core i7-14700HX teria aumentado o desempenho bruto de forma muito mais significativa do que o Core Ultra 7 155H, mas também é um processador que consome mais energia.
Infelizmente, a NPU integrada é de uso muito limitado, pois não é compatível com o Co-Pilot+; o serviço da Microsoft exige pelo menos um processador Lunar Lake ou o equivalente da AMD/Qualcomm. A maioria dos jogos também ainda não utiliza a NPU.
Cinebench R15 Multi Loop
Cinebench R23: Multi Core | Single Core
Cinebench R20: CPU (Multi Core) | CPU (Single Core)
Cinebench R15: CPU Multi 64Bit | CPU Single 64Bit
Blender: v2.79 BMW27 CPU
7-Zip 18.03: 7z b 4 | 7z b 4 -mmt1
Geekbench 6.4: Multi-Core | Single-Core
Geekbench 5.5: Multi-Core | Single-Core
HWBOT x265 Benchmark v2.2: 4k Preset
LibreOffice : 20 Documents To PDF
R Benchmark 2.5: Overall mean
| CPU Performance Rating | |
| Razer Blade 16 2024, RTX 4090 | |
| Asus ROG Zephyrus G16 GA605WV | |
| HP Victus 16 (2024) | |
| Asus TUF Gaming A16 FA617XS -2! | |
| MSI Stealth 16 Mercedes-AMG Motorsport A13VG | |
| Lenovo Legion Slim 7 16APH8 | |
| Dell Inspiron 16 Plus 7630 | |
| HP Victus 16-r0076TX -3! | |
| Alienware x16 R2 P120F | |
| Maingear ML-16 MK2 | |
| Média Intel Core Ultra 7 155H | |
| HP Victus 16-r0077ng | |
| CSL GameStar Notebook VenomGamer G16 | |
| HP Omen 16-n0033dx -2! | |
| Acer Nitro 16 AN16-41-R7YE | |
| Cinebench R23 / Multi Core | |
| Razer Blade 16 2024, RTX 4090 | |
| HP Victus 16 (2024) | |
| Asus ROG Zephyrus G16 GA605WV | |
| MSI Stealth 16 Mercedes-AMG Motorsport A13VG | |
| Alienware x16 R2 P120F | |
| HP Victus 16-r0076TX | |
| Maingear ML-16 MK2 | |
| Asus TUF Gaming A16 FA617XS | |
| Lenovo Legion Slim 7 16APH8 | |
| Dell Inspiron 16 Plus 7630 | |
| HP Victus 16-r0077ng | |
| Média Intel Core Ultra 7 155H (9769 - 19007, n=52) | |
| CSL GameStar Notebook VenomGamer G16 | |
| HP Omen 16-n0033dx | |
| Acer Nitro 16 AN16-41-R7YE | |
| Cinebench R23 / Single Core | |
| Razer Blade 16 2024, RTX 4090 | |
| MSI Stealth 16 Mercedes-AMG Motorsport A13VG | |
| Asus ROG Zephyrus G16 GA605WV | |
| Dell Inspiron 16 Plus 7630 | |
| Asus TUF Gaming A16 FA617XS | |
| Lenovo Legion Slim 7 16APH8 | |
| Média Intel Core Ultra 7 155H (1496 - 1815, n=52) | |
| HP Victus 16 (2024) | |
| HP Victus 16-r0076TX | |
| HP Victus 16-r0077ng | |
| Maingear ML-16 MK2 | |
| Alienware x16 R2 P120F | |
| CSL GameStar Notebook VenomGamer G16 | |
| HP Omen 16-n0033dx | |
| Acer Nitro 16 AN16-41-R7YE | |
| Cinebench R20 / CPU (Multi Core) | |
| Razer Blade 16 2024, RTX 4090 | |
| HP Victus 16 (2024) | |
| Asus ROG Zephyrus G16 GA605WV | |
| MSI Stealth 16 Mercedes-AMG Motorsport A13VG | |
| Alienware x16 R2 P120F | |
| HP Victus 16-r0076TX | |
| Maingear ML-16 MK2 | |
| Asus TUF Gaming A16 FA617XS | |
| Lenovo Legion Slim 7 16APH8 | |
| Dell Inspiron 16 Plus 7630 | |
| HP Victus 16-r0077ng | |
| Média Intel Core Ultra 7 155H (3798 - 7409, n=50) | |
| CSL GameStar Notebook VenomGamer G16 | |
| HP Omen 16-n0033dx | |
| Acer Nitro 16 AN16-41-R7YE | |
| Cinebench R20 / CPU (Single Core) | |
| Razer Blade 16 2024, RTX 4090 | |
| Asus ROG Zephyrus G16 GA605WV | |
| MSI Stealth 16 Mercedes-AMG Motorsport A13VG | |
| Dell Inspiron 16 Plus 7630 | |
| Asus TUF Gaming A16 FA617XS | |
| Lenovo Legion Slim 7 16APH8 | |
| Média Intel Core Ultra 7 155H (601 - 696, n=50) | |
| HP Victus 16 (2024) | |
| HP Victus 16-r0077ng | |
| HP Victus 16-r0076TX | |
| Maingear ML-16 MK2 | |
| Alienware x16 R2 P120F | |
| HP Omen 16-n0033dx | |
| CSL GameStar Notebook VenomGamer G16 | |
| Acer Nitro 16 AN16-41-R7YE | |
| Cinebench R15 / CPU Multi 64Bit | |
| Razer Blade 16 2024, RTX 4090 | |
| HP Victus 16 (2024) | |
| Asus ROG Zephyrus G16 GA605WV | |
| MSI Stealth 16 Mercedes-AMG Motorsport A13VG | |
| HP Victus 16-r0076TX | |
| Alienware x16 R2 P120F | |
| Maingear ML-16 MK2 | |
| Asus TUF Gaming A16 FA617XS | |
| Lenovo Legion Slim 7 16APH8 | |
| Média Intel Core Ultra 7 155H (1932 - 2880, n=56) | |
| Dell Inspiron 16 Plus 7630 | |
| HP Victus 16-r0077ng | |
| CSL GameStar Notebook VenomGamer G16 | |
| HP Omen 16-n0033dx | |
| Acer Nitro 16 AN16-41-R7YE | |
| Cinebench R15 / CPU Single 64Bit | |
| Razer Blade 16 2024, RTX 4090 | |
| Asus ROG Zephyrus G16 GA605WV | |
| Asus TUF Gaming A16 FA617XS | |
| MSI Stealth 16 Mercedes-AMG Motorsport A13VG | |
| Lenovo Legion Slim 7 16APH8 | |
| Dell Inspiron 16 Plus 7630 | |
| CSL GameStar Notebook VenomGamer G16 | |
| Média Intel Core Ultra 7 155H (99.6 - 268, n=52) | |
| HP Victus 16-r0077ng | |
| HP Omen 16-n0033dx | |
| HP Victus 16-r0076TX | |
| Maingear ML-16 MK2 | |
| Acer Nitro 16 AN16-41-R7YE | |
| HP Victus 16 (2024) | |
| Alienware x16 R2 P120F | |
| Blender / v2.79 BMW27 CPU | |
| Acer Nitro 16 AN16-41-R7YE | |
| HP Omen 16-n0033dx | |
| Média Intel Core Ultra 7 155H (175 - 381, n=47) | |
| MSI Stealth 16 Mercedes-AMG Motorsport A13VG | |
| Maingear ML-16 MK2 | |
| Dell Inspiron 16 Plus 7630 | |
| HP Victus 16-r0077ng | |
| CSL GameStar Notebook VenomGamer G16 | |
| Lenovo Legion Slim 7 16APH8 | |
| HP Victus 16-r0076TX | |
| Asus TUF Gaming A16 FA617XS | |
| Alienware x16 R2 P120F | |
| HP Victus 16 (2024) | |
| Asus ROG Zephyrus G16 GA605WV | |
| Razer Blade 16 2024, RTX 4090 | |
| 7-Zip 18.03 / 7z b 4 | |
| Razer Blade 16 2024, RTX 4090 | |
| HP Victus 16 (2024) | |
| Asus ROG Zephyrus G16 GA605WV | |
| HP Victus 16-r0076TX | |
| Lenovo Legion Slim 7 16APH8 | |
| Asus TUF Gaming A16 FA617XS | |
| Alienware x16 R2 P120F | |
| HP Victus 16-r0077ng | |
| Maingear ML-16 MK2 | |
| CSL GameStar Notebook VenomGamer G16 | |
| Dell Inspiron 16 Plus 7630 | |
| Média Intel Core Ultra 7 155H (41739 - 70254, n=50) | |
| HP Omen 16-n0033dx | |
| MSI Stealth 16 Mercedes-AMG Motorsport A13VG | |
| Acer Nitro 16 AN16-41-R7YE | |
| 7-Zip 18.03 / 7z b 4 -mmt1 | |
| Razer Blade 16 2024, RTX 4090 | |
| Asus TUF Gaming A16 FA617XS | |
| Lenovo Legion Slim 7 16APH8 | |
| MSI Stealth 16 Mercedes-AMG Motorsport A13VG | |
| Asus ROG Zephyrus G16 GA605WV | |
| CSL GameStar Notebook VenomGamer G16 | |
| Dell Inspiron 16 Plus 7630 | |
| Acer Nitro 16 AN16-41-R7YE | |
| HP Omen 16-n0033dx | |
| HP Victus 16 (2024) | |
| HP Victus 16-r0077ng | |
| HP Victus 16-r0076TX | |
| Média Intel Core Ultra 7 155H (4594 - 5621, n=50) | |
| Maingear ML-16 MK2 | |
| Alienware x16 R2 P120F | |
| Geekbench 6.4 / Multi-Core | |
| Razer Blade 16 2024, RTX 4090 | |
| Asus ROG Zephyrus G16 GA605WV | |
| HP Victus 16 (2024) | |
| Dell Inspiron 16 Plus 7630 | |
| Lenovo Legion Slim 7 16APH8 | |
| Alienware x16 R2 P120F | |
| Média Intel Core Ultra 7 155H (7732 - 13656, n=55) | |
| MSI Stealth 16 Mercedes-AMG Motorsport A13VG | |
| Maingear ML-16 MK2 | |
| HP Victus 16-r0077ng | |
| CSL GameStar Notebook VenomGamer G16 | |
| Acer Nitro 16 AN16-41-R7YE | |
| Geekbench 6.4 / Single-Core | |
| Razer Blade 16 2024, RTX 4090 | |
| Asus ROG Zephyrus G16 GA605WV | |
| MSI Stealth 16 Mercedes-AMG Motorsport A13VG | |
| Dell Inspiron 16 Plus 7630 | |
| Lenovo Legion Slim 7 16APH8 | |
| HP Victus 16-r0077ng | |
| HP Victus 16 (2024) | |
| Média Intel Core Ultra 7 155H (1901 - 2473, n=52) | |
| Maingear ML-16 MK2 | |
| Alienware x16 R2 P120F | |
| CSL GameStar Notebook VenomGamer G16 | |
| Acer Nitro 16 AN16-41-R7YE | |
| Geekbench 5.5 / Multi-Core | |
| Razer Blade 16 2024, RTX 4090 | |
| HP Victus 16 (2024) | |
| Asus ROG Zephyrus G16 GA605WV | |
| Dell Inspiron 16 Plus 7630 | |
| Alienware x16 R2 P120F | |
| HP Victus 16-r0076TX | |
| Maingear ML-16 MK2 | |
| Asus TUF Gaming A16 FA617XS | |
| Média Intel Core Ultra 7 155H (10017 - 13556, n=52) | |
| Lenovo Legion Slim 7 16APH8 | |
| HP Victus 16-r0077ng | |
| MSI Stealth 16 Mercedes-AMG Motorsport A13VG | |
| CSL GameStar Notebook VenomGamer G16 | |
| HP Omen 16-n0033dx | |
| Acer Nitro 16 AN16-41-R7YE | |
| Geekbench 5.5 / Single-Core | |
| Razer Blade 16 2024, RTX 4090 | |
| Asus ROG Zephyrus G16 GA605WV | |
| Asus TUF Gaming A16 FA617XS | |
| MSI Stealth 16 Mercedes-AMG Motorsport A13VG | |
| Lenovo Legion Slim 7 16APH8 | |
| Dell Inspiron 16 Plus 7630 | |
| Média Intel Core Ultra 7 155H (1462 - 1824, n=52) | |
| HP Victus 16 (2024) | |
| Alienware x16 R2 P120F | |
| HP Victus 16-r0076TX | |
| HP Victus 16-r0077ng | |
| Maingear ML-16 MK2 | |
| CSL GameStar Notebook VenomGamer G16 | |
| HP Omen 16-n0033dx | |
| Acer Nitro 16 AN16-41-R7YE | |
| HWBOT x265 Benchmark v2.2 / 4k Preset | |
| Razer Blade 16 2024, RTX 4090 | |
| Asus ROG Zephyrus G16 GA605WV | |
| HP Victus 16 (2024) | |
| Asus TUF Gaming A16 FA617XS | |
| Alienware x16 R2 P120F | |
| HP Victus 16-r0076TX | |
| Lenovo Legion Slim 7 16APH8 | |
| CSL GameStar Notebook VenomGamer G16 | |
| Maingear ML-16 MK2 | |
| HP Victus 16-r0077ng | |
| Média Intel Core Ultra 7 155H (9.93 - 21.2, n=50) | |
| HP Omen 16-n0033dx | |
| Dell Inspiron 16 Plus 7630 | |
| MSI Stealth 16 Mercedes-AMG Motorsport A13VG | |
| Acer Nitro 16 AN16-41-R7YE | |
| LibreOffice / 20 Documents To PDF | |
| Lenovo Legion Slim 7 16APH8 | |
| CSL GameStar Notebook VenomGamer G16 | |
| HP Victus 16-r0077ng | |
| HP Omen 16-n0033dx | |
| MSI Stealth 16 Mercedes-AMG Motorsport A13VG | |
| HP Victus 16 (2024) | |
| Asus ROG Zephyrus G16 GA605WV | |
| Média Intel Core Ultra 7 155H (37.5 - 79.2, n=49) | |
| Razer Blade 16 2024, RTX 4090 | |
| Acer Nitro 16 AN16-41-R7YE | |
| Alienware x16 R2 P120F | |
| Dell Inspiron 16 Plus 7630 | |
| Maingear ML-16 MK2 | |
| Asus TUF Gaming A16 FA617XS | |
| R Benchmark 2.5 / Overall mean | |
| Maingear ML-16 MK2 | |
| HP Victus 16-r0077ng | |
| Acer Nitro 16 AN16-41-R7YE | |
| Alienware x16 R2 P120F | |
| HP Omen 16-n0033dx | |
| HP Victus 16 (2024) | |
| HP Victus 16-r0076TX | |
| CSL GameStar Notebook VenomGamer G16 | |
| Média Intel Core Ultra 7 155H (0.4457 - 0.53, n=49) | |
| Lenovo Legion Slim 7 16APH8 | |
| Dell Inspiron 16 Plus 7630 | |
| MSI Stealth 16 Mercedes-AMG Motorsport A13VG | |
| Asus TUF Gaming A16 FA617XS | |
| Asus ROG Zephyrus G16 GA605WV | |
| Razer Blade 16 2024, RTX 4090 | |
Cinebench R23: Multi Core | Single Core
Cinebench R20: CPU (Multi Core) | CPU (Single Core)
Cinebench R15: CPU Multi 64Bit | CPU Single 64Bit
Blender: v2.79 BMW27 CPU
7-Zip 18.03: 7z b 4 | 7z b 4 -mmt1
Geekbench 6.4: Multi-Core | Single-Core
Geekbench 5.5: Multi-Core | Single-Core
HWBOT x265 Benchmark v2.2: 4k Preset
LibreOffice : 20 Documents To PDF
R Benchmark 2.5: Overall mean
* ... menor é melhor
AIDA64: FP32 Ray-Trace | FPU Julia | CPU SHA3 | CPU Queen | FPU SinJulia | FPU Mandel | CPU AES | CPU ZLib | FP64 Ray-Trace | CPU PhotoWorxx
| Performance Rating | |
| Asus ROG Zephyrus G16 GA605WV | |
| Razer Blade 16 2024, RTX 4090 | |
| Lenovo Legion Pro 5 16IRX9 | |
| Alienware x16 R2 P120F | |
| HP Victus 16 (2024) | |
| Maingear ML-16 MK2 | |
| Média Intel Core Ultra 7 155H | |
| AIDA64 / FP32 Ray-Trace | |
| Asus ROG Zephyrus G16 GA605WV | |
| Razer Blade 16 2024, RTX 4090 | |
| Lenovo Legion Pro 5 16IRX9 | |
| Alienware x16 R2 P120F | |
| HP Victus 16 (2024) | |
| Maingear ML-16 MK2 | |
| Média Intel Core Ultra 7 155H (6670 - 18470, n=50) | |
| AIDA64 / FPU Julia | |
| Asus ROG Zephyrus G16 GA605WV | |
| Lenovo Legion Pro 5 16IRX9 | |
| Razer Blade 16 2024, RTX 4090 | |
| Alienware x16 R2 P120F | |
| HP Victus 16 (2024) | |
| Maingear ML-16 MK2 | |
| Média Intel Core Ultra 7 155H (40905 - 93181, n=50) | |
| AIDA64 / CPU SHA3 | |
| Lenovo Legion Pro 5 16IRX9 | |
| Razer Blade 16 2024, RTX 4090 | |
| Asus ROG Zephyrus G16 GA605WV | |
| Alienware x16 R2 P120F | |
| HP Victus 16 (2024) | |
| Maingear ML-16 MK2 | |
| Média Intel Core Ultra 7 155H (1940 - 4436, n=50) | |
| AIDA64 / CPU Queen | |
| Lenovo Legion Pro 5 16IRX9 | |
| Razer Blade 16 2024, RTX 4090 | |
| HP Victus 16 (2024) | |
| Alienware x16 R2 P120F | |
| Asus ROG Zephyrus G16 GA605WV | |
| Maingear ML-16 MK2 | |
| Média Intel Core Ultra 7 155H (64698 - 94181, n=50) | |
| AIDA64 / FPU SinJulia | |
| Asus ROG Zephyrus G16 GA605WV | |
| Razer Blade 16 2024, RTX 4090 | |
| Lenovo Legion Pro 5 16IRX9 | |
| HP Victus 16 (2024) | |
| Alienware x16 R2 P120F | |
| Maingear ML-16 MK2 | |
| Média Intel Core Ultra 7 155H (5639 - 10647, n=50) | |
| AIDA64 / FPU Mandel | |
| Asus ROG Zephyrus G16 GA605WV | |
| Razer Blade 16 2024, RTX 4090 | |
| Lenovo Legion Pro 5 16IRX9 | |
| Alienware x16 R2 P120F | |
| HP Victus 16 (2024) | |
| Maingear ML-16 MK2 | |
| Média Intel Core Ultra 7 155H (18236 - 47685, n=50) | |
| AIDA64 / CPU AES | |
| Maingear ML-16 MK2 | |
| Razer Blade 16 2024, RTX 4090 | |
| Lenovo Legion Pro 5 16IRX9 | |
| Alienware x16 R2 P120F | |
| HP Victus 16 (2024) | |
| Asus ROG Zephyrus G16 GA605WV | |
| Média Intel Core Ultra 7 155H (45713 - 152179, n=50) | |
| AIDA64 / CPU ZLib | |
| Lenovo Legion Pro 5 16IRX9 | |
| Razer Blade 16 2024, RTX 4090 | |
| Asus ROG Zephyrus G16 GA605WV | |
| Alienware x16 R2 P120F | |
| Maingear ML-16 MK2 | |
| HP Victus 16 (2024) | |
| Média Intel Core Ultra 7 155H (557 - 1250, n=50) | |
| AIDA64 / FP64 Ray-Trace | |
| Asus ROG Zephyrus G16 GA605WV | |
| Razer Blade 16 2024, RTX 4090 | |
| Lenovo Legion Pro 5 16IRX9 | |
| Alienware x16 R2 P120F | |
| HP Victus 16 (2024) | |
| Maingear ML-16 MK2 | |
| Média Intel Core Ultra 7 155H (3569 - 9802, n=50) | |
| AIDA64 / CPU PhotoWorxx | |
| Alienware x16 R2 P120F | |
| Lenovo Legion Pro 5 16IRX9 | |
| Razer Blade 16 2024, RTX 4090 | |
| Asus ROG Zephyrus G16 GA605WV | |
| Média Intel Core Ultra 7 155H (32719 - 54223, n=50) | |
| HP Victus 16 (2024) | |
| Maingear ML-16 MK2 | |
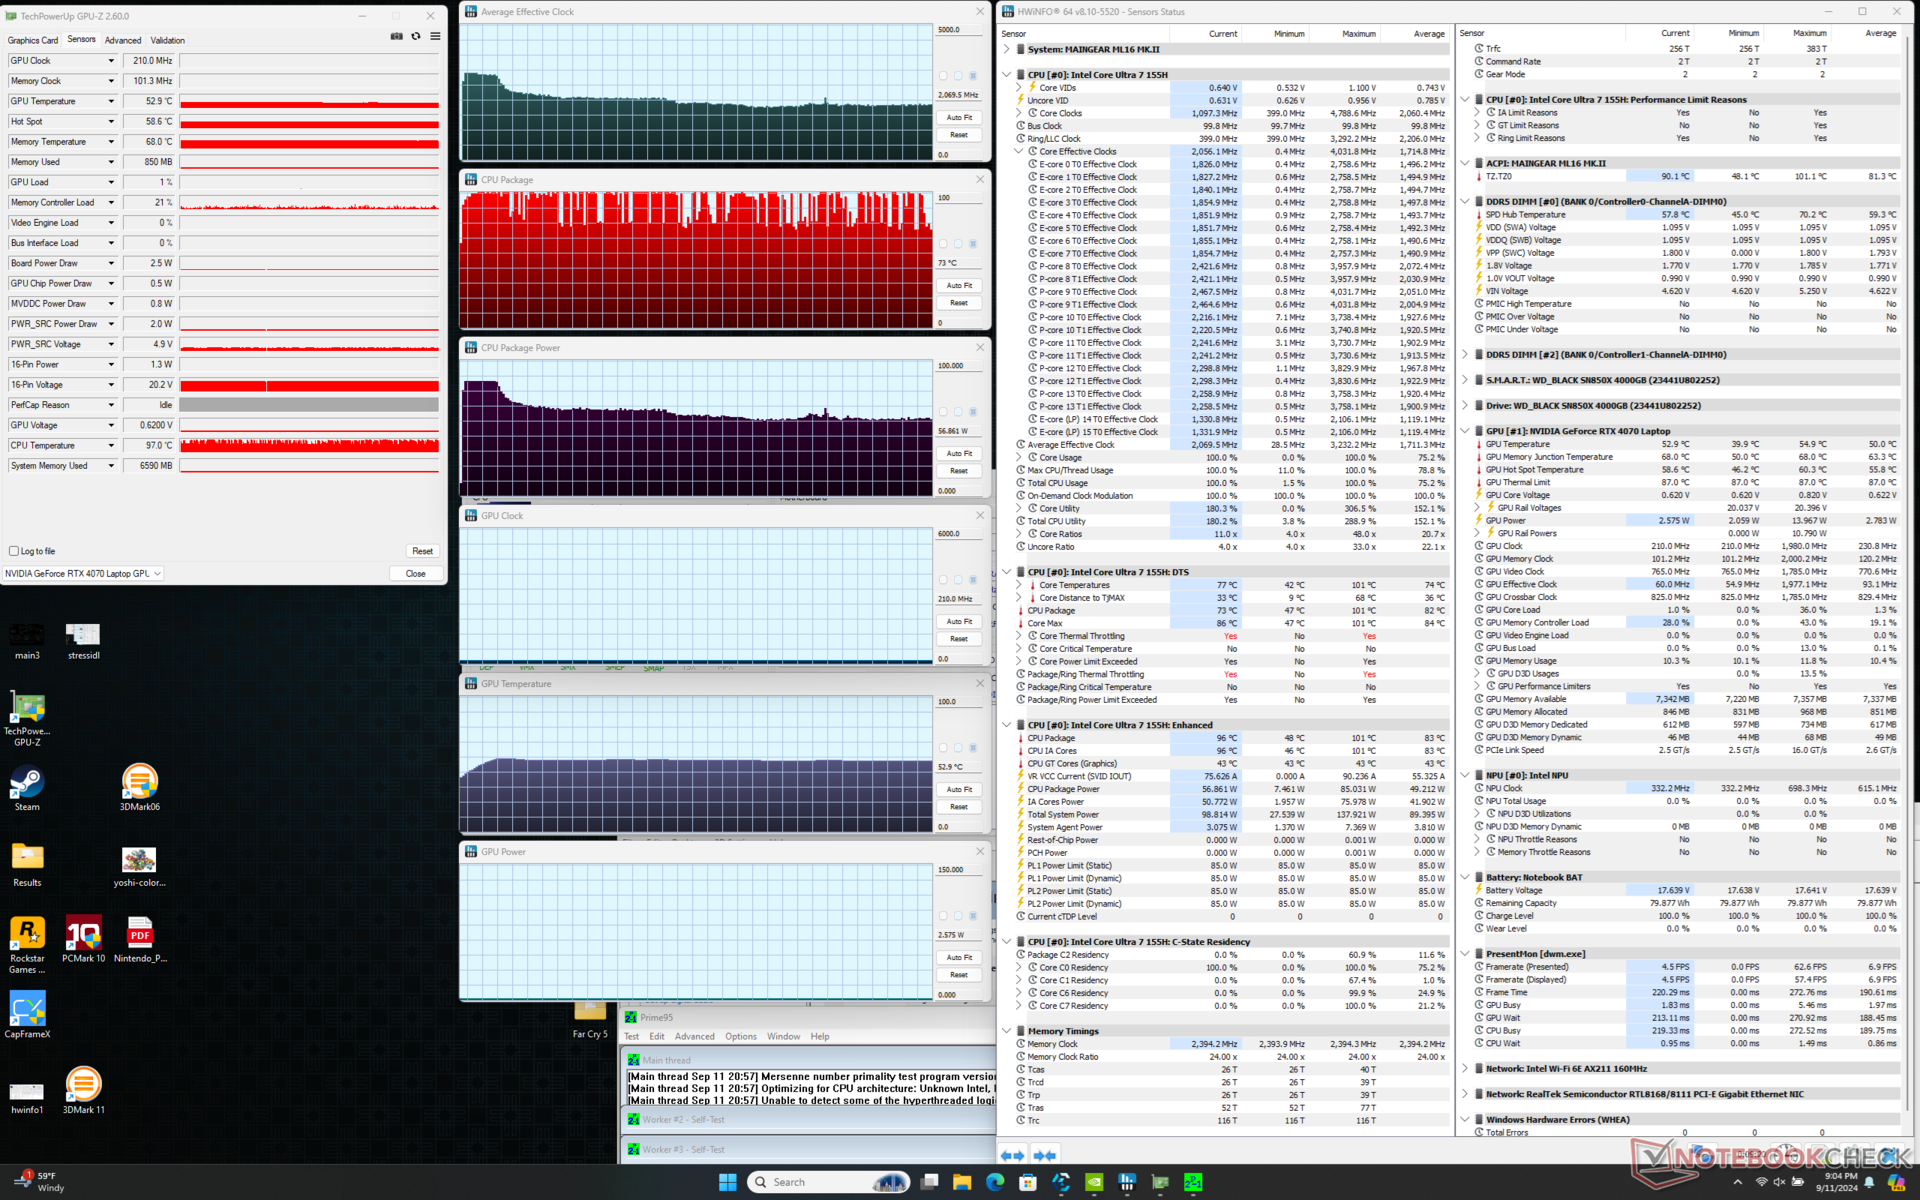
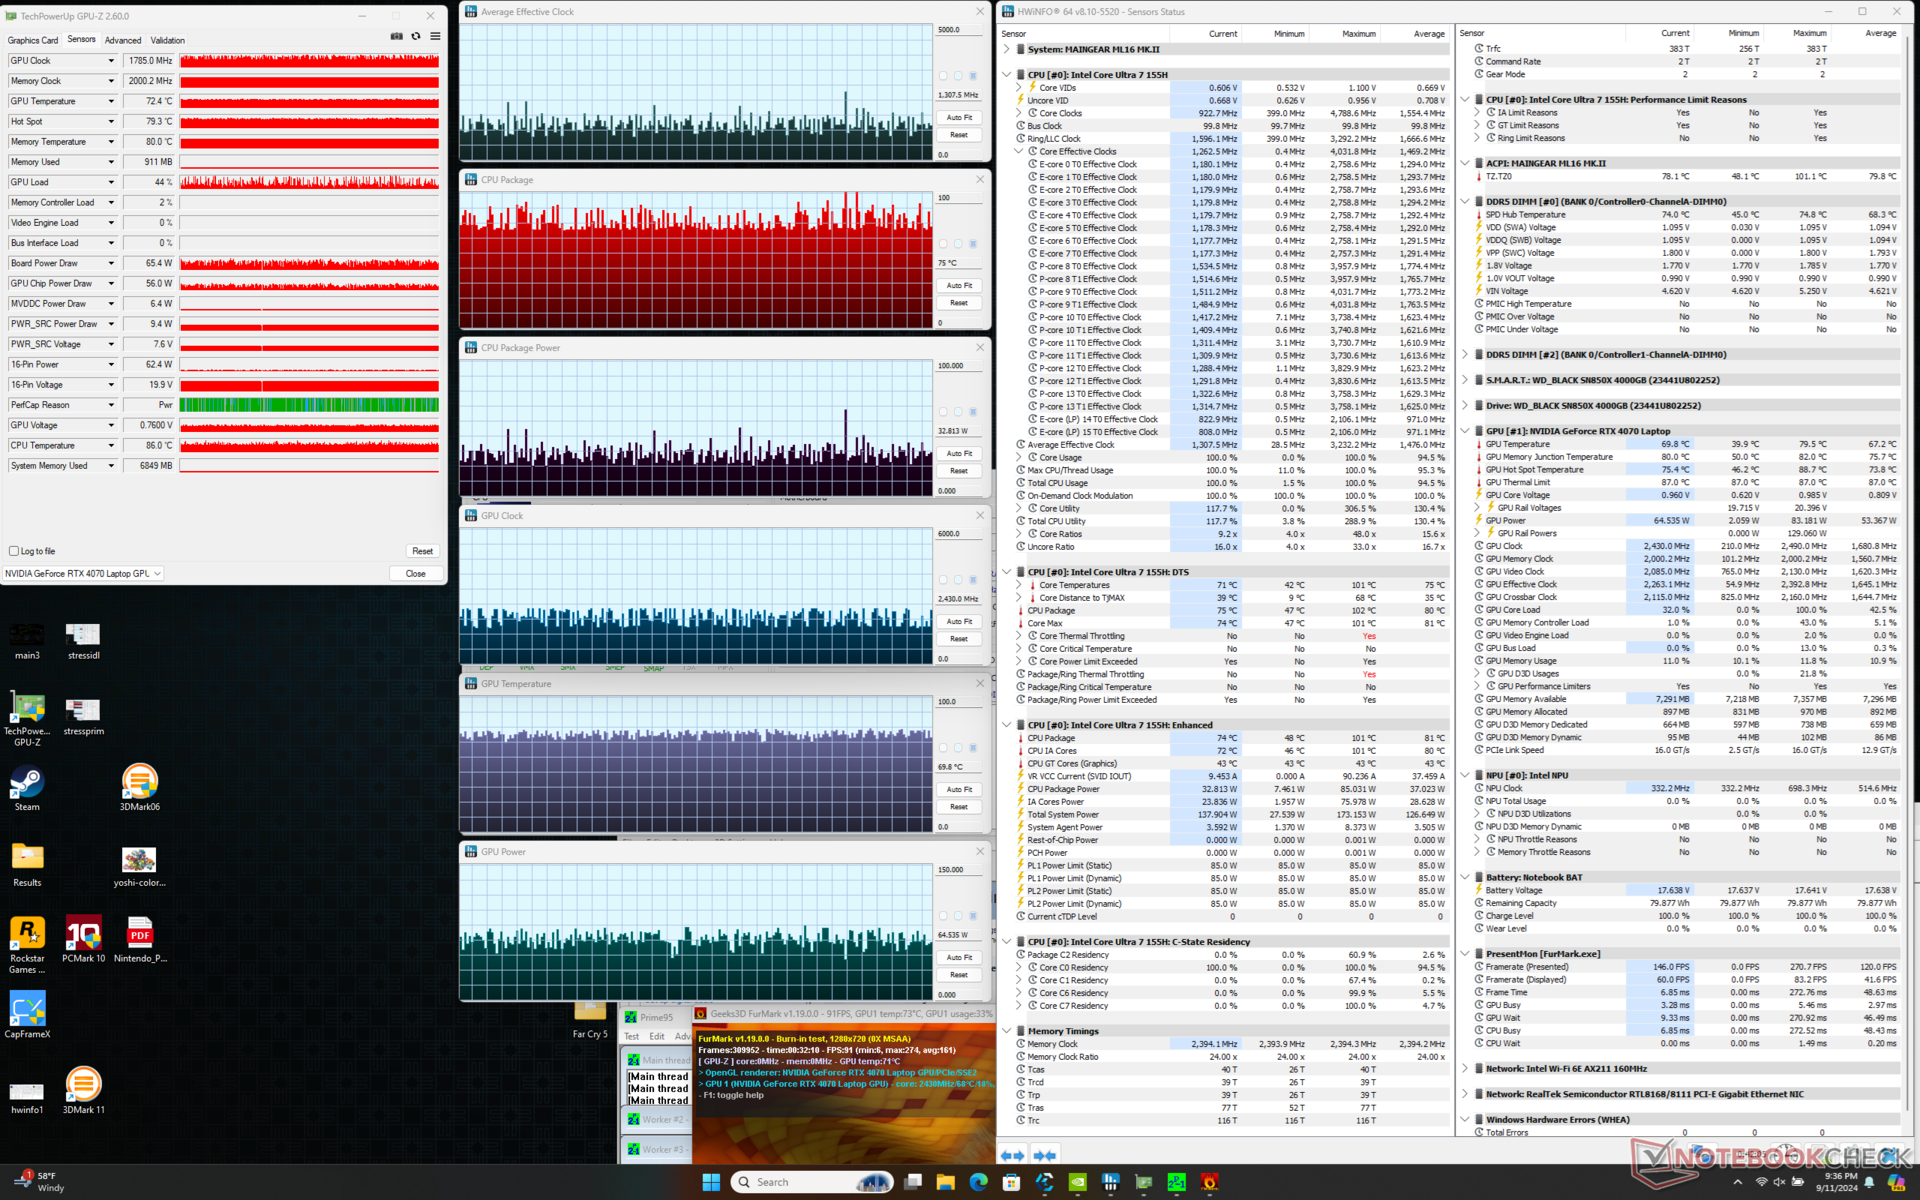
Teste de estresse
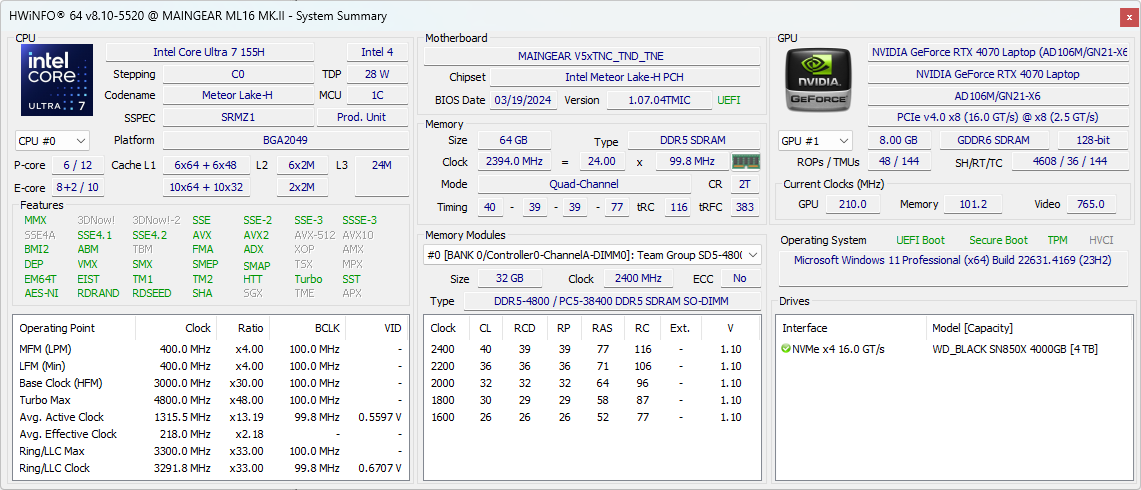
A CPU aumentava para 3,2 GHz, 100 C e 85 W ao iniciar o estresse do Prime95. No entanto, após alguns segundos, a CPU caía para 2,6 GHz e 69 W e, por fim, estabilizava-se em 2,1 GHz e 57 W. A temperatura do núcleo oscilava entre 73 C e 100 C, com aceleração térmica detectada de acordo com o HWiNFO. Essas altas temperaturas do núcleo são mais quentes do que no Razer Blade 16 em condições semelhantes e também são responsáveis pelas temperaturas de superfície muito quentes.
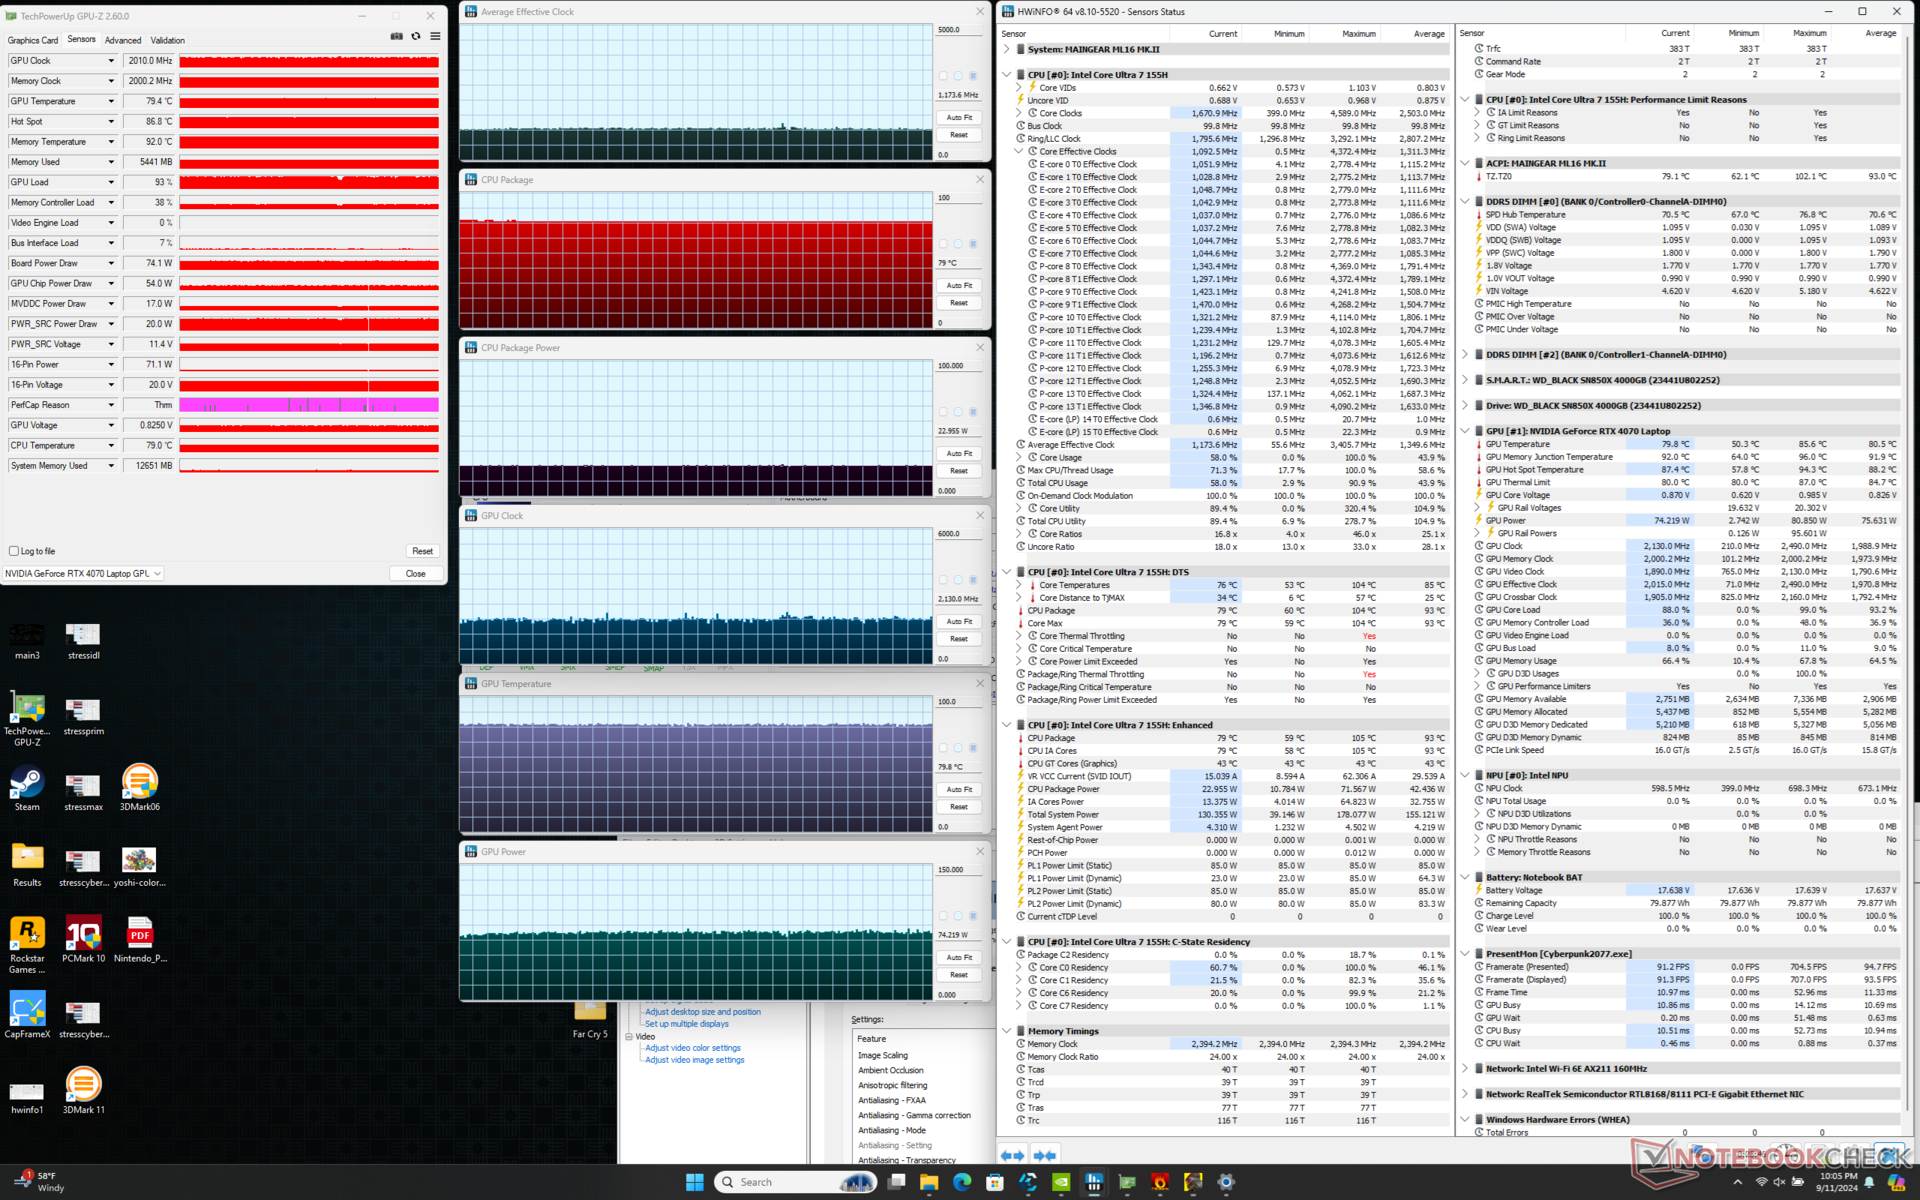
Ao executar o Cyberpunk 2077 no modo Performance, a GPU se estabilizaria em 2160 MHz, 85 C e 80 W, em comparação com 2010 MHz, 80 C e 74 W no modo Balanced, mais silencioso. Se o seu jogo não for pesado em termos de CPU, pode ser preferível executar no modo Balanced, pois a GPU não é muito afetada. Observe que o Painel de Controle da Nvidia lista um TGP de 105 W, mas, de acordo com o GPU-Z, só conseguimos atingir um máximo de 80 W ao jogar.
As temperaturas gerais do núcleo durante os jogos são muito mais altas do que em alternativas como o Blade 16. Nossa CPU e GPU se estabilizariam em 101 C e 85 C, respectivamente, em comparação com 78 C e 75 C no Razer. A ativação do modo de ventilação máxima reduziria as temperaturas do núcleo em apenas alguns graus C, sem melhorar o desempenho.
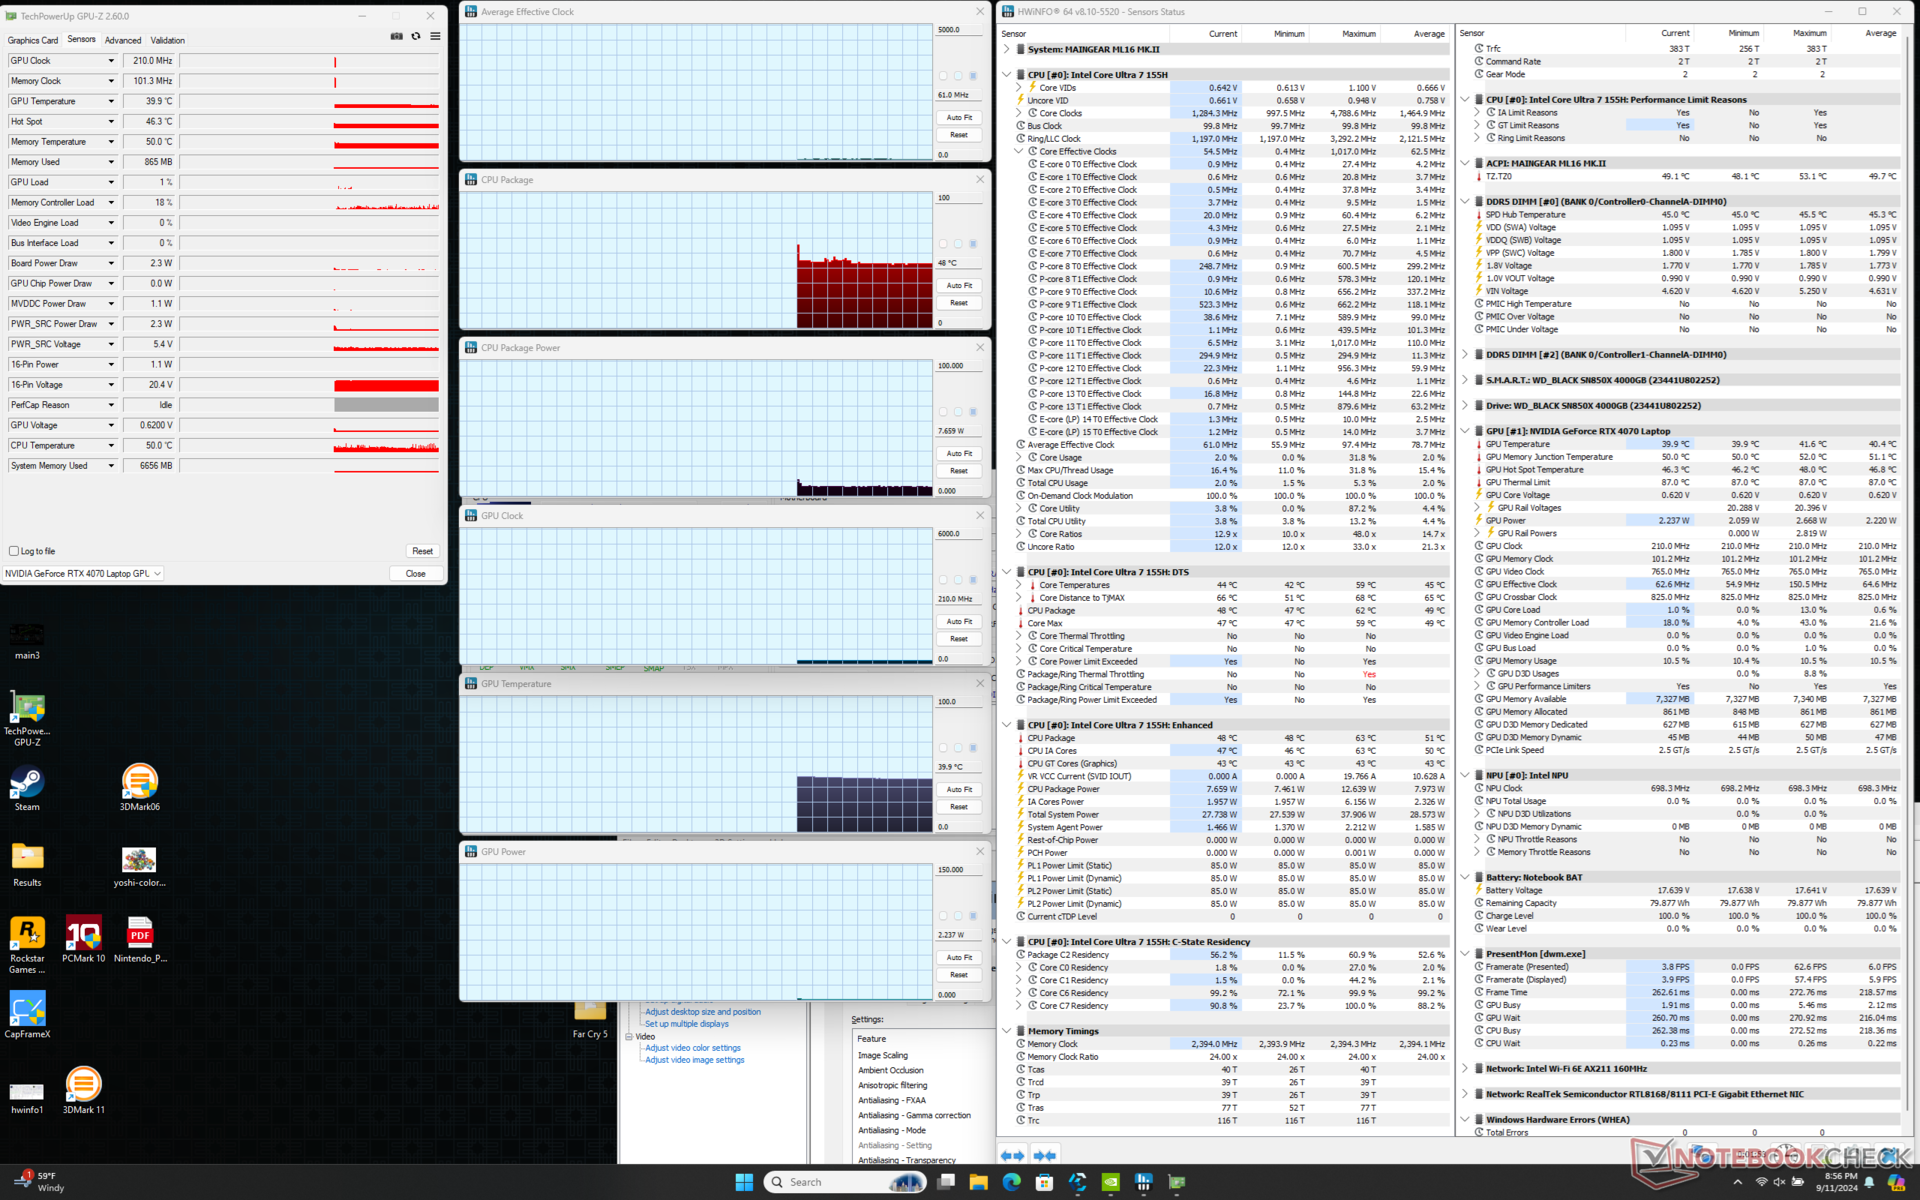

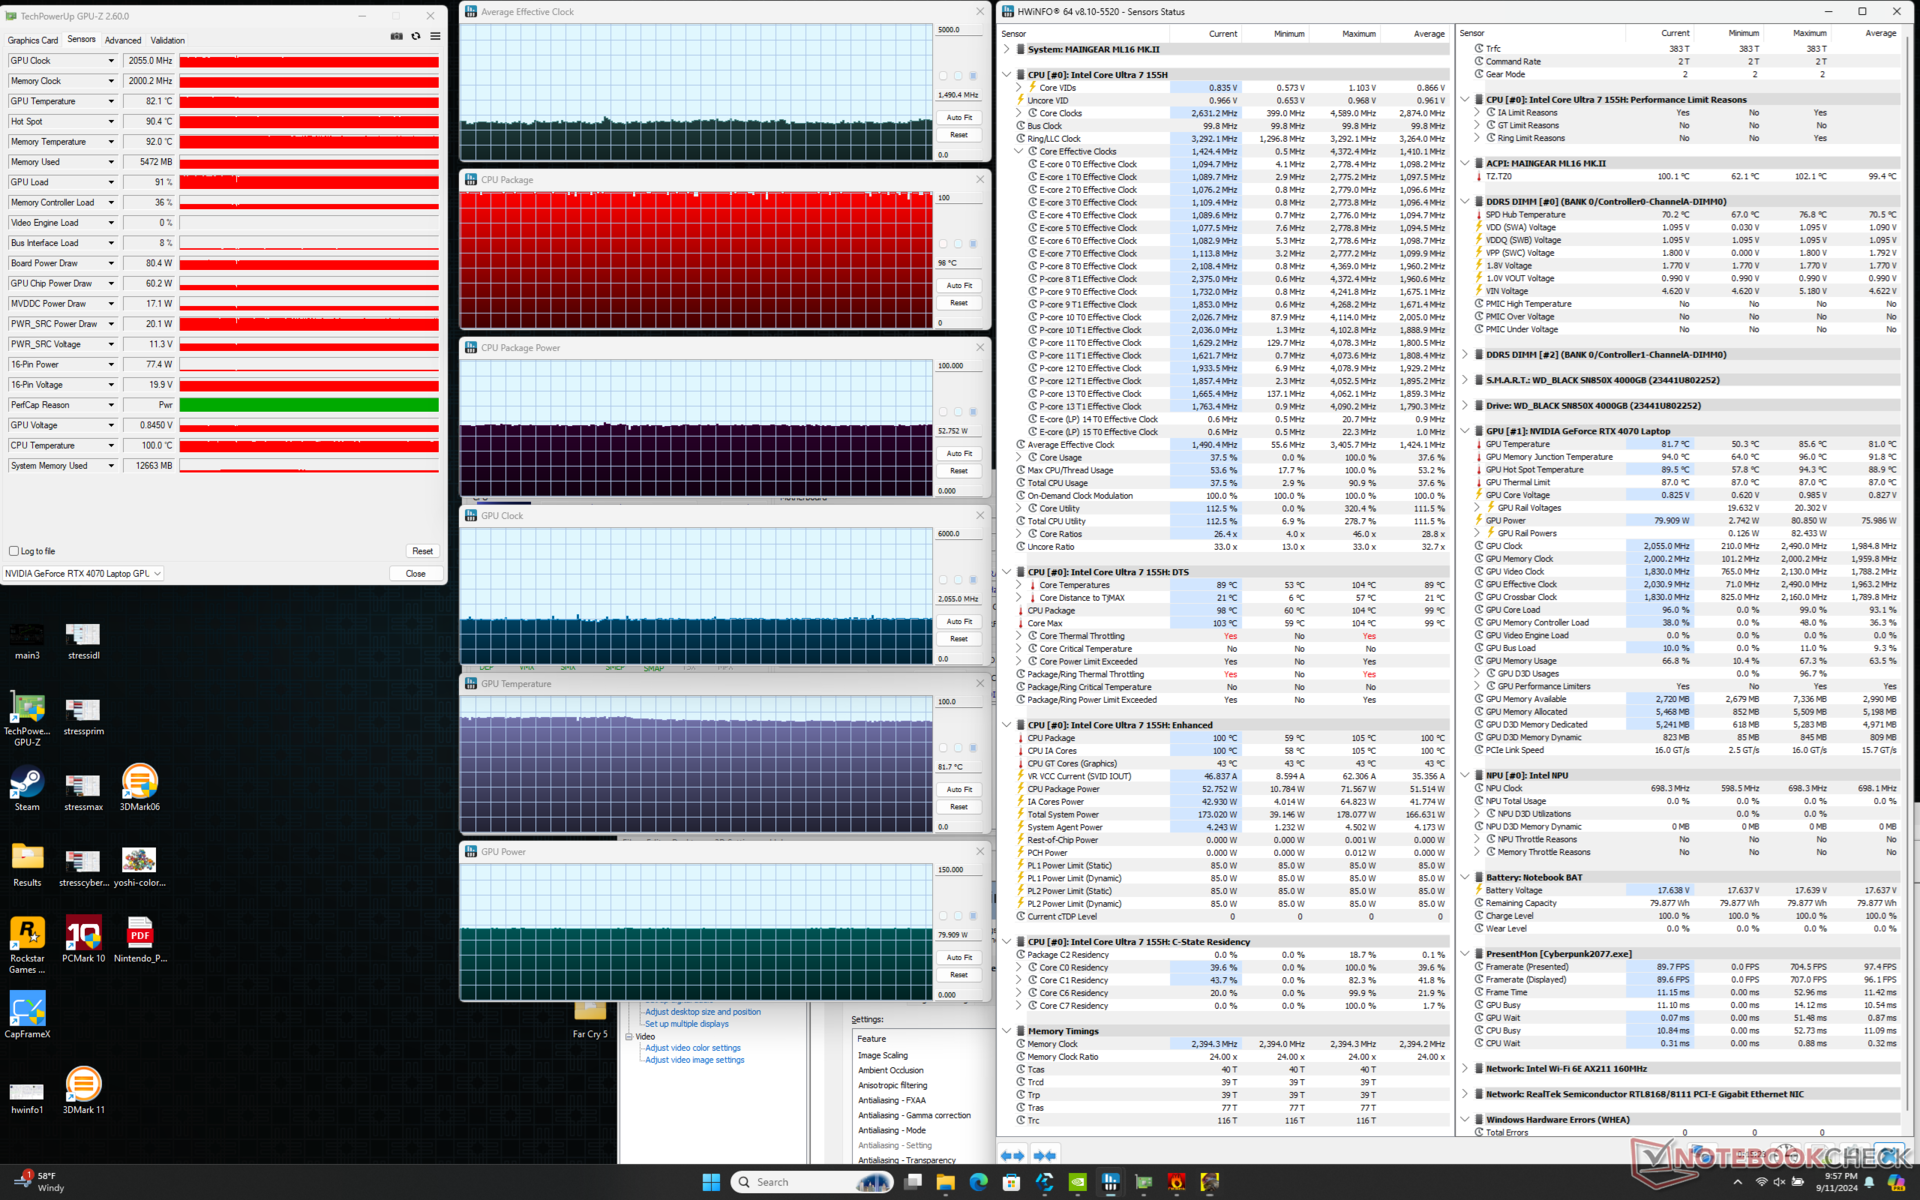
| Clock médio da CPU (GHz) | Clock da GPU (MHz) | Temperatura média da CPU (°C) | Temperatura média da GPU (°C) | |
| Sistema ocioso | -- | -- | 48 | 40 |
| Estresse do Prime95 | 2.1 | -- | 73 - 101 | 53 |
| Estresse do Prime95 + FurMark | 1.1 - 1.4 | ~1785 | 75 - 95 | ~70 |
| Cyberpunk 2077 Stress (Modo balanceado) | 1.2 | 2010 | 79 | 80 |
| Cyberpunk 2077 Stress (Modo de desempenho com ventilador máximo desligado) | 1.4 | 2160 | 101 | 85 |
| Cyberpunk 2077 Stress (Performance mode w/ Max fan on) | 1.5 | 2055 | 98 | 82 |
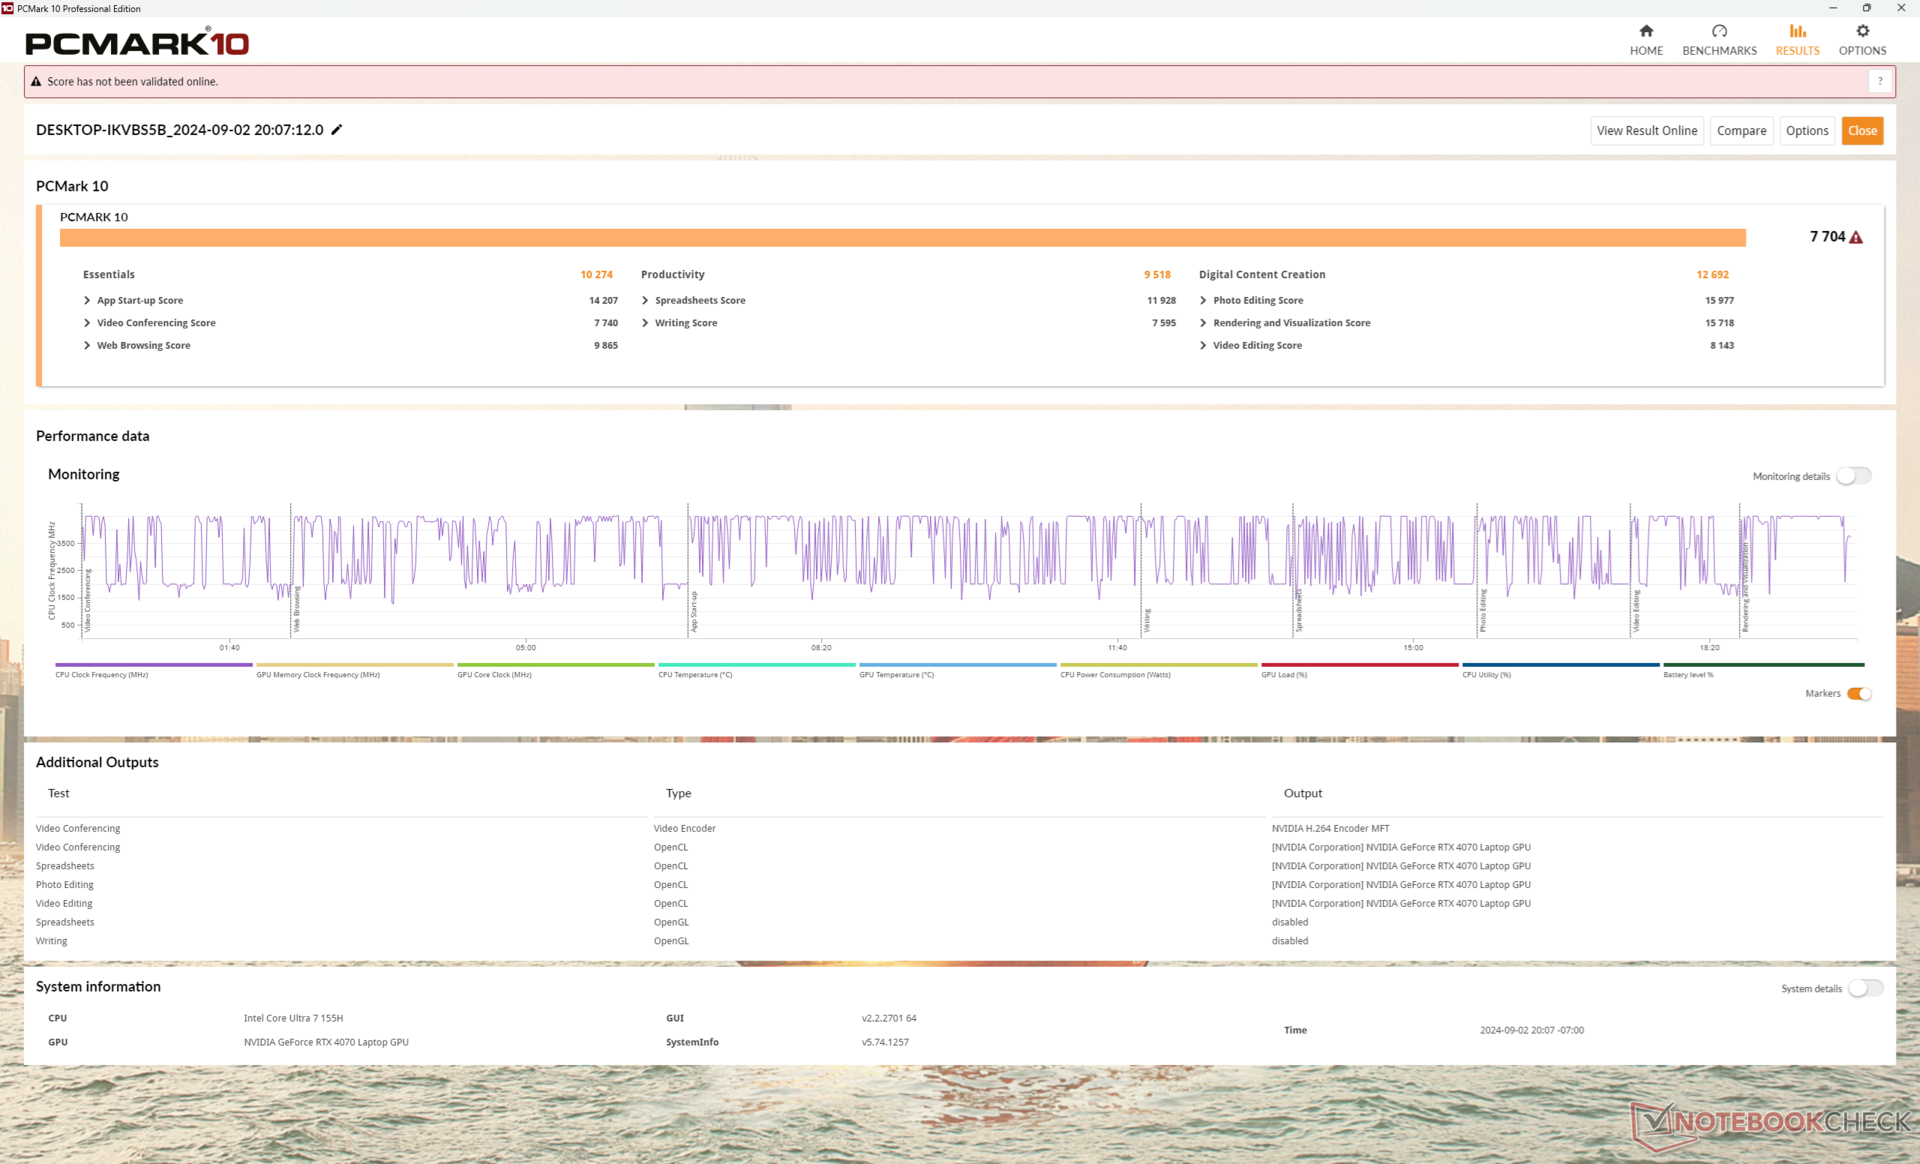
Desempenho do sistema
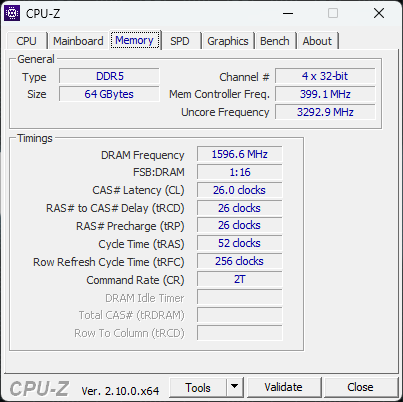
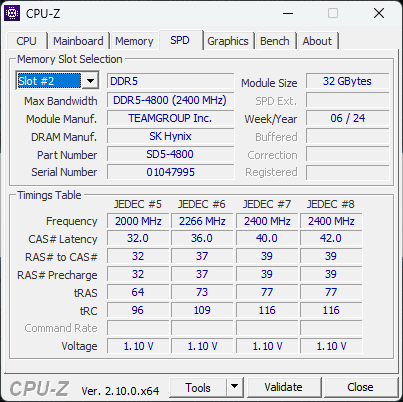
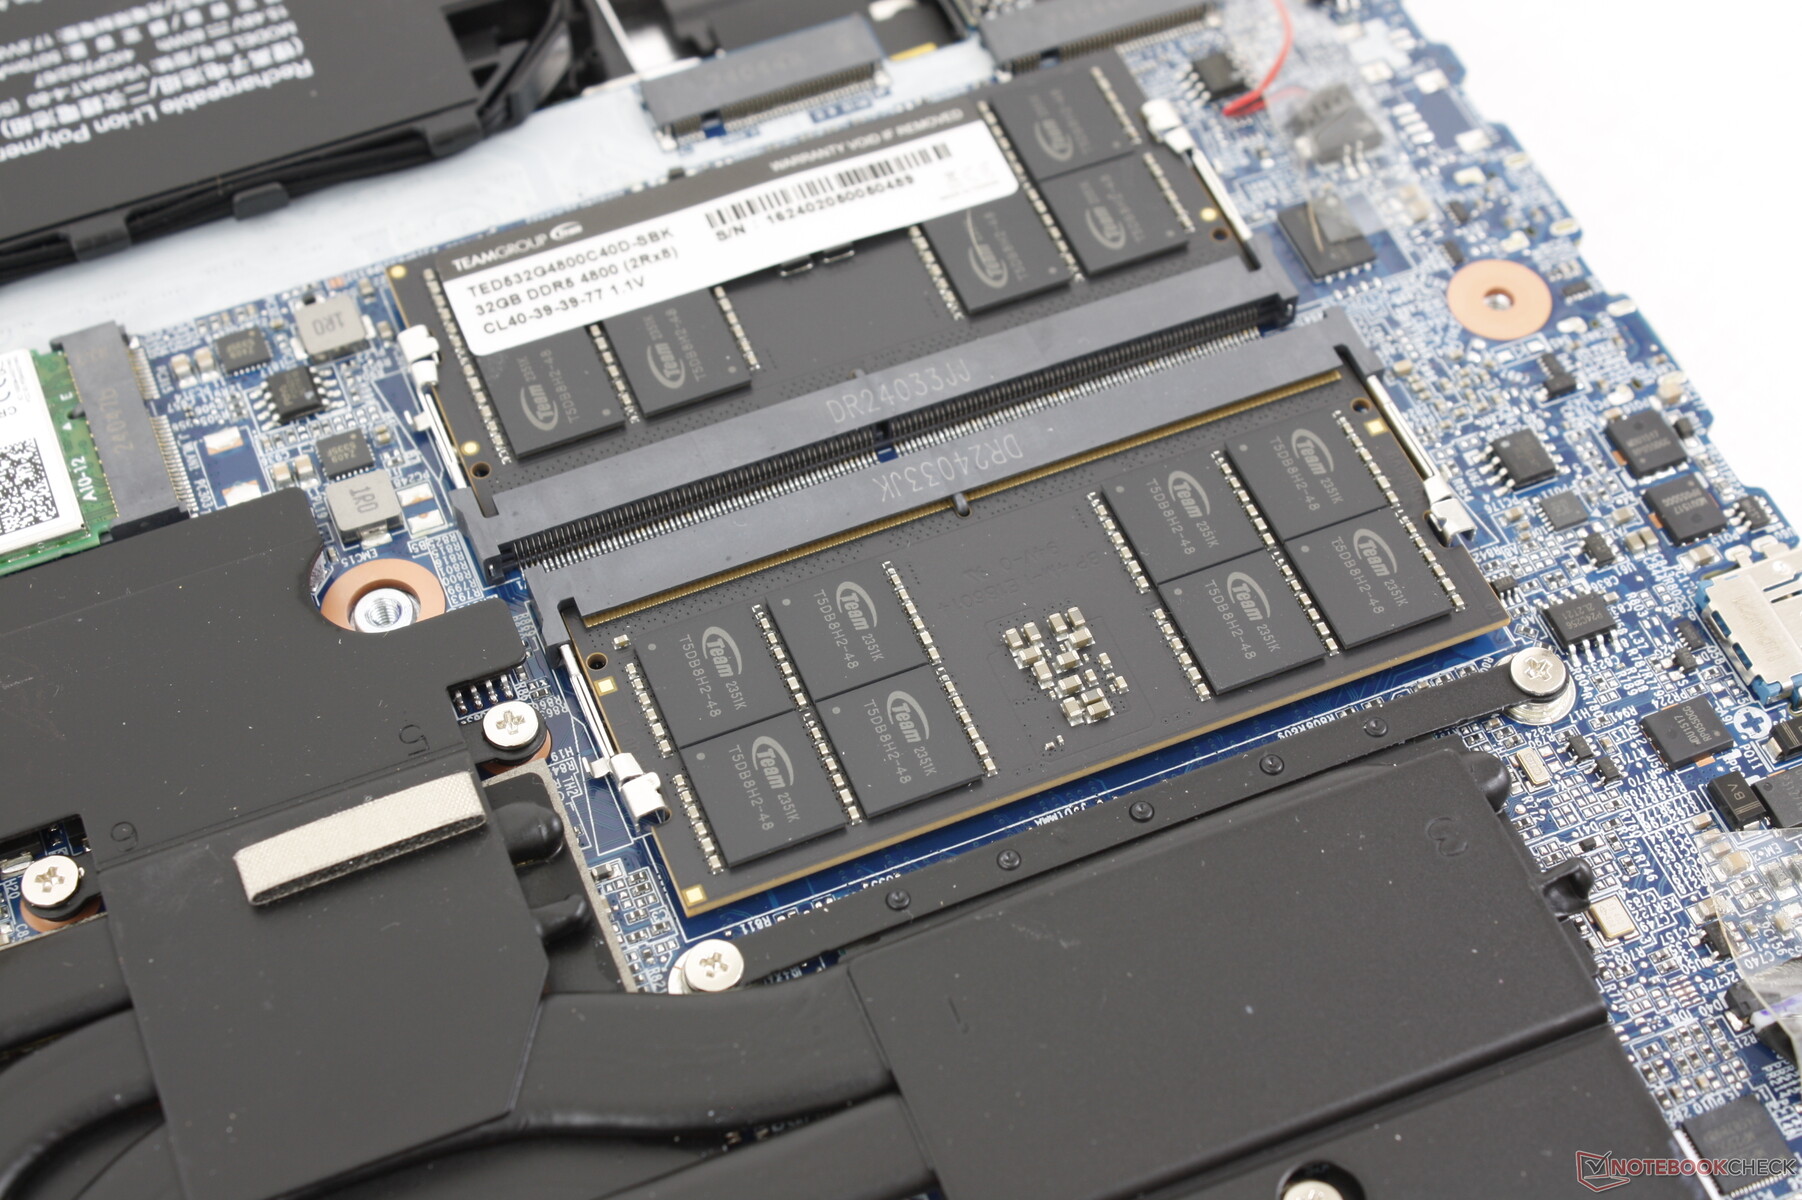
As pontuações do PCMark são comparáveis às de máquinas concorrentes, como o HP Victus 16 ou o Asus ROG Zephyrus G16 para mostrar que a maioria das tarefas cotidianas não é executada de forma significativamente mais rápida ou mais lenta no Maingear, apesar das diferenças de especificação. No entanto, os resultados de memória do CrossMark e do AIDA64 são mais baixos do que o esperado devido ao nosso desempenho bruto da CPU comparativamente mais lento e à RAM DDR5-4800. Os concorrentes, como o Blade 16 ou o Alienware m16 R2, vêm com DDR5-5600 ou LPDDR5-7467 mais rápidos, respectivamente.
CrossMark: Overall | Productivity | Creativity | Responsiveness
WebXPRT 3: Overall
WebXPRT 4: Overall
Mozilla Kraken 1.1: Total
| PCMark 10 / Score | |
| Lenovo Legion Pro 5 16IRX9 | |
| Razer Blade 16 2024, RTX 4090 | |
| Asus ROG Zephyrus G16 GA605WV | |
| Maingear ML-16 MK2 | |
| HP Victus 16 (2024) | |
| Média Intel Core Ultra 7 155H, NVIDIA GeForce RTX 4070 Laptop GPU (7084 - 7761, n=4) | |
| Alienware x16 R2 P120F | |
| PCMark 10 / Essentials | |
| Lenovo Legion Pro 5 16IRX9 | |
| Razer Blade 16 2024, RTX 4090 | |
| HP Victus 16 (2024) | |
| Maingear ML-16 MK2 | |
| Média Intel Core Ultra 7 155H, NVIDIA GeForce RTX 4070 Laptop GPU (10038 - 10393, n=4) | |
| Asus ROG Zephyrus G16 GA605WV | |
| Alienware x16 R2 P120F | |
| PCMark 10 / Productivity | |
| Razer Blade 16 2024, RTX 4090 | |
| Lenovo Legion Pro 5 16IRX9 | |
| Asus ROG Zephyrus G16 GA605WV | |
| HP Victus 16 (2024) | |
| Maingear ML-16 MK2 | |
| Média Intel Core Ultra 7 155H, NVIDIA GeForce RTX 4070 Laptop GPU (9192 - 9518, n=4) | |
| Alienware x16 R2 P120F | |
| PCMark 10 / Digital Content Creation | |
| Lenovo Legion Pro 5 16IRX9 | |
| Asus ROG Zephyrus G16 GA605WV | |
| Razer Blade 16 2024, RTX 4090 | |
| Alienware x16 R2 P120F | |
| Maingear ML-16 MK2 | |
| Média Intel Core Ultra 7 155H, NVIDIA GeForce RTX 4070 Laptop GPU (10100 - 13035, n=4) | |
| HP Victus 16 (2024) | |
| CrossMark / Overall | |
| Razer Blade 16 2024, RTX 4090 | |
| Lenovo Legion Pro 5 16IRX9 | |
| HP Victus 16 (2024) | |
| Asus ROG Zephyrus G16 GA605WV | |
| Média Intel Core Ultra 7 155H, NVIDIA GeForce RTX 4070 Laptop GPU (1687 - 1848, n=4) | |
| Maingear ML-16 MK2 | |
| Alienware x16 R2 P120F | |
| CrossMark / Productivity | |
| Razer Blade 16 2024, RTX 4090 | |
| Lenovo Legion Pro 5 16IRX9 | |
| HP Victus 16 (2024) | |
| Média Intel Core Ultra 7 155H, NVIDIA GeForce RTX 4070 Laptop GPU (1589 - 1750, n=4) | |
| Asus ROG Zephyrus G16 GA605WV | |
| Maingear ML-16 MK2 | |
| Alienware x16 R2 P120F | |
| CrossMark / Creativity | |
| Razer Blade 16 2024, RTX 4090 | |
| Lenovo Legion Pro 5 16IRX9 | |
| Asus ROG Zephyrus G16 GA605WV | |
| HP Victus 16 (2024) | |
| Média Intel Core Ultra 7 155H, NVIDIA GeForce RTX 4070 Laptop GPU (1860 - 2014, n=4) | |
| Maingear ML-16 MK2 | |
| Alienware x16 R2 P120F | |
| CrossMark / Responsiveness | |
| Razer Blade 16 2024, RTX 4090 | |
| HP Victus 16 (2024) | |
| Lenovo Legion Pro 5 16IRX9 | |
| Alienware x16 R2 P120F | |
| Média Intel Core Ultra 7 155H, NVIDIA GeForce RTX 4070 Laptop GPU (1424 - 1683, n=4) | |
| Maingear ML-16 MK2 | |
| Asus ROG Zephyrus G16 GA605WV | |
| WebXPRT 3 / Overall | |
| Razer Blade 16 2024, RTX 4090 | |
| Lenovo Legion Pro 5 16IRX9 | |
| Média Intel Core Ultra 7 155H, NVIDIA GeForce RTX 4070 Laptop GPU (264 - 294, n=4) | |
| HP Victus 16 (2024) | |
| Maingear ML-16 MK2 | |
| Alienware x16 R2 P120F | |
| WebXPRT 4 / Overall | |
| Lenovo Legion Pro 5 16IRX9 | |
| Asus ROG Zephyrus G16 GA605WV | |
| Média Intel Core Ultra 7 155H, NVIDIA GeForce RTX 4070 Laptop GPU (247 - 257, n=4) | |
| HP Victus 16 (2024) | |
| Maingear ML-16 MK2 | |
| Alienware x16 R2 P120F | |
| Mozilla Kraken 1.1 / Total | |
| Alienware x16 R2 P120F | |
| Maingear ML-16 MK2 | |
| Média Intel Core Ultra 7 155H, NVIDIA GeForce RTX 4070 Laptop GPU (546 - 568, n=3) | |
| HP Victus 16 (2024) | |
| Razer Blade 16 2024, RTX 4090 | |
| Lenovo Legion Pro 5 16IRX9 | |
| Asus ROG Zephyrus G16 GA605WV | |
* ... menor é melhor
| PCMark 10 Score | 7704 pontos | |
Ajuda | ||
| AIDA64 / Memory Copy | |
| Alienware x16 R2 P120F | |
| Asus ROG Zephyrus G16 GA605WV | |
| Média Intel Core Ultra 7 155H (62397 - 96791, n=50) | |
| Lenovo Legion Pro 5 16IRX9 | |
| Razer Blade 16 2024, RTX 4090 | |
| HP Victus 16 (2024) | |
| Maingear ML-16 MK2 | |
| AIDA64 / Memory Read | |
| Asus ROG Zephyrus G16 GA605WV | |
| Razer Blade 16 2024, RTX 4090 | |
| Lenovo Legion Pro 5 16IRX9 | |
| Alienware x16 R2 P120F | |
| HP Victus 16 (2024) | |
| Média Intel Core Ultra 7 155H (60544 - 90647, n=50) | |
| Maingear ML-16 MK2 | |
| AIDA64 / Memory Write | |
| Asus ROG Zephyrus G16 GA605WV | |
| Lenovo Legion Pro 5 16IRX9 | |
| Razer Blade 16 2024, RTX 4090 | |
| Alienware x16 R2 P120F | |
| Média Intel Core Ultra 7 155H (58692 - 93451, n=50) | |
| HP Victus 16 (2024) | |
| Maingear ML-16 MK2 | |
| AIDA64 / Memory Latency | |
| Maingear ML-16 MK2 | |
| Média Intel Core Ultra 7 155H (116.2 - 233, n=50) | |
| Alienware x16 R2 P120F | |
| Asus ROG Zephyrus G16 GA605WV | |
| HP Victus 16 (2024) | |
| Razer Blade 16 2024, RTX 4090 | |
| Lenovo Legion Pro 5 16IRX9 | |
* ... menor é melhor
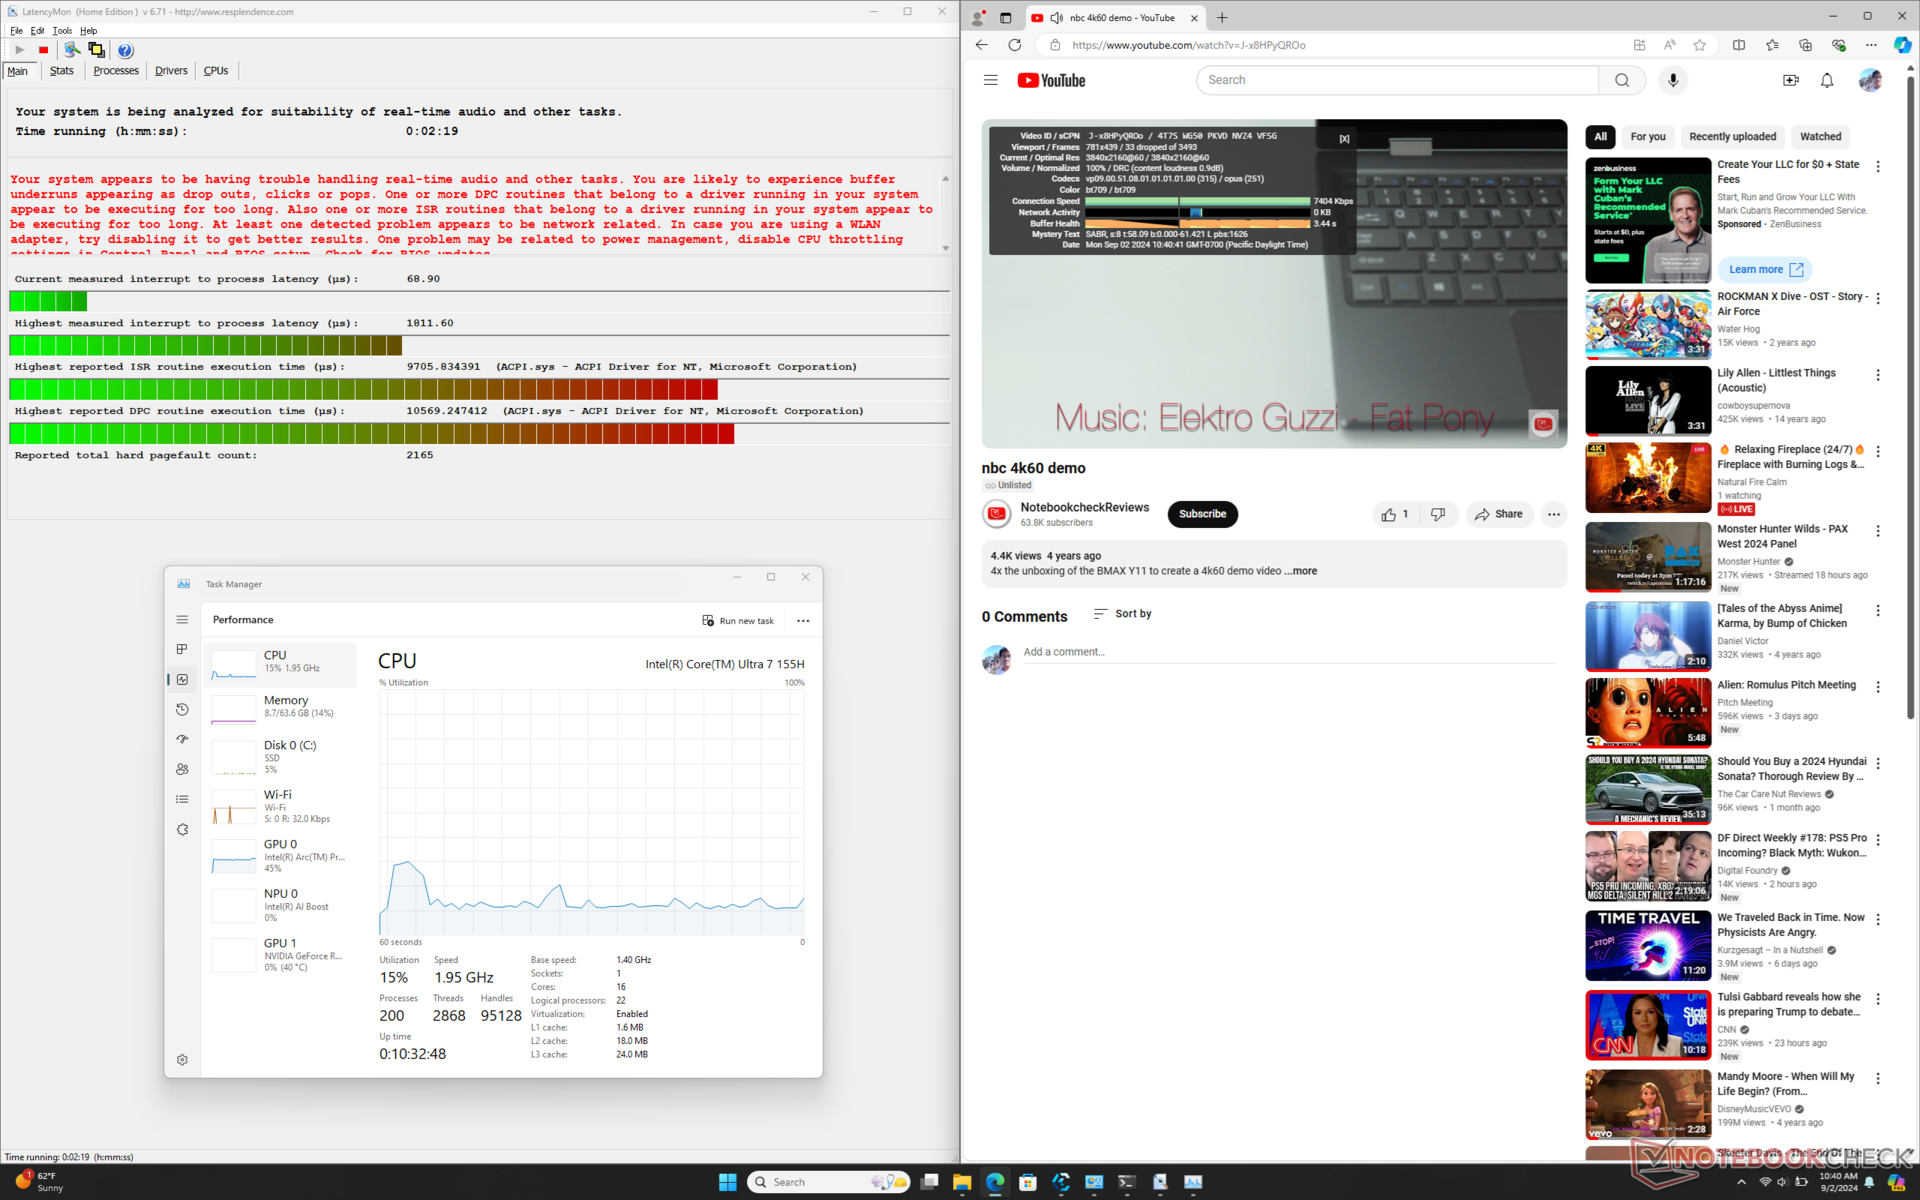
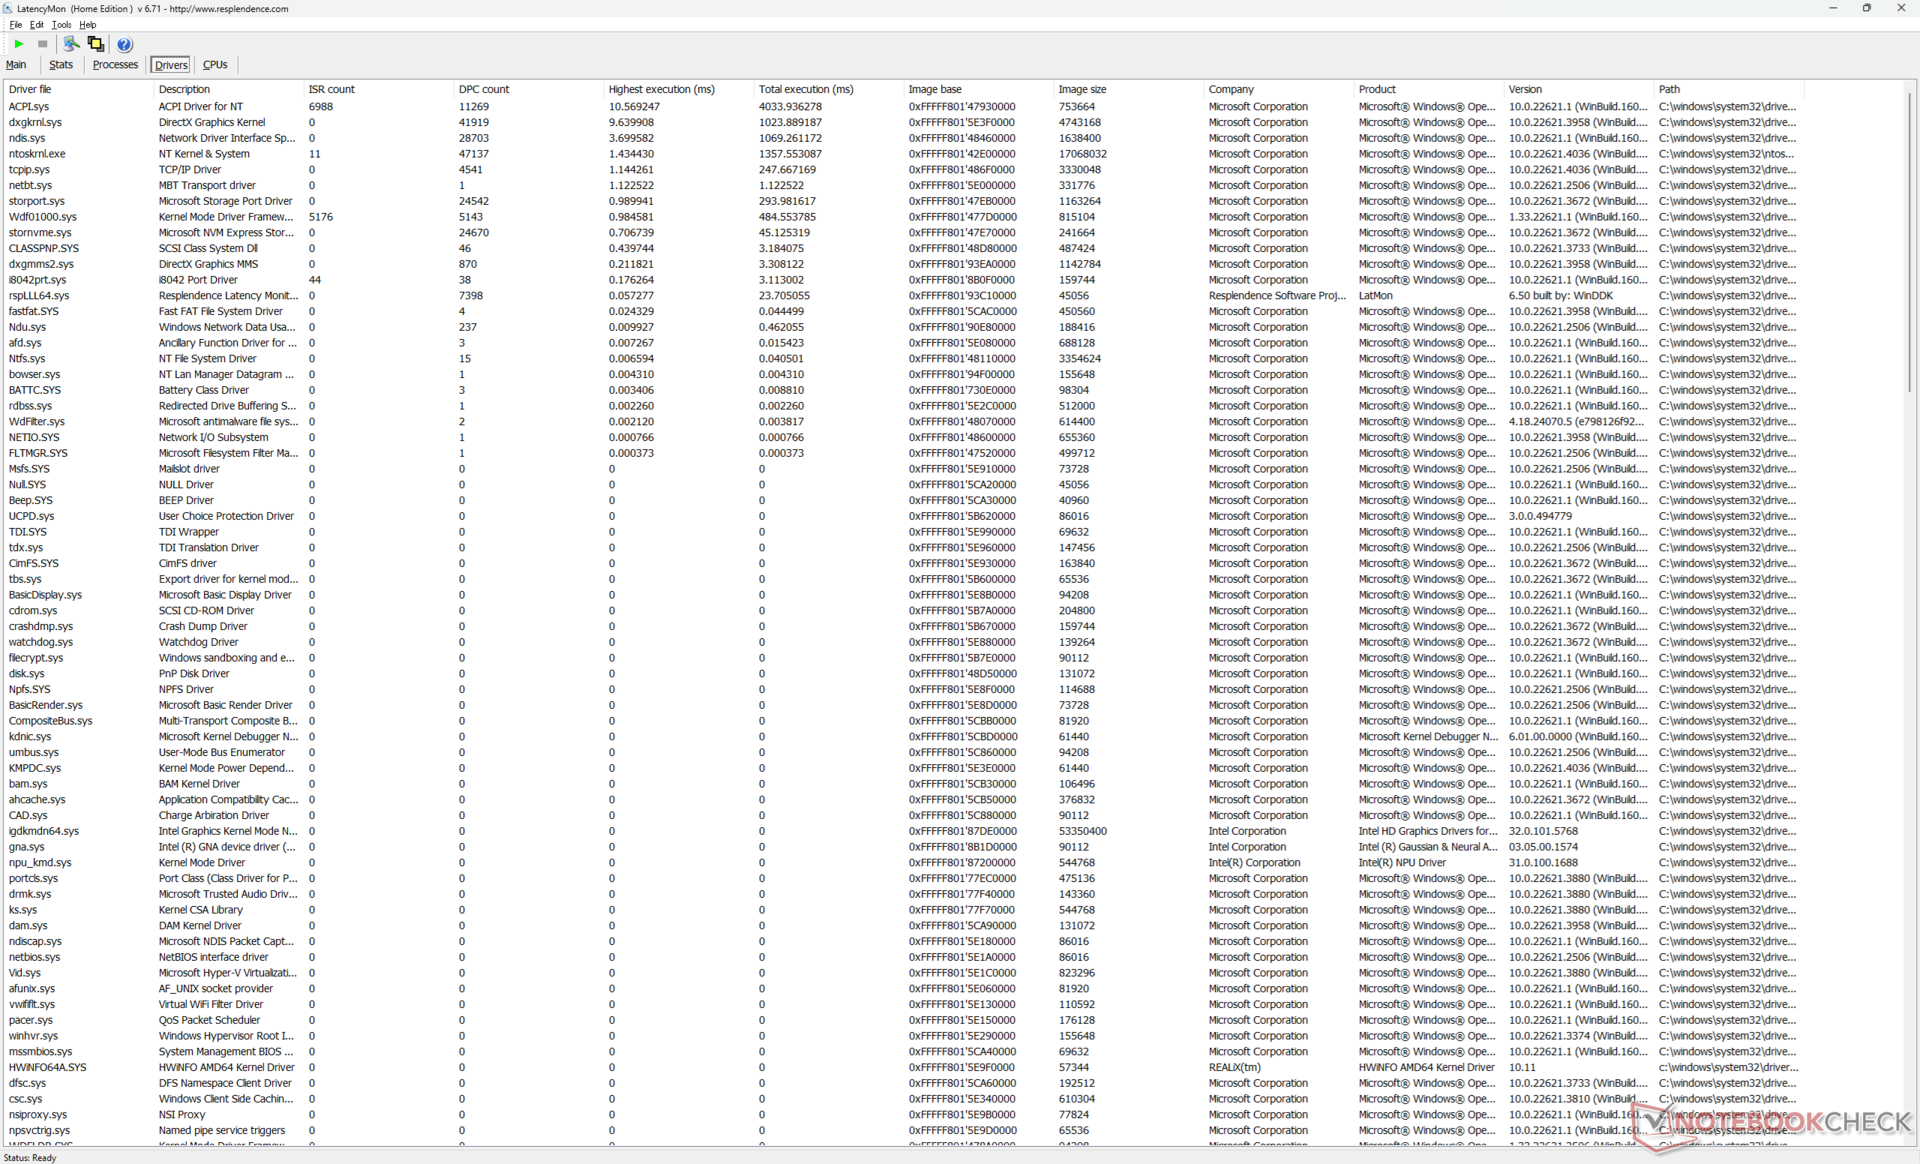
Latência DPC
O LatencyMon revela problemas de DPC maiores do que o esperado relacionados aos drivers ACPI, mesmo quando no modo MSHybrid. Além disso, conseguimos registrar 33 quadros perdidos durante um vídeo de teste de 60 segundos em 4K60, quando não deveria haver nenhum, especialmente considerando a CPU Meteor Lake-H. Esses quadros perdidos se manifestam como gagueira durante o streaming de vídeo 4K e sugerem um problema de driver subjacente ou um mau gerenciamento das atividades em segundo plano que podem interromper a janela principal.
| DPC Latencies / LatencyMon - interrupt to process latency (max), Web, Youtube, Prime95 | |
| Alienware x16 R2 P120F | |
| Maingear ML-16 MK2 | |
| Razer Blade 16 2024, RTX 4090 | |
| Lenovo Legion Pro 5 16IRX9 | |
| HP Victus 16 (2024) | |
| Asus ROG Zephyrus G16 GA605WV | |
* ... menor é melhor
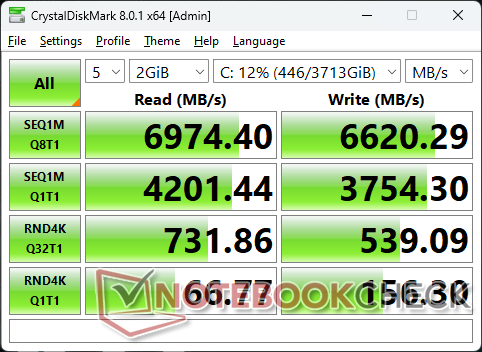
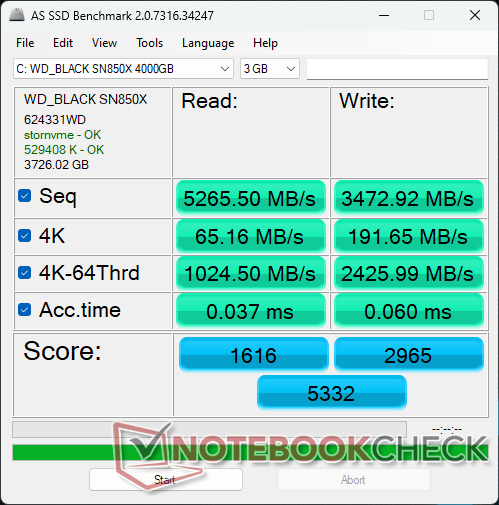
Dispositivos de armazenamento
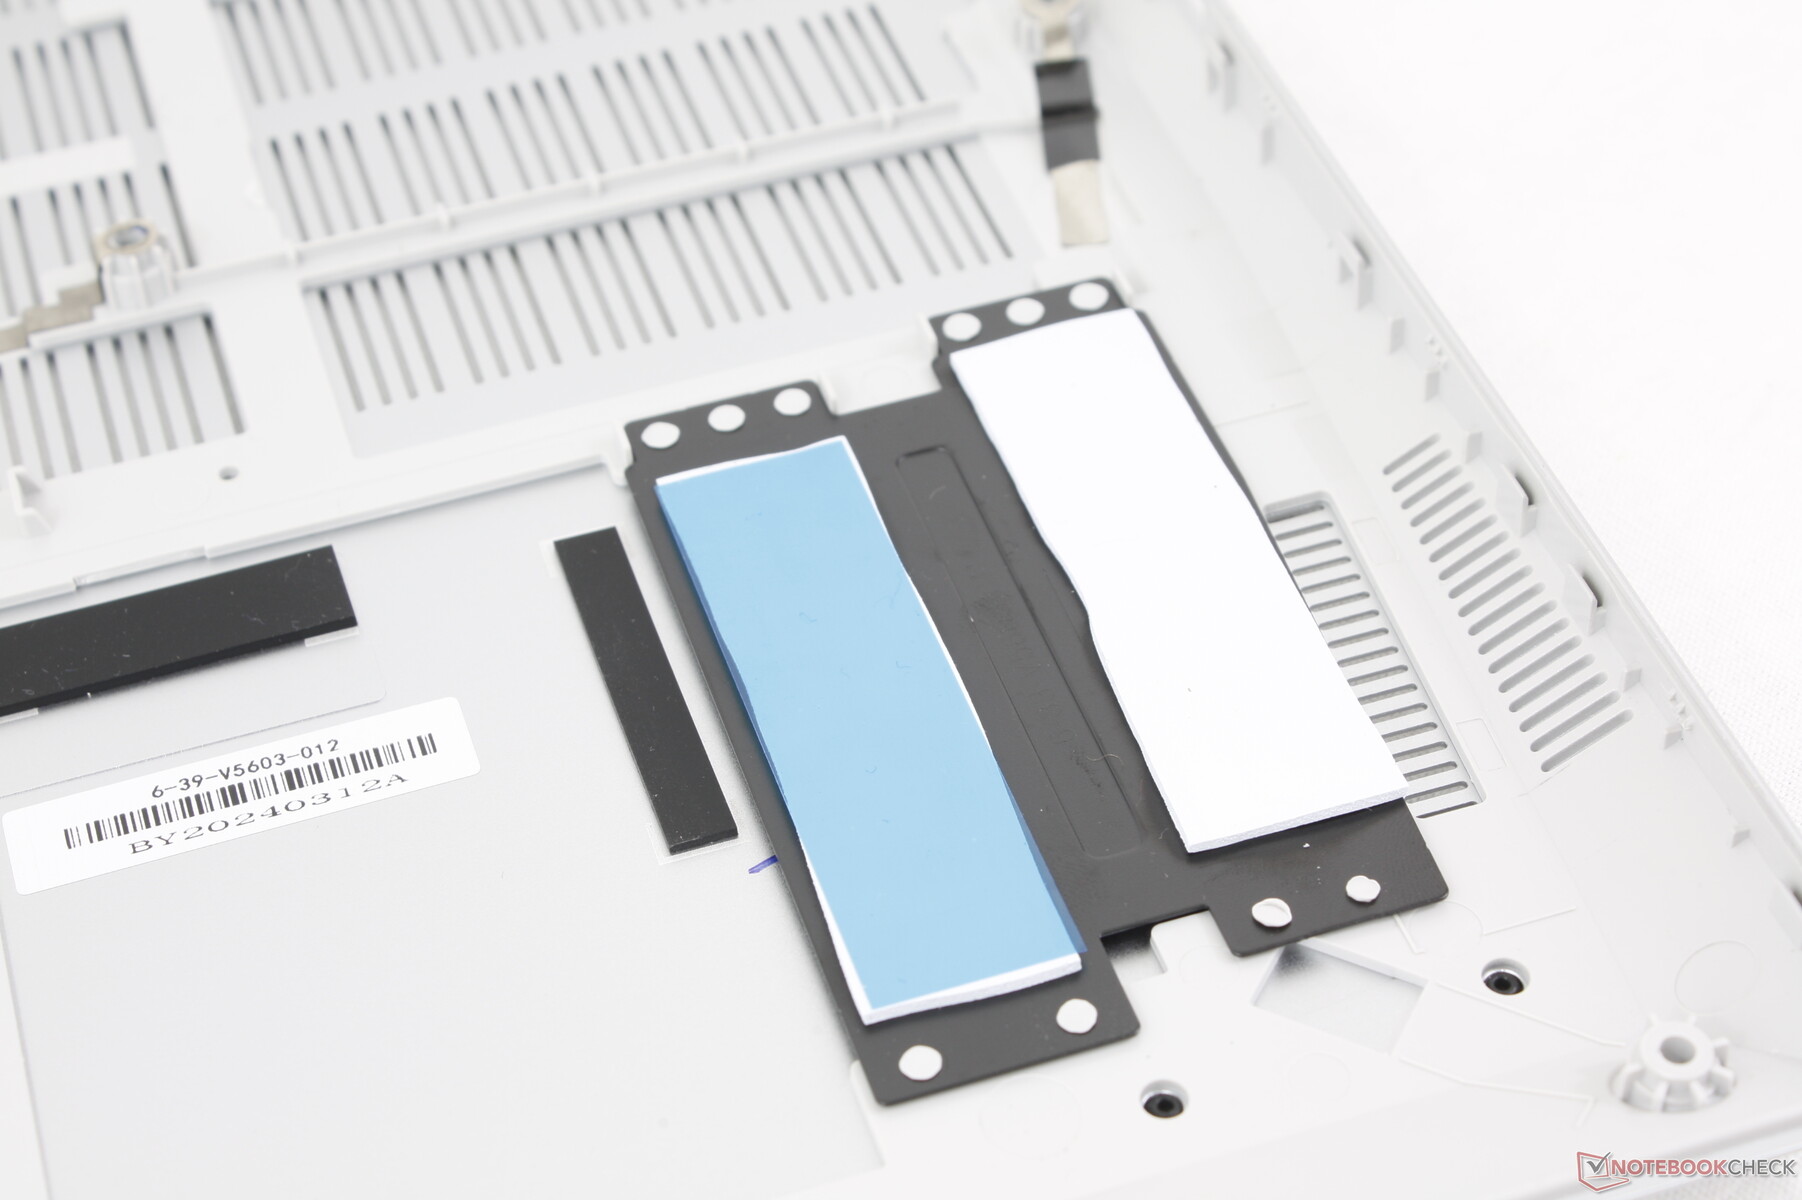
O Maingear é um dos poucos sistemas fornecidos com 4 TB WD Black SN850X PCIe4 x4 NVMe de 4 TB. As taxas de transferência são excelentes, com quase 7.000 MB/s, sem nenhum estrangulamento detectado quando sob tensão. Gostamos do fato de o dissipador de calor e as almofadas térmicas serem padrão para ajudar a dissipar o calor.

| Drive Performance Rating - Percent | |
| Lenovo Legion Pro 5 16IRX9 | |
| Alienware x16 R2 P120F | |
| Razer Blade 16 2024, RTX 4090 | |
| HP Victus 16 (2024) | |
| Maingear ML-16 MK2 | |
| Asus ROG Zephyrus G16 GA605WV | |
* ... menor é melhor
Disk Throttling: DiskSpd Read Loop, Queue Depth 8
Desempenho da GPU
O GeForce RTX 4070 móvel tem um desempenho alguns pontos percentuais mais lento do que o laptop médio em nosso banco de dados com a mesma opção de GPU. O desempenho geral é apenas 5 a 15 por cento melhor do que a base RTX 4060 ou cerca de 15% melhor do que a opção mais antiga RTX 3070 Ti. A diferença se torna muito maior quando se compara o RTX 4070 móvel com o rTX 4080 móvelmas esta última não é configurável nesse modelo.
Lembre-se de que a RTX 4070 móvel é muito mais lenta do que sua equivalente para desktop em cerca de 35 a 40 por cento.
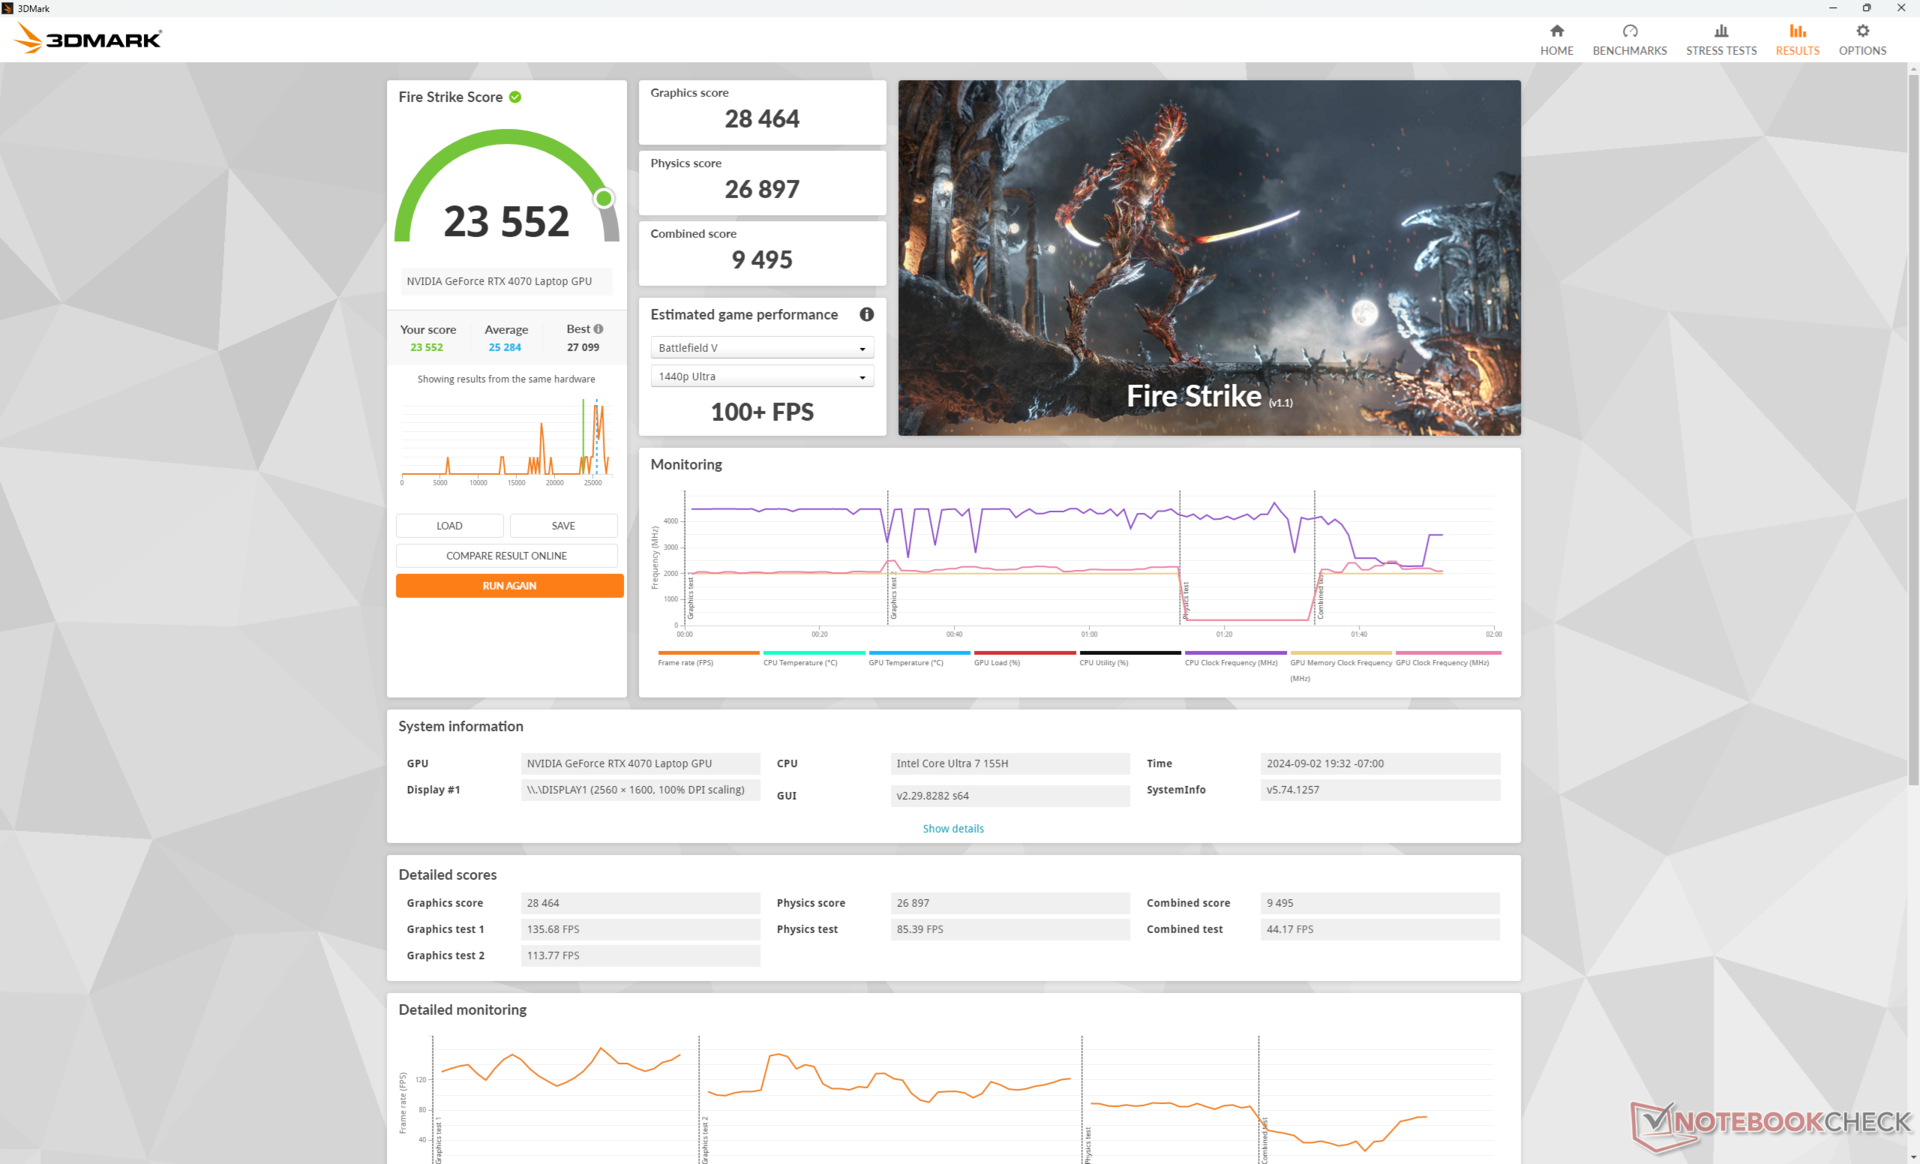
| Perfil de potência | Pontuação de gráficos | Pontuação de física | Pontuação combinada |
| Modo de desempenho | 28464 | 26897 | 9495 |
| Modo equilibrado | 28238 (-0%) | 16060 (-40%) | 8049 (-15%) |
| Energia da bateria | 5539 (-81%) | 12186 (-55%) | 1715 (-82%) |
A execução no modo Balanced em vez do modo Performance afeta significativamente o desempenho da CPU, enquanto o desempenho gráfico não é afetado, de acordo com a tabela de resultados do site Fire Strike acima. Isso está de acordo com nossas observações na seção Teste de estresse acima. A execução com a energia da bateria afeta ainda mais o desempenho geral, mesmo quando definido para o modo Performance.
| 3DMark Performance Rating - Percent | |
| Razer Blade 16 2024, RTX 4090 -1! | |
| KFA2 GeForce RTX 4070 EX Gamer | |
| Alienware x16 R2 P120F | |
| Lenovo Yoga Pro 9 16IMH9 -1! | |
| Média NVIDIA GeForce RTX 4070 Laptop GPU | |
| Maingear ML-16 MK2 | |
| HP Victus 16 (2024) -1! | |
| HP Omen 16-b0085ng -1! | |
| CSL GameStar Notebook VenomGamer G16 -1! | |
| Asus ROG Zephyrus M16 GU603Z -1! | |
| Asus TUF Gaming A16 FA617XS | |
| HP Victus 16-r0076TX | |
| HP Omen 16-n0033dx | |
| Acer Nitro 16 AN16-41-R7YE | |
| Lenovo Legion C7 15IMH05 82EH0030GE -1! | |
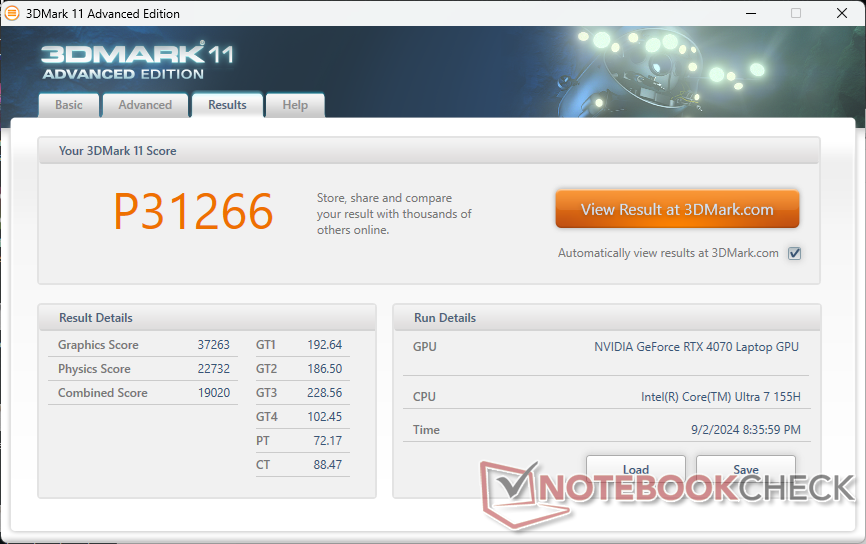
| 3DMark 11 Performance | 31266 pontos | |
| 3DMark Cloud Gate Standard Score | 57717 pontos | |
| 3DMark Fire Strike Score | 23552 pontos | |
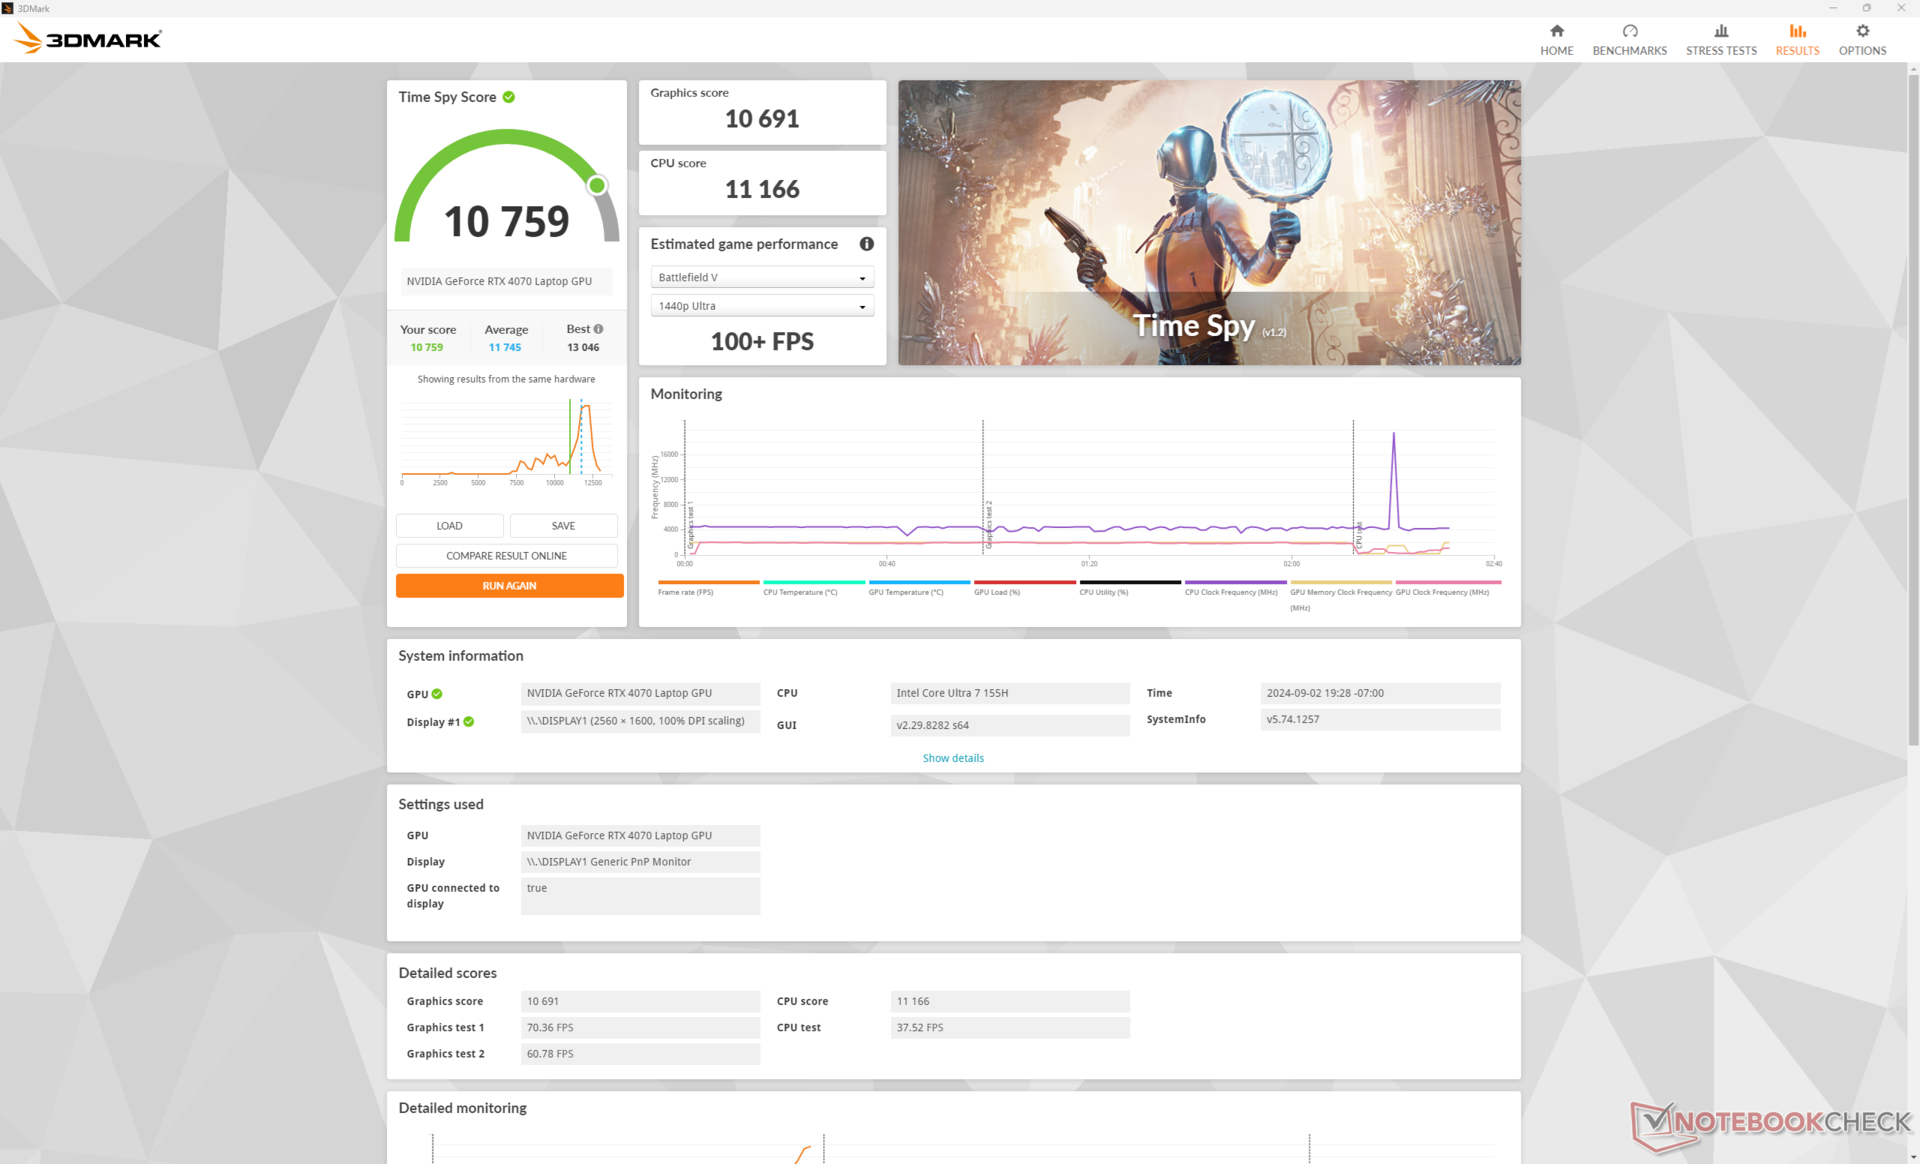
| 3DMark Time Spy Score | 10759 pontos | |
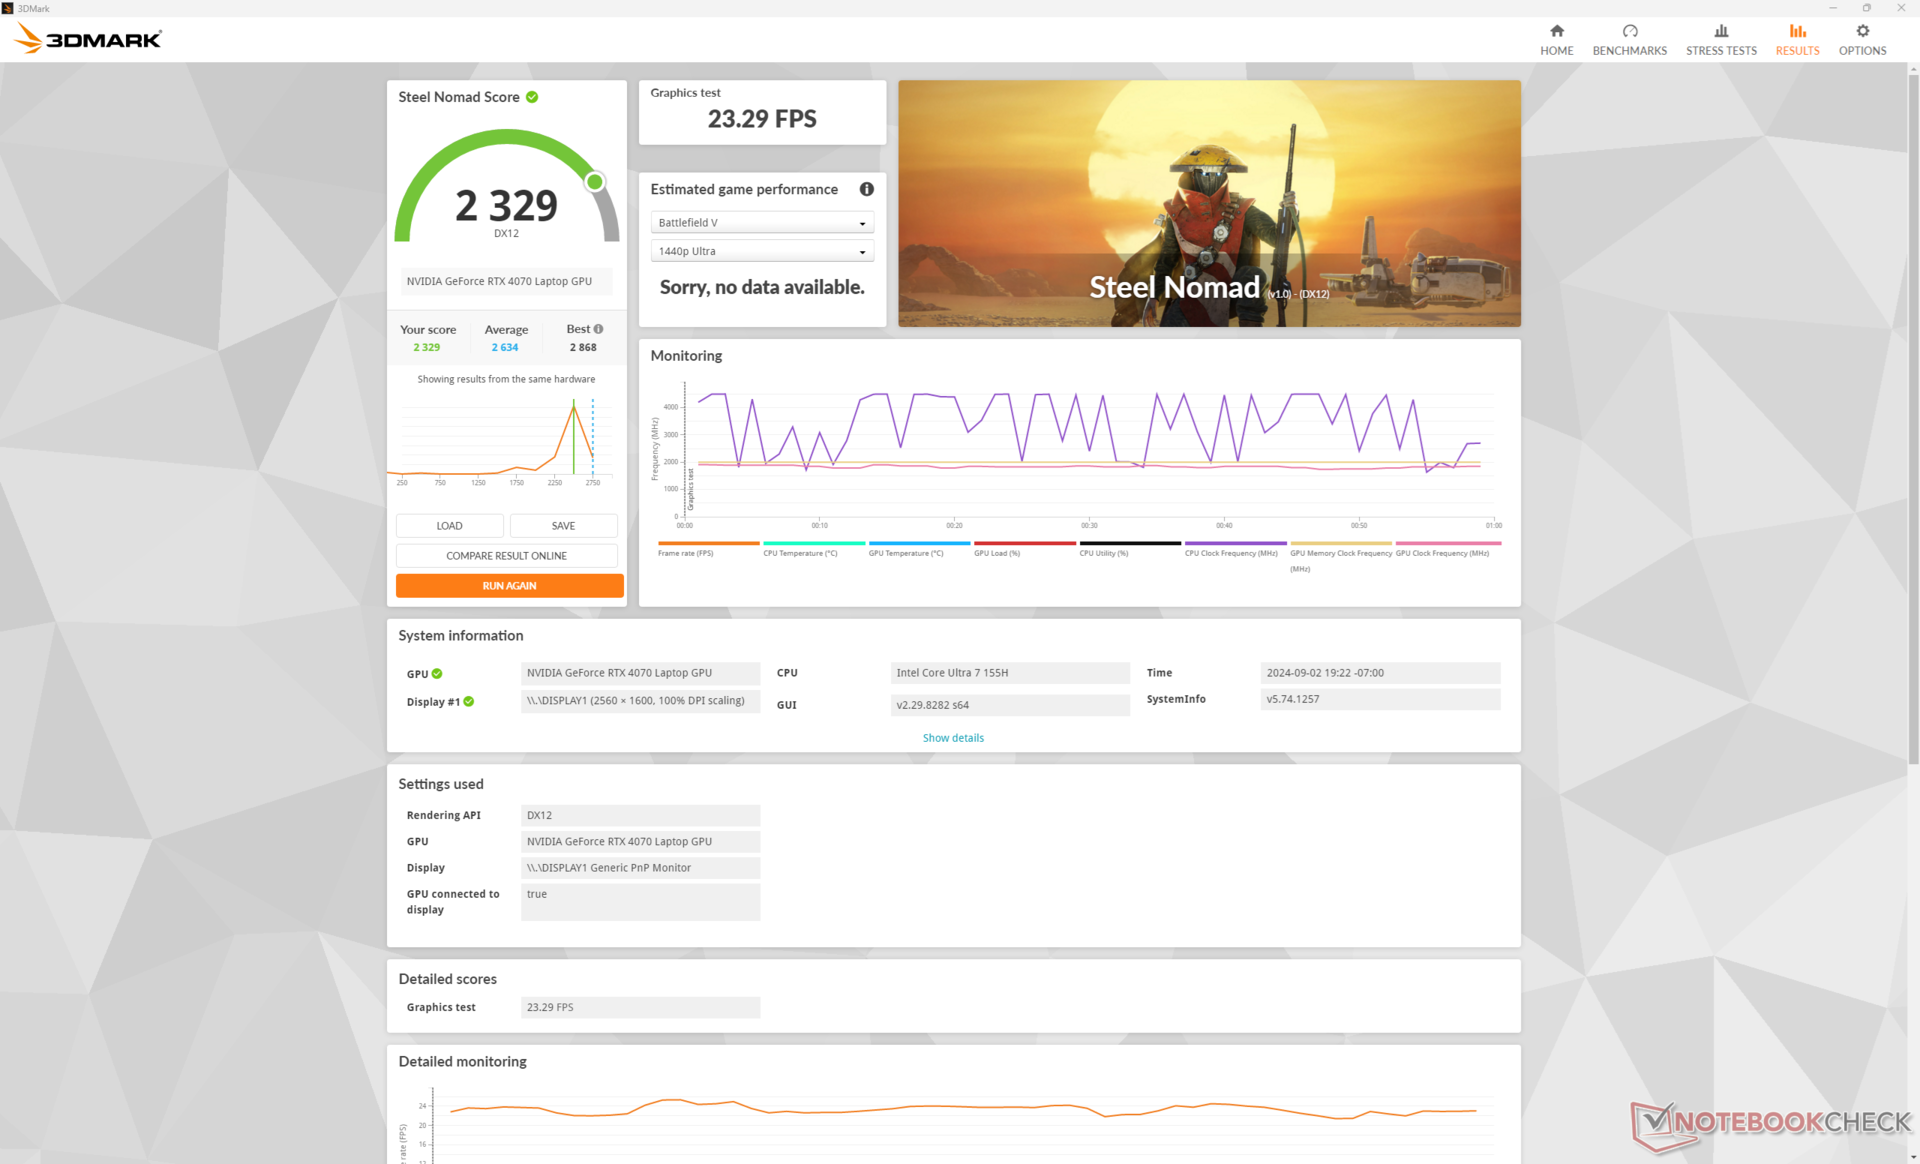
| 3DMark Steel Nomad Score | 2329 pontos | |
Ajuda | ||
* ... menor é melhor
Desempenho em jogos
A RTX 4070 móvel é potente o suficiente para executar títulos modernos em configurações máximas na resolução QHD+ nativa. Títulos mais exigentes, como Cyberpunk 2077, também são possíveis, embora seja necessário que o DLSS atinja 60 FPS ou mais. A execução do benchmark no jogo com as configurações Ultra RT e 1600p nativo, por exemplo, retornaria uma taxa de quadros média de apenas 20,2 contra 63,1 com o DLSS 3 Balanced ativado.
| Performance Rating - Percent | |
| Razer Blade 16 2024, RTX 4090 | |
| Lenovo Legion Pro 5 16IRX9 | |
| Alienware x16 R2 P120F -1! | |
| Maingear ML-16 MK2 | |
| HP Victus 16 (2024) -1! | |
| Asus ROG Zephyrus G16 GA605WV | |
| GTA V - 1920x1080 Highest Settings possible AA:4xMSAA + FX AF:16x | |
| Razer Blade 16 2024, RTX 4090 | |
| Lenovo Legion Pro 5 16IRX9 | |
| Maingear ML-16 MK2 | |
| HP Victus 16 (2024) | |
| Asus ROG Zephyrus G16 GA605WV | |
| Final Fantasy XV Benchmark - 1920x1080 High Quality | |
| Alienware x16 R2 P120F | |
| Razer Blade 16 2024, RTX 4090 | |
| Lenovo Legion Pro 5 16IRX9 | |
| Maingear ML-16 MK2 | |
| HP Victus 16 (2024) | |
| Asus ROG Zephyrus G16 GA605WV | |
| Strange Brigade - 1920x1080 ultra AA:ultra AF:16 | |
| Razer Blade 16 2024, RTX 4090 | |
| Alienware x16 R2 P120F | |
| Lenovo Legion Pro 5 16IRX9 | |
| Maingear ML-16 MK2 | |
| HP Victus 16 (2024) | |
| Asus ROG Zephyrus G16 GA605WV | |
| Dota 2 Reborn - 1920x1080 ultra (3/3) best looking | |
| Razer Blade 16 2024, RTX 4090 | |
| Lenovo Legion Pro 5 16IRX9 | |
| HP Victus 16 (2024) | |
| Asus ROG Zephyrus G16 GA605WV | |
| Maingear ML-16 MK2 | |
| Alienware x16 R2 P120F | |
| X-Plane 11.11 - 1920x1080 high (fps_test=3) | |
| Razer Blade 16 2024, RTX 4090 | |
| Lenovo Legion Pro 5 16IRX9 | |
| HP Victus 16 (2024) | |
| Maingear ML-16 MK2 | |
| Alienware x16 R2 P120F | |
| Asus ROG Zephyrus G16 GA605WV | |
| Far Cry 5 - 1920x1080 Ultra Preset AA:T | |
| Lenovo Legion Pro 5 16IRX9 | |
| Razer Blade 16 2024, RTX 4090 | |
| Alienware x16 R2 P120F | |
| Maingear ML-16 MK2 | |
| Asus ROG Zephyrus G16 GA605WV | |
| Baldur's Gate 3 | |
| 1920x1080 High Preset | |
| Alienware x16 R2 P120F | |
| Lenovo Yoga Pro 9 16IMH9 | |
| Maingear ML-16 MK2 | |
| Média NVIDIA GeForce RTX 4070 Laptop GPU (72.7 - 129.3, n=26) | |
| CSL GameStar Notebook VenomGamer G16 | |
| 1920x1080 Ultra Preset | |
| Razer Blade 16 2024, RTX 4090 | |
| Alienware x16 R2 P120F | |
| Lenovo Yoga Pro 9 16IMH9 | |
| Maingear ML-16 MK2 | |
| Média NVIDIA GeForce RTX 4070 Laptop GPU (66.7 - 128.5, n=28) | |
| CSL GameStar Notebook VenomGamer G16 | |
| 2560x1440 Ultra Preset | |
| Razer Blade 16 2024, RTX 4090 | |
| Alienware x16 R2 P120F | |
| Lenovo Yoga Pro 9 16IMH9 | |
| Média NVIDIA GeForce RTX 4070 Laptop GPU (54.4 - 89.6, n=23) | |
| Maingear ML-16 MK2 | |
| CSL GameStar Notebook VenomGamer G16 | |
| Tiny Tina's Wonderlands | |
| 1920x1080 High Preset (DX12) | |
| KFA2 GeForce RTX 4070 EX Gamer | |
| Alienware x16 R2 P120F | |
| Média NVIDIA GeForce RTX 4070 Laptop GPU (74.3 - 151.4, n=14) | |
| Maingear ML-16 MK2 | |
| Asus TUF Gaming A16 FA617XS | |
| 1920x1080 Badass Preset (DX12) | |
| KFA2 GeForce RTX 4070 EX Gamer | |
| Alienware x16 R2 P120F | |
| Média NVIDIA GeForce RTX 4070 Laptop GPU (58.6 - 115.9, n=17) | |
| Maingear ML-16 MK2 | |
| Asus TUF Gaming A16 FA617XS | |
| 2560x1440 Badass Preset (DX12) | |
| KFA2 GeForce RTX 4070 EX Gamer | |
| Alienware x16 R2 P120F | |
| Média NVIDIA GeForce RTX 4070 Laptop GPU (49.8 - 79.5, n=16) | |
| Maingear ML-16 MK2 | |
| Cyberpunk 2077 2.2 Phantom Liberty | |
| 1920x1080 Medium Preset (FSR off) | |
| Alienware x16 R2 P120F | |
| Média NVIDIA GeForce RTX 4070 Laptop GPU (81.6 - 124.5, n=29) | |
| Lenovo Yoga Pro 9 16IMH9 | |
| Maingear ML-16 MK2 | |
| HP Victus 16 (2024) | |
| CSL GameStar Notebook VenomGamer G16 | |
| 1920x1080 High Preset (FSR off) | |
| Alienware x16 R2 P120F | |
| Média NVIDIA GeForce RTX 4070 Laptop GPU (74.7 - 103.6, n=30) | |
| Lenovo Yoga Pro 9 16IMH9 | |
| Maingear ML-16 MK2 | |
| HP Victus 16 (2024) | |
| CSL GameStar Notebook VenomGamer G16 | |
| 1920x1080 Ultra Preset (FSR off) | |
| Alienware x16 R2 P120F | |
| Razer Blade 16 2024, RTX 4090 | |
| Média NVIDIA GeForce RTX 4070 Laptop GPU (30.7 - 90.7, n=38) | |
| Lenovo Yoga Pro 9 16IMH9 | |
| Maingear ML-16 MK2 | |
| HP Victus 16 (2024) | |
| CSL GameStar Notebook VenomGamer G16 | |
| 2560x1440 Ultra Preset (FSR off) | |
| Razer Blade 16 2024, RTX 4090 | |
| Alienware x16 R2 P120F | |
| Média NVIDIA GeForce RTX 4070 Laptop GPU (24.8 - 57.1, n=35) | |
| Lenovo Yoga Pro 9 16IMH9 | |
| Maingear ML-16 MK2 | |
| CSL GameStar Notebook VenomGamer G16 | |
Cyberpunk 2077 ultra FPS Chart
| baixo | média | alto | ultra | QHD | |
|---|---|---|---|---|---|
| GTA V (2015) | 183.3 | 180.4 | 175 | 115.1 | 90.6 |
| Dota 2 Reborn (2015) | 173.4 | 152.8 | 145.3 | 139.2 | |
| Final Fantasy XV Benchmark (2018) | 187.6 | 146.3 | 110.6 | 80 | |
| X-Plane 11.11 (2018) | 139.9 | 124.4 | 89.8 | ||
| Far Cry 5 (2018) | 125 | 125 | 114 | 101 | |
| Strange Brigade (2018) | 477 | 284 | 224 | 192.8 | 127.9 |
| Tiny Tina's Wonderlands (2022) | 218.7 | 180.9 | 119.4 | 92.9 | 62.7 |
| F1 22 (2022) | 252 | 250 | 206 | 69.2 | 42.9 |
| Baldur's Gate 3 (2023) | 152 | 125.9 | 108.2 | 106.8 | 70.6 |
| Cyberpunk 2077 2.2 Phantom Liberty (2023) | 130 | 106.1 | 88.1 | 76.4 | 44.3 |
Emissões - quentes e altas
Ruído do sistema
O ruído da ventoinha ao navegar ou fazer streaming de vídeo tende a chegar a 27 dB(A) contra um fundo silencioso de 23 dB(A), sendo perceptível, mas tolerável, quando ajustado para o modo Silencioso. Se o senhor estiver jogando no modo Desempenho, o ruído da ventoinha se tornará muito alto, com pouco mais de 55 dB(A), sendo mais alto do que o de concorrentes como o Victus 16, Alienware x16 R2ou Legion Pro 5 16. A ativação do ruído máximo do ventilador aumentaria ainda mais o ruído do ventilador para quase 58 dB(A).

Barulho
| Ocioso |
| 24.1 / 24.1 / 25.6 dB |
| Carga |
| 44.3 / 57.8 dB |
 | ||
30 dB silencioso 40 dB(A) audível 50 dB(A) ruidosamente alto |
||
min: | ||
| Maingear ML-16 MK2 NVIDIA GeForce RTX 4070 Laptop GPU, Ultra 7 155H | Asus ROG Zephyrus G16 GA605WV NVIDIA GeForce RTX 4060 Laptop GPU, Ryzen AI 9 HX 370, Micron 2400 MTFDKBA1T0QFM | HP Victus 16 (2024) NVIDIA GeForce RTX 4060 Laptop GPU, i7-14700HX, Kioxia XG8 KXG80ZNV512G | Alienware x16 R2 P120F NVIDIA GeForce RTX 4080 Laptop GPU, Ultra 9 185H, WDC PC SN810 1TB | Lenovo Legion Pro 5 16IRX9 NVIDIA GeForce RTX 4070 Laptop GPU, i9-14900HX, Samsung PM9A1 MZVL21T0HCLR | Razer Blade 16 2024, RTX 4090 NVIDIA GeForce RTX 4090 Laptop GPU, i9-14900HX, Samsung PM9A1 MZVL22T0HBLB | |
|---|---|---|---|---|---|---|
| Noise | -4% | -10% | 2% | -3% | 3% | |
| desligado / ambiente * | 23 | 24.6 -7% | 25 -9% | 23.4 -2% | 23.9 -4% | 23 -0% |
| Idle Minimum * | 24.1 | 28.6 -19% | 28 -16% | 23.8 1% | 24.3 -1% | 23 5% |
| Idle Average * | 24.1 | 28.6 -19% | 29 -20% | 28.5 -18% | 24.3 -1% | 23 5% |
| Idle Maximum * | 25.6 | 28.6 -12% | 33 -29% | 28.5 -11% | 28.9 -13% | 27.66 -8% |
| Load Average * | 44.3 | 42.8 3% | 45 -2% | 28.8 35% | 45.8 -3% | 43.76 1% |
| Cyberpunk 2077 ultra * | 55.4 | 48.3 13% | ||||
| Load Maximum * | 57.8 | 48.3 16% | 48 17% | 54.2 6% | 56.6 2% | 50.37 13% |
| Witcher 3 ultra * | 43 | 49.5 | 51 | 46.81 |
* ... menor é melhor
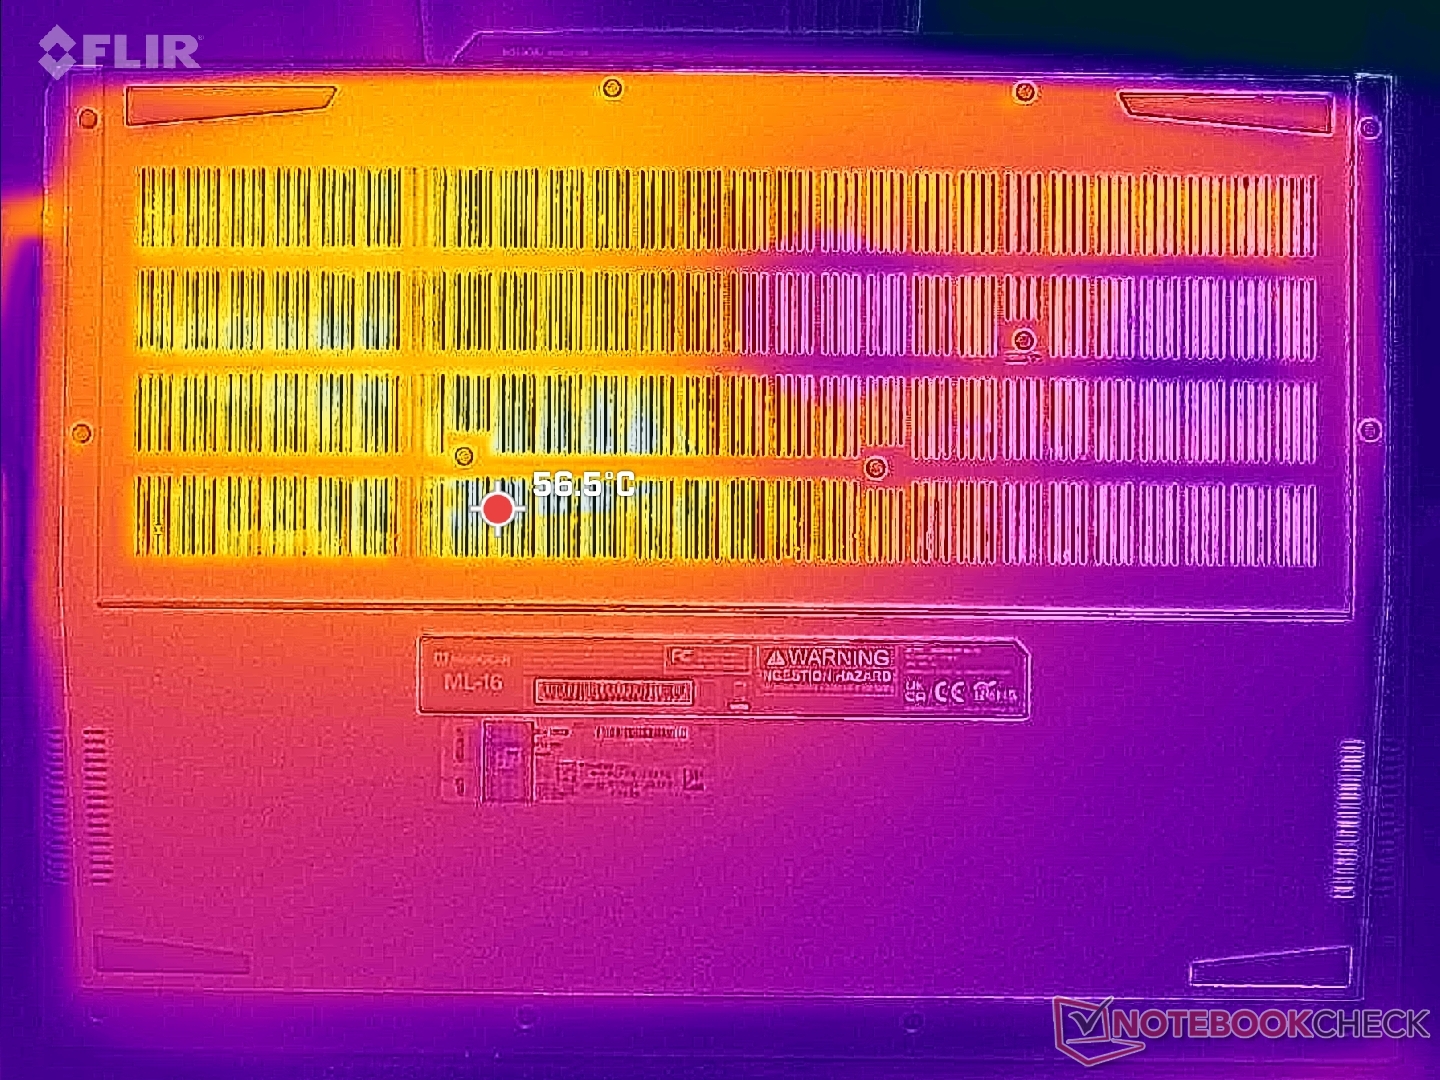
Temperatura
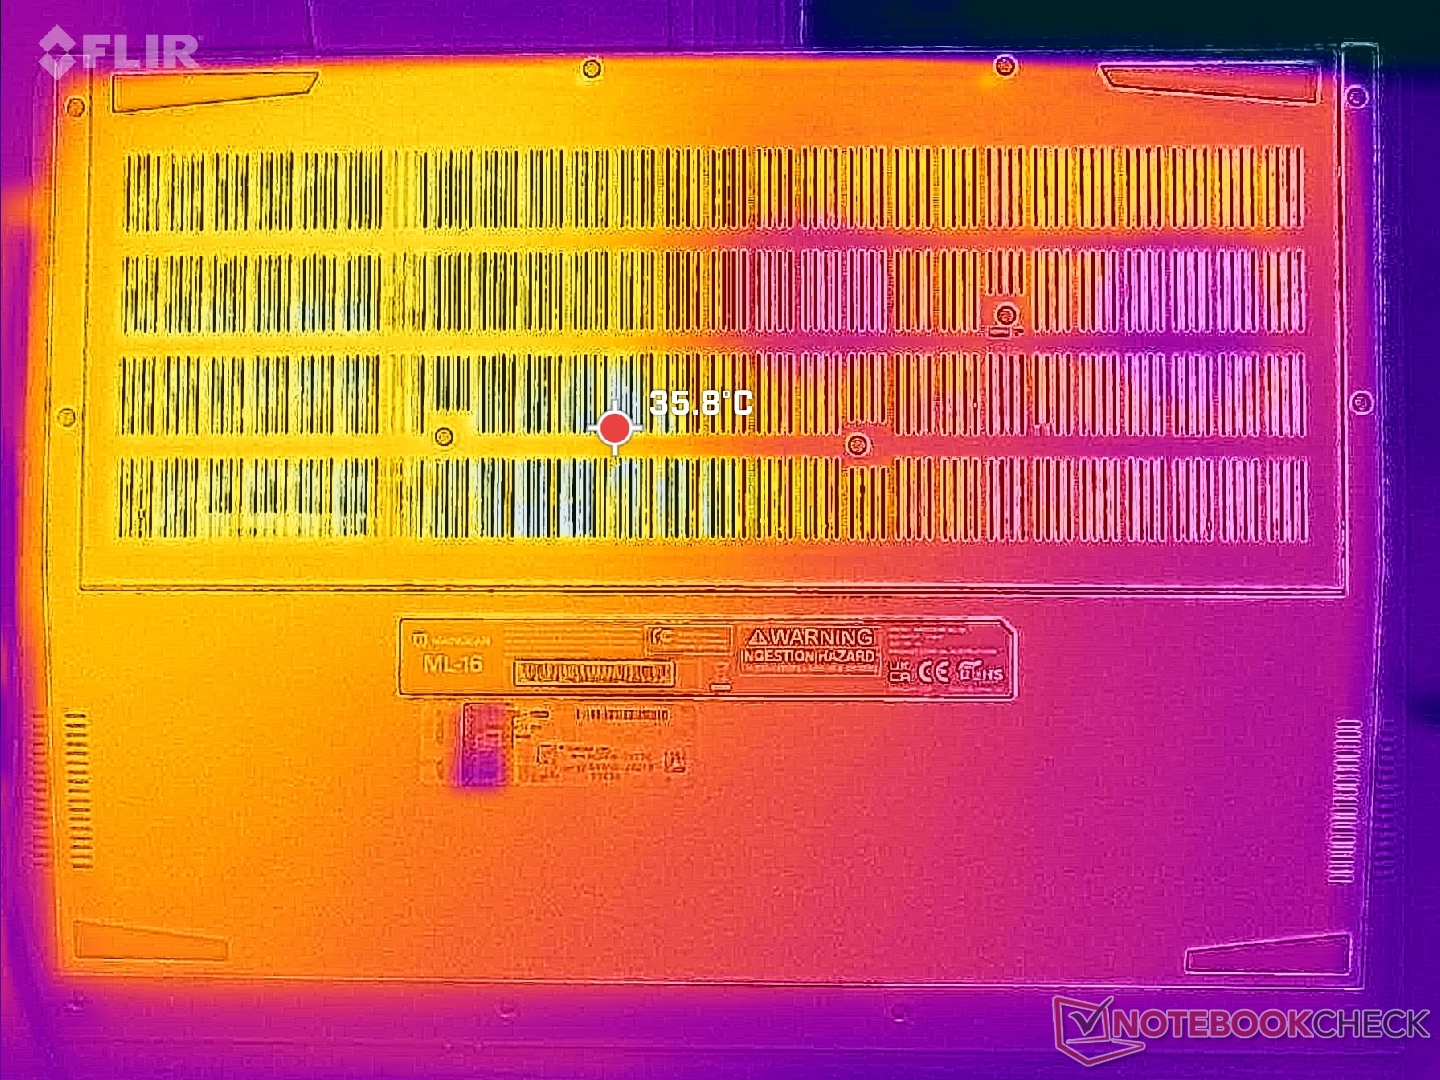
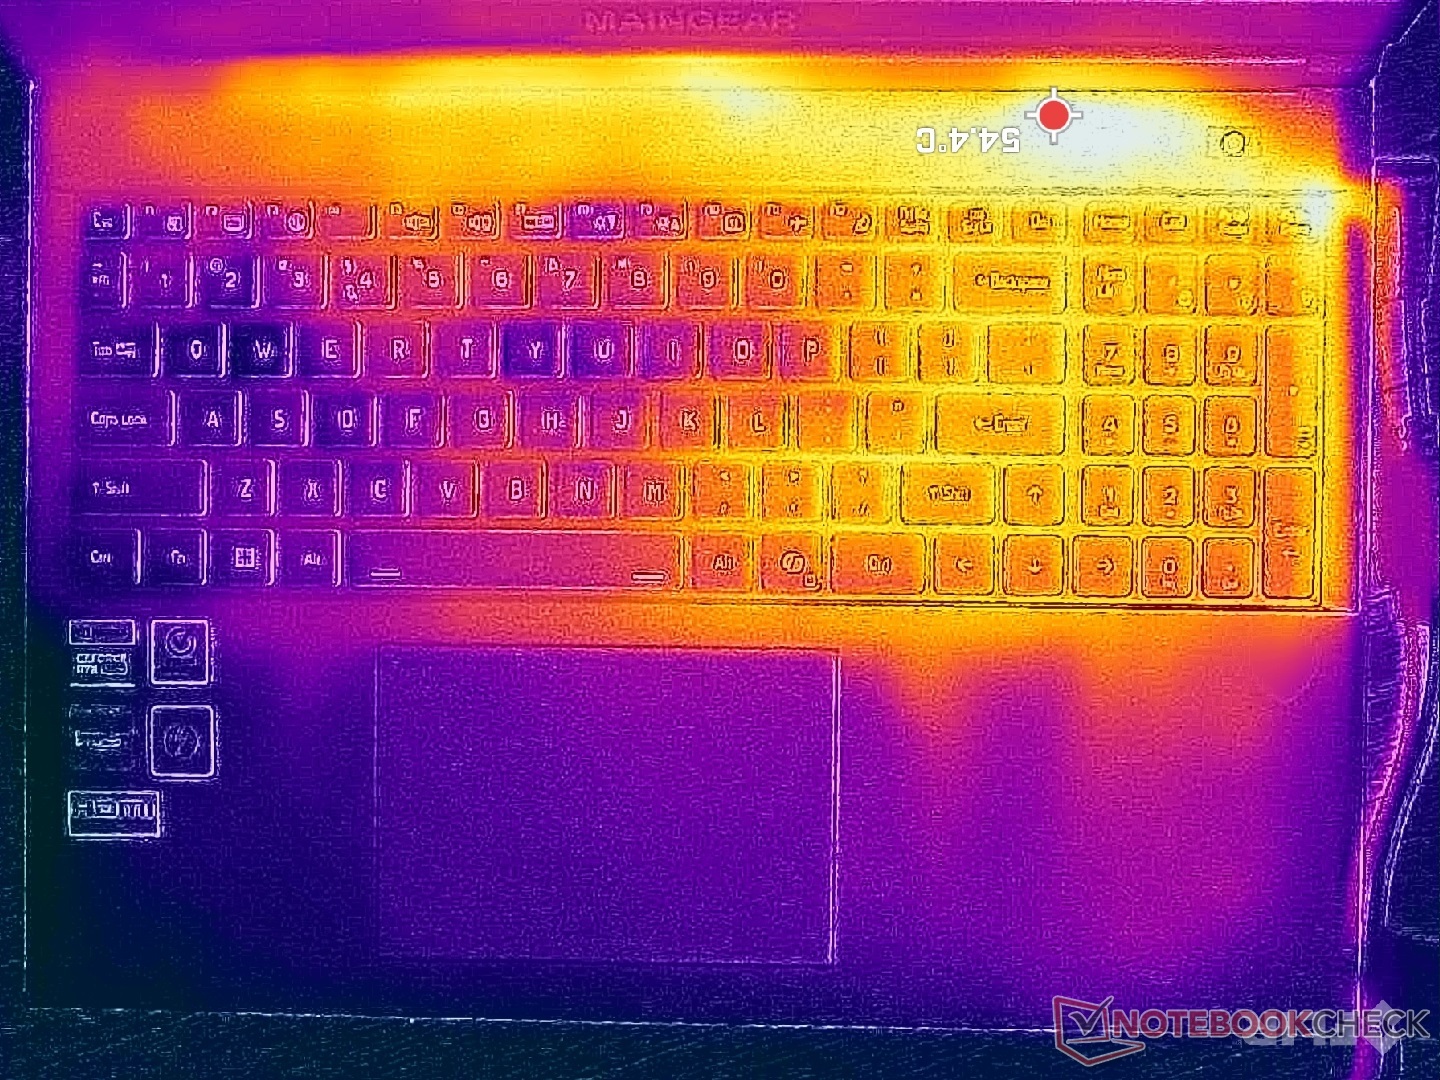
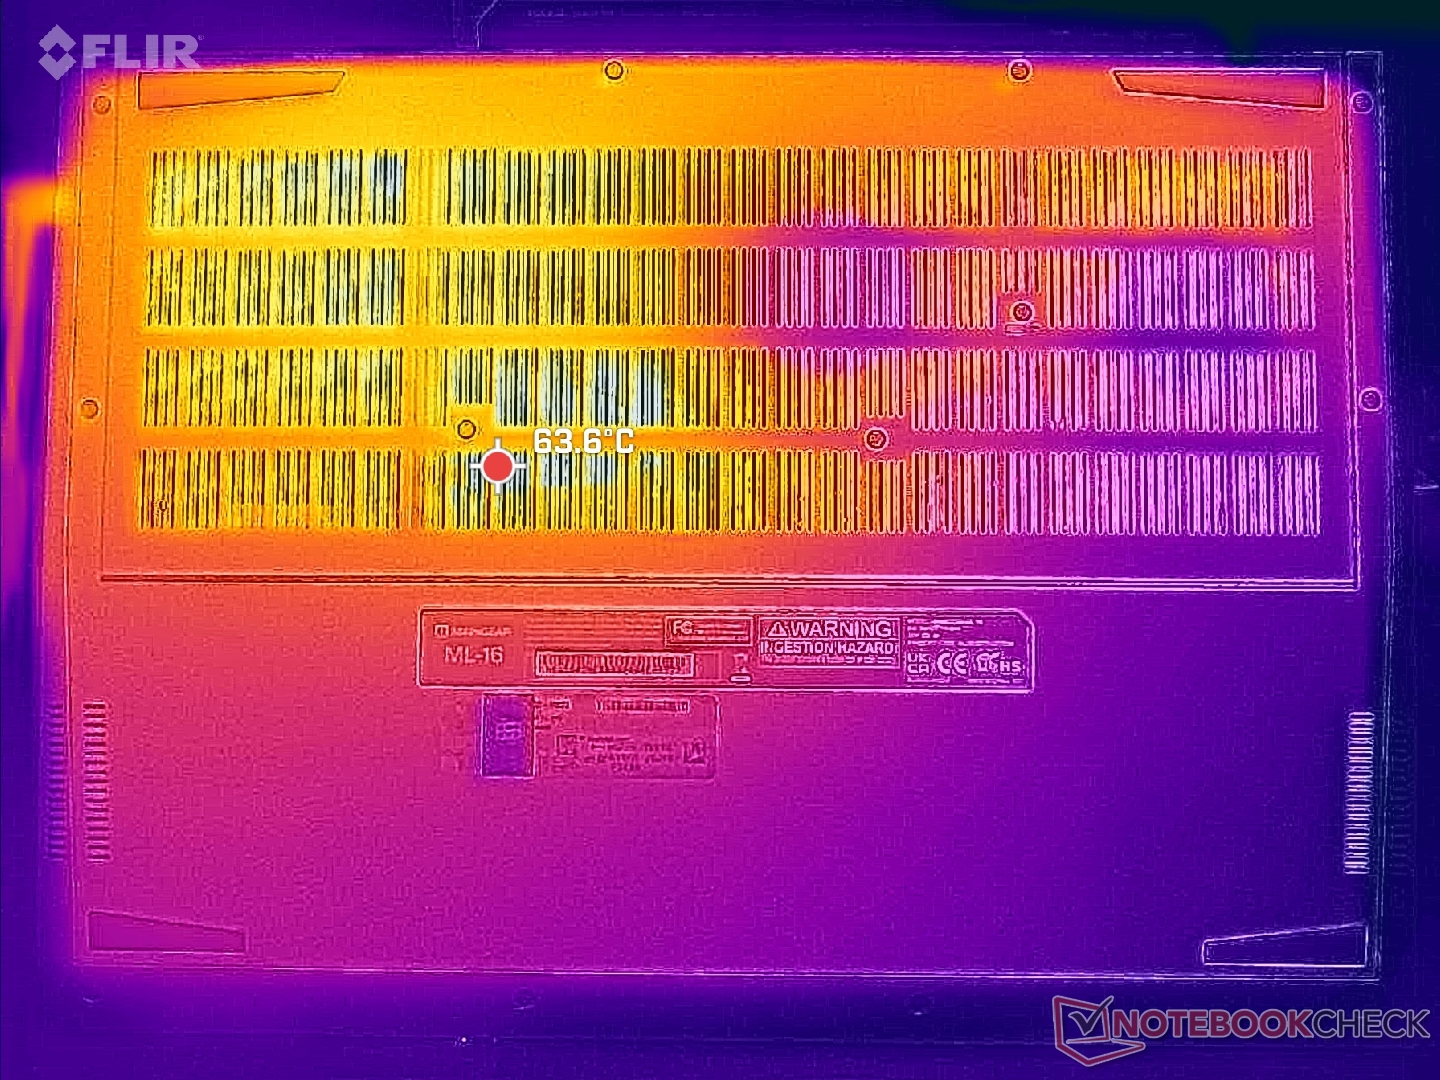
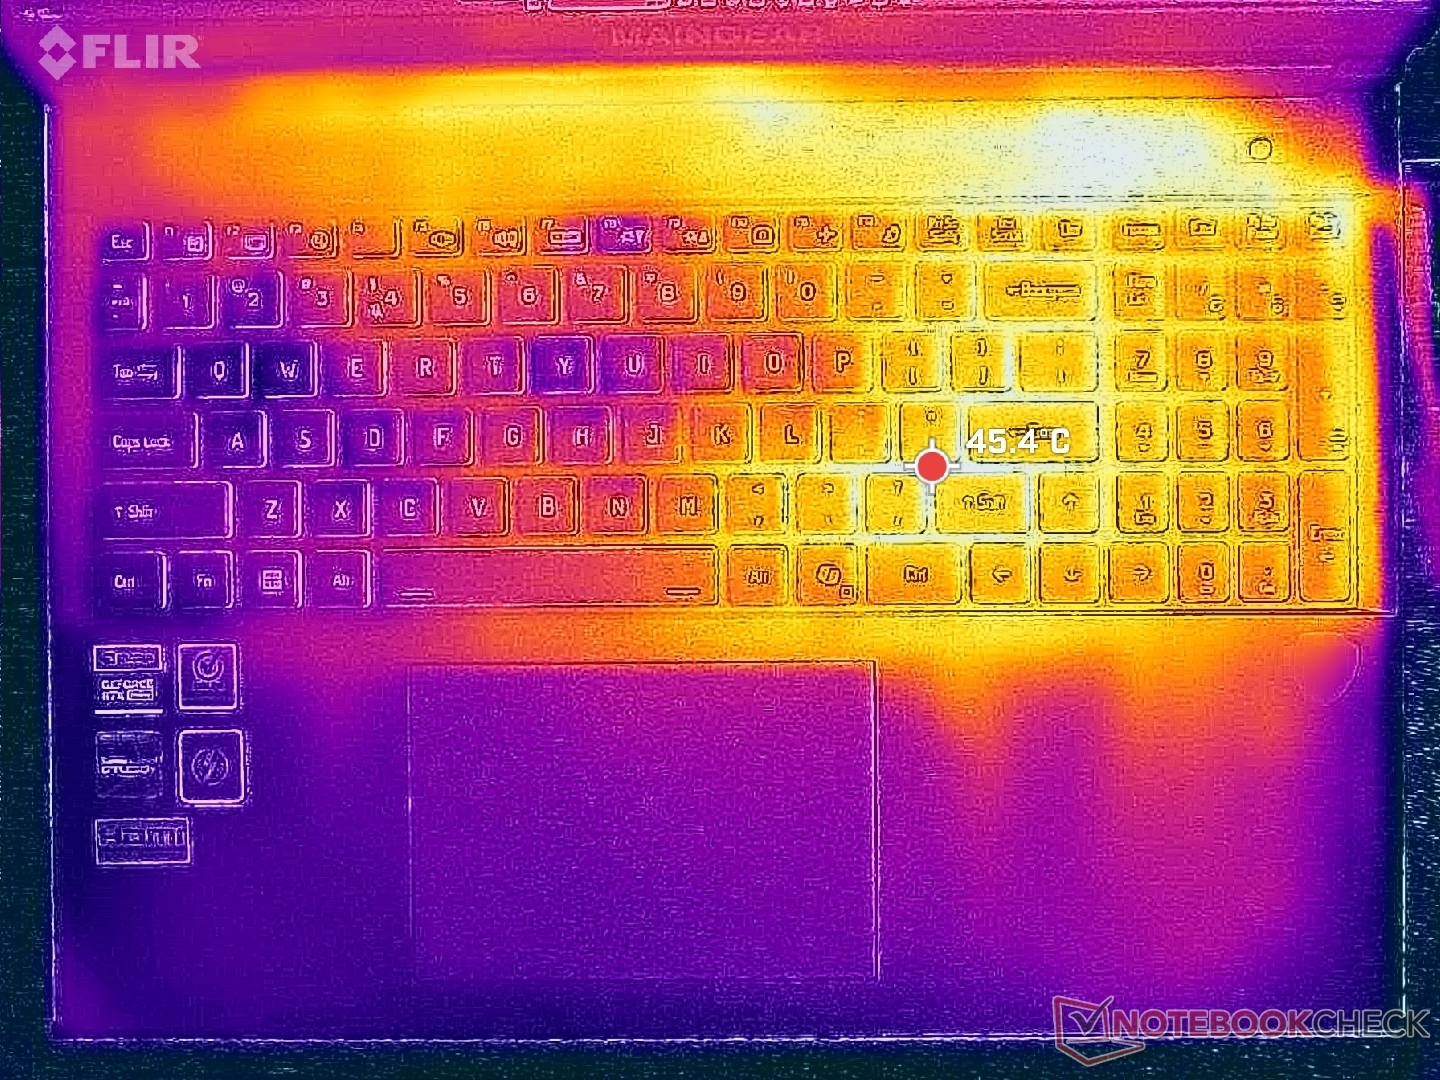
As temperaturas de funcionamento muito quentes, conforme mencionado acima, levam a temperaturas de superfície mais quentes do que a média. Os pontos quentes durante os jogos podem chegar a mais de 54 °C e 56 °C na parte superior e inferior, respectivamente, em comparação com apenas 40 °C no Blade 16 ou 47 C no Legion Pro 5 16IRX9.
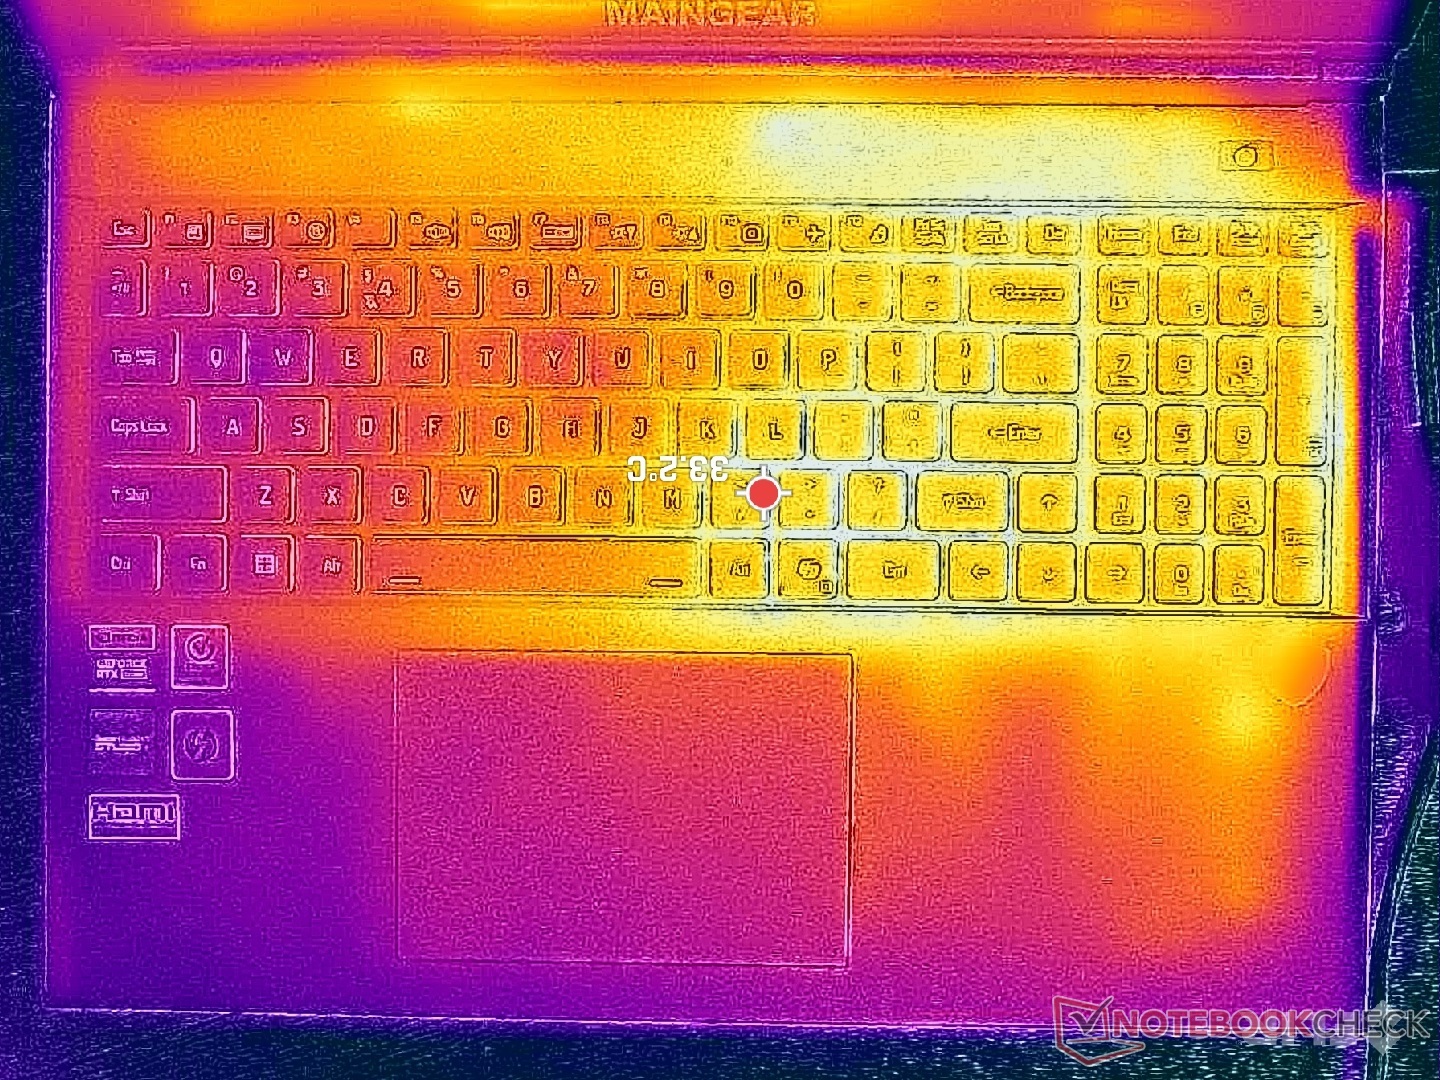
Além disso, a solução de resfriamento assimétrico significa que a metade direita do chassi ou do teclado ficará muito mais quente do que a esquerda. Isso contrasta com a maioria dos outros notebooks para jogos, em que as soluções de resfriamento simétricas são comuns. Isso não é um grande problema, pois a maioria dos jogos utiliza apenas as teclas WASD na metade esquerda do teclado, mas o senhor pode esperar uma palma da mão suada se o jogo exigir entradas do teclado numérico.
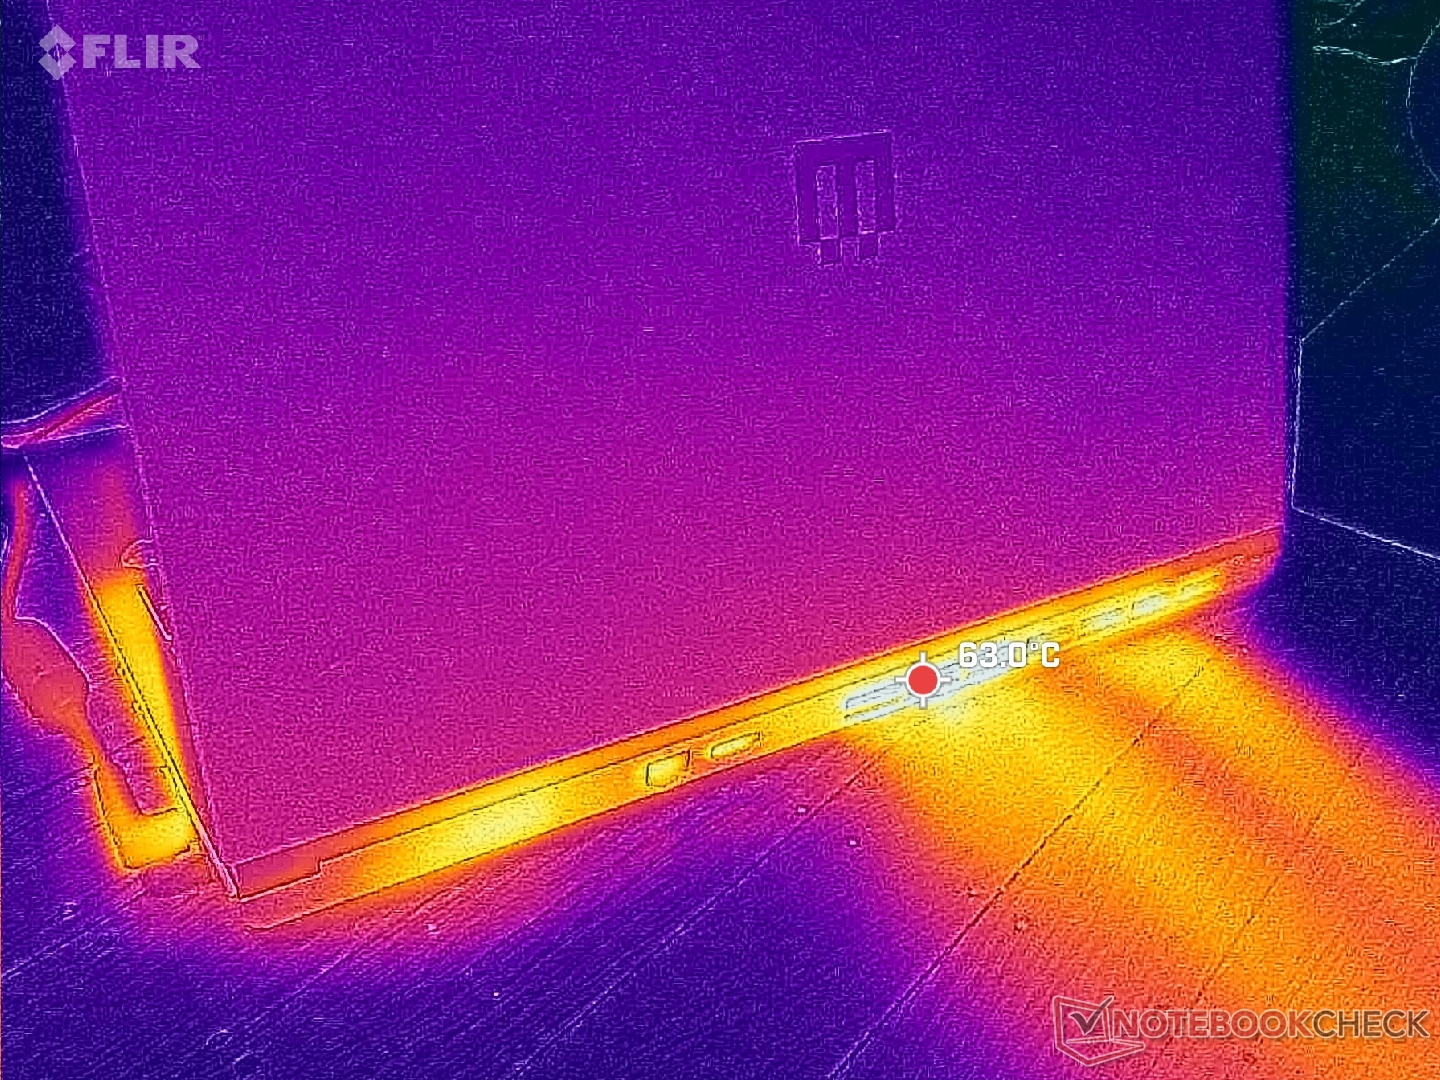
(-) A temperatura máxima no lado superior é 45.2 °C / 113 F, em comparação com a média de 40.4 °C / 105 F , variando de 21.2 a 68.8 °C para a classe Gaming.
(-) A parte inferior aquece até um máximo de 48.8 °C / 120 F, em comparação com a média de 43.2 °C / 110 F
(+) Em uso inativo, a temperatura média para o lado superior é 31.9 °C / 89 F, em comparação com a média do dispositivo de 33.9 °C / ### class_avg_f### F.
(-) 3: The average temperature for the upper side is 40 °C / 104 F, compared to the average of 33.9 °C / 93 F for the class Gaming.
(+) Os apoios para as mãos e o touchpad estão atingindo a temperatura máxima da pele (34.6 °C / 94.3 F) e, portanto, não estão quentes.
(-) A temperatura média da área do apoio para as mãos de dispositivos semelhantes foi 28.9 °C / 84 F (-5.7 °C / -10.3 F).
| Maingear ML-16 MK2 Intel Core Ultra 7 155H, NVIDIA GeForce RTX 4070 Laptop GPU | Asus ROG Zephyrus G16 GA605WV AMD Ryzen AI 9 HX 370, NVIDIA GeForce RTX 4060 Laptop GPU | HP Victus 16 (2024) Intel Core i7-14700HX, NVIDIA GeForce RTX 4060 Laptop GPU | Alienware x16 R2 P120F Intel Core Ultra 9 185H, NVIDIA GeForce RTX 4080 Laptop GPU | Lenovo Legion Pro 5 16IRX9 Intel Core i9-14900HX, NVIDIA GeForce RTX 4070 Laptop GPU | Razer Blade 16 2024, RTX 4090 Intel Core i9-14900HX, NVIDIA GeForce RTX 4090 Laptop GPU | |
|---|---|---|---|---|---|---|
| Heat | 8% | 12% | -4% | 0% | 12% | |
| Maximum Upper Side * | 45.2 | 48.2 -7% | 50 -11% | 51 -13% | 43.8 3% | 45 -0% |
| Maximum Bottom * | 48.8 | 51.3 -5% | 50 -2% | 50.8 -4% | 55.4 -14% | 45 8% |
| Idle Upper Side * | 34.8 | 28 20% | 25 28% | 36.6 -5% | 32.8 6% | 29 17% |
| Idle Bottom * | 38.2 | 28.8 25% | 26 32% | 35.2 8% | 36 6% | 30 21% |
* ... menor é melhor
Alto-falantes
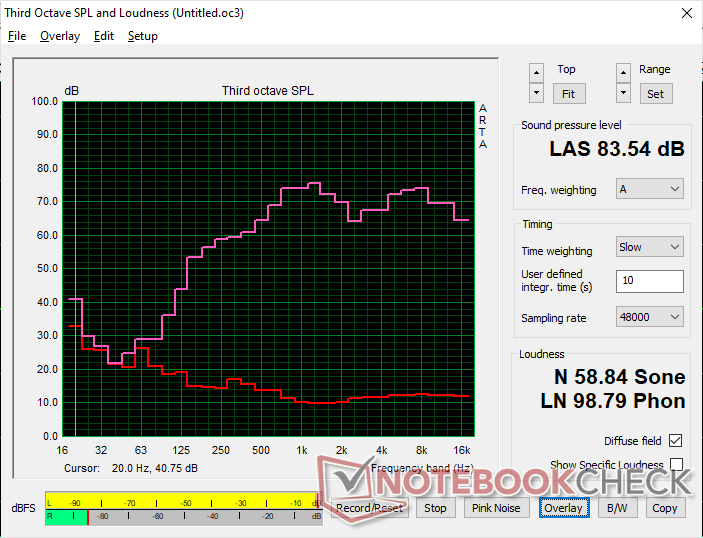
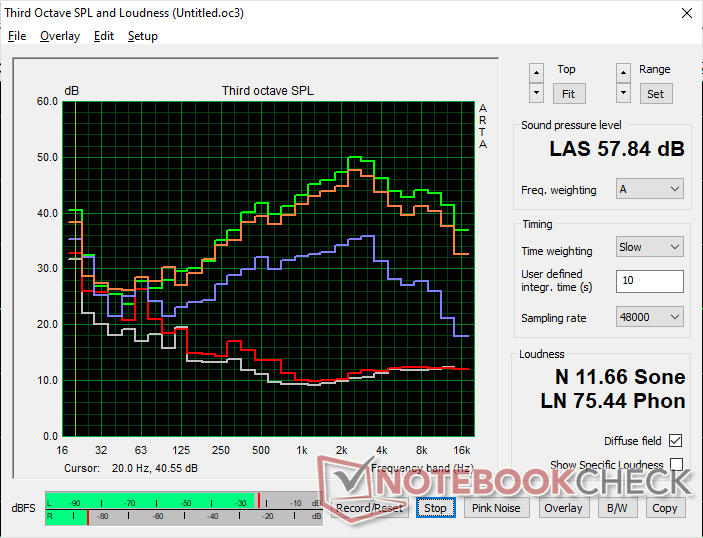
Maingear ML-16 MK2 análise de áudio
(+) | os alto-falantes podem tocar relativamente alto (###valor### dB)
Graves 100 - 315Hz
(-) | quase nenhum baixo - em média 16.1% menor que a mediana
(±) | a linearidade dos graves é média (9.2% delta para a frequência anterior)
Médios 400 - 2.000 Hz
(+) | médios equilibrados - apenas 4.9% longe da mediana
(+) | médios são lineares (4.9% delta para frequência anterior)
Altos 2 - 16 kHz
(+) | agudos equilibrados - apenas 3.3% longe da mediana
(+) | os máximos são lineares (5.1% delta da frequência anterior)
Geral 100 - 16.000 Hz
(+) | o som geral é linear (13.7% diferença em relação à mediana)
Comparado com a mesma classe
» 20% de todos os dispositivos testados nesta classe foram melhores, 6% semelhantes, 74% piores
» O melhor teve um delta de 6%, a média foi 18%, o pior foi 132%
Comparado com todos os dispositivos testados
» 13% de todos os dispositivos testados foram melhores, 3% semelhantes, 83% piores
» O melhor teve um delta de 4%, a média foi 24%, o pior foi 134%
Apple MacBook Pro 16 2021 M1 Pro análise de áudio
(+) | os alto-falantes podem tocar relativamente alto (###valor### dB)
Graves 100 - 315Hz
(+) | bons graves - apenas 3.8% longe da mediana
(+) | o baixo é linear (5.2% delta para a frequência anterior)
Médios 400 - 2.000 Hz
(+) | médios equilibrados - apenas 1.3% longe da mediana
(+) | médios são lineares (2.1% delta para frequência anterior)
Altos 2 - 16 kHz
(+) | agudos equilibrados - apenas 1.9% longe da mediana
(+) | os máximos são lineares (2.7% delta da frequência anterior)
Geral 100 - 16.000 Hz
(+) | o som geral é linear (4.6% diferença em relação à mediana)
Comparado com a mesma classe
» 0% de todos os dispositivos testados nesta classe foram melhores, 0% semelhantes, 100% piores
» O melhor teve um delta de 5%, a média foi 18%, o pior foi 45%
Comparado com todos os dispositivos testados
» 0% de todos os dispositivos testados foram melhores, 0% semelhantes, 100% piores
» O melhor teve um delta de 4%, a média foi 24%, o pior foi 134%
Gerenciamento de energia
Consumo de energia
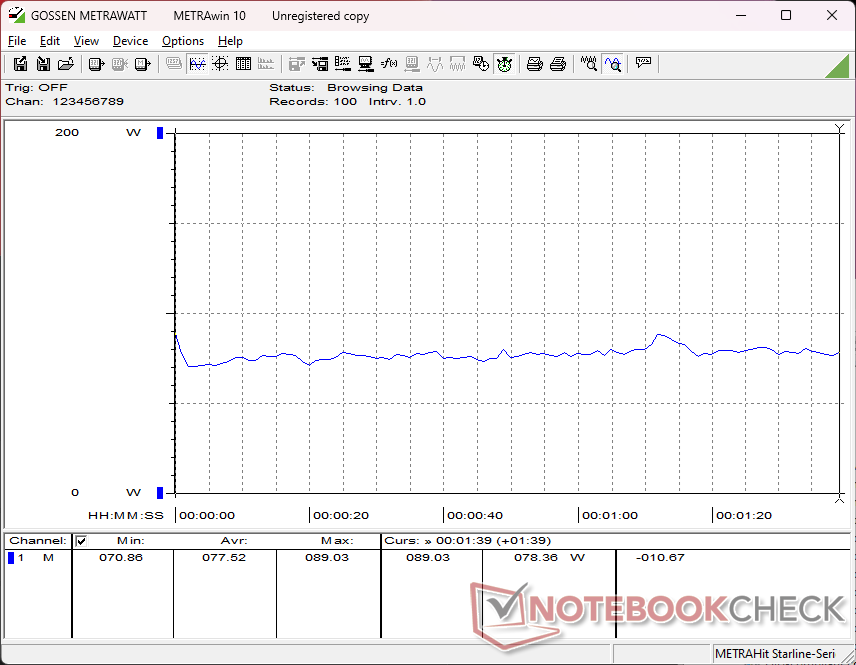
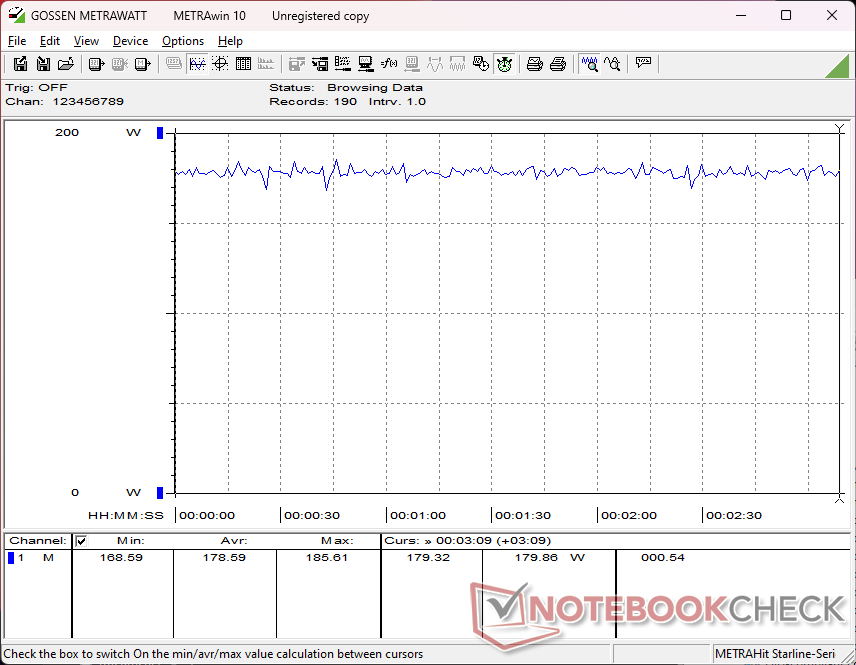
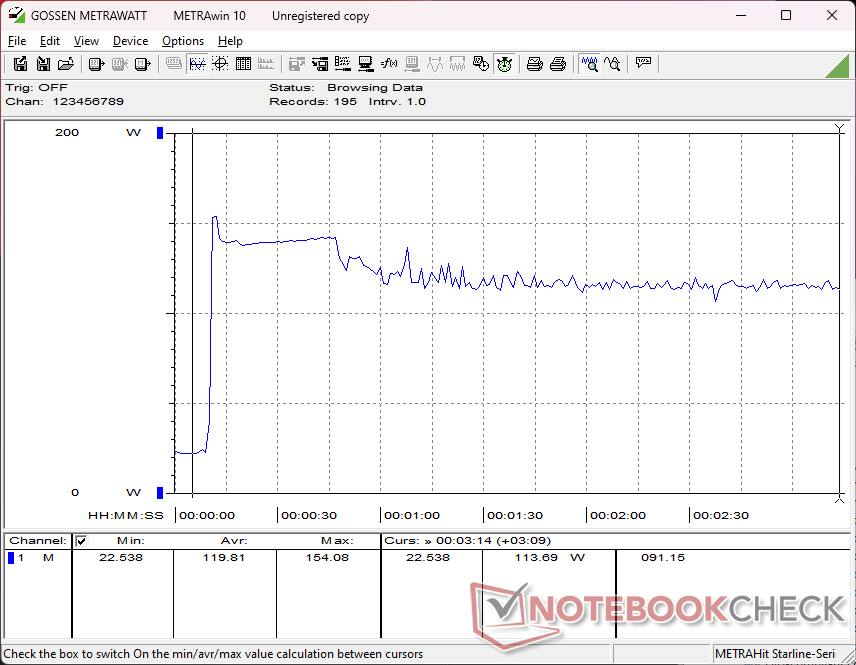
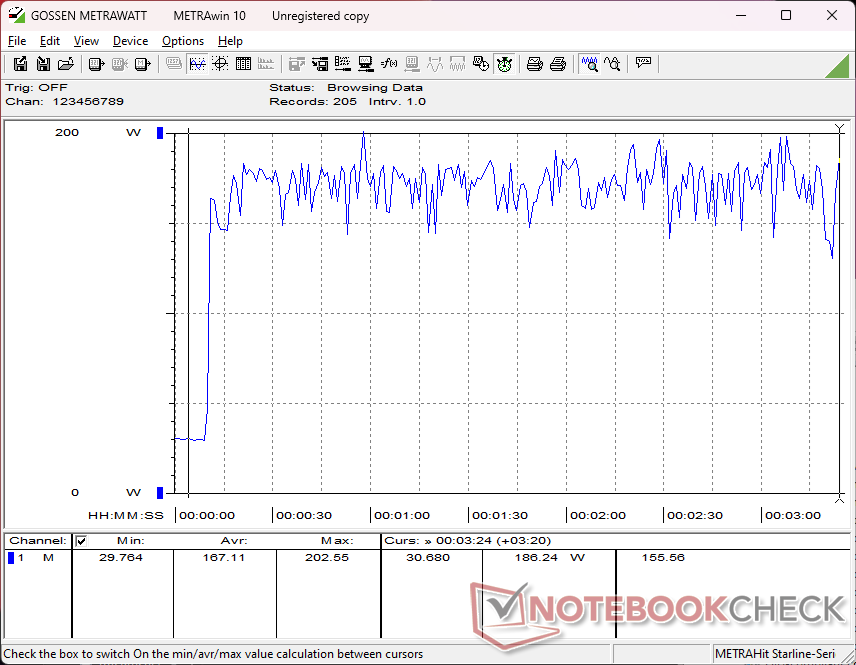
O consumo de energia em marcha lenta varia entre 7 W e 27 W, dependendo da configuração da GPU e do nível de brilho, o que é uma faixa mais ampla em comparação com os concorrentes. Isso também explica a duração relativamente curta da bateria na próxima seção abaixo. A simples ativação do modo dGPU e do brilho máximo da tela faz com que o consumo salte de 7 W para 23 W e, portanto, é recomendável executar no modo MSHybrid se a duração da bateria for importante.
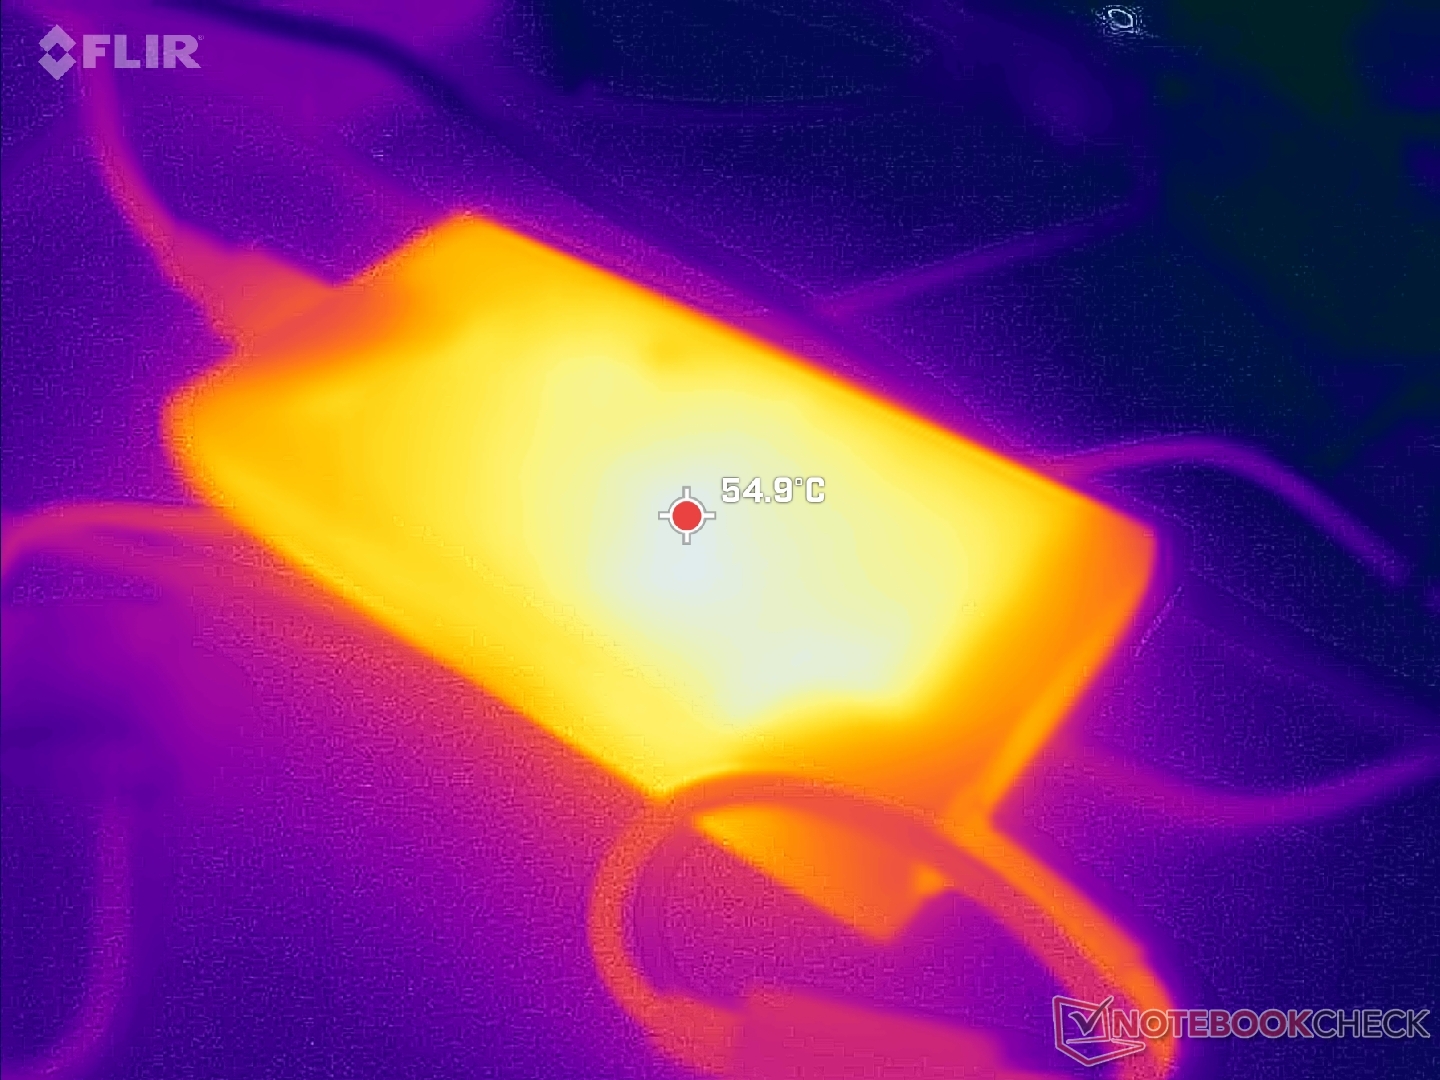
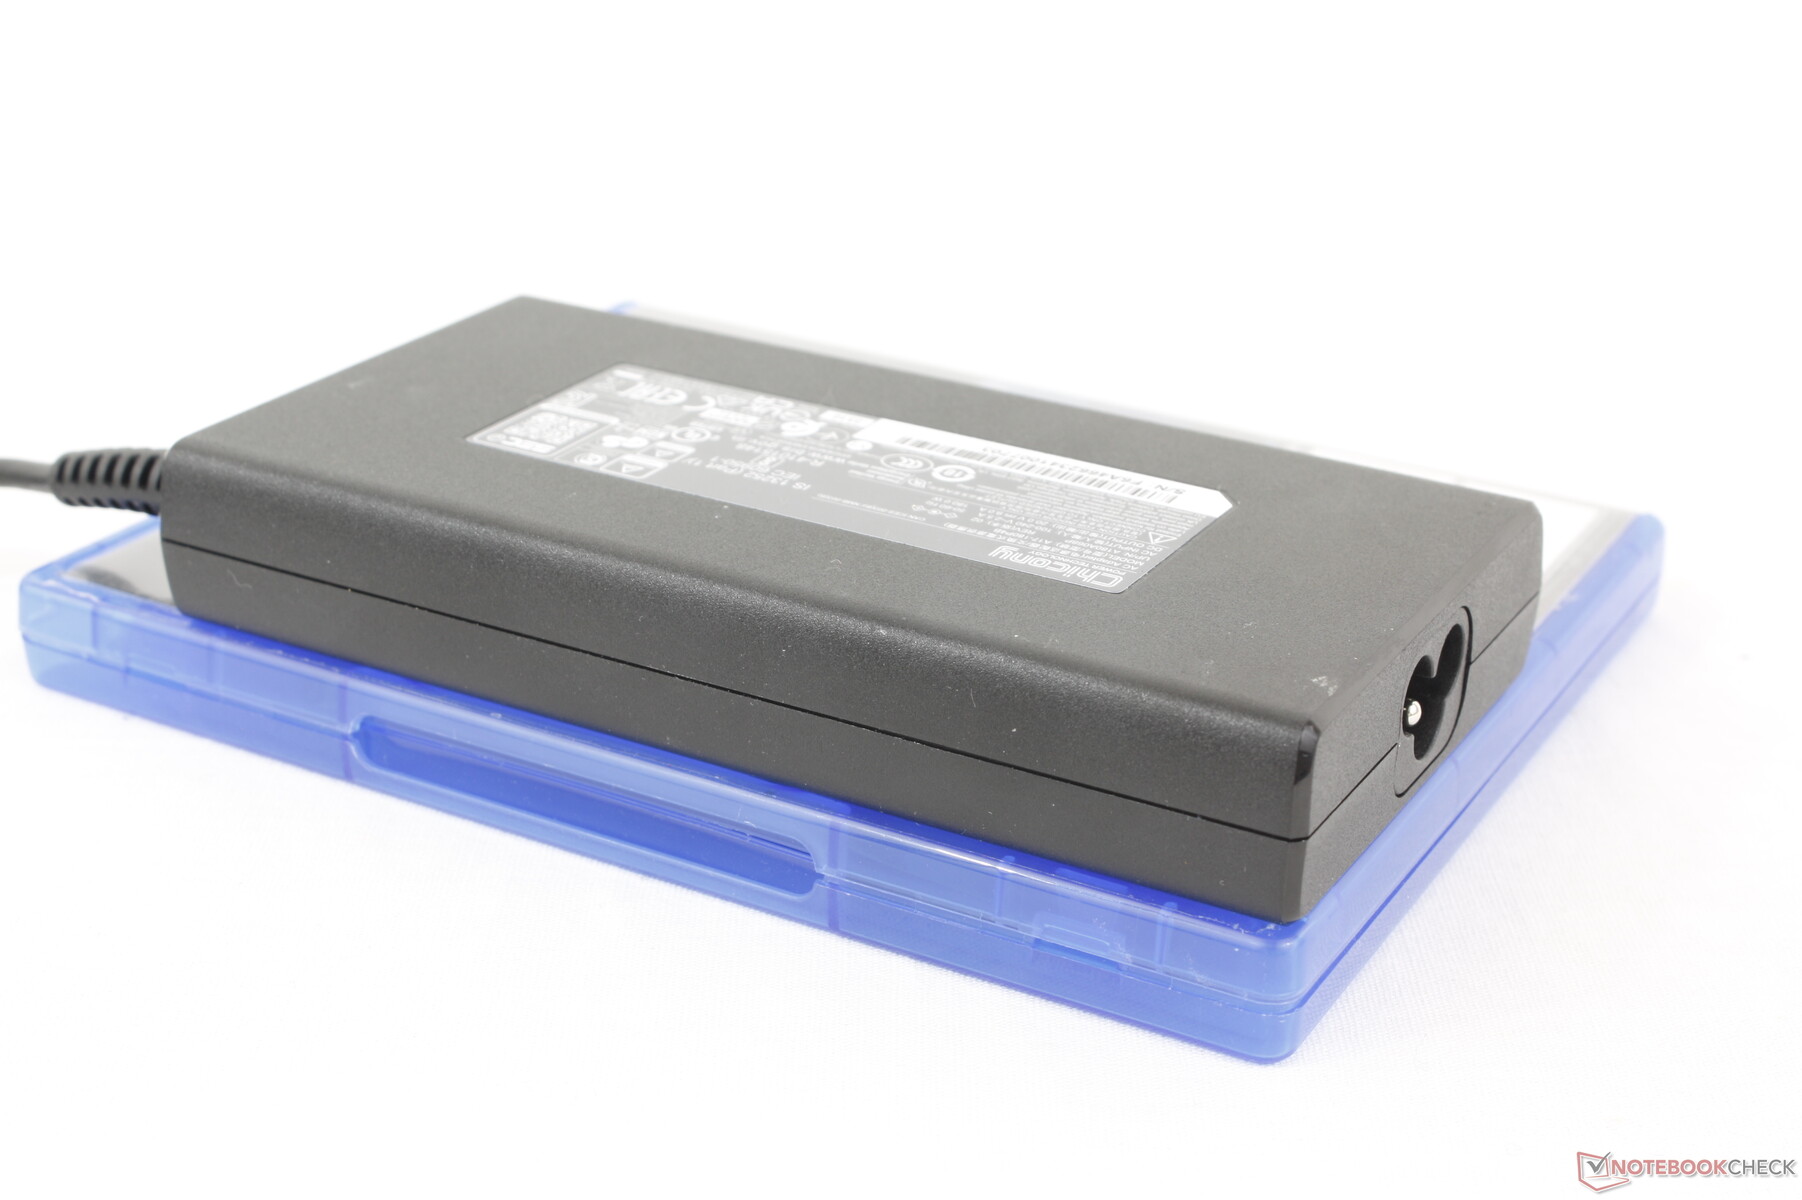
Os jogos exigem cerca de 179 W em média do adaptador CA de 180 W de tamanho médio (~14,4 x 7,5 x 2,3 cm). Isso significa que a taxa de carga ficará muito lenta se os jogos forem executados simultaneamente e também sugere que o desempenho poderia ter sido mais rápido se o modelo tivesse sido fornecido com um adaptador CA de 230 W maior. Na verdade, conseguimos registrar um consumo máximo de 203 W quando a CPU e a GPU estão em plena utilização para provar que o sistema pode exigir mais do que o adaptador CA pode fornecer com segurança. Isso é semelhante ao que observamos no Lenovo Yoga Pro 9i 16 G9 onde descobrimos que o adaptador CA de 170 W é muito pequeno para a CPU Core Ultra H e a GPU RTX 4070.
| desligado | |
| Ocioso | |
| Carga |
|
Key:
min: | |
| Maingear ML-16 MK2 Ultra 7 155H, NVIDIA GeForce RTX 4070 Laptop GPU, , IPS, 2560x1600, 16" | Asus ROG Zephyrus G16 GA605WV Ryzen AI 9 HX 370, NVIDIA GeForce RTX 4060 Laptop GPU, Micron 2400 MTFDKBA1T0QFM, OLED, 2560x1600, 16" | HP Victus 16 (2024) i7-14700HX, NVIDIA GeForce RTX 4060 Laptop GPU, Kioxia XG8 KXG80ZNV512G, IPS, 1920x1080, 16.1" | Alienware x16 R2 P120F Ultra 9 185H, NVIDIA GeForce RTX 4080 Laptop GPU, WDC PC SN810 1TB, IPS, 2560x1600, 16" | Lenovo Legion Pro 5 16IRX9 i9-14900HX, NVIDIA GeForce RTX 4070 Laptop GPU, Samsung PM9A1 MZVL21T0HCLR, IPS, 2560x1600, 16" | Razer Blade 16 2024, RTX 4090 i9-14900HX, NVIDIA GeForce RTX 4090 Laptop GPU, Samsung PM9A1 MZVL22T0HBLB, OLED, 2560x1600, 16" | |
|---|---|---|---|---|---|---|
| Power Consumption | 24% | -9% | -20% | -29% | -39% | |
| Idle Minimum * | 7.7 | 6.9 10% | 9 -17% | 9.9 -29% | 12.5 -62% | 16.9 -119% |
| Idle Average * | 22.9 | 12.6 45% | 15 34% | 14.5 37% | 24.6 -7% | 17.8 22% |
| Idle Maximum * | 26.7 | 13 51% | 23 14% | 33.5 -25% | 24.8 7% | 19.6 27% |
| Load Average * | 77.5 | 84.1 -9% | 123 -59% | 97.5 -26% | 109.6 -41% | 128 -65% |
| Cyberpunk 2077 ultra external monitor * | 178.9 | 124.5 30% | ||||
| Cyberpunk 2077 ultra * | 178.6 | 127.2 29% | ||||
| Load Maximum * | 202.6 | 177.6 12% | 241 -19% | 315.2 -56% | 284.9 -41% | 328 -62% |
| Witcher 3 ultra * | 143.7 | 230 | 218 | 243 |
* ... menor é melhor
Power Consumption Cyberpunk / Stress Test
Power Consumption external Monitor
Duração da bateria
A capacidade da bateria de 80 Wh é média para o tamanho da tela de 16 polegadas. Os tempos de execução, no entanto, estão abaixo da média para um notebook para jogos. Só conseguimos registrar pouco mais de 3,5 horas de navegação em WLAN no mundo real, mesmo quando configurado para o perfil de energia balanceado com MSHybrid ativo, em comparação com o dobro disso no Asus ROG Zephyrus G16 ou HP Victus 16.
O carregamento da capacidade vazia até a capacidade total é relativamente rápido, de 1 a 1,5 horas. O sistema também pode ser recarregado por meio de adaptadores CA USB-C de terceiros, embora em um ritmo mais lento. Lembre-se de que apenas uma das duas portas USB-C suporta recarga.
| Maingear ML-16 MK2 Ultra 7 155H, NVIDIA GeForce RTX 4070 Laptop GPU, 80 Wh | Asus ROG Zephyrus G16 GA605WV Ryzen AI 9 HX 370, NVIDIA GeForce RTX 4060 Laptop GPU, 90 Wh | HP Victus 16 (2024) i7-14700HX, NVIDIA GeForce RTX 4060 Laptop GPU, 83 Wh | Alienware x16 R2 P120F Ultra 9 185H, NVIDIA GeForce RTX 4080 Laptop GPU, 90 Wh | Lenovo Legion Pro 5 16IRX9 i9-14900HX, NVIDIA GeForce RTX 4070 Laptop GPU, 80 Wh | Razer Blade 16 2024, RTX 4090 i9-14900HX, NVIDIA GeForce RTX 4090 Laptop GPU, 95.2 Wh | |
|---|---|---|---|---|---|---|
| Duração da bateria | 62% | 134% | -11% | -13% | 16% | |
| Reader / Idle | 651 | 403 -38% | ||||
| WiFi v1.3 | 218 | 478 119% | 511 134% | 193 -11% | 290 33% | 329 51% |
| Load | 98 | 103 5% | 65 -34% | 79 -19% | ||
| H.264 | 824 | 456 |
Pro
Contra
Veredicto - Surpreendentemente leve, mas um pouco quente demais
O Maingear ML-16 MK2 tem algumas vantagens em relação aos concorrentes de grande nome. O mais notável é o peso leve e a tela relativamente brilhante para ajudar os usuários que nem sempre jogam em casa. Enquanto isso, o teclado numérico integrado pode ser útil para determinados tipos de jogos e trabalhos em planilhas, e a facilidade de manutenção é sempre apreciada pelos entusiastas.
Infelizmente, o modelo sofre com uma longa lista de desvantagens. Por um lado, sua solução de resfriamento é relativamente pequena e não tão eficiente quanto a dos laptops para jogos de 16 polegadas da concorrência. Portanto, as temperaturas do núcleo, as temperaturas da superfície e o ruído da ventoinha são mais quentes e mais altos do que em alternativas como o mais pesado Razer Blade 16 ou o Lenovo Legion Pro. A rigidez do chassi também é mais fraca do que a dos concorrentes, causando uma primeira impressão mais fraca. Esses contratempos podem ser parcialmente atribuídos ao peso mais leve, pois foram feitos cortes no chassi e na solução de resfriamento como resultado. Em outras palavras, o senhor terá que fazer alguns sacrifícios importantes para obter um peso mais leve e portátil.
O Maingear ML-16 MK2 é mais leve e mais brilhante do que esperávamos. No entanto, ele carece de vários recursos avançados, enquanto as temperaturas e o ruído da ventoinha poderiam ser melhores.
Outros recursos avançados, como Optimus 2.0, HDR, OLED, iluminação RGB por tecla, resfriamento por câmara de vapor e interface de metal líquido, não estão disponíveis no ML-16 MK2. Essas omissões podem ser aceitáveis na faixa de US$ 1.500, mas esperávamos um pouco mais, considerando o preço pedido de US$ 2.000 para nossa configuração RTX 4070.
Preço e disponibilidade
A Maingear já está enviando o ML-16 Mark 2 por US$ 1.800 com o GeForce RTX 4060 ou US$ 2.000 com o RTX 4070, conforme analisado.
Observação: Atualizamos recentemente nosso sistema de classificação e os resultados da versão 8 não são comparáveis aos resultados da versão 7. Mais informações estão disponíveis aqui .
Maingear ML-16 MK2
- 09/17/2024 v8
Allen Ngo
 Total Sustainability Score:
 Transparência
A seleção dos dispositivos a serem analisados é feita pela nossa equipe editorial. A amostra de teste foi fornecida ao autor como empréstimo pelo fabricante ou varejista para fins desta revisão. O credor não teve influência nesta revisão, nem o fabricante recebeu uma cópia desta revisão antes da publicação. Não houve obrigação de publicar esta revisão. Nunca aceitamos compensação ou pagamento em troca de nossas avaliações. Como empresa de mídia independente, a Notebookcheck não está sujeita à autoridade de fabricantes, varejistas ou editores.
É assim que o Notebookcheck está testando
Todos os anos, o Notebookcheck analisa de forma independente centenas de laptops e smartphones usando procedimentos padronizados para garantir que todos os resultados sejam comparáveis. Desenvolvemos continuamente nossos métodos de teste há cerca de 20 anos e definimos padrões da indústria no processo. Em nossos laboratórios de teste, equipamentos de medição de alta qualidade são utilizados por técnicos e editores experientes. Esses testes envolvem um processo de validação em vários estágios. Nosso complexo sistema de classificação é baseado em centenas de medições e benchmarks bem fundamentados, o que mantém a objetividade.Price comparison

