Notebookcheck Logo

Análise do mini PC BOSGAME M1: O Ryzen 7 7840HS ainda é uma fera
Mais rápido do que o Ryzen 7 8840HS mais recente.
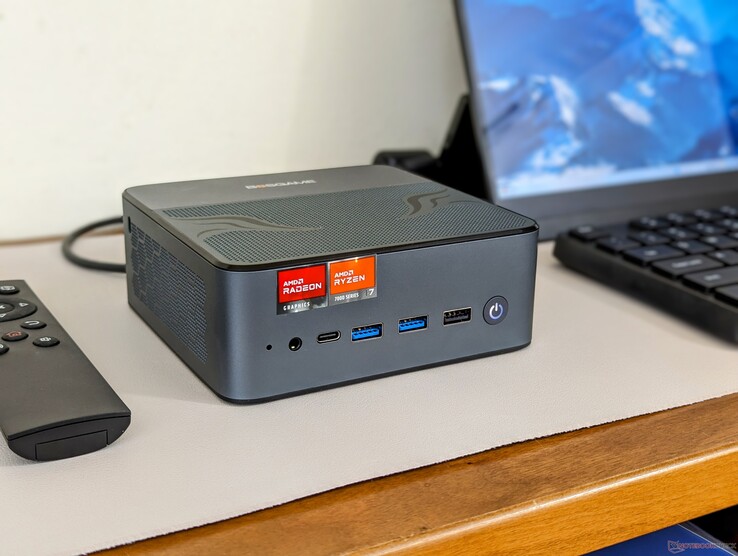
Se o senhor não se importa com a aceleração de IA, o Bosgame M1 é um dos minicomputadores mais rápidos que pode ser adquirido pelo seu tamanho. Ele ainda inclui alto-falantes estéreo integrados, ao contrário da maioria dos outros da categoria.
Bosgame M1
Bosgame M1

Enquanto o Bosgame N95 é voltado para usuários de HTPCs econômicos, o M1 é voltado para usuários de escritório e avançados que precisam de mais desempenho de seus mini PCs. O modelo apresenta uma CPU Ryzen 7 7840HS de classe gamer com gráficos Radeon 780M integrados, SSD NVMe de 1 TB e 32 GB de RAM removível por aproximadamente US$ 690. O M1 é notável por seus alto-falantes estéreo integrados, enquanto a grande maioria dos mini PCs usa alto-falantes externos.

As alternativas ao Bosgame M1 incluem outros mini PCs do tamanho do NUC, como o GMK NucBox K6,Intel NUC 13 Proou Beelink SER7.

Mais análises da Bosgame:

BOSGAME M1
Processador
AMD Ryzen 7 7840HS 8 x 3.8 - 5.1 GHz, 67 W PL2 / Short Burst, 54 W PL1 / Sustained, Phoenix-HS (Zen 4)
Placa gráfica
AMD Radeon 780M, Análises do: 2700 MHz, Memoría: 2800 MHz, DDR5, 31.0.24033.1003
Memória
32 GB 
, ADATA, DDR5-5600, Dual-Channel, 46-45-45-90
placa mãe
AMD Promontory/Bixby FCH
Placa de Som
AMD Zen - Audio Processor - HD Audio Controller
Conexões
1 USB 2.0, 4 USB 3.1 Gen2, 2 USB 4.0 40 Gbps, USB-C Power Delivery (PD), 1 HDMI, 3 DisplayPort, 1 Kensington Lock, Conexões Audio: 3.5 mm combo
Funcionamento em rede
Realtek RTL8125 2.5GBe Family Ethernet Controller (10/100/1000/2500MBit/s), MediaTek Wi-Fi 6E MT7922 160MHz Wireless LAN Card (a/b/g/n = Wi-Fi 4/ac = Wi-Fi 5/ax = Wi-Fi 6/ Wi-Fi 6E 6 GHz), Bluetooth 5.2
Tamanho
altura x largura x profundidade (em mm): 51 x 136 x 132
Sistema Operativo
Microsoft Windows 11 Pro
Características adicionais
Alto falantes: Stereo, HDMI, VESA mounting bracket, 12 Meses Garantia
peso
766 g, Suprimento de energia: 605 g
Preço
690 USD
Note: The manufacturer may use components from different suppliers including display panels, drives or memory sticks with similar specifications.


Possíveis concorrentes em comparação

Rating
Date
Model
Weight
Height
Size
Resolution
Price
84.5 %
v7 (old)
05/2024
BOSGAME M1
R7 7840HS, Radeon 780M
766 g51 mmx
78.9 %
v7 (old)
04/2024
GMK NucBox M5
R7 5700U, Vega 8
505 g48 mmx
83.6 %
v7 (old)
04/2024
GMK NucBox K6
R7 7840HS, Radeon 780M
514 g47 mmx
80.8 %
v7 (old)
04/2023
Intel NUC 13 Pro Kit NUC13ANK
i7-1360P, Iris Xe G7 96EUs
538 g37 mmx
86.6 %
v7 (old)
09/2023
Beelink SER7
R7 7840HS, Radeon 780M
640 g49 mmx

v (old)
11/2022
Beelink GTR6
R9 6900HX, Radeon 680M
815 g43 mmx

Estojo - robusto e pesado

Além da placa metálica removível na parte inferior, o restante do chassi é uma peça única de metal para uma construção sólida e uma sensação que rivaliza com a série NUC. Isso contrasta com alguns designs da Beelink, que têm tampas de plástico ou de malha para uma aparência um pouco mais barata. A principal desvantagem é a falta de opções de cores e de personalização, mas não achamos que isso seja um obstáculo.

Embora seu design geral seja melhor descrito como "semelhante ao NUC", o M1 é, na verdade, maior e mais pesado do que muitos outros mini PCs da classe NUC no mercado, incluindo o NUC 13 Pro e o GMK NucBox K6. Isso pode ser parcialmente atribuído aos alto-falantes integrados que a maioria dos outros mini PCs não possui. No entanto, o design mais robusto tem suas vantagens, como mostrarão as seções de desempenho abaixo.

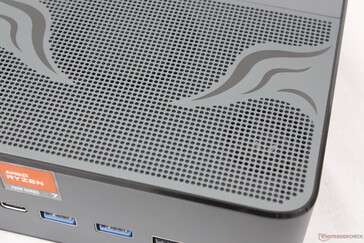
Os alto-falantes integrados ficam voltados para cima e podem ser vistos através das grades
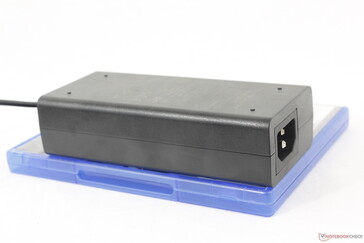
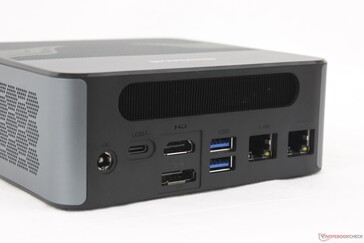
Adaptador CA proprietário de 120 W relativamente grande
Painel inferior com montagem VESA, pés de borracha e alça de borracha para manutenção
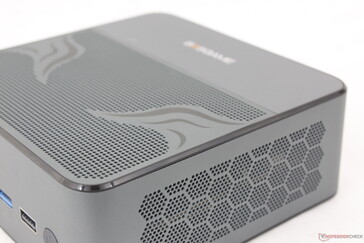
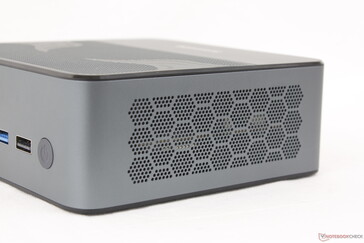
Superfícies de metal fosco com acabamentos em preto brilhante nas bordas e nos cantos

Comparação de tamanho

168 mm 120 mm 43 mm 815 g136 mm 132 mm 51 mm 766 g129 mm 127 mm 48 mm 505 g128 mm 126 mm 47 mm 514 g126 mm 113 mm 49 mm 640 g117 mm 112 mm 37 mm 538 g210 mm 148 mm 1 mm 2.9 g

Conectividade

As opções de portas são amplas e variadas, como é de se esperar de um mini PC. As portas de destaque no M1 incluem DisplayPort de tamanho normal e duas portas USB-C 4.0 para um sistema compatível com dock. Observe que as portas USB-C também são compatíveis com Power Delivery de até 100 W; se o senhor perder o adaptador CA proprietário que acompanha o sistema, os adaptadores CA USB-C universais de terceiros poderão ser usados para alimentar o modelo. Nosso adaptador Lenovo USB-C de 135 W, por exemplo, é compatível com o Bosgame M1. Esperamos que o fabricante simplesmente abandone o adaptador AC especial em barril em favor de adaptadores USB-C universais em modelos futuros.

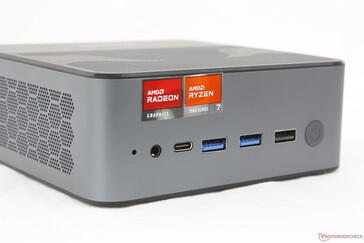
Frontal: Botão de reinicialização, fones de ouvido de 3,5 mm, USB-C 4.0 com Power Delivery + DisplayPort (8K@60 Hz), 2x USB-A 3.2 Gen. 2 (10 Gbps), USB-A 2.0, botão liga/desliga
Certo: Sem portas
Certo: Sem portas
Traseira: Porta do adaptador CA, USB-C 4.0 com Power Delivery + DisplayPort (8K@60 Hz), HDMI 2.0 (4K@60 Hz), DisplayPort 1.4 (4K@144 Hz), 2x USB-A 3.2 Gen. 2 (10 Gbps), 2x RJ-45 (2,5 Gbps)
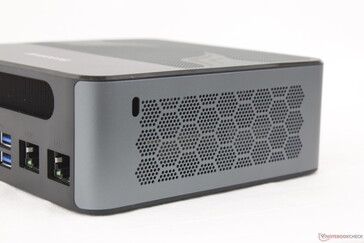
Esquerda: Fechadura Kensington

Comunicação

O MediaTek MT7922 vem com conectividade padrão Wi-Fi 6E e Bluetooth 5.2. As taxas de transferência são estáveis e excelentes quando emparelhado com nossa rede Wi-Fi 6 ou 6E.

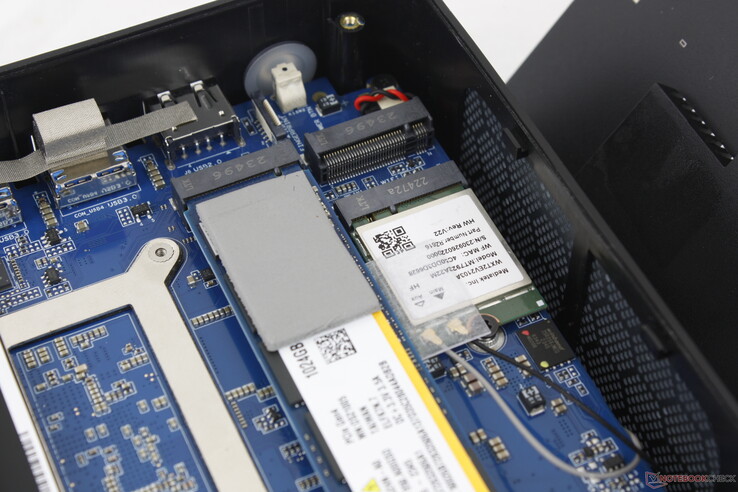
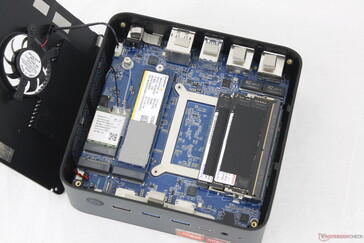
O módulo WLAN removível fica embaixo do slot M.2 secundário
Networking
iperf3 transmit AXE11000
BOSGAME M1
MediaTek Wi-Fi 6E MT7922 160MHz Wireless LAN Card
1470 (1310min - 1625max) MBit/s
GMK NucBox M5
MediaTek RZ616
1335 (782min - 1633max) MBit/s -9%
Beelink SER7
Intel Wi-Fi 6 AX200
1324 (665min - 1408max) MBit/s -10%
Beelink GTR6
MediaTek RZ608
909 (429min - 966max) MBit/s -38%
Intel NUC 13 Pro Kit NUC13ANK
Intel Wi-Fi 6E AX211
833 (805min - 866max) MBit/s -43%
GMK NucBox K6
MediaTek RZ616
634 (574min - 685max) MBit/s -57%
iperf3 receive AXE11000
BOSGAME M1
MediaTek Wi-Fi 6E MT7922 160MHz Wireless LAN Card
1479 (1255min - 1539max) MBit/s
GMK NucBox M5
MediaTek RZ616
1264 (1077min - 1480max) MBit/s -15%
GMK NucBox K6
MediaTek RZ616
1222 (1074min - 1368max) MBit/s -17%
Beelink SER7
Intel Wi-Fi 6 AX200
1193 (588min - 1333max) MBit/s -19%
Intel NUC 13 Pro Kit NUC13ANK
Intel Wi-Fi 6E AX211
939 (921min - 952max) MBit/s -37%
Beelink GTR6
MediaTek RZ608
860 (440min - 882max) MBit/s -42%
iperf3 transmit AXE11000 6GHz
Intel NUC 13 Pro Kit NUC13ANK
Intel Wi-Fi 6E AX211
1445 (736min - 1476max) MBit/s +9%
GMK NucBox M5
MediaTek RZ616
1437 (695min - 1546max) MBit/s +9%
BOSGAME M1
MediaTek Wi-Fi 6E MT7922 160MHz Wireless LAN Card
1324 (1090min - 1580max) MBit/s
Beelink GTR6
MediaTek RZ608
948 (476min - 1030max) MBit/s -28%
GMK NucBox K6
MediaTek RZ616
432 (212min - 471max) MBit/s -67%
iperf3 receive AXE11000 6GHz
Intel NUC 13 Pro Kit NUC13ANK
Intel Wi-Fi 6E AX211
1668 (1467min - 1725max) MBit/s +26%
GMK NucBox M5
MediaTek RZ616
1347 (1315min - 1439max) MBit/s +2%
BOSGAME M1
MediaTek Wi-Fi 6E MT7922 160MHz Wireless LAN Card
1321 (1233min - 1393max) MBit/s
GMK NucBox K6
MediaTek RZ616
984 (937min - 1048max) MBit/s -26%
Beelink GTR6
MediaTek RZ608
886 (867min - 900max) MBit/s -33%
050100150200250300350400450500550600650700750800850900950100010501100115012001250130013501400145015001550Tooltip
BOSGAME M1; iperf3 transmit AXE11000 6GHz; iperf 3.1.3: Ø1324 (1090-1580)
BOSGAME M1; iperf3 receive AXE11000 6GHz; iperf 3.1.3: Ø1321 (1233-1393)

Manutenção

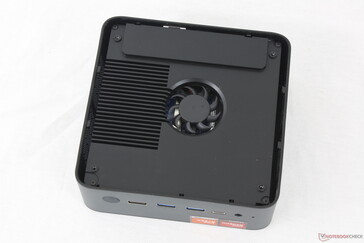
A manutenção é um processo de duas etapas, pois a placa-mãe fica embaixo do aparelho de resfriamento e da placa inferior removível. Felizmente, é necessária apenas uma chave de fenda Phillips para remover essas duas peças. Os proprietários têm acesso a dois slots SODIMM, dois slots M.2 2280 PCIe4 x4 e ao módulo WLAN removível, conforme mostrado abaixo.

Para acessar o outro lado da placa-mãe, é necessário removê-la completamente do chassi. Portanto, a limpeza da segunda ventoinha na parte superior da placa-mãe é muito mais complexa do que a da primeira ventoinha abaixo da placa-mãe.

A remoção da placa inferior revela a ventoinha e o aparato de resfriamento. Uma segunda ventoinha fica do outro lado da placa-mãe
A remoção do dispositivo de resfriamento revela a placa-mãe por baixo

Acessórios e garantia

A caixa de varejo inclui um suporte VESA removível com parafusos, cabo HDMI e o adaptador CA e a documentação habituais. Uma garantia limitada de um ano do fabricante se aplica se o produto for comprado nos EUA.

Desempenho - A Radeon 7 7840HS faz maravilhas para mini PCs


Condições de teste

Colocamos o Windows no modo Desempenho antes de executar os benchmarks abaixo. Não há aplicativos especializados pré-instalados para uma experiência limpa com o Windows.

Processador

O antigo Ryzen 7 7840HS ainda é potente e comparável às CPUs Meteor Lake-H e Hawk Point-HS mais recentes da Intel e da AMD, respectivamente. O Core Ultra 9 185H no muito mais caro Minisforum AtomMan X7 Timuito mais caro, por exemplo, é apenas 10 a 15% mais rápido e tem um desempenho inferior por dólar do que o nosso Bosgame.

Ficar com o Ryzen 7 7840HS mais antigo significa perder a NPU integrada do Ryzen 7 8840HS ou da série Intel Meteor Lake. No entanto, os usuários que não têm interesse na aceleração local de IA podem achar o Ryzen 7 7840HS favorável, pois ele pode superar o Ryzen 7 8840HS quando se trata de aplicativos que não são de IA.

Cinebench R15 Multi Loop

0130260390520650780910104011701300143015601690182019502080221023402470Tooltip
BOSGAME M1 AMD Ryzen 7 7840HS: Ø2554 (2501.09-2597.23)
GMK NucBox M5 AMD Ryzen 7 5700U: Ø1108 (1041.59-1129.53)
GMK NucBox K6 AMD Ryzen 7 7840HS: Ø2520 (2510.2-2537.27)
Intel NUC 13 Pro Kit NUC13ANK Intel Core i7-1360P: Ø1825 (1794.93-2181.38)
Beelink SER7 AMD Ryzen 7 7840HS: Ø2544 (2511.62-2564.76)
Beelink GTR6 AMD Ryzen 9 6900HX: Ø1922 (1894.3-1968.5)
CPU Performance Rating: Percent
Cinebench R23: Multi Core | Single Core
Cinebench R20: CPU (Multi Core) | CPU (Single Core)
Cinebench R15: CPU Multi 64Bit | CPU Single 64Bit
Blender: v2.79 BMW27 CPU
7-Zip 18.03: 7z b 4 | 7z b 4 -mmt1
Geekbench 6.3: Multi-Core | Single-Core
Geekbench 5.5: Multi-Core | Single-Core
HWBOT x265 Benchmark v2.2: 4k Preset
LibreOffice : 20 Documents To PDF
R Benchmark 2.5: Overall mean
CPU Performance Rating
Intel NUC13 Raptor Canyon -2!
Intel Core i9-13900K
92 pt
Geekom A8
AMD Ryzen 9 8945HS
70.6 pt
Beelink SER7
AMD Ryzen 7 7840HS
69.7 pt
Minisforum AtomMan X7 Ti
Intel Core Ultra 9 185H
69.2 pt
BOSGAME M1
AMD Ryzen 7 7840HS
68.9 pt
Average AMD Ryzen 7 7840HS
 
68.8 pt
Minisforum MS-01
Intel Core i9-13900H
67.7 pt
Acemagic F2A
Intel Core Ultra 7 155H
67.2 pt
Minisforum Venus Series NAB9
Intel Core i9-12900HK
65.5 pt
Geekom XT12 Pro
Intel Core i9-12900H
60.2 pt
Intel NUC 13 Pro Kit NUC13ANK -2!
Intel Core i7-1360P
59.6 pt
Beelink GTR6 -2!
AMD Ryzen 9 6900HX
56.3 pt
Minisforum Neptune Series HX90G -2!
AMD Ryzen 9 5900HX
54.6 pt
Maxtang MTN-FP750
AMD Ryzen 7 7735HS
53.3 pt
Minisforum Mercury Series EM780
AMD Ryzen 7 7840U
51.8 pt
Geekom Mini IT12
Intel Core i5-12450H
51.8 pt
GMK NucBox M5
AMD Ryzen 7 5700U
40.7 pt
BOSGAME N95 -2!
Intel Processor N95
20.6 pt
Cinebench R23 / Multi Core
Intel NUC13 Raptor Canyon
Intel Core i9-13900K
32592 Points +102%
Acemagic F2A
Intel Core Ultra 7 155H
18497 Points +15%
Minisforum AtomMan X7 Ti
Intel Core Ultra 9 185H
18016 Points +12%
Geekom A8
AMD Ryzen 9 8945HS
16795 Points +4%
Average AMD Ryzen 7 7840HS
  (15515 - 17214, n=17)
16414 Points +2%
Minisforum MS-01
Intel Core i9-13900H
16209 Points +1%
BOSGAME M1
AMD Ryzen 7 7840HS
16123 (15200.9min - 16122.9max) Points
Beelink SER7
AMD Ryzen 7 7840HS
16105 (15785.6min - 16105.2max) Points 0%
Minisforum Venus Series NAB9
Intel Core i9-12900HK
14659 Points -9%
Minisforum Mercury Series EM780
AMD Ryzen 7 7840U
13726 Points -15%
Minisforum Neptune Series HX90G
AMD Ryzen 9 5900HX
13528 Points -16%
Intel NUC 13 Pro Kit NUC13ANK
Intel Core i7-1360P
12637 Points -22%
Beelink GTR6
AMD Ryzen 9 6900HX
11862 (11361.7min - 11862.4max) Points -26%
Maxtang MTN-FP750
AMD Ryzen 7 7735HS
11072 Points -31%
Geekom XT12 Pro
Intel Core i9-12900H
11036 Points -32%
Geekom Mini IT12
Intel Core i5-12450H
8511 Points -47%
GMK NucBox M5
AMD Ryzen 7 5700U
6649 (6519.7min - 6648.75max) Points -59%
BOSGAME N95
Intel Processor N95
2785 Points -83%
Cinebench R23 / Single Core
Intel NUC13 Raptor Canyon
Intel Core i9-13900K
2203 Points +28%
Intel NUC 13 Pro Kit NUC13ANK
Intel Core i7-1360P
1909 Points +11%
Minisforum Venus Series NAB9
Intel Core i9-12900HK
1901 Points +11%
Minisforum AtomMan X7 Ti
Intel Core Ultra 9 185H
1851 Points +8%
Geekom A8
AMD Ryzen 9 8945HS
1825 Points +6%
Geekom XT12 Pro
Intel Core i9-12900H
1824 Points +6%
Minisforum MS-01
Intel Core i9-13900H
1806 Points +5%
Beelink SER7
AMD Ryzen 7 7840HS
1774 Points +3%
Acemagic F2A
Intel Core Ultra 7 155H
1771 Points +3%
Average AMD Ryzen 7 7840HS
  (1718 - 1812, n=17)
1768 Points +3%
BOSGAME M1
AMD Ryzen 7 7840HS
1718 Points
Geekom Mini IT12
Intel Core i5-12450H
1663 Points -3%
Beelink GTR6
AMD Ryzen 9 6900HX
1608 Points -6%
Maxtang MTN-FP750
AMD Ryzen 7 7735HS
1543 Points -10%
Minisforum Neptune Series HX90G
AMD Ryzen 9 5900HX
1491 Points -13%
Minisforum Mercury Series EM780
AMD Ryzen 7 7840U
1373 Points -20%
GMK NucBox M5
AMD Ryzen 7 5700U
1267 Points -26%
BOSGAME N95
Intel Processor N95
935 Points -46%
Cinebench R20 / CPU (Multi Core)
Intel NUC13 Raptor Canyon
Intel Core i9-13900K
13415 Points +111%
Minisforum AtomMan X7 Ti
Intel Core Ultra 9 185H
7196 Points +13%
Acemagic F2A
Intel Core Ultra 7 155H
7188 Points +13%
Geekom A8
AMD Ryzen 9 8945HS
6591 Points +4%
Average AMD Ryzen 7 7840HS
  (6061 - 6744, n=17)
6414 Points +1%
BOSGAME M1
AMD Ryzen 7 7840HS
6349 Points
Beelink SER7
AMD Ryzen 7 7840HS
6344 Points 0%
Minisforum MS-01
Intel Core i9-13900H
6203 Points -2%
Minisforum Venus Series NAB9
Intel Core i9-12900HK
5691 Points -10%
Minisforum Mercury Series EM780
AMD Ryzen 7 7840U
5398 Points -15%
Minisforum Neptune Series HX90G
AMD Ryzen 9 5900HX
5276 Points -17%
Intel NUC 13 Pro Kit NUC13ANK
Intel Core i7-1360P
4887 Points -23%
Beelink GTR6
AMD Ryzen 9 6900HX
4619 Points -27%
Maxtang MTN-FP750
AMD Ryzen 7 7735HS
4339 Points -32%
Geekom XT12 Pro
Intel Core i9-12900H
4294 Points -32%
Geekom Mini IT12
Intel Core i5-12450H
3270 Points -48%
GMK NucBox M5
AMD Ryzen 7 5700U
2580 Points -59%
BOSGAME N95
Intel Processor N95
1067 Points -83%
Cinebench R20 / CPU (Single Core)
Intel NUC13 Raptor Canyon
Intel Core i9-13900K
853 Points +25%
Intel NUC 13 Pro Kit NUC13ANK
Intel Core i7-1360P
736 Points +8%
Minisforum Venus Series NAB9
Intel Core i9-12900HK
734 Points +8%
Minisforum AtomMan X7 Ti
Intel Core Ultra 9 185H
715 Points +5%
Geekom A8
AMD Ryzen 9 8945HS
711 Points +4%
Geekom XT12 Pro
Intel Core i9-12900H
701 Points +3%
Minisforum MS-01
Intel Core i9-13900H
699 Points +2%
Beelink SER7
AMD Ryzen 7 7840HS
698 Points +2%
Average AMD Ryzen 7 7840HS
  (661 - 705, n=17)
686 Points +1%
BOSGAME M1
AMD Ryzen 7 7840HS
682 Points
Acemagic F2A
Intel Core Ultra 7 155H
679 Points 0%
Geekom Mini IT12
Intel Core i5-12450H
642 Points -6%
Beelink GTR6
AMD Ryzen 9 6900HX
631 Points -7%
Maxtang MTN-FP750
AMD Ryzen 7 7735HS
604 Points -11%
Minisforum Neptune Series HX90G
AMD Ryzen 9 5900HX
580 Points -15%
Minisforum Mercury Series EM780
AMD Ryzen 7 7840U
533 Points -22%
GMK NucBox M5
AMD Ryzen 7 5700U
495 Points -27%
BOSGAME N95
Intel Processor N95
357 Points -48%
Cinebench R15 / CPU Multi 64Bit
Intel NUC13 Raptor Canyon
Intel Core i9-13900K
5321 Points +105%
Minisforum AtomMan X7 Ti
Intel Core Ultra 9 185H
2746 Points +6%
Acemagic F2A
Intel Core Ultra 7 155H
2738 Points +5%
Geekom A8
AMD Ryzen 9 8945HS
2640 Points +2%
Average AMD Ryzen 7 7840HS
  (2473 - 2729, n=17)
2598 Points 0%
BOSGAME M1
AMD Ryzen 7 7840HS
2597 (2501.09min - 2597.23max) Points
Beelink SER7
AMD Ryzen 7 7840HS
2565 (2511.62min - 2564.76max) Points -1%
Minisforum MS-01
Intel Core i9-13900H
2459 Points -5%
Minisforum Venus Series NAB9
Intel Core i9-12900HK
2249 Points -13%
Minisforum Neptune Series HX90G
AMD Ryzen 9 5900HX
2222 Points -14%
Geekom XT12 Pro
Intel Core i9-12900H
2121 Points -18%
Minisforum Mercury Series EM780
AMD Ryzen 7 7840U
2051 Points -21%
Intel NUC 13 Pro Kit NUC13ANK
Intel Core i7-1360P
2030 Points -22%
Beelink GTR6
AMD Ryzen 9 6900HX
1969 (1894.3min - 1968.5max) Points -24%
Maxtang MTN-FP750
AMD Ryzen 7 7735HS
1795 Points -31%
Geekom Mini IT12
Intel Core i5-12450H
1321 Points -49%
GMK NucBox M5
AMD Ryzen 7 5700U
1130 (1041.59min - 1129.53max) Points -56%
BOSGAME N95
Intel Processor N95
452 Points -83%
Cinebench R15 / CPU Single 64Bit
Intel NUC13 Raptor Canyon
Intel Core i9-13900K
319 Points +16%
Geekom A8
AMD Ryzen 9 8945HS
287 Points +4%
Beelink SER7
AMD Ryzen 7 7840HS
283 Points +3%
Average AMD Ryzen 7 7840HS
  (270 - 286, n=17)
278 Points +1%
BOSGAME M1
AMD Ryzen 7 7840HS
275 Points
Intel NUC 13 Pro Kit NUC13ANK
Intel Core i7-1360P
271 Points -1%
Minisforum Venus Series NAB9
Intel Core i9-12900HK
270 Points -2%
Minisforum AtomMan X7 Ti
Intel Core Ultra 9 185H
268 Points -3%
Beelink GTR6
AMD Ryzen 9 6900HX
260 Points -5%
Acemagic F2A
Intel Core Ultra 7 155H
258 Points -6%
Minisforum MS-01
Intel Core i9-13900H
253 Points -8%
Geekom XT12 Pro
Intel Core i9-12900H
251 Points -9%
Maxtang MTN-FP750
AMD Ryzen 7 7735HS
245 Points -11%
Minisforum Neptune Series HX90G
AMD Ryzen 9 5900HX
242 Points -12%
Geekom Mini IT12
Intel Core i5-12450H
239 Points -13%
Minisforum Mercury Series EM780
AMD Ryzen 7 7840U
217 Points -21%
GMK NucBox M5
AMD Ryzen 7 5700U
188.1 Points -32%
BOSGAME N95
Intel Processor N95
155 Points -44%
Blender / v2.79 BMW27 CPU
BOSGAME N95
Intel Processor N95
1103 Seconds * -463%
GMK NucBox M5
AMD Ryzen 7 5700U
427 Seconds * -118%
Geekom Mini IT12
Intel Core i5-12450H
385 Seconds * -96%
Geekom XT12 Pro
Intel Core i9-12900H
296 Seconds * -51%
Maxtang MTN-FP750
AMD Ryzen 7 7735HS
279 Seconds * -42%
Intel NUC 13 Pro Kit NUC13ANK
Intel Core i7-1360P
275 Seconds * -40%
Minisforum Mercury Series EM780
AMD Ryzen 7 7840U
262 Seconds * -34%
Beelink GTR6
AMD Ryzen 9 6900HX
257 Seconds * -31%
Minisforum Venus Series NAB9
Intel Core i9-12900HK
234 Seconds * -19%
Minisforum Neptune Series HX90G
AMD Ryzen 9 5900HX
231 Seconds * -18%
Minisforum MS-01
Intel Core i9-13900H
201 Seconds * -3%
Average AMD Ryzen 7 7840HS
  (185 - 229, n=18)
198.6 Seconds * -1%
Beelink SER7
AMD Ryzen 7 7840HS
196 Seconds * -0%
Geekom A8
AMD Ryzen 9 8945HS
196 Seconds * -0%
BOSGAME M1
AMD Ryzen 7 7840HS
196 Seconds *
Acemagic F2A
Intel Core Ultra 7 155H
178 Seconds * +9%
Minisforum AtomMan X7 Ti
Intel Core Ultra 9 185H
171 Seconds * +13%
Intel NUC13 Raptor Canyon
Intel Core i9-13900K
101 Seconds * +48%
7-Zip 18.03 / 7z b 4
Intel NUC13 Raptor Canyon
Intel Core i9-13900K
127201 MIPS +81%
Minisforum AtomMan X7 Ti
Intel Core Ultra 9 185H
71934 MIPS +2%
Geekom A8
AMD Ryzen 9 8945HS
71874 MIPS +2%
BOSGAME M1
AMD Ryzen 7 7840HS
70417 MIPS
Beelink SER7
AMD Ryzen 7 7840HS
69882 MIPS -1%
Average AMD Ryzen 7 7840HS
  (59538 - 73035, n=18)
69127 MIPS -2%
Acemagic F2A
Intel Core Ultra 7 155H
66438 MIPS -6%
Minisforum MS-01
Intel Core i9-13900H
63093 MIPS -10%
Minisforum Neptune Series HX90G
AMD Ryzen 9 5900HX
61760 MIPS -12%
Beelink GTR6
AMD Ryzen 9 6900HX
57261 MIPS -19%
Minisforum Venus Series NAB9
Intel Core i9-12900HK
55620 MIPS -21%
Intel NUC 13 Pro Kit NUC13ANK
Intel Core i7-1360P
52959 MIPS -25%
Minisforum Mercury Series EM780
AMD Ryzen 7 7840U
50087 MIPS -29%
Maxtang MTN-FP750
AMD Ryzen 7 7735HS
48327 MIPS -31%
Geekom XT12 Pro
Intel Core i9-12900H
47146 MIPS -33%
Geekom Mini IT12
Intel Core i5-12450H
35191 MIPS -50%
GMK NucBox M5
AMD Ryzen 7 5700U
34172 MIPS -51%
BOSGAME N95
Intel Processor N95
12224 MIPS -83%
7-Zip 18.03 / 7z b 4 -mmt1
Intel NUC13 Raptor Canyon
Intel Core i9-13900K
7255 MIPS +10%
Beelink SER7
AMD Ryzen 7 7840HS
6734 MIPS +2%
Geekom A8
AMD Ryzen 9 8945HS
6668 MIPS +1%
BOSGAME M1
AMD Ryzen 7 7840HS
6602 MIPS
Average AMD Ryzen 7 7840HS
  (6049 - 6754, n=18)
6561 MIPS -1%
Minisforum Venus Series NAB9
Intel Core i9-12900HK
6136 MIPS -7%
Beelink GTR6
AMD Ryzen 9 6900HX
6005 MIPS -9%
Intel NUC 13 Pro Kit NUC13ANK
Intel Core i7-1360P
5961 MIPS -10%
Geekom XT12 Pro
Intel Core i9-12900H
5881 MIPS -11%
Minisforum Neptune Series HX90G
AMD Ryzen 9 5900HX
5798 MIPS -12%
Maxtang MTN-FP750
AMD Ryzen 7 7735HS
5796 MIPS -12%
Minisforum AtomMan X7 Ti
Intel Core Ultra 9 185H
5560 MIPS -16%
Acemagic F2A
Intel Core Ultra 7 155H
5485 MIPS -17%
Minisforum MS-01
Intel Core i9-13900H
5473 MIPS -17%
Geekom Mini IT12
Intel Core i5-12450H
5386 MIPS -18%
Minisforum Mercury Series EM780
AMD Ryzen 7 7840U
4657 MIPS -29%
GMK NucBox M5
AMD Ryzen 7 5700U
4599 MIPS -30%
BOSGAME N95
Intel Processor N95
3803 MIPS -42%
Geekbench 6.3 / Multi-Core
Geekom A8
AMD Ryzen 9 8945HS
13619 Points +2%
Minisforum AtomMan X7 Ti
Intel Core Ultra 9 185H
13356 Points 0%
BOSGAME M1
AMD Ryzen 7 7840HS
13326 Points
Average AMD Ryzen 7 7840HS
  (12111 - 13538, n=18)
13025 Points -2%
Beelink SER7
AMD Ryzen 7 7840HS
12694 Points -5%
Minisforum MS-01
Intel Core i9-13900H
12677 Points -5%
Acemagic F2A
Intel Core Ultra 7 155H
12385 Points -7%
Minisforum Venus Series NAB9
Intel Core i9-12900HK
10721 Points -20%
Geekom XT12 Pro
Intel Core i9-12900H
10233 Points -23%
Minisforum Mercury Series EM780
AMD Ryzen 7 7840U
9496 Points -29%
Geekom Mini IT12
Intel Core i5-12450H
8828 Points -34%
Maxtang MTN-FP750
AMD Ryzen 7 7735HS
7854 Points -41%
GMK NucBox M5
AMD Ryzen 7 5700U
6260 Points -53%
Geekbench 6.3 / Single-Core
Geekom A8
AMD Ryzen 9 8945HS
2698 Points +2%
Average AMD Ryzen 7 7840HS
  (2585 - 2721, n=18)
2662 Points +1%
Beelink SER7
AMD Ryzen 7 7840HS
2657 Points +1%
BOSGAME M1
AMD Ryzen 7 7840HS
2640 Points
Minisforum MS-01
Intel Core i9-13900H
2624 Points -1%
Minisforum Venus Series NAB9
Intel Core i9-12900HK
2611 Points -1%
Minisforum AtomMan X7 Ti
Intel Core Ultra 9 185H
2492 Points -6%
Geekom XT12 Pro
Intel Core i9-12900H
2464 Points -7%
Acemagic F2A
Intel Core Ultra 7 155H
2410 Points -9%
Geekom Mini IT12
Intel Core i5-12450H
2286 Points -13%
Maxtang MTN-FP750
AMD Ryzen 7 7735HS
2072 Points -22%
Minisforum Mercury Series EM780
AMD Ryzen 7 7840U
1982 Points -25%
GMK NucBox M5
AMD Ryzen 7 5700U
1625 Points -38%
Geekbench 5.5 / Multi-Core
Intel NUC13 Raptor Canyon
Intel Core i9-13900K
22448 Points +85%
Minisforum AtomMan X7 Ti
Intel Core Ultra 9 185H
13392 Points +11%
Minisforum MS-01
Intel Core i9-13900H
13014 Points +7%
Acemagic F2A
Intel Core Ultra 7 155H
12662 Points +5%
Geekom A8
AMD Ryzen 9 8945HS
12481 Points +3%
BOSGAME M1
AMD Ryzen 7 7840HS
12116 Points
Average AMD Ryzen 7 7840HS
  (8446 - 12339, n=20)
11674 Points -4%
Beelink SER7
AMD Ryzen 7 7840HS
11423 Points -6%
Intel NUC 13 Pro Kit NUC13ANK
Intel Core i7-1360P
10574 Points -13%
Minisforum Venus Series NAB9
Intel Core i9-12900HK
10378 Points -14%
Geekom XT12 Pro
Intel Core i9-12900H
10028 Points -17%
Beelink GTR6
AMD Ryzen 9 6900HX
9350 Points -23%
Minisforum Neptune Series HX90G
AMD Ryzen 9 5900HX
9020 Points -26%
Minisforum Mercury Series EM780
AMD Ryzen 7 7840U
8765 Points -28%
Geekom Mini IT12
Intel Core i5-12450H
8066 Points -33%
Maxtang MTN-FP750
AMD Ryzen 7 7735HS
7368 Points -39%
GMK NucBox M5
AMD Ryzen 7 5700U
5593 Points -54%
BOSGAME N95
Intel Processor N95
2616 Points -78%
Geekbench 5.5 / Single-Core
Intel NUC13 Raptor Canyon
Intel Core i9-13900K
2106 Points +9%
Geekom A8
AMD Ryzen 9 8945HS
1996 Points +4%
Beelink SER7
AMD Ryzen 7 7840HS
1983 Points +3%
Average AMD Ryzen 7 7840HS
  (1837 - 2017, n=20)
1966 Points +2%
BOSGAME M1
AMD Ryzen 7 7840HS
1928 Points
Minisforum MS-01
Intel Core i9-13900H
1867 Points -3%
Minisforum Venus Series NAB9
Intel Core i9-12900HK
1866 Points -3%
Minisforum AtomMan X7 Ti
Intel Core Ultra 9 185H
1856 Points -4%
Intel NUC 13 Pro Kit NUC13ANK
Intel Core i7-1360P
1850 Points -4%
Geekom XT12 Pro
Intel Core i9-12900H
1790 Points -7%
Acemagic F2A
Intel Core Ultra 7 155H
1746 Points -9%
Beelink GTR6
AMD Ryzen 9 6900HX
1652 Points -14%
Geekom Mini IT12
Intel Core i5-12450H
1636 Points -15%
Minisforum Neptune Series HX90G
AMD Ryzen 9 5900HX
1560 Points -19%
Maxtang MTN-FP750
AMD Ryzen 7 7735HS
1534 Points -20%
Minisforum Mercury Series EM780
AMD Ryzen 7 7840U
1472 Points -24%
GMK NucBox M5
AMD Ryzen 7 5700U
1203 Points -38%
BOSGAME N95
Intel Processor N95
1007 Points -48%
HWBOT x265 Benchmark v2.2 / 4k Preset
Intel NUC13 Raptor Canyon
Intel Core i9-13900K
34.5 fps +70%
Minisforum AtomMan X7 Ti
Intel Core Ultra 9 185H
20.9 fps +3%
Geekom A8
AMD Ryzen 9 8945HS
20.9 fps +3%
Beelink SER7
AMD Ryzen 7 7840HS
20.4 fps 0%
BOSGAME M1
AMD Ryzen 7 7840HS
20.3 fps
Average AMD Ryzen 7 7840HS
  (11.7 - 21.8, n=18)
19.8 fps -2%
Acemagic F2A
Intel Core Ultra 7 155H
19.6 fps -3%
Minisforum MS-01
Intel Core i9-13900H
18.7 fps -8%
Minisforum Venus Series NAB9
Intel Core i9-12900HK
16.2 fps -20%
Minisforum Neptune Series HX90G
AMD Ryzen 9 5900HX
15.9 fps -22%
Beelink GTR6
AMD Ryzen 9 6900HX
15.4 fps -24%
Minisforum Mercury Series EM780
AMD Ryzen 7 7840U
14.6 fps -28%
Intel NUC 13 Pro Kit NUC13ANK
Intel Core i7-1360P
14.2 fps -30%
Maxtang MTN-FP750
AMD Ryzen 7 7735HS
12.7 fps -37%
Geekom XT12 Pro
Intel Core i9-12900H
12.3 fps -39%
Geekom Mini IT12
Intel Core i5-12450H
10.4 fps -49%
GMK NucBox M5
AMD Ryzen 7 5700U
8.44 fps -58%
BOSGAME N95
Intel Processor N95
3.25 fps -84%
LibreOffice / 20 Documents To PDF
BOSGAME N95
Intel Processor N95
74.6 s * -57%
Minisforum Mercury Series EM780
AMD Ryzen 7 7840U
67.1 s * -42%
Minisforum Neptune Series HX90G
AMD Ryzen 9 5900HX
59 s * -24%
GMK NucBox M5
AMD Ryzen 7 5700U
58 s * -22%
Maxtang MTN-FP750
AMD Ryzen 7 7735HS
54.8 s * -16%
Geekom Mini IT12
Intel Core i5-12450H
53.2 s * -12%
Geekom A8
AMD Ryzen 9 8945HS
49.9 s * -5%
Minisforum AtomMan X7 Ti
Intel Core Ultra 9 185H
49.5 s * -4%
Average AMD Ryzen 7 7840HS
  (38.3 - 68.3, n=18)
48.6 s * -3%
BOSGAME M1
AMD Ryzen 7 7840HS
47.4 s *
Beelink GTR6
AMD Ryzen 9 6900HX
46 s * +3%
Acemagic F2A
Intel Core Ultra 7 155H
44.5 s * +6%
Intel NUC 13 Pro Kit NUC13ANK
Intel Core i7-1360P
43.7 s * +8%
Intel NUC13 Raptor Canyon
Intel Core i9-13900K
41.6 s * +12%
Beelink SER7
AMD Ryzen 7 7840HS
39.7 s * +16%
Geekom XT12 Pro
Intel Core i9-12900H
39.6 s * +16%
Minisforum Venus Series NAB9
Intel Core i9-12900HK
37.2 s * +22%
Minisforum MS-01
Intel Core i9-13900H
35.1 s * +26%
R Benchmark 2.5 / Overall mean
BOSGAME N95
Intel Processor N95
0.834 sec * -89%
GMK NucBox M5
AMD Ryzen 7 5700U
0.584 sec * -32%
Minisforum Mercury Series EM780
AMD Ryzen 7 7840U
0.581 sec * -32%
Maxtang MTN-FP750
AMD Ryzen 7 7735HS
0.507 sec * -15%
Geekom Mini IT12
Intel Core i5-12450H
0.505 sec * -14%
Minisforum Neptune Series HX90G
AMD Ryzen 9 5900HX
0.492 sec * -11%
Acemagic F2A
Intel Core Ultra 7 155H
0.4652 sec * -5%
Geekom XT12 Pro
Intel Core i9-12900H
0.4632 sec * -5%
Beelink GTR6
AMD Ryzen 9 6900HX
0.4627 sec * -5%
Minisforum AtomMan X7 Ti
Intel Core Ultra 9 185H
0.4627 sec * -5%
Intel NUC 13 Pro Kit NUC13ANK
Intel Core i7-1360P
0.445 sec * -1%
Beelink SER7
AMD Ryzen 7 7840HS
0.4446 sec * -1%
BOSGAME M1
AMD Ryzen 7 7840HS
0.4418 sec *
Average AMD Ryzen 7 7840HS
  (0.4184 - 0.4739, n=18)
0.4394 sec * +1%
Minisforum Venus Series NAB9
Intel Core i9-12900HK
0.4391 sec * +1%
Minisforum MS-01
Intel Core i9-13900H
0.439 sec * +1%
Geekom A8
AMD Ryzen 9 8945HS
0.4346 sec * +2%
Intel NUC13 Raptor Canyon
Intel Core i9-13900K
0.3911 sec * +11%
CPU Performance Rating: Percent
Cinebench R23: Multi Core | Single Core
Cinebench R20: CPU (Multi Core) | CPU (Single Core)
Cinebench R15: CPU Multi 64Bit | CPU Single 64Bit
Blender: v2.79 BMW27 CPU
7-Zip 18.03: 7z b 4 | 7z b 4 -mmt1
Geekbench 6.3: Multi-Core | Single-Core
Geekbench 5.5: Multi-Core | Single-Core
HWBOT x265 Benchmark v2.2: 4k Preset
LibreOffice : 20 Documents To PDF
R Benchmark 2.5: Overall mean

* ... smaller is better

Cinebench R15 CPU Multi 64Bit
2597 Points
Cinebench R15 OpenGL 64Bit
225 fps
Cinebench R15 Ref. Match 64Bit
97.9 %
Cinebench R15 CPU Single 64Bit
275 Points
Cinebench R20 CPU (Multi Core)
6349 Points
Cinebench R20 CPU (Single Core)
682 Points
Cinebench R23 Multi Core
16123 Points
Cinebench R23 Single Core
1718 Points
Ajuda
Performance Rating
BOSGAME M1
AMD Ryzen 7 7840HS, Radeon 780M
98.9 pt
Average AMD Ryzen 7 7840HS
 
96.7 pt
GMK NucBox K6
AMD Ryzen 7 7840HS, Radeon 780M
96.6 pt
Beelink SER7
AMD Ryzen 7 7840HS, Radeon 780M
96.4 pt
Beelink GTR6
AMD Ryzen 9 6900HX, Radeon 680M
69.9 pt
Intel NUC 13 Pro Kit NUC13ANK
Intel Core i7-1360P, Iris Xe G7 96EUs
56.2 pt
GMK NucBox M5
AMD Ryzen 7 5700U, Vega 8
42.8 pt
AIDA64 / FP32 Ray-Trace
Average AMD Ryzen 7 7840HS
  (24712 - 28921, n=19)
26587 KRay/s +2%
BOSGAME M1
AMD Ryzen 7 7840HS, Radeon 780M
26022 KRay/s
Beelink SER7
AMD Ryzen 7 7840HS, Radeon 780M
25685 KRay/s -1%
GMK NucBox K6
AMD Ryzen 7 7840HS, Radeon 780M
25360 KRay/s -3%
Beelink GTR6
AMD Ryzen 9 6900HX, Radeon 680M
13630 KRay/s -48%
Intel NUC 13 Pro Kit NUC13ANK
Intel Core i7-1360P, Iris Xe G7 96EUs
11040 KRay/s -58%
GMK NucBox M5
AMD Ryzen 7 5700U, Vega 8
7345 KRay/s -72%
AIDA64 / FPU Julia
Average AMD Ryzen 7 7840HS
  (103755 - 123167, n=19)
113567 Points +3%
BOSGAME M1
AMD Ryzen 7 7840HS, Radeon 780M
110752 Points
Beelink SER7
AMD Ryzen 7 7840HS, Radeon 780M
109853 Points -1%
GMK NucBox K6
AMD Ryzen 7 7840HS, Radeon 780M
107805 Points -3%
Beelink GTR6
AMD Ryzen 9 6900HX, Radeon 680M
86563 Points -22%
Intel NUC 13 Pro Kit NUC13ANK
Intel Core i7-1360P, Iris Xe G7 96EUs
55557 Points -50%
GMK NucBox M5
AMD Ryzen 7 5700U, Vega 8
45926 Points -59%
AIDA64 / CPU SHA3
BOSGAME M1
AMD Ryzen 7 7840HS, Radeon 780M
4854 MB/s
Average AMD Ryzen 7 7840HS
  (4293 - 5155, n=19)
4797 MB/s -1%
Beelink SER7
AMD Ryzen 7 7840HS, Radeon 780M
4783 MB/s -1%
GMK NucBox K6
AMD Ryzen 7 7840HS, Radeon 780M
4763 MB/s -2%
Beelink GTR6
AMD Ryzen 9 6900HX, Radeon 680M
3033 MB/s -38%
Intel NUC 13 Pro Kit NUC13ANK
Intel Core i7-1360P, Iris Xe G7 96EUs
2728 MB/s -44%
GMK NucBox M5
AMD Ryzen 7 5700U, Vega 8
1503 MB/s -69%
AIDA64 / CPU Queen
BOSGAME M1
AMD Ryzen 7 7840HS, Radeon 780M
117809 Points
Average AMD Ryzen 7 7840HS
  (105028 - 125820, n=19)
116128 Points -1%
Beelink SER7
AMD Ryzen 7 7840HS, Radeon 780M
111969 Points -5%
GMK NucBox K6
AMD Ryzen 7 7840HS, Radeon 780M
111803 Points -5%
Beelink GTR6
AMD Ryzen 9 6900HX, Radeon 680M
94363 Points -20%
Intel NUC 13 Pro Kit NUC13ANK
Intel Core i7-1360P, Iris Xe G7 96EUs
86691 Points -26%
GMK NucBox M5
AMD Ryzen 7 5700U, Vega 8
68805 Points -42%
AIDA64 / FPU SinJulia
Average AMD Ryzen 7 7840HS
  (13857 - 15525, n=19)
14941 Points 0%
BOSGAME M1
AMD Ryzen 7 7840HS, Radeon 780M
14915 Points
GMK NucBox K6
AMD Ryzen 7 7840HS, Radeon 780M
14721 Points -1%
Beelink SER7
AMD Ryzen 7 7840HS, Radeon 780M
14705 Points -1%
Beelink GTR6
AMD Ryzen 9 6900HX, Radeon 680M
12291 Points -18%
GMK NucBox M5
AMD Ryzen 7 5700U, Vega 8
9992 Points -33%
Intel NUC 13 Pro Kit NUC13ANK
Intel Core i7-1360P, Iris Xe G7 96EUs
7269 Points -51%
AIDA64 / FPU Mandel
Average AMD Ryzen 7 7840HS
  (55540 - 65812, n=19)
60589 Points +3%
BOSGAME M1
AMD Ryzen 7 7840HS, Radeon 780M
59072 Points
Beelink SER7
AMD Ryzen 7 7840HS, Radeon 780M
58699 Points -1%
GMK NucBox K6
AMD Ryzen 7 7840HS, Radeon 780M
57534 Points -3%
Beelink GTR6
AMD Ryzen 9 6900HX, Radeon 680M
47561 Points -19%
Intel NUC 13 Pro Kit NUC13ANK
Intel Core i7-1360P, Iris Xe G7 96EUs
27772 Points -53%
GMK NucBox M5
AMD Ryzen 7 5700U, Vega 8
24053 Points -59%
AIDA64 / CPU AES
BOSGAME M1
AMD Ryzen 7 7840HS, Radeon 780M
166944 MB/s
GMK NucBox K6
AMD Ryzen 7 7840HS, Radeon 780M
164041 MB/s -2%
Beelink SER7
AMD Ryzen 7 7840HS, Radeon 780M
161216 MB/s -3%
Average AMD Ryzen 7 7840HS
  (67389 - 177158, n=19)
132175 MB/s -21%
Beelink GTR6
AMD Ryzen 9 6900HX, Radeon 680M
122402 MB/s -27%
Intel NUC 13 Pro Kit NUC13ANK
Intel Core i7-1360P, Iris Xe G7 96EUs
99244 MB/s -41%
GMK NucBox M5
AMD Ryzen 7 5700U, Vega 8
46218 MB/s -72%
AIDA64 / CPU ZLib
Average AMD Ryzen 7 7840HS
  (949 - 1123, n=19)
1065 MB/s +1%
BOSGAME M1
AMD Ryzen 7 7840HS, Radeon 780M
1051 MB/s
GMK NucBox K6
AMD Ryzen 7 7840HS, Radeon 780M
1031 MB/s -2%
Beelink SER7
AMD Ryzen 7 7840HS, Radeon 780M
949 MB/s -10%
Intel NUC 13 Pro Kit NUC13ANK
Intel Core i7-1360P, Iris Xe G7 96EUs
807 MB/s -23%
Beelink GTR6
AMD Ryzen 9 6900HX, Radeon 680M
757 MB/s -28%
GMK NucBox M5
AMD Ryzen 7 5700U, Vega 8
513 MB/s -51%
AIDA64 / FP64 Ray-Trace
Average AMD Ryzen 7 7840HS
  (13100 - 15599, n=19)
14270 KRay/s +3%
Beelink SER7
AMD Ryzen 7 7840HS, Radeon 780M
13904 KRay/s 0%
BOSGAME M1
AMD Ryzen 7 7840HS, Radeon 780M
13897 KRay/s
GMK NucBox K6
AMD Ryzen 7 7840HS, Radeon 780M
13642 KRay/s -2%
Beelink GTR6
AMD Ryzen 9 6900HX, Radeon 680M
7214 KRay/s -48%
Intel NUC 13 Pro Kit NUC13ANK
Intel Core i7-1360P, Iris Xe G7 96EUs
5920 KRay/s -57%
GMK NucBox M5
AMD Ryzen 7 5700U, Vega 8
3892 KRay/s -72%
AIDA64 / CPU PhotoWorxx
BOSGAME M1
AMD Ryzen 7 7840HS, Radeon 780M
41516 MPixel/s
Beelink SER7
AMD Ryzen 7 7840HS, Radeon 780M
41088 MPixel/s -1%
GMK NucBox K6
AMD Ryzen 7 7840HS, Radeon 780M
40760 MPixel/s -2%
Average AMD Ryzen 7 7840HS
  (17615 - 41516, n=19)
37735 MPixel/s -9%
Beelink GTR6
AMD Ryzen 9 6900HX, Radeon 680M
30600 MPixel/s -26%
Intel NUC 13 Pro Kit NUC13ANK
Intel Core i7-1360P, Iris Xe G7 96EUs
29108 MPixel/s -30%
GMK NucBox M5
AMD Ryzen 7 5700U, Vega 8
25066 MPixel/s -40%

Teste de estresse

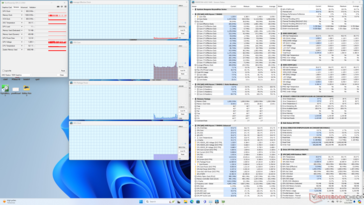
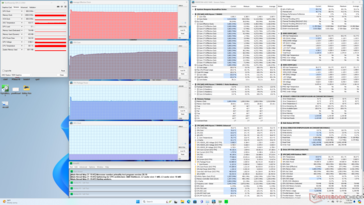
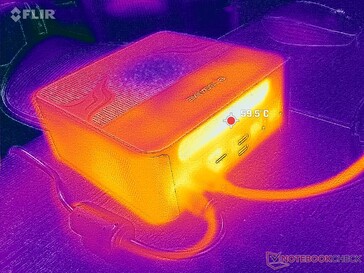
A execução do estresse do Prime95 faz com que a CPU aumente para 4,3 GHz e 65 W nos primeiros segundos antes de se estabelecer em 4 GHz, 54 W e 80 C. Repetindo esse teste no Beelink SER7 com exatamente a mesma CPU Ryzen 7 apresentaria resultados muito semelhantes, embora nosso M1 seja visivelmente maior e mais pesado que o Beelink.

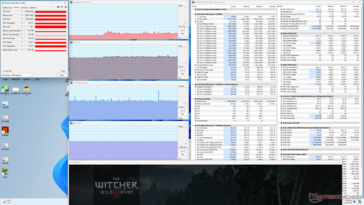
A taxa de clock e a temperatura da GPU durante a execução Witcher 3 para representar o estresse dos jogos se estabilizariam em 2700 MHz e 67 C, respectivamente, em comparação com ~2500 MHz no Beelink SER7 ou no GMK NucBox K6 todos equipados com o mesmo processador AMD. A taxa de clock da GPU ligeiramente mais alta em nosso Bosgame está correlacionada com o desempenho gráfico ligeiramente mais alto na seção Desempenho da GPU abaixo.

Sistema ocioso
Sistema ocioso
Witcher 3 estresse
Witcher 3 estresse
Estresse Prime95
Estresse Prime95
Estresse do Prime95+FurMark
Clock médio da CPU (GHz) Clock da GPU (MHz) Temperatura média da CPU (°C)
Sistema ocioso -- -- 35
Estresse doPrime95 3.9 -- 80
Prime95 + FurMark Stress 4.0 833 - 2100 70
Witcher 3 Estresse ~0,8 2700 67

Desempenho do sistema

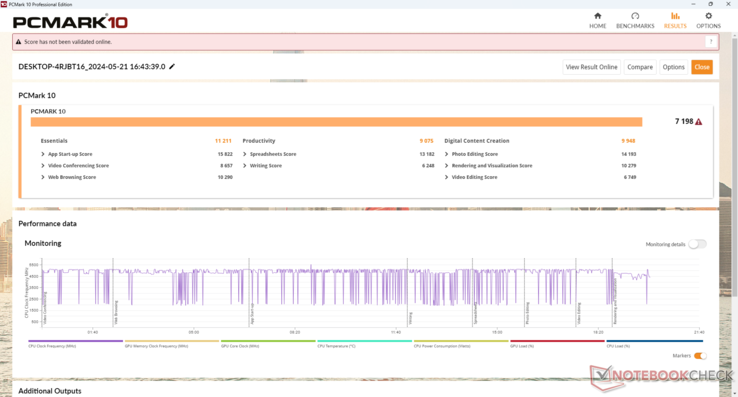
Os resultados do PCMark são comparáveis aos de outros mini PCs de ponta, como o GMK NucBox K6 ou o Beelink SER7. Seu subscore de criação de conteúdo digital, em particular, é muito mais alto do que o de qualquer outro minicomputador executado em hardware Iris Xe ou RX Vega mais antigo.

Embora não tenhamos tido nenhum problema grave em nossa unidade de teste, o sistema emitia um bipe irritante a cada minuto ou mais após a inicialização quando os alto-falantes Bluetooth estavam ativamente procurando. Desconectar os alto-falantes por meio do menu Bluetooth interromperá o bipe.

PCMark 10 Standard
PCMark 10 Standard
PCMark 10 / Score
GMK NucBox K6
Radeon 780M, R7 7840HS, MasonSemi 1TB MC7000
7529 Points +5%
Average AMD Ryzen 7 7840HS, AMD Radeon 780M
  (7039 - 7651, n=8)
7381 Points +3%
Beelink SER7
Radeon 780M, R7 7840HS, Crucial P3 Plus CT1000P3PSSD8
7225 Points 0%
BOSGAME M1
Radeon 780M, R7 7840HS
7198 Points
Beelink GTR6
Radeon 680M, R9 6900HX, Kingston KC3000 512G SKC3000S512G
7109 Points -1%
Intel NUC 13 Pro Kit NUC13ANK
Iris Xe G7 96EUs, i7-1360P, Samsung PM9A1 MZVL2512HCJQ
6281 Points -13%
GMK NucBox M5
Vega 8, R7 5700U, Lexar 1024GB LNM6A1X001T-HNNNG
5293 Points -26%
PCMark 10 / Essentials
Intel NUC 13 Pro Kit NUC13ANK
Iris Xe G7 96EUs, i7-1360P, Samsung PM9A1 MZVL2512HCJQ
11596 Points +3%
Beelink GTR6
Radeon 680M, R9 6900HX, Kingston KC3000 512G SKC3000S512G
11323 Points +1%
GMK NucBox K6
Radeon 780M, R7 7840HS, MasonSemi 1TB MC7000
11214 Points 0%
BOSGAME M1
Radeon 780M, R7 7840HS
11211 Points
Average AMD Ryzen 7 7840HS, AMD Radeon 780M
  (10519 - 11214, n=8)
11024 Points -2%
Beelink SER7
Radeon 780M, R7 7840HS, Crucial P3 Plus CT1000P3PSSD8
10819 Points -3%
GMK NucBox M5
Vega 8, R7 5700U, Lexar 1024GB LNM6A1X001T-HNNNG
9554 Points -15%
PCMark 10 / Productivity
GMK NucBox K6
Radeon 780M, R7 7840HS, MasonSemi 1TB MC7000
10591 Points +17%
Beelink SER7
Radeon 780M, R7 7840HS, Crucial P3 Plus CT1000P3PSSD8
10452 Points +15%
Average AMD Ryzen 7 7840HS, AMD Radeon 780M
  (9075 - 10970, n=8)
10327 Points +14%
Beelink GTR6
Radeon 680M, R9 6900HX, Kingston KC3000 512G SKC3000S512G
10210 Points +13%
BOSGAME M1
Radeon 780M, R7 7840HS
9075 Points
GMK NucBox M5
Vega 8, R7 5700U, Lexar 1024GB LNM6A1X001T-HNNNG
8457 Points -7%
Intel NUC 13 Pro Kit NUC13ANK
Iris Xe G7 96EUs, i7-1360P, Samsung PM9A1 MZVL2512HCJQ
7893 Points -13%
PCMark 10 / Digital Content Creation
BOSGAME M1
Radeon 780M, R7 7840HS
9948 Points
GMK NucBox K6
Radeon 780M, R7 7840HS, MasonSemi 1TB MC7000
9752 Points -2%
Average AMD Ryzen 7 7840HS, AMD Radeon 780M
  (9052 - 9987, n=8)
9600 Points -3%
Beelink SER7
Radeon 780M, R7 7840HS, Crucial P3 Plus CT1000P3PSSD8
9052 Points -9%
Beelink GTR6
Radeon 680M, R9 6900HX, Kingston KC3000 512G SKC3000S512G
8432 Points -15%
Intel NUC 13 Pro Kit NUC13ANK
Iris Xe G7 96EUs, i7-1360P, Samsung PM9A1 MZVL2512HCJQ
7348 Points -26%
GMK NucBox M5
Vega 8, R7 5700U, Lexar 1024GB LNM6A1X001T-HNNNG
4982 Points -50%
CrossMark / Overall
BOSGAME M1
Radeon 780M, R7 7840HS
1891 Points
GMK NucBox K6
Radeon 780M, R7 7840HS, MasonSemi 1TB MC7000
1873 Points -1%
Intel NUC 13 Pro Kit NUC13ANK
Iris Xe G7 96EUs, i7-1360P, Samsung PM9A1 MZVL2512HCJQ
1810 Points -4%
Average AMD Ryzen 7 7840HS, AMD Radeon 780M
  (1566 - 1891, n=8)
1756 Points -7%
Beelink SER7
Radeon 780M, R7 7840HS, Crucial P3 Plus CT1000P3PSSD8
1700 Points -10%
Beelink GTR6
Radeon 680M, R9 6900HX, Kingston KC3000 512G SKC3000S512G
1691 Points -11%
GMK NucBox M5
Vega 8, R7 5700U, Lexar 1024GB LNM6A1X001T-HNNNG
1087 Points -43%
CrossMark / Productivity
BOSGAME M1
Radeon 780M, R7 7840HS
1823 Points
GMK NucBox K6
Radeon 780M, R7 7840HS, MasonSemi 1TB MC7000
1816 Points 0%
Intel NUC 13 Pro Kit NUC13ANK
Iris Xe G7 96EUs, i7-1360P, Samsung PM9A1 MZVL2512HCJQ
1740 Points -5%
Beelink GTR6
Radeon 680M, R9 6900HX, Kingston KC3000 512G SKC3000S512G
1701 Points -7%
Average AMD Ryzen 7 7840HS, AMD Radeon 780M
  (1535 - 1823, n=8)
1690 Points -7%
Beelink SER7
Radeon 780M, R7 7840HS, Crucial P3 Plus CT1000P3PSSD8
1621 Points -11%
GMK NucBox M5
Vega 8, R7 5700U, Lexar 1024GB LNM6A1X001T-HNNNG
1133 Points -38%
CrossMark / Creativity
BOSGAME M1
Radeon 780M, R7 7840HS
2013 Points
GMK NucBox K6
Radeon 780M, R7 7840HS, MasonSemi 1TB MC7000
1994 Points -1%
Intel NUC 13 Pro Kit NUC13ANK
Iris Xe G7 96EUs, i7-1360P, Samsung PM9A1 MZVL2512HCJQ
1970 Points -2%
Beelink SER7
Radeon 780M, R7 7840HS, Crucial P3 Plus CT1000P3PSSD8
1953 Points -3%
Average AMD Ryzen 7 7840HS, AMD Radeon 780M
  (1556 - 2040, n=8)
1915 Points -5%
Beelink GTR6
Radeon 680M, R9 6900HX, Kingston KC3000 512G SKC3000S512G
1698 Points -16%
GMK NucBox M5
Vega 8, R7 5700U, Lexar 1024GB LNM6A1X001T-HNNNG
1042 Points -48%
CrossMark / Responsiveness
BOSGAME M1
Radeon 780M, R7 7840HS
1749 Points
GMK NucBox K6
Radeon 780M, R7 7840HS, MasonSemi 1TB MC7000
1706 Points -2%
Beelink GTR6
Radeon 680M, R9 6900HX, Kingston KC3000 512G SKC3000S512G
1639 Points -6%
Intel NUC 13 Pro Kit NUC13ANK
Iris Xe G7 96EUs, i7-1360P, Samsung PM9A1 MZVL2512HCJQ
1578 Points -10%
Average AMD Ryzen 7 7840HS, AMD Radeon 780M
  (1293 - 1749, n=8)
1528 Points -13%
Beelink SER7
Radeon 780M, R7 7840HS, Crucial P3 Plus CT1000P3PSSD8
1293 Points -26%
GMK NucBox M5
Vega 8, R7 5700U, Lexar 1024GB LNM6A1X001T-HNNNG
1091 Points -38%
WebXPRT 3 / Overall
Beelink SER7
Radeon 780M, R7 7840HS, Crucial P3 Plus CT1000P3PSSD8
332 Points +4%
GMK NucBox K6
Radeon 780M, R7 7840HS, MasonSemi 1TB MC7000
328 Points +3%
Average AMD Ryzen 7 7840HS, AMD Radeon 780M
  (297 - 339, n=8)
323 Points +1%
BOSGAME M1
Radeon 780M, R7 7840HS
319 Points
Intel NUC 13 Pro Kit NUC13ANK
Iris Xe G7 96EUs, i7-1360P, Samsung PM9A1 MZVL2512HCJQ
305 Points -4%
Beelink GTR6
Radeon 680M, R9 6900HX, Kingston KC3000 512G SKC3000S512G
304 Points -5%
GMK NucBox M5
Vega 8, R7 5700U, Lexar 1024GB LNM6A1X001T-HNNNG
214 Points -33%
WebXPRT 4 / Overall
Average AMD Ryzen 7 7840HS, AMD Radeon 780M
  (248 - 319, n=7)
268 Points +4%
Intel NUC 13 Pro Kit NUC13ANK
Iris Xe G7 96EUs, i7-1360P, Samsung PM9A1 MZVL2512HCJQ
266 Points +3%
GMK NucBox K6
Radeon 780M, R7 7840HS, MasonSemi 1TB MC7000
266 Points +3%
Beelink SER7
Radeon 780M, R7 7840HS, Crucial P3 Plus CT1000P3PSSD8
263 Points +2%
BOSGAME M1
Radeon 780M, R7 7840HS
258 Points
Beelink GTR6
Radeon 680M, R9 6900HX, Kingston KC3000 512G SKC3000S512G
233 Points -10%
GMK NucBox M5
Vega 8, R7 5700U, Lexar 1024GB LNM6A1X001T-HNNNG
158.5 Points -39%
Mozilla Kraken 1.1 / Total
GMK NucBox M5
Vega 8, R7 5700U, Lexar 1024GB LNM6A1X001T-HNNNG
802 ms * -52%
Beelink GTR6
Radeon 680M, R9 6900HX, Kingston KC3000 512G SKC3000S512G
564 ms * -7%
GMK NucBox K6
Radeon 780M, R7 7840HS, MasonSemi 1TB MC7000
534 ms * -2%
BOSGAME M1
Radeon 780M, R7 7840HS
526 ms *
Average AMD Ryzen 7 7840HS, AMD Radeon 780M
  (485 - 544, n=8)
519 ms * +1%
Beelink SER7
Radeon 780M, R7 7840HS, Crucial P3 Plus CT1000P3PSSD8
518 ms * +2%
Intel NUC 13 Pro Kit NUC13ANK
Iris Xe G7 96EUs, i7-1360P, Samsung PM9A1 MZVL2512HCJQ
494 ms * +6%

* ... smaller is better

PCMark 10 Score
7198 pontos
Ajuda
AIDA64 / Memory Copy
BOSGAME M1
AMD Ryzen 7 7840HS, Radeon 780M
69508 MB/s
Beelink SER7
AMD Ryzen 7 7840HS, Radeon 780M
69325 MB/s 0%
GMK NucBox K6
AMD Ryzen 7 7840HS, Radeon 780M
69281 MB/s 0%
Average AMD Ryzen 7 7840HS
  (30937 - 72158, n=19)
66323 MB/s -5%
Beelink GTR6
AMD Ryzen 9 6900HX, Radeon 680M
50935 MB/s -27%
Intel NUC 13 Pro Kit NUC13ANK
Intel Core i7-1360P, Iris Xe G7 96EUs
44892 MB/s -35%
GMK NucBox M5
AMD Ryzen 7 5700U, Vega 8
39126 MB/s -44%
AIDA64 / Memory Read
Beelink SER7
AMD Ryzen 7 7840HS, Radeon 780M
61911 MB/s 0%
BOSGAME M1
AMD Ryzen 7 7840HS, Radeon 780M
61765 MB/s
GMK NucBox K6
AMD Ryzen 7 7840HS, Radeon 780M
61708 MB/s 0%
Average AMD Ryzen 7 7840HS
  (30497 - 62147, n=19)
58070 MB/s -6%
Beelink GTR6
AMD Ryzen 9 6900HX, Radeon 680M
51869 MB/s -16%
GMK NucBox M5
AMD Ryzen 7 5700U, Vega 8
46813 MB/s -24%
Intel NUC 13 Pro Kit NUC13ANK
Intel Core i7-1360P, Iris Xe G7 96EUs
45196 MB/s -27%
AIDA64 / Memory Write
Beelink SER7
AMD Ryzen 7 7840HS, Radeon 780M
87358 MB/s +1%
BOSGAME M1
AMD Ryzen 7 7840HS, Radeon 780M
86719 MB/s
GMK NucBox K6
AMD Ryzen 7 7840HS, Radeon 780M
86528 MB/s 0%
Average AMD Ryzen 7 7840HS
  (34590 - 93323, n=19)
84045 MB/s -3%
Beelink GTR6
AMD Ryzen 9 6900HX, Radeon 680M
55316 MB/s -36%
GMK NucBox M5
AMD Ryzen 7 5700U, Vega 8
47048 MB/s -46%
Intel NUC 13 Pro Kit NUC13ANK
Intel Core i7-1360P, Iris Xe G7 96EUs
46179 MB/s -47%
AIDA64 / Memory Latency
GMK NucBox M5
AMD Ryzen 7 5700U, Vega 8
100.1 ns * -11%
Intel NUC 13 Pro Kit NUC13ANK
Intel Core i7-1360P, Iris Xe G7 96EUs
96.1 ns * -7%
Average AMD Ryzen 7 7840HS
  (85.1 - 112, n=19)
92.4 ns * -3%
BOSGAME M1
AMD Ryzen 7 7840HS, Radeon 780M
89.8 ns *
GMK NucBox K6
AMD Ryzen 7 7840HS, Radeon 780M
88.1 ns * +2%
Beelink SER7
AMD Ryzen 7 7840HS, Radeon 780M
85.1 ns * +5%
Beelink GTR6
AMD Ryzen 9 6900HX, Radeon 680M
82.9 ns * +8%

* ... smaller is better

Latência DPC

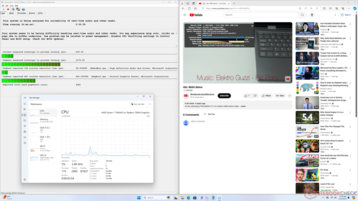
O LatencyMon revela apenas pequenos problemas de DPC ao abrir várias guias do navegador em nossa página inicial. Entretanto, a reprodução de vídeo 4K a 60 FPS infelizmente é imperfeita, com 11 quadros perdidos registrados durante um período de 60 segundos. Idealmente, não deveria haver nenhuma queda de quadros, dada a potência da CPU Zen 4. É nesse ponto que os PCs baseados na Intel têm se mostrado consistentemente melhores em relação à reprodução de vídeo.

LatencyMon
LatencyMon
Lista de motoristas
Lista de motoristas
DPC Latencies / LatencyMon - interrupt to process latency (max), Web, Youtube, Prime95
GMK NucBox K6
Radeon 780M, R7 7840HS, MasonSemi 1TB MC7000
10561.5 μs * -795%
GMK NucBox M5
Vega 8, R7 5700U, Lexar 1024GB LNM6A1X001T-HNNNG
2146.9 μs * -82%
BOSGAME M1
Radeon 780M, R7 7840HS
1179.5 μs *
Intel NUC 13 Pro Kit NUC13ANK
Iris Xe G7 96EUs, i7-1360P, Samsung PM9A1 MZVL2512HCJQ
1087 μs * +8%
Beelink SER7
Radeon 780M, R7 7840HS, Crucial P3 Plus CT1000P3PSSD8
647.9 μs * +45%
Beelink GTR6
Radeon 680M, R9 6900HX, Kingston KC3000 512G SKC3000S512G
509.9 μs * +57%

* ... smaller is better

Dispositivos de armazenamento

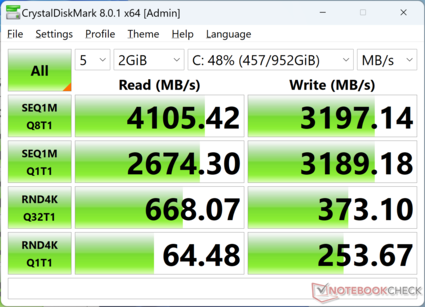
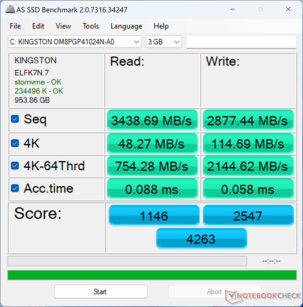
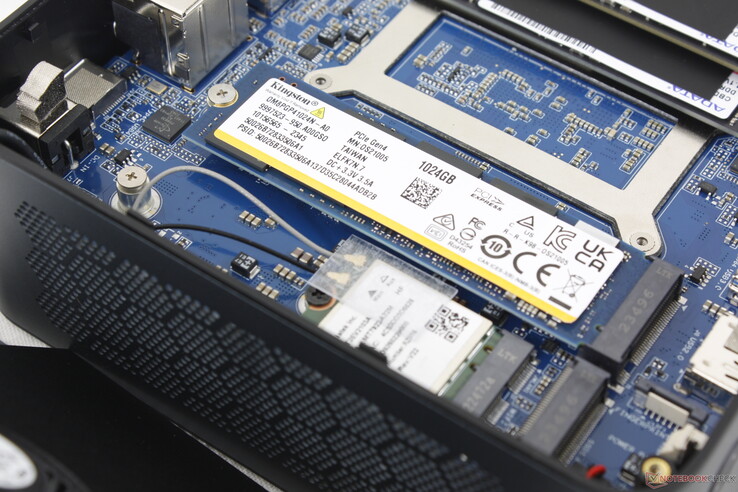
Nossa unidade vem com a unidade de médio porte Kingston OM8SEP41024N-A0 PCIe4 x4 NVMe SSD de médio porte, que oferece taxas de transferência de cerca de 4.000 MB/s em comparação com > 6.500 MB/s em unidades PCIe4 de ponta. Embora nunca recusemos uma unidade mais rápida, a unidade da Kingston combina bem com essa classe de processador específica e faixa de preço alvo.

Uma almofada de resfriamento está incluída para que a unidade dissipe o calor para o aparato de metal do ventilador sob a tampa inferior. Entretanto, o senhor terá que fornecer sua própria almofada de resfriamento se instalar um segundo SSD.

MDL 8
MDL 8
SSD AS
SSD AS
O sistema suporta até duas unidades M.2 internas. Não há suporte para unidades SATA de 2,5 polegadas
CDM 5/6 Read Seq Q32T1: 4105 MB/s
CDM 5/6 Write Seq Q32T1: 3202 MB/s
CDM 5/6 Read 4K Q32T1: 671.2 MB/s
CDM 5/6 Write 4K Q32T1: 372.1 MB/s
CDM 5 Read Seq: 2591 MB/s
CDM 5 Write Seq: 3197 MB/s
CDM 5/6 Read 4K: 64.3 MB/s
CDM 5/6 Write 4K: 247.6 MB/s
Drive Performance Rating - Percent
GMK NucBox K6
MasonSemi 1TB MC7000
85.8 pt
Beelink GTR6
Kingston KC3000 512G SKC3000S512G
83 pt
Intel NUC 13 Pro Kit NUC13ANK
Samsung PM9A1 MZVL2512HCJQ
67.9 pt
BOSGAME M1
 
56 pt
GMK NucBox M5
Lexar 1024GB LNM6A1X001T-HNNNG
48 pt
Beelink SER7
Crucial P3 Plus CT1000P3PSSD8
47.6 pt
DiskSpd
seq read
Beelink GTR6
Kingston KC3000 512G SKC3000S512G
4168 (3579.63min - 4168.09max) MB/s +65%
GMK NucBox K6
MasonSemi 1TB MC7000
3703 (3243.89min - 3702.94max) MB/s +46%
Intel NUC 13 Pro Kit NUC13ANK
Samsung PM9A1 MZVL2512HCJQ
3375 (3310.44min - 3375.33max) MB/s +33%
Beelink SER7
Crucial P3 Plus CT1000P3PSSD8
2718 (2645.56min - 2717.91max) MB/s +7%
GMK NucBox M5
Lexar 1024GB LNM6A1X001T-HNNNG
2560 (2546.51min - 2560.12max) MB/s +1%
BOSGAME M1
 
2533 (2518.88min - 2532.52max) MB/s
seq write
GMK NucBox K6
MasonSemi 1TB MC7000
5595 (1443.73min - 5595.13max) MB/s +76%
Beelink GTR6
Kingston KC3000 512G SKC3000S512G
3938 (3783.49min - 3937.52max) MB/s +24%
Beelink SER7
Crucial P3 Plus CT1000P3PSSD8
3404 (38.3min - 3403.58max) MB/s +7%
Intel NUC 13 Pro Kit NUC13ANK
Samsung PM9A1 MZVL2512HCJQ
3360 (1416.73min - 3360.47max) MB/s +6%
BOSGAME M1
 
3176 (2921.36min - 3176.08max) MB/s
GMK NucBox M5
Lexar 1024GB LNM6A1X001T-HNNNG
2752 (2706.58min - 2751.67max) MB/s -13%
seq q8 t1 read
GMK NucBox K6
MasonSemi 1TB MC7000
7069 (6459.52min - 7068.99max) MB/s +72%
Beelink GTR6
Kingston KC3000 512G SKC3000S512G
7061 (6122.84min - 7060.97max) MB/s +72%
Intel NUC 13 Pro Kit NUC13ANK
Samsung PM9A1 MZVL2512HCJQ
6729 (6134.8min - 6728.5max) MB/s +64%
Beelink SER7
Crucial P3 Plus CT1000P3PSSD8
4893 (3920.33min - 4893.08max) MB/s +19%
BOSGAME M1
 
4109 (3651.18min - 4108.53max) MB/s
GMK NucBox M5
Lexar 1024GB LNM6A1X001T-HNNNG
3536 (3096.86min - 3536.22max) MB/s -14%
seq q8 t1 write
GMK NucBox K6
MasonSemi 1TB MC7000
6669 (1251.16min - 6668.61max) MB/s +109%
Beelink GTR6
Kingston KC3000 512G SKC3000S512G
3938 (3914.12min - 3937.52max) MB/s +24%
BOSGAME M1
 
3187 (3142.8min - 3187.38max) MB/s
GMK NucBox M5
Lexar 1024GB LNM6A1X001T-HNNNG
3126 (3077.57min - 3126.22max) MB/s -2%
Intel NUC 13 Pro Kit NUC13ANK
Samsung PM9A1 MZVL2512HCJQ
2830 (1138.15min - 2830.32max) MB/s -11%
Beelink SER7
Crucial P3 Plus CT1000P3PSSD8
739 (52.85min - 739.46max) MB/s -77%
4k q1 t1 read
Beelink GTR6
Kingston KC3000 512G SKC3000S512G
80.4 (79.66min - 80.38max) MB/s +25%
GMK NucBox K6
MasonSemi 1TB MC7000
71 (70.41min - 71.02max) MB/s +10%
BOSGAME M1
 
64.4 (64.2min - 64.35max) MB/s
GMK NucBox M5
Lexar 1024GB LNM6A1X001T-HNNNG
62.7 (54.67min - 62.69max) MB/s -3%
Intel NUC 13 Pro Kit NUC13ANK
Samsung PM9A1 MZVL2512HCJQ
51.8 (51.62min - 51.84max) MB/s -20%
Beelink SER7
Crucial P3 Plus CT1000P3PSSD8
44.2 (41.58min - 44.2max) MB/s -31%
4k q1 t1 write
Beelink GTR6
Kingston KC3000 512G SKC3000S512G
284 (282.24min - 284.12max) MB/s +9%
BOSGAME M1
 
261 (258.95min - 260.75max) MB/s
GMK NucBox K6
MasonSemi 1TB MC7000
239 (237.67min - 239.17max) MB/s -8%
Intel NUC 13 Pro Kit NUC13ANK
Samsung PM9A1 MZVL2512HCJQ
177.7 (176.17min - 177.7max) MB/s -32%
GMK NucBox M5
Lexar 1024GB LNM6A1X001T-HNNNG
175.4 (153.43min - 175.39max) MB/s -33%
Beelink SER7
Crucial P3 Plus CT1000P3PSSD8
139.4 (137.92min - 139.38max) MB/s -47%
4k q32 t16 read
Beelink SER7
Crucial P3 Plus CT1000P3PSSD8
2810 (2697.36min - 2809.61max) MB/s +255%
GMK NucBox K6
MasonSemi 1TB MC7000
2463 (2040.37min - 2463.15max) MB/s +211%
GMK NucBox M5
Lexar 1024GB LNM6A1X001T-HNNNG
2315 (2310.04min - 2315.42max) MB/s +193%
Beelink GTR6
Kingston KC3000 512G SKC3000S512G
1942 (1940.94min - 1941.94max) MB/s +146%
Intel NUC 13 Pro Kit NUC13ANK
Samsung PM9A1 MZVL2512HCJQ
1225 (1194.7min - 1224.8max) MB/s +55%
BOSGAME M1
 
791 (751.42min - 791.35max) MB/s
4k q32 t16 write
GMK NucBox K6
MasonSemi 1TB MC7000
3983 (3232.63min - 3982.67max) MB/s +28%
Beelink GTR6
Kingston KC3000 512G SKC3000S512G
3741 (3667.09min - 3740.76max) MB/s +20%
BOSGAME M1
 
3112 (3068.44min - 3111.56max) MB/s
GMK NucBox M5
Lexar 1024GB LNM6A1X001T-HNNNG
1400 (948.76min - 1400.43max) MB/s -55%
Beelink SER7
Crucial P3 Plus CT1000P3PSSD8
1066 (54.15min - 1066.13max) MB/s -66%
Intel NUC 13 Pro Kit NUC13ANK
Samsung PM9A1 MZVL2512HCJQ
626 (605.6min - 625.63max) MB/s -80%
AS SSD
Score Total
GMK NucBox K6
MasonSemi 1TB MC7000
7918 Points +86%
Beelink GTR6
Kingston KC3000 512G SKC3000S512G
6722 Points +58%
Intel NUC 13 Pro Kit NUC13ANK
Samsung PM9A1 MZVL2512HCJQ
6005 Points +41%
BOSGAME M1
 
4263 Points
GMK NucBox M5
Lexar 1024GB LNM6A1X001T-HNNNG
3786 Points -11%
Beelink SER7
Crucial P3 Plus CT1000P3PSSD8
2617 Points -39%
Score Read
GMK NucBox K6
MasonSemi 1TB MC7000
3258 Points +184%
Beelink GTR6
Kingston KC3000 512G SKC3000S512G
2207 Points +93%
Intel NUC 13 Pro Kit NUC13ANK
Samsung PM9A1 MZVL2512HCJQ
1673 Points +46%
GMK NucBox M5
Lexar 1024GB LNM6A1X001T-HNNNG
1433 Points +25%
Beelink SER7
Crucial P3 Plus CT1000P3PSSD8
1215 Points +6%
BOSGAME M1
 
1146 Points
Score Write
Intel NUC 13 Pro Kit NUC13ANK
Samsung PM9A1 MZVL2512HCJQ
3574 Points +40%
Beelink GTR6
Kingston KC3000 512G SKC3000S512G
3477 Points +37%
GMK NucBox K6
MasonSemi 1TB MC7000
3000 Points +18%
BOSGAME M1
 
2547 Points
GMK NucBox M5
Lexar 1024GB LNM6A1X001T-HNNNG
1626 Points -36%
Beelink SER7
Crucial P3 Plus CT1000P3PSSD8
800 Points -69%
Seq Read
GMK NucBox K6
MasonSemi 1TB MC7000
5825.09 MB/s +69%
Beelink GTR6
Kingston KC3000 512G SKC3000S512G
5799.1 MB/s +69%
Intel NUC 13 Pro Kit NUC13ANK
Samsung PM9A1 MZVL2512HCJQ
4767 MB/s +39%
Beelink SER7
Crucial P3 Plus CT1000P3PSSD8
3900.61 MB/s +13%
BOSGAME M1
 
3438.69 MB/s
GMK NucBox M5
Lexar 1024GB LNM6A1X001T-HNNNG
3028.67 MB/s -12%
Seq Write
GMK NucBox K6
MasonSemi 1TB MC7000
5783.3 MB/s +101%
Beelink GTR6
Kingston KC3000 512G SKC3000S512G
3737.17 MB/s +30%
Beelink SER7
Crucial P3 Plus CT1000P3PSSD8
3390.67 MB/s +18%
BOSGAME M1
 
2877.44 MB/s
GMK NucBox M5
Lexar 1024GB LNM6A1X001T-HNNNG
2729.51 MB/s -5%
Intel NUC 13 Pro Kit NUC13ANK
Samsung PM9A1 MZVL2512HCJQ
2442 MB/s -15%
4K Read
Intel NUC 13 Pro Kit NUC13ANK
Samsung PM9A1 MZVL2512HCJQ
78.3 MB/s +62%
Beelink GTR6
Kingston KC3000 512G SKC3000S512G
75.39 MB/s +56%
GMK NucBox K6
MasonSemi 1TB MC7000
65.5 MB/s +36%
GMK NucBox M5
Lexar 1024GB LNM6A1X001T-HNNNG
50 MB/s +4%
BOSGAME M1
 
48.27 MB/s
Beelink SER7
Crucial P3 Plus CT1000P3PSSD8
37.69 MB/s -22%
4K Write
Beelink GTR6
Kingston KC3000 512G SKC3000S512G
237.79 MB/s +107%
Intel NUC 13 Pro Kit NUC13ANK
Samsung PM9A1 MZVL2512HCJQ
209 MB/s +82%
GMK NucBox K6
MasonSemi 1TB MC7000
190.06 MB/s +66%
Beelink SER7
Crucial P3 Plus CT1000P3PSSD8
129.29 MB/s +13%
GMK NucBox M5
Lexar 1024GB LNM6A1X001T-HNNNG
126.66 MB/s +10%
BOSGAME M1
 
114.69 MB/s
4K-64 Read
GMK NucBox K6
MasonSemi 1TB MC7000
2610.4 MB/s +246%
Beelink GTR6
Kingston KC3000 512G SKC3000S512G
1551.47 MB/s +106%
Intel NUC 13 Pro Kit NUC13ANK
Samsung PM9A1 MZVL2512HCJQ
1118 MB/s +48%
GMK NucBox M5
Lexar 1024GB LNM6A1X001T-HNNNG
1080.06 MB/s +43%
Beelink SER7
Crucial P3 Plus CT1000P3PSSD8
787.73 MB/s +4%
BOSGAME M1
 
754.28 MB/s
4K-64 Write
Intel NUC 13 Pro Kit NUC13ANK
Samsung PM9A1 MZVL2512HCJQ
3120 MB/s +45%
Beelink GTR6
Kingston KC3000 512G SKC3000S512G
2865.66 MB/s +34%
GMK NucBox K6
MasonSemi 1TB MC7000
2231.47 MB/s +4%
BOSGAME M1
 
2144.62 MB/s
GMK NucBox M5
Lexar 1024GB LNM6A1X001T-HNNNG
1226.59 MB/s -43%
Beelink SER7
Crucial P3 Plus CT1000P3PSSD8
331.93 MB/s -85%
Access Time Read
BOSGAME M1
 
0.088 ms *
GMK NucBox K6
MasonSemi 1TB MC7000
0.079 ms * +10%
GMK NucBox M5
Lexar 1024GB LNM6A1X001T-HNNNG
0.077 ms * +12%
Beelink SER7
Crucial P3 Plus CT1000P3PSSD8
0.066 ms * +25%
Beelink GTR6
Kingston KC3000 512G SKC3000S512G
0.057 ms * +35%
Intel NUC 13 Pro Kit NUC13ANK
Samsung PM9A1 MZVL2512HCJQ
0.045 ms * +49%
Access Time Write
GMK NucBox M5
Lexar 1024GB LNM6A1X001T-HNNNG
0.408 ms * -603%
GMK NucBox K6
MasonSemi 1TB MC7000
0.196 ms * -238%
Beelink SER7
Crucial P3 Plus CT1000P3PSSD8
0.076 ms * -31%
BOSGAME M1
 
0.058 ms *
Beelink GTR6
Kingston KC3000 512G SKC3000S512G
0.047 ms * +19%
Intel NUC 13 Pro Kit NUC13ANK
Samsung PM9A1 MZVL2512HCJQ
0.02 ms * +66%

* ... smaller is better

Disk Throttling: DiskSpd Read Loop, Queue Depth 8

0210420630840105012601470168018902100231025202730294031503360357037803990Tooltip
BOSGAME M1; diskspd 2.0.17 f: Ø4089 (3680.06-4103.47)

Desempenho da GPU

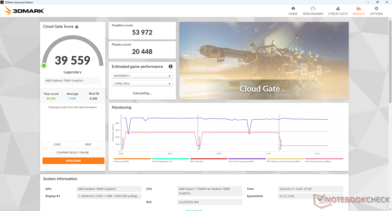
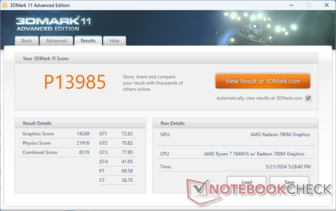
A Radeon 780M é uma das GPUs integradas mais rápidas disponíveis e é ainda mais rápida em uma plataforma de mini PC em comparação com a maioria dos formatos de laptop. Nesse caso, a iGPU do nosso Bosgame é de 15% a 20% mais rápida do que a de um laptop médio com a mesma Radeon 780M. Esse delta é suficiente para igualar ou até mesmo superar um pouco o desempenho dos mais recentes minicomputadores com Intel Arc 8 como no mais caro Acemagic F2A.

Cloud Gate
Cloud Gate
3DMark 11
3DMark 11
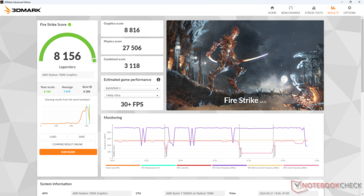
Fire Strike
Fire Strike
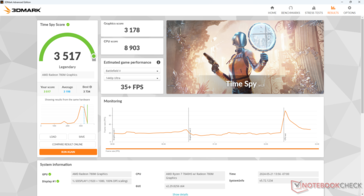
Time Spy
Time Spy
3DMark Performance Rating - Percent
Minisforum Neptune Series HX90G
AMD Radeon RX 6600M, AMD Ryzen 9 5900HX
100 pt
BOSGAME M1
AMD Radeon 780M, AMD Ryzen 7 7840HS
41.1 pt
Beelink SER7 -1!
AMD Radeon 780M, AMD Ryzen 7 7840HS
38.5 pt
Geekom A8
AMD Radeon 780M, AMD Ryzen 9 8945HS
38.2 pt
Acemagic F2A
Intel Arc 8-Core iGPU, Intel Core Ultra 7 155H
37.6 pt
Minisforum AtomMan X7 Ti
Intel Arc 8-Core iGPU, Intel Core Ultra 9 185H
36.6 pt
Average AMD Radeon 780M
 
35.6 pt
Minisforum Mercury Series EM780
AMD Radeon 780M, AMD Ryzen 7 7840U
33.7 pt
Beelink GTR6
AMD Radeon 680M, AMD Ryzen 9 6900HX
32 pt
Minisforum MS-01
Intel Iris Xe Graphics G7 96EUs, Intel Core i9-13900H
25.9 pt
Minisforum Venus Series NAB9
Intel Iris Xe Graphics G7 96EUs, Intel Core i9-12900HK
22 pt
Intel NUC 13 Pro Kit NUC13ANK
Intel Iris Xe Graphics G7 96EUs, Intel Core i7-1360P
21.9 pt
Geekom XT12 Pro
Intel Iris Xe Graphics G7 96EUs, Intel Core i9-12900H
21.9 pt
Maxtang MTN-FP750
AMD Radeon 680M, AMD Ryzen 7 7735HS
19.2 pt
GMK NucBox M5
AMD Radeon RX Vega 8 (Ryzen 4000/5000), AMD Ryzen 7 5700U
16.3 pt
Geekom Mini IT12
Intel UHD Graphics 64EUs (Alder Lake 12th Gen), Intel Core i5-12450H
12.6 pt
BOSGAME N95
Intel UHD Graphics 24EUs (Alder Lake-N), Intel Processor N95
4.8 pt
3DMark 11 - 1280x720 Performance GPU
Minisforum Neptune Series HX90G
AMD Radeon RX 6600M, AMD Ryzen 9 5900HX
31877 Points +124%
BOSGAME M1
AMD Radeon 780M, AMD Ryzen 7 7840HS
14249 Points
Geekom A8
AMD Radeon 780M, AMD Ryzen 9 8945HS
13533 Points -5%
Beelink SER7
AMD Radeon 780M, AMD Ryzen 7 7840HS
12845 Points -10%
Average AMD Radeon 780M
  (7868 - 14249, n=54)
12467 Points -13%
Acemagic F2A
Intel Arc 8-Core iGPU, Intel Core Ultra 7 155H
12085 Points -15%
Minisforum AtomMan X7 Ti
Intel Arc 8-Core iGPU, Intel Core Ultra 9 185H
11691 Points -18%
Minisforum Mercury Series EM780
AMD Radeon 780M, AMD Ryzen 7 7840U
11551 Points -19%
Beelink GTR6
AMD Radeon 680M, AMD Ryzen 9 6900HX
10566 Points -26%
Minisforum MS-01
Intel Iris Xe Graphics G7 96EUs, Intel Core i9-13900H
7676 Points -46%
Intel NUC 13 Pro Kit NUC13ANK
Intel Iris Xe Graphics G7 96EUs, Intel Core i7-1360P
7143 Points -50%
Minisforum Venus Series NAB9
Intel Iris Xe Graphics G7 96EUs, Intel Core i9-12900HK
6999 Points -51%
Geekom XT12 Pro
Intel Iris Xe Graphics G7 96EUs, Intel Core i9-12900H
6975 Points -51%
Maxtang MTN-FP750
AMD Radeon 680M, AMD Ryzen 7 7735HS
6858 Points -52%
GMK NucBox M5
AMD Radeon RX Vega 8 (Ryzen 4000/5000), AMD Ryzen 7 5700U
5388 Points -62%
Geekom Mini IT12
Intel UHD Graphics 64EUs (Alder Lake 12th Gen), Intel Core i5-12450H
3902 Points -73%
BOSGAME N95
Intel UHD Graphics 24EUs (Alder Lake-N), Intel Processor N95
1494 Points -90%
3DMark
1280x720 Cloud Gate Standard Graphics
Minisforum Neptune Series HX90G
AMD Radeon RX 6600M, AMD Ryzen 9 5900HX
145359 Points +169%
BOSGAME M1
AMD Radeon 780M, AMD Ryzen 7 7840HS
53972 Points
Geekom A8
AMD Radeon 780M, AMD Ryzen 9 8945HS
49053 Points -9%
Average AMD Radeon 780M
  (27771 - 53972, n=29)
46628 Points -14%
Beelink GTR6
AMD Radeon 680M, AMD Ryzen 9 6900HX
44579 Points -17%
Minisforum Mercury Series EM780
AMD Radeon 780M, AMD Ryzen 7 7840U
44042 Points -18%
Acemagic F2A
Intel Arc 8-Core iGPU, Intel Core Ultra 7 155H
44014 Points -18%
Minisforum AtomMan X7 Ti
Intel Arc 8-Core iGPU, Intel Core Ultra 9 185H
38976 Points -28%
Minisforum MS-01
Intel Iris Xe Graphics G7 96EUs, Intel Core i9-13900H
38578 Points -29%
Minisforum Venus Series NAB9
Intel Iris Xe Graphics G7 96EUs, Intel Core i9-12900HK
31054 Points -42%
Geekom XT12 Pro
Intel Iris Xe Graphics G7 96EUs, Intel Core i9-12900H
30564 Points -43%
Intel NUC 13 Pro Kit NUC13ANK
Intel Iris Xe Graphics G7 96EUs, Intel Core i7-1360P
27511 Points -49%
GMK NucBox M5
AMD Radeon RX Vega 8 (Ryzen 4000/5000), AMD Ryzen 7 5700U
25003 Points -54%
Maxtang MTN-FP750
AMD Radeon 680M, AMD Ryzen 7 7735HS
24634 Points -54%
Geekom Mini IT12
Intel UHD Graphics 64EUs (Alder Lake 12th Gen), Intel Core i5-12450H
20239 Points -63%
BOSGAME N95
Intel UHD Graphics 24EUs (Alder Lake-N), Intel Processor N95
8304 Points -85%
1920x1080 Fire Strike Graphics
Minisforum Neptune Series HX90G
AMD Radeon RX 6600M, AMD Ryzen 9 5900HX
22884 Points +160%
BOSGAME M1
AMD Radeon 780M, AMD Ryzen 7 7840HS
8816 Points
Geekom A8
AMD Radeon 780M, AMD Ryzen 9 8945HS
8354 Points -5%
Beelink SER7
AMD Radeon 780M, AMD Ryzen 7 7840HS
8001 Points -9%
Average AMD Radeon 780M
  (4550 - 8816, n=56)
7746 Points -12%
Acemagic F2A
Intel Arc 8-Core iGPU, Intel Core Ultra 7 155H
7710 Points -13%
Minisforum AtomMan X7 Ti
Intel Arc 8-Core iGPU, Intel Core Ultra 9 185H
7599 Points -14%
Minisforum Mercury Series EM780
AMD Radeon 780M, AMD Ryzen 7 7840U
7239 Points -18%
Beelink GTR6
AMD Radeon 680M, AMD Ryzen 9 6900HX
6962 Points -21%
Minisforum MS-01
Intel Iris Xe Graphics G7 96EUs, Intel Core i9-13900H
6482 Points -26%
Geekom XT12 Pro
Intel Iris Xe Graphics G7 96EUs, Intel Core i9-12900H
5421 Points -39%
Minisforum Venus Series NAB9
Intel Iris Xe Graphics G7 96EUs, Intel Core i9-12900HK
5407 Points -39%
Intel NUC 13 Pro Kit NUC13ANK
Intel Iris Xe Graphics G7 96EUs, Intel Core i7-1360P
5229 Points -41%
Maxtang MTN-FP750
AMD Radeon 680M, AMD Ryzen 7 7735HS
4424 Points -50%
GMK NucBox M5
AMD Radeon RX Vega 8 (Ryzen 4000/5000), AMD Ryzen 7 5700U
3653 Points -59%
Geekom Mini IT12
Intel UHD Graphics 64EUs (Alder Lake 12th Gen), Intel Core i5-12450H
3057 Points -65%
BOSGAME N95
Intel UHD Graphics 24EUs (Alder Lake-N), Intel Processor N95
1124 Points -87%
2560x1440 Time Spy Graphics
Minisforum Neptune Series HX90G
AMD Radeon RX 6600M, AMD Ryzen 9 5900HX
7685 Points +142%
Acemagic F2A
Intel Arc 8-Core iGPU, Intel Core Ultra 7 155H
3205 Points +1%
Minisforum AtomMan X7 Ti
Intel Arc 8-Core iGPU, Intel Core Ultra 9 185H
3193 Points 0%
BOSGAME M1
AMD Radeon 780M, AMD Ryzen 7 7840HS
3178 Points
Beelink SER7
AMD Radeon 780M, AMD Ryzen 7 7840HS
2908 Points -8%
Geekom A8
AMD Radeon 780M, AMD Ryzen 9 8945HS
2901 Points -9%
Average AMD Radeon 780M
  (1496 - 3196, n=56)
2717 Points -15%
Minisforum Mercury Series EM780
AMD Radeon 780M, AMD Ryzen 7 7840U
2625 Points -17%
Beelink GTR6
AMD Radeon 680M, AMD Ryzen 9 6900HX
2437 Points -23%
Minisforum MS-01
Intel Iris Xe Graphics G7 96EUs, Intel Core i9-13900H
1854 Points -42%
Intel NUC 13 Pro Kit NUC13ANK
Intel Iris Xe Graphics G7 96EUs, Intel Core i7-1360P
1673 Points -47%
Minisforum Venus Series NAB9
Intel Iris Xe Graphics G7 96EUs, Intel Core i9-12900HK
1583 Points -50%
Geekom XT12 Pro
Intel Iris Xe Graphics G7 96EUs, Intel Core i9-12900H
1581 Points -50%
Maxtang MTN-FP750
AMD Radeon 680M, AMD Ryzen 7 7735HS
1399 Points -56%
GMK NucBox M5
AMD Radeon RX Vega 8 (Ryzen 4000/5000), AMD Ryzen 7 5700U
1162 Points -63%
Geekom Mini IT12
Intel UHD Graphics 64EUs (Alder Lake 12th Gen), Intel Core i5-12450H
854 Points -73%
BOSGAME N95
Intel UHD Graphics 24EUs (Alder Lake-N), Intel Processor N95
317 Points -90%
2560x1440 Time Spy Score
Minisforum Neptune Series HX90G
AMD Radeon RX 6600M, AMD Ryzen 9 5900HX
8015 Points +128%
Minisforum AtomMan X7 Ti
Intel Arc 8-Core iGPU, Intel Core Ultra 9 185H
3580 Points +2%
Acemagic F2A
Intel Arc 8-Core iGPU, Intel Core Ultra 7 155H
3569 Points +1%
BOSGAME M1
AMD Radeon 780M, AMD Ryzen 7 7840HS
3517 Points
Beelink SER7
AMD Radeon 780M, AMD Ryzen 7 7840HS
3270 Points -7%
Geekom A8
AMD Radeon 780M, AMD Ryzen 9 8945HS
3264 Points -7%
Average AMD Radeon 780M
  (1707 - 3517, n=56)
3029 Points -14%
Minisforum Mercury Series EM780
AMD Radeon 780M, AMD Ryzen 7 7840U
2916 Points -17%
Beelink GTR6
AMD Radeon 680M, AMD Ryzen 9 6900HX
2735 Points -22%
Minisforum MS-01
Intel Iris Xe Graphics G7 96EUs, Intel Core i9-13900H
2118 Points -40%
Intel NUC 13 Pro Kit NUC13ANK
Intel Iris Xe Graphics G7 96EUs, Intel Core i7-1360P
1907 Points -46%
Minisforum Venus Series NAB9
Intel Iris Xe Graphics G7 96EUs, Intel Core i9-12900HK
1813 Points -48%
Geekom XT12 Pro
Intel Iris Xe Graphics G7 96EUs, Intel Core i9-12900H
1797 Points -49%
Maxtang MTN-FP750
AMD Radeon 680M, AMD Ryzen 7 7735HS
1591 Points -55%
GMK NucBox M5
AMD Radeon RX Vega 8 (Ryzen 4000/5000), AMD Ryzen 7 5700U
1318 Points -63%
Geekom Mini IT12
Intel UHD Graphics 64EUs (Alder Lake 12th Gen), Intel Core i5-12450H
982 Points -72%
BOSGAME N95
Intel UHD Graphics 24EUs (Alder Lake-N), Intel Processor N95
364 Points -90%
3DMark 11 Performance
13985 pontos
3DMark Cloud Gate Standard Score
39559 pontos
3DMark Fire Strike Score
8156 pontos
3DMark Time Spy Score
3517 pontos
Ajuda
Blender
v3.3 Classroom HIP/AMD
Maxtang MTN-FP750
AMD Radeon 680M, AMD Ryzen 7 7735HS
458 Seconds *
Beelink GTR6
AMD Radeon 680M, AMD Ryzen 9 6900HX
356 Seconds *
Minisforum Neptune Series HX90G
AMD Radeon RX 6600M, AMD Ryzen 9 5900HX
87 Seconds *
v3.3 Classroom CPU
BOSGAME N95
Intel UHD Graphics 24EUs (Alder Lake-N), Intel Processor N95
2161 Seconds * -577%
GMK NucBox M5
AMD Radeon RX Vega 8 (Ryzen 4000/5000), AMD Ryzen 7 5700U
758 Seconds * -138%
Geekom Mini IT12
Intel UHD Graphics 64EUs (Alder Lake 12th Gen), Intel Core i5-12450H
663 Seconds * -108%
Geekom XT12 Pro
Intel Iris Xe Graphics G7 96EUs, Intel Core i9-12900H
536 Seconds * -68%
Intel NUC 13 Pro Kit NUC13ANK
Intel Iris Xe Graphics G7 96EUs, Intel Core i7-1360P
464 Seconds * -45%
Maxtang MTN-FP750
AMD Radeon 680M, AMD Ryzen 7 7735HS
460 Seconds * -44%
Beelink GTR6
AMD Radeon 680M, AMD Ryzen 9 6900HX
436 Seconds * -37%
Minisforum Mercury Series EM780
AMD Radeon 780M, AMD Ryzen 7 7840U
426 Seconds * -34%
Minisforum Venus Series NAB9
Intel Iris Xe Graphics G7 96EUs, Intel Core i9-12900HK
413 Seconds * -29%
Minisforum Neptune Series HX90G
AMD Radeon RX 6600M, AMD Ryzen 9 5900HX
405 Seconds * -27%
Average AMD Radeon 780M
  (300 - 664, n=52)
375 Seconds * -18%
Minisforum MS-01
Intel Iris Xe Graphics G7 96EUs, Intel Core i9-13900H
353 Seconds * -11%
BOSGAME M1
AMD Radeon 780M, AMD Ryzen 7 7840HS
319 Seconds *
Beelink SER7
AMD Radeon 780M, AMD Ryzen 7 7840HS
318 Seconds * -0%
Geekom A8
AMD Radeon 780M, AMD Ryzen 9 8945HS
313 Seconds * +2%
Acemagic F2A
Intel Arc 8-Core iGPU, Intel Core Ultra 7 155H
301 Seconds * +6%
Minisforum AtomMan X7 Ti
Intel Arc 8-Core iGPU, Intel Core Ultra 9 185H
294 Seconds * +8%
v3.3 Classroom oneAPI/Intel
Minisforum AtomMan X7 Ti
Intel Arc 8-Core iGPU, Intel Core Ultra 9 185H
254 Seconds *

* ... smaller is better

Desempenho em jogos - Gráficos no nível do Playstation 4

As excelentes pontuações do 3DMark acima se traduzem bem em jogos reais, já que o Bosgame M1 apresentou taxas de quadros acima da média em todos os jogos testados. O mini PC é potente o suficiente para executar Cyberpunk 2077 Phantom Liberty em configurações médias de 1080p a 30 FPS estáveis ou F1 22 em configurações altas de 1080p a 60 FPS estáveis. Consequentemente, um monitor com sincronização adaptativa combinaria muito bem com o Bosgame para fins de jogos.

Os usuários que fizerem upgrade de um monitor Iris Xe 96 EUs Podem esperar mais de 2x o desempenho em jogos.

Performance Rating - Percent
BOSGAME M1
AMD Ryzen 7 7840HS, AMD Radeon 780M
98.8 pt
GMK NucBox K6
AMD Ryzen 7 7840HS, AMD Radeon 780M
94.4 pt
Beelink SER7
AMD Ryzen 7 7840HS, AMD Radeon 780M
92.4 pt
Beelink GTR6 -1!
AMD Ryzen 9 6900HX, AMD Radeon 680M
84.3 pt
Intel NUC 13 Pro Kit NUC13ANK -2!
Intel Core i7-1360P, Intel Iris Xe Graphics G7 96EUs
54 pt
GMK NucBox M5
AMD Ryzen 7 5700U, AMD Radeon RX Vega 8 (Ryzen 4000/5000)
46.2 pt
The Witcher 3 - 1920x1080 Ultra Graphics & Postprocessing (HBAO+)
BOSGAME M1
AMD Ryzen 7 7840HS, AMD Radeon 780M
33.3 (29min) fps
GMK NucBox K6
AMD Ryzen 7 7840HS, AMD Radeon 780M
30.8 (27min) fps -8%
Beelink SER7
AMD Ryzen 7 7840HS, AMD Radeon 780M
30.5 (28min) fps -8%
Beelink GTR6
AMD Ryzen 9 6900HX, AMD Radeon 680M
27.1 (24min) fps -19%
Intel NUC 13 Pro Kit NUC13ANK
Intel Core i7-1360P, Intel Iris Xe Graphics G7 96EUs
16.3 fps -51%
GMK NucBox M5
AMD Ryzen 7 5700U, AMD Radeon RX Vega 8 (Ryzen 4000/5000)
13.7 (12min) fps -59%
Final Fantasy XV Benchmark - 1920x1080 High Quality
BOSGAME M1
AMD Ryzen 7 7840HS, AMD Radeon 780M
30.8 fps
GMK NucBox K6
AMD Ryzen 7 7840HS, AMD Radeon 780M
29.3 fps -5%
Beelink SER7
AMD Ryzen 7 7840HS, AMD Radeon 780M
28.5 fps -7%
Beelink GTR6
AMD Ryzen 9 6900HX, AMD Radeon 680M
24.5 fps -20%
GMK NucBox M5
AMD Ryzen 7 5700U, AMD Radeon RX Vega 8 (Ryzen 4000/5000)
13.1 fps -57%
Strange Brigade - 1920x1080 ultra AA:ultra AF:16
BOSGAME M1
AMD Ryzen 7 7840HS, AMD Radeon 780M
52.1 (5.2min, 33.8P1) fps
GMK NucBox K6
AMD Ryzen 7 7840HS, AMD Radeon 780M
48.8 (11.1min, 31.1P1) fps -6%
Beelink SER7
AMD Ryzen 7 7840HS, AMD Radeon 780M
48.2 (23.8min, 32P1) fps -7%
Beelink GTR6
AMD Ryzen 9 6900HX, AMD Radeon 680M
41.6 (26.5min, 33P1) fps -20%
Intel NUC 13 Pro Kit NUC13ANK
Intel Core i7-1360P, Intel Iris Xe Graphics G7 96EUs
25.2 (5.1min, 6.91P1) fps -52%
GMK NucBox M5
AMD Ryzen 7 5700U, AMD Radeon RX Vega 8 (Ryzen 4000/5000)
22.7 (11.3min, 12.5P1) fps -56%
Dota 2 Reborn - 1920x1080 ultra (3/3) best looking
BOSGAME M1
AMD Ryzen 7 7840HS, AMD Radeon 780M
88.5 (78.9min) fps
GMK NucBox K6
AMD Ryzen 7 7840HS, AMD Radeon 780M
87.4 (16.1min) fps -1%
Beelink SER7
AMD Ryzen 7 7840HS, AMD Radeon 780M
85.6 (74.9min) fps -3%
Beelink GTR6
AMD Ryzen 9 6900HX, AMD Radeon 680M
71.4 (62.3min) fps -19%
Intel NUC 13 Pro Kit NUC13ANK
Intel Core i7-1360P, Intel Iris Xe Graphics G7 96EUs
61.6 (54.6min) fps -30%
GMK NucBox M5
AMD Ryzen 7 5700U, AMD Radeon RX Vega 8 (Ryzen 4000/5000)
47.6 (40.4min) fps -46%
X-Plane 11.11 - 1920x1080 high (fps_test=3)
Beelink GTR6
AMD Ryzen 9 6900HX, AMD Radeon 680M
41.8 fps +8%
GMK NucBox K6
AMD Ryzen 7 7840HS, AMD Radeon 780M
39.7 fps +3%
BOSGAME M1
AMD Ryzen 7 7840HS, AMD Radeon 780M
38.7 fps
Beelink SER7
AMD Ryzen 7 7840HS, AMD Radeon 780M
36.5 fps -6%
GMK NucBox M5
AMD Ryzen 7 5700U, AMD Radeon RX Vega 8 (Ryzen 4000/5000)
25.1 fps -35%
Far Cry 5 - 1920x1080 Ultra Preset AA:T
BOSGAME M1
AMD Ryzen 7 7840HS, AMD Radeon 780M
47 (41min) fps
Beelink SER7
AMD Ryzen 7 7840HS, AMD Radeon 780M
44 (39min) fps -6%
GMK NucBox K6
AMD Ryzen 7 7840HS, AMD Radeon 780M
43 (38min) fps -9%
Intel NUC 13 Pro Kit NUC13ANK
Intel Core i7-1360P, Intel Iris Xe Graphics G7 96EUs
23 (21min) fps -51%
GMK NucBox M5
AMD Ryzen 7 5700U, AMD Radeon RX Vega 8 (Ryzen 4000/5000)
17 (15min) fps -64%
Tiny Tina's Wonderlands
1280x720 Lowest Preset (DX12)
BOSGAME M1
AMD Ryzen 7 7840HS, AMD Radeon 780M
142.1 fps
Beelink SER7
AMD Ryzen 7 7840HS, AMD Radeon 780M
140.6 fps -1%
Geekom A8
AMD Ryzen 9 8945HS, AMD Radeon 780M
130.8 fps -8%
Minisforum Mercury Series EM780
AMD Ryzen 7 7840U, AMD Radeon 780M
118.1 fps -17%
Average AMD Radeon 780M
  (62.6 - 151.2, n=22)
116.9 fps -18%
Minisforum AtomMan X7 Ti
Intel Core Ultra 9 185H, Intel Arc 8-Core iGPU
96.1 fps -32%
Acemagic F2A
Intel Core Ultra 7 155H, Intel Arc 8-Core iGPU
83.8 fps -41%
Maxtang MTN-FP750
AMD Ryzen 7 7735HS, AMD Radeon 680M
76.6 fps -46%
Minisforum MS-01
Intel Core i9-13900H, Intel Iris Xe Graphics G7 96EUs
67.3 fps -53%
Intel NUC 13 Pro Kit NUC13ANK
Intel Core i7-1360P, Intel Iris Xe Graphics G7 96EUs
59.8 fps -58%
Minisforum Venus Series NAB9
Intel Core i9-12900HK, Intel Iris Xe Graphics G7 96EUs
56.5 fps -60%
GMK NucBox M5
AMD Ryzen 7 5700U, AMD Radeon RX Vega 8 (Ryzen 4000/5000)
54.5 fps -62%
Geekom XT12 Pro
Intel Core i9-12900H, Intel Iris Xe Graphics G7 96EUs
49.3 fps -65%
1920x1080 Low Preset (DX12)
Minisforum Neptune Series HX90G
AMD Ryzen 9 5900HX, AMD Radeon RX 6600M
178.8 fps +130%
BOSGAME M1
AMD Ryzen 7 7840HS, AMD Radeon 780M
77.7 fps
Beelink SER7
AMD Ryzen 7 7840HS, AMD Radeon 780M
71.6 fps -8%
Minisforum Mercury Series EM780
AMD Ryzen 7 7840U, AMD Radeon 780M
62.7 fps -19%
Geekom A8
AMD Ryzen 9 8945HS, AMD Radeon 780M
62 fps -20%
Average AMD Radeon 780M
  (34.3 - 77.7, n=22)
61.6 fps -21%
Minisforum AtomMan X7 Ti
Intel Core Ultra 9 185H, Intel Arc 8-Core iGPU
54.6 fps -30%
Minisforum Venus Series NAB9
Intel Core i9-12900HK, Intel Iris Xe Graphics G7 96EUs
53 fps -32%
Acemagic F2A
Intel Core Ultra 7 155H, Intel Arc 8-Core iGPU
50.4 fps -35%
Maxtang MTN-FP750
AMD Ryzen 7 7735HS, AMD Radeon 680M
37.7 fps -51%
Minisforum MS-01
Intel Core i9-13900H, Intel Iris Xe Graphics G7 96EUs
37.5 fps -52%
Intel NUC 13 Pro Kit NUC13ANK
Intel Core i7-1360P, Intel Iris Xe Graphics G7 96EUs
32.5 fps -58%
Geekom XT12 Pro
Intel Core i9-12900H, Intel Iris Xe Graphics G7 96EUs
28.8 fps -63%
GMK NucBox M5
AMD Ryzen 7 5700U, AMD Radeon RX Vega 8 (Ryzen 4000/5000)
27.3 fps -65%
1920x1080 Medium Preset (DX12)
Minisforum Neptune Series HX90G
AMD Ryzen 9 5900HX, AMD Radeon RX 6600M
151 fps +170%
BOSGAME M1
AMD Ryzen 7 7840HS, AMD Radeon 780M
55.9 fps
Beelink SER7
AMD Ryzen 7 7840HS, AMD Radeon 780M
52 fps -7%
Minisforum Mercury Series EM780
AMD Ryzen 7 7840U, AMD Radeon 780M
45.6 fps -18%
Average AMD Radeon 780M
  (28.4 - 55.9, n=22)
45.1 fps -19%
Minisforum AtomMan X7 Ti
Intel Core Ultra 9 185H, Intel Arc 8-Core iGPU
45 fps -19%
Geekom A8
AMD Ryzen 9 8945HS, AMD Radeon 780M
42.5 fps -24%
Acemagic F2A
Intel Core Ultra 7 155H, Intel Arc 8-Core iGPU
40.6 fps -27%
Minisforum Venus Series NAB9
Intel Core i9-12900HK, Intel Iris Xe Graphics G7 96EUs
40.1 fps -28%
Minisforum MS-01
Intel Core i9-13900H, Intel Iris Xe Graphics G7 96EUs
29.5 fps -47%
Maxtang MTN-FP750
AMD Ryzen 7 7735HS, AMD Radeon 680M
28.2 fps -50%
Intel NUC 13 Pro Kit NUC13ANK
Intel Core i7-1360P, Intel Iris Xe Graphics G7 96EUs
25.2 fps -55%
Geekom XT12 Pro
Intel Core i9-12900H, Intel Iris Xe Graphics G7 96EUs
22 fps -61%
GMK NucBox M5
AMD Ryzen 7 5700U, AMD Radeon RX Vega 8 (Ryzen 4000/5000)
21.5 fps -62%
1920x1080 High Preset (DX12)
Minisforum Neptune Series HX90G
AMD Ryzen 9 5900HX, AMD Radeon RX 6600M
96.5 fps +155%
BOSGAME M1
AMD Ryzen 7 7840HS, AMD Radeon 780M
37.9 fps
Beelink SER7
AMD Ryzen 7 7840HS, AMD Radeon 780M
37.1 fps -2%
Geekom A8
AMD Ryzen 9 8945HS, AMD Radeon 780M
32.7 fps -14%
Average AMD Radeon 780M
  (18.6 - 38.8, n=22)
31.4 fps -17%
Minisforum AtomMan X7 Ti
Intel Core Ultra 9 185H, Intel Arc 8-Core iGPU
29.9 fps -21%
Minisforum Mercury Series EM780
AMD Ryzen 7 7840U, AMD Radeon 780M
29.8 fps -21%
Acemagic F2A
Intel Core Ultra 7 155H, Intel Arc 8-Core iGPU
29.1 fps -23%
Minisforum Venus Series NAB9
Intel Core i9-12900HK, Intel Iris Xe Graphics G7 96EUs
24.1 fps -36%
Maxtang MTN-FP750
AMD Ryzen 7 7735HS, AMD Radeon 680M
20.2 fps -47%
Minisforum MS-01
Intel Core i9-13900H, Intel Iris Xe Graphics G7 96EUs
18.2 fps -52%
Intel NUC 13 Pro Kit NUC13ANK
Intel Core i7-1360P, Intel Iris Xe Graphics G7 96EUs
16.1 fps -58%
Geekom XT12 Pro
Intel Core i9-12900H, Intel Iris Xe Graphics G7 96EUs
14.4 fps -62%
GMK NucBox M5
AMD Ryzen 7 5700U, AMD Radeon RX Vega 8 (Ryzen 4000/5000)
13.8 fps -64%
1920x1080 Badass Preset (DX12)
Minisforum Neptune Series HX90G
AMD Ryzen 9 5900HX, AMD Radeon RX 6600M
74.8 fps +147%
BOSGAME M1
AMD Ryzen 7 7840HS, AMD Radeon 780M
30.3 fps
Beelink SER7
AMD Ryzen 7 7840HS, AMD Radeon 780M
30 fps -1%
Geekom A8
AMD Ryzen 9 8945HS, AMD Radeon 780M
29.8 fps -2%
Average AMD Radeon 780M
  (16.5 - 31.3, n=22)
25.7 fps -15%
Minisforum AtomMan X7 Ti
Intel Core Ultra 9 185H, Intel Arc 8-Core iGPU
24.4 fps -19%
Acemagic F2A
Intel Core Ultra 7 155H, Intel Arc 8-Core iGPU
24.1 fps -20%
Minisforum Mercury Series EM780
AMD Ryzen 7 7840U, AMD Radeon 780M
23.8 fps -21%
Minisforum Venus Series NAB9
Intel Core i9-12900HK, Intel Iris Xe Graphics G7 96EUs
18.4 fps -39%
Maxtang MTN-FP750
AMD Ryzen 7 7735HS, AMD Radeon 680M
16.2 fps -47%
Minisforum MS-01
Intel Core i9-13900H, Intel Iris Xe Graphics G7 96EUs
14.2 fps -53%
Intel NUC 13 Pro Kit NUC13ANK
Intel Core i7-1360P, Intel Iris Xe Graphics G7 96EUs
12.7 fps -58%
Geekom XT12 Pro
Intel Core i9-12900H, Intel Iris Xe Graphics G7 96EUs
11.2 fps -63%
GMK NucBox M5
AMD Ryzen 7 5700U, AMD Radeon RX Vega 8 (Ryzen 4000/5000)
10.3 fps -66%
The Witcher 3
1024x768 Low Graphics & Postprocessing
Minisforum Neptune Series HX90G
AMD Ryzen 9 5900HX, AMD Radeon RX 6600M
367 (5.67min, 43.9P0.1, 264P1) fps +128%
BOSGAME M1
AMD Ryzen 7 7840HS, AMD Radeon 780M
160.7 (126min) fps
Geekom A8
AMD Ryzen 9 8945HS, AMD Radeon 780M
153.5 (7.45min, 37.4P0.1, 101.7P1) fps -4%
Beelink SER7
AMD Ryzen 7 7840HS, AMD Radeon 780M
148.1 (121min) fps -8%
Minisforum Mercury Series EM780
AMD Ryzen 7 7840U, AMD Radeon 780M
140.3 (7.89min, 32.5P0.1, 99.6P1) fps -13%
Minisforum AtomMan X7 Ti
Intel Core Ultra 9 185H, Intel Arc 8-Core iGPU
140.2 (26.9min, 57.9P0.1, 101.9P1) fps -13%
Beelink GTR6
AMD Ryzen 9 6900HX, AMD Radeon 680M
139.2 (119min) fps -13%
Average AMD Radeon 780M
  (74 - 163.3, n=37)
136.9 fps -15%
Acemagic F2A
Intel Core Ultra 7 155H, Intel Arc 8-Core iGPU
126 (36.4min, 62.1P0.1, 99.1P1) fps -22%
Minisforum MS-01
Intel Core i9-13900H, Intel Iris Xe Graphics G7 96EUs
117.2 (10.5min, 36P0.1, 69.2P1) fps -27%
Intel NUC 13 Pro Kit NUC13ANK
Intel Core i7-1360P, Intel Iris Xe Graphics G7 96EUs
101.7 fps -37%
Minisforum Venus Series NAB9
Intel Core i9-12900HK, Intel Iris Xe Graphics G7 96EUs
98.1 (22.4min, 35.3P0.1, 58.9P1) fps -39%
Geekom XT12 Pro
Intel Core i9-12900H, Intel Iris Xe Graphics G7 96EUs
87.7 (4.87min, 27.9P0.1, 53P1) fps -45%
Maxtang MTN-FP750
AMD Ryzen 7 7735HS, AMD Radeon 680M
73 (13.3min, 24.8P0.1, 40.9P1) fps -55%
GMK NucBox M5
AMD Ryzen 7 5700U, AMD Radeon RX Vega 8 (Ryzen 4000/5000)
67.6 (60min) fps -58%
Geekom Mini IT12
Intel Core i5-12450H, Intel UHD Graphics 64EUs (Alder Lake 12th Gen)
60.8 (17.3min, 25.8P0.1, 34.4P1) fps -62%
BOSGAME N95
Intel Processor N95, Intel UHD Graphics 24EUs (Alder Lake-N)
22 fps -86%
1366x768 Medium Graphics & Postprocessing
Minisforum Neptune Series HX90G
AMD Ryzen 9 5900HX, AMD Radeon RX 6600M
260 (41.7min, 170.3P0.1, 202P1) fps +150%
BOSGAME M1
AMD Ryzen 7 7840HS, AMD Radeon 780M
103.8 (96min) fps
Beelink SER7
AMD Ryzen 7 7840HS, AMD Radeon 780M
97.1 (91min) fps -6%
Minisforum Mercury Series EM780
AMD Ryzen 7 7840U, AMD Radeon 780M
96.6 (22.3min, 51.2P0.1, 76.4P1) fps -7%
Average AMD Radeon 780M
  (47.7 - 103.8, n=21)
89.6 fps -14%
Geekom A8
AMD Ryzen 9 8945HS, AMD Radeon 780M
88.3 (13.2min, 42.1P0.1, 48.9P1) fps -15%
Minisforum AtomMan X7 Ti
Intel Core Ultra 9 185H, Intel Arc 8-Core iGPU
85.1 (38.5min, 56.2P0.1, 65P1) fps -18%
Beelink GTR6
AMD Ryzen 9 6900HX, AMD Radeon 680M
84 (77min) fps -19%
Acemagic F2A
Intel Core Ultra 7 155H, Intel Arc 8-Core iGPU
78 (43.6min, 56.8P0.1, 64P1) fps -25%
Minisforum MS-01
Intel Core i9-13900H, Intel Iris Xe Graphics G7 96EUs
77.8 (5.64min, 36.3P0.1, 44.1P1) fps -25%
Minisforum Venus Series NAB9
Intel Core i9-12900HK, Intel Iris Xe Graphics G7 96EUs
64 (22.4min, 30.3P0.1, 37.4P1) fps -38%
Geekom XT12 Pro
Intel Core i9-12900H, Intel Iris Xe Graphics G7 96EUs
58.9 (18.1min, 27.8P0.1, 34.9P1) fps -43%
Maxtang MTN-FP750
AMD Ryzen 7 7735HS, AMD Radeon 680M
46.7 (8.69min, 18.5P0.1, 37P1) fps -55%
GMK NucBox M5
AMD Ryzen 7 5700U, AMD Radeon RX Vega 8 (Ryzen 4000/5000)
43.3 (38min) fps -58%
Geekom Mini IT12
Intel Core i5-12450H, Intel UHD Graphics 64EUs (Alder Lake 12th Gen)
37.5 (4.96min, 17.4P0.1, 20.5P1) fps -64%
1920x1080 High Graphics & Postprocessing (Nvidia HairWorks Off)
Minisforum Neptune Series HX90G
AMD Ryzen 9 5900HX, AMD Radeon RX 6600M
144.9 (35min, 96.3P0.1, 115.6P1) fps +178%
BOSGAME M1
AMD Ryzen 7 7840HS, AMD Radeon 780M
52.2 (48min) fps
Beelink SER7
AMD Ryzen 7 7840HS, AMD Radeon 780M
49 (45min) fps -6%
Minisforum AtomMan X7 Ti
Intel Core Ultra 9 185H, Intel Arc 8-Core iGPU
46.8 (28.7min, 32.6P0.1, 37.1P1) fps -10%
Geekom A8
AMD Ryzen 9 8945HS, AMD Radeon 780M
46.2 (14.1min, 14.7P0.1, 16P1) fps -11%
Beelink GTR6
AMD Ryzen 9 6900HX, AMD Radeon 680M
46 (41min) fps -12%
Minisforum Mercury Series EM780
AMD Ryzen 7 7840U, AMD Radeon 780M
45.5 (11.7min, 29.4P0.1, 37P1) fps -13%
Acemagic F2A
Intel Core Ultra 7 155H, Intel Arc 8-Core iGPU
44.8 (26.8min, 32P0.1, 37.7P1) fps -14%
Average AMD Radeon 780M
  (21.3 - 52.2, n=45)
44.2 fps -15%
Minisforum MS-01
Intel Core i9-13900H, Intel Iris Xe Graphics G7 96EUs
43 (19.6min, 20.7P0.1, 22.9P1) fps -18%
Minisforum Venus Series NAB9
Intel Core i9-12900HK, Intel Iris Xe Graphics G7 96EUs
32.2 (15.4min, 16P0.1, 18.1P1) fps -38%
Geekom XT12 Pro
Intel Core i9-12900H, Intel Iris Xe Graphics G7 96EUs
31.4 (16min, 16.2P0.1, 17.4P1) fps -40%
Intel NUC 13 Pro Kit NUC13ANK
Intel Core i7-1360P, Intel Iris Xe Graphics G7 96EUs
31.1 fps -40%
Maxtang MTN-FP750
AMD Ryzen 7 7735HS, AMD Radeon 680M
23.7 (12.8min, 13.7P0.1, 19P1) fps -55%
GMK NucBox M5
AMD Ryzen 7 5700U, AMD Radeon RX Vega 8 (Ryzen 4000/5000)
22 (20min) fps -58%
Geekom Mini IT12
Intel Core i5-12450H, Intel UHD Graphics 64EUs (Alder Lake 12th Gen)
20 (10.1min, 11.2P0.1, 11.3P1) fps -62%
BOSGAME N95
Intel Processor N95, Intel UHD Graphics 24EUs (Alder Lake-N)
7.2 fps -86%
1920x1080 Ultra Graphics & Postprocessing (HBAO+)
Minisforum Neptune Series HX90G
AMD Ryzen 9 5900HX, AMD Radeon RX 6600M
88 (41.9min, 48.7P0.1, 72.5P1) fps +164%
BOSGAME M1
AMD Ryzen 7 7840HS, AMD Radeon 780M
33.3 (29min) fps
Geekom A8
AMD Ryzen 9 8945HS, AMD Radeon 780M
32.4 (8.42min, 11.8P0.1, 17.7P1) fps -3%
Beelink SER7
AMD Ryzen 7 7840HS, AMD Radeon 780M
30.5 (28min) fps -8%
Minisforum Mercury Series EM780
AMD Ryzen 7 7840U, AMD Radeon 780M
28.5 (16.2min, 16.8P0.1, 18P1) fps -14%
Average AMD Radeon 780M
  (14.3 - 36, n=47)
28 fps -16%
Beelink GTR6
AMD Ryzen 9 6900HX, AMD Radeon 680M
27.1 (24min) fps -19%
Acemagic F2A
Intel Core Ultra 7 155H, Intel Arc 8-Core iGPU
24.6 (12min, 16.1P0.1, 21.8P1) fps -26%
Minisforum AtomMan X7 Ti
Intel Core Ultra 9 185H, Intel Arc 8-Core iGPU
24.5 (6.26min, 10.2P0.1, 14.1P1) fps -26%
Minisforum MS-01
Intel Core i9-13900H, Intel Iris Xe Graphics G7 96EUs
19.5 (2.41min, 9.62P0.1, 12.3P1) fps -41%
Intel NUC 13 Pro Kit NUC13ANK
Intel Core i7-1360P, Intel Iris Xe Graphics G7 96EUs
16.3 fps -51%
Geekom XT12 Pro
Intel Core i9-12900H, Intel Iris Xe Graphics G7 96EUs
15.6 (7.23min, 8.72P0.1, 9.46P1) fps -53%
Minisforum Venus Series NAB9
Intel Core i9-12900HK, Intel Iris Xe Graphics G7 96EUs
15.3 (1.624min, 3.11P0.1, 10.2P1) fps -54%
Maxtang MTN-FP750
AMD Ryzen 7 7735HS, AMD Radeon 680M
14.9 (9.2min, 9.5P0.1, 12.3P1) fps -55%
GMK NucBox M5
AMD Ryzen 7 5700U, AMD Radeon RX Vega 8 (Ryzen 4000/5000)
13.7 (12min) fps -59%
Geekom Mini IT12
Intel Core i5-12450H, Intel UHD Graphics 64EUs (Alder Lake 12th Gen)
10.2 (5.61min, 5.81P0.1, 6.02P1) fps -69%
Final Fantasy XV Benchmark
1280x720 Lite Quality
Minisforum Neptune Series HX90G
AMD Ryzen 9 5900HX, AMD Radeon RX 6600M
197.7 fps +134%
BOSGAME M1
AMD Ryzen 7 7840HS, AMD Radeon 780M
84.5 fps
Beelink SER7
AMD Ryzen 7 7840HS, AMD Radeon 780M
76.5 fps -9%
Average AMD Radeon 780M
  (27.8 - 84.5, n=54)
69.7 fps -18%
Minisforum AtomMan X7 Ti
Intel Core Ultra 9 185H, Intel Arc 8-Core iGPU
69.1 fps -18%
Minisforum Mercury Series EM780
AMD Ryzen 7 7840U, AMD Radeon 780M
68.6 fps -19%
Beelink GTR6
AMD Ryzen 9 6900HX, AMD Radeon 680M
68.5 fps -19%
Acemagic F2A
Intel Core Ultra 7 155H, Intel Arc 8-Core iGPU
63.3 fps -25%
Minisforum MS-01
Intel Core i9-13900H, Intel Iris Xe Graphics G7 96EUs
56.3 fps -33%
Geekom A8
AMD Ryzen 9 8945HS, AMD Radeon 780M
54.4 fps -36%
Minisforum Venus Series NAB9
Intel Core i9-12900HK, Intel Iris Xe Graphics G7 96EUs
44.4 fps -47%
Geekom XT12 Pro
Intel Core i9-12900H, Intel Iris Xe Graphics G7 96EUs
42.2 fps -50%
Maxtang MTN-FP750
AMD Ryzen 7 7735HS, AMD Radeon 680M
39.2 fps -54%
GMK NucBox M5
AMD Ryzen 7 5700U, AMD Radeon RX Vega 8 (Ryzen 4000/5000)
35.2 fps -58%
BOSGAME N95
Intel Processor N95, Intel UHD Graphics 24EUs (Alder Lake-N)
12.4 fps -85%
1920x1080 Standard Quality
Minisforum Neptune Series HX90G
AMD Ryzen 9 5900HX, AMD Radeon RX 6600M
111.1 fps +172%
BOSGAME M1
AMD Ryzen 7 7840HS, AMD Radeon 780M
40.9 fps
Beelink SER7
AMD Ryzen 7 7840HS, AMD Radeon 780M
38.2 fps -7%
Minisforum AtomMan X7 Ti
Intel Core Ultra 9 185H, Intel Arc 8-Core iGPU
36.8 fps -10%
Average AMD Radeon 780M
  (21 - 40.9, n=54)
35.2 fps -14%
Beelink GTR6
AMD Ryzen 9 6900HX, AMD Radeon 680M
34.9 fps -15%
Acemagic F2A
Intel Core Ultra 7 155H, Intel Arc 8-Core iGPU
34.8 fps -15%
Minisforum Mercury Series EM780
AMD Ryzen 7 7840U, AMD Radeon 780M
34.4 fps -16%
Minisforum MS-01
Intel Core i9-13900H, Intel Iris Xe Graphics G7 96EUs
31.2 fps -24%
Geekom A8
AMD Ryzen 9 8945HS, AMD Radeon 780M
25.1 fps -39%
Minisforum Venus Series NAB9
Intel Core i9-12900HK, Intel Iris Xe Graphics G7 96EUs
24.3 fps -41%
Geekom XT12 Pro
Intel Core i9-12900H, Intel Iris Xe Graphics G7 96EUs
22.7 fps -44%
Maxtang MTN-FP750
AMD Ryzen 7 7735HS, AMD Radeon 680M
20.5 fps -50%
GMK NucBox M5
AMD Ryzen 7 5700U, AMD Radeon RX Vega 8 (Ryzen 4000/5000)
18 fps -56%
BOSGAME N95
Intel Processor N95, Intel UHD Graphics 24EUs (Alder Lake-N)
5.88 fps -86%
1920x1080 High Quality
Minisforum Neptune Series HX90G
AMD Ryzen 9 5900HX, AMD Radeon RX 6600M
81.4 fps +164%
BOSGAME M1
AMD Ryzen 7 7840HS, AMD Radeon 780M
30.8 fps
Beelink SER7
AMD Ryzen 7 7840HS, AMD Radeon 780M
28.5 fps -7%
Minisforum AtomMan X7 Ti
Intel Core Ultra 9 185H, Intel Arc 8-Core iGPU
26.4 fps -14%
Average AMD Radeon 780M
  (15.9 - 30.8, n=55)
26.3 fps -15%
Minisforum Mercury Series EM780
AMD Ryzen 7 7840U, AMD Radeon 780M
25.7 fps -17%
Beelink GTR6
AMD Ryzen 9 6900HX, AMD Radeon 680M
24.5 fps -20%
Acemagic F2A
Intel Core Ultra 7 155H, Intel Arc 8-Core iGPU
24.4 fps -21%
Minisforum MS-01
Intel Core i9-13900H, Intel Iris Xe Graphics G7 96EUs
21.4 fps -31%
Minisforum Venus Series NAB9
Intel Core i9-12900HK, Intel Iris Xe Graphics G7 96EUs
20.1 fps -35%
Geekom A8
AMD Ryzen 9 8945HS, AMD Radeon 780M
19.5 fps -37%
Geekom XT12 Pro
Intel Core i9-12900H, Intel Iris Xe Graphics G7 96EUs
16.4 fps -47%
Maxtang MTN-FP750
AMD Ryzen 7 7735HS, AMD Radeon 680M
14.6 fps -53%
GMK NucBox M5
AMD Ryzen 7 5700U, AMD Radeon RX Vega 8 (Ryzen 4000/5000)
13.1 fps -57%
BOSGAME N95
Intel Processor N95, Intel UHD Graphics 24EUs (Alder Lake-N)
4.26 fps -86%
Dota 2 Reborn
1280x720 min (0/3) fastest
Geekom A8
AMD Ryzen 9 8945HS, AMD Radeon 780M
159.7 (142.1min) fps 0%
BOSGAME M1
AMD Ryzen 7 7840HS, AMD Radeon 780M
159.5 (137.7min) fps
Beelink SER7
AMD Ryzen 7 7840HS, AMD Radeon 780M
156.9 (136.5min) fps -2%
Minisforum Neptune Series HX90G
AMD Ryzen 9 5900HX, AMD Radeon RX 6600M
154.9 (131.8min) fps -3%
Beelink GTR6
AMD Ryzen 9 6900HX, AMD Radeon 680M
141.9 (121.4min) fps -11%
Average AMD Radeon 780M
  (34.7 - 164.8, n=56)
132.5 fps -17%
Minisforum MS-01
Intel Core i9-13900H, Intel Iris Xe Graphics G7 96EUs
128.6 (80.1min) fps -19%
Intel NUC 13 Pro Kit NUC13ANK
Intel Core i7-1360P, Intel Iris Xe Graphics G7 96EUs
123.8 (98min) fps -22%
Minisforum Venus Series NAB9
Intel Core i9-12900HK, Intel Iris Xe Graphics G7 96EUs
119.5 (88.5min) fps -25%
Maxtang MTN-FP750
AMD Ryzen 7 7735HS, AMD Radeon 680M
115.8 (101.2min) fps -27%
Geekom Mini IT12
Intel Core i5-12450H, Intel UHD Graphics 64EUs (Alder Lake 12th Gen)
115.2 (89.7min) fps -28%
Minisforum Mercury Series EM780
AMD Ryzen 7 7840U, AMD Radeon 780M
112.4 (99min) fps -30%
Minisforum AtomMan X7 Ti
Intel Core Ultra 9 185H, Intel Arc 8-Core iGPU
106.5 (61min) fps -33%
Geekom XT12 Pro
Intel Core i9-12900H, Intel Iris Xe Graphics G7 96EUs
106.3 (81.7min) fps -33%
Acemagic F2A
Intel Core Ultra 7 155H, Intel Arc 8-Core iGPU
103.2 (59.8min) fps -35%
GMK NucBox M5
AMD Ryzen 7 5700U, AMD Radeon RX Vega 8 (Ryzen 4000/5000)
99.7 (85.3min) fps -37%
BOSGAME N95
Intel Processor N95, Intel UHD Graphics 24EUs (Alder Lake-N)
74.2 (56min) fps -53%
1366x768 med (1/3)
BOSGAME M1
AMD Ryzen 7 7840HS, AMD Radeon 780M
126.5 (104.4min) fps
Geekom A8
AMD Ryzen 9 8945HS, AMD Radeon 780M
122.9 (103min) fps -3%
Beelink SER7
AMD Ryzen 7 7840HS, AMD Radeon 780M
121.1 (100.6min) fps -4%
Minisforum Neptune Series HX90G
AMD Ryzen 9 5900HX, AMD Radeon RX 6600M
120.2 (96.5min) fps -5%
Beelink GTR6
AMD Ryzen 9 6900HX, AMD Radeon 680M
112.7 (95min) fps -11%
Average AMD Radeon 780M
  (33.6 - 130.2, n=56)
106.8 fps -16%
Minisforum Mercury Series EM780
AMD Ryzen 7 7840U, AMD Radeon 780M
96.1 (83.8min) fps -24%
Minisforum MS-01
Intel Core i9-13900H, Intel Iris Xe Graphics G7 96EUs
94.5 (67.6min) fps -25%
Intel NUC 13 Pro Kit NUC13ANK
Intel Core i7-1360P, Intel Iris Xe Graphics G7 96EUs
93.9 (77.2min) fps -26%
Minisforum Venus Series NAB9
Intel Core i9-12900HK, Intel Iris Xe Graphics G7 96EUs
89.4 (71.3min) fps -29%
Maxtang MTN-FP750
AMD Ryzen 7 7735HS, AMD Radeon 680M
87.4 (72.1min) fps -31%
Geekom Mini IT12
Intel Core i5-12450H, Intel UHD Graphics 64EUs (Alder Lake 12th Gen)
84.1 (67.8min) fps -34%
Acemagic F2A
Intel Core Ultra 7 155H, Intel Arc 8-Core iGPU
82.95 (57.1min) fps -34%
GMK NucBox M5
AMD Ryzen 7 5700U, AMD Radeon RX Vega 8 (Ryzen 4000/5000)
80.6 (61.8min) fps -36%
Minisforum AtomMan X7 Ti
Intel Core Ultra 9 185H, Intel Arc 8-Core iGPU
80.6 (59.3min) fps -36%
Geekom XT12 Pro
Intel Core i9-12900H, Intel Iris Xe Graphics G7 96EUs
76.3 (61.3min) fps -40%
BOSGAME N95
Intel Processor N95, Intel UHD Graphics 24EUs (Alder Lake-N)
47.8 (40.4min) fps -62%
1920x1080 high (2/3)
Minisforum Neptune Series HX90G
AMD Ryzen 9 5900HX, AMD Radeon RX 6600M
106.8 (85.9min) fps +8%
BOSGAME M1
AMD Ryzen 7 7840HS, AMD Radeon 780M
98.8 (88.1min) fps
Beelink SER7
AMD Ryzen 7 7840HS, AMD Radeon 780M
95.5 (85.2min) fps -3%
Geekom A8
AMD Ryzen 9 8945HS, AMD Radeon 780M
88.3 (74.1min) fps -11%
Beelink GTR6
AMD Ryzen 9 6900HX, AMD Radeon 680M
80.9 (71.6min) fps -18%
Minisforum MS-01
Intel Core i9-13900H, Intel Iris Xe Graphics G7 96EUs
80.8 (65.9min) fps -18%
Minisforum Mercury Series EM780
AMD Ryzen 7 7840U, AMD Radeon 780M
80.5 (72.3min) fps -19%
Average AMD Radeon 780M
  (31.6 - 98.8, n=56)
79.1 fps -20%
Minisforum AtomMan X7 Ti
Intel Core Ultra 9 185H, Intel Arc 8-Core iGPU
79 (48.2min) fps -20%
Acemagic F2A
Intel Core Ultra 7 155H, Intel Arc 8-Core iGPU
77.3 (52.5min) fps -22%
Intel NUC 13 Pro Kit NUC13ANK
Intel Core i7-1360P, Intel Iris Xe Graphics G7 96EUs
67.6 (59.9min) fps -32%
Minisforum Venus Series NAB9
Intel Core i9-12900HK, Intel Iris Xe Graphics G7 96EUs
67 (60.7min) fps -32%
Geekom XT12 Pro
Intel Core i9-12900H, Intel Iris Xe Graphics G7 96EUs
61.3 (54.1min) fps -38%
Maxtang MTN-FP750
AMD Ryzen 7 7735HS, AMD Radeon 680M
60.5 (53.8min) fps -39%
GMK NucBox M5
AMD Ryzen 7 5700U, AMD Radeon RX Vega 8 (Ryzen 4000/5000)
50.5 (43.1min) fps -49%
Geekom Mini IT12
Intel Core i5-12450H, Intel UHD Graphics 64EUs (Alder Lake 12th Gen)
44.4 (41.6min) fps -55%
BOSGAME N95
Intel Processor N95, Intel UHD Graphics 24EUs (Alder Lake-N)
18.8 (17.5min) fps -81%
1920x1080 ultra (3/3) best looking
Minisforum Neptune Series HX90G
AMD Ryzen 9 5900HX, AMD Radeon RX 6600M
96.6 (75.3min) fps +9%
BOSGAME M1
AMD Ryzen 7 7840HS, AMD Radeon 780M
88.5 (78.9min) fps
Beelink SER7
AMD Ryzen 7 7840HS, AMD Radeon 780M
85.6 (74.9min) fps -3%
Geekom A8
AMD Ryzen 9 8945HS, AMD Radeon 780M
82.25 (71min) fps -7%
Minisforum AtomMan X7 Ti
Intel Core Ultra 9 185H, Intel Arc 8-Core iGPU
74.6 (47.1min) fps -16%
Beelink GTR6
AMD Ryzen 9 6900HX, AMD Radeon 680M
71.4 (62.3min) fps -19%
Average AMD Radeon 780M
  (30.8 - 91.2, n=56)
71.4 fps -19%
Acemagic F2A
Intel Core Ultra 7 155H, Intel Arc 8-Core iGPU
71.1 (52min) fps -20%
Minisforum Mercury Series EM780
AMD Ryzen 7 7840U, AMD Radeon 780M
71 (63min) fps -20%
Minisforum MS-01
Intel Core i9-13900H, Intel Iris Xe Graphics G7 96EUs
70.6 (54.1min) fps -20%
Intel NUC 13 Pro Kit NUC13ANK
Intel Core i7-1360P, Intel Iris Xe Graphics G7 96EUs
61.6 (54.6min) fps -30%
Minisforum Venus Series NAB9
Intel Core i9-12900HK, Intel Iris Xe Graphics G7 96EUs
60.6 (54.2min) fps -32%
Geekom XT12 Pro
Intel Core i9-12900H, Intel Iris Xe Graphics G7 96EUs
54.2 (47.8min) fps -39%
Maxtang MTN-FP750
AMD Ryzen 7 7735HS, AMD Radeon 680M
53.1 (47.2min) fps -40%
GMK NucBox M5
AMD Ryzen 7 5700U, AMD Radeon RX Vega 8 (Ryzen 4000/5000)
47.6 (40.4min) fps -46%
Geekom Mini IT12
Intel Core i5-12450H, Intel UHD Graphics 64EUs (Alder Lake 12th Gen)
41 (38.1min) fps -54%
BOSGAME N95
Intel Processor N95, Intel UHD Graphics 24EUs (Alder Lake-N)
17.5 (16.4min) fps -80%
X-Plane 11.11
1280x720 low (fps_test=1)
Geekom A8
AMD Ryzen 9 8945HS, AMD Radeon 780M
66.3 fps +3%
Minisforum MS-01
Intel Core i9-13900H, Intel Iris Xe Graphics G7 96EUs
65.5 fps +2%
Minisforum AtomMan X7 Ti
Intel Core Ultra 9 185H, Intel Arc 8-Core iGPU
64.9 fps +1%
Beelink GTR6
AMD Ryzen 9 6900HX, AMD Radeon 680M
64.8 fps +1%
BOSGAME M1
AMD Ryzen 7 7840HS, AMD Radeon 780M
64.2 fps
Acemagic F2A
Intel Core Ultra 7 155H, Intel Arc 8-Core iGPU
63.1 fps -2%
Minisforum Neptune Series HX90G
AMD Ryzen 9 5900HX, AMD Radeon RX 6600M
60.1 fps -6%
Beelink SER7
AMD Ryzen 7 7840HS, AMD Radeon 780M
57.8 fps -10%
Geekom XT12 Pro
Intel Core i9-12900H, Intel Iris Xe Graphics G7 96EUs
55.5 fps -14%
Minisforum Venus Series NAB9
Intel Core i9-12900HK, Intel Iris Xe Graphics G7 96EUs
54.1 fps -16%
Minisforum Mercury Series EM780
AMD Ryzen 7 7840U, AMD Radeon 780M
54 fps -16%
Average AMD Radeon 780M
  (39 - 69.6, n=58)
53.2 fps -17%
Maxtang MTN-FP750
AMD Ryzen 7 7735HS, AMD Radeon 680M
49.8 fps -22%
GMK NucBox M5
AMD Ryzen 7 5700U, AMD Radeon RX Vega 8 (Ryzen 4000/5000)
40.4 fps -37%
Geekom Mini IT12
Intel Core i5-12450H, Intel UHD Graphics 64EUs (Alder Lake 12th Gen)
36.8 fps -43%
BOSGAME N95
Intel Processor N95, Intel UHD Graphics 24EUs (Alder Lake-N)
24.7 fps -62%
1920x1080 med (fps_test=2)
Beelink GTR6
AMD Ryzen 9 6900HX, AMD Radeon 680M
52.6 fps +14%
Minisforum Neptune Series HX90G
AMD Ryzen 9 5900HX, AMD Radeon RX 6600M
49.8 fps +8%
Minisforum AtomMan X7 Ti
Intel Core Ultra 9 185H, Intel Arc 8-Core iGPU
49.7 fps +7%
Minisforum MS-01
Intel Core i9-13900H, Intel Iris Xe Graphics G7 96EUs
48.3 fps +4%
Geekom A8
AMD Ryzen 9 8945HS, AMD Radeon 780M
47.8 fps +3%
BOSGAME M1
AMD Ryzen 7 7840HS, AMD Radeon 780M
46.3 fps
Beelink SER7
AMD Ryzen 7 7840HS, AMD Radeon 780M
43.5 fps -6%
Geekom XT12 Pro
Intel Core i9-12900H, Intel Iris Xe Graphics G7 96EUs
42.2 fps -9%
Acemagic F2A
Intel Core Ultra 7 155H, Intel Arc 8-Core iGPU
42 fps -9%
Minisforum Mercury Series EM780
AMD Ryzen 7 7840U, AMD Radeon 780M
40.2 fps -13%
Minisforum Venus Series NAB9
Intel Core i9-12900HK, Intel Iris Xe Graphics G7 96EUs
39.9 fps -14%
Maxtang MTN-FP750
AMD Ryzen 7 7735HS, AMD Radeon 680M
39.8 fps -14%
Average AMD Radeon 780M
  (26.2 - 48.9, n=58)
38.9 fps -16%
GMK NucBox M5
AMD Ryzen 7 5700U, AMD Radeon RX Vega 8 (Ryzen 4000/5000)
27.3 fps -41%
Geekom Mini IT12
Intel Core i5-12450H, Intel UHD Graphics 64EUs (Alder Lake 12th Gen)
24.4 fps -47%
BOSGAME N95
Intel Processor N95, Intel UHD Graphics 24EUs (Alder Lake-N)
15 fps -68%
1920x1080 high (fps_test=3)
Minisforum Neptune Series HX90G
AMD Ryzen 9 5900HX, AMD Radeon RX 6600M
47.1 fps +22%
Beelink GTR6
AMD Ryzen 9 6900HX, AMD Radeon 680M
41.8 fps +8%
Minisforum MS-01
Intel Core i9-13900H, Intel Iris Xe Graphics G7 96EUs
40.7 fps +5%
Minisforum AtomMan X7 Ti
Intel Core Ultra 9 185H, Intel Arc 8-Core iGPU
40.5 fps +5%
Geekom A8
AMD Ryzen 9 8945HS, AMD Radeon 780M
39.9 fps +3%
BOSGAME M1
AMD Ryzen 7 7840HS, AMD Radeon 780M
38.7 fps
Beelink SER7
AMD Ryzen 7 7840HS, AMD Radeon 780M
36.5 fps -6%
Geekom XT12 Pro
Intel Core i9-12900H, Intel Iris Xe Graphics G7 96EUs
36 fps -7%
Acemagic F2A
Intel Core Ultra 7 155H, Intel Arc 8-Core iGPU
35 fps -10%
Minisforum Venus Series NAB9
Intel Core i9-12900HK, Intel Iris Xe Graphics G7 96EUs
34.8 fps -10%
Maxtang MTN-FP750
AMD Ryzen 7 7735HS, AMD Radeon 680M
33.8 fps -13%
Minisforum Mercury Series EM780
AMD Ryzen 7 7840U, AMD Radeon 780M
33.8 fps -13%
Average AMD Radeon 780M
  (24.5 - 41.5, n=57)
32.7 fps -16%
GMK NucBox M5
AMD Ryzen 7 5700U, AMD Radeon RX Vega 8 (Ryzen 4000/5000)
25.1 fps -35%
Geekom Mini IT12
Intel Core i5-12450H, Intel UHD Graphics 64EUs (Alder Lake 12th Gen)
21.9 fps -43%
BOSGAME N95
Intel Processor N95, Intel UHD Graphics 24EUs (Alder Lake-N)
13.9 fps -64%
Cyberpunk 2077 2.1 Phantom Liberty
1920x1080 Ultra Preset (FSR on)
BOSGAME M1
AMD Ryzen 7 7840HS, AMD Radeon 780M
33.3 (24.2min) fps
Average AMD Radeon 780M
  (23.1 - 33.3, n=4)
28.6 fps -14%
1280x720 Low Preset (FSR off)
BOSGAME M1
AMD Ryzen 7 7840HS, AMD Radeon 780M
80.6 (51.6min) fps
Geekom A8
AMD Ryzen 9 8945HS, AMD Radeon 780M
73.4 (60.6min) fps -9%
Average AMD Radeon 780M
  (53.6 - 80.6, n=21)
66.5 fps -17%
Minisforum Mercury Series EM780
AMD Ryzen 7 7840U, AMD Radeon 780M
59.6 (45.6min) fps -26%
Minisforum AtomMan X7 Ti
Intel Core Ultra 9 185H, Intel Arc 8-Core iGPU
47.6 (39min) fps -41%
Acemagic F2A
Intel Core Ultra 7 155H, Intel Arc 8-Core iGPU
44.3 (36.6min) fps -45%
Minisforum MS-01
Intel Core i9-13900H, Intel Iris Xe Graphics G7 96EUs
37.3 (28.7min) fps -54%
Minisforum Venus Series NAB9
Intel Core i9-12900HK, Intel Iris Xe Graphics G7 96EUs
31.1 (24min) fps -61%
Geekom XT12 Pro
Intel Core i9-12900H, Intel Iris Xe Graphics G7 96EUs
28.1 (22.5min) fps -65%
GMK NucBox M5
AMD Ryzen 7 5700U, AMD Radeon RX Vega 8 (Ryzen 4000/5000)
24.4 (12.7min) fps -70%
1920x1080 Low Preset (FSR off)
BOSGAME M1
AMD Ryzen 7 7840HS, AMD Radeon 780M
47.9 (37.5min) fps
Geekom A8
AMD Ryzen 9 8945HS, AMD Radeon 780M
44 (37.6min) fps -8%
Average AMD Radeon 780M
  (32.5 - 52.1, n=39)
40.3 fps -16%
Minisforum Mercury Series EM780
AMD Ryzen 7 7840U, AMD Radeon 780M
38.5 (32.2min) fps -20%
Minisforum AtomMan X7 Ti
Intel Core Ultra 9 185H, Intel Arc 8-Core iGPU
34.3 (29.1min) fps -28%
Acemagic F2A
Intel Core Ultra 7 155H, Intel Arc 8-Core iGPU
29.5 (24.1min) fps -38%
Minisforum MS-01
Intel Core i9-13900H, Intel Iris Xe Graphics G7 96EUs
22.5 (17.3min) fps -53%
Minisforum Venus Series NAB9
Intel Core i9-12900HK, Intel Iris Xe Graphics G7 96EUs
18.2 (14.1min) fps -62%
Geekom XT12 Pro
Intel Core i9-12900H, Intel Iris Xe Graphics G7 96EUs
16.4 (13.6min) fps -66%
GMK NucBox M5
AMD Ryzen 7 5700U, AMD Radeon RX Vega 8 (Ryzen 4000/5000)
13.8 (6.57min) fps -71%
1920x1080 Medium Preset (FSR off)
BOSGAME M1
AMD Ryzen 7 7840HS, AMD Radeon 780M
37.5 (30.6min) fps
Geekom A8
AMD Ryzen 9 8945HS, AMD Radeon 780M
33.7 (28.3min) fps -10%
Average AMD Radeon 780M
  (16.3 - 37.5, n=34)
30.9 fps -18%
Minisforum Mercury Series EM780
AMD Ryzen 7 7840U, AMD Radeon 780M
29.9 (25.7min) fps -20%
Minisforum AtomMan X7 Ti
Intel Core Ultra 9 185H, Intel Arc 8-Core iGPU
27.9 (24.4min) fps -26%
Acemagic F2A
Intel Core Ultra 7 155H, Intel Arc 8-Core iGPU
24.8 (19.6min) fps -34%
Minisforum MS-01
Intel Core i9-13900H, Intel Iris Xe Graphics G7 96EUs
17.7 (14.3min) fps -53%
Minisforum Venus Series NAB9
Intel Core i9-12900HK, Intel Iris Xe Graphics G7 96EUs
14.5 (12min) fps -61%
Geekom XT12 Pro
Intel Core i9-12900H, Intel Iris Xe Graphics G7 96EUs
13.1 (11.2min) fps -65%
GMK NucBox M5
AMD Ryzen 7 5700U, AMD Radeon RX Vega 8 (Ryzen 4000/5000)
10.9 (8.08min) fps -71%
1920x1080 High Preset (FSR off)
BOSGAME M1
AMD Ryzen 7 7840HS, AMD Radeon 780M
29.6 (23.3min) fps
Average AMD Radeon 780M
  (13.8 - 29.6, n=35)
24.7 fps -17%
Minisforum AtomMan X7 Ti
Intel Core Ultra 9 185H, Intel Arc 8-Core iGPU
24 (20.6min) fps -19%
Minisforum Mercury Series EM780
AMD Ryzen 7 7840U, AMD Radeon 780M
23.6 (20.2min) fps -20%
Geekom A8
AMD Ryzen 9 8945HS, AMD Radeon 780M
22.4 (15.6min) fps -24%
Acemagic F2A
Intel Core Ultra 7 155H, Intel Arc 8-Core iGPU
20.4 (13.8min) fps -31%
Minisforum MS-01
Intel Core i9-13900H, Intel Iris Xe Graphics G7 96EUs
15 (12.4min) fps -49%
Minisforum Venus Series NAB9
Intel Core i9-12900HK, Intel Iris Xe Graphics G7 96EUs
12.2 (10.3min) fps -59%
Geekom XT12 Pro
Intel Core i9-12900H, Intel Iris Xe Graphics G7 96EUs
11.5 (10min) fps -61%
GMK NucBox M5
AMD Ryzen 7 5700U, AMD Radeon RX Vega 8 (Ryzen 4000/5000)
9.17 (6.25min) fps -69%
1920x1080 Ultra Preset (FSR off)
BOSGAME M1
AMD Ryzen 7 7840HS, AMD Radeon 780M
25.8 (19.9min) fps
Minisforum AtomMan X7 Ti
Intel Core Ultra 9 185H, Intel Arc 8-Core iGPU
21.4 (17.8min) fps -17%
Average AMD Radeon 780M
  (11.5 - 26.3, n=30)
21.3 fps -17%
Minisforum Mercury Series EM780
AMD Ryzen 7 7840U, AMD Radeon 780M
20.5 (17.2min) fps -21%
Geekom A8
AMD Ryzen 9 8945HS, AMD Radeon 780M
20.4 (14.2min) fps -21%
Acemagic F2A
Intel Core Ultra 7 155H, Intel Arc 8-Core iGPU
18.4 (12.7min) fps -29%
Minisforum MS-01
Intel Core i9-13900H, Intel Iris Xe Graphics G7 96EUs
13.1 (10.9min) fps -49%
Minisforum Venus Series NAB9
Intel Core i9-12900HK, Intel Iris Xe Graphics G7 96EUs
10.9 (9.33min) fps -58%
Baldur's Gate 3
1280x720 Low Preset
BOSGAME M1
AMD Ryzen 7 7840HS, AMD Radeon 780M
64.7 fps
Average AMD Radeon 780M
  (30.7 - 67.4, n=13)
57.1 fps -12%
GMK NucBox M5
AMD Ryzen 7 5700U, AMD Radeon RX Vega 8 (Ryzen 4000/5000)
22.5 fps -65%
1920x1080 Low Preset
BOSGAME M1
AMD Ryzen 7 7840HS, AMD Radeon 780M
43.9 fps
Average AMD Radeon 780M
  (20.2 - 43.9, n=21)
36.4 fps -17%
GMK NucBox M5
AMD Ryzen 7 5700U, AMD Radeon RX Vega 8 (Ryzen 4000/5000)
14.2 fps -68%
1920x1080 Medium Preset
BOSGAME M1
AMD Ryzen 7 7840HS, AMD Radeon 780M
36.8 fps
Average AMD Radeon 780M
  (15.7 - 36.8, n=23)
29.2 fps -21%
1920x1080 High Preset
BOSGAME M1
AMD Ryzen 7 7840HS, AMD Radeon 780M
29.9 fps
Average AMD Radeon 780M
  (13.8 - 29.9, n=23)
24.3 fps -19%
1920x1080 Ultra Preset
BOSGAME M1
AMD Ryzen 7 7840HS, AMD Radeon 780M
29.2 fps
Average AMD Radeon 780M
  (13.4 - 29.2, n=22)
23.6 fps -19%
F1 22
1280x720 Ultra Low Preset AA:T AF:16x
Minisforum Neptune Series HX90G
AMD Ryzen 9 5900HX, AMD Radeon RX 6600M
303 (215min, 193P1) fps +62%
Minisforum Neptune Series HX90G
AMD Ryzen 9 5900HX, AMD Radeon RX 6600M
299 (220min, 192P1) fps +60%
BOSGAME M1
AMD Ryzen 7 7840HS, AMD Radeon 780M
186.7 (148min, 125P1) fps
Geekom A8
AMD Ryzen 9 8945HS, AMD Radeon 780M
167.9 (135min, 113P1) fps -10%
Beelink SER7
AMD Ryzen 7 7840HS, AMD Radeon 780M
164.2 (129min, 114P1) fps -12%
Minisforum Mercury Series EM780
AMD Ryzen 7 7840U, AMD Radeon 780M
149.8 (121min, 101P1) fps -20%
Average AMD Radeon 780M
  (85.4 - 186.7, n=27)
143.5 fps -23%
Minisforum AtomMan X7 Ti
Intel Core Ultra 9 185H, Intel Arc 8-Core iGPU
136 (111min, 98P1) fps -27%
Acemagic F2A
Intel Core Ultra 7 155H, Intel Arc 8-Core iGPU
120.8 (99min, 92P1) fps -35%
Minisforum MS-01
Intel Core i9-13900H, Intel Iris Xe Graphics G7 96EUs
94.6 (75min, 75P1) fps -49%
Intel NUC 13 Pro Kit NUC13ANK
Intel Core i7-1360P, Intel Iris Xe Graphics G7 96EUs
80 (64min, 64P1) fps -57%
Minisforum Venus Series NAB9
Intel Core i9-12900HK, Intel Iris Xe Graphics G7 96EUs
76 (60min, 61P1) fps -59%
Maxtang MTN-FP750
AMD Ryzen 7 7735HS, AMD Radeon 680M
75.5 (58min, 58P1) fps -60%
Geekom XT12 Pro
Intel Core i9-12900H, Intel Iris Xe Graphics G7 96EUs
70.2 (55min, 56P1) fps -62%
GMK NucBox M5
AMD Ryzen 7 5700U, AMD Radeon RX Vega 8 (Ryzen 4000/5000)
64.5 (55min, 54P1) fps -65%
Geekom Mini IT12
Intel Core i5-12450H, Intel UHD Graphics 64EUs (Alder Lake 12th Gen)
49.8 (40min, 40P1) fps -73%
1920x1080 Low Preset AA:T AF:16x
Minisforum Neptune Series HX90G
AMD Ryzen 9 5900HX, AMD Radeon RX 6600M
240 (179min, 142P1) fps +118%
BOSGAME M1
AMD Ryzen 7 7840HS, AMD Radeon 780M
109.9 (95min, 85P1) fps
Geekom A8
AMD Ryzen 9 8945HS, AMD Radeon 780M
94.8 (66min, 55P1) fps -14%
Beelink SER7
AMD Ryzen 7 7840HS, AMD Radeon 780M
94.6 (81min, 71P1) fps -14%
Minisforum Mercury Series EM780
AMD Ryzen 7 7840U, AMD Radeon 780M
88.3 (62min, 54P1) fps -20%
Minisforum AtomMan X7 Ti
Intel Core Ultra 9 185H, Intel Arc 8-Core iGPU
84.9 (65min, 66P1) fps -23%
Average AMD Radeon 780M
  (47 - 109.9, n=33)
84.8 fps -23%
Acemagic F2A
Intel Core Ultra 7 155H, Intel Arc 8-Core iGPU
76.3 (64min, 64P1) fps -31%
Minisforum MS-01
Intel Core i9-13900H, Intel Iris Xe Graphics G7 96EUs
57.2 (47min, 47P1) fps -48%
Intel NUC 13 Pro Kit NUC13ANK
Intel Core i7-1360P, Intel Iris Xe Graphics G7 96EUs
48 (40min, 40P1) fps -56%
Maxtang MTN-FP750
AMD Ryzen 7 7735HS, AMD Radeon 680M
45.6 (37min, 29P1) fps -59%
Minisforum Venus Series NAB9
Intel Core i9-12900HK, Intel Iris Xe Graphics G7 96EUs
45.2 (37min, 36P1) fps -59%
Geekom XT12 Pro
Intel Core i9-12900H, Intel Iris Xe Graphics G7 96EUs
42.5 (35min, 34P1) fps -61%
GMK NucBox M5
AMD Ryzen 7 5700U, AMD Radeon RX Vega 8 (Ryzen 4000/5000)
35.7 (31min, 27P1) fps -68%
Geekom Mini IT12
Intel Core i5-12450H, Intel UHD Graphics 64EUs (Alder Lake 12th Gen)
27.3 (23min, 20P1) fps -75%
1920x1080 Medium Preset AA:T AF:16x
Minisforum Neptune Series HX90G
AMD Ryzen 9 5900HX, AMD Radeon RX 6600M
222 (171min, 136P1) fps +134%
BOSGAME M1
AMD Ryzen 7 7840HS, AMD Radeon 780M
95 (81min, 76P1) fps
Beelink SER7
AMD Ryzen 7 7840HS, AMD Radeon 780M
85.7 (72min, 66P1) fps -10%
Geekom A8
AMD Ryzen 9 8945HS, AMD Radeon 780M
85.4 (71min, 65P1) fps -10%
Minisforum Mercury Series EM780
AMD Ryzen 7 7840U, AMD Radeon 780M
77.3 (67min, 62P1) fps -19%
Minisforum AtomMan X7 Ti
Intel Core Ultra 9 185H, Intel Arc 8-Core iGPU
77 (68min, 64P1) fps -19%
Average AMD Radeon 780M
  (41.5 - 95, n=33)
75 fps -21%
Acemagic F2A
Intel Core Ultra 7 155H, Intel Arc 8-Core iGPU
70.8 (60min, 59P1) fps -25%
Minisforum MS-01
Intel Core i9-13900H, Intel Iris Xe Graphics G7 96EUs
52.3 (44min, 43P1) fps -45%
Intel NUC 13 Pro Kit NUC13ANK
Intel Core i7-1360P, Intel Iris Xe Graphics G7 96EUs
44.3 (36min, 36P1) fps -53%
Minisforum Venus Series NAB9
Intel Core i9-12900HK, Intel Iris Xe Graphics G7 96EUs
41.2 (35min, 34P1) fps -57%
Maxtang MTN-FP750
AMD Ryzen 7 7735HS, AMD Radeon 680M
40.6 (33min, 29P1) fps -57%
Geekom XT12 Pro
Intel Core i9-12900H, Intel Iris Xe Graphics G7 96EUs
38.4 (32min, 31P1) fps -60%
GMK NucBox M5
AMD Ryzen 7 5700U, AMD Radeon RX Vega 8 (Ryzen 4000/5000)
32.3 (28min, 25P1) fps -66%
Geekom Mini IT12
Intel Core i5-12450H, Intel UHD Graphics 64EUs (Alder Lake 12th Gen)
24.5 (19min, 18P1) fps -74%
1920x1080 High Preset AA:T AF:16x
Minisforum Neptune Series HX90G
AMD Ryzen 9 5900HX, AMD Radeon RX 6600M
167.7 (142min, 118P1) fps +138%
BOSGAME M1
AMD Ryzen 7 7840HS, AMD Radeon 780M
70.6 (60min, 59P1) fps
Beelink SER7
AMD Ryzen 7 7840HS, AMD Radeon 780M
63 (48min, 51P1) fps -11%
Geekom A8
AMD Ryzen 9 8945HS, AMD Radeon 780M
62.6 (48min, 38P1) fps -11%
Minisforum Mercury Series EM780
AMD Ryzen 7 7840U, AMD Radeon 780M
56.7 (43min, 33P1) fps -20%
Minisforum AtomMan X7 Ti
Intel Core Ultra 9 185H, Intel Arc 8-Core iGPU
55.9 (48min, 46P1) fps -21%
Average AMD Radeon 780M
  (31.7 - 70.6, n=33)
55.9 fps -21%
Acemagic F2A
Intel Core Ultra 7 155H, Intel Arc 8-Core iGPU
55 (47min, 45P1) fps -22%
Minisforum MS-01
Intel Core i9-13900H, Intel Iris Xe Graphics G7 96EUs
37.1 (32min, 29P1) fps -47%
Maxtang MTN-FP750
AMD Ryzen 7 7735HS, AMD Radeon 680M
32.1 (25min, 22P1) fps -55%
Intel NUC 13 Pro Kit NUC13ANK
Intel Core i7-1360P, Intel Iris Xe Graphics G7 96EUs
31.2 (27min, 26P1) fps -56%
Minisforum Venus Series NAB9
Intel Core i9-12900HK, Intel Iris Xe Graphics G7 96EUs
30.1 (25min, 24P1) fps -57%
Geekom XT12 Pro
Intel Core i9-12900H, Intel Iris Xe Graphics G7 96EUs
28.7 (24min, 23P1) fps -59%
GMK NucBox M5
AMD Ryzen 7 5700U, AMD Radeon RX Vega 8 (Ryzen 4000/5000)
23.8 (20min, 18P1) fps -66%
Geekom Mini IT12
Intel Core i5-12450H, Intel UHD Graphics 64EUs (Alder Lake 12th Gen)
17.5 (14min, 13P1) fps -75%
1920x1080 Ultra High Preset AA:T AF:16x
Minisforum Neptune Series HX90G
AMD Ryzen 9 5900HX, AMD Radeon RX 6600M
39.9 (30min, 30P1) fps +108%
Minisforum MS-01
Intel Core i9-13900H, Intel Iris Xe Graphics G7 96EUs
28 (23min, 21P1) fps +46%
Intel NUC 13 Pro Kit NUC13ANK
Intel Core i7-1360P, Intel Iris Xe Graphics G7 96EUs
24 fps +25%
Minisforum Venus Series NAB9
Intel Core i9-12900HK, Intel Iris Xe Graphics G7 96EUs
23.2 (20min, 18P1) fps +21%
BOSGAME M1
AMD Ryzen 7 7840HS, AMD Radeon 780M
19.2 (14min, 14P1) fps
Beelink SER7
AMD Ryzen 7 7840HS, AMD Radeon 780M
17.7 (13min, 13P1) fps -8%
GMK NucBox M5
AMD Ryzen 7 5700U, AMD Radeon RX Vega 8 (Ryzen 4000/5000)
16.8 (13min, 13P1) fps -12%
Average AMD Radeon 780M
  (9.92 - 19.2, n=25)
15.4 fps -20%
Acemagic F2A
Intel Core Ultra 7 155H, Intel Arc 8-Core iGPU
14.9 (11min, 11P1) fps -22%
Minisforum Mercury Series EM780
AMD Ryzen 7 7840U, AMD Radeon 780M
14.3 (5min, 5P1) fps -26%
Minisforum AtomMan X7 Ti
Intel Core Ultra 9 185H, Intel Arc 8-Core iGPU
14 (10min, 10P1) fps -27%
Geekom Mini IT12
Intel Core i5-12450H, Intel UHD Graphics 64EUs (Alder Lake 12th Gen)
13.5 (11min, 10P1) fps -30%
Maxtang MTN-FP750
AMD Ryzen 7 7735HS, AMD Radeon 680M
9.25 (7min, 7P1) fps -52%
Far Cry 5
1280x720 Low Preset AA:T
Minisforum Neptune Series HX90G
AMD Ryzen 9 5900HX, AMD Radeon RX 6600M
137 (108min) fps +56%
Geekom A8
AMD Ryzen 9 8945HS, AMD Radeon 780M
88 (77min) fps 0%
BOSGAME M1
AMD Ryzen 7 7840HS, AMD Radeon 780M
88 (77min) fps
Beelink SER7
AMD Ryzen 7 7840HS, AMD Radeon 780M
84 (73min) fps -5%
Minisforum AtomMan X7 Ti
Intel Core Ultra 9 185H, Intel Arc 8-Core iGPU
79 (39min) fps -10%
Minisforum MS-01
Intel Core i9-13900H, Intel Iris Xe Graphics G7 96EUs
75 (67min) fps -15%
Minisforum Mercury Series EM780
AMD Ryzen 7 7840U, AMD Radeon 780M
73 (61min) fps -17%
Average AMD Radeon 780M
  (42 - 89, n=42)
71.9 fps -18%
Acemagic F2A
Intel Core Ultra 7 155H, Intel Arc 8-Core iGPU
69 (25min) fps -22%
Geekom XT12 Pro
Intel Core i9-12900H, Intel Iris Xe Graphics G7 96EUs
50 (45min) fps -43%
Intel NUC 13 Pro Kit NUC13ANK
Intel Core i7-1360P, Intel Iris Xe Graphics G7 96EUs
46 (37min) fps -48%
Maxtang MTN-FP750
AMD Ryzen 7 7735HS, AMD Radeon 680M
46 (37min) fps -48%
GMK NucBox M5
AMD Ryzen 7 5700U, AMD Radeon RX Vega 8 (Ryzen 4000/5000)
42 (36min) fps -52%
Geekom Mini IT12
Intel Core i5-12450H, Intel UHD Graphics 64EUs (Alder Lake 12th Gen)
36 (32min) fps -59%
BOSGAME N95
Intel Processor N95, Intel UHD Graphics 24EUs (Alder Lake-N)
14 (11min) fps -84%
1920x1080 Medium Preset AA:T
Minisforum Neptune Series HX90G
AMD Ryzen 9 5900HX, AMD Radeon RX 6600M
122 (97min) fps +126%
BOSGAME M1
AMD Ryzen 7 7840HS, AMD Radeon 780M
54 (48min) fps
Beelink SER7
AMD Ryzen 7 7840HS, AMD Radeon 780M
50 (45min) fps -7%
Geekom A8
AMD Ryzen 9 8945HS, AMD Radeon 780M
49 (44min) fps -9%
Minisforum Mercury Series EM780
AMD Ryzen 7 7840U, AMD Radeon 780M
46 (41min) fps -15%
Minisforum AtomMan X7 Ti
Intel Core Ultra 9 185H, Intel Arc 8-Core iGPU
45 (40min) fps -17%
Average AMD Radeon 780M
  (22 - 54, n=44)
42.3 fps -22%
Acemagic F2A
Intel Core Ultra 7 155H, Intel Arc 8-Core iGPU
40 (36min) fps -26%
Minisforum MS-01
Intel Core i9-13900H, Intel Iris Xe Graphics G7 96EUs
39 (33min) fps -28%
Intel NUC 13 Pro Kit NUC13ANK
Intel Core i7-1360P, Intel Iris Xe Graphics G7 96EUs
26 (24min) fps -52%
Geekom XT12 Pro
Intel Core i9-12900H, Intel Iris Xe Graphics G7 96EUs
26 (23min) fps -52%
Maxtang MTN-FP750
AMD Ryzen 7 7735HS, AMD Radeon 680M
25 (22min) fps -54%
GMK NucBox M5
AMD Ryzen 7 5700U, AMD Radeon RX Vega 8 (Ryzen 4000/5000)
20 (17min) fps -63%
Geekom Mini IT12
Intel Core i5-12450H, Intel UHD Graphics 64EUs (Alder Lake 12th Gen)
17 (15min) fps -69%
1920x1080 High Preset AA:T
Minisforum Neptune Series HX90G
AMD Ryzen 9 5900HX, AMD Radeon RX 6600M
116 (92min) fps +137%
BOSGAME M1
AMD Ryzen 7 7840HS, AMD Radeon 780M
49 (43min) fps
Beelink SER7
AMD Ryzen 7 7840HS, AMD Radeon 780M
46 (41min) fps -6%
Minisforum Mercury Series EM780
AMD Ryzen 7 7840U, AMD Radeon 780M
42 (38min) fps -14%
Minisforum AtomMan X7 Ti
Intel Core Ultra 9 185H, Intel Arc 8-Core iGPU
42 (34min) fps -14%
Geekom A8
AMD Ryzen 9 8945HS, AMD Radeon 780M
42 (33min) fps -14%
Average AMD Radeon 780M
  (21 - 49, n=44)
39 fps -20%
Acemagic F2A
Intel Core Ultra 7 155H, Intel Arc 8-Core iGPU
37 (30min) fps -24%
Minisforum MS-01
Intel Core i9-13900H, Intel Iris Xe Graphics G7 96EUs
35 (31min) fps -29%
Intel NUC 13 Pro Kit NUC13ANK
Intel Core i7-1360P, Intel Iris Xe Graphics G7 96EUs
25 (22min) fps -49%
Geekom XT12 Pro
Intel Core i9-12900H, Intel Iris Xe Graphics G7 96EUs
23 (21min) fps -53%
Maxtang MTN-FP750
AMD Ryzen 7 7735HS, AMD Radeon 680M
22 (19min) fps -55%
GMK NucBox M5
AMD Ryzen 7 5700U, AMD Radeon RX Vega 8 (Ryzen 4000/5000)
19 (16min) fps -61%
Geekom Mini IT12
Intel Core i5-12450H, Intel UHD Graphics 64EUs (Alder Lake 12th Gen)
16 (14min) fps -67%
1920x1080 Ultra Preset AA:T
Minisforum Neptune Series HX90G
AMD Ryzen 9 5900HX, AMD Radeon RX 6600M
110 (87min) fps +134%
BOSGAME M1
AMD Ryzen 7 7840HS, AMD Radeon 780M
47 (41min) fps
Beelink SER7
AMD Ryzen 7 7840HS, AMD Radeon 780M
44 (39min) fps -6%
Geekom A8
AMD Ryzen 9 8945HS, AMD Radeon 780M
41 (33min) fps -13%
Minisforum Mercury Series EM780
AMD Ryzen 7 7840U, AMD Radeon 780M
40 (35min) fps -15%
Minisforum AtomMan X7 Ti
Intel Core Ultra 9 185H, Intel Arc 8-Core iGPU
39 (31min) fps -17%
Average AMD Radeon 780M
  (21 - 47, n=44)
37 fps -21%
Acemagic F2A
Intel Core Ultra 7 155H, Intel Arc 8-Core iGPU
35 (31min) fps -26%
Minisforum MS-01
Intel Core i9-13900H, Intel Iris Xe Graphics G7 96EUs
33 (29min) fps -30%
Intel NUC 13 Pro Kit NUC13ANK
Intel Core i7-1360P, Intel Iris Xe Graphics G7 96EUs
23 (21min) fps -51%
Geekom XT12 Pro
Intel Core i9-12900H, Intel Iris Xe Graphics G7 96EUs
22 (20min) fps -53%
Maxtang MTN-FP750
AMD Ryzen 7 7735HS, AMD Radeon 680M
21 (17min) fps -55%
GMK NucBox M5
AMD Ryzen 7 5700U, AMD Radeon RX Vega 8 (Ryzen 4000/5000)
17 (15min) fps -64%
Geekom Mini IT12
Intel Core i5-12450H, Intel UHD Graphics 64EUs (Alder Lake 12th Gen)
15 (13min) fps -68%
Strange Brigade
1280x720 lowest AF:1
Minisforum Neptune Series HX90G
AMD Ryzen 9 5900HX, AMD Radeon RX 6600M
447 (227min, 334P1) fps +154%
BOSGAME M1
AMD Ryzen 7 7840HS, AMD Radeon 780M
175.9 (26.4min, 151.8P1) fps
Beelink SER7
AMD Ryzen 7 7840HS, AMD Radeon 780M
163.2 (109.1min, 139.7P1) fps -7%
Average AMD Radeon 780M
  (74.1 - 175.9, n=48)
149.5 fps -15%
Minisforum Mercury Series EM780
AMD Ryzen 7 7840U, AMD Radeon 780M
147.5 (90.4min, 123.9P1) fps -16%
Acemagic F2A
Intel Core Ultra 7 155H, Intel Arc 8-Core iGPU
147.3 (40.8min, 112.7P1) fps -16%
Beelink GTR6
AMD Ryzen 9 6900HX, AMD Radeon 680M
142.4 (86.5min, 118P1) fps -19%
Minisforum AtomMan X7 Ti
Intel Core Ultra 9 185H, Intel Arc 8-Core iGPU
124.9 (5min, 56.5P1) fps -29%
Minisforum MS-01
Intel Core i9-13900H, Intel Iris Xe Graphics G7 96EUs
115.1 (18.8min, 49.7P1) fps -35%
Intel NUC 13 Pro Kit NUC13ANK
Intel Core i7-1360P, Intel Iris Xe Graphics G7 96EUs
95.4 (19.5min, 37.2P1) fps -46%
Minisforum Venus Series NAB9
Intel Core i9-12900HK, Intel Iris Xe Graphics G7 96EUs
92.3 (16.8min, 31.7P1) fps -48%
Geekom XT12 Pro
Intel Core i9-12900H, Intel Iris Xe Graphics G7 96EUs
81.7 (11.6min, 25.7P1) fps -54%
GMK NucBox M5
AMD Ryzen 7 5700U, AMD Radeon RX Vega 8 (Ryzen 4000/5000)
79.8 (20.7min, 69.9P1) fps -55%
Maxtang MTN-FP750
AMD Ryzen 7 7735HS, AMD Radeon 680M
78.4 (57.8min, 65.5P1) fps -55%
Geekom A8
AMD Ryzen 9 8945HS, AMD Radeon 780M
74.1 (35.8min, 62.6P1) fps -58%
Geekom Mini IT12
Intel Core i5-12450H, Intel UHD Graphics 64EUs (Alder Lake 12th Gen)
63.4 (14.3min, 18.6P1) fps -64%
BOSGAME N95
Intel Processor N95, Intel UHD Graphics 24EUs (Alder Lake-N)
27.9 (6min, 7.32P1) fps -84%
1920x1080 medium AA:medium AF:4
Minisforum Neptune Series HX90G
AMD Ryzen 9 5900HX, AMD Radeon RX 6600M
216 (163.8min, 183.9P1) fps +205%
BOSGAME M1
AMD Ryzen 7 7840HS, AMD Radeon 780M
70.9 (5min, 61.9P1) fps
Minisforum AtomMan X7 Ti
Intel Core Ultra 9 185H, Intel Arc 8-Core iGPU
67.8 (51.1min, 59.2P1) fps -4%
Geekom A8
AMD Ryzen 9 8945HS, AMD Radeon 780M
66.9 (26.4min, 57.6P1) fps -6%
Beelink SER7
AMD Ryzen 7 7840HS, AMD Radeon 780M
65.6 (52.2min, 57P1) fps -7%
Average AMD Radeon 780M
  (31.7 - 70.9, n=49)
62.5 fps -12%
Acemagic F2A
Intel Core Ultra 7 155H, Intel Arc 8-Core iGPU
61.9 (7.4min, 53.4P1) fps -13%
Minisforum Mercury Series EM780
AMD Ryzen 7 7840U, AMD Radeon 780M
61 (45min, 52.7P1) fps -14%
Beelink GTR6
AMD Ryzen 9 6900HX, AMD Radeon 680M
57.4 (43.4min, 51P1) fps -19%
Minisforum MS-01
Intel Core i9-13900H, Intel Iris Xe Graphics G7 96EUs
51.4 (12.7min, 31.6P1) fps -28%
Minisforum Venus Series NAB9
Intel Core i9-12900HK, Intel Iris Xe Graphics G7 96EUs
39.5 (14.3min, 21.5P1) fps -44%
Geekom XT12 Pro
Intel Core i9-12900H, Intel Iris Xe Graphics G7 96EUs
37.9 (9.5min, 21.1P1) fps -47%
Intel NUC 13 Pro Kit NUC13ANK
Intel Core i7-1360P, Intel Iris Xe Graphics G7 96EUs
37.3 (12min, 16.1P1) fps -47%
GMK NucBox M5
AMD Ryzen 7 5700U, AMD Radeon RX Vega 8 (Ryzen 4000/5000)
32.4 (15.3min, 28.3P1) fps -54%
Maxtang MTN-FP750
AMD Ryzen 7 7735HS, AMD Radeon 680M
31.4 (26.4min, 27.4P1) fps -56%
Geekom Mini IT12
Intel Core i5-12450H, Intel UHD Graphics 64EUs (Alder Lake 12th Gen)
25.1 (7.6min, 11.4P1) fps -65%
BOSGAME N95
Intel Processor N95, Intel UHD Graphics 24EUs (Alder Lake-N)
10.2 (5min, 5P1) fps -86%
1920x1080 high AA:high AF:8
Minisforum Neptune Series HX90G
AMD Ryzen 9 5900HX, AMD Radeon RX 6600M
174.1 (119.5min, 125.7P1) fps +187%
BOSGAME M1
AMD Ryzen 7 7840HS, AMD Radeon 780M
60.6 (32.5min, 47.4P1) fps
Minisforum AtomMan X7 Ti
Intel Core Ultra 9 185H, Intel Arc 8-Core iGPU
57.2 (43.9min, 47P1) fps -6%
Geekom A8
AMD Ryzen 9 8945HS, AMD Radeon 780M
56.9 (26.1min, 43.8P1) fps -6%
Beelink SER7
AMD Ryzen 7 7840HS, AMD Radeon 780M
55.6 (39.2min, 42.9P1) fps -8%
Acemagic F2A
Intel Core Ultra 7 155H, Intel Arc 8-Core iGPU
53.3 (25.6min, 41.4P1) fps -12%
Average AMD Radeon 780M
  (27.3 - 60.6, n=49)
52.7 fps -13%
Minisforum Mercury Series EM780
AMD Ryzen 7 7840U, AMD Radeon 780M
51.9 (34.5min, 40.5P1) fps -14%
Beelink GTR6
AMD Ryzen 9 6900HX, AMD Radeon 680M
48.5 (35.1min, 38.2P1) fps -20%
Minisforum MS-01
Intel Core i9-13900H, Intel Iris Xe Graphics G7 96EUs
39.8 (10min, 20.4P1) fps -34%
Minisforum Venus Series NAB9
Intel Core i9-12900HK, Intel Iris Xe Graphics G7 96EUs
32.2 (8.9min, 14.3P1) fps -47%
Intel NUC 13 Pro Kit NUC13ANK
Intel Core i7-1360P, Intel Iris Xe Graphics G7 96EUs
31 (8.5min, 12P1) fps -49%
Geekom XT12 Pro
Intel Core i9-12900H, Intel Iris Xe Graphics G7 96EUs
30.9 (7.3min, 14.6P1) fps -49%
GMK NucBox M5
AMD Ryzen 7 5700U, AMD Radeon RX Vega 8 (Ryzen 4000/5000)
26.8 (14.8min, 19.1P1) fps -56%
Maxtang MTN-FP750
AMD Ryzen 7 7735HS, AMD Radeon 680M
26.7 (16.9min, 20.7P1) fps -56%
Geekom Mini IT12
Intel Core i5-12450H, Intel UHD Graphics 64EUs (Alder Lake 12th Gen)
19.9 (5.1min, 6.2P1) fps -67%
BOSGAME N95
Intel Processor N95, Intel UHD Graphics 24EUs (Alder Lake-N)
9.9 (5min, 5P1) fps -84%
1920x1080 ultra AA:ultra AF:16
Minisforum Neptune Series HX90G
AMD Ryzen 9 5900HX, AMD Radeon RX 6600M
151.8 (107min, 110.3P1) fps +191%
BOSGAME M1
AMD Ryzen 7 7840HS, AMD Radeon 780M
52.1 (5.2min, 33.8P1) fps
Geekom A8
AMD Ryzen 9 8945HS, AMD Radeon 780M
49.2 (21.9min, 29.5P1) fps -6%
Beelink SER7
AMD Ryzen 7 7840HS, AMD Radeon 780M
48.2 (23.8min, 32P1) fps -7%
Minisforum AtomMan X7 Ti
Intel Core Ultra 9 185H, Intel Arc 8-Core iGPU
46.7 (6.9min, 17.1P1) fps -10%
Average AMD Radeon 780M
  (23.5 - 52.1, n=50)
45 fps -14%
Minisforum Mercury Series EM780
AMD Ryzen 7 7840U, AMD Radeon 780M
44 (25.7min, 34P1) fps -16%
Acemagic F2A
Intel Core Ultra 7 155H, Intel Arc 8-Core iGPU
43.8 (23.2min, 25.6P1) fps -16%
Beelink GTR6
AMD Ryzen 9 6900HX, AMD Radeon 680M
41.6 (26.5min, 33P1) fps -20%
Minisforum MS-01
Intel Core i9-13900H, Intel Iris Xe Graphics G7 96EUs
31.7 (5.9min, 8.04P1) fps -39%
Minisforum Venus Series NAB9
Intel Core i9-12900HK, Intel Iris Xe Graphics G7 96EUs
25.8 (5.1min, 7.06P1) fps -50%
Intel NUC 13 Pro Kit NUC13ANK
Intel Core i7-1360P, Intel Iris Xe Graphics G7 96EUs
25.2 (5.1min, 6.91P1) fps -52%
Geekom XT12 Pro
Intel Core i9-12900H, Intel Iris Xe Graphics G7 96EUs
24.8 (5min, 6.77P1) fps -52%
Maxtang MTN-FP750
AMD Ryzen 7 7735HS, AMD Radeon 680M
23.1 (5.3min, 7.5P1) fps -56%
GMK NucBox M5
AMD Ryzen 7 5700U, AMD Radeon RX Vega 8 (Ryzen 4000/5000)
22.7 (11.3min, 12.5P1) fps -56%
Geekom Mini IT12
Intel Core i5-12450H, Intel UHD Graphics 64EUs (Alder Lake 12th Gen)
16.8 (5min, 5P1) fps -68%

Witcher 3 FPS Chart

05101520253035404550Tooltip
BOSGAME M1: Ø51.5 (48-55)
baixomédiaaltoultra
The Witcher 3 (2015) 160.7 103.8 52.2 33.3
Dota 2 Reborn (2015) 159.5 126.5 98.8 88.5
Final Fantasy XV Benchmark (2018) 84.5 40.9 30.8
X-Plane 11.11 (2018) 64.2 46.3 38.7
Far Cry 5 (2018) 88 54 49 47
Strange Brigade (2018) 175.9 70.9 60.6 52.1
Tiny Tina's Wonderlands (2022) 77.7 55.9 37.9 30.3
F1 22 (2022) 109.9 95 70.6 19.2
Baldur's Gate 3 (2023) 43.9 36.8 29.9 29.2
Cyberpunk 2077 2.1 Phantom Liberty (2023) 47.9 37.5 29.6 25.8

Emissões

Ruído do sistema - audível, mas não excessivamente alto

O modelo integra duas ventoinhas, uma na parte superior da placa-mãe e outra na parte inferior. As ventoinhas estão sempre ativas, independentemente da carga na tela, com um zumbido baixo de 32 dB(A) ao executar cargas pouco exigentes, como navegação ou streaming de vídeo. Isso é típico da maioria dos minicomputadores e ficamos satisfeitos em ver que as ventoinhas do M1 são geralmente letárgicas, sem nenhum comportamento irritante de pulsação.

O ruído da ventoinha durante a execução de cargas mais altas, como jogos, induzirá um ruído constante de 42 dB(A). Isso é mais silencioso do que no GMK NucBox K6 e do Beelink SER7, todos com a mesma CPU Ryzen 7 7840HS. Não achamos que o ruído da ventoinha seja alto o suficiente para incomodar, especialmente porque é mais provável que os usuários se sentem mais longe de seus minicomputadores do que de seus laptops.

Perfil de ruído do ventilador (Branco: Fundo, vermelho: Sistema ocioso, Azul: 3DMark 06, Laranja: Witcher 3, Verde: Prime95+FurMark stress)

Barulho

Ocioso
32 / 32 / 32 dB
Carga
38.7 / 42 dB
  red to green bar
 
 
30 dB
silencioso
40 dB(A)
audível
50 dB(A)
ruidosamente alto
 
min: dark, med: mid, max: light   Earthworks M23R, Arta (15 cm de distância)   environment noise: 23.2 dB(A)
dB(A) 0102030405060708090Deep BassMiddle BassHigh BassLower RangeMidsHigher MidsLower HighsMid HighsUpper HighsSuper Highs203438.333.137.232.525242623.422.724.63124.225.722.321.123.74020.324.123.518.120.15021.924.623.521.821.3632226.925.82422.18023.925.522.821.126.110022.124.120.718.5231252326.422.617.523.61602630.119.213.726.320026.326.623.31426.425025.624.722.514.72631530.727.727.416.629.640030.726.422.513.530.850028.226.924.21228.863028.926.821.910.628.980029.126.420.911.729.7100030.627.721.69.730.8125030.427.721.79.630.7160033.429.721.39.733.9200032.529.617.910.232.7250033.729.819.910.533.9315029.326.72110.629.4400025.223.2151125.4500023.121.215.811.123.3630018.416.515.511.518.2800014.614.212.511.614.21000014.215.212.411.713.21250014.215.312.811.412.91600012.613.711.810.611.7SPL41.738.73223.242N3.52.91.60.53.6median 26.3median 26.4median 20.9median 11.5median 26.4Delta5.63.73.51.55.7hearing rangehide median Fan NoiseBOSGAME M1
BOSGAME M1
Radeon 780M, R7 7840HS
GMK NucBox M5
Vega 8, R7 5700U, Lexar 1024GB LNM6A1X001T-HNNNG
GMK NucBox K6
Radeon 780M, R7 7840HS, MasonSemi 1TB MC7000
Intel NUC 13 Pro Kit NUC13ANK
Iris Xe G7 96EUs, i7-1360P, Samsung PM9A1 MZVL2512HCJQ
Beelink SER7
Radeon 780M, R7 7840HS, Crucial P3 Plus CT1000P3PSSD8
Beelink GTR6
Radeon 680M, R9 6900HX, Kingston KC3000 512G SKC3000S512G
Noise
2%
-6%
-3%
11%
5%
off / environment *
23.2
23.4
-1%
23.2
-0%
29.8
-28%
24.5
-6%
23.2
-0%
Idle Minimum *
32
33.8
-6%
31.3
2%
30.2
6%
25.1
22%
23.6
26%
Idle Average *
32
33.8
-6%
31.3
2%
31.1
3%
25.1
22%
23.8
26%
Idle Maximum *
32
33.8
-6%
33.4
-4%
31.9
-0%
25.1
22%
36.2
-13%
Load Average *
38.7
36.5
6%
47.5
-23%
40
-3%
35.9
7%
39.7
-3%
Witcher 3 ultra *
41.7
36.8
12%
43.6
-5%
35.6
15%
41
2%
Load Maximum *
42
36.9
12%
47.7
-14%
40.5
4%
45.4
-8%
43
-2%

* ... smaller is better

Temperatura

O adaptador CA pode atingir mais de 41 °C ao operar cargas exigentes por longos períodos

As temperaturas da superfície são mais quentes na parte frontal e traseira da unidade, como mostram os mapas de temperatura abaixo. O ar fresco é puxado pela parte superior, enquanto o calor residual passa pela parte traseira. Portanto, não é recomendável colocar itens na parte superior da unidade, pois o fluxo de ar será impedido.

O design do GMK NucBox K6 é indiscutivelmente mais fácil de usar quando se trata de controle de temperatura. Em vez de puxar o ar pela superfície superior, o sistema GMK puxa o ar por fendas ao longo das laterais. Esse método permite maior liberdade de posicionamento em comparação com o design Bosgame M1.

Sistema inativo (frente)
Sistema ocioso (traseiro)
Estresse do Prime95+FurMark (frente)
Estresse do Prime95+FurMark (traseiro)

Alto-falantes

Os alto-falantes estéreo integrados de 26 mm ajudam a distinguir o M1 da maioria dos outros mini PCs. Se o seu espaço for limitado ou minimalista, por exemplo, o senhor pode simplesmente usar os alto-falantes integrados em vez de depender de soluções externas.

Infelizmente, os alto-falantes integrados são mais uma solução "plano B" devido à qualidade de áudio média, ao volume médio e ao pequeno atraso de áudio. Eles precisam ser emparelhados com o Windows via Bluetooth e podemos notar um atraso de meio segundo quando comparados aos alto-falantes externos de 3,5 mm. Esse atraso pode ser ignorado na reprodução de música e de vídeos mais casuais, mas certamente podemos notá-lo ao executar jogos ou assistir a vídeos em que as vozes não se sincronizam perfeitamente.

Enquanto isso, a qualidade e o volume do áudio não são nada de especial. Alguns notebooks, como o HP Spectre x360 16, têm alto-falantes integrados mais altos e mais nítidos do que o Bosgame M1. Os alto-falantes do M1 são decentes o suficiente para escritórios ou salas de conferência, mas não têm a potência necessária para ambientes HTPC de sala de estar.

O ruído rosa mostra apenas um volume máximo decente com equilíbrio de frequência ruim
dB(A) 0102030405060708090Deep BassMiddle BassHigh BassLower RangeMidsHigher MidsLower HighsMid HighsUpper HighsSuper Highs2034.933.134.92523.923.423.93122.822.322.84021.523.521.55023.323.523.36330.325.830.38037.522.837.510042.720.742.712546.322.646.316049.919.249.92005323.35325056.622.556.631561.927.461.940067.622.567.650070.424.270.463074.221.974.280075.620.975.610007421.674125073.221.773.2160071.421.371.4200070.717.970.7250068.619.968.6315068.82168.8400066.81566.8500065.315.865.3630064.215.564.2800060.712.560.71000056.812.456.81250052.612.852.61600039.311.839.3SPL82.43282.4N53.51.653.5median 65.3median 20.9median 65.3Delta8.43.58.426.325.821.422.12624.925.127.622.532.523.448.72655.818.860.922.167.2267019.372.317.674.217.774.319.575.31571.711.871.311.27410.574.21072.710.17210.67210.97511.374.811.671.71269.71269.612.371.112.669.61270.111.269.824.784.70.666.6median 12median 71.73.42.2hearing rangehide median Pink NoiseBOSGAME M1Apple MacBook Pro 16 2021 M1 Pro
Frequency diagram (checkboxes can be checked and unchecked to compare devices)
BOSGAME M1 audio analysis

(+) | speakers can play relatively loud (82.4 dB)
Bass 100 - 315 Hz
(±) | reduced bass - on average 13.6% lower than median
(±) | linearity of bass is average (9.2% delta to prev. frequency)
Mids 400 - 2000 Hz
(±) | higher mids - on average 6.8% higher than median
(+) | mids are linear (5.2% delta to prev. frequency)
Highs 2 - 16 kHz
(+) | balanced highs - only 3.2% away from median
(+) | highs are linear (4.6% delta to prev. frequency)
Overall 100 - 16.000 Hz
(±) | linearity of overall sound is average (20.4% difference to median)
Compared to same class
» 29% of all tested devices in this class were better, 14% similar, 57% worse
» The best had a delta of 14%, average was 25%, worst was 40%
Compared to all devices tested
» 50% of all tested devices were better, 8% similar, 42% worse
» The best had a delta of 4%, average was 25%, worst was 134%

Apple MacBook Pro 16 2021 M1 Pro audio analysis

(+) | speakers can play relatively loud (84.7 dB)
Bass 100 - 315 Hz
(+) | good bass - only 3.8% away from median
(+) | bass is linear (5.2% delta to prev. frequency)
Mids 400 - 2000 Hz
(+) | balanced mids - only 1.3% away from median
(+) | mids are linear (2.1% delta to prev. frequency)
Highs 2 - 16 kHz
(+) | balanced highs - only 1.9% away from median
(+) | highs are linear (2.7% delta to prev. frequency)
Overall 100 - 16.000 Hz
(+) | overall sound is linear (4.6% difference to median)
Compared to same class
» 0% of all tested devices in this class were better, 0% similar, 100% worse
» The best had a delta of 5%, average was 18%, worst was 45%
Compared to all devices tested
» 0% of all tested devices were better, 0% similar, 100% worse
» The best had a delta of 4%, average was 25%, worst was 134%

Gerenciamento de energia

Consumo de energia

Em marcha lenta no desktop, consome menos de 9 W em média, sendo um pouco mais eficiente do que o Beelink SER7 e o GMK NucBox K6 em apenas alguns watts. Ao executar jogos, no entanto, o Bosgame exigirá alguns watts a mais em média, provavelmente devido à sua Radeon 780M com clock mais alto mencionada anteriormente.

Conseguimos registrar um consumo máximo de 99 W do adaptador CA de 120 W de tamanho médio (~13,9 x 6,3 x 3,5 cm) quando a CPU está com 100% de utilização. A sobrecarga pode ser útil ao conectar dispositivos ou unidades USB externas.

Witcher 3 ultra consumo de 1080p
consumo do 3DMark 06
Prime95+FurMark estresse iniciado aos 10s
O consumo chegava a 100 W por cerca de 10 segundos ao iniciar o estresse Prime95, antes de cair e se estabilizar em 85 W
Consumo de energia
desligadodarklight 1.1 / 1.4 Watt
Ociosodarkmidlight 7.3 / 7.3 / 8.4 Watt
Carga midlight 72.7 / 99.1 Watt
 color bar
Key: min: dark, med: mid, max: light        Metrahit Energy
BOSGAME M1
R7 7840HS, Radeon 780M, , , x,
GMK NucBox M5
R7 5700U, Vega 8, Lexar 1024GB LNM6A1X001T-HNNNG, , x,
GMK NucBox K6
R7 7840HS, Radeon 780M, MasonSemi 1TB MC7000, , x,
Intel NUC 13 Pro Kit NUC13ANK
i7-1360P, Iris Xe G7 96EUs, Samsung PM9A1 MZVL2512HCJQ, , x,
Beelink SER7
R7 7840HS, Radeon 780M, Crucial P3 Plus CT1000P3PSSD8, , x,
Beelink GTR6
R9 6900HX, Radeon 680M, Kingston KC3000 512G SKC3000S512G, , x,
Power Consumption
43%
7%
5%
-1%
-4%
Idle Minimum *
7.3
5.9
19%
6.7
8%
5.1
30%
6.7
8%
7.6
-4%
Idle Average *
7.3
6.2
15%
7
4%
5.8
21%
7.3
-0%
9.9
-36%
Idle Maximum *
8.4
6.4
24%
7.6
10%
10.2
-21%
11.6
-38%
10.6
-26%
Load Average *
72.7
28.2
61%
74.3
-2%
68.1
6%
64.1
12%
64
12%
Witcher 3 ultra *
80.5
27.5
66%
75
7%
75.8
6%
69
14%
Load Maximum *
99.1
29.5
70%
85.7
14%
108.3
-9%
94.8
4%
80.4
19%

* ... smaller is better

Power Consumption Witcher 3 / Stresstest

0102030405060708090100110Tooltip
BOSGAME M1 R7 7840HS, Radeon 780M; Witcher 3 ultra: Ø80.5 (77.7-83.1)
Beelink GTR7 7840HS R7 7840HS, Radeon 780M; Witcher 3 ultra: Ø79.8 (75.2-83.2)
BOSGAME M1 R7 7840HS, Radeon 780M; 1280x720 Prime95 28.10 and Furmark 1.25: Ø85.4 (84.2-99.1)
Beelink GTR7 7840HS R7 7840HS, Radeon 780M; 1280x720 Prime95 28.10 and Furmark 1.25: Ø109.3 (104-111.7)

Power Consumption external Monitor

0102030405060708090100Tooltip
BOSGAME M1 R7 7840HS, Radeon 780M; Prime95 V2810 Stress (external Monitor): Ø85.9 (84.5-100.1)
Beelink GTR7 7840HS R7 7840HS, Radeon 780M; Prime95 V2810 Stress (external Monitor): Ø77 (52.5-101.5)
BOSGAME M1 R7 7840HS, Radeon 780M; Cinebench R15 Multi (external Monitor): Ø85.7 (77.6-92.1)
Beelink GTR7 7840HS R7 7840HS, Radeon 780M; Cinebench R15 Multi (external Monitor): Ø97.1 (95.3-98.6)
BOSGAME M1 R7 7840HS, Radeon 780M; 1280x720 FurMark 1.19 GPU Stress Test (external Monitor): Ø84.3 (82.7-87)
Beelink GTR7 7840HS R7 7840HS, Radeon 780M; 1280x720 FurMark 1.19 GPU Stress Test (external Monitor): Ø73.7 (69.9-85.6)
BOSGAME M1 R7 7840HS, Radeon 780M; 1920x1080 The Witcher 3 ultra (external Monitor): Ø80.5 (77.7-83.1)
Beelink GTR7 7840HS R7 7840HS, Radeon 780M; 1920x1080 The Witcher 3 ultra (external Monitor): Ø79.8 (75.2-83.2)
BOSGAME M1 R7 7840HS, Radeon 780M; Idle 1min (external Monitor): Ø8.07 (7.06-17.7)
Beelink GTR7 7840HS R7 7840HS, Radeon 780M; Idle 1min (external Monitor): Ø6.19 (5.69-7.54)

Pro

+ suporta 2x SODIMM + 2x SSDs M.2 2280
+ desempenho gráfico acima da média
+ duas portas USB-C 4.0
+ alto-falantes integrados
+ preço razoável
+ design todo em metal

Contra

- um pouco maior e mais pesado do que muitos outros mini PCs
- queda de quadros durante a reprodução de vídeos em 4K60
- os alto-falantes integrados têm uma leve latência
- grande fonte de alimentação externa
- sem opções de barebone
- sem NPU integrada

Veredicto - Ótima opção mesmo sem os alto-falantes integrados

Em análise: Bosgame M1

Os alto-falantes estéreo integrados são um ponto de venda exclusivo do Bosgame M1. Embora possam ser úteis quando não há opções externas disponíveis, a qualidade do áudio deixa muito a desejar para outros fins além do escritório ou da sala de conferência. Ainda é melhor usar alto-falantes externos para reprodução de multimídia ou se estiver em uma sala maior.

Felizmente, o M1 é excelente em todos os outros aspectos. O chassi todo em metal é de alta qualidade, a conectividade é excelente com várias portas USB-C 4.0, a manutenção é relativamente fácil e o desempenho é mais rápido do que o esperado. Os jogadores casuais vão adorar o fato de que ele pode executar a maioria dos jogos em 1080p, enquanto os jogadores hardcore podem apreciar o suporte à eGPU. O preço de menos de US$ 700 também é bastante razoável, considerando que ele vem totalmente equipado com 32 GB de RAM, 1 TB de armazenamento e uma licença do Windows 11 Pro. Uma opção barebones teria tornado o M1 ainda mais barato e competitivo em relação a muitas Alternativas do Beelink.

O Bosgame M1 é uma alternativa sólida ao NUC com níveis de desempenho que rivalizam com as opções de ponta baseadas em Intel. Ele é um pouco maior e mais pesado do que a maioria, mas o desempenho e a qualidade mais do que compensam o tamanho maior.

As principais desvantagens, além dos alto-falantes pouco impressionantes, são o tamanho um pouco maior do chassi, o adaptador CA de 120 W volumoso e alguns quadros perdidos durante a reprodução de vídeo 4K60. No entanto, todos eles são relativamente pequenos e não prejudicam o valor geral ou a qualidade de construção do modelo.

Preço e disponibilidade

O Bosgame M1 já está disponível na Amazon por US$ 690 com 32 GB de RAM, 1 TB SSD e Windows 11 Pro, conforme analisado. Como alternativa, os usuários podem comprar o diretamente do fabricante pelo mesmo preço.

BOSGAME M1 - 05/25/2024 v7 (old)
Allen Ngo

Acabamento
75 / 98 → 76%
Conectividade
64 / 81 → 80%
Peso
79%
Desempenho do jogos
82%
Desempenho da aplicação
97%
Ruído
80%
Audio
81%
Médio
80%
85%
Mini PC - Médio equilibrado

Transparency

The selection of devices to be reviewed is made by our editorial team. The test sample was provided to the author as a loan by the manufacturer or retailer for the purpose of this review. The lender had no influence on this review, nor did the manufacturer receive a copy of this review before publication. There was no obligation to publish this review. We never accept compensation or payment in return for our reviews. As an independent media company, Notebookcheck is not subjected to the authority of manufacturers, retailers or publishers.

This is how Notebookcheck is testing

Every year, Notebookcheck independently reviews hundreds of laptops and smartphones using standardized procedures to ensure that all results are comparable. We have continuously developed our test methods for around 20 years and set industry standards in the process. In our test labs, high-quality measuring equipment is utilized by experienced technicians and editors. These tests involve a multi-stage validation process. Our complex rating system is based on hundreds of well-founded measurements and benchmarks, which maintains objectivity. Further information on our test methods can be found here.

Price comparison

Please share our article, every link counts!
Mail Logo
> Análises e revisões de portáteis e celulares > Análises > Análises > Análise do mini PC BOSGAME M1: O Ryzen 7 7840HS ainda é uma fera
Allen Ngo, 2024-05-27 (Update: 2024-05-27)