

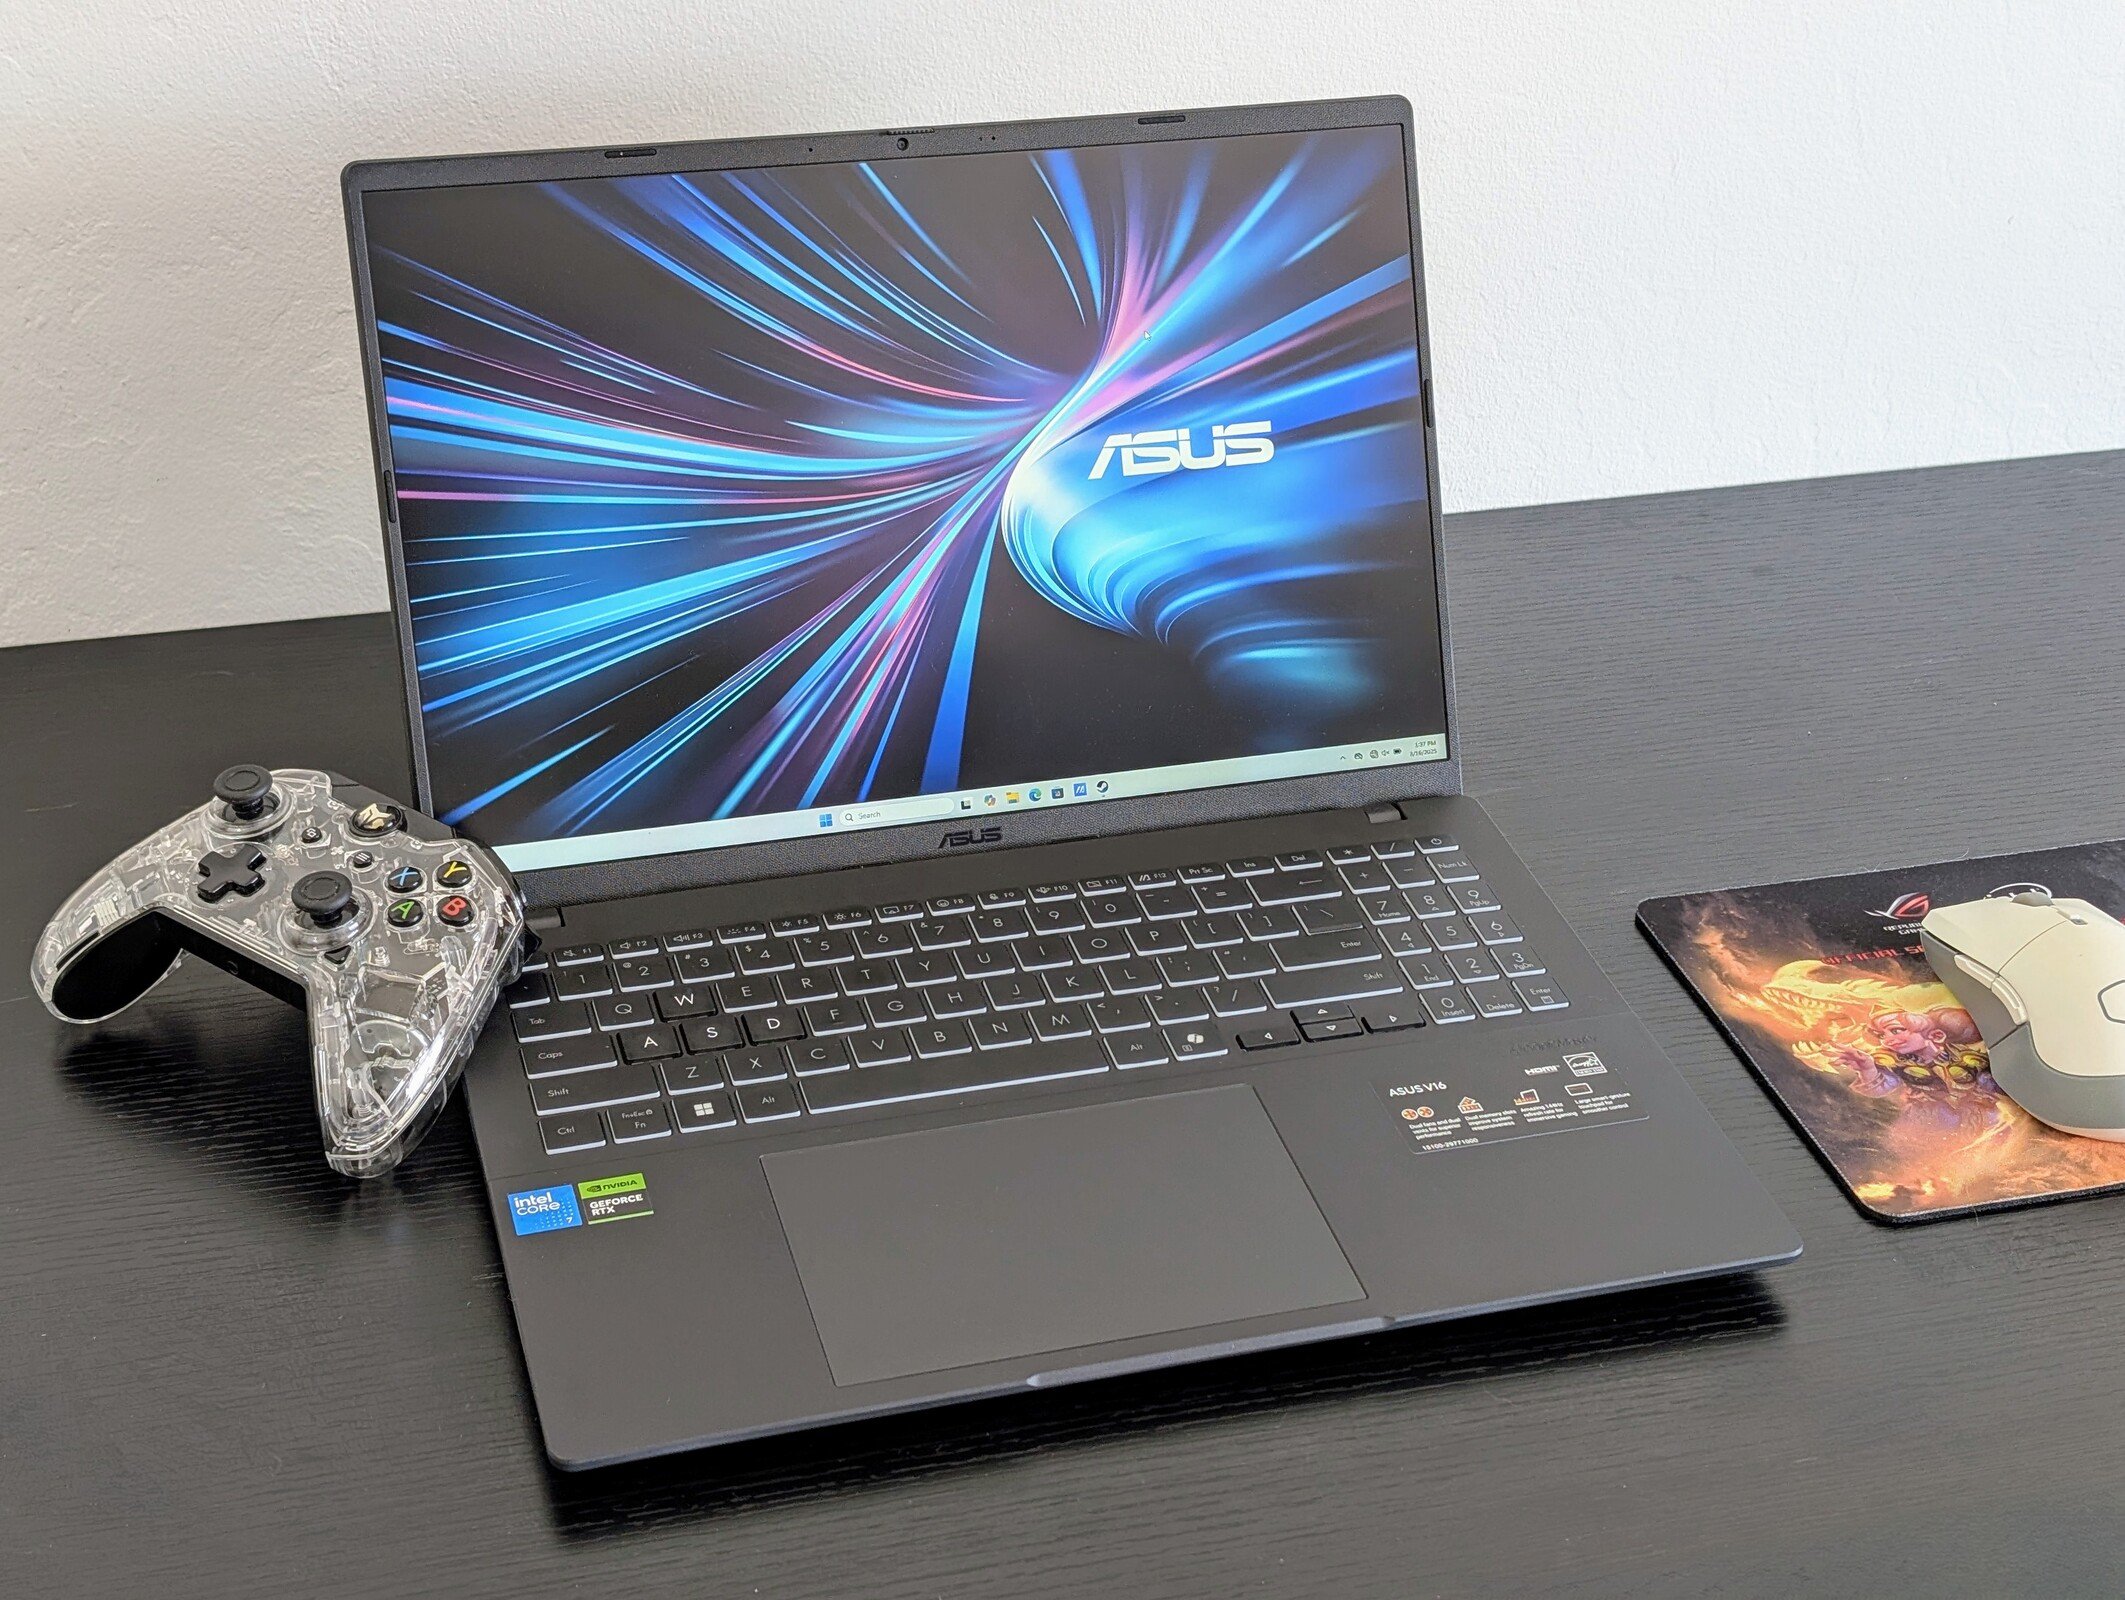
Análise do laptop Asus V16 V3607V: GeForce Gráficos RTX sem gastar muito
Estreia do desempenho do Core 7 240H.
Contanto que o senhor saiba onde estão os cortes, o Asus V16 pode ser uma solução sólida para todos os tipos de trabalho, com desempenho suficiente para a maioria dos cenários de casa, escritório ou sala de aula.Allen Ngo, 👁 Allen Ngo (traduzido por DeepL / Ninh Duy) Publicado 🇺🇸 🇫🇷 ...
Veredicto - Bem completo e econômico
À medida que a série Vivobook sobe de preço, o V16 foi apresentado como a nova opção de baixo custo para usuários com orçamentos mais apertados. O V16 atende muito bem a esse espaço de aproximadamente US$ 1.000, equilibrando uma CPU nova e razoavelmente rápida com uma GPU RTX discreta em um design que é bastante fino e portátil para ser competitivo contra o HP Pavilion Plus 16 ou o mais pesado Dell Inspiron 16 Plus 7640.
No entanto, os cortes são perceptíveis. A tela, por exemplo, oferece pouca cobertura de cores, enquanto o chassi de plástico pode parecer bastante barato. O HP mencionado acima parece mais forte e até oferece cores sRGB >99%, embora a preços mais altos do que o nosso Asus.
A configuração RTX 4050, no momento em que este artigo foi escrito, é vendida por US$ 100 a mais do que a configuração RTX 3050. Os compradores em potencial podem considerar a opção RTX 4050, pois ela oferece um desempenho gráfico 50% mais rápido do que o RTX 3050.
Pro
Contra
Não deve ser confundido com o VivoBook 16, o V16 é o modelo multimídia econômico da Asus com preços iniciais ainda mais baixos do que os da série VivoBook. Ele não possui certos recursos de luxo encontrados no VivoBook, como OLED e designs metálicos atraentes. O 2025 V16 vem com o novo Core 7 240H de gama média alta.
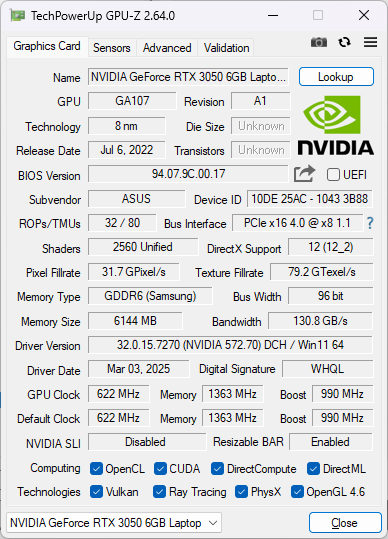
Nossa unidade de teste vem com a CPU mencionada acima, tela IPS de 1200p 144 Hz e o antigo GeForce RTX 3050 de 6 GB para manter os preços abaixo de US$ 1.000. Outras SKUs podem ser fornecidas com a RTX 4050.
As alternativas ao V16 incluem outros notebooks multimídia econômicos com GPUs discretas, como o HP Pavilion Plus 16, Dell Inspiron 16 Plus, ou o Lenovo IdeaPad Pro 5 16.
Mais análises da Asus:
Especificações
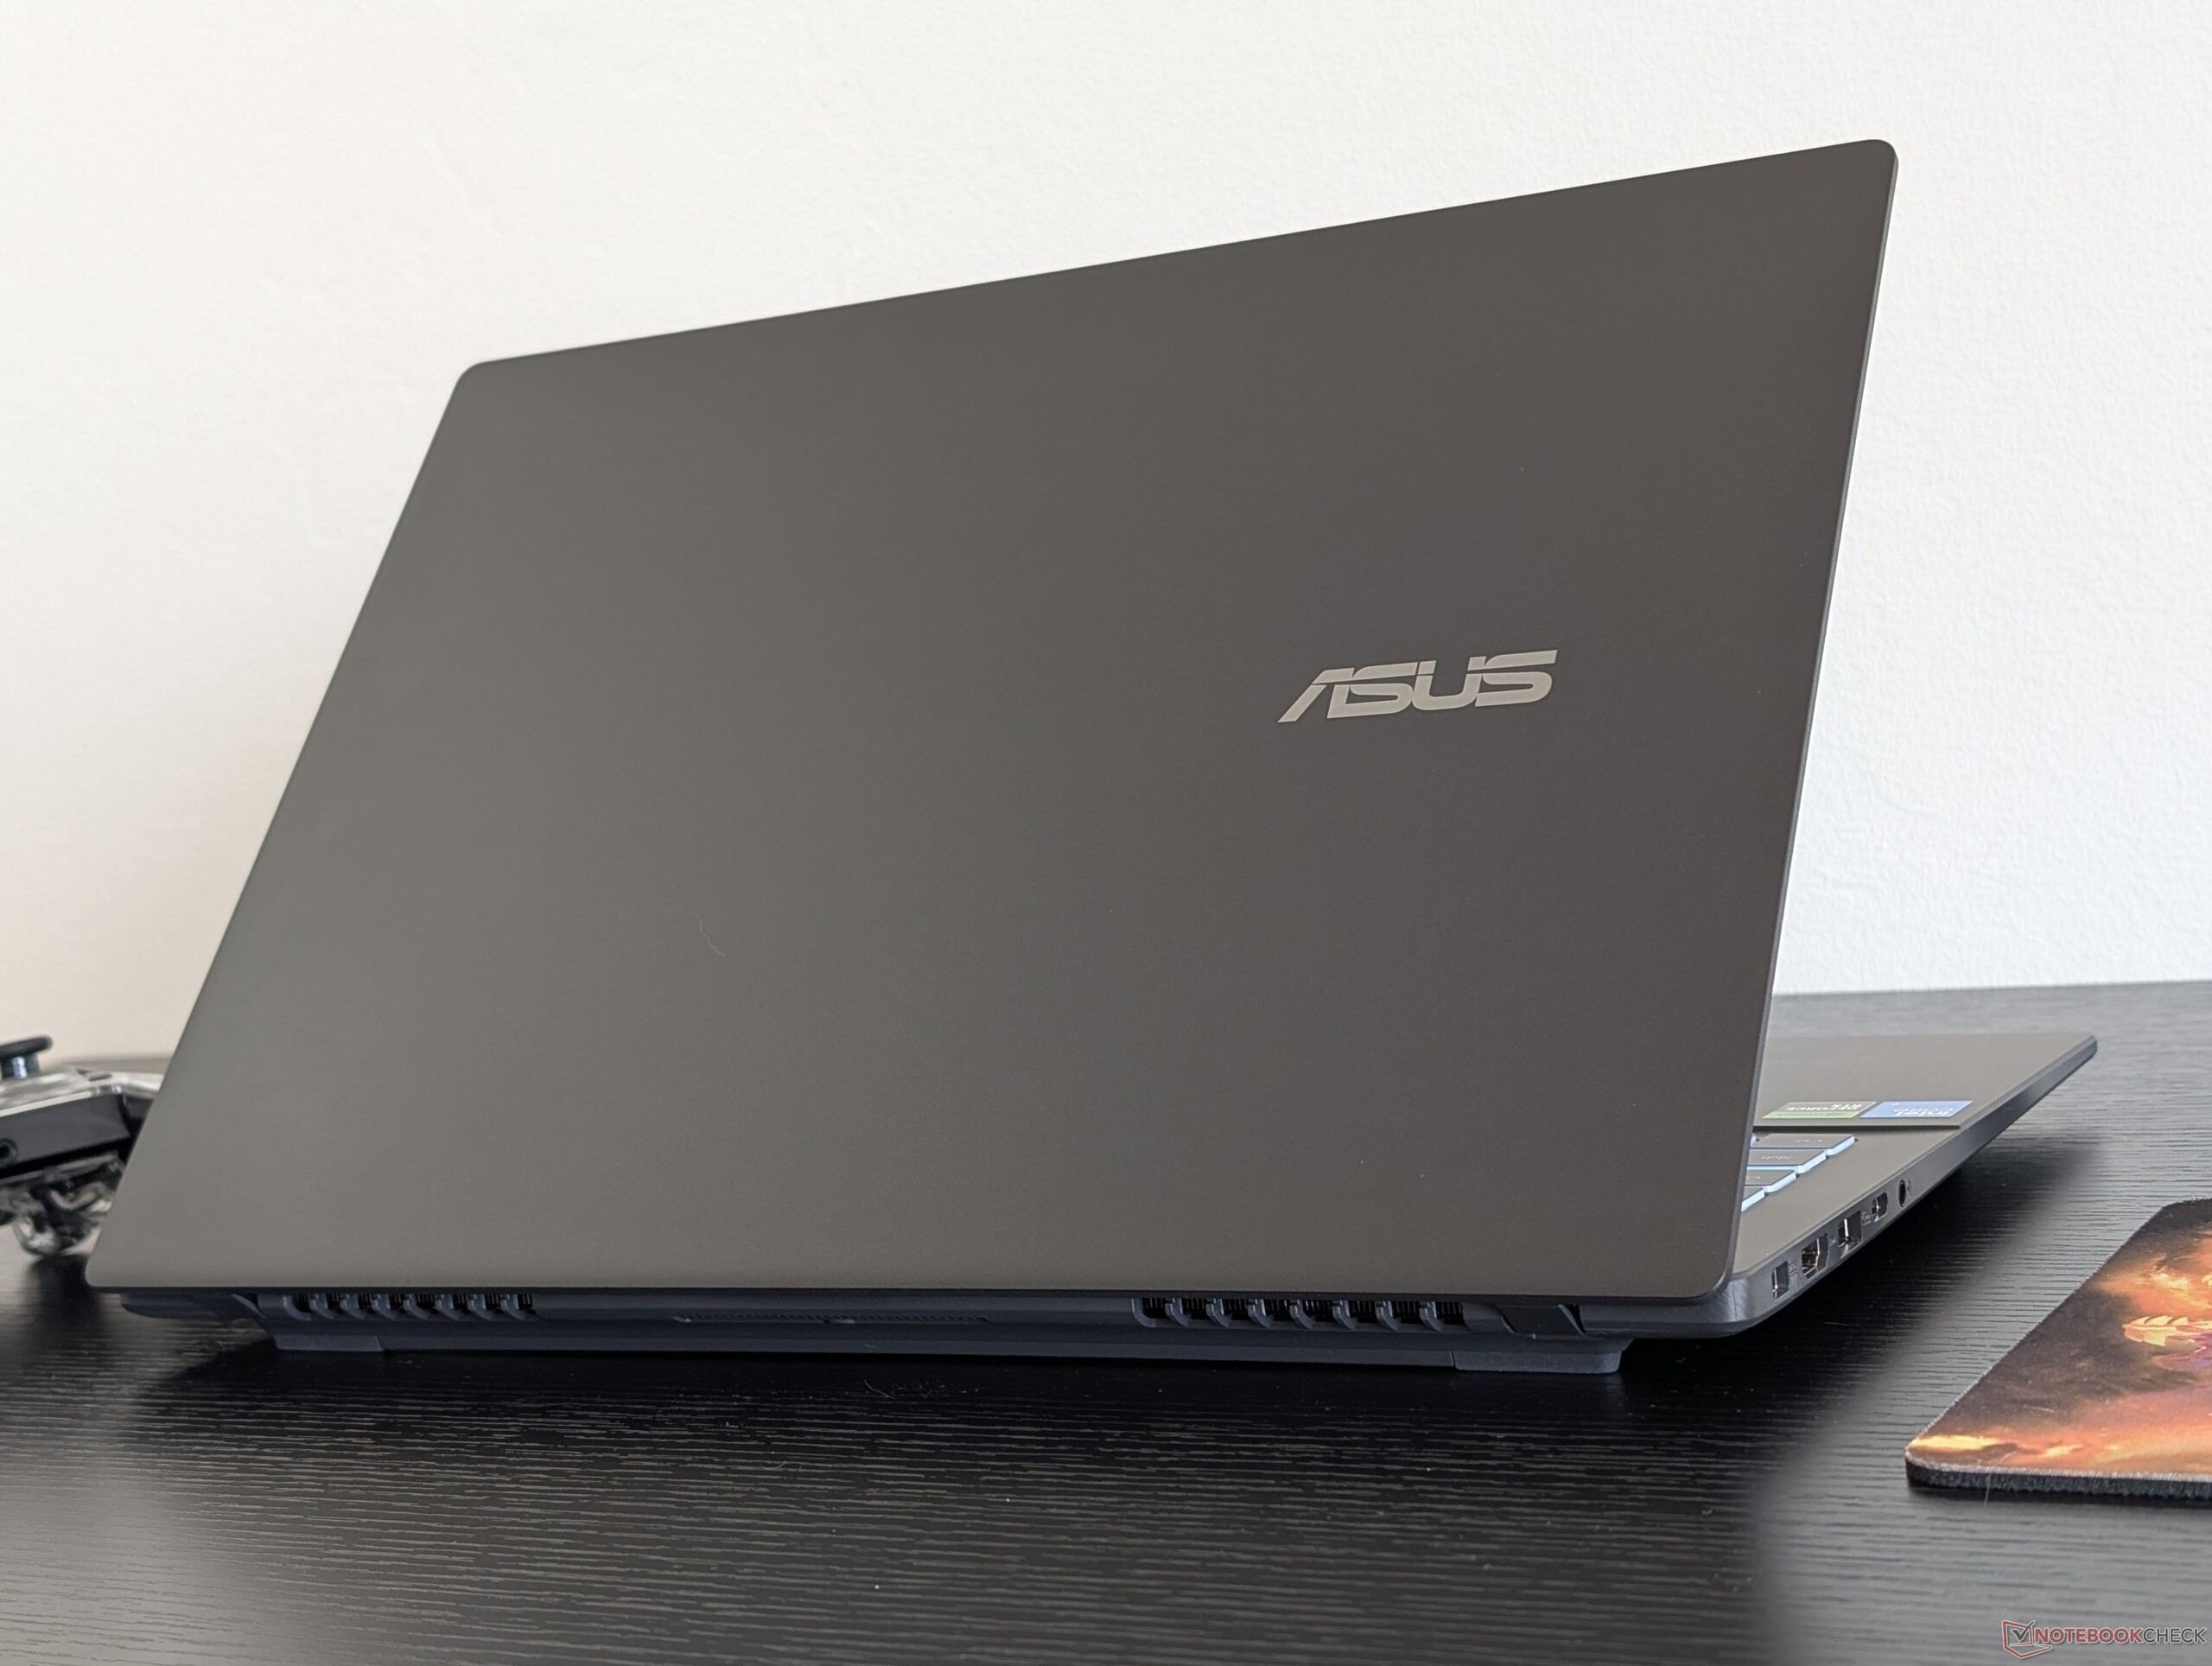
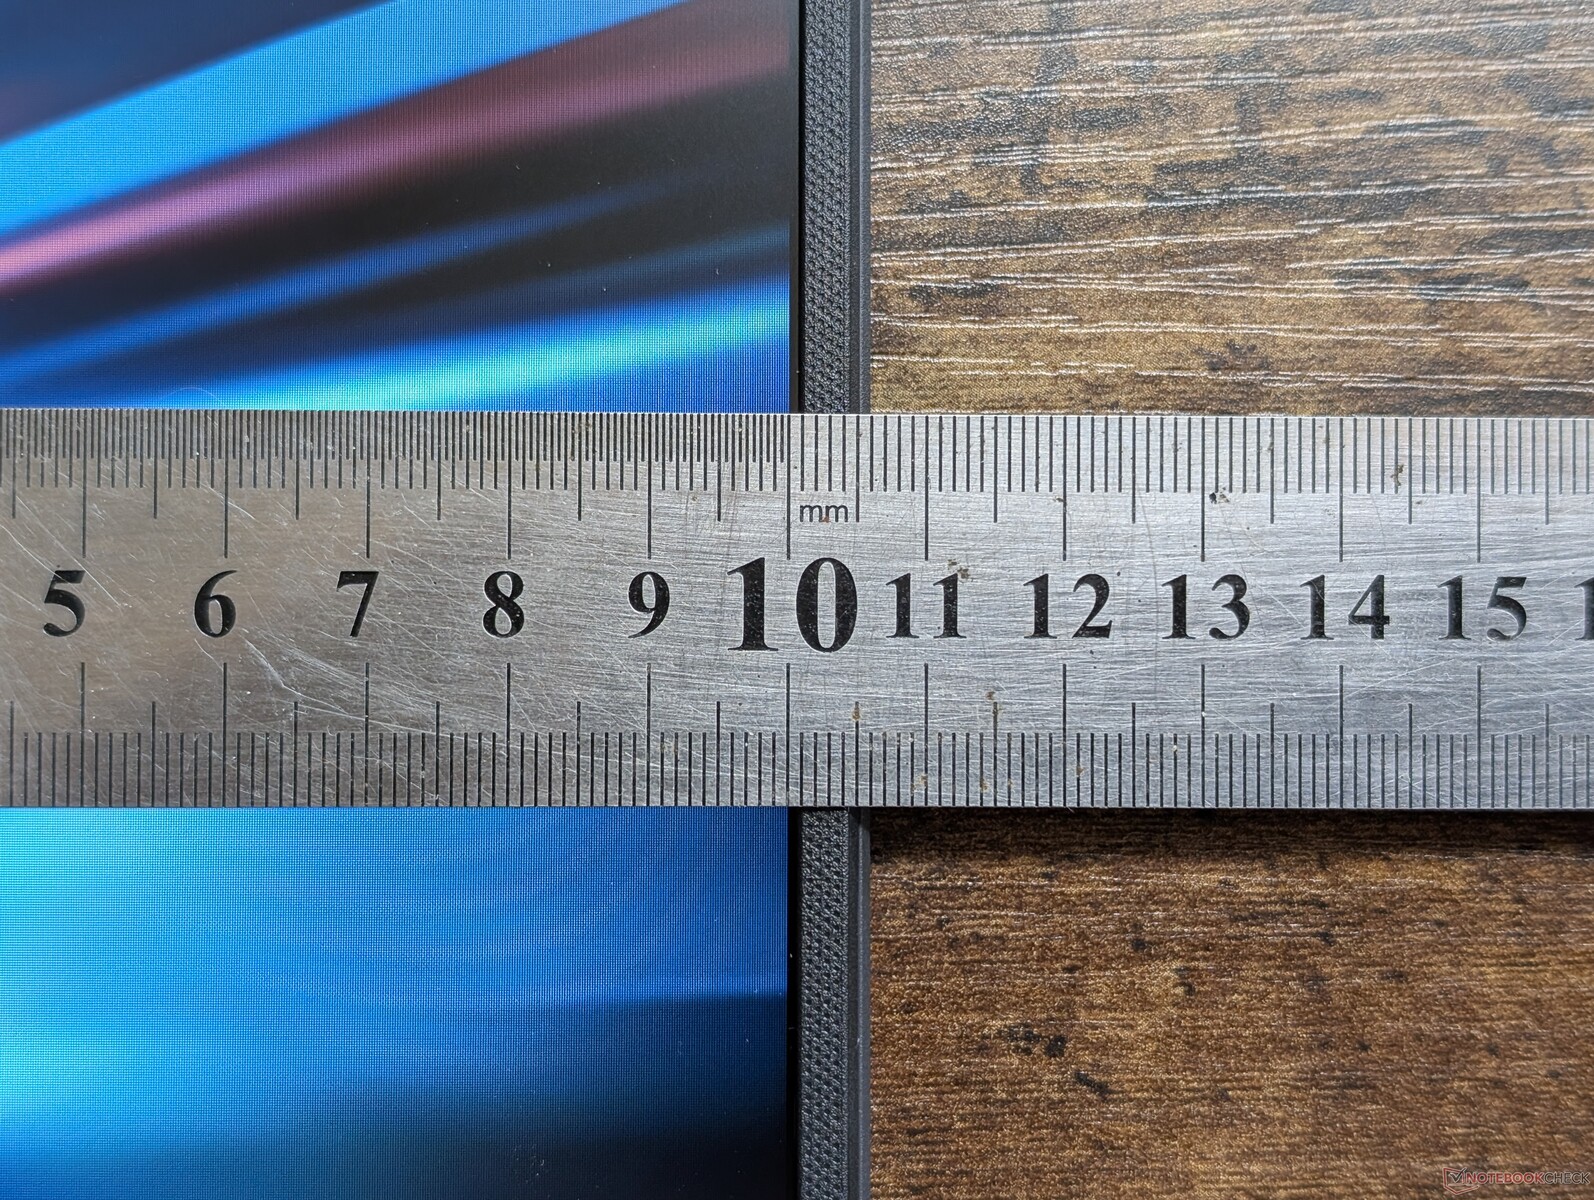
Estojo - Plástico preto monótono
O chassi é totalmente de plástico, incluindo até mesmo a tampa externa, onde os fabricantes costumam usar metal para melhorar a primeira impressão. A base e a tampa são propensas a torcer e são extremamente suscetíveis a impressões digitais desagradáveis.
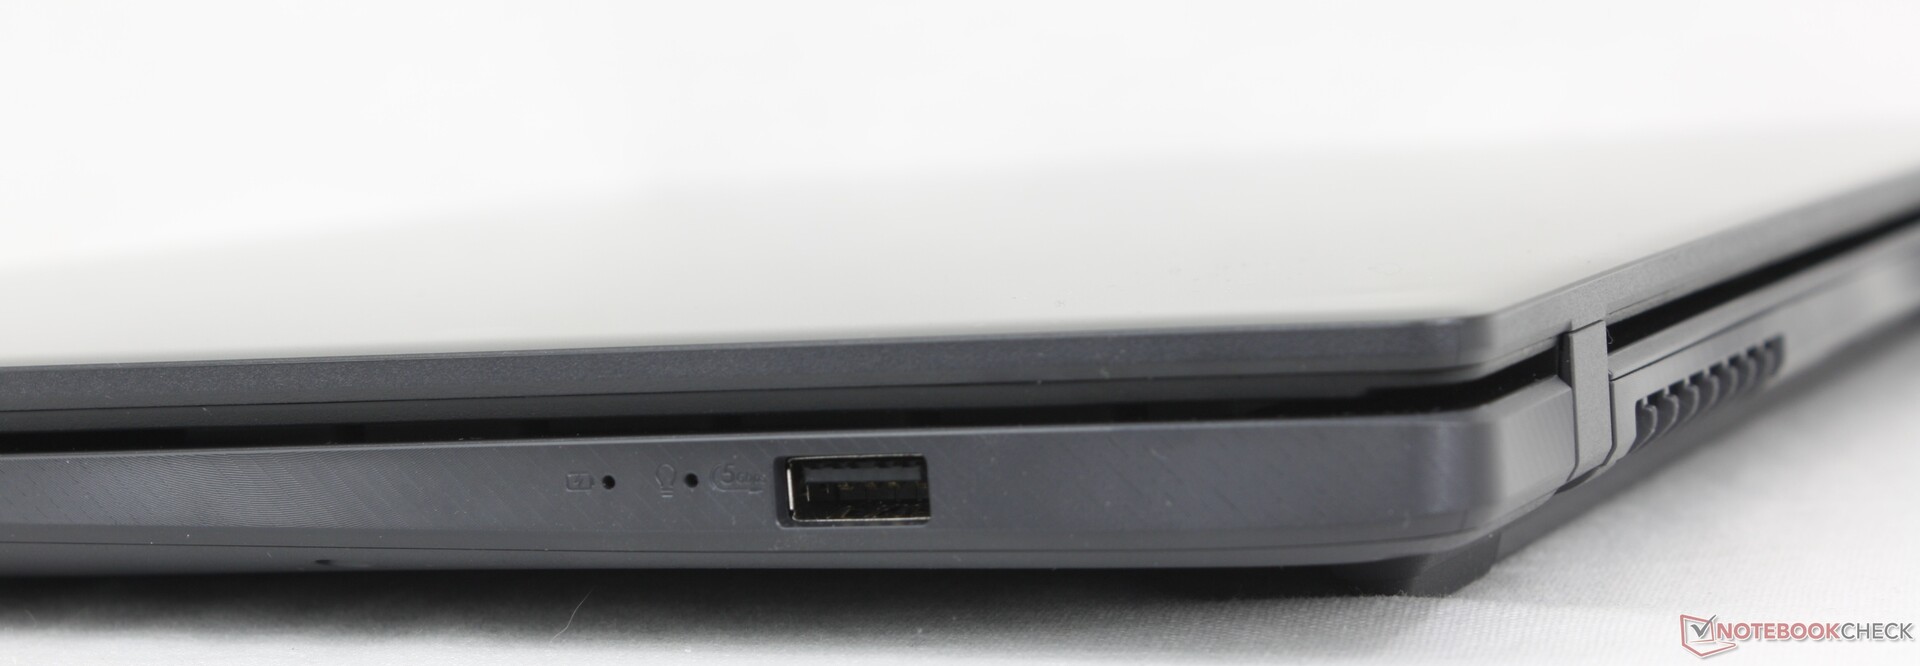
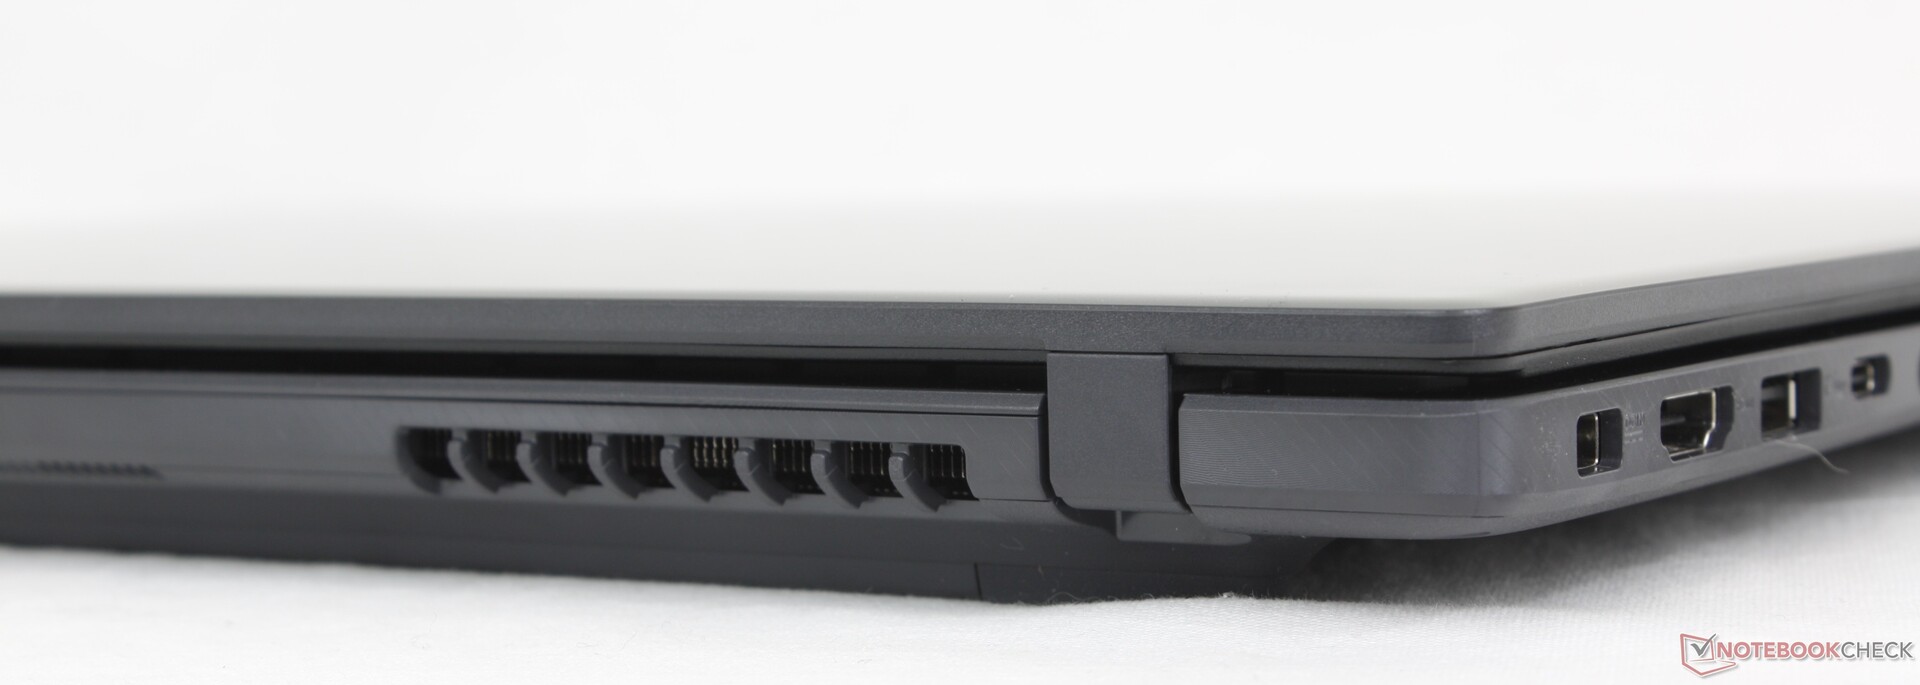
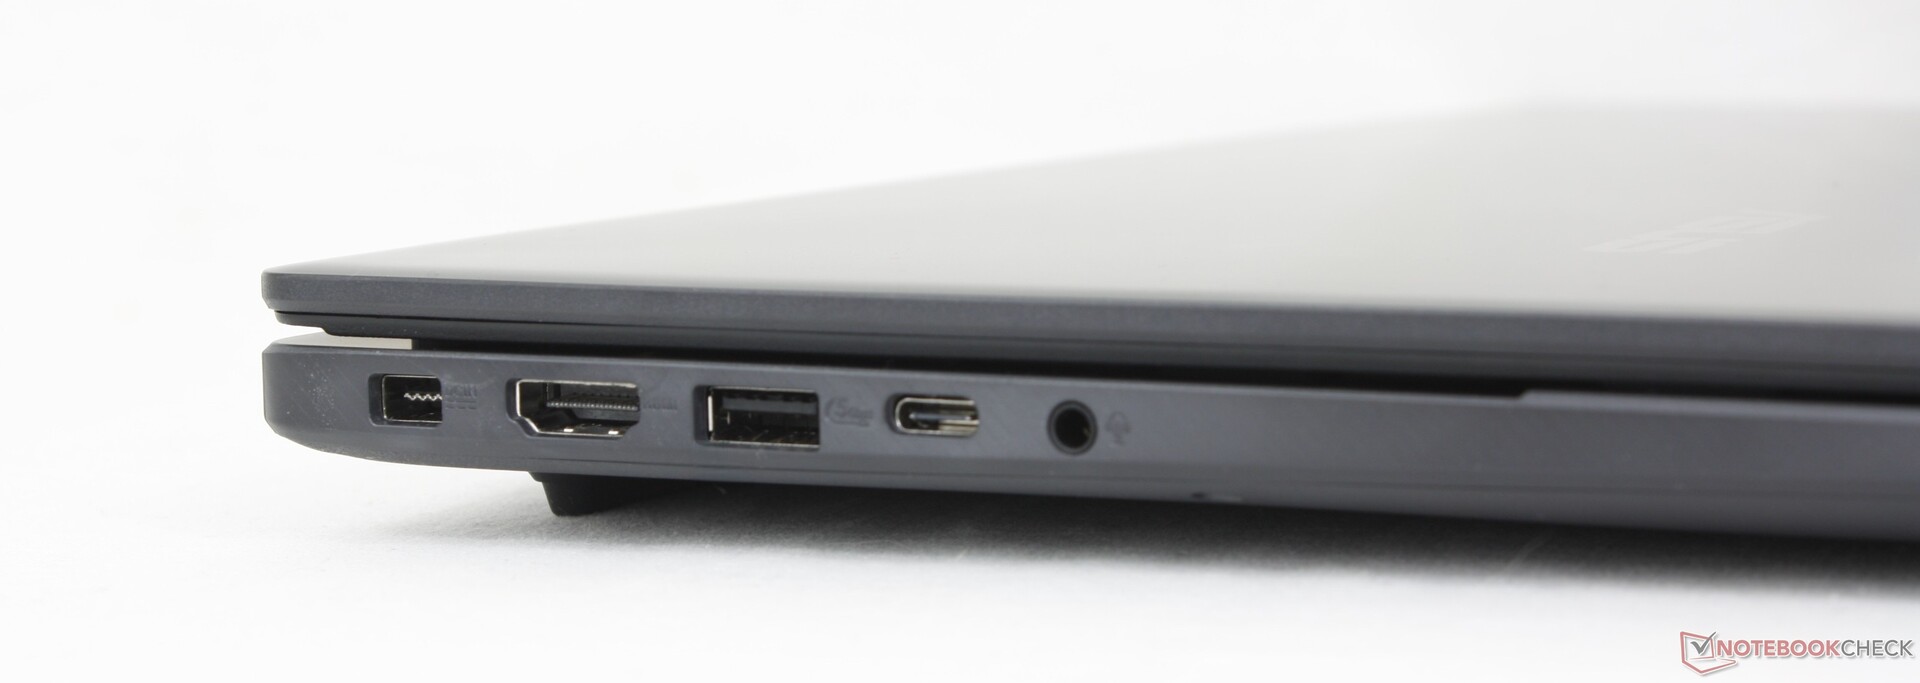
Conectividade
A porta USB-C não é compatível com Thunderbolt, ao contrário do mais caro VivoBook Pro 16 que integra uma variedade maior de portas. Infelizmente, o V16 também utiliza um cabo adaptador AC diferente da série VivoBook.
Comunicação
O Realtek RTL8852BE removível vem com conectividade padrão para Wi-Fi 6 e Bluetooth 5.3. Não há suporte para Wi-Fi 6E ou Wi-Fi 7.
Webcam
Uma webcam de 2 MP com obturador físico é padrão. Não há câmera IR para economizar nos custos.


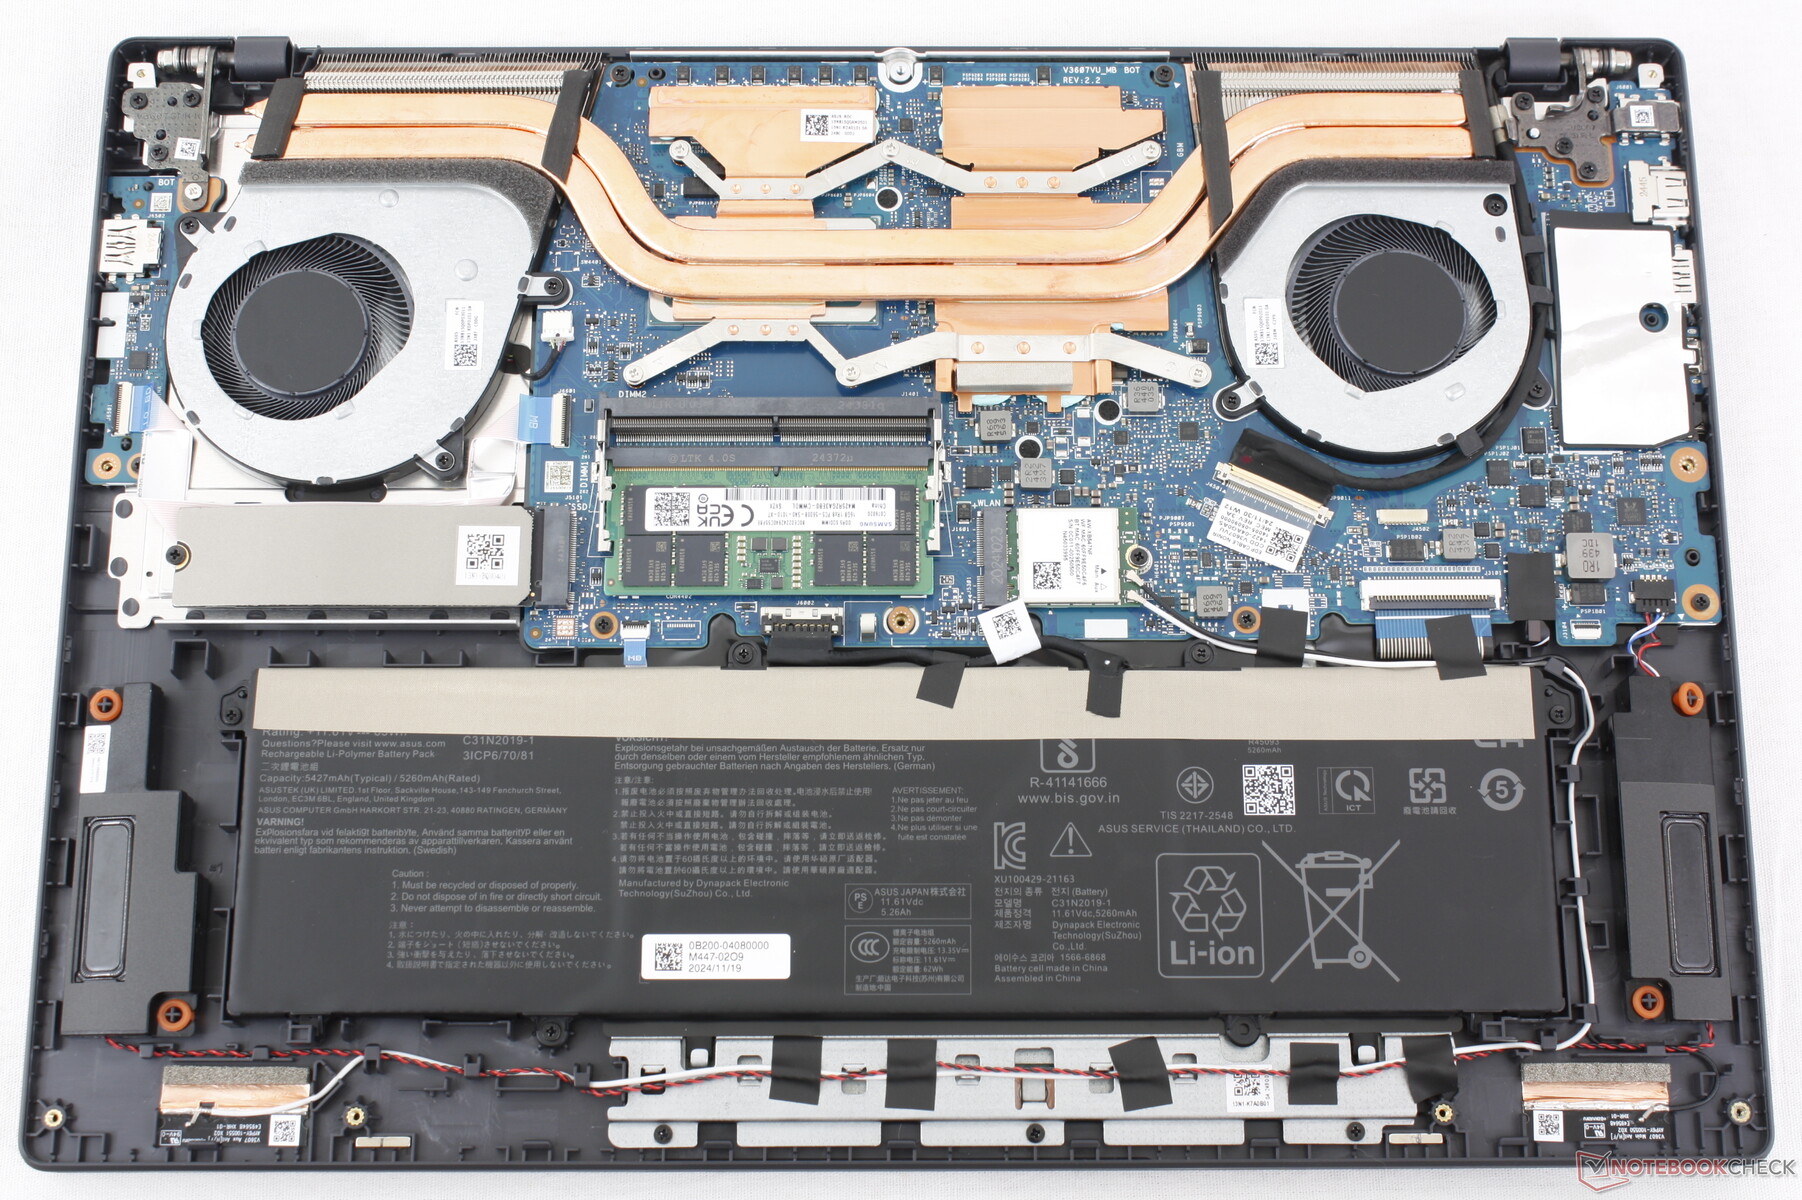
Manutenção
O painel inferior se solta com relativa facilidade com apenas uma chave de fenda Phillips para facilitar a manutenção. Não há suporte para uma SSD secundária.
Sustentabilidade
A Asus pretende ser neutra em termos de carbono, mas não há informações específicas sobre o processo de fabricação do V16. A embalagem de varejo é composta principalmente de papel e papelão, com muito pouco plástico.
Acessórios e garantia
Não há extras na caixa além do adaptador CA e da documentação. A garantia do fabricante de um ano se aplica se o produto for comprado nos EUA.
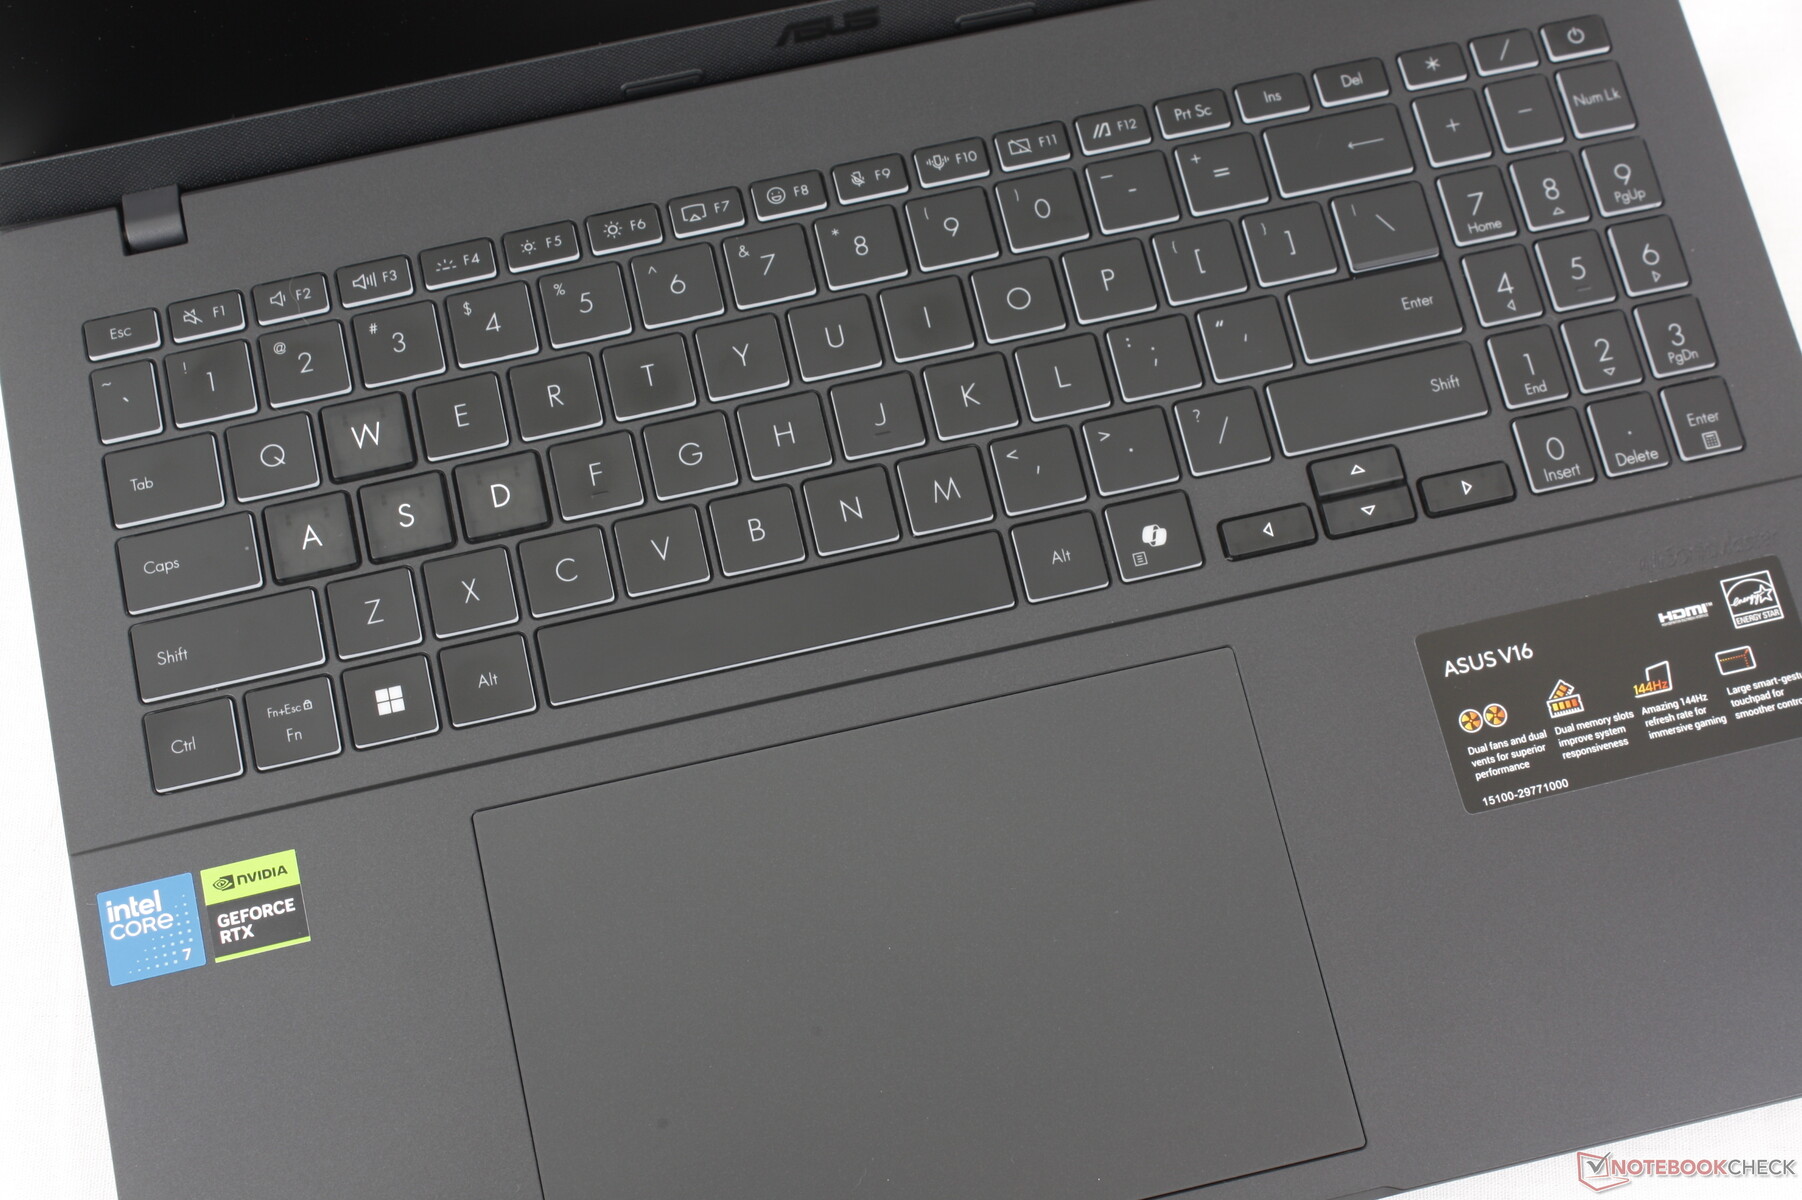
Dispositivos de entrada - VivoBook Vibes
Teclado
O V16 adota o teclado da série VivoBook 16 para melhor ou pior. O deslocamento e o feedback poderiam ter sido mais profundos e mais fortes, respectivamente, mas ele funciona de forma confiável o suficiente sem a necessidade de gastar mais em alternativas com teclados melhores, como um ThinkPad série T ou EliteBook.
Touchpad
O clickpad é grande, com 15 x 10 cm, em comparação com apenas 11,5 x 8 cm no Dell Inspiron 16 Plus 7640. Infelizmente, o feedback é muito suave e silencioso. Pressionar para baixo também exige mais força do que na maioria dos outros laptops, o que pode se tornar desconfortável depois de pouco tempo.
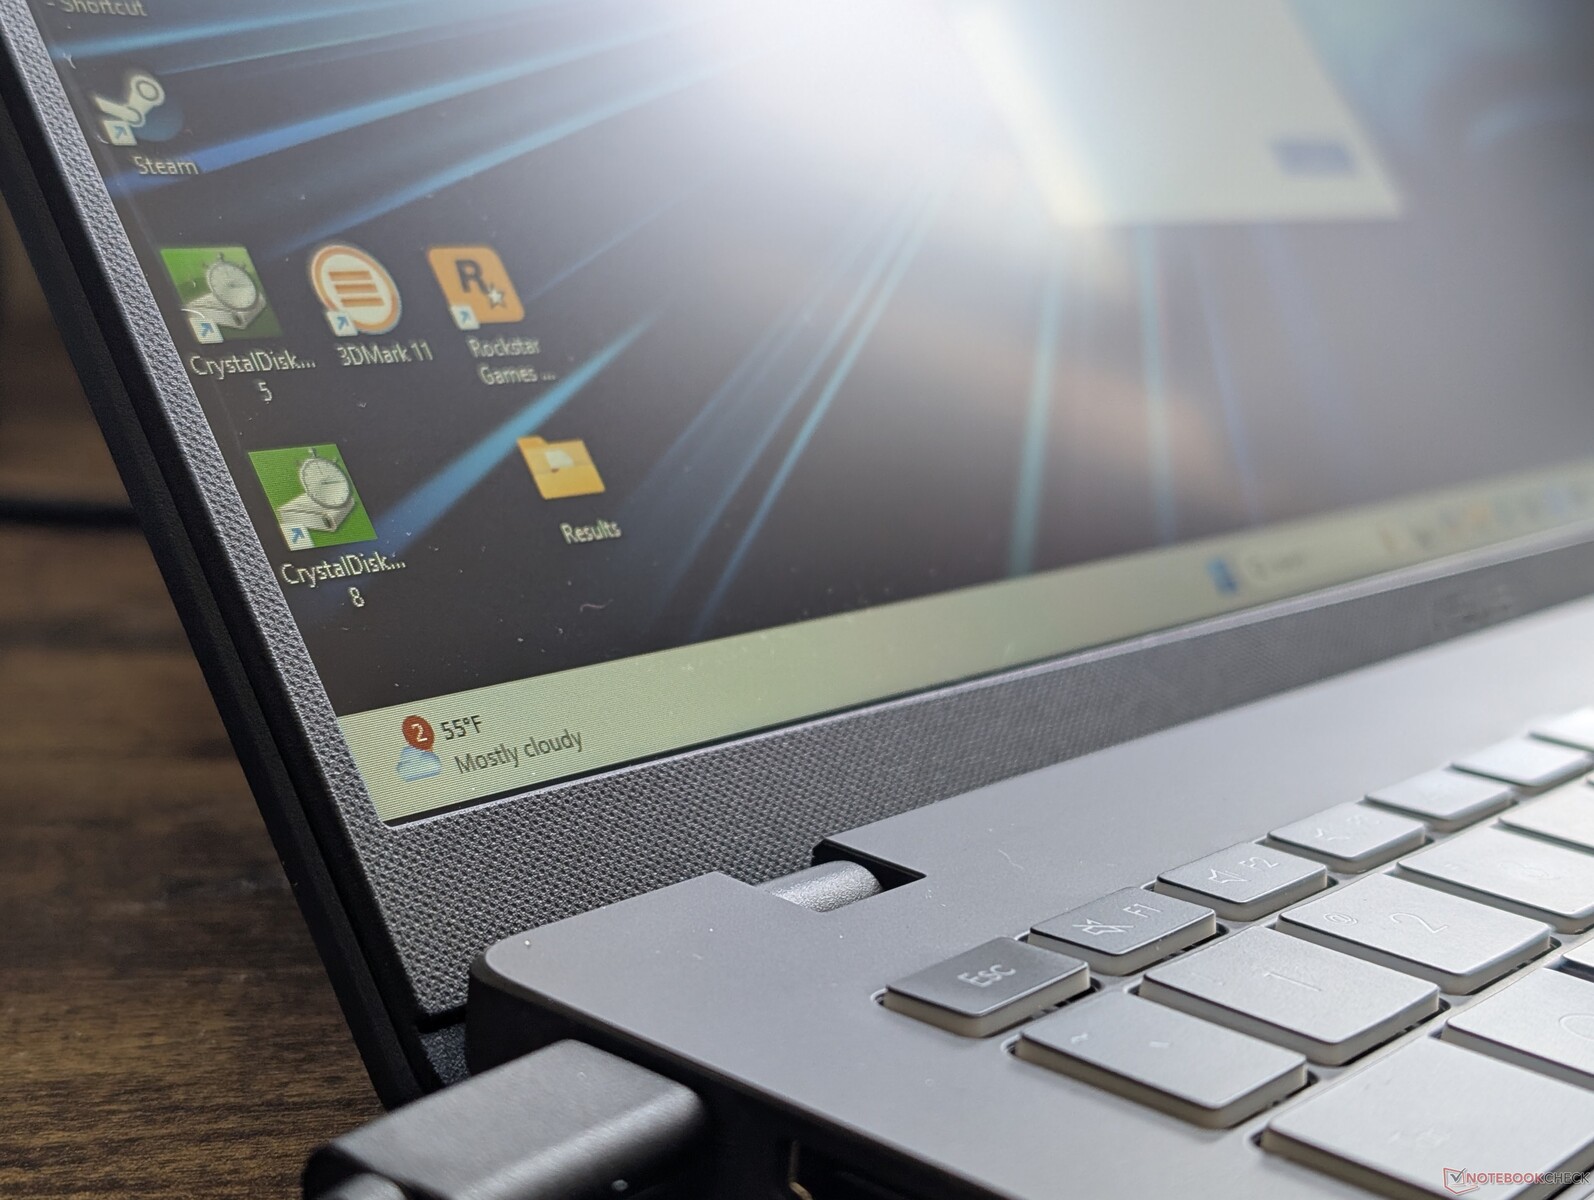
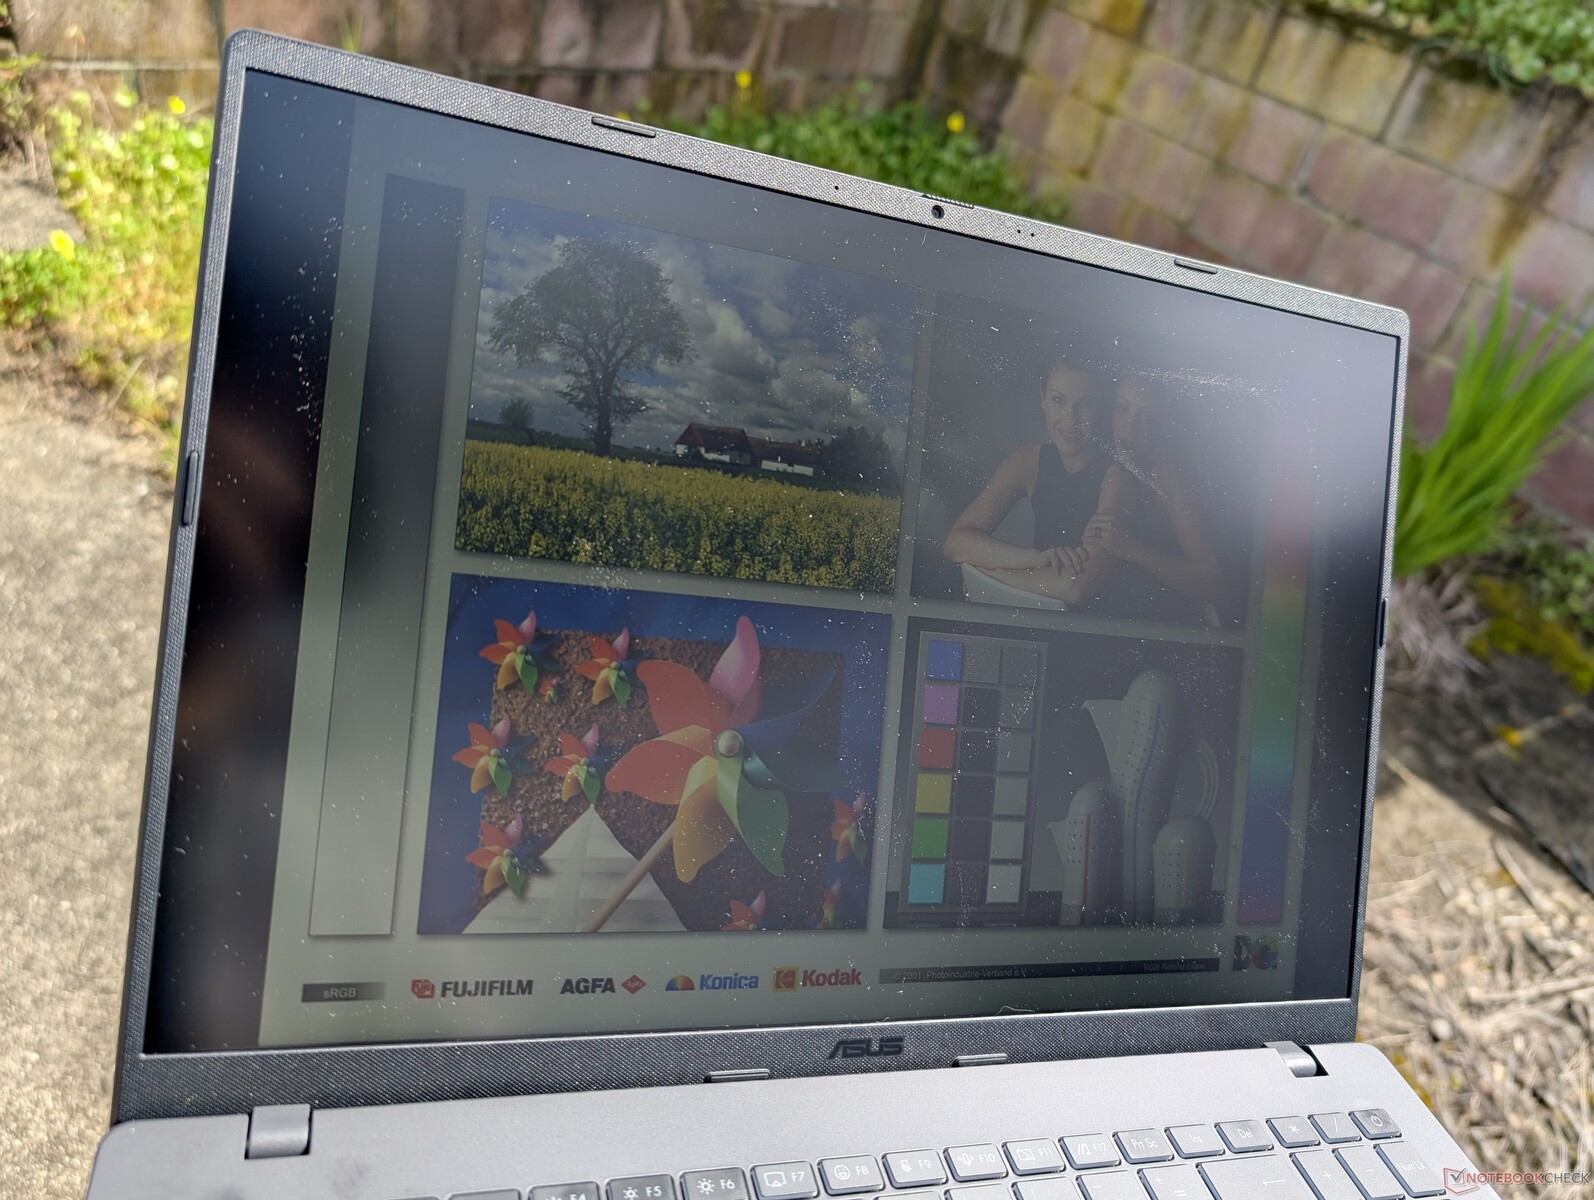
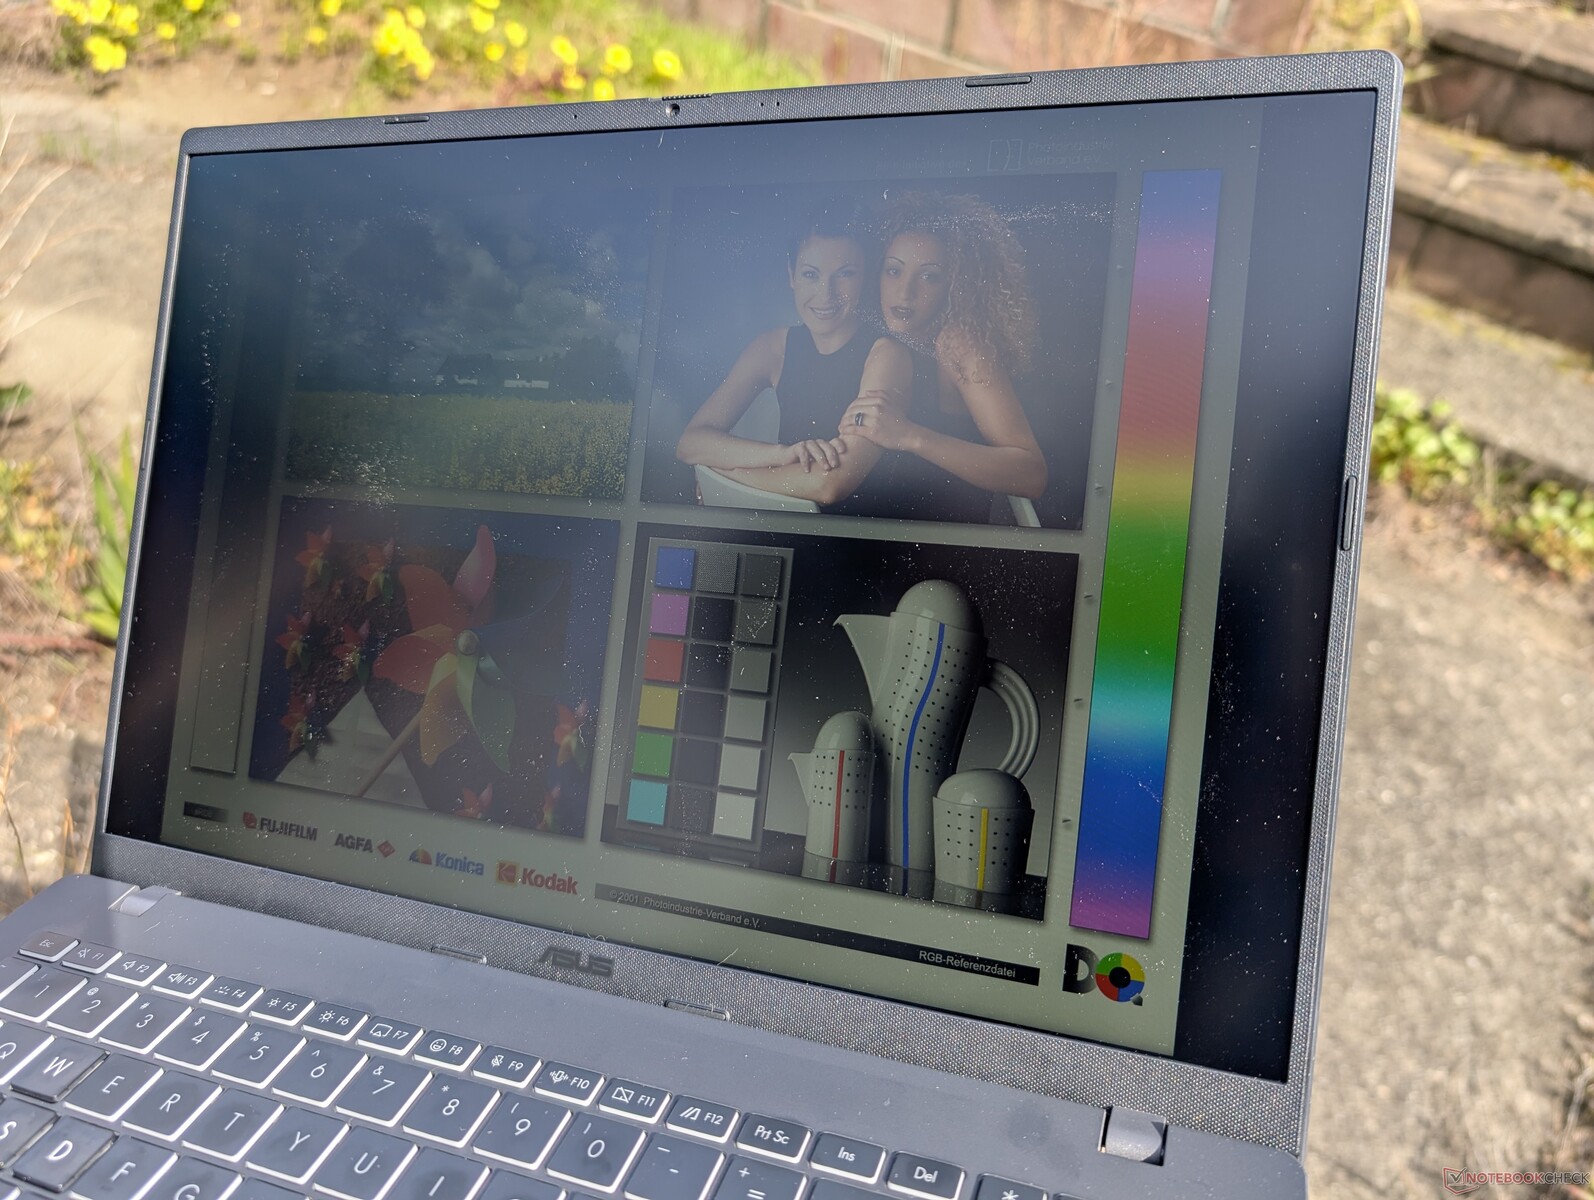
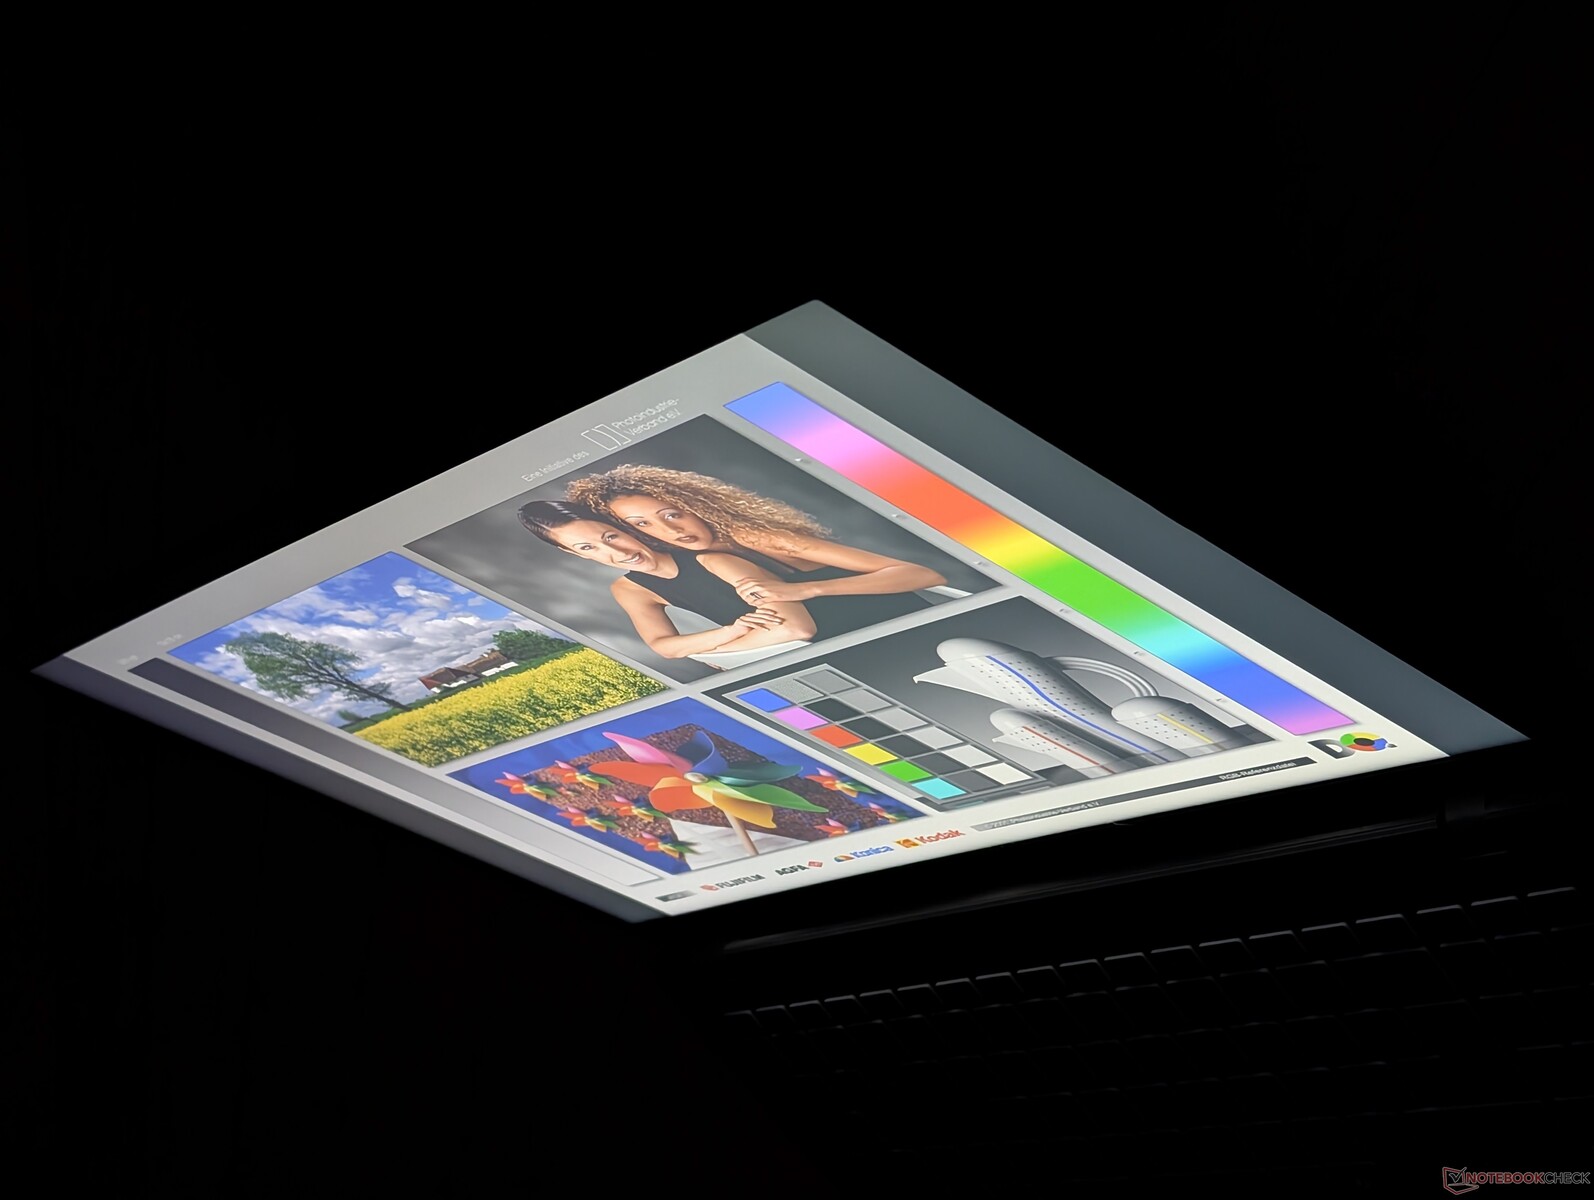
Tela - 144 Hz é padrão
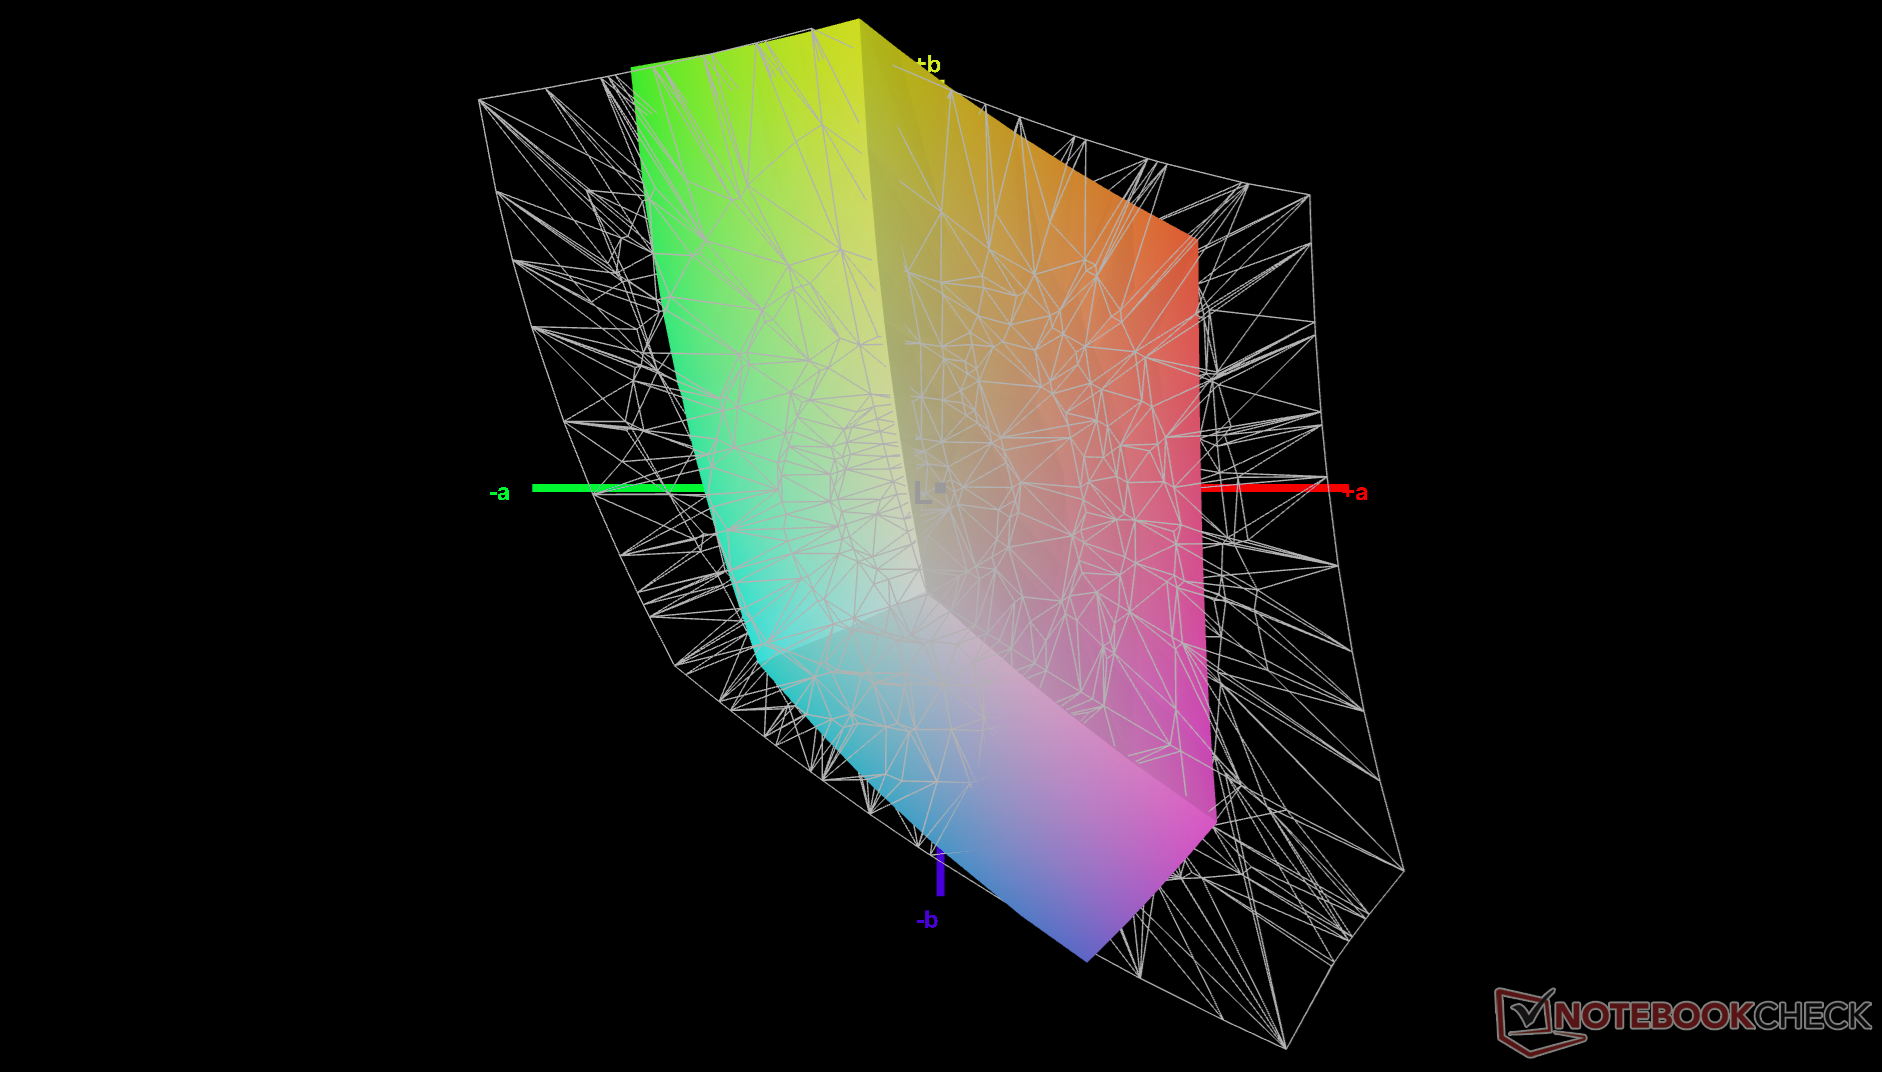
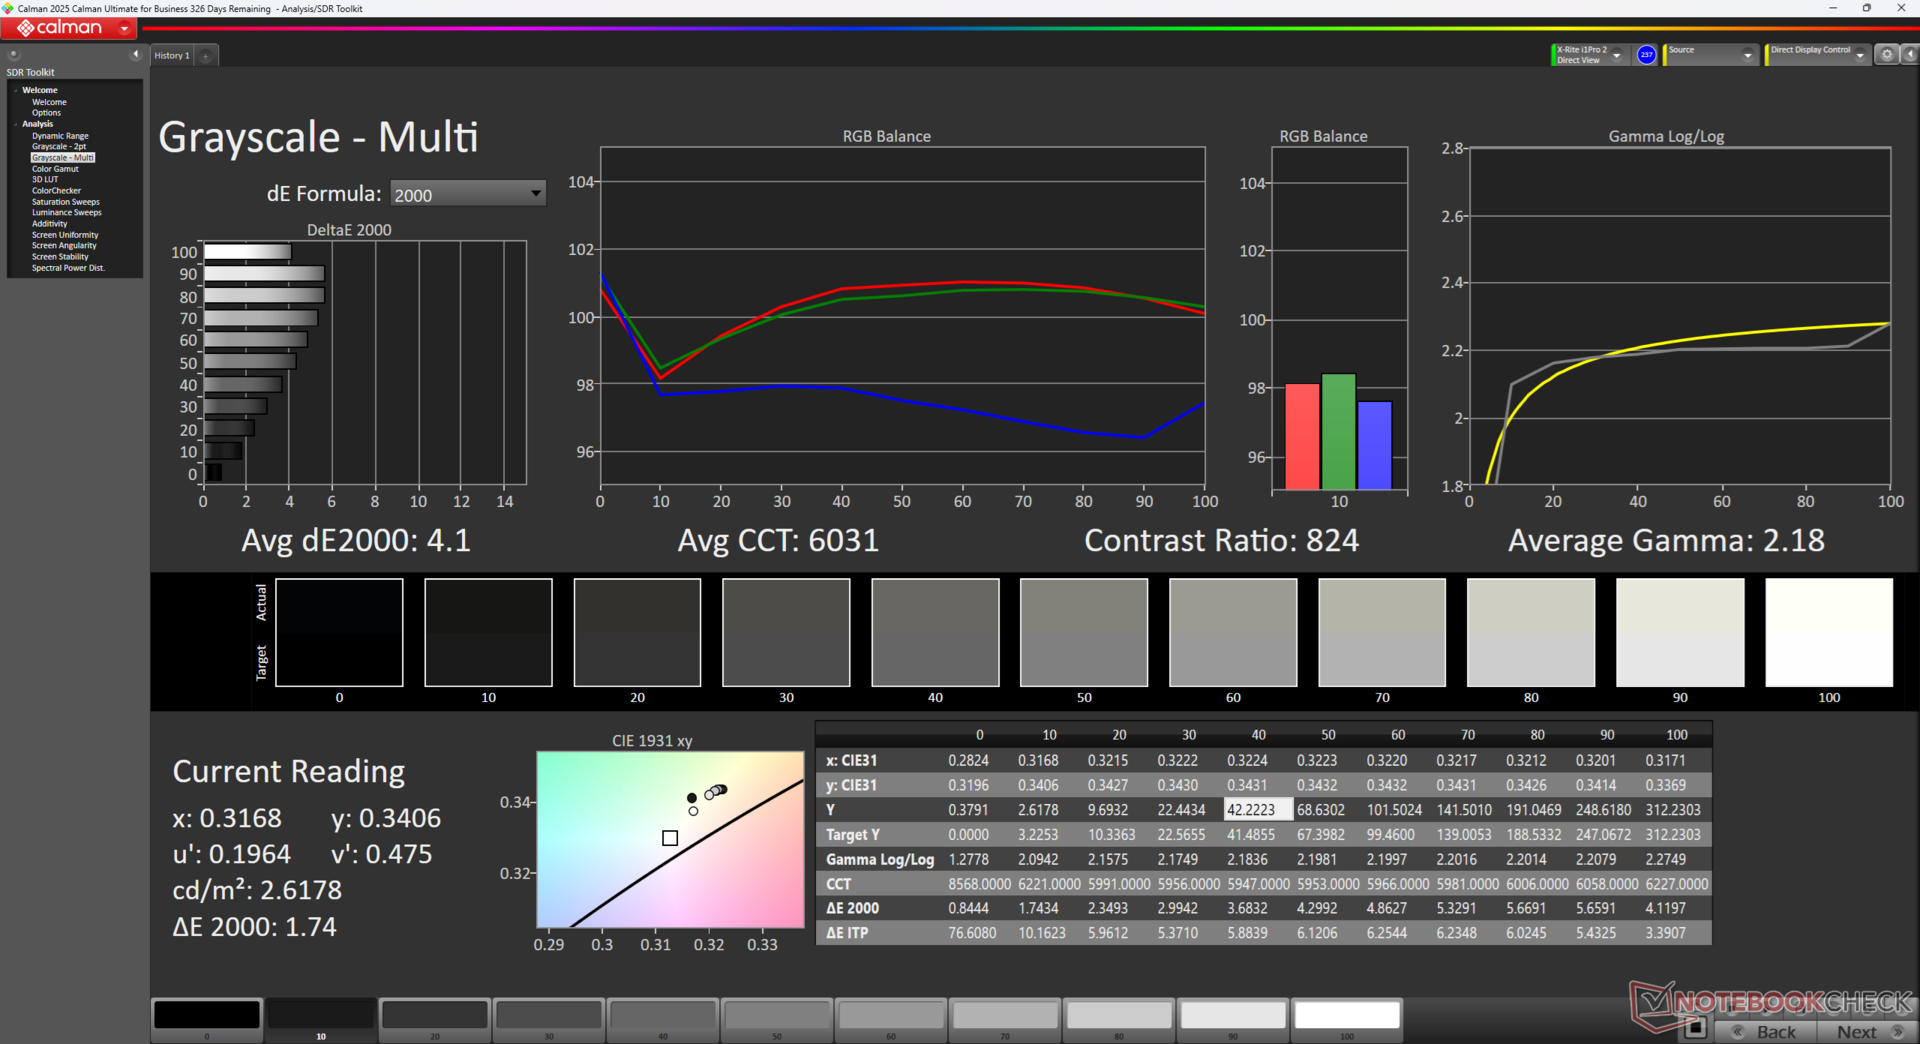
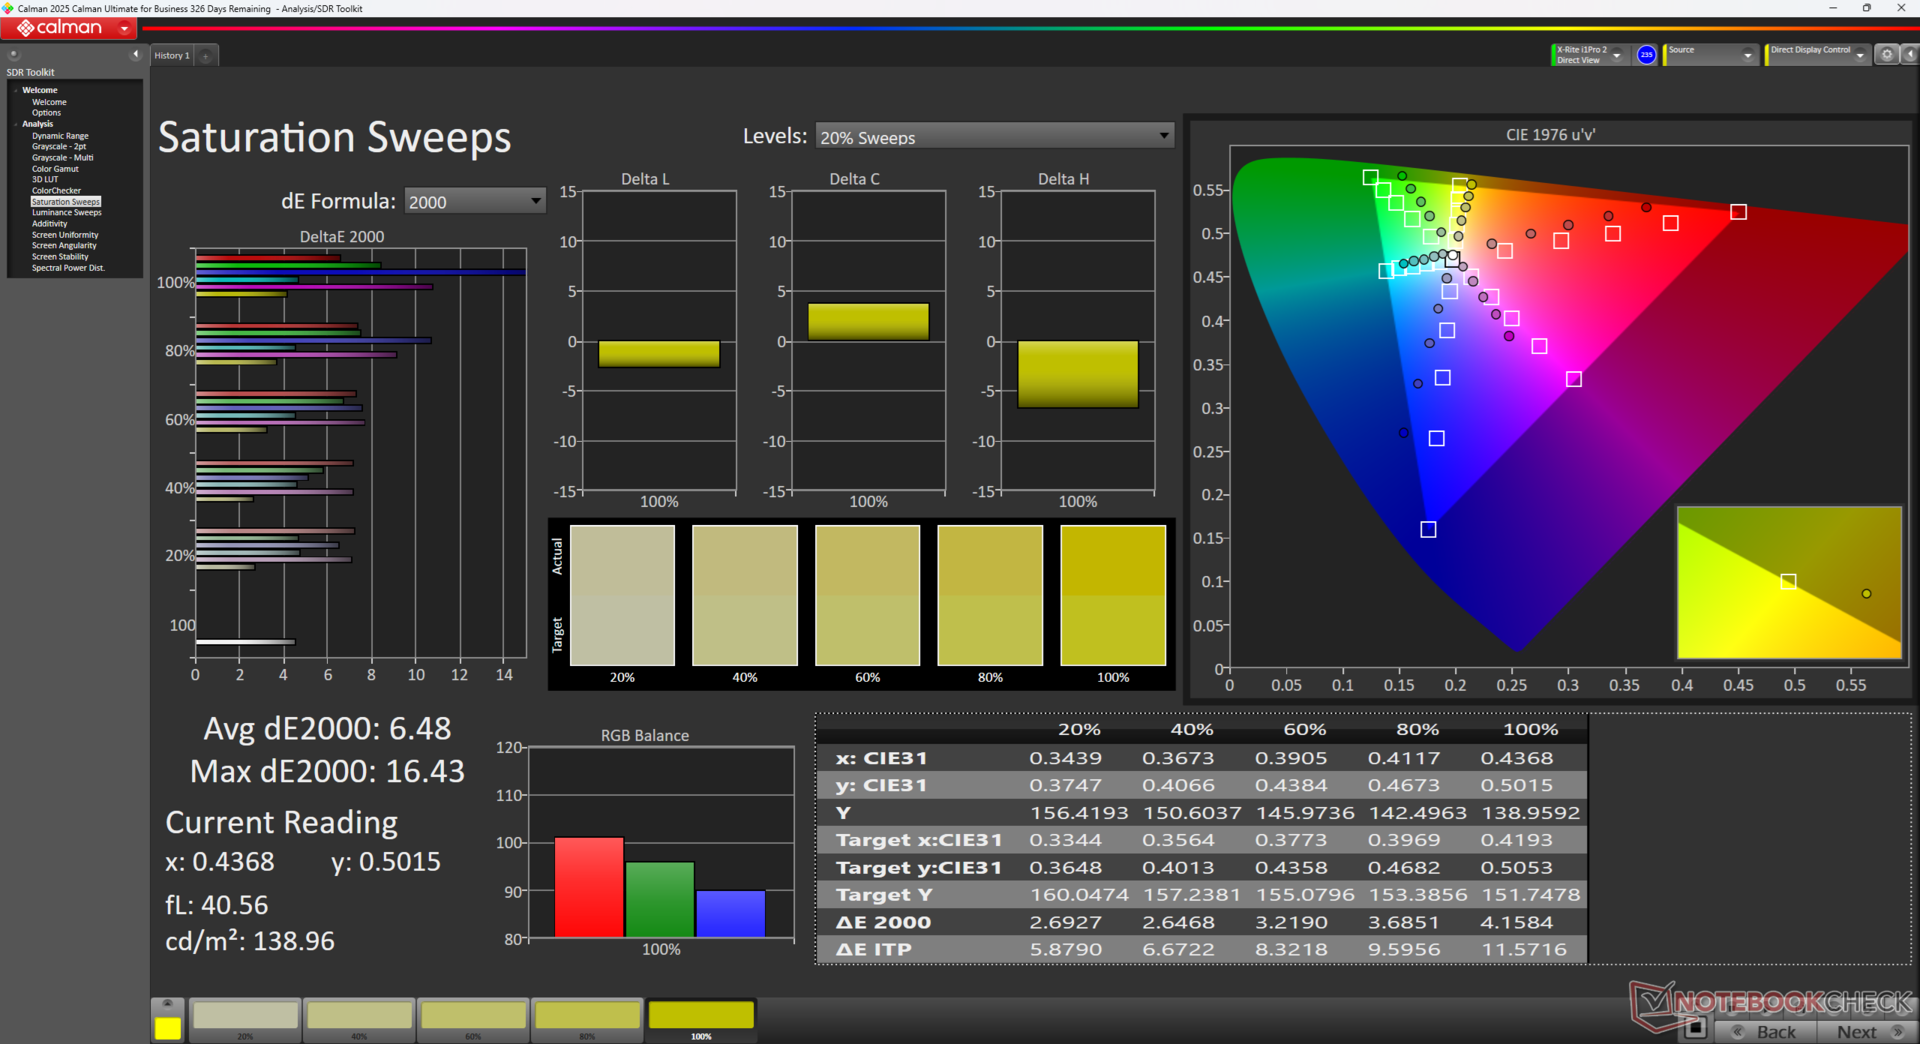
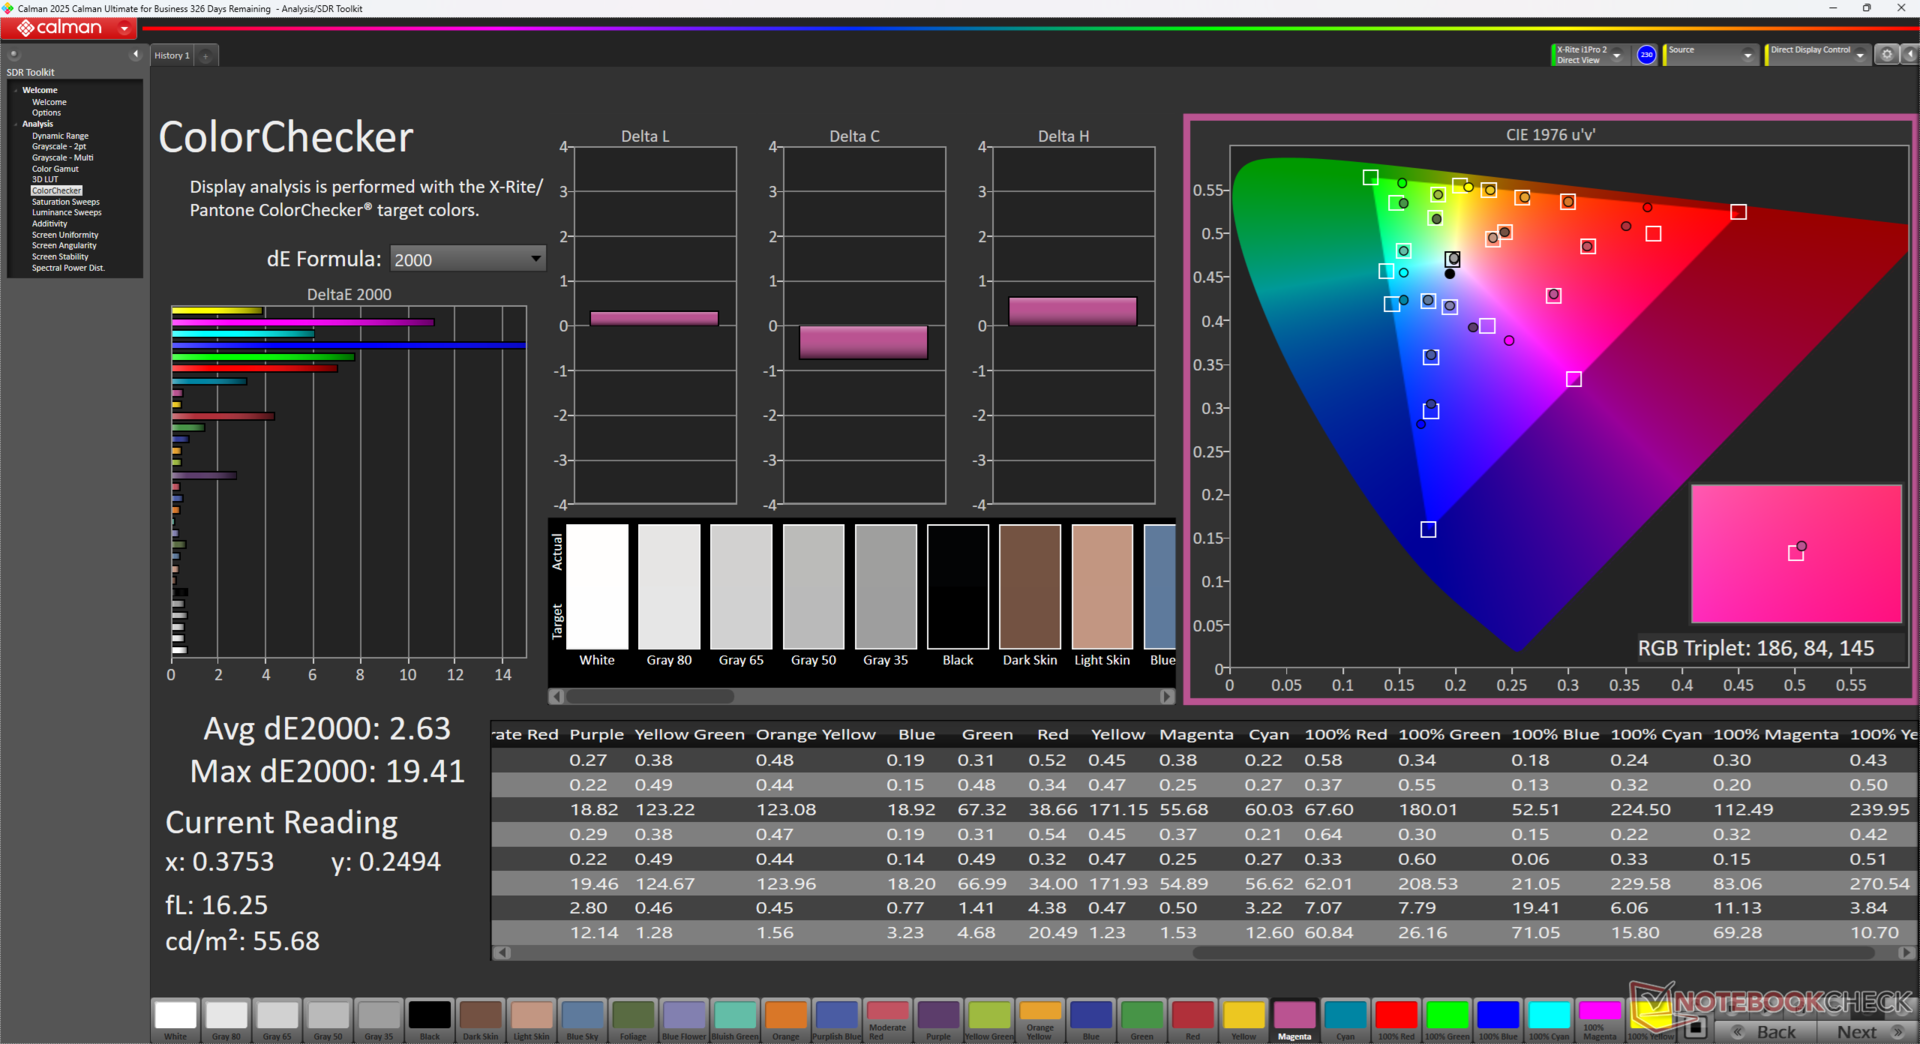
O recurso mais notável da tela é a taxa de atualização nativa de 144 Hz, que proporciona controle do cursor e capacidade de resposta extremamente suaves. De resto, é um painel econômico com cores estreitas, baixa taxa de contraste e brilho máximo médio.

| |||||||||||||||||||||||||
iluminação: 88 %
iluminação com acumulador: 313.3 cd/m²
Contraste: 627:1 (Preto: 0.5 cd/m²)
ΔE Color 6.09 | 0.5-29.43 Ø4.87, calibrated: 2.63
ΔE Greyscale 4.1 | 0.5-98 Ø5.1
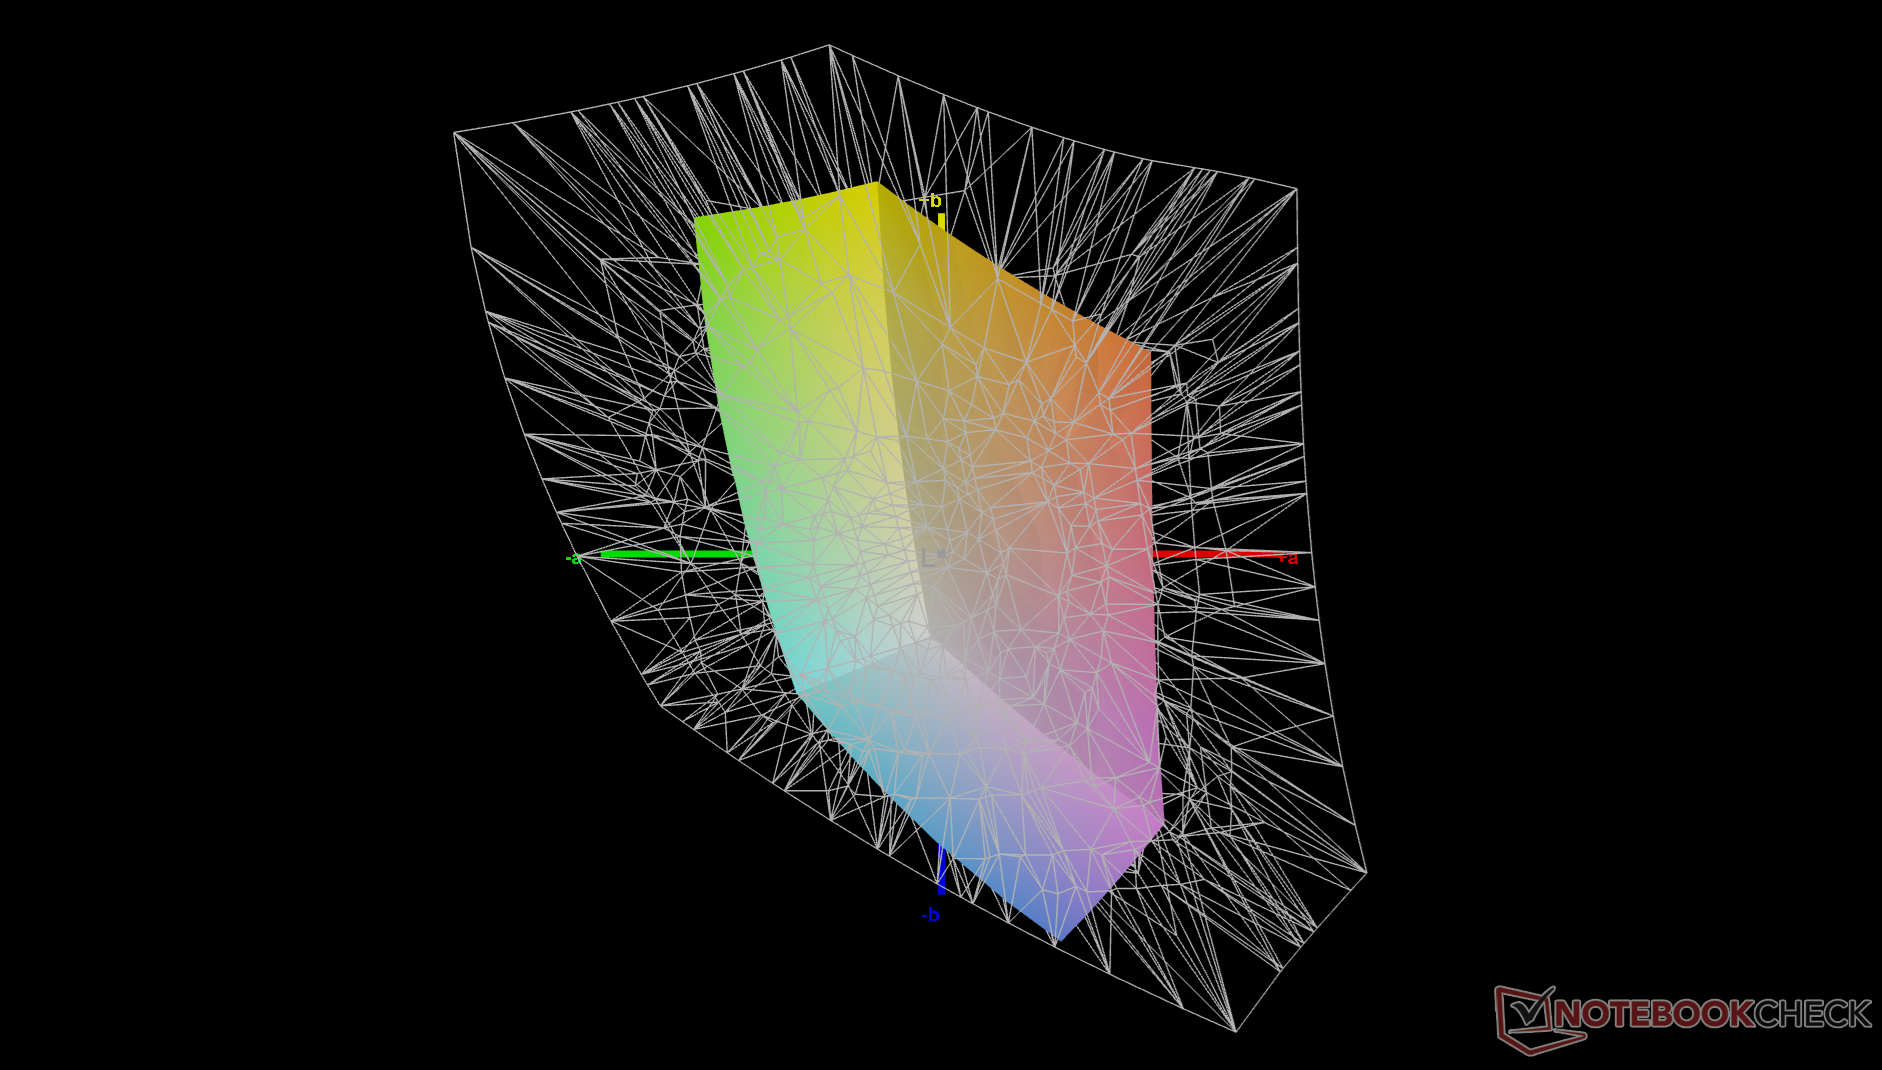
42.2% AdobeRGB 1998 (Argyll 2.2.0 3D)
59.7% sRGB (Argyll 2.2.0 3D)
40.9% Display P3 (Argyll 2.2.0 3D)
Gamma: 2.18
| Asus V16 V3607V MNG007QX2-2, IPS, 1920x1200, 16", 144 Hz | Asus VivoBook Pro 16 K6602VU Samsung ATNA60BX01-1, OLED, 3200x2000, 16", 120 Hz | Dell Inspiron 16 Plus 7640 AU Optronics B160QAN, IPS, 2560x1600, 16", 120 Hz | Lenovo ThinkBook 16 G7 IML LEN160WUXGA, IPS, 1920x1200, 16", 60 Hz | HP Pavilion Plus 16-ab0456tx AU Optronics AUOFDA4, IPS, 2560x1600, 16", 120 Hz | Acer Swift Edge 16 SFE16-44-R0XV Samsung ATNA60BX03-0, OLED, 3200x2000, 16", 120 Hz | |
|---|---|---|---|---|---|---|
| Display | 112% | 78% | 2% | 76% | 115% | |
| Display P3 Coverage | 40.9 | 98.7 141% | 76 86% | 41.6 2% | 74.6 82% | 99.9 144% |
| sRGB Coverage | 59.7 | 99.7 67% | 99.8 67% | 61.2 3% | 99 66% | 100 68% |
| AdobeRGB 1998 Coverage | 42.2 | 96.5 129% | 76.7 82% | 43 2% | 76.5 81% | 98 132% |
| Response Times | 58% | -11% | 9% | 59% | 97% | |
| Response Time Grey 50% / Grey 80% * | 22.9 ? | 0.68 ? 97% | 25.6 ? -12% | 18.4 ? 20% | 9.06 ? 60% | 0.4 ? 98% |
| Response Time Black / White * | 16.1 ? | 13.2 ? 18% | 17.6 ? -9% | 16.5 ? -2% | 6.7 ? 58% | 0.6 ? 96% |
| PWM Frequency | 240 ? | 120 ? | ||||
| Screen | 26% | 45% | -7% | 36% | 7243% | |
| Brightness middle | 313.3 | 353 13% | 314.7 0% | 321.2 3% | 403 29% | 407 30% |
| Brightness | 298 | 354 19% | 291 -2% | 319 7% | 394 32% | 405 36% |
| Brightness Distribution | 88 | 98 11% | 89 1% | 92 5% | 90 2% | 98 11% |
| Black Level * | 0.5 | 0.28 44% | 0.37 26% | 0.34 32% | 0.001 100% | |
| Contrast | 627 | 1124 79% | 868 38% | 1185 89% | 407000 64812% | |
| Colorchecker dE 2000 * | 6.09 | 4.23 31% | 1.62 73% | 8.7 -43% | 3.13 49% | 2.27 63% |
| Colorchecker dE 2000 max. * | 19.31 | 7.13 63% | 2.94 85% | 19.85 -3% | 6.14 68% | 4.46 77% |
| Colorchecker dE 2000 calibrated * | 2.63 | 2.42 8% | 1.08 59% | 1.82 31% | 1.65 37% | 2.17 17% |
| Greyscale dE 2000 * | 4.1 | 2.5 39% | 1.3 68% | 9.2 -124% | 4.5 -10% | 2.3 44% |
| Gamma | 2.18 101% | 2.4 92% | 2.26 97% | 2.83 78% | 2.18 101% | 2.231 99% |
| CCT | 6031 108% | 6642 98% | 6385 102% | 6200 105% | 6261 104% | 6443 101% |
| Média Total (Programa/Configurações) | 65% /
53% | 37% /
44% | 1% /
-3% | 57% /
48% | 2485% /
4695% |
* ... menor é melhor
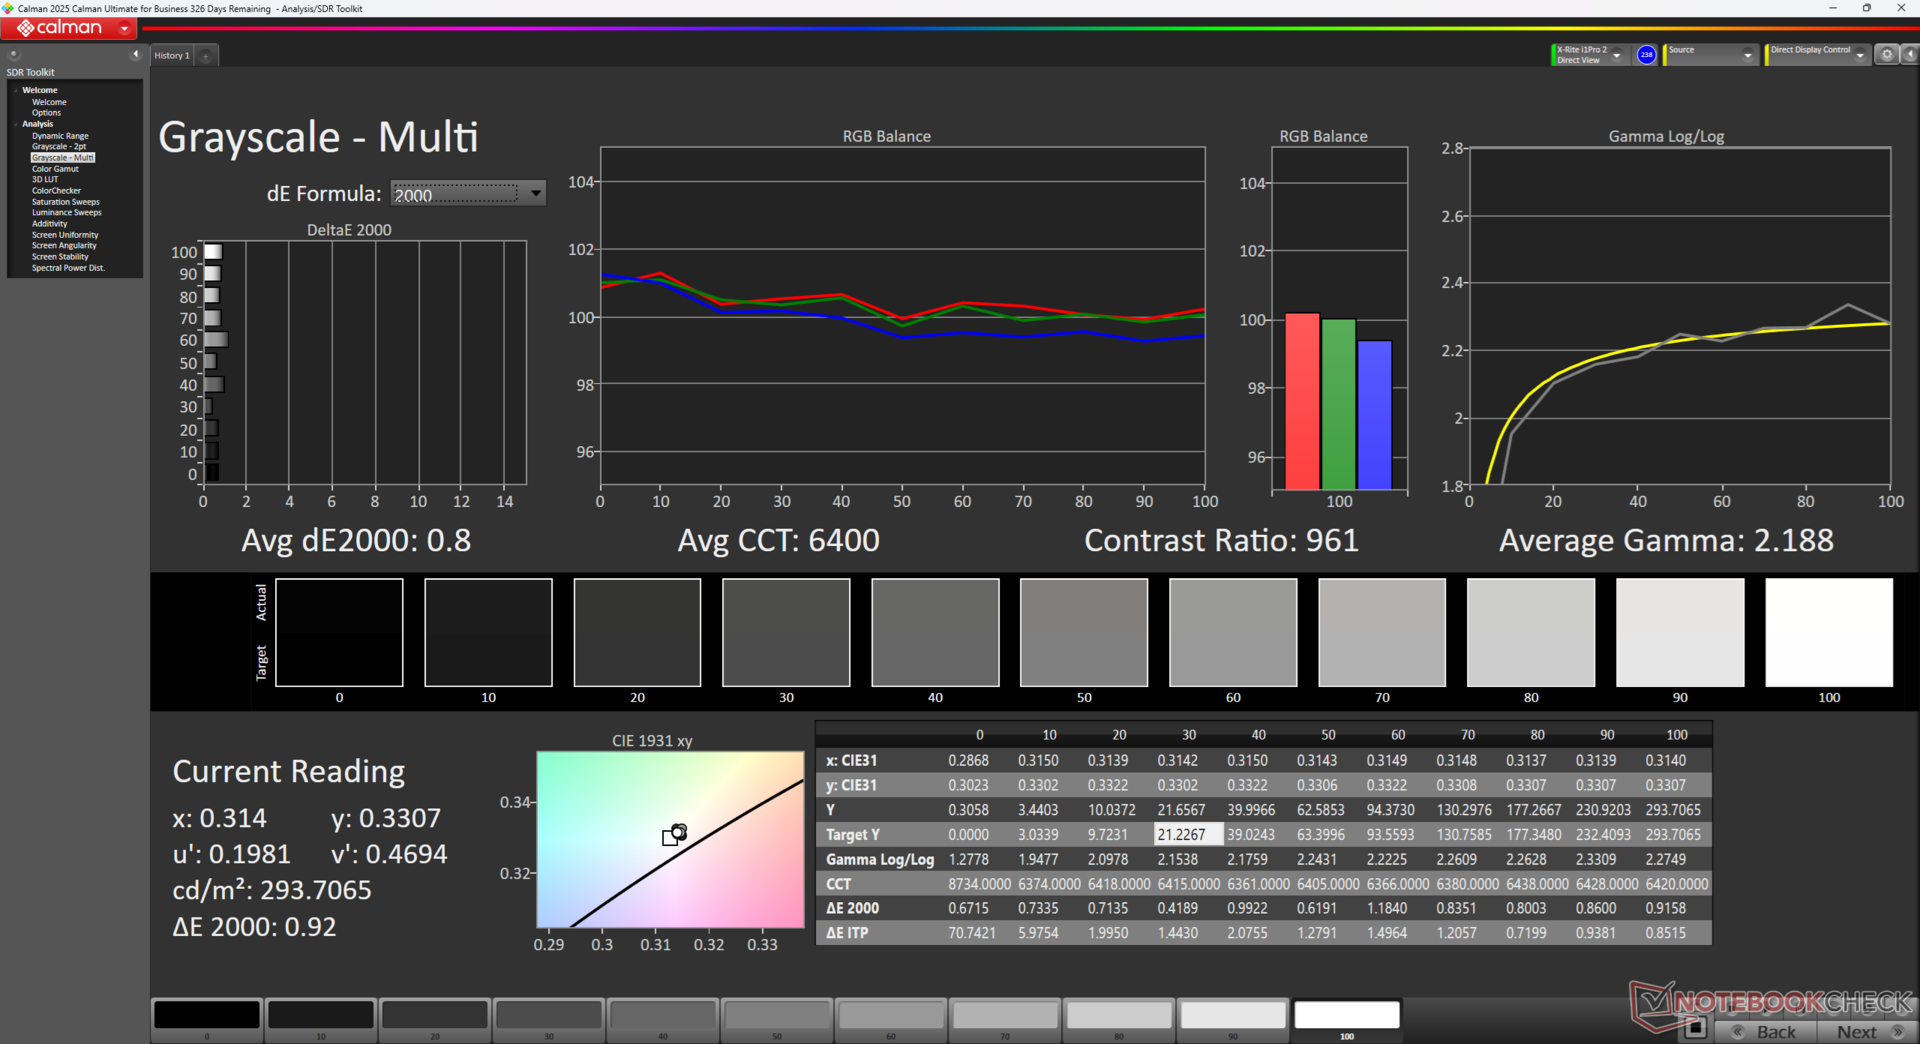
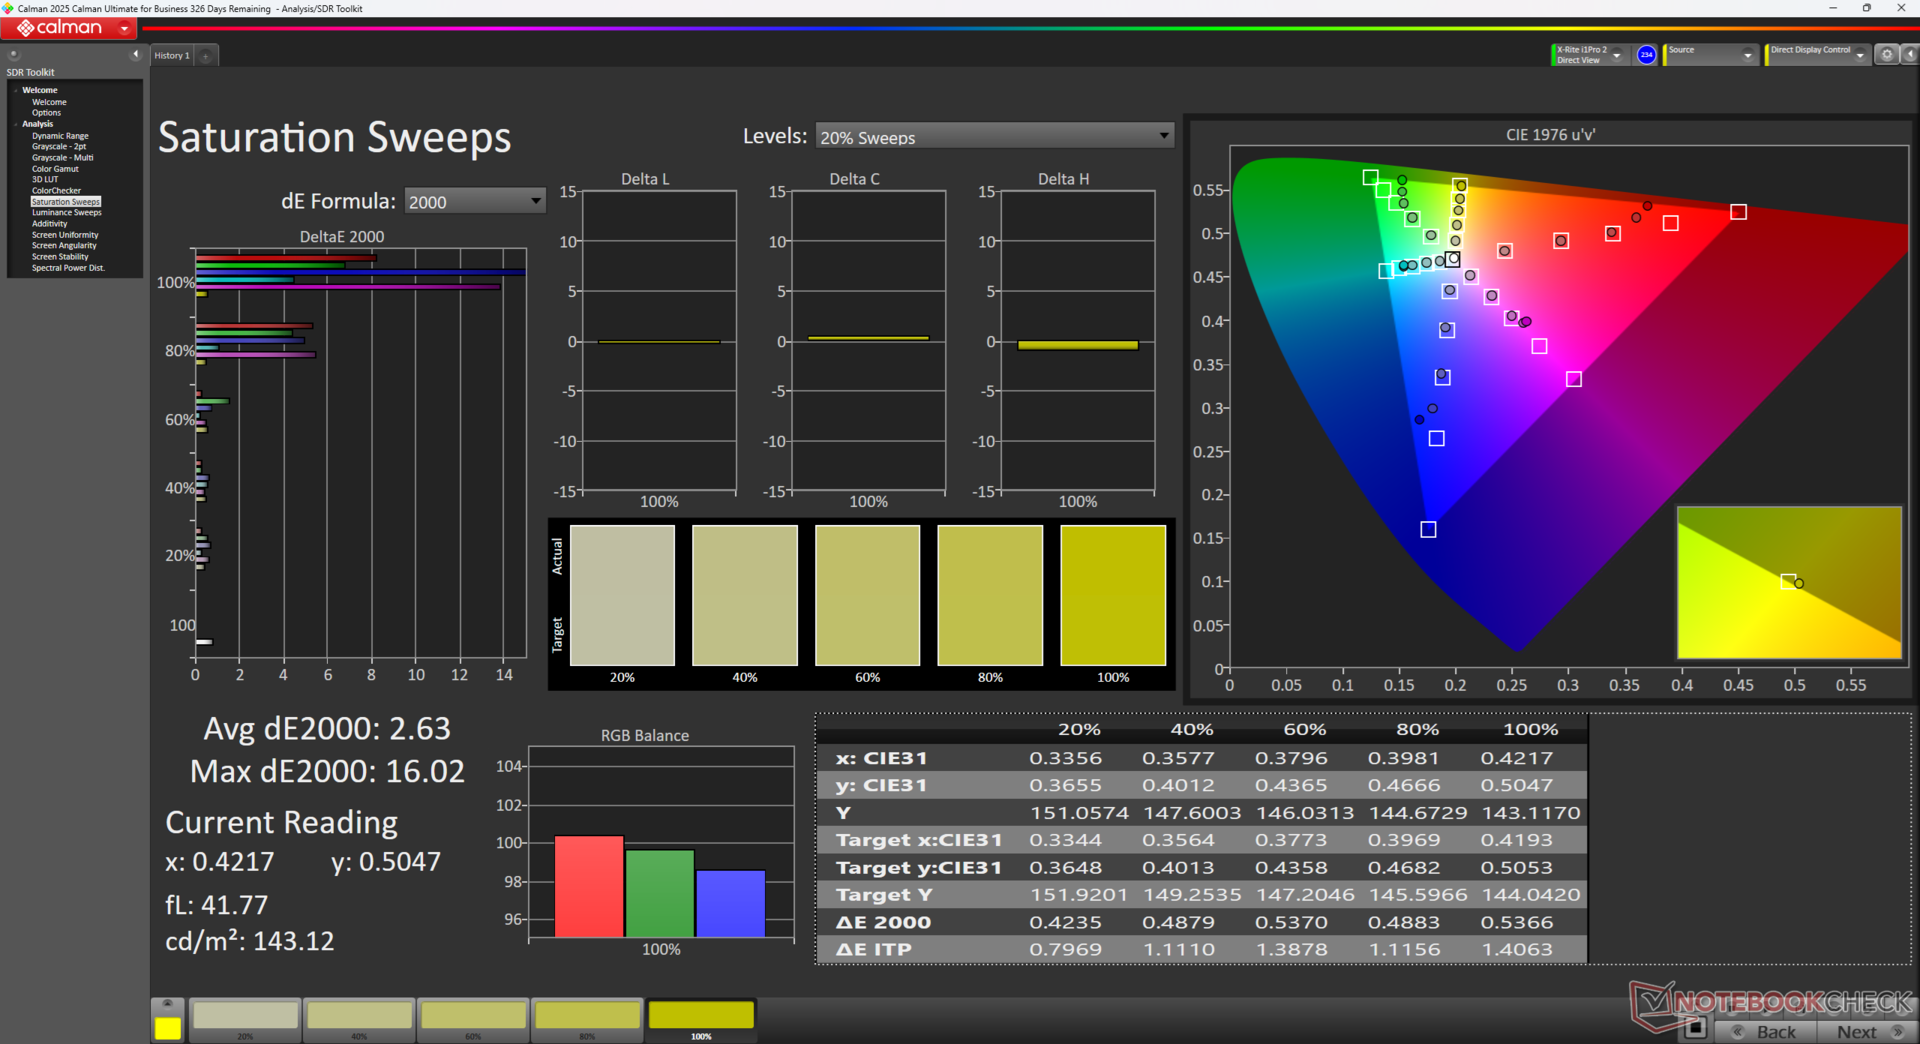
Os valores médios de deltaE em escala de cinza e de cores são decentes e saem da caixa com 4,1 e 6,09, respectivamente. Nossos próprios esforços de calibração com um colorímetro X-Rite melhorariam esses valores para apenas 0,8 e 2,63.

Exibir tempos de resposta
| ↔ Tempo de resposta preto para branco | ||
|---|---|---|
| 16.1 ms ... ascensão ↗ e queda ↘ combinadas | ↗ 8.2 ms ascensão | 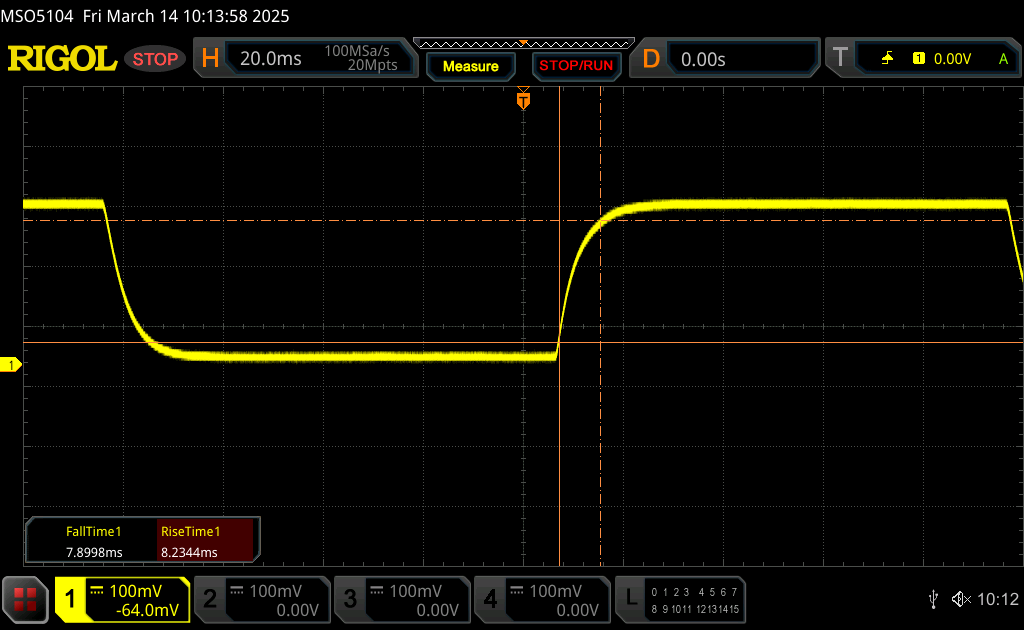 |
| ↘ 7.9 ms queda | ||
| A tela mostra boas taxas de resposta em nossos testes, mas pode ser muito lenta para jogadores competitivos. Em comparação, todos os dispositivos testados variam de 0.1 (mínimo) a 240 (máximo) ms. » 35 % de todos os dispositivos são melhores. Isso significa que o tempo de resposta medido é melhor que a média de todos os dispositivos testados (20.8 ms). | ||
| ↔ Tempo de resposta 50% cinza a 80% cinza | ||
| 22.9 ms ... ascensão ↗ e queda ↘ combinadas | ↗ 11.2 ms ascensão | 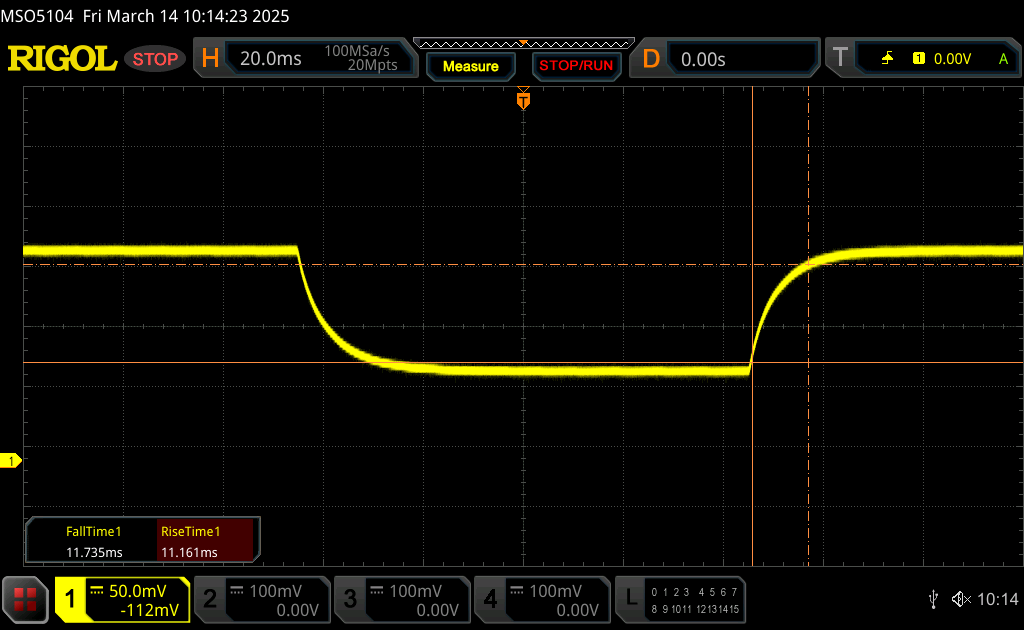 |
| ↘ 11.7 ms queda | ||
| A tela mostra boas taxas de resposta em nossos testes, mas pode ser muito lenta para jogadores competitivos. Em comparação, todos os dispositivos testados variam de 0.165 (mínimo) a 636 (máximo) ms. » 31 % de todos os dispositivos são melhores. Isso significa que o tempo de resposta medido é melhor que a média de todos os dispositivos testados (32.5 ms). | ||
Cintilação da tela / PWM (modulação por largura de pulso)
| Tela tremeluzindo / PWM não detectado | 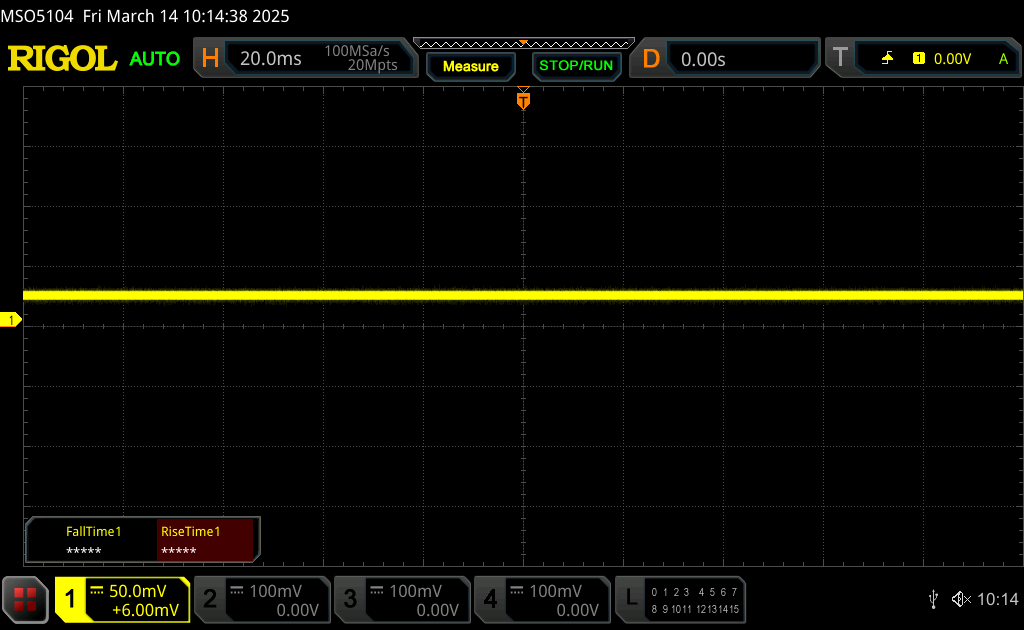 | ||
[pwm_comparison] Em comparação: 53 % de todos os dispositivos testados não usam PWM para escurecer a tela. Se PWM foi detectado, uma média de 8516 (mínimo: 5 - máximo: 343500) Hz foi medida. | |||

Desempenho - Sem melhorias notáveis

Condições de teste
Configuramos o Windows no modo Desempenho e o MyAsus no modo Desempenho e no modo Otimizado antes de executar os benchmarks abaixo. A GPU discreta pode ser completamente desativada sem a necessidade de reiniciar.
Processador
O Core 7 240H tem desempenho semelhante ao do Core Ultra 155H, embora sem a NPU integrada para economizar nos custos. É improvável que o público-alvo de jogadores ou editores econômicos precise ou use a NPU.
Cinebench R15 Multi Loop
Cinebench R23: Multi Core | Single Core
Cinebench R20: CPU (Multi Core) | CPU (Single Core)
Cinebench R15: CPU Multi 64Bit | CPU Single 64Bit
Blender: v2.79 BMW27 CPU
7-Zip 18.03: 7z b 4 | 7z b 4 -mmt1
Geekbench 6.4: Multi-Core | Single-Core
Geekbench 5.5: Multi-Core | Single-Core
HWBOT x265 Benchmark v2.2: 4k Preset
LibreOffice : 20 Documents To PDF
R Benchmark 2.5: Overall mean
| CPU Performance Rating | |
| Lenovo ThinkBook 16p G5 IRX 21N50011GE | |
| Asus TUF Gaming A16 FA608WV | |
| MSI Prestige 16 AI Evo B2HMG | |
| Lenovo ThinkPad Z16 Gen 2 | |
| Média Intel Core 7 240H | |
| Asus V16 V3607V | |
| HP Spectre x360 16 RTX 4050 -1! | |
| Acer Aspire 16 A16-51GM-77G2 | |
| Cinebench R23 / Multi Core | |
| Lenovo ThinkBook 16p G5 IRX 21N50011GE | |
| Asus TUF Gaming A16 FA608WV | |
| MSI Prestige 16 AI Evo B2HMG | |
| Lenovo ThinkPad Z16 Gen 2 | |
| HP Spectre x360 16 RTX 4050 | |
| Asus V16 V3607V | |
| Média Intel Core 7 240H (n=1) | |
| Acer Aspire 16 A16-51GM-77G2 | |
| Cinebench R23 / Single Core | |
| Lenovo ThinkBook 16p G5 IRX 21N50011GE | |
| MSI Prestige 16 AI Evo B2HMG | |
| Asus TUF Gaming A16 FA608WV | |
| Acer Aspire 16 A16-51GM-77G2 | |
| Asus V16 V3607V | |
| Média Intel Core 7 240H (n=1) | |
| Lenovo ThinkPad Z16 Gen 2 | |
| HP Spectre x360 16 RTX 4050 | |
| Cinebench R20 / CPU (Multi Core) | |
| Lenovo ThinkBook 16p G5 IRX 21N50011GE | |
| Asus TUF Gaming A16 FA608WV | |
| MSI Prestige 16 AI Evo B2HMG | |
| Lenovo ThinkPad Z16 Gen 2 | |
| Asus V16 V3607V | |
| Média Intel Core 7 240H (n=1) | |
| HP Spectre x360 16 RTX 4050 | |
| Acer Aspire 16 A16-51GM-77G2 | |
| Cinebench R20 / CPU (Single Core) | |
| Lenovo ThinkBook 16p G5 IRX 21N50011GE | |
| MSI Prestige 16 AI Evo B2HMG | |
| Asus TUF Gaming A16 FA608WV | |
| Acer Aspire 16 A16-51GM-77G2 | |
| Asus V16 V3607V | |
| Média Intel Core 7 240H (n=1) | |
| Lenovo ThinkPad Z16 Gen 2 | |
| HP Spectre x360 16 RTX 4050 | |
| Cinebench R15 / CPU Multi 64Bit | |
| Lenovo ThinkBook 16p G5 IRX 21N50011GE | |
| Asus TUF Gaming A16 FA608WV | |
| MSI Prestige 16 AI Evo B2HMG | |
| Lenovo ThinkPad Z16 Gen 2 | |
| Asus V16 V3607V | |
| Média Intel Core 7 240H (n=1) | |
| HP Spectre x360 16 RTX 4050 | |
| Acer Aspire 16 A16-51GM-77G2 | |
| Cinebench R15 / CPU Single 64Bit | |
| Lenovo ThinkBook 16p G5 IRX 21N50011GE | |
| MSI Prestige 16 AI Evo B2HMG | |
| Asus TUF Gaming A16 FA608WV | |
| Acer Aspire 16 A16-51GM-77G2 | |
| Lenovo ThinkPad Z16 Gen 2 | |
| Asus V16 V3607V | |
| Média Intel Core 7 240H (n=1) | |
| HP Spectre x360 16 RTX 4050 | |
| Blender / v2.79 BMW27 CPU | |
| Acer Aspire 16 A16-51GM-77G2 | |
| Asus V16 V3607V | |
| Média Intel Core 7 240H (n=1) | |
| MSI Prestige 16 AI Evo B2HMG | |
| Lenovo ThinkPad Z16 Gen 2 | |
| Asus TUF Gaming A16 FA608WV | |
| Lenovo ThinkBook 16p G5 IRX 21N50011GE | |
| 7-Zip 18.03 / 7z b 4 -mmt1 | |
| Lenovo ThinkBook 16p G5 IRX 21N50011GE | |
| Acer Aspire 16 A16-51GM-77G2 | |
| Lenovo ThinkPad Z16 Gen 2 | |
| Asus V16 V3607V | |
| Média Intel Core 7 240H (n=1) | |
| Asus TUF Gaming A16 FA608WV | |
| MSI Prestige 16 AI Evo B2HMG | |
| HP Spectre x360 16 RTX 4050 | |
| Geekbench 6.4 / Multi-Core | |
| Lenovo ThinkBook 16p G5 IRX 21N50011GE | |
| MSI Prestige 16 AI Evo B2HMG | |
| Asus TUF Gaming A16 FA608WV | |
| Lenovo ThinkPad Z16 Gen 2 | |
| Média Intel Core 7 240H (11285 - 12846, n=2) | |
| HP Spectre x360 16 RTX 4050 | |
| Asus V16 V3607V | |
| Acer Aspire 16 A16-51GM-77G2 | |
| Geekbench 6.4 / Single-Core | |
| Lenovo ThinkBook 16p G5 IRX 21N50011GE | |
| MSI Prestige 16 AI Evo B2HMG | |
| Asus TUF Gaming A16 FA608WV | |
| Acer Aspire 16 A16-51GM-77G2 | |
| Média Intel Core 7 240H (2646 - 2648, n=2) | |
| Asus V16 V3607V | |
| Lenovo ThinkPad Z16 Gen 2 | |
| HP Spectre x360 16 RTX 4050 | |
| Geekbench 5.5 / Multi-Core | |
| Lenovo ThinkBook 16p G5 IRX 21N50011GE | |
| MSI Prestige 16 AI Evo B2HMG | |
| Asus TUF Gaming A16 FA608WV | |
| HP Spectre x360 16 RTX 4050 | |
| Lenovo ThinkPad Z16 Gen 2 | |
| Asus V16 V3607V | |
| Média Intel Core 7 240H (n=1) | |
| Acer Aspire 16 A16-51GM-77G2 | |
| Geekbench 5.5 / Single-Core | |
| Lenovo ThinkBook 16p G5 IRX 21N50011GE | |
| Asus TUF Gaming A16 FA608WV | |
| MSI Prestige 16 AI Evo B2HMG | |
| Acer Aspire 16 A16-51GM-77G2 | |
| Lenovo ThinkPad Z16 Gen 2 | |
| Asus V16 V3607V | |
| Média Intel Core 7 240H (n=1) | |
| HP Spectre x360 16 RTX 4050 | |
| HWBOT x265 Benchmark v2.2 / 4k Preset | |
| Lenovo ThinkBook 16p G5 IRX 21N50011GE | |
| Asus TUF Gaming A16 FA608WV | |
| MSI Prestige 16 AI Evo B2HMG | |
| Lenovo ThinkPad Z16 Gen 2 | |
| Asus V16 V3607V | |
| Média Intel Core 7 240H (n=1) | |
| HP Spectre x360 16 RTX 4050 | |
| Acer Aspire 16 A16-51GM-77G2 | |
| LibreOffice / 20 Documents To PDF | |
| Asus V16 V3607V | |
| Média Intel Core 7 240H (n=1) | |
| Asus TUF Gaming A16 FA608WV | |
| Lenovo ThinkPad Z16 Gen 2 | |
| Lenovo ThinkBook 16p G5 IRX 21N50011GE | |
| HP Spectre x360 16 RTX 4050 | |
| MSI Prestige 16 AI Evo B2HMG | |
| Acer Aspire 16 A16-51GM-77G2 | |
| R Benchmark 2.5 / Overall mean | |
| HP Spectre x360 16 RTX 4050 | |
| Lenovo ThinkPad Z16 Gen 2 | |
| Acer Aspire 16 A16-51GM-77G2 | |
| MSI Prestige 16 AI Evo B2HMG | |
| Asus V16 V3607V | |
| Média Intel Core 7 240H (n=1) | |
| Asus TUF Gaming A16 FA608WV | |
| Lenovo ThinkBook 16p G5 IRX 21N50011GE | |
* ... menor é melhor
AIDA64: FP32 Ray-Trace | FPU Julia | CPU SHA3 | CPU Queen | FPU SinJulia | FPU Mandel | CPU AES | CPU ZLib | FP64 Ray-Trace | CPU PhotoWorxx
| Performance Rating | |
| Asus VivoBook Pro 16 K6602VU | |
| HP Pavilion Plus 16-ab0456tx | |
| Dell Inspiron 16 Plus 7640 | |
| Acer Swift Edge 16 SFE16-44-R0XV | |
| Asus V16 V3607V | |
| Média Intel Core 7 240H | |
| Lenovo ThinkBook 16 G7 IML | |
| AIDA64 / FP32 Ray-Trace | |
| Acer Swift Edge 16 SFE16-44-R0XV | |
| HP Pavilion Plus 16-ab0456tx | |
| Dell Inspiron 16 Plus 7640 | |
| Asus V16 V3607V | |
| Média Intel Core 7 240H (n=1) | |
| Asus VivoBook Pro 16 K6602VU | |
| Lenovo ThinkBook 16 G7 IML | |
| AIDA64 / FPU Julia | |
| HP Pavilion Plus 16-ab0456tx | |
| Asus VivoBook Pro 16 K6602VU | |
| Dell Inspiron 16 Plus 7640 | |
| Acer Swift Edge 16 SFE16-44-R0XV | |
| Asus V16 V3607V | |
| Média Intel Core 7 240H (n=1) | |
| Lenovo ThinkBook 16 G7 IML | |
| AIDA64 / CPU SHA3 | |
| HP Pavilion Plus 16-ab0456tx | |
| Dell Inspiron 16 Plus 7640 | |
| Asus VivoBook Pro 16 K6602VU | |
| Acer Swift Edge 16 SFE16-44-R0XV | |
| Asus V16 V3607V | |
| Média Intel Core 7 240H (n=1) | |
| Lenovo ThinkBook 16 G7 IML | |
| AIDA64 / CPU Queen | |
| HP Pavilion Plus 16-ab0456tx | |
| Asus VivoBook Pro 16 K6602VU | |
| Dell Inspiron 16 Plus 7640 | |
| Acer Swift Edge 16 SFE16-44-R0XV | |
| Asus V16 V3607V | |
| Média Intel Core 7 240H (n=1) | |
| Lenovo ThinkBook 16 G7 IML | |
| AIDA64 / FPU SinJulia | |
| Acer Swift Edge 16 SFE16-44-R0XV | |
| Dell Inspiron 16 Plus 7640 | |
| HP Pavilion Plus 16-ab0456tx | |
| Asus VivoBook Pro 16 K6602VU | |
| Asus V16 V3607V | |
| Média Intel Core 7 240H (n=1) | |
| Lenovo ThinkBook 16 G7 IML | |
| AIDA64 / FPU Mandel | |
| Acer Swift Edge 16 SFE16-44-R0XV | |
| HP Pavilion Plus 16-ab0456tx | |
| Dell Inspiron 16 Plus 7640 | |
| Asus VivoBook Pro 16 K6602VU | |
| Asus V16 V3607V | |
| Média Intel Core 7 240H (n=1) | |
| Lenovo ThinkBook 16 G7 IML | |
| AIDA64 / CPU AES | |
| Asus VivoBook Pro 16 K6602VU | |
| Dell Inspiron 16 Plus 7640 | |
| HP Pavilion Plus 16-ab0456tx | |
| Acer Swift Edge 16 SFE16-44-R0XV | |
| Asus V16 V3607V | |
| Média Intel Core 7 240H (n=1) | |
| Lenovo ThinkBook 16 G7 IML | |
| AIDA64 / CPU ZLib | |
| Dell Inspiron 16 Plus 7640 | |
| HP Pavilion Plus 16-ab0456tx | |
| Asus VivoBook Pro 16 K6602VU | |
| Asus V16 V3607V | |
| Média Intel Core 7 240H (n=1) | |
| Lenovo ThinkBook 16 G7 IML | |
| Acer Swift Edge 16 SFE16-44-R0XV | |
| AIDA64 / FP64 Ray-Trace | |
| Acer Swift Edge 16 SFE16-44-R0XV | |
| HP Pavilion Plus 16-ab0456tx | |
| Asus VivoBook Pro 16 K6602VU | |
| Dell Inspiron 16 Plus 7640 | |
| Asus V16 V3607V | |
| Média Intel Core 7 240H (n=1) | |
| Lenovo ThinkBook 16 G7 IML | |
| AIDA64 / CPU PhotoWorxx | |
| HP Pavilion Plus 16-ab0456tx | |
| Dell Inspiron 16 Plus 7640 | |
| Asus VivoBook Pro 16 K6602VU | |
| Acer Swift Edge 16 SFE16-44-R0XV | |
| Lenovo ThinkBook 16 G7 IML | |
| Asus V16 V3607V | |
| Média Intel Core 7 240H (n=1) | |
Teste de estresse
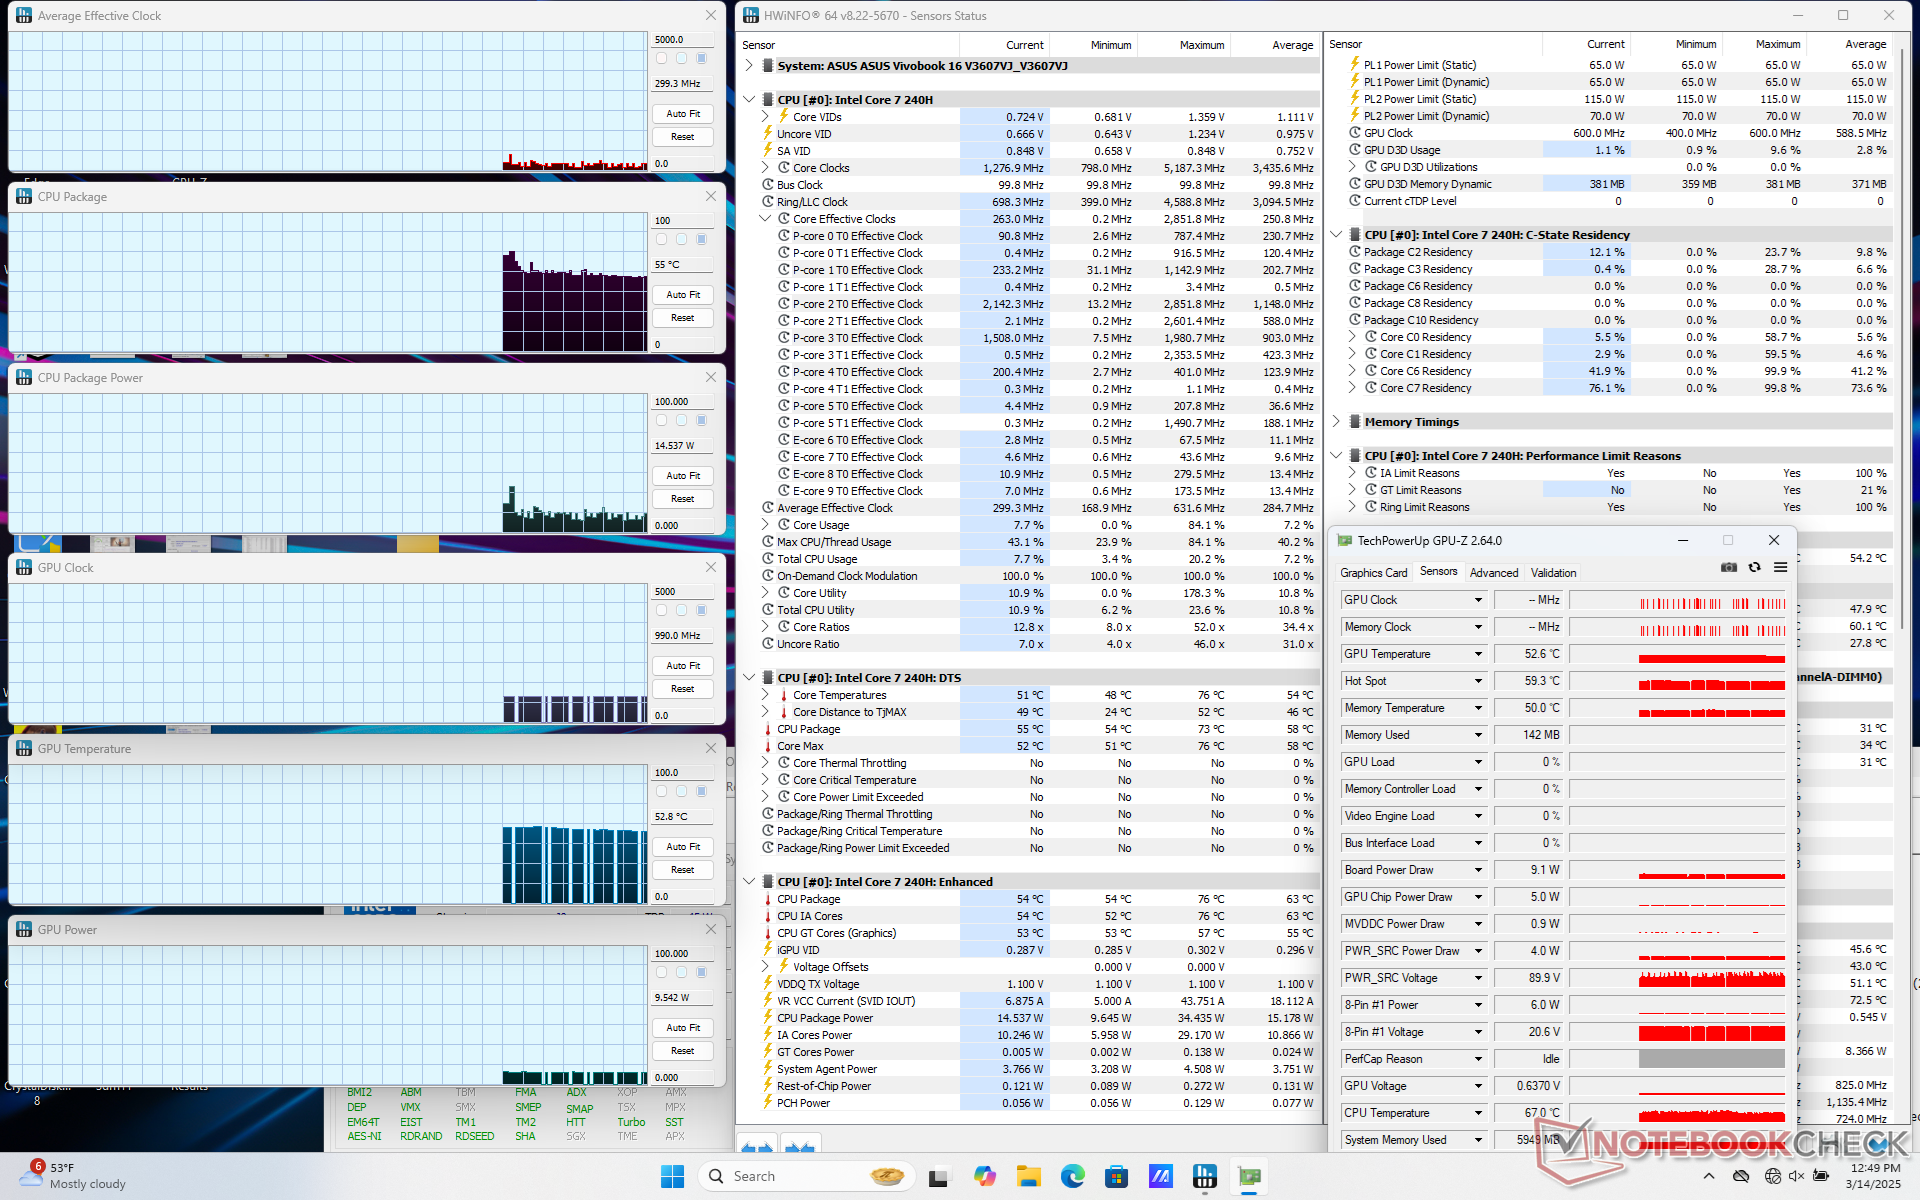
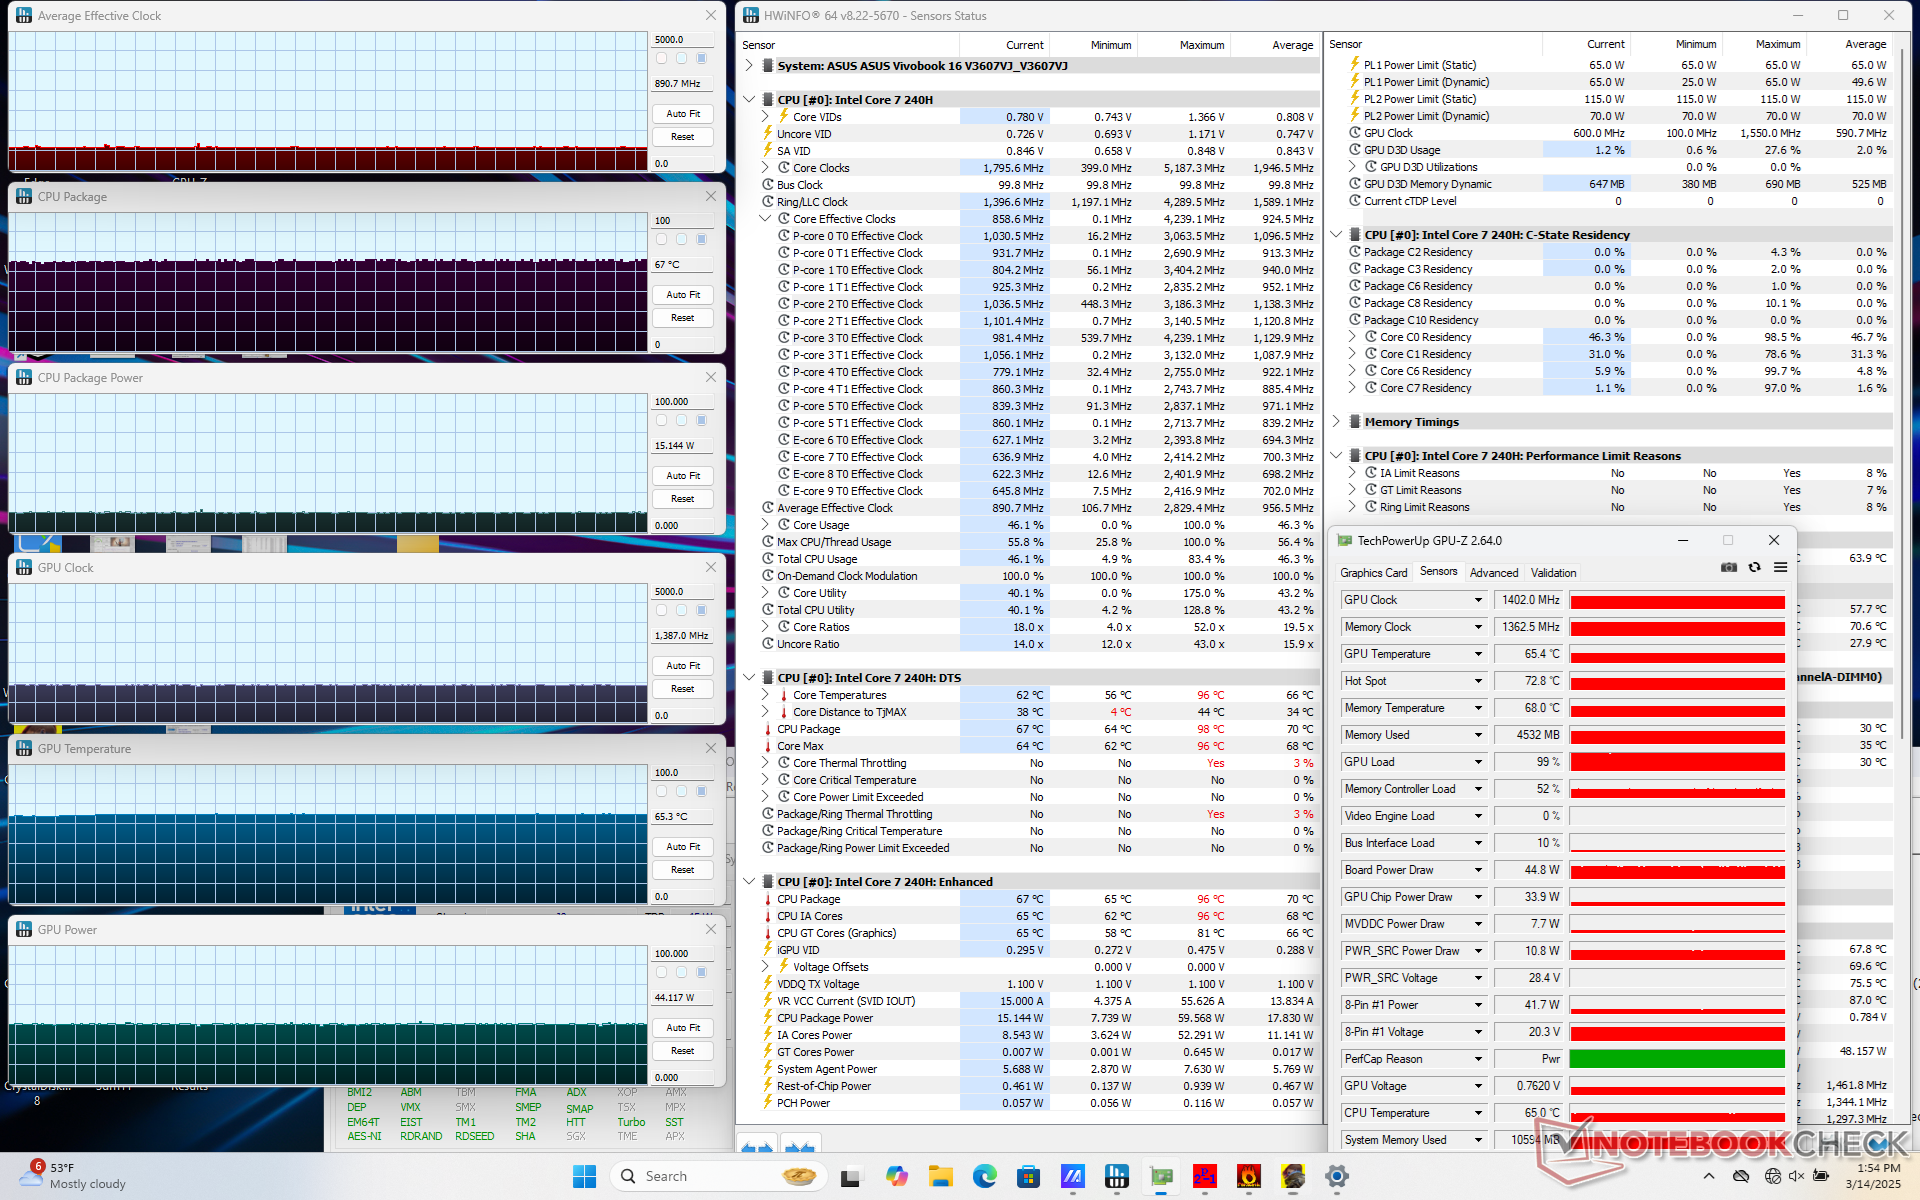
A CPU atingia um pico de 3,9 GHz e 71 W, com duração de apenas um minuto ou mais, até atingir uma temperatura de núcleo de 94 C. Em seguida, ela reduzia para 2,4 GHz e 33 W antes de voltar para ~3,1 GHz e 50 W.
O desempenho em jogos também cairia um pouco se fosse executado no modo Balanced/Standard em vez do modo Performance. O modo "Full-speed" também está disponível no MyAsus, mas não oferece benefícios de desempenho em relação ao modo Performance em nossos testes.
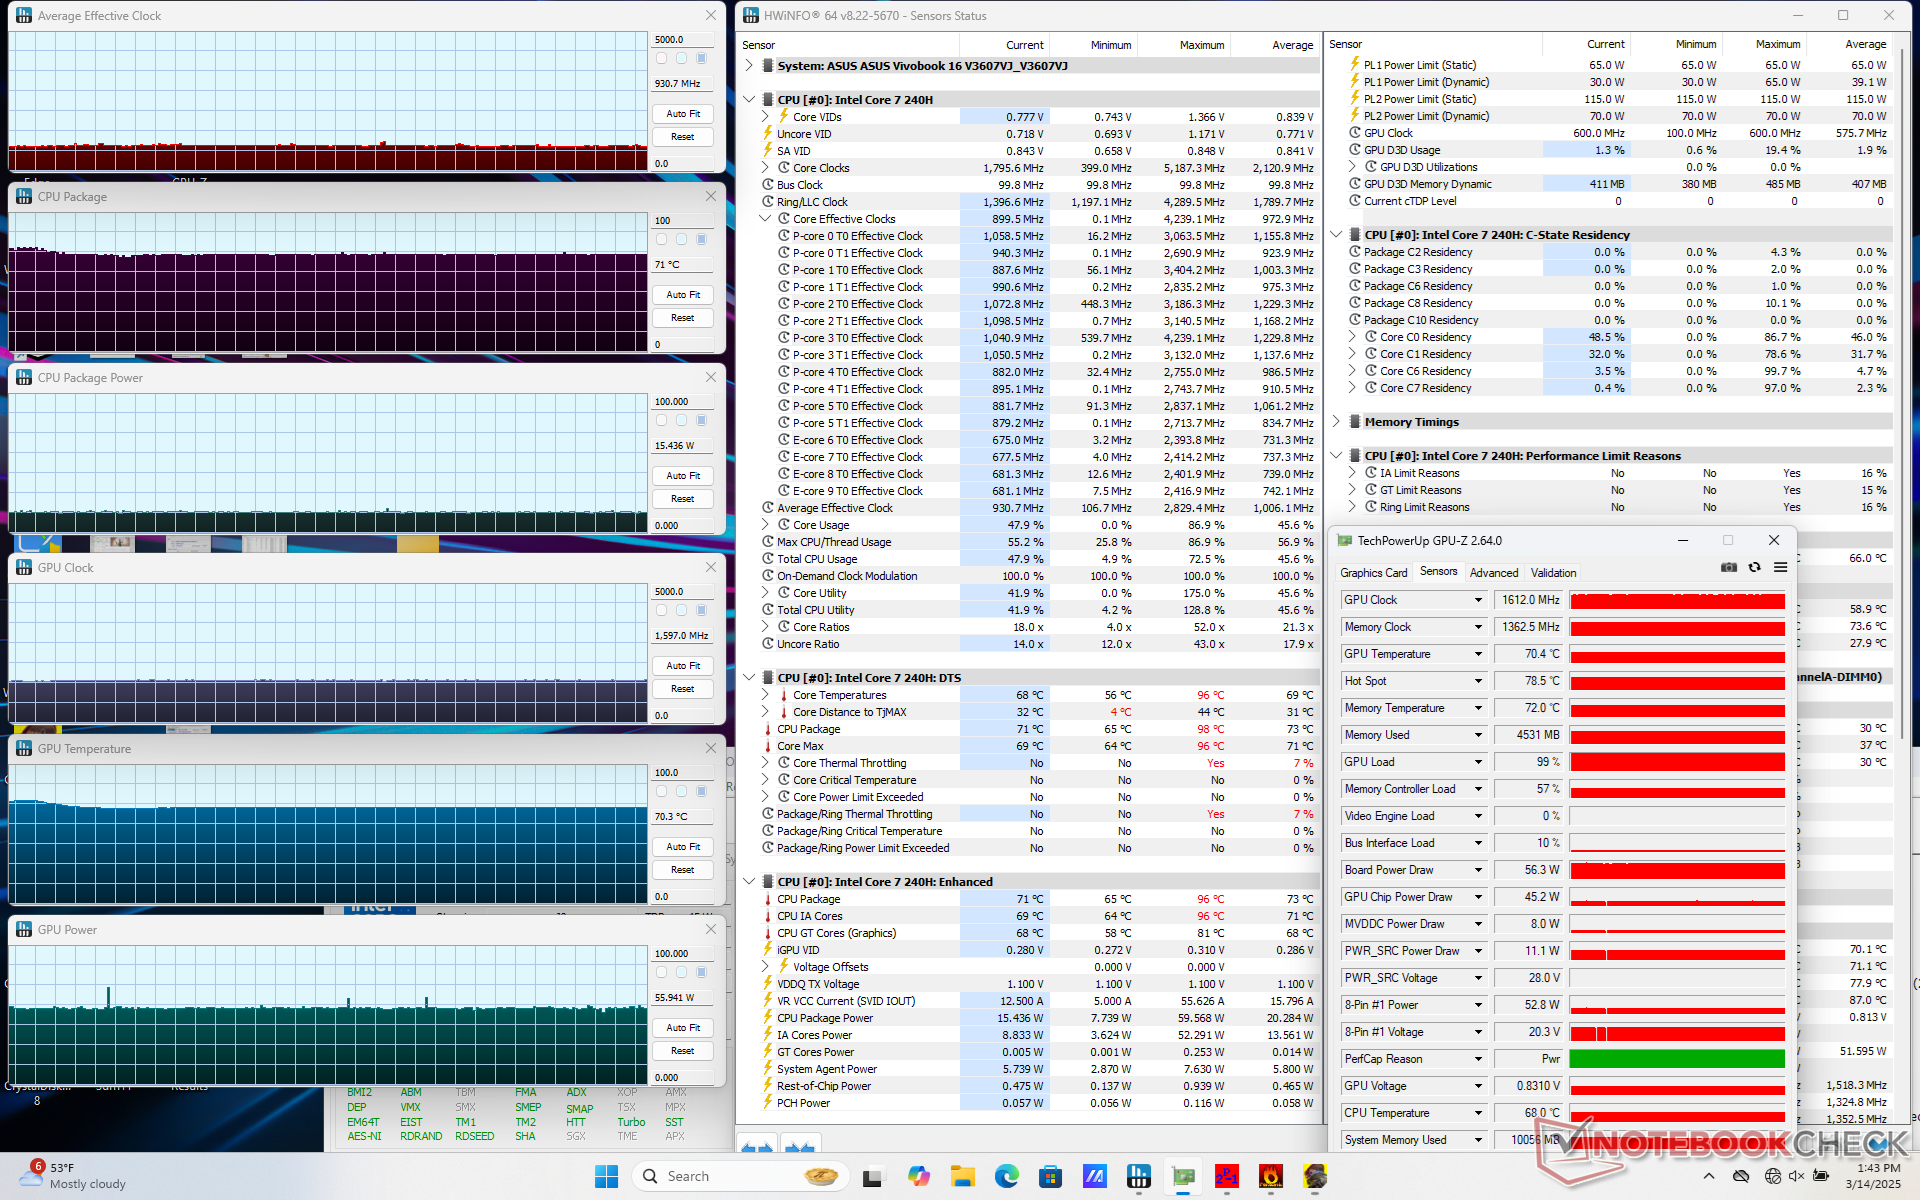
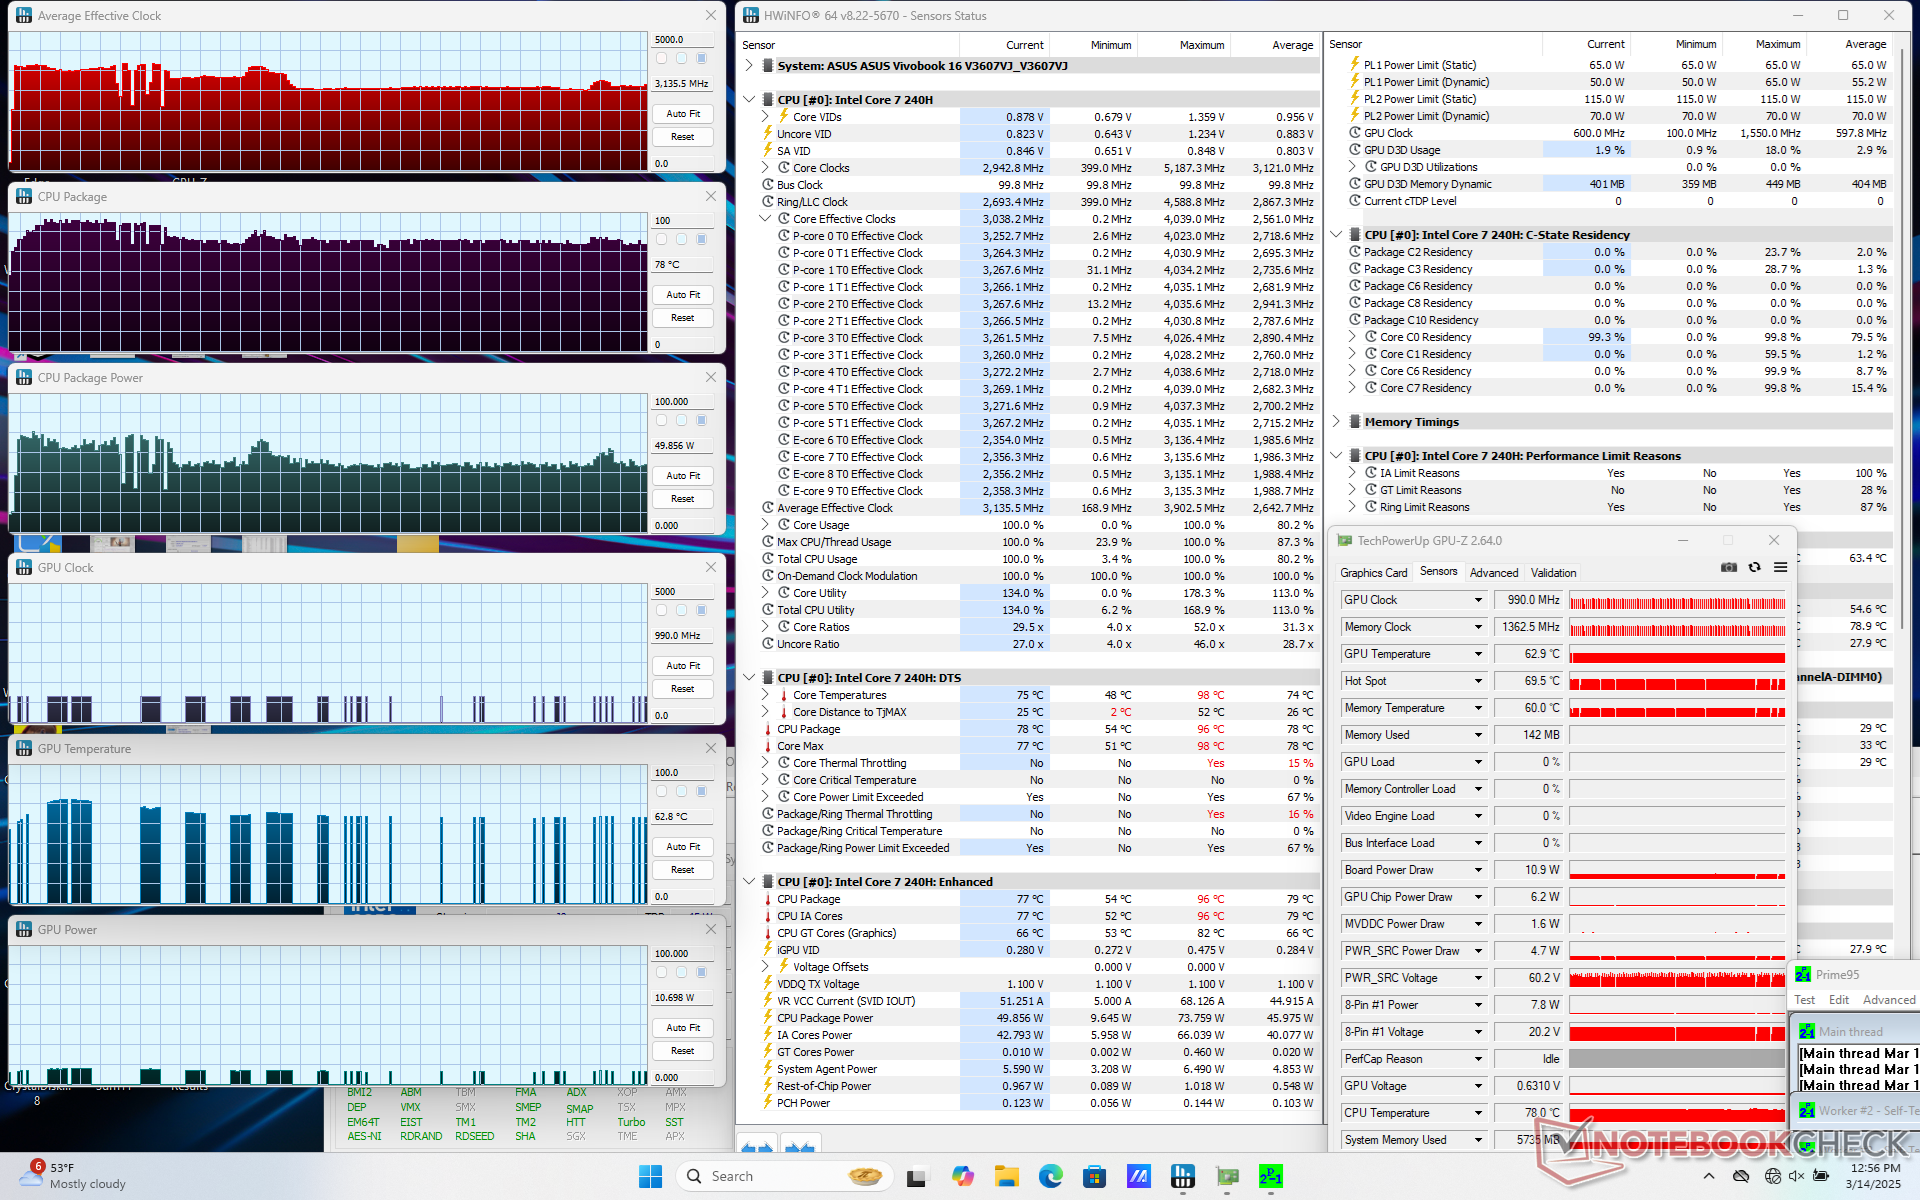
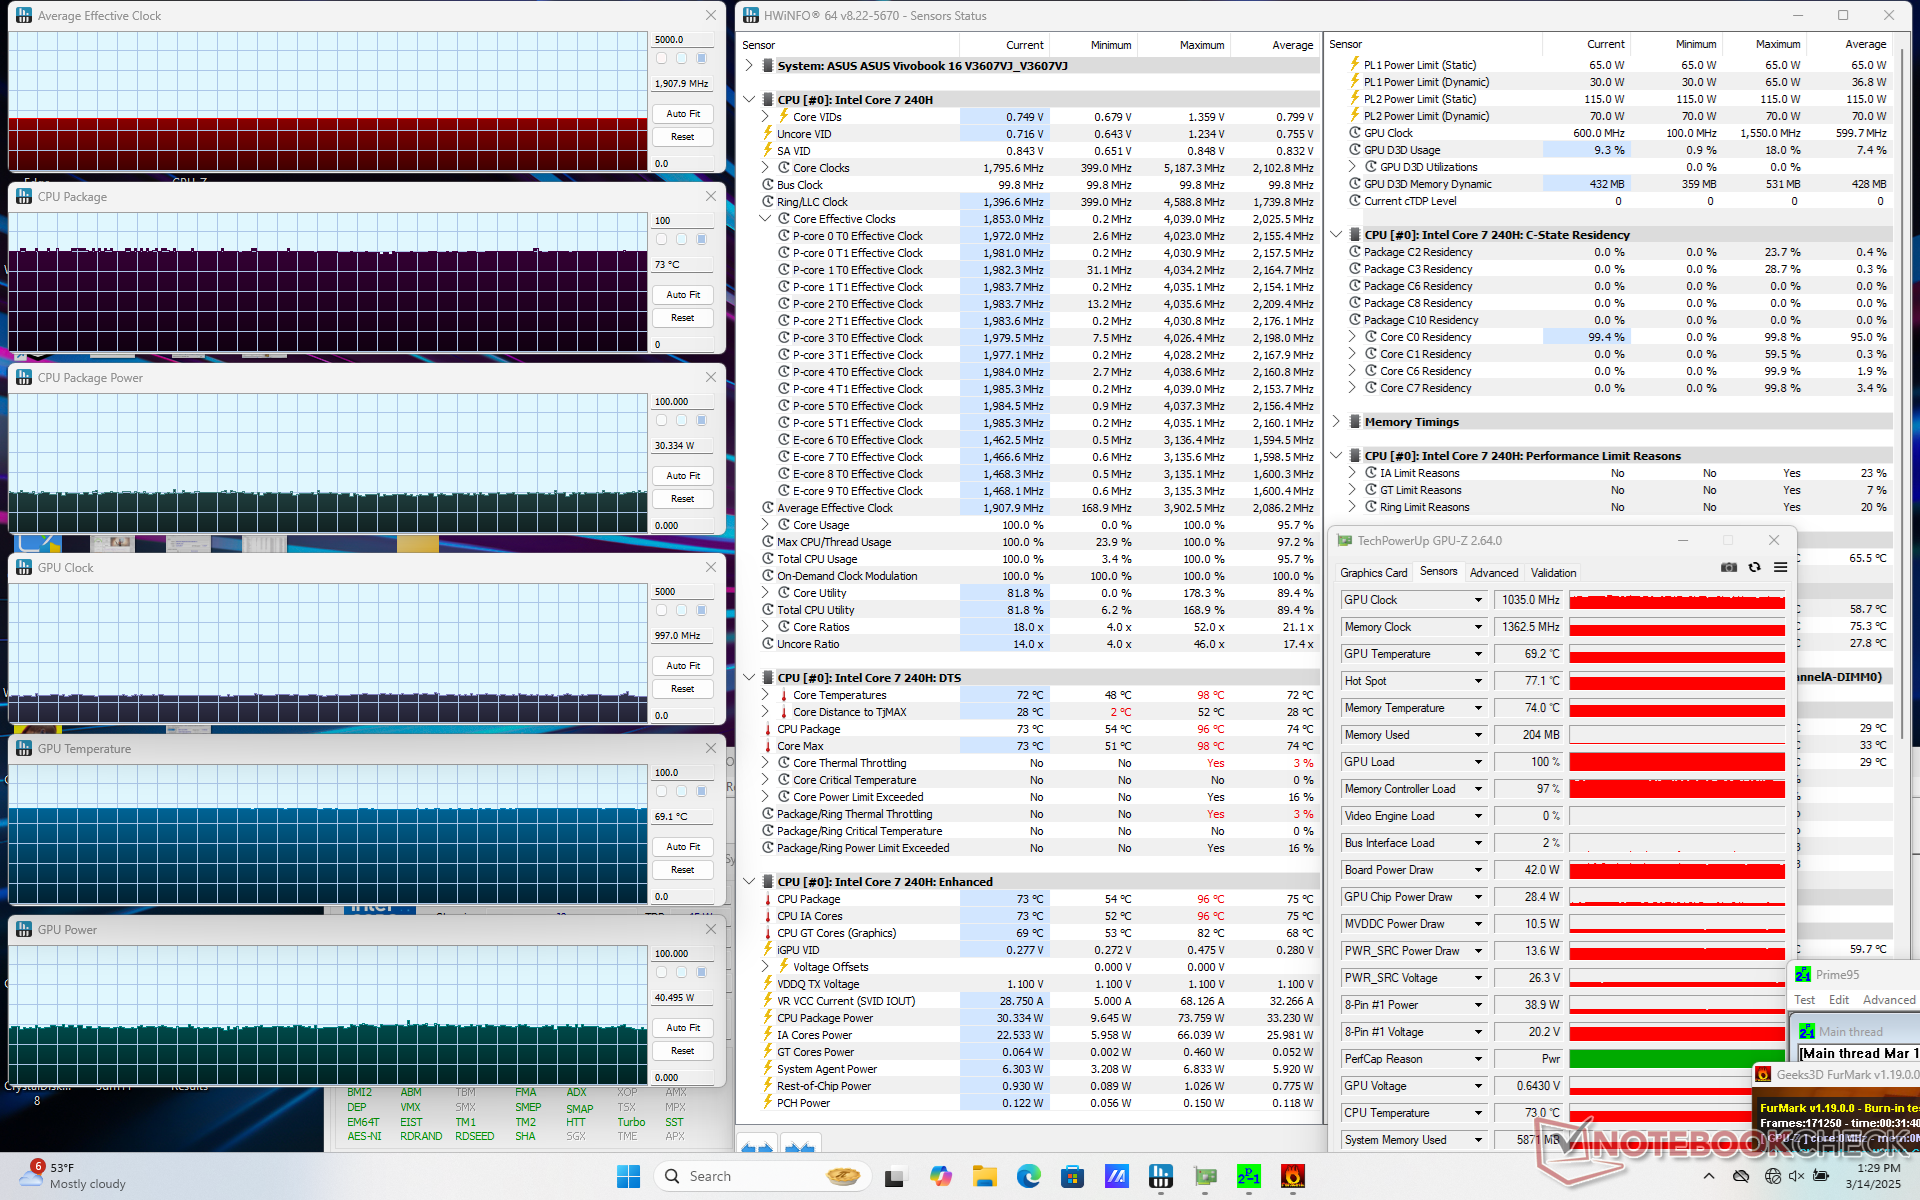
| Clock médio da CPU (GHz) | Clock da GPU (MHz) | Temperatura média da CPU (°C) | Temperatura média da GPU (°C) | |
| Sistema ocioso | -- | -- | 55 | 53 |
| Estresse do Prime95 | 3.1 | -- | 78 | 63 |
| Estresse Prime95 + FurMark | 1.9 | 1035 | 73 | 69 |
| Cyberpunk 2077 Stress (Modo de desempenho) | 0.9 | 1612 | 71 | 70 |
| Estresse do Cyberpunk 2077 (modo balanceado) | 0,9 | 1402 | 67 | 65 |
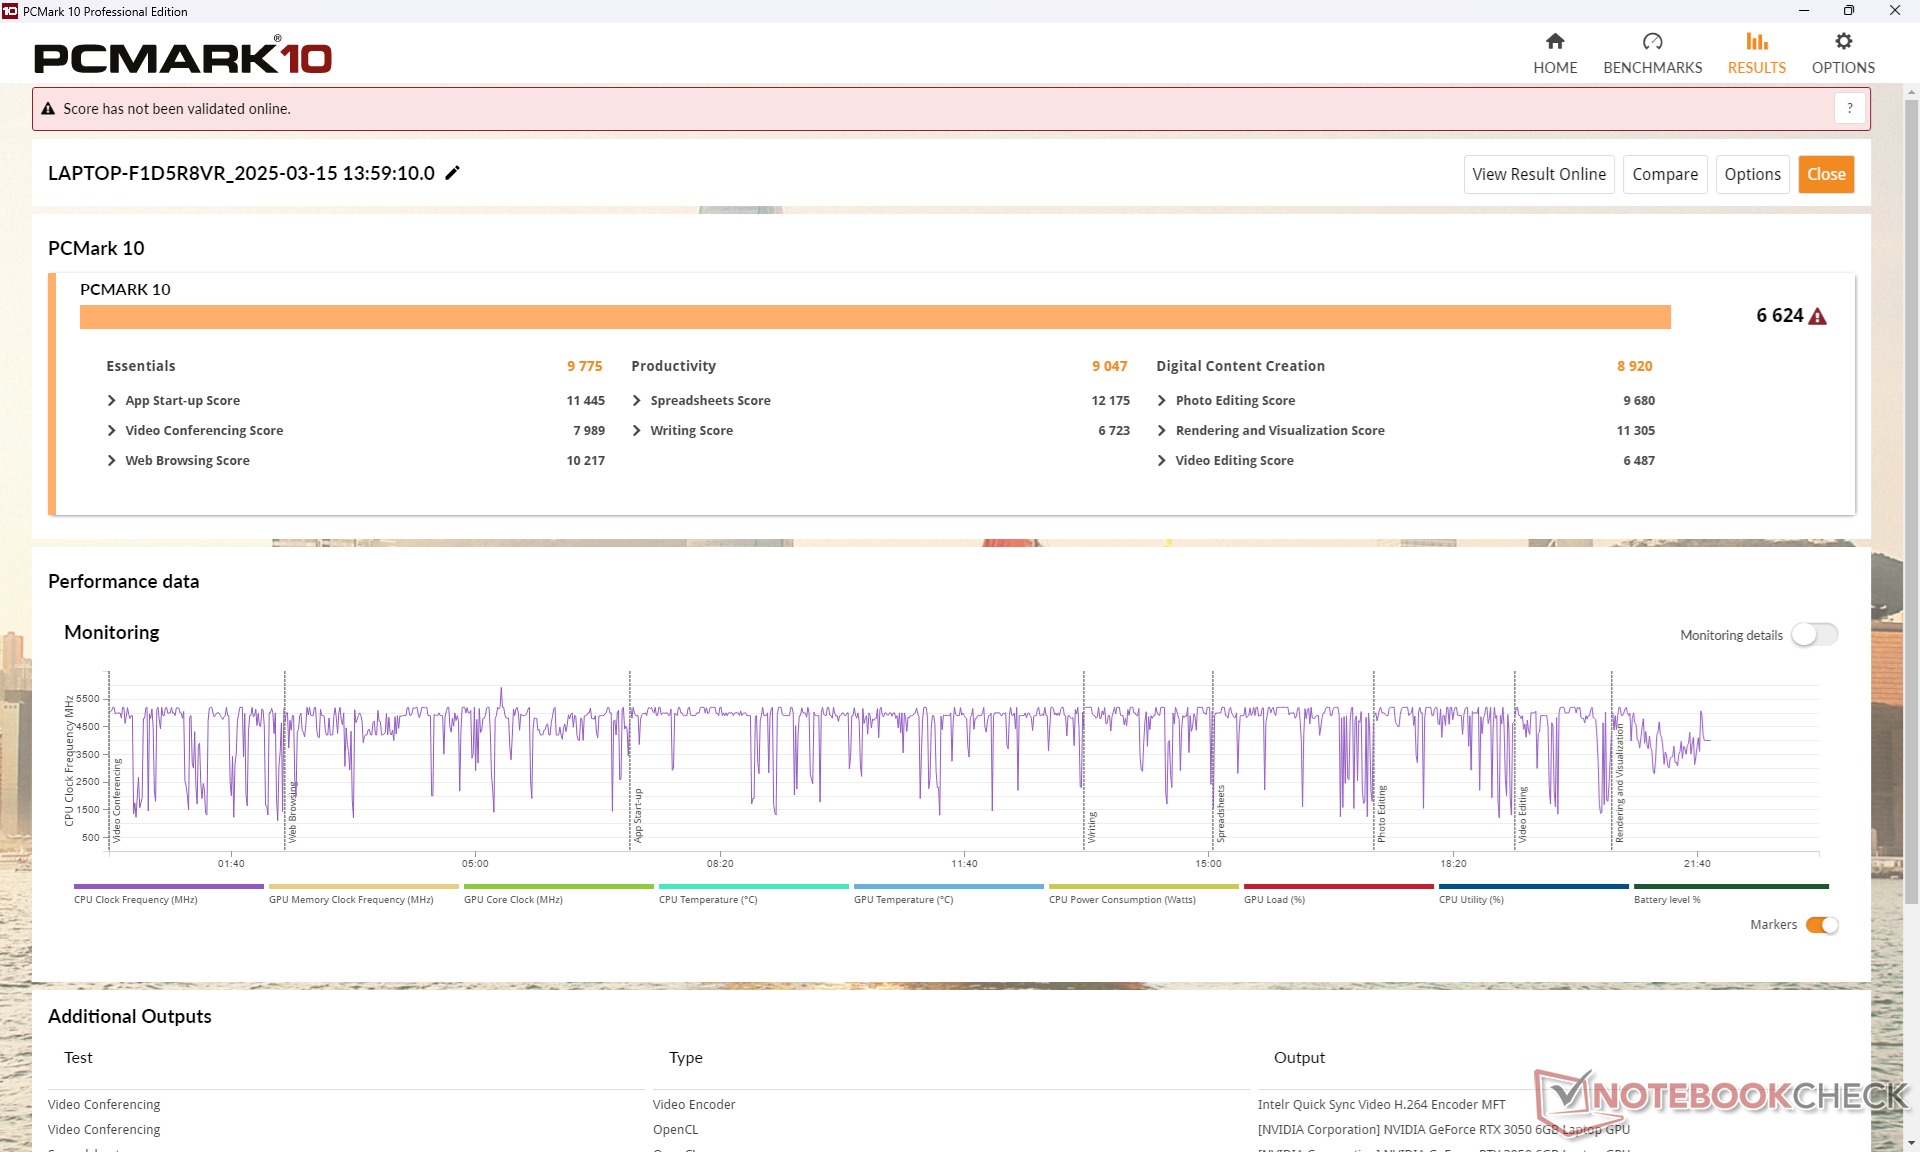
Desempenho do sistema
CrossMark: Overall | Productivity | Creativity | Responsiveness
WebXPRT 3: Overall
WebXPRT 4: Overall
Mozilla Kraken 1.1: Total
| PCMark 10 / Score | |
| Asus VivoBook Pro 16 K6602VU | |
| Dell Inspiron 16 Plus 7640 | |
| Asus V16 V3607V | |
| Média Intel Core 7 240H, NVIDIA GeForce RTX 3050 6GB Laptop GPU (n=1) | |
| HP Pavilion Plus 16-ab0456tx | |
| Acer Swift Edge 16 SFE16-44-R0XV | |
| Lenovo ThinkBook 16 G7 IML | |
| PCMark 10 / Essentials | |
| Dell Inspiron 16 Plus 7640 | |
| Asus VivoBook Pro 16 K6602VU | |
| Acer Swift Edge 16 SFE16-44-R0XV | |
| HP Pavilion Plus 16-ab0456tx | |
| Lenovo ThinkBook 16 G7 IML | |
| Asus V16 V3607V | |
| Média Intel Core 7 240H, NVIDIA GeForce RTX 3050 6GB Laptop GPU (n=1) | |
| PCMark 10 / Productivity | |
| Acer Swift Edge 16 SFE16-44-R0XV | |
| Asus V16 V3607V | |
| Média Intel Core 7 240H, NVIDIA GeForce RTX 3050 6GB Laptop GPU (n=1) | |
| HP Pavilion Plus 16-ab0456tx | |
| Asus VivoBook Pro 16 K6602VU | |
| Dell Inspiron 16 Plus 7640 | |
| Lenovo ThinkBook 16 G7 IML | |
| PCMark 10 / Digital Content Creation | |
| Dell Inspiron 16 Plus 7640 | |
| Asus VivoBook Pro 16 K6602VU | |
| Asus V16 V3607V | |
| Média Intel Core 7 240H, NVIDIA GeForce RTX 3050 6GB Laptop GPU (n=1) | |
| HP Pavilion Plus 16-ab0456tx | |
| Acer Swift Edge 16 SFE16-44-R0XV | |
| Lenovo ThinkBook 16 G7 IML | |
| CrossMark / Overall | |
| Asus V16 V3607V | |
| Média Intel Core 7 240H, NVIDIA GeForce RTX 3050 6GB Laptop GPU (n=1) | |
| HP Pavilion Plus 16-ab0456tx | |
| Asus VivoBook Pro 16 K6602VU | |
| Dell Inspiron 16 Plus 7640 | |
| Lenovo ThinkBook 16 G7 IML | |
| CrossMark / Productivity | |
| Asus V16 V3607V | |
| Média Intel Core 7 240H, NVIDIA GeForce RTX 3050 6GB Laptop GPU (n=1) | |
| Asus VivoBook Pro 16 K6602VU | |
| HP Pavilion Plus 16-ab0456tx | |
| Dell Inspiron 16 Plus 7640 | |
| Lenovo ThinkBook 16 G7 IML | |
| CrossMark / Creativity | |
| HP Pavilion Plus 16-ab0456tx | |
| Asus V16 V3607V | |
| Média Intel Core 7 240H, NVIDIA GeForce RTX 3050 6GB Laptop GPU (n=1) | |
| Dell Inspiron 16 Plus 7640 | |
| Asus VivoBook Pro 16 K6602VU | |
| Lenovo ThinkBook 16 G7 IML | |
| CrossMark / Responsiveness | |
| Asus V16 V3607V | |
| Média Intel Core 7 240H, NVIDIA GeForce RTX 3050 6GB Laptop GPU (n=1) | |
| Asus VivoBook Pro 16 K6602VU | |
| HP Pavilion Plus 16-ab0456tx | |
| Dell Inspiron 16 Plus 7640 | |
| Lenovo ThinkBook 16 G7 IML | |
| WebXPRT 3 / Overall | |
| Dell Inspiron 16 Plus 7640 | |
| HP Pavilion Plus 16-ab0456tx | |
| Acer Swift Edge 16 SFE16-44-R0XV | |
| Acer Swift Edge 16 SFE16-44-R0XV | |
| Lenovo ThinkBook 16 G7 IML | |
| WebXPRT 4 / Overall | |
| Asus V16 V3607V | |
| Média Intel Core 7 240H, NVIDIA GeForce RTX 3050 6GB Laptop GPU (n=1) | |
| HP Pavilion Plus 16-ab0456tx | |
| Dell Inspiron 16 Plus 7640 | |
| Acer Swift Edge 16 SFE16-44-R0XV | |
| Asus VivoBook Pro 16 K6602VU | |
| Lenovo ThinkBook 16 G7 IML | |
| Mozilla Kraken 1.1 / Total | |
| Lenovo ThinkBook 16 G7 IML | |
| Acer Swift Edge 16 SFE16-44-R0XV | |
| Acer Swift Edge 16 SFE16-44-R0XV | |
| Asus VivoBook Pro 16 K6602VU | |
| Dell Inspiron 16 Plus 7640 | |
| Asus V16 V3607V | |
| Média Intel Core 7 240H, NVIDIA GeForce RTX 3050 6GB Laptop GPU (n=1) | |
| HP Pavilion Plus 16-ab0456tx | |
* ... menor é melhor
| PCMark 10 Score | 6624 pontos | |
Ajuda | ||
| AIDA64 / Memory Copy | |
| Acer Swift Edge 16 SFE16-44-R0XV | |
| HP Pavilion Plus 16-ab0456tx | |
| Dell Inspiron 16 Plus 7640 | |
| Asus VivoBook Pro 16 K6602VU | |
| Lenovo ThinkBook 16 G7 IML | |
| Asus V16 V3607V | |
| Média Intel Core 7 240H (n=1) | |
| AIDA64 / Memory Read | |
| Dell Inspiron 16 Plus 7640 | |
| Asus VivoBook Pro 16 K6602VU | |
| HP Pavilion Plus 16-ab0456tx | |
| Acer Swift Edge 16 SFE16-44-R0XV | |
| Asus V16 V3607V | |
| Média Intel Core 7 240H (n=1) | |
| Lenovo ThinkBook 16 G7 IML | |
| AIDA64 / Memory Write | |
| Acer Swift Edge 16 SFE16-44-R0XV | |
| HP Pavilion Plus 16-ab0456tx | |
| Dell Inspiron 16 Plus 7640 | |
| Asus VivoBook Pro 16 K6602VU | |
| Lenovo ThinkBook 16 G7 IML | |
| Asus V16 V3607V | |
| Média Intel Core 7 240H (n=1) | |
| AIDA64 / Memory Latency | |
| Lenovo ThinkBook 16 G7 IML | |
| Dell Inspiron 16 Plus 7640 | |
| Acer Swift Edge 16 SFE16-44-R0XV | |
| Asus V16 V3607V | |
| Média Intel Core 7 240H (n=1) | |
| Asus VivoBook Pro 16 K6602VU | |
| HP Pavilion Plus 16-ab0456tx | |
* ... menor é melhor
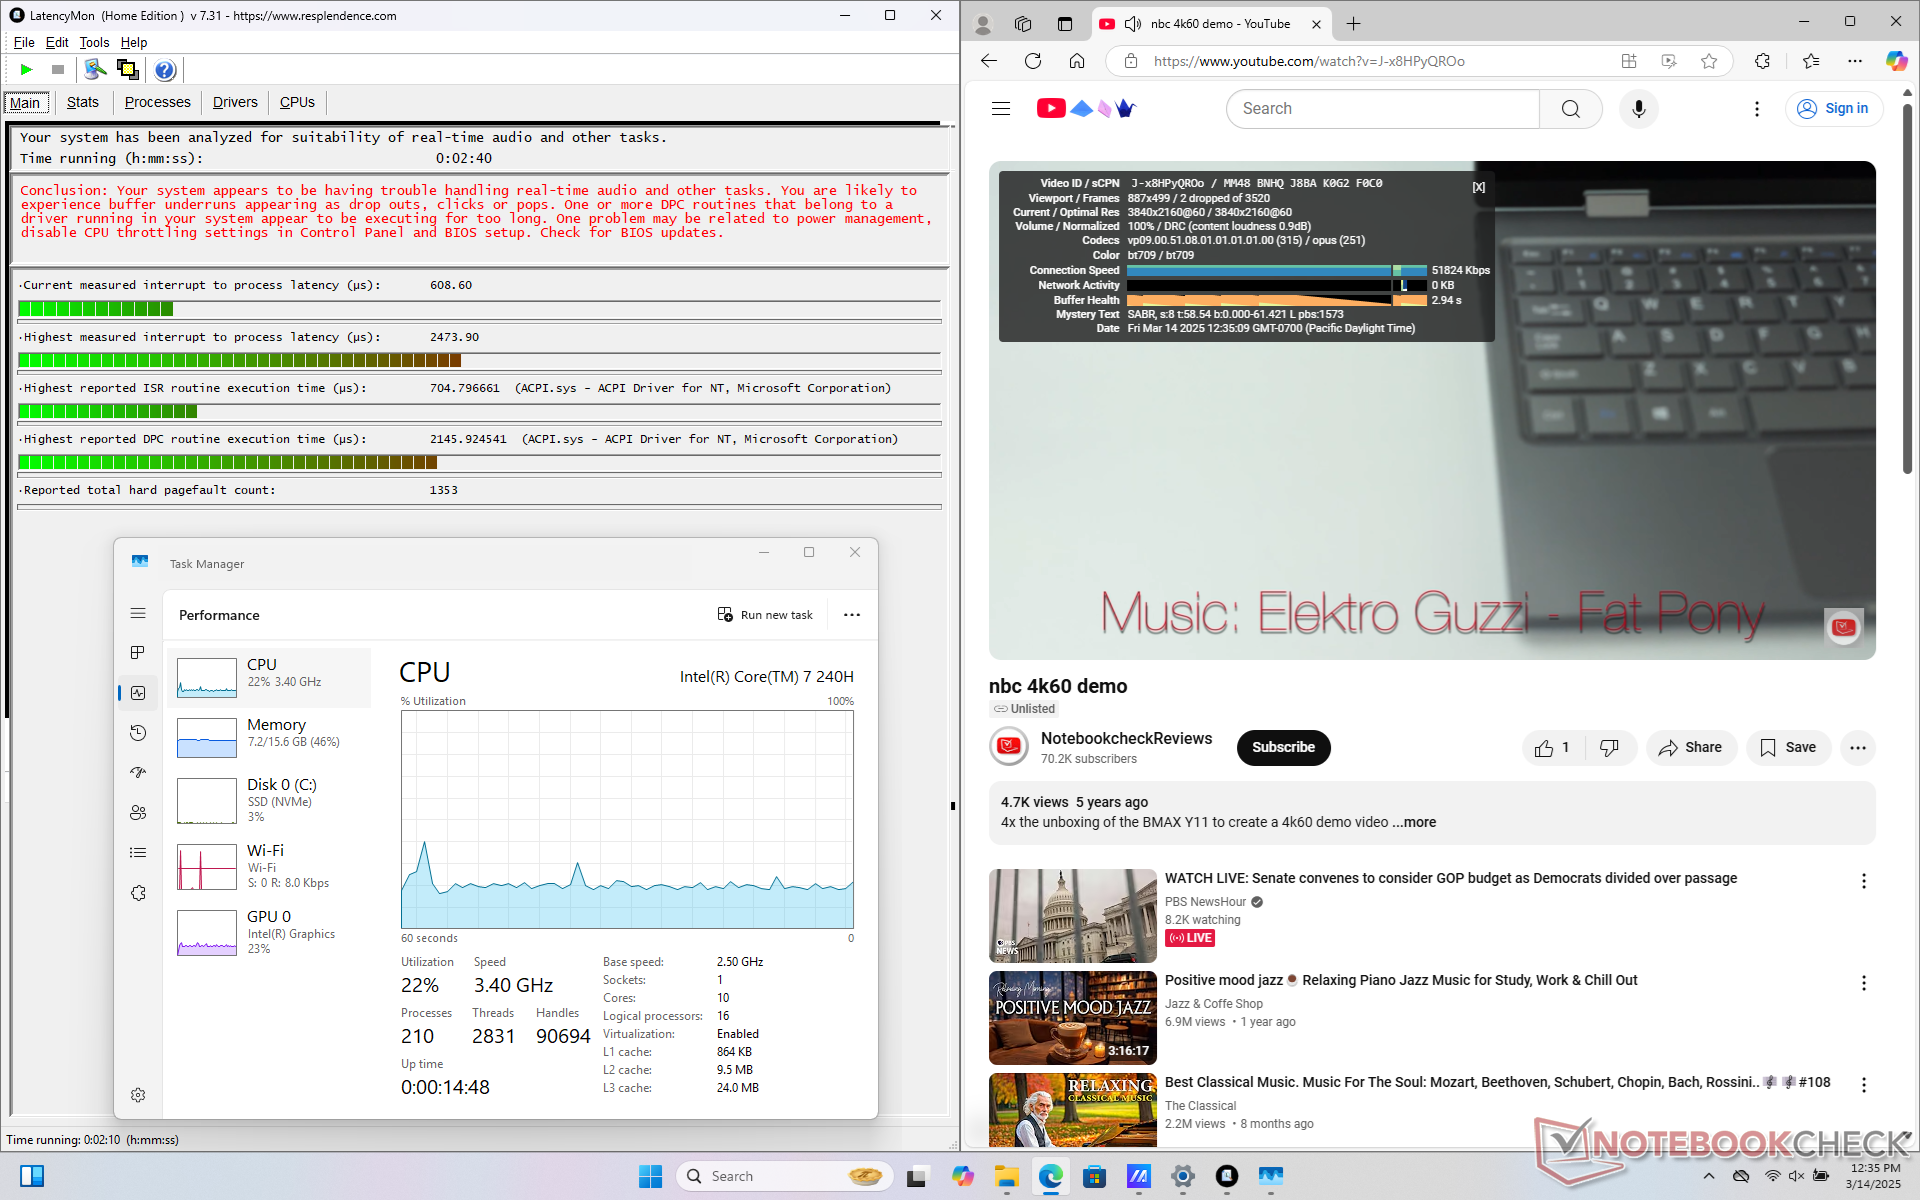
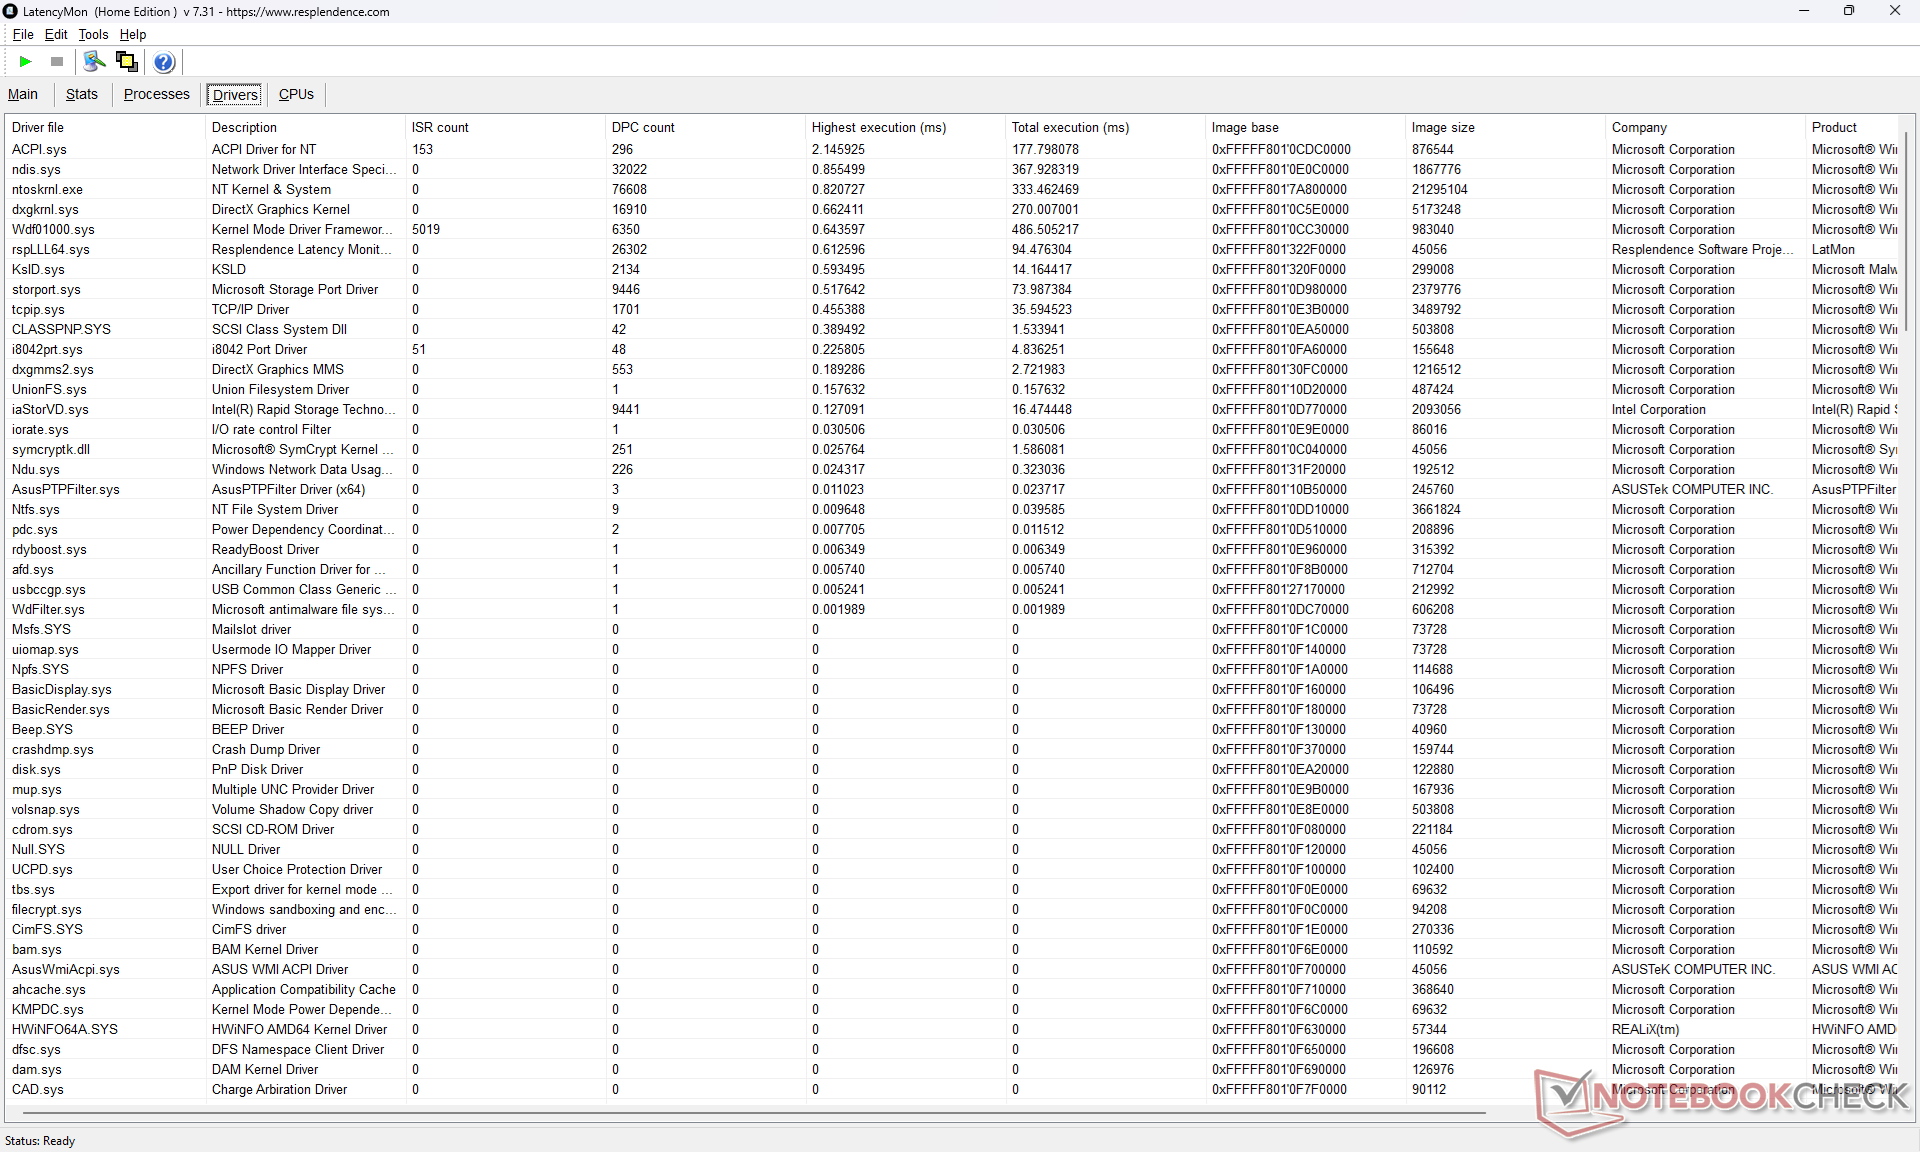
Latência DPC
O LatencyMon mostra problemas de DPC ao abrir várias guias de nossa página inicial e apenas alguns quadros perdidos durante nosso teste de reprodução de vídeo 4K60.
| DPC Latencies / LatencyMon - interrupt to process latency (max), Web, Youtube, Prime95 | |
| Acer Swift Edge 16 SFE16-44-R0XV | |
| HP Pavilion Plus 16-ab0456tx | |
| Asus V16 V3607V | |
| Asus VivoBook Pro 16 K6602VU | |
| Lenovo ThinkBook 16 G7 IML | |
| Dell Inspiron 16 Plus 7640 | |
* ... menor é melhor
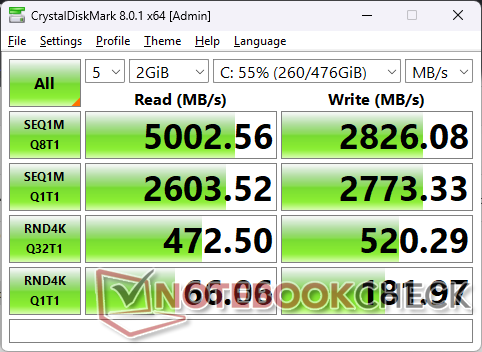
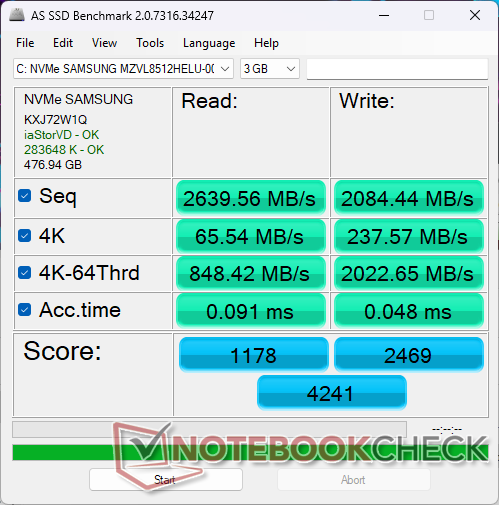
Dispositivos de armazenamento
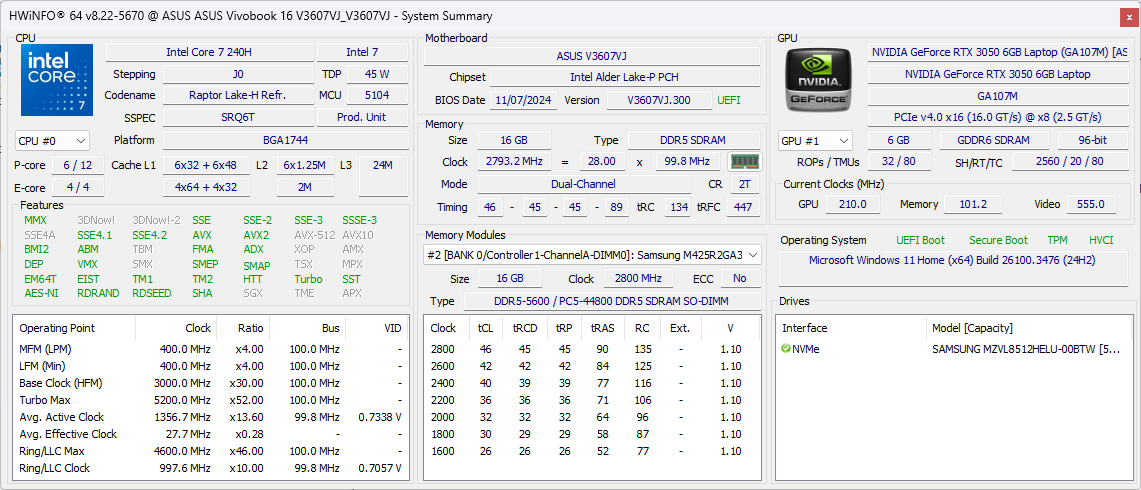
O SSD Samsung MZVL8512HELU PCIe4 de 512 GB atinge o máximo em pouco menos de 5000 MB/s. No entanto, o desempenho diminui após alguns minutos de uso, como mostra o gráfico abaixo.

| Drive Performance Rating - Percent | |
| Acer Swift Edge 16 SFE16-44-R0XV | |
| HP Pavilion Plus 16-ab0456tx | |
| Asus V16 V3607V | |
| Asus VivoBook Pro 16 K6602VU | |
| Dell Inspiron 16 Plus 7640 | |
| Lenovo ThinkBook 16 G7 IML | |
* ... menor é melhor
Disk Throttling: DiskSpd Read Loop, Queue Depth 8
Desempenho da GPU
O GeForce RTX 3050 é cerca de 20 a 25 por cento mais rápido do que o RTX 2050 ou 30 a 35 por cento mais lento que o RTX 4050. Observe que a Asus vem com a melhor versão de 6 GB do RTX 3050 em vez da versão de versão de 4 GB.
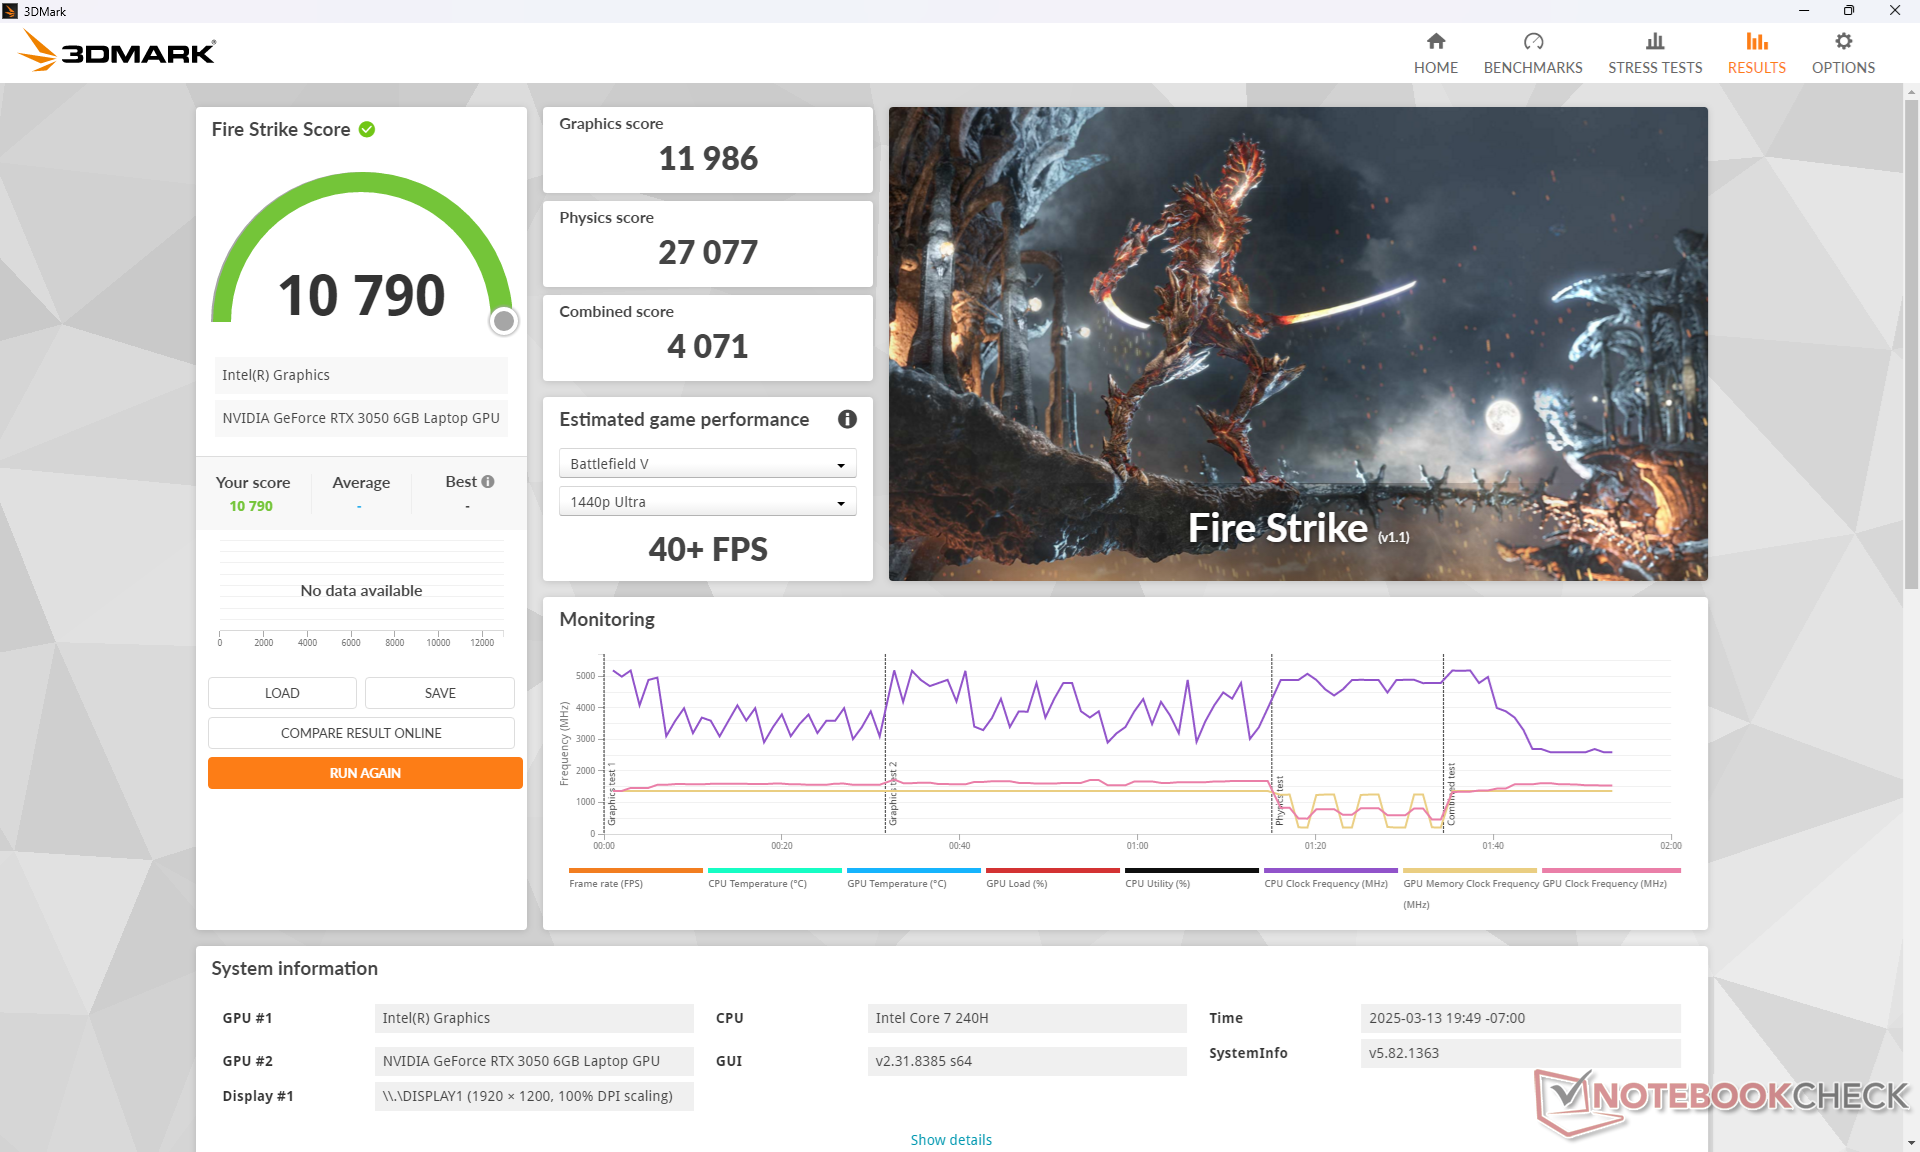
| Perfil de potência | Pontuação de gráficos | Pontuação de física | Pontuação combinada |
| Modo de desempenho | 11986 | 27077 | 4071 |
| Modo equilibrado | 11317 (-6%) | 28246 (-0%) | 3842 (-6%) |
| Energia da bateria | 9900 (-17%) | 20557 (-24%) | 3573 (-12%) |
A execução no modo balanceado afeta ligeiramente o desempenho gráfico, enquanto o modo de bateria reduziria ainda mais o desempenho, conforme mostrado na tabela de resultados do site Fire Strike acima.
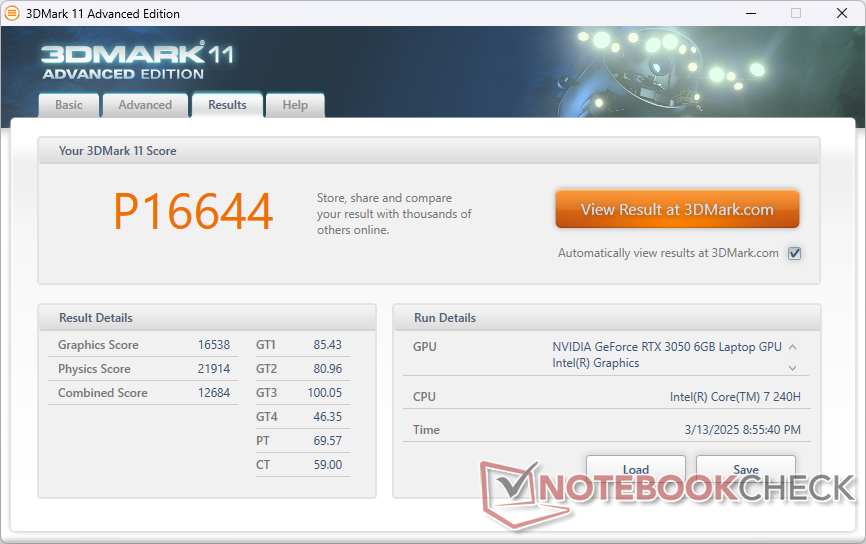
| 3DMark 11 Performance | 16644 pontos | |
| 3DMark Fire Strike Score | 10790 pontos | |
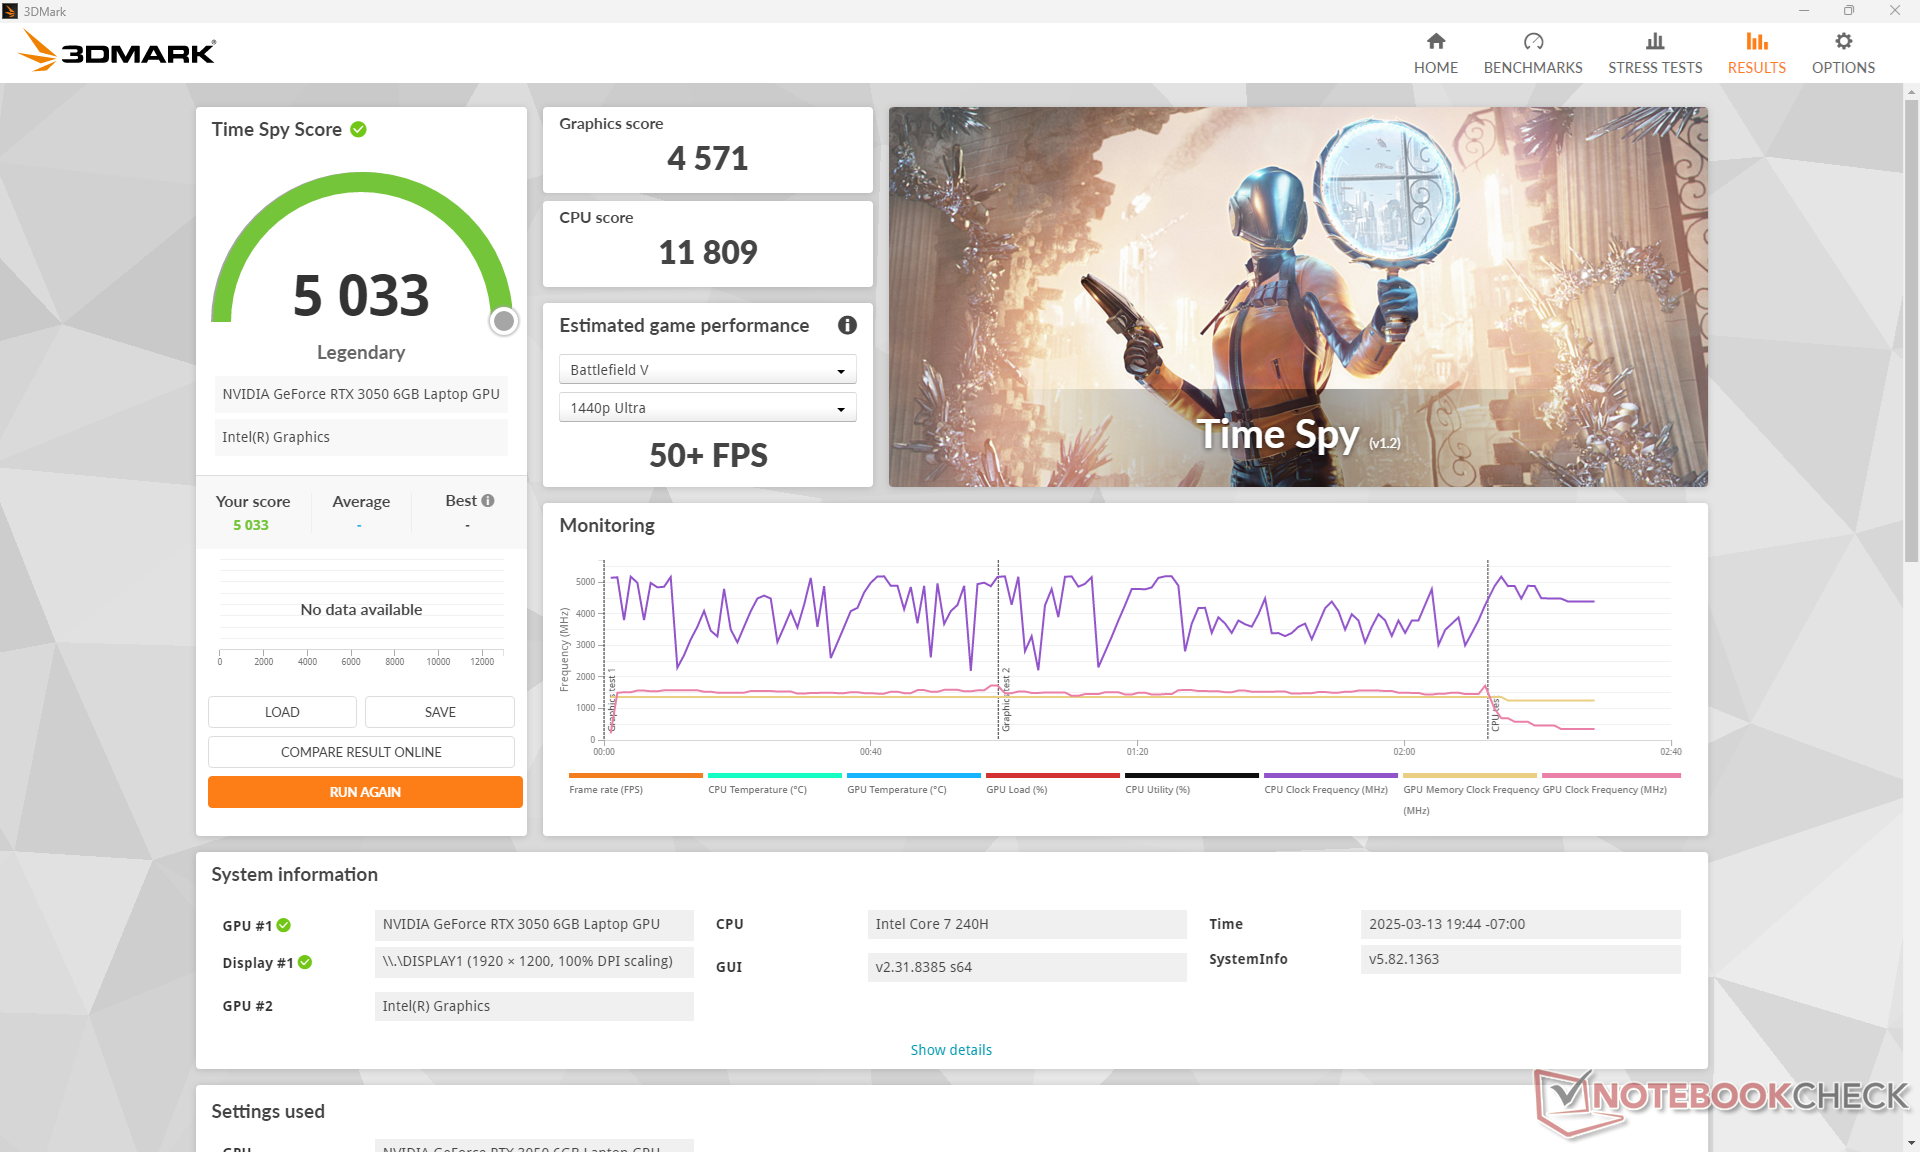
| 3DMark Time Spy Score | 5033 pontos | |
Ajuda | ||
* ... menor é melhor
Desempenho em jogos
A RTX 3050 pode estar ficando velha, mas ainda é potente o suficiente para executar títulos exigentes como Cyberpunk 2077 na resolução nativa de 1080p ou 1200p com a maioria das configurações em High.
| F1 22 | |
| 1280x720 Ultra Low Preset AA:T AF:16x | |
| Lenovo ThinkPad Z16 Gen 2 | |
| Asus V16 V3607V | |
| Média NVIDIA GeForce RTX 3050 6GB Laptop GPU (198 - 236, n=3) | |
| HP Spectre x360 16 RTX 4050 | |
| 1920x1080 Low Preset AA:T AF:16x | |
| HP Spectre x360 16 RTX 4050 | |
| Asus V16 V3607V | |
| Média NVIDIA GeForce RTX 3050 6GB Laptop GPU (110.9 - 163.5, n=4) | |
| Lenovo ThinkPad Z16 Gen 2 | |
| 1920x1080 Medium Preset AA:T AF:16x | |
| HP Spectre x360 16 RTX 4050 | |
| Asus V16 V3607V | |
| Média NVIDIA GeForce RTX 3050 6GB Laptop GPU (106.1 - 151.5, n=4) | |
| Lenovo ThinkPad Z16 Gen 2 | |
| 1920x1080 High Preset AA:T AF:16x | |
| HP Spectre x360 16 RTX 4050 | |
| Asus V16 V3607V | |
| Média NVIDIA GeForce RTX 3050 6GB Laptop GPU (85.5 - 109.7, n=4) | |
| Lenovo ThinkPad Z16 Gen 2 | |
| 1920x1080 Ultra High Preset AA:T AF:16x | |
| HP Spectre x360 16 RTX 4050 | |
| Média NVIDIA GeForce RTX 3050 6GB Laptop GPU (30.7 - 34, n=4) | |
| Asus V16 V3607V | |
| Lenovo ThinkPad Z16 Gen 2 | |
| Tiny Tina's Wonderlands | |
| 1280x720 Lowest Preset (DX12) | |
| Lenovo ThinkPad Z16 Gen 2 | |
| Asus V16 V3607V | |
| Média NVIDIA GeForce RTX 3050 6GB Laptop GPU (n=1) | |
| 1920x1080 Low Preset (DX12) | |
| HP Spectre x360 16 RTX 4050 | |
| Lenovo ThinkPad Z16 Gen 2 | |
| Média NVIDIA GeForce RTX 3050 6GB Laptop GPU (105.6 - 113.3, n=2) | |
| Asus V16 V3607V | |
| 1920x1080 Medium Preset (DX12) | |
| HP Spectre x360 16 RTX 4050 | |
| Lenovo ThinkPad Z16 Gen 2 | |
| Média NVIDIA GeForce RTX 3050 6GB Laptop GPU (84.7 - 89.7, n=2) | |
| Asus V16 V3607V | |
| 1920x1080 High Preset (DX12) | |
| HP Spectre x360 16 RTX 4050 | |
| Lenovo ThinkPad Z16 Gen 2 | |
| Média NVIDIA GeForce RTX 3050 6GB Laptop GPU (55.9 - 59.2, n=2) | |
| Asus V16 V3607V | |
| 1920x1080 Badass Preset (DX12) | |
| HP Spectre x360 16 RTX 4050 | |
| Média NVIDIA GeForce RTX 3050 6GB Laptop GPU (44.3 - 46.4, n=2) | |
| Asus V16 V3607V | |
| Lenovo ThinkPad Z16 Gen 2 | |
Cyberpunk 2077 ultra FPS Chart
| baixo | média | alto | ultra | |
|---|---|---|---|---|
| GTA V (2015) | 184.2 | 178.4 | 127.3 | 63.2 |
| Dota 2 Reborn (2015) | 181.4 | 161.2 | 146.8 | 135.1 |
| Final Fantasy XV Benchmark (2018) | 126.5 | 67.6 | 49.1 | |
| X-Plane 11.11 (2018) | 96.3 | 89.3 | 78.6 | |
| Far Cry 5 (2018) | 149 | 85 | 78 | 74 |
| Strange Brigade (2018) | 246 | 106.9 | 88.4 | 77 |
| Tiny Tina's Wonderlands (2022) | 105.6 | 84.7 | 55.9 | 44.3 |
| F1 22 (2022) | 149.9 | 138.9 | 102 | 31.6 |
| Baldur's Gate 3 (2023) | 59.7 | 50.3 | 45.4 | 44.3 |
| Cyberpunk 2077 2.2 Phantom Liberty (2023) | 66.7 | 51.4 | 42.7 | 36.1 |
Emissões
Ruído do sistema
Em geral, o ruído do ventilador é silencioso sob cargas baixas, mas, infelizmente, aumenta rapidamente quando são introduzidas cargas mais exigentes, como ao iniciar aplicativos. Os jogos no modo Balanced são um pouco mais silenciosos do que no modo Performance (38,3 dB(A) vs. 40,5 dB(A)) ao custo de um desempenho gráfico um pouco mais lento, conforme mencionado acima.
Barulho
| Ocioso |
| 23.5 / 23.7 / 23.7 dB |
| Carga |
| 48 / 51 dB |
 | ||
30 dB silencioso 40 dB(A) audível 50 dB(A) ruidosamente alto |
||
min: | ||
| Asus V16 V3607V GeForce RTX 3050 6GB Laptop GPU, Core 7 240H | Asus VivoBook Pro 16 K6602VU NVIDIA GeForce RTX 4050 Laptop GPU, i9-13900H, Micron 2400 MTFDKBA1T0QFM | Dell Inspiron 16 Plus 7640 NVIDIA GeForce RTX 4060 Laptop GPU, Ultra 7 155H, SK hynix BC901 HFS001TEJ4X164N | Lenovo ThinkBook 16 G7 IML Graphics 4-Core, Ultra 5 125U, SK hynix HFS512GEJ4X112N | HP Pavilion Plus 16-ab0456tx GeForce RTX 3050 6GB Laptop GPU, i7-13700H, WDC PC SN810 1TB | Acer Swift Edge 16 SFE16-44-R0XV Radeon 760M, R5 8640U, Micron 3400 MTFDKBA512TFH 512GB | |
|---|---|---|---|---|---|---|
| Noise | -4% | 5% | 18% | 9% | -13% | |
| desligado / ambiente * | 23.3 | 20.96 10% | 23.8 -2% | 23.1 1% | 22.22 5% | 25 -7% |
| Idle Minimum * | 23.5 | 25.28 -8% | 24.2 -3% | 23.1 2% | 22.22 5% | 26 -11% |
| Idle Average * | 23.7 | 25.28 -7% | 24.2 -2% | 23.1 3% | 22.22 6% | 29 -22% |
| Idle Maximum * | 23.7 | 25.28 -7% | 24.2 -2% | 23.1 3% | 22.22 6% | 39 -65% |
| Load Average * | 48 | 51.88 -8% | 28.9 40% | 23.2 52% | 42.03 12% | 45 6% |
| Cyberpunk 2077 ultra * | 40.5 | 29.2 28% | 43 -6% | |||
| Load Maximum * | 51 | 51.8 -2% | 51 -0% | 32.6 36% | 42.1 17% | 45 12% |
| Witcher 3 ultra * | 49 | 51 | 42.1 |
* ... menor é melhor
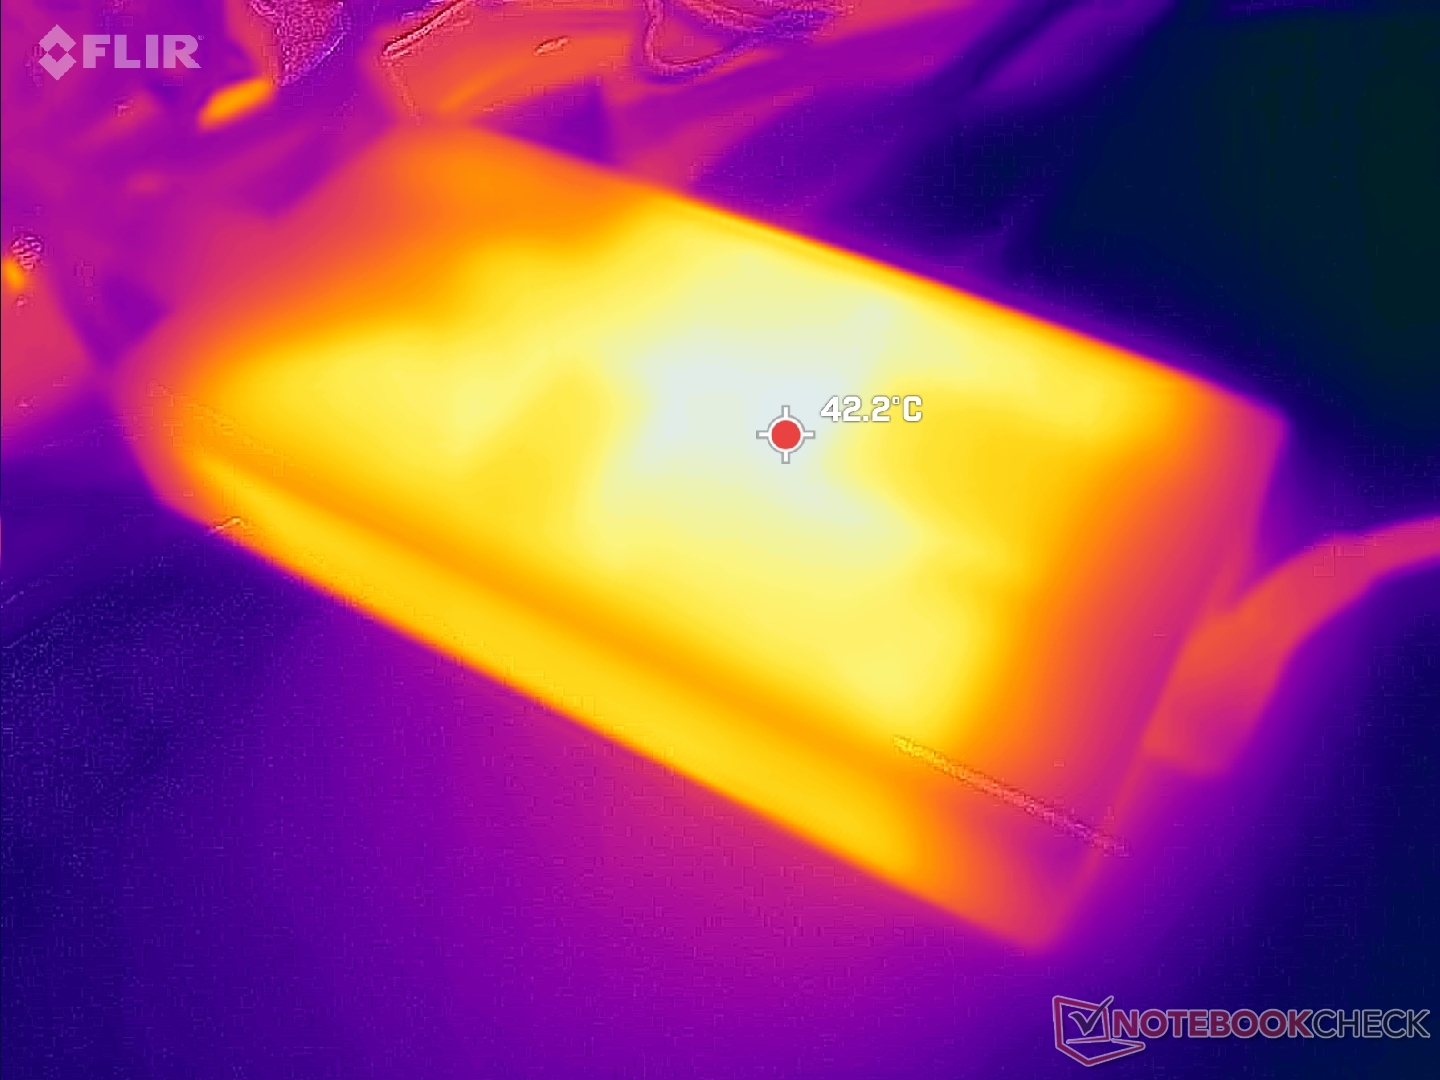
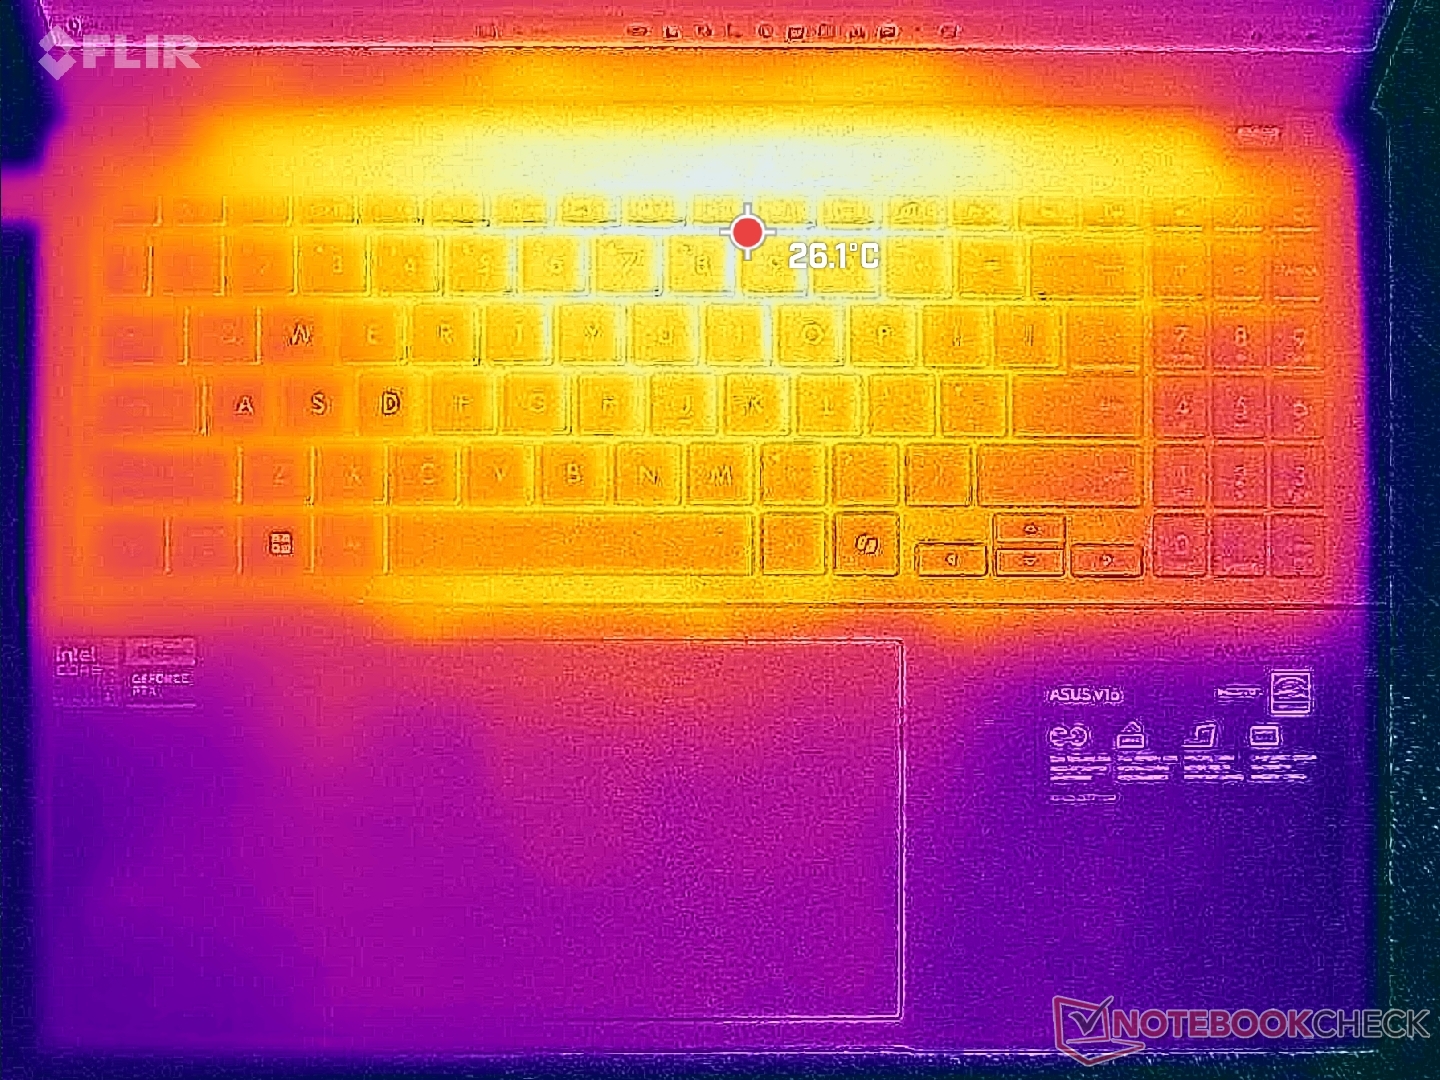
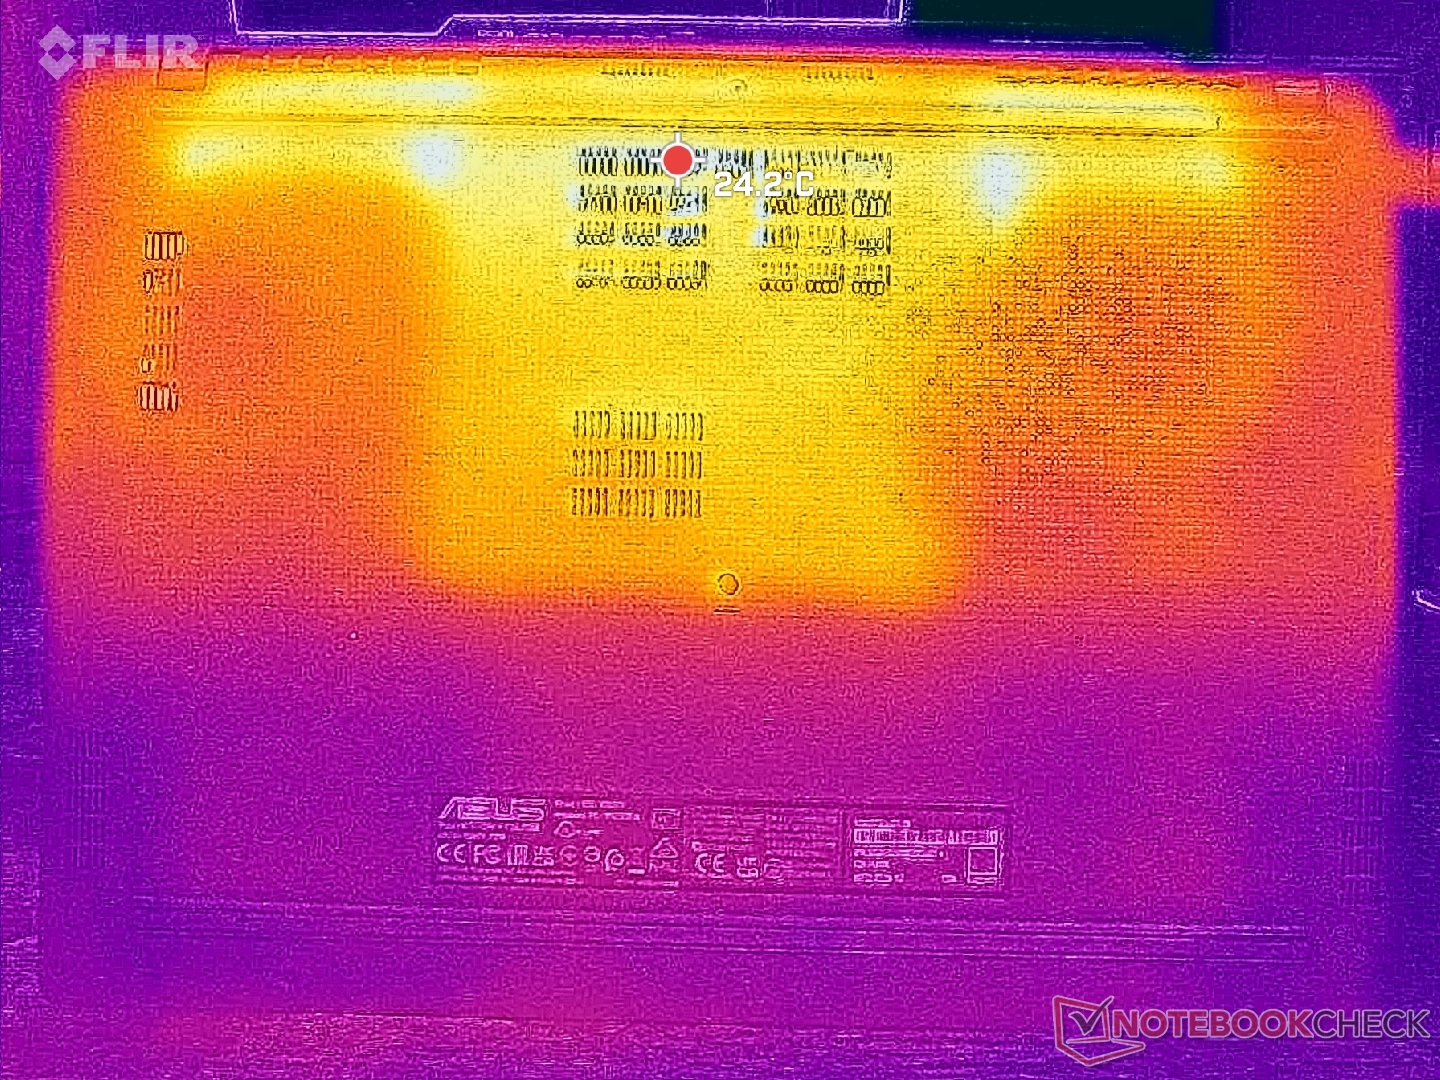
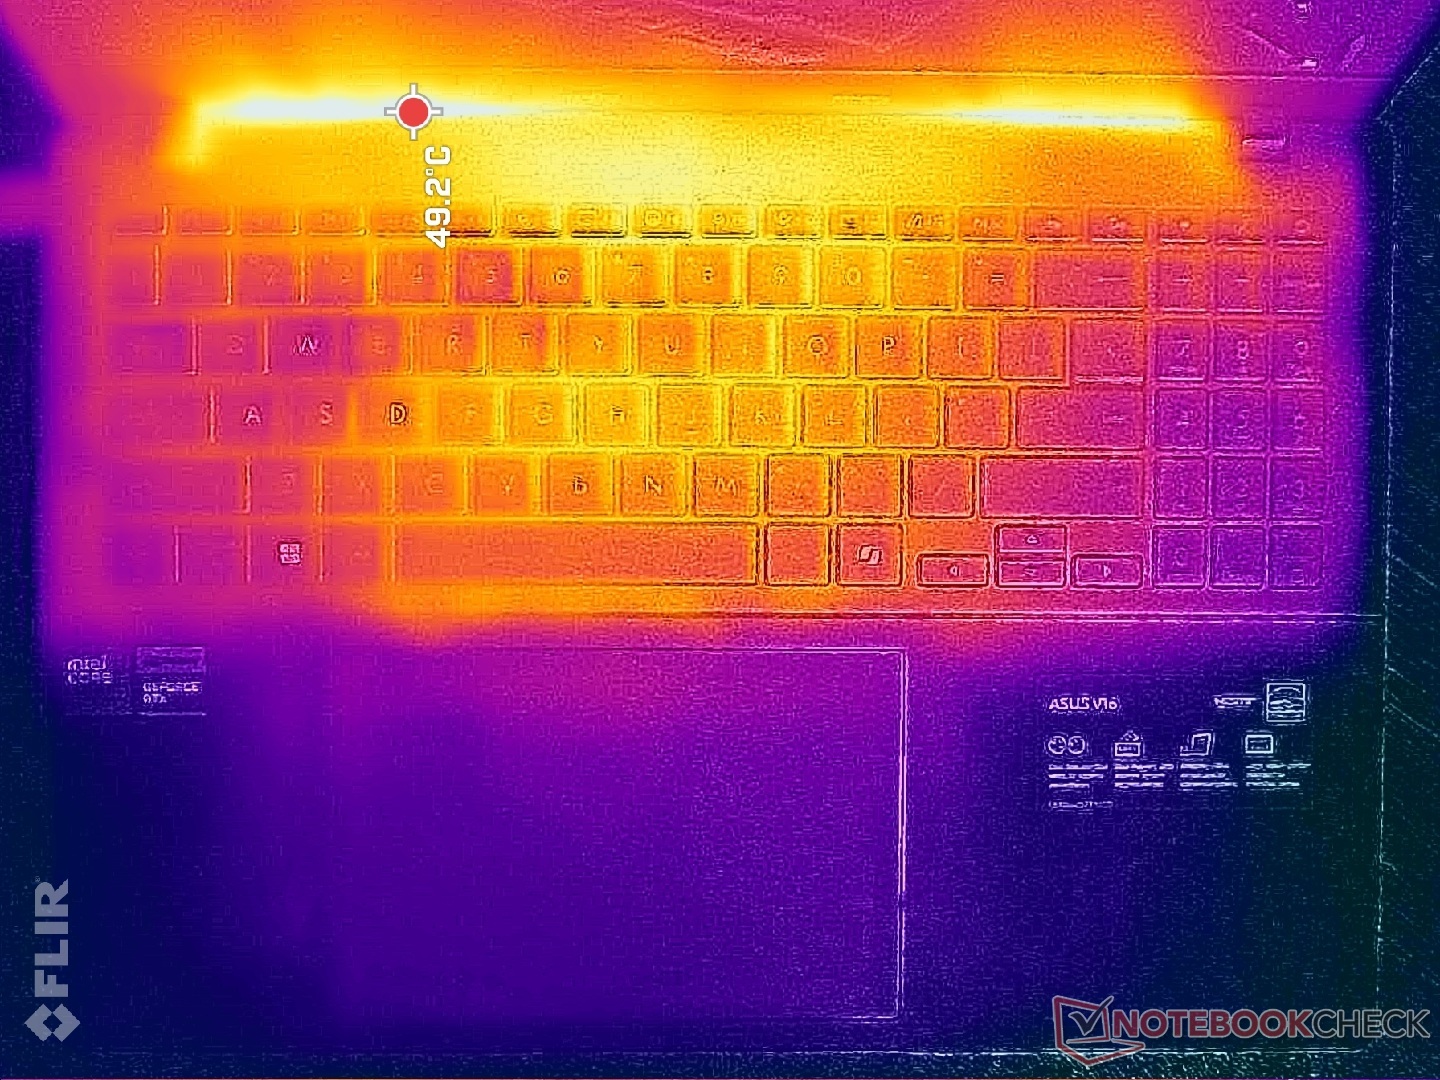
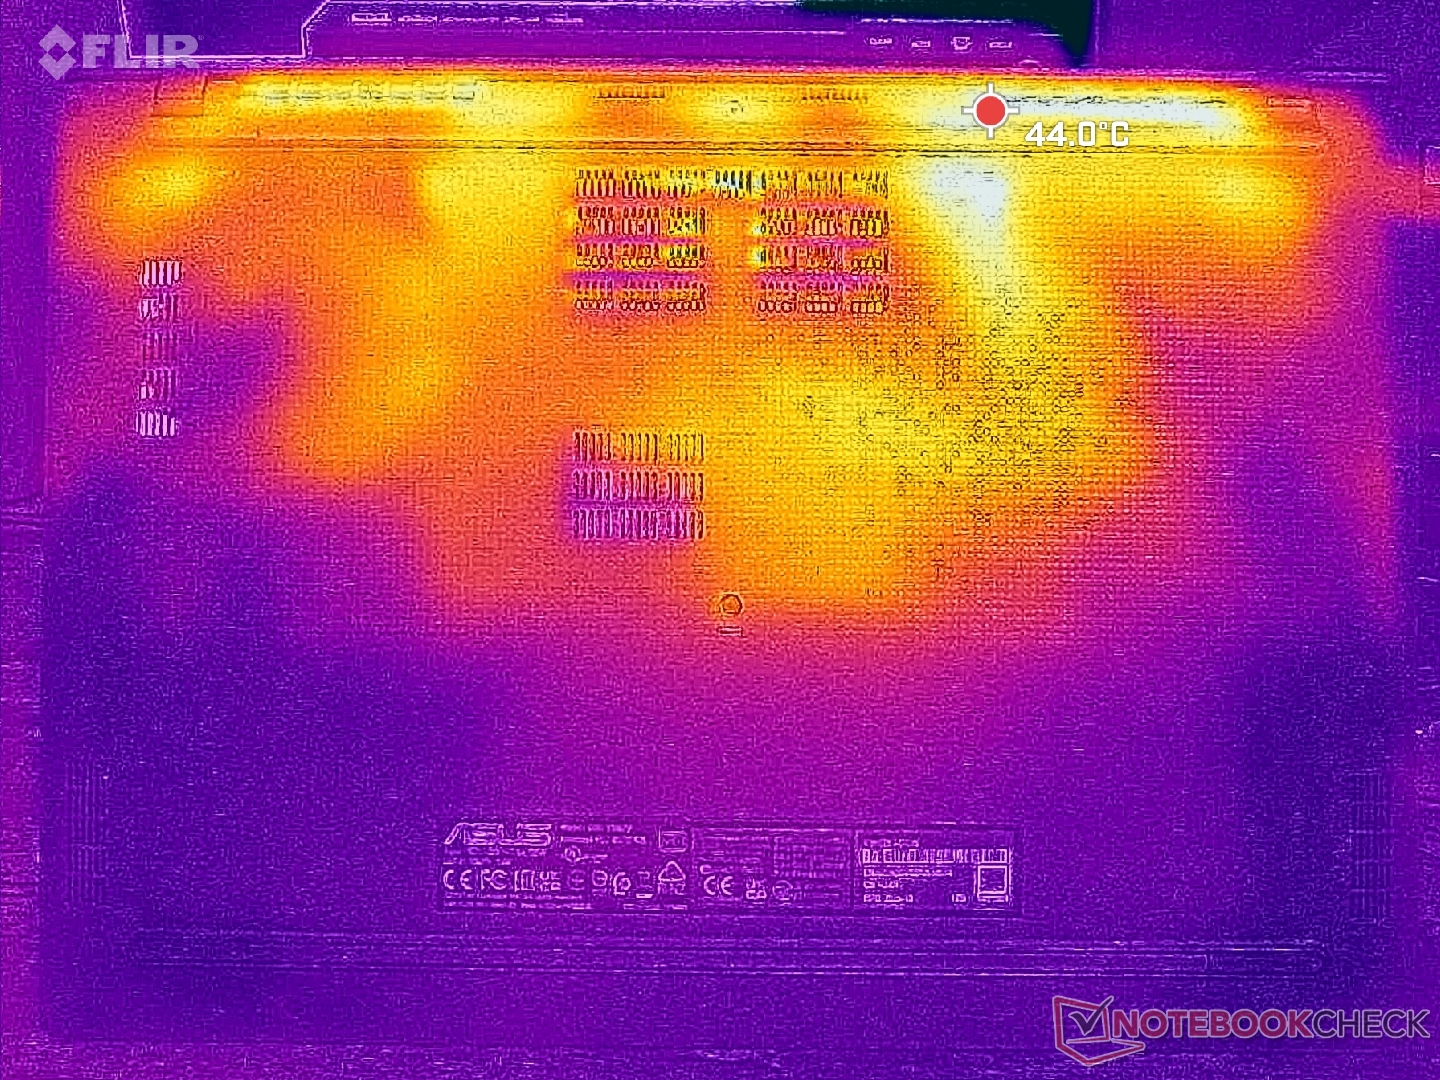
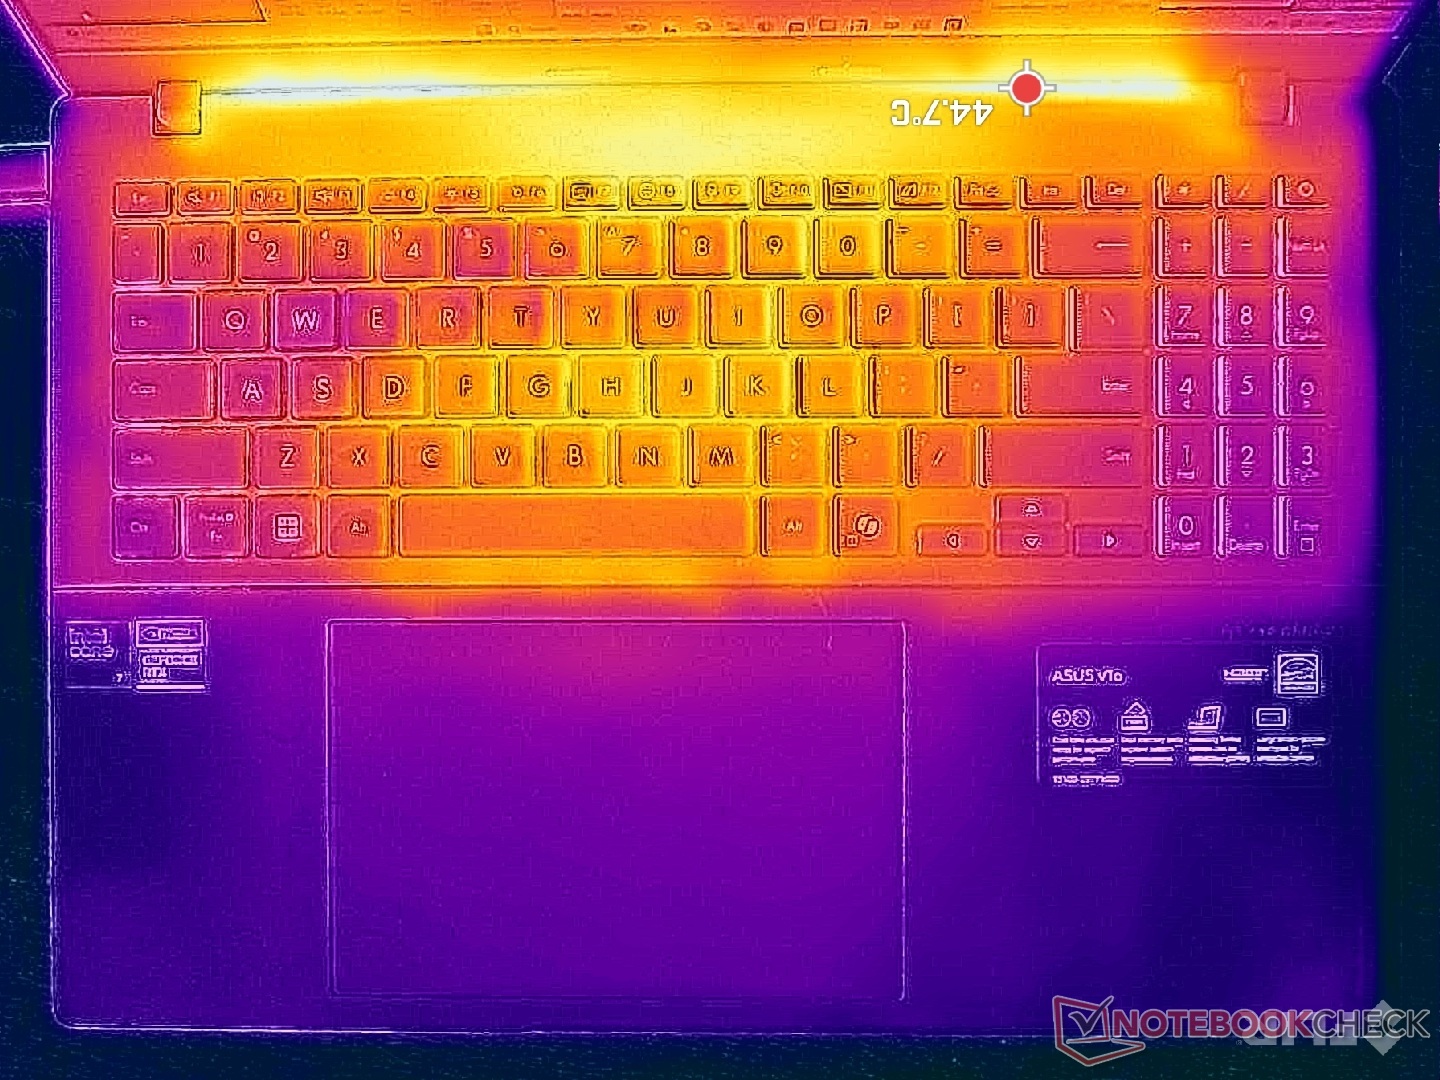
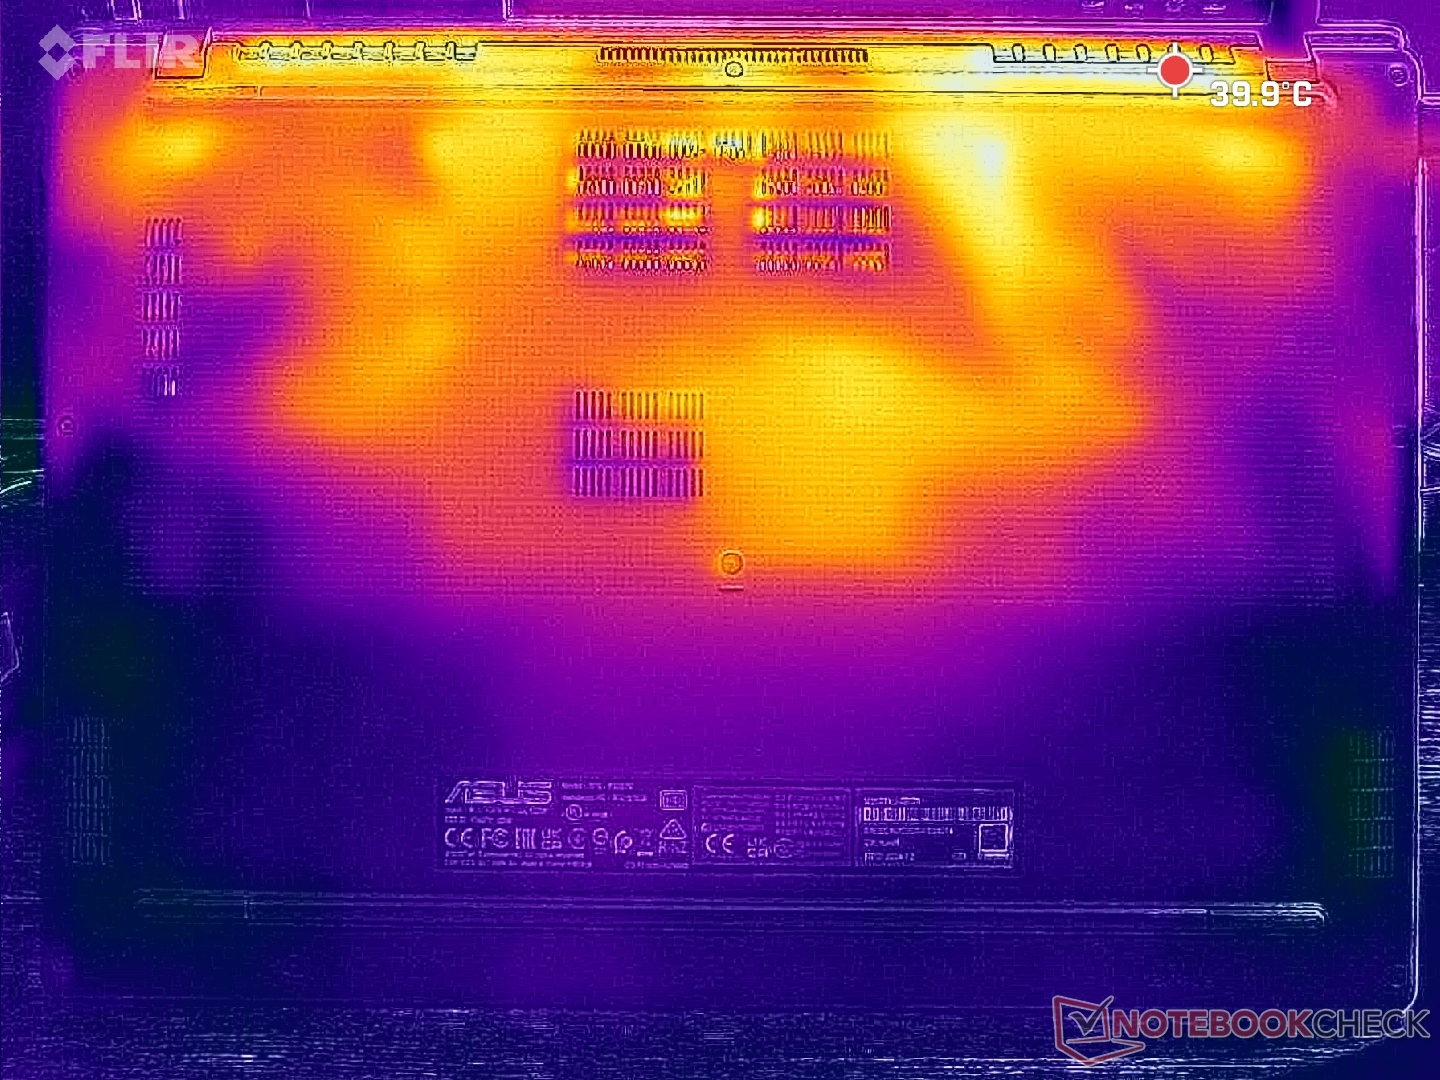
Temperatura
Os pontos quentes estão na parte traseira, onde podem chegar a mais de 40 °C, conforme mostram os mapas de temperatura abaixo. Os apoios para as mãos, o teclado numérico e as teclas WASD permaneceriam mais frios para digitação ou jogos.
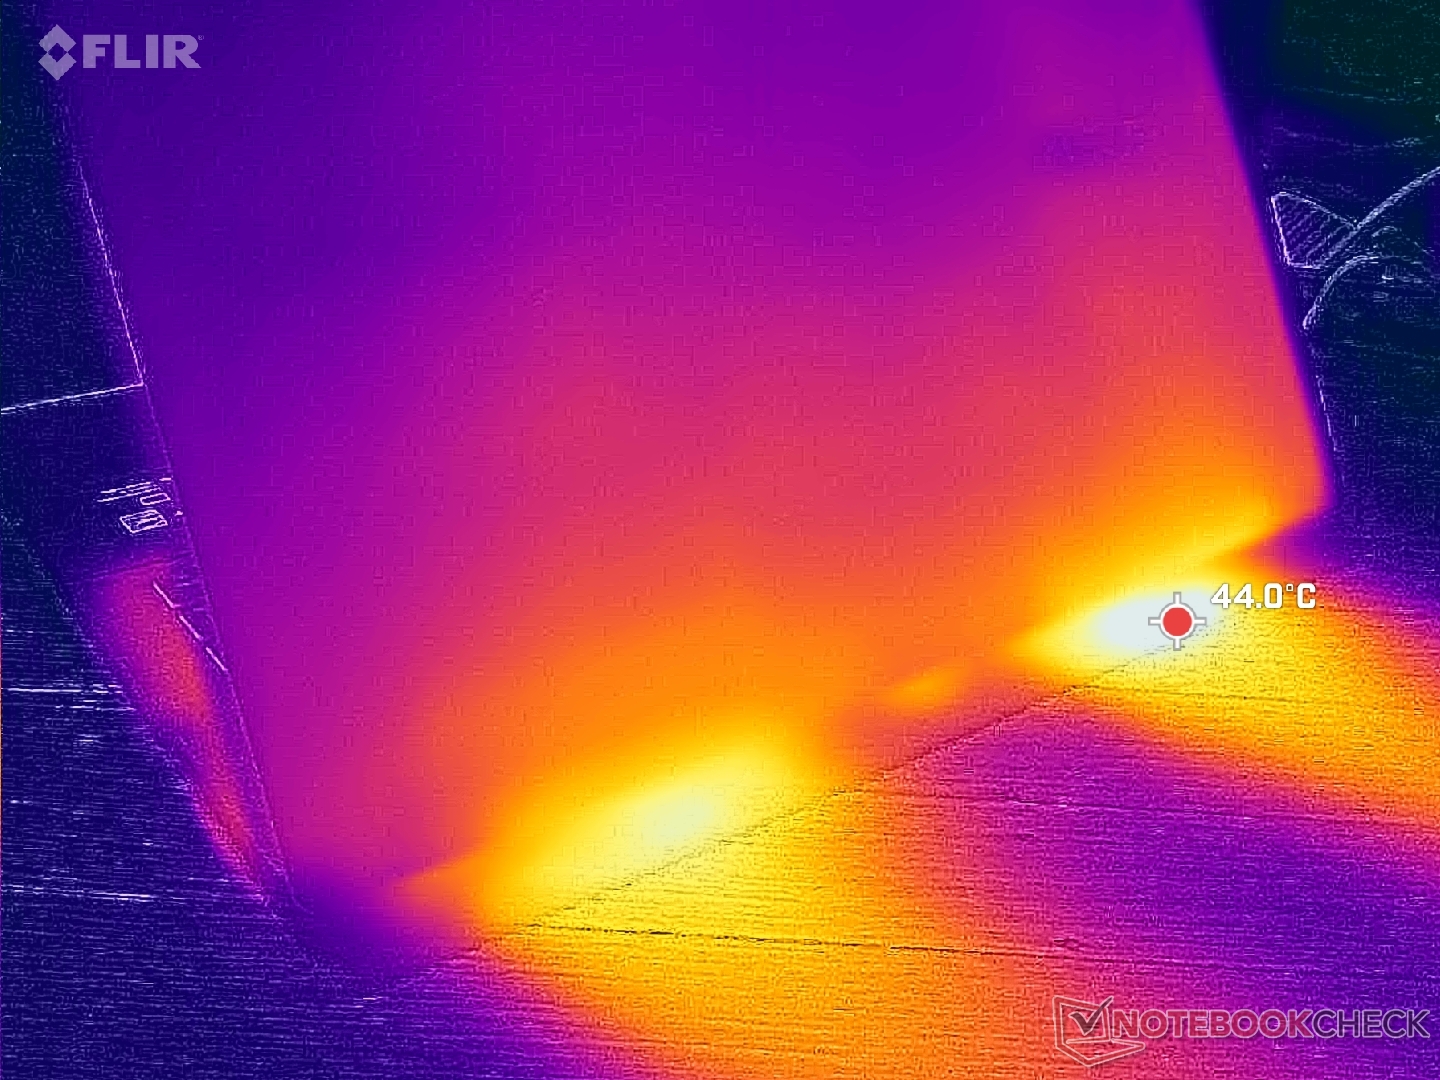
(±) A temperatura máxima no lado superior é 41.2 °C / 106 F, em comparação com a média de 36.9 °C / 98 F , variando de 21.1 a 71 °C para a classe Multimedia.
(+) A parte inferior aquece até um máximo de 34.4 °C / 94 F, em comparação com a média de 39.2 °C / 103 F
(+) Em uso inativo, a temperatura média para o lado superior é 24.6 °C / 76 F, em comparação com a média do dispositivo de 31.3 °C / ### class_avg_f### F.
(+) 3: The average temperature for the upper side is 31.2 °C / 88 F, compared to the average of 31.3 °C / 88 F for the class Multimedia.
(+) Os apoios para as mãos e o touchpad são mais frios que a temperatura da pele, com um máximo de 21.8 °C / 71.2 F e, portanto, são frios ao toque.
(+) A temperatura média da área do apoio para as mãos de dispositivos semelhantes foi 28.8 °C / 83.8 F (+7 °C / 12.6 F).
| Asus V16 V3607V Intel Core 7 240H, NVIDIA GeForce RTX 3050 6GB Laptop GPU | Asus VivoBook Pro 16 K6602VU Intel Core i9-13900H, NVIDIA GeForce RTX 4050 Laptop GPU | Dell Inspiron 16 Plus 7640 Intel Core Ultra 7 155H, NVIDIA GeForce RTX 4060 Laptop GPU | Lenovo ThinkBook 16 G7 IML Intel Core Ultra 5 125U, Intel Graphics 4-Core iGPU (Arc) | HP Pavilion Plus 16-ab0456tx Intel Core i7-13700H, NVIDIA GeForce RTX 3050 6GB Laptop GPU | Acer Swift Edge 16 SFE16-44-R0XV AMD Ryzen 5 8640U, AMD Radeon 760M | |
|---|---|---|---|---|---|---|
| Heat | -30% | -13% | 7% | -28% | -24% | |
| Maximum Upper Side * | 41.2 | 42.6 -3% | 43.4 -5% | 33.2 19% | 49.6 -20% | 48 -17% |
| Maximum Bottom * | 34.4 | 48.4 -41% | 41.6 -21% | 41.2 -20% | 45.8 -33% | 60 -74% |
| Idle Upper Side * | 28.8 | 39.4 -37% | 32.8 -14% | 23.4 19% | 39.2 -36% | 28 3% |
| Idle Bottom * | 29 | 39.8 -37% | 32.4 -12% | 26.6 8% | 35.4 -22% | 31 -7% |
* ... menor é melhor
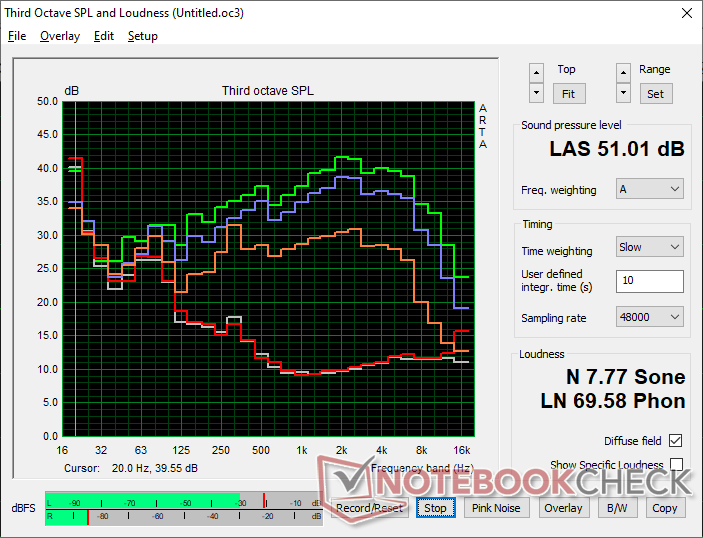
Alto-falantes
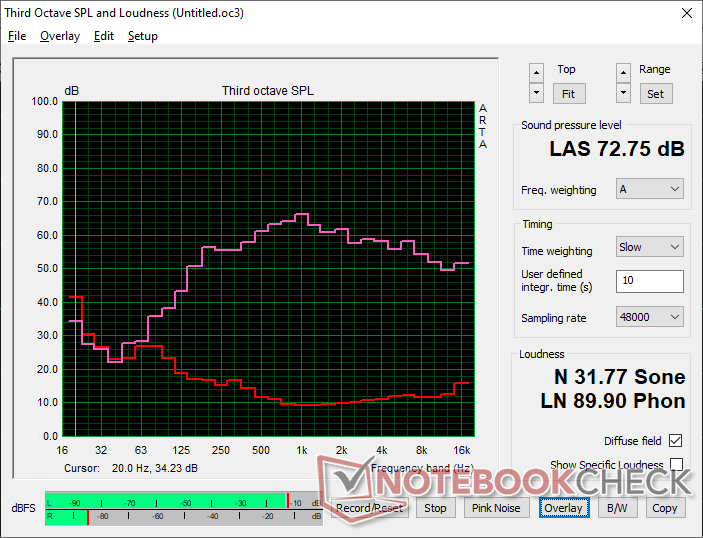
Asus V16 V3607V análise de áudio
(±) | o volume do alto-falante é médio, mas bom (###valor### dB)
Graves 100 - 315Hz
(±) | graves reduzidos - em média 7.7% menor que a mediana
(±) | a linearidade dos graves é média (7.8% delta para a frequência anterior)
Médios 400 - 2.000 Hz
(+) | médios equilibrados - apenas 4.7% longe da mediana
(+) | médios são lineares (4.8% delta para frequência anterior)
Altos 2 - 16 kHz
(+) | agudos equilibrados - apenas 1.9% longe da mediana
(+) | os máximos são lineares (5.3% delta da frequência anterior)
Geral 100 - 16.000 Hz
(+) | o som geral é linear (13.2% diferença em relação à mediana)
Comparado com a mesma classe
» 23% de todos os dispositivos testados nesta classe foram melhores, 5% semelhantes, 72% piores
» O melhor teve um delta de 5%, a média foi 18%, o pior foi 45%
Comparado com todos os dispositivos testados
» 12% de todos os dispositivos testados foram melhores, 3% semelhantes, 86% piores
» O melhor teve um delta de 4%, a média foi 24%, o pior foi 134%
Apple MacBook Pro 16 2021 M1 Pro análise de áudio
(+) | os alto-falantes podem tocar relativamente alto (###valor### dB)
Graves 100 - 315Hz
(+) | bons graves - apenas 3.8% longe da mediana
(+) | o baixo é linear (5.2% delta para a frequência anterior)
Médios 400 - 2.000 Hz
(+) | médios equilibrados - apenas 1.3% longe da mediana
(+) | médios são lineares (2.1% delta para frequência anterior)
Altos 2 - 16 kHz
(+) | agudos equilibrados - apenas 1.9% longe da mediana
(+) | os máximos são lineares (2.7% delta da frequência anterior)
Geral 100 - 16.000 Hz
(+) | o som geral é linear (4.6% diferença em relação à mediana)
Comparado com a mesma classe
» 0% de todos os dispositivos testados nesta classe foram melhores, 0% semelhantes, 100% piores
» O melhor teve um delta de 5%, a média foi 18%, o pior foi 45%
Comparado com todos os dispositivos testados
» 0% de todos os dispositivos testados foram melhores, 0% semelhantes, 100% piores
» O melhor teve um delta de 4%, a média foi 24%, o pior foi 134%
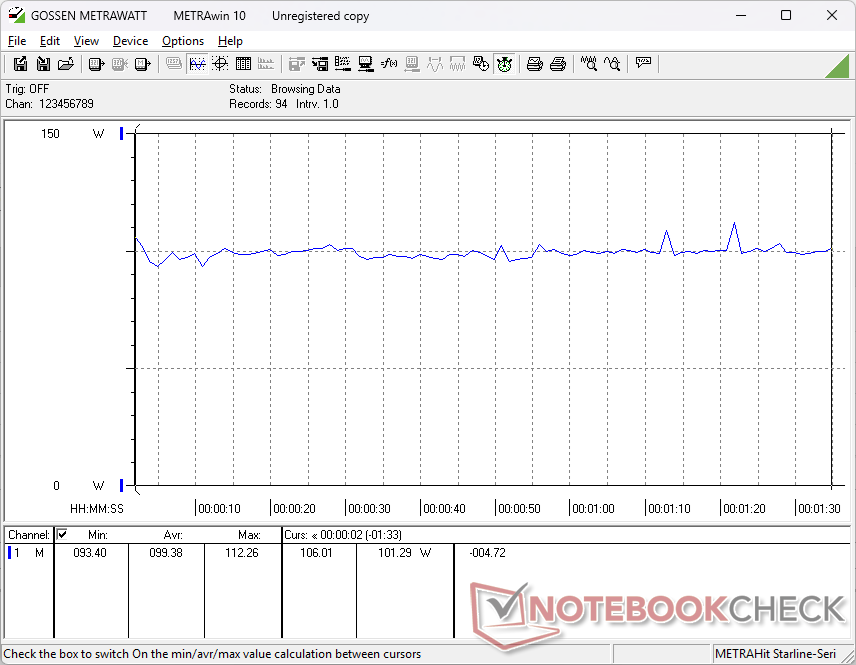
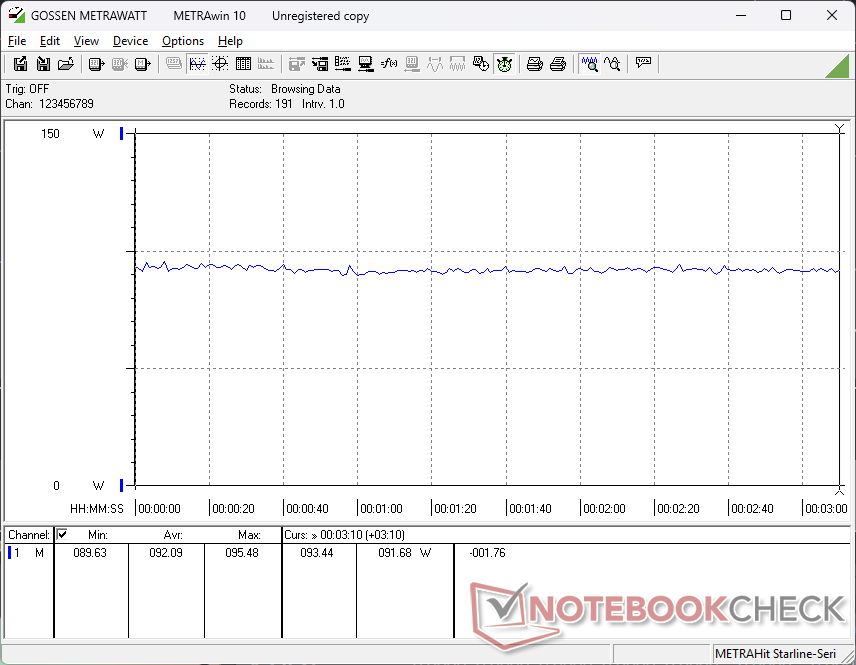
Gerenciamento de energia
Consumo de energia
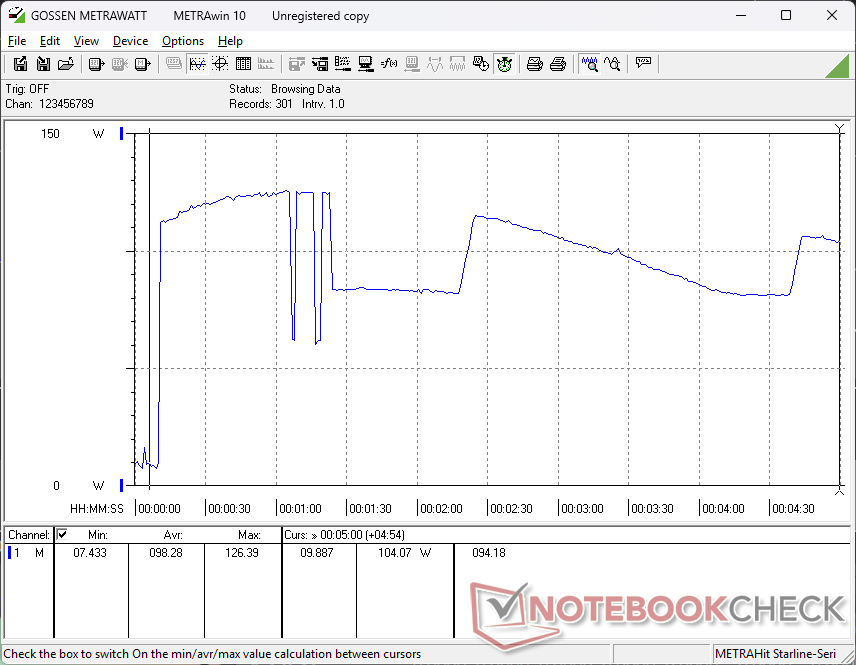
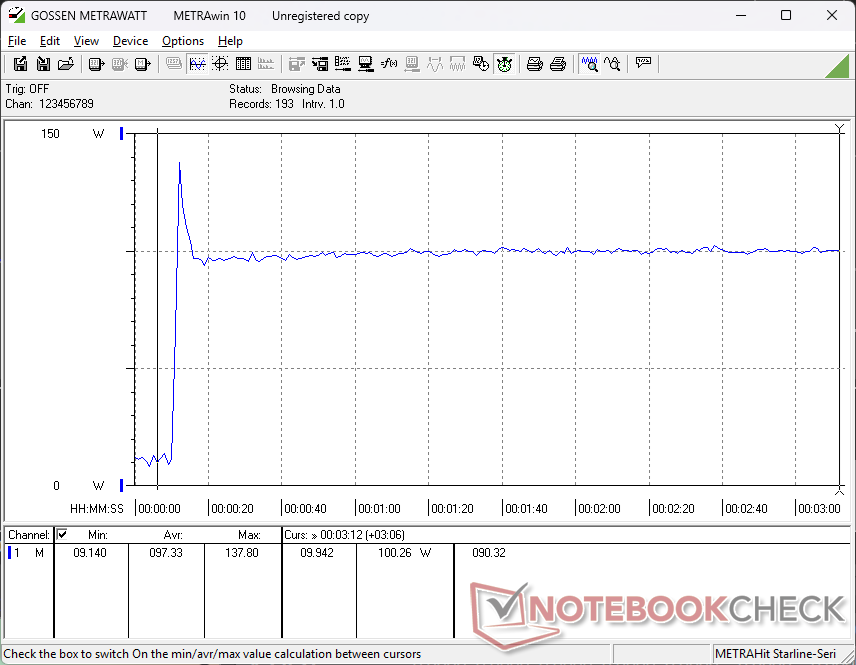
A marcha lenta pode variar de apenas 2 W com a dGPU desativada ou até 11 W com a dGPU ativada e na configuração de brilho máximo. O consumo flutuaria muito ao executar o estresse do Prime95 devido ao comportamento de limitação de desempenho mencionado acima.
| desligado | |
| Ocioso | |
| Carga |
|
Key:
min: | |
| Asus V16 V3607V Core 7 240H, GeForce RTX 3050 6GB Laptop GPU, , IPS, 1920x1200, 16" | Asus VivoBook Pro 16 K6602VU i9-13900H, NVIDIA GeForce RTX 4050 Laptop GPU, Micron 2400 MTFDKBA1T0QFM, OLED, 3200x2000, 16" | Dell Inspiron 16 Plus 7640 Ultra 7 155H, NVIDIA GeForce RTX 4060 Laptop GPU, SK hynix BC901 HFS001TEJ4X164N, IPS, 2560x1600, 16" | Lenovo ThinkBook 16 G7 IML Ultra 5 125U, Graphics 4-Core, SK hynix HFS512GEJ4X112N, IPS, 1920x1200, 16" | HP Pavilion Plus 16-ab0456tx i7-13700H, GeForce RTX 3050 6GB Laptop GPU, WDC PC SN810 1TB, IPS, 2560x1600, 16" | Acer Swift Edge 16 SFE16-44-R0XV R5 8640U, Radeon 760M, Micron 3400 MTFDKBA512TFH 512GB, OLED, 3200x2000, 16" | |
|---|---|---|---|---|---|---|
| Power Consumption | -247% | -22% | 18% | -13% | -19% | |
| Idle Minimum * | 2.1 | 21.06 -903% | 4.2 -100% | 4.3 -105% | 3.3 -57% | 8 -281% |
| Idle Average * | 7.2 | 24.27 -237% | 6.9 4% | 8.9 -24% | 7.3 -1% | 10 -39% |
| Idle Maximum * | 10.7 | 25.12 -135% | 15.2 -42% | 9.1 15% | 14.24 -33% | 15 -40% |
| Load Average * | 99.4 | 52.4 47% | 70.4 29% | 31.7 68% | 91.7 8% | 42 58% |
| Cyberpunk 2077 ultra external monitor * | 88.7 | 35.2 60% | 42.8 52% | |||
| Cyberpunk 2077 ultra * | 92.1 | 39.4 57% | 44.4 52% | |||
| Load Maximum * | 137.8 | 146 -6% | 137.4 -0% | 66.7 52% | 115.8 16% | 49 64% |
| Witcher 3 ultra * | 110.2 | 115.9 | 96.2 |
* ... menor é melhor
Power Consumption Cyberpunk / Stress Test
Power Consumption external Monitor
Duração da bateria
O tempo de execução da WLAN é respeitável, com quase 9 horas de navegação no mundo real, apesar da bateria de 63 Wh de tamanho médio. O teste foi realizado com a dGPU inativa e no modo Eco/Balanced.
| Asus V16 V3607V Core 7 240H, GeForce RTX 3050 6GB Laptop GPU, 63 Wh | Asus VivoBook Pro 16 K6602VU i9-13900H, NVIDIA GeForce RTX 4050 Laptop GPU, 96 Wh | Dell Inspiron 16 Plus 7640 Ultra 7 155H, NVIDIA GeForce RTX 4060 Laptop GPU, 90 Wh | Lenovo ThinkBook 16 G7 IML Ultra 5 125U, Graphics 4-Core, 45 Wh | HP Pavilion Plus 16-ab0456tx i7-13700H, GeForce RTX 3050 6GB Laptop GPU, 68 Wh | Acer Swift Edge 16 SFE16-44-R0XV R5 8640U, Radeon 760M, 54 Wh | |
|---|---|---|---|---|---|---|
| Duração da bateria | 12% | 48% | -2% | 16% | -46% | |
| WiFi v1.3 | 539 | 606 12% | 799 48% | 528 -2% | 624 16% | 290 -46% |
| H.264 | 585 | 720 | ||||
| Reader / Idle | 1150 | |||||
| Load | 79 |
Classificação do Notebookcheck
Asus V16 V3607V
- 03/19/2025 v8
Allen Ngo
 Total Sustainability Score:
 Potential Competitors in Comparison
Imagem | Modelo / Análises | Preço | Peso | Altura | Tela |
|---|---|---|---|---|---|
1. 78.5%  | Asus V16 V3607V Intel Core 7 240H ⎘ NVIDIA GeForce RTX 3050 6GB Laptop GPU ⎘ 16 GB Memória | Preço de tabela: 900 USD | 2 kg | 22 mm | 16.00" 1920x1200 142 PPI IPS |
2. 87.6% v7 (old)  | Asus VivoBook Pro 16 K6602VU Intel Core i9-13900H ⎘ NVIDIA GeForce RTX 4050 Laptop GPU ⎘ 16 GB Memória, 1024 GB SSD | Amazon: 1. $1,649.00 ASUS Vivobook Pro K6602V 202... 2. $1,999.99 ASUS Vivobook Pro 16X OLED L... 3. $1,401.57 ASUS VivoBook Pro 16X OLED S... Preço de tabela: 2199 EUR | 1.9 kg | 19 mm | 16.00" 3200x2000 236 PPI OLED |
3. 83.4%  | Dell Inspiron 16 Plus 7640 Intel Core Ultra 7 155H ⎘ NVIDIA GeForce RTX 4060 Laptop GPU ⎘ 16 GB Memória, 1024 GB SSD | Amazon: $1,208.99 Preço de tabela: 1300 USD | 2.2 kg | 19.9 mm | 16.00" 2560x1600 189 PPI IPS |
4. 83%  | Lenovo ThinkBook 16 G7 IML Intel Core Ultra 5 125U ⎘ Intel Graphics 4-Core iGPU (Arc) ⎘ 16 GB Memória, 512 GB SSD | Amazon: $850.00 Preço de tabela: 750 USD | 1.8 kg | 17.5 mm | 16.00" 1920x1200 142 PPI IPS |
5. 88.7% v7 (old)  | HP Pavilion Plus 16-ab0456tx Intel Core i7-13700H ⎘ NVIDIA GeForce RTX 3050 6GB Laptop GPU ⎘ 16 GB Memória, 1024 GB SSD | Amazon: 1. $35.49 200W 150W 135W AC Charger Fo... 2. $1,120.18 HP Pavilion Plus 16 inch Lap... 3. $55.00 Laptop LCD Bezel for HP Pavi... Preço de tabela: 1350 USD | 1.9 kg | 19.9 mm | 16.00" 2560x1600 189 PPI IPS |
6. 81.3%  | Acer Swift Edge 16 SFE16-44-R0XV AMD Ryzen 5 8640U ⎘ AMD Radeon 760M ⎘ 16 GB Memória, 512 GB SSD | Amazon: 1. $219.89 HOULISE Replacement for Acer... Preço de tabela: 1000 EUR | 1.2 kg | 13 mm | 16.00" 3200x2000 236 PPI OLED |
Transparência
A seleção dos dispositivos a serem analisados é feita pela nossa equipe editorial. A amostra de teste foi fornecida ao autor como empréstimo pelo fabricante ou varejista para fins desta revisão. O credor não teve influência nesta revisão, nem o fabricante recebeu uma cópia desta revisão antes da publicação. Não houve obrigação de publicar esta revisão. Nunca aceitamos compensação ou pagamento em troca de nossas avaliações. Como empresa de mídia independente, a Notebookcheck não está sujeita à autoridade de fabricantes, varejistas ou editores.
É assim que o Notebookcheck está testando
Todos os anos, o Notebookcheck analisa de forma independente centenas de laptops e smartphones usando procedimentos padronizados para garantir que todos os resultados sejam comparáveis. Desenvolvemos continuamente nossos métodos de teste há cerca de 20 anos e definimos padrões da indústria no processo. Em nossos laboratórios de teste, equipamentos de medição de alta qualidade são utilizados por técnicos e editores experientes. Esses testes envolvem um processo de validação em vários estágios. Nosso complexo sistema de classificação é baseado em centenas de medições e benchmarks bem fundamentados, o que mantém a objetividade.
