

Análise do laptop Asus ProArt P16 - O AMD Zen 5 encontra o laptop RTX 4070 e o OLED 4K
Além do ProArt PX13 de 13,3 polegadas, 2 em 1 (analisado extensivamente aqui), a Asus também está lançando um laptop maior, de 16 polegadas, para criadores de conteúdo na forma do ProArt 16. Ele combina um moderno processador AMD Zen 5 com GPUs Nvidia dedicadas, bem como uma tela sensível ao toque OLED 4K de alta resolução. No entanto, ao contrário do pequeno PX13, o novo P16 enfrenta vários dispositivos concorrentes que vêm com especificações semelhantes. O novo ProArt P16 oferece um número suficiente de recursos para se destacar dos outros notebooks multimídia potentes?
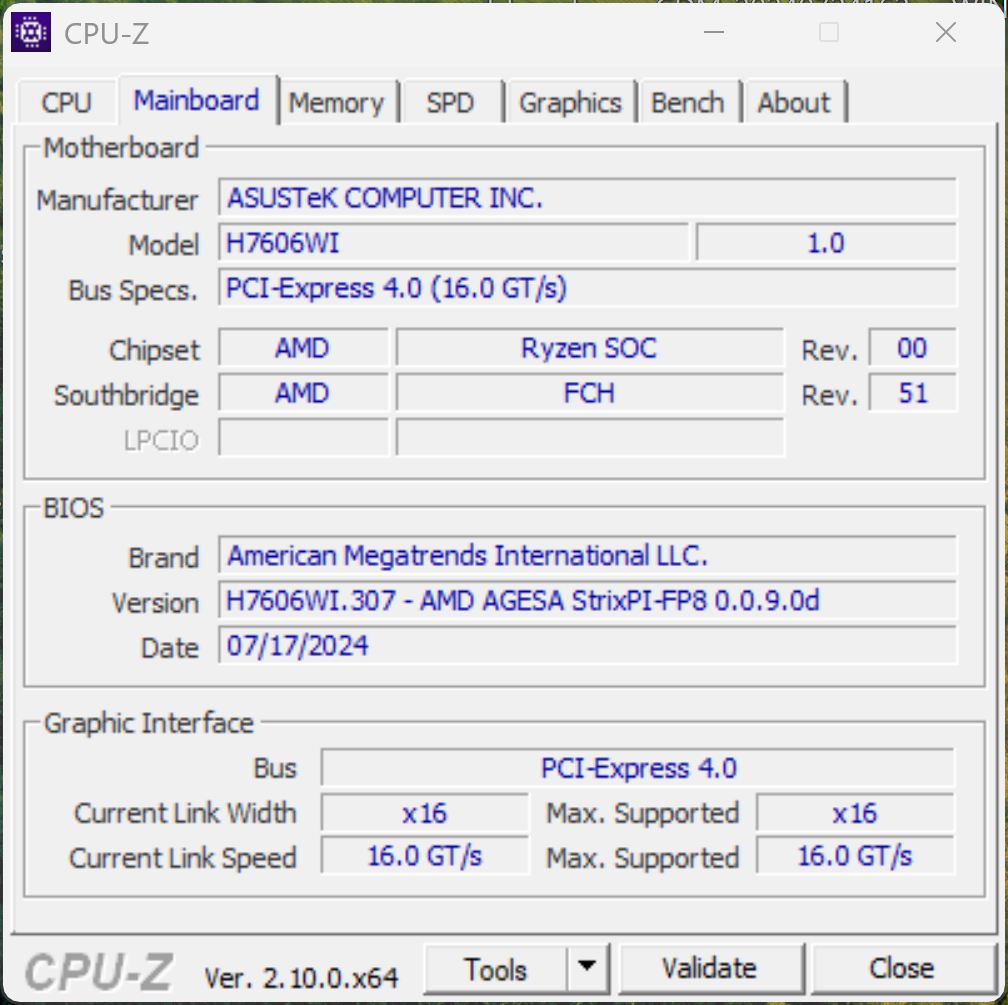
Nosso dispositivo de análise é a variante de ponta com o AMD Ryzen AI 9 HX 37064 GB de RAM, laptop Nvidia GeForce RTX 4070um SSD de 1 TB (variante de varejo com SSD de 2 TB) e um OLED 4K por um preço sugerido de US$ 2.699. A atualização de 32 GB de RAM (PVR: US$ 2.299) para 64 GB de RAM custa US$ 400. O preço de entrada para a versão com o Ryzen AI 9 36524 GB de RAM, um SSD de 1 TB e o laptop GeForce Laptop RTX 4050 fica em US$ 1.899.
Possíveis concorrentes em comparação
Avaliação | Versão | Data | Modelo | Peso | Altura | Size | Resolução | Preço |
|---|---|---|---|---|---|---|---|---|
| 87.8 % | v8 | 08/2024 | Asus ProArt P16 H7606WI Ryzen AI 9 HX 370, NVIDIA GeForce RTX 4070 Laptop GPU | 1.8 kg | 17.3 mm | 16.00" | 3840x2400 | |
| 81.2 % | v8 | 07/2024 | SCHENKER XMG Pro 16 Studio (Mid 24) i9-14900HX, NVIDIA GeForce RTX 4070 Laptop GPU | 2.3 kg | 19.9 mm | 16.00" | 2560x1600 | |
| 88.7 % v7 (old) | v7 (old) | 04/2024 | Lenovo Yoga Pro 9 16IMH9 Ultra 9 185H, NVIDIA GeForce RTX 4070 Laptop GPU | 2.1 kg | 18.3 mm | 16.00" | 3200x2000 | |
| 88.6 % v7 (old) | v7 (old) | 04/2024 | Dell XPS 16 9640 Ultra 7 155H, NVIDIA GeForce RTX 4070 Laptop GPU | 2.3 kg | 18.7 mm | 16.30" | 3840x2400 | |
| 92.3 % v7 (old) | v7 (old) | 02/2024 | Asus ROG Zephyrus G16 2024 GU605M Ultra 7 155H, NVIDIA GeForce RTX 4070 Laptop GPU | 1.8 kg | 16.4 mm | 16.00" | 2560x1600 | |
| 93.2 % v7 (old) | v7 (old) | 11/2023 | Apple MacBook Pro 16 2023 M3 Max Apple M3 Max 16-Core, M3 Max 40-Core GPU | 2.1 kg | 16.9 mm | 16.00" | 3456x2234 | |
| 90.5 % v7 (old) | v7 (old) | 11/2023 | Asus Zenbook Pro 16X UX7602BZ-MY005W i9-13905H, NVIDIA GeForce RTX 4080 Laptop GPU | 2.4 kg | 17.8 mm | 16.00" | 3200x2000 |
Observação: Atualizamos recentemente nosso sistema de classificação e os resultados da versão 8 não são comparáveis aos resultados da versão 7. Mais informações estão disponíveis aqui.
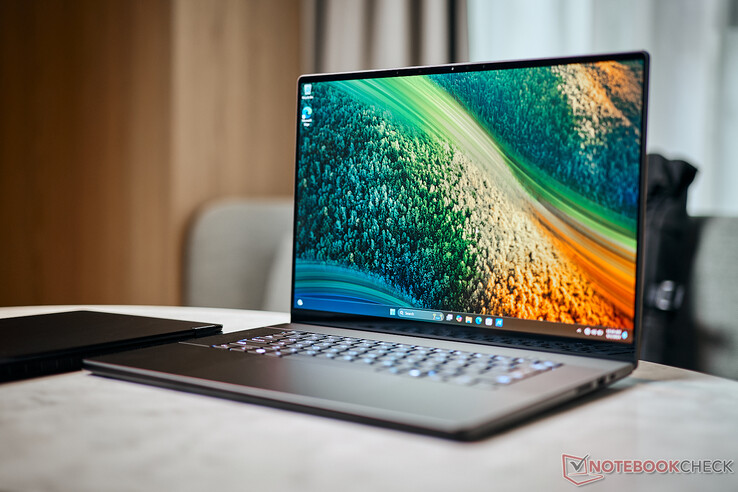
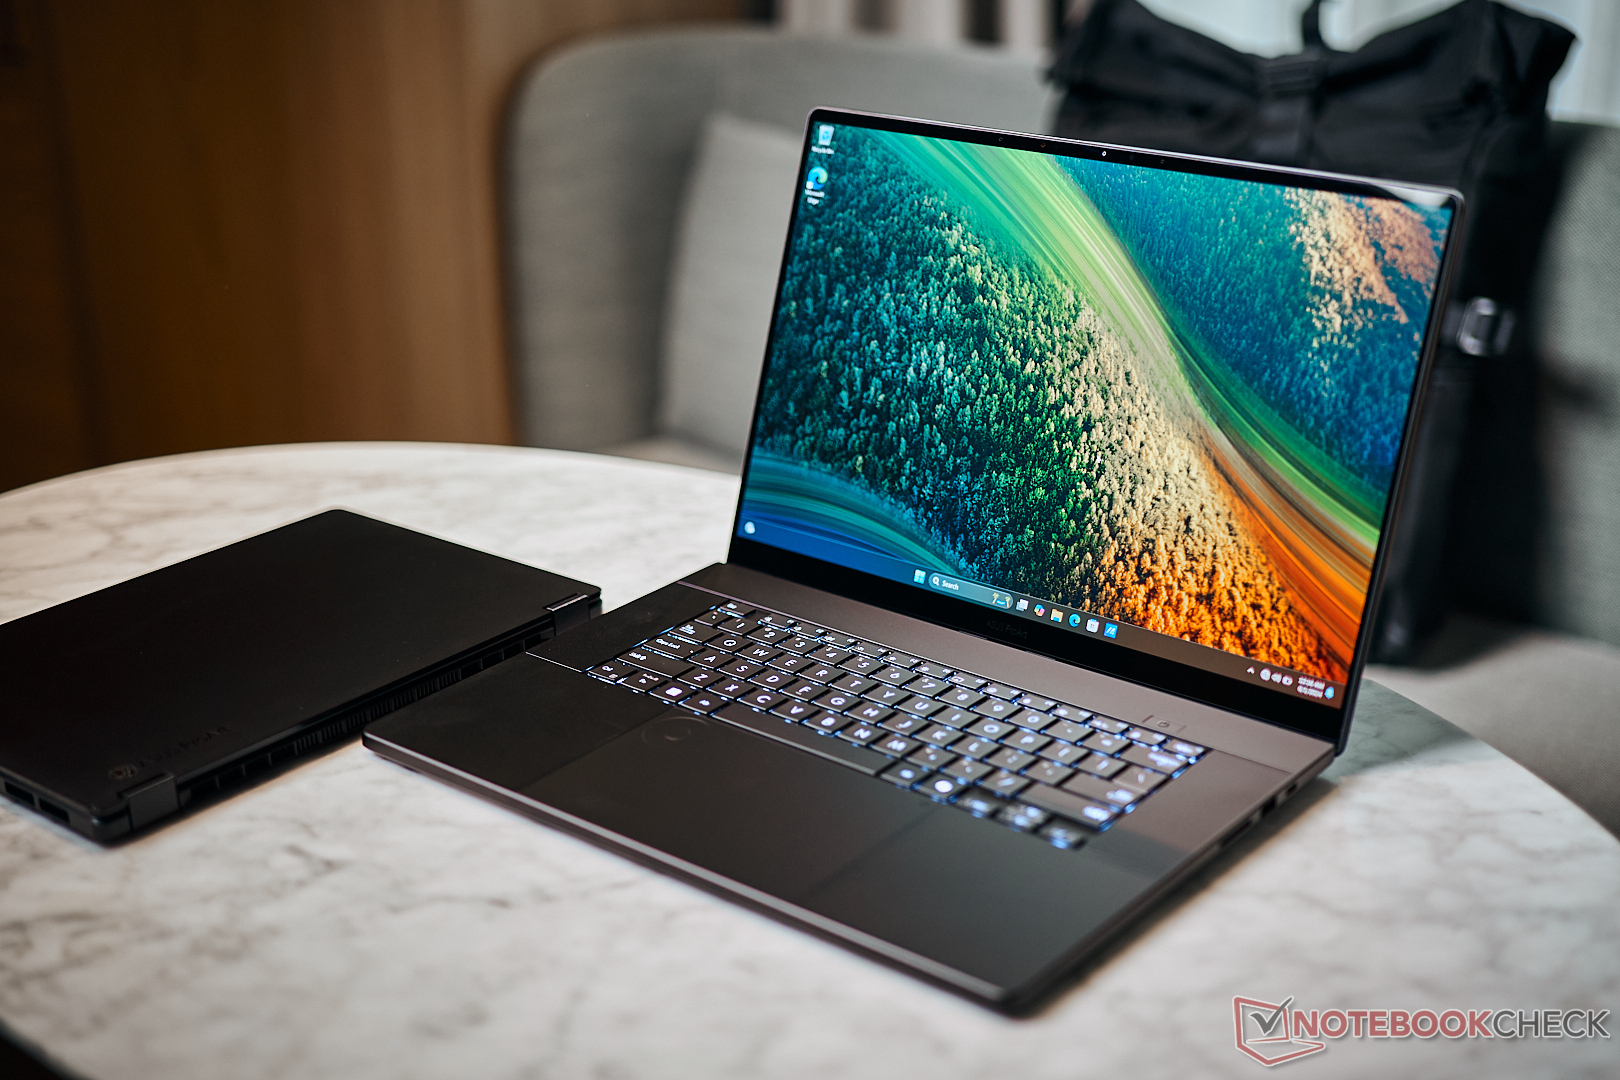
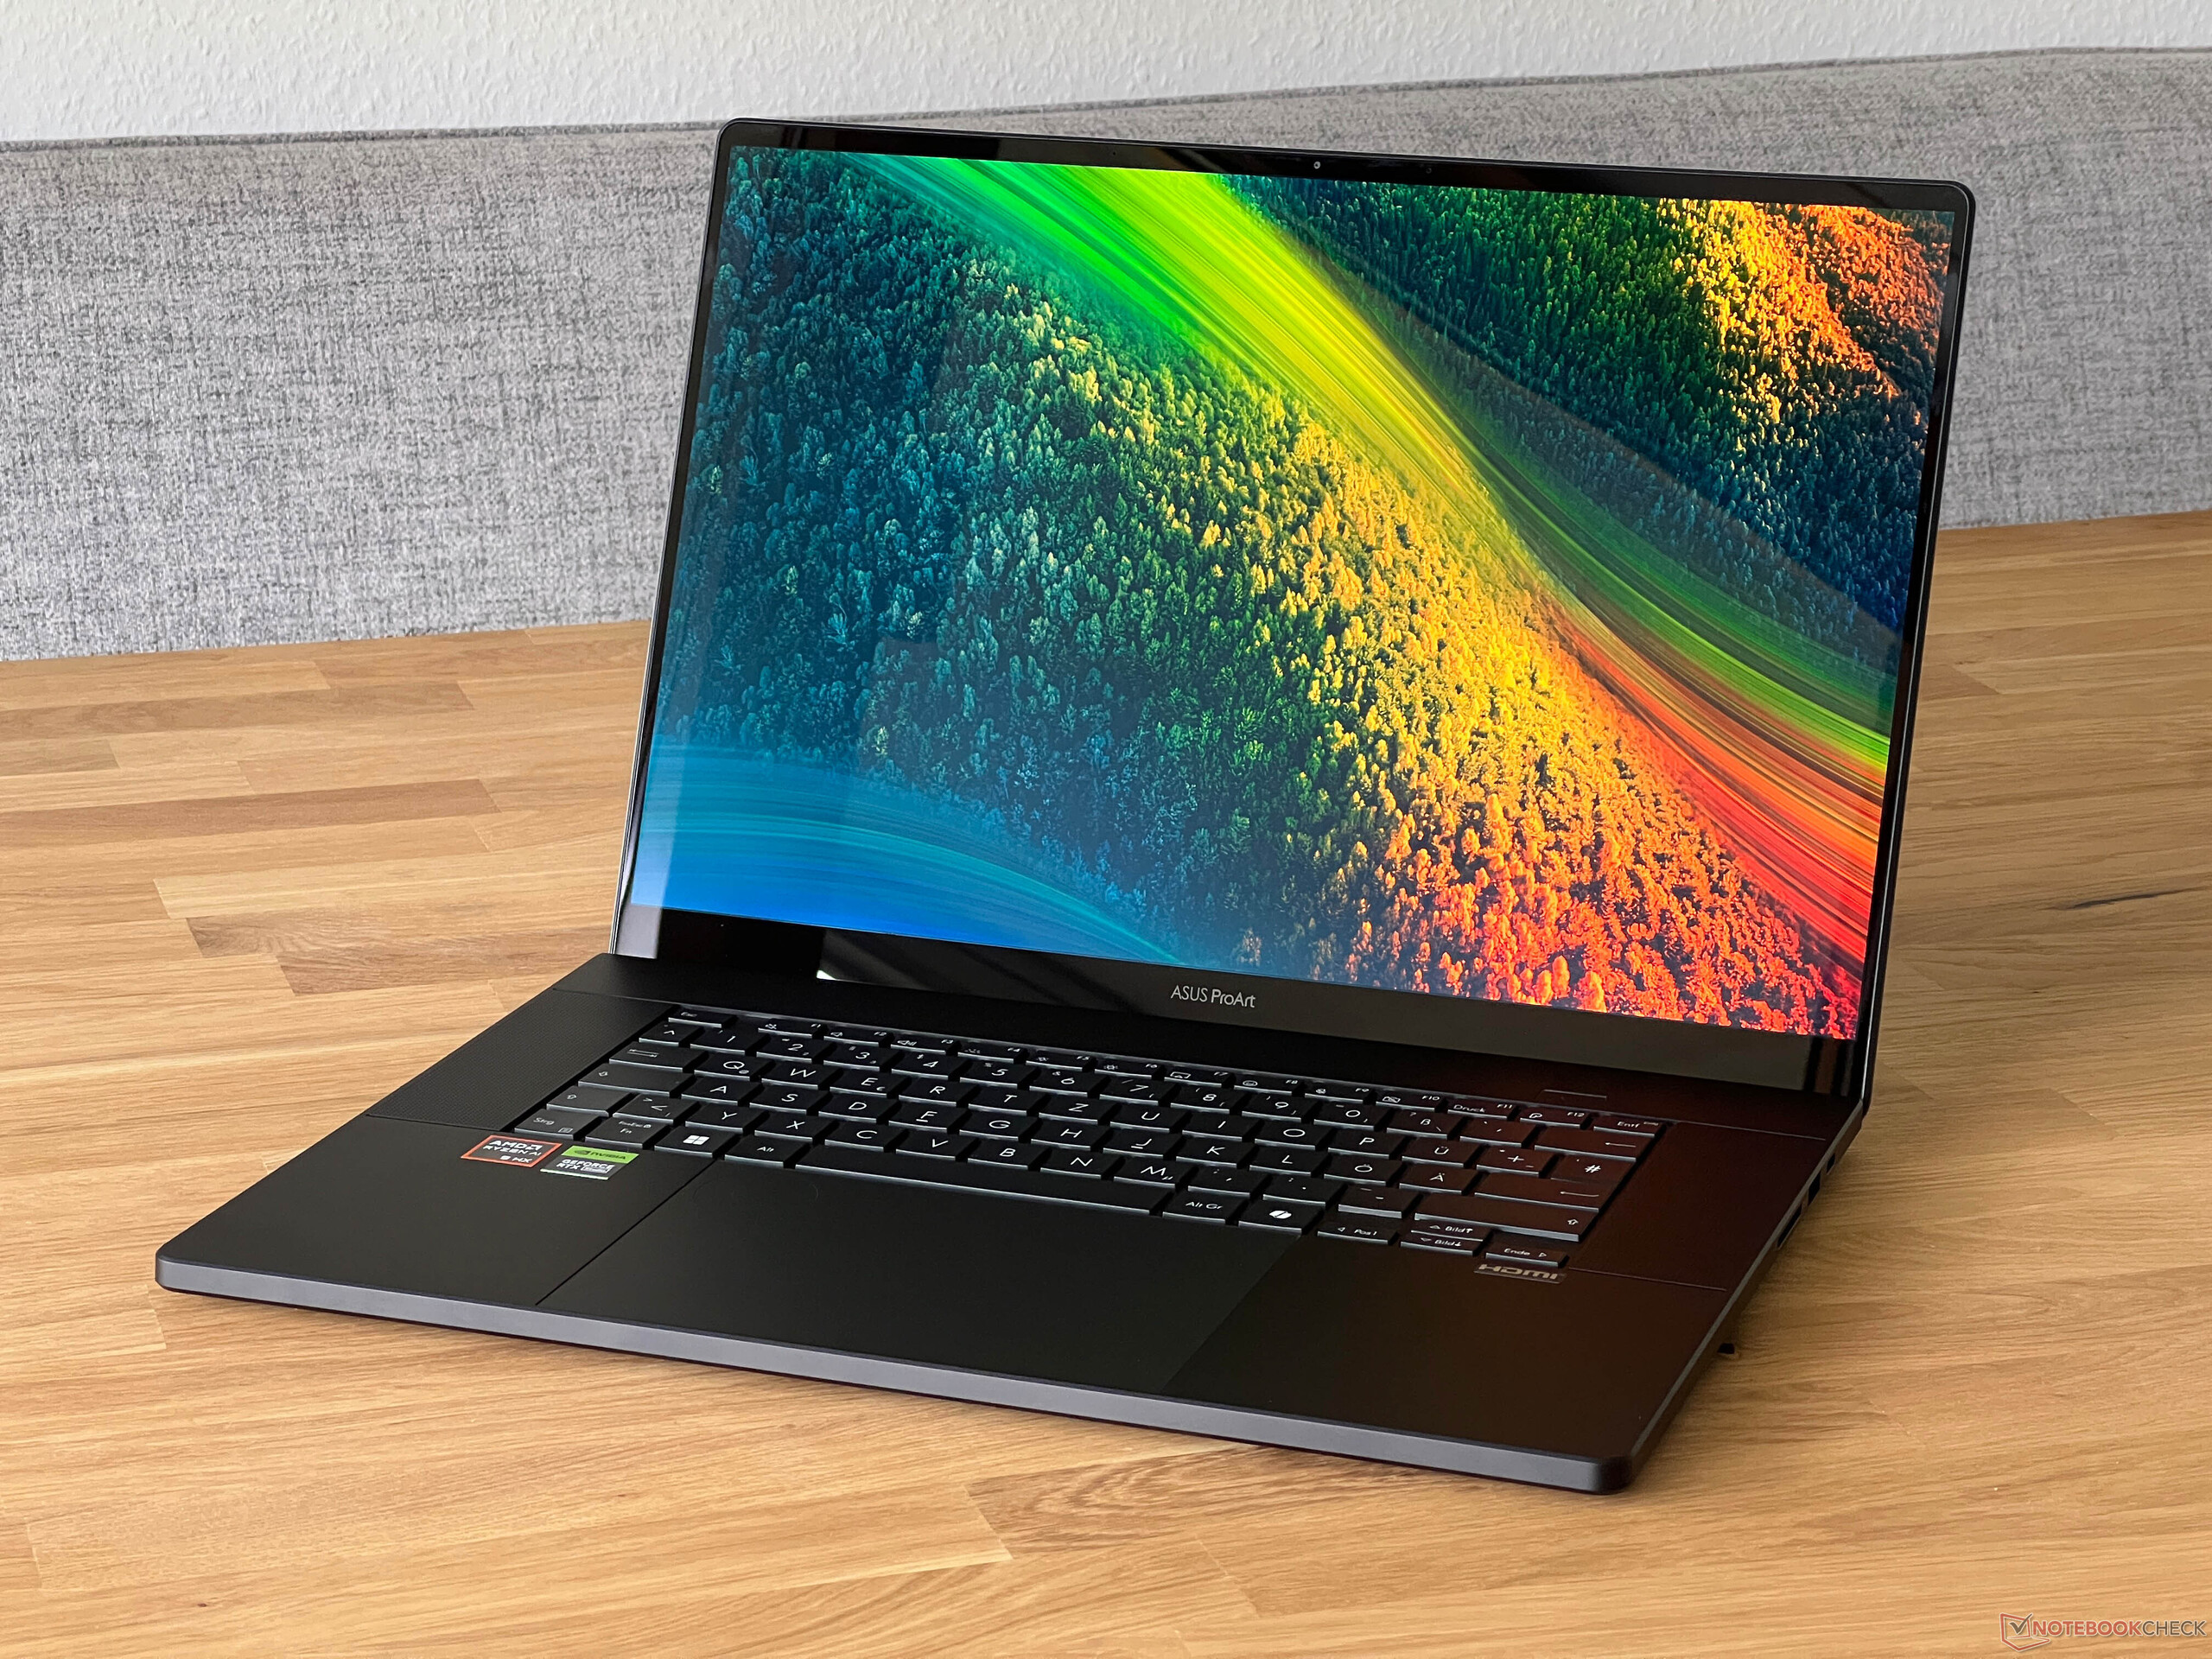
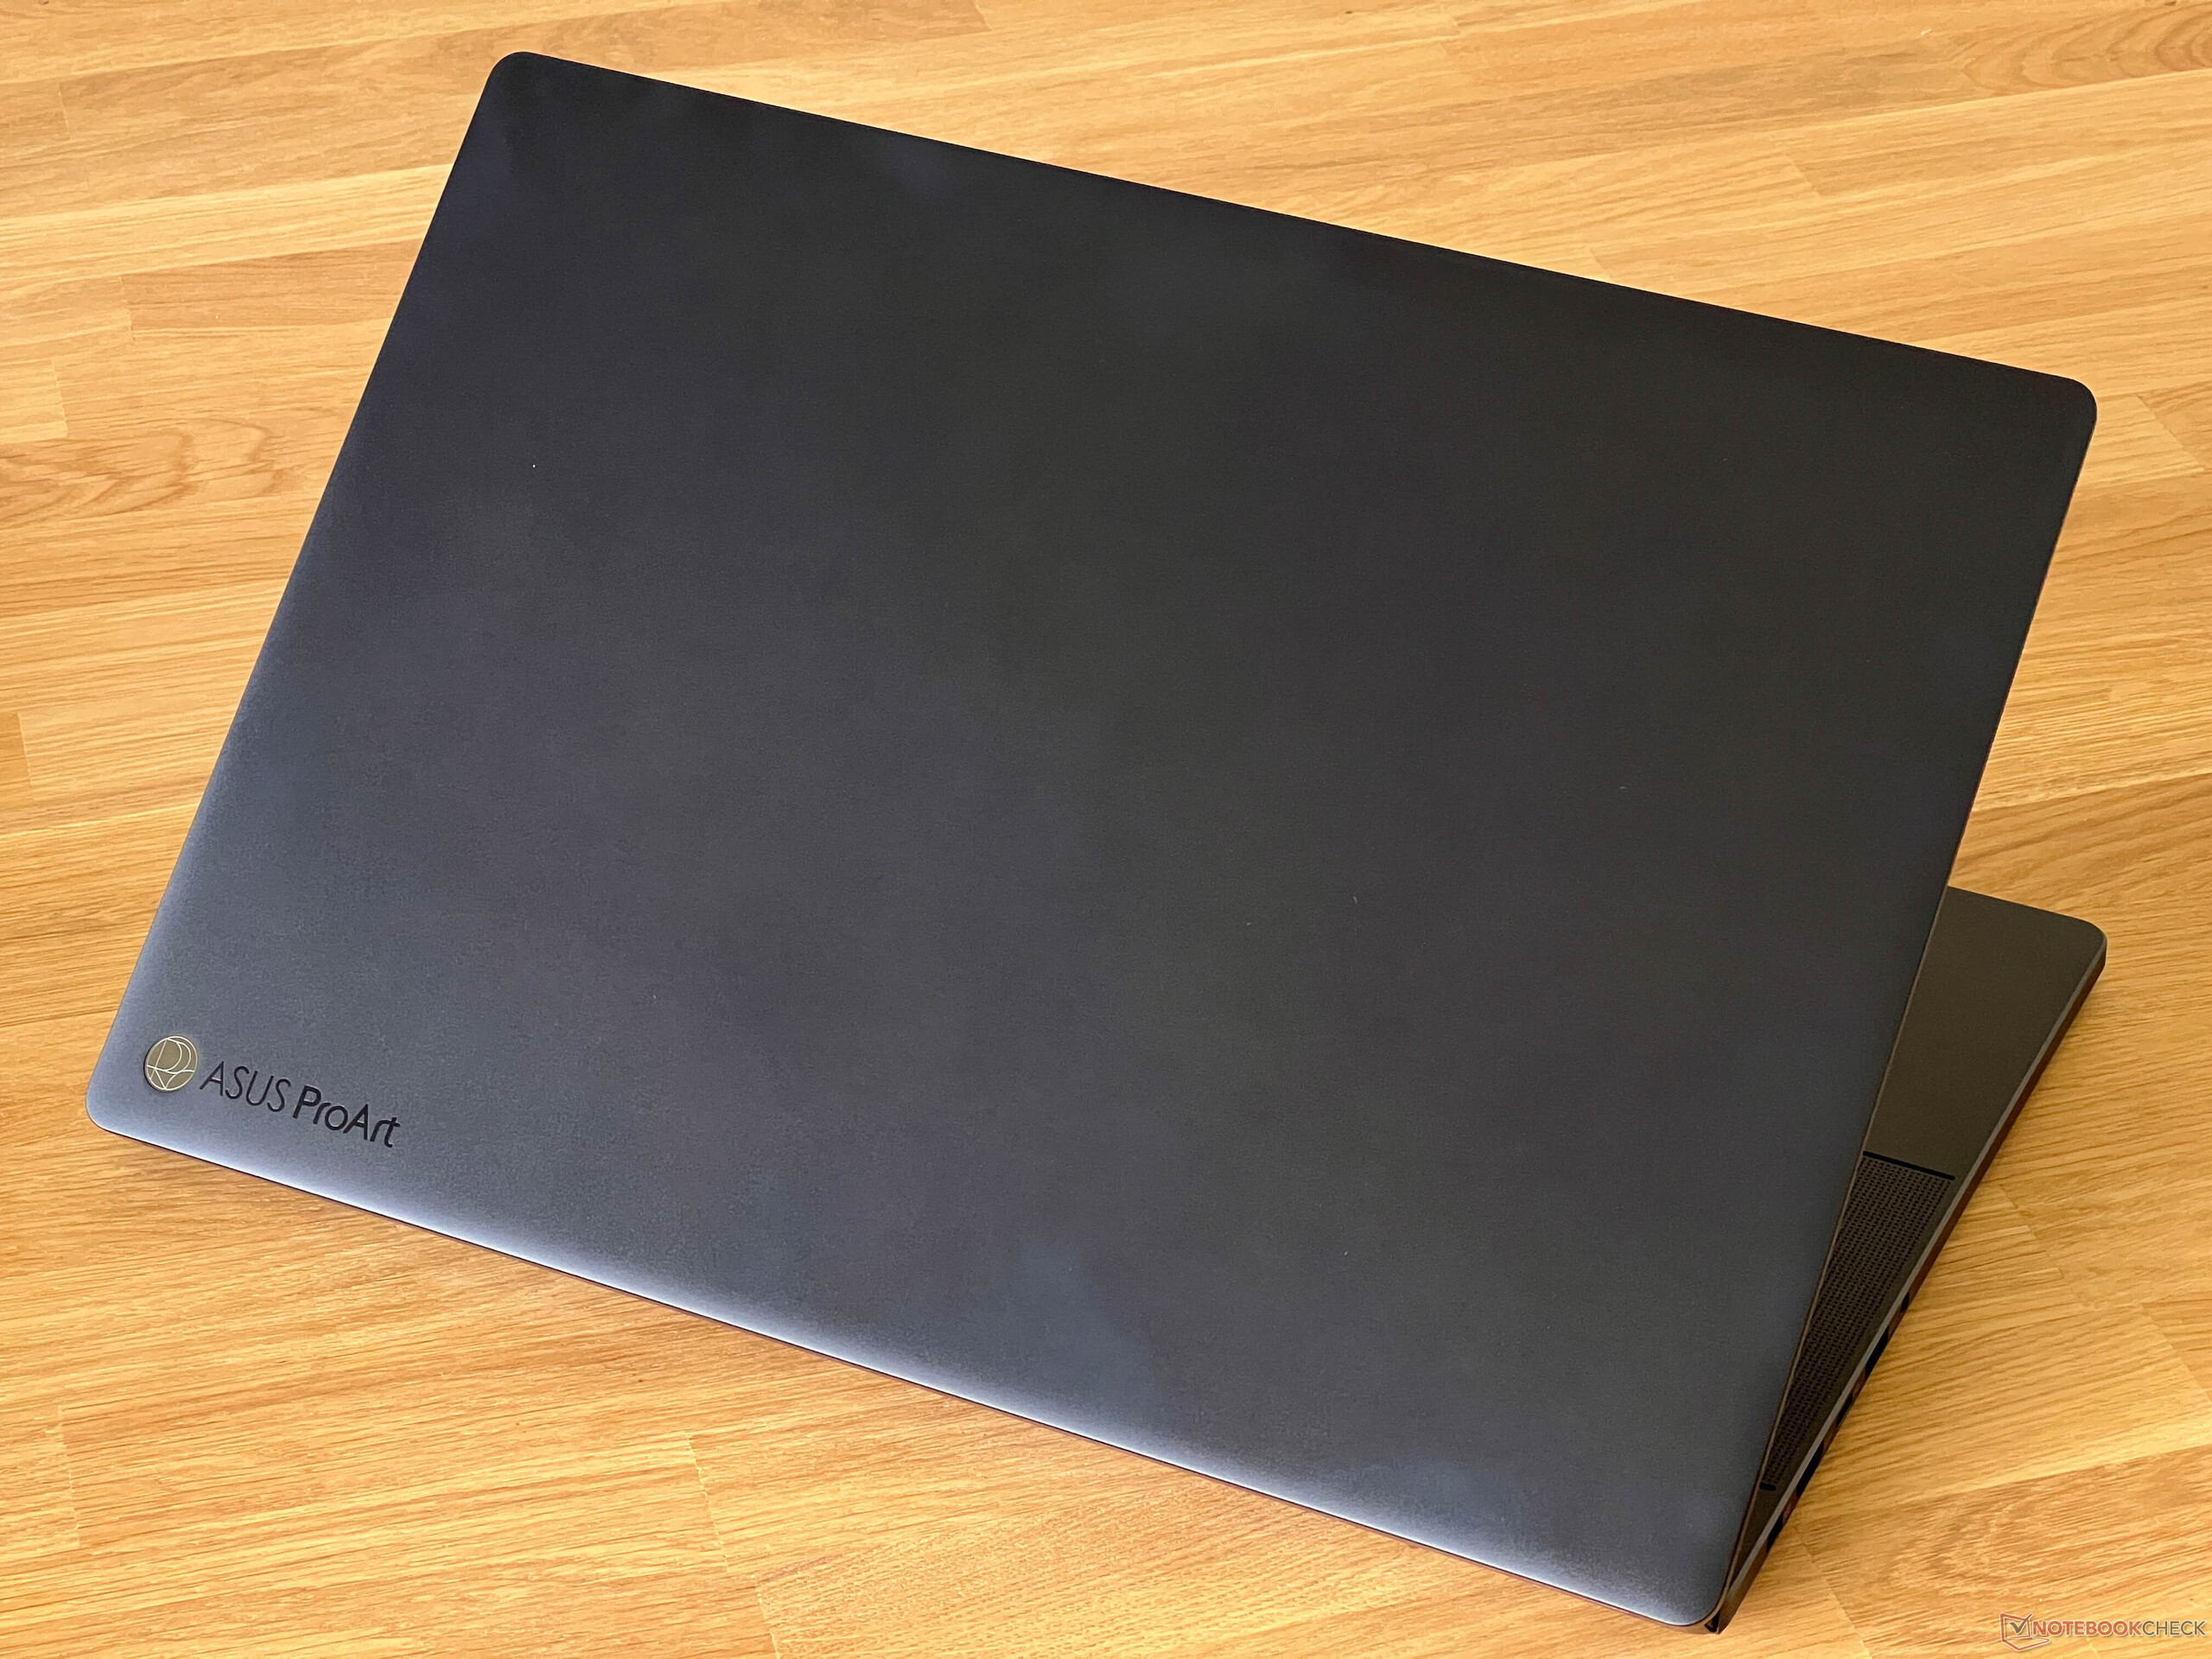
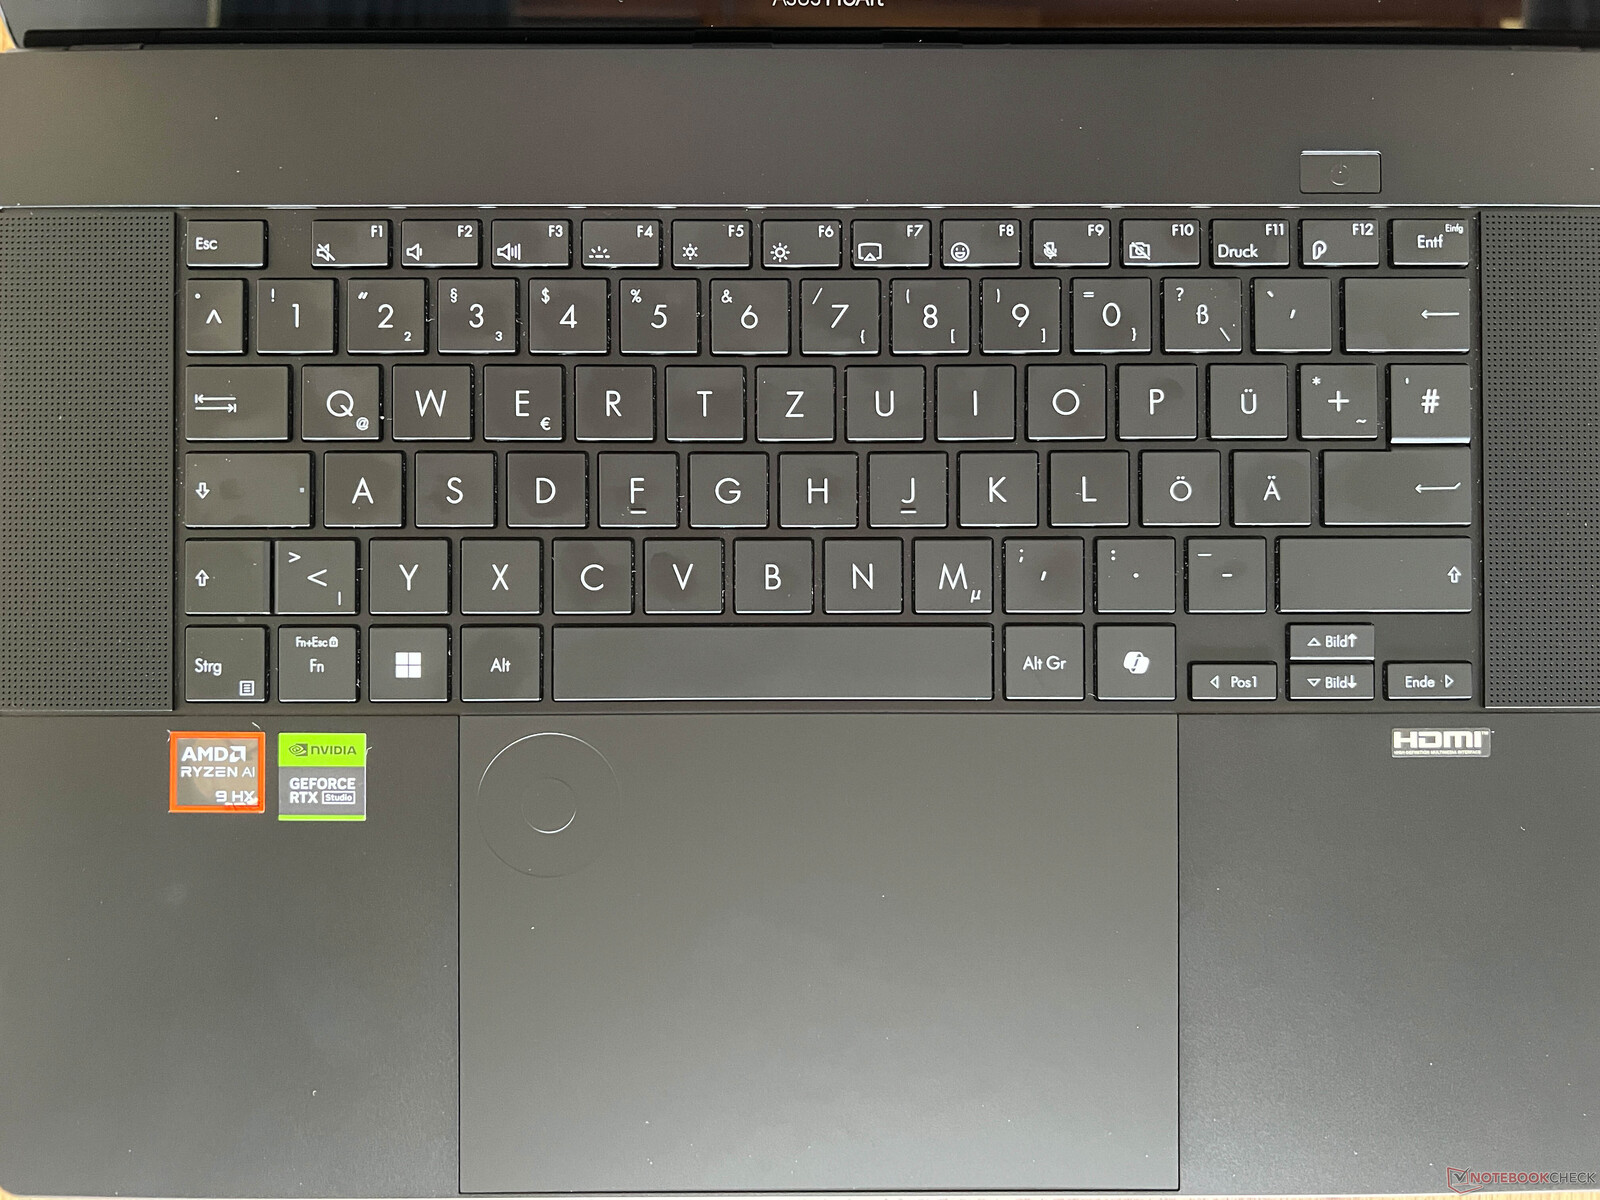
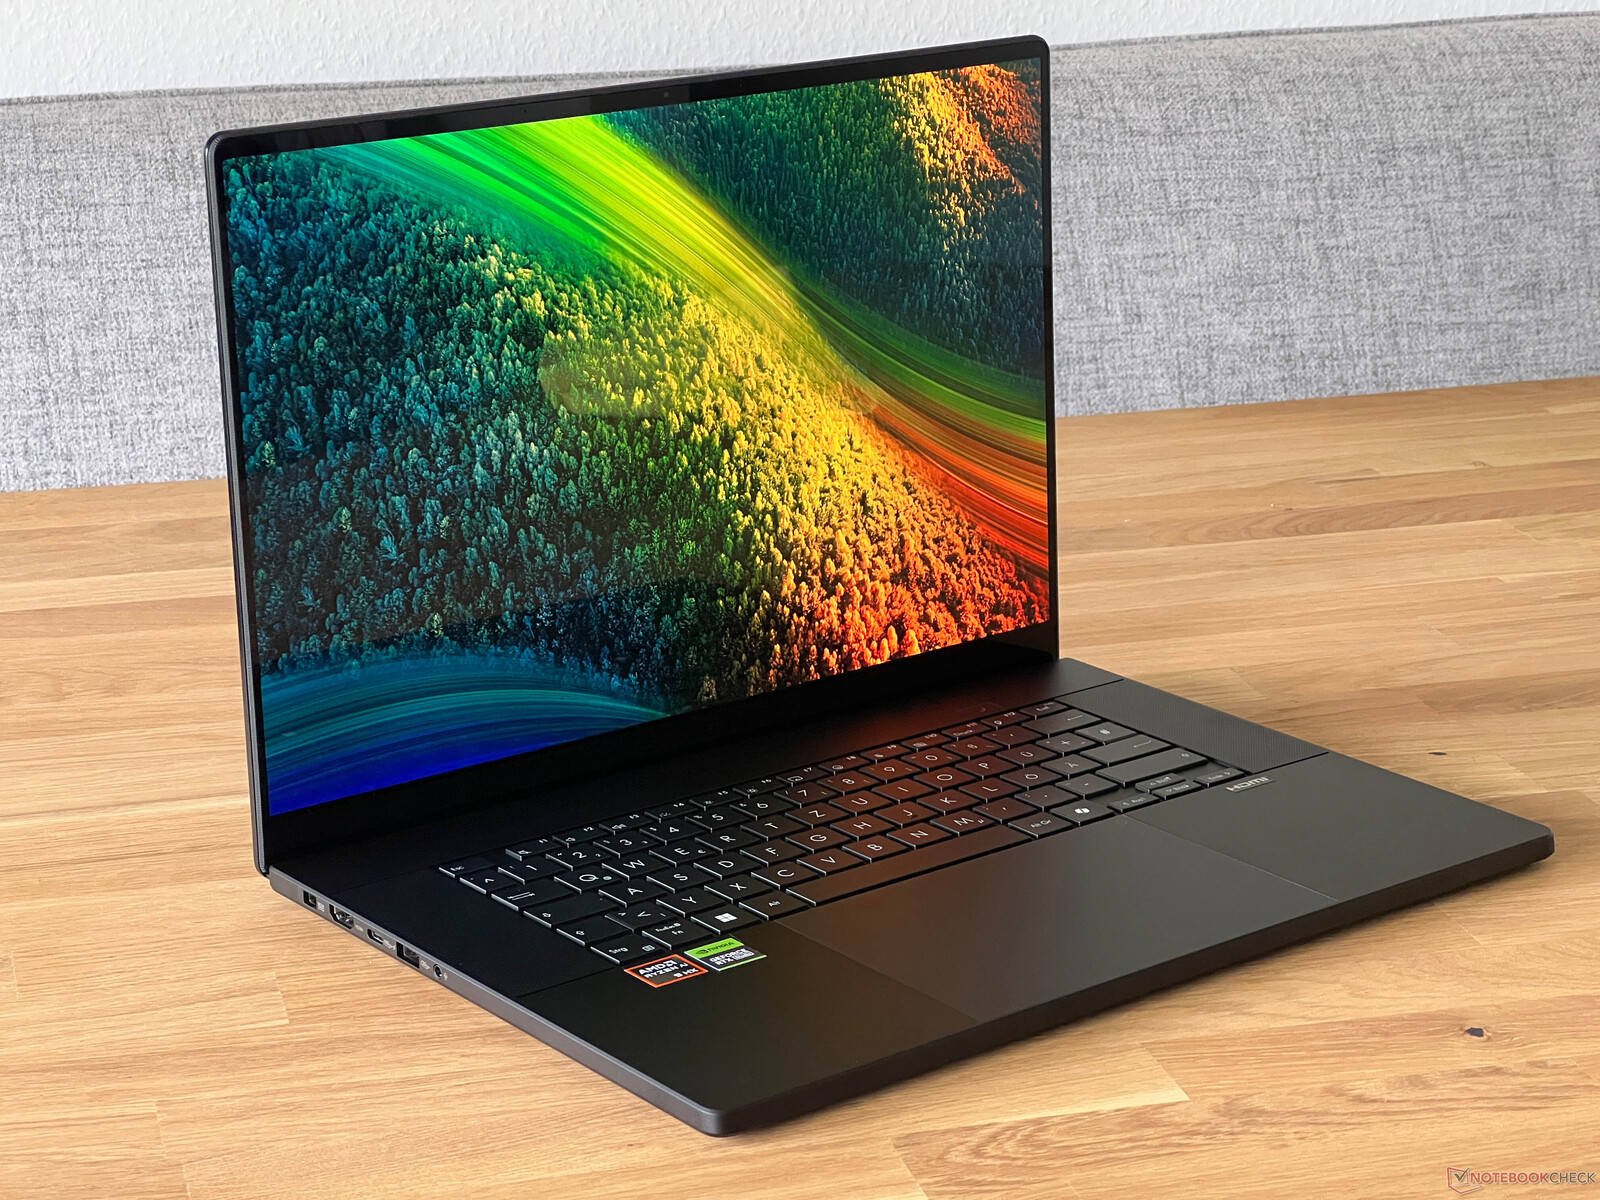
Case - Um unibody de alumínio, como o ROG Zephyrus G16
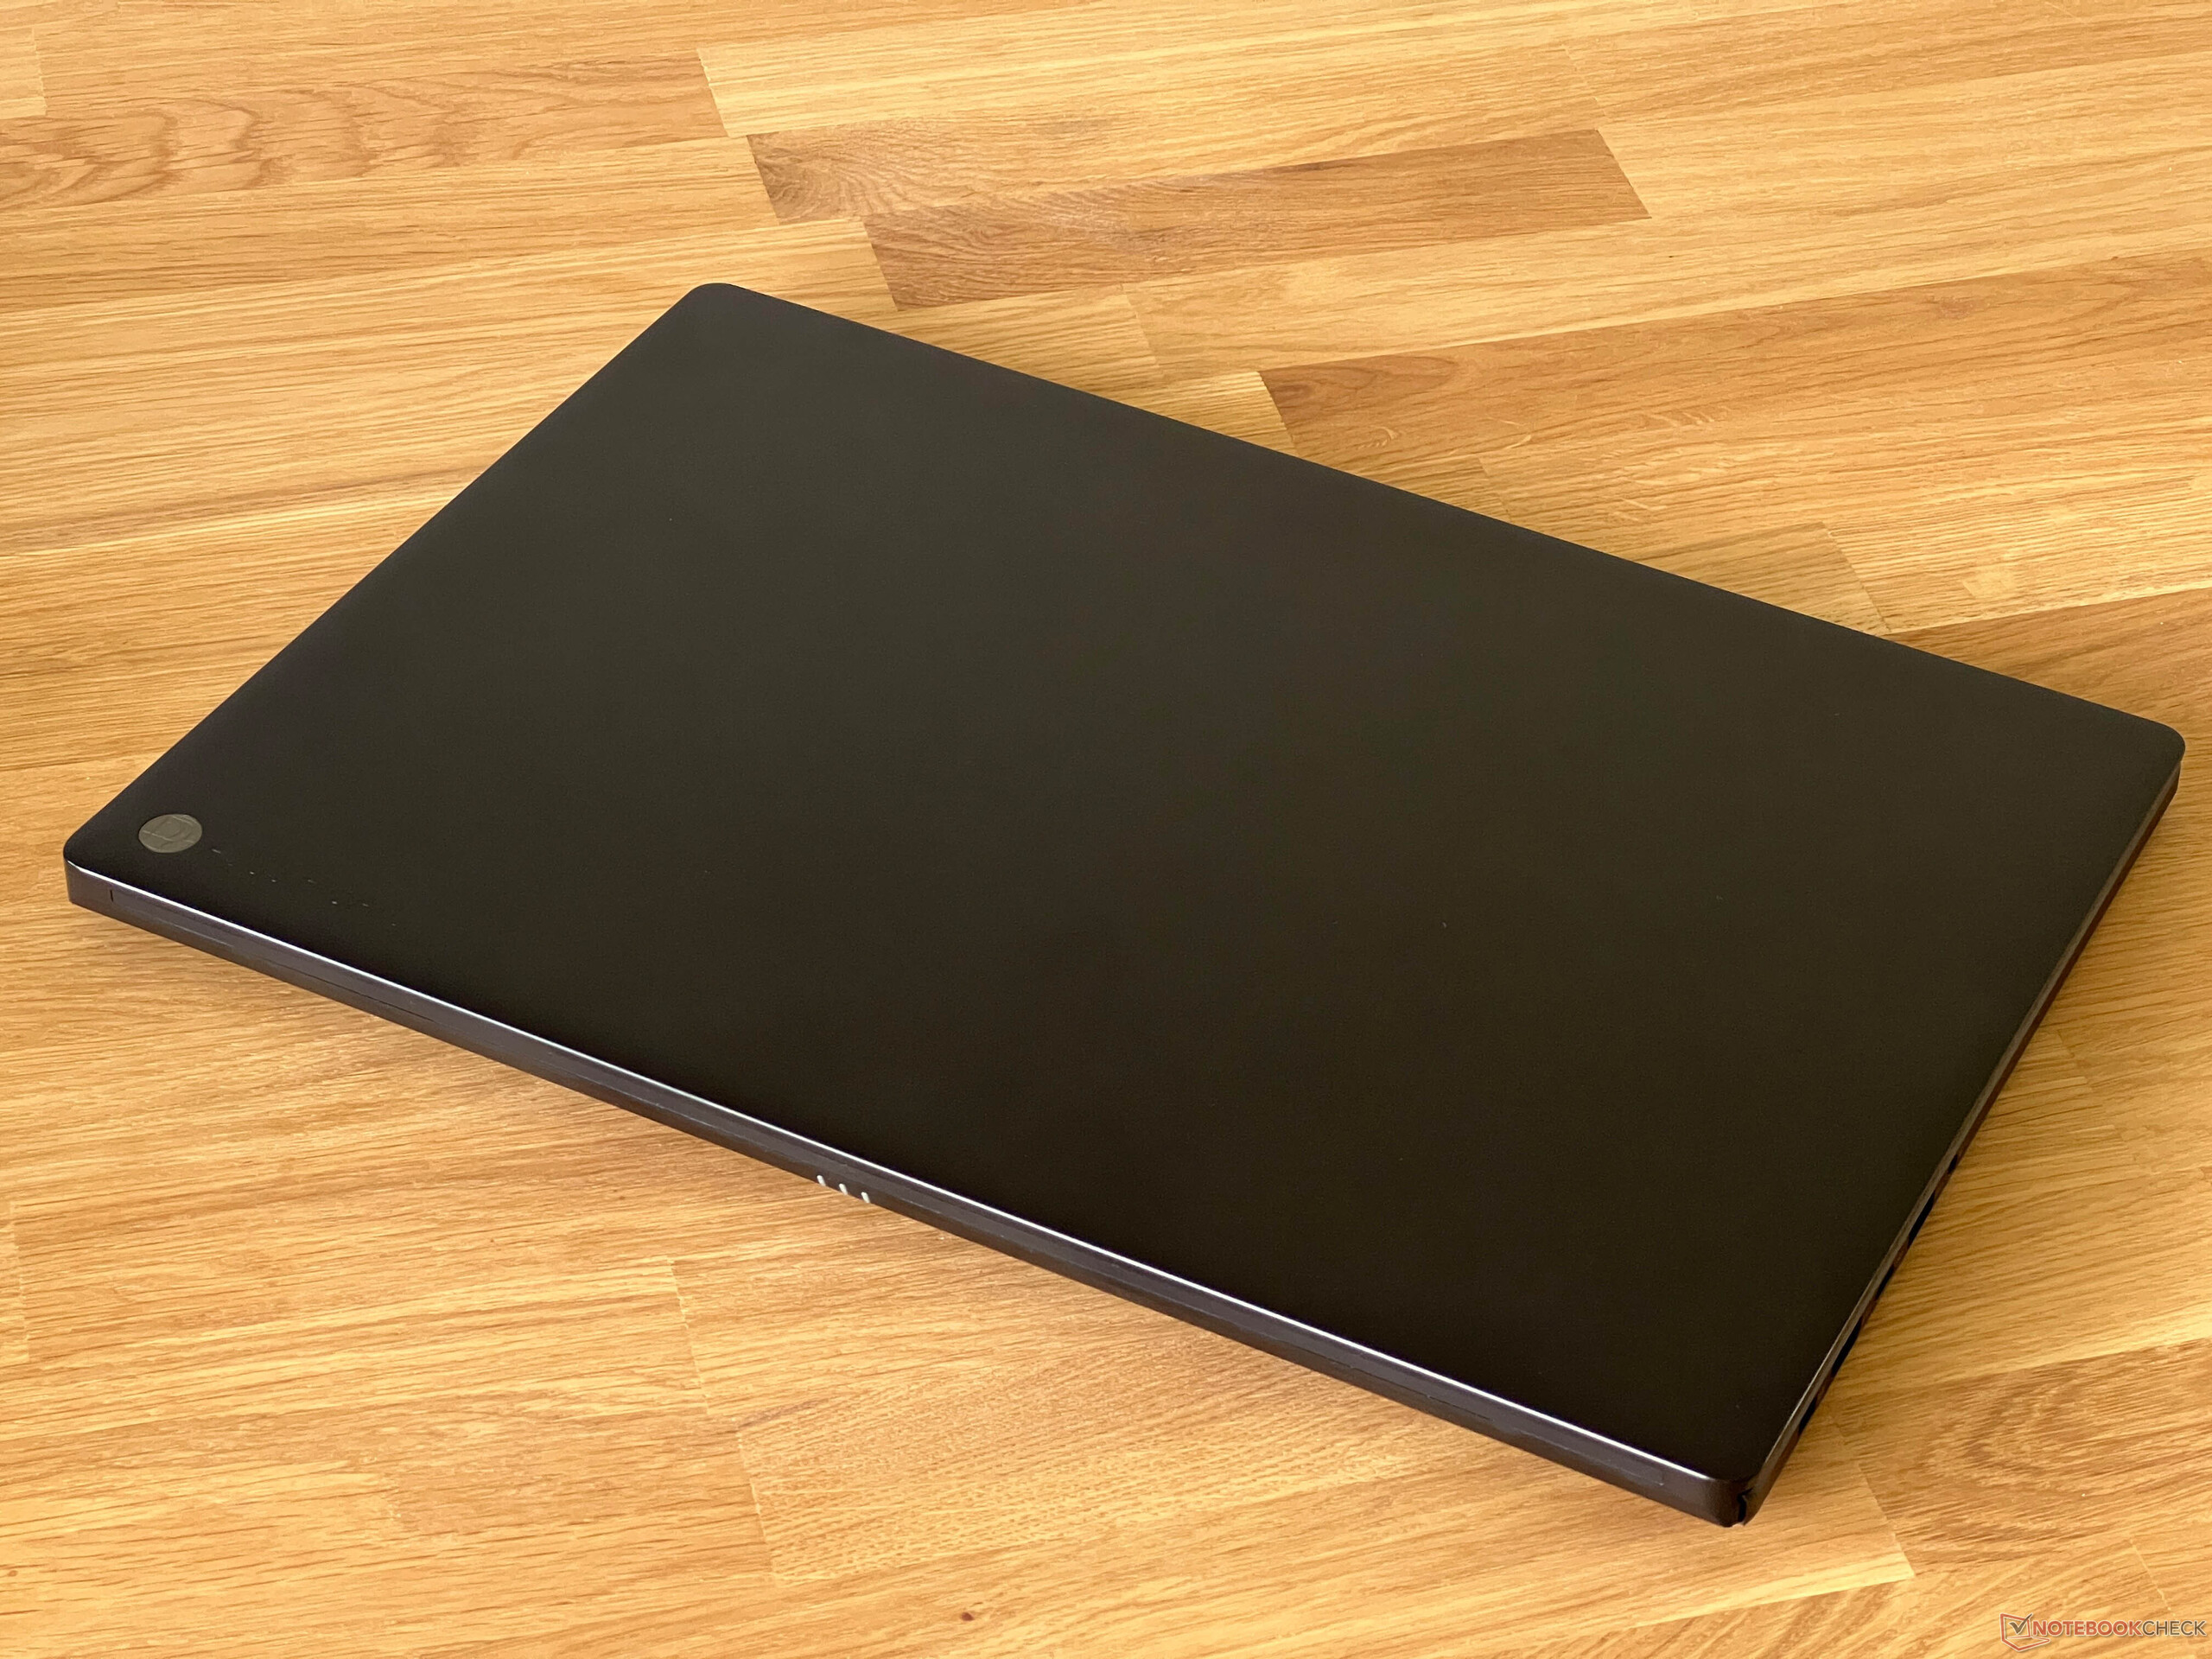
O gabinete unibody de alumínio preto tem muito em comum com o ROG Zephyrus G16no entanto, o ProArt não tem a iluminação LED do gabinete. Assim que o usuário abre a tampa da tela, percebe que não há muitas mudanças em relação ao layout do teclado (as teclas especiais adicionais estão ausentes e o botão liga/desliga tem um formato diferente), mas, fora isso, estamos lidando quase exclusivamente com semelhanças, incluindo as tampas dos alto-falantes e seus 4.110 orifícios. O ProArt P16 só vem na variante de cor Nano Black, que é propensa a atrair rapidamente as impressões digitais.
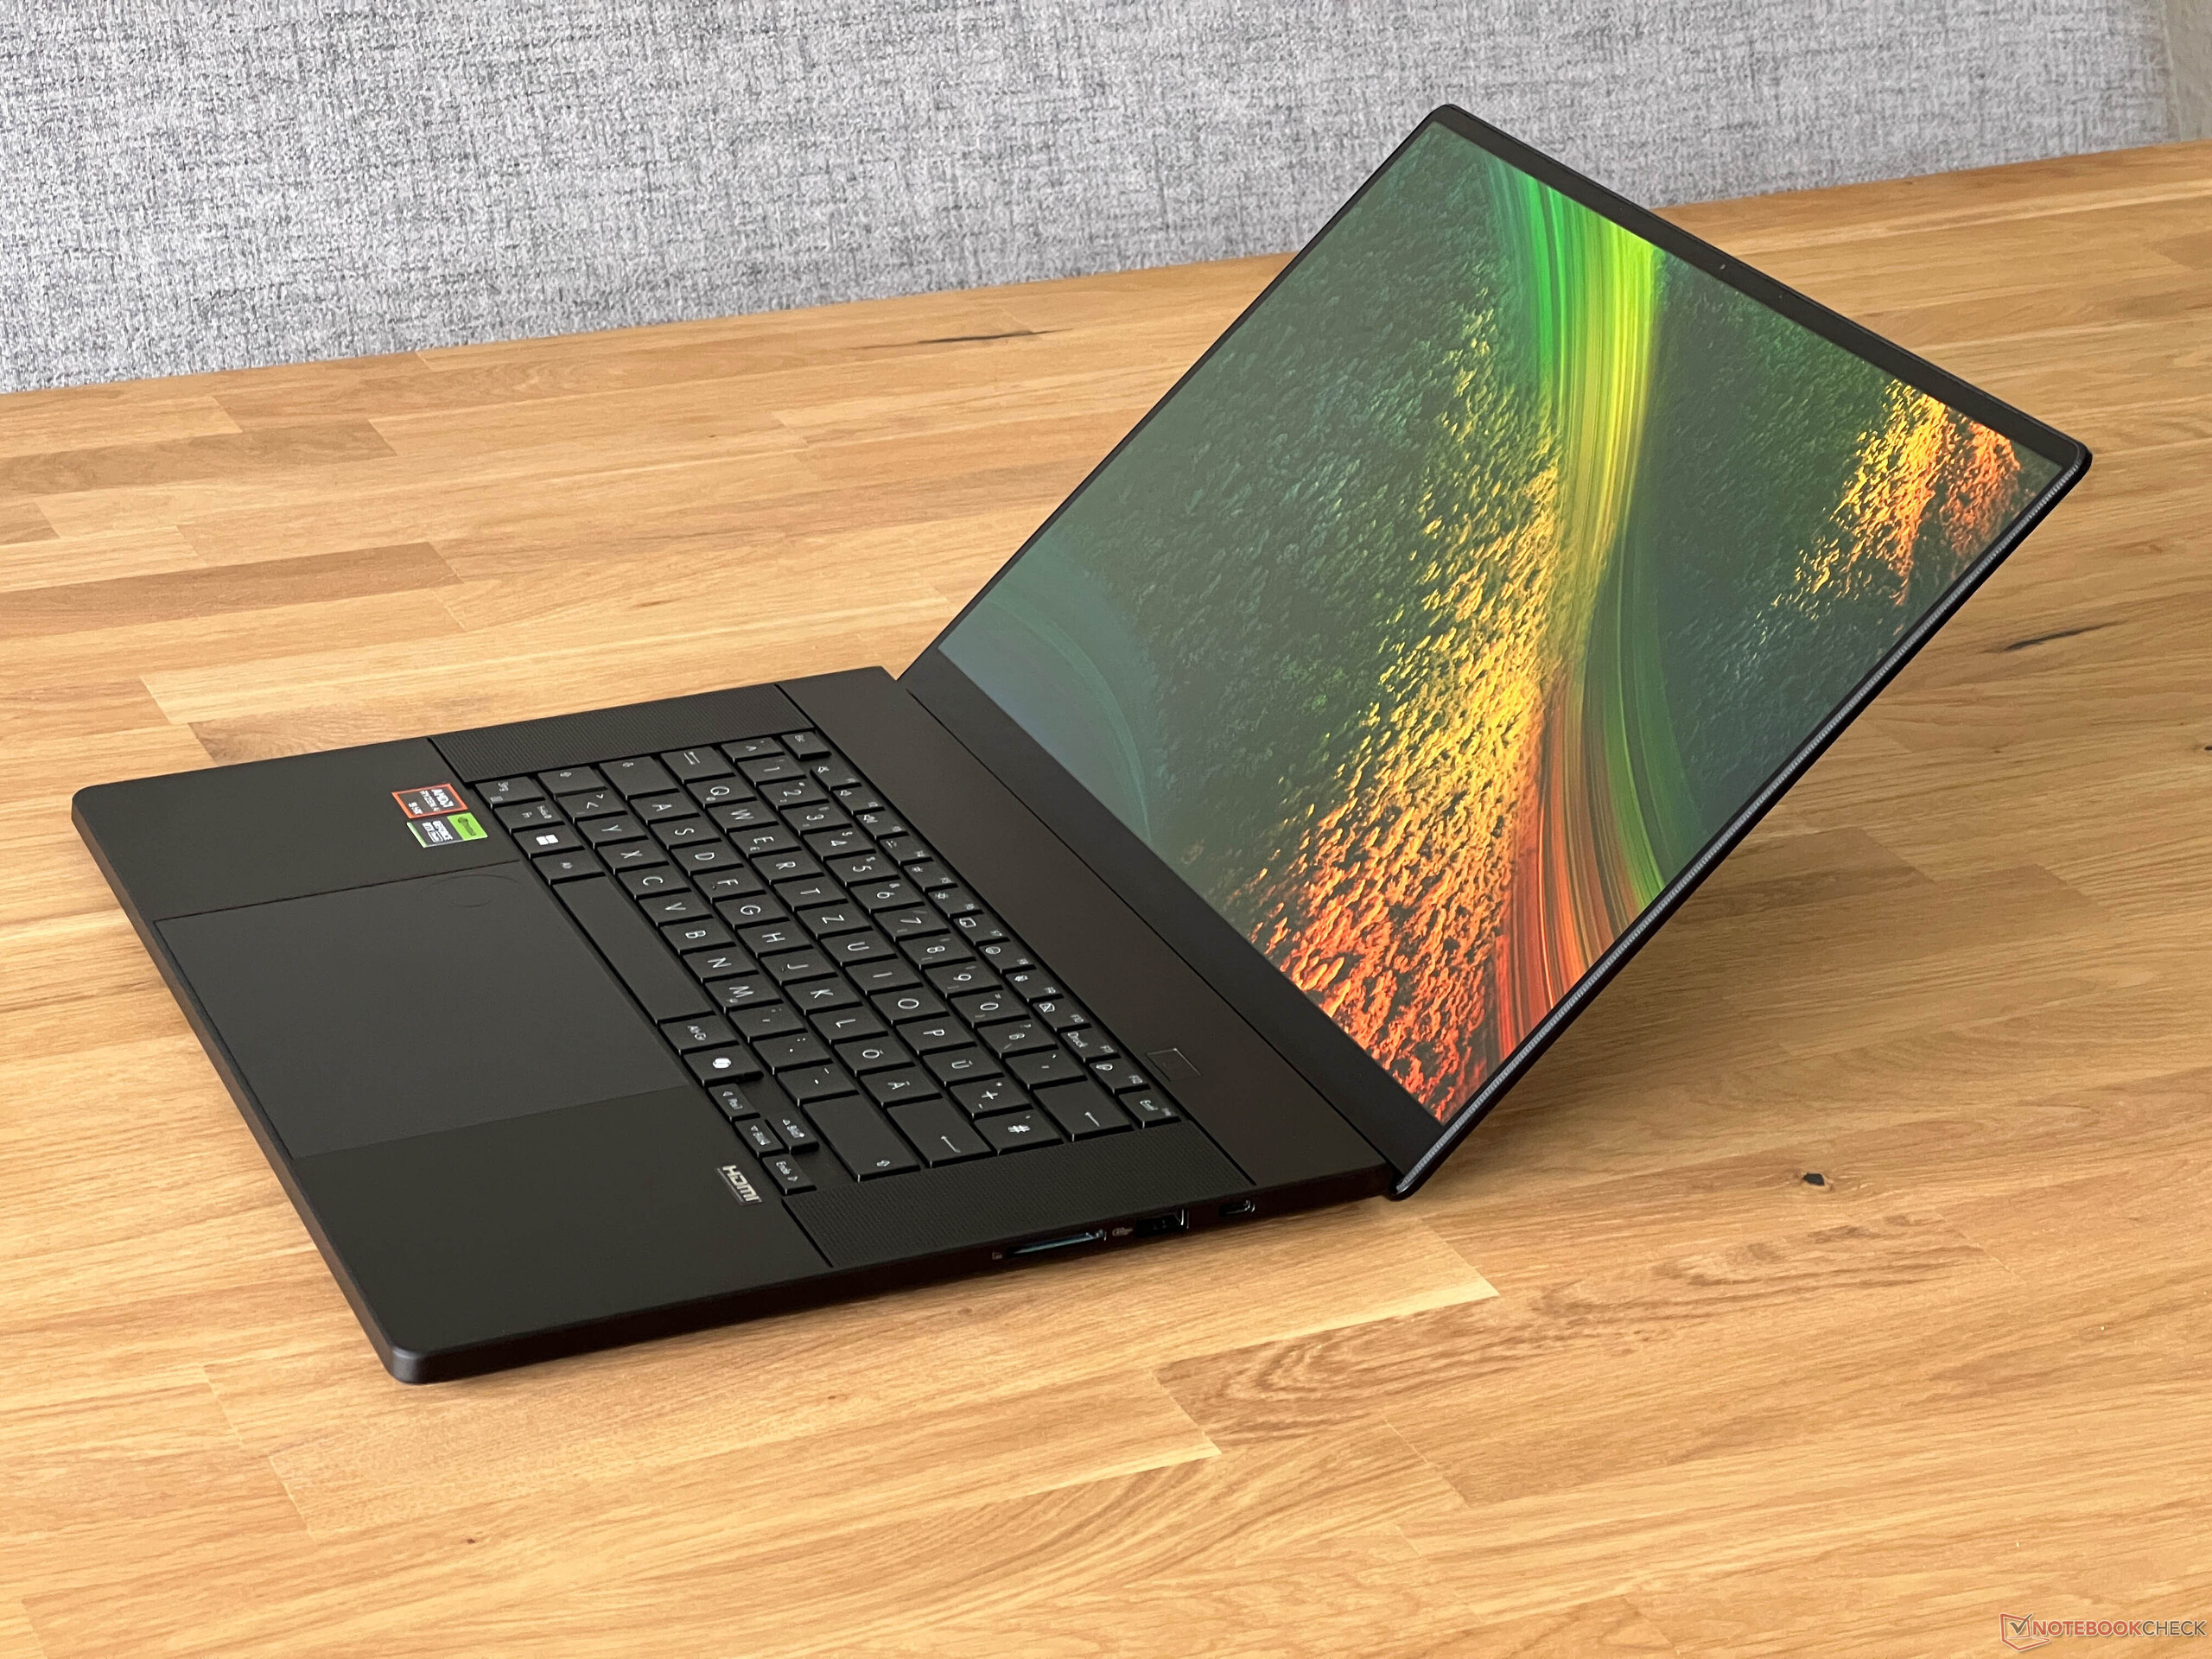
Em termos de qualidade, o P16 também não é muito diferente do Zephyrus G16, tanto por motivos positivos quanto negativos. Os aspectos positivos são a excelente estabilidade e a qualidade de construção, mas as dobradiças levemente frouxas e a oscilação perceptível da tampa continuam a ser características negativas.
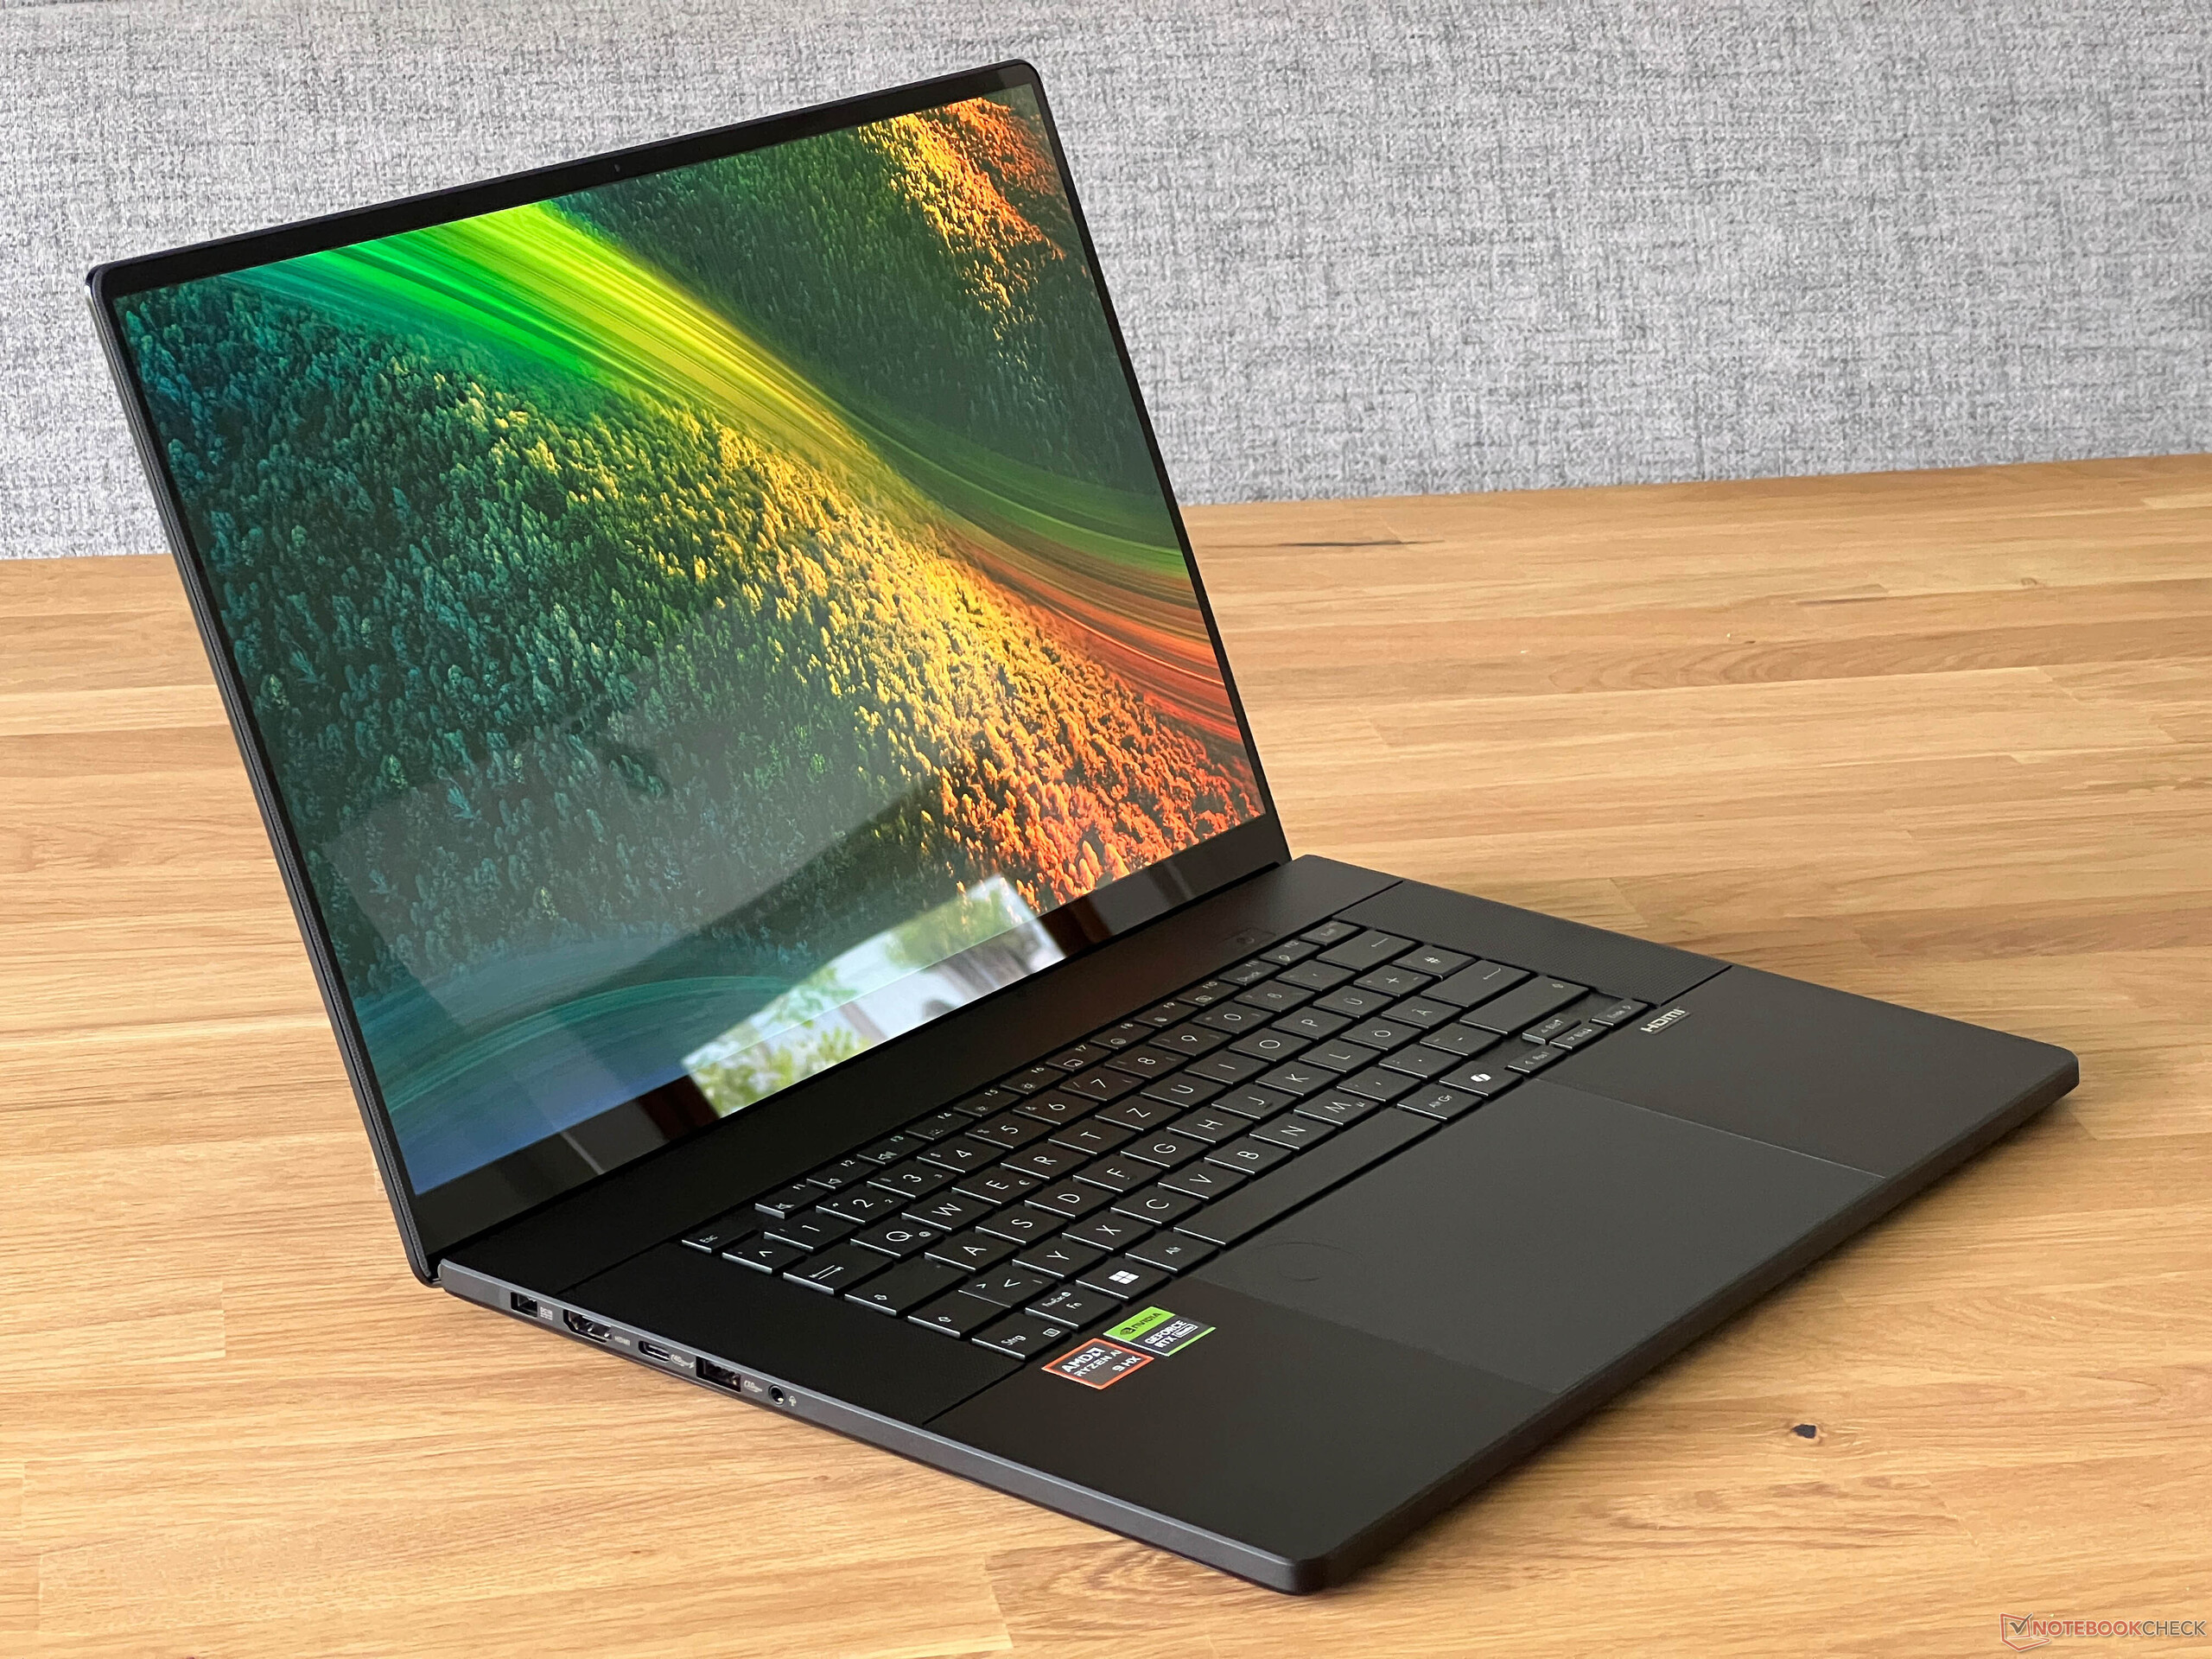
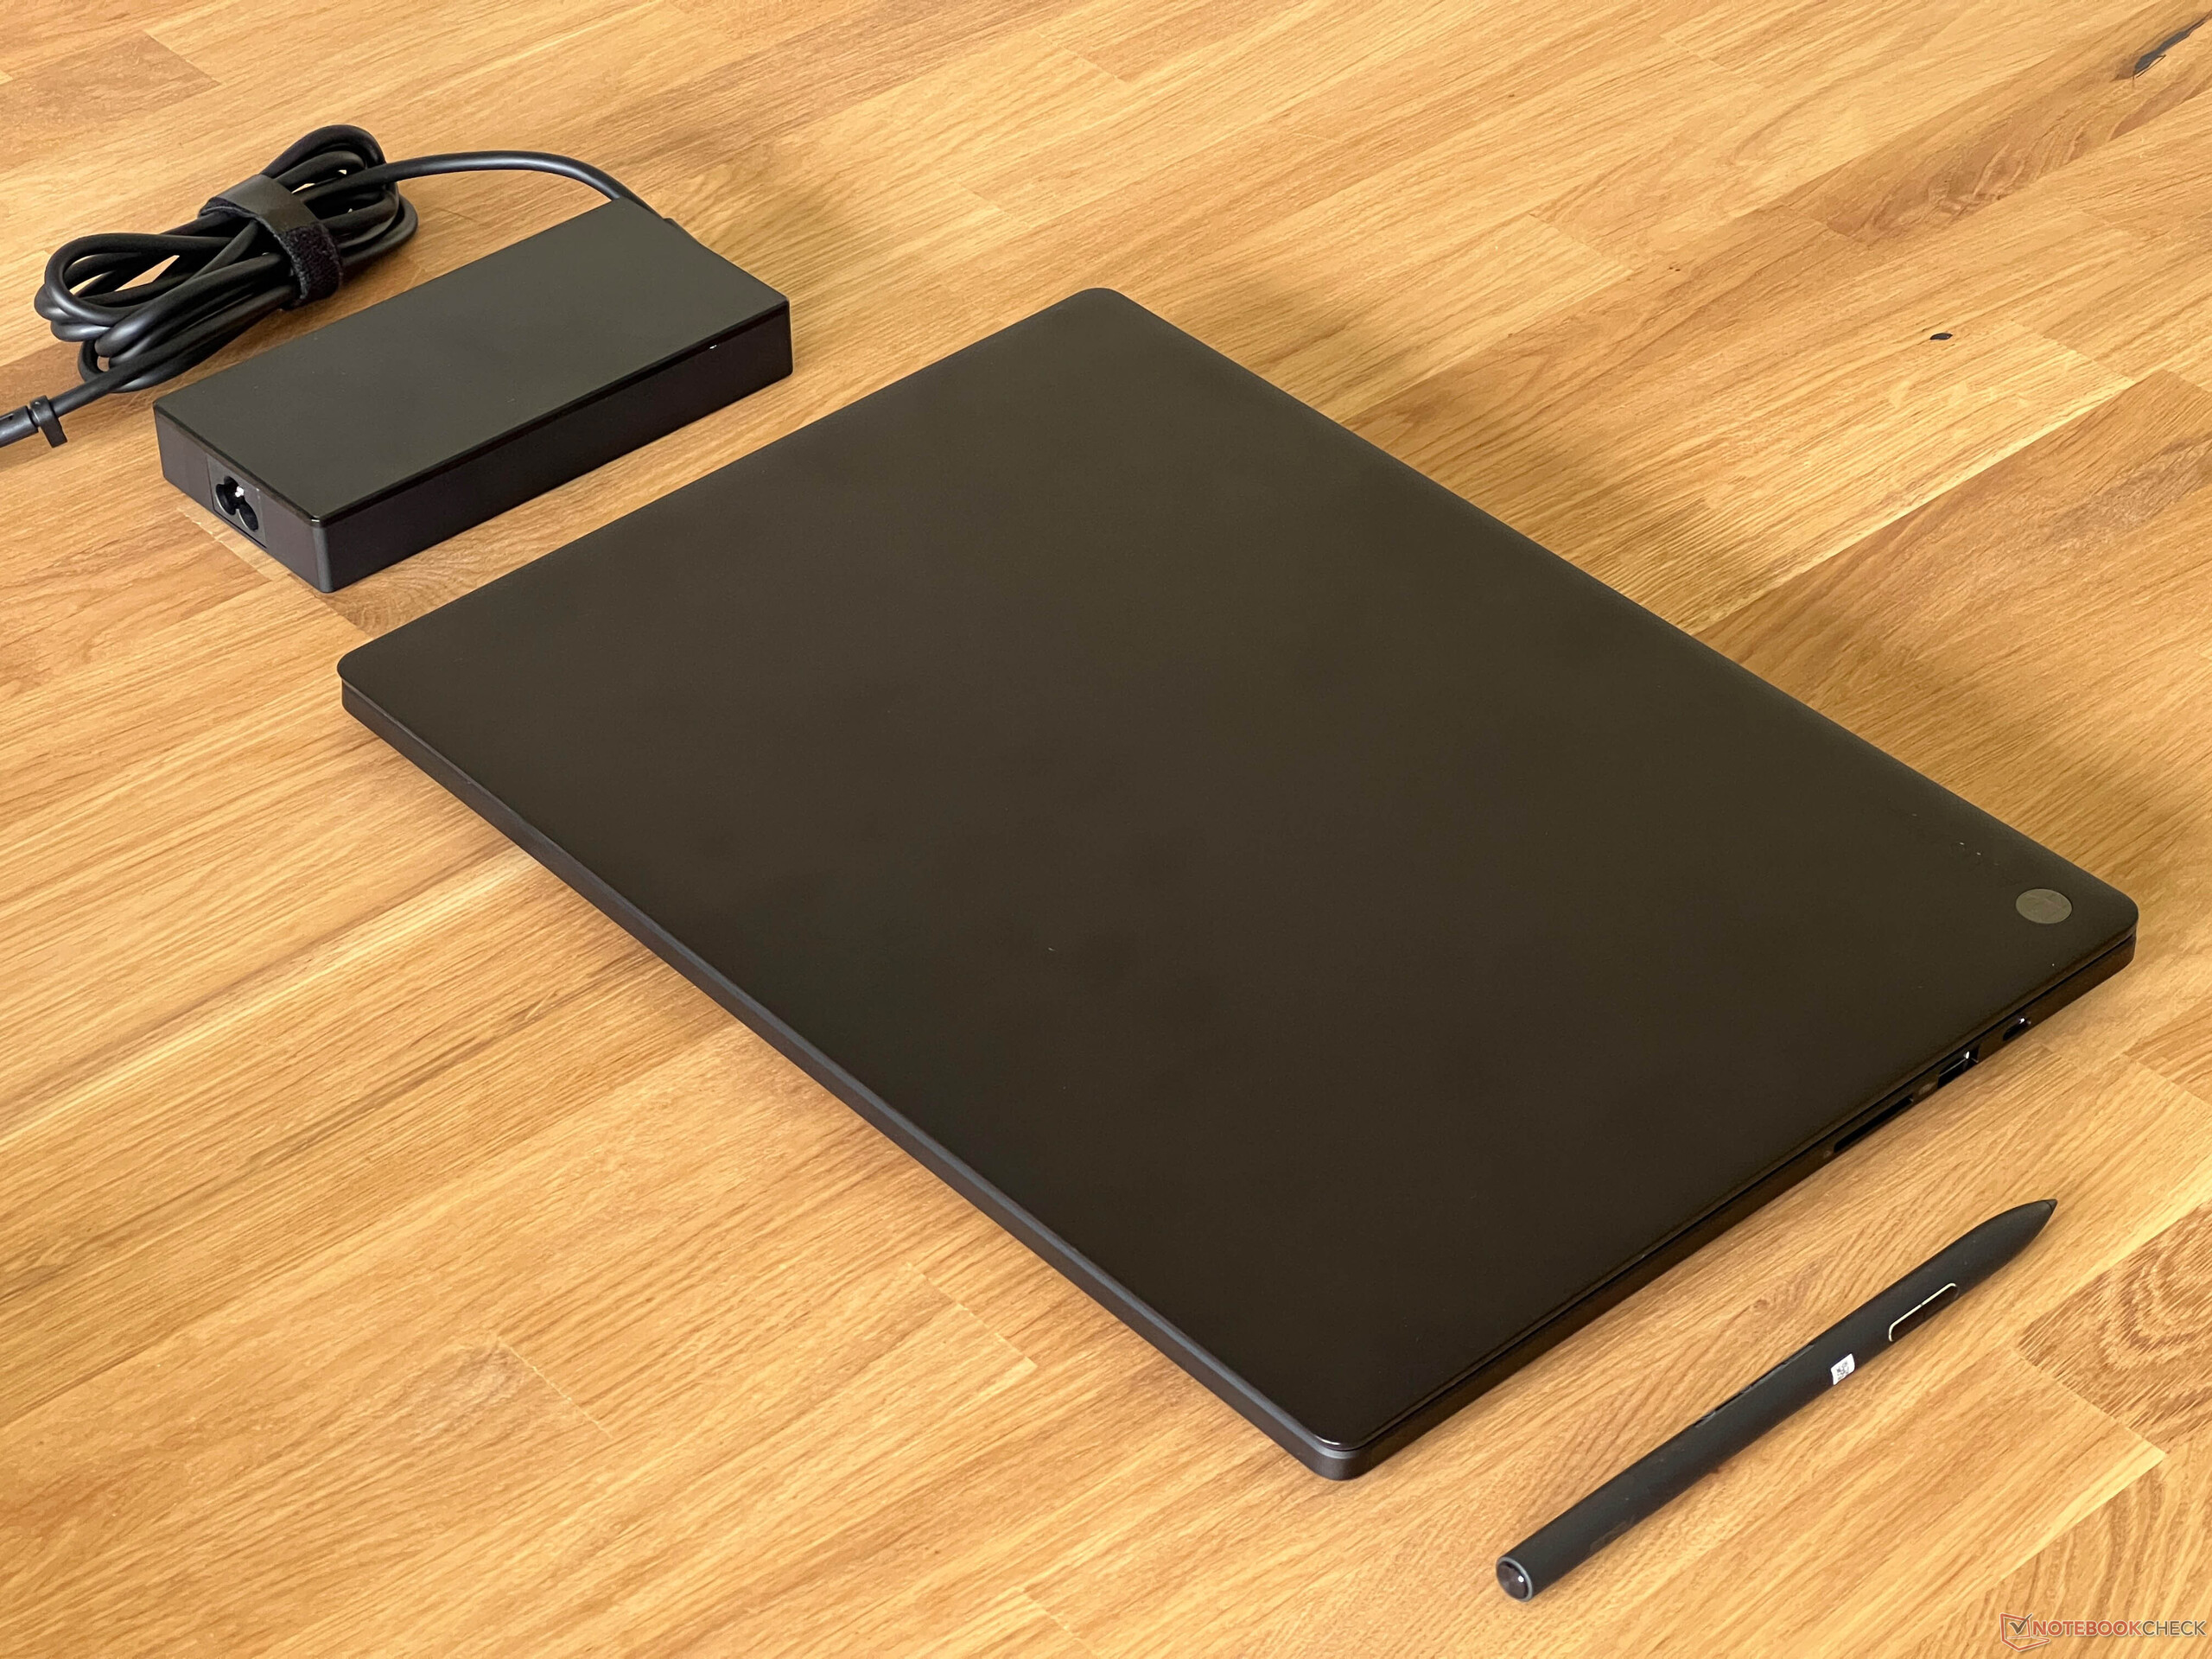
Em termos de tamanho, o ProArt P16 fica no meio do pacote. Uma comparação com o Zenbook Pro 16X também é interessante, pois esse dispositivo é apenas um pouco mais grosso, mas, com 2,4 kg, é consideravelmente mais pesado que o novo P16 e seus 1,8 kg. Isso também faz com que o novo P16 seja o dispositivo mais leve em nossa tabela de comparação - e por uma boa distância (junto com o Zephyrus G16, de construção idêntica). A fonte de alimentação de 200 watts traz mais 588 gramas para a balança.
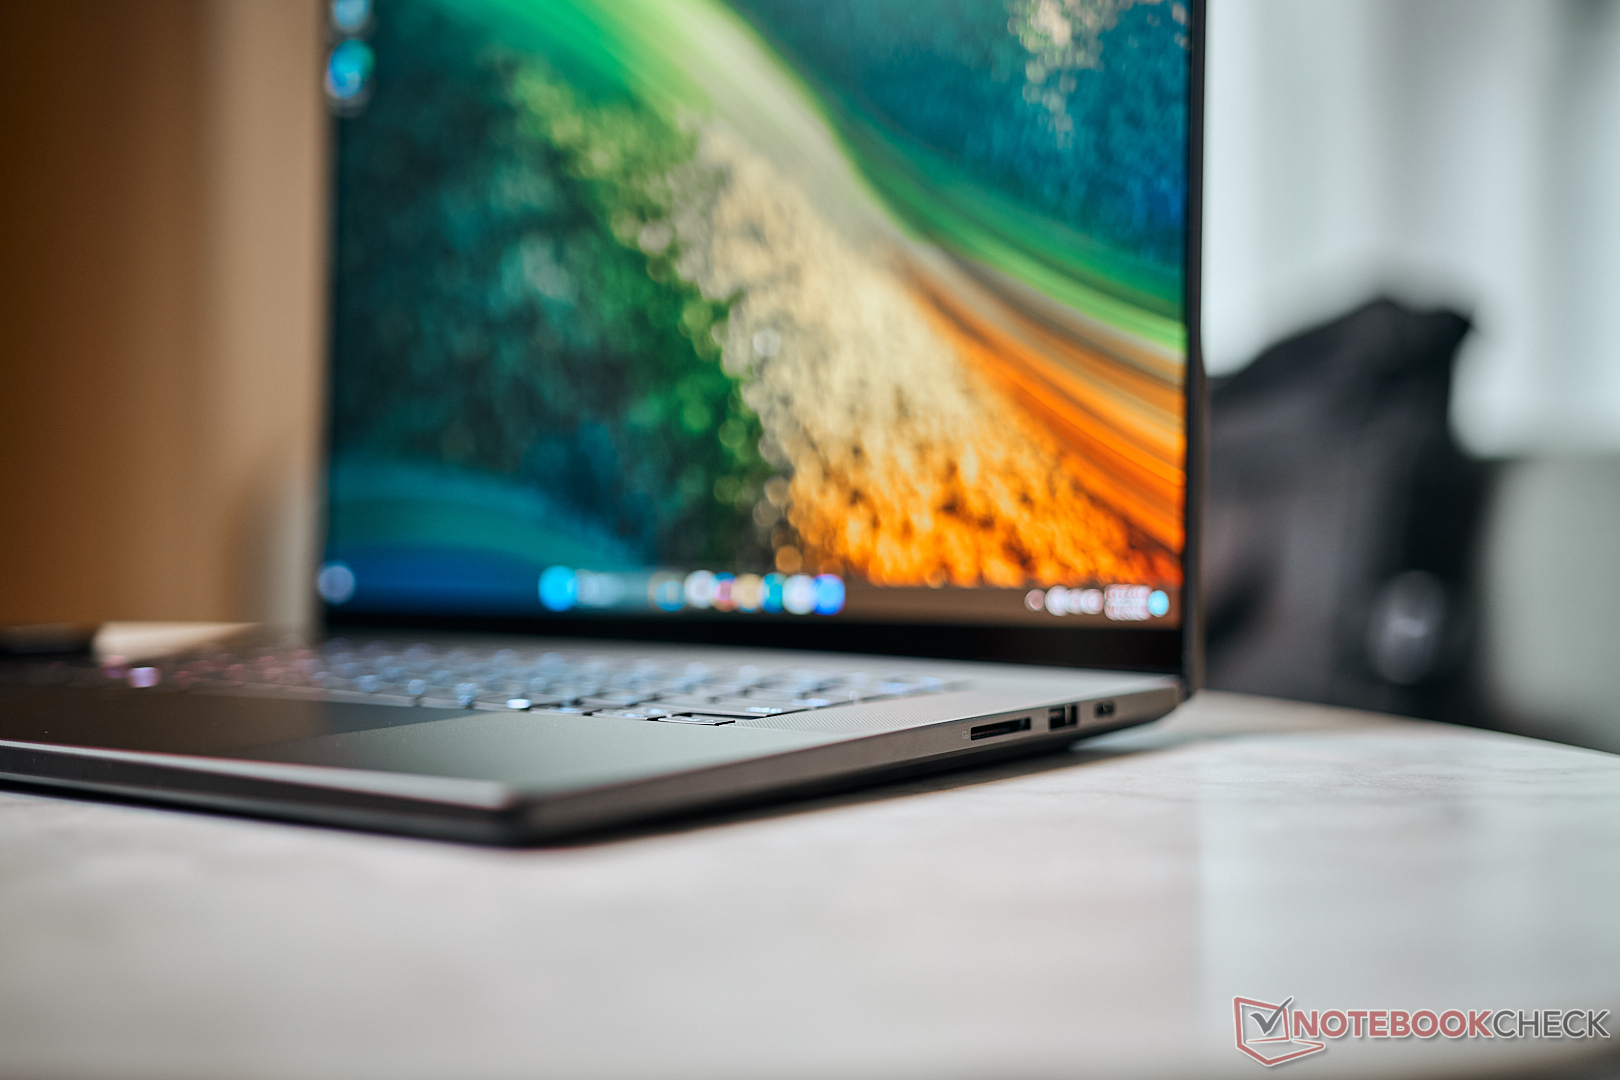
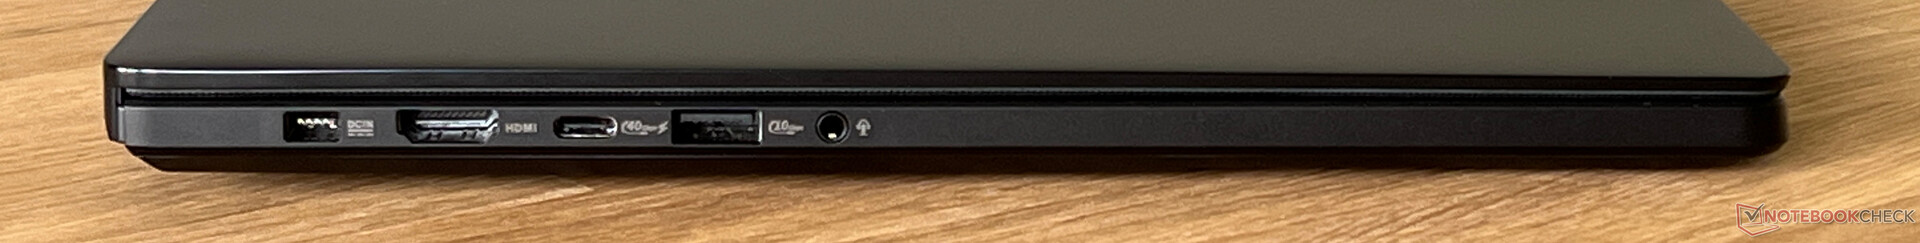
Recursos - USB 4 e Wi-Fi 7
A localização das portas também é a mesma do ROG Zephyrus, mas o ProArt P16 com processador AMD não tem suporte para Thunderbolt 4 em suas portas USB 4.0. No entanto, todos os conectores importantes estão integrados, o que significa que não deve haver nenhum problema quando se trata do uso diário.
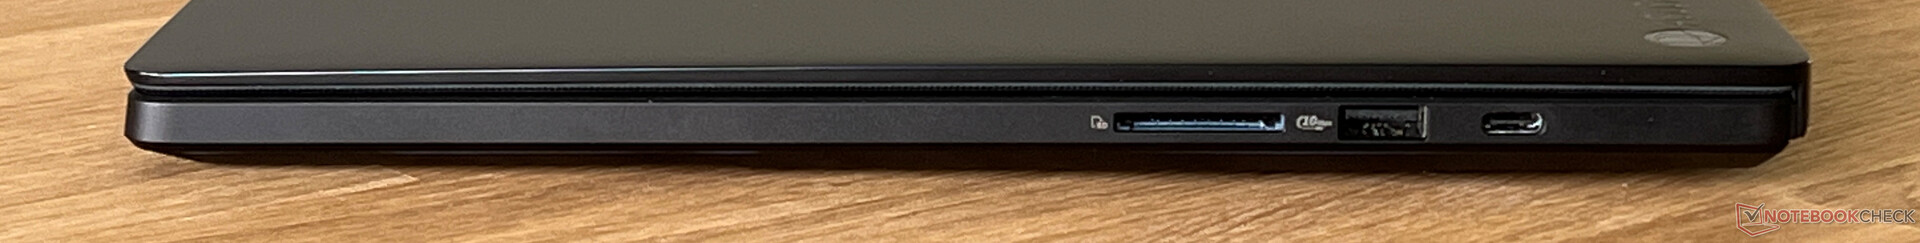
Leitor de cartão SD
O leitor de cartão SD do lado direito não acomoda totalmente os cartões de memória, mas, em comparação com o Zephyrus, a velocidade é melhor. Emparelhado com nosso cartão de referência (Angelbird AV Pro V60), as velocidades de transferência agora são significativamente mais altas, chegando a 254 MB/s e também 127 MB/s ao copiar dados.
| SD Card Reader | |
| average JPG Copy Test (av. of 3 runs) | |
| Apple MacBook Pro 16 2023 M3 Max (Angelbird AV Pro V60) | |
| Dell XPS 16 9640 (Angelbird AV Pro V60) | |
| Asus ProArt P16 H7606WI (Angelbird AV Pro V60) | |
| Média da turma Multimedia (18.4 - 201, n=56, últimos 2 anos) | |
| Asus Zenbook Pro 16X UX7602BZ-MY005W | |
| SCHENKER XMG Pro 16 Studio (Mid 24) (AV PRO microSD 128 GB V60) | |
| Asus ROG Zephyrus G16 2024 GU605M | |
| Lenovo Yoga Pro 9 16IMH9 (Angelbird AV Pro V60) | |
| maximum AS SSD Seq Read Test (1GB) | |
| Asus ProArt P16 H7606WI (Angelbird AV Pro V60) | |
| Apple MacBook Pro 16 2023 M3 Max (Angelbird AV Pro V60) | |
| Dell XPS 16 9640 (Angelbird AV Pro V60) | |
| Média da turma Multimedia (25.8 - 266, n=56, últimos 2 anos) | |
| Asus ROG Zephyrus G16 2024 GU605M | |
| Lenovo Yoga Pro 9 16IMH9 (Angelbird AV Pro V60) | |
| SCHENKER XMG Pro 16 Studio (Mid 24) (AV PRO microSD 128 GB V60) | |
| Asus Zenbook Pro 16X UX7602BZ-MY005W | |
Comunicação
A Asus equipou o ProArt P16 com um moderno módulo MediaTek (MT7925) Wi-Fi 7 que também suporta Bluetooth 5.4. Juntamente com nosso roteador de referência da Asus, registramos velocidades de transferência muito altas, que estão entre as melhores que o senhor encontrará nos laptops atuais. Durante nossos testes, também não encontramos nenhum tipo de problema com a conexão de rede sem fio.
| Networking | |
| Asus ProArt P16 H7606WI | |
| iperf3 transmit AXE11000 | |
| iperf3 receive AXE11000 | |
| SCHENKER XMG Pro 16 Studio (Mid 24) | |
| iperf3 transmit AXE11000 | |
| iperf3 receive AXE11000 | |
| Lenovo Yoga Pro 9 16IMH9 | |
| iperf3 transmit AXE11000 | |
| iperf3 receive AXE11000 | |
| Dell XPS 16 9640 | |
| iperf3 transmit AXE11000 | |
| iperf3 receive AXE11000 | |
| Asus ROG Zephyrus G16 2024 GU605M | |
| iperf3 transmit AXE11000 | |
| iperf3 receive AXE11000 | |
| Apple MacBook Pro 16 2023 M3 Max | |
| iperf3 transmit AXE11000 | |
| iperf3 receive AXE11000 | |
| Asus Zenbook Pro 16X UX7602BZ-MY005W | |
| iperf3 transmit AXE11000 | |
| iperf3 receive AXE11000 | |
| iperf3 transmit AXE11000 6GHz | |
| iperf3 receive AXE11000 6GHz | |
Webcam
A webcam de 1080p é compatível com o Windows Studio Effects atual, mas a qualidade da imagem não é muito boa. Além disso, foi instalado um módulo IR que permite o reconhecimento facial por meio do Windows Hello.


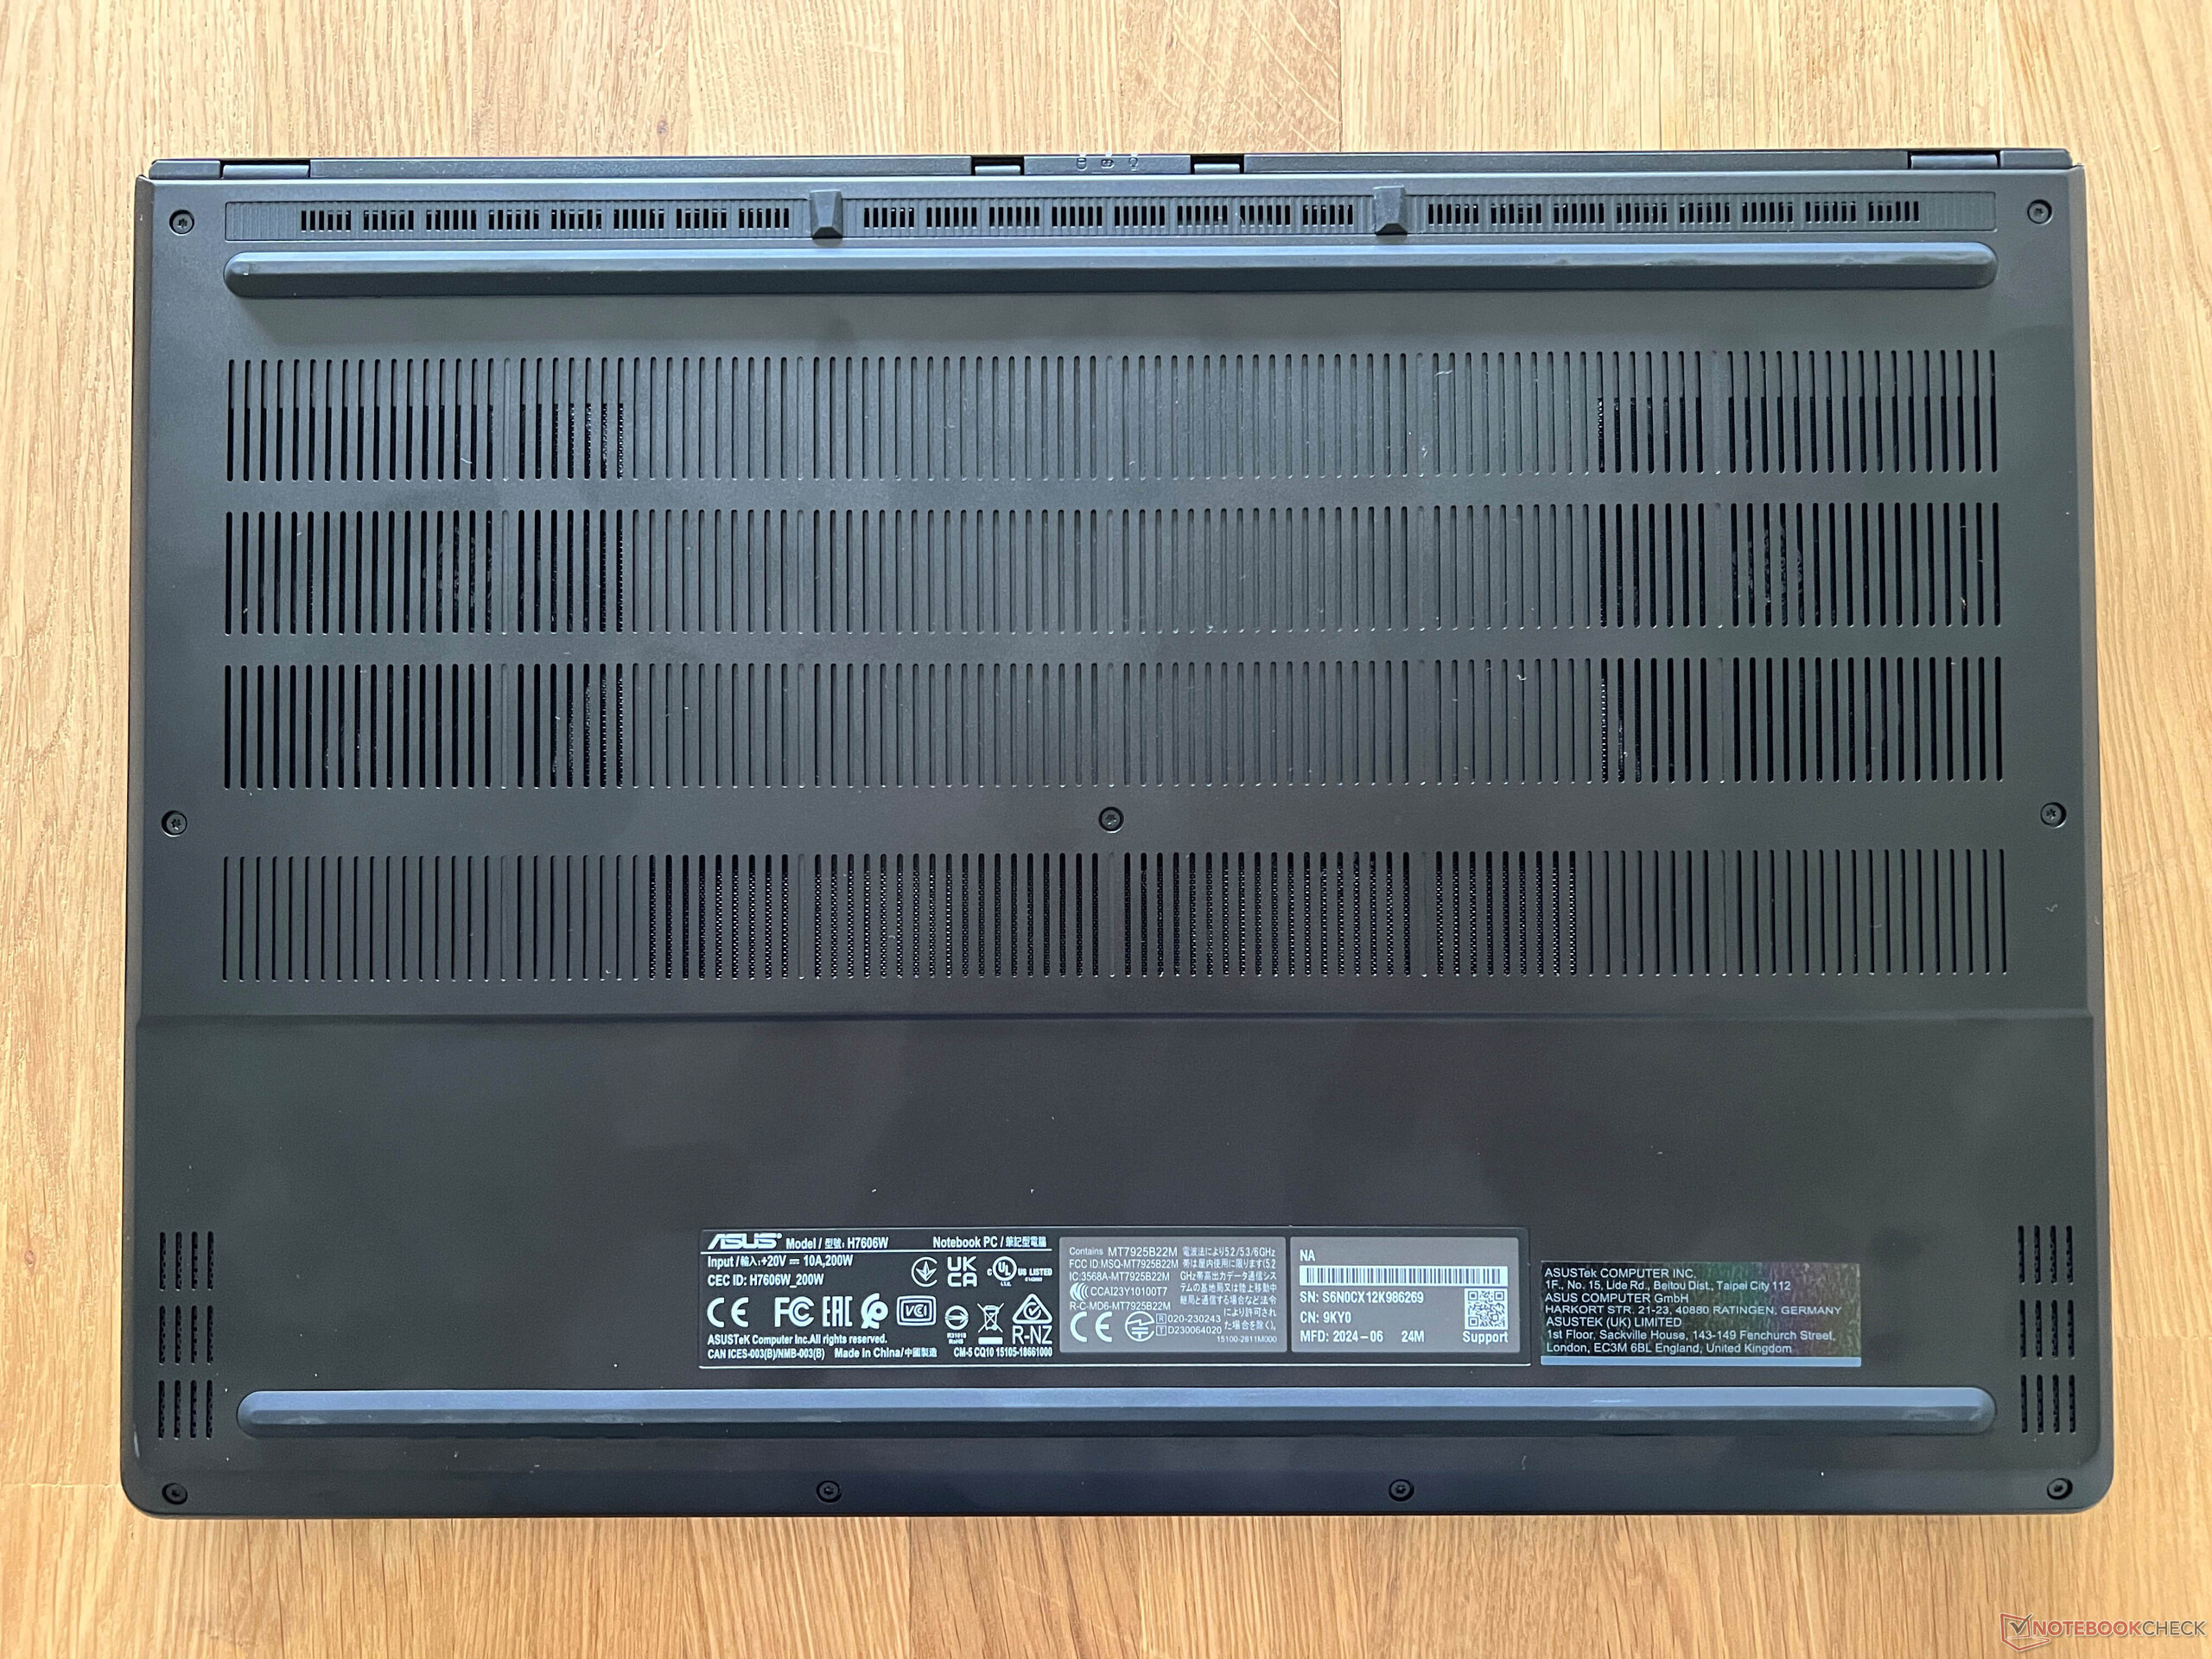
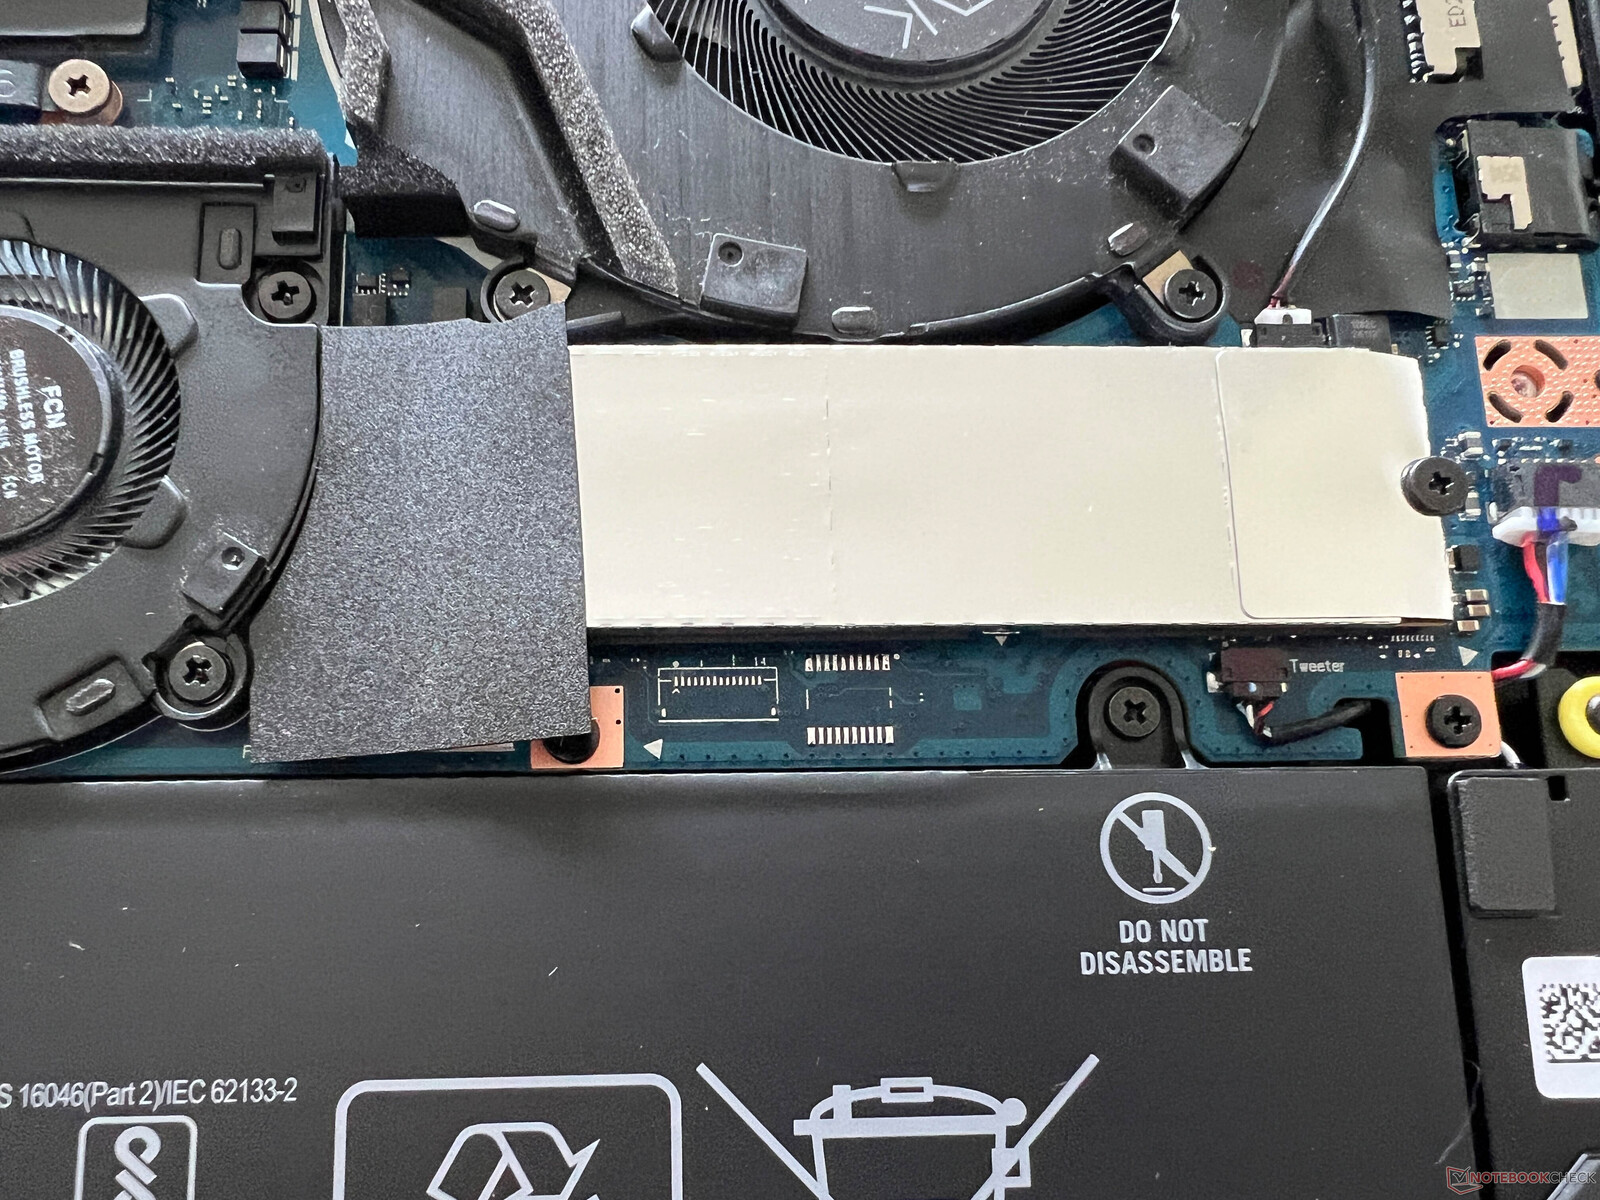
Manutenção
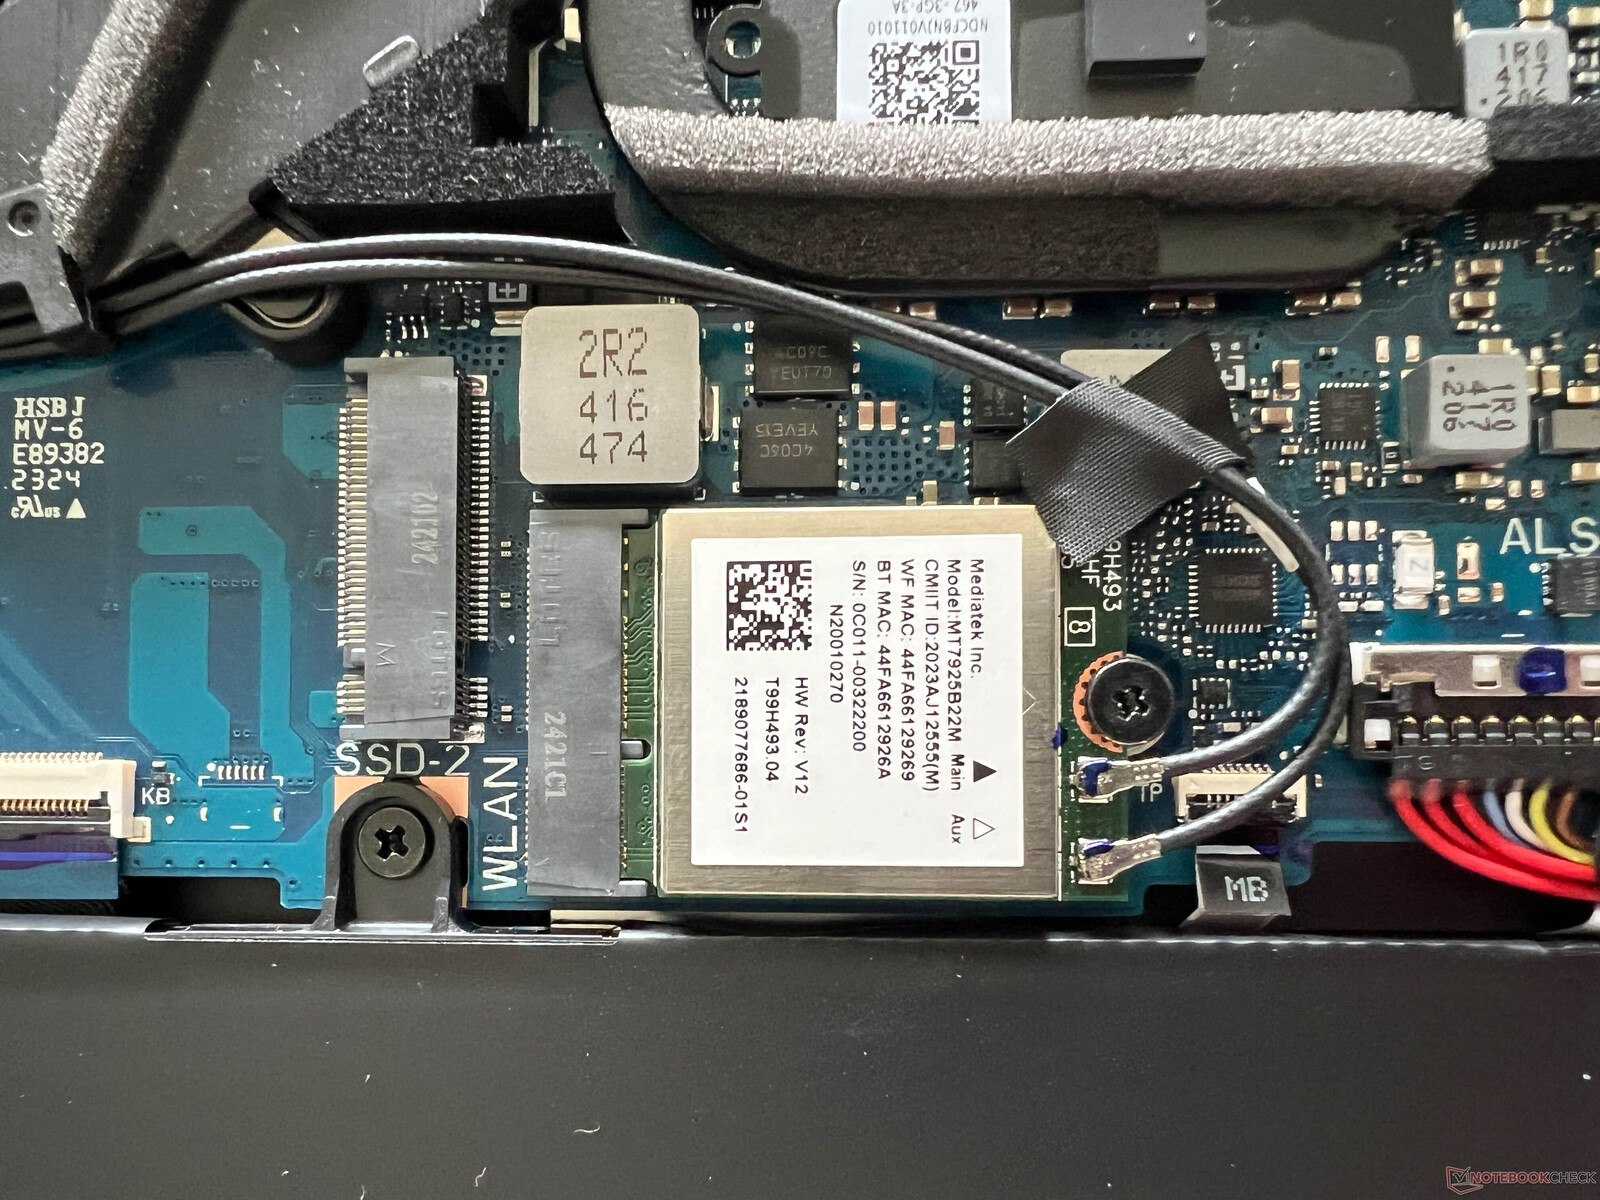
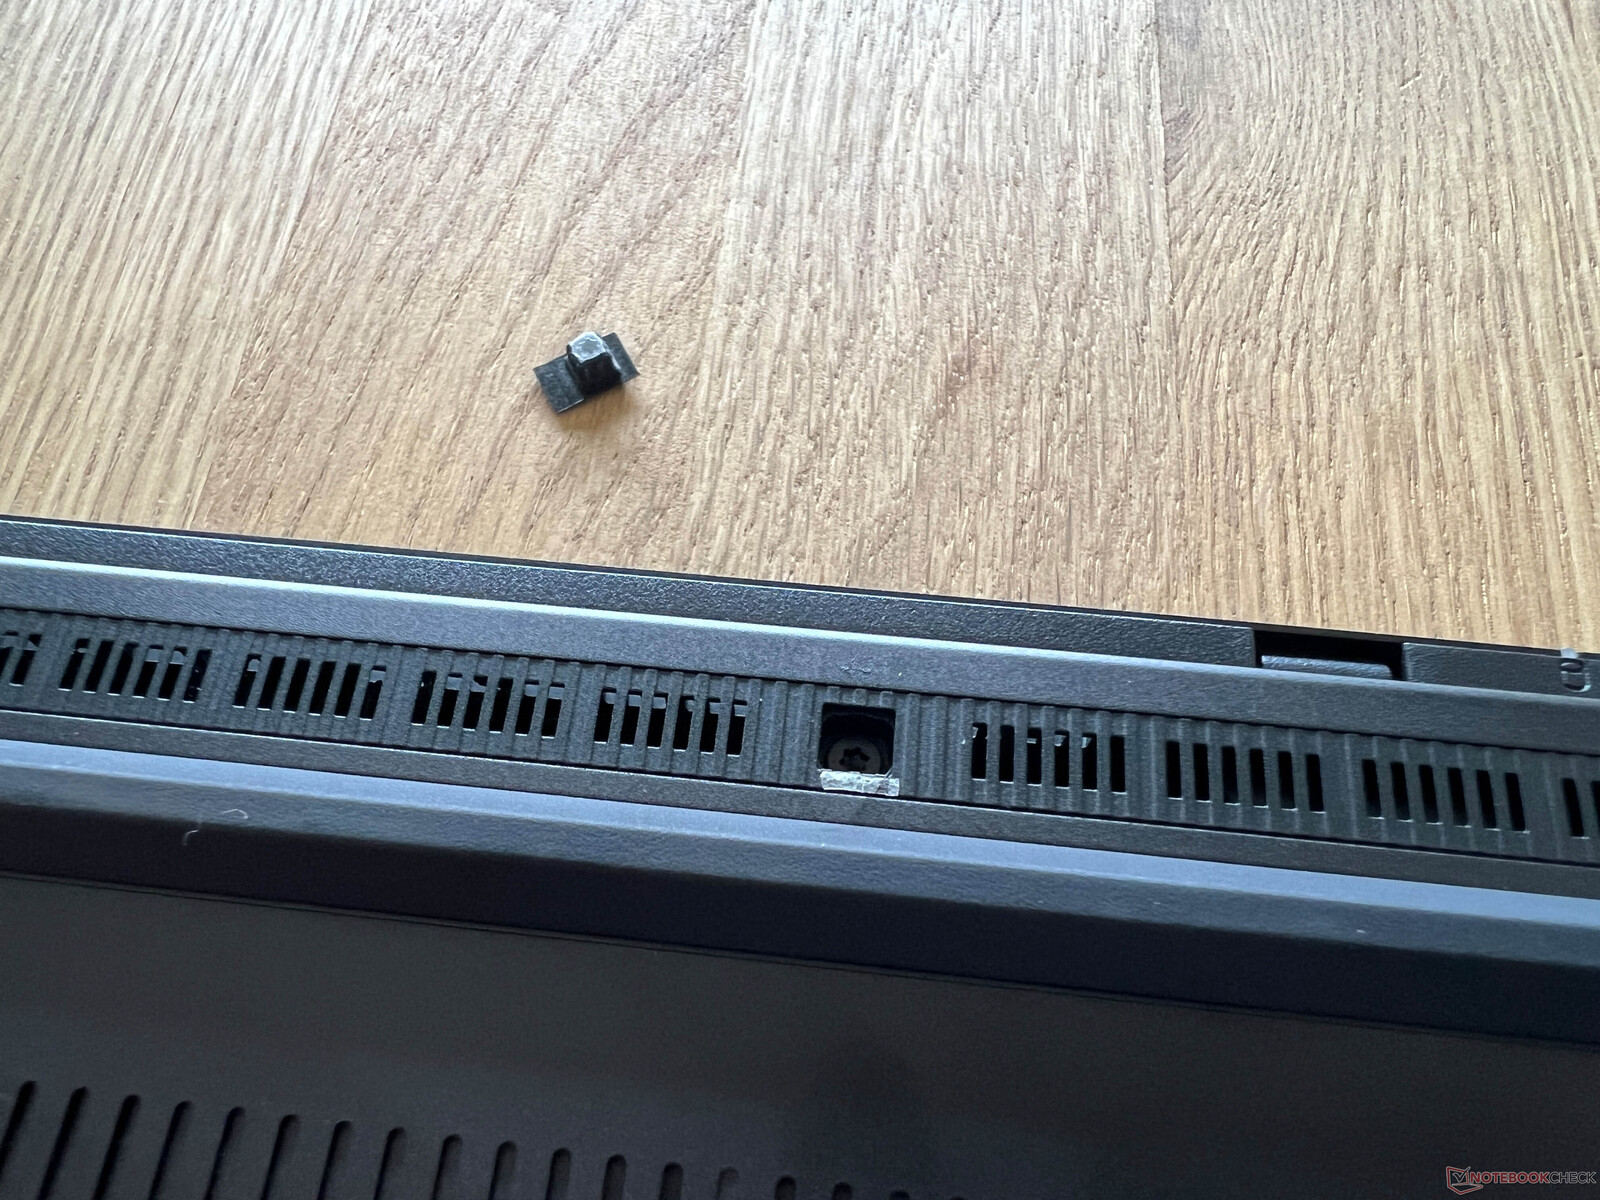
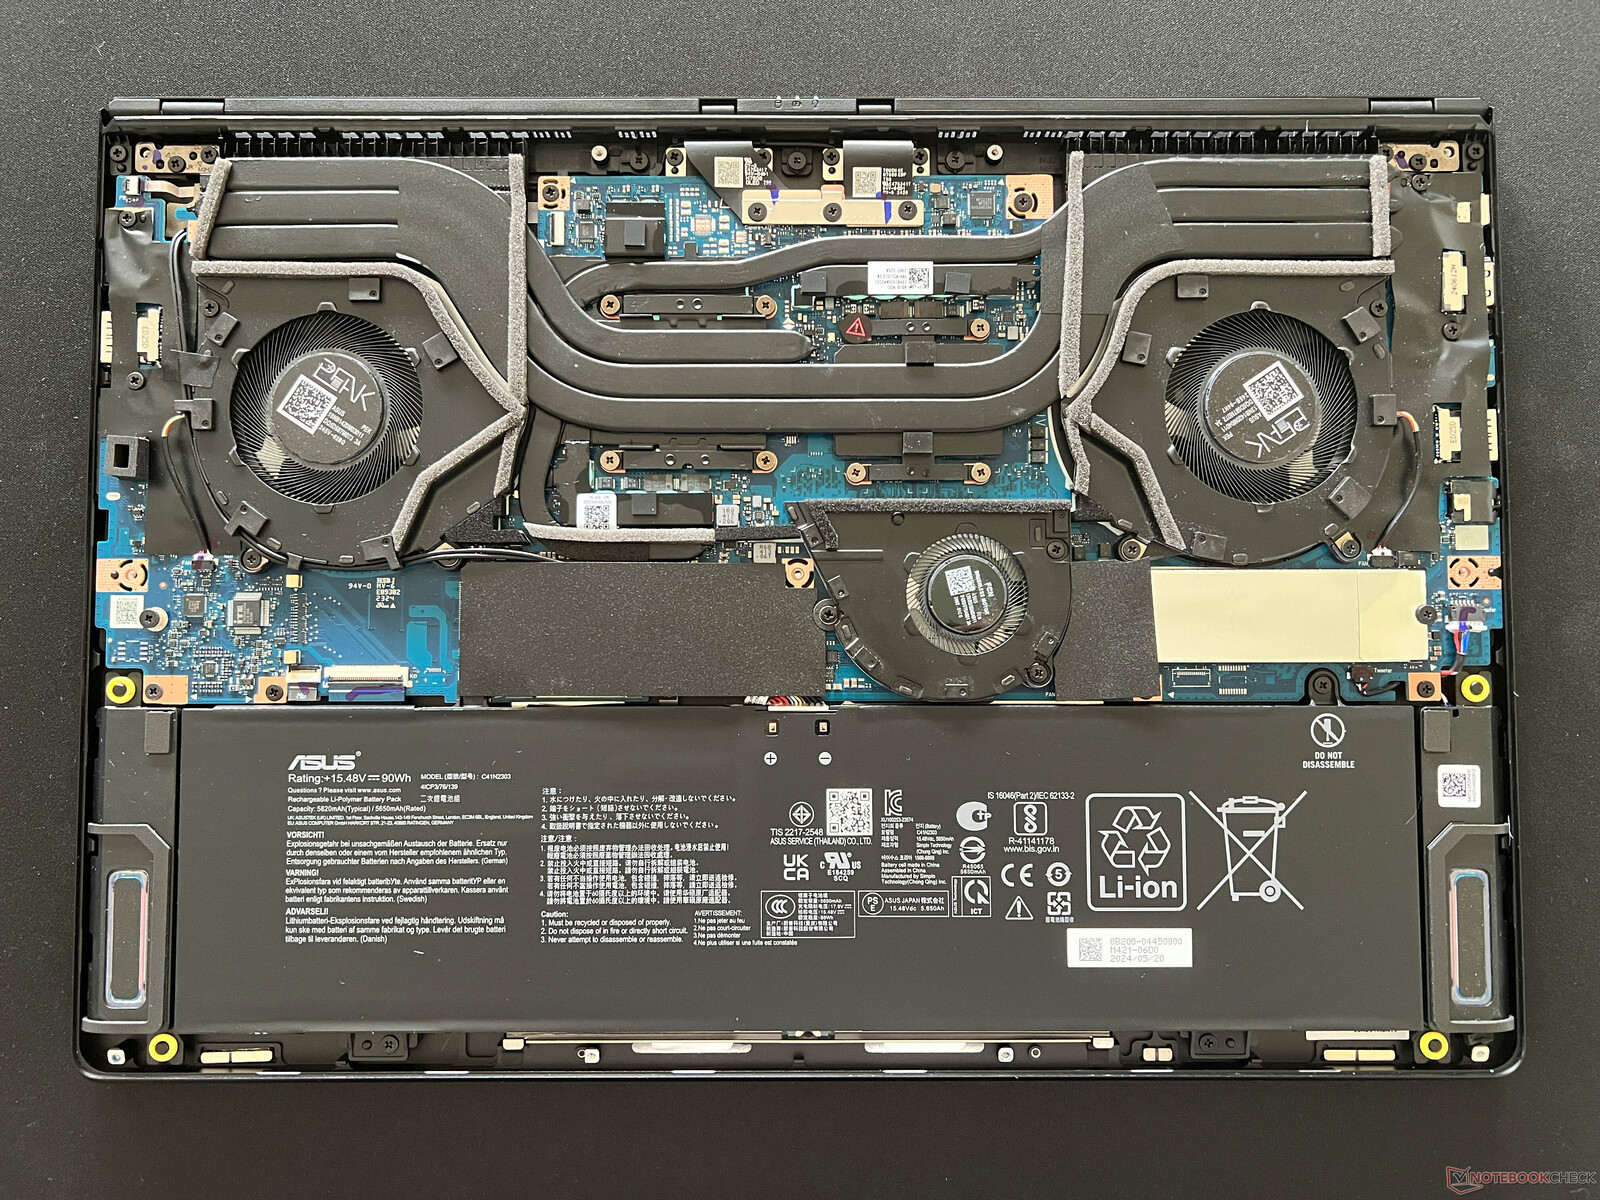
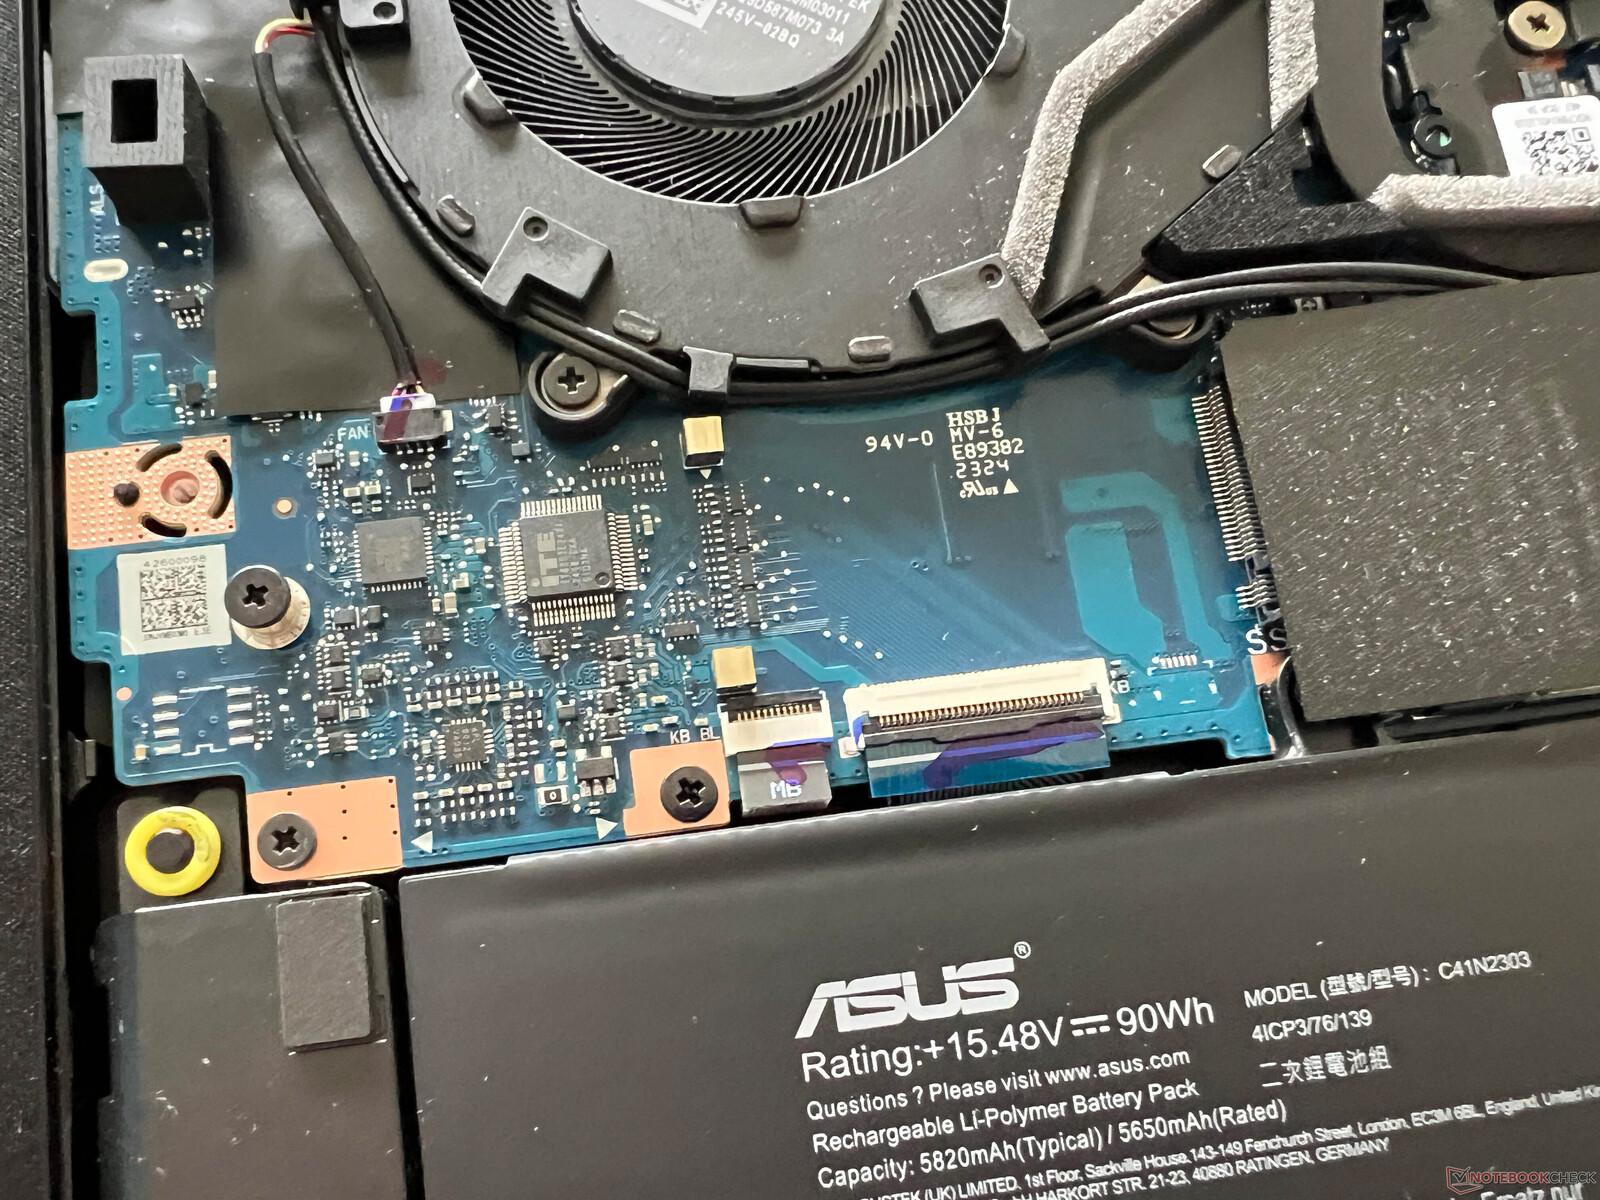
O acesso aos componentes é agravado por dois parafusos ocultos que estão localizados sob tampas de borracha coladas. Como visto nos modelos Zephyrus G16 mais fracos (até o laptop RTX 4070), o dispositivo tem um sistema de resfriamento convencional com um terceiro ventilador adicional pequeno. A RAM é soldada, mas há dois slots para SSD M.2 2280, bem como um módulo Wi-Fi, ambos intercambiáveis. A bateria é parafusada e também pode ser substituída, se necessário.
Dispositivos de entrada - curso das teclas de 1,7 mm e DialPad
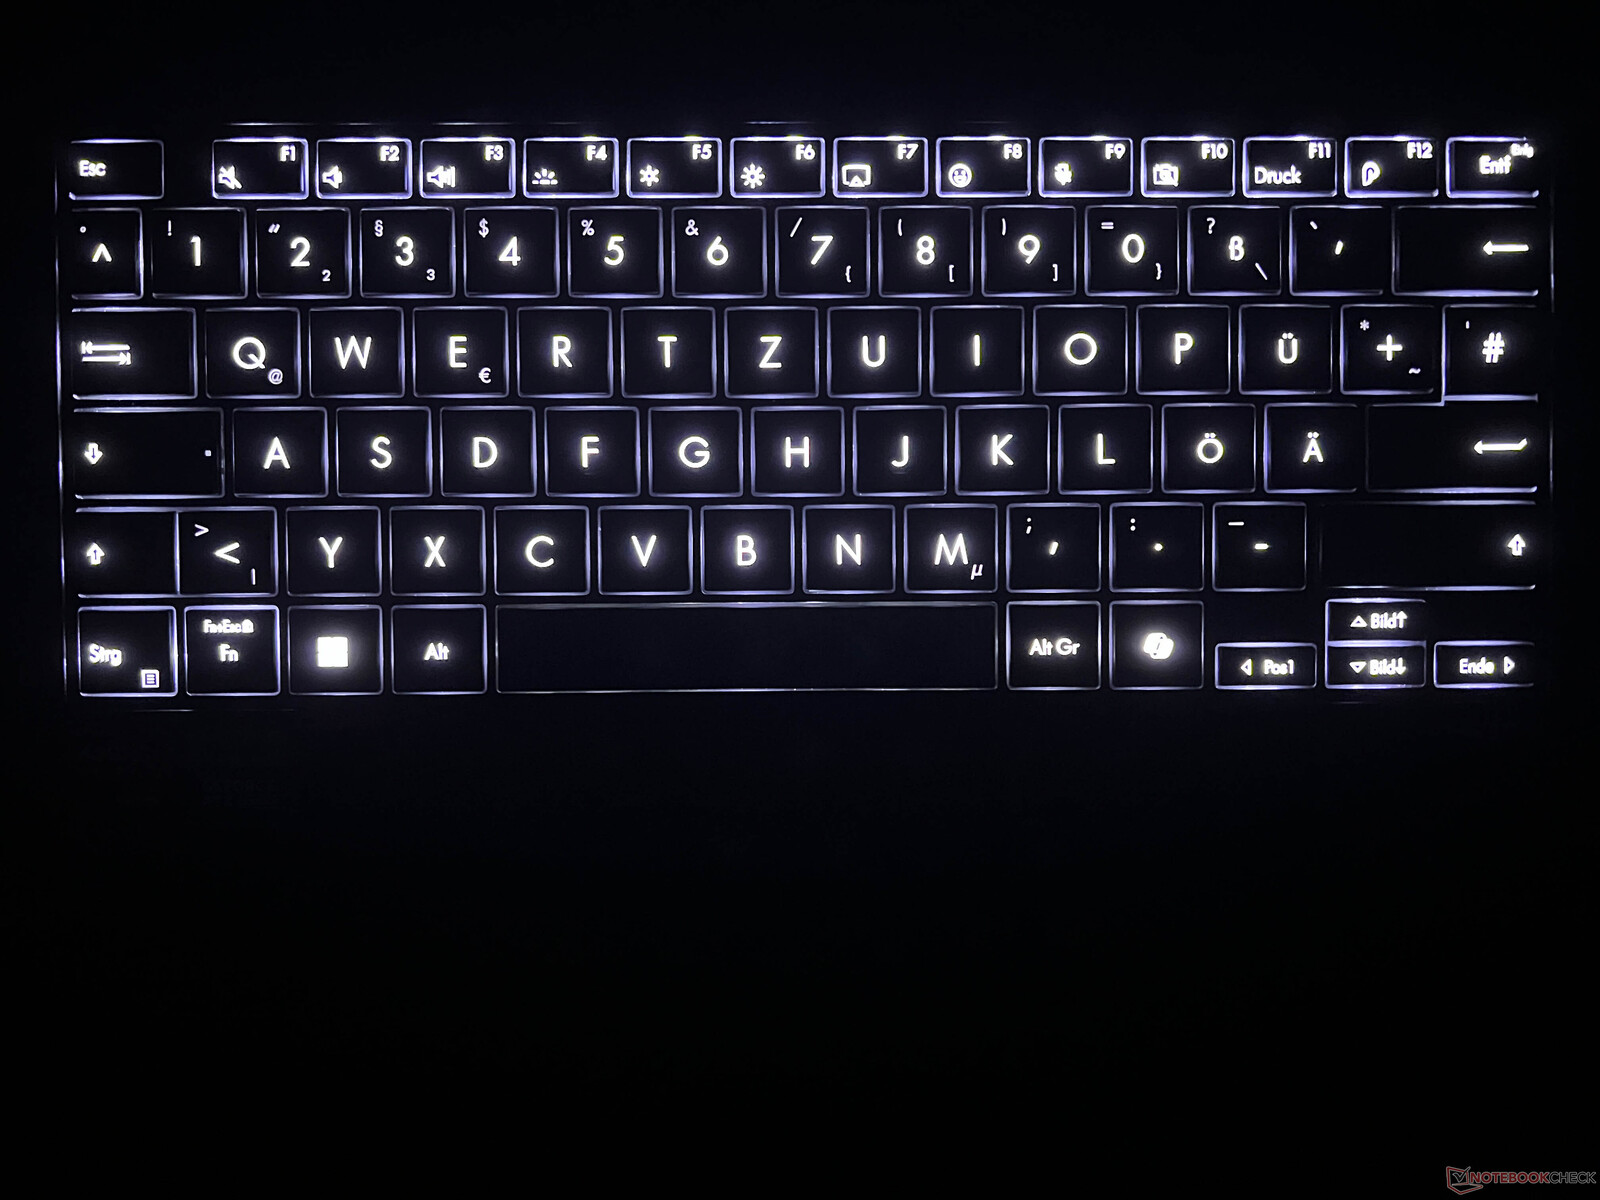
Além da ausência de teclas de função adicionais, o teclado não difere do Zephyrus G16 e, graças ao deslocamento das teclas de 1,7 mm, o senhor tem um dos teclados mais confortáveis do segmento de laptops. A iluminação RGB também não existe, mas a iluminação branca ainda pode ser ajustada automaticamente por meio de um sensor. O layout não é perfeito, pois a tecla Enter de linha única e as pequenas teclas de seta não são ideais.
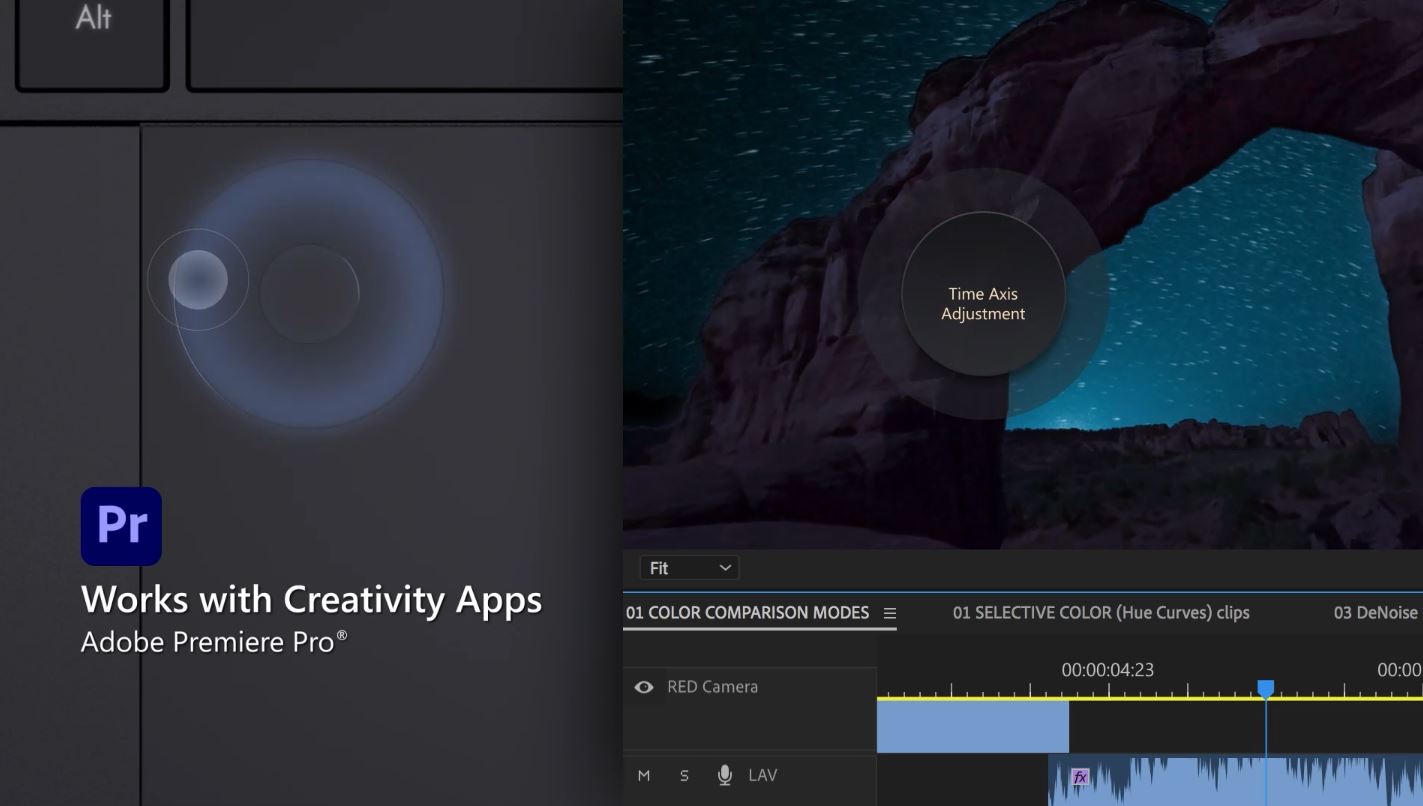
Com 15 x 9,8 cm, o clickpad é muito grande e a navegação do cursor funciona muito bem. Além disso, os cliques mecânicos são agradavelmente silenciosos e dão ao dispositivo um toque premium. O DialPad está integrado na parte superior esquerda do touchpad e também funciona muito bem. Sua utilidade depende, em grande parte, da habilidade do usuário em usar o dial. Devido ao teclado grande, o DialPad não nos incomodou tanto quanto o menor ProArt PX13menor, em situações da vida real.
Obviamente, o ProArt também tem uma tela sensível ao toque capacitiva para entradas e isso também funcionou sem problemas. A caneta Asus Pen 2.0 fornecida funcionou sem problemas, mas não há lugar para prender a caneta no gabinete.
Tela - 4K OLED a 60 Hz
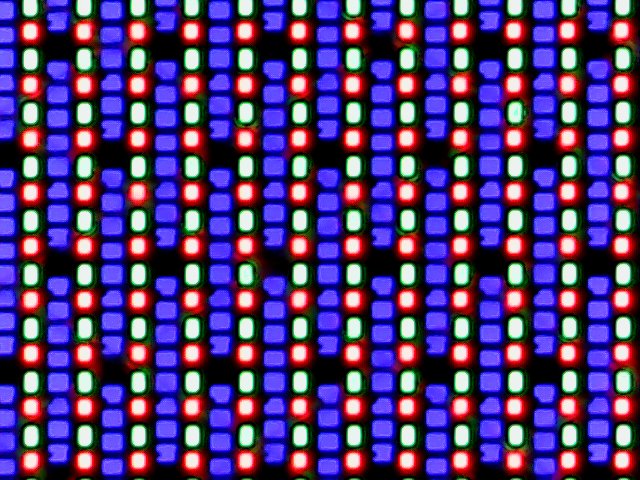
A Asus equipou o ProArt P16 com uma tela táctil OLED com uma resolução de 3.840 x 2.400 pixels e uma proporção de 16:10. Junto com o XPS 16, essa é a resolução mais alta no campo de comparação e todo o conteúdo parece muito nítido. No entanto, as áreas claras parecem um pouco granuladas (o usuário tem a impressão de que a tela está úmida), mas o problema é significativamente menos pronunciado do que, por exemplo, o Dell XPS 16. O grande problema é a frequência, que fica apenas em 60 Hz. Isso é perceptível em movimento e, apesar da resolução um pouco mais alta, é um retrocesso em comparação com o antigo Zenbook Pro 16X que vinha com um OLED de 120 Hz (3.200 x 2.000 pixels).
No modo SDR, o painel tem um brilho médio de 360 cd/m² e, junto com o baixo nível de preto, isso resulta em uma relação de contraste maravilhosa. No modo HDR (que ainda precisa ser ativado manualmente no Windows e os perfis de cores não funcionam mais), medimos um máximo de 605 cd/m² em uma pequena área da tela e apenas 420 cd/m² com uma imagem quase totalmente branca - um valor bastante baixo.
| |||||||||||||||||||||||||
iluminação: 98 %
iluminação com acumulador: 355 cd/m²
Contraste: ∞:1 (Preto: 0 cd/m²)
ΔE Color 1.2 | 0.5-29.43 Ø4.87
ΔE Greyscale 1.2 | 0.5-98 Ø5.1
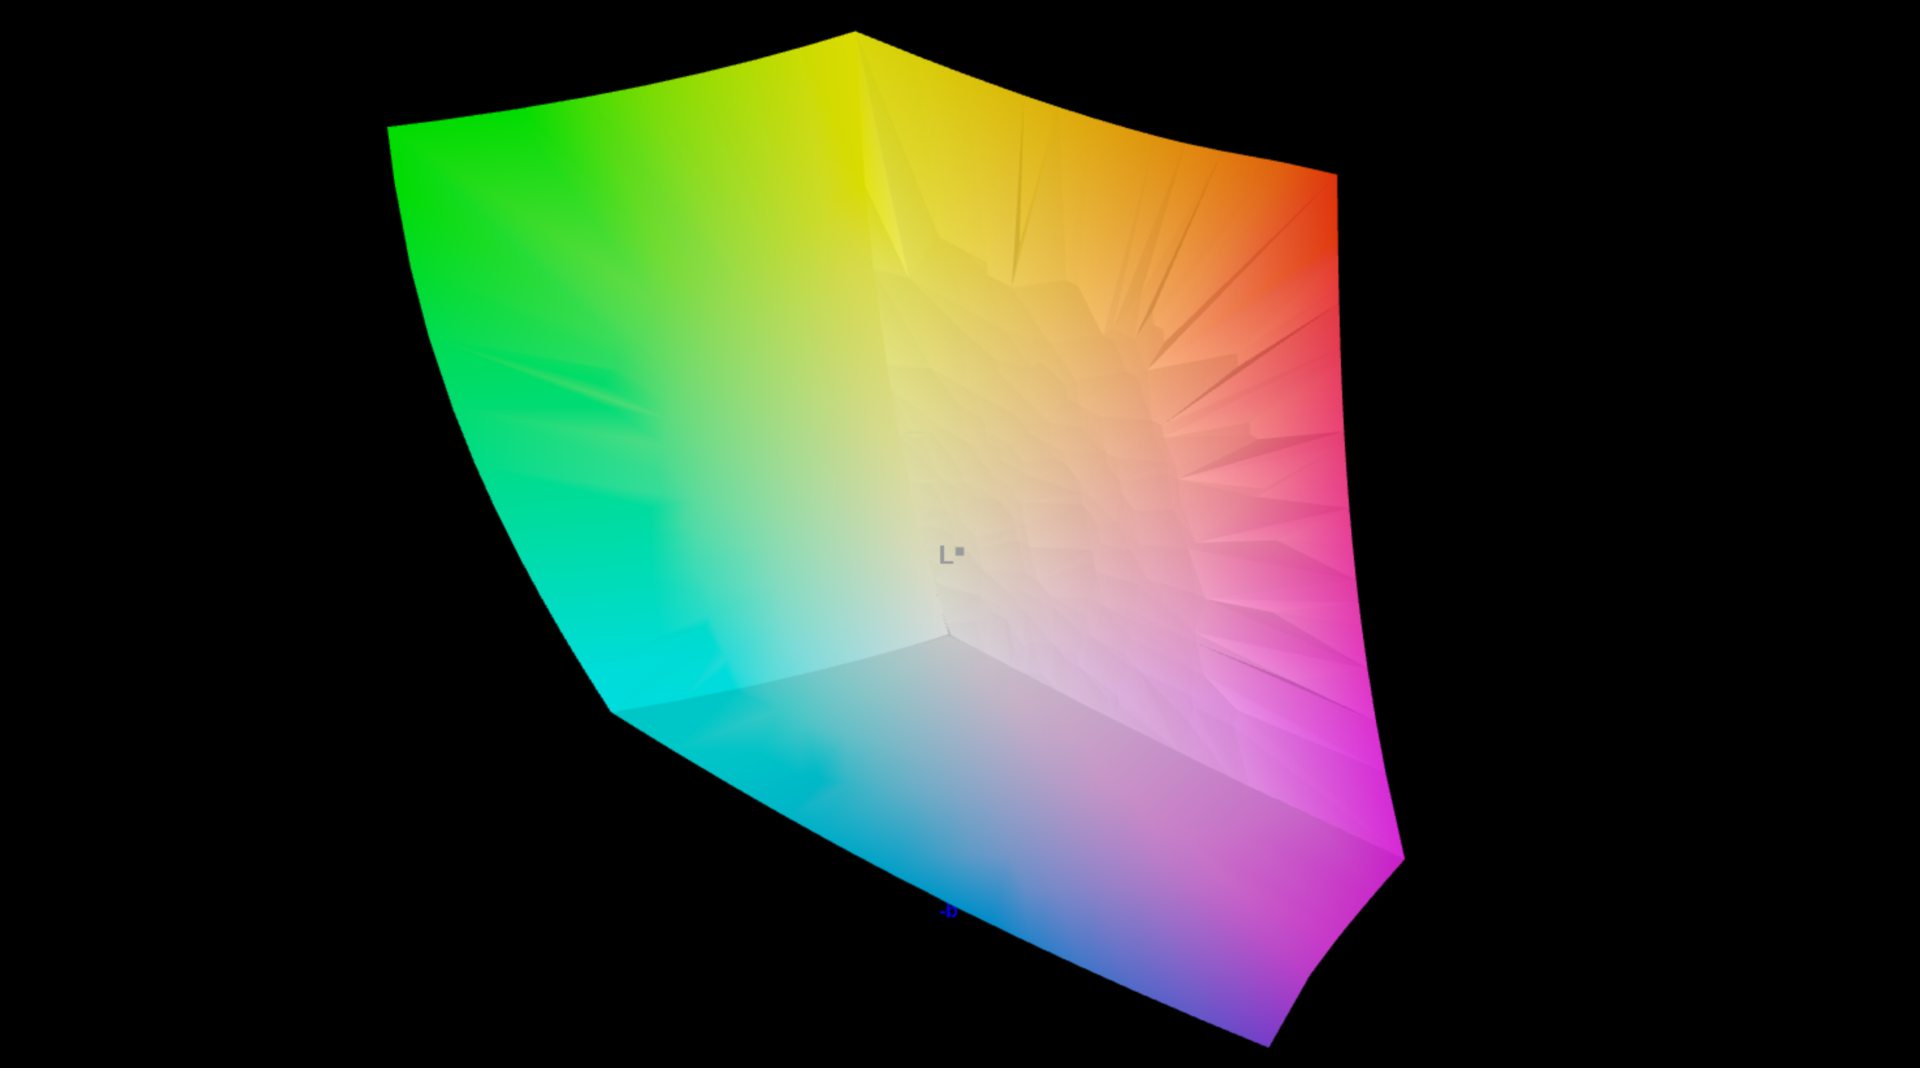
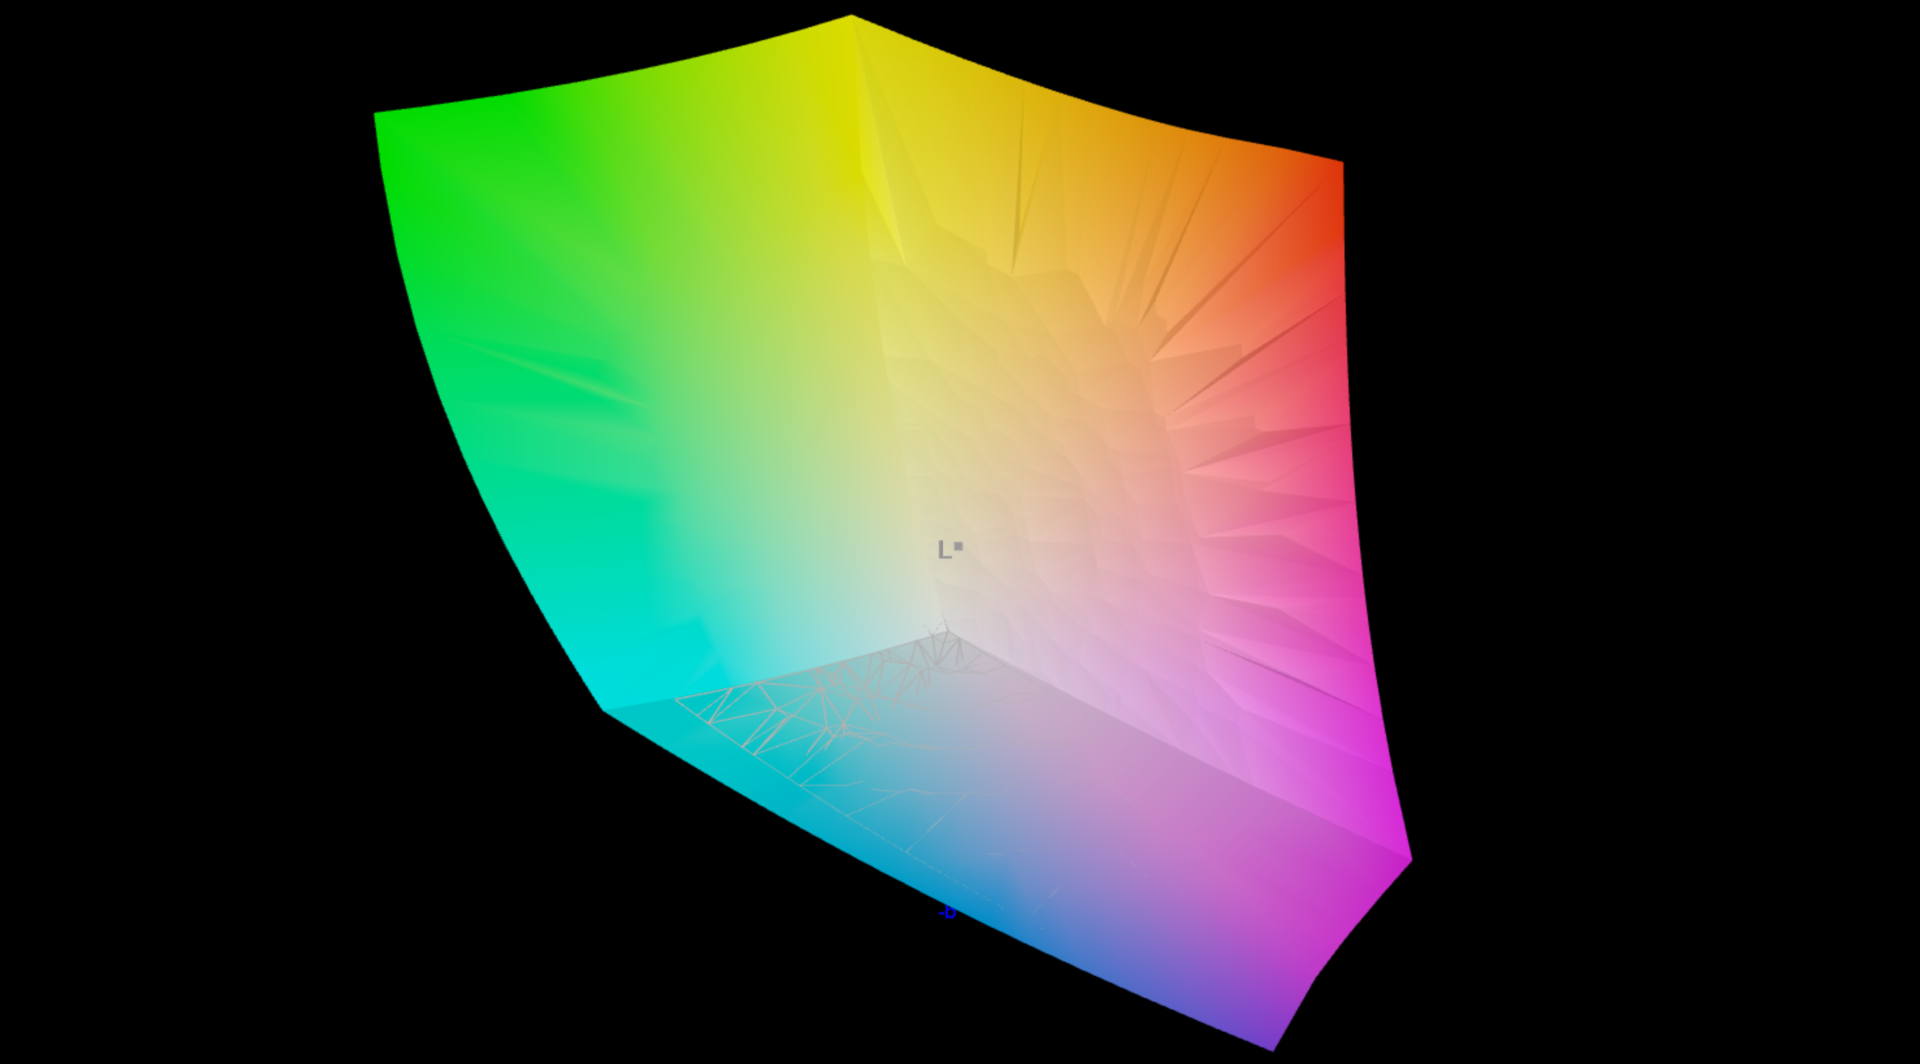
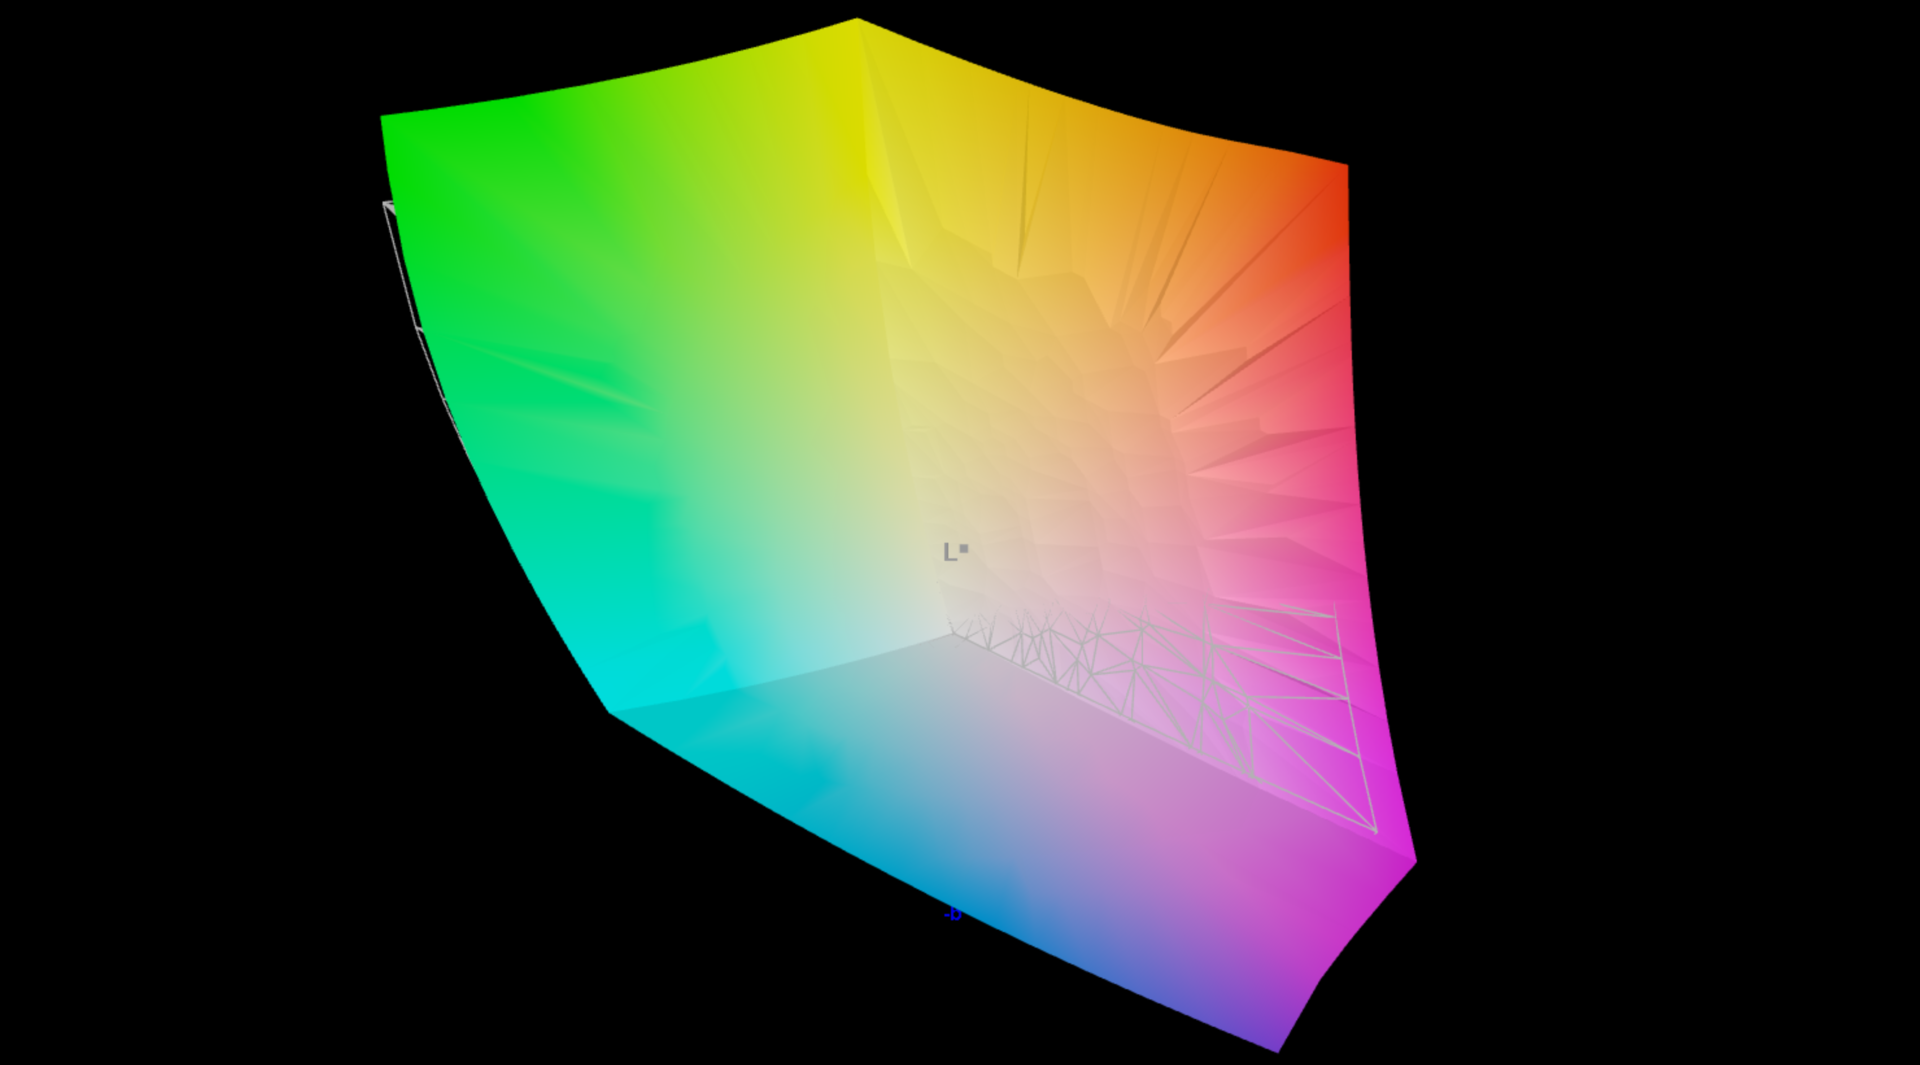
99.1% AdobeRGB 1998 (Argyll 2.2.0 3D)
100% sRGB (Argyll 2.2.0 3D)
99.9% Display P3 (Argyll 2.2.0 3D)
Gamma: 2.14
| Asus ProArt P16 H7606WI ATNA60YV02-0, OLED, 3840x2400, 16", 60 Hz | SCHENKER XMG Pro 16 Studio (Mid 24) BOE CQ NE160QDM-NZ1, IPS, 2560x1600, 16", 240 Hz | Lenovo Yoga Pro 9 16IMH9 LEN160-3.2K, Mini-LED, 3200x2000, 16", 165 Hz | Dell XPS 16 9640 SDC4196, OLED, 3840x2400, 16.3", 90 Hz | Asus ROG Zephyrus G16 2024 GU605M ATNA60DL01-0, OLED, 2560x1600, 16", 240 Hz | Apple MacBook Pro 16 2023 M3 Max Mini-LED, 3456x2234, 16", 120 Hz | Asus Zenbook Pro 16X UX7602BZ-MY005W ATNA60BX01-1, OLED, 3200x2000, 16", 120 Hz | |
|---|---|---|---|---|---|---|---|
| Display | -20% | -5% | -4% | -1% | -1% | -1% | |
| Display P3 Coverage | 99.9 | 68.8 -31% | 97 -3% | 98.3 -2% | 99.9 0% | 99.2 -1% | 99.93 0% |
| sRGB Coverage | 100 | 99.5 0% | 99.9 0% | 100 0% | 100 0% | 100 0% | |
| AdobeRGB 1998 Coverage | 99.1 | 70.8 -29% | 86.6 -13% | 87.8 -11% | 96.9 -2% | 97.48 -2% | |
| Response Times | -554% | -216% | 43% | 155% | -474% | -15% | |
| Response Time Grey 50% / Grey 80% * | 1.58 ? | 12.7 ? -704% | 22.2 ? -1305% | 0.82 ? 48% | 0.22 ? 86% | 66.9 ? -4134% | 1.4 ? 11% |
| Response Time Black / White * | 1.25 ? | 6.3 ? -404% | 17 ? -1260% | 0.85 ? 32% | 0.25 ? 80% | 43.6 ? -3388% | 2 ? -60% |
| PWM Frequency | 240 ? | 4840 ? 1917% | 360 ? 50% | 960 ? 300% | 14877 6099% | 250 ? 4% | |
| Screen | -70% | -18% | -21% | -18% | 13% | -61% | |
| Brightness middle | 355 | 416 17% | 651 83% | 366 3% | 416 17% | 630 77% | 331.8 -7% |
| Brightness | 360 | 392 9% | 673 87% | 367 2% | 418 16% | 604 68% | 334 -7% |
| Brightness Distribution | 98 | 86 -12% | 93 -5% | 96 -2% | 96 -2% | 94 -4% | 98 0% |
| Black Level * | 0.38 | 0.22 | 0.07 | ||||
| Colorchecker dE 2000 * | 1.2 | 2.33 -94% | 1.9 -58% | 1.3 -8% | 1.6 -33% | 1.2 -0% | 1.58 -32% |
| Colorchecker dE 2000 max. * | 2.6 | 6.07 -133% | 4.2 -62% | 3.6 -38% | 2.1 19% | 2.8 -8% | 4.23 -63% |
| Greyscale dE 2000 * | 1.2 | 3.7 -208% | 3 -150% | 2.2 -83% | 2.7 -125% | 1.9 -58% | 4.25 -254% |
| Gamma | 2.14 103% | 2.161 102% | 2.18 101% | 2.14 103% | 2.16 102% | 2.29 96% | 2.206 100% |
| CCT | 6526 100% | 7102 92% | 6738 96% | 6680 97% | 6331 103% | 6812 95% | 6249 104% |
| Contrast | 1095 | 2959 | 4740 | ||||
| Colorchecker dE 2000 calibrated * | 1.02 | 0.6 | 1 | 6.66 | |||
| Média Total (Programa/Configurações) | -215% /
-144% | -80% /
-64% | 6% /
-1% | 45% /
30% | -154% /
-135% | -26% /
-34% |
* ... menor é melhor

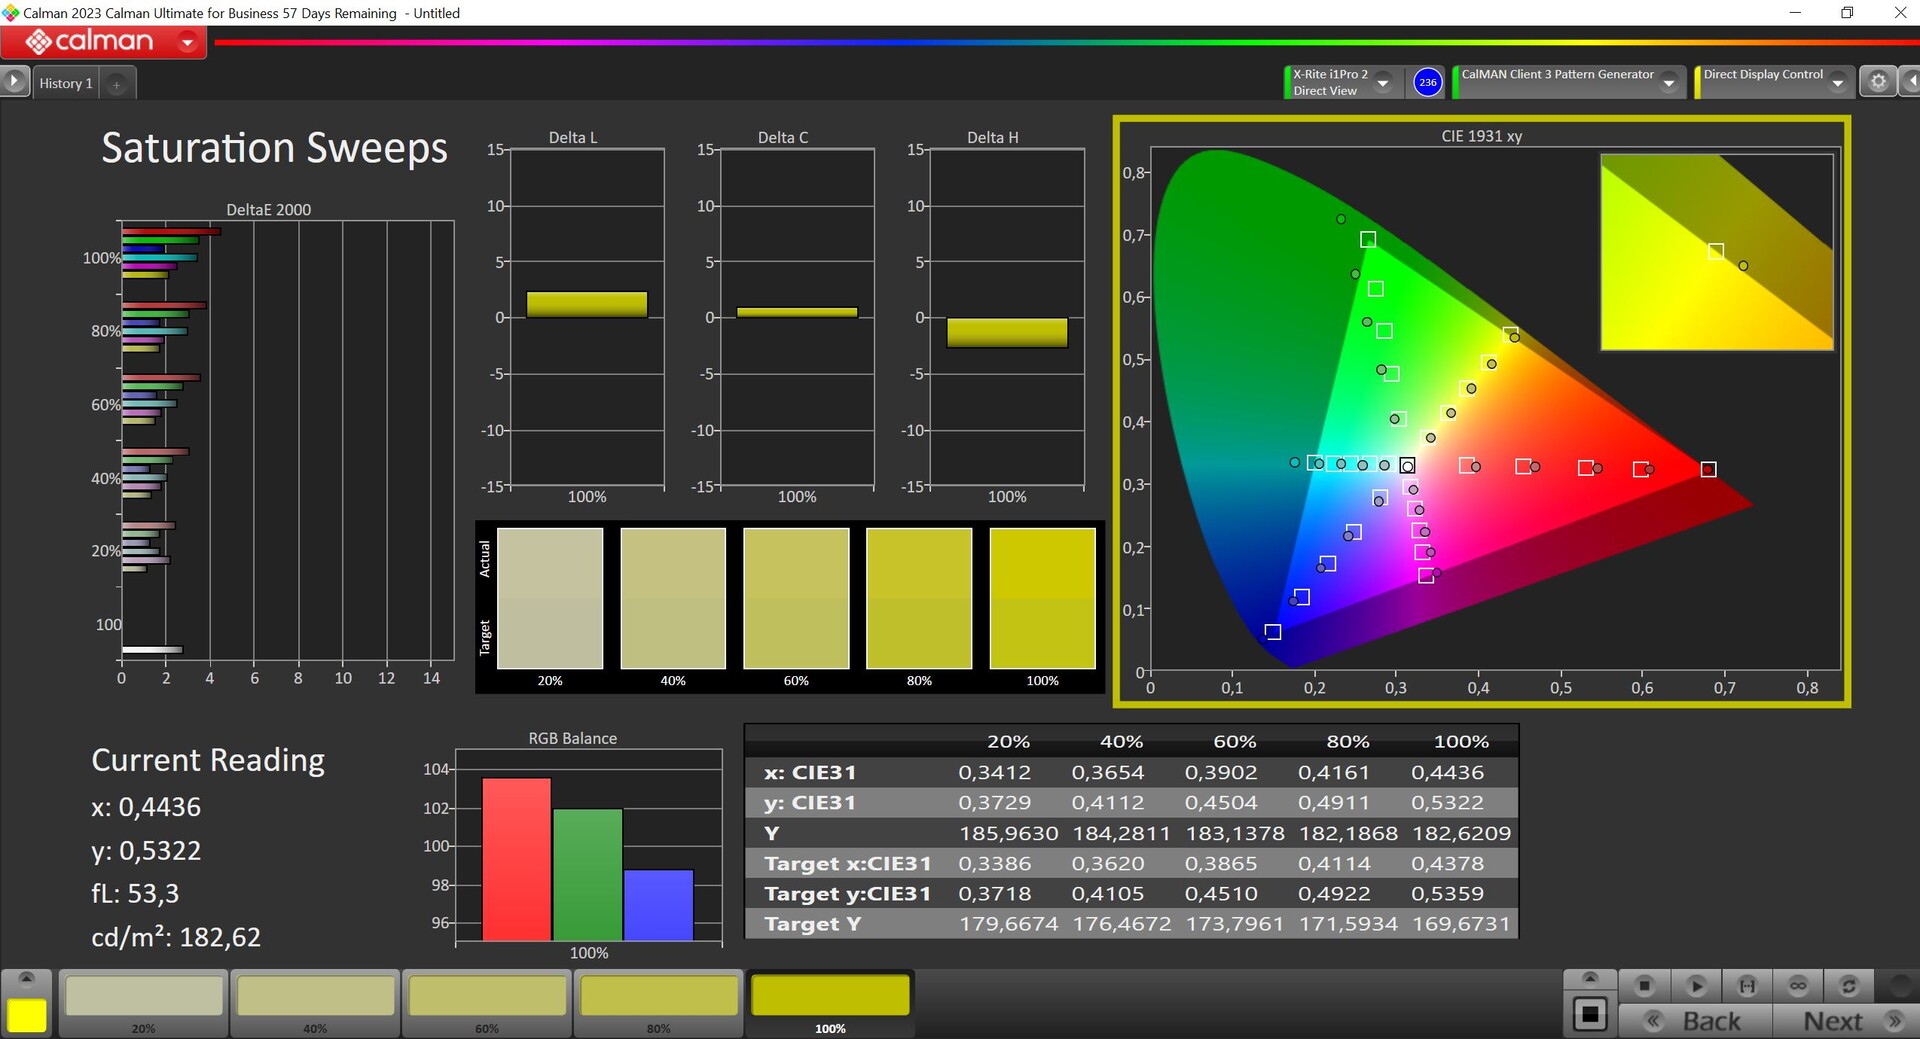
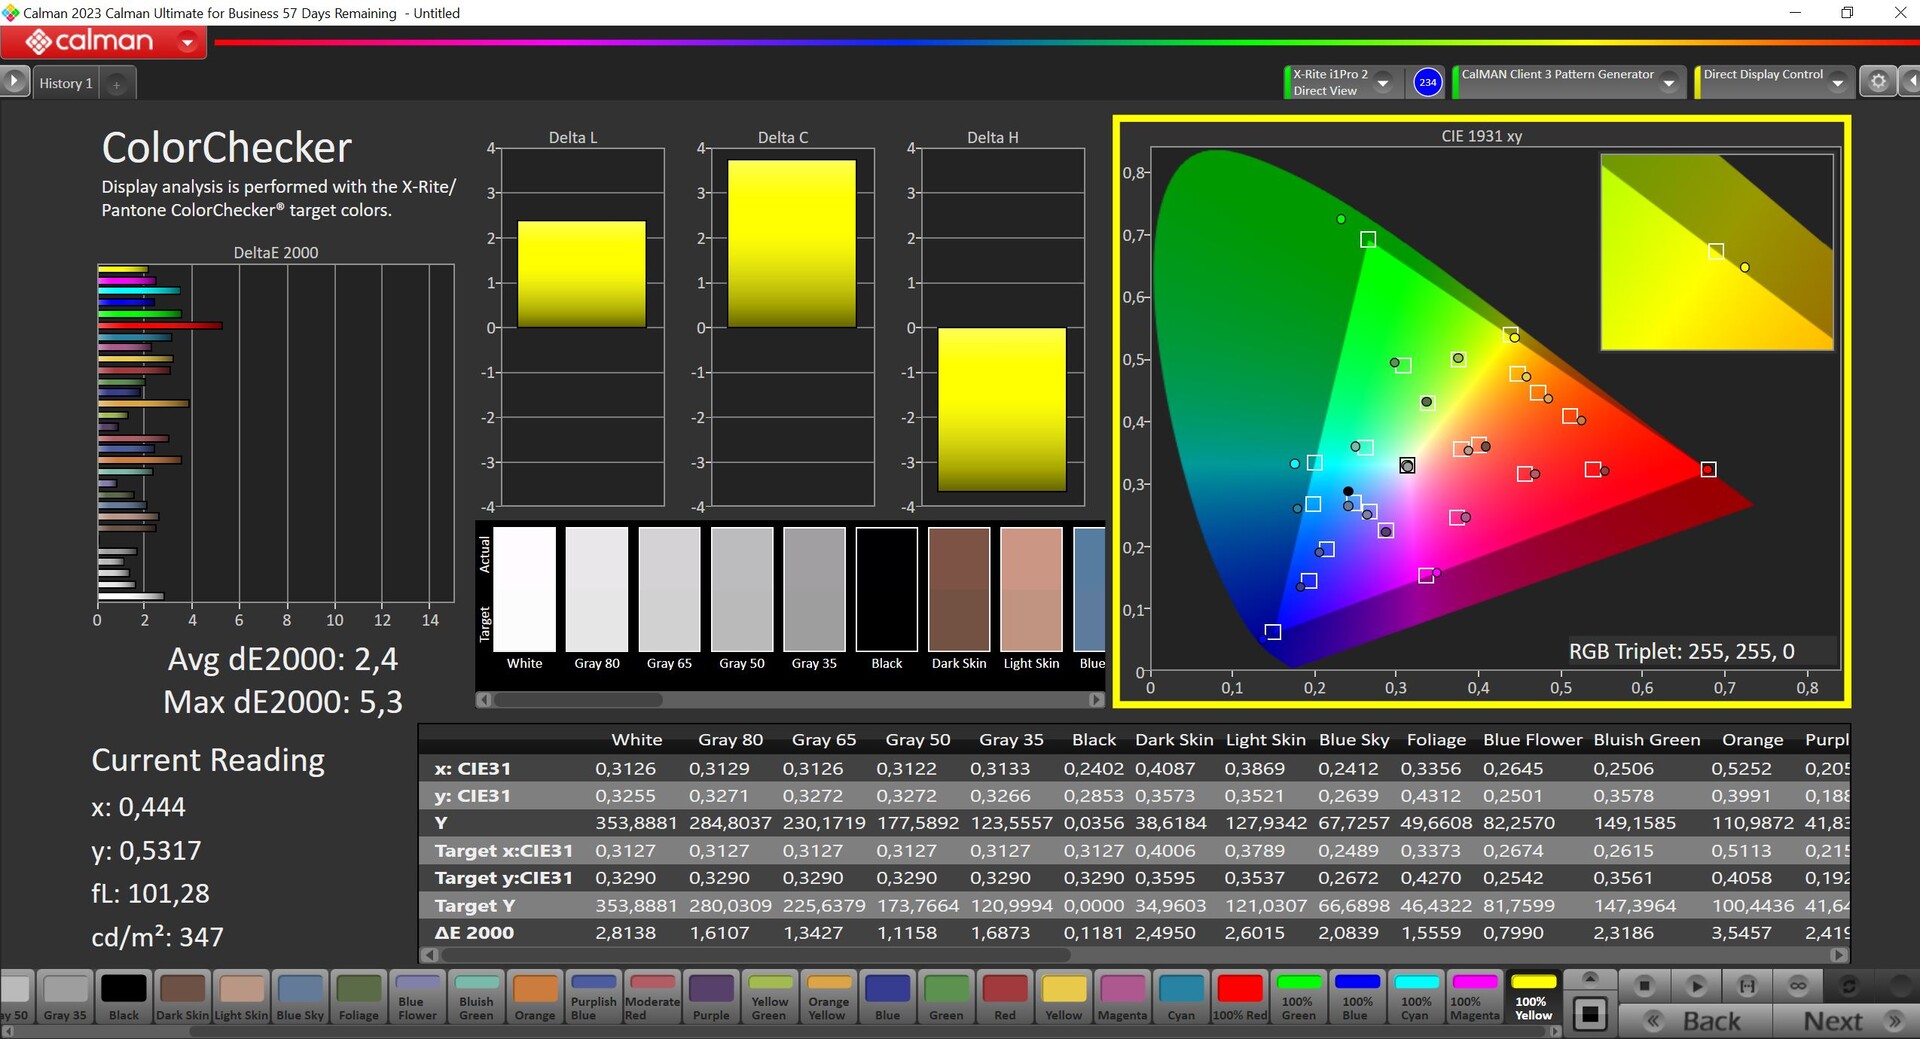
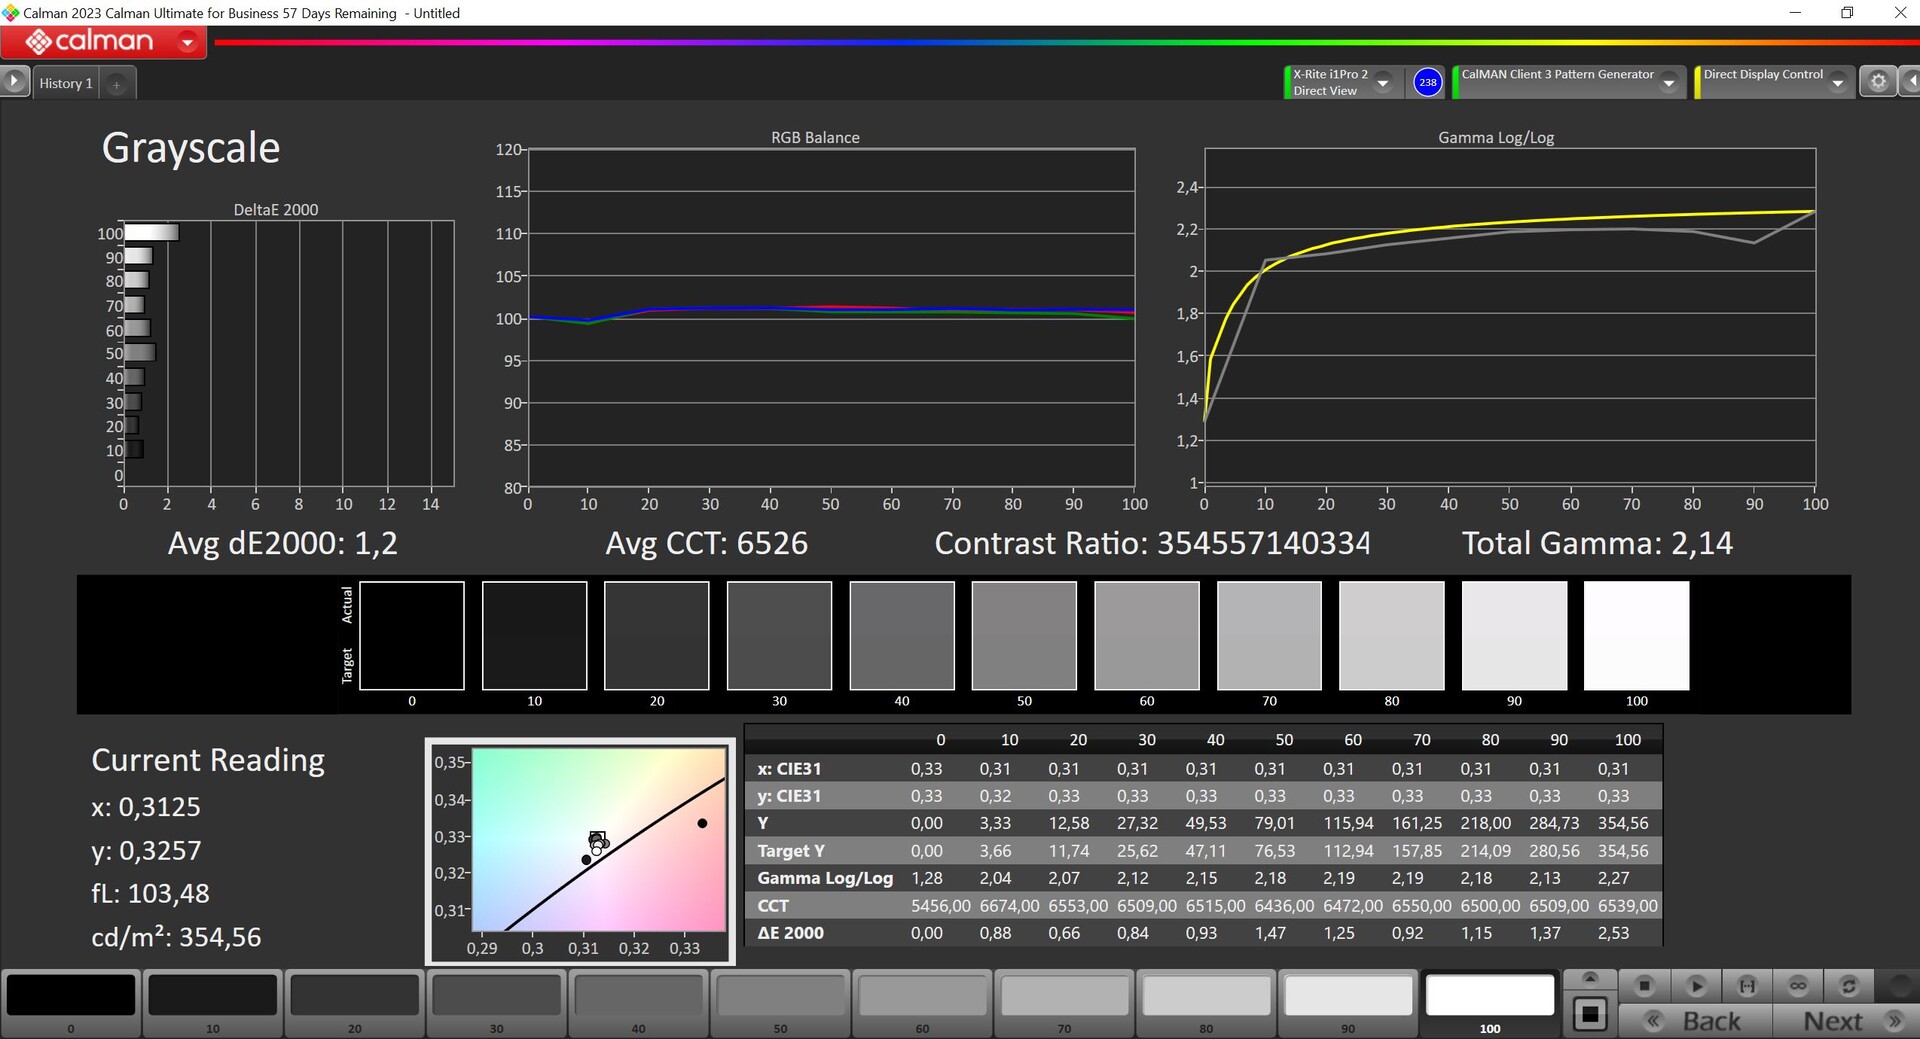
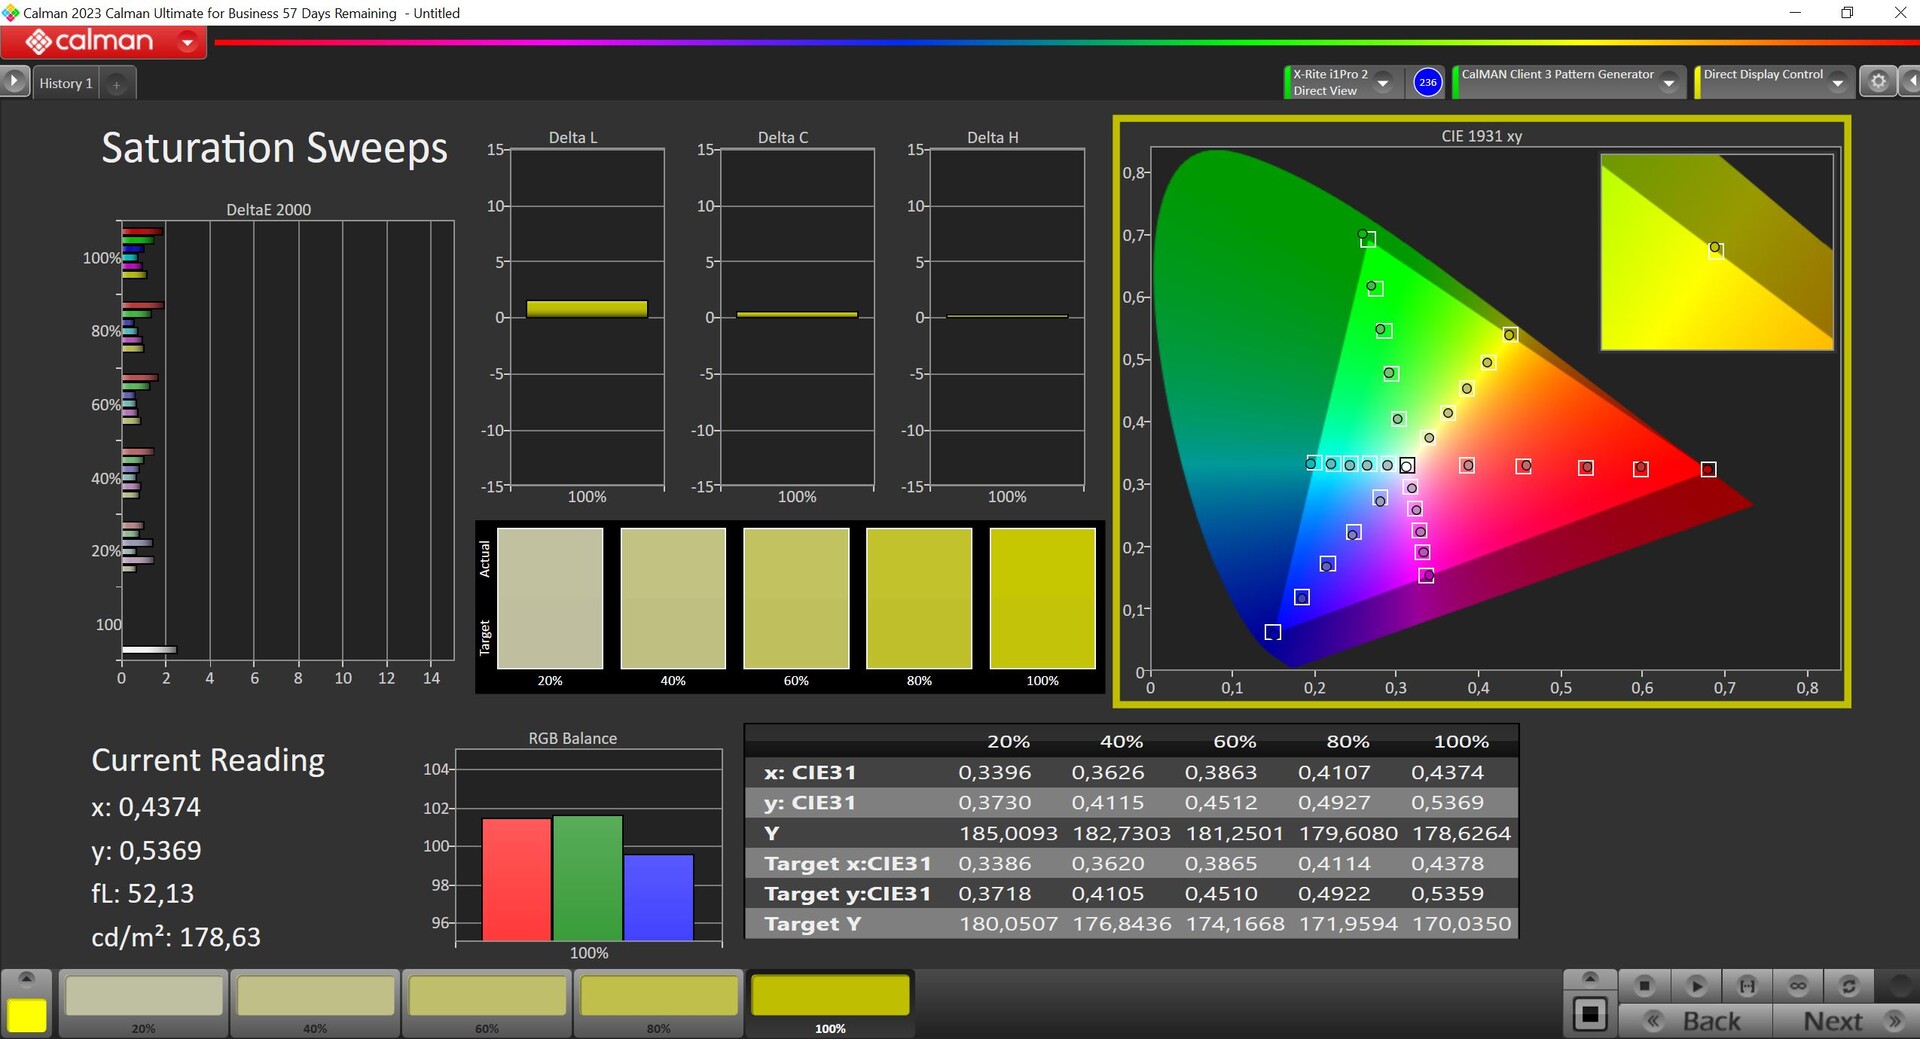
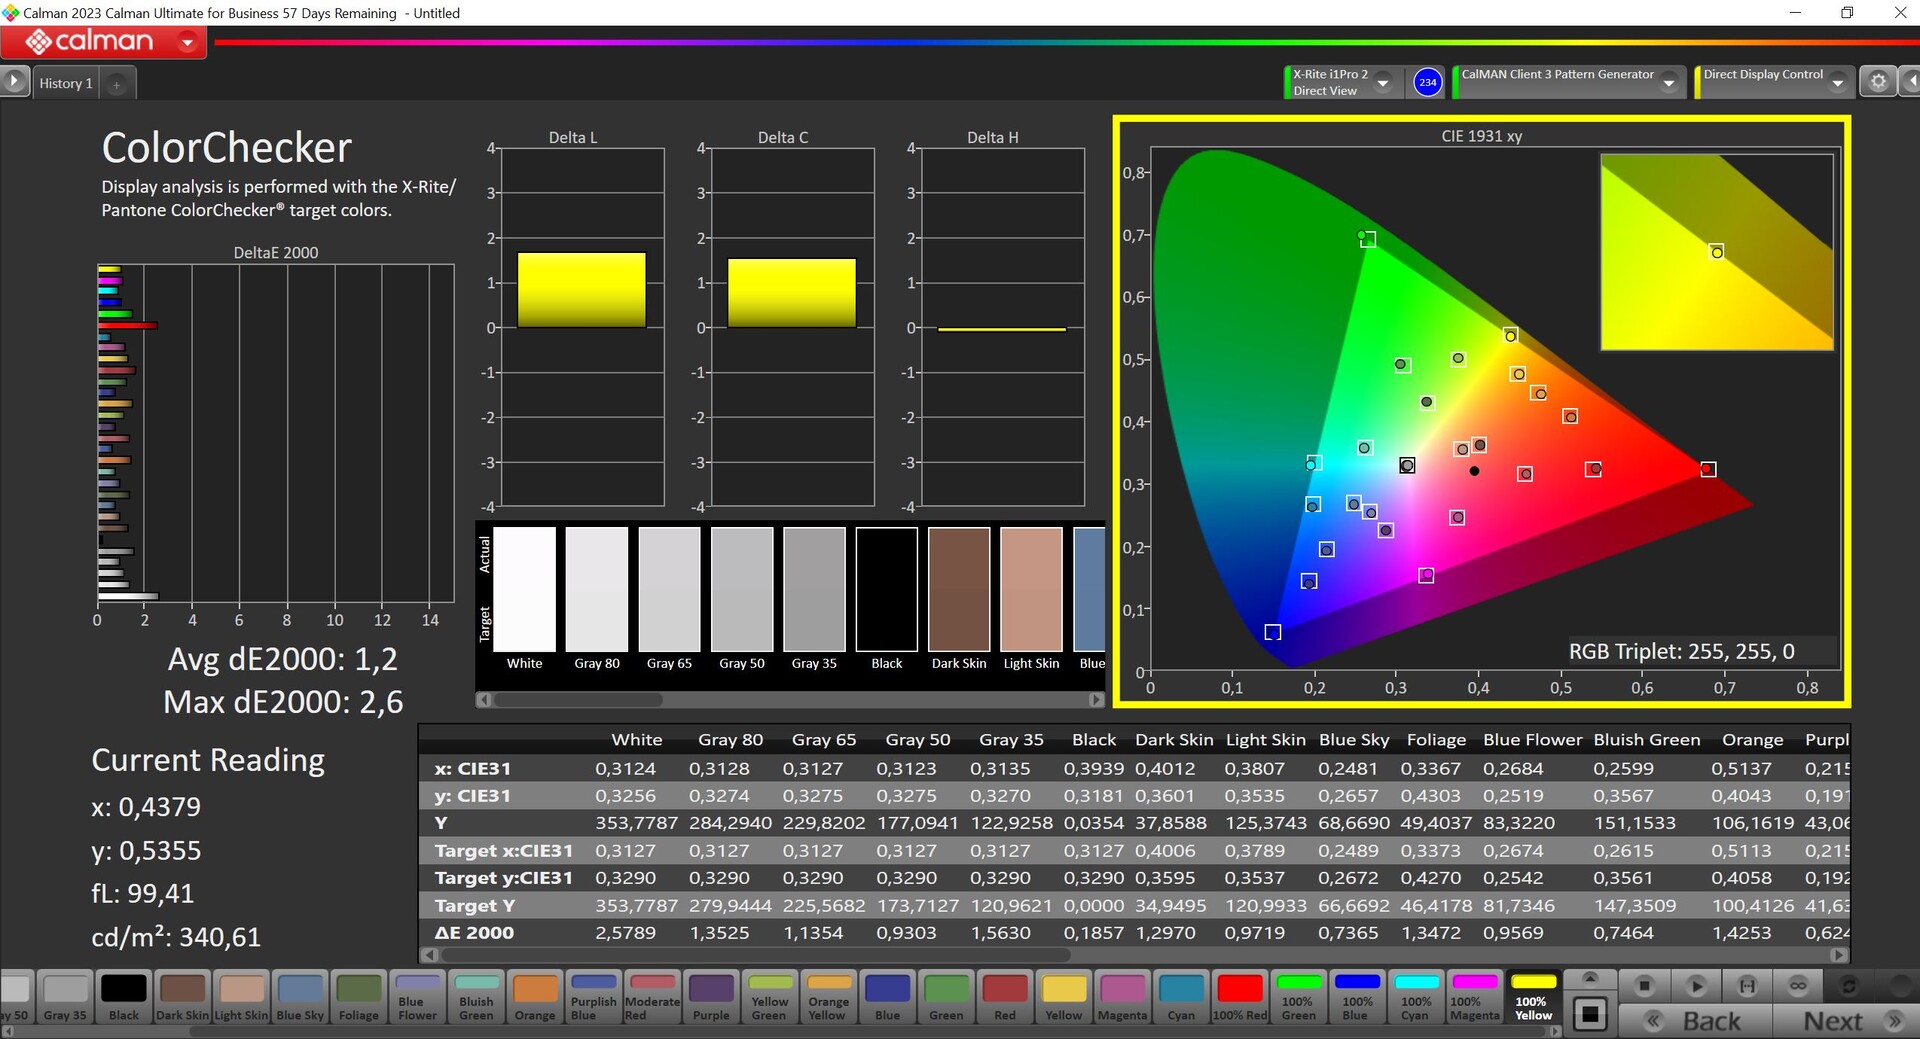
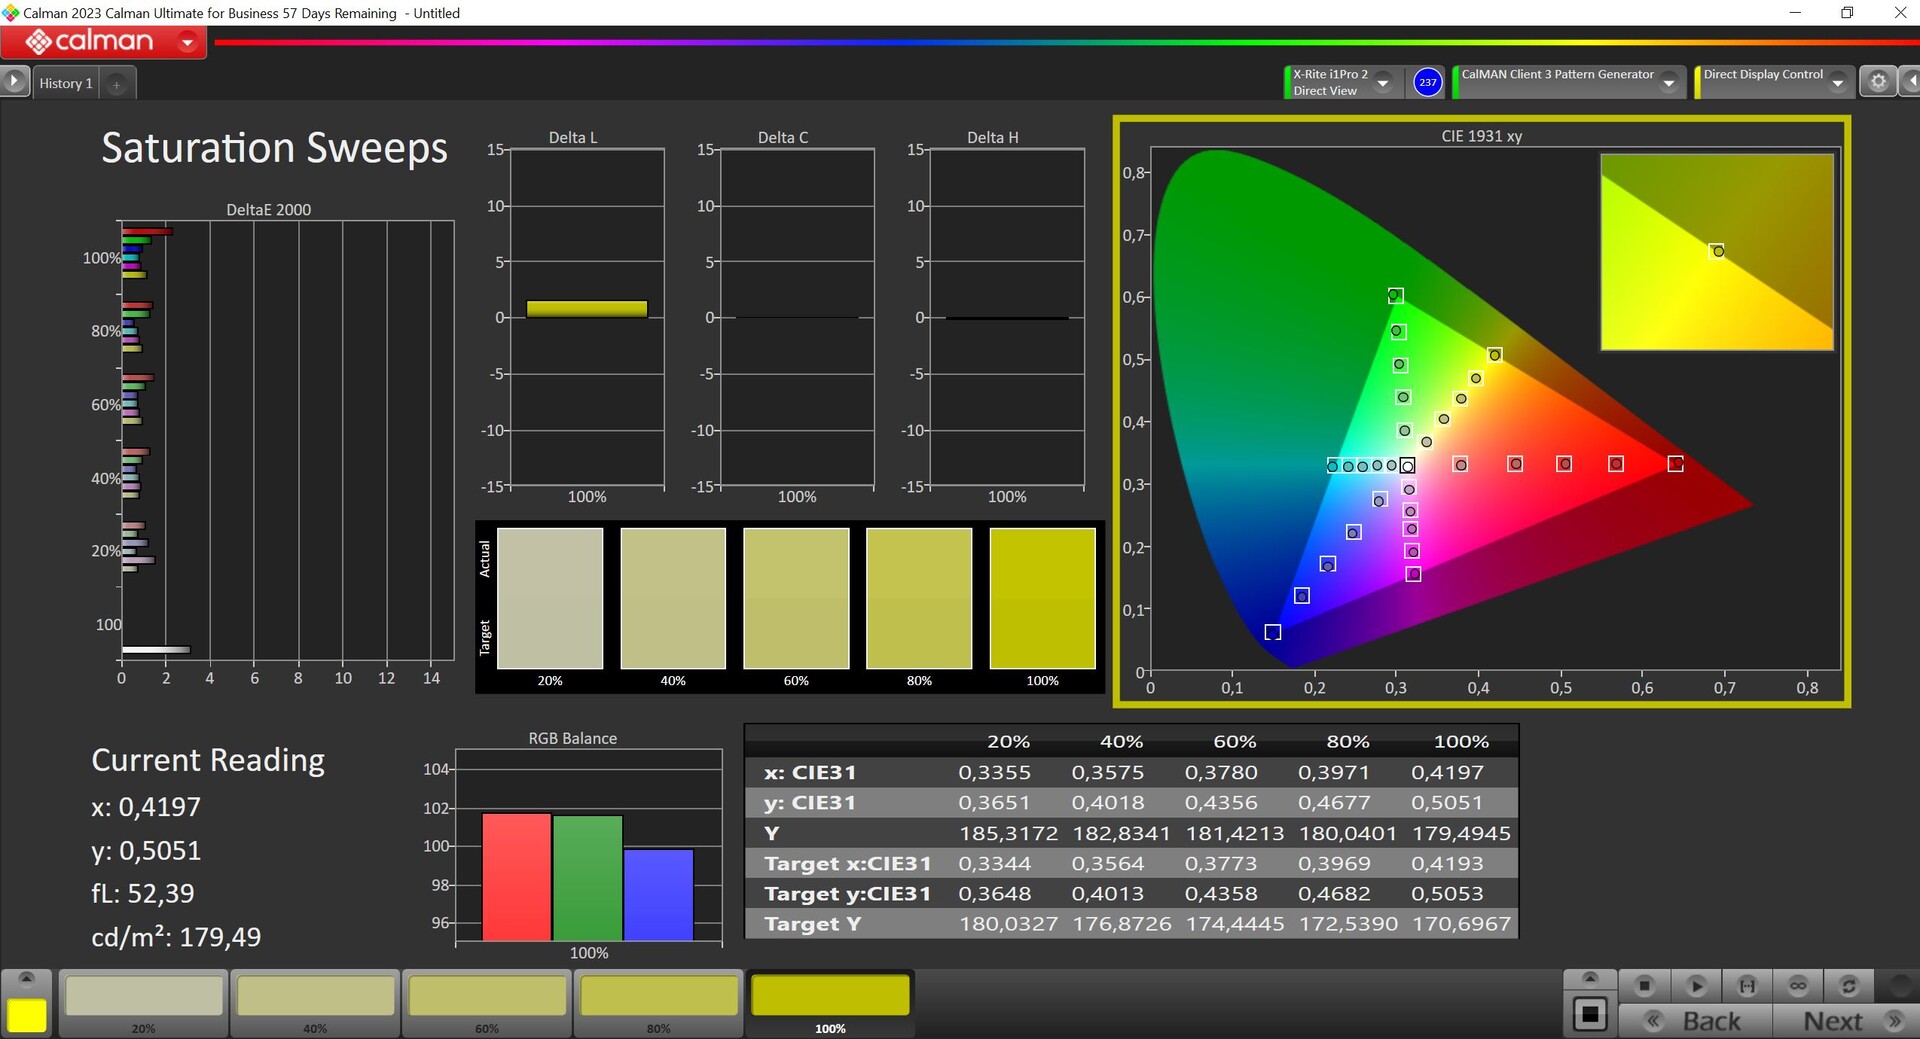
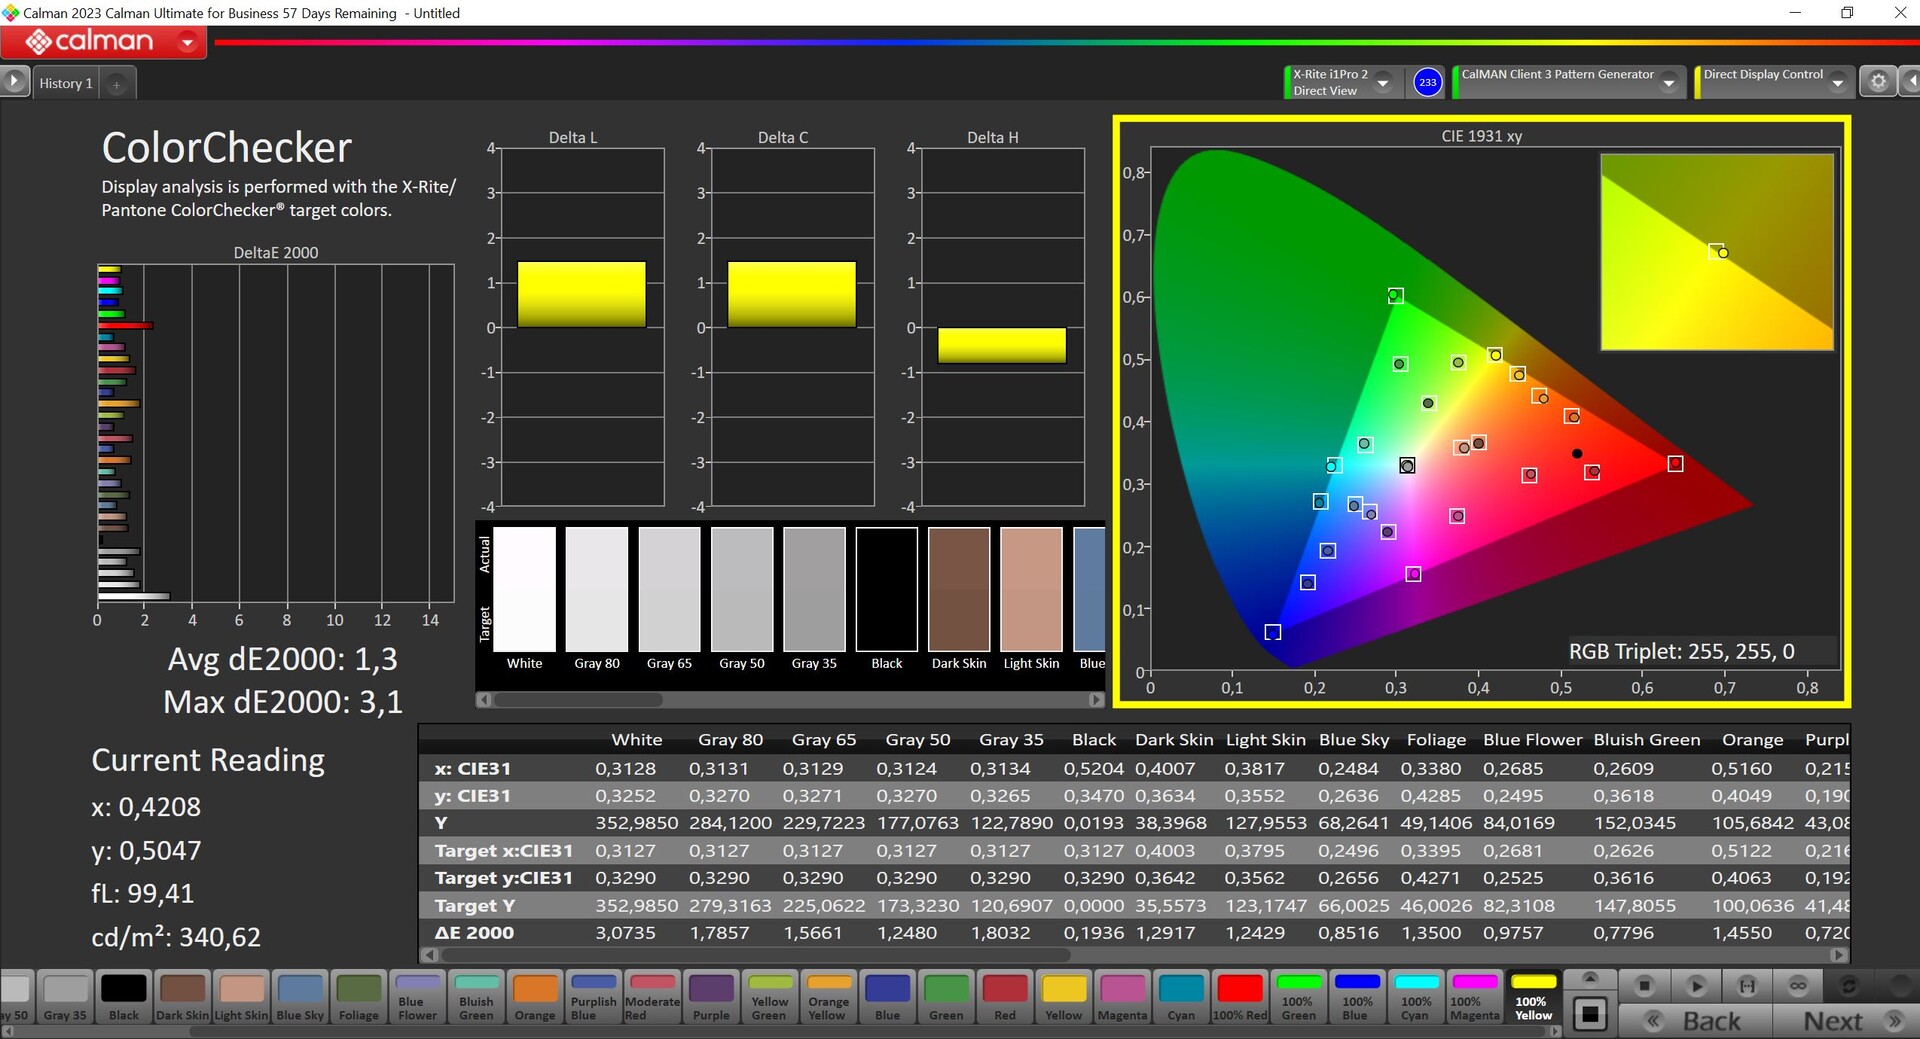
Analisamos o painel usando o software profissional CalMAN (X-Rite i1 Pro 2) e, como de costume, a Asus fornece vários perfis de cores. O modo pré-instalado oferece uma boa imagem para as tarefas diárias, mas as cores são um pouco saturadas demais. As coisas ficam significativamente mais precisas no modo de exibição P3, com as escalas de cinza e os desvios de cores todos abaixo da importante marca de 3. Da mesma forma, o modo sRGB oferece resultados precisos e, graças à cobertura completa do espaço de cores sRGB e P3, o ProArt P16 é perfeitamente adequado para editar imagens e vídeos. Com nossa própria calibração, conseguimos melhorar a reprodução da escala de cinza, mas os desvios de cor aumentaram e é por isso que não estamos fornecendo um perfil para download.

Exibir tempos de resposta
| ↔ Tempo de resposta preto para branco | ||
|---|---|---|
| 1.25 ms ... ascensão ↗ e queda ↘ combinadas | ↗ 0.67 ms ascensão | 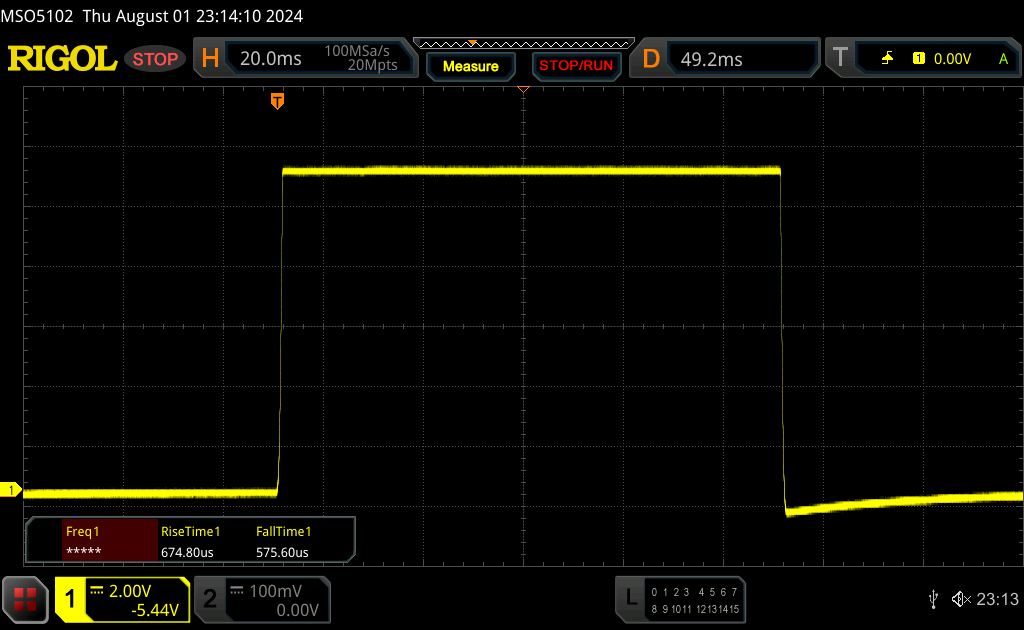 |
| ↘ 0.58 ms queda | ||
| A tela mostra taxas de resposta muito rápidas em nossos testes e deve ser muito adequada para jogos em ritmo acelerado. Em comparação, todos os dispositivos testados variam de 0.1 (mínimo) a 240 (máximo) ms. » 5 % de todos os dispositivos são melhores. Isso significa que o tempo de resposta medido é melhor que a média de todos os dispositivos testados (20.8 ms). | ||
| ↔ Tempo de resposta 50% cinza a 80% cinza | ||
| 1.58 ms ... ascensão ↗ e queda ↘ combinadas | ↗ 0.84 ms ascensão | 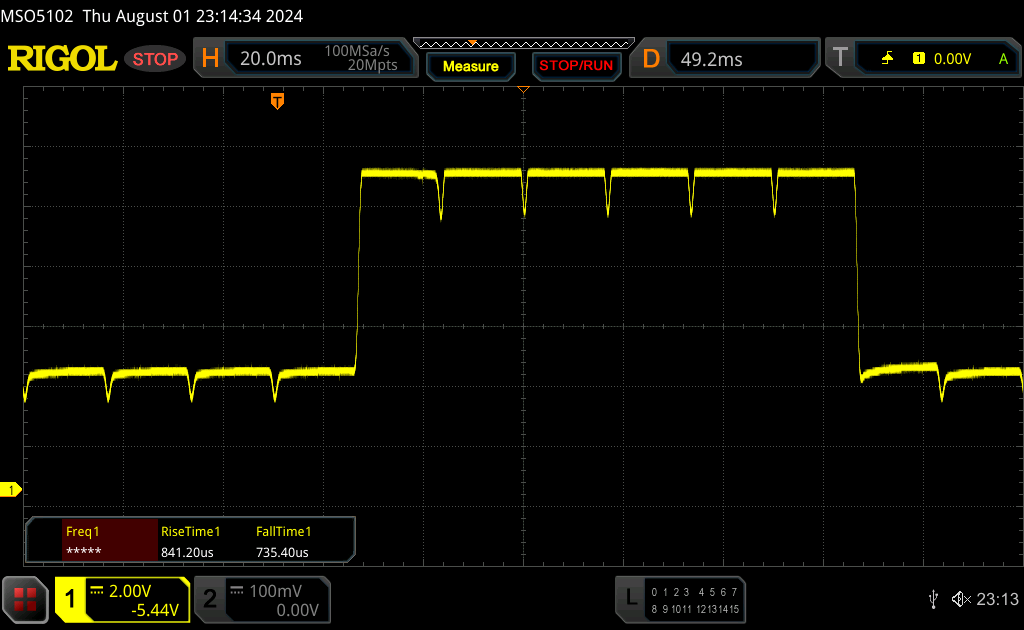 |
| ↘ 0.74 ms queda | ||
| A tela mostra taxas de resposta muito rápidas em nossos testes e deve ser muito adequada para jogos em ritmo acelerado. Em comparação, todos os dispositivos testados variam de 0.165 (mínimo) a 636 (máximo) ms. » 5 % de todos os dispositivos são melhores. Isso significa que o tempo de resposta medido é melhor que a média de todos os dispositivos testados (32.5 ms). | ||
Cintilação da tela / PWM (modulação por largura de pulso)
| Tela tremeluzindo/PWM detectado | 240 Hz Amplitude: 36 % | ≤ 52 % configuração de brilho | 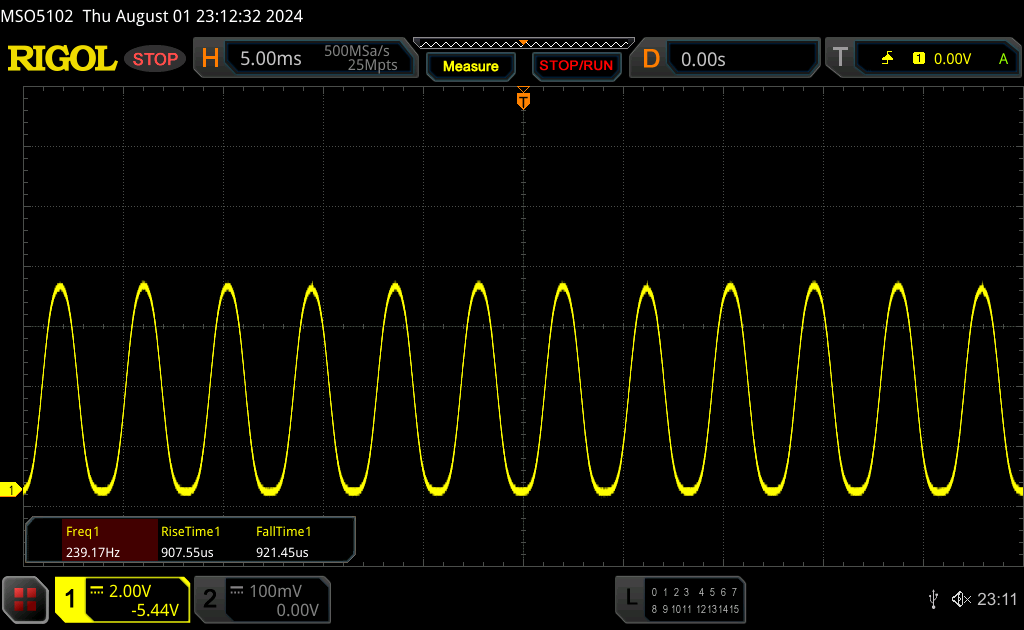 |
| ≤ 93 brilho cd/m² | |||
A luz de fundo da tela pisca em 240 Hz (pior caso, por exemplo, utilizando PWM) Cintilação detectada em uma configuração de brilho de 52 % (93 cd/m²) e abaixo. Não deve haver cintilação ou PWM acima desta configuração de brilho. A frequência de 240 Hz é relativamente baixa, portanto, usuários sensíveis provavelmente notarão cintilação e sentirão fadiga ocular na configuração de brilho indicada e abaixo. A cintilação ocorre em configurações de brilho relativamente baixas, portanto, o uso prolongado nesta configuração de brilho ou inferior pode causar fadiga ocular. [pwm_comparison] Em comparação: 53 % de todos os dispositivos testados não usam PWM para escurecer a tela. Se PWM foi detectado, uma média de 8516 (mínimo: 5 - máximo: 343500) Hz foi medida. | |||
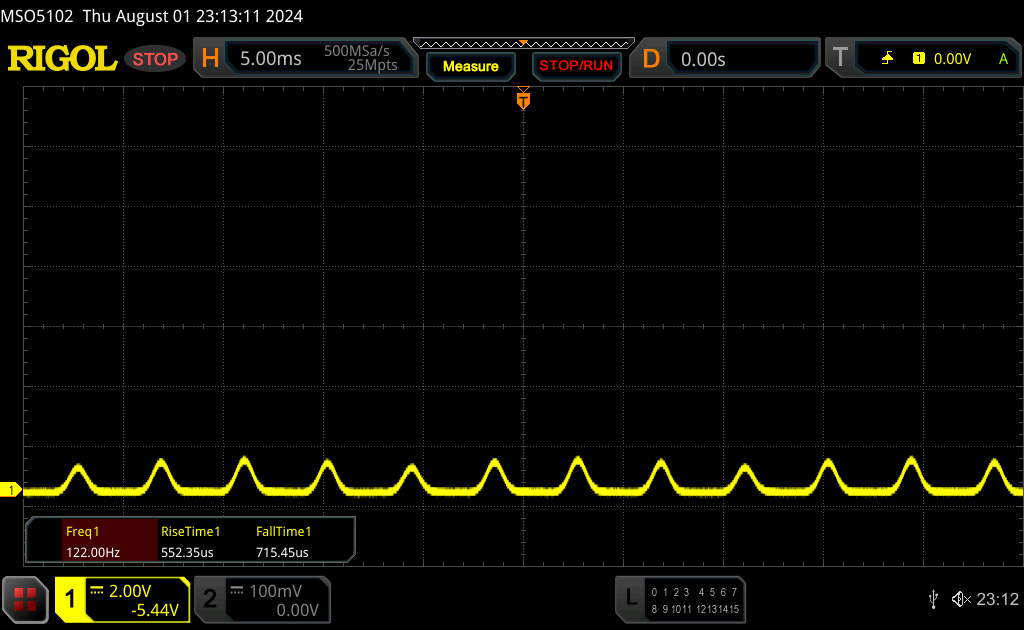

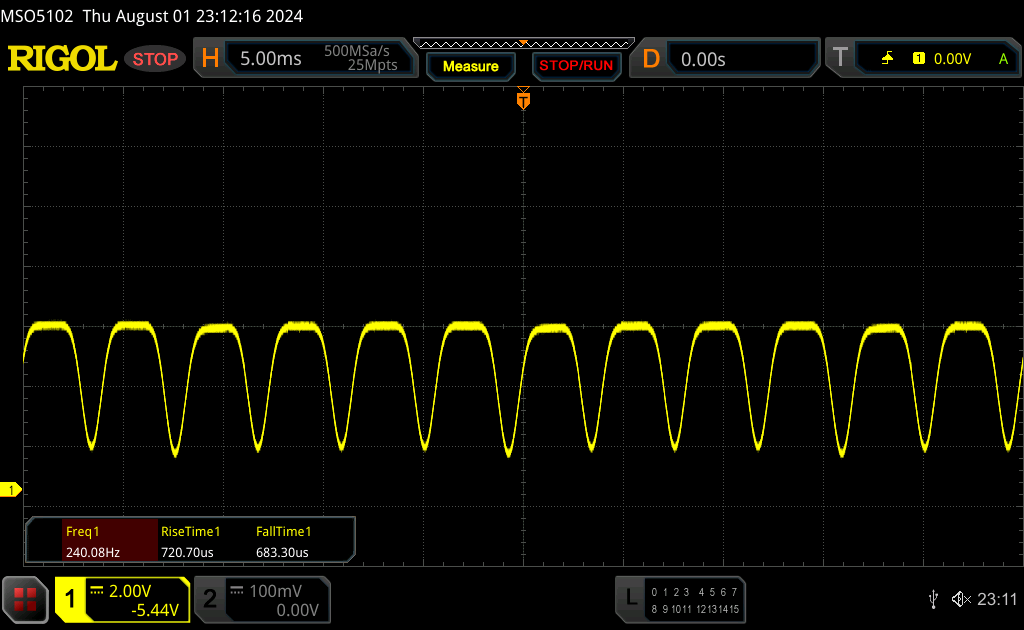
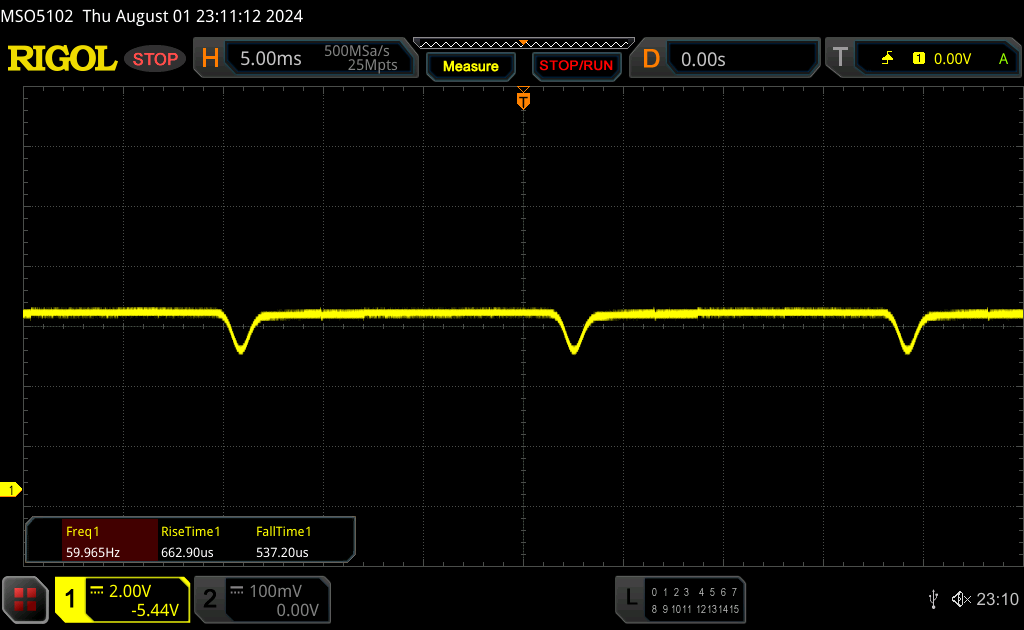
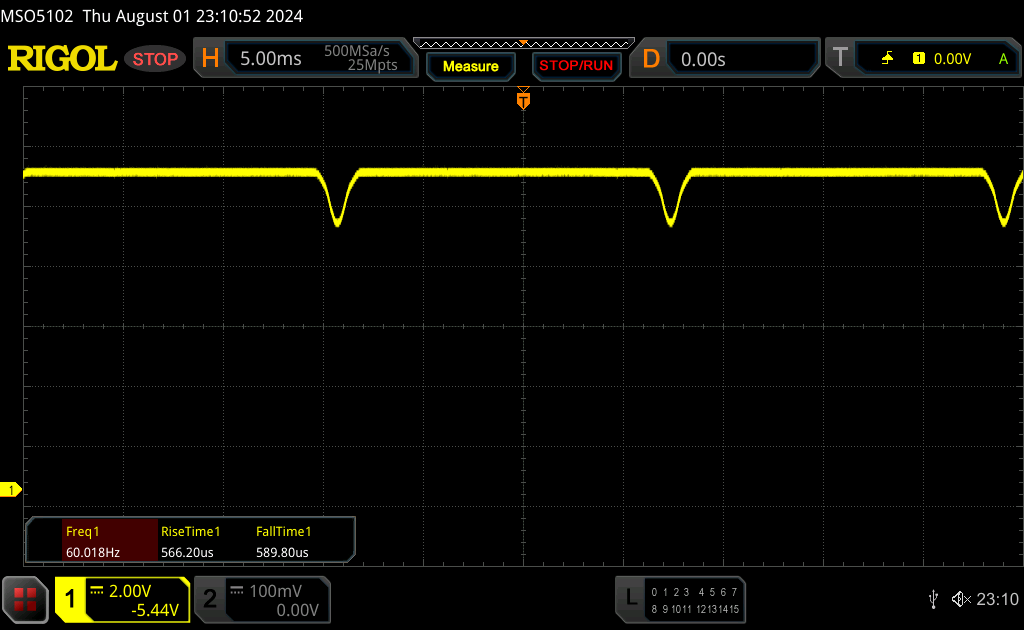
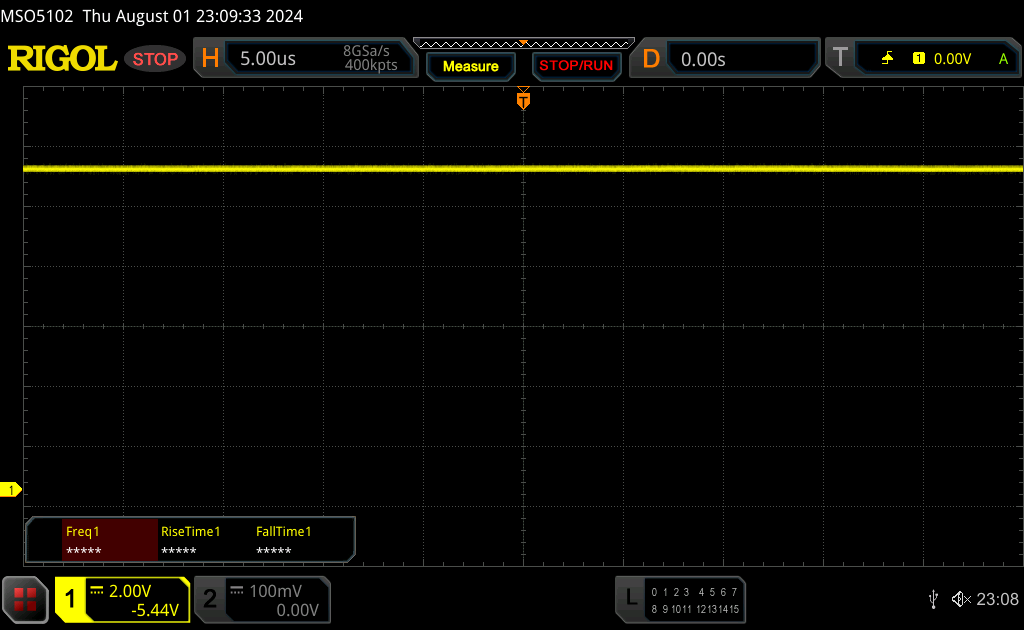
O escurecimento DC em uma frequência de 60 Hz entra em vigor em um brilho de até 53%, abaixo do qual há cintilação em 240 Hz. Para evitar entrar nessa zona prejudicial, a Asus oferece o chamado escurecimento OLED sem cintilação no aplicativo MyAsus.
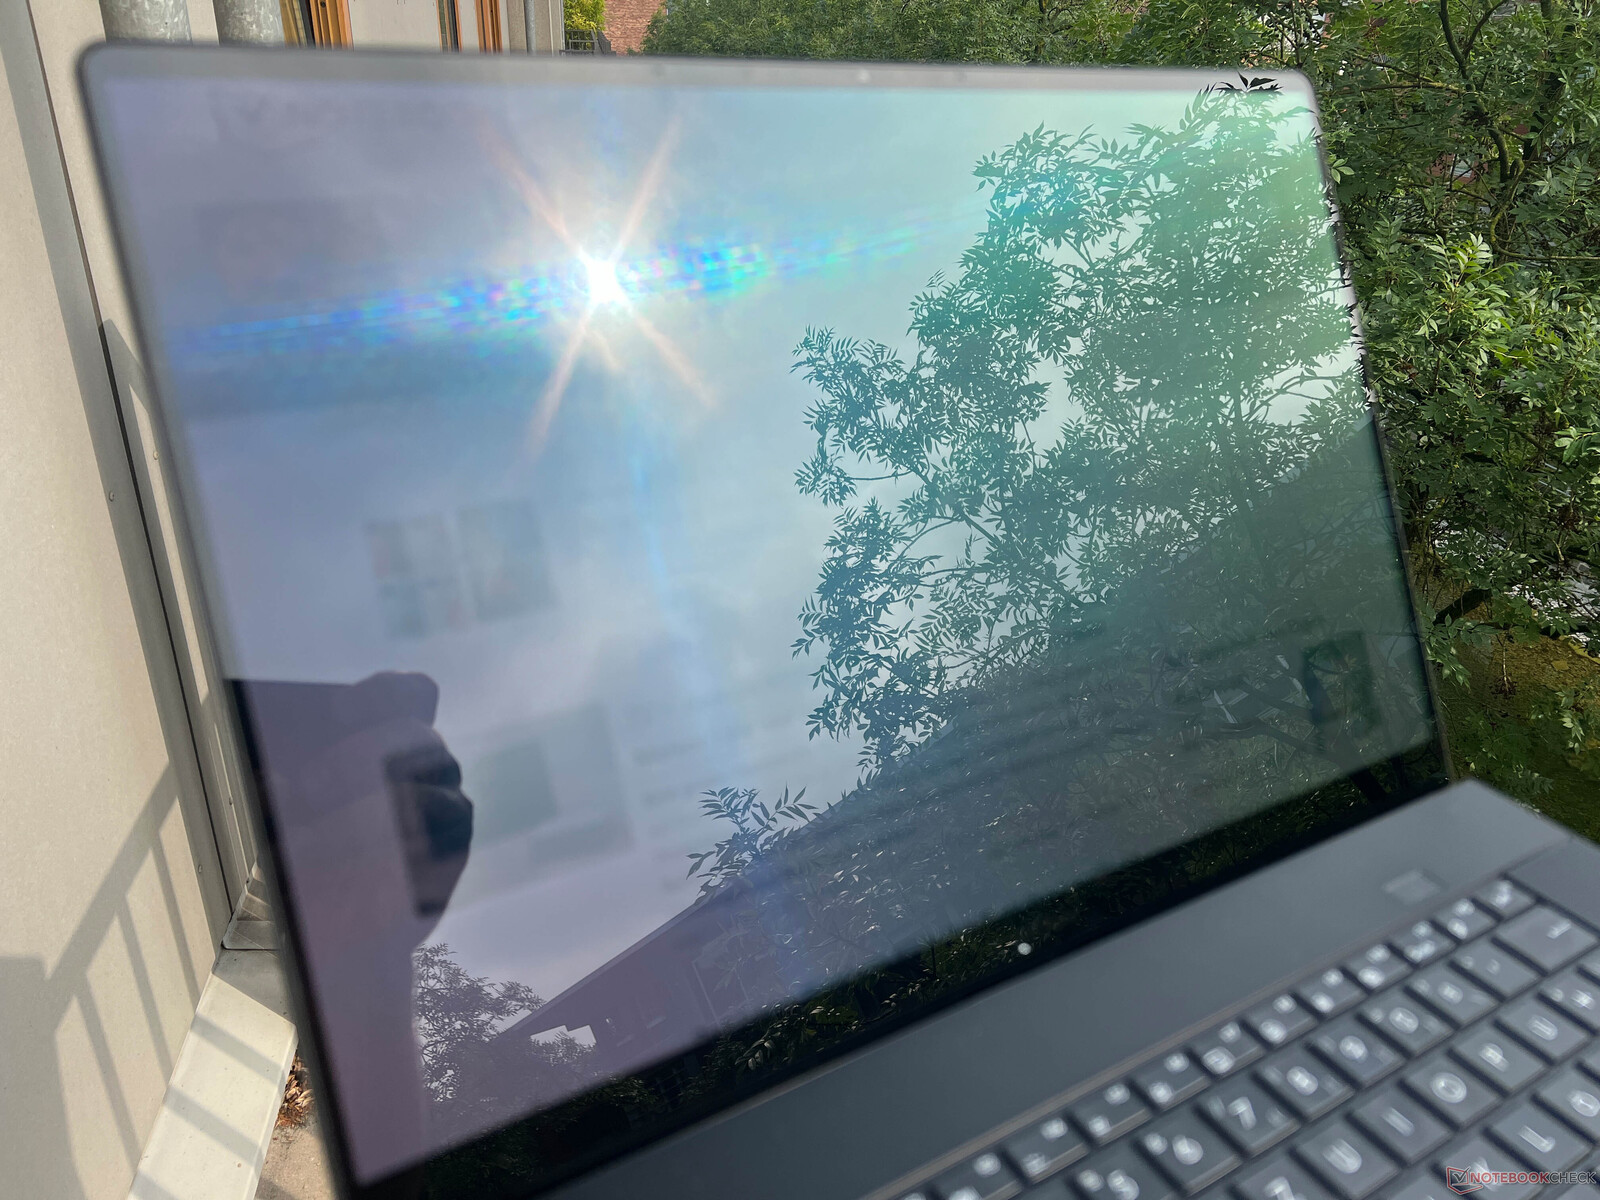

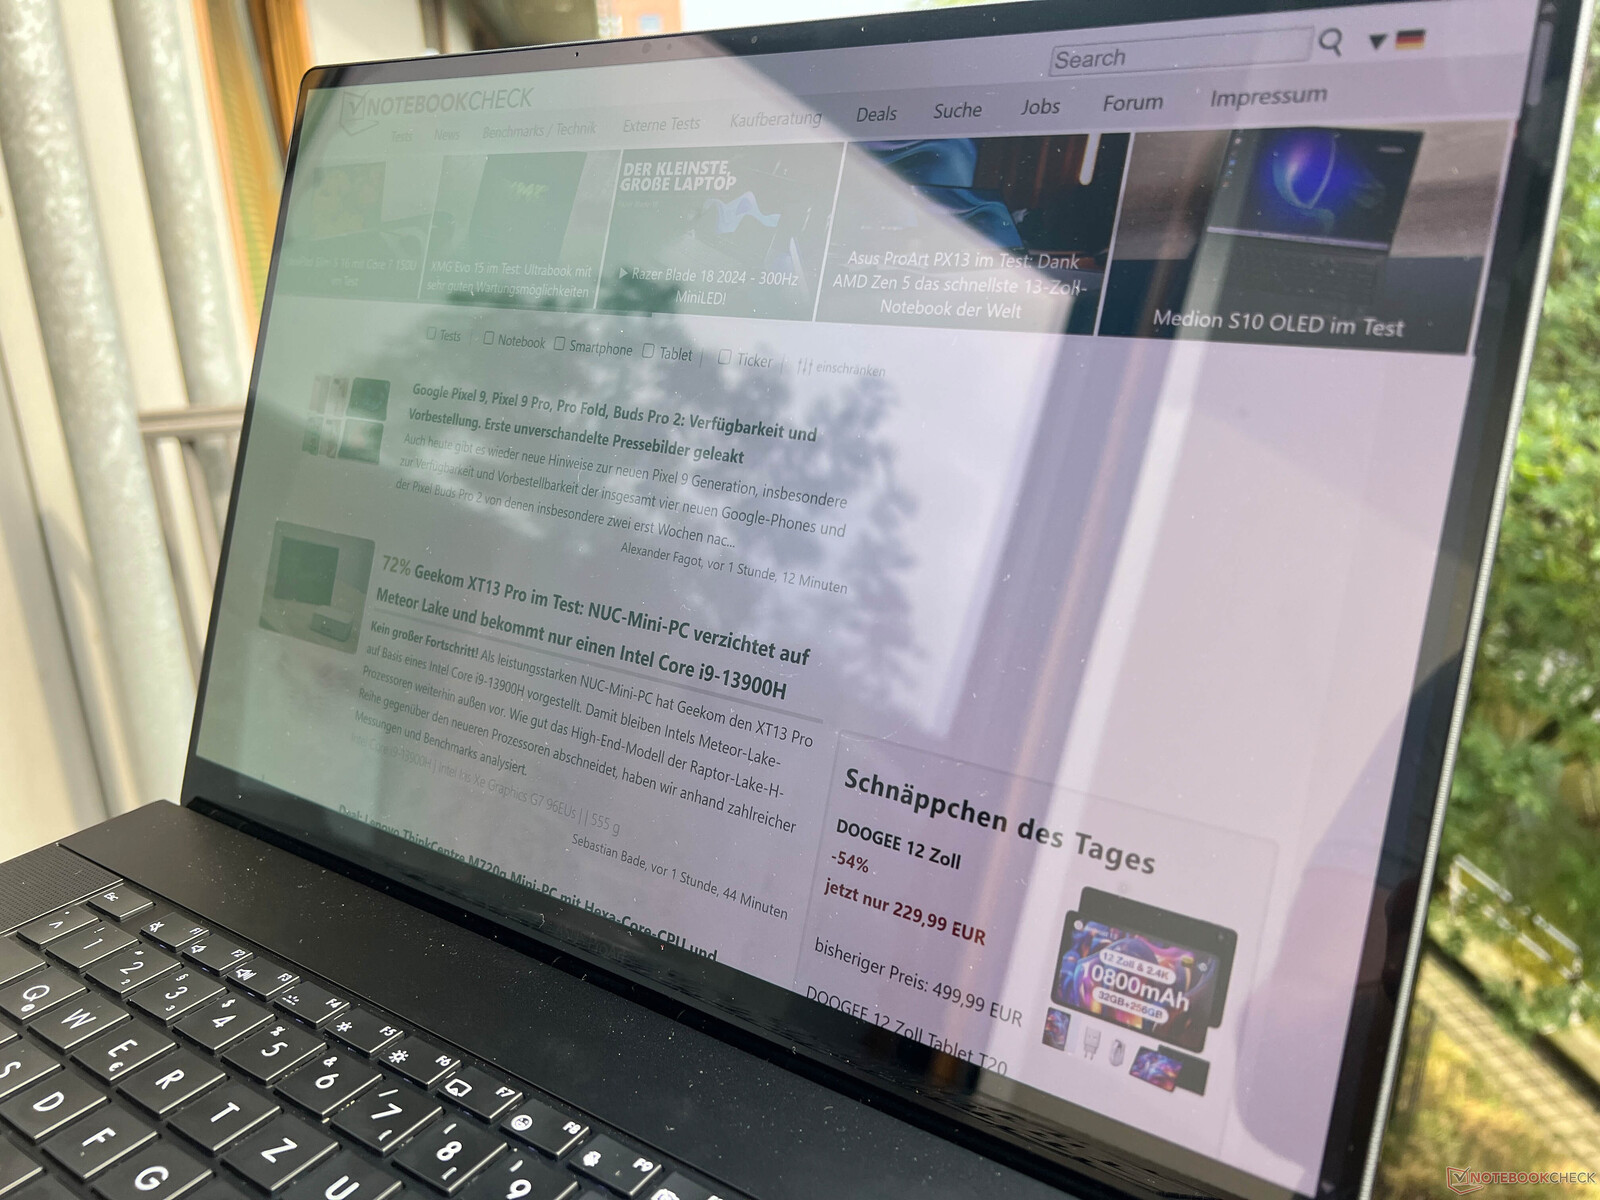
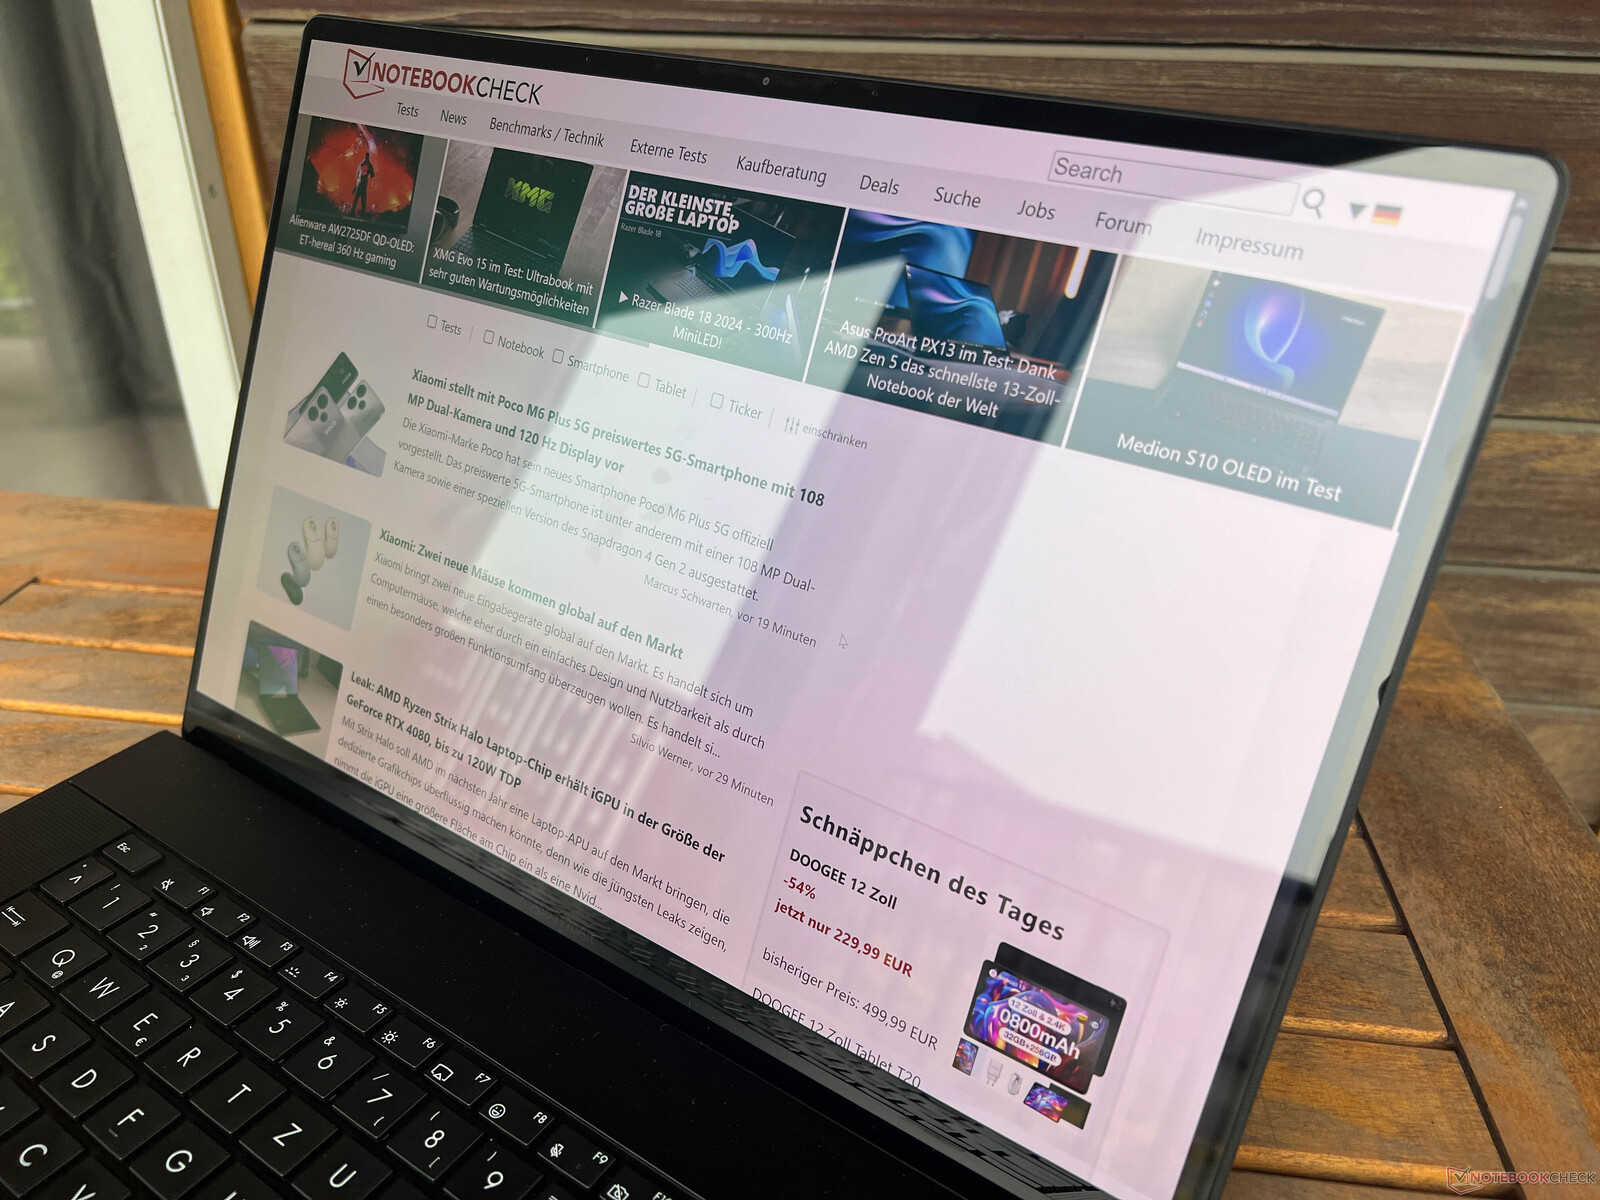
Em ambientes externos, em especial, os reflexos são um problema na tela sensível ao toque muito brilhante. Por esse motivo, sugerimos que o senhor procure um local adequado na sombra. A estabilidade do ângulo de visão é muito boa.

Desempenho - Zen 5 com uma GPU GeForce e 64 GB de RAM
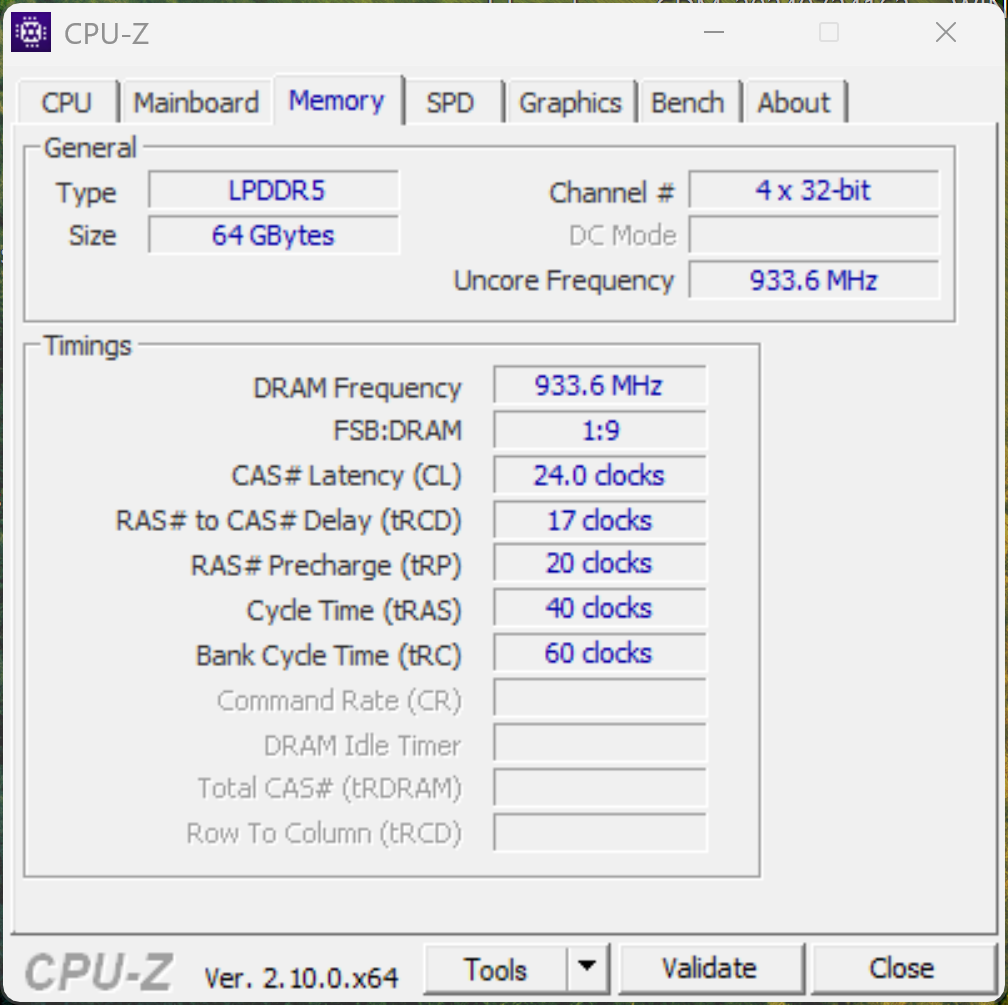
A Asus oferece o novo ProArt P16 com ambos os novos processadores móveis Processadores móveis Ryzen AI 300 que são combinados com RAM LPDDR5x 7500 soldada (24, 32 ou 64 GB). Além disso, temos as atuais GPUs Ada Lovelace da Nvidia (laptop RTX 4050/4060/4070).
Condições de teste
Como de costume, a Asus oferece três perfis de energia diferentes: Whisper, Standard e Performance. Na tabela a seguir, compilamos um resumo de seus respectivos valores de TDP/TGP e desempenho. Como padrão, realizamos os seguintes benchmarks e medições usando o modo Desempenho, que só está disponível quando conectado à rede elétrica.
| Perfil de energia | TDP | CB R23 Multi | TGP | Time Spy Gráficos | CP 2077 QHD/Ultra | Teste de estresse | Velocidade máxima da ventoinha |
|---|---|---|---|---|---|---|---|
| Whisper | 60/55W | 21.046 pontos | 60W | 8.749 pontos | 34 FPS | CPU: 30W GPU: 42W |
42,2 dB(A) |
| Padrão | 70/65W | 22.651 pontos | 80W | 10.526 pontos | 44,2 FPS | CPU: 30W GPU: 65W |
47,1 dB(A) |
| Desempenho | 80W | 23.795 pontos | 105W | 11.941 pontos | 49,4 FPS | CPU: 37W GPU: 85W |
53,2 dB(A) |
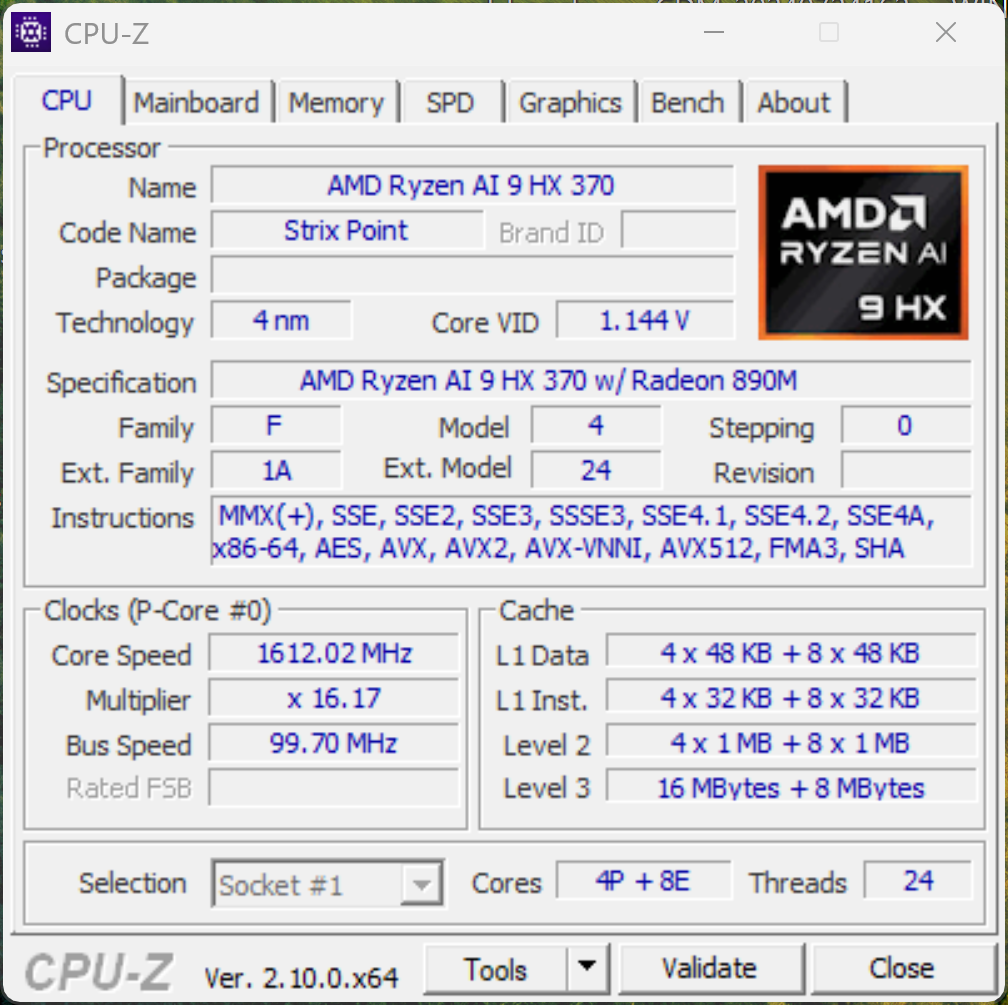
Processador - Ryzen AI 9 HX 370
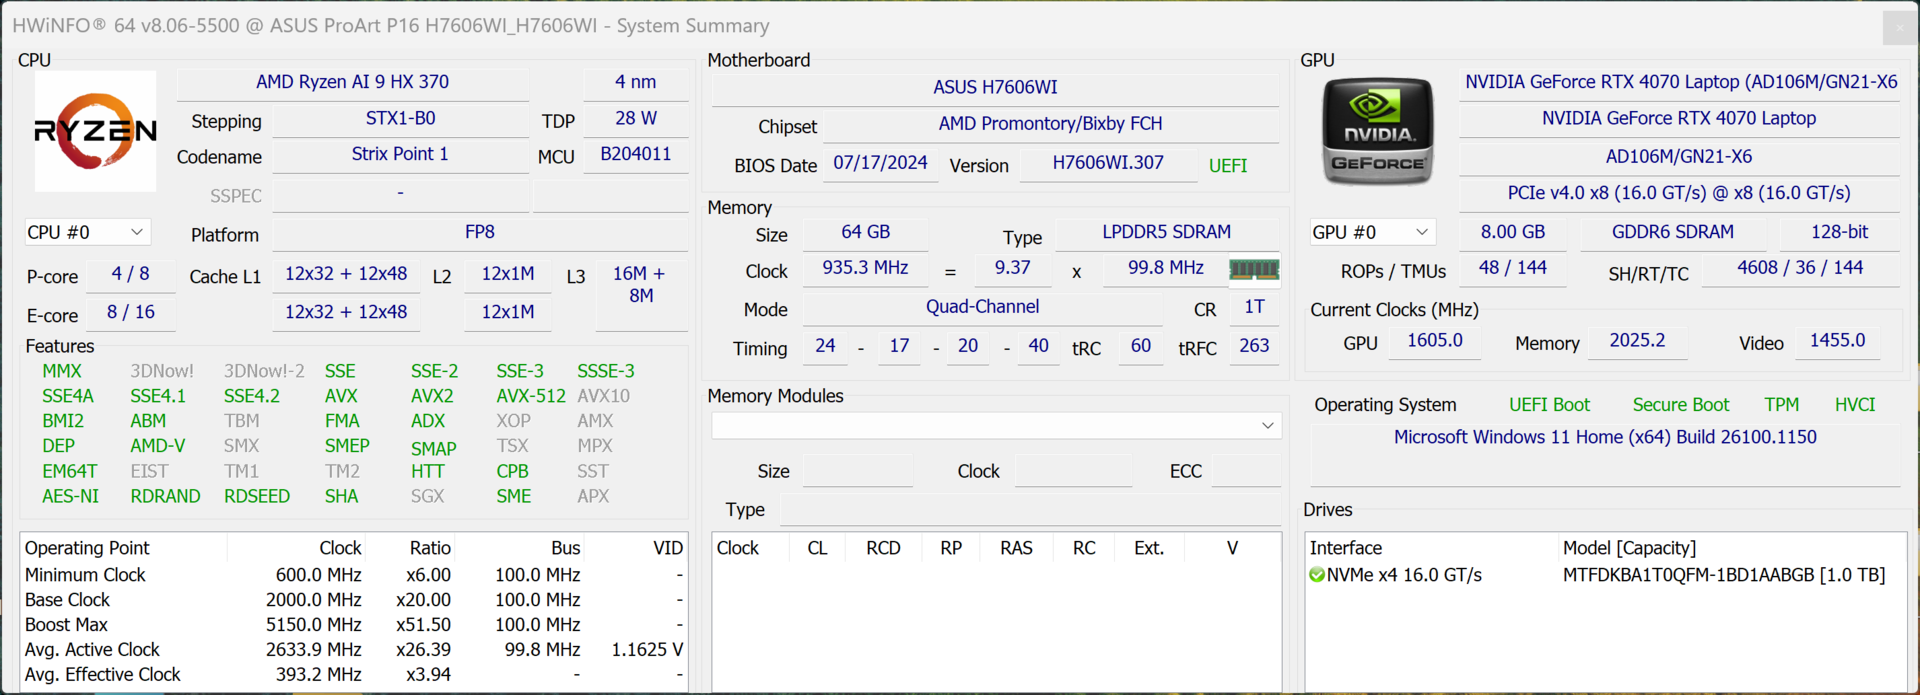
O novo AMD Ryzen AI 9 HX 370 oferece 12 núcleos Zen 5 (24 threads) que podem atingir uma velocidade máxima de 5,1 GHz. Para obter mais análises técnicas, consulte nossa análise de CPU. O processador do ProArt P16 pode consumir consistentemente 80 watts, o que se reflete em um desempenho muito alto e particularmente estável. Somente os concorrentes com o processador Core i9 14900HX e o Apple M3 Max oferecem ainda mais desempenho com os chips Meteor Lake e o Zenbook Pro 16X com seu Core i9 13905H ficando para trás. No modo de bateria, o processador pode consumir um máximo de 70/65 watts e isso só leva a uma pequena queda de desempenho (-7%). Outros benchmarks de CPU podem ser encontrados aqui.
Cinebench R15 Multi Continuous Test
Cinebench R23: Multi Core | Single Core
Cinebench R20: CPU (Multi Core) | CPU (Single Core)
Cinebench R15: CPU Multi 64Bit | CPU Single 64Bit
Blender: v2.79 BMW27 CPU
7-Zip 18.03: 7z b 4 | 7z b 4 -mmt1
Geekbench 6.4: Multi-Core | Single-Core
Geekbench 5.5: Multi-Core | Single-Core
HWBOT x265 Benchmark v2.2: 4k Preset
LibreOffice : 20 Documents To PDF
R Benchmark 2.5: Overall mean
| Cinebench 2024 / CPU Multi Core | |
| Apple MacBook Pro 16 2023 M3 Max | |
| SCHENKER XMG Pro 16 Studio (Mid 24) | |
| Asus ProArt P16 H7606WI | |
| Média AMD Ryzen AI 9 HX 370 (621 - 1284, n=24) | |
| Dell XPS 16 9640 | |
| Média da turma Multimedia (327 - 2069, n=57, últimos 2 anos) | |
| Asus ROG Zephyrus G16 2024 GU605M | |
| Cinebench 2024 / CPU Single Core | |
| Apple MacBook Pro 16 2023 M3 Max | |
| Média da turma Multimedia (72.5 - 178, n=38, últimos 2 anos) | |
| SCHENKER XMG Pro 16 Studio (Mid 24) | |
| Média AMD Ryzen AI 9 HX 370 (113.6 - 121, n=14) | |
| Asus ProArt P16 H7606WI | |
| Dell XPS 16 9640 | |
| Asus ROG Zephyrus G16 2024 GU605M | |
| Cinebench R23 / Multi Core | |
| SCHENKER XMG Pro 16 Studio (Mid 24) | |
| Apple MacBook Pro 16 2023 M3 Max | |
| Asus ProArt P16 H7606WI | |
| Asus Zenbook Pro 16X UX7602BZ-MY005W | |
| Média AMD Ryzen AI 9 HX 370 (10435 - 23805, n=24) | |
| Lenovo Yoga Pro 9 16IMH9 | |
| Dell XPS 16 9640 | |
| Asus ROG Zephyrus G16 2024 GU605M | |
| Média da turma Multimedia (4861 - 30789, n=96, últimos 2 anos) | |
| Cinebench R23 / Single Core | |
| SCHENKER XMG Pro 16 Studio (Mid 24) | |
| Asus ProArt P16 H7606WI | |
| Asus Zenbook Pro 16X UX7602BZ-MY005W | |
| Média AMD Ryzen AI 9 HX 370 (1921 - 2049, n=17) | |
| Apple MacBook Pro 16 2023 M3 Max | |
| Lenovo Yoga Pro 9 16IMH9 | |
| Média da turma Multimedia (878 - 2290, n=87, últimos 2 anos) | |
| Dell XPS 16 9640 | |
| Asus ROG Zephyrus G16 2024 GU605M | |
| Cinebench R20 / CPU (Multi Core) | |
| SCHENKER XMG Pro 16 Studio (Mid 24) | |
| Asus ProArt P16 H7606WI | |
| Média AMD Ryzen AI 9 HX 370 (6449 - 9250, n=16) | |
| Lenovo Yoga Pro 9 16IMH9 | |
| Asus Zenbook Pro 16X UX7602BZ-MY005W | |
| Dell XPS 16 9640 | |
| Asus ROG Zephyrus G16 2024 GU605M | |
| Apple MacBook Pro 16 2023 M3 Max | |
| Média da turma Multimedia (1887 - 11924, n=80, últimos 2 anos) | |
| Cinebench R20 / CPU (Single Core) | |
| Asus ProArt P16 H7606WI | |
| SCHENKER XMG Pro 16 Studio (Mid 24) | |
| Média AMD Ryzen AI 9 HX 370 (753 - 804, n=16) | |
| Lenovo Yoga Pro 9 16IMH9 | |
| Asus ROG Zephyrus G16 2024 GU605M | |
| Média da turma Multimedia (341 - 853, n=80, últimos 2 anos) | |
| Dell XPS 16 9640 | |
| Asus Zenbook Pro 16X UX7602BZ-MY005W | |
| Apple MacBook Pro 16 2023 M3 Max | |
| Cinebench R15 / CPU Multi 64Bit | |
| SCHENKER XMG Pro 16 Studio (Mid 24) | |
| Asus ProArt P16 H7606WI | |
| Apple MacBook Pro 16 2023 M3 Max | |
| Média AMD Ryzen AI 9 HX 370 (2498 - 3505, n=16) | |
| Lenovo Yoga Pro 9 16IMH9 | |
| Asus Zenbook Pro 16X UX7602BZ-MY005W | |
| Dell XPS 16 9640 | |
| Asus ROG Zephyrus G16 2024 GU605M | |
| Média da turma Multimedia (856 - 5224, n=87, últimos 2 anos) | |
| Cinebench R15 / CPU Single 64Bit | |
| Asus ProArt P16 H7606WI | |
| Média AMD Ryzen AI 9 HX 370 (293 - 315, n=16) | |
| SCHENKER XMG Pro 16 Studio (Mid 24) | |
| Lenovo Yoga Pro 9 16IMH9 | |
| Apple MacBook Pro 16 2023 M3 Max | |
| Asus ROG Zephyrus G16 2024 GU605M | |
| Média da turma Multimedia (99.6 - 323, n=82, últimos 2 anos) | |
| Dell XPS 16 9640 | |
| Asus Zenbook Pro 16X UX7602BZ-MY005W | |
| Blender / v2.79 BMW27 CPU | |
| Média da turma Multimedia (100 - 557, n=80, últimos 2 anos) | |
| Apple MacBook Pro 16 2023 M3 Max | |
| Asus ROG Zephyrus G16 2024 GU605M | |
| Dell XPS 16 9640 | |
| Asus Zenbook Pro 16X UX7602BZ-MY005W | |
| Lenovo Yoga Pro 9 16IMH9 | |
| Média AMD Ryzen AI 9 HX 370 (140 - 192, n=16) | |
| Asus ProArt P16 H7606WI | |
| SCHENKER XMG Pro 16 Studio (Mid 24) | |
| 7-Zip 18.03 / 7z b 4 | |
| SCHENKER XMG Pro 16 Studio (Mid 24) | |
| Asus ProArt P16 H7606WI | |
| Média AMD Ryzen AI 9 HX 370 (66154 - 83714, n=16) | |
| Lenovo Yoga Pro 9 16IMH9 | |
| Dell XPS 16 9640 | |
| Asus Zenbook Pro 16X UX7602BZ-MY005W | |
| Asus ROG Zephyrus G16 2024 GU605M | |
| Média da turma Multimedia (29095 - 130368, n=75, últimos 2 anos) | |
| 7-Zip 18.03 / 7z b 4 -mmt1 | |
| SCHENKER XMG Pro 16 Studio (Mid 24) | |
| Asus ProArt P16 H7606WI | |
| Média AMD Ryzen AI 9 HX 370 (5859 - 6497, n=16) | |
| Média da turma Multimedia (3398 - 7545, n=75, últimos 2 anos) | |
| Lenovo Yoga Pro 9 16IMH9 | |
| Asus Zenbook Pro 16X UX7602BZ-MY005W | |
| Dell XPS 16 9640 | |
| Asus ROG Zephyrus G16 2024 GU605M | |
| Geekbench 6.4 / Multi-Core | |
| Apple MacBook Pro 16 2023 M3 Max | |
| SCHENKER XMG Pro 16 Studio (Mid 24) | |
| Asus ProArt P16 H7606WI | |
| Média AMD Ryzen AI 9 HX 370 (11973 - 15671, n=18) | |
| Asus Zenbook Pro 16X UX7602BZ-MY005W | |
| Lenovo Yoga Pro 9 16IMH9 | |
| Dell XPS 16 9640 | |
| Média da turma Multimedia (4983 - 25760, n=77, últimos 2 anos) | |
| Asus ROG Zephyrus G16 2024 GU605M | |
| Geekbench 6.4 / Single-Core | |
| Apple MacBook Pro 16 2023 M3 Max | |
| Asus ProArt P16 H7606WI | |
| Média AMD Ryzen AI 9 HX 370 (2780 - 2965, n=18) | |
| SCHENKER XMG Pro 16 Studio (Mid 24) | |
| Média da turma Multimedia (1534 - 3927, n=73, últimos 2 anos) | |
| Lenovo Yoga Pro 9 16IMH9 | |
| Dell XPS 16 9640 | |
| Asus ROG Zephyrus G16 2024 GU605M | |
| Asus Zenbook Pro 16X UX7602BZ-MY005W | |
| Geekbench 5.5 / Multi-Core | |
| Apple MacBook Pro 16 2023 M3 Max | |
| SCHENKER XMG Pro 16 Studio (Mid 24) | |
| Asus ProArt P16 H7606WI | |
| Lenovo Yoga Pro 9 16IMH9 | |
| Média AMD Ryzen AI 9 HX 370 (11394 - 15407, n=17) | |
| Asus Zenbook Pro 16X UX7602BZ-MY005W | |
| Dell XPS 16 9640 | |
| Asus ROG Zephyrus G16 2024 GU605M | |
| Média da turma Multimedia (4652 - 23059, n=79, últimos 2 anos) | |
| Geekbench 5.5 / Single-Core | |
| Apple MacBook Pro 16 2023 M3 Max | |
| Média AMD Ryzen AI 9 HX 370 (1957 - 2136, n=17) | |
| Asus ProArt P16 H7606WI | |
| SCHENKER XMG Pro 16 Studio (Mid 24) | |
| Lenovo Yoga Pro 9 16IMH9 | |
| Média da turma Multimedia (891 - 2555, n=79, últimos 2 anos) | |
| Dell XPS 16 9640 | |
| Asus ROG Zephyrus G16 2024 GU605M | |
| Asus Zenbook Pro 16X UX7602BZ-MY005W | |
| HWBOT x265 Benchmark v2.2 / 4k Preset | |
| SCHENKER XMG Pro 16 Studio (Mid 24) | |
| Média AMD Ryzen AI 9 HX 370 (20.3 - 28.7, n=16) | |
| Asus ProArt P16 H7606WI | |
| Lenovo Yoga Pro 9 16IMH9 | |
| Asus Zenbook Pro 16X UX7602BZ-MY005W | |
| Dell XPS 16 9640 | |
| Asus ROG Zephyrus G16 2024 GU605M | |
| Média da turma Multimedia (5.26 - 34.3, n=74, últimos 2 anos) | |
| LibreOffice / 20 Documents To PDF | |
| Asus ProArt P16 H7606WI | |
| Média AMD Ryzen AI 9 HX 370 (46.8 - 66.6, n=16) | |
| Média da turma Multimedia (23.9 - 146.7, n=76, últimos 2 anos) | |
| Asus ROG Zephyrus G16 2024 GU605M | |
| Asus Zenbook Pro 16X UX7602BZ-MY005W | |
| SCHENKER XMG Pro 16 Studio (Mid 24) | |
| Dell XPS 16 9640 | |
| Lenovo Yoga Pro 9 16IMH9 | |
| R Benchmark 2.5 / Overall mean | |
| Dell XPS 16 9640 | |
| Asus Zenbook Pro 16X UX7602BZ-MY005W | |
| Média da turma Multimedia (0.3604 - 0.947, n=74, últimos 2 anos) | |
| Asus ROG Zephyrus G16 2024 GU605M | |
| Lenovo Yoga Pro 9 16IMH9 | |
| Média AMD Ryzen AI 9 HX 370 (0.3892 - 0.529, n=16) | |
| SCHENKER XMG Pro 16 Studio (Mid 24) | |
| Asus ProArt P16 H7606WI | |
* ... menor é melhor
AIDA64: FP32 Ray-Trace | FPU Julia | CPU SHA3 | CPU Queen | FPU SinJulia | FPU Mandel | CPU AES | CPU ZLib | FP64 Ray-Trace | CPU PhotoWorxx
| Performance Rating | |
| Asus ProArt P16 H7606WI -2! | |
| Média AMD Ryzen AI 9 HX 370 | |
| SCHENKER XMG Pro 16 Studio (Mid 24) | |
| Lenovo Yoga Pro 9 16IMH9 | |
| Asus Zenbook Pro 16X UX7602BZ-MY005W | |
| Dell XPS 16 9640 | |
| Asus ROG Zephyrus G16 2024 GU605M | |
| Média da turma Multimedia | |
| AIDA64 / FP32 Ray-Trace | |
| Média AMD Ryzen AI 9 HX 370 (24673 - 37654, n=15) | |
| SCHENKER XMG Pro 16 Studio (Mid 24) | |
| Asus Zenbook Pro 16X UX7602BZ-MY005W | |
| Lenovo Yoga Pro 9 16IMH9 | |
| Dell XPS 16 9640 | |
| Asus ROG Zephyrus G16 2024 GU605M | |
| Média da turma Multimedia (5121 - 50388, n=73, últimos 2 anos) | |
| AIDA64 / FPU Julia | |
| Asus ProArt P16 H7606WI | |
| Média AMD Ryzen AI 9 HX 370 (95655 - 147937, n=16) | |
| SCHENKER XMG Pro 16 Studio (Mid 24) | |
| Lenovo Yoga Pro 9 16IMH9 | |
| Asus Zenbook Pro 16X UX7602BZ-MY005W | |
| Dell XPS 16 9640 | |
| Asus ROG Zephyrus G16 2024 GU605M | |
| Média da turma Multimedia (14528 - 201874, n=74, últimos 2 anos) | |
| AIDA64 / CPU SHA3 | |
| Asus ProArt P16 H7606WI | |
| SCHENKER XMG Pro 16 Studio (Mid 24) | |
| Média AMD Ryzen AI 9 HX 370 (4421 - 5843, n=16) | |
| Lenovo Yoga Pro 9 16IMH9 | |
| Asus Zenbook Pro 16X UX7602BZ-MY005W | |
| Dell XPS 16 9640 | |
| Asus ROG Zephyrus G16 2024 GU605M | |
| Média da turma Multimedia (1188 - 8623, n=74, últimos 2 anos) | |
| AIDA64 / CPU Queen | |
| SCHENKER XMG Pro 16 Studio (Mid 24) | |
| Asus ProArt P16 H7606WI | |
| Asus Zenbook Pro 16X UX7602BZ-MY005W | |
| Lenovo Yoga Pro 9 16IMH9 | |
| Asus ROG Zephyrus G16 2024 GU605M | |
| Dell XPS 16 9640 | |
| Média da turma Multimedia (21547 - 181505, n=74, últimos 2 anos) | |
| Média AMD Ryzen AI 9 HX 370 (41744 - 99088, n=16) | |
| AIDA64 / FPU SinJulia | |
| Asus ProArt P16 H7606WI | |
| Média AMD Ryzen AI 9 HX 370 (16445 - 19115, n=16) | |
| SCHENKER XMG Pro 16 Studio (Mid 24) | |
| Lenovo Yoga Pro 9 16IMH9 | |
| Asus ROG Zephyrus G16 2024 GU605M | |
| Dell XPS 16 9640 | |
| Asus Zenbook Pro 16X UX7602BZ-MY005W | |
| Média da turma Multimedia (1240 - 28794, n=74, últimos 2 anos) | |
| AIDA64 / FPU Mandel | |
| Média AMD Ryzen AI 9 HX 370 (50357 - 79251, n=15) | |
| SCHENKER XMG Pro 16 Studio (Mid 24) | |
| Asus Zenbook Pro 16X UX7602BZ-MY005W | |
| Lenovo Yoga Pro 9 16IMH9 | |
| Dell XPS 16 9640 | |
| Asus ROG Zephyrus G16 2024 GU605M | |
| Média da turma Multimedia (9903 - 105740, n=73, últimos 2 anos) | |
| AIDA64 / CPU AES | |
| SCHENKER XMG Pro 16 Studio (Mid 24) | |
| Lenovo Yoga Pro 9 16IMH9 | |
| Dell XPS 16 9640 | |
| Asus ProArt P16 H7606WI | |
| Asus Zenbook Pro 16X UX7602BZ-MY005W | |
| Asus ROG Zephyrus G16 2024 GU605M | |
| Média AMD Ryzen AI 9 HX 370 (67015 - 96781, n=16) | |
| Média da turma Multimedia (26066 - 169946, n=74, últimos 2 anos) | |
| AIDA64 / CPU ZLib | |
| SCHENKER XMG Pro 16 Studio (Mid 24) | |
| Asus ProArt P16 H7606WI | |
| Média AMD Ryzen AI 9 HX 370 (1077 - 1530, n=16) | |
| Lenovo Yoga Pro 9 16IMH9 | |
| Dell XPS 16 9640 | |
| Asus Zenbook Pro 16X UX7602BZ-MY005W | |
| Asus ROG Zephyrus G16 2024 GU605M | |
| Média da turma Multimedia (440 - 2022, n=74, últimos 2 anos) | |
| AIDA64 / FP64 Ray-Trace | |
| Asus ProArt P16 H7606WI | |
| Média AMD Ryzen AI 9 HX 370 (13665 - 20608, n=16) | |
| SCHENKER XMG Pro 16 Studio (Mid 24) | |
| Asus Zenbook Pro 16X UX7602BZ-MY005W | |
| Lenovo Yoga Pro 9 16IMH9 | |
| Dell XPS 16 9640 | |
| Asus ROG Zephyrus G16 2024 GU605M | |
| Média da turma Multimedia (2759 - 26875, n=74, últimos 2 anos) | |
| AIDA64 / CPU PhotoWorxx | |
| Asus Zenbook Pro 16X UX7602BZ-MY005W | |
| Lenovo Yoga Pro 9 16IMH9 | |
| Dell XPS 16 9640 | |
| Asus ROG Zephyrus G16 2024 GU605M | |
| SCHENKER XMG Pro 16 Studio (Mid 24) | |
| Asus ProArt P16 H7606WI | |
| Média AMD Ryzen AI 9 HX 370 (36752 - 51727, n=16) | |
| Média da turma Multimedia (12860 - 58844, n=74, últimos 2 anos) | |
Desempenho do sistema
Tanto em situações cotidianas quanto em benchmarks sintéticos, o ProArt P16 é um sistema muito rápido e ágil, oferecendo reservas suficientes para tarefas exigentes. Ao contrário do pequeno PX13, 64 GB de RAM estão disponíveis como opção. Durante os testes, não foi possível iniciar o LatencyMon e, no F1 24, houve telas azuis reproduzíveis. No entanto, presumimos que se trata de um problema de driver e já estamos em contato com a AMD.
CrossMark: Overall | Productivity | Creativity | Responsiveness
WebXPRT 3: Overall
WebXPRT 4: Overall
Mozilla Kraken 1.1: Total
| PCMark 10 / Score | |
| SCHENKER XMG Pro 16 Studio (Mid 24) | |
| Asus Zenbook Pro 16X UX7602BZ-MY005W | |
| Asus ProArt P16 H7606WI | |
| Média AMD Ryzen AI 9 HX 370, NVIDIA GeForce RTX 4070 Laptop GPU (7696 - 7752, n=3) | |
| Lenovo Yoga Pro 9 16IMH9 | |
| Asus ROG Zephyrus G16 2024 GU605M | |
| Dell XPS 16 9640 | |
| Média da turma Multimedia (4325 - 8670, n=70, últimos 2 anos) | |
| PCMark 10 / Essentials | |
| Asus Zenbook Pro 16X UX7602BZ-MY005W | |
| Lenovo Yoga Pro 9 16IMH9 | |
| SCHENKER XMG Pro 16 Studio (Mid 24) | |
| Média da turma Multimedia (8025 - 12420, n=70, últimos 2 anos) | |
| Dell XPS 16 9640 | |
| Asus ROG Zephyrus G16 2024 GU605M | |
| Asus ProArt P16 H7606WI | |
| Média AMD Ryzen AI 9 HX 370, NVIDIA GeForce RTX 4070 Laptop GPU (9856 - 10144, n=3) | |
| PCMark 10 / Productivity | |
| SCHENKER XMG Pro 16 Studio (Mid 24) | |
| Asus Zenbook Pro 16X UX7602BZ-MY005W | |
| Asus ProArt P16 H7606WI | |
| Média AMD Ryzen AI 9 HX 370, NVIDIA GeForce RTX 4070 Laptop GPU (9713 - 10027, n=3) | |
| Asus ROG Zephyrus G16 2024 GU605M | |
| Dell XPS 16 9640 | |
| Lenovo Yoga Pro 9 16IMH9 | |
| Média da turma Multimedia (6089 - 10615, n=70, últimos 2 anos) | |
| PCMark 10 / Digital Content Creation | |
| Asus ProArt P16 H7606WI | |
| Média AMD Ryzen AI 9 HX 370, NVIDIA GeForce RTX 4070 Laptop GPU (12165 - 13205, n=3) | |
| SCHENKER XMG Pro 16 Studio (Mid 24) | |
| Asus Zenbook Pro 16X UX7602BZ-MY005W | |
| Lenovo Yoga Pro 9 16IMH9 | |
| Asus ROG Zephyrus G16 2024 GU605M | |
| Dell XPS 16 9640 | |
| Média da turma Multimedia (3651 - 13548, n=70, últimos 2 anos) | |
| CrossMark / Overall | |
| SCHENKER XMG Pro 16 Studio (Mid 24) | |
| Apple MacBook Pro 16 2023 M3 Max | |
| Asus Zenbook Pro 16X UX7602BZ-MY005W | |
| Dell XPS 16 9640 | |
| Asus ProArt P16 H7606WI | |
| Média AMD Ryzen AI 9 HX 370, NVIDIA GeForce RTX 4070 Laptop GPU (1785 - 1794, n=2) | |
| Média da turma Multimedia (866 - 2255, n=81, últimos 2 anos) | |
| Asus ROG Zephyrus G16 2024 GU605M | |
| Lenovo Yoga Pro 9 16IMH9 | |
| CrossMark / Productivity | |
| SCHENKER XMG Pro 16 Studio (Mid 24) | |
| Asus Zenbook Pro 16X UX7602BZ-MY005W | |
| Apple MacBook Pro 16 2023 M3 Max | |
| Dell XPS 16 9640 | |
| Média da turma Multimedia (913 - 2050, n=81, últimos 2 anos) | |
| Asus ROG Zephyrus G16 2024 GU605M | |
| Lenovo Yoga Pro 9 16IMH9 | |
| Asus ProArt P16 H7606WI | |
| Média AMD Ryzen AI 9 HX 370, NVIDIA GeForce RTX 4070 Laptop GPU (1611 - 1611, n=2) | |
| CrossMark / Creativity | |
| Apple MacBook Pro 16 2023 M3 Max | |
| SCHENKER XMG Pro 16 Studio (Mid 24) | |
| Asus Zenbook Pro 16X UX7602BZ-MY005W | |
| Asus ProArt P16 H7606WI | |
| Média AMD Ryzen AI 9 HX 370, NVIDIA GeForce RTX 4070 Laptop GPU (2212 - 2270, n=2) | |
| Dell XPS 16 9640 | |
| Lenovo Yoga Pro 9 16IMH9 | |
| Média da turma Multimedia (907 - 2795, n=81, últimos 2 anos) | |
| Asus ROG Zephyrus G16 2024 GU605M | |
| CrossMark / Responsiveness | |
| SCHENKER XMG Pro 16 Studio (Mid 24) | |
| Dell XPS 16 9640 | |
| Asus Zenbook Pro 16X UX7602BZ-MY005W | |
| Apple MacBook Pro 16 2023 M3 Max | |
| Média da turma Multimedia (605 - 2094, n=81, últimos 2 anos) | |
| Asus ROG Zephyrus G16 2024 GU605M | |
| Lenovo Yoga Pro 9 16IMH9 | |
| Média AMD Ryzen AI 9 HX 370, NVIDIA GeForce RTX 4070 Laptop GPU (1225 - 1274, n=2) | |
| Asus ProArt P16 H7606WI | |
| WebXPRT 3 / Overall | |
| Apple MacBook Pro 16 2023 M3 Max | |
| Média da turma Multimedia (136.4 - 545, n=81, últimos 2 anos) | |
| SCHENKER XMG Pro 16 Studio (Mid 24) | |
| Asus ProArt P16 H7606WI | |
| Lenovo Yoga Pro 9 16IMH9 | |
| Média AMD Ryzen AI 9 HX 370, NVIDIA GeForce RTX 4070 Laptop GPU (282 - 298, n=2) | |
| Asus ROG Zephyrus G16 2024 GU605M | |
| Dell XPS 16 9640 | |
| WebXPRT 4 / Overall | |
| SCHENKER XMG Pro 16 Studio (Mid 24) | |
| Média da turma Multimedia (133.2 - 353, n=75, últimos 2 anos) | |
| Lenovo Yoga Pro 9 16IMH9 | |
| Asus ROG Zephyrus G16 2024 GU605M | |
| Dell XPS 16 9640 | |
| Média AMD Ryzen AI 9 HX 370, NVIDIA GeForce RTX 4070 Laptop GPU (244 - 247, n=2) | |
| Asus ProArt P16 H7606WI | |
| Asus Zenbook Pro 16X UX7602BZ-MY005W | |
| Mozilla Kraken 1.1 / Total | |
| Asus ROG Zephyrus G16 2024 GU605M | |
| Asus Zenbook Pro 16X UX7602BZ-MY005W | |
| Lenovo Yoga Pro 9 16IMH9 | |
| Média da turma Multimedia (254 - 1016, n=86, últimos 2 anos) | |
| SCHENKER XMG Pro 16 Studio (Mid 24) | |
| Média AMD Ryzen AI 9 HX 370, NVIDIA GeForce RTX 4070 Laptop GPU (439 - 460, n=2) | |
| Asus ProArt P16 H7606WI | |
| Apple MacBook Pro 16 2023 M3 Max | |
* ... menor é melhor
| PCMark 10 Score | 7752 pontos | |
Ajuda | ||
| AIDA64 / Memory Copy | |
| Lenovo Yoga Pro 9 16IMH9 | |
| Dell XPS 16 9640 | |
| Asus ProArt P16 H7606WI | |
| Asus ROG Zephyrus G16 2024 GU605M | |
| Asus Zenbook Pro 16X UX7602BZ-MY005W | |
| Média AMD Ryzen AI 9 HX 370 (72702 - 93640, n=16) | |
| SCHENKER XMG Pro 16 Studio (Mid 24) | |
| Média da turma Multimedia (21158 - 104459, n=74, últimos 2 anos) | |
| AIDA64 / Memory Read | |
| Asus ProArt P16 H7606WI | |
| Média AMD Ryzen AI 9 HX 370 (84635 - 102937, n=16) | |
| Lenovo Yoga Pro 9 16IMH9 | |
| Asus ROG Zephyrus G16 2024 GU605M | |
| SCHENKER XMG Pro 16 Studio (Mid 24) | |
| Dell XPS 16 9640 | |
| Asus Zenbook Pro 16X UX7602BZ-MY005W | |
| Média da turma Multimedia (24312 - 125604, n=74, últimos 2 anos) | |
| AIDA64 / Memory Write | |
| Asus Zenbook Pro 16X UX7602BZ-MY005W | |
| Asus ProArt P16 H7606WI | |
| Média AMD Ryzen AI 9 HX 370 (83907 - 108954, n=16) | |
| Lenovo Yoga Pro 9 16IMH9 | |
| Dell XPS 16 9640 | |
| Asus ROG Zephyrus G16 2024 GU605M | |
| SCHENKER XMG Pro 16 Studio (Mid 24) | |
| Média da turma Multimedia (23679 - 117933, n=74, últimos 2 anos) | |
| AIDA64 / Memory Latency | |
| Asus ROG Zephyrus G16 2024 GU605M | |
| Dell XPS 16 9640 | |
| Lenovo Yoga Pro 9 16IMH9 | |
| Asus ProArt P16 H7606WI | |
| Média da turma Multimedia (7 - 346, n=74, últimos 2 anos) | |
| Média AMD Ryzen AI 9 HX 370 (87.2 - 119.4, n=16) | |
| Asus Zenbook Pro 16X UX7602BZ-MY005W | |
| SCHENKER XMG Pro 16 Studio (Mid 24) | |
* ... menor é melhor
Latências de DPC
Como já mencionamos, não foi possível iniciar o LatencyMon com nosso dispositivo de análise. No entanto, pelo menos não houve problemas com a reprodução de vídeo 4K (YouTube) em termos de queda de quadros.
Armazenamento em massa
Nosso dispositivo de análise está equipado com uma variante Micron 2400 de 1 TB, porém, 879 GB estão disponíveis para o usuário após a primeira instalação. O SSD M.2 2280 principal é conectado por meio de uma interface PCIe 4.0 x4 rápida, mas, em comparação com a concorrência, o desempenho do SSD não é particularmente bom. No entanto, o desempenho permanece estável durante longos períodos de carga. O ProArt P16 também oferece um segundo slot M.2 2280, o que significa que o armazenamento pode ser facilmente atualizado. Entretanto, o segundo slot só é conectado via Pcie 4.0 x2, que é limitado a uma velocidade máxima de 4 GB/s. Outros benchmarks de SSD podem ser encontrados aqui.

* ... menor é melhor
Continuous Performance Read: DiskSpd Read Loop, Queue Depth 8
Placa de vídeo - GeForce RTX 4070 laptop
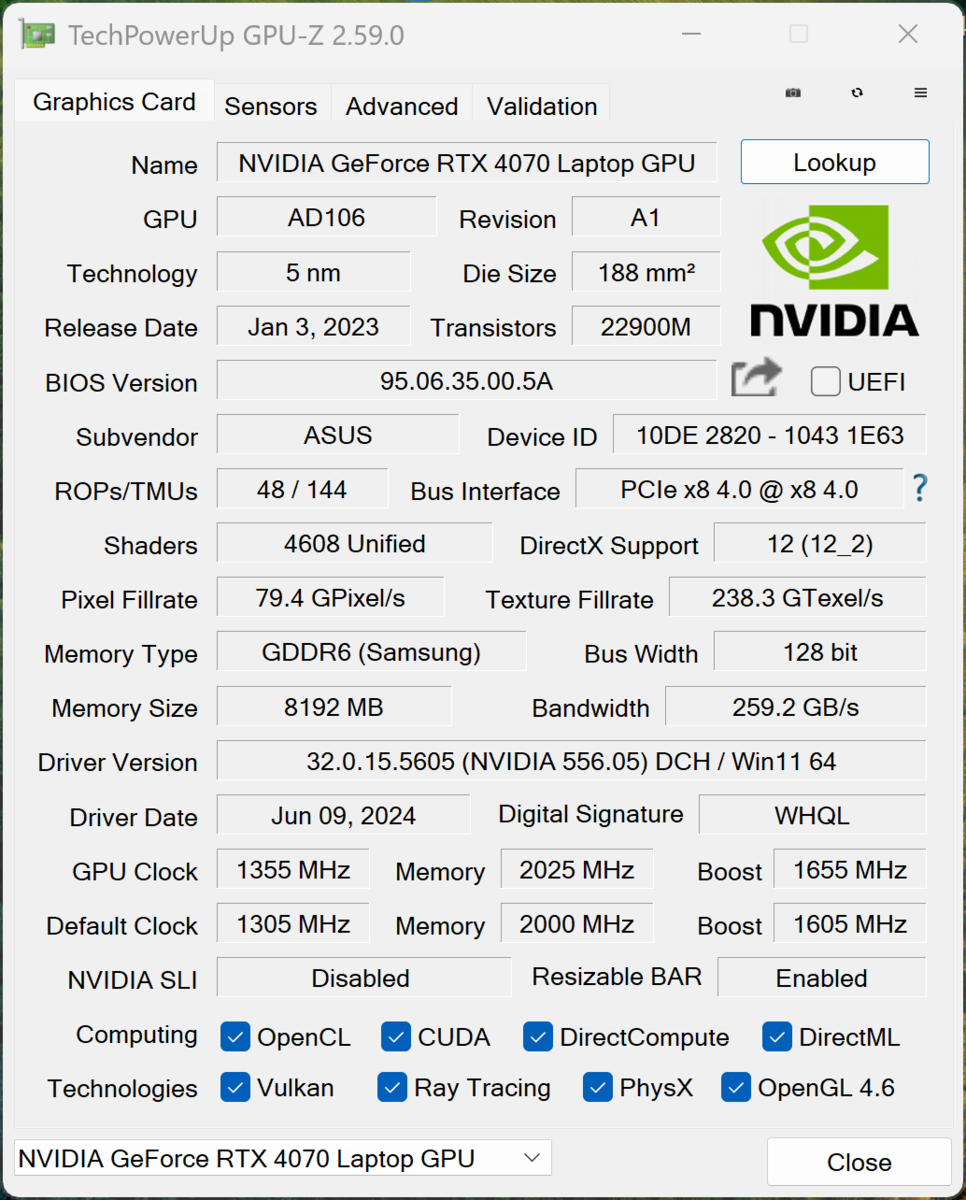
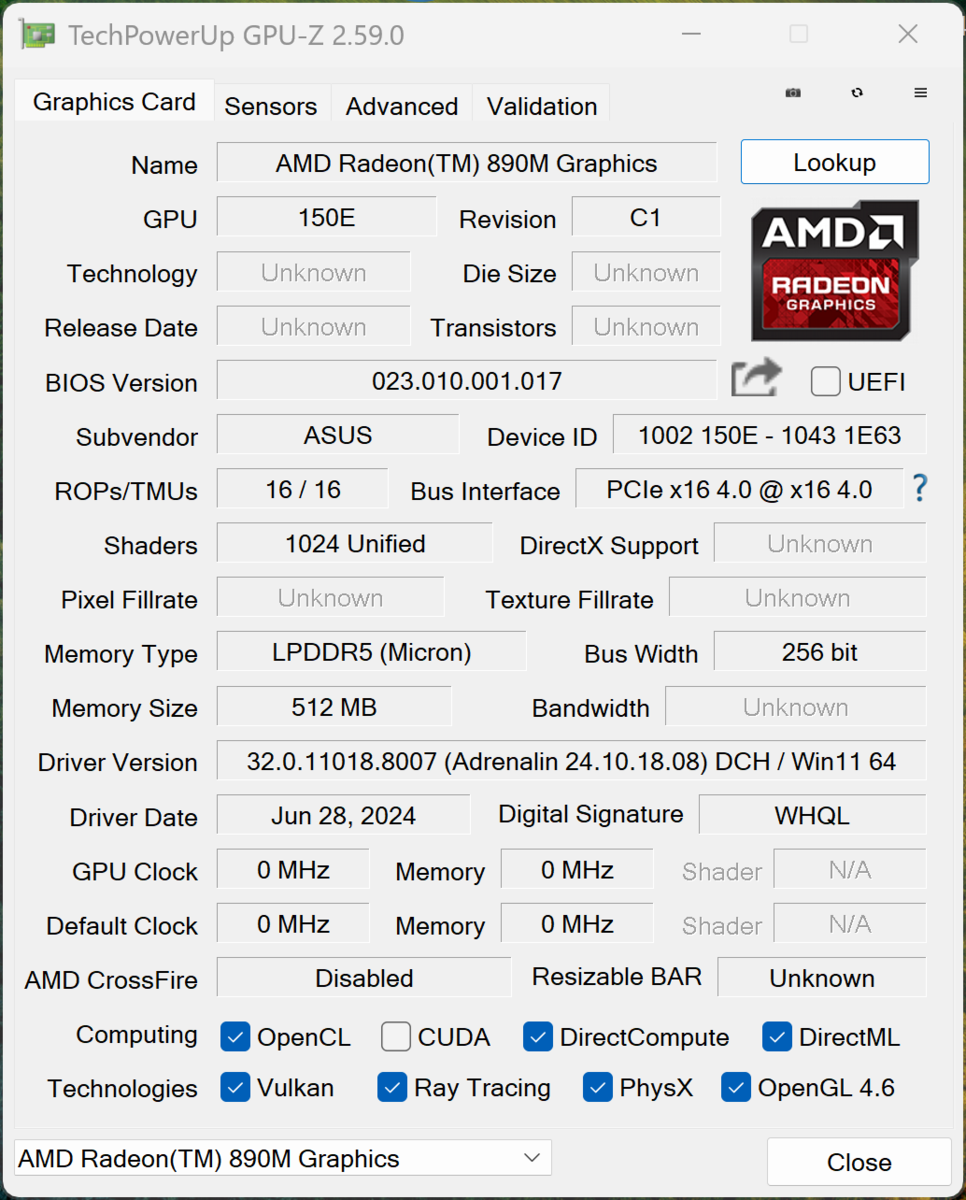
Nosso modelo superior do ProArt P16 está equipado com um laptop dedicado GeForce Laptop RTX 4070. O consumo máximo de energia é de 105 watts (85 watts TGP + 20 watts Dynamic Boost) e a troca de gráficos é feita pela tecnologia Optimus padrão. Com tarefas menos exigentes, os cálculos gráficos ficam a cargo da Radeon 890M.
Nos benchmarks de GPU, o desempenho está no mesmo nível dos outros concorrentes RTX 4070, mas o Laptop RTX 4080 encontrado no Zenbook Pro 16X (máx. 140 watts) é compreensivelmente (e visivelmente) mais rápido. Apple's M3 Max GPU também é consideravelmente mais rápida e tem a vantagem de ter acesso a toda a RAM, enquanto os 8 GB de VRAM do laptop RTX 4070 podem rapidamente se tornar o gargalo, especialmente ao editar vídeos.
Sob carga contínua, a GPU permanece totalmente estável. No modo de bateria, o RTX 4070 pode consumir um máximo de 42 watts, razão pela qual o desempenho da GPU é significativamente menor nesse caso (-35%). Outros benchmarks gráficos podem ser encontrados aqui.
| GFXBench | |
| 3840x2160 4K Aztec Ruins High Tier Offscreen | |
| Apple MacBook Pro 16 2023 M3 Max | |
| Média NVIDIA GeForce RTX 4070 Laptop GPU (123.9 - 127.6, n=2) | |
| Asus ProArt P16 H7606WI | |
| Média da turma Multimedia (36.4 - 232, n=16, últimos 2 anos) | |
| 2560x1440 Aztec Ruins High Tier Offscreen | |
| Apple MacBook Pro 16 2023 M3 Max | |
| Média NVIDIA GeForce RTX 4070 Laptop GPU (282 - 289, n=2) | |
| Asus ProArt P16 H7606WI | |
| Média da turma Multimedia (73.3 - 516, n=16, últimos 2 anos) | |
| 1920x1080 Aztec Ruins Normal Tier Offscreen | |
| Apple MacBook Pro 16 2023 M3 Max | |
| Média NVIDIA GeForce RTX 4070 Laptop GPU (696 - 736, n=2) | |
| Asus ProArt P16 H7606WI | |
| Média da turma Multimedia (178.3 - 1302, n=15, últimos 2 anos) | |
| 3DMark 11 Performance | 33231 pontos | |
| 3DMark Fire Strike Score | 26198 pontos | |
| 3DMark Time Spy Score | 11790 pontos | |
| 3DMark Steel Nomad Score | 2637 pontos | |
| 3DMark Steel Nomad Light Score | 12189 pontos | |
Ajuda | ||
| Blender / v3.3 Classroom OPTIX/RTX | |
| Média da turma Multimedia (19 - 105, n=39, últimos 2 anos) | |
| SCHENKER XMG Pro 16 Studio (Mid 24) | |
| Asus ROG Zephyrus G16 2024 GU605M | |
| Asus ProArt P16 H7606WI | |
| Média NVIDIA GeForce RTX 4070 Laptop GPU (18 - 30, n=67) | |
| Dell XPS 16 9640 | |
| Lenovo Yoga Pro 9 16IMH9 | |
| Asus Zenbook Pro 16X UX7602BZ-MY005W | |
| Blender / v3.3 Classroom CUDA | |
| Média da turma Multimedia (32 - 164, n=39, últimos 2 anos) | |
| Dell XPS 16 9640 | |
| Média NVIDIA GeForce RTX 4070 Laptop GPU (32 - 50, n=66) | |
| Asus ROG Zephyrus G16 2024 GU605M | |
| SCHENKER XMG Pro 16 Studio (Mid 24) | |
| Asus ProArt P16 H7606WI | |
| Lenovo Yoga Pro 9 16IMH9 | |
| Asus Zenbook Pro 16X UX7602BZ-MY005W | |
| Blender / v3.3 Classroom CPU | |
| Média da turma Multimedia (160 - 1042, n=80, últimos 2 anos) | |
| Asus ROG Zephyrus G16 2024 GU605M | |
| Dell XPS 16 9640 | |
| Média NVIDIA GeForce RTX 4070 Laptop GPU (158 - 440, n=66) | |
| Lenovo Yoga Pro 9 16IMH9 | |
| Asus Zenbook Pro 16X UX7602BZ-MY005W | |
| SCHENKER XMG Pro 16 Studio (Mid 24) | |
| Asus ProArt P16 H7606WI | |
| Apple MacBook Pro 16 2023 M3 Max | |
| Blender / v3.3 Classroom METAL | |
| Média da turma Multimedia (17.8 - 121, n=7, últimos 2 anos) | |
| Apple MacBook Pro 16 2023 M3 Max | |
* ... menor é melhor
Desempenho em jogos
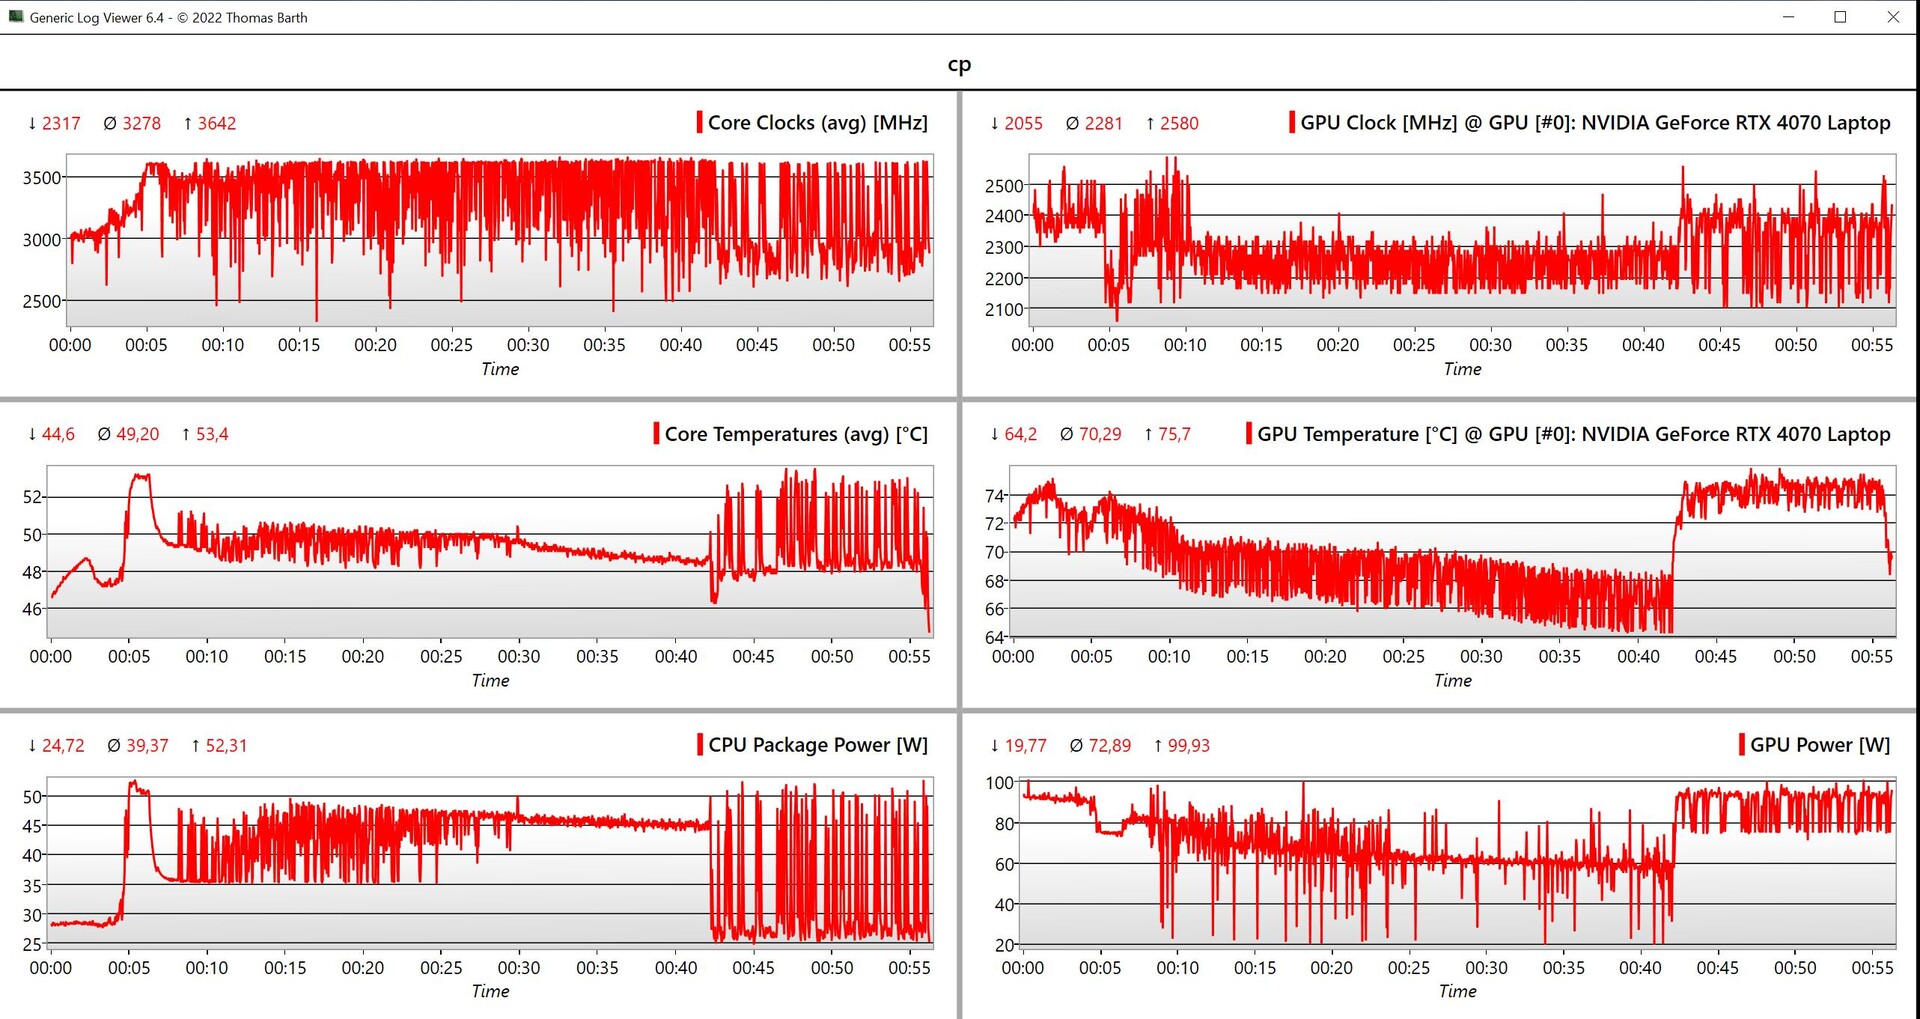
Em suma, o desempenho em jogos do ProArt P16 é muito bom e os resultados estão no nível que se espera de um laptop RTX 4070. Até mesmo os jogos atuais são executados sem esforço na resolução QHD. Por outro lado, para a resolução 4K nativa, o senhor precisa recorrer ao upsampling, como a tecnologia DLSS da Nvidia para títulos exigentes. Em nosso loop do Cyberpunk, encontramos um problema interessante e reproduzível. Embora o desempenho gráfico e o desempenho geral no teste de estresse (consulte a seção de temperatura) tenham permanecido completamente estáveis, nos primeiros 42 minutos, o desempenho do jogo no Cyberpunk caiu um pouco continuamente. Isso pode ser visto claramente ao avaliar os dados da CPU/GPU; no entanto, após 42 minutos, o desempenho voltou ao nível inicial e também permaneceu estável nesse nível. No momento, não conseguimos explicar esse comportamento e, em nossos testes, isso só ocorreu com o Cyberpunk.
| The Witcher 3 - 1920x1080 Ultra Graphics & Postprocessing (HBAO+) | |
| Asus Zenbook Pro 16X UX7602BZ-MY005W | |
| Asus ProArt P16 H7606WI | |
| Lenovo Yoga Pro 9 16IMH9 | |
| Asus ROG Zephyrus G16 2024 GU605M | |
| Dell XPS 16 9640 | |
| Média da turma Multimedia (11 - 143.2, n=62, últimos 2 anos) | |
| GTA V - 1920x1080 Highest Settings possible AA:4xMSAA + FX AF:16x | |
| Asus Zenbook Pro 16X UX7602BZ-MY005W | |
| SCHENKER XMG Pro 16 Studio (Mid 24) | |
| Asus ProArt P16 H7606WI | |
| Lenovo Yoga Pro 9 16IMH9 | |
| Dell XPS 16 9640 | |
| Asus ROG Zephyrus G16 2024 GU605M | |
| Média da turma Multimedia (9.38 - 141.6, n=77, últimos 2 anos) | |
| Call of Duty Modern Warfare 3 2023 | |
| 1920x1080 Extreme Preset | |
| Asus ProArt P16 H7606WI | |
| Média NVIDIA GeForce RTX 4070 Laptop GPU (92 - 120, n=7) | |
| Asus ROG Zephyrus G16 2024 GU605M | |
| Média da turma Multimedia (27 - 120, n=6, últimos 2 anos) | |
| 2560x1440 Extreme Preset | |
| Asus ProArt P16 H7606WI | |
| Média NVIDIA GeForce RTX 4070 Laptop GPU (64 - 83, n=6) | |
| Asus ROG Zephyrus G16 2024 GU605M | |
| Média da turma Multimedia (29 - 83, n=3, últimos 2 anos) | |
| Horizon Forbidden West | |
| 1920x1080 Very High Preset AA:T | |
| Lenovo Yoga Pro 9 16IMH9 | |
| Asus ProArt P16 H7606WI | |
| Média NVIDIA GeForce RTX 4070 Laptop GPU (53.2 - 76.7, n=10) | |
| Dell XPS 16 9640 | |
| Média da turma Multimedia (12.4 - 65.4, n=5, últimos 2 anos) | |
| 2560x1440 Very High Preset AA:T | |
| Lenovo Yoga Pro 9 16IMH9 | |
| Média NVIDIA GeForce RTX 4070 Laptop GPU (40.3 - 59.1, n=9) | |
| Asus ProArt P16 H7606WI | |
| Média da turma Multimedia (40.3 - 56.1, n=3, últimos 2 anos) | |
| Dell XPS 16 9640 | |
Cyberpunk 2077 ultra FPS diagram
| baixo | média | alto | ultra | QHD | 4K | |
|---|---|---|---|---|---|---|
| GTA V (2015) | 168 | 111.2 | 86.6 | 83.7 | ||
| The Witcher 3 (2015) | 224 | 121 | 88 | 71 | ||
| Dota 2 Reborn (2015) | 165.7 | 151.4 | 148.1 | 141.6 | 129.9 | |
| Final Fantasy XV Benchmark (2018) | 189.3 | 152.9 | 115.3 | 85.3 | 47.2 | |
| X-Plane 11.11 (2018) | 95.2 | 88.7 | 72.3 | 63.4 | ||
| Far Cry 5 (2018) | 147 | 130 | 124 | 115 | 102 | 59 |
| Strange Brigade (2018) | 333 | 270 | 164.5 | 206 | 130 | 68.4 |
| F1 23 (2023) | 192.9 | 197.3 | 188.8 | 70.3 | 41 | 19.6 |
| Baldur's Gate 3 (2023) | 150 | 125.6 | 82.8 | 82.5 | 59.9 | 33.4 |
| Cyberpunk 2077 2.2 Phantom Liberty (2023) | 119.4 | 110 | 94.1 | 80.7 | 49.4 | 20.2 |
| Call of Duty Modern Warfare 3 2023 (2023) | 182 | 164 | 127 | 120 | 83 | 49 |
| Horizon Forbidden West (2024) | 100.2 | 91.5 | 71.8 | 64.4 | 49.9 | 30.4 |
Emissões - Excelentes alto-falantes
Emissões de ruído
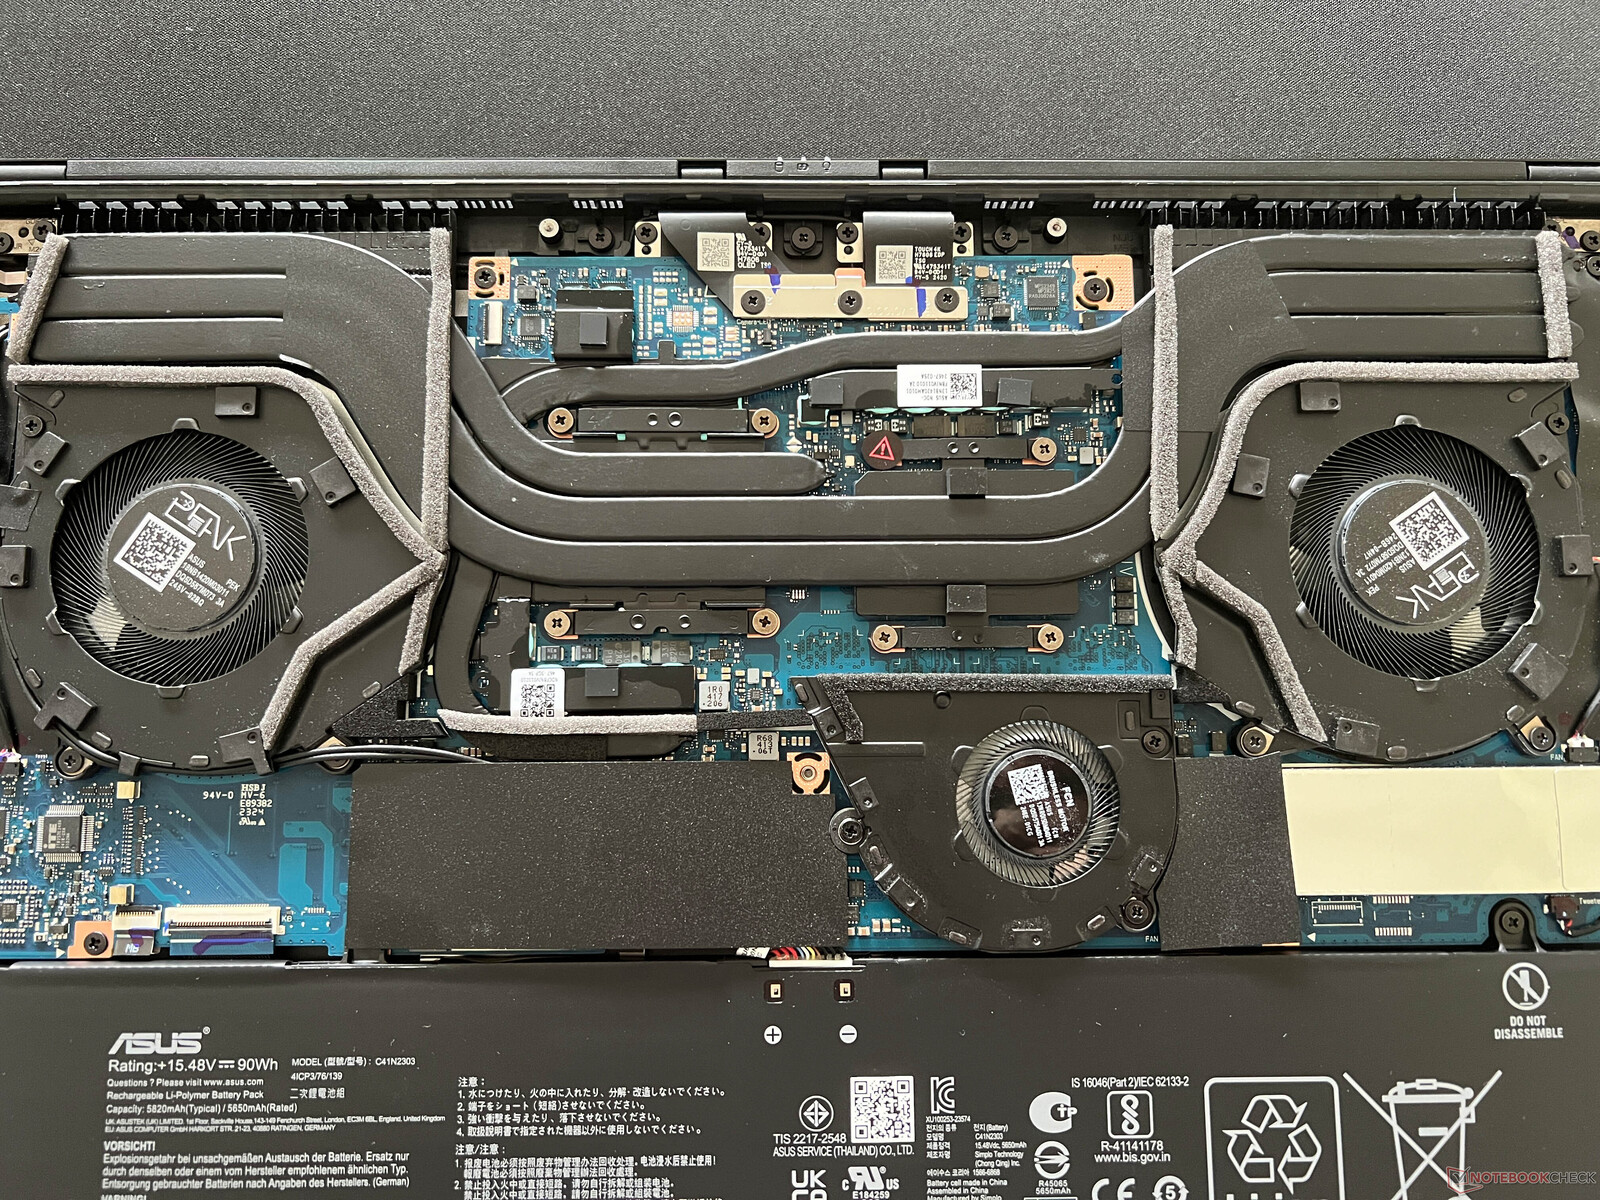
O sistema de resfriamento é composto por três ventoinhas e, embora tenhamos tido problemas para controlar a terceira ventoinha em nossos testes com o ROG Zephyrus G16, isso já foi resolvido. No modo de desempenho, há um ruído silencioso quase sempre presente; no entanto, nos outros dois modos, as ventoinhas ficam inativas com frequência, tanto quando estão ociosas quanto quando realizam tarefas exigentes. Sob carga, os três perfis diferem visivelmente, embora o Standard e o Performance sejam bastante barulhentos.
| Perfil de energia | 3DMark 06 | Cyberpunk 2077Teste de estresse |
|---|---|---|
| Whisper | 34 dB(A) | 42,2 dB(A) |
| Padrão | 42,2 dB(A) | 47,1 dB(A) |
| Desempenho | 51,3 dB(A) | 53,2 dB(A) |
Barulho
| Ocioso |
| 24.4 / 27.7 / 32.3 dB |
| Carga |
| 42.2 / 53.2 dB |
 | ||
30 dB silencioso 40 dB(A) audível 50 dB(A) ruidosamente alto |
||
min: | ||
| Asus ProArt P16 H7606WI NVIDIA GeForce RTX 4070 Laptop GPU, Ryzen AI 9 HX 370, Micron 2400 MTFDKBA1T0QFM | SCHENKER XMG Pro 16 Studio (Mid 24) NVIDIA GeForce RTX 4070 Laptop GPU, i9-14900HX, Samsung 990 Pro 1 TB | Lenovo Yoga Pro 9 16IMH9 NVIDIA GeForce RTX 4070 Laptop GPU, Ultra 9 185H, SK Hynix HFS001TEJ9X115N | Dell XPS 16 9640 NVIDIA GeForce RTX 4070 Laptop GPU, Ultra 7 155H, Kioxia XG8 KXG80ZNV1T02 | Asus ROG Zephyrus G16 2024 GU605M NVIDIA GeForce RTX 4070 Laptop GPU, Ultra 7 155H, WD PC SN560 SDDPNQE-1T00 | Apple MacBook Pro 16 2023 M3 Max M3 Max 40-Core GPU, Apple M3 Max 16-Core, Apple SSD AP8192Z | Asus Zenbook Pro 16X UX7602BZ-MY005W NVIDIA GeForce RTX 4080 Laptop GPU, i9-13905H, Samsung PM9A1 MZVL22T0HBLB | |
|---|---|---|---|---|---|---|---|
| Noise | -8% | 3% | 7% | 7% | 12% | 7% | |
| desligado / ambiente * | 24.4 | 25 -2% | 24.3 -0% | 24.5 -0% | 23.9 2% | 23.7 3% | 24.9 -2% |
| Idle Minimum * | 24.4 | 28 -15% | 24.3 -0% | 24.5 -0% | 23.9 2% | 23.7 3% | 24.9 -2% |
| Idle Average * | 27.7 | 31 -12% | 24.3 12% | 24.5 12% | 27.8 -0% | 23.7 14% | 24.9 10% |
| Idle Maximum * | 32.3 | 35 -8% | 25.8 20% | 27.5 15% | 30.1 7% | 23.7 27% | 24.9 23% |
| Load Average * | 42.2 | 52 -23% | 48.1 -14% | 39.6 6% | 34.2 19% | 40.8 3% | 38 10% |
| Cyberpunk 2077 ultra * | 53.2 | 53 -0% | |||||
| Load Maximum * | 53.2 | 52 2% | 53.9 -1% | 49.7 7% | 46.4 13% | 42.8 20% | 51 4% |
| Witcher 3 ultra * | 49.7 | 49.7 | 46.4 | 42.8 |
* ... menor é melhor
Temperatura
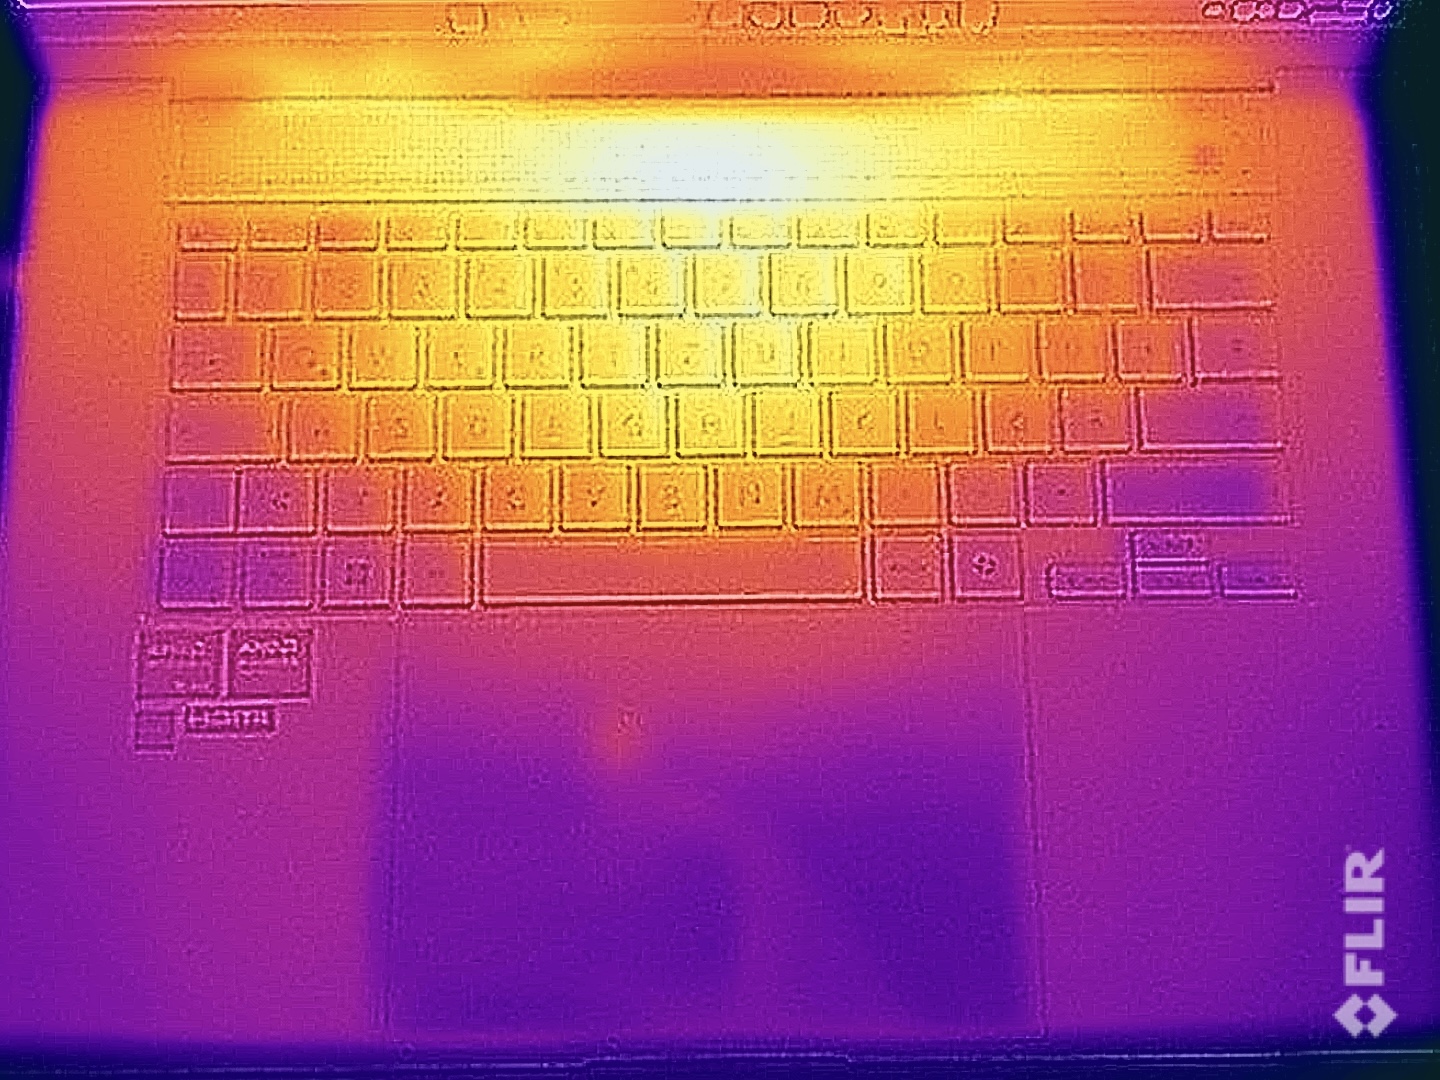
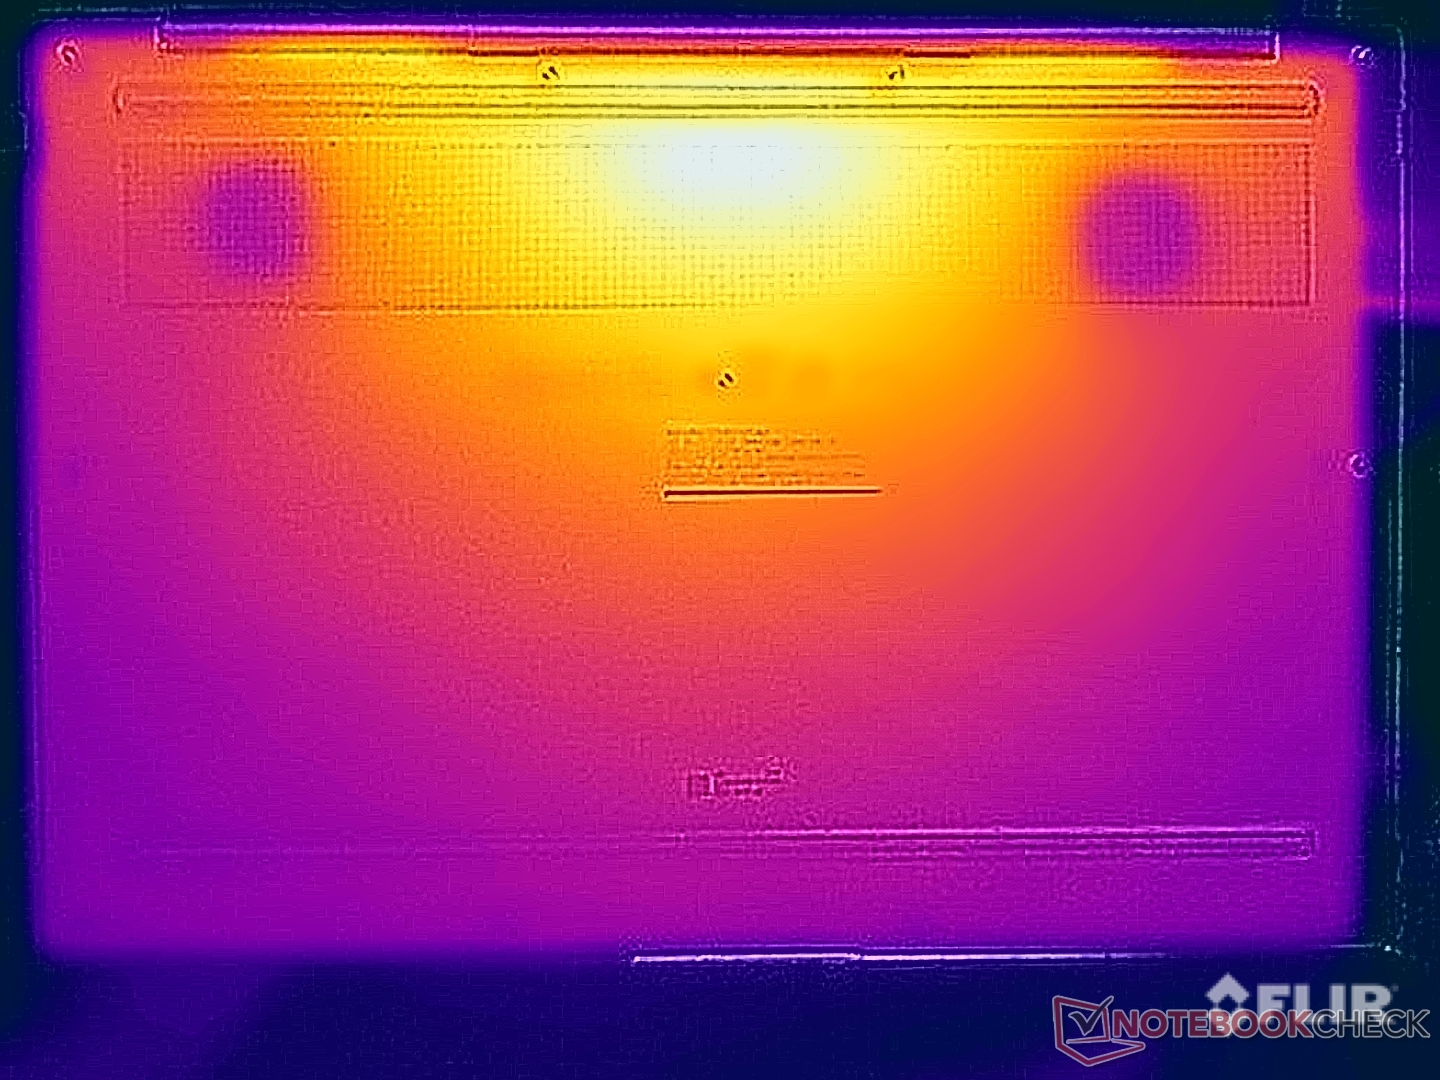
Em sua configuração mais rápida, o ProArt P16 é essencialmente um laptop relativamente quente e, em uso inativo, medimos quase 30 °C na maioria dos lugares. Mas isso não é um problema e não há necessidade de temer quaisquer limitações em situações cotidianas. Sob carga, há um ponto de acesso na área traseira central, tanto na parte superior quanto na parte inferior da unidade base. Nesse cenário, o senhor deve evitar colocar o dispositivo no colo, mas o uso normal do teclado não apresentará nenhum problema.
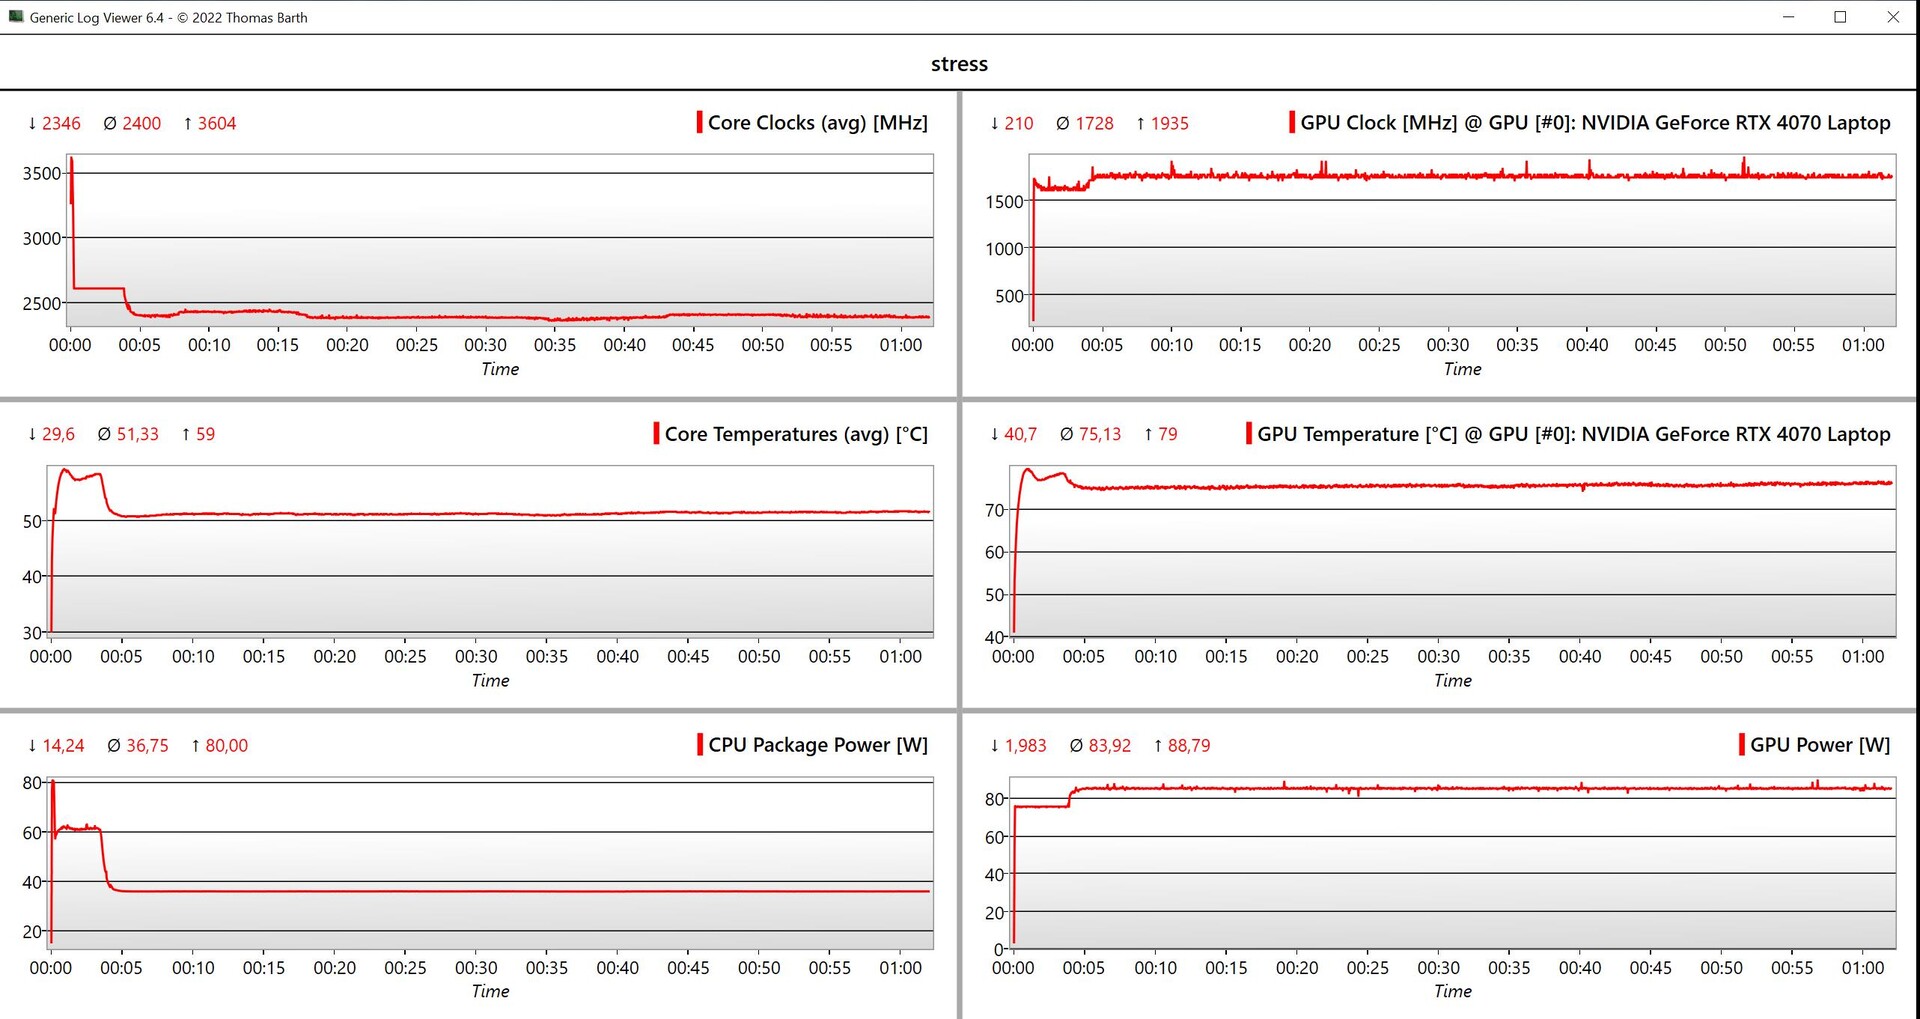
No teste de estresse com carga combinada de CPU/GPU, o processador opera a 60 watts no primeiro minuto e a GPU fica em 75 watts. Depois de aproximadamente 4 minutos, o processador se estabiliza em 37 watts e a placa de vídeo se estabiliza em 85 watts. No geral, um bom resultado e no mesmo nível do Zenbook Pro 16X (45/80 watts).
(-) A temperatura máxima no lado superior é 46.9 °C / 116 F, em comparação com a média de 36.9 °C / 98 F , variando de 21.1 a 71 °C para a classe Multimedia.
(-) A parte inferior aquece até um máximo de 50.9 °C / 124 F, em comparação com a média de 39.2 °C / 103 F
(+) Em uso inativo, a temperatura média para o lado superior é 27.5 °C / 82 F, em comparação com a média do dispositivo de 31.3 °C / ### class_avg_f### F.
(±) 3: The average temperature for the upper side is 37 °C / 99 F, compared to the average of 31.3 °C / 88 F for the class Multimedia.
(+) Os apoios para as mãos e o touchpad estão atingindo a temperatura máxima da pele (34 °C / 93.2 F) e, portanto, não estão quentes.
(-) A temperatura média da área do apoio para as mãos de dispositivos semelhantes foi 28.8 °C / 83.8 F (-5.2 °C / -9.4 F).
| Asus ProArt P16 H7606WI AMD Ryzen AI 9 HX 370, NVIDIA GeForce RTX 4070 Laptop GPU | SCHENKER XMG Pro 16 Studio (Mid 24) Intel Core i9-14900HX, NVIDIA GeForce RTX 4070 Laptop GPU | Lenovo Yoga Pro 9 16IMH9 Intel Core Ultra 9 185H, NVIDIA GeForce RTX 4070 Laptop GPU | Dell XPS 16 9640 Intel Core Ultra 7 155H, NVIDIA GeForce RTX 4070 Laptop GPU | Asus ROG Zephyrus G16 2024 GU605M Intel Core Ultra 7 155H, NVIDIA GeForce RTX 4070 Laptop GPU | Apple MacBook Pro 16 2023 M3 Max Apple M3 Max 16-Core, Apple M3 Max 40-Core GPU | Asus Zenbook Pro 16X UX7602BZ-MY005W Intel Core i9-13905H, NVIDIA GeForce RTX 4080 Laptop GPU | |
|---|---|---|---|---|---|---|---|
| Heat | -23% | 10% | 14% | 0% | 18% | 22% | |
| Maximum Upper Side * | 46.9 | 51 -9% | 41.7 11% | 39.4 16% | 50.3 -7% | 42.3 10% | 28.2 40% |
| Maximum Bottom * | 50.9 | 66 -30% | 46.3 9% | 36.9 28% | 48 6% | 42 17% | 35.1 31% |
| Idle Upper Side * | 28.9 | 35 -21% | 26.2 9% | 28.2 2% | 28.8 -0% | 22.5 22% | 24.6 15% |
| Idle Bottom * | 30 | 39 -30% | 27.2 9% | 27.4 9% | 29.8 1% | 22.9 24% | 29.4 2% |
* ... menor é melhor
Alto-falantes
O sistema de som é composto por 6 módulos (4x woofers, 2 watts cada + 2x tweeters, 2 watts cada). O sistema já era maravilhoso no ROG Zephyrus G16 e nada mudou muito desde então. De acordo com nossas medições, apenas o volume máximo é um pouco menor. Nesse aspecto, o ProArt P16 é um dos melhores laptops do mercado.
Asus ProArt P16 H7606WI análise de áudio
(±) | o volume do alto-falante é médio, mas bom (###valor### dB)
Graves 100 - 315Hz
(+) | bons graves - apenas 3% longe da mediana
(±) | a linearidade dos graves é média (8.3% delta para a frequência anterior)
Médios 400 - 2.000 Hz
(+) | médios equilibrados - apenas 3.5% longe da mediana
(+) | médios são lineares (2.5% delta para frequência anterior)
Altos 2 - 16 kHz
(+) | agudos equilibrados - apenas 3% longe da mediana
(+) | os máximos são lineares (3.6% delta da frequência anterior)
Geral 100 - 16.000 Hz
(+) | o som geral é linear (8.5% diferença em relação à mediana)
Comparado com a mesma classe
» 6% de todos os dispositivos testados nesta classe foram melhores, 2% semelhantes, 92% piores
» O melhor teve um delta de 5%, a média foi 18%, o pior foi 45%
Comparado com todos os dispositivos testados
» 2% de todos os dispositivos testados foram melhores, 1% semelhantes, 98% piores
» O melhor teve um delta de 4%, a média foi 24%, o pior foi 134%
SCHENKER XMG Pro 16 Studio (Mid 24) análise de áudio
(±) | o volume do alto-falante é médio, mas bom (###valor### dB)
Graves 100 - 315Hz
(-) | quase nenhum baixo - em média 15.1% menor que a mediana
(±) | a linearidade dos graves é média (13.6% delta para a frequência anterior)
Médios 400 - 2.000 Hz
(±) | médios mais altos - em média 5.3% maior que a mediana
(+) | médios são lineares (4.4% delta para frequência anterior)
Altos 2 - 16 kHz
(+) | agudos equilibrados - apenas 4.4% longe da mediana
(+) | os máximos são lineares (4.9% delta da frequência anterior)
Geral 100 - 16.000 Hz
(±) | a linearidade do som geral é média (17.7% diferença em relação à mediana)
Comparado com a mesma classe
» 50% de todos os dispositivos testados nesta classe foram melhores, 10% semelhantes, 40% piores
» O melhor teve um delta de 6%, a média foi 18%, o pior foi 132%
Comparado com todos os dispositivos testados
» 33% de todos os dispositivos testados foram melhores, 8% semelhantes, 59% piores
» O melhor teve um delta de 4%, a média foi 24%, o pior foi 134%
Lenovo Yoga Pro 9 16IMH9 análise de áudio
(+) | os alto-falantes podem tocar relativamente alto (###valor### dB)
Graves 100 - 315Hz
(±) | graves reduzidos - em média 7% menor que a mediana
(±) | a linearidade dos graves é média (7.2% delta para a frequência anterior)
Médios 400 - 2.000 Hz
(+) | médios equilibrados - apenas 3.9% longe da mediana
(+) | médios são lineares (4.5% delta para frequência anterior)
Altos 2 - 16 kHz
(+) | agudos equilibrados - apenas 2.8% longe da mediana
(+) | os máximos são lineares (3.2% delta da frequência anterior)
Geral 100 - 16.000 Hz
(+) | o som geral é linear (8.8% diferença em relação à mediana)
Comparado com a mesma classe
» 8% de todos os dispositivos testados nesta classe foram melhores, 2% semelhantes, 91% piores
» O melhor teve um delta de 5%, a média foi 18%, o pior foi 45%
Comparado com todos os dispositivos testados
» 2% de todos os dispositivos testados foram melhores, 1% semelhantes, 97% piores
» O melhor teve um delta de 4%, a média foi 24%, o pior foi 134%
Dell XPS 16 9640 análise de áudio
(+) | os alto-falantes podem tocar relativamente alto (###valor### dB)
Graves 100 - 315Hz
(±) | graves reduzidos - em média 11.2% menor que a mediana
(±) | a linearidade dos graves é média (8.9% delta para a frequência anterior)
Médios 400 - 2.000 Hz
(+) | médios equilibrados - apenas 4.5% longe da mediana
(+) | médios são lineares (3% delta para frequência anterior)
Altos 2 - 16 kHz
(+) | agudos equilibrados - apenas 1.4% longe da mediana
(+) | os máximos são lineares (2% delta da frequência anterior)
Geral 100 - 16.000 Hz
(+) | o som geral é linear (10% diferença em relação à mediana)
Comparado com a mesma classe
» 10% de todos os dispositivos testados nesta classe foram melhores, 1% semelhantes, 89% piores
» O melhor teve um delta de 5%, a média foi 18%, o pior foi 45%
Comparado com todos os dispositivos testados
» 4% de todos os dispositivos testados foram melhores, 1% semelhantes, 95% piores
» O melhor teve um delta de 4%, a média foi 24%, o pior foi 134%
Asus ROG Zephyrus G16 2024 GU605M análise de áudio
(+) | os alto-falantes podem tocar relativamente alto (###valor### dB)
Graves 100 - 315Hz
(+) | bons graves - apenas 3.8% longe da mediana
(±) | a linearidade dos graves é média (8.1% delta para a frequência anterior)
Médios 400 - 2.000 Hz
(+) | médios equilibrados - apenas 3.5% longe da mediana
(+) | médios são lineares (2.4% delta para frequência anterior)
Altos 2 - 16 kHz
(+) | agudos equilibrados - apenas 2.2% longe da mediana
(+) | os máximos são lineares (3.7% delta da frequência anterior)
Geral 100 - 16.000 Hz
(+) | o som geral é linear (7.3% diferença em relação à mediana)
Comparado com a mesma classe
» 1% de todos os dispositivos testados nesta classe foram melhores, 0% semelhantes, 99% piores
» O melhor teve um delta de 6%, a média foi 18%, o pior foi 132%
Comparado com todos os dispositivos testados
» 1% de todos os dispositivos testados foram melhores, 0% semelhantes, 99% piores
» O melhor teve um delta de 4%, a média foi 24%, o pior foi 134%
Apple MacBook Pro 16 2023 M3 Max análise de áudio
(+) | os alto-falantes podem tocar relativamente alto (###valor### dB)
Graves 100 - 315Hz
(±) | graves reduzidos - em média 5% menor que a mediana
(+) | o baixo é linear (5.6% delta para a frequência anterior)
Médios 400 - 2.000 Hz
(+) | médios equilibrados - apenas 1.2% longe da mediana
(+) | médios são lineares (3.1% delta para frequência anterior)
Altos 2 - 16 kHz
(+) | agudos equilibrados - apenas 2.4% longe da mediana
(+) | os máximos são lineares (2.4% delta da frequência anterior)
Geral 100 - 16.000 Hz
(+) | o som geral é linear (5.3% diferença em relação à mediana)
Comparado com a mesma classe
» 1% de todos os dispositivos testados nesta classe foram melhores, 1% semelhantes, 98% piores
» O melhor teve um delta de 5%, a média foi 18%, o pior foi 45%
Comparado com todos os dispositivos testados
» 0% de todos os dispositivos testados foram melhores, 0% semelhantes, 100% piores
» O melhor teve um delta de 4%, a média foi 24%, o pior foi 134%
Asus Zenbook Pro 16X UX7602BZ-MY005W análise de áudio
(+) | os alto-falantes podem tocar relativamente alto (###valor### dB)
Graves 100 - 315Hz
(±) | graves reduzidos - em média 9.8% menor que a mediana
(±) | a linearidade dos graves é média (7.7% delta para a frequência anterior)
Médios 400 - 2.000 Hz
(+) | médios equilibrados - apenas 1.6% longe da mediana
(+) | médios são lineares (4.5% delta para frequência anterior)
Altos 2 - 16 kHz
(+) | agudos equilibrados - apenas 2.1% longe da mediana
(+) | os máximos são lineares (3.3% delta da frequência anterior)
Geral 100 - 16.000 Hz
(+) | o som geral é linear (8.1% diferença em relação à mediana)
Comparado com a mesma classe
» 1% de todos os dispositivos testados nesta classe foram melhores, 1% semelhantes, 98% piores
» O melhor teve um delta de 6%, a média foi 18%, o pior foi 132%
Comparado com todos os dispositivos testados
» 1% de todos os dispositivos testados foram melhores, 1% semelhantes, 98% piores
» O melhor teve um delta de 4%, a média foi 24%, o pior foi 134%
Gerenciamento de energia - Mais resistência do que o ROG Zephyrus G16
Consumo de energia
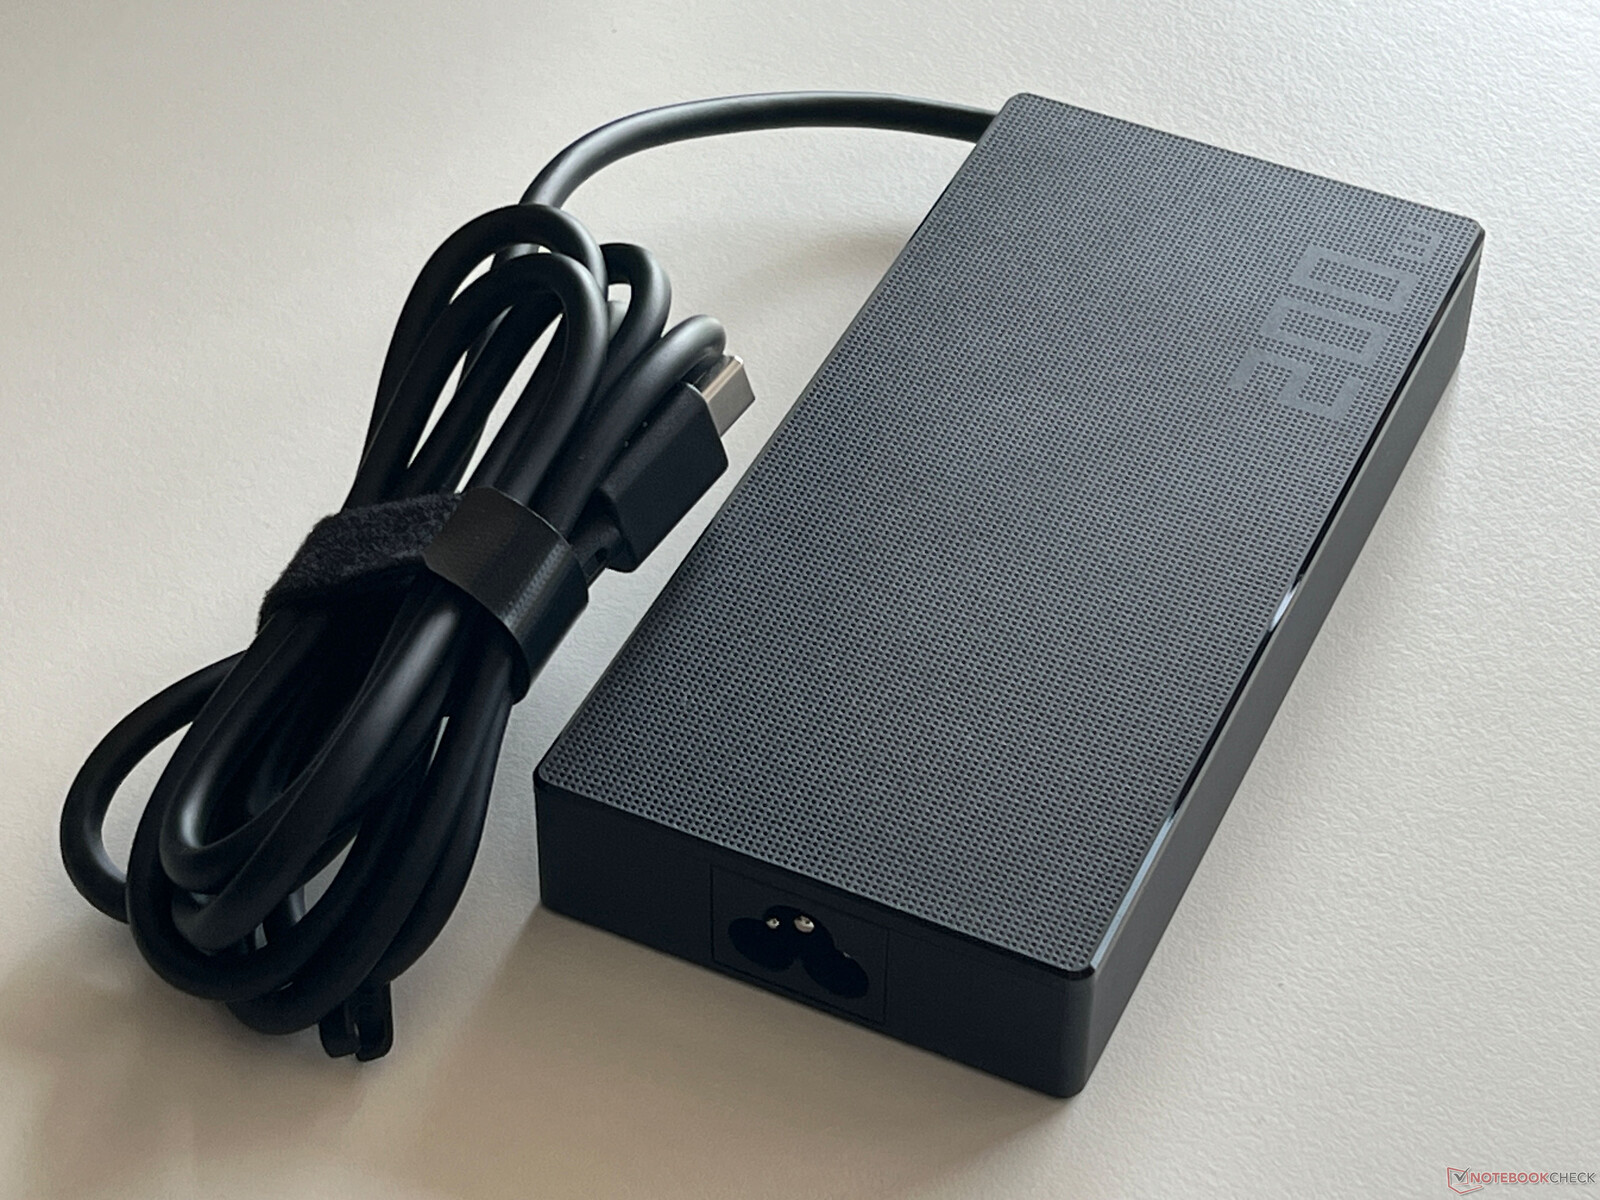
Apesar de seu painel OLED, o ProArt P16 é bastante eficiente. Em modo inativo e com o brilho máximo do SDR, registramos apenas um máximo de 11,6 watts, apesar do papel de parede relativamente brilhante. Durante os jogos, esse consumo ficou em torno de 160 watts e, no teste de estresse, por um breve período, 212,6 watts. Entretanto, após alguns minutos, esse valor cai rapidamente e se estabiliza em 160 watts. Isso significa que a PSU de 200 watts fornecida tem o tamanho adequado.
| desligado | |
| Ocioso | |
| Carga |
|
Key:
min: | |
| Asus ProArt P16 H7606WI Ryzen AI 9 HX 370, NVIDIA GeForce RTX 4070 Laptop GPU, Micron 2400 MTFDKBA1T0QFM, OLED, 3840x2400, 16" | SCHENKER XMG Pro 16 Studio (Mid 24) i9-14900HX, NVIDIA GeForce RTX 4070 Laptop GPU, Samsung 990 Pro 1 TB, IPS, 2560x1600, 16" | Lenovo Yoga Pro 9 16IMH9 Ultra 9 185H, NVIDIA GeForce RTX 4070 Laptop GPU, SK Hynix HFS001TEJ9X115N, Mini-LED, 3200x2000, 16" | Dell XPS 16 9640 Ultra 7 155H, NVIDIA GeForce RTX 4070 Laptop GPU, Kioxia XG8 KXG80ZNV1T02, OLED, 3840x2400, 16.3" | Asus ROG Zephyrus G16 2024 GU605M Ultra 7 155H, NVIDIA GeForce RTX 4070 Laptop GPU, WD PC SN560 SDDPNQE-1T00, OLED, 2560x1600, 16" | Apple MacBook Pro 16 2023 M3 Max Apple M3 Max 16-Core, M3 Max 40-Core GPU, Apple SSD AP8192Z, Mini-LED, 3456x2234, 16" | Asus Zenbook Pro 16X UX7602BZ-MY005W i9-13905H, NVIDIA GeForce RTX 4080 Laptop GPU, Samsung PM9A1 MZVL22T0HBLB, OLED, 3200x2000, 16" | Média NVIDIA GeForce RTX 4070 Laptop GPU | Média da turma Multimedia | |
|---|---|---|---|---|---|---|---|---|---|
| Power Consumption | -129% | -50% | 9% | -3% | -14% | -32% | -56% | 7% | |
| Idle Minimum * | 8 | 31 -288% | 10.3 -29% | 7.7 4% | 8.3 -4% | 5.2 35% | 9 -13% | 12.8 ? -60% | 6.86 ? 14% |
| Idle Average * | 9.9 | 33 -233% | 21.9 -121% | 10.3 -4% | 12.5 -26% | 16.9 -71% | 11.9 -20% | 17.8 ? -80% | 11.5 ? -16% |
| Idle Maximum * | 11.6 | 41 -253% | 22.4 -93% | 10.6 9% | 12.8 -10% | 17.2 -48% | 20.5 -77% | 24.3 ? -109% | 13.5 ? -16% |
| Load Average * | 76.9 | 114 -48% | 96.9 -26% | 76.5 1% | 71.3 7% | 90.5 -18% | 93.5 -22% | 96.9 ? -26% | 71.4 ? 7% |
| Cyberpunk 2077 ultra * | 157.7 | 218 -38% | |||||||
| Cyberpunk 2077 ultra external monitor * | 156.6 | 196.8 -26% | |||||||
| Load Maximum * | 212.6 | 250 -18% | 173.8 18% | 138.5 35% | 169.1 20% | 145.2 32% | 267 -26% | 221 ? -4% | 116.6 ? 45% |
| Witcher 3 ultra * | 159.6 | 126.4 | 127.5 | 109 | 195.7 |
* ... menor é melhor
Power consumption Cyberpunk / stress test
Power consumption with an external monitor
Duração da bateria
Em nossos testes de Wi-Fi, a bateria de 90 Wh foi responsável por uma duração média ligeiramente melhor do que a do Zephyrus G16, de construção semelhante. No teste de Wi-Fi a 150 cd/m² (representando 70% do brilho máximo do SDR), registramos 8 horas e 18 minutos e, com brilho total, cerca de 2 horas a menos (6 horas e 23 minutos). Por outro lado, no teste de vídeo, ficamos extremamente surpresos porque, a 150 cd/m², o tempo de execução foi de 21 horas, o que representa um desempenho extraordinário, considerando o grande painel de 16 polegadas do notebook. Com brilho total, um vídeo HDR pode ser executado por 5 horas.
Com o dispositivo ligado, um ciclo de carregamento completo leva apenas 108 minutos e 80% da capacidade está disponível após 48 minutos.
| Asus ProArt P16 H7606WI Ryzen AI 9 HX 370, NVIDIA GeForce RTX 4070 Laptop GPU, 90 Wh | SCHENKER XMG Pro 16 Studio (Mid 24) i9-14900HX, NVIDIA GeForce RTX 4070 Laptop GPU, 73 Wh | Lenovo Yoga Pro 9 16IMH9 Ultra 9 185H, NVIDIA GeForce RTX 4070 Laptop GPU, 84 Wh | Dell XPS 16 9640 Ultra 7 155H, NVIDIA GeForce RTX 4070 Laptop GPU, 99.5 Wh | Asus ROG Zephyrus G16 2024 GU605M Ultra 7 155H, NVIDIA GeForce RTX 4070 Laptop GPU, 90 Wh | Apple MacBook Pro 16 2023 M3 Max Apple M3 Max 16-Core, M3 Max 40-Core GPU, 99.6 Wh | Asus Zenbook Pro 16X UX7602BZ-MY005W i9-13905H, NVIDIA GeForce RTX 4080 Laptop GPU, 96 Wh | Média da turma Multimedia | |
|---|---|---|---|---|---|---|---|---|
| Duração da bateria | -32% | -26% | -7% | -33% | 19% | 10% | -6% | |
| H.264 | 1260 | 692 -45% | 988 -22% | 671 -47% | 1221 -3% | 864 ? -31% | ||
| WiFi v1.3 | 499 | 337 -32% | 526 5% | 629 26% | 435 -13% | 999 100% | 472.8 -5% | 645 ? 29% |
| Load | 116 | 73 -37% | 87 -25% | 71 -39% | 71 -39% | 144 24% | 99 ? -15% |
Pro
Contra
Veredicto - O ProArt P16 é uma potência compacta com compromissos
O novo Asus ProArt P16 é baseado no conhecido laptop para jogos/multimídia, o ROG Zephyrus G16 e também oferece toneladas de desempenho graças aos novos processadores móveis AMD Zen 5 - e tudo isso em um pacote compacto e particularmente leve, com 1,8 kg. O Ryzen AI 9 HX 370 oferece significativamente mais desempenho de CPU do que o processador Meteor Lake encontrado no Zephyrus G16, mas, como um laptop para usuários criativos, o P16 é mais um substituto para o Zenbook Pro 16X cujo Core i9 13905H não é muito mais lento, mas tem um laptop RTX 4080 que é simplesmente muito mais rápido do que o Laptop RTX 4070 do ProArt. Isso significa que, no que diz respeito ao desempenho da GPU, o senhor terá que aceitar um retrocesso se optar pelo notebook mais leve dos dois.
Em termos de tela, também é discutível se a nova tela sensível ao toque OLED de 60 Hz e 4K é uma melhoria em comparação com o painel OLED de 120 Hz e 3,2K do Zenbook Pro 16X. A resolução mais alta é uma vantagem e a precisão das cores também é muito boa, mas uma frequência de apenas 60 Hz não pode mais ser considerada atualizada quando se trata de um dispositivo tão caro em 2024.
Com o ProArt P16, a Asus está oferecendo uma potência comparativamente leve e compacta para usuários criativos que precisam de uma tela sensível ao toque e estão preparados para dispensar uma frequência mais alta. Em particular, a versão superior de 64 GB é extremamente cara.
No entanto, se o senhor puder conviver com o comprometimento do desempenho, ainda terá um laptop de 16 polegadas comparativamente leve e eficiente, com portas suficientes, um case premium, dispositivos de entrada muito bons e um excelente sistema de som. No entanto, o senhor também obtém isso com o ROG Zephyrus G16 e é aqui que terá que decidir se prefere uma tela sensível ao toque em vez de um OLED de frequência mais alta. Dois SSDs M.2 2280 podem ser instalados no ProArt, mas a RAM é soldada. Há uma opção de 64 GB, mas o salto de preço em relação aos 32 GB é de enormes US$ 400. O ProArt P16 tem um grupo-alvo relativamente pequeno e, se essa é a combinação que o senhor procura, não há como errar.
Preço e disponibilidade
O novo ProArt P16 pode ser encomendado diretamente da Asus.
Observação: Atualizamos recentemente nosso sistema de classificação e os resultados da versão 8 não são comparáveis aos resultados da versão 7. Mais informações estão disponíveis aqui.
Asus ProArt P16 H7606WI
- 08/04/2024 v8
Andreas Osthoff
 Total Sustainability Score:
 Transparência
A seleção dos dispositivos a serem analisados é feita pela nossa equipe editorial. A amostra de teste foi fornecida ao autor como empréstimo pelo fabricante ou varejista para fins desta revisão. O credor não teve influência nesta revisão, nem o fabricante recebeu uma cópia desta revisão antes da publicação. Não houve obrigação de publicar esta revisão. Nunca aceitamos compensação ou pagamento em troca de nossas avaliações. Como empresa de mídia independente, a Notebookcheck não está sujeita à autoridade de fabricantes, varejistas ou editores.
É assim que o Notebookcheck está testando
Todos os anos, o Notebookcheck analisa de forma independente centenas de laptops e smartphones usando procedimentos padronizados para garantir que todos os resultados sejam comparáveis. Desenvolvemos continuamente nossos métodos de teste há cerca de 20 anos e definimos padrões da indústria no processo. Em nossos laboratórios de teste, equipamentos de medição de alta qualidade são utilizados por técnicos e editores experientes. Esses testes envolvem um processo de validação em vários estágios. Nosso complexo sistema de classificação é baseado em centenas de medições e benchmarks bem fundamentados, o que mantém a objetividade.Price comparison

