Notebookcheck Logo

Análise do laptop Asus ROG Zephyrus G16 - Um gamer fino com uma RTX 4090 e potencial não realizado
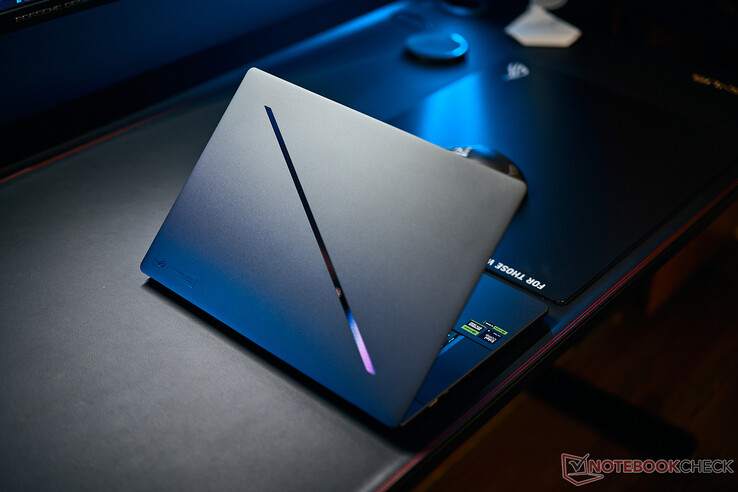
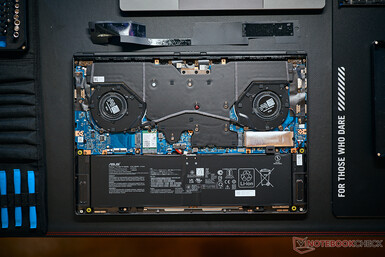
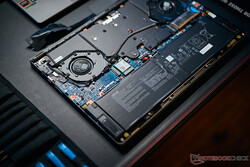
Resfriamento da câmara de vapor.

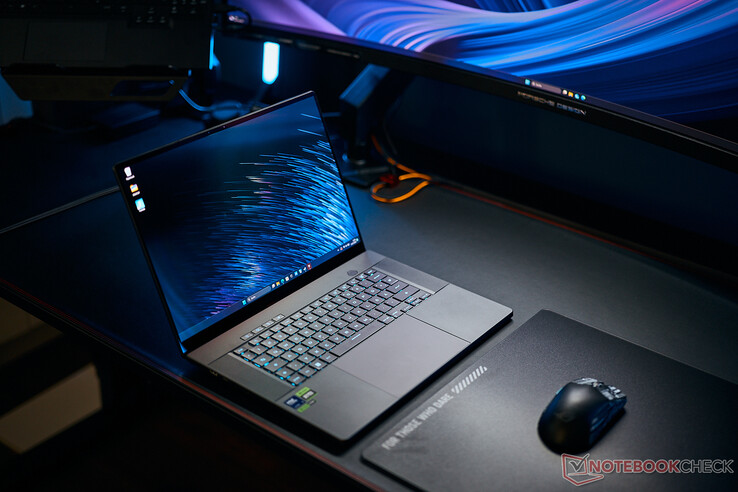
A Asus só equipa os modelos mais potentes do ROG Zephyrus G16 com resfriamento por câmara de vapor. Analisamos o modelo topo de linha com o Core Ultra 9 185H e o laptop GeForce RTX 4090. No entanto, o resfriamento é realmente melhor do que o tipo visto no RTX 4070 e quais compromissos tiveram que ser feitos devido ao gabinete compacto?

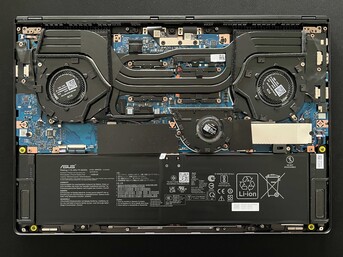
O ROG Zephyrus G16 é atualmente a estrela cadente quando se trata de laptops finos para jogos da Asus. Há alguns meses, analisamos a a variante com o Core Ultra 7 155H e o Nvidia GeForce RTX 4070. Agora, estamos analisando o modelo de ponta com o Core Ultra 9 185H e o laptop GeForce Laptop RTX 4090. Além dos componentes mais potentes, estamos lidando com um resfriamento diferente. Embora as configurações até o laptop RTX 4070 usem uma unidade de resfriamento convencional composta por três ventiladores e tubos de calor, os modelos de ponta (laptop RTX 4080/4090) usam resfriamento por câmara de vapor. Obviamente, queremos saber como o novo resfriamento afeta o desempenho e as emissões.

Nosso dispositivo de análise possui o número GU605MY, custa US$ 3.649 e, além do Core Ultra 9 185H e do laptop GeForce RTX 4090, ele também vem com 32 GB de RAM e a já conhecida tela OLED de 240 Hz. Nesta análise, daremos atenção especial às diferenças entre a configuração do laptop RTX 4070 e o desempenho, bem como às emissões da variante de ponta. Todas as informações adicionais sobre o gabinete, dispositivos de entrada, tela e alto-falantes podem ser encontradas em nossa análise do ROG Zephyrus G16 com o laptop RTX 4070.

A Asus lançará em breve uma atualização com os novos processadores Strix Point da AMD (Zen5), no entanto, esses modelos serão equipados apenas com o laptop GeForce Laptop RTX 4070.

Asus ROG Zephyrus G16 GU605MY (ROG Zephyrus G16 2024 Serie)
Processador
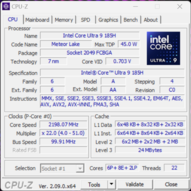
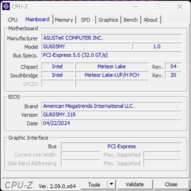
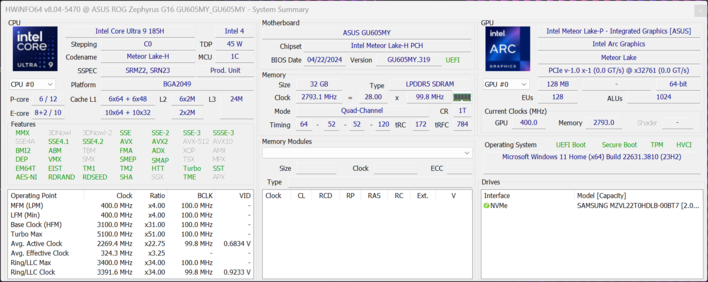
Intel Core Ultra 9 185H 16 x 3.8 - 5.1 GHz, Meteor Lake-H
Placa gráfica
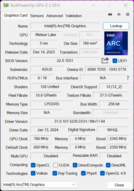
NVIDIA GeForce RTX 4090 Laptop GPU - 16 GB VRAM, Análises do: 1455 MHz, Memoría: 2250 MHz, GDDR6, 555.99
Memória
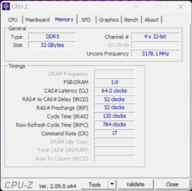
32 GB 
, LPDDR5x-7467, Dual-Channel, onboard
Pantalha
16.00 polegadas 16:10, 2560 x 1600 pixel 189 PPI, ATNA60DL01-0, OLED, Brilhante: sim, 240 Hz
placa mãe
Intel Meteor Lake-U/P/H PCH
Disco rígido
Samsung PM9A1a MZVL22T0HDLB, 2048 GB 
, M.2 PCIe
Placa de Som
Intel Meteor Lake-U/P/H PCH - cAVS (Audio, Voice, Speech)
Conexões
3 USB 3.1 Gen2, 1 Thunderbolt, USB-C Power Delivery (PD), 1 HDMI, Conexões Audio: 3.5mm, Card Reader: SD
Funcionamento em rede
Intel Wi-Fi 6E AX211 (a/b/g/h/n = Wi-Fi 4/ac = Wi-Fi 5/ax = Wi-Fi 6/ Wi-Fi 6E 6 GHz), Bluetooth 5.3
Tamanho
altura x largura x profundidade (em mm): 16.4 x 354 x 246
Bateria
90 Wh Lítio-Ion, 4-cell
Sistema Operativo
Microsoft Windows 11 Home
Camera
Primary Camera: 2 MPix
Características adicionais
Alto falantes: -cell, Teclado: Chiclet, Iluminação do Teclado: sim, 24 Meses Garantia
peso
1.908 kg, Suprimento de energia: 745 g
Preço
4300 Euro
Amazon
Note: The manufacturer may use components from different suppliers including display panels, drives or memory sticks with similar specifications.


Possíveis concorrentes em comparação

Rating
Version
Date
Model
Weight
Height
Size
Resolution
Price
86.1 %v8
07/2024
Asus ROG Zephyrus G16 GU605MY
Ultra 9 185H, NVIDIA GeForce RTX 4090 Laptop GPU
1.9 kg16.4 mm16.00"2560x1600
85.5 %v8
06/2024
SCHENKER XMG Neo 16 (Early 24)
i9-14900HX, NVIDIA GeForce RTX 4090 Laptop GPU
2.5 kg26.6 mm16.00"2560x1600
83.9 %v8
06/2024
Lenovo Legion 9 16IRX9, RTX 4090
i9-14900HX, NVIDIA GeForce RTX 4090 Laptop GPU
2.5 kg22.7 mm16.00"3200x2000
88.4 %
v7 (old)
v7 (old)
05/2024
Alienware x16 R2 P120F
Ultra 9 185H, NVIDIA GeForce RTX 4080 Laptop GPU
2.7 kg18.57 mm16.00"2560x1600
91.1 %
v7 (old)
v7 (old)
02/2024
Razer Blade 16 2024, RTX 4090
i9-14900HX, NVIDIA GeForce RTX 4090 Laptop GPU
2.5 kg22 mm16.00"2560x1600

Diferenças entre o G16 e o laptop RTX 4070

O modelo topo de linha do ROG Zephyrus G16 é visualmente indistinguível do modelo mais fraco equipado com o laptop RTX 4070/4060. No entanto, internamente, as diferenças do sistema de resfriamento se tornam aparentes. Enquanto os modelos mais fracos usam um total de três ventoinhas e tubos de calor regulares, a Asus optou pelo resfriamento por câmara de vapor com duas ventoinhas para seus modelos mais caros.

O resfriamento aumenta o peso de 1,817 kg para 1,908 kg, o que ainda é leve em comparação com os outros notebooks RTX 4090 no segmento de 16 polegadas, já que os dispositivos de comparação são pelo menos meio quilo mais pesados. Além disso, o Zephyrus também é simultaneamente um dos modelos mais finos e compactos. As configurações até o laptop RTX 4070 vêm com uma fonte de alimentação de 200 watts (583 gramas) e, a partir do laptop RTX 4080, a mais potente é a de 240 watts (745 gramas).

Laptop ROG Zephyrus G16 RTX 4090
Laptop ROG Zephyrus G16 RTX 4070

Comparação de tamanho

364.74 mm 289.81 mm 18.57 mm 2.7 kg356.7 mm 253 mm 26.6 mm 2.5 kg357.7 mm 277.7 mm 22.7 mm 2.5 kg355 mm 244 mm 22 mm 2.5 kg354 mm 246 mm 16.4 mm 1.9 kg354 mm 246 mm 16.4 mm 1.8 kg297 mm 210 mm 1 mm 5.7 g

Desempenho - laptop Meteor Lake e RTX 4090

A variante de ponta do Zephyrus está atualmente equipada com o processador Meteor Lake mais rápido, o Core Ultra 9 185H. Quando se trata do desempenho da CPU, ele fica atrás das CPUs HX da Intel. Na versão de 115 watts encontrada aqui, a Nvidia GeForce RTX 4090 da Nvidia está um pouco longe de atingir o desempenho máximo. A RAM instalada é de 32 GB (LPDDR5x 7467), mas, devido ao preço e à falta de possibilidade de atualização, teríamos preferido 64 GB.


Condições de teste

Os perfis básicos de energia permanecem idênticos e o modelo mais potente com o laptop RTX 4090 também oferece os perfis Silencioso, Desempenho e Turbo. Na tabela a seguir, listamos seus valores de TDP/TGP correspondentes, bem como o efeito sobre o desempenho. Abaixo, também adicionamos os valores do modelo RTX 4070 do Zephyrus G16 para que o senhor possa ver uma comparação direta. Em princípio, os modelos com resfriamento por câmara de vapor mais potente podem consumir um pouco mais de energia, mas a diferença é bastante pequena, especialmente quando se trata do processador. Nos perfis Quiet e Performance, o resfriamento da câmara de vapor consegue até mesmo ser um pouco mais alto do que a variante mais fraca do Variante RTX 4070. Como padrão, realizamos os benchmarks e as medições usando o modo turbo, que, no entanto, só está disponível quando conectado à rede elétrica.

Asus ROG Zephyrus G16 RTX 4090 Laptop
Perfil de energia Carga da CPU CB R23 Multi Carga da GPU Time Spy Gráficos Cyberpunk 2077 QHD Ultra volume máximo do ventilador
Silencioso 60 watts 15.750 pontos 55 watts 9.731 pontos 40,2 fps 41,4 dB(A)
Desempenho 100->70 watts 17.452 pontos 90 watts 15.205 pontos 60,2 fps 48,1 dB(A)
Turbo 110->80 watts 19.109 pontos 115 watts 19.109 pontos 68,1 fps 52,3 dB(A)
Asus ROG Zephyrus G16 RTX 4070 Laptop
Perfil de energia Carga da CPU CB R23 Multi Carga da GPU Time Spy Gráficos Cyberpunk 2077 QHD Ultra volume máximo do ventilador
Silencioso 60->45 watts 15.869 pontos 65 watts 9.042 pontos 32,6 fps 41,5 dB(A)
Desempenho 70->50 watts 17.133 pontos 80 watts 10.989 pontos 43,7 fps 46,4 dB(A)
Turbo 95->70 watts 18,372 pontos 105 watts 12,312 pontos 48.7fps 52.4 dB(A)

Processador - Intel Core Ultra 9 185H

O Core Ultra 9 185H é o processador móvel mais rápido da geração Meteor Lake da Intel, no entanto, ele se encontra claramente atrás dos processadores HX (atualização Raptor Lake). Como acabamos de observar na tabela de comparação, também não há diferenças tangíveis entre o Core Ultra 9 e o Core Ultra 7 em ambos os modelos do Zephyrus G16 2024, bem como no Alienware x16 R2. Este último também tem o Core Ultra 9 185H.

No entanto, os outros concorrentes da RTX 4090 com o Core i9 14900HX oferecem um desempenho de CPU significativamente maior, especialmente nos testes de vários núcleos. O desempenho multi-core do ROG Zephyrus G16 nem sempre permanece totalmente estável, embora um déficit de cerca de 10% sob carga sustentada possa ser considerado bastante pequeno. No modo de bateria, o processador pode consumir no máximo 75 watts, mas isso não tem praticamente nenhum efeito sobre o desempenho de vários núcleos (~8%). Outros benchmarks de CPU podem ser encontrados aqui.

Cinebench R15 Multi Continuous Test

02655307951060132515901855212023852650291531803445371039754240450547705035Tooltip
Asus ROG Zephyrus G16 GU605MY Intel Core Ultra 9 185H: Ø2756 (2704.71-3019.32)
SCHENKER XMG Neo 16 (Early 24) Intel Core i9-14900HX: Ø5001 (4861.45-5267.14)
Lenovo Legion 9 16IRX9, RTX 4090 Intel Core i9-14900HX: Ø4648 (4505.52-4878.64)
Alienware x16 R2 P120F Intel Core Ultra 9 185H: Ø2753 (2708.56-2857.35)
Razer Blade 16 2024, RTX 4090 Intel Core i9-14900HX: Ø4396 (4349.72-4455.83)
Asus ROG Zephyrus G16 2024 GU605M Intel Core Ultra 7 155H: Ø2533 (2383.65-2679.17)
CPU Performance Rating: Percent
Cinebench R23: Multi Core | Single Core
Cinebench R20: CPU (Multi Core) | CPU (Single Core)
Cinebench R15: CPU Multi 64Bit | CPU Single 64Bit
Blender: v2.79 BMW27 CPU
7-Zip 18.03: 7z b 4 | 7z b 4 -mmt1
Geekbench 6.3: Multi-Core | Single-Core
Geekbench 5.5: Multi-Core | Single-Core
HWBOT x265 Benchmark v2.2: 4k Preset
LibreOffice : 20 Documents To PDF
R Benchmark 2.5: Overall mean
CPU Performance Rating
SCHENKER XMG Neo 16 (Early 24)
Intel Core i9-14900HX
88.5 pt
Razer Blade 16 2024, RTX 4090
Intel Core i9-14900HX
77.8 pt
Lenovo Legion 9 16IRX9, RTX 4090
Intel Core i9-14900HX
71.5 pt
Average of class Gaming
 
62.9 pt
Asus ROG Zephyrus G16 GU605MY
Intel Core Ultra 9 185H
59.7 pt
Average Intel Core Ultra 9 185H
 
55.4 pt
Asus ROG Zephyrus G16 2024 GU605M
Intel Core Ultra 7 155H
54.2 pt
Alienware x16 R2 P120F
Intel Core Ultra 9 185H
52.5 pt
Cinebench R23 / Multi Core
SCHENKER XMG Neo 16 (Early 24)
Intel Core i9-14900HX
36249 Points +90%
Lenovo Legion 9 16IRX9, RTX 4090
Intel Core i9-14900HX
31889 Points +67%
Razer Blade 16 2024, RTX 4090
Intel Core i9-14900HX
28867 Points +51%
Average of class Gaming
  (5668 - 36249, n=189, last 2 years)
21842 Points +14%
Asus ROG Zephyrus G16 GU605MY
Intel Core Ultra 9 185H
19110 Points
Alienware x16 R2 P120F
Intel Core Ultra 9 185H
18338 (17139.2min - 18337.8max) Points -4%
Average Intel Core Ultra 9 185H
  (12688 - 19851, n=18)
17685 Points -7%
Asus ROG Zephyrus G16 2024 GU605M
Intel Core Ultra 7 155H
17267 Points -10%
Cinebench R23 / Single Core
SCHENKER XMG Neo 16 (Early 24)
Intel Core i9-14900HX
2209 Points +18%
Razer Blade 16 2024, RTX 4090
Intel Core i9-14900HX
2117 Points +13%
Average of class Gaming
  (1136 - 2235, n=187, last 2 years)
1888 Points +1%
Asus ROG Zephyrus G16 GU605MY
Intel Core Ultra 9 185H
1876 Points
Average Intel Core Ultra 9 185H
  (1166 - 1912, n=18)
1789 Points -5%
Lenovo Legion 9 16IRX9, RTX 4090
Intel Core i9-14900HX
1720 Points -8%
Asus ROG Zephyrus G16 2024 GU605M
Intel Core Ultra 7 155H
1681 Points -10%
Alienware x16 R2 P120F
Intel Core Ultra 9 185H
1620 Points -14%
Cinebench R20 / CPU (Multi Core)
SCHENKER XMG Neo 16 (Early 24)
Intel Core i9-14900HX
13824 Points +89%
Lenovo Legion 9 16IRX9, RTX 4090
Intel Core i9-14900HX
11960 Points +64%
Razer Blade 16 2024, RTX 4090
Intel Core i9-14900HX
10968 Points +50%
Average of class Gaming
  (2179 - 13832, n=187, last 2 years)
8311 Points +14%
Asus ROG Zephyrus G16 GU605MY
Intel Core Ultra 9 185H
7299 Points
Alienware x16 R2 P120F
Intel Core Ultra 9 185H
7081 Points -3%
Average Intel Core Ultra 9 185H
  (4843 - 7651, n=18)
6824 Points -7%
Asus ROG Zephyrus G16 2024 GU605M
Intel Core Ultra 7 155H
6682 Points -8%
Cinebench R20 / CPU (Single Core)
SCHENKER XMG Neo 16 (Early 24)
Intel Core i9-14900HX
844 Points +18%
Razer Blade 16 2024, RTX 4090
Intel Core i9-14900HX
810 Points +13%
Average of class Gaming
  (439 - 856, n=187, last 2 years)
726 Points +1%
Asus ROG Zephyrus G16 GU605MY
Intel Core Ultra 9 185H
718 Points
Asus ROG Zephyrus G16 2024 GU605M
Intel Core Ultra 7 155H
693 Points -3%
Average Intel Core Ultra 9 185H
  (442 - 735, n=18)
690 Points -4%
Lenovo Legion 9 16IRX9, RTX 4090
Intel Core i9-14900HX
657 Points -8%
Alienware x16 R2 P120F
Intel Core Ultra 9 185H
622 Points -13%
Cinebench R15 / CPU Multi 64Bit
SCHENKER XMG Neo 16 (Early 24)
Intel Core i9-14900HX
5267 Points +74%
Lenovo Legion 9 16IRX9, RTX 4090
Intel Core i9-14900HX
4879 (4505.52min - 4878.64max) Points +62%
Razer Blade 16 2024, RTX 4090
Intel Core i9-14900HX
4456 (4349.72min - 4455.83max) Points +48%
Average of class Gaming
  (905 - 5663, n=194, last 2 years)
3421 Points +13%
Asus ROG Zephyrus G16 GU605MY
Intel Core Ultra 9 185H
3019 (2704.71min - 3019.32max) Points
Alienware x16 R2 P120F
Intel Core Ultra 9 185H
2857 (2708.56min - 2857.35max) Points -5%
Average Intel Core Ultra 9 185H
  (1582 - 3165, n=20)
2719 Points -10%
Asus ROG Zephyrus G16 2024 GU605M
Intel Core Ultra 7 155H
2679 (2383.65min - 2679.17max) Points -11%
Cinebench R15 / CPU Single 64Bit
Razer Blade 16 2024, RTX 4090
Intel Core i9-14900HX
311 Points +13%
SCHENKER XMG Neo 16 (Early 24)
Intel Core i9-14900HX
310 Points +13%
Average of class Gaming
  (191.9 - 318, n=191, last 2 years)
278 Points +1%
Asus ROG Zephyrus G16 GU605MY
Intel Core Ultra 9 185H
275 Points
Asus ROG Zephyrus G16 2024 GU605M
Intel Core Ultra 7 155H
264 Points -4%
Average Intel Core Ultra 9 185H
  (191.9 - 281, n=18)
263 Points -4%
Lenovo Legion 9 16IRX9, RTX 4090
Intel Core i9-14900HX
247 Points -10%
Alienware x16 R2 P120F
Intel Core Ultra 9 185H
238 Points -13%
Blender / v2.79 BMW27 CPU
Asus ROG Zephyrus G16 2024 GU605M
Intel Core Ultra 7 155H
193 Seconds * -9%
Average Intel Core Ultra 9 185H
  (163 - 285, n=18)
191.9 Seconds * -8%
Alienware x16 R2 P120F
Intel Core Ultra 9 185H
178 Seconds * -1%
Asus ROG Zephyrus G16 GU605MY
Intel Core Ultra 9 185H
177 Seconds *
Average of class Gaming
  (87 - 555, n=182, last 2 years)
170.3 Seconds * +4%
Razer Blade 16 2024, RTX 4090
Intel Core i9-14900HX
113 Seconds * +36%
Lenovo Legion 9 16IRX9, RTX 4090
Intel Core i9-14900HX
106 Seconds * +40%
SCHENKER XMG Neo 16 (Early 24)
Intel Core i9-14900HX
95 Seconds * +46%
7-Zip 18.03 / 7z b 4
SCHENKER XMG Neo 16 (Early 24)
Intel Core i9-14900HX
135229 MIPS +86%
Lenovo Legion 9 16IRX9, RTX 4090
Intel Core i9-14900HX
125676 MIPS +73%
Razer Blade 16 2024, RTX 4090
Intel Core i9-14900HX
115695 MIPS +59%
Average of class Gaming
  (23795 - 140932, n=186, last 2 years)
85304 MIPS +18%
Asus ROG Zephyrus G16 GU605MY
Intel Core Ultra 9 185H
72583 MIPS
Average Intel Core Ultra 9 185H
  (51738 - 76331, n=18)
69105 MIPS -5%
Asus ROG Zephyrus G16 2024 GU605M
Intel Core Ultra 7 155H
68500 MIPS -6%
Alienware x16 R2 P120F
Intel Core Ultra 9 185H
67227 MIPS -7%
7-Zip 18.03 / 7z b 4 -mmt1
SCHENKER XMG Neo 16 (Early 24)
Intel Core i9-14900HX
7406 MIPS +31%
Razer Blade 16 2024, RTX 4090
Intel Core i9-14900HX
7018 MIPS +24%
Average of class Gaming
  (4199 - 7581, n=186, last 2 years)
6311 MIPS +12%
Asus ROG Zephyrus G16 GU605MY
Intel Core Ultra 9 185H
5651 MIPS
Lenovo Legion 9 16IRX9, RTX 4090
Intel Core i9-14900HX
5452 MIPS -4%
Asus ROG Zephyrus G16 2024 GU605M
Intel Core Ultra 7 155H
5439 MIPS -4%
Average Intel Core Ultra 9 185H
  (4199 - 5781, n=18)
5418 MIPS -4%
Alienware x16 R2 P120F
Intel Core Ultra 9 185H
4502 MIPS -20%
Geekbench 6.3 / Multi-Core
SCHENKER XMG Neo 16 (Early 24)
Intel Core i9-14900HX
19451 Points +34%
Razer Blade 16 2024, RTX 4090
Intel Core i9-14900HX
17559 Points +21%
Lenovo Legion 9 16IRX9, RTX 4090
Intel Core i9-14900HX
17499 Points +20%
Asus ROG Zephyrus G16 GU605MY
Intel Core Ultra 9 185H
14540 Points
Average of class Gaming
  (5340 - 19665, n=111, last 2 years)
14175 Points -3%
Average Intel Core Ultra 9 185H
  (9140 - 14540, n=18)
13580 Points -7%
Asus ROG Zephyrus G16 2024 GU605M
Intel Core Ultra 7 155H
13323 Points -8%
Alienware x16 R2 P120F
Intel Core Ultra 9 185H
12825 Points -12%
Geekbench 6.3 / Single-Core
SCHENKER XMG Neo 16 (Early 24)
Intel Core i9-14900HX
3129 Points +22%
Razer Blade 16 2024, RTX 4090
Intel Core i9-14900HX
2964 Points +16%
Average of class Gaming
  (1490 - 3129, n=111, last 2 years)
2648 Points +3%
Asus ROG Zephyrus G16 GU605MY
Intel Core Ultra 9 185H
2559 Points
Average Intel Core Ultra 9 185H
  (1490 - 2573, n=18)
2431 Points -5%
Lenovo Legion 9 16IRX9, RTX 4090
Intel Core i9-14900HX
2419 Points -5%
Asus ROG Zephyrus G16 2024 GU605M
Intel Core Ultra 7 155H
2410 Points -6%
Alienware x16 R2 P120F
Intel Core Ultra 9 185H
2199 Points -14%
Geekbench 5.5 / Multi-Core
SCHENKER XMG Neo 16 (Early 24)
Intel Core i9-14900HX
23086 Points +63%
Lenovo Legion 9 16IRX9, RTX 4090
Intel Core i9-14900HX
21642 Points +53%
Razer Blade 16 2024, RTX 4090
Intel Core i9-14900HX
19372 Points +37%
Average of class Gaming
  (4557 - 23194, n=187, last 2 years)
15010 Points +6%
Asus ROG Zephyrus G16 GU605MY
Intel Core Ultra 9 185H
14137 Points
Average Intel Core Ultra 9 185H
  (9330 - 14230, n=18)
13130 Points -7%
Asus ROG Zephyrus G16 2024 GU605M
Intel Core Ultra 7 155H
12905 Points -9%
Alienware x16 R2 P120F
Intel Core Ultra 9 185H
12759 Points -10%
Geekbench 5.5 / Single-Core
SCHENKER XMG Neo 16 (Early 24)
Intel Core i9-14900HX
2195 Points +19%
Razer Blade 16 2024, RTX 4090
Intel Core i9-14900HX
2131 Points +15%
Average of class Gaming
  (986 - 2210, n=187, last 2 years)
1894 Points +3%
Asus ROG Zephyrus G16 GU605MY
Intel Core Ultra 9 185H
1846 Points
Average Intel Core Ultra 9 185H
  (986 - 1902, n=18)
1782 Points -3%
Asus ROG Zephyrus G16 2024 GU605M
Intel Core Ultra 7 155H
1755 Points -5%
Lenovo Legion 9 16IRX9, RTX 4090
Intel Core i9-14900HX
1729 Points -6%
Alienware x16 R2 P120F
Intel Core Ultra 9 185H
1700 Points -8%
HWBOT x265 Benchmark v2.2 / 4k Preset
SCHENKER XMG Neo 16 (Early 24)
Intel Core i9-14900HX
35.3 fps +66%
Lenovo Legion 9 16IRX9, RTX 4090
Intel Core i9-14900HX
30.7 fps +44%
Razer Blade 16 2024, RTX 4090
Intel Core i9-14900HX
30.1 fps +41%
Average of class Gaming
  (6.72 - 38.9, n=186, last 2 years)
23.5 fps +10%
Asus ROG Zephyrus G16 GU605MY
Intel Core Ultra 9 185H
21.3 fps
Alienware x16 R2 P120F
Intel Core Ultra 9 185H
20.7 fps -3%
Asus ROG Zephyrus G16 2024 GU605M
Intel Core Ultra 7 155H
19.9 fps -7%
Average Intel Core Ultra 9 185H
  (14.1 - 22.7, n=18)
19.9 fps -7%
LibreOffice / 20 Documents To PDF
Lenovo Legion 9 16IRX9, RTX 4090
Intel Core i9-14900HX
53.6 s * -25%
Asus ROG Zephyrus G16 2024 GU605M
Intel Core Ultra 7 155H
49.6 s * -16%
Razer Blade 16 2024, RTX 4090
Intel Core i9-14900HX
47.5 s * -11%
Average of class Gaming
  (31.4 - 96.6, n=183, last 2 years)
47.4 s * -10%
Alienware x16 R2 P120F
Intel Core Ultra 9 185H
45.9 s * -7%
Average Intel Core Ultra 9 185H
  (34.5 - 62, n=18)
44.6 s * -4%
Asus ROG Zephyrus G16 GU605MY
Intel Core Ultra 9 185H
42.9 s *
SCHENKER XMG Neo 16 (Early 24)
Intel Core i9-14900HX
32.9 s * +23%
R Benchmark 2.5 / Overall mean
Alienware x16 R2 P120F
Intel Core Ultra 9 185H
0.503 sec * -17%
Lenovo Legion 9 16IRX9, RTX 4090
Intel Core i9-14900HX
0.4859 sec * -13%
Average Intel Core Ultra 9 185H
  (0.4313 - 0.759, n=19)
0.4712 sec * -9%
Asus ROG Zephyrus G16 2024 GU605M
Intel Core Ultra 7 155H
0.4654 sec * -8%
Average of class Gaming
  (0.3609 - 0.759, n=187, last 2 years)
0.4374 sec * -1%
Asus ROG Zephyrus G16 GU605MY
Intel Core Ultra 9 185H
0.4313 sec *
Razer Blade 16 2024, RTX 4090
Intel Core i9-14900HX
0.3789 sec * +12%
SCHENKER XMG Neo 16 (Early 24)
Intel Core i9-14900HX
0.3658 sec * +15%

* ... smaller is better

Cinebench R15 CPU Multi 64Bit
3019 Points
Cinebench R15 OpenGL 64Bit
192.9 fps
Cinebench R15 Ref. Match 64Bit
99.6 %
Cinebench R15 CPU Single 64Bit
275 Points
Cinebench R20 CPU (Multi Core)
7299 Points
Cinebench R20 CPU (Single Core)
718 Points
Cinebench R23 Single Core
1876 Points
Cinebench R23 Multi Core
19110 Points
Ajuda
Performance Rating
SCHENKER XMG Neo 16 (Early 24)
Intel Core i9-14900HX, NVIDIA GeForce RTX 4090 Laptop GPU
99 pt
Lenovo Legion 9 16IRX9, RTX 4090
Intel Core i9-14900HX, NVIDIA GeForce RTX 4090 Laptop GPU
91.1 pt
Razer Blade 16 2024, RTX 4090
Intel Core i9-14900HX, NVIDIA GeForce RTX 4090 Laptop GPU
85.6 pt
Average of class Gaming
 
70.8 pt
Alienware x16 R2 P120F
Intel Core Ultra 9 185H, NVIDIA GeForce RTX 4080 Laptop GPU
64.9 pt
Asus ROG Zephyrus G16 GU605MY
Intel Core Ultra 9 185H, NVIDIA GeForce RTX 4090 Laptop GPU
61.8 pt
Average Intel Core Ultra 9 185H
 
58.9 pt
Asus ROG Zephyrus G16 2024 GU605M
Intel Core Ultra 7 155H, NVIDIA GeForce RTX 4070 Laptop GPU
58 pt
AIDA64 / FP32 Ray-Trace
SCHENKER XMG Neo 16 (Early 24)
Intel Core i9-14900HX, NVIDIA GeForce RTX 4090 Laptop GPU
30829 KRay/s +77%
Lenovo Legion 9 16IRX9, RTX 4090
Intel Core i9-14900HX, NVIDIA GeForce RTX 4090 Laptop GPU
27535 KRay/s +58%
Razer Blade 16 2024, RTX 4090
Intel Core i9-14900HX, NVIDIA GeForce RTX 4090 Laptop GPU
25682 KRay/s +47%
Average of class Gaming
  (4986 - 60169, n=183, last 2 years)
21864 KRay/s +25%
Alienware x16 R2 P120F
Intel Core Ultra 9 185H, NVIDIA GeForce RTX 4080 Laptop GPU
18676 KRay/s +7%
Asus ROG Zephyrus G16 GU605MY
Intel Core Ultra 9 185H, NVIDIA GeForce RTX 4090 Laptop GPU
17461 KRay/s
Asus ROG Zephyrus G16 2024 GU605M
Intel Core Ultra 7 155H, NVIDIA GeForce RTX 4070 Laptop GPU
16431 KRay/s -6%
Average Intel Core Ultra 9 185H
  (9220 - 18676, n=18)
16273 KRay/s -7%
AIDA64 / FPU Julia
SCHENKER XMG Neo 16 (Early 24)
Intel Core i9-14900HX, NVIDIA GeForce RTX 4090 Laptop GPU
150728 Points +66%
Lenovo Legion 9 16IRX9, RTX 4090
Intel Core i9-14900HX, NVIDIA GeForce RTX 4090 Laptop GPU
136486 Points +50%
Razer Blade 16 2024, RTX 4090
Intel Core i9-14900HX, NVIDIA GeForce RTX 4090 Laptop GPU
127908 Points +41%
Average of class Gaming
  (25360 - 252486, n=183, last 2 years)
106582 Points +17%
Alienware x16 R2 P120F
Intel Core Ultra 9 185H, NVIDIA GeForce RTX 4080 Laptop GPU
96463 Points +6%
Asus ROG Zephyrus G16 GU605MY
Intel Core Ultra 9 185H, NVIDIA GeForce RTX 4090 Laptop GPU
90983 Points
Asus ROG Zephyrus G16 2024 GU605M
Intel Core Ultra 7 155H, NVIDIA GeForce RTX 4070 Laptop GPU
85461 Points -6%
Average Intel Core Ultra 9 185H
  (48865 - 96463, n=18)
84562 Points -7%
AIDA64 / CPU SHA3
SCHENKER XMG Neo 16 (Early 24)
Intel Core i9-14900HX, NVIDIA GeForce RTX 4090 Laptop GPU
7588 MB/s +77%
Lenovo Legion 9 16IRX9, RTX 4090
Intel Core i9-14900HX, NVIDIA GeForce RTX 4090 Laptop GPU
7000 MB/s +64%
Razer Blade 16 2024, RTX 4090
Intel Core i9-14900HX, NVIDIA GeForce RTX 4090 Laptop GPU
6188 MB/s +45%
Average of class Gaming
  (1339 - 10389, n=183, last 2 years)
4896 MB/s +14%
Alienware x16 R2 P120F
Intel Core Ultra 9 185H, NVIDIA GeForce RTX 4080 Laptop GPU
4534 MB/s +6%
Asus ROG Zephyrus G16 GU605MY
Intel Core Ultra 9 185H, NVIDIA GeForce RTX 4090 Laptop GPU
4278 MB/s
Average Intel Core Ultra 9 185H
  (2394 - 4534, n=18)
3964 MB/s -7%
Asus ROG Zephyrus G16 2024 GU605M
Intel Core Ultra 7 155H, NVIDIA GeForce RTX 4070 Laptop GPU
3814 MB/s -11%
AIDA64 / CPU Queen
SCHENKER XMG Neo 16 (Early 24)
Intel Core i9-14900HX, NVIDIA GeForce RTX 4090 Laptop GPU
148966 Points +63%
Razer Blade 16 2024, RTX 4090
Intel Core i9-14900HX, NVIDIA GeForce RTX 4090 Laptop GPU
138473 Points +52%
Lenovo Legion 9 16IRX9, RTX 4090
Intel Core i9-14900HX, NVIDIA GeForce RTX 4090 Laptop GPU
130803 Points +43%
Average of class Gaming
  (50699 - 200651, n=183, last 2 years)
116926 Points +28%
Alienware x16 R2 P120F
Intel Core Ultra 9 185H, NVIDIA GeForce RTX 4080 Laptop GPU
94794 Points +4%
Asus ROG Zephyrus G16 GU605MY
Intel Core Ultra 9 185H, NVIDIA GeForce RTX 4090 Laptop GPU
91400 Points
Asus ROG Zephyrus G16 2024 GU605M
Intel Core Ultra 7 155H, NVIDIA GeForce RTX 4070 Laptop GPU
90347 Points -1%
Average Intel Core Ultra 9 185H
  (66785 - 95241, n=18)
89440 Points -2%
AIDA64 / FPU SinJulia
SCHENKER XMG Neo 16 (Early 24)
Intel Core i9-14900HX, NVIDIA GeForce RTX 4090 Laptop GPU
18114 Points +63%
Lenovo Legion 9 16IRX9, RTX 4090
Intel Core i9-14900HX, NVIDIA GeForce RTX 4090 Laptop GPU
16268 Points +47%
Razer Blade 16 2024, RTX 4090
Intel Core i9-14900HX, NVIDIA GeForce RTX 4090 Laptop GPU
15857 Points +43%
Average of class Gaming
  (4800 - 32988, n=183, last 2 years)
13244 Points +19%
Alienware x16 R2 P120F
Intel Core Ultra 9 185H, NVIDIA GeForce RTX 4080 Laptop GPU
11095 Points 0%
Asus ROG Zephyrus G16 GU605MY
Intel Core Ultra 9 185H, NVIDIA GeForce RTX 4090 Laptop GPU
11092 Points
Asus ROG Zephyrus G16 2024 GU605M
Intel Core Ultra 7 155H, NVIDIA GeForce RTX 4070 Laptop GPU
10641 Points -4%
Average Intel Core Ultra 9 185H
  (7255 - 11392, n=18)
10503 Points -5%
AIDA64 / FPU Mandel
SCHENKER XMG Neo 16 (Early 24)
Intel Core i9-14900HX, NVIDIA GeForce RTX 4090 Laptop GPU
76668 Points +70%
Lenovo Legion 9 16IRX9, RTX 4090
Intel Core i9-14900HX, NVIDIA GeForce RTX 4090 Laptop GPU
68467 Points +52%
Razer Blade 16 2024, RTX 4090
Intel Core i9-14900HX, NVIDIA GeForce RTX 4090 Laptop GPU
64134 Points +42%
Average of class Gaming
  (12321 - 134044, n=183, last 2 years)
53651 Points +19%
Alienware x16 R2 P120F
Intel Core Ultra 9 185H, NVIDIA GeForce RTX 4080 Laptop GPU
48020 Points +6%
Asus ROG Zephyrus G16 GU605MY
Intel Core Ultra 9 185H, NVIDIA GeForce RTX 4090 Laptop GPU
45127 Points
Asus ROG Zephyrus G16 2024 GU605M
Intel Core Ultra 7 155H, NVIDIA GeForce RTX 4070 Laptop GPU
41806 Points -7%
Average Intel Core Ultra 9 185H
  (24004 - 48020, n=18)
41496 Points -8%
AIDA64 / CPU AES
SCHENKER XMG Neo 16 (Early 24)
Intel Core i9-14900HX, NVIDIA GeForce RTX 4090 Laptop GPU
145389 MB/s +72%
Lenovo Legion 9 16IRX9, RTX 4090
Intel Core i9-14900HX, NVIDIA GeForce RTX 4090 Laptop GPU
133395 MB/s +57%
Razer Blade 16 2024, RTX 4090
Intel Core i9-14900HX, NVIDIA GeForce RTX 4090 Laptop GPU
122937 MB/s +45%
Average of class Gaming
  (19065 - 328679, n=183, last 2 years)
109303 MB/s +29%
Average Intel Core Ultra 9 185H
  (53116 - 154066, n=18)
91410 MB/s +8%
Alienware x16 R2 P120F
Intel Core Ultra 9 185H, NVIDIA GeForce RTX 4080 Laptop GPU
88763 MB/s +5%
Asus ROG Zephyrus G16 GU605MY
Intel Core Ultra 9 185H, NVIDIA GeForce RTX 4090 Laptop GPU
84774 MB/s
Asus ROG Zephyrus G16 2024 GU605M
Intel Core Ultra 7 155H, NVIDIA GeForce RTX 4070 Laptop GPU
79475 MB/s -6%
AIDA64 / CPU ZLib
SCHENKER XMG Neo 16 (Early 24)
Intel Core i9-14900HX, NVIDIA GeForce RTX 4090 Laptop GPU
2239 MB/s +86%
Lenovo Legion 9 16IRX9, RTX 4090
Intel Core i9-14900HX, NVIDIA GeForce RTX 4090 Laptop GPU
2043 MB/s +70%
Razer Blade 16 2024, RTX 4090
Intel Core i9-14900HX, NVIDIA GeForce RTX 4090 Laptop GPU
1863 MB/s +55%
Average of class Gaming
  (373 - 2409, n=183, last 2 years)
1361 MB/s +13%
Alienware x16 R2 P120F
Intel Core Ultra 9 185H, NVIDIA GeForce RTX 4080 Laptop GPU
1298 MB/s +8%
Asus ROG Zephyrus G16 GU605MY
Intel Core Ultra 9 185H, NVIDIA GeForce RTX 4090 Laptop GPU
1201 MB/s
Average Intel Core Ultra 9 185H
  (678 - 1341, n=18)
1156 MB/s -4%
Asus ROG Zephyrus G16 2024 GU605M
Intel Core Ultra 7 155H, NVIDIA GeForce RTX 4070 Laptop GPU
1128 MB/s -6%
AIDA64 / FP64 Ray-Trace
SCHENKER XMG Neo 16 (Early 24)
Intel Core i9-14900HX, NVIDIA GeForce RTX 4090 Laptop GPU
16655 KRay/s +79%
Lenovo Legion 9 16IRX9, RTX 4090
Intel Core i9-14900HX, NVIDIA GeForce RTX 4090 Laptop GPU
14791 KRay/s +59%
Razer Blade 16 2024, RTX 4090
Intel Core i9-14900HX, NVIDIA GeForce RTX 4090 Laptop GPU
13993 KRay/s +50%
Average of class Gaming
  (2540 - 31796, n=183, last 2 years)
11775 KRay/s +26%
Alienware x16 R2 P120F
Intel Core Ultra 9 185H, NVIDIA GeForce RTX 4080 Laptop GPU
10078 KRay/s +8%
Asus ROG Zephyrus G16 GU605MY
Intel Core Ultra 9 185H, NVIDIA GeForce RTX 4090 Laptop GPU
9329 KRay/s
Average Intel Core Ultra 9 185H
  (4428 - 10078, n=18)
8523 KRay/s -9%
Asus ROG Zephyrus G16 2024 GU605M
Intel Core Ultra 7 155H, NVIDIA GeForce RTX 4070 Laptop GPU
8449 KRay/s -9%
AIDA64 / CPU PhotoWorxx
Lenovo Legion 9 16IRX9, RTX 4090
Intel Core i9-14900HX, NVIDIA GeForce RTX 4090 Laptop GPU
54702 MPixel/s +5%
Alienware x16 R2 P120F
Intel Core Ultra 9 185H, NVIDIA GeForce RTX 4080 Laptop GPU
53242 MPixel/s +2%
Asus ROG Zephyrus G16 GU605MY
Intel Core Ultra 9 185H, NVIDIA GeForce RTX 4090 Laptop GPU
52181 MPixel/s
Razer Blade 16 2024, RTX 4090
Intel Core i9-14900HX, NVIDIA GeForce RTX 4090 Laptop GPU
49616 MPixel/s -5%
SCHENKER XMG Neo 16 (Early 24)
Intel Core i9-14900HX, NVIDIA GeForce RTX 4090 Laptop GPU
49305 MPixel/s -6%
Asus ROG Zephyrus G16 2024 GU605M
Intel Core Ultra 7 155H, NVIDIA GeForce RTX 4070 Laptop GPU
49238 MPixel/s -6%
Average Intel Core Ultra 9 185H
  (44809 - 53918, n=18)
49034 MPixel/s -6%
Average of class Gaming
  (10805 - 60161, n=184, last 2 years)
40126 MPixel/s -23%

Desempenho do sistema

Um pouco menos surpreendente é o fato de que a variante de ponta do Zephyrus G16 é um laptop muito ágil. Embora os resultados de benchmark também sejam bons, mais uma vez, a concorrência equipada com o processador HX tem um desempenho melhor. No entanto, isso não é perceptível em situações cotidianas. Devido à troca de gráficos Advanced Optimus, há um breve congelamento ocasional durante a inicialização de jogos quando o sistema alterna para a dGPU, mas isso é completamente normal.

PCMark 10 / Score
SCHENKER XMG Neo 16 (Early 24)
NVIDIA GeForce RTX 4090 Laptop GPU, i9-14900HX, Samsung 990 Pro 1 TB
9017 Points +13%
Razer Blade 16 2024, RTX 4090
NVIDIA GeForce RTX 4090 Laptop GPU, i9-14900HX, Samsung PM9A1 MZVL22T0HBLB
8401 Points +5%
Lenovo Legion 9 16IRX9, RTX 4090
NVIDIA GeForce RTX 4090 Laptop GPU, i9-14900HX, Micron 3400 2TB MTFDKBA2T0TFH
8239 Points +3%
Asus ROG Zephyrus G16 GU605MY
NVIDIA GeForce RTX 4090 Laptop GPU, Ultra 9 185H, Samsung PM9A1a MZVL22T0HDLB
7993 Points
Average Intel Core Ultra 9 185H, NVIDIA GeForce RTX 4090 Laptop GPU
  ()
7993 Points 0%
Average of class Gaming
  (5776 - 9852, n=165, last 2 years)
7799 Points -2%
Alienware x16 R2 P120F
NVIDIA GeForce RTX 4080 Laptop GPU, Ultra 9 185H, WDC PC SN810 1TB
7251 Points -9%
Asus ROG Zephyrus G16 2024 GU605M
NVIDIA GeForce RTX 4070 Laptop GPU, Ultra 7 155H, WD PC SN560 SDDPNQE-1T00
7123 Points -11%
PCMark 10 / Essentials
SCHENKER XMG Neo 16 (Early 24)
NVIDIA GeForce RTX 4090 Laptop GPU, i9-14900HX, Samsung 990 Pro 1 TB
11065 Points +2%
Lenovo Legion 9 16IRX9, RTX 4090
NVIDIA GeForce RTX 4090 Laptop GPU, i9-14900HX, Micron 3400 2TB MTFDKBA2T0TFH
11007 Points +2%
Razer Blade 16 2024, RTX 4090
NVIDIA GeForce RTX 4090 Laptop GPU, i9-14900HX, Samsung PM9A1 MZVL22T0HBLB
10915 Points +1%
Asus ROG Zephyrus G16 GU605MY
NVIDIA GeForce RTX 4090 Laptop GPU, Ultra 9 185H, Samsung PM9A1a MZVL22T0HDLB
10835 Points
Average Intel Core Ultra 9 185H, NVIDIA GeForce RTX 4090 Laptop GPU
  ()
10835 Points 0%
Average of class Gaming
  (9057 - 12334, n=164, last 2 years)
10832 Points 0%
Asus ROG Zephyrus G16 2024 GU605M
NVIDIA GeForce RTX 4070 Laptop GPU, Ultra 7 155H, WD PC SN560 SDDPNQE-1T00
10038 Points -7%
Alienware x16 R2 P120F
NVIDIA GeForce RTX 4080 Laptop GPU, Ultra 9 185H, WDC PC SN810 1TB
10036 Points -7%
PCMark 10 / Productivity
SCHENKER XMG Neo 16 (Early 24)
NVIDIA GeForce RTX 4090 Laptop GPU, i9-14900HX, Samsung 990 Pro 1 TB
11681 Points +18%
Razer Blade 16 2024, RTX 4090
NVIDIA GeForce RTX 4090 Laptop GPU, i9-14900HX, Samsung PM9A1 MZVL22T0HBLB
11150 Points +12%
Lenovo Legion 9 16IRX9, RTX 4090
NVIDIA GeForce RTX 4090 Laptop GPU, i9-14900HX, Micron 3400 2TB MTFDKBA2T0TFH
10202 Points +3%
Asus ROG Zephyrus G16 GU605MY
NVIDIA GeForce RTX 4090 Laptop GPU, Ultra 9 185H, Samsung PM9A1a MZVL22T0HDLB
9937 Points
Average Intel Core Ultra 9 185H, NVIDIA GeForce RTX 4090 Laptop GPU
  ()
9937 Points 0%
Average of class Gaming
  (6662 - 14612, n=164, last 2 years)
9904 Points 0%
Asus ROG Zephyrus G16 2024 GU605M
NVIDIA GeForce RTX 4070 Laptop GPU, Ultra 7 155H, WD PC SN560 SDDPNQE-1T00
9208 Points -7%
Alienware x16 R2 P120F
NVIDIA GeForce RTX 4080 Laptop GPU, Ultra 9 185H, WDC PC SN810 1TB
7934 Points -20%
PCMark 10 / Digital Content Creation
SCHENKER XMG Neo 16 (Early 24)
NVIDIA GeForce RTX 4090 Laptop GPU, i9-14900HX, Samsung 990 Pro 1 TB
15394 Points +20%
Lenovo Legion 9 16IRX9, RTX 4090
NVIDIA GeForce RTX 4090 Laptop GPU, i9-14900HX, Micron 3400 2TB MTFDKBA2T0TFH
13516 Points +5%
Razer Blade 16 2024, RTX 4090
NVIDIA GeForce RTX 4090 Laptop GPU, i9-14900HX, Samsung PM9A1 MZVL22T0HBLB
13219 Points +3%
Alienware x16 R2 P120F
NVIDIA GeForce RTX 4080 Laptop GPU, Ultra 9 185H, WDC PC SN810 1TB
12994 Points +1%
Asus ROG Zephyrus G16 GU605MY
NVIDIA GeForce RTX 4090 Laptop GPU, Ultra 9 185H, Samsung PM9A1a MZVL22T0HDLB
12872 Points
Average Intel Core Ultra 9 185H, NVIDIA GeForce RTX 4090 Laptop GPU
  ()
12872 Points 0%
Average of class Gaming
  (6703 - 18475, n=164, last 2 years)
12117 Points -6%
Asus ROG Zephyrus G16 2024 GU605M
NVIDIA GeForce RTX 4070 Laptop GPU, Ultra 7 155H, WD PC SN560 SDDPNQE-1T00
10612 Points -18%
CrossMark / Overall
SCHENKER XMG Neo 16 (Early 24)
NVIDIA GeForce RTX 4090 Laptop GPU, i9-14900HX, Samsung 990 Pro 1 TB
2344 Points +29%
Razer Blade 16 2024, RTX 4090
NVIDIA GeForce RTX 4090 Laptop GPU, i9-14900HX, Samsung PM9A1 MZVL22T0HBLB
2149 Points +18%
Lenovo Legion 9 16IRX9, RTX 4090
NVIDIA GeForce RTX 4090 Laptop GPU, i9-14900HX, Micron 3400 2TB MTFDKBA2T0TFH
1939 Points +7%
Average of class Gaming
  (1247 - 2344, n=146, last 2 years)
1908 Points +5%
Asus ROG Zephyrus G16 GU605MY
NVIDIA GeForce RTX 4090 Laptop GPU, Ultra 9 185H, Samsung PM9A1a MZVL22T0HDLB
1815 Points
Average Intel Core Ultra 9 185H, NVIDIA GeForce RTX 4090 Laptop GPU
  ()
1815 Points 0%
Asus ROG Zephyrus G16 2024 GU605M
NVIDIA GeForce RTX 4070 Laptop GPU, Ultra 7 155H, WD PC SN560 SDDPNQE-1T00
1721 Points -5%
Alienware x16 R2 P120F
NVIDIA GeForce RTX 4080 Laptop GPU, Ultra 9 185H, WDC PC SN810 1TB
1589 Points -12%
CrossMark / Productivity
SCHENKER XMG Neo 16 (Early 24)
NVIDIA GeForce RTX 4090 Laptop GPU, i9-14900HX, Samsung 990 Pro 1 TB
2162 Points +27%
Razer Blade 16 2024, RTX 4090
NVIDIA GeForce RTX 4090 Laptop GPU, i9-14900HX, Samsung PM9A1 MZVL22T0HBLB
2007 Points +18%
Average of class Gaming
  (1299 - 2204, n=146, last 2 years)
1808 Points +6%
Lenovo Legion 9 16IRX9, RTX 4090
NVIDIA GeForce RTX 4090 Laptop GPU, i9-14900HX, Micron 3400 2TB MTFDKBA2T0TFH
1755 Points +3%
Asus ROG Zephyrus G16 GU605MY
NVIDIA GeForce RTX 4090 Laptop GPU, Ultra 9 185H, Samsung PM9A1a MZVL22T0HDLB
1700 Points
Average Intel Core Ultra 9 185H, NVIDIA GeForce RTX 4090 Laptop GPU
  ()
1700 Points 0%
Asus ROG Zephyrus G16 2024 GU605M
NVIDIA GeForce RTX 4070 Laptop GPU, Ultra 7 155H, WD PC SN560 SDDPNQE-1T00
1624 Points -4%
Alienware x16 R2 P120F
NVIDIA GeForce RTX 4080 Laptop GPU, Ultra 9 185H, WDC PC SN810 1TB
1584 Points -7%
CrossMark / Creativity
SCHENKER XMG Neo 16 (Early 24)
NVIDIA GeForce RTX 4090 Laptop GPU, i9-14900HX, Samsung 990 Pro 1 TB
2660 Points +29%
Razer Blade 16 2024, RTX 4090
NVIDIA GeForce RTX 4090 Laptop GPU, i9-14900HX, Samsung PM9A1 MZVL22T0HBLB
2418 Points +17%
Lenovo Legion 9 16IRX9, RTX 4090
NVIDIA GeForce RTX 4090 Laptop GPU, i9-14900HX, Micron 3400 2TB MTFDKBA2T0TFH
2207 Points +7%
Average of class Gaming
  (1275 - 2660, n=146, last 2 years)
2095 Points +1%
Asus ROG Zephyrus G16 GU605MY
NVIDIA GeForce RTX 4090 Laptop GPU, Ultra 9 185H, Samsung PM9A1a MZVL22T0HDLB
2070 Points
Average Intel Core Ultra 9 185H, NVIDIA GeForce RTX 4090 Laptop GPU
  ()
2070 Points 0%
Asus ROG Zephyrus G16 2024 GU605M
NVIDIA GeForce RTX 4070 Laptop GPU, Ultra 7 155H, WD PC SN560 SDDPNQE-1T00
1942 Points -6%
Alienware x16 R2 P120F
NVIDIA GeForce RTX 4080 Laptop GPU, Ultra 9 185H, WDC PC SN810 1TB
1583 Points -24%
CrossMark / Responsiveness
SCHENKER XMG Neo 16 (Early 24)
NVIDIA GeForce RTX 4090 Laptop GPU, i9-14900HX, Samsung 990 Pro 1 TB
2045 Points +37%
Razer Blade 16 2024, RTX 4090
NVIDIA GeForce RTX 4090 Laptop GPU, i9-14900HX, Samsung PM9A1 MZVL22T0HBLB
1851 Points +24%
Lenovo Legion 9 16IRX9, RTX 4090
NVIDIA GeForce RTX 4090 Laptop GPU, i9-14900HX, Micron 3400 2TB MTFDKBA2T0TFH
1769 Points +19%
Average of class Gaming
  (1030 - 2330, n=146, last 2 years)
1708 Points +15%
Alienware x16 R2 P120F
NVIDIA GeForce RTX 4080 Laptop GPU, Ultra 9 185H, WDC PC SN810 1TB
1621 Points +9%
Asus ROG Zephyrus G16 GU605MY
NVIDIA GeForce RTX 4090 Laptop GPU, Ultra 9 185H, Samsung PM9A1a MZVL22T0HDLB
1490 Points
Average Intel Core Ultra 9 185H, NVIDIA GeForce RTX 4090 Laptop GPU
  ()
1490 Points 0%
Asus ROG Zephyrus G16 2024 GU605M
NVIDIA GeForce RTX 4070 Laptop GPU, Ultra 7 155H, WD PC SN560 SDDPNQE-1T00
1424 Points -4%
WebXPRT 3 / Overall
SCHENKER XMG Neo 16 (Early 24)
NVIDIA GeForce RTX 4090 Laptop GPU, i9-14900HX, Samsung 990 Pro 1 TB
336 Points +20%
Razer Blade 16 2024, RTX 4090
NVIDIA GeForce RTX 4090 Laptop GPU, i9-14900HX, Samsung PM9A1 MZVL22T0HBLB
330 Points +17%
Average of class Gaming
  (215 - 480, n=161, last 2 years)
304 Points +8%
Asus ROG Zephyrus G16 2024 GU605M
NVIDIA GeForce RTX 4070 Laptop GPU, Ultra 7 155H, WD PC SN560 SDDPNQE-1T00
283 Points +1%
Asus ROG Zephyrus G16 GU605MY
NVIDIA GeForce RTX 4090 Laptop GPU, Ultra 9 185H, Samsung PM9A1a MZVL22T0HDLB
281 Points
Average Intel Core Ultra 9 185H, NVIDIA GeForce RTX 4090 Laptop GPU
  ()
281 Points 0%
Lenovo Legion 9 16IRX9, RTX 4090
NVIDIA GeForce RTX 4090 Laptop GPU, i9-14900HX, Micron 3400 2TB MTFDKBA2T0TFH
279 Points -1%
Alienware x16 R2 P120F
NVIDIA GeForce RTX 4080 Laptop GPU, Ultra 9 185H, WDC PC SN810 1TB
237 Points -16%
WebXPRT 4 / Overall
SCHENKER XMG Neo 16 (Early 24)
NVIDIA GeForce RTX 4090 Laptop GPU, i9-14900HX, Samsung 990 Pro 1 TB
306 Points +14%
Asus ROG Zephyrus G16 GU605MY
NVIDIA GeForce RTX 4090 Laptop GPU, Ultra 9 185H, Samsung PM9A1a MZVL22T0HDLB
269 Points
Average Intel Core Ultra 9 185H, NVIDIA GeForce RTX 4090 Laptop GPU
  ()
269 Points 0%
Average of class Gaming
  (176.4 - 328, n=149, last 2 years)
267 Points -1%
Asus ROG Zephyrus G16 2024 GU605M
NVIDIA GeForce RTX 4070 Laptop GPU, Ultra 7 155H, WD PC SN560 SDDPNQE-1T00
256 Points -5%
Lenovo Legion 9 16IRX9, RTX 4090
NVIDIA GeForce RTX 4090 Laptop GPU, i9-14900HX, Micron 3400 2TB MTFDKBA2T0TFH
246 Points -9%
Alienware x16 R2 P120F
NVIDIA GeForce RTX 4080 Laptop GPU, Ultra 9 185H, WDC PC SN810 1TB
237 Points -12%
Mozilla Kraken 1.1 / Total
Alienware x16 R2 P120F
NVIDIA GeForce RTX 4080 Laptop GPU, Ultra 9 185H, WDC PC SN810 1TB
594 ms * -14%
Asus ROG Zephyrus G16 2024 GU605M
NVIDIA GeForce RTX 4070 Laptop GPU, Ultra 7 155H, WD PC SN560 SDDPNQE-1T00
548 ms * -5%
Lenovo Legion 9 16IRX9, RTX 4090
NVIDIA GeForce RTX 4090 Laptop GPU, i9-14900HX, Micron 3400 2TB MTFDKBA2T0TFH
535 ms * -2%
Asus ROG Zephyrus G16 GU605MY
NVIDIA GeForce RTX 4090 Laptop GPU, Ultra 9 185H, Samsung PM9A1a MZVL22T0HDLB
522 ms *
Average Intel Core Ultra 9 185H, NVIDIA GeForce RTX 4090 Laptop GPU
  ()
522 ms * -0%
Average of class Gaming
  (421 - 674, n=176, last 2 years)
503 ms * +4%
Razer Blade 16 2024, RTX 4090
NVIDIA GeForce RTX 4090 Laptop GPU, i9-14900HX, Samsung PM9A1 MZVL22T0HBLB
450 ms * +14%
SCHENKER XMG Neo 16 (Early 24)
NVIDIA GeForce RTX 4090 Laptop GPU, i9-14900HX, Samsung 990 Pro 1 TB
428 ms * +18%

* ... smaller is better

PCMark 10 Score
7993 pontos
Ajuda
AIDA64 / Memory Copy
Asus ROG Zephyrus G16 GU605MY
Intel Core Ultra 9 185H, NVIDIA GeForce RTX 4090 Laptop GPU
93766 MB/s
Alienware x16 R2 P120F
Intel Core Ultra 9 185H, NVIDIA GeForce RTX 4080 Laptop GPU
89701 MB/s -4%
Asus ROG Zephyrus G16 2024 GU605M
Intel Core Ultra 7 155H, NVIDIA GeForce RTX 4070 Laptop GPU
89414 MB/s -5%
Average Intel Core Ultra 9 185H
  (69929 - 95718, n=18)
84684 MB/s -10%
Lenovo Legion 9 16IRX9, RTX 4090
Intel Core i9-14900HX, NVIDIA GeForce RTX 4090 Laptop GPU
81940 MB/s -13%
SCHENKER XMG Neo 16 (Early 24)
Intel Core i9-14900HX, NVIDIA GeForce RTX 4090 Laptop GPU
78897 MB/s -16%
Razer Blade 16 2024, RTX 4090
Intel Core i9-14900HX, NVIDIA GeForce RTX 4090 Laptop GPU
78799 MB/s -16%
Average of class Gaming
  (21842 - 94222, n=183, last 2 years)
65265 MB/s -30%
AIDA64 / Memory Read
SCHENKER XMG Neo 16 (Early 24)
Intel Core i9-14900HX, NVIDIA GeForce RTX 4090 Laptop GPU
86939 MB/s +1%
Asus ROG Zephyrus G16 2024 GU605M
Intel Core Ultra 7 155H, NVIDIA GeForce RTX 4070 Laptop GPU
86576 MB/s +1%
Razer Blade 16 2024, RTX 4090
Intel Core i9-14900HX, NVIDIA GeForce RTX 4090 Laptop GPU
86387 MB/s 0%
Asus ROG Zephyrus G16 GU605MY
Intel Core Ultra 9 185H, NVIDIA GeForce RTX 4090 Laptop GPU
86010 MB/s
Alienware x16 R2 P120F
Intel Core Ultra 9 185H, NVIDIA GeForce RTX 4080 Laptop GPU
85092 MB/s -1%
Lenovo Legion 9 16IRX9, RTX 4090
Intel Core i9-14900HX, NVIDIA GeForce RTX 4090 Laptop GPU
84192 MB/s -2%
Average Intel Core Ultra 9 185H
  (64619 - 87768, n=18)
80059 MB/s -7%
Average of class Gaming
  (23681 - 99713, n=183, last 2 years)
69175 MB/s -20%
AIDA64 / Memory Write
Lenovo Legion 9 16IRX9, RTX 4090
Intel Core i9-14900HX, NVIDIA GeForce RTX 4090 Laptop GPU
80589 MB/s +6%
SCHENKER XMG Neo 16 (Early 24)
Intel Core i9-14900HX, NVIDIA GeForce RTX 4090 Laptop GPU
77562 MB/s +2%
Asus ROG Zephyrus G16 GU605MY
Intel Core Ultra 9 185H, NVIDIA GeForce RTX 4090 Laptop GPU
75937 MB/s
Razer Blade 16 2024, RTX 4090
Intel Core i9-14900HX, NVIDIA GeForce RTX 4090 Laptop GPU
75421 MB/s -1%
Asus ROG Zephyrus G16 2024 GU605M
Intel Core Ultra 7 155H, NVIDIA GeForce RTX 4070 Laptop GPU
73337 MB/s -3%
Alienware x16 R2 P120F
Intel Core Ultra 9 185H, NVIDIA GeForce RTX 4080 Laptop GPU
73199 MB/s -4%
Average Intel Core Ultra 9 185H
  (51114 - 93871, n=18)
72390 MB/s -5%
Average of class Gaming
  (22986 - 108954, n=183, last 2 years)
67077 MB/s -12%
AIDA64 / Memory Latency
Average Intel Core Ultra 9 185H
  (121.4 - 259, n=18)
145.8 ns * -6%
Alienware x16 R2 P120F
Intel Core Ultra 9 185H, NVIDIA GeForce RTX 4080 Laptop GPU
142.3 ns * -3%
Asus ROG Zephyrus G16 2024 GU605M
Intel Core Ultra 7 155H, NVIDIA GeForce RTX 4070 Laptop GPU
140 ns * -2%
Asus ROG Zephyrus G16 GU605MY
Intel Core Ultra 9 185H, NVIDIA GeForce RTX 4090 Laptop GPU
137.9 ns *
Lenovo Legion 9 16IRX9, RTX 4090
Intel Core i9-14900HX, NVIDIA GeForce RTX 4090 Laptop GPU
96.2 ns * +30%
Average of class Gaming
  (59.5 - 259, n=183, last 2 years)
93.7 ns * +32%
Razer Blade 16 2024, RTX 4090
Intel Core i9-14900HX, NVIDIA GeForce RTX 4090 Laptop GPU
83.4 ns * +40%
SCHENKER XMG Neo 16 (Early 24)
Intel Core i9-14900HX, NVIDIA GeForce RTX 4090 Laptop GPU
76.1 ns * +45%

* ... smaller is better

Latências de DPC

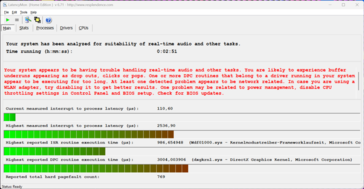
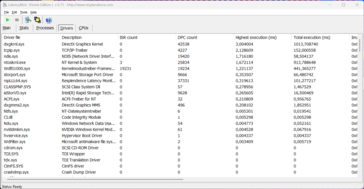
Em nosso teste de latência padronizado (navegação na Internet, reprodução em 4K no YouTube, carga da CPU), com o BIOS atual, o dispositivo de análise apresentou limitações quando se tratava de usar aplicativos de áudio em tempo real. No entanto, esse já era o caso com o modelo Modelo RTX 4070.

LatencyMon - Visão geral
LatencyMon - Drivers
DPC Latencies / LatencyMon - interrupt to process latency (max), Web, Youtube, Prime95
Alienware x16 R2 P120F
NVIDIA GeForce RTX 4080 Laptop GPU, Ultra 9 185H, WDC PC SN810 1TB
16146 μs * -536%
Asus ROG Zephyrus G16 GU605MY
NVIDIA GeForce RTX 4090 Laptop GPU, Ultra 9 185H, Samsung PM9A1a MZVL22T0HDLB
2536.9 μs *
Asus ROG Zephyrus G16 2024 GU605M
NVIDIA GeForce RTX 4070 Laptop GPU, Ultra 7 155H, WD PC SN560 SDDPNQE-1T00
2484.4 μs * +2%
SCHENKER XMG Neo 16 (Early 24)
NVIDIA GeForce RTX 4090 Laptop GPU, i9-14900HX, Samsung 990 Pro 1 TB
2478.6 μs * +2%
Lenovo Legion 9 16IRX9, RTX 4090
NVIDIA GeForce RTX 4090 Laptop GPU, i9-14900HX, Micron 3400 2TB MTFDKBA2T0TFH
2448.1 μs * +4%
Razer Blade 16 2024, RTX 4090
NVIDIA GeForce RTX 4090 Laptop GPU, i9-14900HX, Samsung PM9A1 MZVL22T0HBLB
1389.7 μs * +45%

* ... smaller is better

Armazenamento em massa

O modelo RTX 4090 também oferece dois slots M.2 2280.

O Zephyrus G16 oferece dois slots PCIe 4.0 rápidos para SSDs M.2 2280, o que significa que a capacidade de armazenamento pode ser atualizada de forma rápida e econômica. Nosso dispositivo de análise vem com um Samsung PM9A1a de 2 TB, embora 1,76 TB esteja disponível para o usuário após a primeira instalação. Nos testes sintéticos, a SSD não atendeu às nossas expectativas, mas ainda estamos lidando com uma unidade de armazenamento muito rápida, com velocidades de transferência que permanecem perfeitamente consistentes, mesmo sob carga contínua. Outros benchmarks de SSD podem ser encontrados aqui.

Samsung PM9A1a MZVL22T0HDLB
CDM 5/6 Read Seq Q32T1: 7104 MB/s
CDM 5/6 Write Seq Q32T1: 5141 MB/s
CDM 5/6 Read 4K Q32T1: 397 MB/s
CDM 5/6 Write 4K Q32T1: 415 MB/s
CDM 5/6 Read 4K: 70.1 MB/s
CDM 5/6 Write 4K: 130.1 MB/s
CDM 6 Write 4K Q8T8: 364 MB/s
CDM 6 Read 4K Q8T8: 1030 MB/s
Drive Performance Rating - Percent
SCHENKER XMG Neo 16 (Early 24)
Samsung 990 Pro 1 TB
91.7 pt
Alienware x16 R2 P120F
WDC PC SN810 1TB
79.9 pt
Razer Blade 16 2024, RTX 4090
Samsung PM9A1 MZVL22T0HBLB
76 pt
Average Samsung PM9A1a MZVL22T0HDLB
 
75.1 pt
Lenovo Legion 9 16IRX9, RTX 4090
Micron 3400 2TB MTFDKBA2T0TFH
70.5 pt
Average of class Gaming
 
70.2 pt
Asus ROG Zephyrus G16 GU605MY
Samsung PM9A1a MZVL22T0HDLB
65.4 pt
Asus ROG Zephyrus G16 2024 GU605M
WD PC SN560 SDDPNQE-1T00
47.4 pt
DiskSpd
seq read
Alienware x16 R2 P120F
WDC PC SN810 1TB
4224 (3741.6min - 4224.02max) MB/s +19%
Razer Blade 16 2024, RTX 4090
Samsung PM9A1 MZVL22T0HBLB
3795 (3693.04min - 3794.8max) MB/s +7%
Average Samsung PM9A1a MZVL22T0HDLB
  (3541 - 3908, n=2)
3725 MB/s +5%
Asus ROG Zephyrus G16 GU605MY
Samsung PM9A1a MZVL22T0HDLB
3541 (3501.11min - 3540.88max) MB/s
Average of class Gaming
  (1319 - 7045, n=164, last 2 years)
3475 MB/s -2%
Lenovo Legion 9 16IRX9, RTX 4090
Micron 3400 2TB MTFDKBA2T0TFH
3347 (3203.49min - 3347.47max) MB/s -5%
Asus ROG Zephyrus G16 2024 GU605M
WD PC SN560 SDDPNQE-1T00
3202 (3129.61min - 3201.93max) MB/s -10%
SCHENKER XMG Neo 16 (Early 24)
Samsung 990 Pro 1 TB
3015 (2943.98min - 3014.55max) MB/s -15%
seq write
Alienware x16 R2 P120F
WDC PC SN810 1TB
4899 (4625.25min - 4898.53max) MB/s +55%
SCHENKER XMG Neo 16 (Early 24)
Samsung 990 Pro 1 TB
4826 (4760.33min - 4825.54max) MB/s +53%
Average of class Gaming
  (535 - 9307, n=164, last 2 years)
3805 MB/s +20%
Razer Blade 16 2024, RTX 4090
Samsung PM9A1 MZVL22T0HBLB
3794 (3745.51min - 3793.5max) MB/s +20%
Lenovo Legion 9 16IRX9, RTX 4090
Micron 3400 2TB MTFDKBA2T0TFH
3750 (3377.21min - 3749.92max) MB/s +19%
Average Samsung PM9A1a MZVL22T0HDLB
  (3160 - 4335, n=2)
3748 MB/s +19%
Asus ROG Zephyrus G16 GU605MY
Samsung PM9A1a MZVL22T0HDLB
3160 (3033.95min - 3160.41max) MB/s
Asus ROG Zephyrus G16 2024 GU605M
WD PC SN560 SDDPNQE-1T00
2526 (2498.97min - 2525.81max) MB/s -20%
seq q8 t1 read
SCHENKER XMG Neo 16 (Early 24)
Samsung 990 Pro 1 TB
7140 (5903.9min - 7139.54max) MB/s 0%
Asus ROG Zephyrus G16 GU605MY
Samsung PM9A1a MZVL22T0HDLB
7106 (6065.83min - 7105.62max) MB/s
Average Samsung PM9A1a MZVL22T0HDLB
  (7084 - 7106, n=2)
7095 MB/s 0%
Alienware x16 R2 P120F
WDC PC SN810 1TB
6823 (5715.47min - 6822.87max) MB/s -4%
Razer Blade 16 2024, RTX 4090
Samsung PM9A1 MZVL22T0HBLB
6673 (5801.28min - 6672.72max) MB/s -6%
Lenovo Legion 9 16IRX9, RTX 4090
Micron 3400 2TB MTFDKBA2T0TFH
6523 (5649.96min - 6522.56max) MB/s -8%
Average of class Gaming
  (2594 - 16089, n=164, last 2 years)
6322 MB/s -11%
Asus ROG Zephyrus G16 2024 GU605M
WD PC SN560 SDDPNQE-1T00
5008 (4421.01min - 5007.74max) MB/s -30%
seq q8 t1 write
SCHENKER XMG Neo 16 (Early 24)
Samsung 990 Pro 1 TB
6860 (6824.33min - 6859.91max) MB/s +31%
Average Samsung PM9A1a MZVL22T0HDLB
  (5248 - 5255, n=2)
5252 MB/s 0%
Asus ROG Zephyrus G16 GU605MY
Samsung PM9A1a MZVL22T0HDLB
5248 (5141.58min - 5248.1max) MB/s
Alienware x16 R2 P120F
WDC PC SN810 1TB
5208 (5161.3min - 5208.07max) MB/s -1%
Lenovo Legion 9 16IRX9, RTX 4090
Micron 3400 2TB MTFDKBA2T0TFH
5092 (4641.78min - 5091.77max) MB/s -3%
Razer Blade 16 2024, RTX 4090
Samsung PM9A1 MZVL22T0HBLB
4936 (4909.47min - 4936.28max) MB/s -6%
Average of class Gaming
  (539 - 14571, n=164, last 2 years)
4850 MB/s -8%
Asus ROG Zephyrus G16 2024 GU605M
WD PC SN560 SDDPNQE-1T00
3230 (3169.22min - 3230.03max) MB/s -38%
4k q1 t1 read
Alienware x16 R2 P120F
WDC PC SN810 1TB
79.3 (64.25min - 79.25max) MB/s +13%
Average Samsung PM9A1a MZVL22T0HDLB
  (69.9 - 80.7, n=2)
75.3 MB/s +8%
Razer Blade 16 2024, RTX 4090
Samsung PM9A1 MZVL22T0HBLB
71.4 (66.19min - 71.35max) MB/s +2%
Asus ROG Zephyrus G16 GU605MY
Samsung PM9A1a MZVL22T0HDLB
69.9 (69.26min - 69.89max) MB/s
Average of class Gaming
  (30.6 - 95.9, n=164, last 2 years)
66 MB/s -6%
SCHENKER XMG Neo 16 (Early 24)
Samsung 990 Pro 1 TB
60.5 (49.54min - 60.46max) MB/s -13%
Lenovo Legion 9 16IRX9, RTX 4090
Micron 3400 2TB MTFDKBA2T0TFH
59.1 (58.3min - 59.06max) MB/s -15%
Asus ROG Zephyrus G16 2024 GU605M
WD PC SN560 SDDPNQE-1T00
52.9 (51.15min - 52.91max) MB/s -24%
4k q1 t1 write
Alienware x16 R2 P120F
WDC PC SN810 1TB
244 (238.59min - 244.13max) MB/s +87%
Average of class Gaming
  (78 - 397, n=164, last 2 years)
224 MB/s +72%
Lenovo Legion 9 16IRX9, RTX 4090
Micron 3400 2TB MTFDKBA2T0TFH
209 (203.44min - 208.84max) MB/s +60%
Razer Blade 16 2024, RTX 4090
Samsung PM9A1 MZVL22T0HBLB
205 (202.97min - 204.75max) MB/s +57%
Average Samsung PM9A1a MZVL22T0HDLB
  (130.3 - 230, n=2)
180.2 MB/s +38%
SCHENKER XMG Neo 16 (Early 24)
Samsung 990 Pro 1 TB
174.4 (160.08min - 174.38max) MB/s +34%
Asus ROG Zephyrus G16 GU605MY
Samsung PM9A1a MZVL22T0HDLB
130.3 (127.94min - 130.31max) MB/s
Asus ROG Zephyrus G16 2024 GU605M
WD PC SN560 SDDPNQE-1T00
128.4 (126.56min - 128.36max) MB/s -1%
4k q32 t16 read
SCHENKER XMG Neo 16 (Early 24)
Samsung 990 Pro 1 TB
4920 (4883.21min - 4920.02max) MB/s +724%
Alienware x16 R2 P120F
WDC PC SN810 1TB
4245 (4210.56min - 4245.12max) MB/s +611%
Razer Blade 16 2024, RTX 4090
Samsung PM9A1 MZVL22T0HBLB
3726 (3704.12min - 3725.6max) MB/s +524%
Lenovo Legion 9 16IRX9, RTX 4090
Micron 3400 2TB MTFDKBA2T0TFH
2997 (2834.64min - 2996.72max) MB/s +402%
Average of class Gaming
  (417 - 6172, n=164, last 2 years)
2568 MB/s +330%
Average Samsung PM9A1a MZVL22T0HDLB
  (597 - 3732, n=2)
2165 MB/s +263%
Asus ROG Zephyrus G16 2024 GU605M
WD PC SN560 SDDPNQE-1T00
604 (565.74min - 603.6max) MB/s +1%
Asus ROG Zephyrus G16 GU605MY
Samsung PM9A1a MZVL22T0HDLB
597 (590.16min - 596.69max) MB/s
4k q32 t16 write
SCHENKER XMG Neo 16 (Early 24)
Samsung 990 Pro 1 TB
4522 (4451.05min - 4521.93max) MB/s +1051%
Razer Blade 16 2024, RTX 4090
Samsung PM9A1 MZVL22T0HBLB
3548 (3533.85min - 3548.33max) MB/s +803%
Alienware x16 R2 P120F
WDC PC SN810 1TB
2907 (2737.8min - 2907.05max) MB/s +640%
Lenovo Legion 9 16IRX9, RTX 4090
Micron 3400 2TB MTFDKBA2T0TFH
2673 (2401.6min - 2673.33max) MB/s +580%
Average of class Gaming
  (162.3 - 4869, n=164, last 2 years)
2133 MB/s +443%
Average Samsung PM9A1a MZVL22T0HDLB
  (393 - 2900, n=2)
1647 MB/s +319%
Asus ROG Zephyrus G16 2024 GU605M
WD PC SN560 SDDPNQE-1T00
402 (389.17min - 402.07max) MB/s +2%
Asus ROG Zephyrus G16 GU605MY
Samsung PM9A1a MZVL22T0HDLB
393 (388.68min - 393.4max) MB/s
AS SSD
Score Total
SCHENKER XMG Neo 16 (Early 24)
Samsung 990 Pro 1 TB
9365 Points +67%
Alienware x16 R2 P120F
WDC PC SN810 1TB
8139 Points +45%
Razer Blade 16 2024, RTX 4090
Samsung PM9A1 MZVL22T0HBLB
7040 Points +26%
Average Samsung PM9A1a MZVL22T0HDLB
  (5595 - 8367, n=2)
6981 Points +25%
Lenovo Legion 9 16IRX9, RTX 4090
Micron 3400 2TB MTFDKBA2T0TFH
6847 Points +22%
Average of class Gaming
  (2271 - 13854, n=156, last 2 years)
6746 Points +21%
Asus ROG Zephyrus G16 GU605MY
Samsung PM9A1a MZVL22T0HDLB
5595 Points
Asus ROG Zephyrus G16 2024 GU605M
WD PC SN560 SDDPNQE-1T00
3272 Points -42%
Score Read
SCHENKER XMG Neo 16 (Early 24)
Samsung 990 Pro 1 TB
3496 Points +149%
Alienware x16 R2 P120F
WDC PC SN810 1TB
3204 Points +129%
Razer Blade 16 2024, RTX 4090
Samsung PM9A1 MZVL22T0HBLB
2848 Points +103%
Lenovo Legion 9 16IRX9, RTX 4090
Micron 3400 2TB MTFDKBA2T0TFH
2722 Points +94%
Average of class Gaming
  (776 - 4721, n=156, last 2 years)
2446 Points +74%
Average Samsung PM9A1a MZVL22T0HDLB
  (1402 - 3272, n=2)
2337 Points +67%
Asus ROG Zephyrus G16 GU605MY
Samsung PM9A1a MZVL22T0HDLB
1402 Points
Asus ROG Zephyrus G16 2024 GU605M
WD PC SN560 SDDPNQE-1T00
1020 Points -27%
Score Write
SCHENKER XMG Neo 16 (Early 24)
Samsung 990 Pro 1 TB
4062 Points +13%
Asus ROG Zephyrus G16 GU605MY
Samsung PM9A1a MZVL22T0HDLB
3588 Points
Average Samsung PM9A1a MZVL22T0HDLB
  (3490 - 3588, n=2)
3539 Points -1%
Alienware x16 R2 P120F
WDC PC SN810 1TB
3341 Points -7%
Average of class Gaming
  (515 - 7208, n=156, last 2 years)
3112 Points -13%
Razer Blade 16 2024, RTX 4090
Samsung PM9A1 MZVL22T0HBLB
2766 Points -23%
Lenovo Legion 9 16IRX9, RTX 4090
Micron 3400 2TB MTFDKBA2T0TFH
2686 Points -25%
Asus ROG Zephyrus G16 2024 GU605M
WD PC SN560 SDDPNQE-1T00
1808 Points -50%
Seq Read
SCHENKER XMG Neo 16 (Early 24)
Samsung 990 Pro 1 TB
5684.15 MB/s +6%
Alienware x16 R2 P120F
WDC PC SN810 1TB
5642.41 MB/s +5%
Average Samsung PM9A1a MZVL22T0HDLB
  (5351 - 5637, n=2)
5494 MB/s +3%
Asus ROG Zephyrus G16 GU605MY
Samsung PM9A1a MZVL22T0HDLB
5351 MB/s
Average of class Gaming
  (2260 - 12763, n=156, last 2 years)
4945 MB/s -8%
Razer Blade 16 2024, RTX 4090
Samsung PM9A1 MZVL22T0HBLB
4371 MB/s -18%
Asus ROG Zephyrus G16 2024 GU605M
WD PC SN560 SDDPNQE-1T00
3662 MB/s -32%
Lenovo Legion 9 16IRX9, RTX 4090
Micron 3400 2TB MTFDKBA2T0TFH
2272 MB/s -58%
Seq Write
SCHENKER XMG Neo 16 (Early 24)
Samsung 990 Pro 1 TB
5612.29 MB/s +107%
Alienware x16 R2 P120F
WDC PC SN810 1TB
4787.7 MB/s +76%
Razer Blade 16 2024, RTX 4090
Samsung PM9A1 MZVL22T0HBLB
3791 MB/s +40%
Average of class Gaming
  (495 - 11316, n=156, last 2 years)
3760 MB/s +39%
Average Samsung PM9A1a MZVL22T0HDLB
  (2713 - 4295, n=2)
3504 MB/s +29%
Lenovo Legion 9 16IRX9, RTX 4090
Micron 3400 2TB MTFDKBA2T0TFH
3289 MB/s +21%
Asus ROG Zephyrus G16 GU605MY
Samsung PM9A1a MZVL22T0HDLB
2713 MB/s
Asus ROG Zephyrus G16 2024 GU605M
WD PC SN560 SDDPNQE-1T00
1921 MB/s -29%
4K Read
Average Samsung PM9A1a MZVL22T0HDLB
  (72.9 - 75.6, n=2)
74.2 MB/s +2%
Asus ROG Zephyrus G16 GU605MY
Samsung PM9A1a MZVL22T0HDLB
72.9 MB/s
Alienware x16 R2 P120F
WDC PC SN810 1TB
70.48 MB/s -3%
Average of class Gaming
  (27.8 - 112.1, n=156, last 2 years)
65.2 MB/s -11%
Razer Blade 16 2024, RTX 4090
Samsung PM9A1 MZVL22T0HBLB
61.1 MB/s -16%
SCHENKER XMG Neo 16 (Early 24)
Samsung 990 Pro 1 TB
59.28 MB/s -19%
Lenovo Legion 9 16IRX9, RTX 4090
Micron 3400 2TB MTFDKBA2T0TFH
55.9 MB/s -23%
Asus ROG Zephyrus G16 2024 GU605M
WD PC SN560 SDDPNQE-1T00
42.2 MB/s -42%
4K Write
SCHENKER XMG Neo 16 (Early 24)
Samsung 990 Pro 1 TB
248.48 MB/s +38%
Alienware x16 R2 P120F
WDC PC SN810 1TB
213.62 MB/s +18%
Average of class Gaming
  (108.8 - 512, n=156, last 2 years)
213 MB/s +18%
Average Samsung PM9A1a MZVL22T0HDLB
  (180.5 - 207, n=2)
193.9 MB/s +7%
Lenovo Legion 9 16IRX9, RTX 4090
Micron 3400 2TB MTFDKBA2T0TFH
188.6 MB/s +4%
Asus ROG Zephyrus G16 GU605MY
Samsung PM9A1a MZVL22T0HDLB
180.5 MB/s
Razer Blade 16 2024, RTX 4090
Samsung PM9A1 MZVL22T0HBLB
160.6 MB/s -11%
Asus ROG Zephyrus G16 2024 GU605M
WD PC SN560 SDDPNQE-1T00
157.9 MB/s -13%
4K-64 Read
SCHENKER XMG Neo 16 (Early 24)
Samsung 990 Pro 1 TB
2933.61 MB/s +269%
Alienware x16 R2 P120F
WDC PC SN810 1TB
2569.34 MB/s +224%
Lenovo Legion 9 16IRX9, RTX 4090
Micron 3400 2TB MTFDKBA2T0TFH
2439 MB/s +207%
Razer Blade 16 2024, RTX 4090
Samsung PM9A1 MZVL22T0HBLB
2350 MB/s +196%
Average of class Gaming
  (451 - 3475, n=156, last 2 years)
1881 MB/s +137%
Average Samsung PM9A1a MZVL22T0HDLB
  (794 - 2637, n=2)
1715 MB/s +116%
Asus ROG Zephyrus G16 GU605MY
Samsung PM9A1a MZVL22T0HDLB
794 MB/s
Asus ROG Zephyrus G16 2024 GU605M
WD PC SN560 SDDPNQE-1T00
612 MB/s -23%
4K-64 Write
SCHENKER XMG Neo 16 (Early 24)
Samsung 990 Pro 1 TB
3252.43 MB/s +4%
Asus ROG Zephyrus G16 GU605MY
Samsung PM9A1a MZVL22T0HDLB
3136 MB/s
Average Samsung PM9A1a MZVL22T0HDLB
  (2867 - 3136, n=2)
3001 MB/s -4%
Alienware x16 R2 P120F
WDC PC SN810 1TB
2648.4 MB/s -16%
Average of class Gaming
  (277 - 5909, n=156, last 2 years)
2527 MB/s -19%
Razer Blade 16 2024, RTX 4090
Samsung PM9A1 MZVL22T0HBLB
2226 MB/s -29%
Lenovo Legion 9 16IRX9, RTX 4090
Micron 3400 2TB MTFDKBA2T0TFH
2168 MB/s -31%
Asus ROG Zephyrus G16 2024 GU605M
WD PC SN560 SDDPNQE-1T00
1458 MB/s -54%
Access Time Read
Alienware x16 R2 P120F
WDC PC SN810 1TB
0.09 ms * -275%
Average of class Gaming
  (0.016 - 0.379, n=155, last 2 years)
0.05576 ms * -132%
Average Samsung PM9A1a MZVL22T0HDLB
  (0.024 - 0.046, n=2)
0.035 ms * -46%
Lenovo Legion 9 16IRX9, RTX 4090
Micron 3400 2TB MTFDKBA2T0TFH
0.034 ms * -42%
Razer Blade 16 2024, RTX 4090
Samsung PM9A1 MZVL22T0HBLB
0.033 ms * -38%
Asus ROG Zephyrus G16 2024 GU605M
WD PC SN560 SDDPNQE-1T00
0.032 ms * -33%
Asus ROG Zephyrus G16 GU605MY
Samsung PM9A1a MZVL22T0HDLB
0.024 ms *
SCHENKER XMG Neo 16 (Early 24)
Samsung 990 Pro 1 TB
0.024 ms * -0%
Access Time Write
Alienware x16 R2 P120F
WDC PC SN810 1TB
0.055 ms * -139%
Average of class Gaming
  (0.011 - 1.028, n=156, last 2 years)
0.04728 ms * -106%
Razer Blade 16 2024, RTX 4090
Samsung PM9A1 MZVL22T0HBLB
0.025 ms * -9%
Asus ROG Zephyrus G16 2024 GU605M
WD PC SN560 SDDPNQE-1T00
0.023 ms * -0%
Asus ROG Zephyrus G16 GU605MY
Samsung PM9A1a MZVL22T0HDLB
0.023 ms *
Lenovo Legion 9 16IRX9, RTX 4090
Micron 3400 2TB MTFDKBA2T0TFH
0.023 ms * -0%
Average Samsung PM9A1a MZVL22T0HDLB
  (0.022 - 0.023, n=2)
0.0225 ms * +2%
SCHENKER XMG Neo 16 (Early 24)
Samsung 990 Pro 1 TB
0.016 ms * +30%

* ... smaller is better

Continuous Performance Read: DiskSpd Read Loop, Queue Depth 8

036072010801440180021602520288032403600396043204680504054005760612064806840Tooltip
Asus ROG Zephyrus G16 GU605MY; diskspd 2.0.17 f: Ø7094 (6297.96-7117.29)

Placa de vídeo - GeForce RTX 4090 laptop

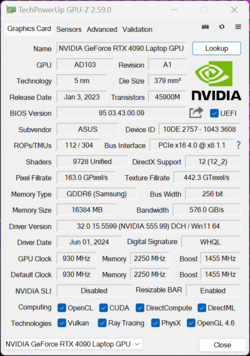
GPU-Z GeForce Laptop RTX 4090

O Zephyrus G16 está disponível com toda a gama de modelos atuais de laptops GeForce RTX (4050-4090), mas o design fino se destaca nas variantes rápidas. No modo turbo, o laptop GeForce Laptop RTX 4090 opera apenas com um TGP de 95 watts + 20 watts de aumento dinâmico, o que significa que está um pouco distante da configuração máxima de 175 watts (150 TGP + 25 watts de aumento dinâmico). Isso é algo que os possíveis compradores devem saber para evitar decepções posteriores. Nos benchmarks de GPU, podemos ver claramente a desvantagem em comparação com outros modelos de laptop RTX 4090 que são entre 15 e 26% mais rápidos. Até mesmo o laptop Laptop RTX 4080 encontrado no Alienware x16 R2 (175W) é um pouco mais rápido do que o RTX 4090 instalado no Zephyrus G16.

A vantagem em comparação com o Zephyrus G16 com o laptop RTX 4070 fica em 50%, o que ainda é, obviamente, enorme - especialmente considerando o gabinete compacto. Basicamente, o laptop RTX 4070 (e também as versões mais fracas) pode alcançar melhor seu potencial quando combinado com o Zephyrus G16. Dependendo do caso de uso, uma quantidade maior de memória de vídeo (16 GB) pode ser uma vantagem adicional, por exemplo, ao editar vídeos.

Sob carga sustentada, o desempenho da GPU permanece estável; no entanto, no modo de bateria, a GPU pode consumir um máximo de 55 watts e é por isso que o desempenho da GPU cai significativamente aqui (-52%). Outros benchmarks de GPU podem ser encontrados aqui.

3DMark Performance Rating - Percent
SCHENKER XMG Neo 16 (Early 24)
NVIDIA GeForce RTX 4090 Laptop GPU, Intel Core i9-14900HX
100 pt
Average NVIDIA GeForce RTX 4090 Laptop GPU
 
93.9 pt
Lenovo Legion 9 16IRX9, RTX 4090
NVIDIA GeForce RTX 4090 Laptop GPU, Intel Core i9-14900HX
92.1 pt
Razer Blade 16 2024, RTX 4090
NVIDIA GeForce RTX 4090 Laptop GPU, Intel Core i9-14900HX
90.4 pt
Alienware x16 R2 P120F
NVIDIA GeForce RTX 4080 Laptop GPU, Intel Core Ultra 9 185H
82 pt
Asus ROG Zephyrus G16 GU605MY
NVIDIA GeForce RTX 4090 Laptop GPU, Intel Core Ultra 9 185H
79.1 pt
Average of class Gaming
 
60.9 pt
Asus ROG Zephyrus G16 2024 GU605M
NVIDIA GeForce RTX 4070 Laptop GPU, Intel Core Ultra 7 155H
52.7 pt
3DMark 11 - 1280x720 Performance GPU
SCHENKER XMG Neo 16 (Early 24)
NVIDIA GeForce RTX 4090 Laptop GPU, Intel Core i9-14900HX
69606 Points +29%
Razer Blade 16 2024, RTX 4090
NVIDIA GeForce RTX 4090 Laptop GPU, Intel Core i9-14900HX
65956 Points +22%
Average NVIDIA GeForce RTX 4090 Laptop GPU
  (54073 - 73027, n=42)
65041 Points +20%
Lenovo Legion 9 16IRX9, RTX 4090
NVIDIA GeForce RTX 4090 Laptop GPU, Intel Core i9-14900HX
64341 Points +19%
Alienware x16 R2 P120F
NVIDIA GeForce RTX 4080 Laptop GPU, Intel Core Ultra 9 185H
56772 Points +5%
Asus ROG Zephyrus G16 GU605MY
NVIDIA GeForce RTX 4090 Laptop GPU, Intel Core Ultra 9 185H
54073 Points
Average of class Gaming
  (1029 - 72178, n=183, last 2 years)
43810 Points -19%
Asus ROG Zephyrus G16 2024 GU605M
NVIDIA GeForce RTX 4070 Laptop GPU, Intel Core Ultra 7 155H
37313 Points -31%
3DMark
1920x1080 Fire Strike Graphics
SCHENKER XMG Neo 16 (Early 24)
NVIDIA GeForce RTX 4090 Laptop GPU, Intel Core i9-14900HX
51946 Points +29%
Razer Blade 16 2024, RTX 4090
NVIDIA GeForce RTX 4090 Laptop GPU, Intel Core i9-14900HX
46527 Points +16%
Average NVIDIA GeForce RTX 4090 Laptop GPU
  (40259 - 53059, n=41)
46365 Points +15%
Lenovo Legion 9 16IRX9, RTX 4090
NVIDIA GeForce RTX 4090 Laptop GPU, Intel Core i9-14900HX
43518 Points +8%
Alienware x16 R2 P120F
NVIDIA GeForce RTX 4080 Laptop GPU, Intel Core Ultra 9 185H
42558 Points +6%
Asus ROG Zephyrus G16 GU605MY
NVIDIA GeForce RTX 4090 Laptop GPU, Intel Core Ultra 9 185H
40259 Points
Average of class Gaming
  (781 - 53059, n=194, last 2 years)
31415 Points -22%
Asus ROG Zephyrus G16 2024 GU605M
NVIDIA GeForce RTX 4070 Laptop GPU, Intel Core Ultra 7 155H
26568 Points -34%
2560x1440 Time Spy Graphics
SCHENKER XMG Neo 16 (Early 24)
NVIDIA GeForce RTX 4090 Laptop GPU, Intel Core i9-14900HX
22134 Points +31%
Average NVIDIA GeForce RTX 4090 Laptop GPU
  (16950 - 23292, n=43)
20950 Points +24%
Lenovo Legion 9 16IRX9, RTX 4090
NVIDIA GeForce RTX 4090 Laptop GPU, Intel Core i9-14900HX
20416 Points +20%
Razer Blade 16 2024, RTX 4090
NVIDIA GeForce RTX 4090 Laptop GPU, Intel Core i9-14900HX
19878 Points +17%
Alienware x16 R2 P120F
NVIDIA GeForce RTX 4080 Laptop GPU, Intel Core Ultra 9 185H
18627 Points +10%
Asus ROG Zephyrus G16 GU605MY
NVIDIA GeForce RTX 4090 Laptop GPU, Intel Core Ultra 9 185H
16950 Points
Average of class Gaming
  (224 - 22717, n=189, last 2 years)
13118 Points -23%
Asus ROG Zephyrus G16 2024 GU605M
NVIDIA GeForce RTX 4070 Laptop GPU, Intel Core Ultra 7 155H
10989 Points -35%
Geekbench 6.3 - GPU OpenCL
SCHENKER XMG Neo 16 (Early 24)
NVIDIA GeForce RTX 4090 Laptop GPU, Intel Core i9-14900HX
190820 Points +18%
Lenovo Legion 9 16IRX9, RTX 4090
NVIDIA GeForce RTX 4090 Laptop GPU, Intel Core i9-14900HX
190540 Points +18%
Average NVIDIA GeForce RTX 4090 Laptop GPU
  (159127 - 209521, n=20)
187721 Points +16%
Razer Blade 16 2024, RTX 4090
NVIDIA GeForce RTX 4090 Laptop GPU, Intel Core i9-14900HX
167047 Points +3%
Asus ROG Zephyrus G16 GU605MY
NVIDIA GeForce RTX 4090 Laptop GPU, Intel Core Ultra 9 185H
161798 Points
Alienware x16 R2 P120F
NVIDIA GeForce RTX 4080 Laptop GPU, Intel Core Ultra 9 185H
153327 Points -5%
Average of class Gaming
  (4321 - 207373, n=110, last 2 years)
116145 Points -28%
Asus ROG Zephyrus G16 2024 GU605M
NVIDIA GeForce RTX 4070 Laptop GPU, Intel Core Ultra 7 155H
107953 Points -33%
3DMark 11 Performance
38012 pontos
3DMark Fire Strike Score
30964 pontos
3DMark Time Spy Score
15660 pontos
3DMark Steel Nomad Score
3915 pontos
Ajuda
Blender / v3.3 Classroom OPTIX/RTX
Asus ROG Zephyrus G16 2024 GU605M
NVIDIA GeForce RTX 4070 Laptop GPU, Intel Core Ultra 7 155H
22 Seconds * -69%
Average of class Gaming
  (9 - 95, n=178, last 2 years)
20.9 Seconds * -61%
Alienware x16 R2 P120F
NVIDIA GeForce RTX 4080 Laptop GPU, Intel Core Ultra 9 185H
15 Seconds * -15%
Asus ROG Zephyrus G16 GU605MY
NVIDIA GeForce RTX 4090 Laptop GPU, Intel Core Ultra 9 185H
13 Seconds *
Lenovo Legion 9 16IRX9, RTX 4090
NVIDIA GeForce RTX 4090 Laptop GPU, Intel Core i9-14900HX
13 Seconds * -0%
SCHENKER XMG Neo 16 (Early 24)
NVIDIA GeForce RTX 4090 Laptop GPU, Intel Core i9-14900HX
13 Seconds * -0%
Average NVIDIA GeForce RTX 4090 Laptop GPU
  (9 - 19, n=39)
12.1 Seconds * +7%
Razer Blade 16 2024, RTX 4090
NVIDIA GeForce RTX 4090 Laptop GPU, Intel Core i9-14900HX
12 Seconds * +8%
Blender / v3.3 Classroom CUDA
Average of class Gaming
  (16 - 175, n=183, last 2 years)
36.5 Seconds * -83%
Asus ROG Zephyrus G16 2024 GU605M
NVIDIA GeForce RTX 4070 Laptop GPU, Intel Core Ultra 7 155H
34 Seconds * -70%
Alienware x16 R2 P120F
NVIDIA GeForce RTX 4080 Laptop GPU, Intel Core Ultra 9 185H
22 Seconds * -10%
Asus ROG Zephyrus G16 GU605MY
NVIDIA GeForce RTX 4090 Laptop GPU, Intel Core Ultra 9 185H
20 Seconds *
Average NVIDIA GeForce RTX 4090 Laptop GPU
  (16 - 24, n=39)
18.3 Seconds * +8%
Razer Blade 16 2024, RTX 4090
NVIDIA GeForce RTX 4090 Laptop GPU, Intel Core i9-14900HX
18 Seconds * +10%
Lenovo Legion 9 16IRX9, RTX 4090
NVIDIA GeForce RTX 4090 Laptop GPU, Intel Core i9-14900HX
18 Seconds * +10%
SCHENKER XMG Neo 16 (Early 24)
NVIDIA GeForce RTX 4090 Laptop GPU, Intel Core i9-14900HX
17 Seconds * +15%
Blender / v3.3 Classroom CPU
Asus ROG Zephyrus G16 2024 GU605M
NVIDIA GeForce RTX 4070 Laptop GPU, Intel Core Ultra 7 155H
330 Seconds * -8%
Asus ROG Zephyrus G16 GU605MY
NVIDIA GeForce RTX 4090 Laptop GPU, Intel Core Ultra 9 185H
305 Seconds *
Alienware x16 R2 P120F
NVIDIA GeForce RTX 4080 Laptop GPU, Intel Core Ultra 9 185H
305 Seconds * -0%
Average of class Gaming
  (138 - 962, n=187, last 2 years)
294 Seconds * +4%
Razer Blade 16 2024, RTX 4090
NVIDIA GeForce RTX 4090 Laptop GPU, Intel Core i9-14900HX
202 Seconds * +34%
Average NVIDIA GeForce RTX 4090 Laptop GPU
  (144 - 305, n=39)
199.1 Seconds * +35%
Lenovo Legion 9 16IRX9, RTX 4090
NVIDIA GeForce RTX 4090 Laptop GPU, Intel Core i9-14900HX
193 Seconds * +37%
SCHENKER XMG Neo 16 (Early 24)
NVIDIA GeForce RTX 4090 Laptop GPU, Intel Core i9-14900HX
167 Seconds * +45%

* ... smaller is better

Desempenho em jogos

A imagem pintada nos testes de GPU também continua nos benchmarks de jogos, pois o laptop RTX 4090 encontrado no Zephyrus G16 combinado com o Core Ultra 185H fica visivelmente atrás da concorrência equipada com as CPUs HX e o laptop RTX 4090. O Alienware x16 R2 combinado com o Core Ultra 9 e o laptop RTX 4080 também oferece um desempenho ligeiramente melhor em jogos. Mais uma vez, o Zephyrus G16 com o laptop RTX 4070 é derrotado por completo, especialmente nos testes QHD.

Em suma, o Zephyrus G16 com o laptop RTX 4090 e o rápido painel OLED são maravilhosamente adequados para jogos. Em sua resolução QHD nativa, o senhor pode, sem hesitação, jogar todos os títulos atuais sem problemas com o máximo de detalhes. Entretanto, nosso loop Cyberpunk 2077 mostra que o desempenho dos jogos ao executar títulos exigentes não é totalmente estável e que há pequenas quedas de desempenho. Outros benchmarks de jogos podem ser encontrados aqui.

Performance Rating - Percent
SCHENKER XMG Neo 16 (Early 24)
Intel Core i9-14900HX, NVIDIA GeForce RTX 4090 Laptop GPU
99.8 pt
Lenovo Legion 9 16IRX9, RTX 4090
Intel Core i9-14900HX, NVIDIA GeForce RTX 4090 Laptop GPU
88 pt
Razer Blade 16 2024, RTX 4090
Intel Core i9-14900HX, NVIDIA GeForce RTX 4090 Laptop GPU
85.8 pt
Alienware x16 R2 P120F -1!
Intel Core Ultra 9 185H, NVIDIA GeForce RTX 4080 Laptop GPU
69.8 pt
Asus ROG Zephyrus G16 GU605MY
Intel Core Ultra 9 185H, NVIDIA GeForce RTX 4090 Laptop GPU
68.7 pt
Average of class Gaming
 
67.7 pt
Asus ROG Zephyrus G16 2024 GU605M
Intel Core Ultra 7 155H, NVIDIA GeForce RTX 4070 Laptop GPU
53.5 pt
GTA V - 1920x1080 Highest Settings possible AA:4xMSAA + FX AF:16x
SCHENKER XMG Neo 16 (Early 24)
Intel Core i9-14900HX, NVIDIA GeForce RTX 4090 Laptop GPU
159.3 (3.25min, 125P1) fps +49%
Razer Blade 16 2024, RTX 4090
Intel Core i9-14900HX, NVIDIA GeForce RTX 4090 Laptop GPU
138.1 (4.19min, 83.3P1) fps +29%
Lenovo Legion 9 16IRX9, RTX 4090
Intel Core i9-14900HX, NVIDIA GeForce RTX 4090 Laptop GPU
136.2 (0.938min, 111.1P1) fps +27%
Average of class Gaming
  (12.1 - 167.7, n=169, last 2 years)
113.7 fps +6%
Asus ROG Zephyrus G16 GU605MY
Intel Core Ultra 9 185H, NVIDIA GeForce RTX 4090 Laptop GPU
107.1 (3.03min, 66.7P1) fps
Asus ROG Zephyrus G16 2024 GU605M
Intel Core Ultra 7 155H, NVIDIA GeForce RTX 4070 Laptop GPU
98.8 (3.78min, 58.8P1) fps -8%
Cyberpunk 2077 2.1 Phantom Liberty - 1920x1080 Ultra Preset (FSR off)
SCHENKER XMG Neo 16 (Early 24)
Intel Core i9-14900HX, NVIDIA GeForce RTX 4090 Laptop GPU
131.5 (62.2min) fps +41%
Lenovo Legion 9 16IRX9, RTX 4090
Intel Core i9-14900HX, NVIDIA GeForce RTX 4090 Laptop GPU
127 (70.6min) fps +36%
Alienware x16 R2 P120F
Intel Core Ultra 9 185H, NVIDIA GeForce RTX 4080 Laptop GPU
99.7 (13.5min) fps +7%
Razer Blade 16 2024, RTX 4090
Intel Core i9-14900HX, NVIDIA GeForce RTX 4090 Laptop GPU
95.35 (70.51min) fps +2%
Asus ROG Zephyrus G16 GU605MY
Intel Core Ultra 9 185H, NVIDIA GeForce RTX 4090 Laptop GPU
93.1 (64.5min) fps
Average of class Gaming
  (6.76 - 144.7, n=80, last 2 years)
86.5 fps -7%
Asus ROG Zephyrus G16 2024 GU605M
Intel Core Ultra 7 155H, NVIDIA GeForce RTX 4070 Laptop GPU
69 fps -26%
Final Fantasy XV Benchmark - 1920x1080 High Quality
SCHENKER XMG Neo 16 (Early 24)
Intel Core i9-14900HX, NVIDIA GeForce RTX 4090 Laptop GPU
196.9 fps +43%
Lenovo Legion 9 16IRX9, RTX 4090
Intel Core i9-14900HX, NVIDIA GeForce RTX 4090 Laptop GPU
165.1 fps +20%
Alienware x16 R2 P120F
Intel Core Ultra 9 185H, NVIDIA GeForce RTX 4080 Laptop GPU
139.8 fps +1%
Asus ROG Zephyrus G16 GU605MY
Intel Core Ultra 9 185H, NVIDIA GeForce RTX 4090 Laptop GPU
138 fps
Razer Blade 16 2024, RTX 4090
Intel Core i9-14900HX, NVIDIA GeForce RTX 4090 Laptop GPU
137.5 fps 0%
Average of class Gaming
  (19.2 - 201, n=181, last 2 years)
119.8 fps -13%
Asus ROG Zephyrus G16 2024 GU605M
Intel Core Ultra 7 155H, NVIDIA GeForce RTX 4070 Laptop GPU
100.8 fps -27%
Strange Brigade - 1920x1080 ultra AA:ultra AF:16
SCHENKER XMG Neo 16 (Early 24)
Intel Core i9-14900HX, NVIDIA GeForce RTX 4090 Laptop GPU
403 (101.2min, 295P1) fps +40%
Lenovo Legion 9 16IRX9, RTX 4090
Intel Core i9-14900HX, NVIDIA GeForce RTX 4090 Laptop GPU
369 (5min, 269P1) fps +28%
Razer Blade 16 2024, RTX 4090
Intel Core i9-14900HX, NVIDIA GeForce RTX 4090 Laptop GPU
359.8 (30.2min, 253P1) fps +25%
Alienware x16 R2 P120F
Intel Core Ultra 9 185H, NVIDIA GeForce RTX 4080 Laptop GPU
293 (38.3min, 184.1P1) fps +2%
Asus ROG Zephyrus G16 GU605MY
Intel Core Ultra 9 185H, NVIDIA GeForce RTX 4090 Laptop GPU
288 fps
Average of class Gaming
  (38.9 - 421, n=178, last 2 years)
229 fps -20%
Asus ROG Zephyrus G16 2024 GU605M
Intel Core Ultra 7 155H, NVIDIA GeForce RTX 4070 Laptop GPU
129.3 (30.4min, 84.7P1) fps -55%
Dota 2 Reborn - 1920x1080 ultra (3/3) best looking
SCHENKER XMG Neo 16 (Early 24)
Intel Core i9-14900HX, NVIDIA GeForce RTX 4090 Laptop GPU
194.6 (165.7min) fps +40%
Razer Blade 16 2024, RTX 4090
Intel Core i9-14900HX, NVIDIA GeForce RTX 4090 Laptop GPU
188.1 (155.2min) fps +36%
Lenovo Legion 9 16IRX9, RTX 4090
Intel Core i9-14900HX, NVIDIA GeForce RTX 4090 Laptop GPU
164.5 (136min) fps +19%
Average of class Gaming
  (65.1 - 220, n=186, last 2 years)
151 fps +9%
Asus ROG Zephyrus G16 GU605MY
Intel Core Ultra 9 185H, NVIDIA GeForce RTX 4090 Laptop GPU
138.7 (119.5min) fps
Alienware x16 R2 P120F
Intel Core Ultra 9 185H, NVIDIA GeForce RTX 4080 Laptop GPU
133 (114.6min) fps -4%
Asus ROG Zephyrus G16 2024 GU605M
Intel Core Ultra 7 155H, NVIDIA GeForce RTX 4070 Laptop GPU
131.6 (114.5min) fps -5%
X-Plane 11.11 - 1920x1080 high (fps_test=3)
Razer Blade 16 2024, RTX 4090
Intel Core i9-14900HX, NVIDIA GeForce RTX 4090 Laptop GPU
146.2 fps +62%
SCHENKER XMG Neo 16 (Early 24)
Intel Core i9-14900HX, NVIDIA GeForce RTX 4090 Laptop GPU
144.5 fps +61%
Lenovo Legion 9 16IRX9, RTX 4090
Intel Core i9-14900HX, NVIDIA GeForce RTX 4090 Laptop GPU
125.6 fps +40%
Average of class Gaming
  (32.8 - 166.2, n=192, last 2 years)
108.2 fps +20%
Asus ROG Zephyrus G16 GU605MY
Intel Core Ultra 9 185H, NVIDIA GeForce RTX 4090 Laptop GPU
90 fps
Alienware x16 R2 P120F
Intel Core Ultra 9 185H, NVIDIA GeForce RTX 4080 Laptop GPU
89.3 fps -1%
Asus ROG Zephyrus G16 2024 GU605M
Intel Core Ultra 7 155H, NVIDIA GeForce RTX 4070 Laptop GPU
81.2 fps -10%
Cyberpunk 2077 2.1 Phantom Liberty
1920x1080 Ultra Preset (FSR off)
SCHENKER XMG Neo 16 (Early 24)
Intel Core i9-14900HX, NVIDIA GeForce RTX 4090 Laptop GPU
131.5 (62.2min) fps +41%
Lenovo Legion 9 16IRX9, RTX 4090
Intel Core i9-14900HX, NVIDIA GeForce RTX 4090 Laptop GPU
127 (70.6min) fps +36%
Average NVIDIA GeForce RTX 4090 Laptop GPU
  (93.1 - 144.7, n=19)
120.8 fps +30%
Alienware x16 R2 P120F
Intel Core Ultra 9 185H, NVIDIA GeForce RTX 4080 Laptop GPU
99.7 (13.5min) fps +7%
Razer Blade 16 2024, RTX 4090
Intel Core i9-14900HX, NVIDIA GeForce RTX 4090 Laptop GPU
95.35 (70.51min) fps +2%
Asus ROG Zephyrus G16 GU605MY
Intel Core Ultra 9 185H, NVIDIA GeForce RTX 4090 Laptop GPU
93.1 (64.5min) fps
Average of class Gaming
  (6.76 - 144.7, n=80, last 2 years)
86.5 fps -7%
Asus ROG Zephyrus G16 2024 GU605M
Intel Core Ultra 7 155H, NVIDIA GeForce RTX 4070 Laptop GPU
69 fps -26%
2560x1440 Ultra Preset (FSR off)
SCHENKER XMG Neo 16 (Early 24)
Intel Core i9-14900HX, NVIDIA GeForce RTX 4090 Laptop GPU
93.8 (53.7min) fps +38%
Average NVIDIA GeForce RTX 4090 Laptop GPU
  (68.1 - 103.9, n=19)
89.9 fps +32%
Lenovo Legion 9 16IRX9, RTX 4090
Intel Core i9-14900HX, NVIDIA GeForce RTX 4090 Laptop GPU
86 (70.4min) fps +26%
Razer Blade 16 2024, RTX 4090
Intel Core i9-14900HX, NVIDIA GeForce RTX 4090 Laptop GPU
83.39 (67.14min) fps +22%
Alienware x16 R2 P120F
Intel Core Ultra 9 185H, NVIDIA GeForce RTX 4080 Laptop GPU
75.4 (25.4min) fps +11%
Asus ROG Zephyrus G16 GU605MY
Intel Core Ultra 9 185H, NVIDIA GeForce RTX 4090 Laptop GPU
68.1 (55.3min) fps
Average of class Gaming
  (24.8 - 110, n=69, last 2 years)
64.9 fps -5%
Asus ROG Zephyrus G16 2024 GU605M
Intel Core Ultra 7 155H, NVIDIA GeForce RTX 4070 Laptop GPU
43.7 fps -36%
F1 23
1920x1080 Ultra High Preset AA:T AF:16x
Lenovo Legion 9 16IRX9, RTX 4090
Intel Core i9-14900HX, NVIDIA GeForce RTX 4090 Laptop GPU
149.2 (10min, 97P1) fps +73%
Average NVIDIA GeForce RTX 4090 Laptop GPU
  (86.2 - 149.2, n=9)
120.4 fps +40%
Razer Blade 16 2024, RTX 4090
Intel Core i9-14900HX, NVIDIA GeForce RTX 4090 Laptop GPU
113.2 (94min, 78P1) fps +31%
Asus ROG Zephyrus G16 GU605MY
Intel Core Ultra 9 185H, NVIDIA GeForce RTX 4090 Laptop GPU
86.2 (59min, 67P1) fps
Average of class Gaming
  (12.9 - 149.2, n=40, last 2 years)
70.8 fps -18%
Asus ROG Zephyrus G16 2024 GU605M
Intel Core Ultra 7 155H, NVIDIA GeForce RTX 4070 Laptop GPU
55.8 (45min, 43P1) fps -35%
2560x1440 Ultra High Preset AA:T AF:16x
Lenovo Legion 9 16IRX9, RTX 4090
Intel Core i9-14900HX, NVIDIA GeForce RTX 4090 Laptop GPU
144.6 (2min, 80P1) fps +149%
Average NVIDIA GeForce RTX 4090 Laptop GPU
  (58 - 144.6, n=9)
83.7 fps +44%
Razer Blade 16 2024, RTX 4090
Intel Core i9-14900HX, NVIDIA GeForce RTX 4090 Laptop GPU
72.4 (58min, 56P1) fps +25%
Asus ROG Zephyrus G16 GU605MY
Intel Core Ultra 9 185H, NVIDIA GeForce RTX 4090 Laptop GPU
58 (36min, 46P1) fps
Average of class Gaming
  (17 - 144.6, n=31, last 2 years)
50.5 fps -13%
Asus ROG Zephyrus G16 2024 GU605M
Intel Core Ultra 7 155H, NVIDIA GeForce RTX 4070 Laptop GPU
36 (22min, 28P1) fps -38%
F1 24
1920x1080 Ultra High Preset AA:T AF:16x
SCHENKER XMG Neo 16 (Early 24)
Intel Core i9-14900HX, NVIDIA GeForce RTX 4090 Laptop GPU
127 (78min, 90P1) fps +44%
Lenovo Legion 9 16IRX9, RTX 4090
Intel Core i9-14900HX, NVIDIA GeForce RTX 4090 Laptop GPU
113.6 (14min, 69P1) fps +29%
Average NVIDIA GeForce RTX 4090 Laptop GPU
  (88 - 127, n=4)
112.2 fps +28%
Asus ROG Zephyrus G16 GU605MY
Intel Core Ultra 9 185H, NVIDIA GeForce RTX 4090 Laptop GPU
88 (55min, 58P1) fps
Average of class Gaming
  (54.1 - 127, n=14, last 2 years)
78.2 fps -11%
2560x1440 Ultra High Preset AA:T AF:16x
SCHENKER XMG Neo 16 (Early 24)
Intel Core i9-14900HX, NVIDIA GeForce RTX 4090 Laptop GPU
84.7 (69min, 68P1) fps +45%
Average NVIDIA GeForce RTX 4090 Laptop GPU
  (58.5 - 84.7, n=4)
73.6 fps +26%
Lenovo Legion 9 16IRX9, RTX 4090
Intel Core i9-14900HX, NVIDIA GeForce RTX 4090 Laptop GPU
72.1 (2min, 56P1) fps +23%
Asus ROG Zephyrus G16 GU605MY
Intel Core Ultra 9 185H, NVIDIA GeForce RTX 4090 Laptop GPU
58.5 (49min, 47P1) fps
Average of class Gaming
  (36.7 - 84.7, n=11, last 2 years)
54.6 fps -7%
Baldur's Gate 3
1920x1080 Ultra Preset
Average NVIDIA GeForce RTX 4090 Laptop GPU
  (118 - 208, n=7)
177.5 fps +50%
Alienware x16 R2 P120F
Intel Core Ultra 9 185H, NVIDIA GeForce RTX 4080 Laptop GPU
159.4 fps +35%
Asus ROG Zephyrus G16 GU605MY
Intel Core Ultra 9 185H, NVIDIA GeForce RTX 4090 Laptop GPU
118 fps
Average of class Gaming
  (34.5 - 208, n=45, last 2 years)
103.5 fps -12%
2560x1440 Ultra Preset
Average NVIDIA GeForce RTX 4090 Laptop GPU
  (99 - 155.2, n=7)
133.2 fps +35%
Alienware x16 R2 P120F
Intel Core Ultra 9 185H, NVIDIA GeForce RTX 4080 Laptop GPU
124.3 fps +26%
Asus ROG Zephyrus G16 GU605MY
Intel Core Ultra 9 185H, NVIDIA GeForce RTX 4090 Laptop GPU
99 fps
Average of class Gaming
  (44 - 155.2, n=34, last 2 years)
82.2 fps -17%
Horizon Forbidden West
1920x1080 Very High Preset AA:T
SCHENKER XMG Neo 16 (Early 24)
Intel Core i9-14900HX, NVIDIA GeForce RTX 4090 Laptop GPU
125.2 (73.2min, 82.8P0.1, 91.6P1) fps +55%
Average NVIDIA GeForce RTX 4090 Laptop GPU
  (81 - 125.2, n=3)
100 fps +23%
Asus ROG Zephyrus G16 GU605MY
Intel Core Ultra 9 185H, NVIDIA GeForce RTX 4090 Laptop GPU
81 fps
Average of class Gaming
  (14.7 - 125.2, n=10, last 2 years)
66.7 fps -18%
2560x1440 Very High Preset AA:T
SCHENKER XMG Neo 16 (Early 24)
Intel Core i9-14900HX, NVIDIA GeForce RTX 4090 Laptop GPU
98 (65.7min, 67.6P0.1, 76.8P1) fps +48%
Average NVIDIA GeForce RTX 4090 Laptop GPU
  (66 - 98, n=3)
79.7 fps +21%
Asus ROG Zephyrus G16 GU605MY
Intel Core Ultra 9 185H, NVIDIA GeForce RTX 4090 Laptop GPU
66 fps
Average of class Gaming
  (24.1 - 98, n=9, last 2 years)
57.1 fps -13%
Call of Duty Modern Warfare 3 2023
1920x1080 Extreme Preset
Razer Blade 16 2024, RTX 4090
Intel Core i9-14900HX, NVIDIA GeForce RTX 4090 Laptop GPU
179 fps +21%
Average NVIDIA GeForce RTX 4090 Laptop GPU
  (148 - 205, n=7)
175.1 fps +18%
Asus ROG Zephyrus G16 GU605MY
Intel Core Ultra 9 185H, NVIDIA GeForce RTX 4090 Laptop GPU
148 fps
Average of class Gaming
  (27 - 205, n=18, last 2 years)
112.5 fps -24%
Asus ROG Zephyrus G16 2024 GU605M
Intel Core Ultra 7 155H, NVIDIA GeForce RTX 4070 Laptop GPU
94 fps -36%
2560x1440 Extreme Preset
Average NVIDIA GeForce RTX 4090 Laptop GPU
  (113 - 162, n=7)
138.6 fps +23%
Razer Blade 16 2024, RTX 4090
Intel Core i9-14900HX, NVIDIA GeForce RTX 4090 Laptop GPU
138 fps +22%
Asus ROG Zephyrus G16 GU605MY
Intel Core Ultra 9 185H, NVIDIA GeForce RTX 4090 Laptop GPU
113 fps
Average of class Gaming
  (48 - 162, n=15, last 2 years)
95.9 fps -15%
Asus ROG Zephyrus G16 2024 GU605M
Intel Core Ultra 7 155H, NVIDIA GeForce RTX 4070 Laptop GPU
64 fps -43%

Cyberpunk 2077 ultra FPS diagram

05101520253035404550556065707580Tooltip
Asus ROG Zephyrus G16 GU605MY Ultra 9 185H, NVIDIA GeForce RTX 4090 Laptop GPU: Ø70.9 (62.3-84.9)
baixomédiaaltoultraQHD DLSSQHD4K DLSS4K
GTA V (2015) 172.6 107.1 103.4 139.9
Dota 2 Reborn (2015) 172.2 150.8 150.3 138.7 135.8
Final Fantasy XV Benchmark (2018) 183.5 168.4 138 113.3 68.9
X-Plane 11.11 (2018) 138.3 111.7 90 75.7
Far Cry 5 (2018) 138 128 117 115 80
Strange Brigade (2018) 431 340 314 288 225 120
Star Wars Jedi Survivor (2023) 173 166 154 148 114 59
F1 23 (2023) 215 217 211 86.2 58 50.1 30.2
Baldur's Gate 3 (2023) 144 126 123 118 99 57
Cyberpunk 2077 2.1 Phantom Liberty (2023) 119.8 106.6 109.6 93.1 68.1 32.9
Call of Duty Modern Warfare 3 2023 (2023) 204 189 155 148 113 73
Horizon Forbidden West (2024) 117 110 89 81 66 42.5
F1 24 (2024) 230 232 216 88 58.5 49.8 30.3
Black Myth: Wukong (2024) 67 40 44 39

Emissões - a câmara de vapor geralmente é mais barulhenta

Emissões de ruído

O volume do ventilador depende muito do perfil de energia selecionado. Em uso inativo e com pouca carga, o Zephyrus G16 permanece muito silencioso, mesmo nos perfis mais rápidos. Ao jogar e usar os perfis Quiet e Performance, o resfriamento da câmara de vapor fica um pouco mais alto do que no modelo RTX 4070 e, sem fones de ouvido, só é possível jogar adequadamente usando o perfil Quiet . No modo turbo, isso chega a 52,3 dB(A), o que representa o volume máximo da ventoinha da variante RTX 4070. No entanto, a concorrência fica ainda um pouco mais barulhenta, com a única exceção sendo o Blade 16 - embora não se possa chamar 50 dB(A) de silencioso. Nosso dispositivo de análise não emitiu nenhum outro ruído eletrônico. De acordo com a Asus, o problema que encontramos com a terceira ventoinha em nossa análise da variante RTX 4070 deve ter sido corrigido por meio de uma atualização do BIOS.

ROG Zephyrus G16 RTX 4070 Laptop
Perfil de energia 3DMark 06 Cyberpunk 2077 teste de estresse
Silencioso 30,9 dB(A) 41,4 dB(A) 41,4 dB(A)
Desempenho 36,1 dB(A) 48,1 dB(A) 48,1 dB(A)
Turbo 49,2 dB(A) 52,3 dB(A) 52,3 dB(A)
ROG Zephyrus G16 RTX 4070 Laptop
Perfil de energia 3DMark 06 Cyberpunk 2077 teste de estresse
Silencioso 30,4 dB(A) 41,5 dB(A) 41,5 dB(A)
Desempenho 34,2 dB(A) 46,4 dB(A) 46,4 dB(A)
Turbo 41,5 dB(A) 52,4 dB(A) 52,4 dB(A)

Barulho

Ocioso
24.6 / 27.8 / 31.9 dB
Carga
49.2 / 52.3 dB
  red to green bar
 
 
30 dB
silencioso
40 dB(A)
audível
50 dB(A)
ruidosamente alto
 
min: dark, med: mid, max: light   Earthworks M23R, Arta (15 cm de distância)   environment noise: 24.6 dB(A)
dB(A) 0102030405060708090Deep BassMiddle BassHigh BassLower RangeMidsHigher MidsLower HighsMid HighsUpper HighsSuper Highs2044.441.143.540.840.240.62538.538.432.435.430.637.3313434.627.129.128.332.74031.532.528.231.130.6315026.730.62425.724.8296327.62824.225.527.528.68027.228.621.421.824.9271002627.421.323.322.226.612528.22720.521.421.428.116026.929.219.420.920.128.12003331.321.421.719.131.725029.831.821.621.121.732.831530.333.118.719.515.632.140031.833.818.320.314.13350032.335.517.421.21234.663030.934.216.218.61233.480034.437.416.420.311.336.4100037.141.516.921.71139125038.342.417.723.610.940.9160039.342.116.424.2114220004043.915.520.711.142.7250038.643.914.819.811.441.8315035.540.213.616.211.939.4400032.338.113.414.512.236.2500031.837.1141412.535.5630031.738.513.913.712.536.5800026.535.213.413.412.732.61000021.729.913.213.212.927.11250019.427.313.213.512.624.6160001521.812.512.511.718.8SPL4852.327.831.924.651N5.8811.40.67.3median 31.8median 35.2median 16.4median 20.3median 12.5median 33.4Delta4.55.22.62.82.65hearing rangehide median Fan NoiseAsus ROG Zephyrus G16 GU605MY
Asus ROG Zephyrus G16 GU605MY
NVIDIA GeForce RTX 4090 Laptop GPU, Ultra 9 185H, Samsung PM9A1a MZVL22T0HDLB
SCHENKER XMG Neo 16 (Early 24)
NVIDIA GeForce RTX 4090 Laptop GPU, i9-14900HX, Samsung 990 Pro 1 TB
Lenovo Legion 9 16IRX9, RTX 4090
NVIDIA GeForce RTX 4090 Laptop GPU, i9-14900HX, Micron 3400 2TB MTFDKBA2T0TFH
Alienware x16 R2 P120F
NVIDIA GeForce RTX 4080 Laptop GPU, Ultra 9 185H, WDC PC SN810 1TB
Razer Blade 16 2024, RTX 4090
NVIDIA GeForce RTX 4090 Laptop GPU, i9-14900HX, Samsung PM9A1 MZVL22T0HBLB
Asus ROG Zephyrus G16 2024 GU605M
NVIDIA GeForce RTX 4070 Laptop GPU, Ultra 7 155H, WD PC SN560 SDDPNQE-1T00
Noise
-5%
12%
9%
10%
9%
off / environment *
24.6
26
-6%
23
7%
23.4
5%
23
7%
23.9
3%
Idle Minimum *
24.6
28
-14%
23
7%
23.8
3%
23
7%
23.9
3%
Idle Average *
27.8
29
-4%
23
17%
28.5
-3%
23
17%
27.8
-0%
Idle Maximum *
31.9
31
3%
23
28%
28.5
11%
27.66
13%
30.1
6%
Load Average *
49.2
51
-4%
39
21%
28.8
41%
43.76
11%
34.2
30%
Cyberpunk 2077 ultra *
52.3
Load Maximum *
52.3
56
-7%
55.56
-6%
54.2
-4%
50.37
4%
46.4
11%
Witcher 3 ultra *
54
55.32
49.5
46.81
46.4

* ... smaller is better

Temperatura

Em uso simples e executando tarefas simples, as superfícies metálicas do gabinete permanecem muito frias e o senhor pode colocar o dispositivo no colo sem hesitar. Ao jogar e no teste de estresse, medimos temperaturas da unidade básica de até 47 °C no meio da área traseira. Isso não é motivo de preocupação, mas o senhor não deve usar o dispositivo no colo em tais situações. Na parte superior da unidade básica, a área central acima do teclado é propensa ao aquecimento, mas o teclado em si permanece significativamente mais frio, com temperaturas máximas de 40 °C no meio e cerca de 36 °C em ambos os lados. Isso significa que a digitação ocorre sem problemas e os jogos também são uma experiência sem restrições.

 43.1 °C45.9 °C44.5 °C 
 34.9 °C39.9 °C36.9 °C 
 30.8 °C29.2 °C30.5 °C 
Máximo: 45.9 °C
Médio: 37.3 °C
47.5 °C46.1 °C47.2 °C
32.8 °C44.5 °C39.5 °C
30.4 °C32.1 °C31.2 °C
Máximo: 47.5 °C
Médio: 39 °C
alimentação elétrica  45.9 °C | Temperatura do quarto 21.8 °C | Fluke t3000FC (calibrated), Voltcraft IR-900
(±) The average temperature for the upper side under maximal load is 37.3 °C / 99 F, compared to the average of 33.9 °C / 93 F for the devices in the class Gaming.
(-) The maximum temperature on the upper side is 45.9 °C / 115 F, compared to the average of 40.5 °C / 105 F, ranging from 21.2 to 68.8 °C for the class Gaming.
(-) The bottom heats up to a maximum of 47.5 °C / 118 F, compared to the average of 43.2 °C / 110 F
(+) In idle usage, the average temperature for the upper side is 25.3 °C / 78 F, compared to the device average of 33.9 °C / 93 F.
(±) 3: The average temperature for the upper side is 36.7 °C / 98 F, compared to the average of 33.9 °C / 93 F for the class Gaming.
(+) The palmrests and touchpad are cooler than skin temperature with a maximum of 30.8 °C / 87.4 F and are therefore cool to the touch.
(±) The average temperature of the palmrest area of similar devices was 28.9 °C / 84 F (-1.9 °C / -3.4 F).
Temperaturas da superfície do teste de estresse (topo)
Temperaturas da superfície do teste de estresse (parte inferior)
Asus ROG Zephyrus G16 GU605MY
Intel Core Ultra 9 185H, NVIDIA GeForce RTX 4090 Laptop GPU
SCHENKER XMG Neo 16 (Early 24)
Intel Core i9-14900HX, NVIDIA GeForce RTX 4090 Laptop GPU
Lenovo Legion 9 16IRX9, RTX 4090
Intel Core i9-14900HX, NVIDIA GeForce RTX 4090 Laptop GPU
Alienware x16 R2 P120F
Intel Core Ultra 9 185H, NVIDIA GeForce RTX 4080 Laptop GPU
Razer Blade 16 2024, RTX 4090
Intel Core i9-14900HX, NVIDIA GeForce RTX 4090 Laptop GPU
Asus ROG Zephyrus G16 2024 GU605M
Intel Core Ultra 7 155H, NVIDIA GeForce RTX 4070 Laptop GPU
Heat
-6%
-32%
-23%
-4%
-8%
Maximum Upper Side *
45.9
47
-2%
56
-22%
51
-11%
45
2%
50.3
-10%
Maximum Bottom *
47.5
56
-18%
53
-12%
50.8
-7%
45
5%
48
-1%
Idle Upper Side *
26.1
27
-3%
38
-46%
36.6
-40%
29
-11%
28.8
-10%
Idle Bottom *
26.6
27
-2%
39
-47%
35.2
-32%
30
-13%
29.8
-12%

* ... smaller is better

Teste de estresse

No teste de estresse com carga combinada de CPU/GPU, o modelo superior Zephyrus não conseguiu ter um desempenho consistente. O consumo de energia da CPU flutuou periodicamente entre 40-80 watts e, após uma hora, ficou em uma média de 53 watts. A placa de vídeo não está sujeita a flutuações tão grandes, mas ainda opera "apenas" com cerca de 58 watts. De acordo com a Asus, nesse cenário, esses valores deveriam ser de 35 watts para o processador e 95 watts para a placa de vídeo; no entanto, não conseguimos reproduzir esses valores.

Dados do teste de estresse da CPU/GPU

Alto-falantes

dB(A) 0102030405060708090Deep BassMiddle BassHigh BassLower RangeMidsHigher MidsLower HighsMid HighsUpper HighsSuper Highs2040.246.32530.637.43128.3364030.637.25024.839.26327.543.98024.951.810022.263.112521.468.116020.165.820019.17125021.772.731515.673.140014.173.95001272.86301274.980011.37610001172.4125010.97316001169.7200011.168250011.469315011.968400012.270.6500012.568.5630012.564.8800012.769.51000012.966.61250012.663.31600011.761.6SPL24.683N0.663.4median 12.5median 69.5Delta2.6338.136.532.836.844.146.527.830.520.533.626.43217.438.721.549.818.447.619.255.422.260.819.163.217.561.71664.515.570.913.475.21275.113.275.612.875.91475.613.373.212.873.113.174.713.273.21377.813.574.913.972.714.465.31360.612.555.525.986.40.871.1median 13.5median 72.727.132.124.832.128.423.428.429.728.229.725.716.525.729.222.129.232.123.832.135.412.335.441.319.741.344.314.944.350.61150.654.616.554.655.414.755.46412.46466.110.966.165.89.265.8667.86670.78.770.768.88.668.867.8967.867.59.867.571.210.171.266.31166.366.811.266.861.111.761.161.511.861.563.21263.264.212.164.264.812.164.864.812.564.865.711.165.779237945.80.445.8median 64.8median 11.2median 64.84.81.94.837.831.737.838.824.638.841.621.341.641.718.741.744.720.444.745.119.245.152.820.152.859.717.359.764.414.164.472.614.472.676.213.876.281.514.581.582.414.182.480.813.680.879.911.779.981.411.481.476.71276.773.51173.577.310.577.37811.17880.511.880.58011.88079.511.379.573.711.473.774.311.774.373.912.173.971137173.212.873.269.311.969.369.611.469.689.923.989.993.70.593.7median 76.7median 11.9median 76.73.81.33.83032.83030.931.430.935.742.935.723.728.123.726.219.726.231.216.431.245.113.845.145.919.845.951.414.551.45913.95964.117.864.168.614.368.667.19.667.167.68.567.672.97.572.977.47.477.4717.77164.88.164.865.88.265.867.58.867.568.89.868.868.710.568.77010.67066.410.966.467.311.267.36411.56464.711.664.767126763.211.863.25510.75581.222.581.254.70.454.7median 67median 10.7median 673.62.53.6hearing rangehide median Pink NoiseAsus ROG Zephyrus G16 GU605MYSCHENKER XMG Neo 16 (Early 24)Lenovo Legion 9 16IRX9, RTX 4090Alienware x16 R2 P120FRazer Blade 16 2024, RTX 4090
Frequency diagram (checkboxes can be checked and unchecked to compare devices)
Asus ROG Zephyrus G16 GU605MY audio analysis

(+) | speakers can play relatively loud (83 dB)
Bass 100 - 315 Hz
(+) | good bass - only 3.3% away from median
(±) | linearity of bass is average (7.6% delta to prev. frequency)
Mids 400 - 2000 Hz
(+) | balanced mids - only 3.4% away from median
(+) | mids are linear (3.1% delta to prev. frequency)
Highs 2 - 16 kHz
(+) | balanced highs - only 1.7% away from median
(+) | highs are linear (4.6% delta to prev. frequency)
Overall 100 - 16.000 Hz
(+) | overall sound is linear (6.5% difference to median)
Compared to same class
» 0% of all tested devices in this class were better, 0% similar, 100% worse
» The best had a delta of 6%, average was 18%, worst was 132%
Compared to all devices tested
» 1% of all tested devices were better, 0% similar, 99% worse
» The best had a delta of 4%, average was 25%, worst was 134%

SCHENKER XMG Neo 16 (Early 24) audio analysis

(+) | speakers can play relatively loud (86 dB)
Bass 100 - 315 Hz
(-) | nearly no bass - on average 16.3% lower than median
(±) | linearity of bass is average (8.6% delta to prev. frequency)
Mids 400 - 2000 Hz
(+) | balanced mids - only 3% away from median
(+) | mids are linear (3.6% delta to prev. frequency)
Highs 2 - 16 kHz
(+) | balanced highs - only 2.5% away from median
(+) | highs are linear (4.9% delta to prev. frequency)
Overall 100 - 16.000 Hz
(+) | overall sound is linear (12.4% difference to median)
Compared to same class
» 14% of all tested devices in this class were better, 3% similar, 83% worse
» The best had a delta of 6%, average was 18%, worst was 132%
Compared to all devices tested
» 9% of all tested devices were better, 2% similar, 89% worse
» The best had a delta of 4%, average was 25%, worst was 134%

Lenovo Legion 9 16IRX9, RTX 4090 audio analysis

(±) | speaker loudness is average but good (78.96 dB)
Bass 100 - 315 Hz
(±) | reduced bass - on average 13.2% lower than median
(±) | linearity of bass is average (8.9% delta to prev. frequency)
Mids 400 - 2000 Hz
(+) | balanced mids - only 3.2% away from median
(+) | mids are linear (3.4% delta to prev. frequency)
Highs 2 - 16 kHz
(+) | balanced highs - only 1.8% away from median
(+) | highs are linear (4% delta to prev. frequency)
Overall 100 - 16.000 Hz
(+) | overall sound is linear (11.3% difference to median)
Compared to same class
» 8% of all tested devices in this class were better, 3% similar, 89% worse
» The best had a delta of 6%, average was 18%, worst was 132%
Compared to all devices tested
» 6% of all tested devices were better, 2% similar, 92% worse
» The best had a delta of 4%, average was 25%, worst was 134%

Alienware x16 R2 P120F audio analysis

(+) | speakers can play relatively loud (89.9 dB)
Bass 100 - 315 Hz
(±) | reduced bass - on average 7.4% lower than median
(±) | linearity of bass is average (7.6% delta to prev. frequency)
Mids 400 - 2000 Hz
(+) | balanced mids - only 2.6% away from median
(+) | mids are linear (3.6% delta to prev. frequency)
Highs 2 - 16 kHz
(+) | balanced highs - only 3.4% away from median
(+) | highs are linear (2.8% delta to prev. frequency)
Overall 100 - 16.000 Hz
(+) | overall sound is linear (8.2% difference to median)
Compared to same class
» 1% of all tested devices in this class were better, 1% similar, 98% worse
» The best had a delta of 6%, average was 18%, worst was 132%
Compared to all devices tested
» 1% of all tested devices were better, 1% similar, 98% worse
» The best had a delta of 4%, average was 25%, worst was 134%

Razer Blade 16 2024, RTX 4090 audio analysis

(±) | speaker loudness is average but good (81.16 dB)
Bass 100 - 315 Hz
(±) | reduced bass - on average 8.2% lower than median
(±) | linearity of bass is average (7.4% delta to prev. frequency)
Mids 400 - 2000 Hz
(+) | balanced mids - only 3.3% away from median
(+) | mids are linear (5.9% delta to prev. frequency)
Highs 2 - 16 kHz
(+) | balanced highs - only 1.6% away from median
(+) | highs are linear (3.1% delta to prev. frequency)
Overall 100 - 16.000 Hz
(+) | overall sound is linear (9.2% difference to median)
Compared to same class
» 3% of all tested devices in this class were better, 1% similar, 96% worse
» The best had a delta of 6%, average was 18%, worst was 132%
Compared to all devices tested
» 3% of all tested devices were better, 1% similar, 97% worse
» The best had a delta of 4%, average was 25%, worst was 134%

Gerenciamento de energia - Mais resistência do que a concorrência

Consumo de energia

Em modo inativo, os valores de consumo representam a variante mais fraca do ROG Zephyrus G16 e isso também não é surpreendente, considerando os painéis OLED idênticos. Ao jogar, com cerca de 170 watts, o Zephyrus G16 é consideravelmente mais eficiente do que a concorrência RTX 4090, que consome pelo menos 230 watts ao jogar. No teste de estresse, observamos brevemente um consumo máximo de energia de 232 watts, que depois se estabilizou rapidamente em torno de 160 watts. Isso significa que a PSU de 240 watts fornecida tem o tamanho adequado.

Consumo de energia
desligadodarklight 0.43 / 1.7 Watt
Ociosodarkmidlight 7.8 / 10.9 / 11.6 Watt
Carga midlight 98.7 / 232 Watt
 color bar
Key: min: dark, med: mid, max: light        Metrahit Energy
Asus ROG Zephyrus G16 GU605MY
Ultra 9 185H, NVIDIA GeForce RTX 4090 Laptop GPU, Samsung PM9A1a MZVL22T0HDLB, OLED, 2560x1600, 16"
SCHENKER XMG Neo 16 (Early 24)
i9-14900HX, NVIDIA GeForce RTX 4090 Laptop GPU, Samsung 990 Pro 1 TB, IPS, 2560x1600, 16"
Lenovo Legion 9 16IRX9, RTX 4090
i9-14900HX, NVIDIA GeForce RTX 4090 Laptop GPU, Micron 3400 2TB MTFDKBA2T0TFH, MiniLED, 3200x2000, 16"
Alienware x16 R2 P120F
Ultra 9 185H, NVIDIA GeForce RTX 4080 Laptop GPU, WDC PC SN810 1TB, IPS, 2560x1600, 16"
Razer Blade 16 2024, RTX 4090
i9-14900HX, NVIDIA GeForce RTX 4090 Laptop GPU, Samsung PM9A1 MZVL22T0HBLB, OLED, 2560x1600, 16"
Asus ROG Zephyrus G16 2024 GU605M
Ultra 7 155H, NVIDIA GeForce RTX 4070 Laptop GPU, WD PC SN560 SDDPNQE-1T00, OLED, 2560x1600, 16"
Average NVIDIA GeForce RTX 4090 Laptop GPU
 
Average of class Gaming
 
Power Consumption
-51%
-108%
-57%
-64%
5%
-97%
-58%
Idle Minimum *
7.8
6
23%
20.5
-163%
9.9
-27%
16.9
-117%
8.3
-6%
16.2 ?(6 - 32.3, n=29)
-108%
Idle Average *
10.9
16
-47%
27.7
-154%
14.5
-33%
17.8
-63%
12.5
-15%
23.1 ?(10.9 - 42.6, n=29)
-112%
Idle Maximum *
11.6
28
-141%
32.1
-177%
33.5
-189%
19.6
-69%
12.8
-10%
34.2 ?(11.6 - 57.9, n=29)
-195%
Load Average *
98.7
130
-32%
105
-6%
97.5
1%
128
-30%
71.3
28%
130.5 ?(79 - 201, n=29)
-32%
Cyberpunk 2077 ultra *
157.3
Cyberpunk 2077 ultra external monitor *
165.5
Load Maximum *
232
361
-56%
323
-39%
315.2
-36%
328
-41%
169.1
27%
324 ?(221 - 418, n=29)
-40%
Witcher 3 ultra *
302
246
230
243
127.5

* ... smaller is better

Power consumption Cyberpunk / stress test

0153045607590105120135150165180195210225Tooltip
Asus ROG Zephyrus G16 GU605MY; 1280x720 Prime95 28.10 and Furmark 1.25: Ø162.6 (146.8-232)
Asus ROG Zephyrus G16 GU605MY; Idle 150cd/m2: Ø9.99 (4.38-19)
Asus ROG Zephyrus G16 GU605MY; Cyberpunk 2077 FHD ultra no FSR 150cd: Ø157.3 (139.6-164.6)

Power consumption with an external monitor

0102030405060708090100110120130140150160170180190Tooltip
Asus ROG Zephyrus G16 GU605MY; Prime95 V2810 Stress (external Monitor): Ø137.1 (124.9-148.9)
Asus ROG Zephyrus G16 GU605MY; Cinebench R15 Multi (external Monitor): Ø146.2 (145.5-147.1)
Asus ROG Zephyrus G16 GU605MY; Cinebench R23 Single (external Monitor): Ø51 (42.9-59.3)
Asus ROG Zephyrus G16 GU605MY; Cinebench R23 Multi (external Monitor): Ø142.4 (133.8-147.6)
Asus ROG Zephyrus G16 GU605MY; 1280x720 FurMark 1.19 GPU Stress Test (external Monitor): Ø148.5 (143.7-157)
Asus ROG Zephyrus G16 GU605MY; Idle 1min (external Monitor): Ø21.4 (20.1-23.4)
Asus ROG Zephyrus G16 GU605MY; Cyberpunk 2077 FHD ultra no FSR (external Monitor): Ø165.5 (143.1-192.6)

Duração da bateria

A bateria de 90 watts-hora é idêntica em todas as versões do Zephyrus G16 2024, mas, no teste de Wi-Fi, a duração da bateria é cerca de 30 minutos mais curta do que no caso da variante RTX 4070. A concorrência direta em jogos com o laptop RTX 4090 ainda é superada. No teste de Wi-Fi a 150 cd/m² e 60 Hz, o senhor pode obter 6,5 horas (5,5 horas a 120 Hz) e 5 horas (60 Hz) com brilho total (4,5 horas a 120 Hz). Com o dispositivo ligado, um ciclo completo de carregamento leva 104 minutos; 80% da capacidade está disponível após 47 minutos.

Tempo de Execução da Bateria
WiFi Websurfing
6h 31min
WiFi Websurfing max. Brightness
5h 03min
Battery Runtime
WiFi Websurfing
Asus ROG Zephyrus G16 2024 GU605M
Ultra 7 155H, NVIDIA GeForce RTX 4070 Laptop GPU, 90 Wh
435 min +11%
Asus ROG Zephyrus G16 GU605MY
Ultra 9 185H, NVIDIA GeForce RTX 4090 Laptop GPU, 90 Wh
391 min
Average of class Gaming
  (85 - 889, n=154, last 2 years)
375 min -4%
SCHENKER XMG Neo 16 (Early 24)
i9-14900HX, NVIDIA GeForce RTX 4090 Laptop GPU, 99.8 Wh
350 min -10%
Razer Blade 16 2024, RTX 4090
i9-14900HX, NVIDIA GeForce RTX 4090 Laptop GPU, 95.2 Wh
329 min -16%
Lenovo Legion 9 16IRX9, RTX 4090
i9-14900HX, NVIDIA GeForce RTX 4090 Laptop GPU, 99.99 Wh
290 min -26%
Alienware x16 R2 P120F
Ultra 9 185H, NVIDIA GeForce RTX 4080 Laptop GPU, 90 Wh
193 min -51%
WiFi Websurfing max. Brightness
Asus ROG Zephyrus G16 2024 GU605M
Ultra 7 155H, NVIDIA GeForce RTX 4070 Laptop GPU, 90 Wh
345 min +14%
Asus ROG Zephyrus G16 GU605MY
Ultra 9 185H, NVIDIA GeForce RTX 4090 Laptop GPU, 90 Wh
303 min
Average of class Gaming
  (156 - 578, n=46, last 2 years)
300 min -1%
Razer Blade 16 2024, RTX 4090
i9-14900HX, NVIDIA GeForce RTX 4090 Laptop GPU, 95.2 Wh
265 min -13%
Lenovo Legion 9 16IRX9, RTX 4090
i9-14900HX, NVIDIA GeForce RTX 4090 Laptop GPU, 99.99 Wh
197 min -35%

Pro

+ Gabinete compacto e de alta qualidade
+ Tela OLED brilhante de 240 Hz, G-Sync
+ Desempenho muito bom em jogos
+ Excelentes alto-falantes
+ Dispositivos de entrada maravilhosos
+ 2x slots para SSD
+ Bom desempenho do sistema

Contra

- O laptop RTX 4090 não atinge seu potencial
- RAM soldada, máximo de 32 GB
- Brilho HDR máximo limitado
- Sem Wi-Fi 7

Veredicto - O laptop RTX 4090 não atinge seu potencial

Análise: Asus ROG Zephyrus G16 2024. Dispositivo para análise fornecido pela Asus Alemanha.

O Asus Zephyrus G16 2024 é um laptop para jogos fino e relativamente leve que também é adequado para outros grupos-alvo, como criadores de conteúdo e usuários de multimídia. Ter optado pelo laptop RTX 4090 significa, é claro, que o desempenho gráfico é o foco principal, mas também é exatamente aí que reside o problema. Em princípio, é bom que a Asus ofereça os modelos de GPU mais rápidos, mas o gabinete fino exige concessões, apesar do resfriamento aprimorado da câmara de vapor. Com um consumo máximo de energia de 115 watts no modo Turbo , o laptop RTX 4090 simplesmente não consegue explorar seu potencial, ficando geralmente de 20 a 25% atrás da concorrência (até mesmo o laptop RTX 4080 encontrado no Alienware x16 é um pouco mais rápido). Apesar disso, o laptop RTX 4090 custará ao senhor o preço total pedido. Isso é simplesmente um compromisso que o senhor tem que aceitar para ter um gabinete mais compacto, mas é algo de que os possíveis compradores devem estar cientes.

A câmara de vapor aumenta o peso em comparação com o resfriamento convencional (modelos até o laptop RTX 4070) em cerca de 100 gramas e é um pouco mais barulhenta nos perfis de energia Quiet e Performance. Ambas as configurações são indistinguíveis uma da outra apenas no modo Turbo. Na verdade, isso significa que o senhor deve usar fones de ouvido ao jogar.

Com o ROG Zephyrus G16, a Asus está oferecendo um notebook de 16 polegadas muito compacto com o GeForce RTX 4090. No entanto, a boa mobilidade exige compromissos em termos de desempenho e outros modelos RTX 4090 têm vantagens quando se trata de desempenho em jogos.

As outras vantagens e desvantagens do Zephyrus G16 também se aplicam à configuração de ponta, incluindo os maravilhosos alto-falantes e o brilhante painel OLED de 240 Hz. No entanto, uma grande desvantagem é a RAM soldada e o senhor não tem nem mesmo 64 GB de RAM na variante de ponta de US$ 3.649.

Qualquer pessoa que esteja em busca do máximo desempenho gráfico em um laptop de 16 polegadas potencialmente compacto estará bem servida pelo ROG Zephyrus G16. Entretanto, o senhor não deve esperar o mesmo desempenho que encontraria nos concorrentes mais pesados/maiores. Se o objetivo for o desempenho puro em jogos, modelos como o XMG Neo 16 ou o Alienware x16 R2 simplesmente oferecem mais potência.

Preço e disponibilidade

O ROG Zephyrus G16 com o Intel Core Ultra 9 185H e um laptop Nvidia GeForce RTX 4090 tem um RRP de US$ 3.649 e o dispositivo pode ser comprado atualmente na Amazon.

Observação: Atualizamos recentemente nosso sistema de classificação e os resultados da versão 8 não são comparáveis aos resultados da versão 7. Mais informações estão disponíveis aqui .

Asus ROG Zephyrus G16 GU605MY - 07/12/2024 v8
Andreas Osthoff

Acabamento
90 / 98 → 92%
Teclado
92%
Mouse
100%
Conectividade
63 / 80 → 79%
Peso
64 / 10-68 → 93%
Bateria
69 / 95 → 73%
Pantalha
87%
Desempenho do jogos
86%
Desempenho da aplicação
86%
Temperatura
87 / 95 → 91%
Ruído
67 / 90 → 75%
Audio
91%
Camera
38 / 75 → 51%
Médio
65%
86%
Gaming - Médio equilibrado
CO2 Emissions
No Data
Materials
50%
Packaging
50%
Power Use
73.2%
Repairability
40%
Software Updates
22.3%
Recycle Logo Total Sustainability Score: 39.3%

Transparency

The selection of devices to be reviewed is made by our editorial team. The test sample was provided to the author as a loan by the manufacturer or retailer for the purpose of this review. The lender had no influence on this review, nor did the manufacturer receive a copy of this review before publication. There was no obligation to publish this review. We never accept compensation or payment in return for our reviews. As an independent media company, Notebookcheck is not subjected to the authority of manufacturers, retailers or publishers.

This is how Notebookcheck is testing

Every year, Notebookcheck independently reviews hundreds of laptops and smartphones using standardized procedures to ensure that all results are comparable. We have continuously developed our test methods for around 20 years and set industry standards in the process. In our test labs, high-quality measuring equipment is utilized by experienced technicians and editors. These tests involve a multi-stage validation process. Our complex rating system is based on hundreds of well-founded measurements and benchmarks, which maintains objectivity. Further information on our test methods can be found here.

Price comparison

Please share our article, every link counts!
Mail Logo
> Análises e revisões de portáteis e celulares > Análises > Análises > Análise do laptop Asus ROG Zephyrus G16 - Um gamer fino com uma RTX 4090 e potencial não realizado
Andreas Osthoff, 2024-07-16 (Update: 2024-07-16)