

Análise do XMG Neo 16 (Early 24): Potência total da RTX 4090 em um laptop compacto para jogos
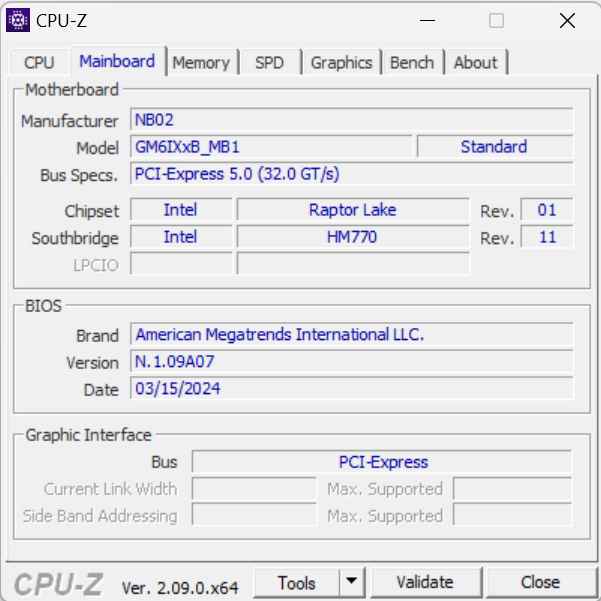
Com o Neo 16, a Schenker está atendendo ao segmento de ponta e, portanto, não há meias medidas: Core i9, GeForce RTX 4090 e 32 GB de RAM equipam o laptop para cenários de aplicativos exigentes (streaming, renderização, jogos). Porém, isso tem um custo: O senhor terá que desembolsar cerca de US$ 4.000 (taxa de câmbio atual do dólar/euro) pelo modelo analisado, embora variantes mais baratas também possam ser adquiridas a partir de US$ 2.000. A base é fornecida pelo barebone Tongfang (GM6IX9B). Os concorrentes são, por exemplo, o Razer Blade 16e o Medion Erazer Beast X40 e o Asus ROG Strix Scar 17.
O dispositivo é semelhante ao modelo 2023, mas tem alguns recursos novos: Uma tela mais brilhante, um sistema de resfriamento revisado e um ângulo de abertura maior. O teclado mecânico (opcional) encontrado no antecessor não faz parte das ofertas do modelo 2024.
Potenziali concorrenti a confrontos
Avaliação | Versão | Data | Modelo | Peso | Altura | Size | Resolução | Preço |
|---|---|---|---|---|---|---|---|---|
| 85.5 % | v8 | 06/2024 | SCHENKER XMG Neo 16 (Early 24) i9-14900HX, NVIDIA GeForce RTX 4090 Laptop GPU | 2.5 kg | 26.6 mm | 16.00" | 2560x1600 | |
| 91.1 % v7 (old) | v7 (old) | 02/2024 | Razer Blade 16 2024, RTX 4090 i9-14900HX, NVIDIA GeForce RTX 4090 Laptop GPU | 2.5 kg | 22 mm | 16.00" | 2560x1600 | |
| 89.2 % v7 (old) | v7 (old) | 02/2024 | Medion Erazer Beast X40 2024 i9-14900HX, NVIDIA GeForce RTX 4090 Laptop GPU | 2.9 kg | 36 mm | 17.00" | 2560x1600 | |
| 87.2 % v7 (old) | v7 (old) | 08/2023 | Asus ROG Strix Scar 17 G733PYV-LL053X R9 7945HX3D, NVIDIA GeForce RTX 4090 Laptop GPU | 2.9 kg | 28.3 mm | 17.30" | 2560x1440 |
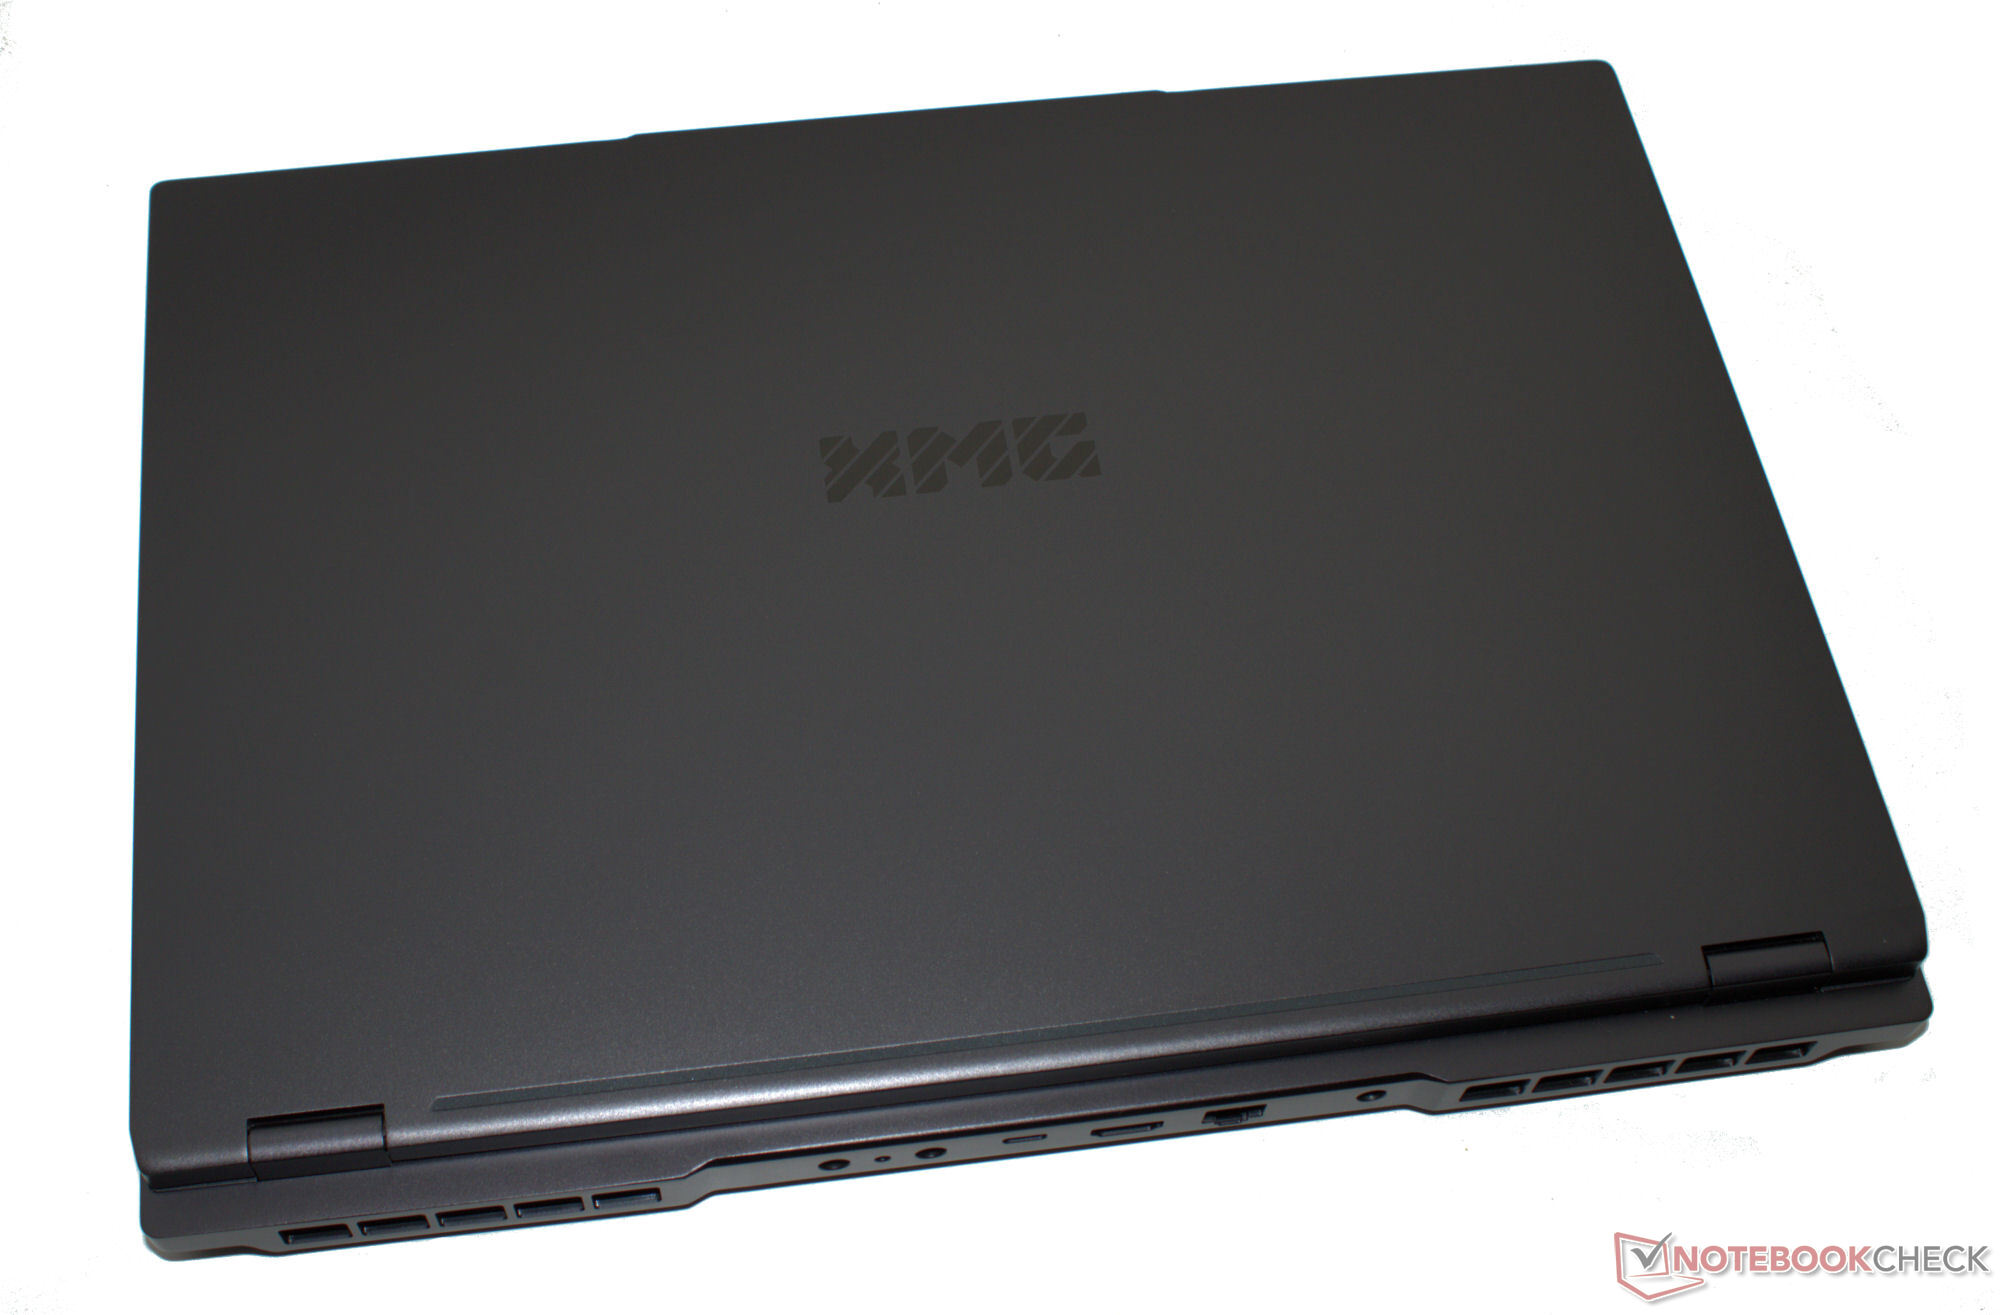
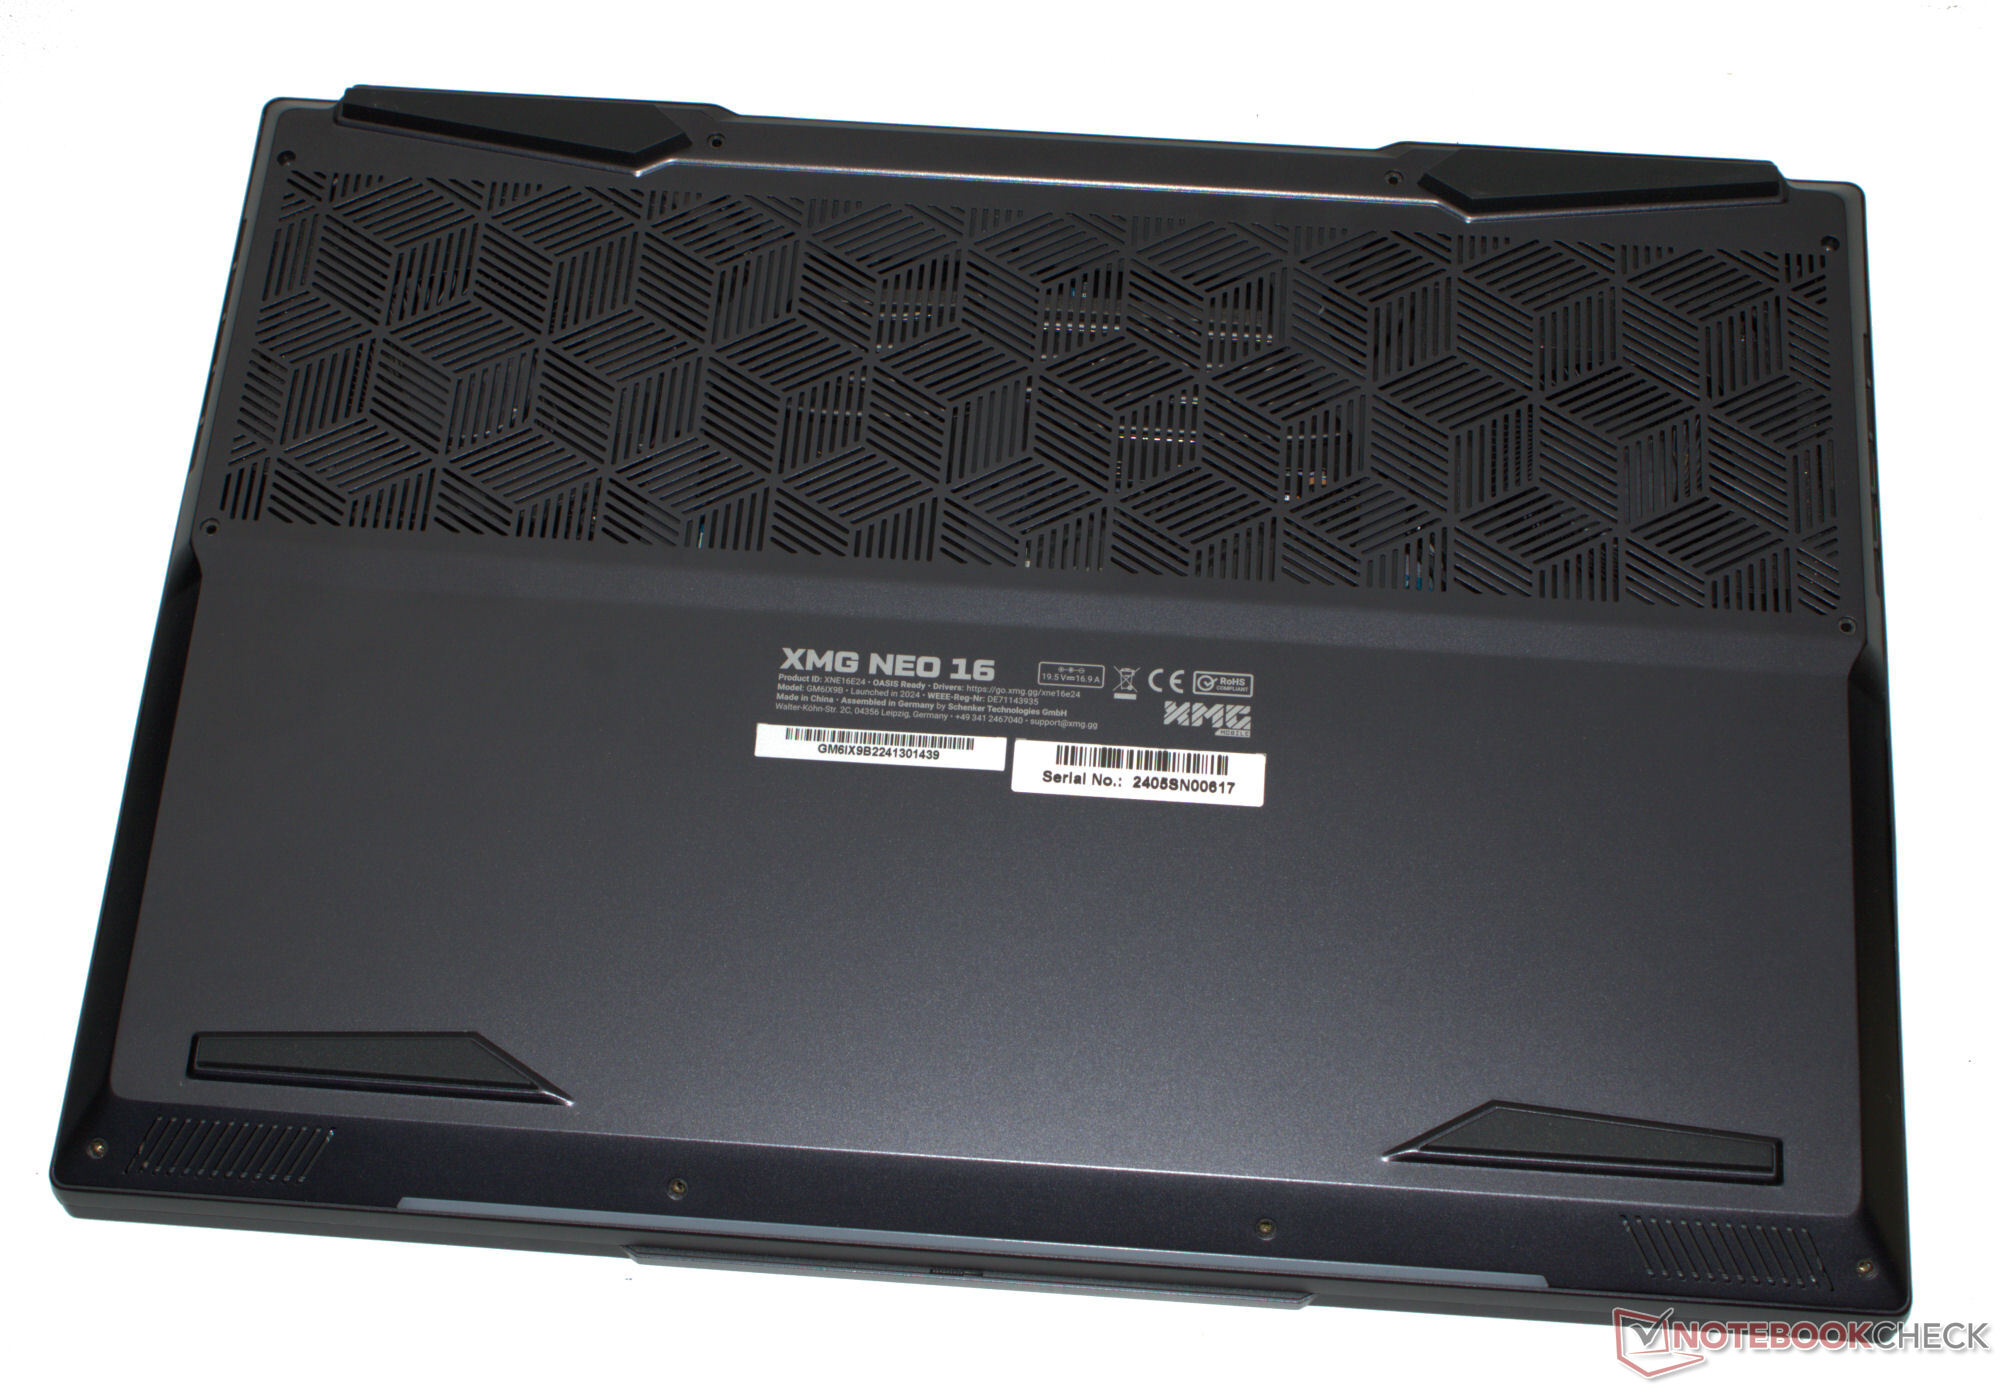
Gabinete - O laptop XMG tem um chassi de alumínio
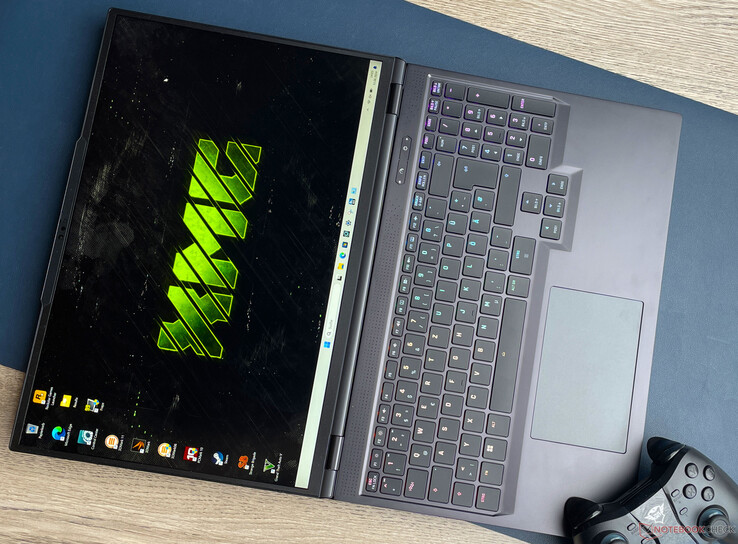
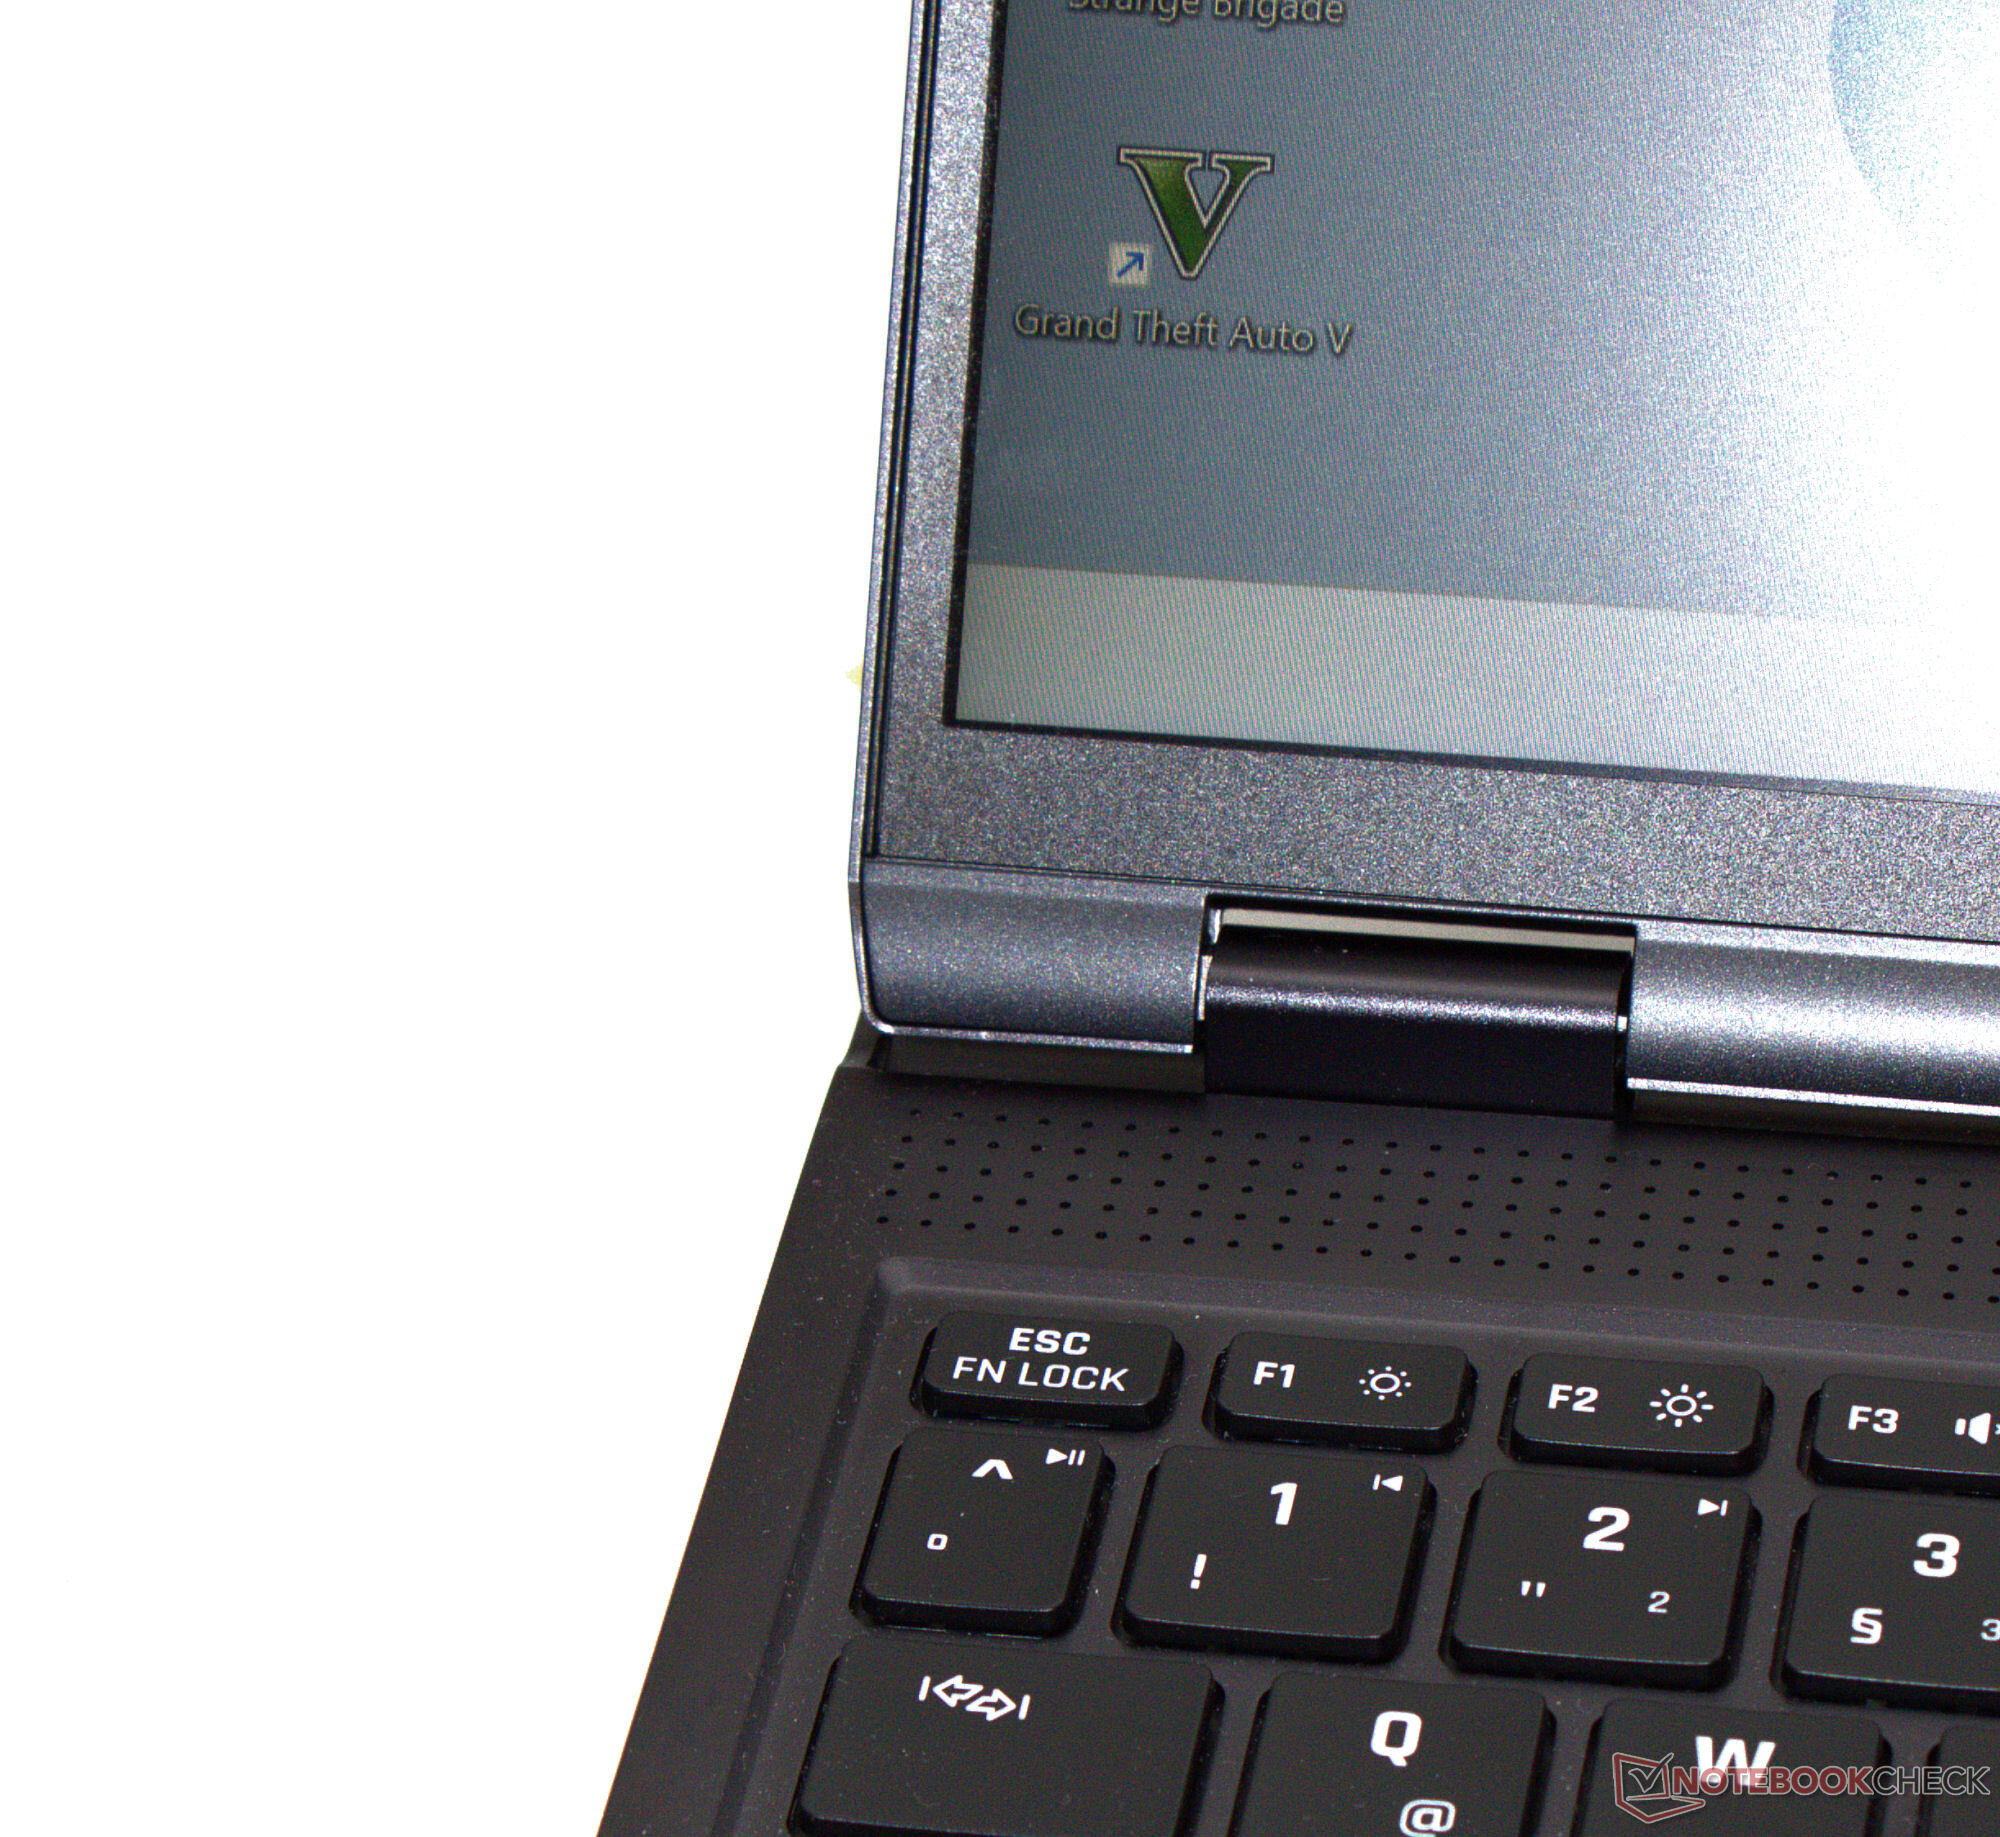
O chassi do modelo 2023 não é usado no modelo Neo atual. A nova tampa tem mais em comum com o gabinete visto nos laptops XMG mais recentes - um passo na direção certa: Em vez de uma mistura de plástico e metal, o fabricante optou por um gabinete feito inteiramente de metal (Exceção: as molduras da tela são feitas de plástico). O chassi é tão estável quanto o senhor espera. A unidade de base e a tampa só podem ser ligeiramente torcidas. A tampa permite um ângulo de abertura de até 180 graus (modelo 2023: 135 graus). Isso facilita a visualização do conteúdo quando há várias pessoas presentes. As dobradiças apertadas mantêm a tampa firmemente no lugar e em praticamente qualquer ângulo. É possível abrir o dispositivo com uma só mão.
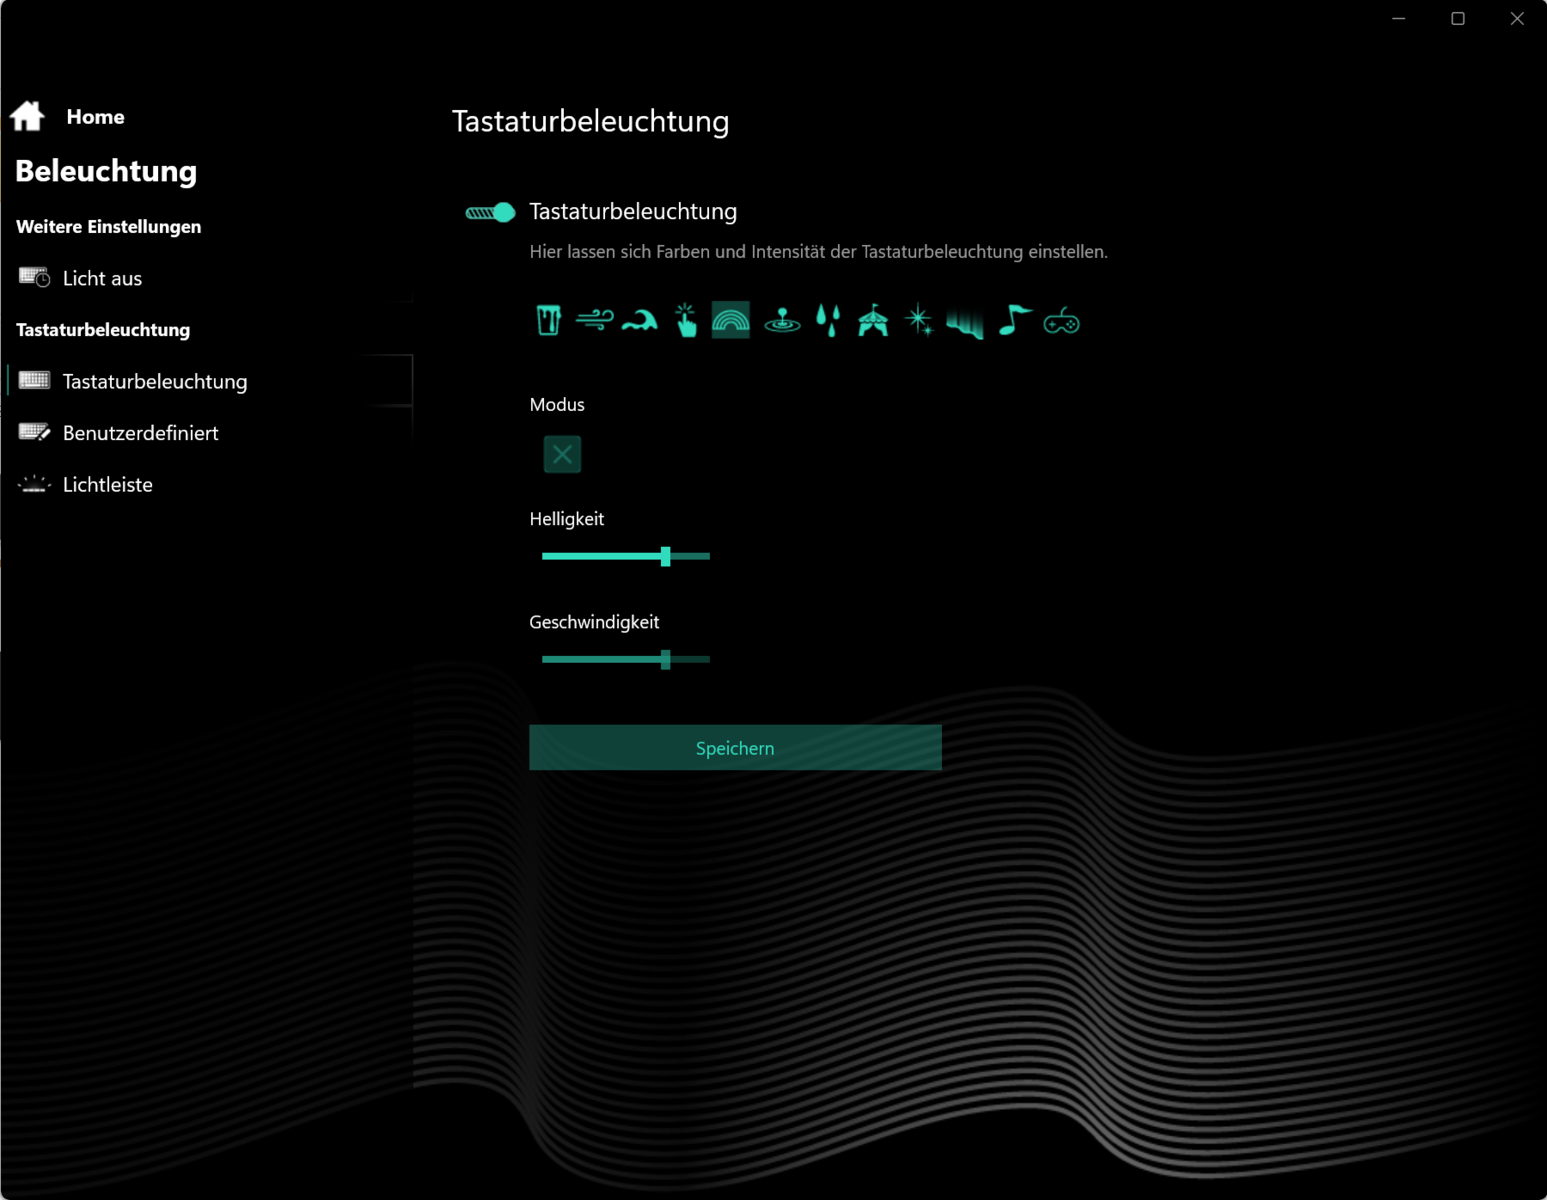
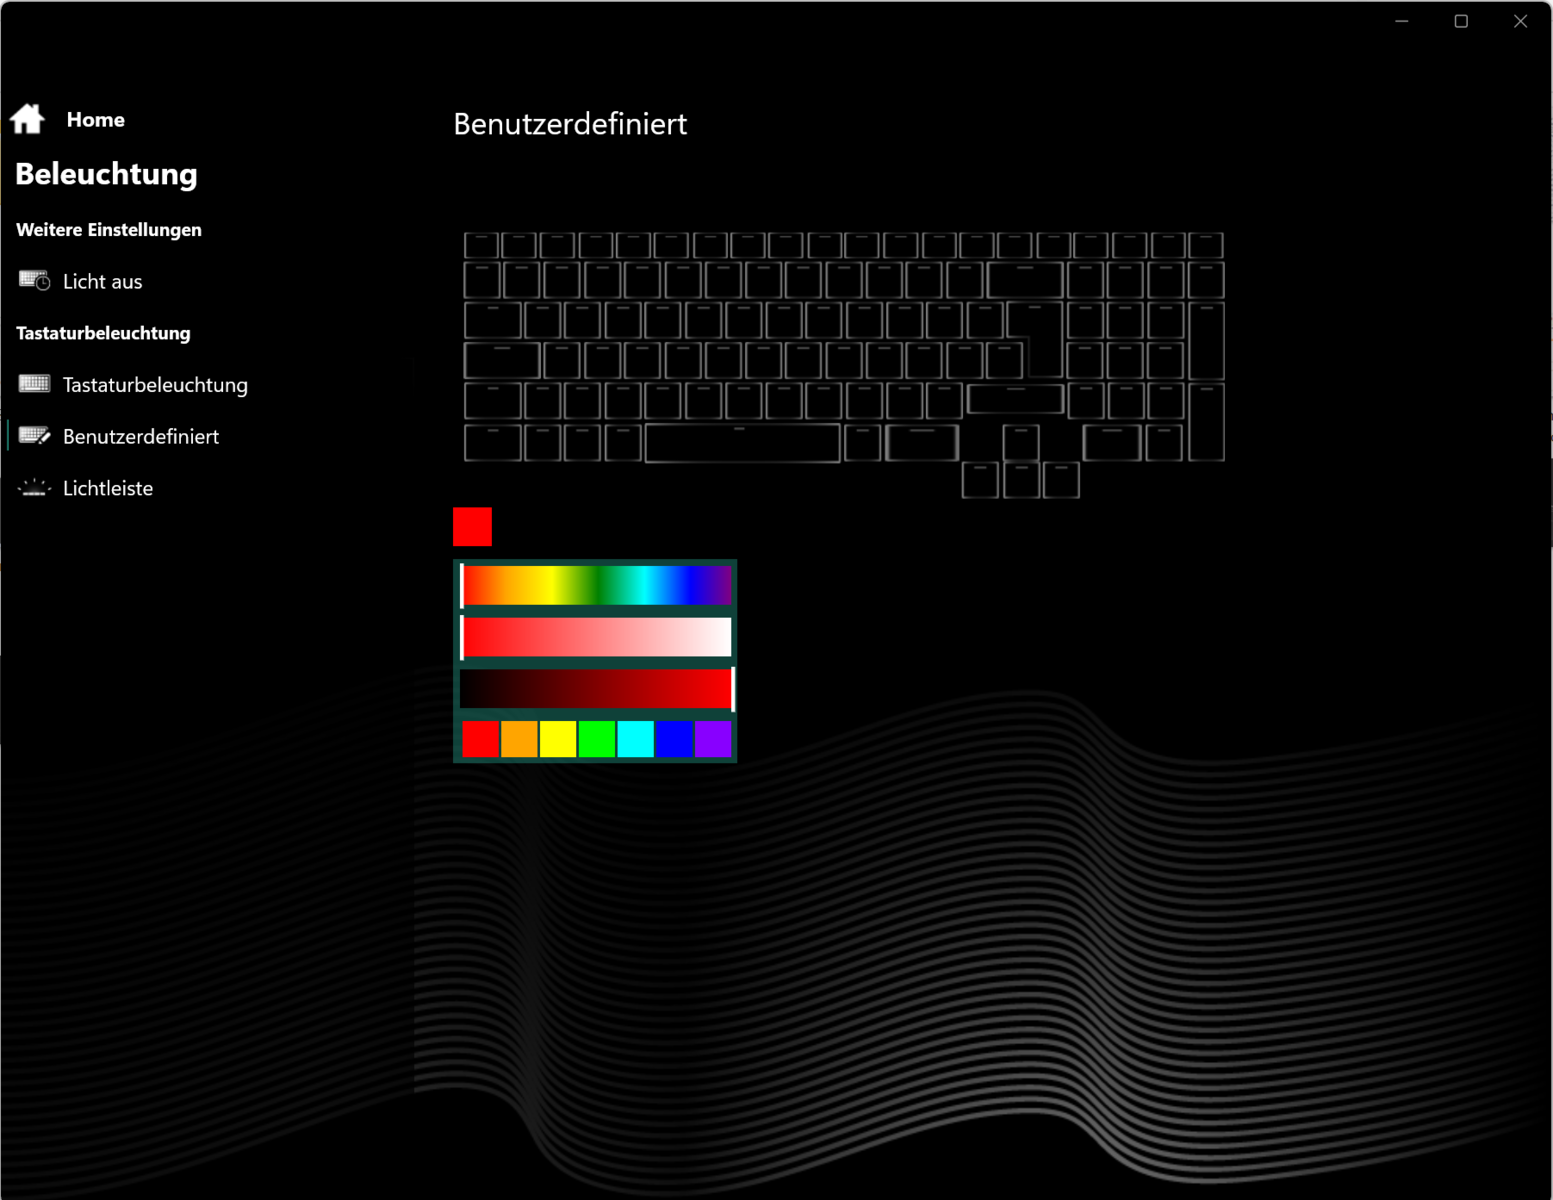
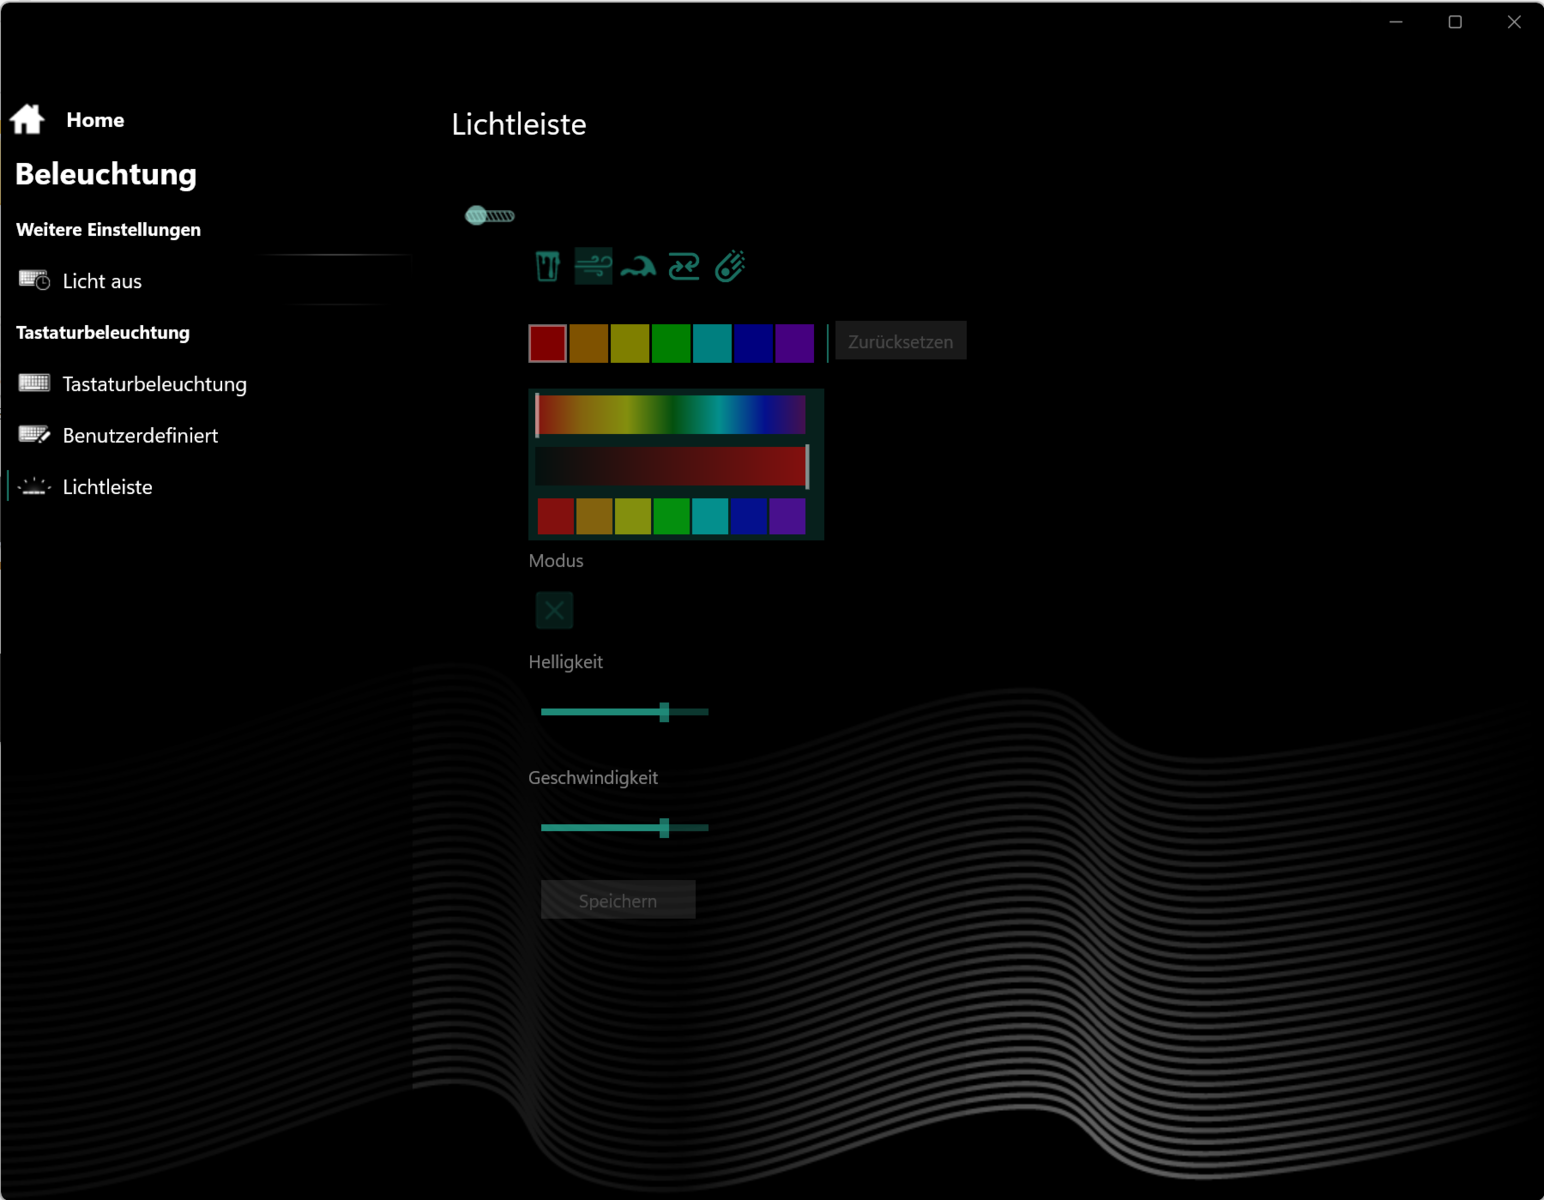
Não há elementos de design atraentes em lugar algum, o que significa que o computador em preto fosco tem uma aparência bastante séria. O alívio da luz colorida é proporcionado, além das teclas retroiluminadas (RGB), por uma faixa de LEDs definida pelo usuário e personalizável individualmente.
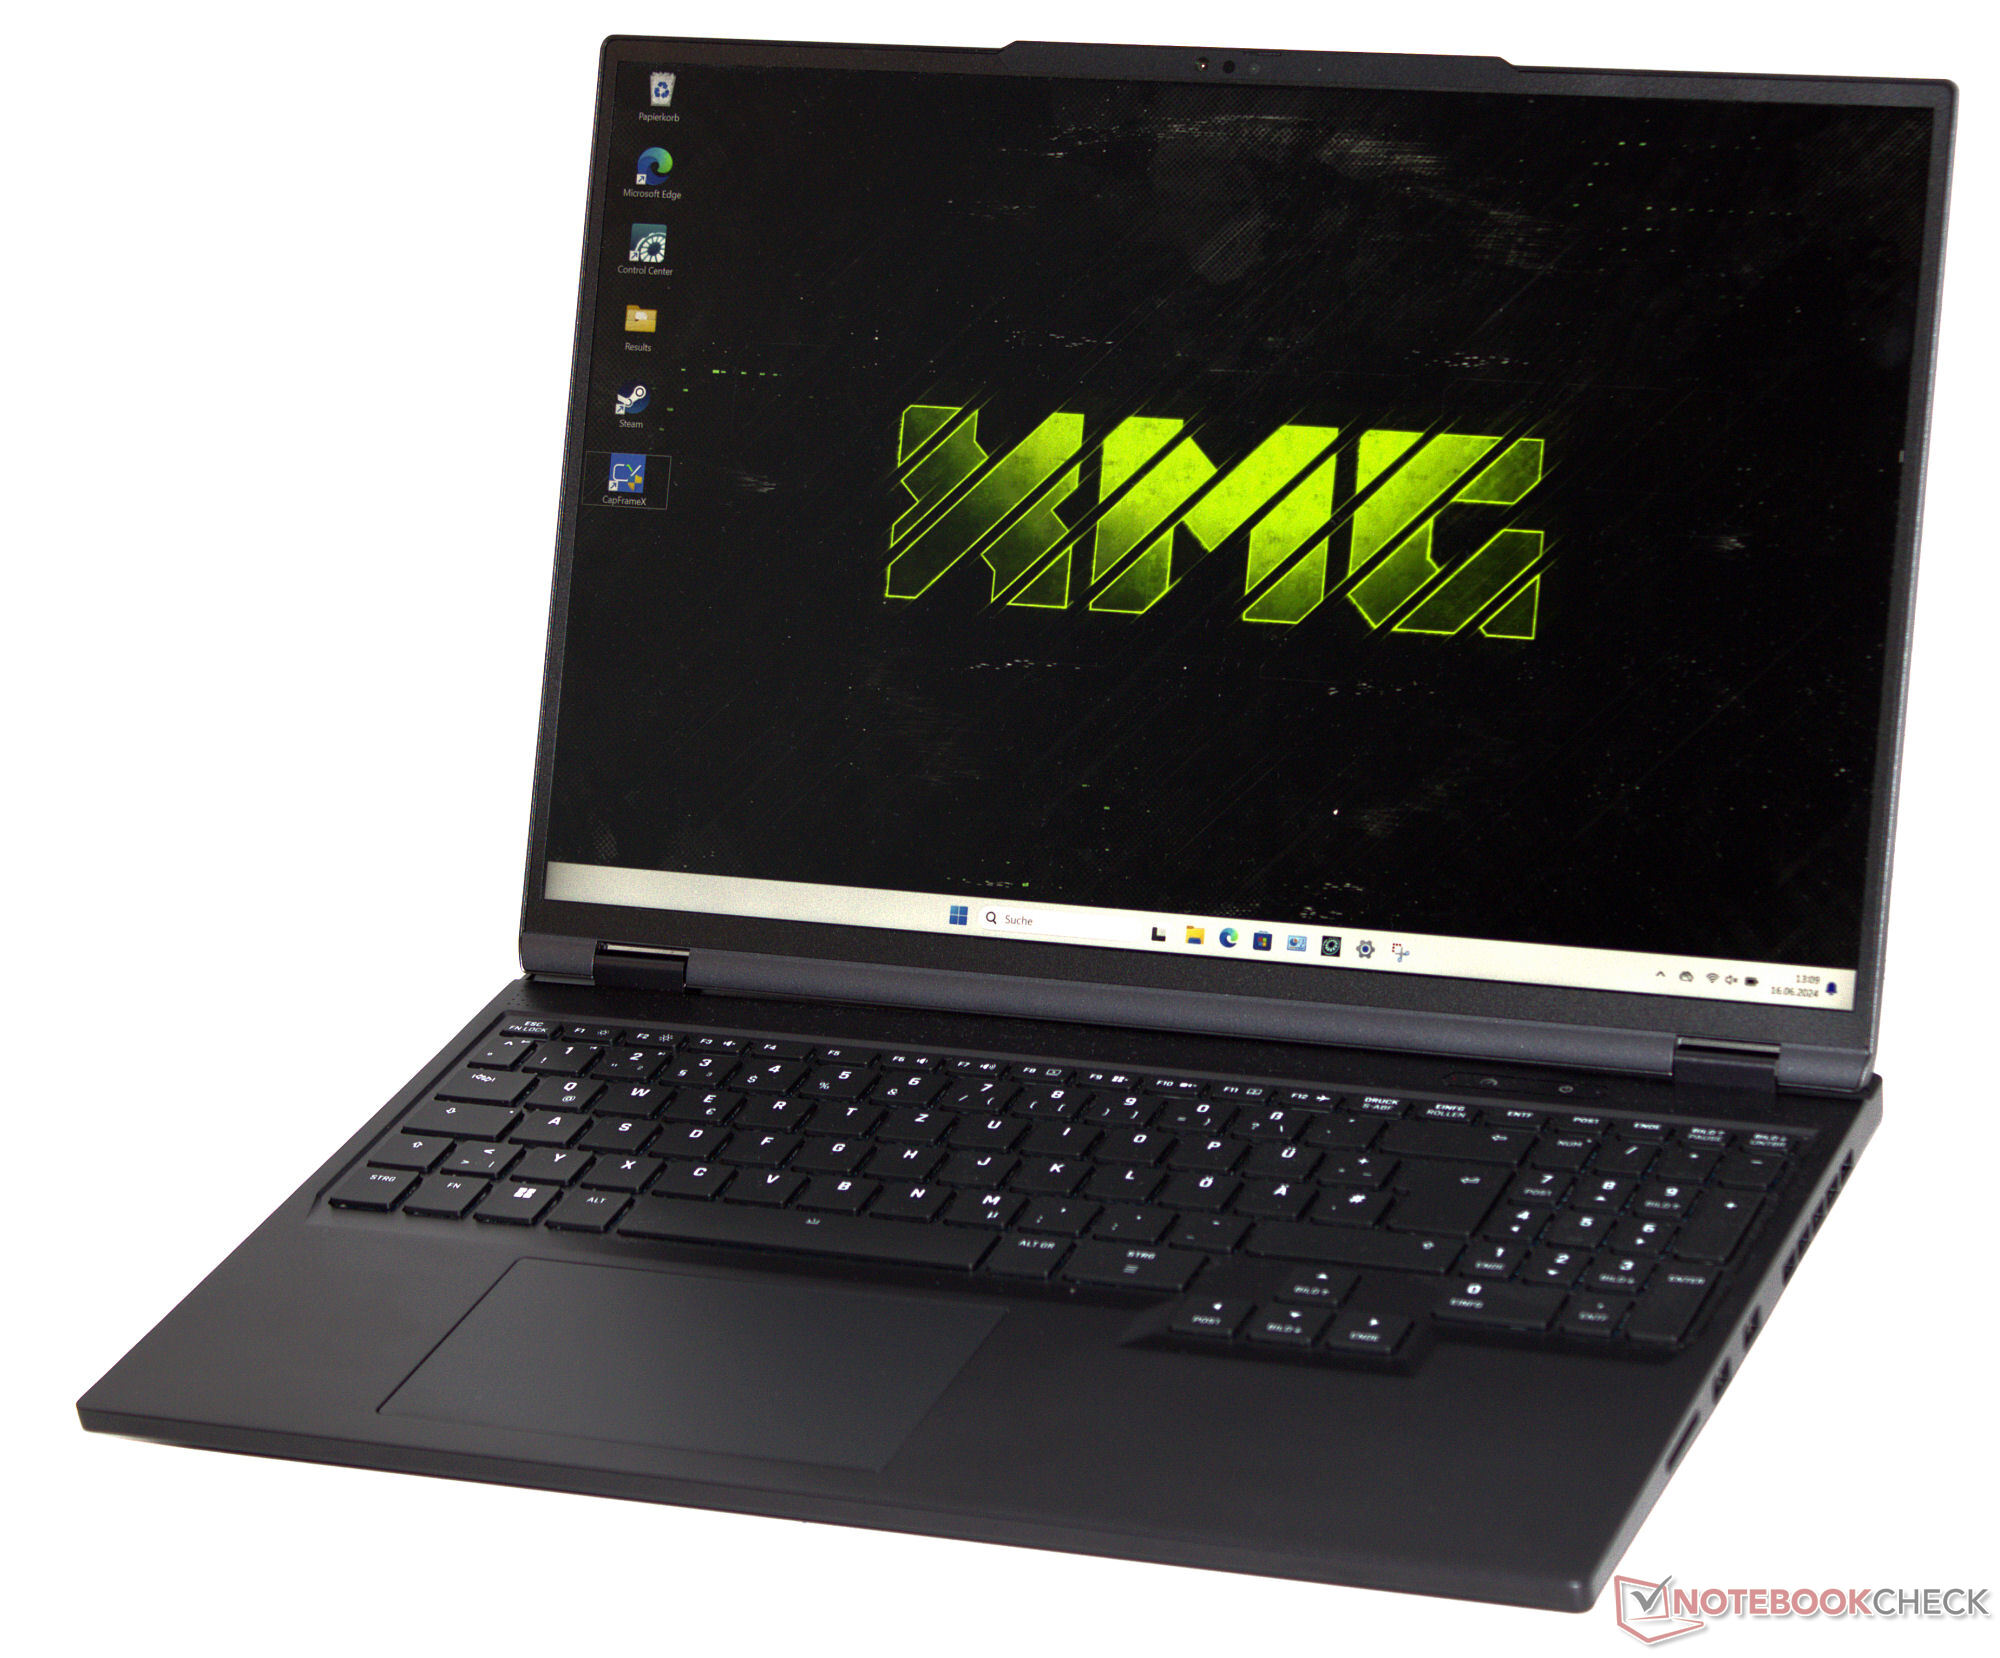
O Neo 16 mais recente parece um pouco mais compacto do que o antecessor, mas, com relação ao peso, não é possível diferenciar os laptops. Somente o Blade 16 oferece mais compacidade - e com um peso quase idêntico.
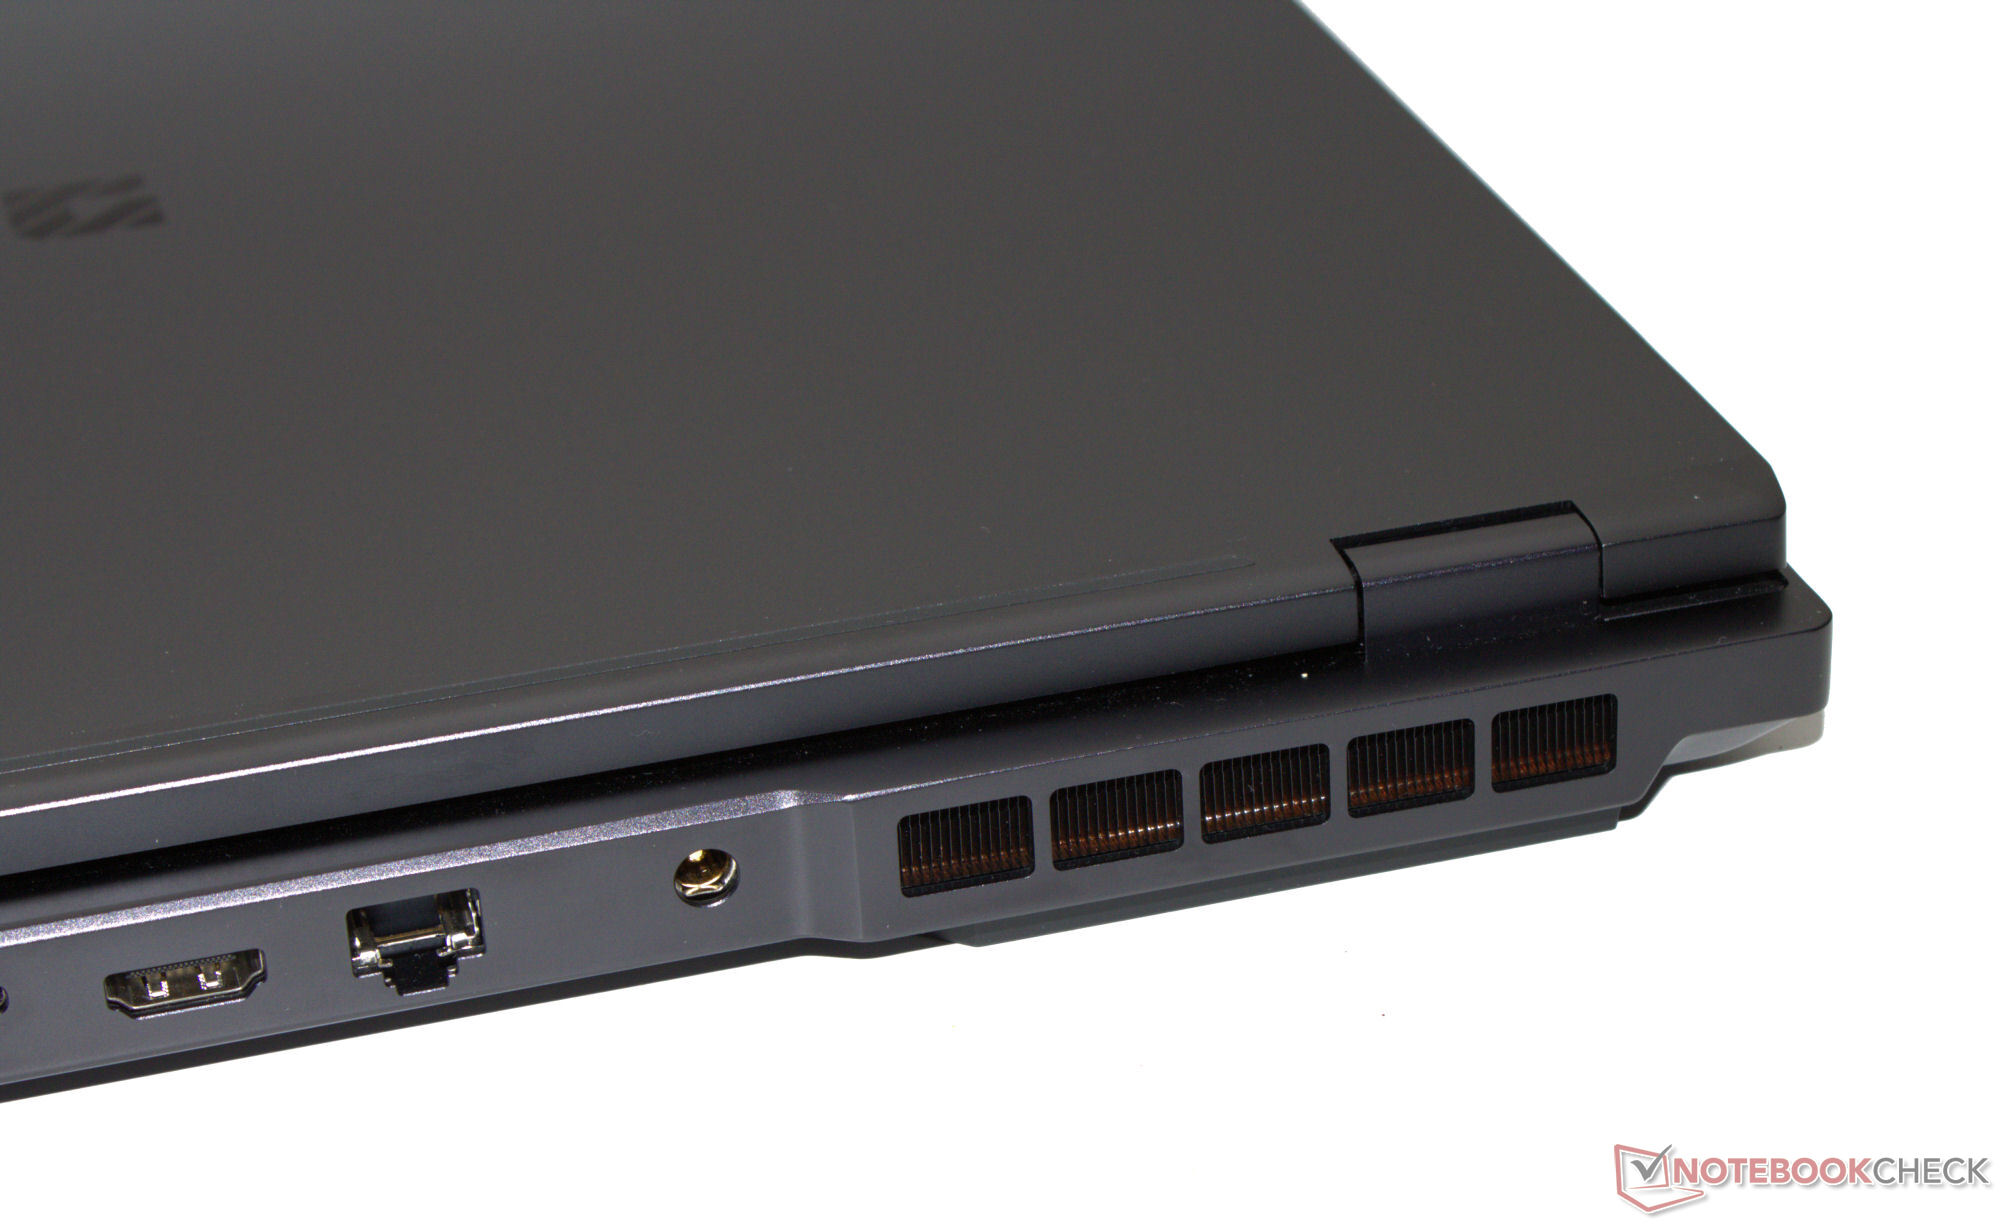
Recursos - O USB 4 está integrado
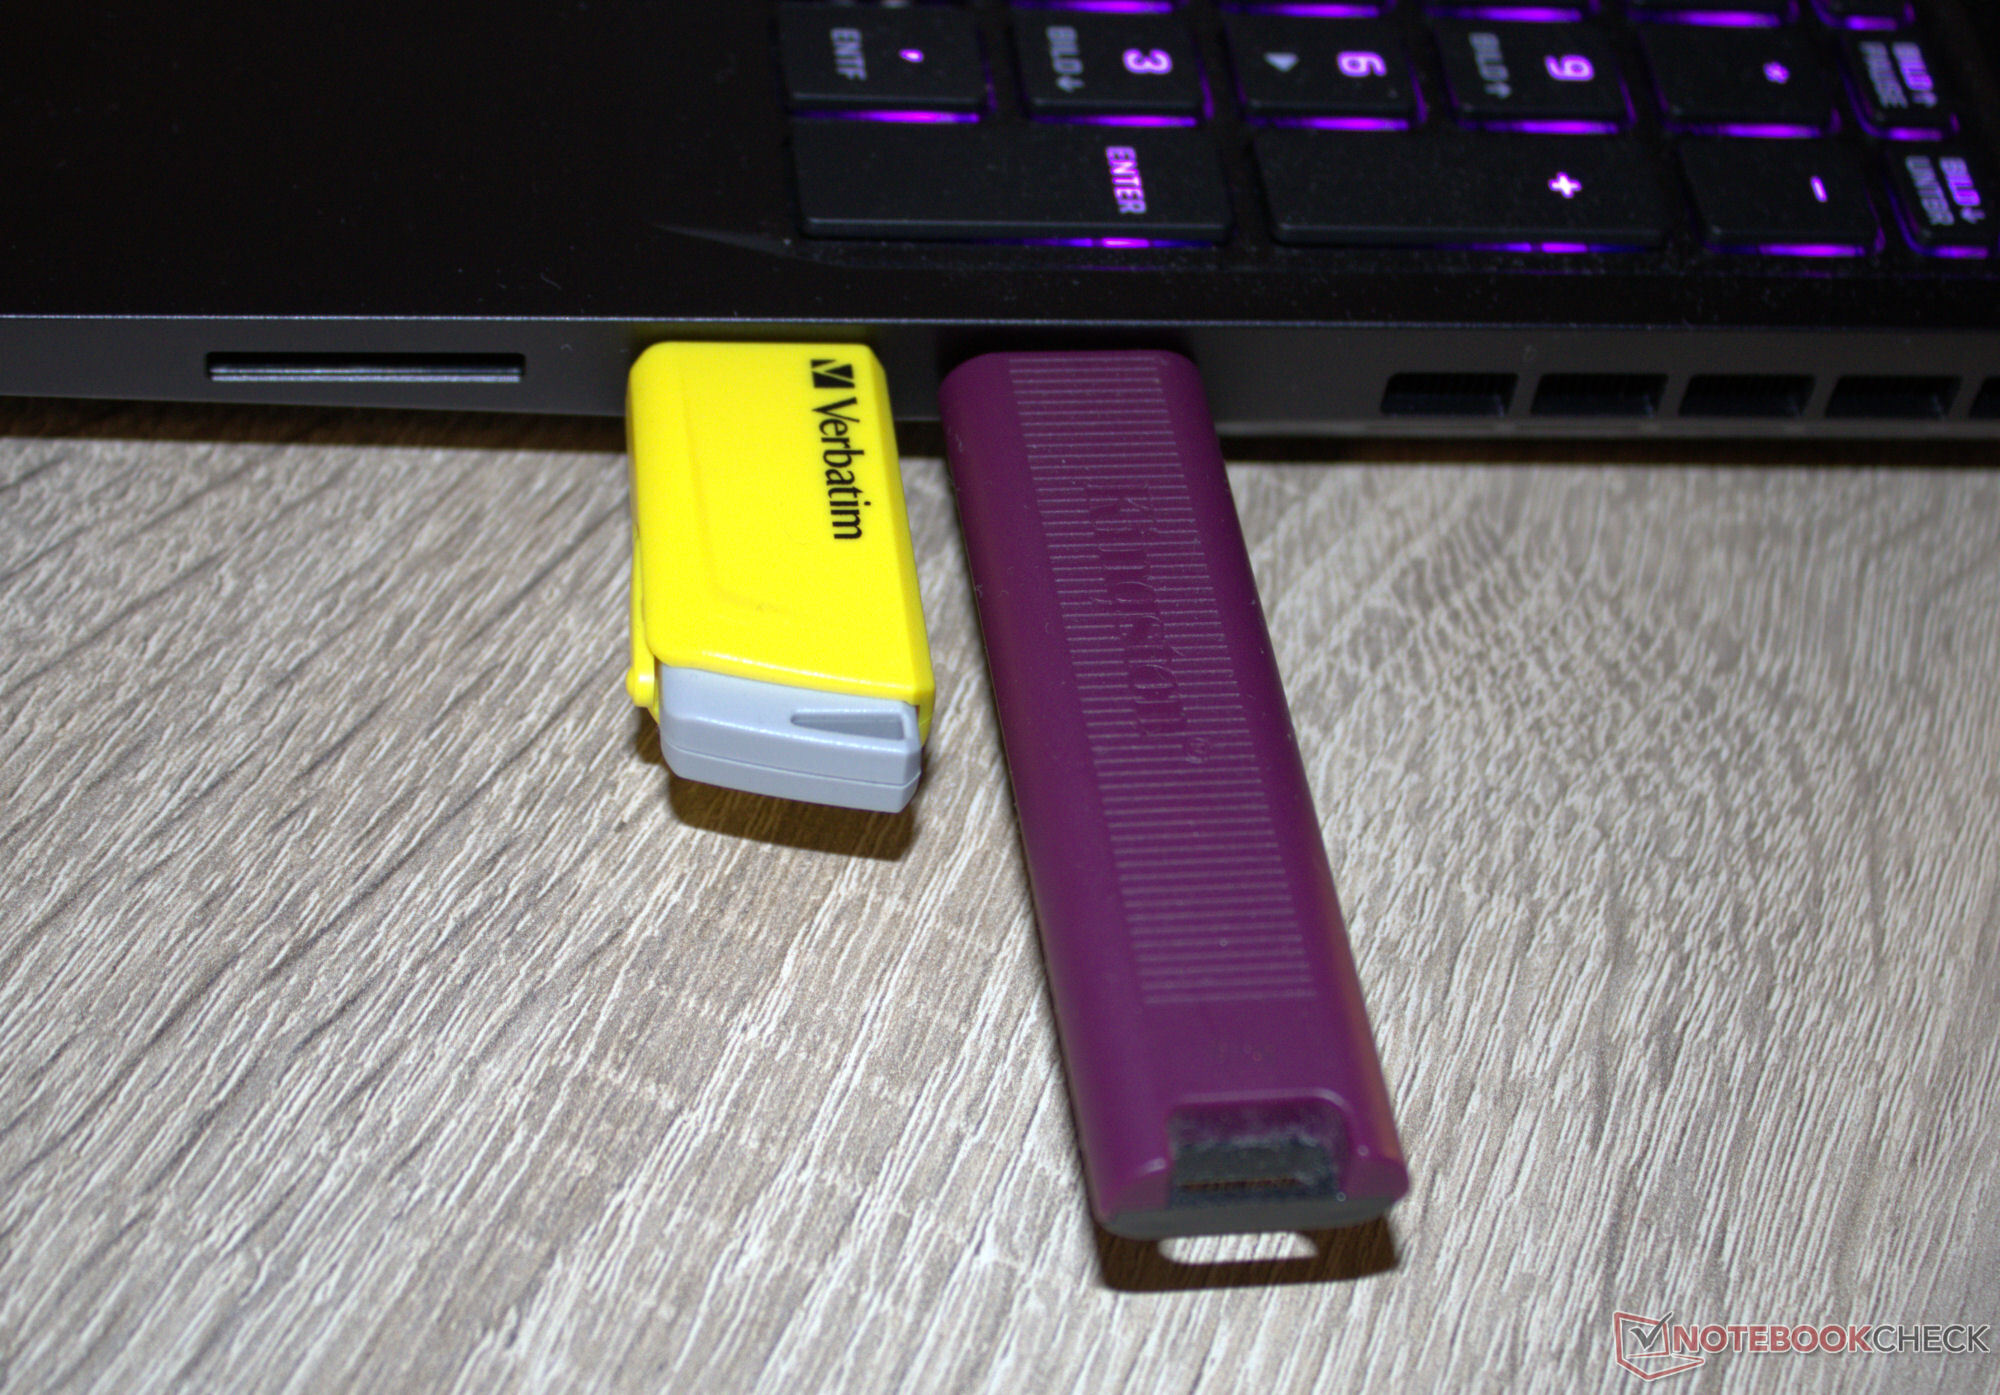
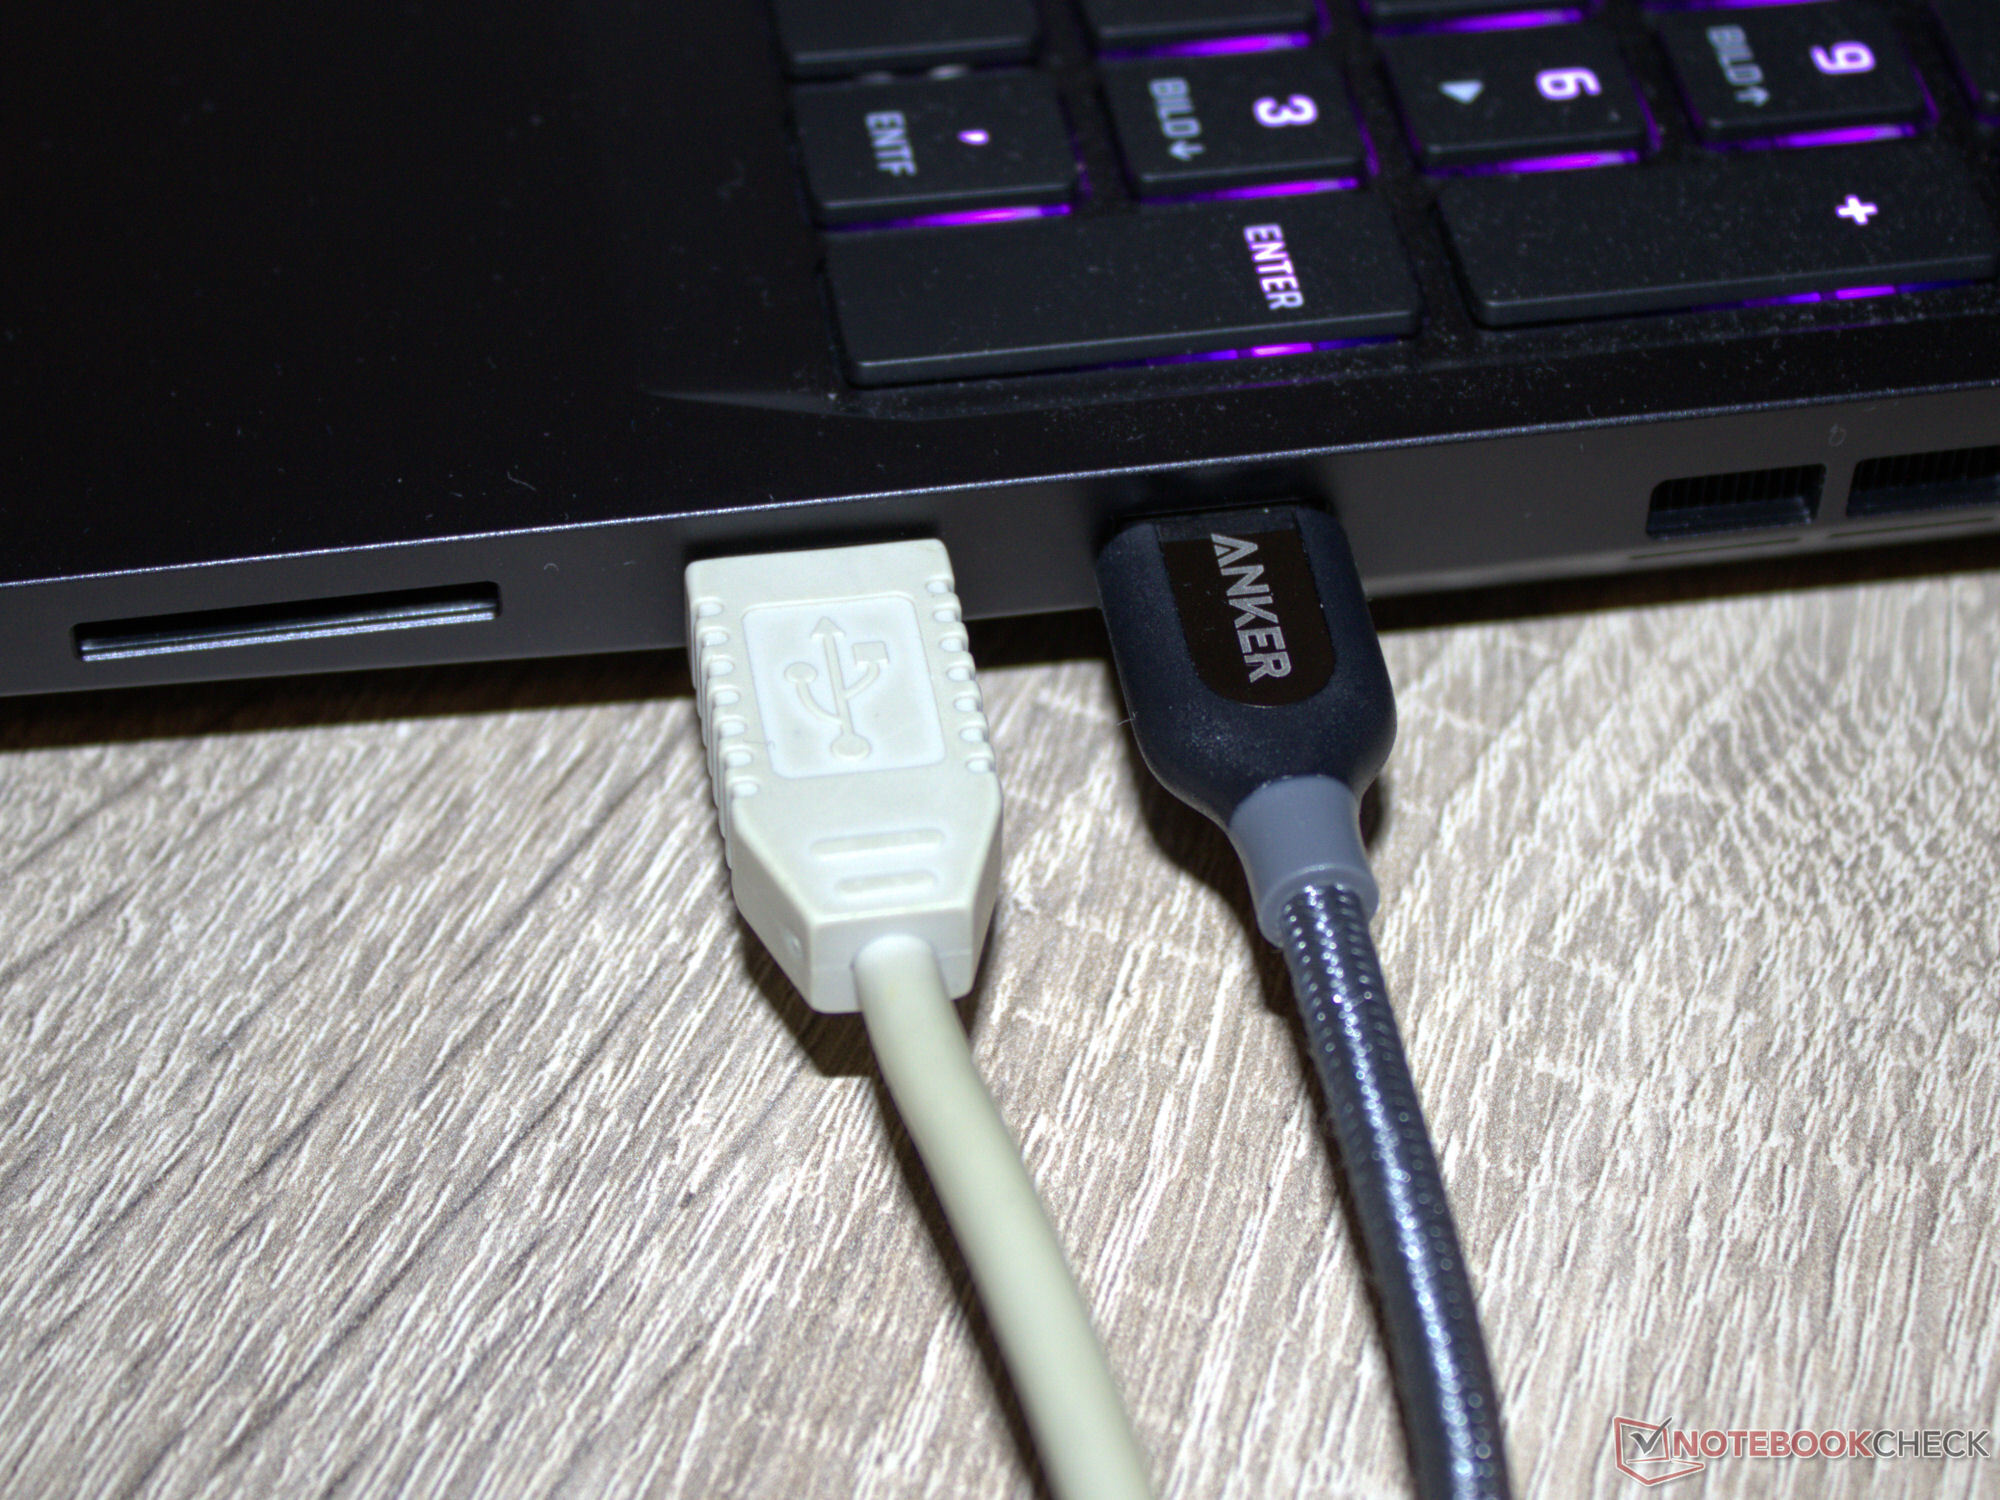
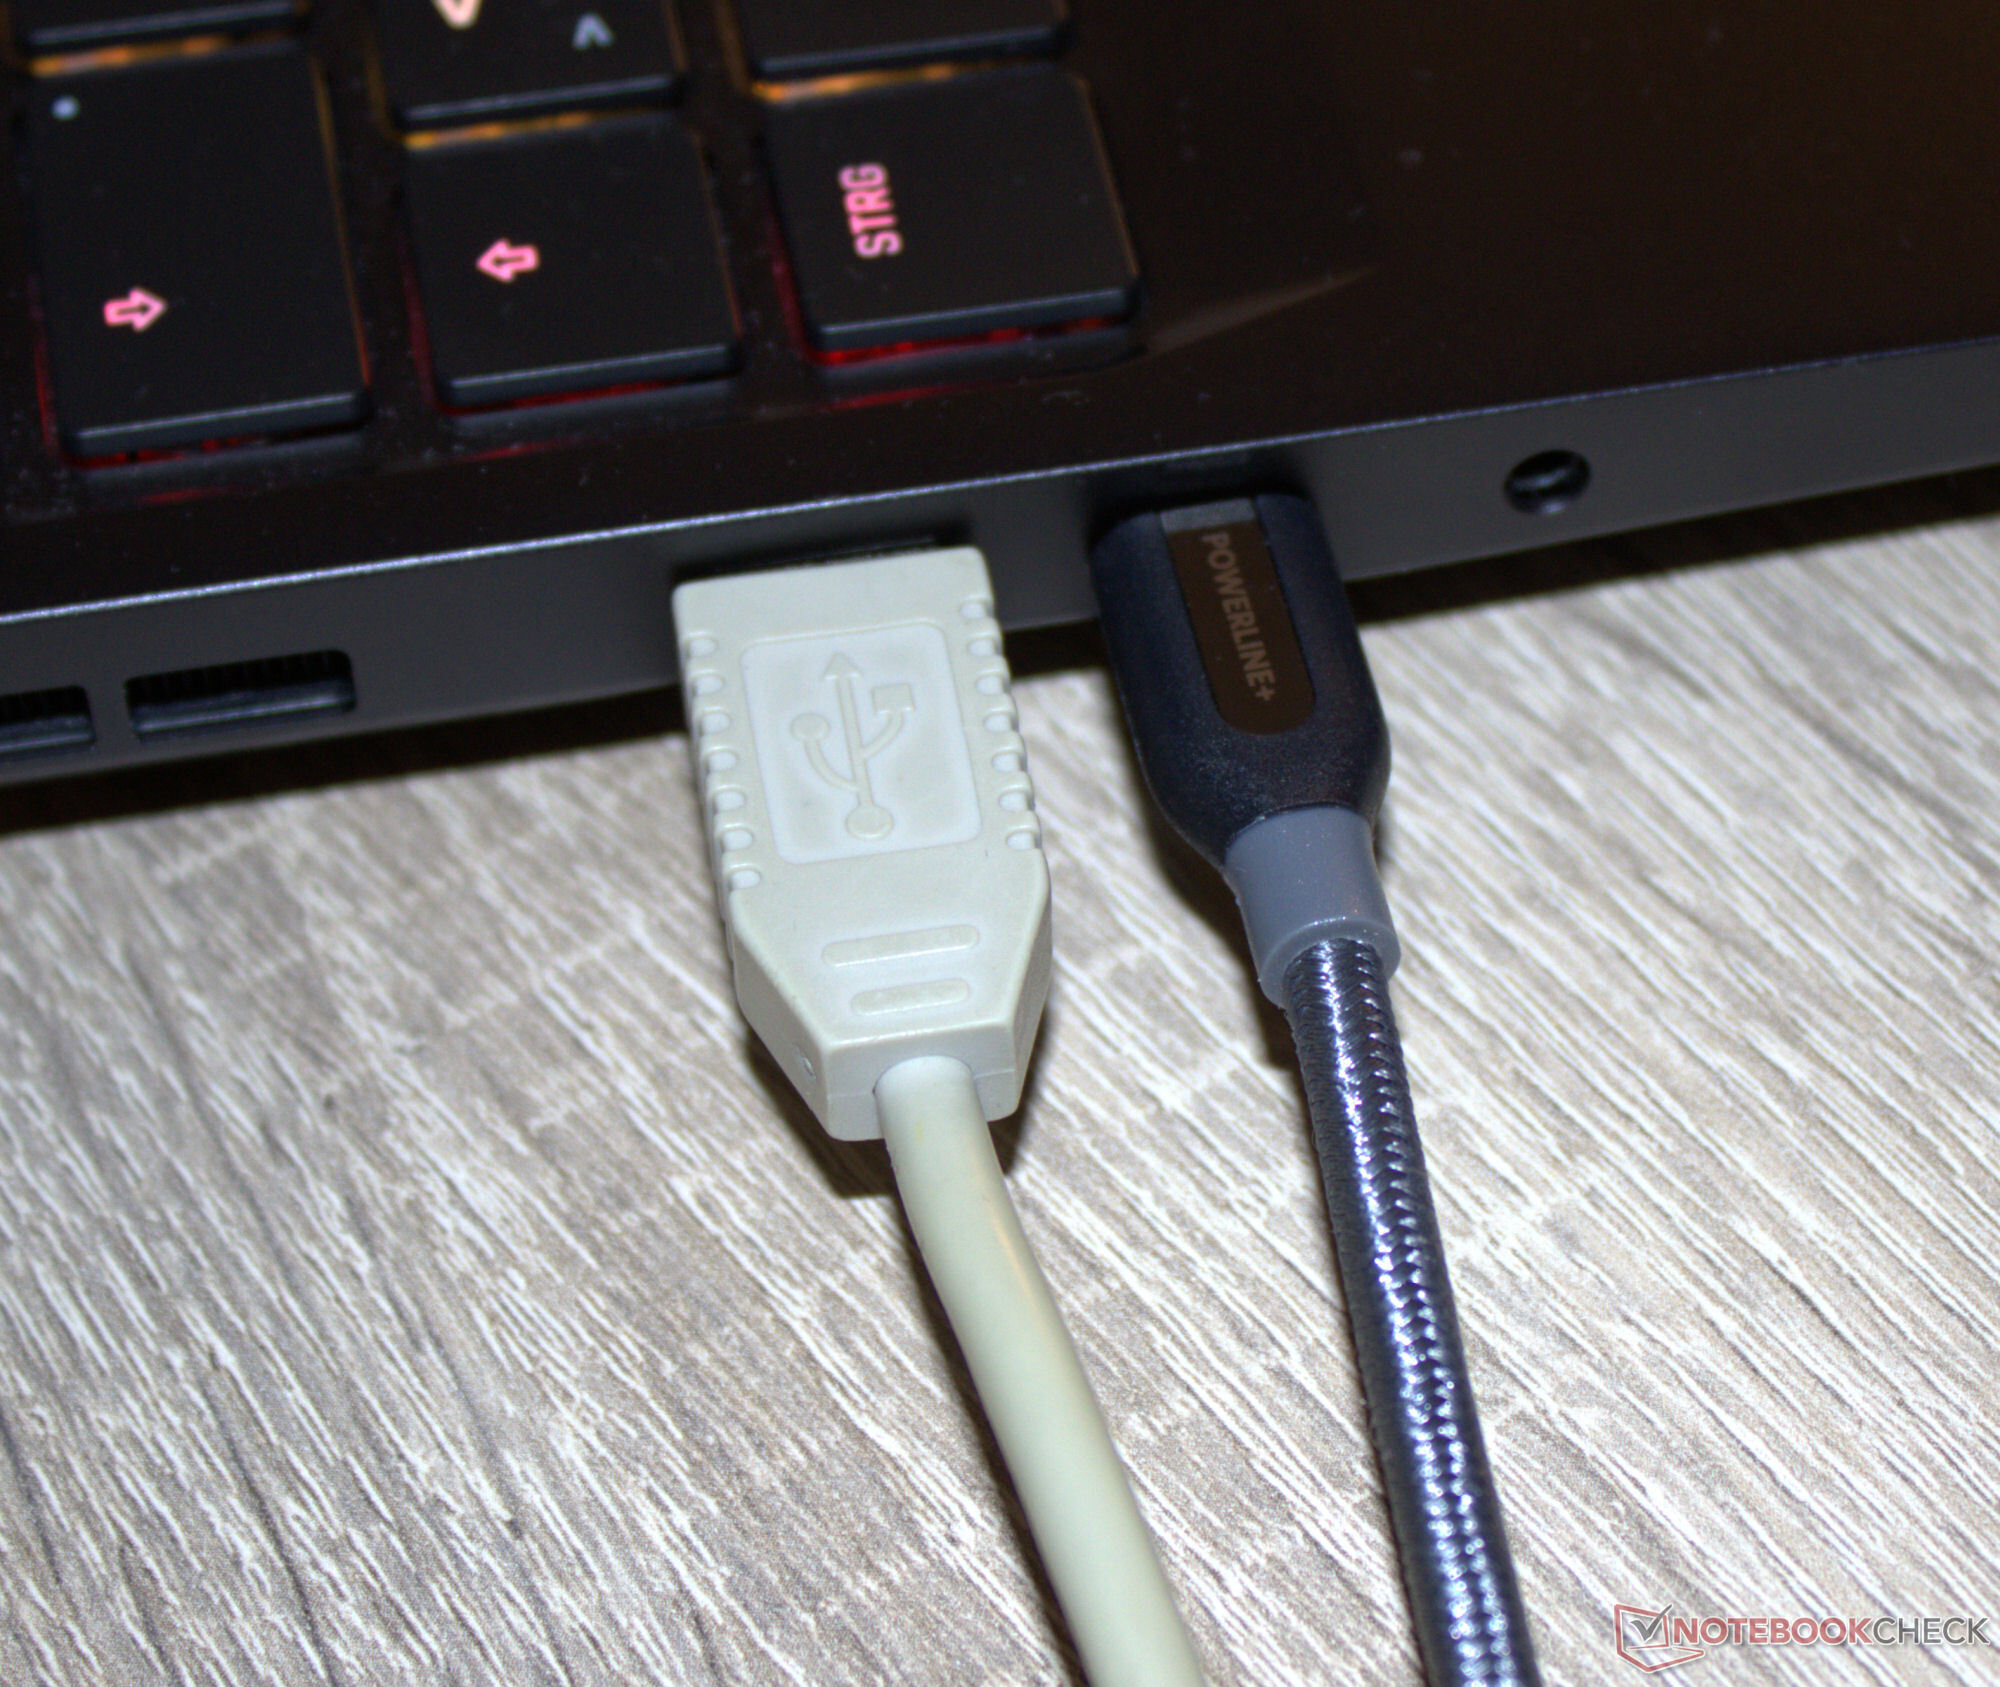
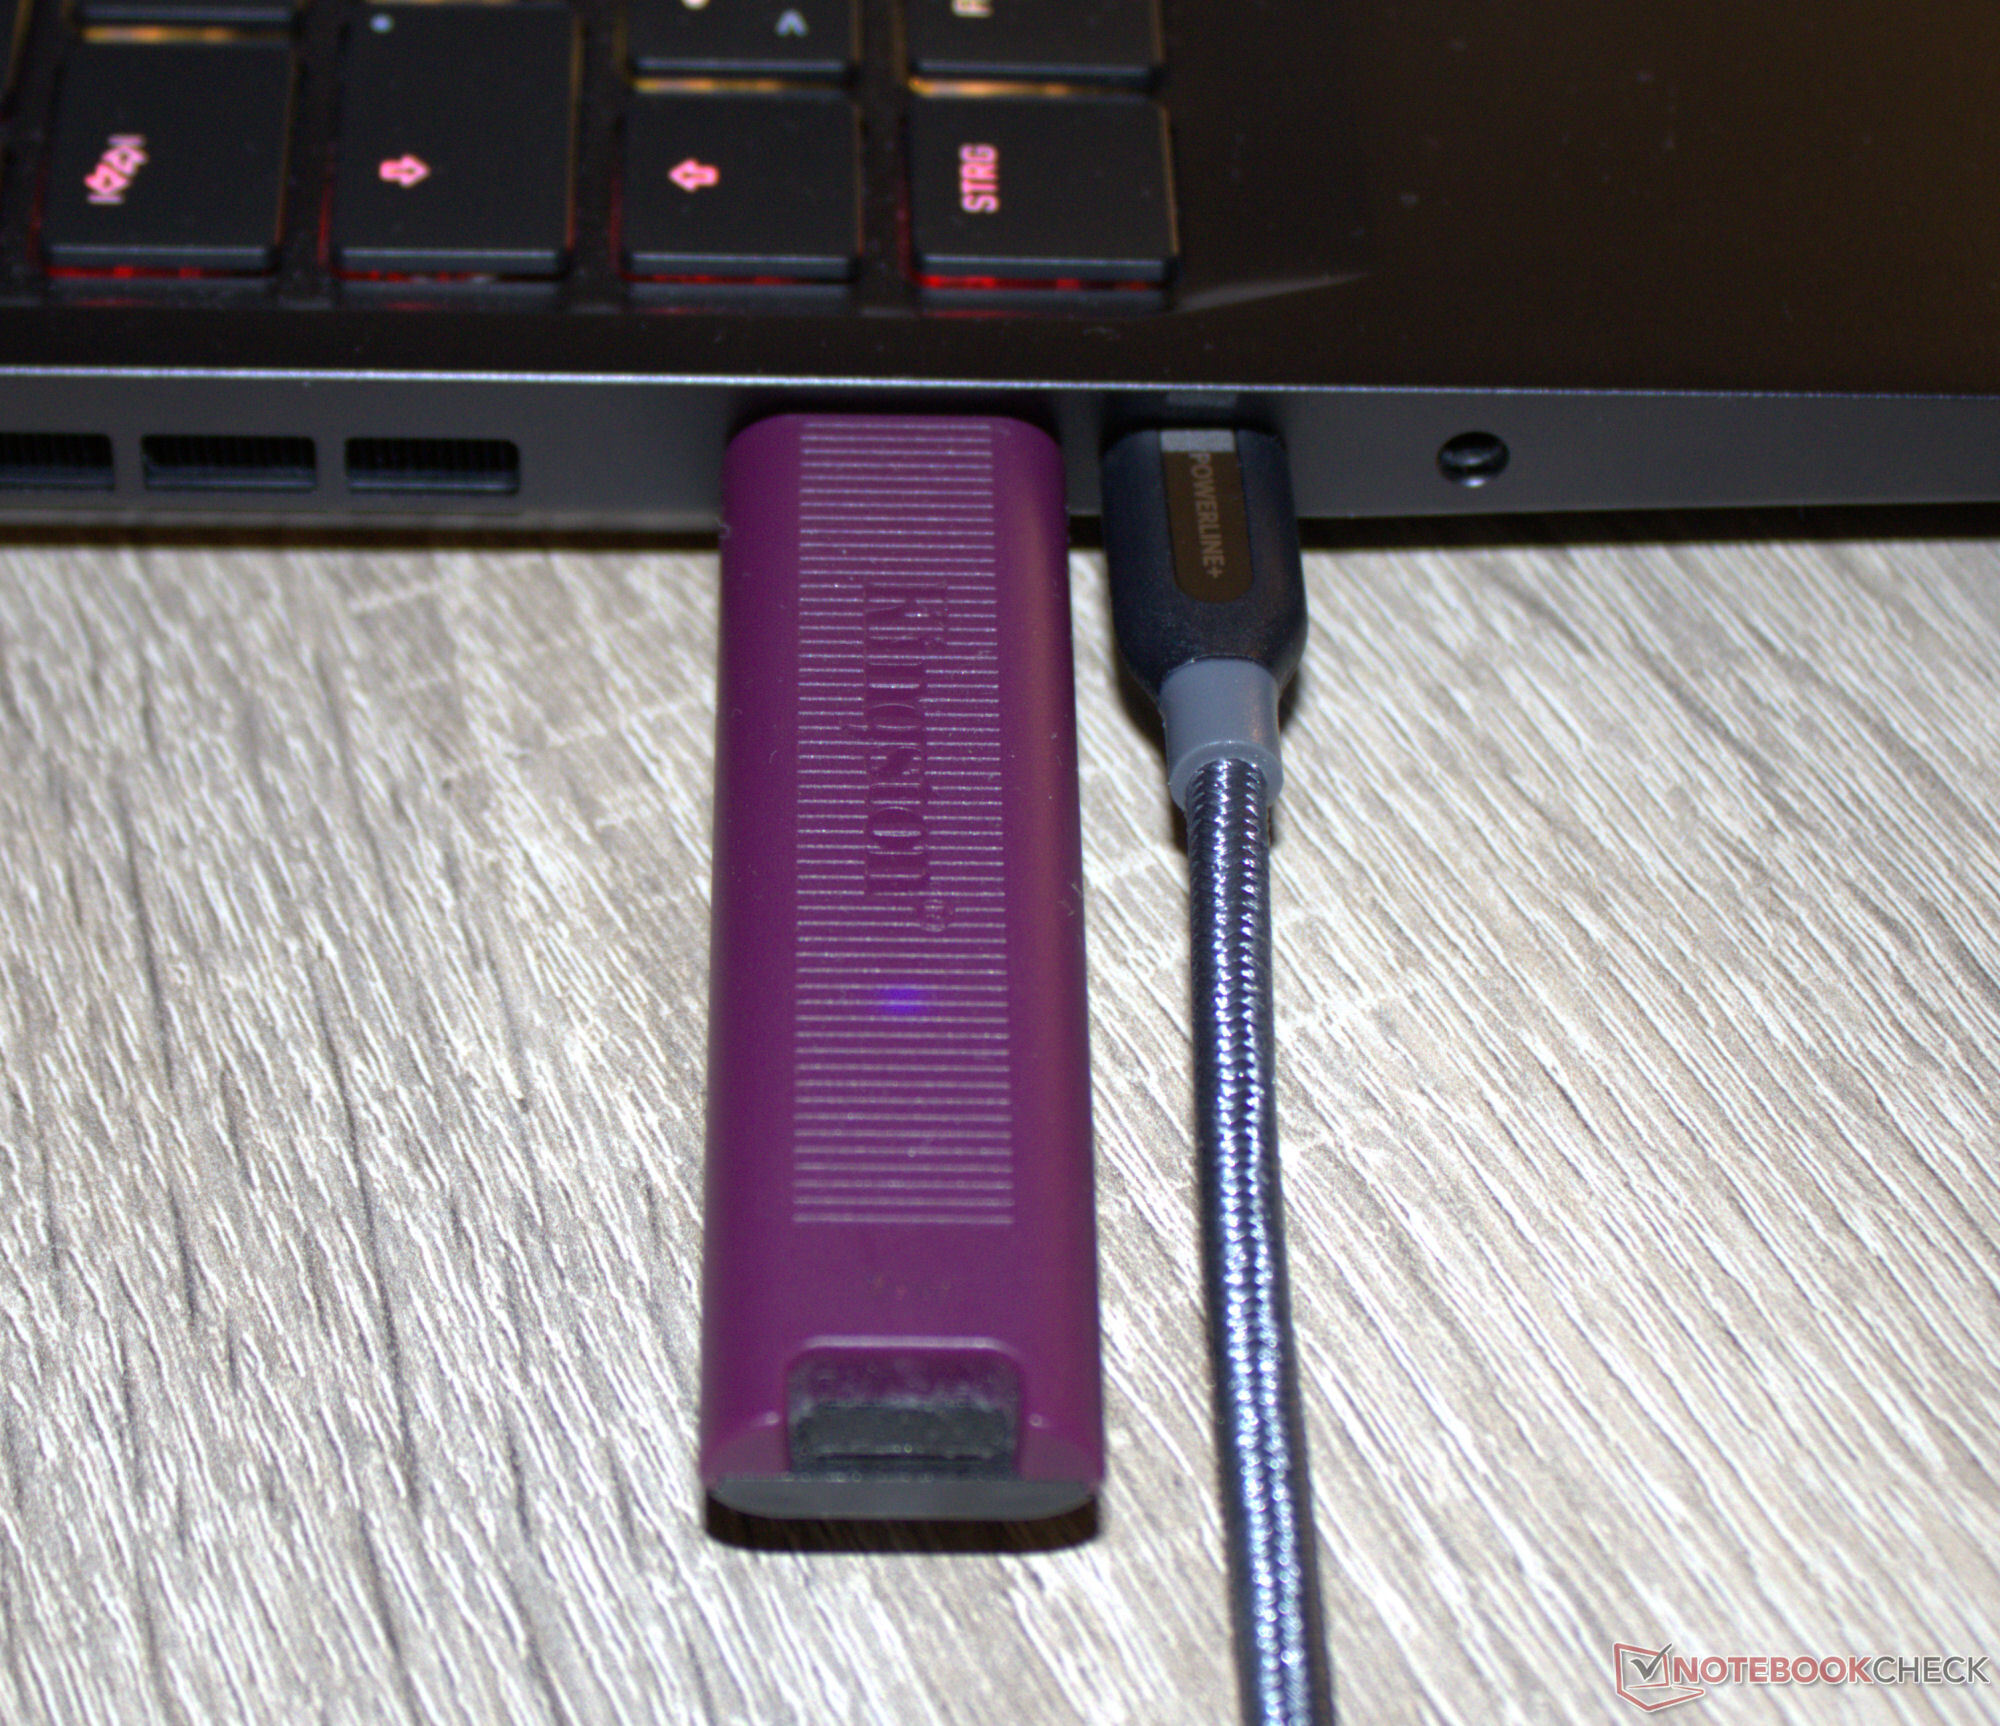
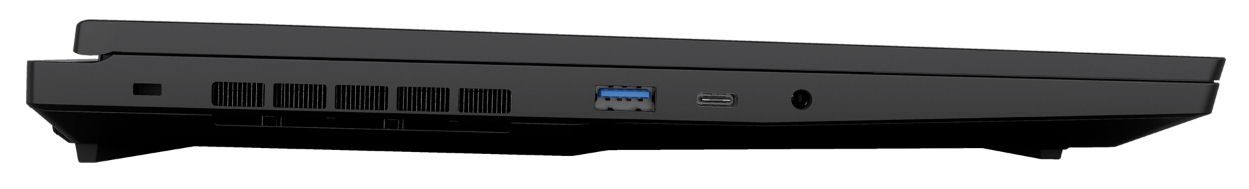
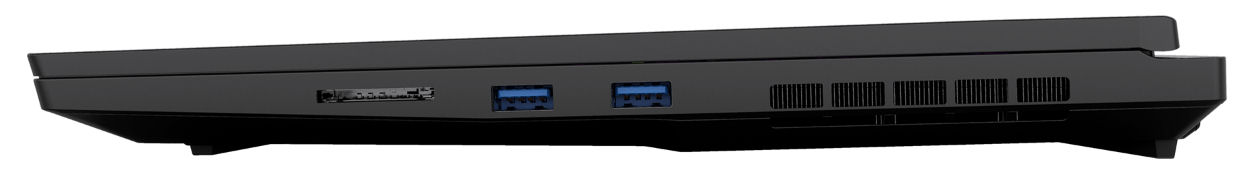
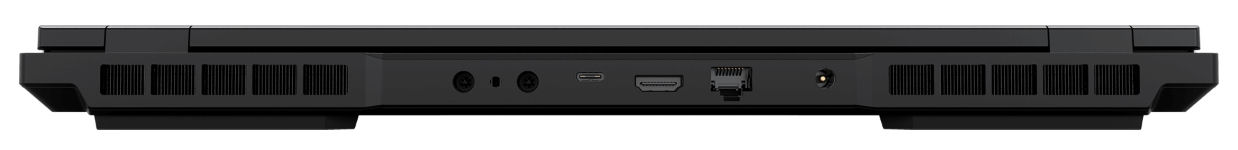
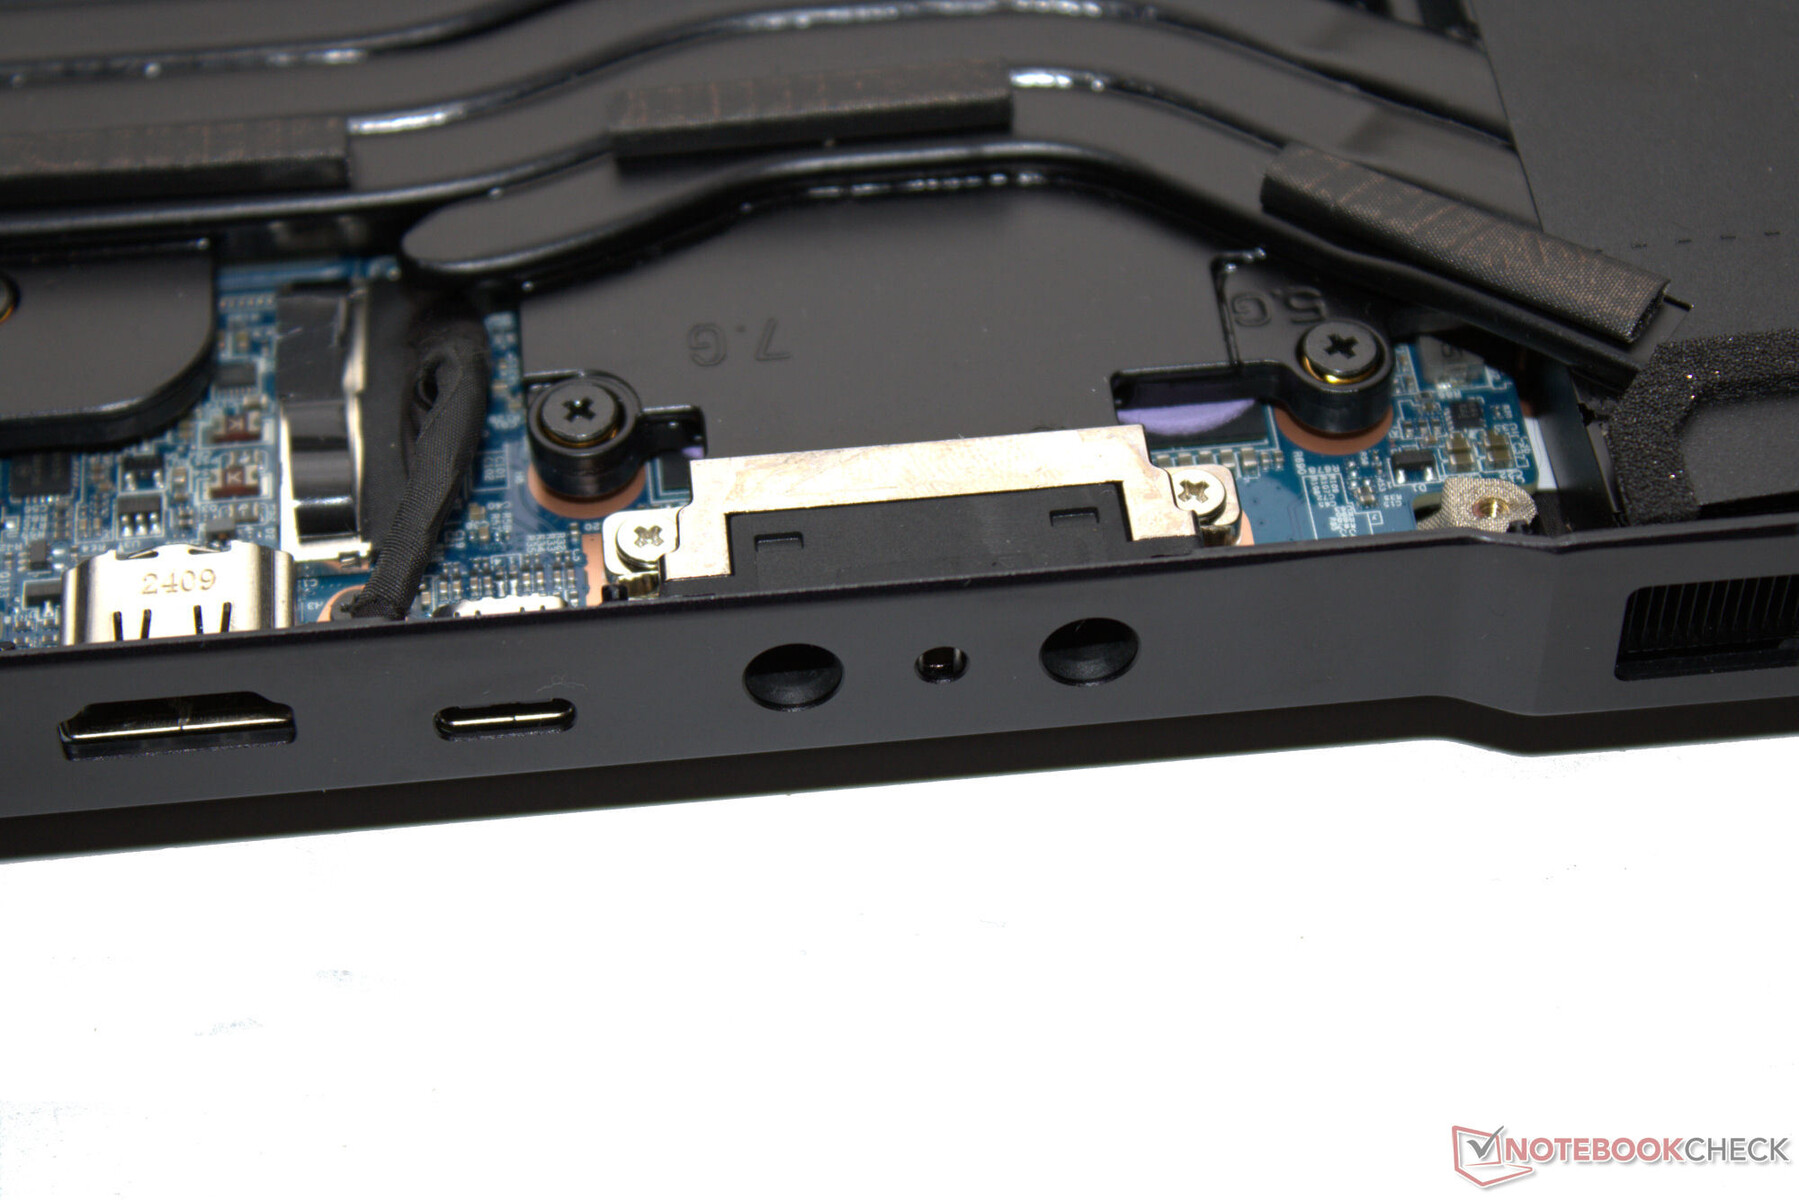
Quatro das cinco portas USB do Neo 16 (3x USB-A, 2x USB-C) operam de acordo com o padrão USB 3.2 Gen 1. Somente a porta USB-C na parte traseira traz o Thunderbolt 4 (USB 4) para a mesa, incluindo suporte para Power Delivery e modo Display Alt. Há um total de duas saídas de vídeo disponíveis (1x HDMI, 1x DP). Um conector de áudio e uma porta Gigabit Ethernet (2,5 GBit/s) completam a oferta.
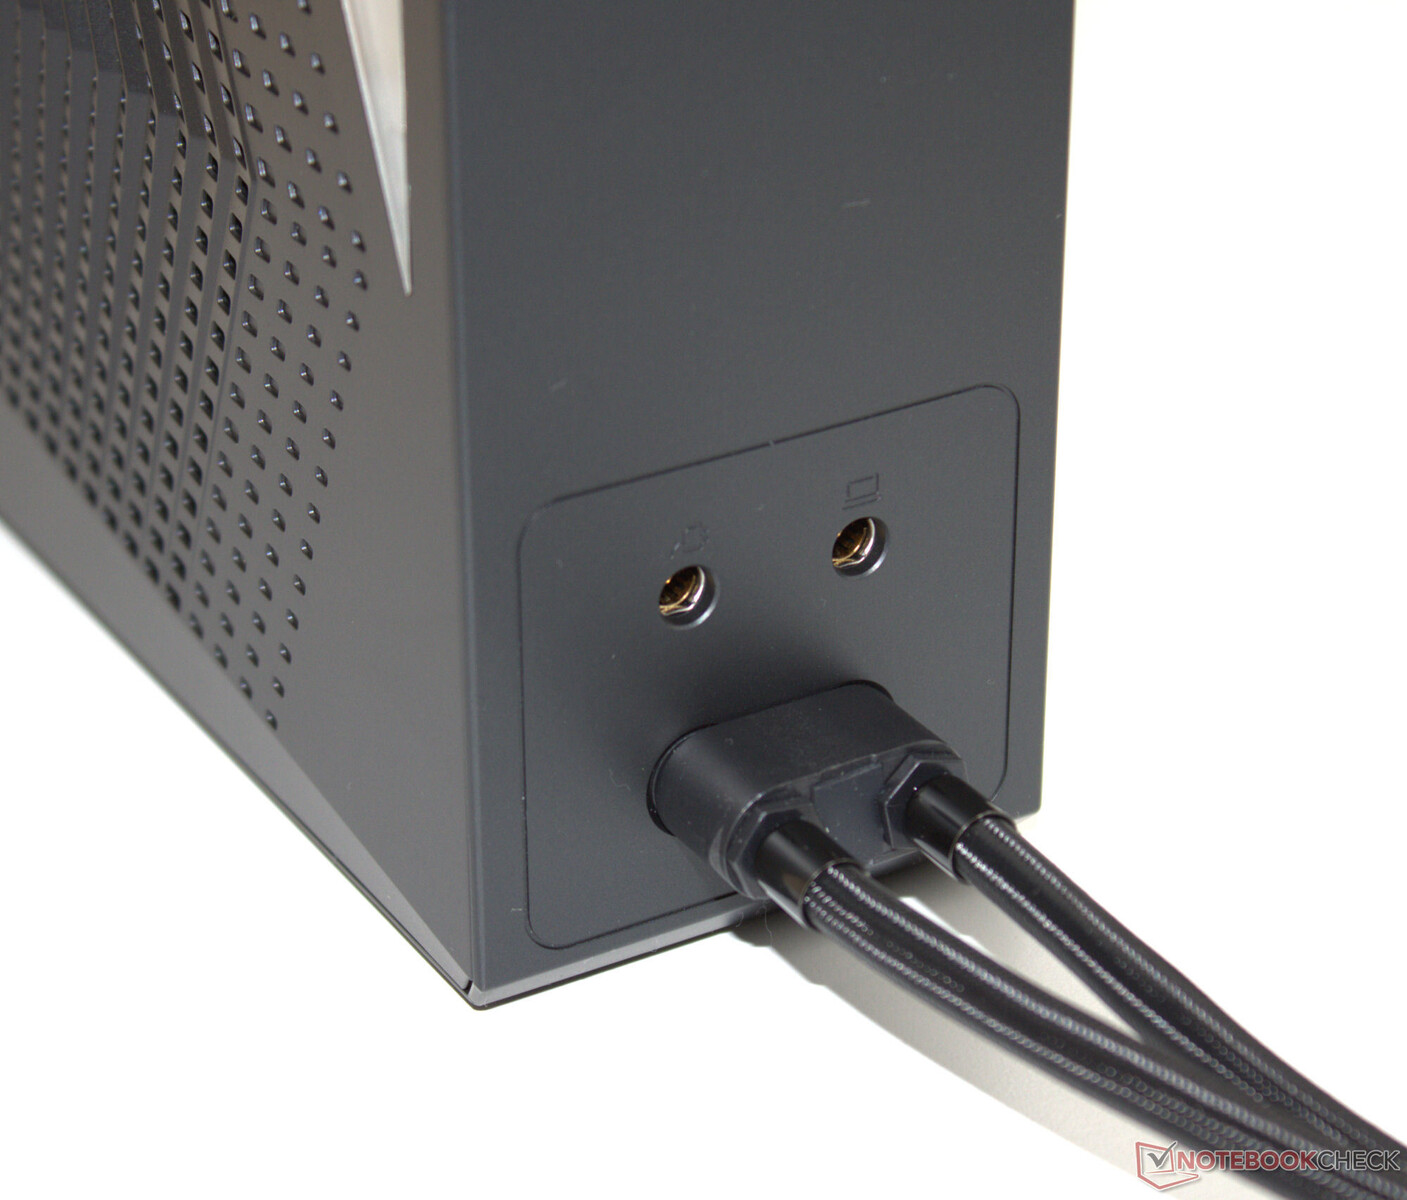
A distância entre as portas USB (lado direito: 12 mm, lado esquerdo: 8 mm) parece ser adequadamente proporcional: Dois pen drives (conectores) de tamanho típico podem ser conectados ao mesmo tempo (veja as imagens da galeria). As saídas de vídeo e os conectores de alimentação podem ser encontrados na parte traseira do dispositivo. Os cabos associados seriam instalados na parte traseira e, portanto, não atrapalhariam.
Leitor de cartão SD
O leitor de cartão SD (referência: AV PRO microSD 128 GB V60) é um dos modelos de média velocidade: As velocidades de transferência de 76 MB/s (transferência de 250 imagens jpg, 5 MB por arquivo) e 87 MB/s (cópia de grandes blocos de dados) podem ser descritas como aceitáveis. O Razer Blade 16 mostra que é possível atingir valores significativamente mais altos.
| SD Card Reader | |
| average JPG Copy Test (av. of 3 runs) | |
| Razer Blade 16 2024, RTX 4090 | |
| Média da turma Gaming (19 - 197.3, n=68, últimos 2 anos) | |
| Medion Erazer Beast X40 2024 (AV PRO microSD 128 GB V60) | |
| SCHENKER XMG Neo 16 (Early 24) (AV PRO microSD 128 GB V60) | |
| SCHENKER XMG Neo 16 E23 (AV PRO microSD 128 GB V60) | |
| maximum AS SSD Seq Read Test (1GB) | |
| Razer Blade 16 2024, RTX 4090 | |
| Média da turma Gaming (25.8 - 263, n=67, últimos 2 anos) | |
| Medion Erazer Beast X40 2024 (AV PRO microSD 128 GB V60) | |
| SCHENKER XMG Neo 16 (Early 24) (AV PRO microSD 128 GB V60) | |
| SCHENKER XMG Neo 16 E23 (AV PRO microSD 128 GB V60) | |
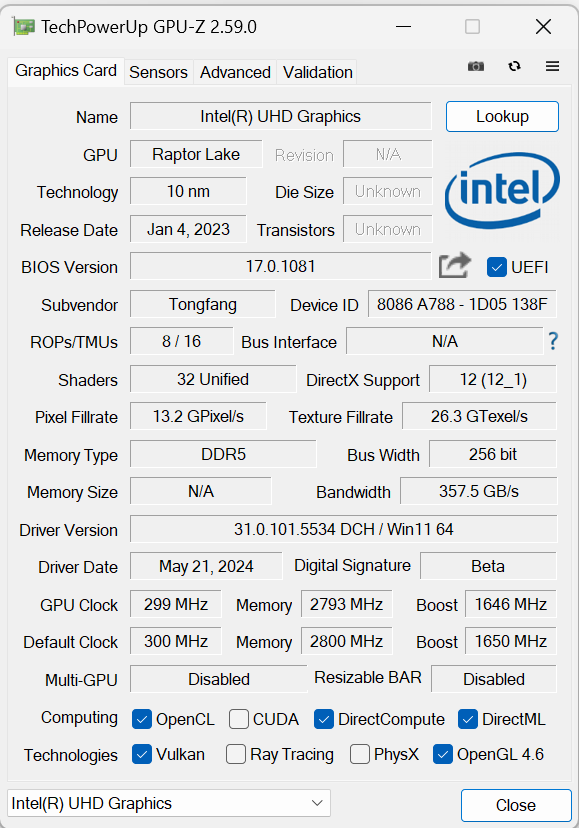
Comunicação
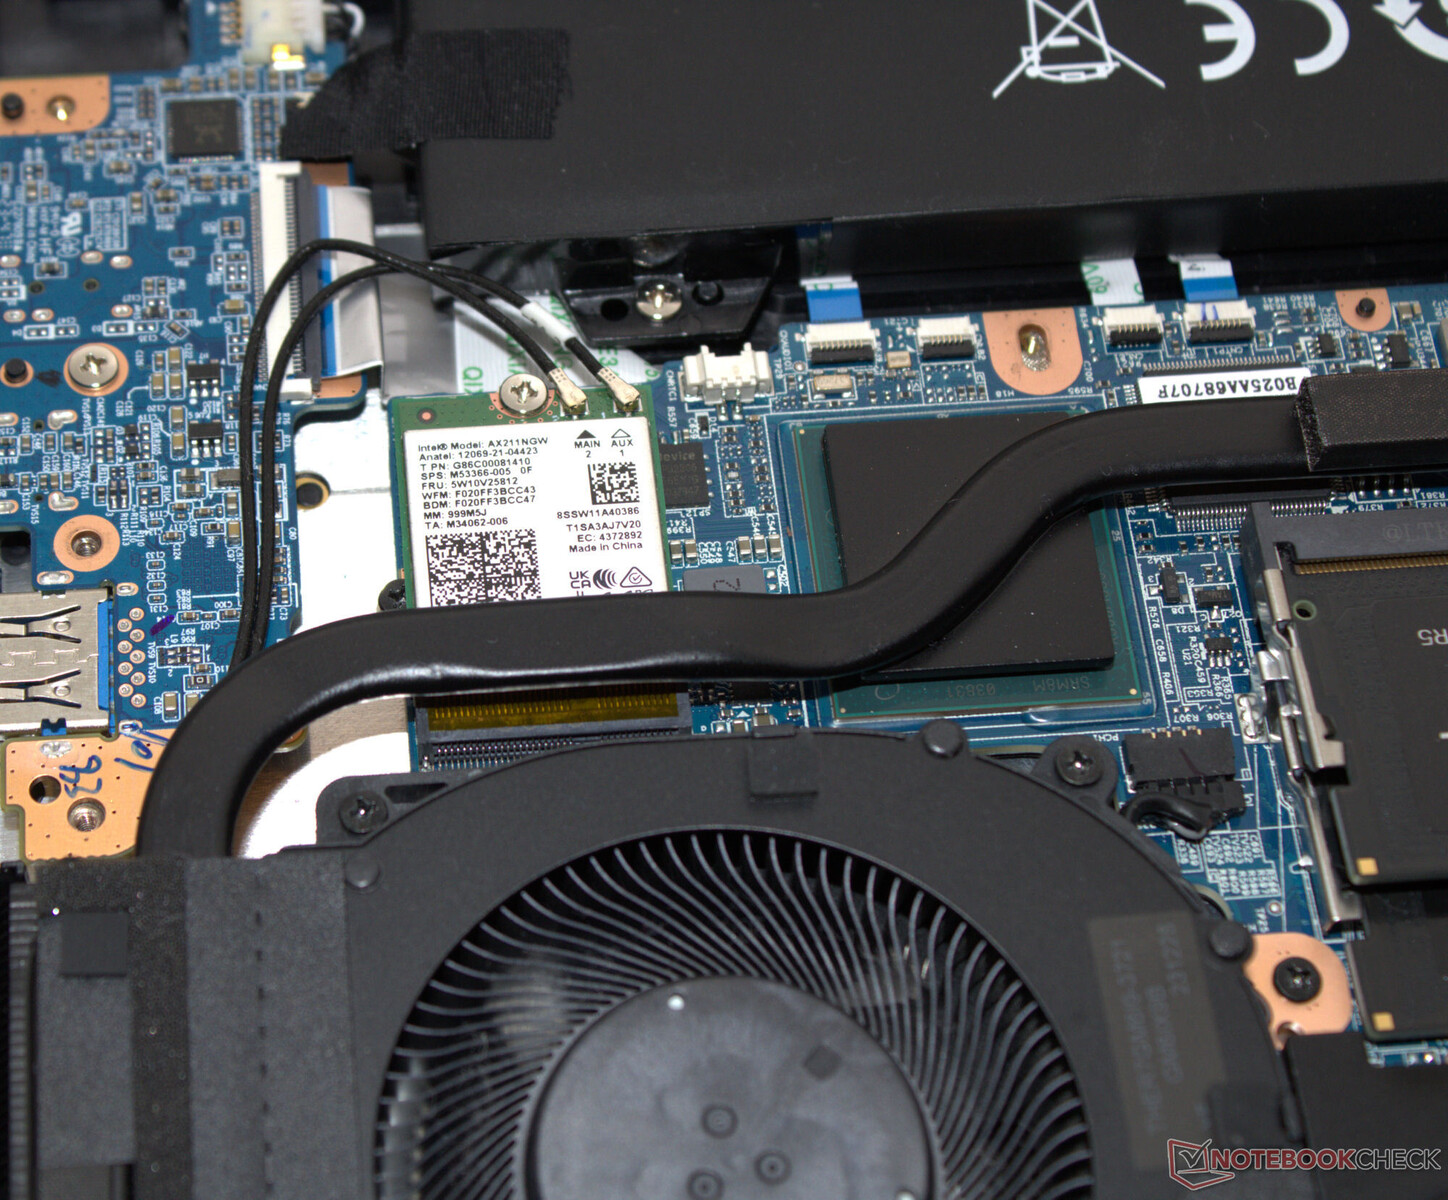
Em condições ideais (sem dispositivos Wi-Fi por perto, curta distância entre o laptop e o PC servidor), é possível obter velocidades de dados de boas a excelentes - um chip WiFi 6E (Intel AX211) torna isso possível. As conexões com fio são realizadas por um controlador Realtek Gigabit Ethernet (RTL8125, 2,5 GBit/s).
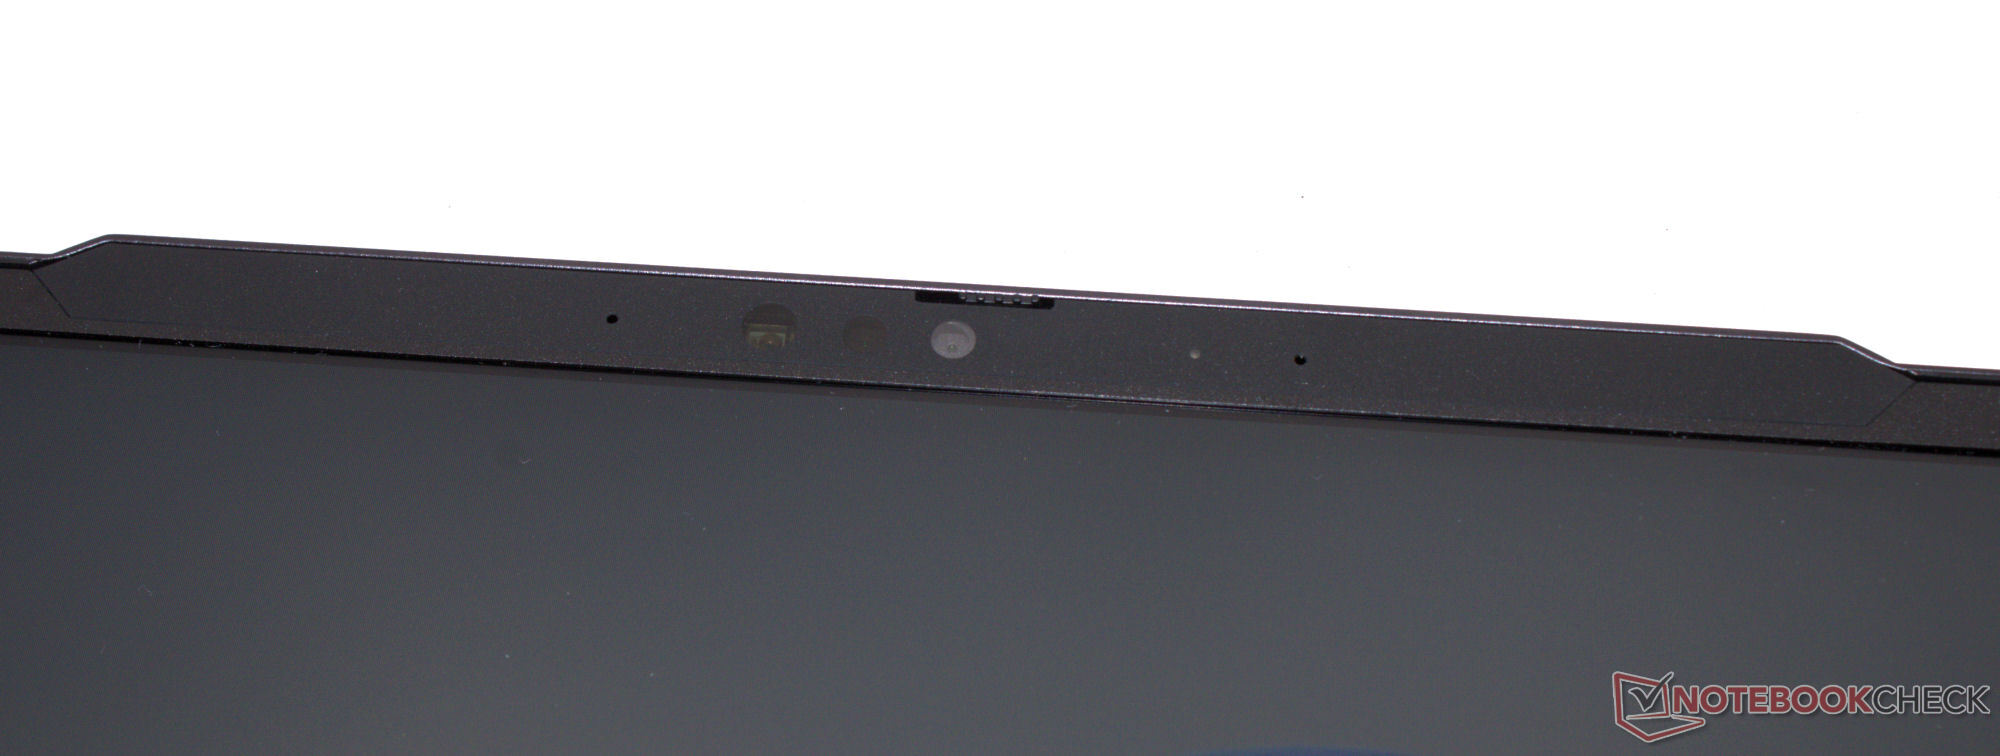
Webcam
A webcam (2,1 MP) oferece qualidade média e o suporte ao Windows Hello é fornecido. Além disso, há um obturador mecânico.

 NVIDIA GeForce RTX 4090 Laptop GPU, i9-14900HX, Samsung 990 Pro 1 TB")
 NVIDIA GeForce RTX 4090 Laptop GPU, i9-14900HX, Samsung 990 Pro 1 TB")
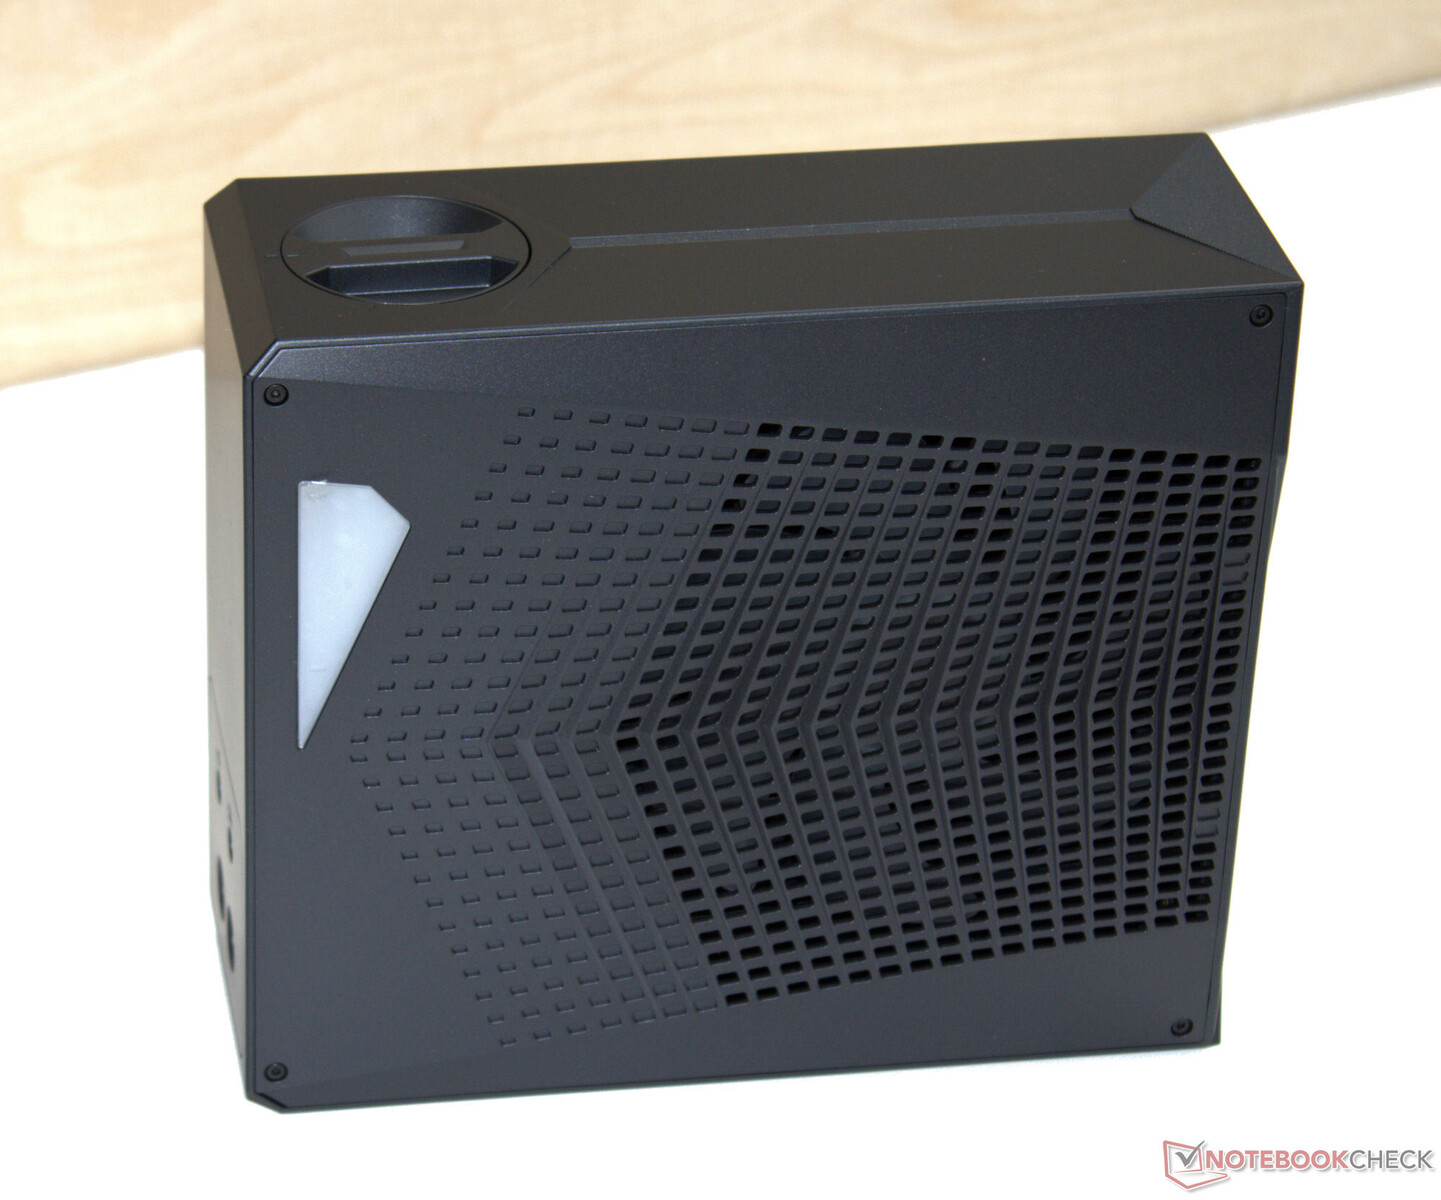
Acessórios
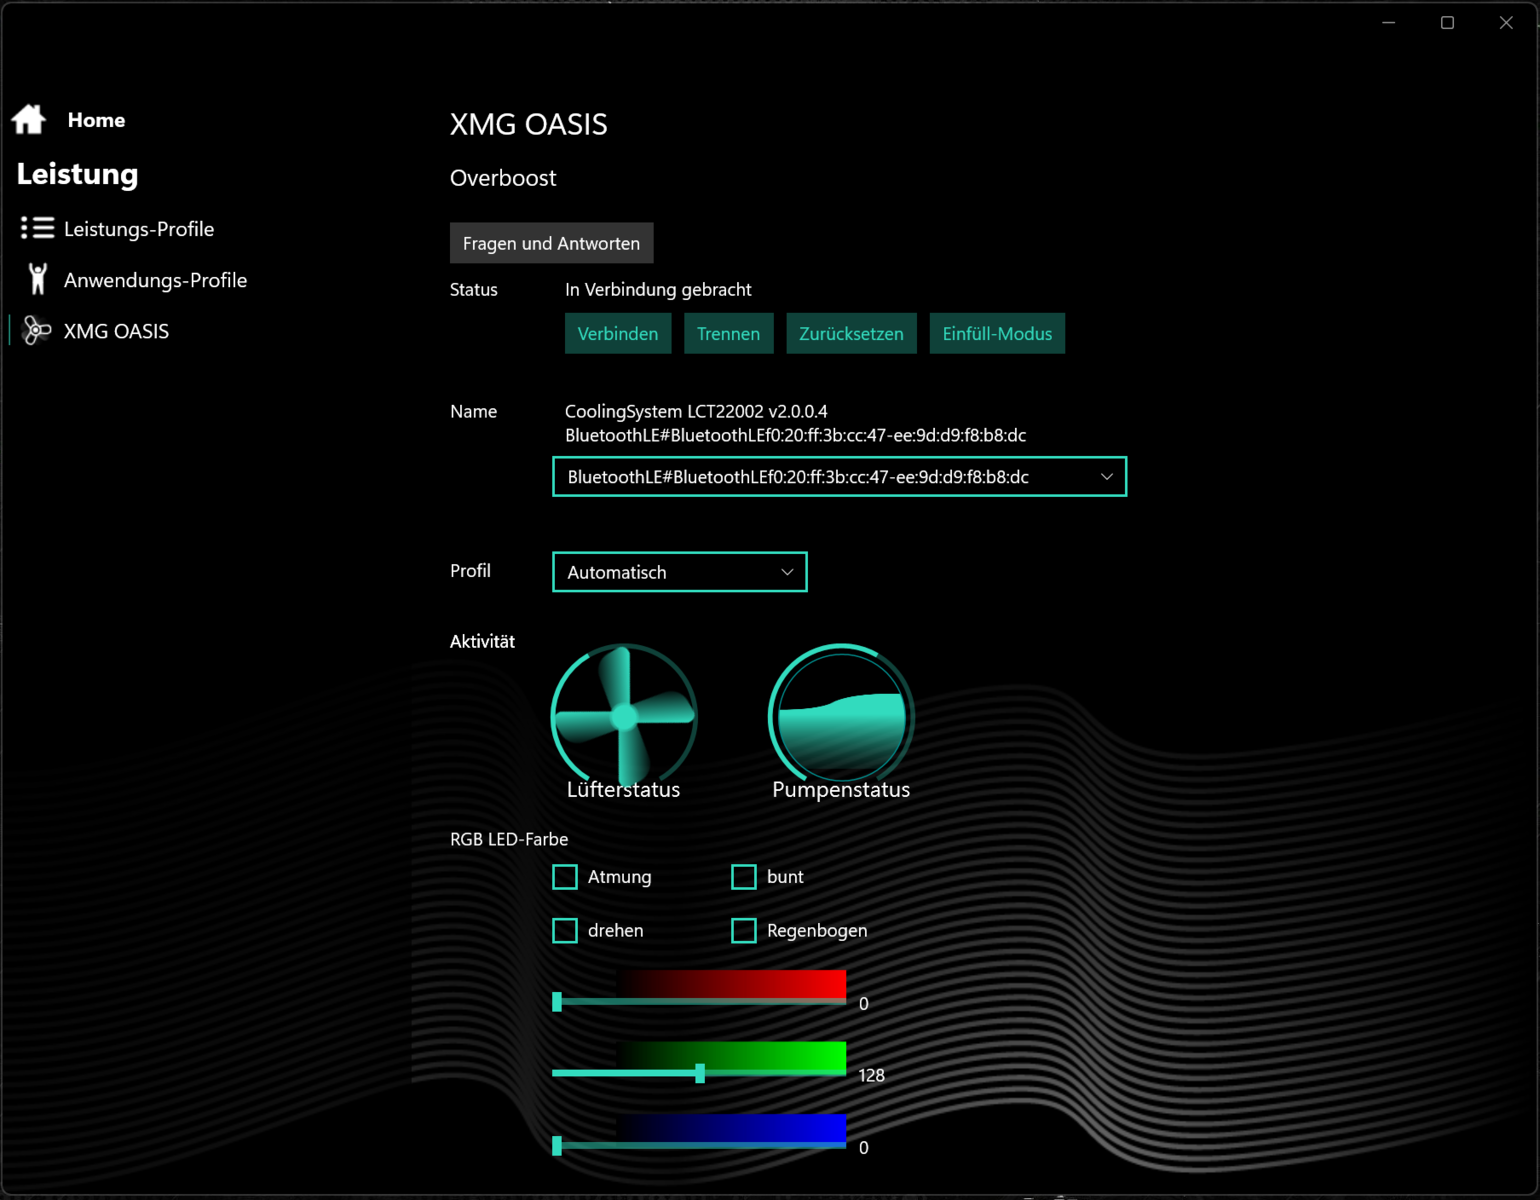
O laptop vem com um pendrive USB (drivers, instruções), adesivos e um mousepad. Um acessório opcional é o resfriamento externo a água https://www.xmg.gg/xmg-oasis-mk2/ ($230).

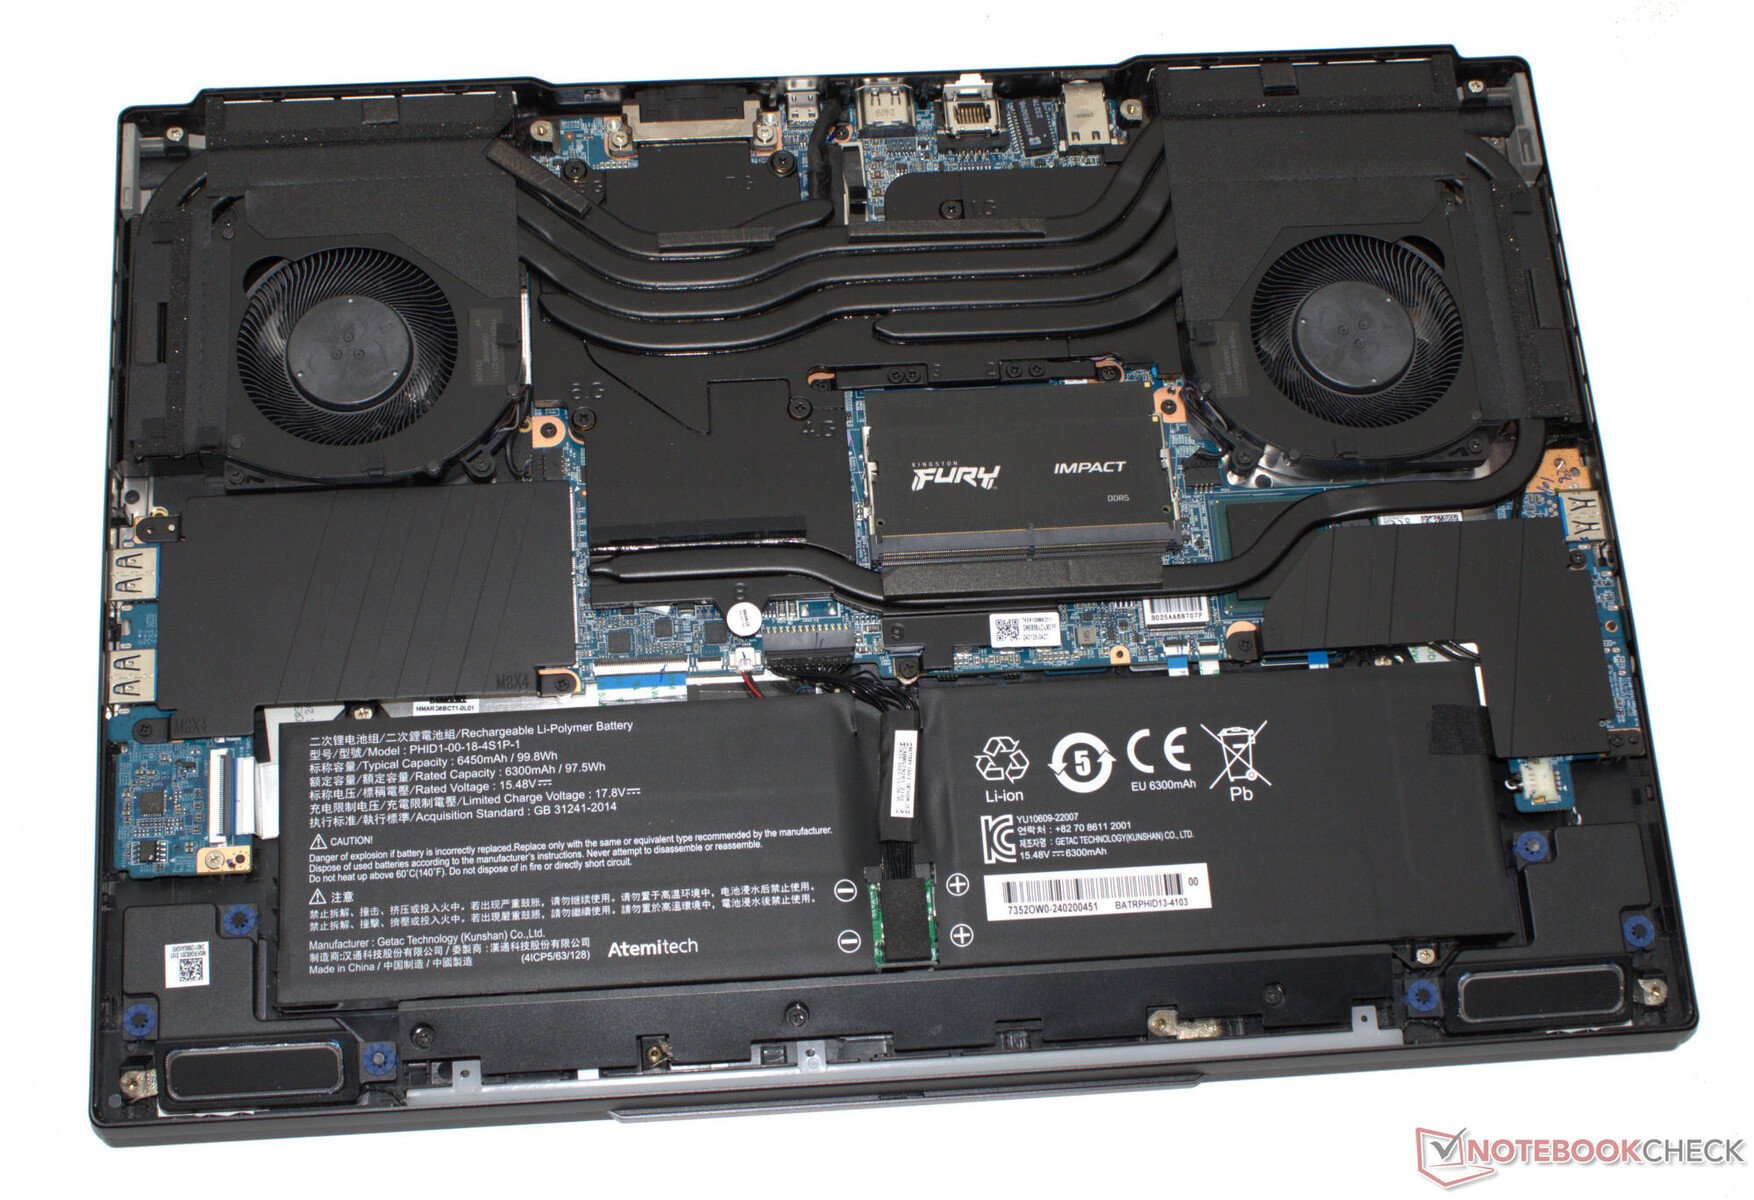
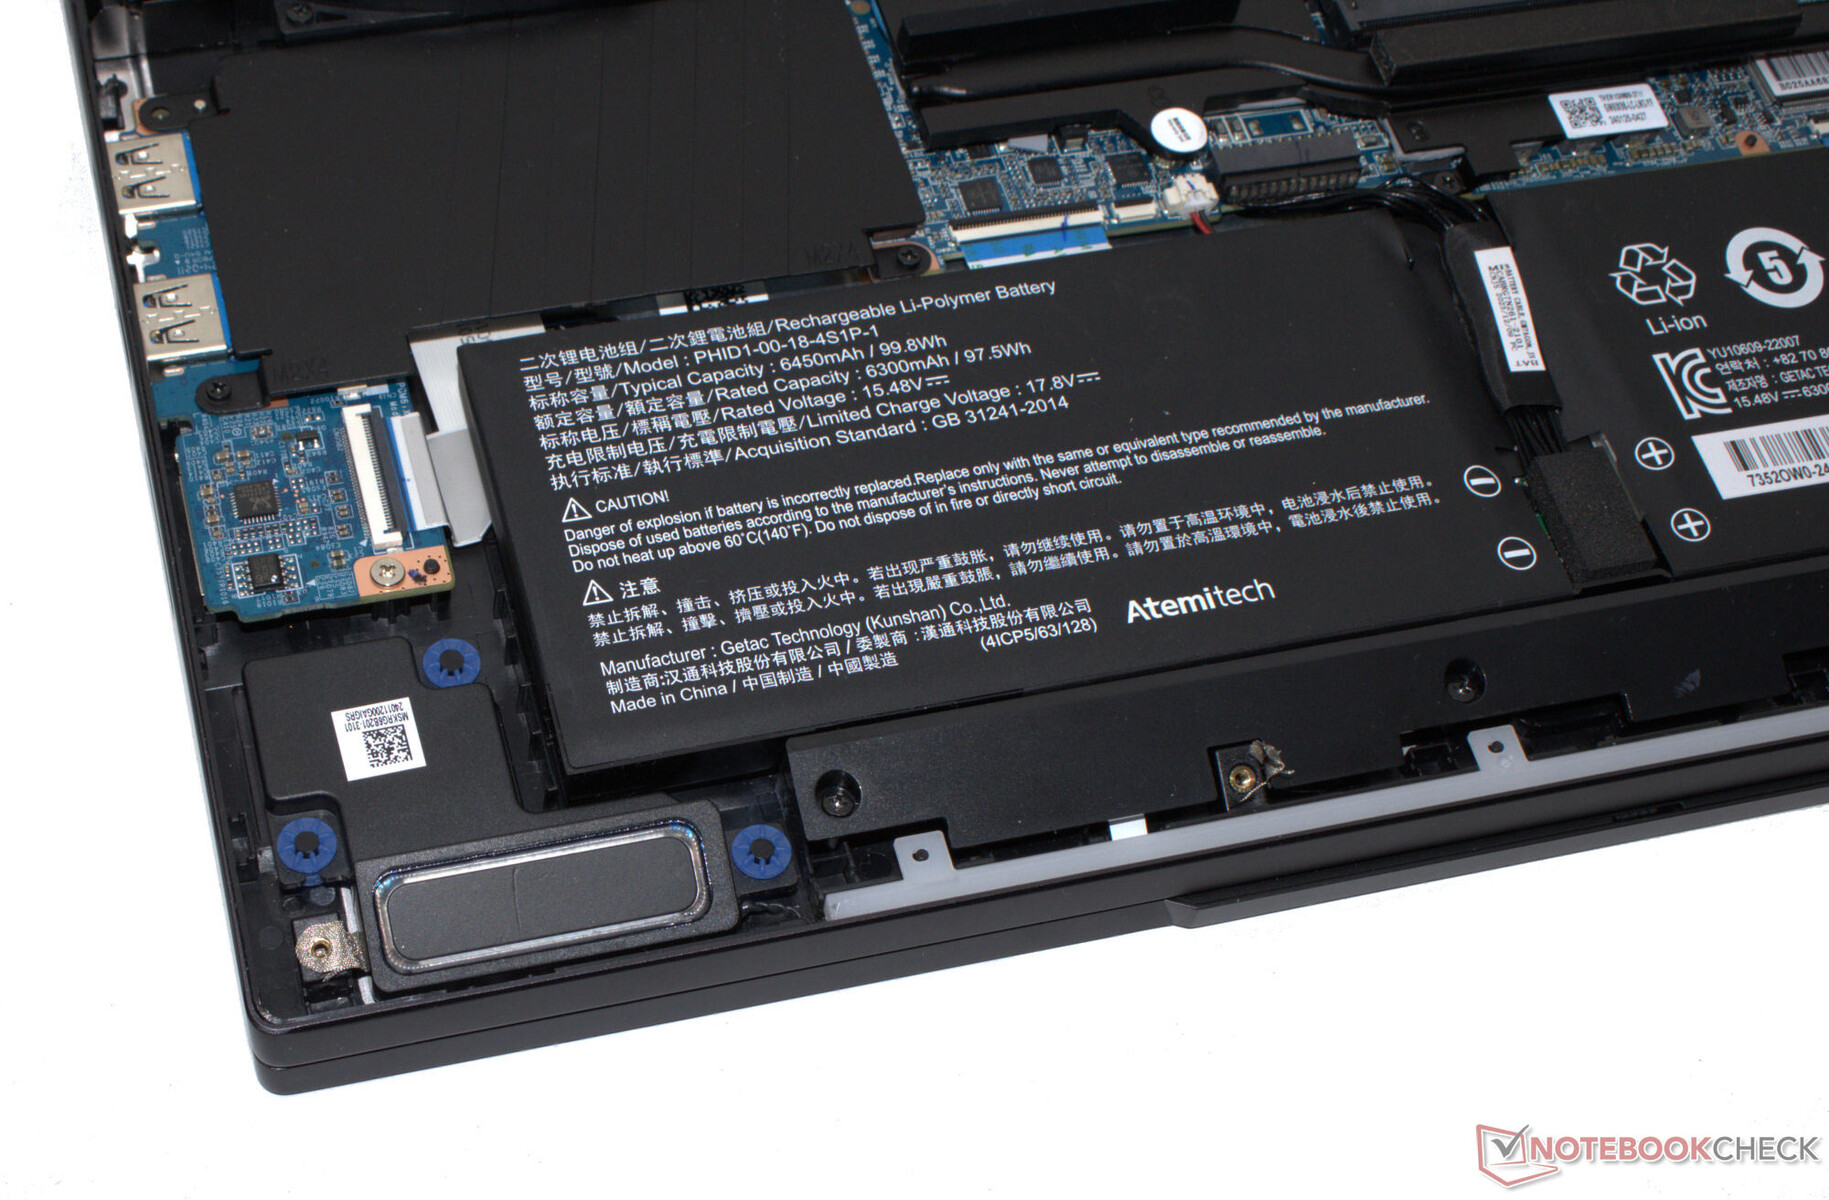
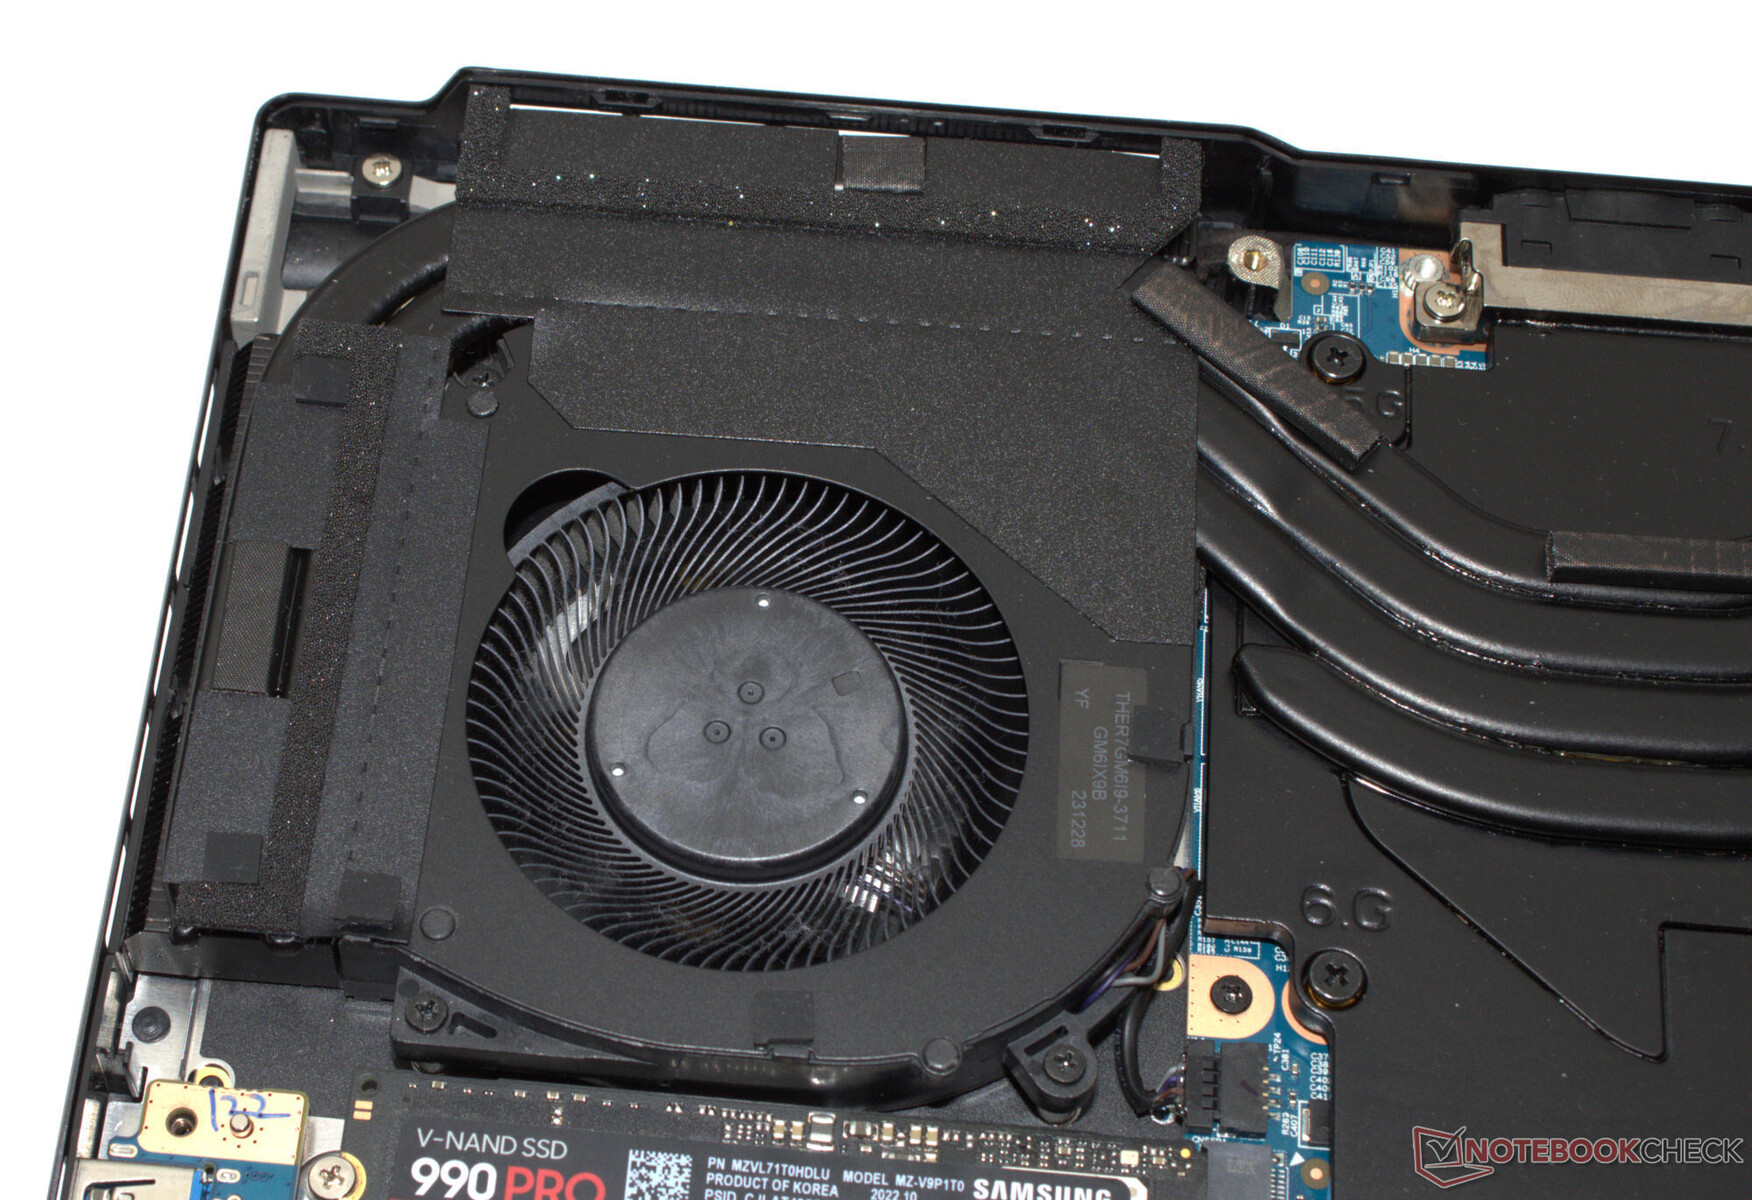
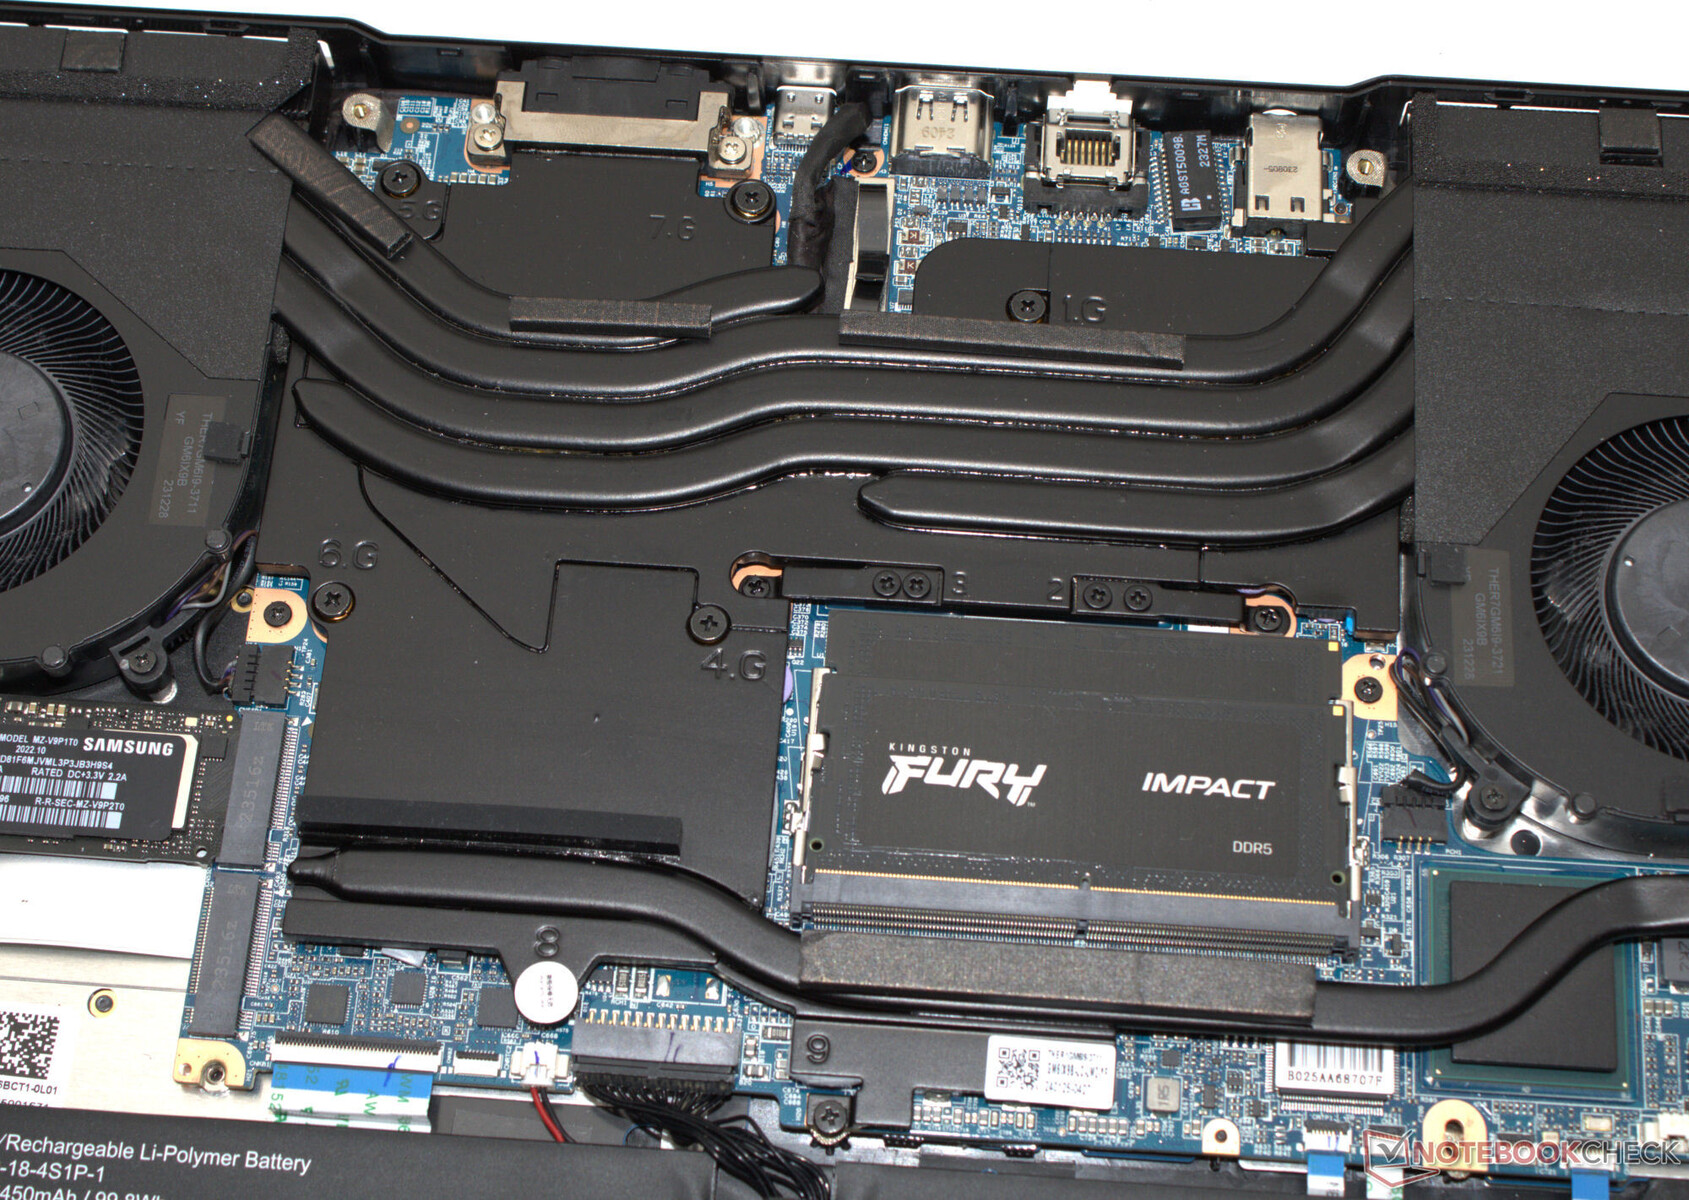
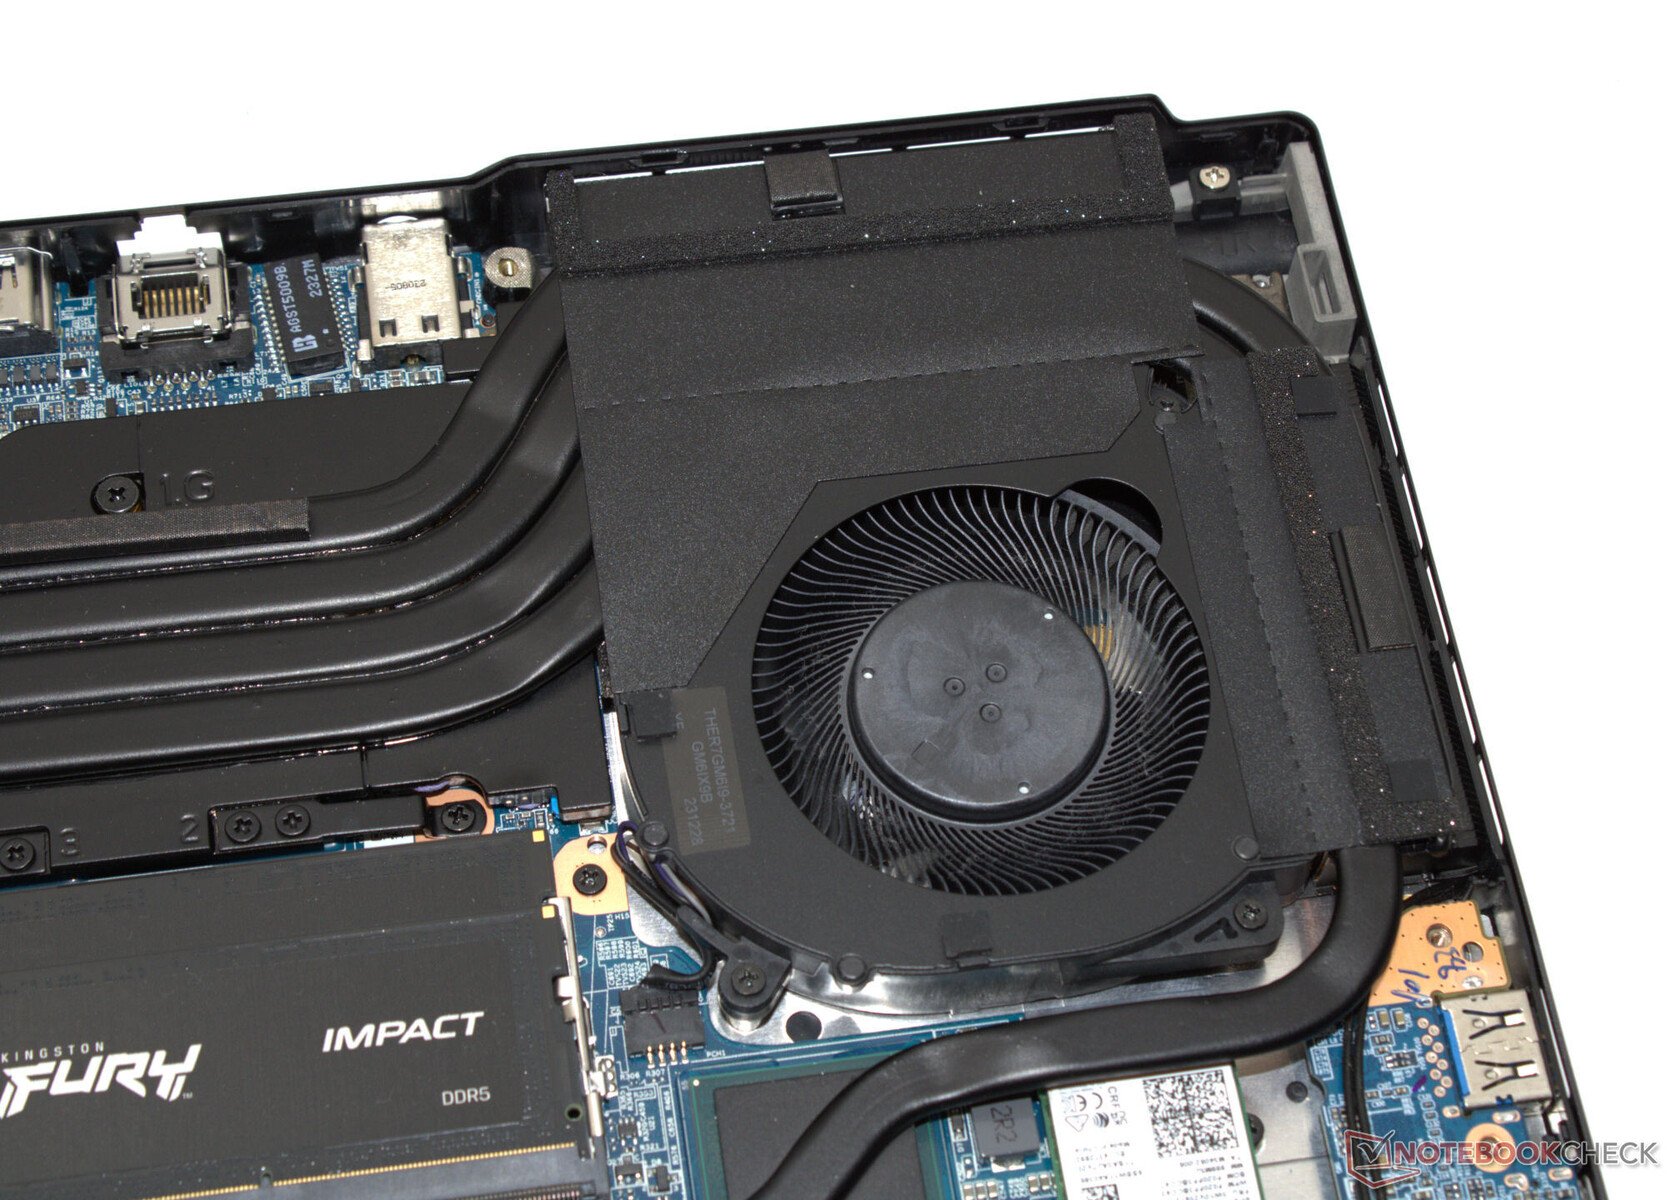
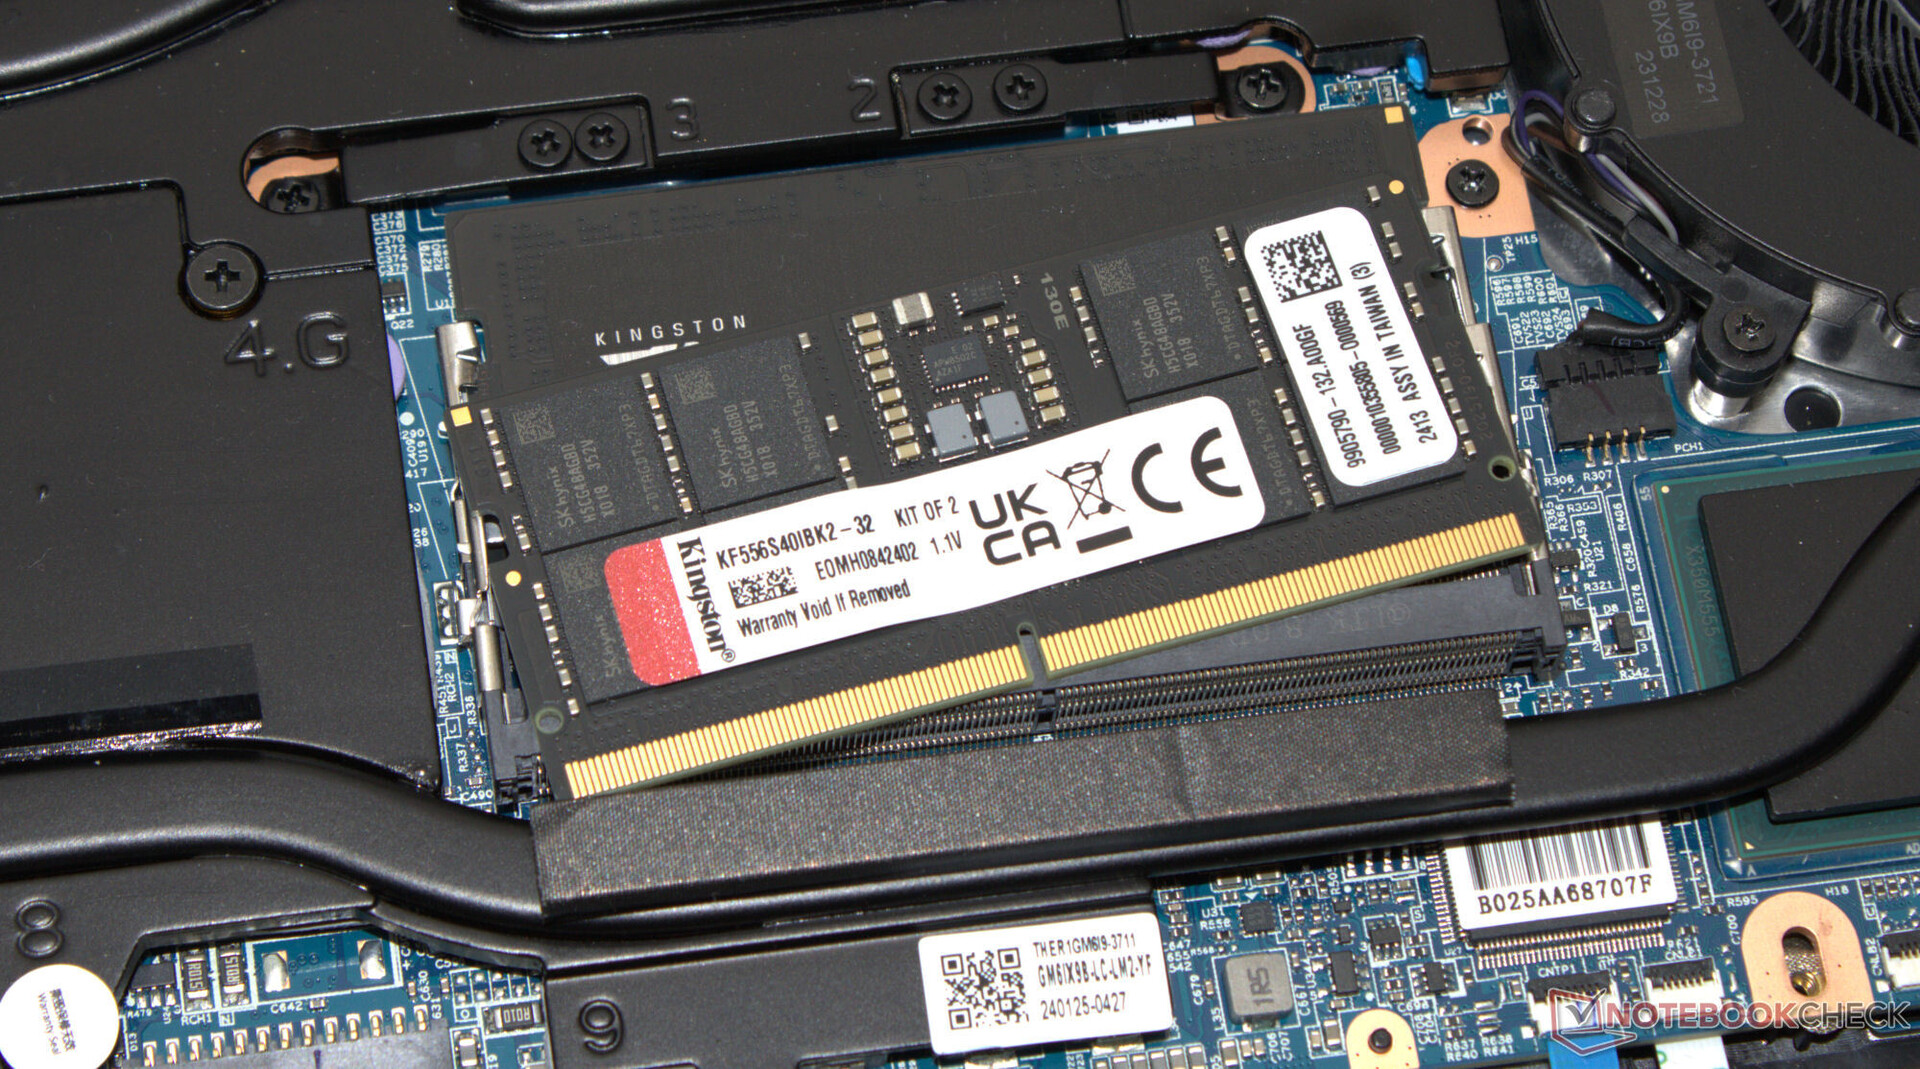
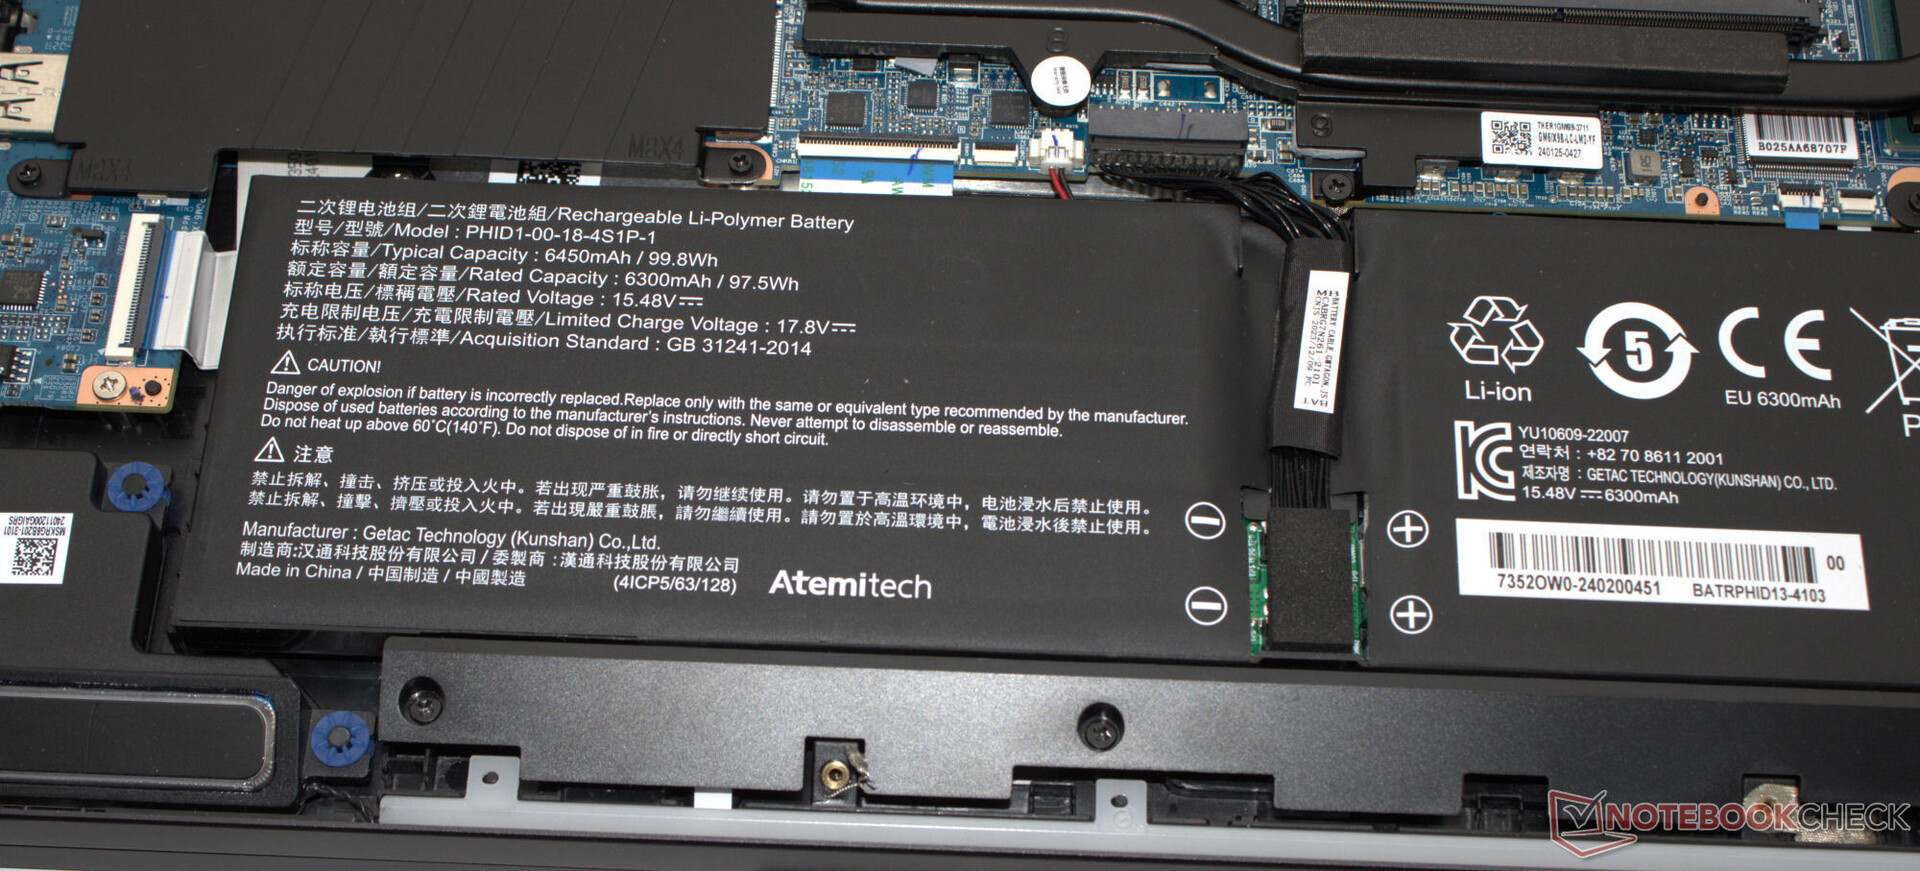
Manutenção
Depois de remover todos os parafusos da base do dispositivo, a tampa da base pode ser separada com a ajuda de um plectro ou de uma espátula plana. Assim, o senhor terá acesso aos bancos de RAM (ambos estão ocupados), às ventoinhas e à bateria. O SSD e os slots de SSD (PCIe 4, M.2 2280) e o módulo Wi-Fi são cobertos por placas adicionais parafusadas.

Garantia
Na UE, a Schenker oferece uma garantia básica de dois anos, incluindo um serviço de retirada e um serviço de reparo rápido de 6 meses (reparos em 48 horas). Uma garantia de 36 meses custará ao senhor entre US$ 100 e US$ 160, dependendo do período de reparo rápido selecionado.
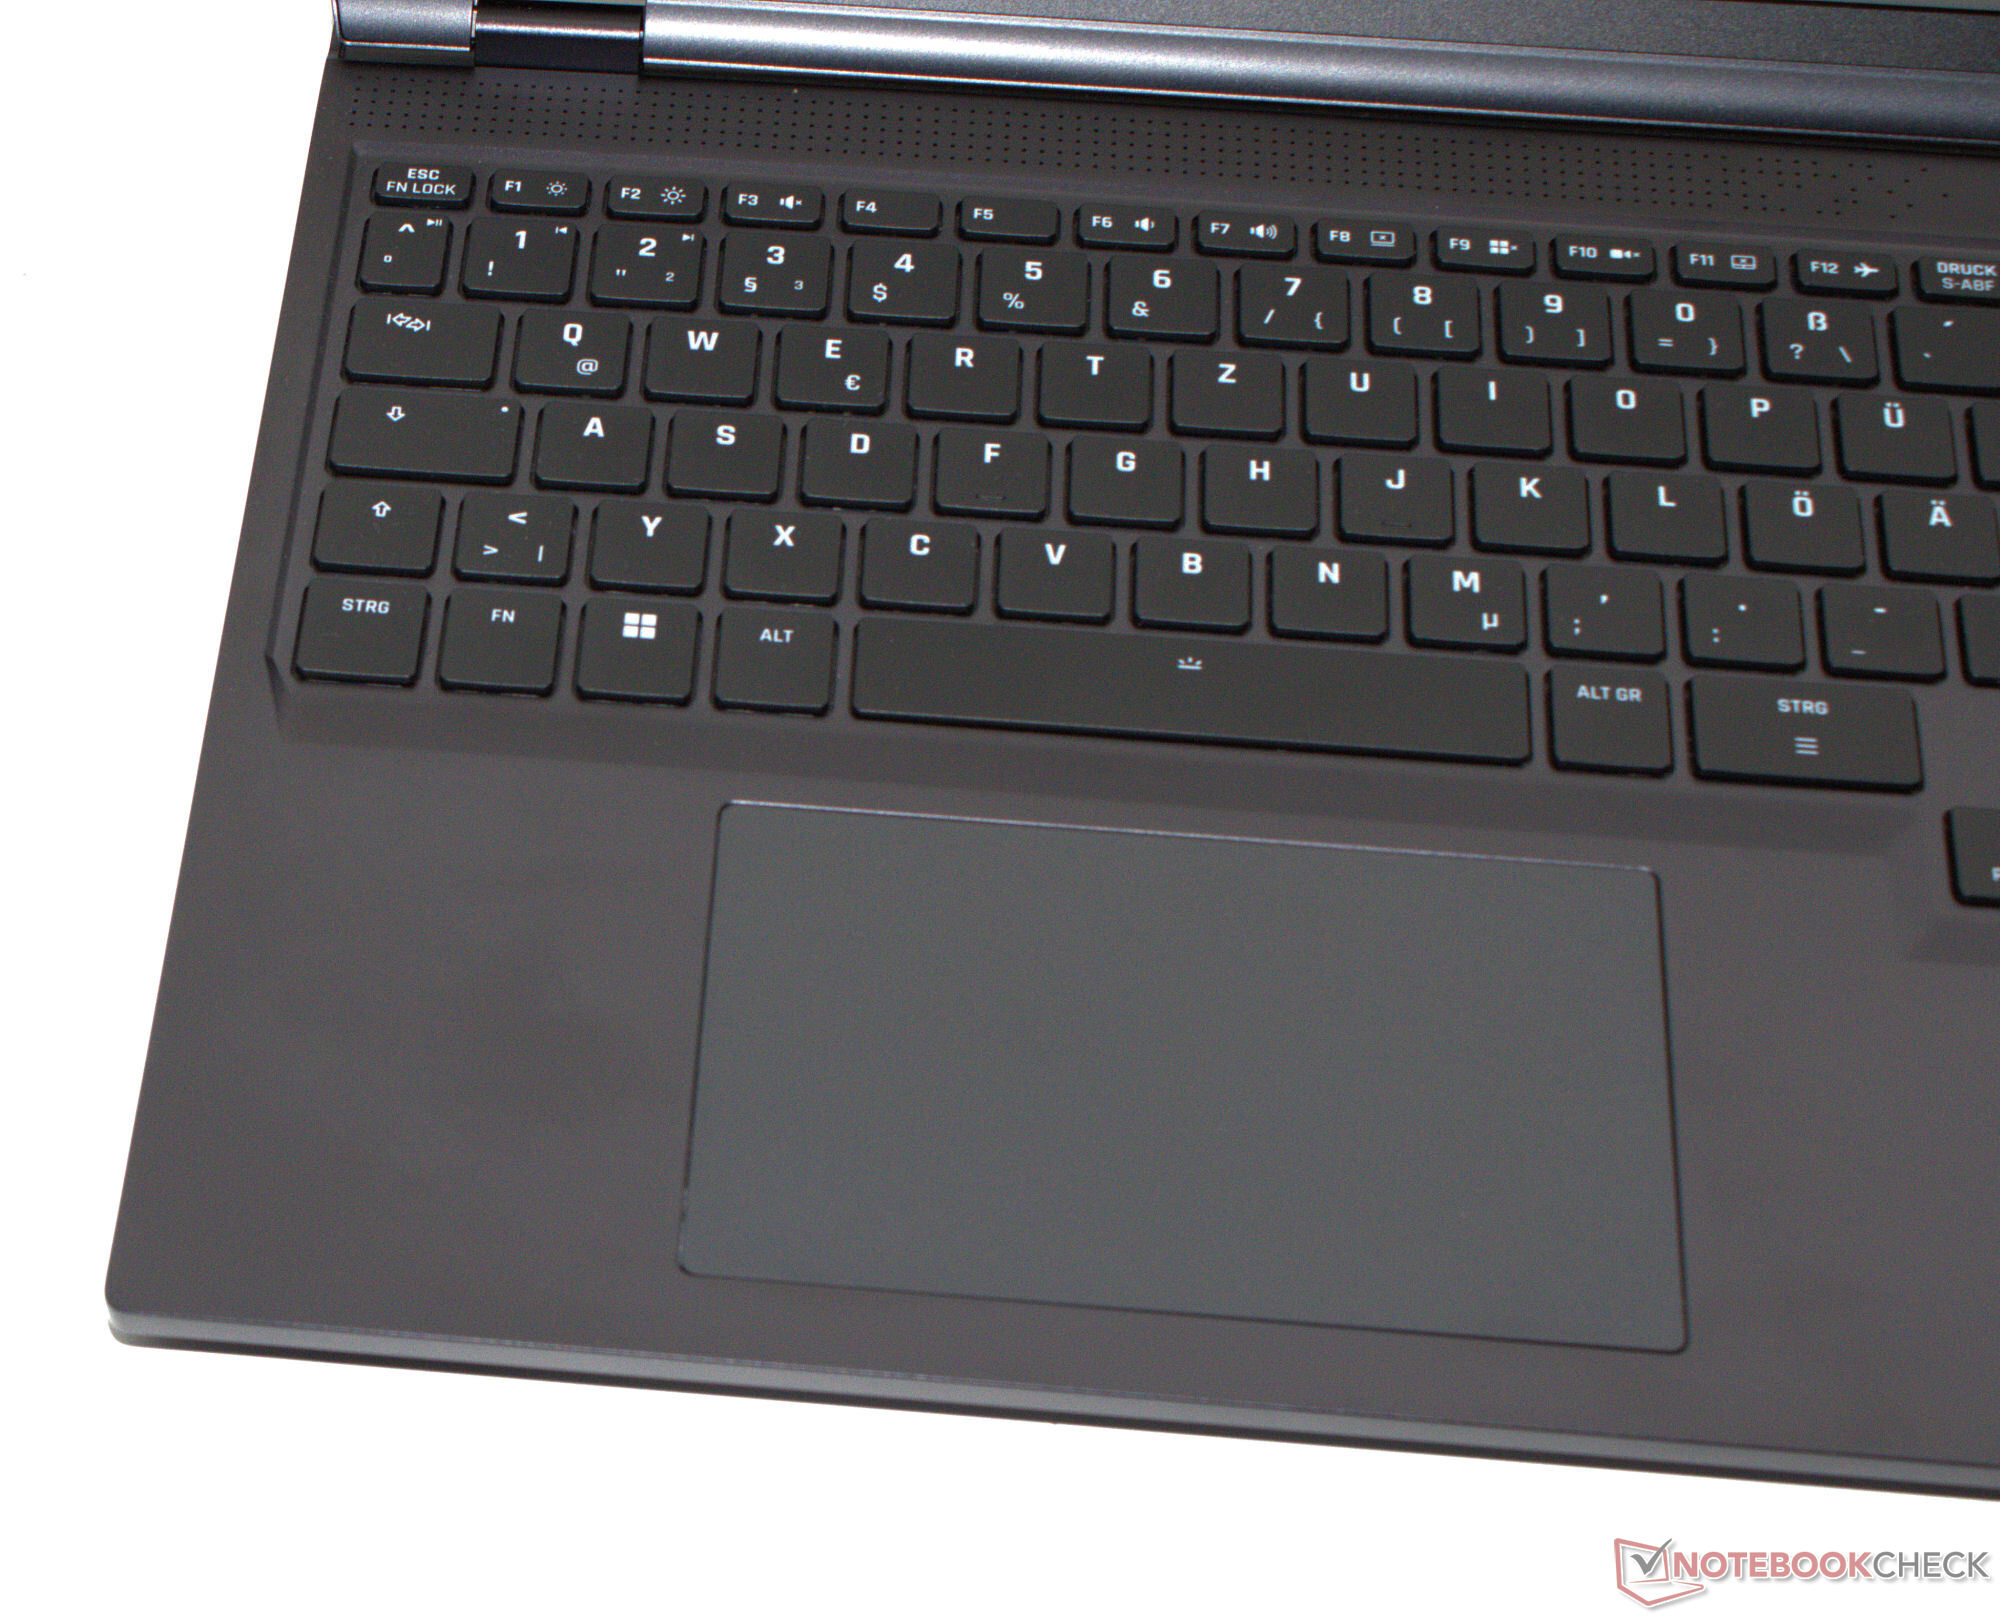
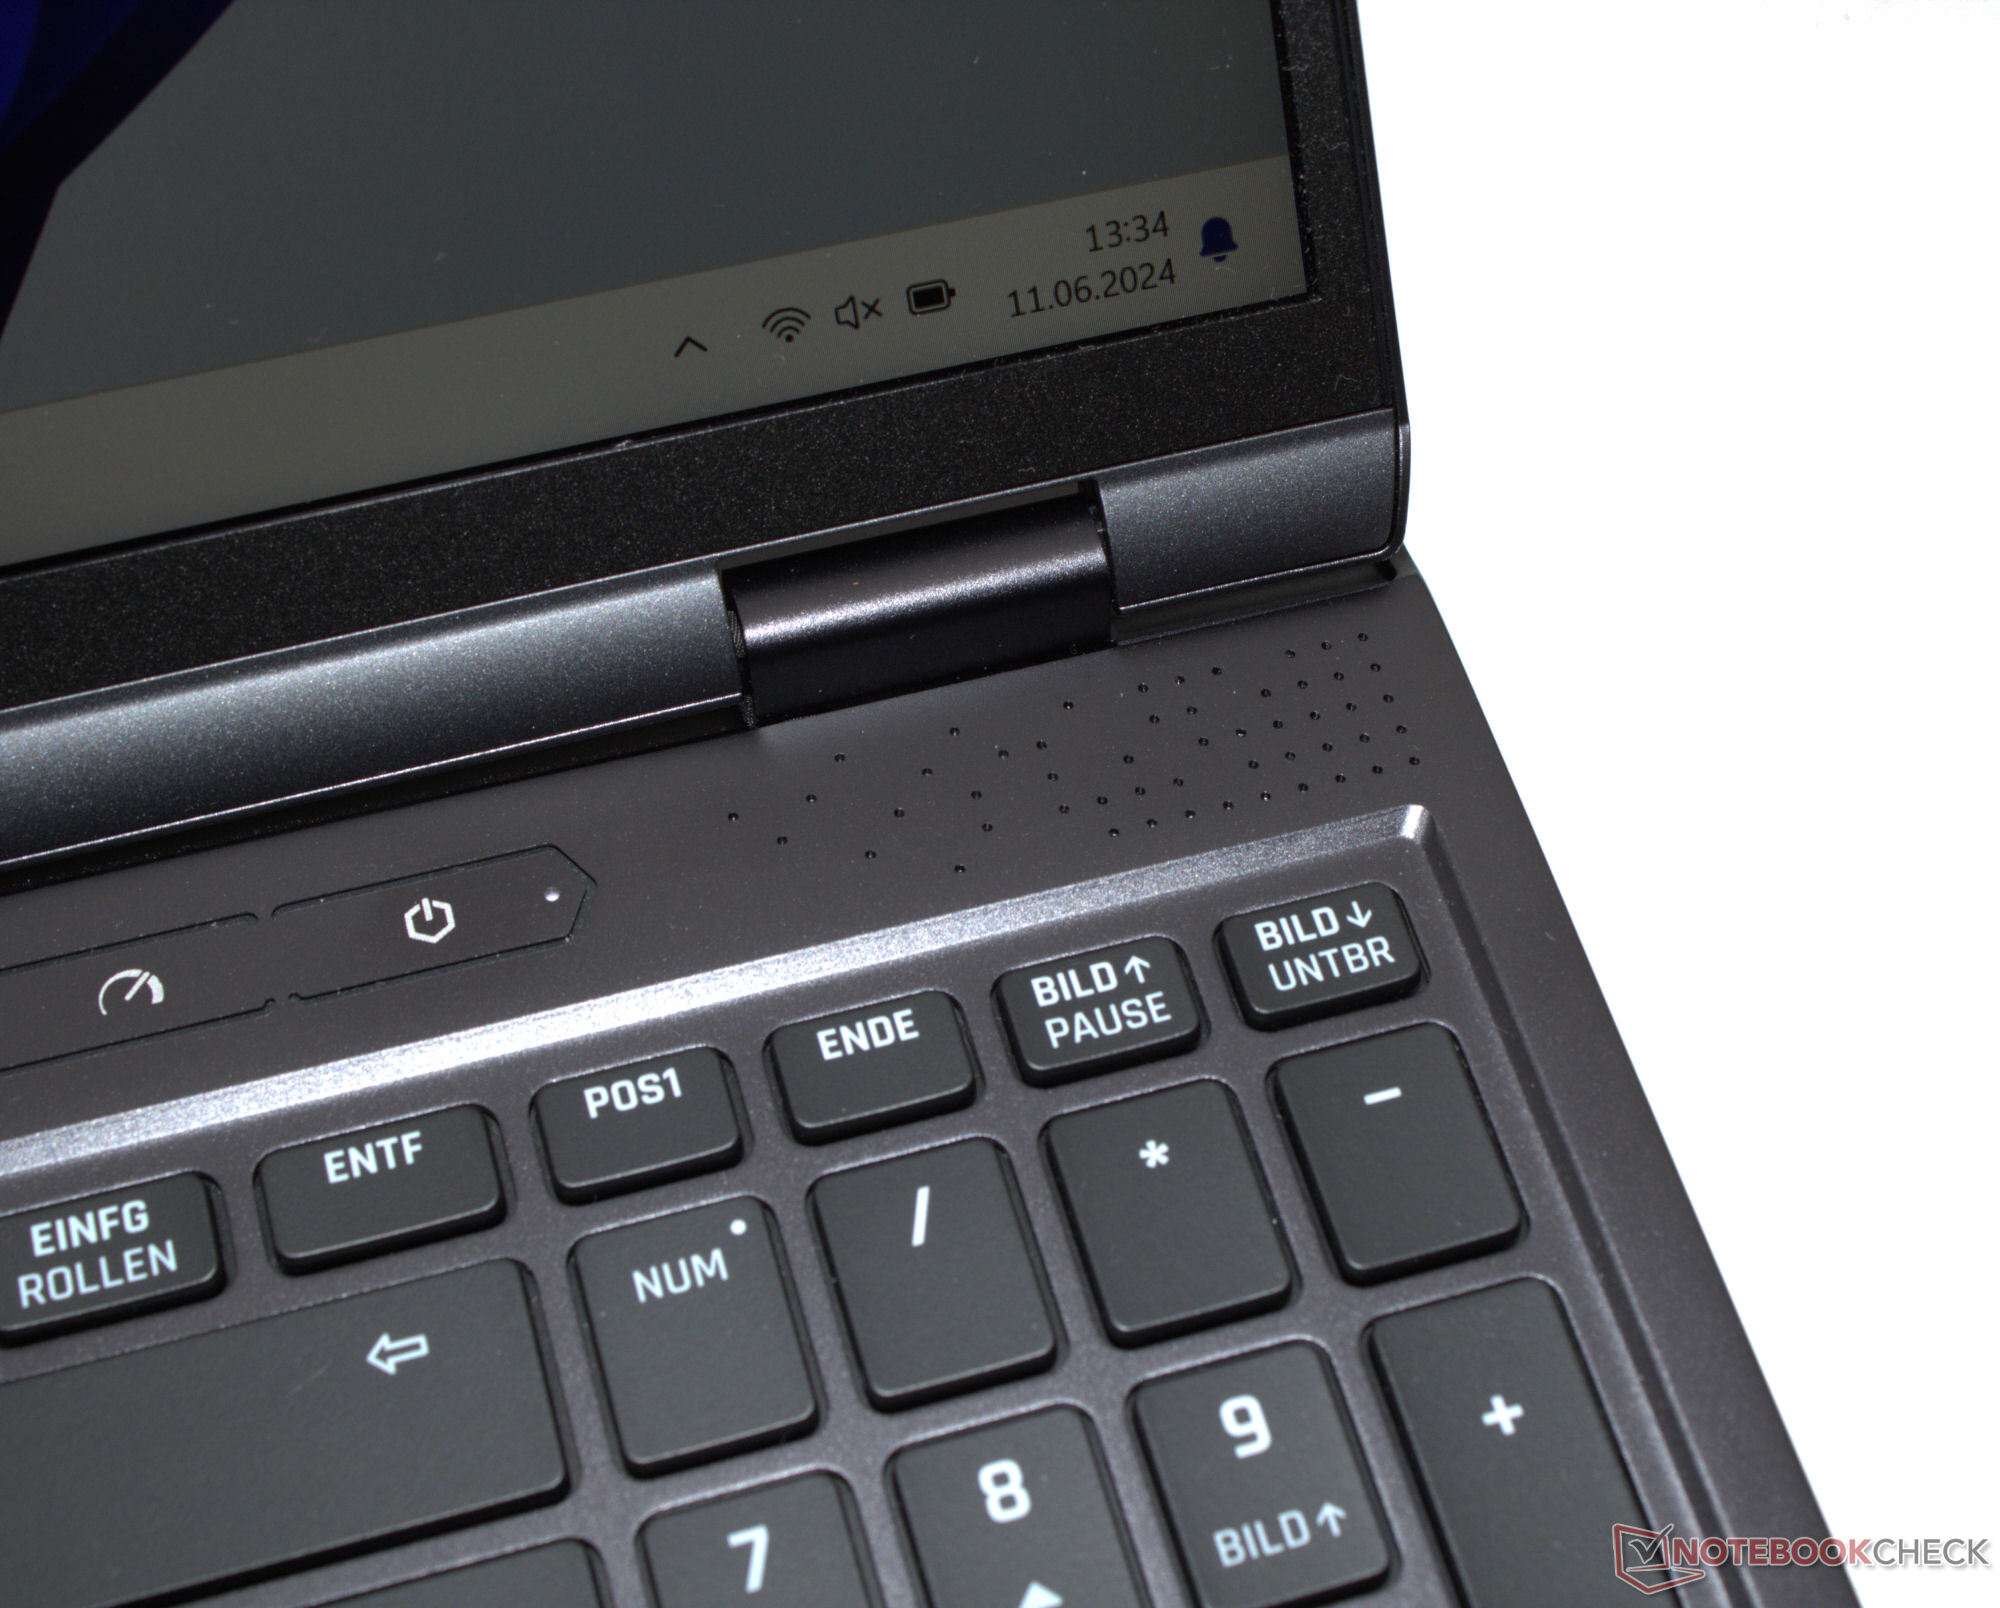
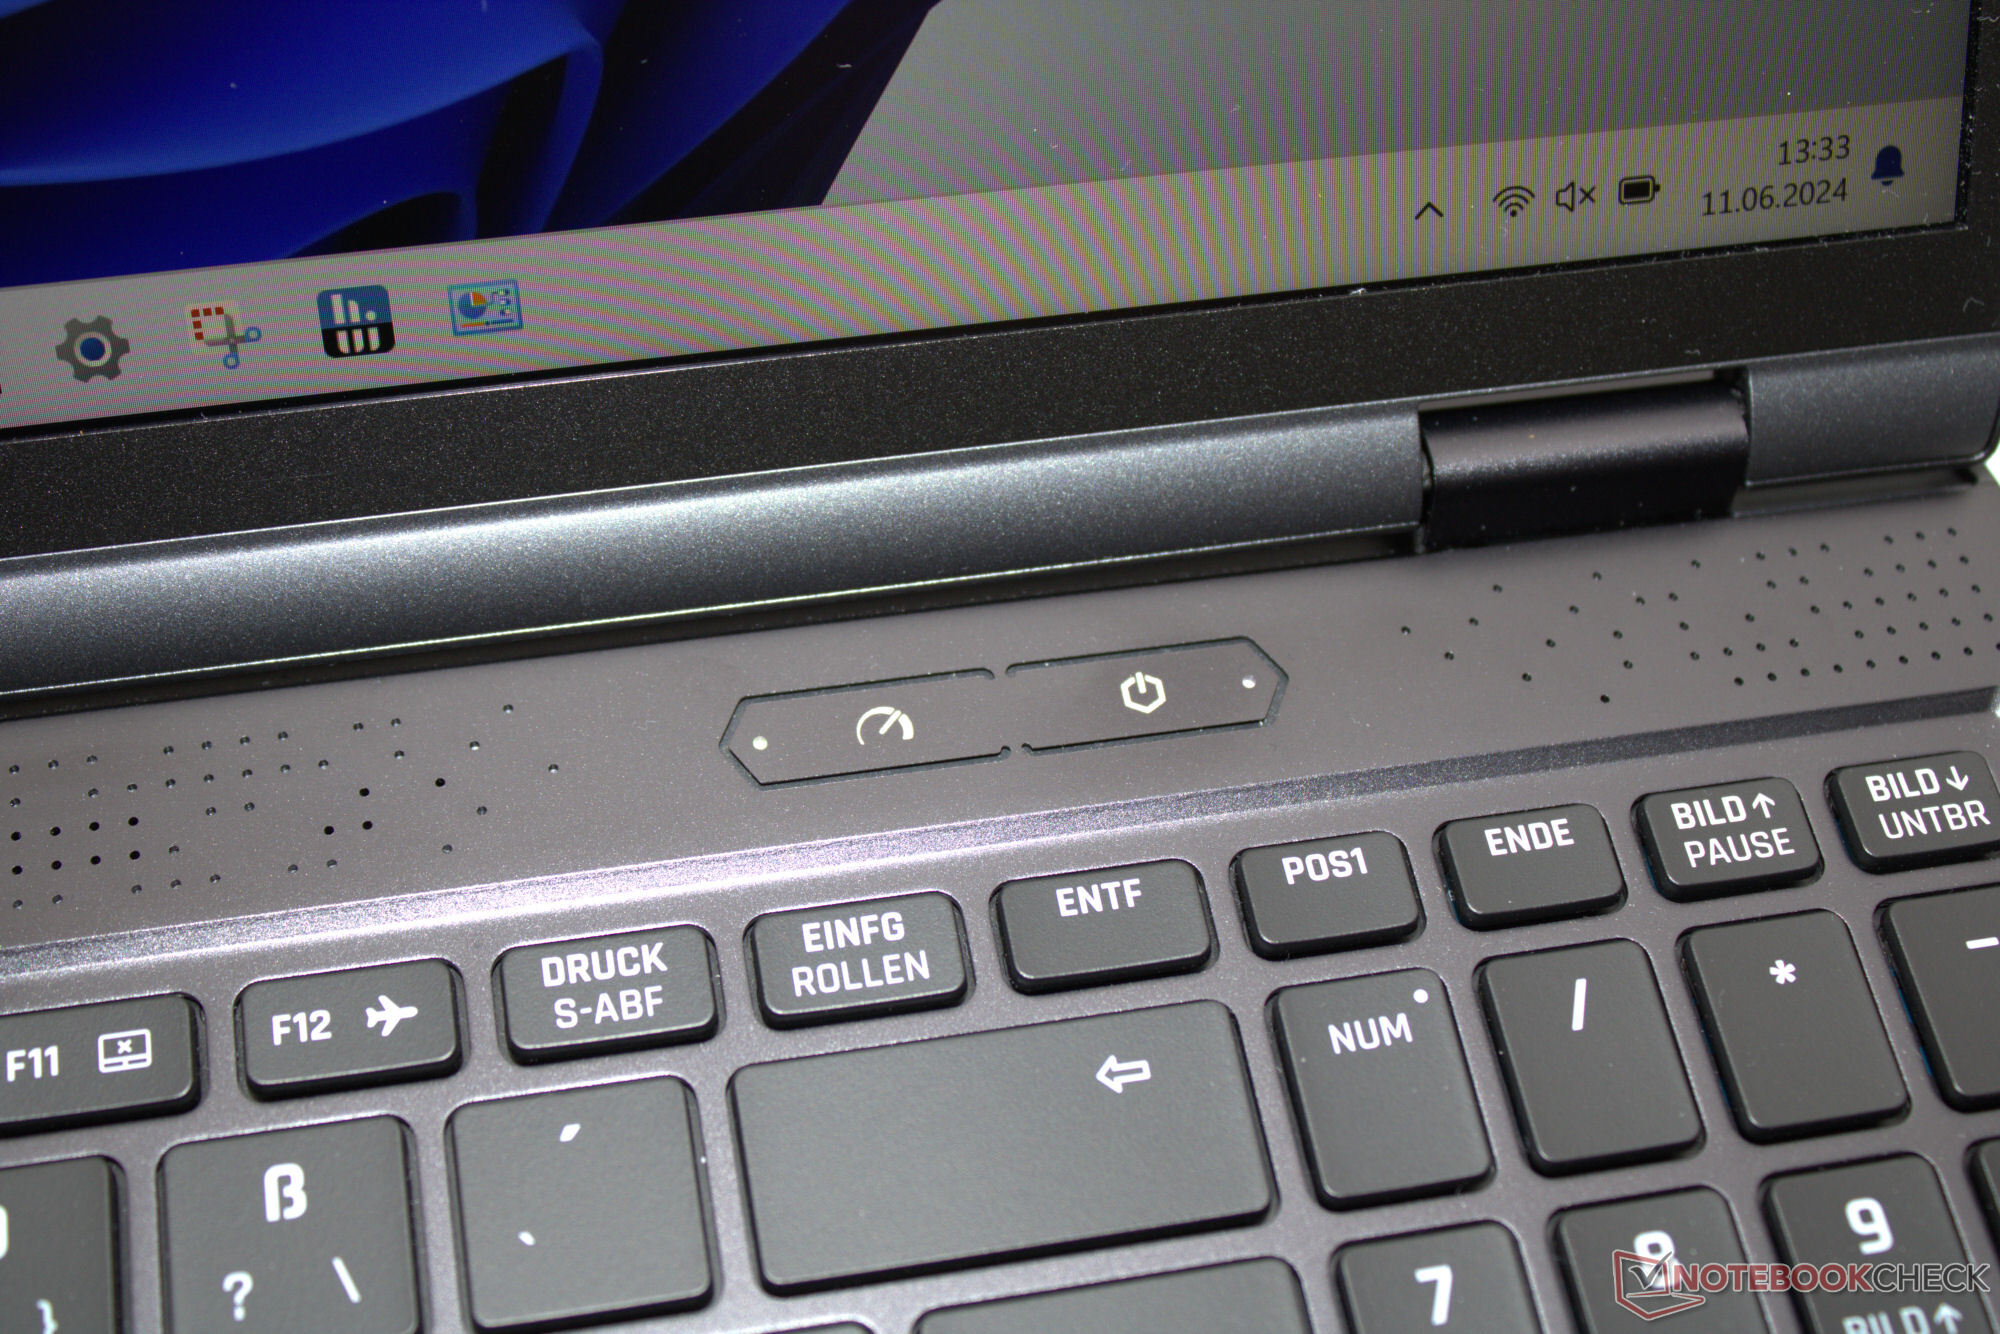
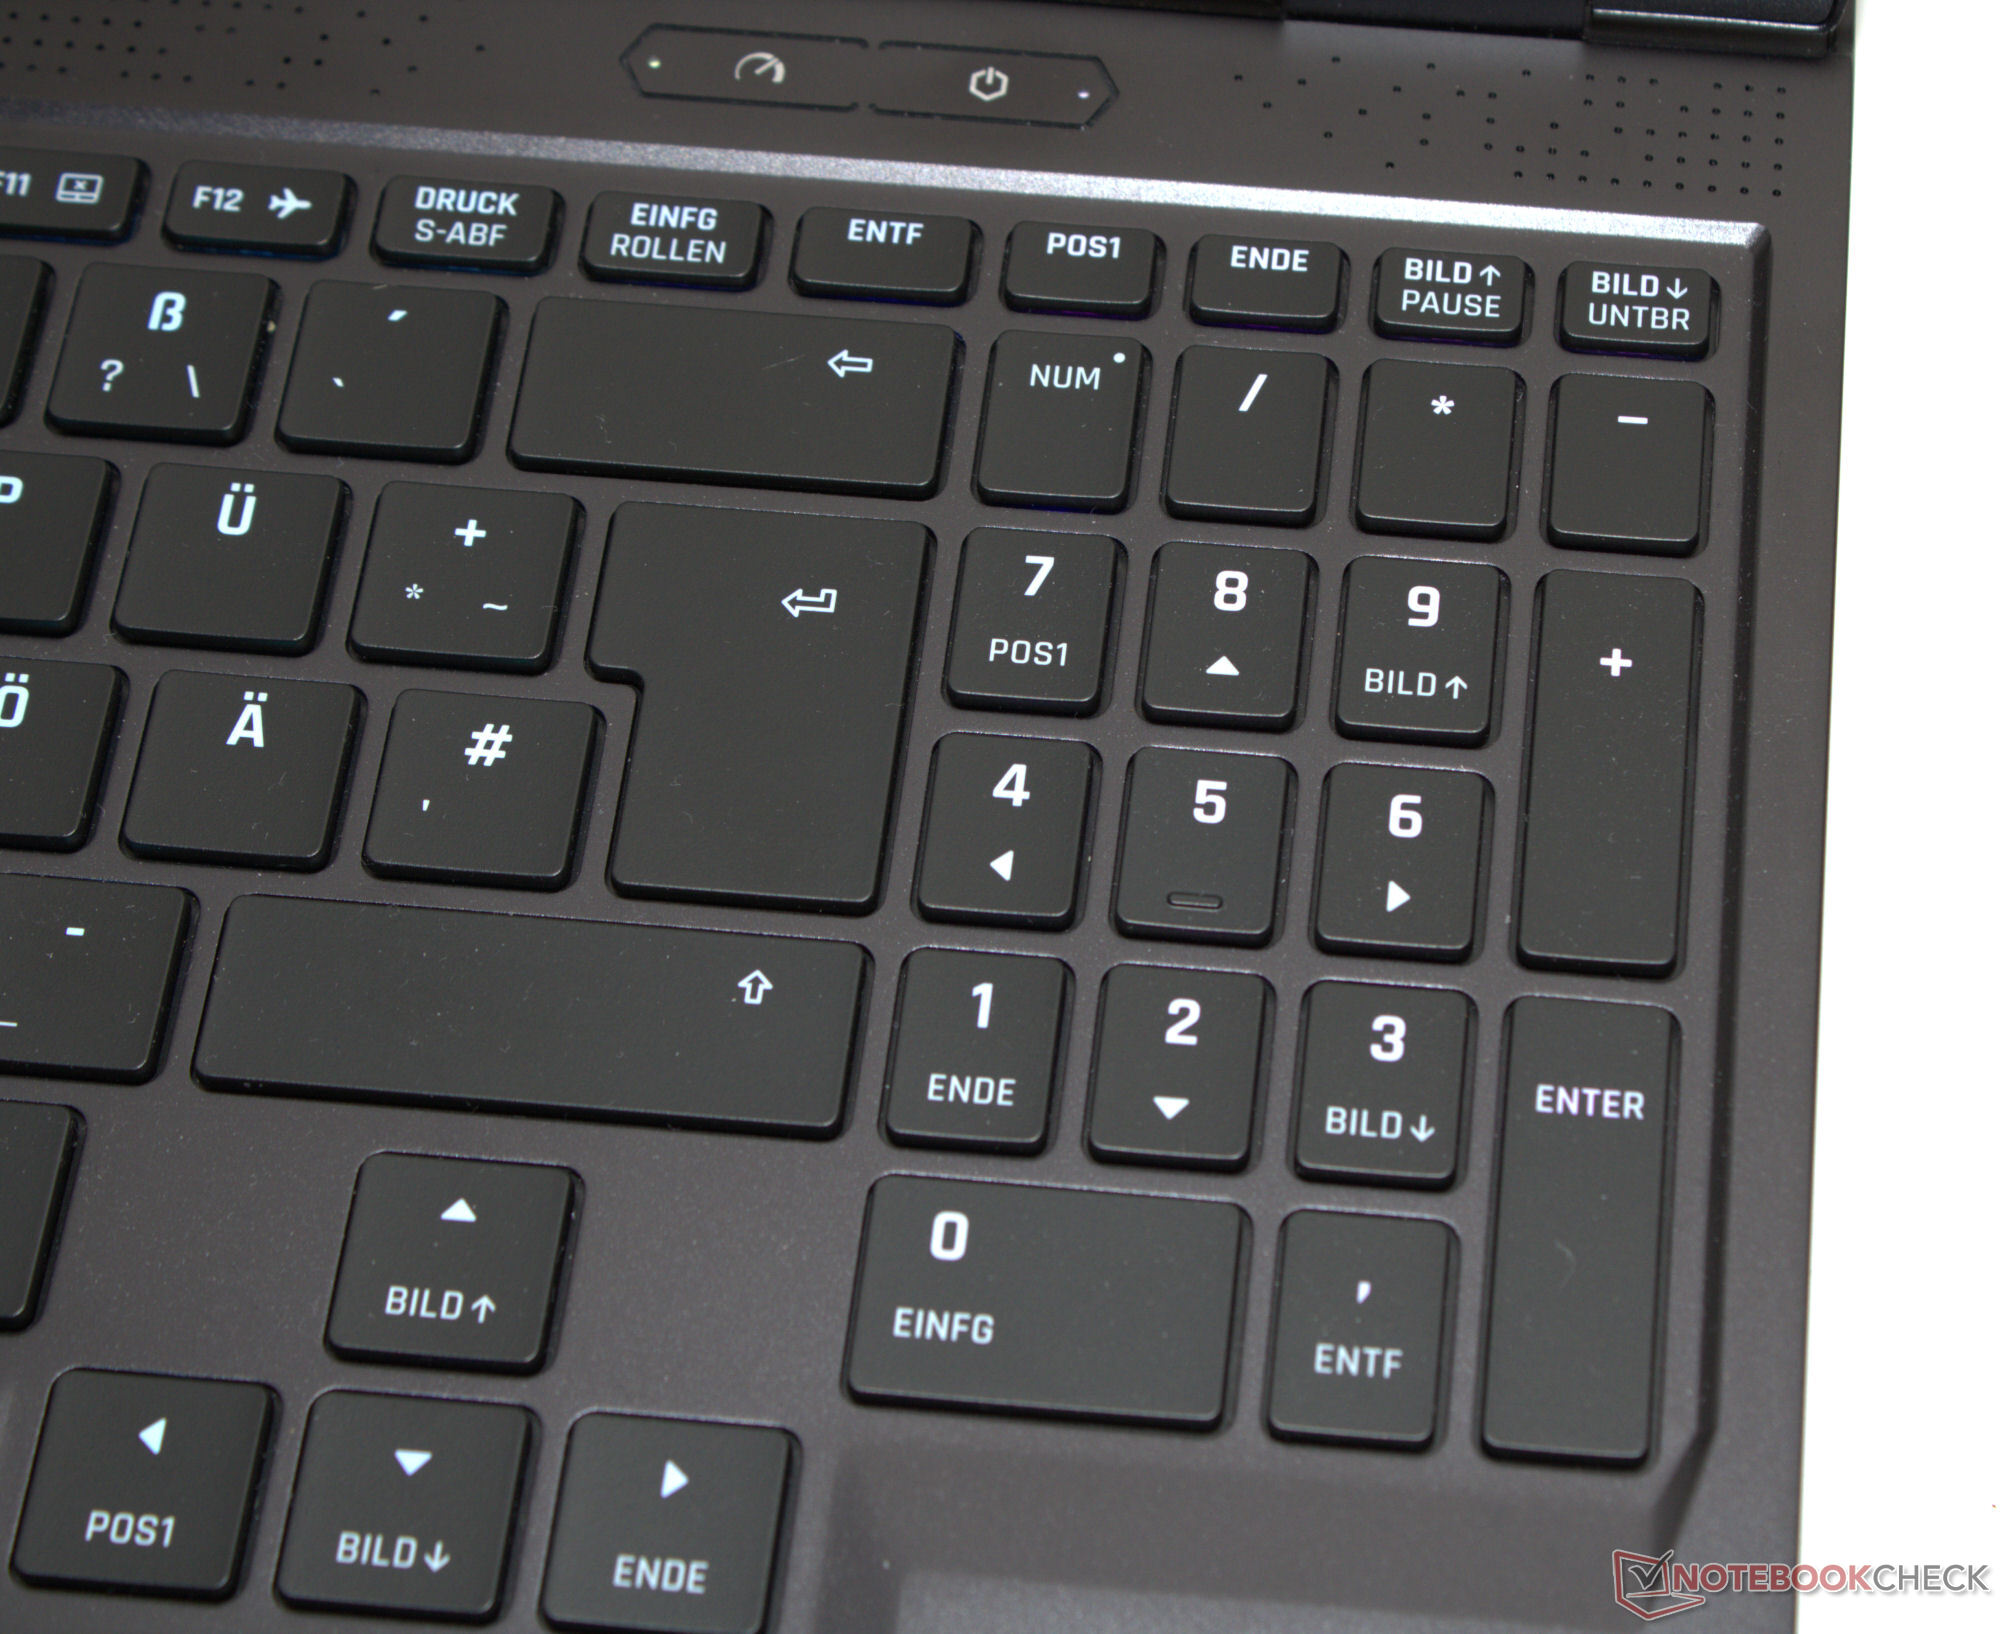
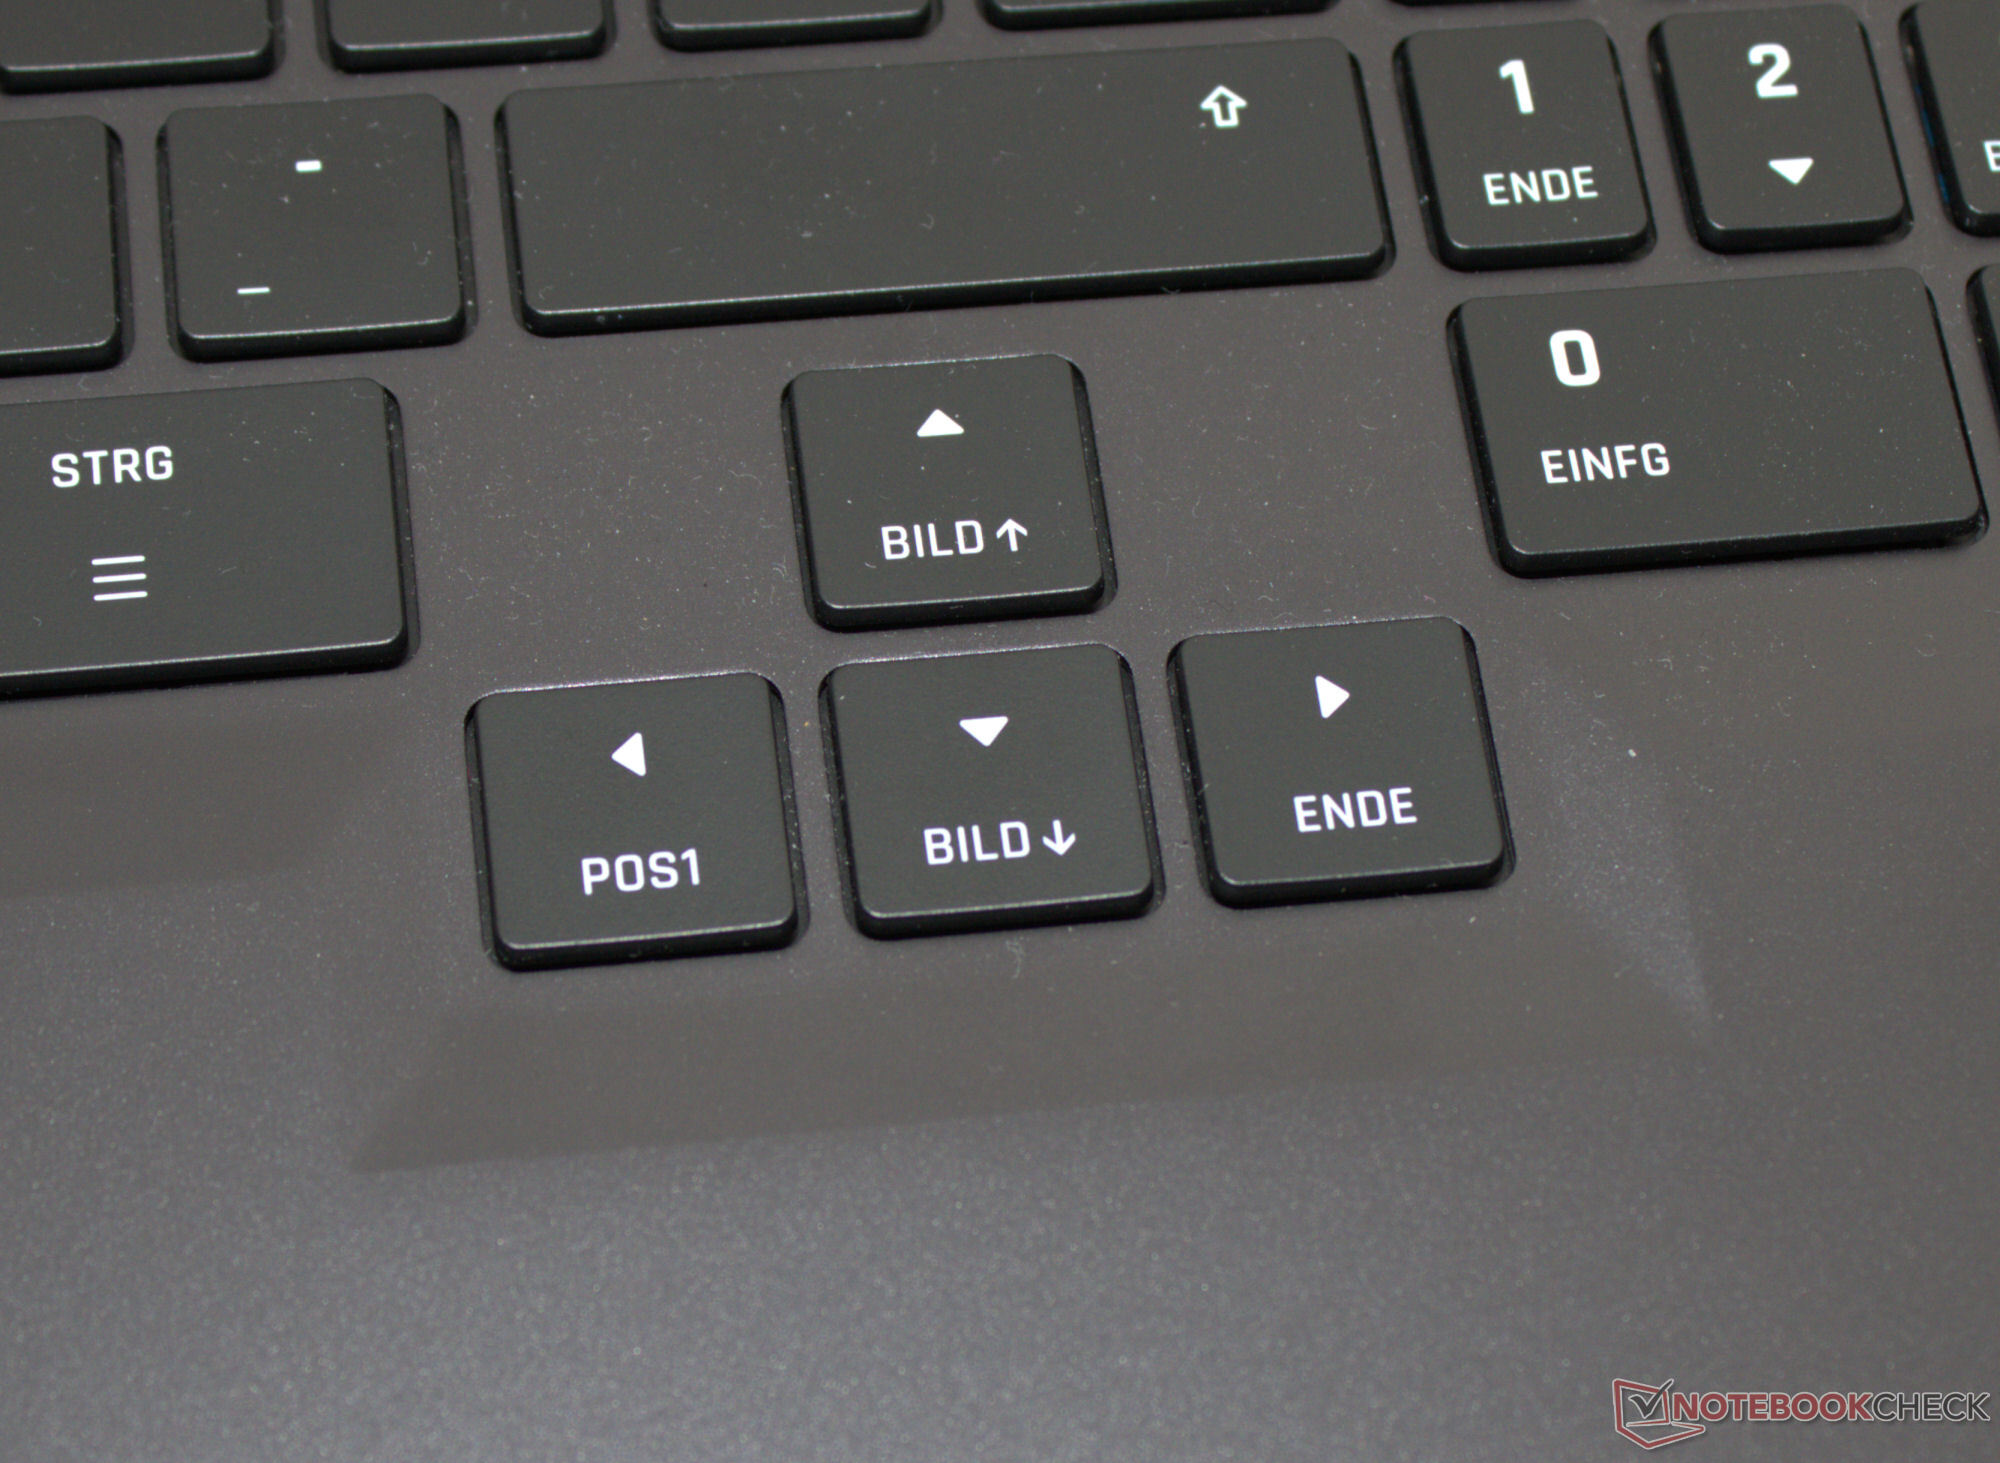
Dispositivos de entrada - Um teclado com iluminação individual das teclas
Teclado
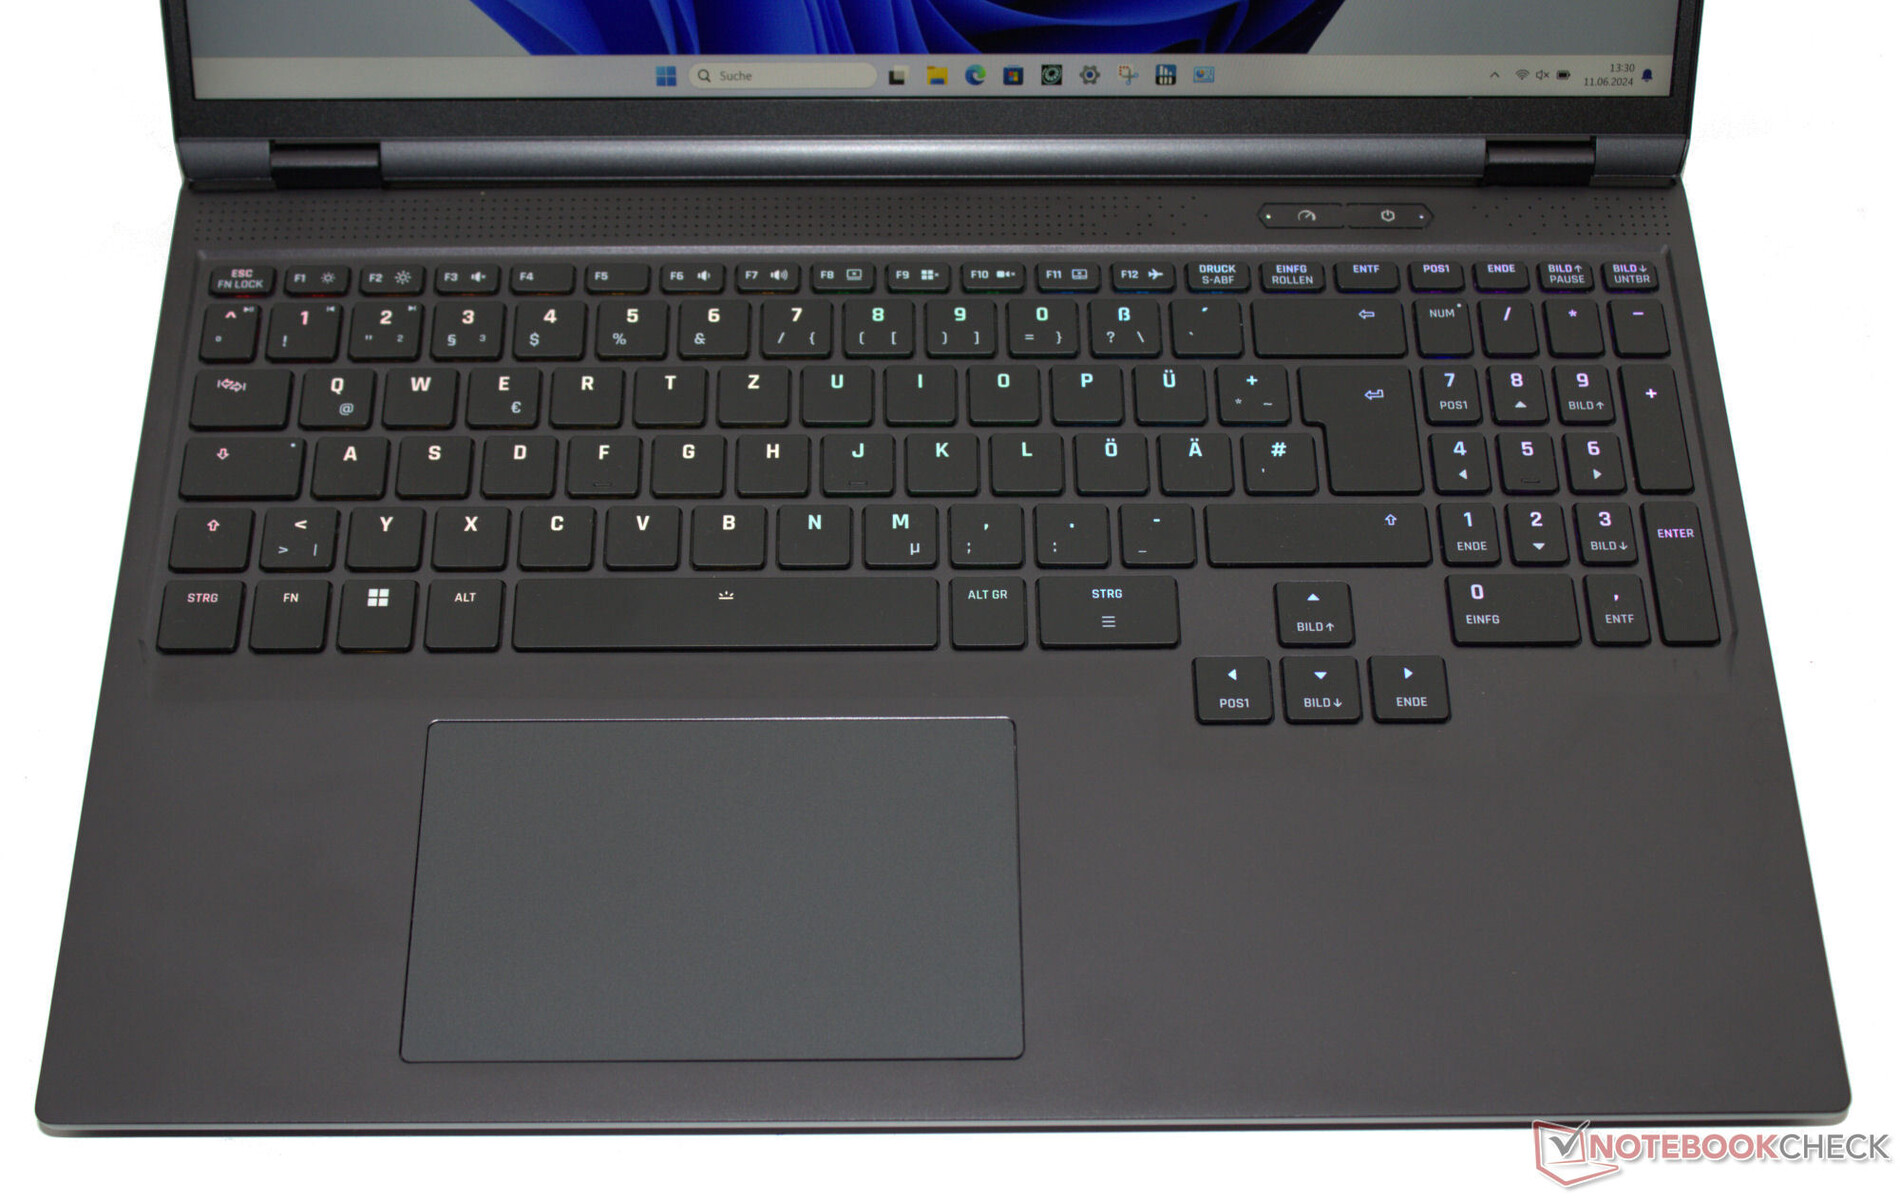
Anteriormente, era possível encomendar o Neo 16 do ano passado com um teclado mecânico opcional, mas o modelo atual tem apenas um teclado chiclet. O teclado cobre toda a largura do laptop e também inclui um teclado numérico e iluminação individual das teclas (RGB). As teclas côncavas e curvas oferecem um curso médio, um ponto de pressão bem definido e uma resistência muito agradável. O teclado não se flexiona ao digitar. O que se nota é o conforto de uso das teclas de seta descentralizadas e de tamanho normal - uma melhoria em relação ao modelo do ano passado.
Touchpad
Uma alternativa ao mouse é o clickpad com capacidade multitoque (cerca de 12,3 x 7,7 cm), cujas superfícies lisas facilitam ao máximo a execução de gestos de deslizamento. Ele oferece um deslocamento curto e um ponto de pressão distinto.
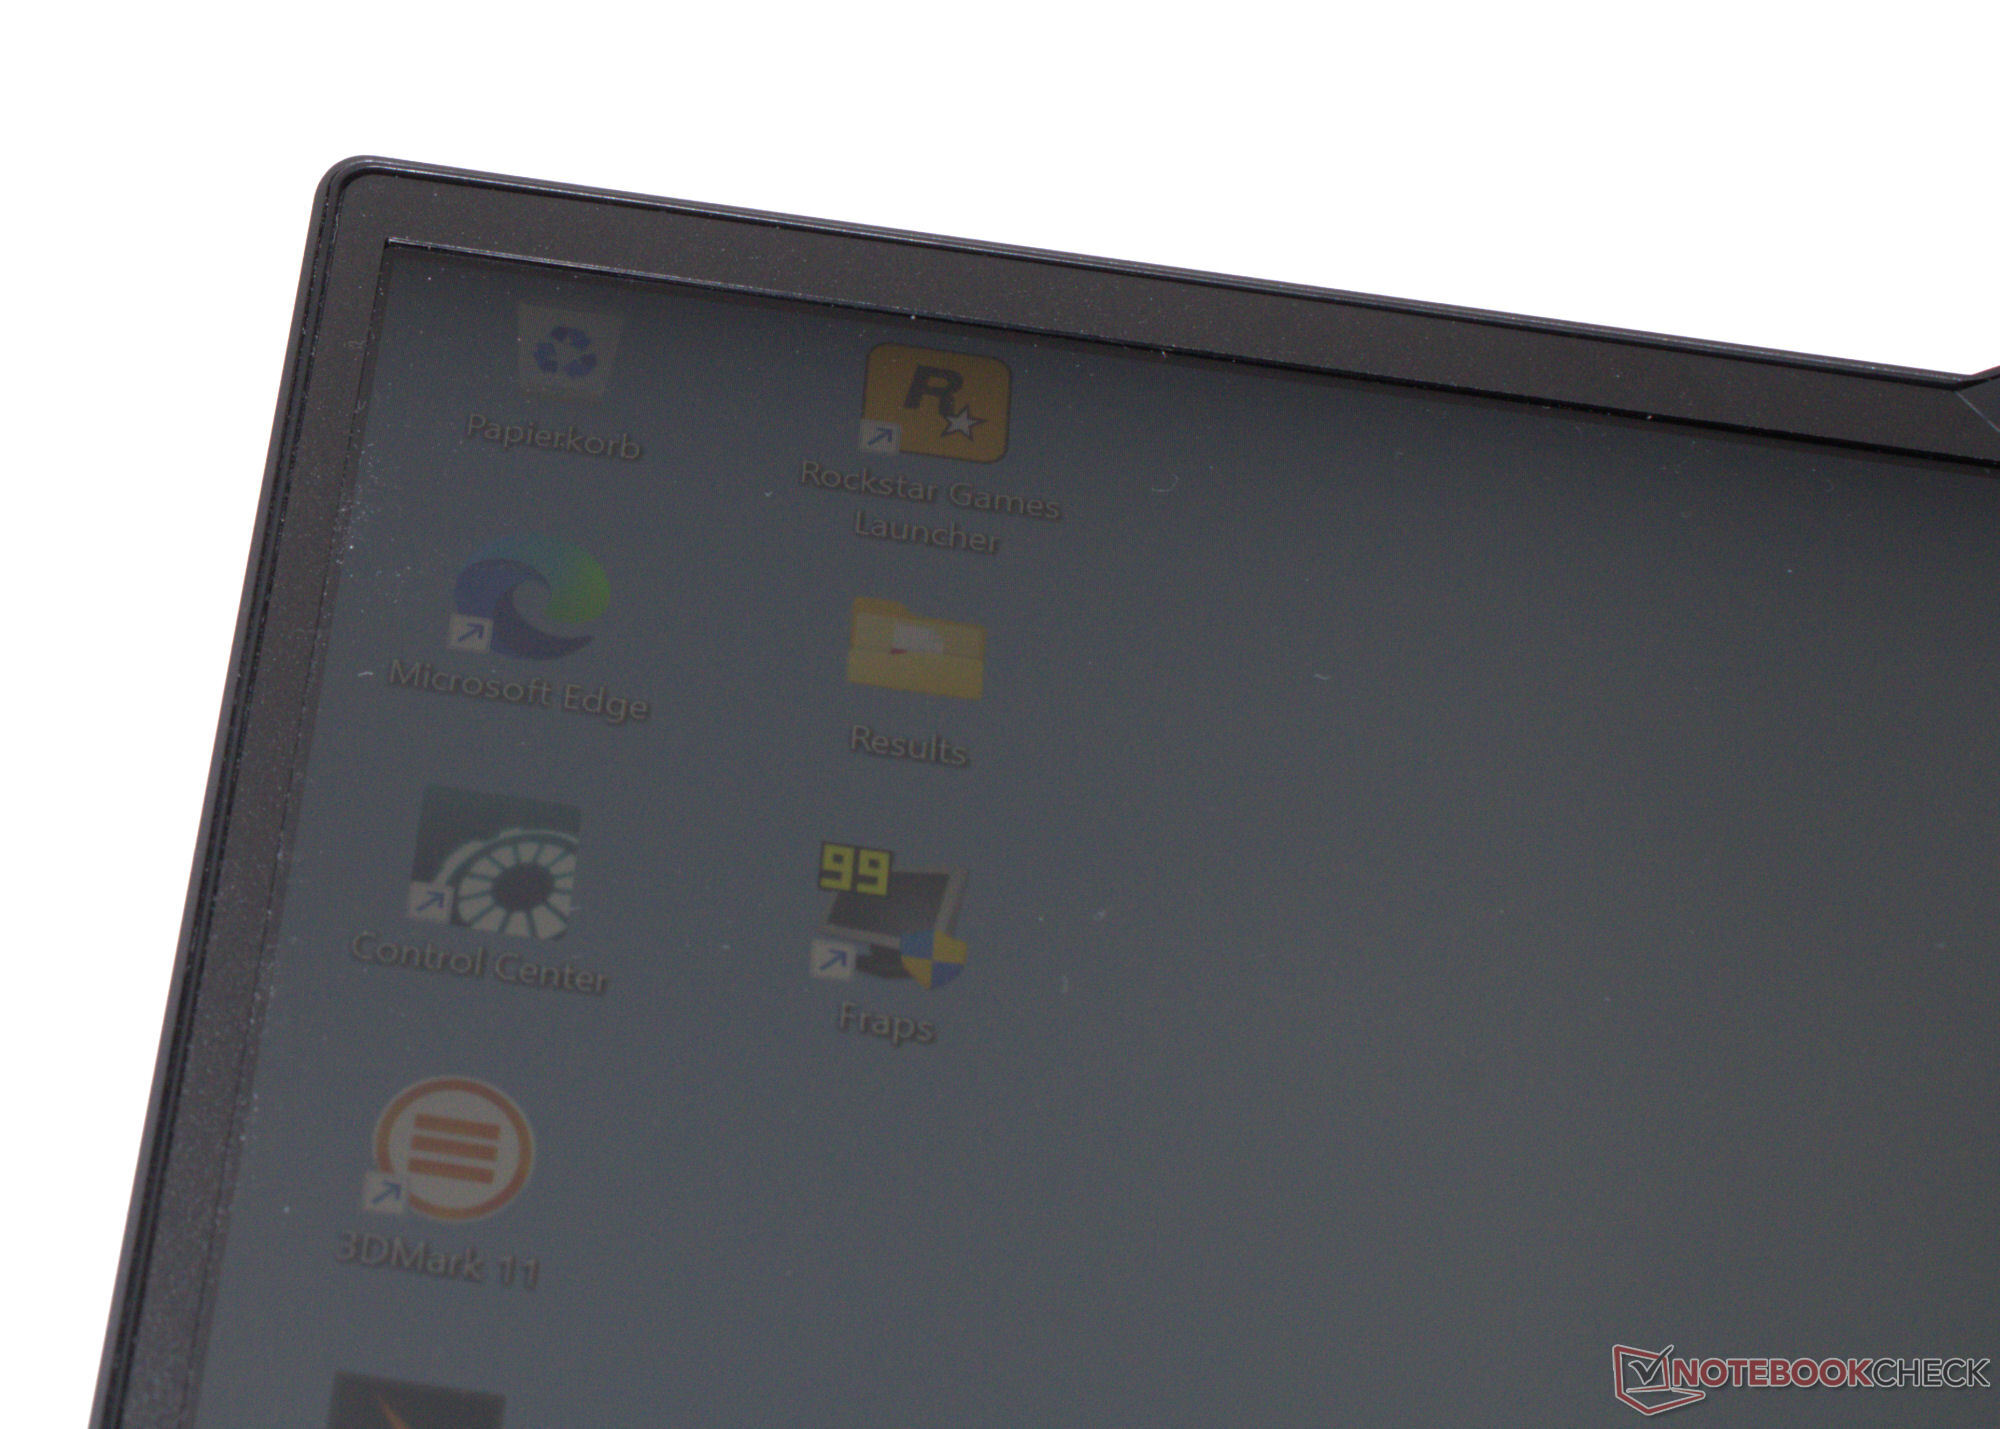
Tela - A Schenker optou por um painel IPS brilhante
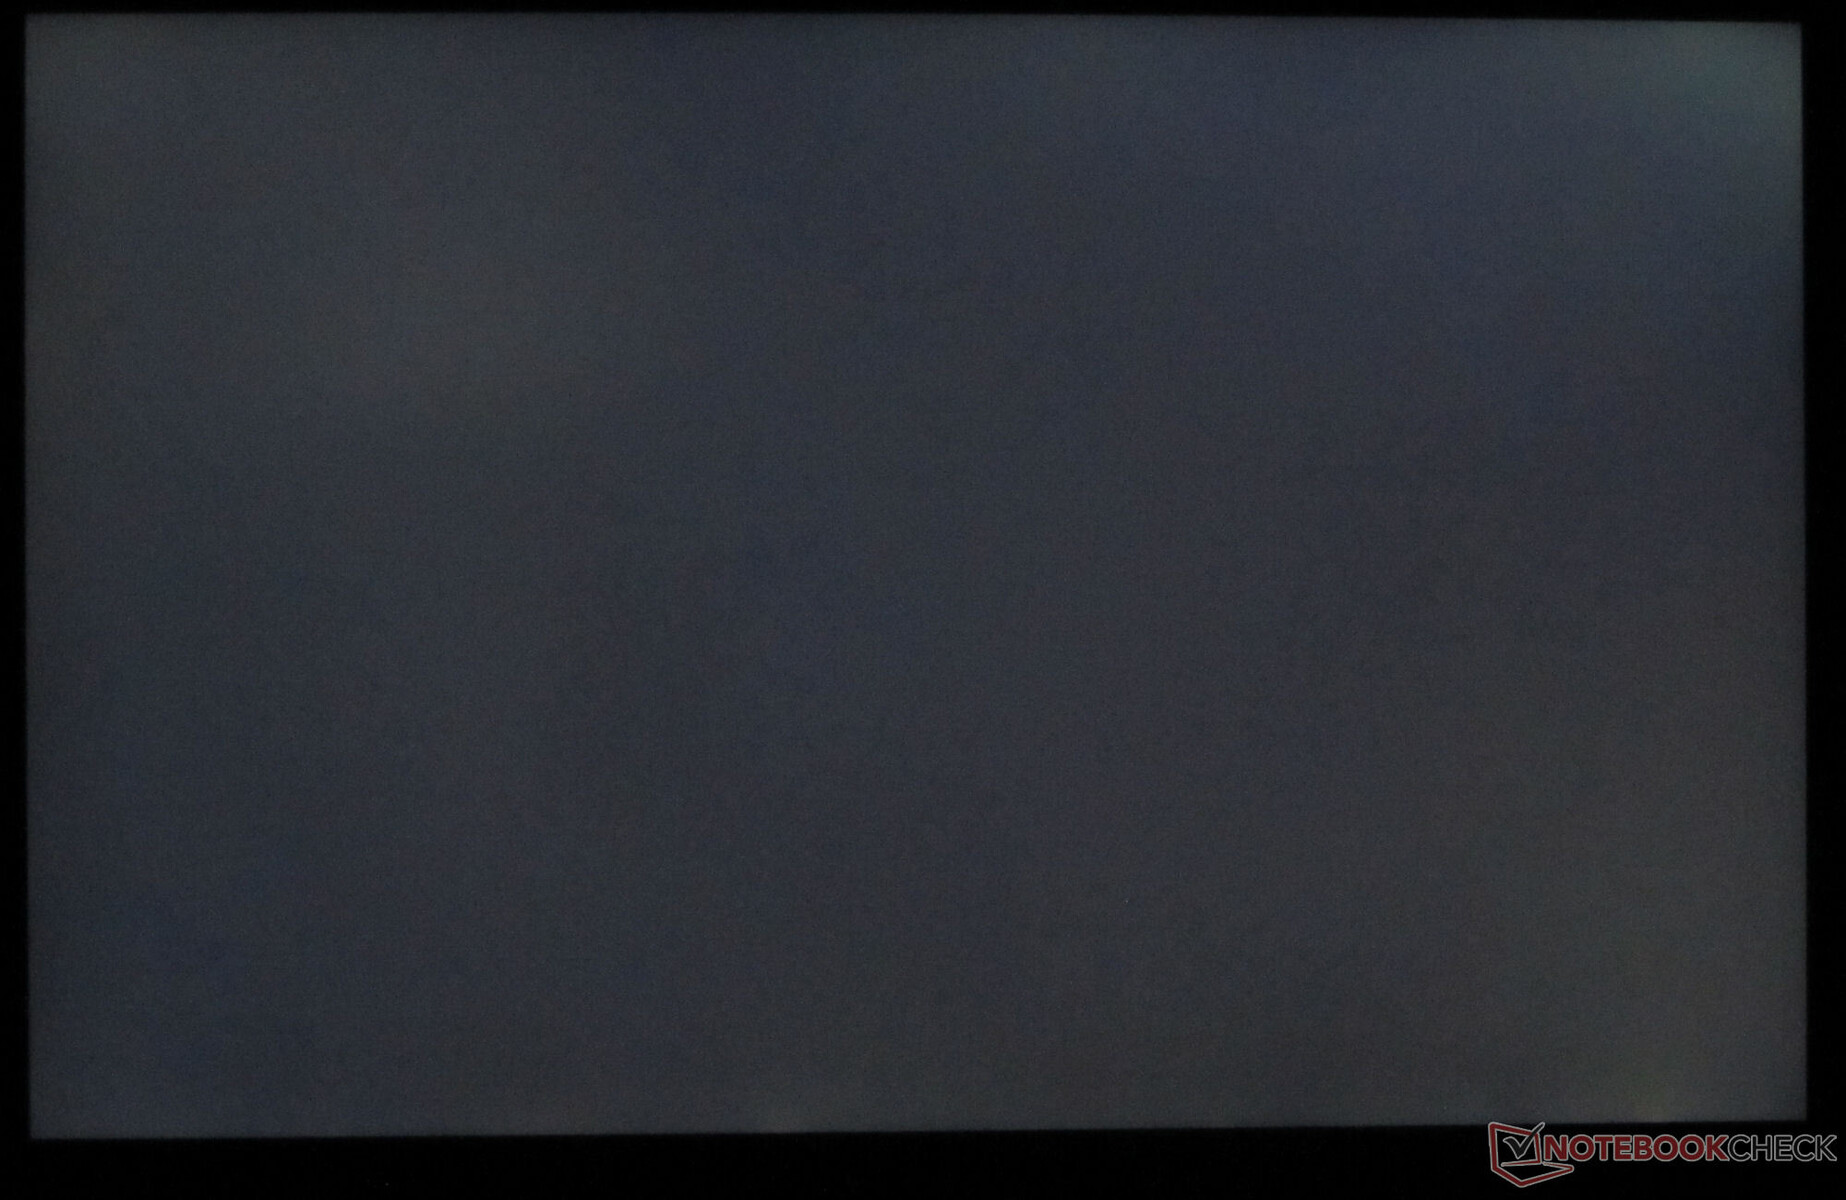
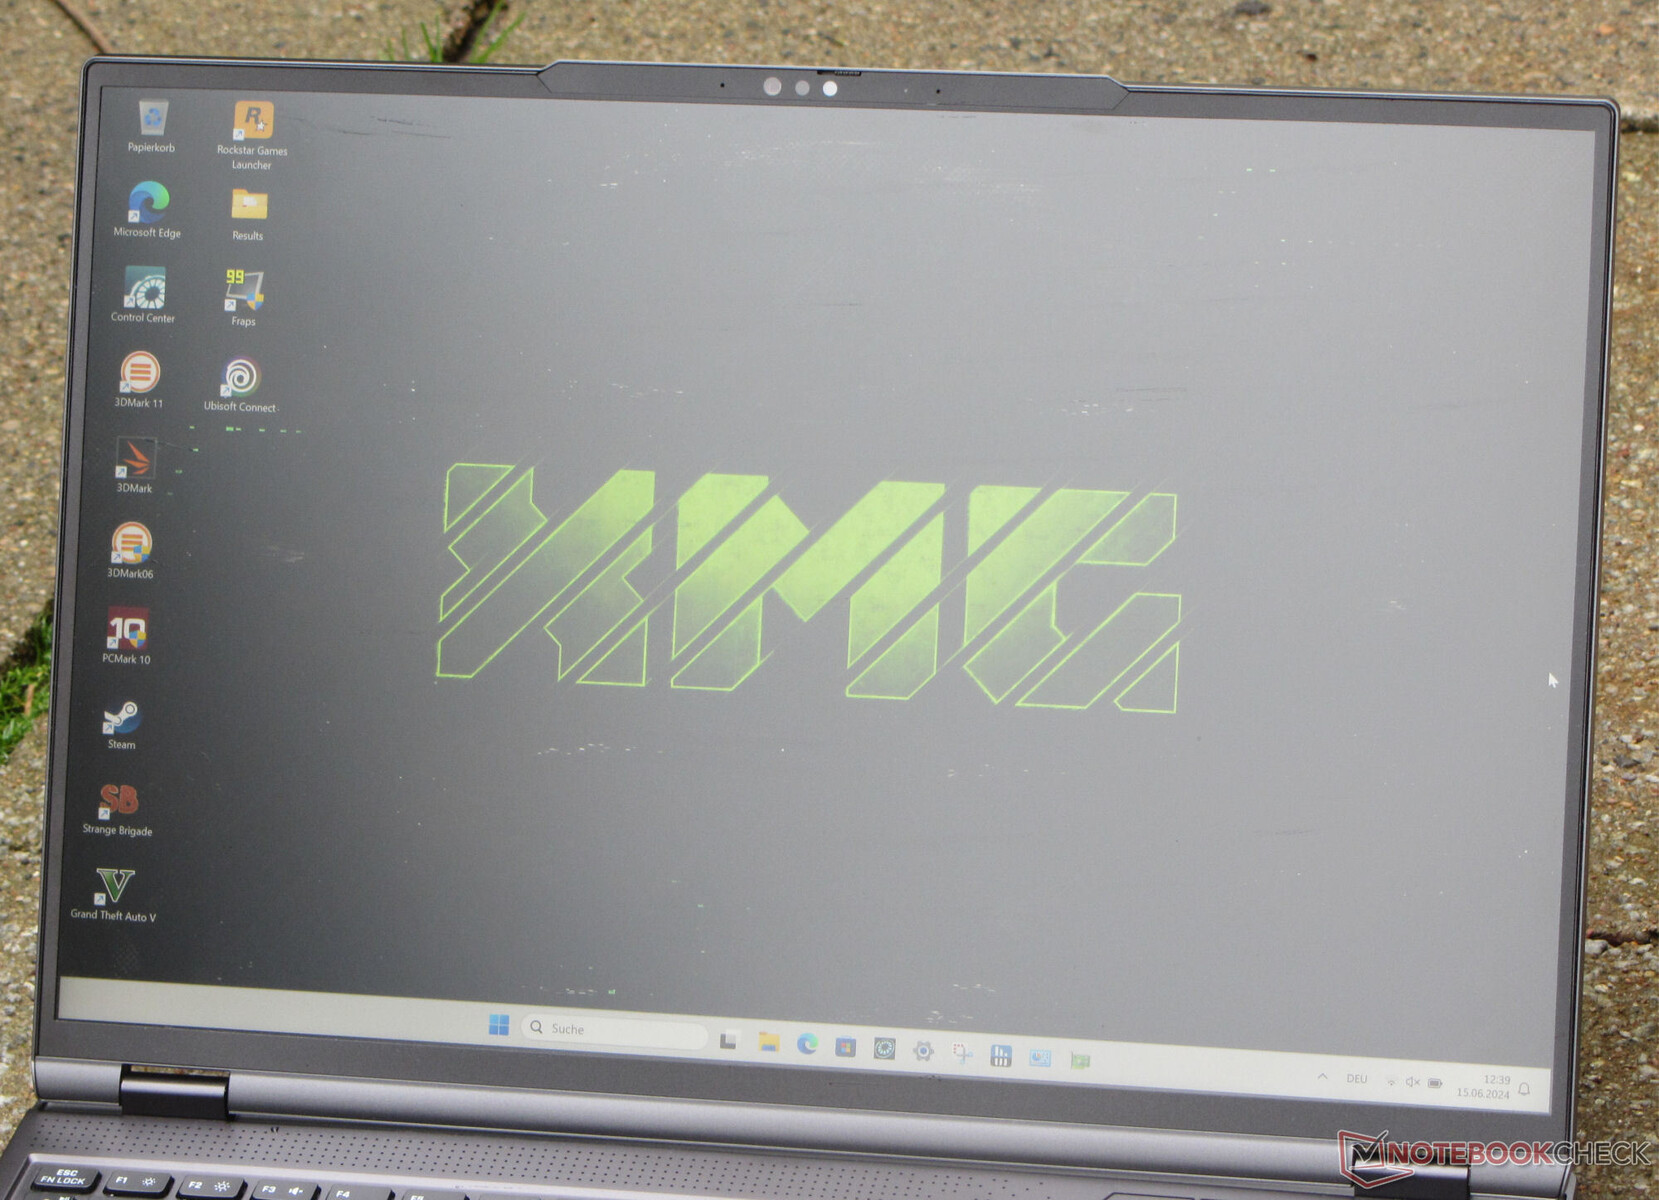
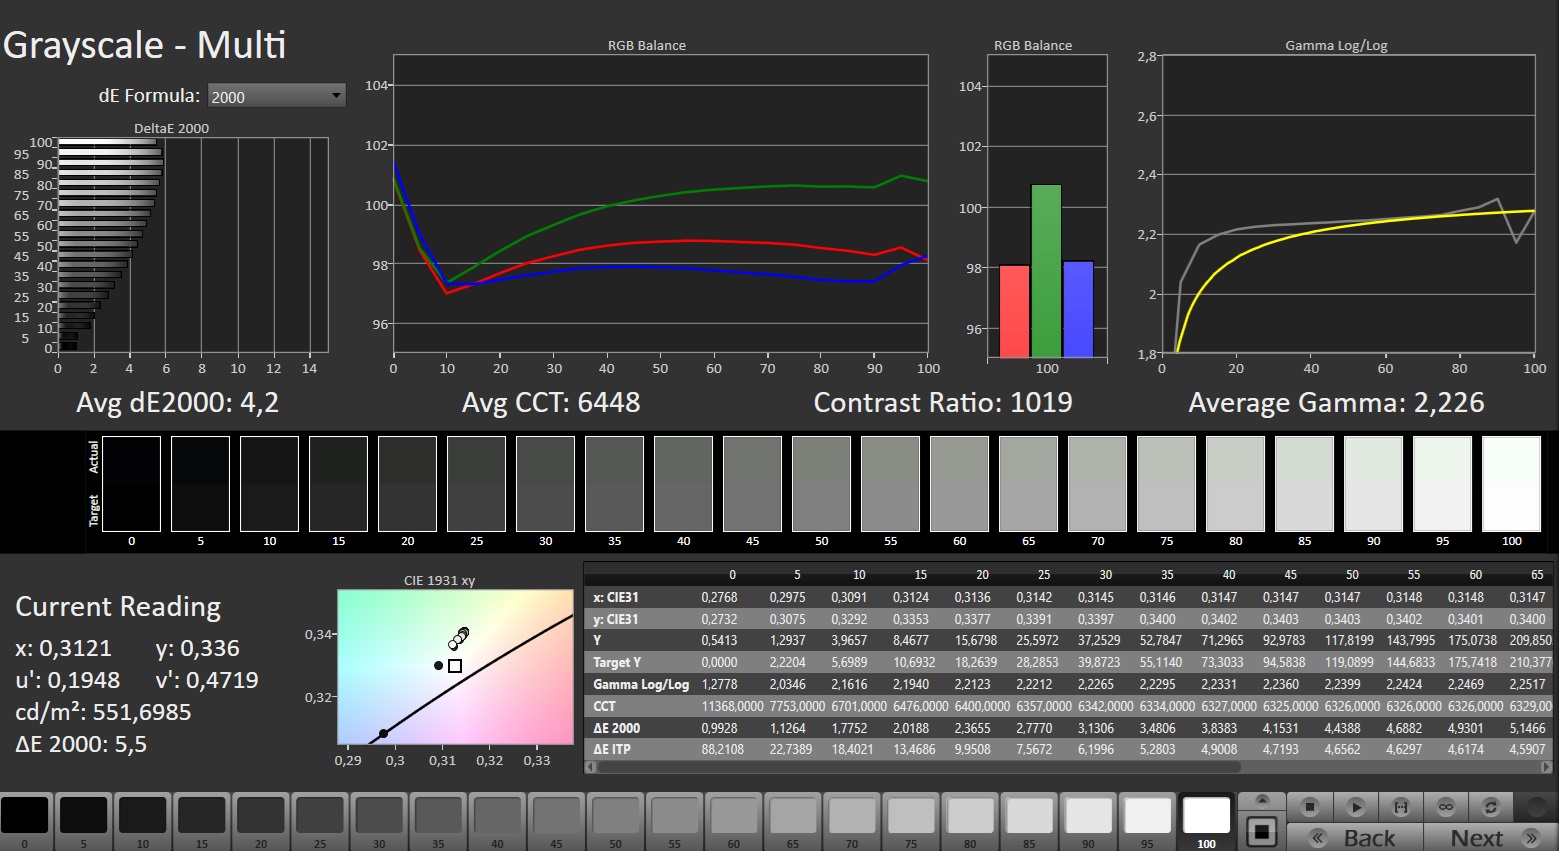
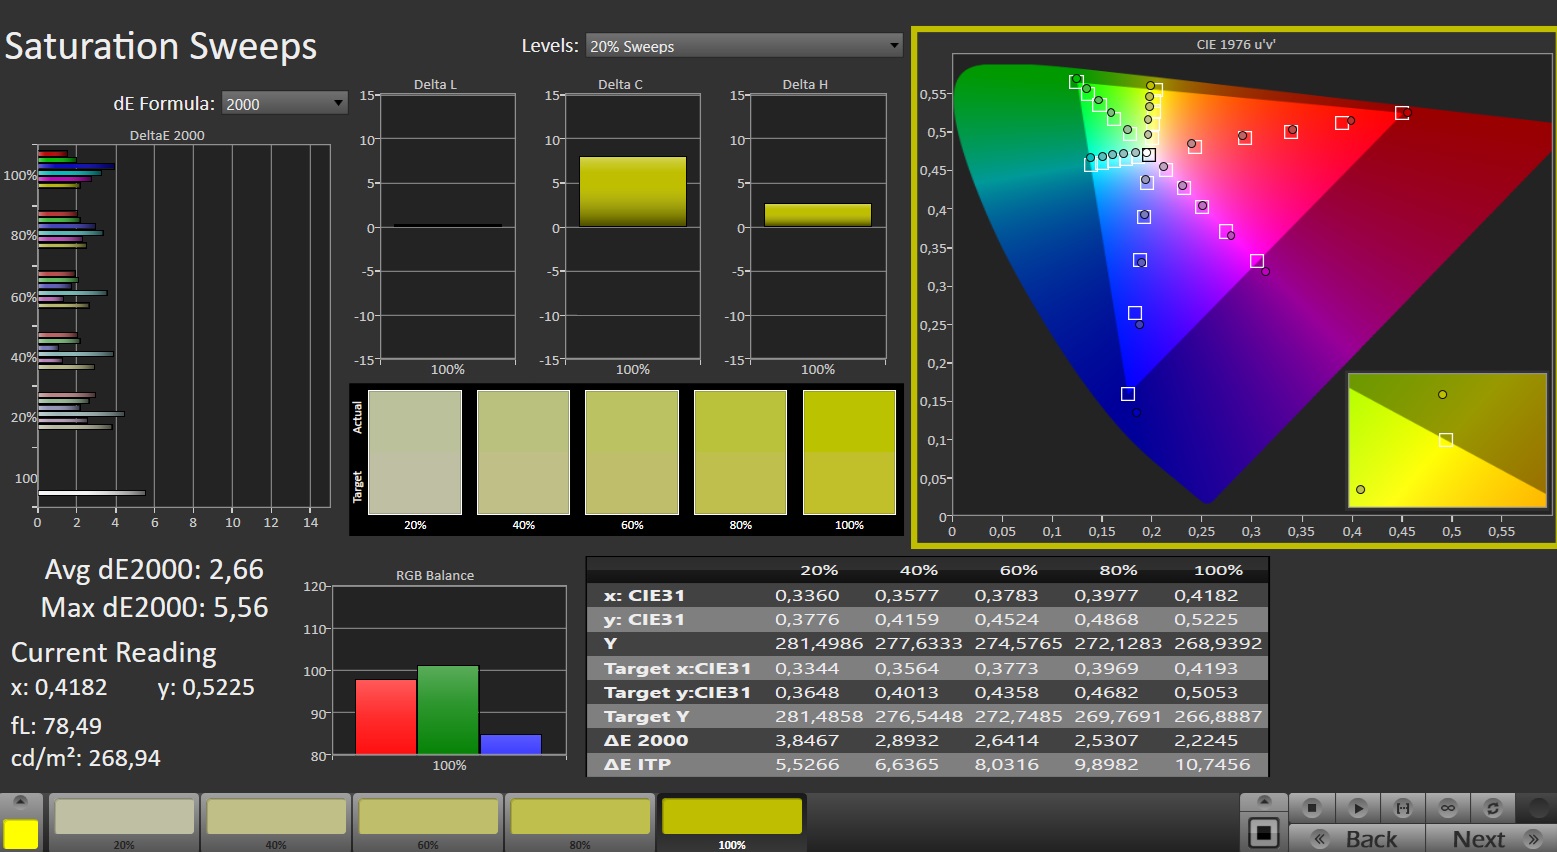
A tela de 16 polegadas instalada (2.560 x 1.600 pixels) não tem falta de brilho (~ 500 cd/m²), mas o contraste (1.000:1) poderia ser maior. Com relação a essa área, o Blade 16 OLED do Blade 16 oferece um pacote geral melhor - devido ao seu design, ele oferece valores de preto e contraste maravilhosos. Em geral, os valores alcançados pelo Neo 16 são mais do que suficientes para que o senhor possa usar o dispositivo em ambientes internos. Em ambientes externos, a tela é legível, desde que o sol não esteja muito forte. Alguns aspectos positivos são que o painel 16:10, 240 Hz (IPS, G-Sync), altamente responsivo e estável em termos de ângulo de visão, não apresenta nenhum sinal de oscilação de PWM, independentemente da configuração de brilho. Não há opções alternativas de tela disponíveis.

| |||||||||||||||||||||||||
iluminação: 85 %
iluminação com acumulador: 530 cd/m²
Contraste: 1000:1 (Preto: 0.53 cd/m²)
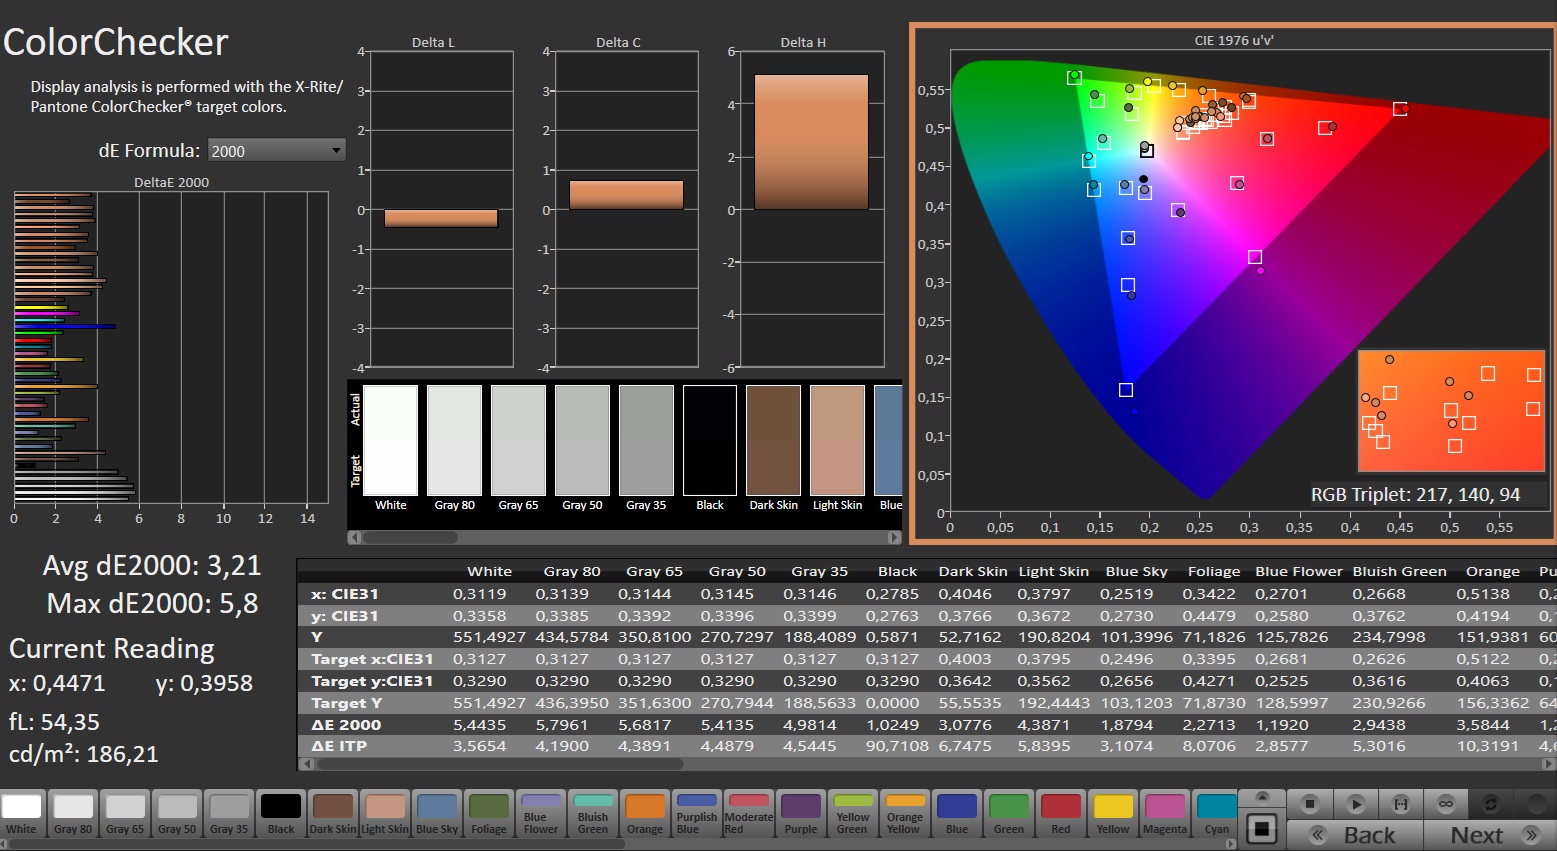
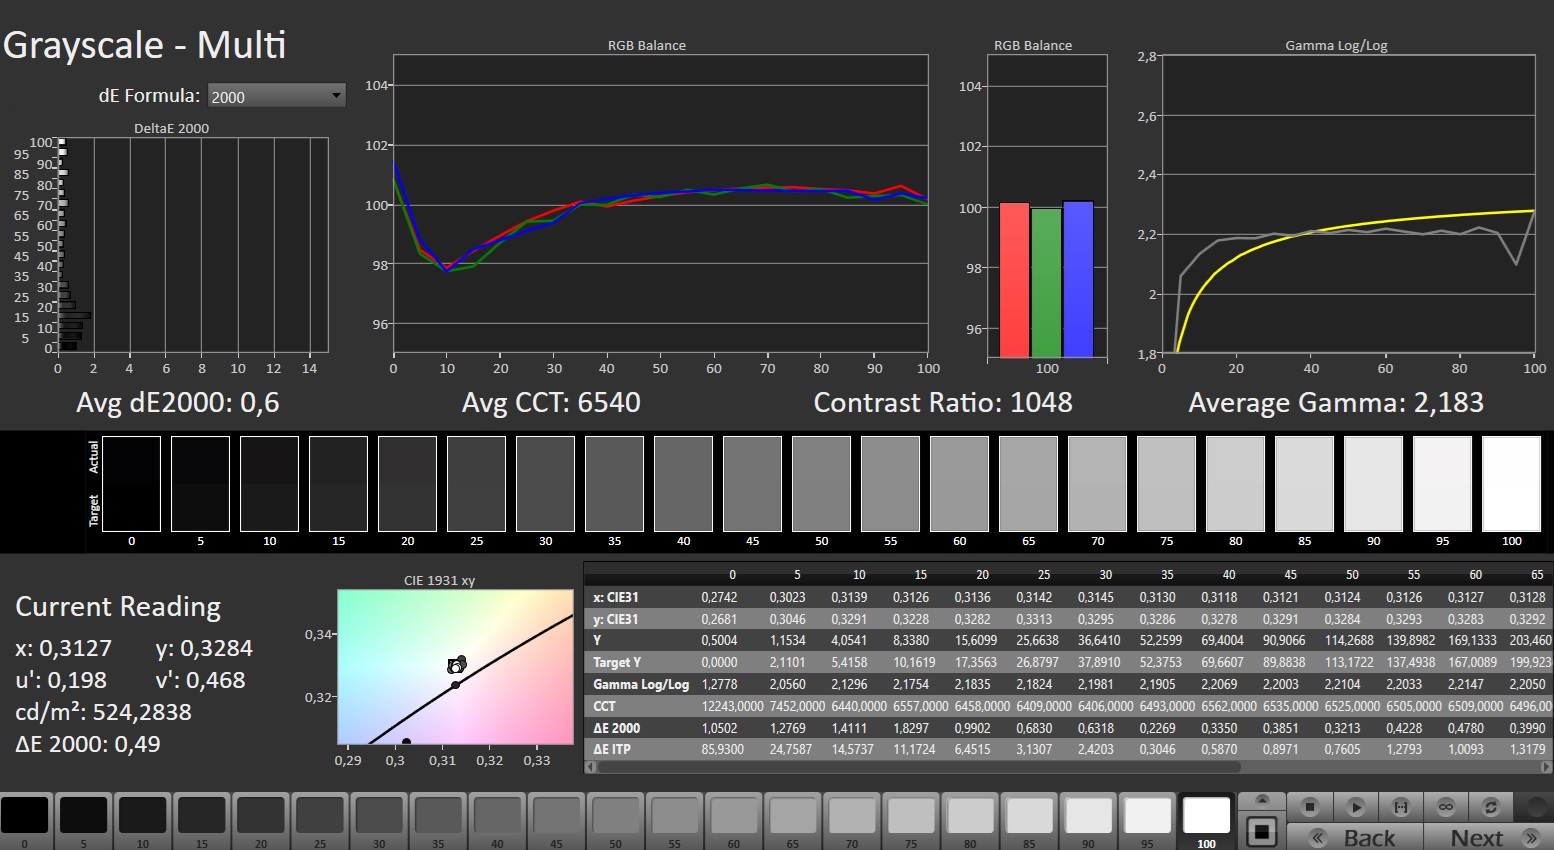
ΔE Color 3.21 | 0.5-29.43 Ø4.87, calibrated: 1.44
ΔE Greyscale 4.2 | 0.5-98 Ø5.1
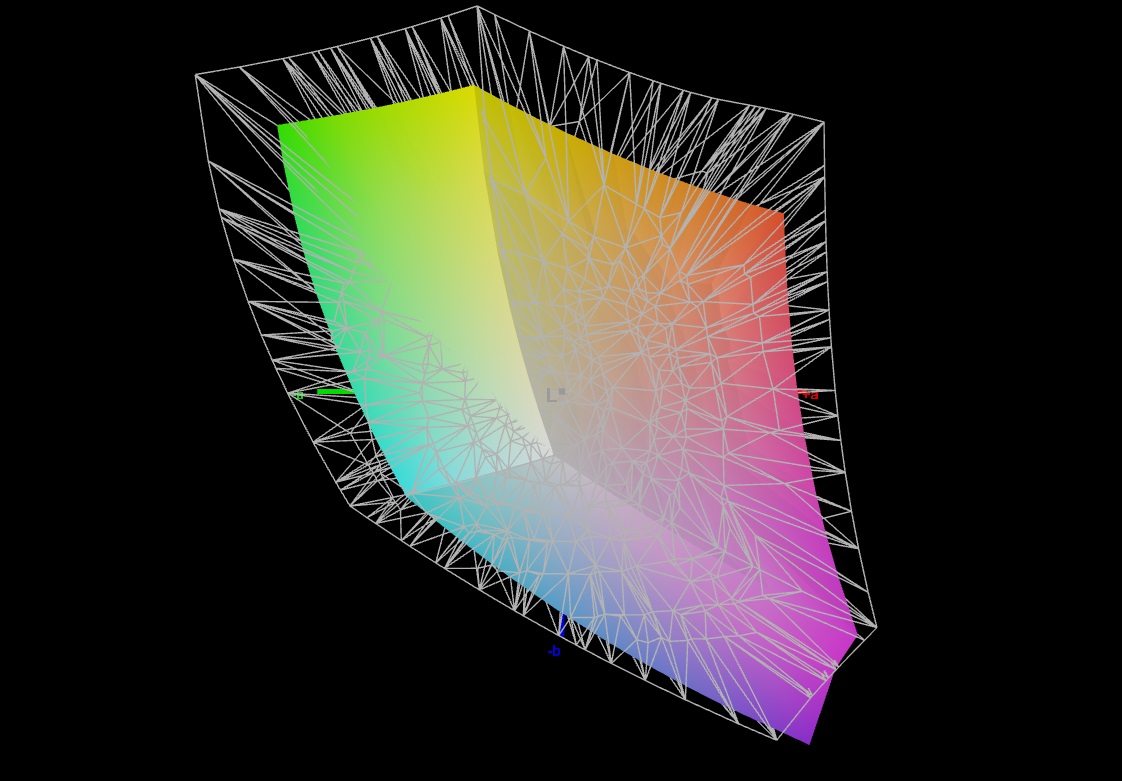
70.6% AdobeRGB 1998 (Argyll 2.2.0 3D)
98% sRGB (Argyll 2.2.0 3D)
70.2% Display P3 (Argyll 2.2.0 3D)
Gamma: 2.226
| SCHENKER XMG Neo 16 (Early 24) BOE NE160QDM-NZA, IPS, 2560x1600, 16" | Razer Blade 16 2024, RTX 4090 Samsung SDC41AB (ATNA60DL03-0), OLED, 2560x1600, 16" | Medion Erazer Beast X40 2024 BOE NE170QDM-NZ1, IPS, 2560x1600, 17" | SCHENKER XMG Neo 16 E23 BOE0AF0 NE160QDM-NZ1, IPS, 2560x1600, 16" | |
|---|---|---|---|---|
| Display | 26% | -1% | -2% | |
| Display P3 Coverage | 70.2 | 99.1 41% | 68.1 -3% | 67.3 -4% |
| sRGB Coverage | 98 | 99.9 2% | 99.5 2% | 96.7 -1% |
| AdobeRGB 1998 Coverage | 70.6 | 95.6 35% | 69 -2% | 68.9 -2% |
| Response Times | 95% | -20% | -49% | |
| Response Time Grey 50% / Grey 80% * | 11.2 ? | 0.24 ? 98% | 11.7 ? -4% | 14.5 ? -29% |
| Response Time Black / White * | 5.1 ? | 0.4 ? 92% | 6.9 ? -35% | 8.6 ? -69% |
| PWM Frequency | 960 | |||
| Screen | 251% | 25% | 15% | |
| Brightness middle | 530 | 418 -21% | 422 -20% | 372 -30% |
| Brightness | 497 | 420 -15% | 388 -22% | 349 -30% |
| Brightness Distribution | 85 | 98 15% | 87 2% | 88 4% |
| Black Level * | 0.53 | 0.02 96% | 0.42 21% | 0.32 40% |
| Contrast | 1000 | 20900 1990% | 1005 1% | 1163 16% |
| Colorchecker dE 2000 * | 3.21 | 1.07 67% | 1.42 56% | 2.06 36% |
| Colorchecker dE 2000 max. * | 5.8 | 4.04 30% | 1.97 66% | 3 48% |
| Colorchecker dE 2000 calibrated * | 1.44 | 1.07 26% | 0.7 51% | 1.5 -4% |
| Greyscale dE 2000 * | 4.2 | 1.12 73% | 1.2 71% | 1.9 55% |
| Gamma | 2.226 99% | 2.29 96% | 2.078 106% | 2.312 95% |
| CCT | 6448 101% | 6417 101% | 6581 99% | 6747 96% |
| Média Total (Programa/Configurações) | 124% /
181% | 1% /
13% | -12% /
2% |
* ... menor é melhor
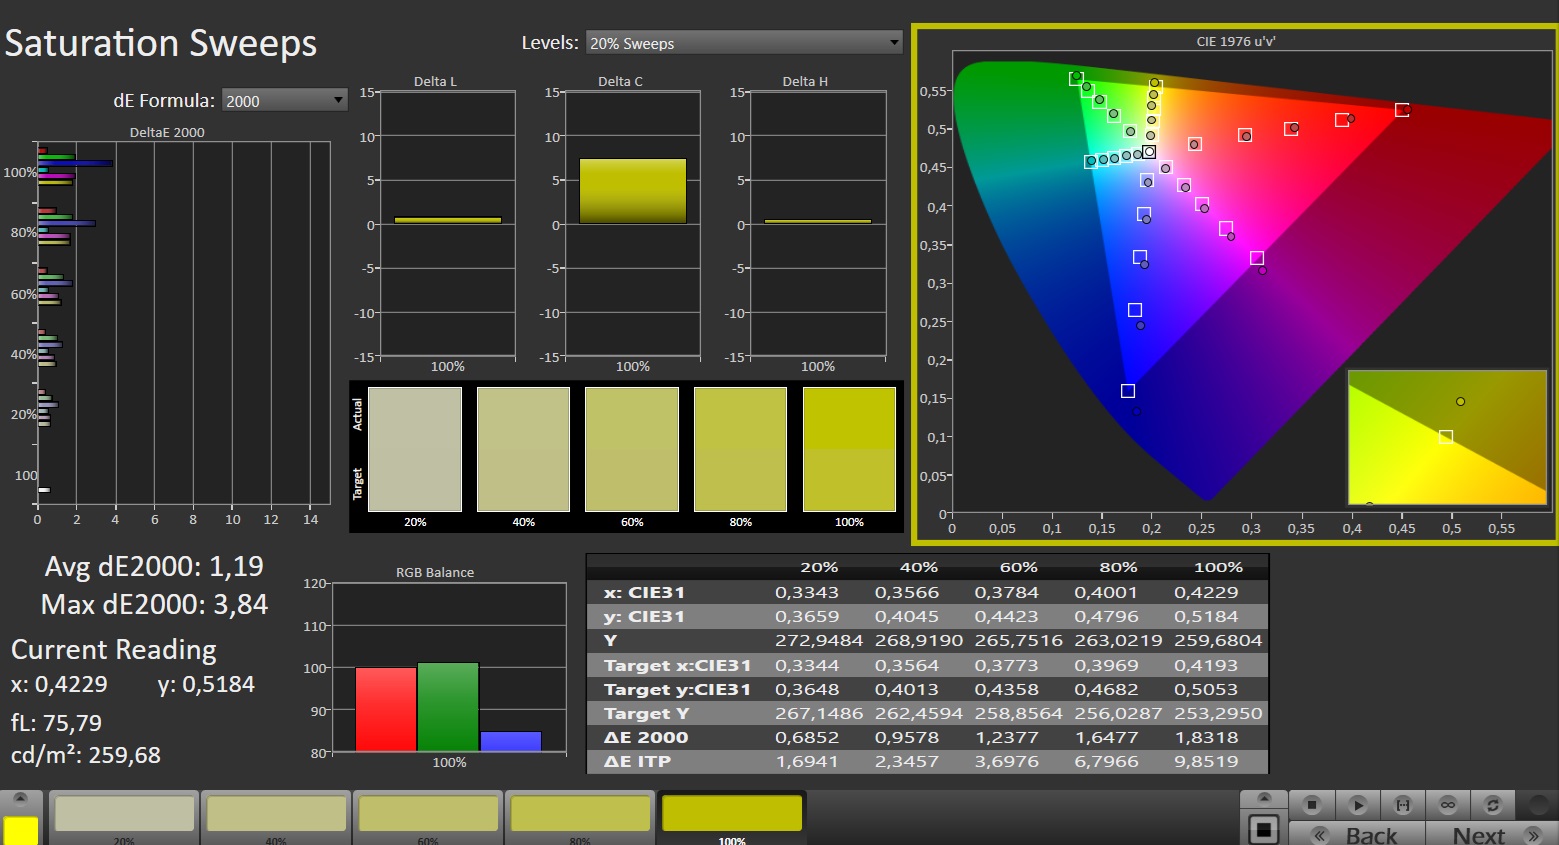
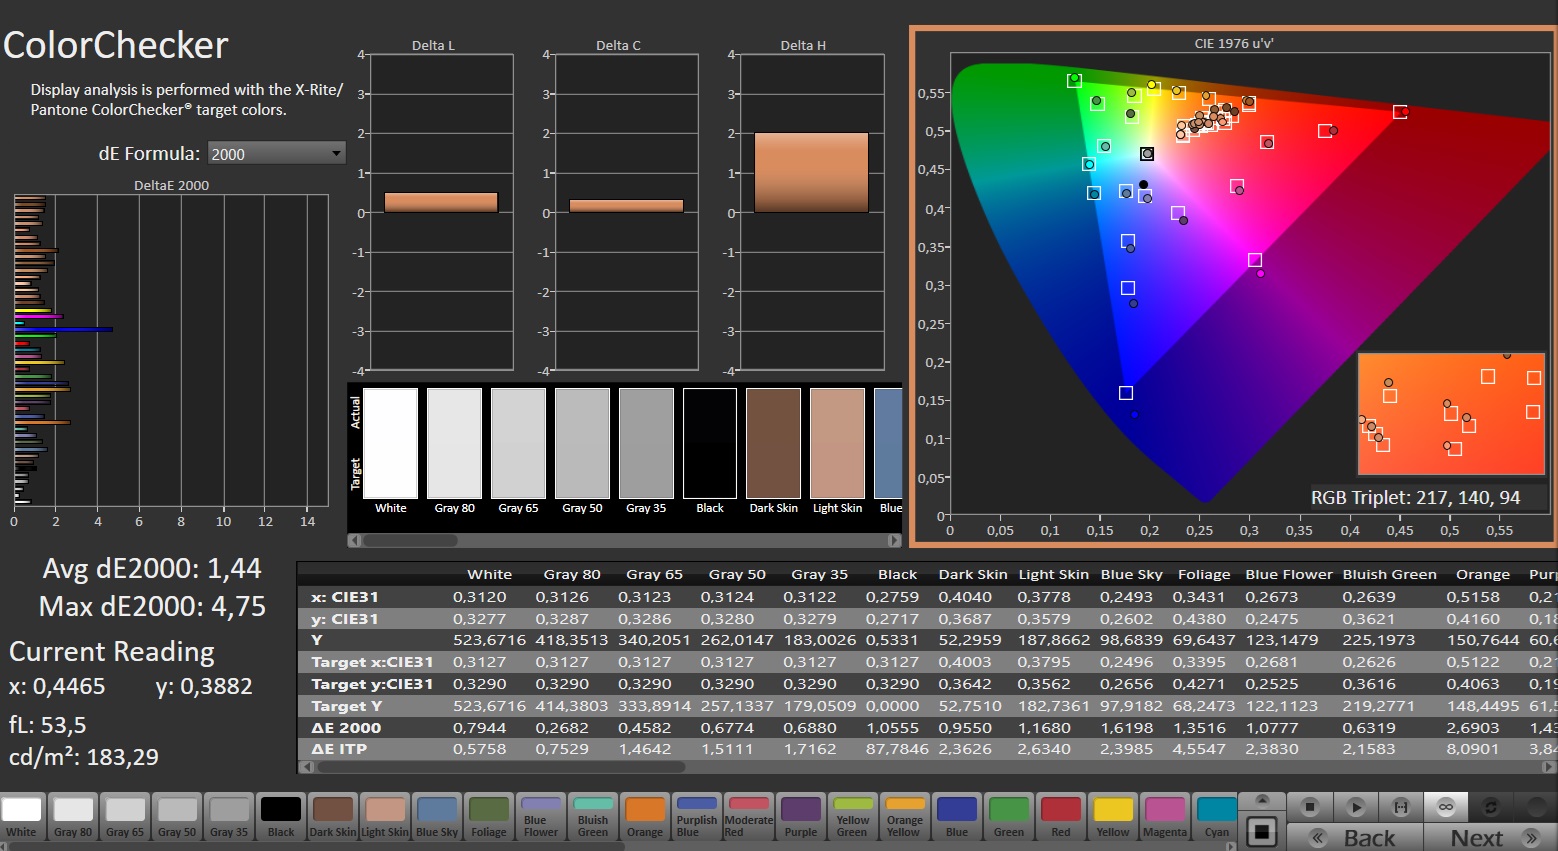
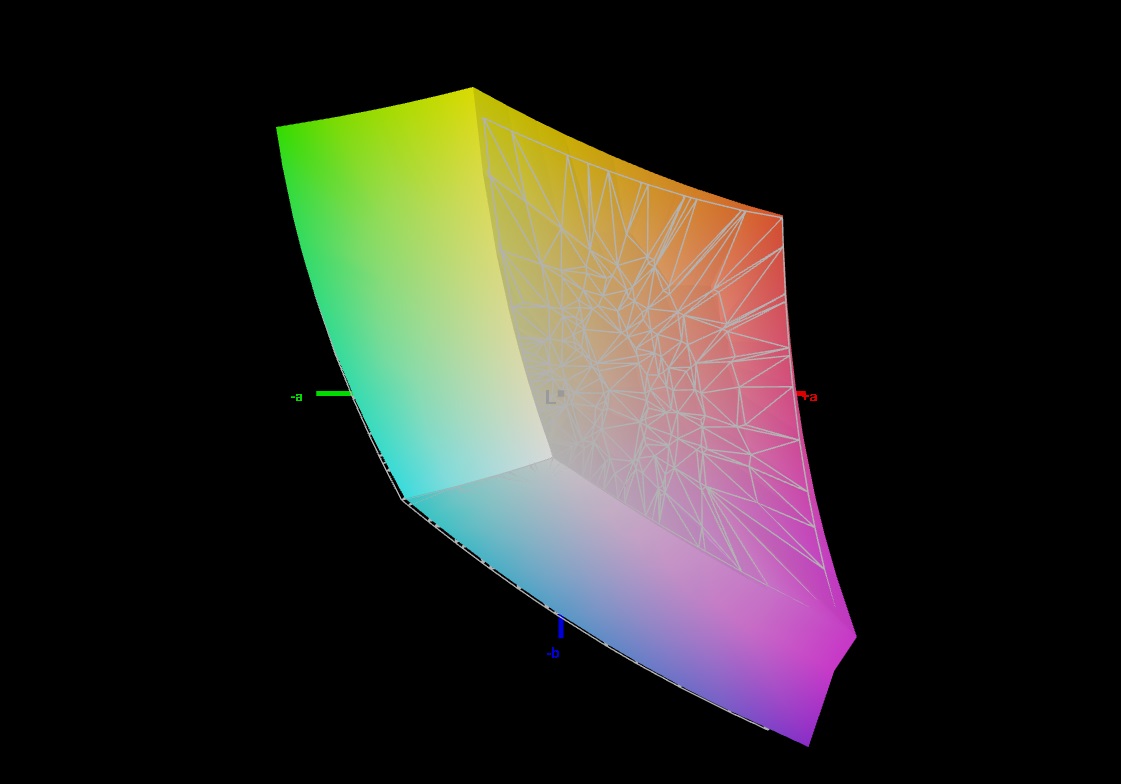
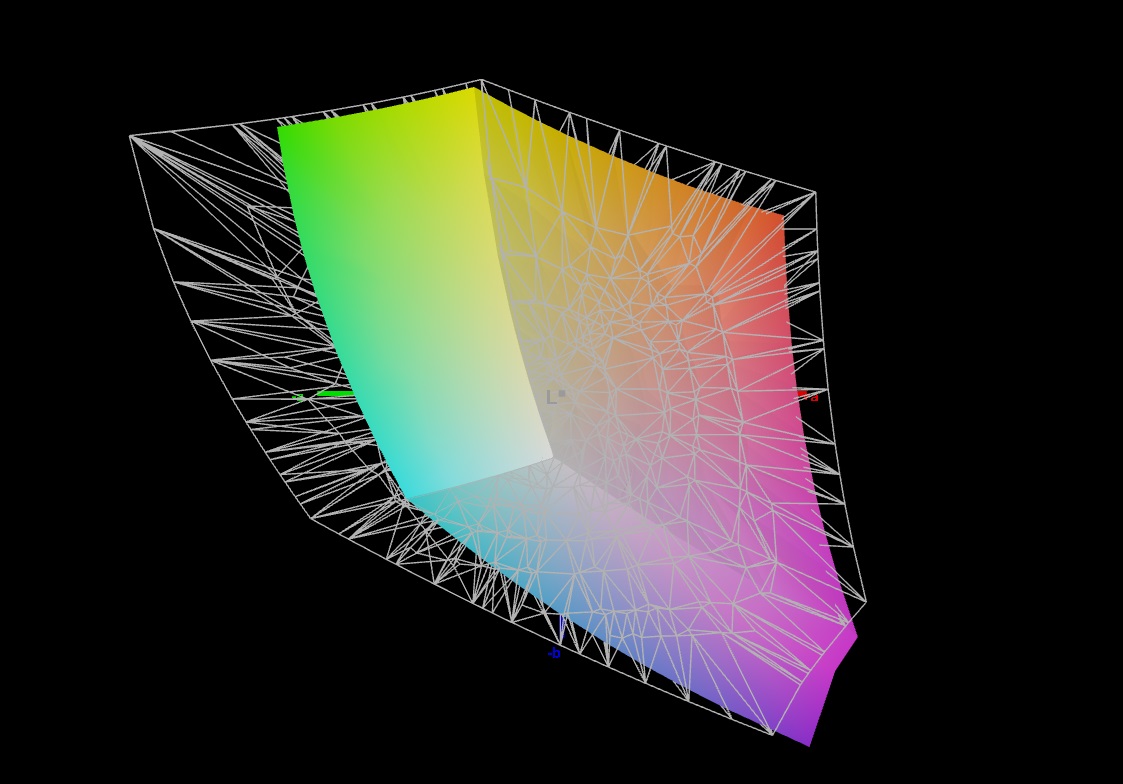
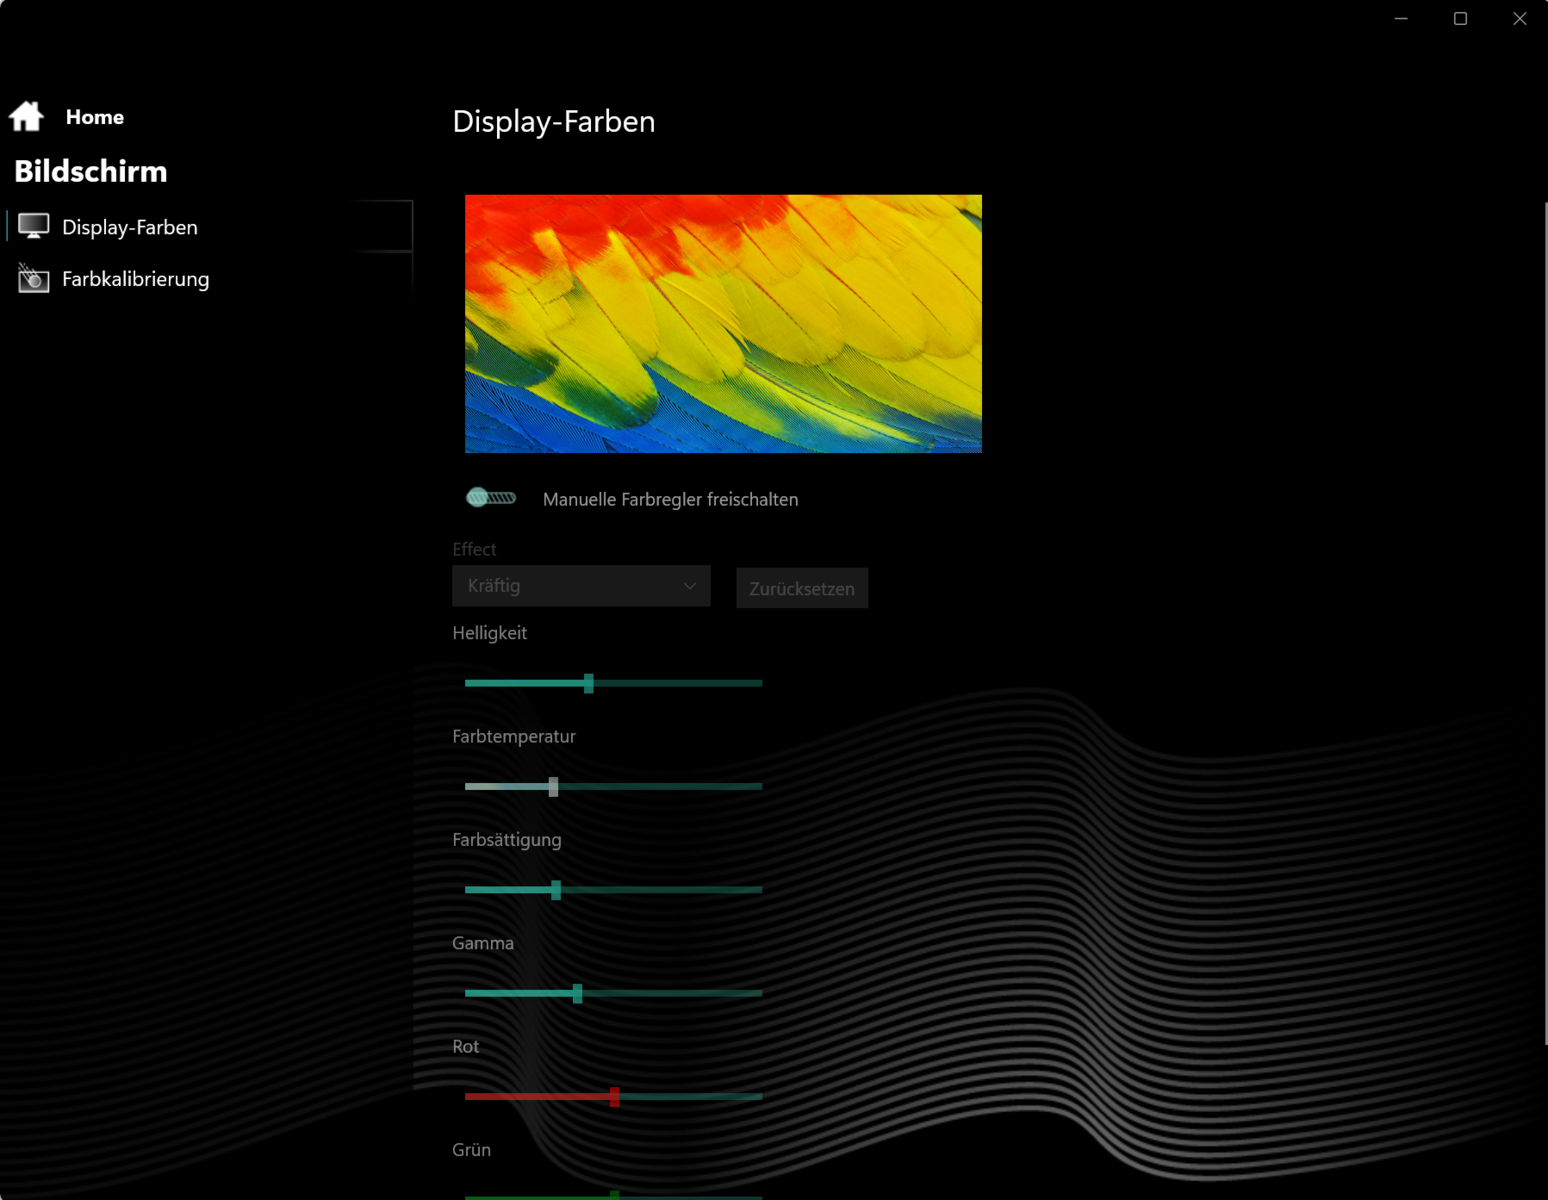
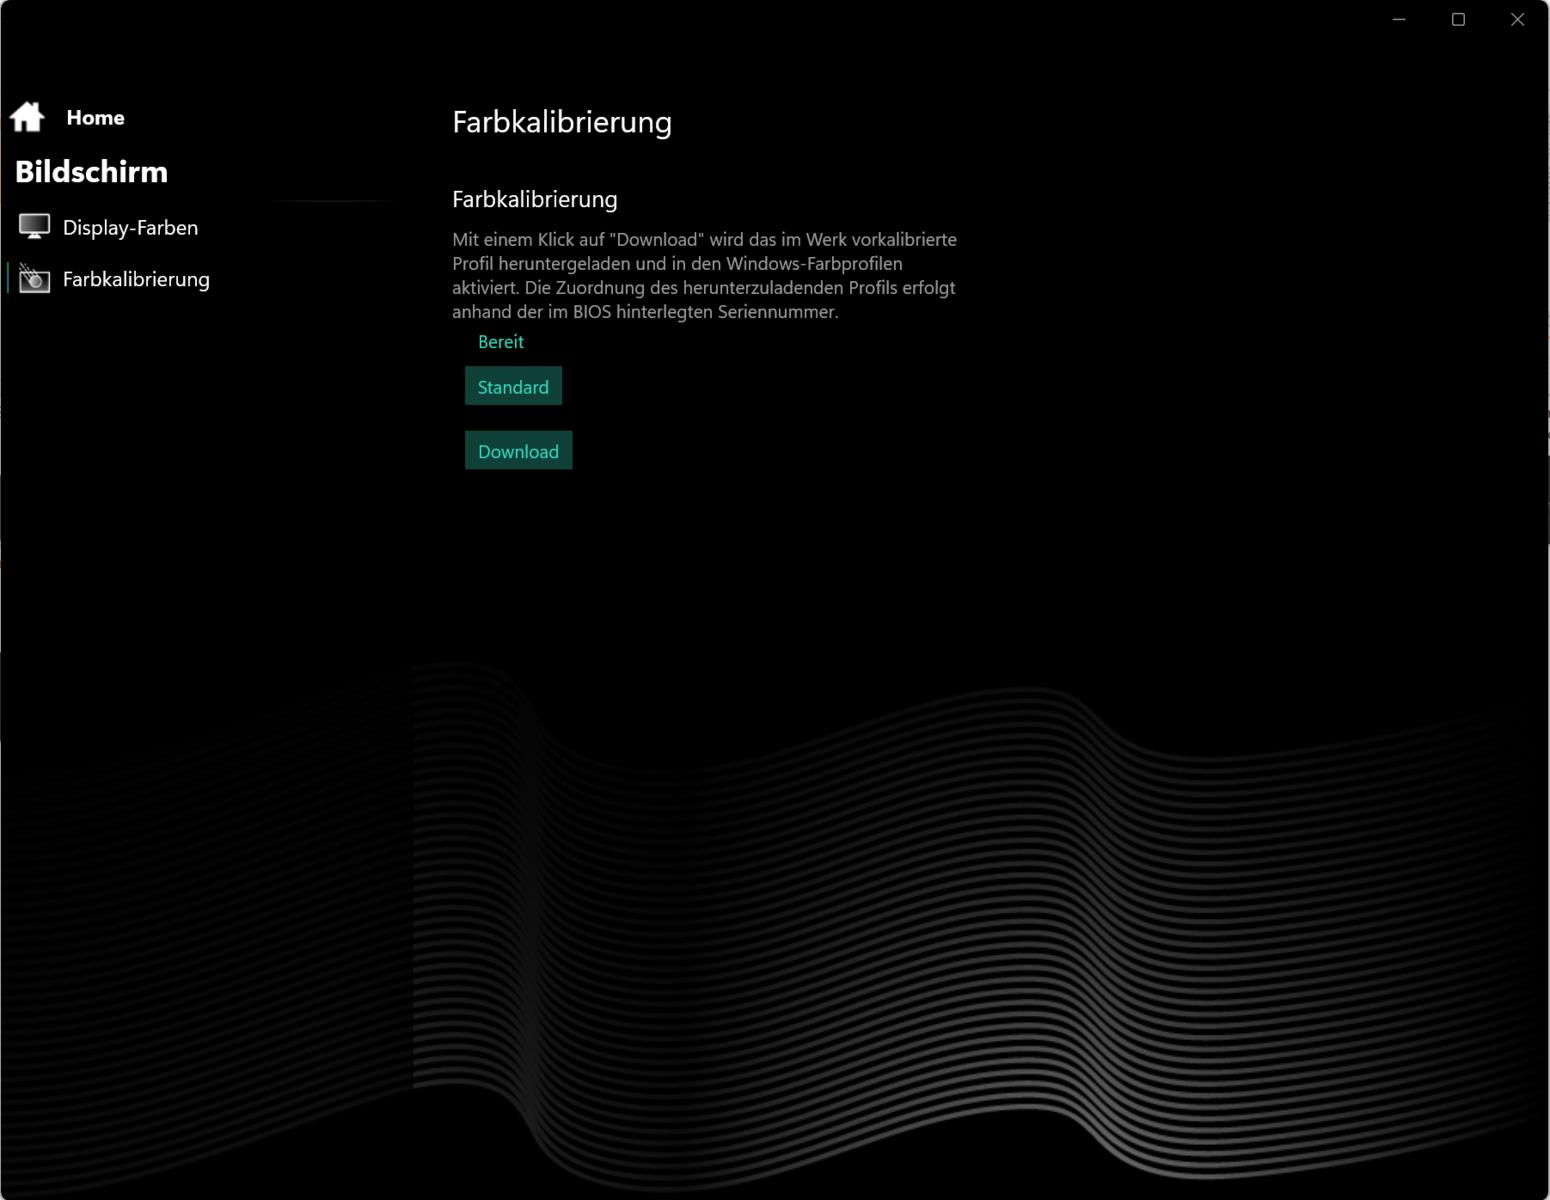
Quando sai da caixa, o monitor oferece uma reprodução de cores decente: Com um DeltaE de 3,2, o desvio não atinge o valor desejado (DeltaE < 3). Uma calibração reduz esse valor para 1,44 - um bom número. De todos os espaços de cores padrão (AdobeRGB, sRGB, DCI P3), o painel - assim como o Erazer Beast X40 do Erazer Beast X40 - só pode exibir o espaço sRGB quase completamente. A exibição de todos os três espaços de cores está reservada para o painel OLED encontrado no Blade 16.
O perfil de cores que criamos pode ser baixado e usado gratuitamente. Um link pode ser encontrado na caixa de informações da tela.
Exibir tempos de resposta
| ↔ Tempo de resposta preto para branco | ||
|---|---|---|
| 5.1 ms ... ascensão ↗ e queda ↘ combinadas | ↗ 1.6 ms ascensão | 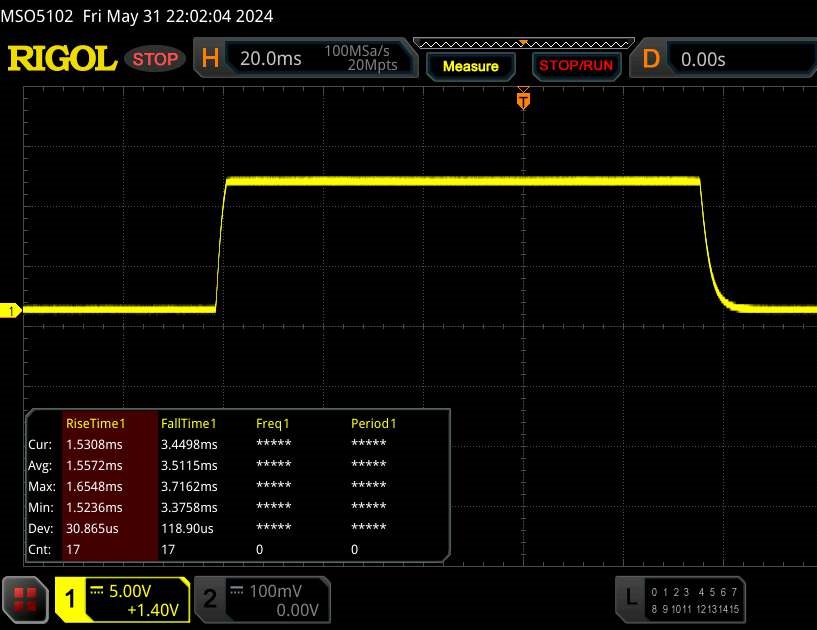 |
| ↘ 3.5 ms queda | ||
| A tela mostra taxas de resposta muito rápidas em nossos testes e deve ser muito adequada para jogos em ritmo acelerado. Em comparação, todos os dispositivos testados variam de 0.1 (mínimo) a 240 (máximo) ms. » 15 % de todos os dispositivos são melhores. Isso significa que o tempo de resposta medido é melhor que a média de todos os dispositivos testados (20.8 ms). | ||
| ↔ Tempo de resposta 50% cinza a 80% cinza | ||
| 11.2 ms ... ascensão ↗ e queda ↘ combinadas | ↗ 5.2 ms ascensão | 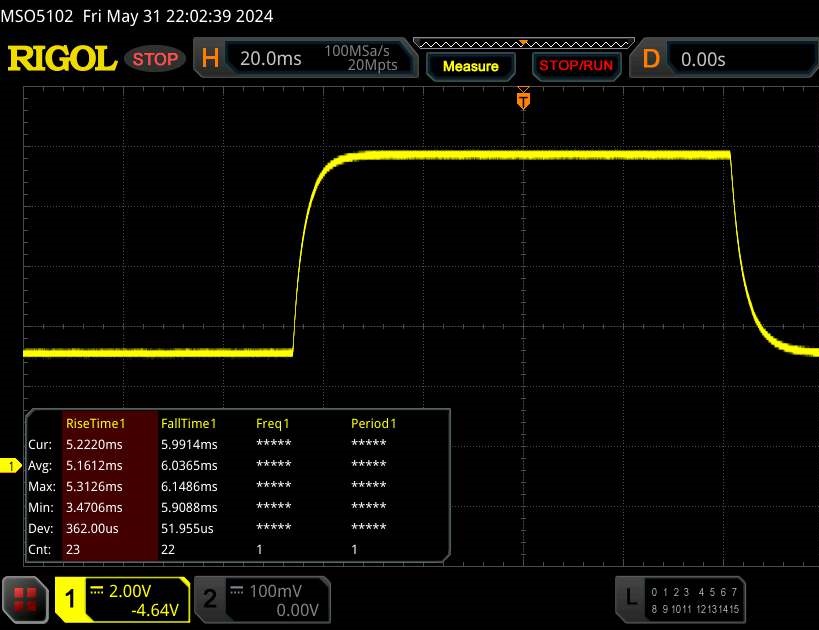 |
| ↘ 6 ms queda | ||
| A tela mostra boas taxas de resposta em nossos testes, mas pode ser muito lenta para jogadores competitivos. Em comparação, todos os dispositivos testados variam de 0.165 (mínimo) a 636 (máximo) ms. » 22 % de todos os dispositivos são melhores. Isso significa que o tempo de resposta medido é melhor que a média de todos os dispositivos testados (32.5 ms). | ||
Cintilação da tela / PWM (modulação por largura de pulso)
| Tela tremeluzindo / PWM não detectado | 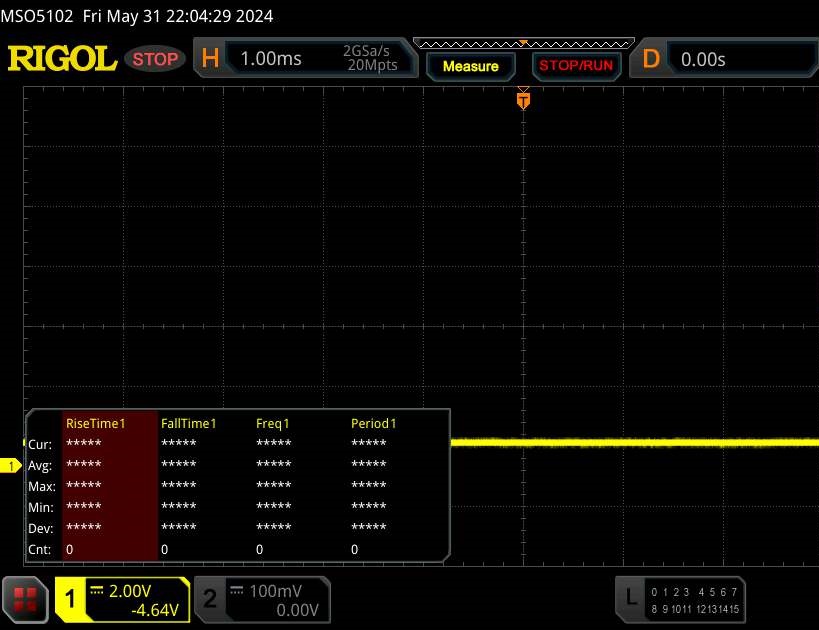 | ||
[pwm_comparison] Em comparação: 53 % de todos os dispositivos testados não usam PWM para escurecer a tela. Se PWM foi detectado, uma média de 8516 (mínimo: 5 - máximo: 343500) Hz foi medida. | |||
Desempenho - Raptor Lake e Ada Lovelace garantem uma tonelada de potência
O Neo 16 (Early 24) é voltado para gamers, criadores e, em geral, todos os grupos de usuários que precisam de muita potência. Cada variante de especificação é equipada com um Core i9 14900HX e a paleta de GPUs varia de RTX 4060 a RTX 4090 - nosso modelo é um RTX 4090. Configurações individuais e a compra do laptop são possíveis via Bestware.com (em alemão). O dispositivo de análise que temos aqui pode ser adquirido por cerca de US$ 4.000, com o modelo básico (RTX 4060) custando aproximadamente US$ 2.000. O resfriamento a água (Oasis MK2), disponível como opção, está incluído nos modelos RTX 4080 ou RTX 4090 Neo 16.
Condições de teste
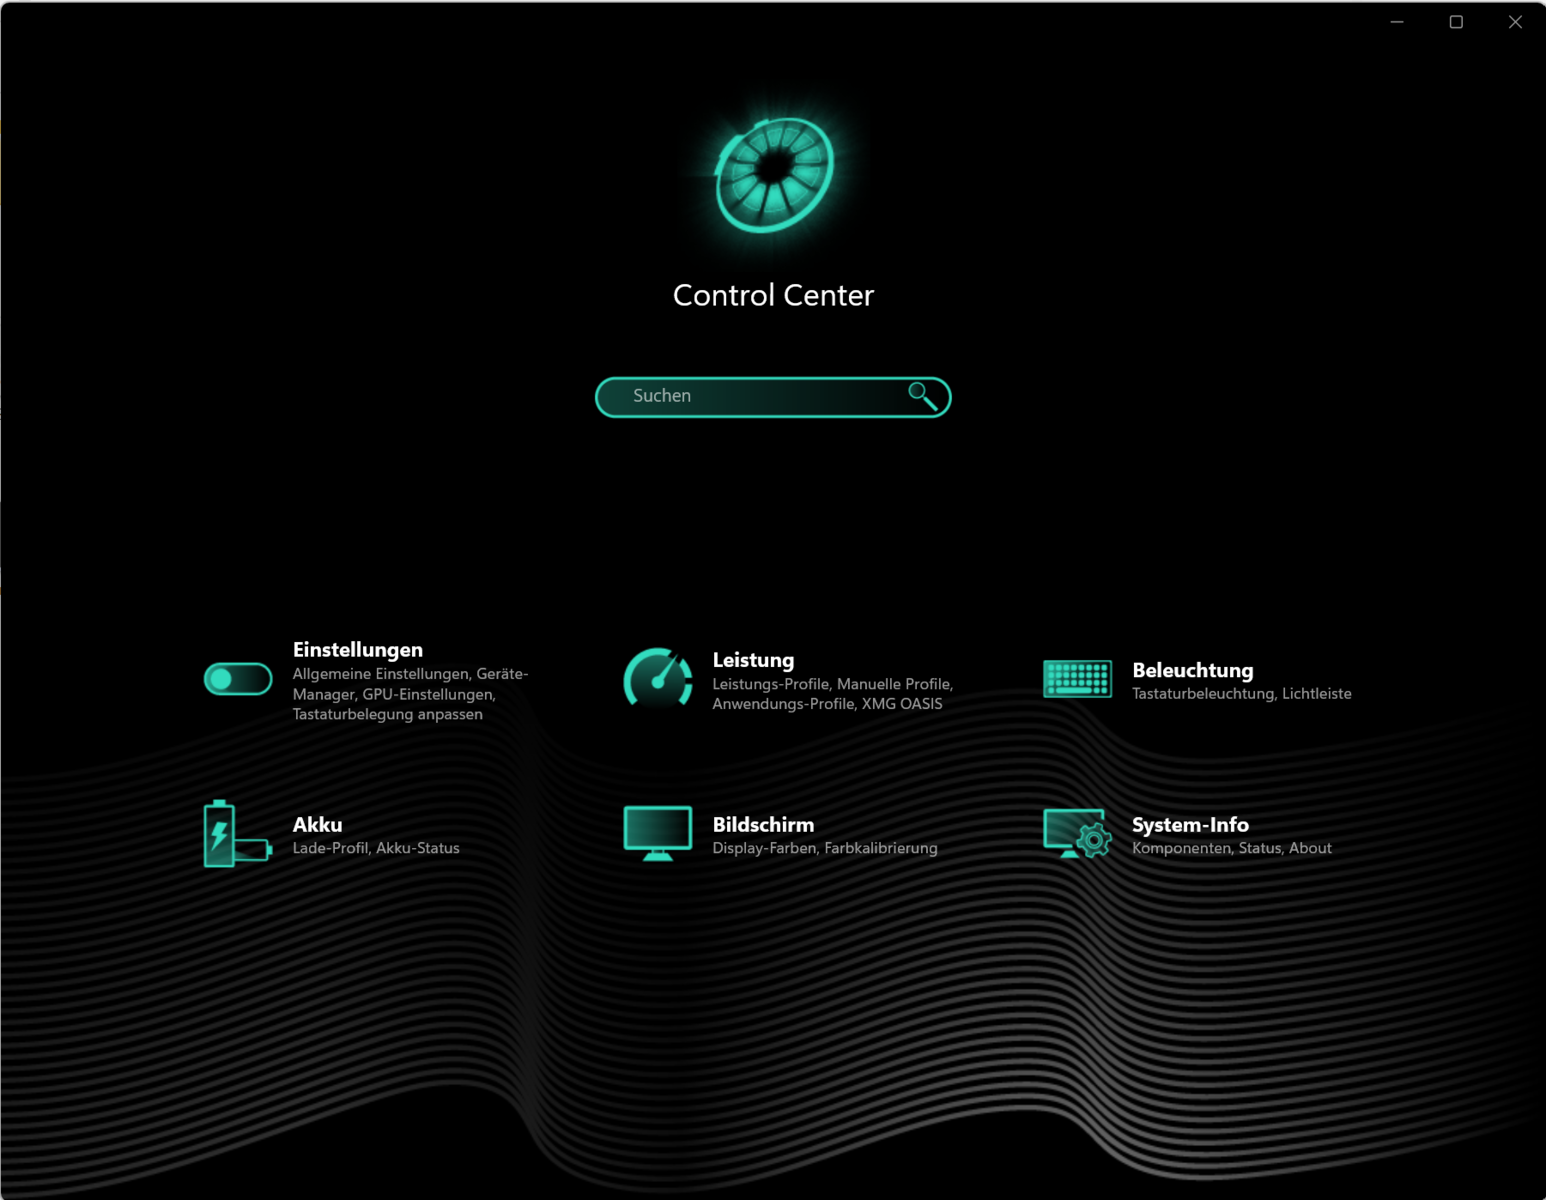
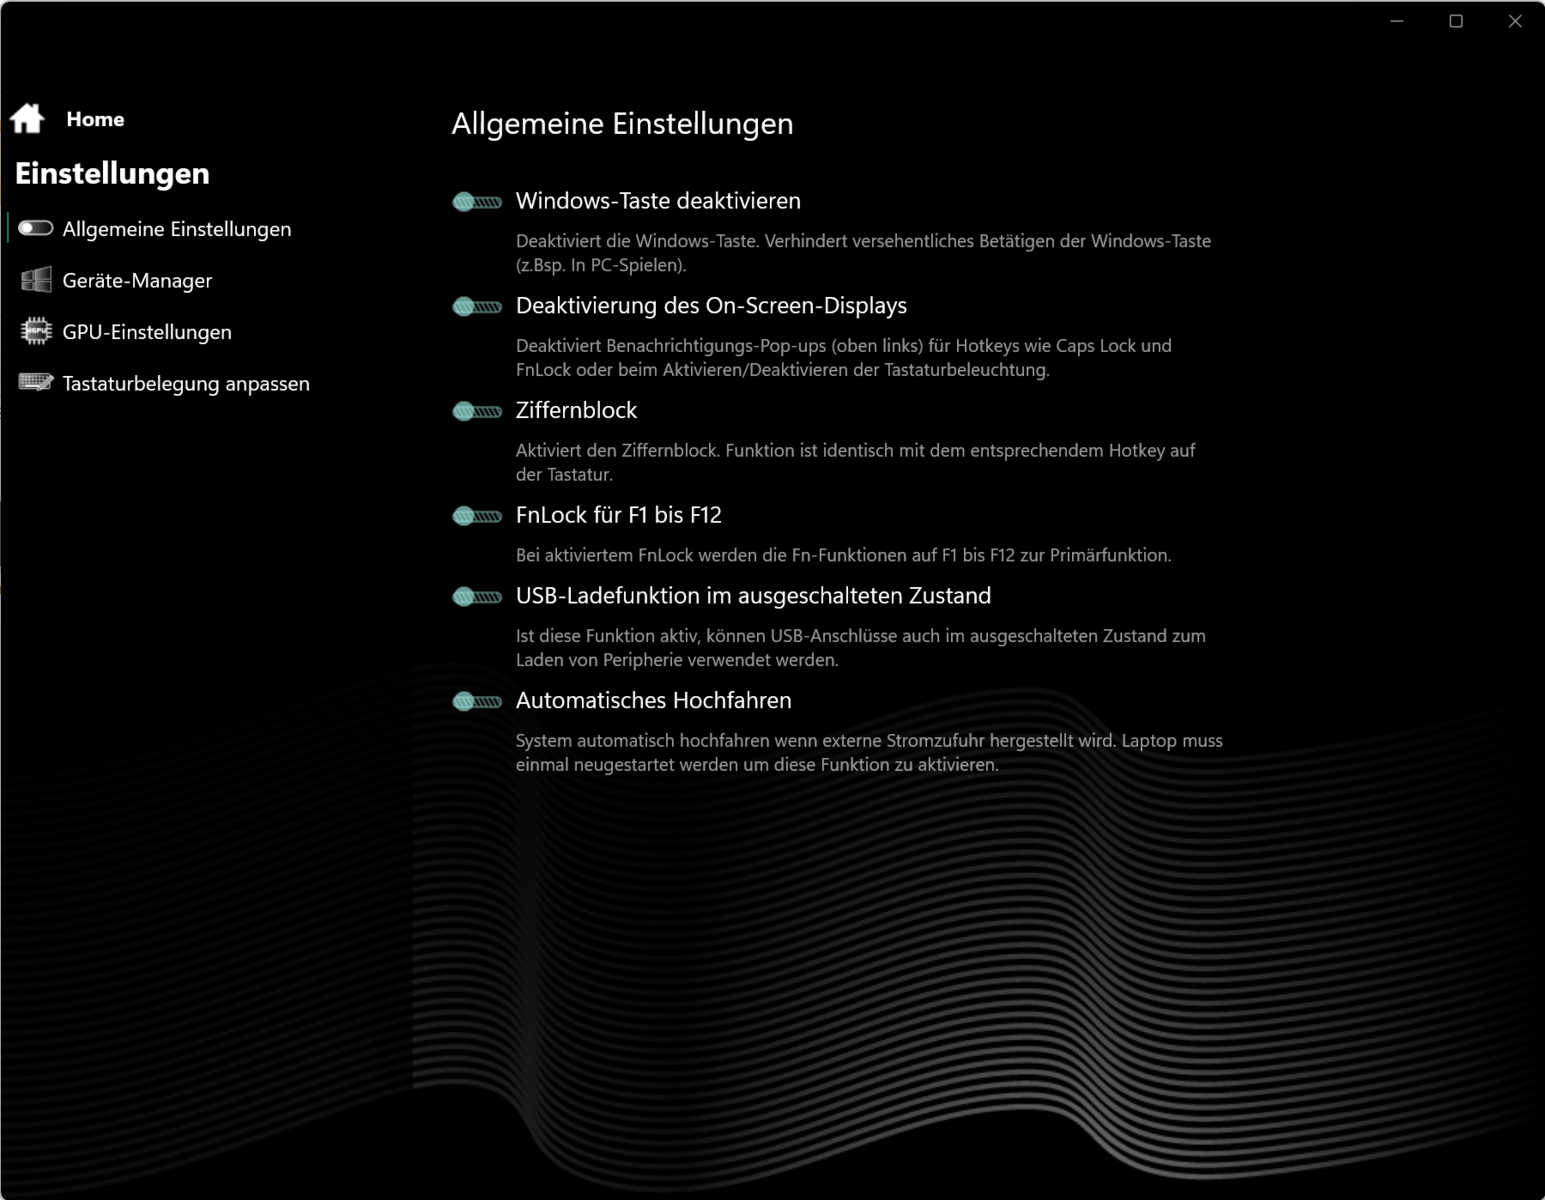
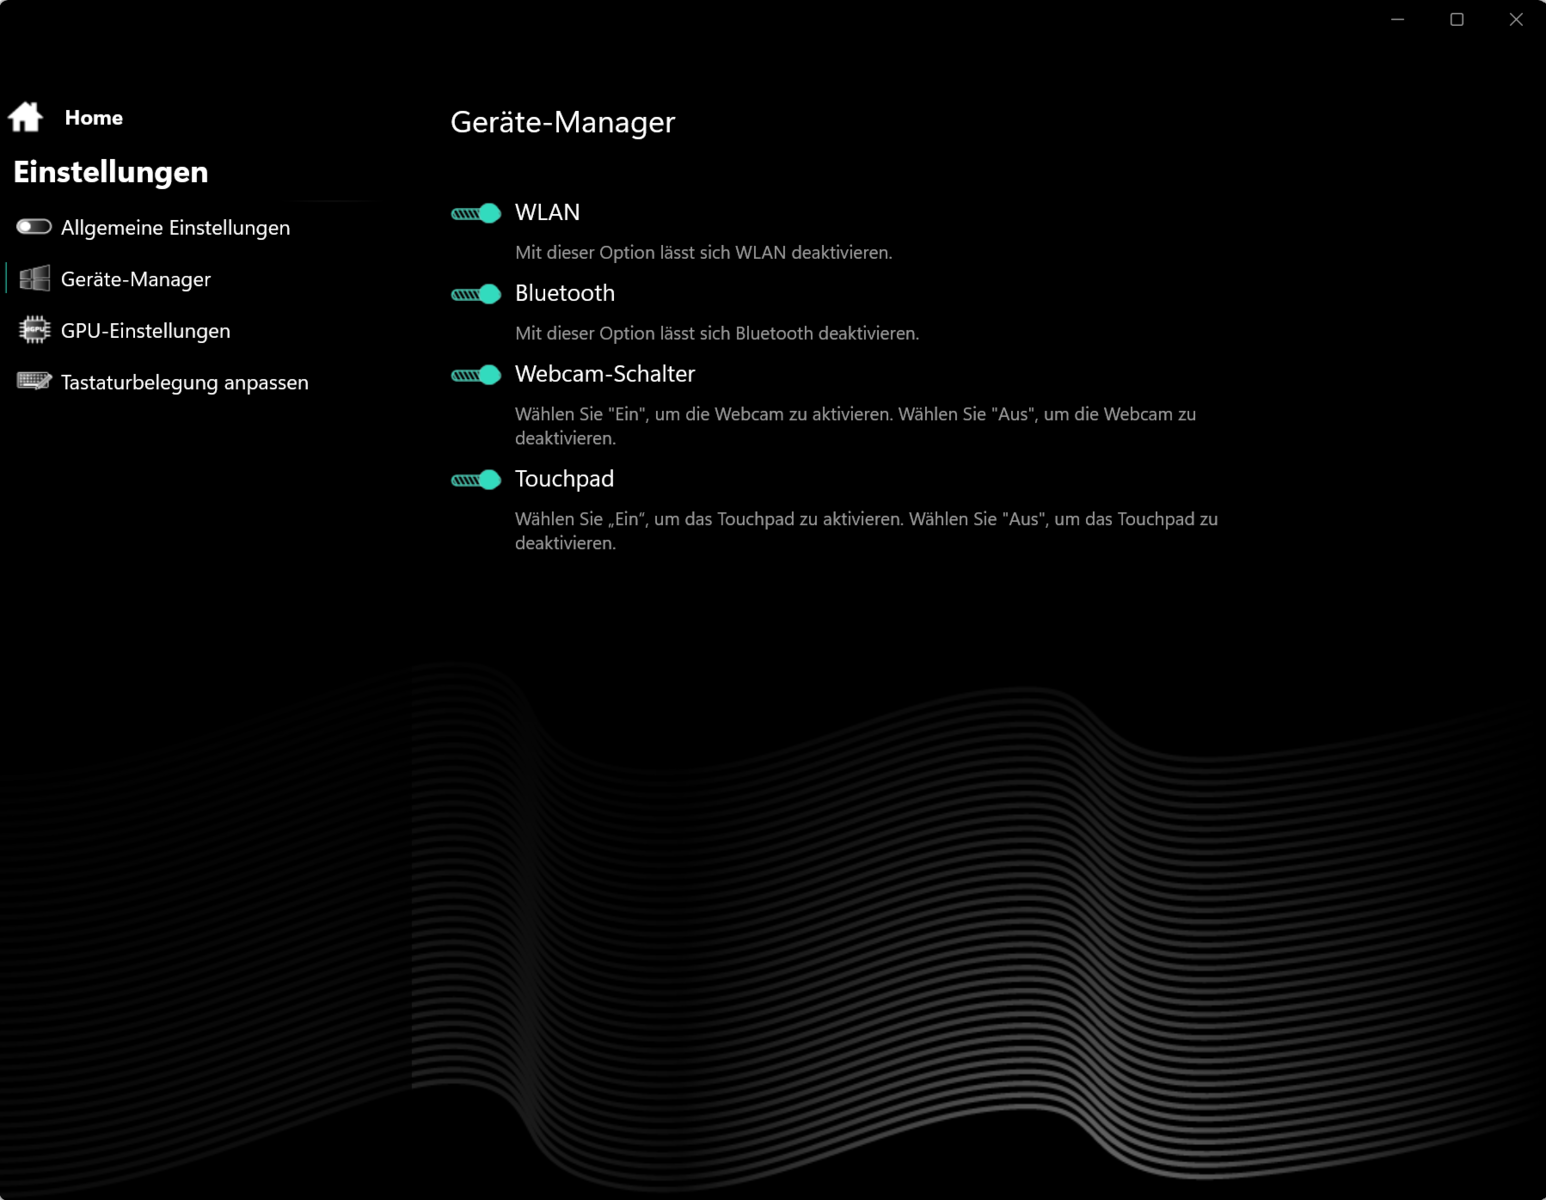
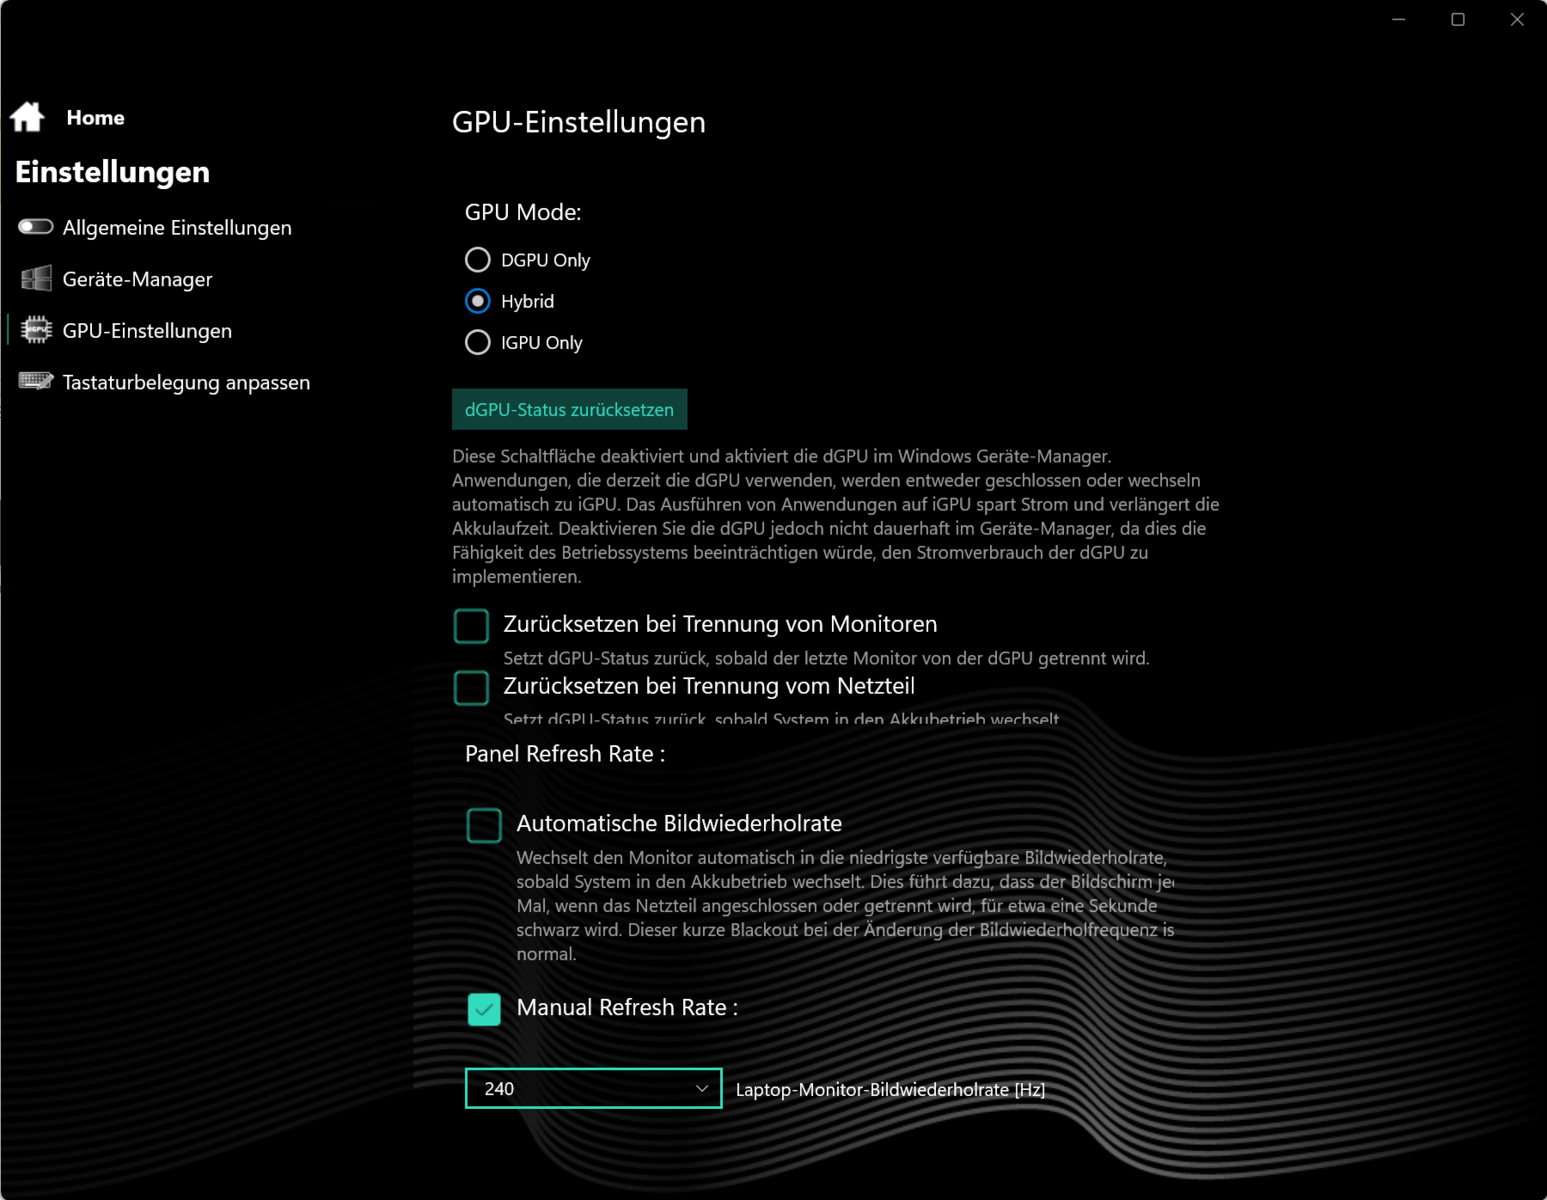
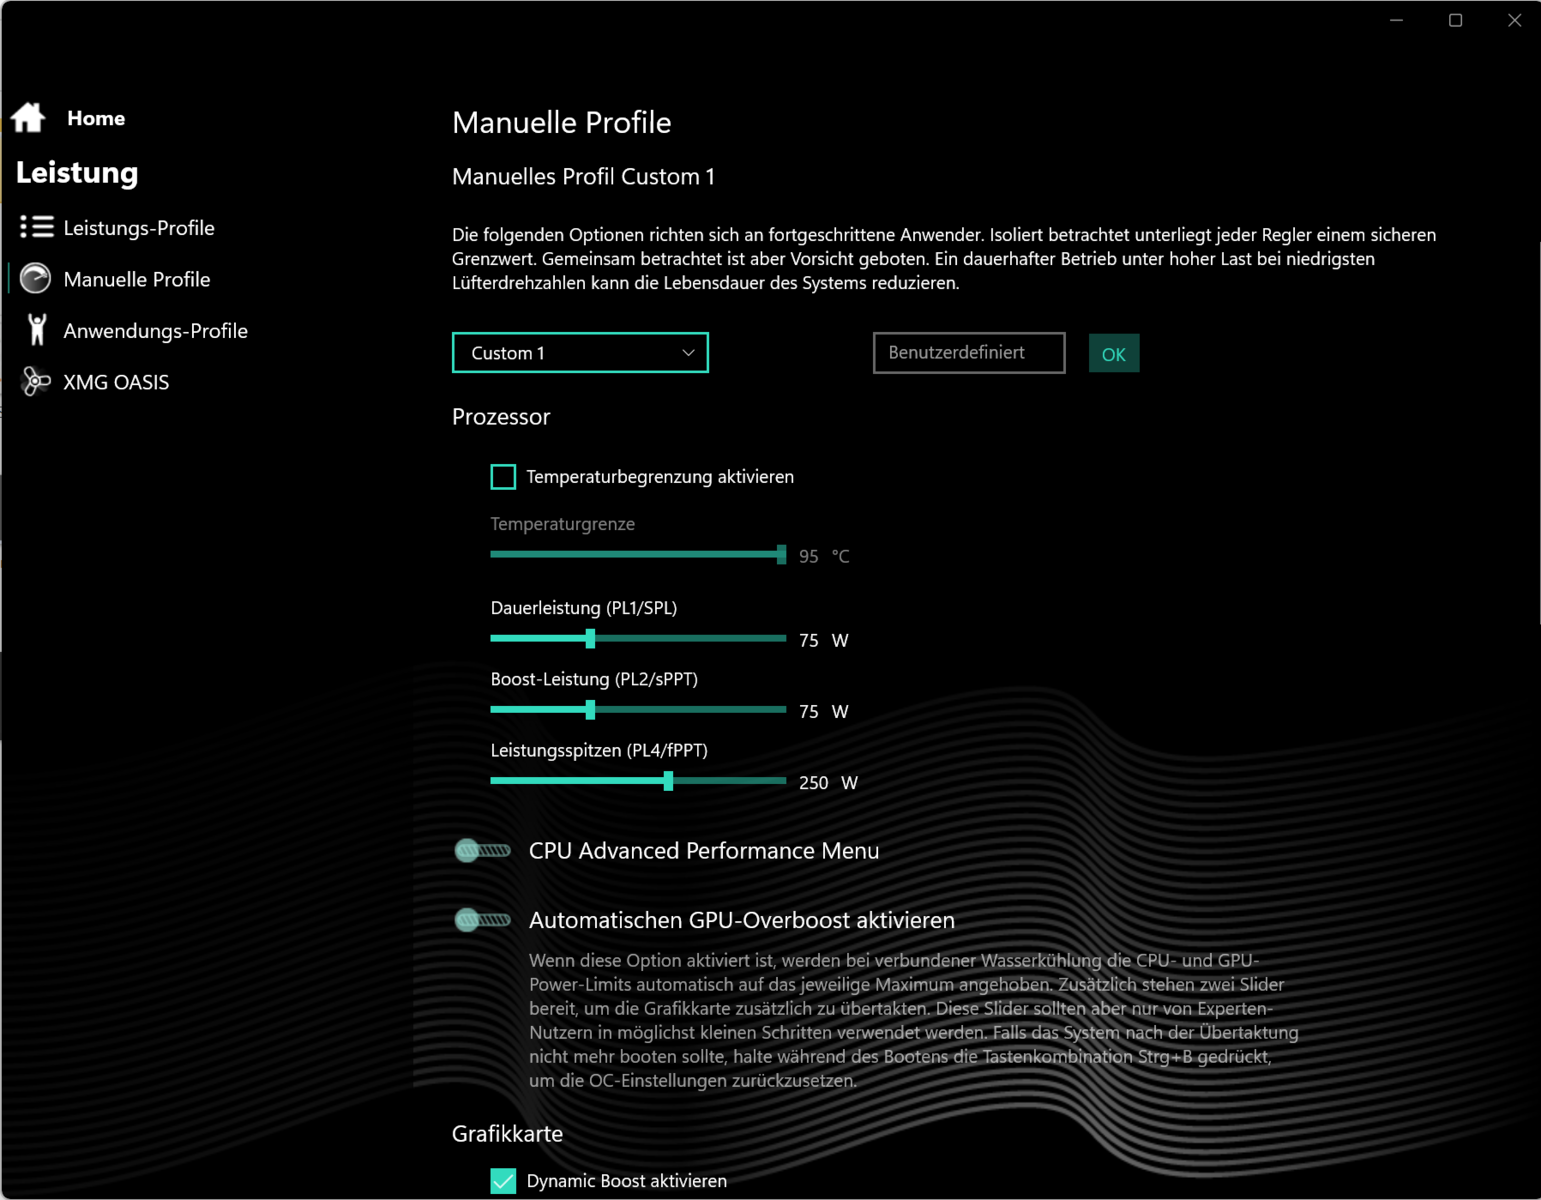
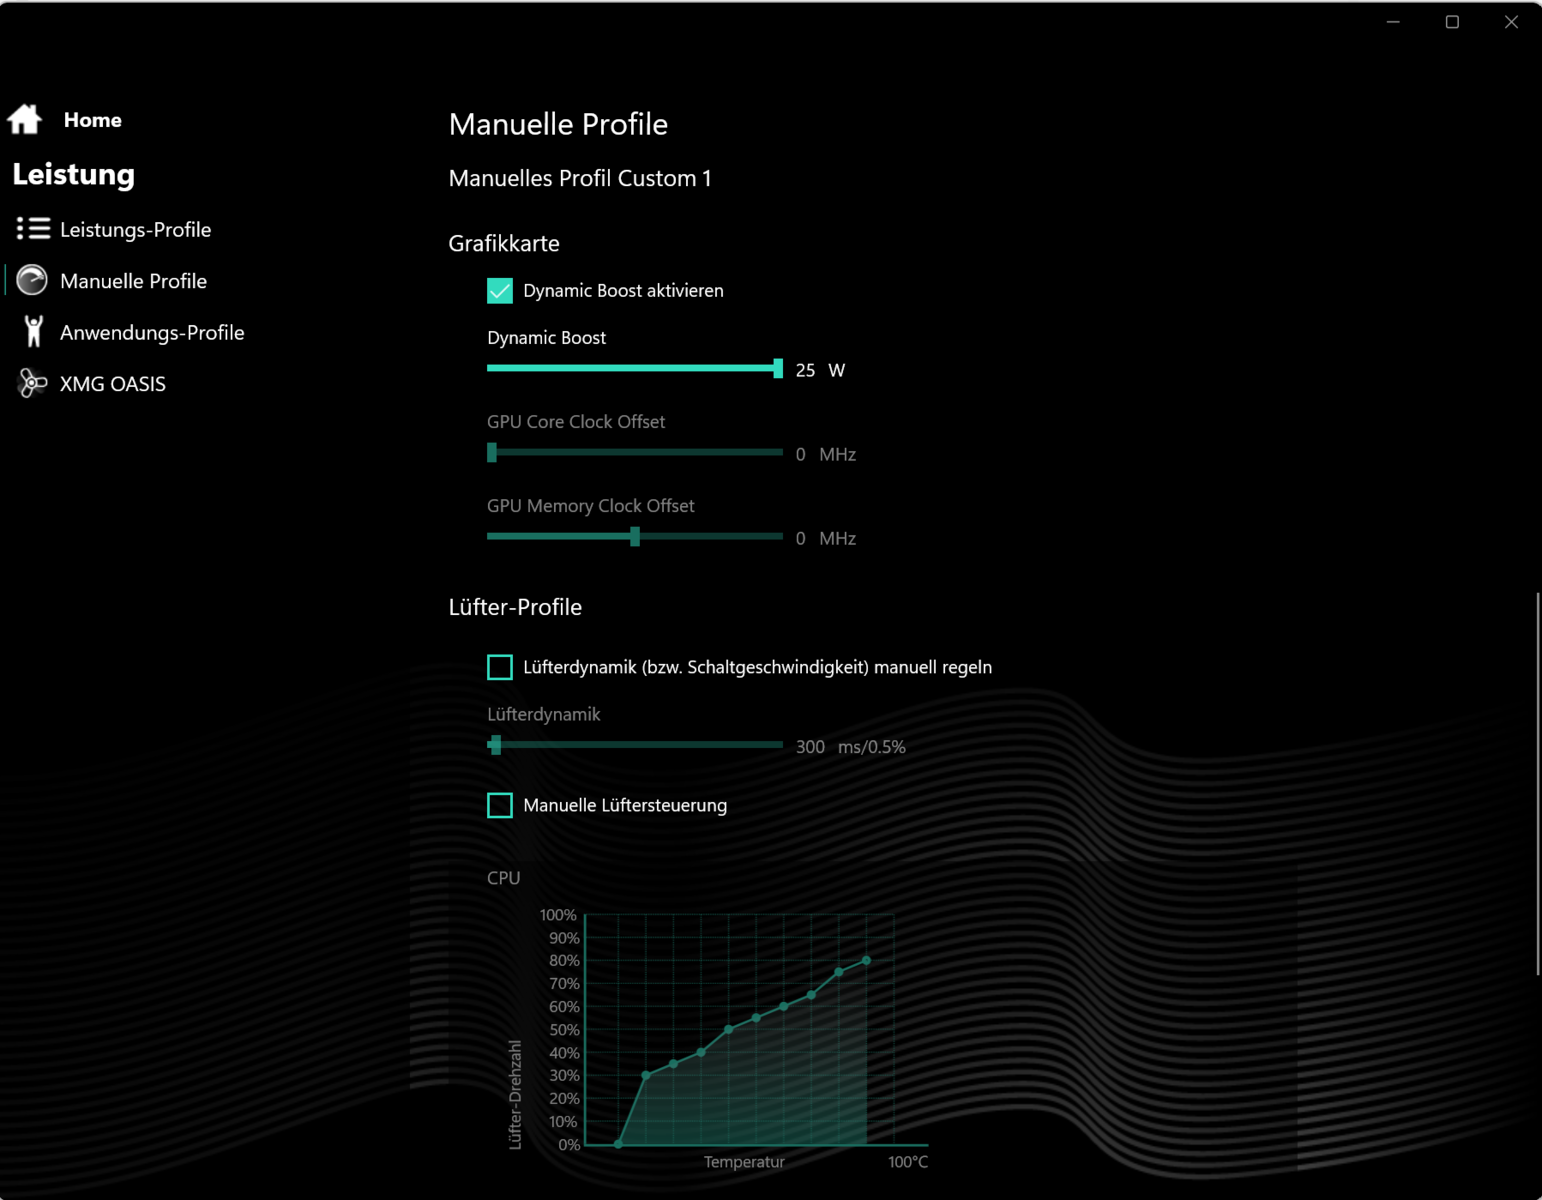
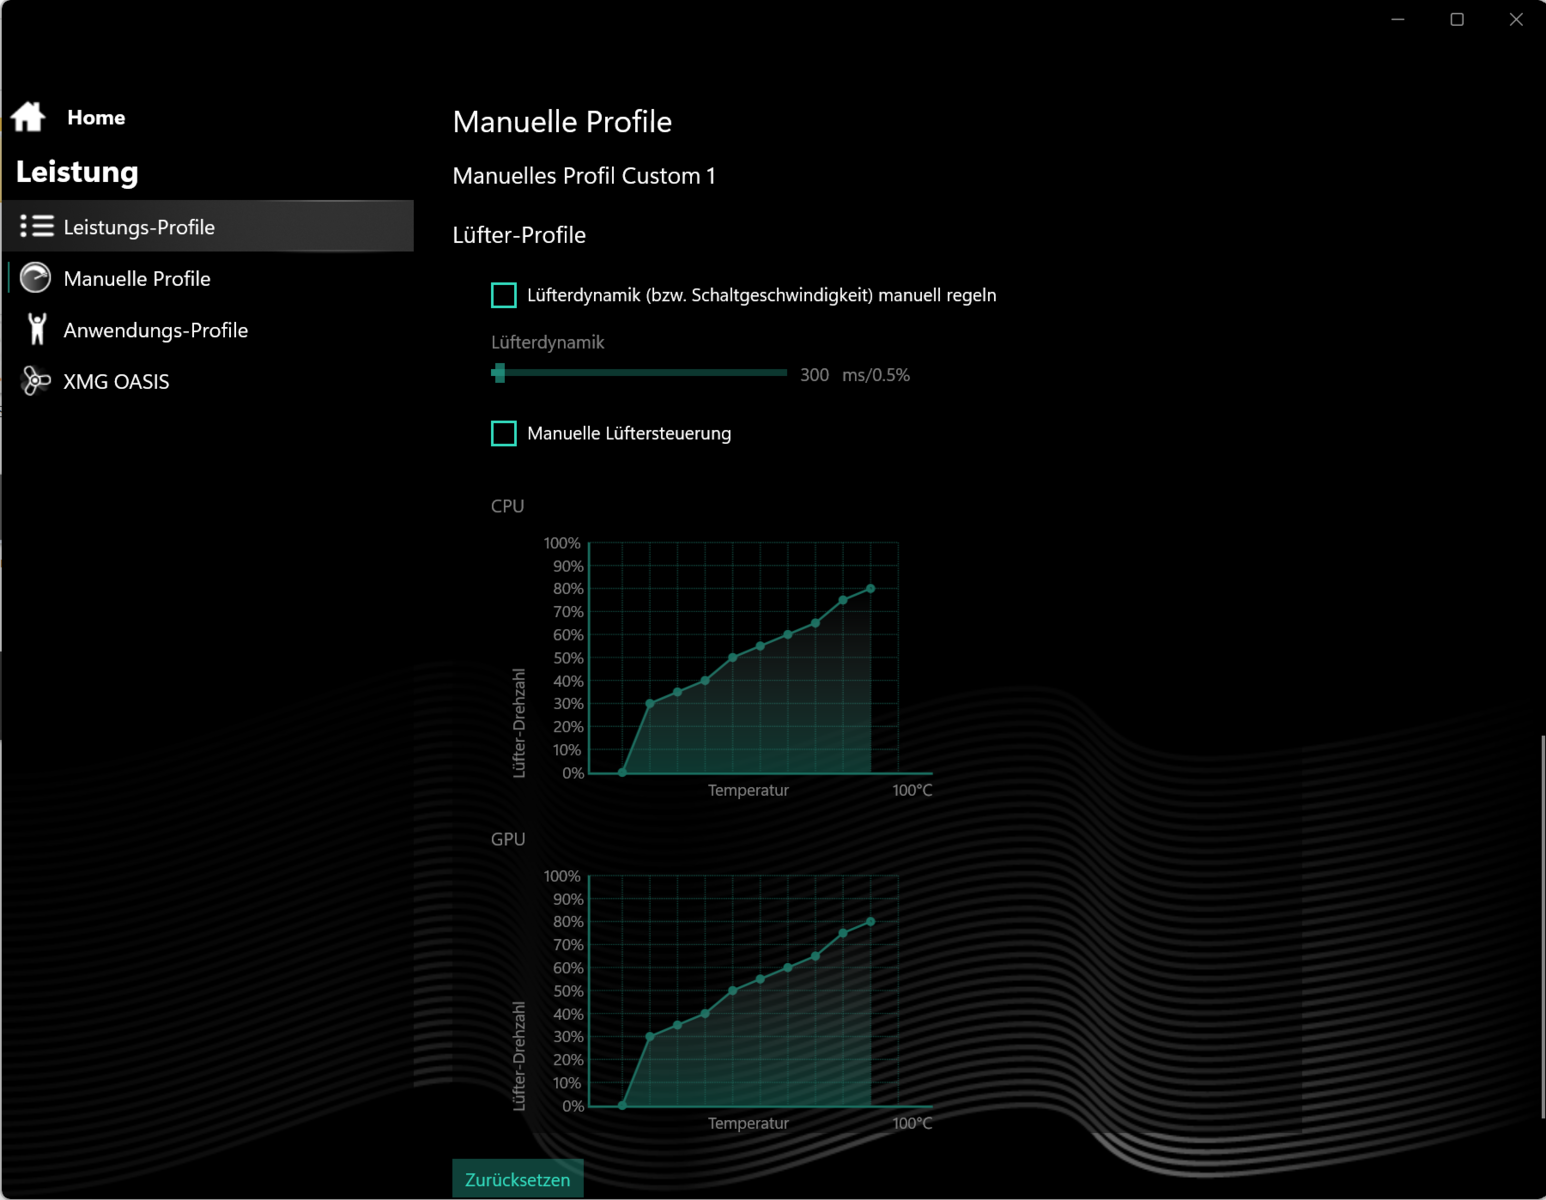
O senhor pode escolher entre três modos de desempenho específicos do fabricante (consulte a tabela). Durante o teste, usamos os modos "Overboost" (benchmarks) e "Balanced" (teste de bateria). O modo GPU foi definido como "Hybrid" (= Optimus). É possível gerenciar perfis individuais por meio do Control Center. Isso significa que o senhor pode ajustar o limite de energia da CPU, o TGP da GPU e/ou o limite superior de temperatura. Uma tecla separada (ao lado do botão liga/desliga) permite alternar rapidamente entre os modos.
Tínhamos à nossa disposição o resfriamento externo a água (Oasis Mk2), disponível como opção, mas não o utilizamos durante os testes. No entanto, fizemos algumas medições independentes dos testes oficiais (consulte a tabela de comparação).
| Overboost | Enthusiast | Balanced | |
|---|---|---|---|
| Limite de potência 1 (HWInfo) | 205 Watt | 205 Watt | 205 Watt |
| Limite de potência 2 (HWInfo) | 205 Watt | 205 Watt | 205 Watt |
| Ruído (Witcher 3) | 54 dB(A) | 51 dB(A) | 32 dB(A) |
| Desempenho (Witcher 3) | 214fps | 198fps | 30fps (lock) |

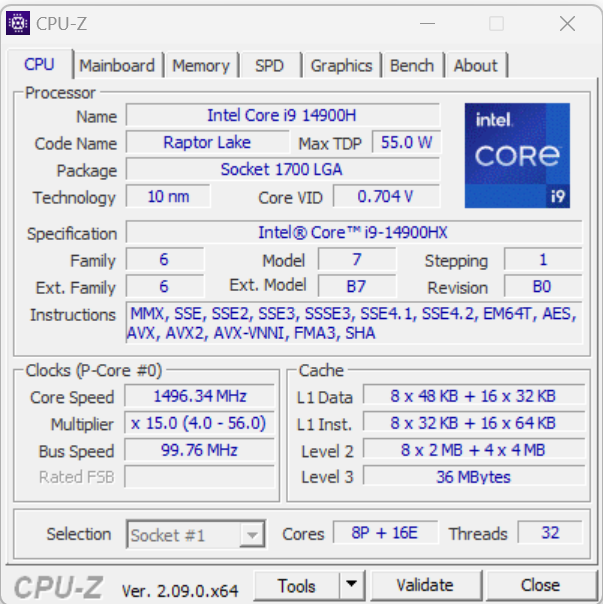
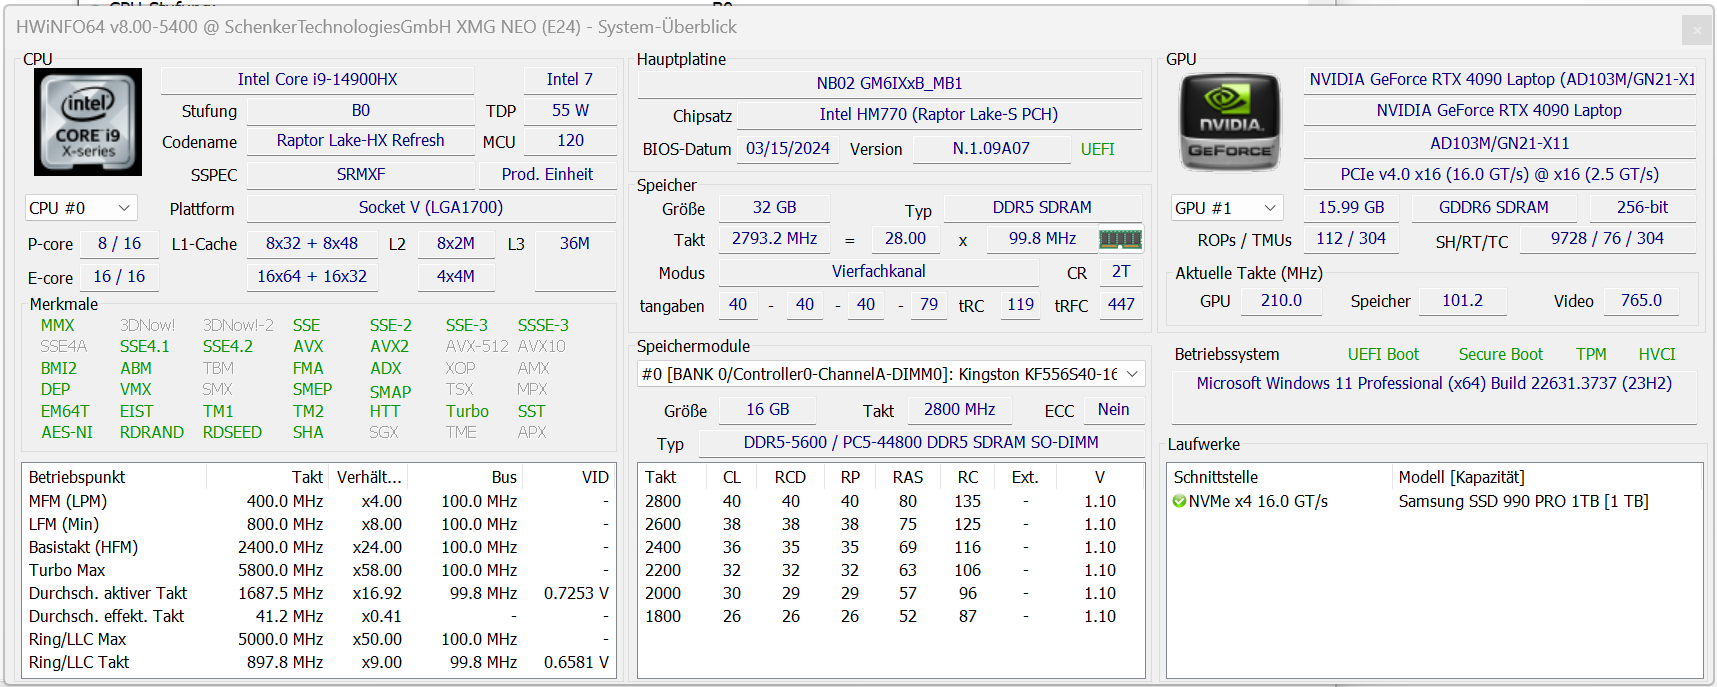
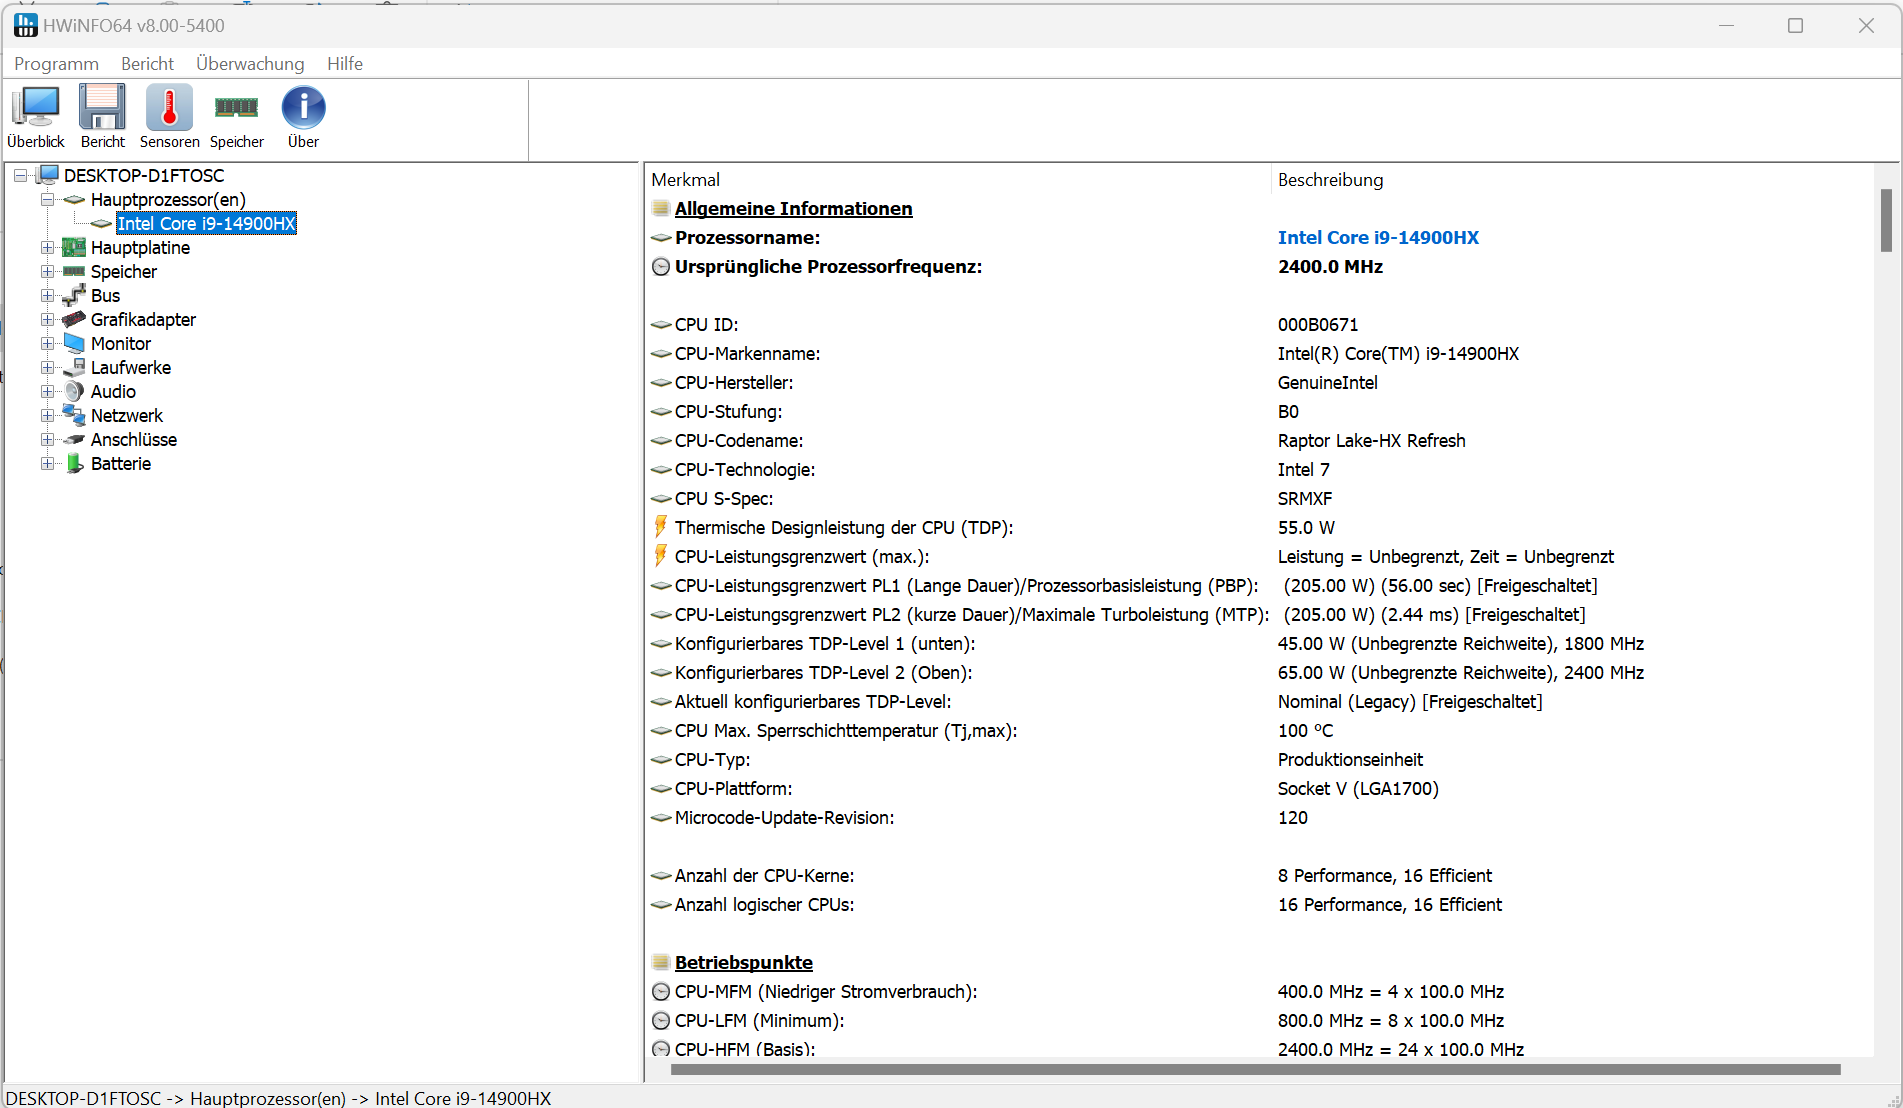
Processador
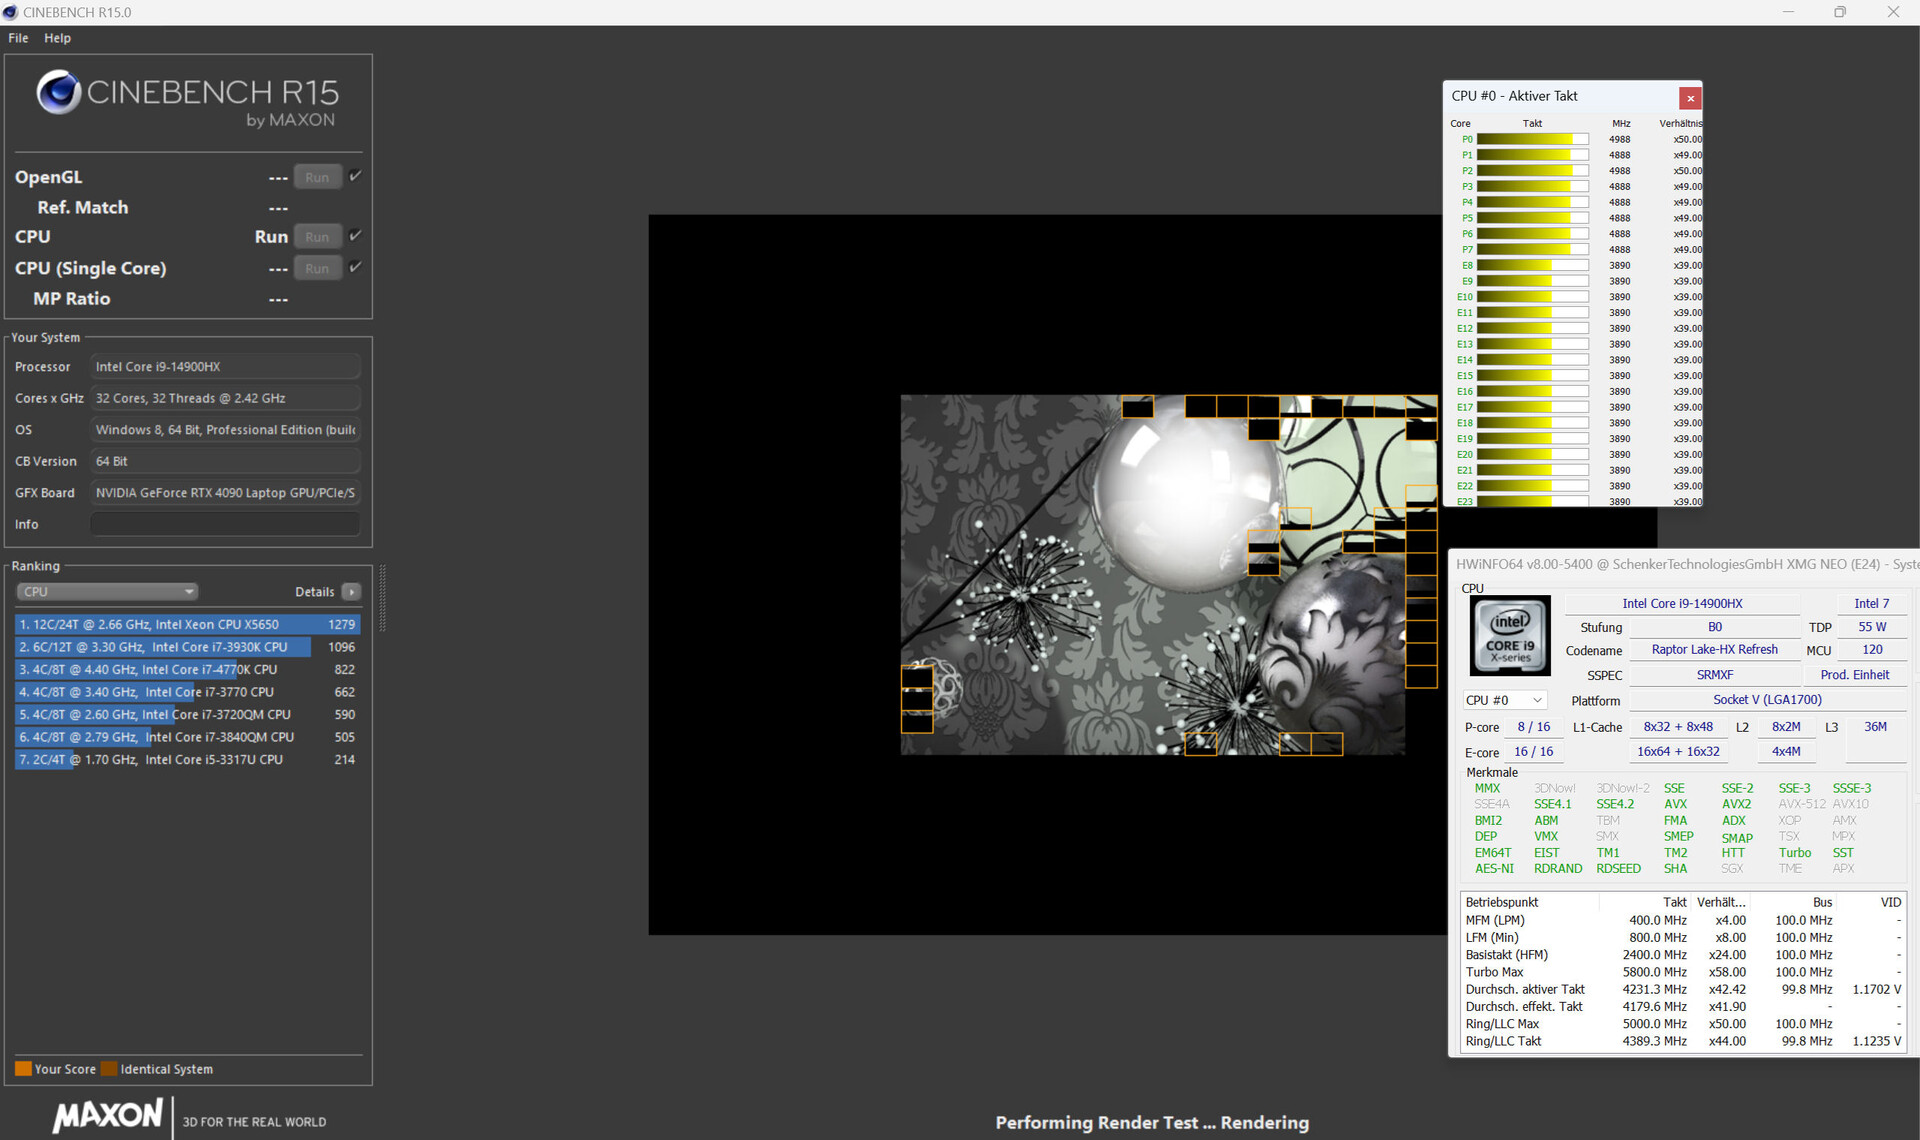
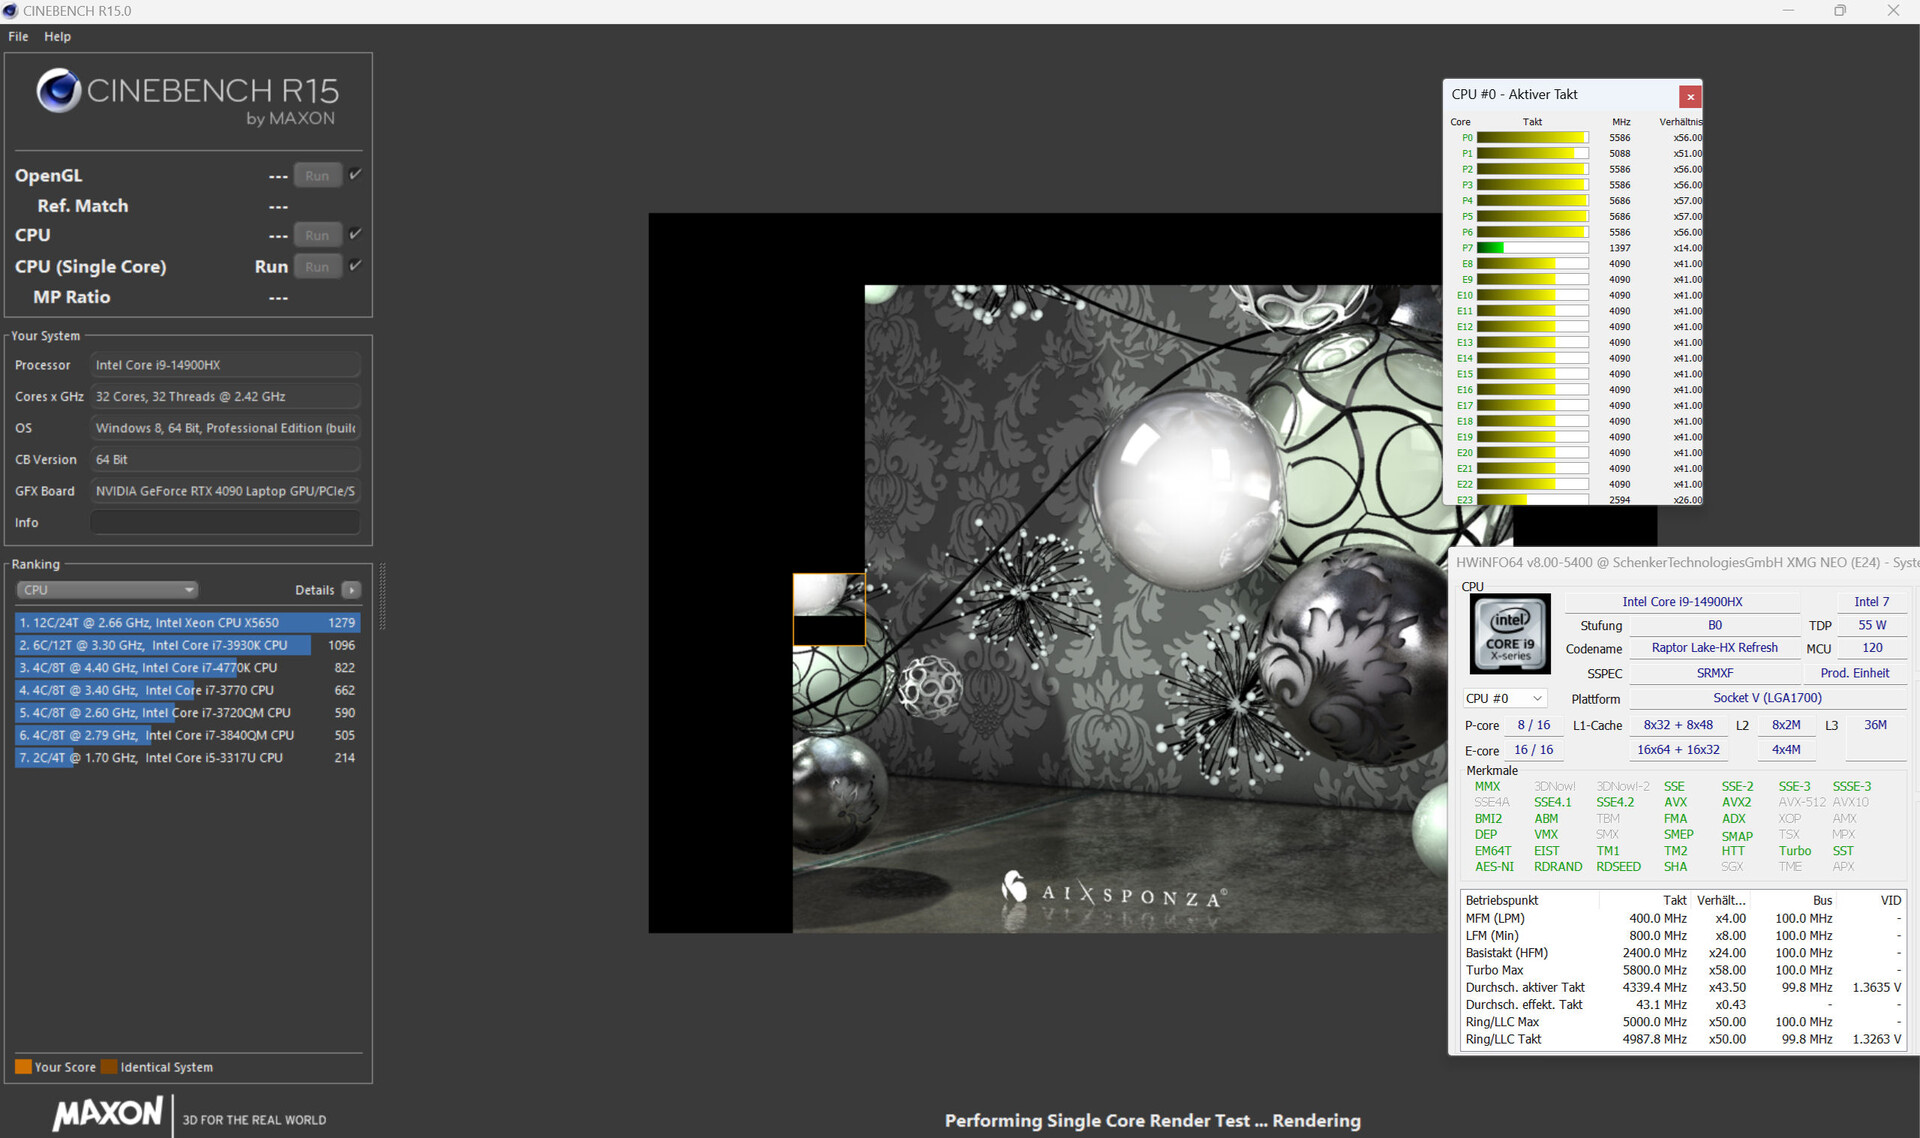
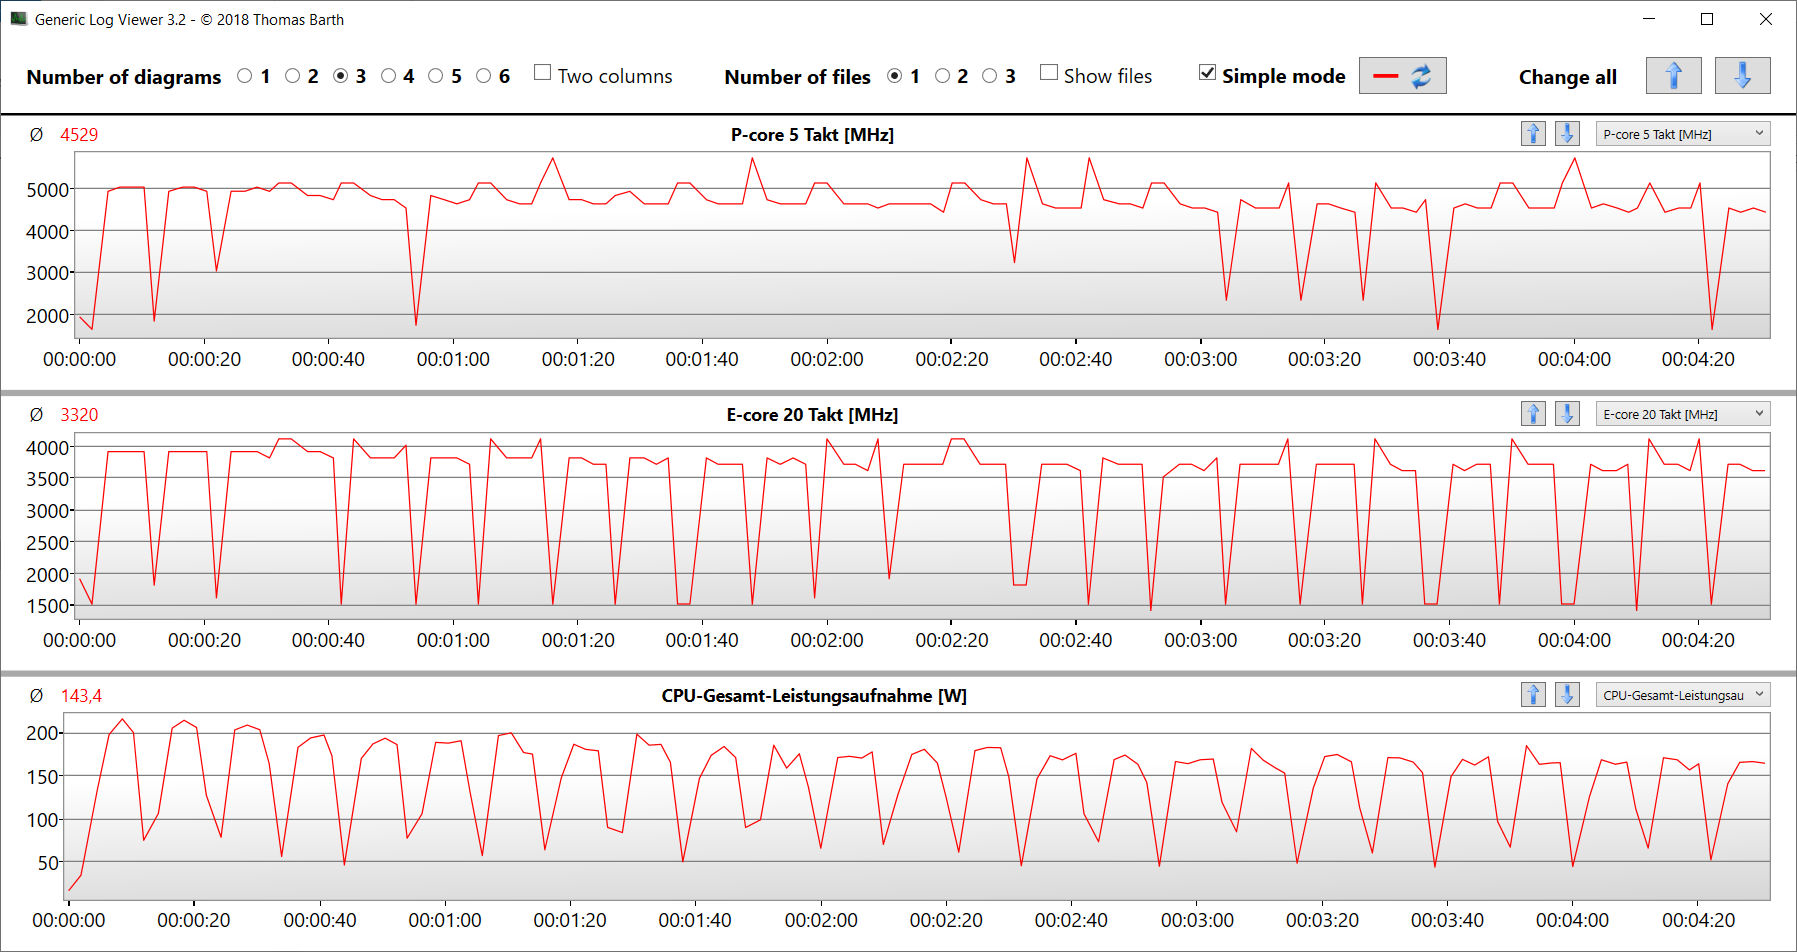
O laptop é alimentado por um Core i9 14900HX (Raptor Lake) - outras CPUs não estão disponíveis. O Core i9 oferece um total de 24 núcleos (8P + 16E = 32 threads) a uma velocidade máxima de 5,8 GHz (P) e 4,1 GHz (E). A carga contínua de vários threads (loop CB15) resulta em um desempenho contínuo, mas ligeiramente decrescente (Overboost) - o uso do resfriamento a água Oasis neutraliza esse efeito. Os outros dois modos de energia garantem um desempenho consistente, mesmo sem o resfriamento a água - é claro, em um nível baixo.
o "Overboost" oferece números de CPU acima da média e o "Enthusiast" está um pouco abaixo da média - isso se aplica principalmente ao desempenho multi-thread. Em cada um dos três perfis, o desempenho single-thread está em um nível igualmente alto. O resfriamento a água opcional (Oasis) resulta em um pequeno aumento de desempenho.
Cinebench R15 Multi Continuous Test
| Cinebench R20 | |
| CPU (Multi Core) | |
| SCHENKER XMG Neo 16 (Early 24) (Overboost, Oasis, Overboost, Oasis) | |
| SCHENKER XMG Neo 16 (Early 24) | |
| Asus ROG Strix Scar 17 G733PYV-LL053X | |
| Lenovo Legion 9 16IRX9, RTX 4090 | |
| Lenovo Legion Pro 7 RTX4090 | |
| Asus ROG Strix Scar 16 G634JZR | |
| SCHENKER XMG Neo 16 E23 | |
| Média Intel Core i9-14900HX (6579 - 13832, n=37) | |
| Razer Blade 16 2024, RTX 4090 | |
| Medion Erazer Beast X40 2024 | |
| Média da turma Gaming (2179 - 15517, n=151, últimos 2 anos) | |
| Alienware x16 R2 P120F | |
| CPU (Single Core) | |
| Medion Erazer Beast X40 2024 | |
| SCHENKER XMG Neo 16 (Early 24) (Overboost, Oasis, Overboost, Oasis) | |
| SCHENKER XMG Neo 16 (Early 24) | |
| Asus ROG Strix Scar 16 G634JZR | |
| Média Intel Core i9-14900HX (657 - 859, n=37) | |
| Razer Blade 16 2024, RTX 4090 | |
| SCHENKER XMG Neo 16 E23 | |
| Lenovo Legion Pro 7 RTX4090 | |
| Asus ROG Strix Scar 17 G733PYV-LL053X | |
| Média da turma Gaming (439 - 866, n=151, últimos 2 anos) | |
| Lenovo Legion 9 16IRX9, RTX 4090 | |
| Alienware x16 R2 P120F | |
| Geekbench 6.4 | |
| Multi-Core | |
| SCHENKER XMG Neo 16 (Early 24) (6.2.1, Overboost, Oasis) | |
| SCHENKER XMG Neo 16 (Early 24) (6.2.1) | |
| Asus ROG Strix Scar 16 G634JZR (6.2.1) | |
| Razer Blade 16 2024, RTX 4090 (6.2.1) | |
| Lenovo Legion 9 16IRX9, RTX 4090 (6.2.1) | |
| Média Intel Core i9-14900HX (13158 - 19665, n=37) | |
| Asus ROG Strix Scar 17 G733PYV-LL053X | |
| Medion Erazer Beast X40 2024 (6.2.1) | |
| Média da turma Gaming (5340 - 21668, n=119, últimos 2 anos) | |
| Alienware x16 R2 P120F (6.2.1) | |
| Single-Core | |
| SCHENKER XMG Neo 16 (Early 24) (6.2.1) | |
| SCHENKER XMG Neo 16 (Early 24) (6.2.1, Overboost, Oasis) | |
| Medion Erazer Beast X40 2024 (6.2.1) | |
| Asus ROG Strix Scar 16 G634JZR (6.2.1) | |
| Média Intel Core i9-14900HX (2419 - 3129, n=37) | |
| Razer Blade 16 2024, RTX 4090 (6.2.1) | |
| Asus ROG Strix Scar 17 G733PYV-LL053X | |
| Média da turma Gaming (1490 - 3219, n=119, últimos 2 anos) | |
| Lenovo Legion 9 16IRX9, RTX 4090 (6.2.1) | |
| Alienware x16 R2 P120F (6.2.1) | |
| HWBOT x265 Benchmark v2.2 - 4k Preset | |
| SCHENKER XMG Neo 16 (Early 24) (Overboost, Oasis) | |
| Asus ROG Strix Scar 17 G733PYV-LL053X | |
| SCHENKER XMG Neo 16 (Early 24) | |
| Lenovo Legion Pro 7 RTX4090 | |
| Asus ROG Strix Scar 16 G634JZR | |
| SCHENKER XMG Neo 16 E23 | |
| Lenovo Legion 9 16IRX9, RTX 4090 | |
| Razer Blade 16 2024, RTX 4090 | |
| Média Intel Core i9-14900HX (16.8 - 38.9, n=37) | |
| Medion Erazer Beast X40 2024 | |
| Média da turma Gaming (6.72 - 42.9, n=148, últimos 2 anos) | |
| Alienware x16 R2 P120F | |
| LibreOffice - 20 Documents To PDF | |
| Lenovo Legion 9 16IRX9, RTX 4090 (6.3.4.2) | |
| Asus ROG Strix Scar 16 G634JZR (6.3.4.2) | |
| Média da turma Gaming (19 - 96.6, n=147, últimos 2 anos) | |
| Razer Blade 16 2024, RTX 4090 (6.3.4.2) | |
| Alienware x16 R2 P120F (6.3.4.2) | |
| Medion Erazer Beast X40 2024 (6.3.4.2) | |
| Média Intel Core i9-14900HX (19 - 85.1, n=37) | |
| Lenovo Legion Pro 7 RTX4090 | |
| Asus ROG Strix Scar 17 G733PYV-LL053X | |
| SCHENKER XMG Neo 16 E23 | |
| SCHENKER XMG Neo 16 (Early 24) (6.3.4.2) | |
| SCHENKER XMG Neo 16 (Early 24) (6.3.4.2, Overboost, Oasis) | |
| R Benchmark 2.5 - Overall mean | |
| Alienware x16 R2 P120F | |
| Lenovo Legion 9 16IRX9, RTX 4090 | |
| Média da turma Gaming (0.3609 - 0.759, n=150, últimos 2 anos) | |
| Asus ROG Strix Scar 17 G733PYV-LL053X | |
| Lenovo Legion Pro 7 RTX4090 | |
| Média Intel Core i9-14900HX (0.3604 - 0.4859, n=37) | |
| SCHENKER XMG Neo 16 (Early 24) (Overboost, Oasis, Overboost, Oasis) | |
| Razer Blade 16 2024, RTX 4090 | |
| SCHENKER XMG Neo 16 E23 | |
| Medion Erazer Beast X40 2024 | |
| Asus ROG Strix Scar 16 G634JZR | |
| SCHENKER XMG Neo 16 (Early 24) | |
* ... menor é melhor
AIDA64: FP32 Ray-Trace | FPU Julia | CPU SHA3 | CPU Queen | FPU SinJulia | FPU Mandel | CPU AES | CPU ZLib | FP64 Ray-Trace | CPU PhotoWorxx
| Performance Rating | |
| Asus ROG Strix Scar 17 G733PYV-LL053X | |
| SCHENKER XMG Neo 16 (Early 24) | |
| SCHENKER XMG Neo 16 (Early 24) | |
| Asus ROG Strix Scar 16 G634JZR | |
| Lenovo Legion 9 16IRX9, RTX 4090 | |
| Lenovo Legion Pro 7 RTX4090 | |
| Razer Blade 16 2024, RTX 4090 | |
| SCHENKER XMG Neo 16 E23 | |
| Média Intel Core i9-14900HX | |
| Medion Erazer Beast X40 2024 | |
| Média da turma Gaming | |
| Alienware x16 R2 P120F | |
| AIDA64 / FP32 Ray-Trace | |
| Asus ROG Strix Scar 17 G733PYV-LL053X (v6.88.6413 Beta) | |
| SCHENKER XMG Neo 16 (Early 24) (v6.92.6600, Overboost, Oasis) | |
| SCHENKER XMG Neo 16 (Early 24) (v6.92.6600) | |
| Lenovo Legion 9 16IRX9, RTX 4090 (v6.92.6600) | |
| Lenovo Legion Pro 7 RTX4090 (v6.85.6300) | |
| Asus ROG Strix Scar 16 G634JZR (v6.92.6600) | |
| Razer Blade 16 2024, RTX 4090 (v6.92.6600) | |
| Média Intel Core i9-14900HX (13098 - 33474, n=36) | |
| SCHENKER XMG Neo 16 E23 (v6.75.6100) | |
| Média da turma Gaming (4986 - 81639, n=147, últimos 2 anos) | |
| Medion Erazer Beast X40 2024 (v6.92.6600) | |
| Alienware x16 R2 P120F (v6.92.6600) | |
| AIDA64 / FPU Julia | |
| Asus ROG Strix Scar 17 G733PYV-LL053X (v6.88.6413 Beta) | |
| SCHENKER XMG Neo 16 (Early 24) (v6.92.6600, Overboost, Oasis) | |
| SCHENKER XMG Neo 16 (Early 24) (v6.92.6600) | |
| Lenovo Legion 9 16IRX9, RTX 4090 (v6.92.6600) | |
| Lenovo Legion Pro 7 RTX4090 (v6.85.6300) | |
| Razer Blade 16 2024, RTX 4090 (v6.92.6600) | |
| Asus ROG Strix Scar 16 G634JZR (v6.92.6600) | |
| Média Intel Core i9-14900HX (67573 - 166040, n=36) | |
| SCHENKER XMG Neo 16 E23 (v6.75.6100) | |
| Média da turma Gaming (25360 - 252486, n=147, últimos 2 anos) | |
| Medion Erazer Beast X40 2024 (v6.92.6600) | |
| Alienware x16 R2 P120F (v6.92.6600) | |
| AIDA64 / CPU SHA3 | |
| Asus ROG Strix Scar 17 G733PYV-LL053X (v6.88.6413 Beta) | |
| SCHENKER XMG Neo 16 (Early 24) (v6.92.6600, Overboost, Oasis) | |
| SCHENKER XMG Neo 16 (Early 24) (v6.92.6600) | |
| Lenovo Legion 9 16IRX9, RTX 4090 (v6.92.6600) | |
| Lenovo Legion Pro 7 RTX4090 (v6.85.6300) | |
| Asus ROG Strix Scar 16 G634JZR (v6.92.6600) | |
| Razer Blade 16 2024, RTX 4090 (v6.92.6600) | |
| Média Intel Core i9-14900HX (3589 - 7979, n=36) | |
| SCHENKER XMG Neo 16 E23 (v6.75.6100) | |
| Medion Erazer Beast X40 2024 (v6.92.6600) | |
| Média da turma Gaming (1339 - 10389, n=147, últimos 2 anos) | |
| Alienware x16 R2 P120F (v6.92.6600) | |
| AIDA64 / CPU Queen | |
| Asus ROG Strix Scar 17 G733PYV-LL053X (v6.88.6413 Beta) | |
| SCHENKER XMG Neo 16 (Early 24) (v6.92.6600) | |
| SCHENKER XMG Neo 16 (Early 24) (v6.92.6600, Overboost, Oasis) | |
| Asus ROG Strix Scar 16 G634JZR (v6.92.6600) | |
| Razer Blade 16 2024, RTX 4090 (v6.92.6600) | |
| Média Intel Core i9-14900HX (118405 - 148966, n=36) | |
| SCHENKER XMG Neo 16 E23 (v6.75.6100) | |
| Lenovo Legion Pro 7 RTX4090 (v6.85.6300) | |
| Medion Erazer Beast X40 2024 (v6.92.6600) | |
| Lenovo Legion 9 16IRX9, RTX 4090 (v6.92.6600) | |
| Média da turma Gaming (50699 - 200651, n=147, últimos 2 anos) | |
| Alienware x16 R2 P120F (v6.92.6600) | |
| AIDA64 / FPU SinJulia | |
| Asus ROG Strix Scar 17 G733PYV-LL053X (v6.88.6413 Beta) | |
| SCHENKER XMG Neo 16 (Early 24) (v6.92.6600, Overboost, Oasis) | |
| SCHENKER XMG Neo 16 (Early 24) (v6.92.6600) | |
| Lenovo Legion 9 16IRX9, RTX 4090 (v6.92.6600) | |
| Asus ROG Strix Scar 16 G634JZR (v6.92.6600) | |
| Razer Blade 16 2024, RTX 4090 (v6.92.6600) | |
| Lenovo Legion Pro 7 RTX4090 (v6.85.6300) | |
| Média Intel Core i9-14900HX (10475 - 18517, n=36) | |
| SCHENKER XMG Neo 16 E23 (v6.75.6100) | |
| Medion Erazer Beast X40 2024 (v6.92.6600) | |
| Média da turma Gaming (4800 - 32988, n=147, últimos 2 anos) | |
| Alienware x16 R2 P120F (v6.92.6600) | |
| AIDA64 / FPU Mandel | |
| Asus ROG Strix Scar 17 G733PYV-LL053X (v6.88.6413 Beta) | |
| SCHENKER XMG Neo 16 (Early 24) (v6.92.6600, Overboost, Oasis) | |
| SCHENKER XMG Neo 16 (Early 24) (v6.92.6600) | |
| Lenovo Legion 9 16IRX9, RTX 4090 (v6.92.6600) | |
| Lenovo Legion Pro 7 RTX4090 (v6.85.6300) | |
| Asus ROG Strix Scar 16 G634JZR (v6.92.6600) | |
| Razer Blade 16 2024, RTX 4090 (v6.92.6600) | |
| Média Intel Core i9-14900HX (32543 - 83662, n=36) | |
| SCHENKER XMG Neo 16 E23 (v6.75.6100) | |
| Média da turma Gaming (12321 - 134044, n=147, últimos 2 anos) | |
| Medion Erazer Beast X40 2024 | |
| Alienware x16 R2 P120F (v6.92.6600) | |
| AIDA64 / CPU AES | |
| Asus ROG Strix Scar 17 G733PYV-LL053X (v6.88.6413 Beta) | |
| Asus ROG Strix Scar 16 G634JZR (v6.92.6600) | |
| SCHENKER XMG Neo 16 E23 (v6.75.6100) | |
| SCHENKER XMG Neo 16 (Early 24) (v6.92.6600, Overboost, Oasis) | |
| SCHENKER XMG Neo 16 (Early 24) (v6.92.6600) | |
| Média Intel Core i9-14900HX (86964 - 241777, n=36) | |
| Lenovo Legion 9 16IRX9, RTX 4090 (v6.92.6600) | |
| Lenovo Legion Pro 7 RTX4090 (v6.85.6300) | |
| Razer Blade 16 2024, RTX 4090 (v6.92.6600) | |
| Média da turma Gaming (19065 - 328679, n=147, últimos 2 anos) | |
| Medion Erazer Beast X40 2024 (v6.92.6600) | |
| Alienware x16 R2 P120F (v6.92.6600) | |
| AIDA64 / CPU ZLib | |
| SCHENKER XMG Neo 16 (Early 24) (v6.92.6600, Overboost, Oasis) | |
| SCHENKER XMG Neo 16 (Early 24) (v6.92.6600) | |
| Asus ROG Strix Scar 17 G733PYV-LL053X (v6.88.6413 Beta) | |
| Lenovo Legion 9 16IRX9, RTX 4090 (v6.92.6600) | |
| Lenovo Legion Pro 7 RTX4090 (v6.85.6300) | |
| Razer Blade 16 2024, RTX 4090 (v6.92.6600) | |
| Asus ROG Strix Scar 16 G634JZR (v6.92.6600) | |
| Média Intel Core i9-14900HX (1054 - 2292, n=36) | |
| SCHENKER XMG Neo 16 E23 (v6.75.6100) | |
| Medion Erazer Beast X40 2024 (v6.92.6600) | |
| Média da turma Gaming (373 - 2531, n=147, últimos 2 anos) | |
| Alienware x16 R2 P120F (v6.92.6600) | |
| AIDA64 / FP64 Ray-Trace | |
| Asus ROG Strix Scar 17 G733PYV-LL053X (v6.88.6413 Beta) | |
| SCHENKER XMG Neo 16 (Early 24) (v6.92.6600, Overboost, Oasis) | |
| SCHENKER XMG Neo 16 (Early 24) (v6.92.6600) | |
| Lenovo Legion 9 16IRX9, RTX 4090 (v6.92.6600) | |
| Lenovo Legion Pro 7 RTX4090 (v6.85.6300) | |
| Asus ROG Strix Scar 16 G634JZR (v6.92.6600) | |
| Razer Blade 16 2024, RTX 4090 (v6.92.6600) | |
| Média Intel Core i9-14900HX (6809 - 18349, n=36) | |
| SCHENKER XMG Neo 16 E23 (v6.75.6100) | |
| Média da turma Gaming (2540 - 43430, n=147, últimos 2 anos) | |
| Medion Erazer Beast X40 2024 (v6.92.6600) | |
| Alienware x16 R2 P120F (v6.92.6600) | |
| AIDA64 / CPU PhotoWorxx | |
| Lenovo Legion 9 16IRX9, RTX 4090 (v6.92.6600) | |
| Alienware x16 R2 P120F (v6.92.6600) | |
| Lenovo Legion Pro 7 RTX4090 (v6.85.6300) | |
| Asus ROG Strix Scar 16 G634JZR (v6.92.6600) | |
| Razer Blade 16 2024, RTX 4090 (v6.92.6600) | |
| SCHENKER XMG Neo 16 (Early 24) (v6.92.6600, Overboost, Oasis) | |
| SCHENKER XMG Neo 16 (Early 24) (v6.92.6600) | |
| Medion Erazer Beast X40 2024 (v6.92.6600) | |
| SCHENKER XMG Neo 16 E23 (v6.75.6100) | |
| Média Intel Core i9-14900HX (23903 - 54702, n=36) | |
| Média da turma Gaming (10805 - 60161, n=147, últimos 2 anos) | |
| Asus ROG Strix Scar 17 G733PYV-LL053X (v6.88.6413 Beta) | |
Desempenho do sistema
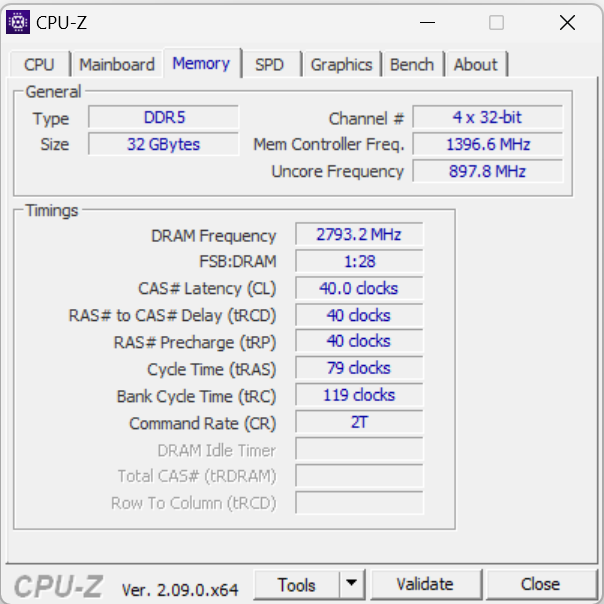
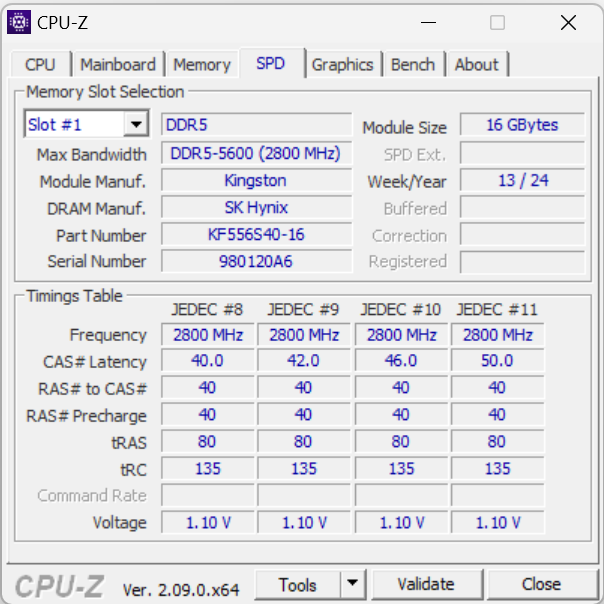
A lista de especificações já revela isso: Não há falta de potência de computação - o que é confirmado pelas excelentes pontuações do PCMark. Os jogos, o streaming e a renderização devem ser as principais áreas operacionais do computador veloz. As velocidades de transferência da RAM estão em um nível normal para a RAM DDR5 5600.
CrossMark: Overall | Productivity | Creativity | Responsiveness
WebXPRT 3: Overall
WebXPRT 4: Overall
Mozilla Kraken 1.1: Total
| PCMark 10 / Score | |
| Asus ROG Strix Scar 17 G733PYV-LL053X | |
| SCHENKER XMG Neo 16 (Early 24) | |
| Medion Erazer Beast X40 2024 | |
| Média Intel Core i9-14900HX, NVIDIA GeForce RTX 4090 Laptop GPU (8230 - 9234, n=13) | |
| Razer Blade 16 2024, RTX 4090 | |
| SCHENKER XMG Neo 16 E23 | |
| Lenovo Legion 9 16IRX9, RTX 4090 | |
| Lenovo Legion Pro 7 RTX4090 | |
| Média da turma Gaming (5776 - 9852, n=133, últimos 2 anos) | |
| Asus ROG Strix Scar 16 G634JZR | |
| Alienware x16 R2 P120F | |
| PCMark 10 / Essentials | |
| Asus ROG Strix Scar 16 G634JZR | |
| Asus ROG Strix Scar 17 G733PYV-LL053X | |
| Média Intel Core i9-14900HX, NVIDIA GeForce RTX 4090 Laptop GPU (10778 - 11628, n=13) | |
| Lenovo Legion Pro 7 RTX4090 | |
| SCHENKER XMG Neo 16 (Early 24) | |
| Lenovo Legion 9 16IRX9, RTX 4090 | |
| SCHENKER XMG Neo 16 E23 | |
| Razer Blade 16 2024, RTX 4090 | |
| Medion Erazer Beast X40 2024 | |
| Média da turma Gaming (9057 - 12600, n=133, últimos 2 anos) | |
| Alienware x16 R2 P120F | |
| PCMark 10 / Productivity | |
| Medion Erazer Beast X40 2024 | |
| SCHENKER XMG Neo 16 (Early 24) | |
| Razer Blade 16 2024, RTX 4090 | |
| Asus ROG Strix Scar 17 G733PYV-LL053X | |
| Média Intel Core i9-14900HX, NVIDIA GeForce RTX 4090 Laptop GPU (9458 - 11759, n=13) | |
| Lenovo Legion 9 16IRX9, RTX 4090 | |
| Média da turma Gaming (6662 - 14612, n=133, últimos 2 anos) | |
| SCHENKER XMG Neo 16 E23 | |
| Lenovo Legion Pro 7 RTX4090 | |
| Alienware x16 R2 P120F | |
| Asus ROG Strix Scar 16 G634JZR | |
| PCMark 10 / Digital Content Creation | |
| Asus ROG Strix Scar 17 G733PYV-LL053X | |
| Asus ROG Strix Scar 16 G634JZR | |
| SCHENKER XMG Neo 16 (Early 24) | |
| Medion Erazer Beast X40 2024 | |
| Média Intel Core i9-14900HX, NVIDIA GeForce RTX 4090 Laptop GPU (13219 - 16462, n=13) | |
| SCHENKER XMG Neo 16 E23 | |
| Lenovo Legion Pro 7 RTX4090 | |
| Lenovo Legion 9 16IRX9, RTX 4090 | |
| Razer Blade 16 2024, RTX 4090 | |
| Alienware x16 R2 P120F | |
| Média da turma Gaming (6807 - 18475, n=133, últimos 2 anos) | |
| CrossMark / Overall | |
| SCHENKER XMG Neo 16 (Early 24) | |
| Razer Blade 16 2024, RTX 4090 | |
| Medion Erazer Beast X40 2024 | |
| Média Intel Core i9-14900HX, NVIDIA GeForce RTX 4090 Laptop GPU (1877 - 2344, n=10) | |
| SCHENKER XMG Neo 16 E23 | |
| Asus ROG Strix Scar 17 G733PYV-LL053X | |
| Asus ROG Strix Scar 16 G634JZR | |
| Lenovo Legion 9 16IRX9, RTX 4090 | |
| Média da turma Gaming (1247 - 2344, n=114, últimos 2 anos) | |
| Alienware x16 R2 P120F | |
| CrossMark / Productivity | |
| SCHENKER XMG Neo 16 (Early 24) | |
| Medion Erazer Beast X40 2024 | |
| Razer Blade 16 2024, RTX 4090 | |
| Média Intel Core i9-14900HX, NVIDIA GeForce RTX 4090 Laptop GPU (1738 - 2162, n=10) | |
| SCHENKER XMG Neo 16 E23 | |
| Asus ROG Strix Scar 17 G733PYV-LL053X | |
| Asus ROG Strix Scar 16 G634JZR | |
| Média da turma Gaming (1299 - 2204, n=114, últimos 2 anos) | |
| Lenovo Legion 9 16IRX9, RTX 4090 | |
| Alienware x16 R2 P120F | |
| CrossMark / Creativity | |
| SCHENKER XMG Neo 16 (Early 24) | |
| SCHENKER XMG Neo 16 E23 | |
| Razer Blade 16 2024, RTX 4090 | |
| Asus ROG Strix Scar 17 G733PYV-LL053X | |
| Média Intel Core i9-14900HX, NVIDIA GeForce RTX 4090 Laptop GPU (2195 - 2660, n=10) | |
| Asus ROG Strix Scar 16 G634JZR | |
| Medion Erazer Beast X40 2024 | |
| Lenovo Legion 9 16IRX9, RTX 4090 | |
| Média da turma Gaming (1275 - 2660, n=114, últimos 2 anos) | |
| Alienware x16 R2 P120F | |
| CrossMark / Responsiveness | |
| SCHENKER XMG Neo 16 (Early 24) | |
| Medion Erazer Beast X40 2024 | |
| Média Intel Core i9-14900HX, NVIDIA GeForce RTX 4090 Laptop GPU (1478 - 2327, n=10) | |
| Razer Blade 16 2024, RTX 4090 | |
| Lenovo Legion 9 16IRX9, RTX 4090 | |
| Asus ROG Strix Scar 16 G634JZR | |
| SCHENKER XMG Neo 16 E23 | |
| Média da turma Gaming (1030 - 2330, n=114, últimos 2 anos) | |
| Asus ROG Strix Scar 17 G733PYV-LL053X | |
| Alienware x16 R2 P120F | |
| WebXPRT 3 / Overall | |
| Asus ROG Strix Scar 17 G733PYV-LL053X | |
| SCHENKER XMG Neo 16 (Early 24) | |
| SCHENKER XMG Neo 16 E23 | |
| Razer Blade 16 2024, RTX 4090 | |
| Medion Erazer Beast X40 2024 | |
| Média Intel Core i9-14900HX, NVIDIA GeForce RTX 4090 Laptop GPU (279 - 339, n=10) | |
| Asus ROG Strix Scar 16 G634JZR | |
| Média da turma Gaming (215 - 480, n=127, últimos 2 anos) | |
| Lenovo Legion 9 16IRX9, RTX 4090 | |
| Lenovo Legion Pro 7 RTX4090 | |
| Alienware x16 R2 P120F | |
| WebXPRT 4 / Overall | |
| Asus ROG Strix Scar 17 G733PYV-LL053X | |
| Asus ROG Strix Scar 16 G634JZR | |
| SCHENKER XMG Neo 16 (Early 24) | |
| SCHENKER XMG Neo 16 E23 | |
| Medion Erazer Beast X40 2024 | |
| Média Intel Core i9-14900HX, NVIDIA GeForce RTX 4090 Laptop GPU (246 - 309, n=8) | |
| Lenovo Legion Pro 7 RTX4090 | |
| Média da turma Gaming (176.4 - 335, n=115, últimos 2 anos) | |
| Lenovo Legion 9 16IRX9, RTX 4090 | |
| Alienware x16 R2 P120F | |
| Mozilla Kraken 1.1 / Total | |
| Alienware x16 R2 P120F | |
| Lenovo Legion 9 16IRX9, RTX 4090 | |
| Média da turma Gaming (409 - 674, n=139, últimos 2 anos) | |
| Lenovo Legion Pro 7 RTX4090 | |
| Média Intel Core i9-14900HX, NVIDIA GeForce RTX 4090 Laptop GPU (428 - 535, n=11) | |
| SCHENKER XMG Neo 16 E23 | |
| Razer Blade 16 2024, RTX 4090 | |
| Asus ROG Strix Scar 16 G634JZR | |
| Medion Erazer Beast X40 2024 | |
| SCHENKER XMG Neo 16 (Early 24) | |
| Asus ROG Strix Scar 17 G733PYV-LL053X | |
* ... menor é melhor
| PCMark 10 Score | 9017 pontos | |
Ajuda | ||
| AIDA64 / Memory Copy | |
| Alienware x16 R2 P120F | |
| Lenovo Legion 9 16IRX9, RTX 4090 | |
| SCHENKER XMG Neo 16 (Early 24) | |
| Asus ROG Strix Scar 16 G634JZR | |
| Razer Blade 16 2024, RTX 4090 | |
| SCHENKER XMG Neo 16 (Early 24) | |
| Lenovo Legion Pro 7 RTX4090 | |
| Medion Erazer Beast X40 2024 | |
| SCHENKER XMG Neo 16 E23 | |
| Média Intel Core i9-14900HX (38028 - 83392, n=36) | |
| Média da turma Gaming (21750 - 97515, n=147, últimos 2 anos) | |
| Asus ROG Strix Scar 17 G733PYV-LL053X | |
| AIDA64 / Memory Read | |
| Asus ROG Strix Scar 16 G634JZR | |
| SCHENKER XMG Neo 16 (Early 24) | |
| Lenovo Legion Pro 7 RTX4090 | |
| SCHENKER XMG Neo 16 (Early 24) | |
| Razer Blade 16 2024, RTX 4090 | |
| Medion Erazer Beast X40 2024 | |
| Alienware x16 R2 P120F | |
| SCHENKER XMG Neo 16 E23 | |
| Lenovo Legion 9 16IRX9, RTX 4090 | |
| Média Intel Core i9-14900HX (43306 - 87568, n=36) | |
| Média da turma Gaming (22956 - 102937, n=147, últimos 2 anos) | |
| Asus ROG Strix Scar 17 G733PYV-LL053X | |
| AIDA64 / Memory Write | |
| Lenovo Legion 9 16IRX9, RTX 4090 | |
| SCHENKER XMG Neo 16 (Early 24) | |
| SCHENKER XMG Neo 16 (Early 24) | |
| Asus ROG Strix Scar 16 G634JZR | |
| Medion Erazer Beast X40 2024 | |
| Lenovo Legion Pro 7 RTX4090 | |
| Razer Blade 16 2024, RTX 4090 | |
| Alienware x16 R2 P120F | |
| Média Intel Core i9-14900HX (37146 - 80589, n=36) | |
| SCHENKER XMG Neo 16 E23 | |
| Média da turma Gaming (22297 - 108954, n=147, últimos 2 anos) | |
| Asus ROG Strix Scar 17 G733PYV-LL053X | |
| AIDA64 / Memory Latency | |
| Alienware x16 R2 P120F | |
| Média da turma Gaming (59.5 - 259, n=147, últimos 2 anos) | |
| Lenovo Legion 9 16IRX9, RTX 4090 | |
| Asus ROG Strix Scar 17 G733PYV-LL053X | |
| SCHENKER XMG Neo 16 E23 | |
| Lenovo Legion Pro 7 RTX4090 | |
| Média Intel Core i9-14900HX (76.1 - 105, n=36) | |
| Razer Blade 16 2024, RTX 4090 | |
| Medion Erazer Beast X40 2024 | |
| Asus ROG Strix Scar 16 G634JZR | |
| SCHENKER XMG Neo 16 (Early 24) | |
| SCHENKER XMG Neo 16 (Early 24) | |
* ... menor é melhor
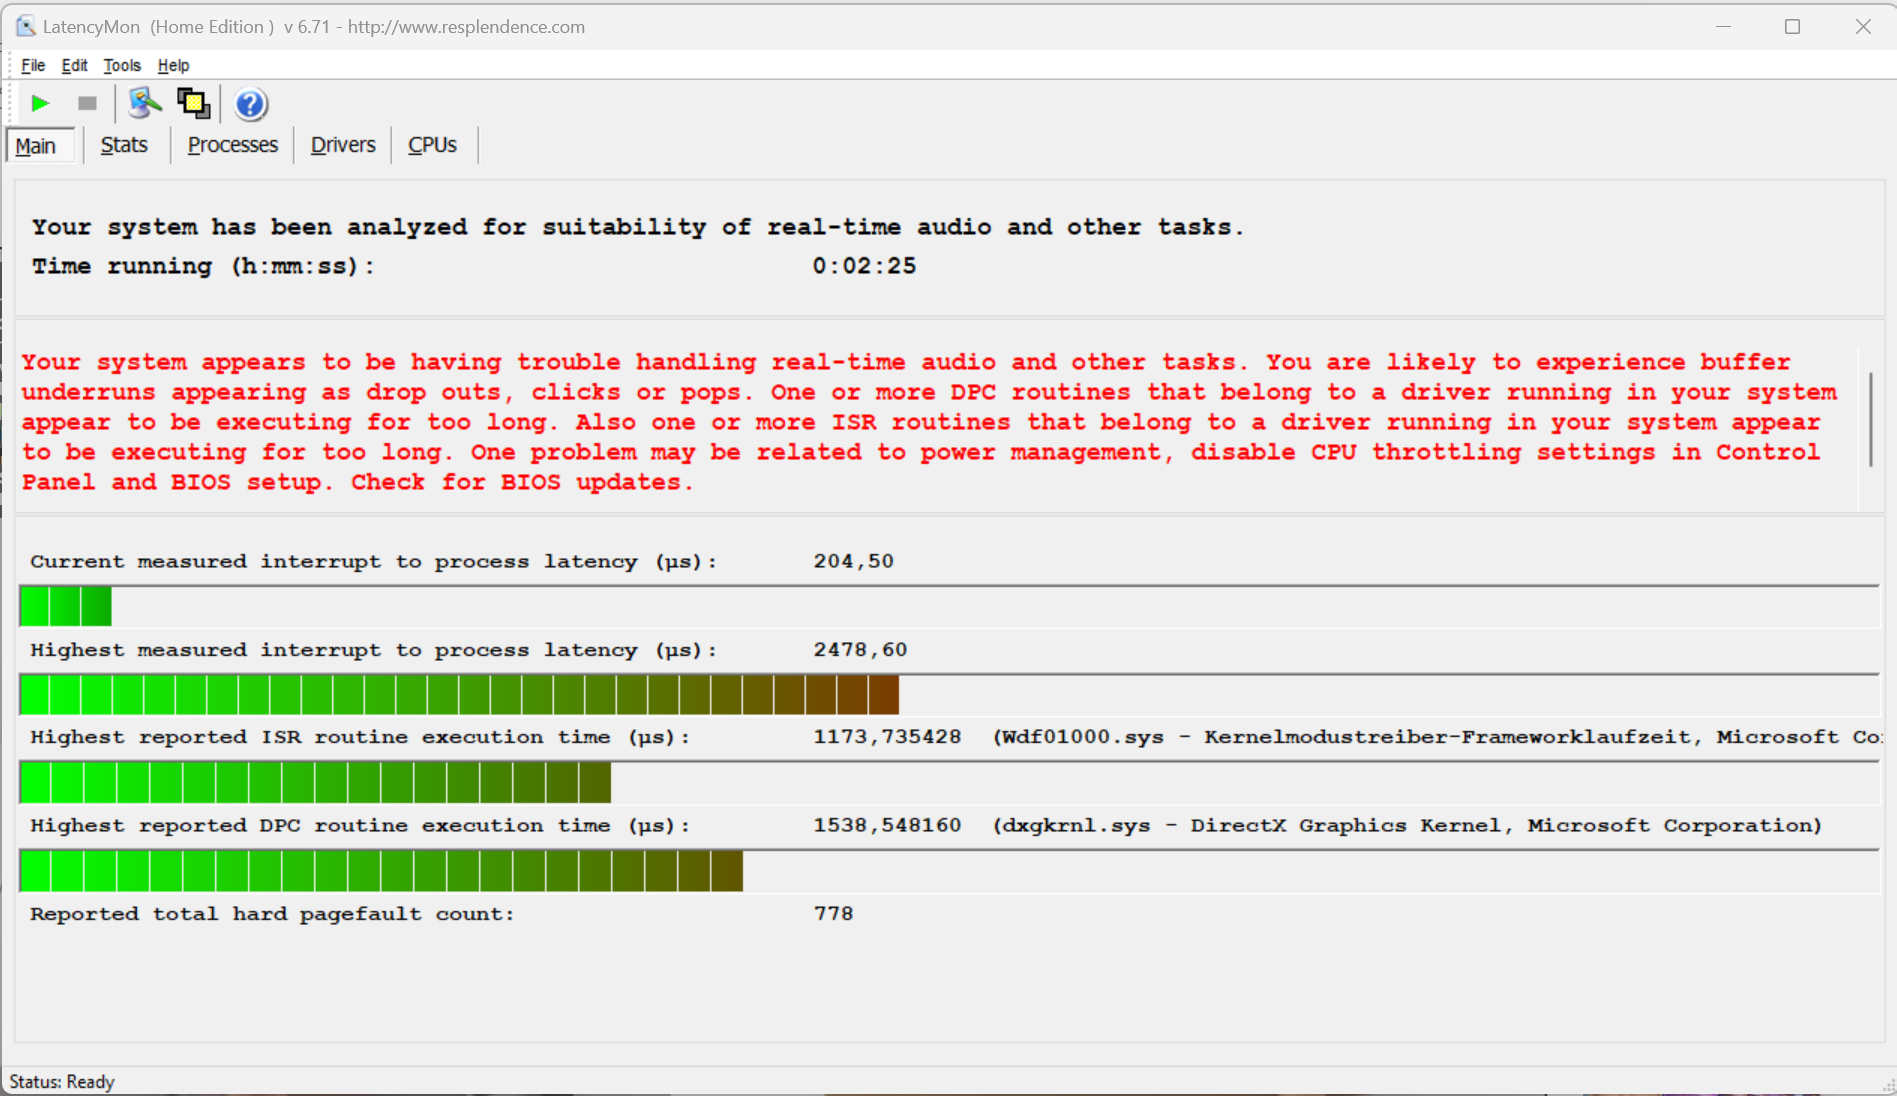
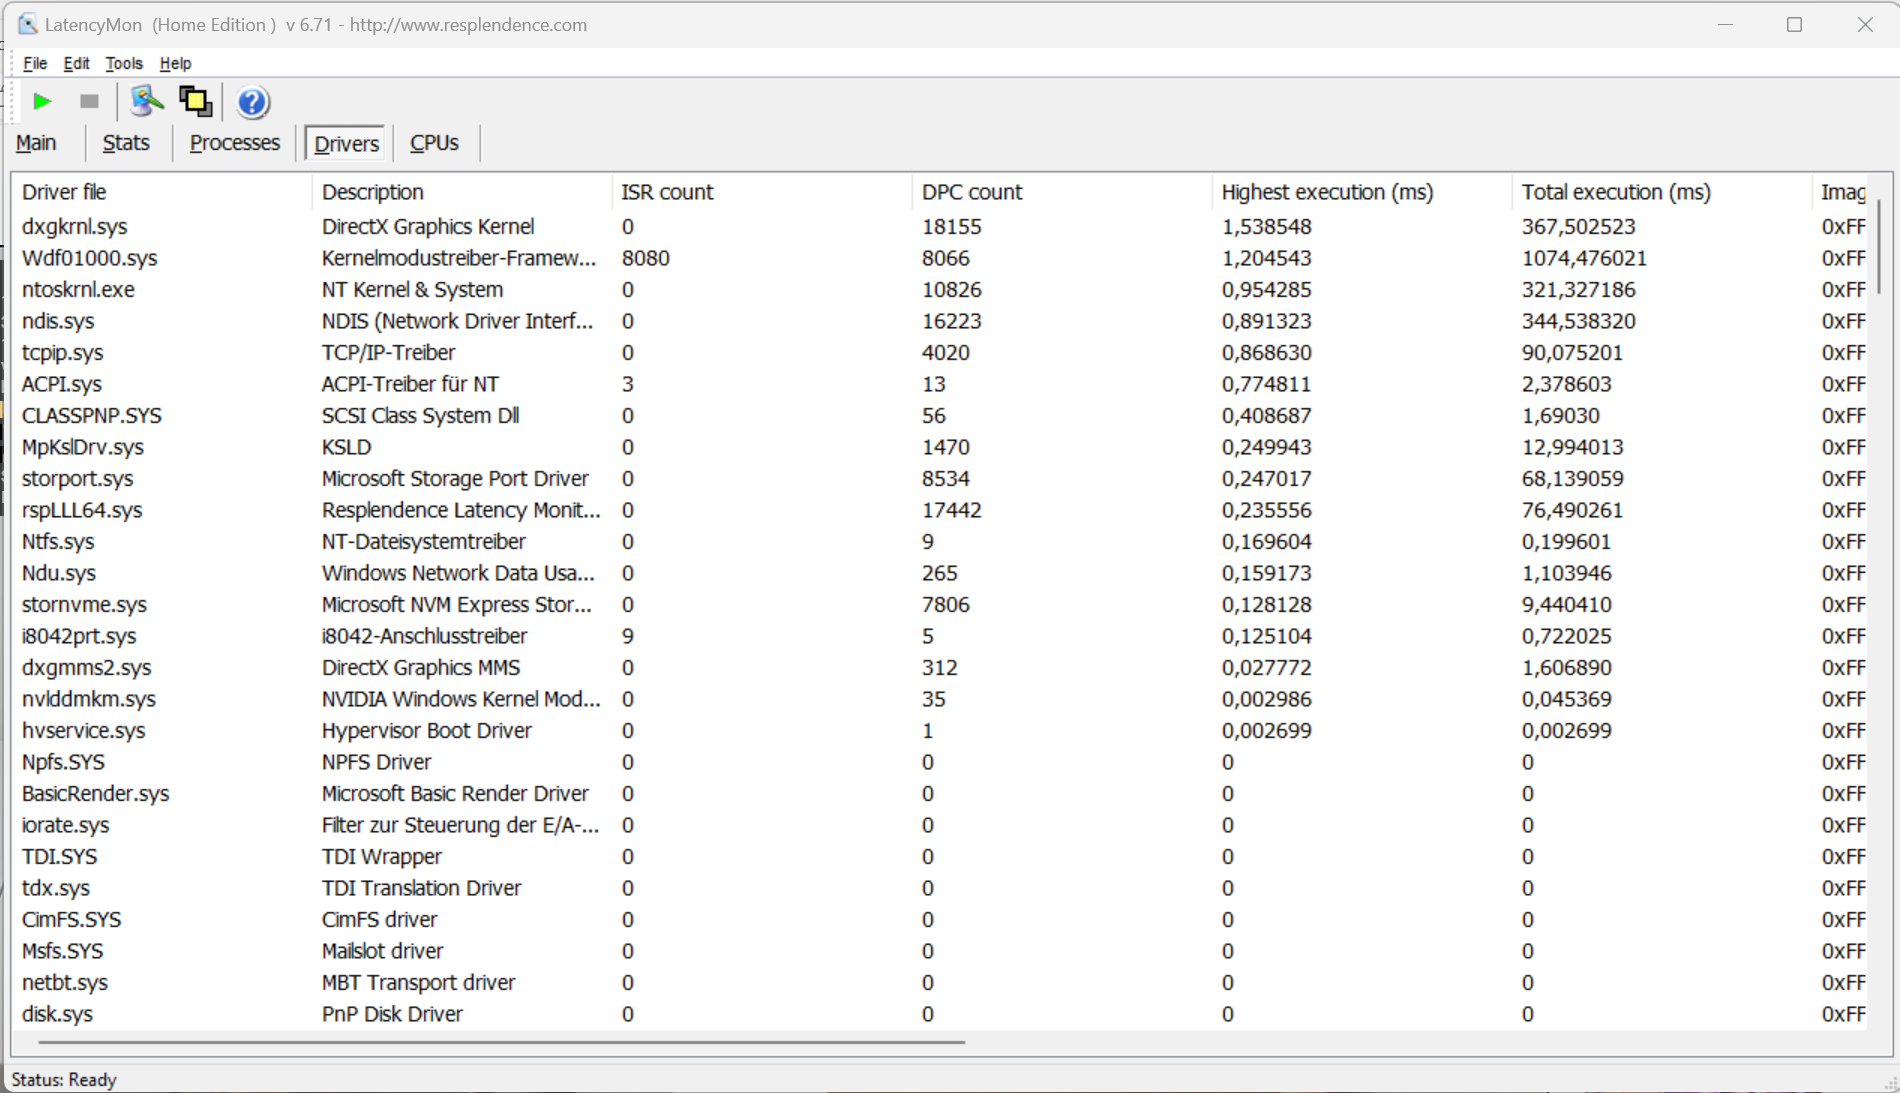
Latências de DPC
O teste padronizado do Latency Monitor (navegação na Internet, reprodução de vídeo 4k, alta carga do Prime95) revelou algumas anomalias. O sistema não parece ser adequado para edição de vídeo e áudio em tempo real. Futuras atualizações de software poderão afetar isso.
| DPC Latencies / LatencyMon - interrupt to process latency (max), Web, Youtube, Prime95 | |
| SCHENKER XMG Neo 16 E23 | |
| SCHENKER XMG Neo 16 (Early 24) | |
| Razer Blade 16 2024, RTX 4090 | |
| Medion Erazer Beast X40 2024 | |
| Asus ROG Strix Scar 17 G733PYV-LL053X | |
* ... menor é melhor
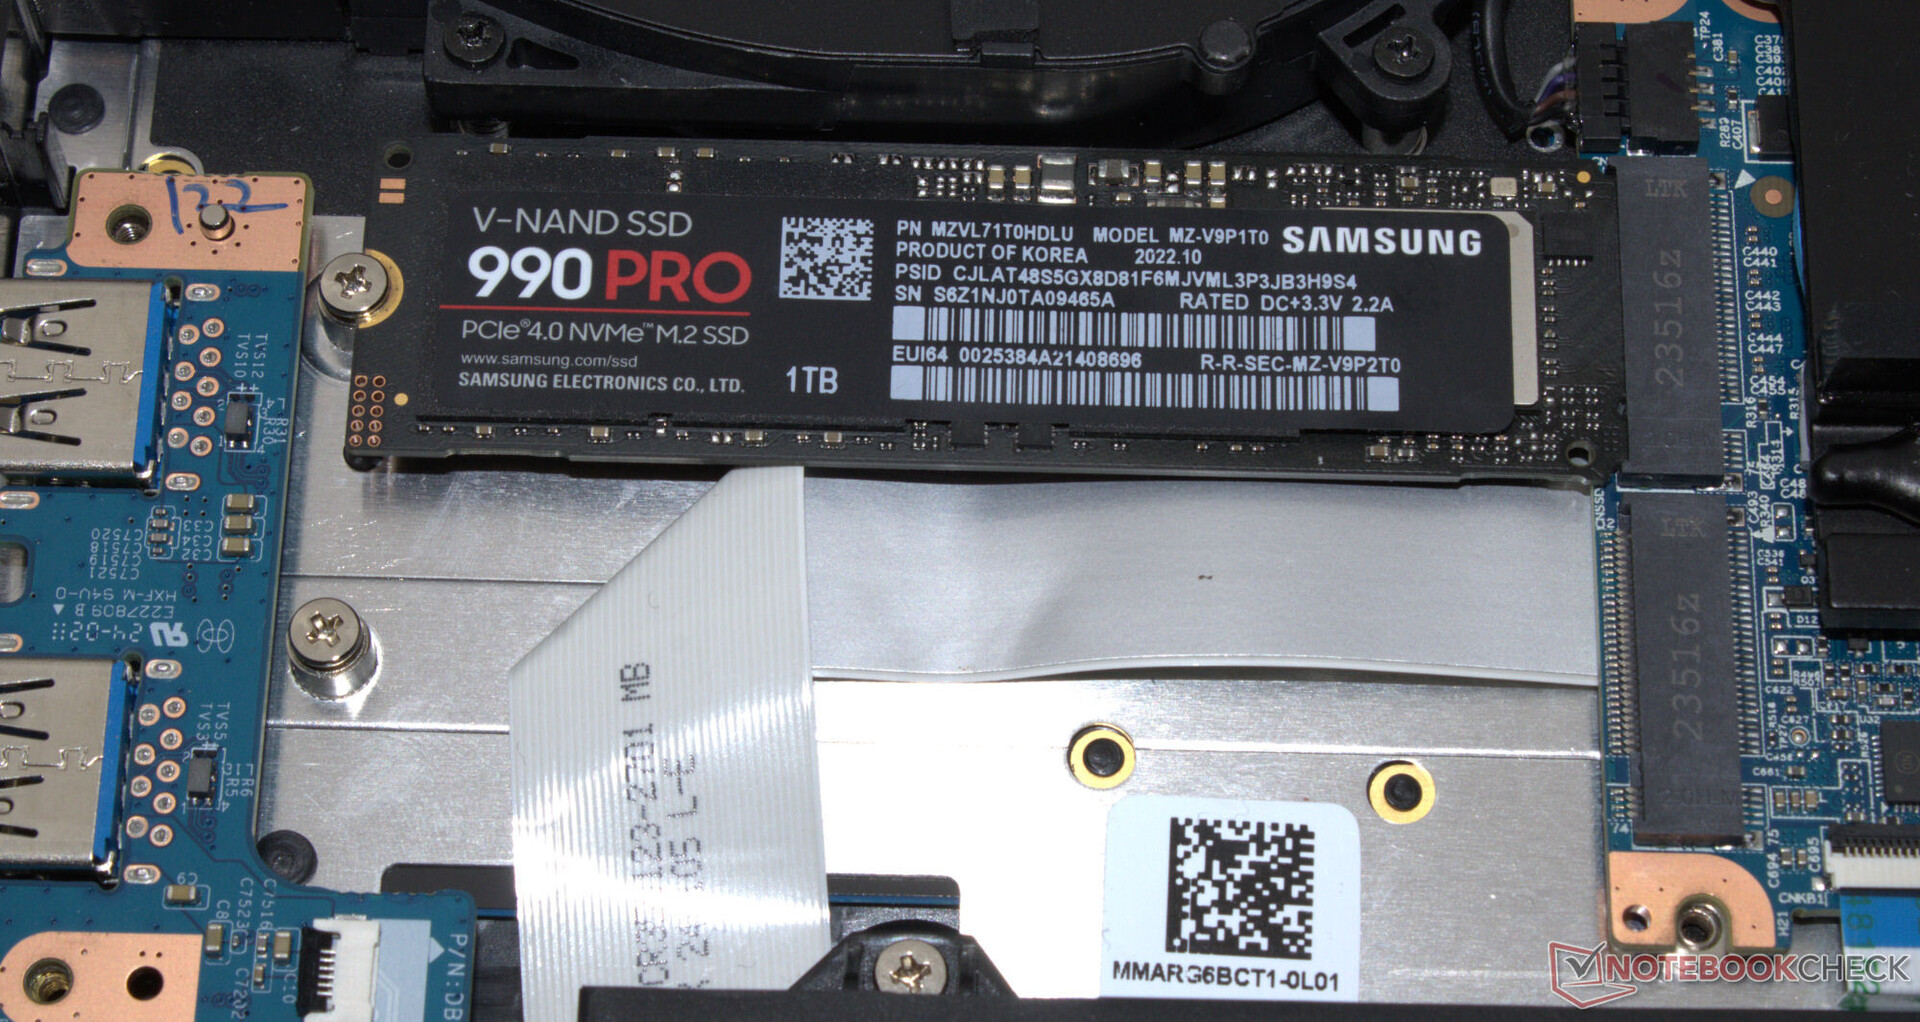
Armazenamento em massa
Como de costume, a Schenker oferece aos clientes uma ampla seleção de SSDs em sua loja on-line - há espaço para dois no interior do Neo. O suporte a RAID 0/1 está disponível. O SSD Samsung do dispositivo analisado (1 TB, PCIe 4, M.2 2280) oferece boas velocidades de transferência. Uma característica positiva é a ausência de limitação térmica.

* ... menor é melhor
Continuous Performance: DiskSpd Read Loop, Queue Depth 8
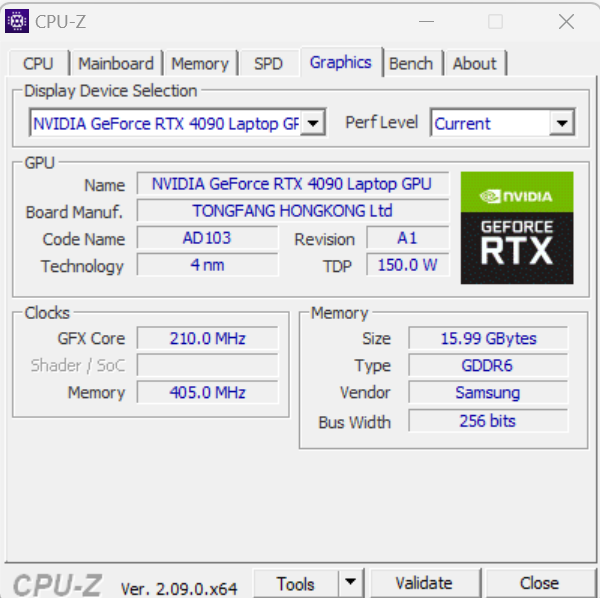
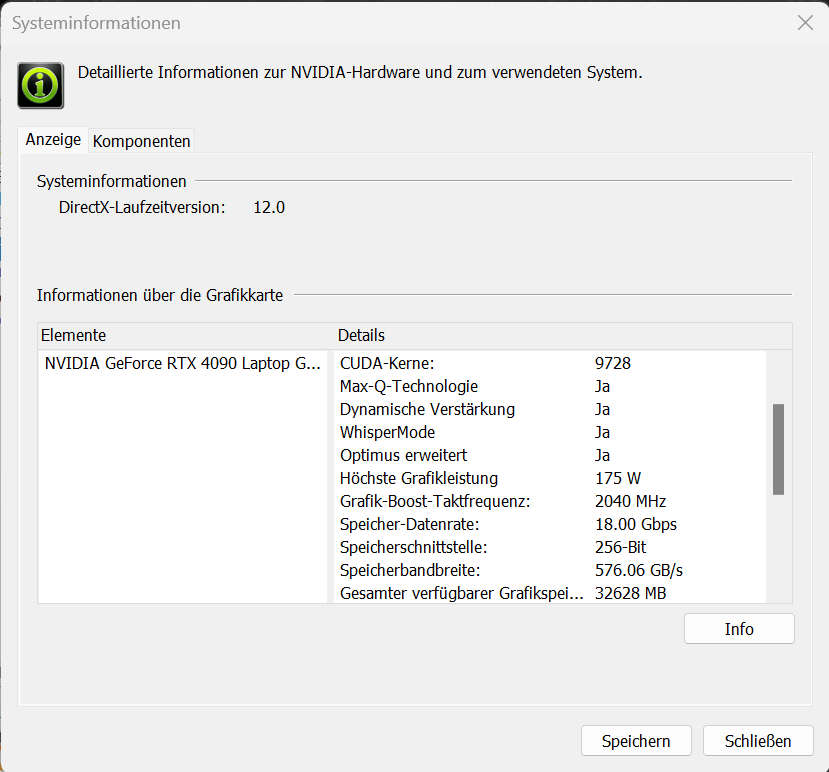
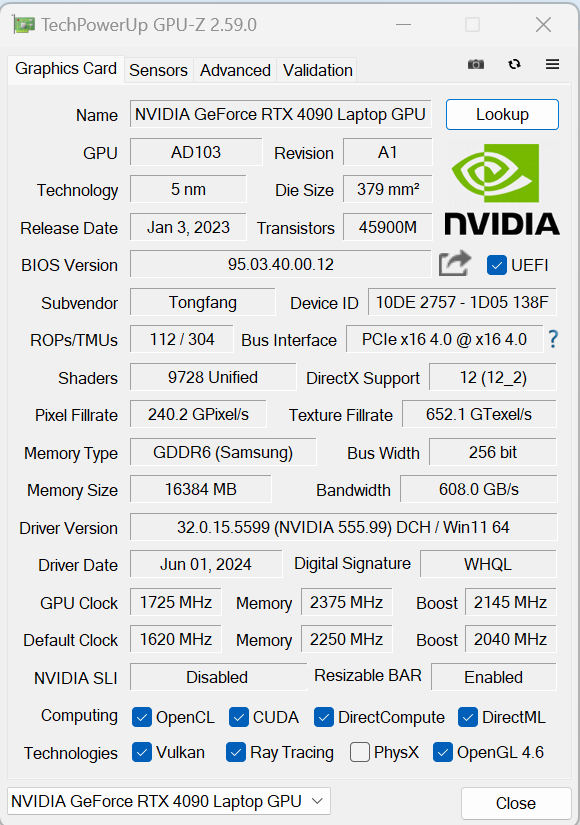
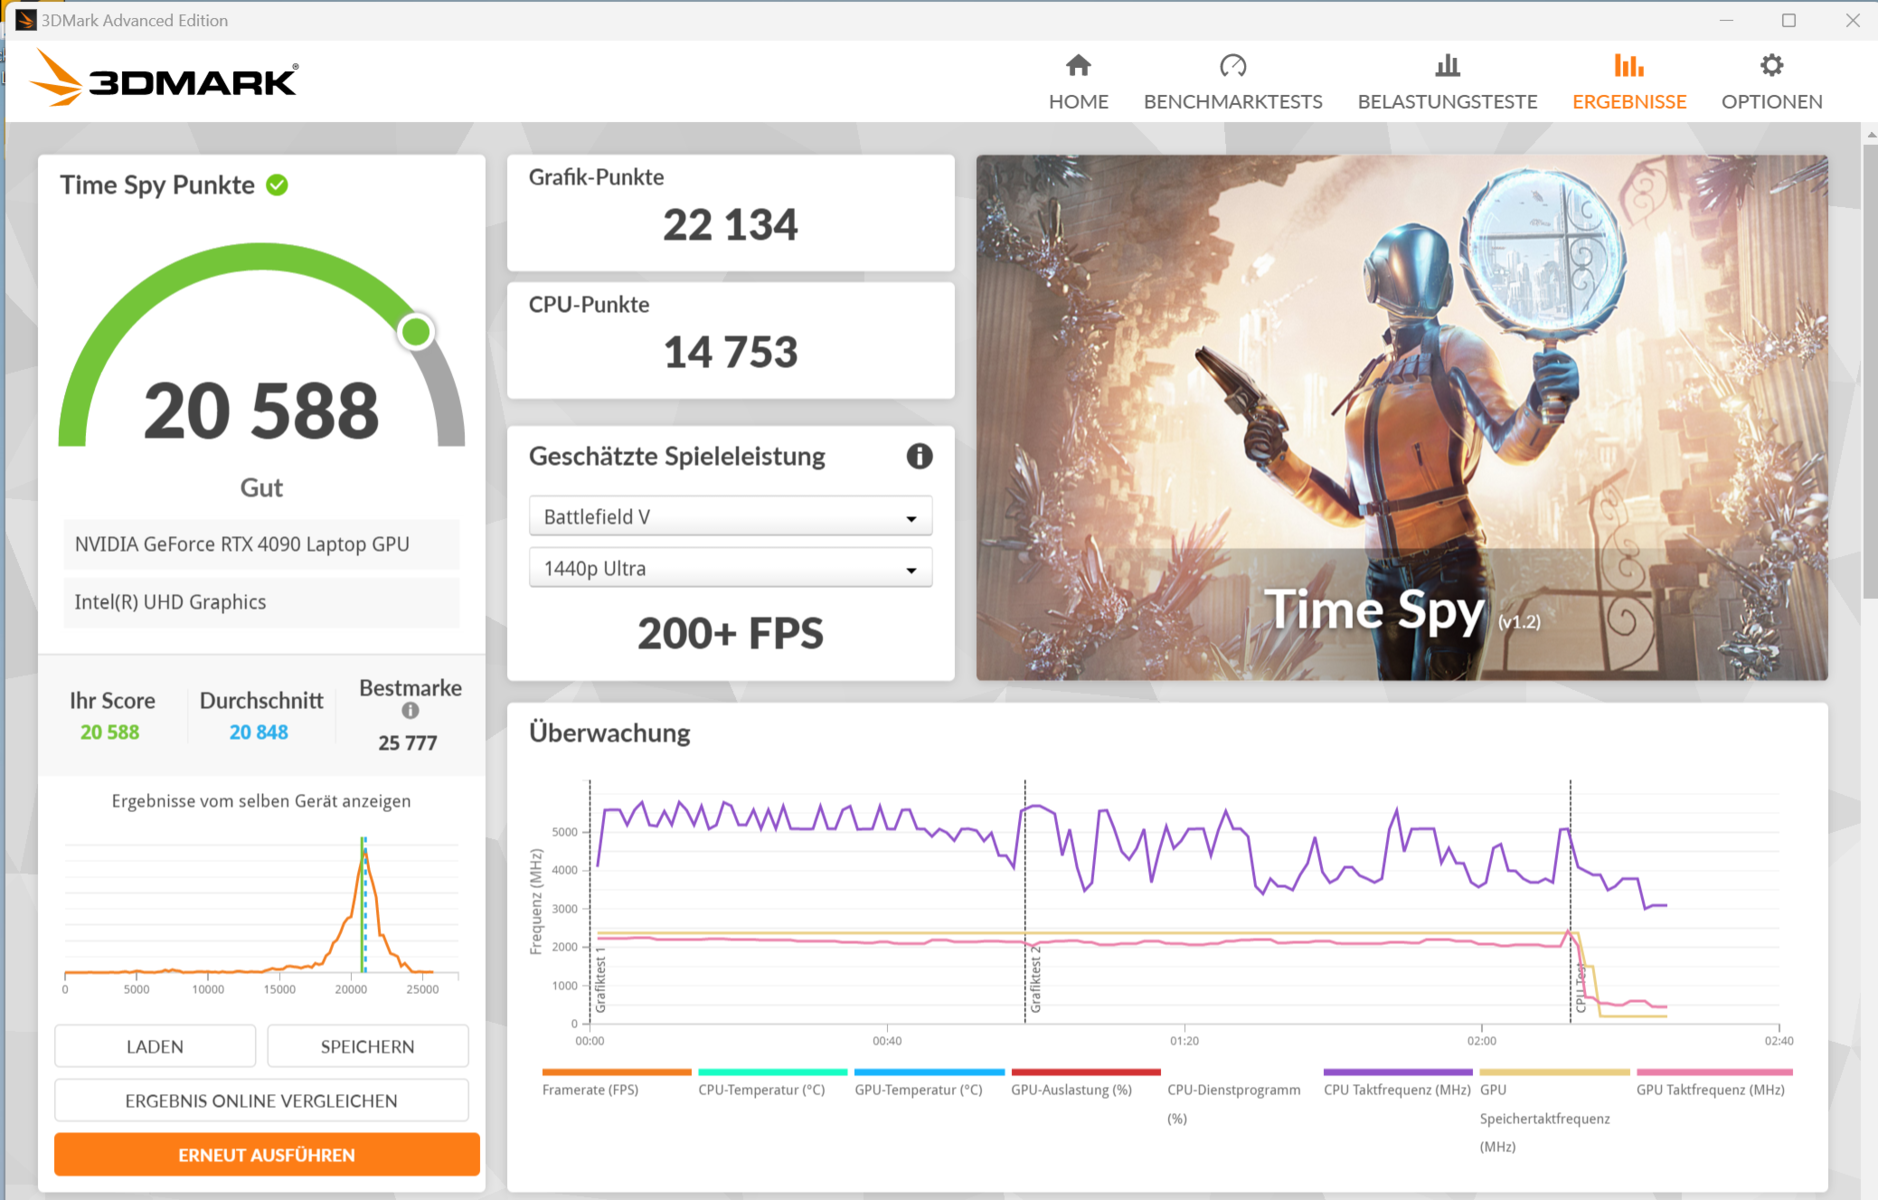
Placa de vídeo
Atualmente, a GeForce RTX 4090 oferece o mais alto desempenho entre as GPUs móveis da Nvidia. 9.728 shaders, um barramento de 256 bits e uma rápida RAM GDDR6 (16.384 MB) caracterizam o acelerador de pixels. O TGP máximo é de 175 watts (150 watts + 25 watts de Dynamic Boost) - não é possível fazer mais.
Os resultados de benchmark estão acima (Overboost) e abaixo (Enthusiast, Balanced) da média da RTX 4090 até o momento. O resfriamento a água Oasis ajuda a obter um pequeno aumento no desempenho. De qualquer forma, o principal concorrente, o Blade 16é mantido à distância. A alternância entre a dGPU e o Optimus não requer uma reinicialização: O Optimus avançado é compatível.
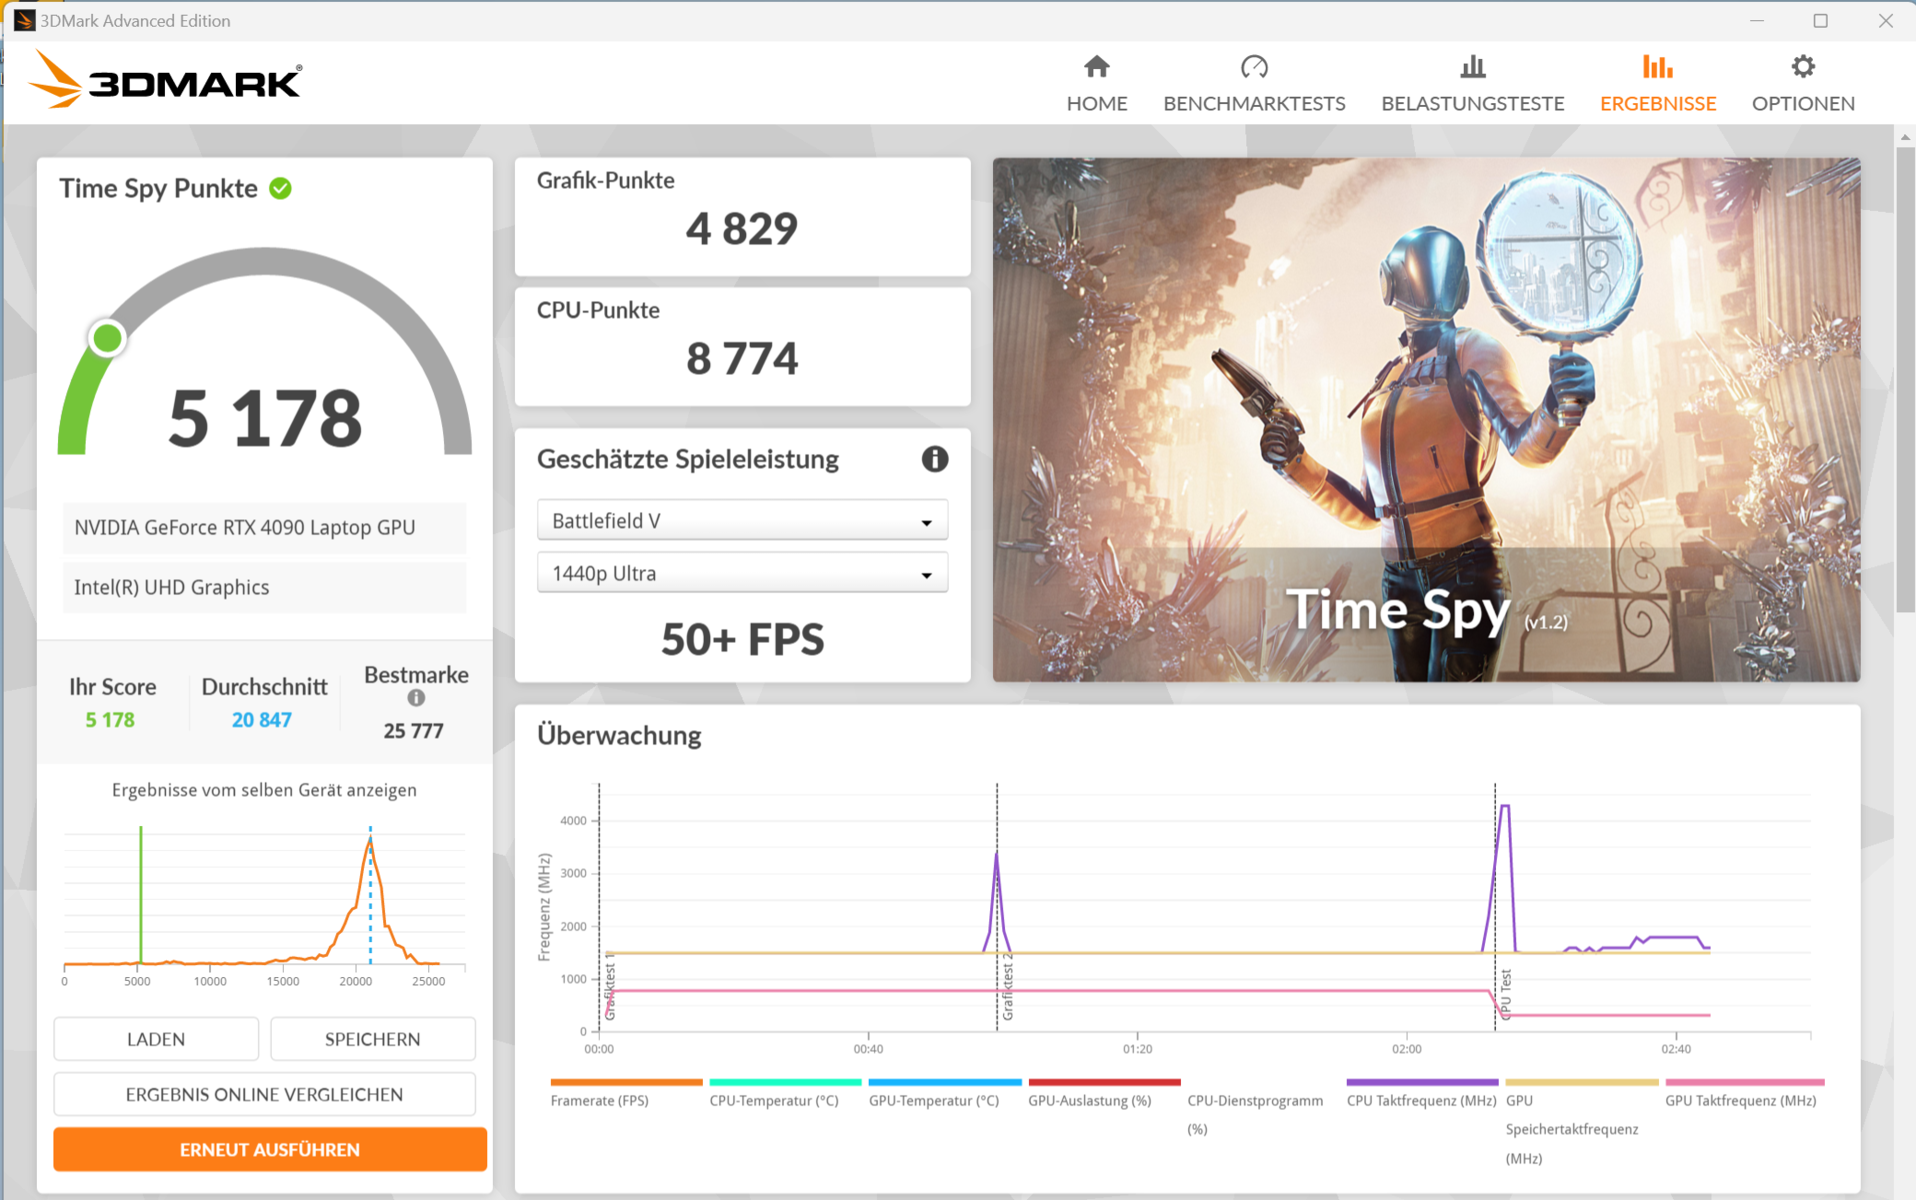
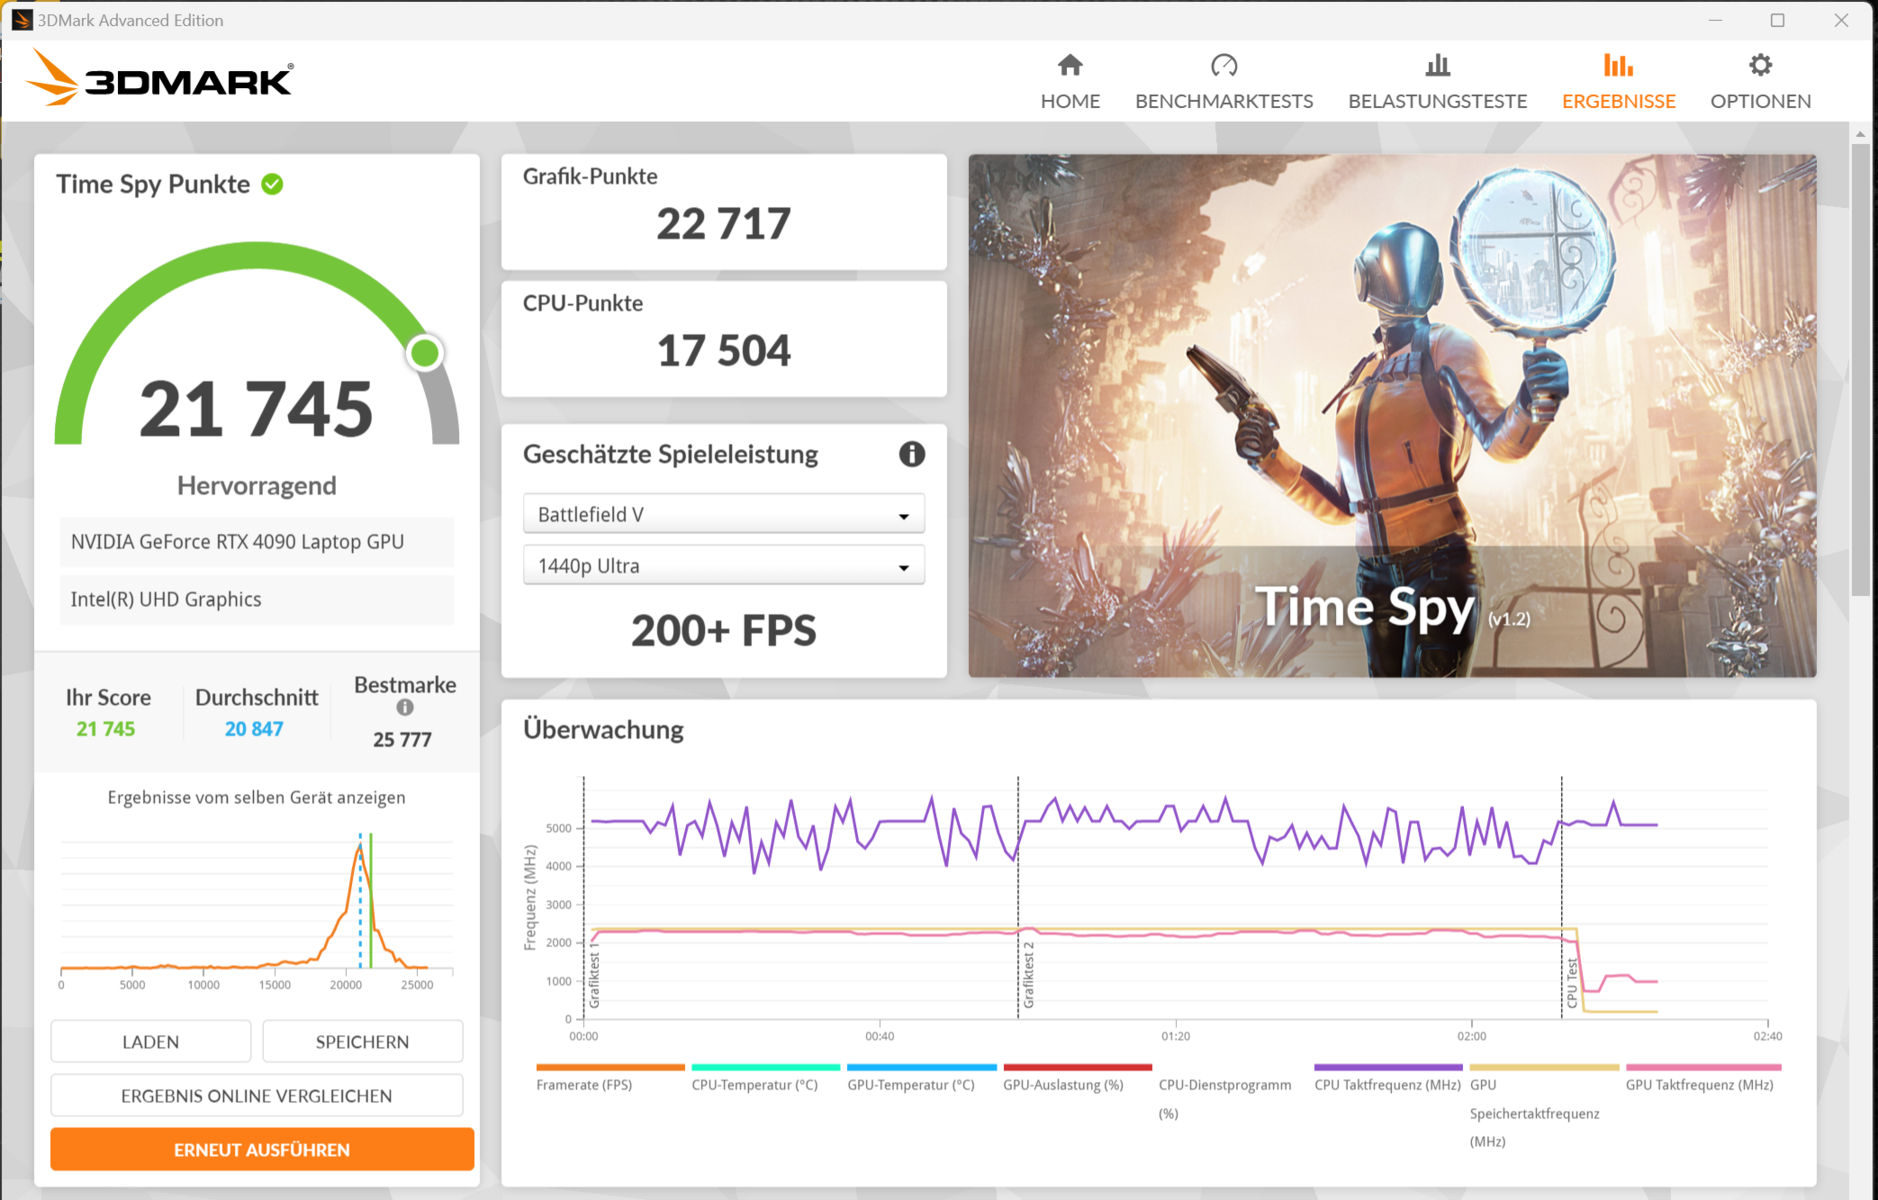
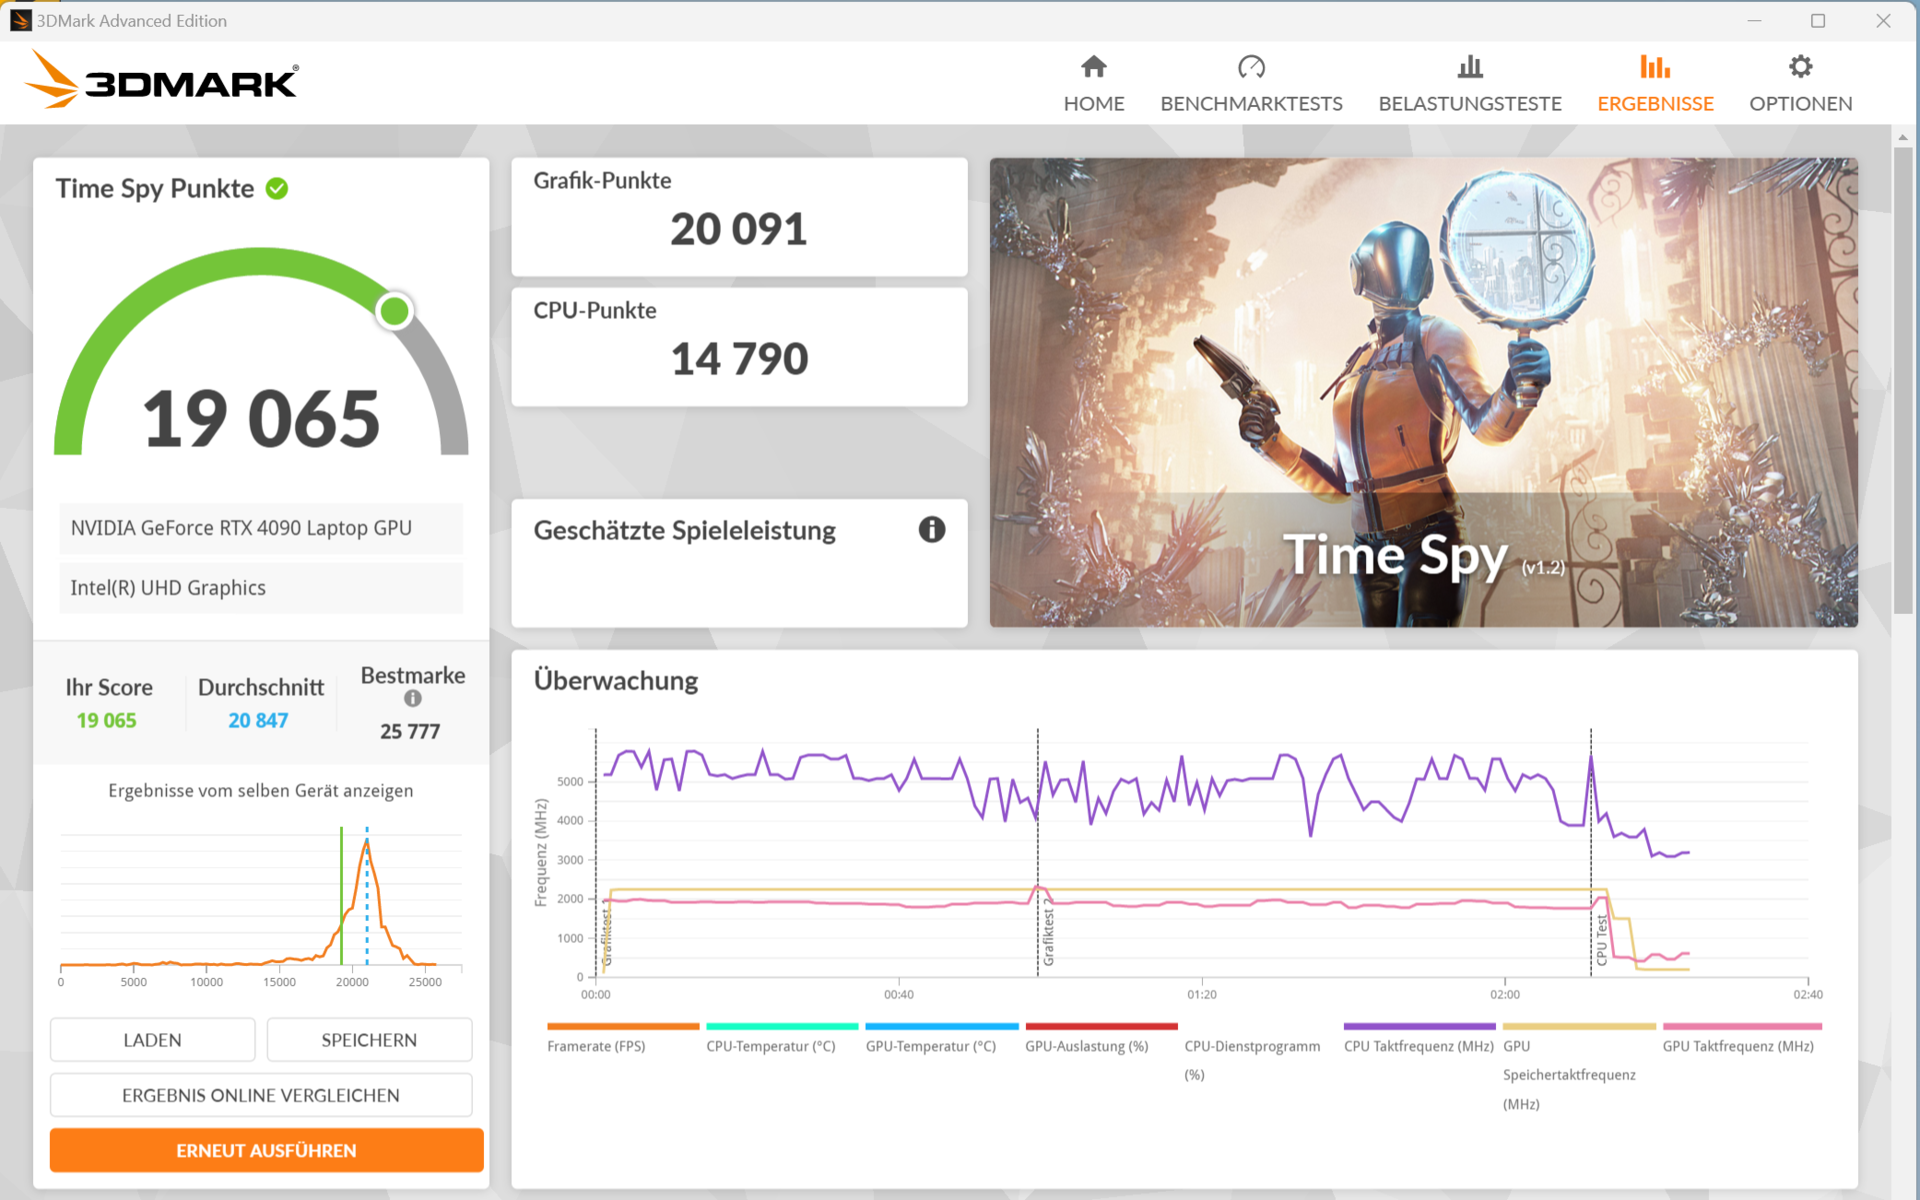
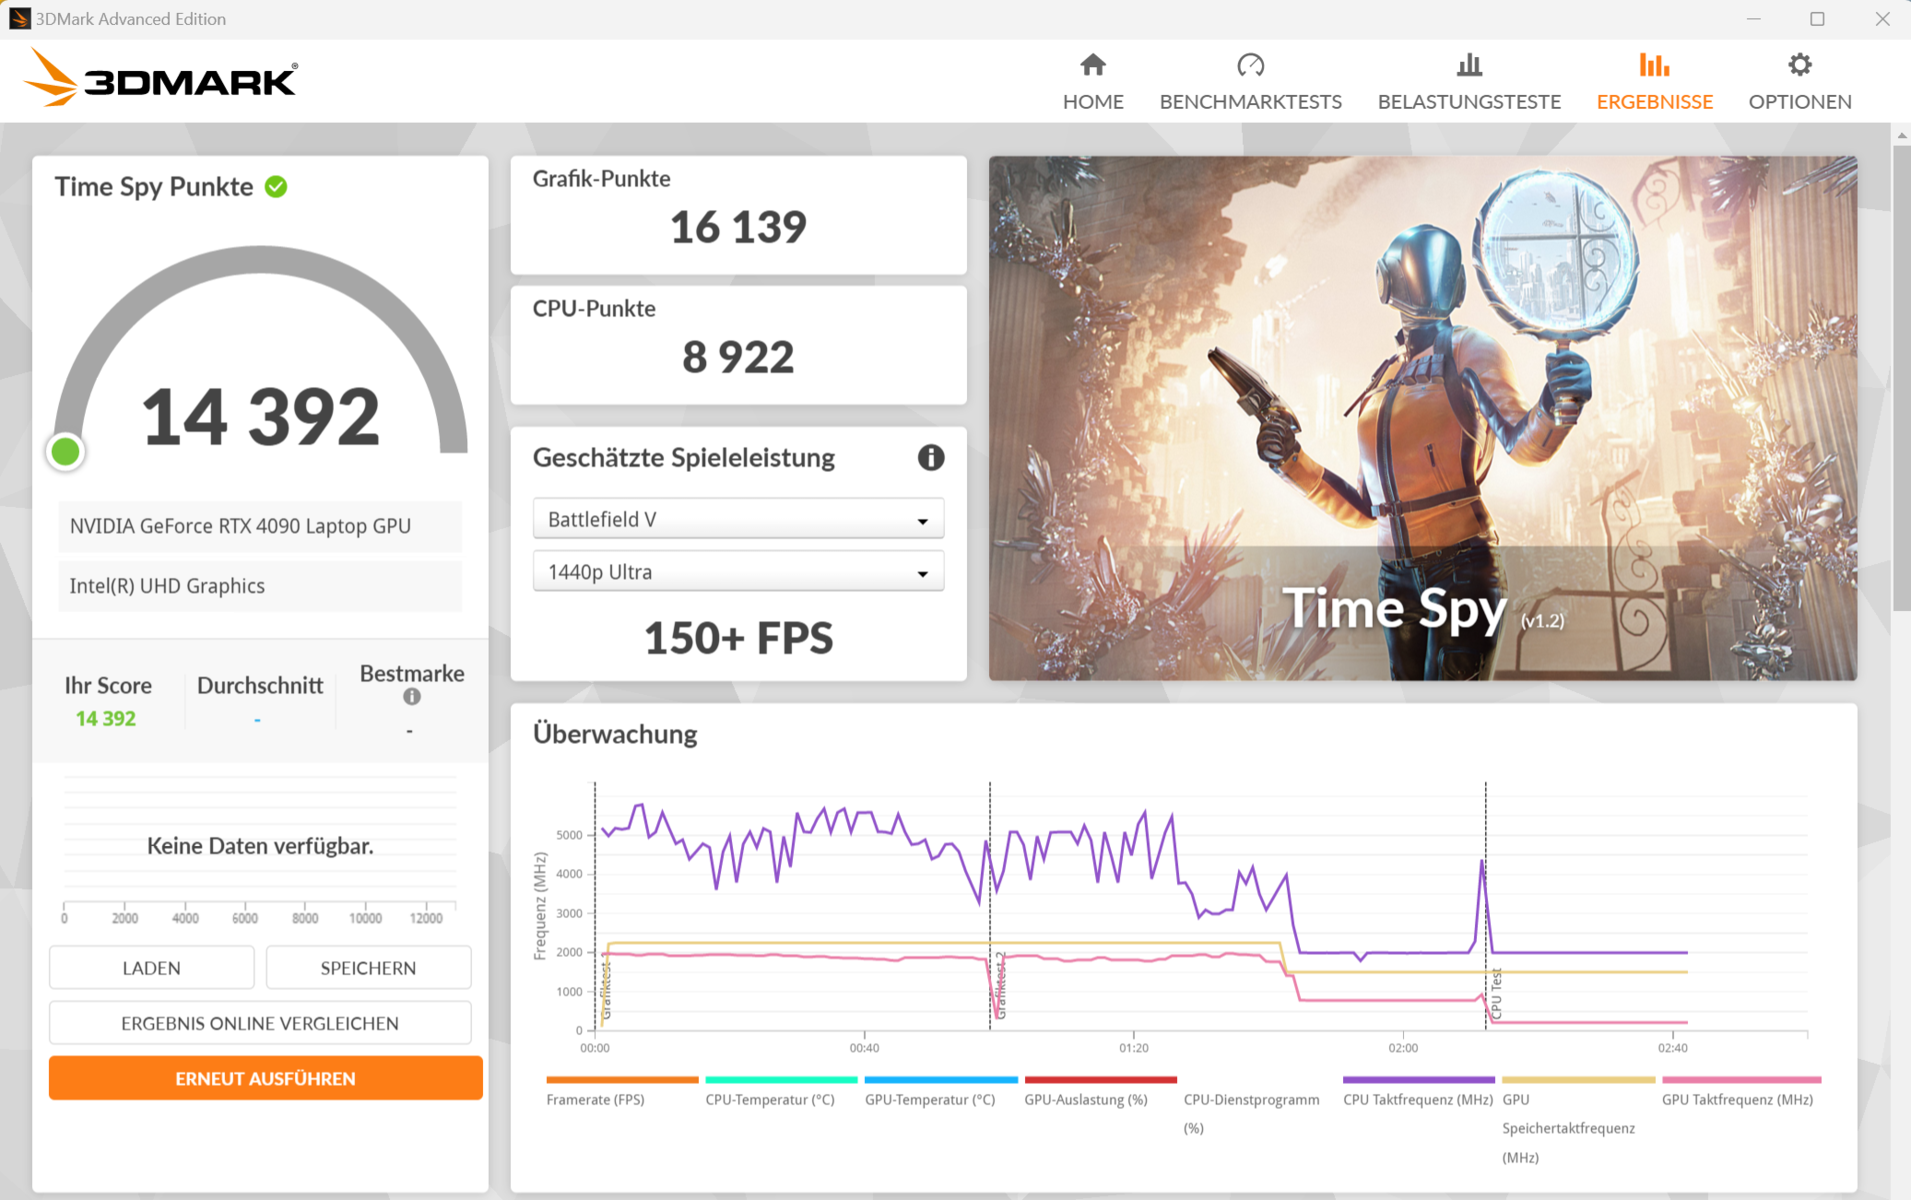
| 3DMark 06 Standard Score | 62889 pontos | |
| 3DMark 11 Performance | 43829 pontos | |
| 3DMark Fire Strike Score | 38597 pontos | |
| 3DMark Time Spy Score | 20588 pontos | |
| 3DMark Steel Nomad Score | 5102 pontos | |
Ajuda | ||
| Geekbench 6.4 | |
| GPU Vulkan | |
| Razer Blade 16 2024, RTX 4090 (6.2.1) | |
| Medion Erazer Beast X40 2024 (6.2.1) | |
| SCHENKER XMG Neo 16 (Early 24) (6.2.1) | |
| Asus ROG Strix Scar 17 G733PYV-LL053X | |
| SCHENKER XMG Neo 16 (Early 24) (6.2.1, Overboost, Oasis) | |
| Lenovo Legion 9 16IRX9, RTX 4090 (6.2.1) | |
| Média NVIDIA GeForce RTX 4090 Laptop GPU (9584 - 196201, n=17) | |
| Alienware x16 R2 P120F (6.2.1) | |
| Asus ROG Strix Scar 16 G634JZR (6.2.1) | |
| Média da turma Gaming (4286 - 231659, n=110, últimos 2 anos) | |
| GPU OpenCL | |
| Medion Erazer Beast X40 2024 (6.2.1) | |
| SCHENKER XMG Neo 16 (Early 24) (6.2.1, Overboost, Oasis) | |
| Asus ROG Strix Scar 17 G733PYV-LL053X | |
| SCHENKER XMG Neo 16 (Early 24) (6.2.1) | |
| Lenovo Legion 9 16IRX9, RTX 4090 (6.2.1) | |
| Média NVIDIA GeForce RTX 4090 Laptop GPU (159127 - 209521, n=20) | |
| Razer Blade 16 2024, RTX 4090 (6.2.1) | |
| Asus ROG Strix Scar 16 G634JZR (6.2.1) | |
| Alienware x16 R2 P120F (6.2.1) | |
| Média da turma Gaming (4321 - 234213, n=118, últimos 2 anos) | |
* ... menor é melhor
Desempenho em jogos
O computador XMG foi projetado para lidar com jogos em QHD nas configurações máximas. As taxas de quadros estão acima da média para a RTX 4090 (Overboost), com o resfriamento a água aumentando ligeiramente o desempenho. As funções da GPU, Frame Generation e DLSS 3, permitiriam resoluções mais altas nas configurações máximas e com ray tracing - embora apenas com jogos que ofereçam esses recursos.
| The Witcher 3 - 1920x1080 Ultra Graphics & Postprocessing (HBAO+) | |
| SCHENKER XMG Neo 16 (Early 24) | |
| SCHENKER XMG Neo 16 (Early 24) (Overboost, Oasis) | |
| SCHENKER XMG Neo 16 E23 | |
| Asus ROG Strix Scar 17 G733PYV-LL053X | |
| Medion Erazer Beast X40 2024 | |
| Lenovo Legion 9 16IRX9, RTX 4090 | |
| Lenovo Legion Pro 7 RTX4090 | |
| Razer Blade 16 2024, RTX 4090 | |
| Média NVIDIA GeForce RTX 4090 Laptop GPU (139.2 - 216, n=35) | |
| Asus ROG Strix Scar 16 G634JZR | |
| Alienware x16 R2 P120F | |
| Média da turma Gaming (18.4 - 214, n=119, últimos 2 anos) | |
| GTA V - 1920x1080 Highest Settings possible AA:4xMSAA + FX AF:16x | |
| Asus ROG Strix Scar 17 G733PYV-LL053X | |
| SCHENKER XMG Neo 16 (Early 24) (Overboost, Oasis) | |
| SCHENKER XMG Neo 16 (Early 24) | |
| SCHENKER XMG Neo 16 E23 | |
| Lenovo Legion Pro 7 RTX4090 | |
| Medion Erazer Beast X40 2024 | |
| Asus ROG Strix Scar 16 G634JZR | |
| Média NVIDIA GeForce RTX 4090 Laptop GPU (91.1 - 167.7, n=40) | |
| Razer Blade 16 2024, RTX 4090 | |
| Lenovo Legion 9 16IRX9, RTX 4090 | |
| Média da turma Gaming (12.1 - 168.2, n=132, últimos 2 anos) | |
| Final Fantasy XV Benchmark - 1920x1080 High Quality | |
| SCHENKER XMG Neo 16 (Early 24) (1.3, Overboost, Oasis) | |
| SCHENKER XMG Neo 16 (Early 24) (1.3) | |
| SCHENKER XMG Neo 16 E23 (1.3) | |
| Lenovo Legion Pro 7 RTX4090 (1.3) | |
| Medion Erazer Beast X40 2024 (1.3) | |
| Asus ROG Strix Scar 17 G733PYV-LL053X (1.3) | |
| Asus ROG Strix Scar 16 G634JZR (1.3) | |
| Média NVIDIA GeForce RTX 4090 Laptop GPU (122.2 - 201, n=40) | |
| Lenovo Legion 9 16IRX9, RTX 4090 (1.3) | |
| Alienware x16 R2 P120F (1.3) | |
| Razer Blade 16 2024, RTX 4090 (1.3) | |
| Média da turma Gaming (19.2 - 201, n=144, últimos 2 anos) | |
| Strange Brigade - 1920x1080 ultra AA:ultra AF:16 | |
| Asus ROG Strix Scar 17 G733PYV-LL053X (1.47.22.14 D3D12) | |
| SCHENKER XMG Neo 16 (Early 24) (1.47.22.14 D3D12, Overboost, Oasis) | |
| SCHENKER XMG Neo 16 (Early 24) (1.47.22.14 D3D12) | |
| SCHENKER XMG Neo 16 E23 (1.47.22.14 D3D12) | |
| Medion Erazer Beast X40 2024 (1.47.22.14 D3D12) | |
| Lenovo Legion 9 16IRX9, RTX 4090 (1.47.22.14 D3D12) | |
| Razer Blade 16 2024, RTX 4090 (1.47.22.14 D3D12) | |
| Média NVIDIA GeForce RTX 4090 Laptop GPU (233 - 421, n=39) | |
| Lenovo Legion Pro 7 RTX4090 (1.47.22.14 D3D12) | |
| Asus ROG Strix Scar 16 G634JZR (1.47.22.14 D3D12) | |
| Alienware x16 R2 P120F (1.47.22.14 D3D12) | |
| Média da turma Gaming (38.9 - 420, n=140, últimos 2 anos) | |
| Dota 2 Reborn - 1920x1080 ultra (3/3) best looking | |
| Asus ROG Strix Scar 17 G733PYV-LL053X | |
| SCHENKER XMG Neo 16 (Early 24) | |
| SCHENKER XMG Neo 16 (Early 24) (Overboost, Oasis) | |
| Medion Erazer Beast X40 2024 | |
| Razer Blade 16 2024, RTX 4090 | |
| SCHENKER XMG Neo 16 E23 | |
| Lenovo Legion Pro 7 RTX4090 | |
| Asus ROG Strix Scar 16 G634JZR | |
| Média NVIDIA GeForce RTX 4090 Laptop GPU (115.7 - 220, n=42) | |
| Lenovo Legion 9 16IRX9, RTX 4090 | |
| Média da turma Gaming (65.1 - 220, n=148, últimos 2 anos) | |
| Alienware x16 R2 P120F | |
| X-Plane 11.11 - 1920x1080 high (fps_test=3) | |
| Asus ROG Strix Scar 17 G733PYV-LL053X | |
| Razer Blade 16 2024, RTX 4090 | |
| SCHENKER XMG Neo 16 (Early 24) | |
| Medion Erazer Beast X40 2024 | |
| Asus ROG Strix Scar 16 G634JZR | |
| SCHENKER XMG Neo 16 (Early 24) (v6.92.6600, Overboost, Oasis) | |
| Lenovo Legion Pro 7 RTX4090 | |
| SCHENKER XMG Neo 16 E23 | |
| Média NVIDIA GeForce RTX 4090 Laptop GPU (77.8 - 166.2, n=46) | |
| Lenovo Legion 9 16IRX9, RTX 4090 | |
| Média da turma Gaming (32.8 - 166.2, n=151, últimos 2 anos) | |
| Alienware x16 R2 P120F | |
| F1 24 | |
| 1920x1080 Ultra High Preset AA:T AF:16x | |
| Asus ROG Strix Scar 17 G733PYV-LL053X (1222678) | |
| SCHENKER XMG Neo 16 (Early 24) (1119215) | |
| XMG Neo 16 E23 | |
| Média NVIDIA GeForce RTX 4090 Laptop GPU (88 - 144.9, n=5) | |
| Lenovo Legion 9 16IRX9, RTX 4090 (1118244) | |
| Média da turma Gaming (54.1 - 148, n=19, últimos 2 anos) | |
| 2560x1440 Ultra High Preset AA:T AF:16x | |
| Asus ROG Strix Scar 17 G733PYV-LL053X (1222678) | |
| SCHENKER XMG Neo 16 (Early 24) (1119215) | |
| XMG Neo 16 E23 | |
| Média NVIDIA GeForce RTX 4090 Laptop GPU (58.5 - 96.8, n=5) | |
| Lenovo Legion 9 16IRX9, RTX 4090 (1118244) | |
| Média da turma Gaming (36.7 - 100, n=16, últimos 2 anos) | |
| 2560x1440 Ultra High Preset + Quality DLSS AF:16x | |
| Asus ROG Strix Scar 17 G733PYV-LL053X (1222678) | |
| SCHENKER XMG Neo 16 (Early 24) (1119215) | |
| Média NVIDIA GeForce RTX 4090 Laptop GPU (88.3 - 150.4, n=3) | |
| Média da turma Gaming (59.2 - 150.4, n=12, últimos 2 anos) | |
| Senua's Saga Hellblade 2 | |
| 1920x1080 High Preset | |
| SCHENKER XMG Neo 16 (Early 24) | |
| Média NVIDIA GeForce RTX 4090 Laptop GPU (74 - 78.8, n=2) | |
| XMG Neo 16 E23 | |
| Média da turma Gaming (38.4 - 78.8, n=6, últimos 2 anos) | |
| 2560x1440 High Preset | |
| SCHENKER XMG Neo 16 (Early 24) | |
| Média NVIDIA GeForce RTX 4090 Laptop GPU (51.8 - 57.3, n=2) | |
| XMG Neo 16 E23 | |
| Média da turma Gaming (27.1 - 57.3, n=4, últimos 2 anos) | |
| 2560x1440 High Preset + Quality DLSS | |
| SCHENKER XMG Neo 16 (Early 24) | |
| Média NVIDIA GeForce RTX 4090 Laptop GPU (n=1) | |
| Média da turma Gaming (42.2 - 83.1, n=3, últimos 2 anos) | |
| Horizon Forbidden West | |
| 1920x1080 Very High Preset AA:T | |
| SCHENKER XMG Neo 16 (Early 24) | |
| Média NVIDIA GeForce RTX 4090 Laptop GPU (81 - 125.2, n=3) | |
| Média da turma Gaming (14.7 - 125.2, n=10, últimos 2 anos) | |
| 2560x1440 Very High Preset AA:T | |
| SCHENKER XMG Neo 16 (Early 24) | |
| Média NVIDIA GeForce RTX 4090 Laptop GPU (66 - 98, n=3) | |
| Média da turma Gaming (24.1 - 98, n=9, últimos 2 anos) | |
| Alone in the Dark | |
| 1920x1080 Cinematic Preset | |
| SCHENKER XMG Neo 16 (Early 24) | |
| Média NVIDIA GeForce RTX 4090 Laptop GPU (141 - 189.9, n=2) | |
| Média da turma Gaming (13.6 - 189.9, n=6, últimos 2 anos) | |
| 2560x1440 Cinematic Preset | |
| SCHENKER XMG Neo 16 (Early 24) | |
| Média NVIDIA GeForce RTX 4090 Laptop GPU (99 - 133.6, n=2) | |
| Média da turma Gaming (64.7 - 133.6, n=4, últimos 2 anos) | |
Usamos o site Witcher 3 para verificar a estabilidade da taxa de quadros: O jogo (configurações máximas, FHD) foi executado por cerca de 1 hora, o personagem do jogo não foi movido e não observamos nenhuma queda na taxa de quadros.
Witcher 3 FPS diagram
| baixo | média | alto | ultra | QHD DLSS | QHD FSR | QHD | 4K DLSS | 4K | |
|---|---|---|---|---|---|---|---|---|---|
| GTA V (2015) | 187.6 | 187.4 | 185.7 | 159.3 | 156 | ||||
| The Witcher 3 (2015) | 643 | 562.3 | 412.7 | 214 | 169.4 | ||||
| Dota 2 Reborn (2015) | 248 | 221 | 210 | 194.6 | |||||
| Final Fantasy XV Benchmark (2018) | 233 | 225 | 196.9 | 162.5 | |||||
| X-Plane 11.11 (2018) | 208 | 184.2 | 144.5 | ||||||
| Far Cry 5 (2018) | 194 | 184 | 172 | 156 | |||||
| Strange Brigade (2018) | 579 | 444 | 397 | 403 | 305 | ||||
| Baldur's Gate 3 (2023) | 253 | 215.5 | 188 | 187 | 133.2 | 114 | 73.1 | ||
| Cyberpunk 2077 2.2 Phantom Liberty (2023) | 168.5 | 157.8 | 138 | 131.5 | 93.8 | ||||
| Alan Wake 2 (2023) | 128.5 | 128 | 123.3 | 87.1 | |||||
| Alone in the Dark (2024) | 219 | 217 | 216 | 189.9 | 133.6 | ||||
| Horizon Forbidden West (2024) | 165.4 | 160.5 | 126.2 | 125.2 | 98 | ||||
| Senua's Saga Hellblade 2 (2024) | 122.3 | 103.3 | 78.8 | 83.1 | 82.1 | 57.3 | |||
| F1 24 (2024) | 346 | 369 | 302 | 127 | 84.7 |
Emissões - O laptop XMG tem emissões específicas de classe
Emissões de ruído
Níveis de ruído de até 56 dB(A) são possíveis, mas, em jogos, esse valor é um pouco menor (Overboost). É possível obter um nível de ruído significativamente mais baixo usando a opção "Balanced", em detrimento do desempenho. Os jogos seriam possíveis. No uso diário (escritório, Internet) e em modo ocioso, o computador geralmente faz seu trabalho silenciosamente, independentemente do modo de desempenho ativo.
O uso do resfriamento externo a água produz algum ruído: A bomba funciona de forma muito silenciosa e os ventiladores são muito mais perceptíveis. Em termos subjetivos, consideramos o nível de ruído do uso do resfriamento externo a água mais agradável, mas não necessariamente mais silencioso.
De vez em quando, são emitidos estalos eletrônicos de dentro do laptop, por exemplo, durante o teste do Diskspd. Presumivelmente, isso se deve ao SSD.
Barulho
| Ocioso |
| 28 / 29 / 31 dB |
| Carga |
| 51 / 56 dB |
 | ||
30 dB silencioso 40 dB(A) audível 50 dB(A) ruidosamente alto |
||
min: | ||
| SCHENKER XMG Neo 16 (Early 24) NVIDIA GeForce RTX 4090 Laptop GPU, i9-14900HX, Samsung 990 Pro 1 TB | Razer Blade 16 2024, RTX 4090 NVIDIA GeForce RTX 4090 Laptop GPU, i9-14900HX, Samsung PM9A1 MZVL22T0HBLB | Medion Erazer Beast X40 2024 NVIDIA GeForce RTX 4090 Laptop GPU, i9-14900HX, Phison E18-1TB-PHISON-SSD-BICS5 | Asus ROG Strix Scar 17 G733PYV-LL053X NVIDIA GeForce RTX 4090 Laptop GPU, R9 7945HX3D, SK hynix PC801 HFS001TEJ9X101N | SCHENKER XMG Neo 16 E23 NVIDIA GeForce RTX 4090 Laptop GPU, i9-13900HX, Crucial P5 Plus 1TB CT1000P5PSSD8 | |
|---|---|---|---|---|---|
| Noise | 14% | 3% | 3% | -12% | |
| desligado / ambiente * | 26 | 23 12% | 25 4% | 23 12% | 25 4% |
| Idle Minimum * | 28 | 23 18% | 28 -0% | 23 18% | 31 -11% |
| Idle Average * | 29 | 23 21% | 29 -0% | 27.7 4% | 33 -14% |
| Idle Maximum * | 31 | 27.66 11% | 32 -3% | 34.7 -12% | 42 -35% |
| Load Average * | 51 | 43.76 14% | 48 6% | 53.4 -5% | 58 -14% |
| Witcher 3 ultra * | 54 | 46.81 13% | 50 7% | 53.4 1% | 57 -6% |
| Load Maximum * | 56 | 50.37 10% | 52 7% | 53.4 5% | 59 -5% |
* ... menor é melhor
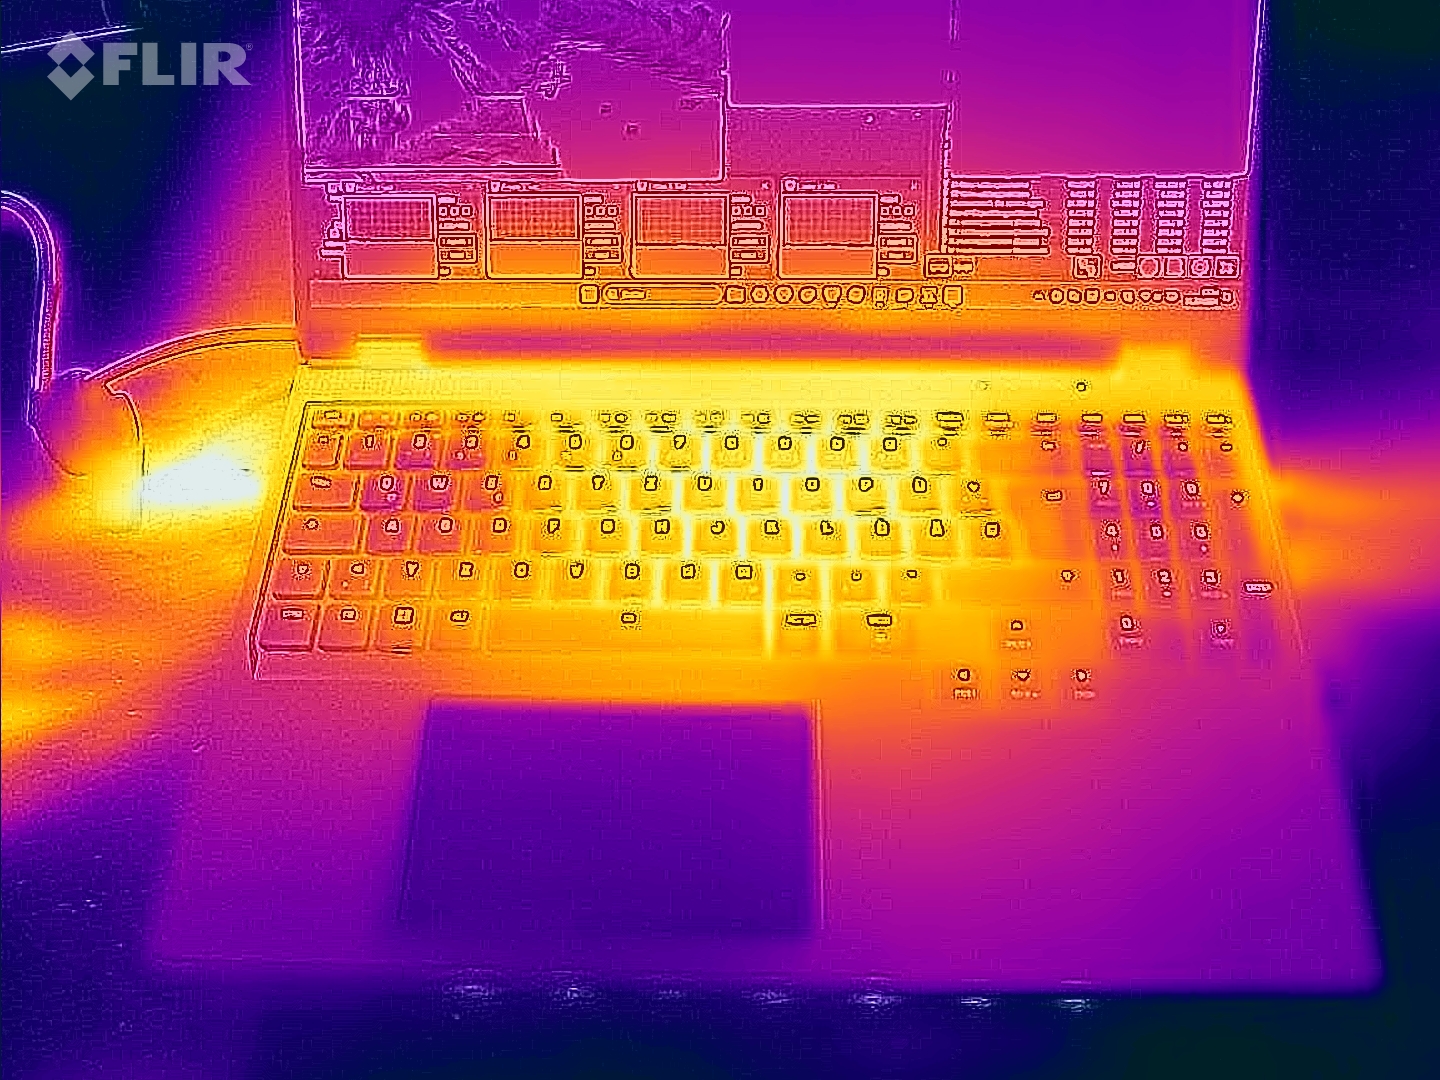
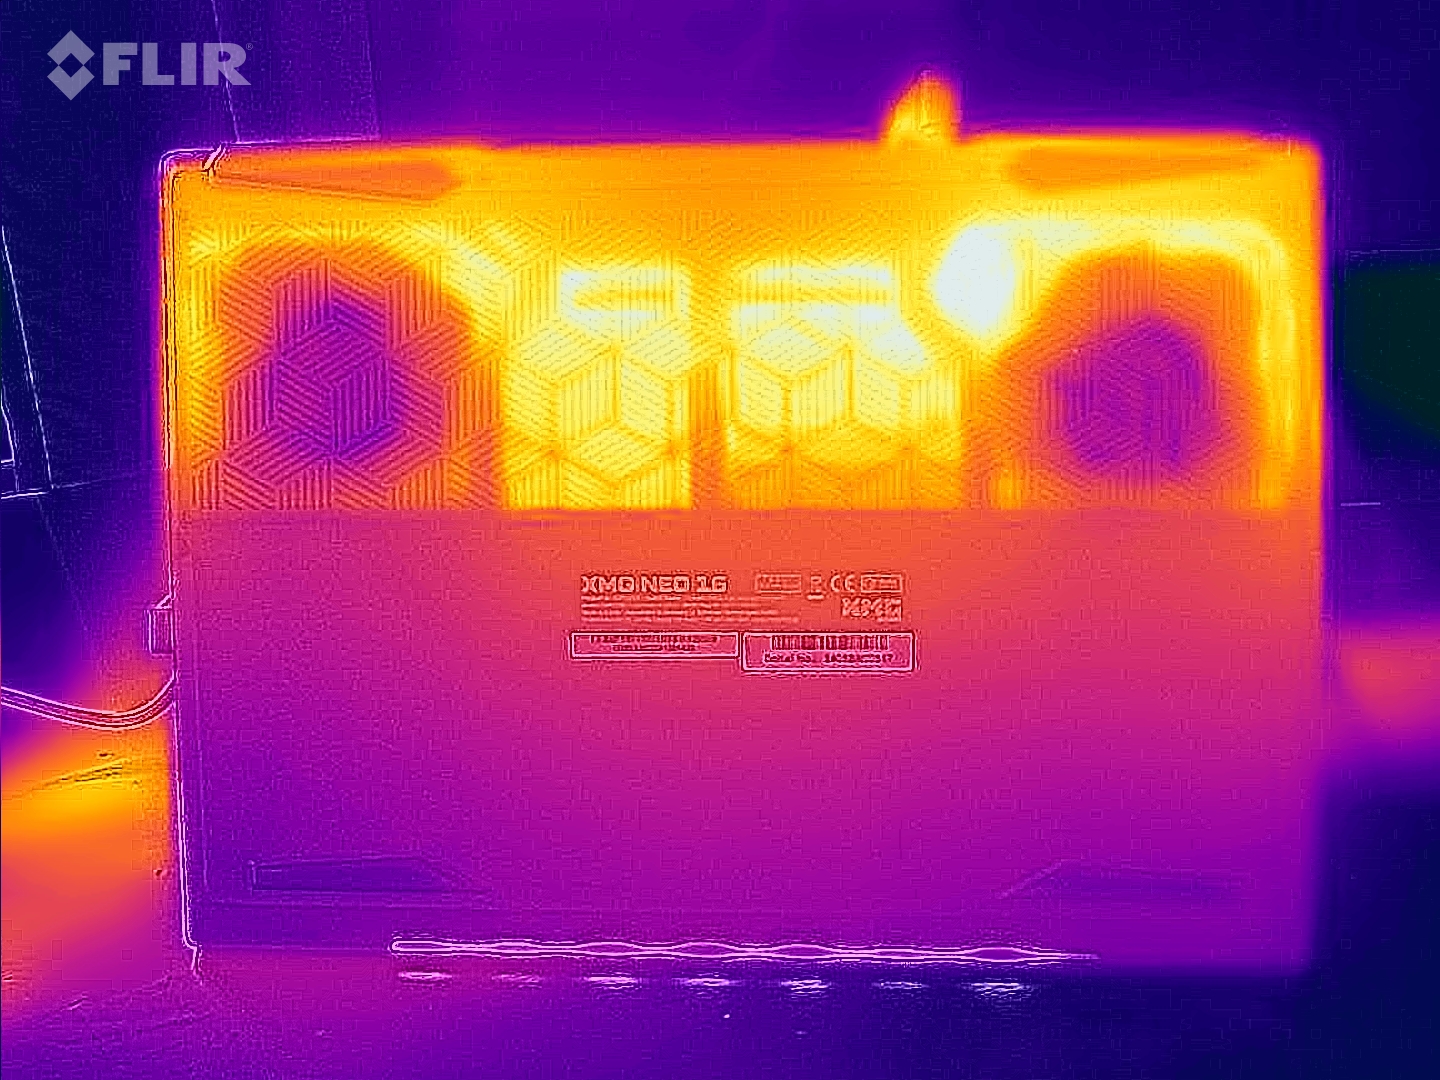
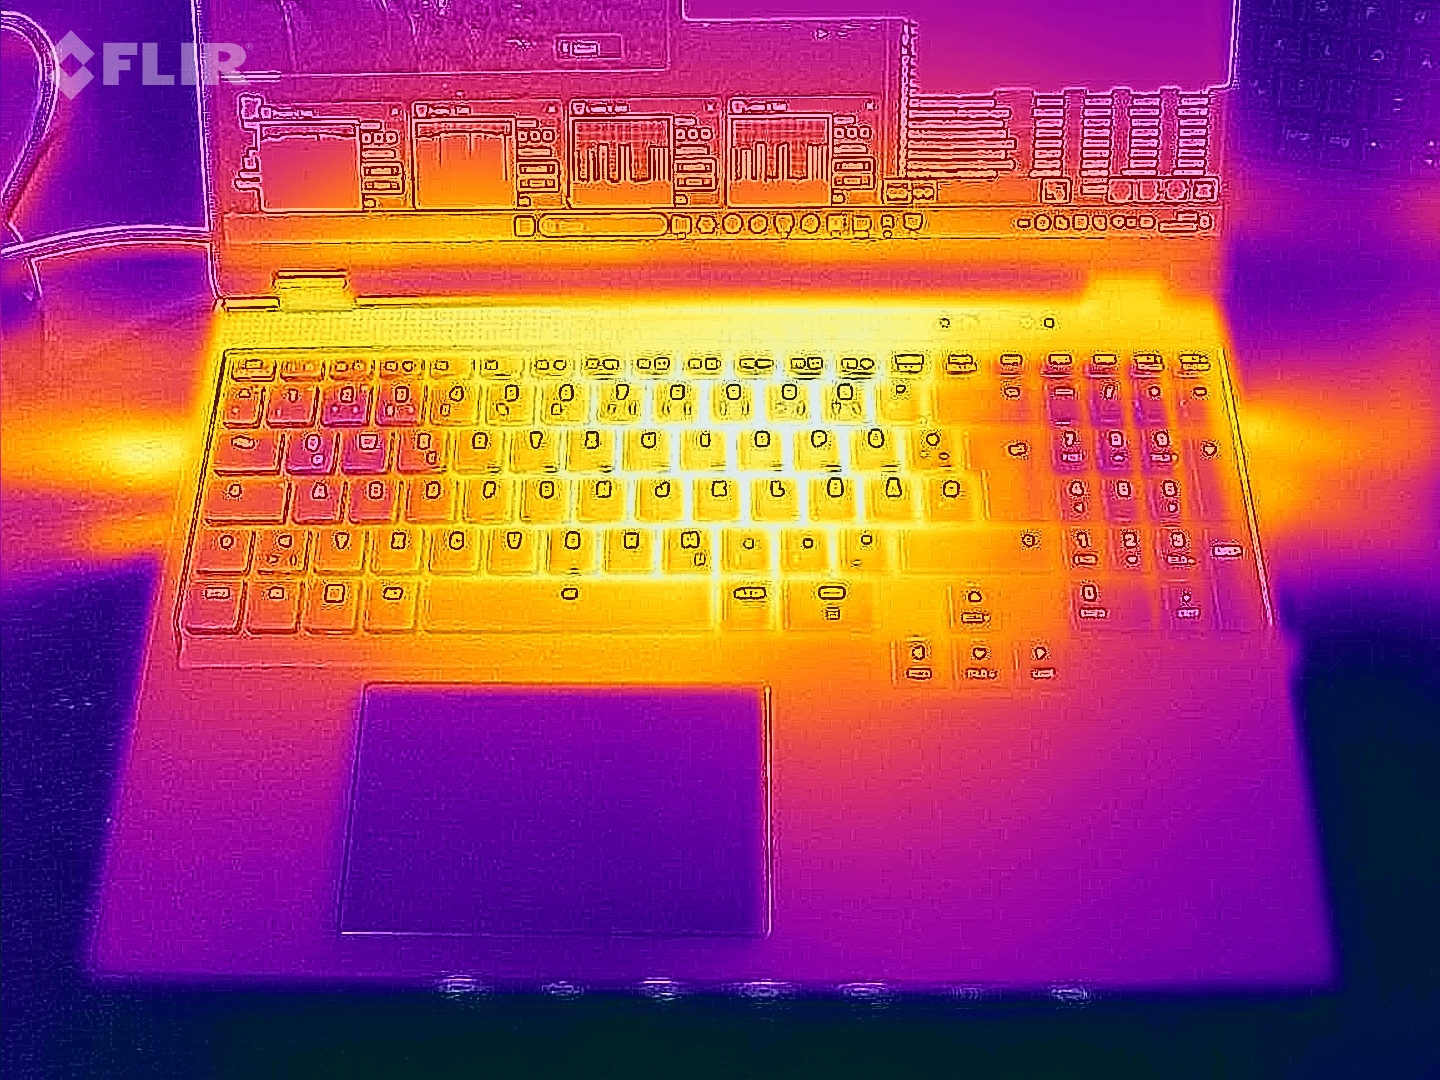
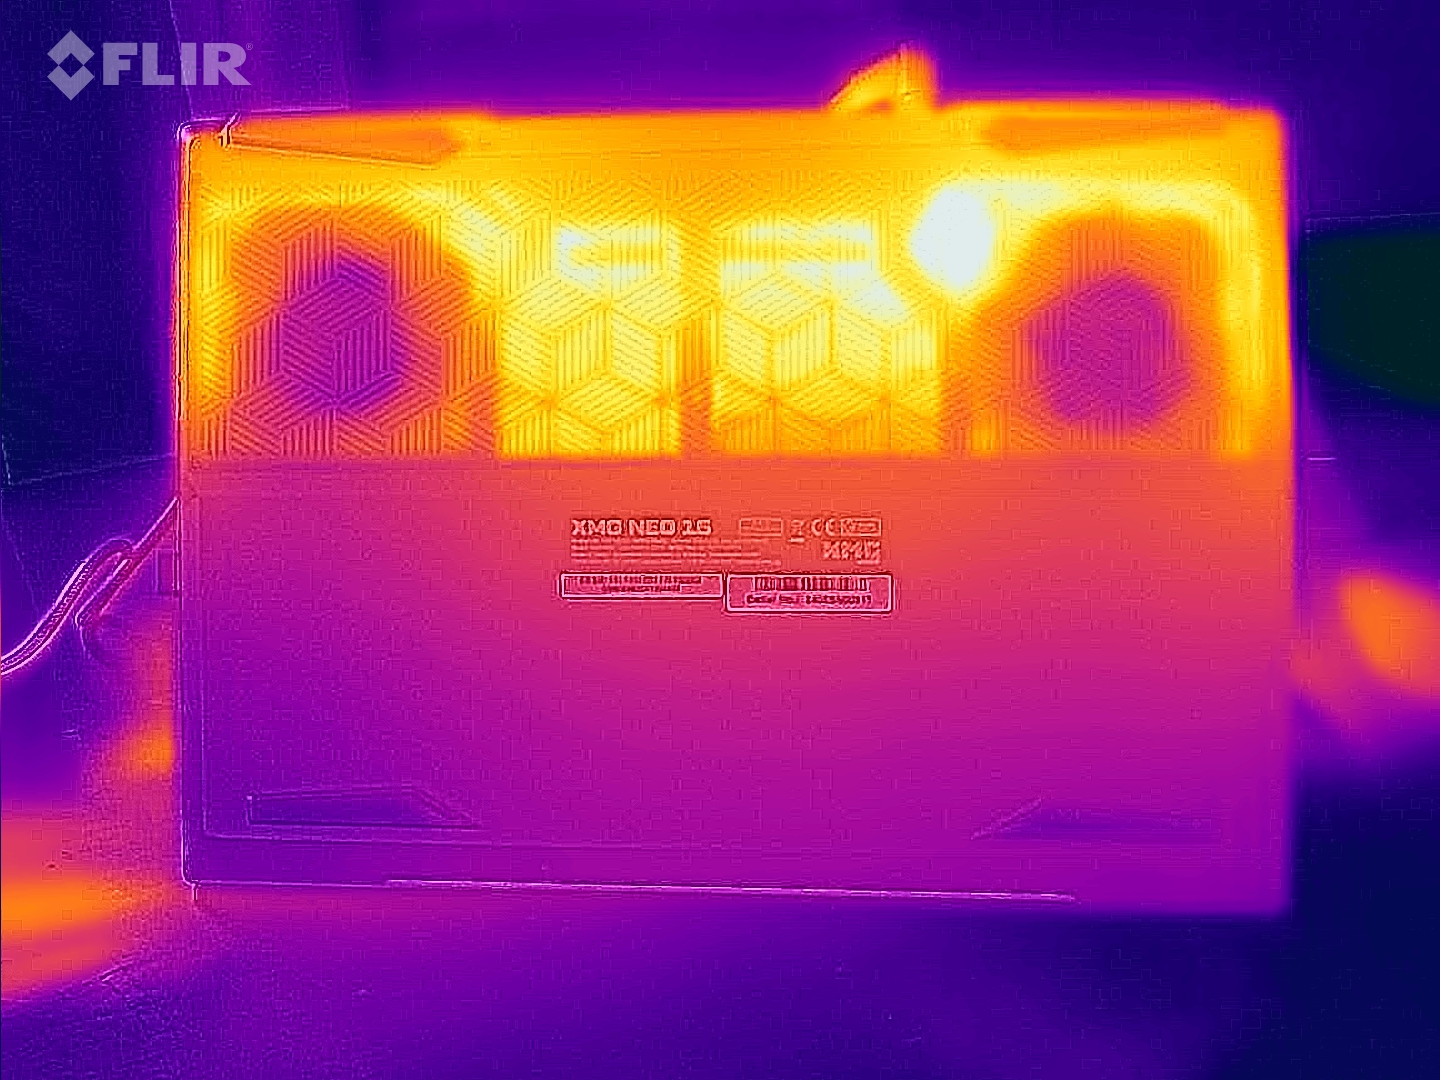
Temperatura
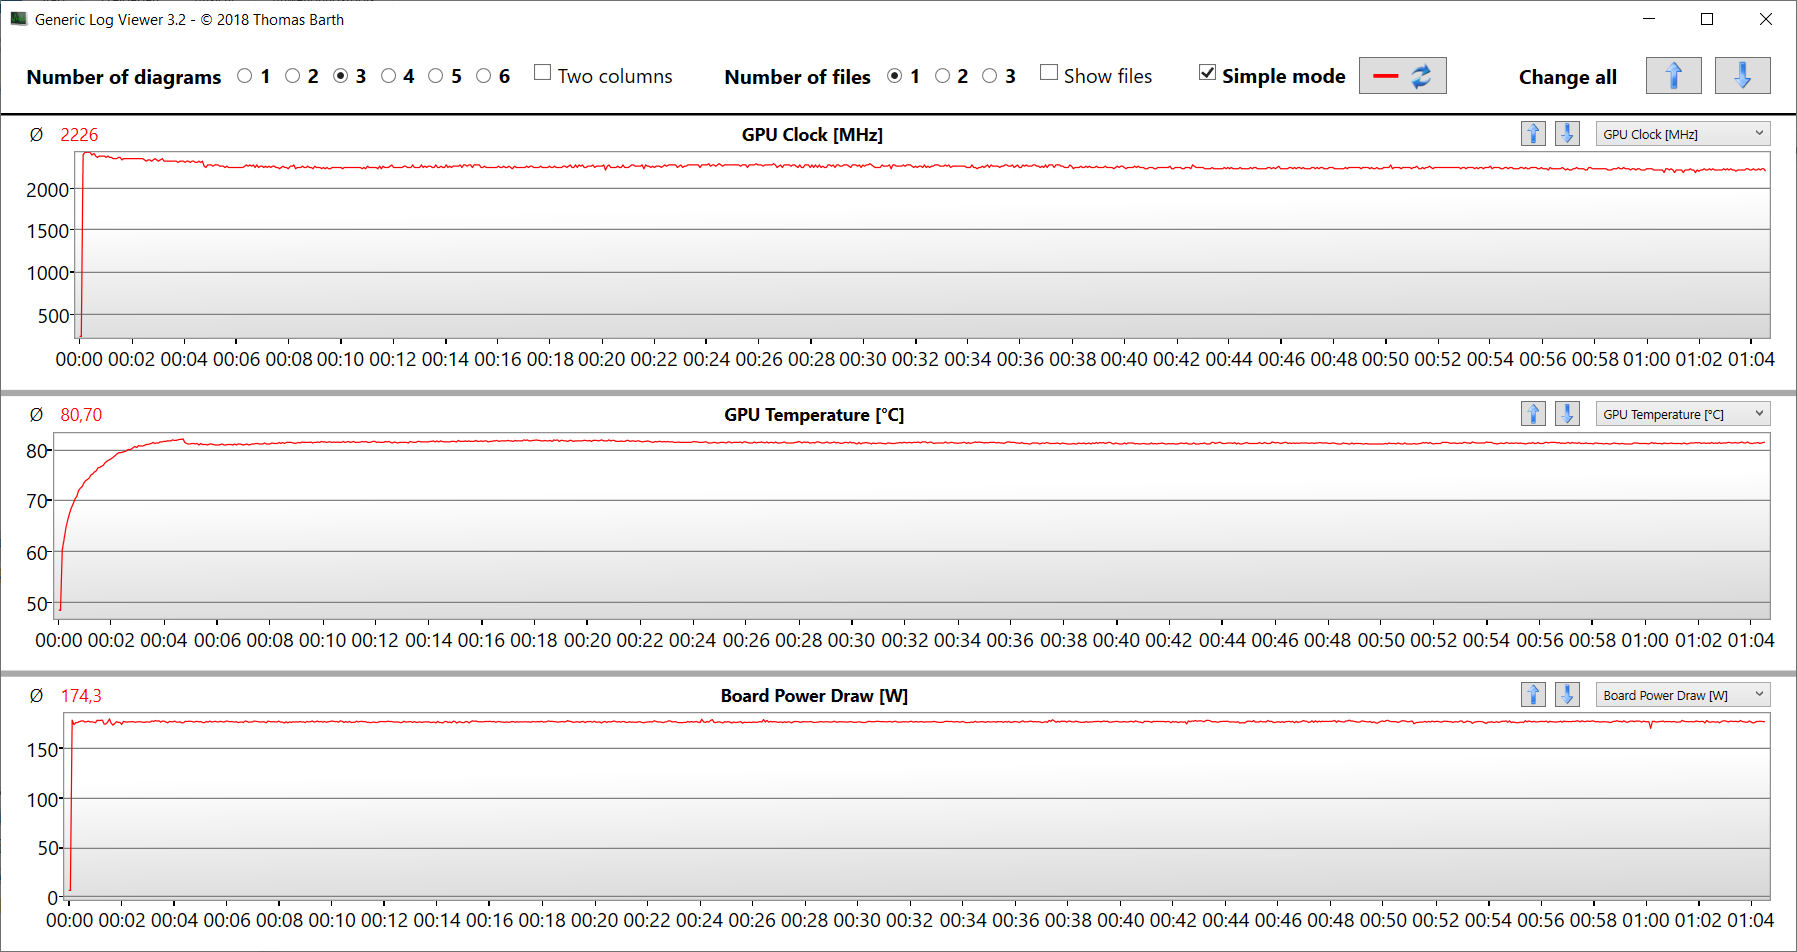
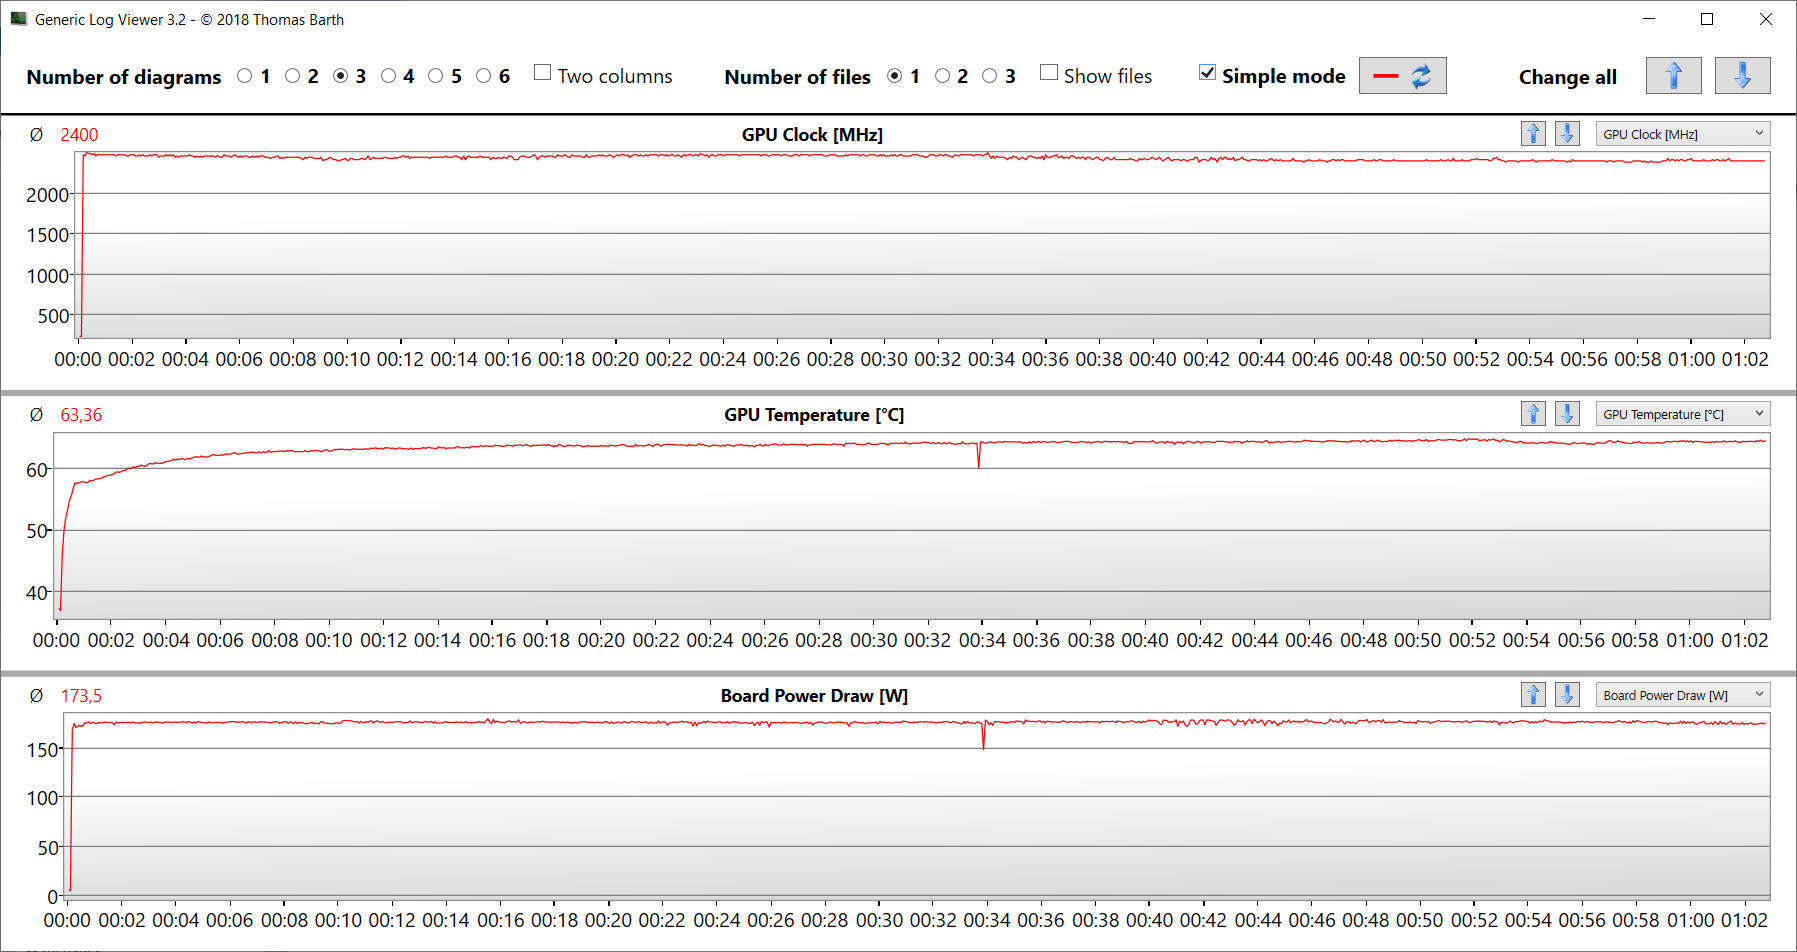
O laptop aquece visivelmente sob carga (teste de estresse e teste Witcher 3 ): Em algumas áreas, as temperaturas às vezes atingem mais de 50 °C. No entanto, no apoio para as mãos, as temperaturas permanecem em um nível moderado. No uso diário (escritório, Internet), os números ficam na zona verde.
O teste Witcher 3 destaca o efeito do resfriamento a água opcional: A temperatura da GPU difere em cerca de 17 °C (80,7 °C vs. 63,4 °C).
(-) A temperatura máxima no lado superior é 47 °C / 117 F, em comparação com a média de 40.4 °C / 105 F , variando de 21.2 a 68.8 °C para a classe Gaming.
(-) A parte inferior aquece até um máximo de 56 °C / 133 F, em comparação com a média de 43.2 °C / 110 F
(+) Em uso inativo, a temperatura média para o lado superior é 26 °C / 79 F, em comparação com a média do dispositivo de 33.9 °C / ### class_avg_f### F.
(-) Jogando The Witcher 3, a temperatura média para o lado superior é 42.4 °C / 108 F, em comparação com a média do dispositivo de 33.9 °C / ## #class_avg_f### F.
(+) Os apoios para as mãos e o touchpad estão atingindo a temperatura máxima da pele (35 °C / 95 F) e, portanto, não estão quentes.
(-) A temperatura média da área do apoio para as mãos de dispositivos semelhantes foi 28.9 °C / 84 F (-6.1 °C / -11 F).
| SCHENKER XMG Neo 16 (Early 24) Intel Core i9-14900HX, NVIDIA GeForce RTX 4090 Laptop GPU | Razer Blade 16 2024, RTX 4090 Intel Core i9-14900HX, NVIDIA GeForce RTX 4090 Laptop GPU | Medion Erazer Beast X40 2024 Intel Core i9-14900HX, NVIDIA GeForce RTX 4090 Laptop GPU | Asus ROG Strix Scar 17 G733PYV-LL053X AMD Ryzen 9 7945HX3D, NVIDIA GeForce RTX 4090 Laptop GPU | SCHENKER XMG Neo 16 E23 Intel Core i9-13900HX, NVIDIA GeForce RTX 4090 Laptop GPU | |
|---|---|---|---|---|---|
| Heat | 2% | -7% | 8% | 1% | |
| Maximum Upper Side * | 47 | 45 4% | 47 -0% | 40.1 15% | 50 -6% |
| Maximum Bottom * | 56 | 45 20% | 54 4% | 46.7 17% | 51 9% |
| Idle Upper Side * | 27 | 29 -7% | 30 -11% | 26.5 2% | 28 -4% |
| Idle Bottom * | 27 | 30 -11% | 32 -19% | 27.7 -3% | 26 4% |
* ... menor é melhor
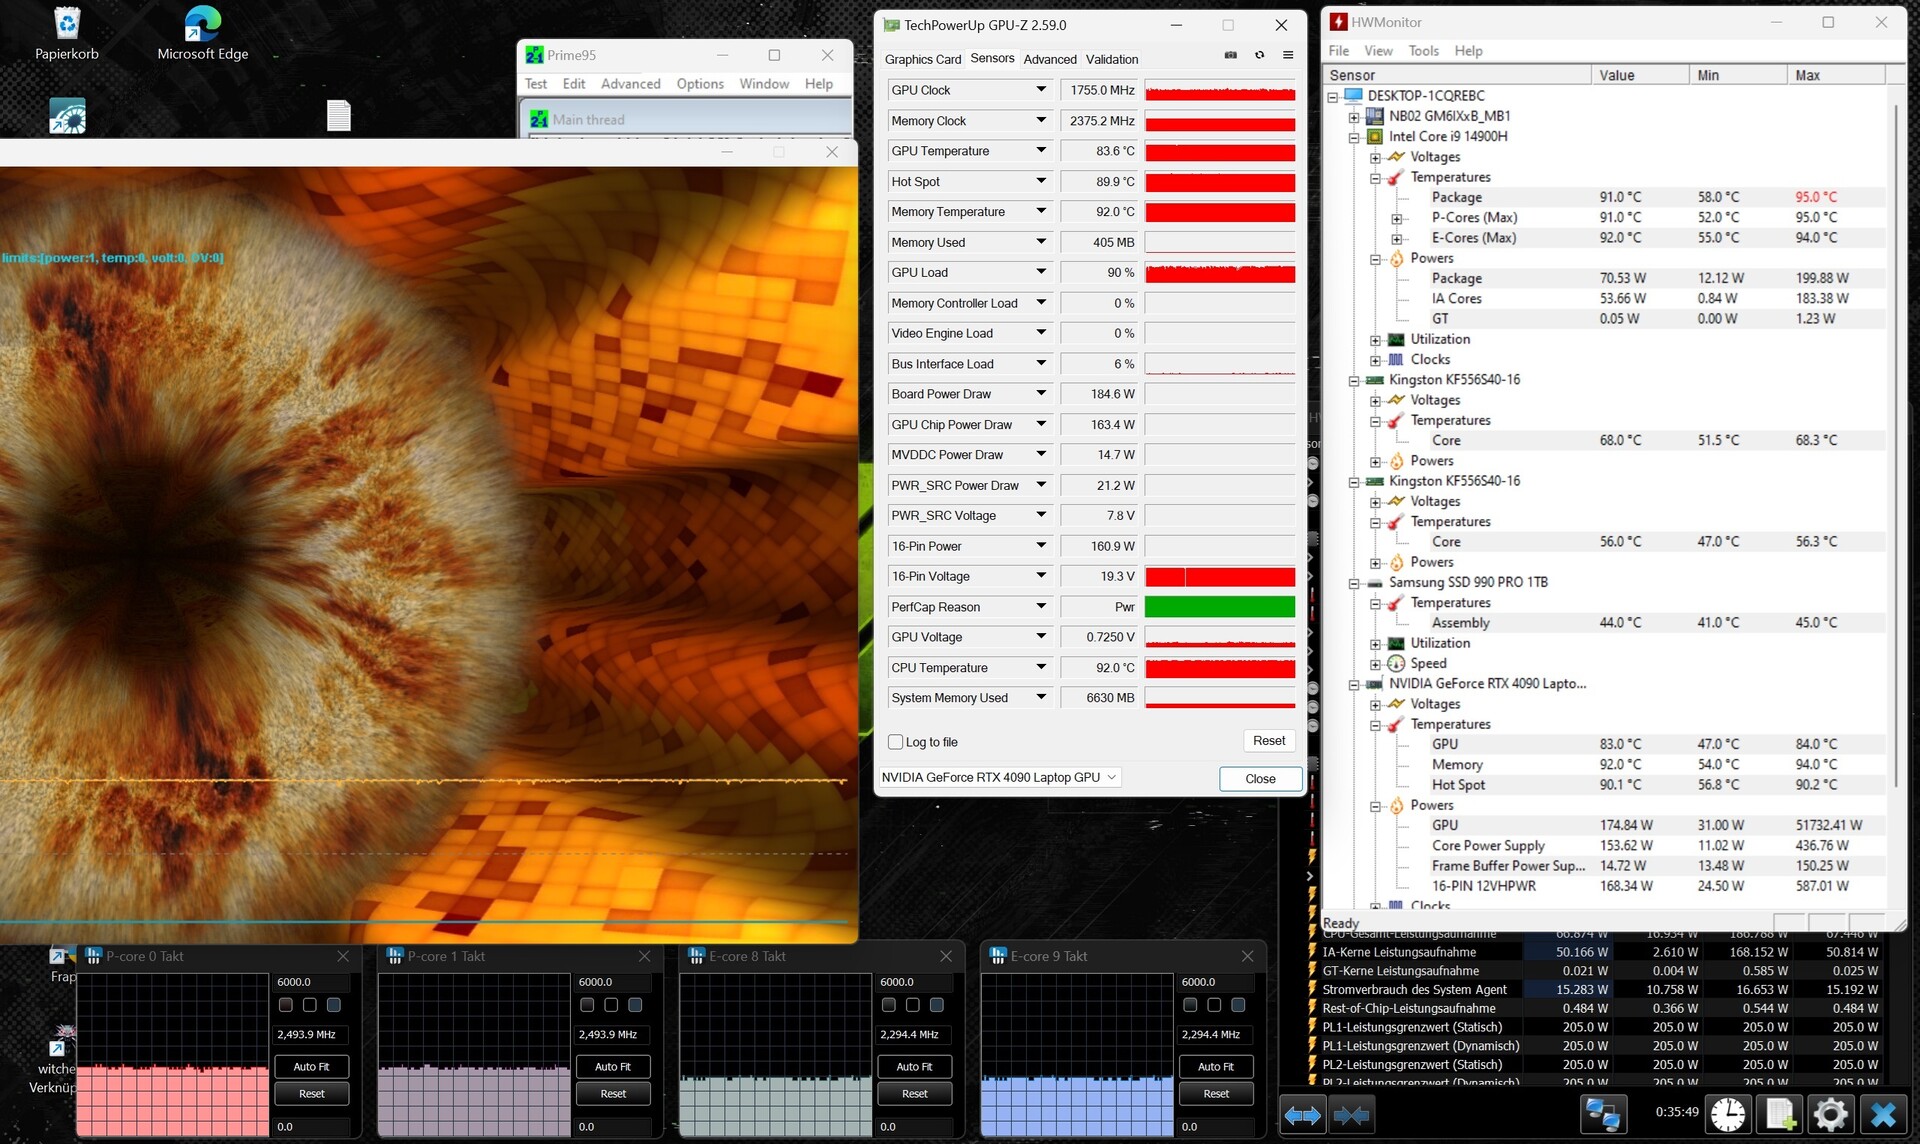
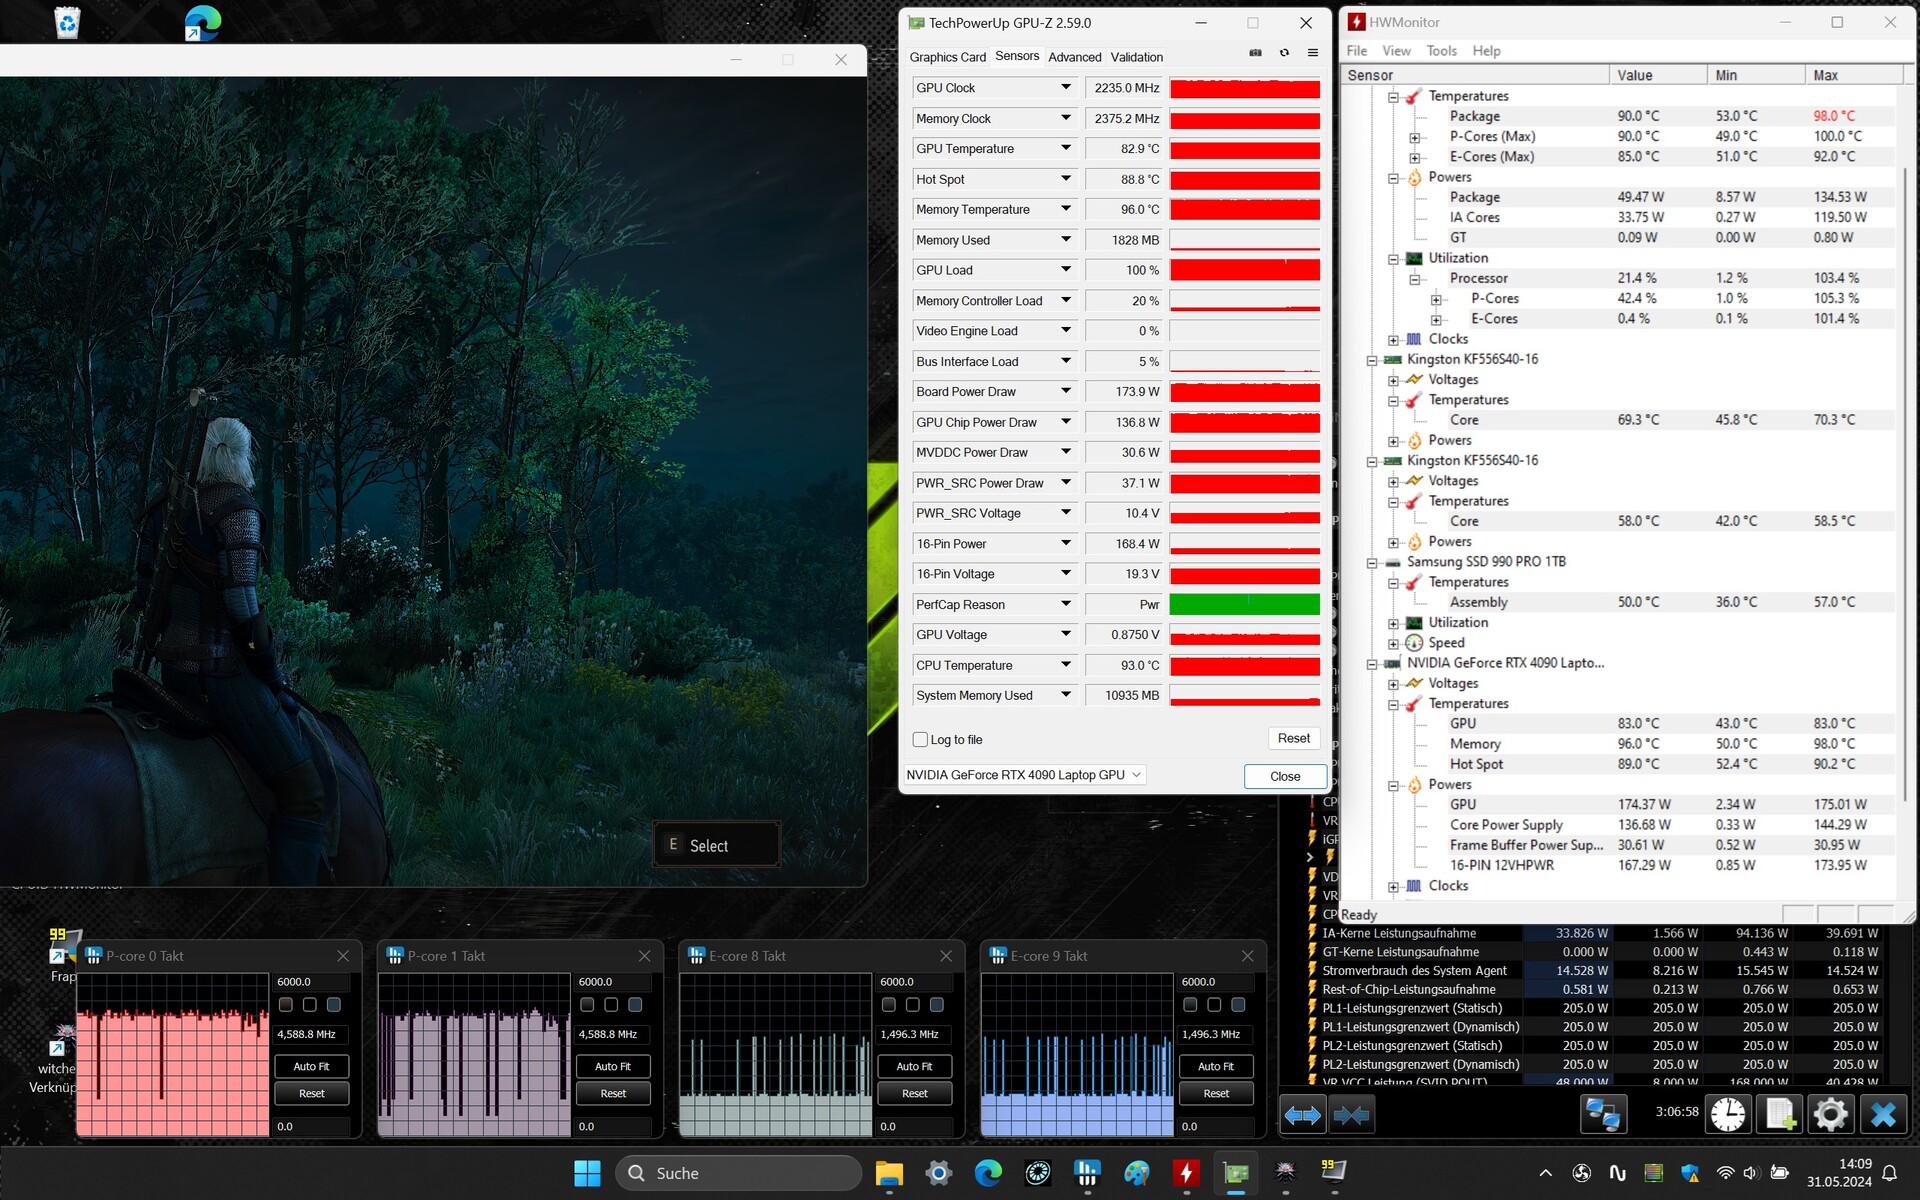
Teste de estresse
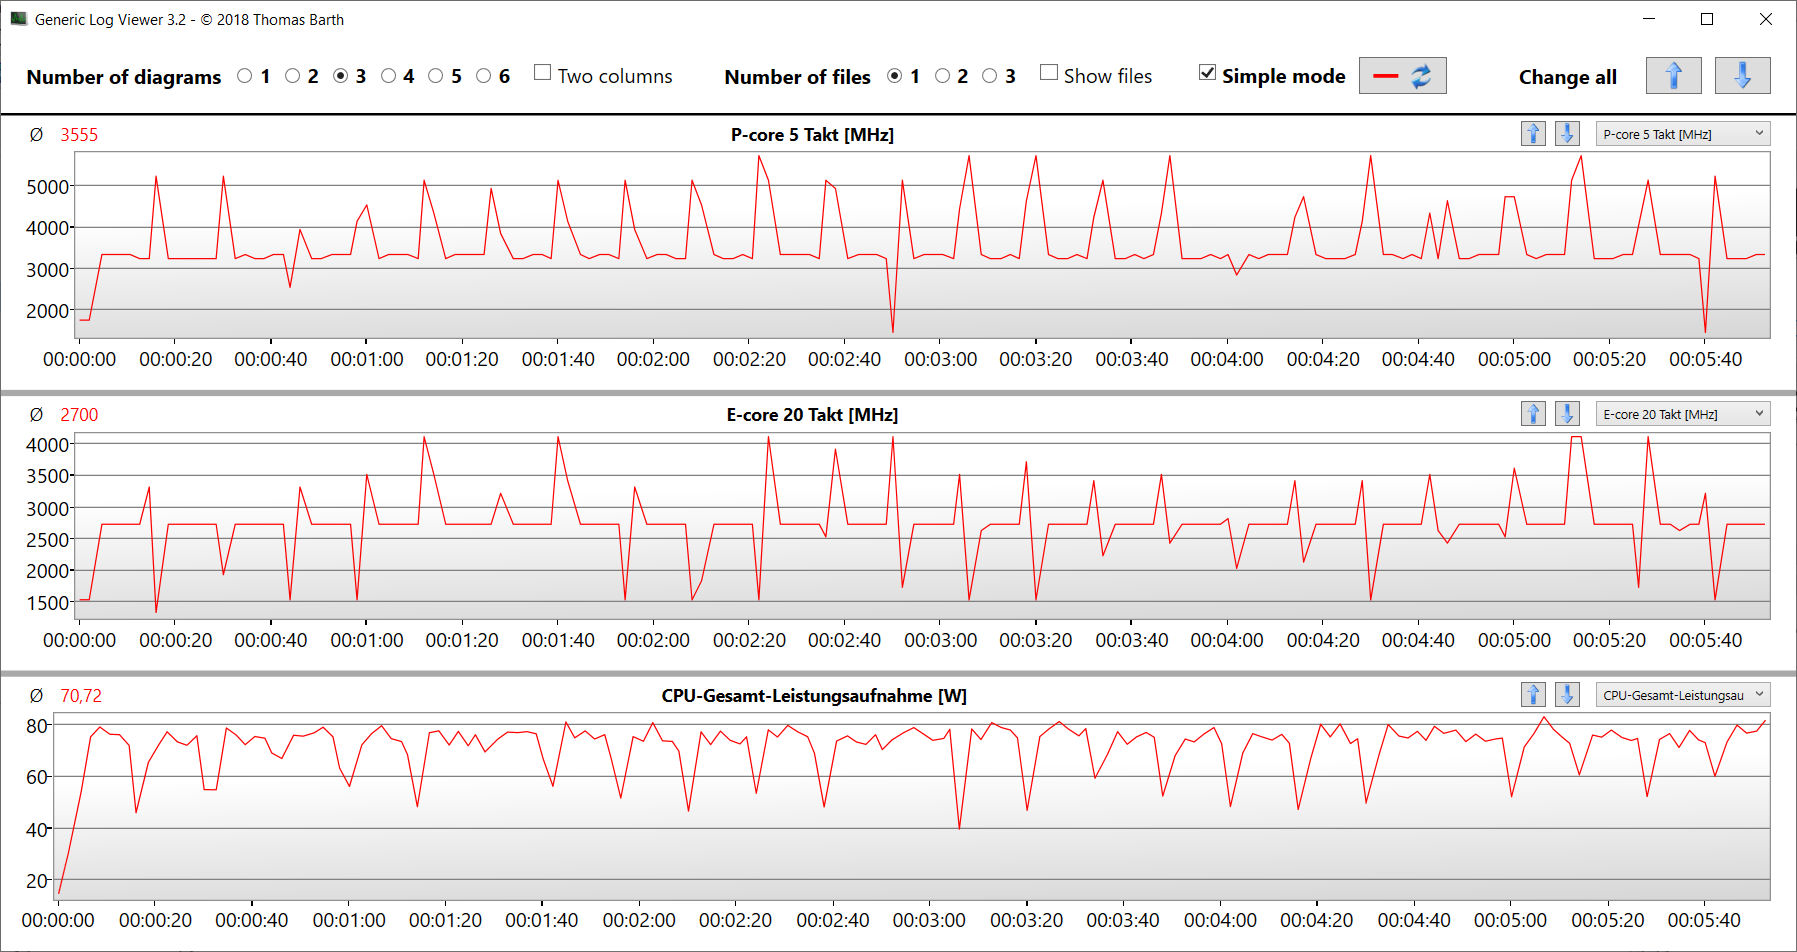
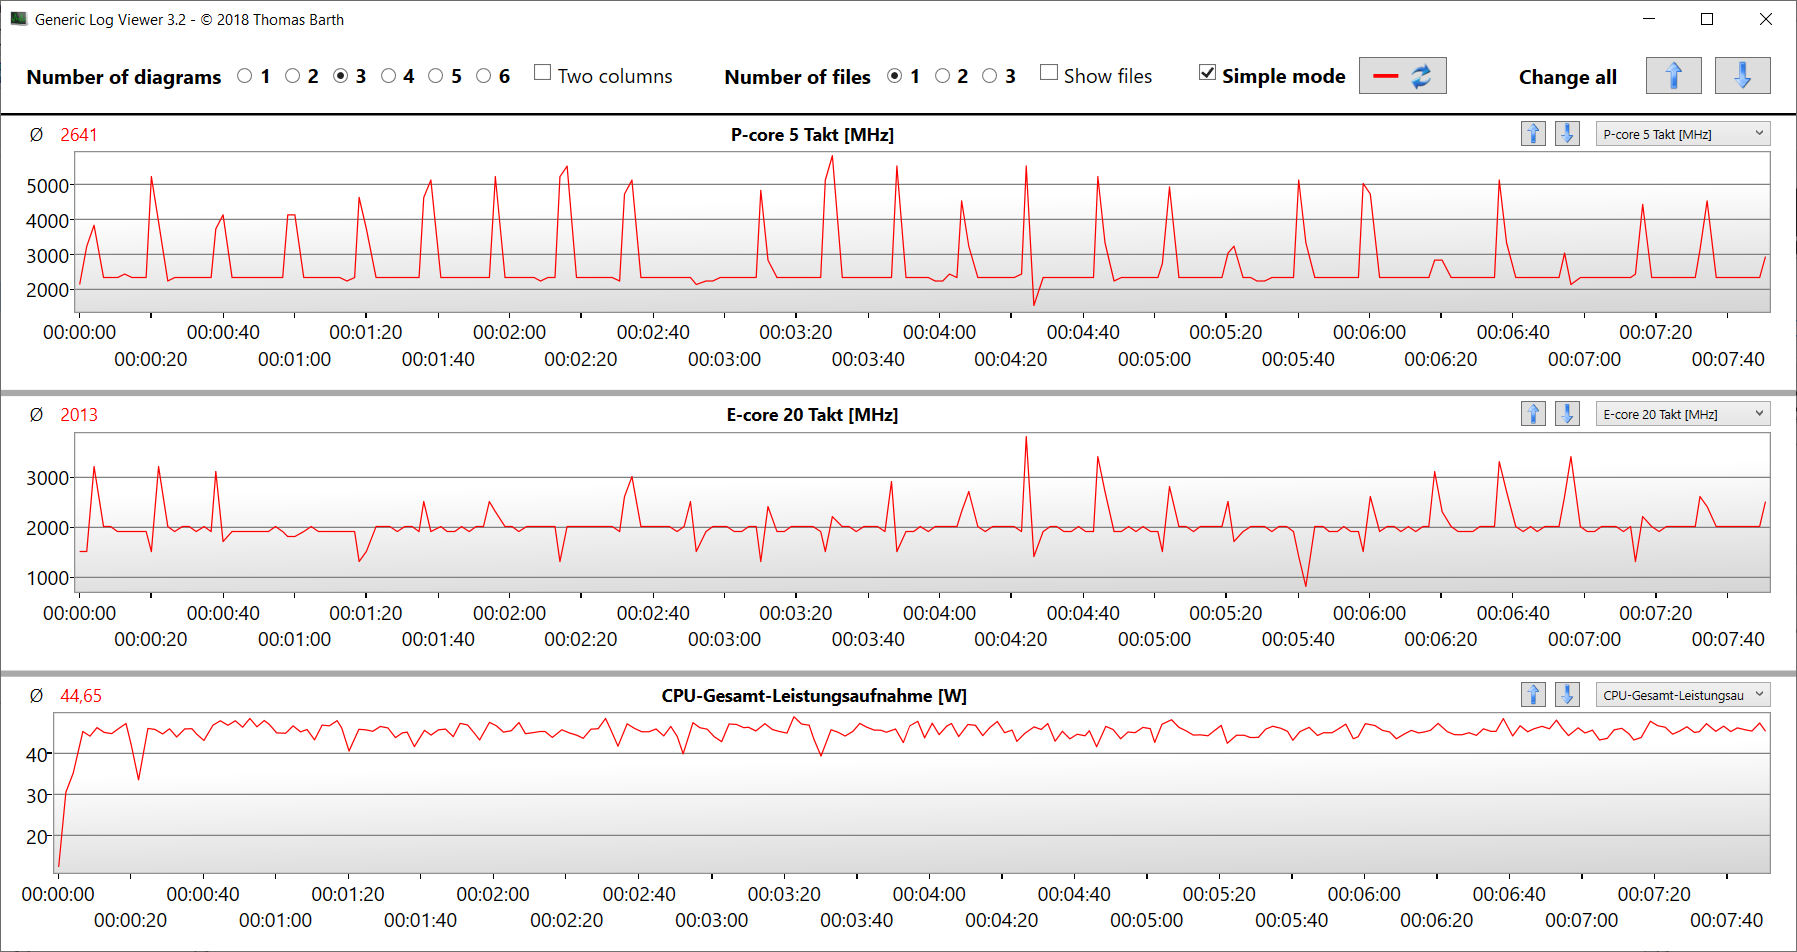
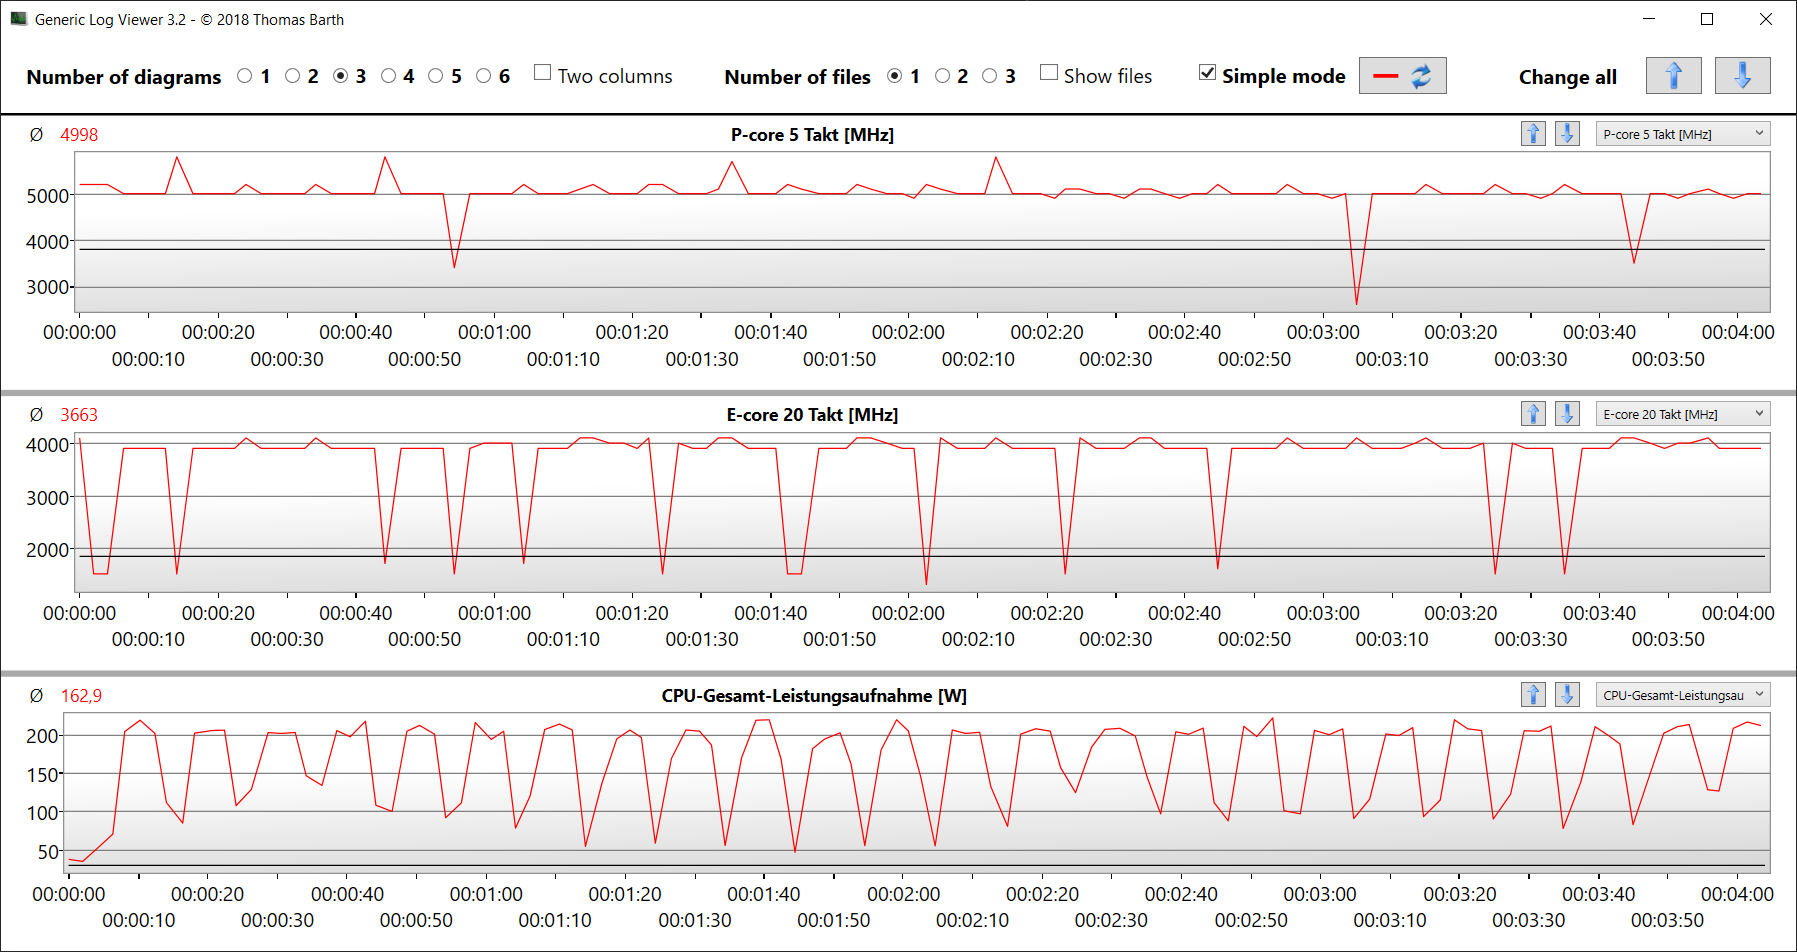
O cenário extremo do teste de estresse (Prime95 e Furmark em operação contínua) verifica a estabilidade do sistema sob carga total. A velocidade da CPU cai no primeiro minuto do teste de cerca de 4,3 a 4,5 GHz (P) e de 3,5 a 3,6 GHz (E) para 2,5 GHz (P) e 2,3 GHz (E). Ao mesmo tempo, a velocidade da GPU aumenta de um ponto inicial de 1.600 MHz para mais de 2.000 MHz.
Alto-falantes
Os alto-falantes estéreo não têm graves. Além disso, a maioria produz um som decente. É possível obter melhor qualidade usando fones de ouvido ou alto-falantes externos.
SCHENKER XMG Neo 16 (Early 24) análise de áudio
(+) | os alto-falantes podem tocar relativamente alto (###valor### dB)
Graves 100 - 315Hz
(-) | quase nenhum baixo - em média 16.3% menor que a mediana
(±) | a linearidade dos graves é média (8.6% delta para a frequência anterior)
Médios 400 - 2.000 Hz
(+) | médios equilibrados - apenas 3% longe da mediana
(+) | médios são lineares (3.6% delta para frequência anterior)
Altos 2 - 16 kHz
(+) | agudos equilibrados - apenas 2.5% longe da mediana
(+) | os máximos são lineares (4.9% delta da frequência anterior)
Geral 100 - 16.000 Hz
(+) | o som geral é linear (12.4% diferença em relação à mediana)
Comparado com a mesma classe
» 14% de todos os dispositivos testados nesta classe foram melhores, 3% semelhantes, 83% piores
» O melhor teve um delta de 6%, a média foi 18%, o pior foi 132%
Comparado com todos os dispositivos testados
» 9% de todos os dispositivos testados foram melhores, 2% semelhantes, 89% piores
» O melhor teve um delta de 4%, a média foi 24%, o pior foi 134%
Razer Blade 16 2024, RTX 4090 análise de áudio
(±) | o volume do alto-falante é médio, mas bom (###valor### dB)
Graves 100 - 315Hz
(±) | graves reduzidos - em média 8.2% menor que a mediana
(±) | a linearidade dos graves é média (7.4% delta para a frequência anterior)
Médios 400 - 2.000 Hz
(+) | médios equilibrados - apenas 3.3% longe da mediana
(+) | médios são lineares (5.9% delta para frequência anterior)
Altos 2 - 16 kHz
(+) | agudos equilibrados - apenas 1.6% longe da mediana
(+) | os máximos são lineares (3.1% delta da frequência anterior)
Geral 100 - 16.000 Hz
(+) | o som geral é linear (9.2% diferença em relação à mediana)
Comparado com a mesma classe
» 3% de todos os dispositivos testados nesta classe foram melhores, 1% semelhantes, 96% piores
» O melhor teve um delta de 6%, a média foi 18%, o pior foi 132%
Comparado com todos os dispositivos testados
» 3% de todos os dispositivos testados foram melhores, 1% semelhantes, 97% piores
» O melhor teve um delta de 4%, a média foi 24%, o pior foi 134%
Gerenciamento de energia - O Schenker Neo oferece uma duração de bateria decente
Consumo de energia
O consumo de energia está em um nível normal para o hardware instalado que temos aqui. O teste Witcher 3 e o teste de estresse foram executados com um consumo de energia ligeiramente menor. A PSU (330 watts) tem o tamanho adequado.
| desligado | |
| Ocioso | |
| Carga |
|
Key:
min: | |
| SCHENKER XMG Neo 16 (Early 24) i9-14900HX, NVIDIA GeForce RTX 4090 Laptop GPU, Samsung 990 Pro 1 TB, IPS, 2560x1600, 16" | Razer Blade 16 2024, RTX 4090 i9-14900HX, NVIDIA GeForce RTX 4090 Laptop GPU, Samsung PM9A1 MZVL22T0HBLB, OLED, 2560x1600, 16" | Medion Erazer Beast X40 2024 i9-14900HX, NVIDIA GeForce RTX 4090 Laptop GPU, Phison E18-1TB-PHISON-SSD-BICS5, IPS, 2560x1600, 17" | Asus ROG Strix Scar 17 G733PYV-LL053X R9 7945HX3D, NVIDIA GeForce RTX 4090 Laptop GPU, SK hynix PC801 HFS001TEJ9X101N, IPS, 2560x1440, 17.3" | SCHENKER XMG Neo 16 E23 i9-13900HX, NVIDIA GeForce RTX 4090 Laptop GPU, Crucial P5 Plus 1TB CT1000P5PSSD8, IPS, 2560x1600, 16" | Média da turma Gaming | |
|---|---|---|---|---|---|---|
| Power Consumption | -22% | -1% | -23% | -9% | -16% | |
| Idle Minimum * | 6 | 16.9 -182% | 7 -17% | 15.4 -157% | 8 -33% | 13.4 ? -123% |
| Idle Average * | 16 | 17.8 -11% | 15 6% | 21.6 -35% | 18 -13% | 18.9 ? -18% |
| Idle Maximum * | 28 | 19.6 30% | 33 -18% | 22.2 21% | 28 -0% | 26.3 ? 6% |
| Load Average * | 130 | 128 2% | 134 -3% | 116.7 10% | 133 -2% | 102.7 ? 21% |
| Witcher 3 ultra * | 302 | 243 20% | 280 7% | 262 13% | 294 3% | |
| Load Maximum * | 361 | 328 9% | 294 19% | 327.1 9% | 399 -11% | 244 ? 32% |
| Cyberpunk 2077 ultra external monitor * | 272 |
* ... menor é melhor
Power consumption Witcher 3 / stress test
Power consumption with an external monitor
Duração da bateria
Nos testes de Wi-Fi e vídeo (carregamento de sites com a ajuda de um script, bem como o vídeo curto Big Buck Bunny (codificação H.264, FHD) em um loop), a máquina de 16 polegadas alcançou tempos de execução de 5 horas e 50 minutos e 6 horas e 58 minutos. Em suma, esses são números decentes.
| SCHENKER XMG Neo 16 (Early 24) i9-14900HX, NVIDIA GeForce RTX 4090 Laptop GPU, 99.8 Wh | Razer Blade 16 2024, RTX 4090 i9-14900HX, NVIDIA GeForce RTX 4090 Laptop GPU, 95.2 Wh | Medion Erazer Beast X40 2024 i9-14900HX, NVIDIA GeForce RTX 4090 Laptop GPU, 99.8 Wh | Asus ROG Strix Scar 17 G733PYV-LL053X R9 7945HX3D, NVIDIA GeForce RTX 4090 Laptop GPU, 90 Wh | SCHENKER XMG Neo 16 E23 i9-13900HX, NVIDIA GeForce RTX 4090 Laptop GPU, 99 Wh | Média da turma Gaming | |
|---|---|---|---|---|---|---|
| Duração da bateria | -11% | 7% | -34% | -2% | -4% | |
| Reader / Idle | 600 | 585 ? -2% | ||||
| H.264 | 418 | 456 9% | 302 -28% | 349 -17% | 447 ? 7% | |
| WiFi v1.3 | 350 | 329 -6% | 374 7% | 287 -18% | 399 14% | 387 ? 11% |
| Load | 122 | 79 -35% | 55 -55% | 84.5 ? -31% | ||
| Witcher 3 ultra | 84 | 74.7 ? |
Pro
Contra
Veredicto - Uma bola de fogo de alta qualidade

O Neo 16 cumpre o que promete: O hardware (Core i9, RTX 4090) da extremidade superior da escala de desempenho permite edição de vídeo, renderização, streaming e, é claro, jogos em QHD. As altas emissões esperadas podem ser reduzidas a um nível mais moderado ao selecionar o modo de desempenho apropriado.
Com o XMG Neo 16 (Early 24), a Schenker oferece muita potência em um formato compacto.
Quem estiver procurando uma solução sem compromisso terá que optar pelo resfriamento externo a água disponível como opcional (US$ 230): Isso ajuda a obter um pequeno aumento no desempenho e a reduzir as emissões. Dito isso, o laptop fica preso a um local fixo.
A tela fosca, de 16 polegadas, 16:10 (2.560 x 1.600 pixels, sRGB, IPS, 240 Hz) causou uma boa impressão, sendo o alto brilho um ponto particularmente agradável. Há espaço para melhorias no que diz respeito ao contraste, bem como à cobertura do espaço de cores. Dois slots de SSD (PCIe 4), incluindo suporte a RAID 0/1, permitem uma grande quantidade de espaço de armazenamento e tempos de carregamento curtos.
Uma única carga de bateria (99,8 Wh) é suficiente para tempos de execução reais de cerca de 6 a 7 horas - números decentes. Ponto positivo: A bateria pode ser carregada por meio de um carregador USB-C (100 watts, 20 V, 5 A) - a porta TB4 é compatível com Power Delivery, o que significa que a PSU (330 watts) poderia, teoricamente, ficar em casa.
Uma alternativa poderia ser o Razer Blade 16 (2024). Esse computador oferece um pouco menos de potência de computação, mas, ao contrário do Neo, oferece maior contraste e uma tela OLED mais vívida.
Preço e disponibilidade
O XMG Neo 16 (Early 24) pode ser configurado e adquirido individualmente na loja on-line da Schenker (em alemão) e os preços representam a taxa de câmbio dólar/euro no momento do teste. Nosso modelo de análise custa cerca de US$ 4.000. Os modelos de nível básico (com uma RTX 4060) começam em cerca de US$ 2.000. A Schenker declarou que sua disponibilidade será no final de junho (RTX 4090) e em meados de julho (RTX 4060/70/80). O resfriamento a água opcional custará cerca de US$ 230.
SCHENKER XMG Neo 16 (Early 24)
- 06/19/2024 v8
Sascha Mölck
 Total Sustainability Score:
 Transparência
A seleção dos dispositivos a serem analisados é feita pela nossa equipe editorial. A amostra de teste foi fornecida ao autor como empréstimo pelo fabricante ou varejista para fins desta revisão. O credor não teve influência nesta revisão, nem o fabricante recebeu uma cópia desta revisão antes da publicação. Não houve obrigação de publicar esta revisão. Nunca aceitamos compensação ou pagamento em troca de nossas avaliações. Como empresa de mídia independente, a Notebookcheck não está sujeita à autoridade de fabricantes, varejistas ou editores.
É assim que o Notebookcheck está testando
Todos os anos, o Notebookcheck analisa de forma independente centenas de laptops e smartphones usando procedimentos padronizados para garantir que todos os resultados sejam comparáveis. Desenvolvemos continuamente nossos métodos de teste há cerca de 20 anos e definimos padrões da indústria no processo. Em nossos laboratórios de teste, equipamentos de medição de alta qualidade são utilizados por técnicos e editores experientes. Esses testes envolvem um processo de validação em vários estágios. Nosso complexo sistema de classificação é baseado em centenas de medições e benchmarks bem fundamentados, o que mantém a objetividade.Price comparison

