

Análise do conversível MSI Summit E13 AI Evo: Problemas sérios de aceleração com o Core Ultra 7
Rápido demais para ser manuseado.
O mais recente Summit E13 A1MTG mostra o que acontece quando o senhor coloca uma CPU Core Ultra-H em um laptop originalmente projetado para um processador da série Core-U. Pode parecer muito rápido no papel, mas os níveis de estrangulamento e temperatura subsequentes precisam de atenção.Allen Ngo, 👁 Allen Ngo (traduzido por DeepL / Ninh Duy) Publicado 🇺🇸 🇫🇷 ...
Veredicto - Um passo à frente e dois passos atrás
O Summit E13 AI Evo A1MTG pode parecer um downgrade quando comparado ao seu antecessor. Ele parece bom no papel com sua CPU Core Ultra H, mas, na prática, o processador é muito mais rápido e agudo do que a maioria dos outros notebooks com a mesma opção de CPU, pois o Summit E13 foi originalmente projetado para processadores ULV Core série U. O modelo mais novo é certamente mais rápido do que a versão original de 2021, mas a diferença não é tão grande quanto poderia ter sido, dada a nossa experiência com outros notebooks Core Ultra H, como o Framework Laptop 13.5. Aspectos como a duração da bateria e a temperatura do núcleo também sofrem com a mudança do processador.
Outras mudanças decepcionantes incluem menos portas USB-C e a remoção do leitor de MicroSD. Até mesmo a tela IPS básica foi reduzida de 120 Hz para apenas 60 Hz, sem melhorias nos lentos tempos de resposta em preto e branco.
Talvez seja hora de redesenhar o chassi, agora que o Summit E13 está chegando aos quatro anos de idade. O processador Core Ultra-H ajuda a separar o modelo da MSI de outros conversíveis de 13 polegadas, mas sua implementação poderia ter sido melhorada com o aprimoramento da solução de resfriamento para suportar as demandas mais altas da CPU. As temperaturas mais altas do que a média e o ruído da ventoinha indicam que a solução de resfriamento está lutando para manter o novo processador à tona.
Pro
Contra
Preço e disponibilidade
Atualmente, a Amazon está oferecendo o Summit E13 AI Evo com Core Ultra 7, 16 GB de RAM LPDDR5 e SSD de 1 TB, conforme analisado, por US$ 1100.
Possíveis concorrentes em comparação
Imagem | Modelo / Análises | Preço | Peso | Altura | Tela |
|---|---|---|---|---|---|
1. 78.6% 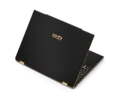 | MSI Summit E13 AI Evo A1MTG Intel Core Ultra 7 155H ⎘ Intel Arc 8-Core iGPU ⎘ 16 GB Memória, 1024 GB SSD | Amazon: $1,099.00 Preço de tabela: 1100 USD | 1.3 kg | 16.2 mm | 13.30" 1920x1200 170 PPI IPS |
2. 86.9% v7 (old)  | MSI Summit E13 Flip Evo A11MT Intel Core i7-1185G7 ⎘ Intel Iris Xe Graphics G7 96EUs ⎘ 32 GB Memória, 1024 GB SSD | Amazon: 1. $969.99 MSI Summit E13 Flip Evo (202... 2. $899.00 MSI Summit E13 Flip Evo Prof... 3. $1,599.00 MSI Summit E13 Flip Evo Busi... Preço de tabela: 1900 USD | 1.4 kg | 14.9 mm | 13.40" 1920x1200 169 PPI IPS |
3. 87% v7 (old)  | Lenovo Yoga Book 9 13IMU9 Intel Core Ultra 7 155U ⎘ Intel Graphics 4-Core iGPU (Arc) ⎘ 16 GB Memória | Amazon: $1,699.00 Preço de tabela: 2000 USD | 1.4 kg | 15.95 mm | 13.30" 2880x1800 255 PPI OLED |
4. 88.1% v7 (old)  | Lenovo ThinkPad L13 Yoga G4 i7-1355U Intel Core i7-1355U ⎘ Intel Iris Xe Graphics G7 96EUs ⎘ 16 GB Memória, 512 GB SSD | Amazon: 1. $899.98 Lenovo ThinkPad T14 Gen 5 Bu... 2. $1,369.00 Lenovo ThinkPad T14 G4 Home ... 3. $649.00 Lenovo - ThinkPad L13 Yoga 2... Preço de tabela: 1589 USD | 1.4 kg | 17.1 mm | 13.30" 1920x1200 170 PPI IPS |
5. 90.3% v7 (old)  | HP Elite Dragonfly Folio 13.5 G3 Intel Core i7-1265U ⎘ Intel Iris Xe Graphics G7 96EUs ⎘ 16 GB Memória, 512 GB SSD | Amazon: 1. $19.99 New Slim 65W USB C Laptop Ch... 2. $49.99 Smatree 13.5 inch Laptop Sle... 3. $34.99 Broonel Black Leather Folio ... Preço de tabela: 3900 USD | 1.4 kg | 17.8 mm | 13.50" 1920x1280 171 PPI IPS |
6. 89% v7 (old)  | Dell Latitude 9330 Intel Core i7-1260U ⎘ Intel Iris Xe Graphics G7 96EUs ⎘ 16 GB Memória | Amazon: 1. $25.99 65W USB C Charger Genuine Re... 2. $42.93 Berfea Protective Cover Case... 3. $36.77 Dell Laptop Charger 90W Watt... | 1.2 kg | 14.1 mm | 13.30" 2560x1600 227 PPI IPS |
Índice
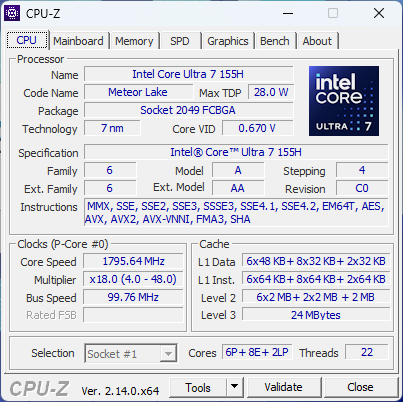
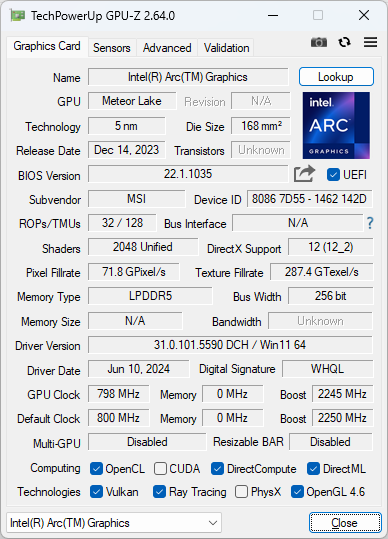
O 2024 Summit E13 AI Evo A1MTG é a versão atualizada do 2021 Summit E13 Flip Evo. Embora o apelido "Flip" tenha sido abandonado, o modelo ainda é um formato 2 em 1, assim como seu antecessor. Ele vem com um processador Intel Core Meteor Lake-H mais recente que substitui a opção mais antiga Tiger Lake-U do modelo 2021.
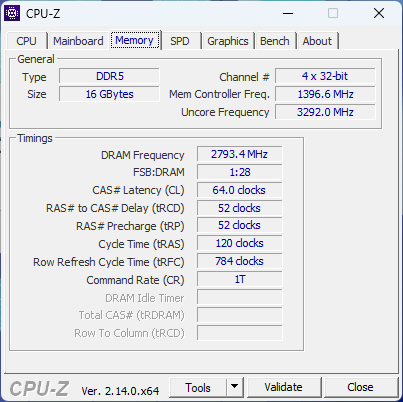
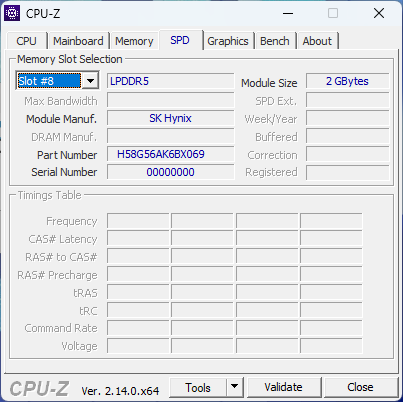
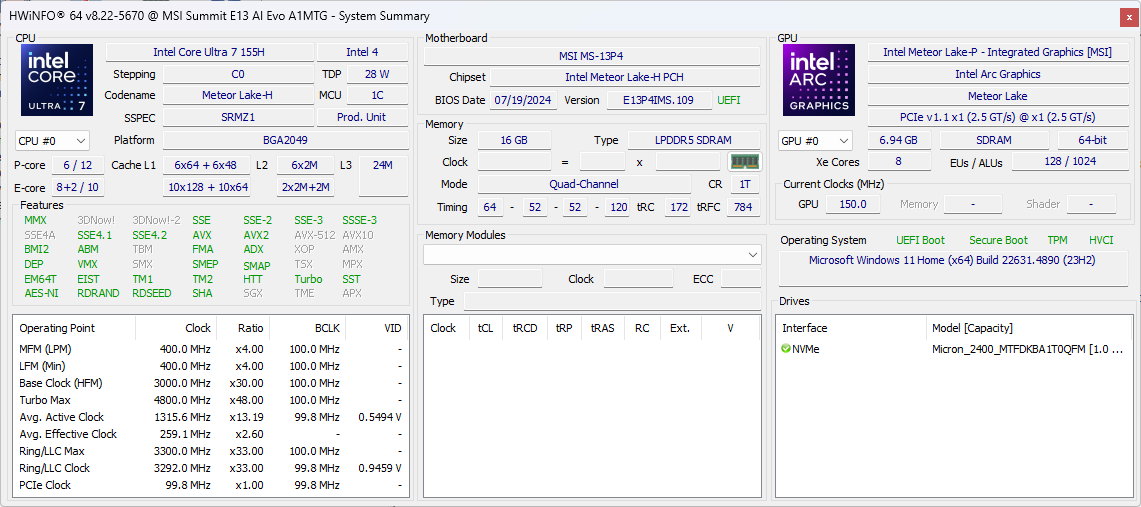
Nossa unidade de teste está equipada com a CPU Core Ultra 7 155H, 16 GB de RAM LPDDR5-5600 e SSD de 1 TB por aproximadamente US$ 1100. Outros SKUs podem oferecer 32 GB de RAM LPDDR5-6400 ou o mais lento Core Ultra 5 125H, mas a tela sensível ao toque IPS de 1200p parece ser fixa em toda a linha.
Os concorrentes incluem outros subnotebooks de escritório de 13 polegadas, como o Dell Latitude 9330, HP Elite Dragonfly Folio, ou Lenovo ThinkPad L13 Yoga G4.
Mais análises da MSI:
Especificações
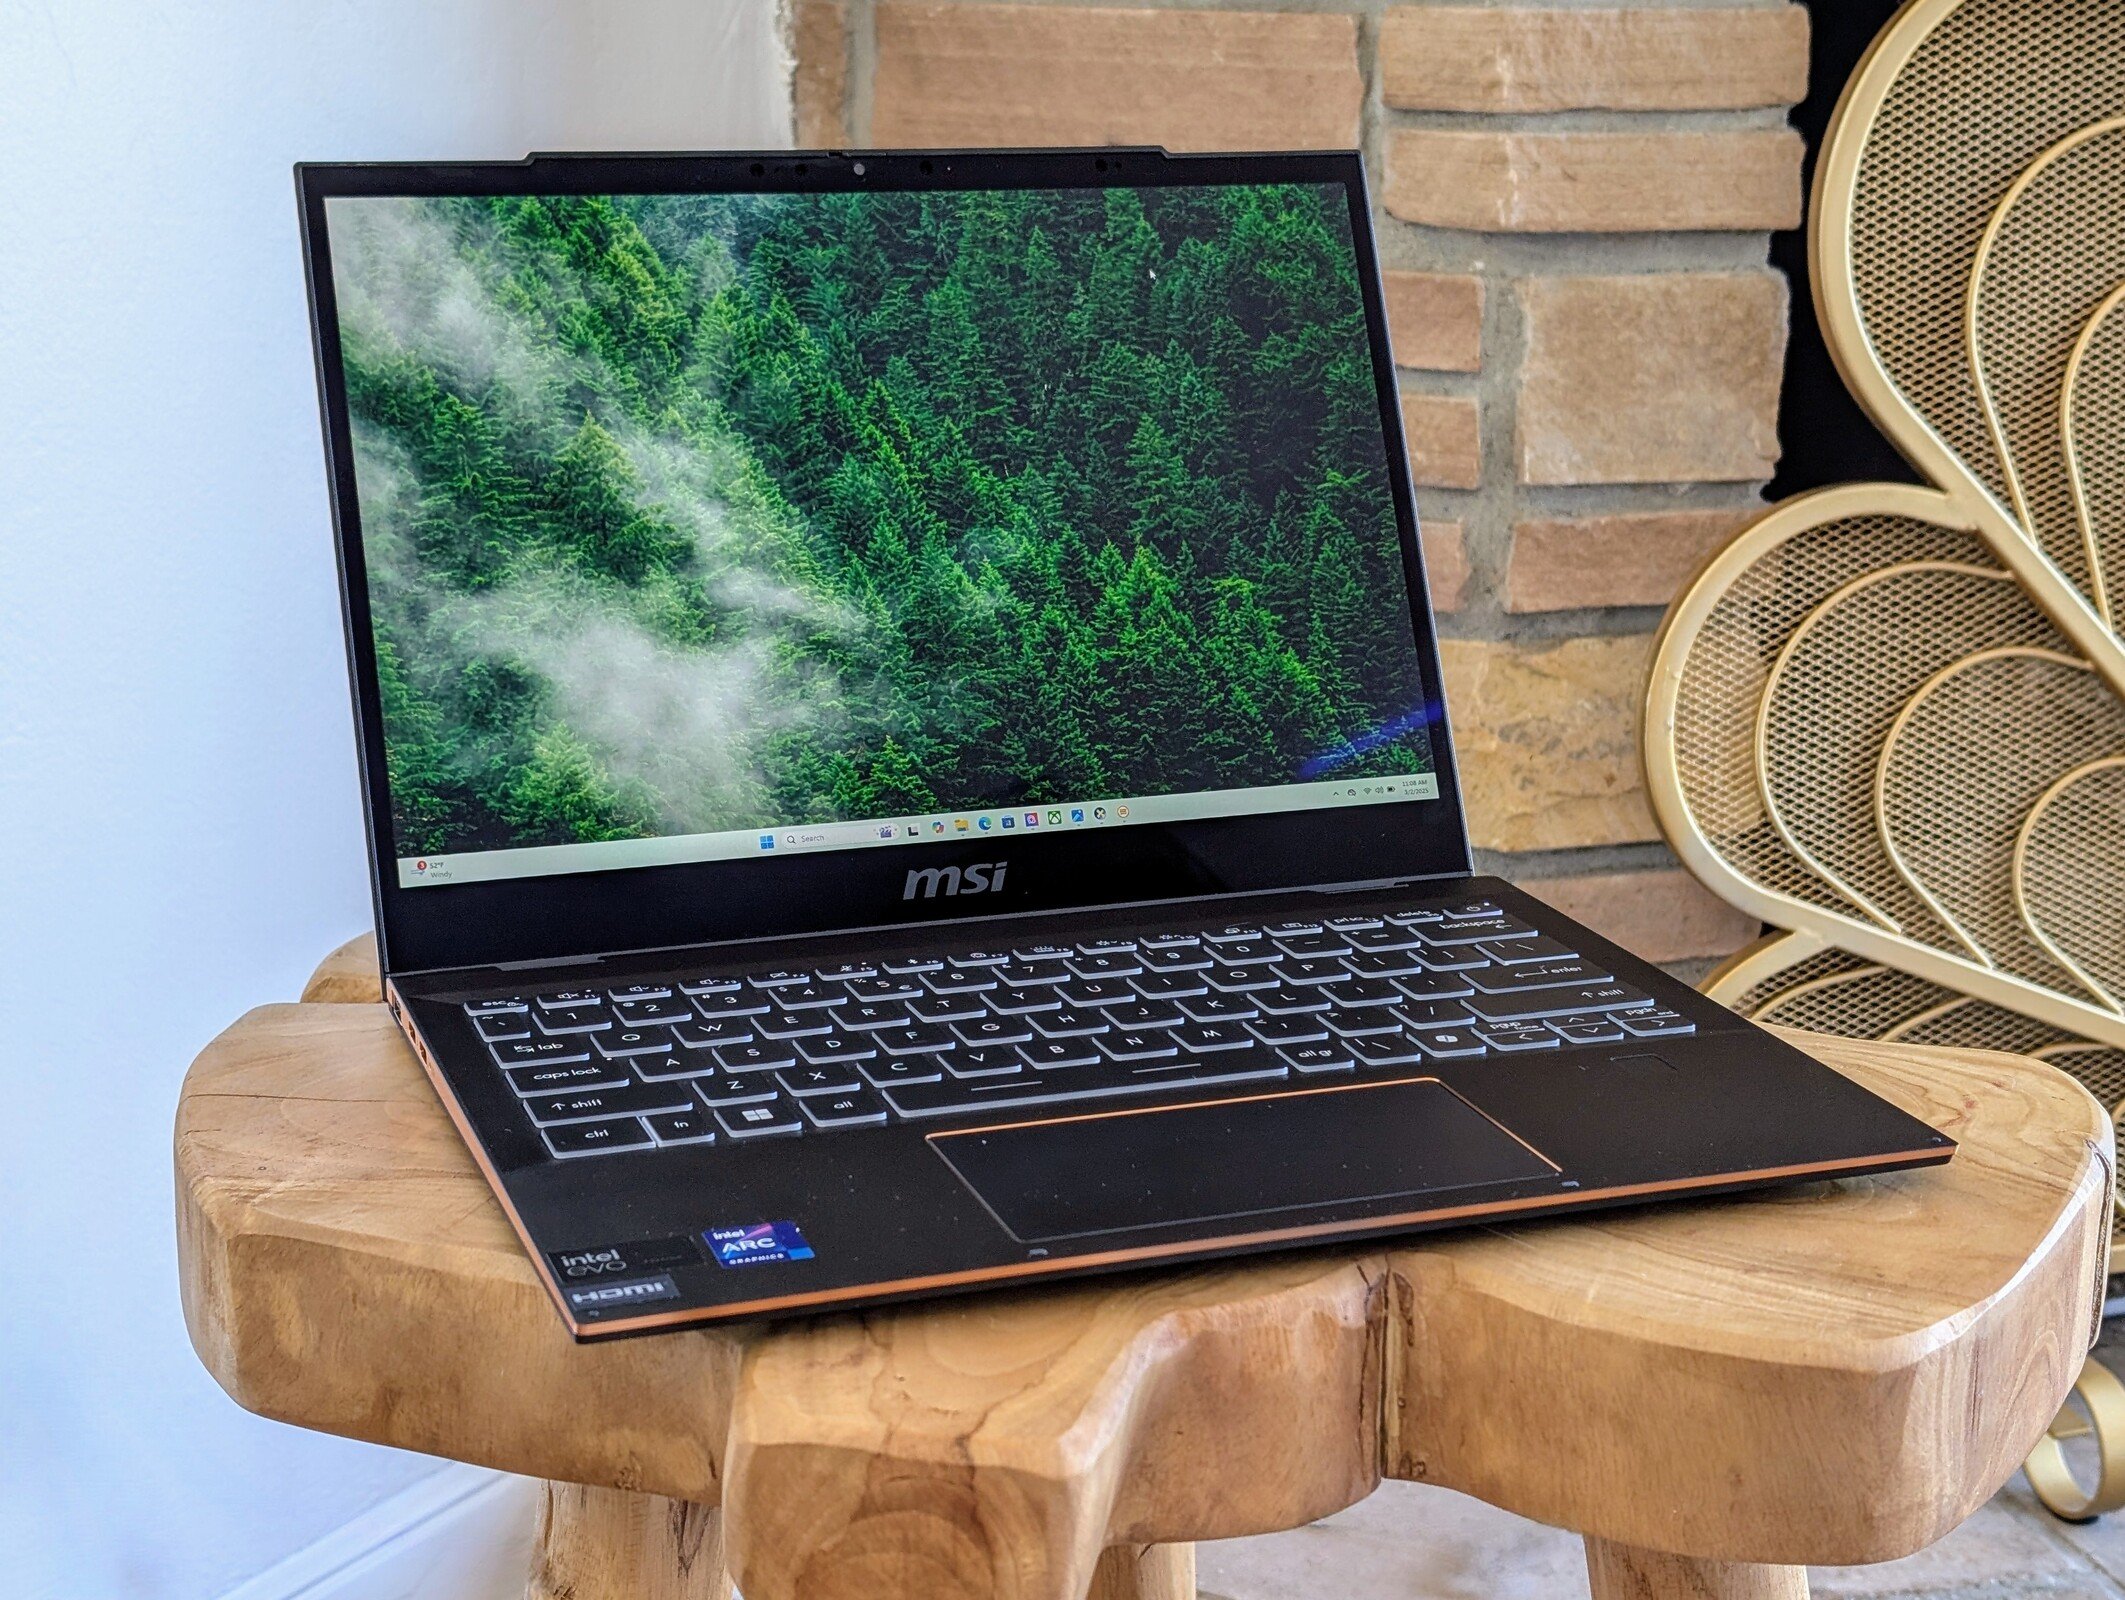
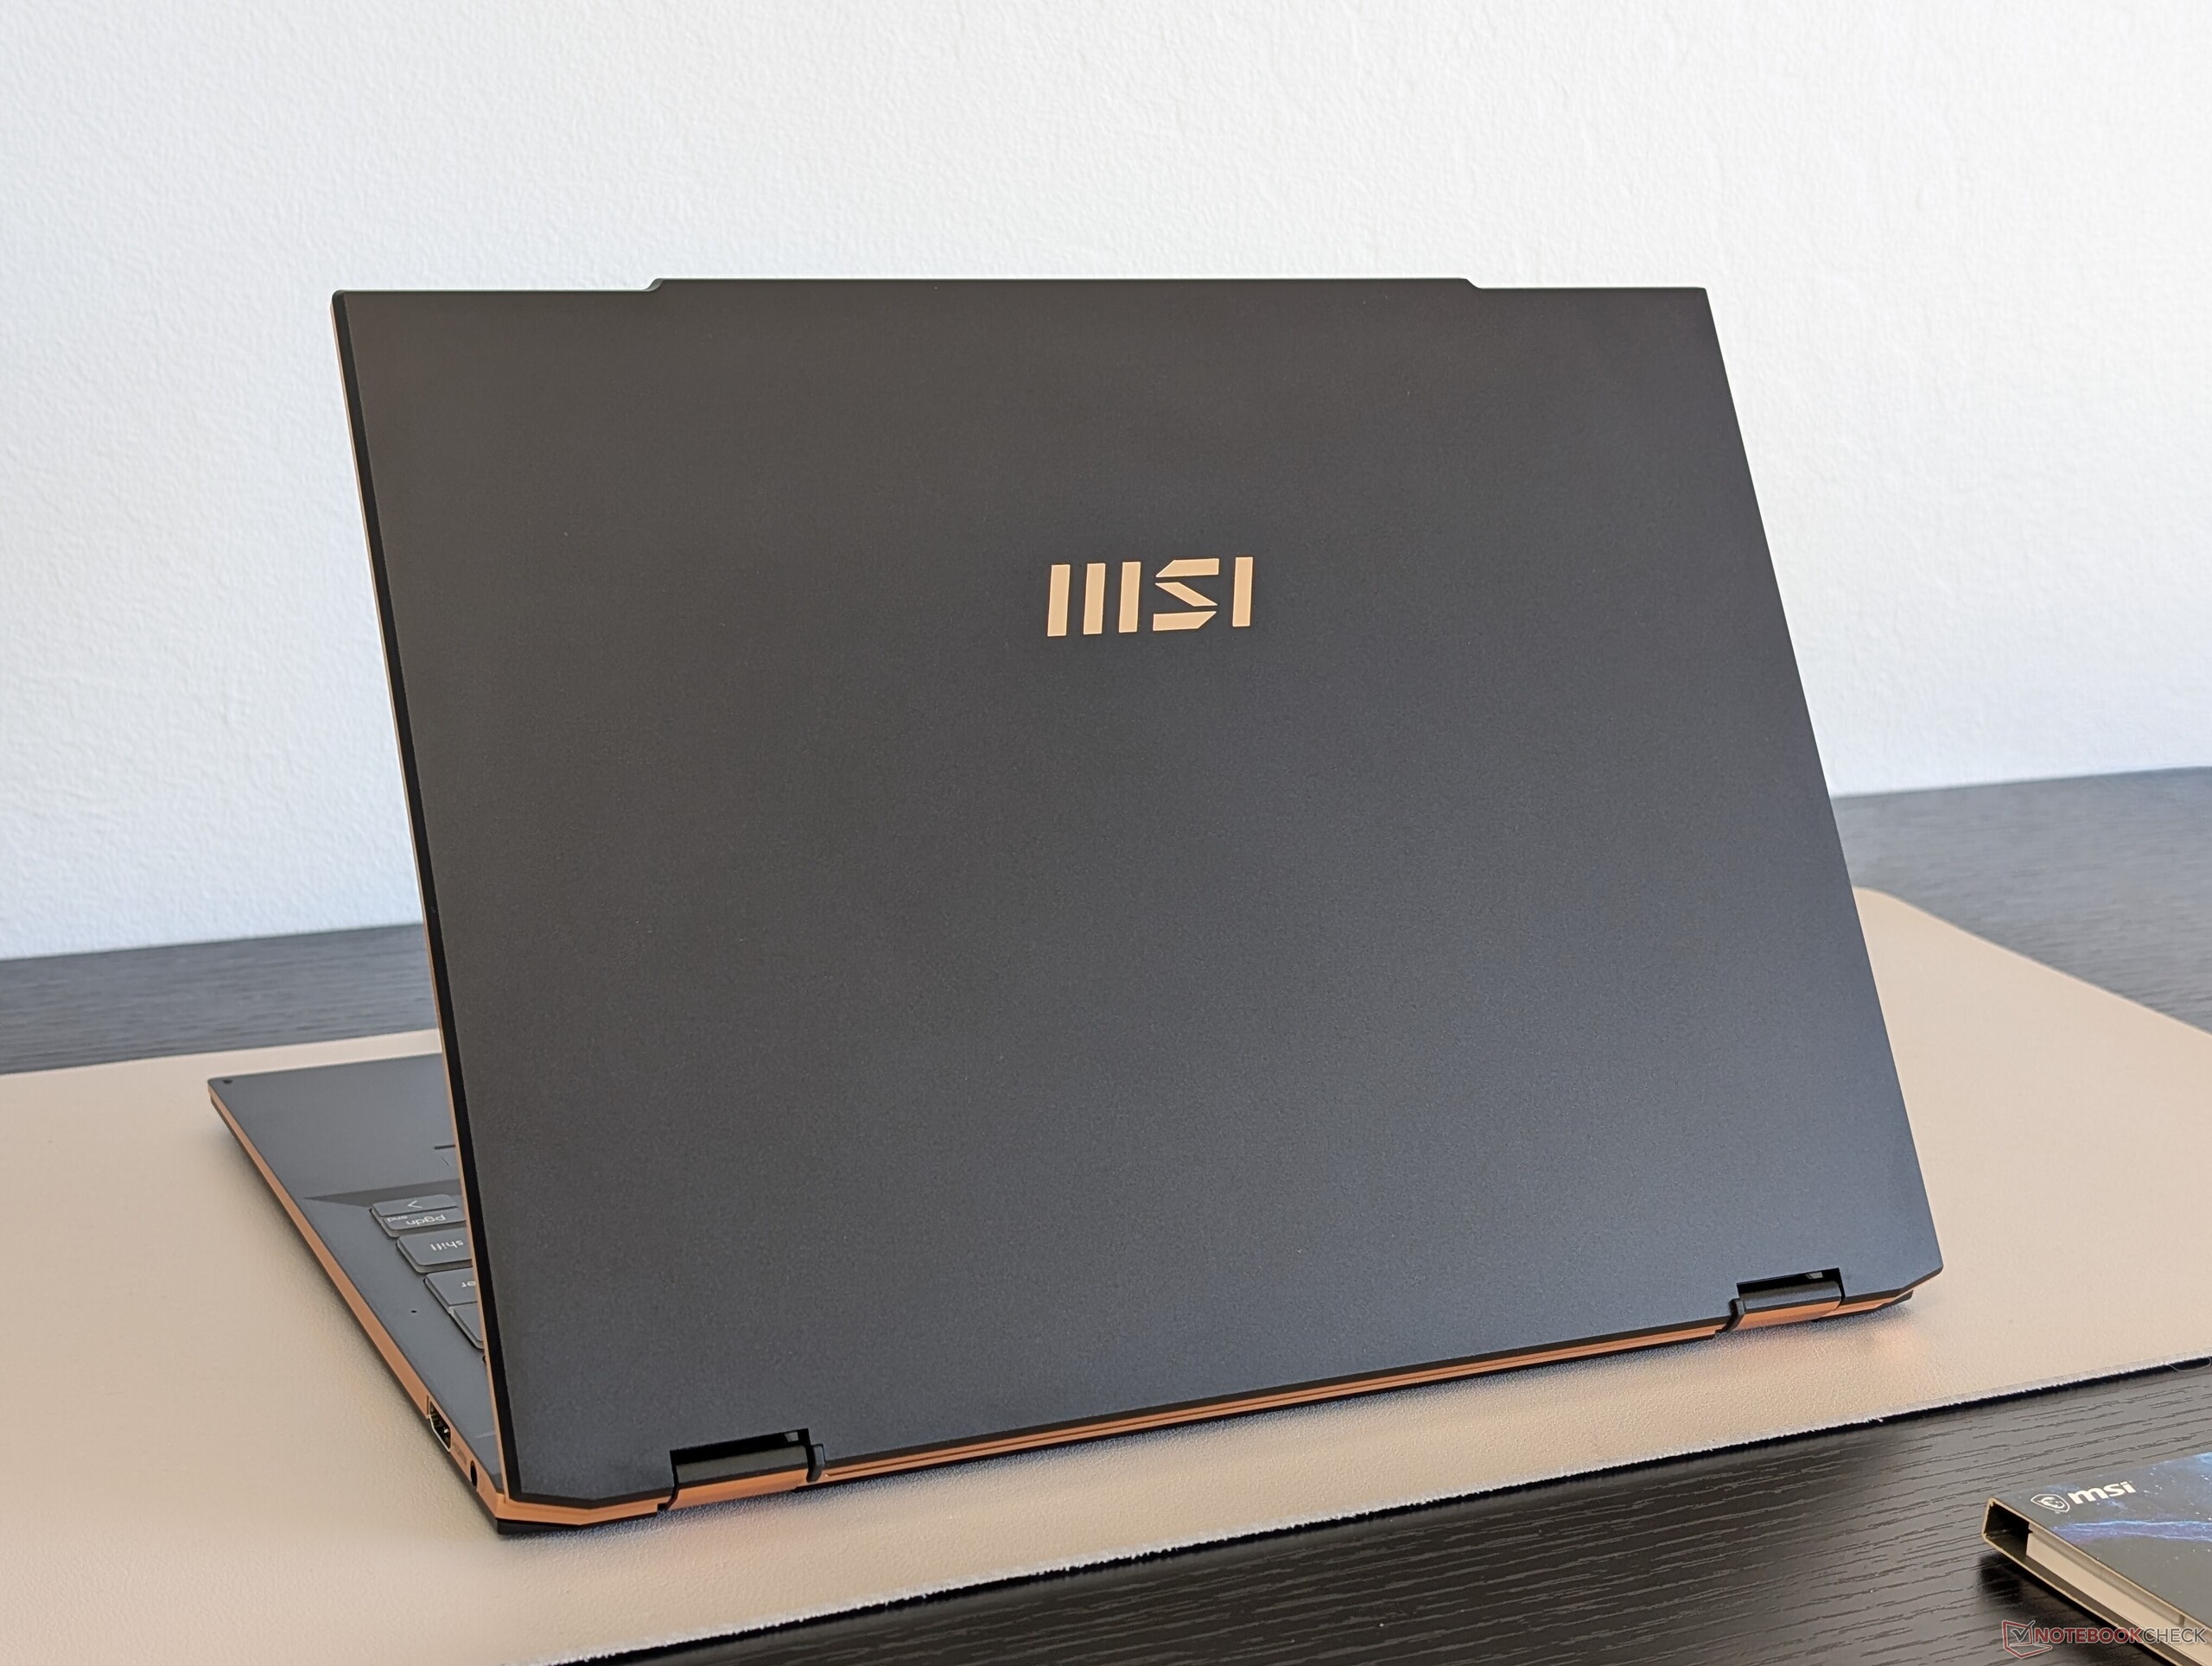
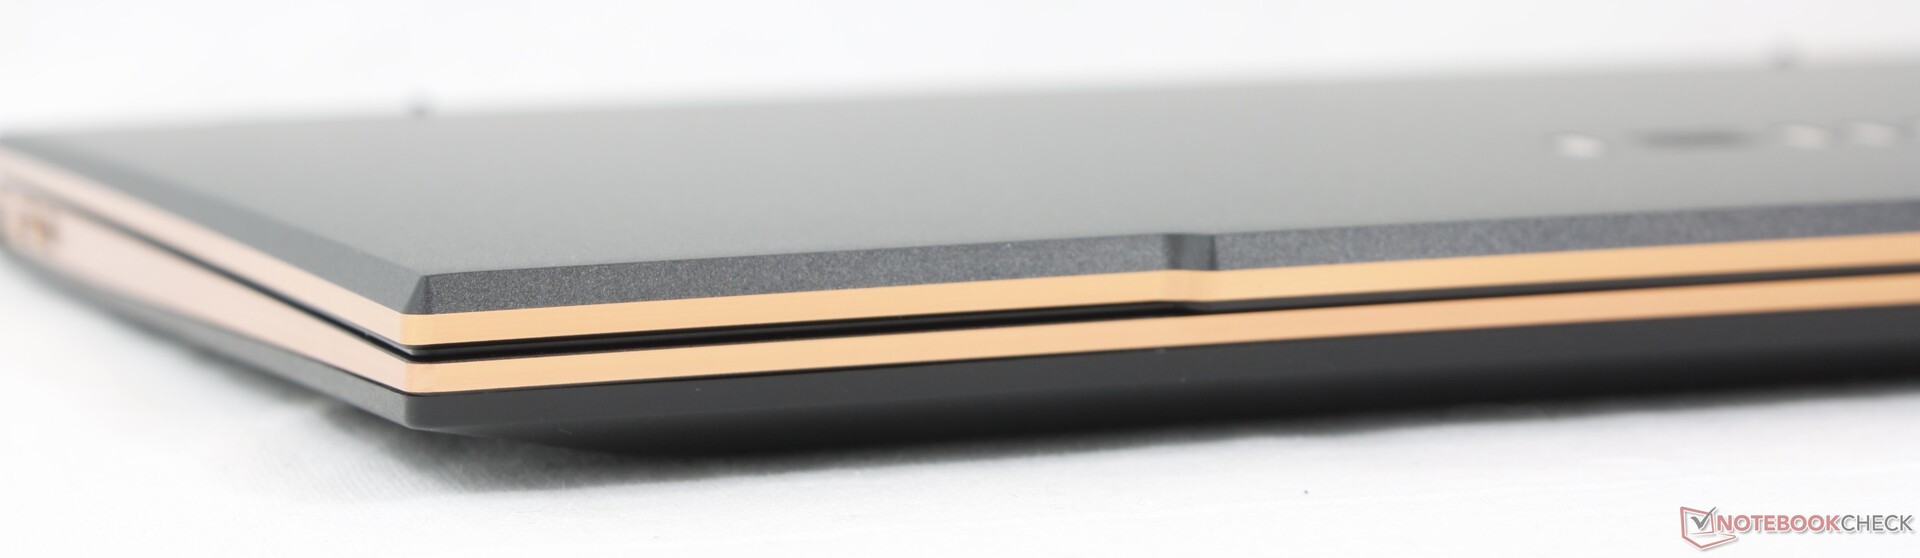
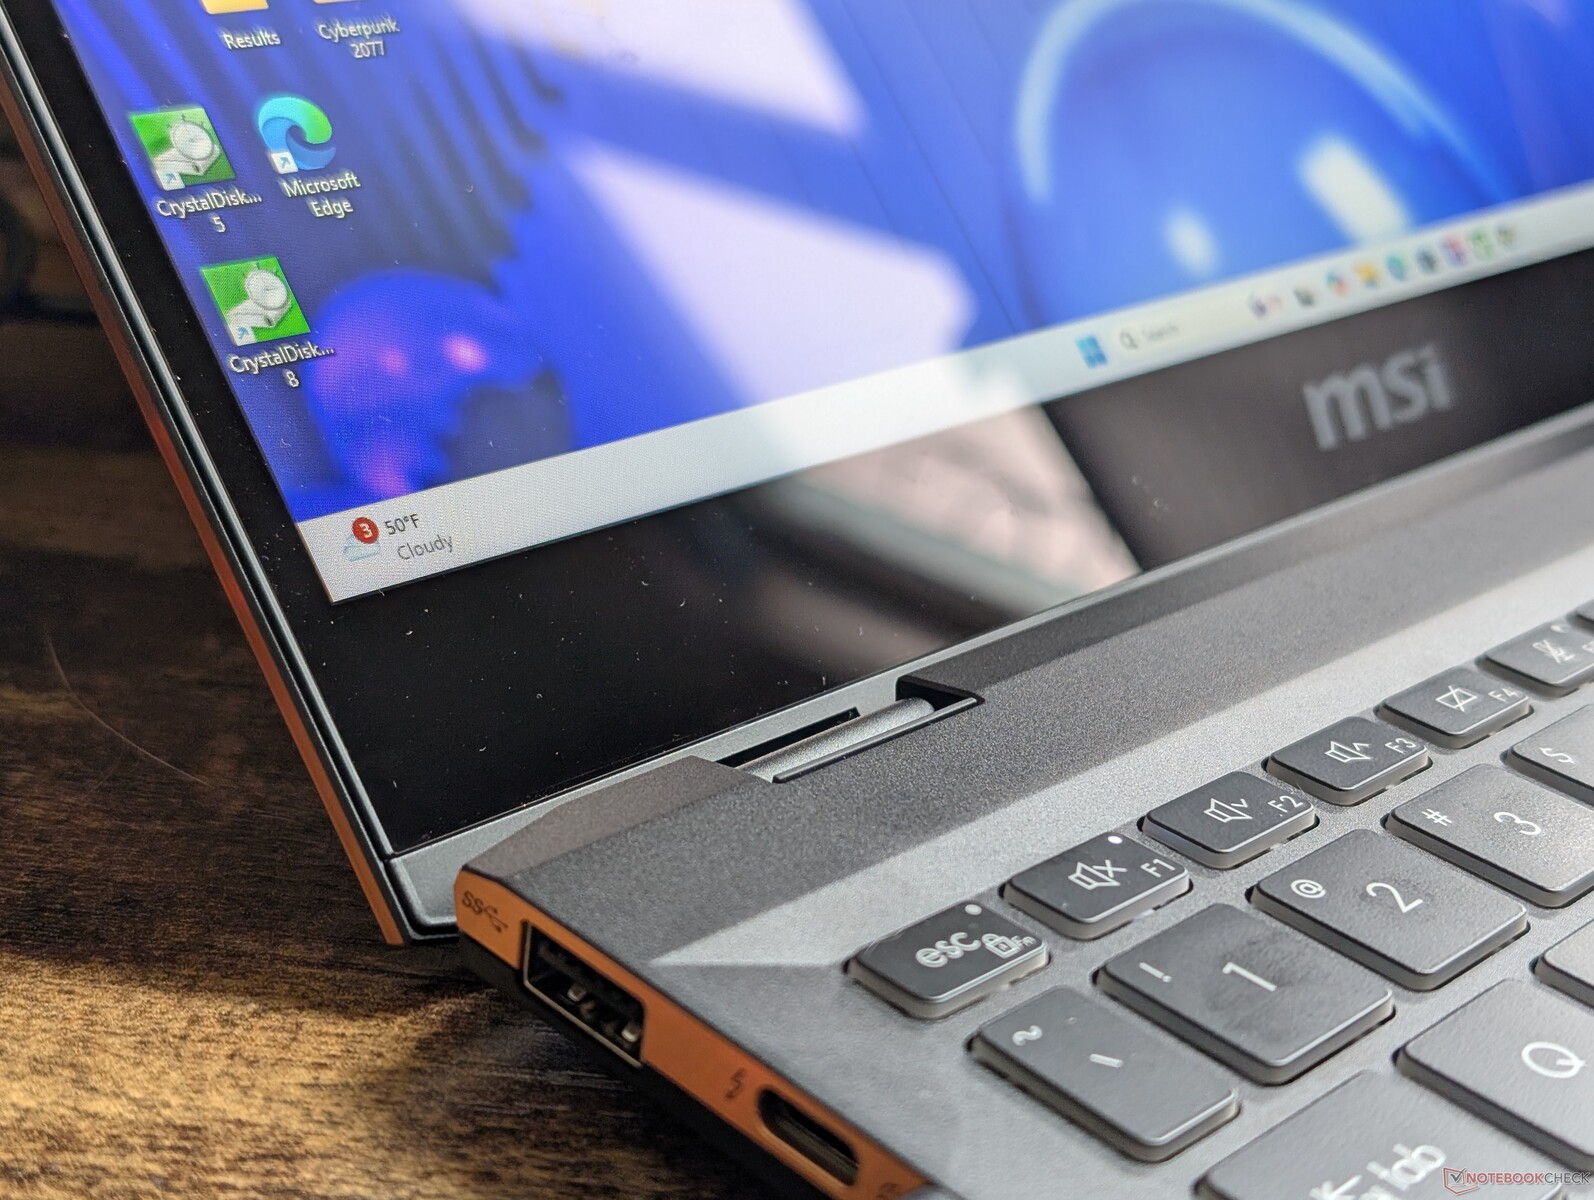
Estojo - Guarnições douradas
O Summit E13 2024 tem portas diferentes e um novo obturador de webcam em comparação com a versão 2021. Fora isso, os chassis são idênticos e não há grandes mudanças entre eles, tanto externa quanto internamente.
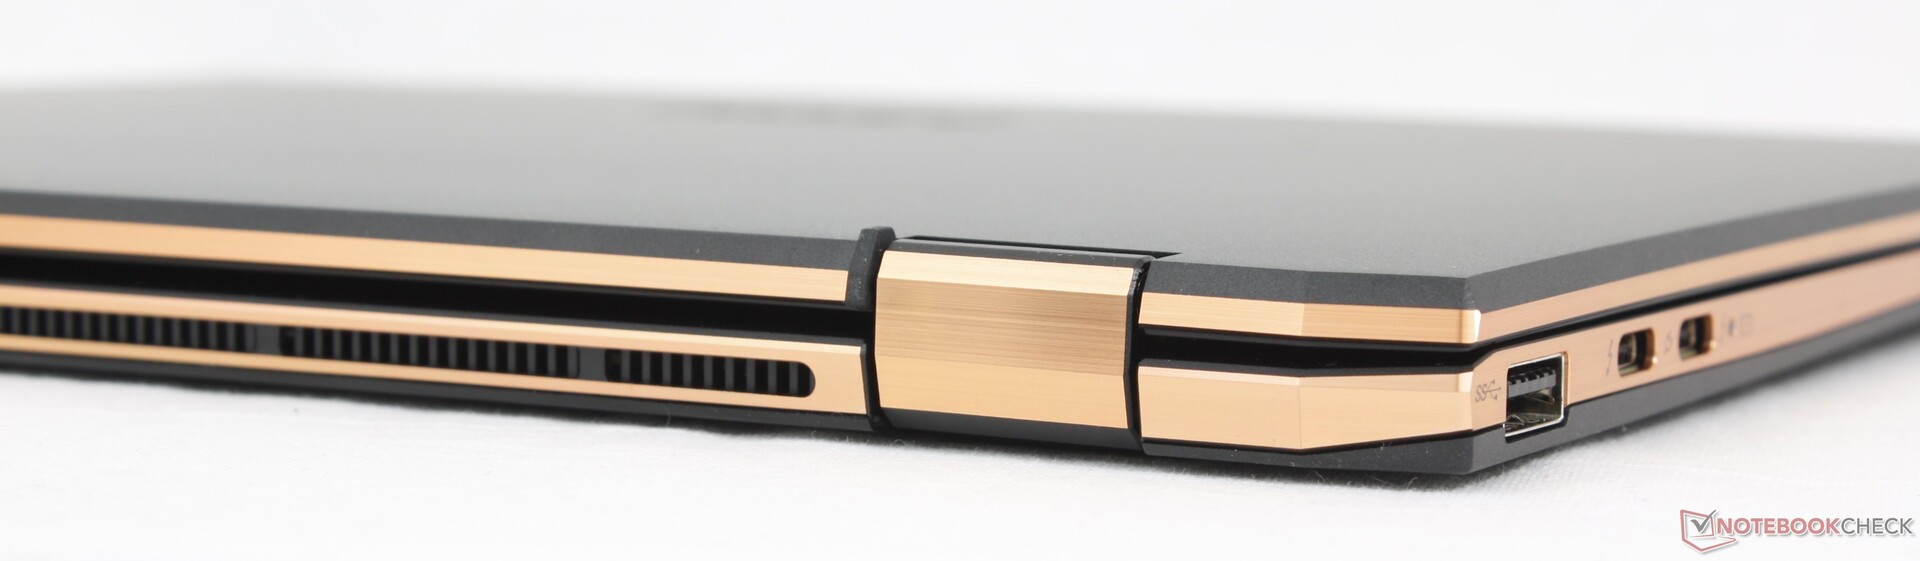
Conectividade - Novas portas este ano
As opções de portas foram alteradas em relação ao modelo de 2021 e não necessariamente para melhor. Uma das portas USB-C foi removida em favor da HDMI, enquanto o leitor MicroSD foi completamente abandonado.


Comunicação
| Networking | |
| iperf3 transmit AX12 | |
| MSI Summit E13 Flip Evo A11MT | |
| iperf3 receive AX12 | |
| MSI Summit E13 Flip Evo A11MT | |
| iperf3 transmit AXE11000 | |
| Lenovo ThinkPad L13 Yoga G4 i7-1355U | |
| HP Elite Dragonfly Folio 13.5 G3 | |
| Dell Latitude 9330 | |
| Lenovo Yoga Book 9 13IMU9 | |
| MSI Summit E13 AI Evo A1MTG | |
| iperf3 receive AXE11000 | |
| Lenovo ThinkPad L13 Yoga G4 i7-1355U | |
| Lenovo Yoga Book 9 13IMU9 | |
| HP Elite Dragonfly Folio 13.5 G3 | |
| Dell Latitude 9330 | |
| MSI Summit E13 AI Evo A1MTG | |
| iperf3 transmit AXE11000 6GHz | |
| HP Elite Dragonfly Folio 13.5 G3 | |
| Dell Latitude 9330 | |
| MSI Summit E13 AI Evo A1MTG | |
| Lenovo Yoga Book 9 13IMU9 | |
| iperf3 receive AXE11000 6GHz | |
| HP Elite Dragonfly Folio 13.5 G3 | |
| MSI Summit E13 AI Evo A1MTG | |
| Dell Latitude 9330 | |
| Lenovo Yoga Book 9 13IMU9 | |
Webcam
A webcam permanece a mesma, com 1080p ou 2 MP apenas com suporte a IR.


Manutenção
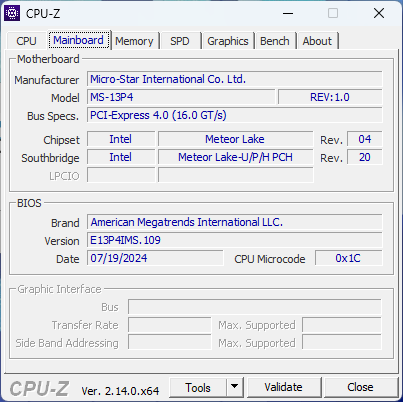
A manutenção é semelhante à do modelo 2021, inclusive o layout da placa-mãe, de acordo com o vídeo de manutenção do LaptopMedia. A RAM não pode ser atualizada e só há suporte para até um SSD M.2 2280.
Sustentabilidade
A MSI não anuncia nenhuma medida de sustentabilidade tomada durante a fabricação. A caixa de varejo é composta principalmente de papel e papelão, com embalagem plástica para o adaptador CA.
Acessórios e garantia
A caixa de varejo inclui a caneta stylus ativa MSI Pen 2, além do adaptador CA e da documentação. A garantia limitada de um ano do fabricante se aplica se o produto for comprado nos EUA.
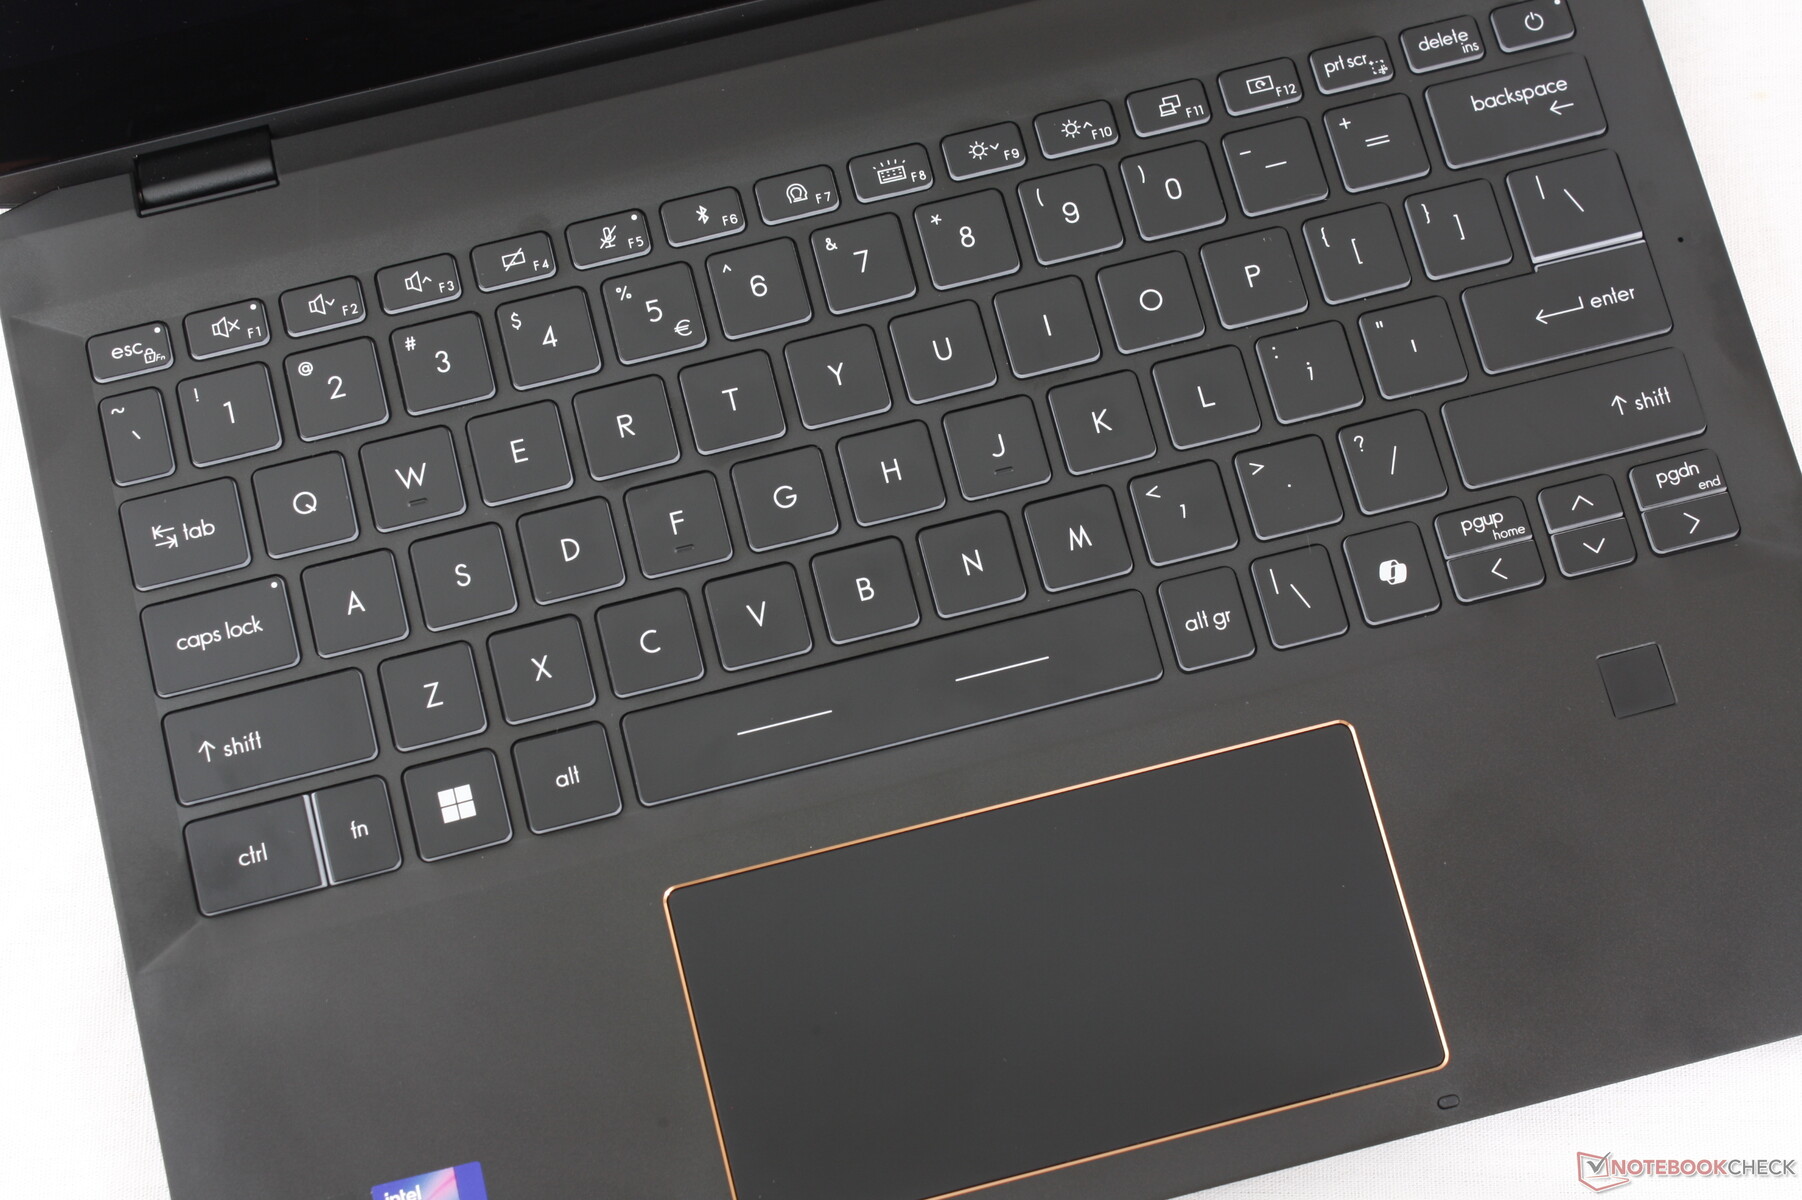
Dispositivos de entrada
O teclado e o clickpad não sofreram alterações no tamanho geral ou no feedback para proporcionar a mesma experiência de digitação do modelo de 2021. A novidade deste ano é a tecla Co-Pilot dedicada e as teclas Fn e Ctrl ligeiramente revisadas. Infelizmente, as pequenas teclas PgUp, PgDn e as teclas de seta continuam sendo muito apertadas, esponjosas e, em geral, pouco confiáveis.
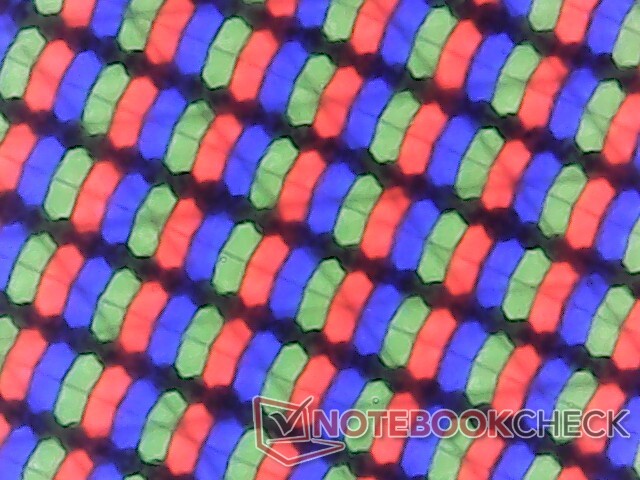
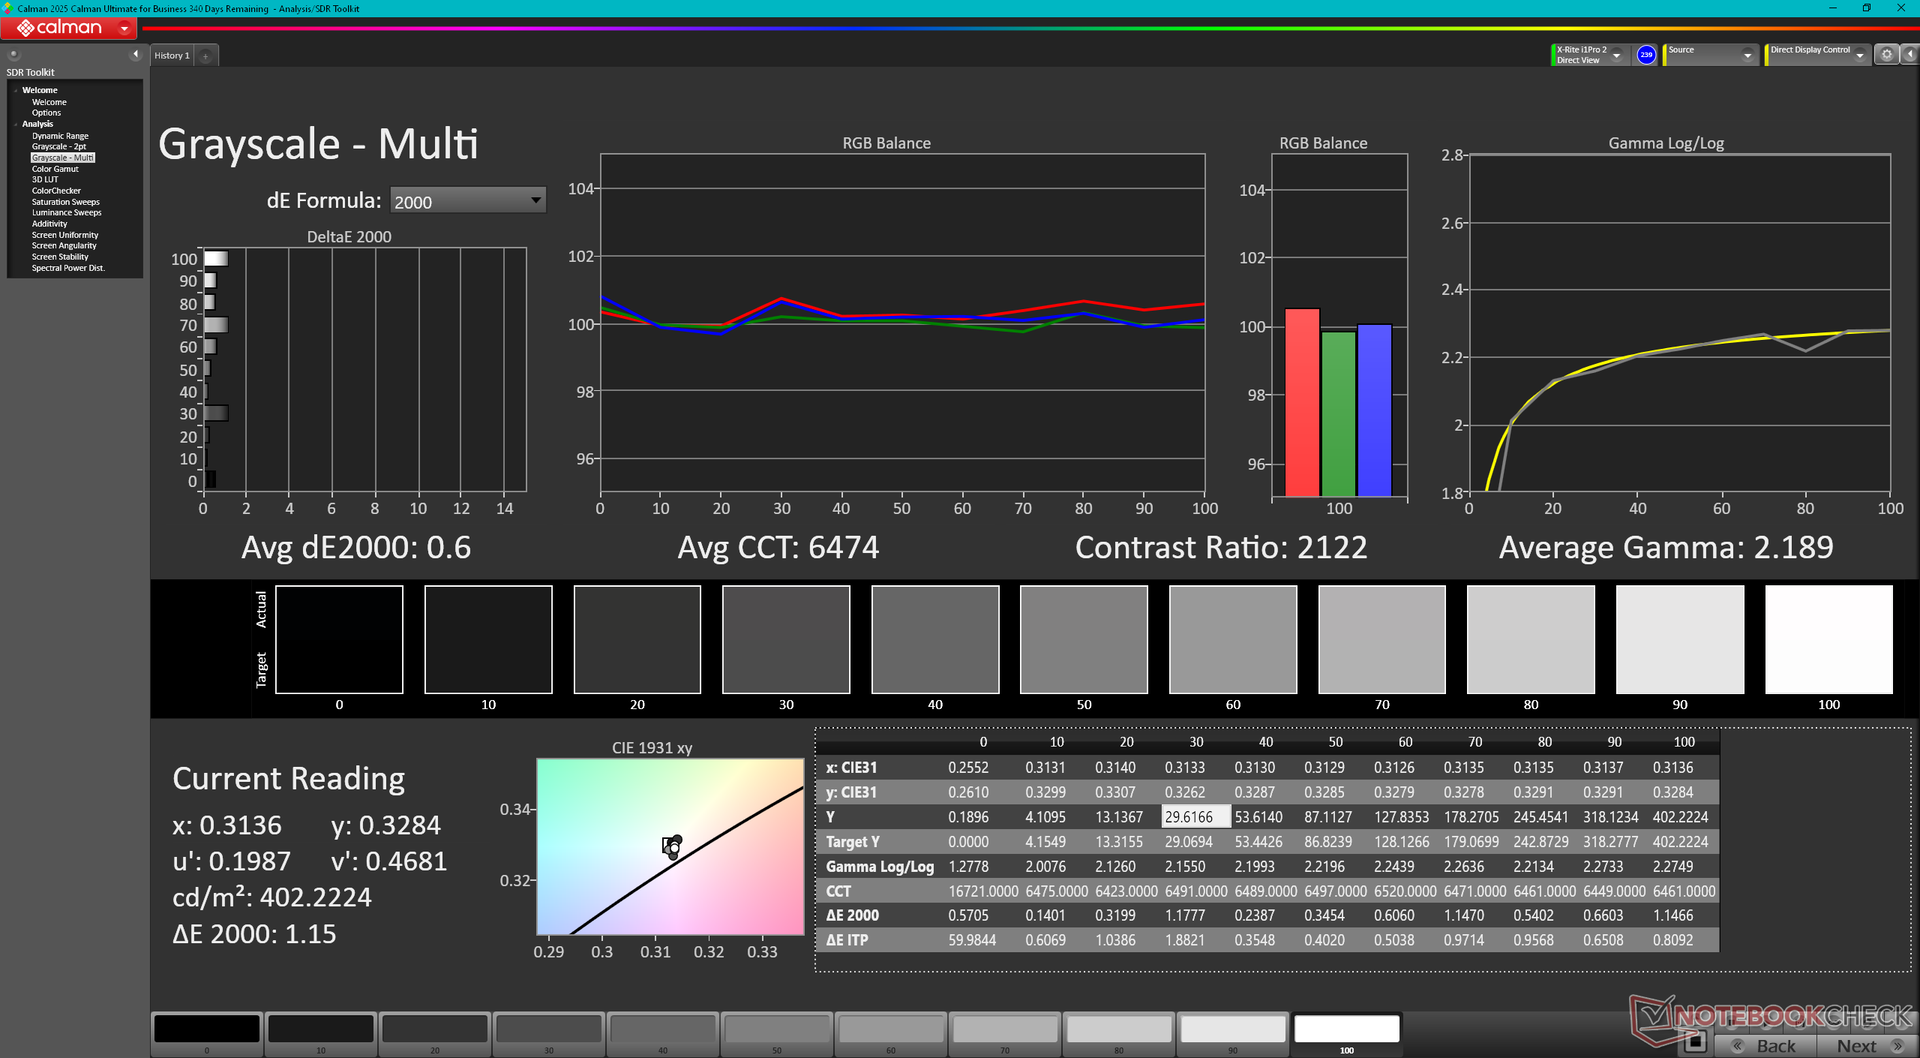
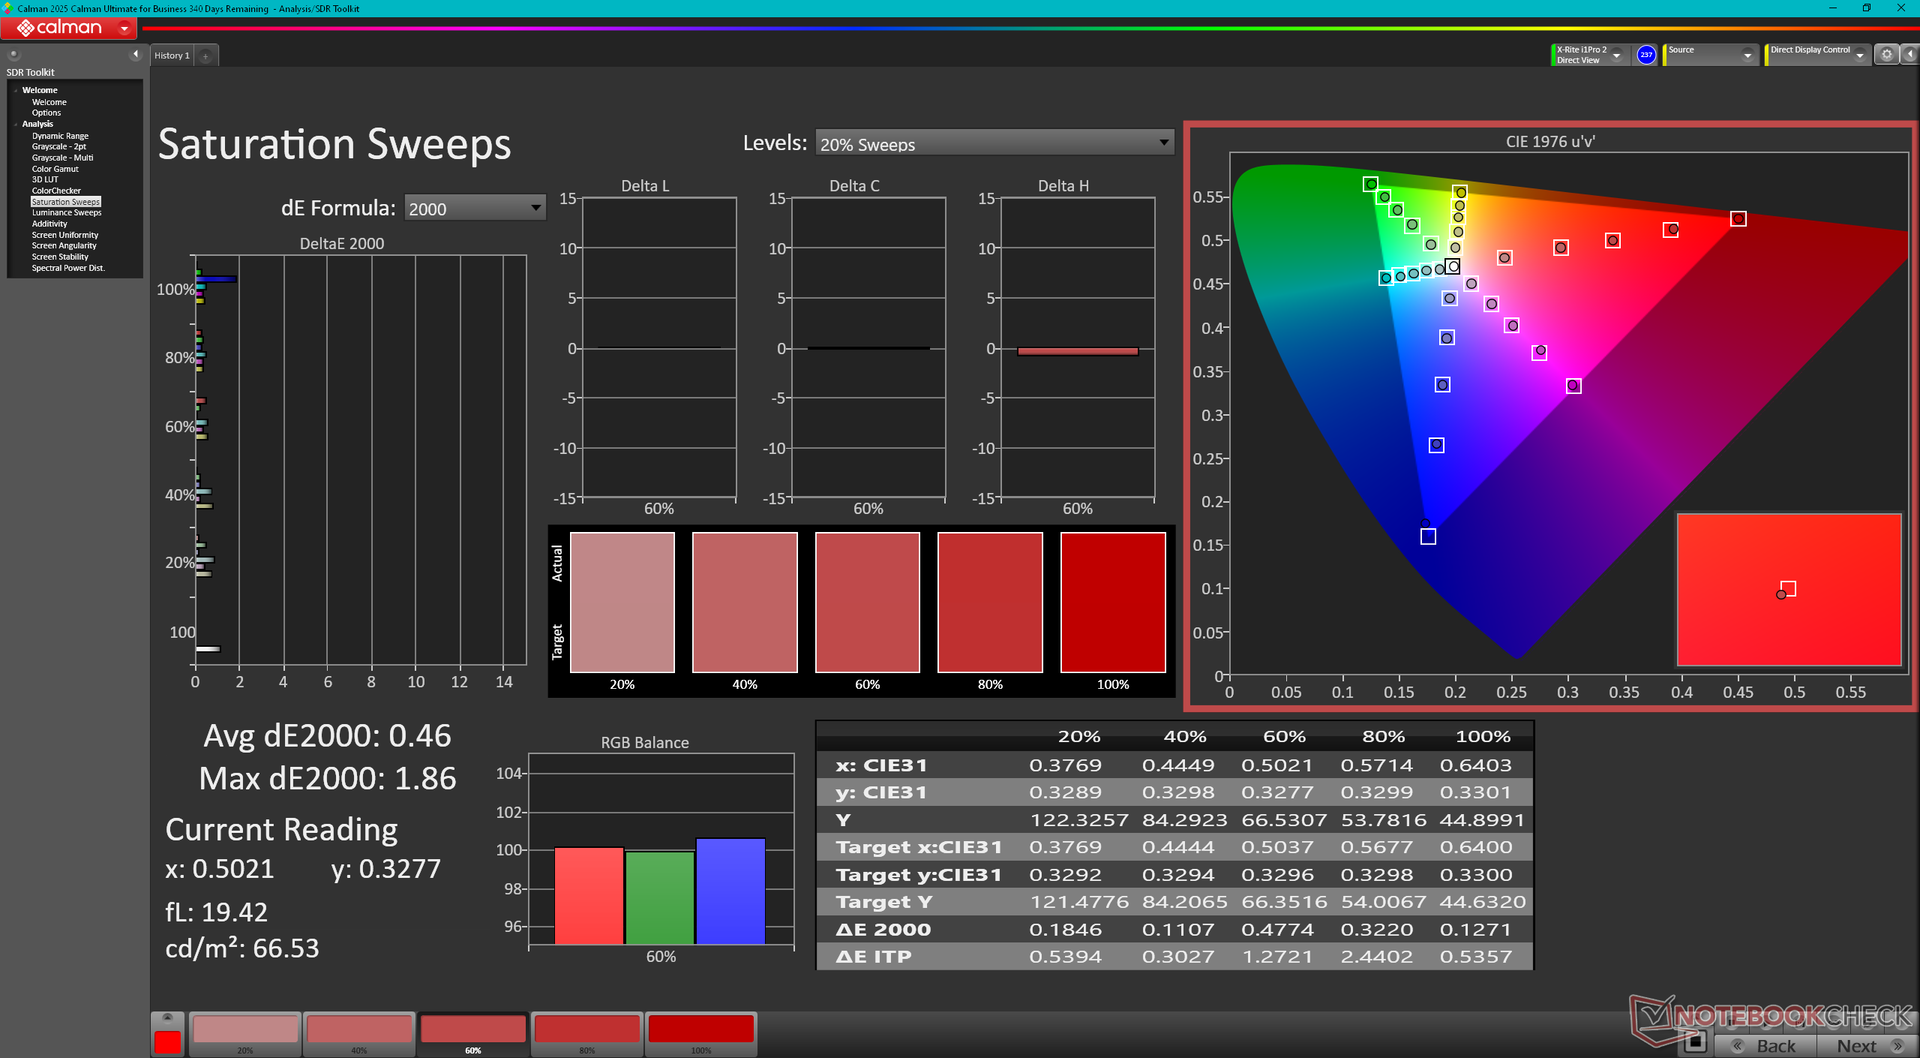
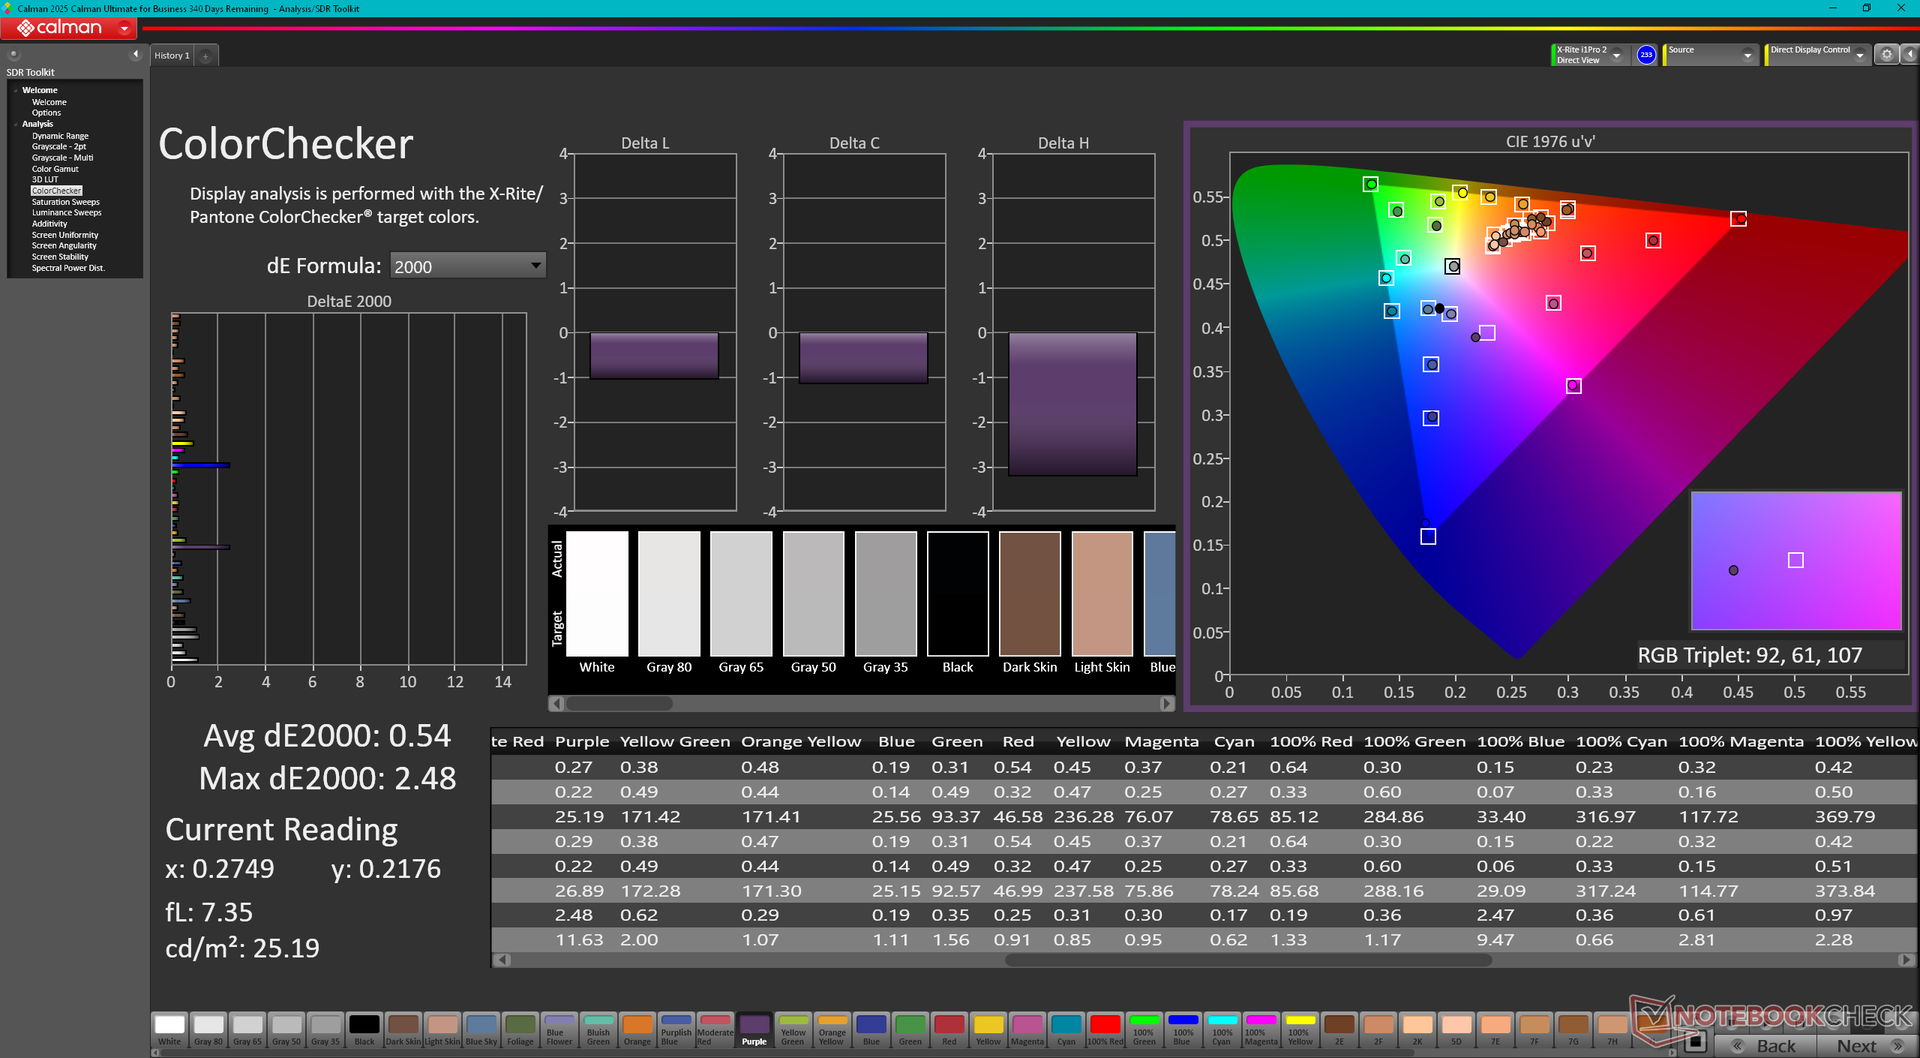
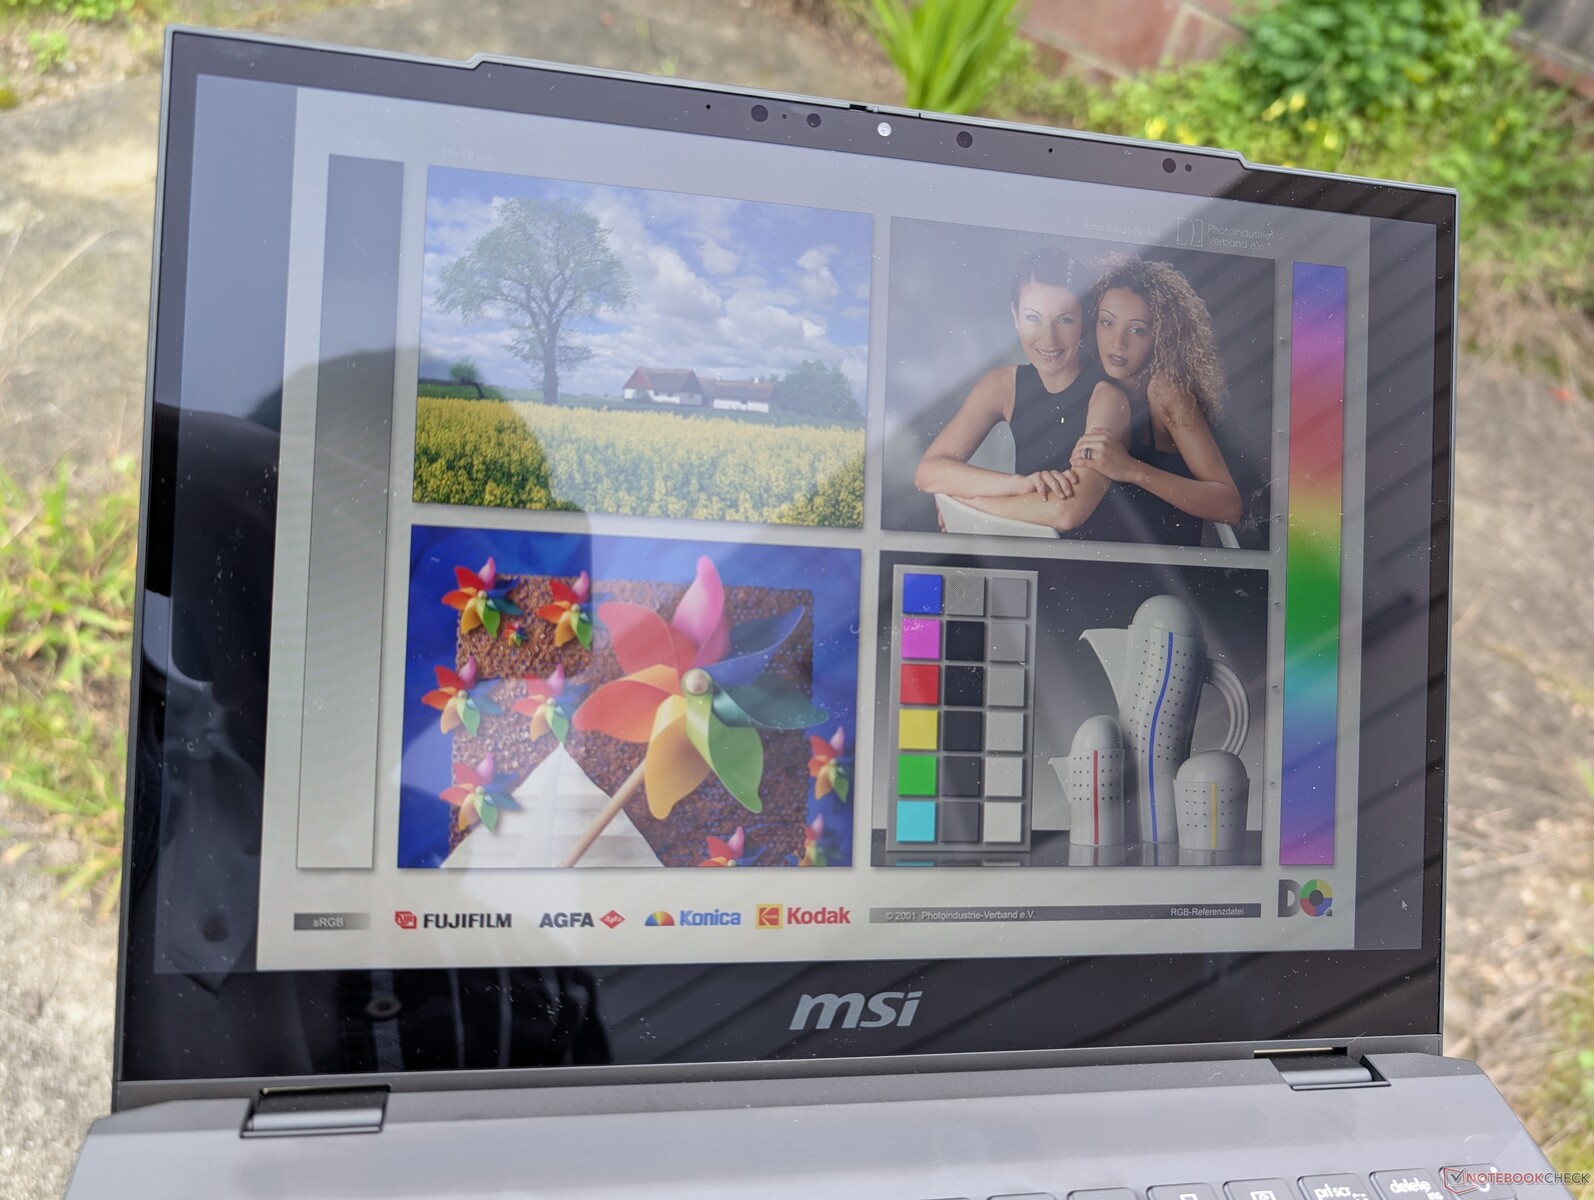
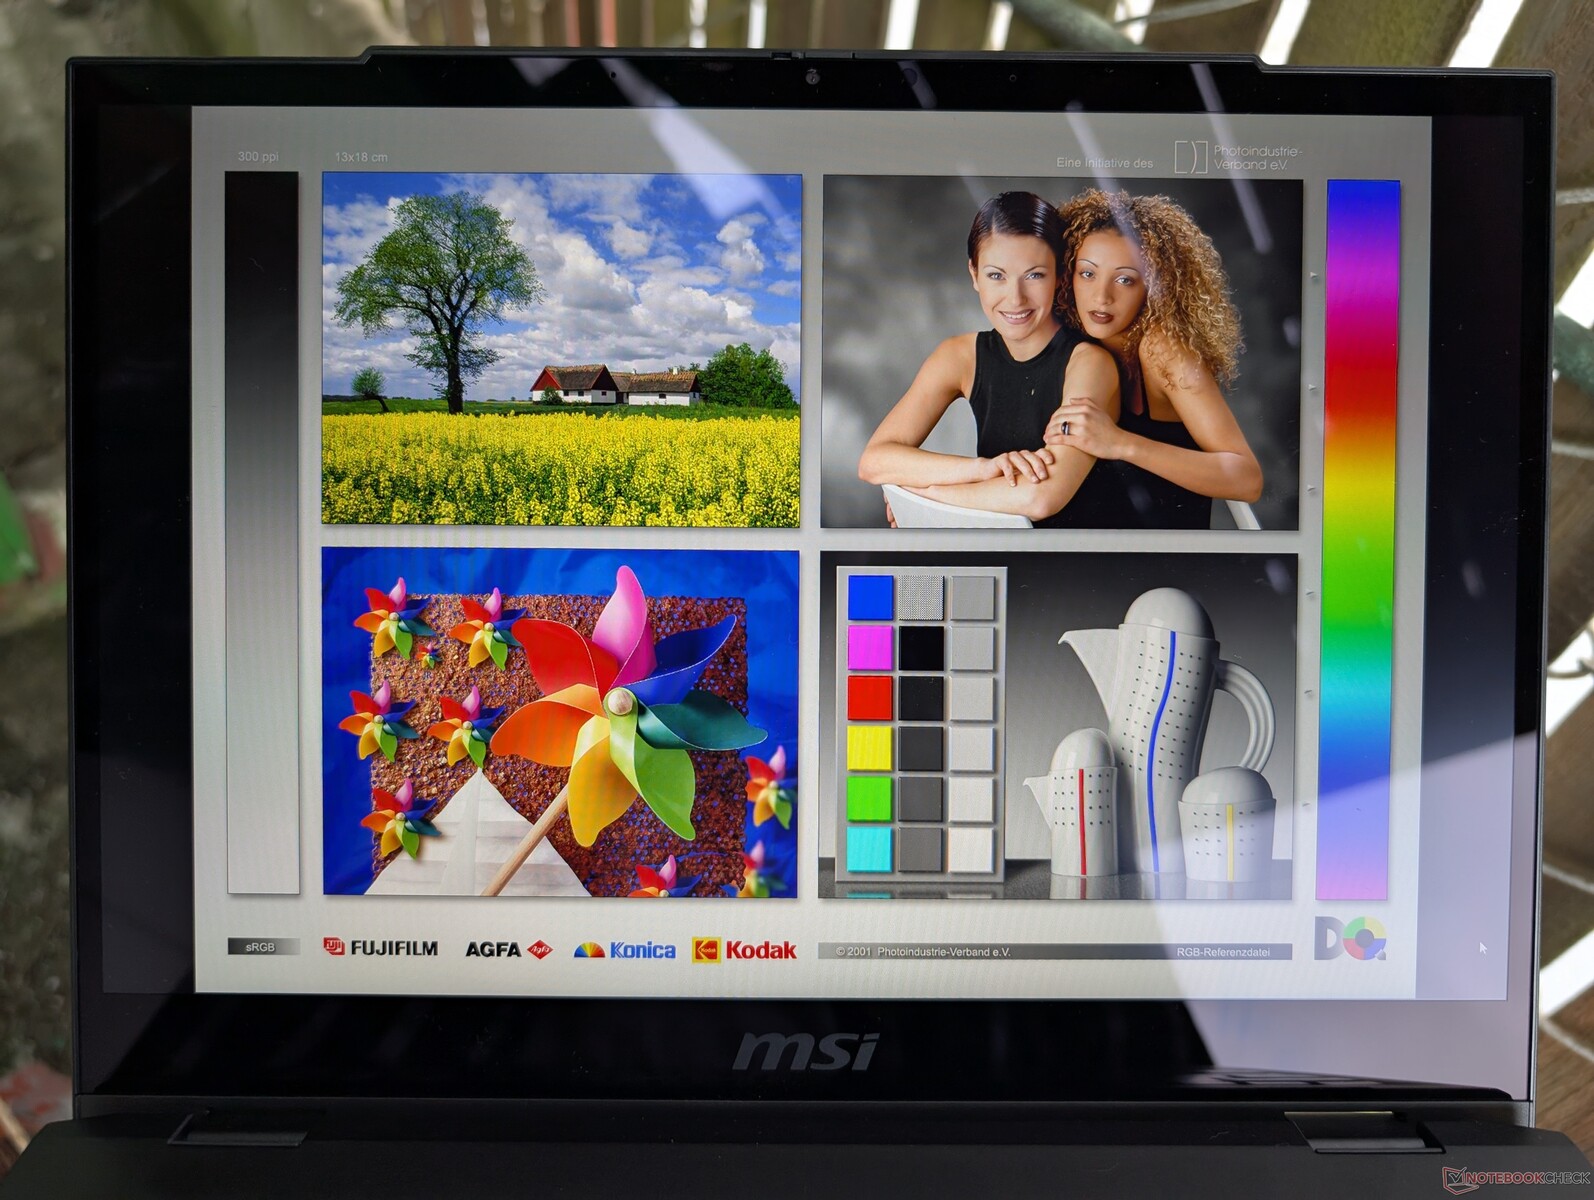
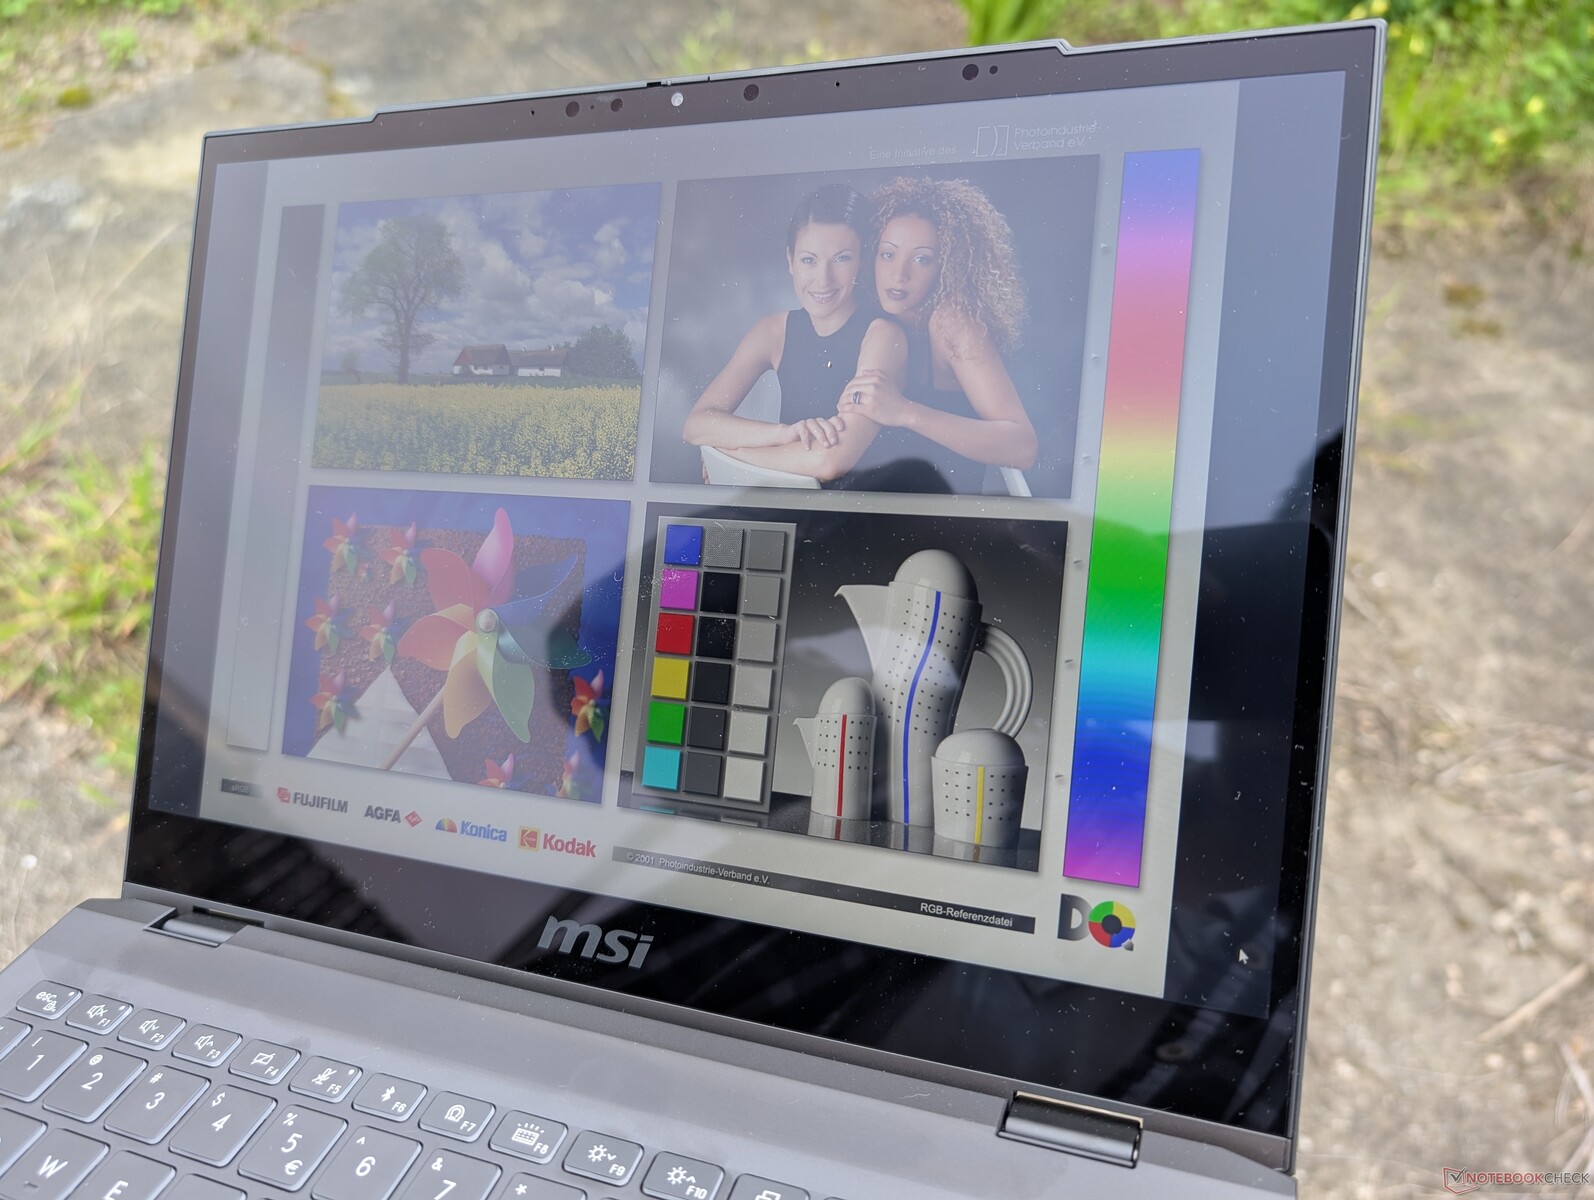
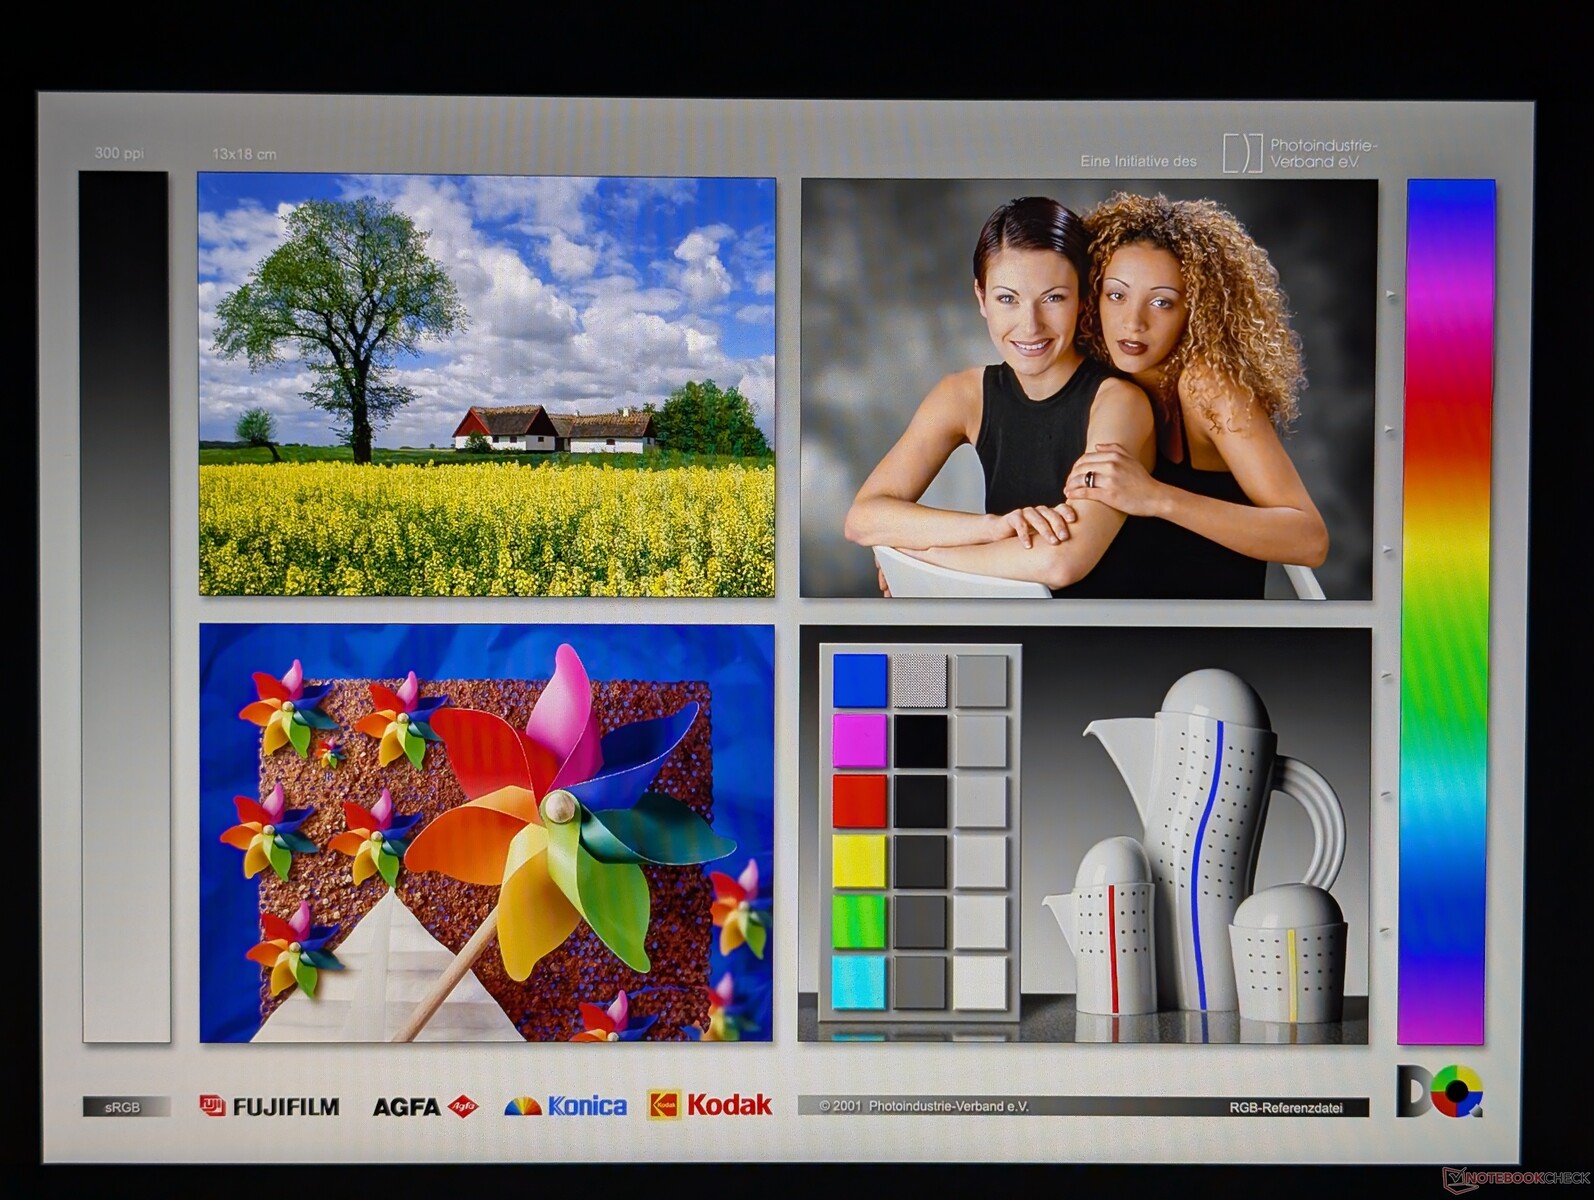
Tela - Apenas mediana para o preço
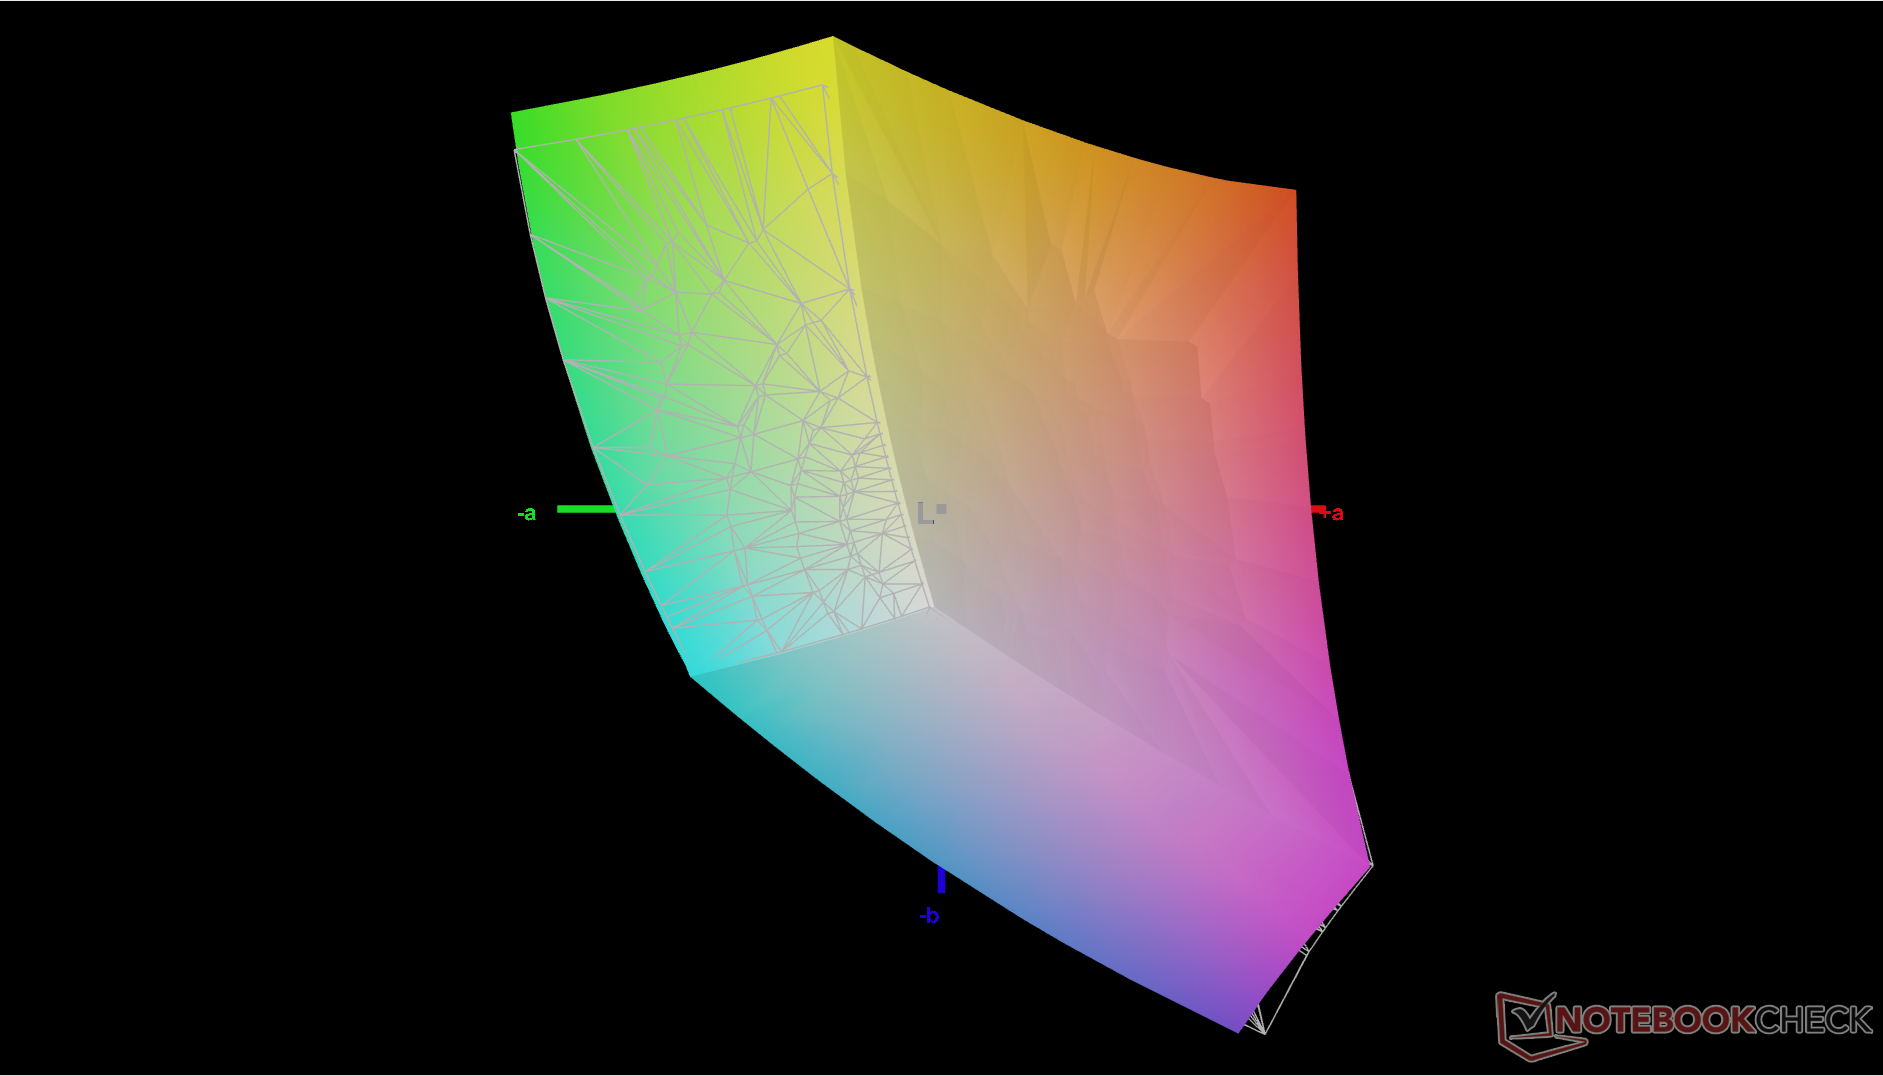
Nossa unidade utiliza um painel Chi Mei de 60 Hz em vez do painel Sharp de 120 Hz do modelo 2021. O painel Chi Mei oferece cores sRGB semelhantes, mas com níveis de contraste um pouco mais baixos. Os tempos de resposta preto-branco e cinza-cinza ainda são muito lentos, mesmo para padrões que não sejam de jogos.
| |||||||||||||||||||||||||
iluminação: 88 %
iluminação com acumulador: 405.2 cd/m²
Contraste: 1192:1 (Preto: 0.34 cd/m²)
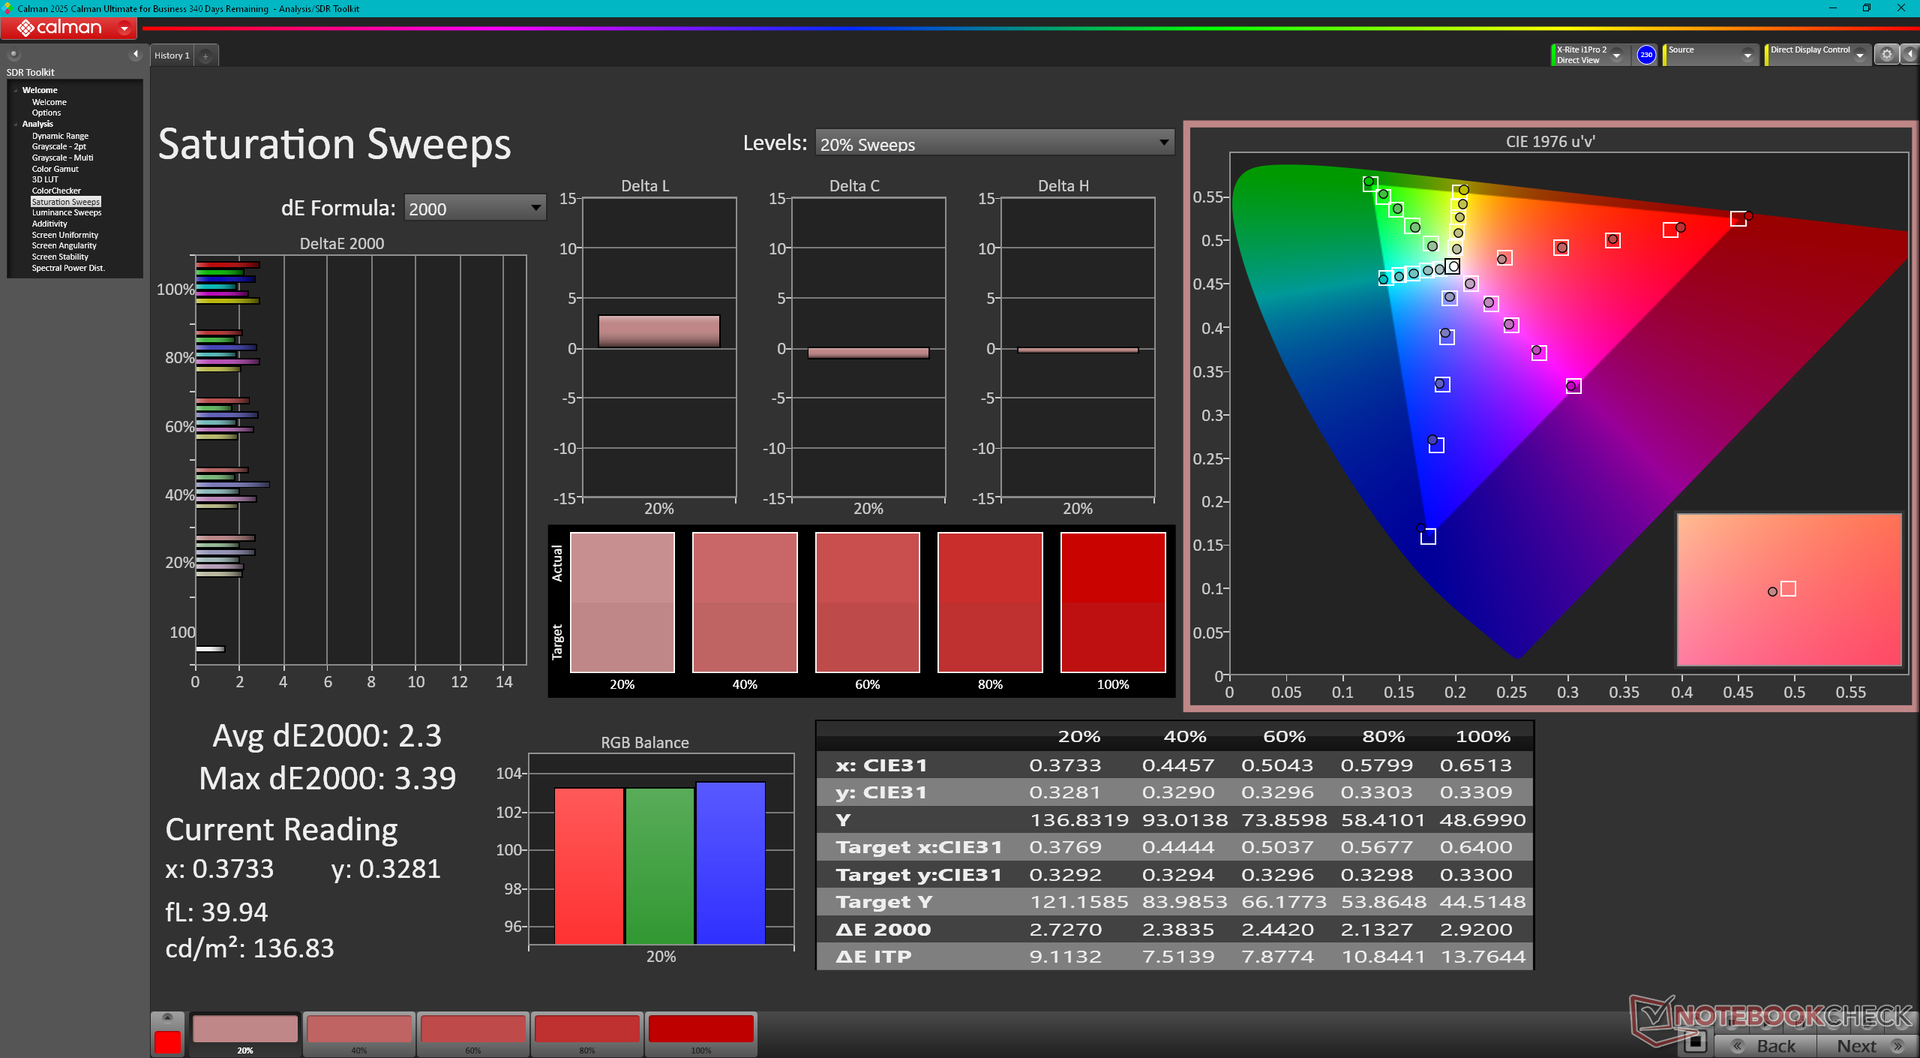
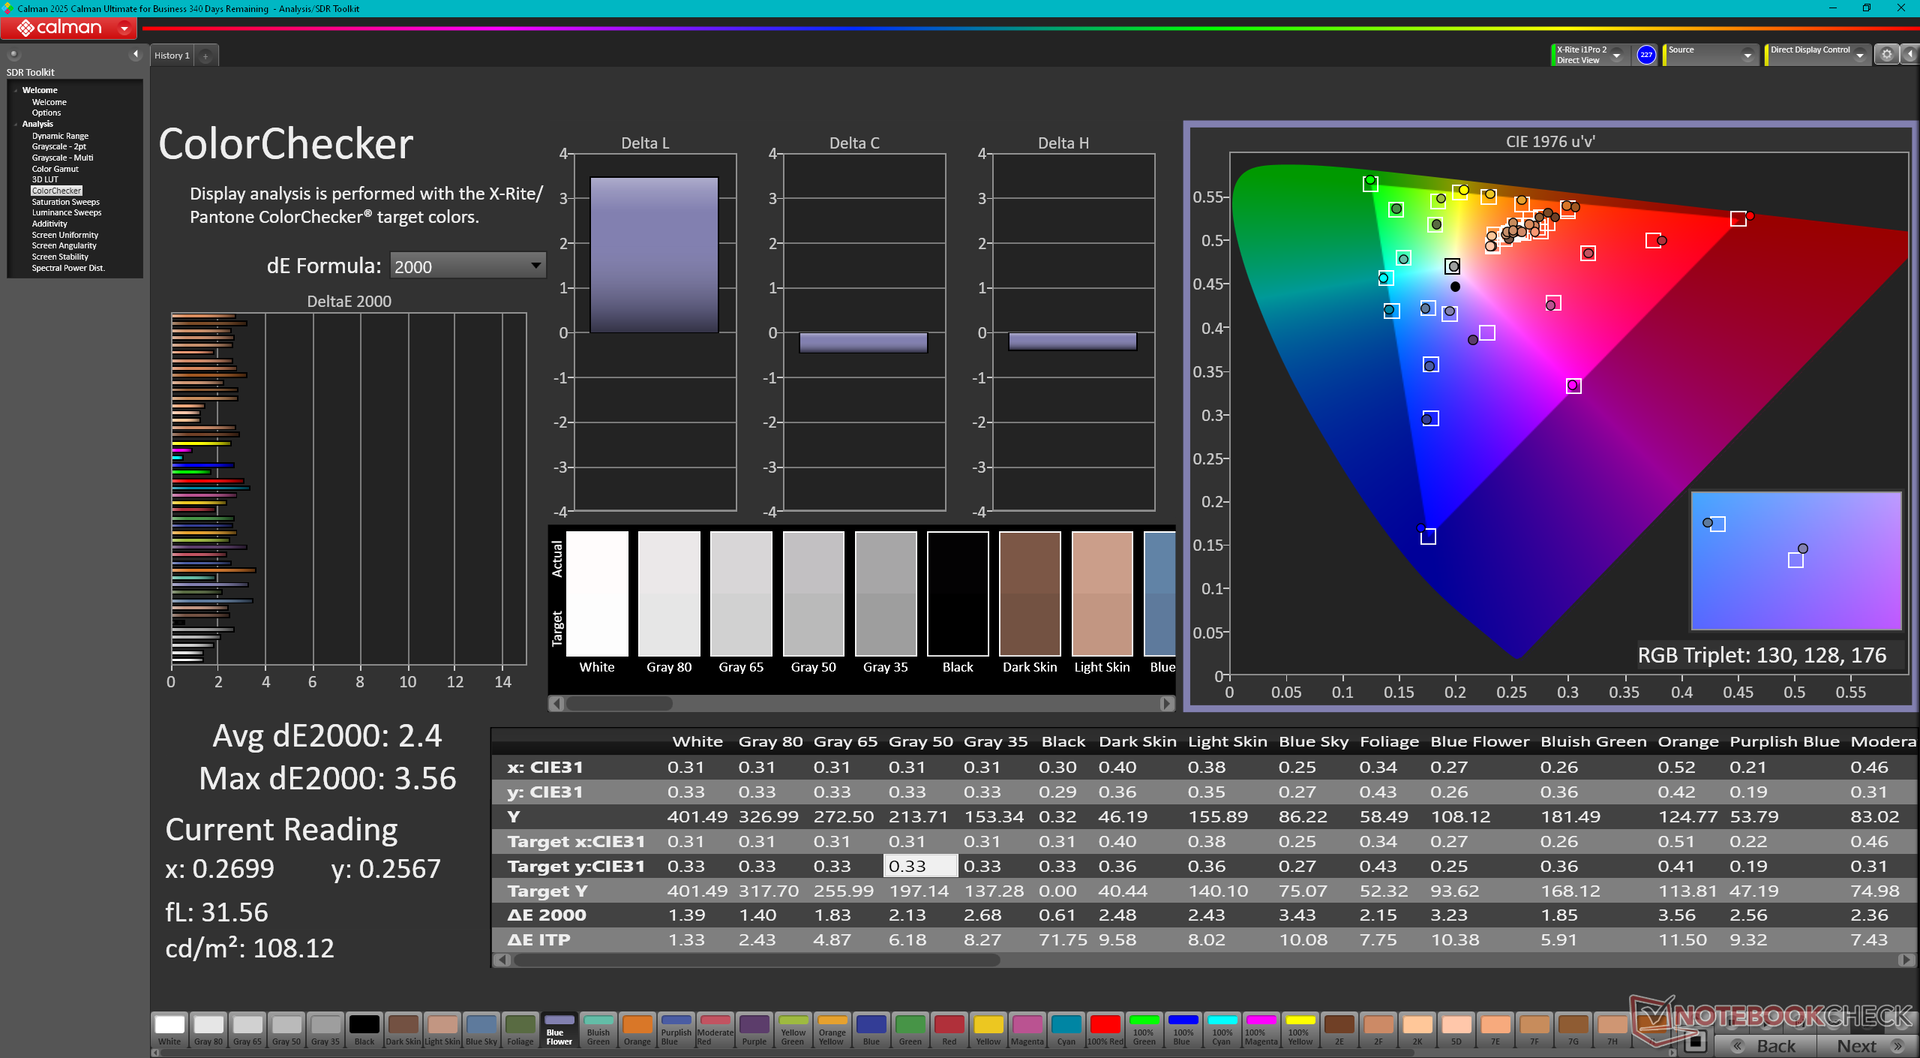
ΔE Color 2.4 | 0.5-29.43 Ø4.86, calibrated: 0.54
ΔE Greyscale 1.9 | 0.5-98 Ø5.1
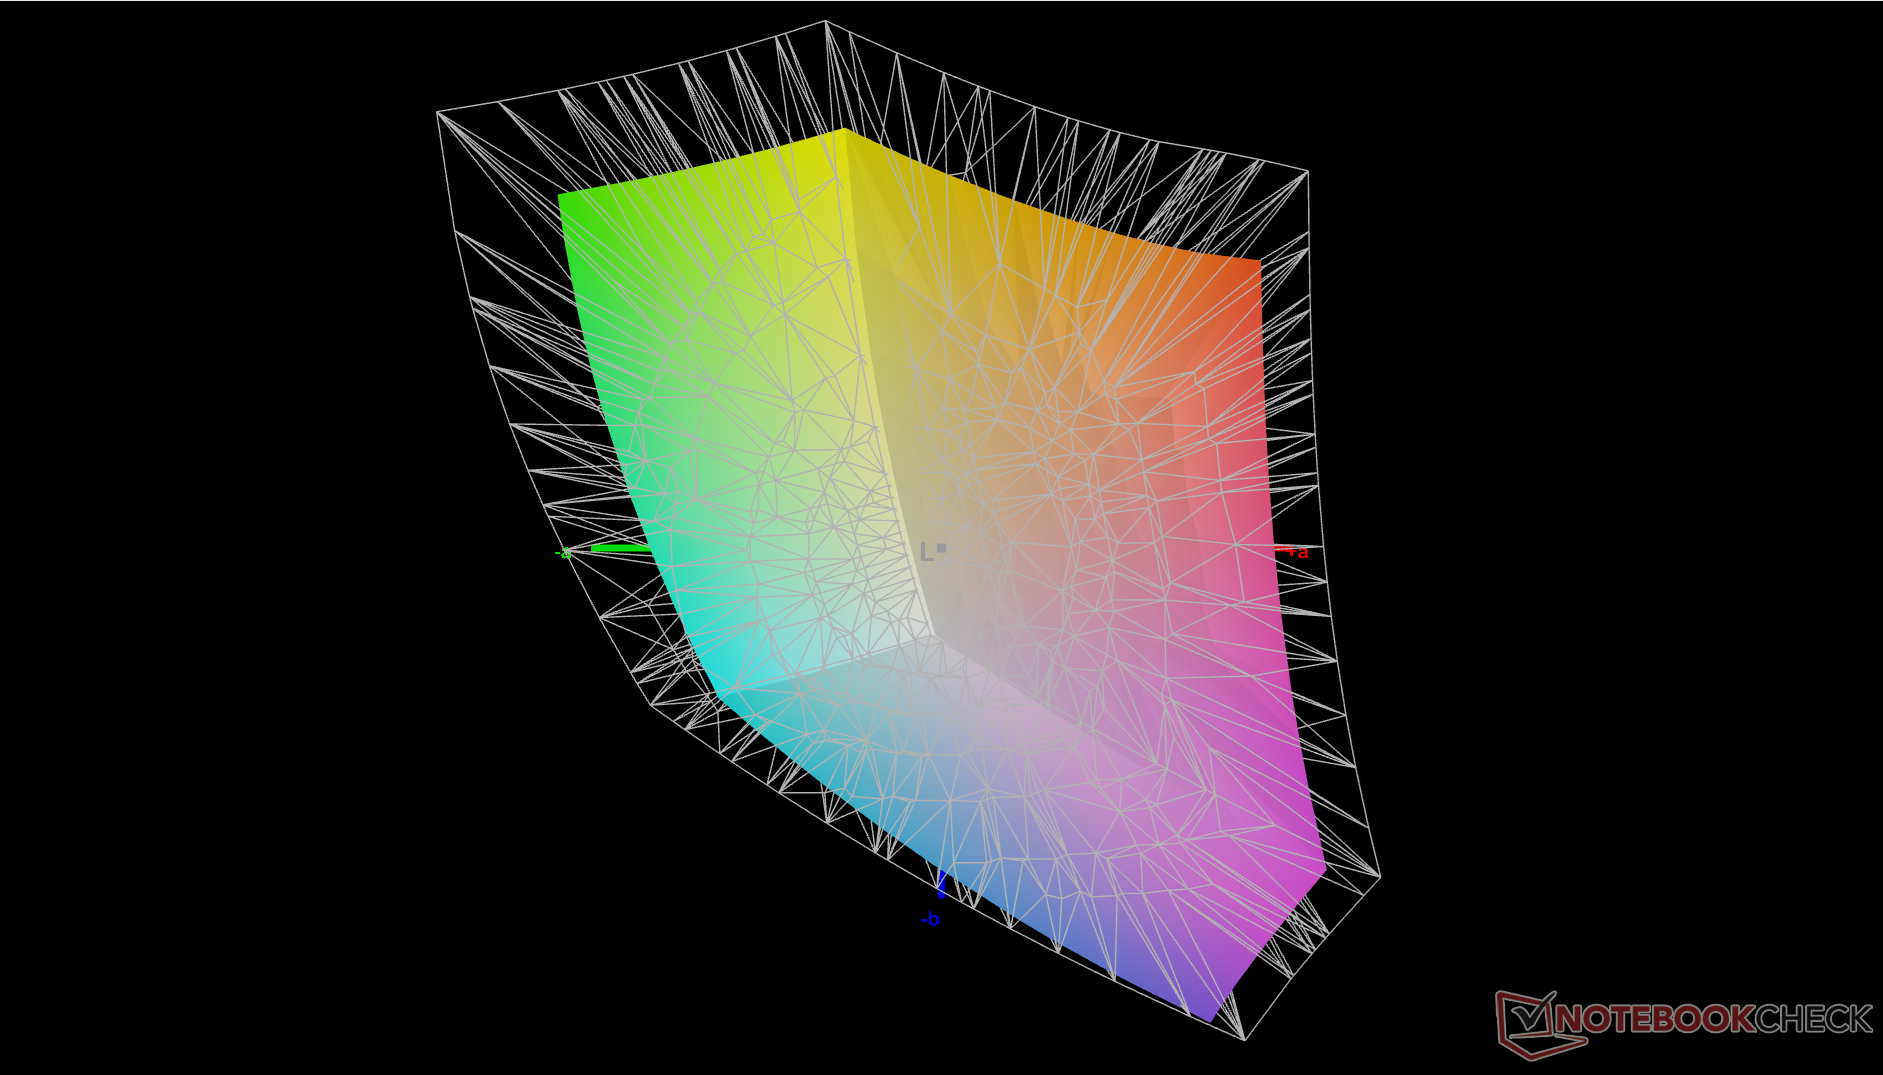
73.1% AdobeRGB 1998 (Argyll 2.2.0 3D)
98.6% sRGB (Argyll 2.2.0 3D)
71.6% Display P3 (Argyll 2.2.0 3D)
Gamma: 2
| MSI Summit E13 AI Evo A1MTG CMN13C6, IPS, 1920x1200, 13.3", 60 Hz | MSI Summit E13 Flip Evo A11MT Sharp LQ134N1JW53, IPS, 1920x1200, 13.4", 120 Hz | Lenovo Yoga Book 9 13IMU9 SDC ATNA33AA02-0, OLED, 2880x1800, 13.3", 60 Hz | Lenovo ThinkPad L13 Yoga G4 i7-1355U NV133WUM-N61, IPS, 1920x1200, 13.3", 60 Hz | HP Elite Dragonfly Folio 13.5 G3 Chi Mei CMN13C0, IPS, 1920x1280, 13.5", 60 Hz | Dell Latitude 9330 AU Optronics B133QAA, IPS, 2560x1600, 13.3", 60 Hz | |
|---|---|---|---|---|---|---|
| Display | -2% | 24% | -0% | -3% | 5% | |
| Display P3 Coverage | 71.6 | 69.8 -3% | 99.7 39% | 71.6 0% | 68.3 -5% | 77.8 9% |
| sRGB Coverage | 98.6 | 98.8 0% | 100 1% | 99.8 1% | 98.6 0% | 99.9 1% |
| AdobeRGB 1998 Coverage | 73.1 | 70.6 -3% | 97 33% | 71.9 -2% | 70.2 -4% | 77.5 6% |
| Response Times | -16% | 96% | 52% | -19% | -29% | |
| Response Time Grey 50% / Grey 80% * | 60 ? | 64 ? -7% | 1.88 ? 97% | 27.3 ? 54% | 66.8 ? -11% | 67.6 ? -13% |
| Response Time Black / White * | 35.1 ? | 44 ? -25% | 2.1 ? 94% | 17.9 ? 49% | 44.4 ? -26% | 50.4 ? -44% |
| PWM Frequency | 60 ? | |||||
| Screen | -3% | -34% | -25% | -6% | -12% | |
| Brightness middle | 405.2 | 551.3 36% | 362.6 -11% | 278.1 -31% | 369.5 -9% | 542.3 34% |
| Brightness | 372 | 517 39% | 368 -1% | 280 -25% | 350 -6% | 516 39% |
| Brightness Distribution | 88 | 91 3% | 97 10% | 92 5% | 87 -1% | 85 -3% |
| Black Level * | 0.34 | 0.37 -9% | 0.34 -0% | 0.24 29% | 0.38 -12% | |
| Contrast | 1192 | 1490 25% | 818 -31% | 1540 29% | 1427 20% | |
| Colorchecker dE 2000 * | 2.4 | 1.45 40% | 4.66 -94% | 2.6 -8% | 2.3 4% | 3.18 -33% |
| Colorchecker dE 2000 max. * | 3.56 | 2.86 20% | 7.25 -104% | 4.81 -35% | 4.34 -22% | 6.05 -70% |
| Colorchecker dE 2000 calibrated * | 0.54 | 1.7 -215% | 0.56 -4% | 0.51 6% | 0.6 -11% | 0.67 -24% |
| Greyscale dE 2000 * | 1.9 | 1.3 32% | 2.6 -37% | 3.9 -105% | 3.1 -63% | 3.1 -63% |
| Gamma | 2 110% | 2.14 103% | 2.2 100% | 2.29 96% | 2.1 105% | 2.08 106% |
| CCT | 6503 100% | 6580 99% | 6055 107% | 5877 111% | 6248 104% | 6140 106% |
| Color Space (Percent of AdobeRGB 1998) | 65 | |||||
| Color Space (Percent of sRGB) | 99 | |||||
| Média Total (Programa/Configurações) | -7% /
-5% | 29% /
2% | 9% /
-9% | -9% /
-7% | -12% /
-11% |
* ... menor é melhor
A tela pode ser calibrada de forma decente, mas nossa própria calibração X-Rite melhoraria ainda mais as cores. Os valores DeltaE médios de escala de cinza e de cores podem ser tão baixos quanto 0,6 e 0,54, respectivamente.

Exibir tempos de resposta
| ↔ Tempo de resposta preto para branco | ||
|---|---|---|
| 35.1 ms ... ascensão ↗ e queda ↘ combinadas | ↗ 17 ms ascensão | 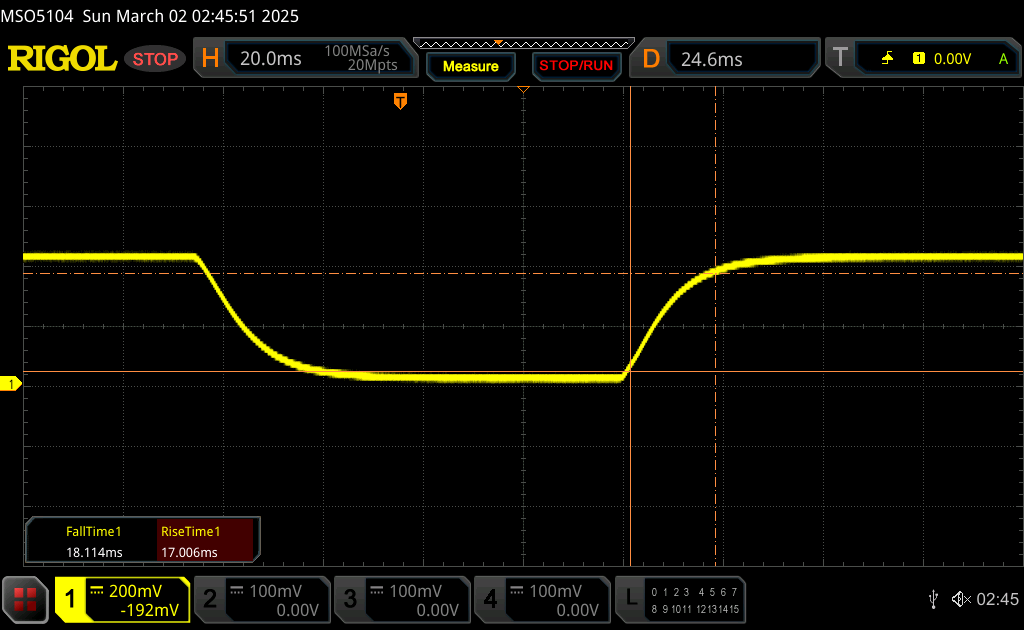 |
| ↘ 18.1 ms queda | ||
| A tela mostra taxas de resposta lentas em nossos testes e será insatisfatória para os jogadores. Em comparação, todos os dispositivos testados variam de 0.1 (mínimo) a 240 (máximo) ms. » 92 % de todos os dispositivos são melhores. Isso significa que o tempo de resposta medido é pior que a média de todos os dispositivos testados (20.7 ms). | ||
| ↔ Tempo de resposta 50% cinza a 80% cinza | ||
| 60 ms ... ascensão ↗ e queda ↘ combinadas | ↗ 27.2 ms ascensão | 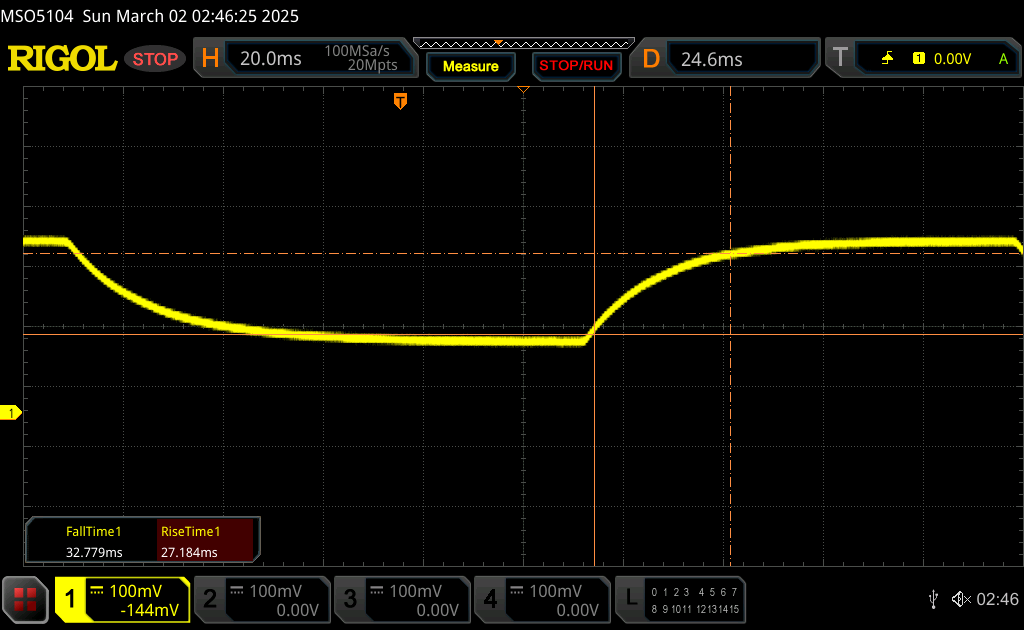 |
| ↘ 32.8 ms queda | ||
| A tela mostra taxas de resposta lentas em nossos testes e será insatisfatória para os jogadores. Em comparação, todos os dispositivos testados variam de 0.165 (mínimo) a 636 (máximo) ms. » 95 % de todos os dispositivos são melhores. Isso significa que o tempo de resposta medido é pior que a média de todos os dispositivos testados (32.4 ms). | ||
Cintilação da tela / PWM (modulação por largura de pulso)
| Tela tremeluzindo / PWM não detectado | 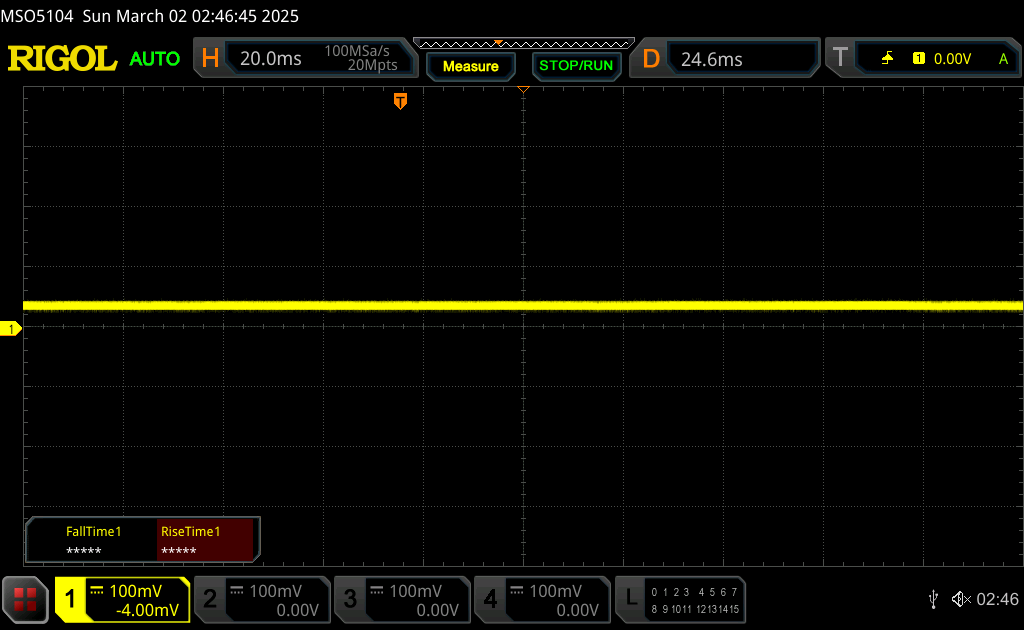 | ||
[pwm_comparison] Em comparação: 53 % de todos os dispositivos testados não usam PWM para escurecer a tela. Se PWM foi detectado, uma média de 8482 (mínimo: 5 - máximo: 343500) Hz foi medida. | |||
Desempenho - O Core Ultra-H é muito difícil de lidar
Condições de teste
Configuramos o Windows para o modo Desempenho e o MSI Center para o modo Desempenho Extremo antes de executar os benchmarks abaixo.
Processador
O desempenho bruto da CPU multi-thread cairia em mais de 20% após o primeiro loop em nosso teste de estresse do CineBench R15 xT. Consequentemente, nosso sistema teria um desempenho cerca de 20% mais lento do que o laptop médio em nosso banco de dados equipado com o mesmo Core Ultra 7 155H core Ultra 7 155H.
Cinebench R15 Multi Loop
Cinebench R23: Multi Core | Single Core
Cinebench R20: CPU (Multi Core) | CPU (Single Core)
Cinebench R15: CPU Multi 64Bit | CPU Single 64Bit
Blender: v2.79 BMW27 CPU
7-Zip 18.03: 7z b 4 | 7z b 4 -mmt1
Geekbench 6.4: Multi-Core | Single-Core
Geekbench 5.5: Multi-Core | Single-Core
HWBOT x265 Benchmark v2.2: 4k Preset
LibreOffice : 20 Documents To PDF
R Benchmark 2.5: Overall mean
| Geekbench 6.4 / Multi-Core | |
| Asus ROG Flow Z13 GZ302EA-RU073W | |
| Média Intel Core Ultra 7 155H (7732 - 13656, n=55) | |
| Framework Laptop 13.5 Ryzen 7 7840U | |
| MSI Prestige 13 AI Plus Evo A2VMG | |
| MSI Summit E13 AI Evo A1MTG | |
| Lenovo Yoga Book 9 13IMU9 | |
| Lenovo ThinkPad L13 Yoga G4 i7-1355U | |
| Geekbench 6.4 / Single-Core | |
| Asus ROG Flow Z13 GZ302EA-RU073W | |
| MSI Prestige 13 AI Plus Evo A2VMG | |
| Framework Laptop 13.5 Ryzen 7 7840U | |
| Lenovo ThinkPad L13 Yoga G4 i7-1355U | |
| Média Intel Core Ultra 7 155H (1901 - 2473, n=52) | |
| Lenovo Yoga Book 9 13IMU9 | |
| MSI Summit E13 AI Evo A1MTG | |
* ... menor é melhor
AIDA64: FP32 Ray-Trace | FPU Julia | CPU SHA3 | CPU Queen | FPU SinJulia | FPU Mandel | CPU AES | CPU ZLib | FP64 Ray-Trace | CPU PhotoWorxx
| Performance Rating | |
| Média Intel Core Ultra 7 155H | |
| MSI Summit E13 AI Evo A1MTG | |
| Lenovo Yoga Book 9 13IMU9 | |
| MSI Summit E13 Flip Evo A11MT | |
| HP Elite Dragonfly Folio 13.5 G3 | |
| Lenovo ThinkPad L13 Yoga G4 i7-1355U | |
| Dell Latitude 9330 | |
| AIDA64 / FP32 Ray-Trace | |
| Média Intel Core Ultra 7 155H (6670 - 18470, n=50) | |
| MSI Summit E13 AI Evo A1MTG | |
| Lenovo Yoga Book 9 13IMU9 | |
| MSI Summit E13 Flip Evo A11MT | |
| Dell Latitude 9330 | |
| HP Elite Dragonfly Folio 13.5 G3 | |
| Lenovo ThinkPad L13 Yoga G4 i7-1355U | |
| AIDA64 / FPU Julia | |
| Média Intel Core Ultra 7 155H (40905 - 93181, n=50) | |
| MSI Summit E13 AI Evo A1MTG | |
| Lenovo Yoga Book 9 13IMU9 | |
| HP Elite Dragonfly Folio 13.5 G3 | |
| Dell Latitude 9330 | |
| Lenovo ThinkPad L13 Yoga G4 i7-1355U | |
| MSI Summit E13 Flip Evo A11MT | |
| AIDA64 / CPU SHA3 | |
| Média Intel Core Ultra 7 155H (1940 - 4436, n=50) | |
| MSI Summit E13 AI Evo A1MTG | |
| Lenovo Yoga Book 9 13IMU9 | |
| MSI Summit E13 Flip Evo A11MT | |
| Dell Latitude 9330 | |
| Lenovo ThinkPad L13 Yoga G4 i7-1355U | |
| HP Elite Dragonfly Folio 13.5 G3 | |
| AIDA64 / CPU Queen | |
| Média Intel Core Ultra 7 155H (64698 - 94181, n=50) | |
| MSI Summit E13 AI Evo A1MTG | |
| HP Elite Dragonfly Folio 13.5 G3 | |
| Lenovo ThinkPad L13 Yoga G4 i7-1355U | |
| MSI Summit E13 Flip Evo A11MT | |
| Dell Latitude 9330 | |
| Lenovo Yoga Book 9 13IMU9 | |
| AIDA64 / FPU SinJulia | |
| Média Intel Core Ultra 7 155H (5639 - 10647, n=50) | |
| MSI Summit E13 AI Evo A1MTG | |
| Lenovo Yoga Book 9 13IMU9 | |
| MSI Summit E13 Flip Evo A11MT | |
| HP Elite Dragonfly Folio 13.5 G3 | |
| Lenovo ThinkPad L13 Yoga G4 i7-1355U | |
| Dell Latitude 9330 | |
| AIDA64 / FPU Mandel | |
| Média Intel Core Ultra 7 155H (18236 - 47685, n=50) | |
| MSI Summit E13 AI Evo A1MTG | |
| Lenovo Yoga Book 9 13IMU9 | |
| MSI Summit E13 Flip Evo A11MT | |
| HP Elite Dragonfly Folio 13.5 G3 | |
| Dell Latitude 9330 | |
| Lenovo ThinkPad L13 Yoga G4 i7-1355U | |
| AIDA64 / CPU AES | |
| Média Intel Core Ultra 7 155H (45713 - 152179, n=50) | |
| MSI Summit E13 Flip Evo A11MT | |
| MSI Summit E13 AI Evo A1MTG | |
| Lenovo Yoga Book 9 13IMU9 | |
| HP Elite Dragonfly Folio 13.5 G3 | |
| Lenovo ThinkPad L13 Yoga G4 i7-1355U | |
| Dell Latitude 9330 | |
| AIDA64 / CPU ZLib | |
| Média Intel Core Ultra 7 155H (557 - 1250, n=50) | |
| MSI Summit E13 AI Evo A1MTG | |
| Lenovo Yoga Book 9 13IMU9 | |
| HP Elite Dragonfly Folio 13.5 G3 | |
| Lenovo ThinkPad L13 Yoga G4 i7-1355U | |
| Dell Latitude 9330 | |
| MSI Summit E13 Flip Evo A11MT | |
| AIDA64 / FP64 Ray-Trace | |
| Média Intel Core Ultra 7 155H (3569 - 9802, n=50) | |
| MSI Summit E13 AI Evo A1MTG | |
| Lenovo Yoga Book 9 13IMU9 | |
| MSI Summit E13 Flip Evo A11MT | |
| Dell Latitude 9330 | |
| HP Elite Dragonfly Folio 13.5 G3 | |
| Lenovo ThinkPad L13 Yoga G4 i7-1355U | |
| AIDA64 / CPU PhotoWorxx | |
| Média Intel Core Ultra 7 155H (32719 - 54223, n=50) | |
| Lenovo Yoga Book 9 13IMU9 | |
| HP Elite Dragonfly Folio 13.5 G3 | |
| MSI Summit E13 AI Evo A1MTG | |
| MSI Summit E13 Flip Evo A11MT | |
| Dell Latitude 9330 | |
| Lenovo ThinkPad L13 Yoga G4 i7-1355U | |
Teste de estresse

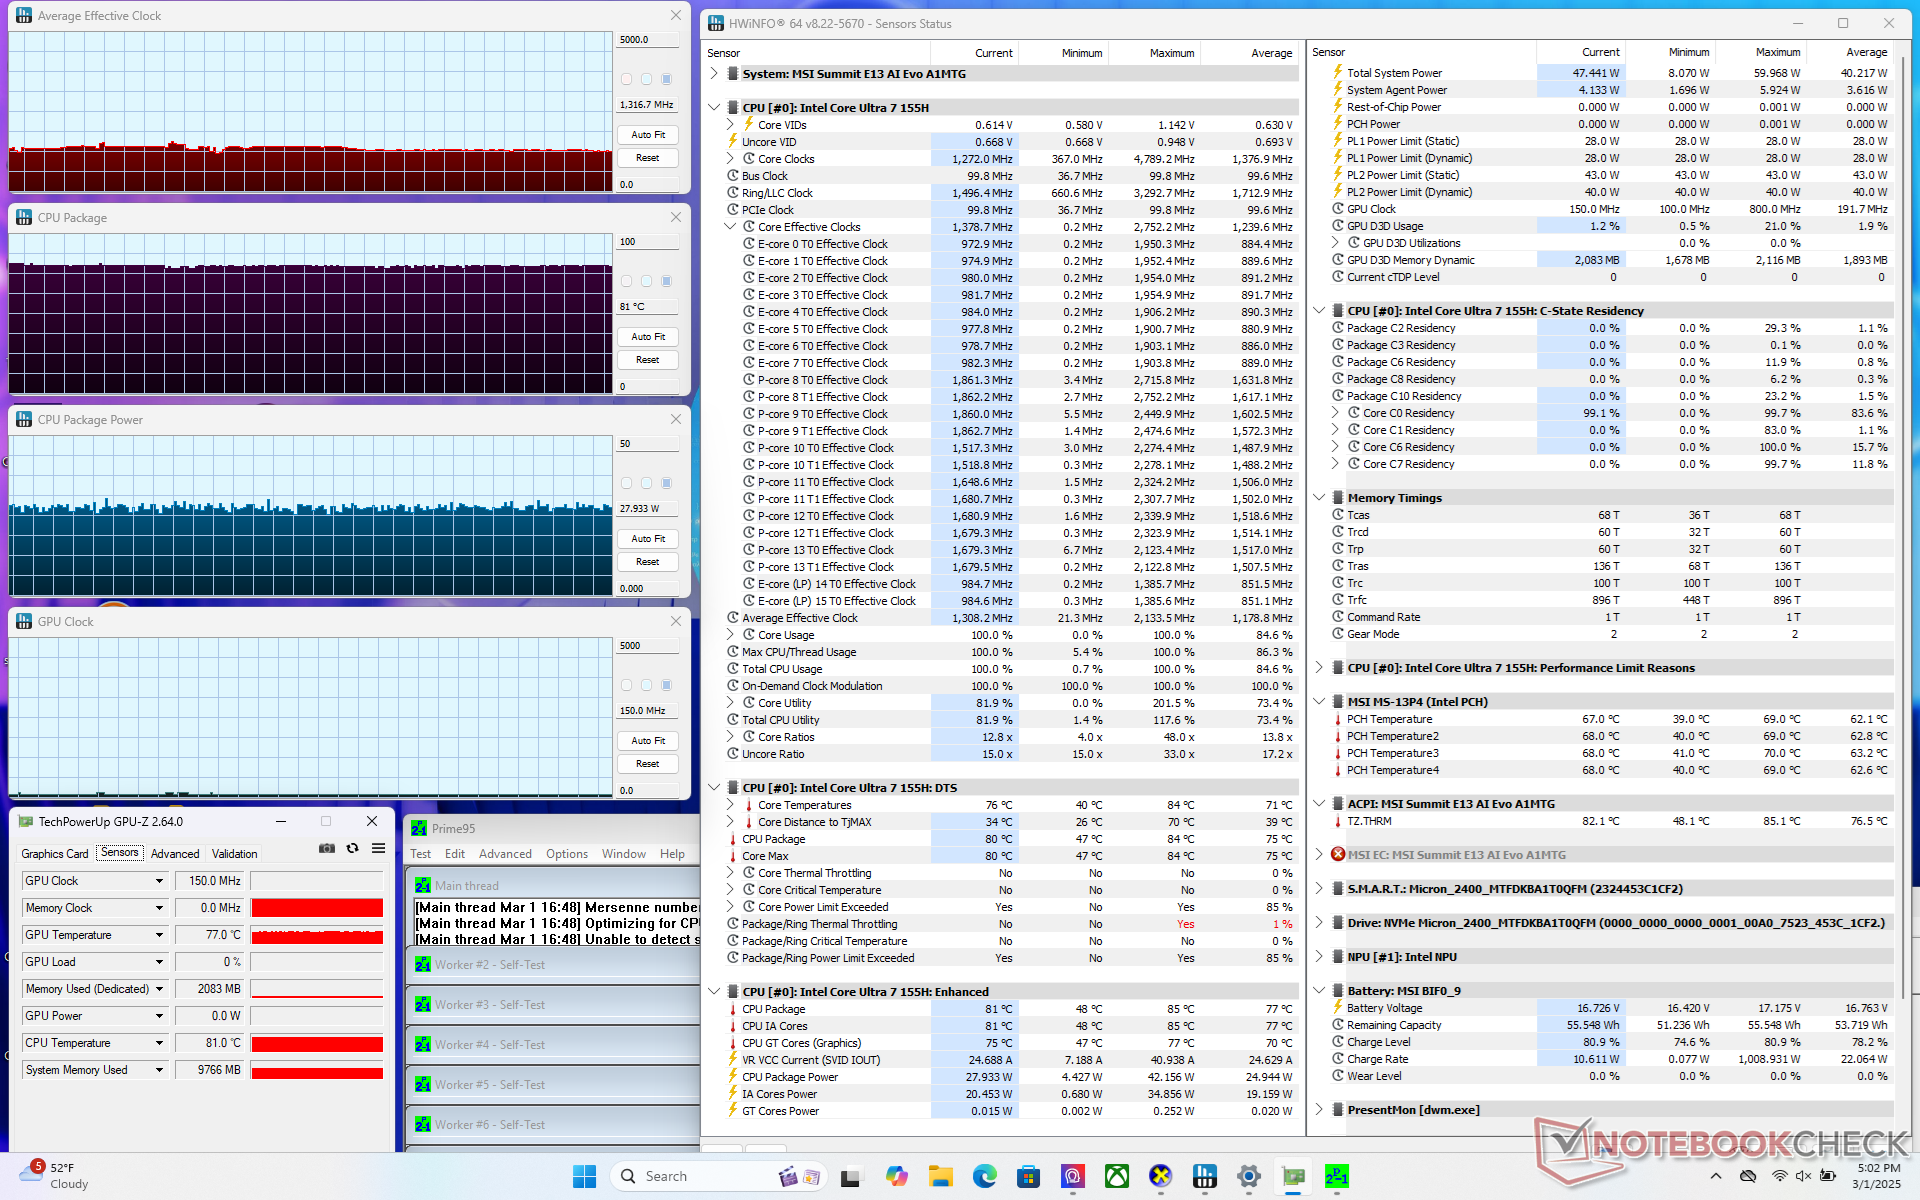
Ao executar o Prime95, a CPU aumentava para 2,1 GHz e 41 W até atingir uma temperatura central de 84 C alguns momentos depois. Em seguida, ela se estabilizava em 1,3 GHz e 28 W para manter uma temperatura central de 81 °C com o Cooler Boost ativado. A temperatura do núcleo aumentaria apenas alguns graus se o Cooler Boost estivesse desativado.
Ao executar o Cyberpunk 2077, a taxa de clock da GPU seria relativamente instável, como mostra a captura de tela abaixo, mesmo quando ociosa no jogo. Isso reflete as taxas de quadros instáveis, conforme observado na seção Desempenho da GPU abaixo. A temperatura do núcleo também era muito alta, 87 °C ou mais de 10 °C mais quente do que no modelo 2021.
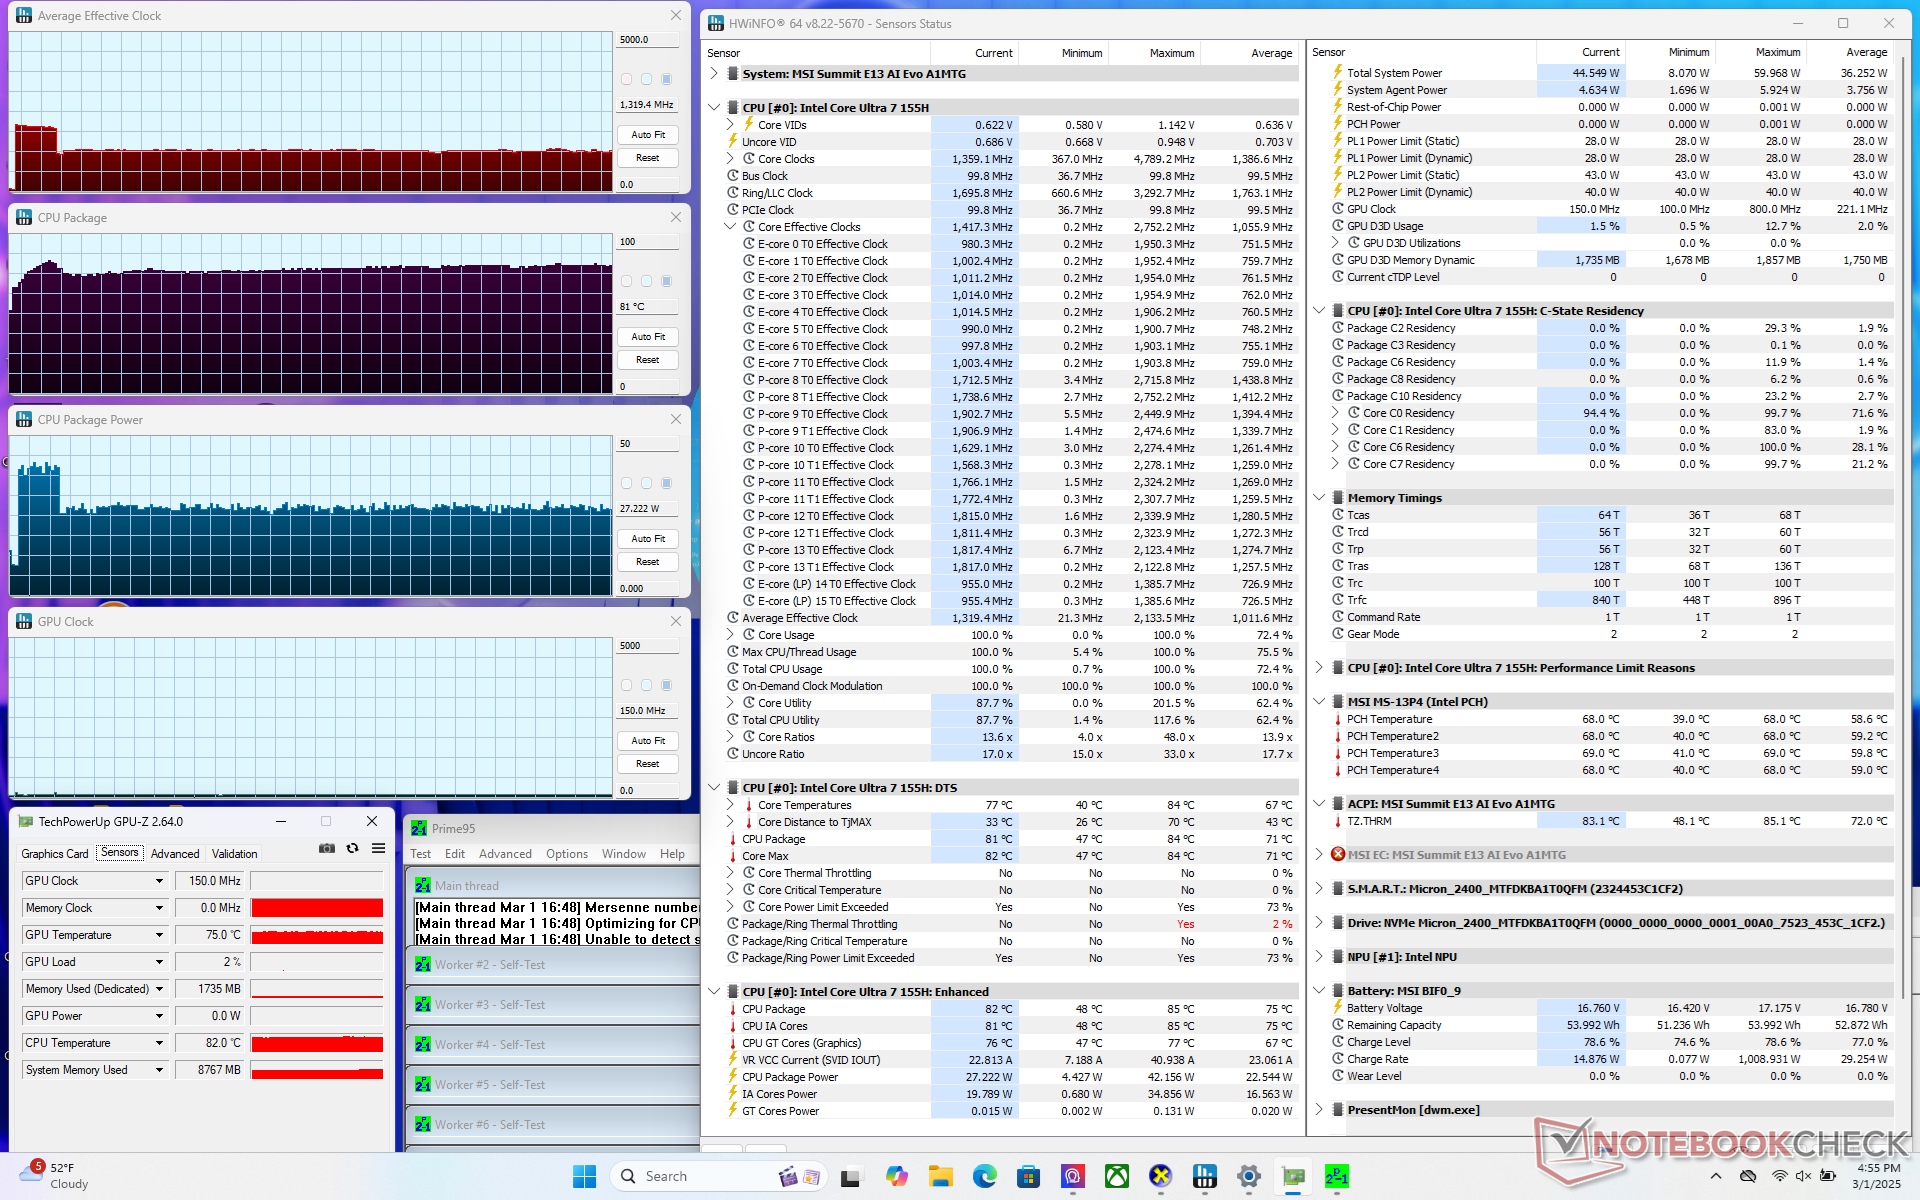
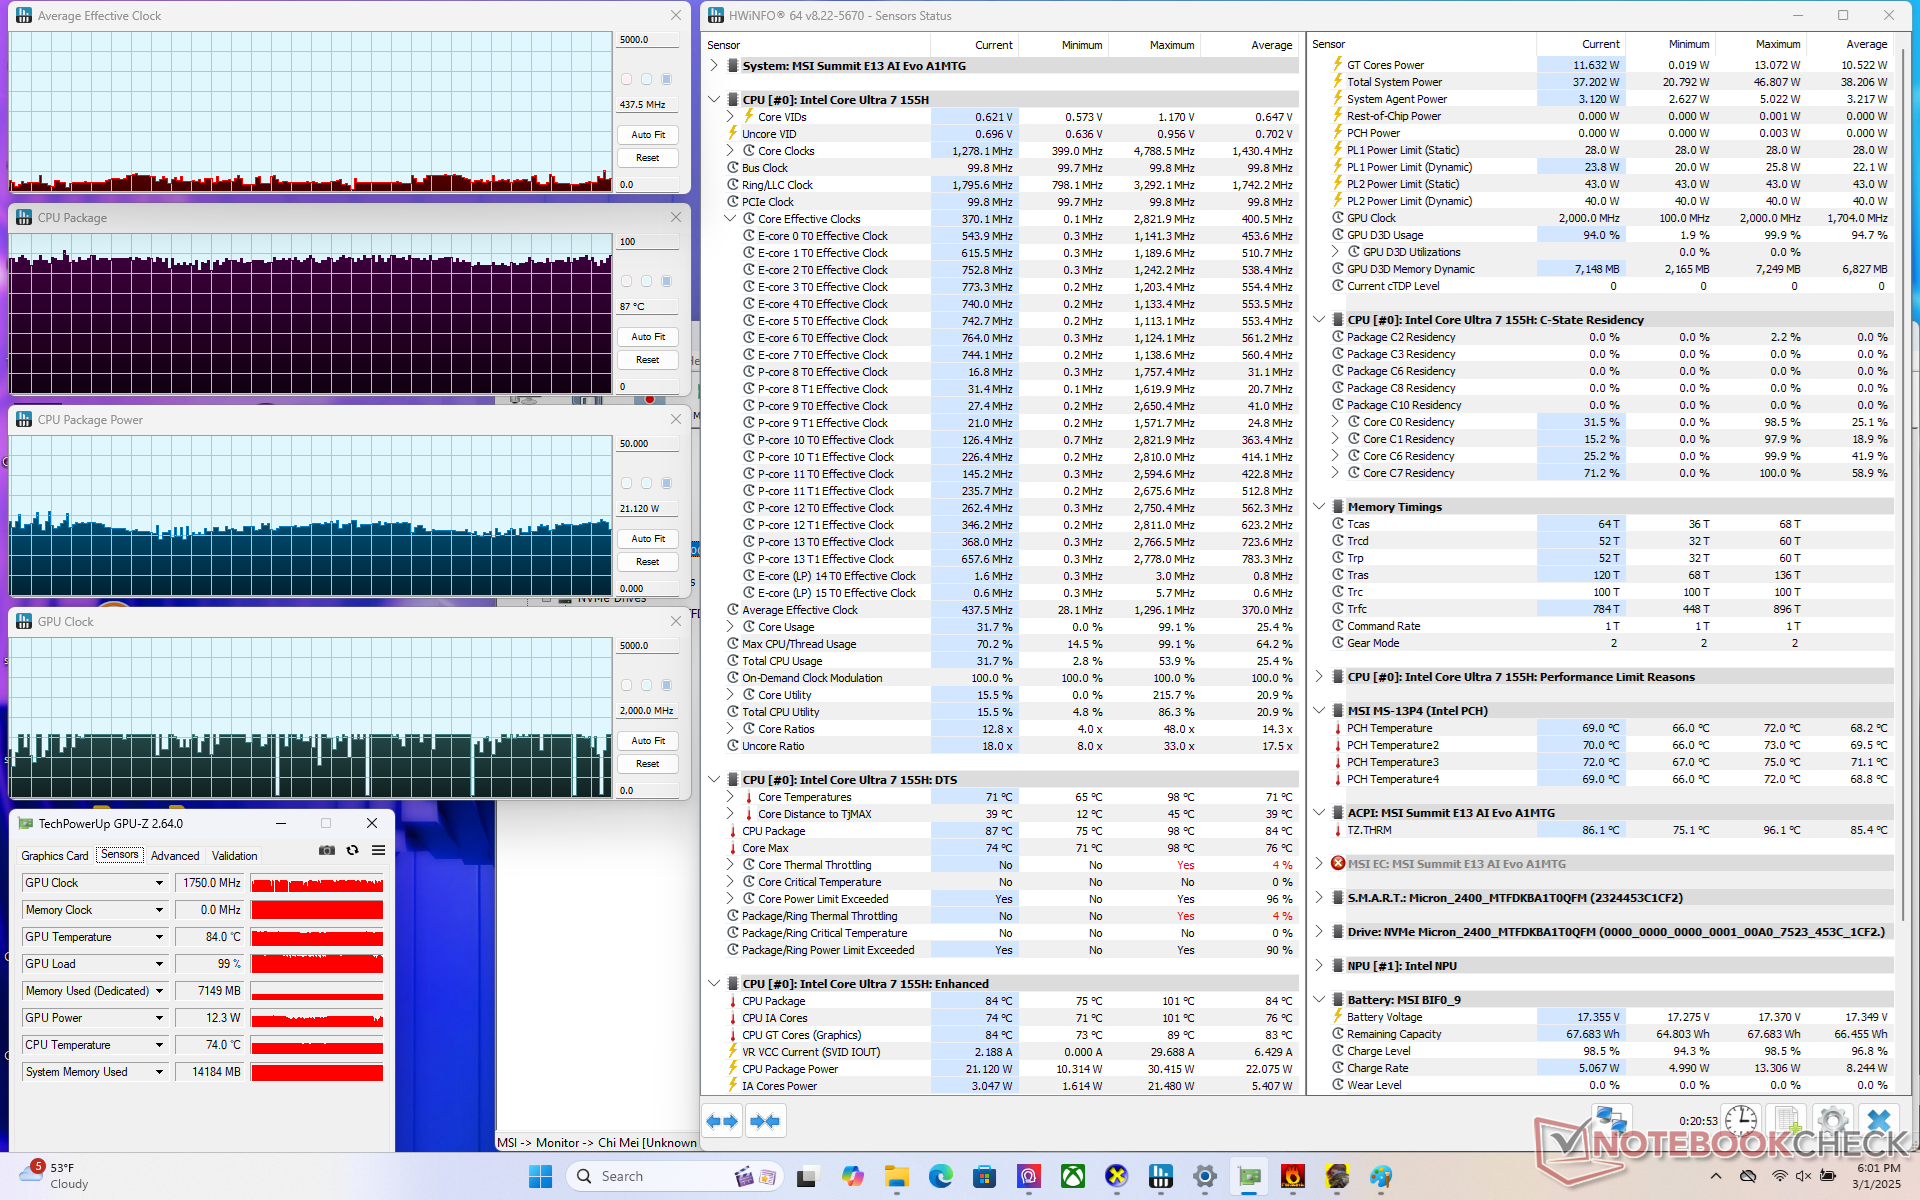
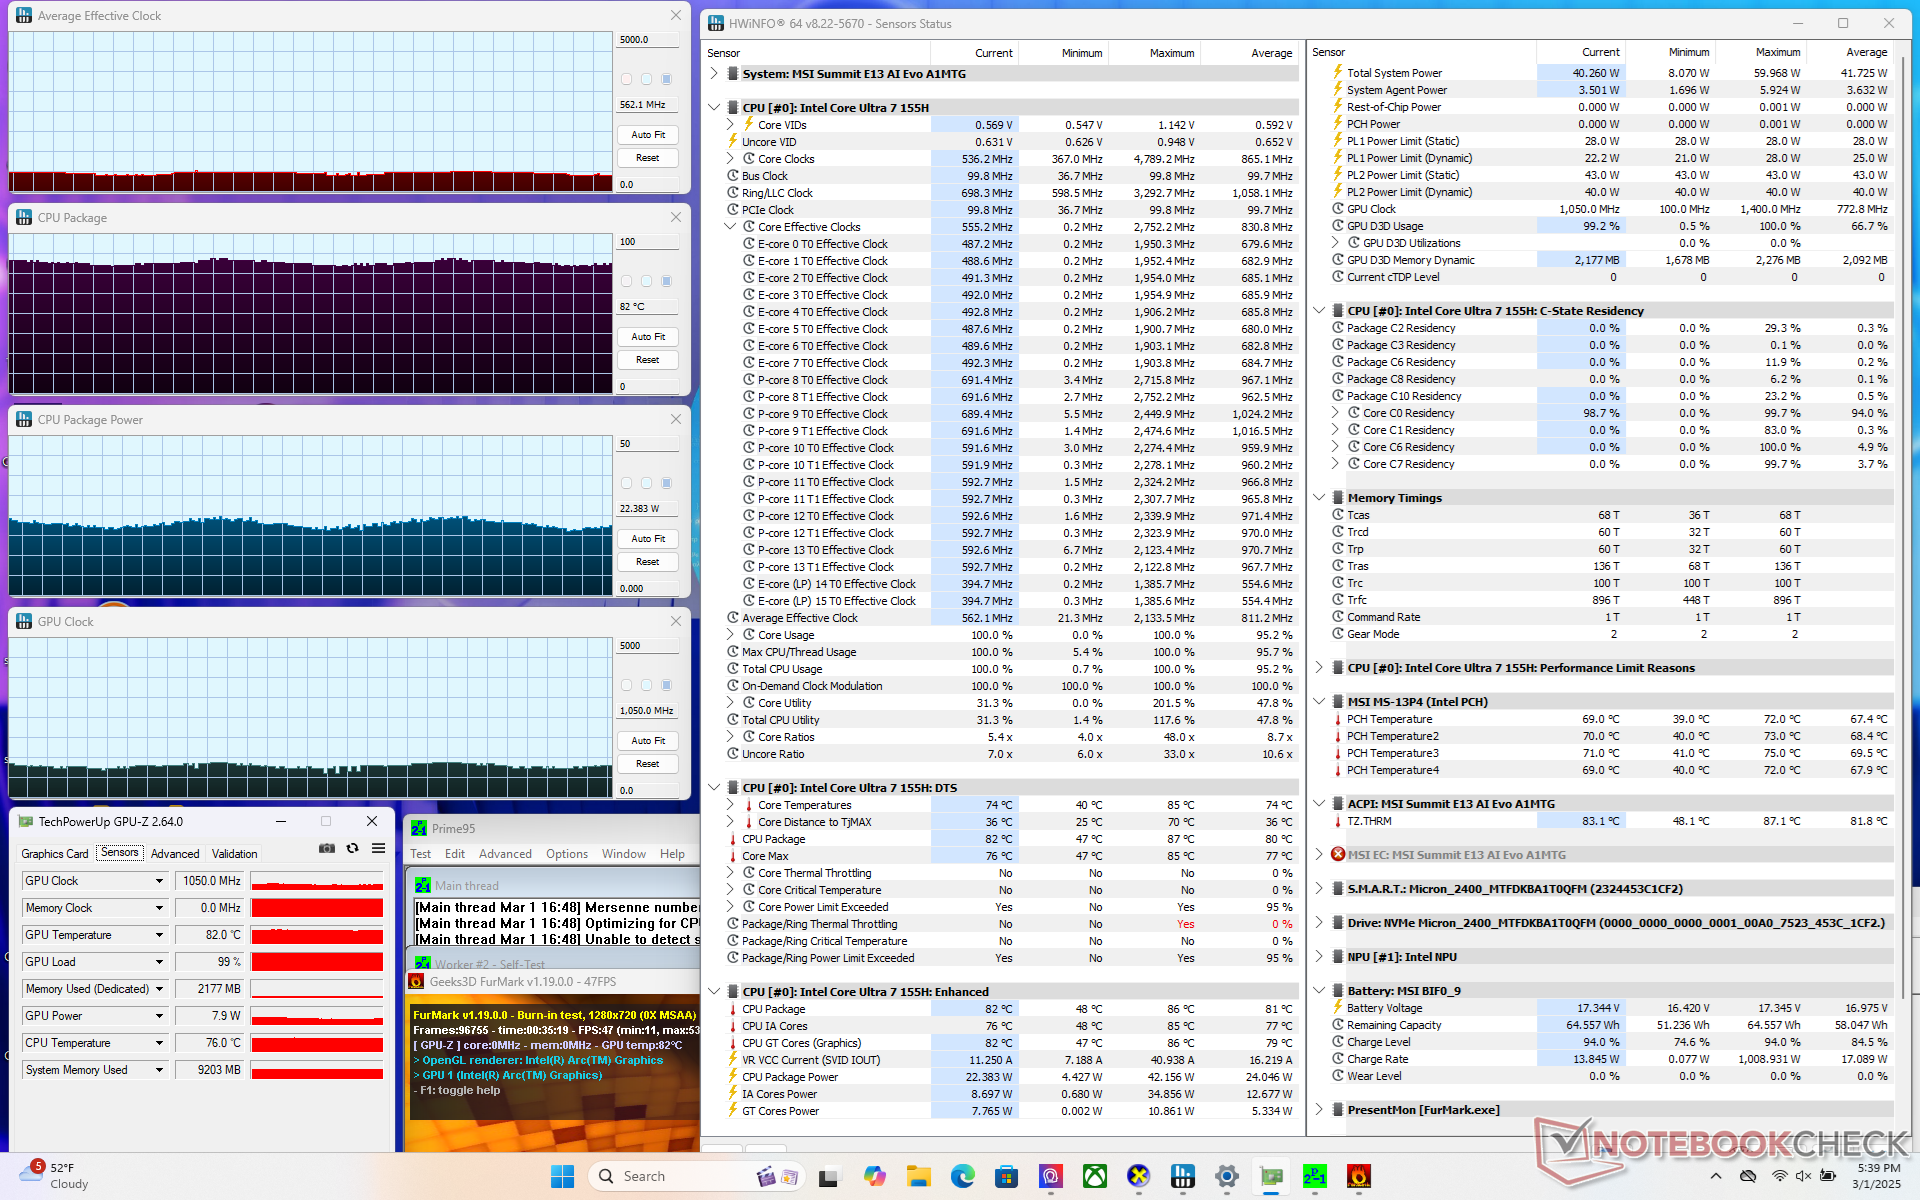
| Clock médio da CPU (GHz) | Clock da GPU (MHz) | Temperatura média da CPU (°C) | |
| Sistema ocioso | -- | -- | 48 |
| Estresse do Prime95 (Cooler Boost On) | 1.3 | -- | 81 |
| Estresse do Prime95 (Cooler Boost desligado) | 1.3 | -- | 81 |
| Prime95 + FurMark Stress | 0.6 | 1050 | 82 |
| Cyberpunk 2077 Stress | 0.4 | ~2000 | 87 |
Desempenho do sistema
CrossMark: Overall | Productivity | Creativity | Responsiveness
WebXPRT 3: Overall
WebXPRT 4: Overall
Mozilla Kraken 1.1: Total
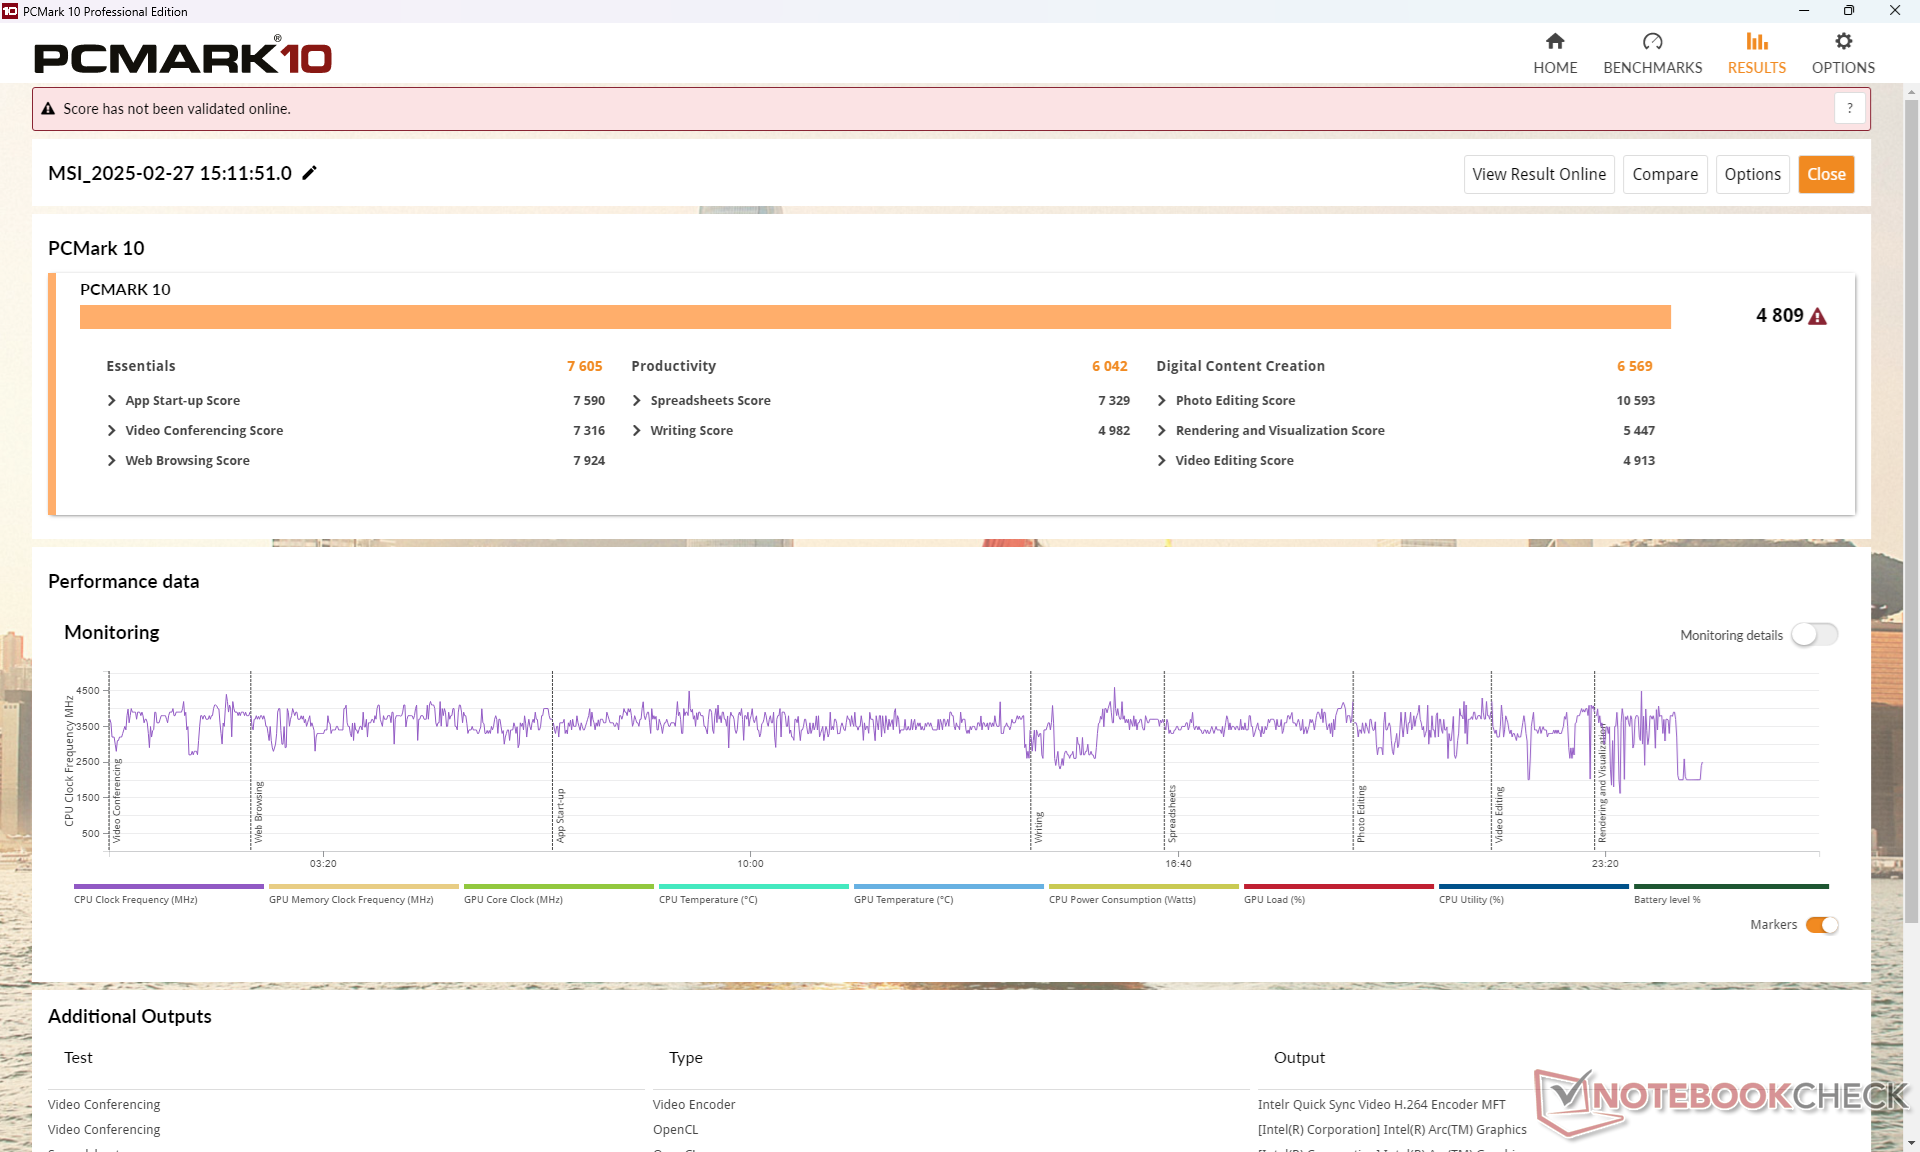
| PCMark 10 / Score | |
| Média Intel Core Ultra 7 155H, Intel Arc 8-Core iGPU (4809 - 7529, n=34) | |
| Lenovo Yoga Book 9 13IMU9 | |
| Lenovo ThinkPad L13 Yoga G4 i7-1355U | |
| HP Elite Dragonfly Folio 13.5 G3 | |
| Dell Latitude 9330 | |
| MSI Summit E13 AI Evo A1MTG | |
| MSI Summit E13 Flip Evo A11MT | |
| PCMark 10 / Essentials | |
| HP Elite Dragonfly Folio 13.5 G3 | |
| Lenovo ThinkPad L13 Yoga G4 i7-1355U | |
| Lenovo Yoga Book 9 13IMU9 | |
| Média Intel Core Ultra 7 155H, Intel Arc 8-Core iGPU (7605 - 11289, n=34) | |
| Dell Latitude 9330 | |
| MSI Summit E13 Flip Evo A11MT | |
| MSI Summit E13 AI Evo A1MTG | |
| PCMark 10 / Productivity | |
| Média Intel Core Ultra 7 155H, Intel Arc 8-Core iGPU (6042 - 10591, n=34) | |
| Lenovo Yoga Book 9 13IMU9 | |
| Lenovo ThinkPad L13 Yoga G4 i7-1355U | |
| HP Elite Dragonfly Folio 13.5 G3 | |
| Dell Latitude 9330 | |
| MSI Summit E13 Flip Evo A11MT | |
| MSI Summit E13 AI Evo A1MTG | |
| PCMark 10 / Digital Content Creation | |
| Média Intel Core Ultra 7 155H, Intel Arc 8-Core iGPU (4985 - 10709, n=34) | |
| Lenovo Yoga Book 9 13IMU9 | |
| MSI Summit E13 AI Evo A1MTG | |
| Lenovo ThinkPad L13 Yoga G4 i7-1355U | |
| HP Elite Dragonfly Folio 13.5 G3 | |
| Dell Latitude 9330 | |
| MSI Summit E13 Flip Evo A11MT | |
| CrossMark / Overall | |
| Média Intel Core Ultra 7 155H, Intel Arc 8-Core iGPU (1366 - 1903, n=34) | |
| MSI Summit E13 AI Evo A1MTG | |
| HP Elite Dragonfly Folio 13.5 G3 | |
| Lenovo ThinkPad L13 Yoga G4 i7-1355U | |
| Lenovo Yoga Book 9 13IMU9 | |
| CrossMark / Productivity | |
| Média Intel Core Ultra 7 155H, Intel Arc 8-Core iGPU (1291 - 1798, n=33) | |
| HP Elite Dragonfly Folio 13.5 G3 | |
| MSI Summit E13 AI Evo A1MTG | |
| Lenovo ThinkPad L13 Yoga G4 i7-1355U | |
| Lenovo Yoga Book 9 13IMU9 | |
| CrossMark / Creativity | |
| Média Intel Core Ultra 7 155H, Intel Arc 8-Core iGPU (1519 - 1929, n=33) | |
| MSI Summit E13 AI Evo A1MTG | |
| HP Elite Dragonfly Folio 13.5 G3 | |
| Lenovo ThinkPad L13 Yoga G4 i7-1355U | |
| Lenovo Yoga Book 9 13IMU9 | |
| CrossMark / Responsiveness | |
| HP Elite Dragonfly Folio 13.5 G3 | |
| MSI Summit E13 AI Evo A1MTG | |
| Média Intel Core Ultra 7 155H, Intel Arc 8-Core iGPU (939 - 1802, n=33) | |
| Lenovo Yoga Book 9 13IMU9 | |
| Lenovo ThinkPad L13 Yoga G4 i7-1355U | |
| WebXPRT 3 / Overall | |
| Lenovo ThinkPad L13 Yoga G4 i7-1355U | |
| HP Elite Dragonfly Folio 13.5 G3 | |
| MSI Summit E13 AI Evo A1MTG | |
| Média Intel Core Ultra 7 155H, Intel Arc 8-Core iGPU (252 - 299, n=34) | |
| Lenovo Yoga Book 9 13IMU9 | |
| MSI Summit E13 Flip Evo A11MT | |
| Dell Latitude 9330 | |
| WebXPRT 4 / Overall | |
| Lenovo ThinkPad L13 Yoga G4 i7-1355U | |
| Média Intel Core Ultra 7 155H, Intel Arc 8-Core iGPU (166.4 - 309, n=29) | |
| Lenovo Yoga Book 9 13IMU9 | |
| HP Elite Dragonfly Folio 13.5 G3 | |
| Dell Latitude 9330 | |
| MSI Summit E13 AI Evo A1MTG | |
| Mozilla Kraken 1.1 / Total | |
| MSI Summit E13 Flip Evo A11MT | |
| Dell Latitude 9330 | |
| HP Elite Dragonfly Folio 13.5 G3 | |
| Lenovo Yoga Book 9 13IMU9 | |
| MSI Summit E13 AI Evo A1MTG | |
| Média Intel Core Ultra 7 155H, Intel Arc 8-Core iGPU (517 - 614, n=35) | |
| Lenovo ThinkPad L13 Yoga G4 i7-1355U | |
* ... menor é melhor
| PCMark 10 Score | 4809 pontos | |
Ajuda | ||
| AIDA64 / Memory Copy | |
| Média Intel Core Ultra 7 155H (62397 - 96791, n=50) | |
| Lenovo Yoga Book 9 13IMU9 | |
| MSI Summit E13 AI Evo A1MTG | |
| Dell Latitude 9330 | |
| HP Elite Dragonfly Folio 13.5 G3 | |
| Lenovo ThinkPad L13 Yoga G4 i7-1355U | |
| MSI Summit E13 Flip Evo A11MT | |
| AIDA64 / Memory Read | |
| Média Intel Core Ultra 7 155H (60544 - 90647, n=50) | |
| MSI Summit E13 AI Evo A1MTG | |
| HP Elite Dragonfly Folio 13.5 G3 | |
| Lenovo Yoga Book 9 13IMU9 | |
| Dell Latitude 9330 | |
| MSI Summit E13 Flip Evo A11MT | |
| Lenovo ThinkPad L13 Yoga G4 i7-1355U | |
| AIDA64 / Memory Write | |
| HP Elite Dragonfly Folio 13.5 G3 | |
| MSI Summit E13 AI Evo A1MTG | |
| Média Intel Core Ultra 7 155H (58692 - 93451, n=50) | |
| Lenovo ThinkPad L13 Yoga G4 i7-1355U | |
| Dell Latitude 9330 | |
| Lenovo Yoga Book 9 13IMU9 | |
| MSI Summit E13 Flip Evo A11MT | |
| AIDA64 / Memory Latency | |
| Lenovo Yoga Book 9 13IMU9 | |
| Média Intel Core Ultra 7 155H (116.2 - 233, n=50) | |
| MSI Summit E13 AI Evo A1MTG | |
| HP Elite Dragonfly Folio 13.5 G3 | |
| Dell Latitude 9330 | |
| Lenovo ThinkPad L13 Yoga G4 i7-1355U | |
| MSI Summit E13 Flip Evo A11MT | |
* ... menor é melhor
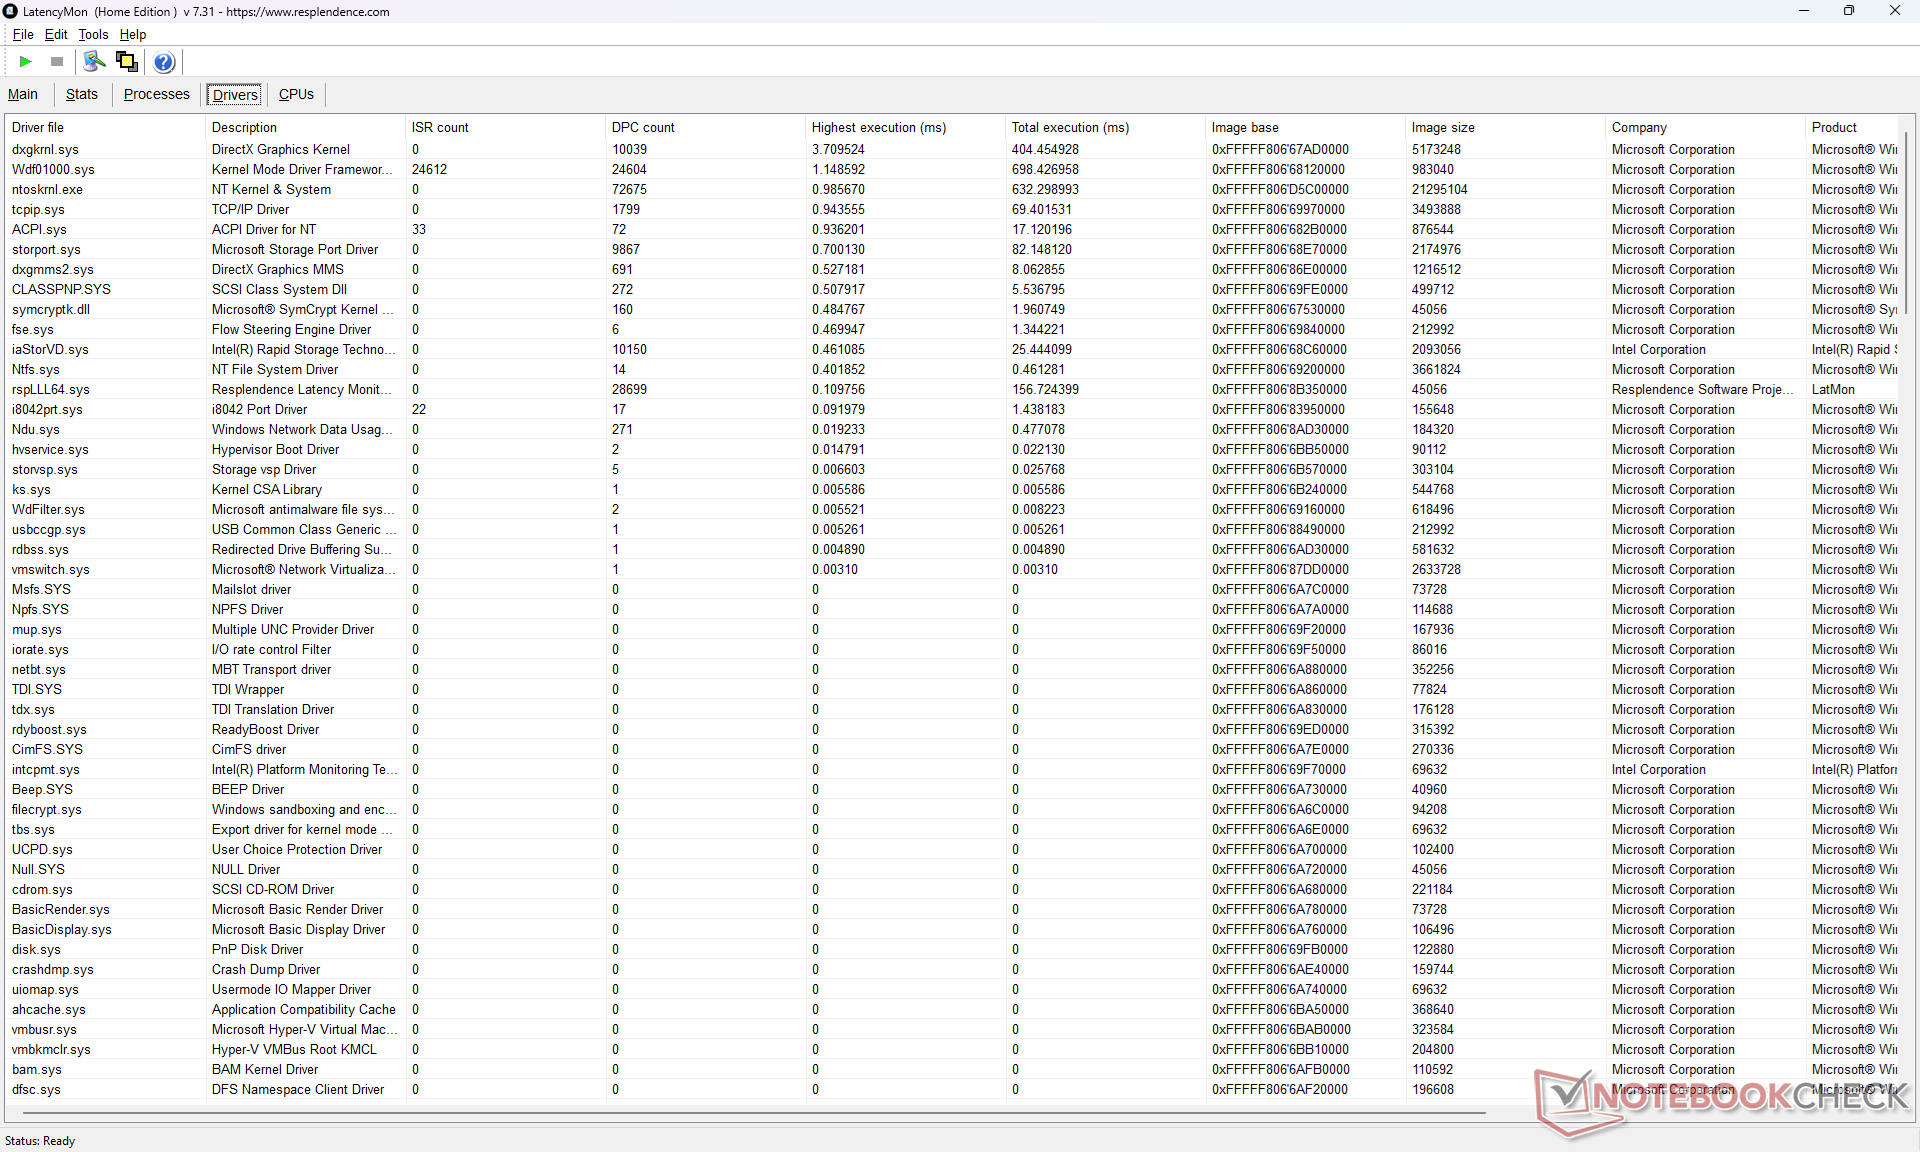
Latência DPC
O LatencyMon revela problemas de DPC ao abrir várias guias do navegador em nossa página inicial. a reprodução de vídeo 4K60 é imperfeita, mas ainda assim suave, com apenas 3 quadros perdidos durante o início do teste.
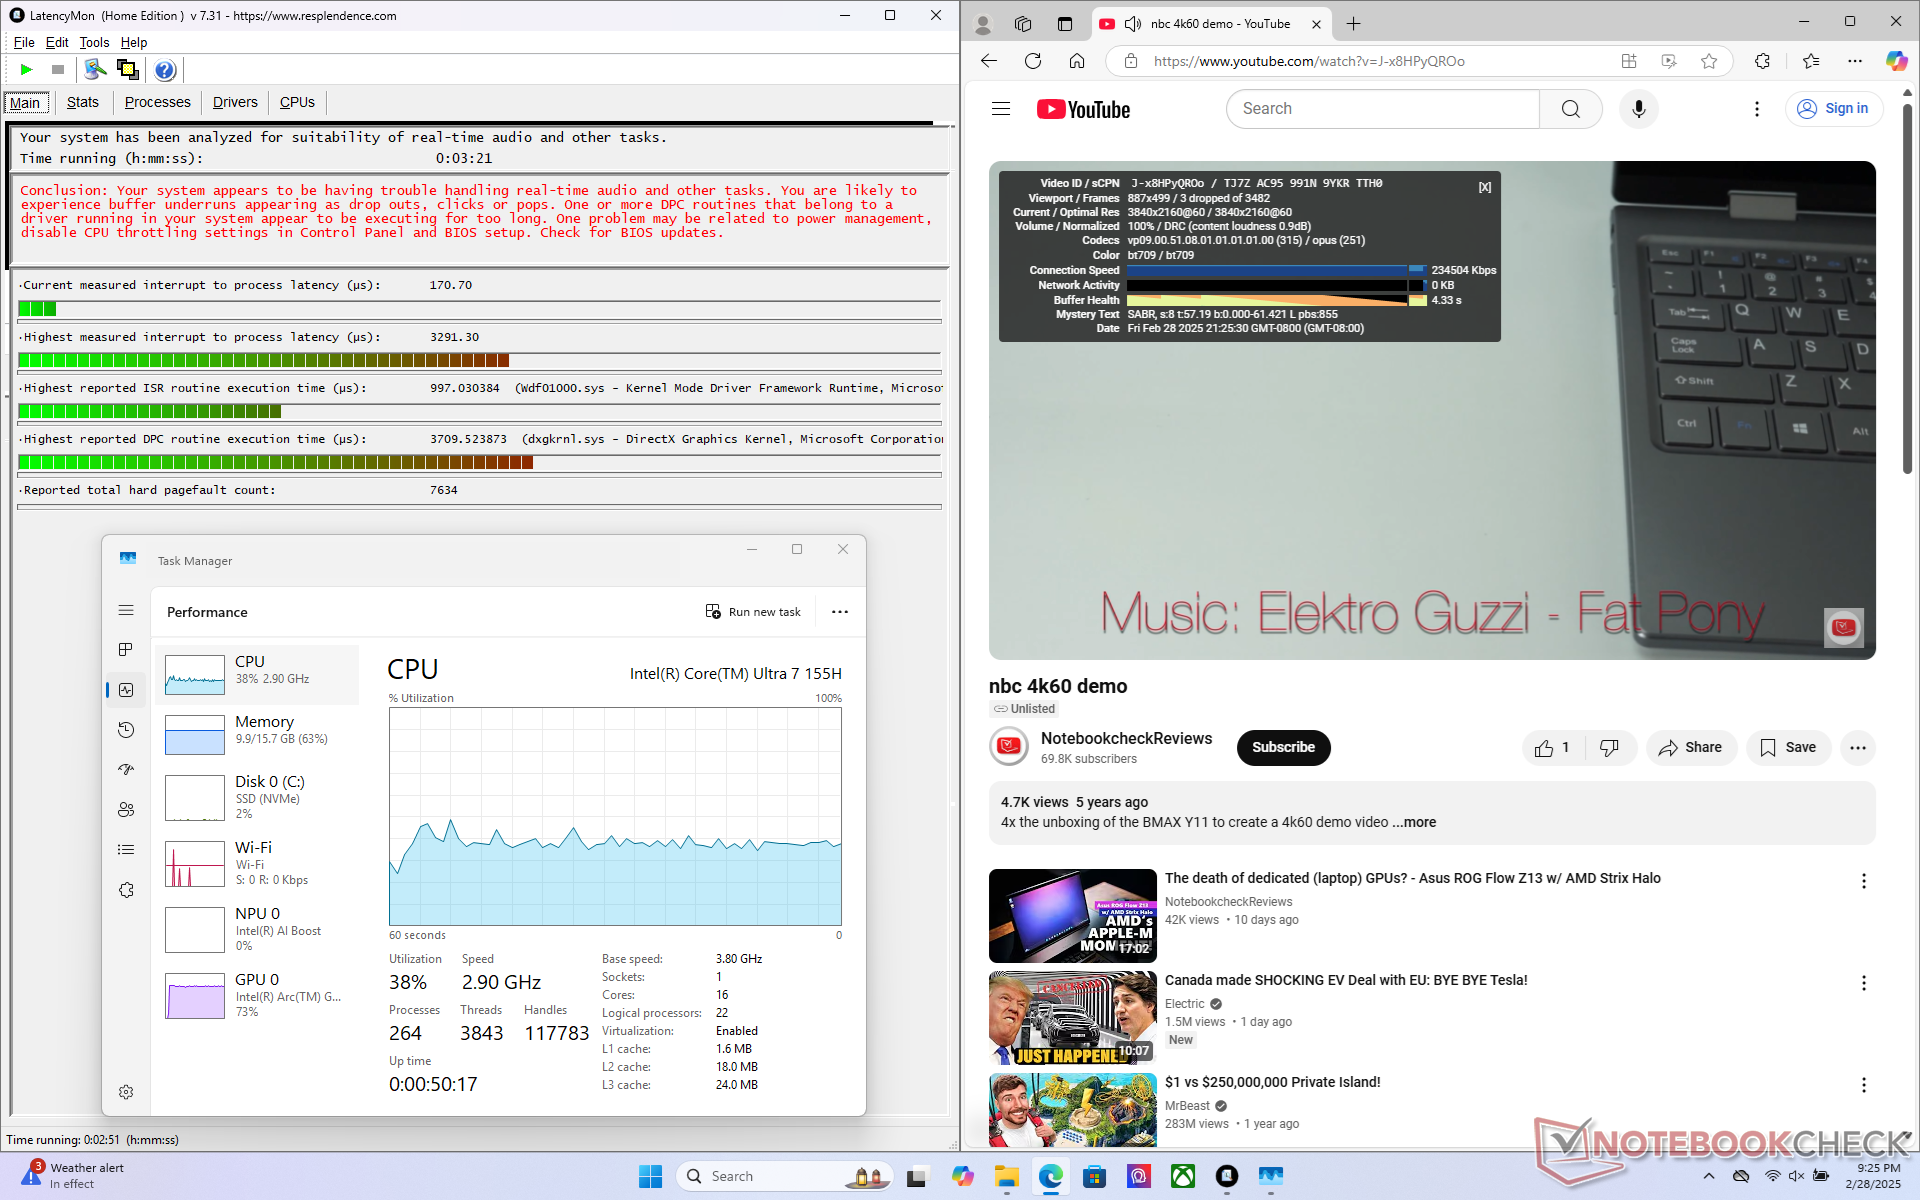
| DPC Latencies / LatencyMon - interrupt to process latency (max), Web, Youtube, Prime95 | |
| Dell Latitude 9330 | |
| HP Elite Dragonfly Folio 13.5 G3 | |
| MSI Summit E13 AI Evo A1MTG | |
| MSI Summit E13 Flip Evo A11MT | |
| Lenovo ThinkPad L13 Yoga G4 i7-1355U | |
| Lenovo Yoga Book 9 13IMU9 | |
* ... menor é melhor
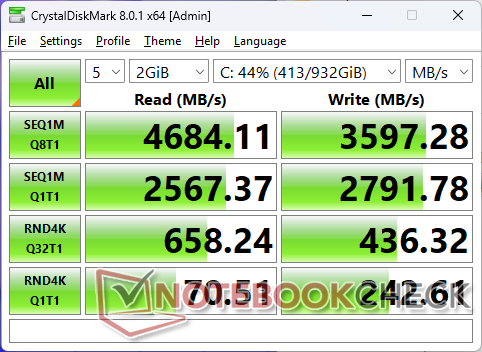
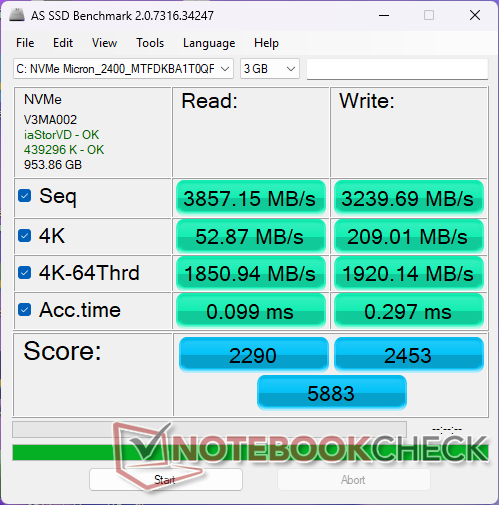
Dispositivos de armazenamento
O Micron 2400 PCIe4 x4 NVMe se estrangula sob estresse. Ao executar o DiskSpd em um loop, por exemplo, as taxas de transferência atingiam ~4300 MB/s antes de cair para apenas ~2600 MB/s após cerca de 5 minutos de teste.

* ... menor é melhor
Disk Throttling: DiskSpd Read Loop, Queue Depth 8
Desempenho da GPU
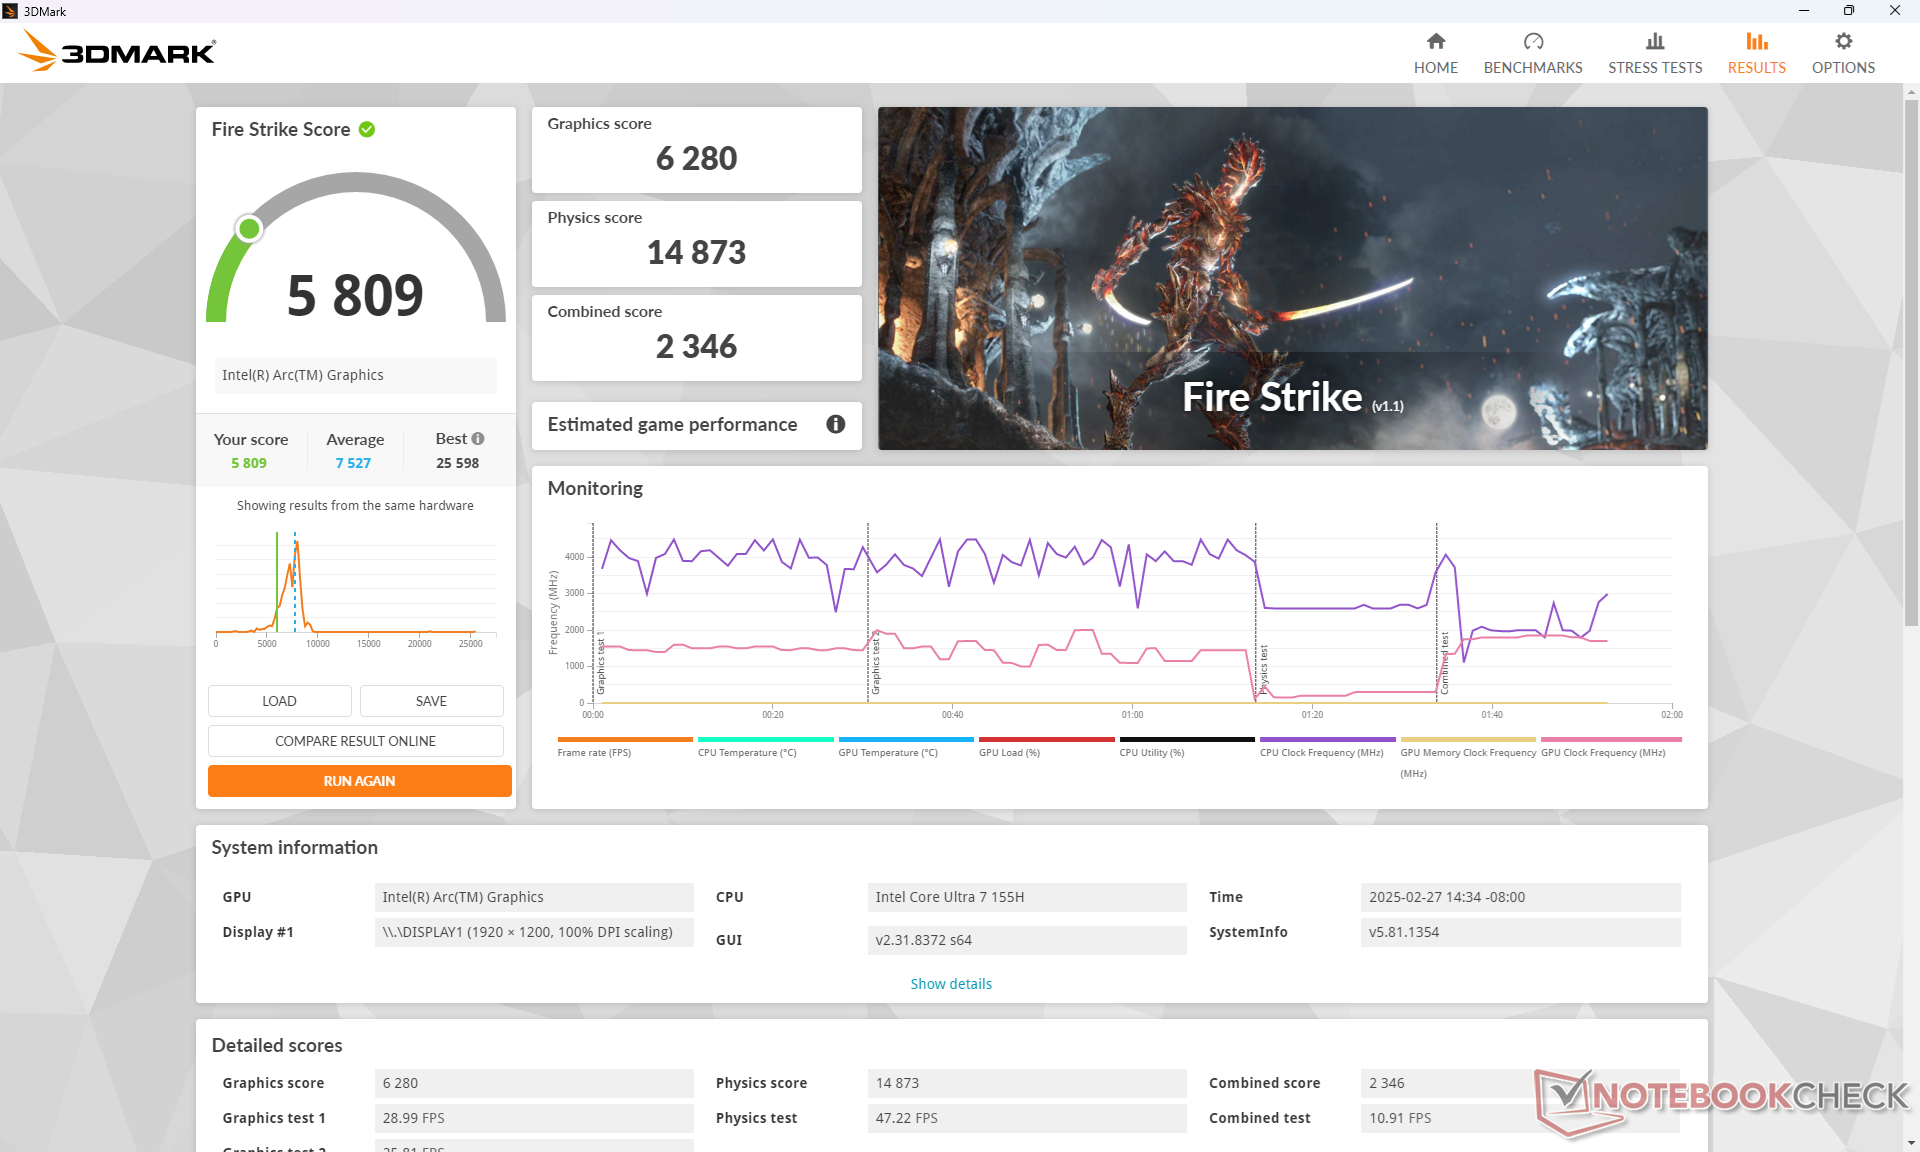
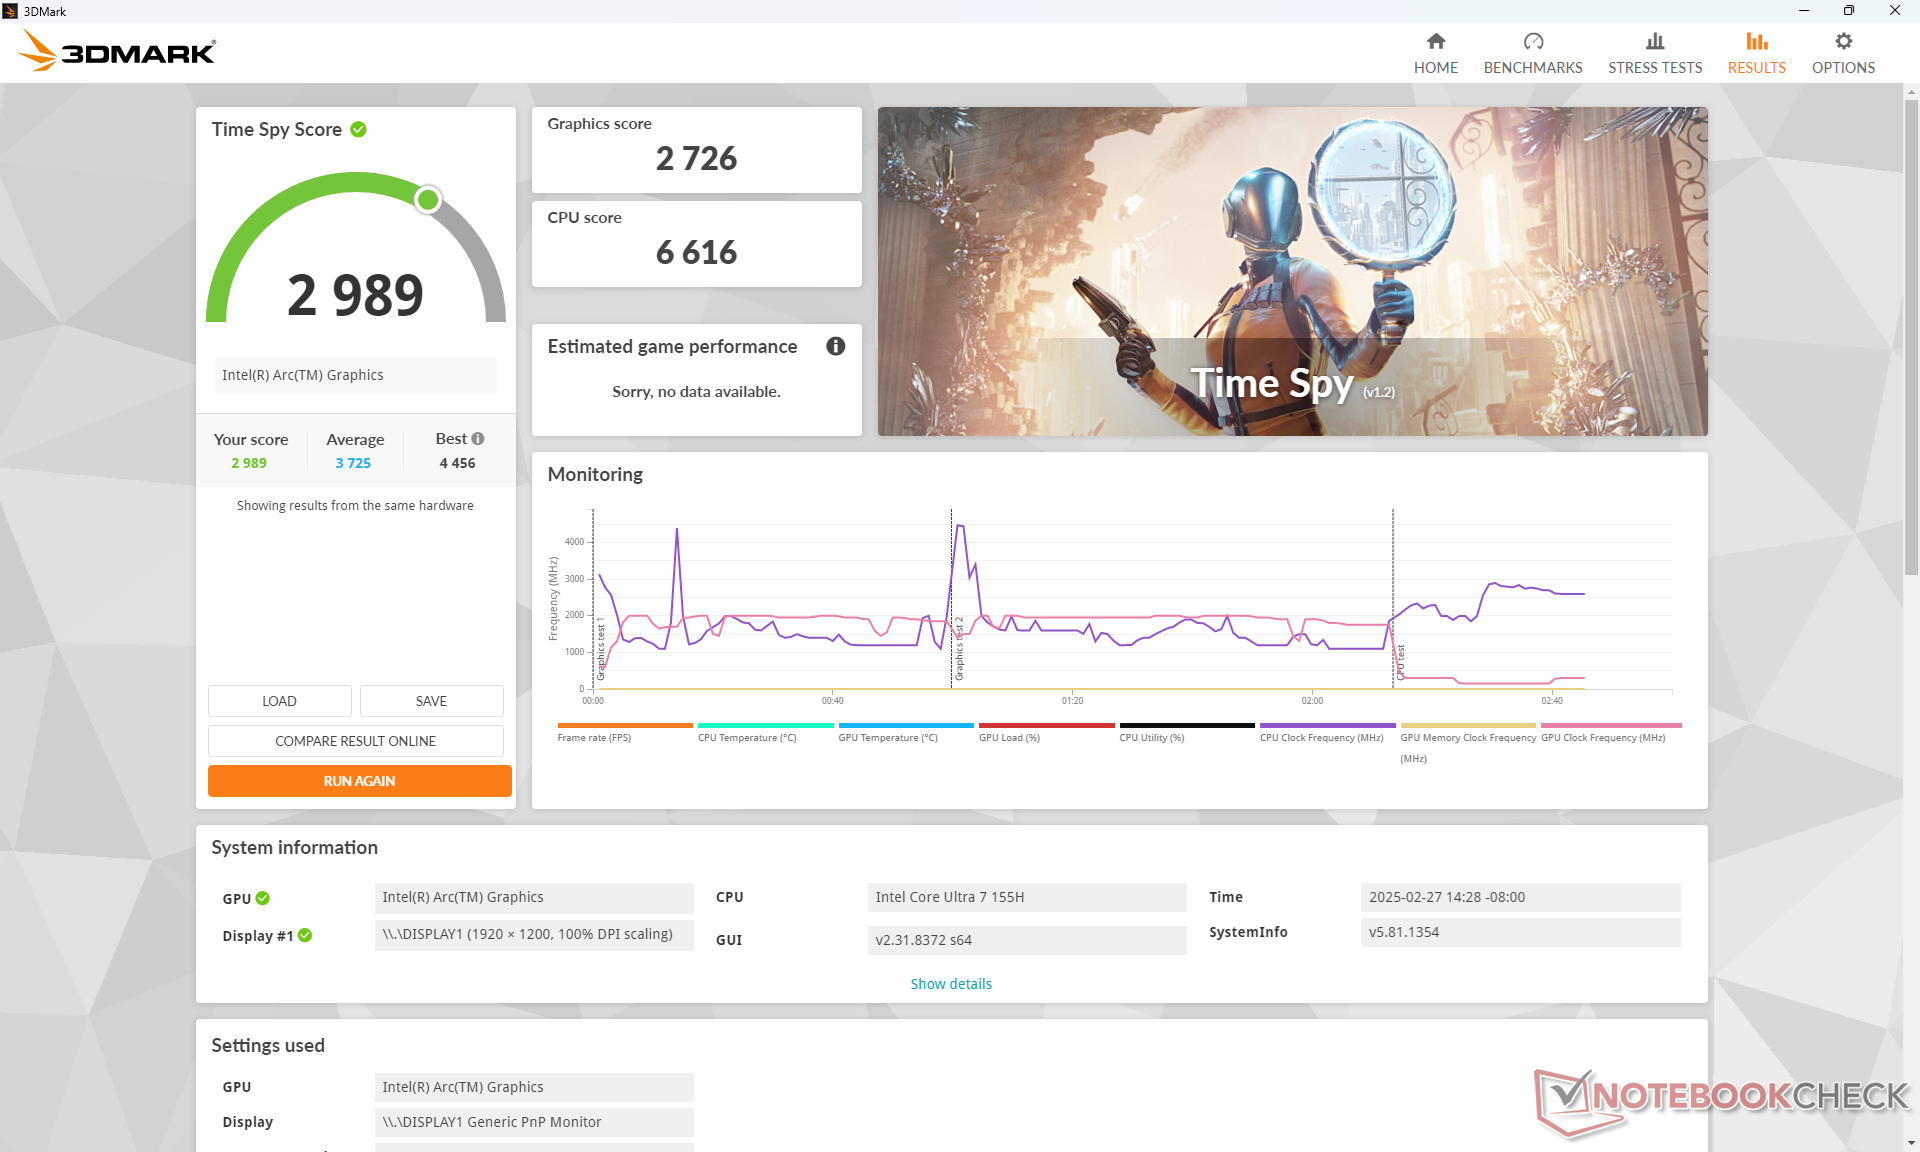
O desempenho mais lento do que o esperado da CPU mencionado acima levou a um desempenho gráfico mais lento do que o esperado. O Arc 8 em nosso MSI tem desempenho cerca de 15 a 25% mais lento do que a média dos notebooks em nosso banco de dados com os mesmos gráficos integrados, de acordo com os benchmarks 3DMark.
O F1 22 e o Cyberpunk 2077 travaram quando as configurações foram colocadas em High ou Ultra.
| Perfil de energia | Pontuação de gráficos | Pontuação de física | Pontuação combinada |
| Modo de desempenho | 6280 | 14873 | 2346 |
| Modo equilibrado | 5786 (-8%) | 9842 (-34%) | 1685 (-28%) |
| Energia da bateria | 5196 (-17%) | 15031 (-0%) | 2267 (-3%) |
A execução no modo Balanced pode afetar o desempenho da CPU de forma bastante significativa com base em nossa tabela de resultados Fire Strike acima.
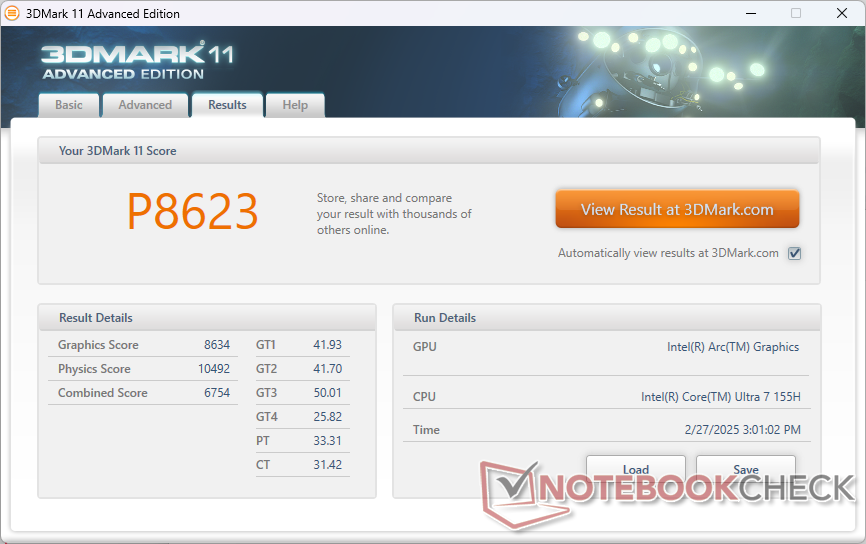
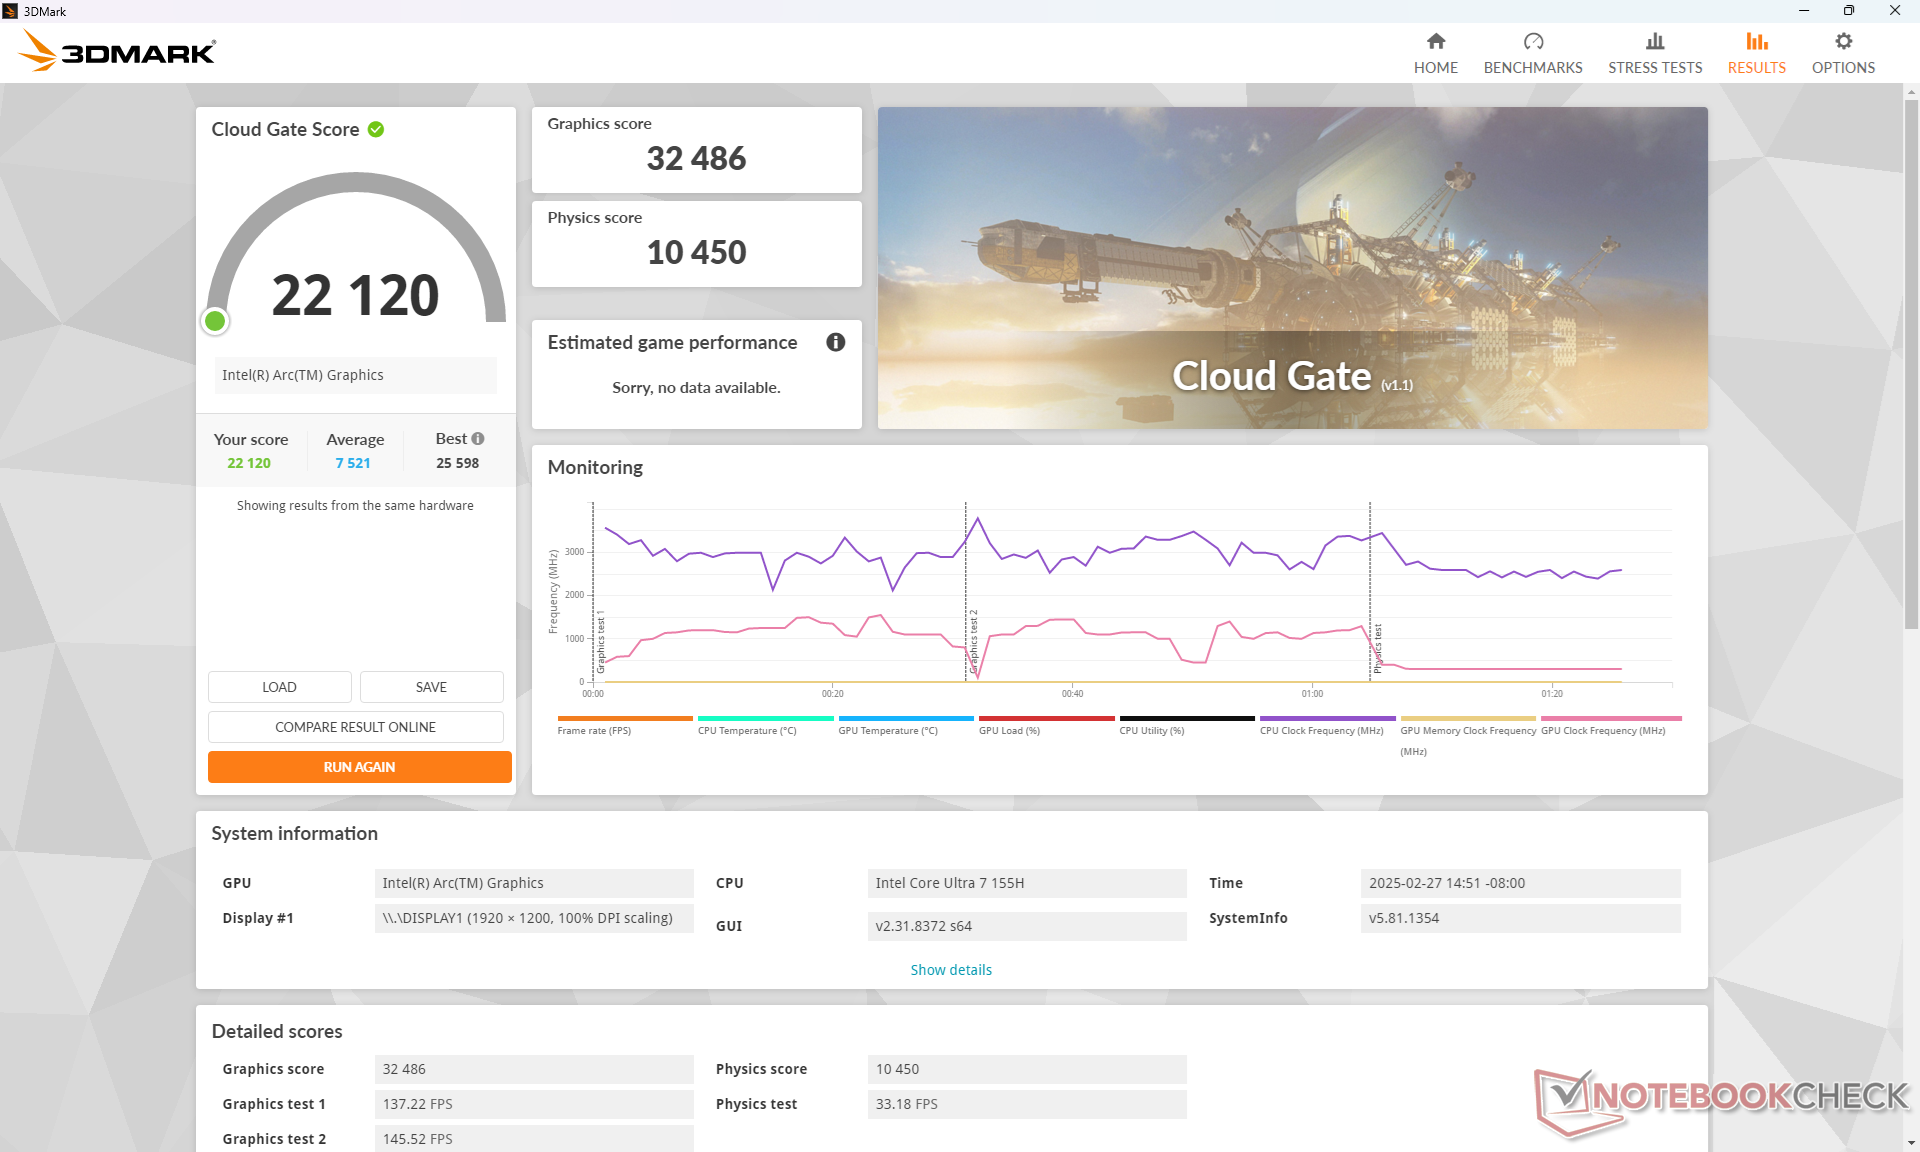
| 3DMark 11 Performance | 8623 pontos | |
| 3DMark Cloud Gate Standard Score | 22120 pontos | |
| 3DMark Fire Strike Score | 5809 pontos | |
| 3DMark Time Spy Score | 2989 pontos | |
Ajuda | ||
* ... menor é melhor
Desempenho em jogos
O desempenho em jogos é ruim. Além das deficiências da CPU e da GPU mencionadas acima, os problemas perceptíveis de fantasmas e gagueira podem distrair, mesmo ao executar títulos pouco exigentes, como o DOTA 2 Reborn.
| Cyberpunk 2077 2.2 Phantom Liberty | |
| 1280x720 Low Preset (FSR off) | |
| MSI Prestige 13 AI Plus Evo A2VMG | |
| Média Intel Arc 8-Core iGPU (34.5 - 58, n=18) | |
| MSI Summit E13 AI Evo A1MTG | |
| Lenovo Yoga Book 9 13IMU9 | |
| 1920x1080 Low Preset (FSR off) | |
| Asus ROG Flow Z13 GZ302EA-RU073W | |
| MSI Prestige 13 AI Plus Evo A2VMG | |
| Média Intel Arc 8-Core iGPU (11.3 - 38, n=36) | |
| MSI Summit E13 AI Evo A1MTG | |
| Lenovo Yoga Book 9 13IMU9 | |
| 1920x1080 Medium Preset (FSR off) | |
| Asus ROG Flow Z13 GZ302EA-RU073W | |
| MSI Prestige 13 AI Plus Evo A2VMG | |
| Média Intel Arc 8-Core iGPU (9.42 - 31.4, n=34) | |
| MSI Summit E13 AI Evo A1MTG | |
| Lenovo Yoga Book 9 13IMU9 | |
| 1920x1080 High Preset (FSR off) | |
| Asus ROG Flow Z13 GZ302EA-RU073W | |
| MSI Prestige 13 AI Plus Evo A2VMG | |
| Média Intel Arc 8-Core iGPU (7.3 - 27.6, n=34) | |
| Lenovo Yoga Book 9 13IMU9 | |
| 1920x1080 Ultra Preset (FSR off) | |
| Asus ROG Flow Z13 GZ302EA-RU073W | |
| MSI Prestige 13 AI Plus Evo A2VMG | |
| Média Intel Arc 8-Core iGPU (13 - 24.7, n=26) | |
| Lenovo Yoga Book 9 13IMU9 | |
Cyberpunk 2077 ultra FPS Chart
| baixo | média | alto | ultra | |
|---|---|---|---|---|
| GTA V (2015) | 50.6 | 51.1 | 23.9 | 12 |
| Dota 2 Reborn (2015) | 93.2 | 83.5 | 65.2 | 63 |
| Final Fantasy XV Benchmark (2018) | 49.2 | 29.4 | 20.7 | |
| X-Plane 11.11 (2018) | 46.2 | 37.5 | 31.4 | |
| Strange Brigade (2018) | 131.2 | 61.3 | 45.7 | 33.9 |
| Tiny Tina's Wonderlands (2022) | 41.5 | 31.7 | 22 | 17.7 |
| F1 22 (2022) | 57.8 | 53.5 | ||
| Baldur's Gate 3 (2023) | 22.8 | 19.5 | 16.8 | 16.3 |
| Cyberpunk 2077 2.2 Phantom Liberty (2023) | 28.3 | 23.4 |
Emissões
Ruído do sistema
O ruído da ventoinha é silencioso quando o usuário está apenas navegando ou fazendo streaming, mas aumenta rapidamente quando são introduzidas cargas mais altas. Além disso, o ruído é relativamente agudo e, portanto, qualquer alteração de RPM tende a ser perceptível. As ventoinhas são mais barulhentas do que na maioria dos outros notebooks empresariais de 13 polegadas ao executar cargas exigentes, como jogos, devido à CPU Core Ultra-H mais exigente.
Barulho
| Ocioso |
| 24.1 / 24.8 / 26.5 dB |
| Carga |
| 39.3 / 49.1 dB |
 | ||
30 dB silencioso 40 dB(A) audível 50 dB(A) ruidosamente alto |
||
min: | ||
| MSI Summit E13 AI Evo A1MTG Arc 8-Core, Ultra 7 155H, Micron 2400 MTFDKBA1T0QFM | MSI Summit E13 Flip Evo A11MT Iris Xe G7 96EUs, i7-1185G7, Phison 1TB SM2801T24GKBB4S-E162 | Lenovo Yoga Book 9 13IMU9 Graphics 4-Core, Ultra 7 155U | Lenovo ThinkPad L13 Yoga G4 i7-1355U Iris Xe G7 96EUs, i7-1355U, Samsung PM9B1 512GB MZAL4512HBLU | HP Elite Dragonfly Folio 13.5 G3 Iris Xe G7 96EUs, i7-1265U, Samsung PM9A1 MZVL2512HCJQ | Dell Latitude 9330 Iris Xe G7 96EUs, i7-1260U | |
|---|---|---|---|---|---|---|
| Noise | 0% | 16% | 11% | 11% | 9% | |
| desligado / ambiente * | 24 | 24.5 -2% | 23.3 3% | 23.1 4% | 24.6 -3% | 23 4% |
| Idle Minimum * | 24.1 | 24.7 -2% | 23.3 3% | 23.4 3% | 24.6 -2% | 23 5% |
| Idle Average * | 24.8 | 24.7 -0% | 23.3 6% | 23.4 6% | 24.6 1% | 23.1 7% |
| Idle Maximum * | 26.5 | 26.4 -0% | 24.6 7% | 23.4 12% | 24.6 7% | 23.1 13% |
| Load Average * | 39.3 | 37.8 4% | 26.2 33% | 33.9 14% | 27.8 29% | 37.1 6% |
| Cyberpunk 2077 ultra * | 45 | |||||
| Load Maximum * | 49.1 | 48.8 1% | 27.3 44% | 36.9 25% | 33.4 32% | 40.5 18% |
| Witcher 3 ultra * | 41.4 | 27.3 | 36.9 | 33.4 | 40.6 |
* ... menor é melhor
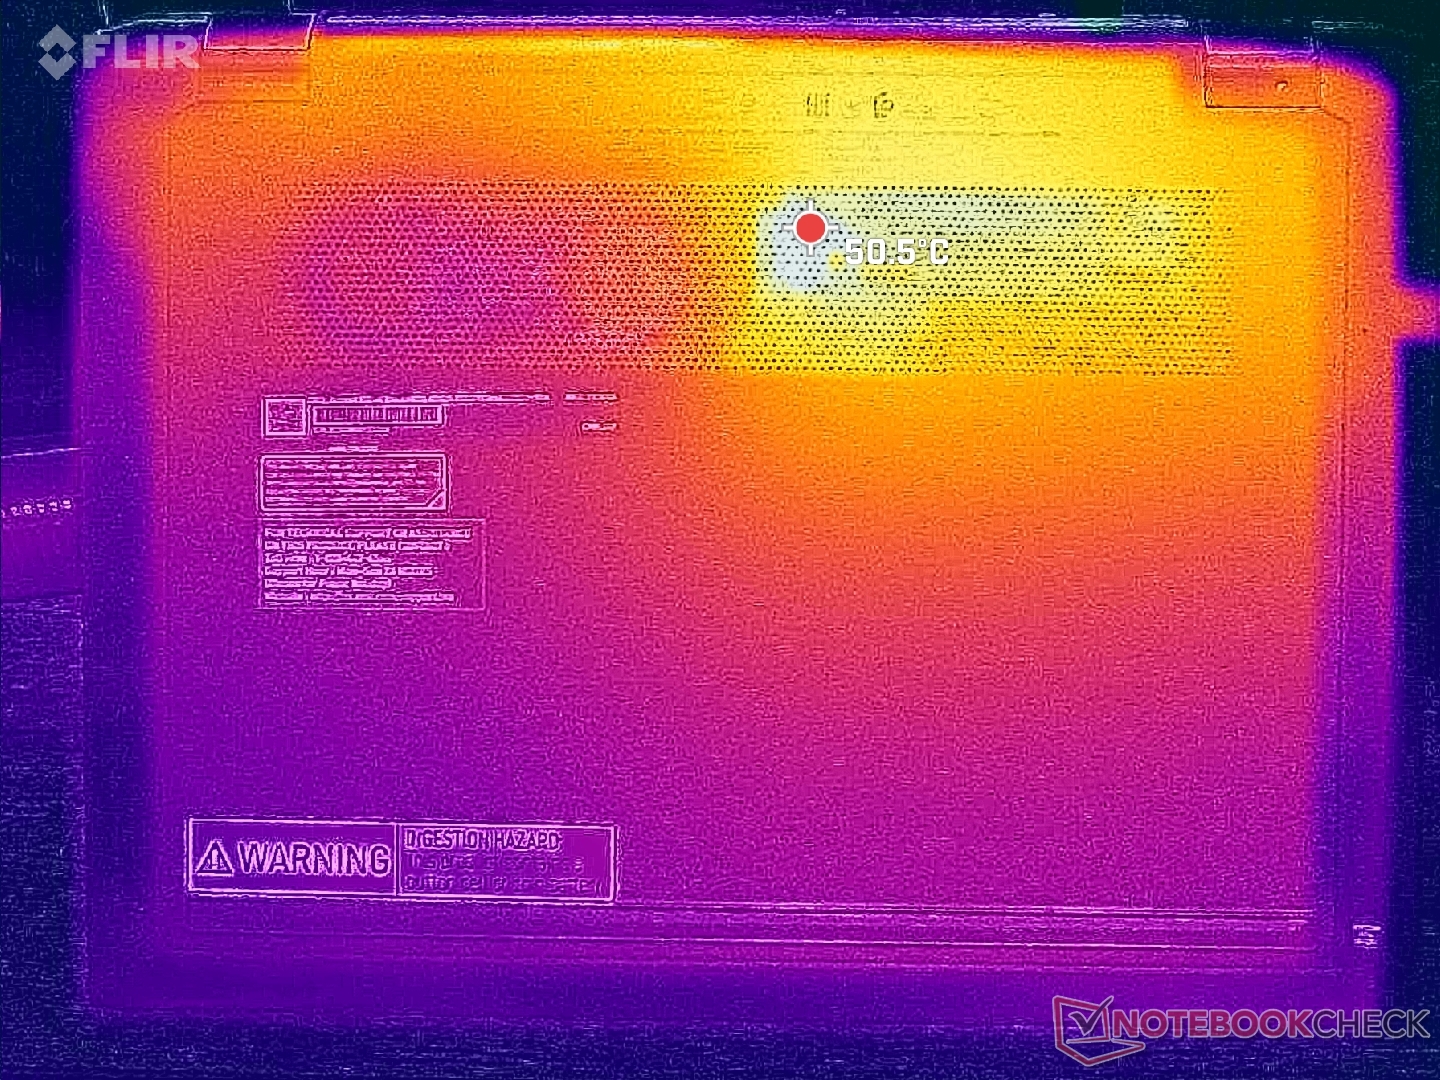
Temperatura
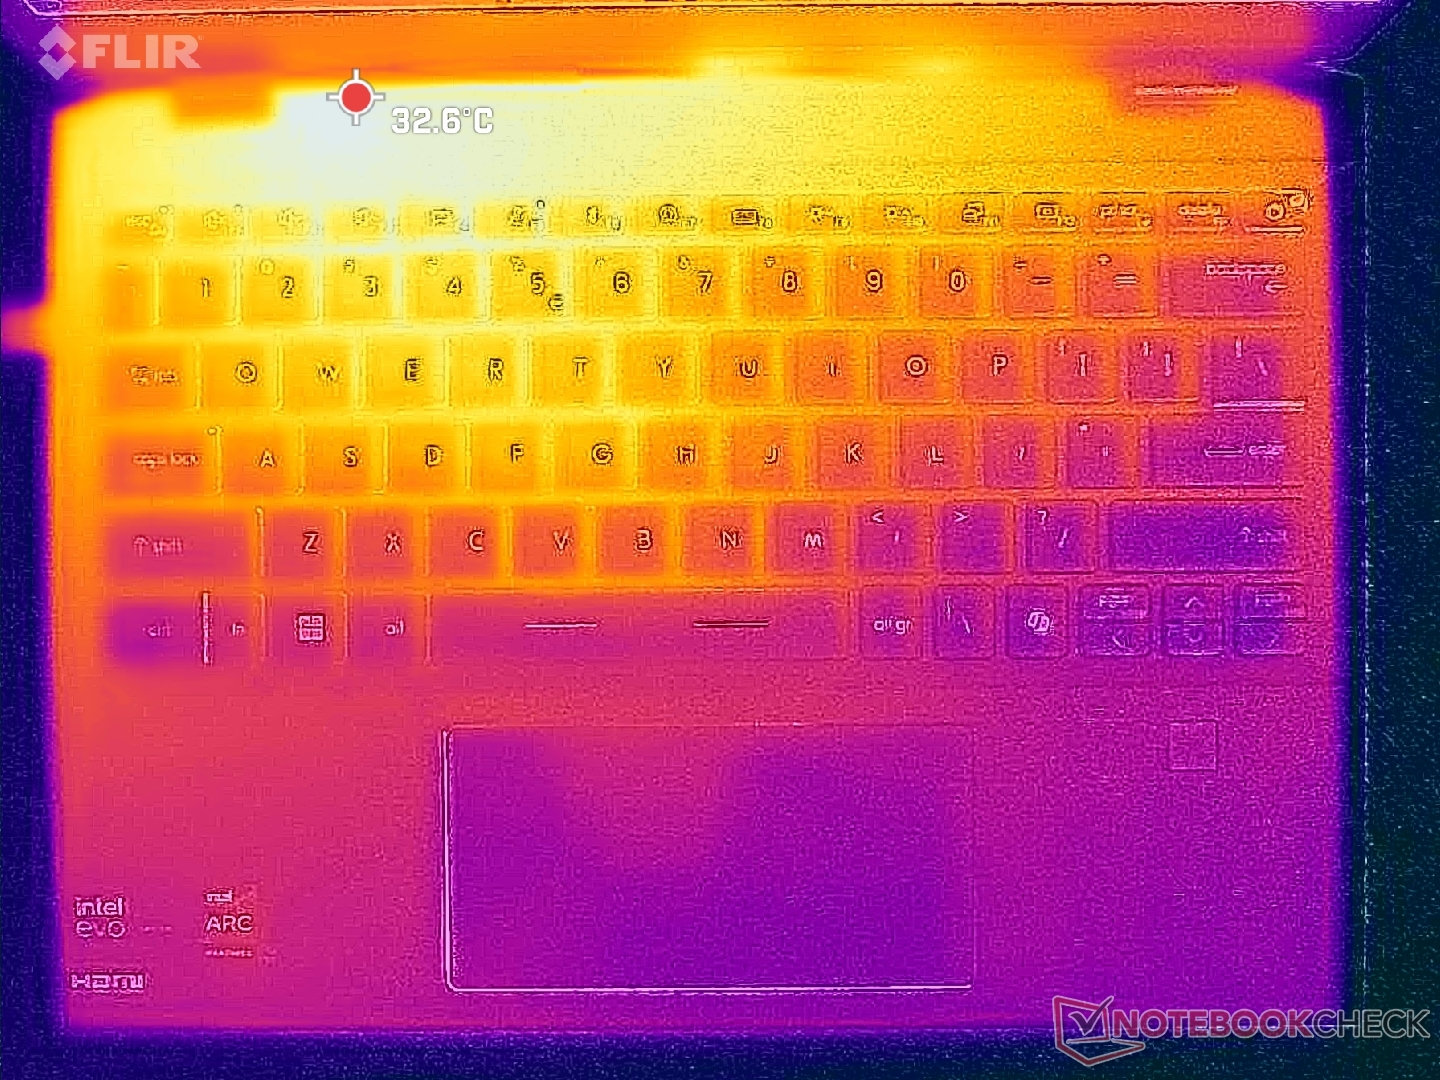
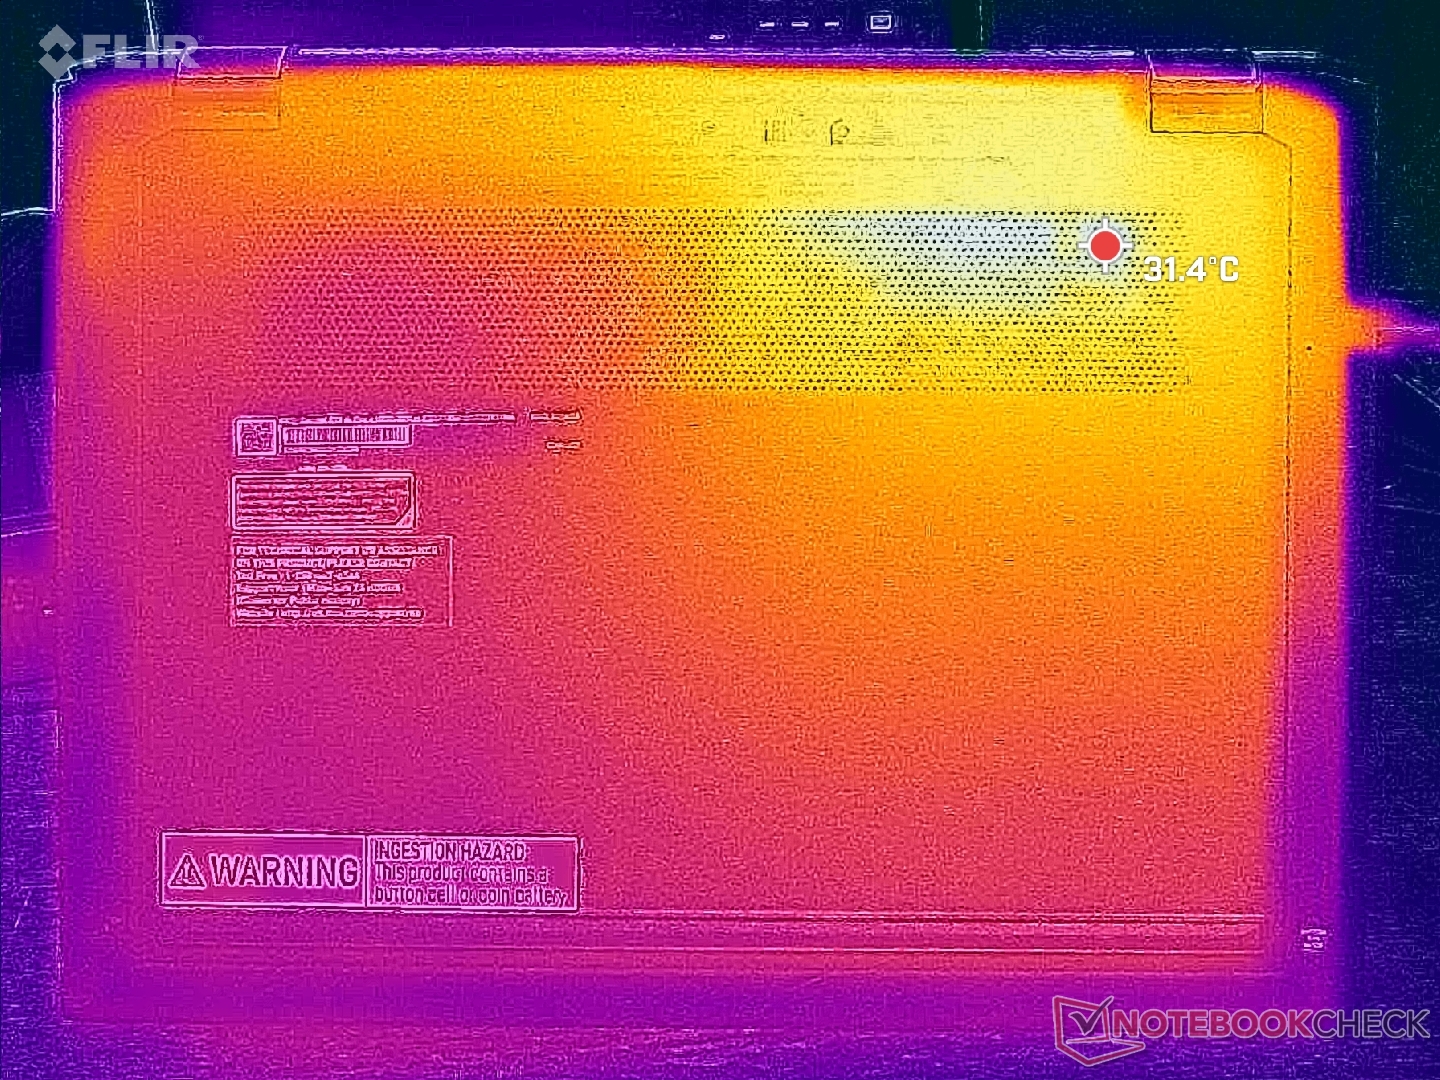
As temperaturas da superfície são muito altas, mesmo quando o computador está simplesmente em marcha lenta na área de trabalho. Os pontos quentes variam de 36 °C quando em marcha lenta até mais de 45 °C ao executar cargas exigentes, o que é mais quente do que a maioria dos outros conversíveis de 13 polegadas.
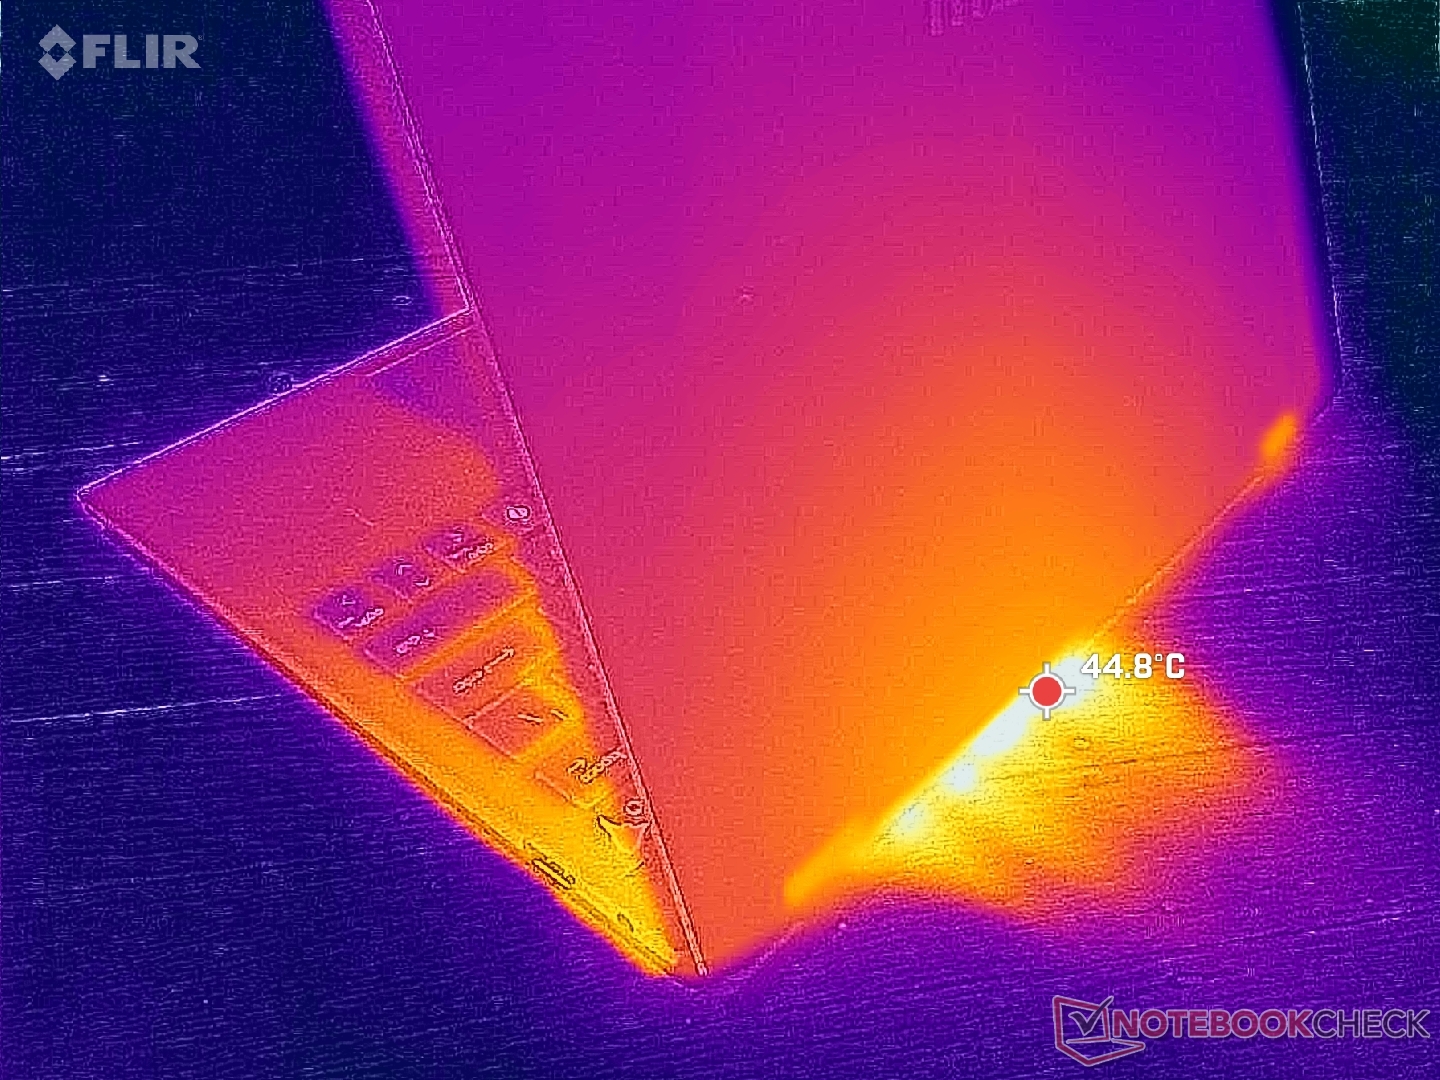
(-) A temperatura máxima no lado superior é 45.2 °C / 113 F, em comparação com a média de 35.4 °C / 96 F , variando de 19.6 a 60 °C para a classe Convertible.
(±) A parte inferior aquece até um máximo de 44.8 °C / 113 F, em comparação com a média de 36.8 °C / 98 F
(+) Em uso inativo, a temperatura média para o lado superior é 30.1 °C / 86 F, em comparação com a média do dispositivo de 30.2 °C / ### class_avg_f### F.
(+) Os apoios para as mãos e o touchpad são mais frios que a temperatura da pele, com um máximo de 28.8 °C / 83.8 F e, portanto, são frios ao toque.
(±) A temperatura média da área do apoio para as mãos de dispositivos semelhantes foi 28 °C / 82.4 F (-0.8 °C / -1.4 F).

| MSI Summit E13 AI Evo A1MTG Intel Core Ultra 7 155H, Intel Arc 8-Core iGPU | MSI Summit E13 Flip Evo A11MT Intel Core i7-1185G7, Intel Iris Xe Graphics G7 96EUs | Lenovo Yoga Book 9 13IMU9 Intel Core Ultra 7 155U, Intel Graphics 4-Core iGPU (Arc) | Lenovo ThinkPad L13 Yoga G4 i7-1355U Intel Core i7-1355U, Intel Iris Xe Graphics G7 96EUs | HP Elite Dragonfly Folio 13.5 G3 Intel Core i7-1265U, Intel Iris Xe Graphics G7 96EUs | Dell Latitude 9330 Intel Core i7-1260U, Intel Iris Xe Graphics G7 96EUs | |
|---|---|---|---|---|---|---|
| Heat | -7% | 10% | 6% | 28% | 12% | |
| Maximum Upper Side * | 45.2 | 52 -15% | 39.2 13% | 38.4 15% | 32.8 27% | 40.6 10% |
| Maximum Bottom * | 44.8 | 57.4 -28% | 41 8% | 46 -3% | 33.4 25% | 50.2 -12% |
| Idle Upper Side * | 34.8 | 30.4 13% | 32.2 7% | 31.2 10% | 24.6 29% | 25 28% |
| Idle Bottom * | 35.8 | 34.2 4% | 31.6 12% | 34.8 3% | 24.6 31% | 27.6 23% |
* ... menor é melhor
Alto-falantes
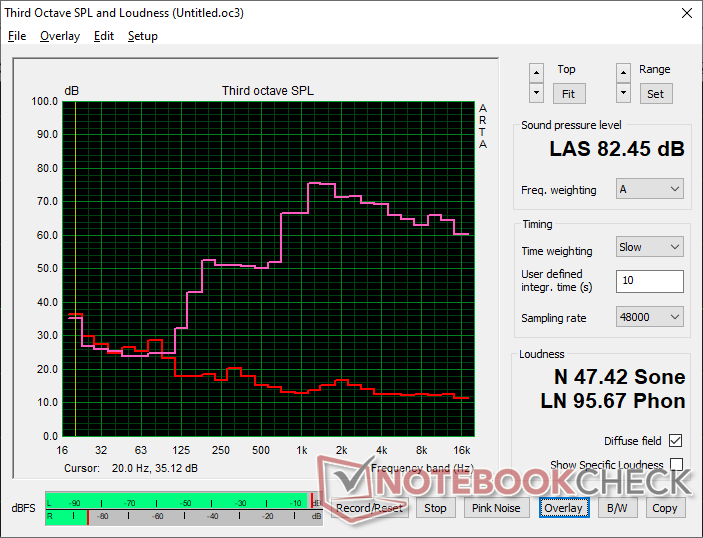
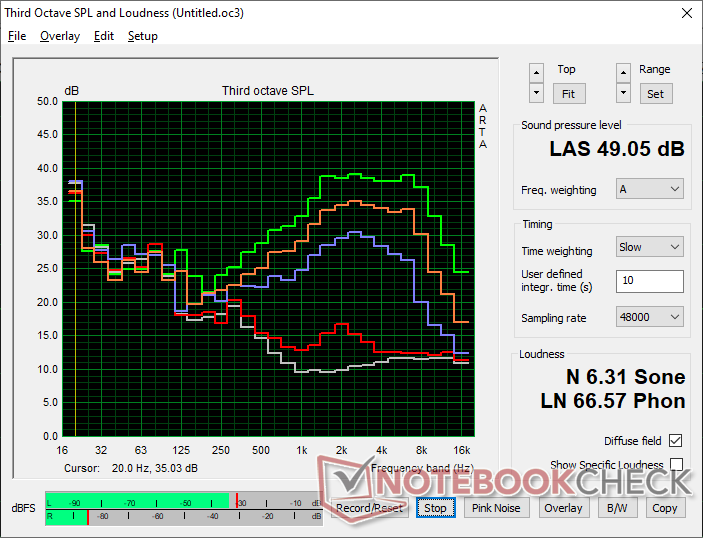
MSI Summit E13 AI Evo A1MTG análise de áudio
(+) | os alto-falantes podem tocar relativamente alto (###valor### dB)
Graves 100 - 315Hz
(-) | quase nenhum baixo - em média 21.9% menor que a mediana
(±) | a linearidade dos graves é média (9.9% delta para a frequência anterior)
Médios 400 - 2.000 Hz
(±) | médios reduzidos - em média 9.2% menor que a mediana
(±) | a linearidade dos médios é média (7.6% delta para frequência anterior)
Altos 2 - 16 kHz
(+) | agudos equilibrados - apenas 3.2% longe da mediana
(+) | os máximos são lineares (3.3% delta da frequência anterior)
Geral 100 - 16.000 Hz
(±) | a linearidade do som geral é média (21.4% diferença em relação à mediana)
Comparado com a mesma classe
» 55% de todos os dispositivos testados nesta classe foram melhores, 12% semelhantes, 33% piores
» O melhor teve um delta de 6%, a média foi 20%, o pior foi 57%
Comparado com todos os dispositivos testados
» 57% de todos os dispositivos testados foram melhores, 7% semelhantes, 35% piores
» O melhor teve um delta de 4%, a média foi 24%, o pior foi 134%
Apple MacBook Pro 16 2021 M1 Pro análise de áudio
(+) | os alto-falantes podem tocar relativamente alto (###valor### dB)
Graves 100 - 315Hz
(+) | bons graves - apenas 3.8% longe da mediana
(+) | o baixo é linear (5.2% delta para a frequência anterior)
Médios 400 - 2.000 Hz
(+) | médios equilibrados - apenas 1.3% longe da mediana
(+) | médios são lineares (2.1% delta para frequência anterior)
Altos 2 - 16 kHz
(+) | agudos equilibrados - apenas 1.9% longe da mediana
(+) | os máximos são lineares (2.7% delta da frequência anterior)
Geral 100 - 16.000 Hz
(+) | o som geral é linear (4.6% diferença em relação à mediana)
Comparado com a mesma classe
» 0% de todos os dispositivos testados nesta classe foram melhores, 0% semelhantes, 100% piores
» O melhor teve um delta de 5%, a média foi 18%, o pior foi 45%
Comparado com todos os dispositivos testados
» 0% de todos os dispositivos testados foram melhores, 0% semelhantes, 100% piores
» O melhor teve um delta de 4%, a média foi 24%, o pior foi 134%
Gerenciamento de energia
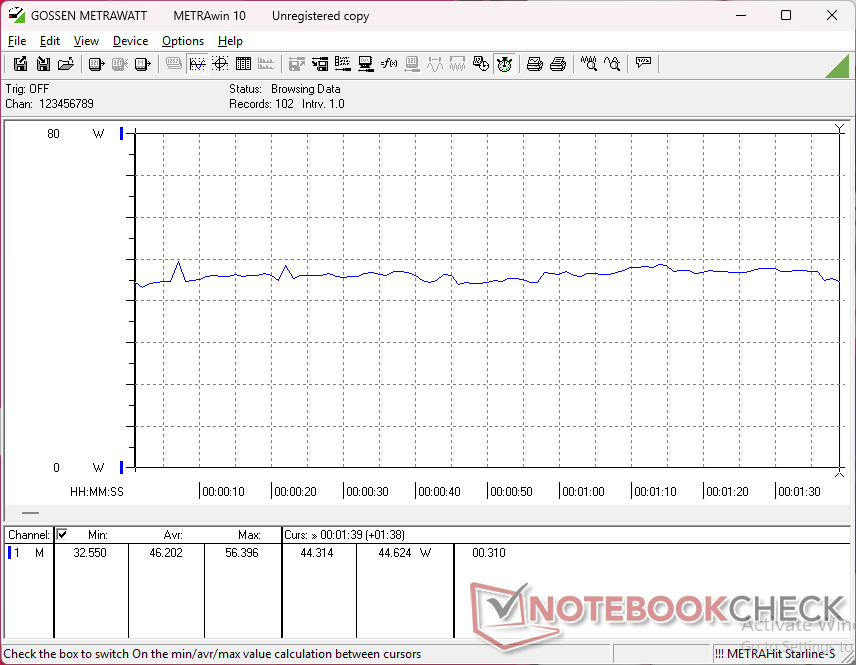
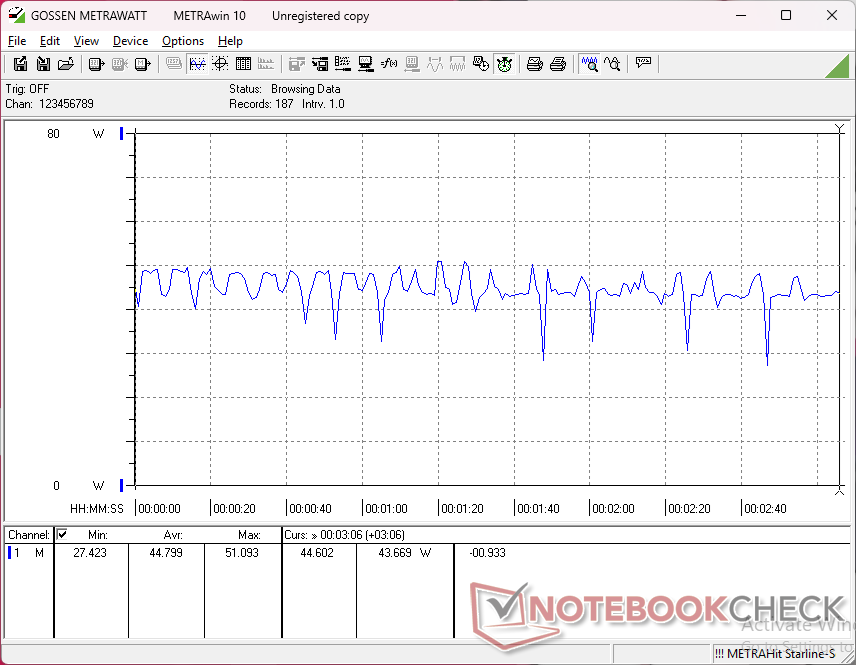
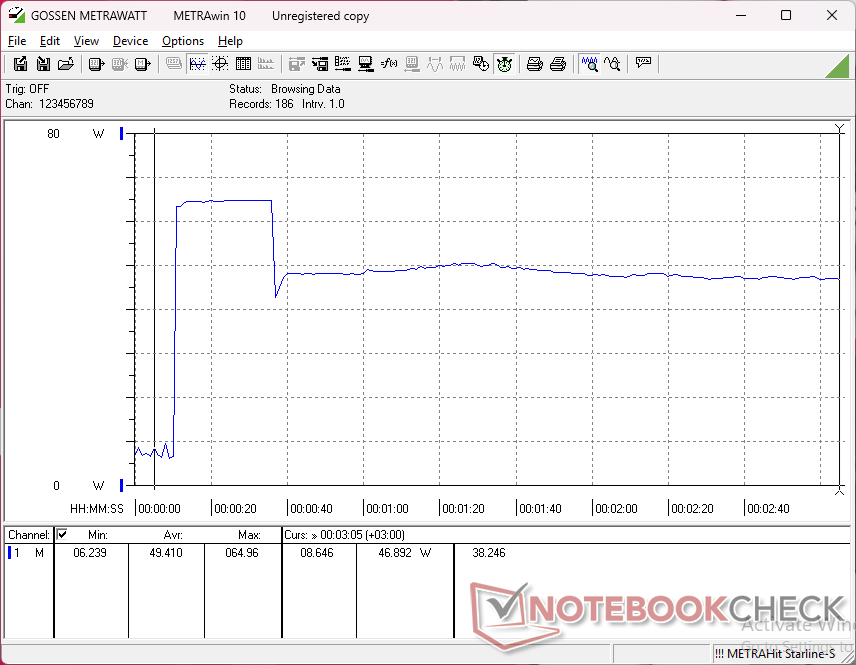
Consumo de energia
O consumo de energia pode ser instável ao executar cargas de GPU exigentes, como o Cyberpunk 2077 , o que se alinha com as interrupções na taxa de quadros mencionadas acima. Isso contrasta com o Framework 13.5 que vem com exatamente a mesma CPU Core Ultra 7 155H, mas com um consumo muito mais estável sob carga.

| desligado | |
| Ocioso | |
| Carga |
|
Key:
min: | |
| MSI Summit E13 AI Evo A1MTG Ultra 7 155H, Arc 8-Core, Micron 2400 MTFDKBA1T0QFM, IPS, 1920x1200, 13.3" | MSI Summit E13 Flip Evo A11MT i7-1185G7, Iris Xe G7 96EUs, Phison 1TB SM2801T24GKBB4S-E162, IPS, 1920x1200, 13.4" | Lenovo Yoga Book 9 13IMU9 Ultra 7 155U, Graphics 4-Core, , OLED, 2880x1800, 13.3" | Lenovo ThinkPad L13 Yoga G4 i7-1355U i7-1355U, Iris Xe G7 96EUs, Samsung PM9B1 512GB MZAL4512HBLU, IPS, 1920x1200, 13.3" | HP Elite Dragonfly Folio 13.5 G3 i7-1265U, Iris Xe G7 96EUs, Samsung PM9A1 MZVL2512HCJQ, IPS, 1920x1280, 13.5" | Dell Latitude 9330 i7-1260U, Iris Xe G7 96EUs, , IPS, 2560x1600, 13.3" | |
|---|---|---|---|---|---|---|
| Power Consumption | -52% | -116% | -59% | -26% | -40% | |
| Idle Minimum * | 2.3 | 4.8 -109% | 7.1 -209% | 5.5 -139% | 3.4 -48% | 4.7 -104% |
| Idle Average * | 4.8 | 8.4 -75% | 9.1 -90% | 8.3 -73% | 4.9 -2% | 8.2 -71% |
| Idle Maximum * | 5 | 8.6 -72% | 18.4 -268% | 9.1 -82% | 9.3 -86% | 8.4 -68% |
| Load Average * | 46.2 | 47.1 -2% | 51.3 -11% | 49.9 -8% | 41.9 9% | 36.8 20% |
| Cyberpunk 2077 ultra external monitor * | 41.9 | |||||
| Cyberpunk 2077 ultra * | 44.8 | |||||
| Load Maximum * | 65 | 65.9 -1% | 65.5 -1% | 60 8% | 67.5 -4% | 49.9 23% |
| Witcher 3 ultra * | 51.6 | 41.5 | 42.4 | 36.4 | 30.4 |
* ... menor é melhor
Power Consumption Cyberpunk / Stress Test
Power Consumption external Monitor
Duração da bateria
O tempo de funcionamento da WLAN é menor do que no antigo Summit E13 em algumas horas, mas ainda é bom no geral, com quase 9,5 horas de uso no mundo real.
| MSI Summit E13 AI Evo A1MTG Ultra 7 155H, Arc 8-Core, 70 Wh | MSI Summit E13 Flip Evo A11MT i7-1185G7, Iris Xe G7 96EUs, 70 Wh | Lenovo Yoga Book 9 13IMU9 Ultra 7 155U, Graphics 4-Core, 80 Wh | Lenovo ThinkPad L13 Yoga G4 i7-1355U i7-1355U, Iris Xe G7 96EUs, 46 Wh | HP Elite Dragonfly Folio 13.5 G3 i7-1265U, Iris Xe G7 96EUs, 53 Wh | Dell Latitude 9330 i7-1260U, Iris Xe G7 96EUs, 50 Wh | |
|---|---|---|---|---|---|---|
| Duração da bateria | 18% | 7% | -35% | -1% | -1% | |
| WiFi v1.3 | 568 | 672 18% | 608 7% | 371 -35% | 565 -1% | 564 -1% |
| Reader / Idle | 1267 | 1637 | 923 | |||
| Load | 109 | 158 | 140 |
Classificação do Notebookcheck
MSI Summit E13 AI Evo A1MTG
- 03/04/2025 v8
Allen Ngo
 Total Sustainability Score:
 Transparência
A seleção dos dispositivos a serem analisados é feita pela nossa equipe editorial. A amostra de teste foi adquirida gratuitamente pelo autor às suas próprias custas. O credor não teve influência nesta revisão, nem o fabricante recebeu uma cópia desta revisão antes da publicação. Não houve obrigação de publicar esta revisão. Nunca aceitamos compensação ou pagamento em troca de nossas avaliações. Como empresa de mídia independente, a Notebookcheck não está sujeita à autoridade de fabricantes, varejistas ou editores.
É assim que o Notebookcheck está testando
Todos os anos, o Notebookcheck analisa de forma independente centenas de laptops e smartphones usando procedimentos padronizados para garantir que todos os resultados sejam comparáveis. Desenvolvemos continuamente nossos métodos de teste há cerca de 20 anos e definimos padrões da indústria no processo. Em nossos laboratórios de teste, equipamentos de medição de alta qualidade são utilizados por técnicos e editores experientes. Esses testes envolvem um processo de validação em vários estágios. Nosso complexo sistema de classificação é baseado em centenas de medições e benchmarks bem fundamentados, o que mantém a objetividade.
