


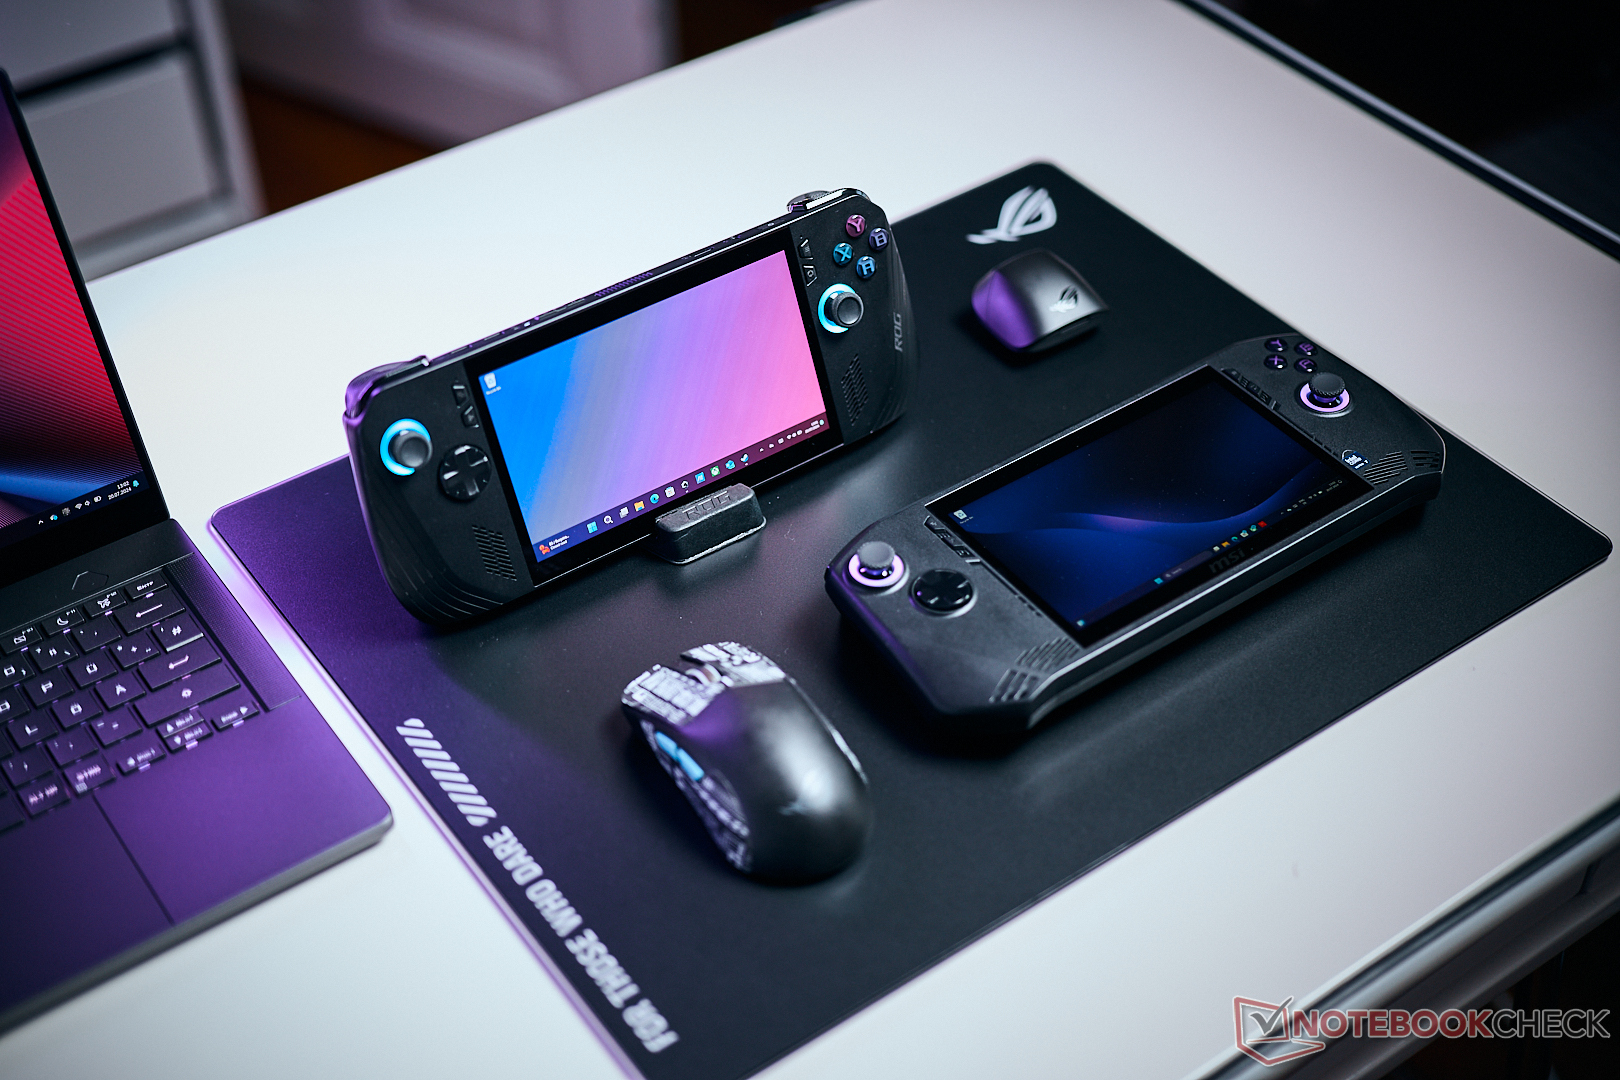
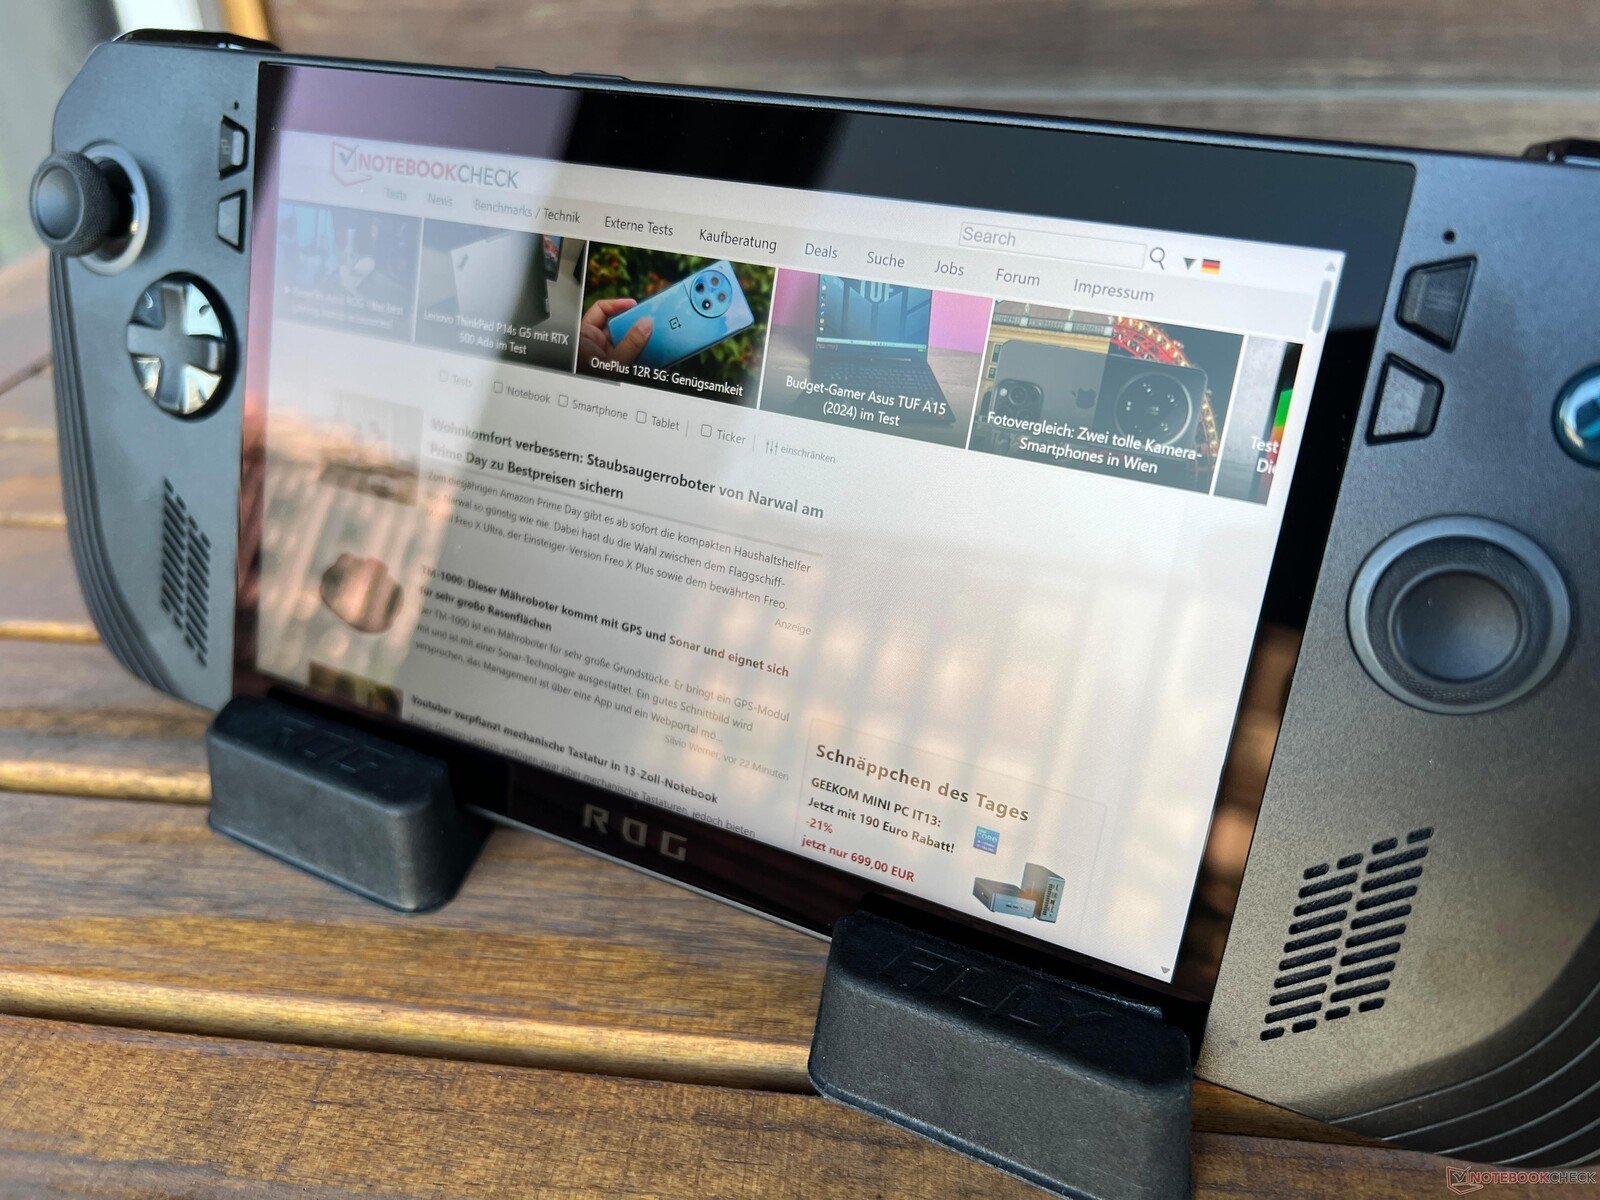
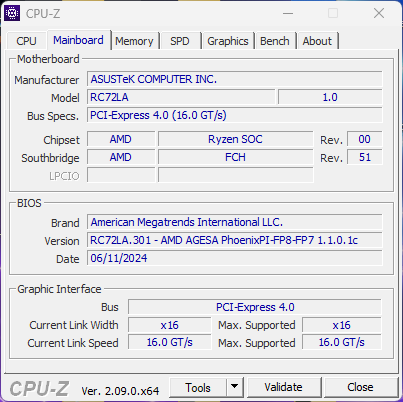
Há um ano, a Asus lançou seu primeiro dispositivo portátil para jogos, o ROG Ally. Agora temos uma versão atualizada chamada ROG Ally X, que está novamente equipada com o mesmo processador AMD Ryzen Z1 Extreme, bem como a tela IPS de 7 polegadas com VRR. Todos os outros aspectos, no entanto, foram aprimorados em comparação com o Ally original. As atualizações mais importantes incluem ergonomia aprimorada, bateria maior e desempenho melhorado graças à memória mais rápida.
Haverá apenas uma SKU por 899 euros (US$ 799), portanto, o preço sugerido é 100 euros (US$ 100) mais alto em comparação com o ROG Ally original. Além da bateria maior de 80 Wh, a Asus também incluiu 24 GB de RAM e 1 TB de armazenamento SSD. Queremos descobrir se o ROG Ally X é realmente uma melhoria ou se o senhor deve se apressar e comprar o ROG Ally original, que já está disponível por menos de 600 euros (e pode cair ainda mais depois que o Ally X for colocado à venda).
Possíveis concorrentes em comparação
Avaliação | Versão | Data | Modelo | Peso | Altura | Size | Resolução | Preço |
|---|---|---|---|---|---|---|---|---|
| 84.6 % | v8 | 07/2024 | Asus ROG Ally X Z1 Extreme, Radeon 780M | 685 g | 36.9 mm | 7.00" | 1920x1080 | |
| 76.9 % | v8 | 06/2024 | GPD Win Mini 2024 7" R7 8840U, Radeon 780M | 526 g | 26 mm | 7.00" | 1920x1080 | |
| 77.4 % | v8 | 06/2024 | MSI Claw Ultra 7 155H, Arc 8-Core | 672 g | 33 mm | 7.00" | 1920x1080 | |
| 88.9 % v7 (old) | v7 (old) | 02/2024 | Valve Steam Deck 1 TB OLED Steam Deck OLED APU, Radeon Radeon Steam Deck 8CU | 640 g | 49 mm | 7.40" | 1280x800 | |
| 66.3 % | v8 | 01/2024 | Lenovo Legion Go Z1 Extreme, Radeon 780M | 845 g | 41 mm | 8.80" | 2560x1600 | |
| 85.2 % v7 (old) | v7 (old) | 01/2024 | Ayaneo Kun R7 7840U, Radeon 780M | 942 g | 22 mm | 8.40" | 2560x1600 | |
| 87.5 % v7 (old) | v7 (old) | 05/2023 | Asus ROG Ally Z1 Extreme Z1 Extreme, Radeon 780M | 611 g | 21.22 mm | 7.00" | 1920x1080 |
Observação: Atualizamos recentemente nosso sistema de classificação e os resultados da versão 8 não são comparáveis aos resultados da versão 7. Mais informações estão disponíveis aqui .
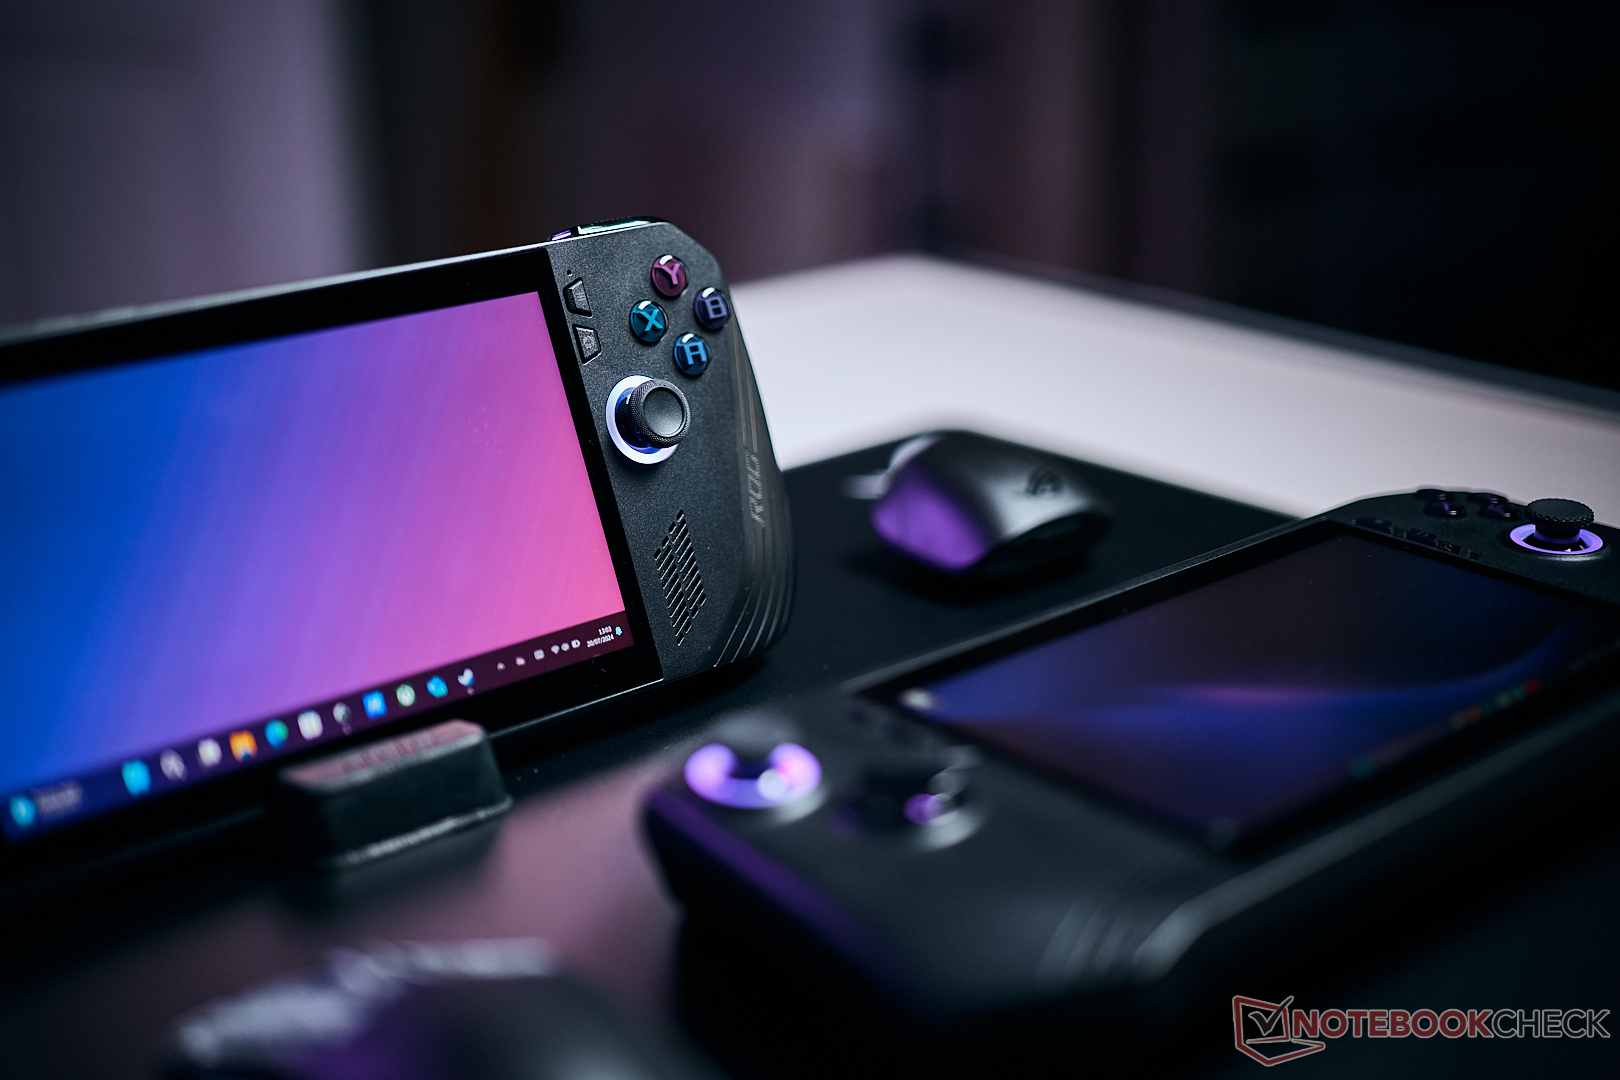
Case - Punhos maiores para maior conforto
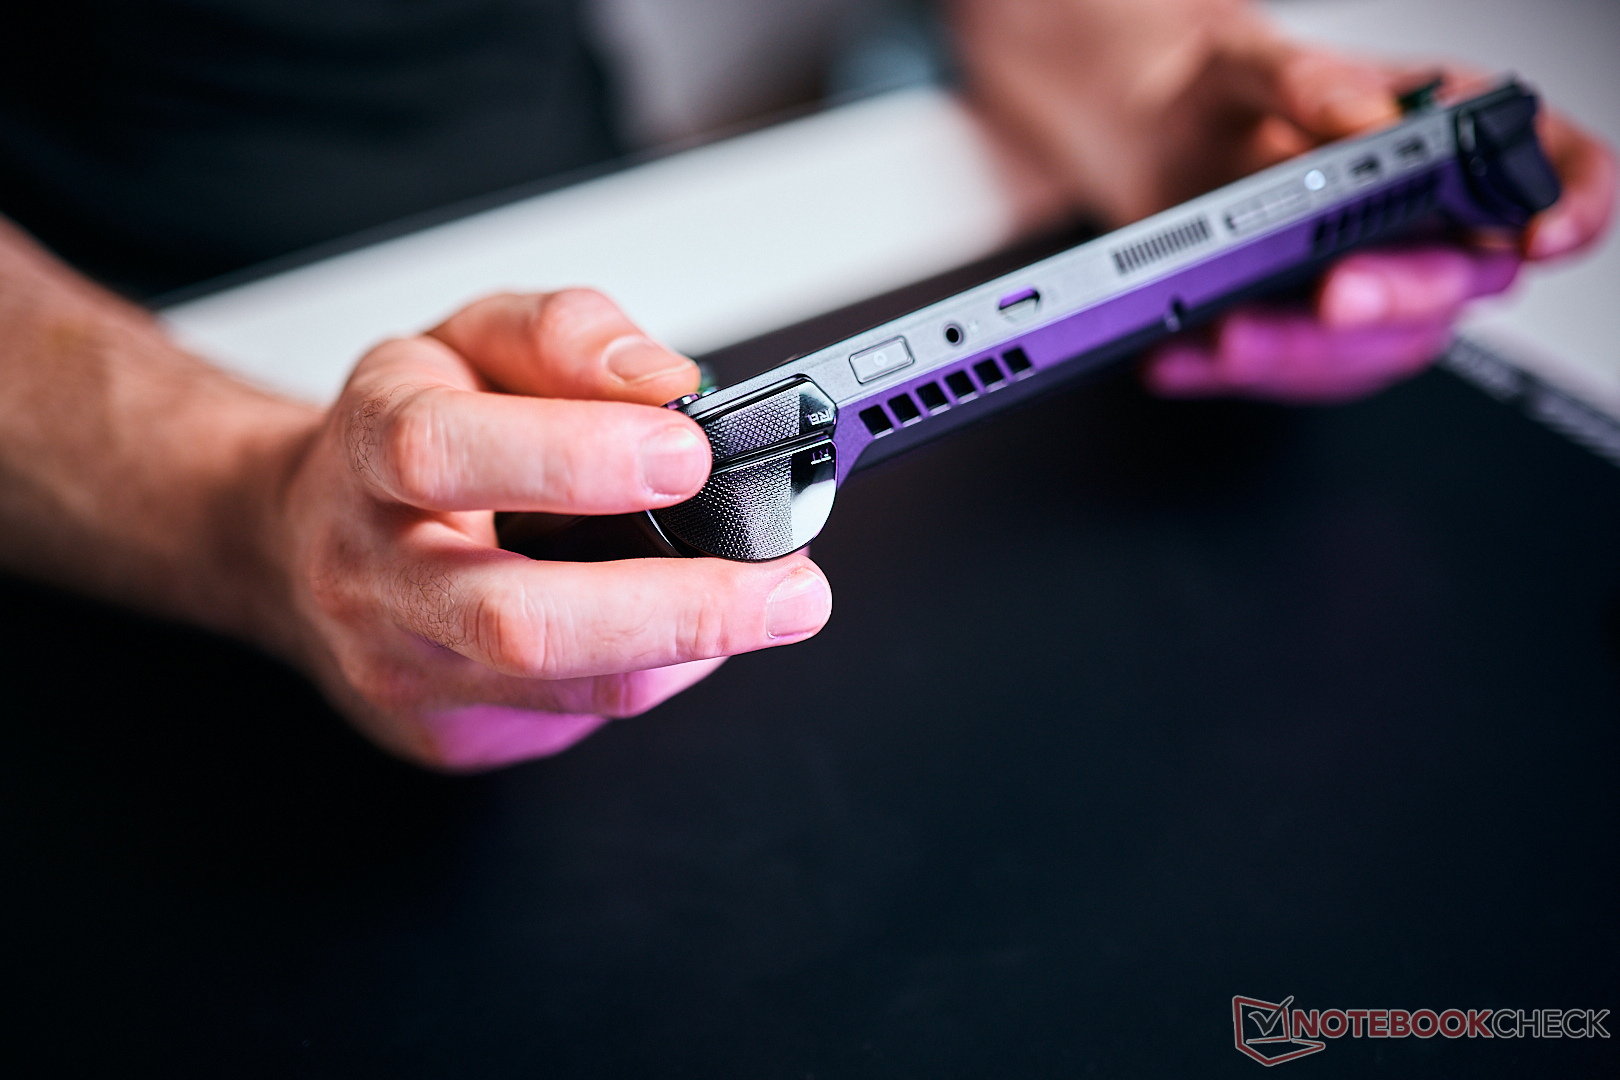
Há duas grandes diferenças em termos de design do chassi. O aspecto mais marcante é a cor, já que o novo Ally X deixa de lado o corpo branco em favor do preto. Isso não é bom nem ruim, mas uma questão de gosto. As superfícies pretas não acumulam impressões digitais com facilidade, o que é bom. O segundo aspecto novo são os punhos maiores. O original ROG Ally original era relativamente plano, o que pode ser cansativo depois de um tempo, especialmente para mãos maiores. Agora, as alças são mais grossas e o novo ROG Ally X é mais confortável de segurar, especialmente durante sessões de jogos mais longas. A parte de trás das alças é coberta com pequenas letras ROG para melhorar o manuseio.
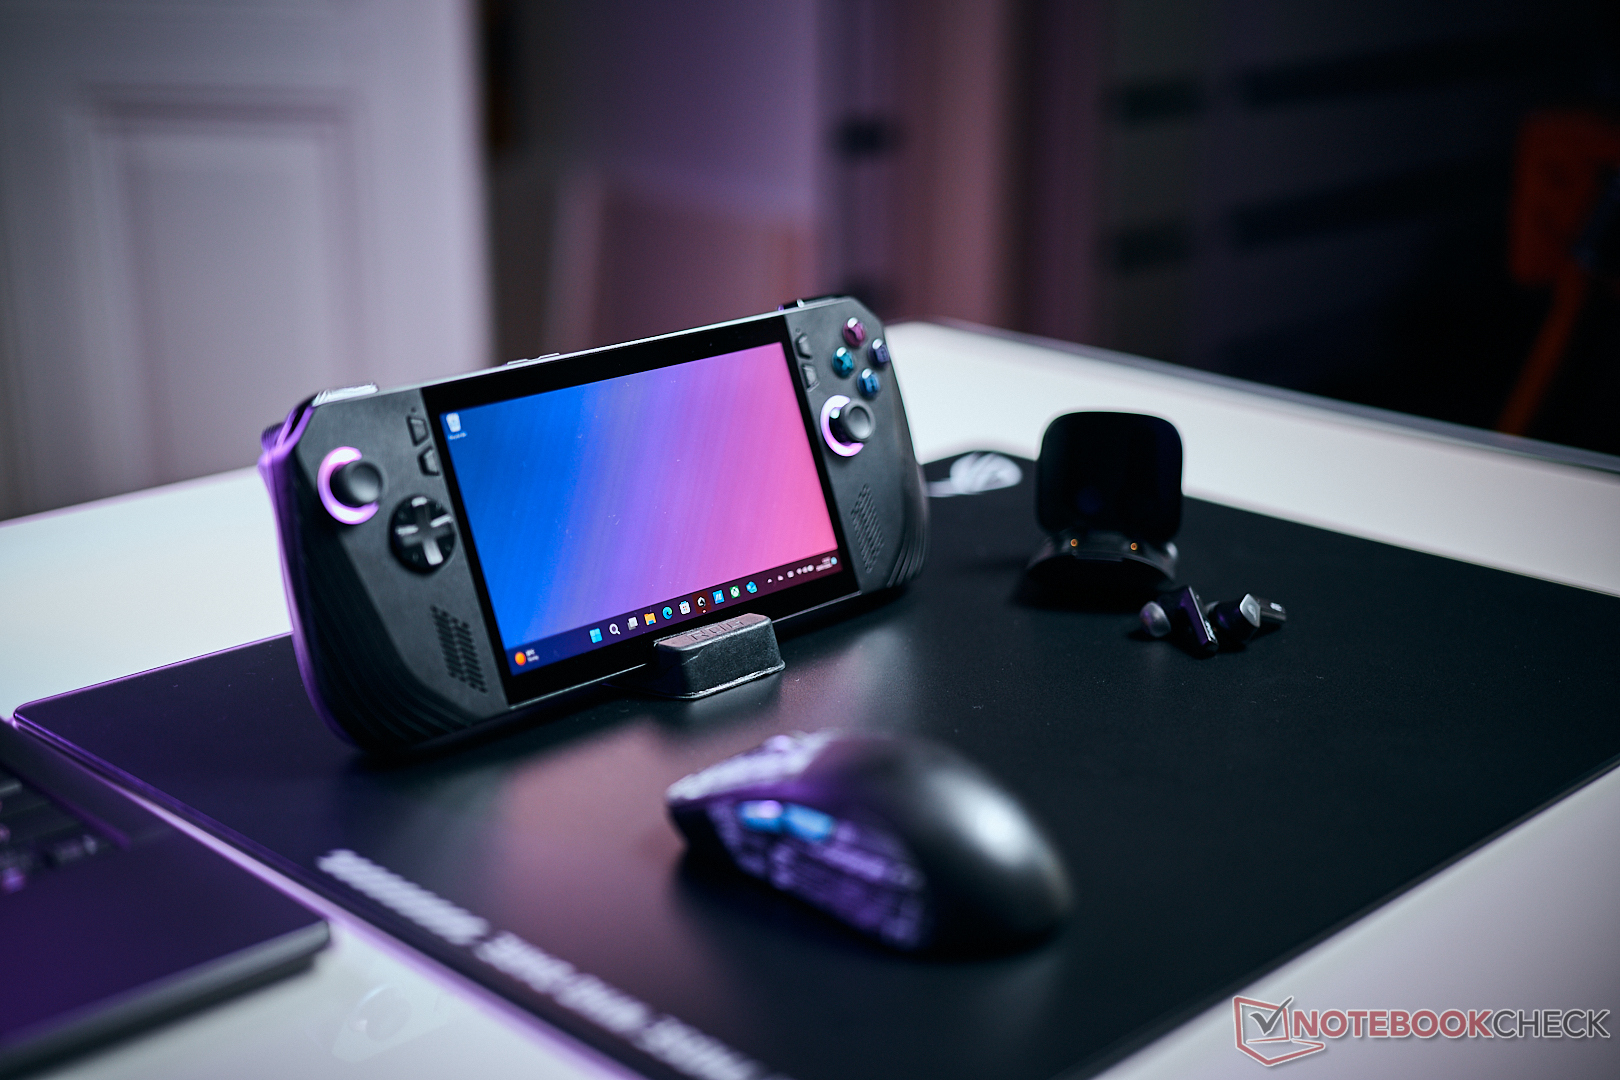
Quanto à qualidade, o senhor ainda tem um chassi de plástico resistente e decente, que é funcional. Podemos ouvir pequenos rangidos, mas isso não acontece quando o senhor usa o dispositivo e não há nenhuma torção. A caixa inclui dois pequenos suportes de papelão preto, que seguram bem o Ally X em uma mesa, por exemplo.

A Asus tentou reduzir o peso o máximo possível para compensar a bateria maior de 80 Wh. A nova versão pesa 685 gramas, em comparação com 611 gramas do ROG Ally original. Isso é perceptível em uma comparação direta, mas nos acostumamos rapidamente com o peso adicional e isso não nos incomodou nem um pouco. A PSU de 65 W pesa 224 gramas.
Devido às alças mais grossas, o ROG Ally X requer mais espaço em sua bolsa e não é tão fácil de transportar. Devido à ergonomia aprimorada, no entanto, estamos muito satisfeitos com esse compromisso.
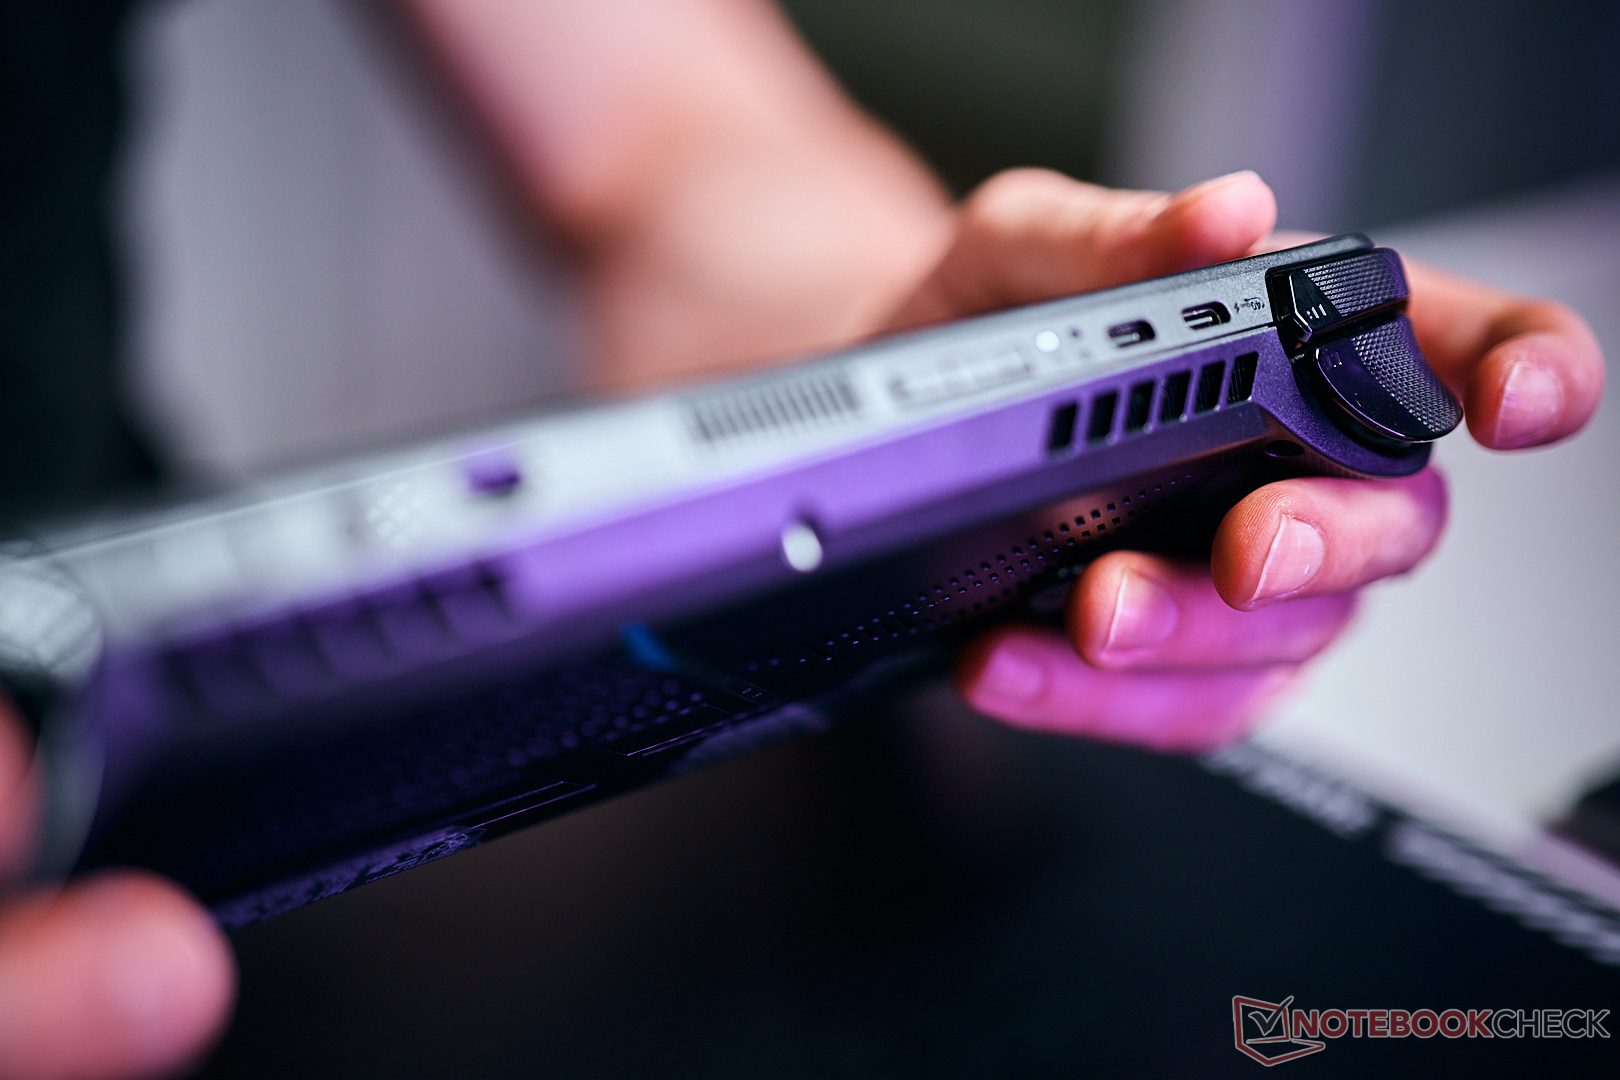
Conectividade - Portátil para jogos agora com USB 4.0
A Asus se livrou do conector XG Mobile e o substituiu por duas portas USB-C padrão. Uma delas suporta o padrão 4.0, portanto, pode ser usada para GPUs externas. Isso significa que o novo ROG Ally X é muito mais versátil e interessante como um PC comum conectado a um monitor com fornecimento de energia, por exemplo. Isso também funciona com o ROG Ally, mas agora o senhor pode conectar unidades adicionais ou dongles USB, por exemplo. O botão de energia é mais uma vez o leitor de impressões digitais, mas não há webcam.
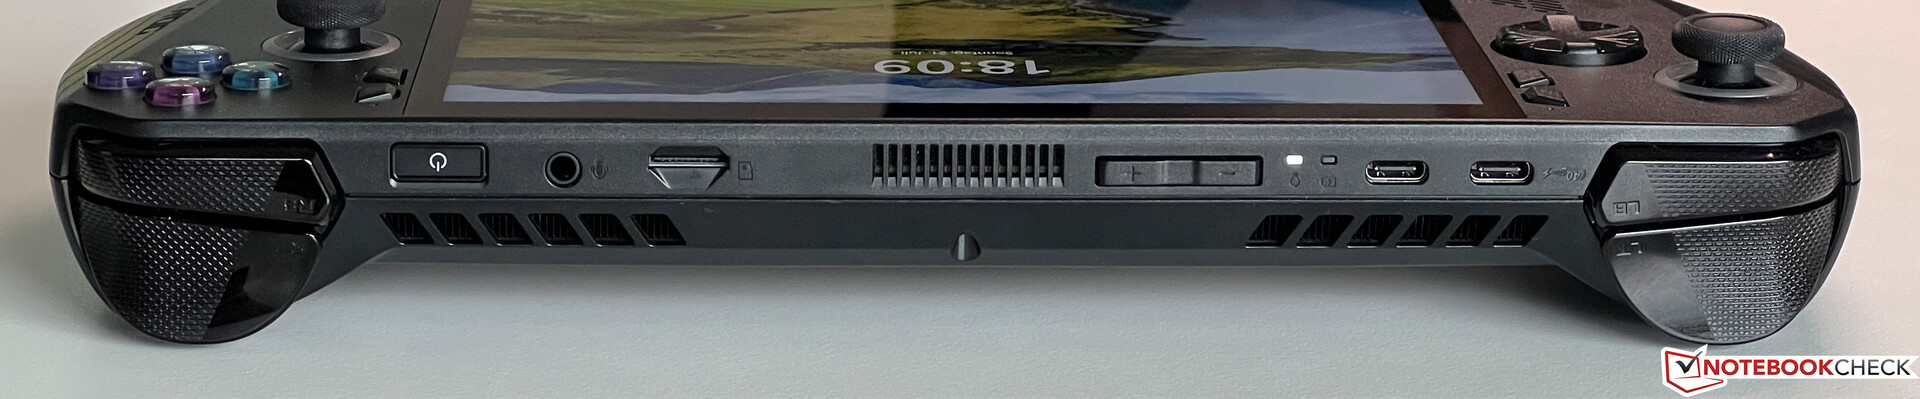
Leitor de cartão SD
O leitor de cartão microSD (mecanismo de mola) é facilmente acessível na parte superior e consegue uma excelente taxa de transferência máxima de 260 MB/s (cai para 90 MB/s quando o usuário copia arquivos) em combinação com o nosso cartão de referência (Angelbird AV Pro V60).
| SD Card Reader | |
| average JPG Copy Test (av. of 3 runs) | |
| Lenovo Legion Go | |
| Ayaneo Kun | |
| Asus ROG Ally Z1 Extreme (Angelbird AV Pro V60) | |
| MSI Claw (Angelbird AV Pro V60) | |
| Média da turma Handheld / UMPC (20.9 - 201, n=14, últimos 2 anos) | |
| Asus ROG Ally X (Angelbird AV Pro v60) | |
| Valve Steam Deck 1 TB OLED | |
| GPD Win Mini 2024 7" (AV Pro SD microSD 128 GB V60) | |
| maximum AS SSD Seq Read Test (1GB) | |
| Asus ROG Ally Z1 Extreme (Angelbird AV Pro V60) | |
| Asus ROG Ally X (Angelbird AV Pro v60) | |
| MSI Claw (Angelbird AV Pro V60) | |
| Ayaneo Kun | |
| Média da turma Handheld / UMPC (74.7 - 260, n=13, últimos 2 anos) | |
| Lenovo Legion Go | |
| GPD Win Mini 2024 7" (AV Pro SD microSD 128 GB V60) | |
Comunicação
O módulo Wi-Fi também não foi alterado, o que significa que o Ally X não é compatível com o padrão Wi-Fi 7 mais recente. No entanto, isso não é um grande problema e o módulo MediaTek (Wi-Fi 6E) ainda consegue taxas de transferência excelentes e estáveis. Também fizemos streaming de alguns jogos durante o período de análise, que funcionou perfeitamente sem nenhuma queda de conexão.
| Networking | |
| Asus ROG Ally X | |
| iperf3 transmit AXE11000 | |
| iperf3 receive AXE11000 | |
| GPD Win Mini 2024 7" | |
| iperf3 transmit AXE11000 | |
| iperf3 receive AXE11000 | |
| iperf3 transmit AXE11000 6GHz | |
| iperf3 receive AXE11000 6GHz | |
| MSI Claw | |
| iperf3 transmit AXE11000 | |
| iperf3 receive AXE11000 | |
| Valve Steam Deck 1 TB OLED | |
| iperf3 transmit AXE11000 | |
| iperf3 receive AXE11000 | |
| iperf3 transmit AXE11000 6GHz | |
| iperf3 receive AXE11000 6GHz | |
| Lenovo Legion Go | |
| iperf3 transmit AXE11000 | |
| iperf3 receive AXE11000 | |
| iperf3 transmit AXE11000 6GHz | |
| iperf3 receive AXE11000 6GHz | |
| Ayaneo Kun | |
| iperf3 transmit AXE11000 | |
| iperf3 receive AXE11000 | |
| iperf3 transmit AXE11000 6GHz | |
| iperf3 receive AXE11000 6GHz | |
| Asus ROG Ally Z1 Extreme | |
| iperf3 transmit AXE11000 | |
| iperf3 receive AXE11000 | |
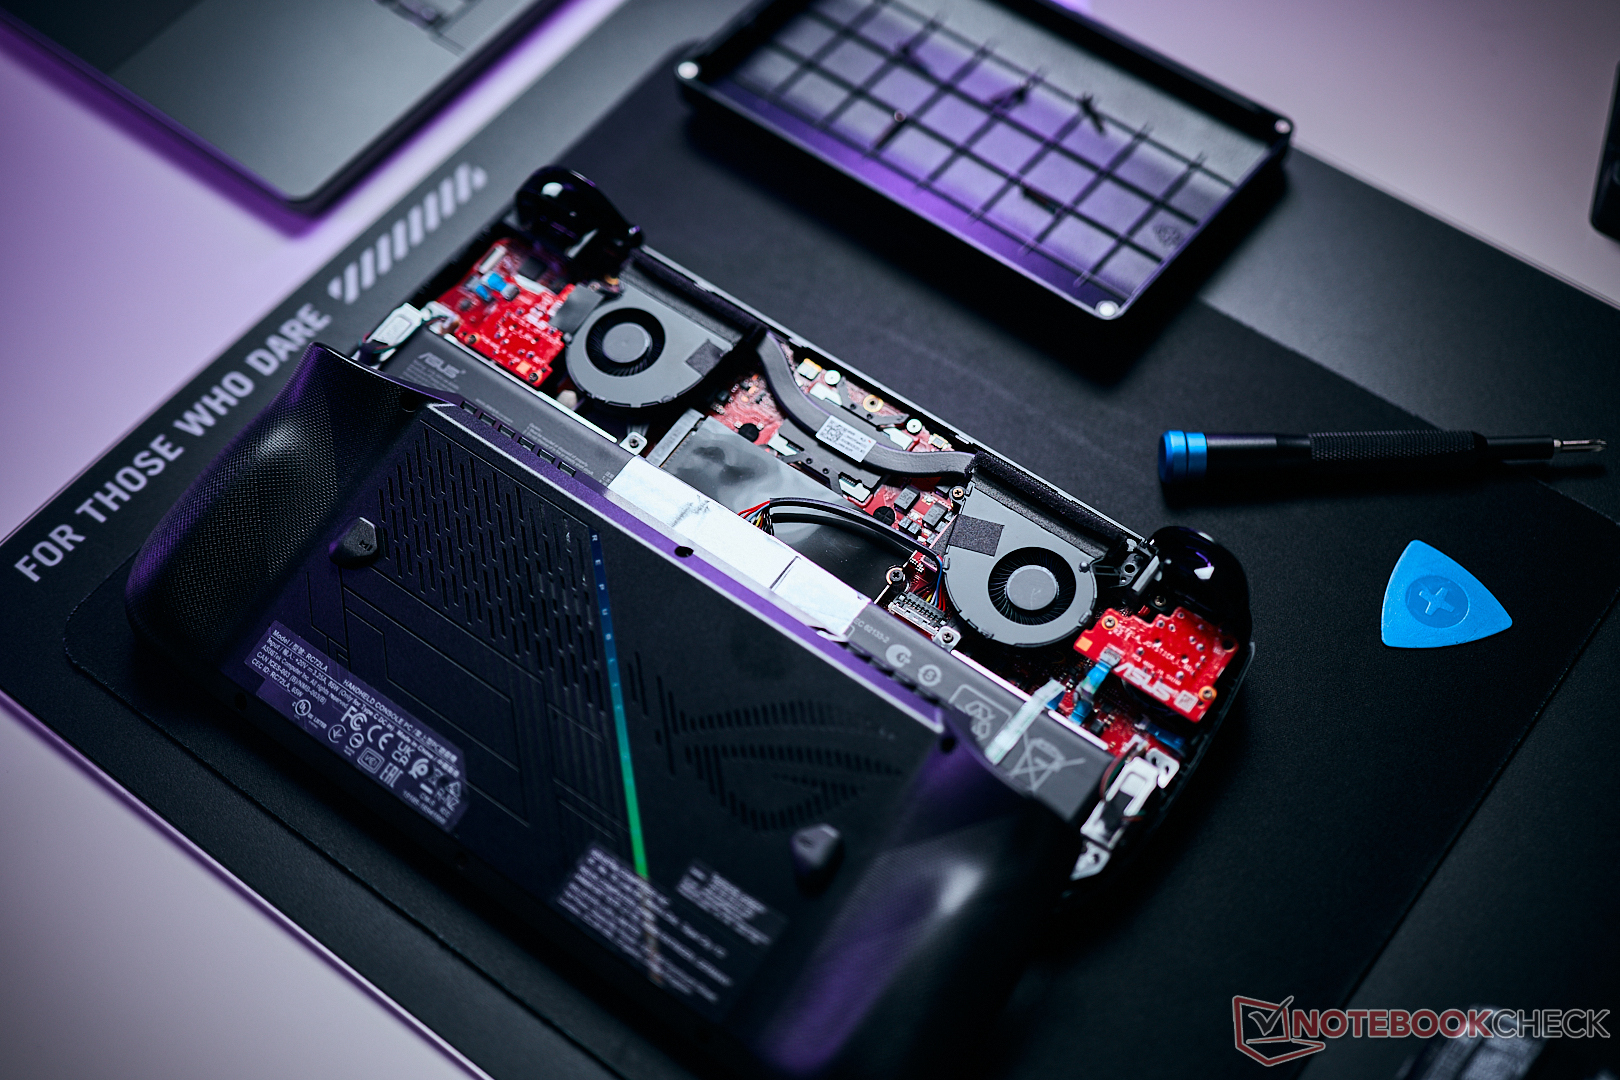
Manutenção
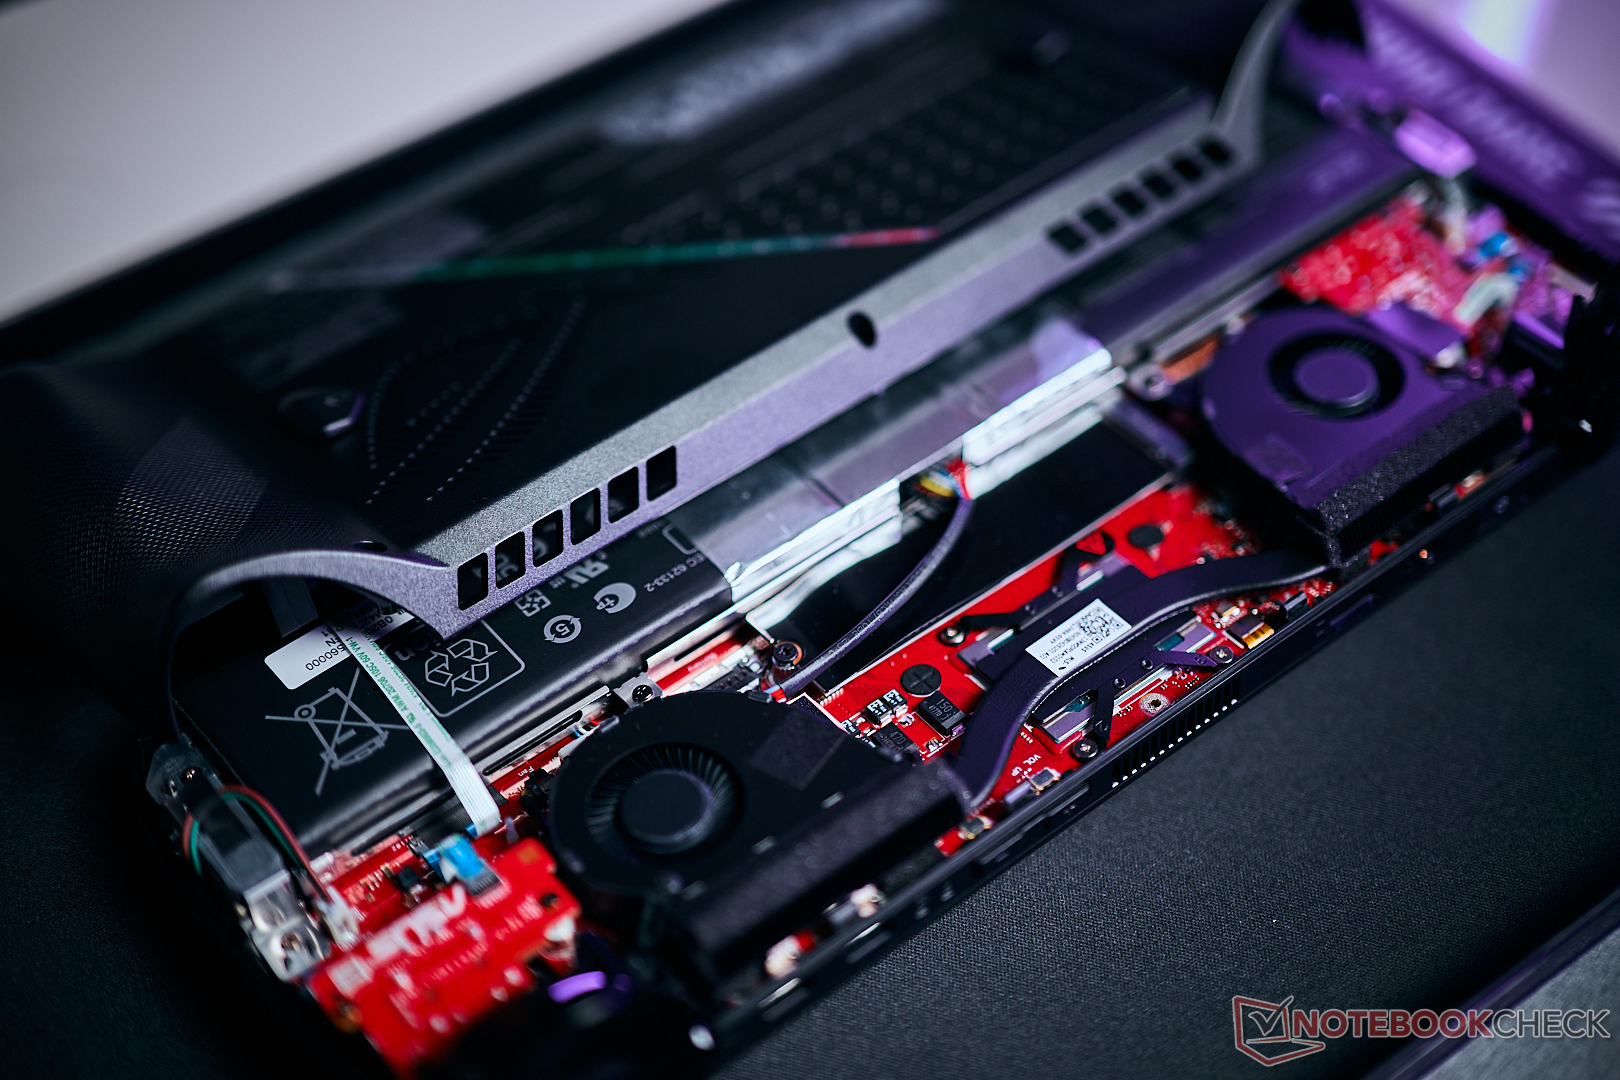
É muito simples remover a tampa traseira do novo ROG Ally X, mas o senhor deve ficar atento ao único cabo de fita que conecta os botões adicionais na parte traseira à placa-mãe. O senhor deve removê-lo cuidadosamente com uma pinça. A boa notícia é que o senhor não precisa remover o cabo para acessar o novo SSD M.2-2280. O novo fator de forma também permite upgrades simples e baratos, bem como capacidades de armazenamento maiores em comparação com o SSD M.2-2230 anterior.
Dispositivos de entrada - Os joysticks e o D-pad foram aprimorados

Além da tela sensível ao toque capacitiva (com Corning Gorilla Glass), um dispositivo portátil para jogos obviamente requer bons botões e joysticks. A Asus alterou alguns componentes e o senhor percebe imediatamente o aumento da resistência dos joysticks, o que permite movimentos mais precisos em torno da posição zero. O D-pad também foi reformulado e é mais fácil de usar. No entanto, não temos certeza absoluta sobre os novos gatilhos (mais uma vez, efeito Hall). Na verdade, há menos resistência em comparação com o ROG Ally original, o que pode dificultar o uso nos primeiros milímetros (especialmente perceptível em jogos de corrida) e o ruído quando o usuário solta o gatilho também é um pouco mais alto. Obviamente, isso também é uma questão de preferência pessoal e não tivemos nenhum problema durante nossas sessões de jogos. Todos os outros botões têm praticamente a mesma sensação. Os anéis ao redor dos joysticks podem mais uma vez ser iluminados (também dependendo do conteúdo da tela).
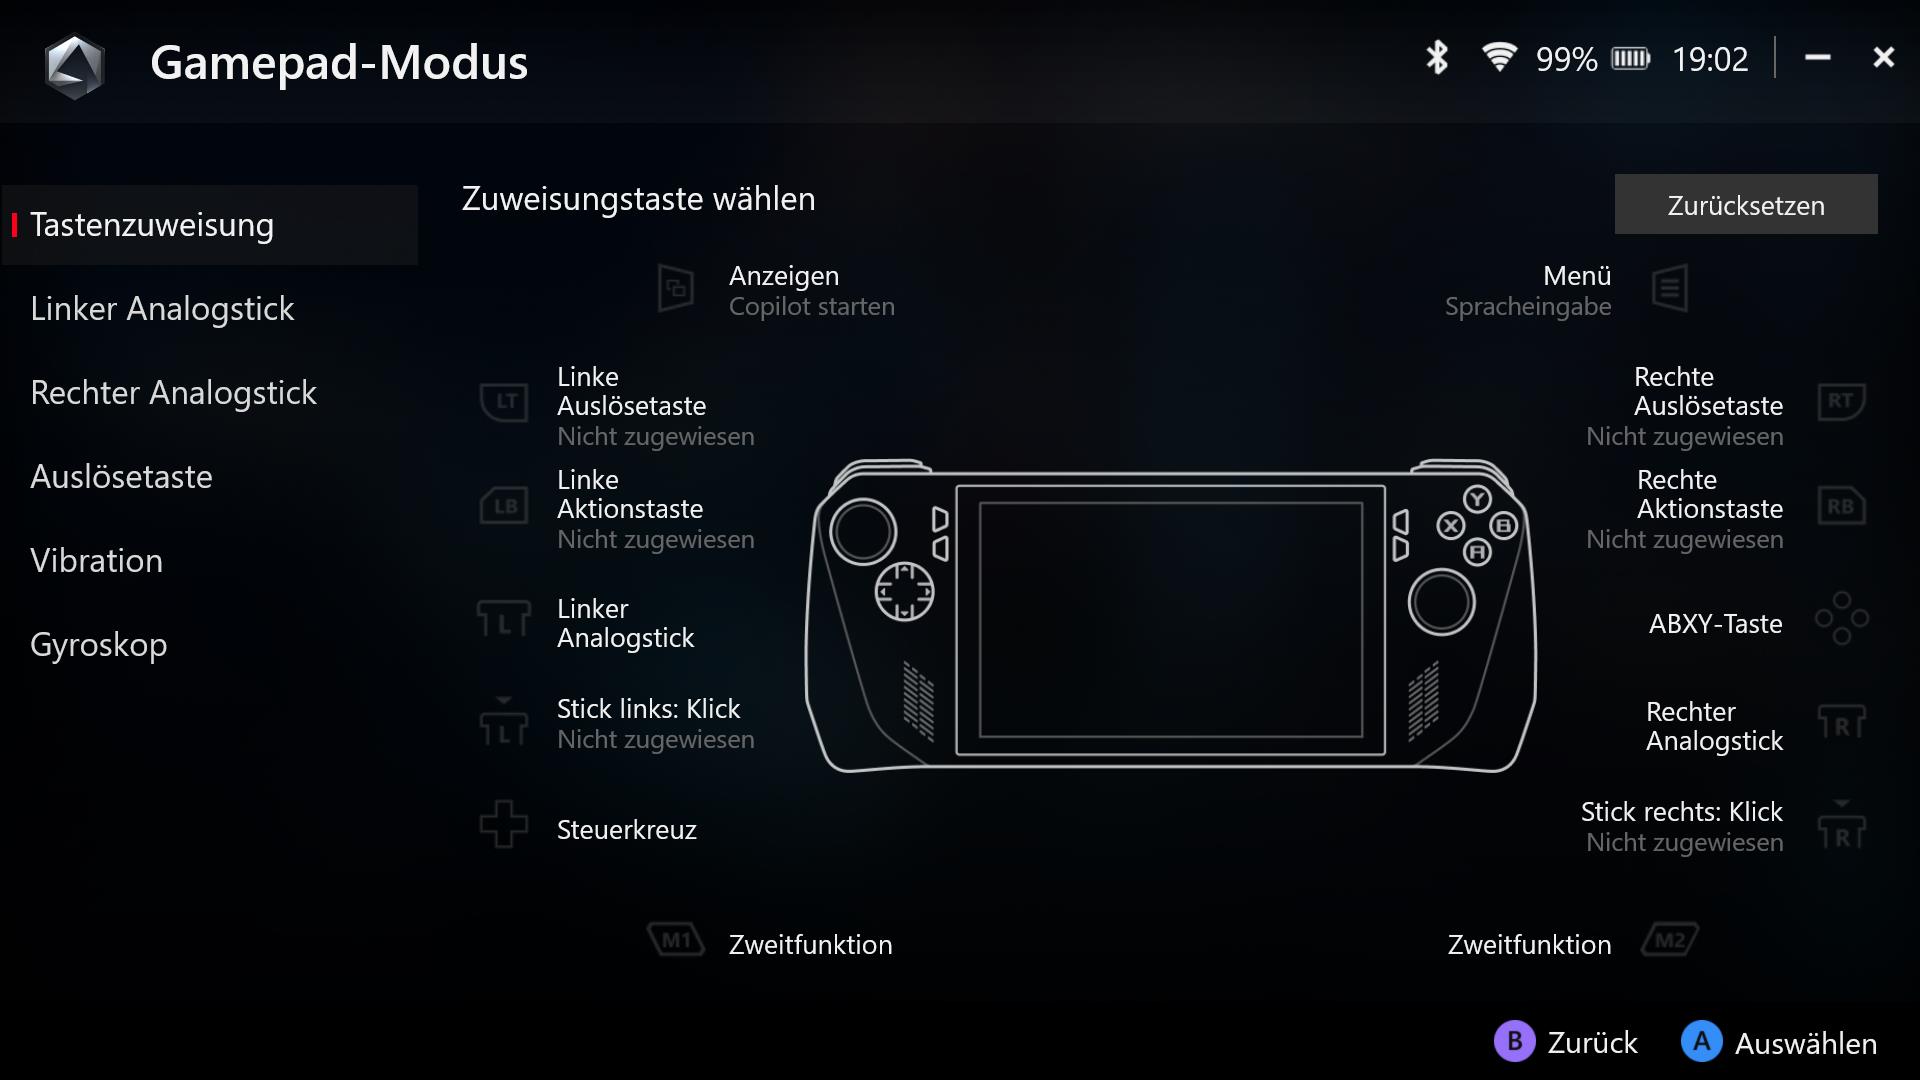
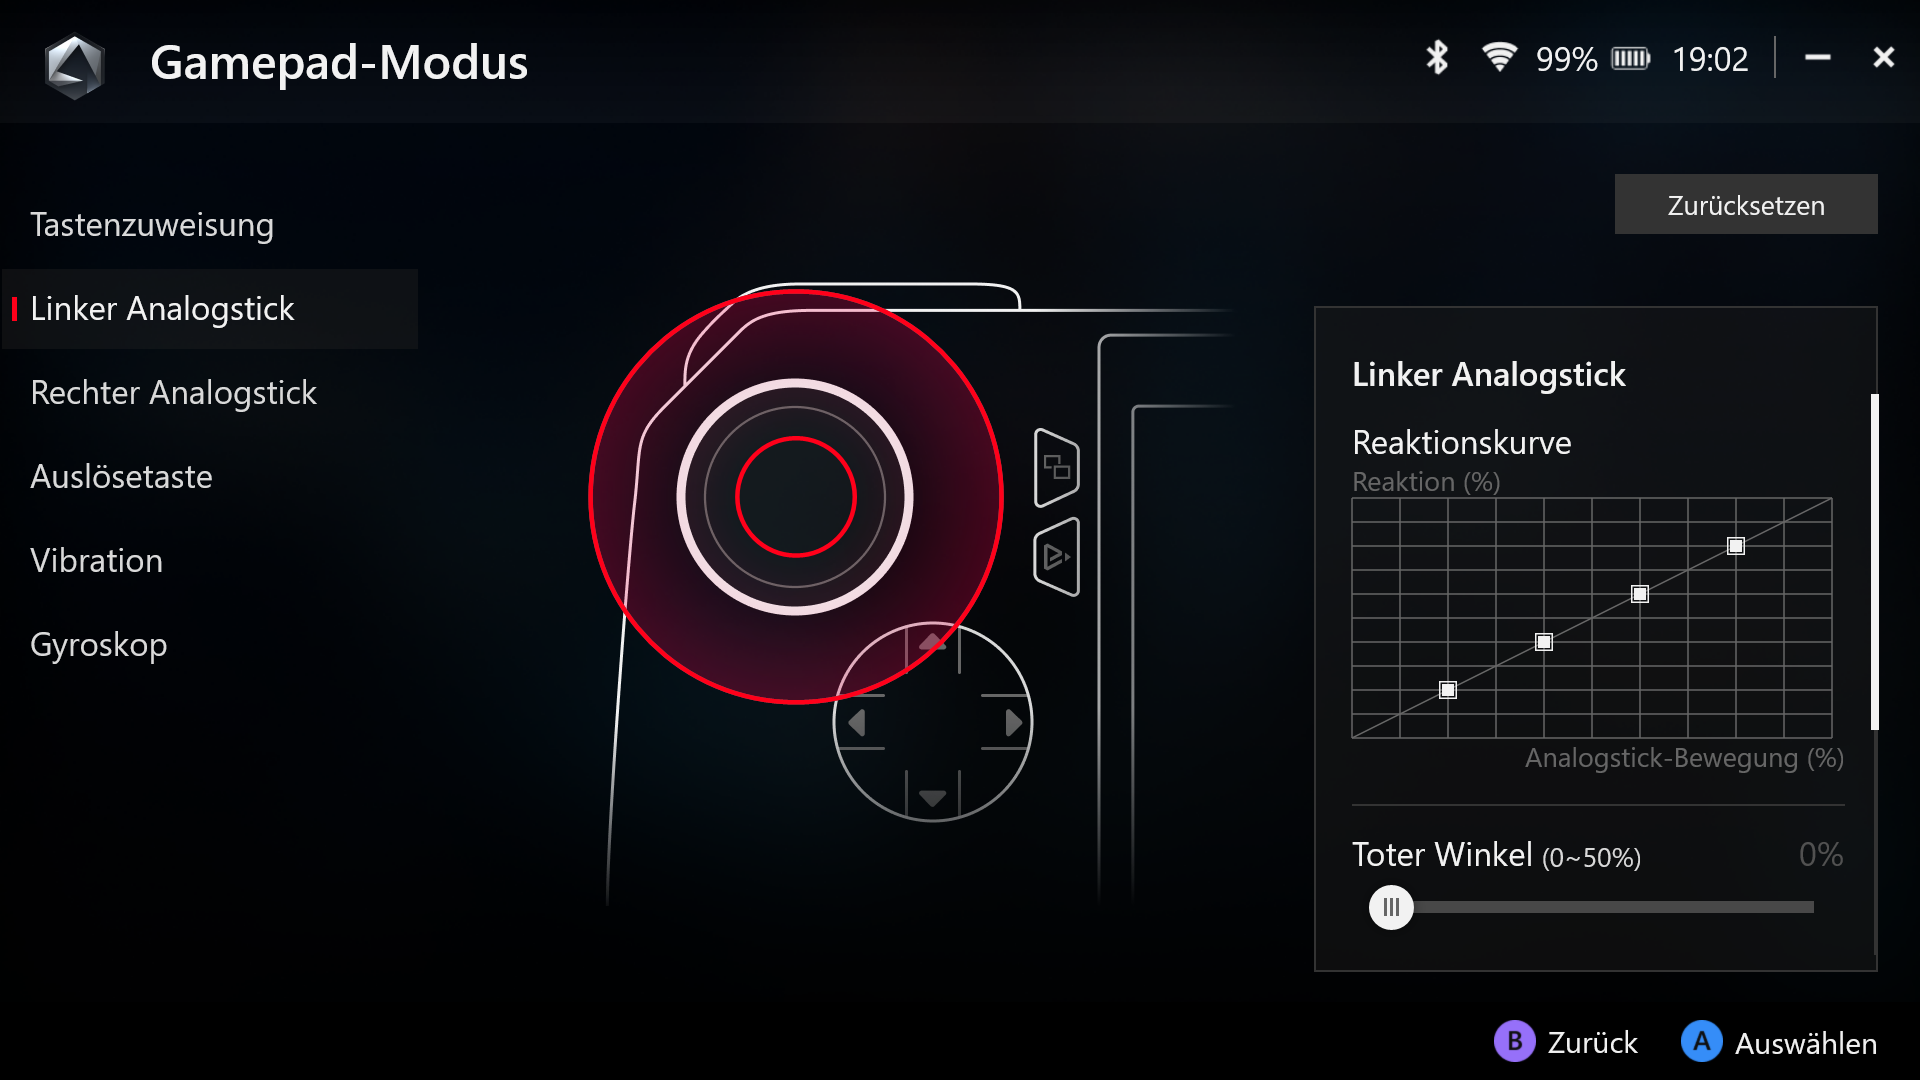
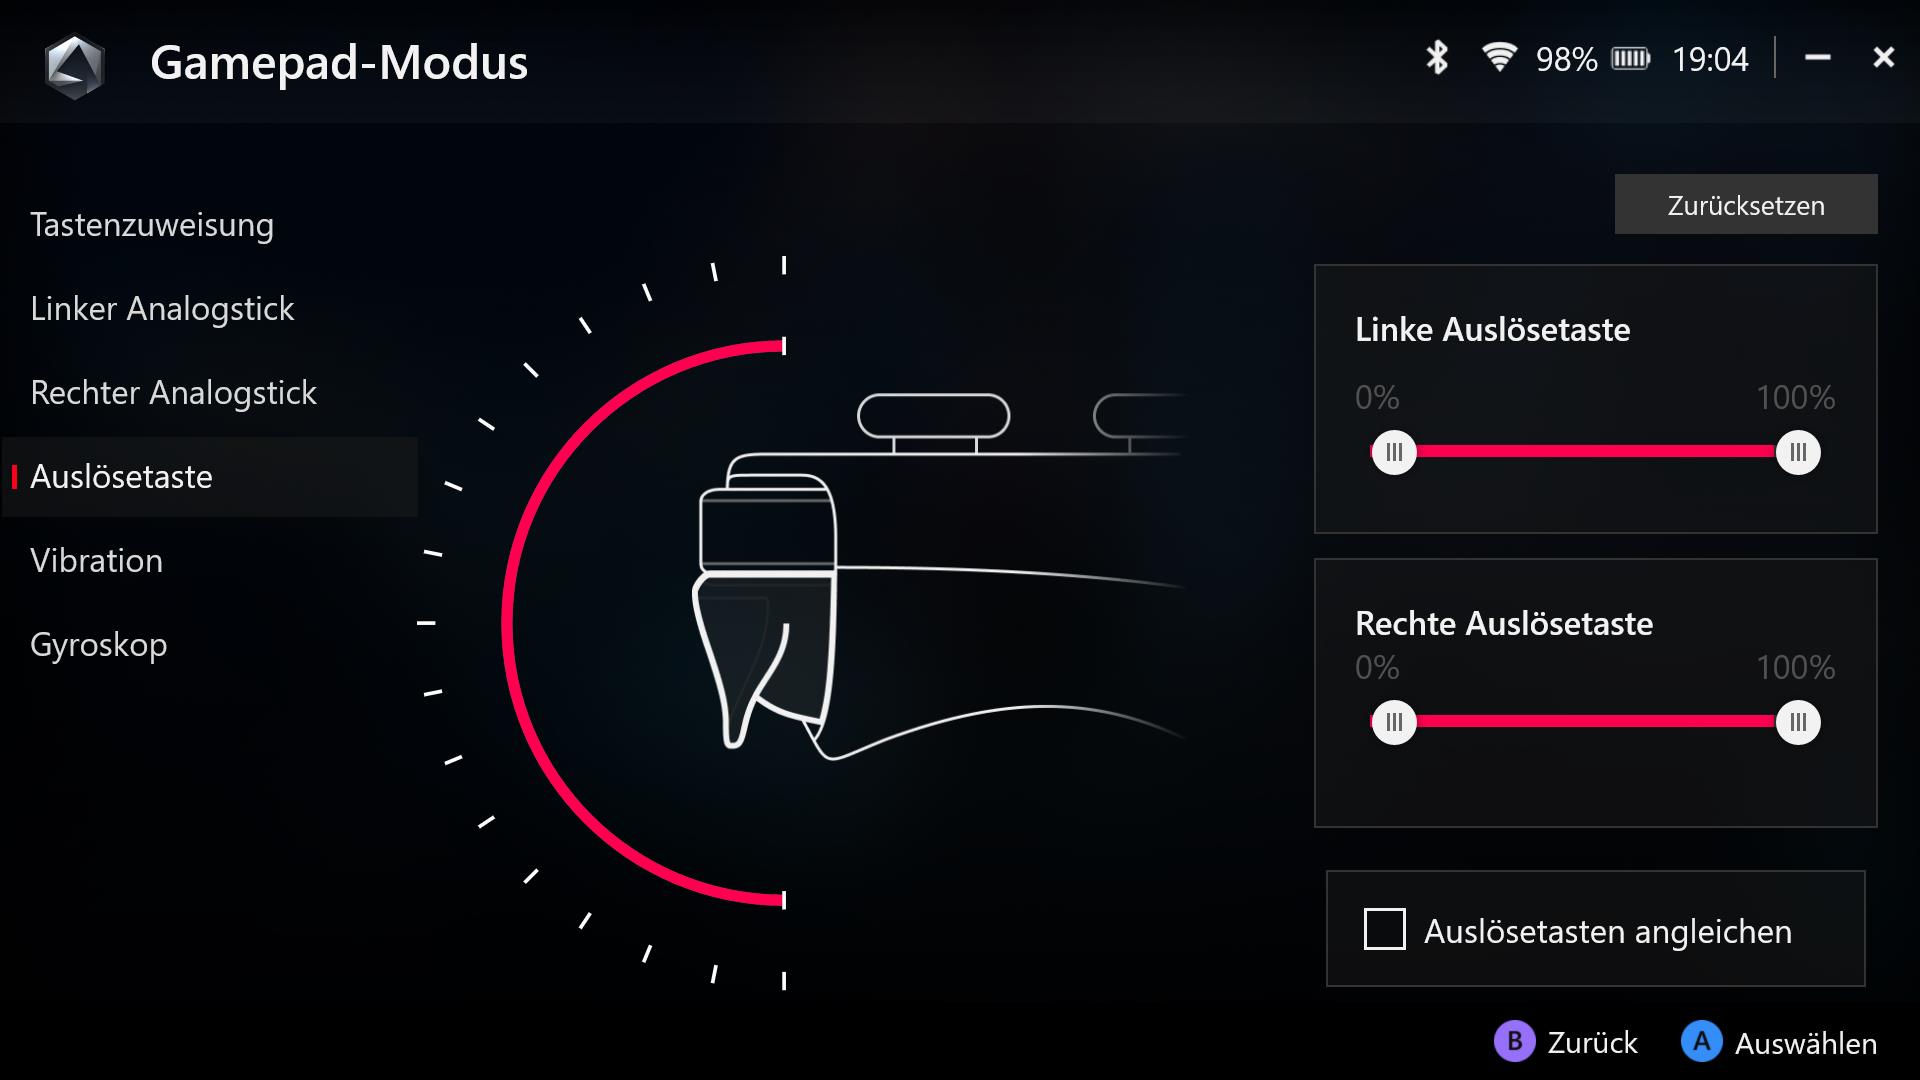
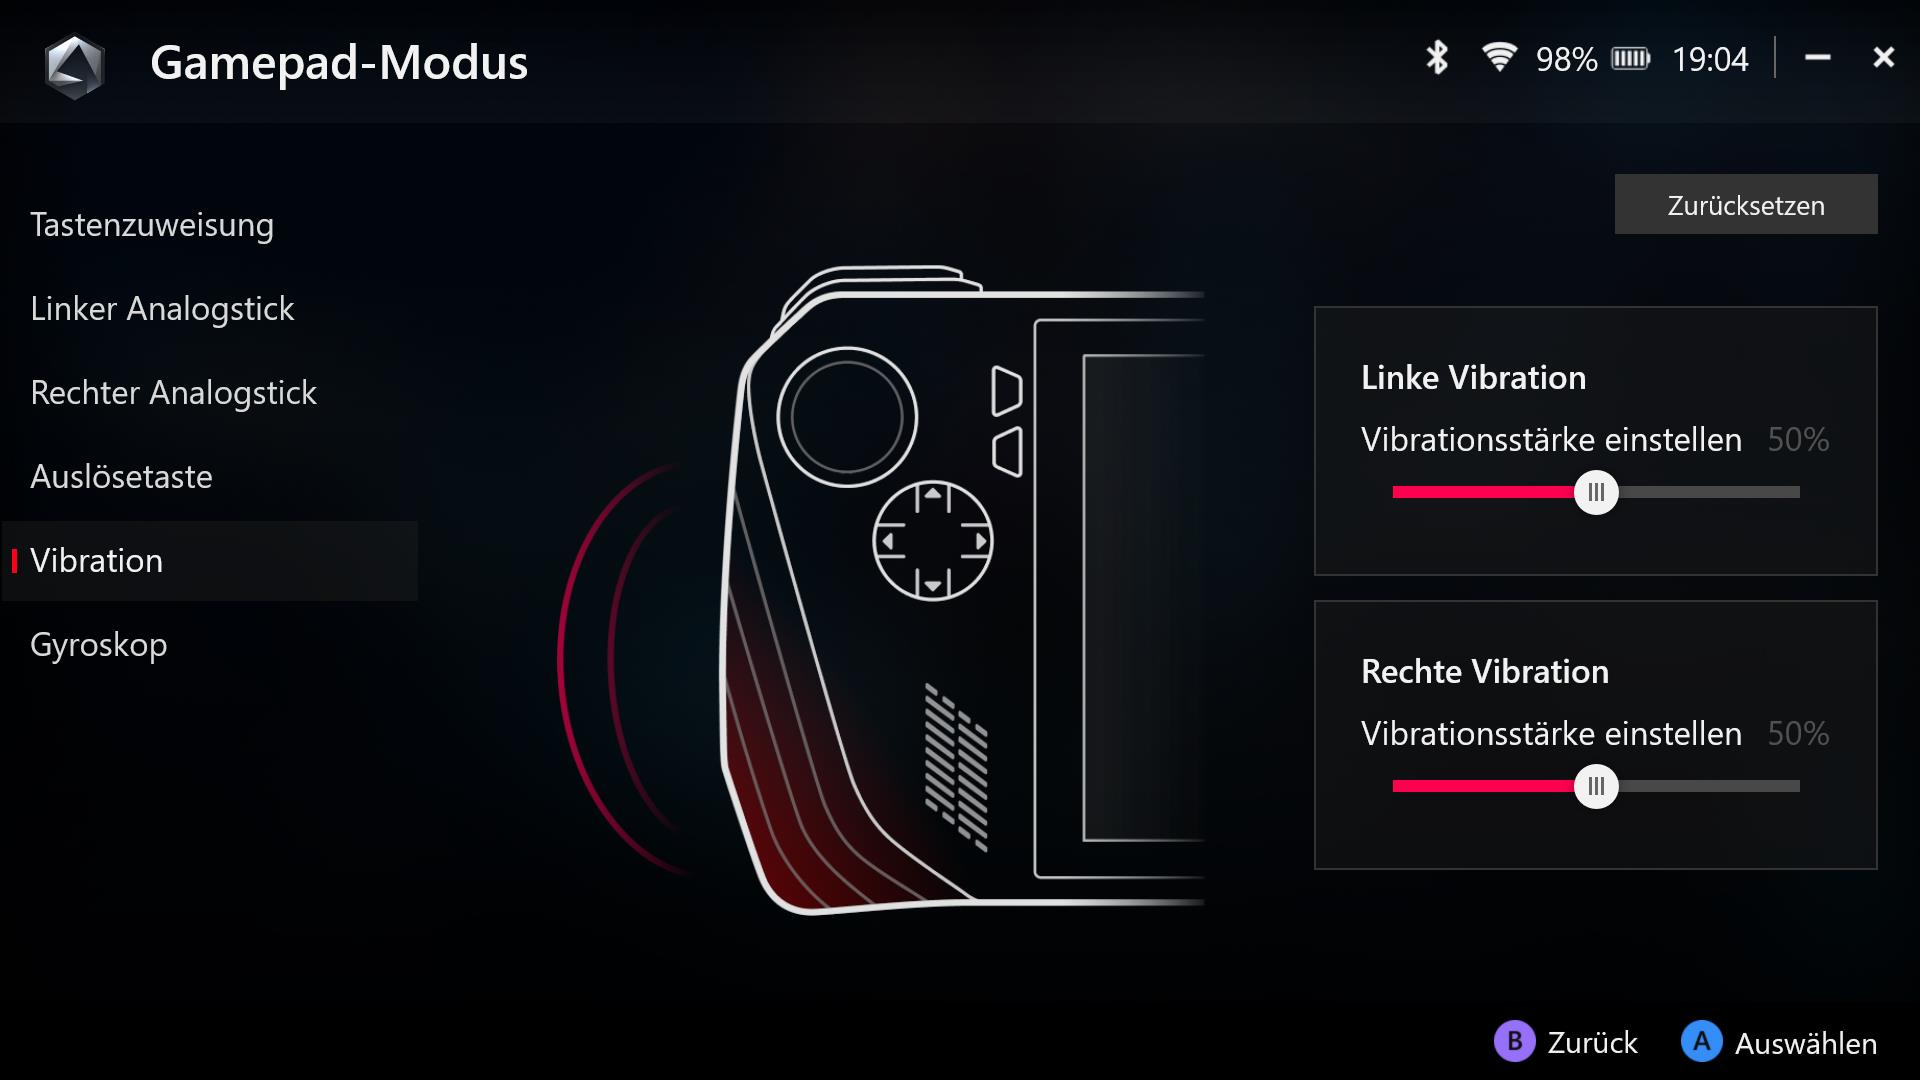
É possível personalizar os controles de forma abrangente no software Armoury Crate SE. Isso começa com o mapeamento simples dos botões e continua com curvas de reação para os joysticks, zonas mortas, deslocamento dos gatilhos (individualmente para os lados esquerdo e direito), vibração (individualmente para os lados esquerdo e direito) e controles de giroscópio. Isso já é muito bom, mas a melhor parte é que o senhor pode personalizar e armazenar tudo isso para cada jogo individualmente.
Os dois botões adicionais na parte traseira agora são muito menores. Eles ainda ativam funções úteis em combinação com o D-pad e os botões (como mostrar a área de trabalho, fazer uma captura de tela, abrir o Gerenciador de tarefas). No entanto, usar o Windows em uma pequena tela sensível ao toque com alguns botões e joysticks ainda é bastante complicado, especialmente a configuração inicial, que pode ser realmente irritante. Recomendamos simplificar o máximo possível e usar um mouse/teclado ou até mesmo uma tela externa com fornecimento de energia e dispositivos de entrada conectados. Depois que tudo estiver configurado, o senhor pode se concentrar no software Armoury Crate SE, o que nos leva à próxima seção.
Software - Armoury Crate SE 1.5
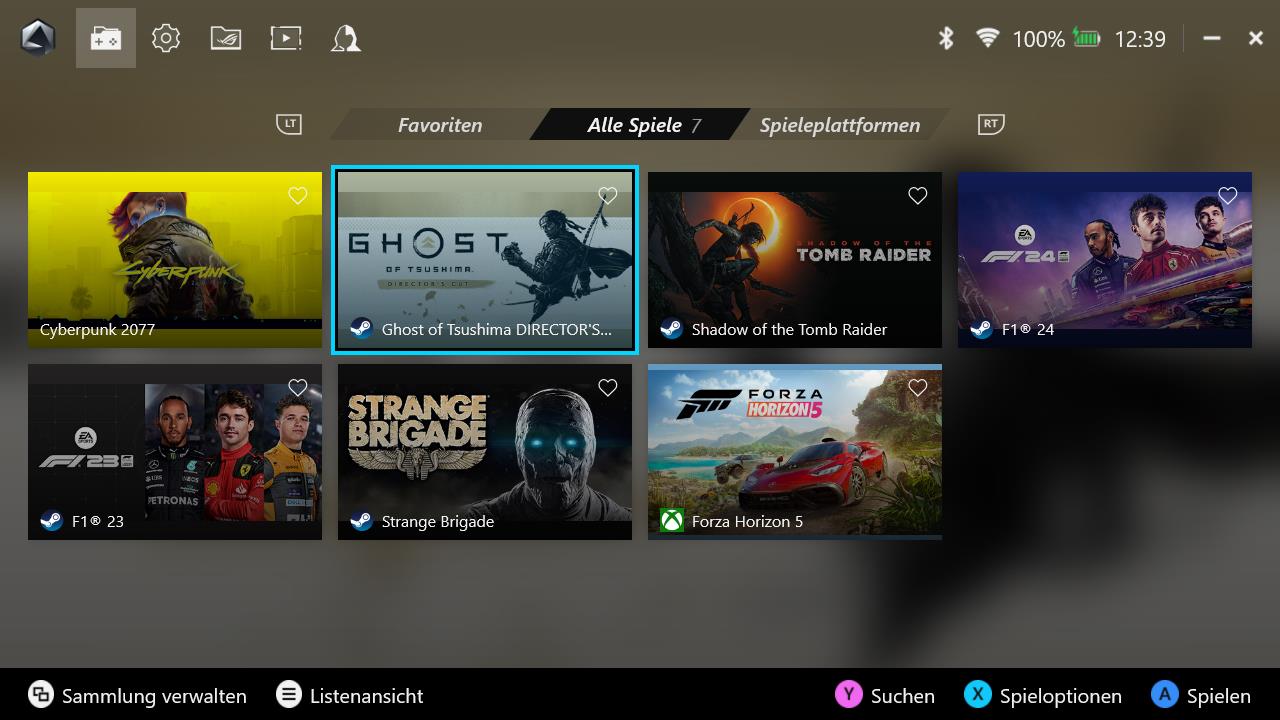
Depois que tudo estiver instalado e configurado, o software Armoury Crate SE se tornará o principal hub para seus objetivos de jogo. O ROG Ally X está equipado com a versão 1.5 do software (o ROG Ally receberá a atualização posteriormente) e foi projetado para funcionar com uma tela sensível ao toque e botões portáteis. Além da biblioteca de jogos, o usuário também pode gerenciar todas as suas configurações. Os jogos que o senhor instalou por meio de lançadores populares, como Steam, Origin, etc., são adicionados automaticamente à biblioteca, mas também é possível adicionar jogos manualmente. O software pode ser iniciado automaticamente quando o dispositivo é inicializado, portanto, o senhor pode ignorar o Windows na maior parte do tempo.
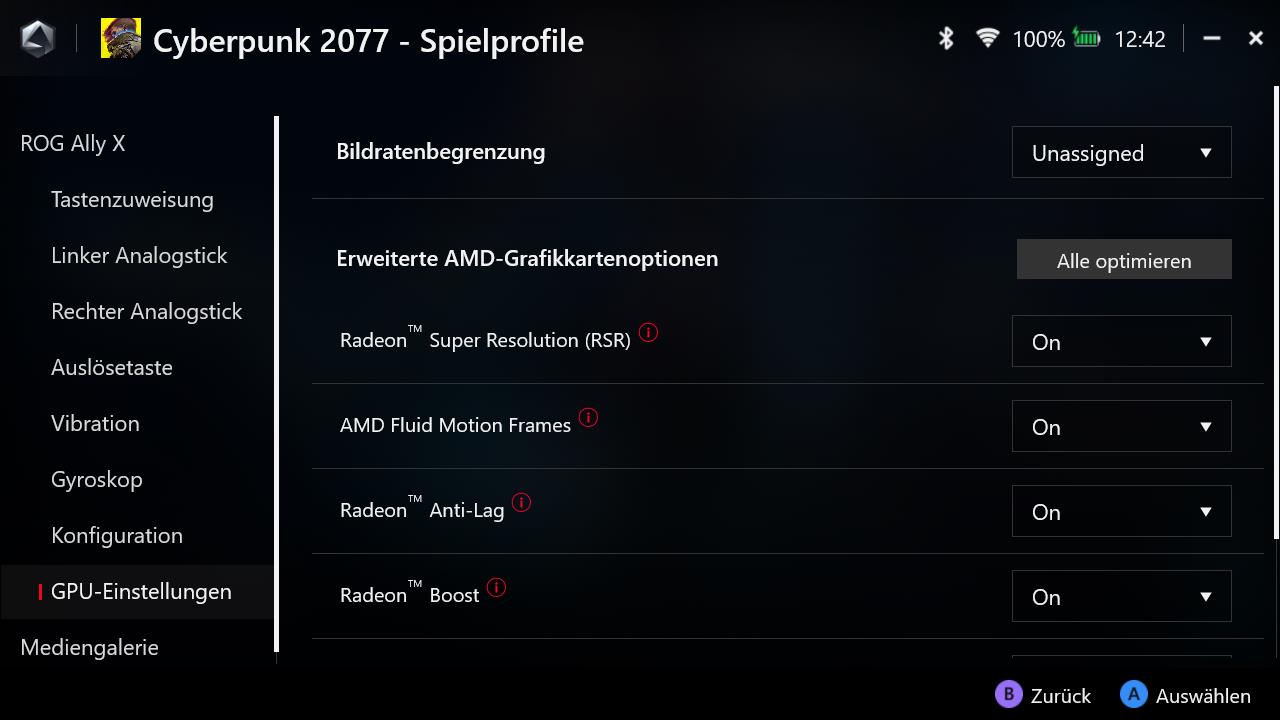
Já falamos sobre as opções de personalização abrangentes para os controles, mas o software Armoury Crate SE não para por aí. Assim como os controles, é possível definir perfis de desempenho para cada jogo (tanto na rede quanto na bateria) e ajustar as configurações da GPU a partir do driver da GPU Radeon sem usar o software Radeon.
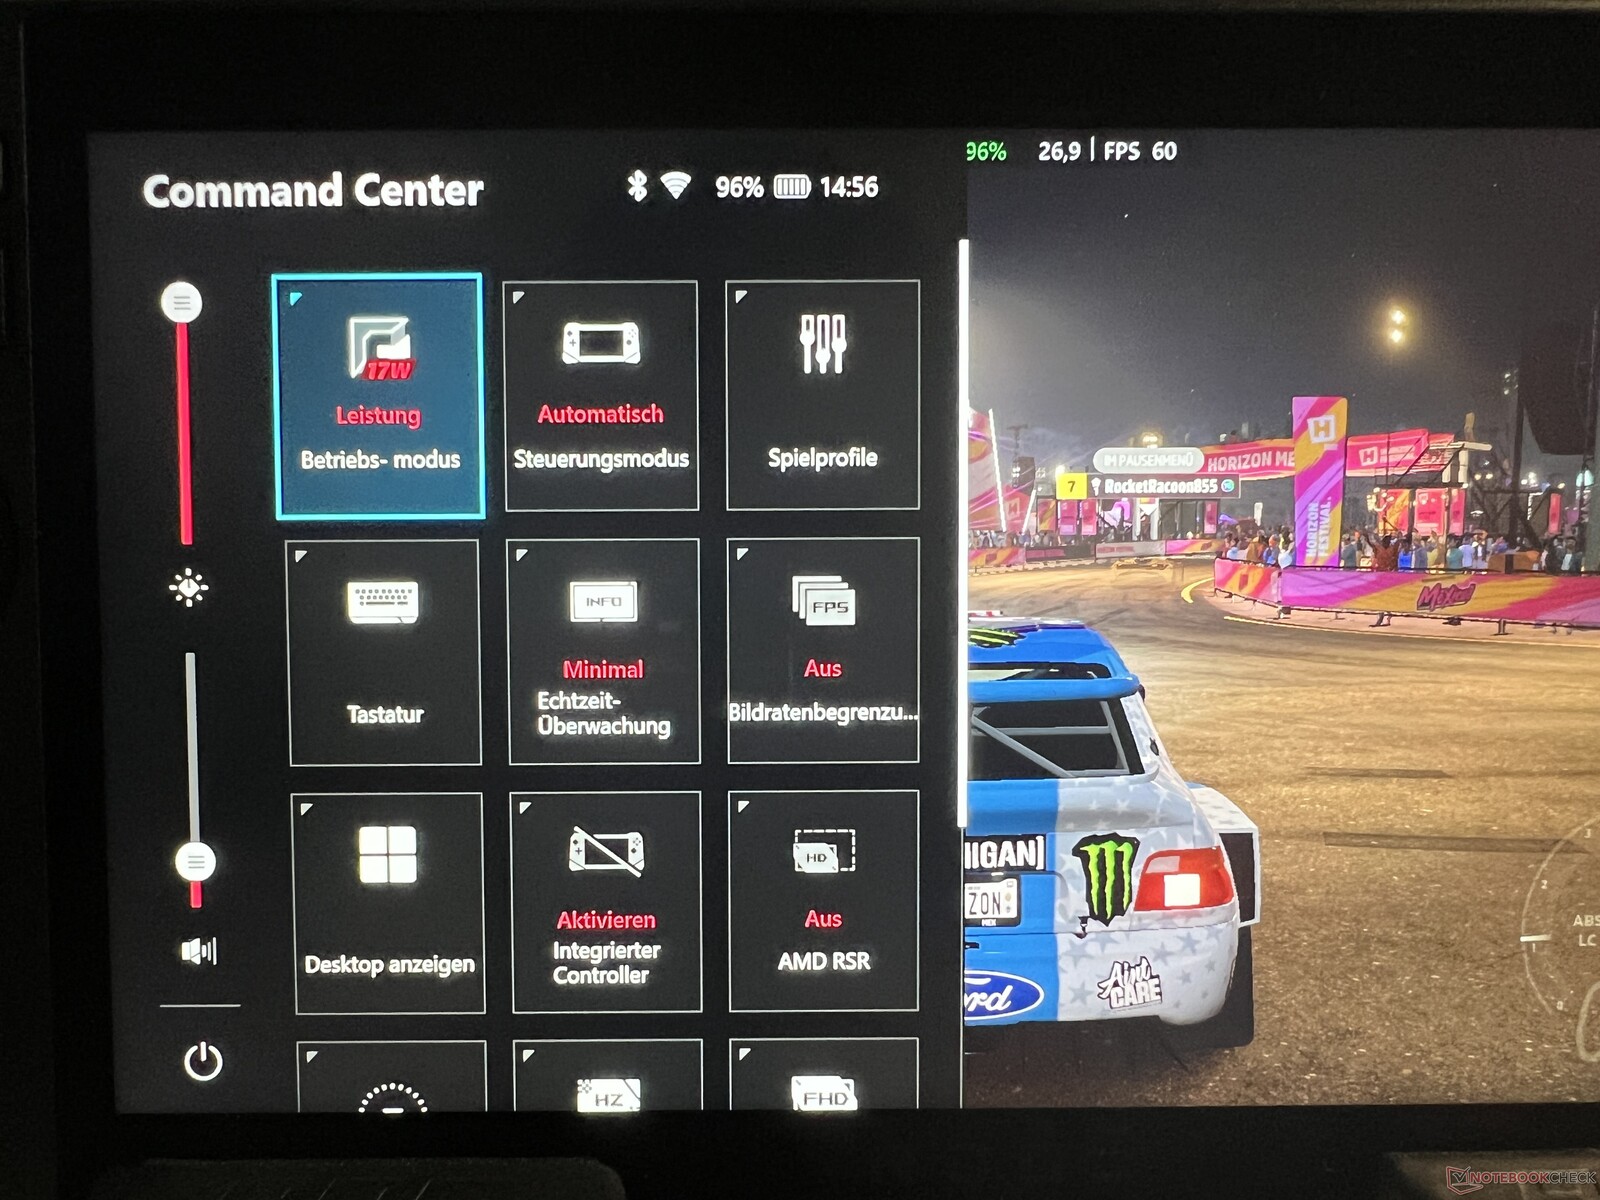
O botão inferior esquerdo ao lado da tela abre o Command Center a qualquer momento, que pode ser configurado com 15 opções (que podem ser escolhidas de um total de 23 opções). Essa é uma maneira muito fácil e confortável de ajustar configurações importantes, como o perfil de energia, o brilho, o volume, a resolução, as opções de GPU ou o brilho dos anéis iluminados do joystick, por exemplo.
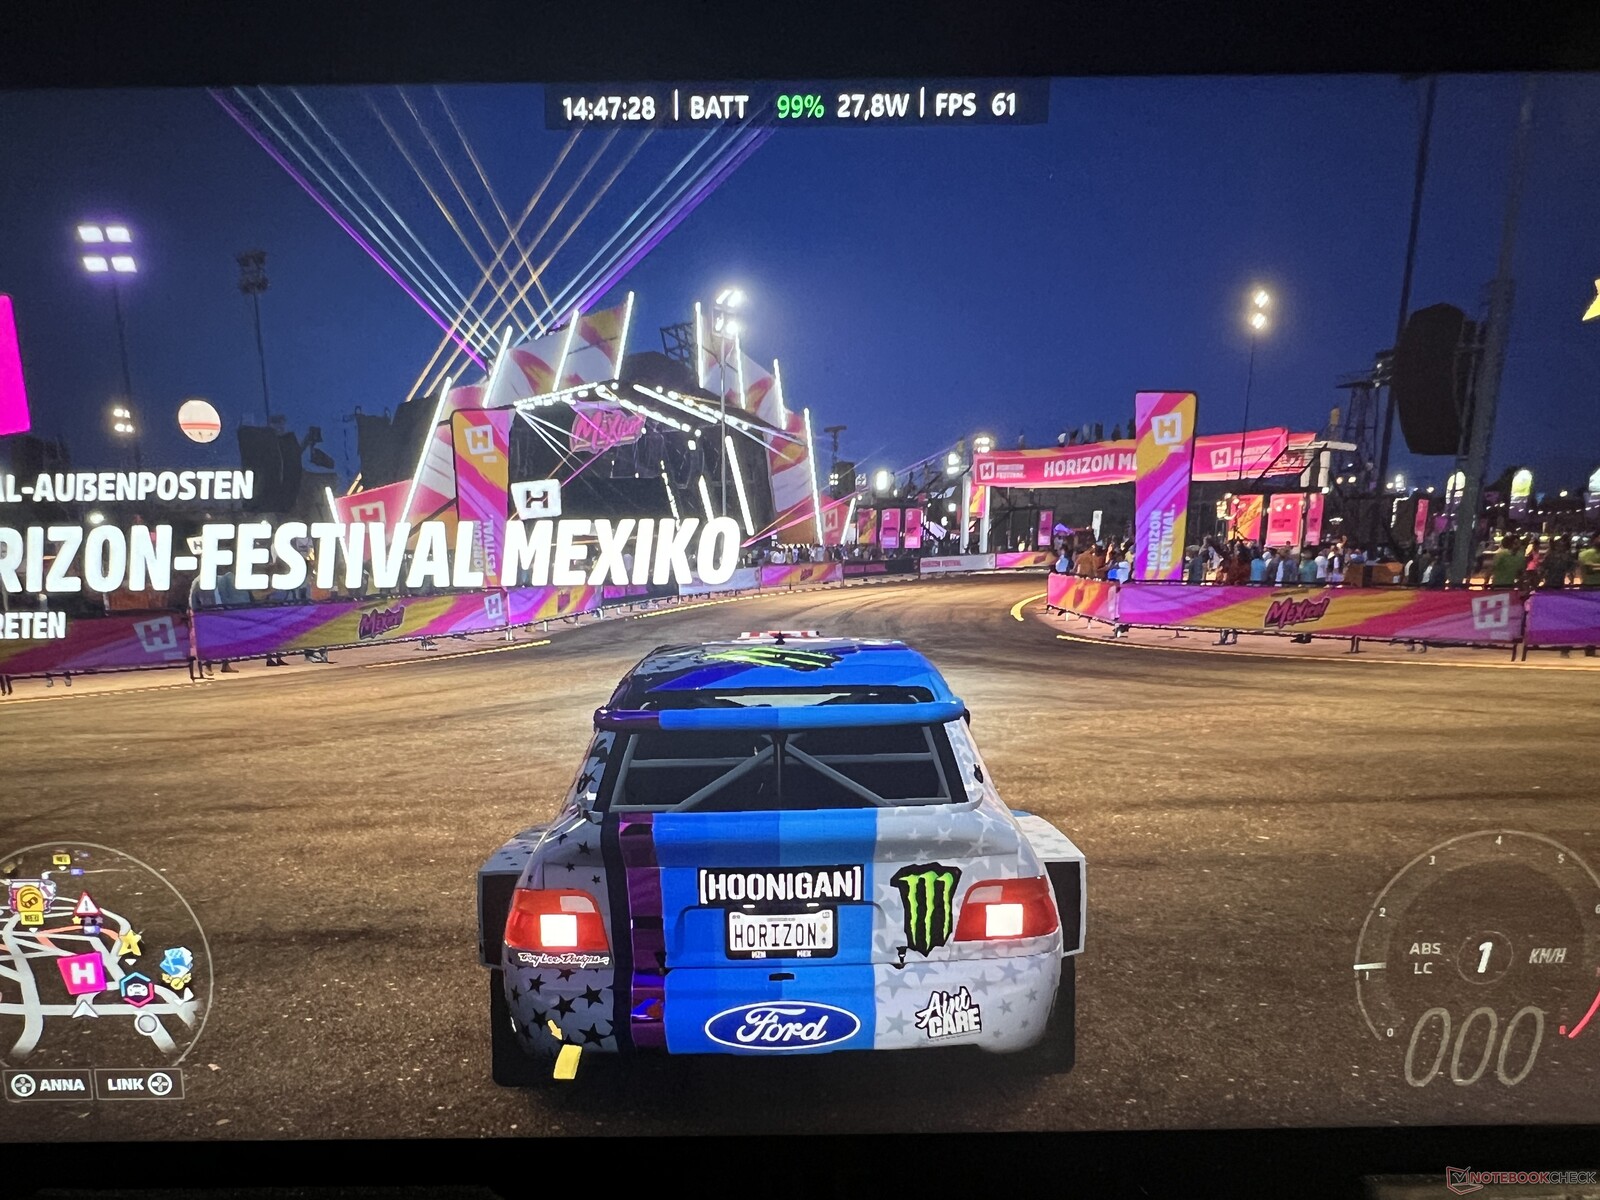
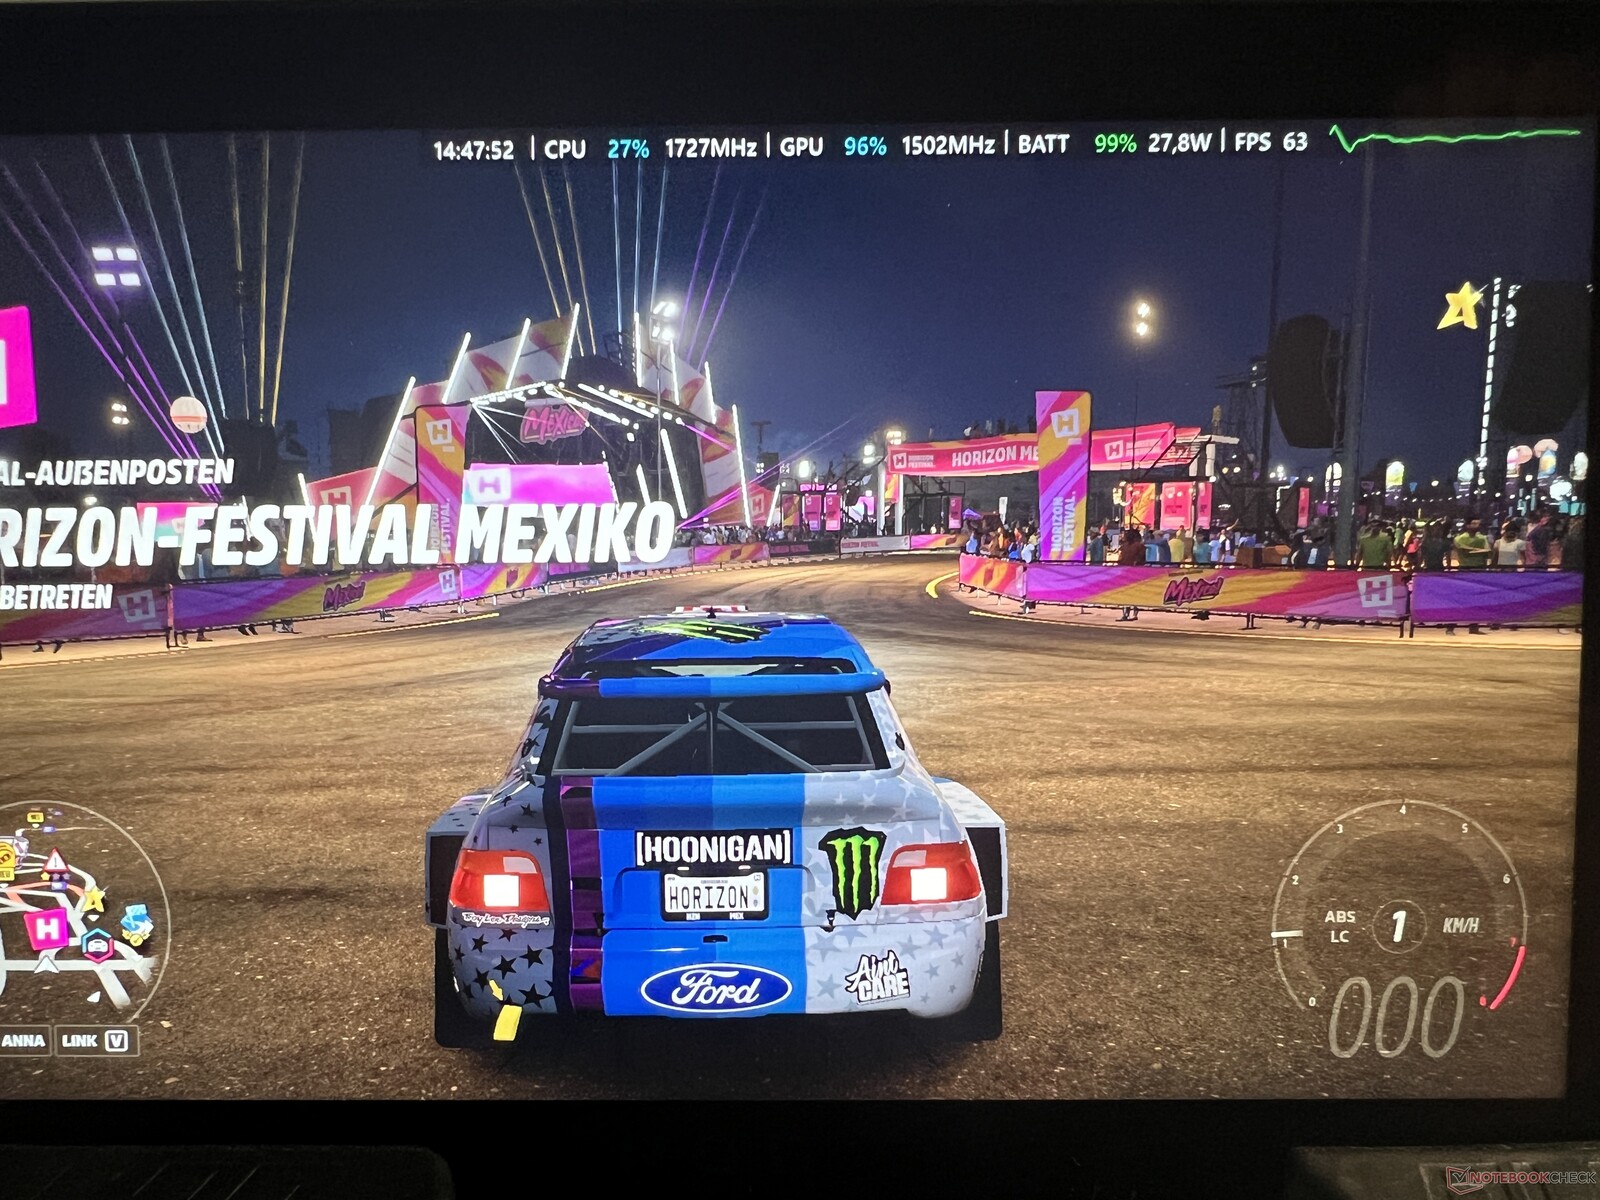
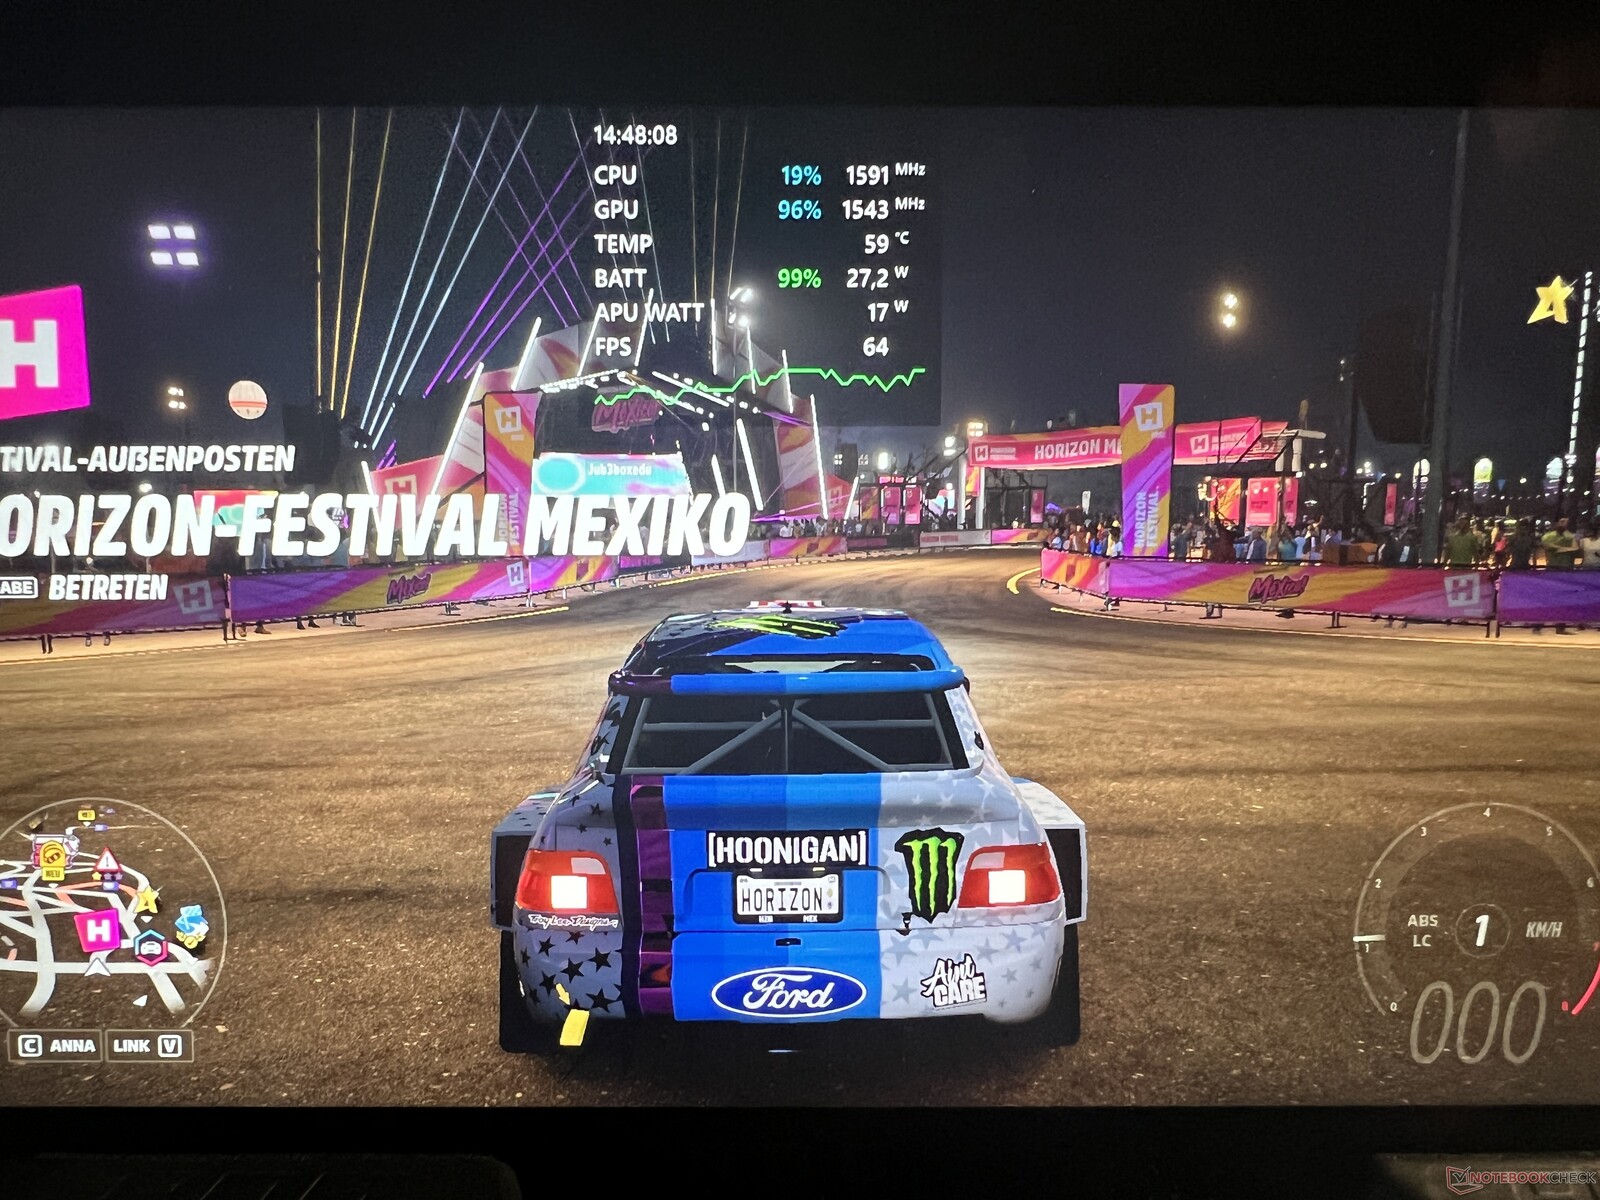
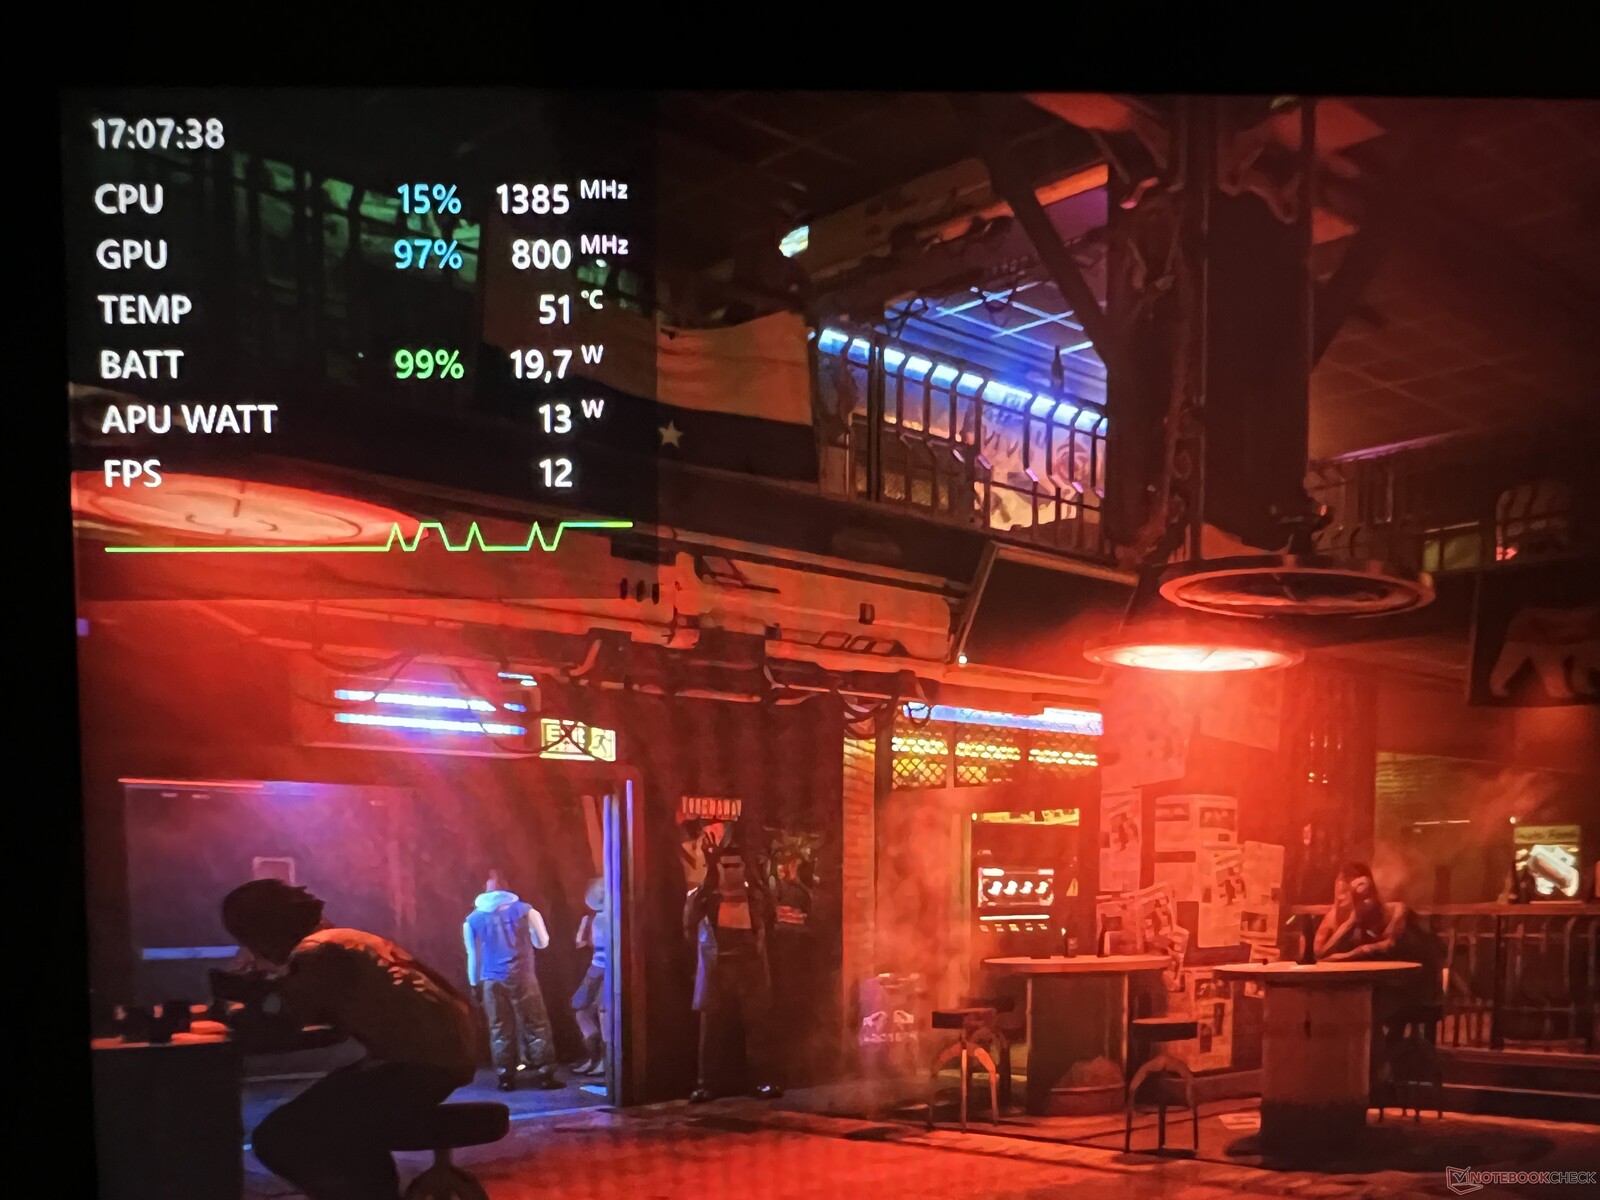
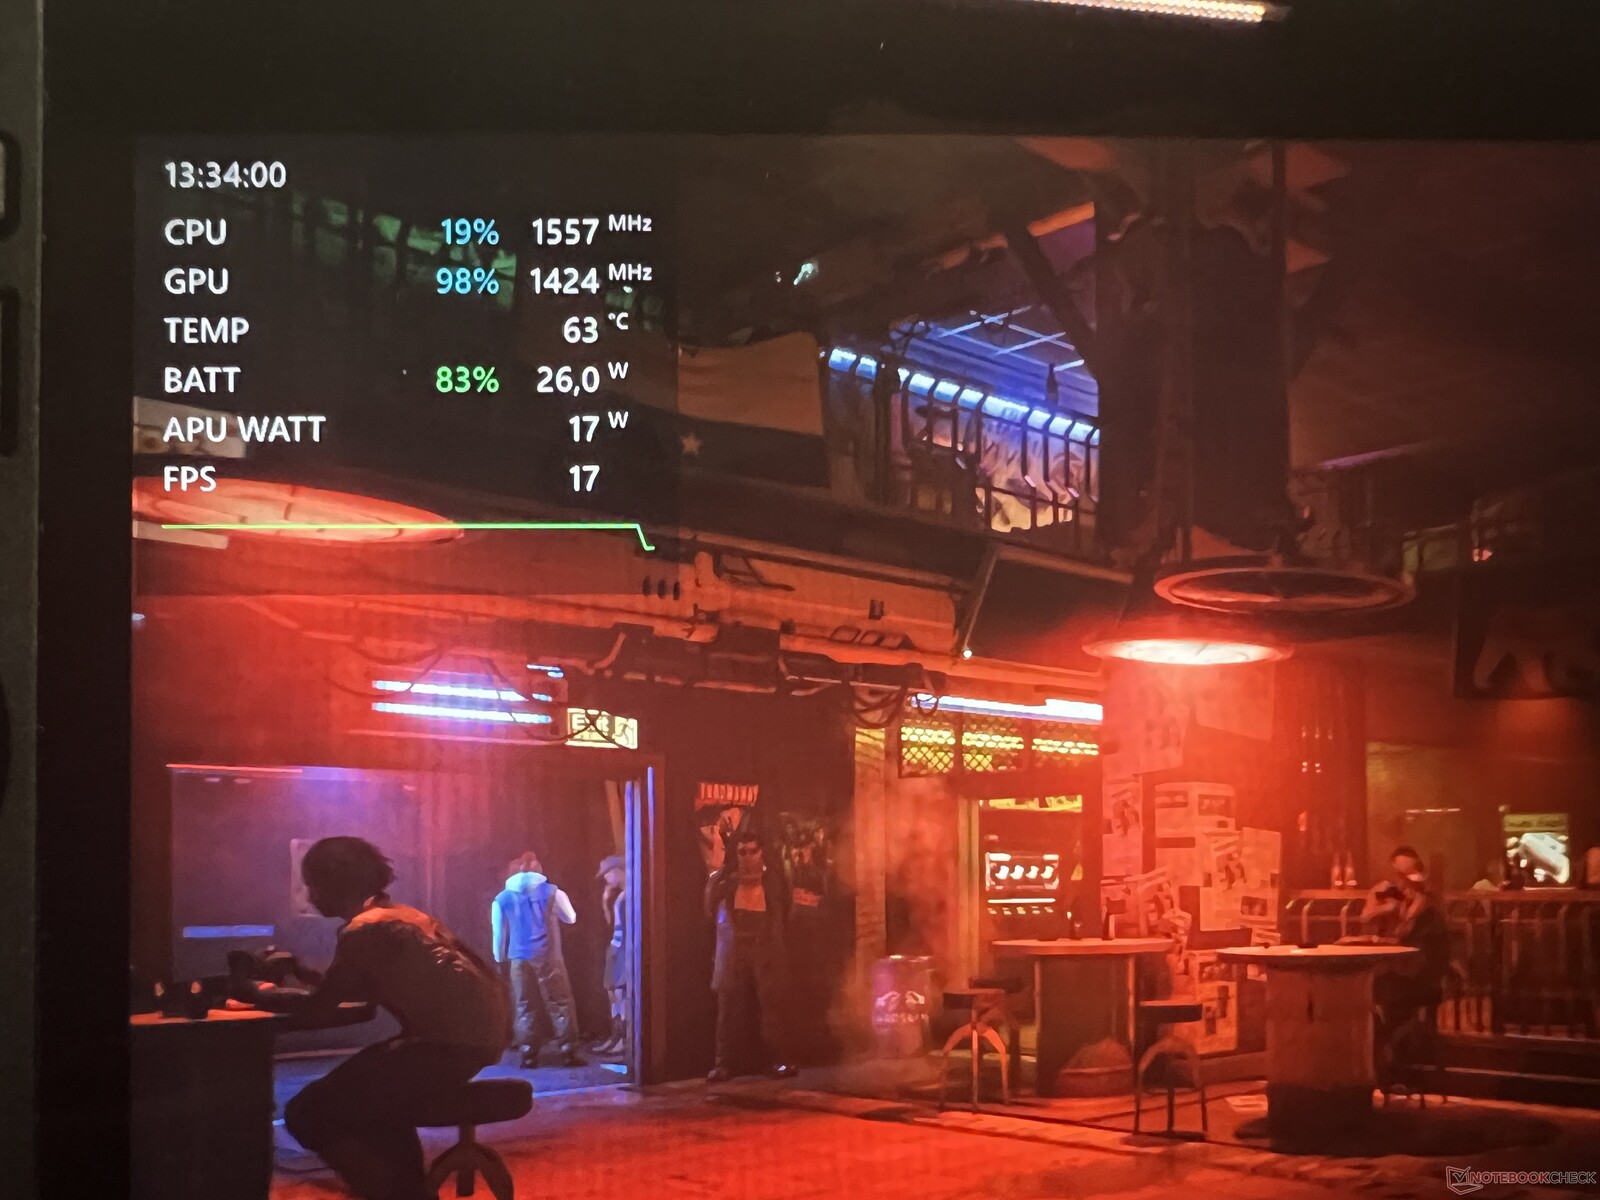
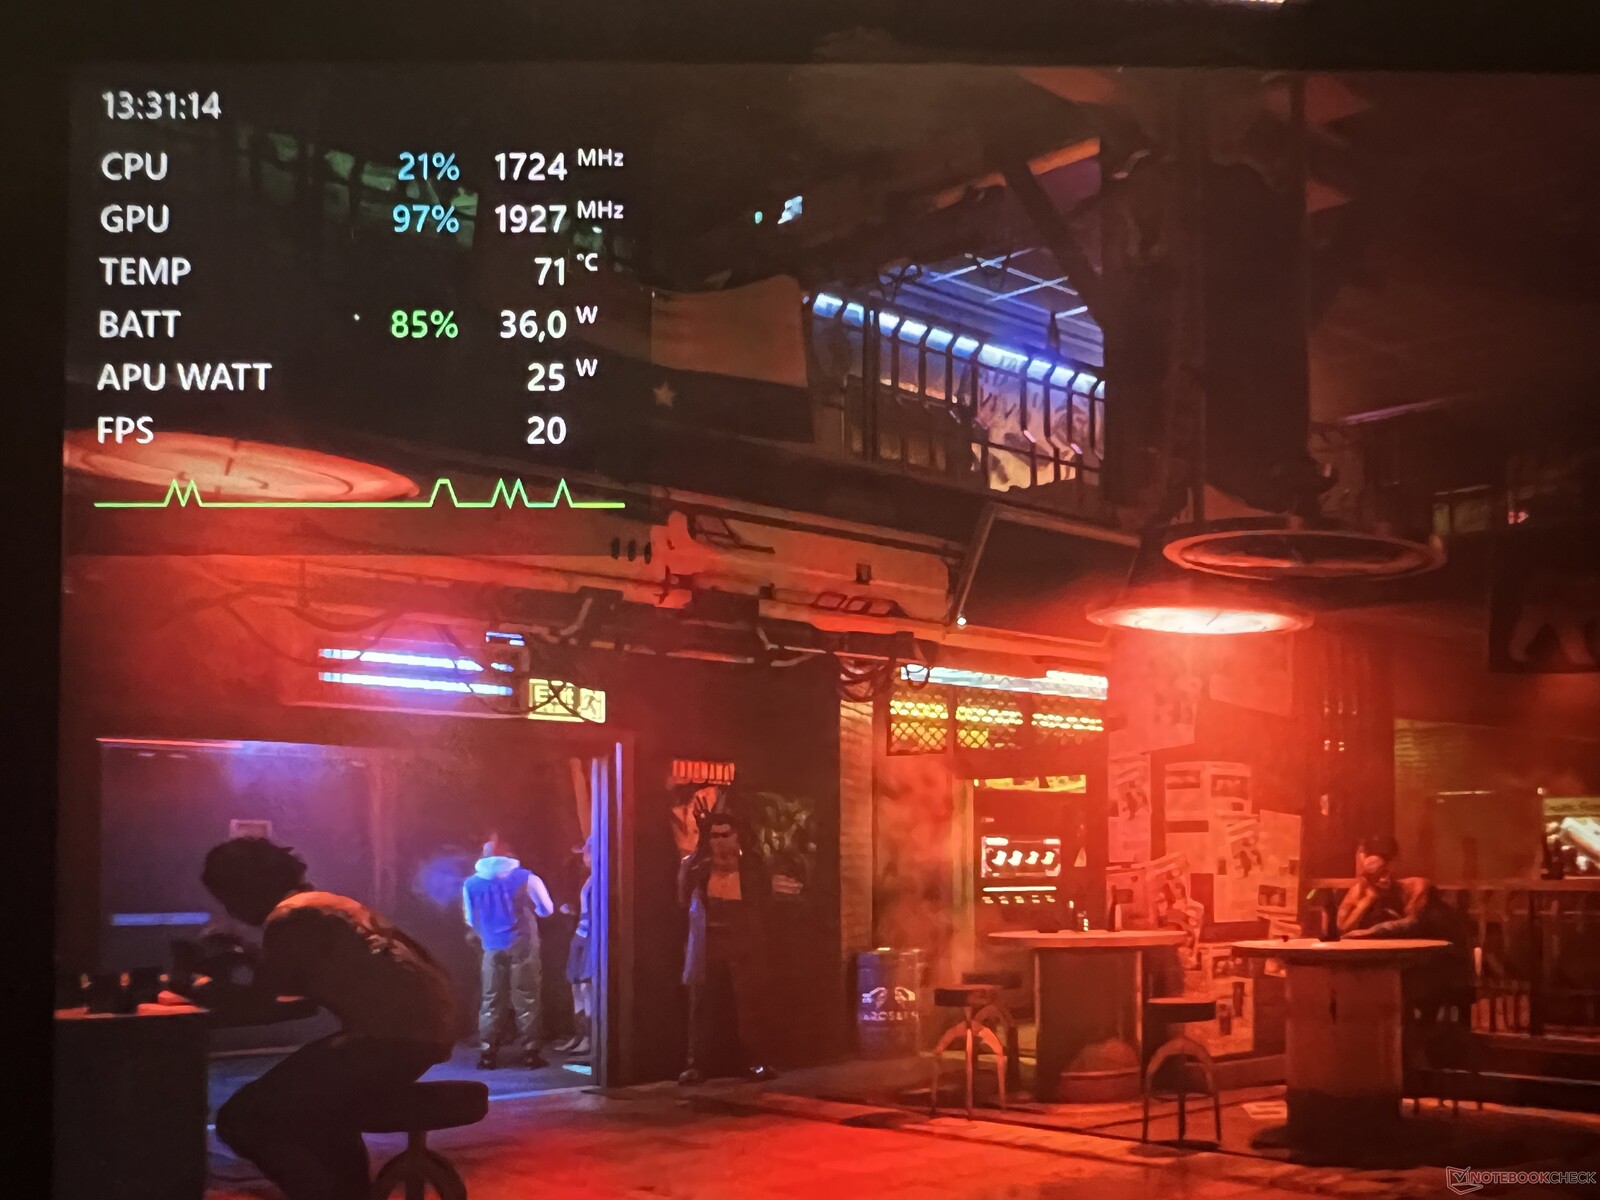
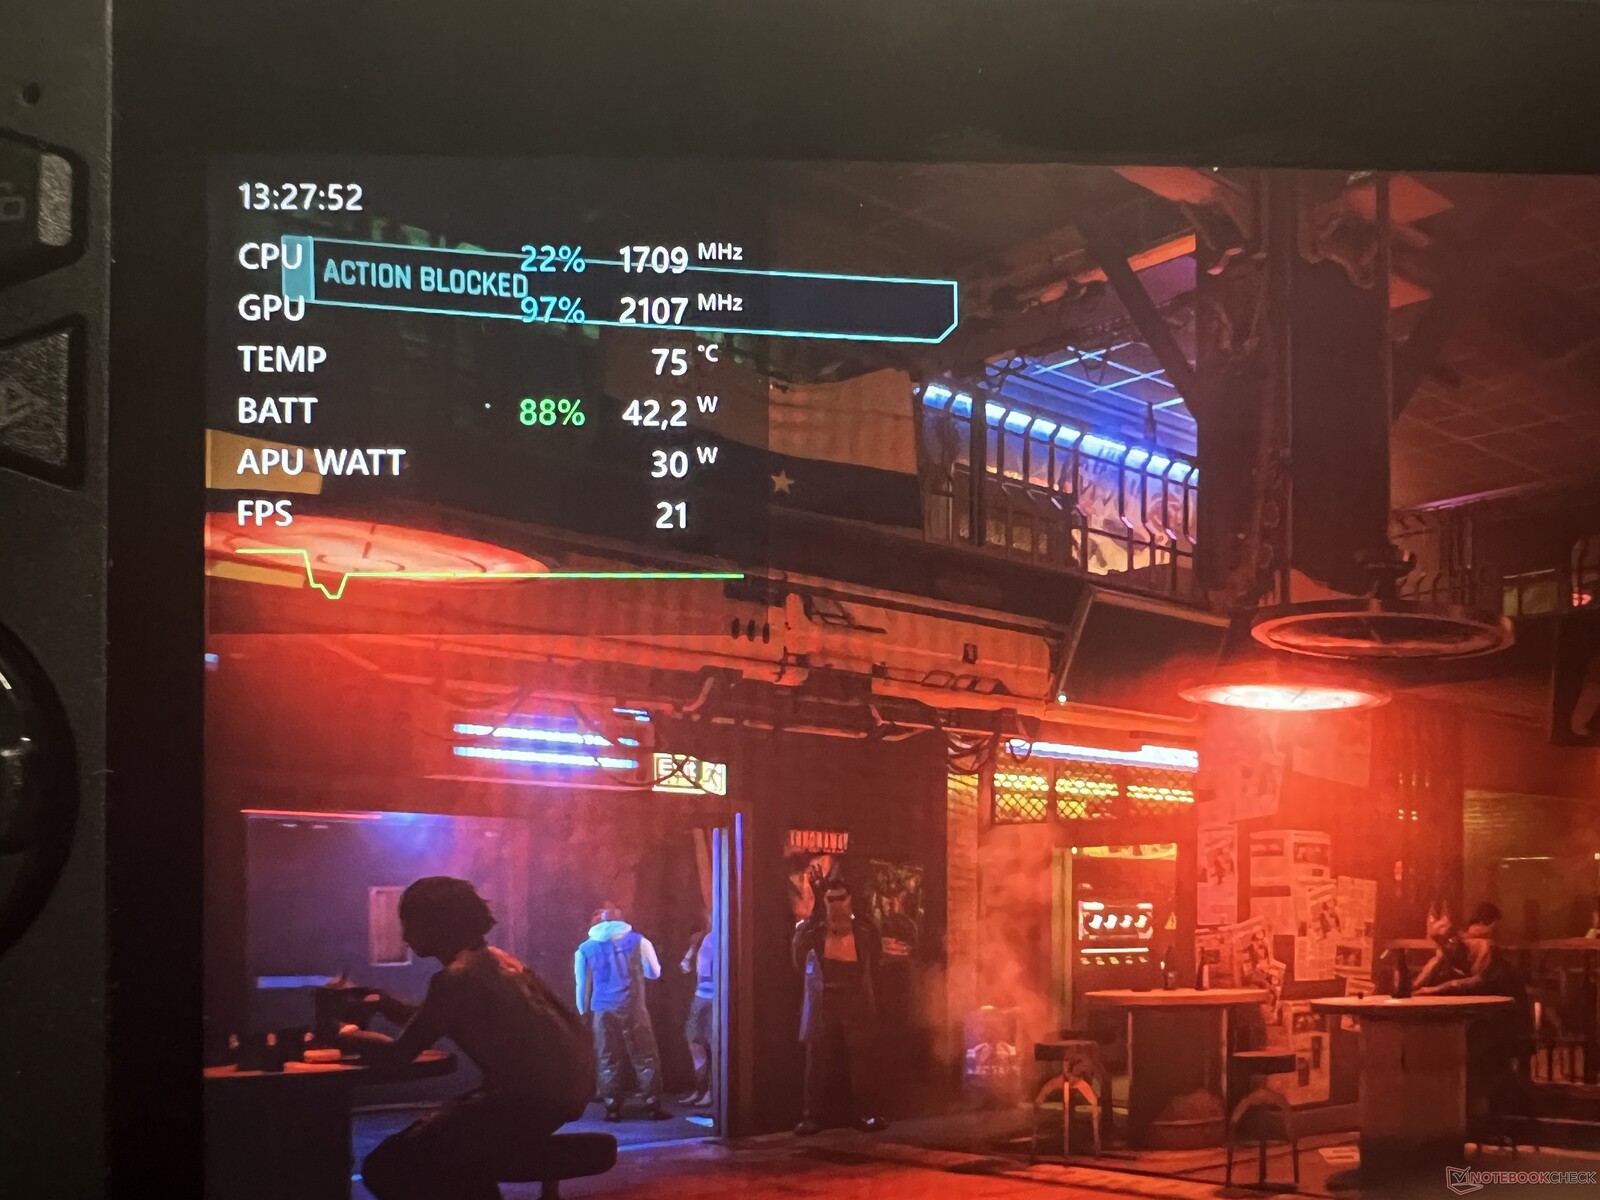
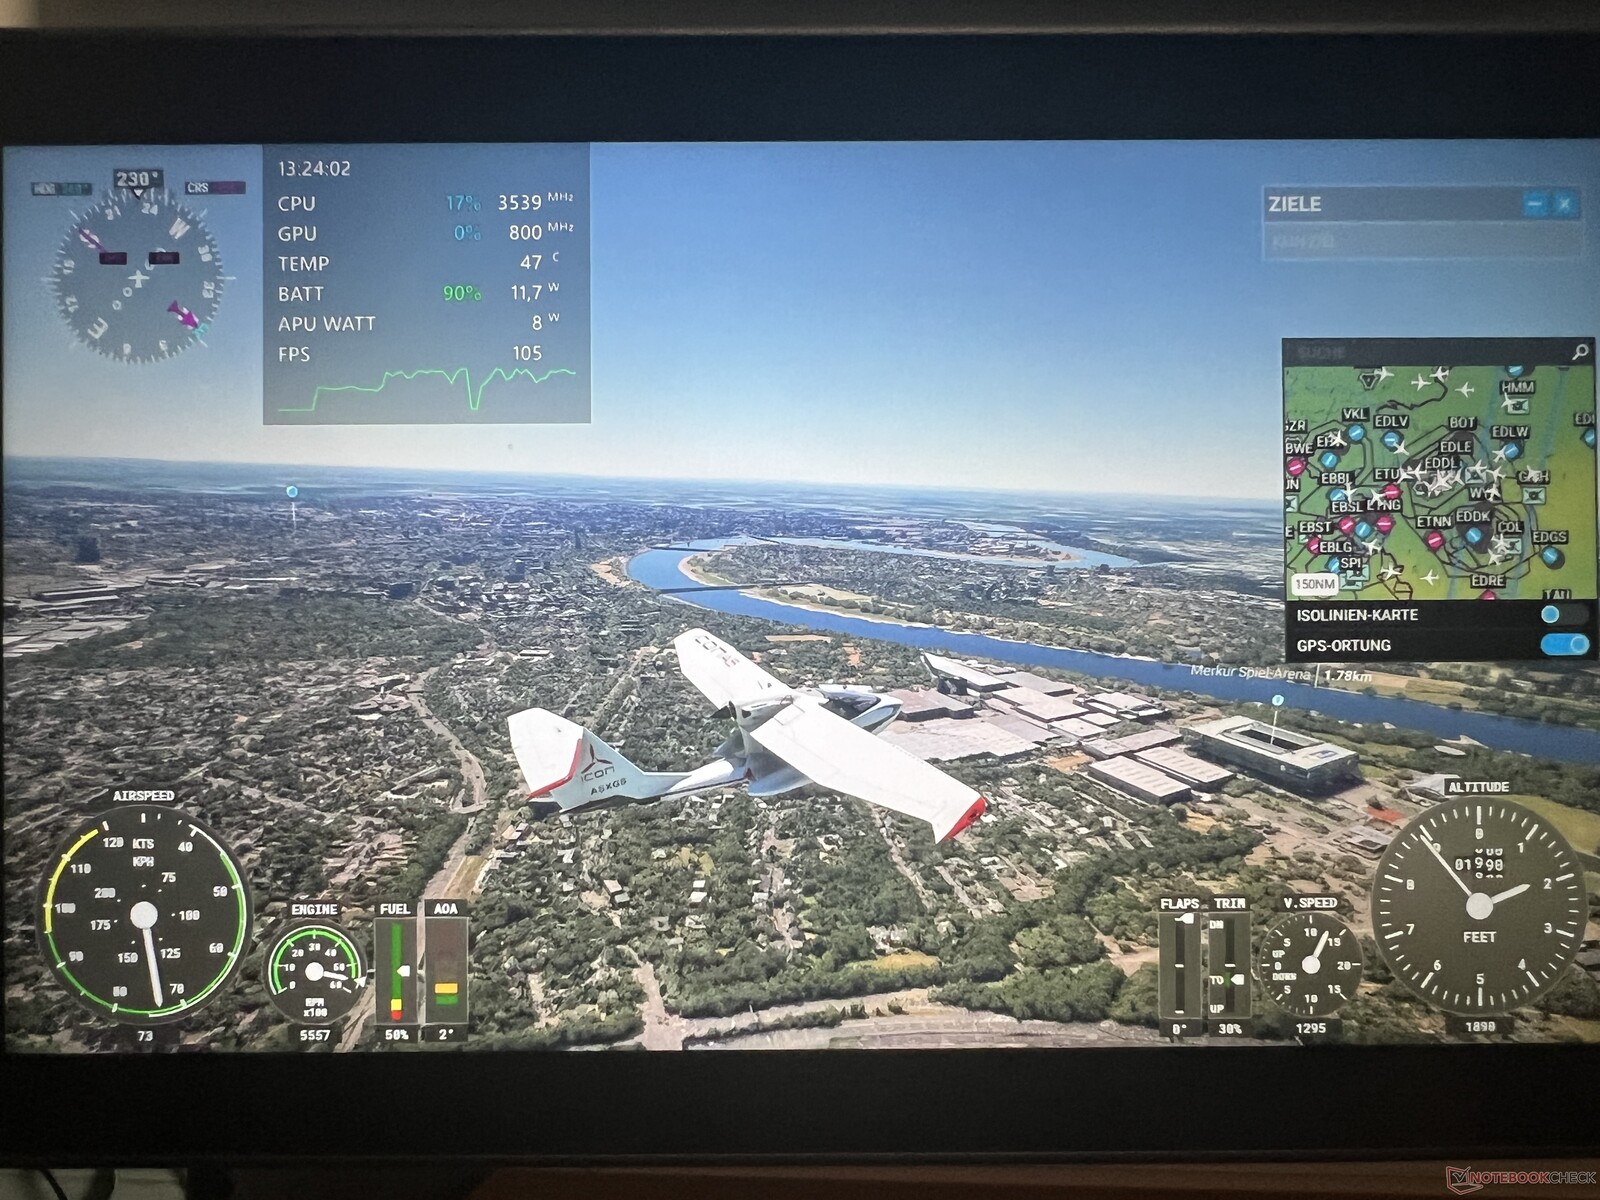
Uma dessas opções é o monitoramento em tempo real com três configurações diferentes: Minimal (Mínimo), Line (Linha) e Box (Caixa). Cada opção aumenta o número de dados exibidos na tela e todos os dados importantes de desempenho são mostrados. O monitor de FPS foi muito confiável (como já era no modelo anterior) e é de grande ajuda quando o senhor tenta encontrar as configurações certas para o seu jogo favorito. Preferimos a opção Minimal (Mínimo) com a hora atual, a carga da bateria, o consumo total do sistema e o número de FPS. As imagens acima mostram todas as versões e elas podem ser movidas livremente pela tela.
Tela - IPS de 7 polegadas com VRR


Não há alterações na tela IPS de 7 polegadas e a qualidade geral da imagem é muito boa. O painel OLED do Steam Deck pode ter uma pequena vantagem, mas o painel do Ally X oferece VRR (taxa de atualização variável) em troca, o que é uma grande melhoria quando o senhor joga jogos com números de fps comparativamente baixos. Em suma, a tela IPS de 120 Hz com tempos de resposta rápidos ainda é uma opção muito boa para jogos. Agora também há PWM e a Asus reduziu o brilho mínimo de 25 para 10 cd/m², o que ajuda em ambientes escuros.
O brilho anunciado ainda é de 500 nits, mas nossa unidade de análise é um pouco mais escura, com 456 nits em média. Parece que temos um painel mais fraco em nossa unidade, enquanto o ROG Ally do ano passado (painel idêntico - ID) era um pouco mais brilhante. O valor de preto é 0,35 cd/m², o que resulta em uma taxa de contraste máxima de quase 1400:1. O conteúdo HDR não é suportado pela tela e não há controle automático para o brilho ou a temperatura da cor.
| |||||||||||||||||||||||||
iluminação: 88 %
iluminação com acumulador: 484 cd/m²
Contraste: 1383:1 (Preto: 0.35 cd/m²)
ΔE Color 2.9 | 0.5-29.43 Ø4.87, calibrated: 1.4
ΔE Greyscale 4.5 | 0.5-98 Ø5.1
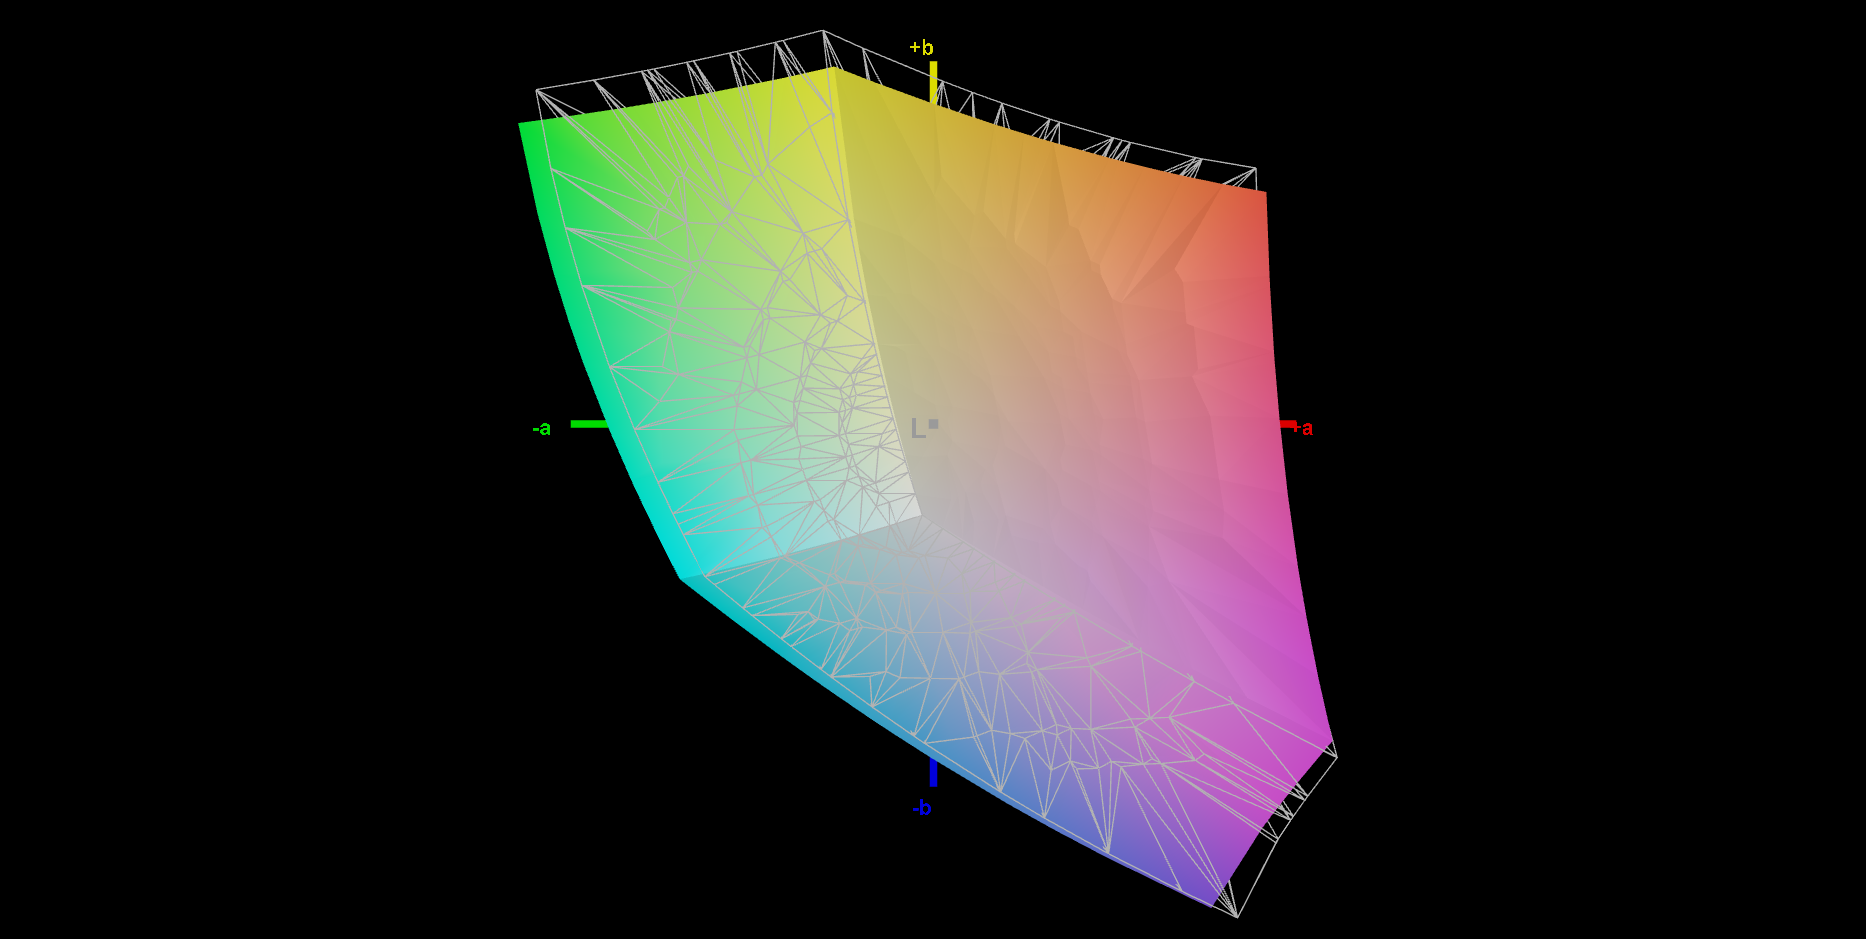
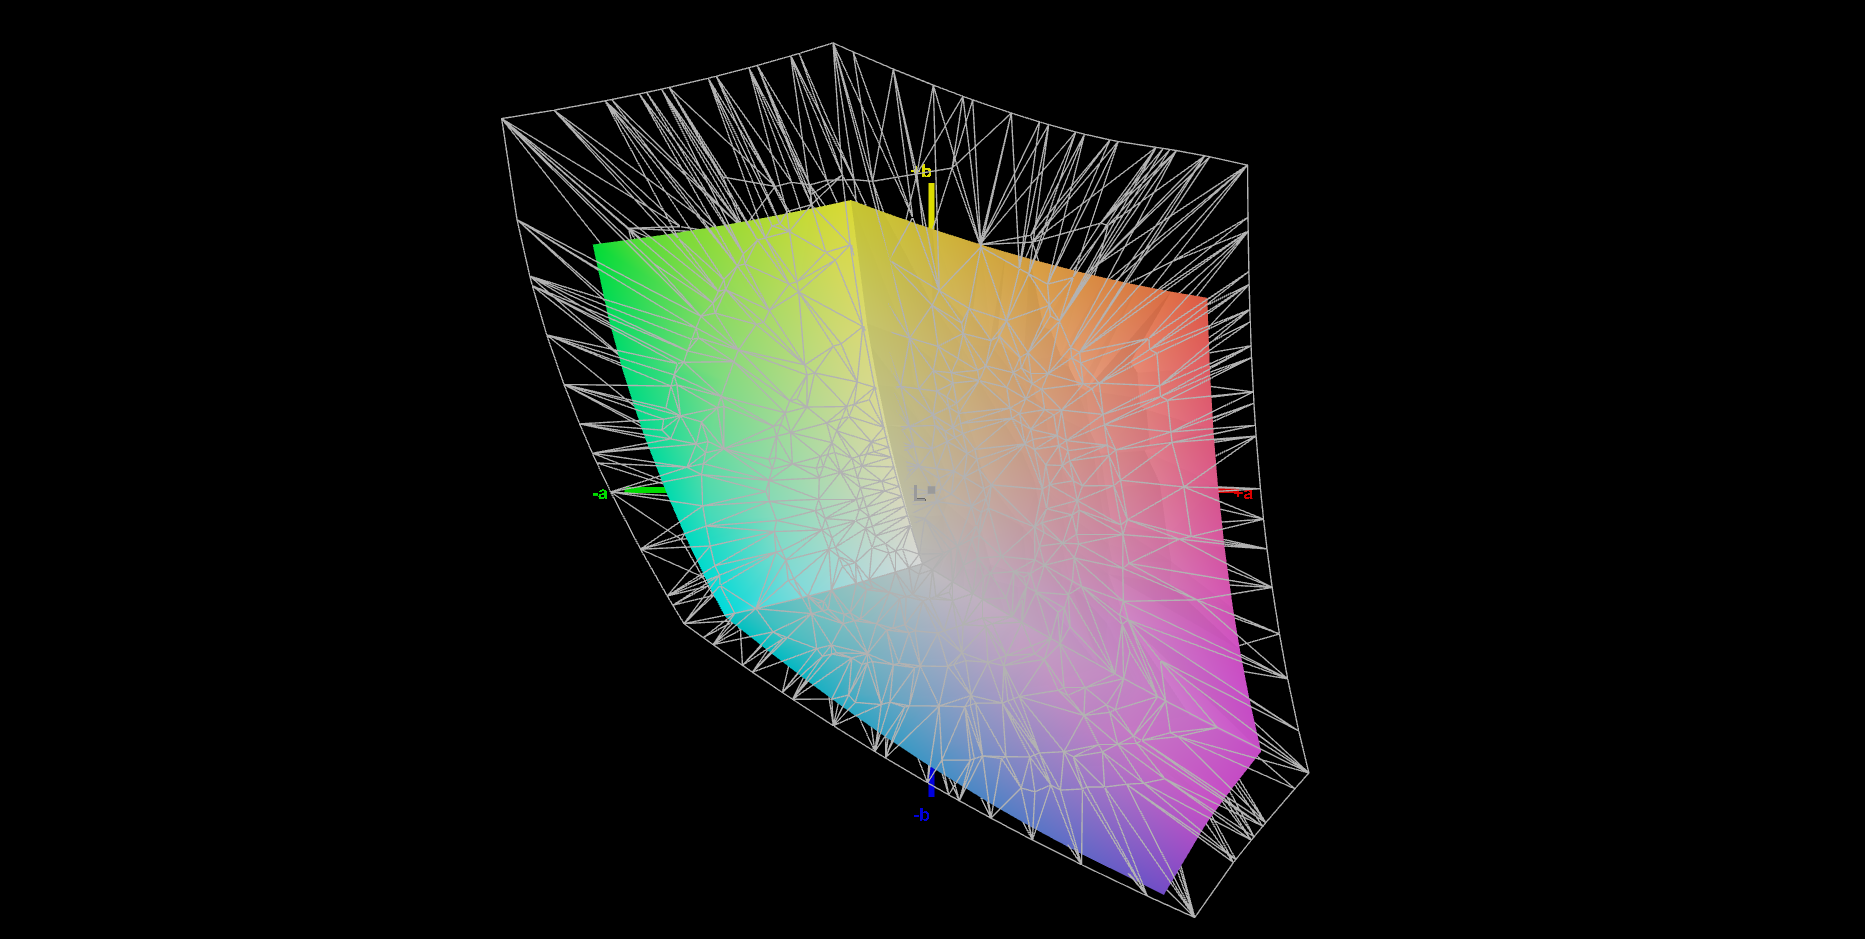
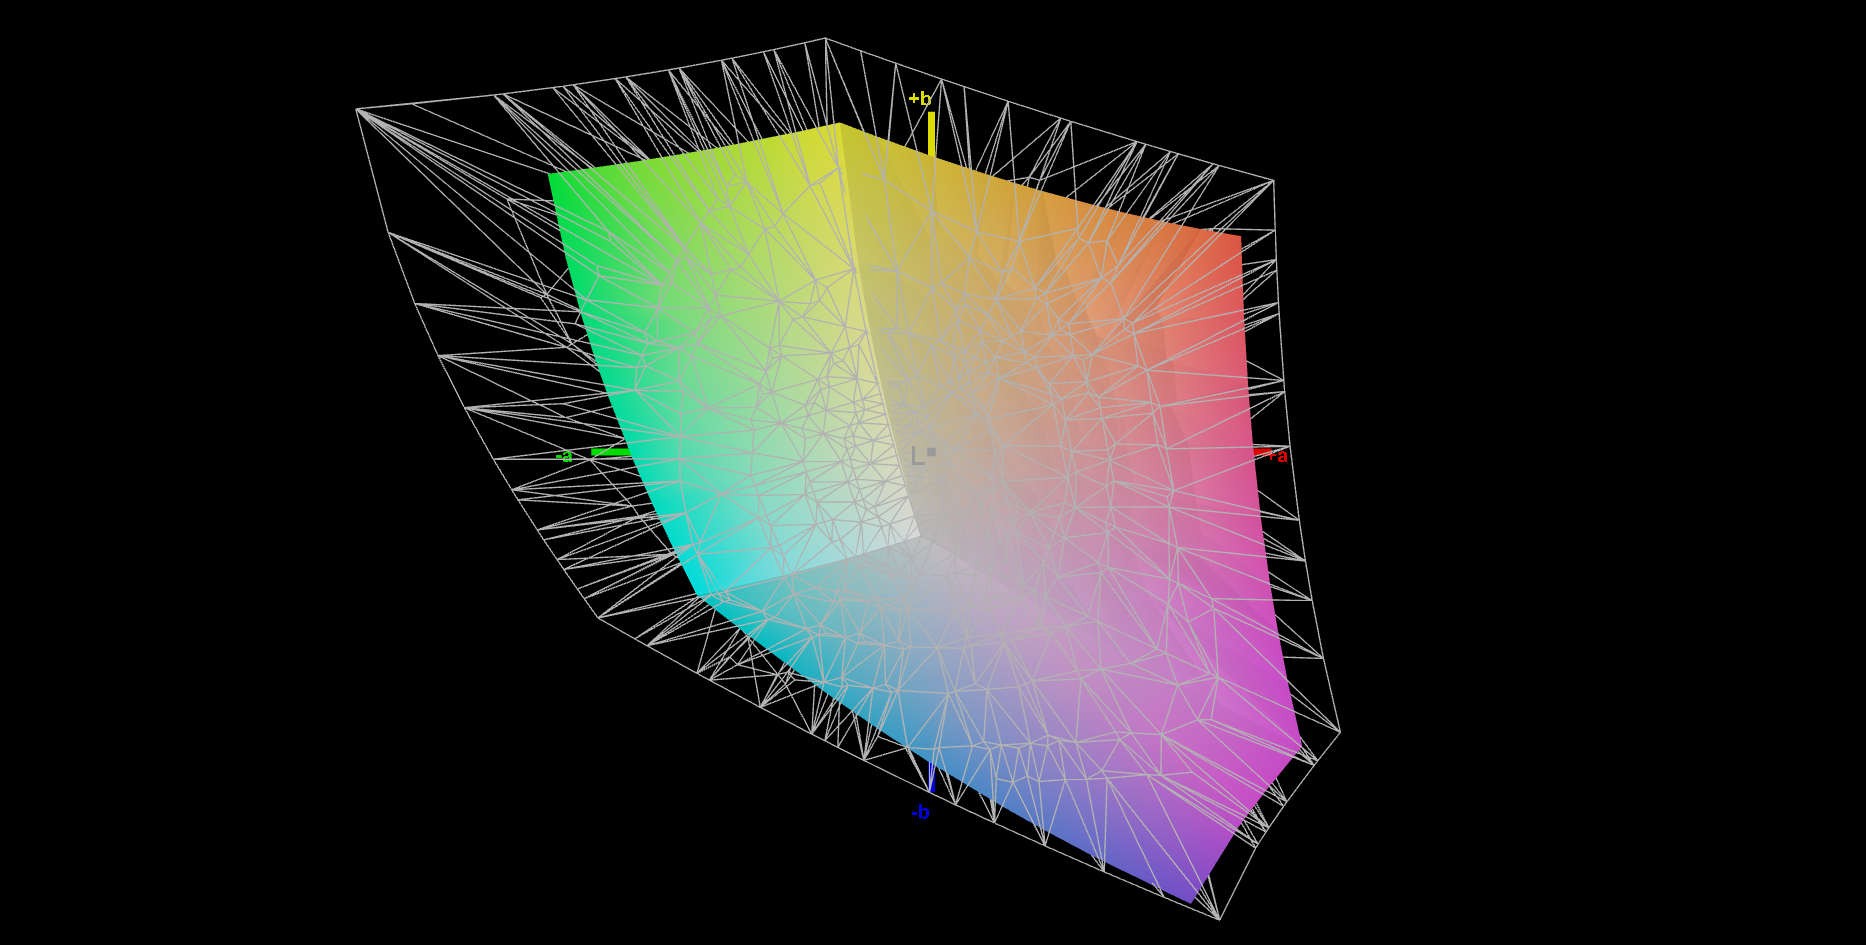
68.5% AdobeRGB 1998 (Argyll 2.2.0 3D)
93.4% sRGB (Argyll 2.2.0 3D)
66.2% Display P3 (Argyll 2.2.0 3D)
Gamma: 2.24
| Asus ROG Ally X TL070FVXS01-0, IPS, 1920x1080, 7", 120 Hz | GPD Win Mini 2024 7" TL070FVSX01-0, IPS, 1920x1080, 7", 120 Hz | MSI Claw TL070FVXS02-0, IPS, 1920x1080, 7", 120 Hz | Valve Steam Deck 1 TB OLED ANX7530 U, OLED, 1280x800, 7.4", 90 Hz | Lenovo Legion Go Legion Go Display, IPS, 2560x1600, 8.8", 144 Hz | Ayaneo Kun Ayaneo 2K, IPS, 2560x1600, 8.4", 60 Hz | Asus ROG Ally Z1 Extreme TL070FVSX01-0, IPS, 1920x1080, 7", 120 Hz | |
|---|---|---|---|---|---|---|---|
| Display | -1% | 1% | 32% | 26% | 27% | -1% | |
| Display P3 Coverage | 66.2 | 64.8 -2% | 67 1% | 99.6 50% | 92.1 39% | 93.52 41% | 65.6 -1% |
| sRGB Coverage | 93.4 | 93.3 0% | 94.4 1% | 100 7% | 99.56 7% | 99.4 6% | 92.1 -1% |
| AdobeRGB 1998 Coverage | 68.5 | 67 -2% | 69.4 1% | 96.1 40% | 90.09 32% | 91.2 33% | 67.9 -1% |
| Response Times | -2% | -6% | -26% | -134% | -167% | -7% | |
| Response Time Grey 50% / Grey 80% * | 9.7 ? | 8.9 ? 8% | 9.2 ? 5% | 9 ? 7% | 20.8 ? -114% | 24.2 ? -149% | 10.5 ? -8% |
| Response Time Black / White * | 5.7 ? | 6.3 ? -11% | 6.6 ? -16% | 9 ? -58% | 14.4 ? -153% | 16.2 ? -184% | 6 ? -5% |
| PWM Frequency | 360 ? | 700 | 20000 | ||||
| Screen | -2% | 6% | 162% | -30% | -10% | -8% | |
| Brightness middle | 484 | 493 2% | 477 -1% | 485 0% | 411 -15% | 680 40% | 513 6% |
| Brightness | 456 | 470 3% | 461 1% | 482 6% | 413 -9% | 678 49% | 474 4% |
| Brightness Distribution | 88 | 86 -2% | 88 0% | 98 11% | 80 -9% | 91 3% | 84 -5% |
| Black Level * | 0.35 | 0.47 -34% | 0.32 9% | 0.03 91% | 0.42 -20% | 0.5 -43% | 0.38 -9% |
| Contrast | 1383 | 1049 -24% | 1491 8% | 16167 1069% | 979 -29% | 1360 -2% | 1350 -2% |
| Colorchecker dE 2000 * | 2.9 | 2.36 19% | 2.6 10% | 2 31% | 5.94 -105% | 4 -38% | 3.7 -28% |
| Colorchecker dE 2000 max. * | 7.1 | 6.36 10% | 5.8 18% | 5 30% | 10.56 -49% | 9 -27% | 8.3 -17% |
| Colorchecker dE 2000 calibrated * | 1.4 | 1.3 7% | 1.5 -7% | 2.95 -111% | 1 29% | ||
| Greyscale dE 2000 * | 4.5 | 4.4 2% | 3.9 13% | 2 56% | 0.92 80% | 9 -100% | 5.1 -13% |
| Gamma | 2.24 98% | 2.28 96% | 2.17 101% | 2 110% | 1.93 114% | 2 110% | 2.14 103% |
| CCT | 7534 86% | 7142 91% | 7250 90% | 6336 103% | 8064 81% | 7188 90% | 7732 84% |
| Média Total (Programa/Configurações) | -2% /
-2% | 0% /
3% | 56% /
103% | -46% /
-33% | -50% /
-24% | -5% /
-6% |
* ... menor é melhor
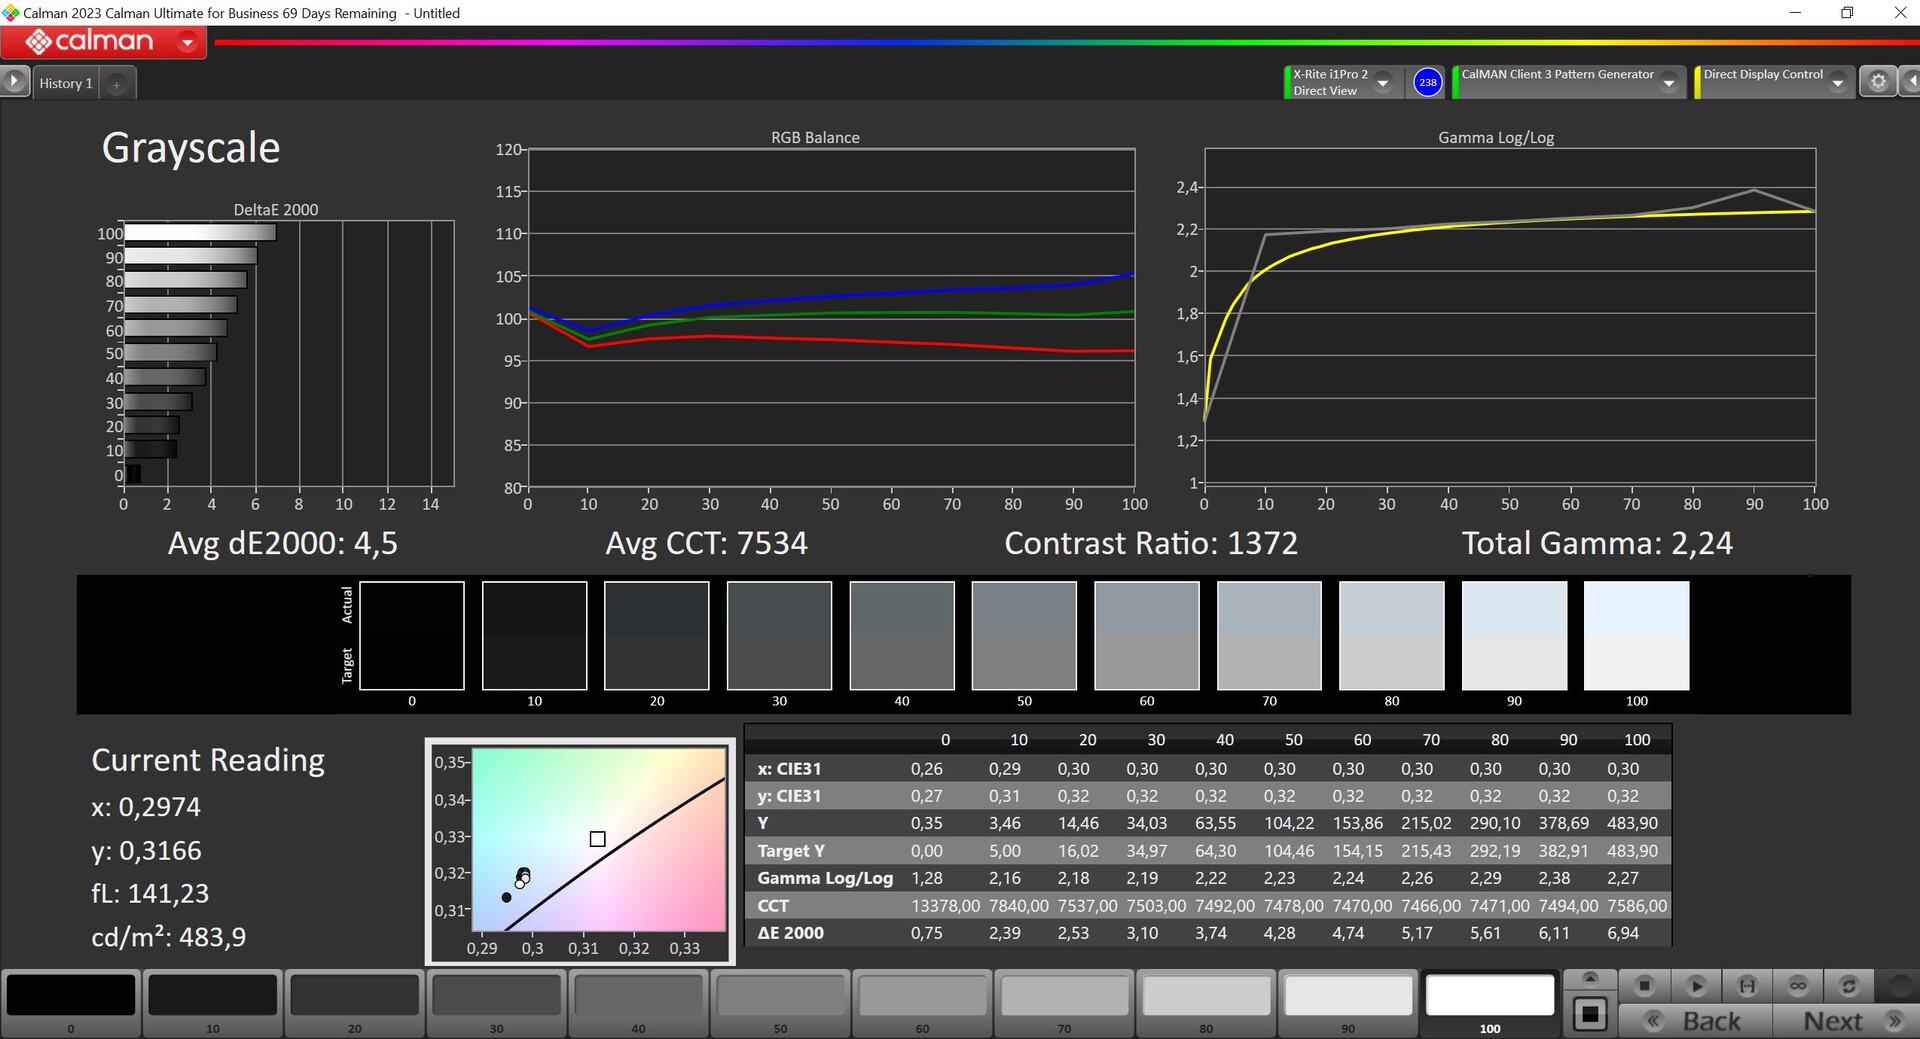
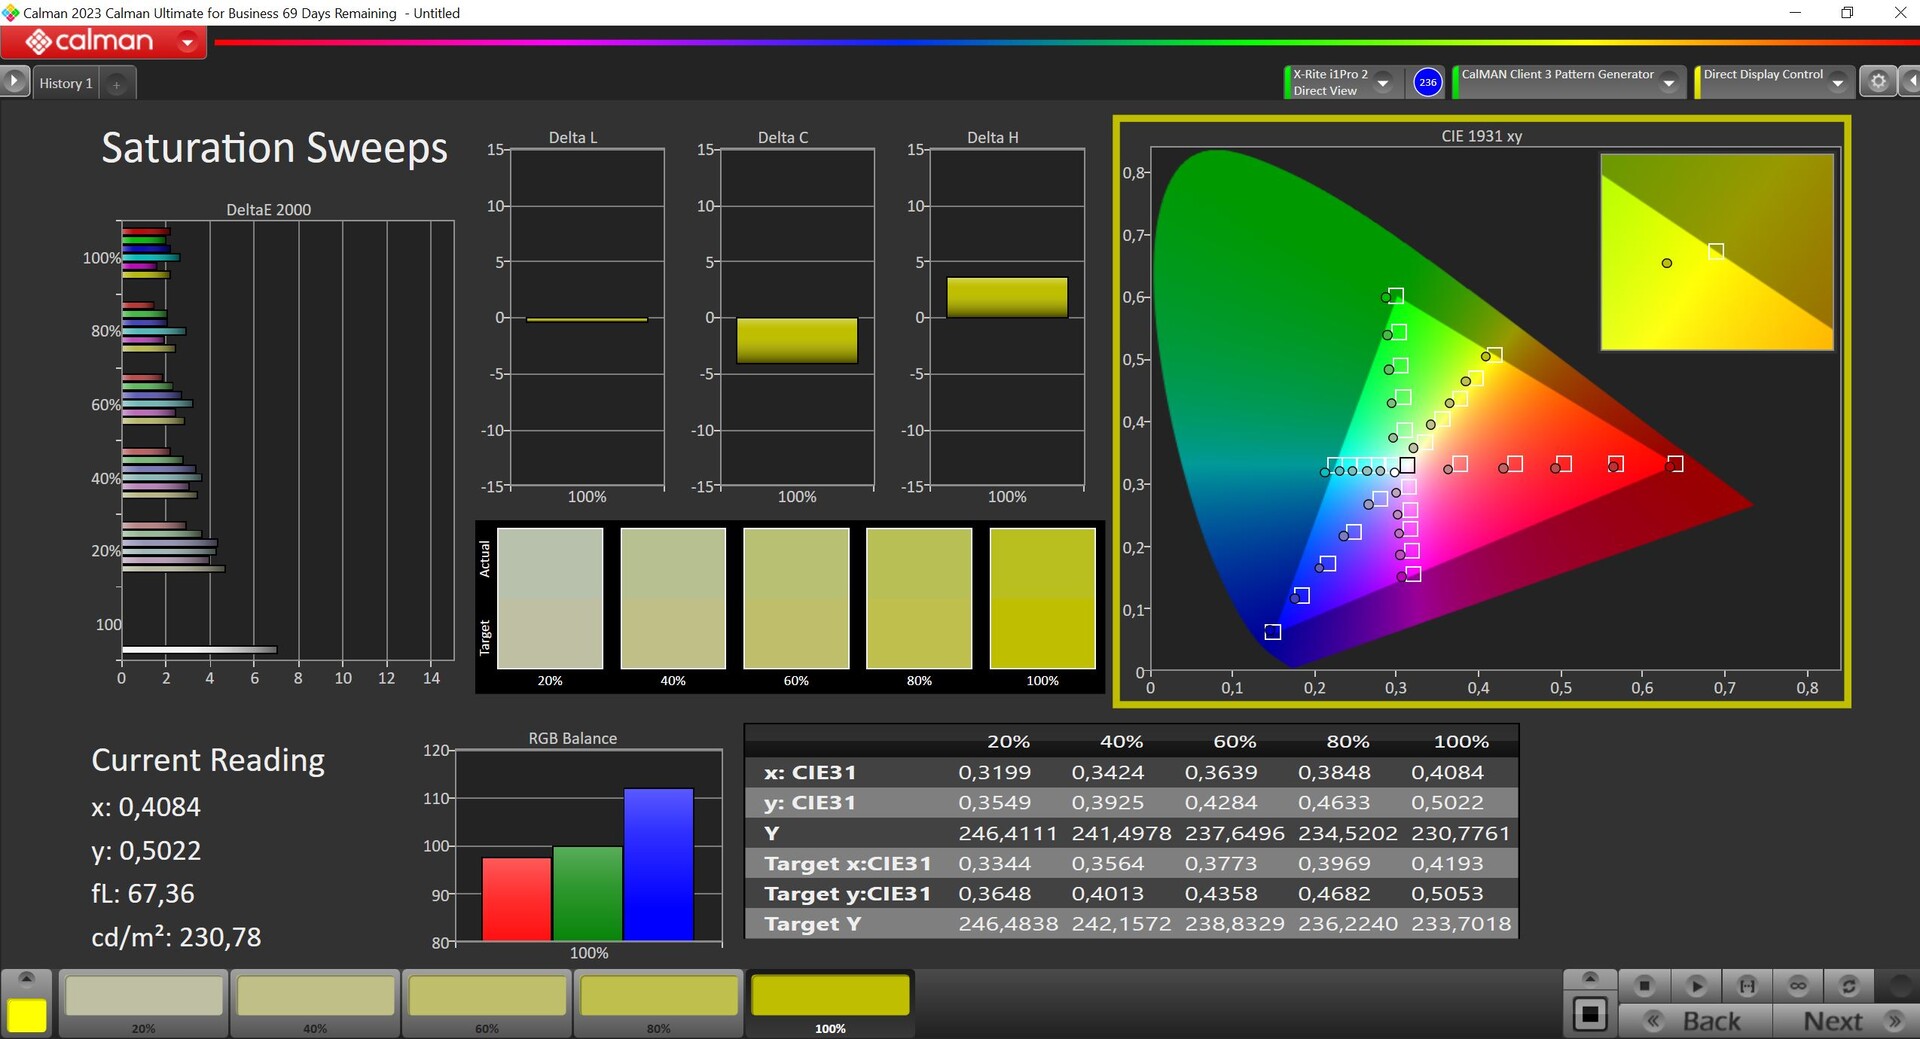
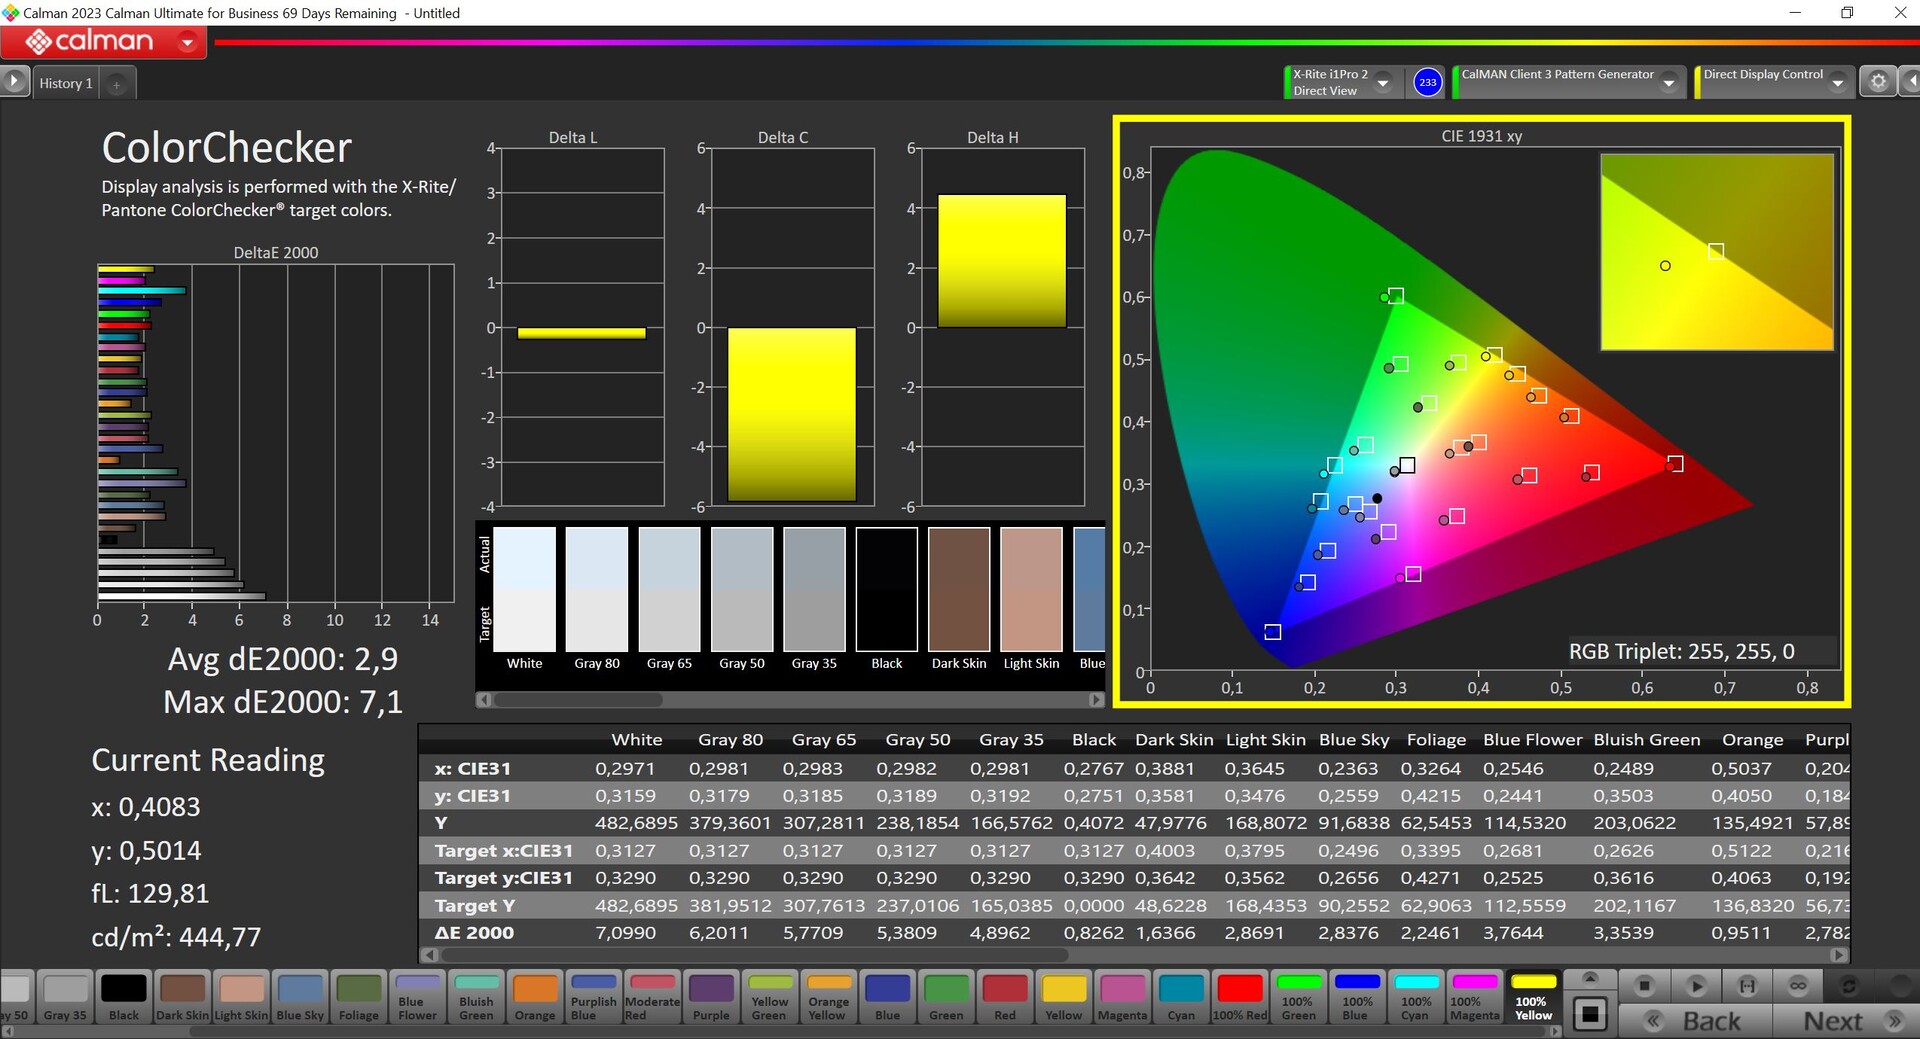
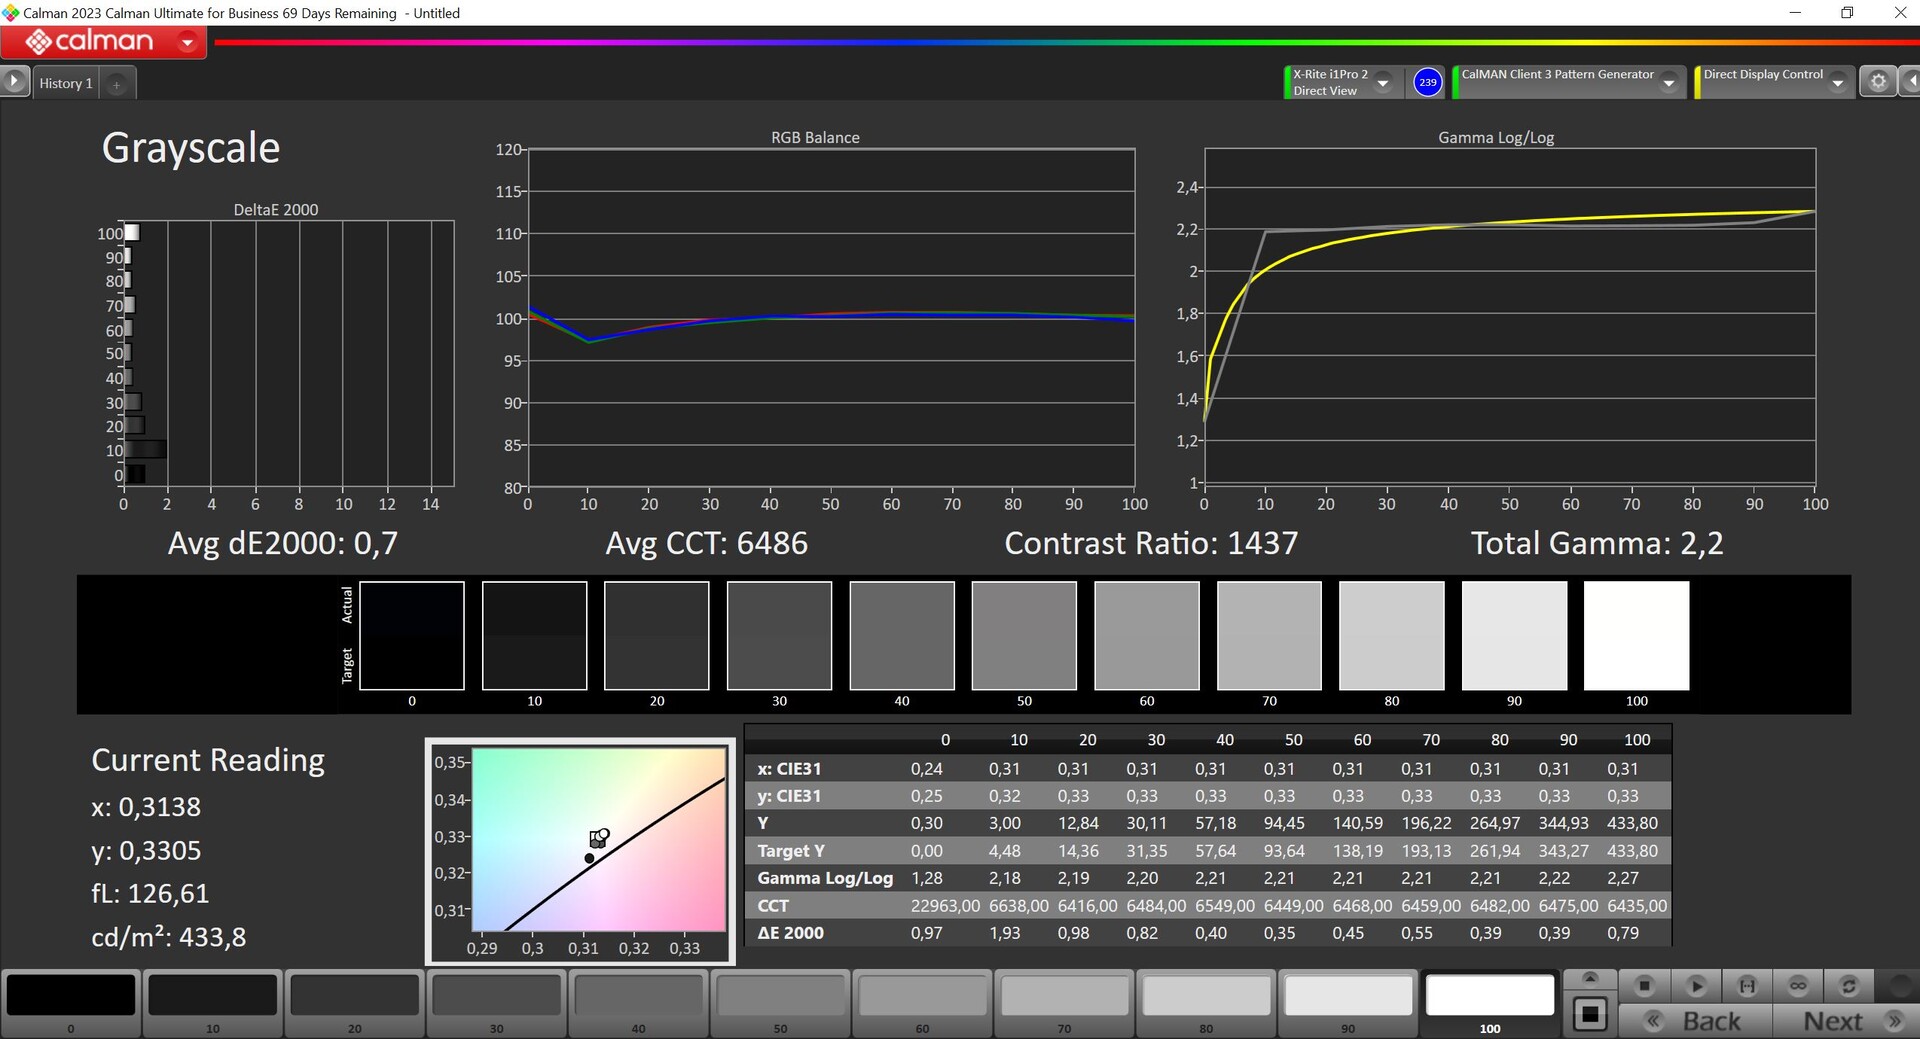
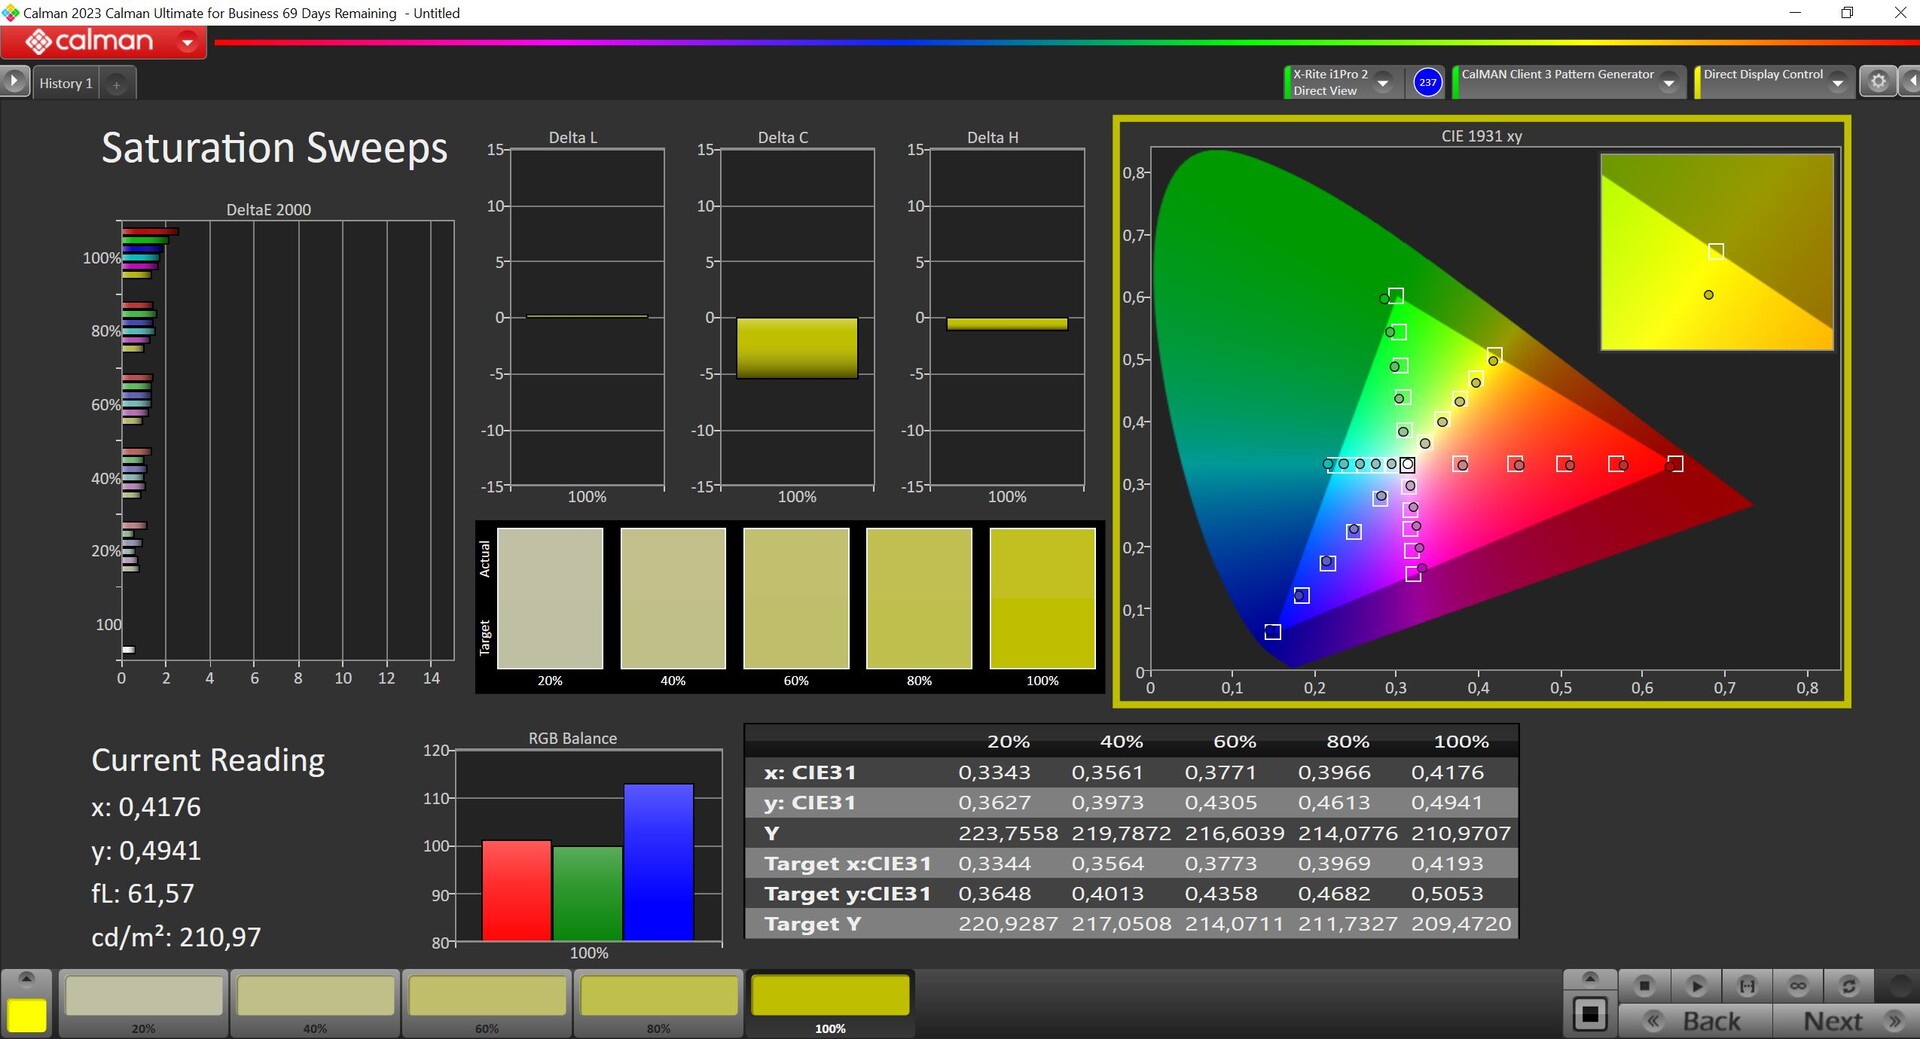
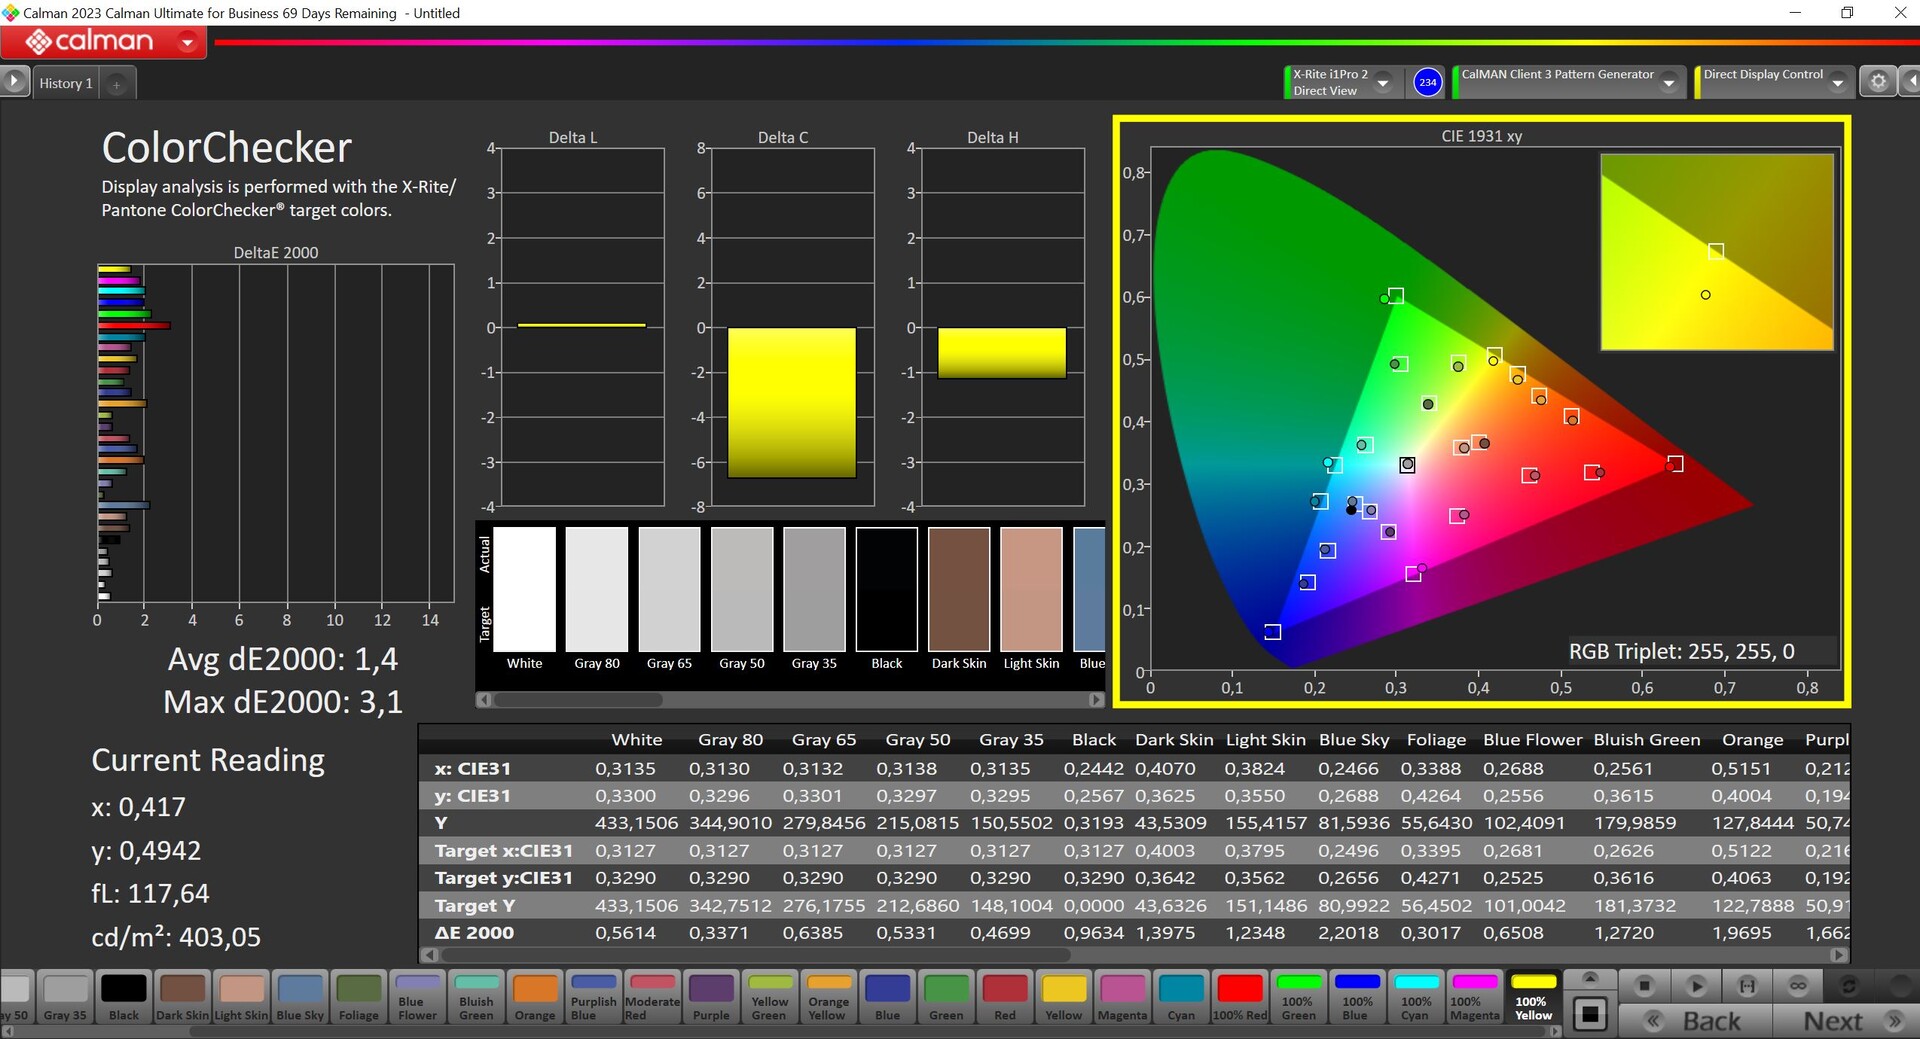
A Asus não envia o ROG Ally X com perfis de cores e as configurações de fábrica mostram um notável reflexo azul em combinação com uma temperatura de cor fria, mas os desvios de cor são aceitáveis. Essa combinação ajuda a maximizar o brilho. O senhor dificilmente editará fotos na tela pequena, portanto, a situação não é ideal, mas não é tão importante quanto em uma tela de laptop maior. Nossa própria calibração (o perfil está vinculado na caixa acima e pode ser baixado gratuitamente) melhora sensivelmente a qualidade da imagem, mas o brilho máximo no centro cai de 484 para 434 nits como resultado.
Exibir tempos de resposta
| ↔ Tempo de resposta preto para branco | ||
|---|---|---|
| 5.7 ms ... ascensão ↗ e queda ↘ combinadas | ↗ 2.5 ms ascensão | 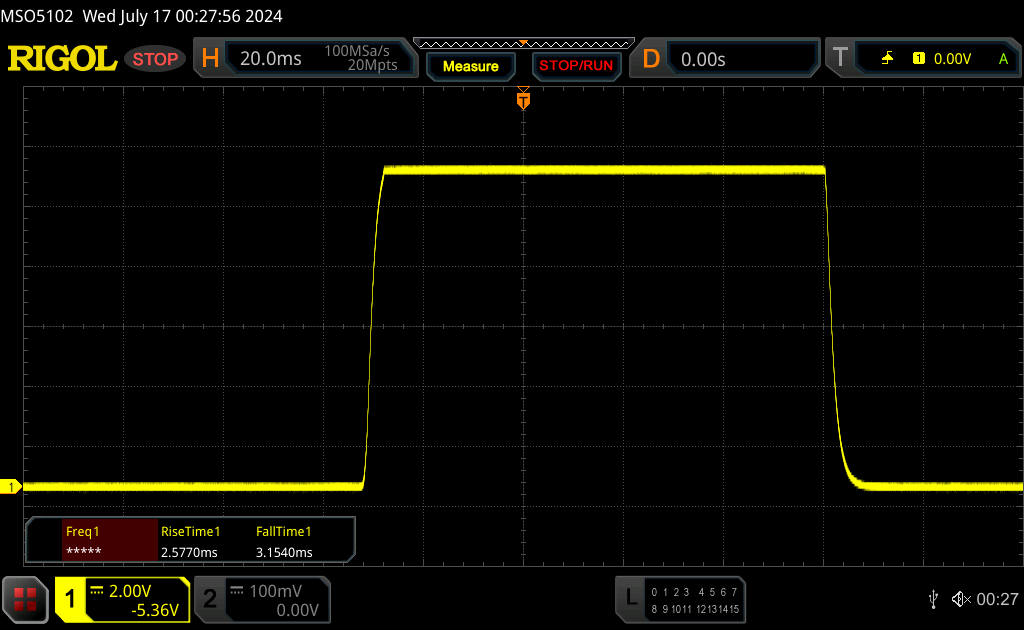 |
| ↘ 3.2 ms queda | ||
| A tela mostra taxas de resposta muito rápidas em nossos testes e deve ser muito adequada para jogos em ritmo acelerado. Em comparação, todos os dispositivos testados variam de 0.1 (mínimo) a 240 (máximo) ms. » 15 % de todos os dispositivos são melhores. Isso significa que o tempo de resposta medido é melhor que a média de todos os dispositivos testados (20.7 ms). | ||
| ↔ Tempo de resposta 50% cinza a 80% cinza | ||
| 9.7 ms ... ascensão ↗ e queda ↘ combinadas | ↗ 4.4 ms ascensão | 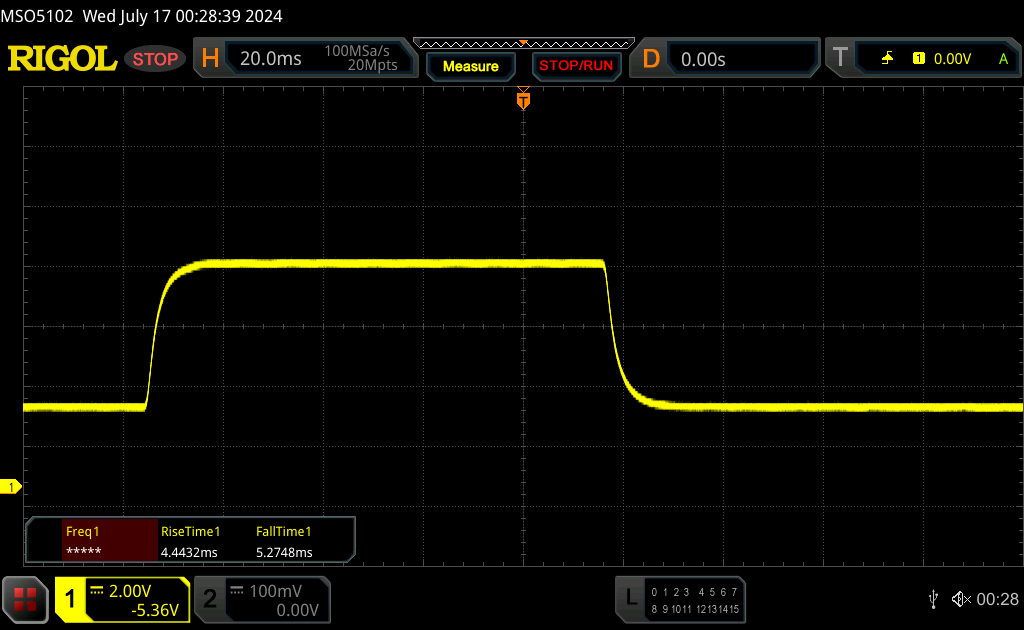 |
| ↘ 5.3 ms queda | ||
| A tela mostra taxas de resposta rápidas em nossos testes e deve ser adequada para jogos. Em comparação, todos os dispositivos testados variam de 0.165 (mínimo) a 636 (máximo) ms. » 20 % de todos os dispositivos são melhores. Isso significa que o tempo de resposta medido é melhor que a média de todos os dispositivos testados (32.5 ms). | ||
Cintilação da tela / PWM (modulação por largura de pulso)
| Tela tremeluzindo / PWM não detectado | 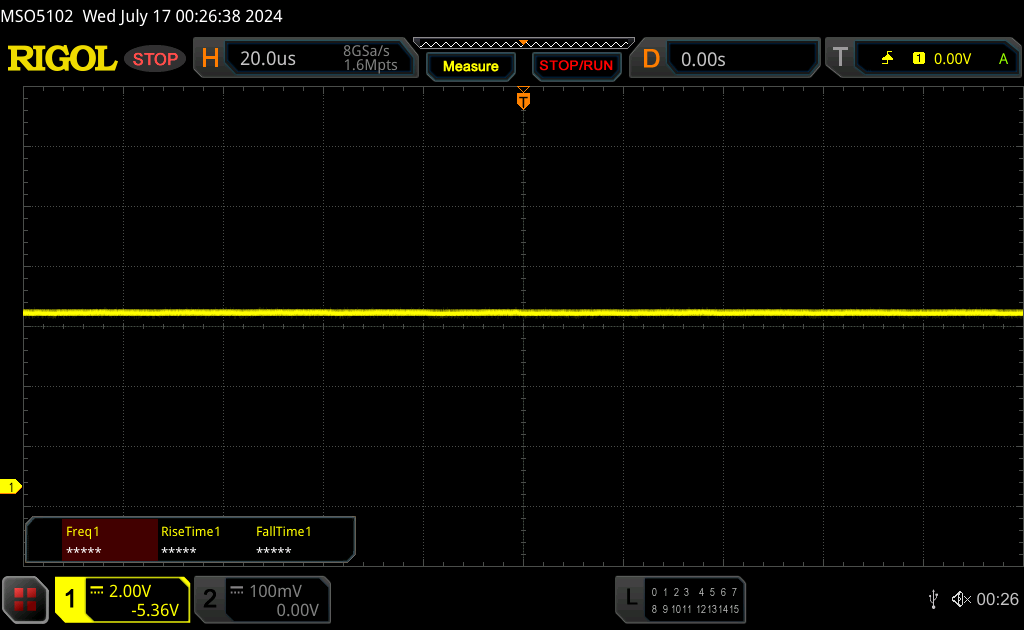 | ||
[pwm_comparison] Em comparação: 53 % de todos os dispositivos testados não usam PWM para escurecer a tela. Se PWM foi detectado, uma média de 8492 (mínimo: 5 - máximo: 343500) Hz foi medida. | |||
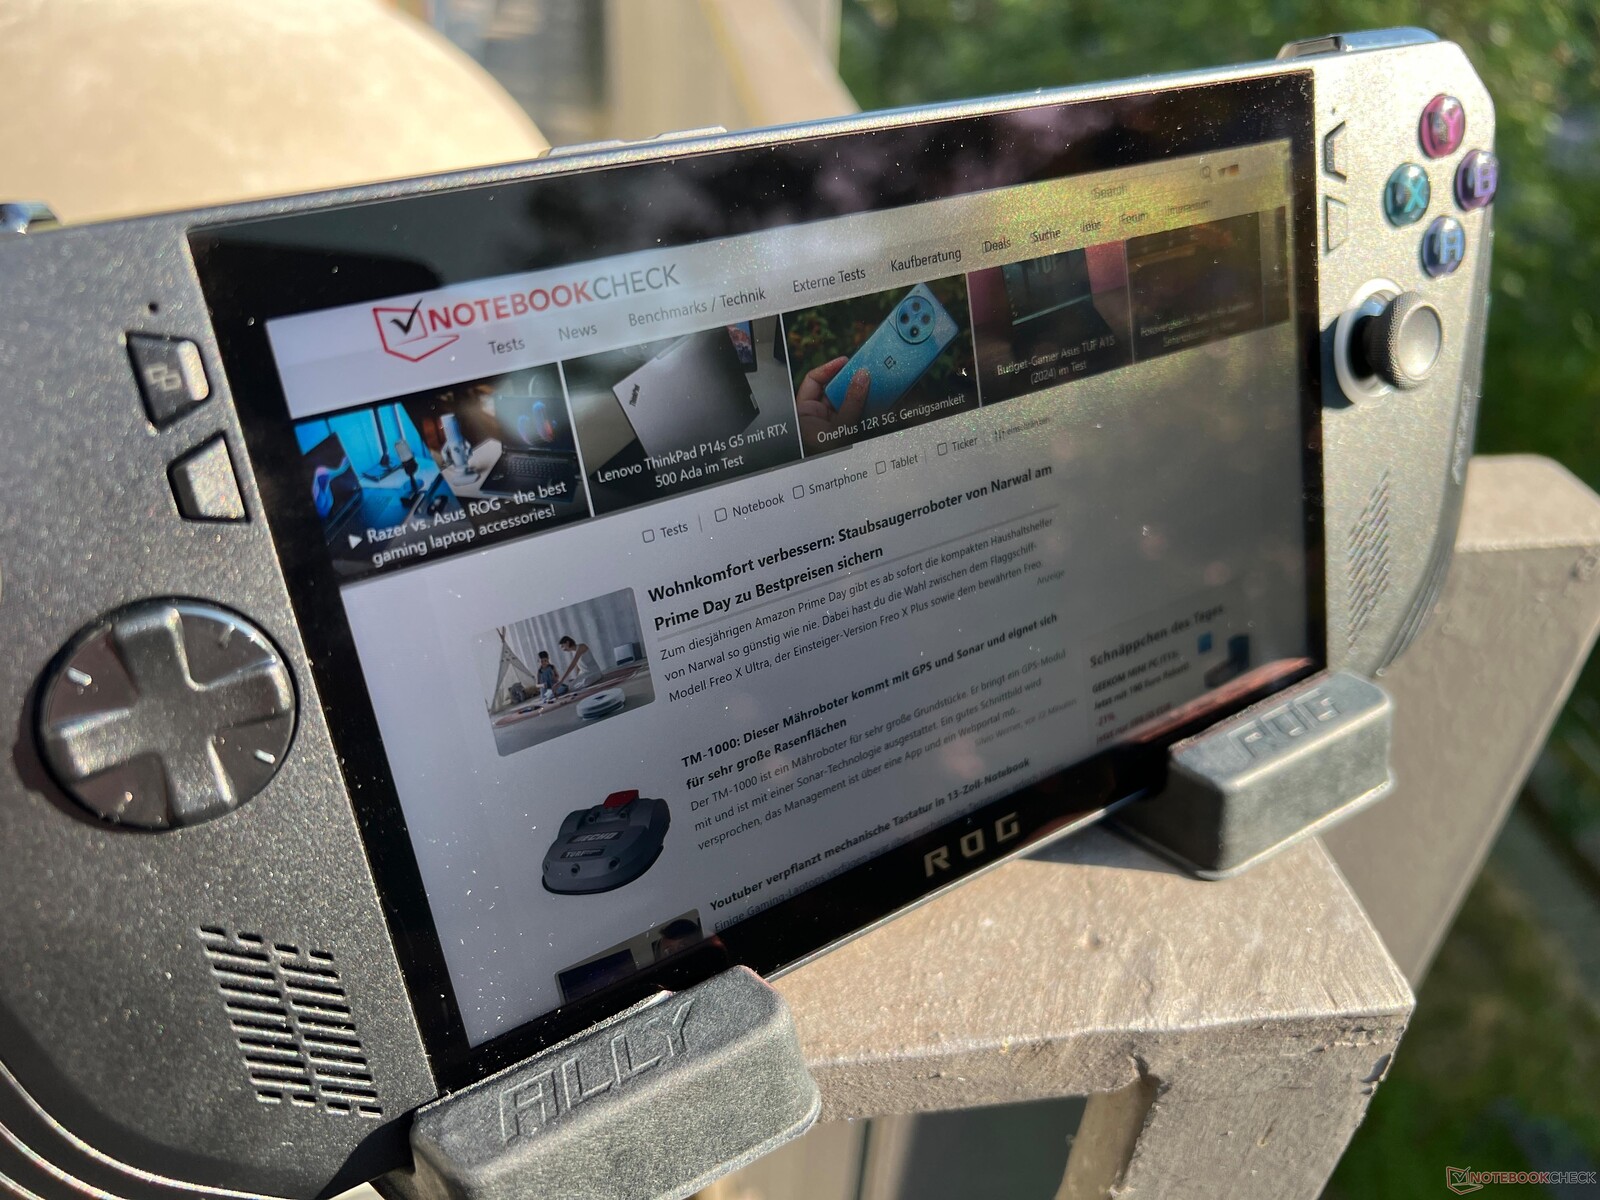
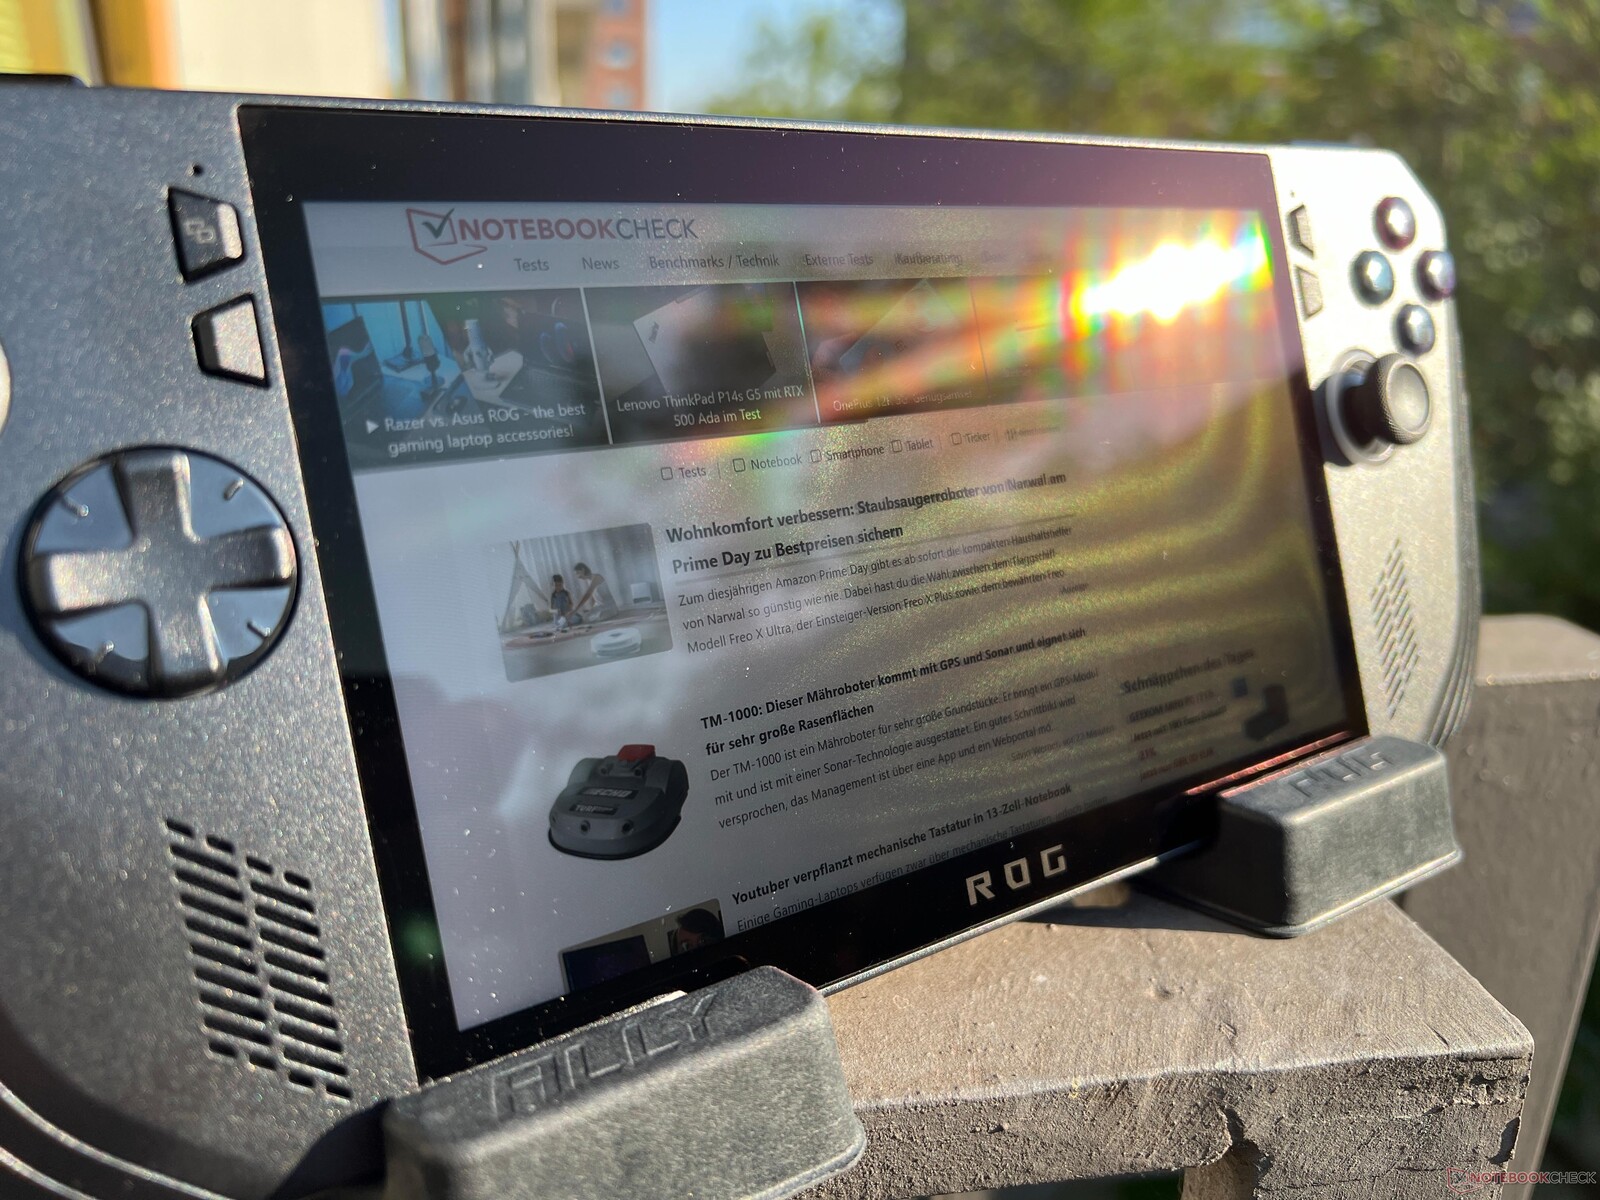
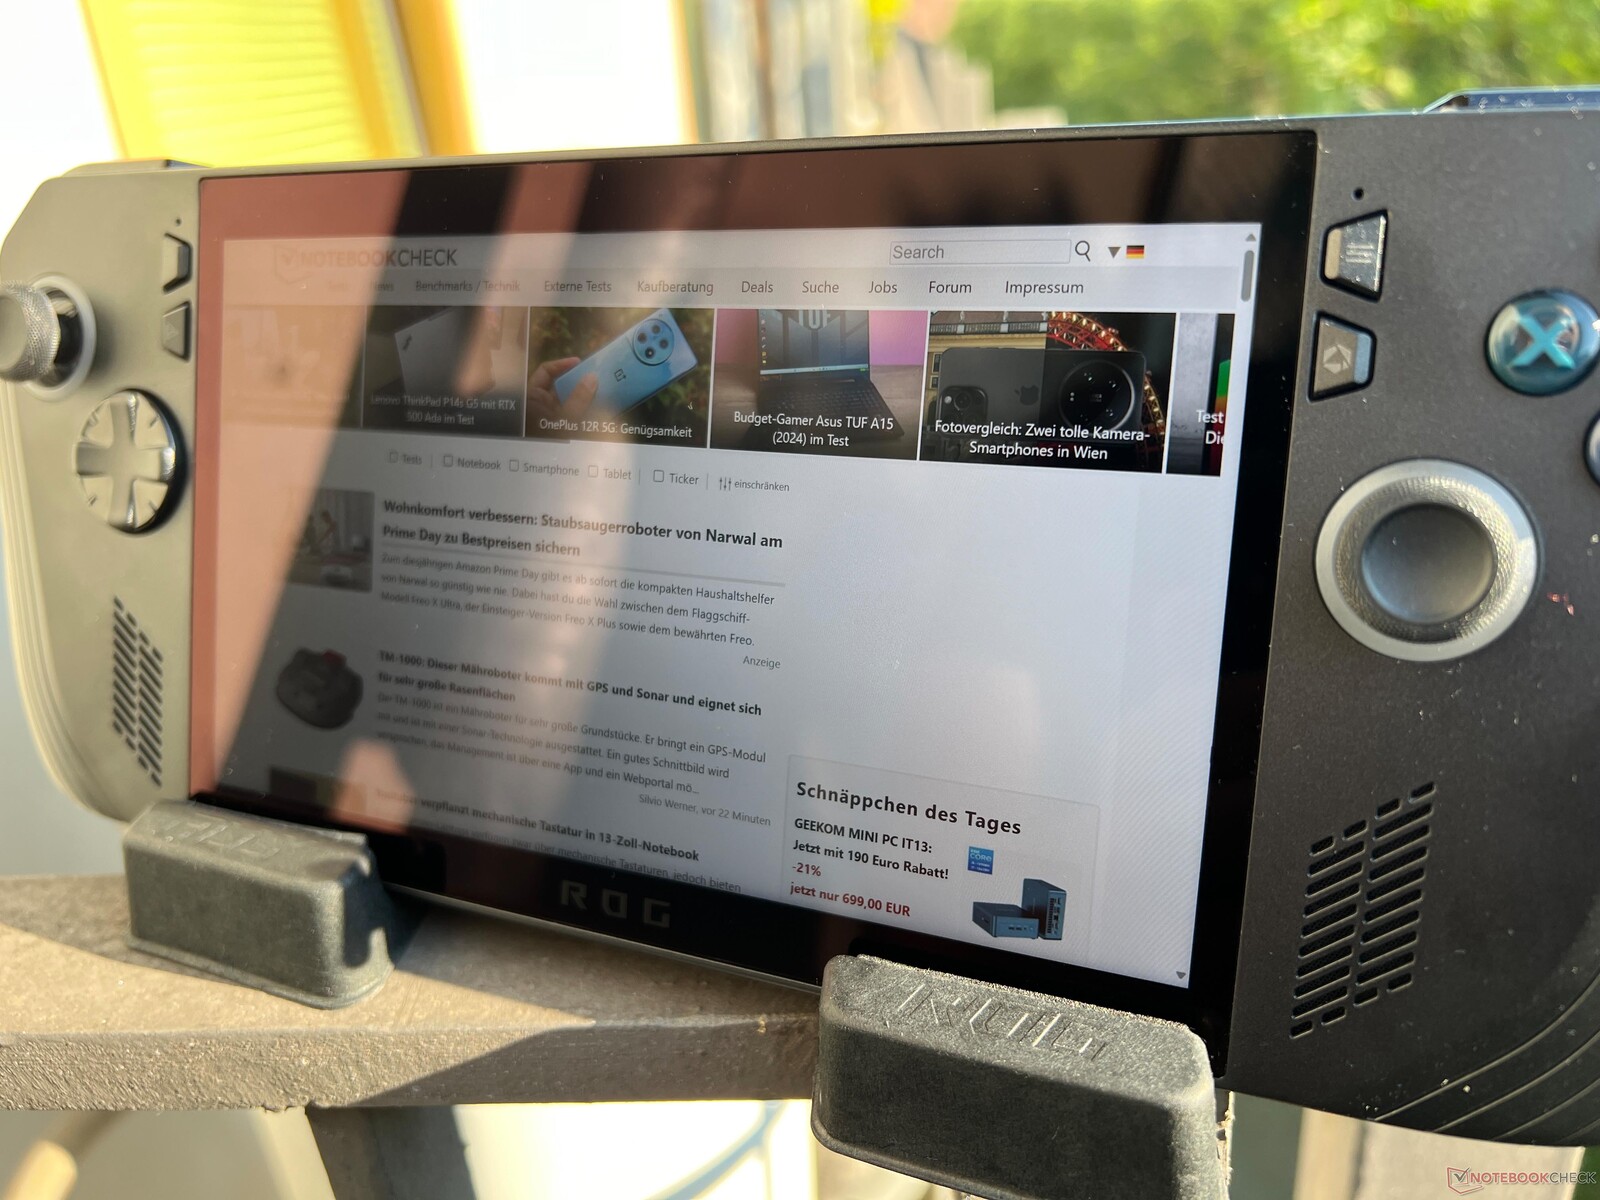
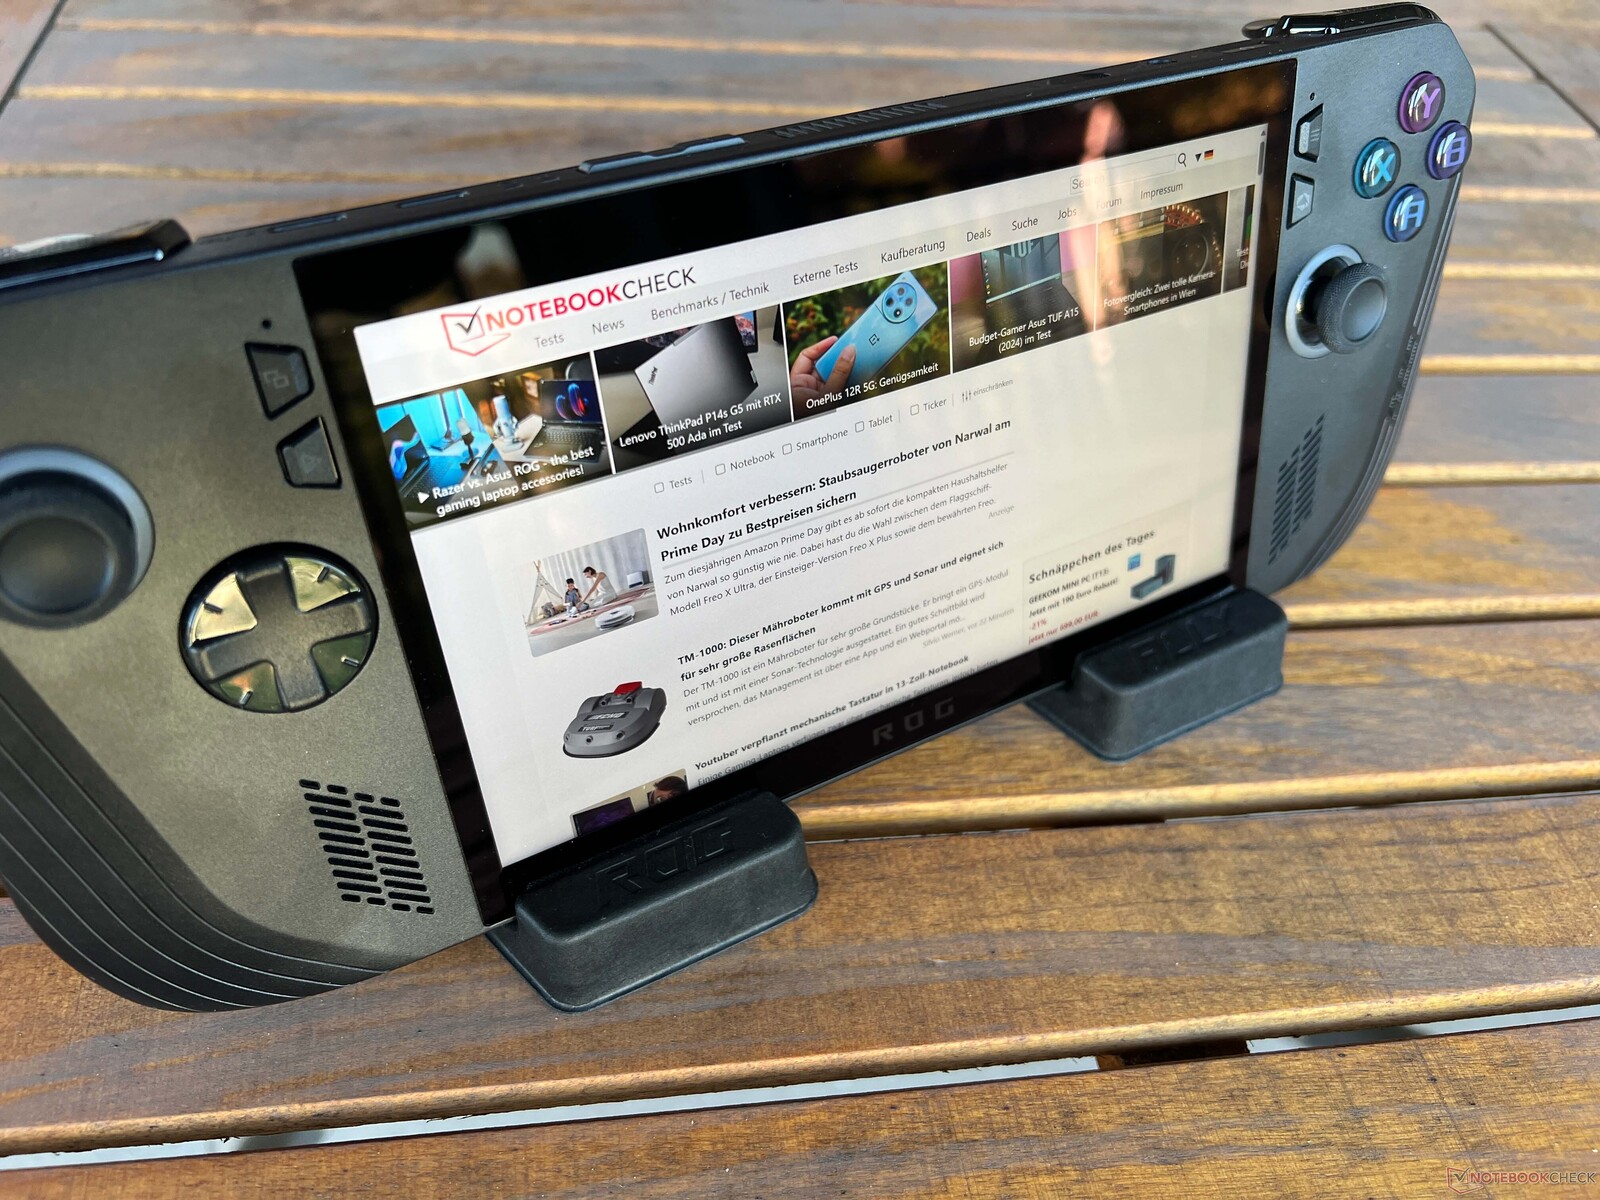
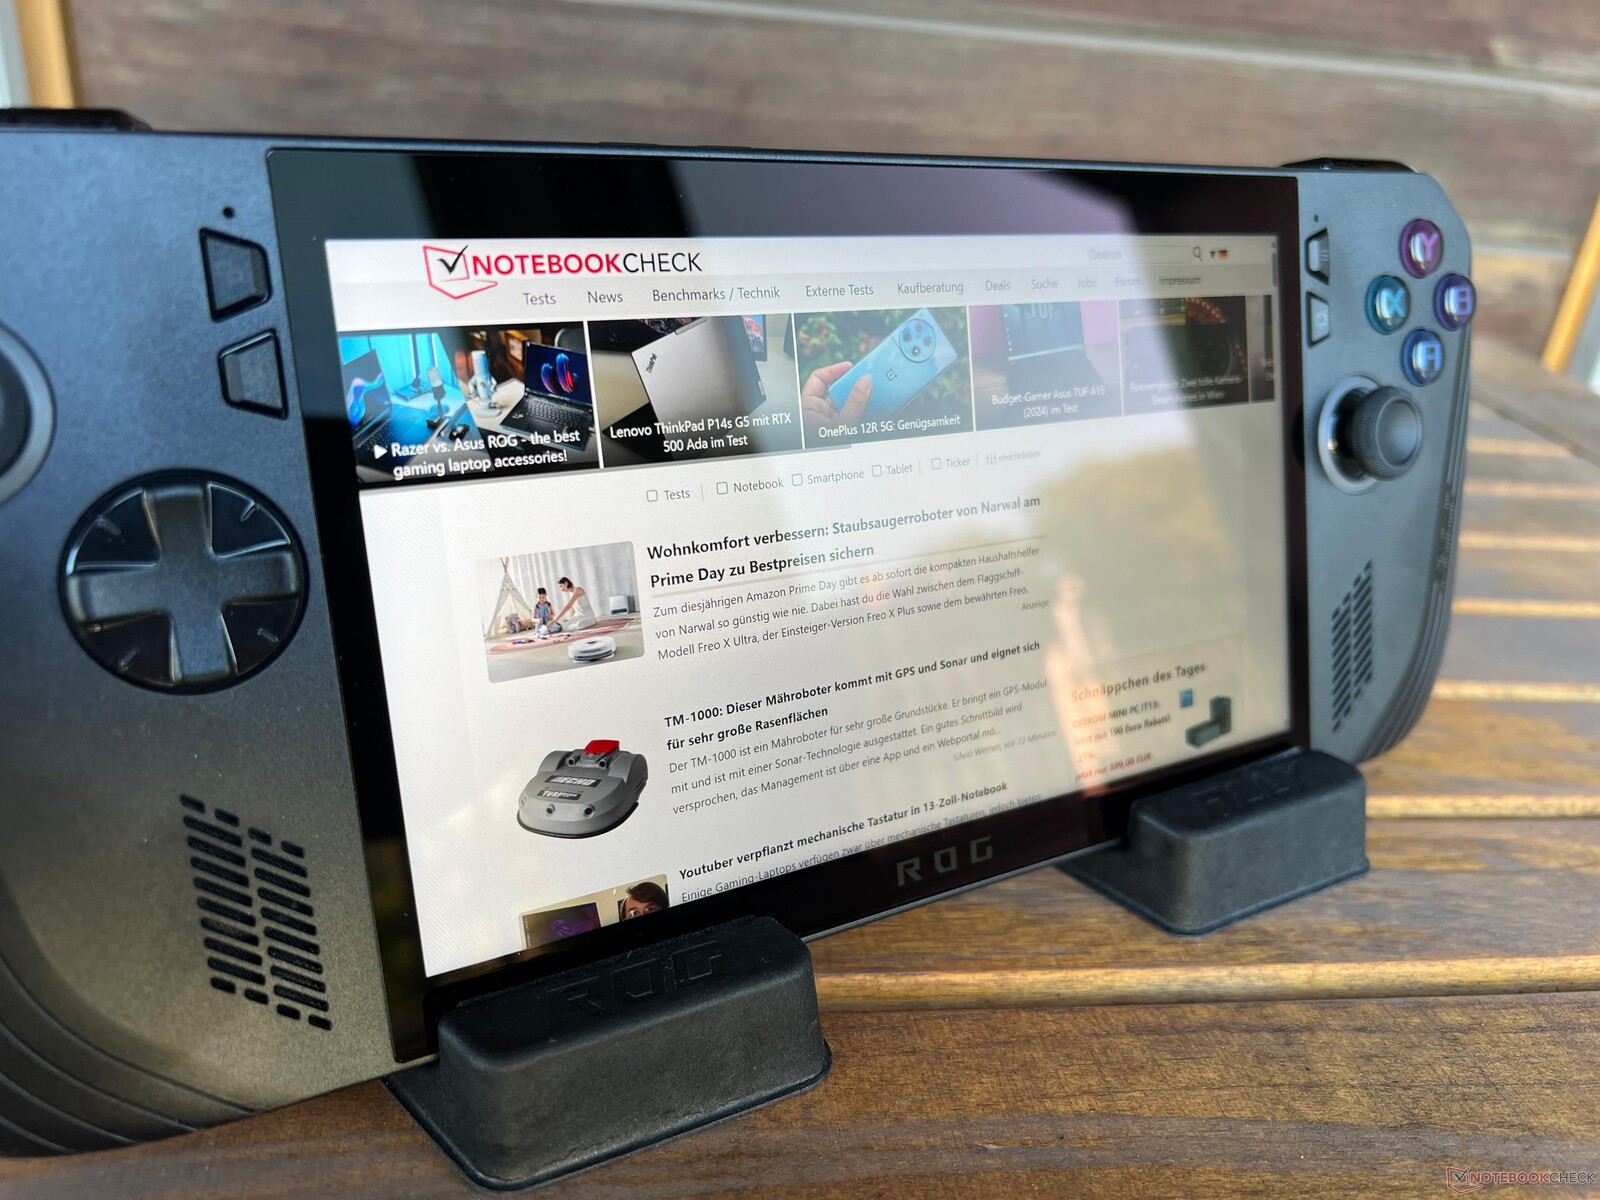
A tela sensível ao toque do Ally X é brilhante, mas é fácil encontrar uma posição adequada ao ar livre com o pequeno dispositivo. Com base em nossas próprias experiências com o ROG Ally original, podemos dizer que o jogo ainda é confortável em dias claros, desde que o senhor evite a luz solar direta. Não há problemas em termos de estabilidade do ângulo de visão.

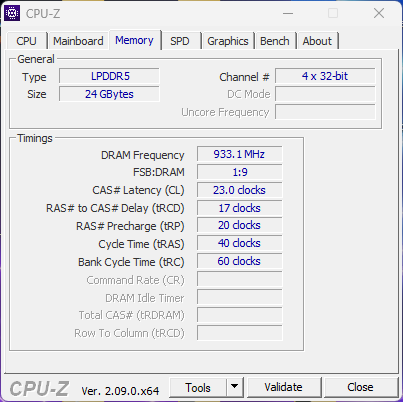
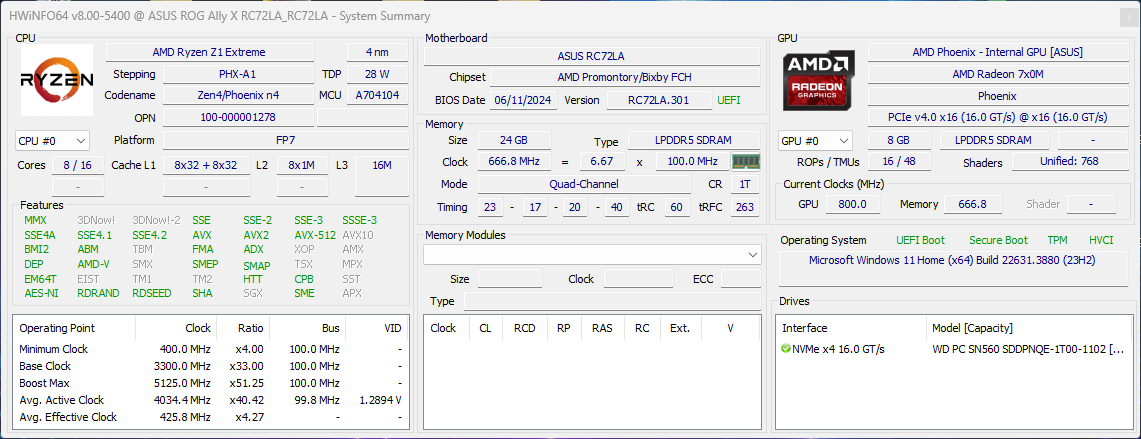
Desempenho - AMD Zen4 com RAM mais rápida
O novo ROG Ally X ainda usa o AMD Ryzen Z1 Extreme com a Radeon 780M. No entanto, a Asus mudou a configuração da memória: em vez de 16 GB de RAM LPDDR5-6400, o senhor agora tem 24 GB de RAM LPDDR5x-7500 mais rápida. 8 dos 24 GB são atribuídos à iGPU por padrão, os outros 16 GB são para o sistema.
Configurações de revisão
A Asus ajustou os perfis de energia conhecidos para o ROG Ally X e tanto o perfil Quiet (10 a 13 Watts) quanto o Performance (15 a 17 Watts) têm um consumo maior de SoC. O modo Turbo ainda usa 30 Watts na rede elétrica e 25 Watts na bateria. Observe que esses valores indicam o consumo de energia sustentado da APU, mas o chip Ryzen pode consumir mais energia por curtos períodos de tempo. Resumimos os perfis de energia e os números de desempenho na tabela a seguir:
| Perfil de energia | APU TDP | CB R23 Multi | Time Spy Gráficos | CP 2077 1080p Med | ruído máximo da ventoinha |
|---|---|---|---|---|---|
| Silencioso | 15/13 W | 8446 pt | 1840 pt | 16,3 FPS | 32,2 dB(A) |
| Desempenho | 29/24/17 W | 12254 pt | 2800 pt | 26,4 FPS | 33,8 dB(A) |
| Turbo (bateria) | 35/30/25 W | 13425 pt | 3017 pt | 31,1 FPS | 37,4 dB(A) |
| Turbo | 53/43/30 W | 15120 Pkt. | 3196 pt | 34.3 FPS | 42.6 dB(A) |
Usamos o modo Turbo na rede elétrica por padrão para nossos benchmarks e medições, para termos uma ideia do melhor desempenho possível. Todos os recursos adicionais, como super-resolução, quadros de movimento fluido e similares, foram desativados para nossos benchmarks de jogos, mas também os abordaremos na seção de jogos.
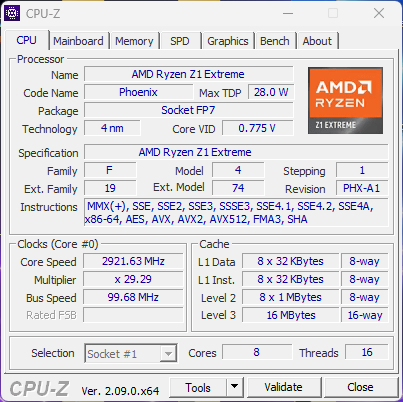
Processador - Ryzen Z1 Extreme
O Ryzen Z1 Extreme da AMD (que é basicamente o Ryzen 7 7840U) tem oito núcleos Zen4 (16 threads) com uma frequência máxima de 5,1 GHz. Ele ainda é um poderoso processador móvel, que oferece mais desempenho do que o Core Ultra 7 155H que o senhor obtém no Claw da MSI da MSI. Em suma, os resultados dos benchmarks são muito bons e a queda de desempenho em cargas de trabalho sustentadas é muito pequena, em torno de 10%. Há também apenas pequenas diferenças em comparação com o original ROG Allyoriginal, o que não é surpreendente. Devido ao TDP máximo mais baixo no modo Turbo com energia da bateria, o desempenho de vários núcleos da CPU é cerca de 11% menor sem a PSU. Outros benchmarks de CPU estão listados em nossa seção de tecnologia.
Cinebench R15 Multi Loop
Cinebench R23: Multi Core | Single Core
Cinebench R20: CPU (Multi Core) | CPU (Single Core)
Cinebench R15: CPU Multi 64Bit | CPU Single 64Bit
Blender: v2.79 BMW27 CPU
7-Zip 18.03: 7z b 4 | 7z b 4 -mmt1
Geekbench 6.4: Multi-Core | Single-Core
Geekbench 5.5: Multi-Core | Single-Core
HWBOT x265 Benchmark v2.2: 4k Preset
LibreOffice : 20 Documents To PDF
R Benchmark 2.5: Overall mean
| CPU Performance Rating | |
| Asus ROG Ally Z1 Extreme | |
| Asus ROG Ally X | |
| Média AMD Ryzen Z1 Extreme | |
| Lenovo Legion Go -2! | |
| MSI Claw | |
| Ayaneo Kun | |
| Média da turma Handheld / UMPC | |
| GPD Win Mini 2024 7" | |
| Valve Steam Deck 1 TB OLED -6! | |
| Cinebench R23 / Multi Core | |
| Asus ROG Ally X | |
| Ayaneo Kun | |
| Asus ROG Ally Z1 Extreme | |
| MSI Claw | |
| Média AMD Ryzen Z1 Extreme (13004 - 15120, n=3) | |
| Lenovo Legion Go | |
| Média da turma Handheld / UMPC (3984 - 16841, n=17, últimos 2 anos) | |
| GPD Win Mini 2024 7" | |
| Valve Steam Deck 1 TB OLED | |
| Cinebench R23 / Single Core | |
| Asus ROG Ally Z1 Extreme | |
| MSI Claw | |
| Média AMD Ryzen Z1 Extreme (1733 - 1779, n=3) | |
| Lenovo Legion Go | |
| Asus ROG Ally X | |
| GPD Win Mini 2024 7" | |
| Média da turma Handheld / UMPC (1088 - 2006, n=16, últimos 2 anos) | |
| Ayaneo Kun | |
| Cinebench R20 / CPU (Multi Core) | |
| Ayaneo Kun | |
| Asus ROG Ally Z1 Extreme | |
| Asus ROG Ally X | |
| Média AMD Ryzen Z1 Extreme (5109 - 5825, n=3) | |
| Lenovo Legion Go | |
| MSI Claw | |
| Média da turma Handheld / UMPC (1521 - 6577, n=15, últimos 2 anos) | |
| GPD Win Mini 2024 7" | |
| Valve Steam Deck 1 TB OLED | |
| Cinebench R20 / CPU (Single Core) | |
| Asus ROG Ally Z1 Extreme | |
| MSI Claw | |
| Média AMD Ryzen Z1 Extreme (672 - 692, n=3) | |
| Lenovo Legion Go | |
| Asus ROG Ally X | |
| GPD Win Mini 2024 7" | |
| Média da turma Handheld / UMPC (357 - 787, n=15, últimos 2 anos) | |
| Ayaneo Kun | |
| Valve Steam Deck 1 TB OLED | |
| Cinebench R15 / CPU Multi 64Bit | |
| Ayaneo Kun | |
| Asus ROG Ally Z1 Extreme | |
| Asus ROG Ally X | |
| Média AMD Ryzen Z1 Extreme (2050 - 2397, n=3) | |
| Lenovo Legion Go | |
| MSI Claw | |
| Média da turma Handheld / UMPC (689 - 2533, n=15, últimos 2 anos) | |
| GPD Win Mini 2024 7" | |
| Valve Steam Deck 1 TB OLED | |
| Cinebench R15 / CPU Single 64Bit | |
| Asus ROG Ally Z1 Extreme | |
| Média AMD Ryzen Z1 Extreme (262 - 280, n=3) | |
| Lenovo Legion Go | |
| GPD Win Mini 2024 7" | |
| Asus ROG Ally X | |
| MSI Claw | |
| Média da turma Handheld / UMPC (155.1 - 304, n=14, últimos 2 anos) | |
| Ayaneo Kun | |
| Blender / v2.79 BMW27 CPU | |
| GPD Win Mini 2024 7" | |
| Média da turma Handheld / UMPC (189 - 588, n=13, últimos 2 anos) | |
| MSI Claw | |
| Asus ROG Ally X | |
| Média AMD Ryzen Z1 Extreme (213 - 214, n=2) | |
| Asus ROG Ally Z1 Extreme | |
| Ayaneo Kun | |
| 7-Zip 18.03 / 7z b 4 | |
| Asus ROG Ally X | |
| Asus ROG Ally Z1 Extreme | |
| Ayaneo Kun | |
| Média AMD Ryzen Z1 Extreme (56966 - 64454, n=3) | |
| Lenovo Legion Go | |
| MSI Claw | |
| Média da turma Handheld / UMPC (19684 - 66618, n=14, últimos 2 anos) | |
| GPD Win Mini 2024 7" | |
| Valve Steam Deck 1 TB OLED | |
| 7-Zip 18.03 / 7z b 4 -mmt1 | |
| Asus ROG Ally Z1 Extreme | |
| Média AMD Ryzen Z1 Extreme (6077 - 6316, n=2) | |
| Asus ROG Ally X | |
| GPD Win Mini 2024 7" | |
| Ayaneo Kun | |
| MSI Claw | |
| Média da turma Handheld / UMPC (3653 - 6143, n=14, últimos 2 anos) | |
| Valve Steam Deck 1 TB OLED | |
| Geekbench 6.4 / Multi-Core | |
| Asus ROG Ally X | |
| Asus ROG Ally Z1 Extreme | |
| Média AMD Ryzen Z1 Extreme (10872 - 12026, n=4) | |
| Lenovo Legion Go | |
| Lenovo Legion Go | |
| MSI Claw | |
| GPD Win Mini 2024 7" | |
| Média da turma Handheld / UMPC (4587 - 13426, n=16, últimos 2 anos) | |
| Ayaneo Kun | |
| Valve Steam Deck 1 TB OLED | |
| Geekbench 6.4 / Single-Core | |
| Asus ROG Ally X | |
| Lenovo Legion Go | |
| Lenovo Legion Go | |
| Média AMD Ryzen Z1 Extreme (2530 - 2550, n=4) | |
| Asus ROG Ally Z1 Extreme | |
| GPD Win Mini 2024 7" | |
| MSI Claw | |
| Média da turma Handheld / UMPC (1348 - 2904, n=16, últimos 2 anos) | |
| Ayaneo Kun | |
| Valve Steam Deck 1 TB OLED | |
| Geekbench 5.5 / Multi-Core | |
| Asus ROG Ally Z1 Extreme | |
| Asus ROG Ally X | |
| Média AMD Ryzen Z1 Extreme (9589 - 10917, n=4) | |
| MSI Claw | |
| Lenovo Legion Go | |
| Lenovo Legion Go | |
| Média da turma Handheld / UMPC (3932 - 11975, n=16, últimos 2 anos) | |
| Ayaneo Kun | |
| GPD Win Mini 2024 7" | |
| Valve Steam Deck 1 TB OLED | |
| Geekbench 5.5 / Single-Core | |
| Asus ROG Ally Z1 Extreme | |
| Asus ROG Ally X | |
| Média AMD Ryzen Z1 Extreme (1896 - 1956, n=4) | |
| Lenovo Legion Go | |
| Lenovo Legion Go | |
| GPD Win Mini 2024 7" | |
| MSI Claw | |
| Média da turma Handheld / UMPC (875 - 2134, n=16, últimos 2 anos) | |
| Valve Steam Deck 1 TB OLED | |
| Ayaneo Kun | |
| HWBOT x265 Benchmark v2.2 / 4k Preset | |
| Asus ROG Ally X | |
| Ayaneo Kun | |
| Asus ROG Ally Z1 Extreme | |
| Média AMD Ryzen Z1 Extreme (16.3 - 18.7, n=3) | |
| Lenovo Legion Go | |
| Média da turma Handheld / UMPC (7.07 - 20.8, n=14, últimos 2 anos) | |
| MSI Claw | |
| GPD Win Mini 2024 7" | |
| LibreOffice / 20 Documents To PDF | |
| Média da turma Handheld / UMPC (41.1 - 92.8, n=14, últimos 2 anos) | |
| Ayaneo Kun | |
| Lenovo Legion Go | |
| Asus ROG Ally X | |
| GPD Win Mini 2024 7" | |
| Média AMD Ryzen Z1 Extreme (43 - 52.3, n=3) | |
| MSI Claw | |
| Asus ROG Ally Z1 Extreme | |
| R Benchmark 2.5 / Overall mean | |
| Média da turma Handheld / UMPC (0.4167 - 0.756, n=15, últimos 2 anos) | |
| Ayaneo Kun | |
| Ayaneo Kun | |
| GPD Win Mini 2024 7" | |
| MSI Claw | |
| Lenovo Legion Go | |
| Asus ROG Ally X | |
| Média AMD Ryzen Z1 Extreme (0.4447 - 0.4662, n=3) | |
| Asus ROG Ally Z1 Extreme | |
* ... menor é melhor
AIDA64: FP32 Ray-Trace | FPU Julia | CPU SHA3 | CPU Queen | FPU SinJulia | FPU Mandel | CPU AES | CPU ZLib | FP64 Ray-Trace | CPU PhotoWorxx
| Performance Rating | |
| Ayaneo Kun | |
| Asus ROG Ally X | |
| Asus ROG Ally Z1 Extreme | |
| Média AMD Ryzen Z1 Extreme | |
| Lenovo Legion Go | |
| Média da turma Handheld / UMPC | |
| GPD Win Mini 2024 7" | |
| MSI Claw | |
| AIDA64 / FP32 Ray-Trace | |
| Ayaneo Kun | |
| Ayaneo Kun | |
| Asus ROG Ally X | |
| Asus ROG Ally Z1 Extreme | |
| Média AMD Ryzen Z1 Extreme (20714 - 24519, n=3) | |
| Lenovo Legion Go | |
| Média da turma Handheld / UMPC (6990 - 26450, n=15, últimos 2 anos) | |
| GPD Win Mini 2024 7" | |
| MSI Claw | |
| AIDA64 / FPU Julia | |
| Ayaneo Kun | |
| Ayaneo Kun | |
| Asus ROG Ally X | |
| Asus ROG Ally Z1 Extreme | |
| Média AMD Ryzen Z1 Extreme (86738 - 103637, n=3) | |
| Lenovo Legion Go | |
| Média da turma Handheld / UMPC (42932 - 109745, n=15, últimos 2 anos) | |
| GPD Win Mini 2024 7" | |
| MSI Claw | |
| AIDA64 / CPU SHA3 | |
| Ayaneo Kun | |
| Ayaneo Kun | |
| Asus ROG Ally X | |
| Asus ROG Ally Z1 Extreme | |
| Média AMD Ryzen Z1 Extreme (3854 - 4465, n=3) | |
| Lenovo Legion Go | |
| Média da turma Handheld / UMPC (1403 - 4847, n=15, últimos 2 anos) | |
| GPD Win Mini 2024 7" | |
| MSI Claw | |
| AIDA64 / CPU Queen | |
| Ayaneo Kun | |
| Ayaneo Kun | |
| Asus ROG Ally X | |
| Asus ROG Ally Z1 Extreme | |
| Média AMD Ryzen Z1 Extreme (95153 - 107867, n=3) | |
| Lenovo Legion Go | |
| Média da turma Handheld / UMPC (41744 - 114294, n=15, últimos 2 anos) | |
| GPD Win Mini 2024 7" | |
| MSI Claw | |
| AIDA64 / FPU SinJulia | |
| Ayaneo Kun | |
| Ayaneo Kun | |
| Asus ROG Ally X | |
| Asus ROG Ally Z1 Extreme | |
| Média AMD Ryzen Z1 Extreme (12936 - 14281, n=3) | |
| Lenovo Legion Go | |
| Média da turma Handheld / UMPC (4425 - 16980, n=15, últimos 2 anos) | |
| GPD Win Mini 2024 7" | |
| MSI Claw | |
| AIDA64 / FPU Mandel | |
| Ayaneo Kun | |
| Ayaneo Kun | |
| Asus ROG Ally X | |
| Asus ROG Ally Z1 Extreme | |
| Média AMD Ryzen Z1 Extreme (46180 - 55457, n=3) | |
| Lenovo Legion Go | |
| Média da turma Handheld / UMPC (23380 - 58482, n=15, últimos 2 anos) | |
| GPD Win Mini 2024 7" | |
| MSI Claw | |
| AIDA64 / CPU AES | |
| Ayaneo Kun | |
| Ayaneo Kun | |
| GPD Win Mini 2024 7" | |
| Média da turma Handheld / UMPC (21547 - 166333, n=15, últimos 2 anos) | |
| Asus ROG Ally X | |
| Asus ROG Ally Z1 Extreme | |
| Média AMD Ryzen Z1 Extreme (57678 - 80158, n=3) | |
| MSI Claw | |
| Lenovo Legion Go | |
| AIDA64 / CPU ZLib | |
| Ayaneo Kun | |
| Ayaneo Kun | |
| Asus ROG Ally X | |
| Asus ROG Ally Z1 Extreme | |
| Média AMD Ryzen Z1 Extreme (687 - 987, n=3) | |
| Média da turma Handheld / UMPC (356 - 1112, n=15, últimos 2 anos) | |
| MSI Claw | |
| Lenovo Legion Go | |
| GPD Win Mini 2024 7" | |
| AIDA64 / FP64 Ray-Trace | |
| Ayaneo Kun | |
| Ayaneo Kun | |
| Asus ROG Ally X | |
| Asus ROG Ally Z1 Extreme | |
| Média AMD Ryzen Z1 Extreme (10740 - 13049, n=3) | |
| Lenovo Legion Go | |
| Média da turma Handheld / UMPC (3766 - 14181, n=15, últimos 2 anos) | |
| GPD Win Mini 2024 7" | |
| MSI Claw | |
| AIDA64 / CPU PhotoWorxx | |
| MSI Claw | |
| Asus ROG Ally X | |
| GPD Win Mini 2024 7" | |
| Média da turma Handheld / UMPC (19472 - 54726, n=15, últimos 2 anos) | |
| Asus ROG Ally Z1 Extreme | |
| Média AMD Ryzen Z1 Extreme (34764 - 39932, n=3) | |
| Lenovo Legion Go | |
| Ayaneo Kun | |
| Ayaneo Kun | |
Desempenho do sistema
O ROG Ally X oferece o desempenho de um subnotebook/laptop moderno sem dGPU e pode ser facilmente usado como um minicomputador ou até mesmo como dispositivo principal, especialmente em combinação com uma tela externa e dispositivos de entrada conectados. Os resultados de benchmark são muito bons e não tivemos nenhum problema de estabilidade durante o período de análise.
CrossMark: Overall | Productivity | Creativity | Responsiveness
WebXPRT 3: Overall
WebXPRT 4: Overall
Mozilla Kraken 1.1: Total
| PCMark 10 / Score | |
| Asus ROG Ally X | |
| Asus ROG Ally Z1 Extreme | |
| Média AMD Ryzen Z1 Extreme, AMD Radeon 780M (6439 - 7149, n=3) | |
| GPD Win Mini 2024 7" | |
| MSI Claw | |
| Lenovo Legion Go | |
| Média da turma Handheld / UMPC (5219 - 7471, n=15, últimos 2 anos) | |
| Ayaneo Kun | |
| PCMark 10 / Essentials | |
| Asus ROG Ally X | |
| GPD Win Mini 2024 7" | |
| Média AMD Ryzen Z1 Extreme, AMD Radeon 780M (10081 - 10633, n=3) | |
| Asus ROG Ally Z1 Extreme | |
| Lenovo Legion Go | |
| Média da turma Handheld / UMPC (8427 - 11262, n=15, últimos 2 anos) | |
| MSI Claw | |
| Ayaneo Kun | |
| PCMark 10 / Productivity | |
| Asus ROG Ally Z1 Extreme | |
| Asus ROG Ally X | |
| GPD Win Mini 2024 7" | |
| Média AMD Ryzen Z1 Extreme, AMD Radeon 780M (8996 - 10074, n=3) | |
| Lenovo Legion Go | |
| Média da turma Handheld / UMPC (7213 - 10031, n=15, últimos 2 anos) | |
| MSI Claw | |
| Ayaneo Kun | |
| PCMark 10 / Digital Content Creation | |
| Asus ROG Ally X | |
| MSI Claw | |
| Ayaneo Kun | |
| Média AMD Ryzen Z1 Extreme, AMD Radeon 780M (7990 - 9408, n=3) | |
| Asus ROG Ally Z1 Extreme | |
| Média da turma Handheld / UMPC (6350 - 10026, n=15, últimos 2 anos) | |
| Lenovo Legion Go | |
| GPD Win Mini 2024 7" | |
| CrossMark / Overall | |
| Asus ROG Ally Z1 Extreme | |
| Média AMD Ryzen Z1 Extreme, AMD Radeon 780M (1693 - 1718, n=2) | |
| MSI Claw | |
| Asus ROG Ally X | |
| GPD Win Mini 2024 7" | |
| Média da turma Handheld / UMPC (840 - 1847, n=13, últimos 2 anos) | |
| Ayaneo Kun | |
| Valve Steam Deck 1 TB OLED | |
| CrossMark / Productivity | |
| Asus ROG Ally Z1 Extreme | |
| Média AMD Ryzen Z1 Extreme, AMD Radeon 780M (1639 - 1662, n=2) | |
| MSI Claw | |
| Asus ROG Ally X | |
| GPD Win Mini 2024 7" | |
| Média da turma Handheld / UMPC (874 - 1719, n=13, últimos 2 anos) | |
| Ayaneo Kun | |
| Valve Steam Deck 1 TB OLED | |
| CrossMark / Creativity | |
| Asus ROG Ally Z1 Extreme | |
| Média AMD Ryzen Z1 Extreme, AMD Radeon 780M (1868 - 1878, n=2) | |
| Asus ROG Ally X | |
| MSI Claw | |
| GPD Win Mini 2024 7" | |
| Média da turma Handheld / UMPC (808 - 2077, n=13, últimos 2 anos) | |
| Ayaneo Kun | |
| Valve Steam Deck 1 TB OLED | |
| CrossMark / Responsiveness | |
| MSI Claw | |
| Ayaneo Kun | |
| Asus ROG Ally Z1 Extreme | |
| Média AMD Ryzen Z1 Extreme, AMD Radeon 780M (1392 - 1451, n=2) | |
| Asus ROG Ally X | |
| Média da turma Handheld / UMPC (759 - 1610, n=13, últimos 2 anos) | |
| GPD Win Mini 2024 7" | |
| Valve Steam Deck 1 TB OLED | |
| WebXPRT 3 / Overall | |
| Asus ROG Ally Z1 Extreme | |
| Média AMD Ryzen Z1 Extreme, AMD Radeon 780M (300 - 432, n=3) | |
| GPD Win Mini 2024 7" | |
| Asus ROG Ally X | |
| Lenovo Legion Go | |
| MSI Claw | |
| Média da turma Handheld / UMPC (188.4 - 323, n=15, últimos 2 anos) | |
| Ayaneo Kun | |
| Ayaneo Kun | |
| WebXPRT 4 / Overall | |
| Asus ROG Ally Z1 Extreme | |
| Média AMD Ryzen Z1 Extreme, AMD Radeon 780M (248 - 277, n=2) | |
| MSI Claw | |
| Asus ROG Ally X | |
| Média da turma Handheld / UMPC (107 - 291, n=12, últimos 2 anos) | |
| Ayaneo Kun | |
| Valve Steam Deck 1 TB OLED | |
| Mozilla Kraken 1.1 / Total | |
| Ayaneo Kun | |
| Ayaneo Kun | |
| Média da turma Handheld / UMPC (428 - 895, n=15, últimos 2 anos) | |
| Lenovo Legion Go | |
| Média AMD Ryzen Z1 Extreme, AMD Radeon 780M (536 - 556, n=2) | |
| GPD Win Mini 2024 7" | |
| Asus ROG Ally X | |
| MSI Claw | |
* ... menor é melhor
| PCMark 10 Score | 7149 pontos | |
Ajuda | ||
| AIDA64 / Memory Copy | |
| Asus ROG Ally Z1 Extreme | |
| MSI Claw | |
| Média AMD Ryzen Z1 Extreme (74414 - 92447, n=3) | |
| Lenovo Legion Go | |
| Asus ROG Ally X | |
| GPD Win Mini 2024 7" | |
| Média da turma Handheld / UMPC (32617 - 107929, n=16, últimos 2 anos) | |
| Ayaneo Kun | |
| Ayaneo Kun | |
| Valve Steam Deck 1 TB OLED | |
| AIDA64 / Memory Read | |
| MSI Claw | |
| Média da turma Handheld / UMPC (25380 - 100208, n=15, últimos 2 anos) | |
| Asus ROG Ally X | |
| Lenovo Legion Go | |
| Média AMD Ryzen Z1 Extreme (50337 - 58713, n=3) | |
| Asus ROG Ally Z1 Extreme | |
| GPD Win Mini 2024 7" | |
| Ayaneo Kun | |
| Valve Steam Deck 1 TB OLED | |
| AIDA64 / Memory Write | |
| Lenovo Legion Go | |
| Asus ROG Ally X | |
| Média AMD Ryzen Z1 Extreme (92869 - 108872, n=3) | |
| Asus ROG Ally Z1 Extreme | |
| GPD Win Mini 2024 7" | |
| Média da turma Handheld / UMPC (25596 - 117883, n=17, últimos 2 anos) | |
| MSI Claw | |
| Ayaneo Kun | |
| Ayaneo Kun | |
| Ayaneo Kun | |
| Valve Steam Deck 1 TB OLED | |
| AIDA64 / Memory Latency | |
| MSI Claw | |
| Ayaneo Kun | |
| Ayaneo Kun | |
| Média da turma Handheld / UMPC (99.8 - 147.6, n=16, últimos 2 anos) | |
| Asus ROG Ally X | |
| Lenovo Legion Go | |
| GPD Win Mini 2024 7" | |
| Média AMD Ryzen Z1 Extreme (113.7 - 122.1, n=3) | |
| Asus ROG Ally Z1 Extreme | |
| Valve Steam Deck 1 TB OLED | |
* ... menor é melhor
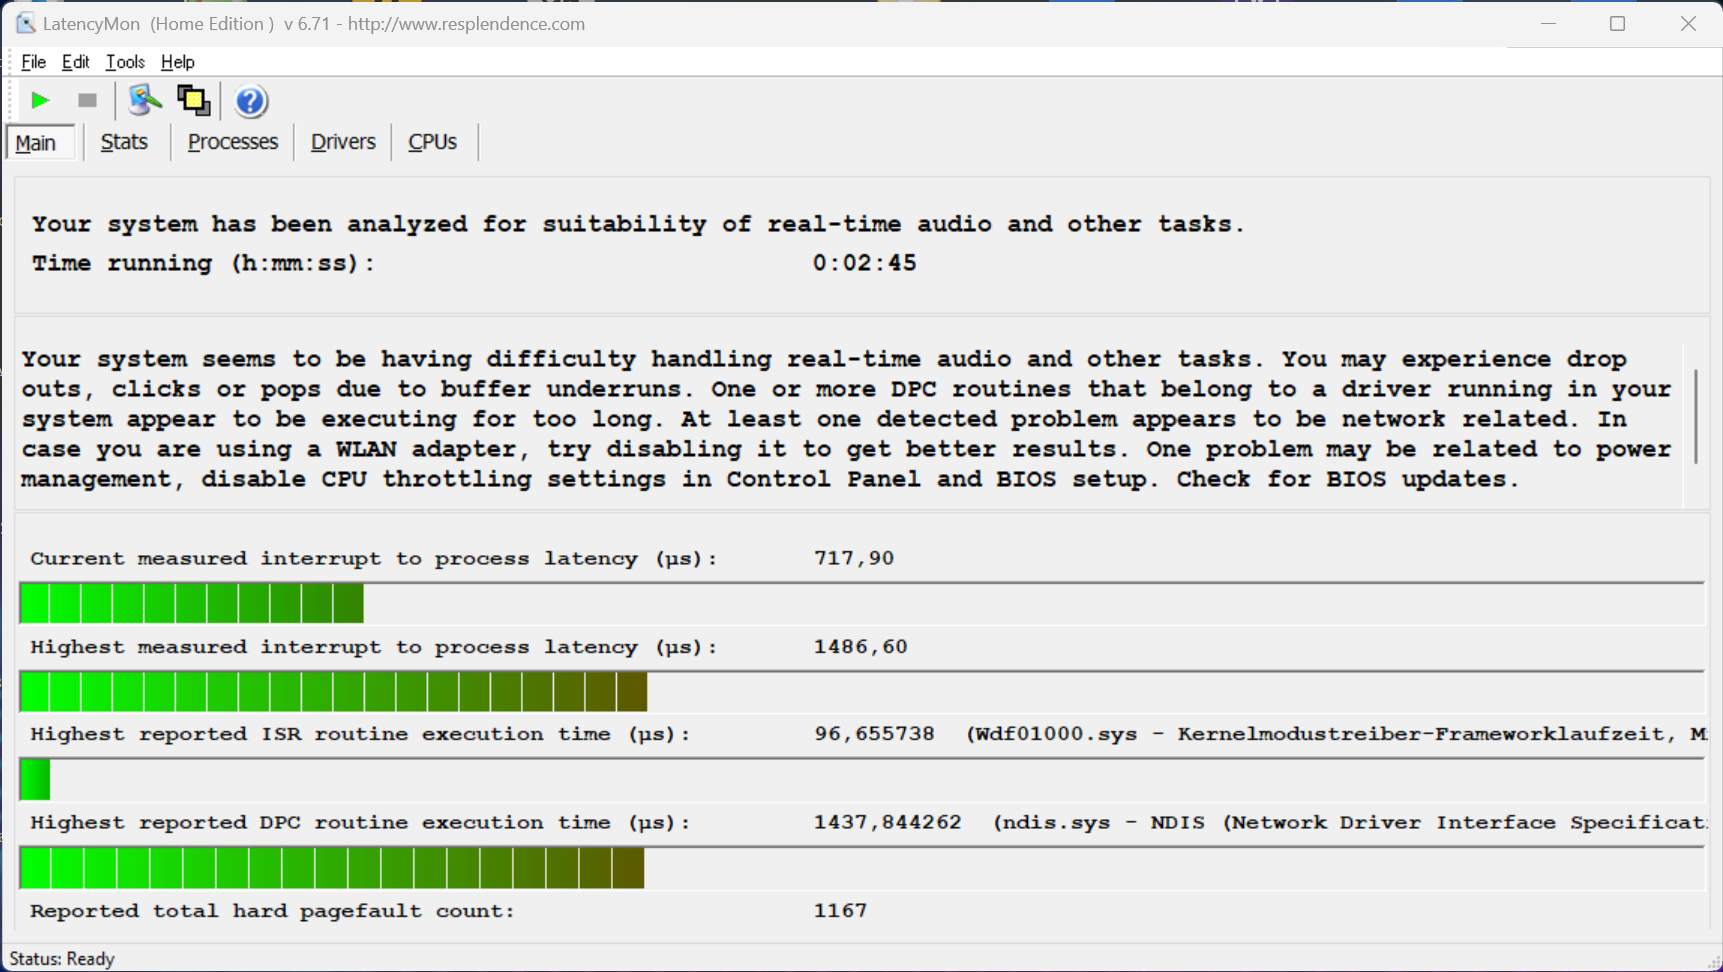
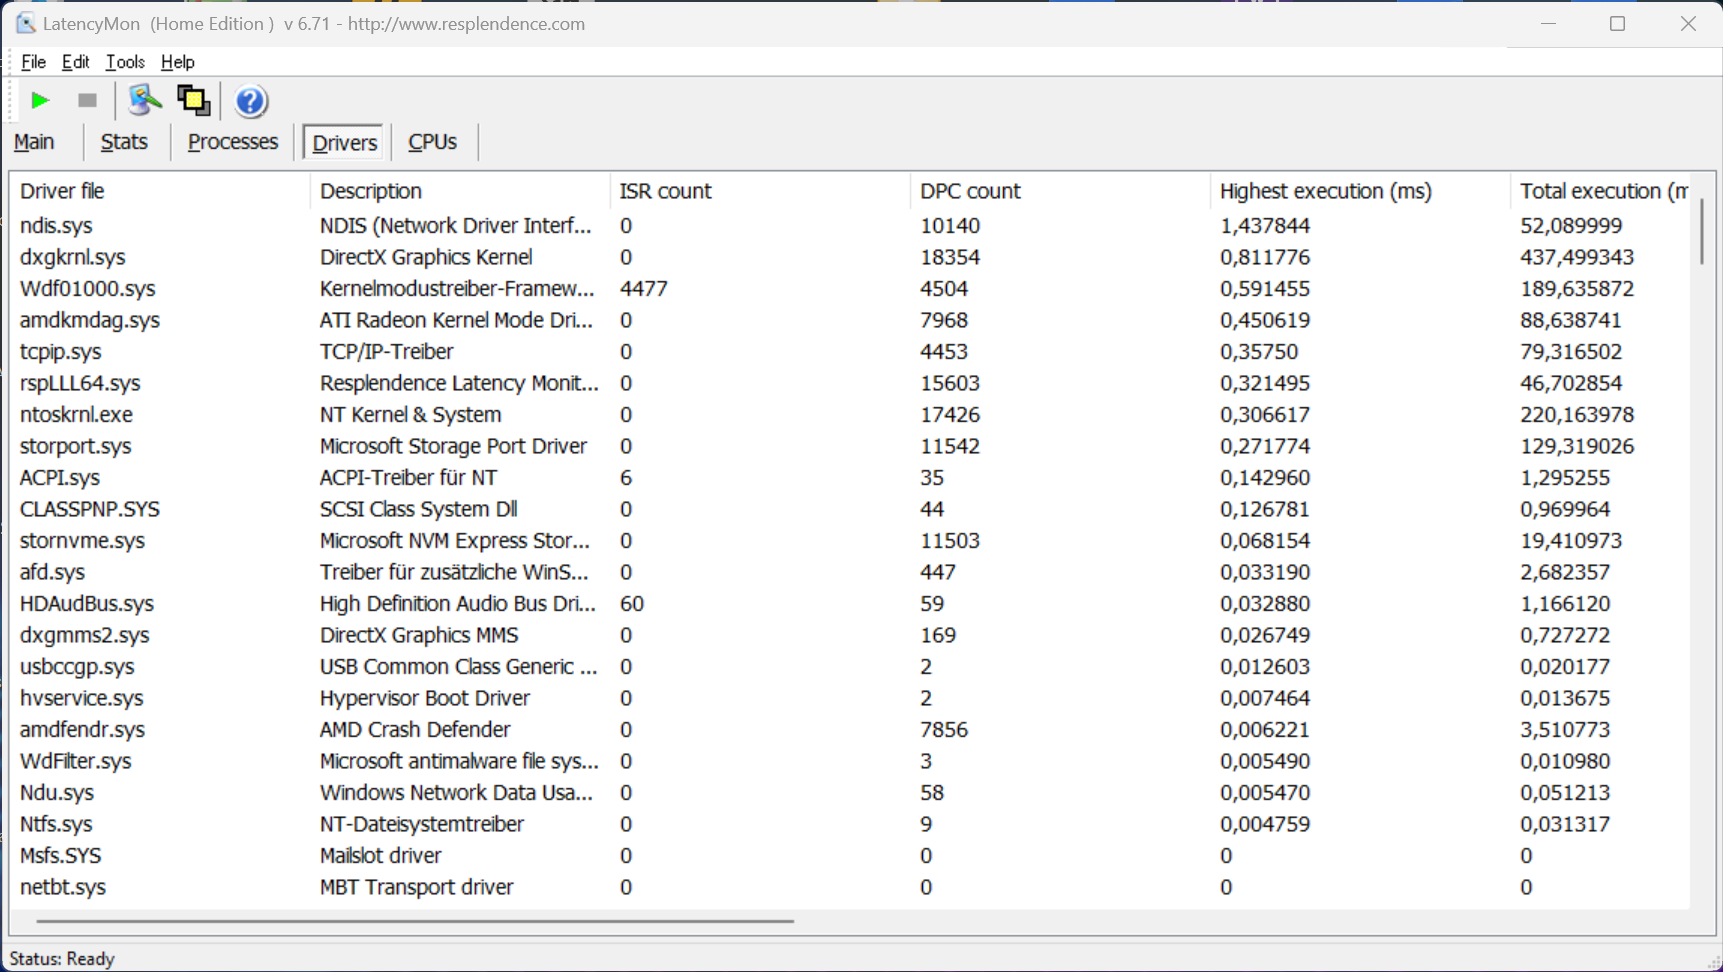
Latência DPC
Nosso teste de latência padronizado (navegação na Web, reprodução em 4K no YouTube, carga da CPU) mostra algumas limitações para a unidade de análise com a versão atual do BIOS quando o usuário deseja usar aplicativos de áudio em tempo real. Entretanto, esse não deve ser um cenário muito comum para um dispositivo portátil para jogos.
| DPC Latencies / LatencyMon - interrupt to process latency (max), Web, Youtube, Prime95 | |
| GPD Win Mini 2024 7" | |
| MSI Claw | |
| Asus ROG Ally X | |
| Asus ROG Ally Z1 Extreme | |
| Ayaneo Kun | |
* ... menor é melhor
Dispositivos de armazenamento
O novo ROG Ally X é equipado com um SSD M.2-2280 comum conectado via PCIe 4.0. Ele é equipado com uma unidade de 1 TB por padrão, e nossa unidade foi fornecida pela Western Digital (SN560). O senhor pode usar 891 GB para seus próprios arquivos/aplicativos após a configuração inicial. As taxas de transferência são boas e há apenas uma pequena queda de desempenho em cargas de trabalho sustentadas. É fácil fazer upgrade da unidade se o senhor tiver uma biblioteca de jogos abrangente. Mais benchmarks de SSD estão listados aqui.

| Drive Performance Rating - Percent | |
| Ayaneo Kun | |
| Lenovo Legion Go | |
| Média da turma Handheld / UMPC | |
| MSI Claw | |
| Média WD PC SN560 SDDPNQE-1T00 | |
| Asus ROG Ally X | |
| GPD Win Mini 2024 7" -11! | |
| Valve Steam Deck 1 TB OLED -11! | |
| Asus ROG Ally Z1 Extreme | |
* ... menor é melhor
Disk Throttling: DiskSpd Read Loop, Queue Depth 8
Desempenho da GPU - Radeon 780M
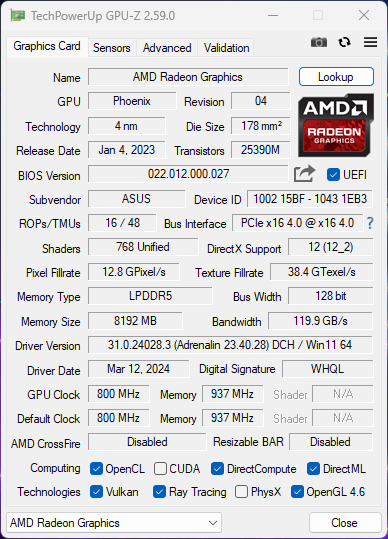
A Radeon 780M da AMD não mudou em comparação com a ROG Allydo ano passado, mas a memória mais rápida faz a diferença. O resultado é a Radeon 780M mais rápida que testamos até agora. Isso significa que a iGPU da Radeon ainda está um pouco atrás da Intel Arc Graphics no MSI Claw no teste Time Spy, mas está à frente na classificação geral de desempenho. Em geral, o Ally X também está à frente dos outros rivais da AMD.
Já dissemos que 8 GB de RAM agora são alocados para a GPU por padrão, mas o senhor também pode ajustar esse valor manualmente. Há também opções de driver como super resolução, quadros de movimento fluido, Radeon chill, etc., que podem ser acessadas diretamente do software Armoury Crate SE e essas opções podem ser configuradas para cada jogo individualmente sem usar o software Radeon.
O modo Turbo tem um consumo reduzido de energia da bateria, portanto, o desempenho máximo da GPU com a bateria também é afetado. A diferença, no entanto, é pequena, apenas 6%. Mais benchmarks de GPU estão disponíveis aqui.
| 3DMark Performance Rating - Percent | |
| Asus ROG Ally X | |
| MSI Claw | |
| Ayaneo Kun | |
| Asus ROG Ally Z1 Extreme | |
| Média da turma Handheld / UMPC | |
| Média AMD Radeon 780M | |
| Lenovo Legion Go | |
| GPD Win Mini 2024 7" | |
| 3DMark 11 Performance | 13368 pontos | |
| 3DMark Fire Strike Score | 8172 pontos | |
| 3DMark Time Spy Score | 3507 pontos | |
| 3DMark Steel Nomad Score | 519 pontos | |
| 3DMark Steel Nomad Light Score | 2972 pontos | |
Ajuda | ||
| Blender / v3.3 Classroom CPU | |
| GPD Win Mini 2024 7" | |
| Média da turma Handheld / UMPC (290 - 980, n=15, últimos 2 anos) | |
| Lenovo Legion Go | |
| MSI Claw | |
| Ayaneo Kun | |
| Ayaneo Kun | |
| Média AMD Radeon 780M (300 - 664, n=62) | |
| Asus ROG Ally Z1 Extreme | |
| Asus ROG Ally X | |
* ... menor é melhor
Desempenho em jogos

Essa é a seção mais importante para um dispositivo portátil para jogos. Obviamente, realizamos nossos benchmarks padrão para jogos e o ROG Ally X está no topo dos gráficos de comparação e também está à frente do MSI Claw com CPU Intel. Dependendo do título, pode haver pequenas variações, mas o desempenho geral em jogos é muito bom.
Tivemos duas unidades de análise do ROG Ally X e ambos os editores (que usaram muito o ROG Ally original) acham que o perfil de desempenho representa o melhor compromisso entre desempenho/consumo de energia/ruído do ventilador. Isso se deve ao limite de energia ligeiramente maior, mas também ao desempenho aprimorado graças a uma RAM maior/mais rápida. Gostaríamos de mencionar dois exemplos específicos: O Forza Horizon 5 exigia o modo Turbo para obter 60 fps constantes em 1080p e configurações médias. O novo Ally X pode fazer isso com o perfil Performance, o que faz uma enorme diferença em termos de ruído da ventoinha e duração da bateria. Esse também é o caso do Ghost of Tsushima (1080p, configurações médias, FSR + FG): Onde antes tínhamos que usar o modo Turbo, agora podemos usar o modo Performance.
| Performance Rating - Percent | |
| Asus ROG Ally X | |
| Lenovo Legion Go | |
| Asus ROG Ally Z1 Extreme | |
| Ayaneo Kun | |
| MSI Claw -1! | |
| Média da turma Handheld / UMPC | |
| GPD Win Mini 2024 7" -1! | |
| Valve Steam Deck 1 TB OLED -3! | |
| The Witcher 3 - 1920x1080 Ultra Graphics & Postprocessing (HBAO+) | |
| Ayaneo Kun | |
| Asus ROG Ally X | |
| Lenovo Legion Go | |
| Asus ROG Ally Z1 Extreme | |
| Média da turma Handheld / UMPC (17.5 - 33.9, n=11, últimos 2 anos) | |
| MSI Claw | |
| GPD Win Mini 2024 7" | |
| GTA V - 1920x1080 Highest Settings possible AA:4xMSAA + FX AF:16x | |
| Asus ROG Ally X | |
| Ayaneo Kun | |
| Ayaneo Kun | |
| Asus ROG Ally Z1 Extreme | |
| Lenovo Legion Go | |
| Média da turma Handheld / UMPC (14 - 32.8, n=16, últimos 2 anos) | |
| Valve Steam Deck 1 TB OLED | |
| Final Fantasy XV Benchmark - 1920x1080 High Quality | |
| Asus ROG Ally X (1.3) | |
| Ayaneo Kun (1.3) | |
| Asus ROG Ally Z1 Extreme (1.3) | |
| Lenovo Legion Go (1.3) | |
| Média da turma Handheld / UMPC (18.4 - 34.4, n=18, últimos 2 anos) | |
| MSI Claw (1.3) | |
| GPD Win Mini 2024 7" (1.3) | |
| Valve Steam Deck 1 TB OLED (1.3) | |
| Strange Brigade - 1920x1080 ultra AA:ultra AF:16 | |
| Asus ROG Ally X (1.47.22.14 D3D12) | |
| Ayaneo Kun (1.47.22.14 D3D12) | |
| Asus ROG Ally Z1 Extreme (1.47.22.14 D3D12) | |
| MSI Claw | |
| Média da turma Handheld / UMPC (30 - 56.1, n=18, últimos 2 anos) | |
| Lenovo Legion Go (1.47.22.14 D3D12) | |
| GPD Win Mini 2024 7" (1.47.22.14 D3D12) | |
| Valve Steam Deck 1 TB OLED | |
| Dota 2 Reborn - 1920x1080 ultra (3/3) best looking | |
| Lenovo Legion Go | |
| Asus ROG Ally X | |
| Asus ROG Ally Z1 Extreme | |
| Média da turma Handheld / UMPC (30.8 - 85, n=18, últimos 2 anos) | |
| MSI Claw | |
| GPD Win Mini 2024 7" | |
| Ayaneo Kun | |
| Ayaneo Kun | |
| X-Plane 11.11 - 1920x1080 high (fps_test=3) | |
| MSI Claw | |
| Lenovo Legion Go | |
| Asus ROG Ally X | |
| Média da turma Handheld / UMPC (24.5 - 50.5, n=18, últimos 2 anos) | |
| Asus ROG Ally Z1 Extreme | |
| GPD Win Mini 2024 7" | |
| Ayaneo Kun | |
| Ayaneo Kun | |
| F1 23 | |
| 1920x1080 Low Preset AA:T AF:16x | |
| Ayaneo Kun | |
| Asus ROG Ally X | |
| Média AMD Radeon 780M (42.4 - 95.4, n=30) | |
| Média da turma Handheld / UMPC (43.2 - 95.4, n=8, últimos 2 anos) | |
| MSI Claw | |
| 1920x1080 Medium Preset AA:T AF:16x | |
| Ayaneo Kun | |
| Asus ROG Ally X | |
| Média AMD Radeon 780M (38.1 - 84.4, n=30) | |
| Média da turma Handheld / UMPC (38.6 - 84.4, n=8, últimos 2 anos) | |
| MSI Claw | |
| 1920x1080 High Preset AA:T AF:16x | |
| Ayaneo Kun | |
| Lenovo Legion Go | |
| Asus ROG Ally X | |
| Média AMD Radeon 780M (27.3 - 61.1, n=31) | |
| Média da turma Handheld / UMPC (27.3 - 61.1, n=9, últimos 2 anos) | |
| MSI Claw | |
| 1920x1080 Ultra High Preset AA:T AF:16x | |
| Ayaneo Kun | |
| Asus ROG Ally X | |
| Média AMD Radeon 780M (6.25 - 14.7, n=22) | |
| Média da turma Handheld / UMPC (6.25 - 14.6, n=7, últimos 2 anos) | |
| F1 24 | |
| 1920x1080 Low Preset AA:T AF:16x | |
| Ayaneo Kun | |
| Asus ROG Ally X | |
| Média AMD Radeon 780M (43.3 - 94.8, n=19) | |
| Média da turma Handheld / UMPC (43.3 - 91.5, n=8, últimos 2 anos) | |
| 1920x1080 Medium Preset AA:T AF:16x | |
| Ayaneo Kun | |
| Asus ROG Ally X | |
| Média AMD Radeon 780M (36.4 - 80.2, n=20) | |
| Média da turma Handheld / UMPC (37.1 - 78.3, n=8, últimos 2 anos) | |
| 1920x1080 High Preset AA:T AF:16x | |
| Ayaneo Kun | |
| Asus ROG Ally X | |
| Média AMD Radeon 780M (23.3 - 59.9, n=20) | |
| Média da turma Handheld / UMPC (27.1 - 59.5, n=9, últimos 2 anos) | |
| 1920x1080 Ultra High Preset AA:T AF:16x | |
| Ayaneo Kun | |
| Asus ROG Ally X | |
| Média da turma Handheld / UMPC (6.39 - 20.1, n=6, últimos 2 anos) | |
| Média AMD Radeon 780M (6.39 - 14.5, n=13) | |
O desempenho em jogos fica completamente estável quando o TDP se estabelece no valor designado. Isso é claramente visível no gráfico abaixo, onde listamos os números de FPS durante nosso teste Cyberpunk de 30 minutos com três perfis de energia diferentes. Todos eles mostram uma pequena queda no desempenho, mas depois o desempenho se mantém estável. Esse também é o caso da energia da bateria.
Cyberpunk 2077 ultra FPS chart
Além do modo Turbo, também realizamos nossos benchmarks de jogos com todos os outros perfis de energia. Se o senhor joga títulos modernos e exigentes, como Cyberpunk 2077, Ghost of Tsushima ou Baldur's Gate 3, o modo Turbo pode fazer a diferença entre uma jogabilidade suave e uma experiência ruim. De modo geral, porém, o modo Desempenho também consegue bons números de fps. O modo Silencioso, por outro lado, é visivelmente mais lento e requer ajustes adicionais nas configurações.
| The Witcher 3 | |
| 1920x1080 High Graphics & Postprocessing (Nvidia HairWorks Off) | |
| ROG Ally X Turbo 30W | |
| ROG Ally X Turbo 25W | |
| ROG Ally X Performance 17W | |
| ROG Ally X Quiet 13W | |
| 1920x1080 Ultra Graphics & Postprocessing (HBAO+) | |
| ROG Ally X Turbo 30W | |
| ROG Ally X Turbo 25W | |
| ROG Ally X Performance 17W | |
| ROG Ally X Quiet 13W | |
| GTA V | |
| 1366x768 Normal/Off AF:4x | |
| ROG Ally X Turbo 30W | |
| ROG Ally X Turbo 25W | |
| ROG Ally X Performance 17W | |
| ROG Ally X Quiet 13W | |
| 1920x1080 High/On (Advanced Graphics Off) AA:2xMSAA + FX AF:8x | |
| ROG Ally X Turbo 30W | |
| ROG Ally X Turbo 25W | |
| ROG Ally X Performance 17W | |
| ROG Ally X Quiet 13W | |
| 1920x1080 Highest Settings possible AA:4xMSAA + FX AF:16x | |
| ROG Ally X Turbo 30W | |
| ROG Ally X Turbo 25W | |
| ROG Ally X Performance 17W | |
| ROG Ally X Quiet 13W | |
| Final Fantasy XV Benchmark | |
| 1280x720 Lite Quality | |
| ROG Ally X Turbo 30W | |
| ROG Ally X Turbo 25W | |
| ROG Ally X Performance 17W | |
| ROG Ally X Quiet 13W | |
| 1920x1080 Standard Quality | |
| ROG Ally X Turbo 30W | |
| ROG Ally X Turbo 25W | |
| ROG Ally X Performance 17W | |
| ROG Ally X Quiet 13W | |
| 1920x1080 High Quality | |
| ROG Ally X Turbo 30W | |
| ROG Ally X Turbo 25W | |
| ROG Ally X Performance 17W | |
| ROG Ally X Quiet 13W | |
| Strange Brigade | |
| 1920x1080 medium AA:medium AF:4 | |
| ROG Ally X Turbo 30W | |
| ROG Ally X Turbo 25W | |
| ROG Ally X Performance 17W | |
| ROG Ally X Quiet 13W | |
| 1920x1080 high AA:high AF:8 | |
| ROG Ally X Turbo 30W | |
| ROG Ally X Turbo 25W | |
| ROG Ally X Performance 17W | |
| ROG Ally X Quiet 13W | |
| 1920x1080 ultra AA:ultra AF:16 | |
| ROG Ally X Turbo 30W | |
| ROG Ally X Turbo 25W | |
| ROG Ally X Performance 17W | |
| ROG Ally X Quiet 13W | |
| F1 23 | |
| 1920x1080 Medium Preset AA:T AF:16x | |
| ROG Ally X Turbo 30W | |
| ROG Ally X Turbo 25W | |
| ROG Ally X Performance 17W | |
| ROG Ally X Quiet 13W | |
| 1920x1080 High Preset AA:T AF:16x | |
| ROG Ally X Turbo 30W | |
| ROG Ally X Turbo 25W | |
| ROG Ally X Performance 17W | |
| ROG Ally X Quiet 13W | |
| F1 24 | |
| 1920x1080 Medium Preset AA:T AF:16x | |
| ROG Ally X Turbo 30W | |
| ROG Ally X Turbo 25W | |
| ROG Ally X Performance 17W | |
| ROG Ally X Quiet 13W | |
| 1920x1080 High Preset AA:T AF:16x | |
| ROG Ally X Turbo 30W | |
| ROG Ally X Turbo 25W | |
| ROG Ally X Performance 17W | |
| ROG Ally X Quiet 13W | |
| Cyberpunk 2077 2.2 Phantom Liberty | |
| 1920x1080 Low Preset (FSR off) | |
| ROG Ally X Turbo 30W | |
| ROG Ally X Turbo 25W | |
| ROG Ally X Performance 17W | |
| ROG Ally X Quiet 13W | |
| 1920x1080 Medium Preset (FSR off) | |
| ROG Ally X Turbo 30W | |
| ROG Ally X Turbo 25W | |
| ROG Ally X Performance 17W | |
| ROG Ally X Quiet 13W | |
| Far Cry 5 | |
| 1920x1080 Medium Preset AA:T | |
| ROG Ally X Turbo 30W | |
| ROG Ally X Turbo 25W | |
| ROG Ally X Performance 17W | |
| ROG Ally X Quiet 13W | |
| 1920x1080 High Preset AA:T | |
| ROG Ally X Turbo 30W | |
| ROG Ally X Turbo 25W | |
| ROG Ally X Performance 17W | |
| ROG Ally X Quiet 13W | |
| 1920x1080 Ultra Preset AA:T | |
| ROG Ally X Turbo 30W | |
| ROG Ally X Turbo 25W | |
| ROG Ally X Performance 17W | |
| ROG Ally X Quiet 13W | |
| Baldur's Gate 3 | |
| 1920x1080 Low Preset | |
| ROG Ally X Turbo 30W | |
| ROG Ally X Turbo 25W | |
| ROG Ally X Performance 17W | |
| ROG Ally X Quiet 13W | |
| 1920x1080 Medium Preset | |
| ROG Ally X Turbo 30W | |
| ROG Ally X Turbo 25W | |
| ROG Ally X Performance 17W | |
| ROG Ally X Quiet 13W | |
| Forza Horizon 5 | |
| 1920x1080 Medium Preset | |
| ROG Ally X Turbo 30W | |
| ROG Ally X Turbo 25W | |
| ROG Ally X Performance 17W | |
| ROG Ally X Quiet 13W | |
| 1920x1080 High Preset | |
| ROG Ally X Turbo 30W | |
| ROG Ally X Turbo 25W | |
| ROG Ally X Performance 17W | |
| ROG Ally X Quiet 13W | |
| Shadow of the Tomb Raider | |
| 1920x1080 Medium Preset | |
| ROG Ally X Turbo 30W | |
| ROG Ally X Turbo 25W | |
| ROG Ally X Performance 17W | |
| ROG Ally X Quiet 13W | |
| 1920x1080 High Preset AA:SM | |
| ROG Ally X Turbo 30W | |
| ROG Ally X Turbo 25W | |
| ROG Ally X Performance 17W | |
| ROG Ally X Quiet 13W | |
| Ghost of Tsushima | |
| 1920x1080 Low Preset | |
| ROG Ally X Turbo 30W | |
| ROG Ally X Turbo 25W | |
| ROG Ally X Performance 17W | |
| ROG Ally X Quiet 13W | |
| 1920x1080 Medium Preset AA:T | |
| ROG Ally X Turbo 30W | |
| ROG Ally X Turbo 25W | |
| ROG Ally X Performance 17W | |
| ROG Ally X Quiet 13W | |
| 1920x1080 High Preset AA:T | |
| ROG Ally X Turbo 30W | |
| ROG Ally X Turbo 25W | |
| ROG Ally X Performance 17W | |
| ROG Ally X Quiet 13W | |
| Dota 2 Reborn | |
| 1920x1080 high (2/3) | |
| ROG Ally X Turbo 25W | |
| ROG Ally X Turbo 30W | |
| ROG Ally X Performance 17W | |
| ROG Ally X Quiet 13W | |
| 1920x1080 ultra (3/3) best looking | |
| ROG Ally X Turbo 30W | |
| ROG Ally X Turbo 25W | |
| ROG Ally X Performance 17W | |
| ROG Ally X Quiet 13W | |
Também é possível melhorar o desempenho dos jogos com recursos adicionais. O driver da AMD oferece recursos como super-resolução (escalonamento de 720p para 1080p) e geração de quadros, por exemplo. Há também a tecnologia FSR da AMD, mas ela não é suportada por todos os jogos. Tomamos o Cyberpunk 2077 como exemplo de todos os recursos da AMD e também adicionamos o FSR 2.1 por meio das configurações do jogo. O Cyberpunk também deve receber suporte para FSR 3 em um futuro próximo. Nossos resultados mostram claramente que é possível melhorar significativamente o desempenho dos jogos. Ghost of Tsushima é um exemplo em que desativamos os recursos do driver AMD e usamos o FSR mais a geração de quadros por meio das configurações do jogo. A geração de quadros, em particular, funciona muito bem com esse título e aumenta substancialmente o desempenho, de modo que o senhor pode jogar com o perfil Performance em 1080p /High com mais de 40 fps. Graças a essas tecnologias, o ROG Ally X pode lidar facilmente com todos os títulos AAA.
| Perfil de energia | 1080p Baixo | 1080p Médio | 1080p Alto |
|---|---|---|---|
| Desempenho (FSR 3) | 39,8 FPS | 33,4 FPS | 28,8 FPS |
| Desempenho (FSR 3 + FG) | 59,2 FPS | 52,9 FPS | 44,5 FPS |
| Turbo (FSR 3) | 42,9 FPS | 36 FPS | 31,4 FPS |
| Turbo (FSR 3 + FG) | 70.9 FPS | 61.6 FPS | 53.8 FPS |
| Perfil de potência | Médio | Alto | Ultra |
|---|---|---|---|
| Desempenho | 39,9 FPS | 33 FPS | 30,3 FPS |
| Desempenho (FSR 2.1) | 59 FPS | 39.4 FPS | 35.5 FPS |
| Turbo | 52,4 FPS | 38 FPS | 35,3 FPS |
| Turbo (FSR 2.1) | 64 FPS | 44,2 FPS | 40,9 FPS |
As tabelas de visão geral a seguir mostram os benchmarks de jogos que realizamos com os quatro perfis de energia diferentes.
Gaming Benchmarks Turbo (30 Watts)
| baixo | média | alto | ultra | |
|---|---|---|---|---|
| GTA V (2015) | 144.5 | 144 | 66.5 | 27.1 |
| The Witcher 3 (2015) | 149 | 49 | 31.1 | |
| Dota 2 Reborn (2015) | 120.7 | 105.3 | 86.5 | 76.2 |
| Final Fantasy XV Benchmark (2018) | 80.7 | 39.6 | 30 | |
| X-Plane 11.11 (2018) | 54 | 40.6 | 33.2 | |
| Far Cry 5 (2018) | 78 | 46 | 42 | 40 |
| Strange Brigade (2018) | 161.1 | 70.1 | 60 | 51.6 |
| Shadow of the Tomb Raider (2018) | 104 | 47 | 42 | 37 |
| Forza Horizon 5 (2021) | 113 | 78 | 69 | 36 |
| F1 22 (2022) | 94.9 | 86.7 | 64.6 | 17.8 |
| Star Wars Jedi Survivor (2023) | 23.1 | 20.8 | 19.5 | 18.3 |
| F1 23 (2023) | 89.6 | 79 | 56.6 | 13 |
| Baldur's Gate 3 (2023) | 41.1 | 32.1 | 26.6 | 25.8 |
| Cyberpunk 2077 2.2 Phantom Liberty (2023) | 44.1 | 34.3 | 27.2 | 22.9 |
| Total War Pharaoh (2023) | 92.2 | 68 | 40.4 | 32 |
| Call of Duty Modern Warfare 3 2023 (2023) | 68 | 57 | 38 | 37 |
| Horizon Forbidden West (2024) | 29.4 | 26 | 18.7 | 16.3 |
| Ghost of Tsushima (2024) | 36.1 | 29.4 | 26.1 | 20.6 |
| F1 24 (2024) | 90.9 | 75.5 | 55.1 | 13.4 |
Gaming Benchmarks Turbo (25 Watts)
| baixo | média | alto | ultra | |
|---|---|---|---|---|
| GTA V (2015) | 141.1 | 137.9 | 65.8 | 26.8 |
| The Witcher 3 (2015) | 47.1 | 29.6 | ||
| Dota 2 Reborn (2015) | 114.3 | 93.9 | 86.9 | 71.9 |
| Final Fantasy XV Benchmark (2018) | 77.9 | 38.2 | 28.9 | |
| X-Plane 11.11 (2018) | 39.3 | 27.1 | 28.2 | |
| Far Cry 5 (2018) | 72 | 45 | 41 | 39 |
| Strange Brigade (2018) | 163.6 | 68.1 | 58.1 | 50 |
| Shadow of the Tomb Raider (2018) | 100 | 46 | 40 | 35 |
| Forza Horizon 5 (2021) | 106 | 74 | 62 | 32 |
| F1 23 (2023) | 85.5 | 76.4 | 53.8 | 12.1 |
| Baldur's Gate 3 (2023) | 39.2 | 30.4 | 25.3 | 25.1 |
| Cyberpunk 2077 2.2 Phantom Liberty (2023) | 41.5 | 31.1 | 25.1 | 21.7 |
| Ghost of Tsushima (2024) | 34.9 | 28.3 | 25.3 | 19.7 |
| F1 24 (2024) | 83.4 | 72.1 | 52.3 | 12.6 |
Gaming Benchmarks Performance (17 Watts)
| baixo | média | alto | ultra | |
|---|---|---|---|---|
| GTA V (2015) | 130.4 | 124.8 | 58.7 | 25.3 |
| The Witcher 3 (2015) | 45.7 | 25.7 | ||
| Dota 2 Reborn (2015) | 121.3 | 105.2 | 81.9 | 66.7 |
| Final Fantasy XV Benchmark (2018) | 67 | 34.8 | 26.6 | |
| X-Plane 11.11 (2018) | 51.9 | 38.4 | 32.3 | |
| Far Cry 5 (2018) | 73 | 40 | 37 | 35 |
| Strange Brigade (2018) | 156.3 | 64.9 | 53.9 | 45.1 |
| Shadow of the Tomb Raider (2018) | 91 | 41 | 38 | 33 |
| Forza Horizon 5 (2021) | 102 | 61 | 60 | 31 |
| F1 23 (2023) | 67.3 | 62.5 | 44.1 | 9.98 |
| Baldur's Gate 3 (2023) | 33 | 25.7 | 21.6 | 21.2 |
| Cyberpunk 2077 2.2 Phantom Liberty (2023) | 33.9 | 26.4 | 21.9 | 18.7 |
| Call of Duty Modern Warfare 3 2023 (2023) | 52 | 39 | 29 | 27 |
| Ghost of Tsushima (2024) | 33.3 | 24.6 | 21.4 | 16.7 |
| F1 24 (2024) | 69 | 61.1 | 43.8 | 10.1 |
Gaming Benchmarks Quiet (13 Watts)
| baixo | média | alto | ultra | |
|---|---|---|---|---|
| GTA V (2015) | 121 | 100.6 | 41.4 | 18.6 |
| The Witcher 3 (2015) | 27.5 | 17.5 | ||
| Dota 2 Reborn (2015) | 116.4 | 102.4 | 61.1 | 55 |
| Final Fantasy XV Benchmark (2018) | 44.7 | 24 | 19.3 | |
| X-Plane 11.11 (2018) | 48.7 | 35.6 | 30.3 | |
| Far Cry 5 (2018) | 47 | 25 | 23 | 22 |
| Strange Brigade (2018) | 141 | 46.2 | 38.8 | 32.8 |
| Shadow of the Tomb Raider (2018) | 61 | 27 | 24 | 21 |
| Forza Horizon 5 (2021) | 66 | 39 | 35 | 19 |
| F1 23 (2023) | 43.2 | 38.6 | 27.3 | 6.25 |
| Baldur's Gate 3 (2023) | 20.2 | 15.7 | 13.8 | 13.5 |
| Cyberpunk 2077 2.2 Phantom Liberty (2023) | 32.6 | 16.3 | 13.8 | 11.5 |
| Ghost of Tsushima (2024) | 10.6 | 16.5 | 14.6 | 11.8 |
| F1 24 (2024) | 43.3 | 37.1 | 27.1 | 6.39 |
Emissões - Somente o modo Turbo (30 Watts) é alto
Ruído do sistema
Em geral, as duas ventoinhas são desligadas durante a marcha lenta e cargas de trabalho leves (navegação na Web, YouTube como PC de mesa) e também não há sons eletrônicos indesejados. Quando o senhor começa a estressar o sistema, isso depende exclusivamente do perfil de energia. O modo Turbo na rede elétrica é um exemplo negativo e pode ser irritante em cenas de jogos silenciosos, com cerca de 43 dB(A). O ruído já é muito mais agradável no Turbo com a energia da bateria e há apenas um murmúrio silencioso (ou nada com o som do jogo) quando o senhor usa o modo Performance.
| Perfil de energia | 3DMark 06 | Cyberpunk 2077 | Teste de estresse |
|---|---|---|---|
| Silencioso | 32,2 dB(A) | 32,2 dB(A) | 32,2 dB(A) |
| Desempenho | 33,8 dB(A) | 33,8 dB(A) | 33,8 dB(A) |
| Turbo (bateria) | 37,4 dB(A) | 37,4 dB(A) | 37,4 dB(A) |
| Turbo | 42,6 dB(A) | 42,6 dB(A) | 42,6 dB(A) |
Barulho
| Ocioso |
| 24.7 / 24.7 / 28.5 dB |
| Carga |
| 42.6 / 42.6 dB |
 | ||
30 dB silencioso 40 dB(A) audível 50 dB(A) ruidosamente alto |
||
min: | ||
| Asus ROG Ally X Radeon 780M, Z1 Extreme, WD PC SN560 SDDPNQE-1T00 | GPD Win Mini 2024 7" Radeon 780M, R7 8840U, Kioxia BG5 KBG50ZNS512G | MSI Claw Arc 8-Core, Ultra 7 155H, Kioxia BG5 KBG50ZNS1T02 | Valve Steam Deck 1 TB OLED Radeon Radeon Steam Deck 8CU, Steam Deck OLED APU, Phison ESMP001TKB5C3 | Lenovo Legion Go Radeon 780M, Z1 Extreme, WD PC SN740 512GB SDDPMQD-512G-1101 | Ayaneo Kun Radeon 780M, R7 7840U, Phison M.2 2280 E18 4000GB | Asus ROG Ally Z1 Extreme Radeon 780M, Z1 Extreme, Micron 2400 MTFDKBK512QFM | |
|---|---|---|---|---|---|---|---|
| Noise | 3% | -7% | 7% | 10% | -5% | 6% | |
| desligado / ambiente * | 24.7 | 24.2 2% | 25.7 -4% | 24.7 -0% | 23 7% | 23.3 6% | |
| Idle Minimum * | 24.7 | 24.7 -0% | 25.7 -4% | 25 -1% | 23 7% | 25.31 -2% | 23.3 6% |
| Idle Average * | 24.7 | 26.2 -6% | 31.7 -28% | 25 -1% | 23 7% | 25.31 -2% | 23.3 6% |
| Idle Maximum * | 28.5 | 28 2% | 31.7 -11% | 25 12% | 25 12% | 34.5 -21% | 27.3 4% |
| Load Average * | 42.6 | 34.2 20% | 36.6 14% | 31.3 27% | 37 13% | 34.9 18% | 39.2 8% |
| Cyberpunk 2077 ultra * | 42.6 | 45.5 -7% | |||||
| Load Maximum * | 42.6 | 42.5 -0% | 45.5 -7% | 40.8 4% | 37 13% | 50.78 -19% | 39.2 8% |
| Witcher 3 ultra * | 43 | 46 | 39.2 |
* ... menor é melhor
Temperatura

Podemos ser breves aqui, pois não há problemas com as temperaturas da superfície. A tela sensível ao toque esquenta durante os jogos, mas as alças quase não esquentam, o que também é muito fácil de ver nas imagens térmicas. Os exaustores da ventoinha na parte superior também não são problema, e toda a parte traseira permanece bem fria.
(±) A temperatura máxima no lado superior é 42.7 °C / 109 F, em comparação com a média de 38.4 °C / 101 F , variando de 26.6 a 55 °C para a classe Handheld / UMPC.
(+) A parte inferior aquece até um máximo de 39.7 °C / 103 F, em comparação com a média de 38 °C / 100 F
(+) Em uso inativo, a temperatura média para o lado superior é 27.4 °C / 81 F, em comparação com a média do dispositivo de 31.6 °C / ### class_avg_f### F.
(-) 3: The average temperature for the upper side is 40 °C / 104 F, compared to the average of 31.6 °C / 89 F for the class Handheld / UMPC.
(-) Os apoios para as mãos e o touchpad podem ficar muito quentes ao toque, com um máximo de 42.2 °C / 108 F.
(-) A temperatura média da área do apoio para as mãos de dispositivos semelhantes foi 30.5 °C / 86.9 F (-11.7 °C / -21.1 F).


| Asus ROG Ally X AMD Ryzen Z1 Extreme, AMD Radeon 780M | GPD Win Mini 2024 7" AMD Ryzen 7 8840U, AMD Radeon 780M | MSI Claw Intel Core Ultra 7 155H, Intel Arc 8-Core iGPU | Valve Steam Deck 1 TB OLED AMD Steam Deck OLED APU, AMD Radeon Steam Deck 8CU | Lenovo Legion Go AMD Ryzen Z1 Extreme, AMD Radeon 780M | Ayaneo Kun AMD Ryzen 7 7840U, AMD Radeon 780M | Asus ROG Ally Z1 Extreme AMD Ryzen Z1 Extreme, AMD Radeon 780M | |
|---|---|---|---|---|---|---|---|
| Heat | -18% | -6% | -3% | ||||
| Maximum Upper Side * | 42.7 | 46.6 -9% | 41.8 2% | 44.4 -4% | |||
| Maximum Bottom * | 39.7 | 48 -21% | 35.9 10% | 37.9 5% | |||
| Idle Upper Side * | 28 | 32.6 -16% | 31.6 -13% | 29.9 -7% | |||
| Idle Bottom * | 27.2 | 33.6 -24% | 33.6 -24% | 28.3 -4% |
* ... menor é melhor
Alto-falantes
Os dois alto-falantes estéreo estão localizados na parte frontal e têm bom desempenho. A Asus até conseguiu melhorar o desempenho em comparação com o original ROG Ally original. O novo Ally X só é superado pelo Steam Deck OLED em nosso grupo de comparação.
Asus ROG Ally X análise de áudio
(+) | os alto-falantes podem tocar relativamente alto (###valor### dB)
Graves 100 - 315Hz
(-) | quase nenhum baixo - em média 26% menor que a mediana
(±) | a linearidade dos graves é média (7.7% delta para a frequência anterior)
Médios 400 - 2.000 Hz
(+) | médios equilibrados - apenas 3.9% longe da mediana
(+) | médios são lineares (3.6% delta para frequência anterior)
Altos 2 - 16 kHz
(+) | agudos equilibrados - apenas 1.1% longe da mediana
(+) | os máximos são lineares (1.8% delta da frequência anterior)
Geral 100 - 16.000 Hz
(+) | o som geral é linear (14.7% diferença em relação à mediana)
Comparado com a mesma classe
» 11% de todos os dispositivos testados nesta classe foram melhores, 17% semelhantes, 72% piores
» O melhor teve um delta de 12%, a média foi 18%, o pior foi 23%
Comparado com todos os dispositivos testados
» 17% de todos os dispositivos testados foram melhores, 4% semelhantes, 79% piores
» O melhor teve um delta de 4%, a média foi 24%, o pior foi 134%
GPD Win Mini 2024 7" análise de áudio
(±) | o volume do alto-falante é médio, mas bom (###valor### dB)
Graves 100 - 315Hz
(-) | quase nenhum baixo - em média 24.4% menor que a mediana
(±) | a linearidade dos graves é média (10.7% delta para a frequência anterior)
Médios 400 - 2.000 Hz
(+) | médios equilibrados - apenas 4.2% longe da mediana
(+) | médios são lineares (6.6% delta para frequência anterior)
Altos 2 - 16 kHz
(+) | agudos equilibrados - apenas 4.5% longe da mediana
(+) | os máximos são lineares (4.5% delta da frequência anterior)
Geral 100 - 16.000 Hz
(±) | a linearidade do som geral é média (21.7% diferença em relação à mediana)
Comparado com a mesma classe
» 78% de todos os dispositivos testados nesta classe foram melhores, 11% semelhantes, 11% piores
» O melhor teve um delta de 12%, a média foi 18%, o pior foi 23%
Comparado com todos os dispositivos testados
» 59% de todos os dispositivos testados foram melhores, 7% semelhantes, 34% piores
» O melhor teve um delta de 4%, a média foi 24%, o pior foi 134%
MSI Claw análise de áudio
(+) | os alto-falantes podem tocar relativamente alto (###valor### dB)
Graves 100 - 315Hz
(-) | quase nenhum baixo - em média 17.2% menor que a mediana
(±) | a linearidade dos graves é média (9.2% delta para a frequência anterior)
Médios 400 - 2.000 Hz
(+) | médios equilibrados - apenas 4.3% longe da mediana
(+) | médios são lineares (4.3% delta para frequência anterior)
Altos 2 - 16 kHz
(+) | agudos equilibrados - apenas 3.7% longe da mediana
(+) | os máximos são lineares (4.5% delta da frequência anterior)
Geral 100 - 16.000 Hz
(+) | o som geral é linear (14.9% diferença em relação à mediana)
Comparado com a mesma classe
» 17% de todos os dispositivos testados nesta classe foram melhores, 11% semelhantes, 72% piores
» O melhor teve um delta de 12%, a média foi 18%, o pior foi 23%
Comparado com todos os dispositivos testados
» 18% de todos os dispositivos testados foram melhores, 4% semelhantes, 78% piores
» O melhor teve um delta de 4%, a média foi 24%, o pior foi 134%
Valve Steam Deck 1 TB OLED análise de áudio
(+) | os alto-falantes podem tocar relativamente alto (###valor### dB)
Graves 100 - 315Hz
(-) | quase nenhum baixo - em média 22% menor que a mediana
(±) | a linearidade dos graves é média (14.7% delta para a frequência anterior)
Médios 400 - 2.000 Hz
(+) | médios equilibrados - apenas 1% longe da mediana
(+) | médios são lineares (2.1% delta para frequência anterior)
Altos 2 - 16 kHz
(+) | agudos equilibrados - apenas 1.9% longe da mediana
(+) | os máximos são lineares (6.1% delta da frequência anterior)
Geral 100 - 16.000 Hz
(+) | o som geral é linear (12.9% diferença em relação à mediana)
Comparado com a mesma classe
» 6% de todos os dispositivos testados nesta classe foram melhores, 6% semelhantes, 89% piores
» O melhor teve um delta de 12%, a média foi 18%, o pior foi 23%
Comparado com todos os dispositivos testados
» 11% de todos os dispositivos testados foram melhores, 3% semelhantes, 87% piores
» O melhor teve um delta de 4%, a média foi 24%, o pior foi 134%
Lenovo Legion Go análise de áudio
(±) | o volume do alto-falante é médio, mas bom (###valor### dB)
Graves 100 - 315Hz
(-) | quase nenhum baixo - em média 16.4% menor que a mediana
(±) | a linearidade dos graves é média (8.1% delta para a frequência anterior)
Médios 400 - 2.000 Hz
(±) | médios mais altos - em média 5.2% maior que a mediana
(+) | médios são lineares (6% delta para frequência anterior)
Altos 2 - 16 kHz
(±) | máximos mais altos - em média 5.7% maior que a mediana
(±) | a linearidade dos máximos é média (9.7% delta para frequência anterior)
Geral 100 - 16.000 Hz
(±) | a linearidade do som geral é média (22.7% diferença em relação à mediana)
Comparado com a mesma classe
» 89% de todos os dispositivos testados nesta classe foram melhores, 6% semelhantes, 6% piores
» O melhor teve um delta de 12%, a média foi 18%, o pior foi 23%
Comparado com todos os dispositivos testados
» 65% de todos os dispositivos testados foram melhores, 6% semelhantes, 30% piores
» O melhor teve um delta de 4%, a média foi 24%, o pior foi 134%
Ayaneo Kun análise de áudio
(+) | os alto-falantes podem tocar relativamente alto (###valor### dB)
Graves 100 - 315Hz
(-) | quase nenhum baixo - em média 24.3% menor que a mediana
(±) | a linearidade dos graves é média (7% delta para a frequência anterior)
Médios 400 - 2.000 Hz
(+) | médios equilibrados - apenas 2.1% longe da mediana
(+) | médios são lineares (6% delta para frequência anterior)
Altos 2 - 16 kHz
(+) | agudos equilibrados - apenas 4.7% longe da mediana
(±) | a linearidade dos máximos é média (8.3% delta para frequência anterior)
Geral 100 - 16.000 Hz
(±) | a linearidade do som geral é média (17.5% diferença em relação à mediana)
Comparado com a mesma classe
» 33% de todos os dispositivos testados nesta classe foram melhores, 17% semelhantes, 50% piores
» O melhor teve um delta de 12%, a média foi 18%, o pior foi 23%
Comparado com todos os dispositivos testados
» 31% de todos os dispositivos testados foram melhores, 8% semelhantes, 61% piores
» O melhor teve um delta de 4%, a média foi 24%, o pior foi 134%
Asus ROG Ally Z1 Extreme análise de áudio
(+) | os alto-falantes podem tocar relativamente alto (###valor### dB)
Graves 100 - 315Hz
(-) | quase nenhum baixo - em média 15.5% menor que a mediana
(±) | a linearidade dos graves é média (8.4% delta para a frequência anterior)
Médios 400 - 2.000 Hz
(+) | médios equilibrados - apenas 3.1% longe da mediana
(+) | médios são lineares (3% delta para frequência anterior)
Altos 2 - 16 kHz
(+) | agudos equilibrados - apenas 1.9% longe da mediana
(+) | os máximos são lineares (2.3% delta da frequência anterior)
Geral 100 - 16.000 Hz
(+) | o som geral é linear (13.5% diferença em relação à mediana)
Comparado com a mesma classe
» 25% de todos os dispositivos testados nesta classe foram melhores, 5% semelhantes, 71% piores
» O melhor teve um delta de 5%, a média foi 18%, o pior foi 45%
Comparado com todos os dispositivos testados
» 13% de todos os dispositivos testados foram melhores, 4% semelhantes, 84% piores
» O melhor teve um delta de 4%, a média foi 24%, o pior foi 134%
Gerenciamento de energia - Agora com uma enorme bateria de 80 Wh
Consumo de energia
O consumo ocioso do ROG Ally X é um pouco maior em comparação com o antigo ROG Allymas o computador de mão de 7 polegadas ainda é um dos dispositivos mais eficientes. O consumo durante os jogos depende do perfil de energia, o que é visível nas imagens a seguir, bem como na tabela abaixo. Tiramos essas imagens depois que a APU atingiu o consumo pretendido (o valor é mais alto durante os momentos iniciais da sessão de jogos).
| Perfil de energia | Consumo de energia APS | Sistema de consumo de energia |
|---|---|---|
| Leise | 13 Watts | ~19-20 Watts |
| Leistung | 17 Watts | 25,5-26,5 Watts |
| Turbo Akku | 25 Watts | 35-36 Watts |
| Turbo | 30 Watts | 42-43 Watts |
| Cloud Gaming | 8 Watts | 11-12 Watts |
O monitoramento em tempo real do Ally X mostra o consumo da APU, mas também o consumo total do sistema, o que é um bom indicador da duração da bateria. Os números de consumo durante os jogos em nuvem também são interessantes. Testamos o Flight Simulator 2020 da Microsoft por meio do Xbox Game Pass e, embora o consumo possa ser bastante alto durante as telas de carregamento e os menus, o consumo da APU durante o jogo real é muito baixo, com 8 Watts (sistema total de 11 a 12 Watts). O senhor também pode ver que a carga da iGPU é de 0%. O Ally X é ainda mais eficiente quando o senhor emula jogos. Jogamos alguns clássicos do SNES, como Super Mario ou Super Mario Kart, e o consumo total do sistema ficou entre 8 e 9 Watts.
Medimos até 66,8 Watts durante o teste de estresse, mas esse valor rapidamente se estabiliza em torno de 50 Watts. O adaptador de energia de 65 W incluído é, portanto, suficiente.
| desligado | |
| Ocioso | |
| Carga |
|
Key:
min: | |
| Asus ROG Ally X Z1 Extreme, Radeon 780M, WD PC SN560 SDDPNQE-1T00, IPS, 1920x1080, 7" | GPD Win Mini 2024 7" R7 8840U, Radeon 780M, Kioxia BG5 KBG50ZNS512G, IPS, 1920x1080, 7" | MSI Claw Ultra 7 155H, Arc 8-Core, Kioxia BG5 KBG50ZNS1T02, IPS, 1920x1080, 7" | Valve Steam Deck 1 TB OLED Steam Deck OLED APU, Radeon Radeon Steam Deck 8CU, Phison ESMP001TKB5C3, OLED, 1280x800, 7.4" | Lenovo Legion Go Z1 Extreme, Radeon 780M, WD PC SN740 512GB SDDPMQD-512G-1101, IPS, 2560x1600, 8.8" | Ayaneo Kun R7 7840U, Radeon 780M, Phison M.2 2280 E18 4000GB, IPS, 2560x1600, 8.4" | Asus ROG Ally Z1 Extreme Z1 Extreme, Radeon 780M, Micron 2400 MTFDKBK512QFM, IPS, 1920x1080, 7" | Média AMD Radeon 780M | Média da turma Handheld / UMPC | |
|---|---|---|---|---|---|---|---|---|---|
| Power Consumption | 0% | -34% | 14% | -70% | -136% | 2% | -27% | -31% | |
| Idle Minimum * | 4.3 | 6.1 -42% | 7.8 -81% | 4.5 -5% | 11.5 -167% | 14 -226% | 4.2 2% | 6.04 ? -40% | 7.38 ? -72% |
| Idle Average * | 6.7 | 7.9 -18% | 11.5 -72% | 7.21 -8% | 12 -79% | 17.56 -162% | 6.1 9% | 8.25 ? -23% | 9.43 ? -41% |
| Idle Maximum * | 7.5 | 9 -20% | 11.8 -57% | 9.66 -29% | 17.4 -132% | 27 -260% | 6.3 16% | 10.5 ? -40% | 12.9 ? -72% |
| Load Average * | 48.2 | 32.6 32% | 53.1 -10% | 22.86 53% | 45 7% | 38.1 21% | 56.6 -17% | 57.2 ? -19% | 40 ? 17% |
| Cyberpunk 2077 ultra * | 61.3 | 54.4 11% | |||||||
| Cyberpunk 2077 ultra external monitor * | 53.9 | ||||||||
| Load Maximum * | 66.8 | 34.9 48% | 64.6 3% | 27.8 58% | 54 19% | 101 -51% | 67.2 -1% | 75.7 ? -13% | 57.3 ? 14% |
| Witcher 3 ultra * | 33.3 | 42.6 | 83.5 | 64.1 |
* ... menor é melhor
Power consumption Cyberpunk / Stress test
Power consumption external screen
Tempo de duração da bateria
A Asus dobrou a capacidade da bateria de 40 Wh para 80 Wh para o novo ROG Ally. Já vimos os valores de consumo durante os jogos, e o senhor pode esperar um pouco mais de duas horas no modo Turbo, cerca de 3 horas no modo Desempenho e cerca de 4 horas no modo Silencioso. Isso é confirmado por nossos testes. Durante os jogos em nuvem, o senhor terá cerca de 7 horas e até 8 horas para jogos emulados. Essa é uma grande melhoria em relação ao original ROG Ally original e o usuário fica muito mais tranquilo quando se trata do status da bateria. Isso significa que o Ally X está no mesmo nível do Steam Deck (que também dura de 2 a 4 horas, dependendo da configuração).
O Ally X também teve um desempenho muito bom em nossos testes de bateria padrão, o que não é realmente surpreendente quando se combina uma bateria de 80 Wh (que é mais do que a maioria dos notebooks tem) com uma pequena tela de 7 polegadas. Nosso teste de Wi-Fi a 150 nits (43% do brilho máximo) funciona por quase 16 horas a 60 Hz e quase 15 horas a 120 Hz. Com o brilho máximo, ainda obtemos cerca de 12,5 horas (60 Hz) e cerca de 12 horas (120 Hz), respectivamente. A reprodução de vídeo a 150 nits é possível por 19,5 horas.
O tempo de carregamento com o adaptador de 65 W incluído é de 128 minutos quando o dispositivo é ligado (50% após 53 minutos, 80% após 84 minutos). Ambas as portas USB-C suportam carregamento rápido de até 100 Watts, o que supostamente reduz o tempo de carregamento entre 0-50%. Obviamente, testamos essa afirmação com uma PSU de 100 W e podemos confirmar o carregamento mais rápido, mas também para níveis de bateria acima de 50%. Uma recarga completa levou 93 minutos e 50% está disponível após apenas 29 minutos (80% após 51 minutos).
| Asus ROG Ally X Z1 Extreme, Radeon 780M, 80 Wh | GPD Win Mini 2024 7" R7 8840U, Radeon 780M, 44 Wh | MSI Claw Ultra 7 155H, Arc 8-Core, 53 Wh | Valve Steam Deck 1 TB OLED Steam Deck OLED APU, Radeon Radeon Steam Deck 8CU, 50 Wh | Lenovo Legion Go Z1 Extreme, Radeon 780M, 49.2 Wh | Ayaneo Kun R7 7840U, Radeon 780M, 75 Wh | Asus ROG Ally Z1 Extreme Z1 Extreme, Radeon 780M, 40 Wh | Média da turma Handheld / UMPC | |
|---|---|---|---|---|---|---|---|---|
| Duração da bateria | -35% | -47% | -41% | -62% | -49% | -52% | -41% | |
| H.264 | 1174 | 527 -55% | 568 -52% | 629 ? -46% | ||||
| WiFi v1.3 | 949 | 518 -45% | 466 -51% | 559 -41% | 358 -62% | 602 -37% | 465 -51% | 575 ? -39% |
| Cyberpunk 2077 ultra 150cd | 124 | 76 -39% | ||||||
| Load | 128 | 96 -25% | 76 -41% | 50 -61% | 79.3 ? -38% | |||
| Gaming | 252 | 97 | 122 | 129.2 ? | ||||
| Witcher 3 ultra | 101 | 57 | 86.5 ? |
Pro
Contra
Veredicto - O ROG Ally X é o melhor dispositivo portátil para jogos no momento
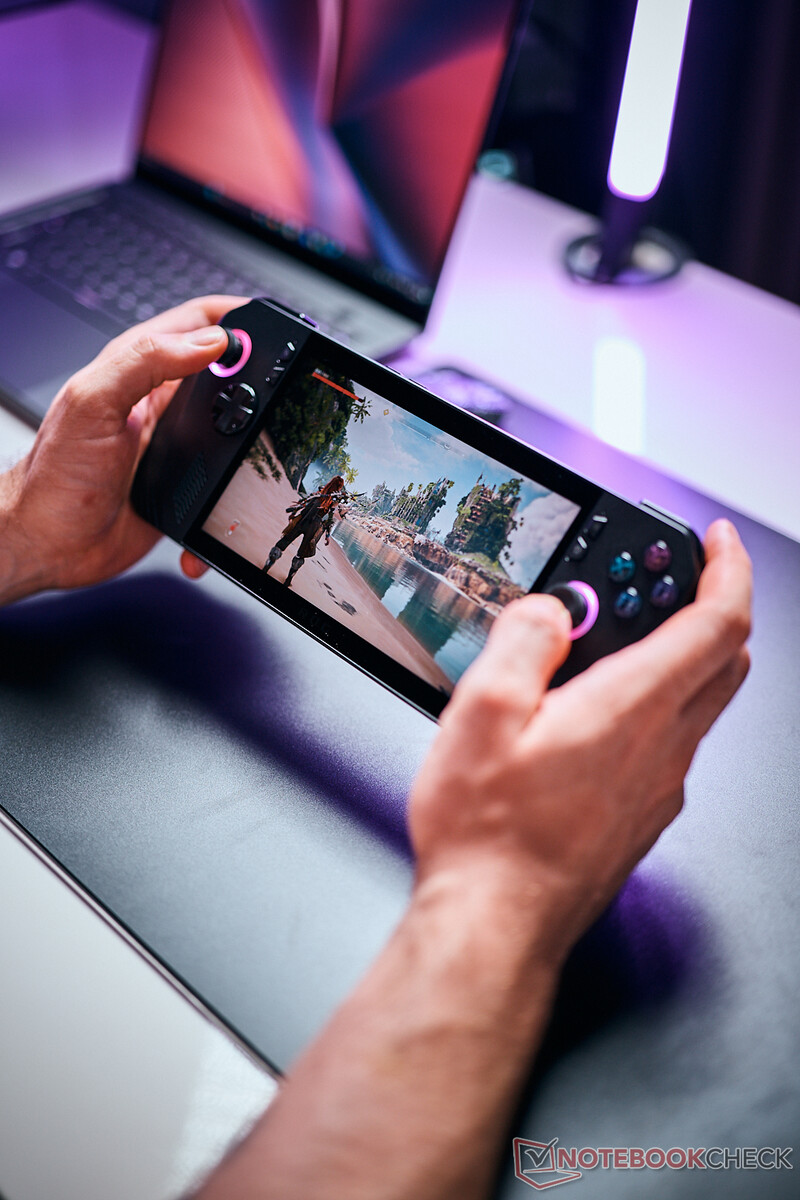
O ROG Ally original já era um dispositivo portátil muito bom para jogos e a Asus usa o novo ROG Ally X para eliminar as desvantagens do primeiro modelo, especialmente em termos de ergonomia e duração da bateria. O novo chassi tem alças maiores, portanto, até mesmo as sessões de jogos mais longas são mais confortáveis. A resistência para sessões de jogos mais longas é fornecida pela enorme bateria de 80 Wh e o modo Performance ajustado acaba sendo a configuração ideal para jogos móveis. O senhor terá que reduzir alguns detalhes (especialmente nos títulos AAA modernos), mas, em troca, terá um tempo de execução de quase três horas e ventoinhas quase inaudíveis.
O SoC da AMD oferece basicamente o mesmo desempenho de CPU de antes, mas a iGPU se beneficia da RAM mais rápida e o senhor obtém 8 GB a mais (8 GB alocados para a Radeon 780M, 16 GB para o restante do sistema). Graças aos recursos abrangentes da GPU, o senhor pode jogar todos os títulos modernos sem problemas no ROG Ally X. Os dispositivos de entrada aprimorados também ajudam; especialmente os joysticks e o D-pad são muito melhores do que antes. A tela IPS permanece inalterada e é excelente para jogos graças a recursos como 120 Hz e VRR.
Mais desempenho, ergonomia aprimorada e vida útil da bateria muito mais longa: O novo ROG Ally X oferece o melhor pacote geral entre os dispositivos portáteis para jogos e a Asus conseguiu corrigir praticamente todas as reclamações que tínhamos sobre o ROG Ally original. O preço mais alto de 899 euros é, portanto, justificado.
A Asus conseguiu melhorar o jogador móvel em quase todos os aspectos e o pacote geral é difícil de ser superado no momento. Além das vantagens mencionadas, o senhor também recebe um SSD M.2-2280 regular, o que facilita muito os upgrades de SSD. Agora há duas portas USB-C, portanto, é ainda mais fácil usar o Ally X como um PC pequeno. A implementação do software foi continuamente aprimorada desde o lançamento do ROG Ally original e tudo funciona muito bem.
Não há muitas desvantagens. Uma webcam seria bom e um módulo Wi-Fi 7 certamente já está na lista de tarefas para a próxima iteração. No entanto, não temos certeza sobre a tela, pois o painel IPS é muito bom para jogos. Uma tela OLED melhoraria a qualidade da imagem, mas o senhor teria que abrir mão de recursos como o VRR. Também não há problema com o PWM na tela IPS. Depois, há o processador, no qual gostaríamos de ver uma das novas APUs AMD Zen5, mas isso provavelmente aumentaria o custo. E ainda temos que esperar uma semana para ver o desempenho real dos novos chips.
Entre os rivais, o novo ROG Ally X é uma das unidades mais caras, com preço de 899 euros (US$ 799), mas achamos que isso se justifica. O computador de mão Claw da MSI da MSI, caiu recentemente para 749 euros (US$ 649), mas simplesmente não é tão bom em muitos aspectos. O Steam Deck OLED ainda é um forte concorrente, mas o desempenho é muito inferior. Dispositivos como o Legion Go só fazem sentido se o usuário precisar de uma tela maior. Os usuários preocupados com o preço devem ficar de olho no original ROG Ally original. Ele já está disponível por menos de 600 euros e os preços provavelmente cairão ainda mais quando o ROG Ally X chegar às prateleiras. O senhor poderia usar uma pequena parte da economia para adquirir um banco de energia de grande capacidade para aumentar a duração da bateria.
Preço e disponibilidade
O senhor pode encomendar o novo Asus ROG Ally X na Best Buy por US$ 799.
Observação: Atualizamos recentemente nosso sistema de classificação e os resultados da versão 8 não são comparáveis aos resultados da versão 7. Mais informações estão disponíveis aqui .
Asus ROG Ally X
- 07/22/2024 v8
Andreas Osthoff
 Total Sustainability Score:
 Transparência
A seleção dos dispositivos a serem analisados é feita pela nossa equipe editorial. A amostra de teste foi fornecida ao autor como empréstimo pelo fabricante ou varejista para fins desta revisão. O credor não teve influência nesta revisão, nem o fabricante recebeu uma cópia desta revisão antes da publicação. Não houve obrigação de publicar esta revisão. Nunca aceitamos compensação ou pagamento em troca de nossas avaliações. Como empresa de mídia independente, a Notebookcheck não está sujeita à autoridade de fabricantes, varejistas ou editores.
É assim que o Notebookcheck está testando
Todos os anos, o Notebookcheck analisa de forma independente centenas de laptops e smartphones usando procedimentos padronizados para garantir que todos os resultados sejam comparáveis. Desenvolvemos continuamente nossos métodos de teste há cerca de 20 anos e definimos padrões da indústria no processo. Em nossos laboratórios de teste, equipamentos de medição de alta qualidade são utilizados por técnicos e editores experientes. Esses testes envolvem um processo de validação em vários estágios. Nosso complexo sistema de classificação é baseado em centenas de medições e benchmarks bem fundamentados, o que mantém a objetividade.Price comparison

