

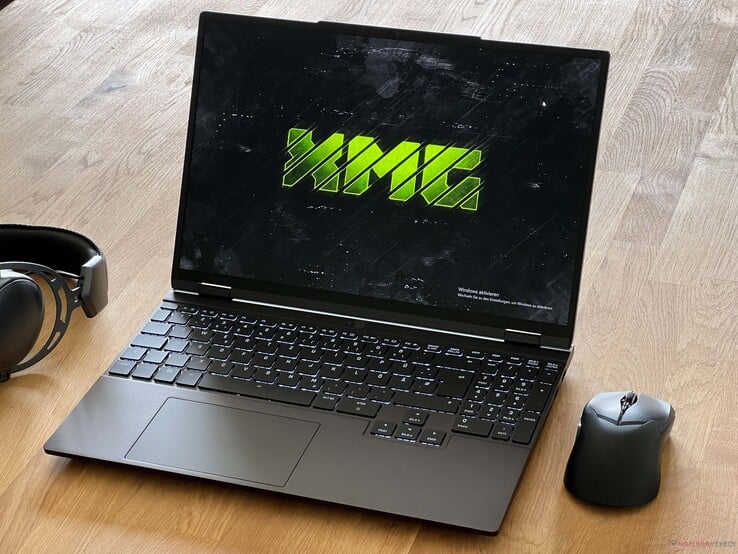
Análise do laptop Schenker XMG Evo 15 (M24) - Ultrabook alemão com tela brilhante e excelentes opções de manutenção
Até agora, os notebooks XMG eram voltados principalmente para gamers e clientes que precisavam de placas de vídeo dedicadas e rápidas. Com os novos modelos XMG Evo (14 e 15 polegadas), o fabricante alemão agora também está lançando dois ultrabooks sem GPUs dedicadas. Os gabinetes são mais compactos, mas, ao mesmo tempo, o senhor não precisa prescindir de amplas opções de manutenção. O fabricante também oferece aos clientes a escolha entre CPUs Ryzen 8000 da AMD (a partir de 1.049 euros) ou chips Meteor Lake da Intel (a partir de 1.199 euros), o que, de acordo com Schenker, não gera grandes diferenças de desempenho. A tela é sempre um painel WQHD fosco (2.560 x 1.600 pixels) com um brilho de 500 nits e uma frequência de 240 Hz.
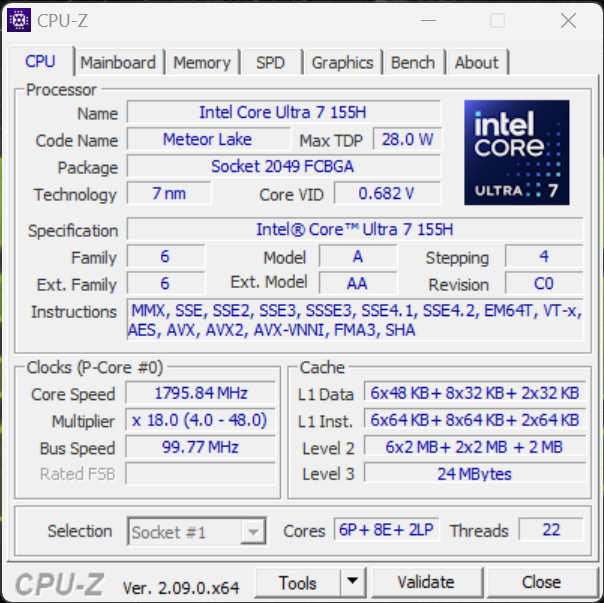
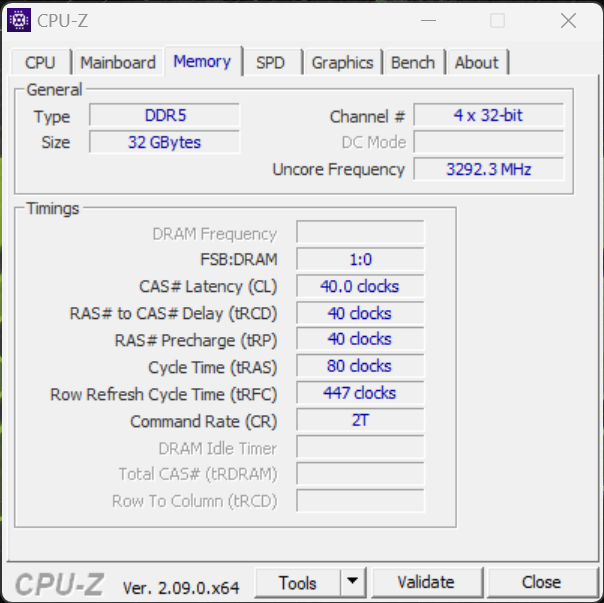
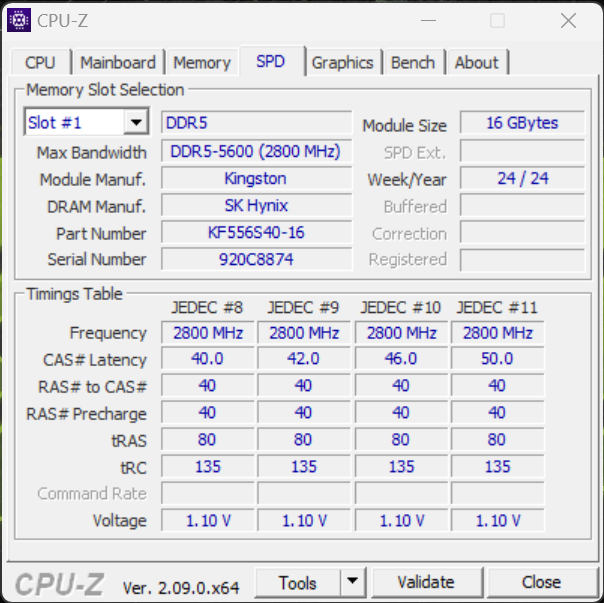
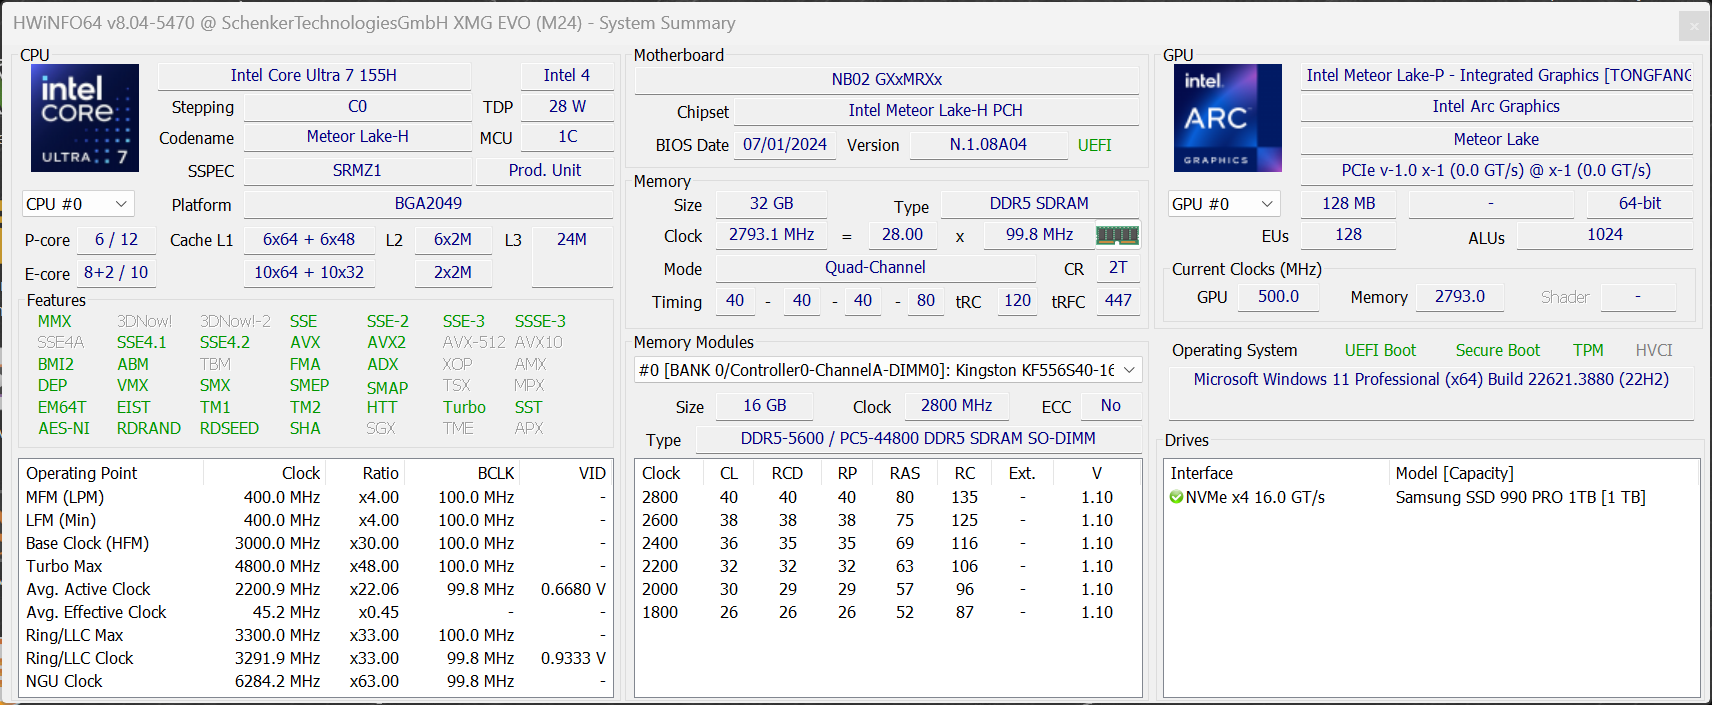
Testamos o novo XMG Evo 15 (M24) com Intel Core Ultra 7 155H incluindo o Arc Graphics iGPU em combinação com 32 GB de RAM (DDR5-5600) e a versão de 1 TB do Samsung 990 Pro. Nessa configuração (incluindo a pré-instalação do Windows 11), o preço é de 1.400 euros.
Possíveis concorrentes em comparação
Avaliação | Versão | Data | Modelo | Peso | Altura | Size | Resolução | Preço |
|---|---|---|---|---|---|---|---|---|
| 84.7 % | v8 | 08/2024 | SCHENKER XMG Evo 15 (M24) Ultra 7 155H, Arc 8-Core | 1.7 kg | 19.9 mm | 15.30" | 2560x1600 | |
| 82.1 % | v8 | 07/2024 | Dell Inspiron 16 7640 2-in-1 Ultra 7 155H, Arc 8-Core | 2.1 kg | 18.99 mm | 16.00" | 2560x1600 | |
| 76.7 % | v8 | 07/2024 | Medion S10 OLED Ultra 7 155H, Arc 8-Core | 1.6 kg | 17.8 mm | 16.00" | 3840x2400 | |
| 89.7 % v7 (old) | v7 (old) | 04/2024 | Xiaomi RedmiBook Pro 16 2024 Ultra 7 155H, Arc 8-Core | 1.9 kg | 15.9 mm | 16.00" | 3072x1920 | |
| 87.9 % v7 (old) | v7 (old) | 05/2024 | Lenovo IdeaPad Pro 5 16IMH G9 Ultra 7 155H, Arc 8-Core | 1.9 kg | 17.5 mm | 16.00" | 2560x1600 | |
| 89.9 % v7 (old) | v7 (old) | 05/2024 | Lenovo ThinkPad T16 G2 21K70035GE R7 7840U, Radeon 780M | 1.8 kg | 23.8 mm | 16.00" | 1920x1200 |
Observação: Atualizamos recentemente nosso sistema de classificação e os resultados da versão 8 não são comparáveis aos resultados da versão 7. Mais informações podem ser encontradas aqui.
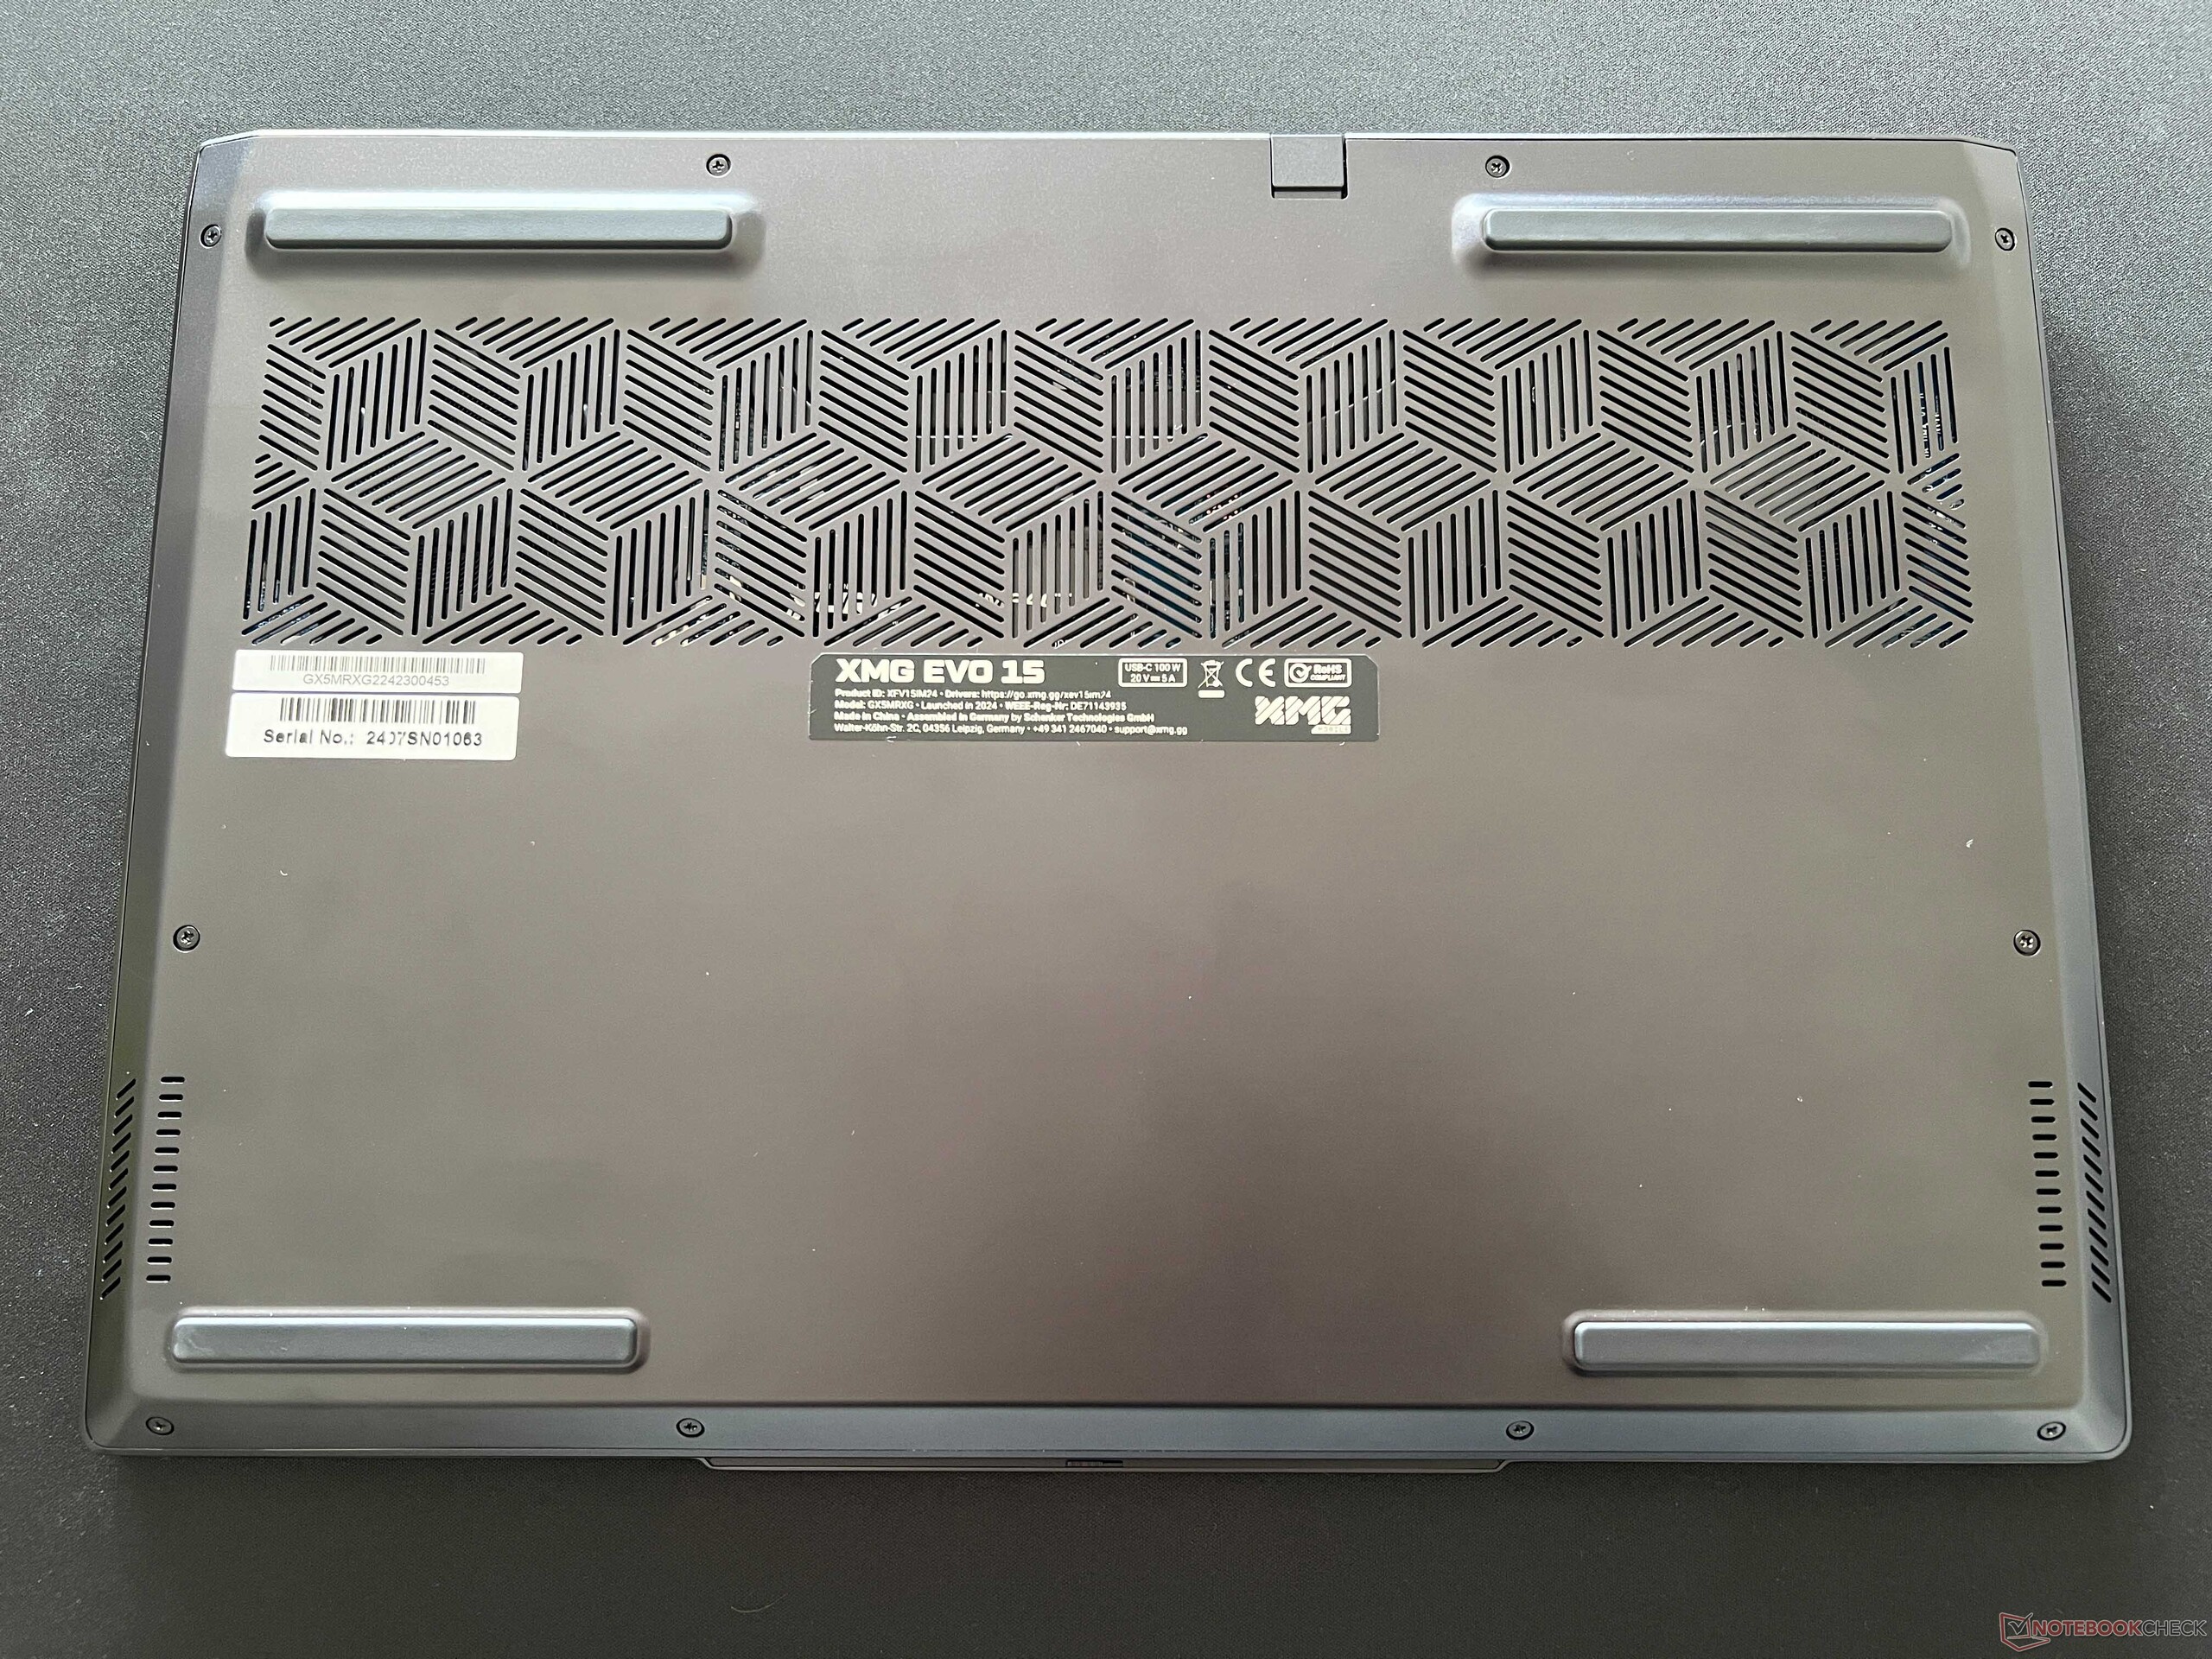
Estojo - Tampa de alumínio resistente

O XMG Evo 15 apresenta um chassi de alumínio preto, que é um pouco semelhante ao do XMG Fusion 15 para gamers. No entanto, o Evo 15 é mais compacto (especialmente mais fino) e também não tem as aberturas de resfriamento em ambos os lados. No geral, o notebook parece muito simples e também pode ser usado em um ambiente profissional sem problemas; se necessário, o laptop também pode ser encomendado sem o logotipo na tampa da tela. No entanto, as superfícies de alumínio são bastante sensíveis a impressões digitais e precisam ser limpas regularmente.
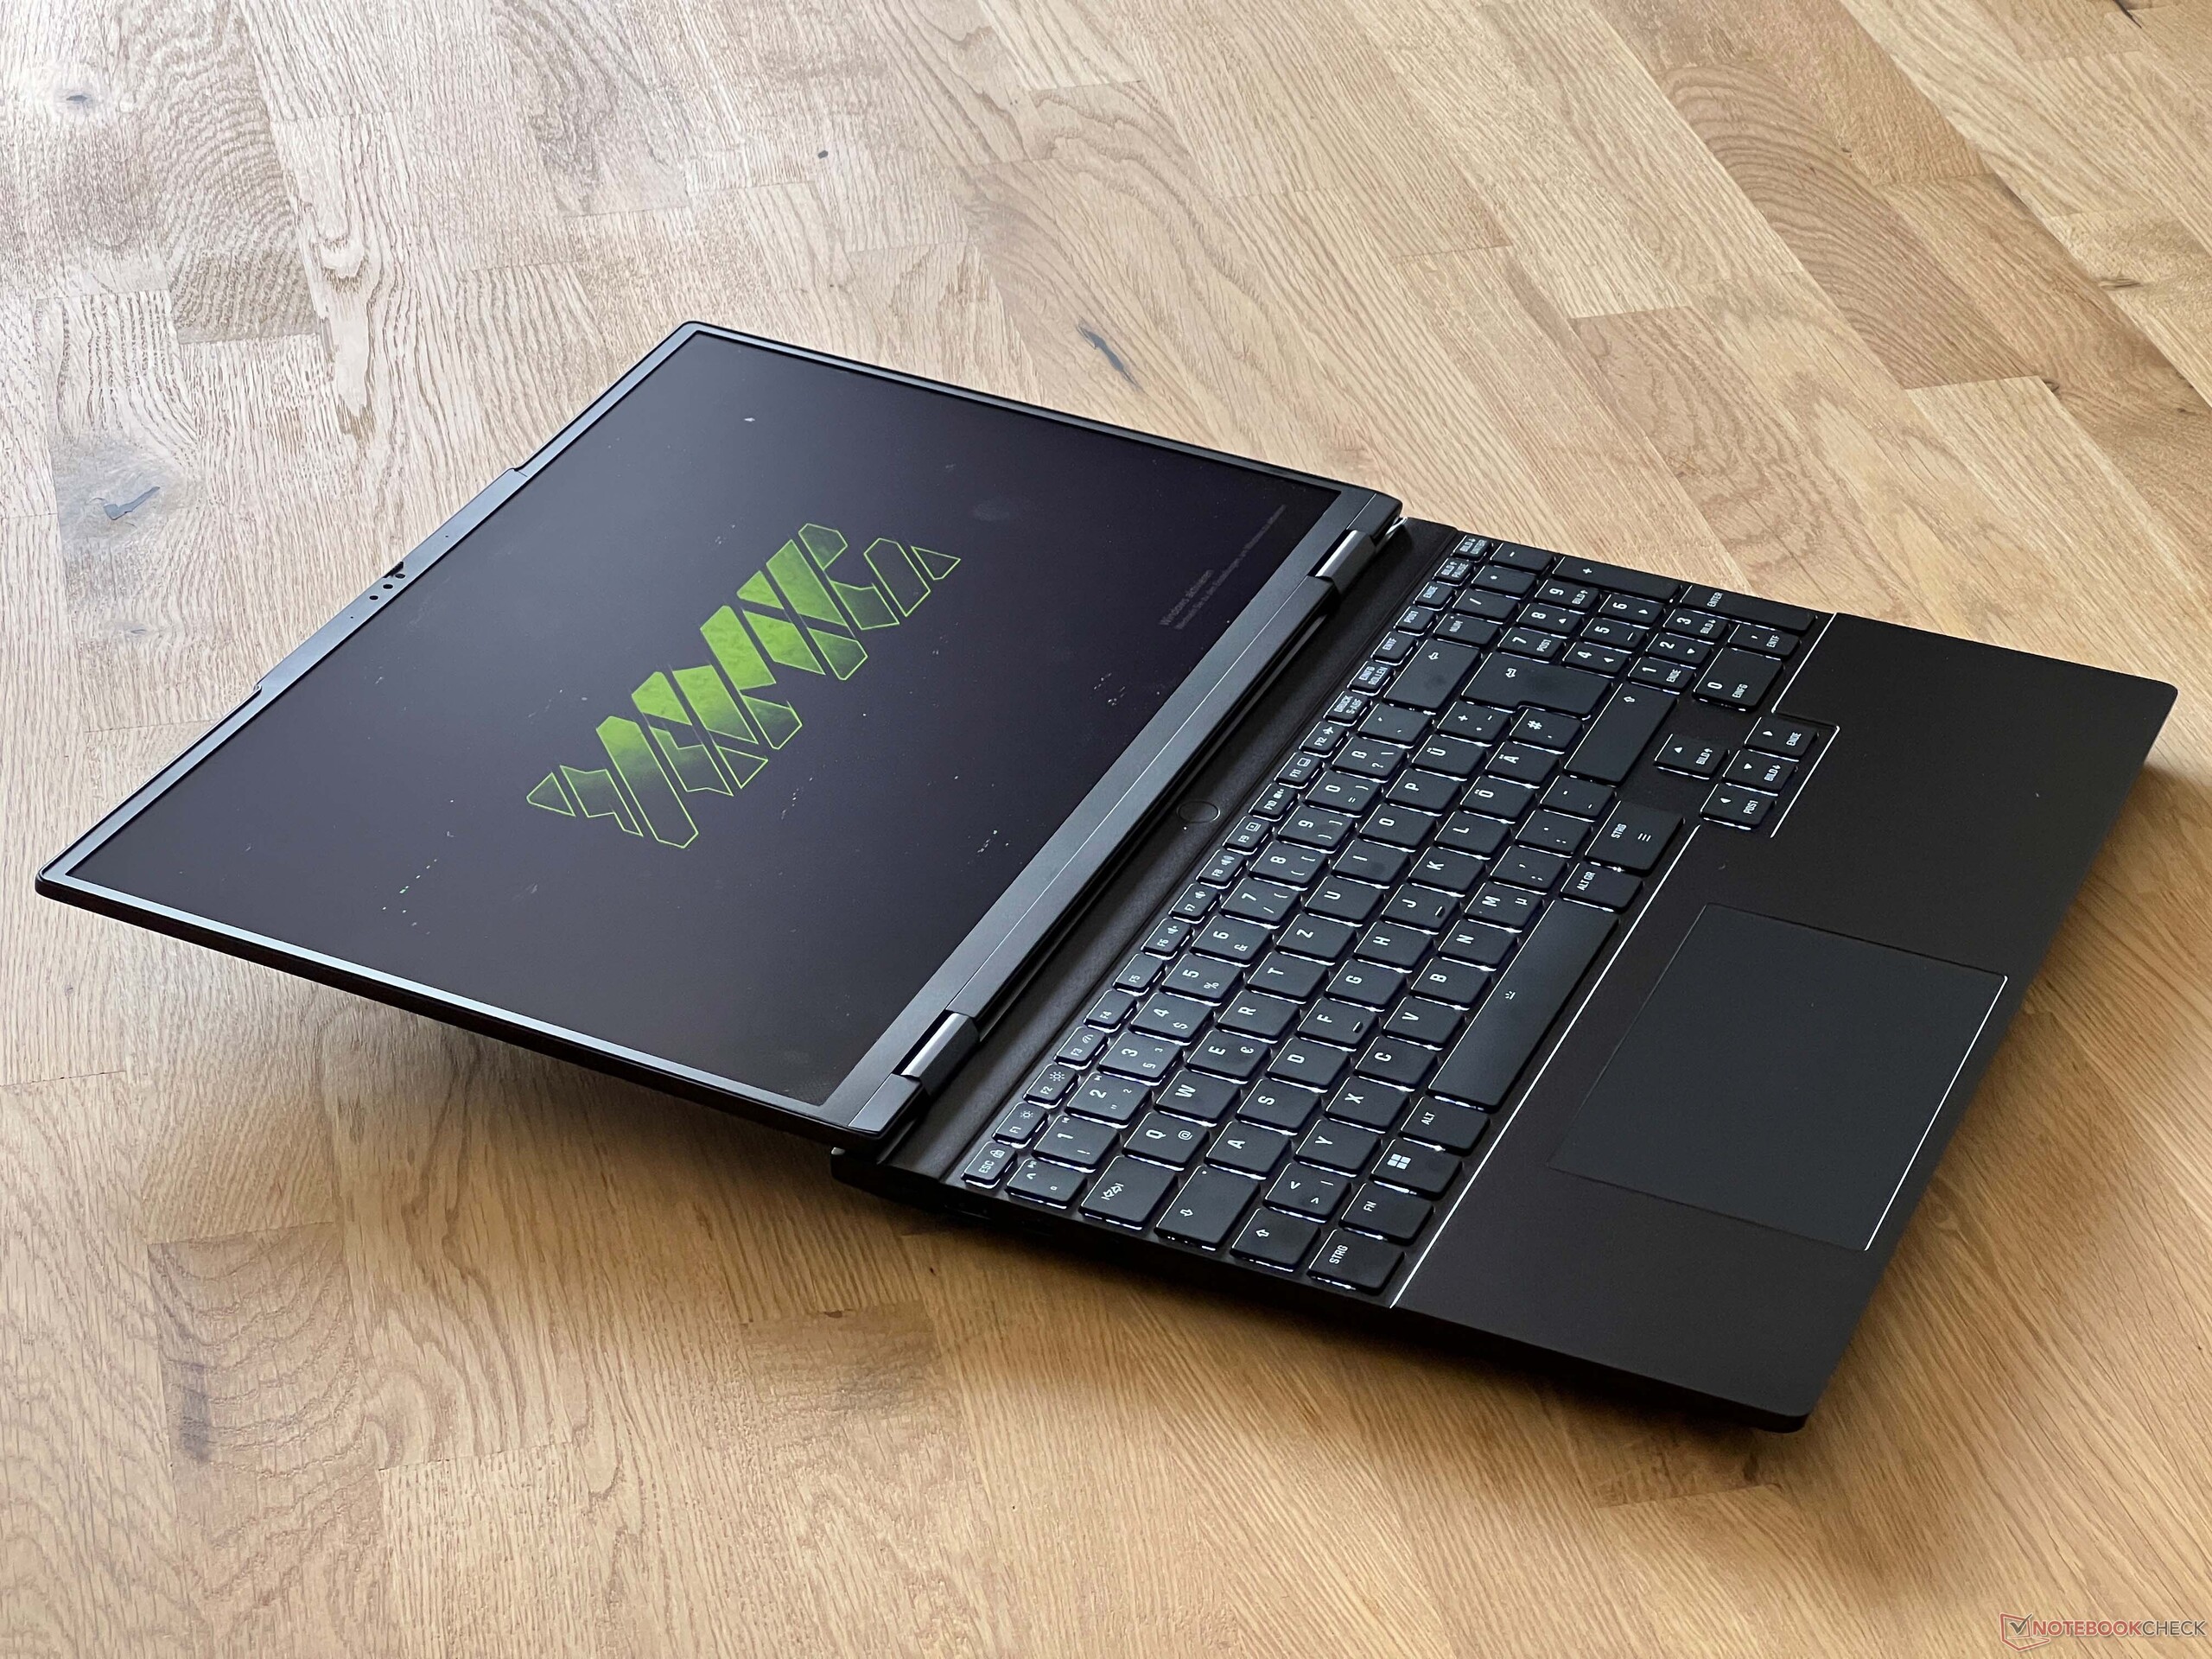
Em termos de qualidade, o novo Evo 15 tem um bom desempenho, pois o acabamento é muito bom e o laptop causa uma impressão geral de alta qualidade. A unidade de base é muito estável e só pode ser um pouco amassada na área central do teclado se o senhor colocar as mãos sobre ela. A tampa da tela também é estável e não conseguimos provocar nenhuma distorção na imagem. O ângulo máximo de abertura é de 180 graus e as dobradiças mantêm a tela firmemente na posição, exceto por um leve ressalto, mas abri-la com uma mão também é possível sem problemas, graças à leve saliência da câmera.

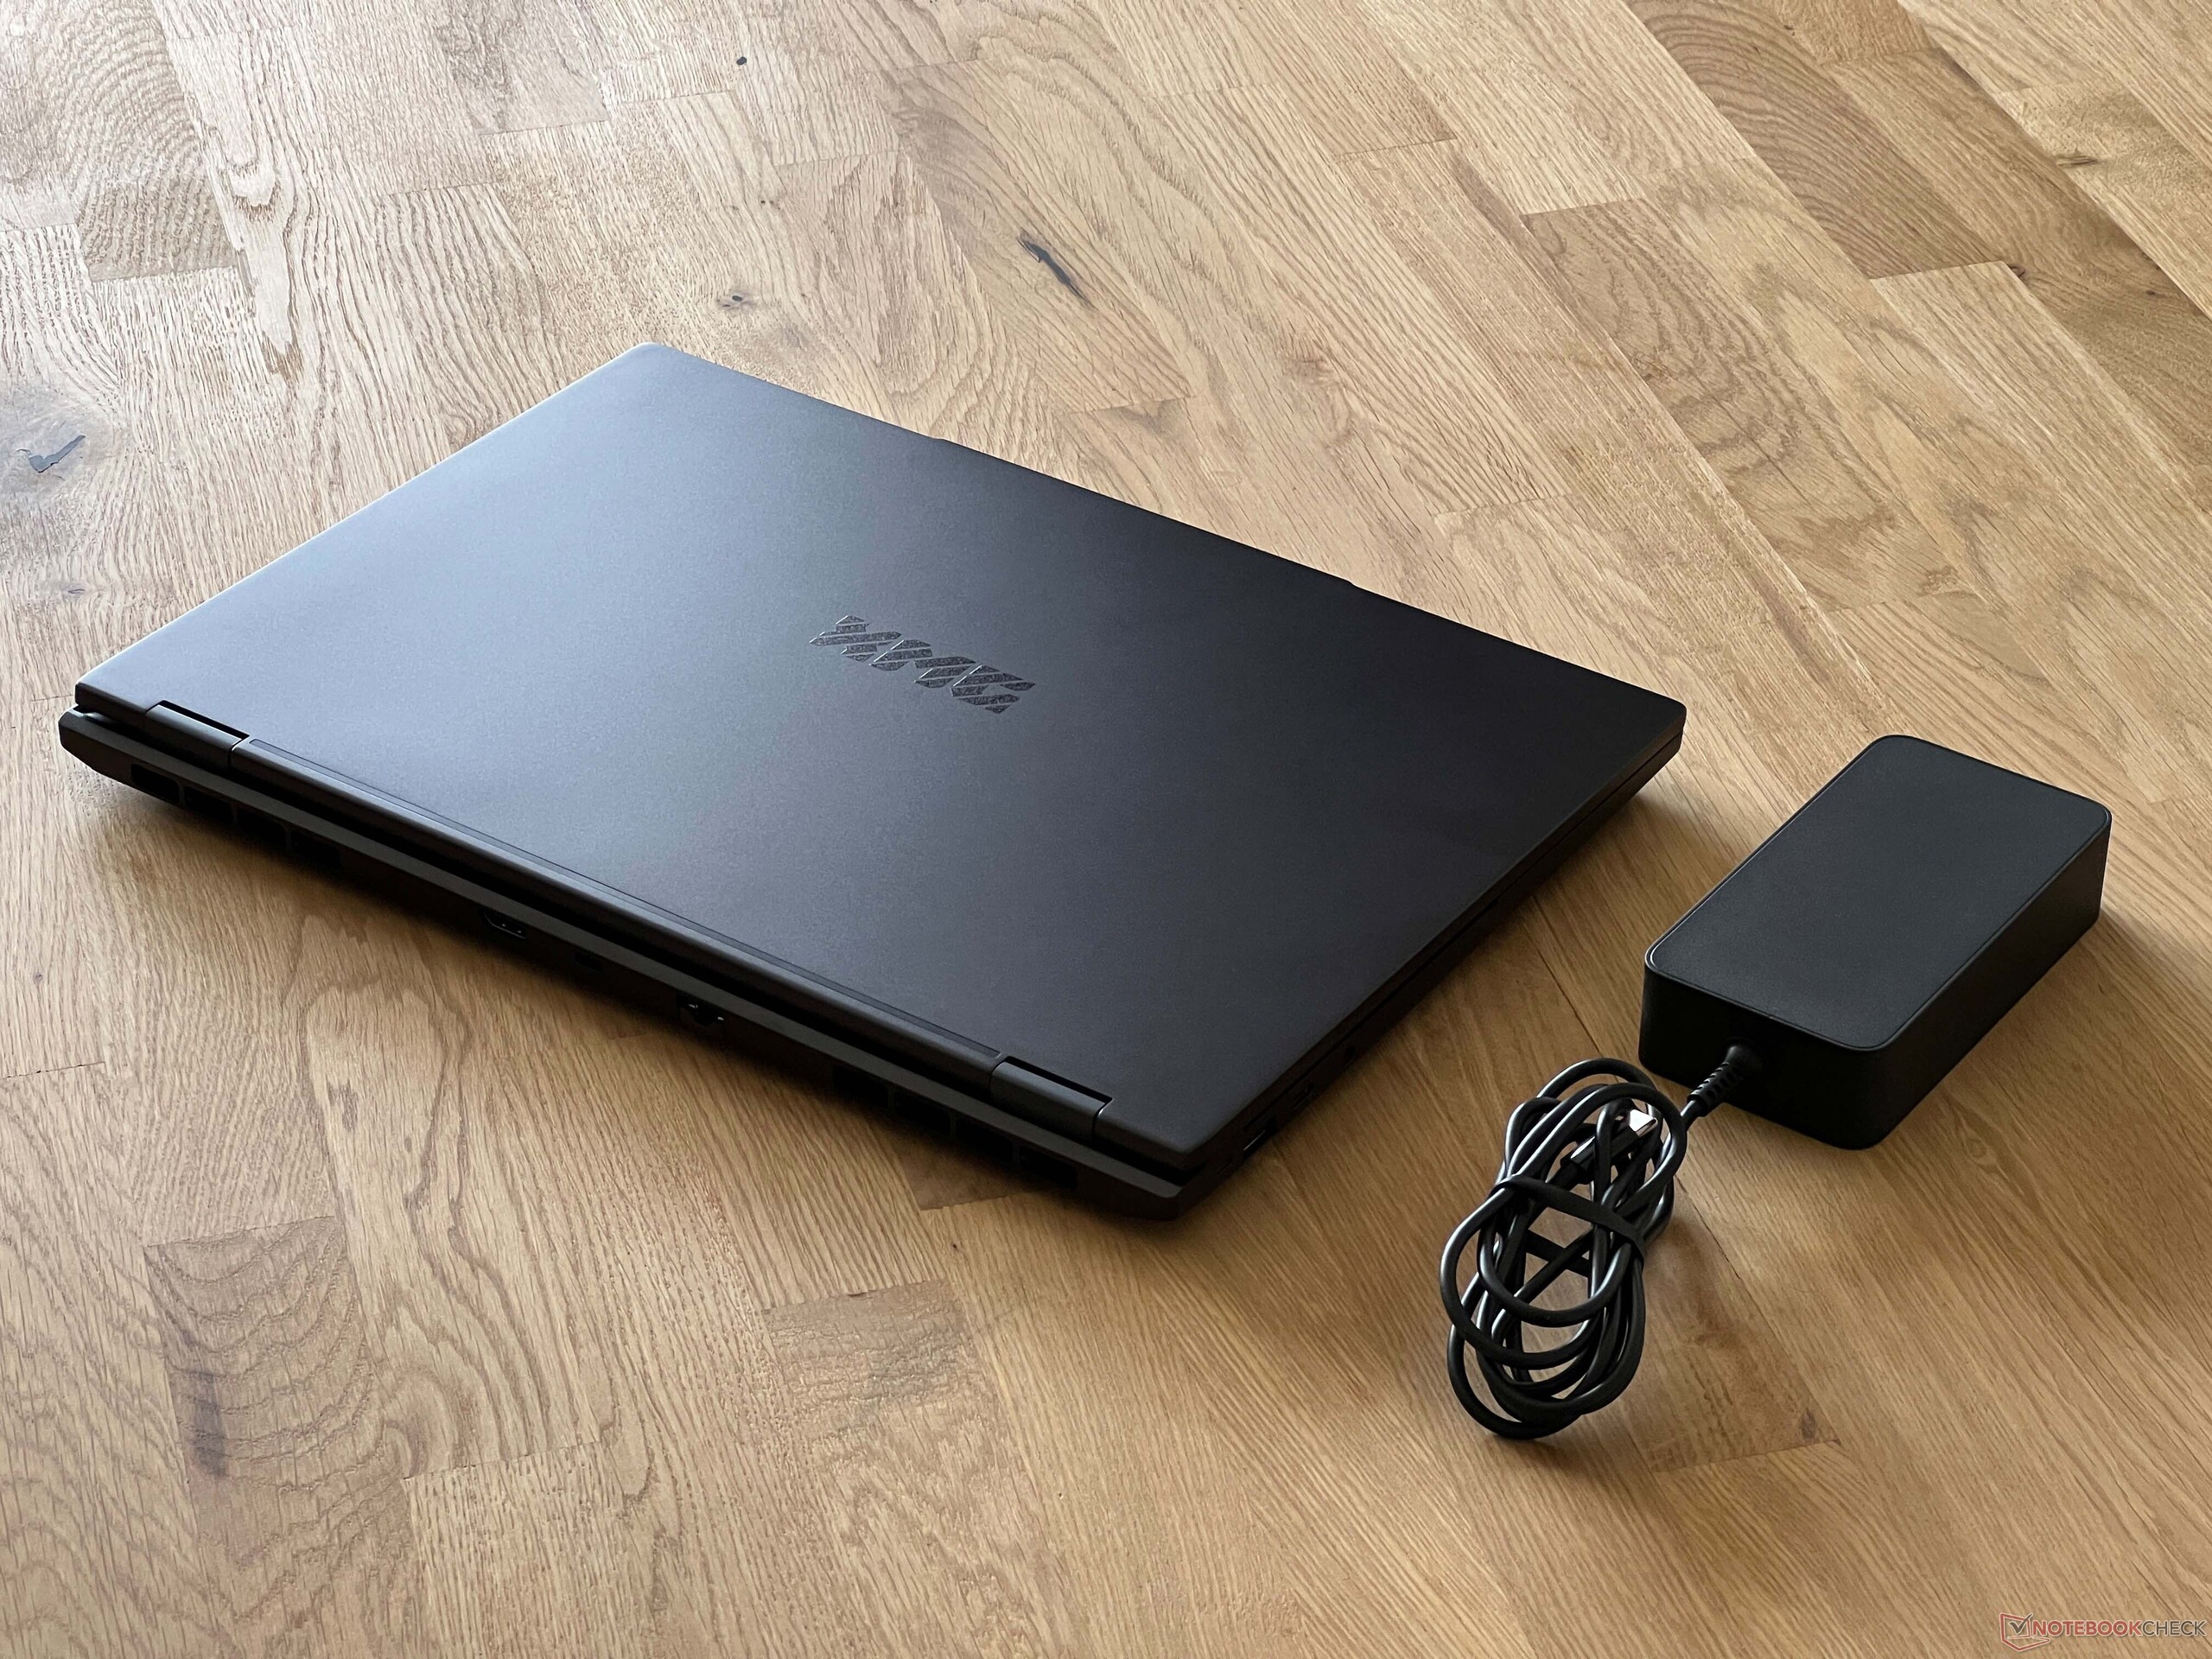
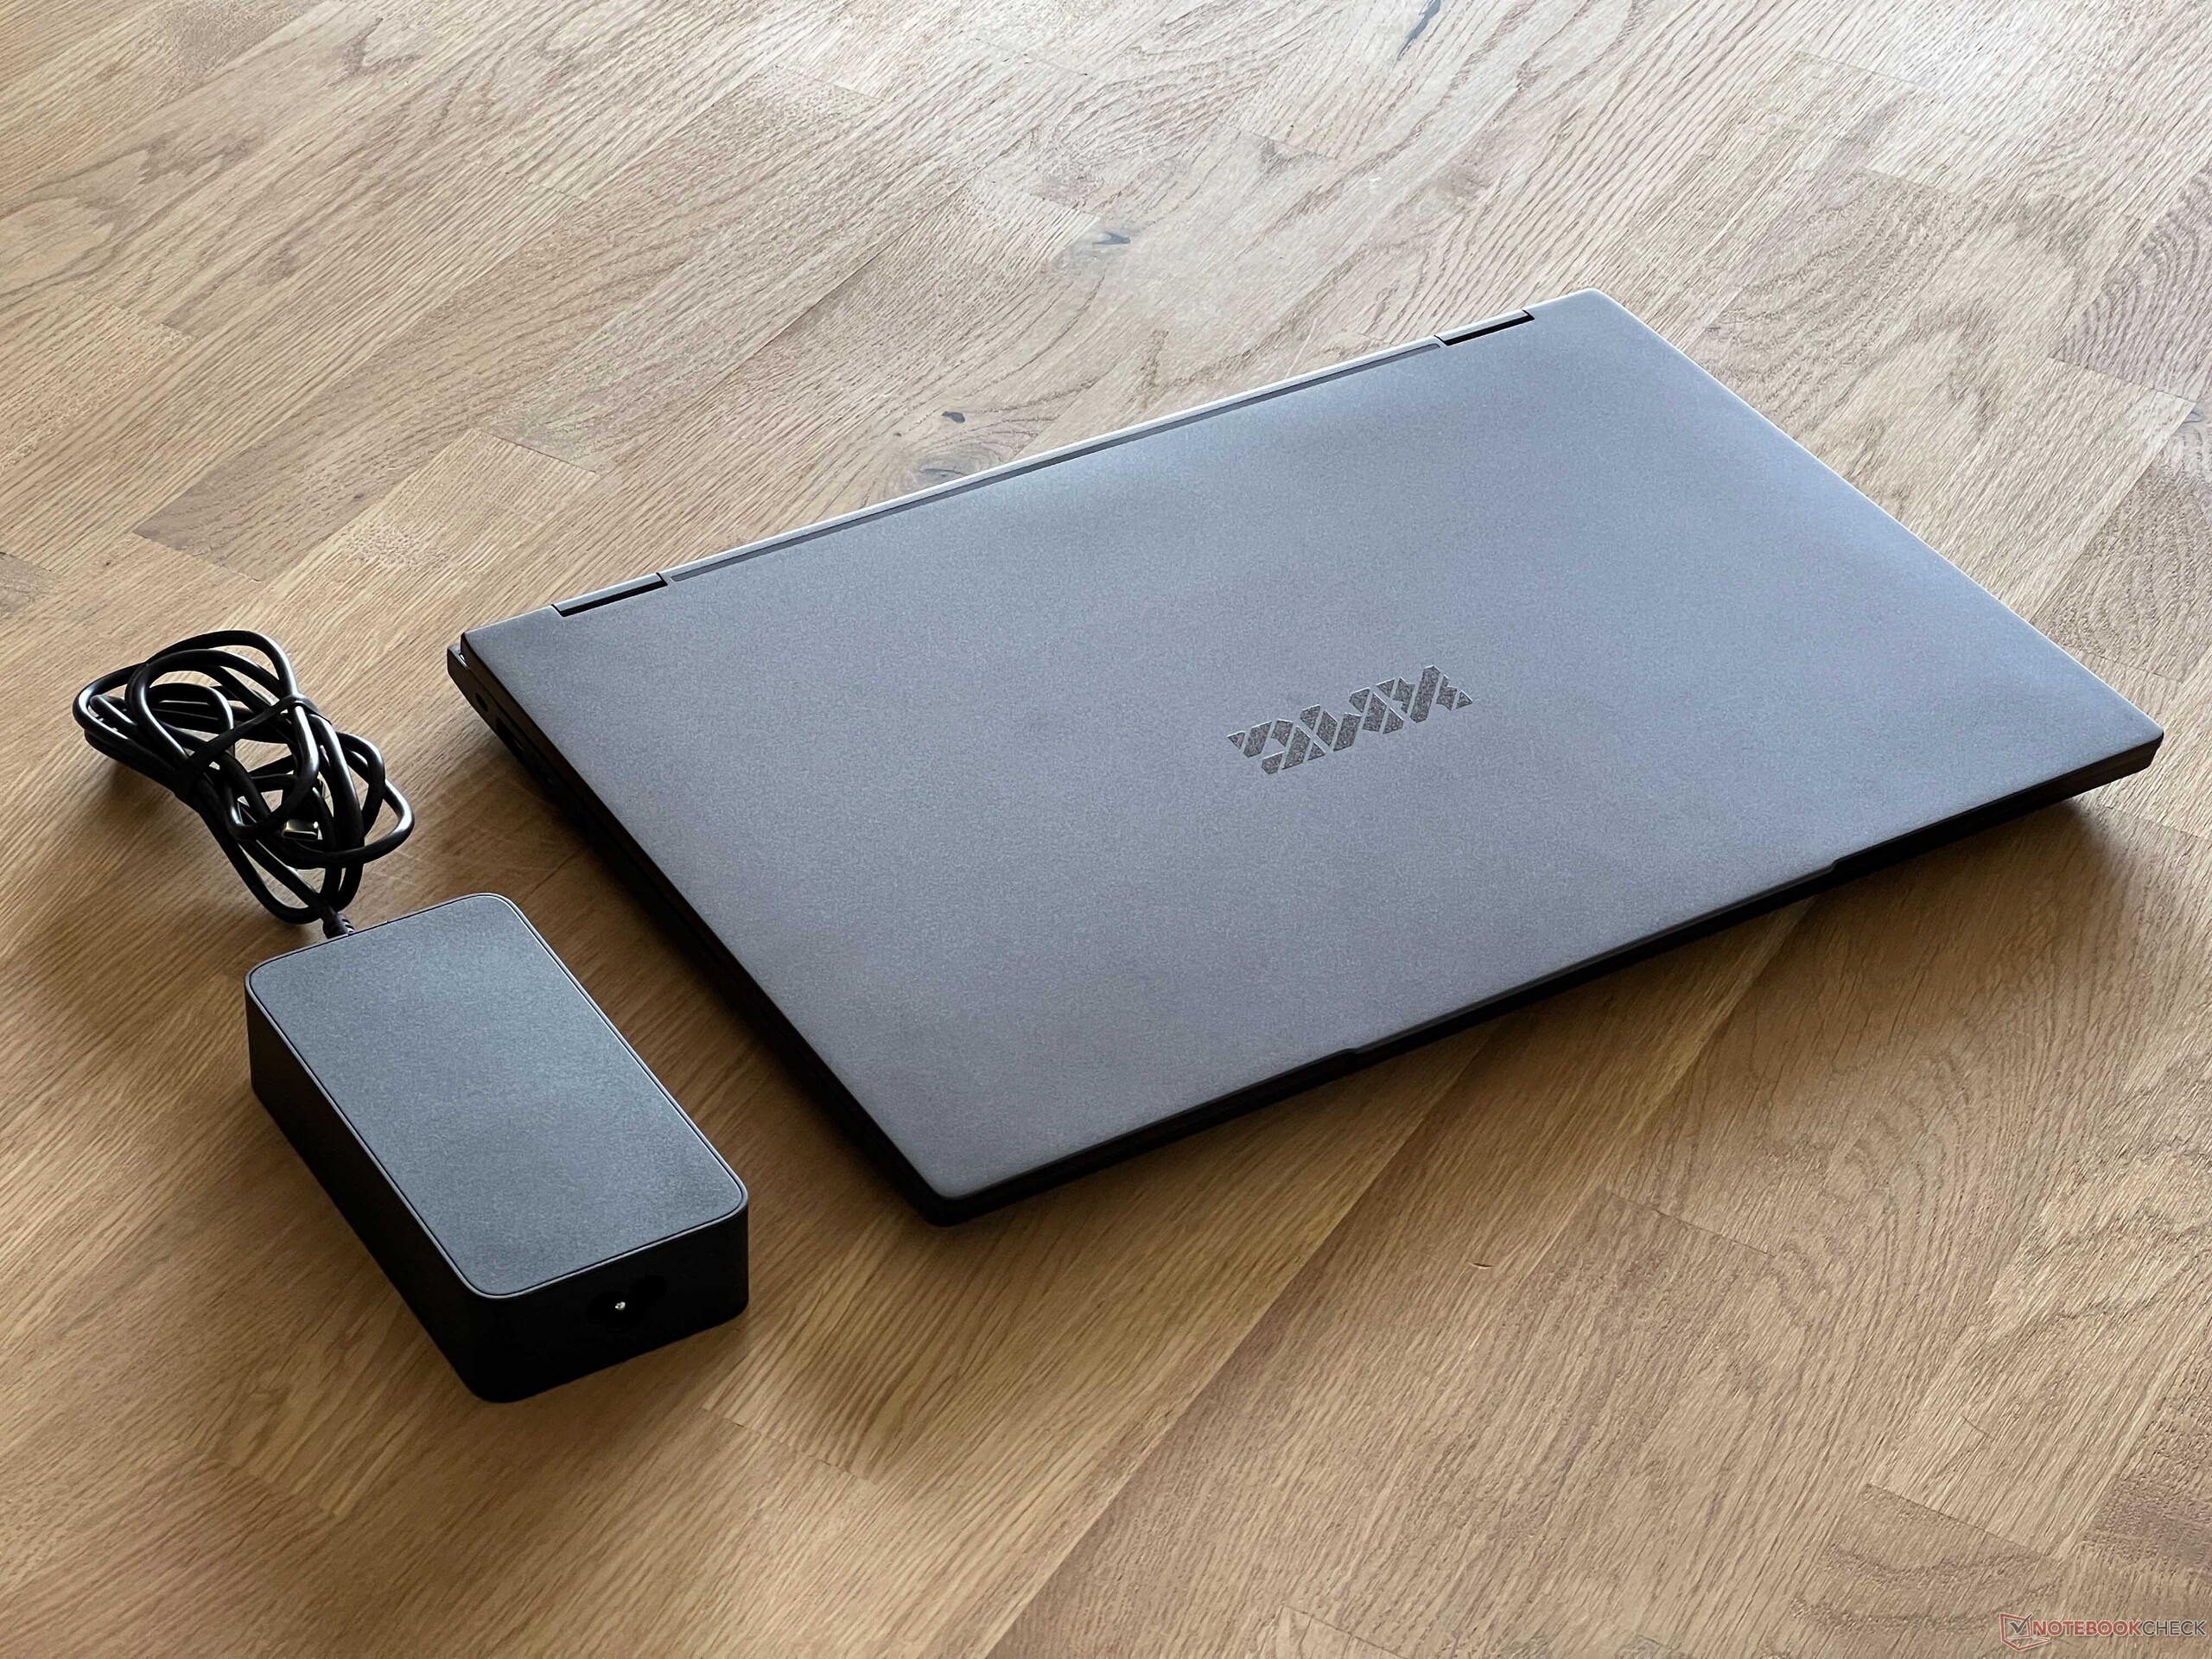
Com uma espessura de aproximadamente 2 cm, o Evo 15 não é o notebook mais fino, mas também não tem a pretensão de ser. No entanto, sua pegada é visivelmente mais compacta do que a de seus concorrentes de 16 polegadas. Com um peso de cerca de 1,7 kg, ele também é um dos modelos mais leves em nosso campo de comparação. A fonte de alimentação de 100 watts pesa 513 gramas, mas isso inclui o longo cabo de alimentação (1,8 + 1,5 metros).
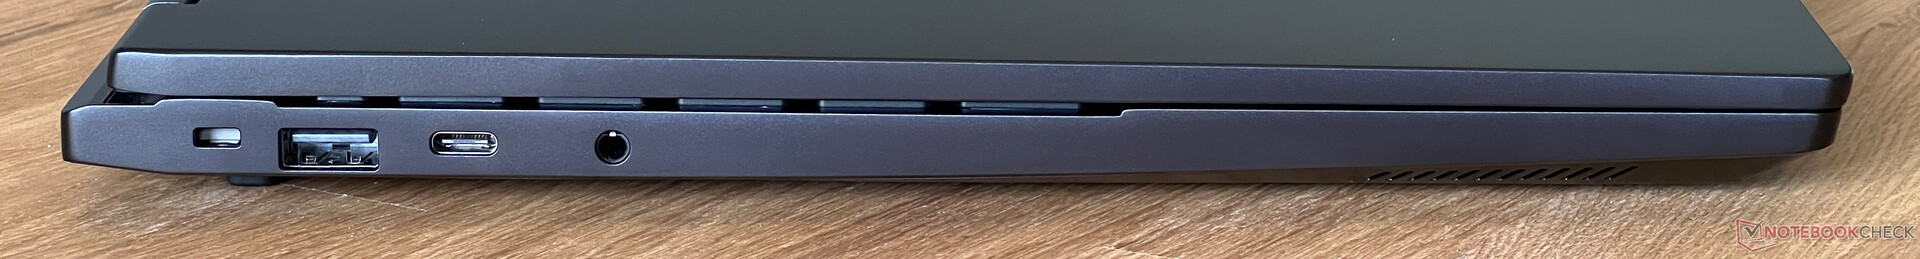
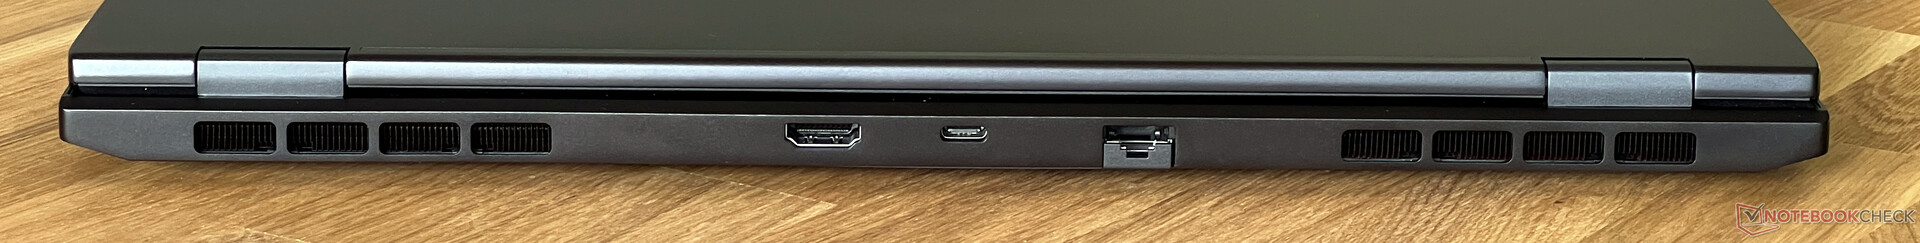
Recursos - Thunderbolt 4 e USB 2.0
As portas estão distribuídas nas duas áreas laterais traseiras e na parte traseira. Em princípio, todos os padrões modernos, incluindo Thunderbolt 4 (ou USB 4.0 no modelo AMD) estão disponíveis e também há portas USB suficientes, mas não sabemos o que uma porta USB 2.0 está fazendo em um laptop moderno. Pelo menos há apenas uma delas, as outras duas estão em conformidade com o padrão USB 3.2 Gen1.
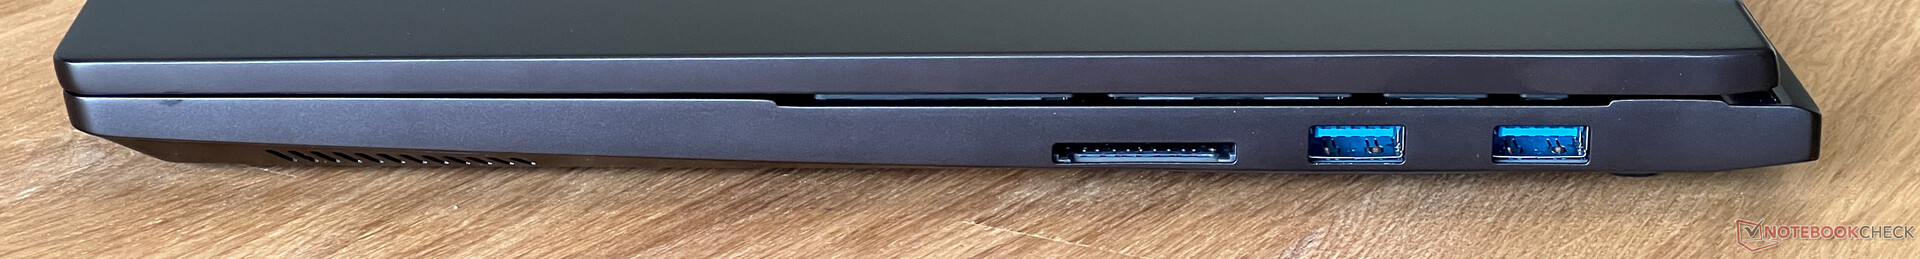
Leitor de cartão SD
Em conjunto com nosso cartão de referência (Angelbird AV Pro V60), o leitor de cartão SD completo atinge taxas de transferência de até 90 MB/s e ~50 MB/s ao copiar dados. Em geral, esses resultados estão um pouco abaixo da média.
| SD Card Reader | |
| average JPG Copy Test (av. of 3 runs) | |
| SCHENKER XMG Evo 15 (M24) (ADATA V90) | |
| SCHENKER XMG Evo 15 (M24) (Angelbird AV Pro V60) | |
| Média da turma Multimedia (18.4 - 201, n=56, últimos 2 anos) | |
| Lenovo IdeaPad Pro 5 16IMH G9 (Angelbird AV Pro V60) | |
| Dell Inspiron 16 7640 2-in-1 (Toshiba Exceria Pro SDXC 64 GB UHS-II) | |
| maximum AS SSD Seq Read Test (1GB) | |
| SCHENKER XMG Evo 15 (M24) (ADATA V90) | |
| SCHENKER XMG Evo 15 (M24) (Angelbird AV Pro V60) | |
| Média da turma Multimedia (25.8 - 266, n=56, últimos 2 anos) | |
| Lenovo IdeaPad Pro 5 16IMH G9 (Angelbird AV Pro V60) | |
| Dell Inspiron 16 7640 2-in-1 (Toshiba Exceria Pro SDXC 64 GB UHS-II) | |
Comunicação
O Evo 15 é um dos poucos notebooks multimídia modernos que ainda possui uma conexão de rede Gigabit RJ45. O módulo AX211 da Intel também está disponível para redes sem fio (Wi-Fi 6E). Em conjunto com nosso roteador de referência da Asus, as taxas de transferência foram boas e não tivemos problemas com o sinal Wi-Fi durante o teste.
| Networking | |
| SCHENKER XMG Evo 15 (M24) | |
| iperf3 transmit AXE11000 | |
| iperf3 receive AXE11000 | |
| Dell Inspiron 16 7640 2-in-1 | |
| iperf3 transmit AXE11000 | |
| iperf3 receive AXE11000 | |
| iperf3 transmit AXE11000 6GHz | |
| iperf3 receive AXE11000 6GHz | |
| Medion S10 OLED | |
| iperf3 transmit AXE11000 | |
| iperf3 receive AXE11000 | |
| Xiaomi RedmiBook Pro 16 2024 | |
| iperf3 transmit AXE11000 | |
| iperf3 receive AXE11000 | |
| Lenovo IdeaPad Pro 5 16IMH G9 | |
| iperf3 transmit AXE11000 | |
| iperf3 receive AXE11000 | |
| Lenovo ThinkPad T16 G2 21K70035GE | |
| iperf3 transmit AXE11000 | |
| iperf3 receive AXE11000 | |
| iperf3 transmit AXE11000 6GHz | |
| iperf3 receive AXE11000 6GHz | |
Webcam
Uma câmera de 2 MP com obturador mecânico está embutida na borda superior da tela, o que proporciona uma qualidade de imagem média. Os efeitos do Microsoft Studio também são suportados e a câmera IR adicional permite o reconhecimento facial via Windows Hello.

 Arc 8-Core, Ultra 7 155H, Samsung 990 Pro 1 TB")
 Arc 8-Core, Ultra 7 155H, Samsung 990 Pro 1 TB")
Acessórios
Além da fonte de alimentação de 100 watts, o escopo da entrega também inclui um pendrive USB com drivers e um mouse pad XMG grande feito de tecido.
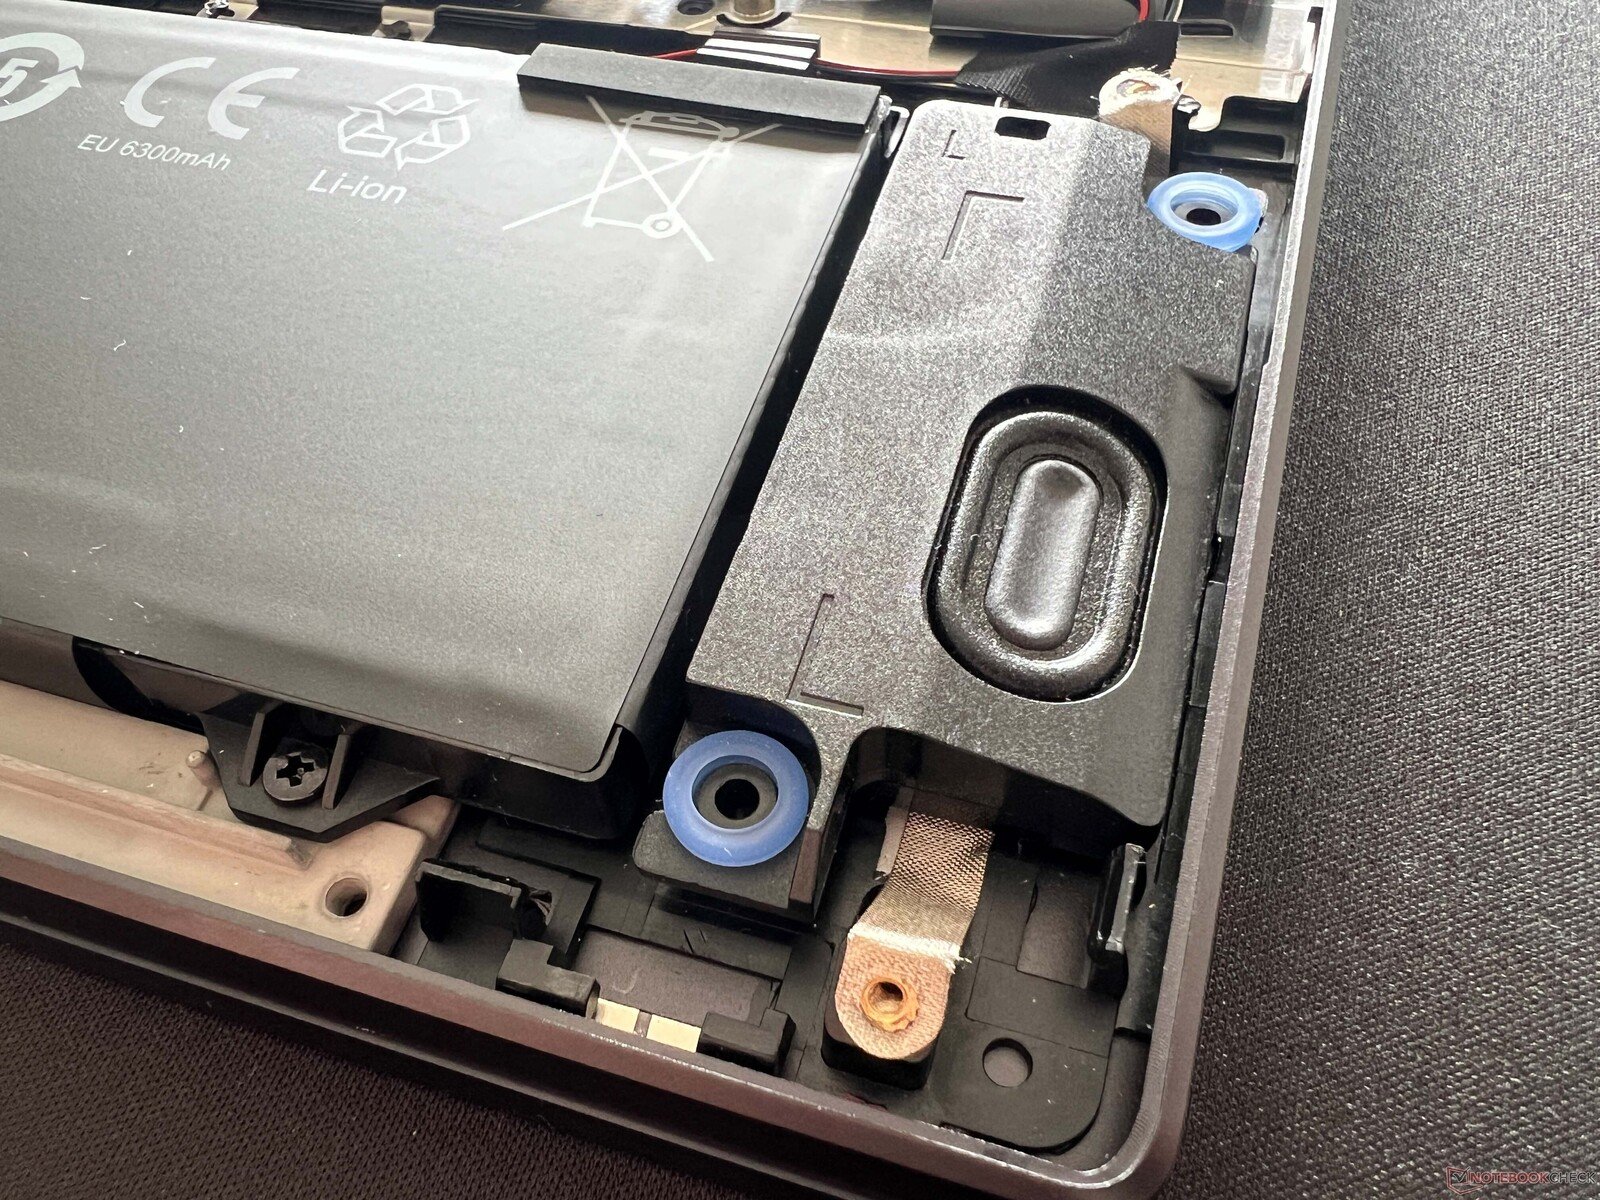
Manutenção
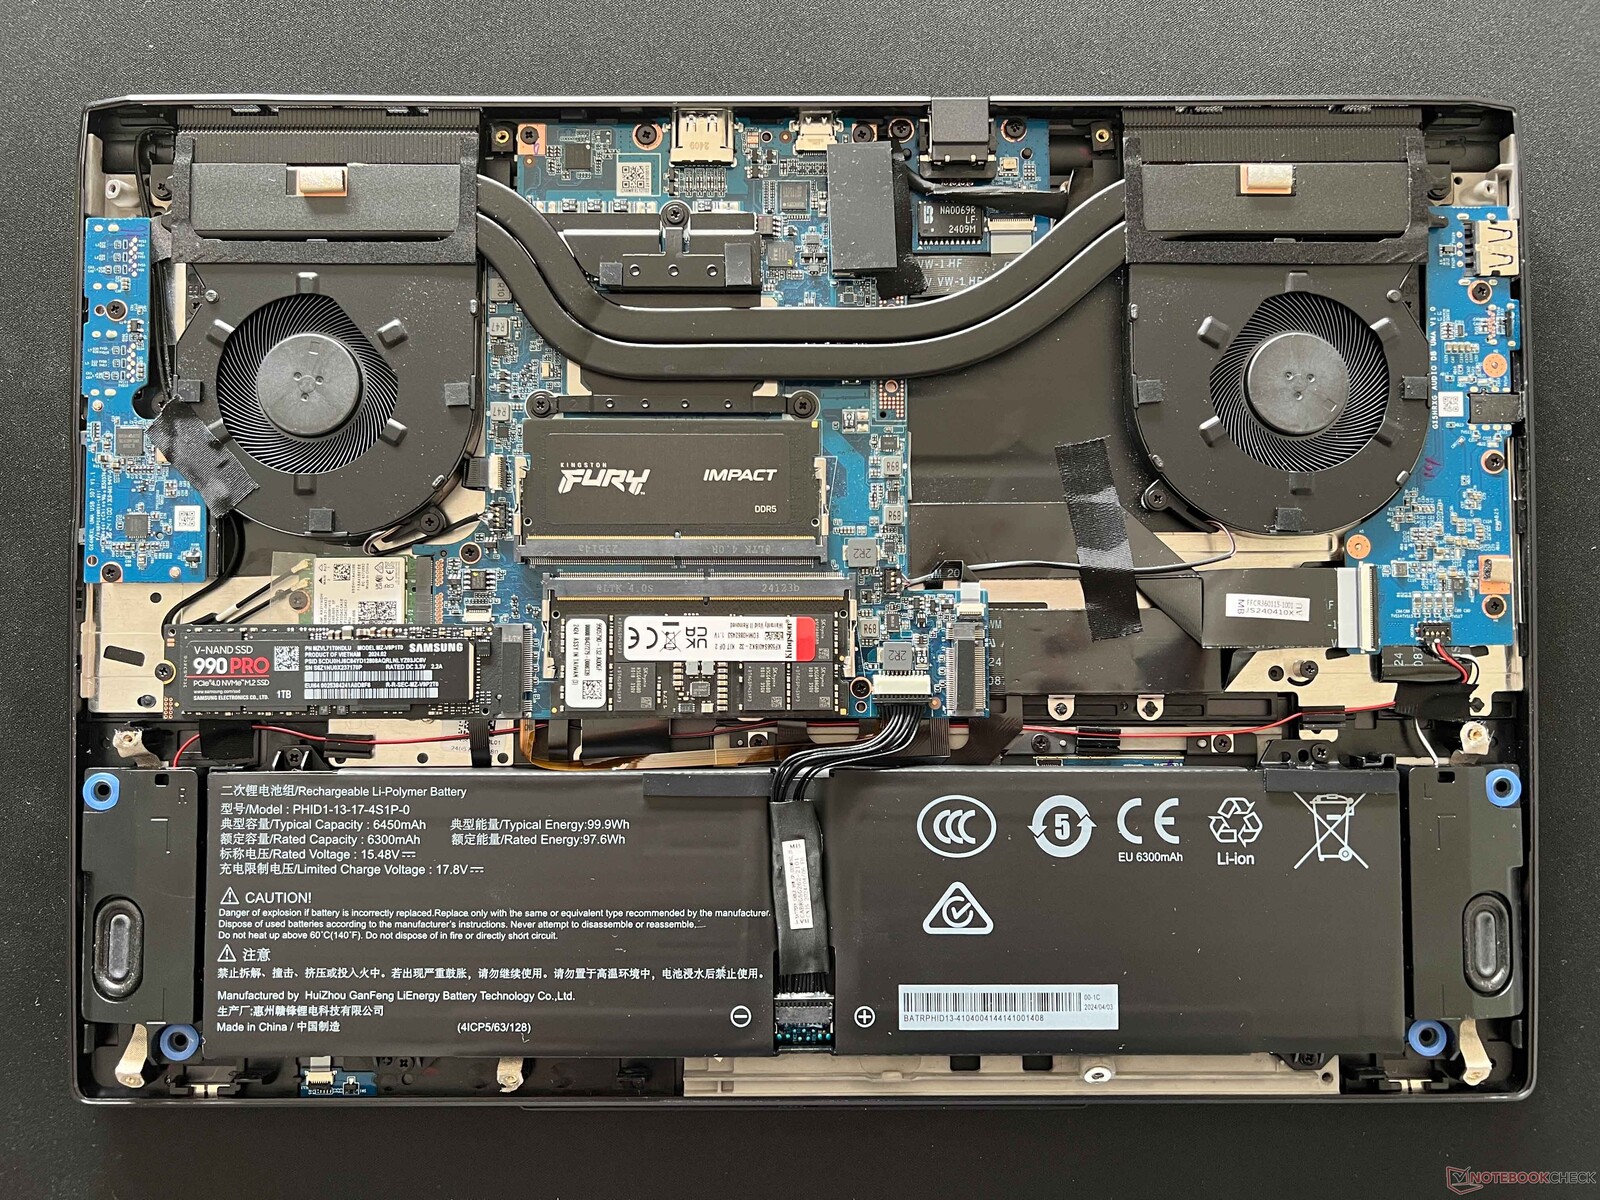
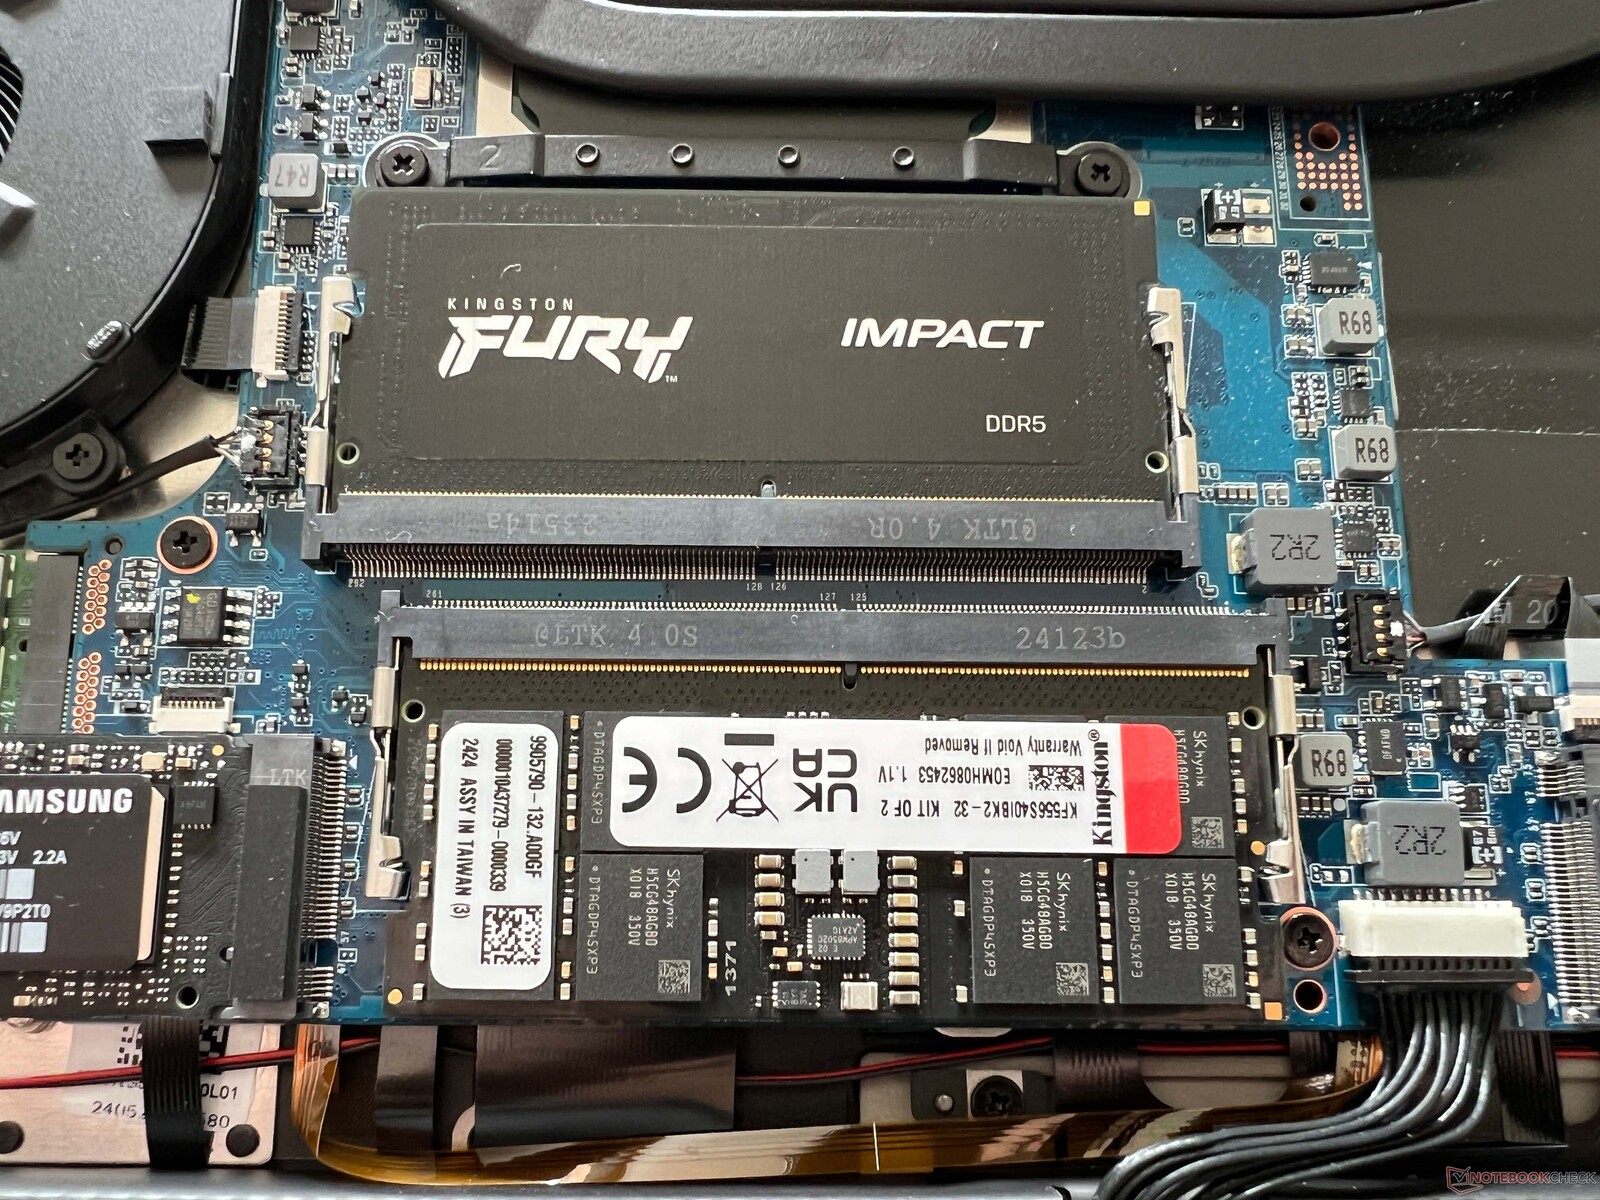
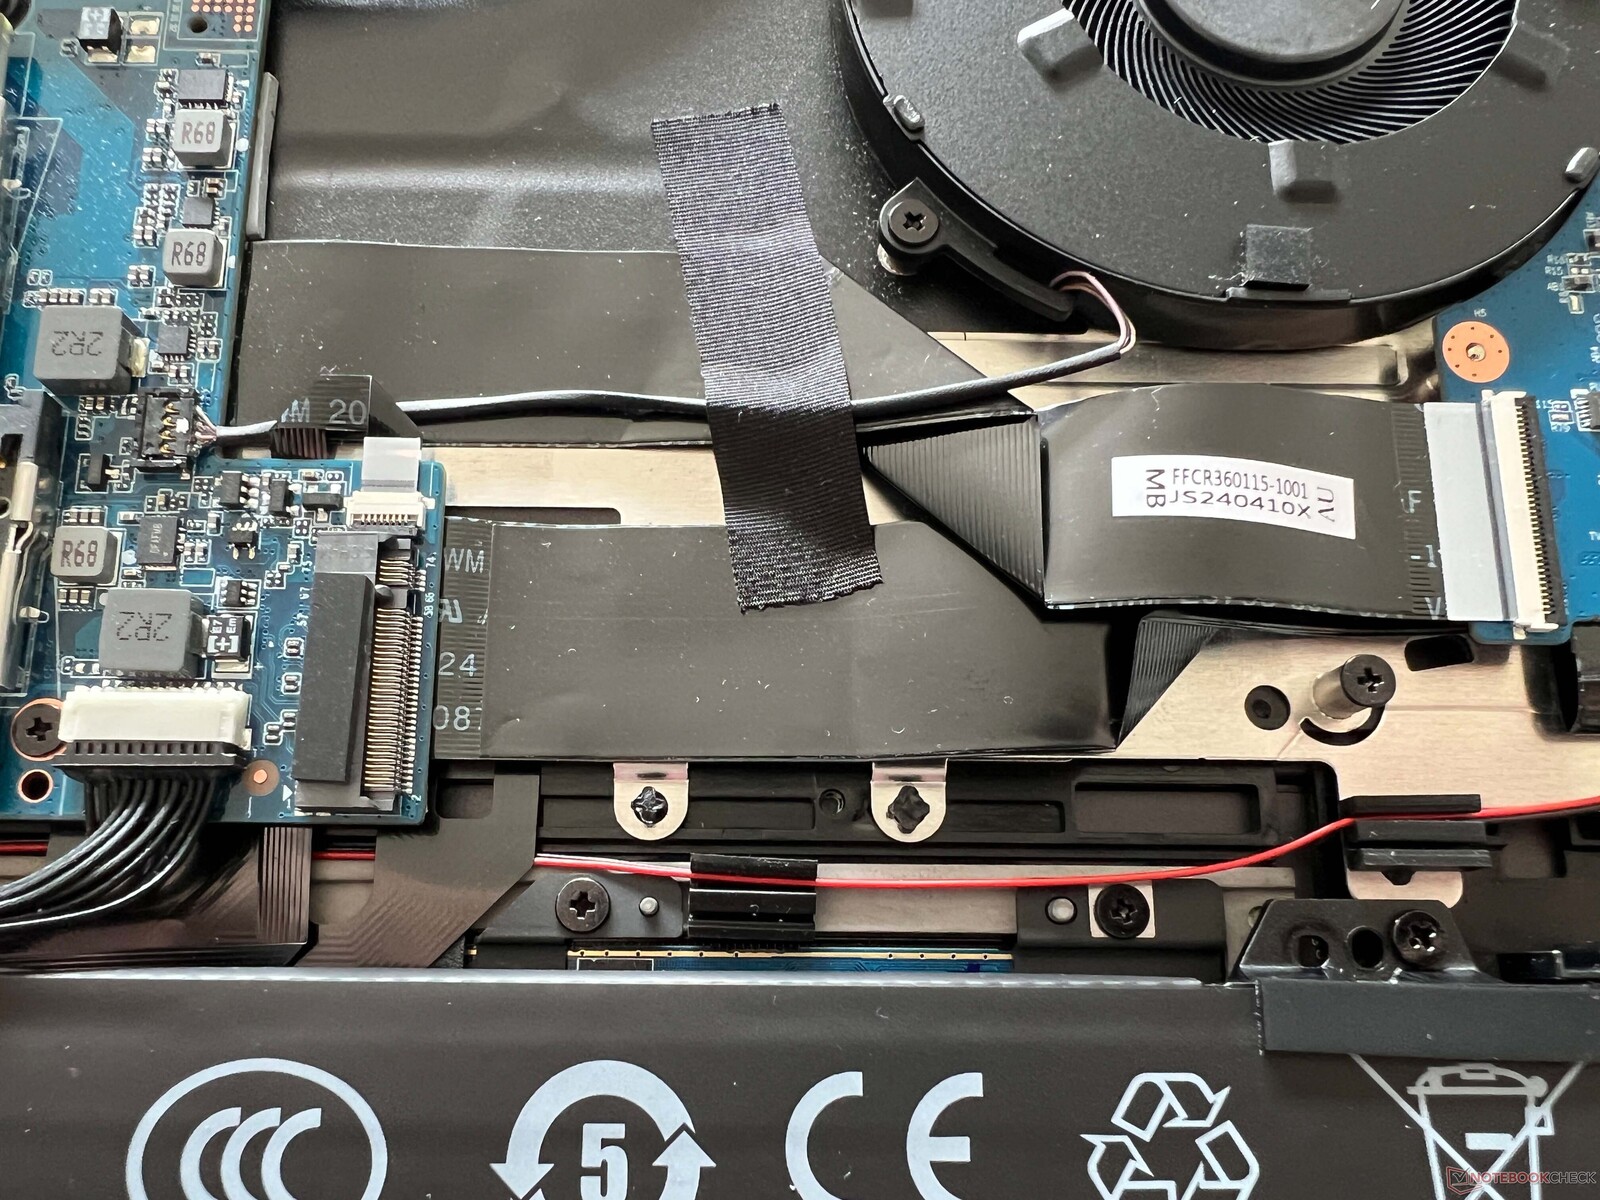
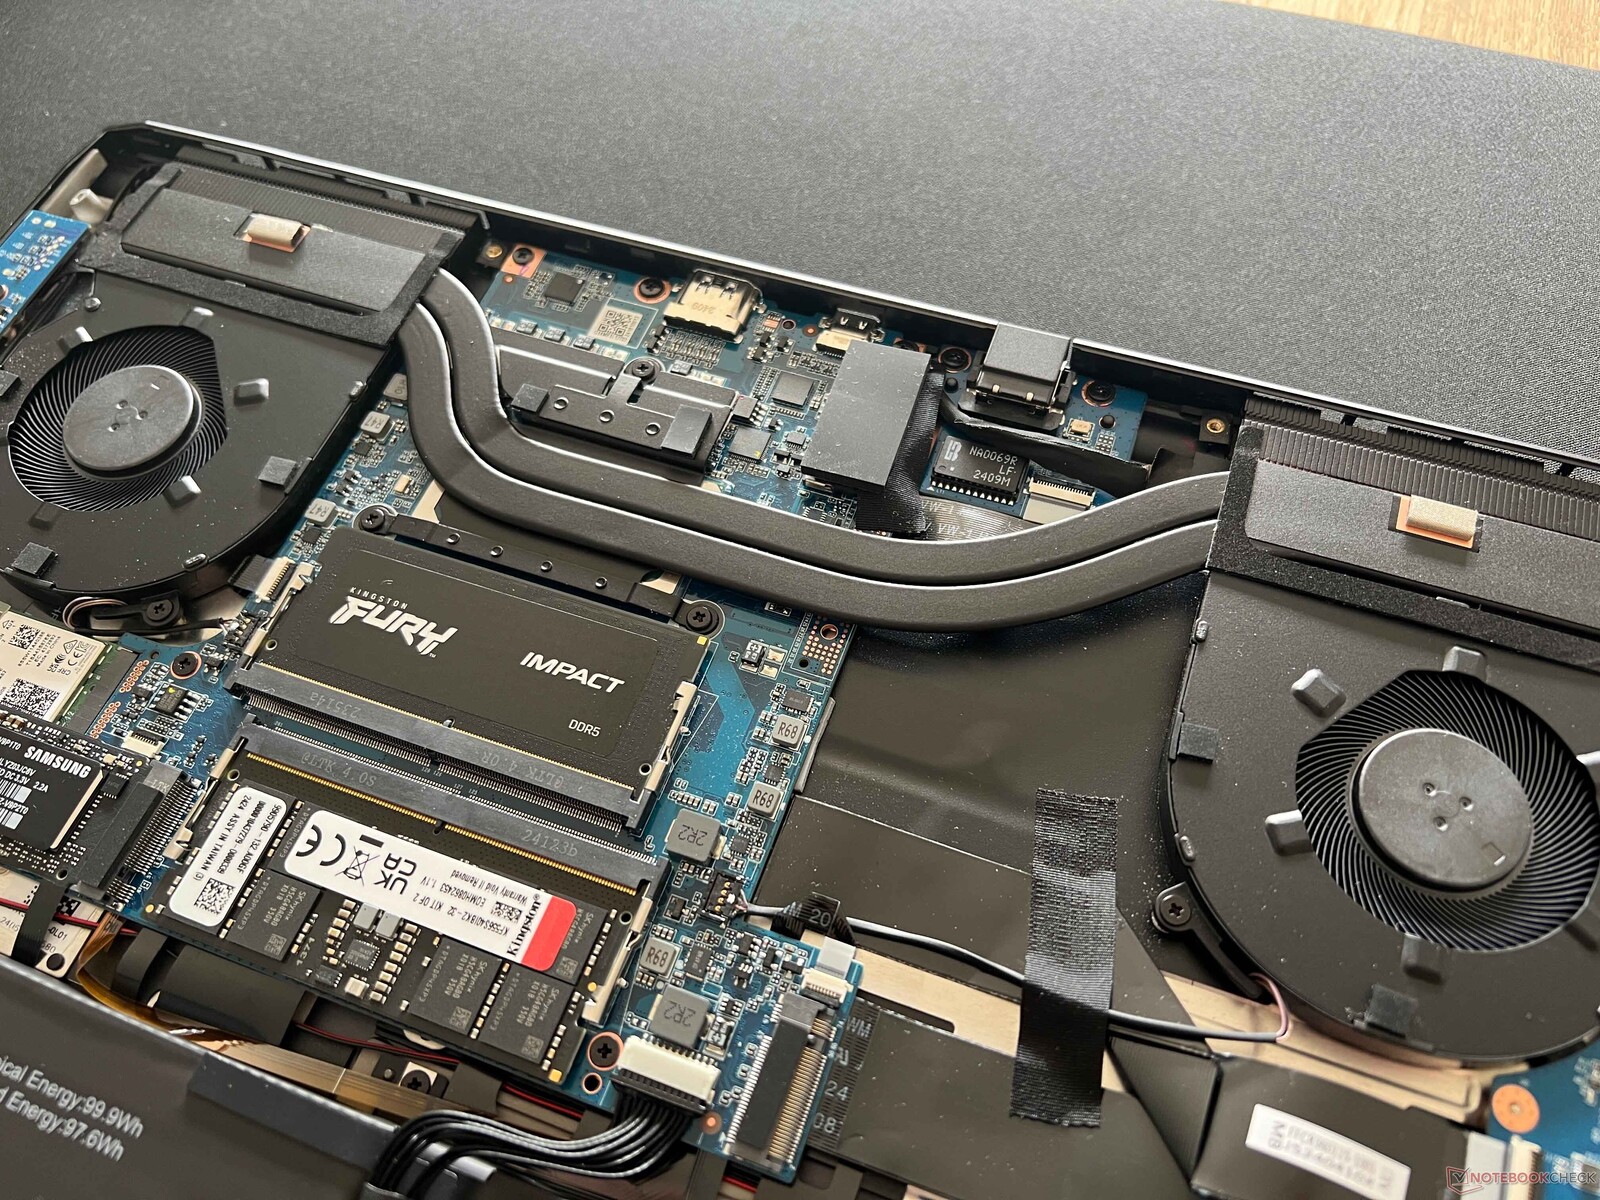
Agora chegamos a um destaque do Evo 15, as opções de manutenção. Depois de remover a tampa inferior (que é fixada com parafusos Phillips normais), o senhor pode acessar as ventoinhas e a bateria parafusada, bem como os dois slots SO-DIMM para a RAM e os dois slots SSD M.2 2280; portanto, as atualizações são uma brincadeira de criança. O módulo WLAN também pode ser substituído, se necessário.
Sustentabilidade
Na página do produto da Schenker não há informações sobre as emissões de CO2 geradas durante a fabricação do laptop. A embalagem é em grande parte feita de papelão e plástico. Falaremos sobre o consumo de energia mais tarde, mas o consumo em modo de espera de 1,4 watts é muito alto.
Dispositivos de entrada - Teclado grande com teclado numérico
O teclado ocupa toda a largura da unidade base e também oferece um teclado numérico dedicado, embora essas teclas sejam um pouco mais estreitas. No entanto, as teclas de seta não são reduzidas em tamanho. A experiência geral de digitação é confortável e mesmo textos longos não são problema, embora notebooks comerciais como o ThinkPad T16 ainda ofereçam vantagens nesse aspecto. Além disso, as teclas maiores, em particular, são muito barulhentas e parecem um pouco frágeis. Com base em uma pesquisa com seus clientes, a Schenker decidiu não instalar uma tecla dedicada ao copiloto. A luz de fundo branca oferece atualmente dois níveis de intensidade, mas em breve será lançada uma atualização que oferecerá quatro níveis de intensidade.
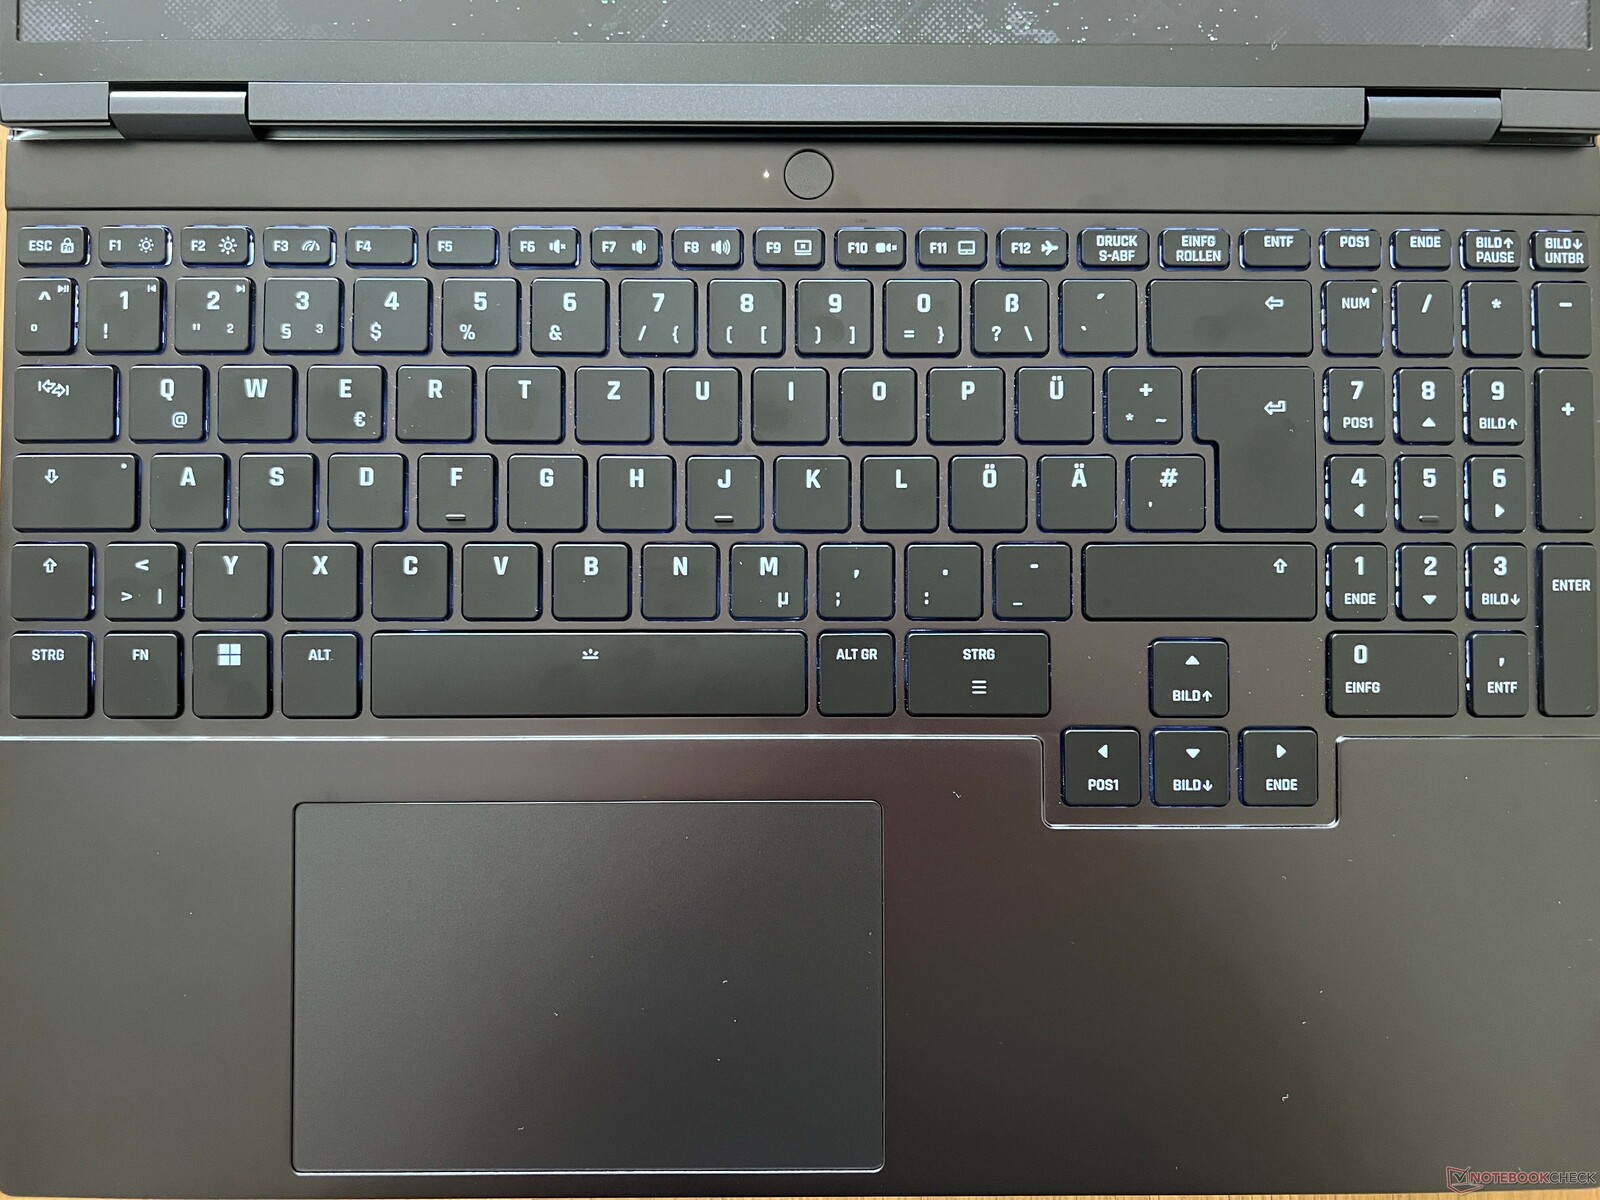
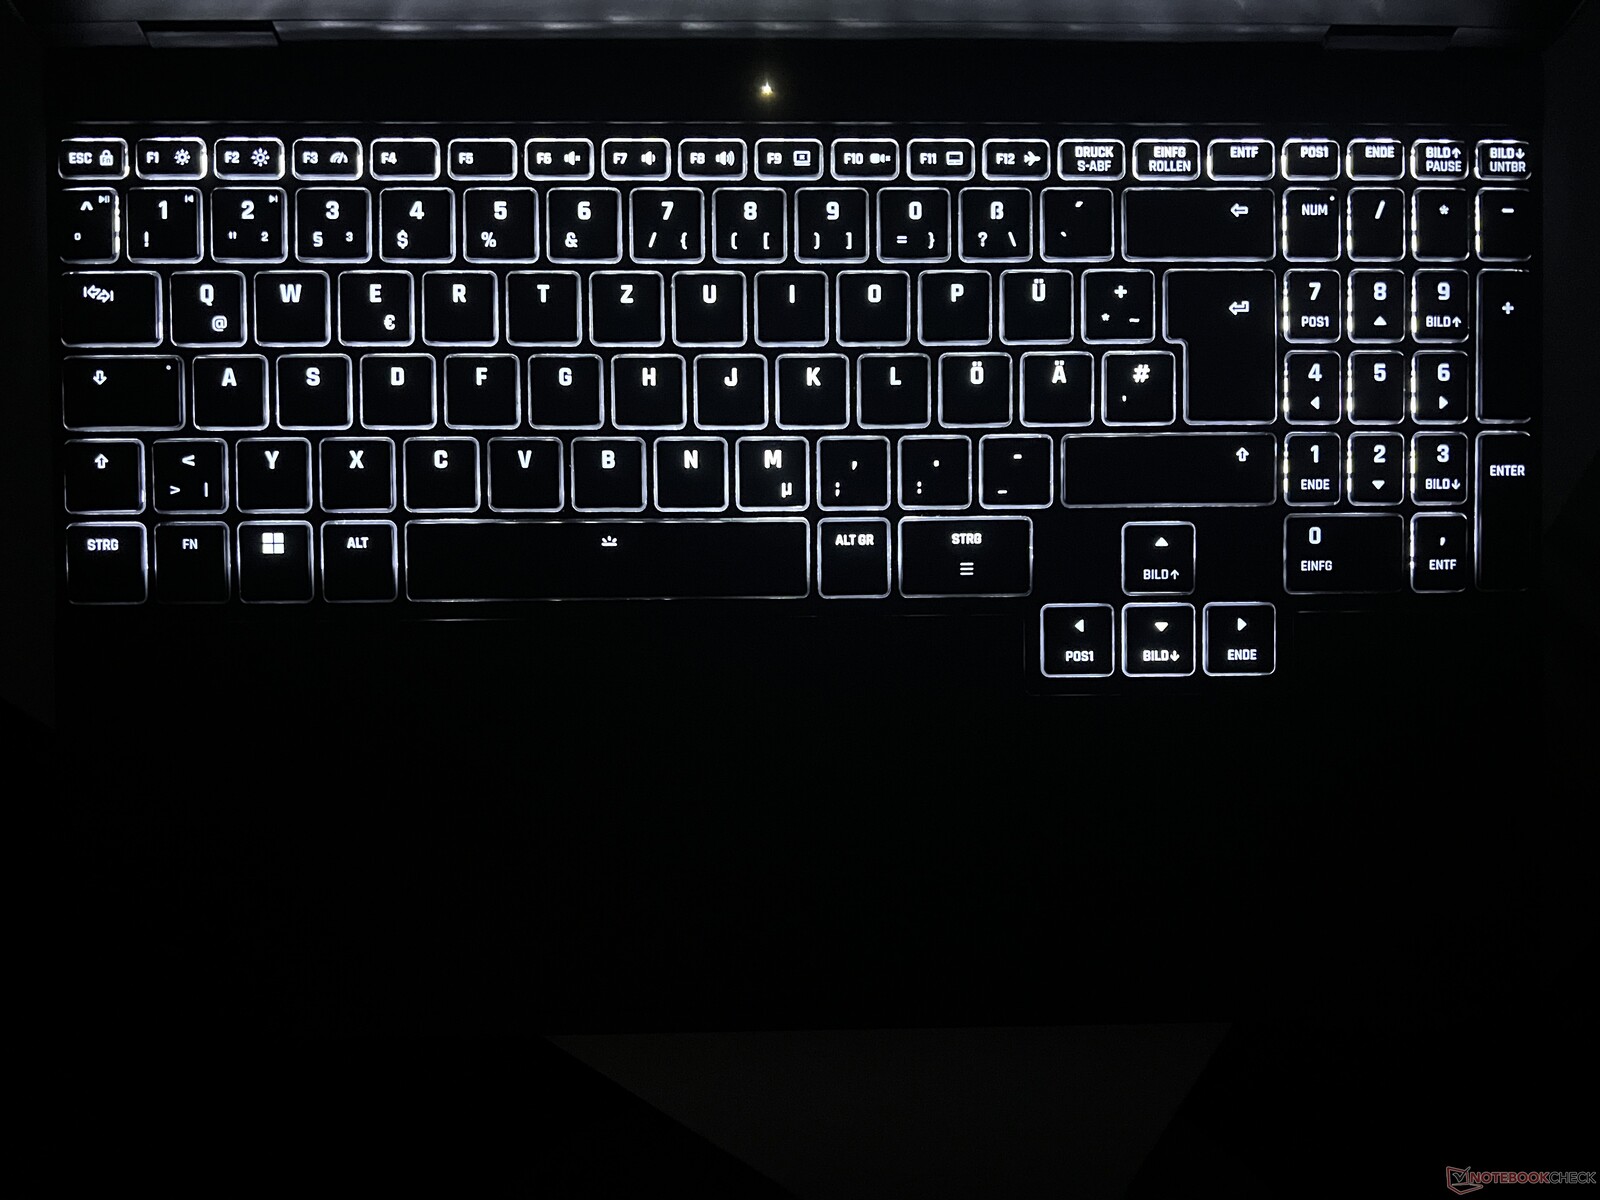
Com 12,3 x 7,7 cm, o ClickPad oferece espaço suficiente para entradas e controle do ponteiro, mas está claramente deslocado para a esquerda, o que leva algum tempo para se acostumar. O teclado pode ser clicado na área inferior, mas isso resulta em um som alto e barato.
Tela - IPS com 240 Hz
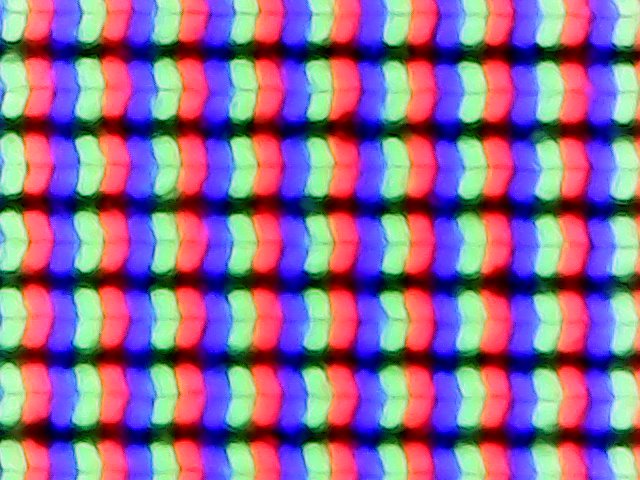
A Schenker usa o painel WQHD familiar com 240 Hz do Fusion 15, portanto, é um painel IPS fosco com uma resolução de 2.560 x 1.600 pixels. A impressão subjetiva da imagem é excelente, pois todo o conteúdo é muito nítido e a reprodução de cores também é boa, embora, é claro, o senhor não possa esperar as cores brilhantes dos painéis OLED. No entanto, também não há cintilação de PWM, mas os tempos de resposta ainda são muito rápidos. Apesar da superfície fosca, mesmo as superfícies brilhantes não parecem granuladas e os movimentos são muito suaves graças à alta frequência. O Adaptive Sync também é compatível, mas não há um sensor de brilho instalado.
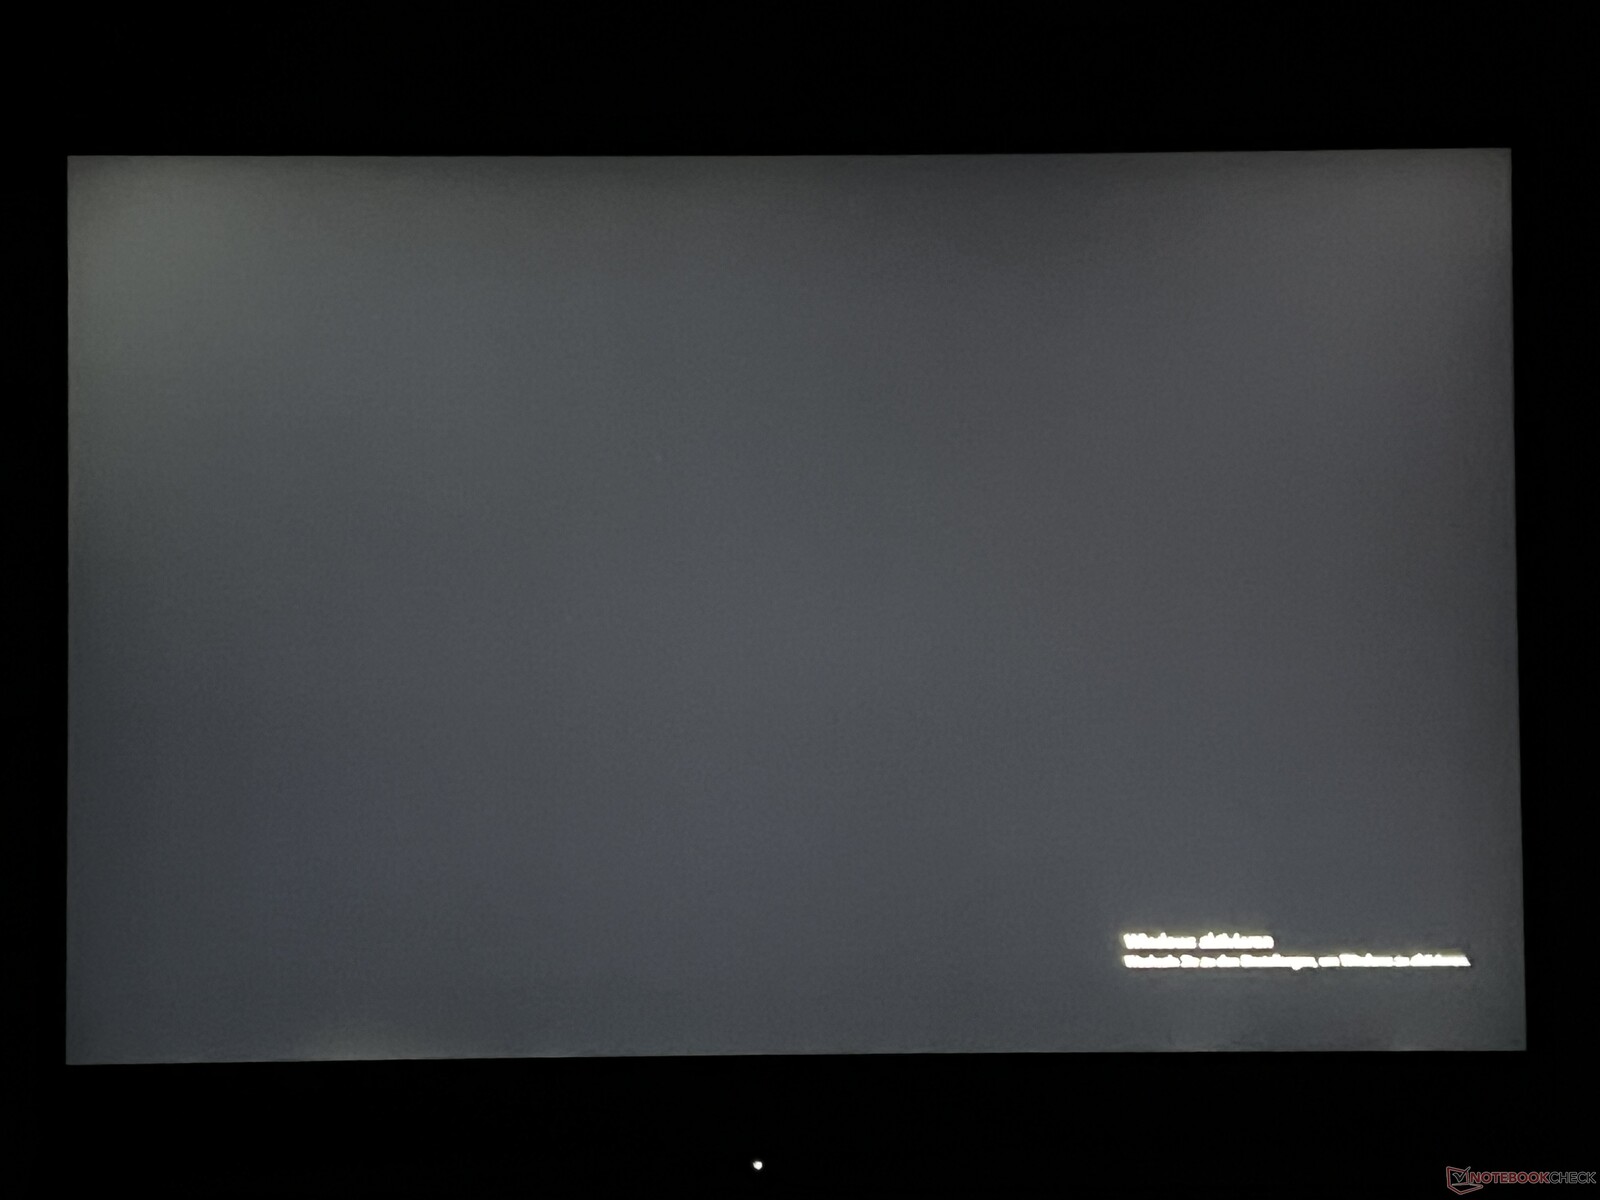
O brilho é especificado em 500 cd/m², mas nosso dispositivo de teste obteve um resultado significativamente melhor com uma média de 585 cd/m². No entanto, o valor de preto sofre com isso, que é de 0,61 cd/m², e faz com que o conteúdo preto pareça um pouco cinza escuro. Além disso, a taxa de contraste máxima é de apenas ~1.000:1.
| |||||||||||||||||||||||||
iluminação: 93 %
iluminação com acumulador: 608 cd/m²
Contraste: 997:1 (Preto: 0.61 cd/m²)
ΔE Color 2.1 | 0.5-29.43 Ø4.87, calibrated: 1.2
ΔE Greyscale 2.7 | 0.5-98 Ø5.1
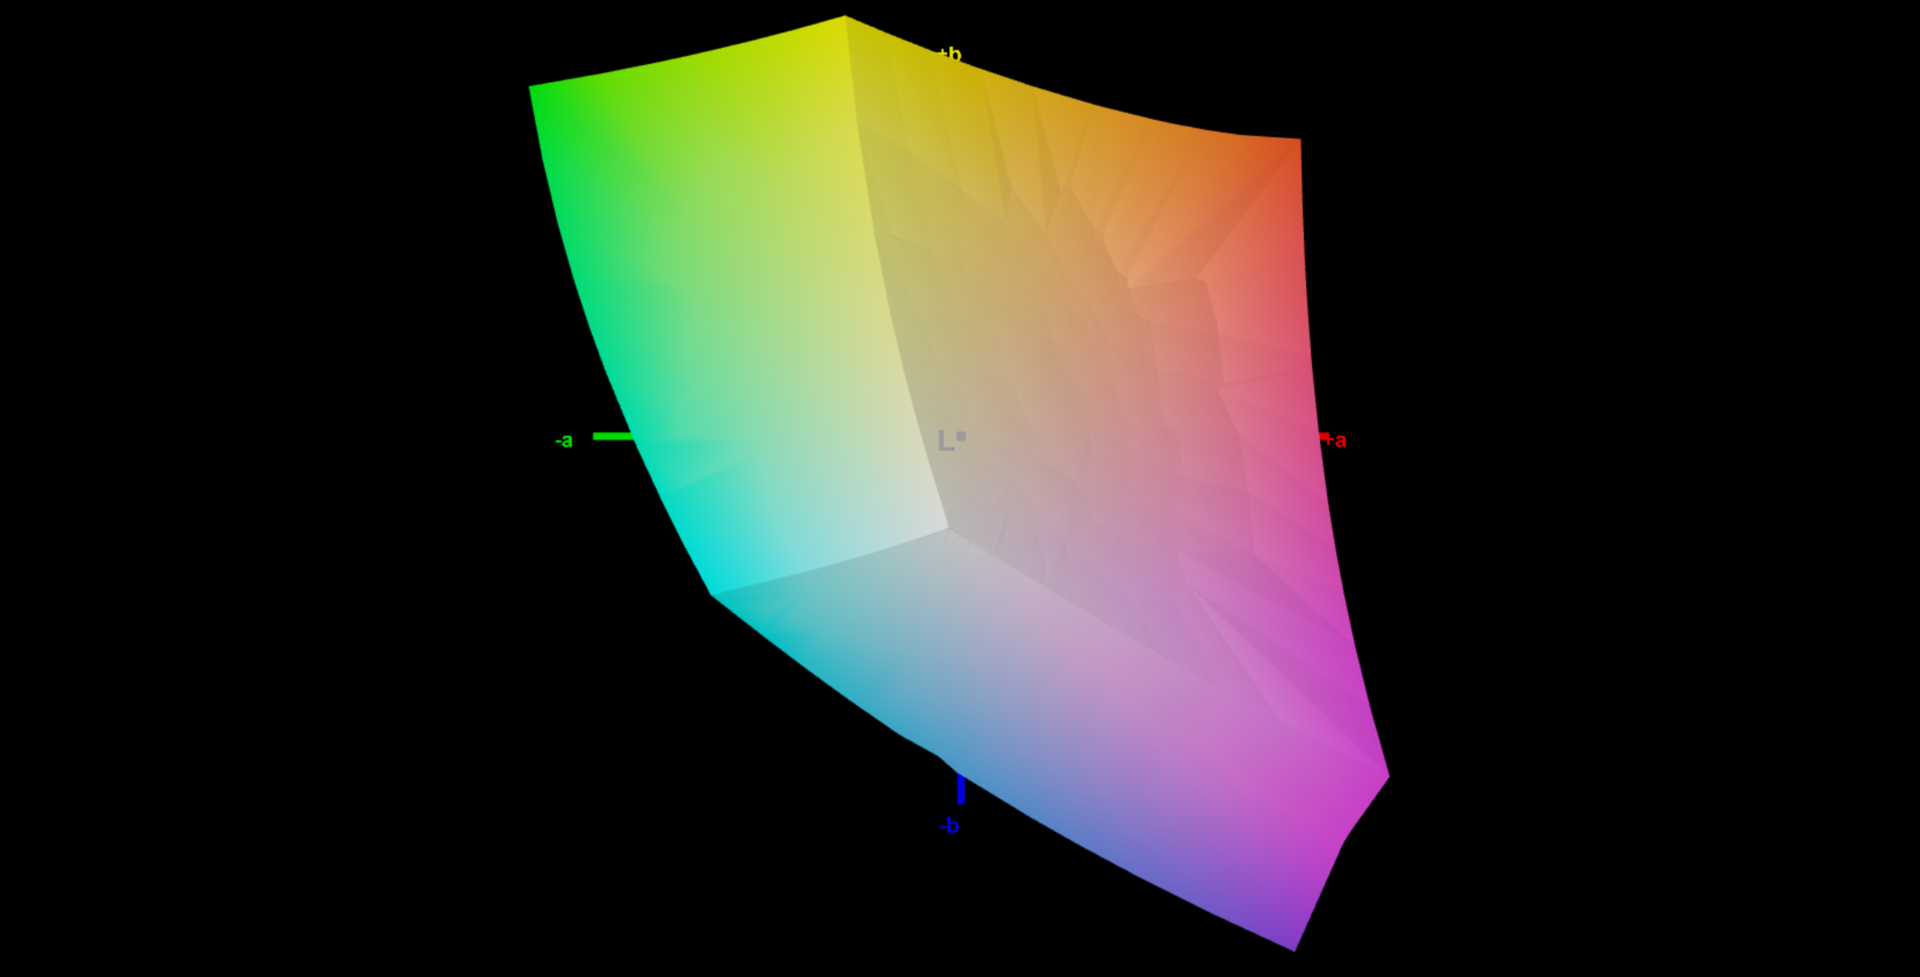
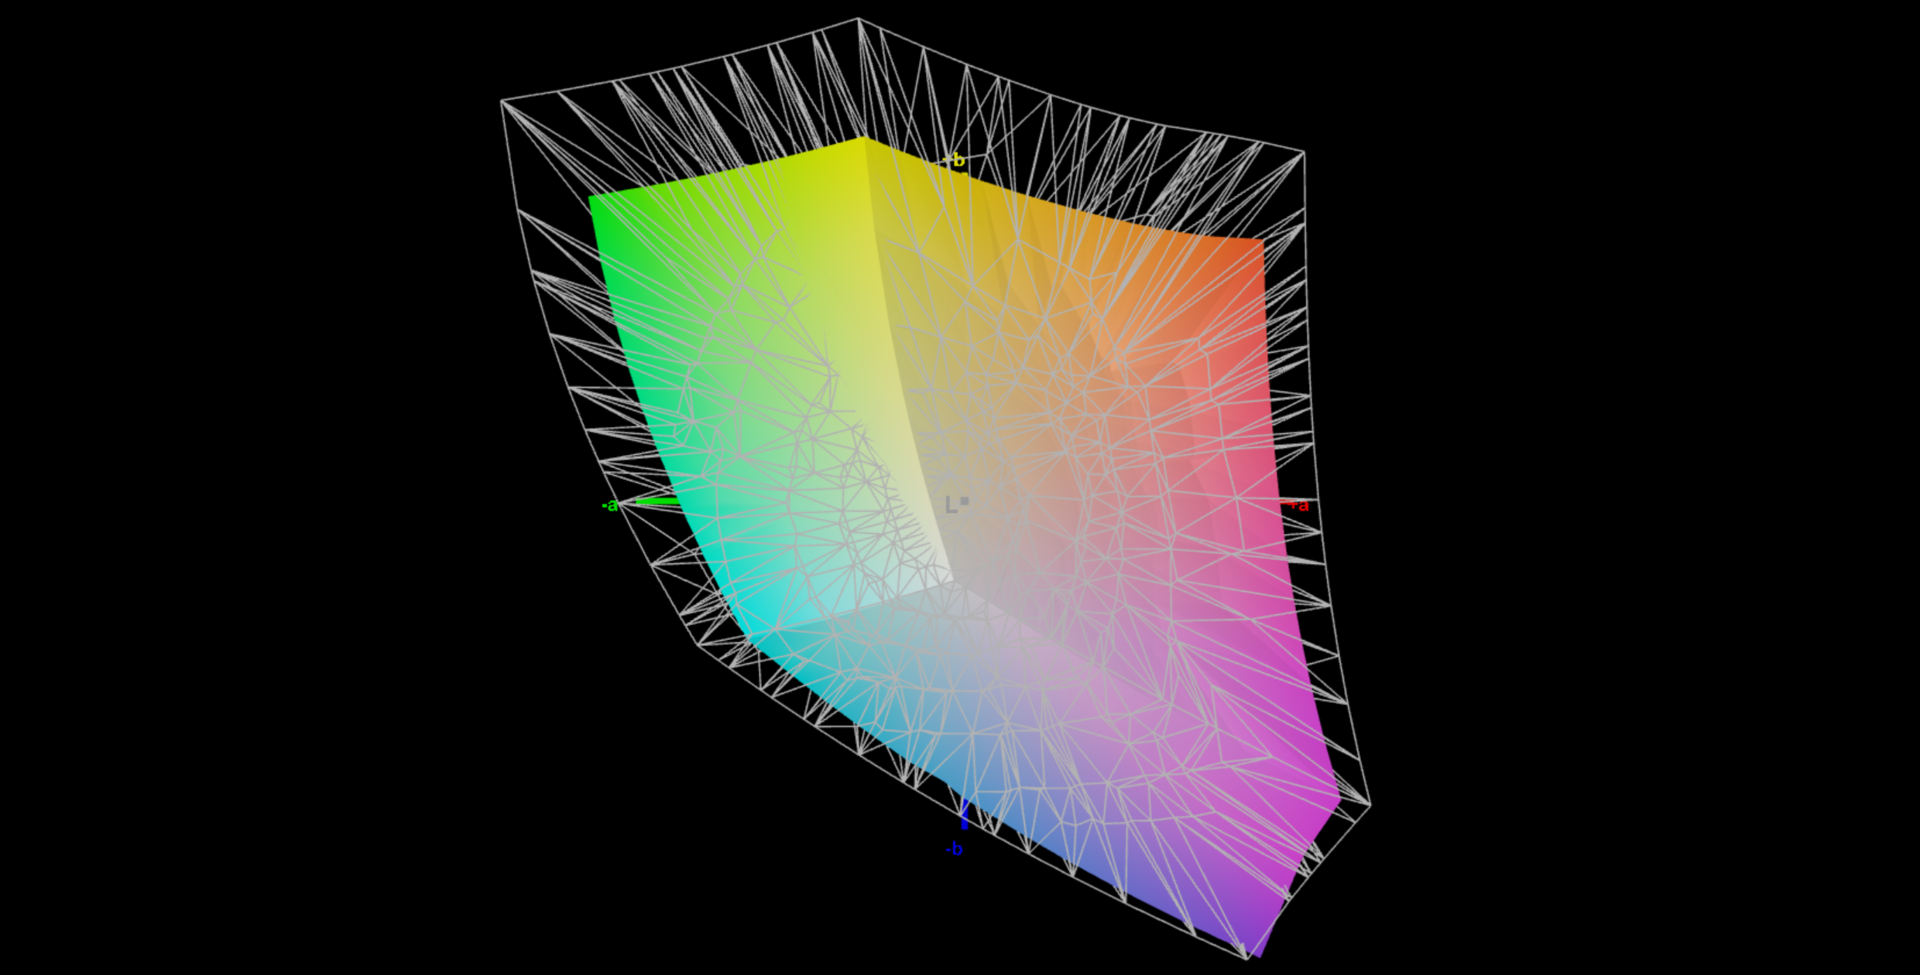
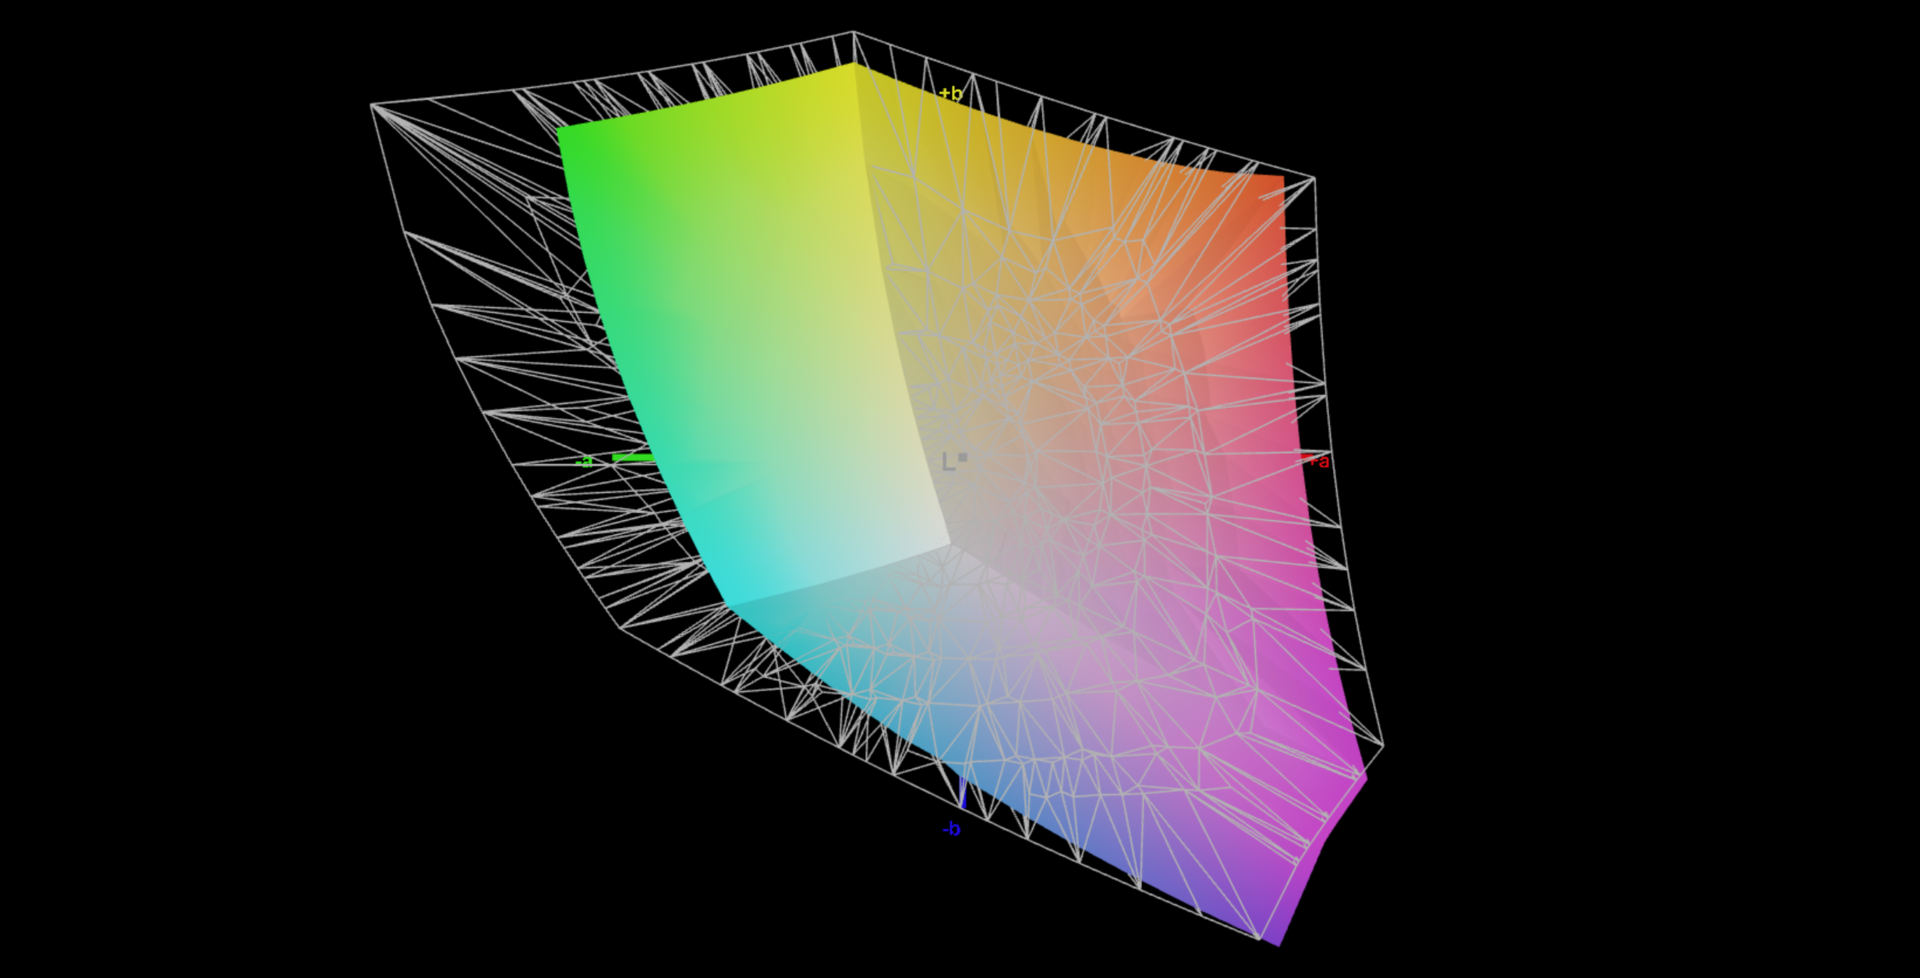
74.2% AdobeRGB 1998 (Argyll 2.2.0 3D)
100% sRGB (Argyll 2.2.0 3D)
73.6% Display P3 (Argyll 2.2.0 3D)
Gamma: 2.2
| SCHENKER XMG Evo 15 (M24) NE153QDM-NZ1, IPS, 2560x1600, 15.3", 240 Hz | Dell Inspiron 16 7640 2-in-1 AU Optronics B160QAT, Mini-LED, 2560x1600, 16", 90 Hz | Medion S10 OLED Samsung SDC4174, OLED, 3840x2400, 16", 60 Hz | Xiaomi RedmiBook Pro 16 2024 TL160MDMP03_0, IPS, 3072x1920, 16", 165 Hz | Lenovo IdeaPad Pro 5 16IMH G9 NE160QDM-NY2, IPS, 2560x1600, 16", 120 Hz | Lenovo ThinkPad T16 G2 21K70035GE B160UAN01.K, IPS LED, 1920x1200, 16", Hz | |
|---|---|---|---|---|---|---|
| Display | 20% | 23% | 18% | -10% | 2% | |
| Display P3 Coverage | 73.6 | 99.4 35% | 99.9 36% | 98.8 34% | 63.3 -14% | 75.9 3% |
| sRGB Coverage | 100 | 100 0% | 100 0% | 100 0% | 95.2 -5% | 98.2 -2% |
| AdobeRGB 1998 Coverage | 74.2 | 92.5 25% | 98.6 33% | 89.9 21% | 65.3 -12% | 77.2 4% |
| Response Times | -527% | 71% | -437% | -141% | -548% | |
| Response Time Grey 50% / Grey 80% * | 4.6 ? | 15.4 ? -235% | 1.7 ? 63% | 39.2 ? -752% | 15 ? -226% | 40.8 ? -787% |
| Response Time Black / White * | 6.6 ? | 60.6 ? -818% | 1.4 ? 79% | 14.6 ? -121% | 10.3 ? -56% | 26.9 ? -308% |
| PWM Frequency | 2753.7 ? | 60 ? | ||||
| Screen | 3% | 329% | -8% | -12% | -31% | |
| Brightness middle | 608 | 413 -32% | 307 -50% | 520 -14% | 368 -39% | 446 -27% |
| Brightness | 585 | 409 -30% | 307 -48% | 510 -13% | 368 -37% | 425 -27% |
| Brightness Distribution | 93 | 97 4% | 96 3% | 93 0% | 91 -2% | 91 -2% |
| Black Level * | 0.61 | 0.14 77% | 0.01 98% | 0.35 43% | 0.31 49% | 0.28 54% |
| Contrast | 997 | 2950 196% | 30700 2979% | 1486 49% | 1187 19% | 1593 60% |
| Colorchecker dE 2000 * | 2.1 | 3.48 -66% | 2.1 -0% | 2.9 -38% | 2.4 -14% | 3.7 -76% |
| Colorchecker dE 2000 max. * | 4.3 | 6.97 -62% | 4.87 -13% | 6.2 -44% | 6.5 -51% | 8.8 -105% |
| Colorchecker dE 2000 calibrated * | 1.2 | 2.08 -73% | 1.1 8% | 0.8 33% | 1.6 -33% | |
| Greyscale dE 2000 * | 2.7 | 4.5 -67% | 0.9 67% | 4.3 -59% | 4.5 -67% | 6 -122% |
| Gamma | 2.2 100% | 2.15 102% | 2.197 100% | 2.19 100% | 2.21 100% | 2.2 100% |
| CCT | 6168 105% | 6446 101% | 6513 100% | 7422 88% | 6324 103% | 6499 100% |
| Média Total (Programa/Configurações) | -168% /
-75% | 141% /
227% | -142% /
-63% | -54% /
-30% | -192% /
-98% |
* ... menor é melhor
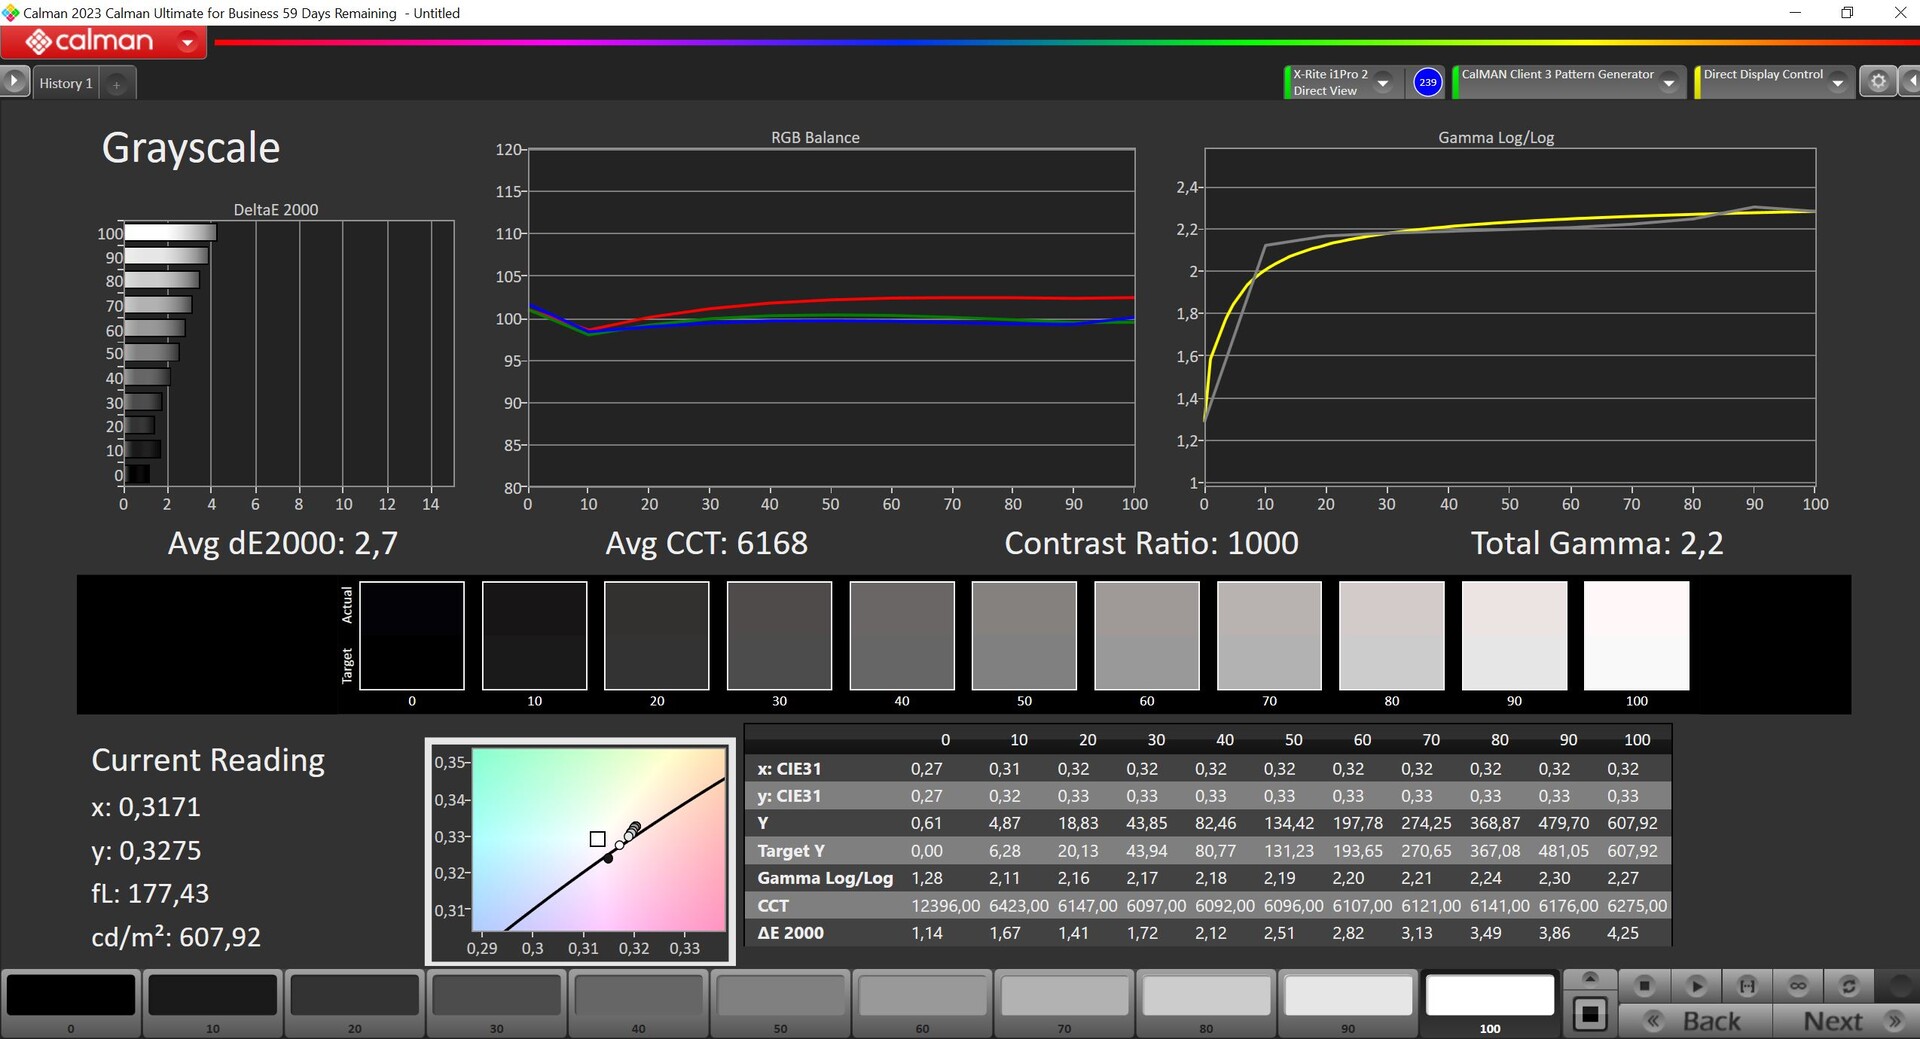
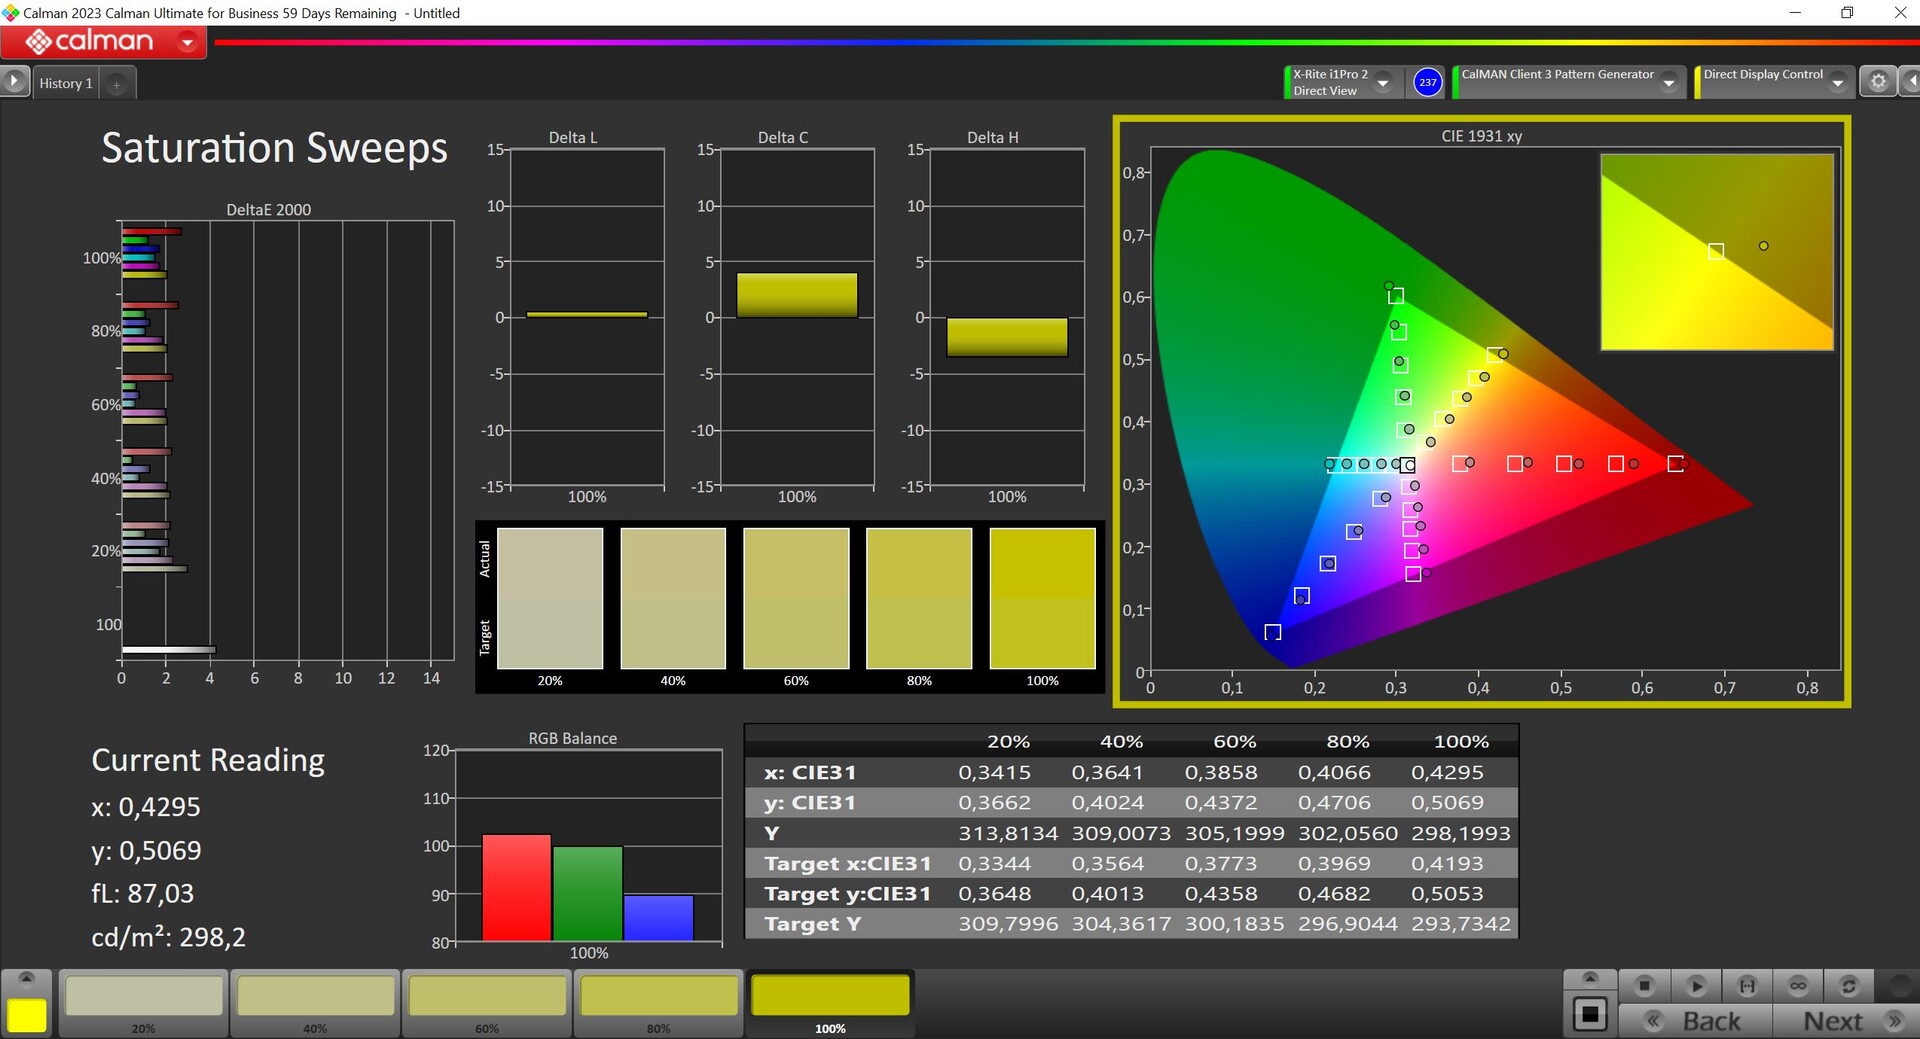
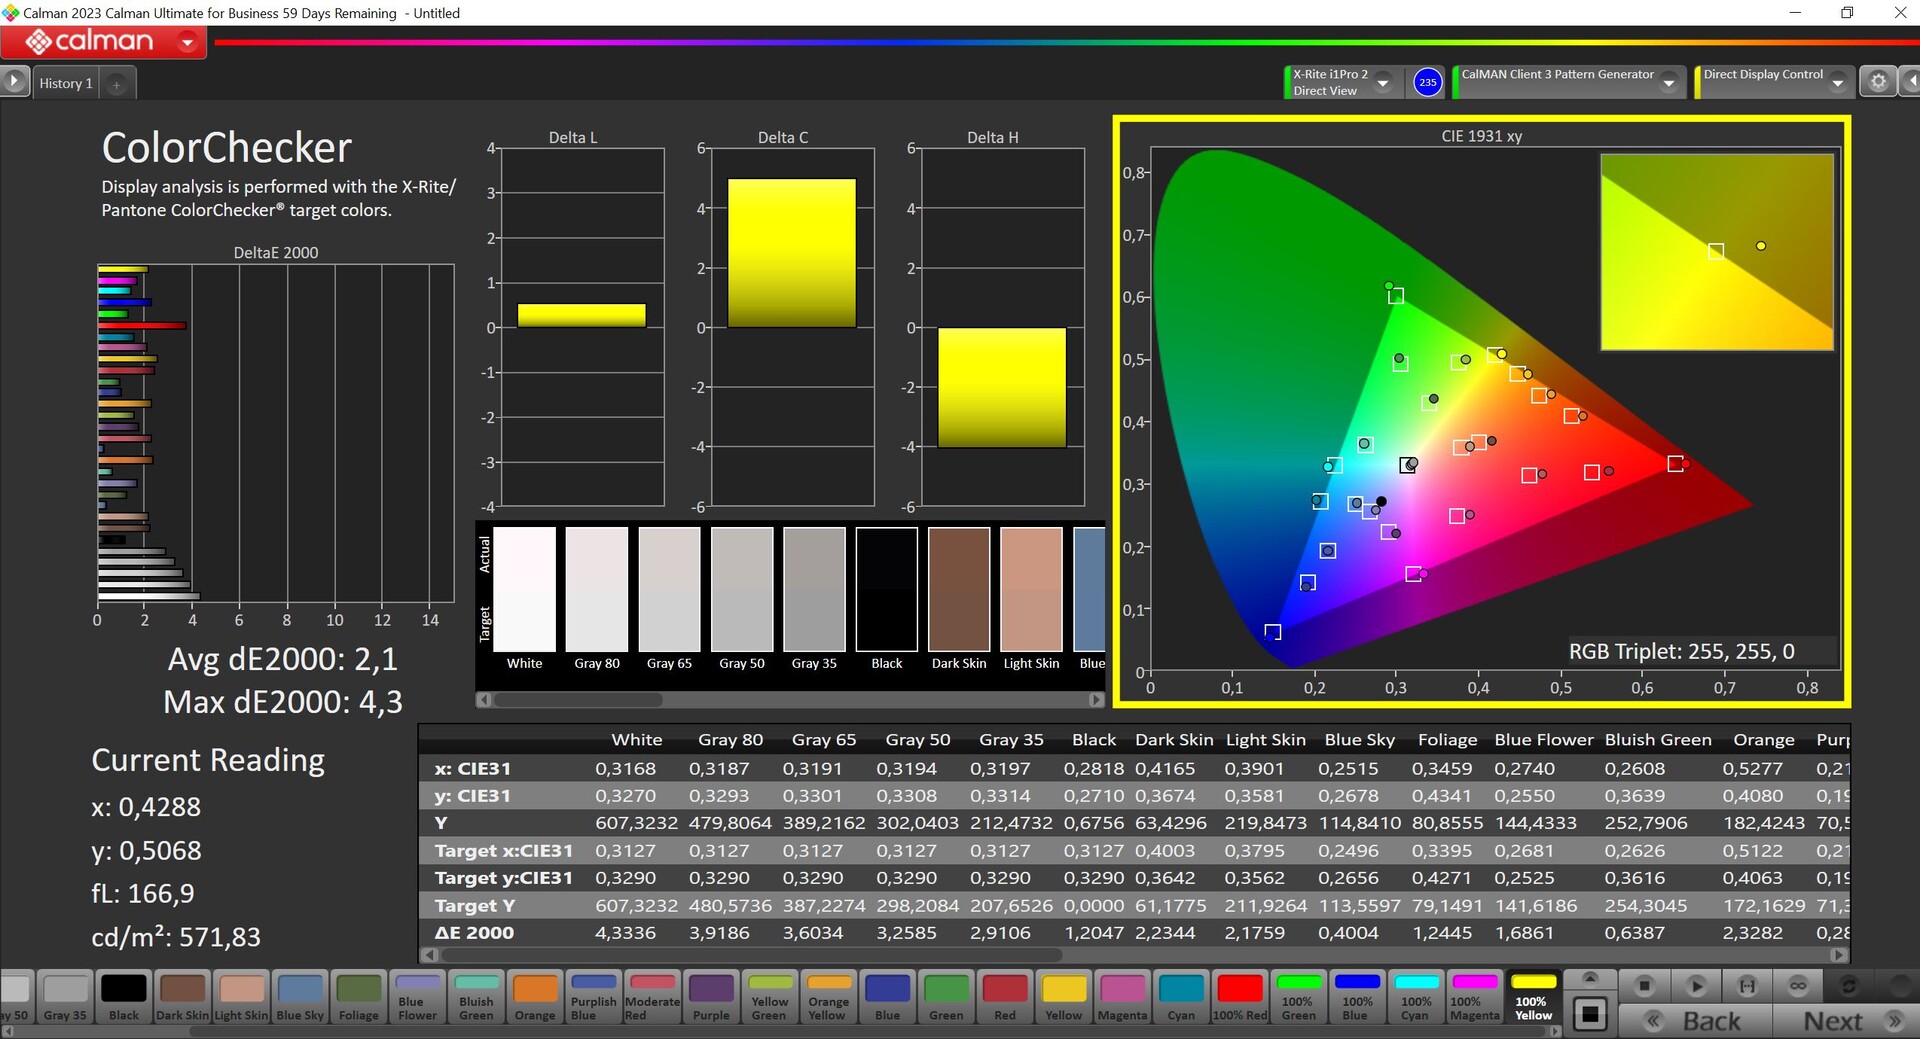
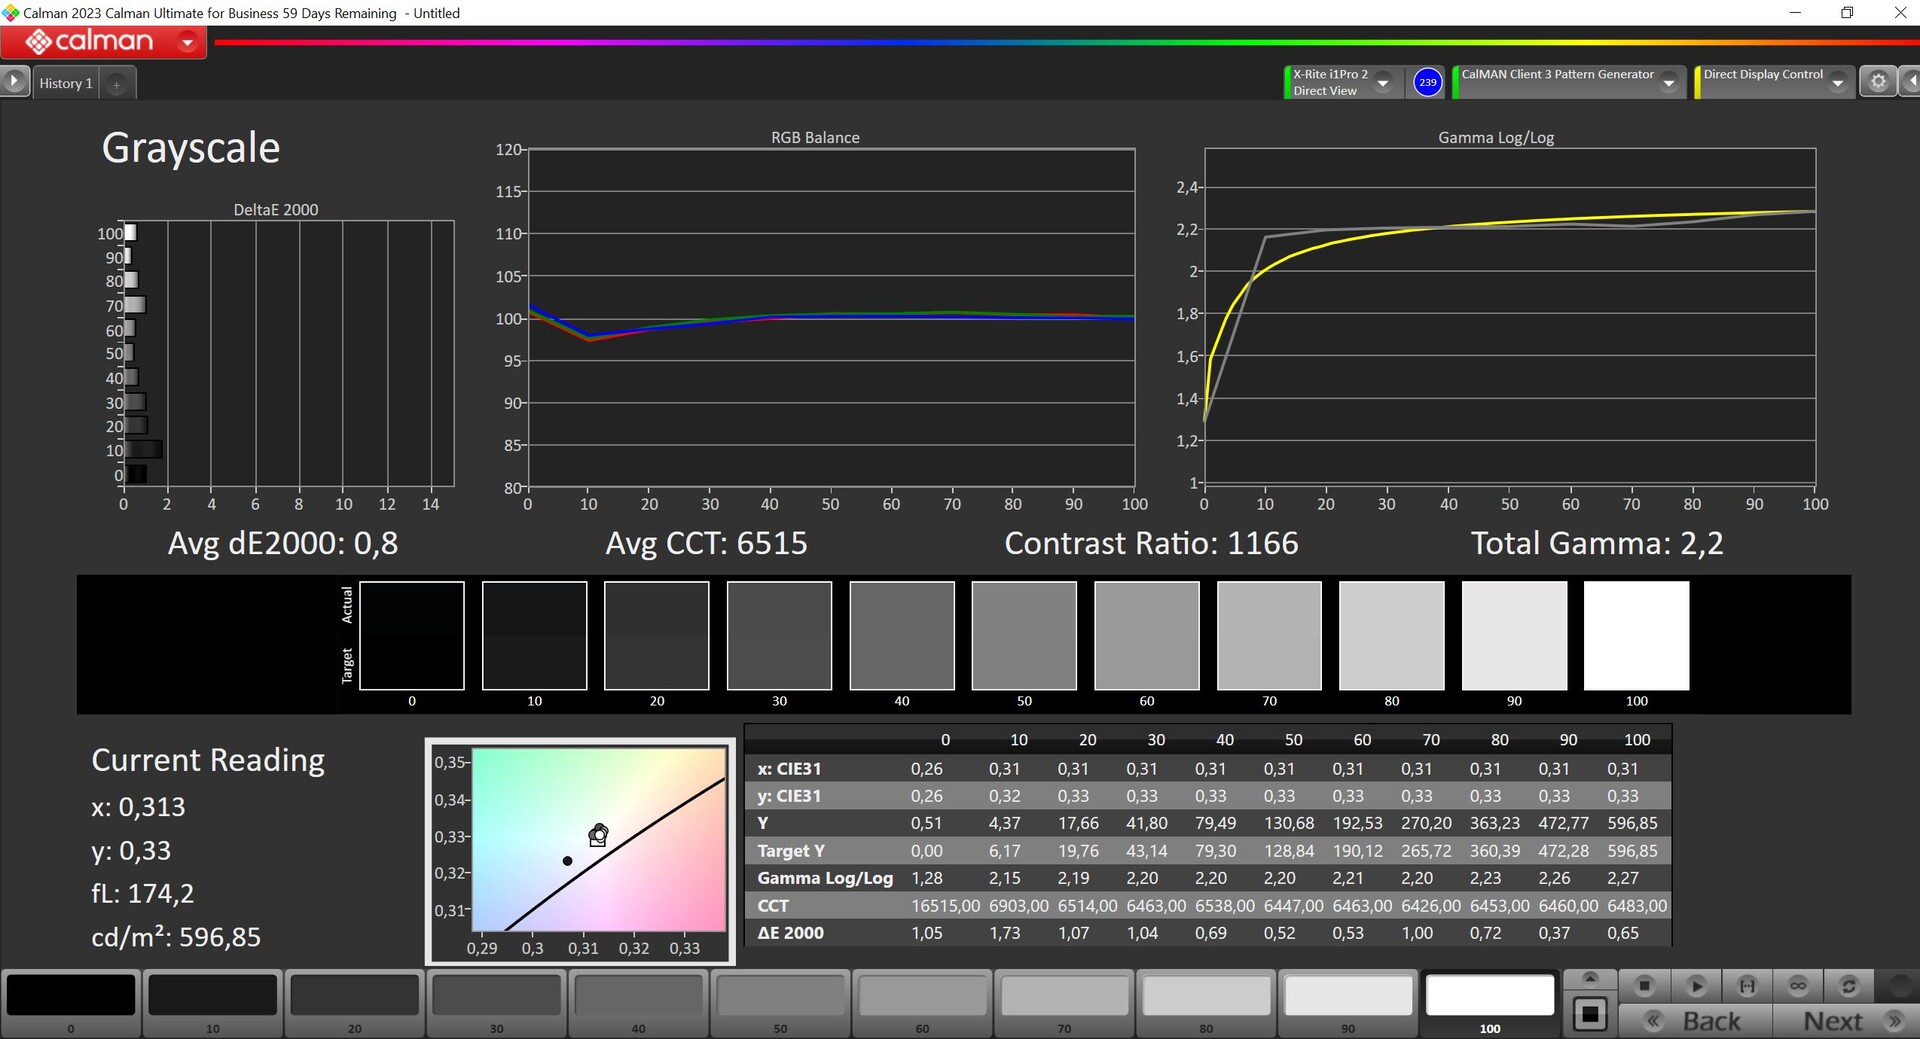
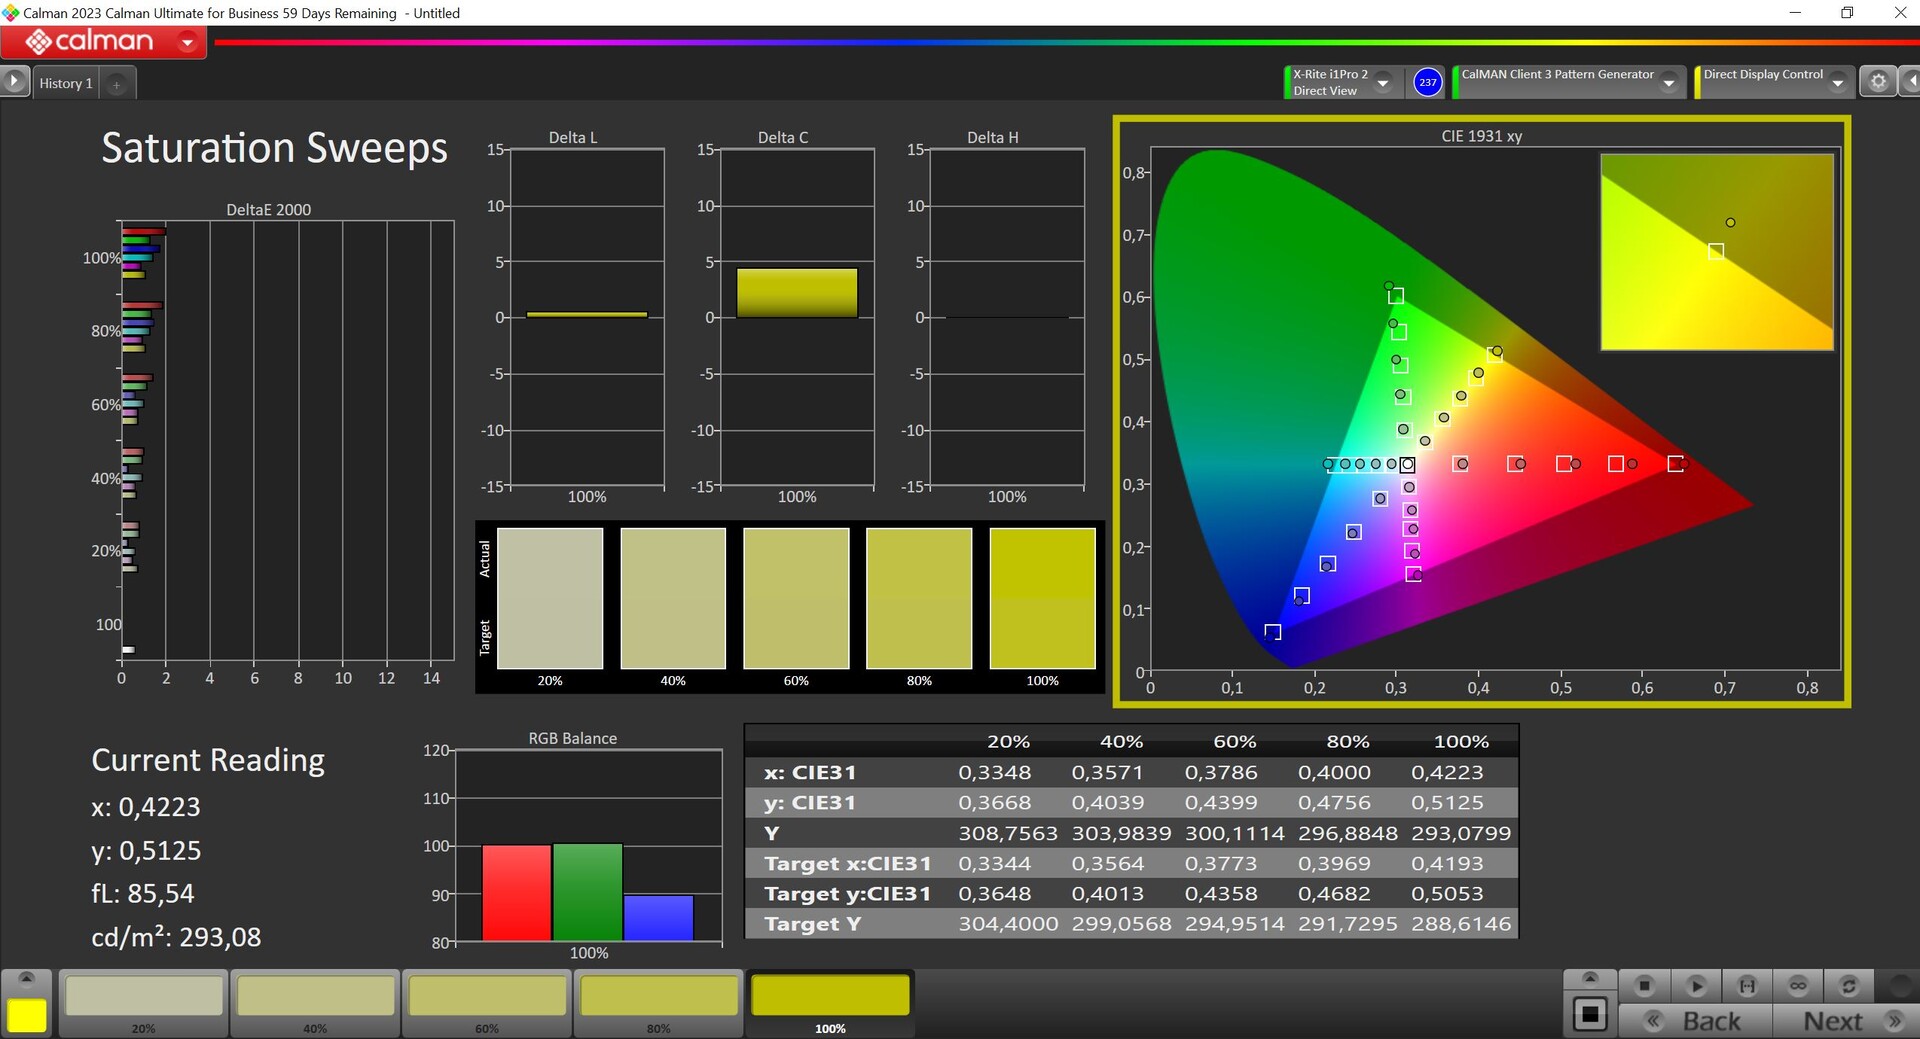
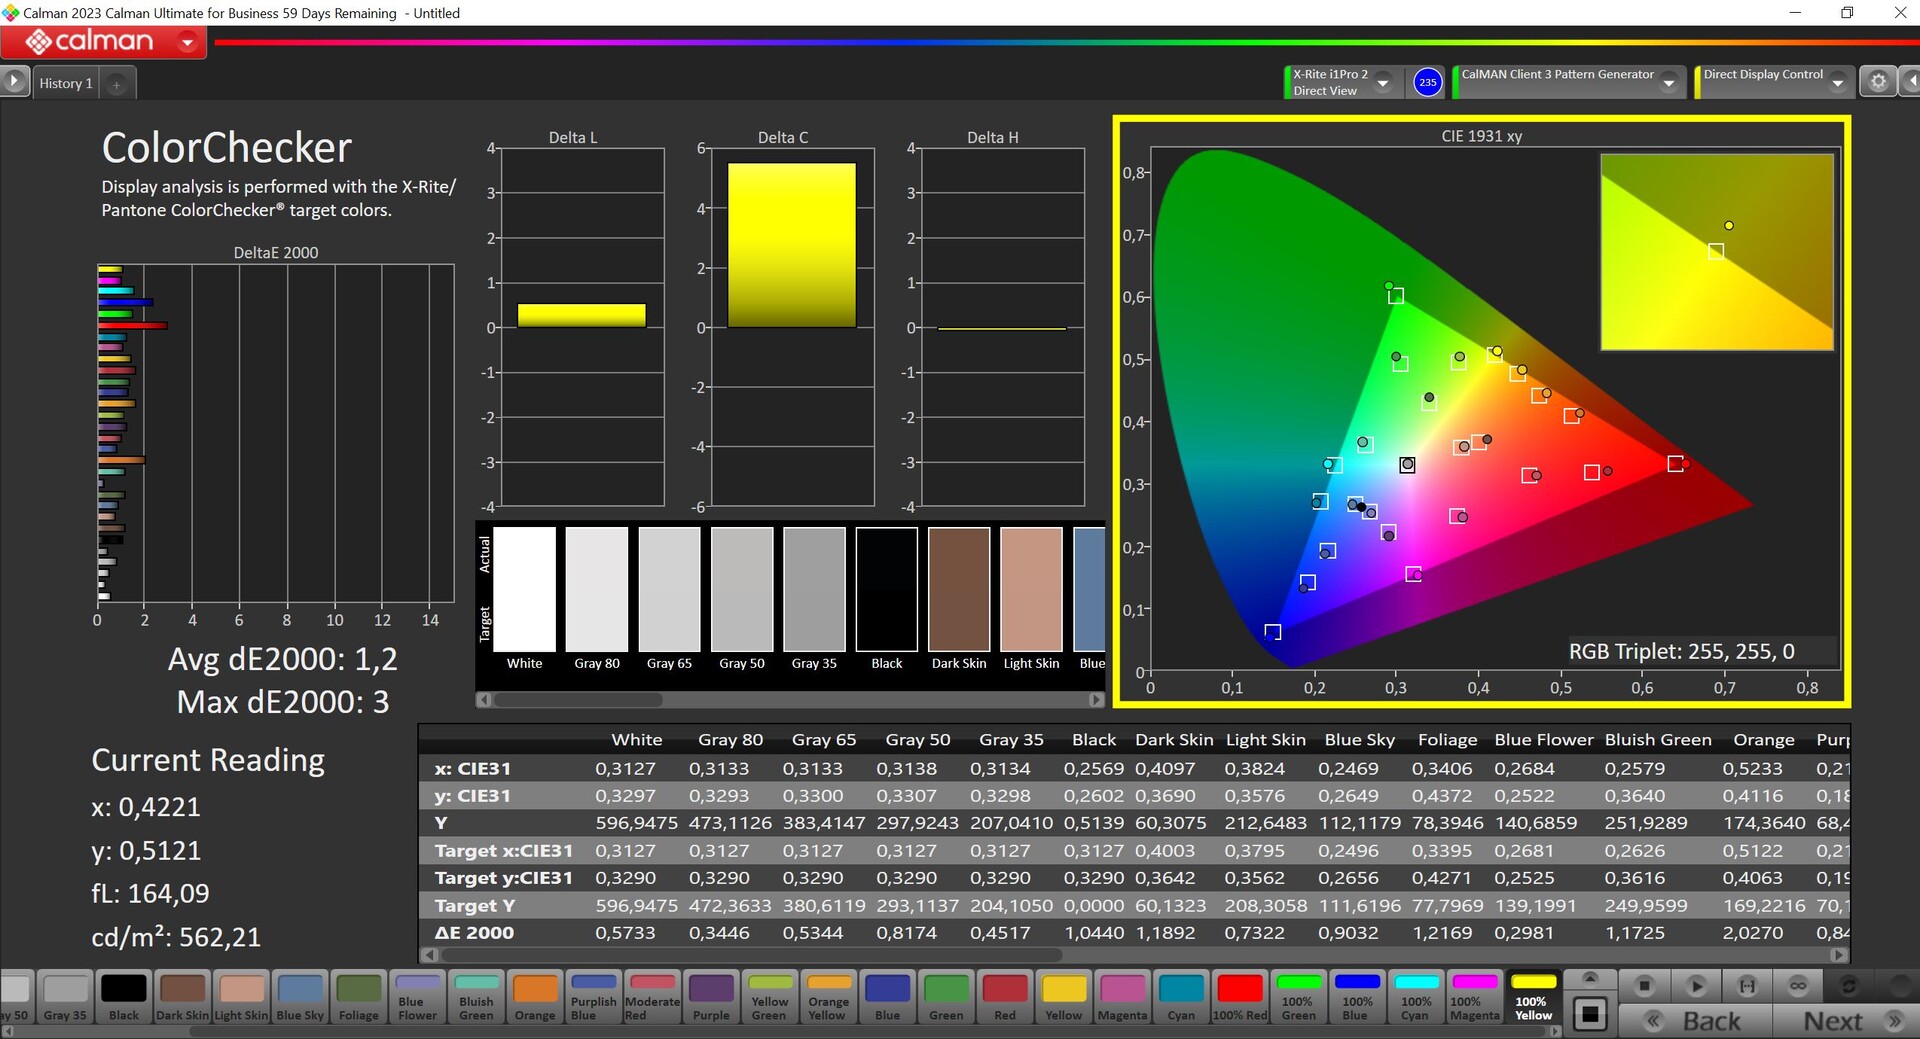
Medimos o painel com o software profissional CalMAN (X-Rite i1 Pro2) e o senhor pode baixar um perfil pré-calibrado do fabricante no Control Center, que também usamos para a medição. No entanto, a temperatura da cor aqui é um pouco quente demais e há também alguns valores para cores e escala de cinza que excedem o valor-alvo de 3. Com nossa própria calibração (o perfil está disponível para download gratuito acima), podemos melhorar significativamente a exibição e todos os valores estão dentro da faixa-alvo. Juntamente com a cobertura sRGB completa, o Evo 15 é, portanto, também adequado para editar imagens/vídeos sem restrições.
Exibir tempos de resposta
| ↔ Tempo de resposta preto para branco | ||
|---|---|---|
| 6.6 ms ... ascensão ↗ e queda ↘ combinadas | ↗ 2.8 ms ascensão | 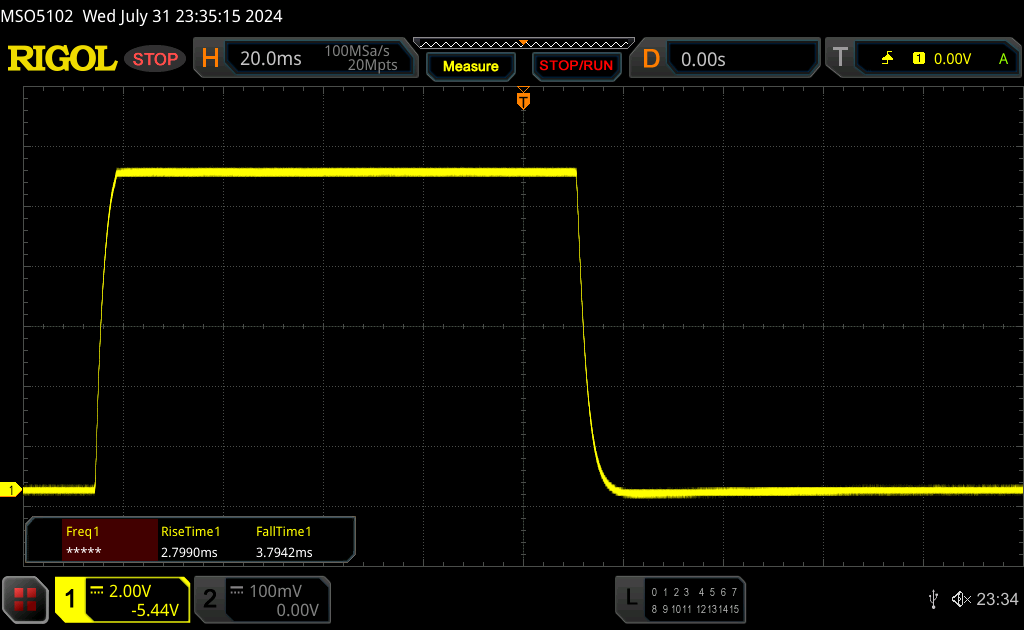 |
| ↘ 3.8 ms queda | ||
| A tela mostra taxas de resposta muito rápidas em nossos testes e deve ser muito adequada para jogos em ritmo acelerado. Em comparação, todos os dispositivos testados variam de 0.1 (mínimo) a 240 (máximo) ms. » 18 % de todos os dispositivos são melhores. Isso significa que o tempo de resposta medido é melhor que a média de todos os dispositivos testados (20.8 ms). | ||
| ↔ Tempo de resposta 50% cinza a 80% cinza | ||
| 4.6 ms ... ascensão ↗ e queda ↘ combinadas | ↗ 1.3 ms ascensão | 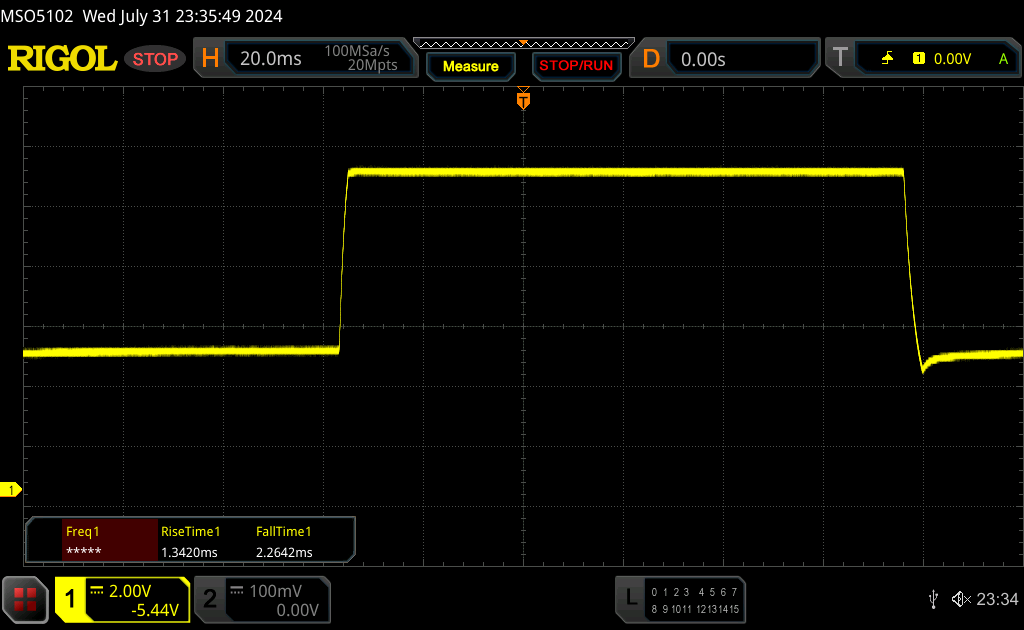 |
| ↘ 2.3 ms queda | ||
| A tela mostra taxas de resposta muito rápidas em nossos testes e deve ser muito adequada para jogos em ritmo acelerado. Em comparação, todos os dispositivos testados variam de 0.165 (mínimo) a 636 (máximo) ms. » 13 % de todos os dispositivos são melhores. Isso significa que o tempo de resposta medido é melhor que a média de todos os dispositivos testados (32.5 ms). | ||
Cintilação da tela / PWM (modulação por largura de pulso)
| Tela tremeluzindo / PWM não detectado | 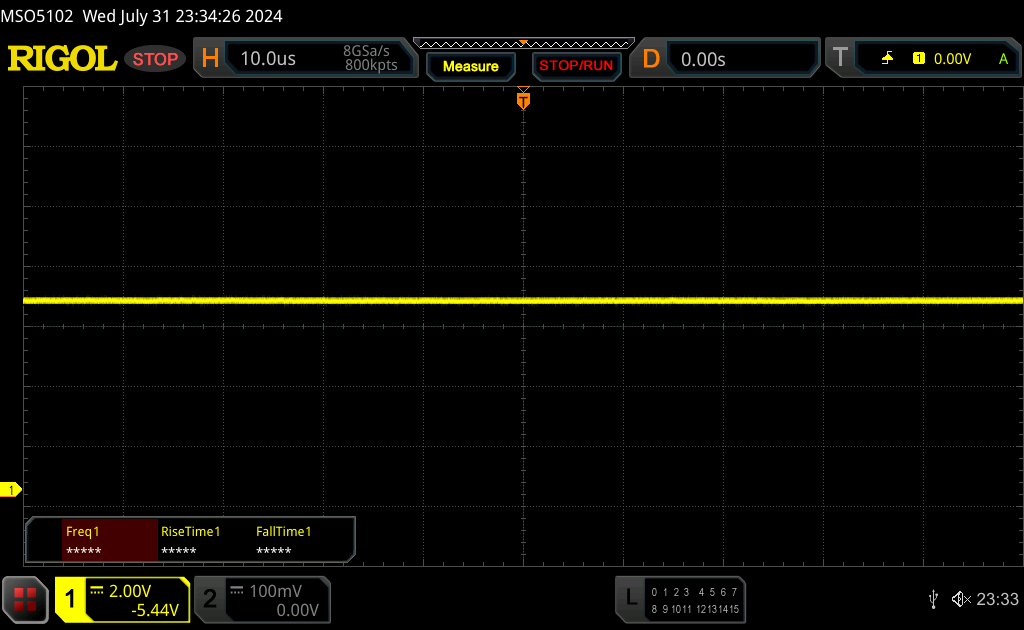 | ||
[pwm_comparison] Em comparação: 53 % de todos os dispositivos testados não usam PWM para escurecer a tela. Se PWM foi detectado, uma média de 8516 (mínimo: 5 - máximo: 343500) Hz foi medida. | |||
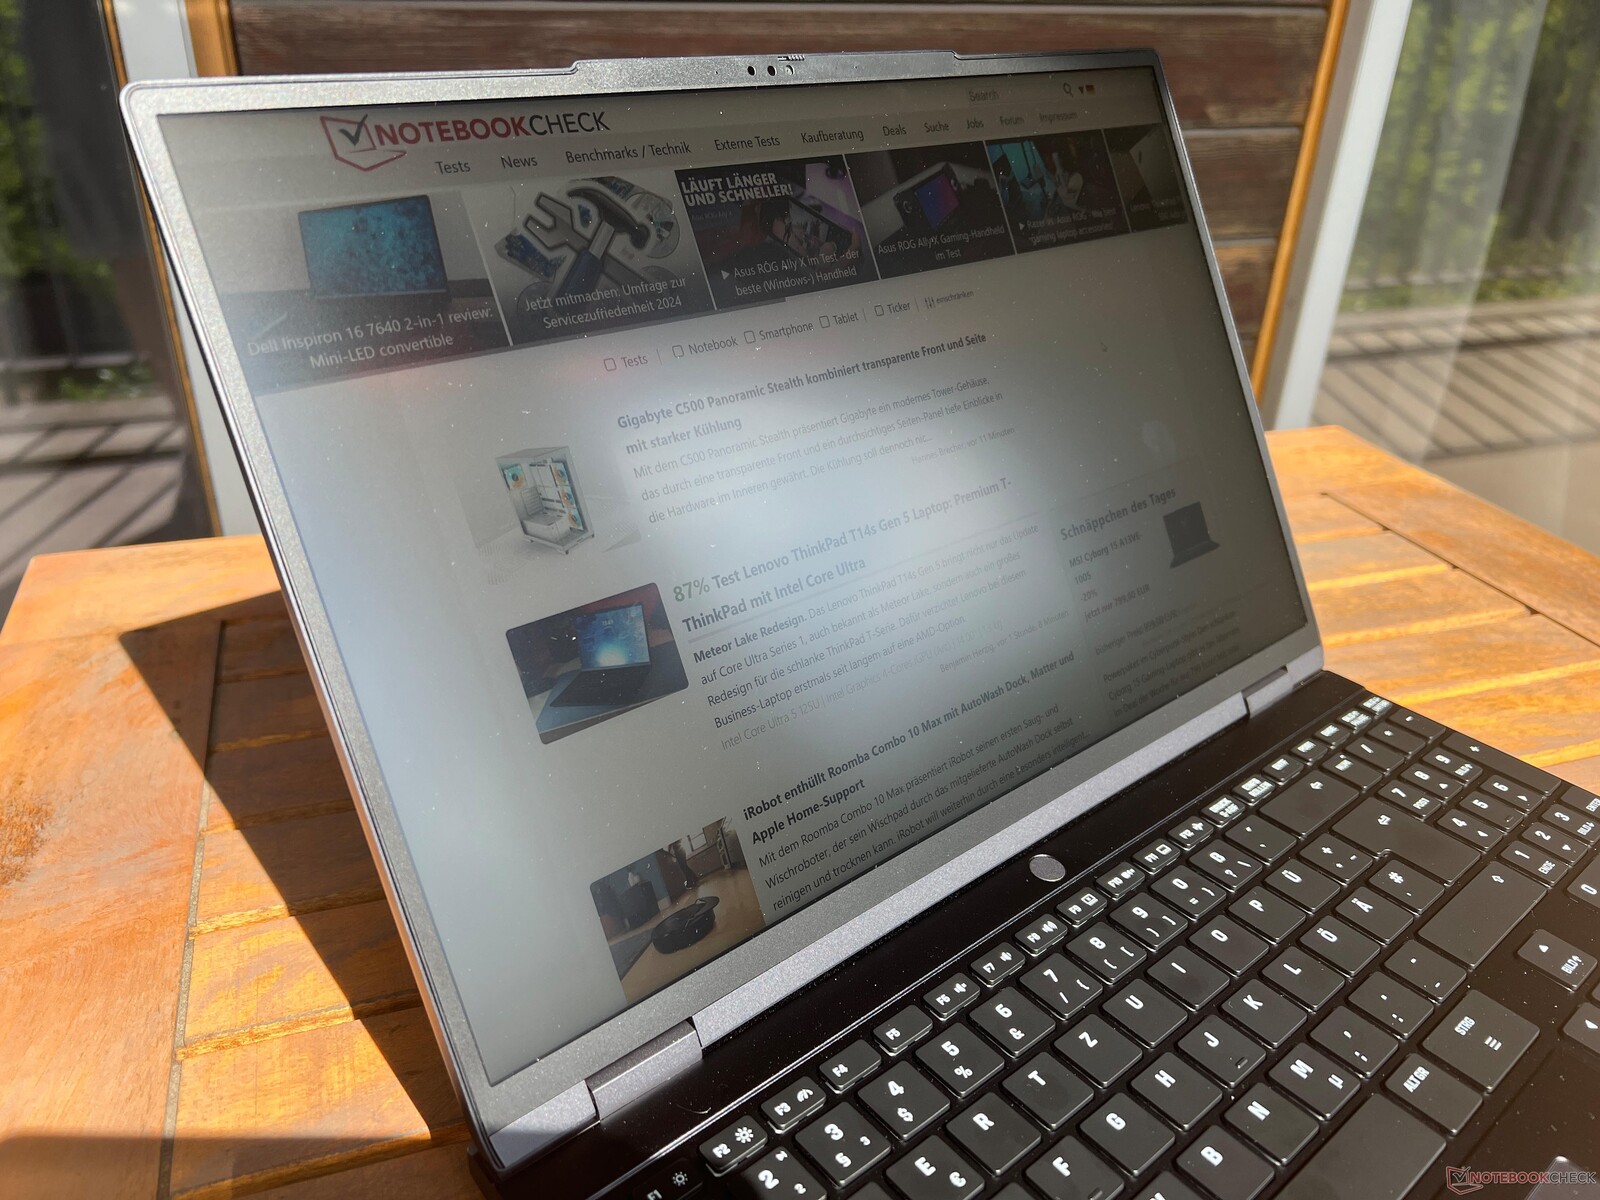
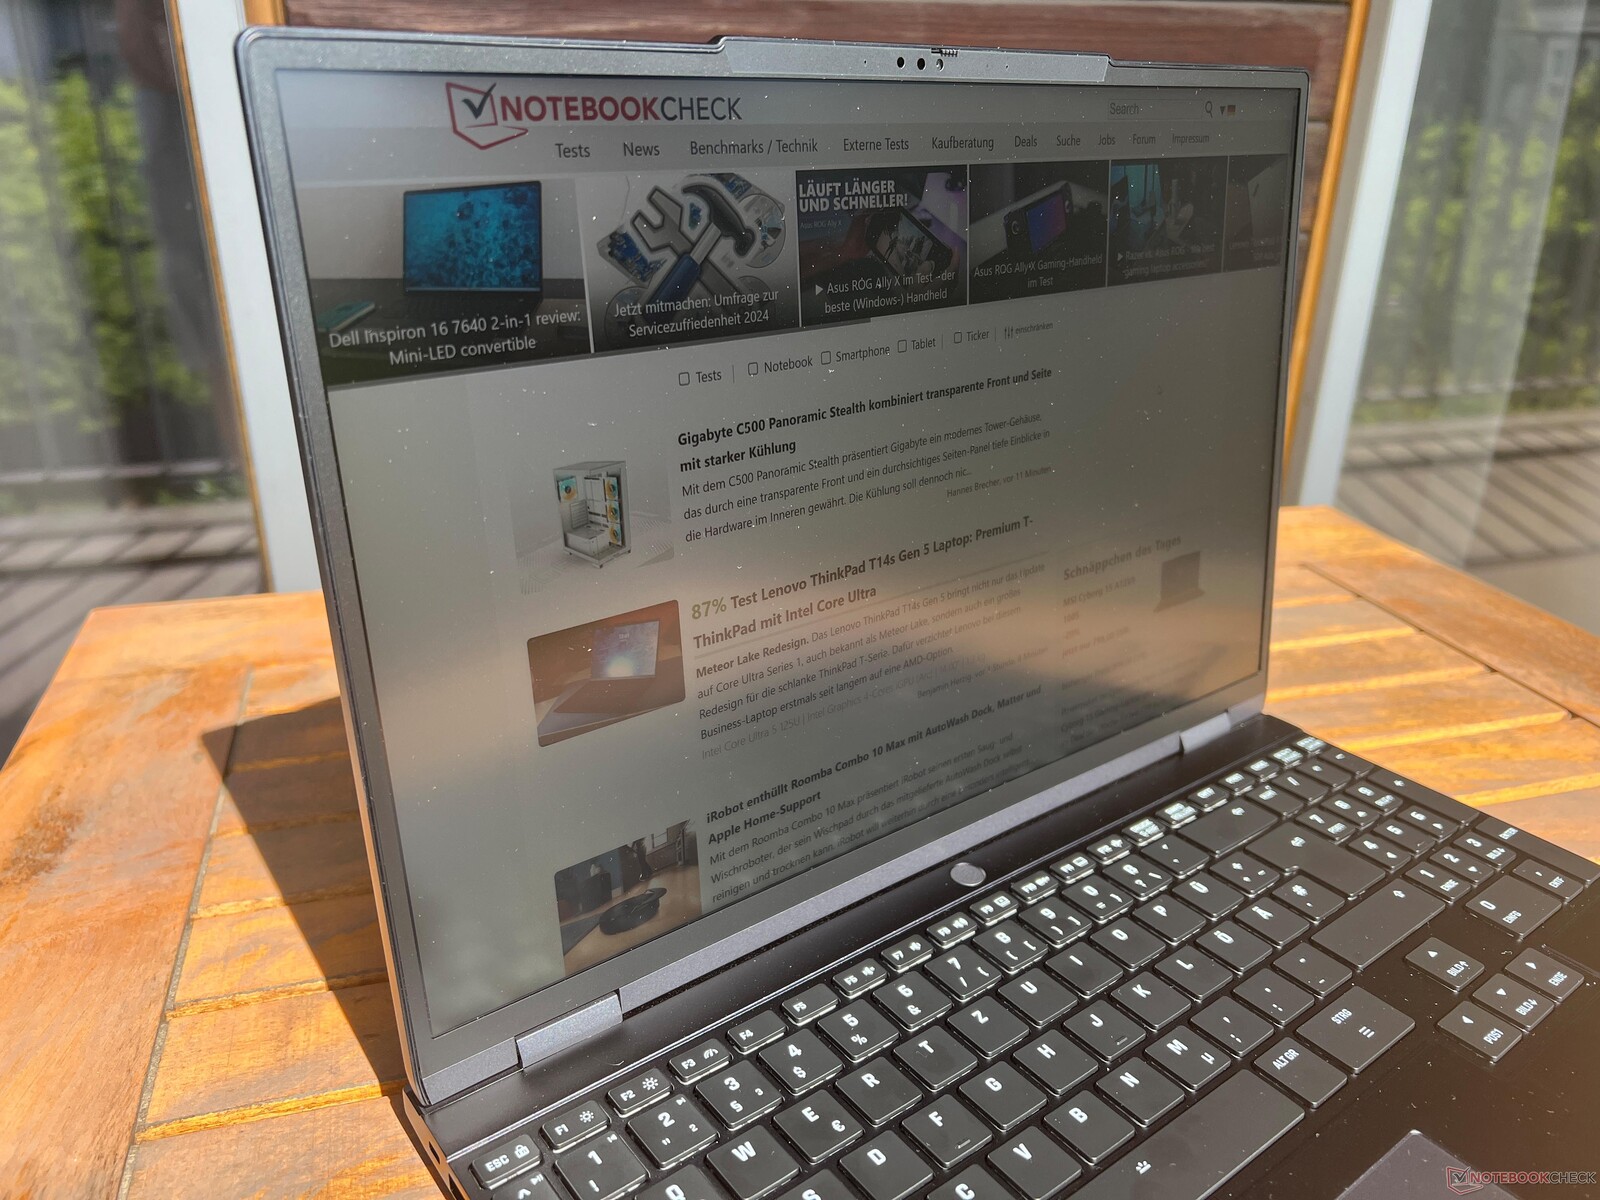
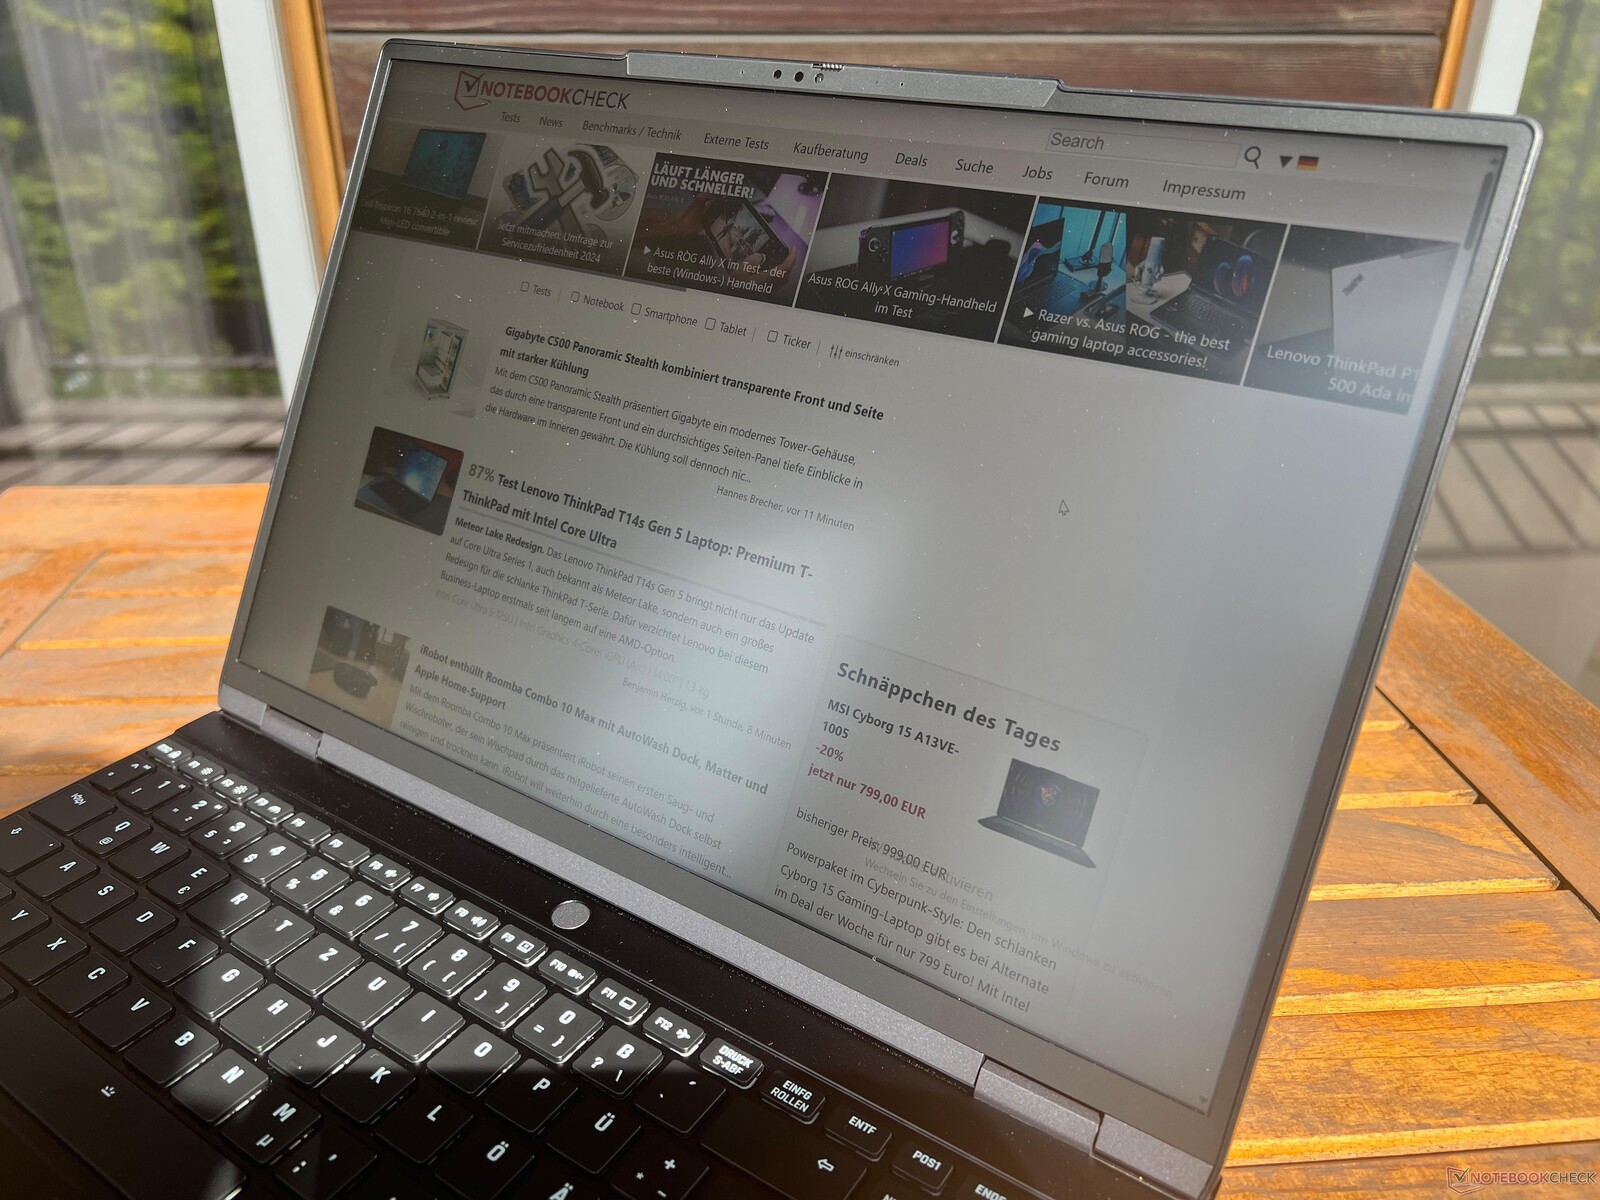

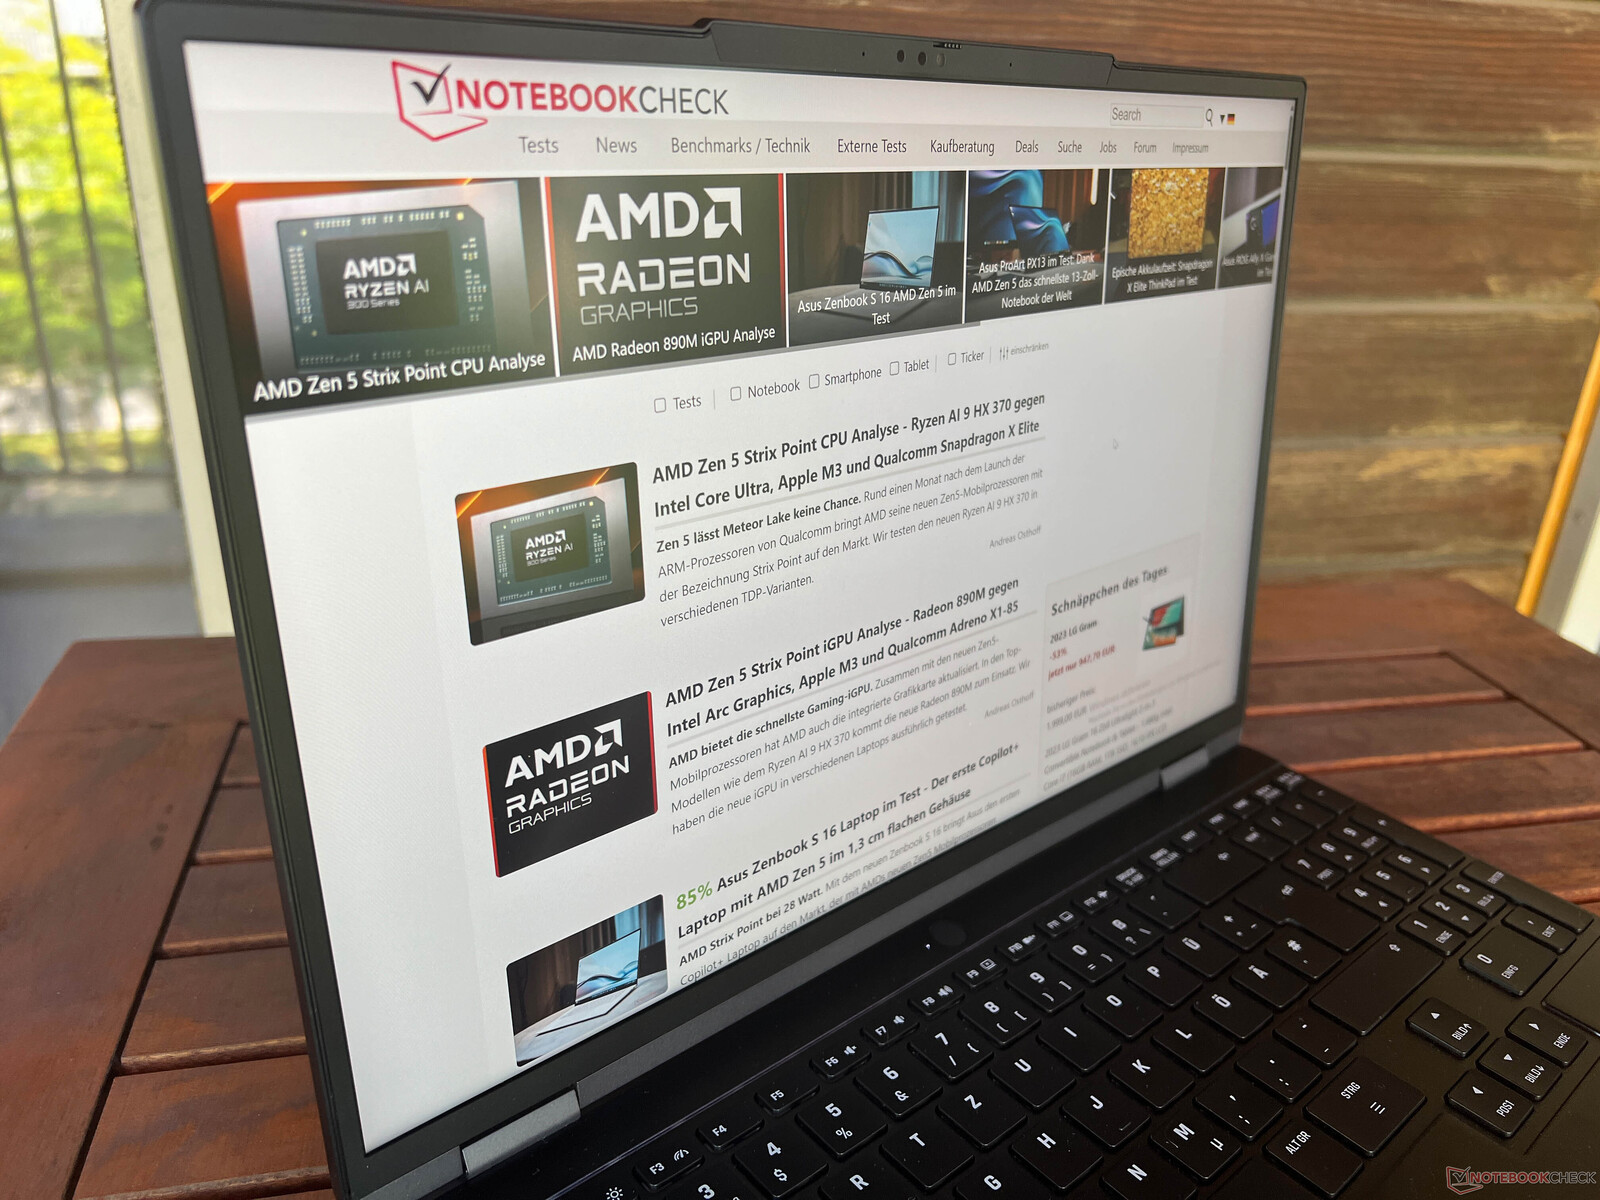
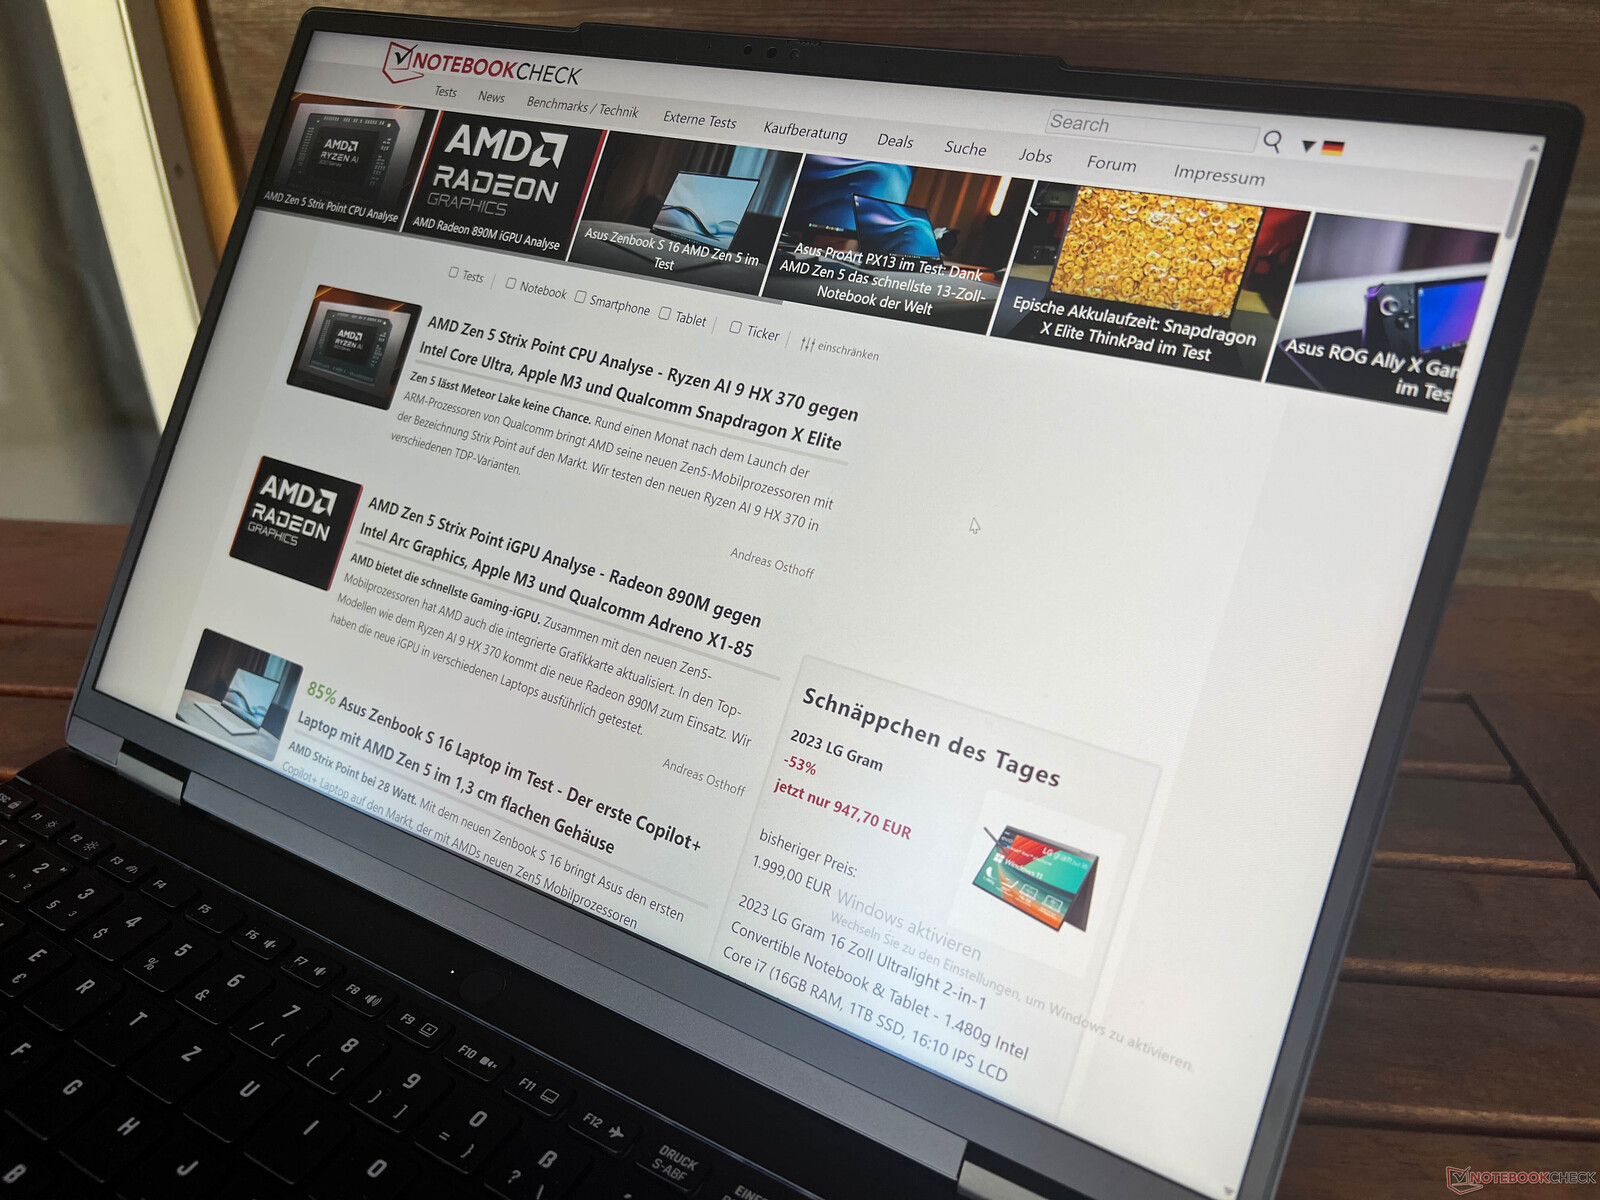
O painel fosco funciona muito bem em ambientes externos graças ao alto brilho e, mesmo em dias claros, o senhor ainda consegue ver o conteúdo com clareza. A estabilidade do ângulo de visão do painel IPS é muito boa.

Desempenho - Meteor Lake e até 96 GB de RAM
O XMG Evo 15 está equipado com o AMD Ryzen 7 8845HS ou o Intel Core Ultra 7 155H em nosso dispositivo de teste. Os dois slots de RAM permitem até 96 GB de RAM DDR5, mas a frequência é limitada de 5600 a 4800 MHz ao usar módulos de 48 GB devido a restrições térmicas.
Condições de teste
O Control Center pré-instalado oferece três perfis de energia diferentes (Balanced, Enthusiast e Overboost), que também podem ser convenientemente alternados usando a combinação de teclas Fn+F3. Realizamos os benchmarks e as medições com o perfil padrão Enthusiast. Resumimos os valores de desempenho dos três perfis na tabela a seguir:
| Perfil de energia | CPU TDP | CPU TDP (bateria) | CB R23 Multi | Time Spy Gráficos | max. Volume do ventilador |
|---|---|---|---|---|---|
| Balanceado | 35 watts | 25 watts | 12.759 pontos | 2.623 pontos | 35,4 dB(A) |
| Enthusiast | 45 watts | 35 watts | 14.957 pontos | 3.690 pontos | 40,4 dB(A) |
| Overboost | 70 watts | 35 watts | 18.790 pontos | 3.633 pontos | 48,1 dB(A) |
Processador - Core Ultra 7 155H
O Intel Core Ultra 7 155H é usado atualmente em muitos notebooks, mas o XMG Evo 15 é um dos poucos modelos que não tem um limite de energia de curto prazo aumentado. No modo Entusiasta, o consumo é de 45 watts e esse valor é mantido constante (isso também se aplica aos outros perfis de desempenho com 70 e 35 watts) e não há perda de desempenho sob carga contínua. No modo entusiasta, o desempenho já é muito bom, mas se o senhor precisar de ainda mais potência, poderá usar facilmente o modo overboost (+25% de desempenho de vários núcleos). No entanto, no modo de bateria, o consumo máximo cai para 35 watts, o que resulta em uma redução de 15% no desempenho. Outros benchmarks de CPU podem ser encontrados em nossa seção de tecnologia.
Cinebench R15 Multi loop
Cinebench R23: Multi Core | Single Core
Cinebench R20: CPU (Multi Core) | CPU (Single Core)
Cinebench R15: CPU Multi 64Bit | CPU Single 64Bit
Blender: v2.79 BMW27 CPU
7-Zip 18.03: 7z b 4 | 7z b 4 -mmt1
Geekbench 6.4: Multi-Core | Single-Core
Geekbench 5.5: Multi-Core | Single-Core
HWBOT x265 Benchmark v2.2: 4k Preset
LibreOffice : 20 Documents To PDF
R Benchmark 2.5: Overall mean
| CPU Performance Rating | |
| Lenovo IdeaPad Pro 5 16IMH G9 | |
| Xiaomi RedmiBook Pro 16 2024 | |
| Média da turma Multimedia | |
| Dell Inspiron 16 7640 2-in-1 | |
| SCHENKER XMG Evo 15 (M24) | |
| Medion S10 OLED | |
| Média Intel Core Ultra 7 155H | |
| Lenovo ThinkPad T16 G2 21K70035GE | |
| Cinebench R23 / Multi Core | |
| Lenovo IdeaPad Pro 5 16IMH G9 | |
| Xiaomi RedmiBook Pro 16 2024 | |
| Média da turma Multimedia (4861 - 30789, n=96, últimos 2 anos) | |
| Dell Inspiron 16 7640 2-in-1 | |
| Medion S10 OLED | |
| Média Intel Core Ultra 7 155H (9769 - 19007, n=52) | |
| SCHENKER XMG Evo 15 (M24) | |
| Lenovo ThinkPad T16 G2 21K70035GE | |
| Cinebench R23 / Single Core | |
| Média da turma Multimedia (878 - 2290, n=87, últimos 2 anos) | |
| Medion S10 OLED | |
| Lenovo IdeaPad Pro 5 16IMH G9 | |
| Xiaomi RedmiBook Pro 16 2024 | |
| Dell Inspiron 16 7640 2-in-1 | |
| SCHENKER XMG Evo 15 (M24) | |
| Média Intel Core Ultra 7 155H (1496 - 1815, n=52) | |
| Lenovo ThinkPad T16 G2 21K70035GE | |
| Cinebench R20 / CPU (Multi Core) | |
| Lenovo IdeaPad Pro 5 16IMH G9 | |
| Xiaomi RedmiBook Pro 16 2024 | |
| Dell Inspiron 16 7640 2-in-1 | |
| Medion S10 OLED | |
| Média da turma Multimedia (1887 - 11924, n=80, últimos 2 anos) | |
| Média Intel Core Ultra 7 155H (3798 - 7409, n=50) | |
| SCHENKER XMG Evo 15 (M24) | |
| Lenovo ThinkPad T16 G2 21K70035GE | |
| Cinebench R20 / CPU (Single Core) | |
| Lenovo IdeaPad Pro 5 16IMH G9 | |
| Medion S10 OLED | |
| SCHENKER XMG Evo 15 (M24) | |
| Lenovo ThinkPad T16 G2 21K70035GE | |
| Média da turma Multimedia (341 - 853, n=80, últimos 2 anos) | |
| Xiaomi RedmiBook Pro 16 2024 | |
| Dell Inspiron 16 7640 2-in-1 | |
| Média Intel Core Ultra 7 155H (601 - 696, n=50) | |
| Cinebench R15 / CPU Multi 64Bit | |
| Xiaomi RedmiBook Pro 16 2024 | |
| Lenovo IdeaPad Pro 5 16IMH G9 | |
| Dell Inspiron 16 7640 2-in-1 | |
| Média da turma Multimedia (856 - 5224, n=87, últimos 2 anos) | |
| Média Intel Core Ultra 7 155H (1932 - 2880, n=56) | |
| Medion S10 OLED | |
| SCHENKER XMG Evo 15 (M24) | |
| Lenovo ThinkPad T16 G2 21K70035GE | |
| Cinebench R15 / CPU Single 64Bit | |
| Lenovo IdeaPad Pro 5 16IMH G9 | |
| Lenovo ThinkPad T16 G2 21K70035GE | |
| SCHENKER XMG Evo 15 (M24) | |
| Média da turma Multimedia (99.6 - 323, n=82, últimos 2 anos) | |
| Medion S10 OLED | |
| Xiaomi RedmiBook Pro 16 2024 | |
| Dell Inspiron 16 7640 2-in-1 | |
| Média Intel Core Ultra 7 155H (99.6 - 268, n=52) | |
| Blender / v2.79 BMW27 CPU | |
| Média da turma Multimedia (100 - 557, n=80, últimos 2 anos) | |
| Lenovo ThinkPad T16 G2 21K70035GE | |
| Média Intel Core Ultra 7 155H (175 - 381, n=47) | |
| Dell Inspiron 16 7640 2-in-1 | |
| SCHENKER XMG Evo 15 (M24) | |
| Medion S10 OLED | |
| Lenovo IdeaPad Pro 5 16IMH G9 | |
| Xiaomi RedmiBook Pro 16 2024 | |
| 7-Zip 18.03 / 7z b 4 | |
| Lenovo IdeaPad Pro 5 16IMH G9 | |
| Xiaomi RedmiBook Pro 16 2024 | |
| Dell Inspiron 16 7640 2-in-1 | |
| SCHENKER XMG Evo 15 (M24) | |
| Média da turma Multimedia (29095 - 130368, n=75, últimos 2 anos) | |
| Média Intel Core Ultra 7 155H (41739 - 70254, n=50) | |
| Medion S10 OLED | |
| Lenovo ThinkPad T16 G2 21K70035GE | |
| 7-Zip 18.03 / 7z b 4 -mmt1 | |
| Lenovo ThinkPad T16 G2 21K70035GE | |
| Média da turma Multimedia (3398 - 7545, n=75, últimos 2 anos) | |
| SCHENKER XMG Evo 15 (M24) | |
| Medion S10 OLED | |
| Xiaomi RedmiBook Pro 16 2024 | |
| Lenovo IdeaPad Pro 5 16IMH G9 | |
| Dell Inspiron 16 7640 2-in-1 | |
| Média Intel Core Ultra 7 155H (4594 - 5621, n=50) | |
| Geekbench 6.4 / Multi-Core | |
| Média da turma Multimedia (4983 - 25760, n=77, últimos 2 anos) | |
| Xiaomi RedmiBook Pro 16 2024 | |
| Lenovo IdeaPad Pro 5 16IMH G9 | |
| SCHENKER XMG Evo 15 (M24) | |
| Média Intel Core Ultra 7 155H (7732 - 13656, n=55) | |
| Dell Inspiron 16 7640 2-in-1 | |
| Medion S10 OLED | |
| Lenovo ThinkPad T16 G2 21K70035GE | |
| Geekbench 6.4 / Single-Core | |
| Média da turma Multimedia (1534 - 3927, n=73, últimos 2 anos) | |
| Lenovo ThinkPad T16 G2 21K70035GE | |
| SCHENKER XMG Evo 15 (M24) | |
| Medion S10 OLED | |
| Lenovo IdeaPad Pro 5 16IMH G9 | |
| Xiaomi RedmiBook Pro 16 2024 | |
| Média Intel Core Ultra 7 155H (1901 - 2473, n=52) | |
| Dell Inspiron 16 7640 2-in-1 | |
| Geekbench 5.5 / Multi-Core | |
| Xiaomi RedmiBook Pro 16 2024 | |
| Lenovo IdeaPad Pro 5 16IMH G9 | |
| Dell Inspiron 16 7640 2-in-1 | |
| Média da turma Multimedia (4652 - 23059, n=79, últimos 2 anos) | |
| Média Intel Core Ultra 7 155H (10017 - 13556, n=52) | |
| SCHENKER XMG Evo 15 (M24) | |
| Medion S10 OLED | |
| Lenovo ThinkPad T16 G2 21K70035GE | |
| Geekbench 5.5 / Single-Core | |
| Média da turma Multimedia (891 - 2555, n=79, últimos 2 anos) | |
| SCHENKER XMG Evo 15 (M24) | |
| Lenovo IdeaPad Pro 5 16IMH G9 | |
| Xiaomi RedmiBook Pro 16 2024 | |
| Medion S10 OLED | |
| Dell Inspiron 16 7640 2-in-1 | |
| Lenovo ThinkPad T16 G2 21K70035GE | |
| Média Intel Core Ultra 7 155H (1462 - 1824, n=52) | |
| HWBOT x265 Benchmark v2.2 / 4k Preset | |
| Lenovo IdeaPad Pro 5 16IMH G9 | |
| Xiaomi RedmiBook Pro 16 2024 | |
| Dell Inspiron 16 7640 2-in-1 | |
| SCHENKER XMG Evo 15 (M24) | |
| Média da turma Multimedia (5.26 - 34.3, n=74, últimos 2 anos) | |
| Medion S10 OLED | |
| Média Intel Core Ultra 7 155H (9.93 - 21.2, n=50) | |
| Lenovo ThinkPad T16 G2 21K70035GE | |
| LibreOffice / 20 Documents To PDF | |
| Média da turma Multimedia (23.9 - 146.7, n=76, últimos 2 anos) | |
| Média Intel Core Ultra 7 155H (37.5 - 79.2, n=49) | |
| Medion S10 OLED | |
| Xiaomi RedmiBook Pro 16 2024 | |
| Dell Inspiron 16 7640 2-in-1 | |
| Lenovo ThinkPad T16 G2 21K70035GE | |
| SCHENKER XMG Evo 15 (M24) | |
| Lenovo IdeaPad Pro 5 16IMH G9 | |
| R Benchmark 2.5 / Overall mean | |
| Dell Inspiron 16 7640 2-in-1 | |
| Média Intel Core Ultra 7 155H (0.4457 - 0.53, n=49) | |
| Média da turma Multimedia (0.3604 - 0.947, n=74, últimos 2 anos) | |
| Lenovo ThinkPad T16 G2 21K70035GE | |
| Xiaomi RedmiBook Pro 16 2024 | |
| Medion S10 OLED | |
| Lenovo IdeaPad Pro 5 16IMH G9 | |
| SCHENKER XMG Evo 15 (M24) | |
* ... menor é melhor
AIDA64: FP32 Ray-Trace | FPU Julia | CPU SHA3 | CPU Queen | FPU SinJulia | FPU Mandel | CPU AES | CPU ZLib | FP64 Ray-Trace | CPU PhotoWorxx
| Performance Rating | |
| Lenovo ThinkPad T16 G2 21K70035GE | |
| Lenovo IdeaPad Pro 5 16IMH G9 | |
| Xiaomi RedmiBook Pro 16 2024 | |
| Média da turma Multimedia | |
| Dell Inspiron 16 7640 2-in-1 | |
| SCHENKER XMG Evo 15 (M24) | |
| Medion S10 OLED | |
| Média Intel Core Ultra 7 155H | |
| AIDA64 / FP32 Ray-Trace | |
| Lenovo ThinkPad T16 G2 21K70035GE | |
| Lenovo IdeaPad Pro 5 16IMH G9 | |
| Média da turma Multimedia (5121 - 50388, n=73, últimos 2 anos) | |
| Medion S10 OLED | |
| Dell Inspiron 16 7640 2-in-1 | |
| Xiaomi RedmiBook Pro 16 2024 | |
| Média Intel Core Ultra 7 155H (6670 - 18470, n=50) | |
| SCHENKER XMG Evo 15 (M24) | |
| AIDA64 / FPU Julia | |
| Lenovo ThinkPad T16 G2 21K70035GE | |
| Lenovo IdeaPad Pro 5 16IMH G9 | |
| Xiaomi RedmiBook Pro 16 2024 | |
| Medion S10 OLED | |
| Média da turma Multimedia (14528 - 201874, n=74, últimos 2 anos) | |
| Dell Inspiron 16 7640 2-in-1 | |
| SCHENKER XMG Evo 15 (M24) | |
| Média Intel Core Ultra 7 155H (40905 - 93181, n=50) | |
| AIDA64 / CPU SHA3 | |
| Lenovo IdeaPad Pro 5 16IMH G9 | |
| Lenovo ThinkPad T16 G2 21K70035GE | |
| Xiaomi RedmiBook Pro 16 2024 | |
| Média da turma Multimedia (1188 - 8623, n=74, últimos 2 anos) | |
| Medion S10 OLED | |
| Dell Inspiron 16 7640 2-in-1 | |
| SCHENKER XMG Evo 15 (M24) | |
| Média Intel Core Ultra 7 155H (1940 - 4436, n=50) | |
| AIDA64 / CPU Queen | |
| Lenovo ThinkPad T16 G2 21K70035GE | |
| Dell Inspiron 16 7640 2-in-1 | |
| Média da turma Multimedia (21547 - 181505, n=74, últimos 2 anos) | |
| Xiaomi RedmiBook Pro 16 2024 | |
| Lenovo IdeaPad Pro 5 16IMH G9 | |
| Média Intel Core Ultra 7 155H (64698 - 94181, n=50) | |
| SCHENKER XMG Evo 15 (M24) | |
| Medion S10 OLED | |
| AIDA64 / FPU SinJulia | |
| Lenovo ThinkPad T16 G2 21K70035GE | |
| Lenovo IdeaPad Pro 5 16IMH G9 | |
| Dell Inspiron 16 7640 2-in-1 | |
| Xiaomi RedmiBook Pro 16 2024 | |
| Média da turma Multimedia (1240 - 28794, n=74, últimos 2 anos) | |
| SCHENKER XMG Evo 15 (M24) | |
| Média Intel Core Ultra 7 155H (5639 - 10647, n=50) | |
| Medion S10 OLED | |
| AIDA64 / FPU Mandel | |
| Lenovo ThinkPad T16 G2 21K70035GE | |
| Lenovo IdeaPad Pro 5 16IMH G9 | |
| Medion S10 OLED | |
| Média da turma Multimedia (9903 - 105740, n=73, últimos 2 anos) | |
| Xiaomi RedmiBook Pro 16 2024 | |
| Dell Inspiron 16 7640 2-in-1 | |
| SCHENKER XMG Evo 15 (M24) | |
| Média Intel Core Ultra 7 155H (18236 - 47685, n=50) | |
| AIDA64 / CPU AES | |
| SCHENKER XMG Evo 15 (M24) | |
| Lenovo IdeaPad Pro 5 16IMH G9 | |
| Média Intel Core Ultra 7 155H (45713 - 152179, n=50) | |
| Média da turma Multimedia (26066 - 169946, n=74, últimos 2 anos) | |
| Lenovo ThinkPad T16 G2 21K70035GE | |
| Dell Inspiron 16 7640 2-in-1 | |
| Xiaomi RedmiBook Pro 16 2024 | |
| Medion S10 OLED | |
| AIDA64 / CPU ZLib | |
| Lenovo IdeaPad Pro 5 16IMH G9 | |
| Xiaomi RedmiBook Pro 16 2024 | |
| Dell Inspiron 16 7640 2-in-1 | |
| Medion S10 OLED | |
| Média da turma Multimedia (440 - 2022, n=74, últimos 2 anos) | |
| Média Intel Core Ultra 7 155H (557 - 1250, n=50) | |
| SCHENKER XMG Evo 15 (M24) | |
| Lenovo ThinkPad T16 G2 21K70035GE | |
| AIDA64 / FP64 Ray-Trace | |
| Lenovo ThinkPad T16 G2 21K70035GE | |
| Lenovo IdeaPad Pro 5 16IMH G9 | |
| Média da turma Multimedia (2759 - 26875, n=74, últimos 2 anos) | |
| Medion S10 OLED | |
| Dell Inspiron 16 7640 2-in-1 | |
| Xiaomi RedmiBook Pro 16 2024 | |
| SCHENKER XMG Evo 15 (M24) | |
| Média Intel Core Ultra 7 155H (3569 - 9802, n=50) | |
| AIDA64 / CPU PhotoWorxx | |
| Lenovo IdeaPad Pro 5 16IMH G9 | |
| Xiaomi RedmiBook Pro 16 2024 | |
| Média Intel Core Ultra 7 155H (32719 - 54223, n=50) | |
| SCHENKER XMG Evo 15 (M24) | |
| Dell Inspiron 16 7640 2-in-1 | |
| Média da turma Multimedia (12860 - 58844, n=74, últimos 2 anos) | |
| Medion S10 OLED | |
| Lenovo ThinkPad T16 G2 21K70035GE | |
Desempenho do sistema
O desempenho geral do sistema é excelente e o Evo 15 é um sistema muito rápido no uso diário. Também não tivemos problemas com a estabilidade do sistema durante nosso período de teste.
CrossMark: Overall | Productivity | Creativity | Responsiveness
WebXPRT 3: Overall
WebXPRT 4: Overall
Mozilla Kraken 1.1: Total
| PCMark 10 / Score | |
| SCHENKER XMG Evo 15 (M24) | |
| Lenovo IdeaPad Pro 5 16IMH G9 | |
| Dell Inspiron 16 7640 2-in-1 | |
| Xiaomi RedmiBook Pro 16 2024 | |
| Média da turma Multimedia (4325 - 8670, n=70, últimos 2 anos) | |
| Média Intel Core Ultra 7 155H, Intel Arc 8-Core iGPU (4809 - 7529, n=34) | |
| Lenovo ThinkPad T16 G2 21K70035GE | |
| Medion S10 OLED | |
| PCMark 10 / Essentials | |
| Lenovo IdeaPad Pro 5 16IMH G9 | |
| SCHENKER XMG Evo 15 (M24) | |
| Dell Inspiron 16 7640 2-in-1 | |
| Xiaomi RedmiBook Pro 16 2024 | |
| Média da turma Multimedia (8025 - 12420, n=70, últimos 2 anos) | |
| Média Intel Core Ultra 7 155H, Intel Arc 8-Core iGPU (7605 - 11289, n=34) | |
| Lenovo ThinkPad T16 G2 21K70035GE | |
| Medion S10 OLED | |
| PCMark 10 / Productivity | |
| Média da turma Multimedia (6089 - 10615, n=70, últimos 2 anos) | |
| Lenovo IdeaPad Pro 5 16IMH G9 | |
| Lenovo ThinkPad T16 G2 21K70035GE | |
| SCHENKER XMG Evo 15 (M24) | |
| Dell Inspiron 16 7640 2-in-1 | |
| Média Intel Core Ultra 7 155H, Intel Arc 8-Core iGPU (6042 - 10591, n=34) | |
| Xiaomi RedmiBook Pro 16 2024 | |
| Medion S10 OLED | |
| PCMark 10 / Digital Content Creation | |
| SCHENKER XMG Evo 15 (M24) | |
| Xiaomi RedmiBook Pro 16 2024 | |
| Lenovo IdeaPad Pro 5 16IMH G9 | |
| Dell Inspiron 16 7640 2-in-1 | |
| Média da turma Multimedia (3651 - 13548, n=70, últimos 2 anos) | |
| Média Intel Core Ultra 7 155H, Intel Arc 8-Core iGPU (4985 - 10709, n=34) | |
| Medion S10 OLED | |
| Lenovo ThinkPad T16 G2 21K70035GE | |
| CrossMark / Overall | |
| SCHENKER XMG Evo 15 (M24) | |
| Xiaomi RedmiBook Pro 16 2024 | |
| Média da turma Multimedia (866 - 2255, n=81, últimos 2 anos) | |
| Dell Inspiron 16 7640 2-in-1 | |
| Medion S10 OLED | |
| Média Intel Core Ultra 7 155H, Intel Arc 8-Core iGPU (1366 - 1903, n=34) | |
| Lenovo ThinkPad T16 G2 21K70035GE | |
| Lenovo IdeaPad Pro 5 16IMH G9 | |
| CrossMark / Productivity | |
| SCHENKER XMG Evo 15 (M24) | |
| Xiaomi RedmiBook Pro 16 2024 | |
| Medion S10 OLED | |
| Média da turma Multimedia (913 - 2050, n=81, últimos 2 anos) | |
| Dell Inspiron 16 7640 2-in-1 | |
| Média Intel Core Ultra 7 155H, Intel Arc 8-Core iGPU (1291 - 1798, n=33) | |
| Lenovo ThinkPad T16 G2 21K70035GE | |
| Lenovo IdeaPad Pro 5 16IMH G9 | |
| CrossMark / Creativity | |
| Média da turma Multimedia (907 - 2795, n=81, últimos 2 anos) | |
| Xiaomi RedmiBook Pro 16 2024 | |
| Dell Inspiron 16 7640 2-in-1 | |
| SCHENKER XMG Evo 15 (M24) | |
| Lenovo IdeaPad Pro 5 16IMH G9 | |
| Média Intel Core Ultra 7 155H, Intel Arc 8-Core iGPU (1519 - 1929, n=33) | |
| Medion S10 OLED | |
| Lenovo ThinkPad T16 G2 21K70035GE | |
| CrossMark / Responsiveness | |
| SCHENKER XMG Evo 15 (M24) | |
| Xiaomi RedmiBook Pro 16 2024 | |
| Medion S10 OLED | |
| Média da turma Multimedia (605 - 2094, n=81, últimos 2 anos) | |
| Média Intel Core Ultra 7 155H, Intel Arc 8-Core iGPU (939 - 1802, n=33) | |
| Dell Inspiron 16 7640 2-in-1 | |
| Lenovo ThinkPad T16 G2 21K70035GE | |
| Lenovo IdeaPad Pro 5 16IMH G9 | |
| WebXPRT 3 / Overall | |
| Média da turma Multimedia (136.4 - 545, n=81, últimos 2 anos) | |
| Lenovo IdeaPad Pro 5 16IMH G9 | |
| Dell Inspiron 16 7640 2-in-1 | |
| SCHENKER XMG Evo 15 (M24) | |
| Xiaomi RedmiBook Pro 16 2024 | |
| Média Intel Core Ultra 7 155H, Intel Arc 8-Core iGPU (252 - 299, n=34) | |
| Lenovo ThinkPad T16 G2 21K70035GE | |
| Medion S10 OLED | |
| WebXPRT 4 / Overall | |
| Média da turma Multimedia (133.2 - 353, n=75, últimos 2 anos) | |
| SCHENKER XMG Evo 15 (M24) | |
| Lenovo IdeaPad Pro 5 16IMH G9 | |
| Dell Inspiron 16 7640 2-in-1 | |
| Xiaomi RedmiBook Pro 16 2024 | |
| Média Intel Core Ultra 7 155H, Intel Arc 8-Core iGPU (166.4 - 309, n=29) | |
| Medion S10 OLED | |
| Lenovo ThinkPad T16 G2 21K70035GE | |
| Mozilla Kraken 1.1 / Total | |
| Medion S10 OLED | |
| Medion S10 OLED | |
| Lenovo ThinkPad T16 G2 21K70035GE | |
| Média Intel Core Ultra 7 155H, Intel Arc 8-Core iGPU (517 - 614, n=35) | |
| SCHENKER XMG Evo 15 (M24) | |
| Dell Inspiron 16 7640 2-in-1 | |
| Xiaomi RedmiBook Pro 16 2024 | |
| Lenovo IdeaPad Pro 5 16IMH G9 | |
| Média da turma Multimedia (254 - 1016, n=86, últimos 2 anos) | |
* ... menor é melhor
| PCMark 10 Score | 7331 pontos | |
Ajuda | ||
| AIDA64 / Memory Copy | |
| Lenovo IdeaPad Pro 5 16IMH G9 | |
| Xiaomi RedmiBook Pro 16 2024 | |
| Média Intel Core Ultra 7 155H (62397 - 96791, n=50) | |
| Dell Inspiron 16 7640 2-in-1 | |
| Média da turma Multimedia (21158 - 104459, n=74, últimos 2 anos) | |
| SCHENKER XMG Evo 15 (M24) | |
| Lenovo ThinkPad T16 G2 21K70035GE | |
| Medion S10 OLED | |
| AIDA64 / Memory Read | |
| Lenovo IdeaPad Pro 5 16IMH G9 | |
| Xiaomi RedmiBook Pro 16 2024 | |
| Média Intel Core Ultra 7 155H (60544 - 90647, n=50) | |
| SCHENKER XMG Evo 15 (M24) | |
| Medion S10 OLED | |
| Dell Inspiron 16 7640 2-in-1 | |
| Média da turma Multimedia (24312 - 125604, n=74, últimos 2 anos) | |
| Lenovo ThinkPad T16 G2 21K70035GE | |
| AIDA64 / Memory Write | |
| Lenovo ThinkPad T16 G2 21K70035GE | |
| Dell Inspiron 16 7640 2-in-1 | |
| Lenovo IdeaPad Pro 5 16IMH G9 | |
| Média Intel Core Ultra 7 155H (58692 - 93451, n=50) | |
| Média da turma Multimedia (23679 - 117933, n=74, últimos 2 anos) | |
| SCHENKER XMG Evo 15 (M24) | |
| Xiaomi RedmiBook Pro 16 2024 | |
| Medion S10 OLED | |
| AIDA64 / Memory Latency | |
| Dell Inspiron 16 7640 2-in-1 | |
| Média Intel Core Ultra 7 155H (116.2 - 233, n=50) | |
| Medion S10 OLED | |
| Xiaomi RedmiBook Pro 16 2024 | |
| Lenovo IdeaPad Pro 5 16IMH G9 | |
| SCHENKER XMG Evo 15 (M24) | |
| Lenovo ThinkPad T16 G2 21K70035GE | |
| Média da turma Multimedia (7 - 346, n=74, últimos 2 anos) | |
* ... menor é melhor
Latências de DPC
Em nosso teste de latência padronizado (navegação na Internet, reprodução de 4K no YouTube, carga da CPU), o dispositivo de teste com a versão atual do BIOS mostra pequenas limitações para o uso de aplicativos de áudio em tempo real.
| DPC Latencies / LatencyMon - interrupt to process latency (max), Web, Youtube, Prime95 | |
| Medion S10 OLED | |
| SCHENKER XMG Evo 15 (M24) | |
| Dell Inspiron 16 7640 2-in-1 | |
| Lenovo IdeaPad Pro 5 16IMH G9 | |
| Lenovo ThinkPad T16 G2 21K70035GE | |
| Xiaomi RedmiBook Pro 16 2024 | |
* ... menor é melhor
Armazenamento em massa
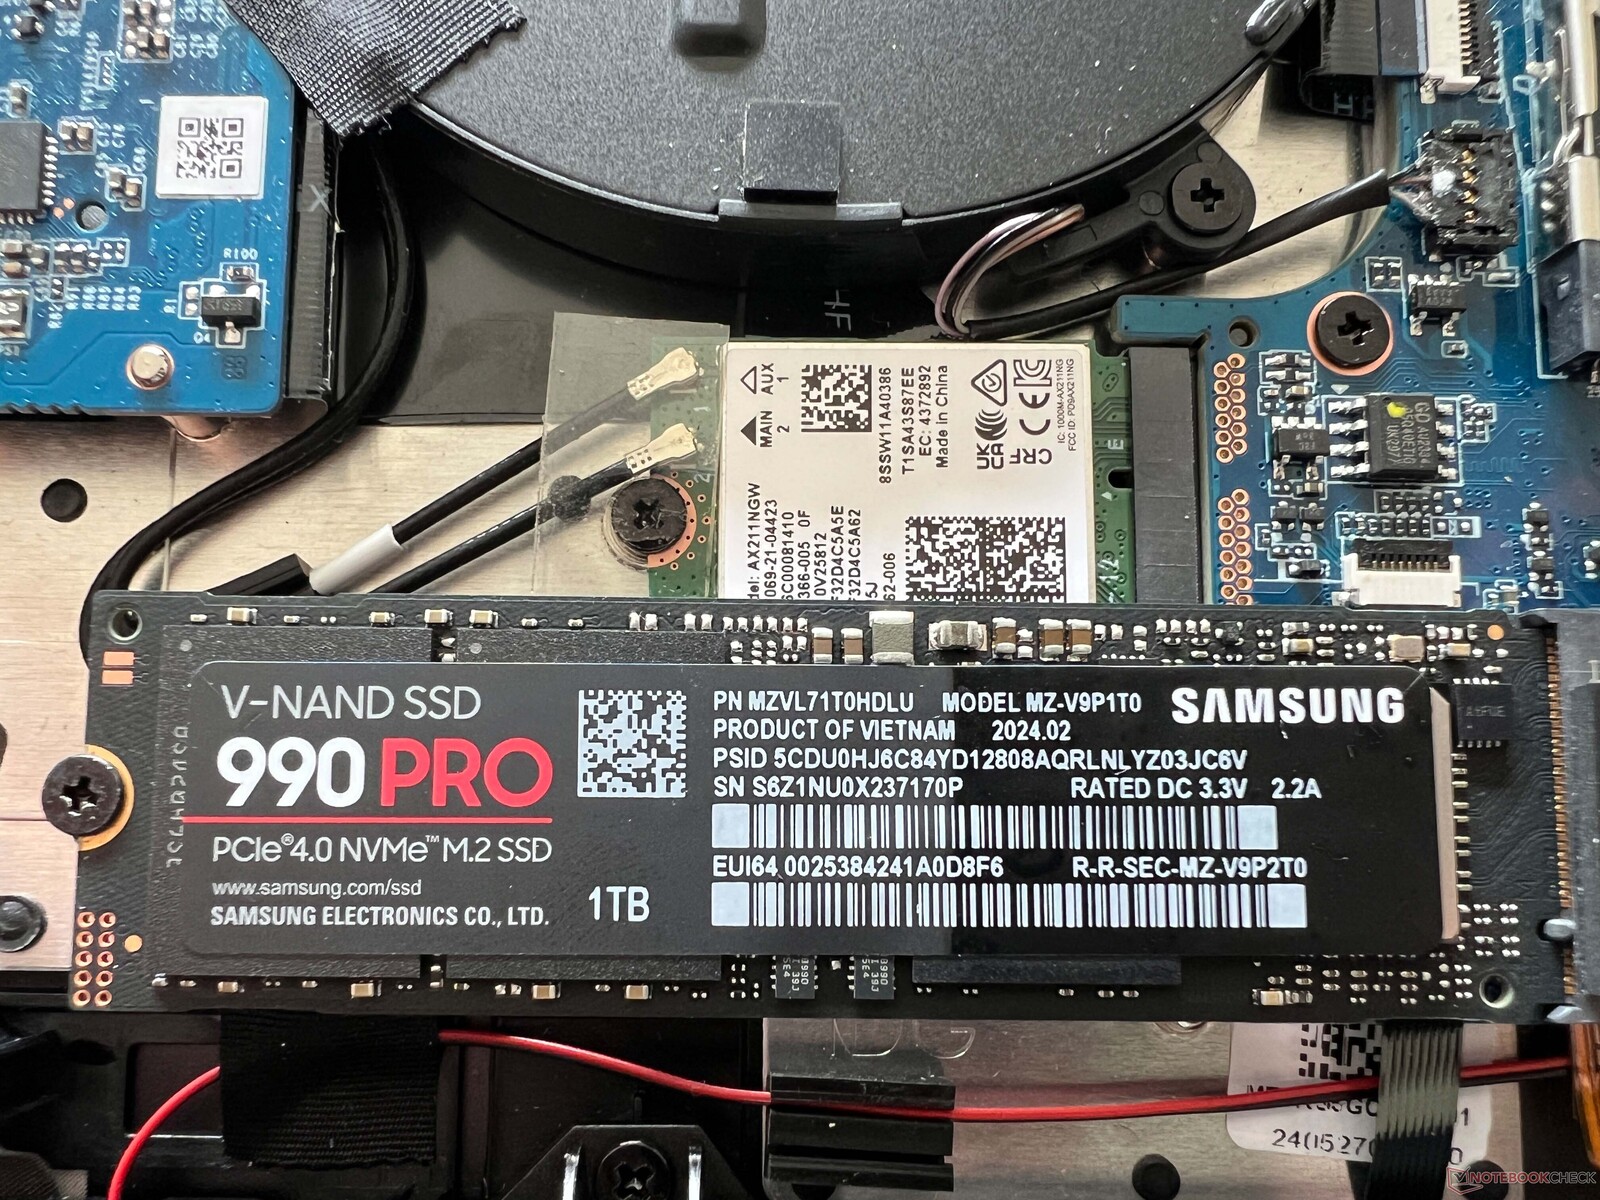
O XMG Evo 15 (M24) oferece dois slots M.2-2280, que são conectados via PCIe 4.0 e também suportam uma matriz RAID (0/1). O Evo é equipado com um WD Blue SN580 de 500 GB como padrão, mas nosso dispositivo de teste está equipado com a versão de 1 TB do Samsung 990 Pro, que é um SSD extremamente rápido com taxas de transferência de até 7 GB/s. Além disso, o desempenho permanece completamente estável, mesmo sob carga prolongada, o que não é uma coisa natural. Após a inicialização, o usuário tem 878 GB à sua disposição. Outros benchmarks de SSD podem ser encontrados aqui.

* ... menor é melhor
Continuous read: DiskSpd Read Loop, Queue Depth 8
Placa de vídeo - Intel Arc Graphics
O Evo 15 usa a placa de vídeo integrada Arc Graphics do processador Intel, embora essa seja a versão rápida com 8 núcleos Xe. A iGPU se beneficia da configuração de RAM de canal duplo e, em comparação com os concorrentes com RAM 7467 mais rápida (por exemplo, o RedmiBook Pro 16 ou IdeaPad Pro 5 16), o desempenho gráfico nos benchmarks sintéticos é apenas marginalmente inferior no geral. A Radeon 780M é superada nos benchmarks. Nas tabelas de GPU, também incluímos a Schenker Via 14 Pro com a Radeon 780M, pois ele deve oferecer um desempenho comparável ao do XMG Evo 15 com um processador AMD.
A GPU Intel atual é uma boa opção para multimídia diária e as atualizações de driver nos últimos meses também melhoraram o desempenho em jogos e, em geral, não há surpresas aqui. Em termos de desempenho real em jogos, no entanto, a Arc Graphics perde sua liderança e as iGPUs estão no mesmo nível de desempenho.
O desempenho gráfico permanece constante sob carga constante, mas o desempenho cai em cerca de 26% no modo de bateria. Outros benchmarks de GPU podem ser encontrados em nossa seção de tecnologia.
| 3DMark 11 Performance | 13430 pontos | |
| 3DMark Fire Strike Score | 7941 pontos | |
| 3DMark Time Spy Score | 4067 pontos | |
| 3DMark Steel Nomad Score | 757 pontos | |
| 3DMark Steel Nomad Light Score | 3248 pontos | |
Ajuda | ||
| Blender / v3.3 Classroom CPU | |
| Média Intel Arc 8-Core iGPU (294 - 692, n=41) | |
| Média da turma Multimedia (160 - 1042, n=80, últimos 2 anos) | |
| Lenovo ThinkPad T16 G2 21K70035GE | |
| Dell Inspiron 16 7640 2-in-1 | |
| SCHENKER XMG Evo 15 (M24) | |
| Medion S10 OLED | |
| Xiaomi RedmiBook Pro 16 2024 | |
| Lenovo IdeaPad Pro 5 16IMH G9 | |
| Blender / v3.3 Classroom oneAPI/Intel | |
| Média da turma Multimedia (203 - 401, n=5, últimos 2 anos) | |
| Média Intel Arc 8-Core iGPU (208 - 309, n=16) | |
| Dell Inspiron 16 7640 2-in-1 | |
* ... menor é melhor
| The Witcher 3 - 1920x1080 Ultra Graphics & Postprocessing (HBAO+) | |
| Média da turma Multimedia (11 - 143.2, n=62, últimos 2 anos) | |
| SCHENKER XMG Evo 15 (M24) | |
| Lenovo IdeaPad Pro 5 16IMH G9 | |
| Xiaomi RedmiBook Pro 16 2024 | |
| Lenovo ThinkPad T16 G2 21K70035GE | |
| Dell Inspiron 16 7640 2-in-1 | |
| GTA V - 1920x1080 Highest Settings possible AA:4xMSAA + FX AF:16x | |
| Média da turma Multimedia (9.38 - 141.6, n=77, últimos 2 anos) | |
| SCHENKER VIA 14 Pro (M24) | |
| Lenovo ThinkPad T16 G2 21K70035GE | |
| SCHENKER XMG Evo 15 (M24) | |
| Lenovo IdeaPad Pro 5 16IMH G9 | |
| Xiaomi RedmiBook Pro 16 2024 | |
| Medion S10 OLED | |
Cyberpunk 2077 Ultra FPS chart
| baixo | média | alto | ultra | |
|---|---|---|---|---|
| GTA V (2015) | 169.3 | 160.2 | 44.7 | 17.8 |
| The Witcher 3 (2015) | 152 | 93 | 49 | 26 |
| Dota 2 Reborn (2015) | 107.4 | 90.8 | 83.3 | 80.5 |
| Final Fantasy XV Benchmark (2018) | 77 | 40.3 | 29.2 | |
| X-Plane 11.11 (2018) | 54 | 40.4 | 35.8 | |
| Far Cry 5 (2018) | 77 | 43 | 41 | 38 |
| Strange Brigade (2018) | 171 | 73 | 62 | 52 |
| F1 22 (2022) | 96.1 | 87 | 65.2 | 16.9 |
| Baldur's Gate 3 (2023) | 40.3 | 31.1 | 27.5 | 26.2 |
| Cyberpunk 2077 2.2 Phantom Liberty (2023) | 37.9 | 31.4 | 26.7 | 23.7 |
| Total War Pharaoh (2023) | 101.4 | 77.6 | 58.9 | 52 |
Emissões - Silêncio na vida cotidiana
Emissões de ruído
O resfriamento do Evo 15 geralmente é desativado ou muito silencioso quando em marcha lenta ou com pouca carga. Se o senhor colocar o laptop sob mais carga, isso dependerá do perfil de energia ativa. No modo Entusiasta, o máximo é 40,4 dB(A), e no modo Equilibrado e no modo Bateria, o máximo é 35,4 dB(A). Se o senhor quiser usar a potência total do processador no modo Overboost, o resfriamento será significativamente mais alto, com um máximo de 48,1 dB(A). Após o término da fase de carga, os ventiladores reduzem a velocidade novamente com muita rapidez (em todos os perfis). Não houve outros ruídos eletrônicos em nosso dispositivo de teste Evo 15.
Barulho
| Ocioso |
| 24.7 / 24.7 / 28.9 dB |
| Carga |
| 32.7 / 40.4 dB |
 | ||
30 dB silencioso 40 dB(A) audível 50 dB(A) ruidosamente alto |
||
min: | ||
| SCHENKER XMG Evo 15 (M24) Arc 8-Core, Ultra 7 155H, Samsung 990 Pro 1 TB | Dell Inspiron 16 7640 2-in-1 Arc 8-Core, Ultra 7 155H, Micron 2550 1TB | Medion S10 OLED Arc 8-Core, Ultra 7 155H, Phison PS5019-E19 SSO1TBITC4-E19-V7 | Xiaomi RedmiBook Pro 16 2024 Arc 8-Core, Ultra 7 155H, YMTC PC300-1TB | Lenovo IdeaPad Pro 5 16IMH G9 Arc 8-Core, Ultra 7 155H, Samsung PM9C1a MZAL81T0HDLB | Lenovo ThinkPad T16 G2 21K70035GE Radeon 780M, R7 7840U, SK hynix PC801 HFS001TEJ9X162N | |
|---|---|---|---|---|---|---|
| Noise | -4% | -9% | 4% | -6% | 8% | |
| desligado / ambiente * | 24.7 | 22.9 7% | 25 -1% | 24.4 1% | 24.1 2% | 24.5 1% |
| Idle Minimum * | 24.7 | 22.9 7% | 26 -5% | 24.4 1% | 24.1 2% | 24.5 1% |
| Idle Average * | 24.7 | 22.9 7% | 27 -9% | 24.4 1% | 24.1 2% | 24.5 1% |
| Idle Maximum * | 28.9 | 25 13% | 28 3% | 24.4 16% | 28.2 2% | 24.5 15% |
| Load Average * | 32.7 | 45.1 -38% | 43 -31% | 32 2% | 44.4 -36% | 26.6 19% |
| Cyberpunk 2077 ultra * | 40.4 | 44.9 -11% | 42 -4% | |||
| Load Maximum * | 40.4 | 44.9 -11% | 48 -19% | 39.7 2% | 44.4 -10% | 35.5 12% |
| Witcher 3 ultra * | 30.6 | 36.5 | 37.2 |
* ... menor é melhor
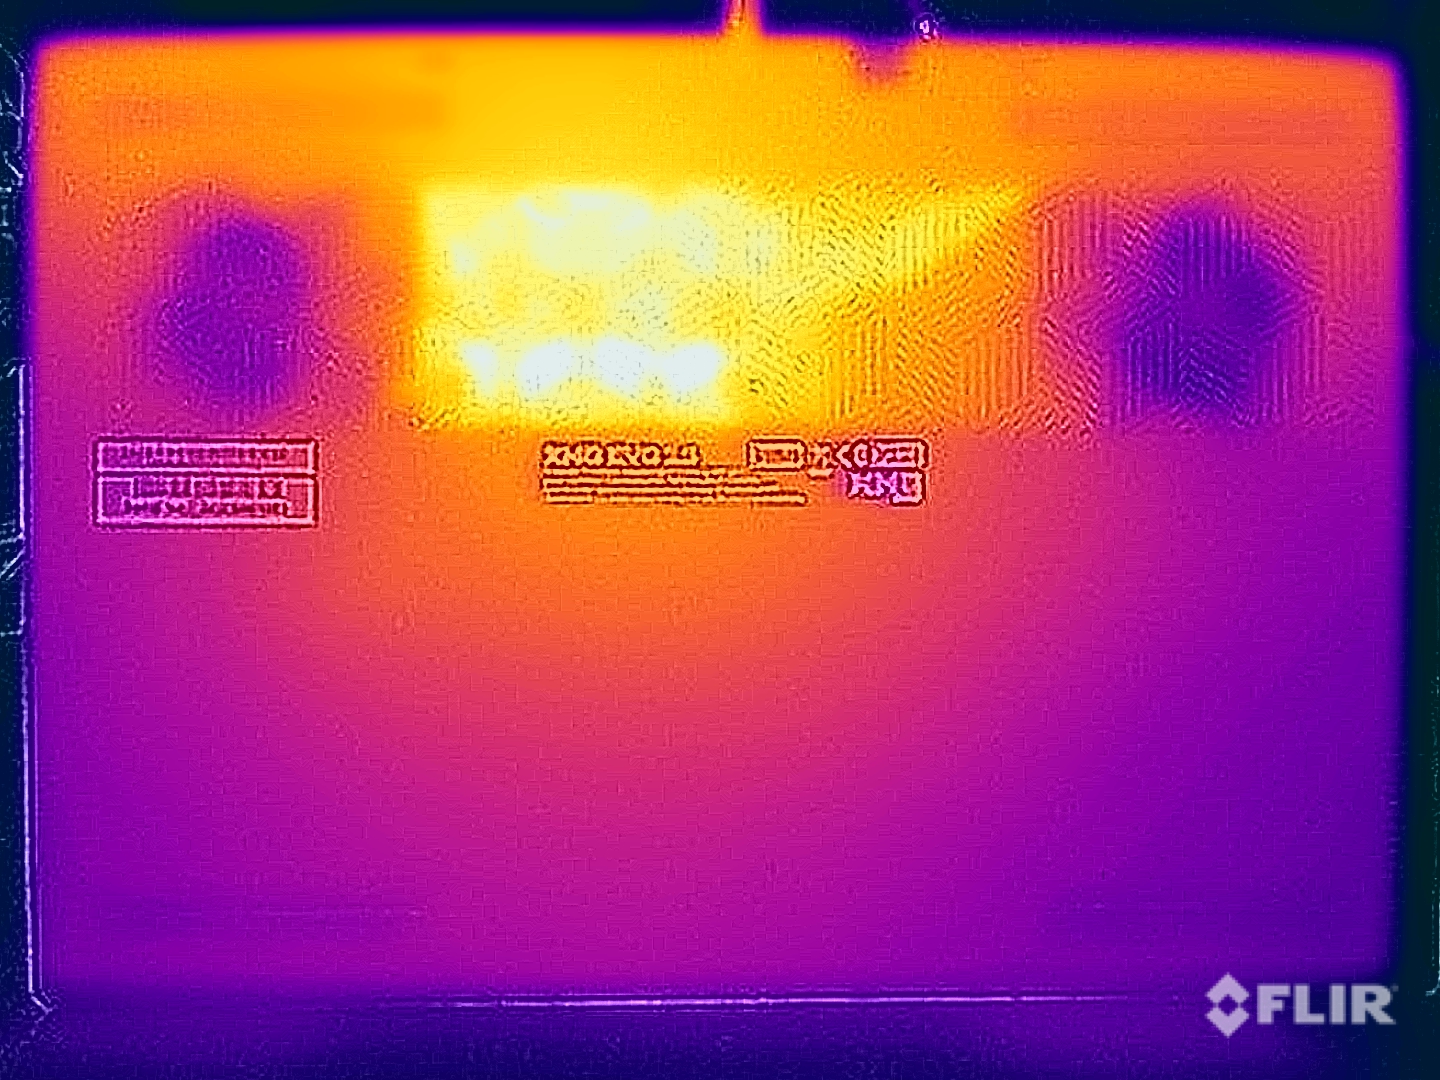
Temperatura
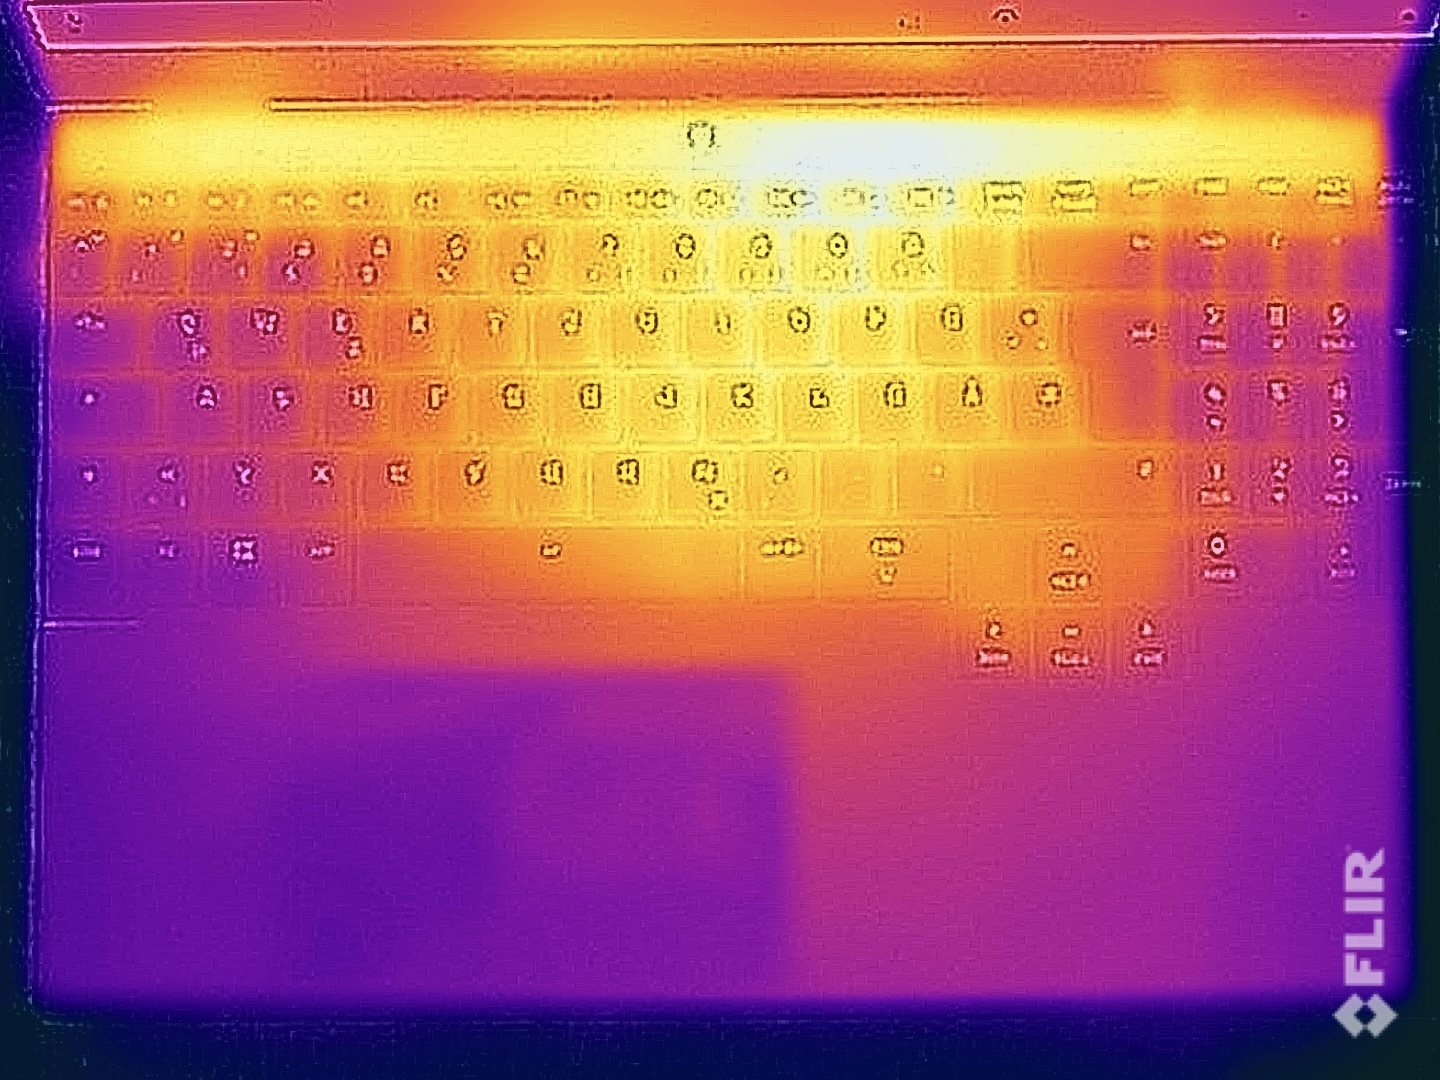
A carcaça de alumínio do Evo 15 permanece muito fria sob carga baixa e não há problemas mesmo sob carga. A parte de baixo pode chegar a quase 50 °C em casos extremos, mas o ponto de acesso está na parte de baixo, na área central traseira. O dispositivo pode ser usado até mesmo sobre as coxas. A área do teclado permanece significativamente mais fria em geral, mesmo sob carga, e não há restrições ao digitar. No teste de estresse, o processador permanece constante em seu valor de TDP especificado.

(±) A temperatura máxima no lado superior é 41.7 °C / 107 F, em comparação com a média de 36.9 °C / 98 F , variando de 21.1 a 71 °C para a classe Multimedia.
(-) A parte inferior aquece até um máximo de 49.6 °C / 121 F, em comparação com a média de 39.2 °C / 103 F
(+) Em uso inativo, a temperatura média para o lado superior é 29.5 °C / 85 F, em comparação com a média do dispositivo de 31.3 °C / ### class_avg_f### F.
(±) 3: The average temperature for the upper side is 34.3 °C / 94 F, compared to the average of 31.3 °C / 88 F for the class Multimedia.
(+) Os apoios para as mãos e o touchpad estão atingindo a temperatura máxima da pele (32 °C / 89.6 F) e, portanto, não estão quentes.
(-) A temperatura média da área do apoio para as mãos de dispositivos semelhantes foi 28.8 °C / 83.8 F (-3.2 °C / -5.8 F).
| SCHENKER XMG Evo 15 (M24) Intel Core Ultra 7 155H, Intel Arc 8-Core iGPU | Dell Inspiron 16 7640 2-in-1 Intel Core Ultra 7 155H, Intel Arc 8-Core iGPU | Medion S10 OLED Intel Core Ultra 7 155H, Intel Arc 8-Core iGPU | Xiaomi RedmiBook Pro 16 2024 Intel Core Ultra 7 155H, Intel Arc 8-Core iGPU | Lenovo IdeaPad Pro 5 16IMH G9 Intel Core Ultra 7 155H, Intel Arc 8-Core iGPU | Lenovo ThinkPad T16 G2 21K70035GE AMD Ryzen 7 7840U, AMD Radeon 780M | |
|---|---|---|---|---|---|---|
| Heat | -1% | -12% | 10% | 19% | 4% | |
| Maximum Upper Side * | 41.7 | 46.8 -12% | 55 -32% | 40.3 3% | 36.3 13% | 48.7 -17% |
| Maximum Bottom * | 49.6 | 45.6 8% | 55 -11% | 45.9 7% | 39.1 21% | 52 -5% |
| Idle Upper Side * | 31.1 | 32.2 -4% | 32 -3% | 26.3 15% | 24.9 20% | 26.4 15% |
| Idle Bottom * | 33.1 | 31.4 5% | 33 -0% | 27.9 16% | 26.1 21% | 26.3 21% |
* ... menor é melhor
Alto-falante
O Evo 15 oferece dois alto-falantes estéreo que proporcionam uma qualidade de som decente. Embora existam laptops multimídia com sistemas de som melhores (que também têm mais alto-falantes), o Evo é um dos melhores modelos nessa disciplina dentro do grupo de comparação. O som é claro e distinto no geral, com a única queda perceptível nos graves.
SCHENKER XMG Evo 15 (M24) análise de áudio
(+) | os alto-falantes podem tocar relativamente alto (###valor### dB)
Graves 100 - 315Hz
(-) | quase nenhum baixo - em média 17.9% menor que a mediana
(±) | a linearidade dos graves é média (11.6% delta para a frequência anterior)
Médios 400 - 2.000 Hz
(+) | médios equilibrados - apenas 3.7% longe da mediana
(+) | médios são lineares (4.5% delta para frequência anterior)
Altos 2 - 16 kHz
(+) | agudos equilibrados - apenas 2.2% longe da mediana
(+) | os máximos são lineares (6.5% delta da frequência anterior)
Geral 100 - 16.000 Hz
(+) | o som geral é linear (11.8% diferença em relação à mediana)
Comparado com a mesma classe
» 15% de todos os dispositivos testados nesta classe foram melhores, 4% semelhantes, 81% piores
» O melhor teve um delta de 5%, a média foi 18%, o pior foi 45%
Comparado com todos os dispositivos testados
» 7% de todos os dispositivos testados foram melhores, 2% semelhantes, 91% piores
» O melhor teve um delta de 4%, a média foi 24%, o pior foi 134%
Dell Inspiron 16 7640 2-in-1 análise de áudio
(+) | os alto-falantes podem tocar relativamente alto (###valor### dB)
Graves 100 - 315Hz
(±) | graves reduzidos - em média 13.9% menor que a mediana
(±) | a linearidade dos graves é média (14% delta para a frequência anterior)
Médios 400 - 2.000 Hz
(+) | médios equilibrados - apenas 3.6% longe da mediana
(+) | médios são lineares (3.6% delta para frequência anterior)
Altos 2 - 16 kHz
(+) | agudos equilibrados - apenas 4.5% longe da mediana
(+) | os máximos são lineares (2.8% delta da frequência anterior)
Geral 100 - 16.000 Hz
(+) | o som geral é linear (12% diferença em relação à mediana)
Comparado com a mesma classe
» 11% de todos os dispositivos testados nesta classe foram melhores, 4% semelhantes, 85% piores
» O melhor teve um delta de 6%, a média foi 20%, o pior foi 57%
Comparado com todos os dispositivos testados
» 8% de todos os dispositivos testados foram melhores, 2% semelhantes, 90% piores
» O melhor teve um delta de 4%, a média foi 24%, o pior foi 134%
Medion S10 OLED análise de áudio
(+) | os alto-falantes podem tocar relativamente alto (###valor### dB)
Graves 100 - 315Hz
(-) | quase nenhum baixo - em média 17.3% menor que a mediana
(±) | a linearidade dos graves é média (9.5% delta para a frequência anterior)
Médios 400 - 2.000 Hz
(+) | médios equilibrados - apenas 4.3% longe da mediana
(+) | médios são lineares (4.3% delta para frequência anterior)
Altos 2 - 16 kHz
(+) | agudos equilibrados - apenas 1.2% longe da mediana
(+) | os máximos são lineares (5% delta da frequência anterior)
Geral 100 - 16.000 Hz
(+) | o som geral é linear (12.9% diferença em relação à mediana)
Comparado com a mesma classe
» 21% de todos os dispositivos testados nesta classe foram melhores, 4% semelhantes, 74% piores
» O melhor teve um delta de 5%, a média foi 18%, o pior foi 45%
Comparado com todos os dispositivos testados
» 11% de todos os dispositivos testados foram melhores, 3% semelhantes, 87% piores
» O melhor teve um delta de 4%, a média foi 24%, o pior foi 134%
Xiaomi RedmiBook Pro 16 2024 análise de áudio
(+) | os alto-falantes podem tocar relativamente alto (###valor### dB)
Graves 100 - 315Hz
(±) | graves reduzidos - em média 13.6% menor que a mediana
(±) | a linearidade dos graves é média (7.9% delta para a frequência anterior)
Médios 400 - 2.000 Hz
(±) | médios mais altos - em média 5.3% maior que a mediana
(+) | médios são lineares (5% delta para frequência anterior)
Altos 2 - 16 kHz
(+) | agudos equilibrados - apenas 2.8% longe da mediana
(+) | os máximos são lineares (5.3% delta da frequência anterior)
Geral 100 - 16.000 Hz
(+) | o som geral é linear (13% diferença em relação à mediana)
Comparado com a mesma classe
» 22% de todos os dispositivos testados nesta classe foram melhores, 5% semelhantes, 74% piores
» O melhor teve um delta de 5%, a média foi 18%, o pior foi 45%
Comparado com todos os dispositivos testados
» 11% de todos os dispositivos testados foram melhores, 2% semelhantes, 86% piores
» O melhor teve um delta de 4%, a média foi 24%, o pior foi 134%
Lenovo IdeaPad Pro 5 16IMH G9 análise de áudio
(±) | o volume do alto-falante é médio, mas bom (###valor### dB)
Graves 100 - 315Hz
(-) | quase nenhum baixo - em média 22.3% menor que a mediana
(±) | a linearidade dos graves é média (10.5% delta para a frequência anterior)
Médios 400 - 2.000 Hz
(+) | médios equilibrados - apenas 2.6% longe da mediana
(+) | médios são lineares (4.6% delta para frequência anterior)
Altos 2 - 16 kHz
(+) | agudos equilibrados - apenas 1.2% longe da mediana
(+) | os máximos são lineares (3.9% delta da frequência anterior)
Geral 100 - 16.000 Hz
(+) | o som geral é linear (13.9% diferença em relação à mediana)
Comparado com a mesma classe
» 27% de todos os dispositivos testados nesta classe foram melhores, 4% semelhantes, 69% piores
» O melhor teve um delta de 5%, a média foi 18%, o pior foi 45%
Comparado com todos os dispositivos testados
» 14% de todos os dispositivos testados foram melhores, 4% semelhantes, 82% piores
» O melhor teve um delta de 4%, a média foi 24%, o pior foi 134%
Lenovo ThinkPad T16 G2 21K70035GE análise de áudio
(±) | o volume do alto-falante é médio, mas bom (###valor### dB)
Graves 100 - 315Hz
(-) | quase nenhum baixo - em média 23.9% menor que a mediana
(±) | a linearidade dos graves é média (13.8% delta para a frequência anterior)
Médios 400 - 2.000 Hz
(+) | médios equilibrados - apenas 3.9% longe da mediana
(+) | médios são lineares (6.9% delta para frequência anterior)
Altos 2 - 16 kHz
(+) | agudos equilibrados - apenas 2.1% longe da mediana
(+) | os máximos são lineares (4.2% delta da frequência anterior)
Geral 100 - 16.000 Hz
(±) | a linearidade do som geral é média (19.9% diferença em relação à mediana)
Comparado com a mesma classe
» 39% de todos os dispositivos testados nesta classe foram melhores, 9% semelhantes, 52% piores
» O melhor teve um delta de 7%, a média foi 21%, o pior foi 53%
Comparado com todos os dispositivos testados
» 48% de todos os dispositivos testados foram melhores, 7% semelhantes, 44% piores
» O melhor teve um delta de 4%, a média foi 24%, o pior foi 134%
Gerenciamento de energia
Consumo de energia
A tela grande e brilhante afeta o consumo de energia e medimos um máximo de pouco menos de 14 watts no modo inativo. Tanto em jogos quanto no teste de estresse, o consumo é de 76 a 78 watts e permanece absolutamente estável, portanto, a fonte de alimentação de 100 watts é totalmente suficiente. No perfil Overboost, medimos um máximo de 107,9 watts, de modo que a fonte de alimentação não tem mais margem de manobra para carregar a bateria, por exemplo. No entanto, a bateria também não é utilizada aqui. Como já mencionamos, o consumo em modo de espera de 1,4 watts é muito alto.
| desligado | |
| Ocioso | |
| Carga |
|
Key:
min: | |
| SCHENKER XMG Evo 15 (M24) Ultra 7 155H, Arc 8-Core, Samsung 990 Pro 1 TB, IPS, 2560x1600, 15.3" | Dell Inspiron 16 7640 2-in-1 Ultra 7 155H, Arc 8-Core, Micron 2550 1TB, Mini-LED, 2560x1600, 16" | Medion S10 OLED Ultra 7 155H, Arc 8-Core, Phison PS5019-E19 SSO1TBITC4-E19-V7, OLED, 3840x2400, 16" | Xiaomi RedmiBook Pro 16 2024 Ultra 7 155H, Arc 8-Core, YMTC PC300-1TB, IPS, 3072x1920, 16" | Lenovo IdeaPad Pro 5 16IMH G9 Ultra 7 155H, Arc 8-Core, Samsung PM9C1a MZAL81T0HDLB, IPS, 2560x1600, 16" | Lenovo ThinkPad T16 G2 21K70035GE R7 7840U, Radeon 780M, SK hynix PC801 HFS001TEJ9X162N, IPS LED, 1920x1200, 16" | Média Intel Arc 8-Core iGPU | Média da turma Multimedia | |
|---|---|---|---|---|---|---|---|---|
| Power Consumption | 3% | 10% | 1% | 20% | 40% | 20% | -4% | |
| Idle Minimum * | 7.7 | 6.1 21% | 7 9% | 4.2 45% | 3.5 55% | 3.7 52% | 5.34 ? 31% | 6.86 ? 11% |
| Idle Average * | 13.2 | 13.5 -2% | 10 24% | 11.6 12% | 9.6 27% | 7.2 45% | 8.54 ? 35% | 11.5 ? 13% |
| Idle Maximum * | 13.7 | 13.8 -1% | 19 -39% | 12.3 10% | 9.9 28% | 8.7 36% | 11.9 ? 13% | 13.5 ? 1% |
| Load Average * | 76.2 | 63.6 17% | 52 32% | 61.9 19% | 62.7 18% | 44.1 42% | 54 ? 29% | 71.4 ? 6% |
| Cyberpunk 2077 ultra * | 76.7 | 67 13% | 53.2 31% | |||||
| Cyberpunk 2077 ultra external monitor * | 72.7 | 64.6 11% | 49.2 32% | |||||
| Load Maximum * | 78.1 | 109.7 -40% | 95 -22% | 140.6 -80% | 101.2 -30% | 58.2 25% | 84.9 ? -9% | 116.6 ? -49% |
| Witcher 3 ultra * | 57 | 55.8 | 50.9 |
* ... menor é melhor
Powr consumption Cyberpunk / Stress test
Power consumption with the external monitor
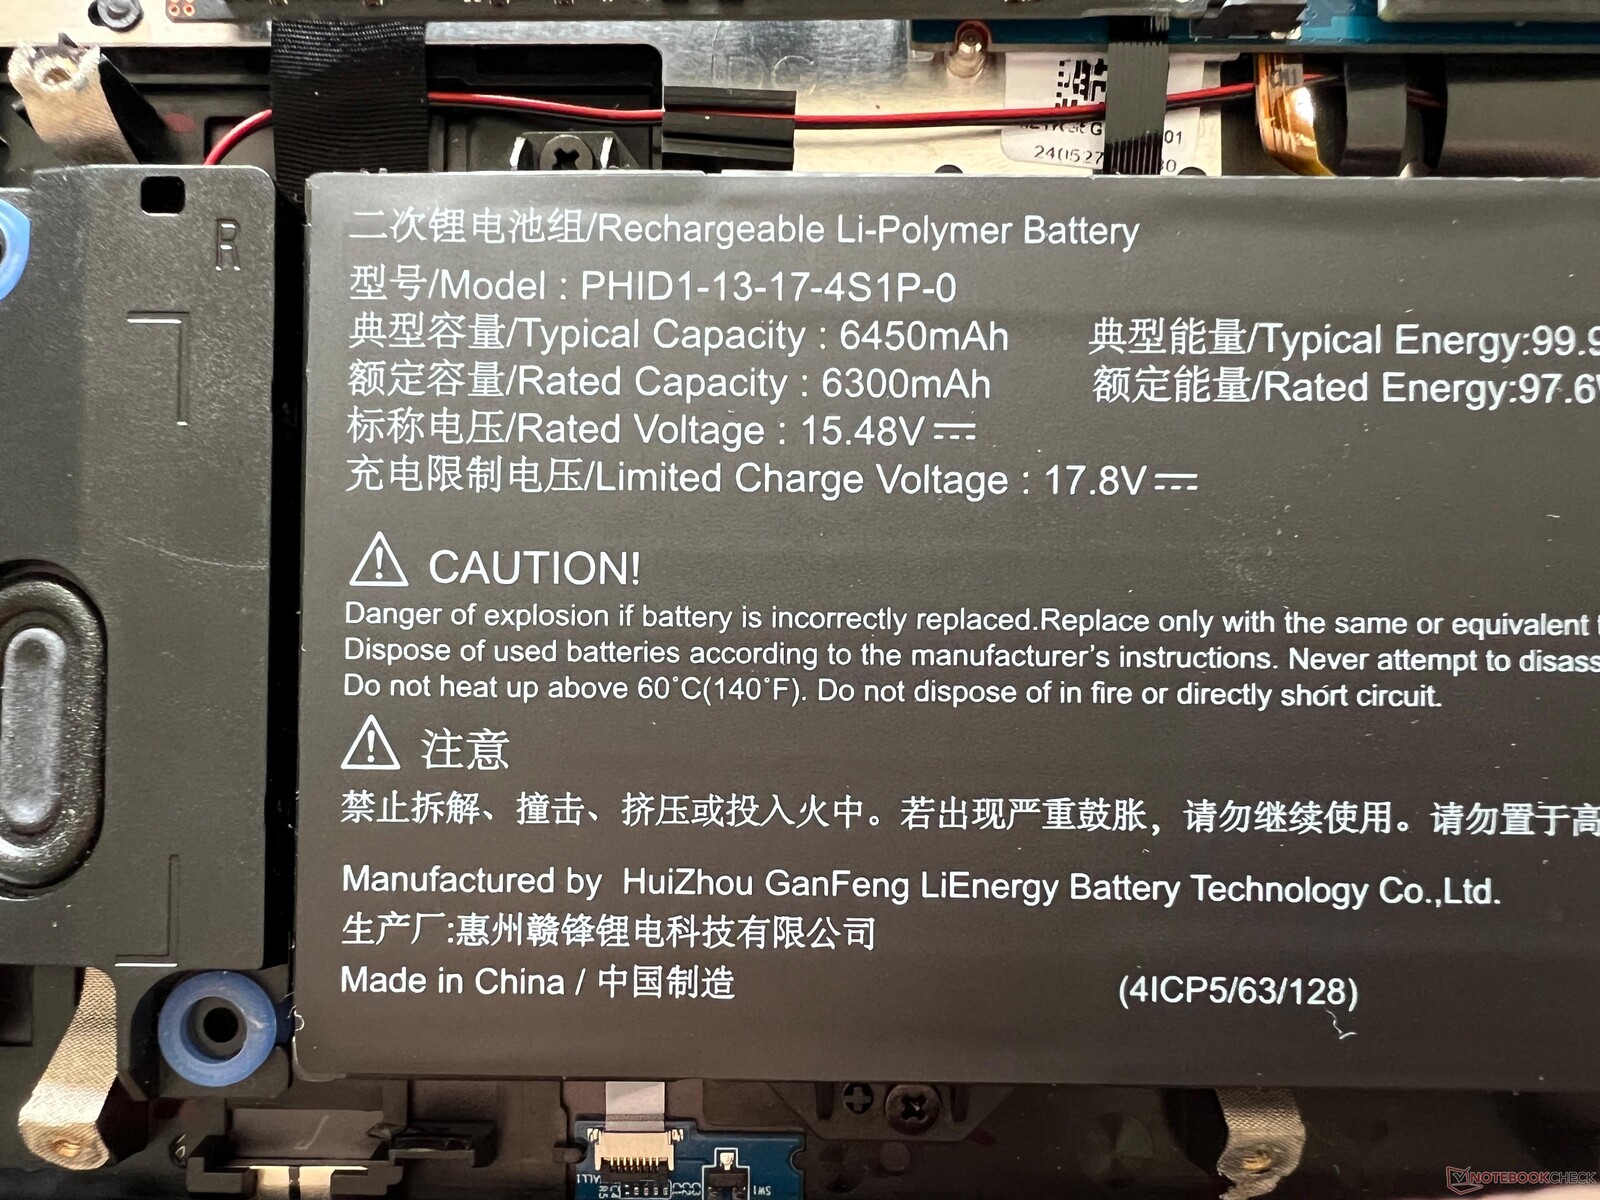
Duração da bateria
A Schenker instalou uma enorme bateria de 99,8 Wh no Evo 15, o que resulta em bons tempos de funcionamento geral, apesar da tela que consome muita energia, embora o Medion S10 ofereça ainda mais resistência. No teste WLAN com 150 cd/m² (corresponde a 58% do brilho máximo no dispositivo de teste), medimos 10:25 horas a 60 Hz e 08:25 horas a 240 Hz. Com brilho total, o tempo de execução cai para 8 horas (60 Hz) ou 6:39 horas (240 Hz), portanto, o senhor deve definitivamente reduzir a frequência no modo de bateria.
O teste de vídeo dura pouco mais de 12 horas e, sob carga, o pior cenário é de 2:14 horas. Uma carga completa leva longos 165 minutos quando o dispositivo é ligado (80% após 130 minutos) e não há função de carga rápida.

| SCHENKER XMG Evo 15 (M24) Ultra 7 155H, Arc 8-Core, 99.9 Wh | Dell Inspiron 16 7640 2-in-1 Ultra 7 155H, Arc 8-Core, 90 Wh | Medion S10 OLED Ultra 7 155H, Arc 8-Core, 70 Wh | Xiaomi RedmiBook Pro 16 2024 Ultra 7 155H, Arc 8-Core, 99 Wh | Lenovo IdeaPad Pro 5 16IMH G9 Ultra 7 155H, Arc 8-Core, 84 Wh | Lenovo ThinkPad T16 G2 21K70035GE R7 7840U, Radeon 780M, 52.5 Wh | Média da turma Multimedia | |
|---|---|---|---|---|---|---|---|
| Duração da bateria | -11% | -30% | 43% | 1% | -27% | -1% | |
| H.264 | 729 | 1308 79% | 957 31% | 864 ? 19% | |||
| WiFi v1.3 | 625 | 686 10% | 436 -30% | 983 57% | 756 21% | 658 5% | 645 ? 3% |
| Load | 134 | 93 -31% | 124 -7% | 68 -49% | 56 -58% | 99 ? -26% |
Pro
Contra
Veredicto - Um dos melhores notebooks multimídia sem dGPU

Com o novo XMG Evo 15 (M24), o fabricante alemão Schenker está lançando um bom notebook multimídia sem uma placa de vídeo dedicada. Não é o notebook mais fino do mercado, mas o Evo 15 não tem essa pretensão. Por outro lado, o senhor tem opções de manutenção muito boas e tanto a RAM (máx. 96 GB) quanto a capacidade do SSD (2 slots M.2-2280) podem ser facilmente atualizadas. Também há portas suficientes, embora nos perguntemos como uma porta USB 2.0 antiga conseguiu entrar no dispositivo. Entretanto, como há muitas outras portas USB rápidas (Intel com Thunderbolt 4, AMD com USB 4.0), isso não é um grande problema. Também não há muito do que reclamar quando se trata dos dispositivos de entrada e alto-falantes.
No que diz respeito à tela, é possível reconhecer as raízes dos jogos e a relação com o XMG Fusion 15 mas isso não é uma desvantagem. O painel IPS fosco oferece uma alta resolução e uma frequência rápida de 240 Hz. Além disso, não há PWM e os tempos de resposta também são rápidos. O brilho é muito bom, com quase 600 cd/m², o que, por sua vez, afeta o nível de preto e, portanto, a taxa de contraste. Quem espera pretos intensos como os de um painel OLED certamente ficará desapontado. Após a calibração, a precisão das cores é excelente e, graças à cobertura total de sRGB, o painel também é adequado para edição de imagens. A grande bateria de 99,8 Wh pode compensar bem o consumo de energia da tela e, de modo geral, a resistência longe da tomada é decente.
Excelentes opções de manutenção, tela IPS brilhante com cores precisas e bons valores de desempenho com perfis de energia coerentes: O novo Schenker XMG Evo 15 é um notebook multimídia interessante, sem placa de vídeo dedicada, que está disponível com processadores AMD e Intel e não tem pontos fracos reais.
O desempenho do Evo 15 com o processador Intel é muito bom em geral e, acima de tudo, estável, pois não há limites de energia absurdamente altos a curto prazo. Se o senhor precisar de um desempenho mais alto, poderá usar o modo Overboost, mas terá de suportar ventoinhas mais barulhentas. Em geral, porém, o Evo 15 é um companheiro muito silencioso, especialmente para as tarefas diárias.
Com todos esses aspectos positivos, o novo Evo 15 é quase inigualável no mercado. Resta saber se o senhor deve escolher o modelo Intel ou AMD. Embora o modelo AMD tenha apenas USB 4.0 em vez de Thunderbolt 4, o fabricante afirma que o desempenho (apesar dos limites de potência ligeiramente inferiores do Ryzen 7 8845HS) é comparável. Também não esperamos grandes diferenças na duração da bateria, o que levanta a questão de por que os clientes deveriam pagar 150 euros a mais pelo processador Intel. O modelo da AMD, que custa a partir de 1.049 euros, definitivamente oferece uma melhor relação preço-desempenho.
Preço e disponibilidade
O novo Schenker XMG Evo 15 (M24) já pode ser encomendado na Bestware. O modelo AMD custa a partir de 1.049 euros, enquanto a versão Intel custa 1.199 euros.
Observação: Atualizamos recentemente nosso sistema de classificação e os resultados da versão 8 não são comparáveis aos resultados da versão 7. Mais informações podem ser encontradas aqui.
SCHENKER XMG Evo 15 (M24)
- 07/31/2024 v8
Andreas Osthoff
 Total Sustainability Score:
 Transparência
A seleção dos dispositivos a serem analisados é feita pela nossa equipe editorial. A amostra de teste foi fornecida ao autor como empréstimo pelo fabricante ou varejista para fins desta revisão. O credor não teve influência nesta revisão, nem o fabricante recebeu uma cópia desta revisão antes da publicação. Não houve obrigação de publicar esta revisão. Nunca aceitamos compensação ou pagamento em troca de nossas avaliações. Como empresa de mídia independente, a Notebookcheck não está sujeita à autoridade de fabricantes, varejistas ou editores.
É assim que o Notebookcheck está testando
Todos os anos, o Notebookcheck analisa de forma independente centenas de laptops e smartphones usando procedimentos padronizados para garantir que todos os resultados sejam comparáveis. Desenvolvemos continuamente nossos métodos de teste há cerca de 20 anos e definimos padrões da indústria no processo. Em nossos laboratórios de teste, equipamentos de medição de alta qualidade são utilizados por técnicos e editores experientes. Esses testes envolvem um processo de validação em vários estágios. Nosso complexo sistema de classificação é baseado em centenas de medições e benchmarks bem fundamentados, o que mantém a objetividade.Price comparison
