Notebookcheck Logo
Teaser

Análise do laptop Gigabyte G5 KF5 2024: Jogos com RTX 4060 a preço de banana - o negócio vale a pena?

Mega pechincha?

Intel Core i7-13620H, uma RTX 4060, além de 16 GB de RAM e um SSD de 1 TB - tudo isso por 899 euros. Não é possível obter uma RTX 4060 gamer muito mais barata no momento. Verificamos se o G5 mais recente vale o dinheiro e se é um candidato à nossa lista dos notebooks para jogos com melhor custo-benefício.
Christian Hintze, 👁 Christian Hintze (traduzido por DeepL / Ninh Duy) Published 🇺🇸 🇩🇪 ...
Alder Lake Deal Gaming Geforce GPU Laptop / Notebook Nvidia Raptor Lake

Veredicto - O sistema de resfriamento é a área problemática

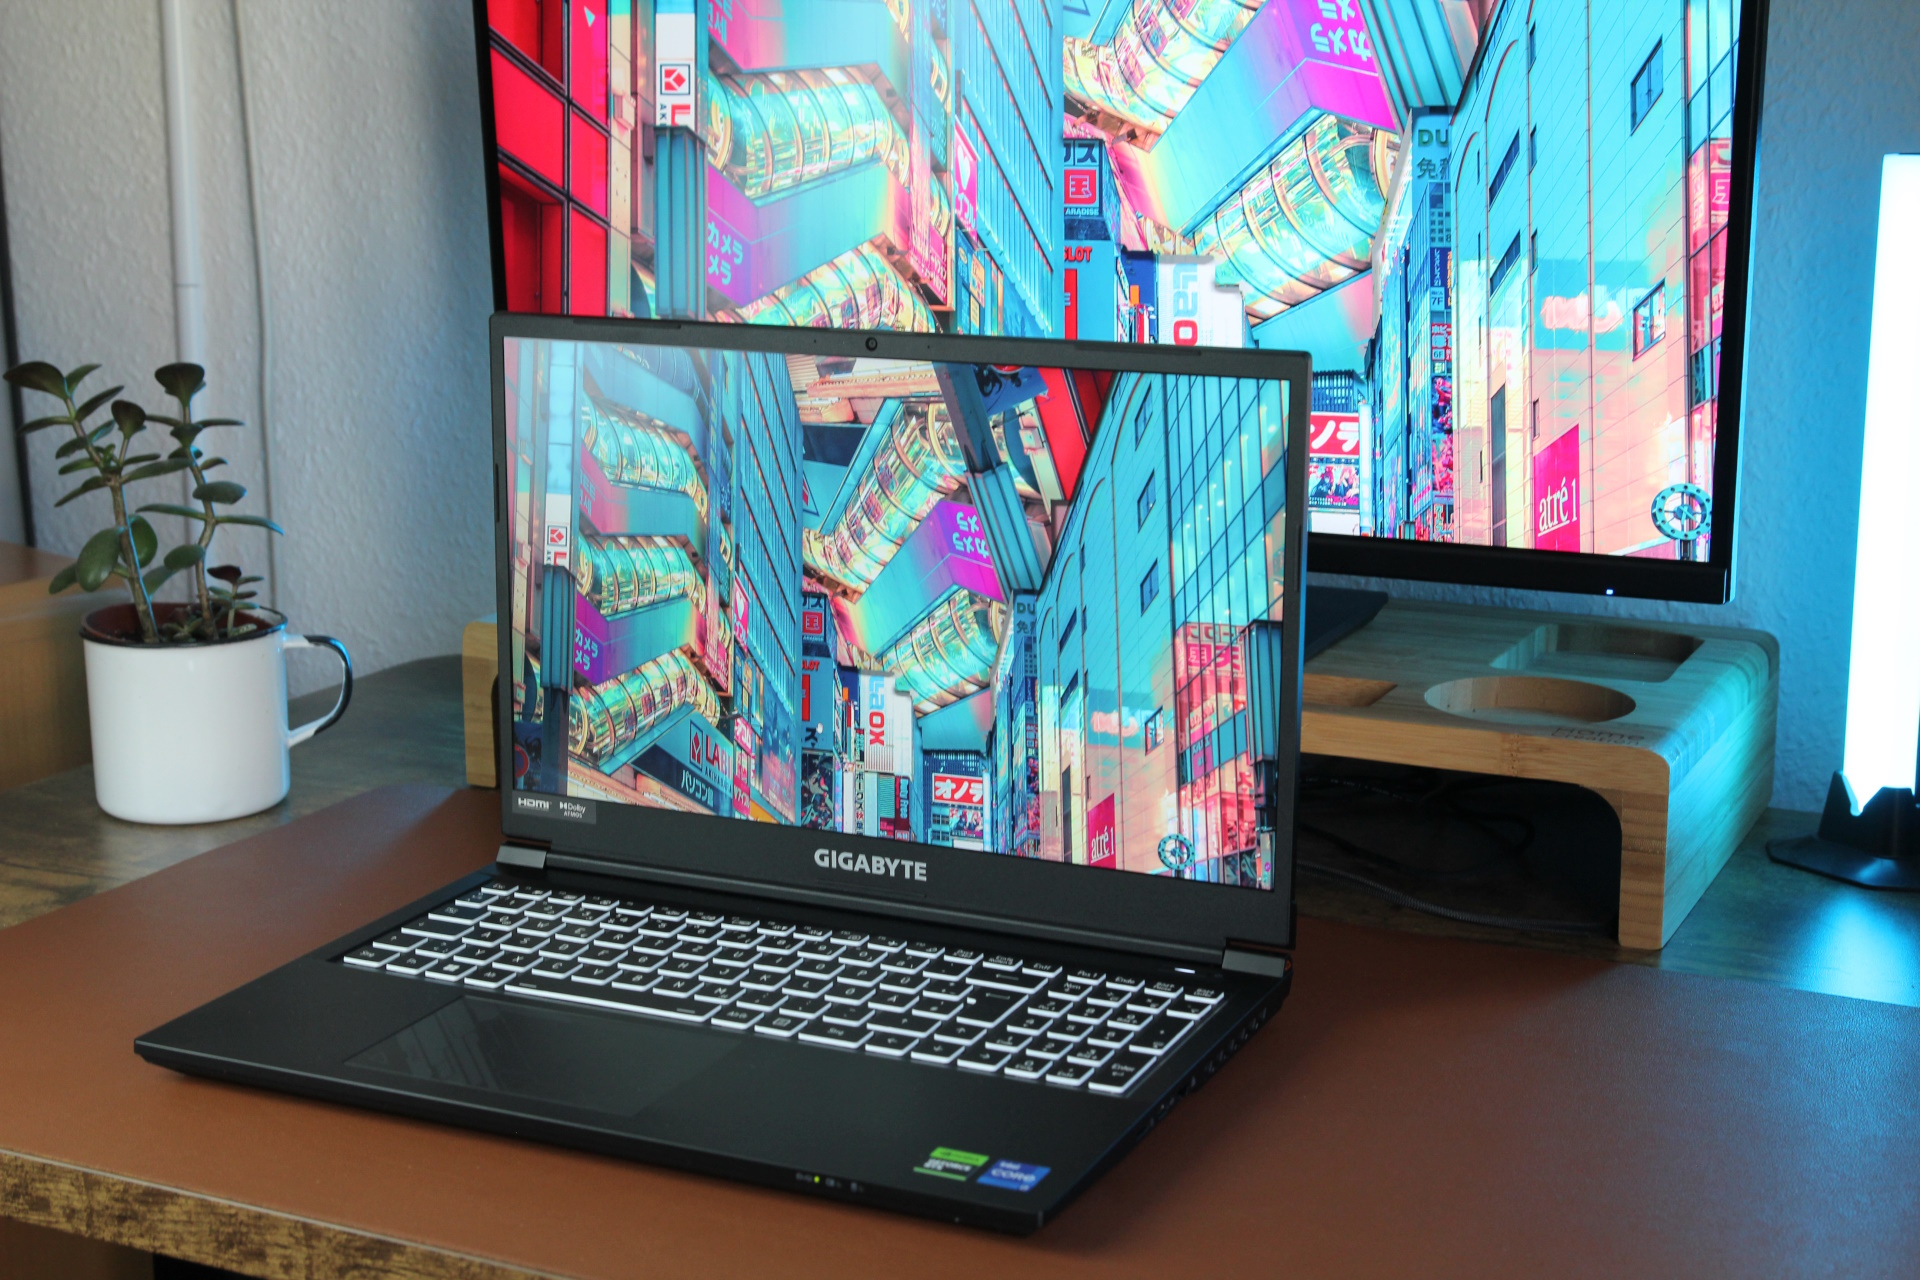
Um laptop RTX 4060 por apenas 899 euros tem seu apelo, e o senhor pode aceitar uma webcam de 720p, a falta de uma porta Thunderbolt e talvez até mesmo o ruído um pouco mais alto. O G5 também faz algumas coisas surpreendentemente bem: o design sutil é agradável, o teclado é mais do que sólido, a tela mediana brilha com alta precisão de cores e o desempenho da CPU está um pouco acima da média.

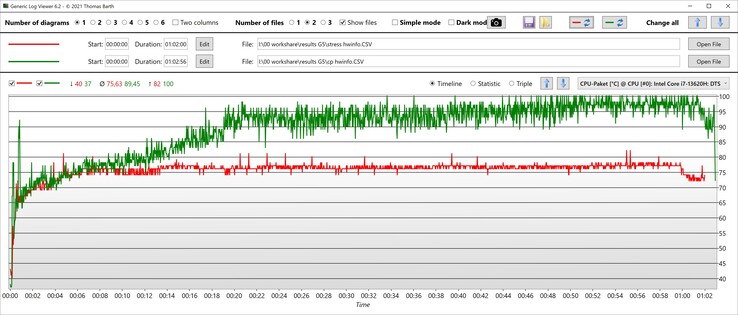
O que não está certo, no entanto, é o sistema de resfriamento: se a CPU atinge constantemente 100 °C durante os jogos, isso não é necessariamente favorável à durabilidade do hardware. Não é de se admirar que o laptop também seja bastante barulhento. Isso pode ser uma falha do nosso modelo de teste, mas o antecessor também teve que lidar com problemas de temperatura. Não entendemos por que a Gigabyte não consertou esse ponto fraco entre as duas gerações do laptop. Se o fabricante descobrir uma falha em nosso modelo, atualizaremos o teste.
Pro

+ preço baixo
+ 2 slots para SSD M.2
+ bom teclado
+ a tela calibrada é muito fiel às cores (sRGB)
+ bom desempenho da CPU

Contra

- sem Thunderbolt
- webcam 720p
- sem interruptor MUX
- A CPU fica muito quente durante os jogos
- Aceleração do SSD
- altas latências
- desempenho gráfico um pouco abaixo da média
- sistema de resfriamento sobrecarregado
- comparativamente barulhento
Bestpreis 939€ hardwarecamp24
GIGABYTE G5 KF5-H3DE554KD, Core i7-13620H, 16GB RAM, 1TB SSD, GeForce RTX 4060, DE

Price comparison

Possíveis concorrentes em comparação

Image
Model / Review
Geizhals
Weight
Height
Display
1.
76.3%
Gigabyte G5 KF5 2024
Intel Core i7-13620H ⎘
NVIDIA GeForce RTX 4060 Laptop GPU ⎘
16 GB Memória, 1024 GB SSD
Bestpreis 939€ hardwarecamp24
2 kg22.7 mm15.60"
1920x1080
141 PPI
IPS
2.
79%
Lenovo LOQ 15IRX9
Lenovo LOQ 15IRX9
Intel Core i5-13450HX ⎘
NVIDIA GeForce RTX 4060 Laptop GPU ⎘
16 GB Memória, 1024 GB SSD
Bestpreis 995€ computeruniverse.net
2. 995€ Cyberport.de
3. 999€ hardwarecamp24
2.4 kg23.9 mm15.60"
1920x1080
141 PPI
IPS
3.
80.3%
Asus TUF Gaming A15 FA507UV
AMD Ryzen 9 8945H ⎘
NVIDIA GeForce RTX 4060 Laptop GPU ⎘
16 GB Memória, 1024 GB SSD
Bestpreis 1268.26€ TechnikLaden
2. 1268.28€ 1ashop.at
3. 1268.28€ haym.infotec
2.1 kg22.4 mm15.60"
1920x1080
141 PPI
IPS
4.
82.3%
Lenovo Legion Pro 5 16IRX9 G9
Intel Core i7-14700HX ⎘
NVIDIA GeForce RTX 4060 Laptop GPU ⎘
32 GB Memória, 1024 GB SSD
Bestpreis 1568.98€ Jacob Elektronik direkt
2. 1569€ PC-KING
3. 1582.16€ Jacob Elektronik direkt (AT)
2.5 kg26.55 mm16.00"
2560x1600
189 PPI
IPS
5.
83.4%
Dell Inspiron 16 Plus 7640
Intel Core Ultra 7 155H ⎘
NVIDIA GeForce RTX 4060 Laptop GPU ⎘
16 GB Memória, 1024 GB SSD
Listenpreis 1300 USD
Geizhals Suche
2.2 kg19.9 mm16.00"
2560x1600
189 PPI
IPS

A série G5 marca a entrada acessível da Gigabyte em laptops para jogos. Em comparação com o antecessor com Intel Gen12 Alder Lake, o modelo 2024 recebe uma atualização para Intel Gen13 Raptor Lake, ou seja, o Core i7-13620H e a RTX 4060 o senhor tem a certeza de que a RTX 4060 permanece, assim como os 16 GB de RAM, enquanto a capacidade do SSD foi duplicada para 1 TB. Com apenas 899 euros, ele é ainda mais barato que seu antecessor, o que o torna um dos preços mais baixos de todos os tempos nesse segmento de desempenho. Testamos se o atual G5 KF5 é interessante para aqueles que querem economizar ou se ele é muito caro.

Além do seu antecessor, também comparamos o sistema com outros notebooks econômicos para jogos, como o LOQ 15e o Asus TUF Gaming A15 (2024) mas também com os dispositivos mais caros devido à falta de alternativas Lenovo Legion Pro 5 16IRX9 G9 e Dell Inspiron 16 Plus 7640.

Especificações - Core i7-13620H e RTX 4060 por menos de 900 euros

G5 KF5 (G5 Serie)
Processador
Intel Core i7-13620H 10 x 1.8 - 4.9 GHz, Raptor Lake-H
Placa gráfica
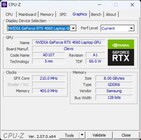
NVIDIA GeForce RTX 4060 Laptop GPU - 8 GB VRAM, 75 W TDP, Geforce 565.90, Optimus
Memória
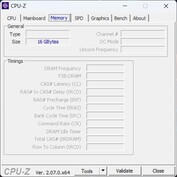
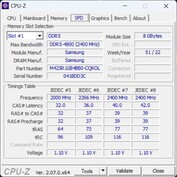
16 GB 
, 2x 8 GB Samsung DDR5-4800
Pantalha
15.60 polegadas 16:9, 1920 x 1080 pixel 141 PPI, Sharp SHP153F (LQ156M1JW30), IPS, Brilhante: não, HDR, 360 Hz
placa mãe
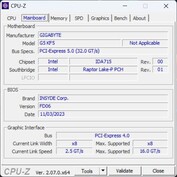
Intel Alder Lake-P PCH
Disco rígido
Gigabyte AG450E1024-SI, 1024 GB 
, 876 GB livre
Placa de Som
Intel Raptor Lake-P/U/H PCH - cAVS
Conexões
1 USB 2.0, 1 USB 3.0, 2 USB 3.1 Gen2, 1 HDMI, 1 DisplayPort, 1 Kensington Lock, Conexões Audio: Headset + Microphone, Card Reader: MicroSD Reader
Funcionamento em rede
Realtek Semiconductor RTL8168/8111 PCI-E Gigabit Ethernet NIC (10/100/1000MBit/s), Intel Wi-Fi 6E AX211 (a/b/g/h/n = Wi-Fi 4/ac = Wi-Fi 5/ax = Wi-Fi 6/ Wi-Fi 6E 6 GHz), Bluetooth Bluetooth 5.2
Tamanho
altura x largura x profundidade (em mm): 22.7 x 360 x 238
Bateria
54 Wh Lítio-Ion
Sistema Operativo
Microsoft Windows 11 Home
Camera
Webcam: 720p IR Webcam
Primary Camera: 0.9 MPix
Características adicionais
Teclado: Chiclet 1 Zone RGB, Iluminação do Teclado: sim, 24 Meses Garantia
peso
2.018 kg, Suprimento de energia: 478 g
Preço
899 Euro
Note: The manufacturer may use components from different suppliers including display panels, drives or memory sticks with similar specifications.


Caixa e recursos: Caixa plástica em cinza ferro

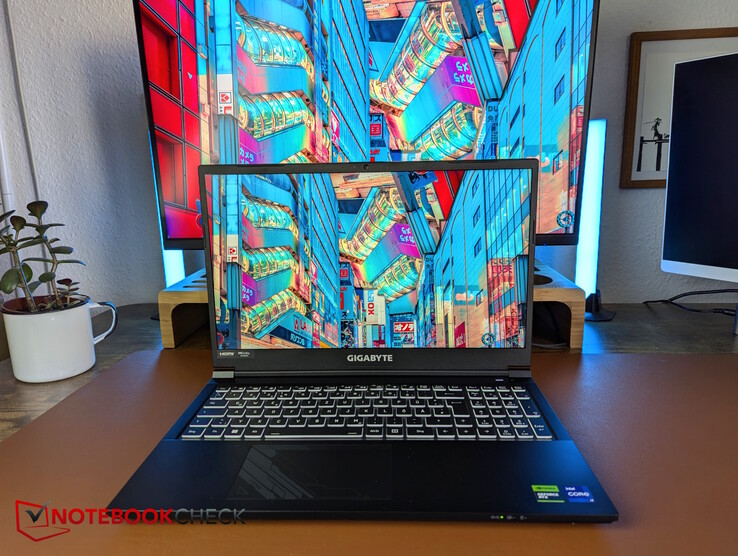
Externamente, praticamente nada mudou em relação ao seu antecessor, pois ele também copiou seu design Clevo de plástico ("Iron Gray") do Gigabyte G5 KE (na época, ainda com a RTX 3060). Curiosamente, o antigo suporte Thunderbolt 4 da porta USB-C esquerda foi removido. Também foram feitas economias na webcam, que só tem uma resolução de 720p e é bastante desfocada; ela também tem altos desvios de cor.

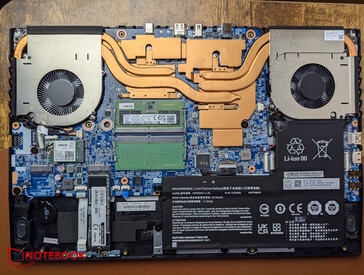
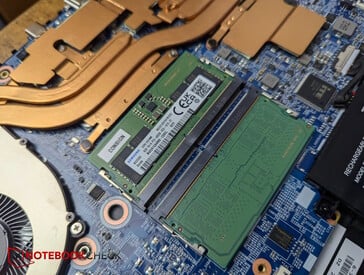
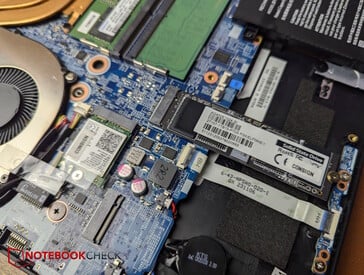
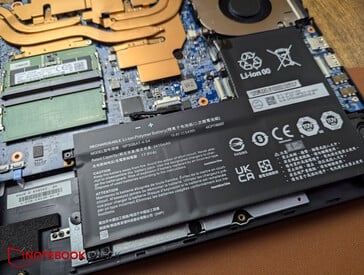
Para a manutenção, 13 parafusos Phillips precisam ser removidos, dois dos quais estão cobertos por um adesivo de vedação, o que pode invalidar a garantia se não for feito corretamente. No interior, o senhor tem acesso aos dois slots SSD M.2, ao módulo WiFi removível, à bateria, aos dois slots de RAM e ao sistema de resfriamento.

Sem placa de base
Sem placa de base
RAM DDR5
RAM DDR5
Dois slots para SSD M.2 e módulo WiFi
A bateria
A bateria

A base racha e estala levemente quando o senhor tenta torcê-la. A tampa balança levemente quando ajustada e abre até um máximo de 140 graus.

Comparação de tamanhos

363.4 mm 261.75 mm 26.55 mm 2.5 kg359.86 mm 258.7 mm 23.9 mm 2.4 kg360 mm 238 mm 22.7 mm 2 kg360 mm 238 mm 22.7 mm 1.9 kg356.78 mm 250.6 mm 19.9 mm 2.2 kg354 mm 251 mm 22.4 mm 2.1 kg297 mm 210 mm 1 mm 5.7 g
Esquerda: Kensington, USB-A 3.0, USB-A 2.0, entrada para microfone, entrada para fone de ouvido
À direita: Leitor microSD, USB-C 3.2 Gen2, LAN (1 GbE)
Traseira: USB-C 3.2 Gen2, HDMI 2.1, MiniDP 1.4, alimentação
SD Card Reader
average JPG Copy Test (av. of 3 runs)
Average of class Gaming
  (19 - 202, n=87, last 2 years)
95.9 MB/s +36%
Gigabyte G5 KF5 2024
Intel Core i7-13620H
70.6 (55.19min - 75.59max) MB/s
Gigabyte G5 KF
Intel Core i5-12500H
69.8 (63.44min - 75.35max) MB/s -1%
Dell Inspiron 16 Plus 7640
Intel Core Ultra 7 155H (Angelbird AV Pro V60)
22.2 MB/s -69%
maximum AS SSD Seq Read Test (1GB)
Average of class Gaming
  (25.8 - 269, n=87, last 2 years)
120.4 MB/s +33%
Gigabyte G5 KF5 2024
Intel Core i7-13620H
90.74 MB/s
Gigabyte G5 KF
Intel Core i5-12500H
89.47 MB/s -1%
Dell Inspiron 16 Plus 7640
Intel Core Ultra 7 155H (Angelbird AV Pro V60)
28.7 MB/s -68%
Networking
iperf3 transmit AXE11000
Lenovo Legion Pro 5 16IRX9 G9
Intel Wi-Fi 6E AX211
1549 (752min - 1707max) MBit/s +8%
Gigabyte G5 KF5 2024
Intel Wi-Fi 6E AX211
1432 (1380min - 1467max) MBit/s
Gigabyte G5 KF
Intel Wi-Fi 6E AX211
1347 (1198min - 1410max) MBit/s -6%
Average Intel Wi-Fi 6E AX211
  (64 - 1921, n=242)
1231 MBit/s -14%
Average of class Gaming
  (469 - 1843, n=147, last 2 years)
1227 MBit/s -14%
Lenovo LOQ 15IRX9
Realtek RTL8852BE
830 (747min - 873max) MBit/s -42%
Dell Inspiron 16 Plus 7640
Intel Wi-Fi 6E AX211
811 (428min - 1008max) MBit/s -43%
Asus TUF Gaming A15 FA507UV
Realtek RTL8852BE
806 (513min - 843max) MBit/s -44%
iperf3 receive AXE11000
Gigabyte G5 KF5 2024
Intel Wi-Fi 6E AX211
1650 (1563min - 1691max) MBit/s
Gigabyte G5 KF
Intel Wi-Fi 6E AX211
1631 (1392min - 1669max) MBit/s -1%
Lenovo Legion Pro 5 16IRX9 G9
Intel Wi-Fi 6E AX211
1477 (1386min - 1517max) MBit/s -10%
Average of class Gaming
  (680 - 1890, n=147, last 2 years)
1390 MBit/s -16%
Average Intel Wi-Fi 6E AX211
  (582 - 1890, n=242)
1382 MBit/s -16%
Dell Inspiron 16 Plus 7640
Intel Wi-Fi 6E AX211
1000 (899min - 1078max) MBit/s -39%
Lenovo LOQ 15IRX9
Realtek RTL8852BE
975 (950min - 986max) MBit/s -41%
Asus TUF Gaming A15 FA507UV
Realtek RTL8852BE
956 (936min - 974max) MBit/s -42%
iperf3 transmit AXE11000 6GHz
Gigabyte G5 KF
Intel Wi-Fi 6E AX211
1594 (1547min - 1650max) MBit/s +2%
Lenovo Legion Pro 5 16IRX9 G9
Intel Wi-Fi 6E AX211
1585 (1369min - 1655max) MBit/s +1%
Gigabyte G5 KF5 2024
Intel Wi-Fi 6E AX211
1566 (780min - 1615max) MBit/s
Average of class Gaming
  (648 - 1878, n=68, last 2 years)
1429 MBit/s -9%
Average Intel Wi-Fi 6E AX211
  (385 - 1851, n=214)
1368 MBit/s -13%
Dell Inspiron 16 Plus 7640
Intel Wi-Fi 6E AX211
705 (634min - 769max) MBit/s -55%
iperf3 receive AXE11000 6GHz
Gigabyte G5 KF
Intel Wi-Fi 6E AX211
1654 (1581min - 1671max) MBit/s +4%
Gigabyte G5 KF5 2024
Intel Wi-Fi 6E AX211
1585 (1568min - 1606max) MBit/s
Lenovo Legion Pro 5 16IRX9 G9
Intel Wi-Fi 6E AX211
1540 (774min - 1556max) MBit/s -3%
Average Intel Wi-Fi 6E AX211
  (700 - 1857, n=213)
1493 MBit/s -6%
Average of class Gaming
  (853 - 1788, n=68, last 2 years)
1488 MBit/s -6%
Dell Inspiron 16 Plus 7640
Intel Wi-Fi 6E AX211
700 (607min - 805max) MBit/s -56%
05010015020025030035040045050055060065070075080085090095010001050110011501200125013001350140014501500155016001650Tooltip
Gigabyte G5 KF5 2024 Intel Wi-Fi 6E AX211; iperf3 transmit AXE11000 6GHz; iperf 3.1.3: Ø1540 (780-1615)
Gigabyte G5 KF5 2024 Intel Wi-Fi 6E AX211; iperf3 receive AXE11000 6GHz; iperf 3.1.3: Ø1584 (1568-1606)
Gigabyte G5 KF5 2024 Intel Wi-Fi 6E AX211; iperf3 transmit AXE11000; iperf 3.1.3: Ø1432 (1380-1467)
Lenovo LOQ 15IRX9 Realtek RTL8852BE; iperf3 transmit AXE11000; iperf 3.1.3: Ø830 (747-873)
Asus TUF Gaming A15 FA507UV Realtek RTL8852BE; iperf3 transmit AXE11000; iperf 3.1.3: Ø806 (513-843)
Gigabyte G5 KF5 2024 Intel Wi-Fi 6E AX211; iperf3 receive AXE11000; iperf 3.1.3: Ø1649 (1563-1691)
Lenovo LOQ 15IRX9 Realtek RTL8852BE; iperf3 receive AXE11000; iperf 3.1.3: Ø974 (950-986)
Asus TUF Gaming A15 FA507UV Realtek RTL8852BE; iperf3 receive AXE11000; iperf 3.1.3: Ø956 (936-974)
ColorChecker
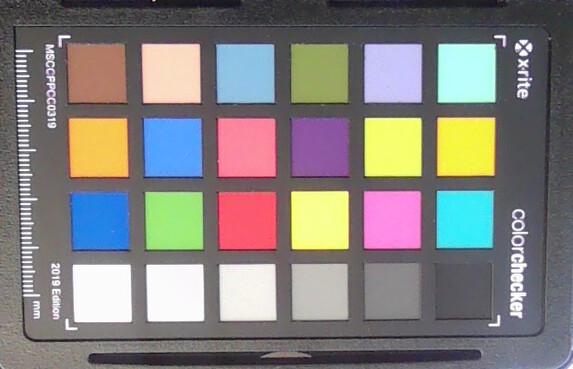
19.3 ∆E
18.5 ∆E
23.1 ∆E
23.1 ∆E
20.4 ∆E
18 ∆E
23.3 ∆E
27.9 ∆E
17.2 ∆E
14 ∆E
17.4 ∆E
25.2 ∆E
26.2 ∆E
24.5 ∆E
20.6 ∆E
15.6 ∆E
19.3 ∆E
29.3 ∆E
1.8 ∆E
10.7 ∆E
20.7 ∆E
22.4 ∆E
21.5 ∆E
12.8 ∆E
ColorChecker Gigabyte G5 KF5 2024: 19.7 ∆E min: 1.76 - max: 29.31 ∆E

Sustentabilidade

Embora a Gigabyte envie o G5 em uma caixa de papelão, o laptop para jogos e a fonte de alimentação ainda estão embrulhados em sacos plásticos e protegidos contra choques por materiais Styrodur. Aparentemente, não são usados materiais reciclados, e o fabricante não fornece nenhuma informação sobre as emissões de CO2 durante a produção do G5.

Dispositivos de entrada - G5 com bons dispositivos de entrada

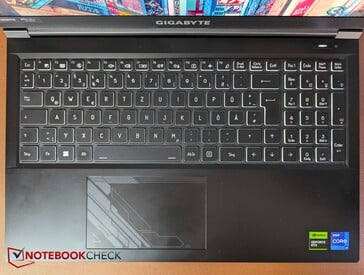
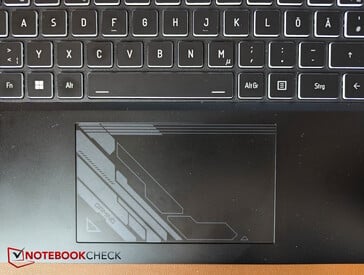
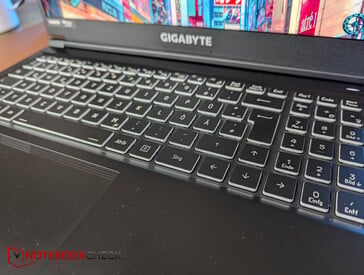
O layout e a rotulagem são ligeiramente diferentes do G5 KE, mas seguem o antecessor direto G5 KF com sua tecla Enter maior e rotulagem mais fina e clara. O layout é claro e as letras são fáceis de ler, mesmo sem luz de fundo. A iluminação de zona única do teclado pode ser configurada em cores e o brilho pode ser ajustado em quatro níveis. O ponto de pressão é agradável com um toque médio, enquanto o feedback é bom. A digitação é rápida com emissões de ruído moderadas.

O touchpad mede aproximadamente 12 x 7,2 cm e oferece propriedades de deslizamento decentes, que só enfraquecem um pouco com movimentos muito lentos. Os ruídos de clique dos botões integrados do mouse são moderados.

O teclado
O teclado
O touchpad
O touchpad
Os botões sem iluminação
A luz de fundo
A luz de fundo

Tela - Gigabyte com tela FHD nítida

Não há sangramento grave da luz de fundo
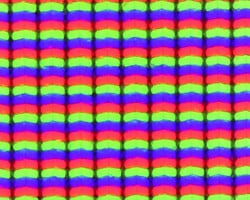
Estrutura do subpixel

A Gigabyte mudou a tela do G5. Os últimos modelos do G5 usavam um painel Chi-Mei, mas nossa amostra de teste agora tem uma tela IPS Full HD fosca da Sharp com uma taxa de atualização máxima de 144 Hz.

Em média, a tela brilha a pouco mais de 300 nits, o que está na faixa mais baixa atualmente. A uniformidade da iluminação é de 87%.

O nível de preto e o contraste são médios. O painel não troca os pixels com excessiva rapidez, mas também não é particularmente lento. O sangramento da luz de fundo não é um problema, nem o PWM.

Resumindo subjetivamente, temos um monitor decente para o preço geral, que certamente não é um dos melhores da categoria, mas faz seu trabalho de forma confiável. Para obter resoluções mais altas, cores e contrastes mais brilhantes, bem como outras tecnologias de painel (OLED, MiniLEDs), o senhor terá que ir mais fundo no bolso.

297
cd/m²
306
cd/m²
302
cd/m²
307
cd/m²
342
cd/m²
317
cd/m²
299
cd/m²
299
cd/m²
299
cd/m²
Distribuição do brilho
Sharp SHP153F (LQ156M1JW30) tested with X-Rite i1Pro 3
Máximo: 342 cd/m² (Nits) Médio: 307.6 cd/m² Minimum: 18.8 cd/m²
iluminação: 87 %
iluminação com acumulador: 342 cd/m²
Contraste: 1179:1 (Preto: 0.29 cd/m²)
ΔE Color 2.46 | 0.5-29.43 Ø4.91, calibrated: 0.82
ΔE Greyscale 3.03 | 0.5-98 Ø5.2
68.8% AdobeRGB 1998 (Argyll 2.2.0 3D)
98.9% sRGB (Argyll 2.2.0 3D)
67.9% Display P3 (Argyll 2.2.0 3D)
Gamma: 2.51
Gigabyte G5 KF5 2024
Sharp SHP153F (LQ156M1JW30), IPS, 1920x1080, 15.6", 360 Hz
Gigabyte G5 KF
Chi Mei N156HRA-EA1, IPS, 1920x1080, 15.6", 144 Hz
Lenovo LOQ 15IRX9
BOE NJ NE156FHM-NX9, IPS, 1920x1080, 15.6", 144 Hz
Asus TUF Gaming A15 FA507UV
AU Optronics B156HAN15.H, IPS, 1920x1080, 15.6", 144 Hz
Lenovo Legion Pro 5 16IRX9 G9
BOE NE160QDM-NZB, IPS, 2560x1600, 16", 240 Hz
Dell Inspiron 16 Plus 7640
AU Optronics B160QAN, IPS, 2560x1600, 16", 120 Hz
Display
-35%
5%
3%
25%
8%
Display P3 Coverage
67.9
43.2
-36%
73.7
9%
70.5
4%
99.22
46%
76
12%
sRGB Coverage
98.9
64.3
-35%
99.1
0%
98.5
0%
99.93
1%
99.8
1%
AdobeRGB 1998 Coverage
68.8
44.7
-35%
72.6
6%
72.7
6%
87.81
28%
76.7
11%
Response Times
-58%
-191%
-152%
29%
-99%
Response Time Grey 50% / Grey 80% *
13 ?(6.6, 6.4)
25.1 ?(11.7, 13.4)
-93%
42.2 ?(19.1, 23.1)
-225%
31.7 ?(14.7, 17)
-144%
4.8 ?(2.2, 2.6)
63%
25.6 ?(12.3, 13.3)
-97%
Response Time Black / White *
8.8 ?(4.6, 4.2)
10.8 ?(9.9, 7.9)
-23%
22.6 ?(11.2, 11.4)
-157%
22.9 ?(11.7, 11.2)
-160%
9.2 ?(4.6, 4.6)
-5%
17.6 ?(8.5, 9.1)
-100%
PWM Frequency
Screen
-134%
-3%
-13%
-4%
8%
Brightness middle
342
297
-13%
306
-11%
315
-8%
518
51%
314.7
-8%
Brightness
308
275
-11%
287
-7%
303
-2%
491
59%
291
-6%
Brightness Distribution
87
85
-2%
88
1%
90
3%
90
3%
89
2%
Black Level *
0.29
0.34
-17%
0.21
28%
0.25
14%
0.36
-24%
0.28
3%
Contrast
1179
874
-26%
1457
24%
1260
7%
1439
22%
1124
-5%
Colorchecker dE 2000 *
2.46
6.23
-153%
2.25
9%
2.26
8%
4.32
-76%
1.62
34%
Colorchecker dE 2000 max. *
4.12
20.93
-408%
4.84
-17%
7.37
-79%
6.37
-55%
2.94
29%
Colorchecker dE 2000 calibrated *
0.82
4.74
-478%
1.45
-77%
1.03
-26%
0.75
9%
1.08
-32%
Greyscale dE 2000 *
3.03
5.92
-95%
2.4
21%
4
-32%
3.66
-21%
1.3
57%
Gamma
2.51 88%
2.49 88%
2.259 97%
2.116 104%
2.19 100%
2.26 97%
CCT
7056 92%
6279 104%
6790 96%
7570 86%
6841 95%
6385 102%
Total Average (Program / Settings)
-76% / -102%
-63% / -28%
-54% / -29%
17% / 7%
-28% / -7%

* ... smaller is better

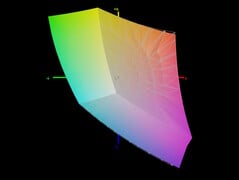
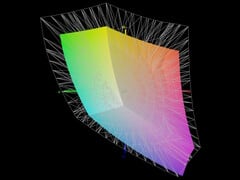
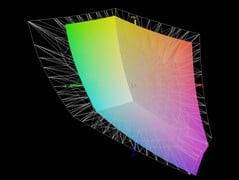
Com o painel usado, certamente não é surpreendente que, dos espaços de cores usuais, apenas o sRGB seja quase totalmente coberto.

sRGB
sRGB
Display P3
Display P3
AdobeRGB
AdobeRGB

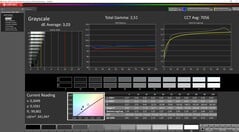
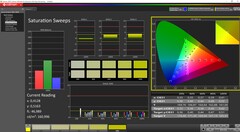
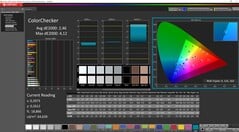
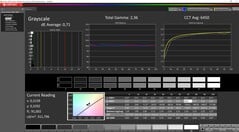
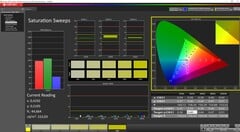
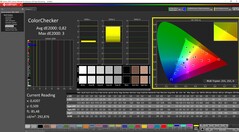
As cores e a escala de cinza da tela são ótimas desde o início, mas os valores DeltaE podem ser significativamente reduzidos usando nossa calibração manual por meio do colorímetro Xrite e do software Calman, de modo que os desvios na escala de cinza caem de 3,03 para apenas 0,71 e de 2,46 para apenas 0,82 no ColorChecker. Portanto, o painel é bastante preciso em termos de cores e é até mesmo adequado para tarefas leves de edição de fotos e vídeos, desde que o espaço de cores sRGB seja suficiente.

Escala de cinza
Escala de cinza
Saturação
Saturação
ColorChecker
ColorChecker
Escala de cinza calibrada
Saturação calibrada
Saturação calibrada
ColorChecker calibrado

Display Response Times

Display response times show how fast the screen is able to change from one color to the next. Slow response times can lead to afterimages and can cause moving objects to appear blurry (ghosting). Gamers of fast-paced 3D titles should pay special attention to fast response times.
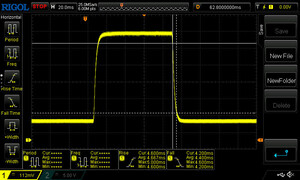
       Response Time Black to White
8.8 ms ... rise ↗ and fall ↘ combined↗ 4.6 ms rise
↘ 4.2 ms fall
The screen shows fast response rates in our tests and should be suited for gaming.
In comparison, all tested devices range from 0.1 (minimum) to 240 (maximum) ms. » 21 % of all devices are better.
This means that the measured response time is better than the average of all tested devices (20.9 ms).
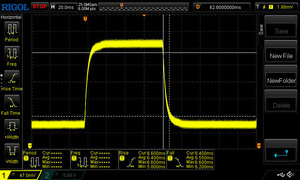
       Response Time 50% Grey to 80% Grey
13 ms ... rise ↗ and fall ↘ combined↗ 6.6 ms rise
↘ 6.4 ms fall
The screen shows good response rates in our tests, but may be too slow for competitive gamers.
In comparison, all tested devices range from 0.165 (minimum) to 636 (maximum) ms. » 23 % of all devices are better.
This means that the measured response time is better than the average of all tested devices (32.8 ms).

Screen Flickering / PWM (Pulse-Width Modulation)

To dim the screen, some notebooks will simply cycle the backlight on and off in rapid succession - a method called Pulse Width Modulation (PWM) . This cycling frequency should ideally be undetectable to the human eye. If said frequency is too low, users with sensitive eyes may experience strain or headaches or even notice the flickering altogether.
Screen flickering / PWM not detected

In comparison: 53 % of all tested devices do not use PWM to dim the display. If PWM was detected, an average of 8710 (minimum: 5 - maximum: 343500) Hz was measured.

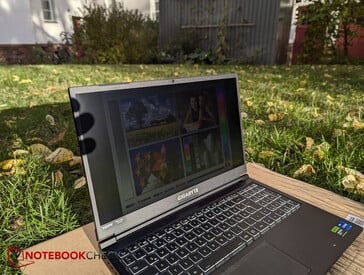
Em ambientes externos, os 300 nits não são ideais, mas podem ser usados. A luz do sol deve ser evitada a todo custo.

Lá fora, na sombra
Lá fora, na sombra
Ao ar livre, sob luz solar direta
Ângulos de visão IPS estáveis

Desempenho - CPU superior, GPU inferior

Nosso G5 KF5 está equipado com um Intel Core i7-13620H e uma RTX 4060 além de 16 GB de RAM DDR5 e um SSD de 1 TB. O G5 também está disponível como modelo MF5 e, nesse caso, um RTX 4050 mais fraca, que parece ser a única diferença. Com essa combinação de hardware, o G5 está posicionado como um jogador econômico e também é capaz de lidar com algumas tarefas leves de Criador.

Condições de teste

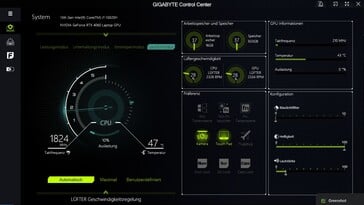
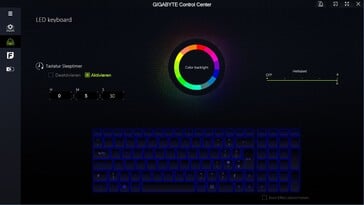
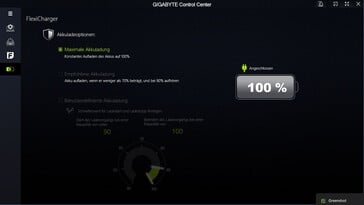
O Gigabyte Control Center vem pré-instalado no G5. O software não é particularmente abrangente (sem chave MUX) e raramente vimos uma central de controle tão pixelizada e sem atrativos. Pelo menos encontramos quatro perfis de desempenho (silencioso, economia de energia, entretenimento, desempenho), além das configurações do teclado. Selecionamos o modo de desempenho para nossos benchmarks e usamos o modo de economia de energia para os testes de bateria. Como não está claro como esses modos interagem ou influenciam os modos de energia do Windows, também definimos o Windows para o modo de desempenho (ou modo de economia de energia para os testes de bateria).

O Centro de controle da Gigabyte
A aparência pixelizada não é muito agradável (com zoom).
Macros e luz de fundo do teclado
Configurações de carregamento da bateria

Processador

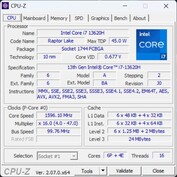
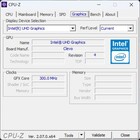
O Intel Core i7-13620H é uma CPU de ponta para laptops com 6 núcleos P e 4 E, um total de 16 threads e uma frequência de clock de 1,8 (núcleos E de clock básico) a 4,9 GHz (núcleo P turbo de núcleo único). Uma unidade gráfica Intel Xe com apenas 64 dos 96 EUs está integrada.

Em nosso teste de resistência Cinebench R15, há apenas uma ligeira queda de pontos nas primeiras quatro execuções, após o que o desempenho permanece constante. No geral, o processador do G5 tem um desempenho um pouco melhor do que a média dos notebooks com a mesma CPU do nosso banco de dados e até supera o Core i5-13450HX no LOQ 15. Em comparação com o antecessor, o desempenho da CPU aumentou em 21%.

No modo de bateria, o desempenho no Cinebench R15 cai em cerca de 35%.

Cinebench R15/Mode Desempenho Entretenimento Silencioso Economia de energia Bateria
Pontuação 2.396 2.296 840 768 1.555
TDP primeiro 93, cai para 65 W ao longo do tempo primeiro 85, depois brevemente 65, depois 45 W primeiro 28, depois 20, depois 15 W 15 W 36 W

Cinebench R15 Multi loop

0210420630840105012601470168018902100231025202730294031503360357037803990Tooltip
Gigabyte G5 KF5 2024 Intel Core i7-13620H: Ø2161 (2113.38-2395.78)
Gigabyte G5 KF Intel Core i5-12500H: Ø1808 (1783.56-2001.16)
Lenovo LOQ 15IRX9 Intel Core i5-13450HX: Ø2170 (2104.93-2503.76)
Asus TUF Gaming A15 FA507UV AMD Ryzen 9 8945H: Ø2688 (2638-2777.2)
Lenovo Legion Pro 5 16IRX9 G9 Intel Core i7-14700HX: Ø3774 (3668.72-4136.93)
Dell Inspiron 16 Plus 7640 Intel Core Ultra 7 155H: Ø2341 (1793.16-2787.26)
CPU Performance Rating: Percent
Cinebench R23: Multi Core | Single Core
Cinebench R20: CPU (Multi Core) | CPU (Single Core)
Cinebench R15: CPU Multi 64Bit | CPU Single 64Bit
Blender: v2.79 BMW27 CPU
7-Zip 18.03: 7z b 4 | 7z b 4 -mmt1
Geekbench 6.3: Multi-Core | Single-Core
Geekbench 5.5: Multi-Core | Single-Core
HWBOT x265 Benchmark v2.2: 4k Preset
LibreOffice : 20 Documents To PDF
R Benchmark 2.5: Overall mean
CPU Performance Rating
Lenovo Legion Pro 5 16IRX9 G9
Intel Core i7-14700HX
86.7 pt
Average of class Gaming
 
73.7 pt
Asus TUF Gaming A15 FA507UV
AMD Ryzen 9 8945H
68.1 pt
Dell Inspiron 16 Plus 7640
Intel Core Ultra 7 155H
63.8 pt
Gigabyte G5 KF5 2024
Intel Core i7-13620H
61.6 pt
Average Intel Core i7-13620H
 
59.9 pt
Lenovo LOQ 15IRX9
Intel Core i5-13450HX
58.4 pt
Gigabyte G5 KF
Intel Core i5-12500H
51 pt
Cinebench R23 / Multi Core
Lenovo Legion Pro 5 16IRX9 G9
Intel Core i7-14700HX
28122 Points +91%
Average of class Gaming
  (5668 - 36249, n=189, last 2 years)
21994 Points +50%
Dell Inspiron 16 Plus 7640
Intel Core Ultra 7 155H
17675 (14726min - 17675max) Points +20%
Asus TUF Gaming A15 FA507UV
AMD Ryzen 9 8945H
17423 Points +19%
Lenovo LOQ 15IRX9
Intel Core i5-13450HX
16797 Points +14%
Gigabyte G5 KF5 2024
Intel Core i7-13620H
14686 Points
Average Intel Core i7-13620H
  (10819 - 15496, n=5)
14303 Points -3%
Gigabyte G5 KF
Intel Core i5-12500H
13471 Points -8%
Cinebench R23 / Single Core
Lenovo Legion Pro 5 16IRX9 G9
Intel Core i7-14700HX
2128 Points +14%
Average of class Gaming
  (1136 - 2235, n=188, last 2 years)
1894 Points +2%
Gigabyte G5 KF5 2024
Intel Core i7-13620H
1862 Points
Average Intel Core i7-13620H
  (1805 - 1871, n=5)
1843 Points -1%
Asus TUF Gaming A15 FA507UV
AMD Ryzen 9 8945H
1814 Points -3%
Dell Inspiron 16 Plus 7640
Intel Core Ultra 7 155H
1733 Points -7%
Lenovo LOQ 15IRX9
Intel Core i5-13450HX
1710 Points -8%
Gigabyte G5 KF
Intel Core i5-12500H
1690 Points -9%
Cinebench R20 / CPU (Multi Core)
Lenovo Legion Pro 5 16IRX9 G9
Intel Core i7-14700HX
10498 Points +89%
Average of class Gaming
  (2179 - 13832, n=186, last 2 years)
8352 Points +50%
Asus TUF Gaming A15 FA507UV
AMD Ryzen 9 8945H
6859 Points +23%
Dell Inspiron 16 Plus 7640
Intel Core Ultra 7 155H
6807 Points +22%
Lenovo LOQ 15IRX9
Intel Core i5-13450HX
6532 Points +18%
Gigabyte G5 KF5 2024
Intel Core i7-13620H
5558 Points
Average Intel Core i7-13620H
  (4214 - 5905, n=5)
5426 Points -2%
Gigabyte G5 KF
Intel Core i5-12500H
5115 Points -8%
Cinebench R20 / CPU (Single Core)
Lenovo Legion Pro 5 16IRX9 G9
Intel Core i7-14700HX
818 Points +17%
Average of class Gaming
  (439 - 856, n=186, last 2 years)
727 Points +4%
Average Intel Core i7-13620H
  (693 - 719, n=5)
704 Points +1%
Gigabyte G5 KF5 2024
Intel Core i7-13620H
697 Points
Asus TUF Gaming A15 FA507UV
AMD Ryzen 9 8945H
670 Points -4%
Dell Inspiron 16 Plus 7640
Intel Core Ultra 7 155H
666 Points -4%
Lenovo LOQ 15IRX9
Intel Core i5-13450HX
652 Points -6%
Gigabyte G5 KF
Intel Core i5-12500H
651 Points -7%
Cinebench R15 / CPU Multi 64Bit
Lenovo Legion Pro 5 16IRX9 G9
Intel Core i7-14700HX
4137 (3668.72min - 4136.93max) Points +73%
Average of class Gaming
  (905 - 5663, n=193, last 2 years)
3440 Points +44%
Dell Inspiron 16 Plus 7640
Intel Core Ultra 7 155H
2787 (1793.16min - 2787.26max) Points +16%
Asus TUF Gaming A15 FA507UV
AMD Ryzen 9 8945H
2777 Points +16%
Lenovo LOQ 15IRX9
Intel Core i5-13450HX
2503 Points +4%
Gigabyte G5 KF5 2024
Intel Core i7-13620H
2396 (2113.38min - 2395.78max) Points
Average Intel Core i7-13620H
  (1681 - 2492, n=5)
2239 Points -7%
Gigabyte G5 KF
Intel Core i5-12500H
2001 Points -16%
Cinebench R15 / CPU Single 64Bit
Lenovo Legion Pro 5 16IRX9 G9
Intel Core i7-14700HX
300 Points +12%
Asus TUF Gaming A15 FA507UV
AMD Ryzen 9 8945H
284 Points +6%
Average of class Gaming
  (191.9 - 318, n=190, last 2 years)
278 Points +3%
Gigabyte G5 KF5 2024
Intel Core i7-13620H
269 Points
Average Intel Core i7-13620H
  (258 - 269, n=5)
263 Points -2%
Dell Inspiron 16 Plus 7640
Intel Core Ultra 7 155H
255 Points -5%
Lenovo LOQ 15IRX9
Intel Core i5-13450HX
239 Points -11%
Gigabyte G5 KF
Intel Core i5-12500H
233 Points -13%
Blender / v2.79 BMW27 CPU
Gigabyte G5 KF
Intel Core i5-12500H
256 Seconds * -17%
Average Intel Core i7-13620H
  (215 - 289, n=5)
238 Seconds * -9%
Lenovo LOQ 15IRX9
Intel Core i5-13450HX
229 Seconds * -5%
Gigabyte G5 KF5 2024
Intel Core i7-13620H
218 Seconds *
Dell Inspiron 16 Plus 7640
Intel Core Ultra 7 155H
191 Seconds * +12%
Asus TUF Gaming A15 FA507UV
AMD Ryzen 9 8945H
182 Seconds * +17%
Average of class Gaming
  (87 - 555, n=181, last 2 years)
169.4 Seconds * +22%
Lenovo Legion Pro 5 16IRX9 G9
Intel Core i7-14700HX
126 Seconds * +42%
7-Zip 18.03 / 7z b 4
Lenovo Legion Pro 5 16IRX9 G9
Intel Core i7-14700HX
104730 MIPS +73%
Average of class Gaming
  (23795 - 140932, n=185, last 2 years)
85738 MIPS +42%
Asus TUF Gaming A15 FA507UV
AMD Ryzen 9 8945H
73222 MIPS +21%
Dell Inspiron 16 Plus 7640
Intel Core Ultra 7 155H
61730 MIPS +2%
Gigabyte G5 KF5 2024
Intel Core i7-13620H
60545 MIPS
Lenovo LOQ 15IRX9
Intel Core i5-13450HX
59026 MIPS -3%
Average Intel Core i7-13620H
  (45983 - 62324, n=5)
56733 MIPS -6%
Gigabyte G5 KF
Intel Core i5-12500H
49343 MIPS -19%
7-Zip 18.03 / 7z b 4 -mmt1
Lenovo Legion Pro 5 16IRX9 G9
Intel Core i7-14700HX
6979 MIPS +14%
Asus TUF Gaming A15 FA507UV
AMD Ryzen 9 8945H
6615 MIPS +9%
Average of class Gaming
  (4199 - 7581, n=185, last 2 years)
6322 MIPS +4%
Gigabyte G5 KF5 2024
Intel Core i7-13620H
6096 MIPS
Average Intel Core i7-13620H
  (5742 - 6326, n=5)
5994 MIPS -2%
Dell Inspiron 16 Plus 7640
Intel Core Ultra 7 155H
5461 MIPS -10%
Lenovo LOQ 15IRX9
Intel Core i5-13450HX
5370 MIPS -12%
Gigabyte G5 KF
Intel Core i5-12500H
5258 MIPS -14%
Geekbench 6.3 / Multi-Core
Lenovo Legion Pro 5 16IRX9 G9
Intel Core i7-14700HX
17562 Points +37%
Average of class Gaming
  (5340 - 19665, n=112, last 2 years)
14207 Points +11%
Dell Inspiron 16 Plus 7640
Intel Core Ultra 7 155H
13018 Points +2%
Gigabyte G5 KF5 2024
Intel Core i7-13620H
12779 Points
Lenovo LOQ 15IRX9
Intel Core i5-13450HX
12684 Points -1%
Asus TUF Gaming A15 FA507UV
AMD Ryzen 9 8945H
12662 Points -1%
Average Intel Core i7-13620H
  (9131 - 13077, n=4)
11886 Points -7%
Gigabyte G5 KF
Intel Core i5-12500H
8714 Points -32%
Geekbench 6.3 / Single-Core
Lenovo Legion Pro 5 16IRX9 G9
Intel Core i7-14700HX
2884 Points +13%
Asus TUF Gaming A15 FA507UV
AMD Ryzen 9 8945H
2711 Points +7%
Average of class Gaming
  (1490 - 3129, n=112, last 2 years)
2651 Points +4%
Average Intel Core i7-13620H
  (2544 - 2605, n=4)
2586 Points +2%
Gigabyte G5 KF5 2024
Intel Core i7-13620H
2544 Points
Dell Inspiron 16 Plus 7640
Intel Core Ultra 7 155H
2401 Points -6%
Lenovo LOQ 15IRX9
Intel Core i5-13450HX
2381 Points -6%
Gigabyte G5 KF
Intel Core i5-12500H
2239 Points -12%
Geekbench 5.5 / Multi-Core
Lenovo Legion Pro 5 16IRX9 G9
Intel Core i7-14700HX
19597 Points +68%
Average of class Gaming
  (4557 - 23194, n=186, last 2 years)
15098 Points +29%
Dell Inspiron 16 Plus 7640
Intel Core Ultra 7 155H
12600 Points +8%
Lenovo LOQ 15IRX9
Intel Core i5-13450HX
12005 Points +3%
Asus TUF Gaming A15 FA507UV
AMD Ryzen 9 8945H
11949 Points +2%
Gigabyte G5 KF5 2024
Intel Core i7-13620H
11699 Points
Average Intel Core i7-13620H
  (8357 - 12223, n=5)
11000 Points -6%
Gigabyte G5 KF
Intel Core i5-12500H
8194 Points -30%
Geekbench 5.5 / Single-Core
Lenovo Legion Pro 5 16IRX9 G9
Intel Core i7-14700HX
2133 Points +19%
Asus TUF Gaming A15 FA507UV
AMD Ryzen 9 8945H
1991 Points +11%
Average of class Gaming
  (986 - 2210, n=186, last 2 years)
1898 Points +6%
Average Intel Core i7-13620H
  (1793 - 1865, n=5)
1823 Points +1%
Gigabyte G5 KF5 2024
Intel Core i7-13620H
1799 Points
Dell Inspiron 16 Plus 7640
Intel Core Ultra 7 155H
1793 Points 0%
Lenovo LOQ 15IRX9
Intel Core i5-13450HX
1696 Points -6%
Gigabyte G5 KF
Intel Core i5-12500H
1618 Points -10%
HWBOT x265 Benchmark v2.2 / 4k Preset
Lenovo Legion Pro 5 16IRX9 G9
Intel Core i7-14700HX
27.4 fps +55%
Average of class Gaming
  (6.72 - 38.9, n=185, last 2 years)
23.6 fps +33%
Asus TUF Gaming A15 FA507UV
AMD Ryzen 9 8945H
21.9 fps +24%
Dell Inspiron 16 Plus 7640
Intel Core Ultra 7 155H
19.5 fps +10%
Gigabyte G5 KF5 2024
Intel Core i7-13620H
17.7 fps
Lenovo LOQ 15IRX9
Intel Core i5-13450HX
17.5 fps -1%
Average Intel Core i7-13620H
  (12.9 - 17.7, n=5)
16.2 fps -8%
Gigabyte G5 KF
Intel Core i5-12500H
14.2 fps -20%
LibreOffice / 20 Documents To PDF
Lenovo LOQ 15IRX9
Intel Core i5-13450HX
59.3 s * -15%
Lenovo Legion Pro 5 16IRX9 G9
Intel Core i7-14700HX
52.3 s * -2%
Gigabyte G5 KF5 2024
Intel Core i7-13620H
51.4 s *
Gigabyte G5 KF
Intel Core i5-12500H
50.1 s * +3%
Average of class Gaming
  (31.4 - 199, n=182, last 2 years)
48.1 s * +6%
Average Intel Core i7-13620H
  (41.5 - 56.8, n=5)
47.8 s * +7%
Asus TUF Gaming A15 FA507UV
AMD Ryzen 9 8945H
47.5 s * +8%
Dell Inspiron 16 Plus 7640
Intel Core Ultra 7 155H
43.5 s * +15%
R Benchmark 2.5 / Overall mean
Gigabyte G5 KF
Intel Core i5-12500H
0.535 sec * -20%
Lenovo LOQ 15IRX9
Intel Core i5-13450HX
0.4838 sec * -8%
Dell Inspiron 16 Plus 7640
Intel Core Ultra 7 155H
0.4709 sec * -6%
Average Intel Core i7-13620H
  (0.4438 - 0.4509, n=5)
0.4471 sec * -0%
Gigabyte G5 KF5 2024
Intel Core i7-13620H
0.446 sec *
Average of class Gaming
  (0.3609 - 0.759, n=186, last 2 years)
0.4366 sec * +2%
Asus TUF Gaming A15 FA507UV
AMD Ryzen 9 8945H
0.4298 sec * +4%
Lenovo Legion Pro 5 16IRX9 G9
Intel Core i7-14700HX
0.4003 sec * +10%

* ... smaller is better

Cinebench R15 CPU Multi 64Bit
2396 Points
Cinebench R15 OpenGL 64Bit
209 fps
Cinebench R15 Ref. Match 64Bit
99.6 %
Cinebench R15 CPU Single 64Bit
269 Points
Cinebench R20 CPU (Multi Core)
5558 Points
Cinebench R20 CPU (Single Core)
697 Points
Cinebench R23 Single Core
1862 Points
Cinebench R23 Multi Core
14686 Points
Ajuda
Performance Rating
Lenovo Legion Pro 5 16IRX9 G9
Intel Core i7-14700HX, NVIDIA GeForce RTX 4060 Laptop GPU
94.1 pt
Asus TUF Gaming A15 FA507UV
AMD Ryzen 9 8945H, NVIDIA GeForce RTX 4060 Laptop GPU
89 pt
Average of class Gaming
 
83.1 pt
Dell Inspiron 16 Plus 7640
Intel Core Ultra 7 155H, NVIDIA GeForce RTX 4060 Laptop GPU
58.8 pt
Lenovo LOQ 15IRX9
Intel Core i5-13450HX, NVIDIA GeForce RTX 4060 Laptop GPU
58.2 pt
Gigabyte G5 KF
Intel Core i5-12500H, NVIDIA GeForce RTX 4060 Laptop GPU
52.7 pt
Gigabyte G5 KF5 2024
Intel Core i7-13620H, NVIDIA GeForce RTX 4060 Laptop GPU
49.7 pt
Average Intel Core i7-13620H
 
49.4 pt
AIDA64 / FP32 Ray-Trace
Asus TUF Gaming A15 FA507UV
AMD Ryzen 9 8945H, NVIDIA GeForce RTX 4060 Laptop GPU
28698 KRay/s +125%
Lenovo Legion Pro 5 16IRX9 G9
Intel Core i7-14700HX, NVIDIA GeForce RTX 4060 Laptop GPU
23676 KRay/s +86%
Average of class Gaming
  (4986 - 60169, n=182, last 2 years)
21963 KRay/s +72%
Dell Inspiron 16 Plus 7640
Intel Core Ultra 7 155H, NVIDIA GeForce RTX 4060 Laptop GPU
14038 KRay/s +10%
Lenovo LOQ 15IRX9
Intel Core i5-13450HX, NVIDIA GeForce RTX 4060 Laptop GPU
13747 KRay/s +8%
Gigabyte G5 KF5 2024
Intel Core i7-13620H, NVIDIA GeForce RTX 4060 Laptop GPU
12760 KRay/s
Average Intel Core i7-13620H
  (10779 - 13601, n=5)
12202 KRay/s -4%
Gigabyte G5 KF
Intel Core i5-12500H, NVIDIA GeForce RTX 4060 Laptop GPU
11802 KRay/s -8%
AIDA64 / FPU Julia
Asus TUF Gaming A15 FA507UV
AMD Ryzen 9 8945H, NVIDIA GeForce RTX 4060 Laptop GPU
122466 Points +88%
Lenovo Legion Pro 5 16IRX9 G9
Intel Core i7-14700HX, NVIDIA GeForce RTX 4060 Laptop GPU
116556 Points +79%
Average of class Gaming
  (25360 - 252486, n=182, last 2 years)
106952 Points +64%
Lenovo LOQ 15IRX9
Intel Core i5-13450HX, NVIDIA GeForce RTX 4060 Laptop GPU
71834 Points +10%
Dell Inspiron 16 Plus 7640
Intel Core Ultra 7 155H, NVIDIA GeForce RTX 4060 Laptop GPU
70839 Points +9%
Gigabyte G5 KF5 2024
Intel Core i7-13620H, NVIDIA GeForce RTX 4060 Laptop GPU
65073 Points
Average Intel Core i7-13620H
  (54287 - 67187, n=5)
62844 Points -3%
Gigabyte G5 KF
Intel Core i5-12500H, NVIDIA GeForce RTX 4060 Laptop GPU
59683 Points -8%
AIDA64 / CPU SHA3
Lenovo Legion Pro 5 16IRX9 G9
Intel Core i7-14700HX, NVIDIA GeForce RTX 4060 Laptop GPU
5567 MB/s +110%
Asus TUF Gaming A15 FA507UV
AMD Ryzen 9 8945H, NVIDIA GeForce RTX 4060 Laptop GPU
5113 MB/s +92%
Average of class Gaming
  (1339 - 10389, n=182, last 2 years)
4920 MB/s +85%
Lenovo LOQ 15IRX9
Intel Core i5-13450HX, NVIDIA GeForce RTX 4060 Laptop GPU
3530 MB/s +33%
Dell Inspiron 16 Plus 7640
Intel Core Ultra 7 155H, NVIDIA GeForce RTX 4060 Laptop GPU
3277 MB/s +23%
Gigabyte G5 KF
Intel Core i5-12500H, NVIDIA GeForce RTX 4060 Laptop GPU
2983 MB/s +12%
Gigabyte G5 KF5 2024
Intel Core i7-13620H, NVIDIA GeForce RTX 4060 Laptop GPU
2657 MB/s
Average Intel Core i7-13620H
  (2357 - 2773, n=5)
2605 MB/s -2%
AIDA64 / CPU Queen
Lenovo Legion Pro 5 16IRX9 G9
Intel Core i7-14700HX, NVIDIA GeForce RTX 4060 Laptop GPU
152200 Points +94%
Asus TUF Gaming A15 FA507UV
AMD Ryzen 9 8945H, NVIDIA GeForce RTX 4060 Laptop GPU
125950 Points +60%
Average of class Gaming
  (50699 - 200651, n=182, last 2 years)
117347 Points +49%
Dell Inspiron 16 Plus 7640
Intel Core Ultra 7 155H, NVIDIA GeForce RTX 4060 Laptop GPU
87819 Points +12%
Lenovo LOQ 15IRX9
Intel Core i5-13450HX, NVIDIA GeForce RTX 4060 Laptop GPU
86148 Points +10%
Gigabyte G5 KF
Intel Core i5-12500H, NVIDIA GeForce RTX 4060 Laptop GPU
79989 Points +2%
Gigabyte G5 KF5 2024
Intel Core i7-13620H, NVIDIA GeForce RTX 4060 Laptop GPU
78523 Points
Average Intel Core i7-13620H
  (66885 - 78867, n=5)
76259 Points -3%
AIDA64 / FPU SinJulia
Asus TUF Gaming A15 FA507UV
AMD Ryzen 9 8945H, NVIDIA GeForce RTX 4060 Laptop GPU
15856 Points +95%
Lenovo Legion Pro 5 16IRX9 G9
Intel Core i7-14700HX, NVIDIA GeForce RTX 4060 Laptop GPU
14434 Points +78%
Average of class Gaming
  (4800 - 32988, n=182, last 2 years)
13290 Points +64%
Dell Inspiron 16 Plus 7640
Intel Core Ultra 7 155H, NVIDIA GeForce RTX 4060 Laptop GPU
9893 Points +22%
Lenovo LOQ 15IRX9
Intel Core i5-13450HX, NVIDIA GeForce RTX 4060 Laptop GPU
9344 Points +15%
Gigabyte G5 KF5 2024
Intel Core i7-13620H, NVIDIA GeForce RTX 4060 Laptop GPU
8124 Points
Average Intel Core i7-13620H
  (6737 - 8421, n=5)
7775 Points -4%
Gigabyte G5 KF
Intel Core i5-12500H, NVIDIA GeForce RTX 4060 Laptop GPU
7322 Points -10%
AIDA64 / FPU Mandel
Asus TUF Gaming A15 FA507UV
AMD Ryzen 9 8945H, NVIDIA GeForce RTX 4060 Laptop GPU
65523 Points +108%
Lenovo Legion Pro 5 16IRX9 G9
Intel Core i7-14700HX, NVIDIA GeForce RTX 4060 Laptop GPU
58380 Points +85%
Average of class Gaming
  (12321 - 134044, n=182, last 2 years)
53819 Points +71%
Dell Inspiron 16 Plus 7640
Intel Core Ultra 7 155H, NVIDIA GeForce RTX 4060 Laptop GPU
35006 Points +11%
Lenovo LOQ 15IRX9
Intel Core i5-13450HX, NVIDIA GeForce RTX 4060 Laptop GPU
34956 Points +11%
Gigabyte G5 KF5 2024
Intel Core i7-13620H, NVIDIA GeForce RTX 4060 Laptop GPU
31508 Points
Average Intel Core i7-13620H
  (27242 - 32787, n=5)
30835 Points -2%
Gigabyte G5 KF
Intel Core i5-12500H, NVIDIA GeForce RTX 4060 Laptop GPU
29112 Points -8%
AIDA64 / CPU AES
Lenovo Legion Pro 5 16IRX9 G9
Intel Core i7-14700HX, NVIDIA GeForce RTX 4060 Laptop GPU
113157 MB/s +109%
Average of class Gaming
  (19065 - 328679, n=182, last 2 years)
109208 MB/s +102%
Gigabyte G5 KF
Intel Core i5-12500H, NVIDIA GeForce RTX 4060 Laptop GPU
105881 MB/s +96%
Asus TUF Gaming A15 FA507UV
AMD Ryzen 9 8945H, NVIDIA GeForce RTX 4060 Laptop GPU
90481 MB/s +67%
Lenovo LOQ 15IRX9
Intel Core i5-13450HX, NVIDIA GeForce RTX 4060 Laptop GPU
70330 MB/s +30%
Dell Inspiron 16 Plus 7640
Intel Core Ultra 7 155H, NVIDIA GeForce RTX 4060 Laptop GPU
68050 MB/s +26%
Average Intel Core i7-13620H
  (52697 - 85895, n=5)
61535 MB/s +14%
Gigabyte G5 KF5 2024
Intel Core i7-13620H, NVIDIA GeForce RTX 4060 Laptop GPU
54096 MB/s
AIDA64 / CPU ZLib
Lenovo Legion Pro 5 16IRX9 G9
Intel Core i7-14700HX, NVIDIA GeForce RTX 4060 Laptop GPU
1682 MB/s +115%
Average of class Gaming
  (373 - 2409, n=182, last 2 years)
1369 MB/s +75%
Asus TUF Gaming A15 FA507UV
AMD Ryzen 9 8945H, NVIDIA GeForce RTX 4060 Laptop GPU
1150 MB/s +47%
Dell Inspiron 16 Plus 7640
Intel Core Ultra 7 155H, NVIDIA GeForce RTX 4060 Laptop GPU
1045 MB/s +34%
Lenovo LOQ 15IRX9
Intel Core i5-13450HX, NVIDIA GeForce RTX 4060 Laptop GPU
1002 MB/s +28%
Gigabyte G5 KF
Intel Core i5-12500H, NVIDIA GeForce RTX 4060 Laptop GPU
864 MB/s +10%
Gigabyte G5 KF5 2024
Intel Core i7-13620H, NVIDIA GeForce RTX 4060 Laptop GPU
782 MB/s
Average Intel Core i7-13620H
  (697 - 835, n=5)
778 MB/s -1%
AIDA64 / FP64 Ray-Trace
Asus TUF Gaming A15 FA507UV
AMD Ryzen 9 8945H, NVIDIA GeForce RTX 4060 Laptop GPU
15513 KRay/s +128%
Lenovo Legion Pro 5 16IRX9 G9
Intel Core i7-14700HX, NVIDIA GeForce RTX 4060 Laptop GPU
12928 KRay/s +90%
Average of class Gaming
  (2540 - 31796, n=182, last 2 years)
11830 KRay/s +74%
Lenovo LOQ 15IRX9
Intel Core i5-13450HX, NVIDIA GeForce RTX 4060 Laptop GPU
7428 KRay/s +9%
Dell Inspiron 16 Plus 7640
Intel Core Ultra 7 155H, NVIDIA GeForce RTX 4060 Laptop GPU
7347 KRay/s +8%
Gigabyte G5 KF5 2024
Intel Core i7-13620H, NVIDIA GeForce RTX 4060 Laptop GPU
6800 KRay/s
Average Intel Core i7-13620H
  (6077 - 7364, n=5)
6709 KRay/s -1%
Gigabyte G5 KF
Intel Core i5-12500H, NVIDIA GeForce RTX 4060 Laptop GPU
6169 KRay/s -9%
AIDA64 / CPU PhotoWorxx
Lenovo Legion Pro 5 16IRX9 G9
Intel Core i7-14700HX, NVIDIA GeForce RTX 4060 Laptop GPU
49671 MPixel/s +59%
Average of class Gaming
  (10805 - 60161, n=183, last 2 years)
40303 MPixel/s +29%
Dell Inspiron 16 Plus 7640
Intel Core Ultra 7 155H, NVIDIA GeForce RTX 4060 Laptop GPU
39530 MPixel/s +27%
Lenovo LOQ 15IRX9
Intel Core i5-13450HX, NVIDIA GeForce RTX 4060 Laptop GPU
36764 MPixel/s +18%
Asus TUF Gaming A15 FA507UV
AMD Ryzen 9 8945H, NVIDIA GeForce RTX 4060 Laptop GPU
33410 MPixel/s +7%
Average Intel Core i7-13620H
  (22766 - 34544, n=5)
31208 MPixel/s 0%
Gigabyte G5 KF5 2024
Intel Core i7-13620H, NVIDIA GeForce RTX 4060 Laptop GPU
31165 MPixel/s
Gigabyte G5 KF
Intel Core i5-12500H, NVIDIA GeForce RTX 4060 Laptop GPU
27635 MPixel/s -11%

Desempenho do sistema

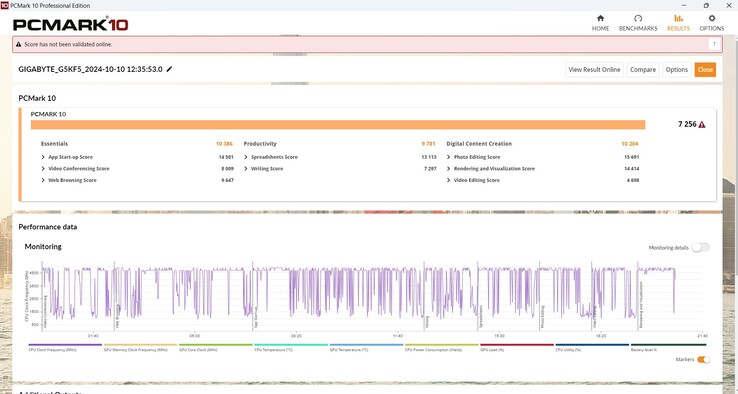
Os resultados do G5 no PCMark 10 não são dignos de nota e ele fica no meio do caminho. No CrossMark, nosso Gigabyte tem um desempenho praticamente no nível esperado. Raramente notamos qualquer problema no modo Windows, somente ao percorrer o navegador é que houve alguns soluços.

PCMark 10
PCMark 10
PCMark 10 / Score
Lenovo Legion Pro 5 16IRX9 G9
NVIDIA GeForce RTX 4060 Laptop GPU, i7-14700HX, Samsung PM9A1 MZVL21T0HCLR
8278 Points +14%
Asus TUF Gaming A15 FA507UV
NVIDIA GeForce RTX 4060 Laptop GPU, R9 8945H, WD PC SN560 SDDPNQE-1T00
7943 Points +9%
Average of class Gaming
  (5776 - 9852, n=163, last 2 years)
7813 Points +8%
Gigabyte G5 KF5 2024
NVIDIA GeForce RTX 4060 Laptop GPU, i7-13620H, Gigabyte AG450E1024-SI
7256 Points
Dell Inspiron 16 Plus 7640
NVIDIA GeForce RTX 4060 Laptop GPU, Ultra 7 155H, SK hynix BC901 HFS001TEJ4X164N
7042 Points -3%
Average Intel Core i7-13620H, NVIDIA GeForce RTX 4060 Laptop GPU
  (6678 - 7256, n=3)
7031 Points -3%
Lenovo LOQ 15IRX9
NVIDIA GeForce RTX 4060 Laptop GPU, i5-13450HX, Micron 2400 MTFDKCD1T0QFM
6929 Points -5%
Gigabyte G5 KF
NVIDIA GeForce RTX 4060 Laptop GPU, i5-12500H, SSSTC CA6-8D512
6318 Points -13%
PCMark 10 / Essentials
Lenovo Legion Pro 5 16IRX9 G9
NVIDIA GeForce RTX 4060 Laptop GPU, i7-14700HX, Samsung PM9A1 MZVL21T0HCLR
11087 Points +7%
Asus TUF Gaming A15 FA507UV
NVIDIA GeForce RTX 4060 Laptop GPU, R9 8945H, WD PC SN560 SDDPNQE-1T00
10873 Points +5%
Average of class Gaming
  (9057 - 12334, n=162, last 2 years)
10836 Points +4%
Gigabyte G5 KF5 2024
NVIDIA GeForce RTX 4060 Laptop GPU, i7-13620H, Gigabyte AG450E1024-SI
10386 Points
Average Intel Core i7-13620H, NVIDIA GeForce RTX 4060 Laptop GPU
  (9909 - 10809, n=3)
10368 Points 0%
Gigabyte G5 KF
NVIDIA GeForce RTX 4060 Laptop GPU, i5-12500H, SSSTC CA6-8D512
10328 Points -1%
Dell Inspiron 16 Plus 7640
NVIDIA GeForce RTX 4060 Laptop GPU, Ultra 7 155H, SK hynix BC901 HFS001TEJ4X164N
10279 Points -1%
Lenovo LOQ 15IRX9
NVIDIA GeForce RTX 4060 Laptop GPU, i5-13450HX, Micron 2400 MTFDKCD1T0QFM
9379 Points -10%
PCMark 10 / Productivity
Asus TUF Gaming A15 FA507UV
NVIDIA GeForce RTX 4060 Laptop GPU, R9 8945H, WD PC SN560 SDDPNQE-1T00
10269 Points +5%
Average of class Gaming
  (6662 - 14612, n=162, last 2 years)
9909 Points +1%
Lenovo Legion Pro 5 16IRX9 G9
NVIDIA GeForce RTX 4060 Laptop GPU, i7-14700HX, Samsung PM9A1 MZVL21T0HCLR
9823 Points 0%
Gigabyte G5 KF5 2024
NVIDIA GeForce RTX 4060 Laptop GPU, i7-13620H, Gigabyte AG450E1024-SI
9781 Points
Gigabyte G5 KF
NVIDIA GeForce RTX 4060 Laptop GPU, i5-12500H, SSSTC CA6-8D512
9736 Points 0%
Average Intel Core i7-13620H, NVIDIA GeForce RTX 4060 Laptop GPU
  (8642 - 9781, n=3)
9244 Points -5%
Lenovo LOQ 15IRX9
NVIDIA GeForce RTX 4060 Laptop GPU, i5-13450HX, Micron 2400 MTFDKCD1T0QFM
8800 Points -10%
Dell Inspiron 16 Plus 7640
NVIDIA GeForce RTX 4060 Laptop GPU, Ultra 7 155H, SK hynix BC901 HFS001TEJ4X164N
8079 Points -17%
PCMark 10 / Digital Content Creation
Lenovo Legion Pro 5 16IRX9 G9
NVIDIA GeForce RTX 4060 Laptop GPU, i7-14700HX, Samsung PM9A1 MZVL21T0HCLR
14135 Points +39%
Asus TUF Gaming A15 FA507UV
NVIDIA GeForce RTX 4060 Laptop GPU, R9 8945H, WD PC SN560 SDDPNQE-1T00
12182 Points +19%
Average of class Gaming
  (6807 - 18475, n=162, last 2 years)
12168 Points +19%
Dell Inspiron 16 Plus 7640
NVIDIA GeForce RTX 4060 Laptop GPU, Ultra 7 155H, SK hynix BC901 HFS001TEJ4X164N
11413 Points +12%
Lenovo LOQ 15IRX9
NVIDIA GeForce RTX 4060 Laptop GPU, i5-13450HX, Micron 2400 MTFDKCD1T0QFM
10937 Points +7%
Gigabyte G5 KF5 2024
NVIDIA GeForce RTX 4060 Laptop GPU, i7-13620H, Gigabyte AG450E1024-SI
10204 Points
Average Intel Core i7-13620H, NVIDIA GeForce RTX 4060 Laptop GPU
  (9437 - 10204, n=3)
9848 Points -3%
Gigabyte G5 KF
NVIDIA GeForce RTX 4060 Laptop GPU, i5-12500H, SSSTC CA6-8D512
6807 Points -33%
CrossMark / Overall
Lenovo Legion Pro 5 16IRX9 G9
NVIDIA GeForce RTX 4060 Laptop GPU, i7-14700HX, Samsung PM9A1 MZVL21T0HCLR
2132 Points +7%
Gigabyte G5 KF5 2024
NVIDIA GeForce RTX 4060 Laptop GPU, i7-13620H, Gigabyte AG450E1024-SI
1986 Points
Average Intel Core i7-13620H, NVIDIA GeForce RTX 4060 Laptop GPU
  (1857 - 1986, n=3)
1929 Points -3%
Average of class Gaming
  (1247 - 2344, n=144, last 2 years)
1910 Points -4%
Lenovo LOQ 15IRX9
NVIDIA GeForce RTX 4060 Laptop GPU, i5-13450HX, Micron 2400 MTFDKCD1T0QFM
1804 Points -9%
Asus TUF Gaming A15 FA507UV
NVIDIA GeForce RTX 4060 Laptop GPU, R9 8945H, WD PC SN560 SDDPNQE-1T00
1800 Points -9%
Gigabyte G5 KF
NVIDIA GeForce RTX 4060 Laptop GPU, i5-12500H, SSSTC CA6-8D512
1744 Points -12%
Dell Inspiron 16 Plus 7640
NVIDIA GeForce RTX 4060 Laptop GPU, Ultra 7 155H, SK hynix BC901 HFS001TEJ4X164N
1685 Points -15%
CrossMark / Productivity
Lenovo Legion Pro 5 16IRX9 G9
NVIDIA GeForce RTX 4060 Laptop GPU, i7-14700HX, Samsung PM9A1 MZVL21T0HCLR
1973 Points +3%
Gigabyte G5 KF5 2024
NVIDIA GeForce RTX 4060 Laptop GPU, i7-13620H, Gigabyte AG450E1024-SI
1908 Points
Average Intel Core i7-13620H, NVIDIA GeForce RTX 4060 Laptop GPU
  (1765 - 1908, n=3)
1847 Points -3%
Average of class Gaming
  (1299 - 2204, n=144, last 2 years)
1809 Points -5%
Asus TUF Gaming A15 FA507UV
NVIDIA GeForce RTX 4060 Laptop GPU, R9 8945H, WD PC SN560 SDDPNQE-1T00
1761 Points -8%
Lenovo LOQ 15IRX9
NVIDIA GeForce RTX 4060 Laptop GPU, i5-13450HX, Micron 2400 MTFDKCD1T0QFM
1728 Points -9%
Gigabyte G5 KF
NVIDIA GeForce RTX 4060 Laptop GPU, i5-12500H, SSSTC CA6-8D512
1708 Points -10%
Dell Inspiron 16 Plus 7640
NVIDIA GeForce RTX 4060 Laptop GPU, Ultra 7 155H, SK hynix BC901 HFS001TEJ4X164N
1592 Points -17%
CrossMark / Creativity
Lenovo Legion Pro 5 16IRX9 G9
NVIDIA GeForce RTX 4060 Laptop GPU, i7-14700HX, Samsung PM9A1 MZVL21T0HCLR
2399 Points +16%
Average of class Gaming
  (1275 - 2660, n=144, last 2 years)
2099 Points +2%
Gigabyte G5 KF5 2024
NVIDIA GeForce RTX 4060 Laptop GPU, i7-13620H, Gigabyte AG450E1024-SI
2067 Points
Average Intel Core i7-13620H, NVIDIA GeForce RTX 4060 Laptop GPU
  (2013 - 2067, n=3)
2042 Points -1%
Dell Inspiron 16 Plus 7640
NVIDIA GeForce RTX 4060 Laptop GPU, Ultra 7 155H, SK hynix BC901 HFS001TEJ4X164N
1929 Points -7%
Asus TUF Gaming A15 FA507UV
NVIDIA GeForce RTX 4060 Laptop GPU, R9 8945H, WD PC SN560 SDDPNQE-1T00
1918 Points -7%
Lenovo LOQ 15IRX9
NVIDIA GeForce RTX 4060 Laptop GPU, i5-13450HX, Micron 2400 MTFDKCD1T0QFM
1904 Points -8%
Gigabyte G5 KF
NVIDIA GeForce RTX 4060 Laptop GPU, i5-12500H, SSSTC CA6-8D512
1760 Points -15%
CrossMark / Responsiveness
Gigabyte G5 KF5 2024
NVIDIA GeForce RTX 4060 Laptop GPU, i7-13620H, Gigabyte AG450E1024-SI
1989 Points
Lenovo Legion Pro 5 16IRX9 G9
NVIDIA GeForce RTX 4060 Laptop GPU, i7-14700HX, Samsung PM9A1 MZVL21T0HCLR
1885 Points -5%
Average Intel Core i7-13620H, NVIDIA GeForce RTX 4060 Laptop GPU
  (1734 - 1989, n=3)
1866 Points -6%
Gigabyte G5 KF
NVIDIA GeForce RTX 4060 Laptop GPU, i5-12500H, SSSTC CA6-8D512
1804 Points -9%
Lenovo LOQ 15IRX9
NVIDIA GeForce RTX 4060 Laptop GPU, i5-13450HX, Micron 2400 MTFDKCD1T0QFM
1748 Points -12%
Average of class Gaming
  (1030 - 2330, n=144, last 2 years)
1707 Points -14%
Asus TUF Gaming A15 FA507UV
NVIDIA GeForce RTX 4060 Laptop GPU, R9 8945H, WD PC SN560 SDDPNQE-1T00
1593 Points -20%
Dell Inspiron 16 Plus 7640
NVIDIA GeForce RTX 4060 Laptop GPU, Ultra 7 155H, SK hynix BC901 HFS001TEJ4X164N
1333 Points -33%
WebXPRT 3 / Overall
Average Intel Core i7-13620H, NVIDIA GeForce RTX 4060 Laptop GPU
  (292 - 319, n=3)
310 Points
Asus TUF Gaming A15 FA507UV
NVIDIA GeForce RTX 4060 Laptop GPU, R9 8945H, WD PC SN560 SDDPNQE-1T00
308 Points
Average of class Gaming
  (215 - 480, n=160, last 2 years)
304 Points
Lenovo Legion Pro 5 16IRX9 G9
NVIDIA GeForce RTX 4060 Laptop GPU, i7-14700HX, Samsung PM9A1 MZVL21T0HCLR
301 Points
Dell Inspiron 16 Plus 7640
NVIDIA GeForce RTX 4060 Laptop GPU, Ultra 7 155H, SK hynix BC901 HFS001TEJ4X164N
290 Points
Lenovo LOQ 15IRX9
NVIDIA GeForce RTX 4060 Laptop GPU, i5-13450HX, Micron 2400 MTFDKCD1T0QFM
262 Points
Gigabyte G5 KF
NVIDIA GeForce RTX 4060 Laptop GPU, i5-12500H, SSSTC CA6-8D512
246 Points
WebXPRT 4 / Overall
Lenovo Legion Pro 5 16IRX9 G9
NVIDIA GeForce RTX 4060 Laptop GPU, i7-14700HX, Samsung PM9A1 MZVL21T0HCLR
273 Points
Average Intel Core i7-13620H, NVIDIA GeForce RTX 4060 Laptop GPU
  ()
270 Points
Average of class Gaming
  (176.4 - 328, n=149, last 2 years)
268 Points
Asus TUF Gaming A15 FA507UV
NVIDIA GeForce RTX 4060 Laptop GPU, R9 8945H, WD PC SN560 SDDPNQE-1T00
263 Points
Dell Inspiron 16 Plus 7640
NVIDIA GeForce RTX 4060 Laptop GPU, Ultra 7 155H, SK hynix BC901 HFS001TEJ4X164N
257 Points
Lenovo LOQ 15IRX9
NVIDIA GeForce RTX 4060 Laptop GPU, i5-13450HX, Micron 2400 MTFDKCD1T0QFM
243 Points
Mozilla Kraken 1.1 / Total
Gigabyte G5 KF
NVIDIA GeForce RTX 4060 Laptop GPU, i5-12500H, SSSTC CA6-8D512
562 ms * -10%
Gigabyte G5 KF
NVIDIA GeForce RTX 4060 Laptop GPU, i5-12500H, SSSTC CA6-8D512
562 ms * -10%
Lenovo LOQ 15IRX9
NVIDIA GeForce RTX 4060 Laptop GPU, i5-13450HX, Micron 2400 MTFDKCD1T0QFM
550 ms * -7%
Dell Inspiron 16 Plus 7640
NVIDIA GeForce RTX 4060 Laptop GPU, Ultra 7 155H, SK hynix BC901 HFS001TEJ4X164N
519 ms * -1%
Gigabyte G5 KF5 2024
NVIDIA GeForce RTX 4060 Laptop GPU, i7-13620H, Gigabyte AG450E1024-SI
513 ms *
Average Intel Core i7-13620H, NVIDIA GeForce RTX 4060 Laptop GPU
  (508 - 516, n=4)
511 ms * -0%
Asus TUF Gaming A15 FA507UV
NVIDIA GeForce RTX 4060 Laptop GPU, R9 8945H, WD PC SN560 SDDPNQE-1T00
505 ms * +2%
Average of class Gaming
  (421 - 674, n=175, last 2 years)
502 ms * +2%
Lenovo Legion Pro 5 16IRX9 G9
NVIDIA GeForce RTX 4060 Laptop GPU, i7-14700HX, Samsung PM9A1 MZVL21T0HCLR
467 ms * +9%

* ... smaller is better

PCMark 10 Score
7256 pontos
Ajuda
AIDA64 / Memory Copy
Lenovo Legion Pro 5 16IRX9 G9
Intel Core i7-14700HX, NVIDIA GeForce RTX 4060 Laptop GPU
78742 MB/s +53%
Average of class Gaming
  (21842 - 94222, n=182, last 2 years)
65546 MB/s +28%
Dell Inspiron 16 Plus 7640
Intel Core Ultra 7 155H, NVIDIA GeForce RTX 4060 Laptop GPU
63520 MB/s +24%
Asus TUF Gaming A15 FA507UV
AMD Ryzen 9 8945H, NVIDIA GeForce RTX 4060 Laptop GPU
61823 MB/s +20%
Lenovo LOQ 15IRX9
Intel Core i5-13450HX, NVIDIA GeForce RTX 4060 Laptop GPU
58673 MB/s +14%
Gigabyte G5 KF5 2024
Intel Core i7-13620H, NVIDIA GeForce RTX 4060 Laptop GPU
51393 MB/s
Average Intel Core i7-13620H
  (38066 - 53927, n=5)
50052 MB/s -3%
Gigabyte G5 KF
Intel Core i5-12500H, NVIDIA GeForce RTX 4060 Laptop GPU
43470 MB/s -15%
AIDA64 / Memory Read
Lenovo Legion Pro 5 16IRX9 G9
Intel Core i7-14700HX, NVIDIA GeForce RTX 4060 Laptop GPU
86175 MB/s +47%
Dell Inspiron 16 Plus 7640
Intel Core Ultra 7 155H, NVIDIA GeForce RTX 4060 Laptop GPU
77153 MB/s +31%
Average of class Gaming
  (23681 - 99713, n=182, last 2 years)
69486 MB/s +18%
Lenovo LOQ 15IRX9
Intel Core i5-13450HX, NVIDIA GeForce RTX 4060 Laptop GPU
68109 MB/s +16%
Asus TUF Gaming A15 FA507UV
AMD Ryzen 9 8945H, NVIDIA GeForce RTX 4060 Laptop GPU
61696 MB/s +5%
Gigabyte G5 KF5 2024
Intel Core i7-13620H, NVIDIA GeForce RTX 4060 Laptop GPU
58755 MB/s
Average Intel Core i7-13620H
  (40342 - 61853, n=5)
56860 MB/s -3%
Gigabyte G5 KF
Intel Core i5-12500H, NVIDIA GeForce RTX 4060 Laptop GPU
47117 MB/s -20%
AIDA64 / Memory Write
Asus TUF Gaming A15 FA507UV
AMD Ryzen 9 8945H, NVIDIA GeForce RTX 4060 Laptop GPU
78716 MB/s +54%
Lenovo Legion Pro 5 16IRX9 G9
Intel Core i7-14700HX, NVIDIA GeForce RTX 4060 Laptop GPU
76689 MB/s +50%
Average of class Gaming
  (22986 - 108954, n=182, last 2 years)
67309 MB/s +31%
Dell Inspiron 16 Plus 7640
Intel Core Ultra 7 155H, NVIDIA GeForce RTX 4060 Laptop GPU
65616 MB/s +28%
Lenovo LOQ 15IRX9
Intel Core i5-13450HX, NVIDIA GeForce RTX 4060 Laptop GPU
59981 MB/s +17%
Gigabyte G5 KF5 2024
Intel Core i7-13620H, NVIDIA GeForce RTX 4060 Laptop GPU
51235 MB/s
Average Intel Core i7-13620H
  (38595 - 54111, n=5)
49719 MB/s -3%
Gigabyte G5 KF
Intel Core i5-12500H, NVIDIA GeForce RTX 4060 Laptop GPU
46588 MB/s -9%
AIDA64 / Memory Latency
Dell Inspiron 16 Plus 7640
Intel Core Ultra 7 155H, NVIDIA GeForce RTX 4060 Laptop GPU
120.2 ns * -14%
Gigabyte G5 KF5 2024
Intel Core i7-13620H, NVIDIA GeForce RTX 4060 Laptop GPU
105.6 ns *
Average Intel Core i7-13620H
  (75.9 - 108.2, n=5)
99.8 ns * +5%
Lenovo LOQ 15IRX9
Intel Core i5-13450HX, NVIDIA GeForce RTX 4060 Laptop GPU
94.2 ns * +11%
Average of class Gaming
  (59.5 - 259, n=182, last 2 years)
93.8 ns * +11%
Asus TUF Gaming A15 FA507UV
AMD Ryzen 9 8945H, NVIDIA GeForce RTX 4060 Laptop GPU
92.6 ns * +12%
Gigabyte G5 KF
Intel Core i5-12500H, NVIDIA GeForce RTX 4060 Laptop GPU
83.8 ns * +21%
Lenovo Legion Pro 5 16IRX9 G9
Intel Core i7-14700HX, NVIDIA GeForce RTX 4060 Laptop GPU
82.7 ns * +22%

* ... smaller is better

Latências de DPC

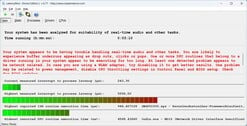
Mesmo ao mover o ponteiro do mouse depois de iniciar o LatencyMon, são detectadas latências mais altas, que aumentam a cada nova ação (abrir o navegador, abrir várias guias, reproduzir vídeo). Nosso vídeo do YouTube também tem dois quadros perdidos. Em geral, os valores de latência são claramente muito altos, mesmo em comparação. A carga extremamente alta da iGPU de 89% ao reproduzir o vídeo do YouTube também é perceptível.

YouTube
YouTube
LatencyMon Main
LatencyMon Main
Drivers LatencyMon
Drivers LatencyMon
DPC Latencies / LatencyMon - interrupt to process latency (max), Web, Youtube, Prime95
Gigabyte G5 KF5 2024
NVIDIA GeForce RTX 4060 Laptop GPU, i7-13620H, Gigabyte AG450E1024-SI
5596.5 μs *
Gigabyte G5 KF
NVIDIA GeForce RTX 4060 Laptop GPU, i5-12500H, SSSTC CA6-8D512
1905 μs * +66%
Lenovo LOQ 15IRX9
NVIDIA GeForce RTX 4060 Laptop GPU, i5-13450HX, Micron 2400 MTFDKCD1T0QFM
1689.3 μs * +70%
Lenovo Legion Pro 5 16IRX9 G9
NVIDIA GeForce RTX 4060 Laptop GPU, i7-14700HX, Samsung PM9A1 MZVL21T0HCLR
951.7 μs * +83%
Asus TUF Gaming A15 FA507UV
NVIDIA GeForce RTX 4060 Laptop GPU, R9 8945H, WD PC SN560 SDDPNQE-1T00
790.8 μs * +86%
Dell Inspiron 16 Plus 7640
NVIDIA GeForce RTX 4060 Laptop GPU, Ultra 7 155H, SK hynix BC901 HFS001TEJ4X164N
770.1 μs * +86%

* ... smaller is better

Armazenamento em massa

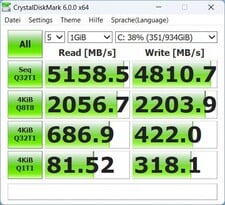
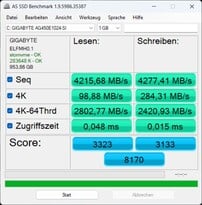
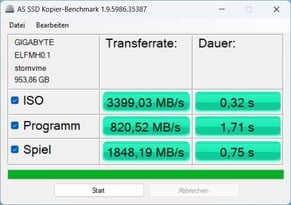
O fabricante usa um SSD NVMe com 1 TB de memória de sua própria marca Gigabyte em nossa amostra de teste. Ele oferece taxas de transferência sequencial de 4.000 a 5.000 MB/s. Isso significa que, em geral, ele é até um pouco mais rápido do que os concorrentes listados aqui.

No entanto, ele não consegue manter esse desempenho devido ao estrangulamento térmico em nosso teste de resistência após a 16ª passagem do DiskSpd. Depois disso, o desempenho oscila muito e cai drasticamente várias vezes.

Crystaldiskmark 6
Crystaldiskmark 6
SSD AS
SSD AS
Cópia de SSD AS
Cópia de SSD AS
Gigabyte AG450E1024-SI
CDM 5/6 Read Seq Q32T1: 5159 MB/s
CDM 5/6 Write Seq Q32T1: 4811 MB/s
CDM 5/6 Read 4K Q32T1: 687 MB/s
CDM 5/6 Write 4K Q32T1: 422 MB/s
CDM 5/6 Read 4K: 81.5 MB/s
CDM 5/6 Write 4K: 318 MB/s
CDM 6 Write 4K Q8T8: 2204 MB/s
CDM 6 Read 4K Q8T8: 2057 MB/s
Drive Performance Rating - Percent
Gigabyte G5 KF5 2024
Gigabyte AG450E1024-SI
90.1 pt
Average Gigabyte AG450E1024-SI
 
86.6 pt
Lenovo Legion Pro 5 16IRX9 G9
Samsung PM9A1 MZVL21T0HCLR
86.4 pt
Gigabyte G5 KF
SSSTC CA6-8D512
86.3 pt
Average of class Gaming
 
77.3 pt
Lenovo LOQ 15IRX9
Micron 2400 MTFDKCD1T0QFM
68.8 pt
Asus TUF Gaming A15 FA507UV
WD PC SN560 SDDPNQE-1T00
63.7 pt
Dell Inspiron 16 Plus 7640
SK hynix BC901 HFS001TEJ4X164N
44.7 pt
DiskSpd
seq read
Gigabyte G5 KF
SSSTC CA6-8D512
4094 (1992.5min - 4093.83max) MB/s +37%
Lenovo Legion Pro 5 16IRX9 G9
Samsung PM9A1 MZVL21T0HCLR
3497 (3441.46min - 3497.42max) MB/s +17%
Average of class Gaming
  (1319 - 7045, n=164, last 2 years)
3477 MB/s +17%
Gigabyte G5 KF5 2024
Gigabyte AG450E1024-SI
2981 (2922.38min - 2980.98max) MB/s
Asus TUF Gaming A15 FA507UV
WD PC SN560 SDDPNQE-1T00
2943 (2931.61min - 2942.92max) MB/s -1%
Average Gigabyte AG450E1024-SI
  (2366 - 2981, n=3)
2656 MB/s -11%
Lenovo LOQ 15IRX9
Micron 2400 MTFDKCD1T0QFM
2364 (2348.18min - 2364.12max) MB/s -21%
Dell Inspiron 16 Plus 7640
SK hynix BC901 HFS001TEJ4X164N
2253 (2222.1min - 2252.66max) MB/s -24%
seq write
Gigabyte G5 KF5 2024
Gigabyte AG450E1024-SI
4772 (4589.99min - 4772.17max) MB/s
Average Gigabyte AG450E1024-SI
  (4659 - 4772, n=3)
4729 MB/s -1%
Gigabyte G5 KF
SSSTC CA6-8D512
3870 (2222.52min - 3870.29max) MB/s -19%
Average of class Gaming
  (535 - 9307, n=164, last 2 years)
3818 MB/s -20%
Lenovo Legion Pro 5 16IRX9 G9
Samsung PM9A1 MZVL21T0HCLR
3403 (3360.48min - 3402.53max) MB/s -29%
Asus TUF Gaming A15 FA507UV
WD PC SN560 SDDPNQE-1T00
3126 (3069.81min - 3126.43max) MB/s -34%
Lenovo LOQ 15IRX9
Micron 2400 MTFDKCD1T0QFM
3103 (3061.84min - 3102.82max) MB/s -35%
Dell Inspiron 16 Plus 7640
SK hynix BC901 HFS001TEJ4X164N
2368 (2226.29min - 2367.89max) MB/s -50%
seq q8 t1 read
Gigabyte G5 KF
SSSTC CA6-8D512
6922 (6017.7min - 6922.07max) MB/s +41%
Lenovo Legion Pro 5 16IRX9 G9
Samsung PM9A1 MZVL21T0HCLR
6599 (5813.31min - 6598.9max) MB/s +35%
Average of class Gaming
  (2594 - 16089, n=164, last 2 years)
6318 MB/s +29%
Average Gigabyte AG450E1024-SI
  (4897 - 5181, n=3)
5077 MB/s +4%
Gigabyte G5 KF5 2024
Gigabyte AG450E1024-SI
4897 (4033.03min - 4896.79max) MB/s
Asus TUF Gaming A15 FA507UV
WD PC SN560 SDDPNQE-1T00
4869 (4298.53min - 4868.87max) MB/s -1%
Lenovo LOQ 15IRX9
Micron 2400 MTFDKCD1T0QFM
4611 (4173.71min - 4610.79max) MB/s -6%
Dell Inspiron 16 Plus 7640
SK hynix BC901 HFS001TEJ4X164N
3290 (2756.65min - 3289.51max) MB/s -33%
seq q8 t1 write
Lenovo Legion Pro 5 16IRX9 G9
Samsung PM9A1 MZVL21T0HCLR
4934 (4925.79min - 4933.55max) MB/s +2%
Average of class Gaming
  (539 - 14571, n=164, last 2 years)
4859 MB/s +1%
Gigabyte G5 KF5 2024
Gigabyte AG450E1024-SI
4817 (4142.4min - 4817.36max) MB/s
Average Gigabyte AG450E1024-SI
  (4775 - 4821, n=3)
4804 MB/s 0%
Dell Inspiron 16 Plus 7640
SK hynix BC901 HFS001TEJ4X164N
4053 (3806.69min - 4053.03max) MB/s -16%
Gigabyte G5 KF
SSSTC CA6-8D512
3975 (1794.3min - 3974.73max) MB/s -17%
Lenovo LOQ 15IRX9
Micron 2400 MTFDKCD1T0QFM
3612 (3558.24min - 3612.04max) MB/s -25%
Asus TUF Gaming A15 FA507UV
WD PC SN560 SDDPNQE-1T00
3140 (3055.76min - 3139.87max) MB/s -35%
4k q1 t1 read
Gigabyte G5 KF
SSSTC CA6-8D512
81.7 MB/s 0%
Gigabyte G5 KF5 2024
Gigabyte AG450E1024-SI
81.5 (80.26min - 81.51max) MB/s
Lenovo Legion Pro 5 16IRX9 G9
Samsung PM9A1 MZVL21T0HCLR
80.5 (78.06min - 80.5max) MB/s -1%
Average of class Gaming
  (30.6 - 95.9, n=164, last 2 years)
65.9 MB/s -19%
Asus TUF Gaming A15 FA507UV
WD PC SN560 SDDPNQE-1T00
62.9 (61.89min - 62.92max) MB/s -23%
Average Gigabyte AG450E1024-SI
  (47.2 - 81.5, n=3)
61.6 MB/s -24%
Lenovo LOQ 15IRX9
Micron 2400 MTFDKCD1T0QFM
54.4 (52.28min - 54.35max) MB/s -33%
Dell Inspiron 16 Plus 7640
SK hynix BC901 HFS001TEJ4X164N
44.5 (43.13min - 44.5max) MB/s -45%
4k q1 t1 write
Gigabyte G5 KF5 2024
Gigabyte AG450E1024-SI
330 (328.21min - 330.19max) MB/s
Average Gigabyte AG450E1024-SI
  (298 - 340, n=3)
323 MB/s -2%
Gigabyte G5 KF
SSSTC CA6-8D512
296 (231.06min - 296.08max) MB/s -10%
Lenovo LOQ 15IRX9
Micron 2400 MTFDKCD1T0QFM
266 (259.13min - 265.64max) MB/s -19%
Lenovo Legion Pro 5 16IRX9 G9
Samsung PM9A1 MZVL21T0HCLR
251 (246.36min - 251.38max) MB/s -24%
Asus TUF Gaming A15 FA507UV
WD PC SN560 SDDPNQE-1T00
229 (227.99min - 229max) MB/s -31%
Average of class Gaming
  (78 - 397, n=164, last 2 years)
223 MB/s -32%
Dell Inspiron 16 Plus 7640
SK hynix BC901 HFS001TEJ4X164N
123 (117.55min - 122.97max) MB/s -63%
4k q32 t16 read
Lenovo Legion Pro 5 16IRX9 G9
Samsung PM9A1 MZVL21T0HCLR
4117 (4077.22min - 4117.27max) MB/s +18%
Gigabyte G5 KF5 2024
Gigabyte AG450E1024-SI
3485 (3458.58min - 3485.22max) MB/s
Average Gigabyte AG450E1024-SI
  (3293 - 3485, n=3)
3360 MB/s -4%
Gigabyte G5 KF
SSSTC CA6-8D512
3181 (1310.9min - 3180.87max) MB/s -9%
Lenovo LOQ 15IRX9
Micron 2400 MTFDKCD1T0QFM
2852 (1702.21min - 2851.88max) MB/s -18%
Average of class Gaming
  (417 - 6172, n=164, last 2 years)
2565 MB/s -26%
Asus TUF Gaming A15 FA507UV
WD PC SN560 SDDPNQE-1T00
1544 (1272.83min - 1543.53max) MB/s -56%
Dell Inspiron 16 Plus 7640
SK hynix BC901 HFS001TEJ4X164N
575 (568.91min - 575.1max) MB/s -84%
4k q32 t16 write
Lenovo Legion Pro 5 16IRX9 G9
Samsung PM9A1 MZVL21T0HCLR
3534 (3522.28min - 3534.26max) MB/s +11%
Average Gigabyte AG450E1024-SI
  (3074 - 3443, n=3)
3237 MB/s +1%
Gigabyte G5 KF5 2024
Gigabyte AG450E1024-SI
3195 (3175.09min - 3194.61max) MB/s
Lenovo LOQ 15IRX9
Micron 2400 MTFDKCD1T0QFM
2535 (2457.97min - 2535.38max) MB/s -21%
Gigabyte G5 KF
SSSTC CA6-8D512
2147 (1232.2min - 2146.52max) MB/s -33%
Average of class Gaming
  (162.3 - 4869, n=164, last 2 years)
2128 MB/s -33%
Asus TUF Gaming A15 FA507UV
WD PC SN560 SDDPNQE-1T00
2038 (1836.85min - 2038.27max) MB/s -36%
Dell Inspiron 16 Plus 7640
SK hynix BC901 HFS001TEJ4X164N
394 (375.37min - 394.14max) MB/s -88%
AS SSD
Score Total
Average Gigabyte AG450E1024-SI
  (7807 - 8778, n=3)
8252 Points +1%
Gigabyte G5 KF5 2024
Gigabyte AG450E1024-SI
8170 Points
Lenovo Legion Pro 5 16IRX9 G9
Samsung PM9A1 MZVL21T0HCLR
7769 Points -5%
Gigabyte G5 KF
SSSTC CA6-8D512
7237 Points -11%
Average of class Gaming
  (2271 - 13854, n=155, last 2 years)
6733 Points -18%
Lenovo LOQ 15IRX9
Micron 2400 MTFDKCD1T0QFM
5947 Points -27%
Asus TUF Gaming A15 FA507UV
WD PC SN560 SDDPNQE-1T00
5043 Points -38%
Dell Inspiron 16 Plus 7640
SK hynix BC901 HFS001TEJ4X164N
4307 Points -47%
Score Read
Gigabyte G5 KF5 2024
Gigabyte AG450E1024-SI
3323 Points
Average Gigabyte AG450E1024-SI
  (3051 - 3323, n=3)
3175 Points -4%
Gigabyte G5 KF
SSSTC CA6-8D512
3127 Points -6%
Lenovo Legion Pro 5 16IRX9 G9
Samsung PM9A1 MZVL21T0HCLR
2963 Points -11%
Average of class Gaming
  (776 - 4721, n=155, last 2 years)
2440 Points -27%
Lenovo LOQ 15IRX9
Micron 2400 MTFDKCD1T0QFM
2363 Points -29%
Asus TUF Gaming A15 FA507UV
WD PC SN560 SDDPNQE-1T00
1749 Points -47%
Dell Inspiron 16 Plus 7640
SK hynix BC901 HFS001TEJ4X164N
1260 Points -62%
Score Write
Average Gigabyte AG450E1024-SI
  (3133 - 4006, n=3)
3443 Points +10%
Lenovo Legion Pro 5 16IRX9 G9
Samsung PM9A1 MZVL21T0HCLR
3262 Points +4%
Gigabyte G5 KF5 2024
Gigabyte AG450E1024-SI
3133 Points
Average of class Gaming
  (515 - 7208, n=155, last 2 years)
3109 Points -1%
Gigabyte G5 KF
SSSTC CA6-8D512
2608 Points -17%
Dell Inspiron 16 Plus 7640
SK hynix BC901 HFS001TEJ4X164N
2482 Points -21%
Asus TUF Gaming A15 FA507UV
WD PC SN560 SDDPNQE-1T00
2449 Points -22%
Lenovo LOQ 15IRX9
Micron 2400 MTFDKCD1T0QFM
2414 Points -23%
Seq Read
Gigabyte G5 KF
SSSTC CA6-8D512
5712.7 MB/s +36%
Average of class Gaming
  (2260 - 12763, n=155, last 2 years)
4948 MB/s +17%
Asus TUF Gaming A15 FA507UV
WD PC SN560 SDDPNQE-1T00
4260.13 MB/s +1%
Gigabyte G5 KF5 2024
Gigabyte AG450E1024-SI
4215 MB/s
Average Gigabyte AG450E1024-SI
  (4161 - 4215, n=3)
4196 MB/s 0%
Dell Inspiron 16 Plus 7640
SK hynix BC901 HFS001TEJ4X164N
4056.14 MB/s -4%
Lenovo LOQ 15IRX9
Micron 2400 MTFDKCD1T0QFM
3796.49 MB/s -10%
Lenovo Legion Pro 5 16IRX9 G9
Samsung PM9A1 MZVL21T0HCLR
3027 MB/s -28%
Seq Write
Average Gigabyte AG450E1024-SI
  (4234 - 4432, n=3)
4314 MB/s +1%
Gigabyte G5 KF5 2024
Gigabyte AG450E1024-SI
4277 MB/s
Average of class Gaming
  (495 - 11316, n=155, last 2 years)
3759 MB/s -12%
Gigabyte G5 KF
SSSTC CA6-8D512
3701.25 MB/s -13%
Lenovo Legion Pro 5 16IRX9 G9
Samsung PM9A1 MZVL21T0HCLR
3510 MB/s -18%
Asus TUF Gaming A15 FA507UV
WD PC SN560 SDDPNQE-1T00
3100.95 MB/s -27%
Lenovo LOQ 15IRX9
Micron 2400 MTFDKCD1T0QFM
3051.23 MB/s -29%
Dell Inspiron 16 Plus 7640
SK hynix BC901 HFS001TEJ4X164N
2267 MB/s -47%
4K Read
Gigabyte G5 KF5 2024
Gigabyte AG450E1024-SI
98.9 MB/s
Average Gigabyte AG450E1024-SI
  (61.9 - 98.9, n=3)
79.7 MB/s -19%
Gigabyte G5 KF
SSSTC CA6-8D512
79.16 MB/s -20%
Lenovo Legion Pro 5 16IRX9 G9
Samsung PM9A1 MZVL21T0HCLR
75.4 MB/s -24%
Average of class Gaming
  (27.8 - 112.1, n=155, last 2 years)
65 MB/s -34%
Asus TUF Gaming A15 FA507UV
WD PC SN560 SDDPNQE-1T00
56.75 MB/s -43%
Lenovo LOQ 15IRX9
Micron 2400 MTFDKCD1T0QFM
53.84 MB/s -46%
Dell Inspiron 16 Plus 7640
SK hynix BC901 HFS001TEJ4X164N
49.59 MB/s -50%
4K Write
Gigabyte G5 KF5 2024
Gigabyte AG450E1024-SI
284 MB/s
Gigabyte G5 KF
SSSTC CA6-8D512
282.28 MB/s -1%
Average Gigabyte AG450E1024-SI
  (255 - 284, n=3)
274 MB/s -4%
Lenovo LOQ 15IRX9
Micron 2400 MTFDKCD1T0QFM
226.41 MB/s -20%
Lenovo Legion Pro 5 16IRX9 G9
Samsung PM9A1 MZVL21T0HCLR
217 MB/s -24%
Average of class Gaming
  (108.8 - 512, n=155, last 2 years)
212 MB/s -25%
Asus TUF Gaming A15 FA507UV
WD PC SN560 SDDPNQE-1T00
187.56 MB/s -34%
Dell Inspiron 16 Plus 7640
SK hynix BC901 HFS001TEJ4X164N
164.61 MB/s -42%
4K-64 Read
Gigabyte G5 KF5 2024
Gigabyte AG450E1024-SI
2803 MB/s
Average Gigabyte AG450E1024-SI
  (2551 - 2803, n=3)
2676 MB/s -5%
Lenovo Legion Pro 5 16IRX9 G9
Samsung PM9A1 MZVL21T0HCLR
2585 MB/s -8%
Gigabyte G5 KF
SSSTC CA6-8D512
2476.84 MB/s -12%
Lenovo LOQ 15IRX9
Micron 2400 MTFDKCD1T0QFM
1929.3 MB/s -31%
Average of class Gaming
  (451 - 3475, n=155, last 2 years)
1874 MB/s -33%
Asus TUF Gaming A15 FA507UV
WD PC SN560 SDDPNQE-1T00
1266.17 MB/s -55%
Dell Inspiron 16 Plus 7640
SK hynix BC901 HFS001TEJ4X164N
804.71 MB/s -71%
4K-64 Write
Average Gigabyte AG450E1024-SI
  (2421 - 3279, n=3)
2738 MB/s +13%
Lenovo Legion Pro 5 16IRX9 G9
Samsung PM9A1 MZVL21T0HCLR
2694 MB/s +11%
Average of class Gaming
  (277 - 5909, n=155, last 2 years)
2524 MB/s +4%
Gigabyte G5 KF5 2024
Gigabyte AG450E1024-SI
2421 MB/s
Dell Inspiron 16 Plus 7640
SK hynix BC901 HFS001TEJ4X164N
2090.45 MB/s -14%
Gigabyte G5 KF
SSSTC CA6-8D512
1955.15 MB/s -19%
Asus TUF Gaming A15 FA507UV
WD PC SN560 SDDPNQE-1T00
1951.29 MB/s -19%
Lenovo LOQ 15IRX9
Micron 2400 MTFDKCD1T0QFM
1882 MB/s -22%
Access Time Read
Dell Inspiron 16 Plus 7640
SK hynix BC901 HFS001TEJ4X164N
0.093 ms * -94%
Average Gigabyte AG450E1024-SI
  (0.048 - 0.088, n=3)
0.06767 ms * -41%
Asus TUF Gaming A15 FA507UV
WD PC SN560 SDDPNQE-1T00
0.063 ms * -31%
Average of class Gaming
  (0.016 - 0.379, n=154, last 2 years)
0.05551 ms * -16%
Gigabyte G5 KF5 2024
Gigabyte AG450E1024-SI
0.048 ms *
Lenovo LOQ 15IRX9
Micron 2400 MTFDKCD1T0QFM
0.033 ms * +31%
Lenovo Legion Pro 5 16IRX9 G9
Samsung PM9A1 MZVL21T0HCLR
0.032 ms * +33%
Gigabyte G5 KF
SSSTC CA6-8D512
0.025 ms * +48%
Access Time Write
Dell Inspiron 16 Plus 7640
SK hynix BC901 HFS001TEJ4X164N
0.318 ms * -2020%
Lenovo LOQ 15IRX9
Micron 2400 MTFDKCD1T0QFM
0.097 ms * -547%
Average of class Gaming
  (0.011 - 1.028, n=155, last 2 years)
0.04751 ms * -217%
Lenovo Legion Pro 5 16IRX9 G9
Samsung PM9A1 MZVL21T0HCLR
0.02 ms * -33%
Asus TUF Gaming A15 FA507UV
WD PC SN560 SDDPNQE-1T00
0.02 ms * -33%
Gigabyte G5 KF
SSSTC CA6-8D512
0.017 ms * -13%
Gigabyte G5 KF5 2024
Gigabyte AG450E1024-SI
0.015 ms *
Average Gigabyte AG450E1024-SI
  (0.015 - 0.015, n=3)
0.015 ms * -0%

* ... smaller is better

Continuous read: DiskSpd Read Loop, Queue Depth 8

033567010051340167520102345268030153350368540204355469050255360569560306365Tooltip
Gigabyte G5 KF5 2024 Gigabyte AG450E1024-SI; diskspd 2.0.17 f: Ø3808 (1282.15-5176.82)
Lenovo LOQ 15IRX9 Micron 2400 MTFDKCD1T0QFM; diskspd 2.0.17 f: Ø3364 (2261.87-4608.28)
Asus TUF Gaming A15 FA507UV WD PC SN560 SDDPNQE-1T00; diskspd 2.0.17 f: Ø4300 (3774.46-4795.98)
Lenovo Legion Pro 5 16IRX9 G9 Samsung PM9A1 MZVL21T0HCLR; diskspd 2.0.17 f: Ø4251 (3284.07-6624.06)

Gráficos

A RTX 4060 tem direito a um TGP máximo de 75 W no G5, o que é um valor bastante médio. Provavelmente, esse também é o motivo pelo qual o G5 decepciona nos benchmarks 3D sintéticos. Somente no teste Cloud Gate, que não é mais suportado, ele atinge um valor inesperadamente bom. Seus outros resultados são mais um reflexo do seu antecessor e são cerca de 6% piores do que a média dos notebooks com RTX 4060 do nosso banco de dados. Com exceção do Dell Inspiron 16 Plus 7640 todos os concorrentes são mais rápidos, especialmente o Legion 5 Pro, pelo menos se o senhor excluir o teste Cloud Gate.

A situação é semelhante nos jogos: O G5 ainda tem um bom desempenho em títulos com muita CPU, mas não consegue acompanhar a concorrência em jogos com muita GPU. Além disso, ao contrário da maioria dos outros notebooks, nosso teste de resistência do Cyberpunk 2077 mostra uma queda contínua na taxa de quadros ao longo do tempo. Esse comportamento instável indica um sistema de resfriamento sobrecarregado, e o estrangulamento do SSD também é uma indicação disso. Apesar do desempenho comparativamente fraco, o senhor pode jogar praticamente qualquer jogo em Full HD com detalhes médios a máximos com a RTX 4060 no G5.

No modo de bateria, um total de 73% do desempenho 3D é perdido em outra execução do Fire Strike.

3DMark 11
3DMark 11
Cloud Gate
Cloud Gate
Fire Strike
Fire Strike
Time Spy
Time Spy
3DMark Performance Rating - Percent
Average of class Gaming
 
96.2 pt
Lenovo Legion Pro 5 16IRX9 G9
NVIDIA GeForce RTX 4060 Laptop GPU, Intel Core i7-14700HX
83.7 pt
Asus TUF Gaming A15 FA507UV -1!
NVIDIA GeForce RTX 4060 Laptop GPU, AMD Ryzen 9 8945H
83.2 pt
Gigabyte G5 KF5 2024
NVIDIA GeForce RTX 4060 Laptop GPU, Intel Core i7-13620H
81.5 pt
Average NVIDIA GeForce RTX 4060 Laptop GPU
 
81.2 pt
Lenovo LOQ 15IRX9 -1!
NVIDIA GeForce RTX 4060 Laptop GPU, Intel Core i5-13450HX
80.6 pt
Gigabyte G5 KF
NVIDIA GeForce RTX 4060 Laptop GPU, Intel Core i5-12500H
78.1 pt
Dell Inspiron 16 Plus 7640 -1!
NVIDIA GeForce RTX 4060 Laptop GPU, Intel Core Ultra 7 155H
67.5 pt
3DMark 11 - 1280x720 Performance GPU
Average of class Gaming
  (1029 - 72178, n=182, last 2 years)
43891 Points +33%
Lenovo Legion Pro 5 16IRX9 G9
NVIDIA GeForce RTX 4060 Laptop GPU, Intel Core i7-14700HX
36945 Points +12%
Asus TUF Gaming A15 FA507UV
NVIDIA GeForce RTX 4060 Laptop GPU, AMD Ryzen 9 8945H
36493 Points +11%
Lenovo LOQ 15IRX9
NVIDIA GeForce RTX 4060 Laptop GPU, Intel Core i5-13450HX
35608 Points +8%
Average NVIDIA GeForce RTX 4060 Laptop GPU
  (28136 - 38912, n=56)
34832 Points +6%
Gigabyte G5 KF
NVIDIA GeForce RTX 4060 Laptop GPU, Intel Core i5-12500H
33490 Points +2%
Gigabyte G5 KF5 2024
NVIDIA GeForce RTX 4060 Laptop GPU, Intel Core i7-13620H
32903 Points
Dell Inspiron 16 Plus 7640
NVIDIA GeForce RTX 4060 Laptop GPU, Intel Core Ultra 7 155H
30097 Points -9%
3DMark
1280x720 Cloud Gate Standard Graphics
Gigabyte G5 KF5 2024
NVIDIA GeForce RTX 4060 Laptop GPU, Intel Core i7-13620H
170179 Points
Average NVIDIA GeForce RTX 4060 Laptop GPU
  (81407 - 180228, n=28)
149832 Points -12%
Gigabyte G5 KF
NVIDIA GeForce RTX 4060 Laptop GPU, Intel Core i5-12500H
148762 Points -13%
Average of class Gaming
  (15902 - 193851, n=100, last 2 years)
144470 Points -15%
Lenovo Legion Pro 5 16IRX9 G9
NVIDIA GeForce RTX 4060 Laptop GPU, Intel Core i7-14700HX
138926 Points -18%
1920x1080 Fire Strike Graphics
Average of class Gaming
  (781 - 53059, n=193, last 2 years)
31461 Points +23%
Asus TUF Gaming A15 FA507UV
NVIDIA GeForce RTX 4060 Laptop GPU, AMD Ryzen 9 8945H
28015 Points +10%
Lenovo Legion Pro 5 16IRX9 G9
NVIDIA GeForce RTX 4060 Laptop GPU, Intel Core i7-14700HX
27046 Points +6%
Lenovo LOQ 15IRX9
NVIDIA GeForce RTX 4060 Laptop GPU, Intel Core i5-13450HX
27026 Points +6%
Average NVIDIA GeForce RTX 4060 Laptop GPU
  (20533 - 29656, n=53)
25748 Points +1%
Gigabyte G5 KF5 2024
NVIDIA GeForce RTX 4060 Laptop GPU, Intel Core i7-13620H
25556 Points
Gigabyte G5 KF
NVIDIA GeForce RTX 4060 Laptop GPU, Intel Core i5-12500H
24789 Points -3%
Dell Inspiron 16 Plus 7640
NVIDIA GeForce RTX 4060 Laptop GPU, Intel Core Ultra 7 155H
22476 Points -12%
2560x1440 Time Spy Graphics
Average of class Gaming
  (224 - 22717, n=188, last 2 years)
13142 Points +43%
Lenovo Legion Pro 5 16IRX9 G9
NVIDIA GeForce RTX 4060 Laptop GPU, Intel Core i7-14700HX
10919 Points +19%
Asus TUF Gaming A15 FA507UV
NVIDIA GeForce RTX 4060 Laptop GPU, AMD Ryzen 9 8945H
10189 Points +11%
Average NVIDIA GeForce RTX 4060 Laptop GPU
  (7484 - 11451, n=55)
9936 Points +8%
Lenovo LOQ 15IRX9
NVIDIA GeForce RTX 4060 Laptop GPU, Intel Core i5-13450HX
9830 Points +7%
Gigabyte G5 KF
NVIDIA GeForce RTX 4060 Laptop GPU, Intel Core i5-12500H
9199 Points 0%
Gigabyte G5 KF5 2024
NVIDIA GeForce RTX 4060 Laptop GPU, Intel Core i7-13620H
9183 Points
Dell Inspiron 16 Plus 7640
NVIDIA GeForce RTX 4060 Laptop GPU, Intel Core Ultra 7 155H
8229 Points -10%
3DMark 11 Performance
29001 pontos
3DMark Cloud Gate Standard Score
58918 pontos
3DMark Fire Strike Score
20767 pontos
3DMark Time Spy Score
9497 pontos
Ajuda
Blender
v3.3 Classroom OPTIX/RTX
Lenovo LOQ 15IRX9
NVIDIA GeForce RTX 4060 Laptop GPU, Intel Core i5-13450HX
25 Seconds * -0%
Gigabyte G5 KF5 2024
NVIDIA GeForce RTX 4060 Laptop GPU, Intel Core i7-13620H
25 Seconds *
Gigabyte G5 KF
NVIDIA GeForce RTX 4060 Laptop GPU, Intel Core i5-12500H
24 Seconds * +4%
Dell Inspiron 16 Plus 7640
NVIDIA GeForce RTX 4060 Laptop GPU, Intel Core Ultra 7 155H
24 Seconds * +4%
Average NVIDIA GeForce RTX 4060 Laptop GPU
  (19 - 28, n=52)
23 Seconds * +8%
Lenovo Legion Pro 5 16IRX9 G9
NVIDIA GeForce RTX 4060 Laptop GPU, Intel Core i7-14700HX
21 Seconds * +16%
Asus TUF Gaming A15 FA507UV
NVIDIA GeForce RTX 4060 Laptop GPU, AMD Ryzen 9 8945H
21 Seconds * +16%
Average of class Gaming
  (9 - 95, n=178, last 2 years)
20.8 Seconds * +17%
v3.3 Classroom CUDA
Dell Inspiron 16 Plus 7640
NVIDIA GeForce RTX 4060 Laptop GPU, Intel Core Ultra 7 155H
44 Seconds * -2%
Lenovo LOQ 15IRX9
NVIDIA GeForce RTX 4060 Laptop GPU, Intel Core i5-13450HX
44 Seconds * -2%
Average NVIDIA GeForce RTX 4060 Laptop GPU
  (39 - 53, n=52)
43.2 Seconds * -0%
Gigabyte G5 KF5 2024
NVIDIA GeForce RTX 4060 Laptop GPU, Intel Core i7-13620H
43 Seconds *
Gigabyte G5 KF
NVIDIA GeForce RTX 4060 Laptop GPU, Intel Core i5-12500H
42 Seconds * +2%
Lenovo Legion Pro 5 16IRX9 G9
NVIDIA GeForce RTX 4060 Laptop GPU, Intel Core i7-14700HX
41 Seconds * +5%
Asus TUF Gaming A15 FA507UV
NVIDIA GeForce RTX 4060 Laptop GPU, AMD Ryzen 9 8945H
41 Seconds * +5%
Average of class Gaming
  (16 - 175, n=184, last 2 years)
36.9 Seconds * +14%
v3.3 Classroom CPU
Gigabyte G5 KF
NVIDIA GeForce RTX 4060 Laptop GPU, Intel Core i5-12500H
452 Seconds * -20%
Lenovo LOQ 15IRX9
NVIDIA GeForce RTX 4060 Laptop GPU, Intel Core i5-13450HX
397 Seconds * -5%
Gigabyte G5 KF5 2024
NVIDIA GeForce RTX 4060 Laptop GPU, Intel Core i7-13620H
378 Seconds *
Dell Inspiron 16 Plus 7640
NVIDIA GeForce RTX 4060 Laptop GPU, Intel Core Ultra 7 155H
365 Seconds * +3%
Average NVIDIA GeForce RTX 4060 Laptop GPU
  (189 - 452, n=52)
311 Seconds * +18%
Asus TUF Gaming A15 FA507UV
NVIDIA GeForce RTX 4060 Laptop GPU, AMD Ryzen 9 8945H
293 Seconds * +22%
Average of class Gaming
  (138 - 962, n=187, last 2 years)
293 Seconds * +22%
Lenovo Legion Pro 5 16IRX9 G9
NVIDIA GeForce RTX 4060 Laptop GPU, Intel Core i7-14700HX
228 Seconds * +40%

* ... smaller is better

Performance Rating - Percent
Average of class Gaming
 
92.3 pt
Lenovo Legion Pro 5 16IRX9 G9
Intel Core i7-14700HX, NVIDIA GeForce RTX 4060 Laptop GPU
90 pt
Asus TUF Gaming A15 FA507UV
AMD Ryzen 9 8945H, NVIDIA GeForce RTX 4060 Laptop GPU
80.8 pt
Lenovo LOQ 15IRX9 -1!
Intel Core i5-13450HX, NVIDIA GeForce RTX 4060 Laptop GPU
79.6 pt
Gigabyte G5 KF5 2024
Intel Core i7-13620H, NVIDIA GeForce RTX 4060 Laptop GPU
79.1 pt
Gigabyte G5 KF
Intel Core i5-12500H, NVIDIA GeForce RTX 4060 Laptop GPU
74.4 pt
Dell Inspiron 16 Plus 7640 -1!
Intel Core Ultra 7 155H, NVIDIA GeForce RTX 4060 Laptop GPU
68.9 pt
Baldur's Gate 3 - 1920x1080 Ultra Preset
Average of class Gaming
  (34.5 - 208, n=45, last 2 years)
103.5 fps +23%
Asus TUF Gaming A15 FA507UV
AMD Ryzen 9 8945H, NVIDIA GeForce RTX 4060 Laptop GPU
93.9 (67.7min, 75.2P0.1, 79P1) fps +12%
Gigabyte G5 KF5 2024
Intel Core i7-13620H, NVIDIA GeForce RTX 4060 Laptop GPU
84 fps
Dell Inspiron 16 Plus 7640
Intel Core Ultra 7 155H, NVIDIA GeForce RTX 4060 Laptop GPU
76.7 fps -9%
Gigabyte G5 KF
Intel Core i5-12500H, NVIDIA GeForce RTX 4060 Laptop GPU
75.1 (28.1min, 36.6P0.1, 54.5P1) fps -11%
Lenovo Legion Pro 5 16IRX9 G9
Intel Core i7-14700HX, NVIDIA GeForce RTX 4060 Laptop GPU
66.5 fps -21%
GTA V - 1920x1080 Highest Settings possible AA:4xMSAA + FX AF:16x
Lenovo Legion Pro 5 16IRX9 G9
Intel Core i7-14700HX, NVIDIA GeForce RTX 4060 Laptop GPU
124.9 (3.49min, 76.9P1) fps +22%
Average of class Gaming
  (12.1 - 167.7, n=169, last 2 years)
113.8 fps +11%
Lenovo LOQ 15IRX9
Intel Core i5-13450HX, NVIDIA GeForce RTX 4060 Laptop GPU
112.6 (5.45min, 76.9P1) fps +10%
Gigabyte G5 KF
Intel Core i5-12500H, NVIDIA GeForce RTX 4060 Laptop GPU
107.6 (4.17min, 66.7P1) fps +5%
Asus TUF Gaming A15 FA507UV
AMD Ryzen 9 8945H, NVIDIA GeForce RTX 4060 Laptop GPU
107.2 (4.45min, 76.9P1) fps +5%
Gigabyte G5 KF5 2024
Intel Core i7-13620H, NVIDIA GeForce RTX 4060 Laptop GPU
102.4 (8.53min, 71.4P1) fps
Final Fantasy XV Benchmark - 1920x1080 High Quality
Average of class Gaming
  (19.2 - 201, n=181, last 2 years)
120.1 fps +29%
Lenovo Legion Pro 5 16IRX9 G9
Intel Core i7-14700HX, NVIDIA GeForce RTX 4060 Laptop GPU
106.1 fps +14%
Asus TUF Gaming A15 FA507UV
AMD Ryzen 9 8945H, NVIDIA GeForce RTX 4060 Laptop GPU
100.7 fps +8%
Lenovo LOQ 15IRX9
Intel Core i5-13450HX, NVIDIA GeForce RTX 4060 Laptop GPU
99.9 fps +7%
Gigabyte G5 KF5 2024
Intel Core i7-13620H, NVIDIA GeForce RTX 4060 Laptop GPU
93.2 fps
Gigabyte G5 KF
Intel Core i5-12500H, NVIDIA GeForce RTX 4060 Laptop GPU
91.9 fps -1%
Dell Inspiron 16 Plus 7640
Intel Core Ultra 7 155H, NVIDIA GeForce RTX 4060 Laptop GPU
78.8 fps -15%
Strange Brigade - 1920x1080 ultra AA:ultra AF:16
Average of class Gaming
  (38.9 - 421, n=178, last 2 years)
229 fps +34%
Lenovo Legion Pro 5 16IRX9 G9
Intel Core i7-14700HX, NVIDIA GeForce RTX 4060 Laptop GPU
199.9 (40.2min, 143.4P1) fps +17%
Asus TUF Gaming A15 FA507UV
AMD Ryzen 9 8945H, NVIDIA GeForce RTX 4060 Laptop GPU
184.2 (41min, 136.6P1) fps +8%
Lenovo LOQ 15IRX9
Intel Core i5-13450HX, NVIDIA GeForce RTX 4060 Laptop GPU
182.7 (43.5min, 133.1P1) fps +7%
Gigabyte G5 KF
Intel Core i5-12500H, NVIDIA GeForce RTX 4060 Laptop GPU
172.1 (71.6min, 126.4P1) fps +1%
Gigabyte G5 KF5 2024
Intel Core i7-13620H, NVIDIA GeForce RTX 4060 Laptop GPU
170.8 (53.4min, 126.3P1) fps
Dell Inspiron 16 Plus 7640
Intel Core Ultra 7 155H, NVIDIA GeForce RTX 4060 Laptop GPU
153.5 (48min, 114.7P1) fps -10%
Dota 2 Reborn - 1920x1080 ultra (3/3) best looking
Lenovo Legion Pro 5 16IRX9 G9
Intel Core i7-14700HX, NVIDIA GeForce RTX 4060 Laptop GPU
183.8 (158.1min) fps +19%
Gigabyte G5 KF5 2024
Intel Core i7-13620H, NVIDIA GeForce RTX 4060 Laptop GPU
154.5 (133.1min) fps
Average of class Gaming
  (65.1 - 220, n=186, last 2 years)
151.2 fps -2%
Lenovo LOQ 15IRX9
Intel Core i5-13450HX, NVIDIA GeForce RTX 4060 Laptop GPU
141 (122.7min) fps -9%
Asus TUF Gaming A15 FA507UV
AMD Ryzen 9 8945H, NVIDIA GeForce RTX 4060 Laptop GPU
139.5 (122.4min) fps -10%
Dell Inspiron 16 Plus 7640
Intel Core Ultra 7 155H, NVIDIA GeForce RTX 4060 Laptop GPU
135.1 (116.3min) fps -13%
Gigabyte G5 KF
Intel Core i5-12500H, NVIDIA GeForce RTX 4060 Laptop GPU
131.2 (115min) fps -15%
X-Plane 11.11 - 1920x1080 high (fps_test=3)
Lenovo Legion Pro 5 16IRX9 G9
Intel Core i7-14700HX, NVIDIA GeForce RTX 4060 Laptop GPU
135.1 fps +32%
Average of class Gaming
  (32.8 - 166.2, n=193, last 2 years)
108.5 fps +6%
Gigabyte G5 KF5 2024
Intel Core i7-13620H, NVIDIA GeForce RTX 4060 Laptop GPU
102 fps
Lenovo LOQ 15IRX9
Intel Core i5-13450HX, NVIDIA GeForce RTX 4060 Laptop GPU
92.2 fps -10%
Asus TUF Gaming A15 FA507UV
AMD Ryzen 9 8945H, NVIDIA GeForce RTX 4060 Laptop GPU
91.7 fps -10%
Gigabyte G5 KF
Intel Core i5-12500H, NVIDIA GeForce RTX 4060 Laptop GPU
87.1 fps -15%
Dell Inspiron 16 Plus 7640
Intel Core Ultra 7 155H, NVIDIA GeForce RTX 4060 Laptop GPU
86.5 fps -15%

Cyberpunk 2077 ultra FPS chart

05101520253035404550556065Tooltip
Gigabyte G5 KF5 2024 i7-13620H, NVIDIA GeForce RTX 4060 Laptop GPU: Ø57.1 (51.9-62.1)
Lenovo LOQ 15IRX9 i5-13450HX, NVIDIA GeForce RTX 4060 Laptop GPU: Ø65.1 (61.4-65.8)
Asus TUF Gaming A15 FA507UV R9 8945H, NVIDIA GeForce RTX 4060 Laptop GPU: Ø66.8 (63.8-67.8)
Lenovo Legion Pro 5 16IRX9 G9 i7-14700HX, NVIDIA GeForce RTX 4060 Laptop GPU: Ø68.5 (65-69.4)
baixomédiaaltoultra
GTA V (2015) 186.4 181.2 170.6 102.4
Dota 2 Reborn (2015) 188.7 172.3 164.9 154.5
Final Fantasy XV Benchmark (2018) 187.2 129.6 93.2
X-Plane 11.11 (2018) 159.3 131.1 102
Strange Brigade (2018) 441 253 192.3 170.8
Baldur's Gate 3 (2023) 125 98 86 84
Cyberpunk 2077 2.1 Phantom Liberty (2023) 114 91 77.2 68.2

Emissões e energia - Sistema de resfriamento sobrecarregado

Emissões de ruído

No modo de desempenho, as ventoinhas ficam ligadas com frequência e o ruído fica em torno de 27,87 dB. Em nosso teste 3dMark06, as ventoinhas permanecem nesse nível por um longo tempo, mas depois aumentam até a velocidade máxima de 54,82 dB pouco antes do final, que também medimos no Cyberpoint 2077 ou em nosso teste de estresse. O antecessor também era tão barulhento, a concorrência direta permanece um pouco mais silenciosa, o Legion Pro 5 pelo menos atinge níveis de ruído semelhantes, mas também tem um desempenho melhor do que o nosso G5.

Além disso, um ruído de clique alto sob cargas 3D pesadas é perturbador em nosso modelo de teste. Parece que algo no interior bate periodicamente (aprox. 2 - 3 Hz) contra a carcaça, o que não causa uma boa impressão. Se levantarmos o laptop e mudarmos sua posição na mão, o ruído muda e também pode desaparecer completamente. Se o colocarmos no chão novamente, o ruído geralmente volta a aparecer. Para a parte de manutenção, só abrimos a caixa depois dessas constatações, mas não conseguimos encontrar nenhuma peça solta.

Barulho

Ocioso
23 / 23 / 27.87 dB
Carga
54.82 / 54.82 dB
  red to green bar
 
 
30 dB
silencioso
40 dB(A)
audível
50 dB(A)
ruidosamente alto
 
min: dark, med: mid, max: light   Earthworks M23R, Arta (15 cm de distância)   environment noise: 23 dB(A)
dB(A) 0102030405060708090Deep BassMiddle BassHigh BassLower RangeMidsHigher MidsLower HighsMid HighsUpper HighsSuper Highs2032.534.832.52525.525.325.53128.926.528.94024.620.824.65025.423.225.46326.828.226.88024.118.524.110023.822.223.812522.114.822.116025.713.925.720027.121.227.12503014.83031533.811.333.840034.69.834.650035.49.935.463036.510.336.580037.710.237.7100043.110.243.1125043.610.243.6160045.910.545.920004511.245250045.31245.3315043.611.643.6400043.812.243.8500042.912.642.9630041.112.441.1800036.712.436.71000033.912.733.9125003112.5311600025.911.725.9SPL54.823.954.8N9.30.59.3median 36.5median 12median 36.5Delta7.61.87.641.636.235.645.641.438.637.929.637.136.147.848.141.344.245.134.232.428.231.132.830.429.730.130.928.340.529.725.326.237.628.920.619.818.52931.422.320.41929.432.822.824.717.329.129.526.126.219.128.831.82422.520.730.532.122.722.116.430.730.921.722.21431.935.425.825.412.834.53731.235.812.538.636.425.527.7123837.325.426.311.738.538.924.926.911.940.438.221.923.912.14038.221.323.312.240.436.420.121.412.438.835.718.620.313.13836.117.818.313.138.33416.716.113.336.431.614.814.913.134.530.114.813.913.233.625.116.113.913.628.721.515.413.513.225.317.714.813.112.721.515.113.612.312.117.847.734.136.425.149.76.11.92.20.76.9median 32.8median 21.7median 22.1median 13.1median 34.55.44.45.21.85hearing rangehide median Fan NoiseGigabyte G5 KF5 2024Lenovo LOQ 15IRX9
Gigabyte G5 KF5 2024
NVIDIA GeForce RTX 4060 Laptop GPU, i7-13620H, Gigabyte AG450E1024-SI
Gigabyte G5 KF
NVIDIA GeForce RTX 4060 Laptop GPU, i5-12500H, SSSTC CA6-8D512
Lenovo LOQ 15IRX9
NVIDIA GeForce RTX 4060 Laptop GPU, i5-13450HX, Micron 2400 MTFDKCD1T0QFM
Asus TUF Gaming A15 FA507UV
NVIDIA GeForce RTX 4060 Laptop GPU, R9 8945H, WD PC SN560 SDDPNQE-1T00
Lenovo Legion Pro 5 16IRX9 G9
NVIDIA GeForce RTX 4060 Laptop GPU, i7-14700HX, Samsung PM9A1 MZVL21T0HCLR
Dell Inspiron 16 Plus 7640
NVIDIA GeForce RTX 4060 Laptop GPU, Ultra 7 155H, SK hynix BC901 HFS001TEJ4X164N
Noise
7%
-9%
1%
5%
9%
off / environment *
23
23
-0%
25
-9%
25
-9%
23
-0%
23.8
-3%
Idle Minimum *
23
23
-0%
26
-13%
25
-9%
23
-0%
24.2
-5%
Idle Average *
23
23
-0%
34
-48%
27
-17%
23
-0%
24.2
-5%
Idle Maximum *
27.87
28
-0%
36
-29%
33
-18%
25
10%
24.2
13%
Load Average *
54.82
29.94
45%
48
12%
40
27%
45.18
18%
28.9
47%
Cyberpunk 2077 ultra *
54.82
48
12%
45
18%
52.69
4%
Load Maximum *
54.82
55.5
-1%
50
9%
46
16%
53.13
3%
51
7%
Witcher 3 ultra *
55.05
51

* ... smaller is better

Temperatura

Apesar das ventoinhas bastante barulhentas sob tensão, as temperaturas da superfície não são de forma alguma baixas. Medimos um ponto quente de até 67 °C na parte inferior, centralmente em direção à tela. Isso é um pouco demais para o nosso gosto. Infelizmente, a Gigabyte não conseguiu otimizar o predecessor igualmente quente aqui.

A temperatura da GPU sobe para 88 °C tanto nos testes de estresse como nos testes de jogos. A temperatura da CPU é ainda pior: embora já esteja entre 76 - 82 °C no teste de estresse, ela aumenta continuamente até 100 °C nos jogos e não cai mais. Isso é tudo menos ideal para a durabilidade do hardware! Ao mesmo tempo, isso explica a queda contínua de fps no Cyberpunk 2077 mostrada acima.

A temperatura da CPU sobe para 100 °C durante os jogos!
 45 °C50 °C39 °C 
 41 °C41 °C32 °C 
 25 °C33 °C27 °C 
Máximo: 50 °C
Médio: 37 °C
44 °C66 °C53 °C
31 °C39 °C28 °C
29 °C24 °C23 °C
Máximo: 66 °C
Médio: 37.4 °C
alimentação elétrica  56 °C | Temperatura do quarto 18.5 °C | Fluke t3000FC (calibrated), Fluke 62 Mini
(±) The average temperature for the upper side under maximal load is 37 °C / 99 F, compared to the average of 33.9 °C / 93 F for the devices in the class Gaming.
(-) The maximum temperature on the upper side is 50 °C / 122 F, compared to the average of 40.5 °C / 105 F, ranging from 21.2 to 68.8 °C for the class Gaming.
(-) The bottom heats up to a maximum of 66 °C / 151 F, compared to the average of 43.2 °C / 110 F
(+) In idle usage, the average temperature for the upper side is 27.9 °C / 82 F, compared to the device average of 33.9 °C / 93 F.
(±) 3: The average temperature for the upper side is 36.8 °C / 98 F, compared to the average of 33.9 °C / 93 F for the class Gaming.
(+) The palmrests and touchpad are reaching skin temperature as a maximum (33 °C / 91.4 F) and are therefore not hot.
(-) The average temperature of the palmrest area of similar devices was 28.9 °C / 84 F (-4.1 °C / -7.4 F).
Gigabyte G5 KF5 2024
Intel Core i7-13620H, NVIDIA GeForce RTX 4060 Laptop GPU
Gigabyte G5 KF
Intel Core i5-12500H, NVIDIA GeForce RTX 4060 Laptop GPU
Lenovo LOQ 15IRX9
Intel Core i5-13450HX, NVIDIA GeForce RTX 4060 Laptop GPU
Asus TUF Gaming A15 FA507UV
AMD Ryzen 9 8945H, NVIDIA GeForce RTX 4060 Laptop GPU
Lenovo Legion Pro 5 16IRX9 G9
Intel Core i7-14700HX, NVIDIA GeForce RTX 4060 Laptop GPU
Dell Inspiron 16 Plus 7640
Intel Core Ultra 7 155H, NVIDIA GeForce RTX 4060 Laptop GPU
Heat
-1%
5%
8%
-1%
15%
Maximum Upper Side *
50
54
-8%
47
6%
53
-6%
50
-0%
43.4
13%
Maximum Bottom *
66
61
8%
58
12%
46
30%
57
14%
41.6
37%
Idle Upper Side *
32
34
-6%
32
-0%
32
-0%
36
-13%
32.8
-3%
Idle Bottom *
37
36
3%
36
3%
34
8%
39
-5%
32.4
12%

* ... smaller is better

Alto-falante

Os dois alto-falantes estéreo estão localizados nas laterais em direção à parte frontal e irradiam para baixo. Eles não são particularmente altos e não têm muitos graves, embora os agudos sejam lineares. Recomendamos conectar fones de ouvido à entrada de áudio ao jogar.

dB(A) 0102030405060708090Deep BassMiddle BassHigh BassLower RangeMidsHigher MidsLower HighsMid HighsUpper HighsSuper Highs2027.634.827.62524.225.324.23125.826.525.84021.620.821.65022.723.222.76324.628.224.68017.418.517.410020.422.220.412519.114.819.116018.313.918.320028.721.228.725037.714.837.731547.111.347.1400539.85350057.29.957.263058.210.358.280068.610.268.610007110.271125059.410.259.4160070.510.570.520007311.273250071.21271.2315066.611.666.6400067.212.267.2500063.312.663.3630059.312.459.3800059.512.459.51000054.712.754.7125004812.5481600047.511.747.5SPL79.823.979.8N41.10.541.1median 58.2median 12median 58.2Delta12.91.812.945.63937.135.844.251.331.134.430.931.326.234.518.529.2193617.343.719.147.920.75216.458.31458.412.861.712.566.61267.811.767.311.966.912.163.712.263.712.464.913.16413.16013.358.513.166.313.271.813.677.113.272.712.768.812.167.425.180.70.747.7median 13.1median 641.85.3hearing rangehide median Pink NoiseGigabyte G5 KF5 2024Lenovo LOQ 15IRX9
Frequency diagram (checkboxes can be checked and unchecked to compare devices)
Gigabyte G5 KF5 2024 audio analysis

(±) | speaker loudness is average but good (79.8 dB)
Bass 100 - 315 Hz
(-) | nearly no bass - on average 29.6% lower than median
(±) | linearity of bass is average (12.3% delta to prev. frequency)
Mids 400 - 2000 Hz
(±) | higher mids - on average 7.2% higher than median
(±) | linearity of mids is average (13.3% delta to prev. frequency)
Highs 2 - 16 kHz
(±) | higher highs - on average 5.9% higher than median
(+) | highs are linear (6.1% delta to prev. frequency)
Overall 100 - 16.000 Hz
(±) | linearity of overall sound is average (29.1% difference to median)
Compared to same class
» 94% of all tested devices in this class were better, 2% similar, 4% worse
» The best had a delta of 6%, average was 18%, worst was 132%
Compared to all devices tested
» 85% of all tested devices were better, 3% similar, 12% worse
» The best had a delta of 4%, average was 25%, worst was 134%

Lenovo LOQ 15IRX9 audio analysis

(±) | speaker loudness is average but good (81 dB)
Bass 100 - 315 Hz
(±) | reduced bass - on average 14.6% lower than median
(±) | linearity of bass is average (9.6% delta to prev. frequency)
Mids 400 - 2000 Hz
(+) | balanced mids - only 2.1% away from median
(+) | mids are linear (3.6% delta to prev. frequency)
Highs 2 - 16 kHz
(±) | higher highs - on average 5.9% higher than median
(±) | linearity of highs is average (8.2% delta to prev. frequency)
Overall 100 - 16.000 Hz
(+) | overall sound is linear (14.7% difference to median)
Compared to same class
» 27% of all tested devices in this class were better, 7% similar, 66% worse
» The best had a delta of 6%, average was 18%, worst was 132%
Compared to all devices tested
» 17% of all tested devices were better, 4% similar, 79% worse
» The best had a delta of 4%, average was 25%, worst was 134%

Consumo de energia

No modo de economia de energia, o consumo ocioso é de apenas 5,2 W. Nos outros perfis de desempenho, no entanto, o consumo salta para cerca de 20 W.

Em jogos (Cyberpunk 2077), medimos um consumo médio de 144 W. Até 165 W foram registrados por curtos períodos no teste de estresse. A pequena unidade de fonte de alimentação (aprox. 13,6 x 6,7 x 2,3 cm (C x L x A)) foi projetada para 150 W e deve ser capaz de lidar com todos os consumos médios medidos e absorver os picos curtos. No entanto, não há muito espaço para carregamento durante as exigentes sessões de jogos.

Consumo de energia
desligadodarklight 0.1 / 1 Watt
Ociosodarkmidlight 5.2 / 19.6 / 23 Watt
Carga midlight 84 / 165 Watt
 color bar
Key: min: dark, med: mid, max: light        Metrahit Energy

Energieaufnahme Cyberpunk / Stresstest

0102030405060708090100110120130140150160Tooltip
Gigabyte G5 KF5 2024; 1280x720 Prime95 28.10 and Furmark 1.25: Ø141.1 (137.37-165.27)
Gigabyte G5 KF5 2024; Idle 150cd/m2: Ø21.7 (20.81-27.463)
Gigabyte G5 KF5 2024; Cyberpunk 2077 FHD ultra no FSR 150cd: Ø143.9 (137.73-151.57)

Power consumption with the external monitor

0102030405060708090100110120130140Tooltip
Gigabyte G5 KF5 2024; Prime95 V2810 Stress (external Monitor): Ø111.5 (97.03-142.09)
Gigabyte G5 KF5 2024; Cinebench R15 Multi (external Monitor): Ø125.6 (119.31-140.51)
Gigabyte G5 KF5 2024; Cinebench R23 Multi (external Monitor): Ø128.4 (110.8-142.44)
Gigabyte G5 KF5 2024; 1280x720 FurMark 1.19 GPU Stress Test (external Monitor): Ø125.5 (119.52-130.45)
Gigabyte G5 KF5 2024; Idle 1min (external Monitor): Ø19.2 (18.333-20.862)
Gigabyte G5 KF5 2024; Cyberpunk 2077 FHD ultra no FSR (external Monitor): Ø144 (140.8-147.04)

Duração da bateria

O preço baixo também se reflete na capacidade da bateria de apenas 54 Wh. Os concorrentes listados têm de 60 a 90 Wh para oferecer. No entanto, nosso G5 tem um desempenho muito bom em termos de duração da bateria, especialmente em comparação com o LOQ 15 (60 Wh) e o Legion Pro 5 (80 Wh), onde ele pode até mesmo alcançar melhores tempos de execução de WiFi (5,5 a 7h) e vídeo (6h).

Tempo de Execução da Bateria
WiFi Websurfing
7h 15min
WiFi Websurfing max. Brightness
5h 23min
Big Buck Bunny H.264 1080p
6h 03min
Carga (máximo brilho)
1h 05min
Gigabyte G5 KF5 2024
i7-13620H, NVIDIA GeForce RTX 4060 Laptop GPU, 54 Wh
Gigabyte G5 KF
i5-12500H, NVIDIA GeForce RTX 4060 Laptop GPU, 54 Wh
Lenovo LOQ 15IRX9
i5-13450HX, NVIDIA GeForce RTX 4060 Laptop GPU, 60 Wh
Asus TUF Gaming A15 FA507UV
R9 8945H, NVIDIA GeForce RTX 4060 Laptop GPU, 90 Wh
Lenovo Legion Pro 5 16IRX9 G9
i7-14700HX, NVIDIA GeForce RTX 4060 Laptop GPU, 80 Wh
Dell Inspiron 16 Plus 7640
Ultra 7 155H, NVIDIA GeForce RTX 4060 Laptop GPU, 90 Wh
Average of class Gaming
 
Battery Runtime
-3%
-26%
61%
6%
84%
11%
H.264
363
268
-26%
312
-14%
WiFi v1.3
435
316
-27%
320
-26%
702
61%
308
-29%
799
84%
Load
65
94
45%
105
62%
Reader / Idle
514

Avaliação geral do Notebookcheck

Um laptop RTX 4060 por 899 euros: Apesar de alguns compromissos, como uma webcam de 720p e a falta de uma porta Thunderbolt, o Gigabyte G5 impressiona com seu design sólido, bom teclado e alta precisão de cores da tela. No entanto, seu sistema de resfriamento parece ser muito fraco, o que nos impede de recomendá-lo para compra.

Gigabyte G5 KF5 2024 - 10/17/2024 v8
Christian Hintze

Acabamento
73 / 98 → 75%
Teclado
84%
Mouse
82%
Conectividade
61 / 80 → 77%
Peso
63 / 10-68 → 91%
Bateria
76 / 95 → 79%
Pantalha
81%
Desempenho do jogos
73%
Desempenho da aplicação
84%
AI Performance
94%
Temperatura
75 / 95 → 79%
Ruído
67 / 90 → 75%
Audio
60%
Camera
24 / 75 → 32%
Médio
57%
76%
Gaming - Médio equilibrado
CO2 Emissions
No Data
Materials
0%
Packaging
15%
Power Use
77.1%
Repairability
50%
Software Updates
22.3%
Recycle Logo Total Sustainability Score: 27.4%

Transparency

The selection of devices to be reviewed is made by our editorial team. The test sample was provided to the author as a loan by the manufacturer or retailer for the purpose of this review. The lender had no influence on this review, nor did the manufacturer receive a copy of this review before publication. There was no obligation to publish this review. We never accept compensation or payment in return for our reviews. As an independent media company, Notebookcheck is not subjected to the authority of manufacturers, retailers or publishers.

This is how Notebookcheck is testing

Every year, Notebookcheck independently reviews hundreds of laptops and smartphones using standardized procedures to ensure that all results are comparable. We have continuously developed our test methods for around 20 years and set industry standards in the process. In our test labs, high-quality measuring equipment is utilized by experienced technicians and editors. These tests involve a multi-stage validation process. Our complex rating system is based on hundreds of well-founded measurements and benchmarks, which maintains objectivity. Further information on our test methods can be found here.

Please share our article, every link counts!
Mail Logo
> Análises e revisões de portáteis e celulares > Análises > Análises > Análise do laptop Gigabyte G5 KF5 2024: Jogos com RTX 4060 a preço de banana - o negócio vale a pena?
Christian Hintze, 2024-10-24 (Update: 2024-10-24)