

Análise do Geekom XT13 Pro: O mini-PC NUC dispensa o Meteor Lake e recebe apenas um Intel Core i9-13900H
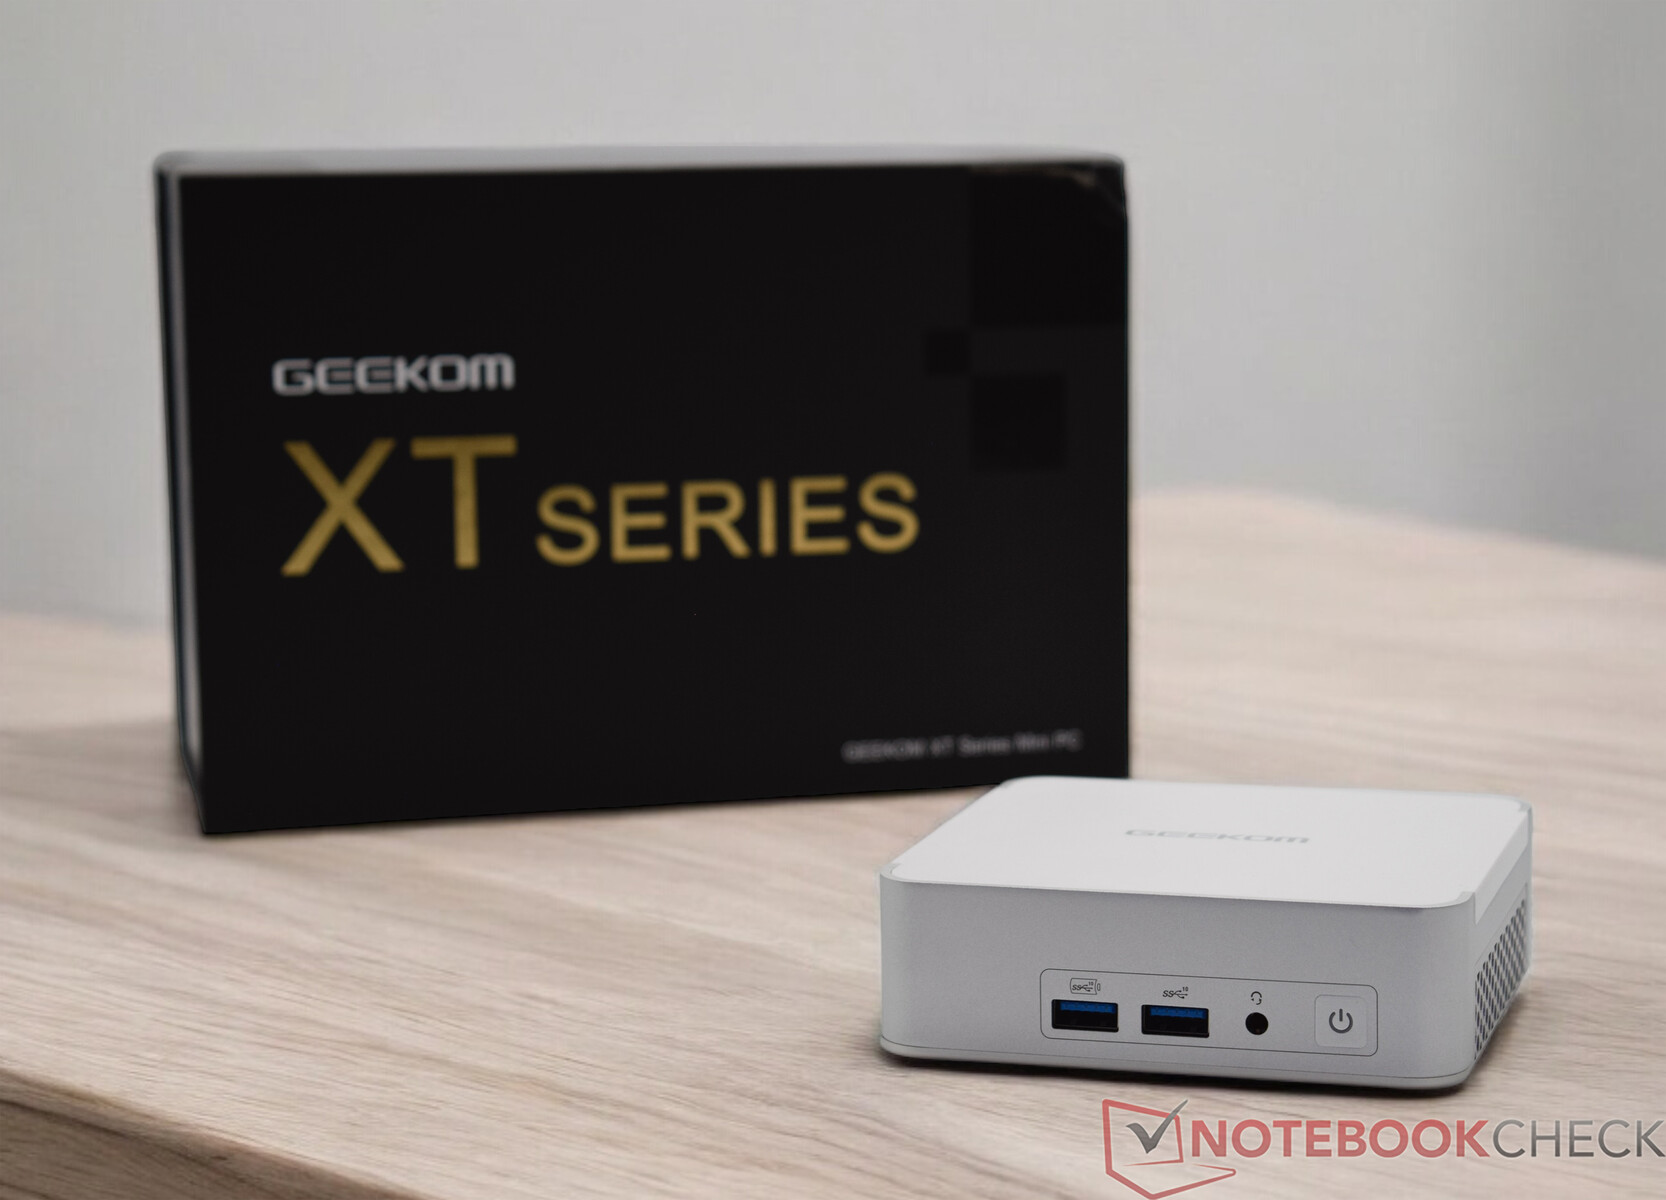
O Geekom XT13 Pro herdou o Geekom XT12 Pro e vem na configuração superior com um Intel Core i9-13900H equipado. Há também 32 GB de RAM DDR4 e um SSD de 2 TB, embora isso tenha um preço. O preço é de 999 euros, portanto, não é realmente uma pechincha. Por 769 euros, o Geekom XT13 Pro está disponível com um Intel Core i7-13620H e um SSD de 1 TB. A Geekom decidiu não usar os processadores Meteor Lake mais recentes e está mantendo os processadores Raptor Lake mais antigos. Esse teste mostrará se essa é a maneira correta de enfrentar a concorrência.
A questão também é saber se esse preço é justificado. Também abordaremos esse ponto importante especificamente após a análise de desempenho. De qualquer forma, o próprio fabricante estabelece um padrão muito alto.
Possíveis concorrentes em comparação
Avaliação | Versão | Data | Modelo | Memória | Peso | Altura |
|---|---|---|---|---|---|---|
| 72.4 % | v8 | 08/2024 | Geekom XT13 Pro i9-13900H, Iris Xe G7 96EUs | 32768 MB | 555 g | 37 mm |
| 80.8 % | v8 | 06/2024 | Aoostar GEM12 R7 8845HS, Radeon 780M | 32768 MB | 653 g | 60 mm |
| 87.5 % v7 (old) | v7 (old) | 05/2024 | Minisforum AtomMan X7 Ti Ultra 9 185H, Arc 8-Core | 32768 MB | 863 g | 48.6 mm |
| 83.4 % v7 (old) | v7 (old) | 04/2024 | Acemagic F2A Ultra 7 155H, Arc 8-Core | 32768 MB | 768 g | 57 mm |
| 84.1 % | v8 | 04/2024 | Geekom XT12 Pro i9-12900H, Iris Xe G7 96EUs | 32768 MB | 545 g | 37 mm |
| 82.6 % v7 (old) | v7 (old) | 03/2024 | Geekom A7 R9 7940HS, Radeon 780M | 32768 MB | 417 g | 38 mm |
Observação: Atualizamos nosso sistema de classificação e os resultados da versão 8 não são comparáveis aos resultados da versão 7, disponíveis aqui.
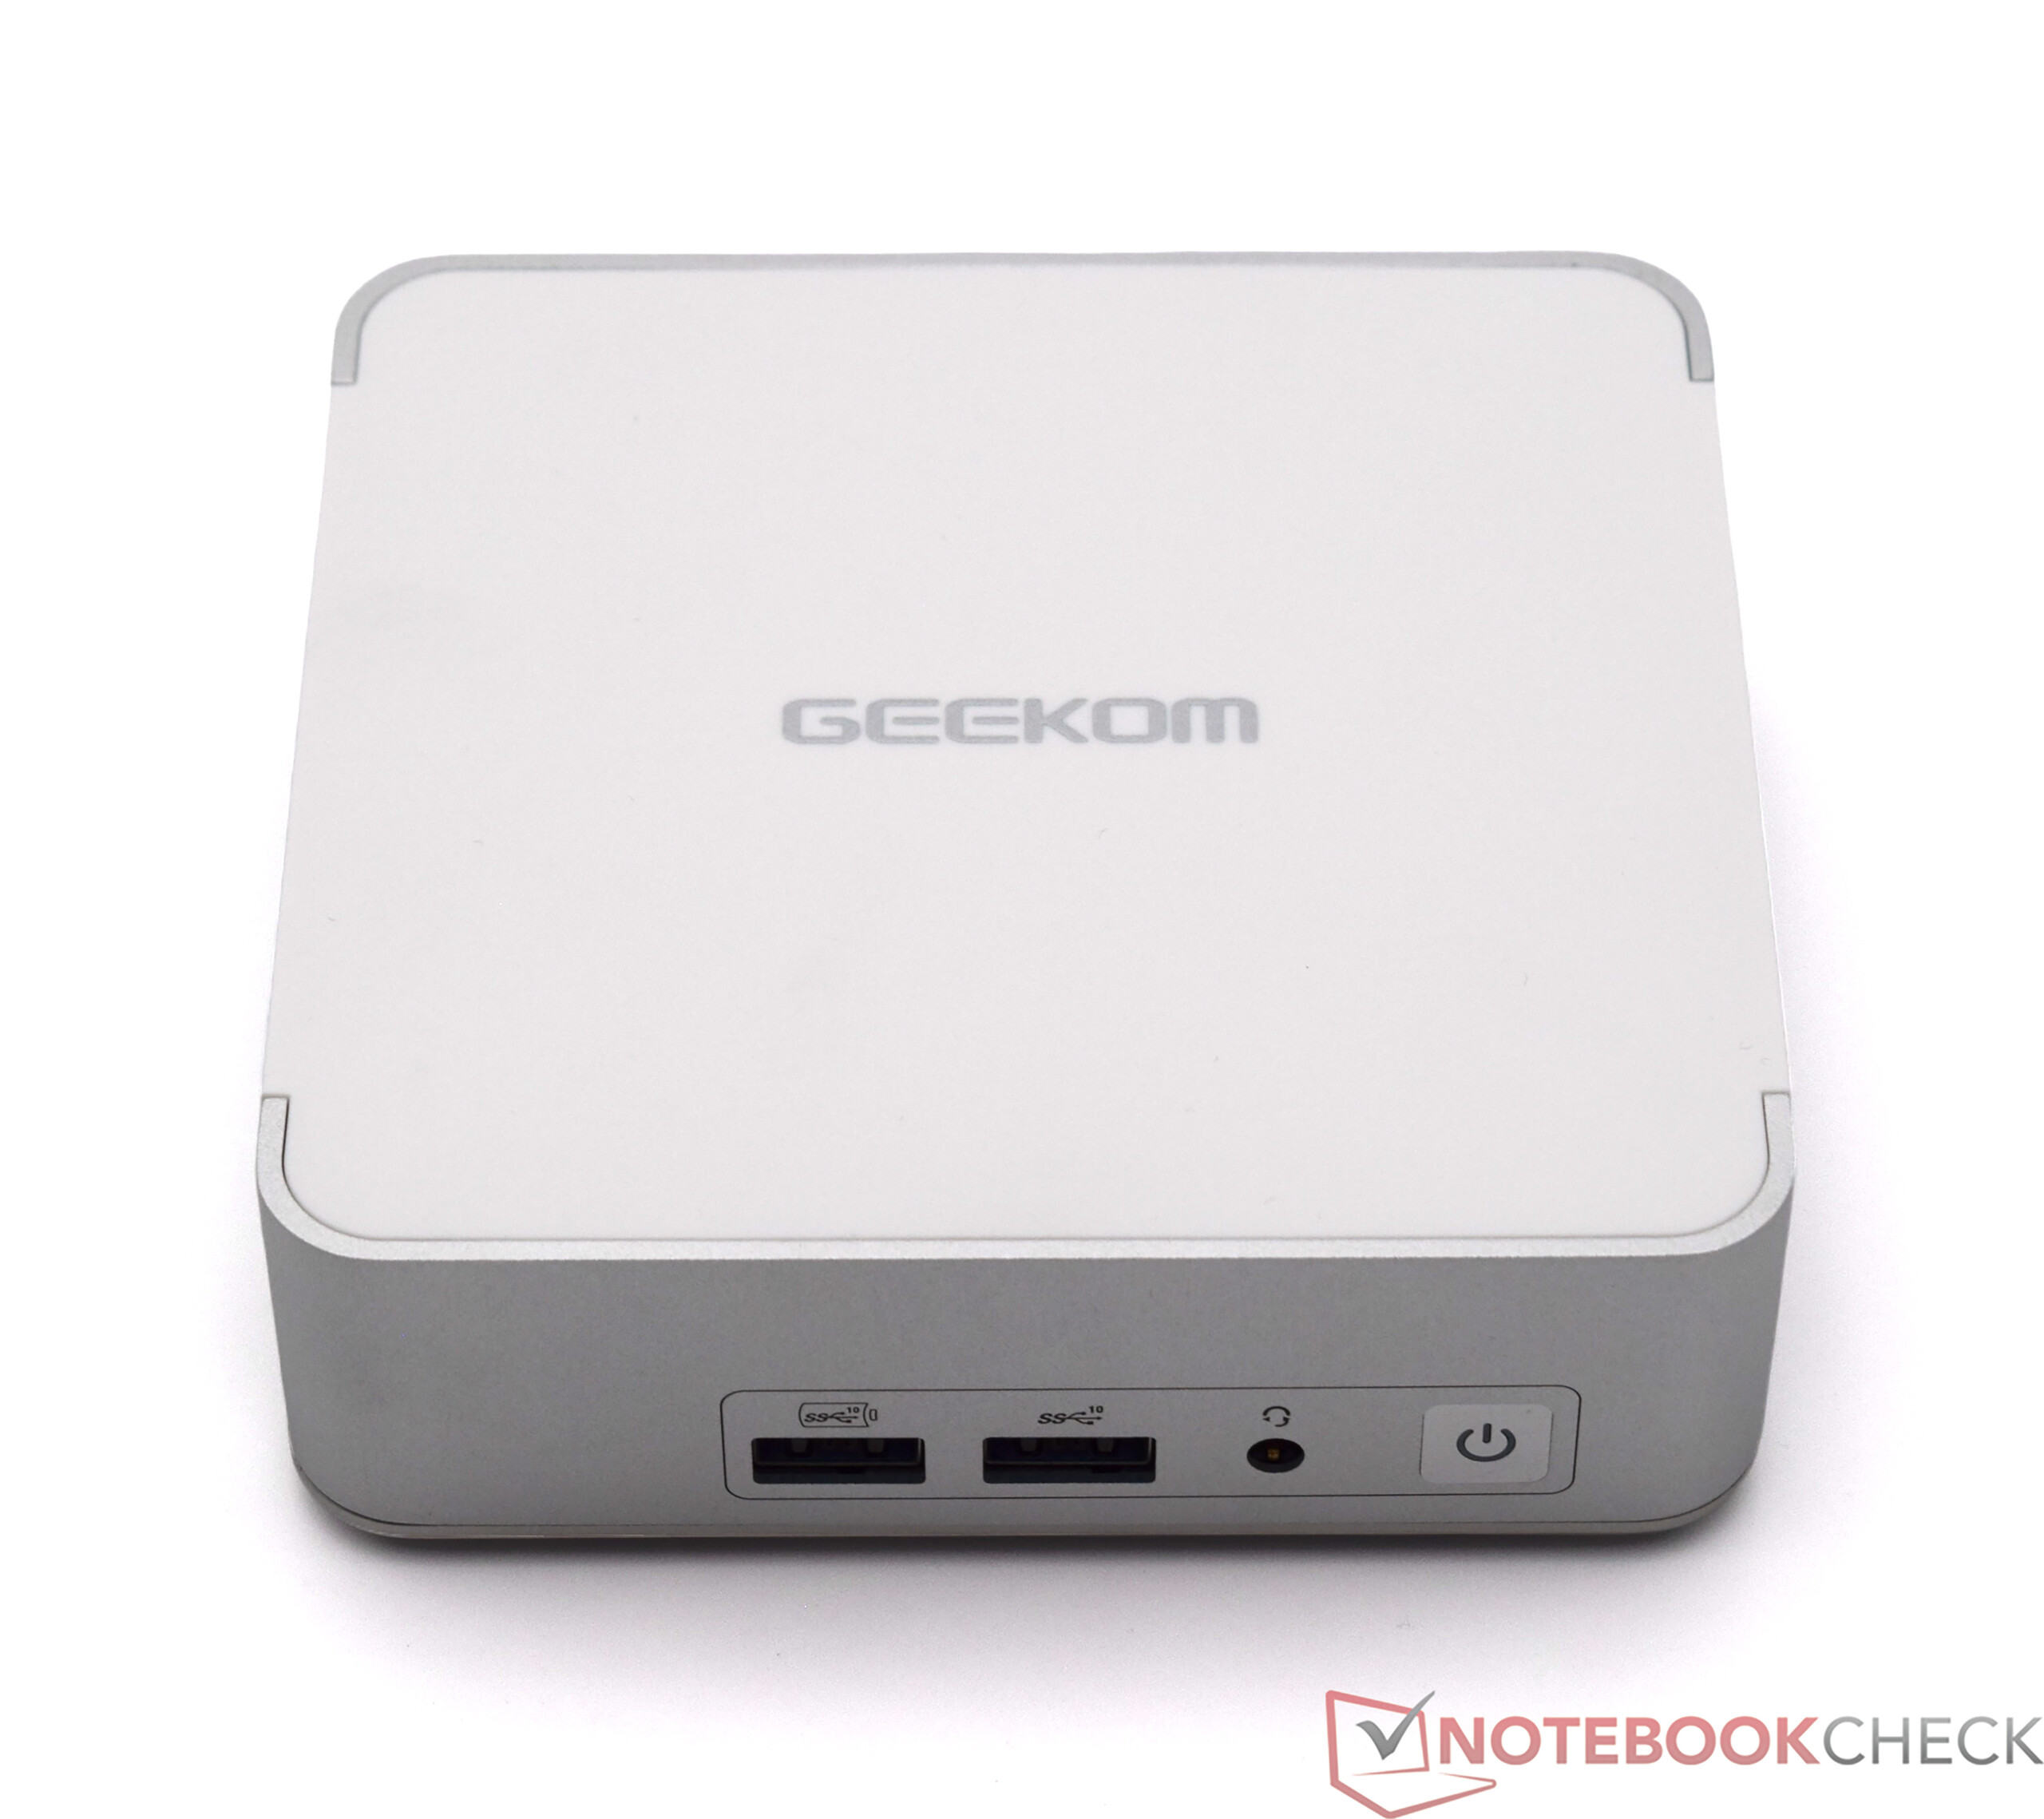
Case - Processamento perfeito de metal e plástico
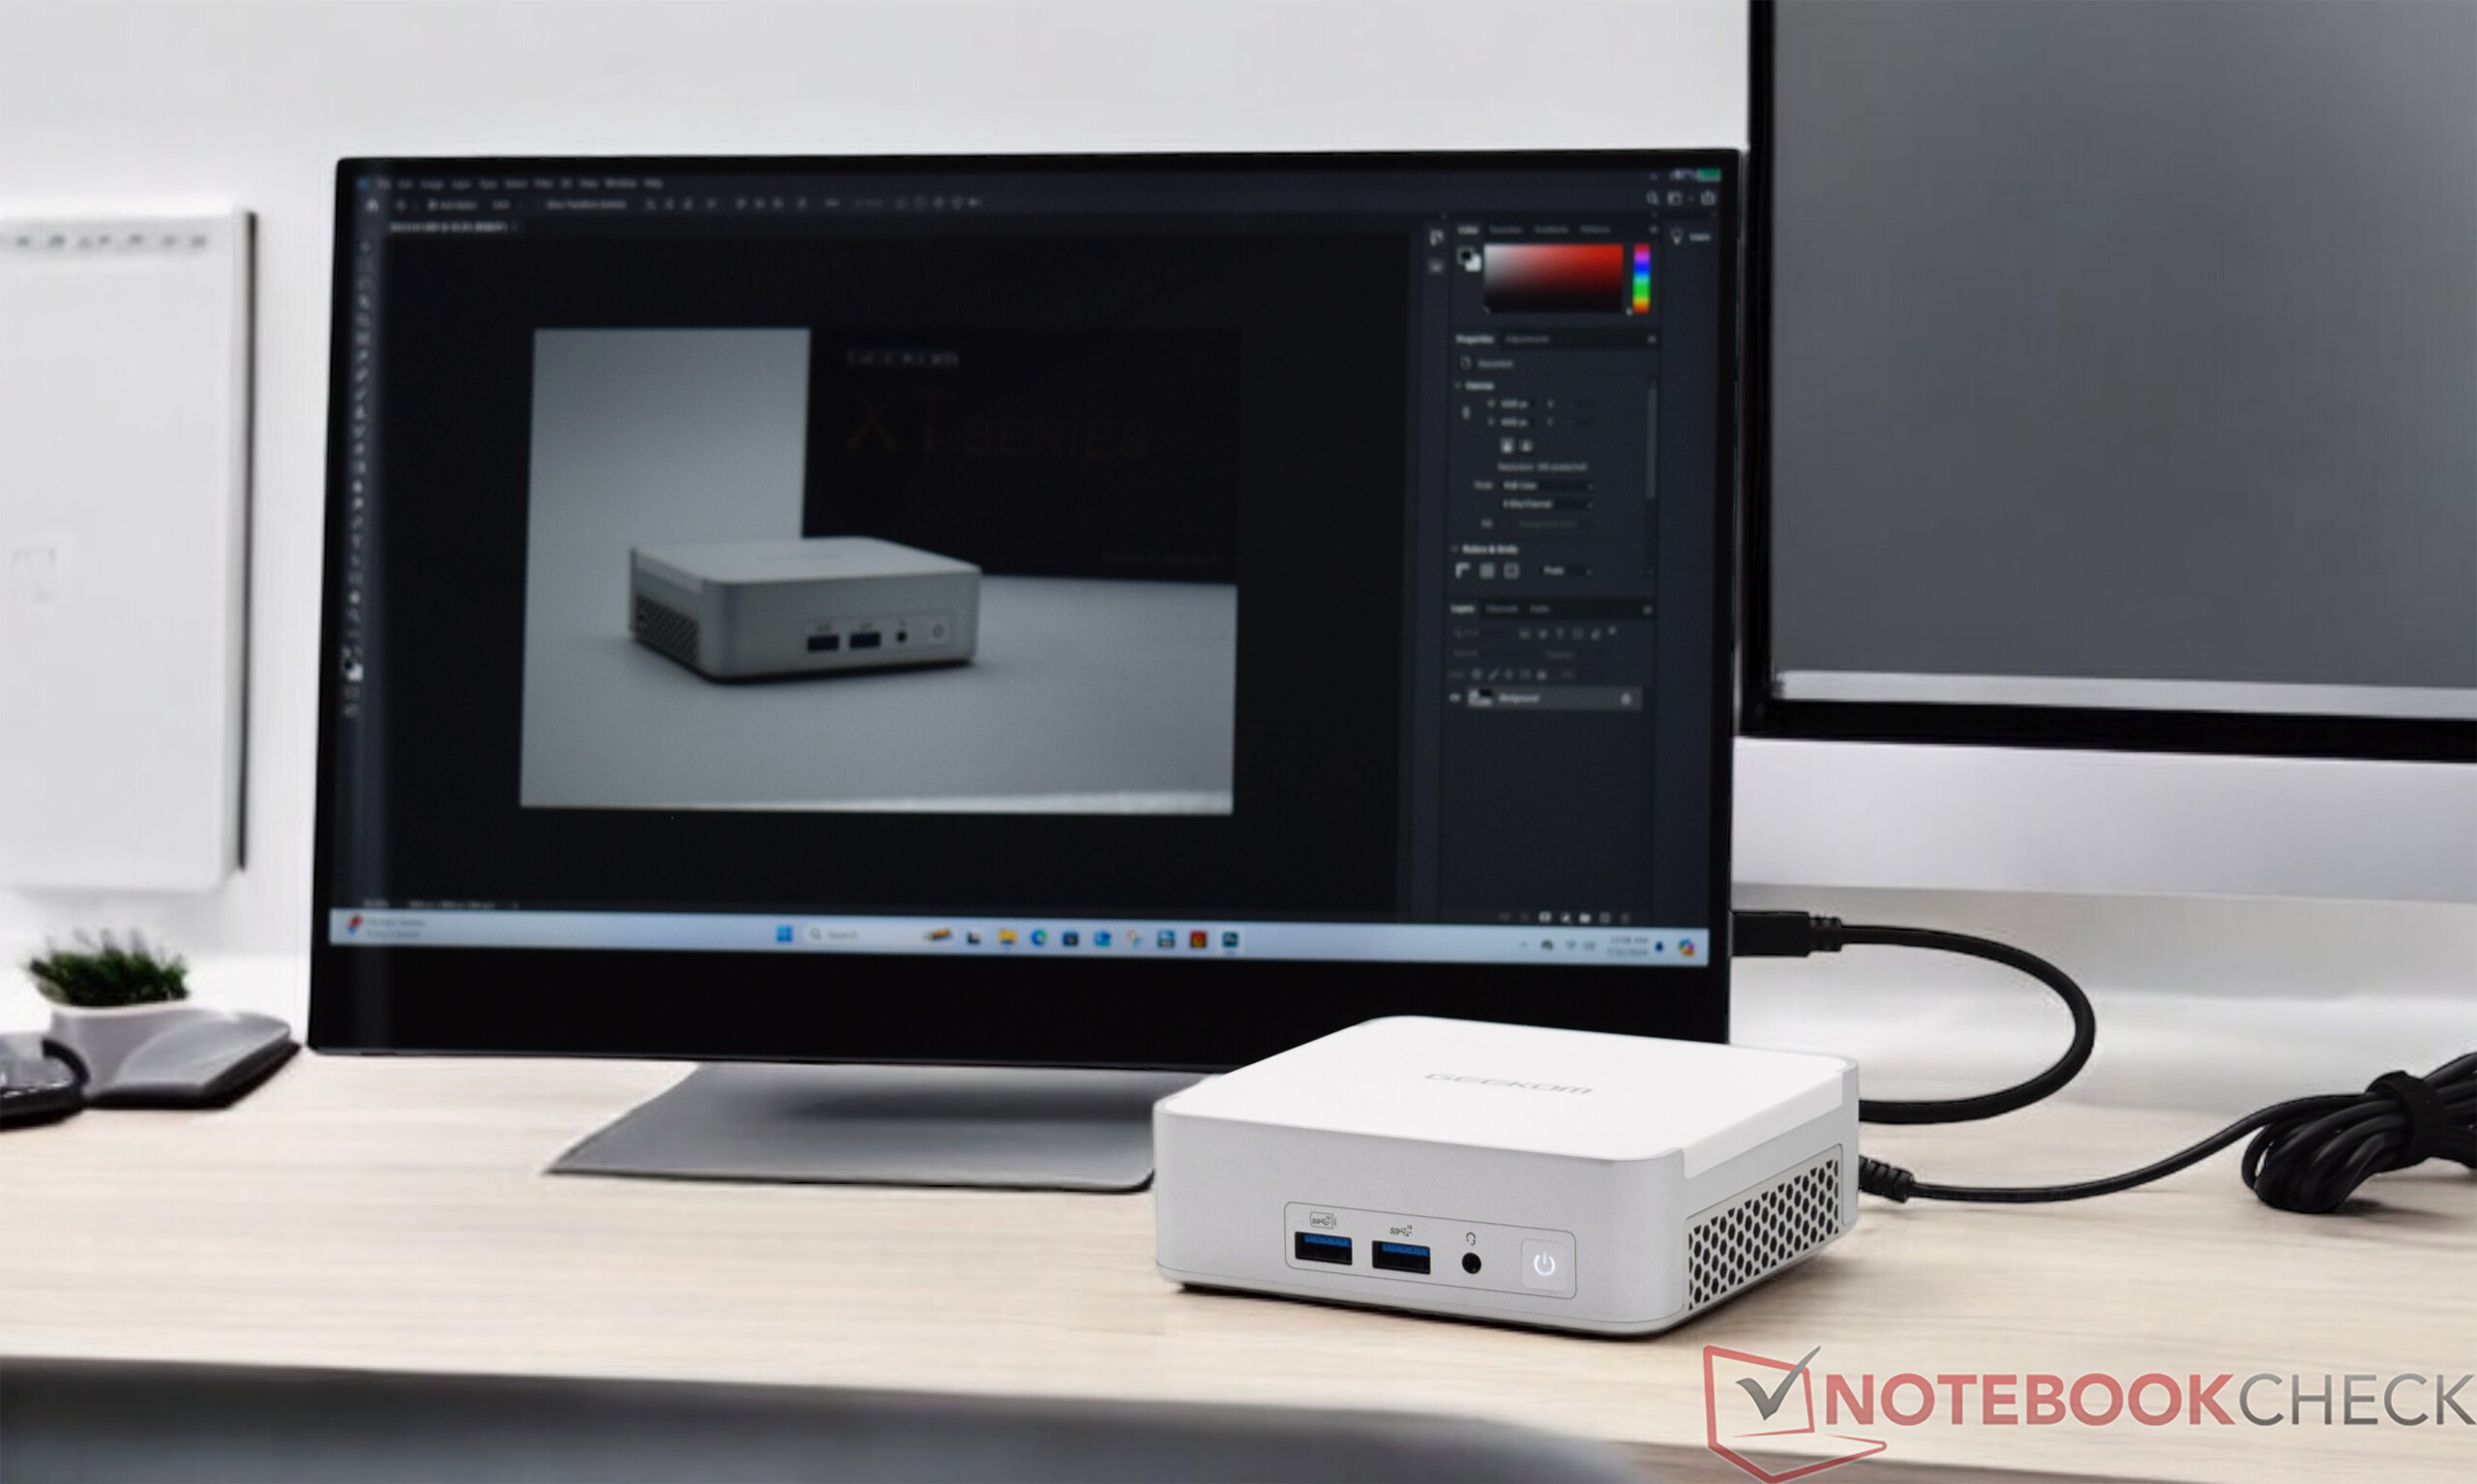
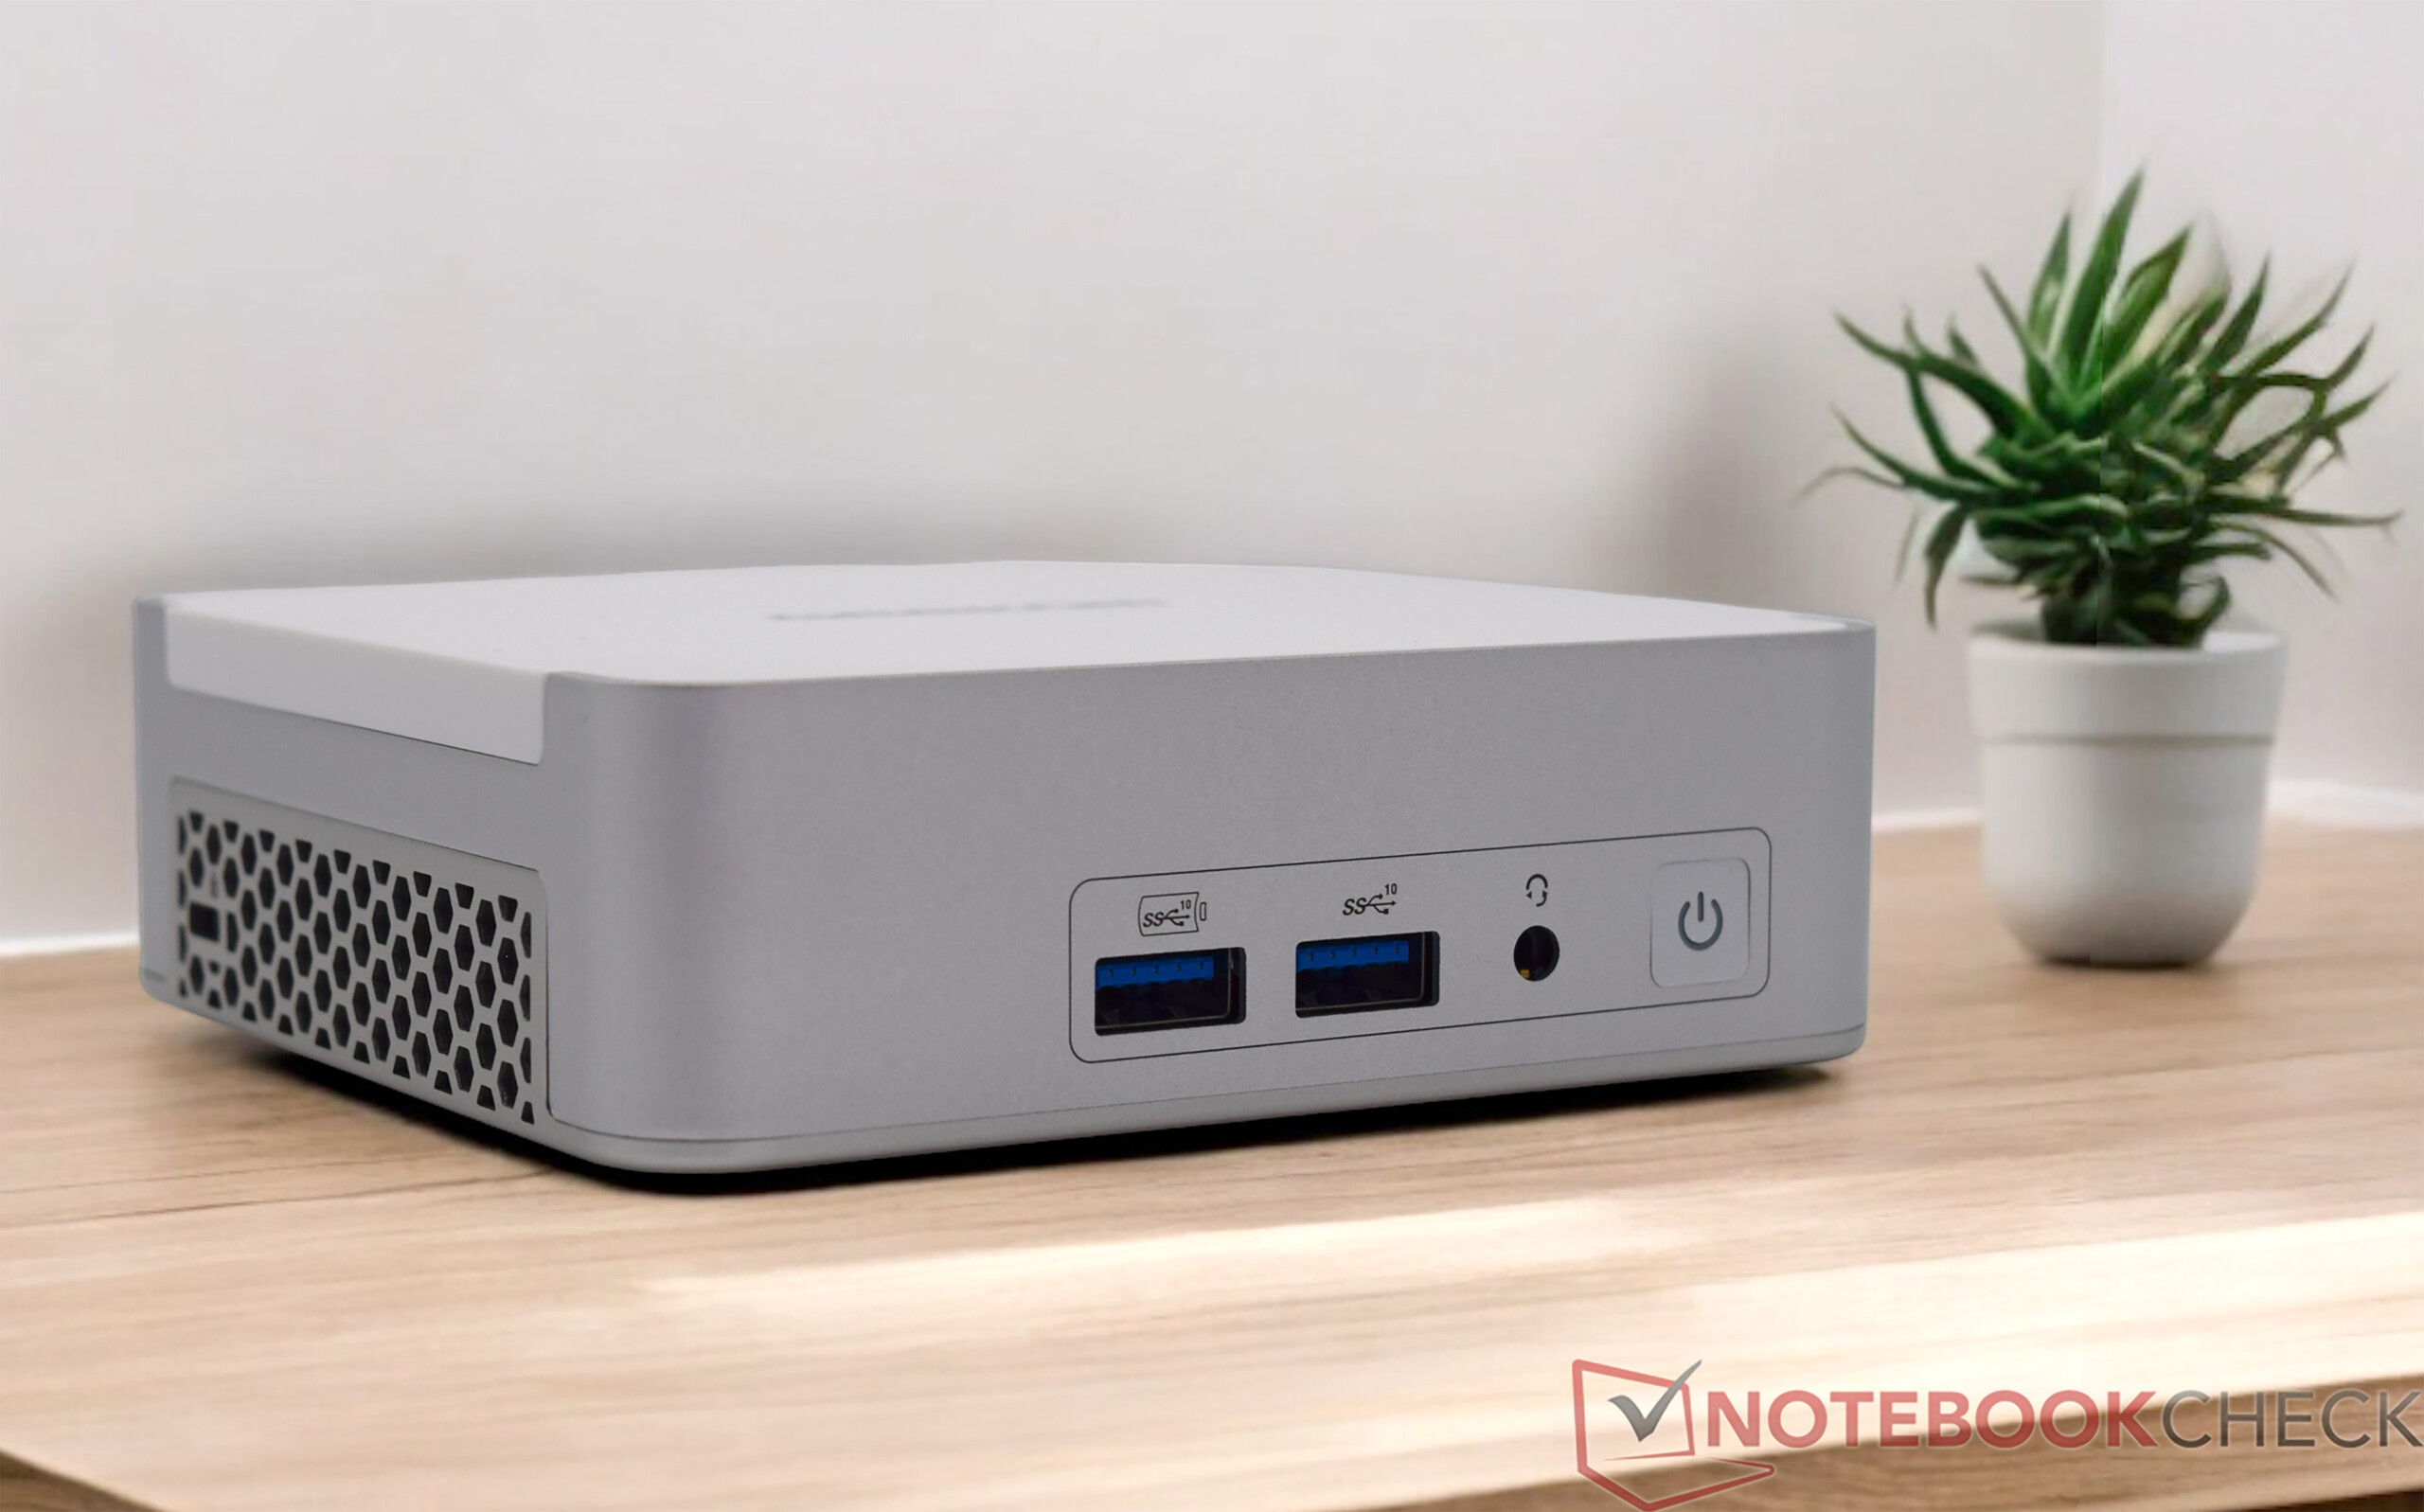
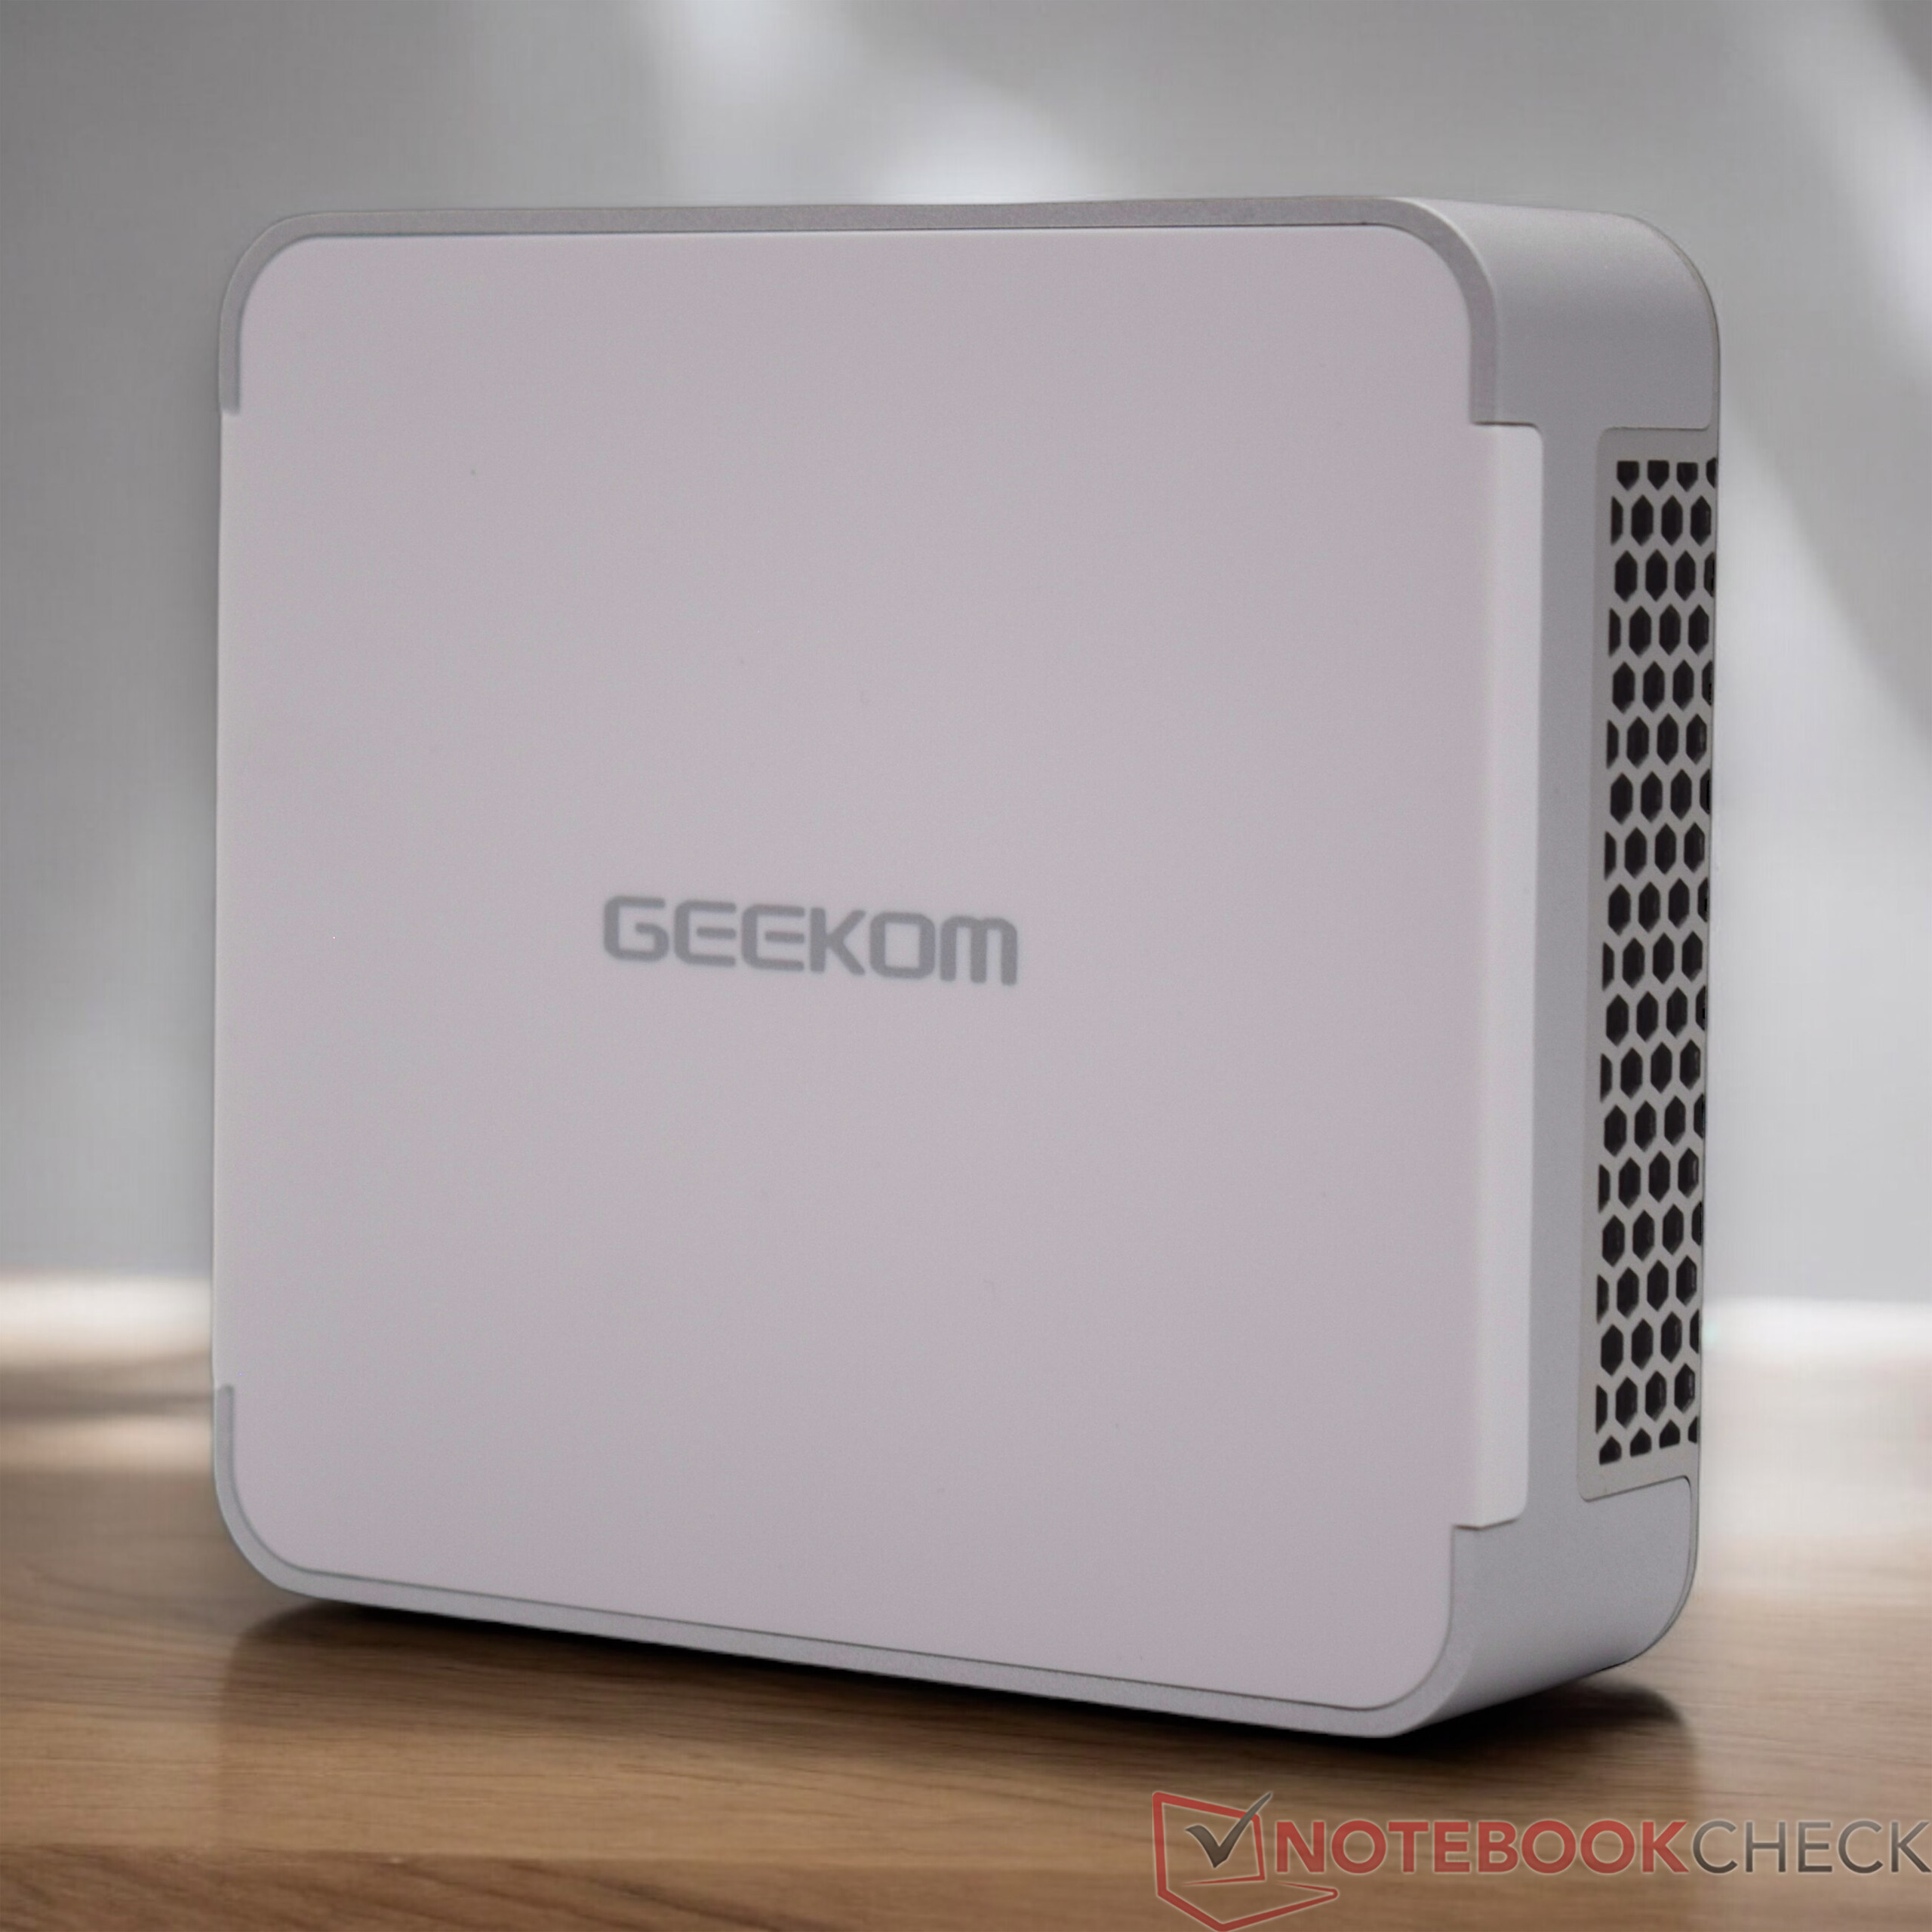
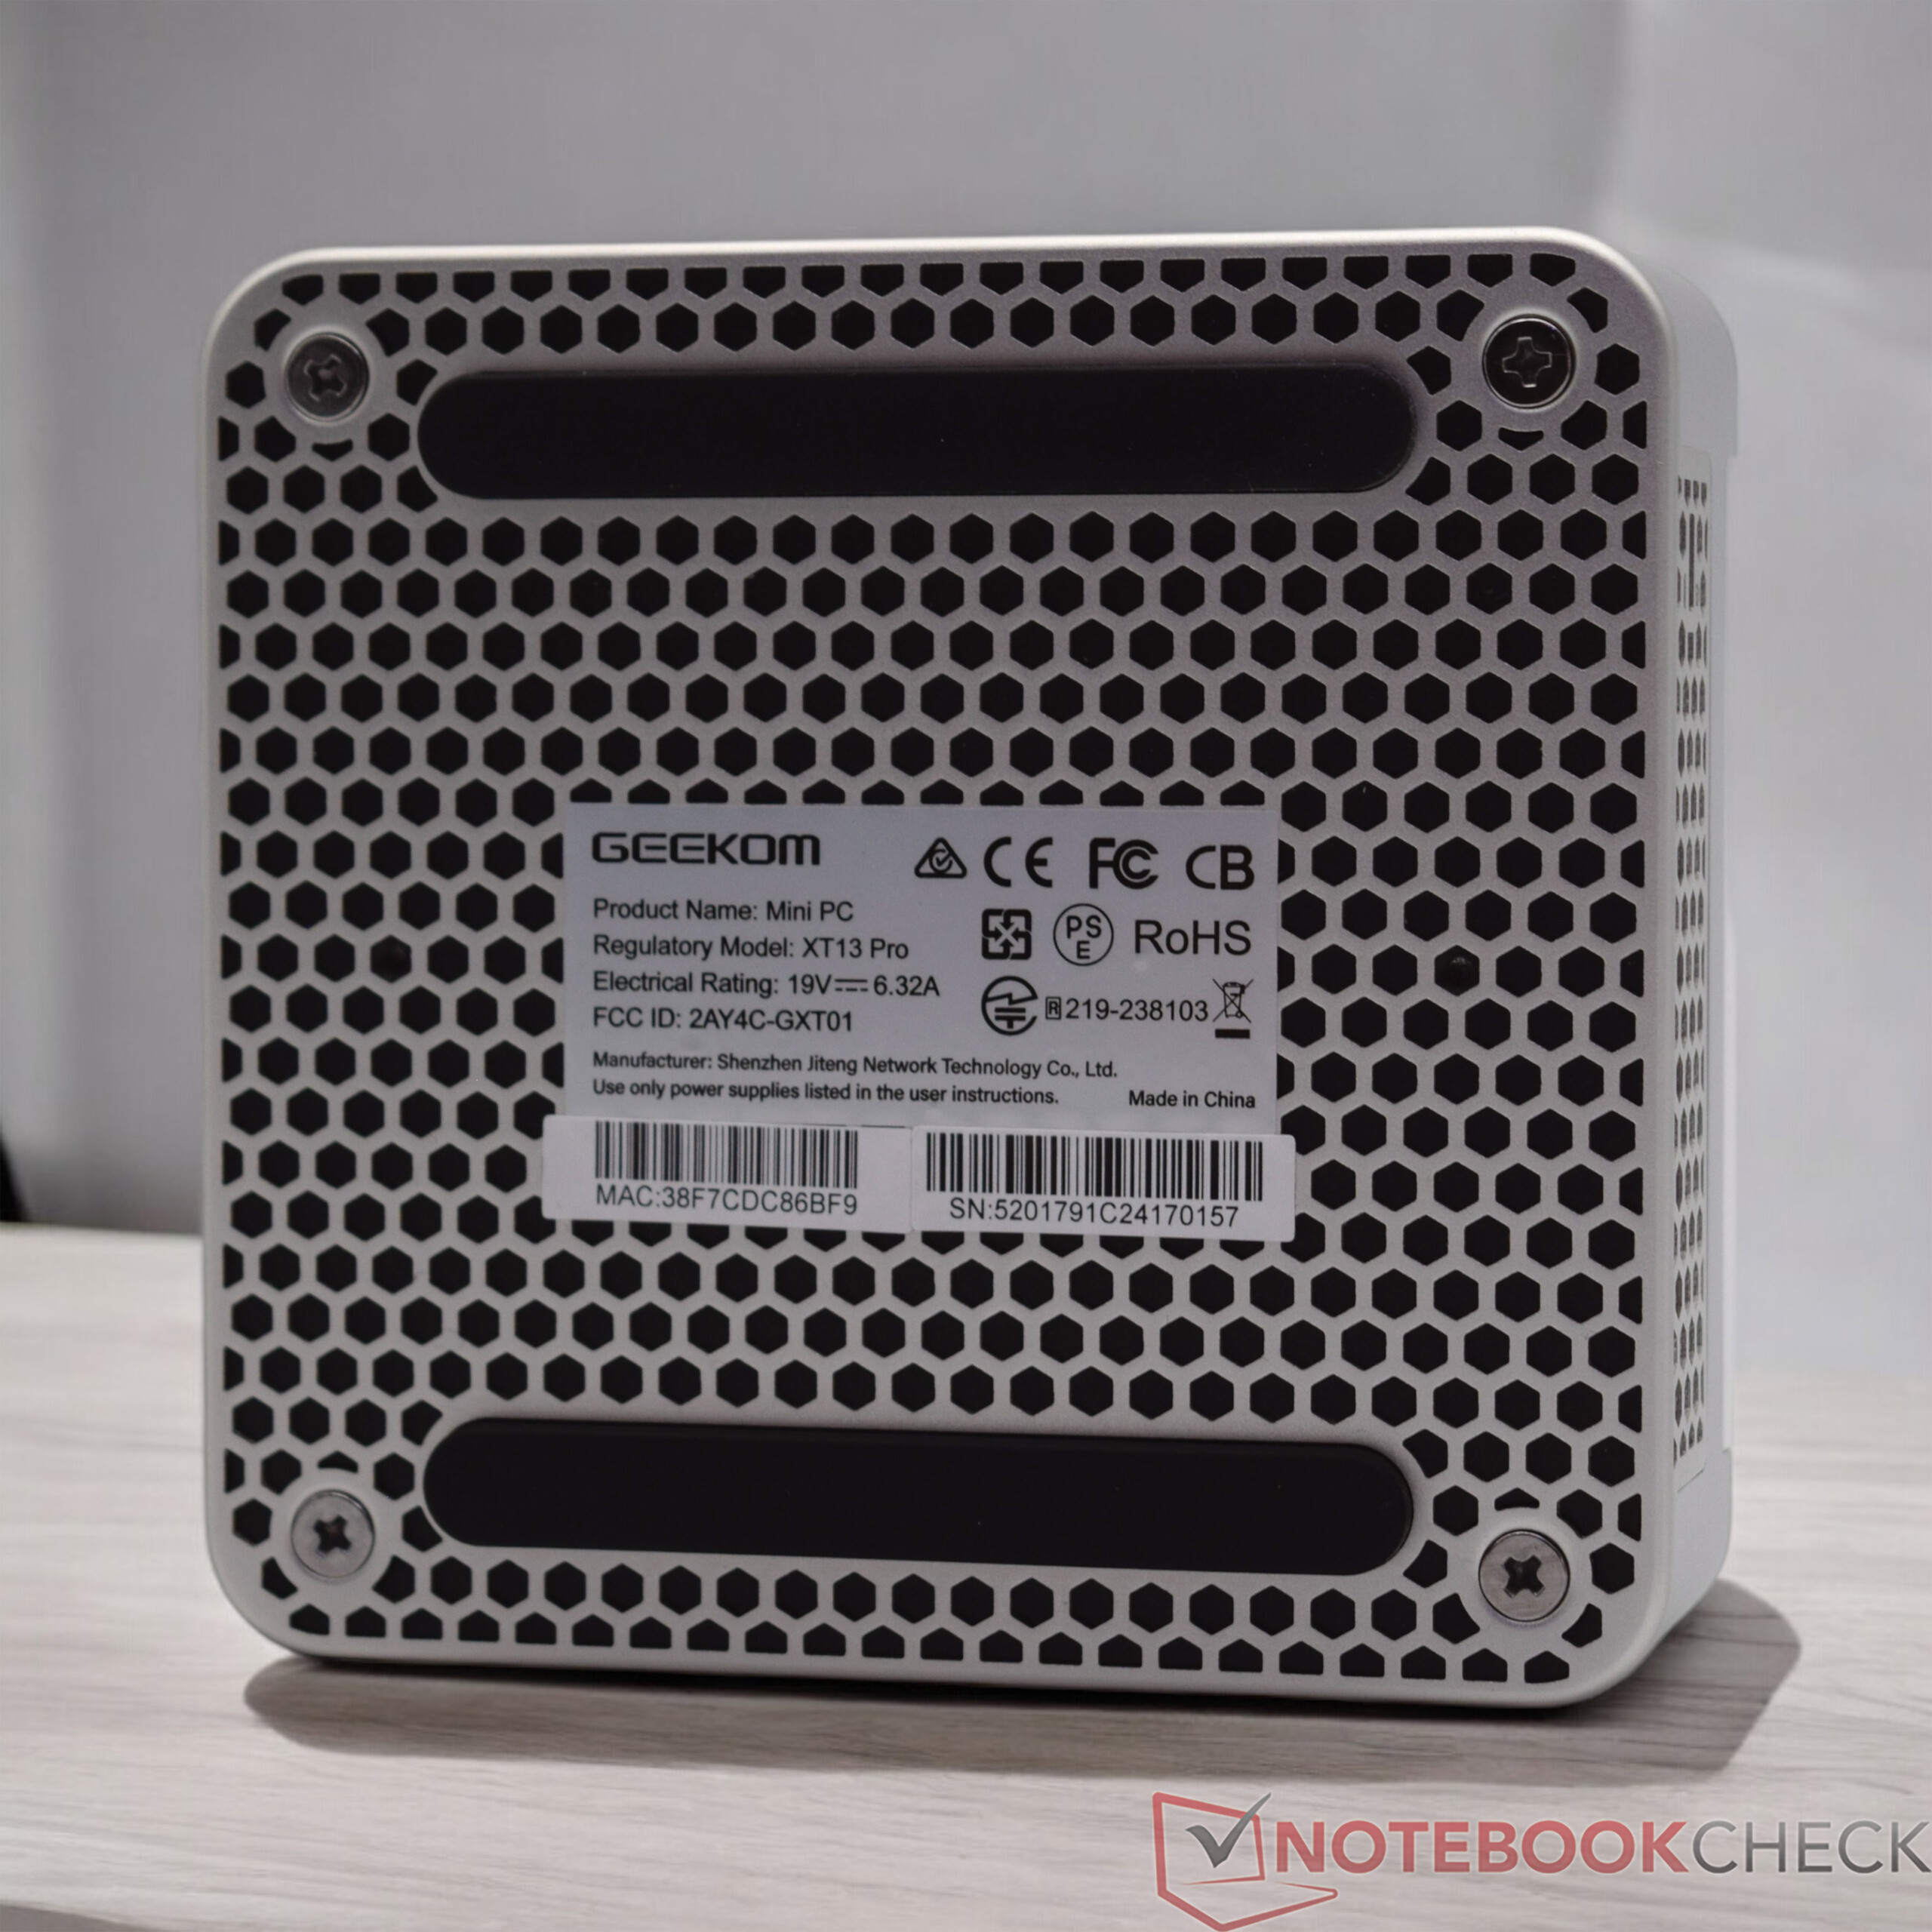
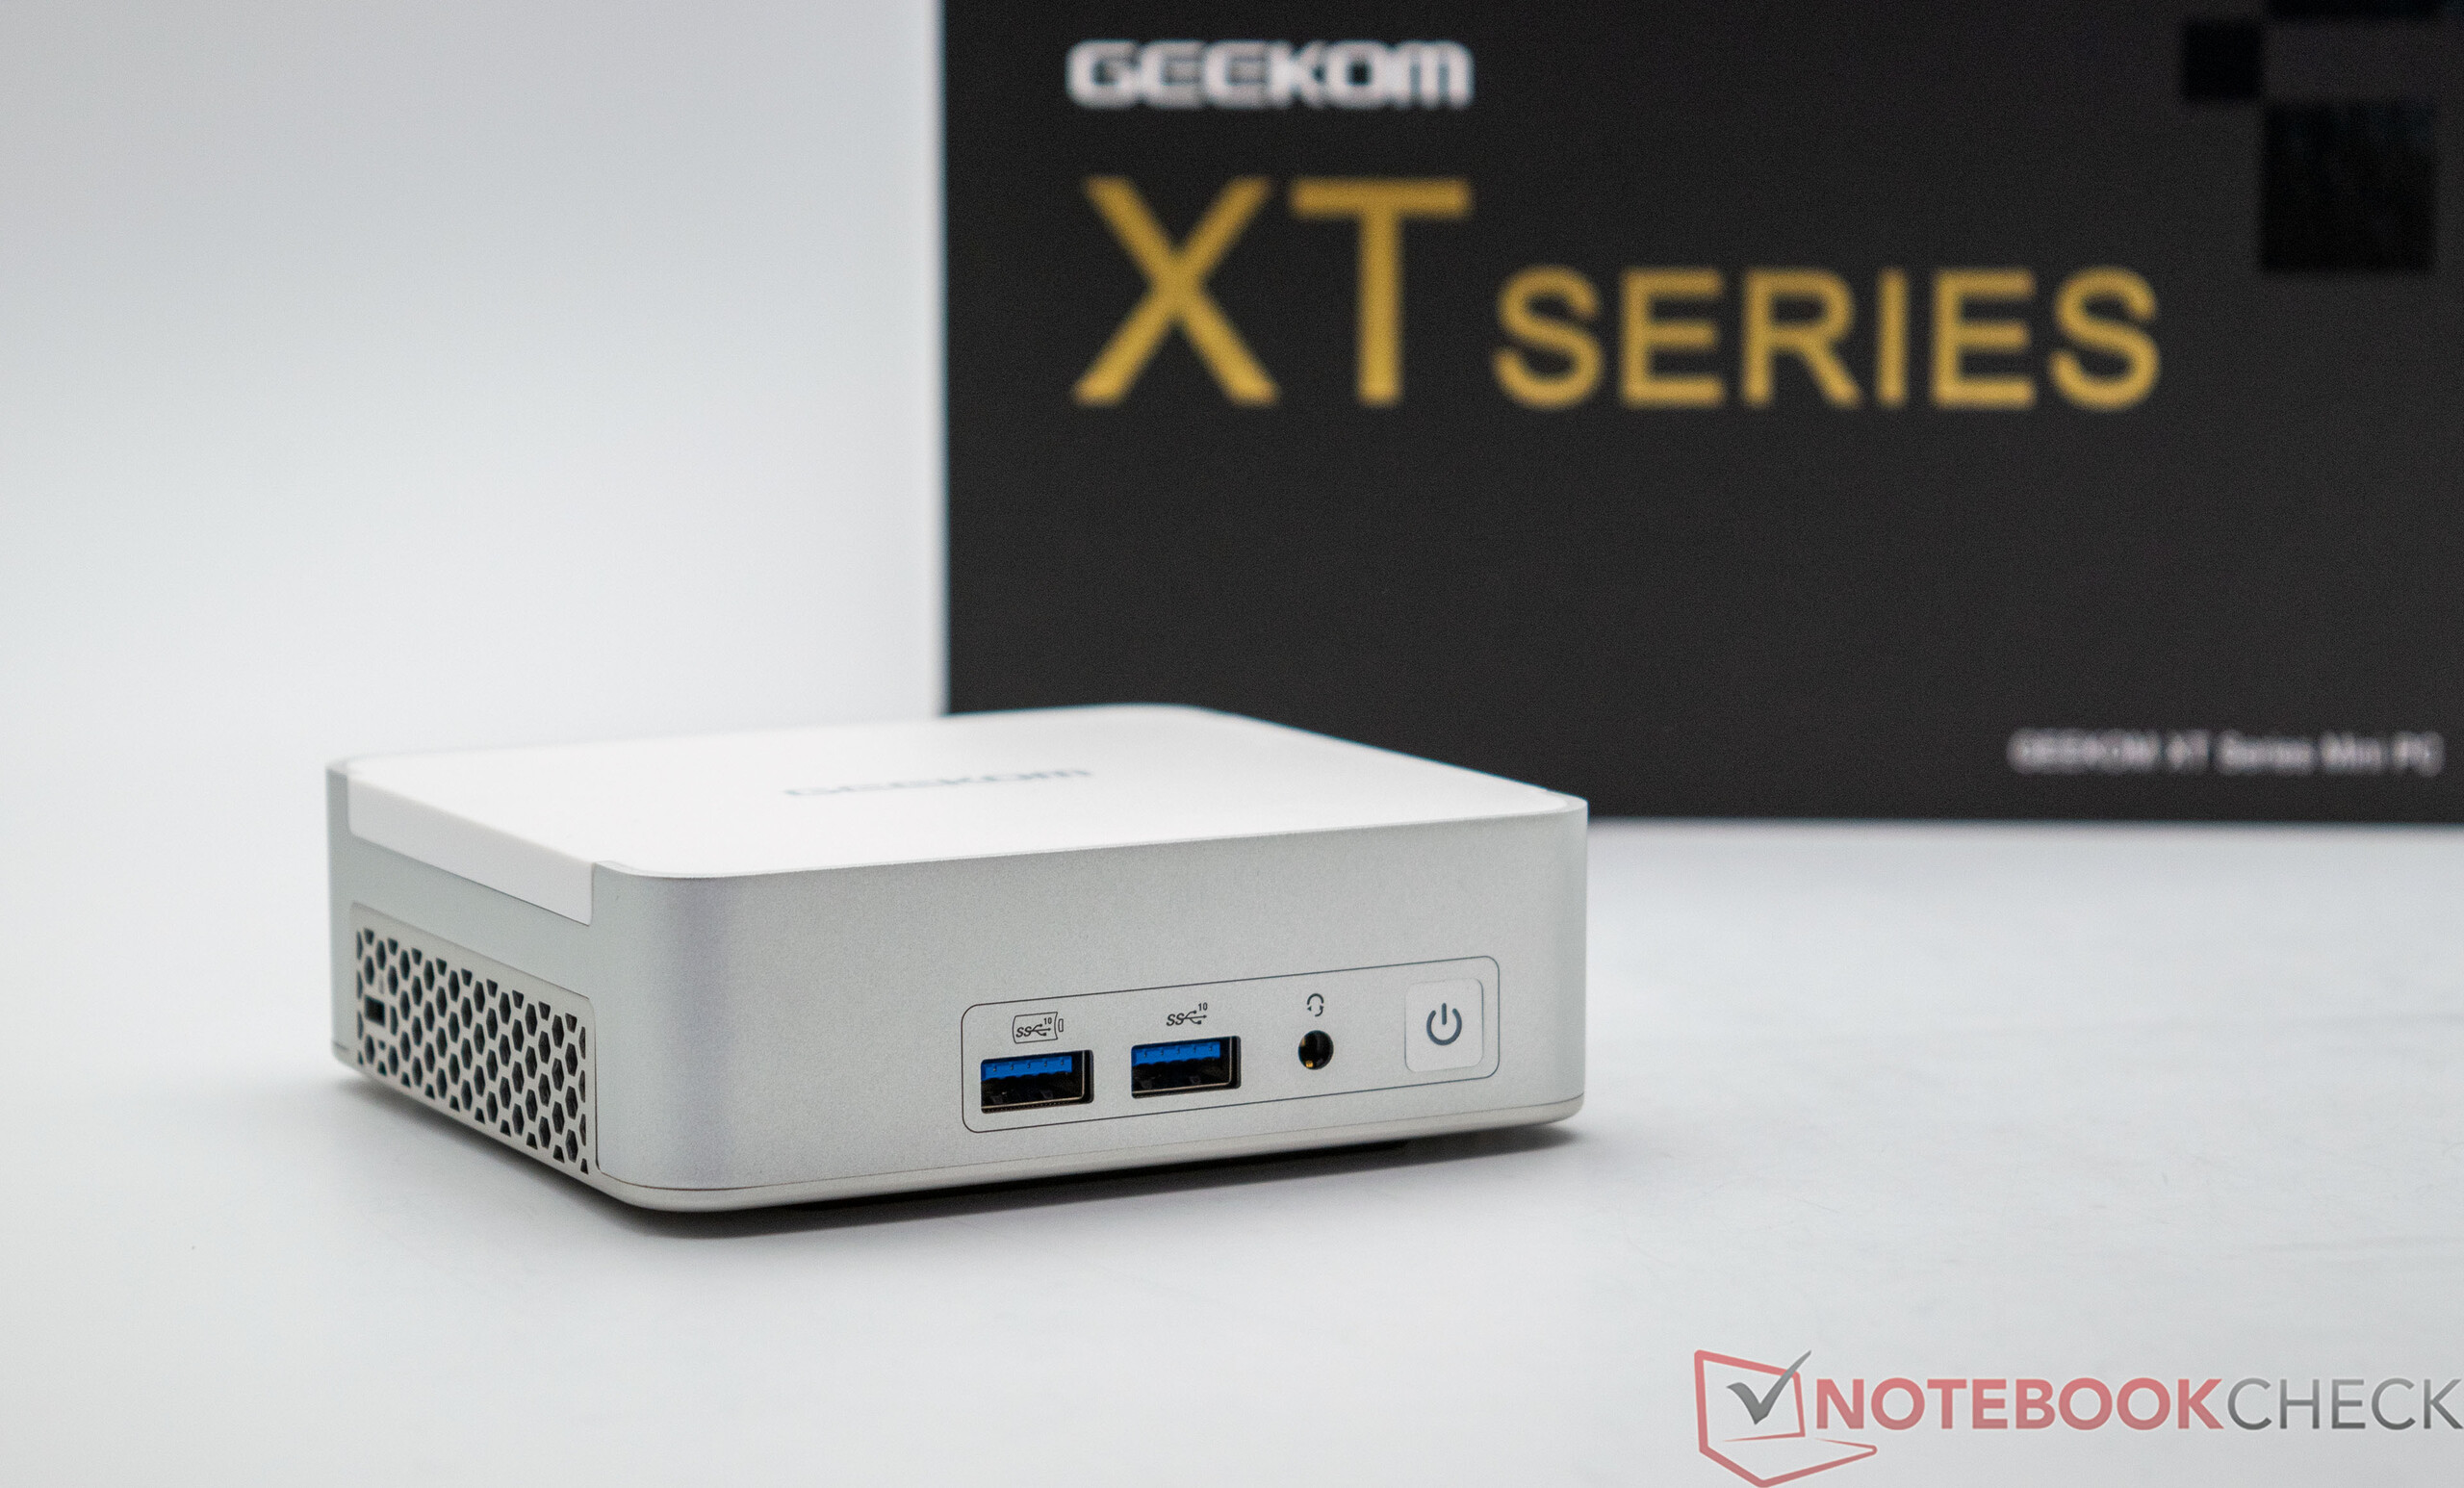
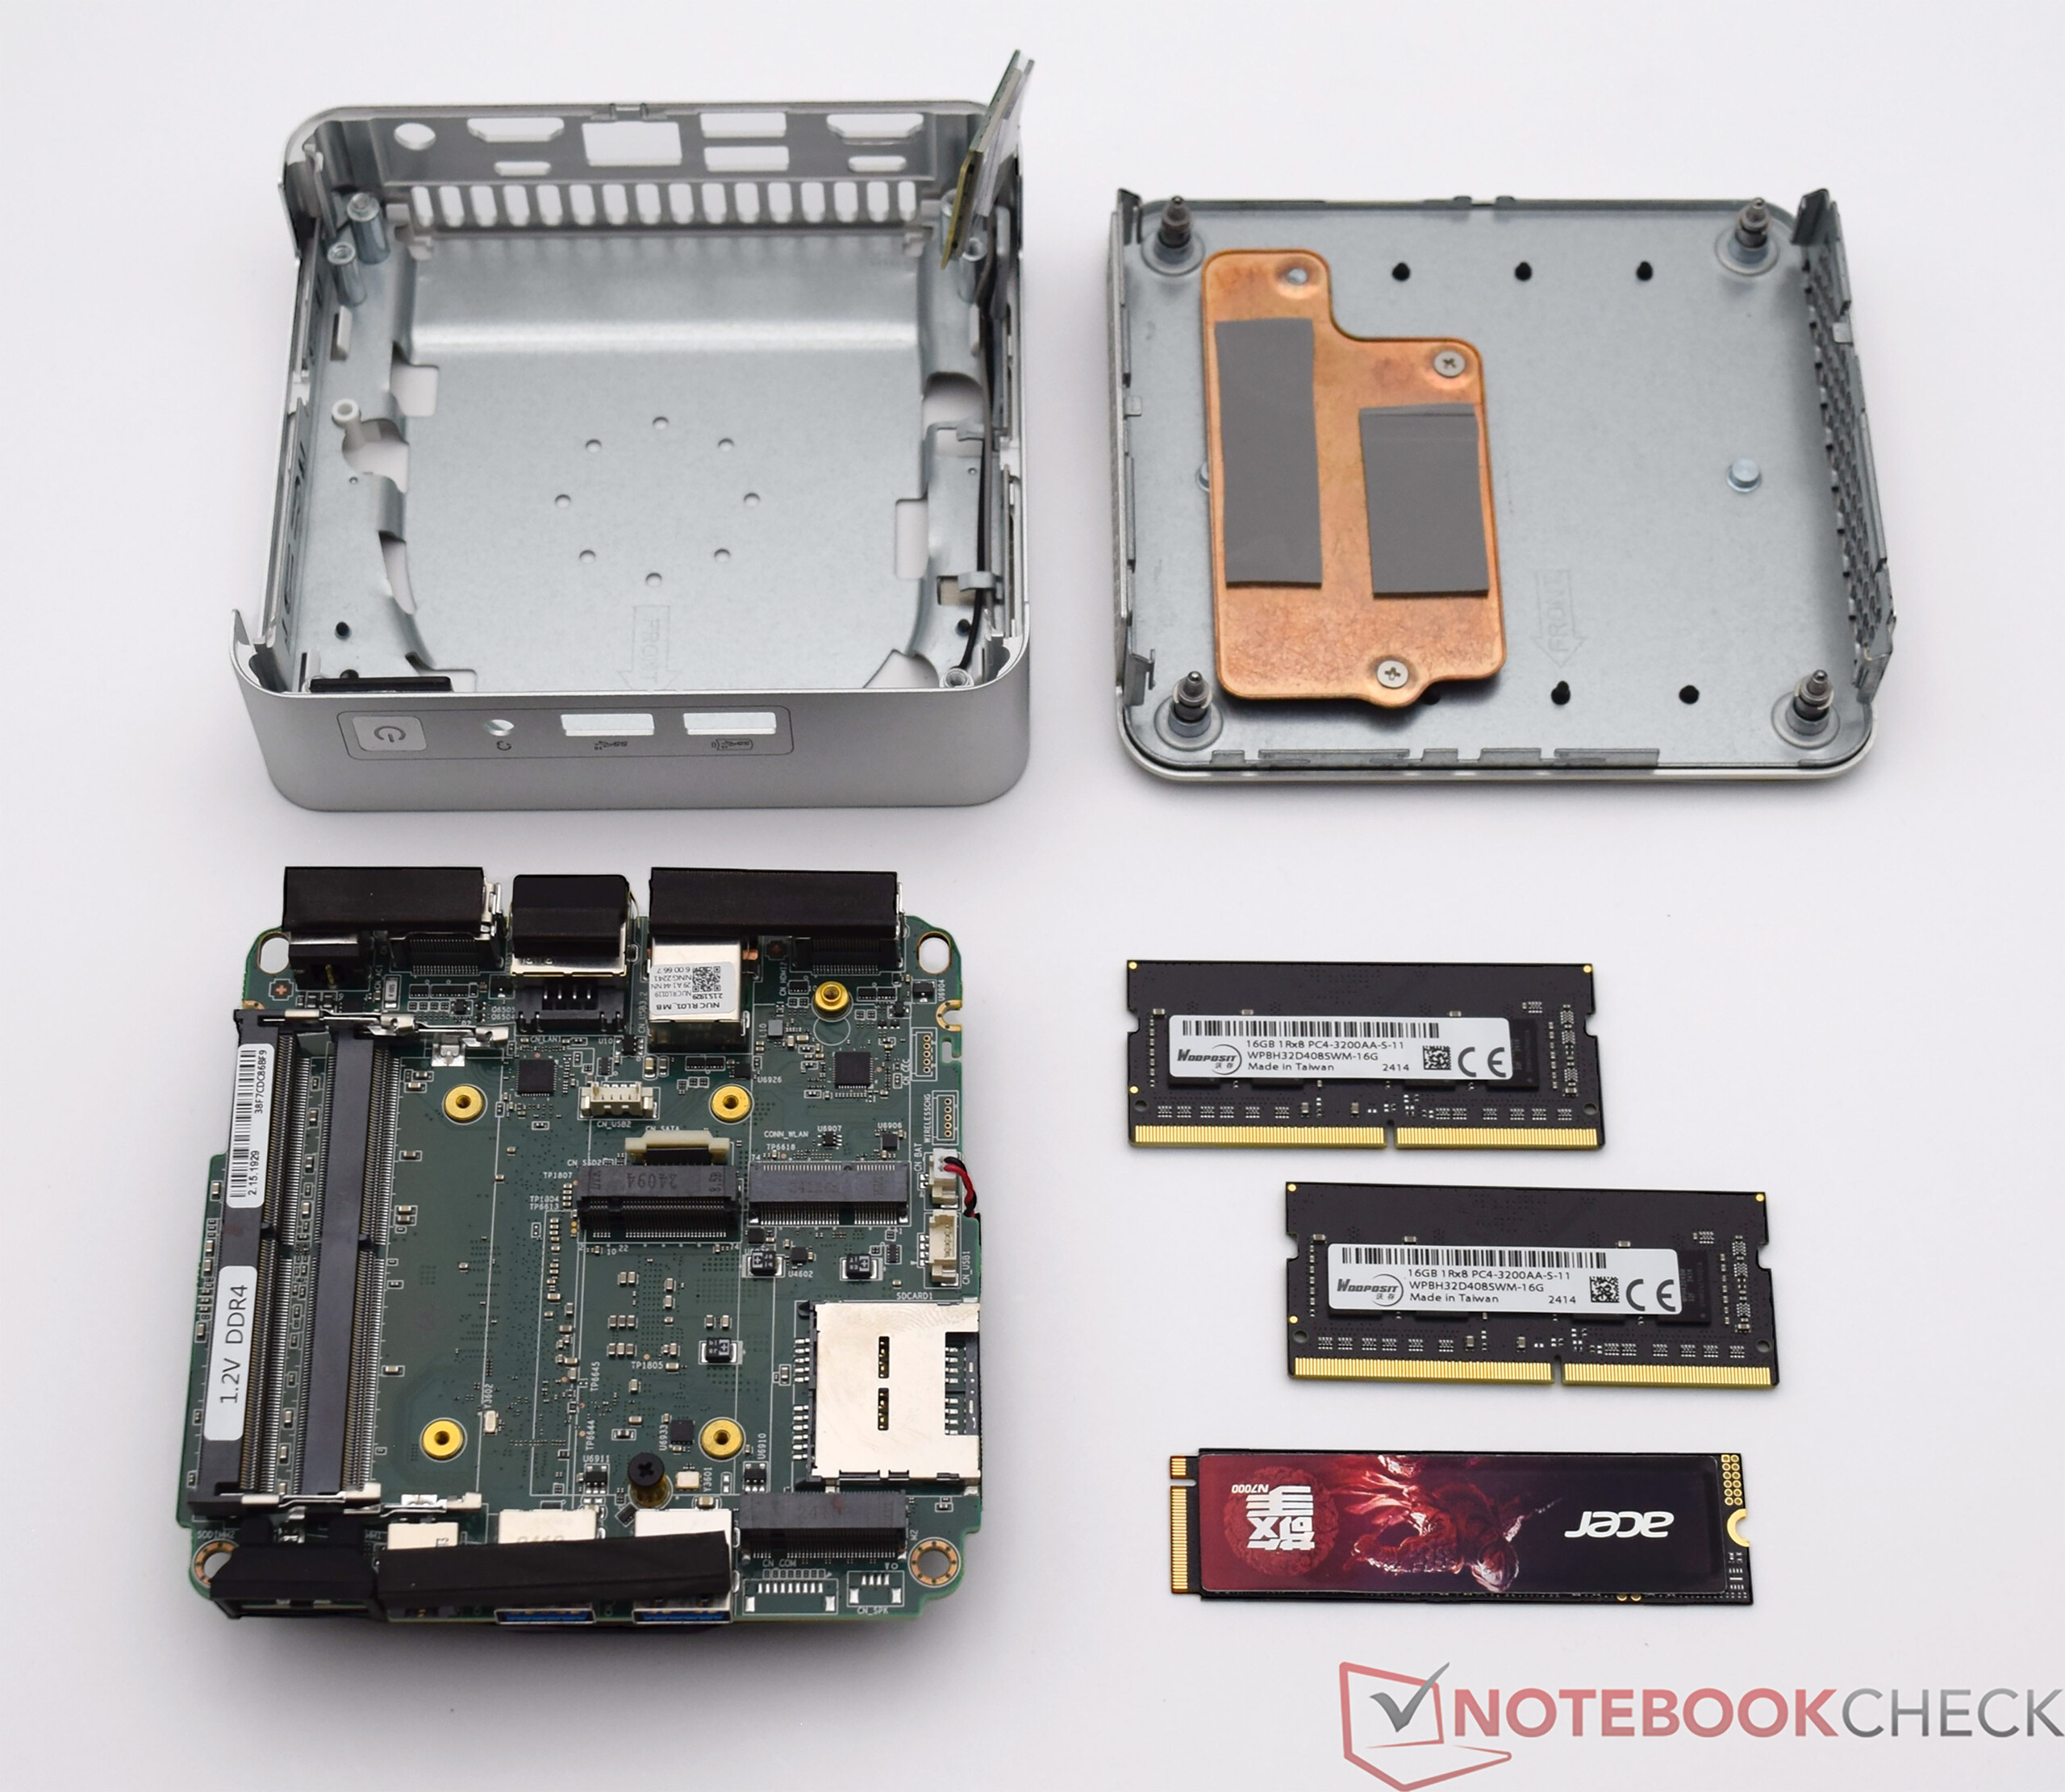
O gabinete do Geekom XT13 Pro é familiar, pois foi usado para o Geekom XT12 Pro. A semelhança com o Intel NUC 13 Pro Desk Edition Kit também não pode ser negada. Basicamente, não há nada de errado com o visual. Mais uma vez, nossa amostra de teste tem acabamento perfeito e tudo se encaixa perfeitamente. No entanto, gostaríamos de ver uma nova caixa para diferenciá-lo um pouco da concorrência interna. O mini-PC ocupa apenas 11,7 x 11,2 centímetros na mesa, o que o torna um dos dispositivos mais compactos. O Geekom XT13 Pro também pode ser conectado diretamente a um monitor usando o suporte VESA fornecido.
Equipamento - Boa seleção e 2x USB4
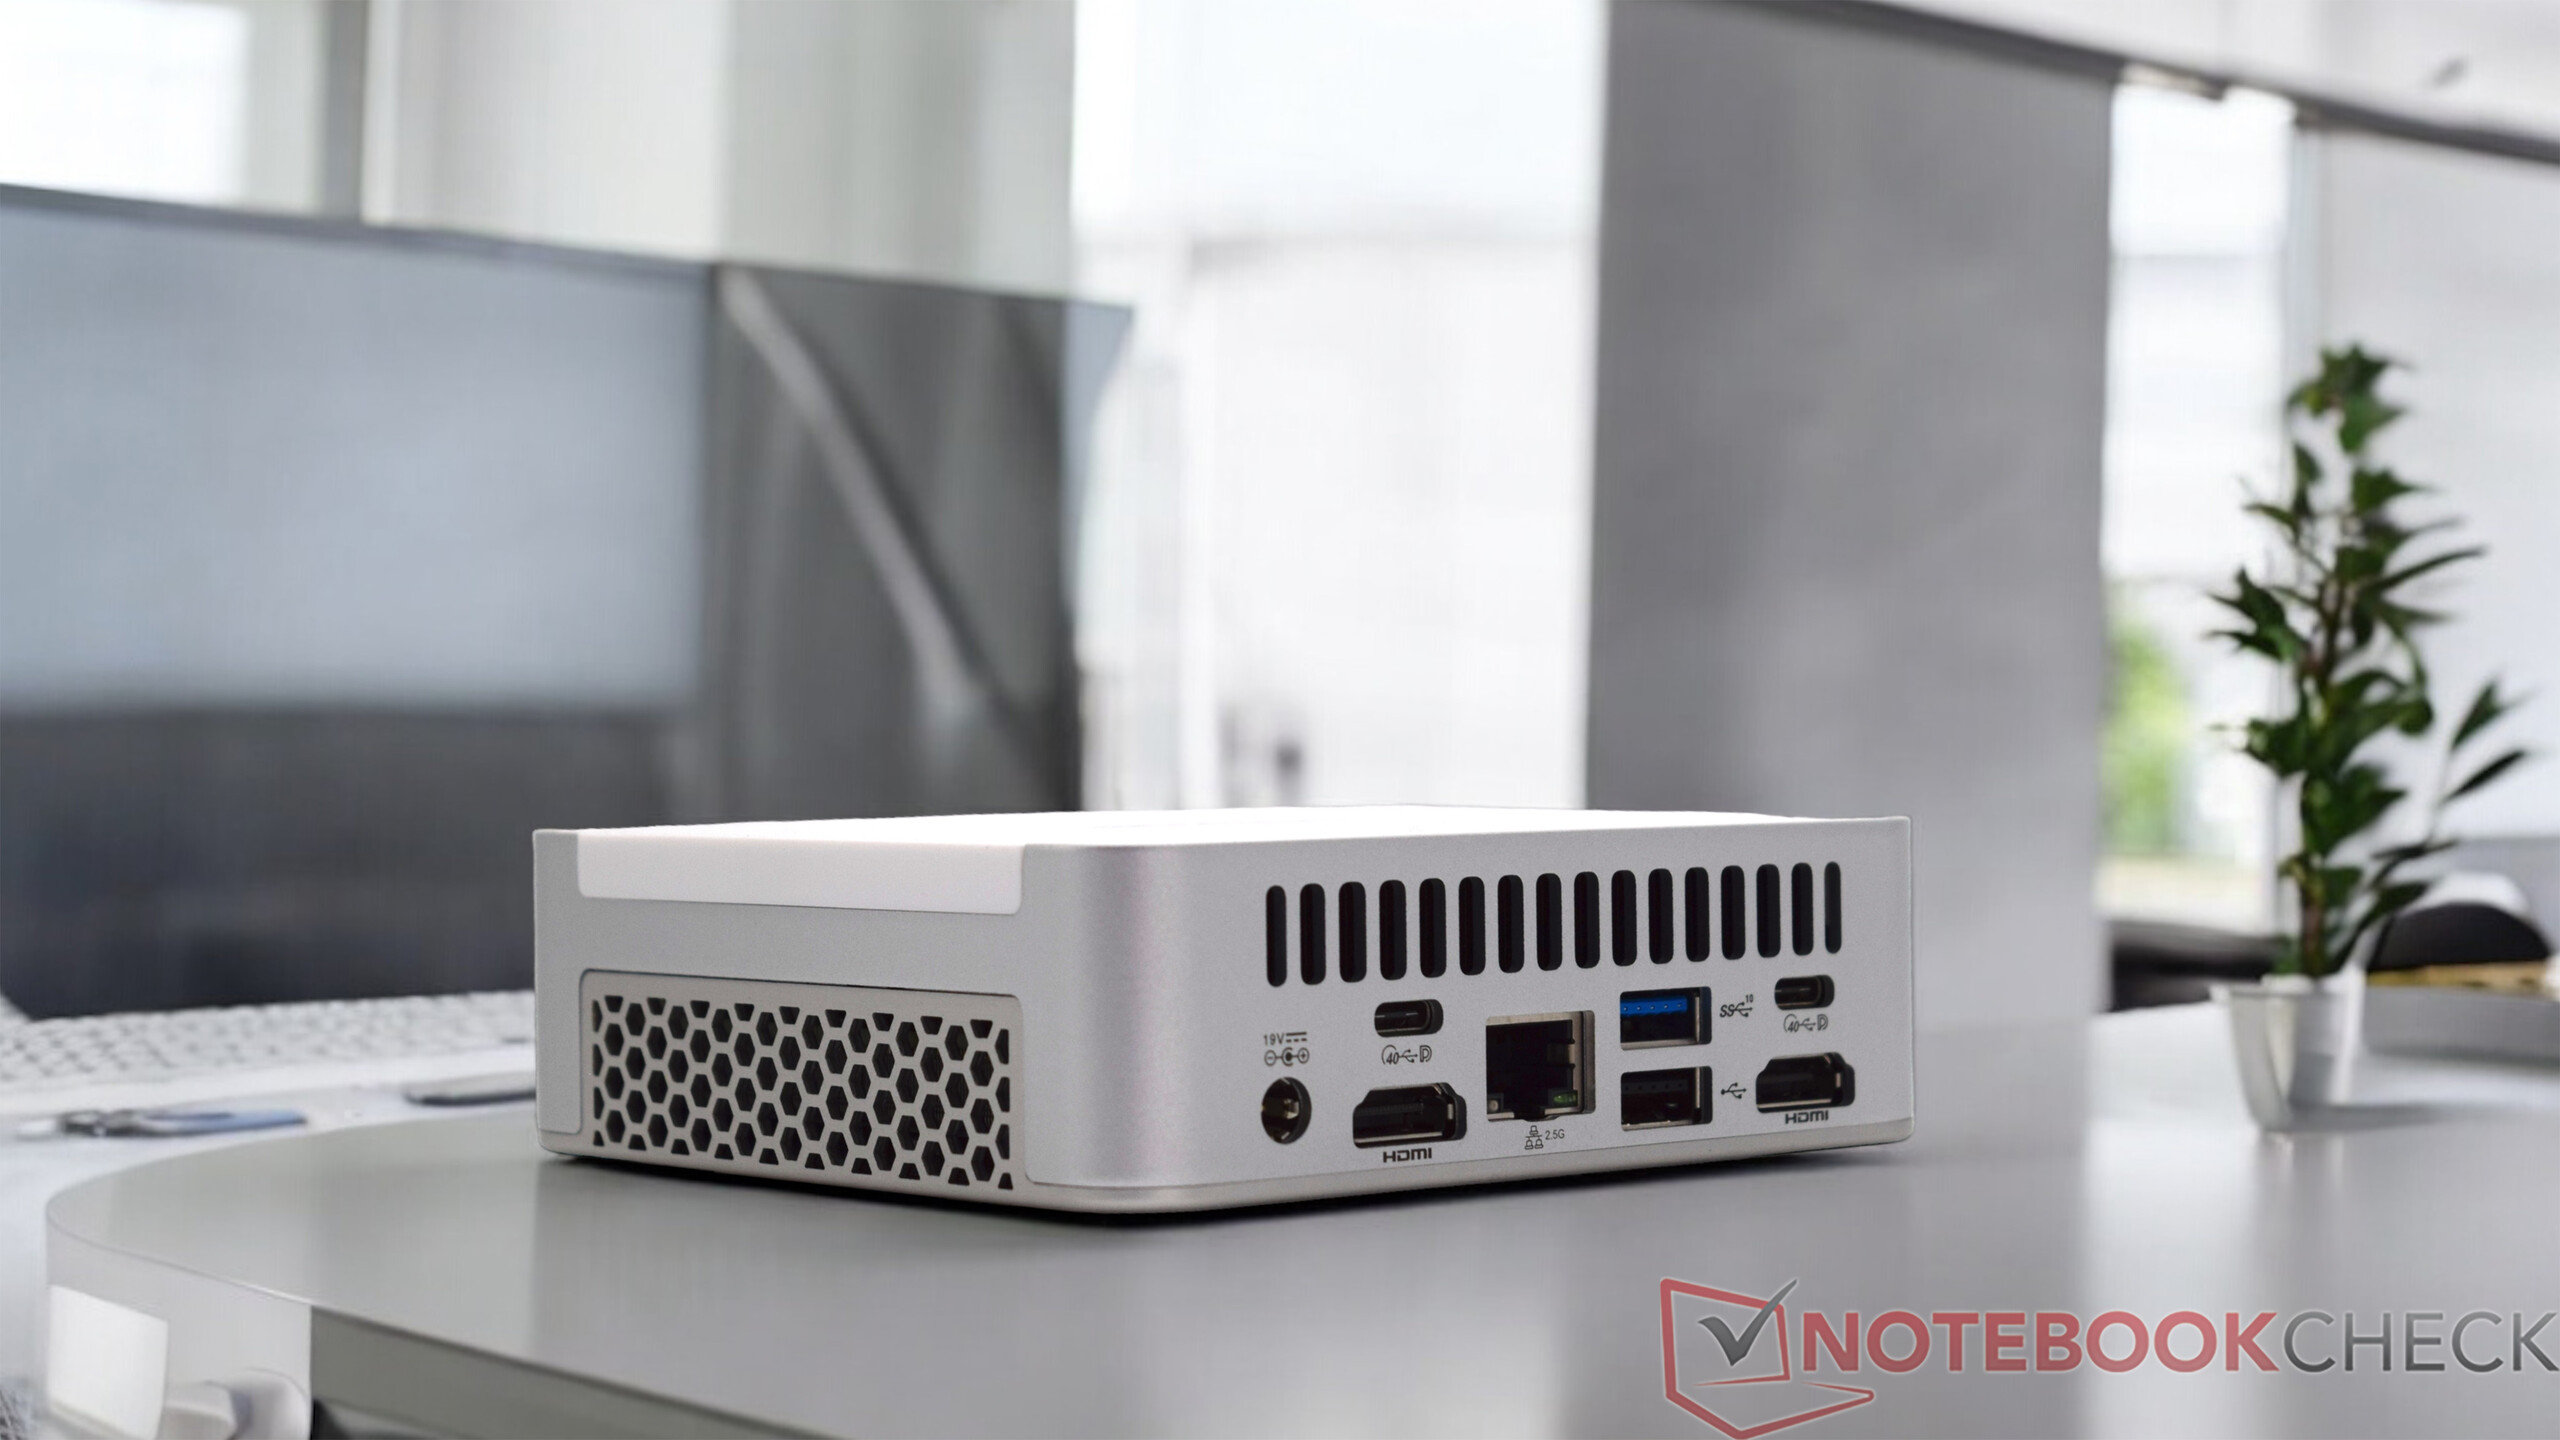
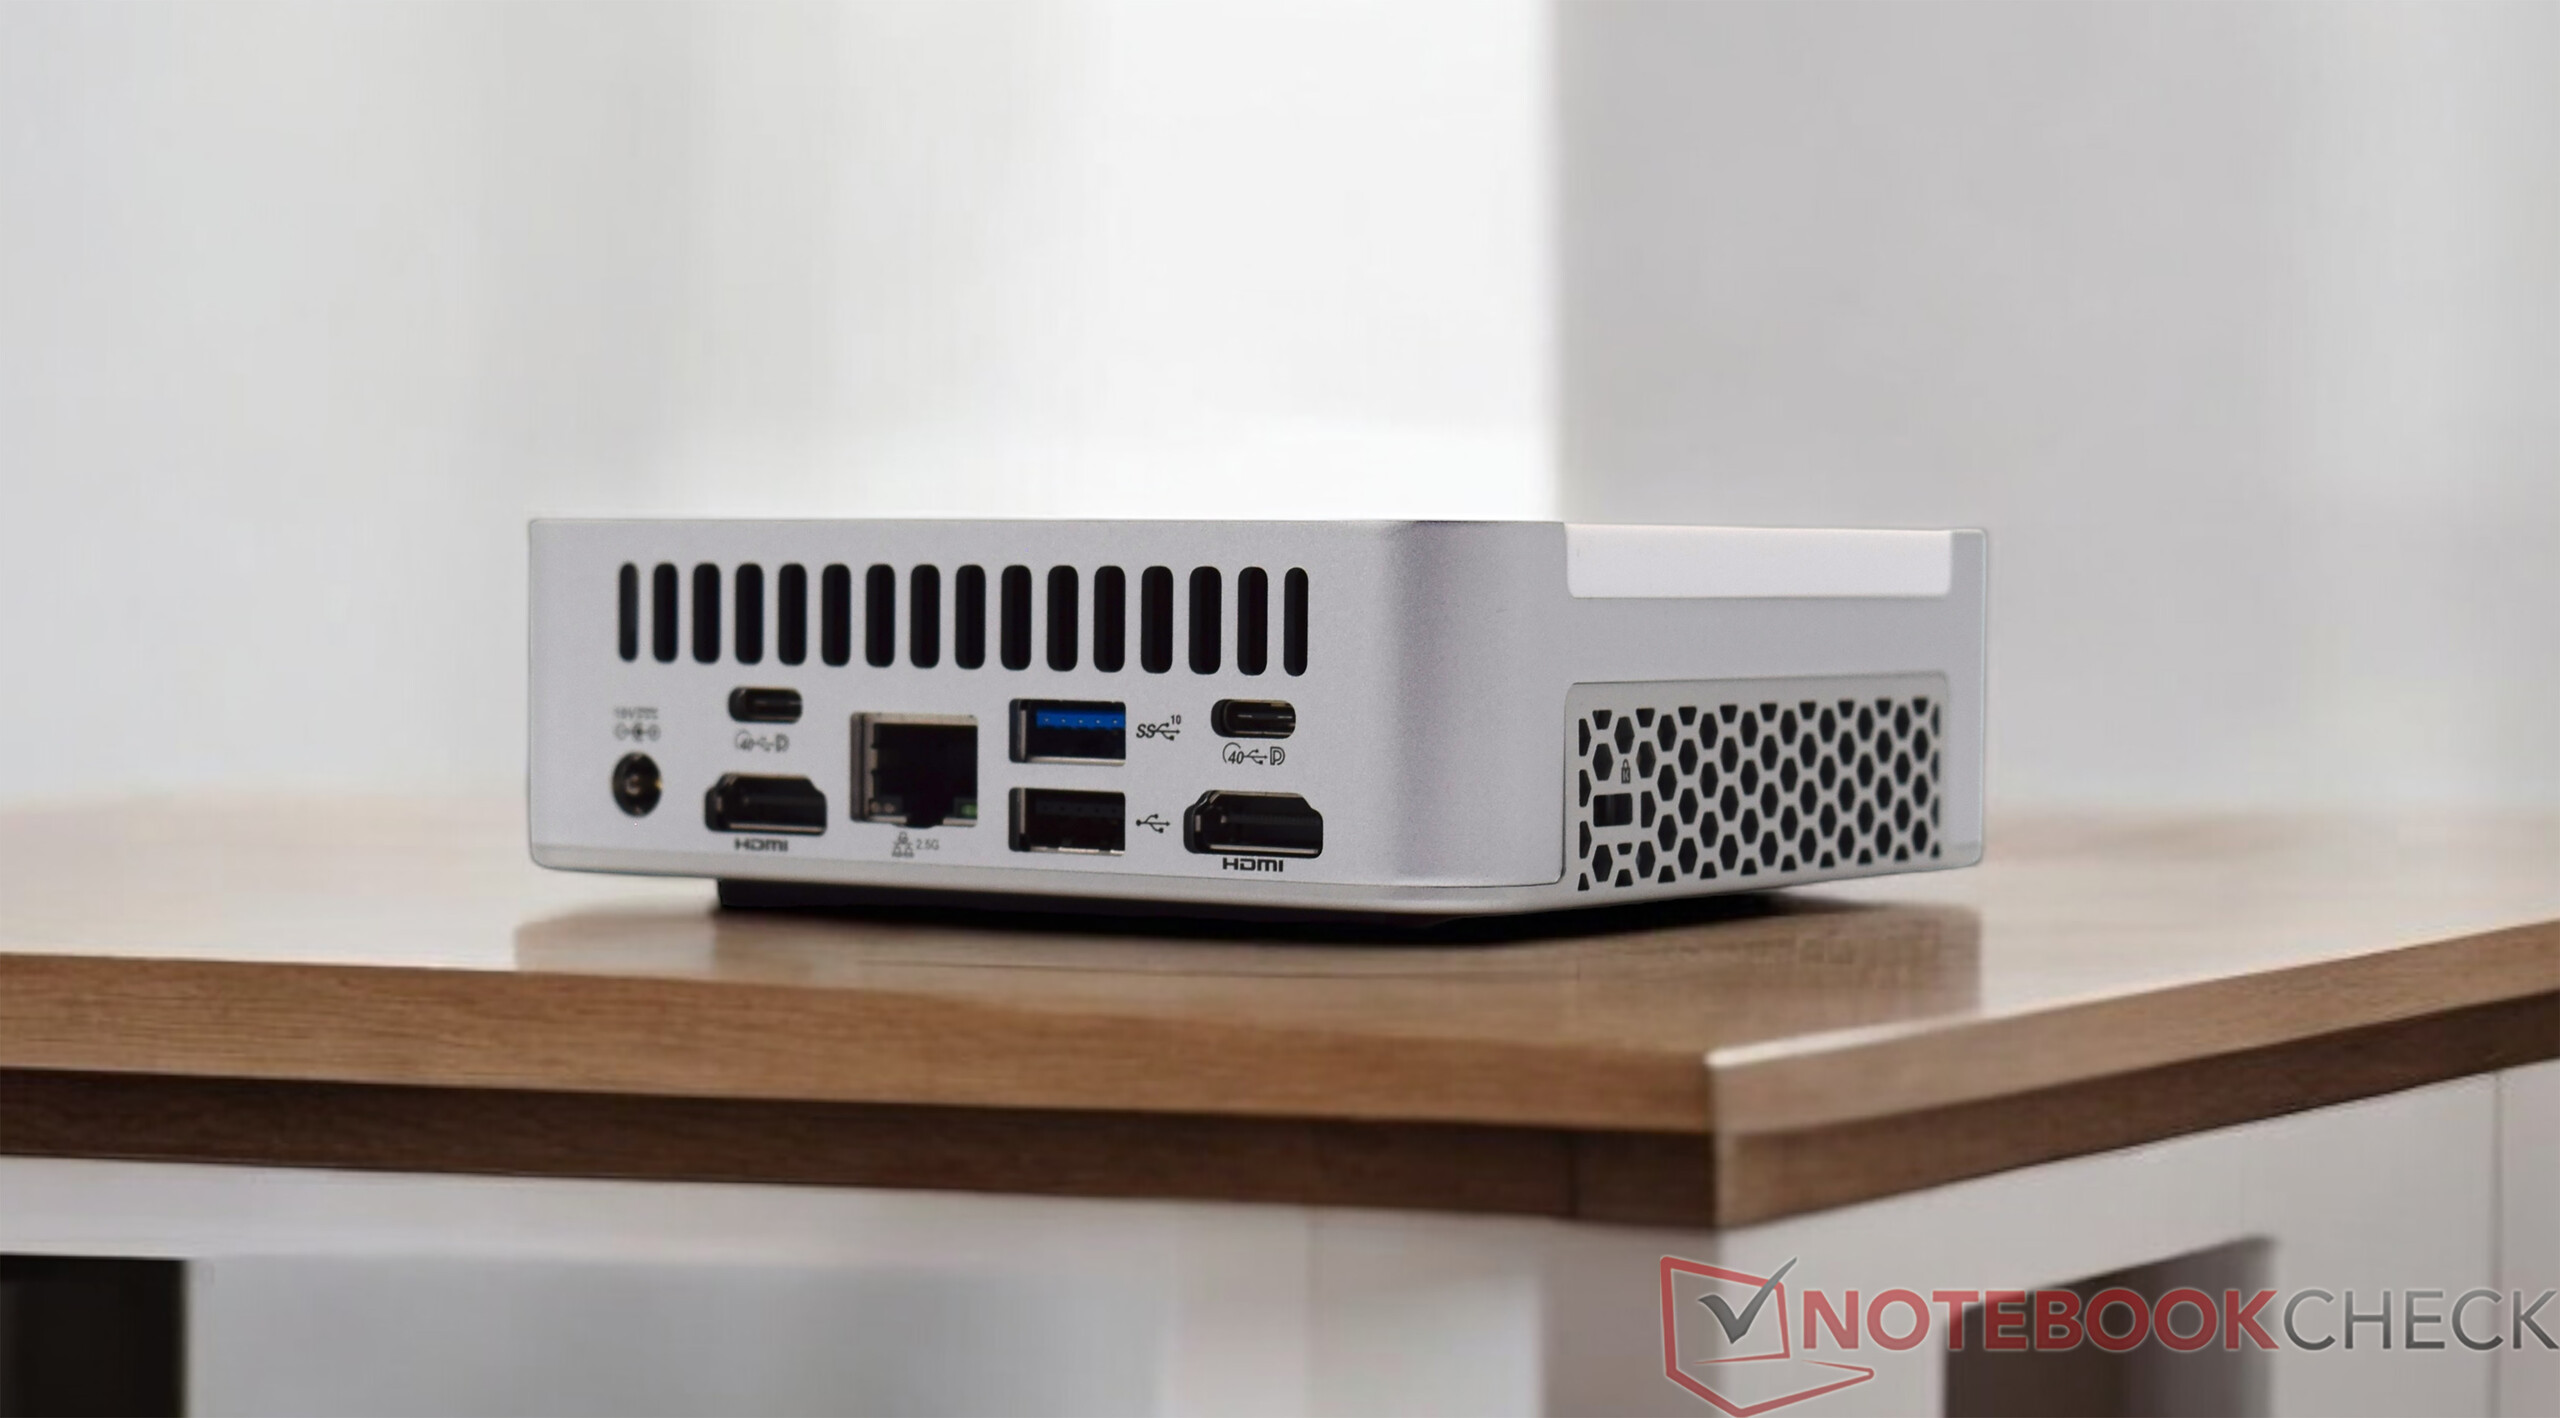
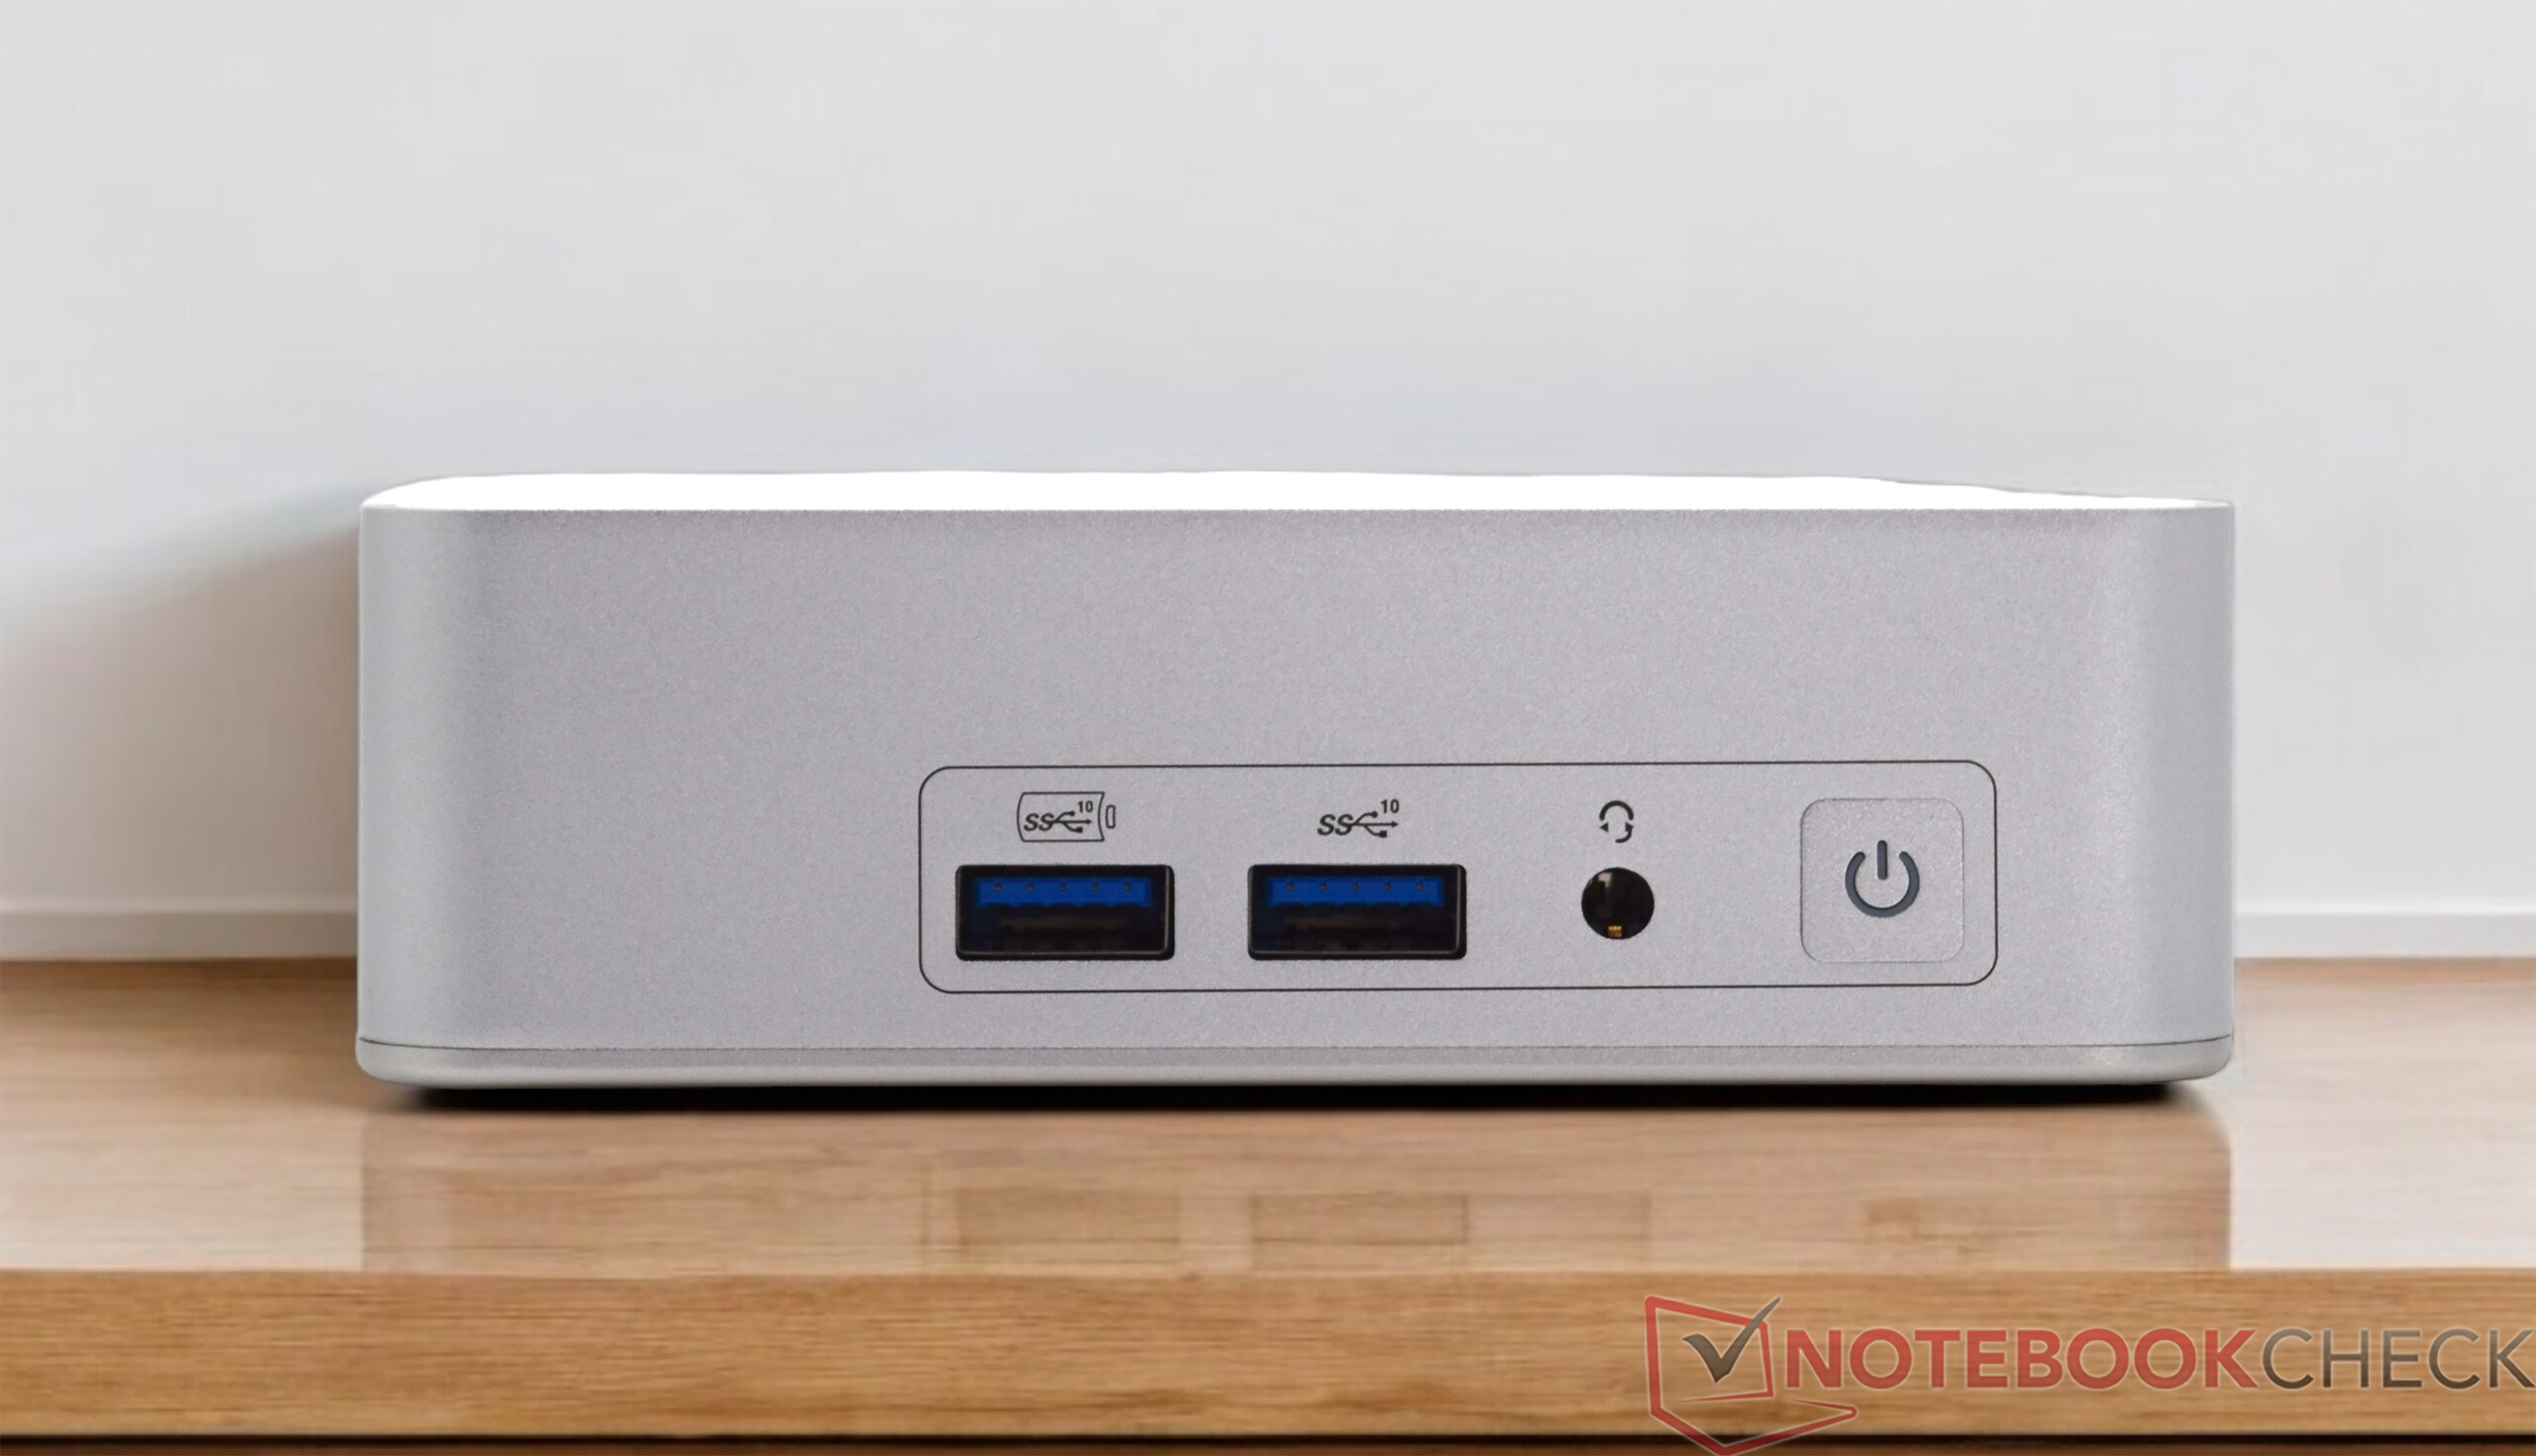
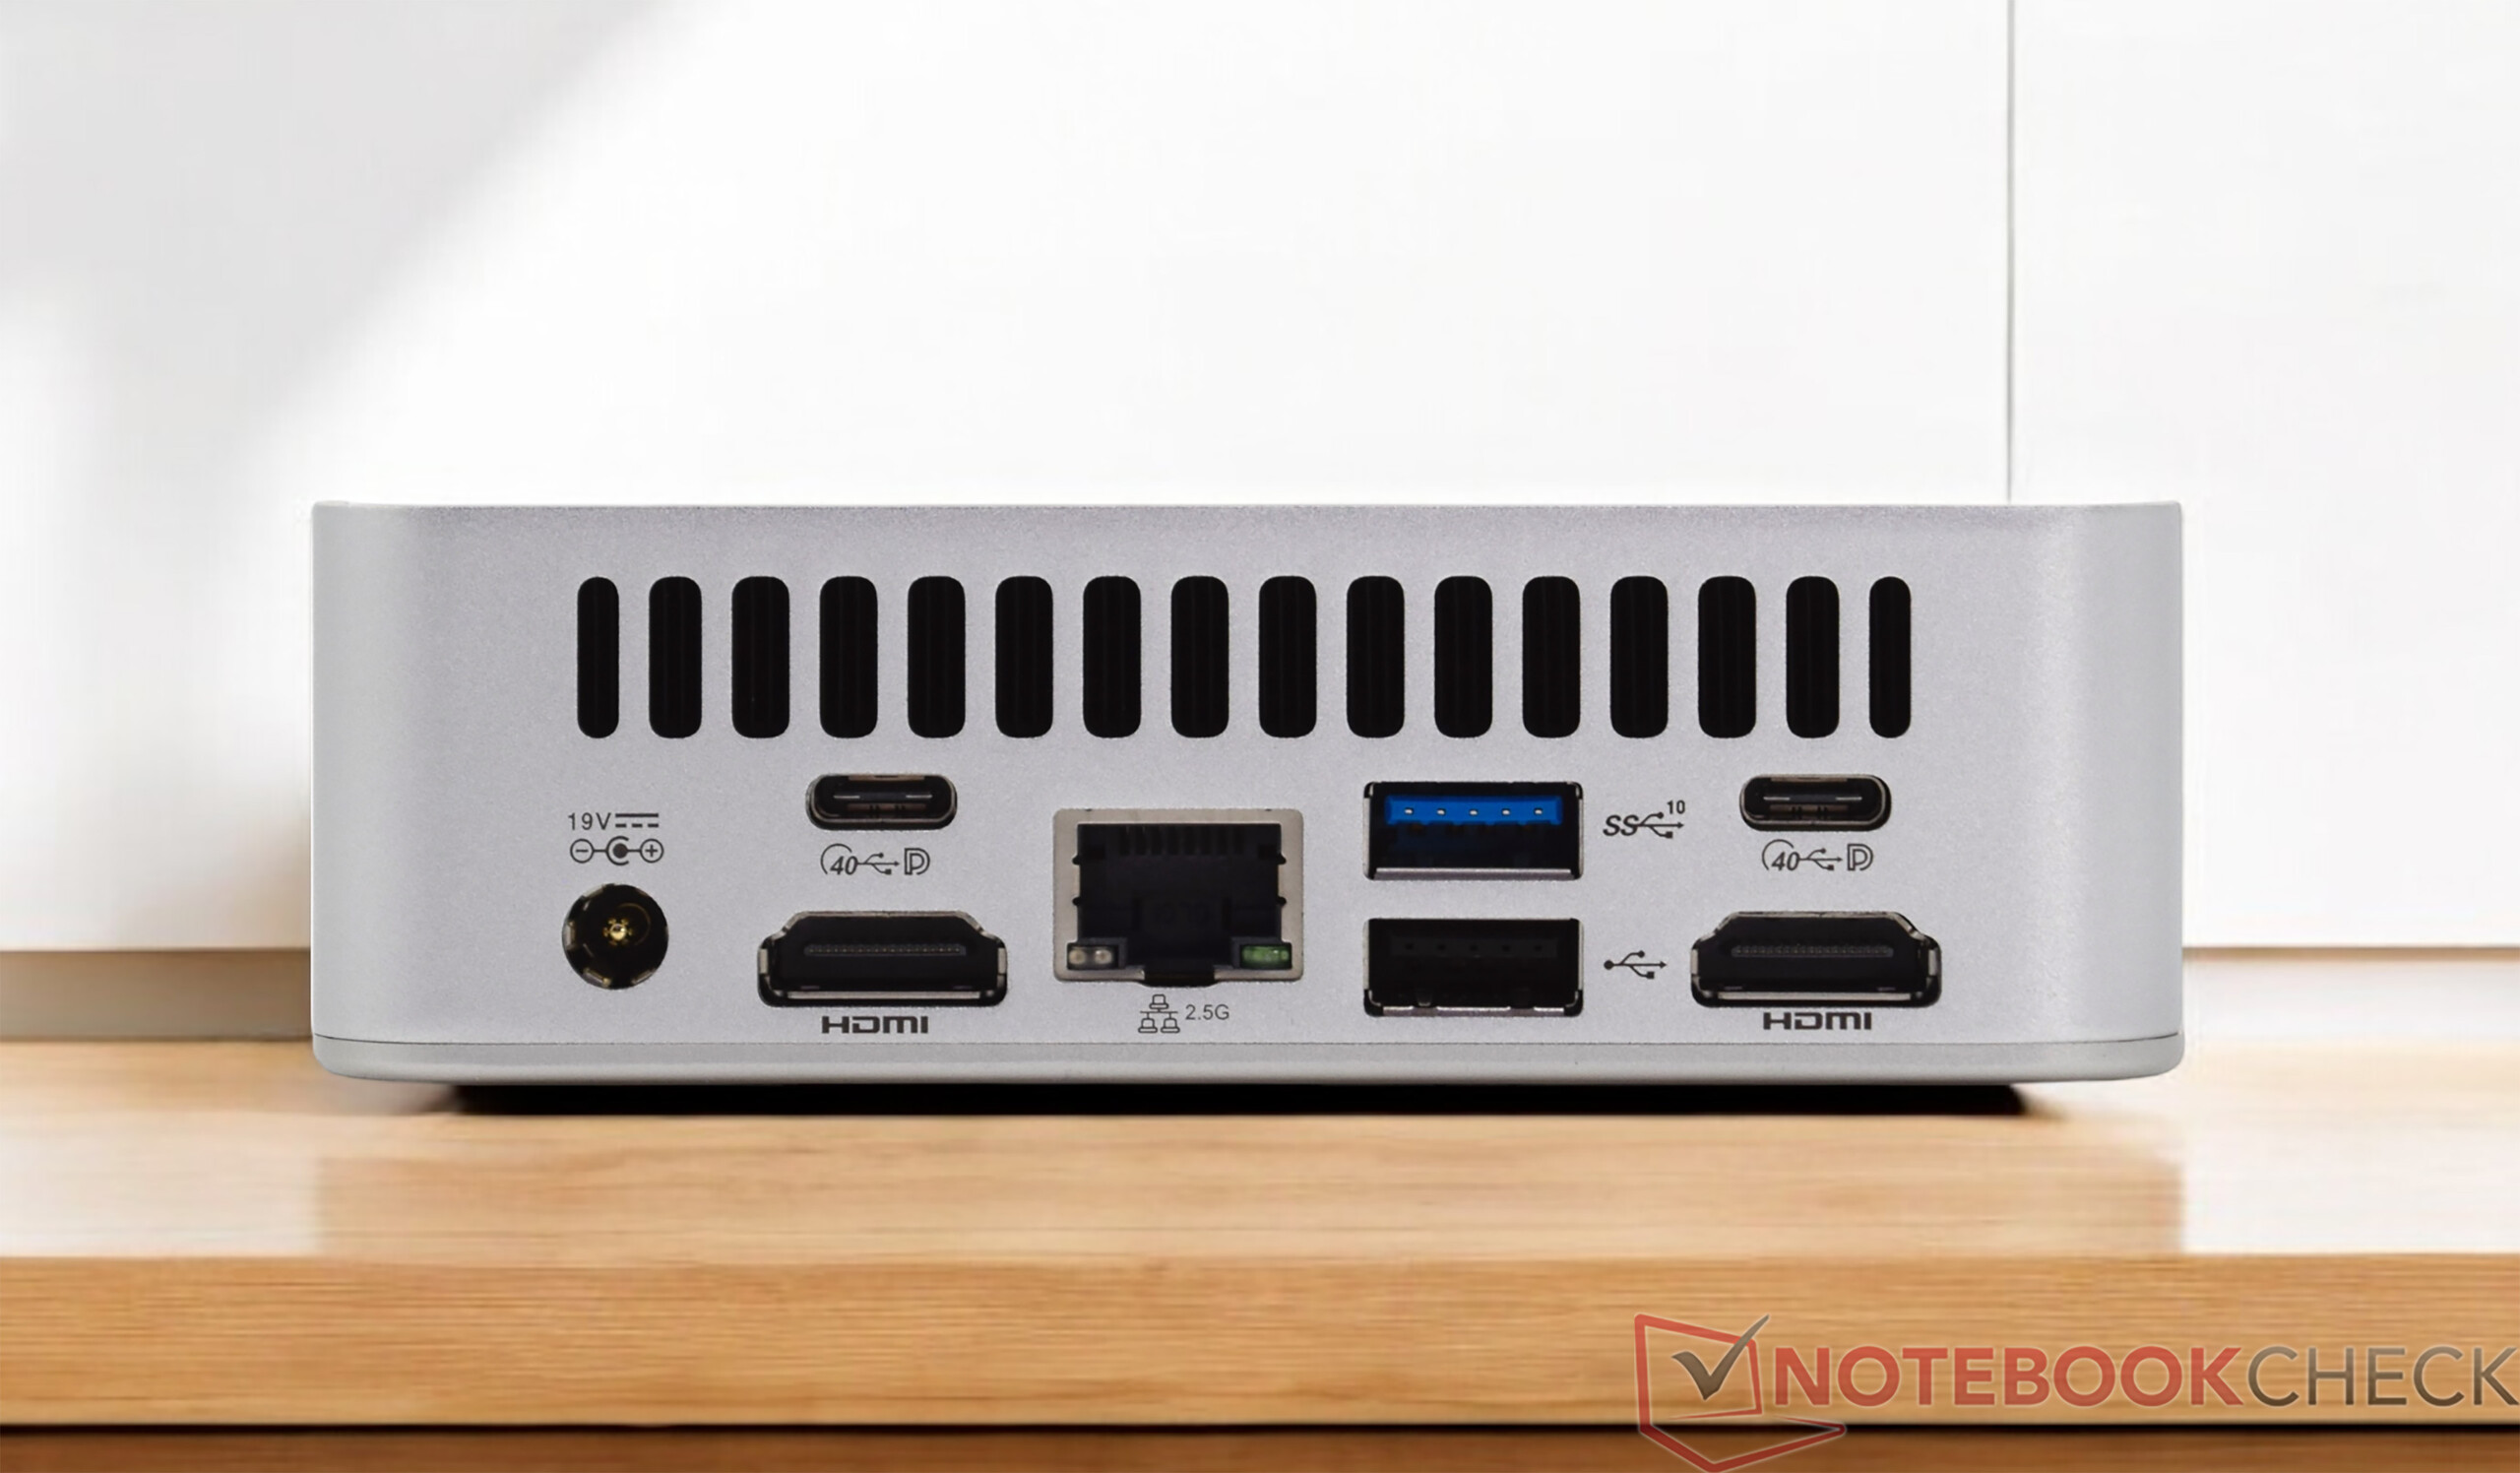
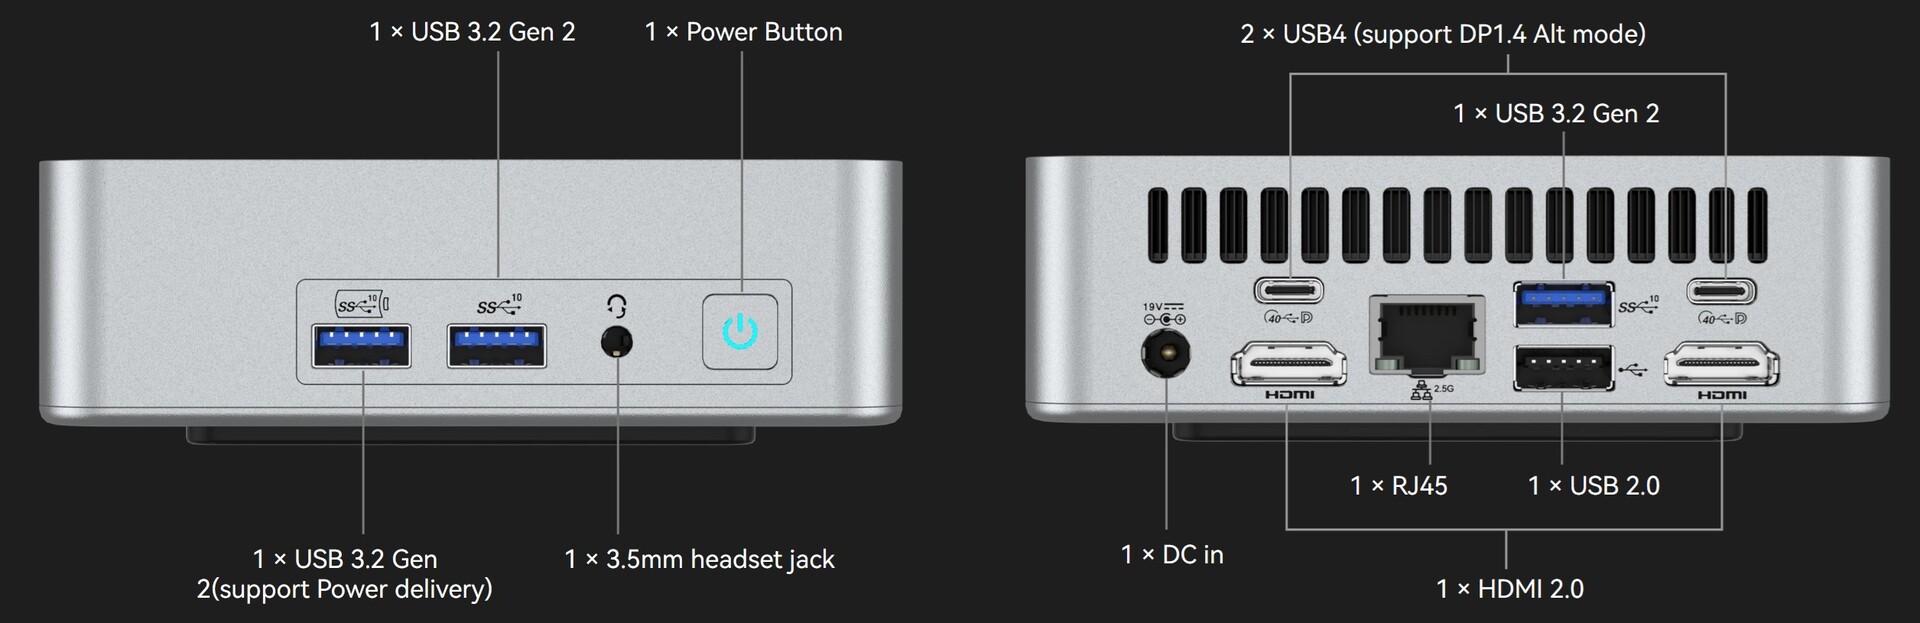
Em termos de interfaces externas, o Geekom XT13 Pro tem as mesmas opções que o Geekom XT12 Pro. Embora o dispositivo seja muito compacto, há muitas conexões diferentes. Os dois soquetes USB-C na parte traseira são portas USB4 modernas, expandindo muito a gama de aplicações com os acessórios certos. Um total de quatro telas pode ser operado simultaneamente e há também uma conexão LAN.
Comunicação
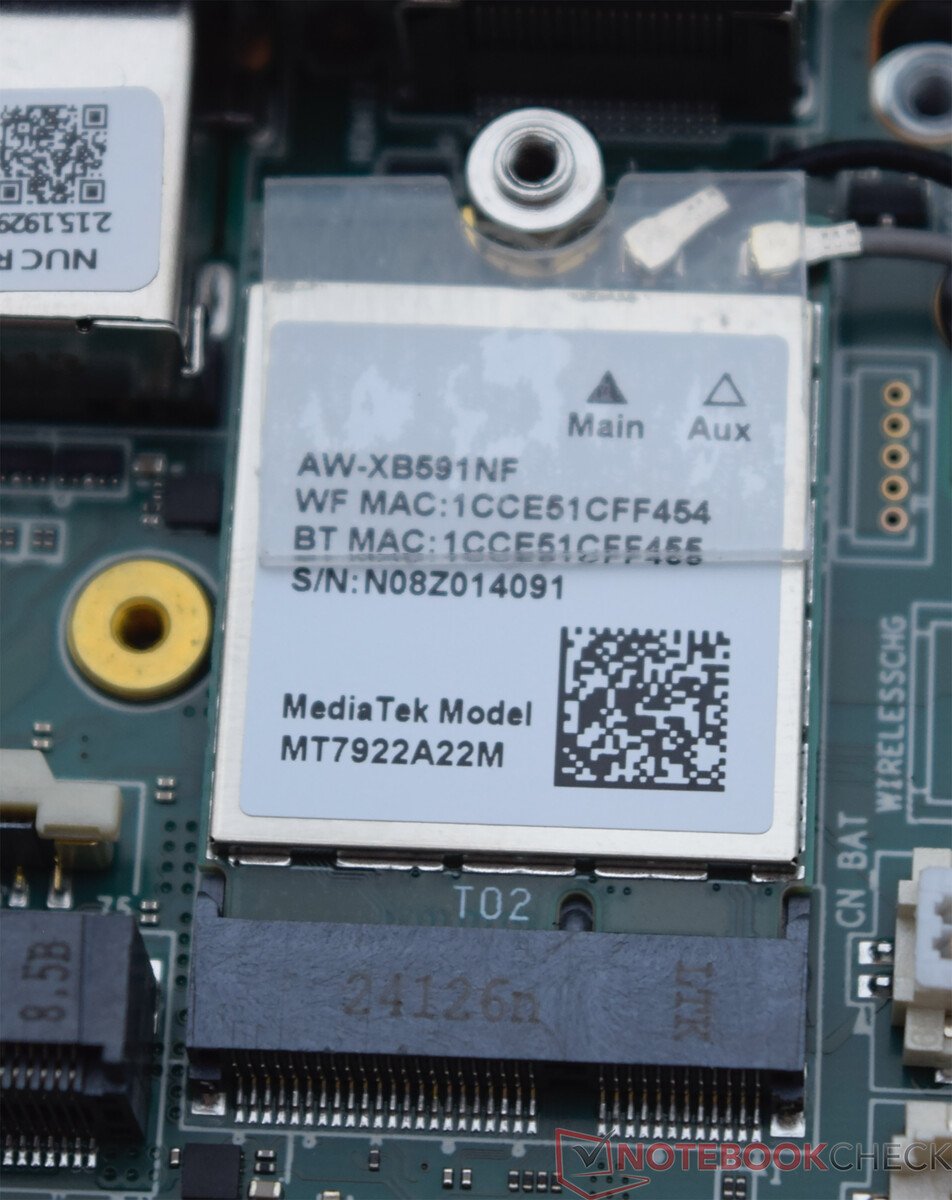
O Geekom XT13 Pro usa um módulo sem fio bem conhecido que a Geekom instala em muitos de seus dispositivos. O módulo WLAN MediaTek Wi-Fi 6E MT7922 pode proporcionar um desempenho adequado em nosso dispositivo de teste. No entanto, se possível, a faixa de frequência de 6 GHz deve ser usada principalmente. Como alternativa, a conexão por cabo também pode ser usada. Taxas de dados de até 2,5 GBit/s são possíveis.
Acessórios
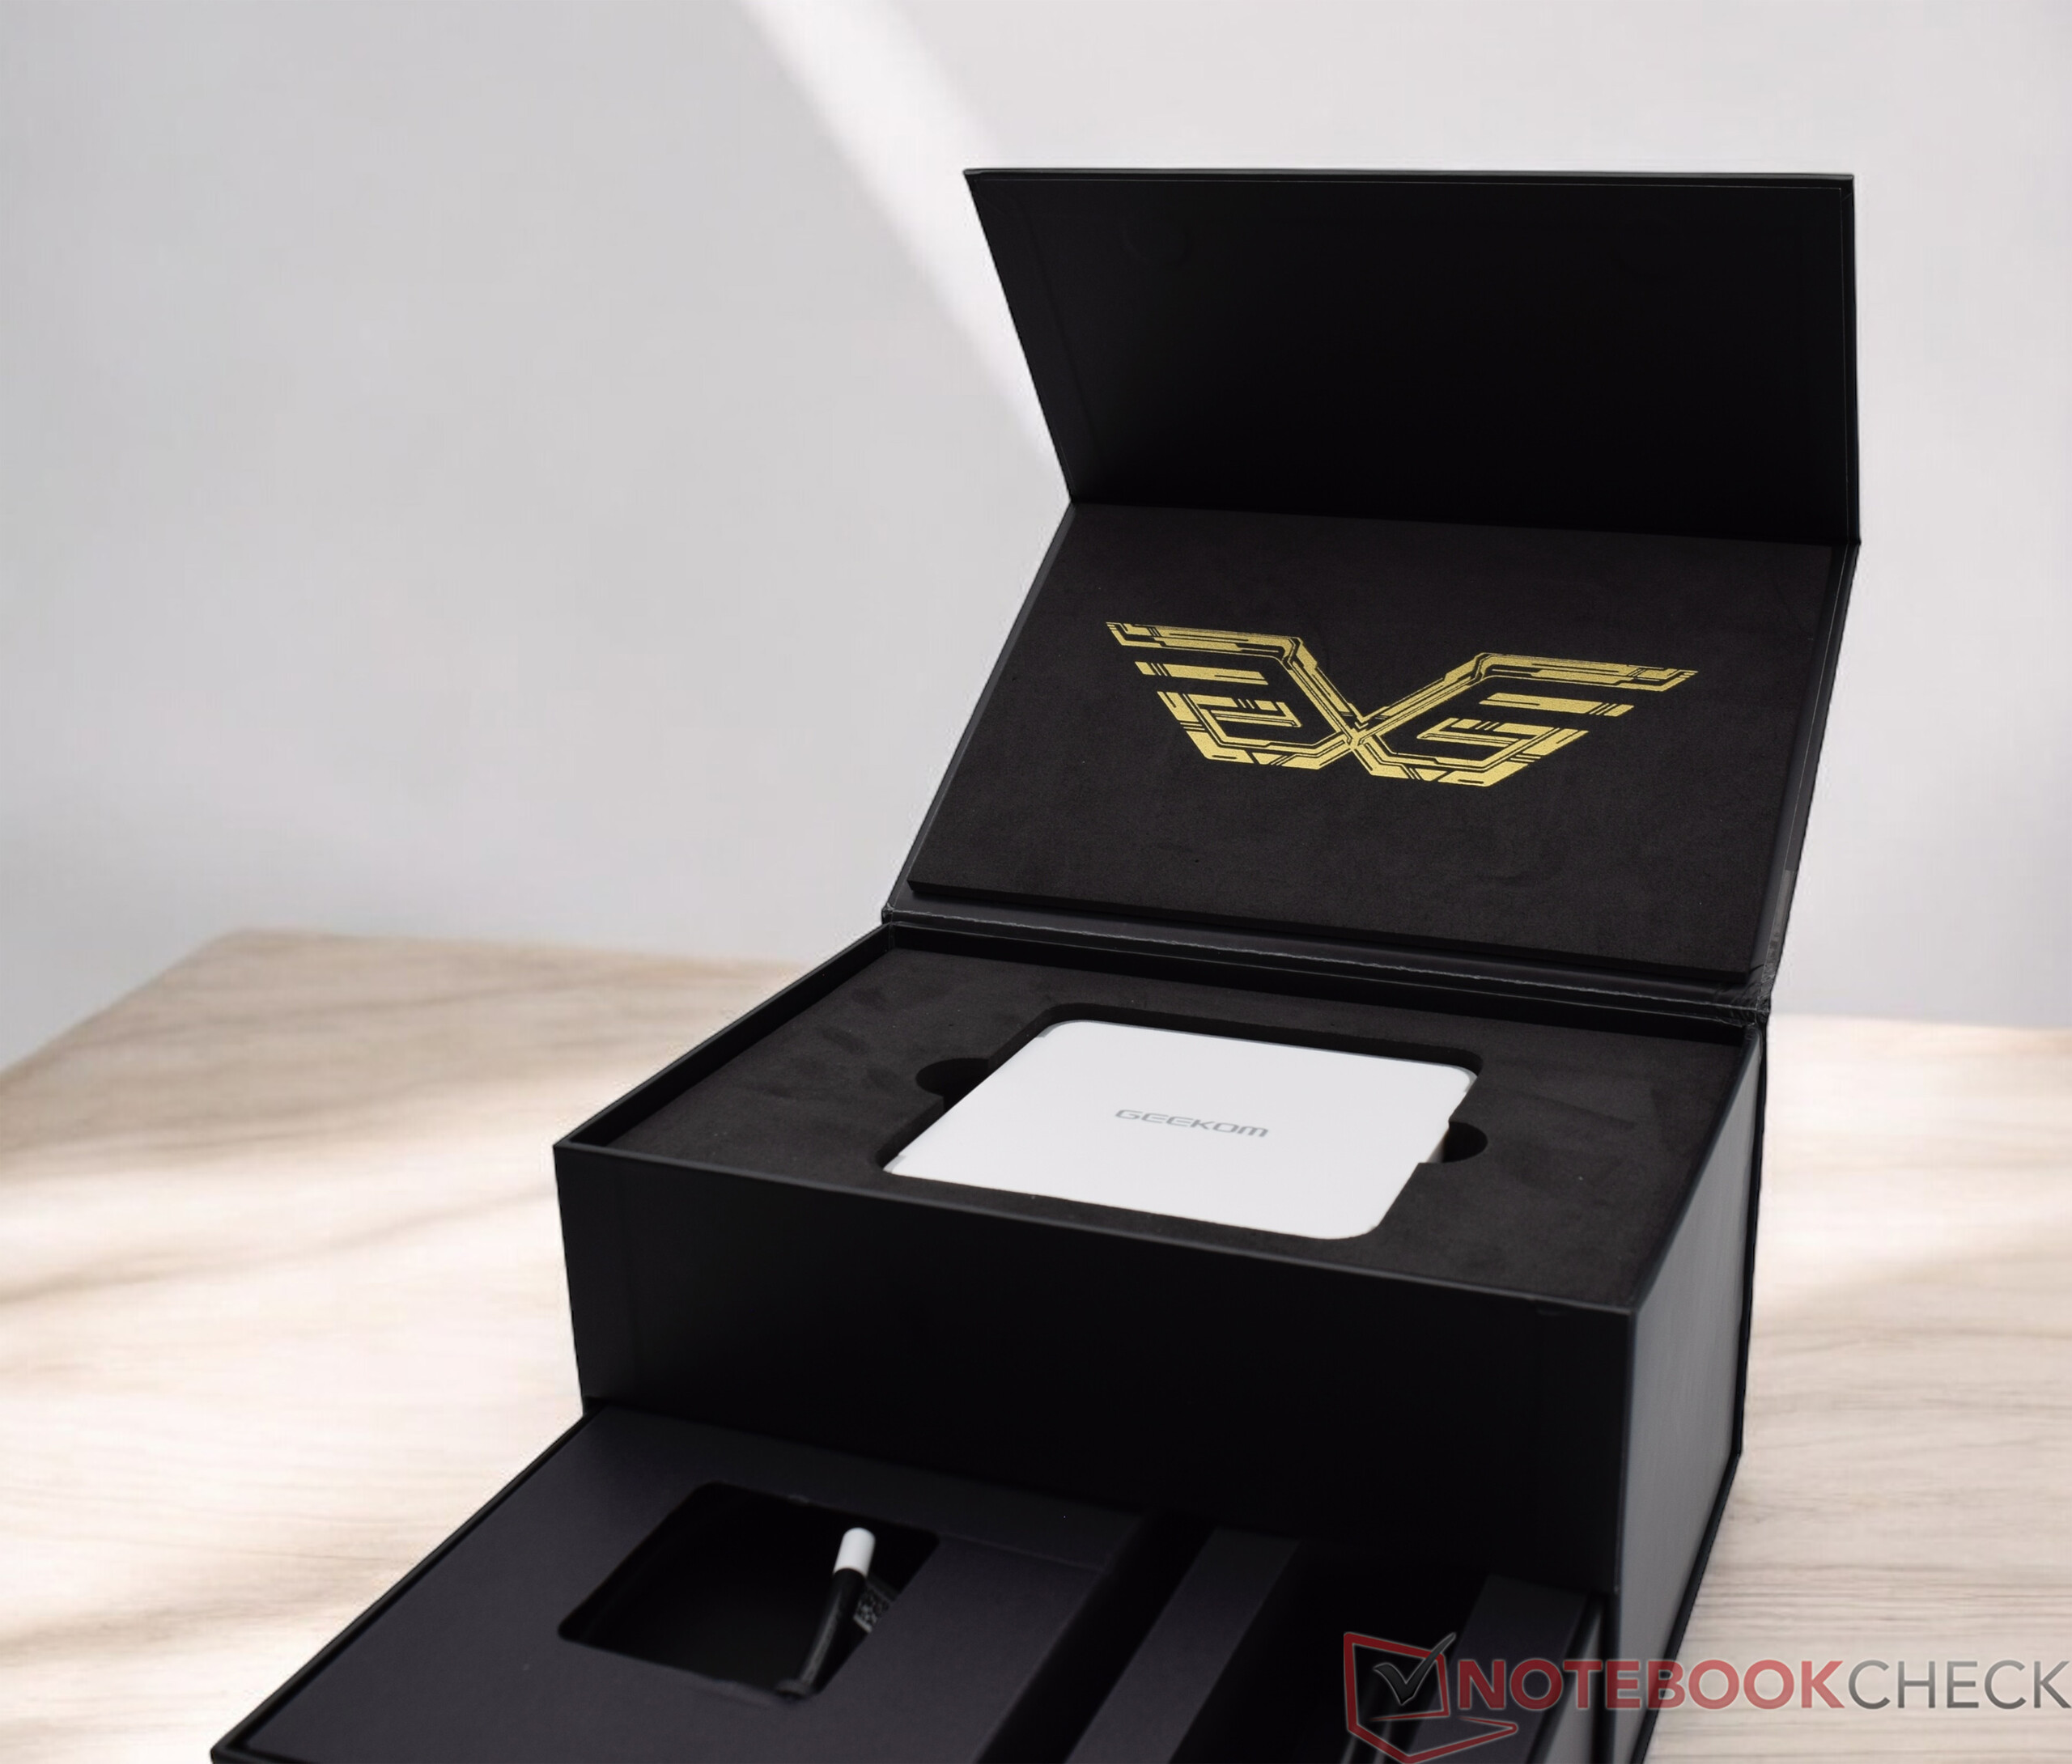
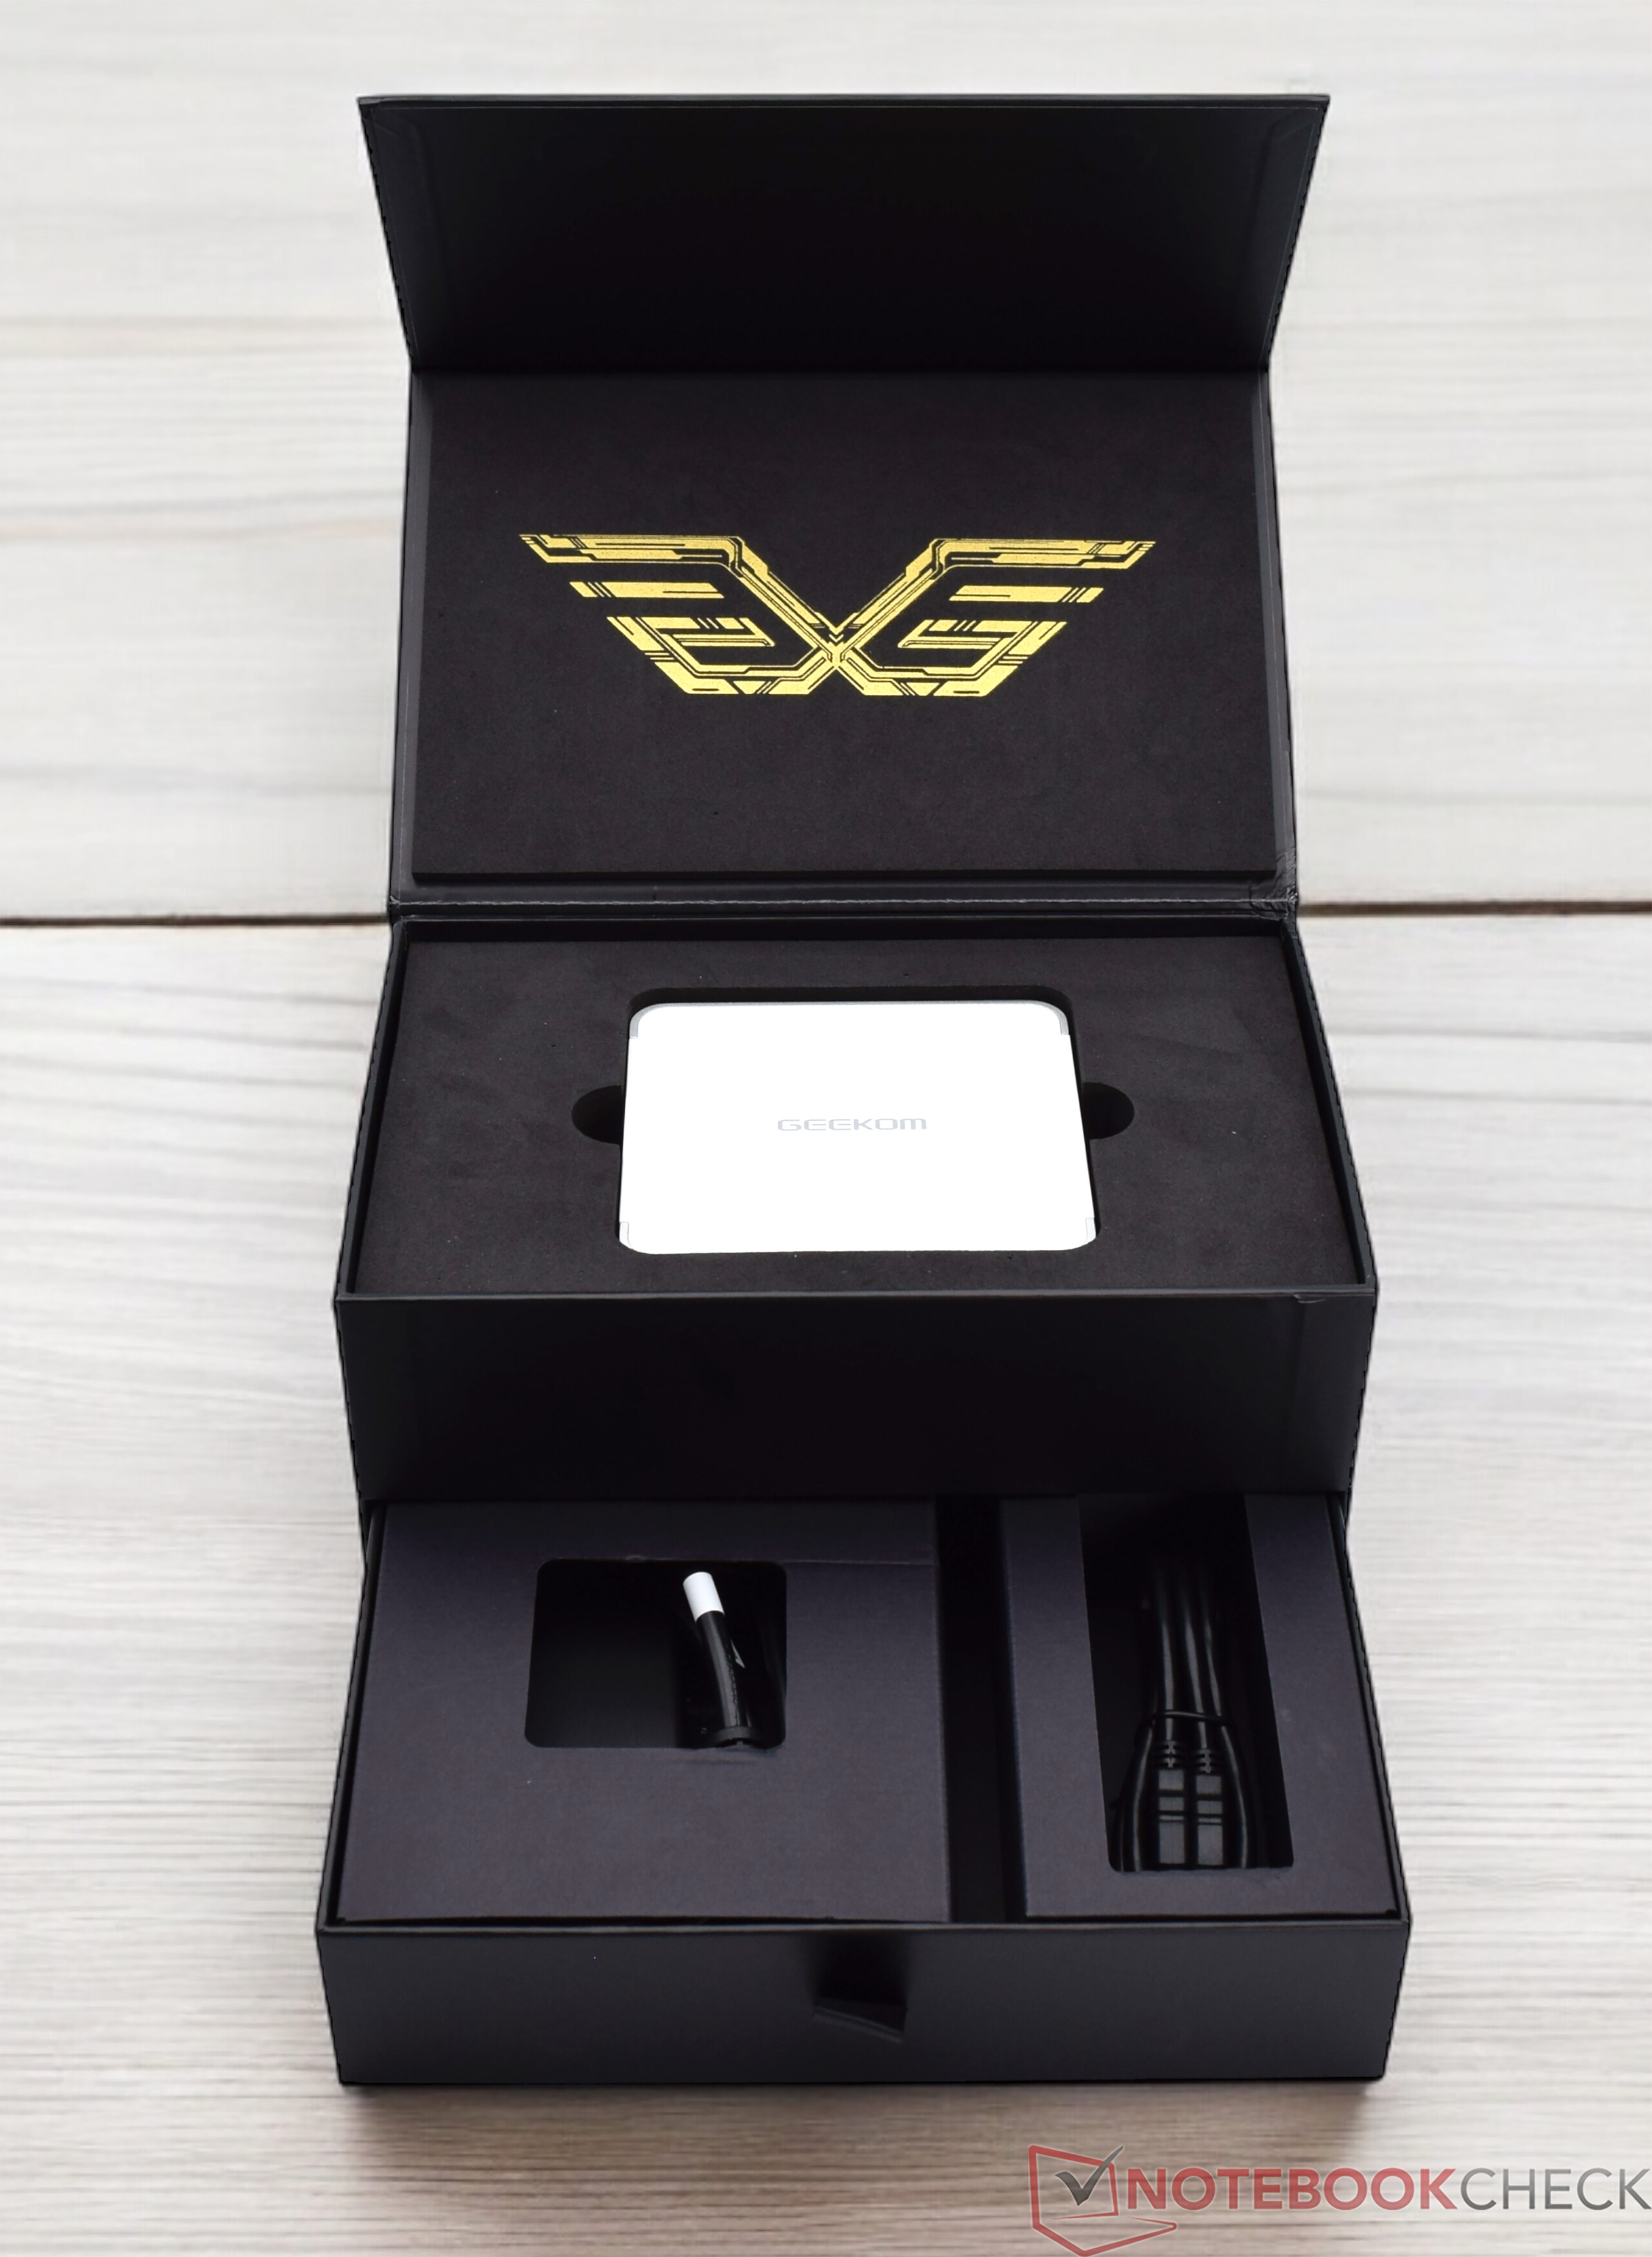
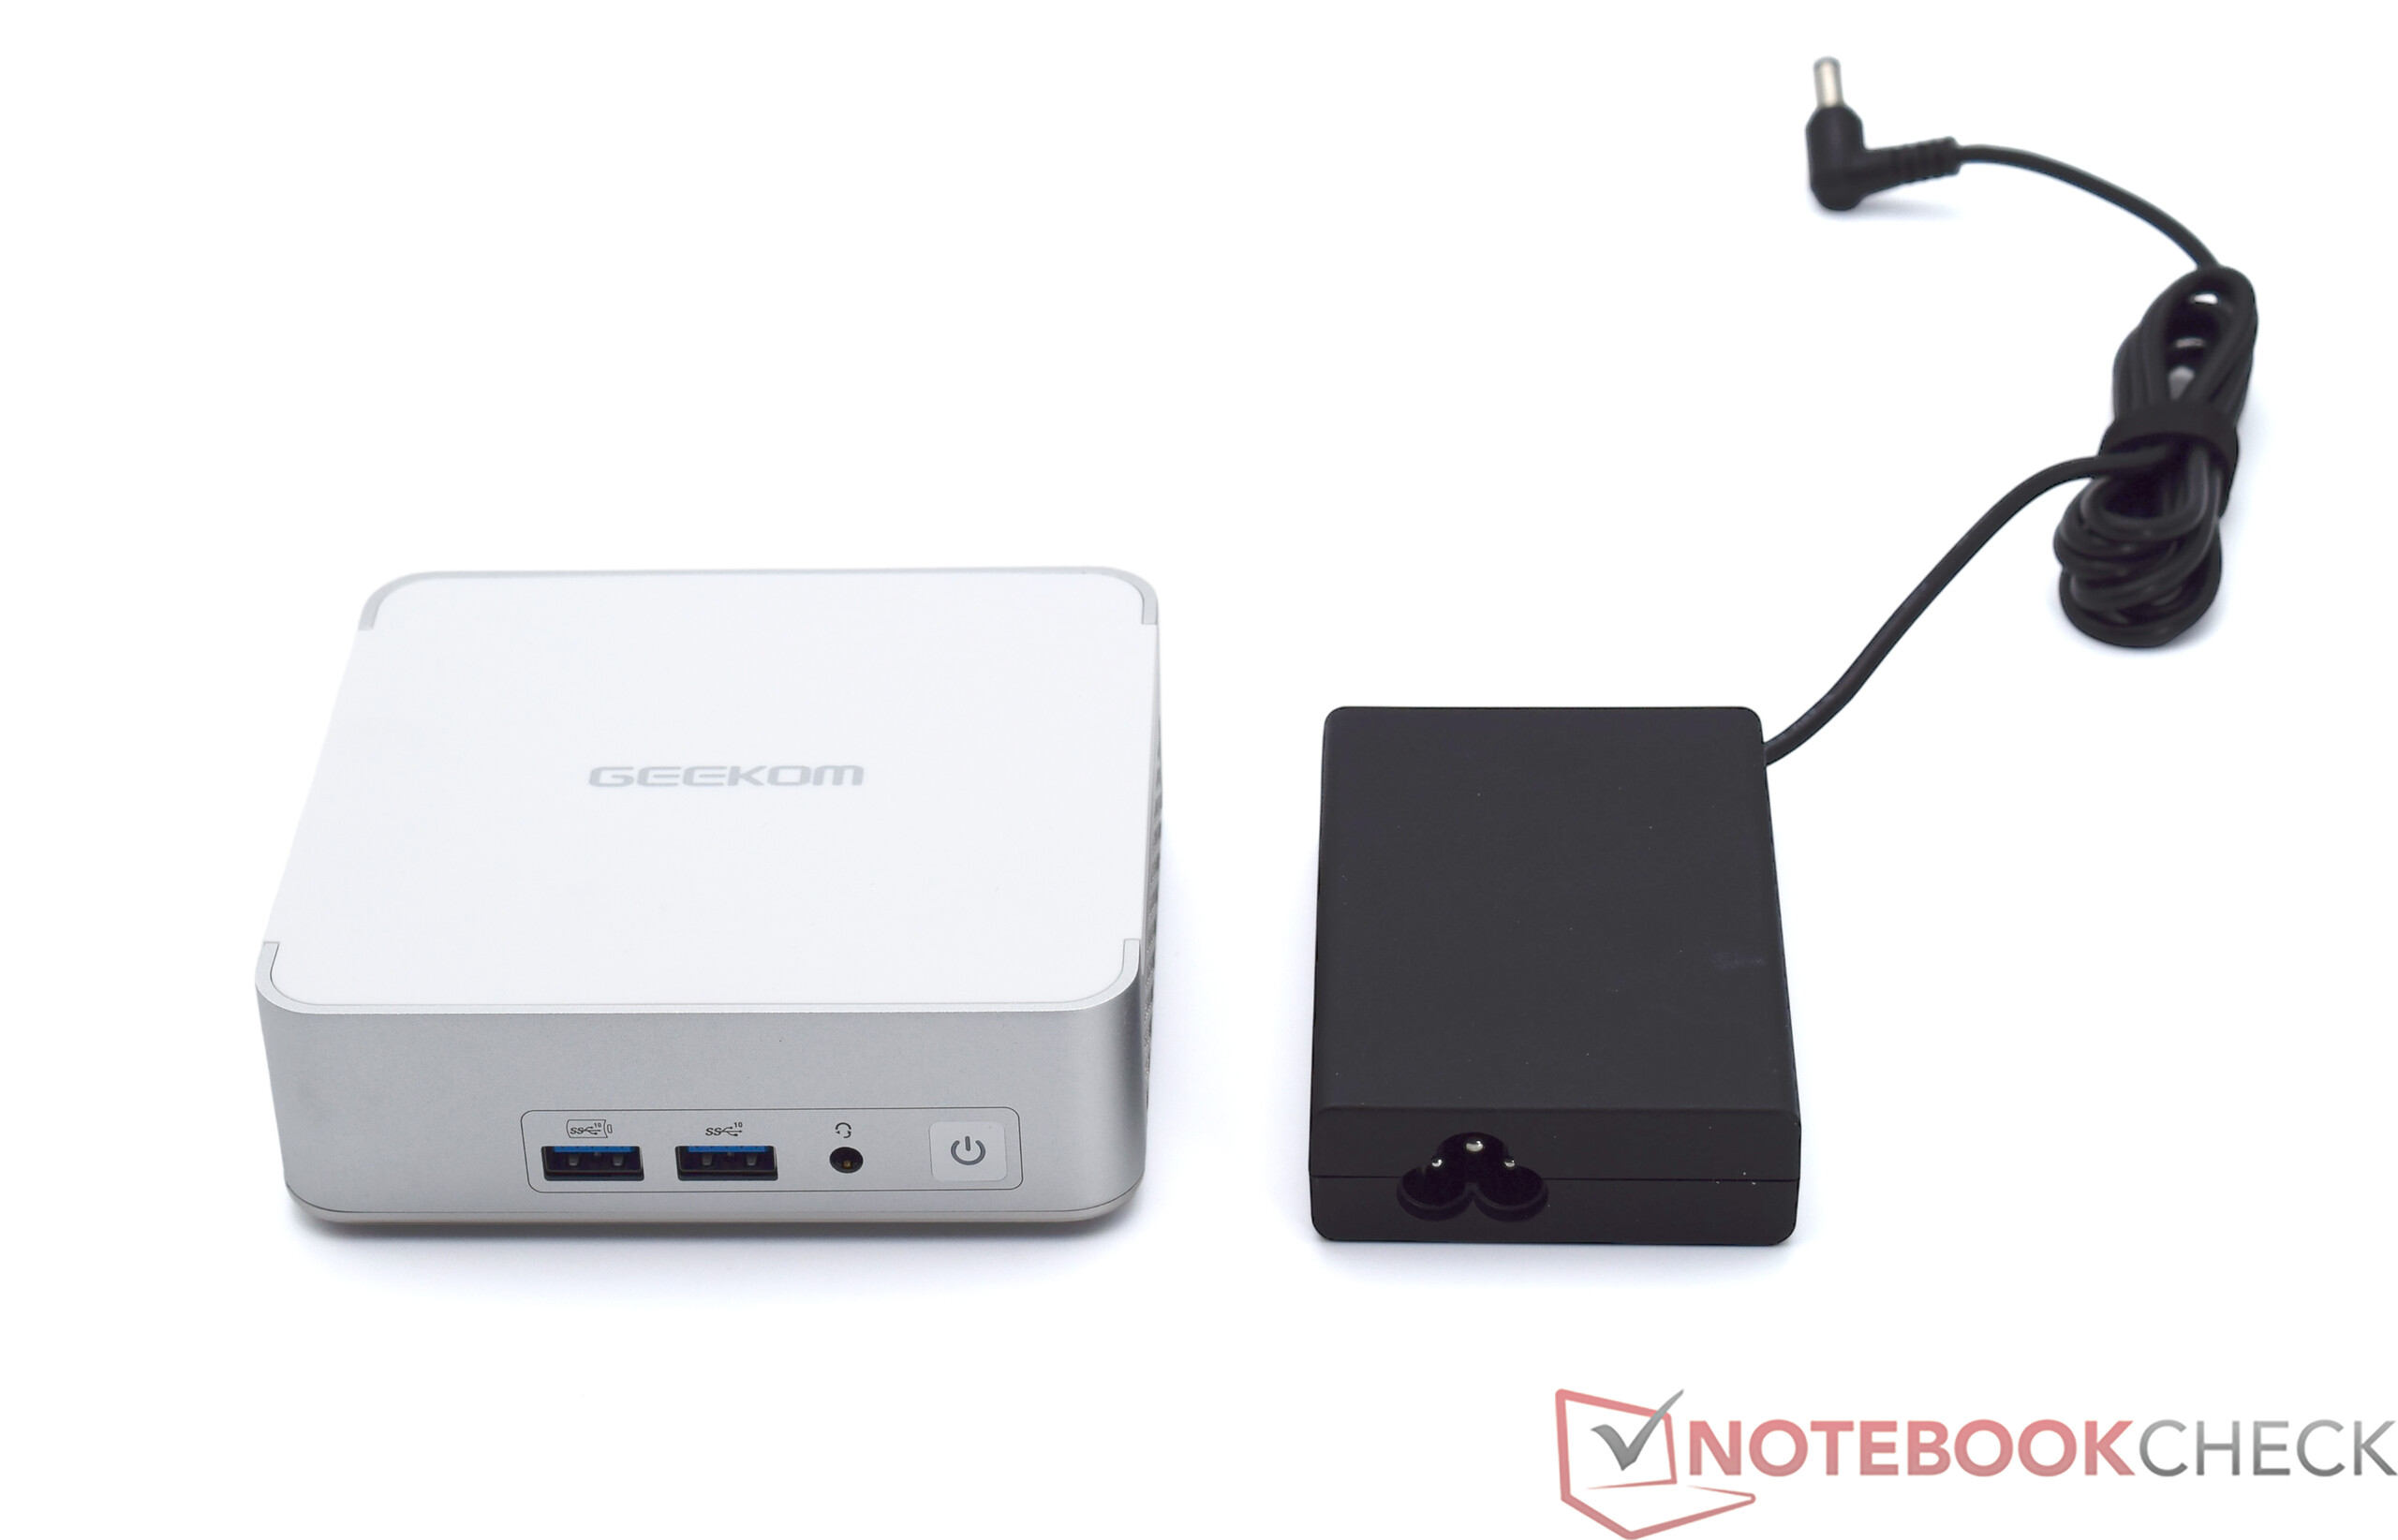
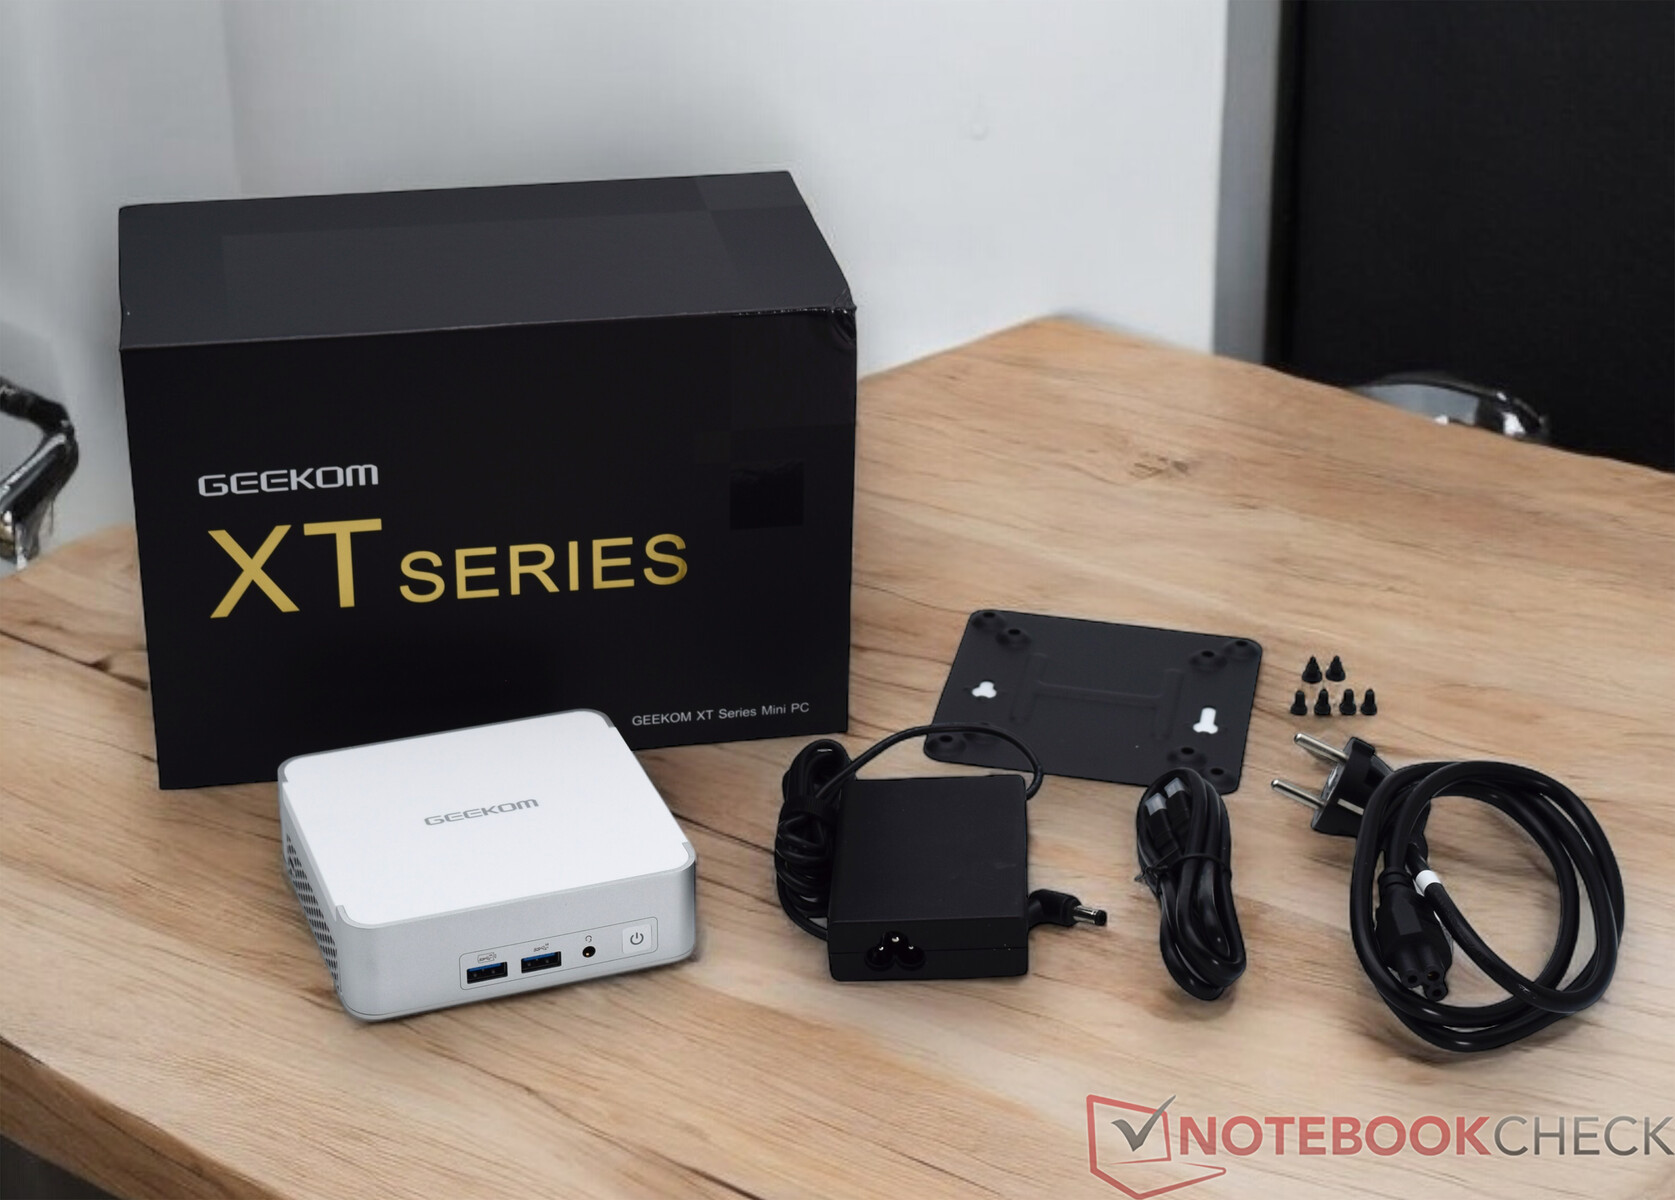
O escopo de entrega do Geekom XT13 Pro oferece o padrão habitual. Além do próprio dispositivo, a caixa também contém a fonte de alimentação de 120 watts e um suporte VESA com material de montagem. Um cabo HDMI e o cartão de agradecimento obrigatório da Geekom também estão incluídos.
Manutenção
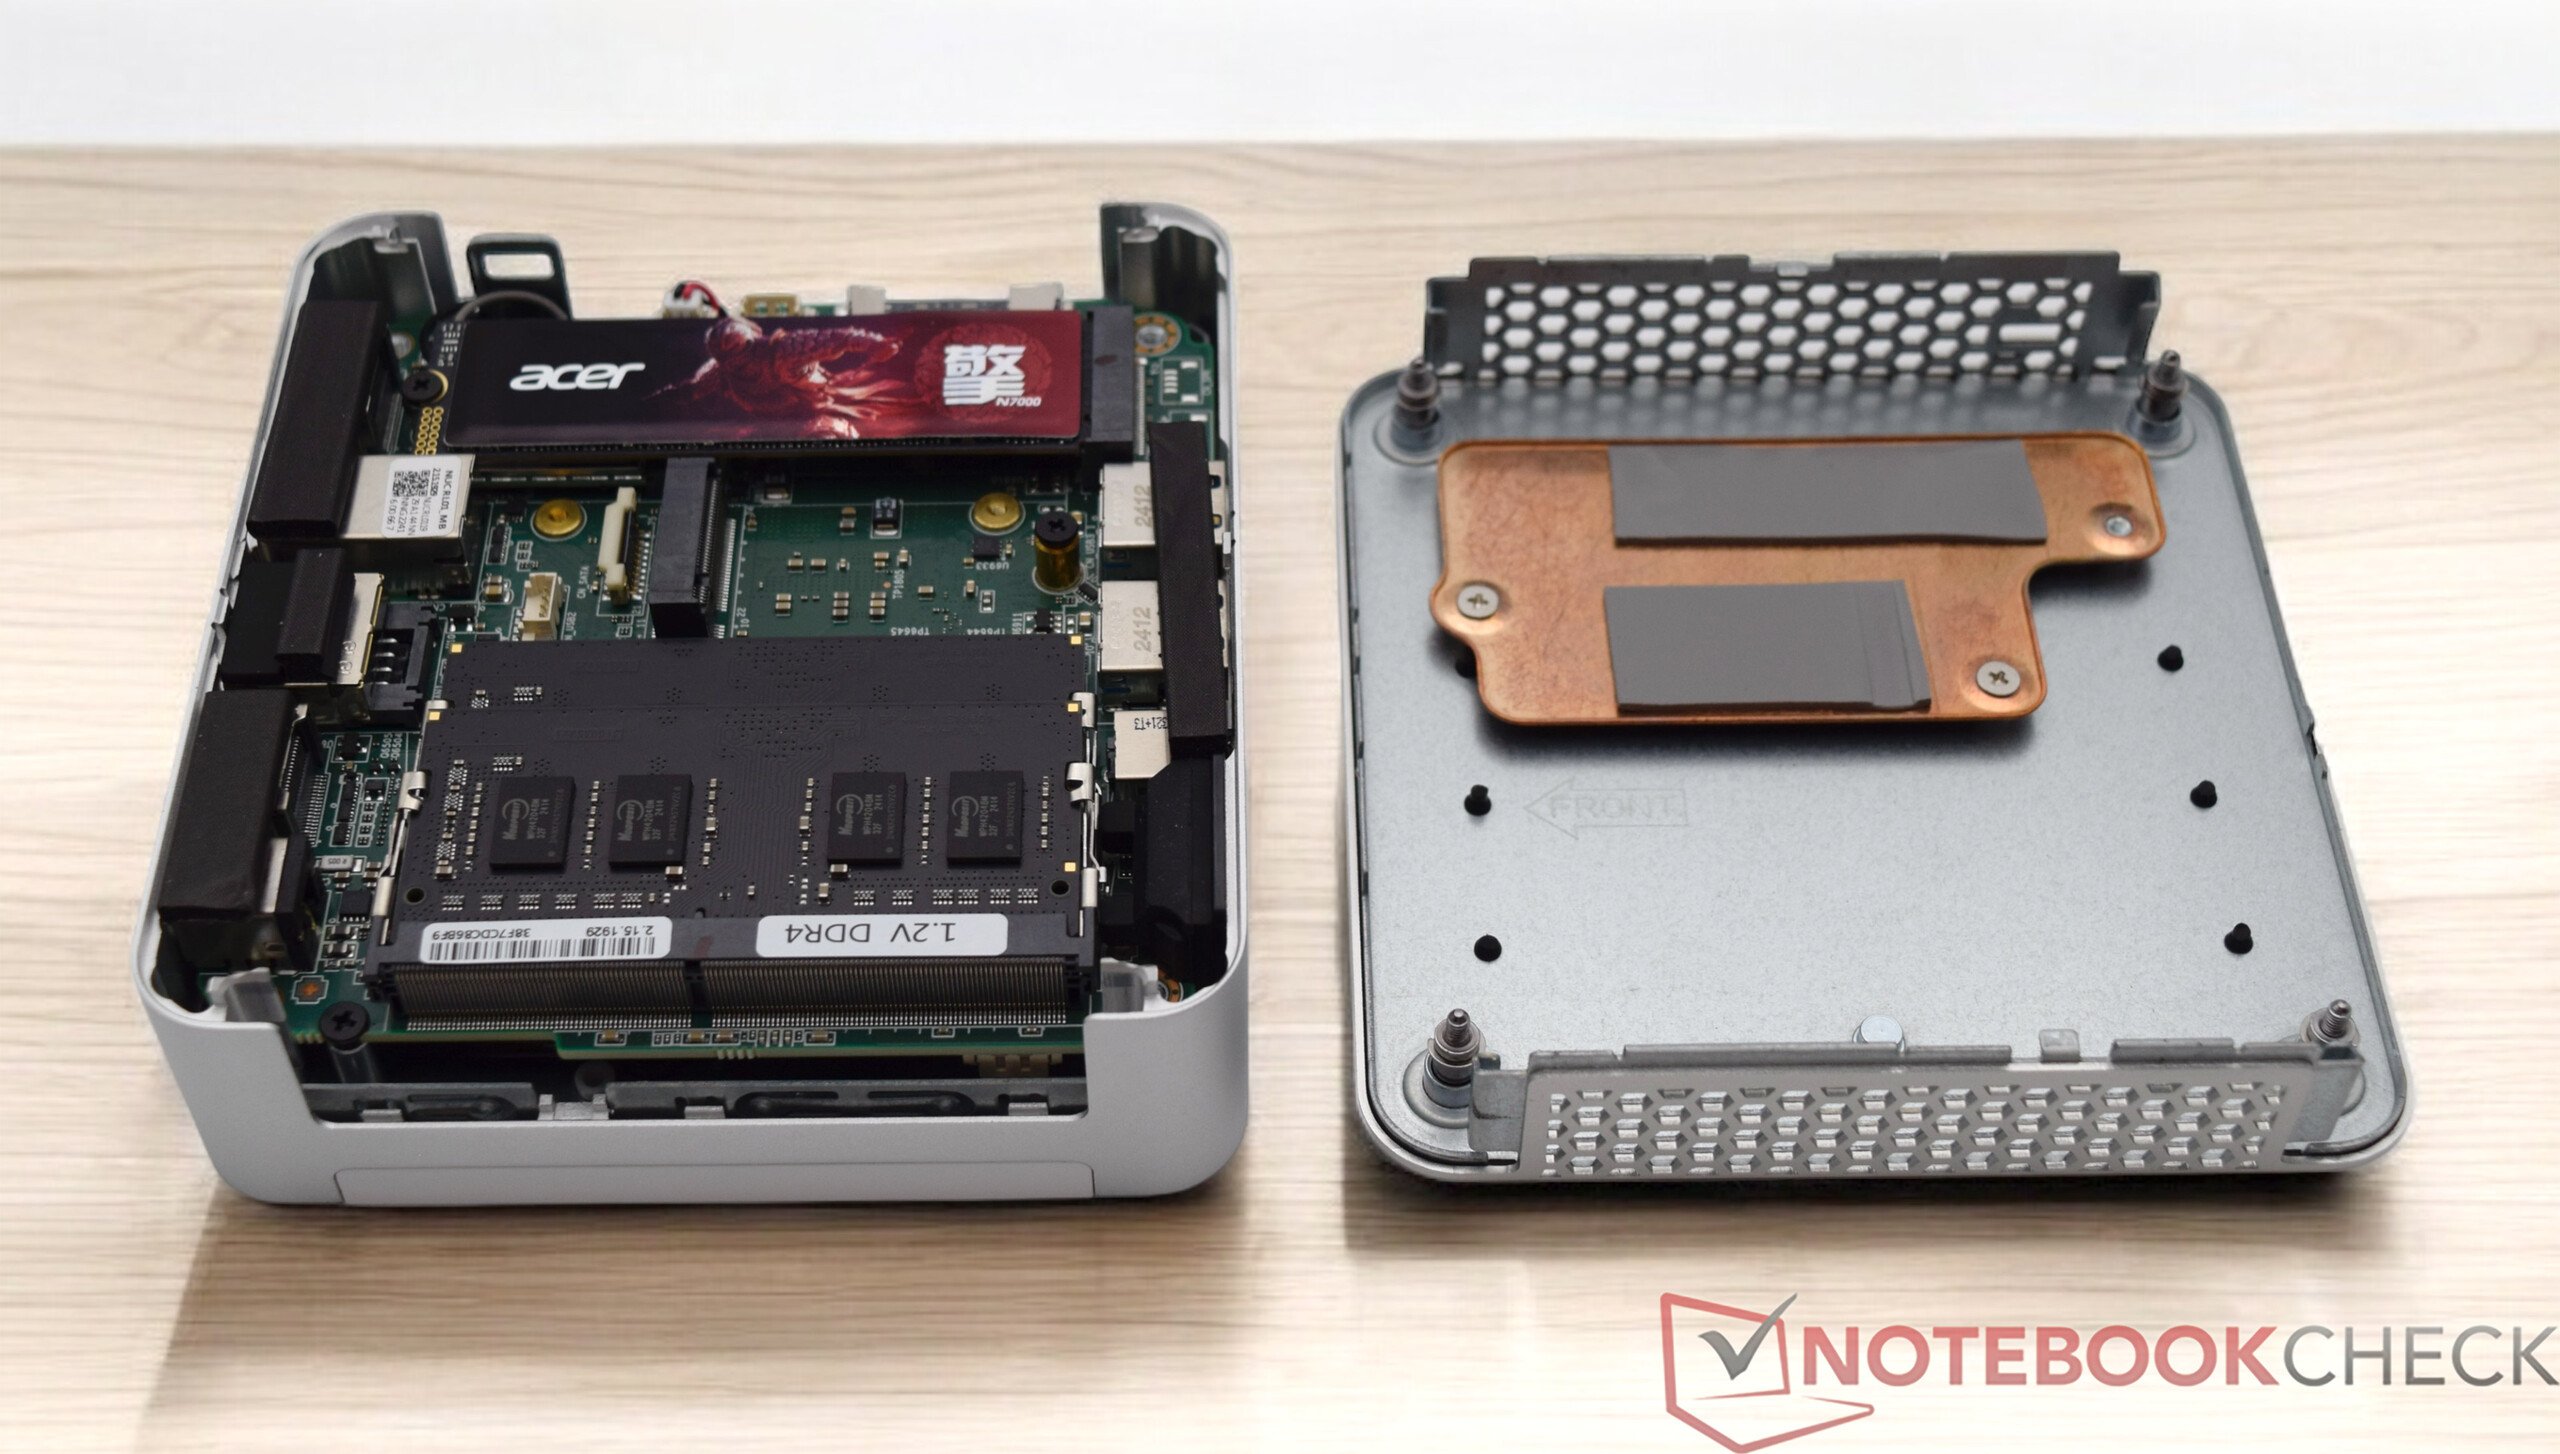
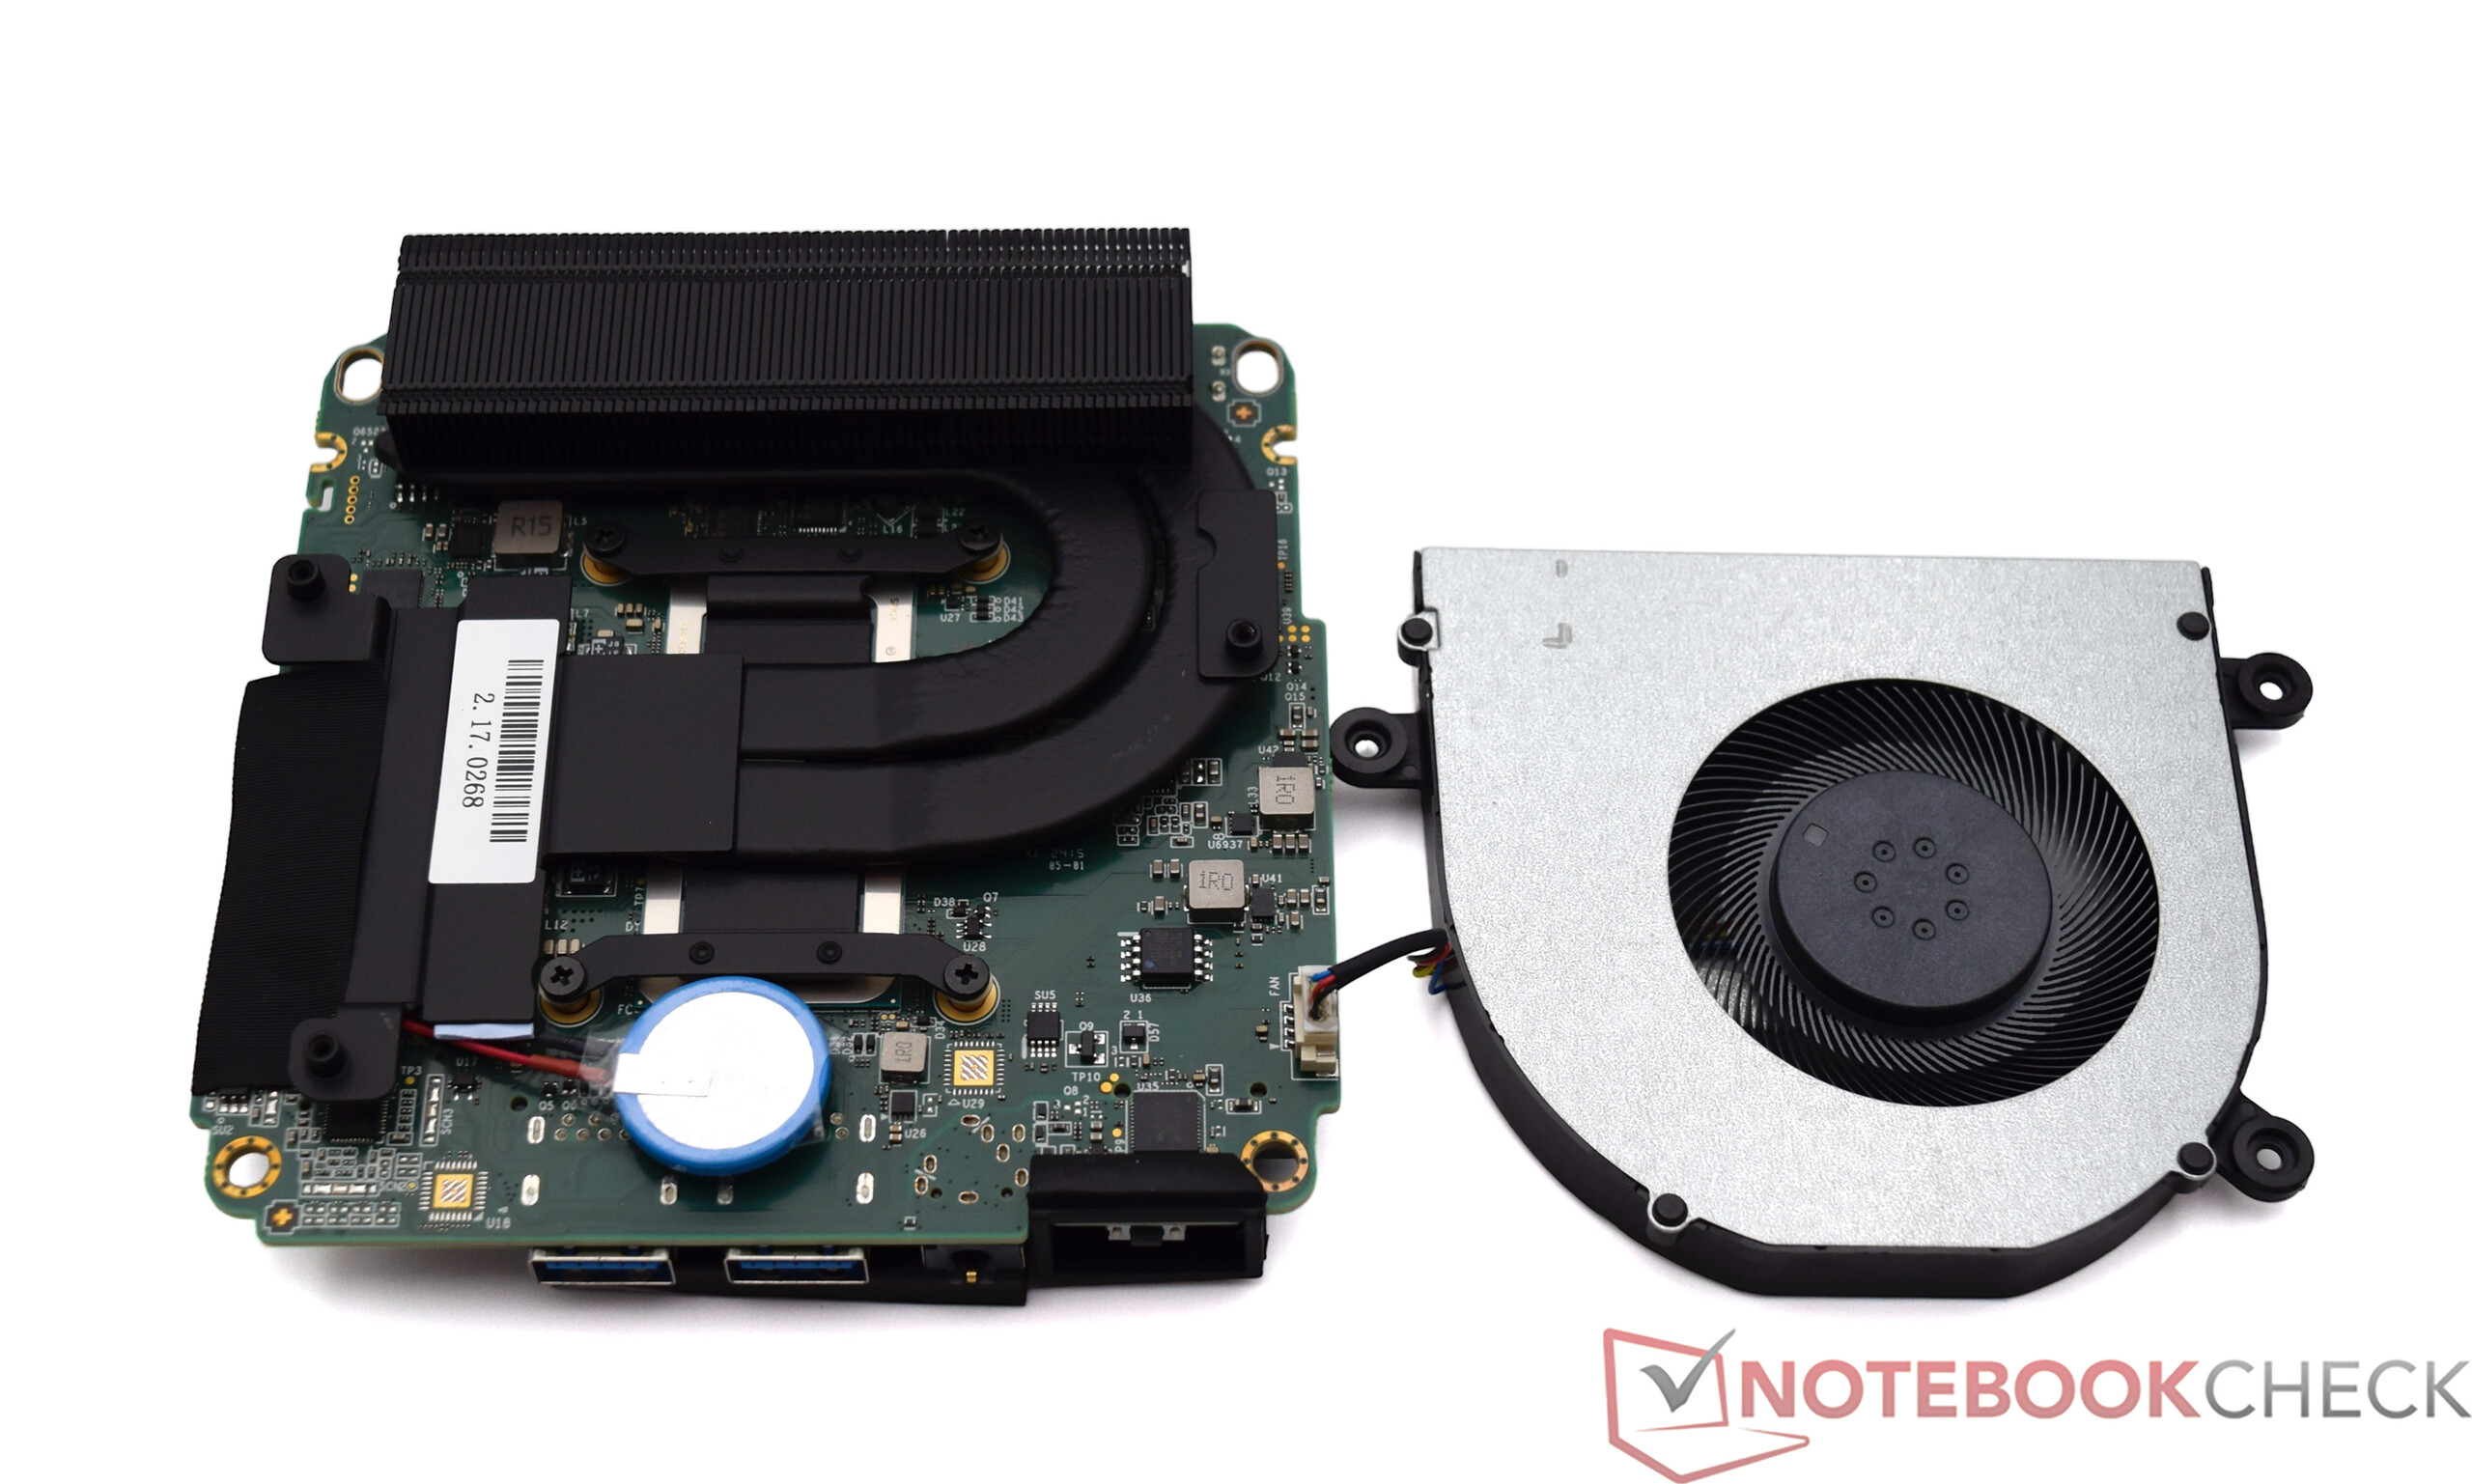
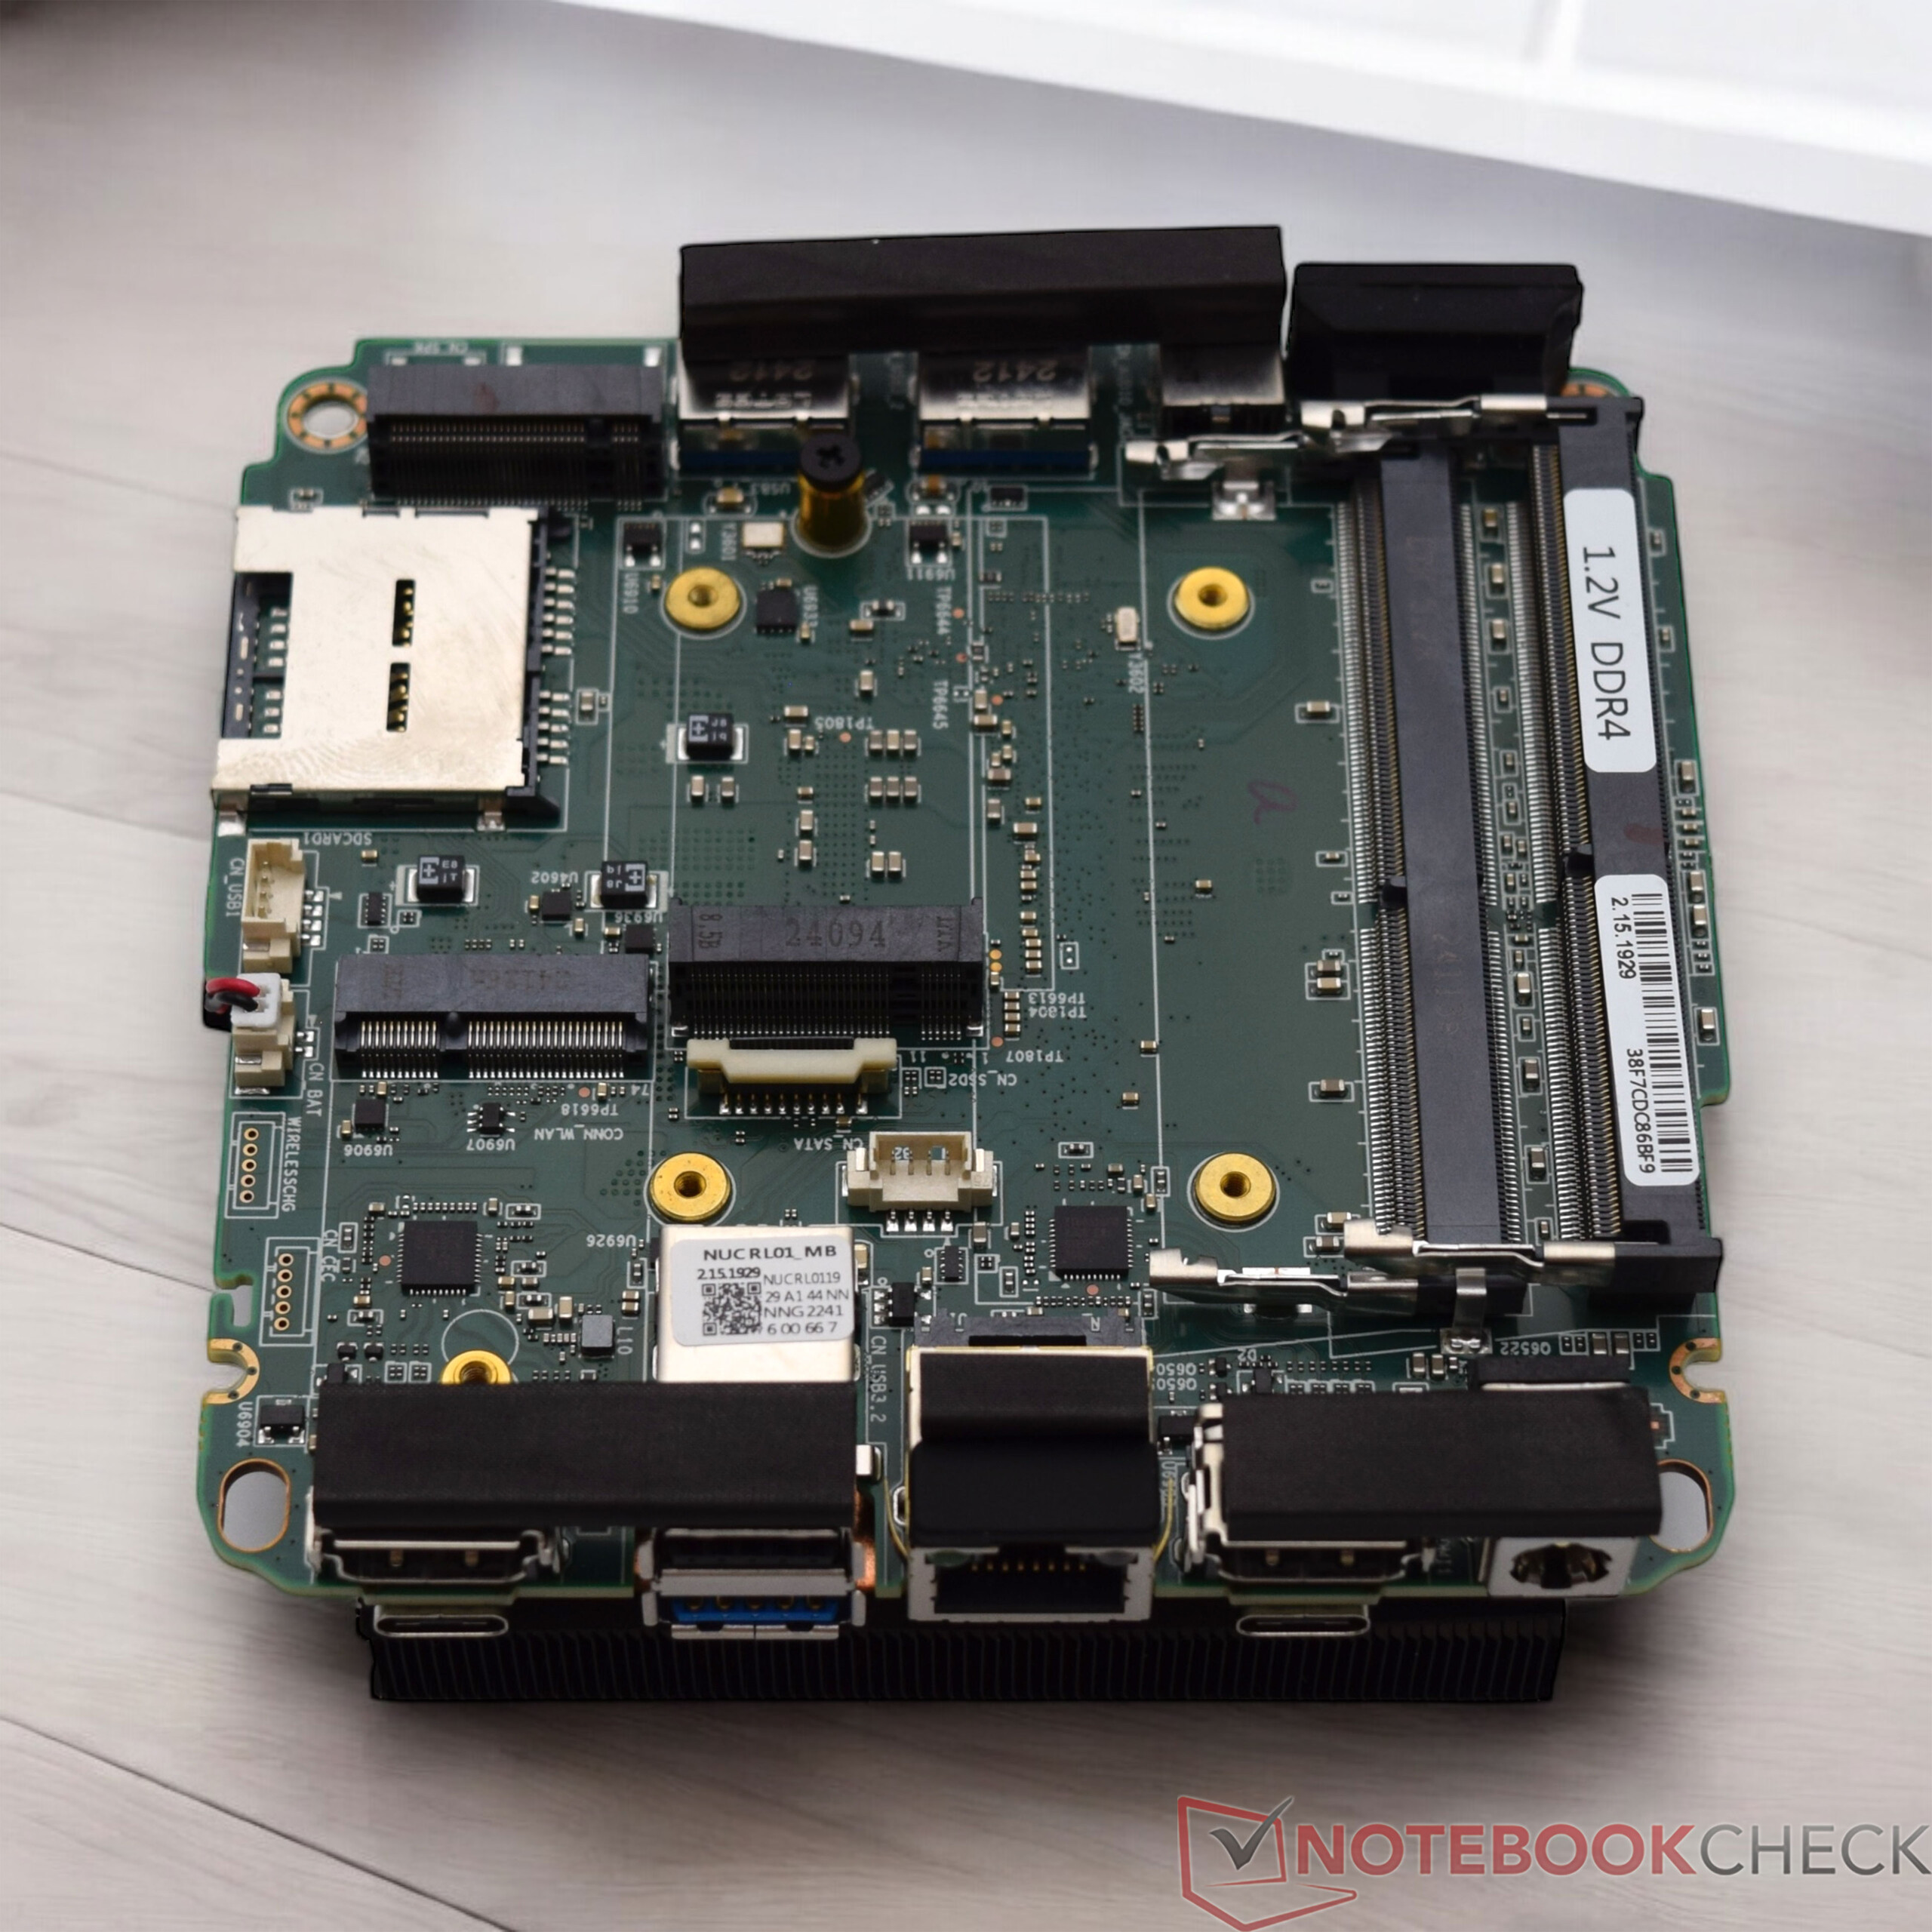
O Geekom XT13 Pro é fácil de abrir. Apenas quatro parafusos pequenos precisam ser soltos na parte inferior, que prendem a placa de base ao restante do gabinete. Há um cooler para SSD na própria placa de base, e é por isso que o senhor deve ter um pouco mais de cuidado nesse ponto. A RAM e o armazenamento em massa são facilmente acessíveis. No nosso caso, é possível instalar um SSD adicional. Entretanto, o padrão correto deve ser observado aqui, pois somente SSDs SATA com comprimento de 42 milímetros são compatíveis.
Sustentabilidade
O Geekom XT13 Pro é entregue em uma caixa comparativamente grande com muito "ar". Já vimos a Geekom fazer as coisas de forma diferente. Além disso, os acessórios padrão fornecidos são embalados em sacos plásticos separados, o que poderia ser melhorado em termos de sustentabilidade. O dispositivo em si é feito principalmente de metal e plástico. Entretanto, não sabemos se foram usados materiais reciclados em sua fabricação. Como ponto positivo, o fabricante oferece uma garantia de 36 meses.
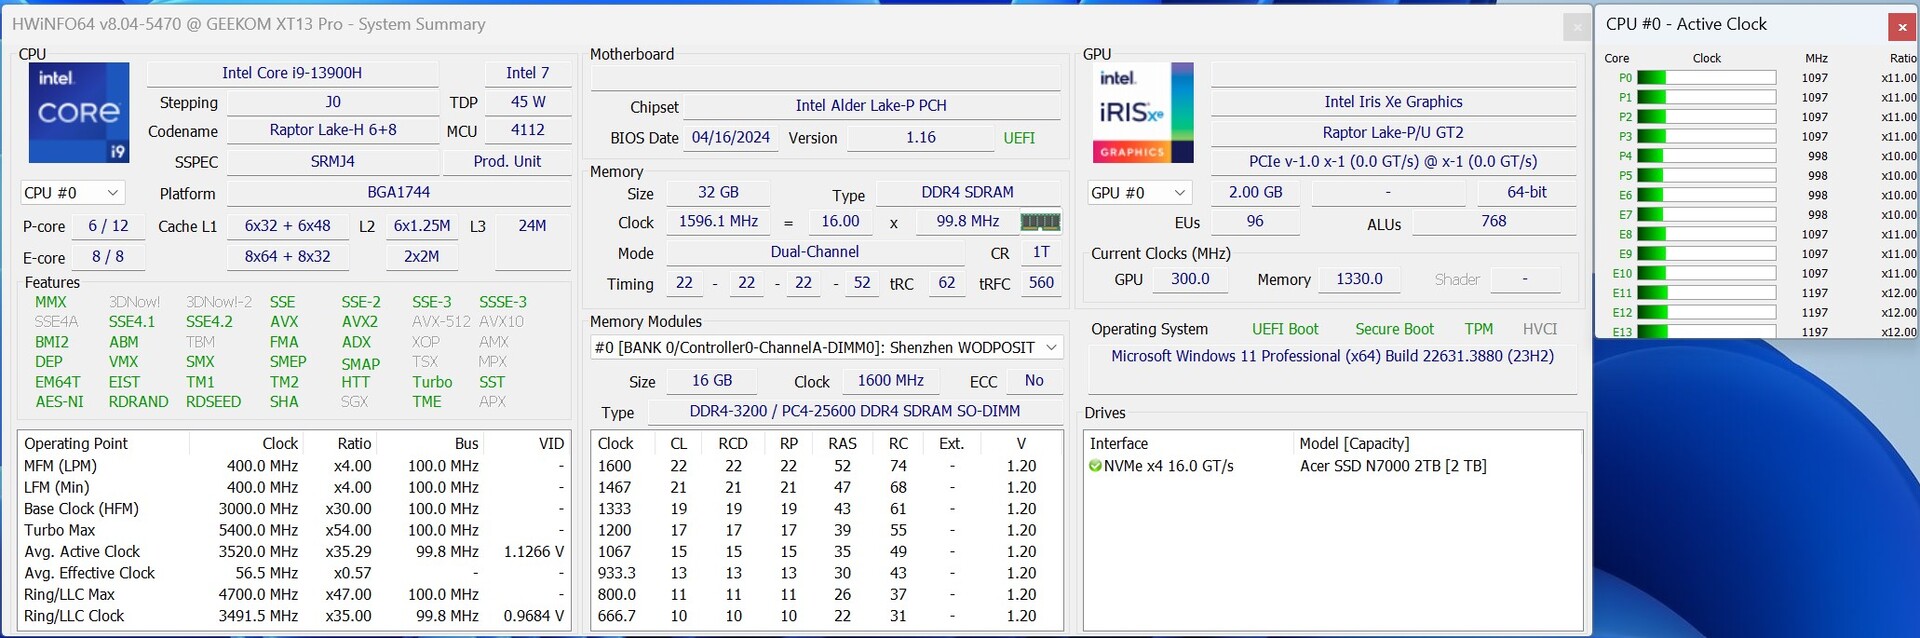
Desempenho - Intel Core i9-13900H com 14 núcleos e 20 threads
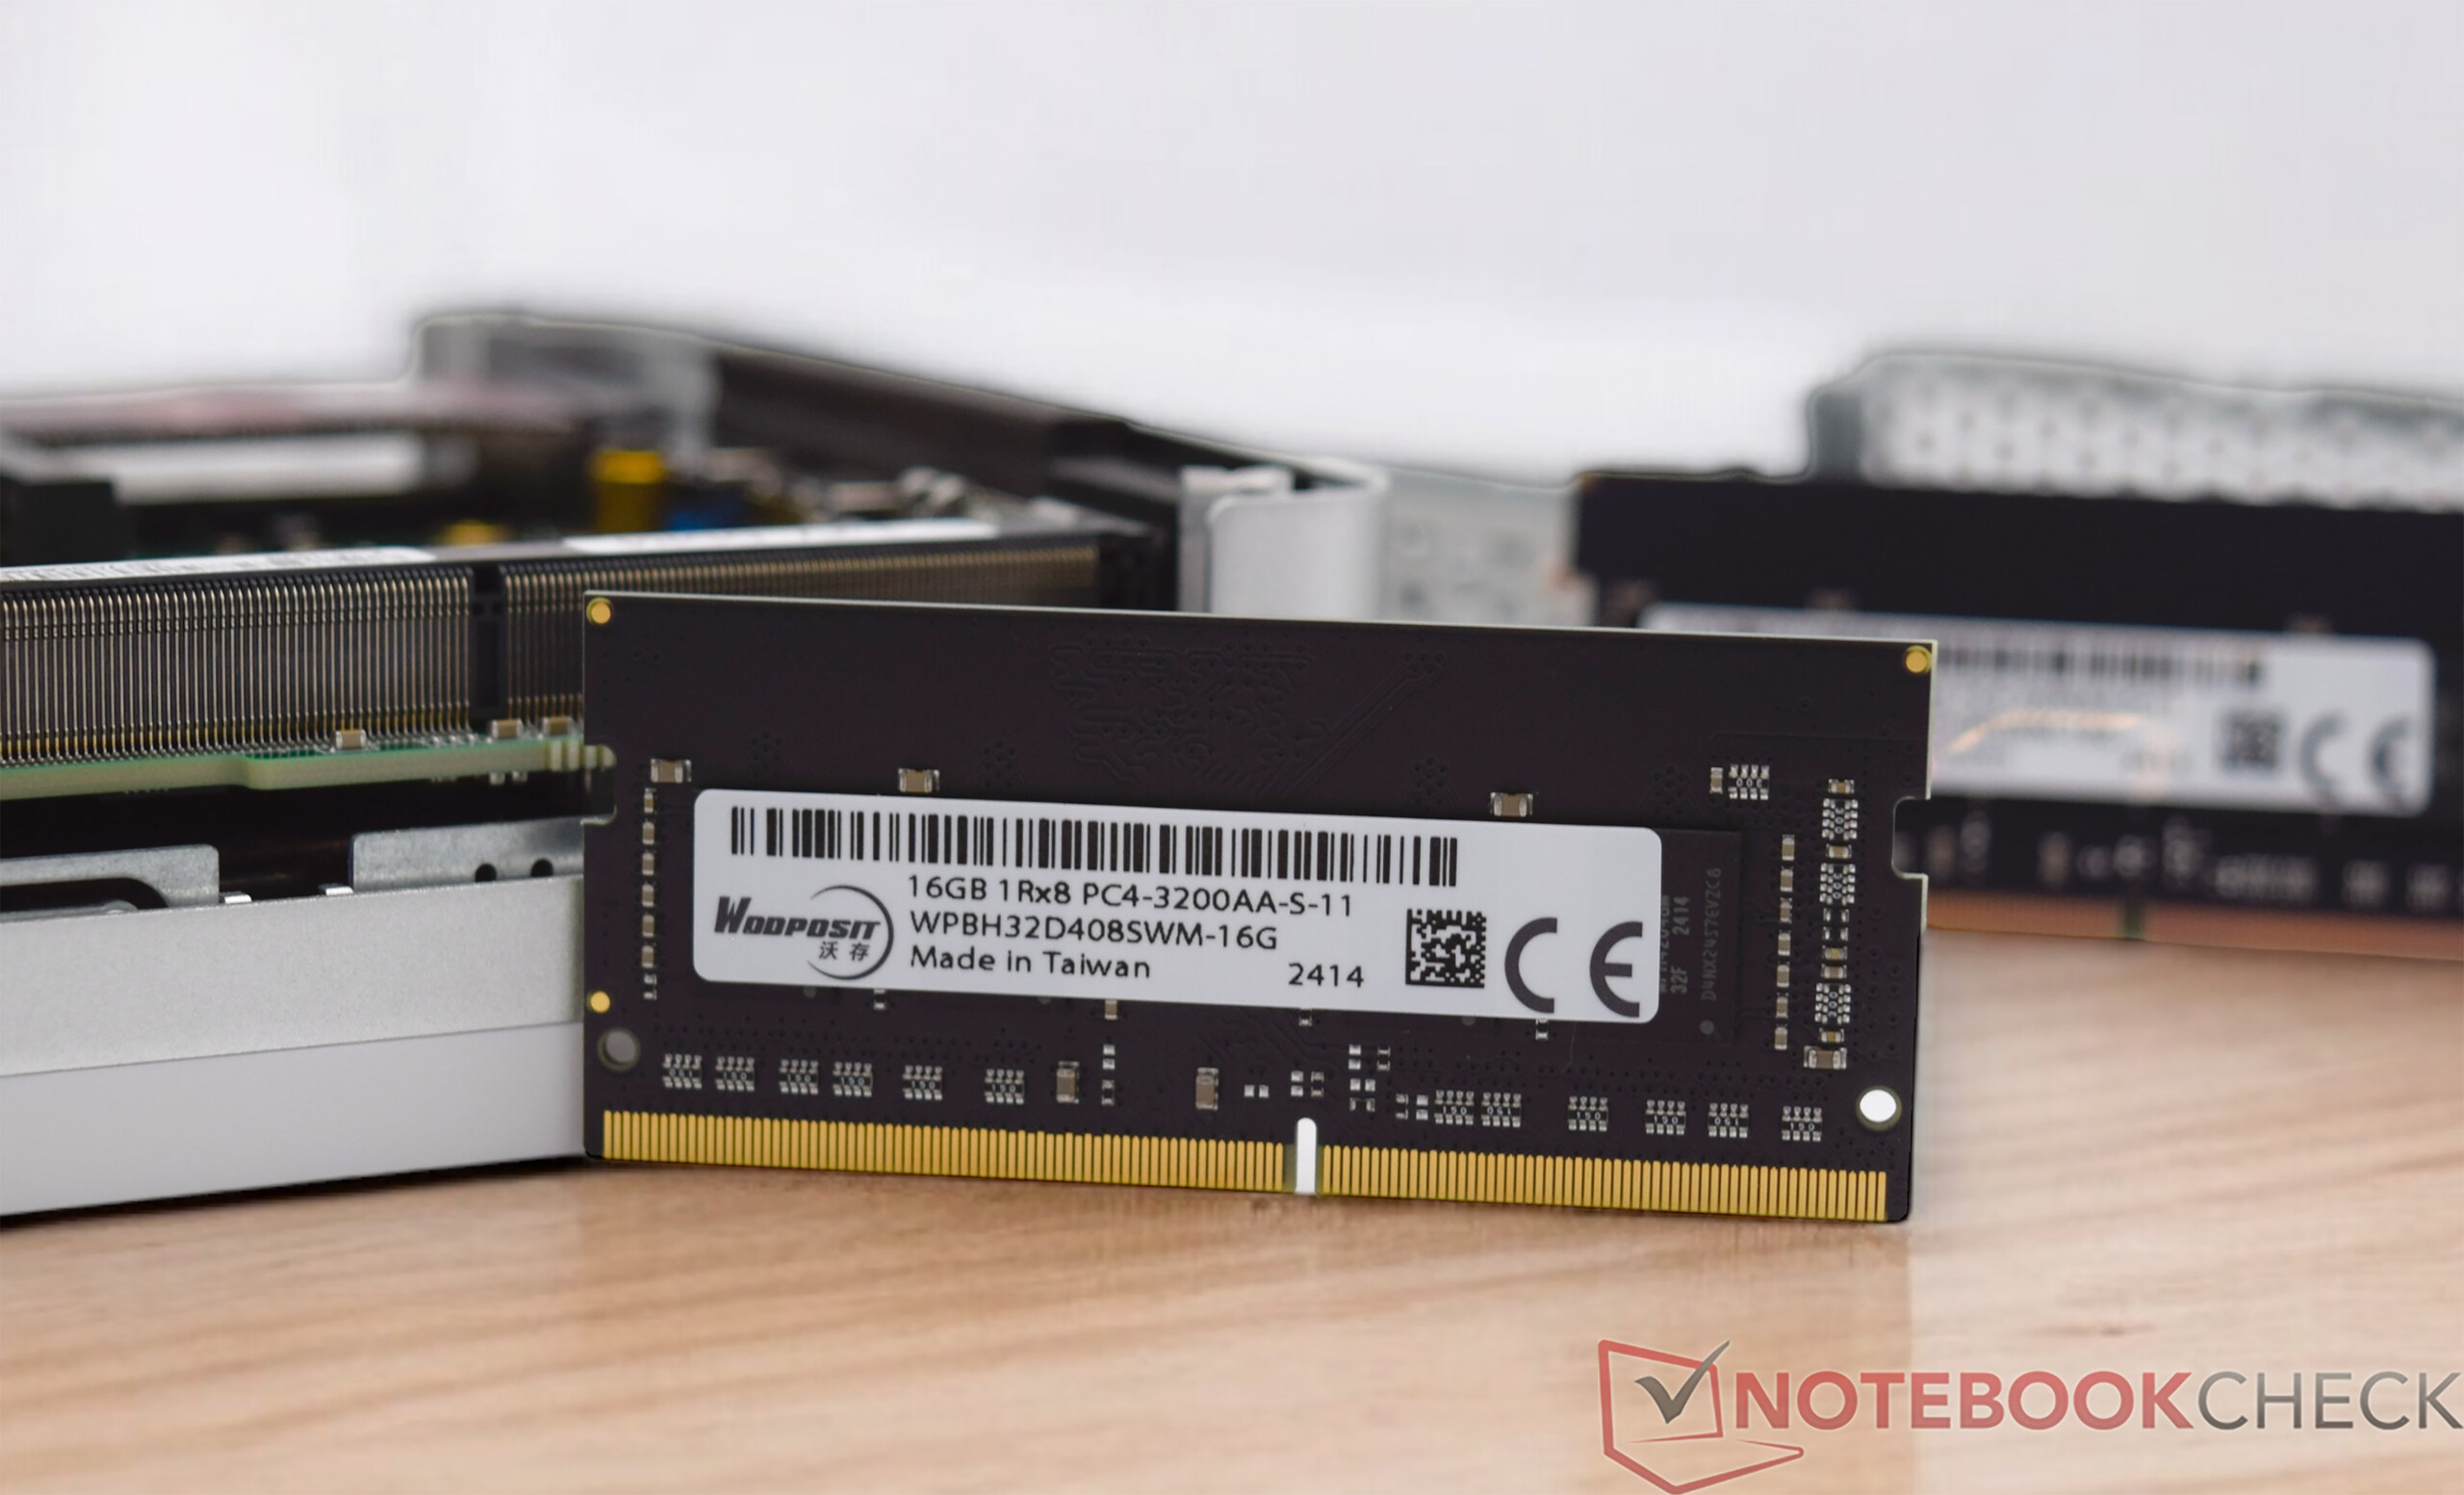
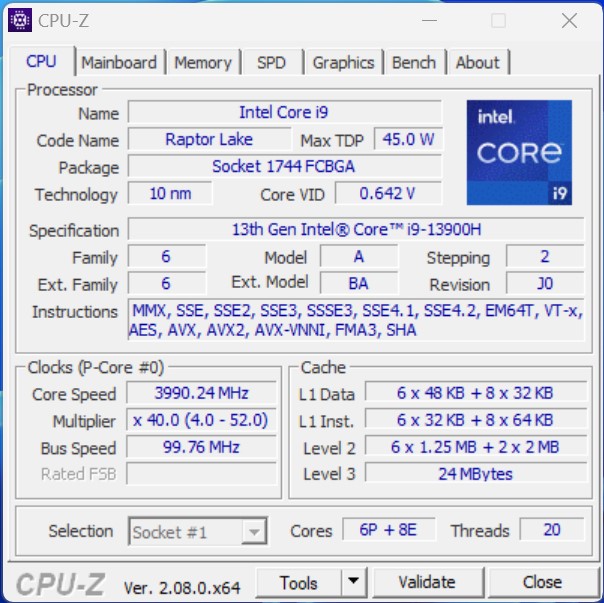
O Geekom XT13 Pro vem na configuração superior com o Intel Core i9-13900H na configuração superior. Como alternativa, o PC NUC também pode ser equipado com um Intel Core i7-13620H um pouco mais fraco Intel Core i7-13620H um pouco mais fraco, que também é equipado com núcleos 6P e deve ter apenas uma pequena desvantagem em relação ao modelo superior em termos de desempenho. a RAM DDR4 de 32 GB está sempre incluída, embora o SSD NVMe rápido forneça uma configuração básica sólida. O Geekom XT13 Pro também não é uma tarefa intransponível para aplicativos que exigem muito desempenho. No entanto, o desempenho 3D da iGPU é o maior ponto fraco, mas isso pode ser visivelmente melhorado com uma eGPU.
Condições de teste
Para todos os testes de desempenho com o Geekom XT13 Pro, usamos o perfil de energia "Alto desempenho". Houve apenas desvios desse perfil nas medições de consumo de energia e ruído, de acordo com nossos Critérios de teste. De acordo com as especificações do fabricante, a Geekom permite que o SoC opere com o menor consumo de energia possível. Em números, isso significa um limite de energia de 35 watts sob carga contínua, embora até 64 watts sejam permitidos por períodos curtos.
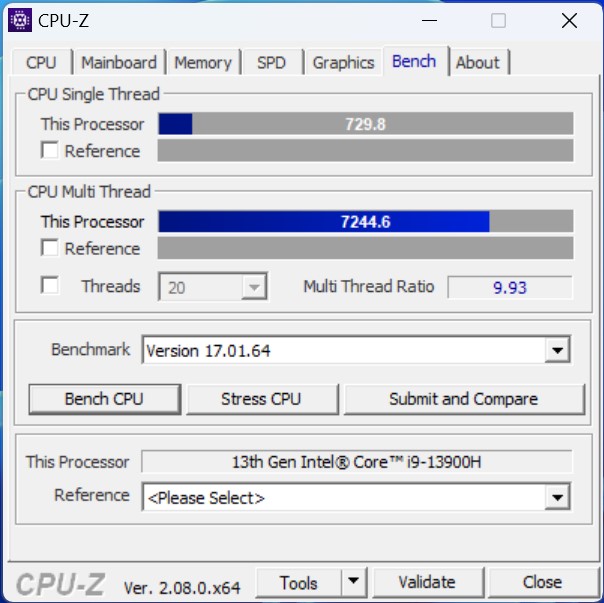
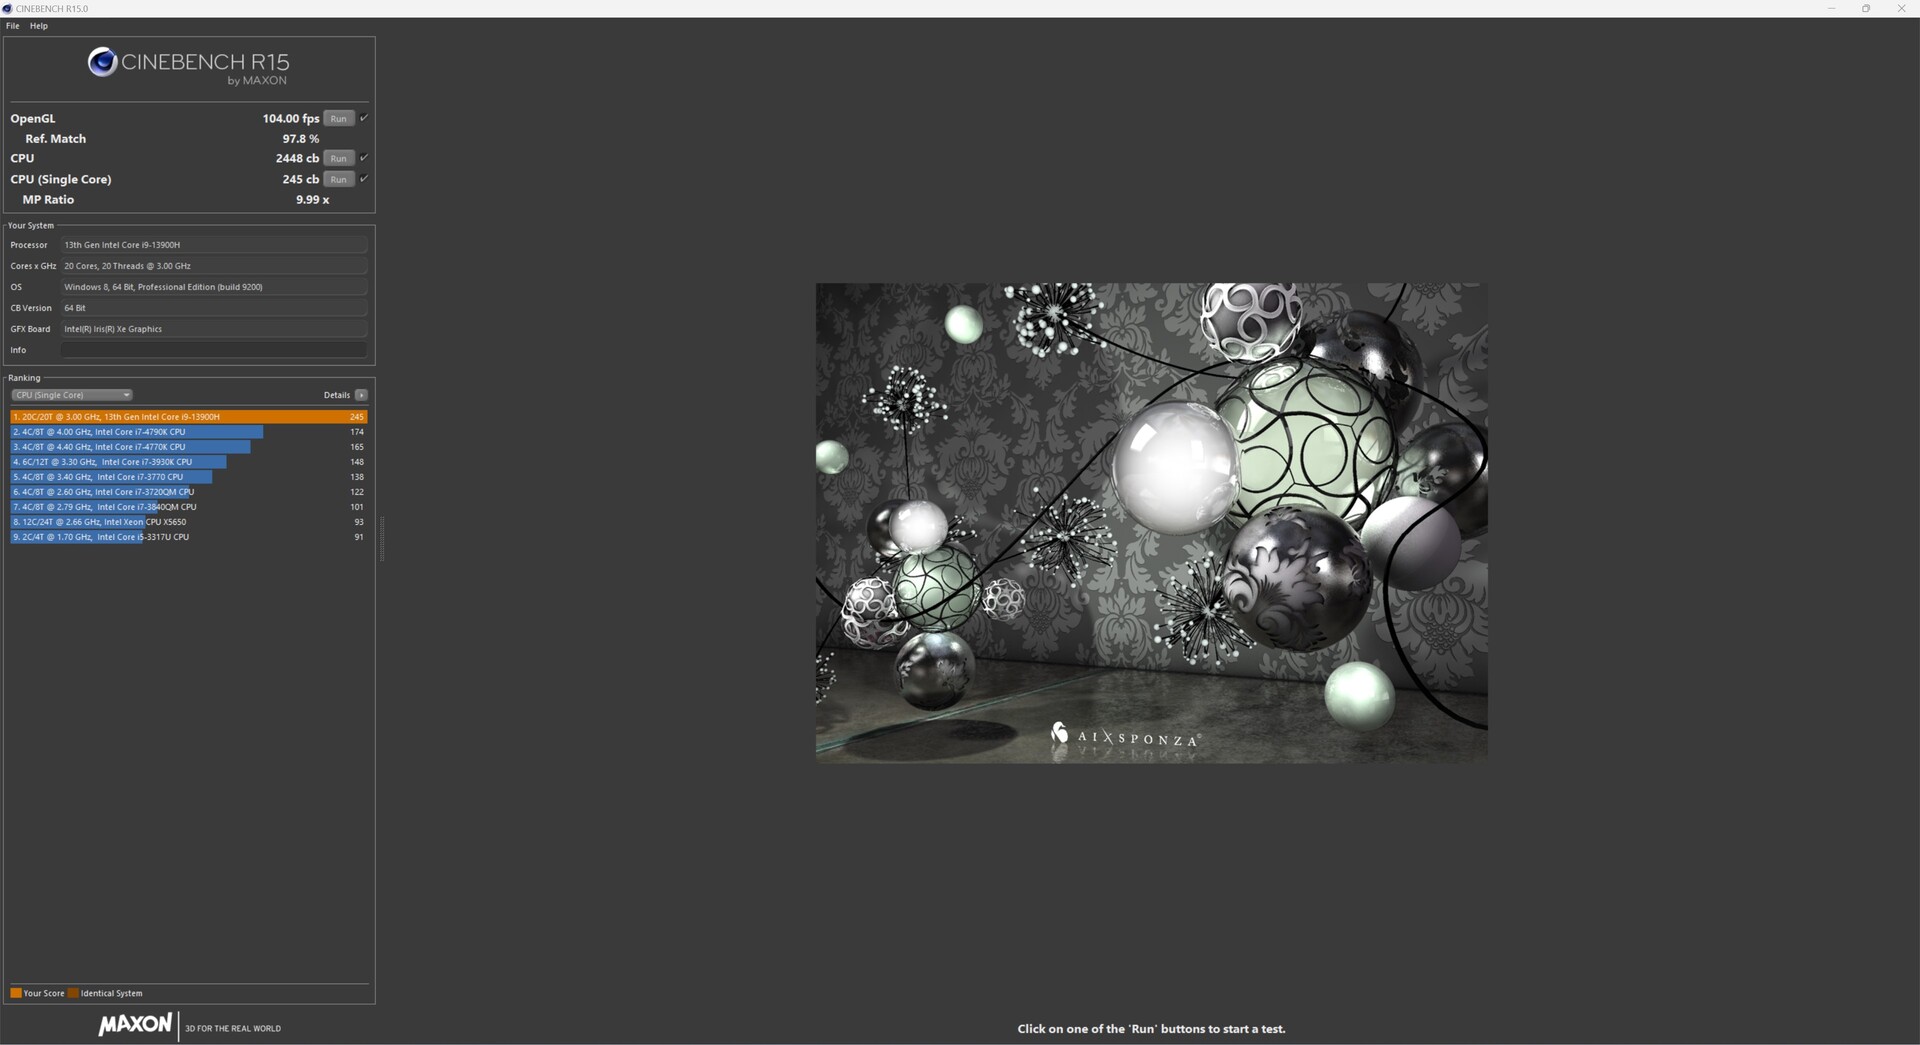
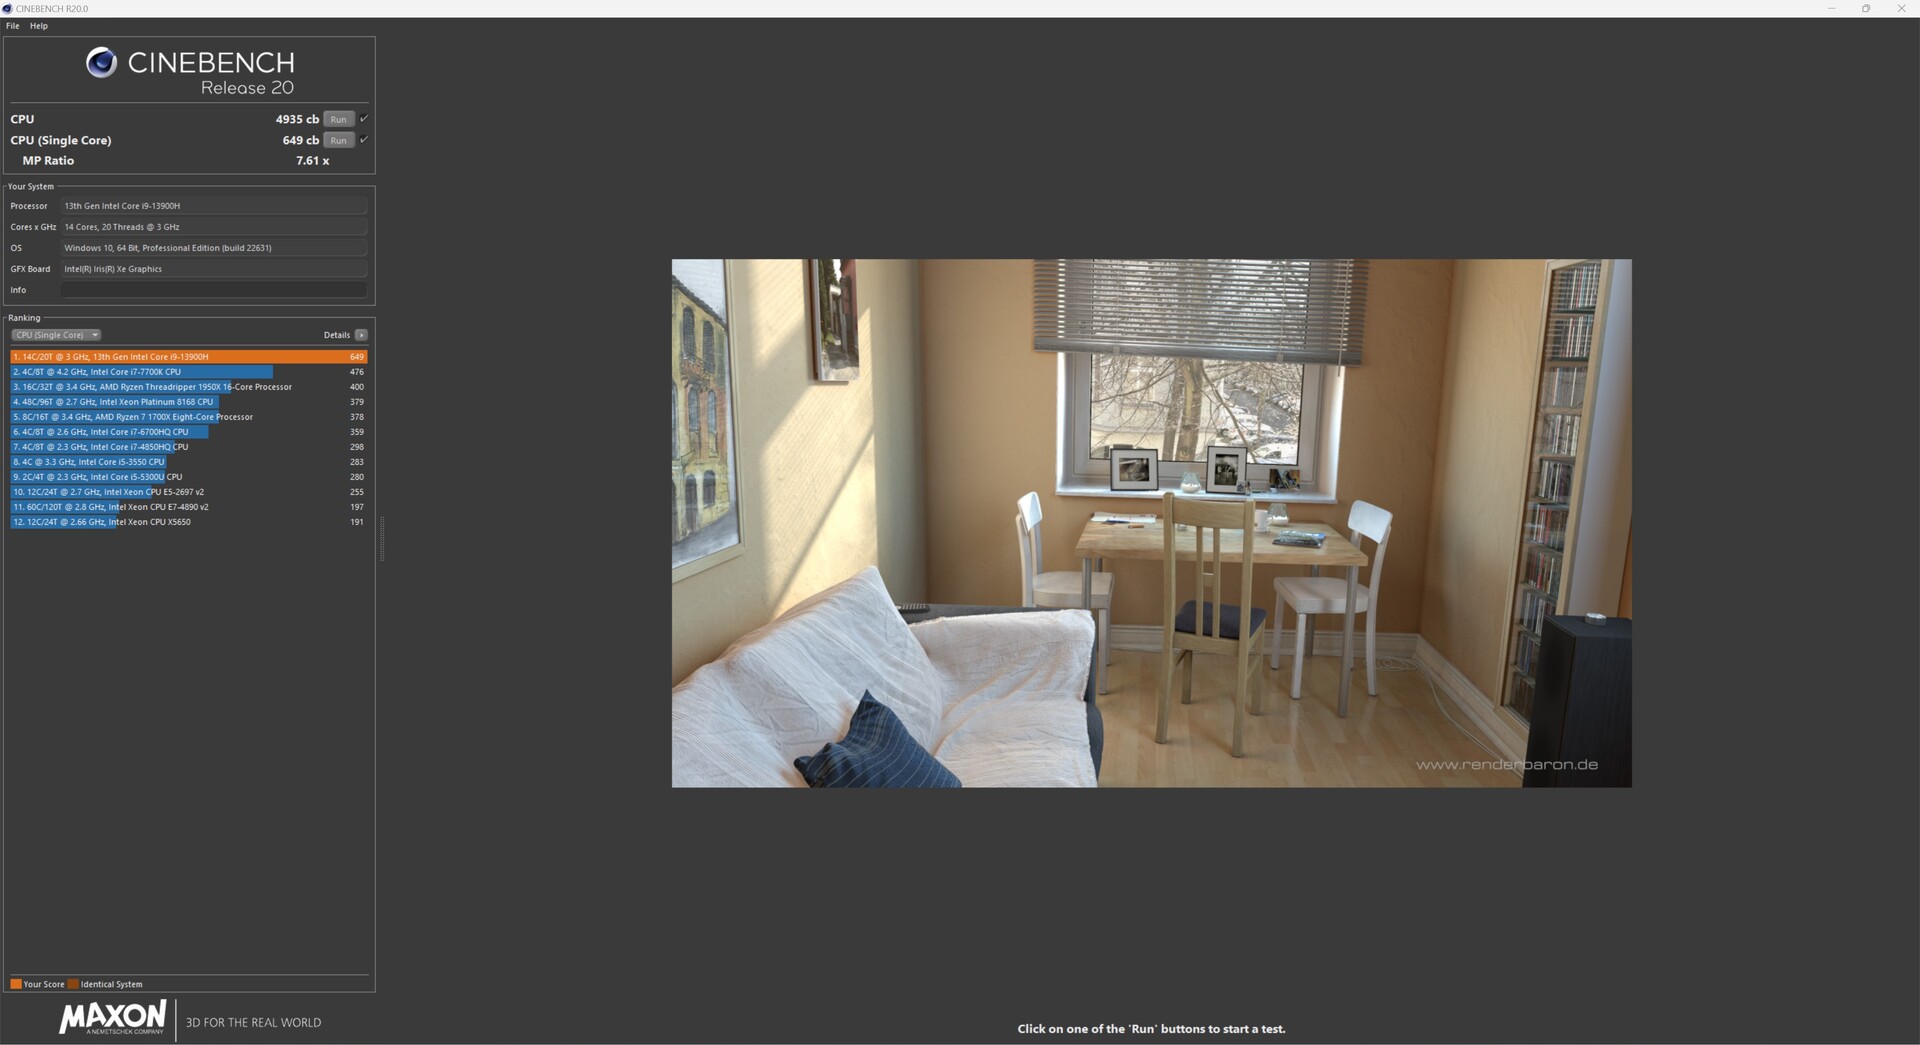
Processador

O Intel Core i9-13900H é baseado na arquitetura Raptor Lake e combina núcleos 6P e 8E. Tecnicamente, existem Intel Core i9-12900H como podemos ver em nossos resultados de benchmark na classificação de desempenho em comparação com o Geekom XT12 Pro. Em detalhes, no entanto, vemos uma pequena vantagem a favor do Intel Core i9-13900H, que pode chamar a atenção para si mesmo com um desempenho multi-core ligeiramente melhor. Um AMD Ryzen 9 7940HS ou os modelos mais novos da Intel da série Meteor Lake. No entanto, a diferença para os modelos um pouco mais rápidos dos concorrentes não é muito grande. Não há dúvida de que há uma diferença perceptível no desempenho no uso diário devido às pequenas diferenças.
O senhor pode encontrar mais benchmarks para os processadores aqui.
| Performance Rating - Percent | |
| Geekom A7 | |
| Aoostar GEM12 | |
| Minisforum AtomMan X7 Ti | |
| Acemagic F2A | |
| Geekom XT13 Pro | |
| Geekom XT12 Pro | |
| Cinebench 2024 | |
| CPU Multi Core | |
| Minisforum AtomMan X7 Ti | |
| Acemagic F2A | |
| Aoostar GEM12 | |
| Geekom A7 | |
| Geekom XT13 Pro | |
| Geekom XT12 Pro | |
| CPU Single Core | |
| Minisforum AtomMan X7 Ti | |
| Geekom A7 | |
| Geekom XT12 Pro | |
| Aoostar GEM12 | |
| Acemagic F2A | |
| Geekom XT13 Pro | |
| Cinebench R15 | |
| CPU Single 64Bit | |
| Aoostar GEM12 | |
| Geekom A7 | |
| Minisforum AtomMan X7 Ti | |
| Acemagic F2A | |
| Geekom XT12 Pro | |
| Geekom XT13 Pro | |
| CPU Multi 64Bit | |
| Minisforum AtomMan X7 Ti | |
| Acemagic F2A | |
| Aoostar GEM12 | |
| Geekom A7 | |
| Geekom XT13 Pro | |
| Geekom XT12 Pro | |
| Cinebench R20 | |
| CPU (Single Core) | |
| Minisforum AtomMan X7 Ti | |
| Geekom XT12 Pro | |
| Geekom A7 | |
| Aoostar GEM12 | |
| Acemagic F2A | |
| Geekom XT13 Pro | |
| CPU (Multi Core) | |
| Minisforum AtomMan X7 Ti | |
| Acemagic F2A | |
| Aoostar GEM12 | |
| Geekom A7 | |
| Geekom XT13 Pro | |
| Geekom XT12 Pro | |
| Cinebench R11.5 | |
| CPU Single 64Bit | |
| Geekom A7 | |
| Aoostar GEM12 | |
| Minisforum AtomMan X7 Ti | |
| Acemagic F2A | |
| Geekom XT12 Pro | |
| Geekom XT13 Pro | |
| CPU Multi 64Bit | |
| Minisforum AtomMan X7 Ti | |
| Acemagic F2A | |
| Geekom A7 | |
| Aoostar GEM12 | |
| Geekom XT13 Pro | |
| Geekom XT12 Pro | |
| Cinebench R10 | |
| Rendering Single CPUs 64Bit | |
| Minisforum AtomMan X7 Ti | |
| Geekom A7 | |
| Aoostar GEM12 | |
| Acemagic F2A | |
| Geekom XT13 Pro | |
| Geekom XT12 Pro | |
| Rendering Multiple CPUs 64Bit | |
| Acemagic F2A | |
| Minisforum AtomMan X7 Ti | |
| Aoostar GEM12 | |
| Geekom A7 | |
| Geekom XT13 Pro | |
| Geekom XT12 Pro | |
| Blender - v2.79 BMW27 CPU | |
| Geekom XT12 Pro | |
| Geekom XT13 Pro | |
| Geekom A7 | |
| Aoostar GEM12 | |
| Acemagic F2A | |
| Minisforum AtomMan X7 Ti | |
| wPrime 2.10 | |
| 32m | |
| Geekom XT12 Pro | |
| Acemagic F2A | |
| Geekom XT13 Pro | |
| Minisforum AtomMan X7 Ti | |
| Aoostar GEM12 | |
| Geekom A7 | |
| 1024m | |
| Minisforum AtomMan X7 Ti | |
| Geekom XT13 Pro | |
| Geekom XT12 Pro | |
| Acemagic F2A | |
| Aoostar GEM12 | |
| Geekom A7 | |
| WinRAR - Result | |
| Geekom XT12 Pro | |
| Minisforum AtomMan X7 Ti | |
| Acemagic F2A | |
| Geekom A7 | |
| Aoostar GEM12 | |
| Geekom XT13 Pro | |
| Geekbench 5.0 | |
| 5.0 Multi-Core | |
| Minisforum AtomMan X7 Ti | |
| Acemagic F2A | |
| Geekom A7 | |
| Aoostar GEM12 | |
| Geekom XT13 Pro | |
| Geekom XT12 Pro | |
| 5.0 Single-Core | |
| Geekom A7 | |
| Aoostar GEM12 | |
| Minisforum AtomMan X7 Ti | |
| Geekom XT12 Pro | |
| Acemagic F2A | |
| Geekom XT13 Pro | |
| Geekbench 4.4 | |
| 64 Bit Single-Core Score | |
| Geekom A7 | |
| Aoostar GEM12 | |
| Geekom XT12 Pro | |
| Minisforum AtomMan X7 Ti | |
| Geekom XT13 Pro | |
| Acemagic F2A | |
| 64 Bit Multi-Core Score | |
| Geekom A7 | |
| Minisforum AtomMan X7 Ti | |
| Aoostar GEM12 | |
| Acemagic F2A | |
| Geekom XT13 Pro | |
| Geekom XT12 Pro | |
| 3DMark 11 - 1280x720 Performance Physics | |
| Geekom A7 | |
| Minisforum AtomMan X7 Ti | |
| Aoostar GEM12 | |
| Acemagic F2A | |
| Geekom XT13 Pro | |
| Geekom XT12 Pro | |
| HWBOT x265 Benchmark v2.2 - 4k Preset | |
| Minisforum AtomMan X7 Ti | |
| Geekom A7 | |
| Aoostar GEM12 | |
| Acemagic F2A | |
| Geekom XT13 Pro | |
| Geekom XT12 Pro | |
| R Benchmark 2.5 - Overall mean | |
| Geekom XT13 Pro | |
| Acemagic F2A | |
| Geekom XT12 Pro | |
| Minisforum AtomMan X7 Ti | |
| Aoostar GEM12 | |
| Geekom A7 | |
| LibreOffice - 20 Documents To PDF | |
| Geekom A7 | |
| Minisforum AtomMan X7 Ti | |
| Aoostar GEM12 | |
| Geekom XT13 Pro | |
| Acemagic F2A | |
| Geekom XT12 Pro | |
| WebXPRT 3 - Overall | |
| Geekom A7 | |
| Aoostar GEM12 | |
| Geekom XT12 Pro | |
| Acemagic F2A | |
| Geekom XT13 Pro | |
| Minisforum AtomMan X7 Ti | |
| Mozilla Kraken 1.1 - Total | |
| Geekom XT13 Pro | |
| Acemagic F2A | |
| Minisforum AtomMan X7 Ti | |
| Aoostar GEM12 | |
| Geekom XT12 Pro | |
| Geekom A7 | |
| 3DMark | |
| 1920x1080 Fire Strike Physics | |
| Aoostar GEM12 | |
| Minisforum AtomMan X7 Ti | |
| Geekom A7 | |
| Acemagic F2A | |
| Geekom XT13 Pro | |
| Geekom XT12 Pro | |
| 2560x1440 Time Spy CPU | |
| Minisforum AtomMan X7 Ti | |
| Aoostar GEM12 | |
| Geekom A7 | |
| Acemagic F2A | |
| Geekom XT13 Pro | |
| Geekom XT12 Pro | |
| Super Pi mod 1.5 XS 1M - 1M | |
| Geekom XT13 Pro | |
| Geekom XT12 Pro | |
| Geekom A7 | |
| Aoostar GEM12 | |
| Acemagic F2A | |
| Minisforum AtomMan X7 Ti | |
| Super Pi mod 1.5 XS 2M - 2M | |
| Geekom A7 | |
| Aoostar GEM12 | |
| Geekom XT13 Pro | |
| Geekom XT12 Pro | |
| Acemagic F2A | |
| Minisforum AtomMan X7 Ti | |
| Super Pi Mod 1.5 XS 32M - 32M | |
| Aoostar GEM12 | |
| Geekom A7 | |
| Geekom XT13 Pro | |
| Geekom XT12 Pro | |
| Acemagic F2A | |
| Minisforum AtomMan X7 Ti | |
* ... menor é melhor
AIDA64: FP32 Ray-Trace | FPU Julia | CPU SHA3 | CPU Queen | FPU SinJulia | FPU Mandel | CPU AES | CPU ZLib | FP64 Ray-Trace | CPU PhotoWorxx
| Performance Rating | |
| Geekom A7 | |
| Aoostar GEM12 | |
| Minisforum AtomMan X7 Ti | |
| Acemagic F2A | |
| Média da turma Mini PC | |
| Geekom XT13 Pro | |
| Geekom XT12 Pro | |
| AIDA64 / FP32 Ray-Trace | |
| Aoostar GEM12 | |
| Geekom A7 | |
| Acemagic F2A | |
| Minisforum AtomMan X7 Ti | |
| Média da turma Mini PC (764 - 51004, n=116, últimos 2 anos) | |
| Geekom XT13 Pro | |
| Geekom XT12 Pro | |
| AIDA64 / FPU Julia | |
| Aoostar GEM12 | |
| Geekom A7 | |
| Minisforum AtomMan X7 Ti | |
| Acemagic F2A | |
| Média da turma Mini PC (4140 - 214250, n=116, últimos 2 anos) | |
| Geekom XT13 Pro | |
| Geekom XT12 Pro | |
| AIDA64 / CPU SHA3 | |
| Geekom A7 | |
| Aoostar GEM12 | |
| Minisforum AtomMan X7 Ti | |
| Acemagic F2A | |
| Média da turma Mini PC (290 - 9399, n=116, últimos 2 anos) | |
| Geekom XT13 Pro | |
| Geekom XT12 Pro | |
| AIDA64 / CPU Queen | |
| Geekom A7 | |
| Aoostar GEM12 | |
| Geekom XT13 Pro | |
| Acemagic F2A | |
| Minisforum AtomMan X7 Ti | |
| Geekom XT12 Pro | |
| Média da turma Mini PC (8172 - 184747, n=116, últimos 2 anos) | |
| AIDA64 / FPU SinJulia | |
| Aoostar GEM12 | |
| Geekom A7 | |
| Minisforum AtomMan X7 Ti | |
| Acemagic F2A | |
| Média da turma Mini PC (408 - 29064, n=116, últimos 2 anos) | |
| Geekom XT13 Pro | |
| Geekom XT12 Pro | |
| AIDA64 / FPU Mandel | |
| Aoostar GEM12 | |
| Geekom A7 | |
| Acemagic F2A | |
| Minisforum AtomMan X7 Ti | |
| Média da turma Mini PC (2088 - 113499, n=116, últimos 2 anos) | |
| Geekom XT13 Pro | |
| Geekom XT12 Pro | |
| AIDA64 / CPU AES | |
| Geekom A7 | |
| Minisforum AtomMan X7 Ti | |
| Acemagic F2A | |
| Geekom XT13 Pro | |
| Geekom XT12 Pro | |
| Média da turma Mini PC (3691 - 325960, n=116, últimos 2 anos) | |
| Aoostar GEM12 | |
| AIDA64 / CPU ZLib | |
| Minisforum AtomMan X7 Ti | |
| Acemagic F2A | |
| Aoostar GEM12 | |
| Geekom A7 | |
| Geekom XT13 Pro | |
| Média da turma Mini PC (76.7 - 2039, n=116, últimos 2 anos) | |
| Geekom XT12 Pro | |
| AIDA64 / FP64 Ray-Trace | |
| Aoostar GEM12 | |
| Geekom A7 | |
| Acemagic F2A | |
| Minisforum AtomMan X7 Ti | |
| Média da turma Mini PC (432 - 26952, n=116, últimos 2 anos) | |
| Geekom XT13 Pro | |
| Geekom XT12 Pro | |
| AIDA64 / CPU PhotoWorxx | |
| Minisforum AtomMan X7 Ti | |
| Geekom A7 | |
| Aoostar GEM12 | |
| Acemagic F2A | |
| Média da turma Mini PC (5296 - 51727, n=116, últimos 2 anos) | |
| Geekom XT13 Pro | |
| Geekom XT12 Pro | |
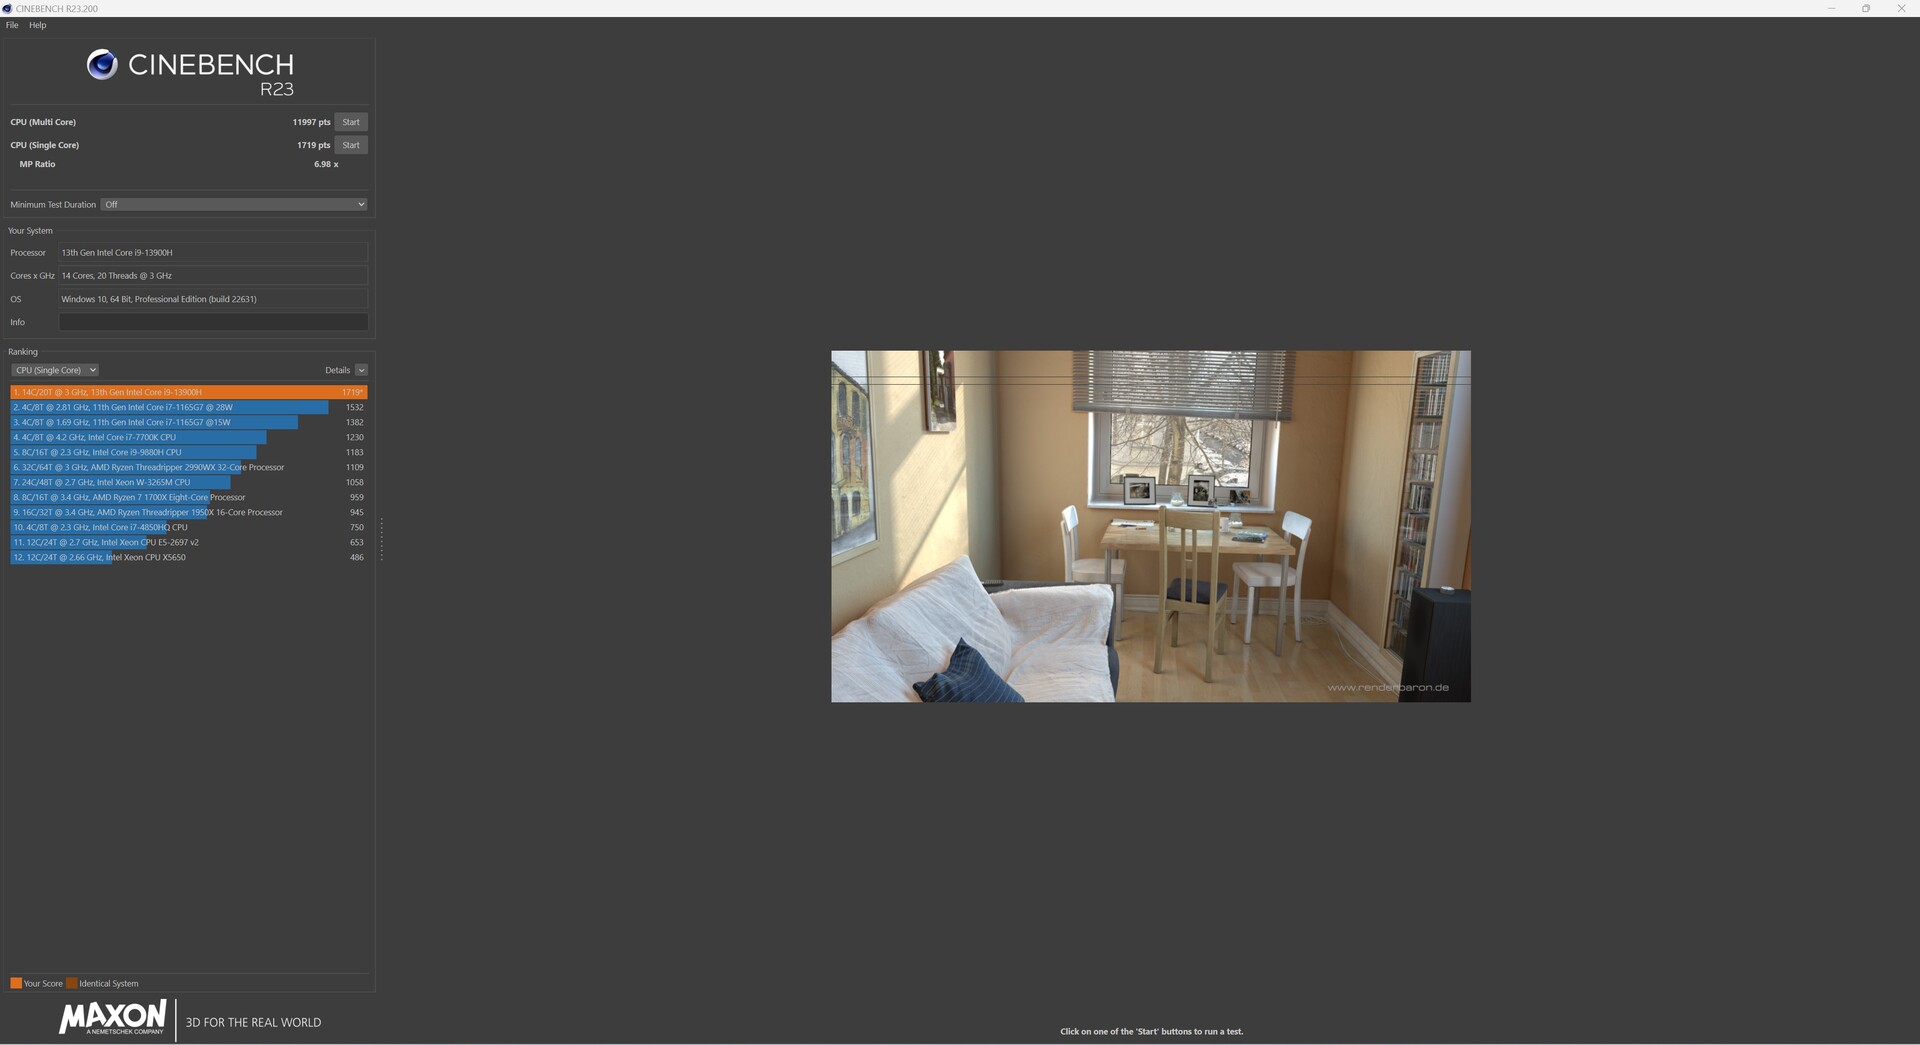
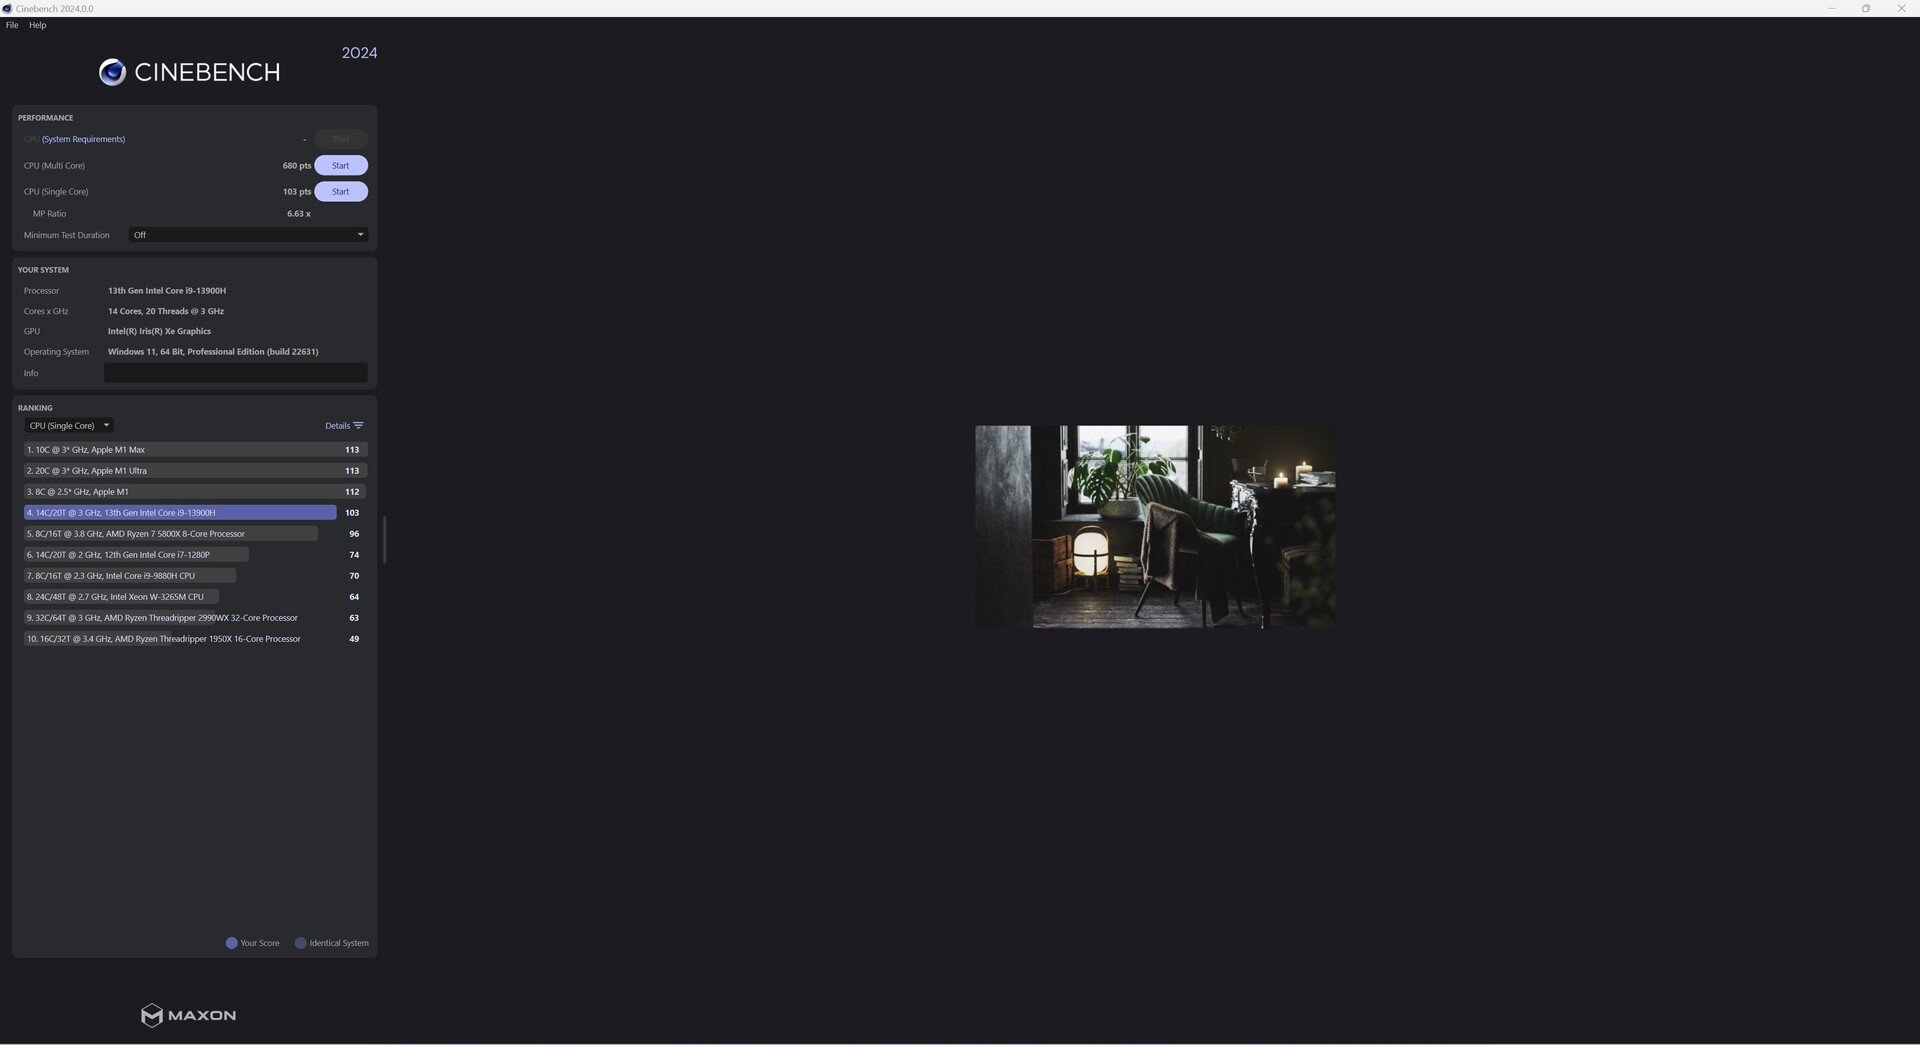
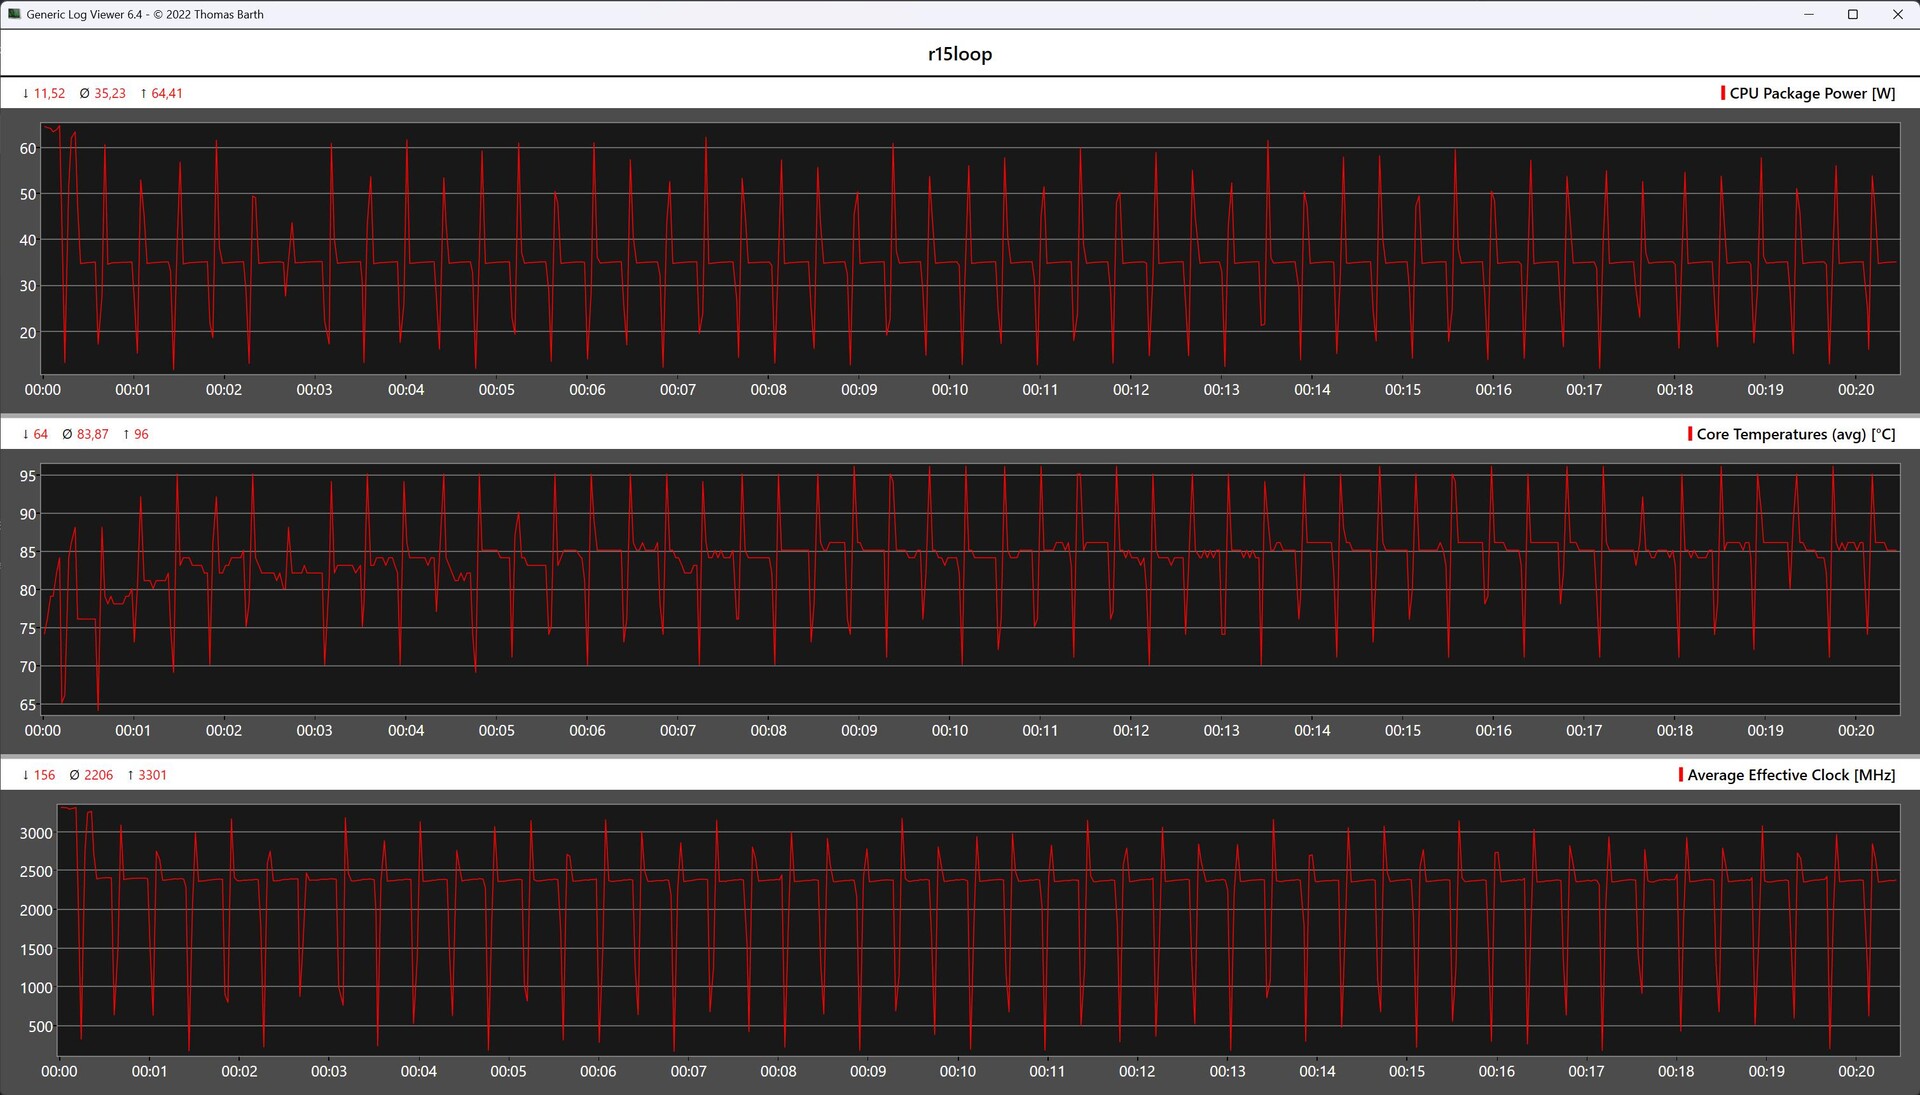
Cinebench R15 Multi loop
O loop contínuo do Cinebench R15 de nossa amostra de teste é quase paralelo ao do Geekom XT12 Pro. No entanto, no final, o modelo mais recente do XT13 Pro consegue se distanciar com uma clara vantagem. Também é possível observar que o pequeno sistema de resfriamento não consegue manter o Turbo do SoC por um longo período de tempo. O limite máximo de energia de 64 watts é atingido apenas por um curto período de tempo, pois o consumo de energia precisa ser reduzido devido às altas temperaturas.
Desempenho do sistema
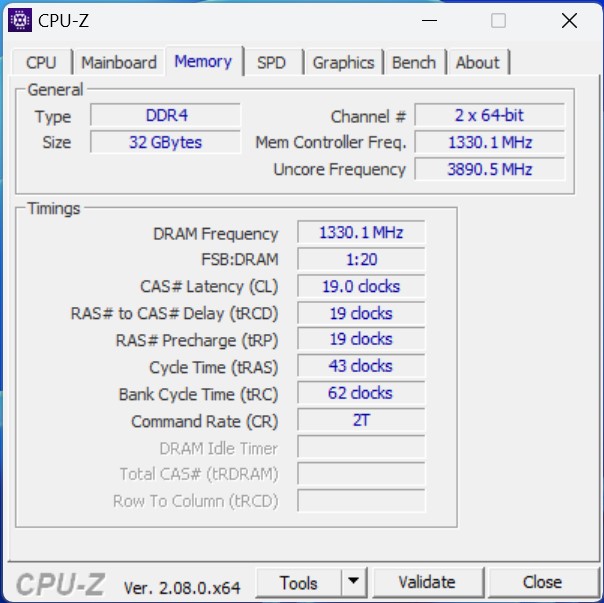
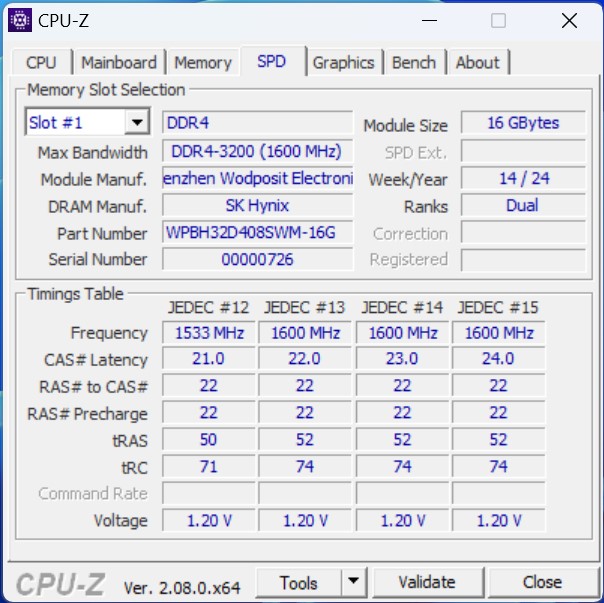
Nos testes de desempenho do sistema, o desempenho documentado do Geekom XT13 Pro é bom o suficiente apenas para um lugar na parte inferior da classificação. Subjetivamente, porém, podemos dizer que o Geekom XT13 Pro oferece um desempenho decente. Não foi possível observar nenhuma latência perceptível ao trabalhar com o dispositivo durante a fase de teste. Quando se trata da escolha da RAM, o padrão DDR4 mais lento se vinga, como pode ser visto nos benchmarks AIDA64. Tecnicamente, o Intel Core i9-13900H poderia ser combinado com DDR5 (5.200 MT/s).
| AIDA64 / Memory Copy | |
| Minisforum AtomMan X7 Ti | |
| Aoostar GEM12 | |
| Geekom A7 | |
| Acemagic F2A | |
| Média da turma Mini PC (8377 - 89287, n=116, últimos 2 anos) | |
| Geekom XT13 Pro | |
| Geekom XT12 Pro | |
| AIDA64 / Memory Read | |
| Minisforum AtomMan X7 Ti | |
| Acemagic F2A | |
| Geekom A7 | |
| Aoostar GEM12 | |
| Média da turma Mini PC (8974 - 100086, n=116, últimos 2 anos) | |
| Geekom XT12 Pro | |
| Geekom XT13 Pro | |
| AIDA64 / Memory Write | |
| Geekom A7 | |
| Aoostar GEM12 | |
| Minisforum AtomMan X7 Ti | |
| Acemagic F2A | |
| Média da turma Mini PC (8762 - 100538, n=116, últimos 2 anos) | |
| Geekom XT13 Pro | |
| Geekom XT12 Pro | |
| AIDA64 / Memory Latency | |
| Acemagic F2A | |
| Minisforum AtomMan X7 Ti | |
| Média da turma Mini PC (44.9 - 184.8, n=116, últimos 2 anos) | |
| Geekom A7 | |
| Aoostar GEM12 | |
| Geekom XT13 Pro | |
| Geekom XT12 Pro | |
* ... menor é melhor
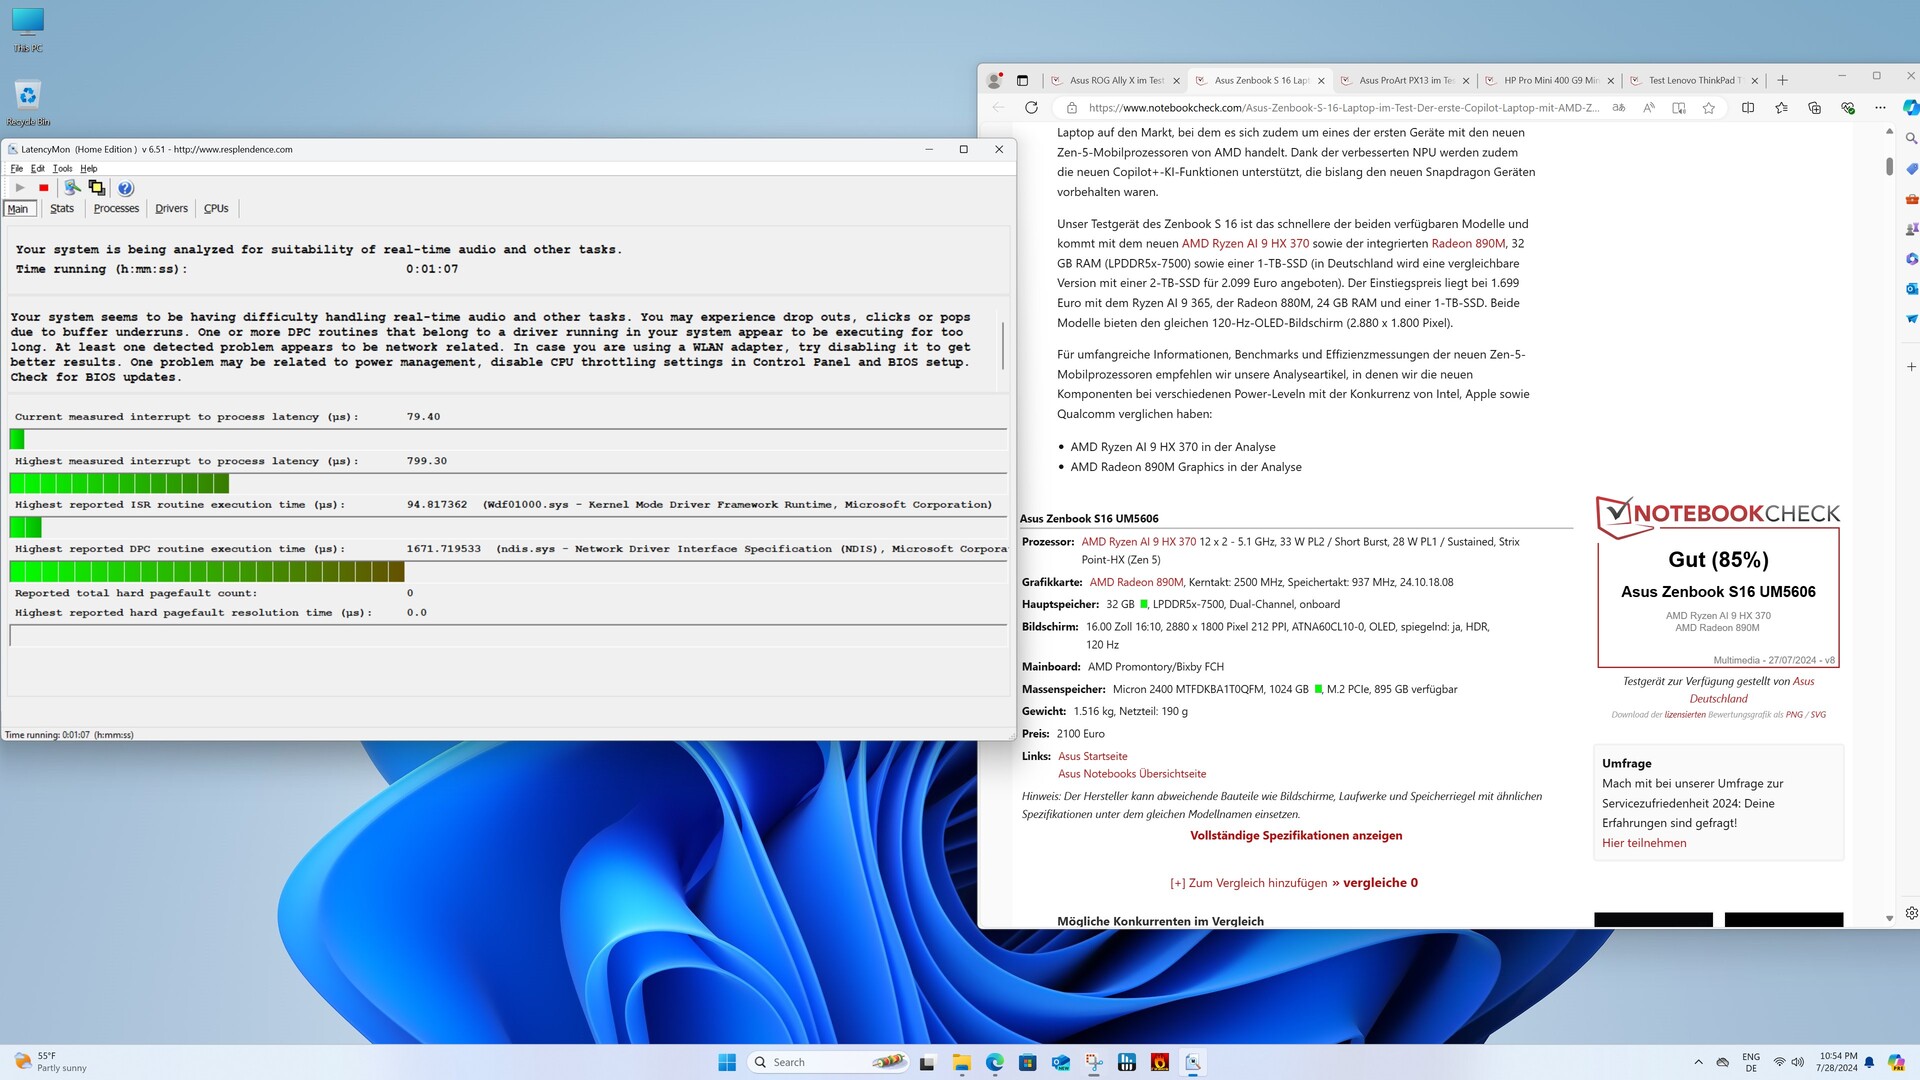
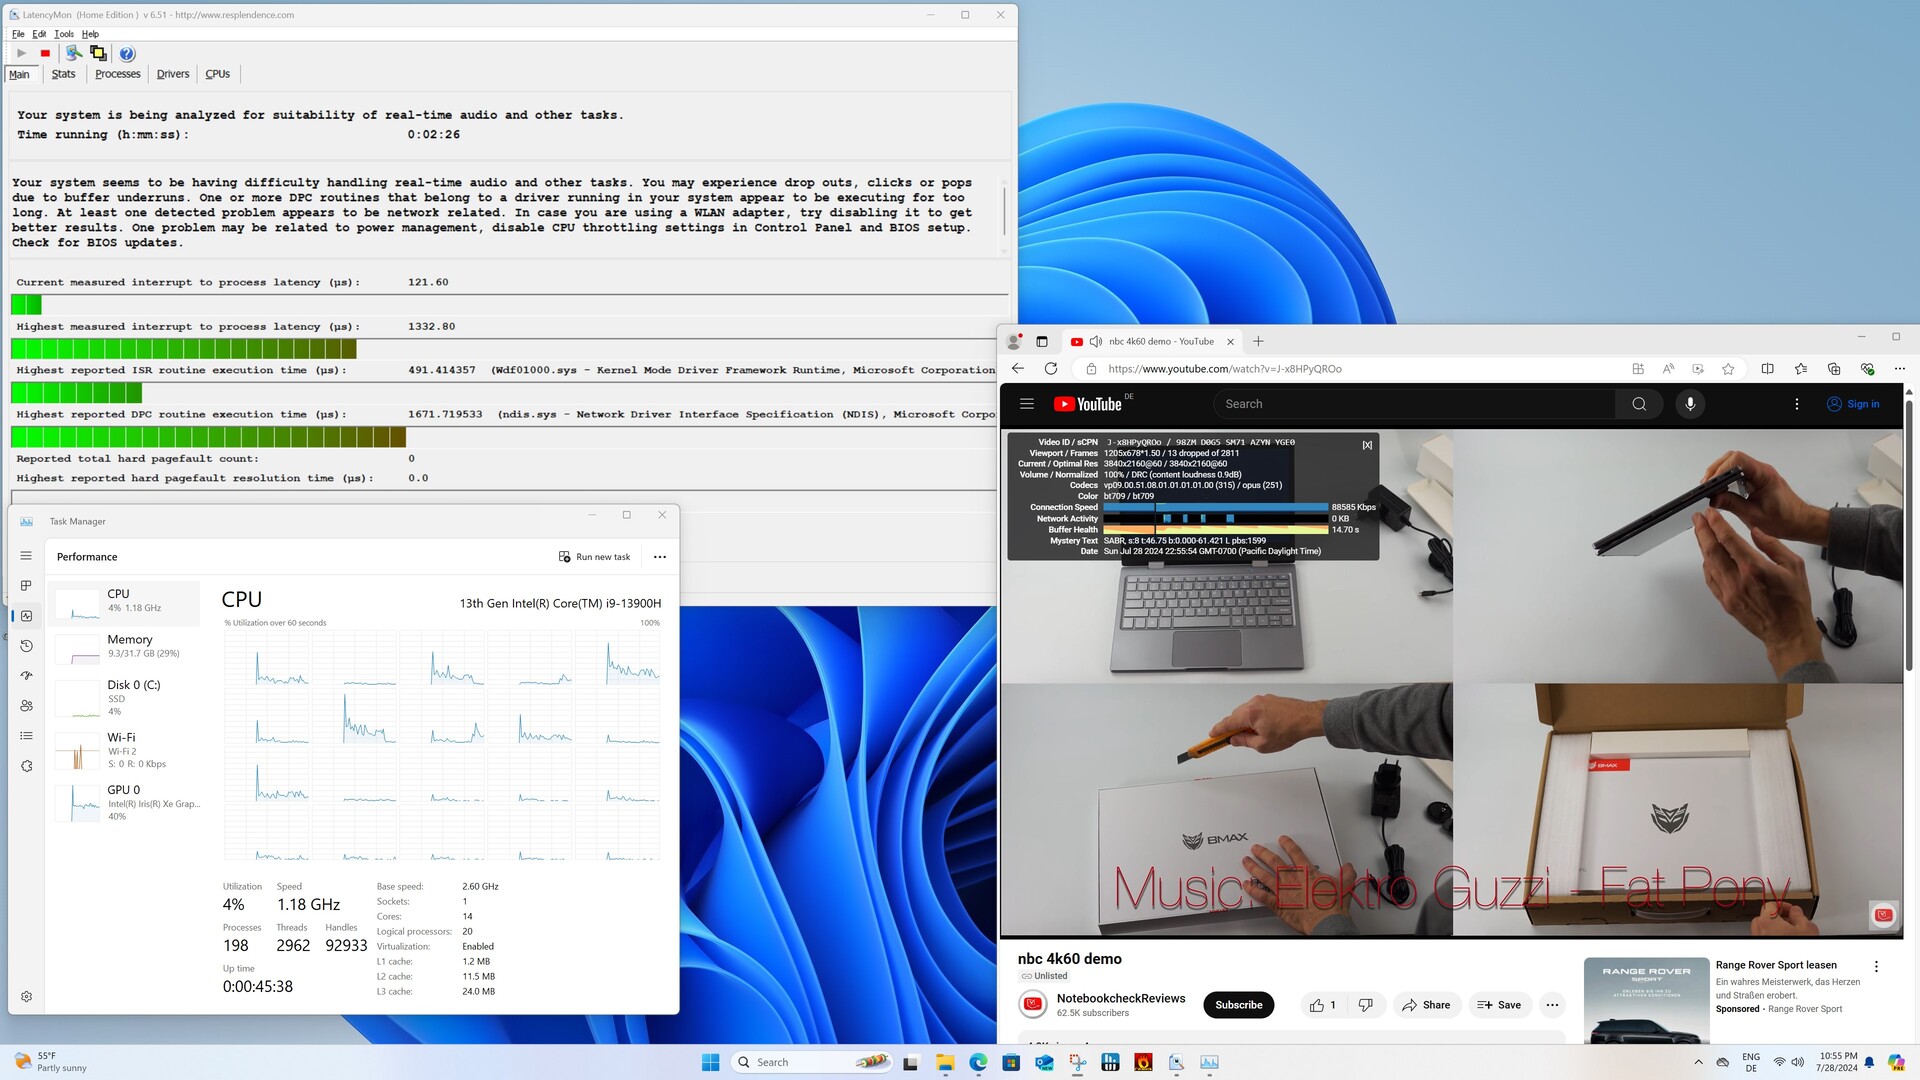
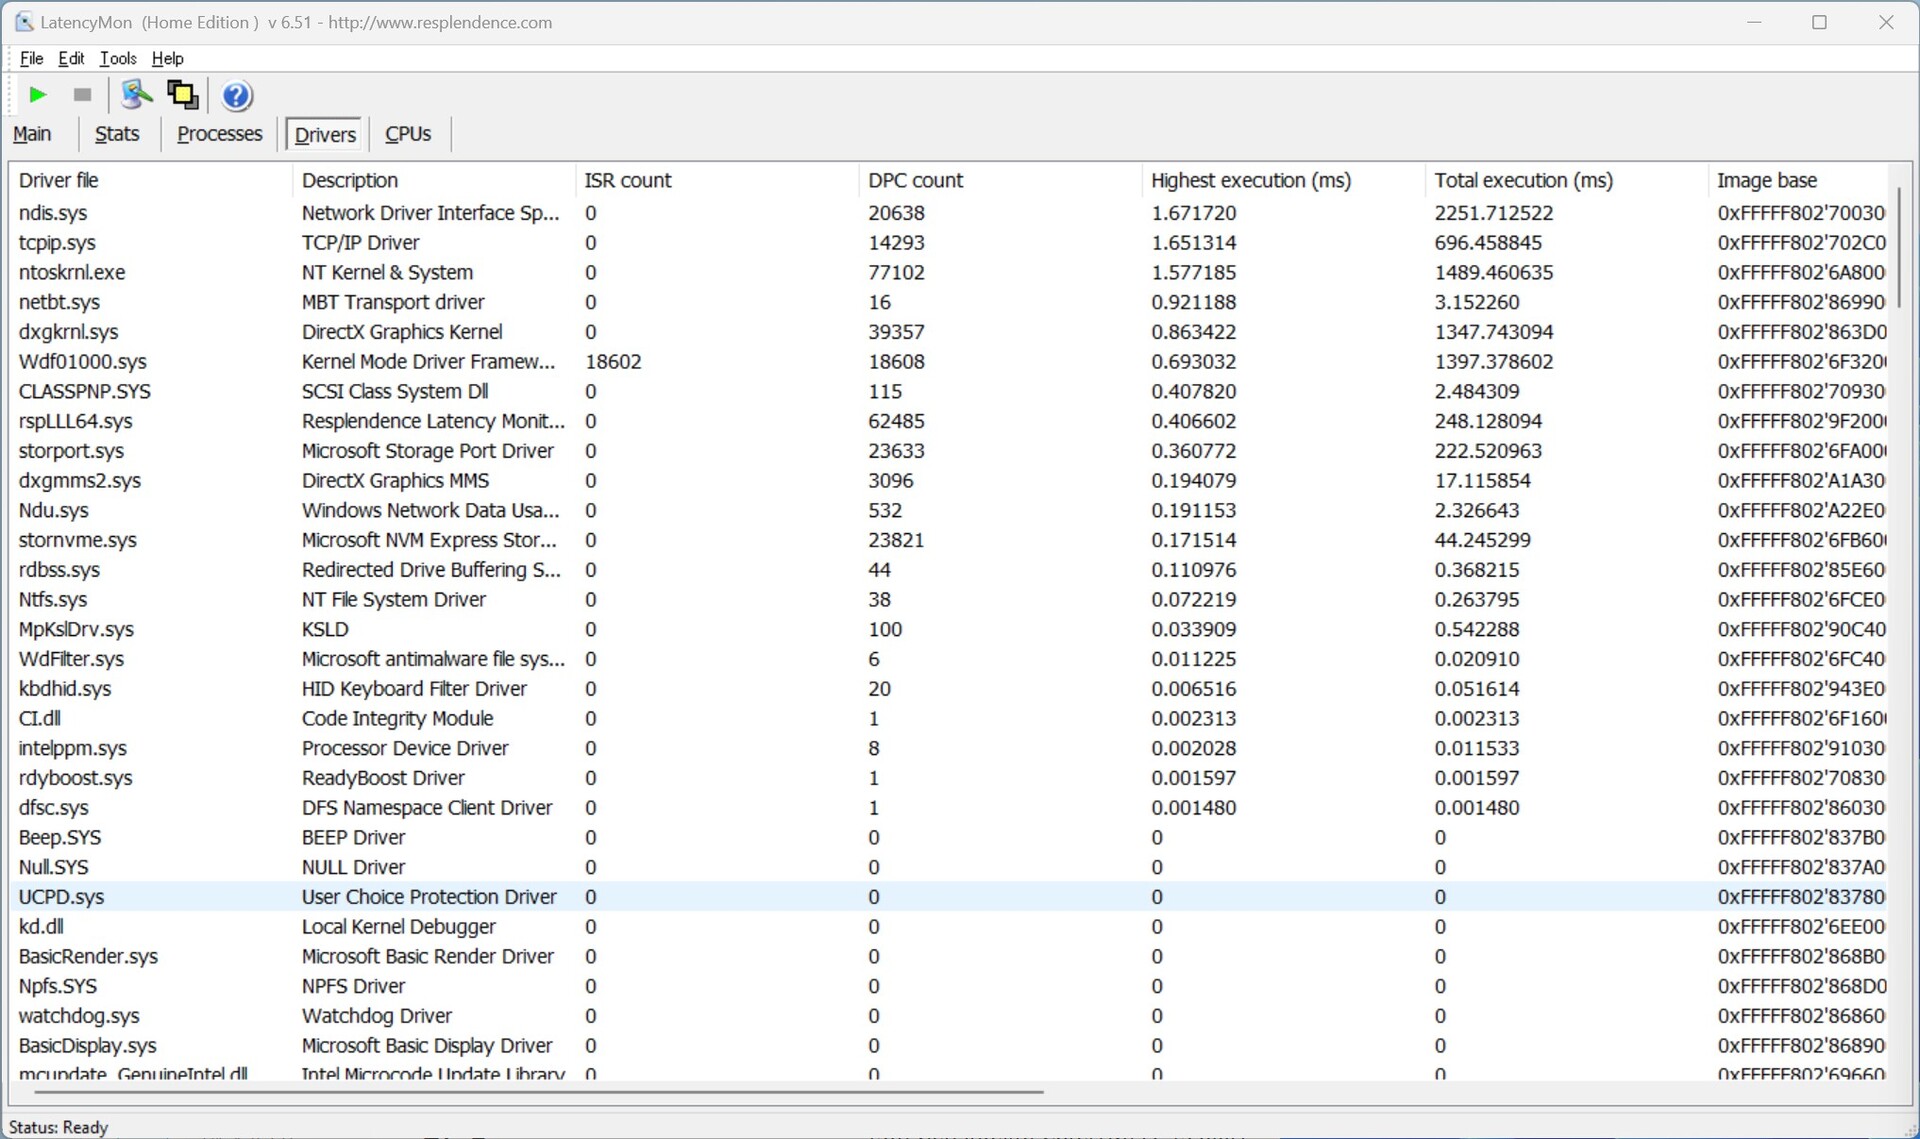
Latências de DPC
Não observamos latências de DPC extremamente excessivas com o Geekom XT13 Pro. Esse foi o caso do Geekom XT12 Pro. No entanto, nossa amostra de teste está longe de apresentar resultados excepcionais. Atingimos o valor máximo mesmo quando simplesmente navegamos com o navegador Edge.

| DPC Latencies / LatencyMon - interrupt to process latency (max), Web, Youtube, Prime95 | |
| Acemagic F2A | |
| Geekom XT12 Pro | |
| Minisforum AtomMan X7 Ti | |
| Geekom XT13 Pro | |
| Geekom A7 | |
| Aoostar GEM12 | |
* ... menor é melhor
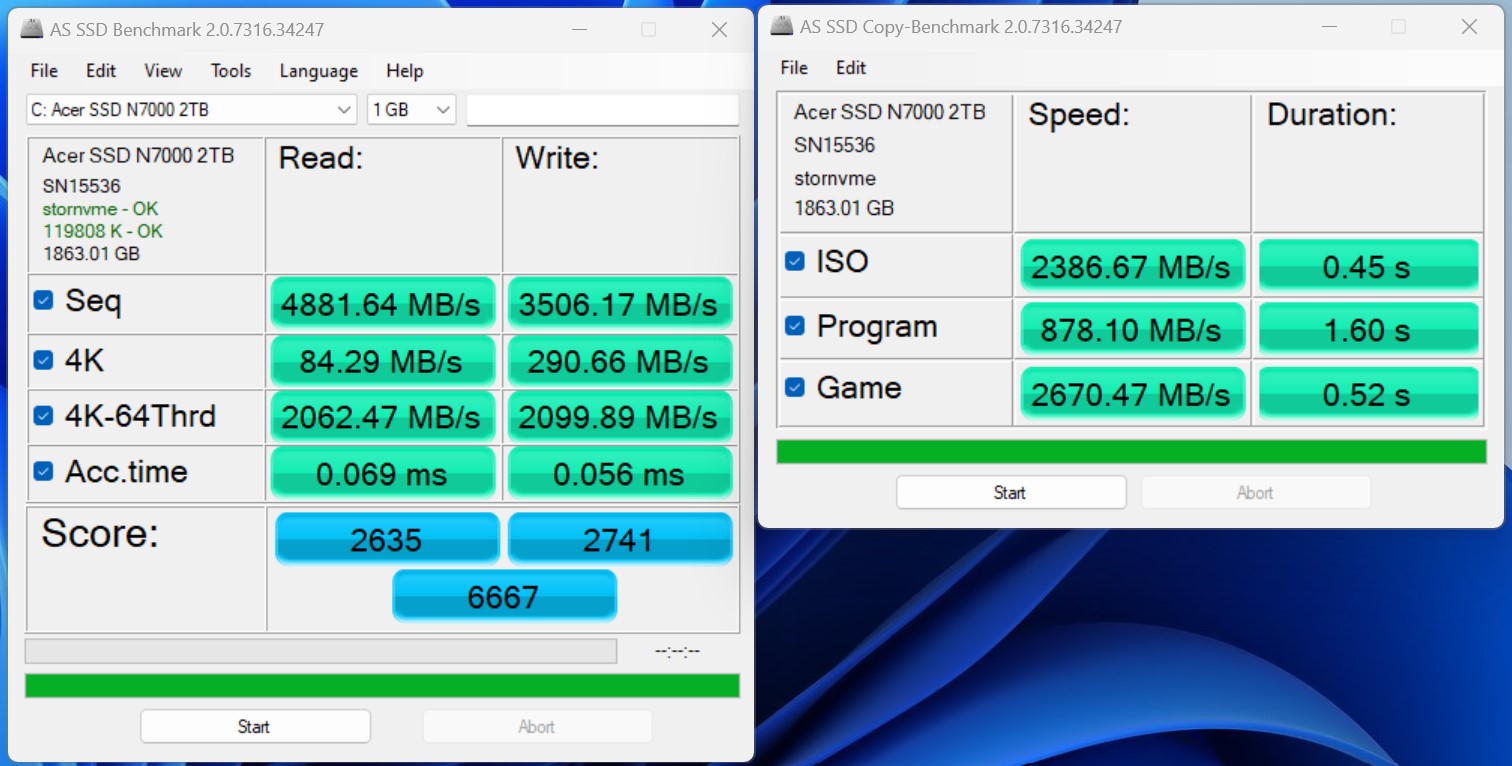
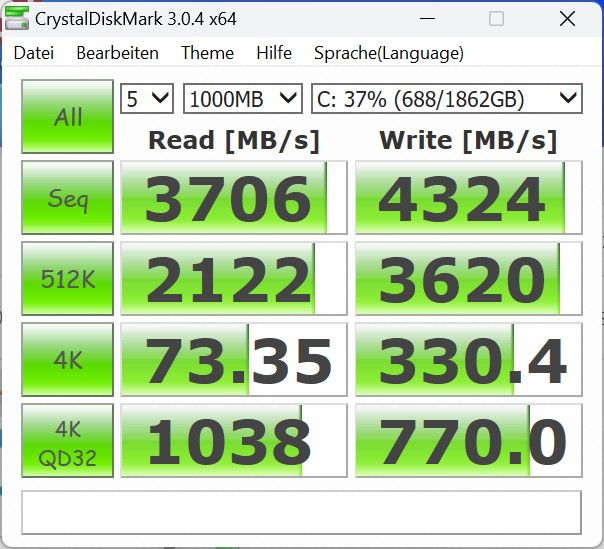
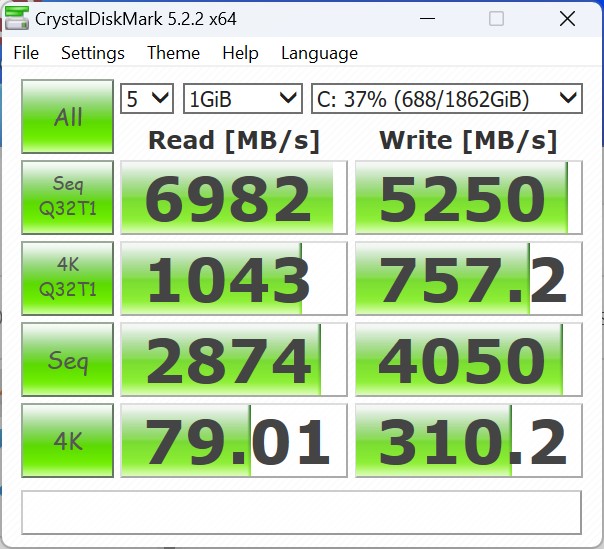
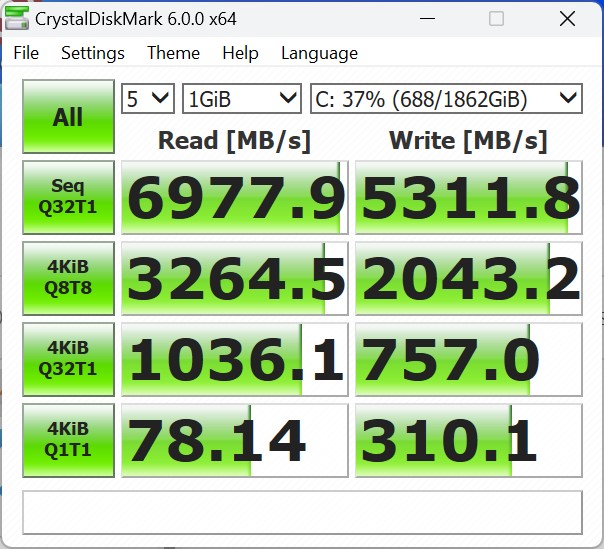
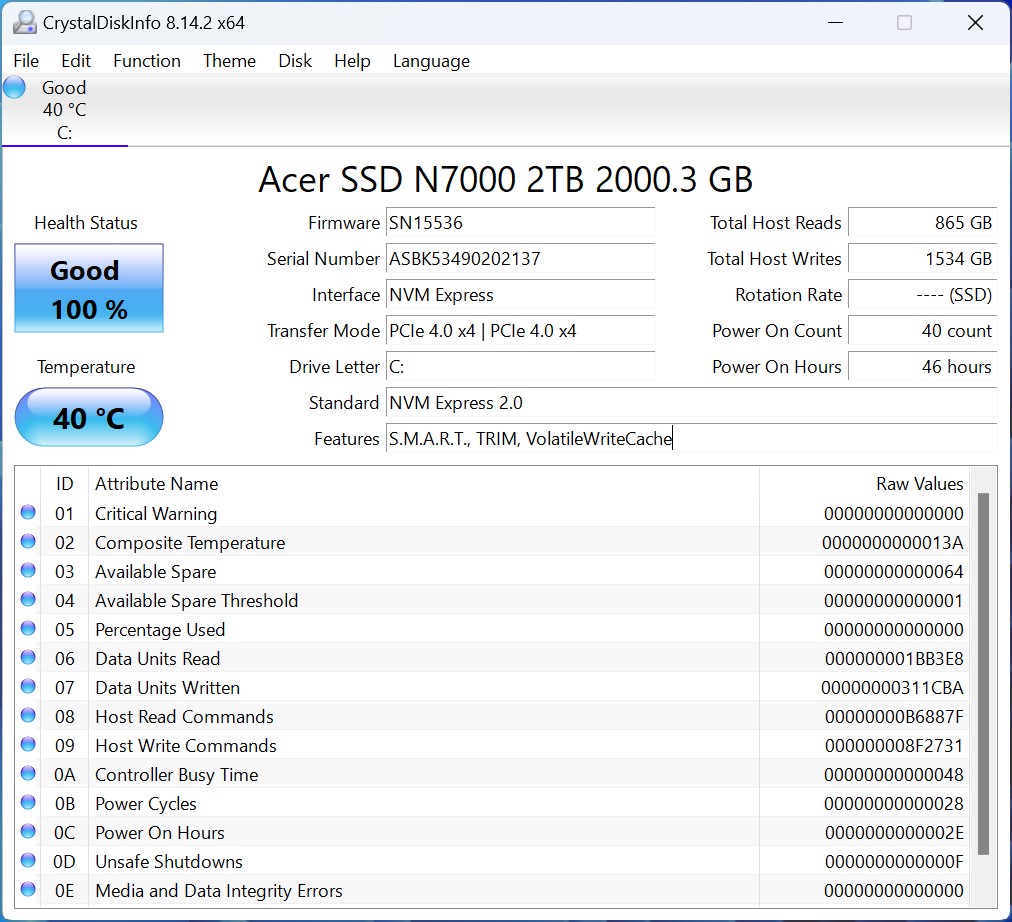
Armazenamento em massa
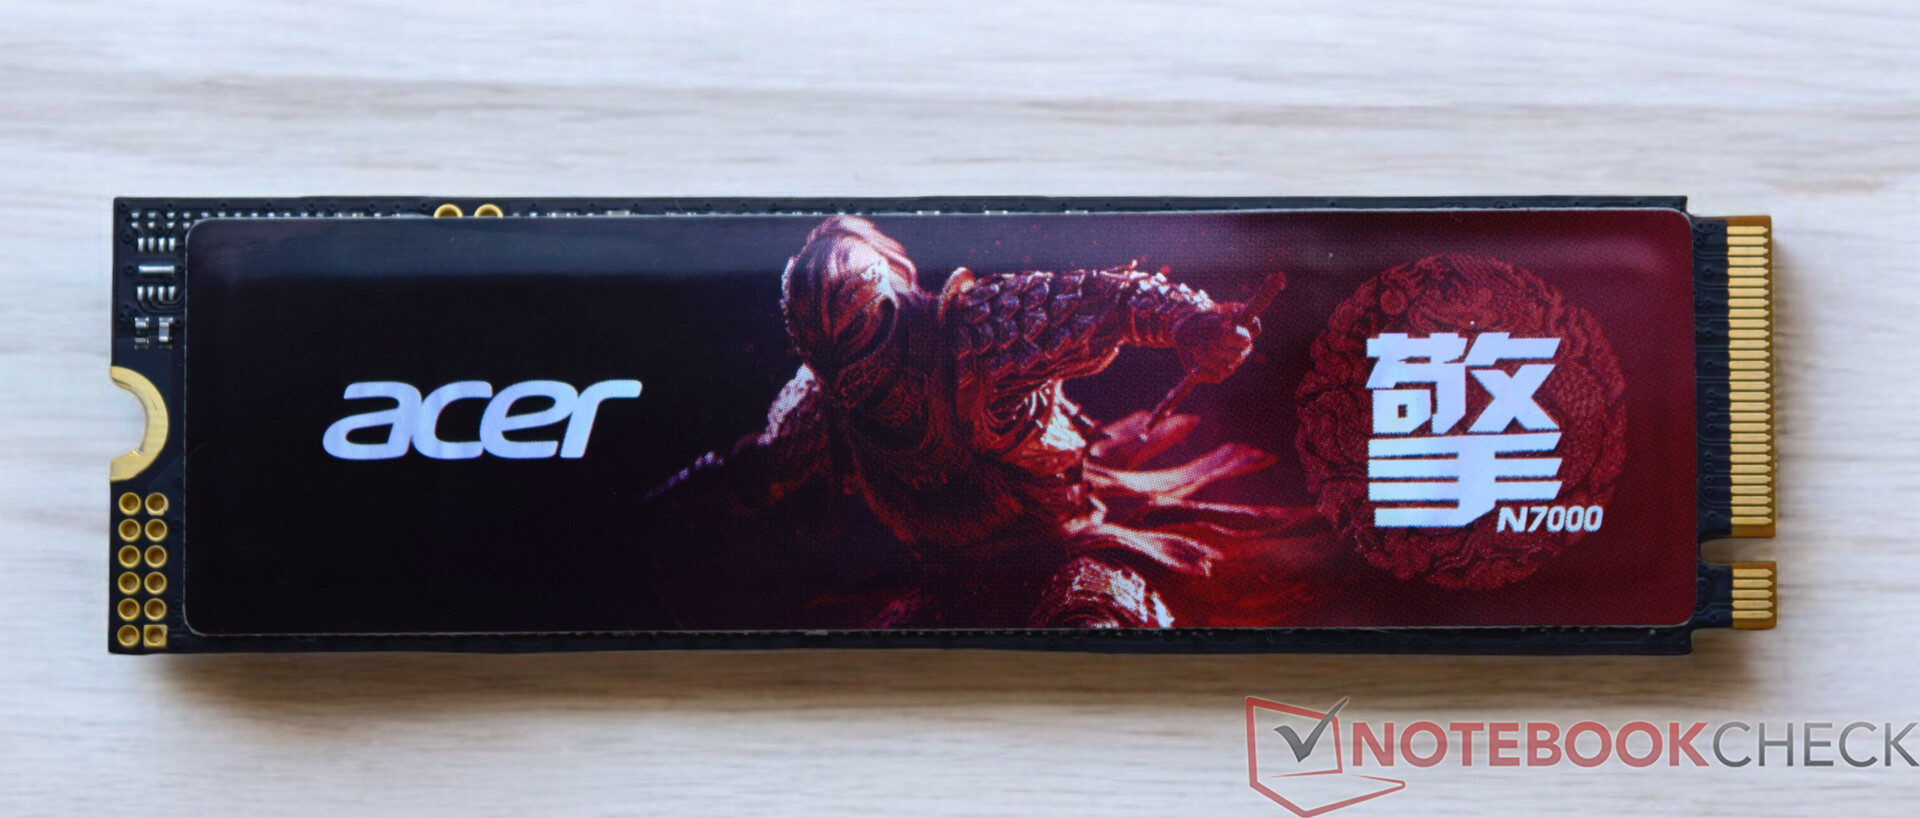
O Geekom XT13 Pro é equipado com um SSD com 2 TB de espaço de armazenamento da Acer. O mesmo modelo já estava no Geekom GT13 e apresentou um excelente desempenho em todos os testes. A conexão técnica é ótima e as taxas de transferência resultantes são muito altas. Sob carga contínua, o Acer N7000 tem pequenos problemas para manter o desempenho de leitura estável. Felizmente, não há nenhuma desvantagem extrema. Como pode ser visto no gráfico, o Acer N7000 ainda pode ter um desempenho significativamente melhor com desempenho de leitura reduzido do que o Geekom XT12 Pro ou o Acemagic F2A. O teste do Geekom XT12 Pro revelou um problema com a posição da almofada térmica, o que não é o caso do Geekom XT13 Pro. As almofadas térmicas estão na posição correta. Como já mencionamos na seção de manutenção, um SSD adicional pode ser instalado no Geekom XT13 Pro. No entanto, o segundo slot M.2 suporta apenas SSDs SATA com um comprimento de 42 milímetros (M.2-2242).
Para mais comparações e benchmarks, consulte nossa Tabela de comparação.

| Drive Performance Rating - Percent | |
| Aoostar GEM12 | |
| Geekom XT13 Pro | |
| Geekom XT12 Pro | |
| Minisforum AtomMan X7 Ti | |
| Geekom A7 | |
| Média da turma Mini PC | |
| Acemagic F2A | |
* ... menor é melhor
Continuous read: DiskSpd Read Loop, Queue Depth 8
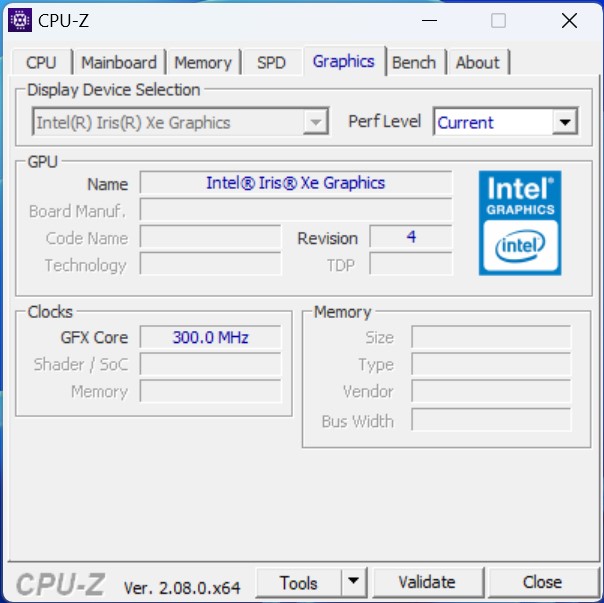
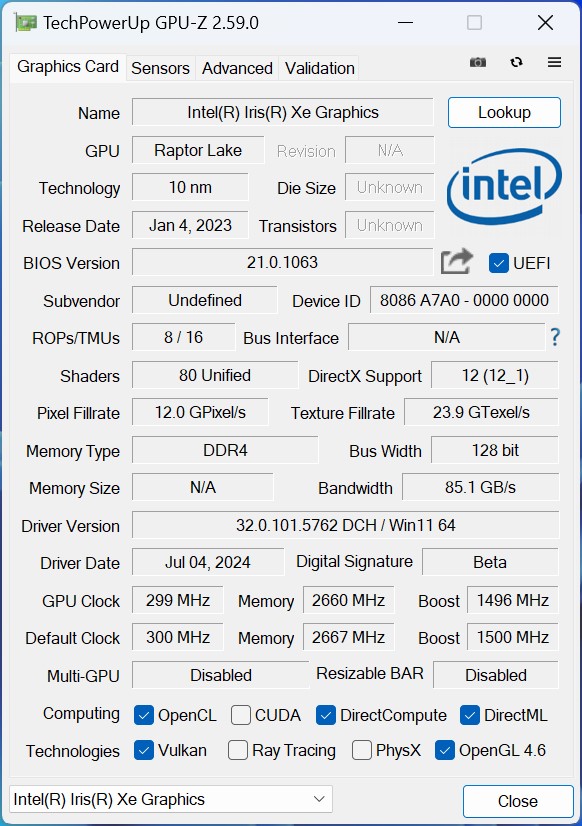
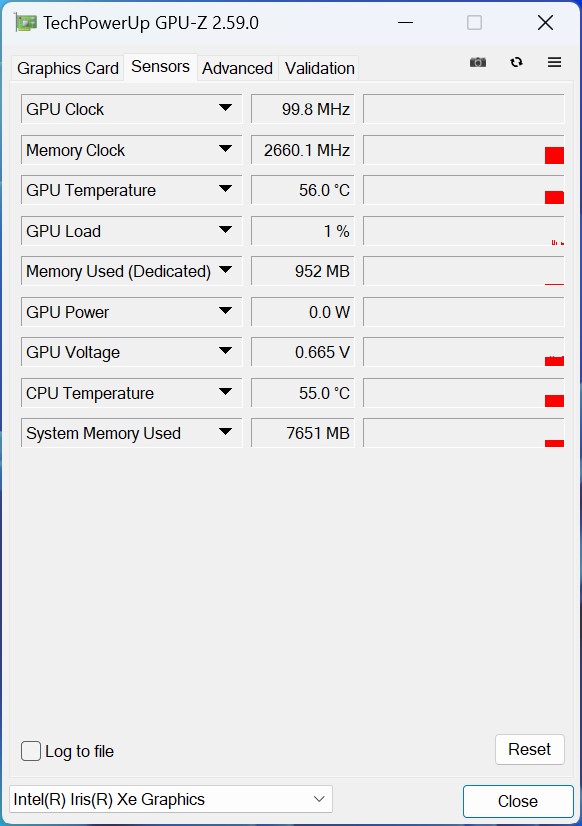
Gráficos
A Intel Iris Xe Graphics G7 faz os cálculos 3D e é responsável pela saída da imagem. Com 96 UEs, o Intel Core i9-13900H é o modelo mais rápido da série. No entanto, o modelo desatualizado tem dificuldade em se impor contra os representantes modernos. Se a Geekom já tivesse se atrevido a instalar um SoC Meteor Lake no XT13 Pro, seria possível esperar um aumento claramente perceptível no desempenho 3D. O desempenho de uma iGPU Intel Arc de 8 núcleos pode ser visto perfeitamente nos dados de comparação. Enquanto isso, o senhor obtém ainda mais desempenho 3D se uma AMD Radeon 780M estiver instalada no sistema. A própria Geekom agora oferece vários dispositivos com essa iGPU, o que significa que o fabricante está dificultando sua vida nessa disciplina. Um exemplo disso é o Geekom A7e o Geekom A8ou o Geekom AE7.
Outras comparações e benchmarks podem ser encontrados em nossa Tabela de comparação de GPUs.
| 3DMark Performance Rating - Percent | |
| Geekom A7 | |
| Aoostar GEM12 | |
| Acemagic F2A | |
| Minisforum AtomMan X7 Ti | |
| Geekom XT13 Pro | |
| Geekom XT12 Pro | |
| 3DMark 11 - 1280x720 Performance GPU | |
| Geekom A7 | |
| Aoostar GEM12 | |
| Acemagic F2A | |
| Minisforum AtomMan X7 Ti | |
| Geekom XT13 Pro | |
| Geekom XT12 Pro | |
| 3DMark | |
| 2560x1440 Time Spy Graphics | |
| Acemagic F2A | |
| Minisforum AtomMan X7 Ti | |
| Geekom A7 | |
| Aoostar GEM12 | |
| Geekom XT13 Pro | |
| Geekom XT12 Pro | |
| 1920x1080 Fire Strike Graphics | |
| Geekom A7 | |
| Aoostar GEM12 | |
| Acemagic F2A | |
| Minisforum AtomMan X7 Ti | |
| Geekom XT13 Pro | |
| Geekom XT12 Pro | |
| Unigine Heaven 4.0 | |
| Extreme Preset OpenGL | |
| Aoostar GEM12 | |
| Acemagic F2A | |
| Minisforum AtomMan X7 Ti | |
| Geekom A7 | |
| Geekom XT13 Pro | |
| Geekom XT12 Pro | |
| Extreme Preset DX11 | |
| Aoostar GEM12 | |
| Minisforum AtomMan X7 Ti | |
| Acemagic F2A | |
| Geekom A7 | |
| Geekom XT13 Pro | |
| Geekom XT12 Pro | |
| Unigine Valley 1.0 | |
| 1920x1080 Extreme HD DirectX AA:x8 | |
| Aoostar GEM12 | |
| Minisforum AtomMan X7 Ti | |
| Geekom A7 | |
| Acemagic F2A | |
| Geekom XT13 Pro | |
| Geekom XT12 Pro | |
| 1920x1080 Extreme HD Preset OpenGL AA:x8 | |
| Minisforum AtomMan X7 Ti | |
| Aoostar GEM12 | |
| Acemagic F2A | |
| Geekom XT13 Pro | |
| Geekom XT12 Pro | |
| Geekom A7 | |
| Unigine Superposition | |
| 1280x720 720p Low | |
| Aoostar GEM12 | |
| Acemagic F2A | |
| Minisforum AtomMan X7 Ti | |
| Geekom A7 | |
| Geekom XT13 Pro | |
| Geekom XT12 Pro | |
| 1920x1080 1080p High | |
| Aoostar GEM12 | |
| Acemagic F2A | |
| Minisforum AtomMan X7 Ti | |
| Geekom A7 | |
| Geekom XT13 Pro | |
| Geekom XT12 Pro | |
| 1920x1080 1080p Extreme | |
| Acemagic F2A | |
| Minisforum AtomMan X7 Ti | |
| Aoostar GEM12 | |
| Geekom A7 | |
| Geekom XT13 Pro | |
| Geekom XT12 Pro | |
| ComputeMark v2.1 | |
| 1024x600 Normal, Score | |
| Geekom A7 | |
| Aoostar GEM12 | |
| Acemagic F2A | |
| Minisforum AtomMan X7 Ti | |
| Geekom XT13 Pro | |
| Geekom XT12 Pro | |
| 1024x600 Normal, Fluid 3DTex | |
| Aoostar GEM12 | |
| Geekom A7 | |
| Minisforum AtomMan X7 Ti | |
| Acemagic F2A | |
| Geekom XT13 Pro | |
| Geekom XT12 Pro | |
| 1024x600 Normal, Fluid 2DTexArr | |
| Geekom A7 | |
| Aoostar GEM12 | |
| Minisforum AtomMan X7 Ti | |
| Acemagic F2A | |
| Geekom XT13 Pro | |
| Geekom XT12 Pro | |
| 1024x600 Normal, Mandel Vector | |
| Geekom A7 | |
| Aoostar GEM12 | |
| Acemagic F2A | |
| Minisforum AtomMan X7 Ti | |
| Geekom XT12 Pro | |
| Geekom XT13 Pro | |
| 1024x600 Normal, Mandel Scalar | |
| Geekom A7 | |
| Aoostar GEM12 | |
| Acemagic F2A | |
| Minisforum AtomMan X7 Ti | |
| Geekom XT12 Pro | |
| Geekom XT13 Pro | |
| 1024x600 Normal, QJuliaRayTrace | |
| Geekom A7 | |
| Aoostar GEM12 | |
| Acemagic F2A | |
| Minisforum AtomMan X7 Ti | |
| Geekom XT13 Pro | |
| Geekom XT12 Pro | |
| LuxMark v2.0 64Bit | |
| Room GPUs-only | |
| Geekom A7 | |
| Aoostar GEM12 | |
| Minisforum AtomMan X7 Ti | |
| Geekom XT13 Pro | |
| Acemagic F2A | |
| Sala GPUs-only | |
| Minisforum AtomMan X7 Ti | |
| Acemagic F2A | |
| Geekom XT13 Pro | |
| Geekom A7 | |
| Aoostar GEM12 | |
| Affinity Photo 2 - Combined (Single / Multi GPU) | |
| Minisforum AtomMan X7 Ti | |
| Acemagic F2A | |
| Geekom XT13 Pro | |
| Geekom XT12 Pro | |
| Aoostar GEM12 | |
| Geekom A7 | |
| Geekom XT13 Pro, Intel Iris Xe Graphics G7 96EUs i9-13900H | Aoostar GEM12, AMD Radeon 780M R7 8845HS | Minisforum AtomMan X7 Ti, Intel Arc 8-Core iGPU Ultra 9 185H | Acemagic F2A, Intel Arc 8-Core iGPU Ultra 7 155H | Geekom XT12 Pro, Intel Iris Xe Graphics G7 96EUs i9-12900H | Geekom A7, AMD Radeon 780M R9 7940HS | Média da turma Mini PC | |
|---|---|---|---|---|---|---|---|
| SPECviewperf 2020 | 309% | 36% | 25% | -4% | 278% | 188% | |
| 3840x2160 Medical (medical-03) | 3.63 | 11.2 209% | 4.23 17% | 5.05 39% | 3.49 -4% | 11.1 206% | 7.92 ? 118% |
| 3840x2160 Energy (energy-03) | 3.15 | 19.9 532% | 6.03 91% | 4.61 46% | 3.05 -3% | 14.1 348% | 11.3 ? 259% |
| 3840x2160 Creo (creo-03) | 16 | 33.4 109% | 18.5 16% | 17.9 12% | 14.8 -7% | 31.4 96% | 30.1 ? 88% |
| 3840x2160 CATIA (catia-06) | 7.9 | 23.2 194% | 11.1 41% | 10 27% | 7.78 -2% | 24.8 214% | 18.2 ? 130% |
| 3840x2160 3ds Max (3dsmax-07) | 10.3 | 20.4 98% | 14.9 45% | 12.9 25% | 9.69 -6% | 20.9 103% | 22.1 ? 115% |
| 3840x2160 Siemens NX (snx-04) | 6.13 | 64.1 946% | 6.24 2% | 5.7 -7% | 6.29 3% | 61.4 902% | 36.2 ? 491% |
| 3840x2160 Maya (maya-06) | 26.8 | 47.7 78% | 37.7 41% | 35.4 32% | 23.9 -11% | 47 75% | 56.7 ? 112% |
| 3DMark 05 Standard | 29045 pontos | |
| 3DMark 06 Score 1366x768 | 30156 pontos | |
| 3DMark Vantage P Result | 28599 pontos | |
| 3DMark 11 Performance | 8024 pontos | |
| 3DMark Ice Storm Standard Score | 155640 pontos | |
| 3DMark Cloud Gate Standard Score | 28112 pontos | |
| 3DMark Fire Strike Score | 5448 pontos | |
| 3DMark Fire Strike Extreme Score | 2570 pontos | |
| 3DMark Time Spy Score | 1920 pontos | |
| 3DMark Steel Nomad Score | 183 pontos | |
| 3DMark Steel Nomad Light Score | 1276 pontos | |
Ajuda | ||
Desempenho em jogos
A iGPU Intel Iris Xe não é capaz de lidar com a maioria dos jogos. A iGPU antiga só atinge taxas de quadros adequadas, se é que consegue, em resoluções baixas e em uma predefinição gráfica baixa ou média. Se o senhor ainda quiser usar o Geekom XT13 Pro para jogos, terá que fazer o desvio por meio de uma placa gráfica externa. Vários modelos podem ser usados com o dispositivo via USB4.
| Dota 2 Reborn | |
| 1280x720 min (0/3) fastest | |
| Geekom A7 | |
| Aoostar GEM12 | |
| Geekom XT13 Pro | |
| Minisforum AtomMan X7 Ti | |
| Geekom XT12 Pro | |
| Acemagic F2A | |
| 1920x1080 high (2/3) | |
| Geekom A7 | |
| Aoostar GEM12 | |
| Minisforum AtomMan X7 Ti | |
| Acemagic F2A | |
| Geekom XT13 Pro | |
| Geekom XT12 Pro | |
| GTA V | |
| 1024x768 Lowest Settings possible | |
| Geekom A7 | |
| Aoostar GEM12 | |
| Minisforum AtomMan X7 Ti | |
| Acemagic F2A | |
| Geekom XT13 Pro | |
| 1920x1080 High/On (Advanced Graphics Off) AA:2xMSAA + FX AF:8x | |
| Geekom A7 | |
| Aoostar GEM12 | |
| Minisforum AtomMan X7 Ti | |
| Acemagic F2A | |
| Geekom XT13 Pro | |
| Cyberpunk 2077 2.2 Phantom Liberty | |
| 1920x1080 Low Preset (FSR off) | |
| Aoostar GEM12 | |
| Minisforum AtomMan X7 Ti | |
| Acemagic F2A | |
| Geekom XT13 Pro | |
| Geekom XT12 Pro | |
| 1920x1080 High Preset (FSR off) | |
| Aoostar GEM12 | |
| Minisforum AtomMan X7 Ti | |
| Acemagic F2A | |
| Geekom XT13 Pro | |
| Geekom XT12 Pro | |
| Baldur's Gate 3 | |
| 1280x720 Low Preset | |
| Aoostar GEM12 | |
| Geekom XT13 Pro | |
| 1920x1080 High Preset | |
| Aoostar GEM12 | |
| Geekom XT13 Pro | |
| F1 24 | |
| 1920x1080 Low Preset AA:T AF:16x | |
| Geekom XT13 Pro | |
| 1920x1080 High Preset AA:T AF:16x | |
| Geekom XT13 Pro | |
FPS chart
| baixo | média | alto | ultra | |
|---|---|---|---|---|
| GTA V (2015) | 123.5 | 105.9 | 22.1 | 9 |
| Dota 2 Reborn (2015) | 117.2 | 82.9 | 72.5 | 66.5 |
| Final Fantasy XV Benchmark (2018) | 46 | 25.7 | 18.2 | |
| Baldur's Gate 3 (2023) | 19.9 | 15.4 | 13.5 | 13 |
| Cyberpunk 2077 2.2 Phantom Liberty (2023) | 18.6 | 15 | 13 | 11.4 |
| F1 24 (2024) | 43.1 | 37.3 | 26.7 |
Verificação de desempenho do Geekom XT13 Pro com uma Nvidia GeForce RTX 3060 Ti
O Geekom XT13 Pro tem duas portas USB4, que suportam o uso de placas gráficas externas. Sem influenciar o resultado geral, realizamos alguns testes com o Razer Core X e uma Nvidia GeForce RTX 3060 Ti. Em comparação com a iGPU antiga do Intel Core i9-13900H, o desempenho 3D pode ser enormemente aumentado. A comparação com os outros dispositivos de teste mostra um resultado quase idêntico nos testes sintéticos. O desempenho em jogos também pode ser significativamente aumentado com essa combinação, como pode ser visto nos jogos testados. Às vezes, até mesmo os jogos mais modernos podem ser desfrutados com todos os detalhes.
| Performance Rating - Percent | |
| Geekom AE7 (Nvidia GeForce RTX 3060 Ti FE) | |
| Geekom A8 (Nvidia GeForce RTX 3060 Ti FE) | |
| Geekom GT13 Pro (Nvidia GeForce RTX 3060 Ti FE) | |
| Geekom XT13 Pro (Nvidia GeForce RTX 3060 Ti FE) | |
| Geekom XT12 Pro (Nvidia GeForce RTX 3060 Ti FE) | |
| Minisforum UH125 Pro (Nvidia GeForce RTX 3060 Ti FE) | |
| 3DMark 11 - 1280x720 Performance GPU | |
| Geekom A8 (Nvidia GeForce RTX 3060 Ti FE) | |
| Geekom AE7 (Nvidia GeForce RTX 3060 Ti FE) | |
| Geekom XT13 Pro (Nvidia GeForce RTX 3060 Ti FE) | |
| Geekom GT13 Pro (Nvidia GeForce RTX 3060 Ti FE) | |
| Geekom XT12 Pro (Nvidia GeForce RTX 3060 Ti FE) | |
| Minisforum UH125 Pro (Nvidia GeForce RTX 3060 Ti FE) | |
| 3DMark | |
| 2560x1440 Time Spy Graphics | |
| Geekom A8 (Nvidia GeForce RTX 3060 Ti FE) | |
| Geekom AE7 (Nvidia GeForce RTX 3060 Ti FE) | |
| Geekom XT13 Pro (Nvidia GeForce RTX 3060 Ti FE) | |
| Geekom GT13 Pro (Nvidia GeForce RTX 3060 Ti FE) | |
| Geekom XT12 Pro (Nvidia GeForce RTX 3060 Ti FE) | |
| Minisforum UH125 Pro (Nvidia GeForce RTX 3060 Ti FE) | |
| 1920x1080 Fire Strike Graphics | |
| Geekom AE7 (Nvidia GeForce RTX 3060 Ti FE) | |
| Geekom GT13 Pro (Nvidia GeForce RTX 3060 Ti FE) | |
| Geekom A8 (Nvidia GeForce RTX 3060 Ti FE) | |
| Geekom XT13 Pro (Nvidia GeForce RTX 3060 Ti FE) | |
| Minisforum UH125 Pro (Nvidia GeForce RTX 3060 Ti FE) | |
| Geekom XT12 Pro (Nvidia GeForce RTX 3060 Ti FE) | |
| 3840x2160 Fire Strike Ultra Graphics | |
| Geekom GT13 Pro (Nvidia GeForce RTX 3060 Ti FE) | |
| Geekom AE7 (Nvidia GeForce RTX 3060 Ti FE) | |
| Geekom XT12 Pro (Nvidia GeForce RTX 3060 Ti FE) | |
| Geekom XT13 Pro (Nvidia GeForce RTX 3060 Ti FE) | |
| Geekom A8 (Nvidia GeForce RTX 3060 Ti FE) | |
| Minisforum UH125 Pro (Nvidia GeForce RTX 3060 Ti FE) | |
| Unigine Superposition | |
| 1280x720 720p Low | |
| Geekom AE7 (Nvidia GeForce RTX 3060 Ti FE) | |
| Geekom GT13 Pro (Nvidia GeForce RTX 3060 Ti FE) | |
| Geekom A8 (Nvidia GeForce RTX 3060 Ti FE) | |
| Geekom XT13 Pro (Nvidia GeForce RTX 3060 Ti FE) | |
| Geekom XT12 Pro (Nvidia GeForce RTX 3060 Ti FE) | |
| Minisforum UH125 Pro (Nvidia GeForce RTX 3060 Ti FE) | |
| 1920x1080 1080p High | |
| Geekom GT13 Pro (Nvidia GeForce RTX 3060 Ti FE) | |
| Geekom A8 (Nvidia GeForce RTX 3060 Ti FE) | |
| Geekom AE7 (Nvidia GeForce RTX 3060 Ti FE) | |
| Geekom XT13 Pro (Nvidia GeForce RTX 3060 Ti FE) | |
| Minisforum UH125 Pro (Nvidia GeForce RTX 3060 Ti FE) | |
| Geekom XT12 Pro (Nvidia GeForce RTX 3060 Ti FE) | |
| 1920x1080 1080p Extreme | |
| Geekom GT13 Pro (Nvidia GeForce RTX 3060 Ti FE) | |
| Geekom XT13 Pro (Nvidia GeForce RTX 3060 Ti FE) | |
| Geekom XT12 Pro (Nvidia GeForce RTX 3060 Ti FE) | |
| Minisforum UH125 Pro (Nvidia GeForce RTX 3060 Ti FE) | |
| Geekom A8 (Nvidia GeForce RTX 3060 Ti FE) | |
| Geekom AE7 (Nvidia GeForce RTX 3060 Ti FE) | |
| 3840x2160 4k Optimized | |
| Geekom GT13 Pro (Nvidia GeForce RTX 3060 Ti FE) | |
| Geekom XT13 Pro (Nvidia GeForce RTX 3060 Ti FE) | |
| Geekom XT12 Pro (Nvidia GeForce RTX 3060 Ti FE) | |
| Geekom A8 (Nvidia GeForce RTX 3060 Ti FE) | |
| Minisforum UH125 Pro (Nvidia GeForce RTX 3060 Ti FE) | |
| Geekom AE7 (Nvidia GeForce RTX 3060 Ti FE) | |
| 7680x4320 8k Optimized | |
| Geekom GT13 Pro (Nvidia GeForce RTX 3060 Ti FE) | |
| Geekom XT13 Pro (Nvidia GeForce RTX 3060 Ti FE) | |
| Geekom XT12 Pro (Nvidia GeForce RTX 3060 Ti FE) | |
| Minisforum UH125 Pro (Nvidia GeForce RTX 3060 Ti FE) | |
| Geekom A8 (Nvidia GeForce RTX 3060 Ti FE) | |
| Geekom AE7 (Nvidia GeForce RTX 3060 Ti FE) | |
| Unigine Valley 1.0 | |
| 1920x1080 Extreme HD DirectX AA:x8 | |
| Geekom XT12 Pro (Nvidia GeForce RTX 3060 Ti FE) | |
| Geekom GT13 Pro (Nvidia GeForce RTX 3060 Ti FE) | |
| Geekom XT13 Pro (Nvidia GeForce RTX 3060 Ti FE) | |
| Geekom A8 (Nvidia GeForce RTX 3060 Ti FE) | |
| Geekom AE7 (Nvidia GeForce RTX 3060 Ti FE) | |
| Minisforum UH125 Pro (Nvidia GeForce RTX 3060 Ti FE) | |
| 1920x1080 Extreme HD Preset OpenGL AA:x8 | |
| Geekom GT13 Pro (Nvidia GeForce RTX 3060 Ti FE) | |
| Geekom XT12 Pro (Nvidia GeForce RTX 3060 Ti FE) | |
| Geekom XT13 Pro (Nvidia GeForce RTX 3060 Ti FE) | |
| Geekom A8 (Nvidia GeForce RTX 3060 Ti FE) | |
| Geekom AE7 (Nvidia GeForce RTX 3060 Ti FE) | |
| Minisforum UH125 Pro (Nvidia GeForce RTX 3060 Ti FE) | |
| Unigine Heaven 4.0 | |
| Extreme Preset OpenGL | |
| Geekom A8 (Nvidia GeForce RTX 3060 Ti FE) | |
| Geekom AE7 (Nvidia GeForce RTX 3060 Ti FE) | |
| Geekom GT13 Pro (Nvidia GeForce RTX 3060 Ti FE) | |
| Geekom XT13 Pro (Nvidia GeForce RTX 3060 Ti FE) | |
| Minisforum UH125 Pro (Nvidia GeForce RTX 3060 Ti FE) | |
| Geekom XT12 Pro (Nvidia GeForce RTX 3060 Ti FE) | |
| Extreme Preset DX11 | |
| Geekom XT13 Pro (Nvidia GeForce RTX 3060 Ti FE) | |
| Geekom GT13 Pro (Nvidia GeForce RTX 3060 Ti FE) | |
| Geekom A8 (Nvidia GeForce RTX 3060 Ti FE) | |
| Geekom XT12 Pro (Nvidia GeForce RTX 3060 Ti FE) | |
| Geekom AE7 (Nvidia GeForce RTX 3060 Ti FE) | |
| Minisforum UH125 Pro (Nvidia GeForce RTX 3060 Ti FE) | |
| ComputeMark v2.1 | |
| 1024x600 Normal, Score | |
| Geekom GT13 Pro (Nvidia GeForce RTX 3060 Ti FE) | |
| Geekom AE7 (Nvidia GeForce RTX 3060 Ti FE) | |
| Geekom A8 (Nvidia GeForce RTX 3060 Ti FE) | |
| Geekom XT13 Pro (Nvidia GeForce RTX 3060 Ti FE) | |
| Minisforum UH125 Pro (Nvidia GeForce RTX 3060 Ti FE) | |
| Geekom XT12 Pro (Nvidia GeForce RTX 3060 Ti FE) | |
| 1024x600 Normal, Fluid 3DTex | |
| Geekom GT13 Pro (Nvidia GeForce RTX 3060 Ti FE) | |
| Geekom AE7 (Nvidia GeForce RTX 3060 Ti FE) | |
| Minisforum UH125 Pro (Nvidia GeForce RTX 3060 Ti FE) | |
| Geekom A8 (Nvidia GeForce RTX 3060 Ti FE) | |
| Geekom XT13 Pro (Nvidia GeForce RTX 3060 Ti FE) | |
| Geekom XT12 Pro (Nvidia GeForce RTX 3060 Ti FE) | |
| 1024x600 Normal, Fluid 2DTexArr | |
| Geekom GT13 Pro (Nvidia GeForce RTX 3060 Ti FE) | |
| Geekom AE7 (Nvidia GeForce RTX 3060 Ti FE) | |
| Minisforum UH125 Pro (Nvidia GeForce RTX 3060 Ti FE) | |
| Geekom A8 (Nvidia GeForce RTX 3060 Ti FE) | |
| Geekom XT13 Pro (Nvidia GeForce RTX 3060 Ti FE) | |
| Geekom XT12 Pro (Nvidia GeForce RTX 3060 Ti FE) | |
| 1024x600 Normal, Mandel Vector | |
| Geekom GT13 Pro (Nvidia GeForce RTX 3060 Ti FE) | |
| Geekom AE7 (Nvidia GeForce RTX 3060 Ti FE) | |
| Geekom A8 (Nvidia GeForce RTX 3060 Ti FE) | |
| Geekom XT13 Pro (Nvidia GeForce RTX 3060 Ti FE) | |
| Minisforum UH125 Pro (Nvidia GeForce RTX 3060 Ti FE) | |
| Geekom XT12 Pro (Nvidia GeForce RTX 3060 Ti FE) | |
| 1024x600 Normal, Mandel Scalar | |
| Geekom GT13 Pro (Nvidia GeForce RTX 3060 Ti FE) | |
| Geekom AE7 (Nvidia GeForce RTX 3060 Ti FE) | |
| Geekom A8 (Nvidia GeForce RTX 3060 Ti FE) | |
| Geekom XT13 Pro (Nvidia GeForce RTX 3060 Ti FE) | |
| Minisforum UH125 Pro (Nvidia GeForce RTX 3060 Ti FE) | |
| Geekom XT12 Pro (Nvidia GeForce RTX 3060 Ti FE) | |
| 1024x600 Normal, QJuliaRayTrace | |
| Geekom GT13 Pro (Nvidia GeForce RTX 3060 Ti FE) | |
| Geekom AE7 (Nvidia GeForce RTX 3060 Ti FE) | |
| Geekom A8 (Nvidia GeForce RTX 3060 Ti FE) | |
| Geekom XT13 Pro (Nvidia GeForce RTX 3060 Ti FE) | |
| Minisforum UH125 Pro (Nvidia GeForce RTX 3060 Ti FE) | |
| Geekom XT12 Pro (Nvidia GeForce RTX 3060 Ti FE) | |
| Photoshop PugetBench - GPU Score | |
| Geekom A8 (Nvidia GeForce RTX 3060 Ti FE) | |
| Geekom AE7 (Nvidia GeForce RTX 3060 Ti FE) | |
| Geekom XT12 Pro (Nvidia GeForce RTX 3060 Ti FE) | |
| Geekom GT13 Pro (Nvidia GeForce RTX 3060 Ti FE) | |
| Minisforum UH125 Pro (Nvidia GeForce RTX 3060 Ti FE) | |
| Geekom XT13 Pro (Nvidia GeForce RTX 3060 Ti FE) | |
| Premiere Pro PugetBench - GPU 0.9 | |
| Geekom A8 (Nvidia GeForce RTX 3060 Ti FE) | |
| Geekom AE7 (Nvidia GeForce RTX 3060 Ti FE) | |
| Geekom GT13 Pro (Nvidia GeForce RTX 3060 Ti FE) | |
| Minisforum UH125 Pro (Nvidia GeForce RTX 3060 Ti FE) | |
| Geekom XT13 Pro (Nvidia GeForce RTX 3060 Ti FE) | |
| Geekom XT12 Pro (Nvidia GeForce RTX 3060 Ti FE) | |
| Cyberpunk 2077 2.2 Phantom Liberty | |
| 1280x720 Low Preset (FSR off) | |
| Geekom AE7 (Nvidia GeForce RTX 3060 Ti FE) | |
| Geekom A8 (Nvidia GeForce RTX 3060 Ti FE) | |
| Geekom XT13 Pro (Nvidia GeForce RTX 3060 Ti FE) | |
| Geekom GT13 Pro (Nvidia GeForce RTX 3060 Ti FE) | |
| Geekom XT12 Pro (Nvidia GeForce RTX 3060 Ti FE) | |
| Minisforum UH125 Pro (Nvidia GeForce RTX 3060 Ti FE) | |
| Geekom XT13 Pro | |
| 1920x1080 Medium Preset (FSR off) | |
| Geekom AE7 (Nvidia GeForce RTX 3060 Ti FE) | |
| Geekom XT13 Pro (Nvidia GeForce RTX 3060 Ti FE) | |
| Geekom A8 (Nvidia GeForce RTX 3060 Ti FE) | |
| Geekom GT13 Pro (Nvidia GeForce RTX 3060 Ti FE) | |
| Geekom XT12 Pro (Nvidia GeForce RTX 3060 Ti FE) | |
| Minisforum UH125 Pro (Nvidia GeForce RTX 3060 Ti FE) | |
| Geekom XT13 Pro | |
| 1920x1080 Ultra Preset (FSR off) | |
| Geekom AE7 (Nvidia GeForce RTX 3060 Ti FE) | |
| Geekom XT13 Pro (Nvidia GeForce RTX 3060 Ti FE) | |
| Geekom GT13 Pro (Nvidia GeForce RTX 3060 Ti FE) | |
| Geekom A8 (Nvidia GeForce RTX 3060 Ti FE) | |
| Geekom XT12 Pro (Nvidia GeForce RTX 3060 Ti FE) | |
| Minisforum UH125 Pro (Nvidia GeForce RTX 3060 Ti FE) | |
| Geekom XT13 Pro | |
| Baldur's Gate 3 | |
| 1920x1080 Low Preset | |
| Geekom GT13 Pro (Nvidia GeForce RTX 3060 Ti FE) | |
| Geekom XT12 Pro (Nvidia GeForce RTX 3060 Ti FE) | |
| Geekom XT13 Pro (Nvidia GeForce RTX 3060 Ti FE) | |
| Geekom AE7 (Nvidia GeForce RTX 3060 Ti FE) | |
| Geekom A8 (Nvidia GeForce RTX 3060 Ti FE) | |
| Minisforum UH125 Pro (Nvidia GeForce RTX 3060 Ti FE) | |
| Geekom XT13 Pro | |
| 1920x1080 Medium Preset | |
| Geekom XT13 Pro (Nvidia GeForce RTX 3060 Ti FE) | |
| Geekom GT13 Pro (Nvidia GeForce RTX 3060 Ti FE) | |
| Geekom A8 (Nvidia GeForce RTX 3060 Ti FE) | |
| Geekom XT12 Pro (Nvidia GeForce RTX 3060 Ti FE) | |
| Geekom AE7 (Nvidia GeForce RTX 3060 Ti FE) | |
| Minisforum UH125 Pro (Nvidia GeForce RTX 3060 Ti FE) | |
| Geekom XT13 Pro | |
| 1920x1080 Ultra Preset | |
| Geekom GT13 Pro (Nvidia GeForce RTX 3060 Ti FE) | |
| Geekom XT13 Pro (Nvidia GeForce RTX 3060 Ti FE) | |
| Geekom A8 (Nvidia GeForce RTX 3060 Ti FE) | |
| Geekom XT12 Pro (Nvidia GeForce RTX 3060 Ti FE) | |
| Geekom AE7 (Nvidia GeForce RTX 3060 Ti FE) | |
| Minisforum UH125 Pro (Nvidia GeForce RTX 3060 Ti FE) | |
| Geekom XT13 Pro | |
| F1 24 | |
| 1920x1080 Low Preset AA:T AF:16x | |
| Geekom AE7 (Nvidia GeForce RTX 3060 Ti FE) | |
| Geekom A8 (Nvidia GeForce RTX 3060 Ti FE) | |
| Geekom GT13 Pro (Nvidia GeForce RTX 3060 Ti FE) | |
| Geekom XT13 Pro (Nvidia GeForce RTX 3060 Ti FE) | |
| Geekom XT12 Pro (Nvidia GeForce RTX 3060 Ti FE) | |
| Minisforum UH125 Pro (Nvidia GeForce RTX 3060 Ti FE) | |
| Geekom XT13 Pro | |
| 1920x1080 Medium Preset AA:T AF:16x | |
| Geekom A8 (Nvidia GeForce RTX 3060 Ti FE) | |
| Geekom AE7 (Nvidia GeForce RTX 3060 Ti FE) | |
| Geekom XT12 Pro (Nvidia GeForce RTX 3060 Ti FE) | |
| Geekom XT13 Pro (Nvidia GeForce RTX 3060 Ti FE) | |
| Geekom GT13 Pro (Nvidia GeForce RTX 3060 Ti FE) | |
| Minisforum UH125 Pro (Nvidia GeForce RTX 3060 Ti FE) | |
| Geekom XT13 Pro | |
| 1920x1080 Ultra High Preset AA:T AF:16x | |
| Geekom AE7 (Nvidia GeForce RTX 3060 Ti FE) | |
| Geekom A8 (Nvidia GeForce RTX 3060 Ti FE) | |
| Geekom XT13 Pro (Nvidia GeForce RTX 3060 Ti FE) | |
| Geekom GT13 Pro (Nvidia GeForce RTX 3060 Ti FE) | |
| Geekom XT12 Pro (Nvidia GeForce RTX 3060 Ti FE) | |
| Minisforum UH125 Pro (Nvidia GeForce RTX 3060 Ti FE) | |
| Geekom XT13 Pro, Intel Iris Xe Graphics G7 96EUs i9-13900H | Geekom XT13 Pro (Nvidia GeForce RTX 3060 Ti FE), i9-13900H | Geekom GT13 Pro (Nvidia GeForce RTX 3060 Ti FE), i9-13900H | Geekom XT12 Pro (Nvidia GeForce RTX 3060 Ti FE), i9-12900H | Minisforum UH125 Pro (Nvidia GeForce RTX 3060 Ti FE), Ultra 5 125H | Geekom AE7 (Nvidia GeForce RTX 3060 Ti FE), R9 7940HS | Geekom A8 (Nvidia GeForce RTX 3060 Ti FE), R9 8945HS | Média da turma Mini PC | |
|---|---|---|---|---|---|---|---|---|
| SPECviewperf 2020 | 391% | 387% | 321% | 182% | 395% | 516% | 188% | |
| 3840x2160 Medical (medical-03) | 3.63 | 13 258% | 10.8 198% | 11.8 225% | 10.9 200% | 13 258% | 10.8 198% | 7.92 ? 118% |
| 3840x2160 Energy (energy-03) | 3.15 | 20.9 563% | 21 567% | 18.9 500% | 17.8 465% | 20.9 563% | 50.3 1497% | 11.3 ? 259% |
| 3840x2160 Creo (creo-03) | 16 | 74.2 364% | 76.4 378% | 62.7 292% | 26.6 66% | 76.8 380% | 76.6 379% | 30.1 ? 88% |
| 3840x2160 CATIA (catia-06) | 7.9 | 39.4 399% | 40.1 408% | 32.8 315% | 23.6 199% | 39.2 396% | 38.8 391% | 18.2 ? 130% |
| 3840x2160 3ds Max (3dsmax-07) | 10.3 | 47.2 358% | 47.3 359% | 40 288% | 28.7 179% | 46.5 351% | 45.9 346% | 22.1 ? 115% |
| 3840x2160 Siemens NX (snx-04) | 6.13 | 16.5 169% | 16.5 169% | 15.2 148% | 11.4 86% | 16.6 171% | 16.6 171% | 36.2 ? 491% |
| 3840x2160 Maya (maya-06) | 26.8 | 194 624% | 196 631% | 155 478% | 47.5 77% | 199 643% | 195 628% | 56.7 ? 112% |
| baixo | média | alto | ultra | QHD | 4K | |
|---|---|---|---|---|---|---|
| GTA V (2015) | 182.2 | 178.4 | 170.3 | 104.2 | 92.7 | 103.4 |
| Dota 2 Reborn (2015) | 165.8 | 138.3 | 132 | 121.9 | 104.6 | |
| Final Fantasy XV Benchmark (2018) | 183.7 | 142.2 | 98.8 | 77.6 | 48.6 | |
| X-Plane 11.11 (2018) | 146.4 | 137.9 | 106.3 | 92.1 | ||
| Baldur's Gate 3 (2023) | 113 | 91.3 | 79 | 78.5 | 61.6 | 37.1 |
| Cyberpunk 2077 2.2 Phantom Liberty (2023) | 88.2 | 81.4 | 71.7 | 64.4 | 44.5 | 22.2 |
| F1 24 (2024) | 76.9 | 73.1 | 60.5 | 42.2 | 36.9 | 19.2 |
Emissões - Resfriamento fraco e baixo consumo de energia
Emissões de ruído
Mesmo os dispositivos com o mesmo design não foram capazes de impressionar com os melhores valores em termos de emissões de ruído. Isso também se aplica ao Geekom XT13 Pro, pelo menos sob carga. O minicomputador é muito silencioso quando está ocioso e quase não é ouvido. Entretanto, a ventoinha está sempre funcionando, o que significa que a operação semipassiva não é possível. Sob carga, a ventoinha ocasionalmente acelera consideravelmente e conseguimos medir um nível de pressão sonora de pico de 49,5 dB(A). Entretanto, o volume máximo nem sempre está presente. Durante o teste de estresse, a velocidade da ventoinha oscilou várias vezes, de modo que o Geekom XT13 Pro atingiu apenas 38 dB(A) sob carga. Observamos o mesmo fenômeno sob carga média. Aqui, o volume mensurável oscila entre 38 e 42,2 dB(A)
Infelizmente, o Geekom XT12 Pro não é um dos dispositivos mais silenciosos. O dispositivo funciona quase silenciosamente quando está em marcha lenta, sendo possível ouvir apenas um ruído baixo da ventoinha. Isso muda sob carga, pois o mini-PC é claramente audível em até 44,2 dB(A). Conseguimos medir até 47,2 dB(A) durante os jogos. No entanto, não conseguimos detectar um nível de pressão sonora permanentemente alto durante os jogos. Aqui, o resultado oscilou entre 39 e 47,2 dB(A).
Barulho
| Ocioso |
| 27.6 / 27.8 / 27.9 dB |
| Carga |
| 42.2 / 49.5 dB |
 | ||
30 dB silencioso 40 dB(A) audível 50 dB(A) ruidosamente alto |
||
min: | ||
| Geekom XT13 Pro i9-13900H, Iris Xe G7 96EUs | Aoostar GEM12 R7 8845HS, Radeon 780M | Minisforum AtomMan X7 Ti Ultra 9 185H, Arc 8-Core | Acemagic F2A Ultra 7 155H, Arc 8-Core | Geekom XT12 Pro i9-12900H, Iris Xe G7 96EUs | Geekom A7 R9 7940HS, Radeon 780M | |
|---|---|---|---|---|---|---|
| Noise | 10% | 1% | 2% | 2% | -9% | |
| desligado / ambiente * | 25 | 24.3 3% | 24.1 4% | 24.9 -0% | 25.4 -2% | 25.4 -2% |
| Idle Minimum * | 27.6 | 27.5 -0% | 29.8 -8% | 25.4 8% | 28 -1% | 33.3 -21% |
| Idle Average * | 27.8 | 27.6 1% | 29.9 -8% | 25.7 8% | 28.1 -1% | 33.6 -21% |
| Idle Maximum * | 27.9 | 27.6 1% | 30 -8% | 25.7 8% | 28.5 -2% | 33.7 -21% |
| Load Average * | 42.2 | 36 15% | 37.3 12% | 47.8 -13% | 39.6 6% | 43.3 -3% |
| Cyberpunk 2077 ultra * | 46.6 | 35.4 24% | ||||
| Load Maximum * | 49.5 | 38.2 23% | 43.5 12% | 49 1% | 44.2 11% | 43.3 13% |
| Witcher 3 ultra * | 35.4 | 40.2 | 45.23 | 47.2 | 43.2 |
* ... menor é melhor
Temperatura
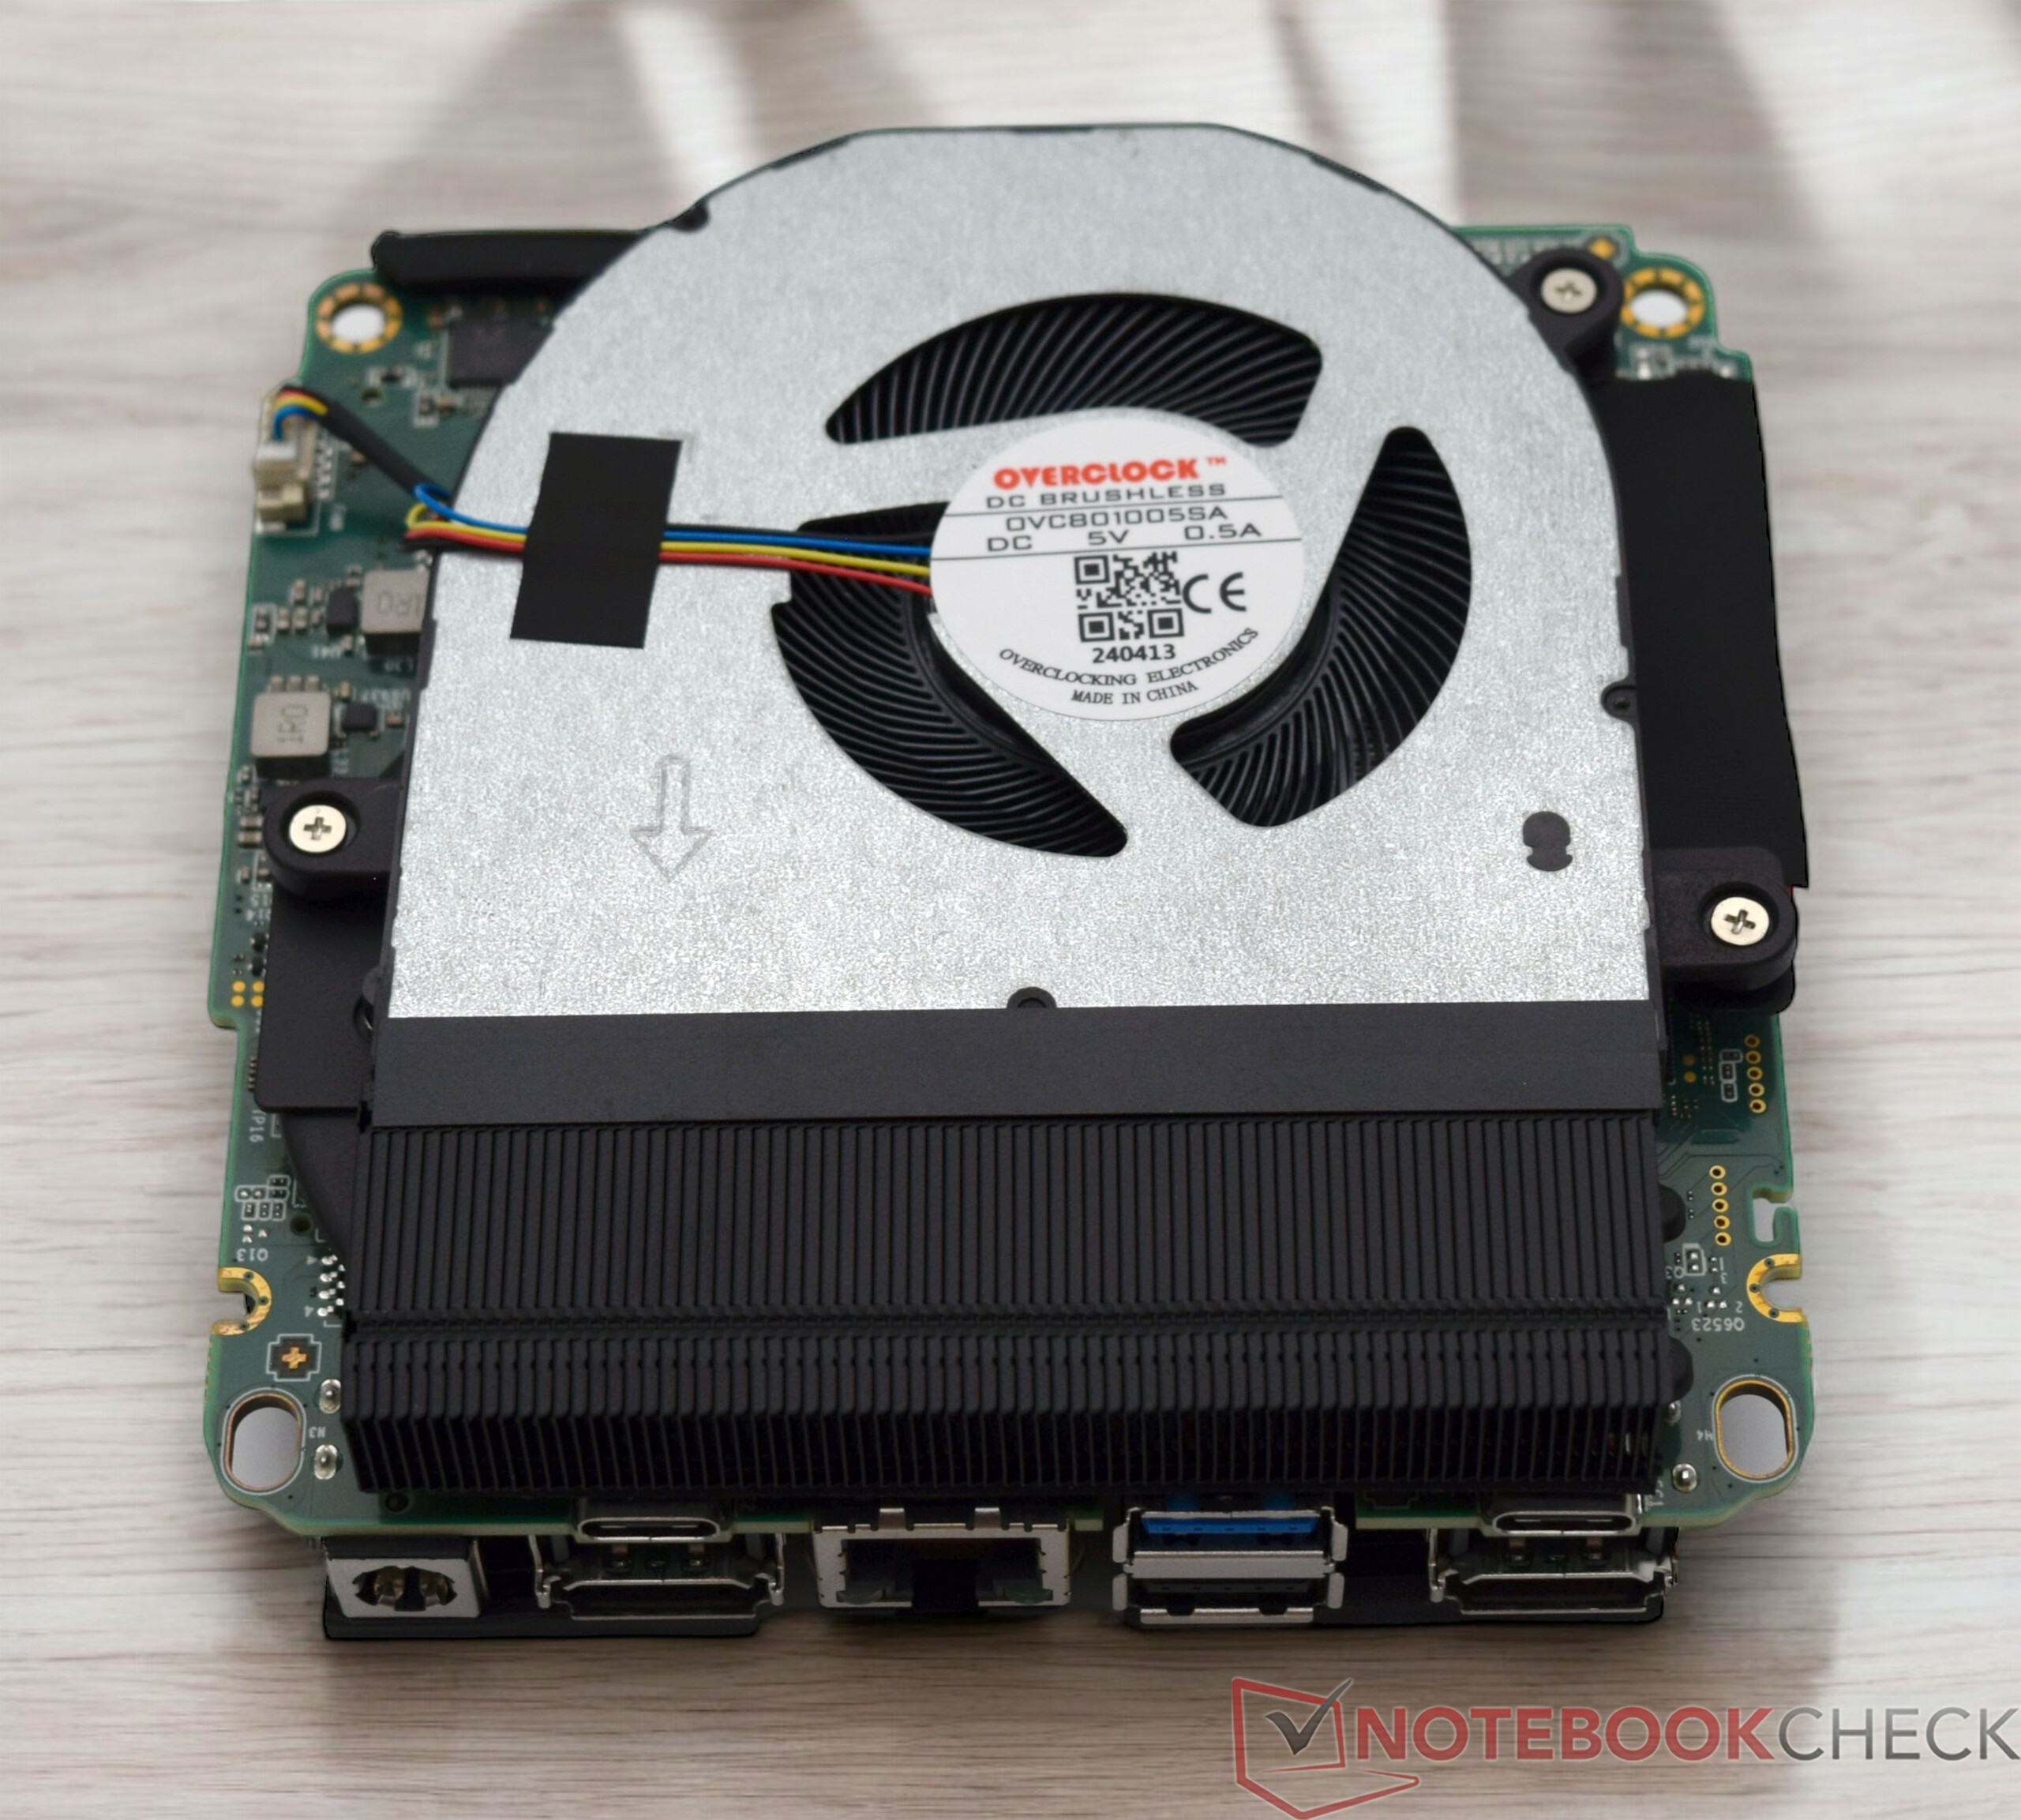
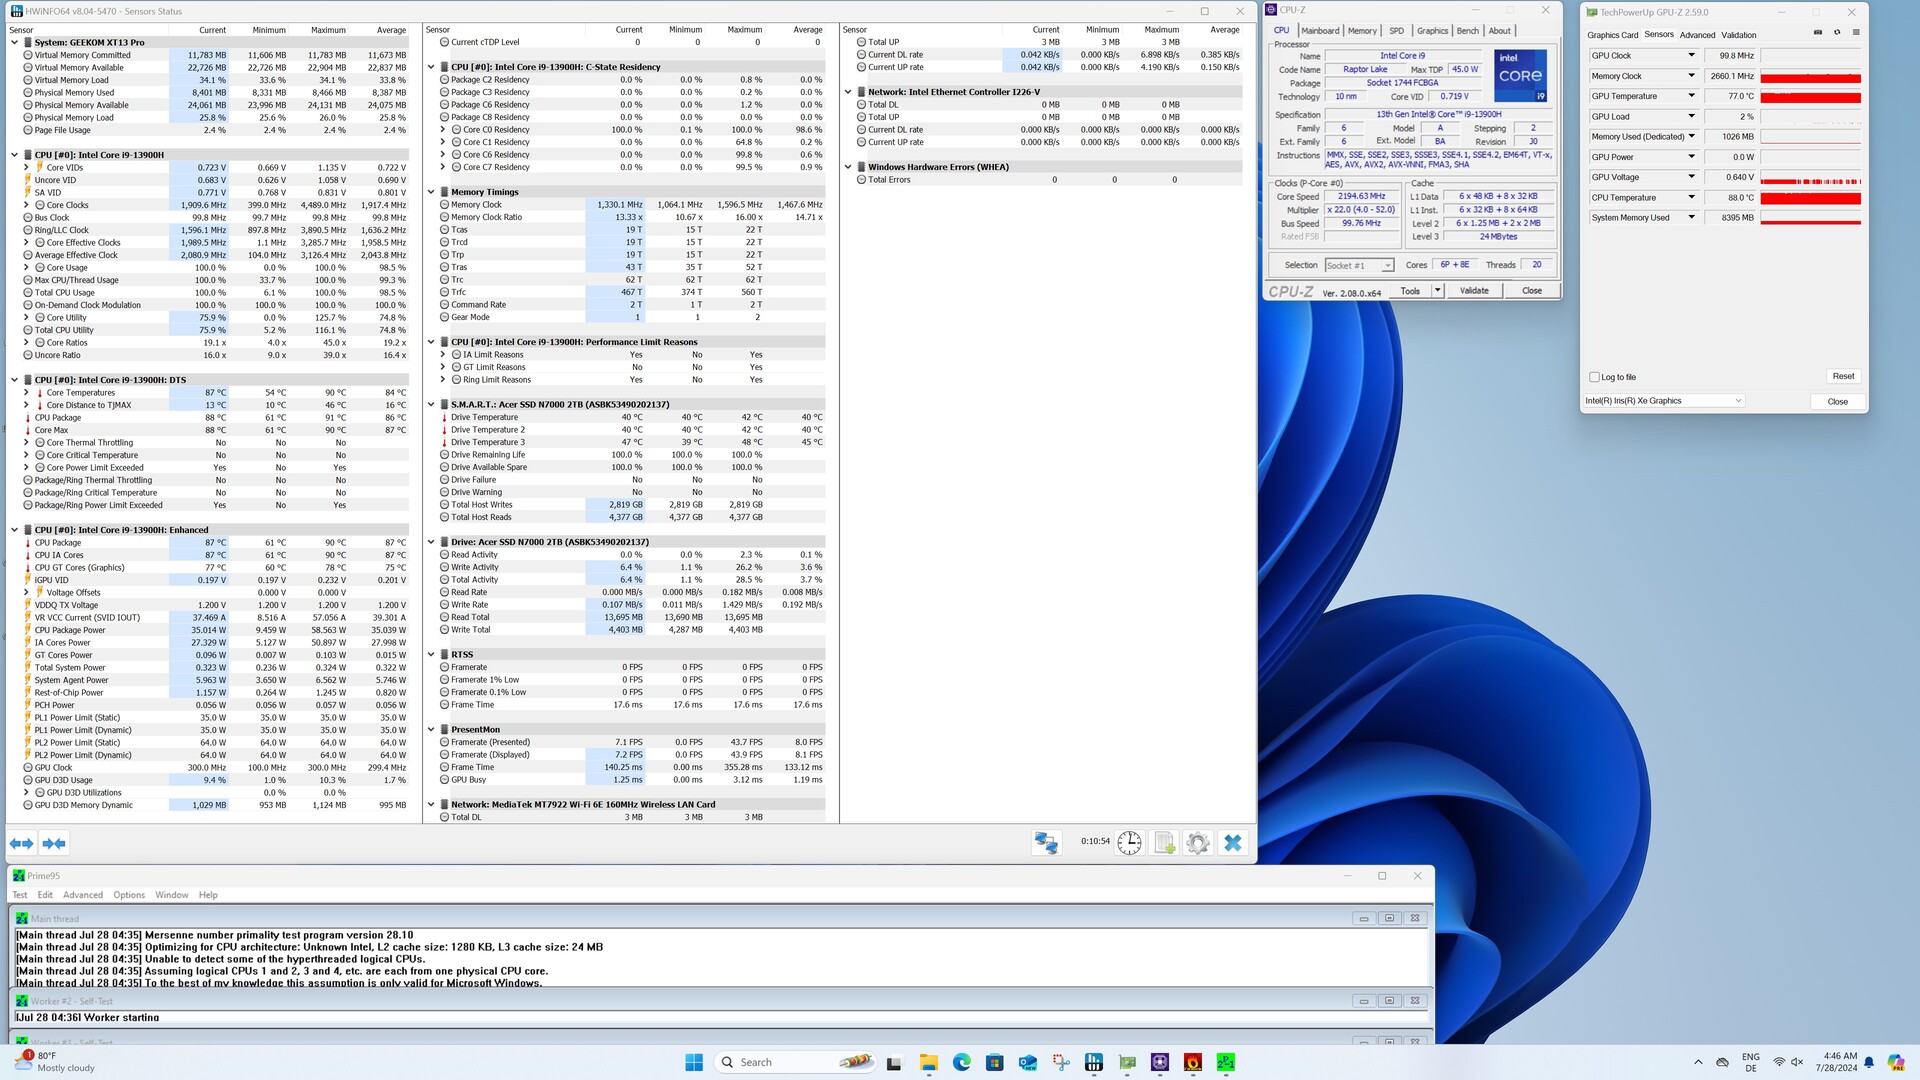
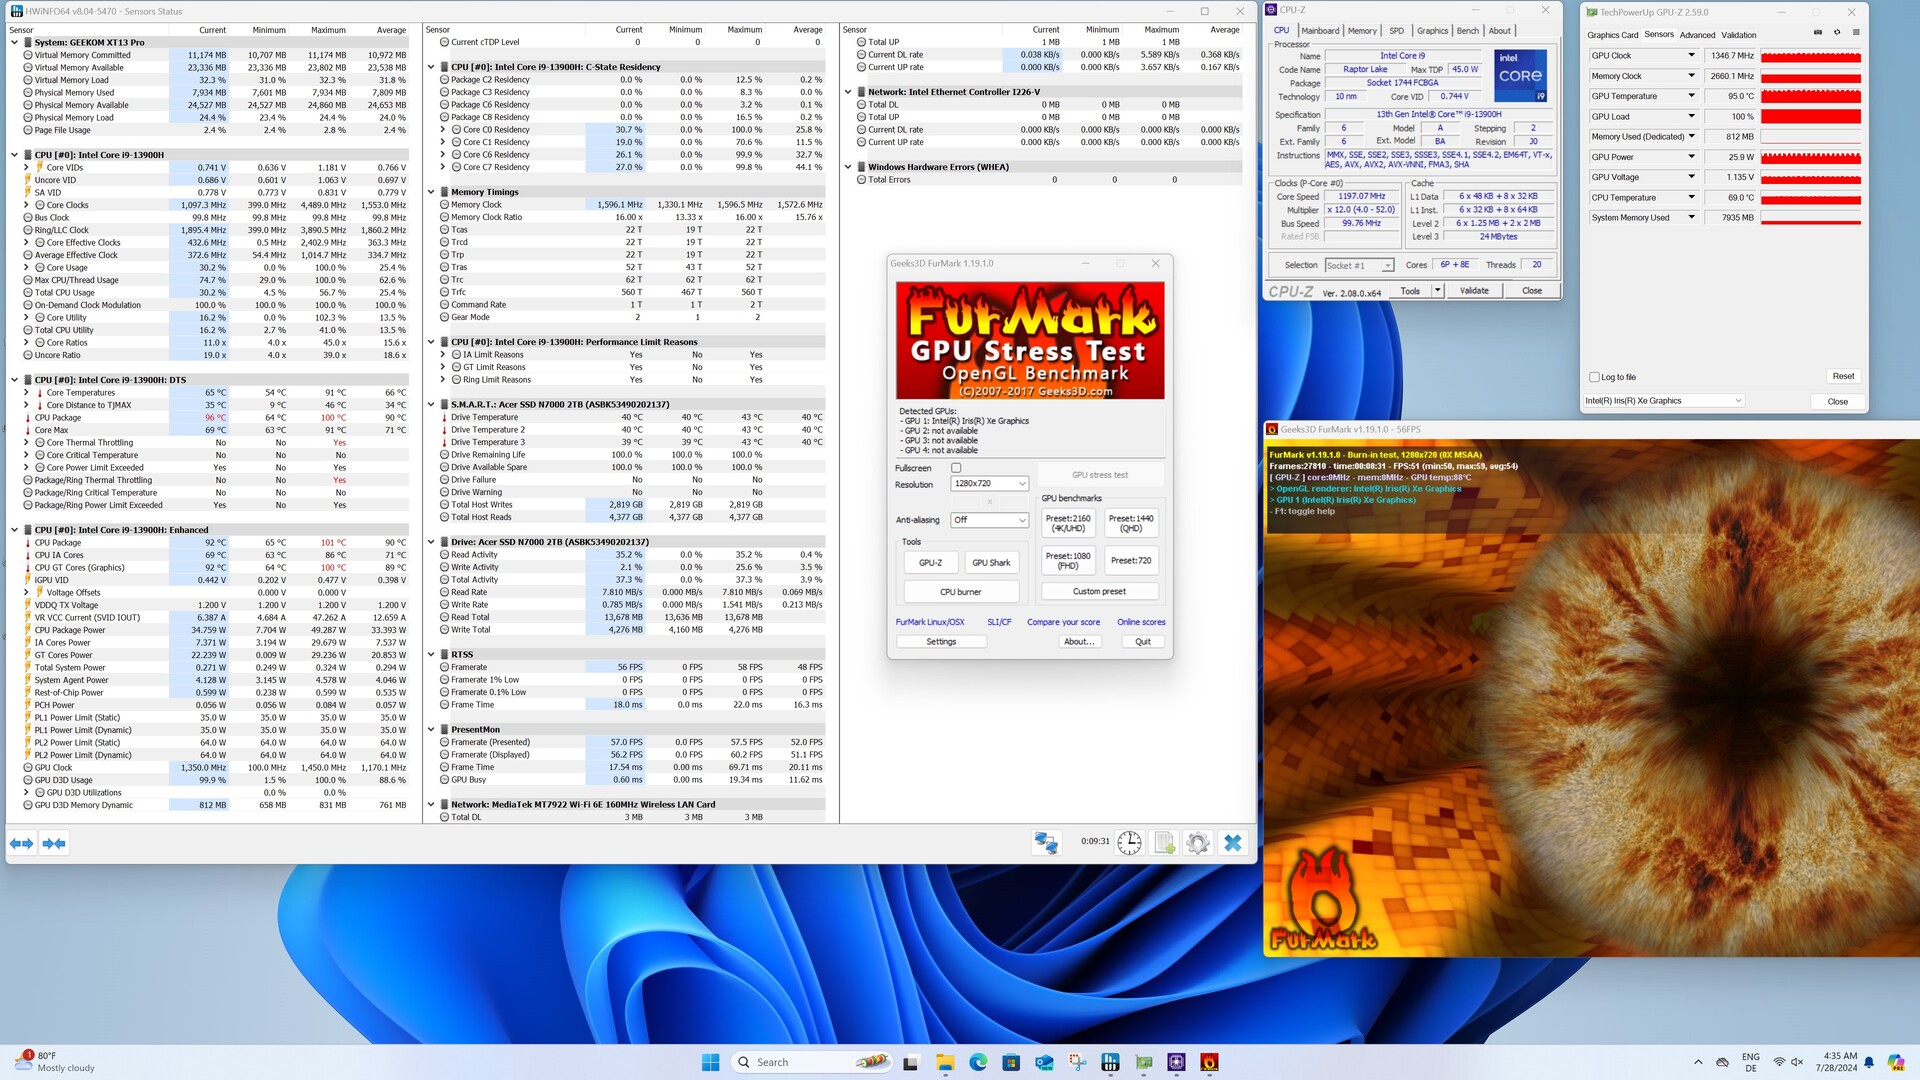
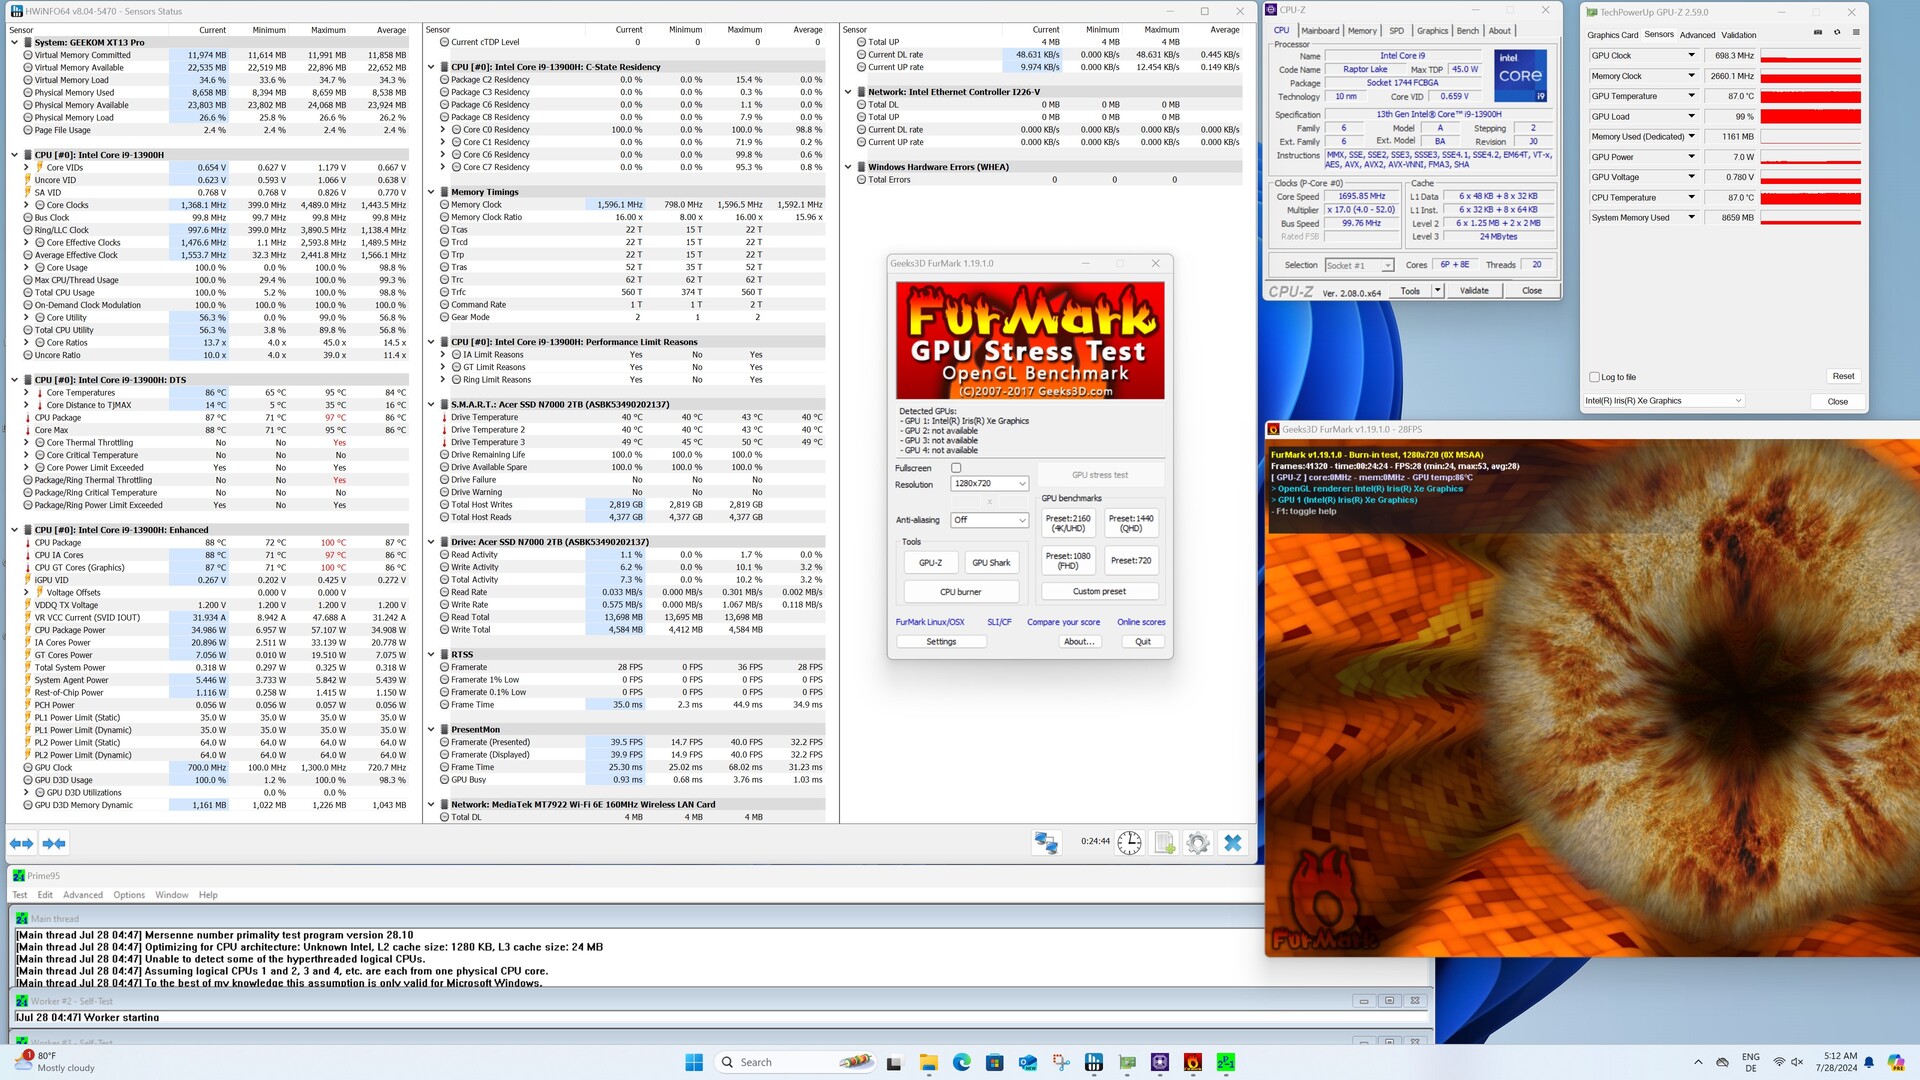
A carcaça se aquece visivelmente sob carga. No entanto, não encontramos nenhum valor crítico. O SoC parece um pouco diferente, pois a Geekom não limita a temperatura máxima, que rapidamente atinge 100 °C sob carga. Ao contrário do Cinebench R15 multi-loop, o Intel Core i9-13900H não excede o limite de 64 watts no teste de estresse. O SoC se aquece muito rapidamente e o desempenho precisa ser reduzido. Em um período de tempo mais longo, a temperatura se estabiliza em torno de 90 °C, o que não é um problema para o processador. O design extremamente compacto simplesmente impossibilita a instalação de um sistema de resfriamento mais potente.
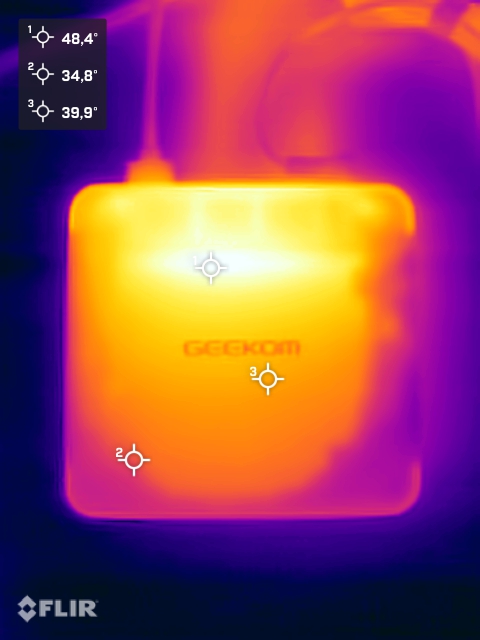
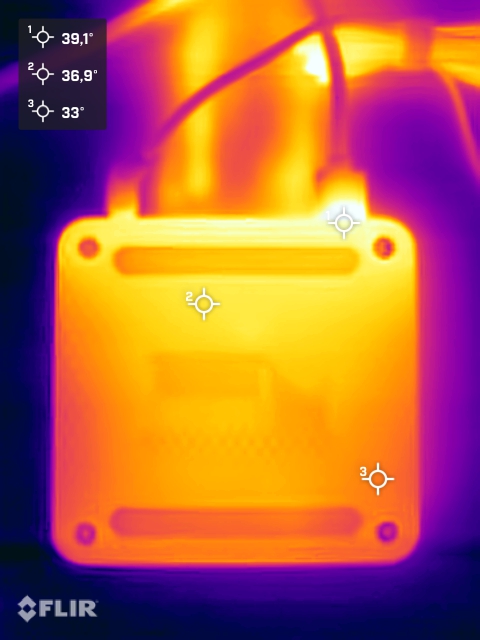
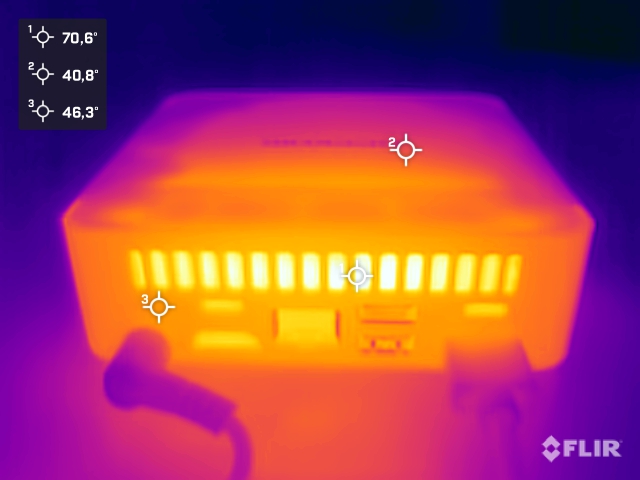
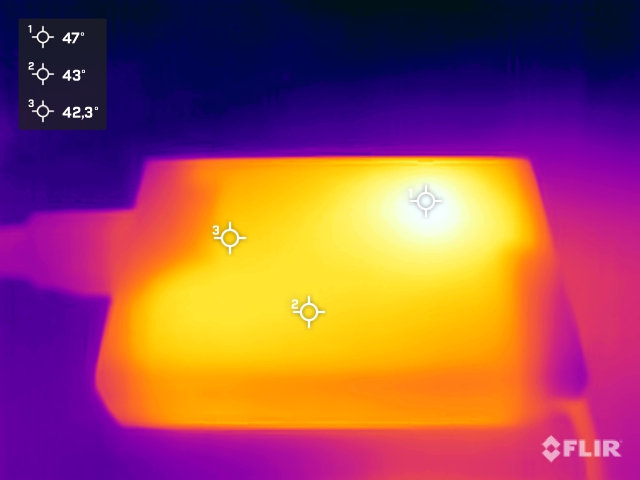
(-) A temperatura máxima no lado superior é 45.7 °C / 114 F, em comparação com a média de 35.7 °C / 96 F , variando de 21.6 a 69.5 °C para a classe Mini PC.
(±) A parte inferior aquece até um máximo de 40.3 °C / 105 F, em comparação com a média de 36.1 °C / 97 F
(+) Em uso inativo, a temperatura média para o lado superior é 27.9 °C / 82 F, em comparação com a média do dispositivo de 32.3 °C / ### class_avg_f### F.
Consumo de energia
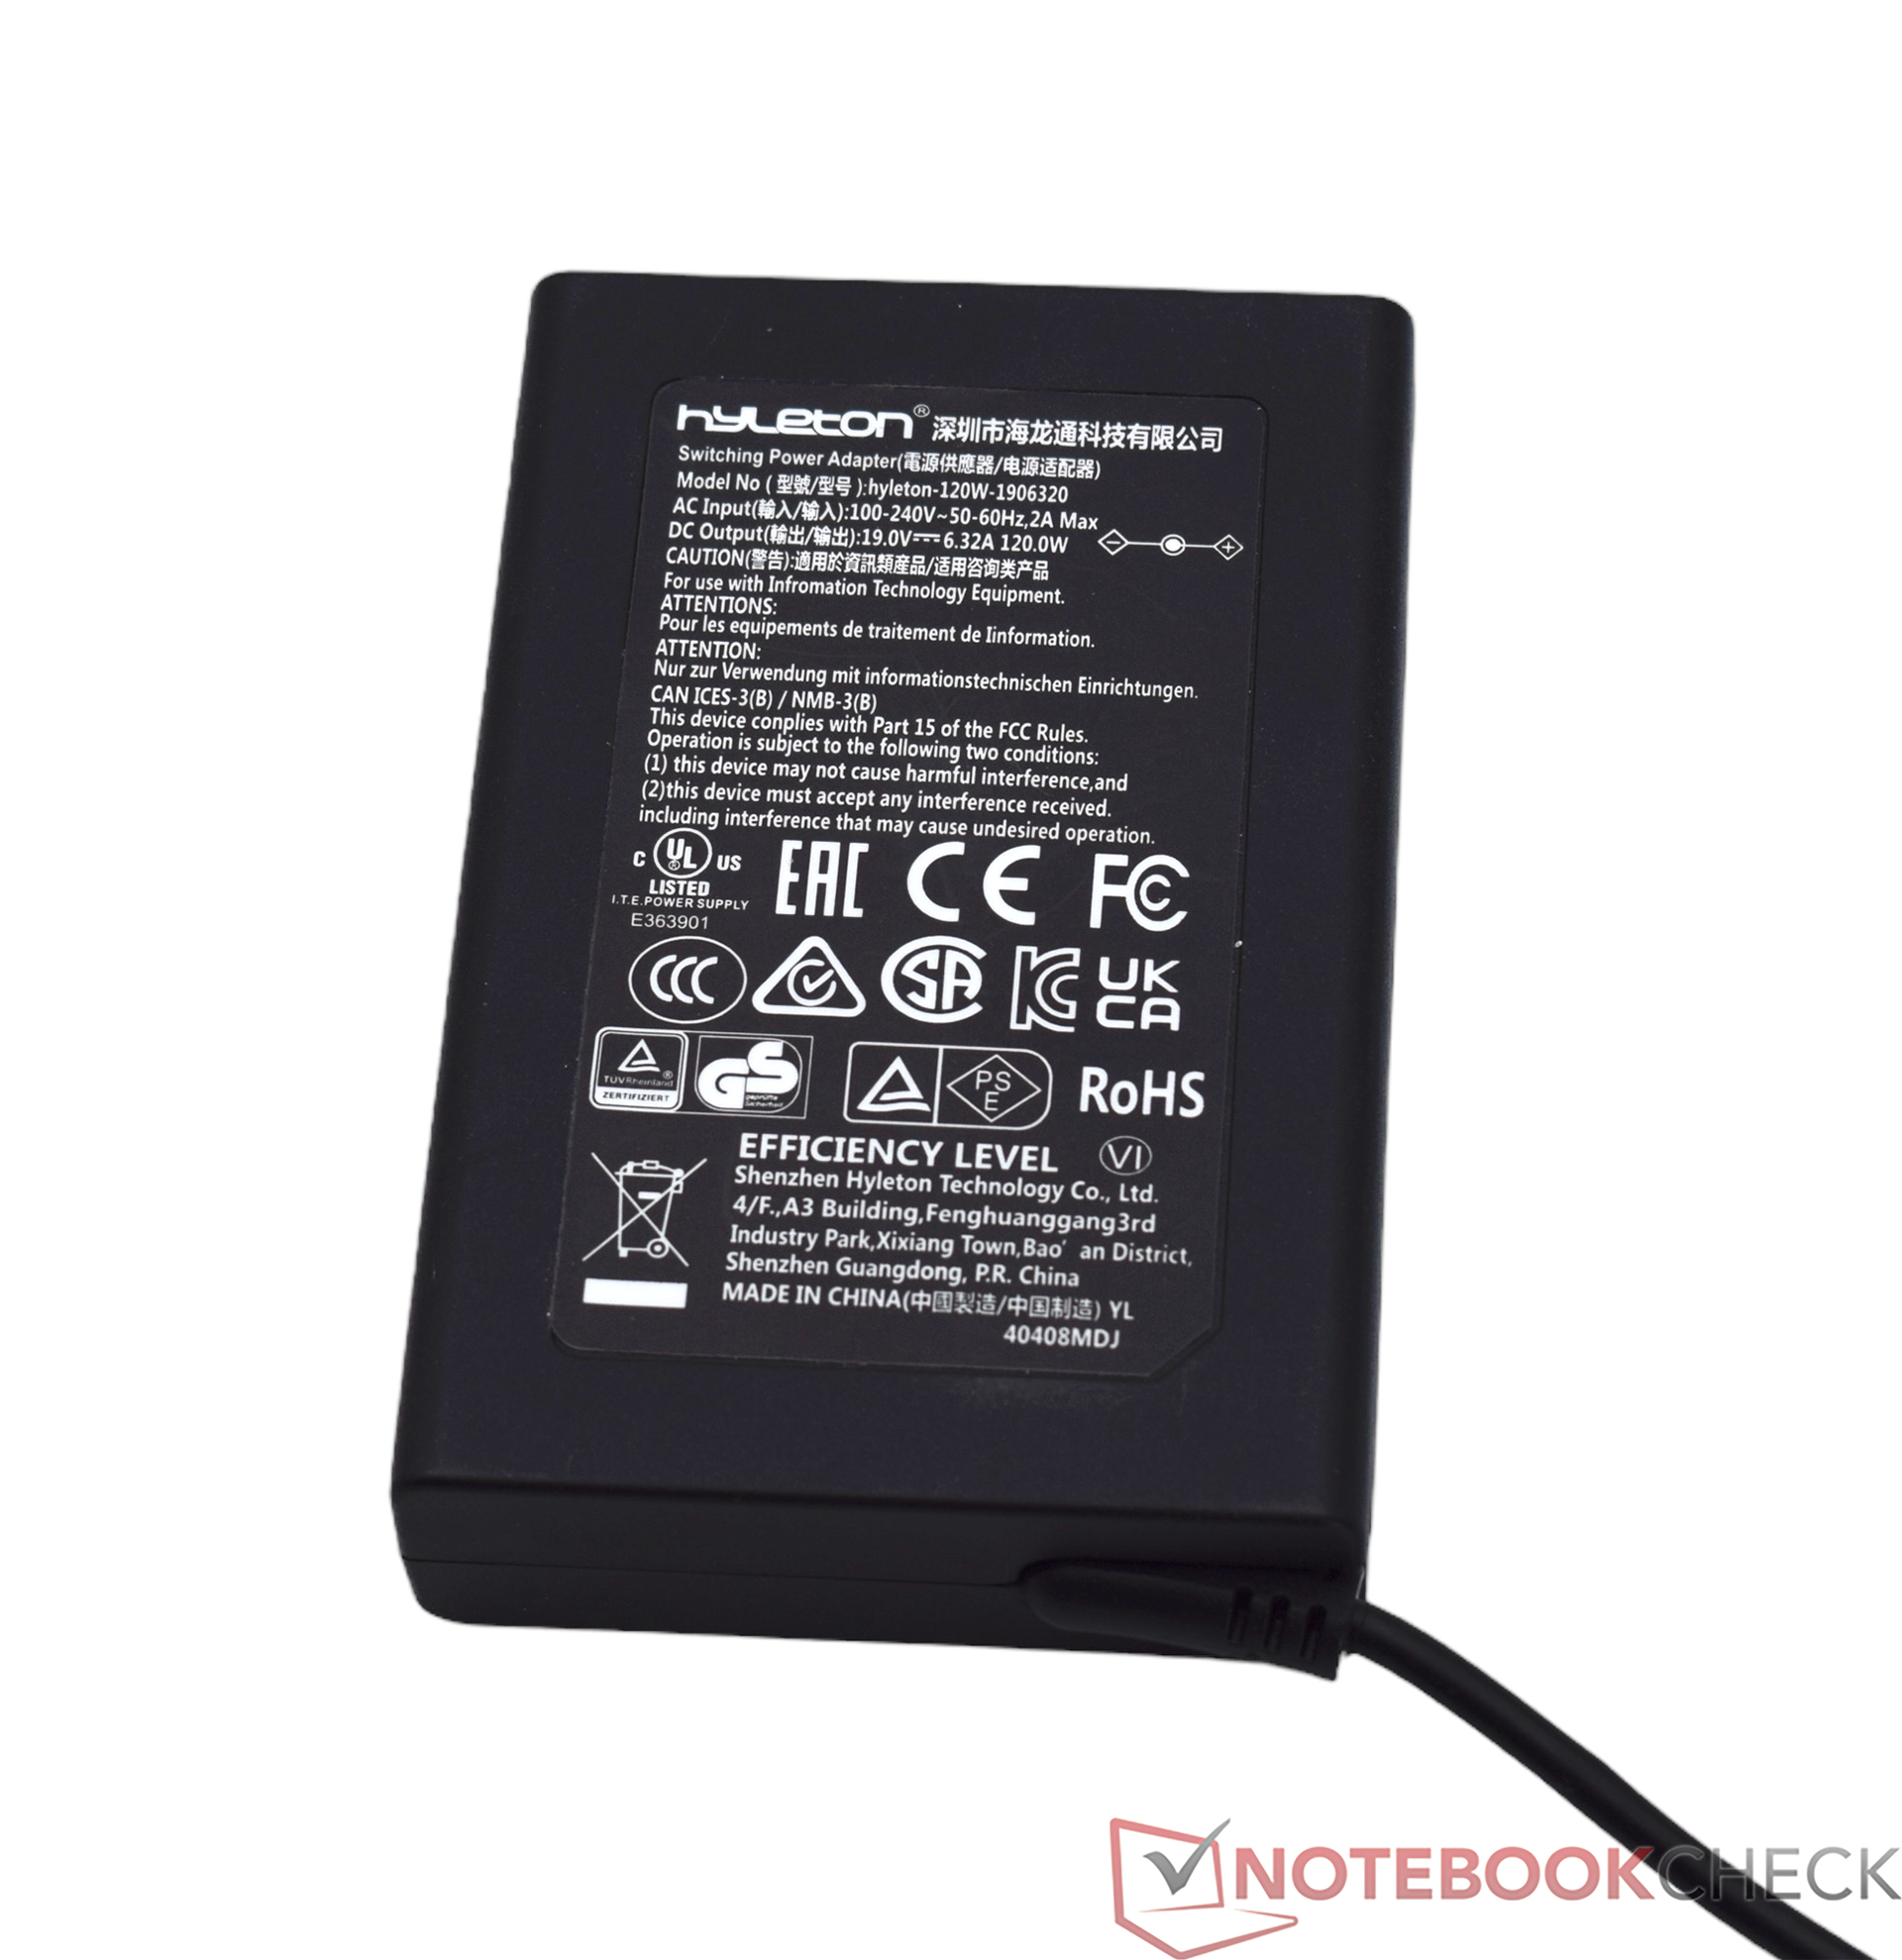
O consumo de energia do Geekom XT13 Pro se compara muito favoravelmente ao de seus concorrentes. Medimos apenas valores baixos, mesmo no modo inativo. Os limites de baixa potência (PL1 e PL2) do Intel Core i9-13900H garantem um requisito de energia relativamente baixo sob carga. Sob carga média, o sistema funciona com um pouco menos de 50 watts. Sob carga, só vemos os 94,5 watts por um curto período de tempo, quando o sistema ainda pode usar o Turbo. Pudemos observar um comportamento um tanto peculiar. No teste Cinebench R23 Sigle, documentamos muitos picos, o que nunca foi visto em outros dispositivos de teste. Repetimos o teste várias vezes, com o mesmo resultado. É razoável supor que o SoC esteja trabalhando repetidamente em um limite de temperatura nesse caso, o que permite que ele absorva brevemente mais energia. A fonte de alimentação é fornecida por uma pequena unidade de fonte de alimentação com 120 watts. A mesma unidade de fonte de alimentação está incluída em muitos dispositivos Geekom.
| desligado | |
| Ocioso | |
| Carga |
|
Key:
min: | |
| Geekom XT13 Pro i9-13900H, Iris Xe G7 96EUs | Aoostar GEM12 R7 8845HS, Radeon 780M | Minisforum AtomMan X7 Ti Ultra 9 185H, Arc 8-Core | Acemagic F2A Ultra 7 155H, Arc 8-Core | Geekom XT12 Pro i9-12900H, Iris Xe G7 96EUs | Geekom A7 R9 7940HS, Radeon 780M | Média Intel Iris Xe Graphics G7 96EUs | Média da turma Mini PC | |
|---|---|---|---|---|---|---|---|---|
| Power Consumption | -38% | -34% | -35% | -21% | 11% | 2% | -40% | |
| Idle Minimum * | 6.3 | 8.2 -30% | 8.2 -30% | 9.1 -44% | 5.7 10% | 3.8 40% | 5.39 ? 14% | 9.45 ? -50% |
| Idle Average * | 7.1 | 10 -41% | 12.1 -70% | 10.3 -45% | 9.5 -34% | 4.8 32% | 8.6 ? -21% | 11.5 ? -62% |
| Idle Maximum * | 9 | 14.6 -62% | 14 -56% | 14.4 -60% | 16.5 -83% | 6.5 28% | 10.9 ? -21% | 14.8 ? -64% |
| Load Average * | 49.8 | 73.9 -48% | 53.1 -7% | 54.9 -10% | 53.3 -7% | 71.9 -44% | 45.5 ? 9% | 58.8 ? -18% |
| Cyberpunk 2077 ultra external monitor * | 54 | 79.9 -48% | ||||||
| Load Maximum * | 94.5 | 95.3 -1% | 100.4 -6% | 110.4 -17% | 87.8 7% | 94.7 -0% | 67.7 ? 28% | 99.5 ? -5% |
* ... menor é melhor
Efficiency
| Performance Rating - Percent | |
| Geekom A8 | |
| Minisforum AtomMan X7 Ti | |
| Acemagic F2A | |
| Geekom XT13 Pro | |
| Geekom XT12 Pro | |
| Power Consumption | |
| Cinebench R23 Multi Power Efficiency - external Monitor | |
| Geekom A8 | |
| Minisforum AtomMan X7 Ti | |
| Geekom XT13 Pro | |
| Acemagic F2A | |
| Geekom XT12 Pro | |
| Cinebench R23 Single Power Efficiency - external Monitor | |
| Geekom A8 | |
| Minisforum AtomMan X7 Ti | |
| Acemagic F2A | |
| Geekom XT13 Pro | |
| Geekom XT12 Pro | |
| Cinebench R15 Multi Efficiency (external Monitor) | |
| Geekom A8 | |
| Minisforum AtomMan X7 Ti | |
| Geekom XT13 Pro | |
| Acemagic F2A | |
| Geekom XT12 Pro | |
Power consumption with external monitor
Power consumption with external monitor
Pro
Contra
Veredicto - Preço premium sem desempenho premium

O Geekom XT13 Pro é um mini-PC poderoso. No entanto, já pudemos comprovar isso com o Geekom XT12 Pro. Se compararmos esses dois modelos entre si, o senhor pode optar pelo dispositivo mais antigo sem nenhuma perda perceptível de desempenho. O Intel Core i9-13900H do Geekom XT13 Pro não pode proporcionar um aumento perceptível no desempenho. As diferenças técnicas em comparação com o Intel Core i9-12900H são muito pequenas. A Geekom não se atreve a dar o passo ousado de um mini-PC baseado na série Meteor Lake. Isso significa que a Geekom ficou para trás, pois muitos outros fabricantes já equiparam suas séries de modelos com os mais recentes processadores da Intel. A maior desvantagem do Geekom XT13 Pro é a iGPU, que é inferior aos representantes modernos em todos os testes. No entanto, a Geekom não é apenas inferior aos seus concorrentes aqui, mas também a si mesma. O próprio portfólio da Geekom inclui mini-PCs com os mais recentes SoCs AMD, que tecnicamente não são muito piores, mas oferecem um resultado geral melhor. Ainda nem vimos o preço. Infelizmente, o Geekom XT13 Pro está completamente fora de linha aqui. o preço atual é de 999 euros para ser o modelo superior. Outros mini-PCs custam um pouco menos, mas oferecem mais desempenho.
O Geekom XT13 Pro oferece desempenho adequado com o Intel Core i9-13900H e impressiona com seus recursos versáteis. No entanto, a relação preço-desempenho do Geekom XT13 Pro não é a mesma.
A boa conectividade, com a qual a Geekom marcou pontos repetidamente no passado, deve ser enfatizada positivamente. As numerosas conexões incluem duas portas USB4, o que pode influenciar a decisão de compra em termos de preparação para o futuro. A garantia de três anos do fabricante também favorece um dispositivo da Geekom. É claro que isso também está disponível para outros dispositivos do fabricante. A eficiência só poderia ser ligeiramente aumentada em comparação com o Geekom XT12 Pro. Nessa disciplina, o Intel Core i9-13900H é claramente inferior aos processadores Meteor Lake mais modernos. Por esse motivo, não podemos dar ao Geekom XT13 Pro uma recomendação de compra, mesmo em relação ao alto preço de compra. Se a Geekom XT13 Pro não quiser se tornar um aquecedor de prateleira, a Geekom precisa urgentemente revisar seus preços atuais.
Observação: Atualizamos recentemente nosso sistema de classificação e os resultados da versão 8 não são comparáveis aos resultados da versão 7. Mais informações podem ser encontradas aqui.
Geekom XT13 Pro
- 07/30/2024 v8
Sebastian Bade
 Total Sustainability Score:
 Transparência
A seleção dos dispositivos a serem analisados é feita pela nossa equipe editorial. A amostra de teste foi fornecida gratuitamente ao autor pelo fabricante para fins de revisão. Não houve influência de terceiros nesta revisão, nem o fabricante recebeu uma cópia desta revisão antes da publicação. Não houve obrigação de publicar esta revisão. Nunca aceitamos compensação ou pagamento em troca de nossas avaliações. Como empresa de mídia independente, a Notebookcheck não está sujeita à autoridade de fabricantes, varejistas ou editores.
É assim que o Notebookcheck está testando
Todos os anos, o Notebookcheck analisa de forma independente centenas de laptops e smartphones usando procedimentos padronizados para garantir que todos os resultados sejam comparáveis. Desenvolvemos continuamente nossos métodos de teste há cerca de 20 anos e definimos padrões da indústria no processo. Em nossos laboratórios de teste, equipamentos de medição de alta qualidade são utilizados por técnicos e editores experientes. Esses testes envolvem um processo de validação em vários estágios. Nosso complexo sistema de classificação é baseado em centenas de medições e benchmarks bem fundamentados, o que mantém a objetividade.Price comparison
