

Análise do minicomputador Geekom GT13 Pro - Alternativa elegante ao NUC com Intel Core i9-13900H, 32 GB de RAM DDR4 e SSD de 2 TB
Com o Geekom GT13 Pro, o fabricante tem em seu portfólio um minicomputador muito potente baseado em processadores Intel. Infelizmente, a Geekom usa apenas processadores Raptor Lake H, embora a Intel tenha lançado recentemente os mais novos chips Meteor Lake. Na melhor configuração, o Intel Core i9-13900H é usado, emparelhado com 32 GB de RAM e um SSD de 2 TB. Em termos de preço, o senhor terá que ir fundo no bolso, pois a conta final chega a 930 euros. Por apenas 721 euros, o Geekom GT13 Pro baseado no Intel Core i7-13620H é significativamente mais barato. Com 32 GB de RAM, o modelo mais barato tem a mesma quantidade de memória de trabalho, embora o armazenamento em massa tenha apenas metade do tamanho, com 1 TB.
Vamos dar uma olhada mais de perto no desempenho do Geekom GT13 Pro em relação a outros minicomputadores de alto desempenho. No entanto, devido ao preço, as expectativas já são muito altas. Na tabela a seguir, compilamos uma visão geral dos dispositivos de comparação que acompanham a Geekom nesta análise.
Possíveis concorrentes em comparação
Data | Versão | Modelo | Memória | Peso | Altura | Preço |
|---|---|---|---|---|---|---|
06/2024 | v8 | Geekom GT13 Pro i9-13900H, Iris Xe G7 96EUs | 32768 MB | 440 g | 37 mm | 930 EUR |
06/2024 | v8 | Aoostar GEM12 R7 8845HS, Radeon 780M | 32768 MB | 653 g | 60 mm | 649 US-Dollar |
05/2024 | v7 (old) | Minisforum AtomMan X7 Ti Ultra 9 185H, Arc 8-Core | 32768 MB | 863 g | 48.6 mm | 959 Euro |
05/2024 | v7 (old) | Geekom A8 R9 8945HS, Radeon 780M | 32768 MB | 432 g | 38 mm | 949 EUR |
04/2024 | v8 | Geekom XT12 Pro i9-12900H, Iris Xe G7 96EUs | 32768 MB | 545 g | 37 mm | 899 EUR |
04/2024 | v7 (old) | Acemagic F2A Ultra 7 155H, Arc 8-Core | 32768 MB | 768 g | 57 mm | 1199 EUR |
12/2023 | v7 (old) | Minisforum EliteMini UM780 XTX R7 7840HS, Radeon 780M | 32768 MB | 750 g | 52.3 mm | 879 EUR |
08/2023 | v7 (old) | Khadas Mind i7-1360P, Iris Xe G7 96EUs | 32768 MB | 438 g | 20 mm | 799 Euro |
Observação: Atualizamos nosso sistema de classificação e os resultados da versão 8 não são comparáveis aos resultados da versão 7, disponíveis aqui.

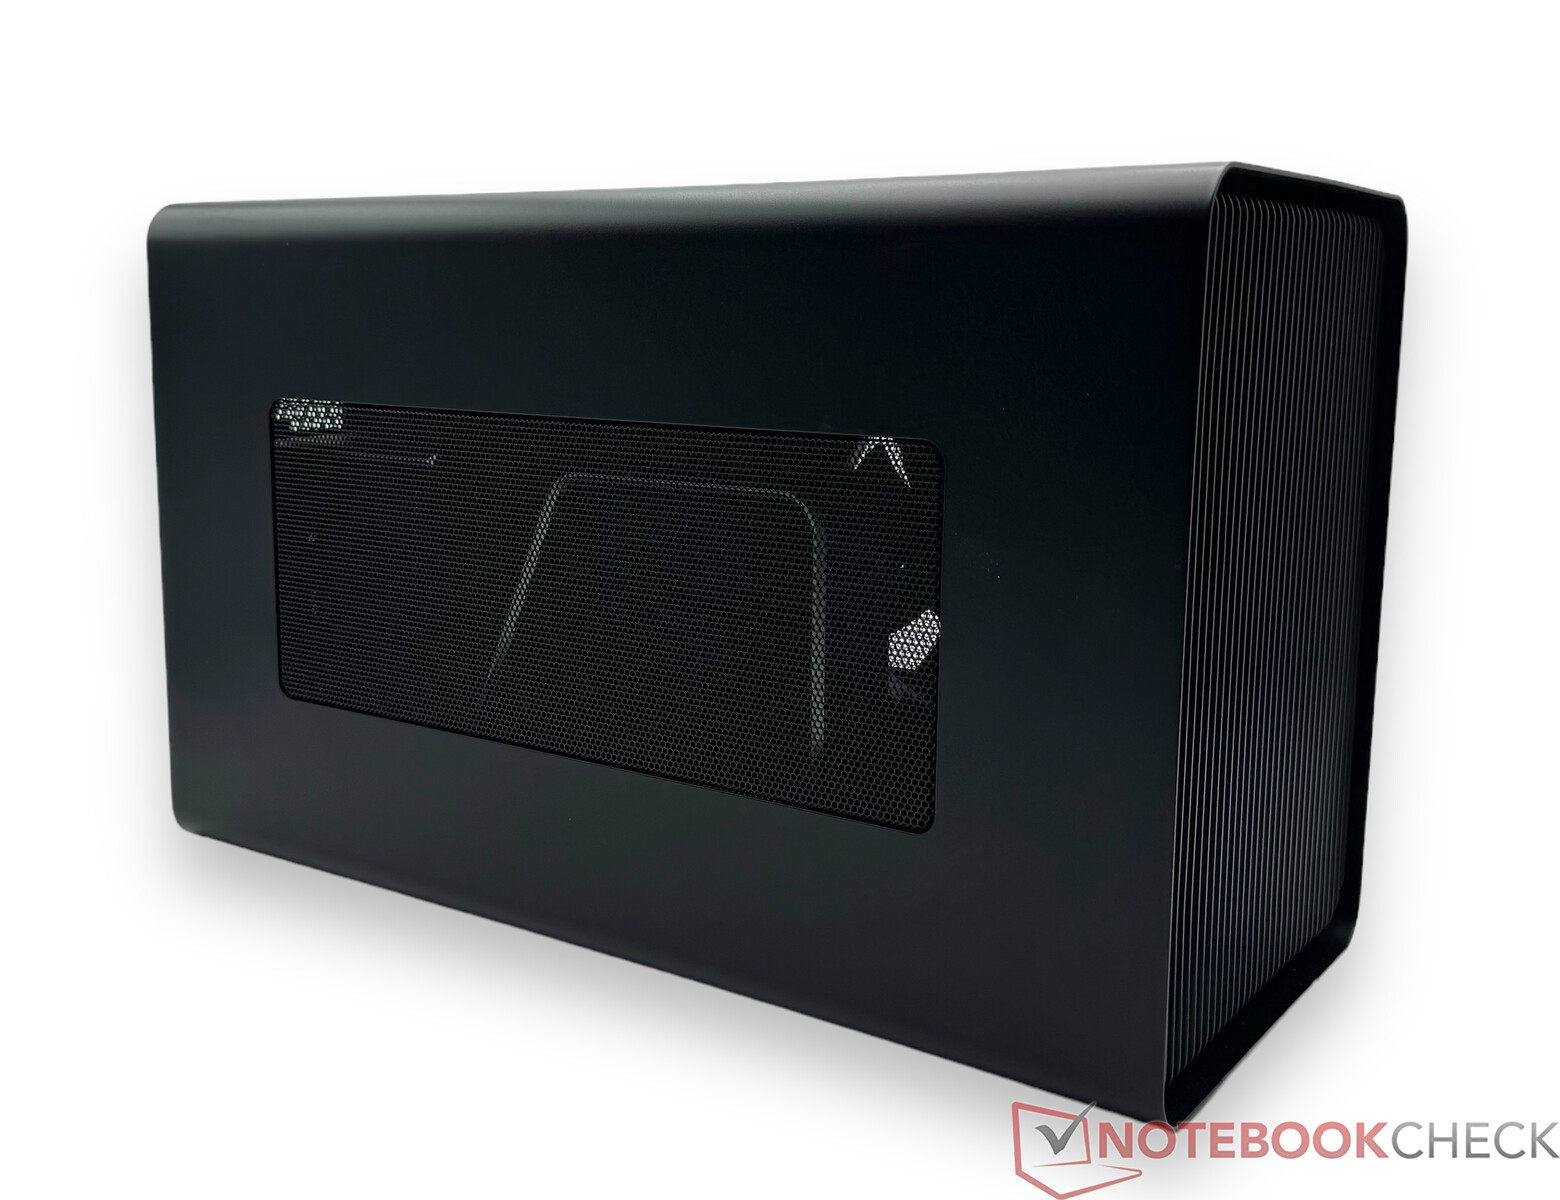
Caixa - Caixa de 0,5L feita de alumínio com uma cor diferente
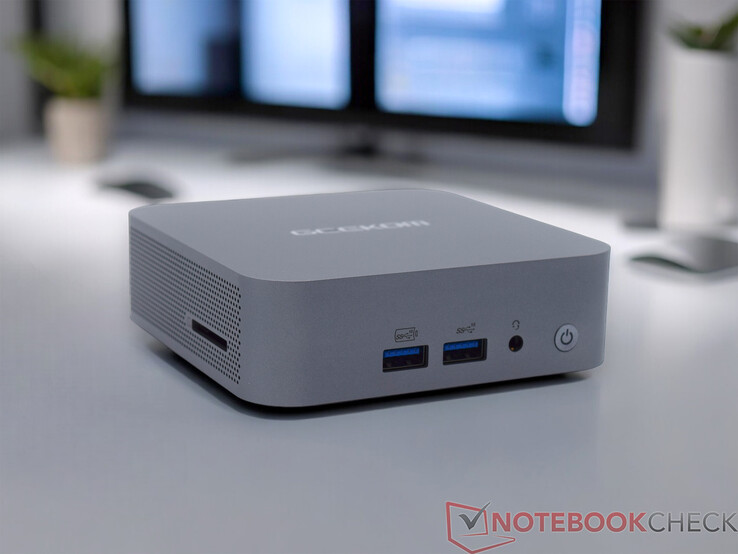
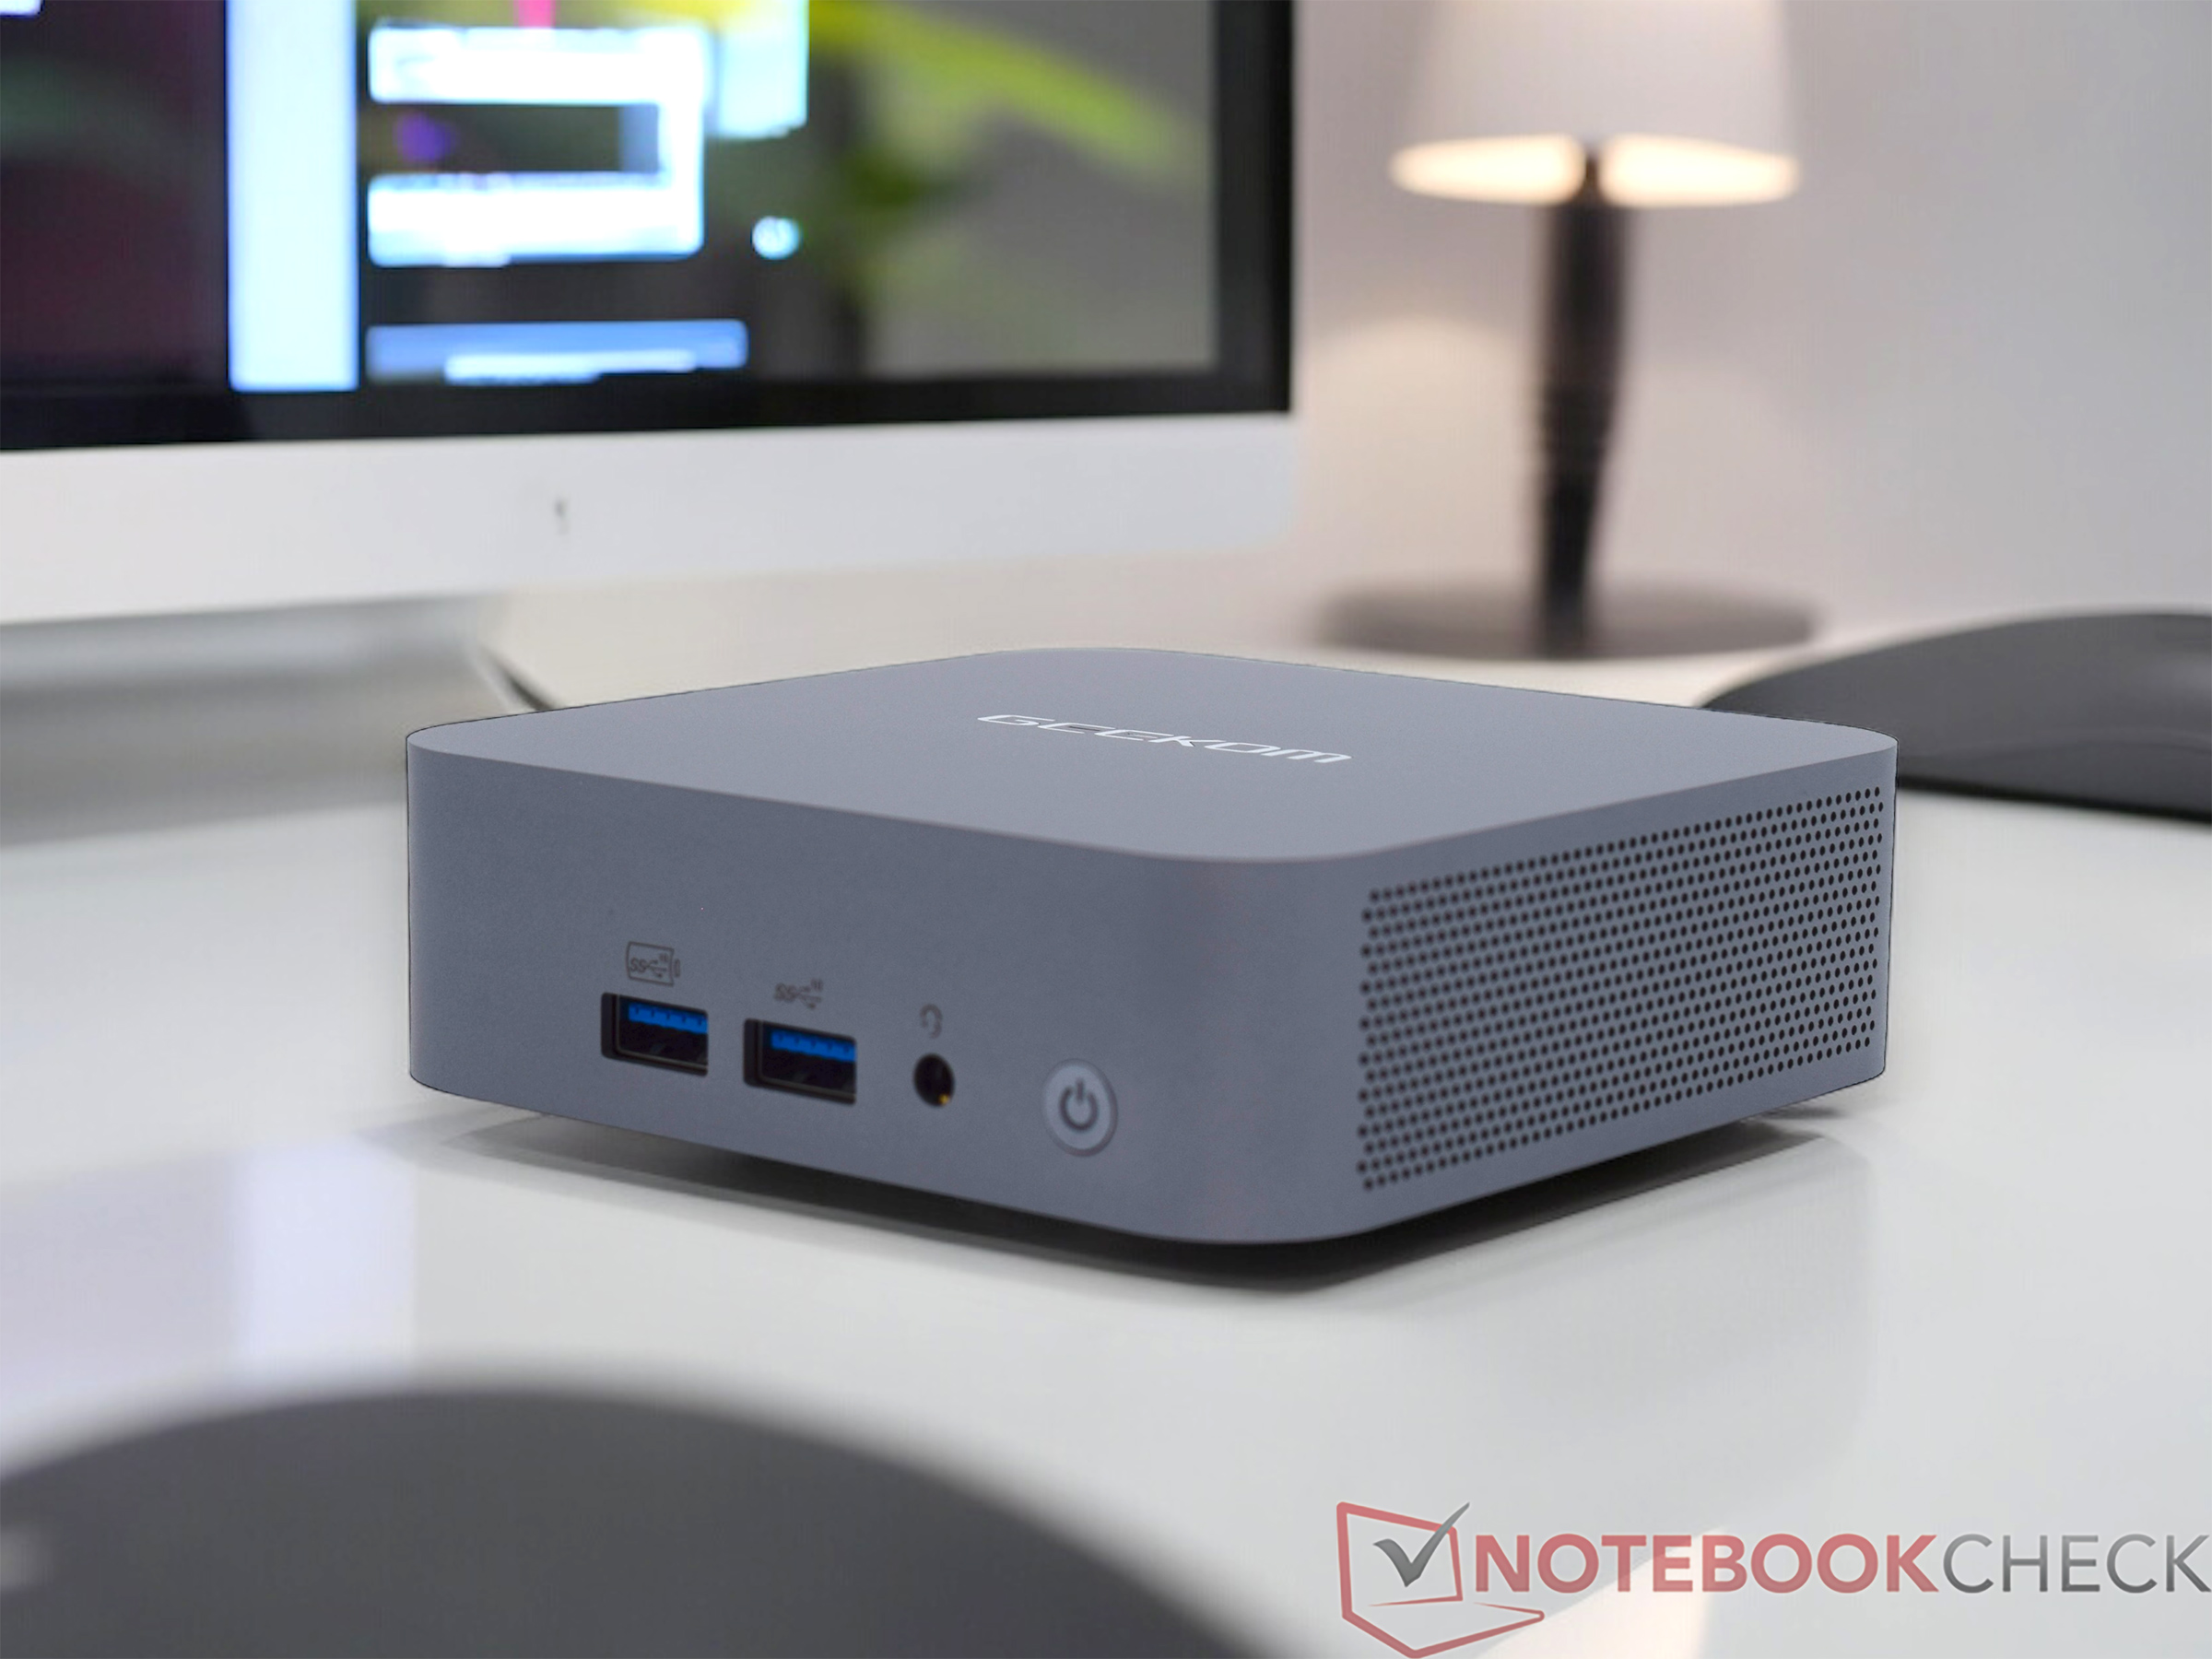
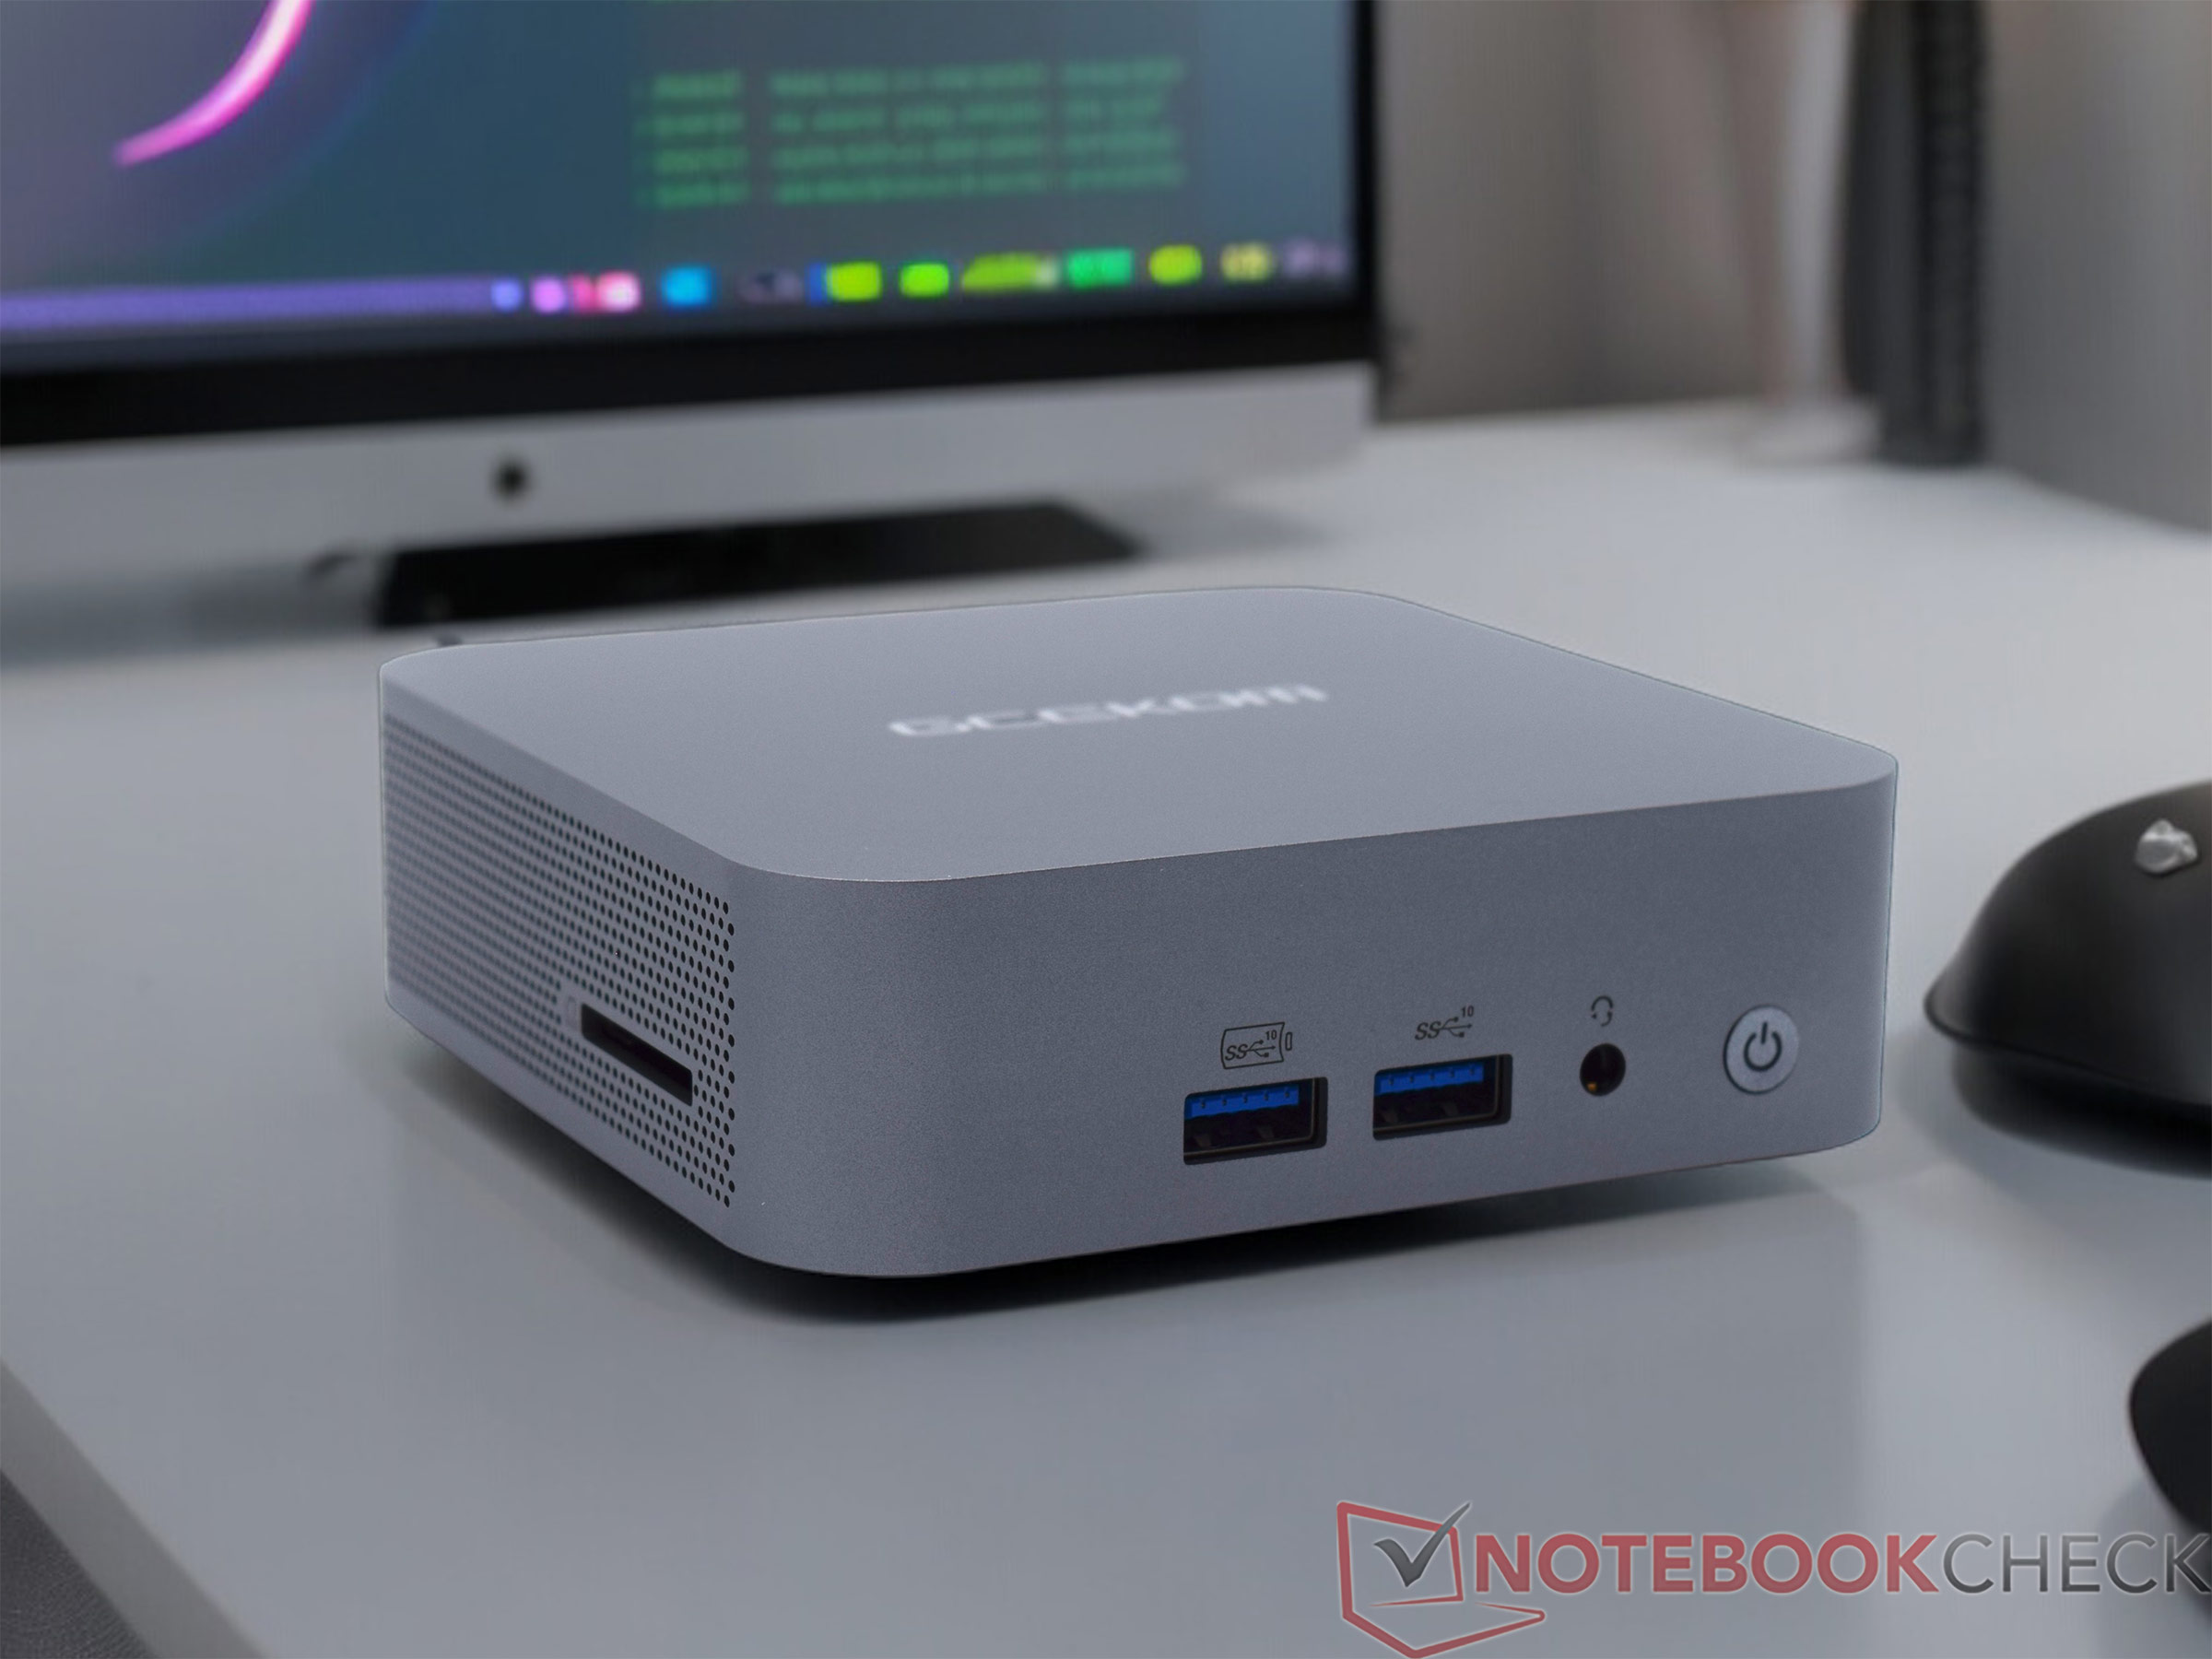
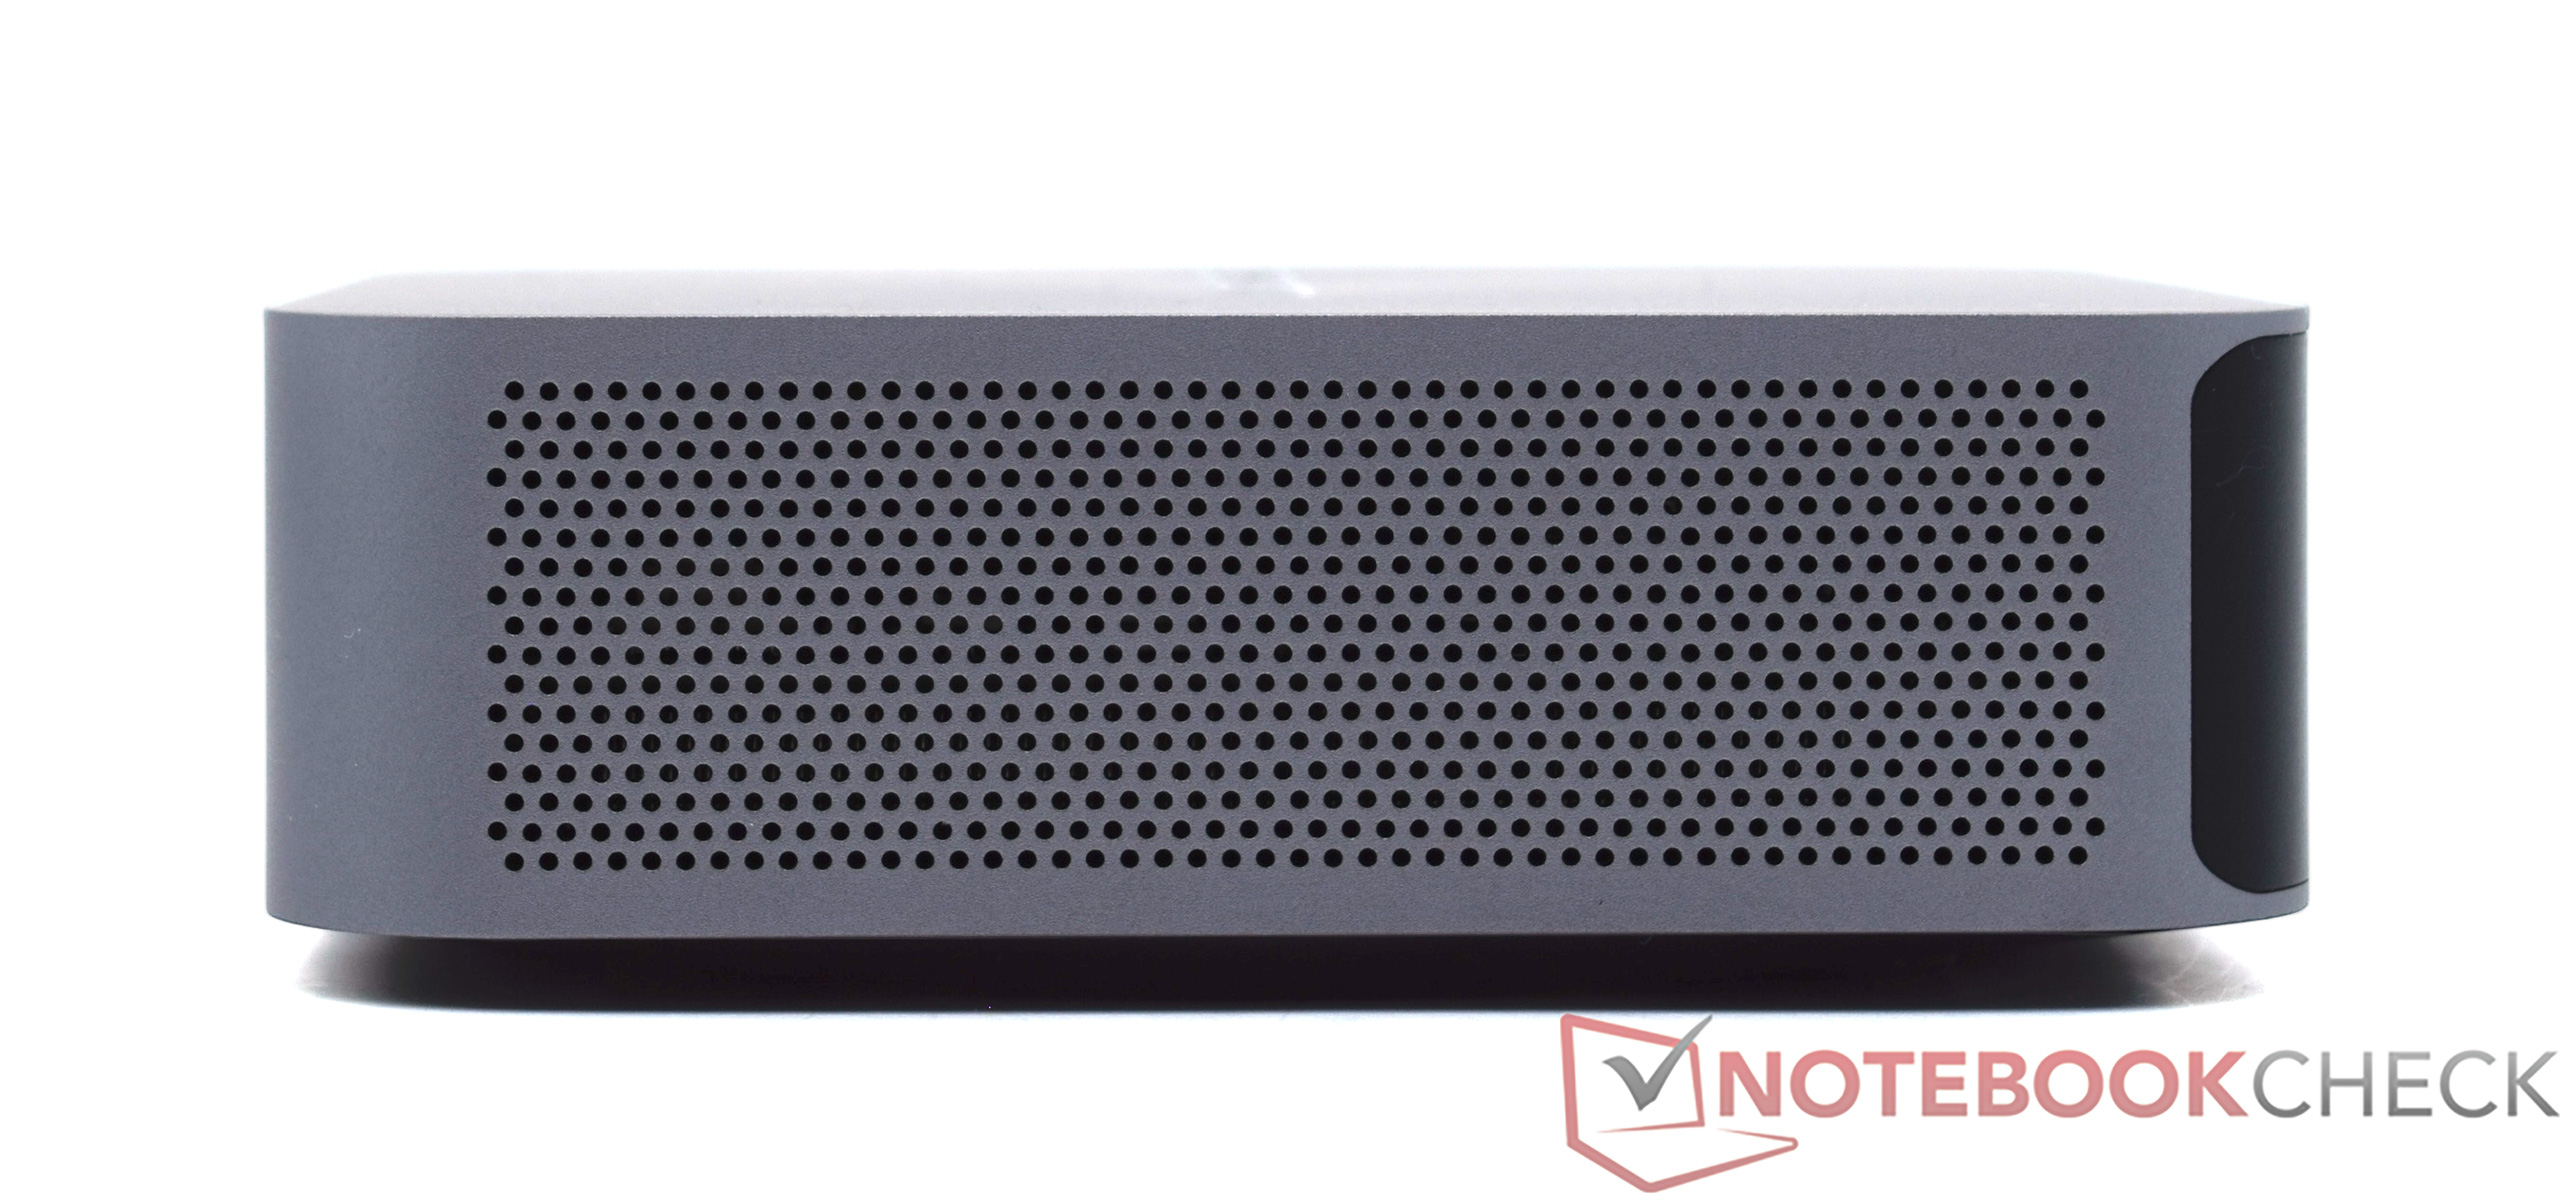
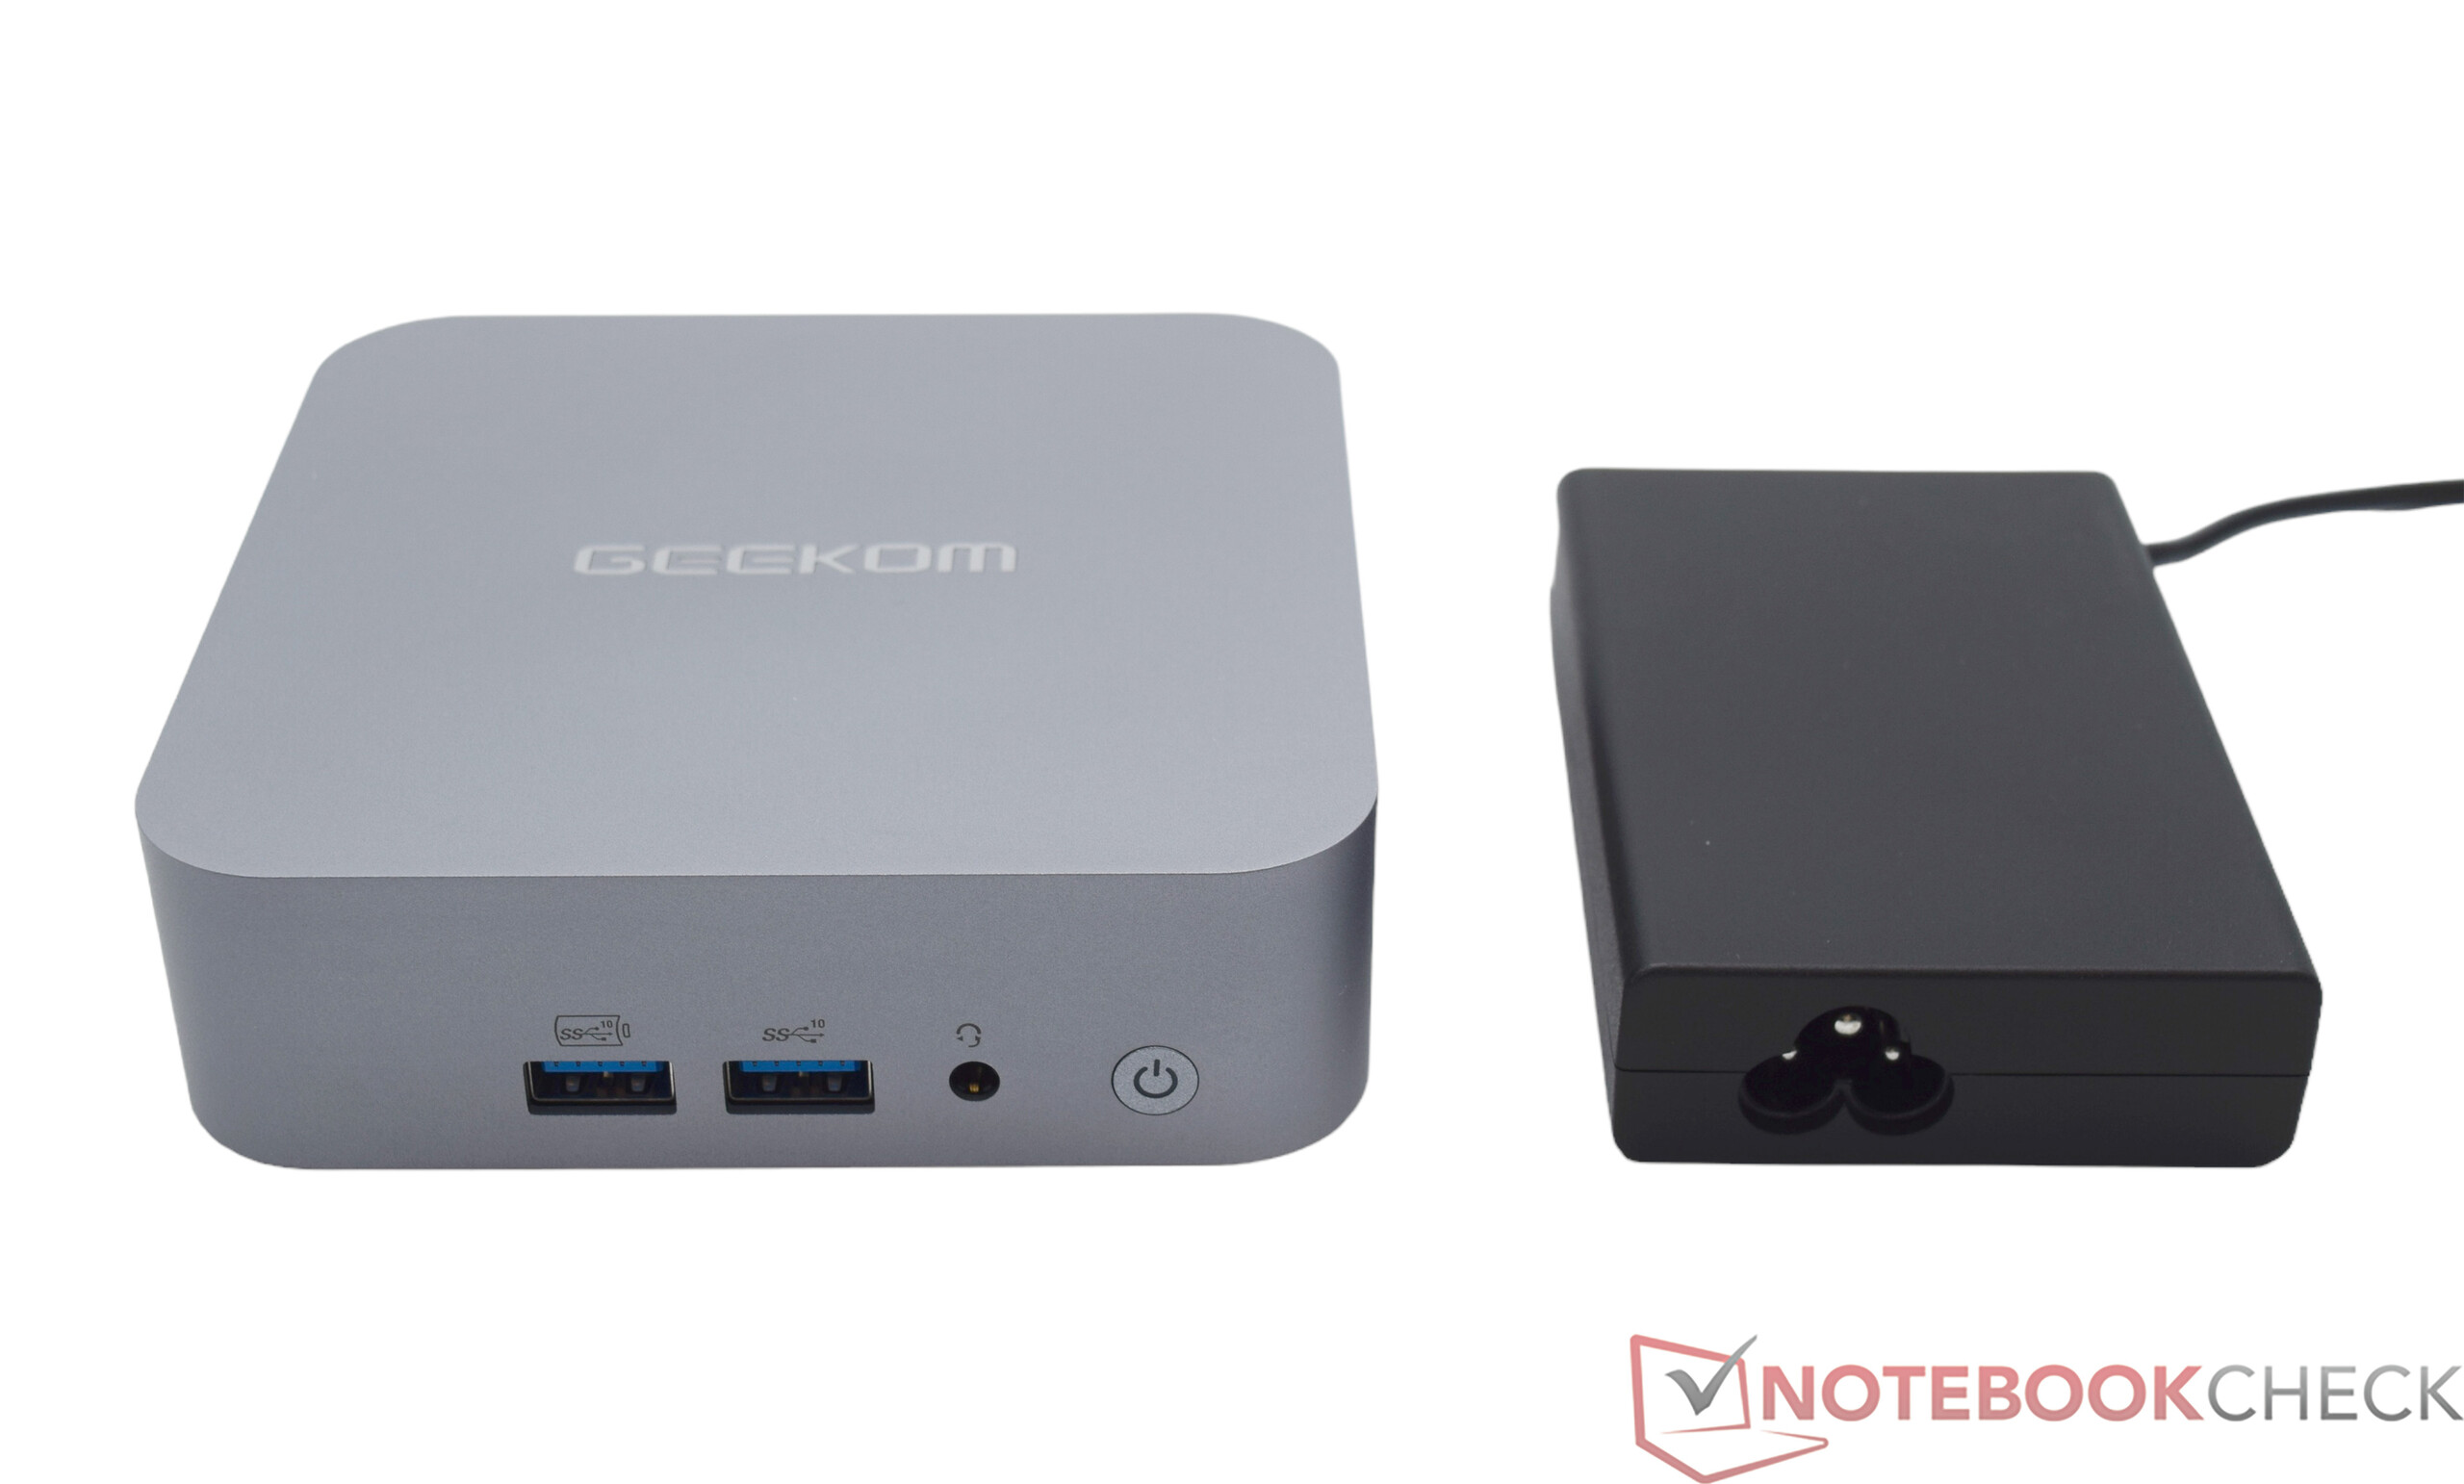
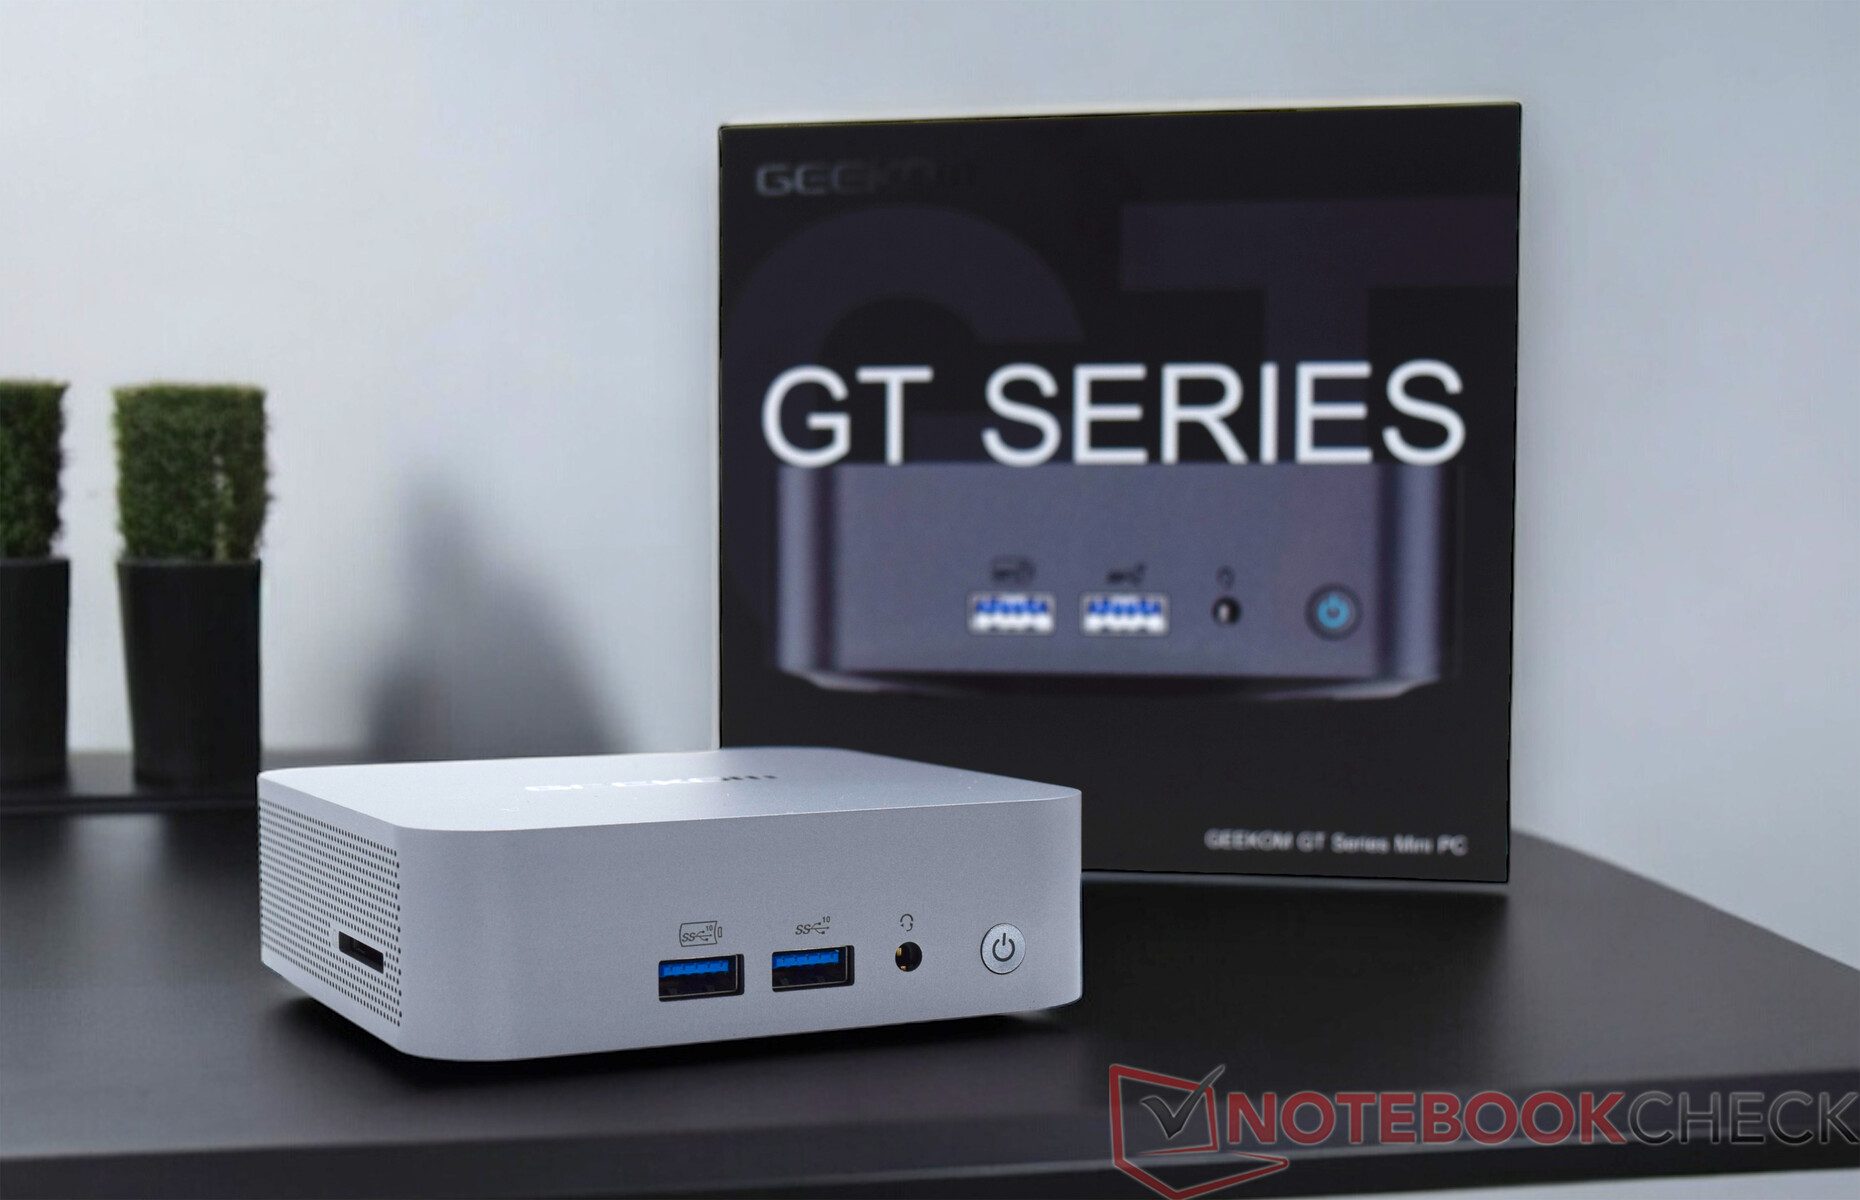
Aqueles que já leram nossos testes do Geekom A7 ou o Geekom A8vai notar muitas semelhanças quando olhar para o Geekom GT13 Pro. E sim, os aparelhos são semelhantes por fora. O Geekom GT13 Pro só se destaca visualmente devido ao seu esquema de cores diferente. Em contraste com os dois dispositivos prateados, o gabinete da variante Intel copiada é cinza escuro. A própria Geekom chama essa cor de cinza basalto. Subjetivamente, gostamos um pouco mais do design. Em última análise, o Geekom GT13 Pro compartilha as mesmas vantagens e desvantagens. O excelente acabamento e a escolha dos materiais são certamente argumentos a favor do dispositivo da Geekom. O mini-PC também tem um design extremamente compacto, o que não é necessariamente uma vantagem em termos da unidade de resfriamento integrada. Nossa amostra de teste pesa apenas 440 gramas e é um dos dispositivos mais leves aqui. A unidade de fonte de alimentação pesa mais 249 gramas.
Equipamento - Boa seleção, incluindo 2x USB4
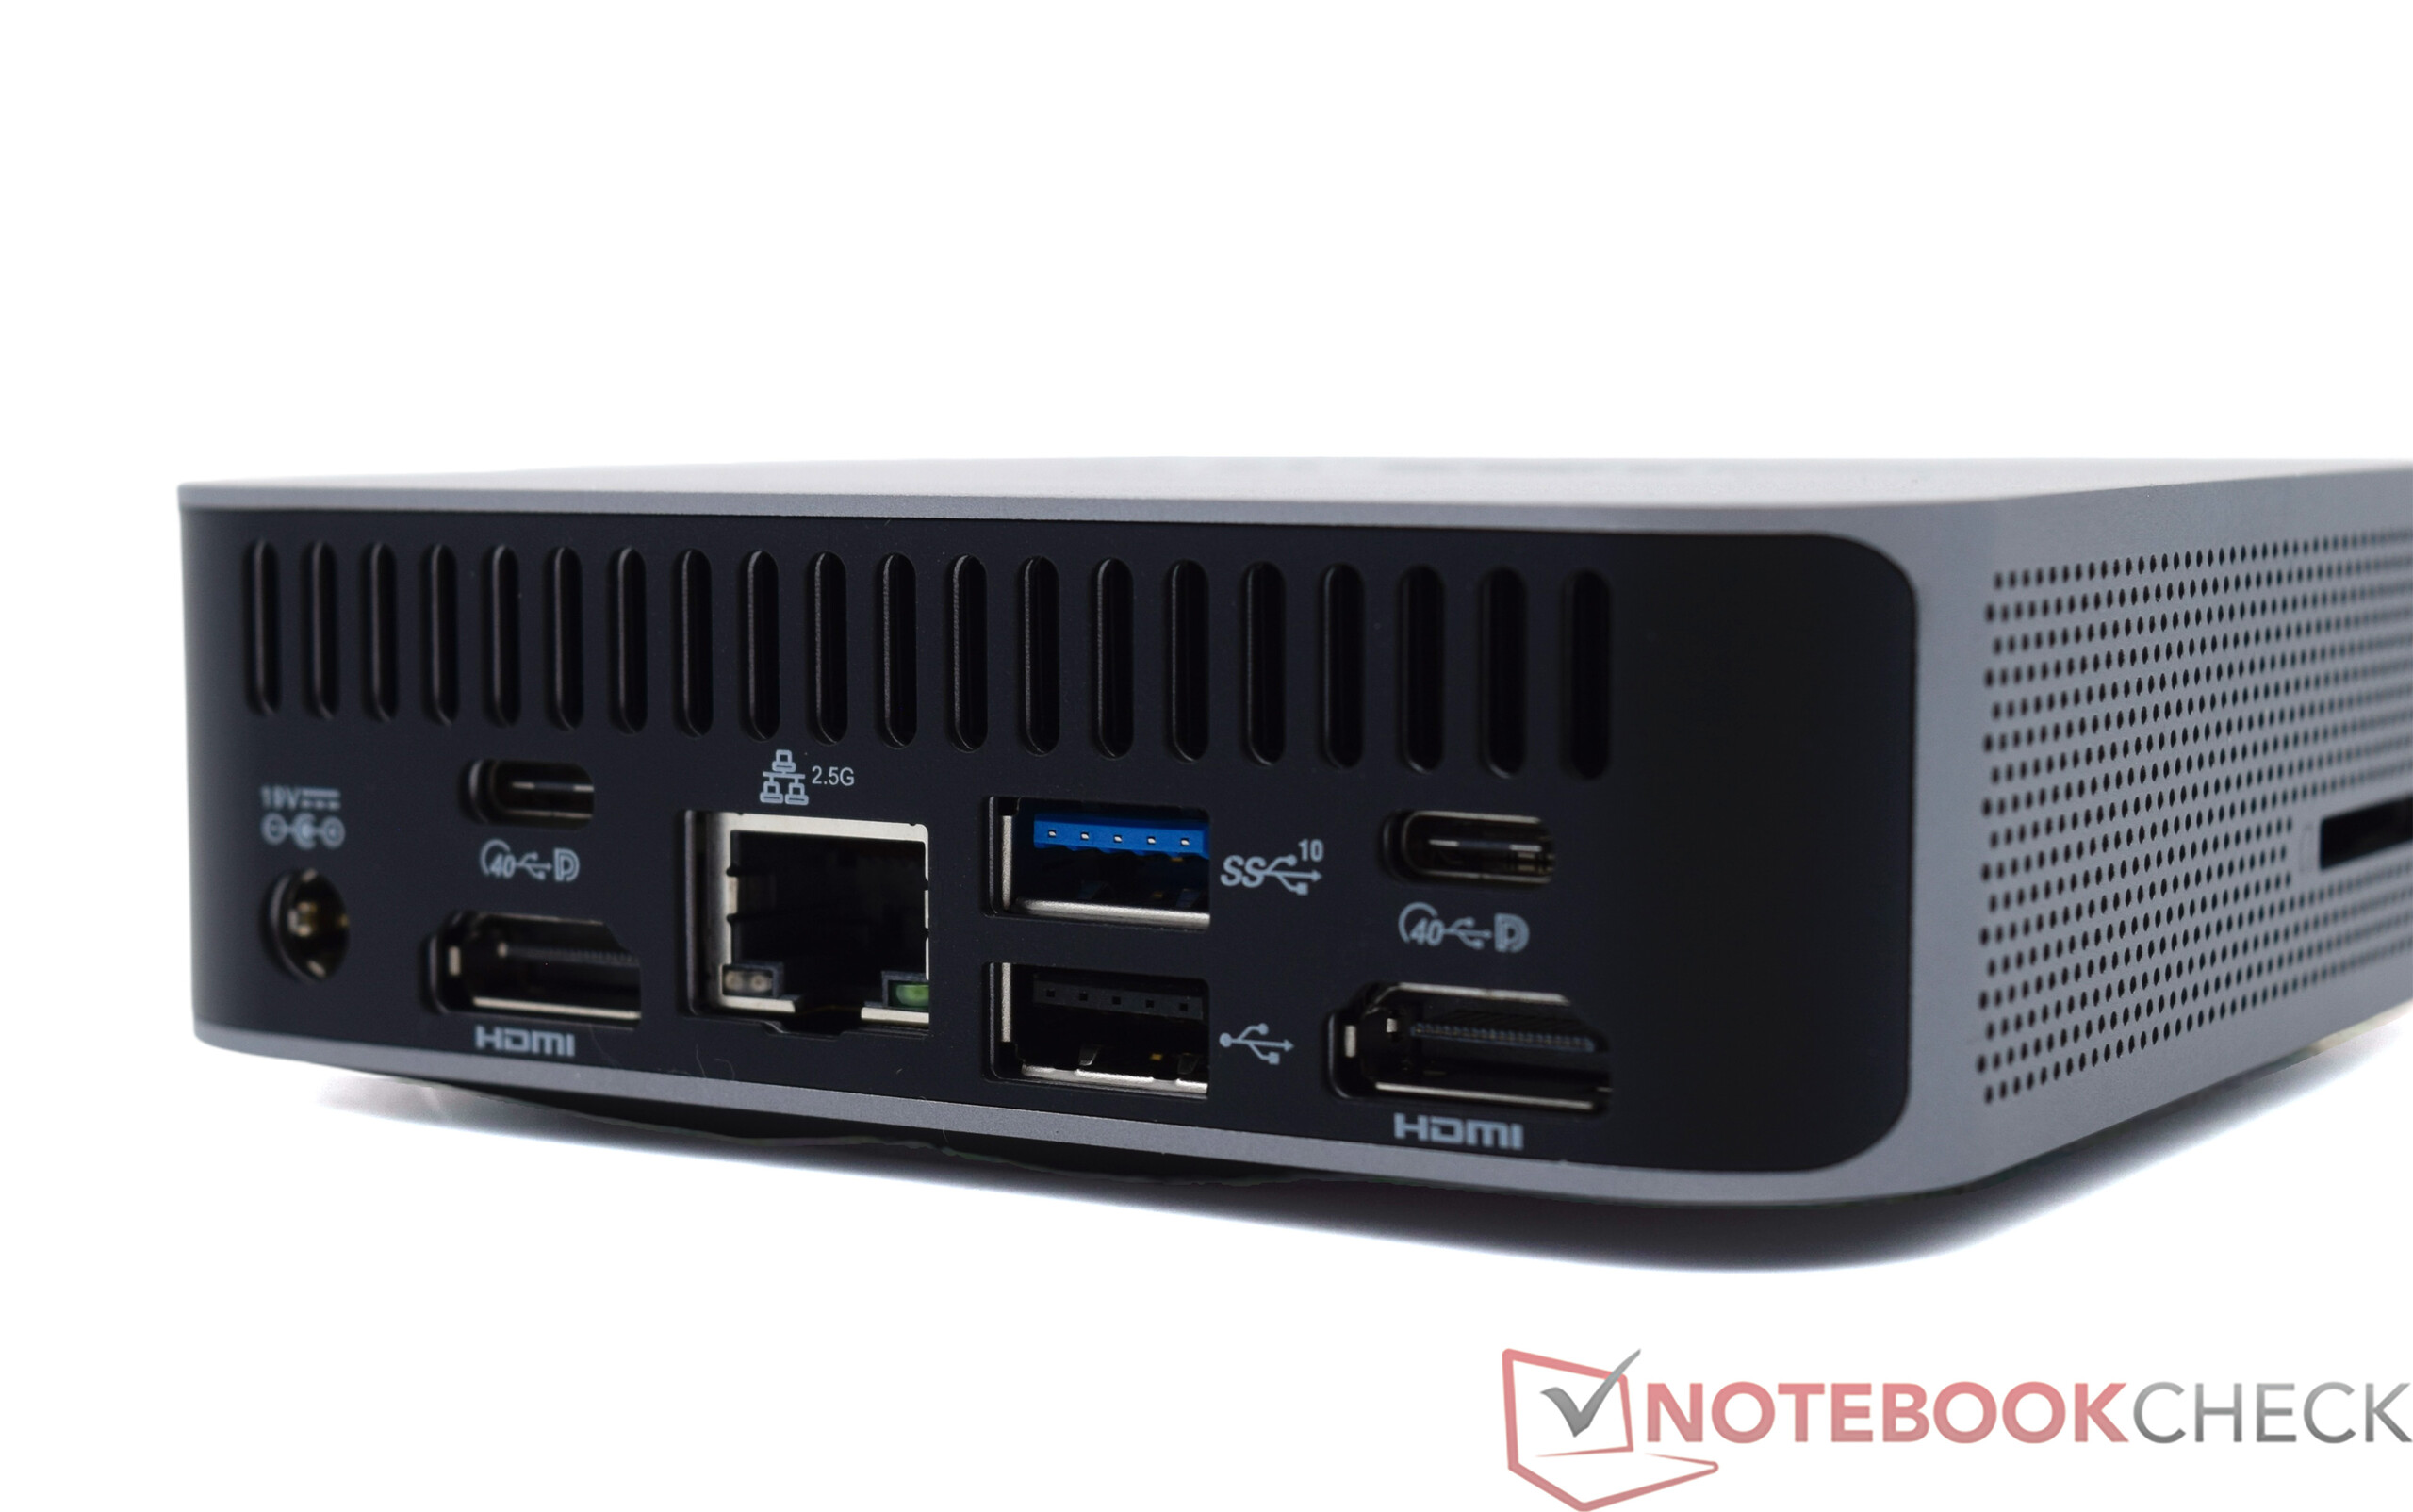
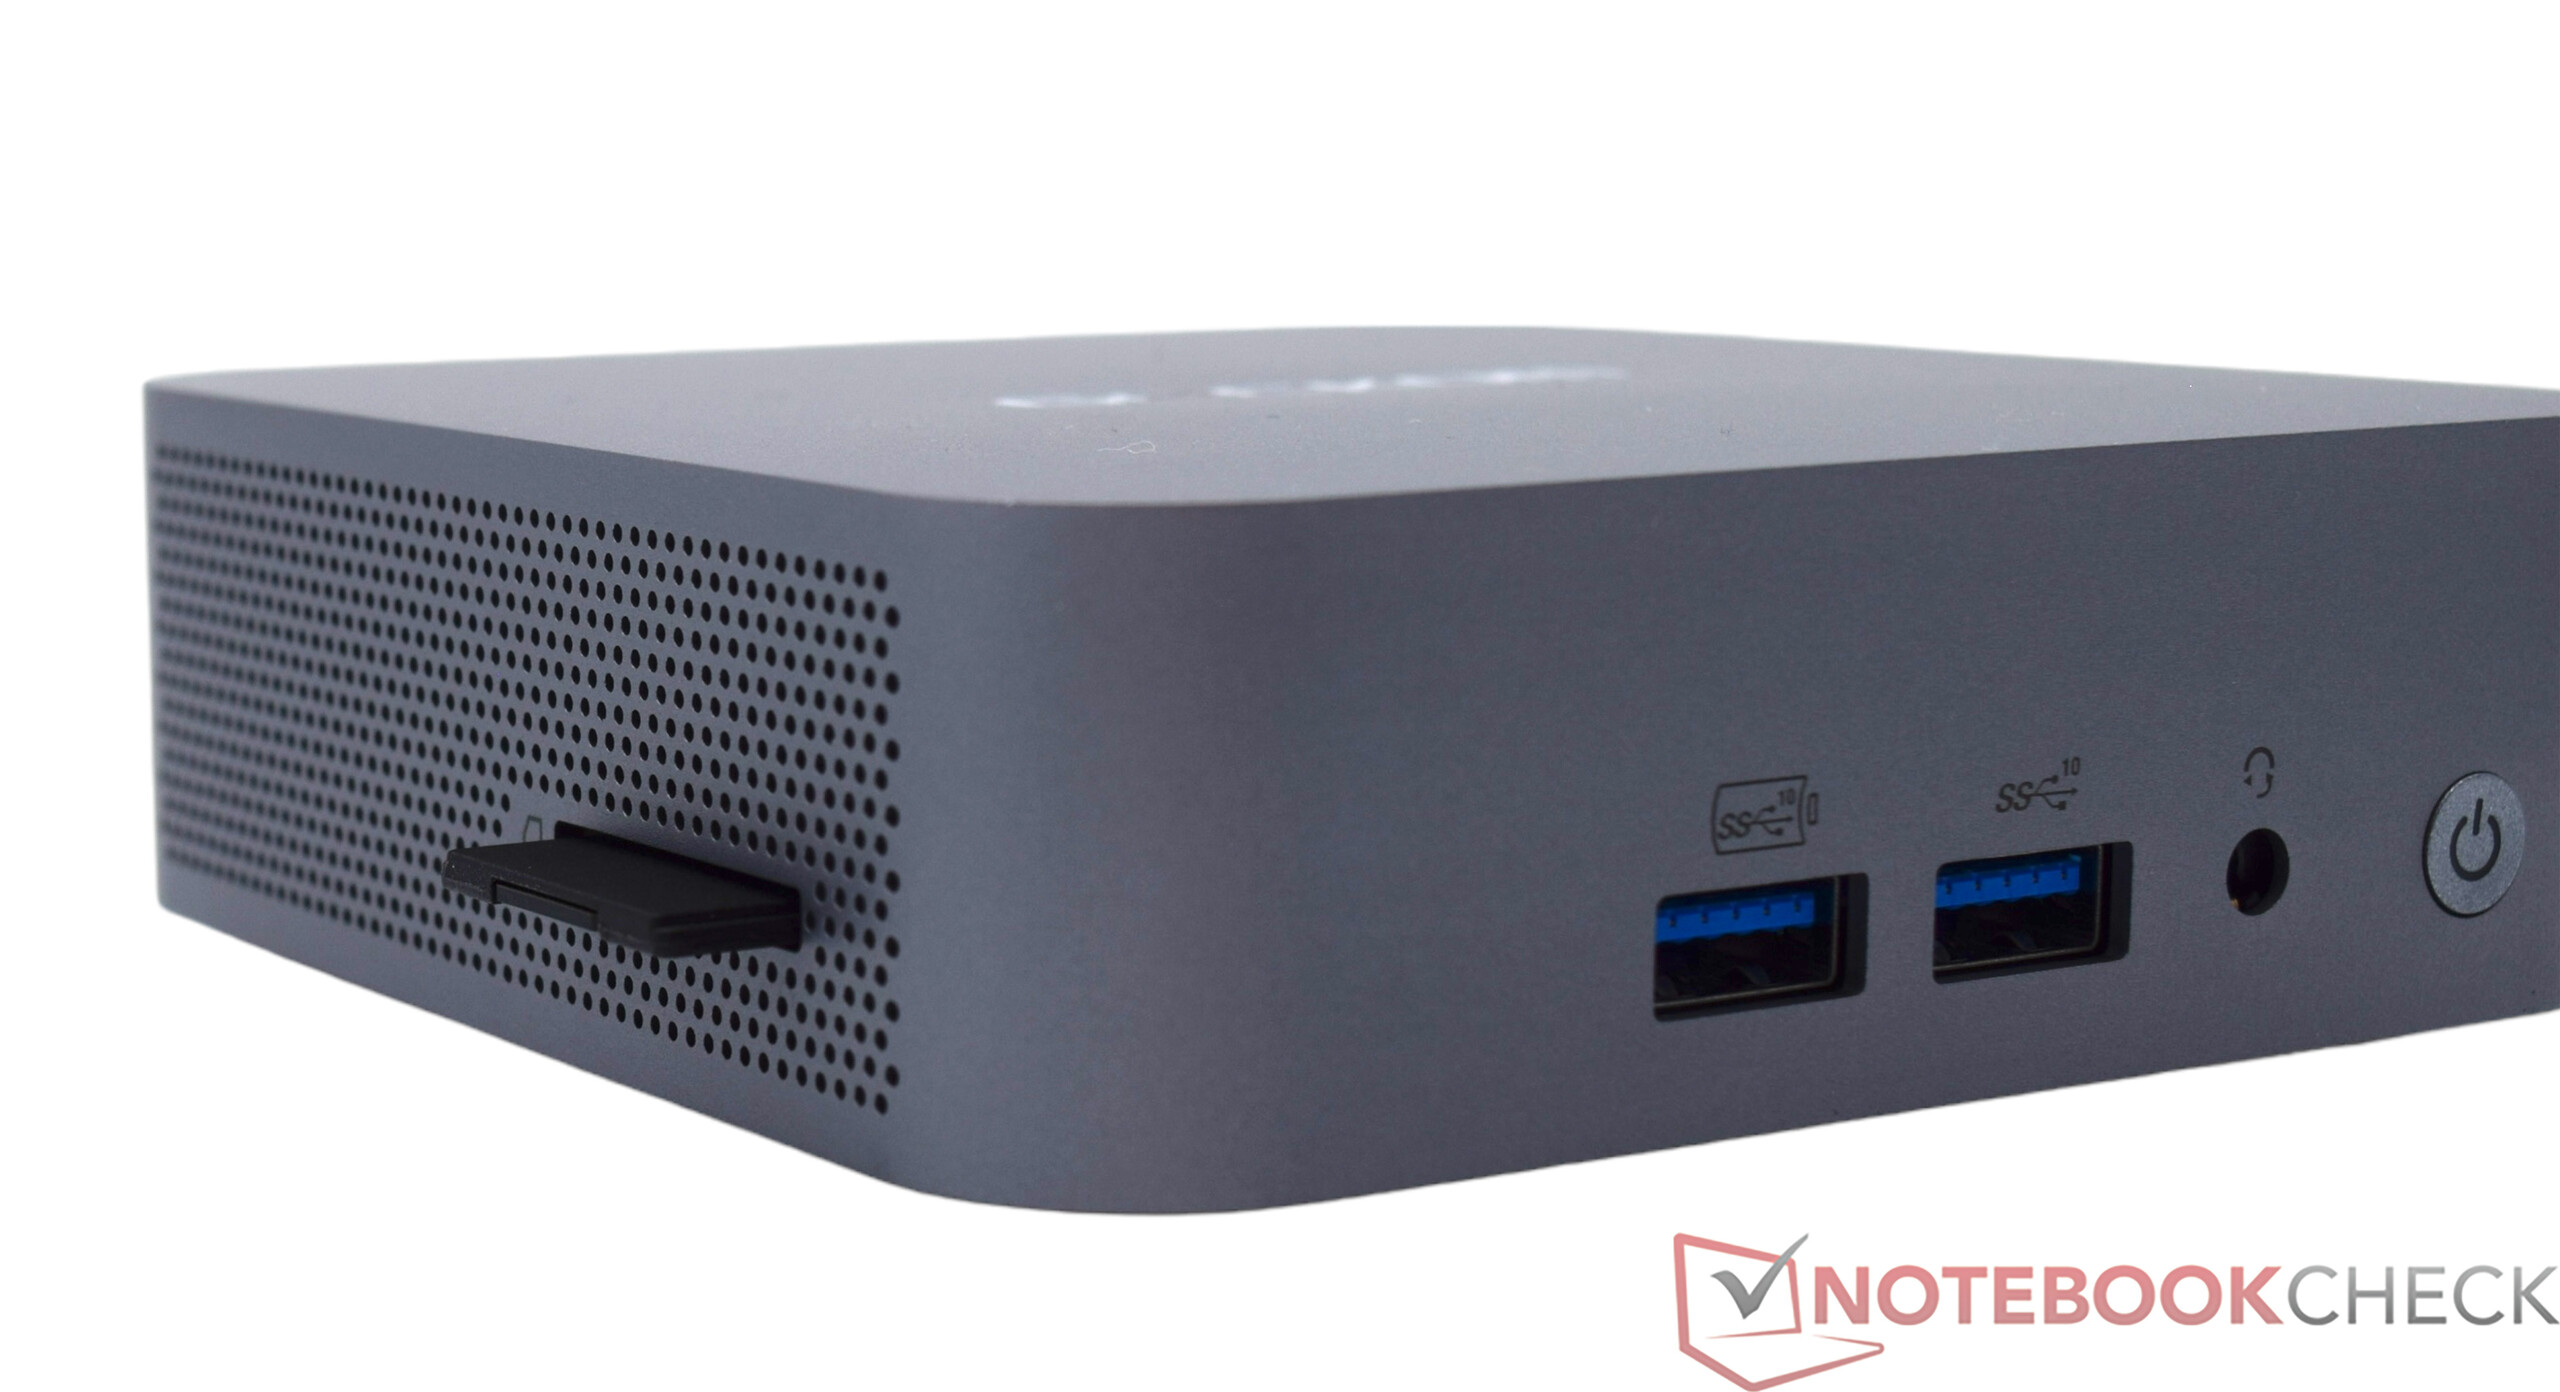
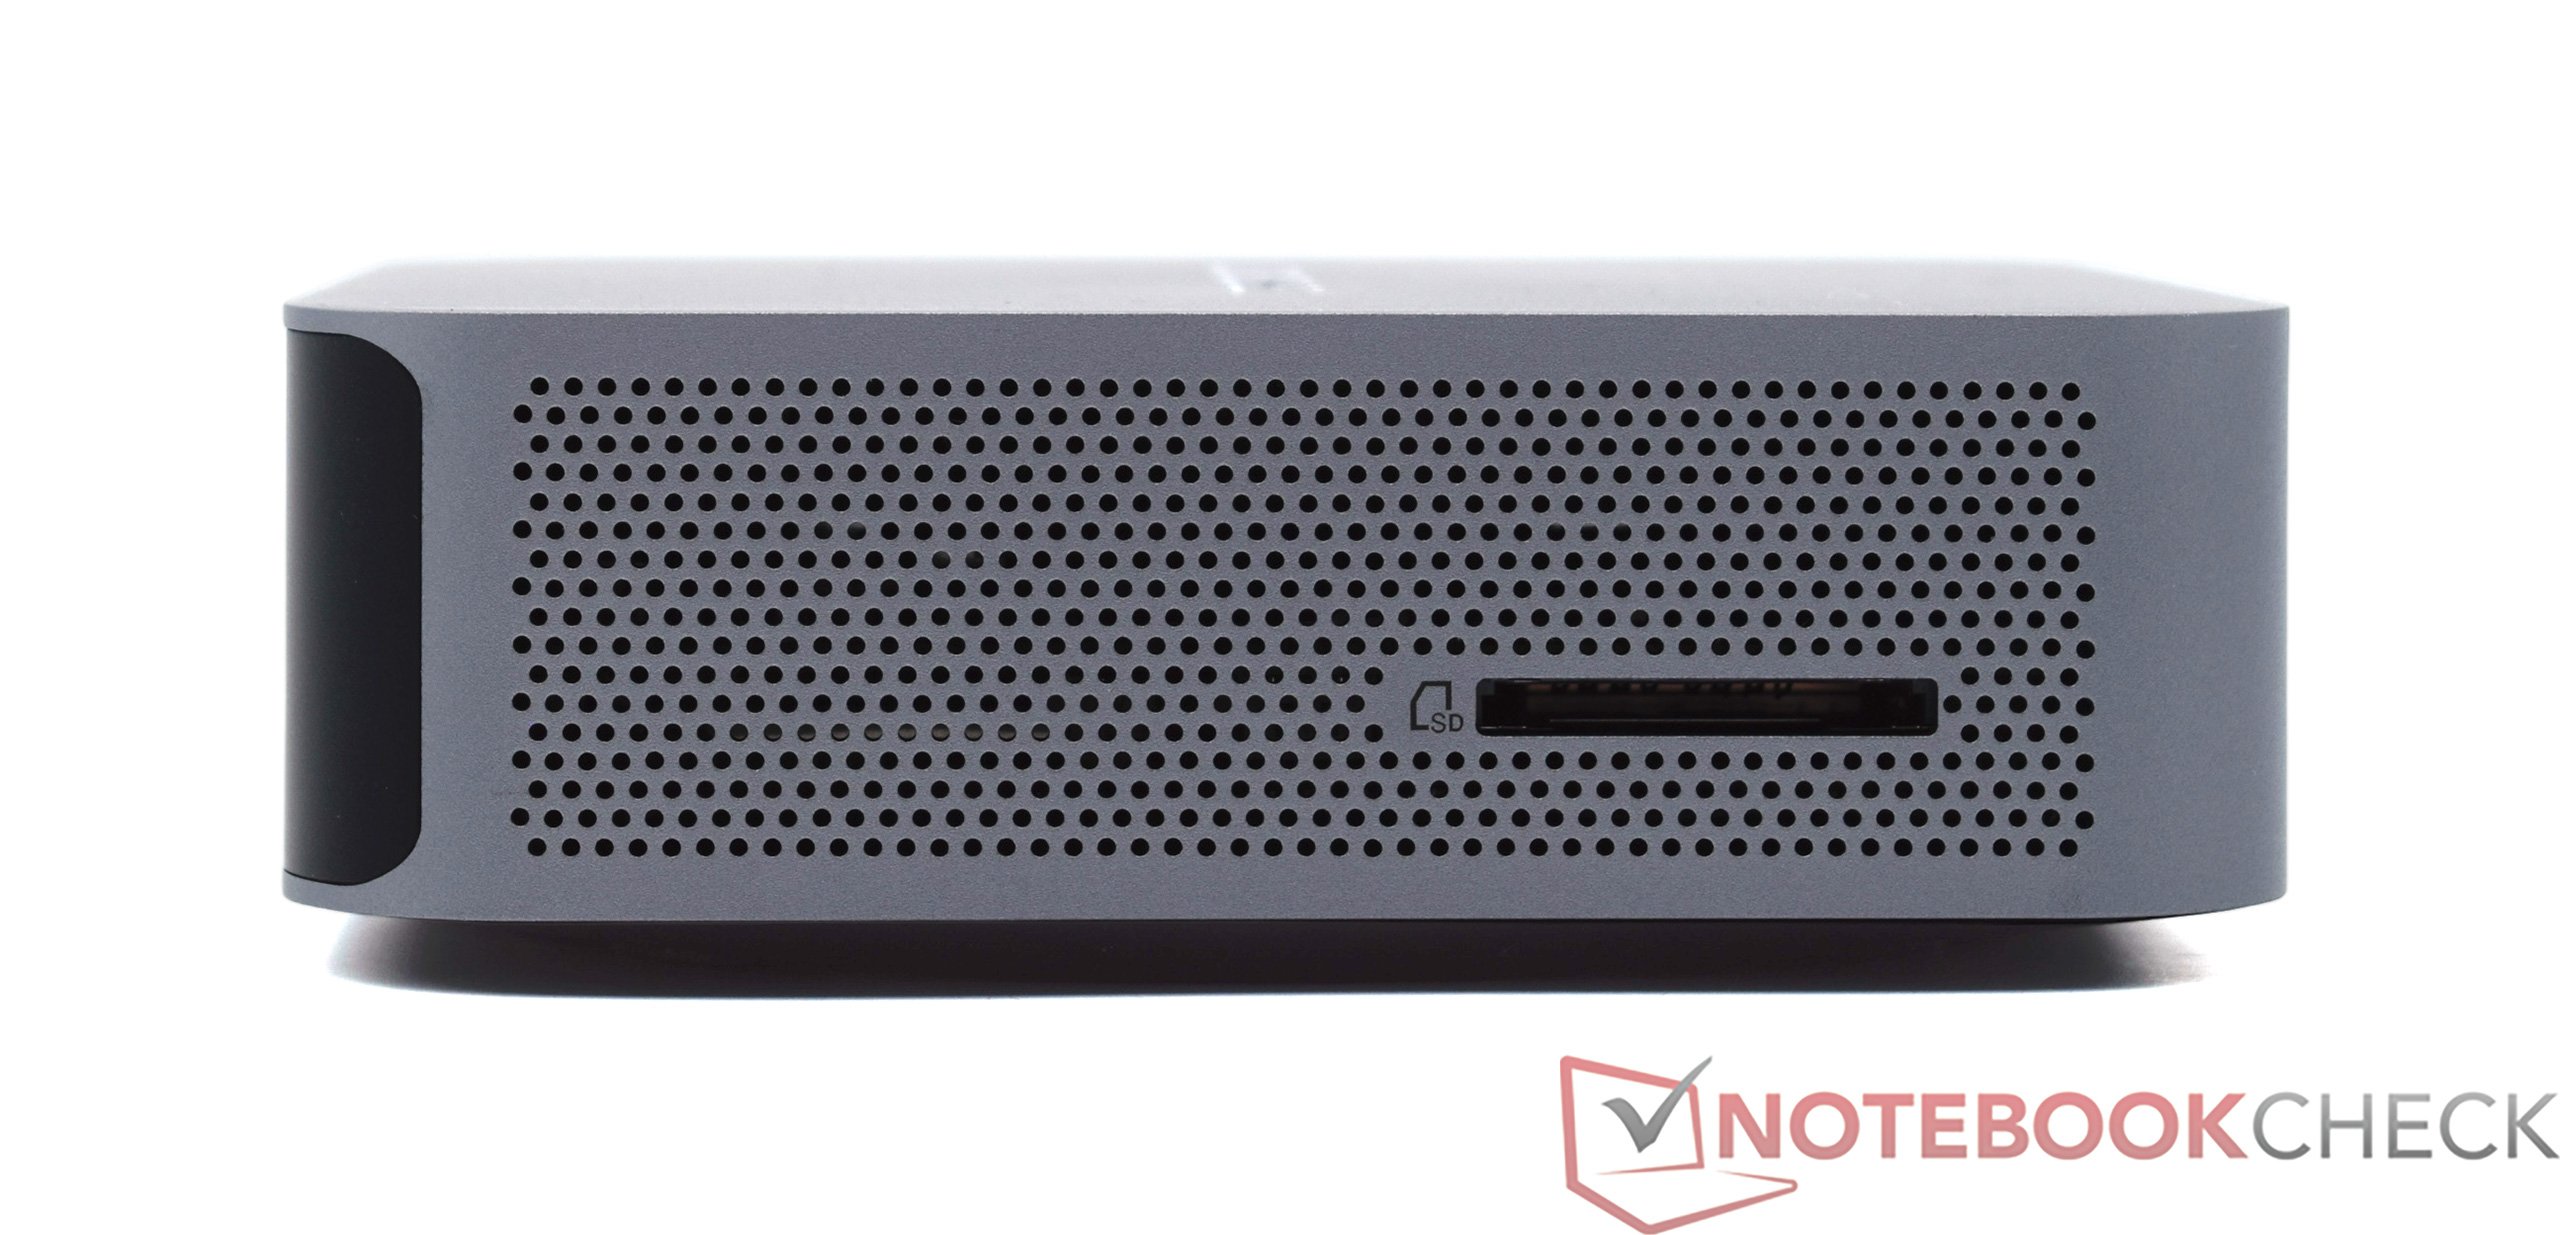
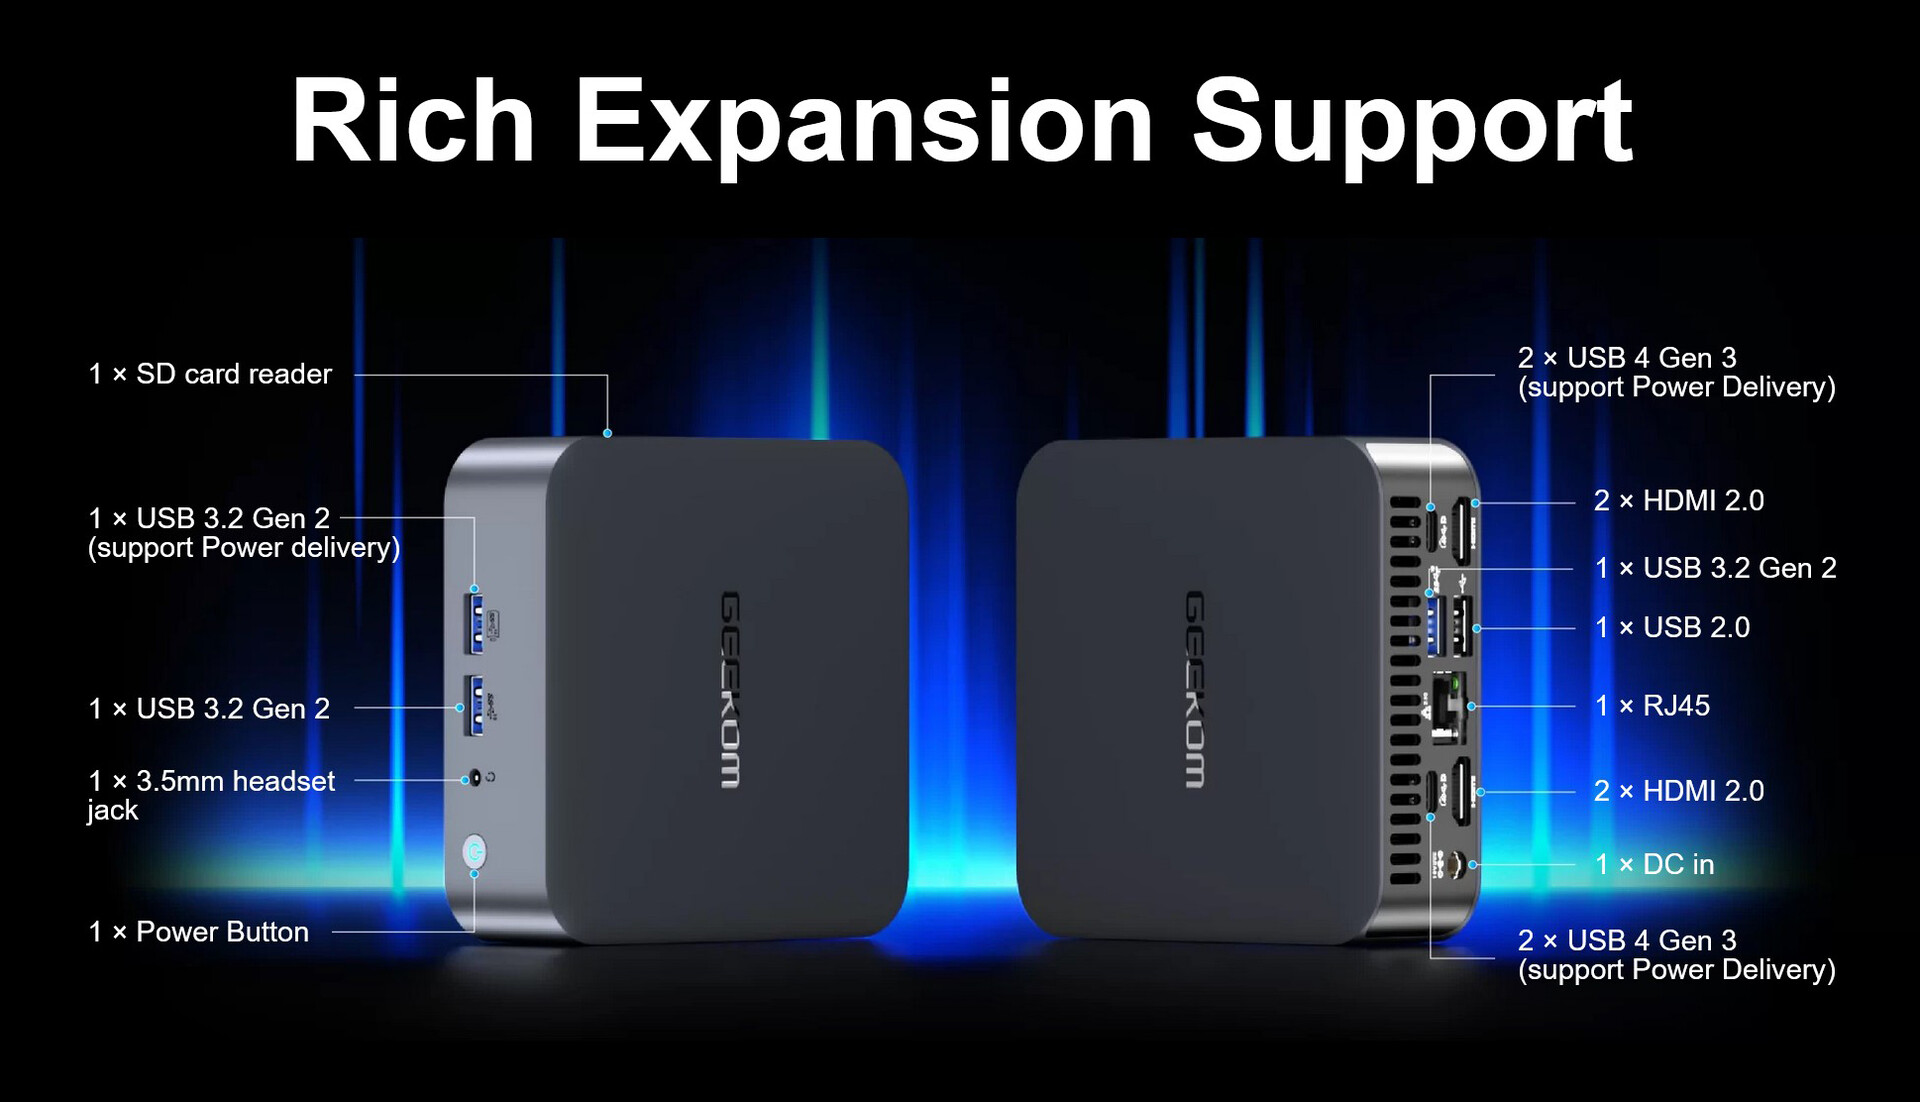
Já vimos muitas vezes que a Geekom oferece muitas opções de conectividade, apesar de seu design extremamente compacto. O Geekom GT13 Pro não é exceção e oferece muitas opções de conectividade externa. Quatro portas USB-A são suficientes, especialmente porque há duas interfaces mais modernas com USB4, que podem ser usadas para expandir enormemente a gama de aplicativos do minicomputador. Também daremos outra olhada no desempenho com uma placa de vídeo externa. O Geekom GT13 Pro pode lidar com até quatro telas 4K ao mesmo tempo. Também é possível controlar um monitor de 8K. O rápido leitor de cartão SD, localizado no lado esquerdo, não deve ser esquecido e deve ser destacado positivamente.
| SD Card Reader | |
| average JPG Copy Test (av. of 3 runs) | |
| Khadas Mind (AV Pro SD microSD 128 GB V60) | |
| Geekom A5 (AV Pro SD microSD 128 GB V60) | |
| Geekom A8 (AV Pro SD microSD 128 GB V60) | |
| Geekom GT13 Pro (AV Pro SD microSD 128 GB V60) | |
| Geekom Mini IT13 | |
| Geekom Mini IT12 (AV Pro SD microSD 128 GB V60) | |
| Média da turma Mini PC (15.1 - 214, n=28, últimos 2 anos) | |
| Zotac ZBOX Magnus EN173070C (AV Pro SD microSD 128 GB V60) | |
| maximum AS SSD Seq Read Test (1GB) | |
| Khadas Mind (AV Pro SD microSD 128 GB V60) | |
| Geekom A8 (AV Pro SD microSD 128 GB V60) | |
| Geekom A5 (AV Pro SD microSD 128 GB V60) | |
| Geekom Mini IT13 | |
| Geekom GT13 Pro (AV Pro SD microSD 128 GB V60) | |
| Geekom Mini IT12 (AV Pro SD microSD 128 GB V60) | |
| Média da turma Mini PC (18.2 - 241, n=28, últimos 2 anos) | |
| Zotac ZBOX Magnus EN173070C (AV Pro SD microSD 128 GB V60) | |
Comunicação
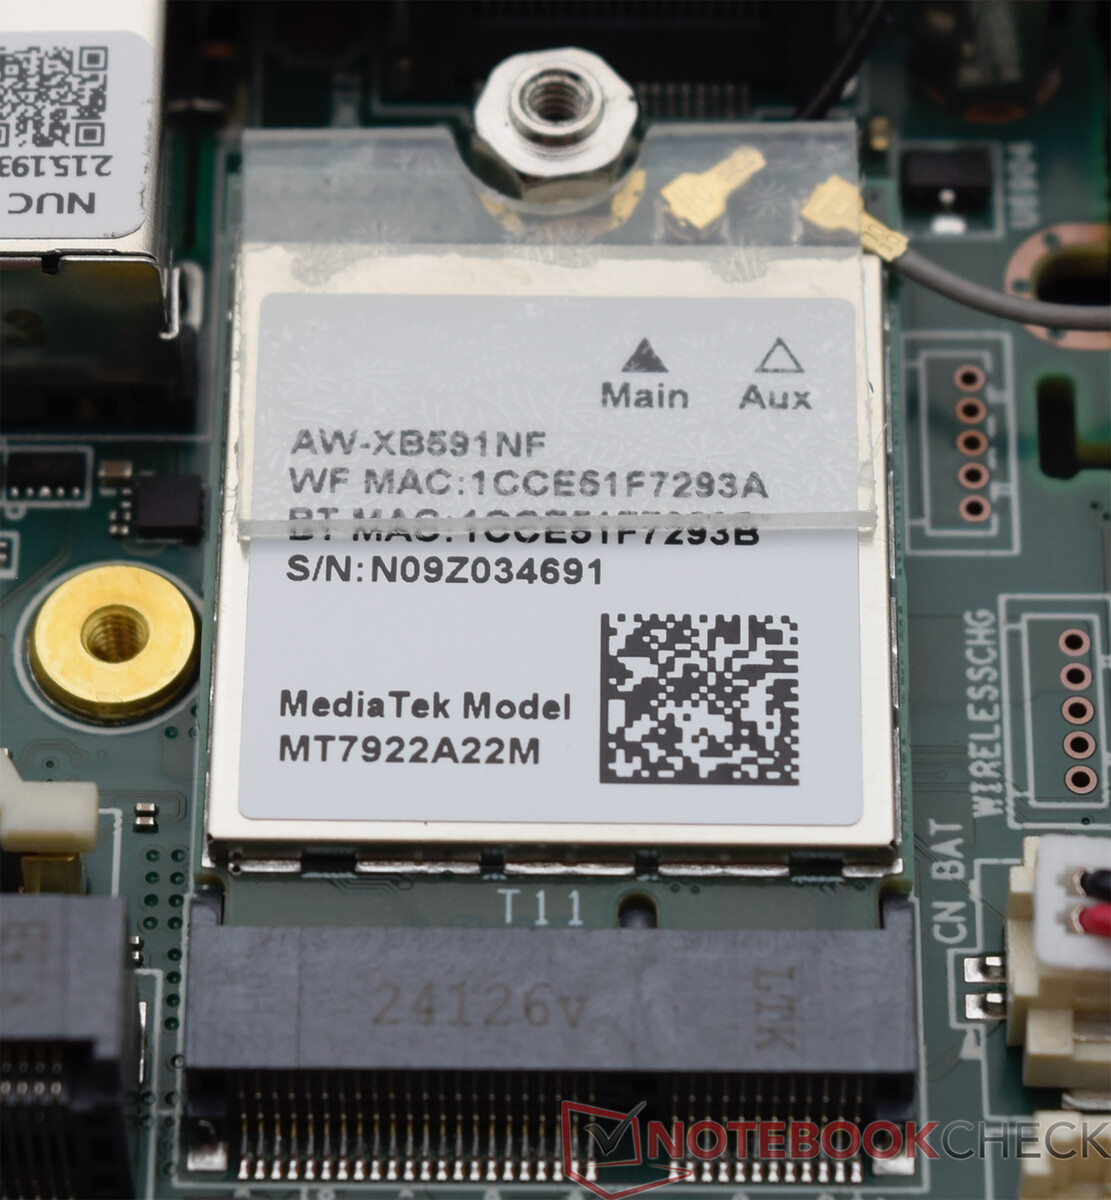
No Geekom GT13 Pro, encontramos o mesmo módulo de rádio, que também é usado no Geekom A8. O módulo WLAN MediaTek Wi-Fi 6E MT7922 permite trabalhar com as faixas de frequência de 2,4 GHz, 5 GHz e 6 GHz. Nossas medições estão limitadas às faixas de frequência de 5 e 6 GHz. Documentamos apenas pequenas diferenças de desempenho em conjunto com nosso roteador de teste Asus ROG Rapture GT-AXE11000. Infelizmente, a Geekom não inclui um módulo Wi-Fi moderno. Tanto o Acemagic F2A bem como o Minisforum AtomMan X7 Ti podem fornecer consistentemente resultados ligeiramente melhores com o Intel Wi-Fi 7 BE200. O Geekom GT13 Pro também tem um soquete RJ45. Aqui é possível obter taxas de transferência de dados de até 2,5 GBit/s.
Acessórios
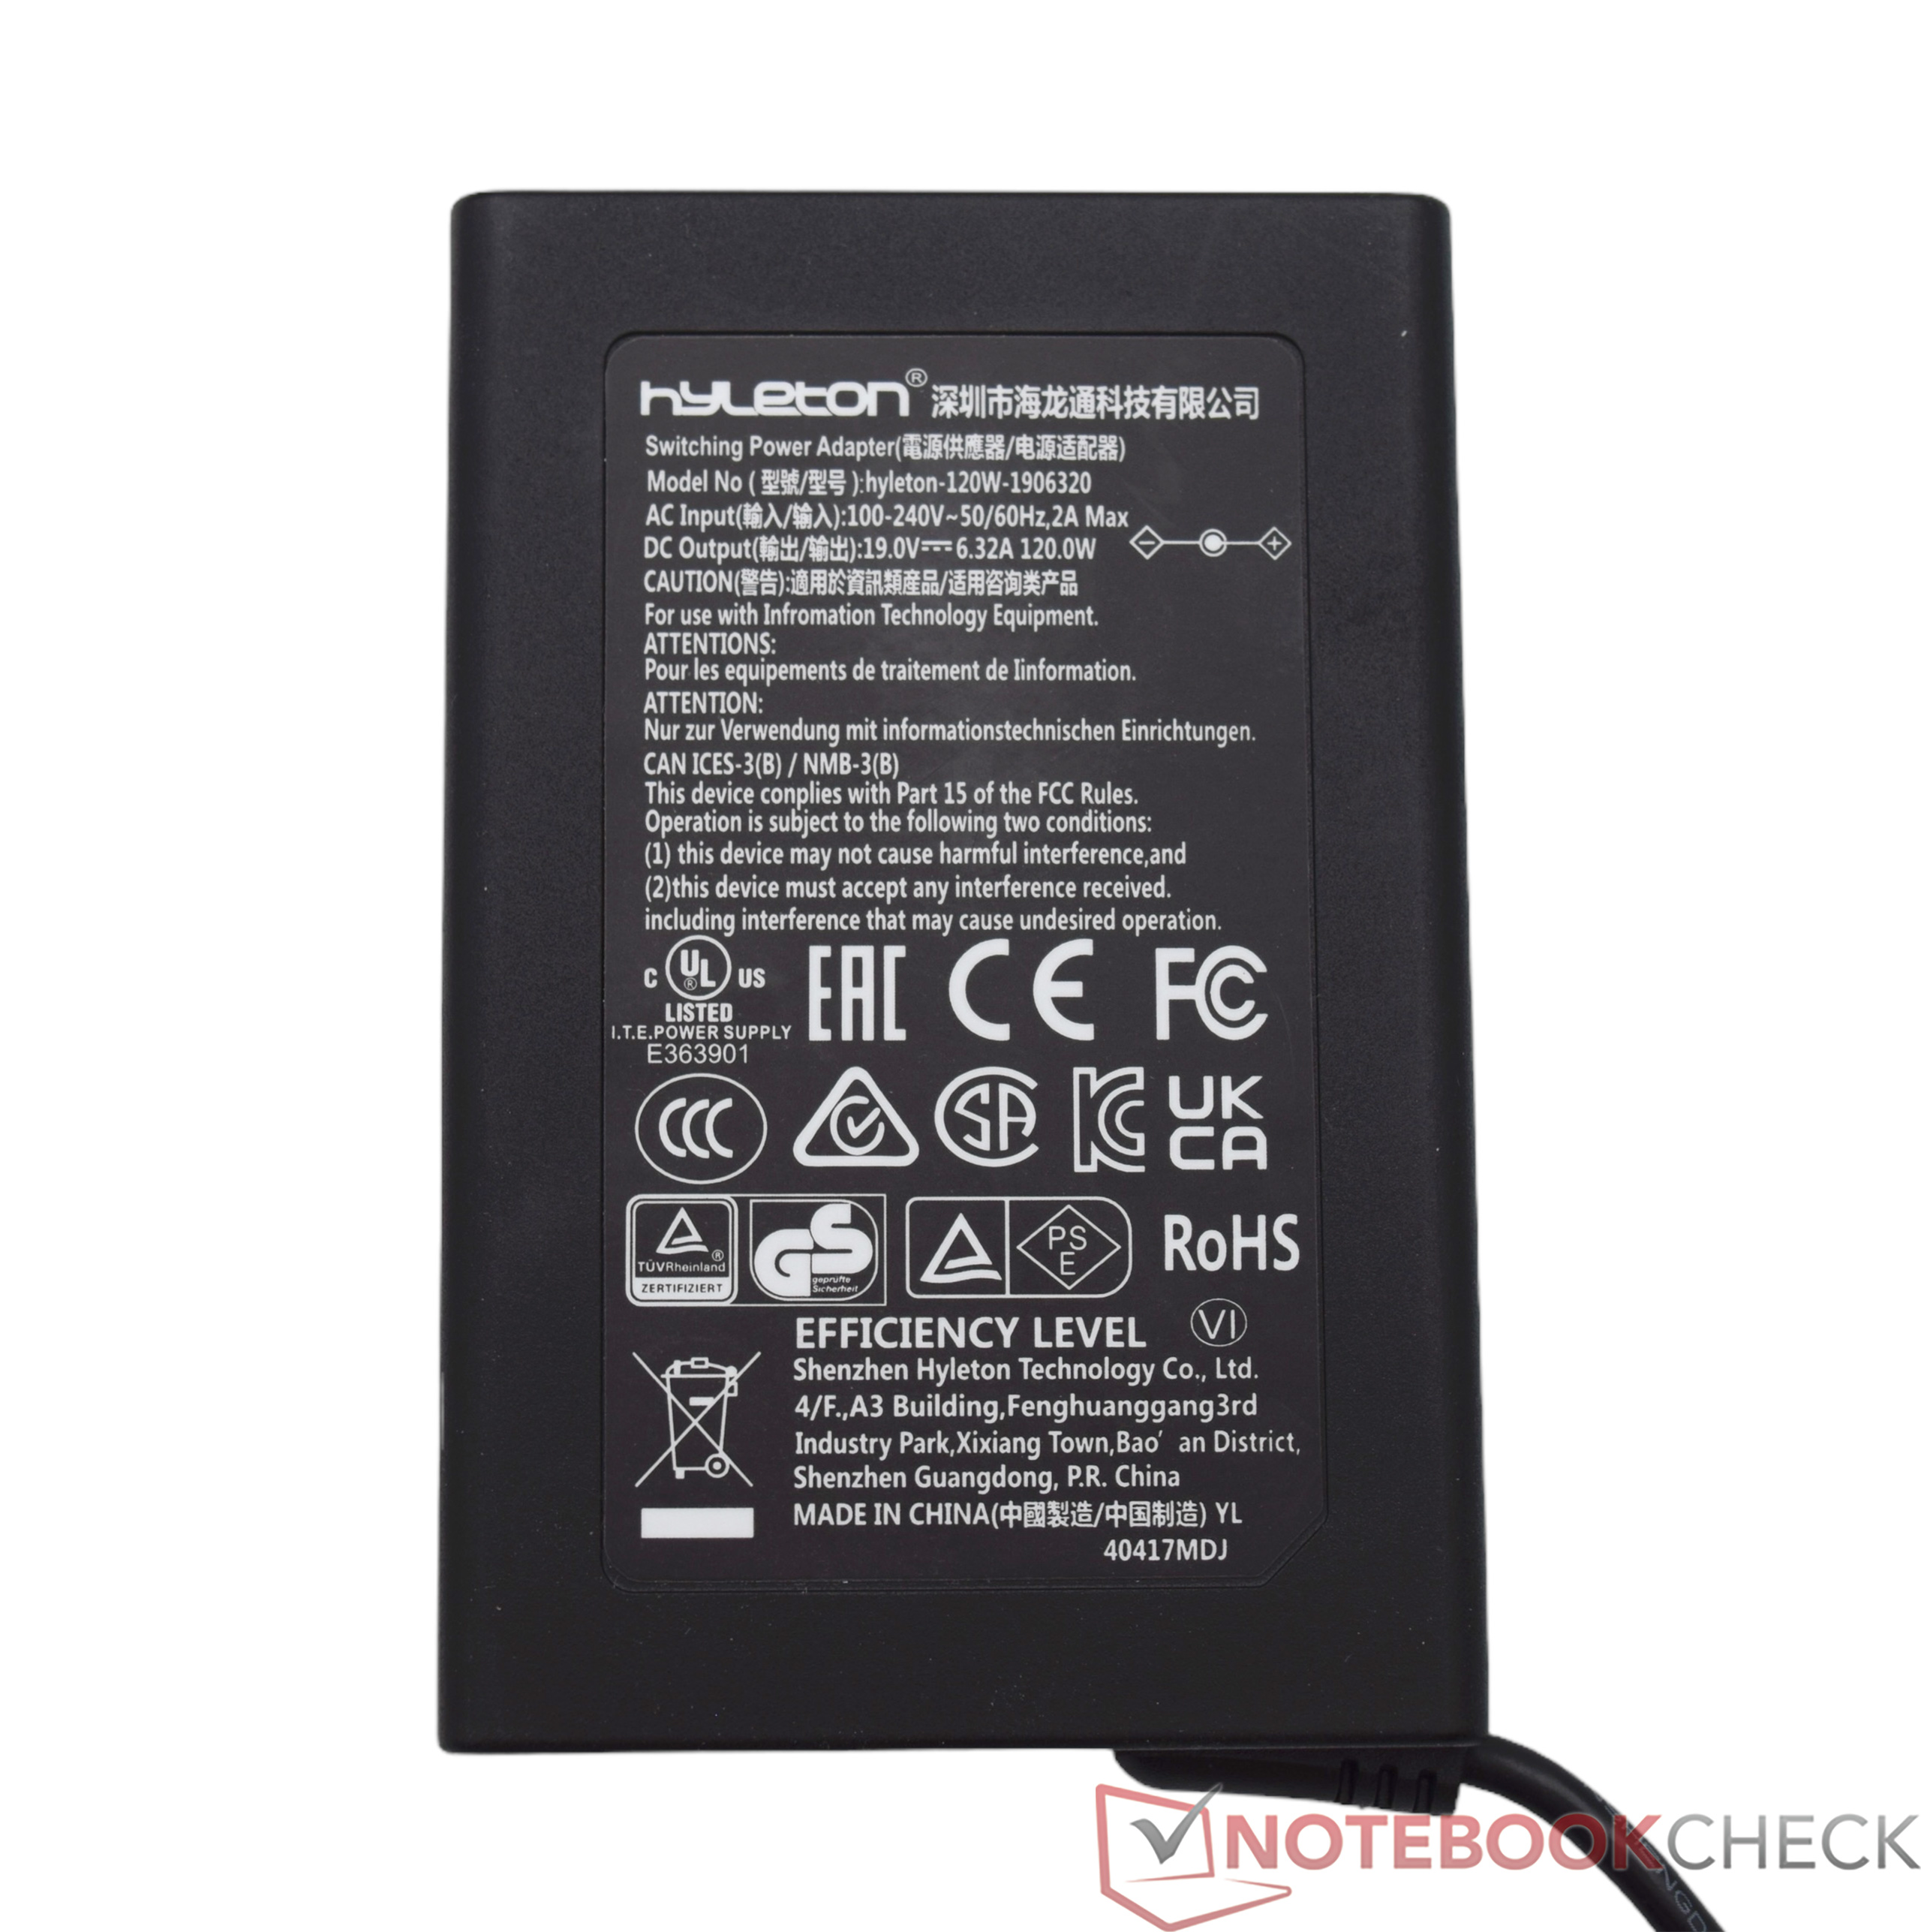
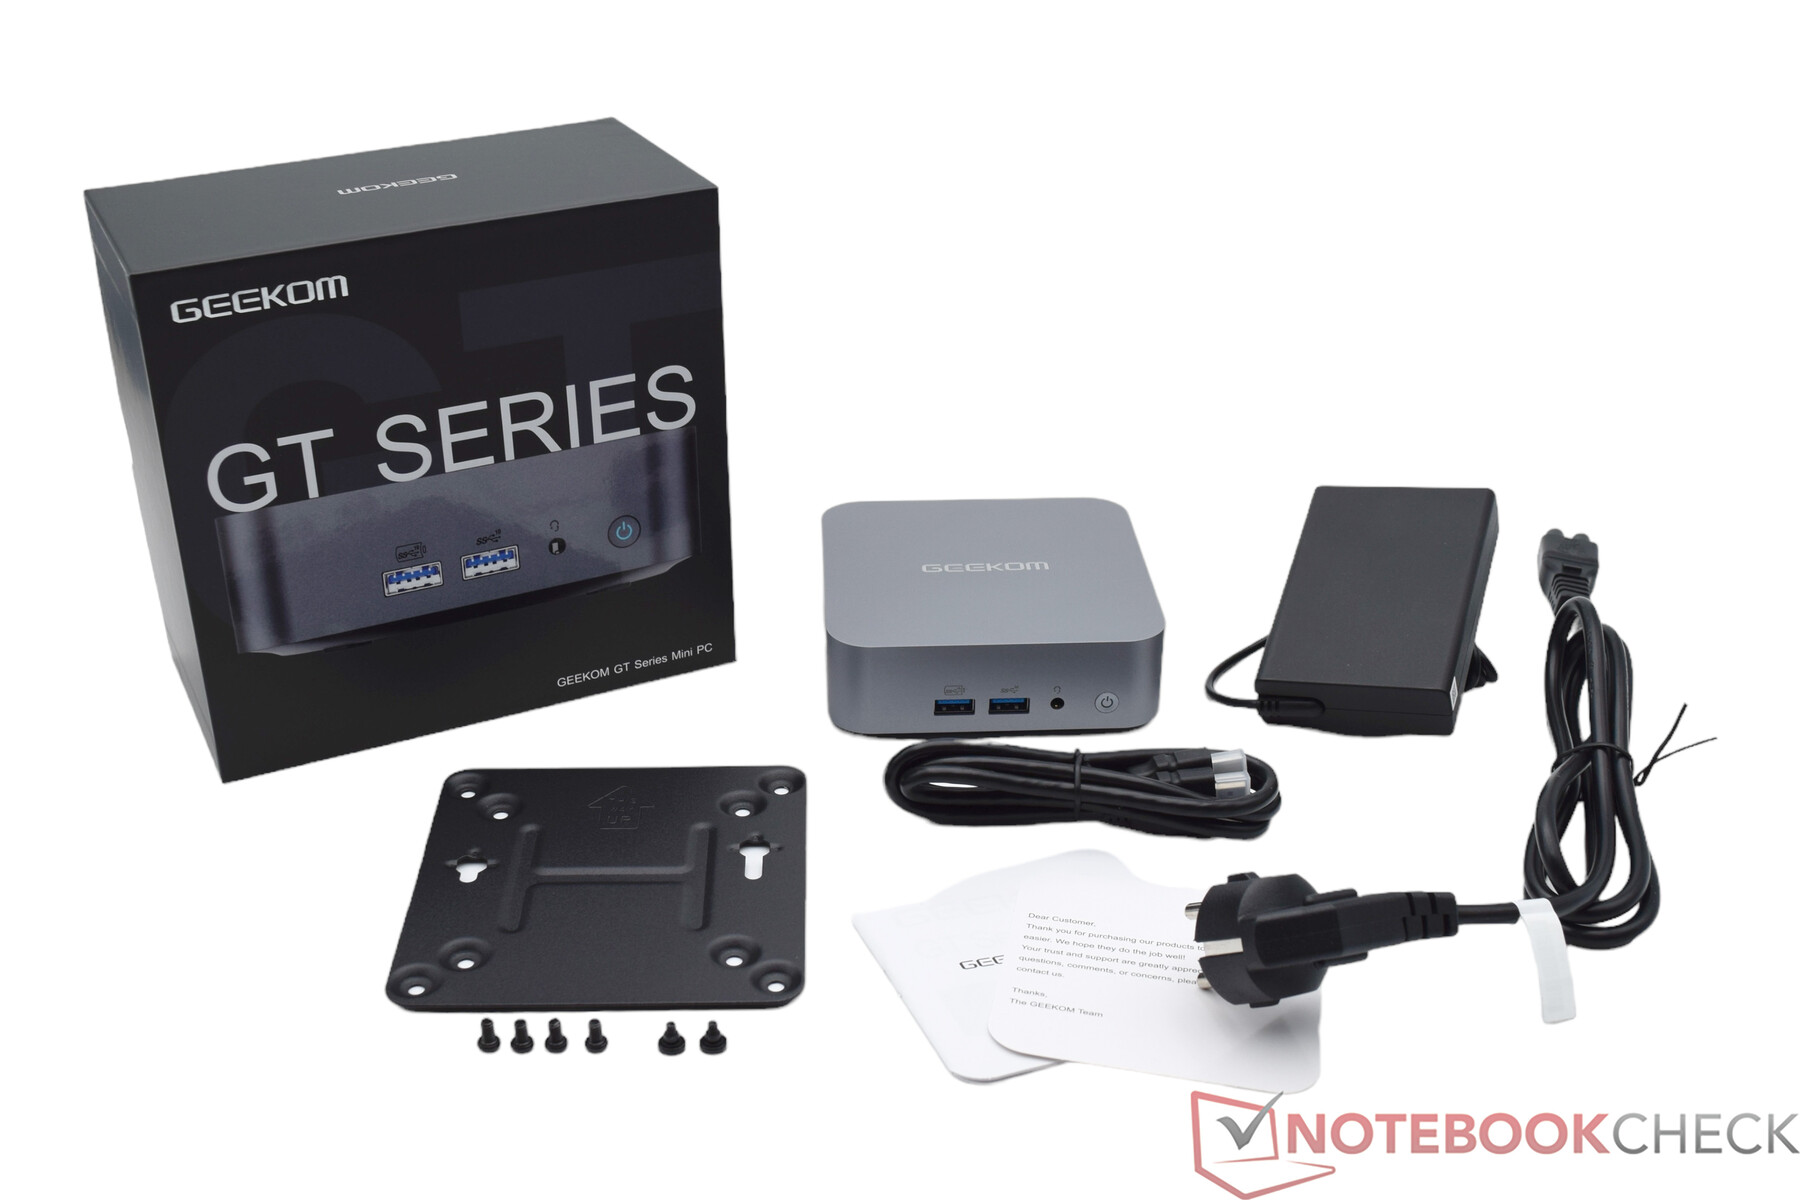
O Geekom GT13 Pro vem com uma fonte de alimentação de 120 watts. Há também um cabo HDMI e uma placa de montagem VESA na caixa. O fabricante também inclui um pequeno manual do usuário, que descreve as opções de conexão e a instalação de RAM e SSD, entre outras coisas. A Geekom entrega o produto em uma pequena caixa de papelão. A quantidade de plástico ainda poderia ser minimizada, pois o cabo HDMI e a placa de montagem VESA são embalados separadamente.
Manutenção
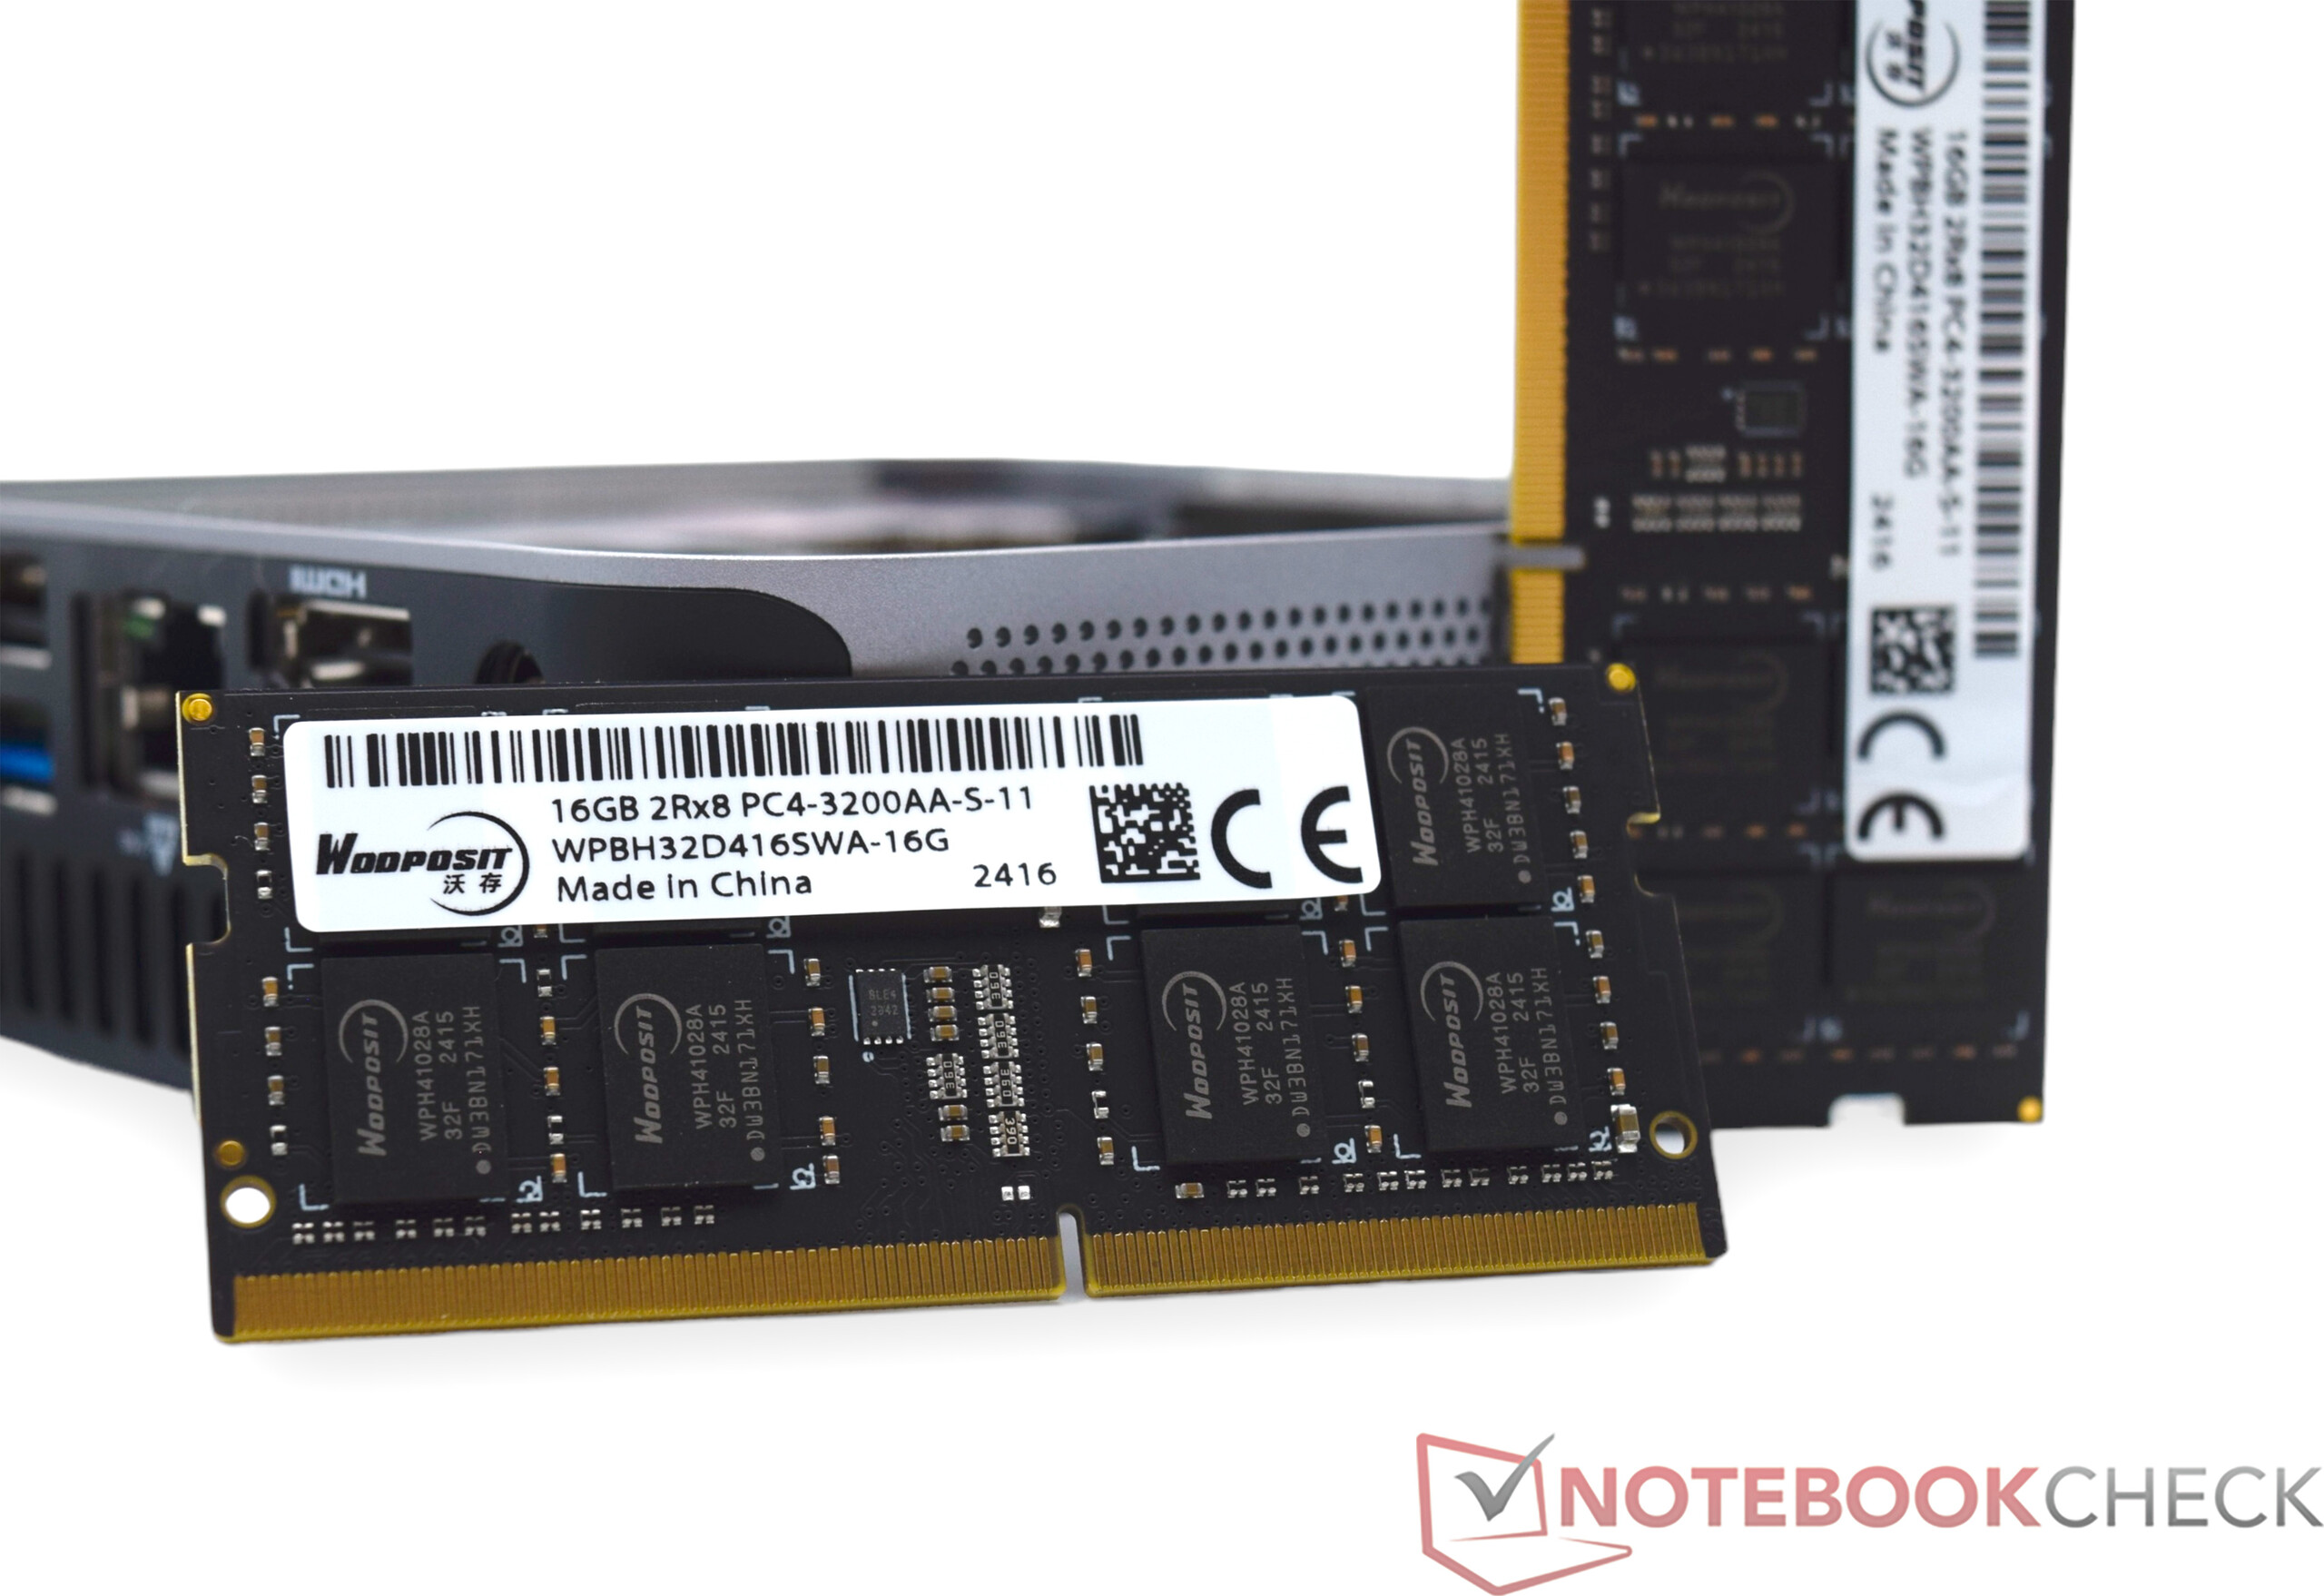
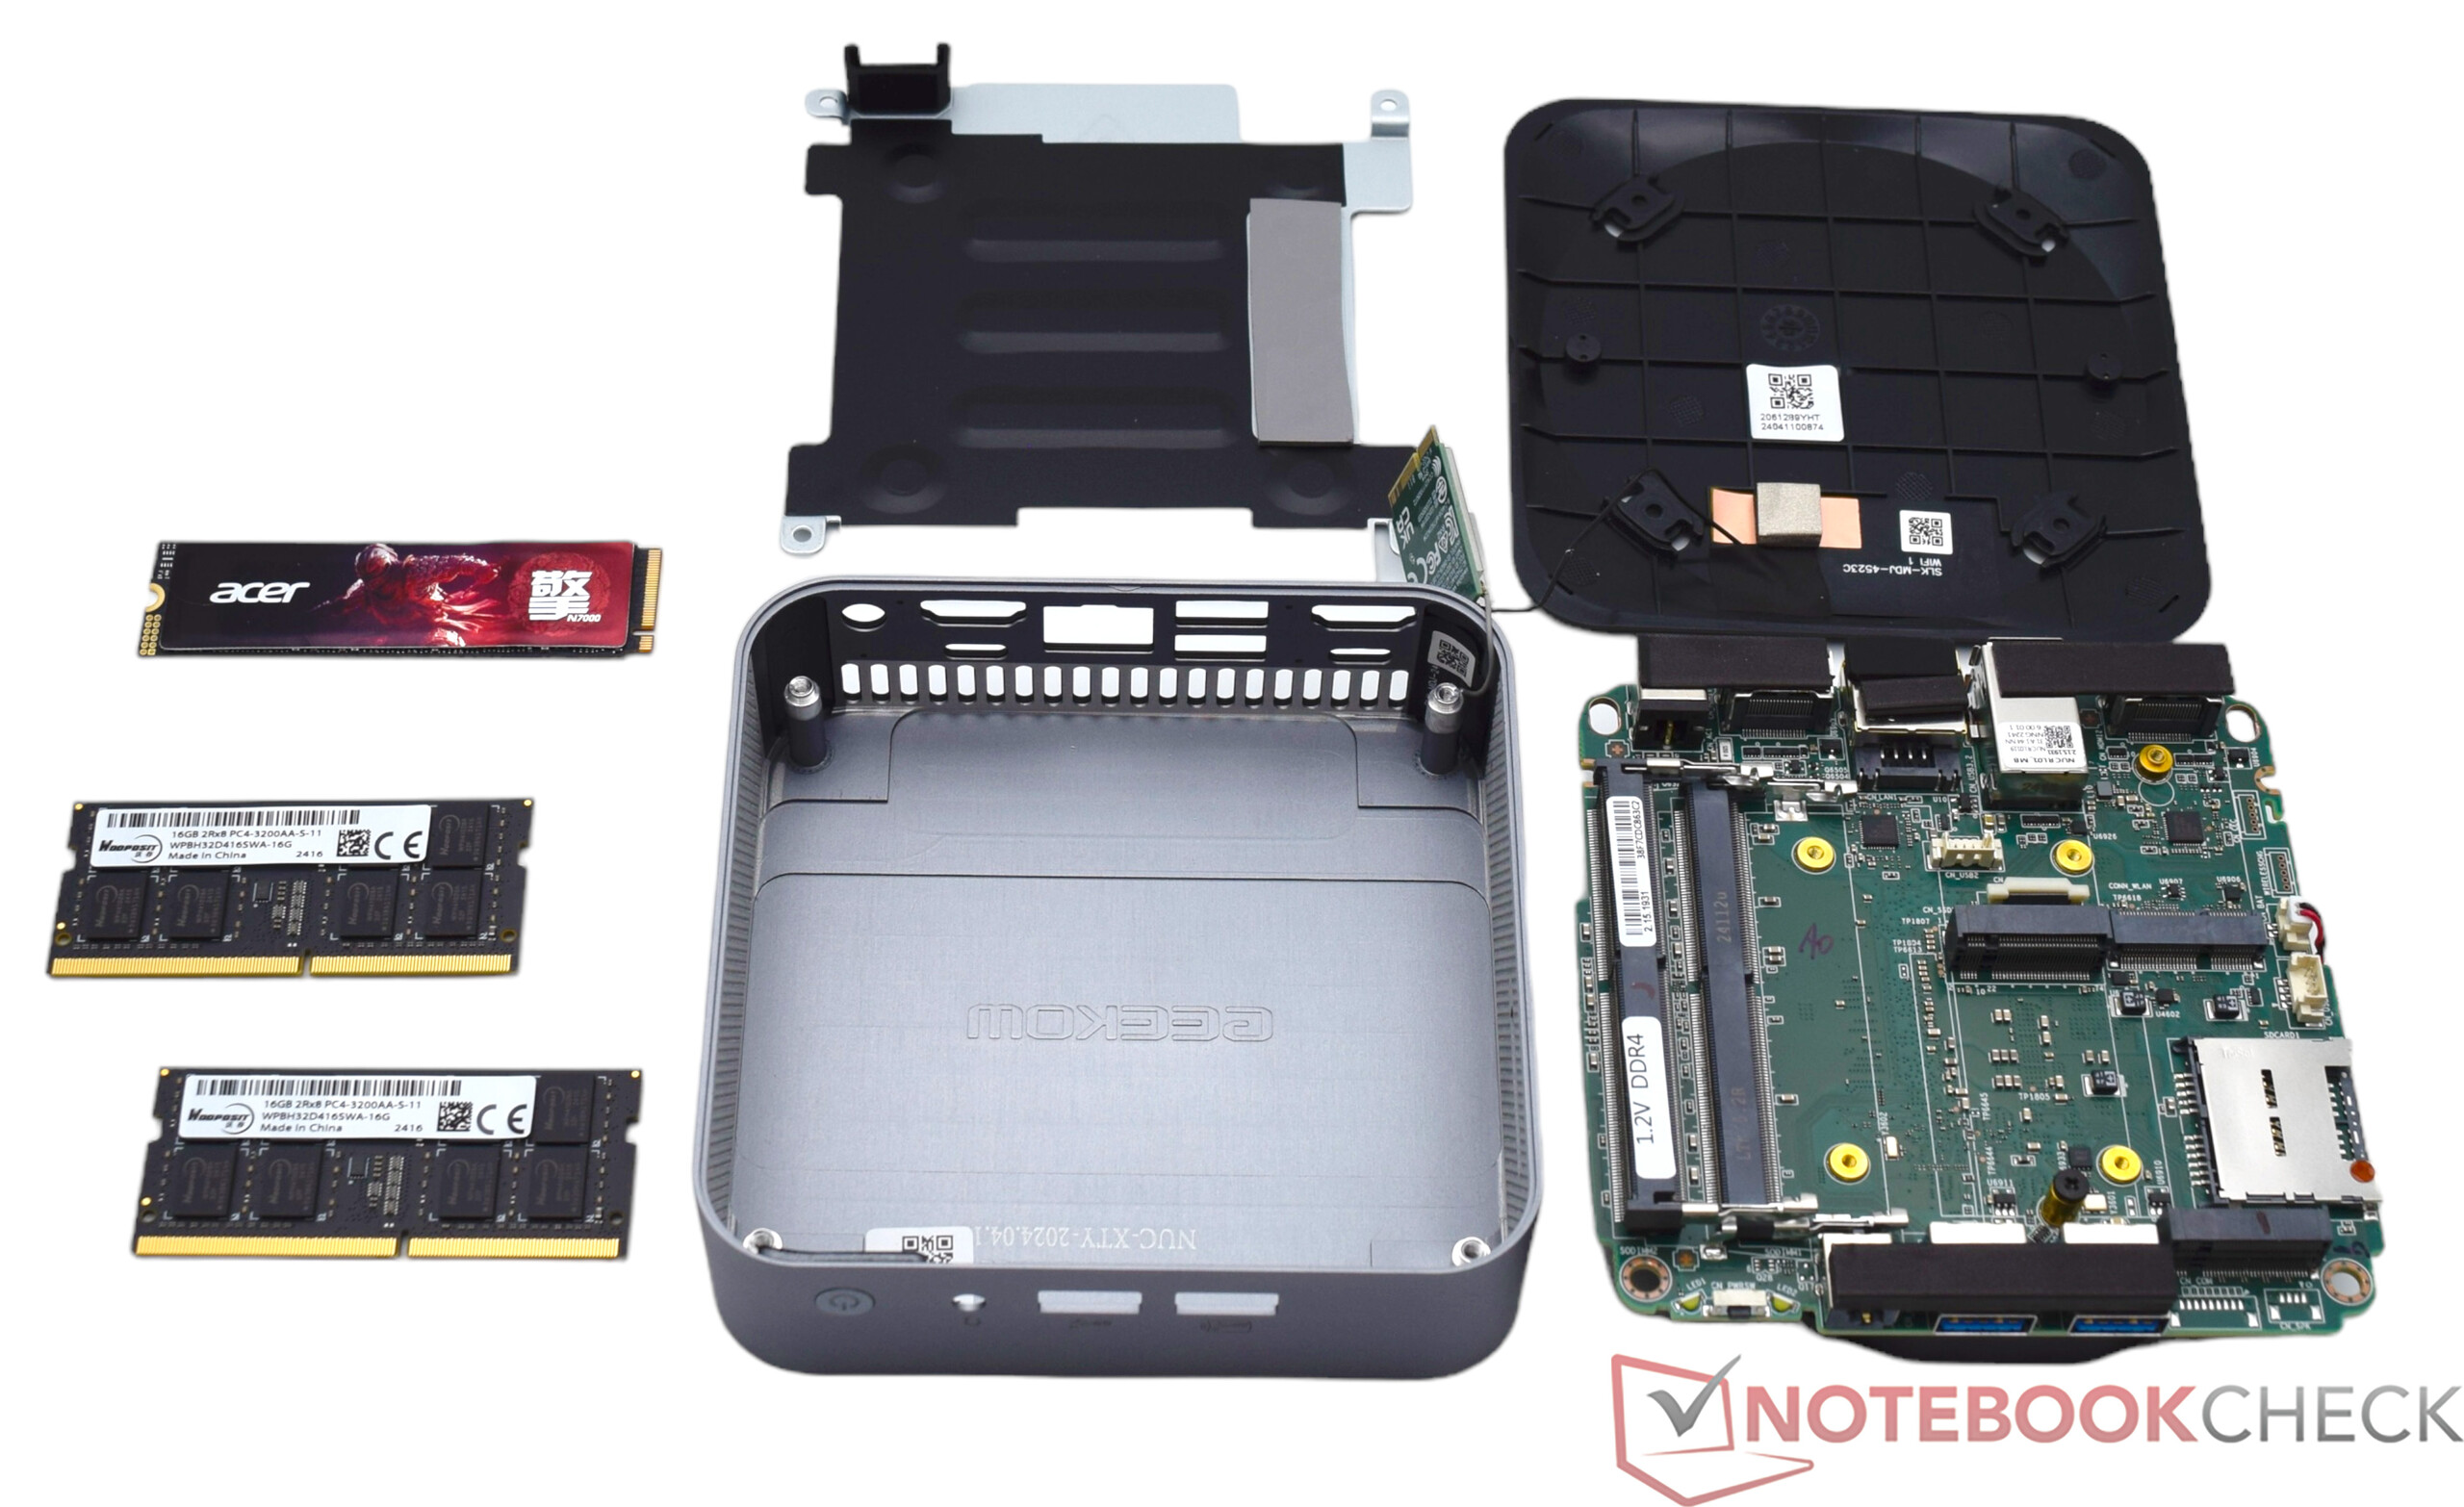
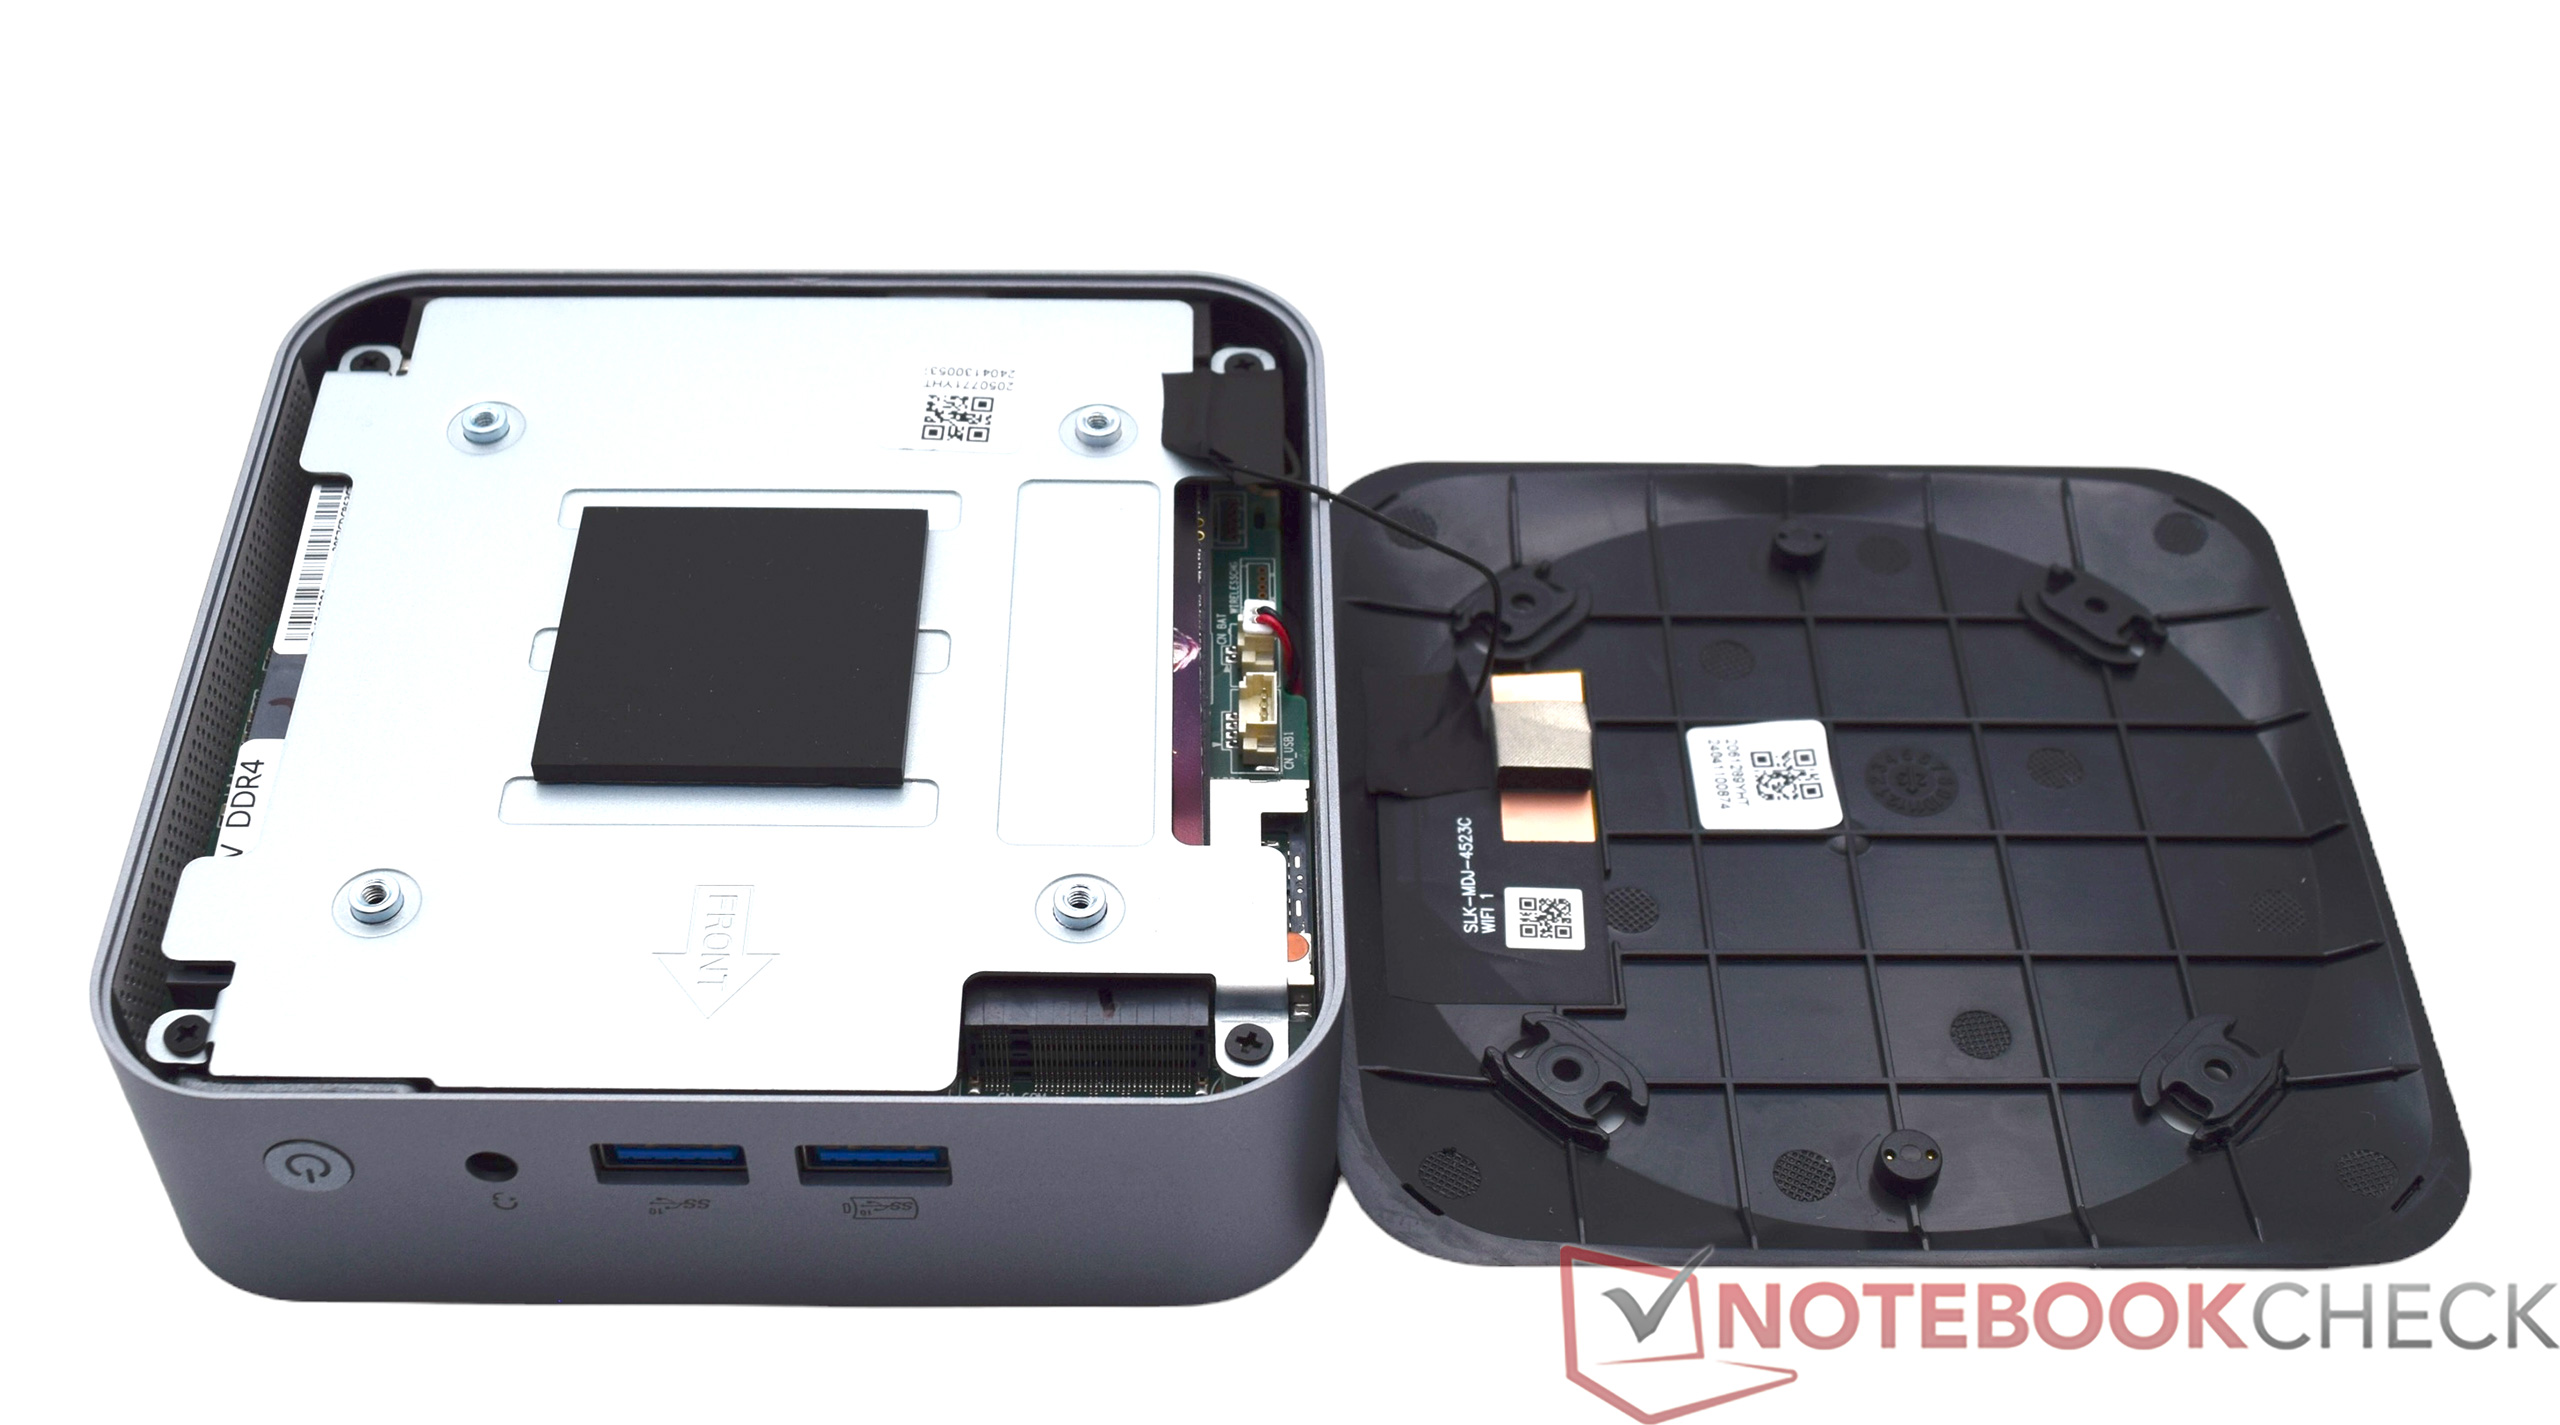
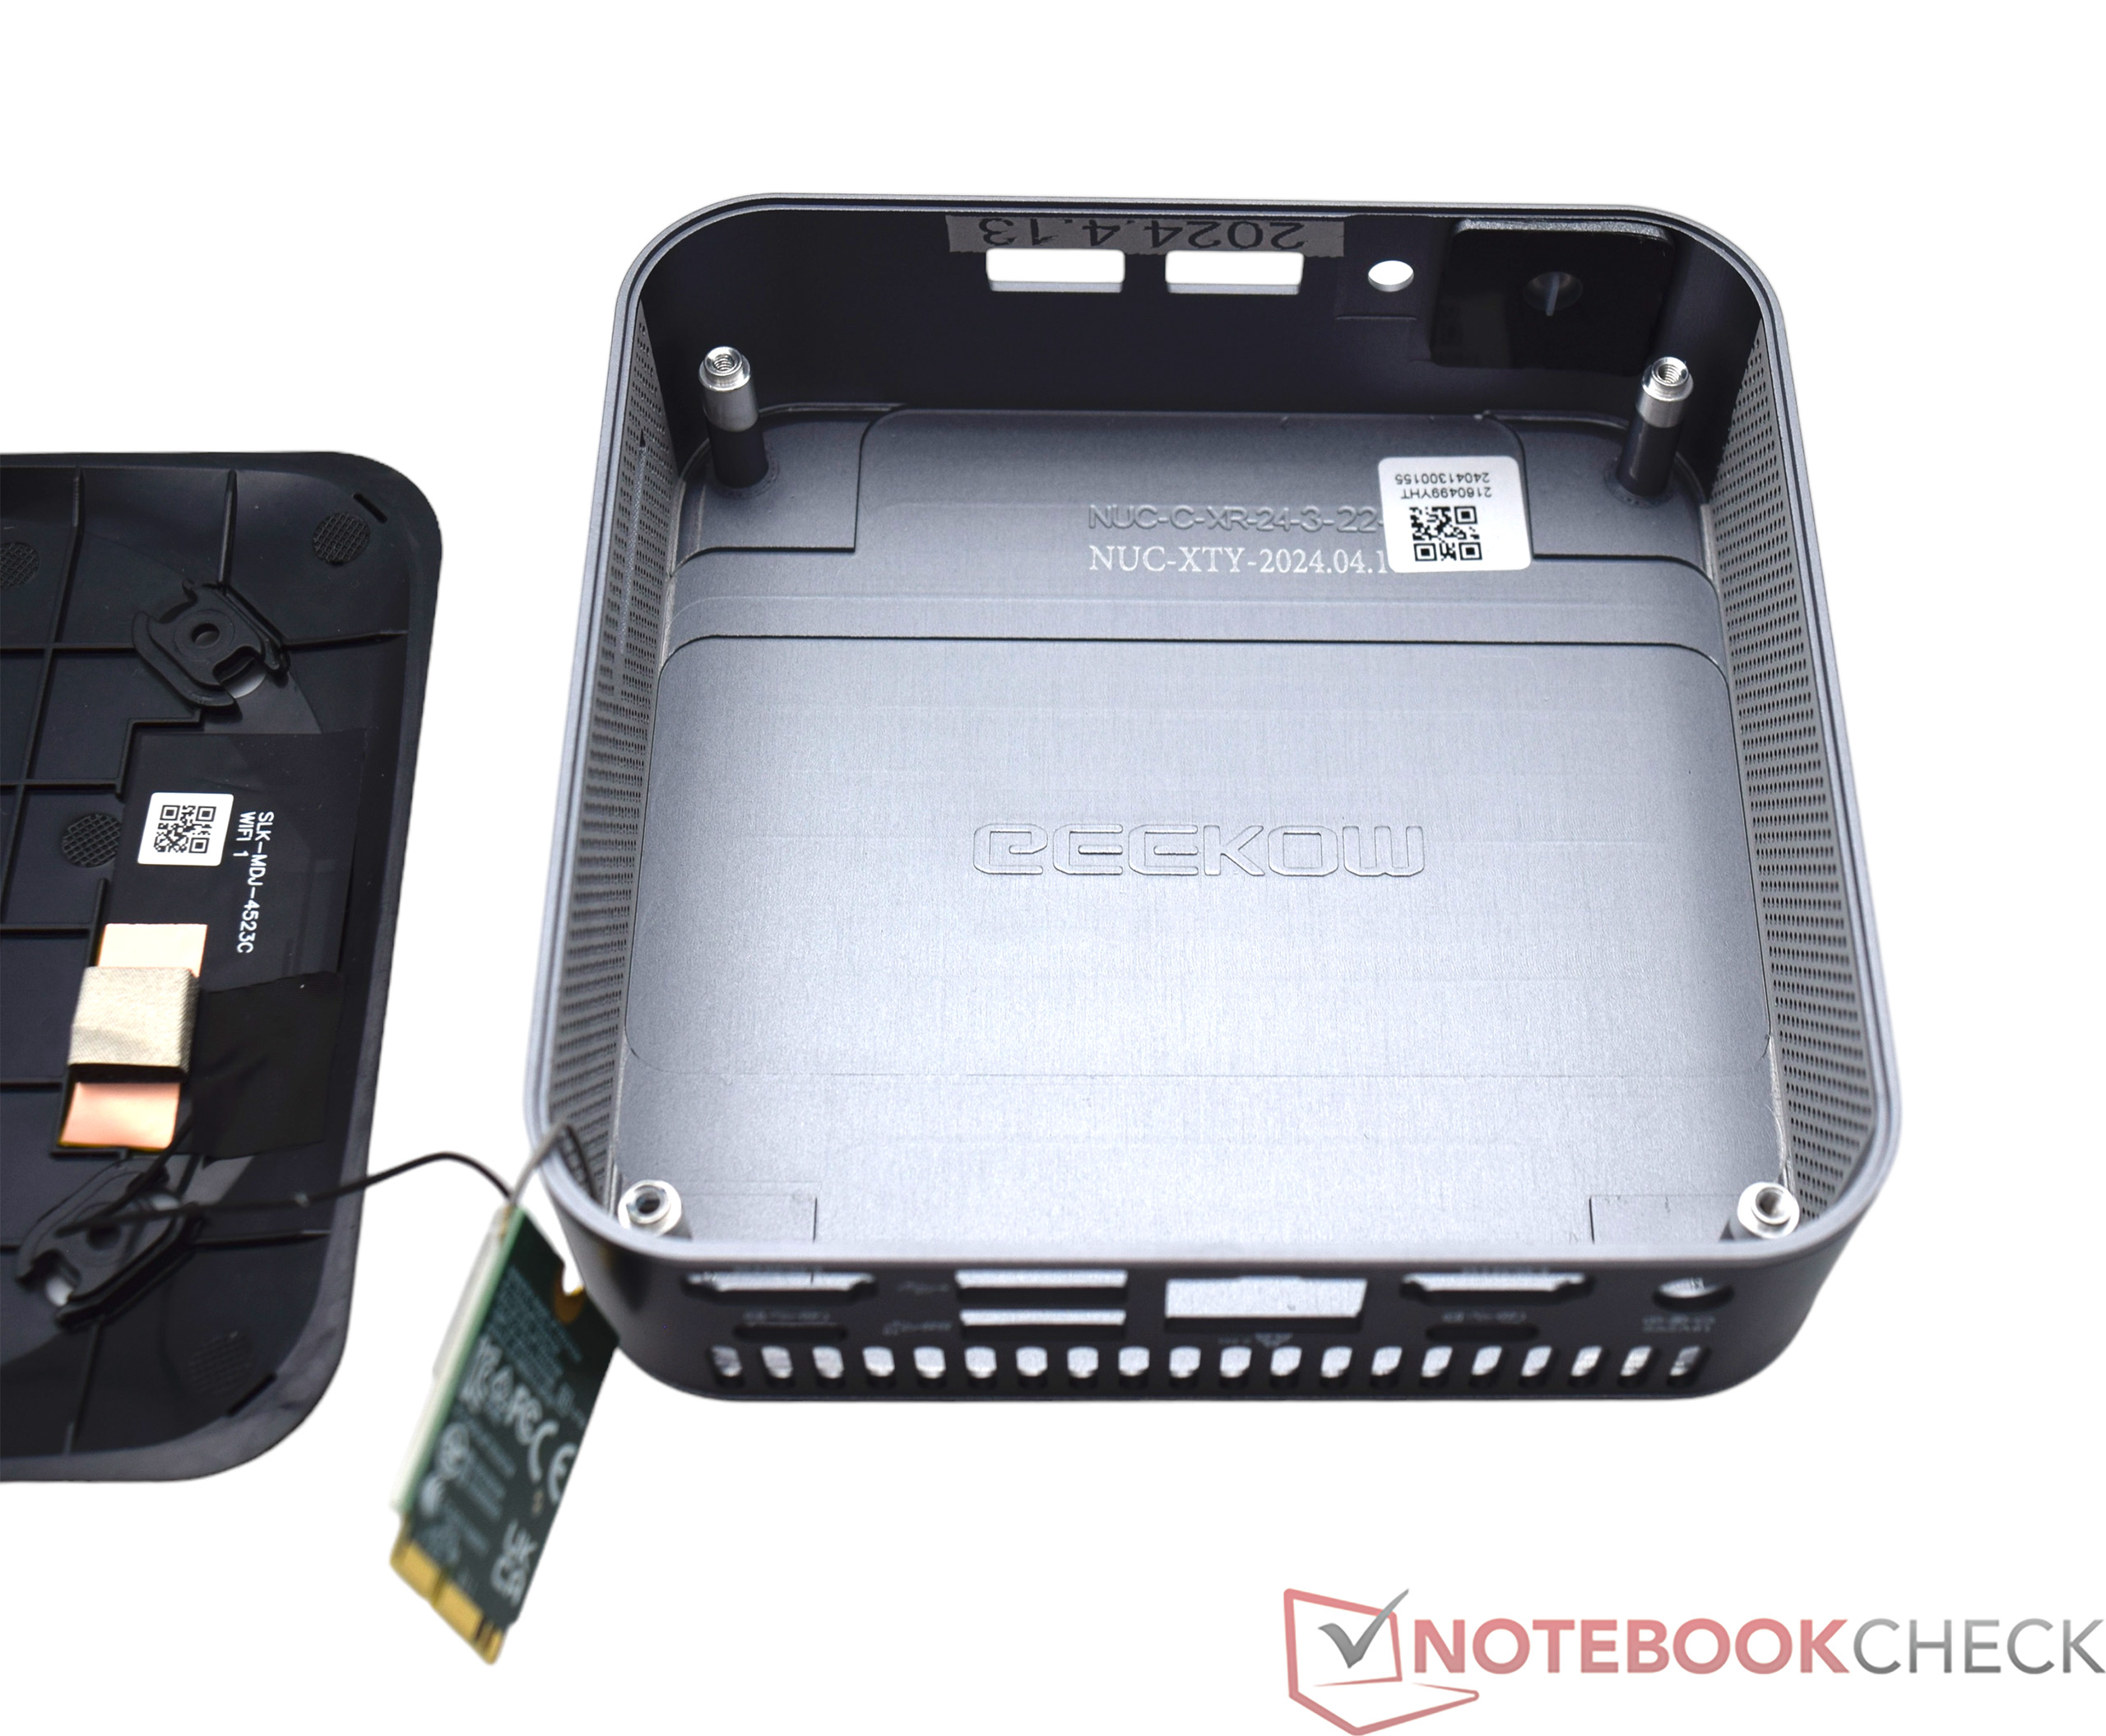
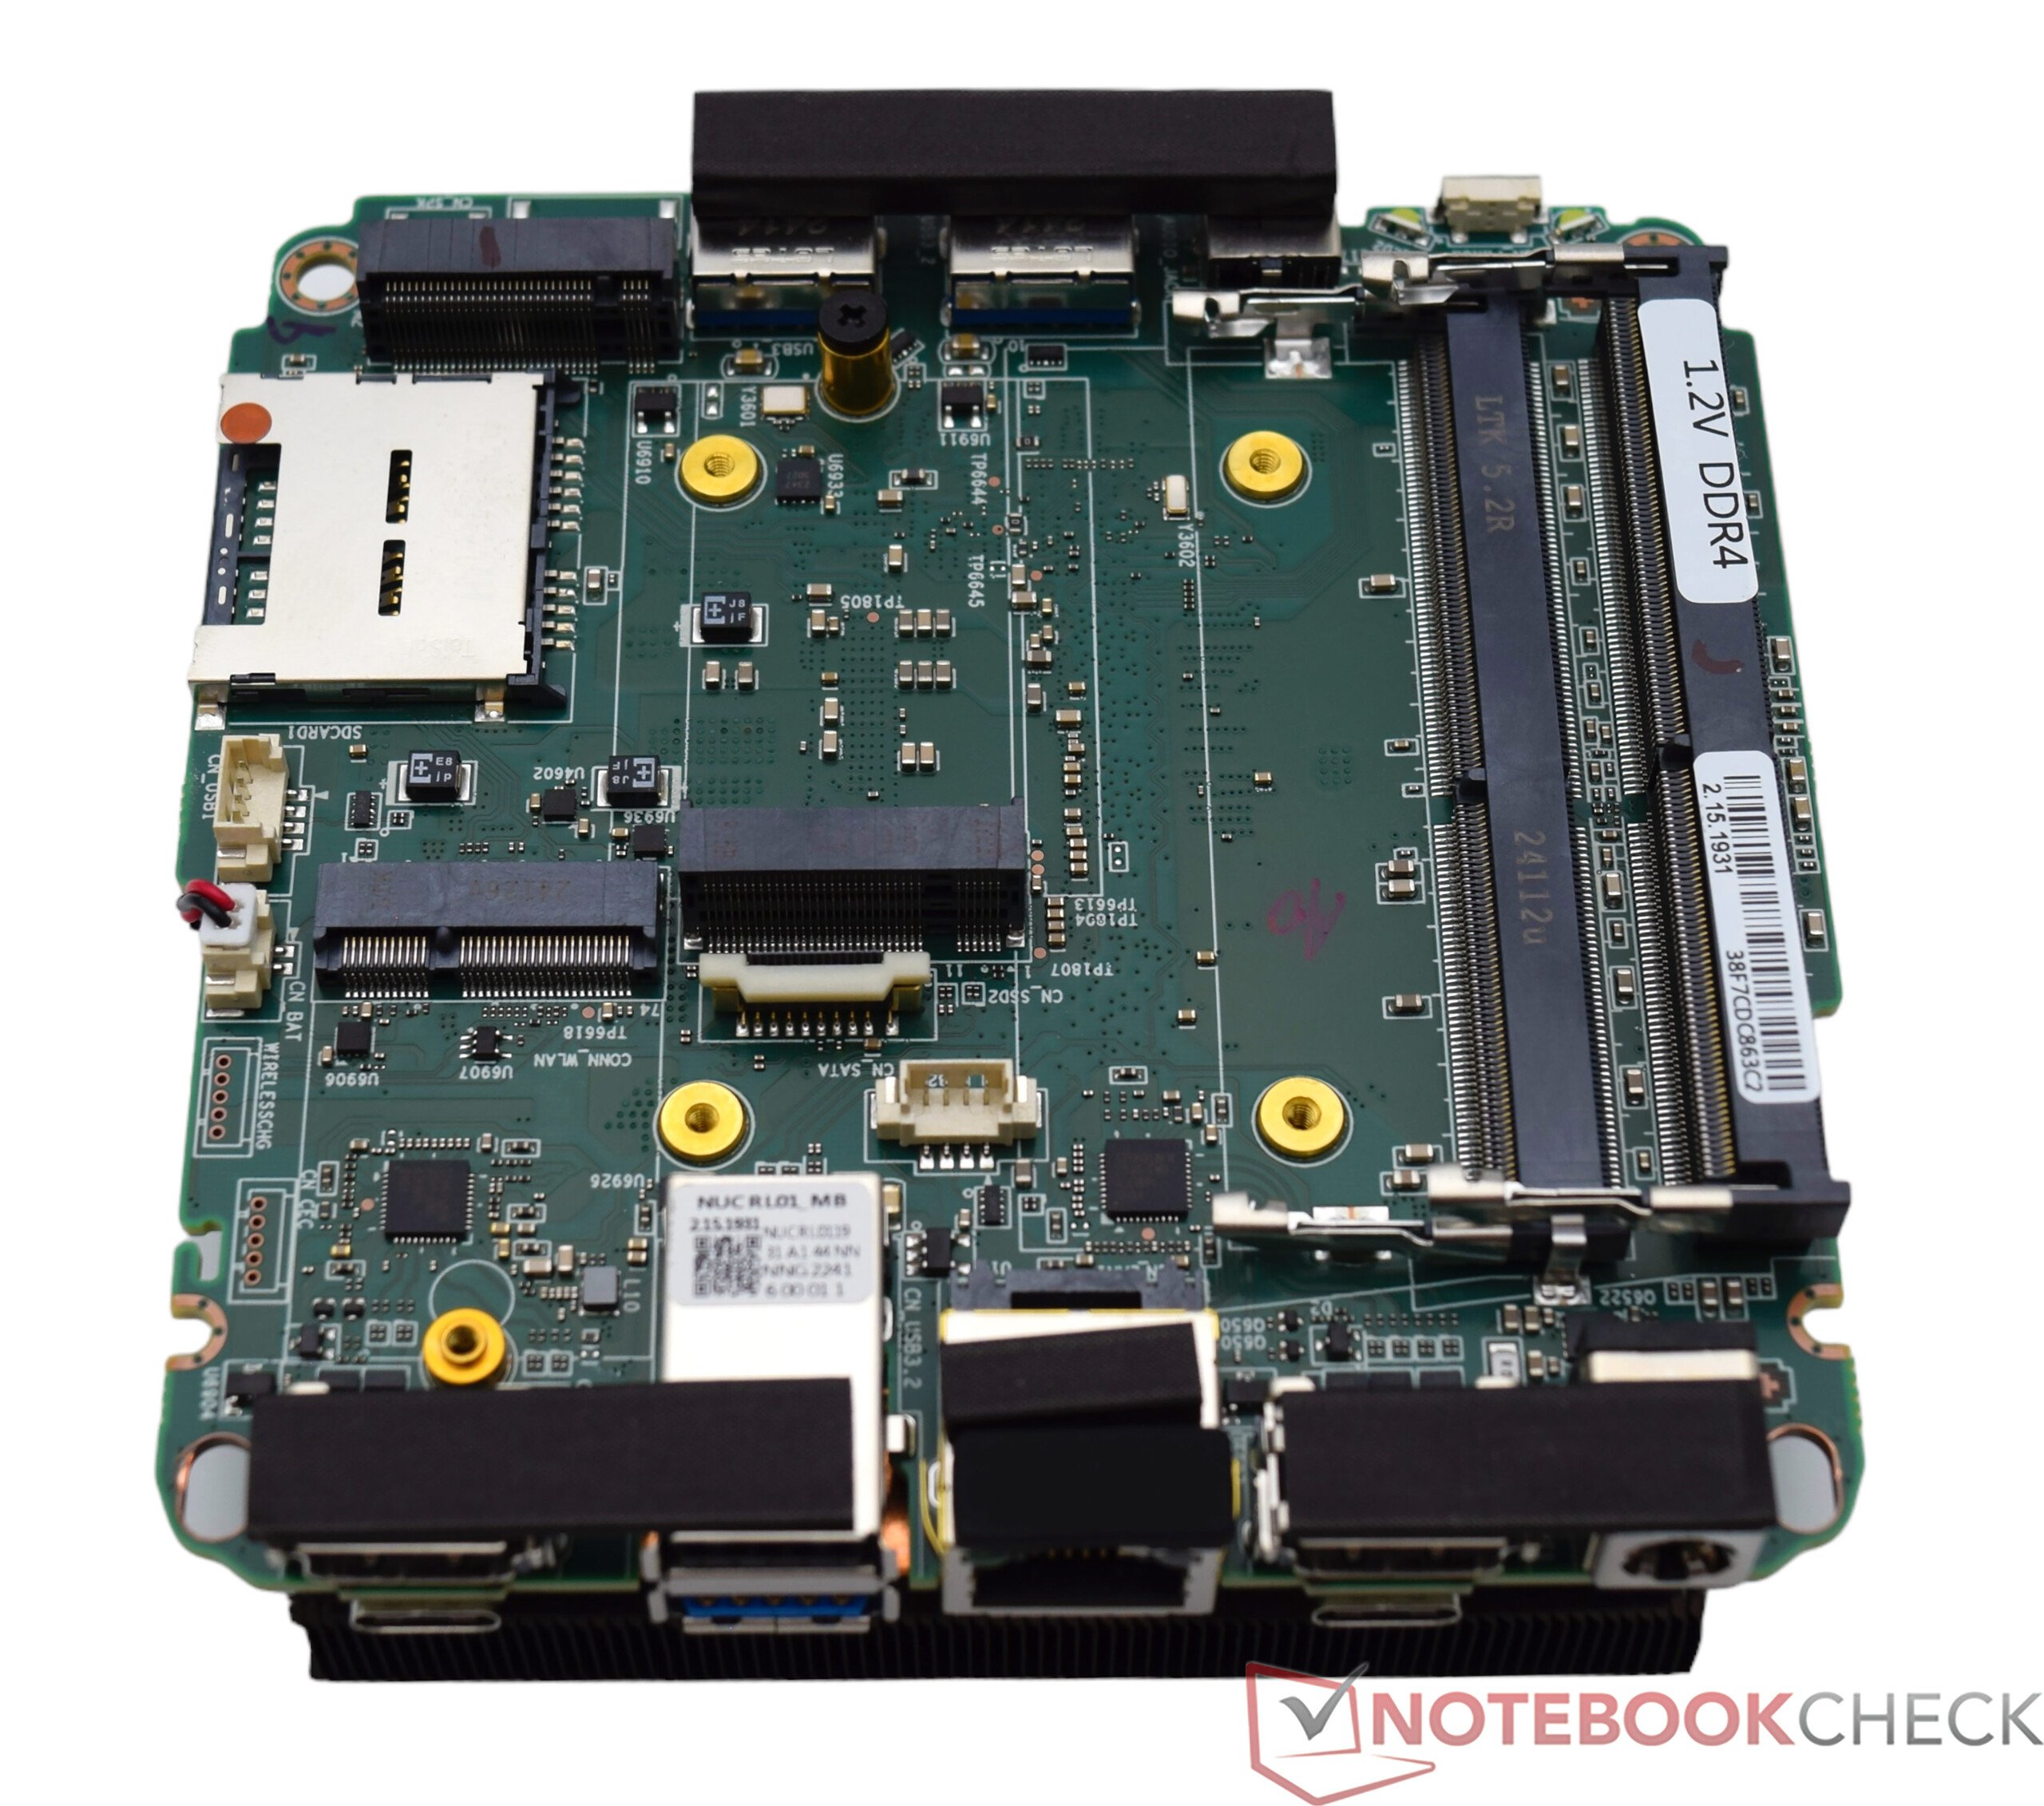
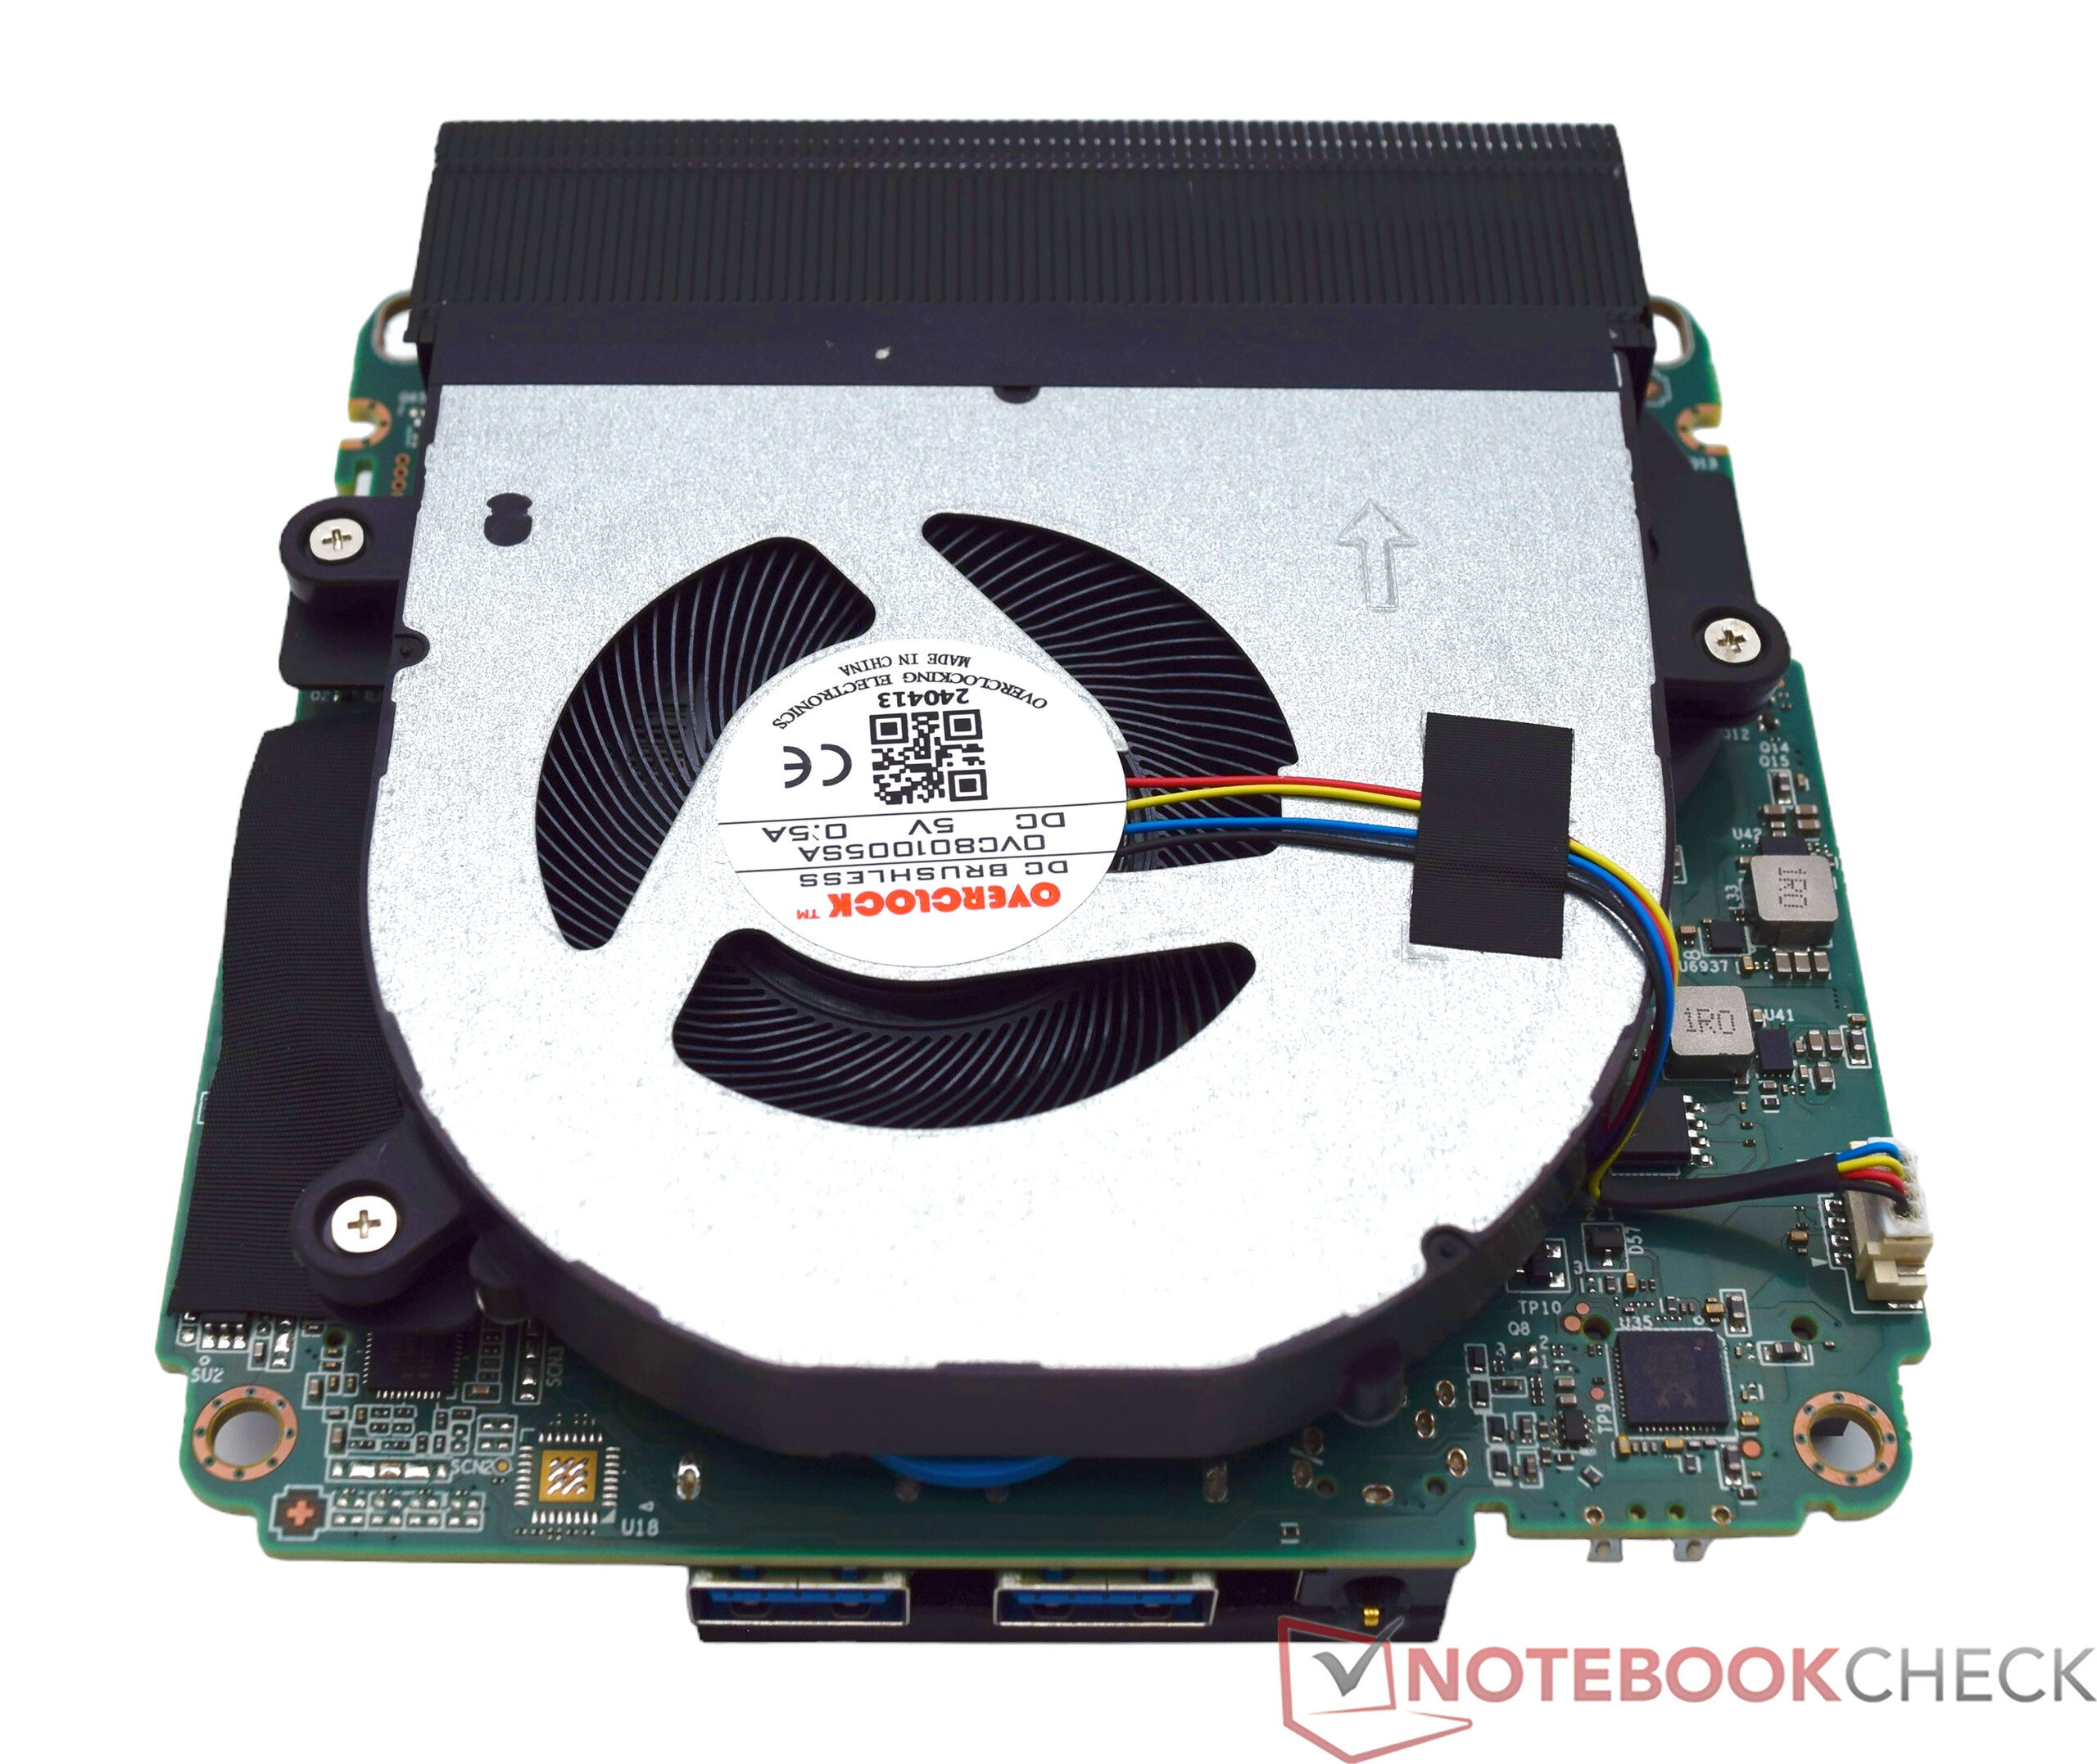
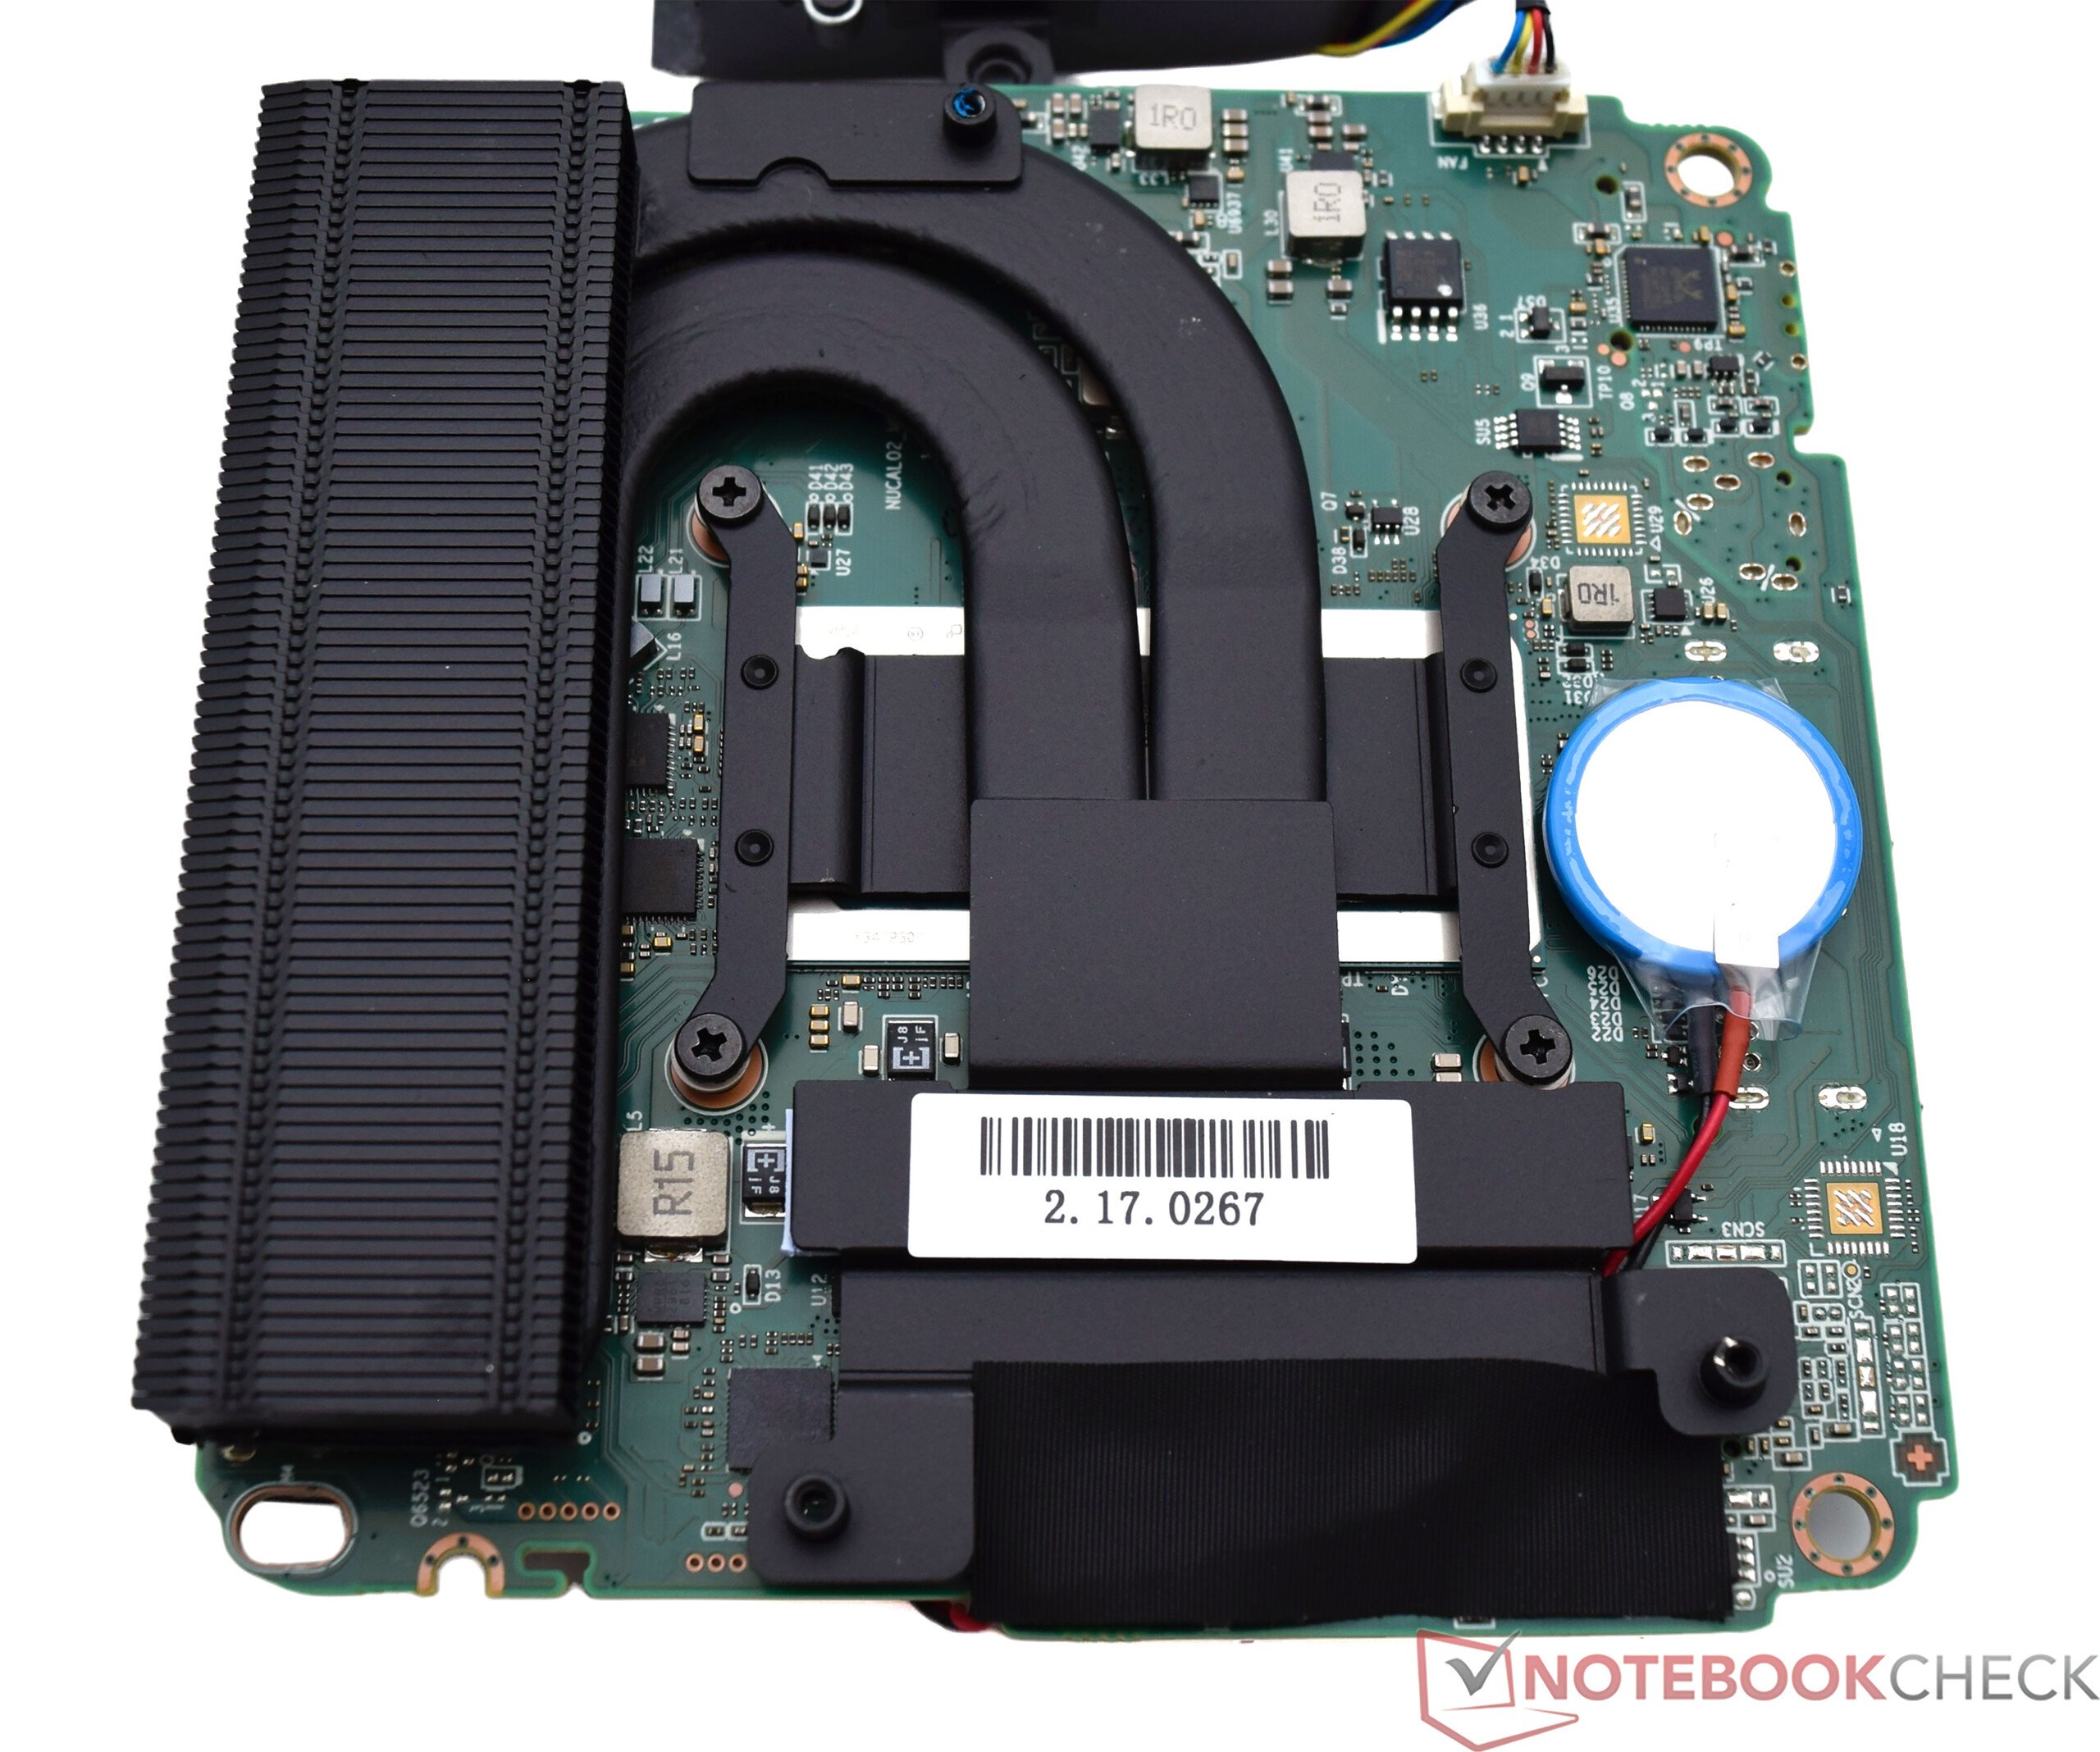
O Geekom GT13 Pro é sempre vendido junto com a RAM e o SSD. Isso significa que o dispositivo não precisa necessariamente ser aberto para instalar os componentes de hardware que faltam, como é o caso das variantes barebone. Se o senhor ainda precisar acessar o interior, pode abrir o Geekom GT13 Pro pela parte inferior. Quatro parafusos estão escondidos sob os pés de borracha colados, que prendem a tampa de plástico. O senhor deve tomar cuidado aqui para não danificar o cabo da antena WLAN. Há outra placa de metal sob a tampa de plástico, que também precisa ser removida se o senhor quiser acessar o SSD ou a RAM. O módulo WLAN também pode ser substituído. Para acessar a unidade de resfriamento, que o fabricante anuncia como IceBlast 1.5, a placa deve ser completamente removida da caixa, o que não é um grande desafio na prática.
Desempenho - Processador Intel Raptor Lake com até 14 núcleos
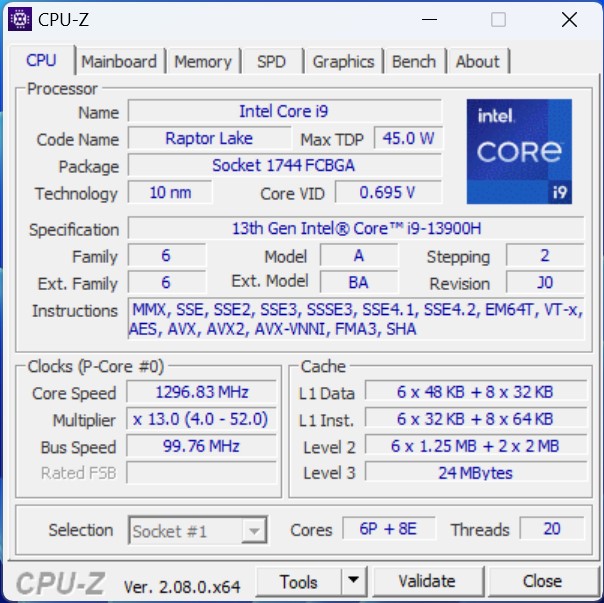
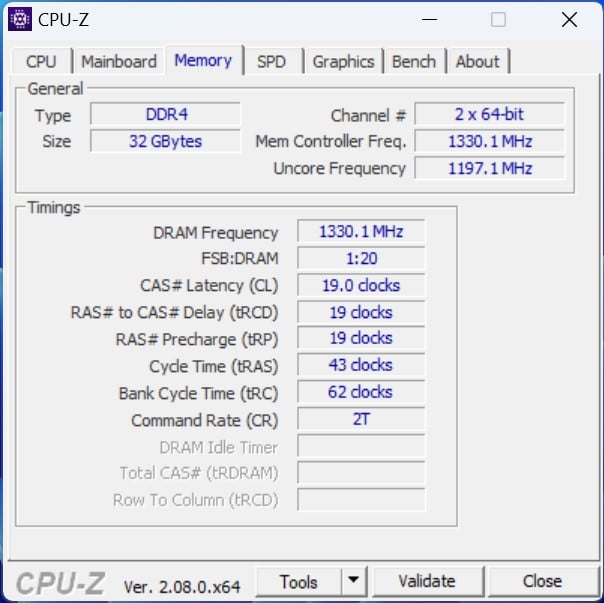
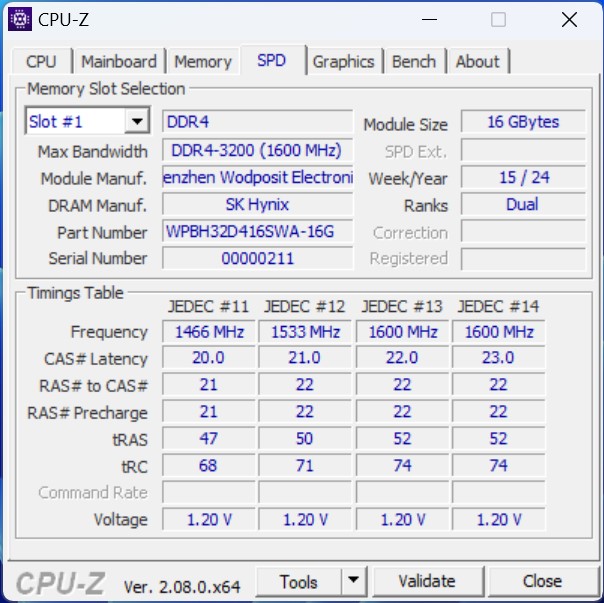
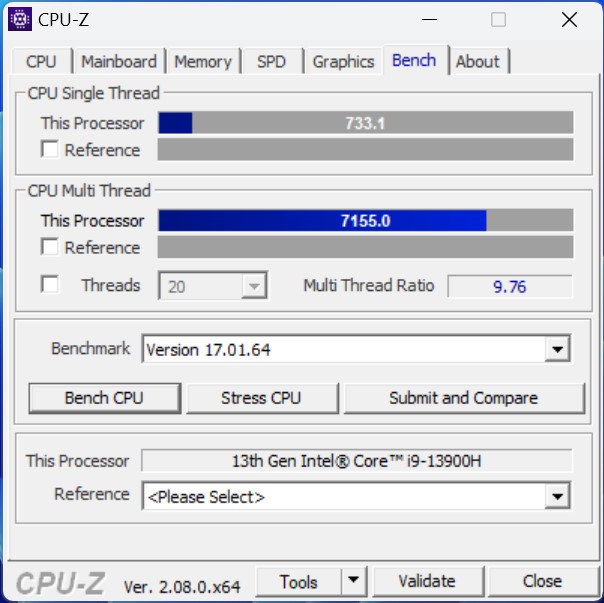
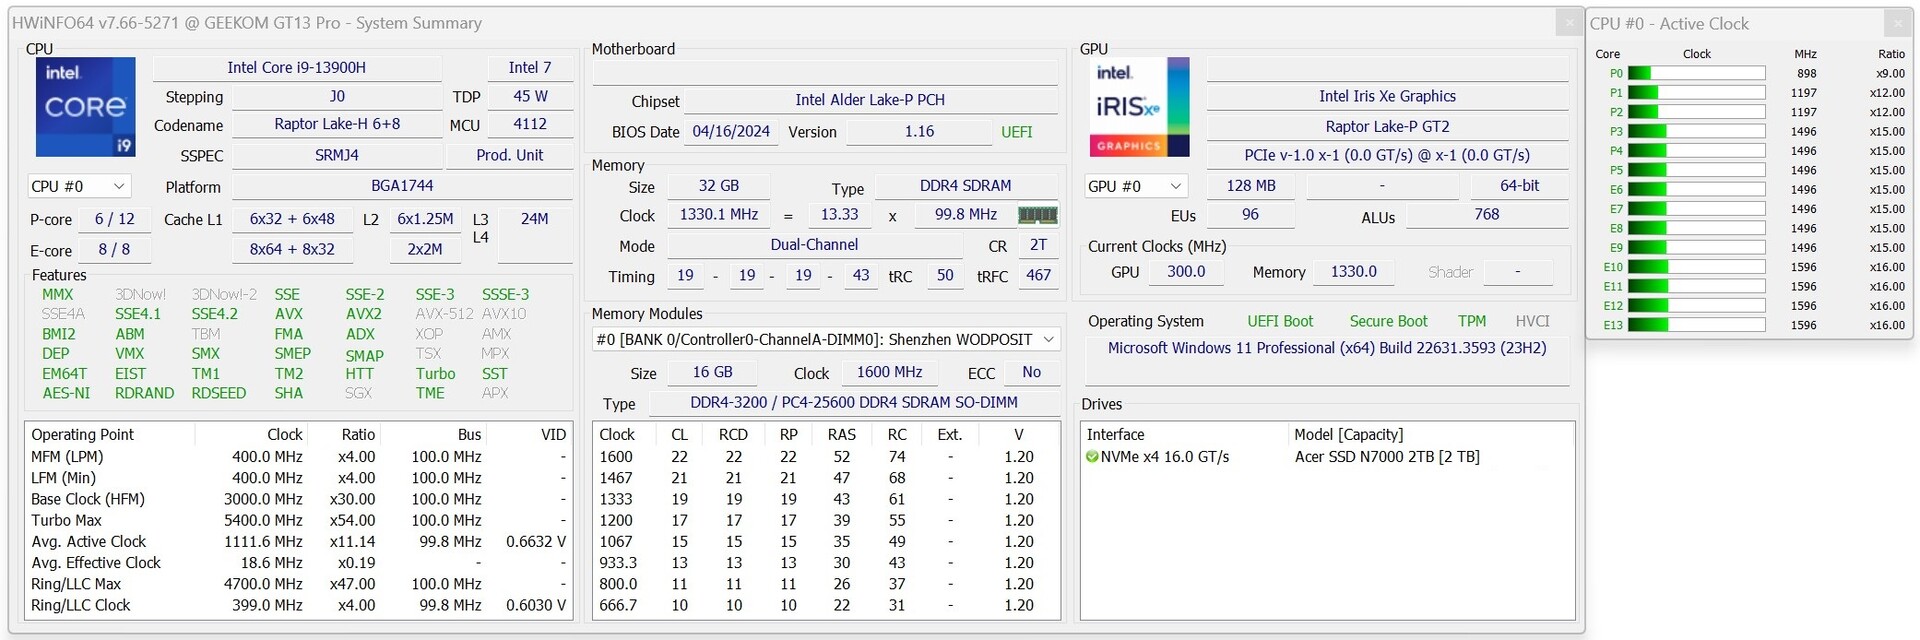
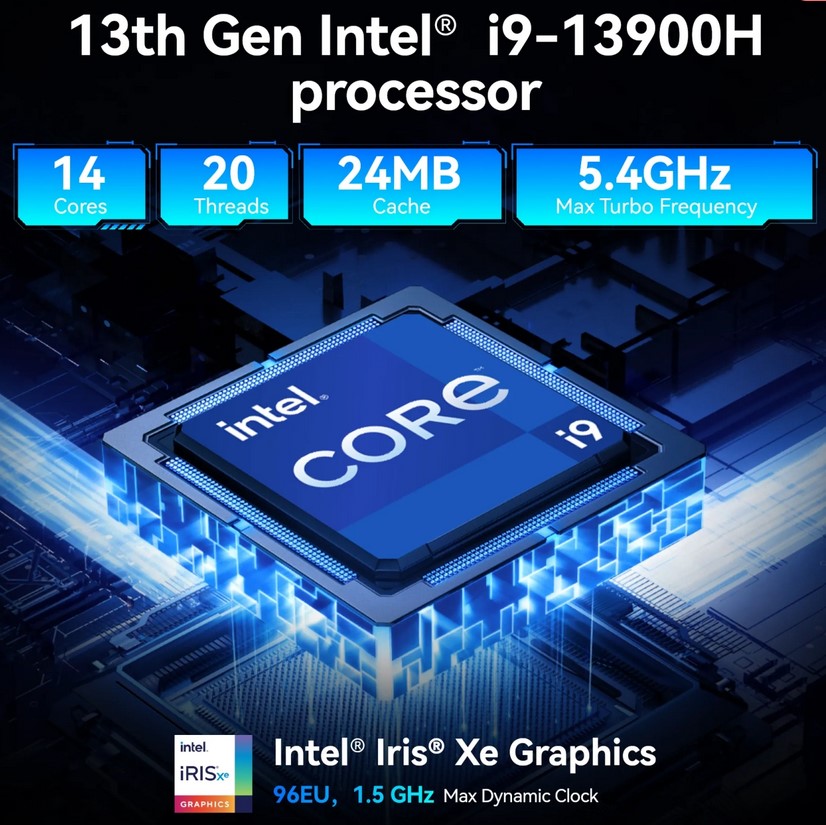
O Geekom GT13 Pro está disponível em duas versões. O modelo superior com Intel Core i9-13900H equipado com 14 núcleos garante um bom desempenho multi-thread. Se o senhor quiser economizar um pouco mais, também pode comprar o elegante minicomputador com um Intel Core i7-13620H. Com 10 núcleos e 16 threads, esse processador também deve lidar bem com o uso diário. 32 GB de RAM DDR4 estão sempre incluídos e, portanto, servem como uma base sólida para lidar com tarefas que exigem muita memória.
Condições de teste
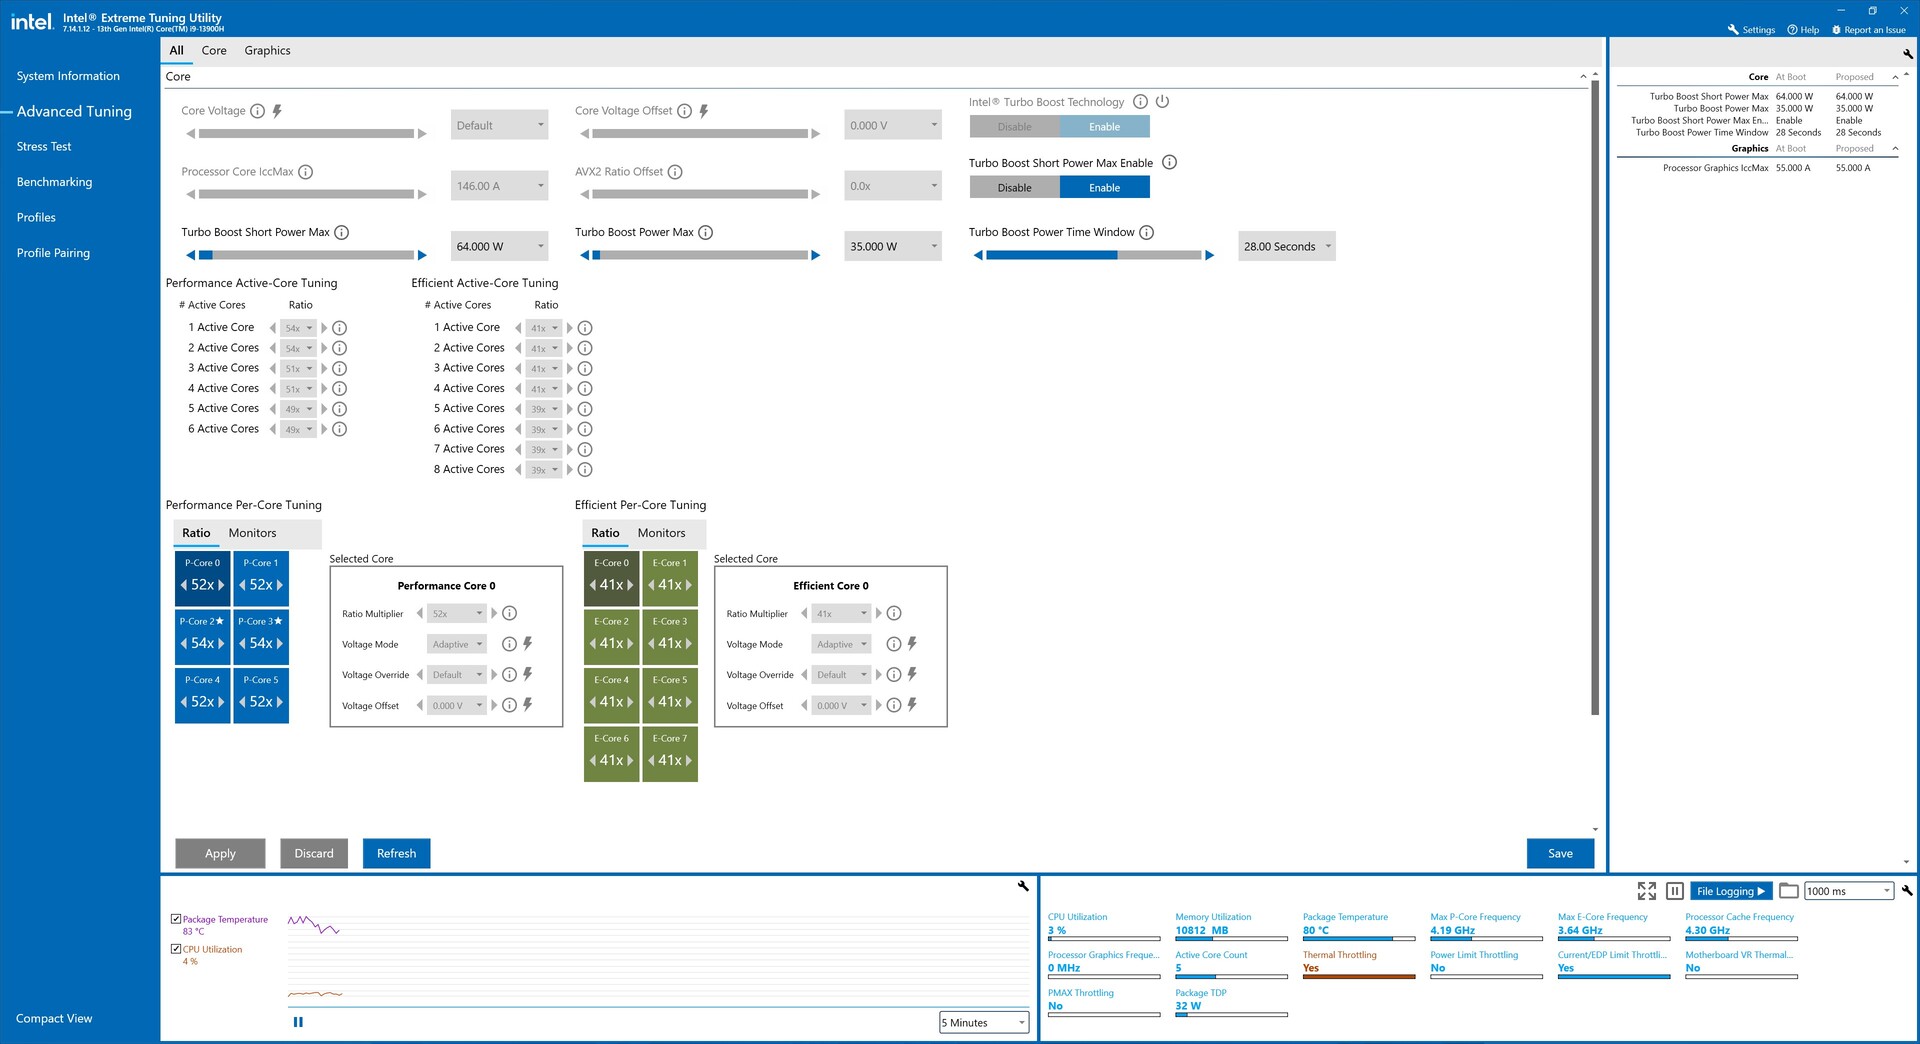
Para todos os testes de desempenho com o Geekom GT13 Pro, usamos o plano de energia de "desempenho máximo". Houve apenas desvios em relação a isso nas medições de consumo de energia e ruído, de acordo com nossos Critérios de teste. Os limites de energia do fabricante para o Intel Core i9-13900H são definidos como 64 watts (PL2) e 35 watts (PL1).
Processador
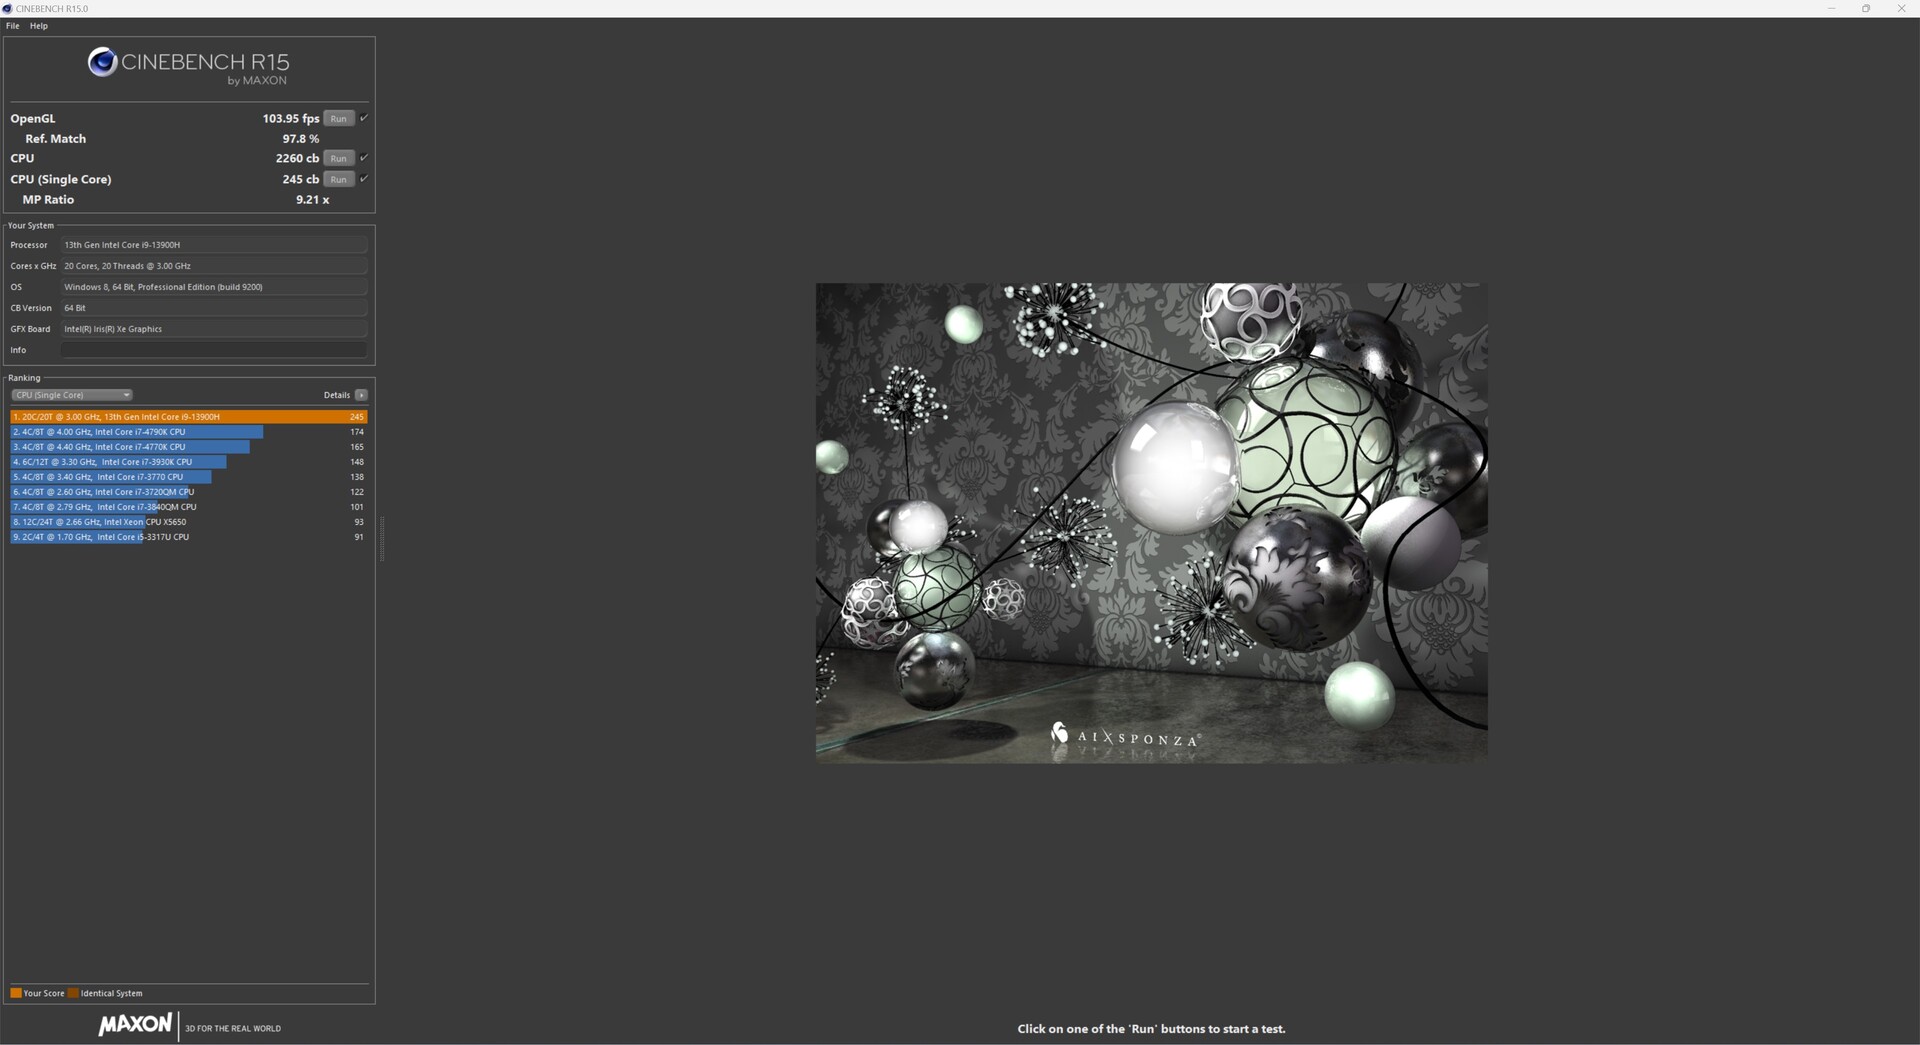
O Geekom GT13 Pro topo de linha vem com um Intel Core i9-13900H. No entanto, na classificação de desempenho, podemos ver que nossa amostra de teste está apenas no meio do campo. Devido à baixa capacidade de resfriamento, que anda de mãos dadas com o design extremamente compacto, o SoC só pode ser operado com um TDP mínimo de apenas 35 watts sob carga contínua. Isso tem efeitos mais graves nos benchmarks multi-thread, nos quais o Intel Core i9-13900H às vezes oferece desempenho de 20 a 30% inferior ao que documentamos em média para esse processador até o momento.
Para mais comparações e benchmarks, consulte nossa Tabela de comparação de CPUs.
| Performance Rating - Percent | |
| Geekom A8 | |
| Minisforum EliteMini UM780 XTX | |
| Aoostar GEM12 | |
| Minisforum AtomMan X7 Ti | |
| Média Intel Core i9-13900H | |
| Acemagic F2A | |
| Geekom GT13 Pro | |
| Geekom XT12 Pro | |
| Khadas Mind | |
| Blender - v2.79 BMW27 CPU | |
| Khadas Mind | |
| Geekom XT12 Pro | |
| Geekom GT13 Pro | |
| Média Intel Core i9-13900H (166 - 268, n=24) | |
| Aoostar GEM12 | |
| Geekom A8 | |
| Minisforum EliteMini UM780 XTX | |
| Acemagic F2A | |
| Minisforum AtomMan X7 Ti | |
| WinRAR - Result | |
| Geekom XT12 Pro | |
| Minisforum AtomMan X7 Ti | |
| Geekom A8 | |
| Acemagic F2A | |
| Minisforum EliteMini UM780 XTX | |
| Média Intel Core i9-13900H (6365 - 9303, n=3) | |
| Aoostar GEM12 | |
| Geekom GT13 Pro | |
| Khadas Mind | |
| 3DMark 11 - 1280x720 Performance Physics | |
| Geekom A8 | |
| Minisforum EliteMini UM780 XTX | |
| Minisforum AtomMan X7 Ti | |
| Média Intel Core i9-13900H (15540 - 25420, n=29) | |
| Aoostar GEM12 | |
| Acemagic F2A | |
| Geekom GT13 Pro | |
| Geekom XT12 Pro | |
| Khadas Mind | |
| WebXPRT 3 - Overall | |
| Minisforum EliteMini UM780 XTX | |
| Khadas Mind | |
| Geekom A8 | |
| Geekom GT13 Pro | |
| Média Intel Core i9-13900H (171.4 - 340, n=20) | |
| Aoostar GEM12 | |
| Geekom XT12 Pro | |
| Acemagic F2A | |
| Minisforum AtomMan X7 Ti | |
* ... menor é melhor
AIDA64: FP32 Ray-Trace | FPU Julia | CPU SHA3 | CPU Queen | FPU SinJulia | FPU Mandel | CPU AES | CPU ZLib | FP64 Ray-Trace | CPU PhotoWorxx
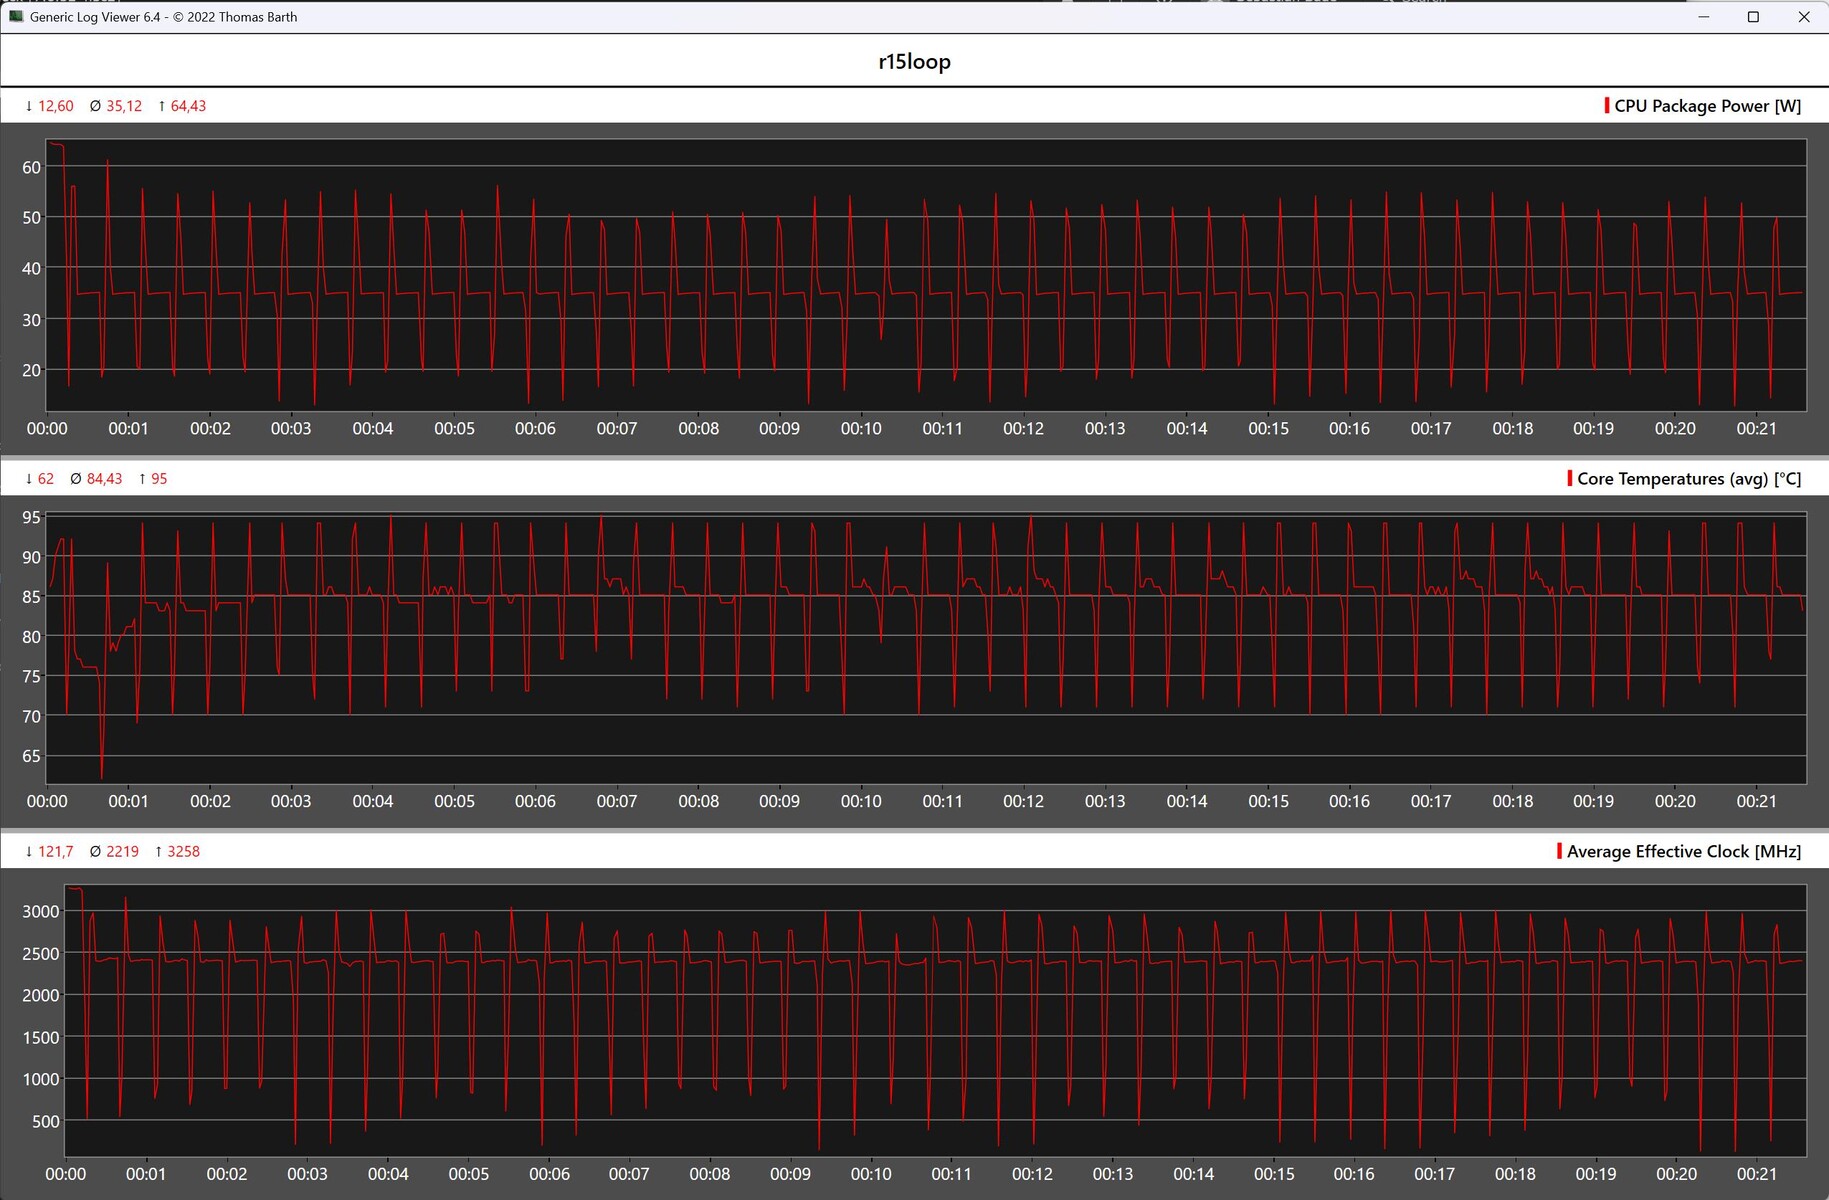
Cinebench R15 Multi loop
Uma olhada no loop contínuo do Cinebench R15 mostra que um resultado significativamente melhor pode ser obtido no início. Durante a primeira execução, o Intel Core i9-13900H consegue manter o valor PL2 (64 watts) por um pouco mais de tempo do que em execuções posteriores. No entanto, com algumas exceções, o SoC oferece desempenho estável a um máximo de 35 watts.
Desempenho do sistema
De modo geral, o Geekom GT13 Pro domina muito bem os testes de sistema. No entanto, o sistema de teste tem dificuldade em se manter contra seus concorrentes. As perdas de desempenho, que são parcialmente autoinfligidas, provavelmente contribuem para esse resultado. No entanto, o desempenho em tarefas cotidianas está em um bom nível. A generosa memória de trabalho e o rápido armazenamento em massa contribuem para um sistema subjetivamente de bom desempenho.
| AIDA64 / Memory Copy | |
| Minisforum AtomMan X7 Ti | |
| Geekom A8 | |
| Aoostar GEM12 | |
| Minisforum EliteMini UM780 XTX | |
| Khadas Mind | |
| Acemagic F2A | |
| Média da turma Mini PC (8377 - 154332, n=112, últimos 2 anos) | |
| Geekom XT12 Pro | |
| Geekom GT13 Pro | |
| AIDA64 / Memory Read | |
| Minisforum AtomMan X7 Ti | |
| Acemagic F2A | |
| Minisforum EliteMini UM780 XTX | |
| Geekom A8 | |
| Aoostar GEM12 | |
| Khadas Mind | |
| Média da turma Mini PC (8974 - 123769, n=112, últimos 2 anos) | |
| Geekom XT12 Pro | |
| Geekom GT13 Pro | |
| AIDA64 / Memory Write | |
| Geekom A8 | |
| Minisforum EliteMini UM780 XTX | |
| Aoostar GEM12 | |
| Khadas Mind | |
| Minisforum AtomMan X7 Ti | |
| Acemagic F2A | |
| Média da turma Mini PC (8762 - 216693, n=112, últimos 2 anos) | |
| Geekom XT12 Pro | |
| Geekom GT13 Pro | |
| AIDA64 / Memory Latency | |
| Acemagic F2A | |
| Minisforum AtomMan X7 Ti | |
| Média da turma Mini PC (94.2 - 184.8, n=112, últimos 2 anos) | |
| Minisforum EliteMini UM780 XTX | |
| Geekom A8 | |
| Khadas Mind | |
| Aoostar GEM12 | |
| Geekom GT13 Pro | |
| Geekom XT12 Pro | |
* ... menor é melhor
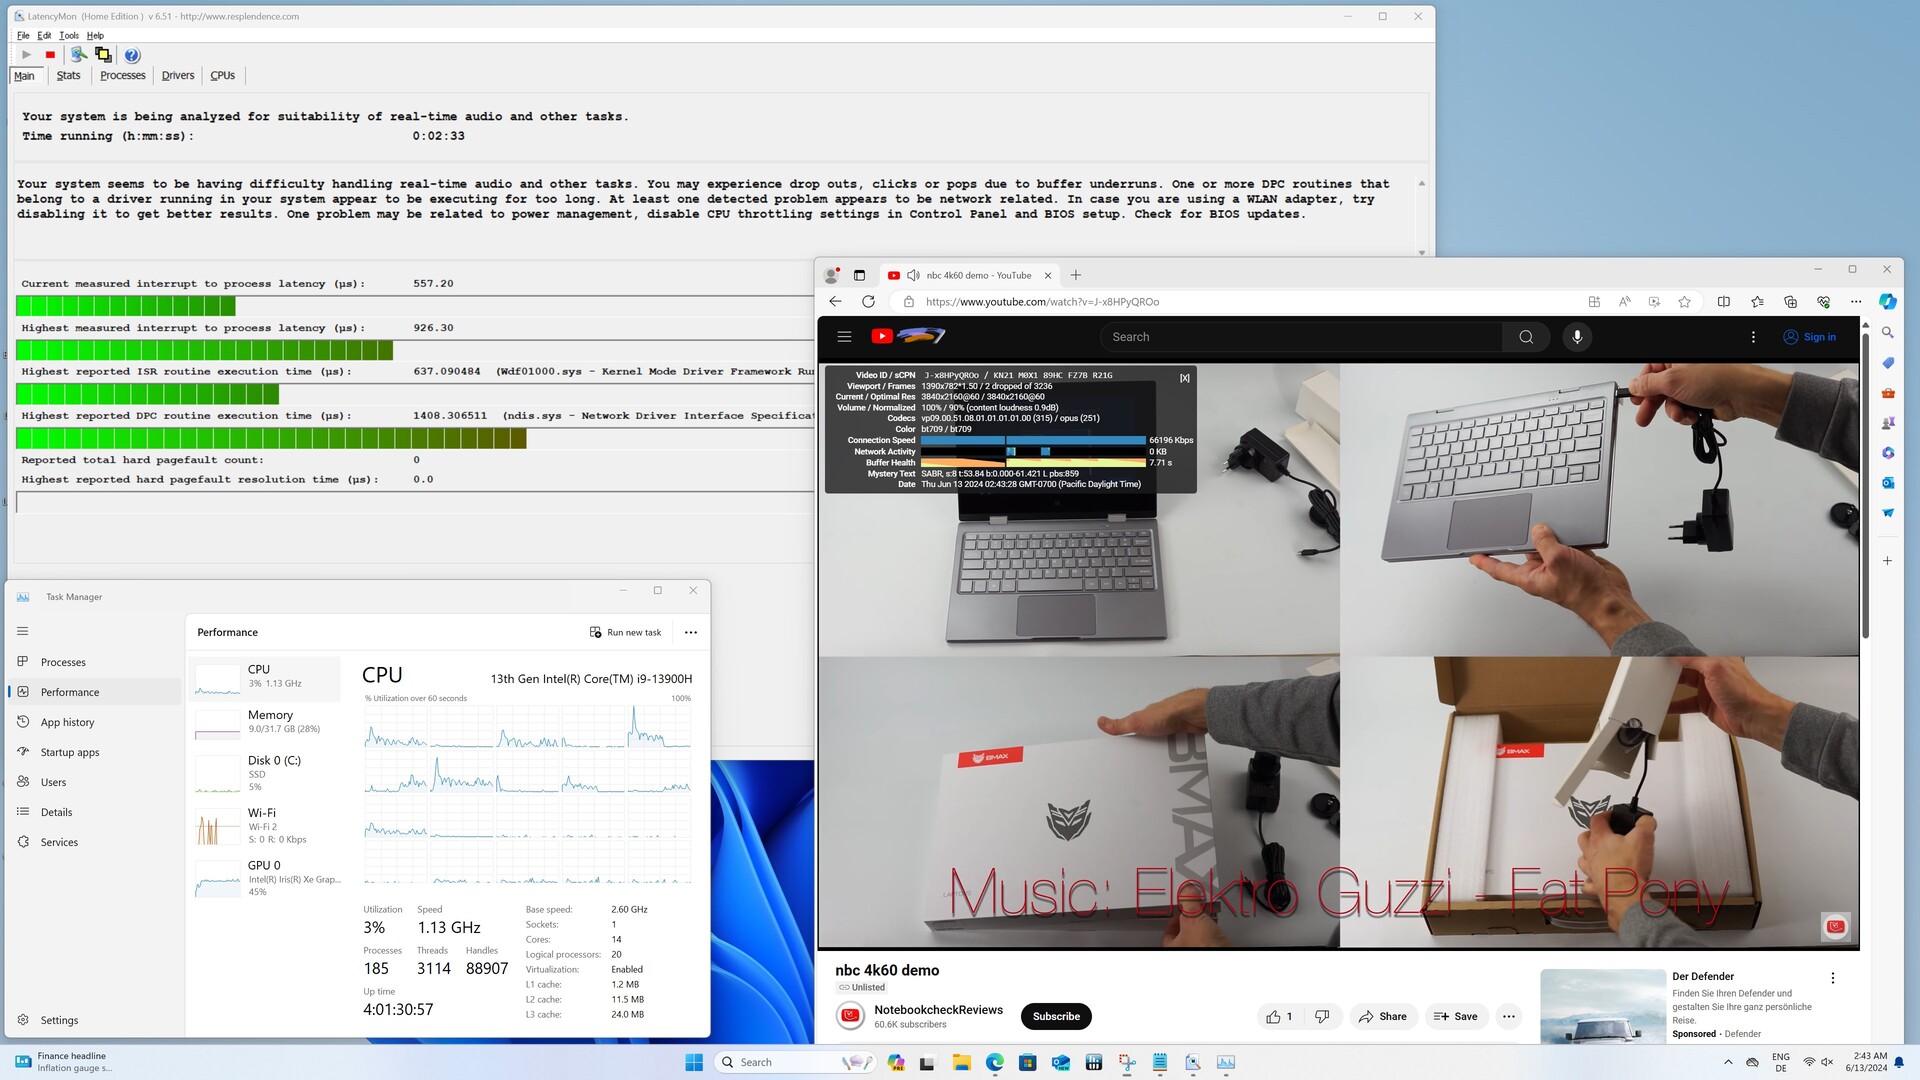
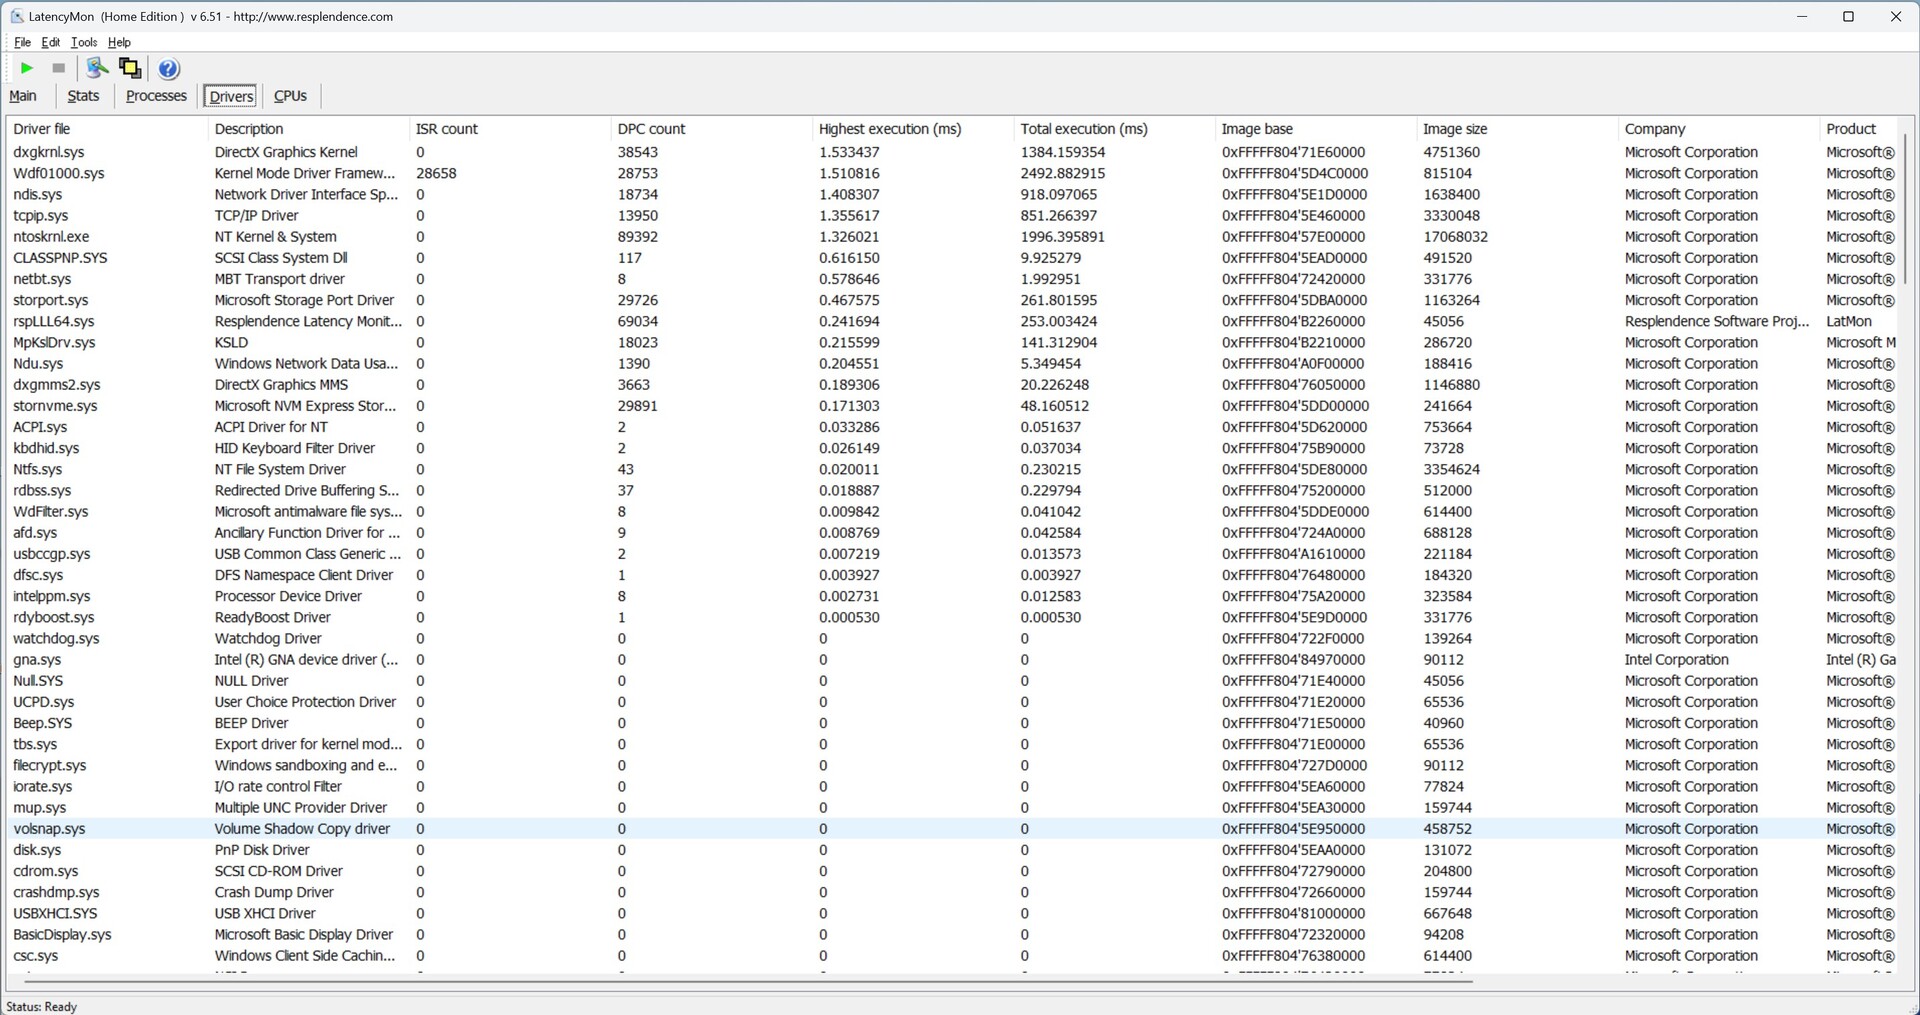
Latências de DPC
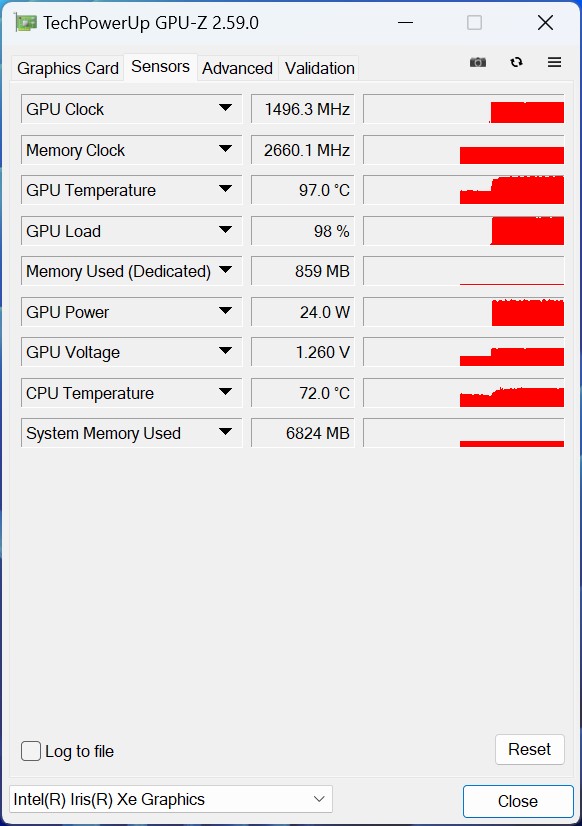
Infelizmente, o Geekom GT13 Pro não atinge as latências DPC ideais. Já documentamos o aumento das latências ao navegar na Internet, que aumentam um pouco novamente ao reproduzir o vídeo de teste 4K. Apenas dois quadros perdidos são aceitáveis e não reduzem de forma alguma a qualidade como cliente de streaming. Ao mesmo tempo, a iGPU é carregada com cerca de 45%.

| DPC Latencies / LatencyMon - interrupt to process latency (max), Web, Youtube, Prime95 | |
| Acemagic F2A | |
| Geekom XT12 Pro | |
| Geekom A8 | |
| Minisforum AtomMan X7 Ti | |
| Geekom GT13 Pro | |
| Minisforum EliteMini UM780 XTX | |
| Aoostar GEM12 | |
| Khadas Mind | |
* ... menor é melhor
Armazenamento em massa
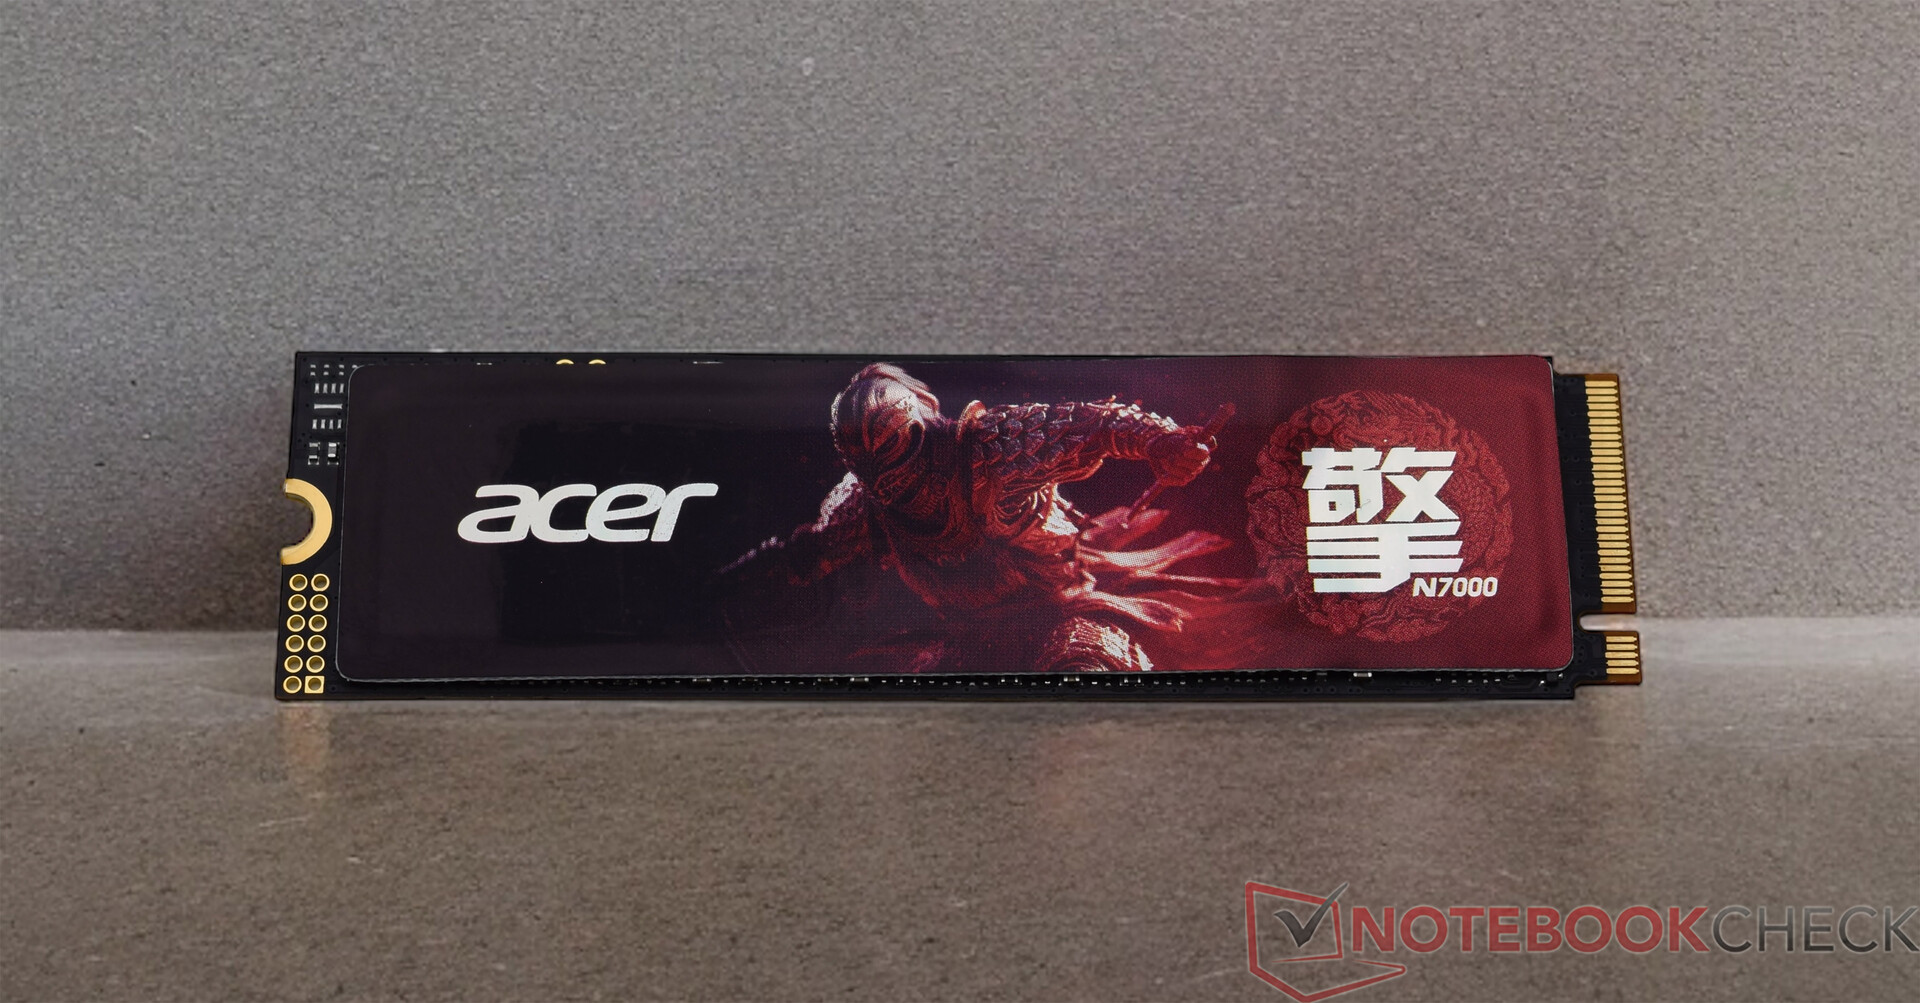
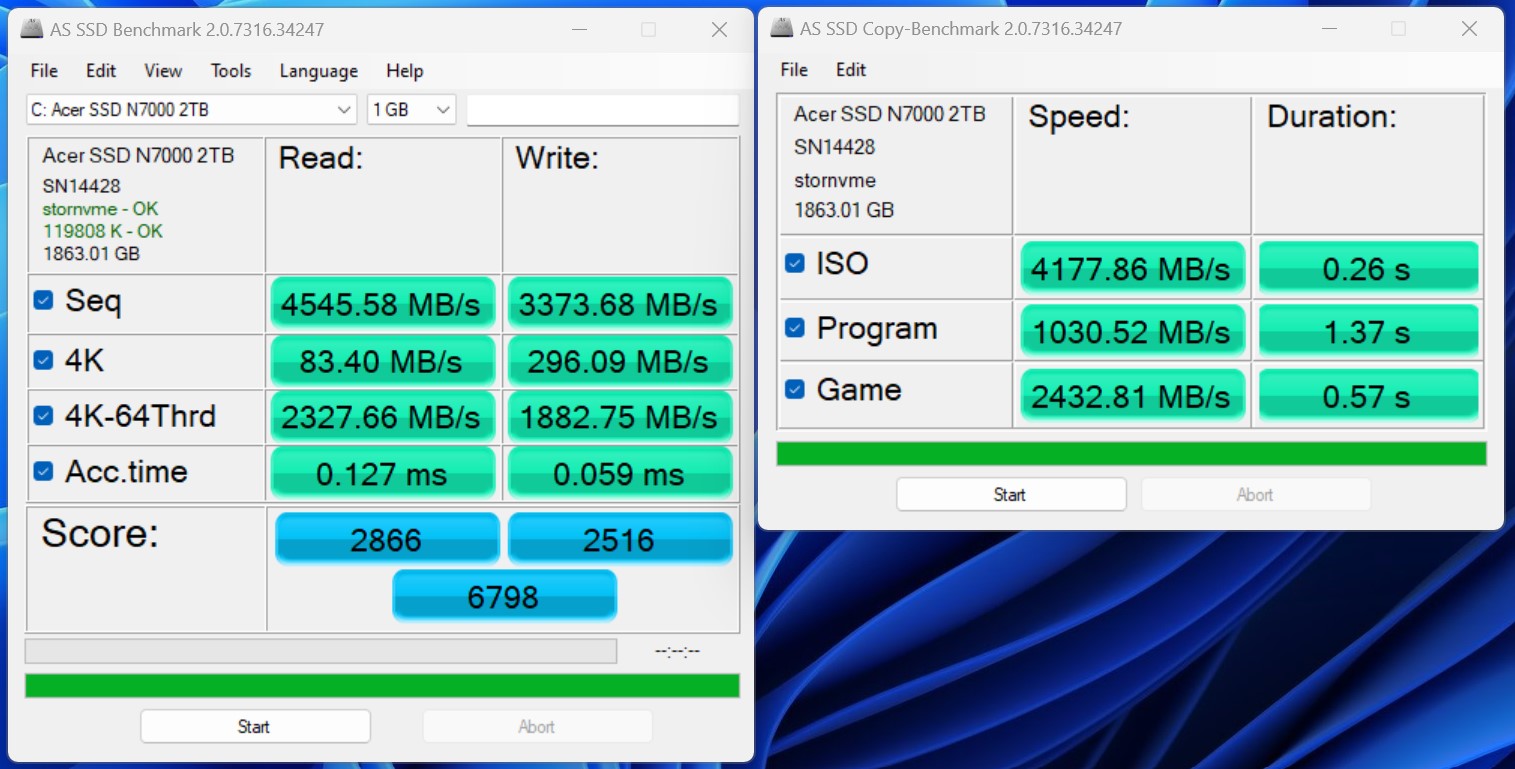
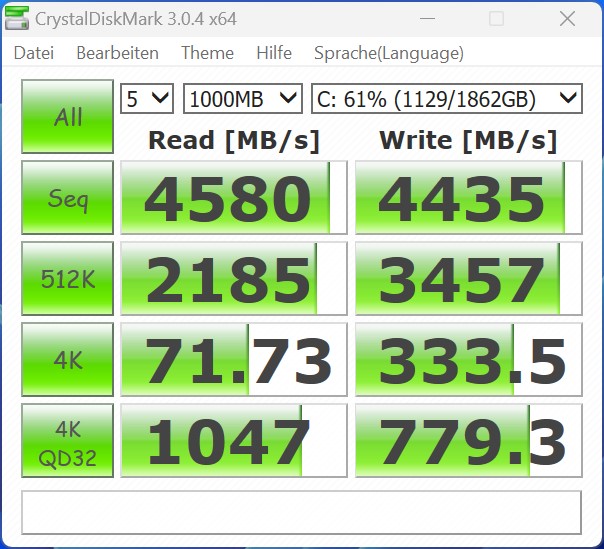
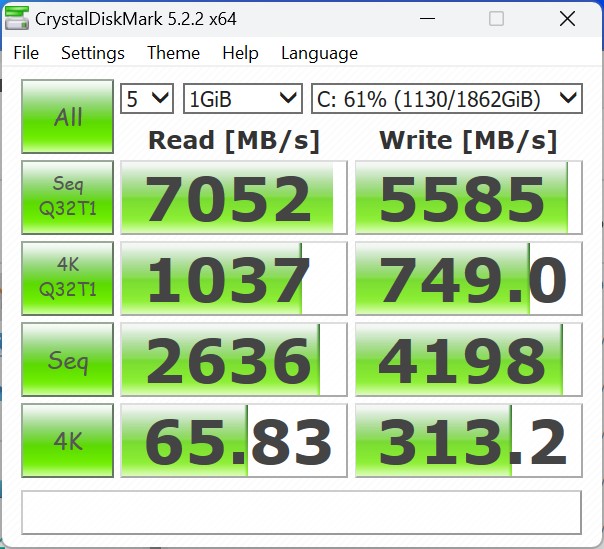
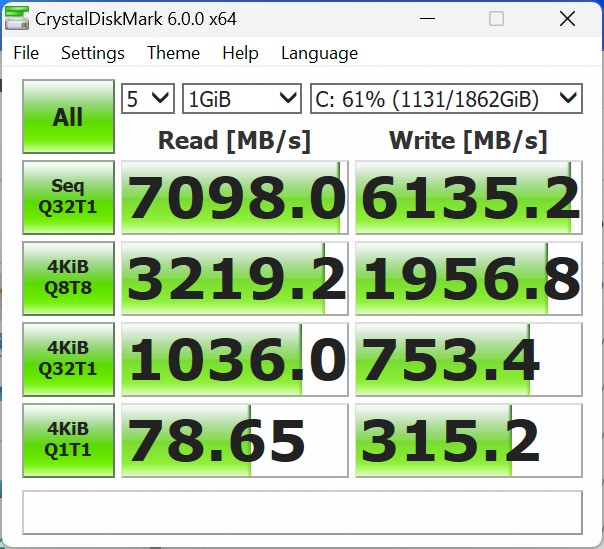
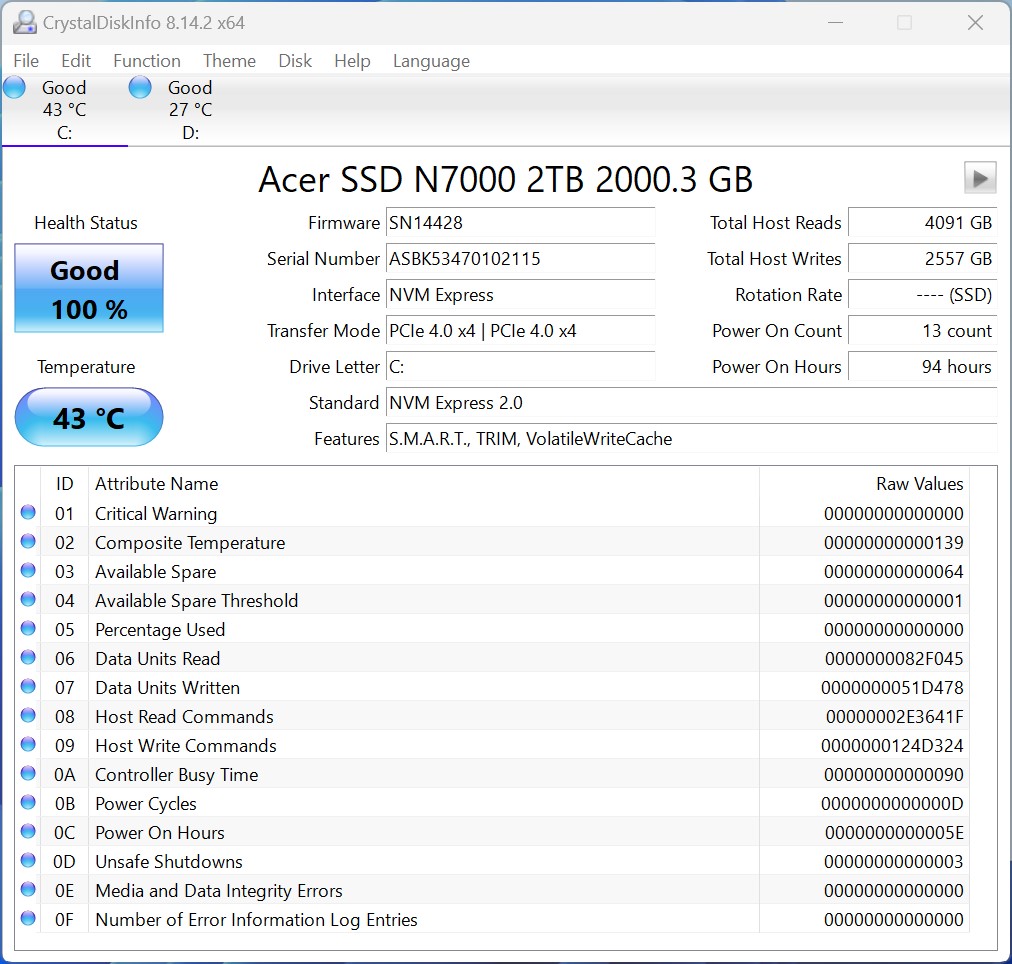
Com 2 TB de espaço de armazenamento, o Geekom GT13 Pro está excelentemente equipado e oferece espaço de armazenamento suficiente para muitos aplicativos. Um SSD da Acer está instalado, o que é impressionante em termos de desempenho. Os resultados documentados são suficientes para colocá-lo atrás do Aoostar GEM12 para garantir o segundo lugar em nossa classificação. Entretanto, a SSD tem problemas para manter seu alto nível de desempenho sob carga contínua. Embora o fabricante tenha instalado um resfriamento passivo para a SSD, isso não é suficiente para manter o desempenho estável. Em comparação com os valores iniciais, a taxa de leitura cai em quase 50%. Entretanto, isso não é uma falha total, como pode ser visto no gráfico de desempenho contínuo. Com pouco menos de 4.000 MB/s, o Acer N7000 ainda é mais rápido do que os dispositivos de armazenamento em massa de outros mini-PCs. Um total de dois SSDs pode ser instalado no Geekom GT13 Pro. No entanto, deve-se observar que o segundo slot M.2 suporta apenas SSDs SATA com comprimento de 42 milímetros.
Para mais comparações e benchmarks, consulte nossa Tabela de comparação.

| Drive Performance Rating - Percent | |
| Aoostar GEM12 | |
| Geekom GT13 Pro | |
| Khadas Mind | |
| Geekom XT12 Pro | |
| Minisforum EliteMini UM780 XTX | |
| Minisforum AtomMan X7 Ti | |
| Geekom A8 | |
| Média da turma Mini PC | |
| Acemagic F2A | |
* ... menor é melhor
Continuous read: DiskSpd Read Loop, Queue Depth 8
Placa de vídeo
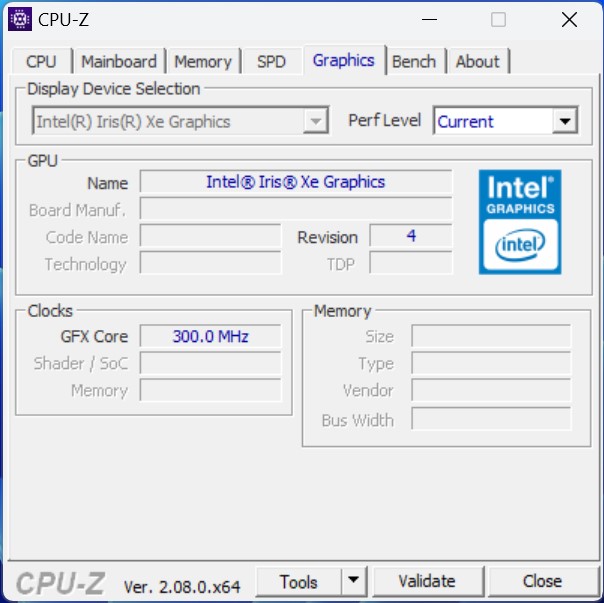
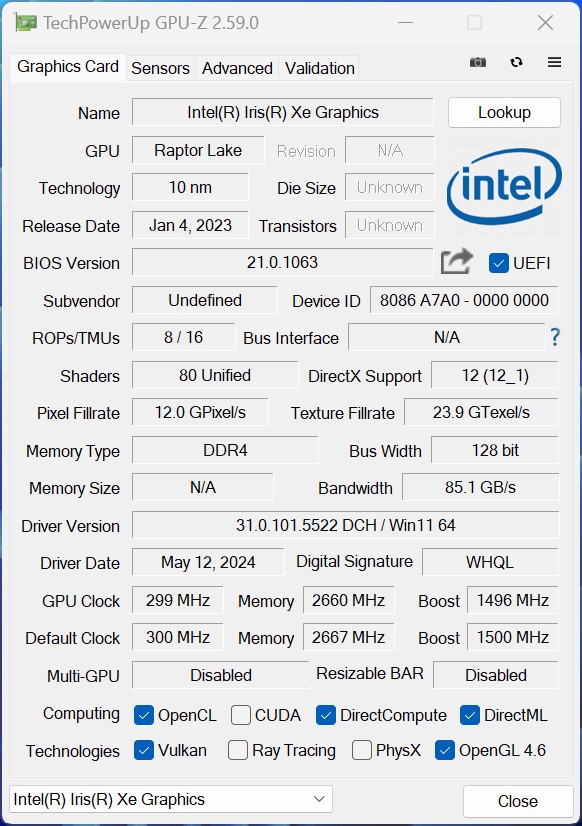
A escolha do processador tem um impacto significativo no desempenho 3D. Como a Geekom optou por um Intel Core i9-13900Ha iGPU é apenas a Intel Iris Xe Graphics G7. No entanto, o adaptador gráfico com 96 EUs é usado no nível de configuração mais alto. No entanto, a Intel Iris Xe Graphics G7 não consegue mais acompanhar as iGPUs mais recentes dos modelos Meteor Lake. Vemos quase duas classes na classificação. Todos os dispositivos equipados com a Intel Iris Xe Graphics G7 estão no terço inferior. O desempenho entre os dispositivos é quase idêntico. Todos os outros dispositivos que podem competir com iGPUs mais modernas e mais potentes (Intel Arc 8 e AMD Radeon 780) podem se diferenciar claramente.
Para mais comparações e benchmarks, consulte nossa Tabela de comparação de GPUs.
| 3DMark Performance Rating - Percent | |
| Geekom A8 | |
| Minisforum EliteMini UM780 XTX | |
| Aoostar GEM12 | |
| Acemagic F2A | |
| Minisforum AtomMan X7 Ti | |
| Geekom GT13 Pro | |
| Khadas Mind | |
| Geekom XT12 Pro | |
| 3DMark 11 - 1280x720 Performance GPU | |
| Geekom A8 | |
| Aoostar GEM12 | |
| Minisforum EliteMini UM780 XTX | |
| Acemagic F2A | |
| Minisforum AtomMan X7 Ti | |
| Geekom GT13 Pro | |
| Geekom XT12 Pro | |
| Khadas Mind | |
| Unigine Valley 1.0 | |
| 1920x1080 Extreme HD DirectX AA:x8 | |
| Aoostar GEM12 | |
| Minisforum EliteMini UM780 XTX | |
| Geekom A8 | |
| Minisforum AtomMan X7 Ti | |
| Khadas Mind | |
| Acemagic F2A | |
| Geekom GT13 Pro | |
| Geekom XT12 Pro | |
| 1920x1080 Extreme HD Preset OpenGL AA:x8 | |
| Minisforum AtomMan X7 Ti | |
| Aoostar GEM12 | |
| Minisforum EliteMini UM780 XTX | |
| Khadas Mind | |
| Acemagic F2A | |
| Geekom GT13 Pro | |
| Geekom A8 | |
| Geekom XT12 Pro | |
| Affinity Photo 2 - Combined (Single / Multi GPU) | |
| Minisforum AtomMan X7 Ti | |
| Acemagic F2A | |
| Geekom GT13 Pro | |
| Geekom XT12 Pro | |
| Khadas Mind | |
| Aoostar GEM12 | |
| Geekom A8 | |
| Minisforum EliteMini UM780 XTX | |
| Photoshop PugetBench - GPU Score | |
| Geekom A8 | |
| Aoostar GEM12 | |
| Acemagic F2A | |
| Minisforum AtomMan X7 Ti | |
| Geekom GT13 Pro | |
| Geekom XT12 Pro | |
| Premiere Pro PugetBench - GPU 0.9 | |
| Acemagic F2A | |
| Aoostar GEM12 | |
| Geekom A8 | |
| Geekom GT13 Pro | |
| Geekom XT12 Pro | |
| Khadas Mind | |
| Minisforum AtomMan X7 Ti | |
| DaVinci Resolve PugetBench - GPU Effects 0.93 | |
| Aoostar GEM12 | |
| Minisforum AtomMan X7 Ti | |
| Acemagic F2A | |
| Geekom GT13 Pro | |
| Geekom XT12 Pro | |
| Geekom GT13 Pro, Intel Iris Xe Graphics G7 96EUs i9-13900H | Geekom XT12 Pro, Intel Iris Xe Graphics G7 96EUs i9-12900H | Khadas Mind, Intel Iris Xe Graphics G7 96EUs i7-1360P | Aoostar GEM12, AMD Radeon 780M R7 8845HS | Minisforum AtomMan X7 Ti, Intel Arc 8-Core iGPU Ultra 9 185H | Geekom A8, AMD Radeon 780M R9 8945HS | Acemagic F2A, Intel Arc 8-Core iGPU Ultra 7 155H | Minisforum EliteMini UM780 XTX, AMD Radeon 780M R7 7840HS | Média da turma Mini PC | |
|---|---|---|---|---|---|---|---|---|---|
| SPECviewperf 12 | -5% | -9% | 662% | 20% | 674% | 26% | 725% | 498% | |
| 1900x1060 3ds Max (3dsmax-05) (fps) | 41.4 | 40.1 -3% | 37.8 -9% | 85.7 107% | 49.7 20% | 87.4 111% | 49.8 20% | 85 105% | 97.1 ? 135% |
| 1900x1060 Catia (catia-04) (fps) | 38.6 | 37.1 -4% | 39.4 2% | 86.6 124% | 51.3 33% | 86.4 124% | 48.2 25% | 89.8 133% | 82.4 ? 113% |
| 1900x1060 Creo (creo-01) (fps) | 28.2 | 26.9 -5% | 7.37 -74% | 53.3 89% | 22.7 -20% | 55.1 95% | 23.1 -18% | 51.1 81% | 46.2 ? 64% |
| 1900x1060 Energy (energy-01) (fps) | 0.41 | 0.4 -2% | 0.46 12% | 18.4 4388% | 0.67 63% | 19 4534% | 0.91 122% | 20.1 4802% | 13.2 ? 3120% |
| 1900x1060 Maya (maya-04) (fps) | 42.4 | 38.3 -10% | 41.3 -3% | 67.3 59% | 58 37% | 75 77% | 54.9 29% | 73.4 73% | 80.6 ? 90% |
| 1900x1060 Medical (medical-01) (fps) | 12.2 | 11.8 -3% | 12 -2% | 51.4 321% | 15.9 30% | 47.7 291% | 16.9 39% | 61.7 406% | 39.7 ? 225% |
| 1900x1060 Showcase (showcase-01) (fps) | 19.1 | 16.6 -13% | 21.2 11% | 30.3 59% | 19.9 4% | 25.8 35% | 18.2 -5% | 30.1 58% | 48.6 ? 154% |
| 1900x1060 Solidworks (sw-03) (fps) | 46.6 | 45.3 -3% | 41.6 -11% | 114 145% | 43 -8% | 106 127% | 42.7 -8% | 113 142% | 85 ? 82% |
| SPECviewperf 13 | -5% | -3% | 165% | 13% | 160% | 14% | 186% | 188% | |
| 3ds Max (3dsmax-06) (fps) | 41.2 | 40.1 -3% | 39 -5% | 82.4 100% | 48.5 18% | 85.8 108% | 46.4 13% | 86.1 109% | 94.5 ? 129% |
| Catia (catia-05) (fps) | 54.7 | 51.3 -6% | 57.1 4% | 124 127% | 76.8 40% | 126 130% | 71.6 31% | 132 141% | 116.1 ? 112% |
| Creo (creo-02) (fps) | 42.7 | 41.1 -4% | 37.5 -12% | 90.7 112% | 29.3 -31% | 92.8 117% | 29.6 -31% | 93.6 119% | 98.3 ? 130% |
| Energy (energy-02) (fps) | 4.62 | 4.5 -3% | 4.34 -6% | 22.2 381% | 5.27 14% | 22.6 389% | 5.69 23% | 25.8 458% | 27.2 ? 489% |
| Maya (maya-05) (fps) | 51.6 | 47.5 -8% | 46.3 -10% | 109 111% | 62.5 21% | 103 100% | 59.5 15% | 108 109% | 123 ? 138% |
| Medical (medical-02) (fps) | 15.6 | 14.4 -8% | 16 3% | 70.5 352% | 25 60% | 69.2 344% | 29.7 90% | 79.8 412% | 63 ? 304% |
| Showcase (showcase-02) (fps) | 19.1 | 17.3 -9% | 21.4 12% | 29.9 57% | 19.9 4% | 24.2 27% | 18.2 -5% | 30 57% | 47.4 ? 148% |
| Solidworks (sw-04) (fps) | 58.3 | 57.1 -2% | 53.7 -8% | 104 78% | 45.6 -22% | 97.3 67% | 44.8 -23% | 107 84% | 88.7 ? 52% |
| SPECviewperf 2020 | -2% | -1% | 309% | 38% | 367% | 29% | 288% | 353% | |
| 3840x2160 Medical (medical-03) (fps) | 2.69 | 3.49 30% | 2.67 -1% | 11.2 316% | 4.23 57% | 10.9 305% | 5.05 88% | 12 346% | 14.7 ? 446% |
| 3840x2160 Energy (energy-03) (fps) | 3.17 | 3.05 -4% | 2.97 -6% | 19.9 528% | 6.03 90% | 31 878% | 4.61 45% | 15.4 386% | 22.4 ? 607% |
| 3840x2160 Creo (creo-03) (fps) | 16.3 | 14.8 -9% | 16.9 4% | 33.4 105% | 18.5 13% | 35.6 118% | 17.9 10% | 31.4 93% | 39.6 ? 143% |
| 3840x2160 CATIA (catia-06) (fps) | 8.53 | 7.78 -9% | 8.82 3% | 23.2 172% | 11.1 30% | 24.6 188% | 10 17% | 24.4 186% | 25.8 ? 202% |
| 3840x2160 3ds Max (3dsmax-07) (fps) | 10.3 | 9.69 -6% | 10.1 -2% | 20.4 98% | 14.9 45% | 21 104% | 12.9 25% | 21 104% | 35.2 ? 242% |
| 3840x2160 Siemens NX (snx-04) (fps) | 6.62 | 6.29 -5% | 6.01 -9% | 64.1 868% | 6.24 -6% | 65.9 895% | 5.7 -14% | 61.5 829% | 46.6 ? 604% |
| 3840x2160 Maya (maya-06) (fps) | 27.3 | 23.9 -12% | 27.8 2% | 47.7 75% | 37.7 38% | 50.1 84% | 35.4 30% | 47.2 73% | 89.2 ? 227% |
| Média Total (Programa/Configurações) | -4% /
-4% | -4% /
-5% | 379% /
381% | 24% /
23% | 400% /
402% | 23% /
23% | 400% /
405% | 346% /
346% |
| 3DMark 05 Standard | 43190 pontos | |
| 3DMark 06 Standard Score | 33774 pontos | |
| 3DMark Vantage P Result | 28241 pontos | |
| 3DMark 11 Performance | 8027 pontos | |
| 3DMark Ice Storm Standard Score | 147975 pontos | |
| 3DMark Cloud Gate Standard Score | 27505 pontos | |
| 3DMark Fire Strike Score | 5420 pontos | |
| 3DMark Fire Strike Extreme Score | 2573 pontos | |
| 3DMark Time Spy Score | 1926 pontos | |
| 3DMark Steel Nomad Score | 186 pontos | |
| 3DMark Steel Nomad Light Score | 1283 pontos | |
Ajuda | ||
Desempenho em jogos
Muitos jogos modernos sobrecarregam a iGPU Intel Iris Xe. No entanto, podemos ver que as taxas de quadros jogáveis ainda podem ser alcançadas em alguns jogos se o nível de detalhes for sacrificado. Mesmo assim, não podemos certificar que o Geekom GT13 Pro seja adequado para jogos nessa configuração. O senhor obtém um desempenho 3D visivelmente melhor com o Geekom A8 ou o Aoostar GEM12. Como alternativa, o senhor também pode dar uma olhada no Minisforum AtomMan X7 Ti que recebeu uma iGPU significativamente mais potente com o SoC Meteor Lake da Intel.
| Cyberpunk 2077 2.2 Phantom Liberty | |
| 1920x1080 Low Preset (FSR off) | |
| Minisforum EliteMini UM780 XTX | |
| Geekom A8 | |
| Aoostar GEM12 | |
| Minisforum AtomMan X7 Ti | |
| Acemagic F2A | |
| Geekom GT13 Pro | |
| Geekom XT12 Pro | |
| 1920x1080 High Preset (FSR off) | |
| Minisforum EliteMini UM780 XTX | |
| Aoostar GEM12 | |
| Minisforum AtomMan X7 Ti | |
| Geekom A8 | |
| Acemagic F2A | |
| Geekom GT13 Pro | |
| Geekom XT12 Pro | |
| Baldur's Gate 3 | |
| 1920x1080 Low Preset AA:SM | |
| Geekom A8 | |
| Aoostar GEM12 | |
| Minisforum AtomMan X7 Ti | |
| Geekom GT13 Pro | |
| 1920x1080 High Preset AA:T | |
| Aoostar GEM12 | |
| Minisforum AtomMan X7 Ti | |
| Geekom A8 | |
| Geekom GT13 Pro | |
| Borderlands 3 | |
| 1280x720 Very Low Overall Quality (DX11) | |
| Geekom A8 | |
| Aoostar GEM12 | |
| Minisforum EliteMini UM780 XTX | |
| Minisforum AtomMan X7 Ti | |
| Acemagic F2A | |
| Geekom GT13 Pro | |
| Khadas Mind | |
| Geekom XT12 Pro | |
| 1920x1080 High Overall Quality (DX11) | |
| Minisforum EliteMini UM780 XTX | |
| Aoostar GEM12 | |
| Minisforum AtomMan X7 Ti | |
| Geekom A8 | |
| Acemagic F2A | |
| Geekom GT13 Pro | |
| Khadas Mind | |
| Geekom XT12 Pro | |
| GTA V | |
| 1024x768 Lowest Settings possible | |
| Geekom A8 | |
| Aoostar GEM12 | |
| Minisforum EliteMini UM780 XTX | |
| Minisforum AtomMan X7 Ti | |
| Acemagic F2A | |
| Geekom GT13 Pro | |
| Khadas Mind | |
| 1920x1080 High/On (Advanced Graphics Off) AA:2xMSAA + FX AF:8x | |
| Minisforum EliteMini UM780 XTX | |
| Aoostar GEM12 | |
| Geekom A8 | |
| Minisforum AtomMan X7 Ti | |
| Acemagic F2A | |
| Khadas Mind | |
| Geekom GT13 Pro | |
| F1 2020 | |
| 1280x720 Ultra Low Preset | |
| Minisforum EliteMini UM780 XTX | |
| Geekom A8 | |
| Aoostar GEM12 | |
| Minisforum AtomMan X7 Ti | |
| Geekom GT13 Pro | |
| Geekom XT12 Pro | |
| 1920x1080 High Preset AA:T AF:16x | |
| Minisforum EliteMini UM780 XTX | |
| Geekom A8 | |
| Aoostar GEM12 | |
| Minisforum AtomMan X7 Ti | |
| Geekom GT13 Pro | |
| Geekom XT12 Pro | |
| Shadow of the Tomb Raider | |
| 1280x720 Lowest Preset | |
| Acemagic F2A | |
| Minisforum EliteMini UM780 XTX | |
| Aoostar GEM12 | |
| Minisforum AtomMan X7 Ti | |
| Geekom A8 | |
| Geekom GT13 Pro | |
| Khadas Mind | |
| Geekom XT12 Pro | |
| 1920x1080 High Preset AA:SM | |
| Acemagic F2A | |
| Minisforum EliteMini UM780 XTX | |
| Aoostar GEM12 | |
| Minisforum AtomMan X7 Ti | |
| Geekom A8 | |
| Khadas Mind | |
| Geekom GT13 Pro | |
| Geekom XT12 Pro | |
FPS chart
| baixo | média | alto | ultra | |
|---|---|---|---|---|
| GTA V (2015) | 119.7 | 97.4 | 22 | 9.07 |
| Dota 2 Reborn (2015) | 109.8 | 80.2 | 65.5 | 58.6 |
| Final Fantasy XV Benchmark (2018) | 45.1 | 25.3 | 18.2 | |
| Far Cry 5 (2018) | 58 | 30 | 28 | 27 |
| Strange Brigade (2018) | 98.7 | 42.5 | 33.8 | 26.9 |
| Shadow of the Tomb Raider (2018) | 57.1 | 22.2 | 20.9 | 18 |
| Far Cry New Dawn (2019) | 52 | 31 | 29 | 27 |
| Metro Exodus (2019) | 38.5 | 19.1 | 14.2 | 11.2 |
| Total War: Three Kingdoms (2019) | 100.3 | 39.6 | 30.2 | 22.2 |
| Borderlands 3 (2019) | 54.4 | 26.5 | 16.7 | 12.7 |
| F1 2020 (2020) | 93.8 | 49.1 | 38.7 | 24.9 |
| F1 2021 (2021) | 105.6 | 52.2 | 39.9 | 29.4 |
| GRID Legends (2022) | 58.8 | 40.2 | 30.8 | 27.9 |
| Tiny Tina's Wonderlands (2022) | 34 | 26.4 | 16.7 | 13.2 |
| F1 22 (2022) | 46.3 | 43.1 | 31.2 | 24.9 |
| F1 23 (2023) | 43.2 | 39.4 | 28 | 21.9 |
| Baldur's Gate 3 (2023) | 18 | 14 | 11.7 | 11.2 |
| Cyberpunk 2077 2.2 Phantom Liberty (2023) | 18.2 | 14.7 | 12.8 | 11.5 |
| Total War Pharaoh (2023) | 68.9 | 48.8 | 34.8 | 30.9 |
| Prince of Persia The Lost Crown (2024) | 132.8 | 93.4 | 87.8 | |
| F1 24 (2024) | 40.4 | 35.4 | 25.6 | 20.4 |
Verificação do desempenho do Geekom GT13 Pro com o Razer Core X
O Geekom GT13 Pro permite o uso de placas de vídeo externas que podem ser conectadas via USB4. Analisamos de perto o desempenho junto com a Razer Core X e uma Nvidia GeForce RTX 3060 Ti. Como esperado, o desempenho 3D pode ser enormemente aumentado. Com essa combinação, o minicomputador cobre uma ampla gama de tarefas e é adequado tanto para jogos quanto para edição de vídeo. O desempenho da Nvidia GeForce RTX 3060 Ti, que está conectada somente via USB4, não consegue acompanhar o desempenho de um PC desktop convencional. A largura de banda disponível para comunicação com a placa de vídeo externa é apenas na velocidade PCIe x4 3.0.
Geekom GT13 Pro com Razer Core X e Nvidia GeForce RTX 3060 Ti
| Performance Rating - Percent | |
| Geekom A8 (Nvidia GeForce RTX 3060 Ti FE) | |
| Geekom GT13 Pro (Nvidia GeForce RTX 3060 Ti FE) | |
| Geekom XT12 Pro (Nvidia GeForce RTX 3060 Ti FE) | |
| 3DMark 11 - 1280x720 Performance GPU | |
| Geekom A8 (Nvidia GeForce RTX 3060 Ti FE) | |
| Geekom GT13 Pro (Nvidia GeForce RTX 3060 Ti FE) | |
| Geekom XT12 Pro (Nvidia GeForce RTX 3060 Ti FE) | |
| 3DMark | |
| 2560x1440 Time Spy Graphics | |
| Geekom A8 (Nvidia GeForce RTX 3060 Ti FE) | |
| Geekom GT13 Pro (Nvidia GeForce RTX 3060 Ti FE) | |
| Geekom XT12 Pro (Nvidia GeForce RTX 3060 Ti FE) | |
| 1920x1080 Fire Strike Graphics | |
| Geekom GT13 Pro (Nvidia GeForce RTX 3060 Ti FE) | |
| Geekom A8 (Nvidia GeForce RTX 3060 Ti FE) | |
| Geekom XT12 Pro (Nvidia GeForce RTX 3060 Ti FE) | |
| 3840x2160 Fire Strike Ultra Graphics | |
| Geekom GT13 Pro (Nvidia GeForce RTX 3060 Ti FE) | |
| Geekom XT12 Pro (Nvidia GeForce RTX 3060 Ti FE) | |
| Geekom A8 (Nvidia GeForce RTX 3060 Ti FE) | |
| Unigine Superposition | |
| 1280x720 720p Low | |
| Geekom GT13 Pro (Nvidia GeForce RTX 3060 Ti FE) | |
| Geekom A8 (Nvidia GeForce RTX 3060 Ti FE) | |
| Geekom XT12 Pro (Nvidia GeForce RTX 3060 Ti FE) | |
| 1920x1080 1080p High | |
| Geekom GT13 Pro (Nvidia GeForce RTX 3060 Ti FE) | |
| Geekom A8 (Nvidia GeForce RTX 3060 Ti FE) | |
| Geekom XT12 Pro (Nvidia GeForce RTX 3060 Ti FE) | |
| 1920x1080 1080p Extreme | |
| Geekom GT13 Pro (Nvidia GeForce RTX 3060 Ti FE) | |
| Geekom XT12 Pro (Nvidia GeForce RTX 3060 Ti FE) | |
| Geekom A8 (Nvidia GeForce RTX 3060 Ti FE) | |
| 3840x2160 4k Optimized | |
| Geekom GT13 Pro (Nvidia GeForce RTX 3060 Ti FE) | |
| Geekom XT12 Pro (Nvidia GeForce RTX 3060 Ti FE) | |
| Geekom A8 (Nvidia GeForce RTX 3060 Ti FE) | |
| 7680x4320 8k Optimized | |
| Geekom GT13 Pro (Nvidia GeForce RTX 3060 Ti FE) | |
| Geekom XT12 Pro (Nvidia GeForce RTX 3060 Ti FE) | |
| Geekom A8 (Nvidia GeForce RTX 3060 Ti FE) | |
| Unigine Valley 1.0 | |
| 1920x1080 Extreme HD DirectX AA:x8 | |
| Geekom XT12 Pro (Nvidia GeForce RTX 3060 Ti FE) | |
| Geekom GT13 Pro (Nvidia GeForce RTX 3060 Ti FE) | |
| Geekom A8 (Nvidia GeForce RTX 3060 Ti FE) | |
| 1920x1080 Extreme HD Preset OpenGL AA:x8 | |
| Geekom GT13 Pro (Nvidia GeForce RTX 3060 Ti FE) | |
| Geekom XT12 Pro (Nvidia GeForce RTX 3060 Ti FE) | |
| Geekom A8 (Nvidia GeForce RTX 3060 Ti FE) | |
| Unigine Heaven 4.0 | |
| Extreme Preset OpenGL | |
| Geekom A8 (Nvidia GeForce RTX 3060 Ti FE) | |
| Geekom GT13 Pro (Nvidia GeForce RTX 3060 Ti FE) | |
| Geekom XT12 Pro (Nvidia GeForce RTX 3060 Ti FE) | |
| Extreme Preset DX11 | |
| Geekom GT13 Pro (Nvidia GeForce RTX 3060 Ti FE) | |
| Geekom A8 (Nvidia GeForce RTX 3060 Ti FE) | |
| Geekom XT12 Pro (Nvidia GeForce RTX 3060 Ti FE) | |
| ComputeMark v2.1 | |
| 1024x600 Normal, Score | |
| Geekom GT13 Pro (Nvidia GeForce RTX 3060 Ti FE) | |
| Geekom A8 (Nvidia GeForce RTX 3060 Ti FE) | |
| Geekom XT12 Pro (Nvidia GeForce RTX 3060 Ti FE) | |
| 1024x600 Normal, Fluid 3DTex | |
| Geekom GT13 Pro (Nvidia GeForce RTX 3060 Ti FE) | |
| Geekom A8 (Nvidia GeForce RTX 3060 Ti FE) | |
| Geekom XT12 Pro (Nvidia GeForce RTX 3060 Ti FE) | |
| 1024x600 Normal, Fluid 2DTexArr | |
| Geekom GT13 Pro (Nvidia GeForce RTX 3060 Ti FE) | |
| Geekom A8 (Nvidia GeForce RTX 3060 Ti FE) | |
| Geekom XT12 Pro (Nvidia GeForce RTX 3060 Ti FE) | |
| 1024x600 Normal, Mandel Vector | |
| Geekom GT13 Pro (Nvidia GeForce RTX 3060 Ti FE) | |
| Geekom A8 (Nvidia GeForce RTX 3060 Ti FE) | |
| Geekom XT12 Pro (Nvidia GeForce RTX 3060 Ti FE) | |
| 1024x600 Normal, Mandel Scalar | |
| Geekom GT13 Pro (Nvidia GeForce RTX 3060 Ti FE) | |
| Geekom A8 (Nvidia GeForce RTX 3060 Ti FE) | |
| Geekom XT12 Pro (Nvidia GeForce RTX 3060 Ti FE) | |
| 1024x600 Normal, QJuliaRayTrace | |
| Geekom GT13 Pro (Nvidia GeForce RTX 3060 Ti FE) | |
| Geekom A8 (Nvidia GeForce RTX 3060 Ti FE) | |
| Geekom XT12 Pro (Nvidia GeForce RTX 3060 Ti FE) | |
| DaVinci Resolve PugetBench - GPU Effects 0.93 | |
| Geekom A8 (Nvidia GeForce RTX 3060 Ti FE) | |
| Geekom XT12 Pro (Nvidia GeForce RTX 3060 Ti FE) | |
| Geekom GT13 Pro (Nvidia GeForce RTX 3060 Ti FE) | |
| Photoshop PugetBench - GPU Score | |
| Geekom A8 (Nvidia GeForce RTX 3060 Ti FE) | |
| Geekom XT12 Pro (Nvidia GeForce RTX 3060 Ti FE) | |
| Geekom GT13 Pro (Nvidia GeForce RTX 3060 Ti FE) | |
| Premiere Pro PugetBench - GPU 0.9 | |
| Geekom A8 (Nvidia GeForce RTX 3060 Ti FE) | |
| Geekom GT13 Pro (Nvidia GeForce RTX 3060 Ti FE) | |
| Geekom XT12 Pro (Nvidia GeForce RTX 3060 Ti FE) | |
| baixo | média | alto | ultra | QHD | 4K DLSS | 4K | |
|---|---|---|---|---|---|---|---|
| GTA V (2015) | 182.1 | 178 | 170.7 | 103.6 | 91.6 | 103.8 | |
| Dota 2 Reborn (2015) | 180.5 | 157.2 | 146.6 | 133.3 | 108.6 | ||
| Final Fantasy XV Benchmark (2018) | 188 | 142.7 | 98.6 | 78 | 48.3 | ||
| X-Plane 11.11 (2018) | 151.3 | 135 | 106.6 | 95.4 | |||
| Far Cry 5 (2018) | 160 | 138 | 132 | 121 | 99 | 58 | |
| Strange Brigade (2018) | 214 | 160.5 | 156.8 | 152.9 | 130.2 | 84.5 | |
| Shadow of the Tomb Raider (2018) | 118.5 | 101 | 100.8 | 98.5 | 85.9 | 49.6 | |
| Far Cry New Dawn (2019) | 138 | 119 | 115 | 104 | 93 | 60 | |
| Metro Exodus (2019) | 144.8 | 91.6 | 69.6 | 52.5 | 45.8 | 33.7 | |
| Total War: Three Kingdoms (2019) | 300.4 | 145.6 | 95 | 70.1 | 49.3 | 26.7 | |
| Borderlands 3 (2019) | 155.8 | 132.4 | 104.8 | 84.6 | 64.6 | 38.3 | |
| F1 2020 (2020) | 207 | 127.8 | 128.9 | 105.5 | 90.6 | 61.4 | |
| F1 2021 (2021) | 143.5 | 110.1 | 69.1 | 51.7 | 48.1 | 41.4 | |
| Far Cry 6 (2021) | 78 | 65 | 53.9 | 46.9 | 45.8 | ||
| GRID Legends (2022) | 119.2 | 99.7 | 84 | 70.9 | 64.7 | 51 | |
| Tiny Tina's Wonderlands (2022) | 178.2 | 138.7 | 100.2 | 81.4 | 61.7 | 36.1 | |
| F1 22 (2022) | 61.4 | 56.1 | 43.2 | 27.6 | 26.2 | 19.6 | |
| F1 23 (2023) | 67.9 | 66.2 | 54.6 | 33.3 | 31.9 | 10.3 | |
| Baldur's Gate 3 (2023) | 113.4 | 90.8 | 78.9 | 79 | 61.4 | 54.7 | 36.9 |
| Cyberpunk 2077 2.2 Phantom Liberty (2023) | 85.3 | 80.4 | 71.3 | 63.9 | 44.9 | 22.1 | |
| Assassin's Creed Mirage (2023) | 88 | 82 | 77 | 63 | 59 | 56 | |
| Avatar Frontiers of Pandora (2023) | 53 | 49 | 43 | 30 | 23 | 9.7 | |
| Skull & Bones (2024) | 83 | 77 | 64 | 54 | 45 | 31 | |
| F1 24 (2024) | 77.3 | 72.8 | 61.3 | 42 | 36.5 | 28.9 | 19.6 |
| Geekom GT13 Pro, Intel Iris Xe Graphics G7 96EUs i9-13900H | Geekom GT13 Pro (Nvidia GeForce RTX 3060 Ti FE), i9-13900H | Geekom A8 (Nvidia GeForce RTX 3060 Ti FE), R9 8945HS | Minisforum MS-01 (Nvidia GeForce RTX 3060 Ti FE), i9-13900H | Geekom XT12 Pro (Nvidia GeForce RTX 3060 Ti FE), i9-12900H | |
|---|---|---|---|---|---|
| SPECviewperf 12 | 679% | 674% | 687% | 630% | |
| 1900x1060 3ds Max (3dsmax-05) (fps) | 41.4 | 147 255% | 146 253% | 147 255% | 124 200% |
| 1900x1060 Catia (catia-04) (fps) | 38.6 | 116 201% | 112 190% | 116 201% | 95.2 147% |
| 1900x1060 Creo (creo-01) (fps) | 28.2 | 62.9 123% | 62.9 123% | 64.2 128% | 53.5 90% |
| 1900x1060 Energy (energy-01) (fps) | 0.41 | 13.4 3168% | 13.3 3144% | 13.4 3168% | 13.4 3168% |
| 1900x1060 Maya (maya-04) (fps) | 42.4 | 228 438% | 235 454% | 235 454% | 182 329% |
| 1900x1060 Medical (medical-01) (fps) | 12.2 | 73.4 502% | 74.8 513% | 76.4 526% | 74.4 510% |
| 1900x1060 Showcase (showcase-01) (fps) | 19.1 | 149 680% | 141 638% | 149 680% | 123 544% |
| 1900x1060 Solidworks (sw-03) (fps) | 46.6 | 77.2 66% | 81.6 75% | 84.6 82% | 71.7 54% |
| SPECviewperf 13 | 386% | 374% | 385% | 311% | |
| 3ds Max (3dsmax-06) (fps) | 41.2 | 147 257% | 145 252% | 147 257% | 124 201% |
| Catia (catia-05) (fps) | 54.7 | 164 200% | 163 198% | 163 198% | 135 147% |
| Creo (creo-02) (fps) | 42.7 | 232 443% | 231 441% | 231 441% | 194 354% |
| Energy (energy-02) (fps) | 4.62 | 25.9 461% | 25.9 461% | 25.9 461% | 24 419% |
| Maya (maya-05) (fps) | 51.6 | 363 603% | 351 580% | 361 600% | 298 478% |
| Medical (medical-02) (fps) | 15.6 | 65.2 318% | 64.1 311% | 64.9 316% | 56.7 263% |
| Showcase (showcase-02) (fps) | 19.1 | 151 691% | 141 638% | 150 685% | 125 554% |
| Solidworks (sw-04) (fps) | 58.3 | 127 118% | 125 114% | 129 121% | 102 75% |
| SPECviewperf 2020 | 390% | 518% | 436% | 327% | |
| 3840x2160 Medical (medical-03) (fps) | 2.69 | 10.8 301% | 10.8 301% | 10.8 301% | 11.8 339% |
| 3840x2160 Energy (energy-03) (fps) | 3.17 | 21 562% | 50.3 1487% | 31.1 881% | 18.9 496% |
| 3840x2160 Creo (creo-03) (fps) | 16.3 | 76.4 369% | 76.6 370% | 76.8 371% | 62.7 285% |
| 3840x2160 CATIA (catia-06) (fps) | 8.53 | 40.1 370% | 38.8 355% | 39.7 365% | 32.8 285% |
| 3840x2160 3ds Max (3dsmax-07) (fps) | 10.3 | 47.3 359% | 45.9 346% | 47.6 362% | 40 288% |
| 3840x2160 Siemens NX (snx-04) (fps) | 6.62 | 16.5 149% | 16.6 151% | 16.6 151% | 15.2 130% |
| 3840x2160 Maya (maya-06) (fps) | 27.3 | 196 618% | 195 614% | 197 622% | 155 468% |
| Média Total (Programa/Configurações) | 485% /
489% | 522% /
522% | 503% /
505% | 423% /
427% |
Emissões - IceBlast 1.5 atinge rapidamente seu limite
Emissões de ruído
Em termos de resfriamento, o Geekom GT13 Pro é muito limitado devido ao seu design. No entanto, o minicomputador ainda é extremamente silencioso quando está em marcha lenta, embora a pequena ventoinha possa ser claramente audível sob carga. No teste, medimos um nível máximo de pressão sonora de 48,5 dB(A). O GT13 Pro só atinge esse nível de ruído por um curto período, desde que o valor PL2 seja atingido. Sob carga prolongada, o SoC trabalha com o limite PL1, o que significa que o volume se estabiliza em torno de 39 dB(A). Se não houver carga permanente, o que simulamos com o Prime95, por exemplo, o ventilador funciona de forma muito nervosa. O nível de pressão sonora sob carga média oscila de 38 a 44 dB(A) em nossa amostra de teste.
Barulho
| Ocioso |
| 27.9 / 27.9 / 28 dB |
| Carga |
| 43.8 / 48.5 dB |
 | ||
30 dB silencioso 40 dB(A) audível 50 dB(A) ruidosamente alto |
||
min: | ||
| Geekom GT13 Pro i9-13900H, Iris Xe G7 96EUs | Aoostar GEM12 R7 8845HS, Radeon 780M | Minisforum AtomMan X7 Ti Ultra 9 185H, Arc 8-Core | Geekom A8 R9 8945HS, Radeon 780M | Geekom XT12 Pro i9-12900H, Iris Xe G7 96EUs | Acemagic F2A Ultra 7 155H, Arc 8-Core | Minisforum EliteMini UM780 XTX R7 7840HS, Radeon 780M | Khadas Mind i7-1360P, Iris Xe G7 96EUs | |
|---|---|---|---|---|---|---|---|---|
| Noise | 9% | 1% | 4% | 2% | 2% | 6% | -13% | |
| desligado / ambiente * (dB) | 24.3 | 24.3 -0% | 24.1 1% | 24.4 -0% | 25.4 -5% | 24.9 -2% | 24.8 -2% | 25.2 -4% |
| Idle Minimum * (dB) | 27.9 | 27.5 1% | 29.8 -7% | 24.5 12% | 28 -0% | 25.4 9% | 28.5 -2% | 34.4 -23% |
| Idle Average * (dB) | 27.9 | 27.6 1% | 29.9 -7% | 24.7 11% | 28.1 -1% | 25.7 8% | 28.5 -2% | 34.4 -23% |
| Idle Maximum * (dB) | 28 | 27.6 1% | 30 -7% | 24.7 12% | 28.5 -2% | 25.7 8% | 28.7 -3% | 34.5 -23% |
| Load Average * (dB) | 43.8 | 36 18% | 37.3 15% | 48.5 -11% | 39.6 10% | 47.8 -9% | 32.4 26% | 44.7 -2% |
| Cyberpunk 2077 ultra * (dB) | 45.4 | 35.4 22% | ||||||
| Load Maximum * (dB) | 48.5 | 38.2 21% | 43.5 10% | 49.2 -1% | 44.2 9% | 49 -1% | 39.6 18% | 50.4 -4% |
| Witcher 3 ultra * (dB) | 35.4 | 40.2 | 47 | 47.2 | 45.23 | 32.7 | 49 |
* ... menor é melhor
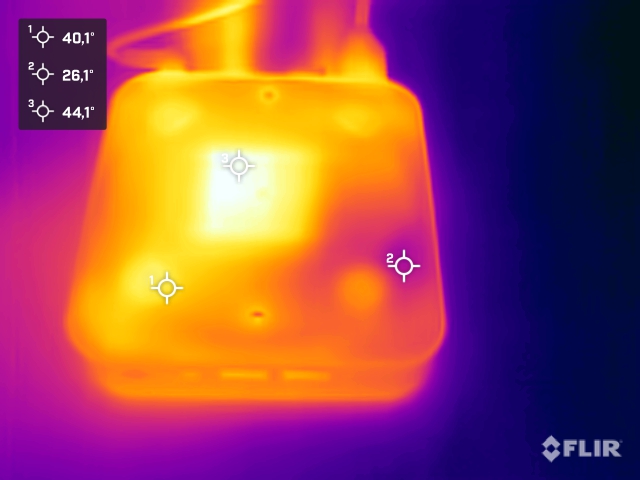
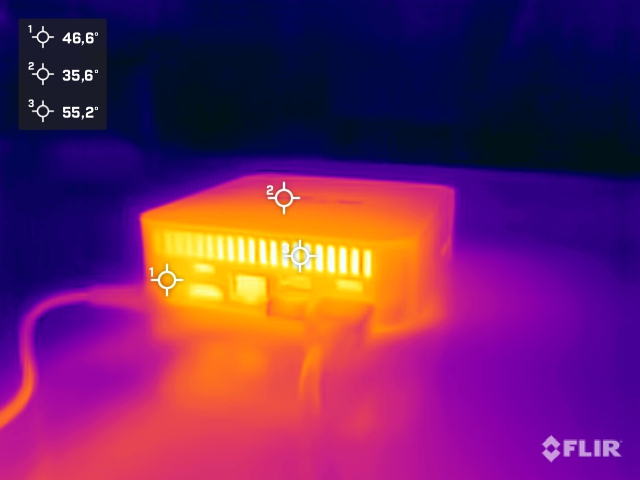
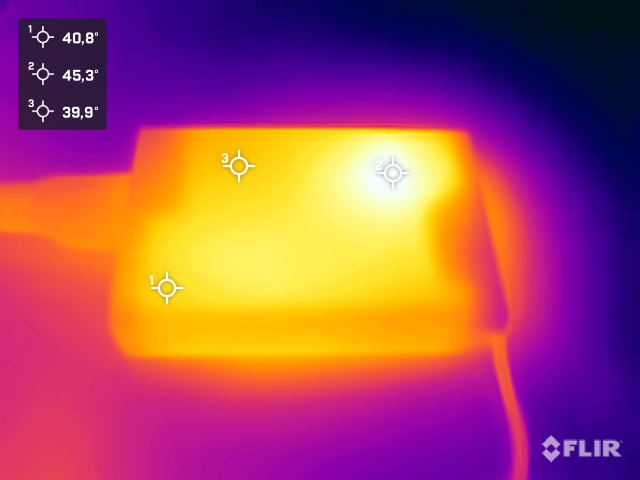
Temperatura
A carcaça do Geekom GT13 Pro aquece visivelmente tanto em modo inativo quanto sob carga. Sob carga, as temperaturas da superfície voltam a subir ligeiramente. No entanto, os 50 °C não são atingidos. Registramos temperaturas relativamente altas com o Intel Core i9-13900H, o que se deve à ventilação insuficiente da unidade de resfriamento compacta. A 100 °C, o SoC atinge o valor máximo que a própria Intel indica nas especificações. É importante saber que os 100 °C são atingidos apenas por um curto período de tempo. A temperatura da CPU cai ligeiramente quando o PL1 opera com um máximo de 35 watts. Em média, a temperatura do Intel Core i9-13900H fica em torno de 90 °C.
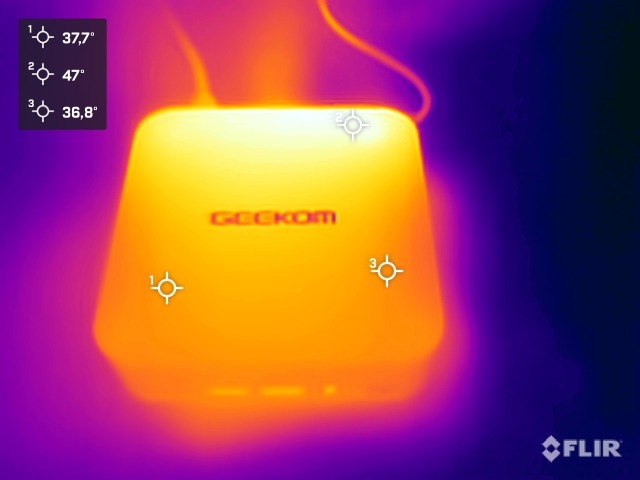
(-) A temperatura máxima no lado superior é 48.2 °C / 119 F, em comparação com a média de 35.9 °C / 97 F , variando de 21.6 a 69.5 °C para a classe Mini PC.
(-) A parte inferior aquece até um máximo de 45.7 °C / 114 F, em comparação com a média de 36.6 °C / 98 F
(-) Em uso inativo, a temperatura média para o lado superior é 38.2 °C / 101 F, em comparação com a média do dispositivo de 32.4 °C / ### class_avg_f### F.
Gerenciamento de energia
Em geral, os mini-PCs são econômicos e consomem muito menos energia do que um PC de mesa convencional. No entanto, há diferenças entre os mini-PCs em termos de consumo de energia. Com 7,9 a 22,3 watts, o Geekom GT13 Pro não é particularmente econômico no modo inativo quando comparado com seus concorrentes. Sob carga média, nosso dispositivo de teste requer 57 watts e a fonte de alimentação de 120 watts precisa fornecer 93,4 watts em seu pico.
| desligado | |
| Ocioso | |
| Carga |
|
Key:
min: | |
| Geekom GT13 Pro i9-13900H, Iris Xe G7 96EUs | Aoostar GEM12 R7 8845HS, Radeon 780M | Minisforum AtomMan X7 Ti Ultra 9 185H, Arc 8-Core | Geekom A8 R9 8945HS, Radeon 780M | Geekom XT12 Pro i9-12900H, Iris Xe G7 96EUs | Acemagic F2A Ultra 7 155H, Arc 8-Core | Minisforum EliteMini UM780 XTX R7 7840HS, Radeon 780M | Khadas Mind i7-1360P, Iris Xe G7 96EUs | Média Intel Iris Xe Graphics G7 96EUs | Média da turma Mini PC | |
|---|---|---|---|---|---|---|---|---|---|---|
| Power Consumption | -7% | 3% | 31% | 15% | 1% | 2% | 18% | 29% | -5% | |
| Idle Minimum * (Watt) | 7.9 | 8.2 -4% | 8.2 -4% | 3.2 59% | 5.7 28% | 9.1 -15% | 8.5 -8% | 7.8 1% | 5.48 ? 31% | 9.52 ? -21% |
| Idle Average * (Watt) | 10.3 | 10 3% | 12.1 -17% | 4.9 52% | 9.5 8% | 10.3 -0% | 10.5 -2% | 10.9 -6% | 8.65 ? 16% | 11.7 ? -14% |
| Idle Maximum * (Watt) | 22.3 | 14.6 35% | 14 37% | 6.8 70% | 16.5 26% | 14.4 35% | 12.9 42% | 11.8 47% | 10.9 ? 51% | 15.3 ? 31% |
| Load Average * (Watt) | 57.44 | 73.9 -29% | 53.1 8% | 71.3 -24% | 53.3 7% | 54.9 4% | 67.2 -17% | 39.2 32% | 45.6 ? 21% | 61.3 ? -7% |
| Cyberpunk 2077 ultra external monitor * (Watt) | 55.9 | 79.9 -43% | ||||||||
| Load Maximum * (Watt) | 93.4 | 95.3 -2% | 100.4 -7% | 93.2 -0% | 87.8 6% | 110.4 -18% | 97.2 -4% | 76.4 18% | 67.8 ? 27% | 106 ? -13% |
* ... menor é melhor
Efficiency overview
| Power Consumption / Cinebench R15 Multi Efficiency (external Monitor) | |
| Geekom A8 | |
| Minisforum AtomMan X7 Ti | |
| Khadas Mind | |
| Acemagic F2A | |
| Geekom GT13 Pro | |
| Geekom XT12 Pro | |
| Power Consumption / Cinebench R23 Single Power Efficiency - external Monitor | |
| Geekom A8 | |
| Minisforum AtomMan X7 Ti | |
| Geekom GT13 Pro | |
| Acemagic F2A | |
| Khadas Mind | |
| Geekom XT12 Pro | |
| Power Consumption / Cinebench R23 Multi Power Efficiency - external Monitor | |
| Geekom A8 | |
| Geekom GT13 Pro | |
| Minisforum AtomMan X7 Ti | |
| Khadas Mind | |
| Acemagic F2A | |
| Geekom XT12 Pro | |
Power consumtion with external monitor
Power consumtion with external monitor
Pro
Contra
Veredicto - Ótima aparência com desempenho médio a um preço premium
O fabricante comercializa um PC elegante e muito compacto como o Geekom GT13 Pro. Com o Intel Core i9-13900H, há um SoC potente, que não é baseado na atual arquitetura Meteor Lake. Em princípio, o processador oferece desempenho adequado se cargas contínuas não forem necessariamente geradas. Devido ao seu design pequeno, o Intel Core i9-13900H só pode ser operado com um consumo de energia muito baixo.
O Geekom GT13 Pro é um minicomputador elegante e potente, que impressiona por seus excelentes recursos. Infelizmente, o preço não corresponde exatamente ao desempenho do Geekom GT13 Pro.
Visualmente, o Geekom GT13 Pro impressiona com seu design elegante. O visual não é totalmente novo, pois o Geekom A7 e o Geekom A8 já se baseiam na mesma estrutura. Em termos de cores, a Geekom adota uma abordagem diferente com o GT13 Pro, diferenciando-o de seus equivalentes da AMD. A conectividade é um dos pontos fortes do Geekom GT13 Pro e é até um pouco melhor do que a dos concorrentes internos mencionados anteriormente. Duas portas USB4 são boas e podem fazer a diferença na prática se for necessário conectar muitos dispositivos externos. O Geekom GT13 Pro passou perfeitamente no teste com uma placa gráfica externa, embora seus concorrentes também não tenham ficado aquém. A Geekom não deve perder de vista a possibilidade de oferecer uma interface OCuLink para não perder o contato com alguns de seus adversários. Enquanto o Thunderbolt 5 não estiver disponível, a interface OCuLink é atualmente a melhor opção quando se trata de operar placas de vídeo externas.
O design compacto é elegante e os materiais escolhidos também são de alta qualidade. No entanto, a Geekom tem que se perguntar se o conceito é o correto quando se trata de acomodar componentes muito potentes em um espaço muito pequeno. O gabinete oferece fluxo de ar limitado, o que dificulta a refrigeração do processador. Em última análise, isso significa que o Geekom GT13 Pro é claramente audível sob carga. O Minisforum e o Aoostar demonstram com seus dispositivos que até mesmo componentes potentes podem ser resfriados de forma significativamente mais silenciosa.
Por fim, também temos que analisar o preço novamente: No momento do teste, o Geekom GT13 Pro custava 930 euros em nossa configuração. Isso significa que o GT13 Pro não é realmente uma pechincha e provavelmente terá dificuldades para competir com seus concorrentes, alguns dos quais são significativamente mais baratos.
Preços e disponibilidade
Geekom GT13 Pro
- 06/21/2024 v8
Sebastian Bade
 Total Sustainability Score:
 Transparência
A seleção dos dispositivos a serem analisados é feita pela nossa equipe editorial. A amostra de teste foi fornecida gratuitamente ao autor pelo fabricante para fins de revisão. Não houve influência de terceiros nesta revisão, nem o fabricante recebeu uma cópia desta revisão antes da publicação. Não houve obrigação de publicar esta revisão. Nunca aceitamos compensação ou pagamento em troca de nossas avaliações. Como empresa de mídia independente, a Notebookcheck não está sujeita à autoridade de fabricantes, varejistas ou editores.
É assim que o Notebookcheck está testando
Todos os anos, o Notebookcheck analisa de forma independente centenas de laptops e smartphones usando procedimentos padronizados para garantir que todos os resultados sejam comparáveis. Desenvolvemos continuamente nossos métodos de teste há cerca de 20 anos e definimos padrões da indústria no processo. Em nossos laboratórios de teste, equipamentos de medição de alta qualidade são utilizados por técnicos e editores experientes. Esses testes envolvem um processo de validação em vários estágios. Nosso complexo sistema de classificação é baseado em centenas de medições e benchmarks bem fundamentados, o que mantém a objetividade.