Notebookcheck Logo

Análise do Geekom XT12 Pro: Alternativa elegante ao mini-PC NUC com Intel Core i9-12900H, 32 GB de RAM DDR4 e SSD de 1 TB

O Alder Lake-H ainda é rápido!

A Geekom apresentou o XT12 Pro há alguns dias como um mini-PC NUC poderoso e eficiente. No entanto, com base em um Intel Core i9-12900H, o senhor terá que se contentar com um processador um pouco mais antigo. Usando várias medições e benchmarks, analisamos se a Geekom pode manter sua promessa de eficiência e qual é o desempenho do XT12 Pro em relação à concorrência.

Como o Geekom XT12 Pro, o minicomputador deveria ganhar pontos com desempenho excepcional e boa eficiência. No entanto, a Geekom instala apenas um Intel Core i9-12900H. No entanto, o SoC pertence à série Alder Lake-H e foi lançado há dois anos. Mais tarde, o senhor saberá mais sobre o desempenho do processador no duelo atual. Afinal de contas, a Geekom está usando o modelo superior aqui, embora não haja outras configurações disponíveis no momento. Com 32 GB de RAM e um SSD de 1 TB, o dispositivo está disponível atualmente por 749 euros. Isso já inclui um desconto, pois o preço sugerido pelo fabricante está listado em 899 euros. Se esse preço é justificado é uma questão legítima, que será esclarecida após analisarmos o desempenho em comparação com seus concorrentes. No entanto, devido ao preço, o fabricante já está estabelecendo um padrão muito alto para si mesmo.

Geekom XT12 Pro
Processador
Intel Core i9-12900H 14 x 1.8 - 5 GHz, 80 W PL2 / Short Burst, 35 W PL1 / Sustained, Alder Lake-H
Placa gráfica
Memória
32 GB 
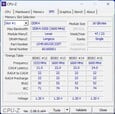
, DDR4-3200, 2 von 2 belegt, max. 64 GB
placa mãe
Intel Alder Lake-P PCH
Disco rígido
Lexar SSD NM7A1 1TB, 1024 GB 
, 913 GB livre
Placa de Som
Intel Alder Lake-P PCH - cAVS (Audio, Voice, Speech)
Conexões
1 USB 2.0, 3 USB 3.1 Gen2, 2 USB 4.0 40 Gbps, 2 Thunderbolt, 2 HDMI, 2 DisplayPort, 1 Kensington Lock, Conexões Audio: 3.5mm Klinke
Funcionamento em rede
Intel Ethernet Controller I225-V (10/100/1000/2500MBit/s), MediaTek Wi-Fi 6E MT7922 160MHz Wireless LAN Card (a/b/g/n = Wi-Fi 4/ac = Wi-Fi 5/ax = Wi-Fi 6/ Wi-Fi 6E 6 GHz), Bluetooth 5.2
Tamanho
altura x largura x profundidade (em mm): 37 x 117 x 112
Sistema Operativo
Microsoft Windows 11 Pro
Características adicionais
120-Watt-Netzteil, VESA-Mount, 36 Meses Garantia
peso
545 g, Suprimento de energia: 218 g
Preço
899 EUR
Note: The manufacturer may use components from different suppliers including display panels, drives or memory sticks with similar specifications.


Possíveis concorrentes em comparação

Rating
Date
Model
Memory
Weight
Height
84.1 %
04/2024
Geekom XT12 Pro
i9-12900H, Iris Xe G7 96EUs
32768 MB545 g37 mm
87.3 %
v7 (old)
12/2023
Minisforum EliteMini UM780 XTX
R7 7840HS, Radeon 780M
32768 MB750 g52.3 mm
85.1 %
v7 (old)
01/2023
Minisforum Neptune Series NAD9
i9-12900H, Iris Xe G7 96EUs
16384 MB1.2 kg66 mm
83.4 %
v7 (old)
04/2024
Acemagic F2A
Ultra 7 155H, Arc 8-Core
32768 MB768 g57 mm
83.1 %
v7 (old)
08/2023
Intel NUC 13 Pro Desk Edition Kit
i7-1360P, Iris Xe G7 96EUs
32768 MB558 g37 mm
82.6 %
v7 (old)
03/2024
Geekom A7
R9 7940HS, Radeon 780M
32768 MB417 g38 mm
78.8 %
v7 (old)
08/2023
Khadas Mind
i7-1360P, Iris Xe G7 96EUs
32768 MB438 g20 mm

Geekom XT12 Pro em detalhes

Geekom XT12 Pro
Geekom XT12 Pro
Geekom XT12 Pro
Geekom XT12 Pro
Geekom XT12 Pro
Geekom XT12 Pro
Geekom XT12 Pro
Geekom XT12 Pro
Geekom XT12 Pro
Geekom XT12 Pro
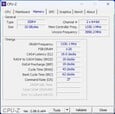
Geekom XT12 Pro - DDR4-RAM
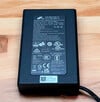
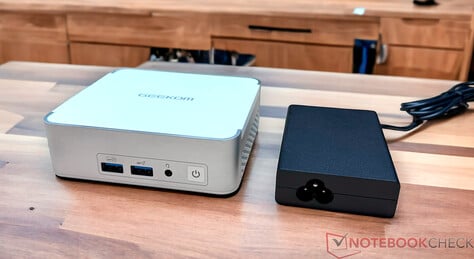
Geekom XT12 Pro e a fonte de alimentação (19 V; 6,32 A)
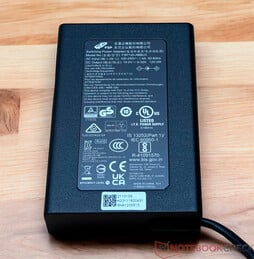
Unidade de fonte de alimentação (19 V; 6,32 A)

Caixa - Metal e plástico com acabamento perfeito

O Geekom XT12 Pro é extremamente compacto e combina muita tecnologia em um espaço muito pequeno. O XT12 Pro precisa de apenas 11,7 x 11,2 centímetros na mesa. A escolha dos materiais é uma mistura de metal e plástico. O último é usado para a tampa, embora a estabilidade não seja prejudicada por isso. No entanto, o Geekom A7 ainda parecia um pouco mais premium. A caixa de metal tem um excelente acabamento e pode ser aberta pela parte de baixo. A Geekom também usa isso para resfriar os dispositivos de armazenamento em massa. Em termos de cor, o Geekom XT12 Pro está disponível apenas em prata e branco. O fabricante não pode negar sua semelhança com o Intel NUC 13 Pro Desk Edition Kit. A Geekom afirma que, embora os dispositivos pareçam quase idênticos, na verdade eles estão usando um design interno.

O Geekom XT12 pode ser conectado a um monitor usando o suporte VESA fornecido.

Comparação de tamanho

208 mm 180 mm 66 mm 1.2 kg146 mm 146 mm 57 mm 768 g130 mm 126 mm 52.3 mm 750 g146 mm 105 mm 20 mm 438 g117 mm 112 mm 37 mm 545 g117 mm 112 mm 37 mm 558 g112 mm 112 mm 38 mm 417 g297 mm 210 mm 1 mm 5.7 g

Conectividade - Muitas opções e 2x USB4

A Geekom forneceu ao XT12 Pro muitas interfaces externas úteis. Elas estão distribuídas na parte frontal e traseira. Quatro soquetes USB-A e dois UBS-C são mais do que suficientes e devem atender a todas as necessidades. As portas Type-C também suportam USB4, o que amplia as possibilidades de uso do XT12 Pro quase sem limites com os acessórios certos. As telas podem ser conectadas diretamente via HDMI, mas também via USB4. Isso significa que o mini-PC pode ser operado com quatro telas ao mesmo tempo. Uma conexão de rede também está disponível.

Conectividade no Geekom XT12 Pro

Comunicação

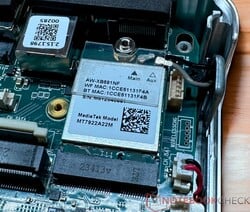
Módulo WLAN
Módulo WLAN

O Geekom XT12 Pro usa o mesmo módulo sem fio que o Geekom A7. O módulo WLAN MediaTek Wi-Fi 6E MT7922 não atinge os melhores valores, mas é suficiente para a transmissão de dados em uso normal. Se possível, a faixa de frequência de 6 GHz deve ser usada principalmente. A diferença de desempenho em comparação com a faixa de frequência de 5 GHz, um pouco mais lenta, já é perceptível ao transferir muitos dados. Como alternativa, o Geekom XT12 Pro também pode lidar com uma conexão de rede com fio. É possível obter taxas de dados de até 2,5 GBit/s.

Networking
iperf3 receive AXE11000 6GHz
Acemagic F2A
Intel Wi-Fi 7 BE200 320MHz
1770 (1584min - 1790max) MBit/s +54%
Intel NUC 13 Pro Desk Edition Kit
Intel Wi-Fi 6E AX211
1448 (1357min - 1490max) MBit/s +26%
Khadas Mind
Intel Wi-Fi 6E AX211
1445 (1342min - 1468max) MBit/s +25%
Average MediaTek Wi-Fi 6E MT7922 160MHz Wireless LAN Card
  (684 - 1771, n=38)
1440 MBit/s +25%
Average of class Mini PC
  (684 - 1771, n=53, last 2 years)
1381 MBit/s +20%
Geekom A7
MediaTek Wi-Fi 6E MT7922 160MHz Wireless LAN Card
1375 (688min - 1438max) MBit/s +19%
Geekom XT12 Pro
MediaTek Wi-Fi 6E MT7922 160MHz Wireless LAN Card
1152 (576min - 1273max) MBit/s
iperf3 transmit AXE11000 6GHz
Acemagic F2A
Intel Wi-Fi 7 BE200 320MHz
1615 (767min - 1670max) MBit/s +23%
Intel NUC 13 Pro Desk Edition Kit
Intel Wi-Fi 6E AX211
1511 (1451min - 1552max) MBit/s +15%
Average MediaTek Wi-Fi 6E MT7922 160MHz Wireless LAN Card
  (394 - 1800, n=37)
1407 MBit/s +7%
Geekom A7
MediaTek Wi-Fi 6E MT7922 160MHz Wireless LAN Card
1367 (1268min - 1443max) MBit/s +4%
Khadas Mind
Intel Wi-Fi 6E AX211
1348 (1293min - 1402max) MBit/s +3%
Average of class Mini PC
  (394 - 1800, n=53, last 2 years)
1328 MBit/s +1%
Geekom XT12 Pro
MediaTek Wi-Fi 6E MT7922 160MHz Wireless LAN Card
1315 (691min - 1352max) MBit/s
iperf3 receive AXE11000
Average MediaTek Wi-Fi 6E MT7922 160MHz Wireless LAN Card
  (707 - 1775, n=54)
1407 MBit/s +58%
Minisforum Neptune Series NAD9
Intel Wi-Fi 6E AX210
1318 (663min - 1363max) MBit/s +48%
Intel NUC 13 Pro Desk Edition Kit
Intel Wi-Fi 6E AX211
1117 (884min - 1368max) MBit/s +25%
Khadas Mind
Intel Wi-Fi 6E AX211
1059 (937min - 1173max) MBit/s +19%
Minisforum EliteMini UM780 XTX
Intel Killer Wi-Fi 6E AX1675x (210NGW)
934 (915min - 943max) MBit/s +5%
Average of class Mini PC
  (192.9 - 1796, n=113, last 2 years)
932 MBit/s +4%
Geekom XT12 Pro
MediaTek Wi-Fi 6E MT7922 160MHz Wireless LAN Card
892 (460min - 921max) MBit/s
Geekom A7
MediaTek Wi-Fi 6E MT7922 160MHz Wireless LAN Card
858 (827min - 886max) MBit/s -4%
Acemagic F2A
Intel Wi-Fi 7 BE200 320MHz
838 (728min - 926max) MBit/s -6%
iperf3 transmit AXE11000
Minisforum Neptune Series NAD9
Intel Wi-Fi 6E AX210
1320 (1165min - 1353max) MBit/s +124%
Intel NUC 13 Pro Desk Edition Kit
Intel Wi-Fi 6E AX211
1301 (514min - 1422max) MBit/s +121%
Average MediaTek Wi-Fi 6E MT7922 160MHz Wireless LAN Card
  (358 - 1785, n=54)
1288 MBit/s +119%
Khadas Mind
Intel Wi-Fi 6E AX211
1108 (703min - 1199max) MBit/s +88%
Average of class Mini PC
  (184.1 - 1776, n=113, last 2 years)
864 MBit/s +47%
Geekom A7
MediaTek Wi-Fi 6E MT7922 160MHz Wireless LAN Card
831 (755min - 940max) MBit/s +41%
Minisforum EliteMini UM780 XTX
Intel Killer Wi-Fi 6E AX1675x (210NGW)
729 (668min - 784max) MBit/s +24%
Acemagic F2A
Intel Wi-Fi 7 BE200 320MHz
709 (369min - 977max) MBit/s +20%
Geekom XT12 Pro
MediaTek Wi-Fi 6E MT7922 160MHz Wireless LAN Card
589 (295min - 624max) MBit/s
050100150200250300350400450500550600650700750800850900950100010501100115012001250130013501400Tooltip
Geekom XT12 Pro MediaTek Wi-Fi 6E MT7922 160MHz Wireless LAN Card; iperf3 transmit AXE11000 6GHz; iperf 3.1.3: Ø1292 (691-1352)
Geekom A7 MediaTek Wi-Fi 6E MT7922 160MHz Wireless LAN Card; iperf3 transmit AXE11000 6GHz; iperf 3.1.3: Ø1367 (1268-1443)
Geekom XT12 Pro MediaTek Wi-Fi 6E MT7922 160MHz Wireless LAN Card; iperf3 receive AXE11000 6GHz; iperf 3.1.3: Ø1132 (576-1273)
Geekom A7 MediaTek Wi-Fi 6E MT7922 160MHz Wireless LAN Card; iperf3 receive AXE11000 6GHz; iperf 3.1.3: Ø1352 (688-1438)
Geekom XT12 Pro MediaTek Wi-Fi 6E MT7922 160MHz Wireless LAN Card; iperf3 receive AXE11000; iperf 3.1.3: Ø876 (460-921)
Geekom A7 MediaTek Wi-Fi 6E MT7922 160MHz Wireless LAN Card; iperf3 receive AXE11000; iperf 3.1.3: Ø858 (827-886)
Geekom XT12 Pro MediaTek Wi-Fi 6E MT7922 160MHz Wireless LAN Card; iperf3 transmit AXE11000; iperf 3.1.3: Ø579 (295-624)
Geekom A7 MediaTek Wi-Fi 6E MT7922 160MHz Wireless LAN Card; iperf3 transmit AXE11000; iperf 3.1.3: Ø831 (755-940)

Acessórios

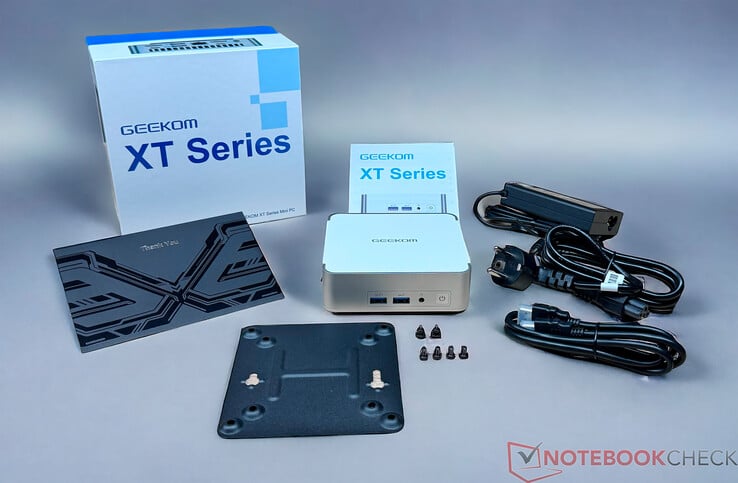
O Geekom XT12 Pro vem com tudo o que o senhor precisa. Além da unidade de fonte de alimentação de 120 watts, há também um suporte VESA na caixa. Um cabo HDMI e o cartão de agradecimento obrigatório da Geekom também estão incluídos.

Escopo de entrega do Geekom XT12 Pro

Manutenção

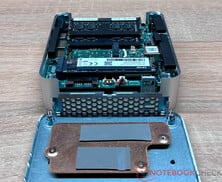
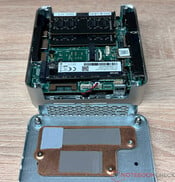
O Geekom XT12 Pro pode ser aberto sem maiores problemas: quatro parafusos de fácil acesso prendem a placa de base ao gabinete. Depois de soltá-los, a placa de base e o cooler SSD podem ser removidos. Devido às almofadas condutoras de calor, o senhor deve ter um pouco de cuidado aqui. A RAM e o armazenamento em massa ficam facilmente acessíveis. Outra SSD pode ser acomodada no próprio dispositivo. Entretanto, somente SSDs SATA com comprimento de 42 milímetros podem ser instalados aqui.

Parte interna do Geekom XT12 Pro
Geekom XT12 Pro desmontado
Geekom XT12 Pro - Placa de circuito impresso
Geekom XT12 Pro - Tubo de calor

Desempenho - O Intel Core i9-12900H tem 14 núcleos com 20 threads

O Geekom XT12 Pro está disponível apenas na versão que testamos. O Intel Core i9-12900H fornece uma base muito sólida para dominar até mesmo as tarefas que exigem muito desempenho. Juntamente com a RAM de 32 GB e o SSD de 1 TB, o senhor está bem equipado por enquanto.

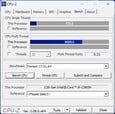
CPU-Z
CPU-Z
CPU-Z
CPU-Z
CPU-Z
CPU-Z
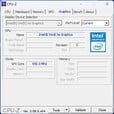
GPU-Z
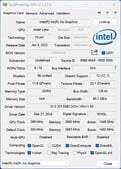
GPU-Z
HWiNFO

Condições de teste

Para todos os testes de desempenho com o Geekom XT12 Pro, usamos o plano de energia de "desempenho máximo". Houve apenas desvios desse plano nas medições de consumo de energia e ruído, de acordo com nossos Critérios de teste.

Processador

Intel Core i9-12900H (Fonte: Geekom)

O Intel Core i9-12900H é baseado na arquitetura Alder Lake e combina núcleos 6P e 8E. Juntos, eles fornecem ao usuário 20 threads. Mesmo depois de mais de dois anos, o SoC ainda não está desatualizado e, em comparação, vemos uma diferença razoável em relação às APUs AMD Ryzen mais modernas.

Em termos de limites de energia, a Geekom limita o Intel Core i9-12900H a um máximo de 80 watts, embora 35 watts estejam permanentemente disponíveis. No entanto, não atingimos o valor máximo em nenhum momento. Já podemos afirmar isso neste momento. No teste, geralmente vemos apenas cerca de 60 watts, o que significa que o fabricante não está explorando todo o potencial aqui. No entanto, o SoC é operado de acordo com as especificações do fabricante, pois 35 watts estão permanentemente disponíveis. No duelo com os concorrentes, nossa amostra de teste frequentemente tem que admitir a derrota. O mesmo quadro pode ser visto nos benchmarks AIDA64. A desvantagem da memória DDR4 mais antiga fica evidente aqui.

O senhor pode encontrar mais benchmarks para os processadores aqui.

Cinebench R15
Cinebench R15
Cinebench R20
Cinebench R20
Cinebench R23
Cinebench R23
Cinebench 2024
Cinebench 2024
Performance Rating - Percent
Minisforum EliteMini UM780 XTX
AMD Ryzen 7 7840HS
55.2 pt
Geekom A7
AMD Ryzen 9 7940HS
54.8 pt
Acemagic F2A
Intel Core Ultra 7 155H
52.8 pt
Intel NUC 13 Pro Desk Edition Kit
Intel Core i7-1360P
51.4 pt
Minisforum Neptune Series NAD9
Intel Core i9-12900H
50.1 pt
Geekom XT12 Pro
Intel Core i9-12900H
49.1 pt
Khadas Mind
Intel Core i7-1360P
48.6 pt
Cinebench R23
Multi Core
Acemagic F2A
Intel Core Ultra 7 155H
18497 Points +68%
Minisforum EliteMini UM780 XTX
AMD Ryzen 7 7840HS
16706 Points +51%
Geekom A7
AMD Ryzen 9 7940HS
15556 Points +41%
Minisforum Neptune Series NAD9
Intel Core i9-12900H
13320 Points +21%
Intel NUC 13 Pro Desk Edition Kit
Intel Core i7-1360P
12155 Points +10%
Geekom XT12 Pro
Intel Core i9-12900H
11036 Points
Khadas Mind
Intel Core i7-1360P
9859 Points -11%
Single Core
Intel NUC 13 Pro Desk Edition Kit
Intel Core i7-1360P
1878 Points +3%
Khadas Mind
Intel Core i7-1360P
1877 Points +3%
Geekom XT12 Pro
Intel Core i9-12900H
1824 Points
Minisforum EliteMini UM780 XTX
AMD Ryzen 7 7840HS
1779 Points -2%
Acemagic F2A
Intel Core Ultra 7 155H
1771 Points -3%
Geekom A7
AMD Ryzen 9 7940HS
1747 Points -4%
Minisforum Neptune Series NAD9
Intel Core i9-12900H
1743 Points -4%
Cinebench R15
CPU Single 64Bit
Minisforum EliteMini UM780 XTX
AMD Ryzen 7 7840HS
279 Points +11%
Geekom A7
AMD Ryzen 9 7940HS
278 Points +11%
Khadas Mind
Intel Core i7-1360P
270 Points +8%
Intel NUC 13 Pro Desk Edition Kit
Intel Core i7-1360P
267 Points +6%
Acemagic F2A
Intel Core Ultra 7 155H
258 Points +3%
Geekom XT12 Pro
Intel Core i9-12900H
251 Points
Minisforum Neptune Series NAD9
Intel Core i9-12900H
247 Points -2%
CPU Multi 64Bit
Acemagic F2A
Intel Core Ultra 7 155H
2738 Points +29%
Minisforum EliteMini UM780 XTX
AMD Ryzen 7 7840HS
2608 Points +23%
Geekom A7
AMD Ryzen 9 7940HS
2470 Points +16%
Geekom XT12 Pro
Intel Core i9-12900H
2121 Points
Minisforum Neptune Series NAD9
Intel Core i9-12900H
2067 Points -3%
Intel NUC 13 Pro Desk Edition Kit
Intel Core i7-1360P
1990 Points -6%
Khadas Mind
Intel Core i7-1360P
1642 Points -23%
Cinebench R20
CPU (Single Core)
Khadas Mind
Intel Core i7-1360P
724 Points +3%
Intel NUC 13 Pro Desk Edition Kit
Intel Core i7-1360P
723 Points +3%
Geekom XT12 Pro
Intel Core i9-12900H
701 Points
Geekom A7
AMD Ryzen 9 7940HS
692 Points -1%
Minisforum EliteMini UM780 XTX
AMD Ryzen 7 7840HS
690 Points -2%
Minisforum Neptune Series NAD9
Intel Core i9-12900H
682 Points -3%
Acemagic F2A
Intel Core Ultra 7 155H
679 Points -3%
CPU (Multi Core)
Acemagic F2A
Intel Core Ultra 7 155H
7188 Points +67%
Minisforum EliteMini UM780 XTX
AMD Ryzen 7 7840HS
6509 Points +52%
Geekom A7
AMD Ryzen 9 7940HS
6277 Points +46%
Minisforum Neptune Series NAD9
Intel Core i9-12900H
4941 Points +15%
Intel NUC 13 Pro Desk Edition Kit
Intel Core i7-1360P
4687 Points +9%
Geekom XT12 Pro
Intel Core i9-12900H
4294 Points
Khadas Mind
Intel Core i7-1360P
3820 Points -11%
Cinebench R11.5
CPU Single 64Bit
Geekom A7
AMD Ryzen 9 7940HS
3.34 Points +12%
Minisforum EliteMini UM780 XTX
AMD Ryzen 7 7840HS
3.33 Points +11%
Khadas Mind
Intel Core i7-1360P
3.27 Points +9%
Intel NUC 13 Pro Desk Edition Kit
Intel Core i7-1360P
3.25 Points +9%
Acemagic F2A
Intel Core Ultra 7 155H
3.13 Points +5%
Geekom XT12 Pro
Intel Core i9-12900H
2.99 Points
Minisforum Neptune Series NAD9
Intel Core i9-12900H
2.86 Points -4%
CPU Multi 64Bit
Acemagic F2A
Intel Core Ultra 7 155H
33.49 Points +59%
Minisforum EliteMini UM780 XTX
AMD Ryzen 7 7840HS
30.25 Points +43%
Geekom A7
AMD Ryzen 9 7940HS
29.8 Points +41%
Minisforum Neptune Series NAD9
Intel Core i9-12900H
25.96 Points +23%
Intel NUC 13 Pro Desk Edition Kit
Intel Core i7-1360P
24.69 Points +17%
Geekom XT12 Pro
Intel Core i9-12900H
21.11 Points
Khadas Mind
Intel Core i7-1360P
19.54 Points -7%
Cinebench R10
Rendering Single CPUs 64Bit
Khadas Mind
Intel Core i7-1360P
15227 Points +14%
Intel NUC 13 Pro Desk Edition Kit
Intel Core i7-1360P
15176 Points +13%
Geekom A7
AMD Ryzen 9 7940HS
14300 Points +7%
Minisforum EliteMini UM780 XTX
AMD Ryzen 7 7840HS
14177 Points +6%
Acemagic F2A
Intel Core Ultra 7 155H
13938 Points +4%
Geekom XT12 Pro
Intel Core i9-12900H
13378 Points
Minisforum Neptune Series NAD9
Intel Core i9-12900H
12846 Points -4%
Rendering Multiple CPUs 64Bit
Acemagic F2A
Intel Core Ultra 7 155H
95005 Points +36%
Minisforum EliteMini UM780 XTX
AMD Ryzen 7 7840HS
87064 Points +25%
Geekom A7
AMD Ryzen 9 7940HS
84721 Points +22%
Minisforum Neptune Series NAD9
Intel Core i9-12900H
77409 Points +11%
Intel NUC 13 Pro Desk Edition Kit
Intel Core i7-1360P
73480 Points +6%
Geekom XT12 Pro
Intel Core i9-12900H
69621 Points
Khadas Mind
Intel Core i7-1360P
61639 Points -11%
Blender - v2.79 BMW27 CPU
Khadas Mind
Intel Core i7-1360P
324 Seconds * -9%
Geekom XT12 Pro
Intel Core i9-12900H
296 Seconds *
Minisforum Neptune Series NAD9
Intel Core i9-12900H
273 Seconds * +8%
Intel NUC 13 Pro Desk Edition Kit
Intel Core i7-1360P
268 Seconds * +9%
Geekom A7
AMD Ryzen 9 7940HS
202 Seconds * +32%
Minisforum EliteMini UM780 XTX
AMD Ryzen 7 7840HS
192 Seconds * +35%
Acemagic F2A
Intel Core Ultra 7 155H
178 Seconds * +40%
wPrime 2.10
32m
Khadas Mind
Intel Core i7-1360P
4.957 s * -21%
Geekom XT12 Pro
Intel Core i9-12900H
4.111 s *
Intel NUC 13 Pro Desk Edition Kit
Intel Core i7-1360P
3.754 s * +9%
Acemagic F2A
Intel Core Ultra 7 155H
3.523 s * +14%
Minisforum Neptune Series NAD9
Intel Core i9-12900H
3.421 s * +17%
Geekom A7
AMD Ryzen 9 7940HS
2.648 s * +36%
Minisforum EliteMini UM780 XTX
AMD Ryzen 7 7840HS
2.626 s * +36%
1024m
Intel NUC 13 Pro Desk Edition Kit
Intel Core i7-1360P
304.68 s * -50%
Khadas Mind
Intel Core i7-1360P
240.083 s * -18%
Geekom XT12 Pro
Intel Core i9-12900H
202.68 s *
Minisforum Neptune Series NAD9
Intel Core i9-12900H
189.07 s * +7%
Acemagic F2A
Intel Core Ultra 7 155H
139.617 s * +31%
Geekom A7
AMD Ryzen 9 7940HS
98.222 s * +52%
Minisforum EliteMini UM780 XTX
AMD Ryzen 7 7840HS
72.819 s * +64%
X264 HD Benchmark 4.0
Pass 1
Acemagic F2A
Intel Core Ultra 7 155H
325 (323min - 328max) fps +24%
Intel NUC 13 Pro Desk Edition Kit
Intel Core i7-1360P
312.5 (304min - 328max) fps +19%
Minisforum EliteMini UM780 XTX
AMD Ryzen 7 7840HS
298 (288min - 300max) fps +14%
Geekom A7
AMD Ryzen 9 7940HS
292.5 (291min - 296max) fps +12%
Khadas Mind
Intel Core i7-1360P
273 (264min - 275max) fps +4%
Geekom XT12 Pro
Intel Core i9-12900H
262 (259min - 282max) fps
Minisforum Neptune Series NAD9
Intel Core i9-12900H
245 (239min - 261max) fps -6%
Pass 2
Acemagic F2A
Intel Core Ultra 7 155H
154.15 (153.8min - 154.3max) fps +67%
Minisforum EliteMini UM780 XTX
AMD Ryzen 7 7840HS
149.3 (148.8min - 149.8max) fps +62%
Geekom A7
AMD Ryzen 9 7940HS
140.8 (138.2min - 144.7max) fps +53%
Minisforum Neptune Series NAD9
Intel Core i9-12900H
125.25 (105.2min - 130max) fps +36%
Intel NUC 13 Pro Desk Edition Kit
Intel Core i7-1360P
114.95 (107min - 127.4max) fps +25%
Khadas Mind
Intel Core i7-1360P
94.7 (87.4min - 101.7max) fps +3%
Geekom XT12 Pro
Intel Core i9-12900H
92.2 (91min - 114.5max) fps
WinRAR - Result
Geekom XT12 Pro
Intel Core i9-12900H
7945 KB/s
Minisforum Neptune Series NAD9
Intel Core i9-12900H
7937 KB/s 0%
Acemagic F2A
Intel Core Ultra 7 155H
7723 KB/s -3%
Minisforum EliteMini UM780 XTX
AMD Ryzen 7 7840HS
7699 KB/s -3%
Geekom A7
AMD Ryzen 9 7940HS
7490 KB/s -6%
Khadas Mind
Intel Core i7-1360P
6079 KB/s -23%
Intel NUC 13 Pro Desk Edition Kit
Intel Core i7-1360P
4933 KB/s -38%
TrueCrypt
AES Mean 100MB
Geekom A7
AMD Ryzen 9 7940HS
15.1 GB/s +35%
Minisforum EliteMini UM780 XTX
AMD Ryzen 7 7840HS
14.9 GB/s +33%
Intel NUC 13 Pro Desk Edition Kit
Intel Core i7-1360P
12.3 GB/s +10%
Geekom XT12 Pro
Intel Core i9-12900H
11.2 GB/s
Acemagic F2A
Intel Core Ultra 7 155H
10.6 GB/s -5%
Khadas Mind
Intel Core i7-1360P
9.5 GB/s -15%
Minisforum Neptune Series NAD9
Intel Core i9-12900H
8.6 GB/s -23%
Twofish Mean 100MB
Intel NUC 13 Pro Desk Edition Kit
Intel Core i7-1360P
2.3 GB/s +21%
Minisforum EliteMini UM780 XTX
AMD Ryzen 7 7840HS
2.1 GB/s +11%
Geekom A7
AMD Ryzen 9 7940HS
2.1 GB/s +11%
Minisforum Neptune Series NAD9
Intel Core i9-12900H
2 GB/s +5%
Geekom XT12 Pro
Intel Core i9-12900H
1.9 GB/s
Khadas Mind
Intel Core i7-1360P
1.7 GB/s -11%
Acemagic F2A
Intel Core Ultra 7 155H
1.7 GB/s -11%
Serpent Mean 100MB
Minisforum EliteMini UM780 XTX
AMD Ryzen 7 7840HS
1.3 GB/s +18%
Geekom A7
AMD Ryzen 9 7940HS
1.3 GB/s +18%
Intel NUC 13 Pro Desk Edition Kit
Intel Core i7-1360P
1.2 GB/s +9%
Geekom XT12 Pro
Intel Core i9-12900H
1.1 GB/s
Acemagic F2A
Intel Core Ultra 7 155H
1 GB/s -9%
Minisforum Neptune Series NAD9
Intel Core i9-12900H
0.974 GB/s -11%
Khadas Mind
Intel Core i7-1360P
0.935 GB/s -15%
Geekbench 5.5
Multi-Core
Acemagic F2A
Intel Core Ultra 7 155H
12662 Points +26%
Geekom A7
AMD Ryzen 9 7940HS
12261 Points +22%
Minisforum EliteMini UM780 XTX
AMD Ryzen 7 7840HS
12177 Points +21%
Intel NUC 13 Pro Desk Edition Kit
Intel Core i7-1360P
10269 Points +2%
Geekom XT12 Pro
Intel Core i9-12900H
10028 Points
Minisforum Neptune Series NAD9
Intel Core i9-12900H
9695 Points -3%
Khadas Mind
Intel Core i7-1360P
9159 Points -9%
Single-Core
Geekom A7
AMD Ryzen 9 7940HS
2008 Points +12%
Minisforum EliteMini UM780 XTX
AMD Ryzen 7 7840HS
1943 Points +9%
Minisforum Neptune Series NAD9
Intel Core i9-12900H
1861 Points +4%
Intel NUC 13 Pro Desk Edition Kit
Intel Core i7-1360P
1832 Points +2%
Khadas Mind
Intel Core i7-1360P
1824 Points +2%
Geekom XT12 Pro
Intel Core i9-12900H
1790 Points
Acemagic F2A
Intel Core Ultra 7 155H
1746 Points -2%
Geekbench 5.0
5.0 Multi-Core
Acemagic F2A
Intel Core Ultra 7 155H
12438 Points +26%
Geekom A7
AMD Ryzen 9 7940HS
12127 Points +23%
Minisforum EliteMini UM780 XTX
AMD Ryzen 7 7840HS
11933 Points +21%
Intel NUC 13 Pro Desk Edition Kit
Intel Core i7-1360P
10213 Points +3%
Geekom XT12 Pro
Intel Core i9-12900H
9892 Points
Minisforum Neptune Series NAD9
Intel Core i9-12900H
9663 Points -2%
Khadas Mind
Intel Core i7-1360P
9000 Points -9%
5.0 Single-Core
Geekom A7
AMD Ryzen 9 7940HS
1918 Points +12%
Minisforum EliteMini UM780 XTX
AMD Ryzen 7 7840HS
1900 Points +11%
Minisforum Neptune Series NAD9
Intel Core i9-12900H
1838 Points +7%
Khadas Mind
Intel Core i7-1360P
1826 Points +7%
Intel NUC 13 Pro Desk Edition Kit
Intel Core i7-1360P
1784 Points +4%
Geekom XT12 Pro
Intel Core i9-12900H
1710 Points
Acemagic F2A
Intel Core Ultra 7 155H
1708 Points 0%
Geekbench 4.4
64 Bit Single-Core Score
Geekom A7
AMD Ryzen 9 7940HS
8253 Points +8%
Khadas Mind
Intel Core i7-1360P
8084 Points +6%
Minisforum EliteMini UM780 XTX
AMD Ryzen 7 7840HS
8048 Points +5%
Minisforum Neptune Series NAD9
Intel Core i9-12900H
8015 Points +5%
Intel NUC 13 Pro Desk Edition Kit
Intel Core i7-1360P
7950 Points +4%
Geekom XT12 Pro
Intel Core i9-12900H
7635 Points
Acemagic F2A
Intel Core Ultra 7 155H
6927 Points -9%
64 Bit Multi-Core Score
Minisforum EliteMini UM780 XTX
AMD Ryzen 7 7840HS
48743 Points +30%
Geekom A7
AMD Ryzen 9 7940HS
48723 Points +30%
Acemagic F2A
Intel Core Ultra 7 155H
45250 Points +21%
Intel NUC 13 Pro Desk Edition Kit
Intel Core i7-1360P
39116 Points +5%
Geekom XT12 Pro
Intel Core i9-12900H
37359 Points
Minisforum Neptune Series NAD9
Intel Core i9-12900H
36692 Points -2%
Khadas Mind
Intel Core i7-1360P
33052 Points -12%
3DMark 11 - 1280x720 Performance Physics
Minisforum EliteMini UM780 XTX
AMD Ryzen 7 7840HS
22960 Points +38%
Geekom A7
AMD Ryzen 9 7940HS
22600 Points +36%
Acemagic F2A
Intel Core Ultra 7 155H
20846 Points +25%
Intel NUC 13 Pro Desk Edition Kit
Intel Core i7-1360P
18679 Points +12%
Minisforum Neptune Series NAD9
Intel Core i9-12900H
18382 Points +11%
Geekom XT12 Pro
Intel Core i9-12900H
16634 Points
Khadas Mind
Intel Core i7-1360P
15245 Points -8%
7-Zip 18.03
7z b 4
Minisforum EliteMini UM780 XTX
AMD Ryzen 7 7840HS
72684 MIPS +54%
Geekom A7
AMD Ryzen 9 7940HS
70707 MIPS +50%
Acemagic F2A
Intel Core Ultra 7 155H
66438 MIPS +41%
Intel NUC 13 Pro Desk Edition Kit
Intel Core i7-1360P
51340 MIPS +9%
Minisforum Neptune Series NAD9
Intel Core i9-12900H
51151 MIPS +8%
Geekom XT12 Pro
Intel Core i9-12900H
47146 MIPS
Khadas Mind
Intel Core i7-1360P
43201 MIPS -8%
7z b 4 -mmt1
Geekom A7
AMD Ryzen 9 7940HS
6744 MIPS +15%
Minisforum EliteMini UM780 XTX
AMD Ryzen 7 7840HS
6563 MIPS +12%
Minisforum Neptune Series NAD9
Intel Core i9-12900H
6019 MIPS +2%
Khadas Mind
Intel Core i7-1360P
5904 MIPS 0%
Geekom XT12 Pro
Intel Core i9-12900H
5881 MIPS
Intel NUC 13 Pro Desk Edition Kit
Intel Core i7-1360P
5840 MIPS -1%
Acemagic F2A
Intel Core Ultra 7 155H
5485 MIPS -7%
HWBOT x265 Benchmark v2.2 - 4k Preset
Minisforum EliteMini UM780 XTX
AMD Ryzen 7 7840HS
20.9 fps +70%
Geekom A7
AMD Ryzen 9 7940HS
20.6 fps +67%
Acemagic F2A
Intel Core Ultra 7 155H
19.6 fps +59%
Minisforum Neptune Series NAD9
Intel Core i9-12900H
14.1 fps +15%
Intel NUC 13 Pro Desk Edition Kit
Intel Core i7-1360P
13.9 fps +13%
Geekom XT12 Pro
Intel Core i9-12900H
12.3 fps
Khadas Mind
Intel Core i7-1360P
11.4 fps -7%
R Benchmark 2.5 - Overall mean
Acemagic F2A
Intel Core Ultra 7 155H
0.4652 sec * -0%
Minisforum Neptune Series NAD9
Intel Core i9-12900H
0.4641 sec * -0%
Geekom XT12 Pro
Intel Core i9-12900H
0.4632 sec *
Intel NUC 13 Pro Desk Edition Kit
Intel Core i7-1360P
0.45 sec * +3%
Khadas Mind
Intel Core i7-1360P
0.4463 sec * +4%
Minisforum EliteMini UM780 XTX
AMD Ryzen 7 7840HS
0.4354 sec * +6%
Geekom A7
AMD Ryzen 9 7940HS
0.4351 sec * +6%
LibreOffice - 20 Documents To PDF
Geekom A7
AMD Ryzen 9 7940HS
54.8 s * -38%
Minisforum EliteMini UM780 XTX
AMD Ryzen 7 7840HS
53.9 s * -36%
Intel NUC 13 Pro Desk Edition Kit
Intel Core i7-1360P
46.9 s * -18%
Acemagic F2A
Intel Core Ultra 7 155H
44.5 s * -12%
Khadas Mind
Intel Core i7-1360P
40.9 s * -3%
Geekom XT12 Pro
Intel Core i9-12900H
39.6 s *
Minisforum Neptune Series NAD9
Intel Core i9-12900H
38 s * +4%
WebXPRT 3 - Overall
Geekom A7
AMD Ryzen 9 7940HS
333 Points +14%
Minisforum EliteMini UM780 XTX
AMD Ryzen 7 7840HS
324 Points +11%
Khadas Mind
Intel Core i7-1360P
316 Points +9%
Minisforum Neptune Series NAD9
Intel Core i9-12900H
311 Points +7%
Intel NUC 13 Pro Desk Edition Kit
Intel Core i7-1360P
301 Points +3%
Geekom XT12 Pro
Intel Core i9-12900H
291 Points
Acemagic F2A
Intel Core Ultra 7 155H
276 Points -5%
Mozilla Kraken 1.1 - Total
Minisforum Neptune Series NAD9
Intel Core i9-12900H
577 ms * -13%
Acemagic F2A
Intel Core Ultra 7 155H
535 ms * -5%
Minisforum EliteMini UM780 XTX
AMD Ryzen 7 7840HS
517 ms * -1%
Geekom XT12 Pro
Intel Core i9-12900H
511 ms *
Geekom A7
AMD Ryzen 9 7940HS
503 ms * +2%
Khadas Mind
Intel Core i7-1360P
502 ms * +2%
Intel NUC 13 Pro Desk Edition Kit
Intel Core i7-1360P
496 ms * +3%
3DMark
1920x1080 Fire Strike Physics
Minisforum EliteMini UM780 XTX
AMD Ryzen 7 7840HS
28906 Points +30%
Geekom A7
AMD Ryzen 9 7940HS
25816 Points +16%
Intel NUC 13 Pro Desk Edition Kit
Intel Core i7-1360P
25349 Points +14%
Acemagic F2A
Intel Core Ultra 7 155H
25043 Points +13%
Minisforum Neptune Series NAD9
Intel Core i9-12900H
22244 Points 0%
Geekom XT12 Pro
Intel Core i9-12900H
22242 Points
Khadas Mind
Intel Core i7-1360P
18564 Points -17%
2560x1440 Time Spy CPU
Minisforum EliteMini UM780 XTX
AMD Ryzen 7 7840HS
11159 Points +40%
Minisforum Neptune Series NAD9
Intel Core i9-12900H
10539 Points +32%
Geekom A7
AMD Ryzen 9 7940HS
10397 Points +30%
Acemagic F2A
Intel Core Ultra 7 155H
10014 Points +25%
Intel NUC 13 Pro Desk Edition Kit
Intel Core i7-1360P
8845 Points +11%
Geekom XT12 Pro
Intel Core i9-12900H
7985 Points
Khadas Mind
Intel Core i7-1360P
7942 Points -1%

* ... smaller is better

Performance Rating - Percent
Geekom A7
AMD Ryzen 9 7940HS, 4000 MHz
43.1 pt
Minisforum EliteMini UM780 XTX
AMD Ryzen 7 7840HS, 3800 MHz
42.4 pt
Acemagic F2A
Intel Core Ultra 7 155H, 3800 MHz
39 pt
Intel NUC 13 Pro Desk Edition Kit
Intel Core i7-1360P, 1600 MHz
38 pt
Geekom XT12 Pro
Intel Core i9-12900H, 1800 MHz
36.5 pt
Khadas Mind
Intel Core i7-1360P, 1600 MHz
36.5 pt
Minisforum Neptune Series NAD9
Intel Core i9-12900H, 1800 MHz
35.9 pt
Geekbench 5.5
Multi-Core
Acemagic F2A
Intel Core Ultra 7 155H, 3800 MHz
12662 Points +26%
Geekom A7
AMD Ryzen 9 7940HS, 4000 MHz
12261 Points +22%
Minisforum EliteMini UM780 XTX
AMD Ryzen 7 7840HS, 3800 MHz
12177 Points +21%
Intel NUC 13 Pro Desk Edition Kit
Intel Core i7-1360P, 1600 MHz
10269 Points +2%
Geekom XT12 Pro
Intel Core i9-12900H, 1800 MHz
10028 Points
Minisforum Neptune Series NAD9
Intel Core i9-12900H, 1800 MHz
9695 Points -3%
Khadas Mind
Intel Core i7-1360P, 1600 MHz
9159 Points -9%
Single-Core
Geekom A7
AMD Ryzen 9 7940HS, 4000 MHz
2008 Points +12%
Minisforum EliteMini UM780 XTX
AMD Ryzen 7 7840HS, 3800 MHz
1943 Points +9%
Minisforum Neptune Series NAD9
Intel Core i9-12900H, 1800 MHz
1861 Points +4%
Intel NUC 13 Pro Desk Edition Kit
Intel Core i7-1360P, 1600 MHz
1832 Points +2%
Khadas Mind
Intel Core i7-1360P, 1600 MHz
1824 Points +2%
Geekom XT12 Pro
Intel Core i9-12900H, 1800 MHz
1790 Points
Acemagic F2A
Intel Core Ultra 7 155H, 3800 MHz
1746 Points -2%
Geekbench 5.0
5.0 Multi-Core
Acemagic F2A
Intel Core Ultra 7 155H, 3800 MHz
12438 Points +26%
Geekom A7
AMD Ryzen 9 7940HS, 4000 MHz
12127 Points +23%
Minisforum EliteMini UM780 XTX
AMD Ryzen 7 7840HS, 3800 MHz
11933 Points +21%
Intel NUC 13 Pro Desk Edition Kit
Intel Core i7-1360P, 1600 MHz
10213 Points +3%
Geekom XT12 Pro
Intel Core i9-12900H, 1800 MHz
9892 Points
Minisforum Neptune Series NAD9
Intel Core i9-12900H, 1800 MHz
9663 Points -2%
Khadas Mind
Intel Core i7-1360P, 1600 MHz
9000 Points -9%
5.0 Single-Core
Geekom A7
AMD Ryzen 9 7940HS, 4000 MHz
1918 Points +12%
Minisforum EliteMini UM780 XTX
AMD Ryzen 7 7840HS, 3800 MHz
1900 Points +11%
Minisforum Neptune Series NAD9
Intel Core i9-12900H, 1800 MHz
1838 Points +7%
Khadas Mind
Intel Core i7-1360P, 1600 MHz
1826 Points +7%
Intel NUC 13 Pro Desk Edition Kit
Intel Core i7-1360P, 1600 MHz
1784 Points +4%
Geekom XT12 Pro
Intel Core i9-12900H, 1800 MHz
1710 Points
Acemagic F2A
Intel Core Ultra 7 155H, 3800 MHz
1708 Points 0%
Geekbench 4.4
64 Bit Single-Core Score
Geekom A7
AMD Ryzen 9 7940HS, 4000 MHz
8253 Points +8%
Khadas Mind
Intel Core i7-1360P, 1600 MHz
8084 Points +6%
Minisforum EliteMini UM780 XTX
AMD Ryzen 7 7840HS, 3800 MHz
8048 Points +5%
Minisforum Neptune Series NAD9
Intel Core i9-12900H, 1800 MHz
8015 Points +5%
Intel NUC 13 Pro Desk Edition Kit
Intel Core i7-1360P, 1600 MHz
7950 Points +4%
Geekom XT12 Pro
Intel Core i9-12900H, 1800 MHz
7635 Points
Acemagic F2A
Intel Core Ultra 7 155H, 3800 MHz
6927 Points -9%
64 Bit Multi-Core Score
Minisforum EliteMini UM780 XTX
AMD Ryzen 7 7840HS, 3800 MHz
48743 Points +30%
Geekom A7
AMD Ryzen 9 7940HS, 4000 MHz
48723 Points +30%
Acemagic F2A
Intel Core Ultra 7 155H, 3800 MHz
45250 Points +21%
Intel NUC 13 Pro Desk Edition Kit
Intel Core i7-1360P, 1600 MHz
39116 Points +5%
Geekom XT12 Pro
Intel Core i9-12900H, 1800 MHz
37359 Points
Minisforum Neptune Series NAD9
Intel Core i9-12900H, 1800 MHz
36692 Points -2%
Khadas Mind
Intel Core i7-1360P, 1600 MHz
33052 Points -12%
Geekbench 6.0
Single-Core
Geekom A7
AMD Ryzen 9 7940HS, 4000 MHz
2603 Points +12%
Minisforum EliteMini UM780 XTX
AMD Ryzen 7 7840HS, 3800 MHz
2572 Points +11%
Khadas Mind
Intel Core i7-1360P, 1600 MHz
2478 Points +7%
Khadas Mind
Intel Core i7-1360P, 1600 MHz
2444 Points +5%
Intel NUC 13 Pro Desk Edition Kit
Intel Core i7-1360P, 1600 MHz
2454 Points +6%
Geekom XT12 Pro
Intel Core i9-12900H, 1800 MHz
2325 Points
Acemagic F2A
Intel Core Ultra 7 155H, 3800 MHz
2313 Points -1%
Minisforum Neptune Series NAD9
Intel Core i9-12900H, 1800 MHz
2093 Points -10%
Multi-Core
Geekom A7
AMD Ryzen 9 7940HS, 4000 MHz
12882 Points +30%
Minisforum EliteMini UM780 XTX
AMD Ryzen 7 7840HS, 3800 MHz
12727 Points +28%
Acemagic F2A
Intel Core Ultra 7 155H, 3800 MHz
12061 Points +21%
Intel NUC 13 Pro Desk Edition Kit
Intel Core i7-1360P, 1600 MHz
10485 Points +6%
Geekom XT12 Pro
Intel Core i9-12900H, 1800 MHz
9930 Points
Khadas Mind
Intel Core i7-1360P, 1600 MHz
9451 Points -5%
Khadas Mind
Intel Core i7-1360P, 1600 MHz
9448 Points -5%
Minisforum Neptune Series NAD9
Intel Core i9-12900H, 1800 MHz
9067 Points -9%
GPU OpenCL 6.0
Acemagic F2A
Intel Core Ultra 7 155H, 3800 MHz
33510 Points +113%
Geekom A7
AMD Ryzen 9 7940HS, 4000 MHz
32752 Points +108%
Minisforum EliteMini UM780 XTX
AMD Ryzen 7 7840HS, 3800 MHz
31897 Points +103%
Intel NUC 13 Pro Desk Edition Kit
Intel Core i7-1360P, 1600 MHz
16320 Points +4%
Minisforum Neptune Series NAD9
Intel Core i9-12900H, 1800 MHz
15826 Points +1%
Khadas Mind
Intel Core i7-1360P, 1600 MHz
15772 Points 0%
Khadas Mind
Intel Core i7-1360P, 1600 MHz
15564 Points -1%
Geekom XT12 Pro
Intel Core i9-12900H, 1800 MHz
15718 Points
GPU Vulkan 6.0
Minisforum EliteMini UM780 XTX
AMD Ryzen 7 7840HS, 3800 MHz
30868 Points +53%
Geekom A7
AMD Ryzen 9 7940HS, 4000 MHz
30410 Points +51%
Khadas Mind
Intel Core i7-1360P, 1600 MHz
21704 Points +7%
Khadas Mind
Intel Core i7-1360P, 1600 MHz
21642 Points +7%
Intel NUC 13 Pro Desk Edition Kit
Intel Core i7-1360P, 1600 MHz
20826 Points +3%
Acemagic F2A
Intel Core Ultra 7 155H, 3800 MHz
20794 Points +3%
Minisforum Neptune Series NAD9
Intel Core i9-12900H, 1800 MHz
20288 Points 0%
Geekom XT12 Pro
Intel Core i9-12900H, 1800 MHz
20199 Points
Performance Rating
Minisforum EliteMini UM780 XTX
AMD Ryzen 7 7840HS, Radeon 780M
98.3 pt
Geekom A7
AMD Ryzen 9 7940HS, Radeon 780M
94.6 pt
Acemagic F2A
Intel Core Ultra 7 155H, Arc 8-Core
77.4 pt
Average of class Mini PC
 
55.4 pt
Minisforum Neptune Series NAD9
Intel Core i9-12900H, Iris Xe G7 96EUs
52.6 pt
Intel NUC 13 Pro Desk Edition Kit
Intel Core i7-1360P, Iris Xe G7 96EUs
51.9 pt
Geekom XT12 Pro
Intel Core i9-12900H, Iris Xe G7 96EUs
51.6 pt
Khadas Mind
Intel Core i7-1360P, Iris Xe G7 96EUs
49.6 pt
AIDA64 / FP32 Ray-Trace
Minisforum EliteMini UM780 XTX
AMD Ryzen 7 7840HS, Radeon 780M
26889 KRay/s +157%
Geekom A7
AMD Ryzen 9 7940HS, Radeon 780M
25359 KRay/s +142%
Acemagic F2A
Intel Core Ultra 7 155H, Arc 8-Core
17544 KRay/s +67%
Average of class Mini PC
  (561 - 51004, n=119, last 2 years)
12449 KRay/s +19%
Intel NUC 13 Pro Desk Edition Kit
Intel Core i7-1360P, Iris Xe G7 96EUs
11188 KRay/s +7%
Minisforum Neptune Series NAD9
Intel Core i9-12900H, Iris Xe G7 96EUs
10952 KRay/s +5%
Geekom XT12 Pro
Intel Core i9-12900H, Iris Xe G7 96EUs
10476 KRay/s
Khadas Mind
Intel Core i7-1360P, Iris Xe G7 96EUs
9567 KRay/s -9%
AIDA64 / FPU Julia
Minisforum EliteMini UM780 XTX
AMD Ryzen 7 7840HS, Radeon 780M
113684 Points +110%
Geekom A7
AMD Ryzen 9 7940HS, Radeon 780M
107540 Points +99%
Acemagic F2A
Intel Core Ultra 7 155H, Arc 8-Core
88829 Points +64%
Average of class Mini PC
  (3604 - 214250, n=119, last 2 years)
62645 Points +16%
Intel NUC 13 Pro Desk Edition Kit
Intel Core i7-1360P, Iris Xe G7 96EUs
56942 Points +5%
Minisforum Neptune Series NAD9
Intel Core i9-12900H, Iris Xe G7 96EUs
55221 Points +2%
Geekom XT12 Pro
Intel Core i9-12900H, Iris Xe G7 96EUs
54166 Points
Khadas Mind
Intel Core i7-1360P, Iris Xe G7 96EUs
47763 Points -12%
AIDA64 / CPU SHA3
Minisforum EliteMini UM780 XTX
AMD Ryzen 7 7840HS, Radeon 780M
4953 MB/s +98%
Geekom A7
AMD Ryzen 9 7940HS, Radeon 780M
4753 MB/s +90%
Acemagic F2A
Intel Core Ultra 7 155H, Arc 8-Core
4246 MB/s +70%
Average of class Mini PC
  (225 - 9399, n=119, last 2 years)
2760 MB/s +10%
Intel NUC 13 Pro Desk Edition Kit
Intel Core i7-1360P, Iris Xe G7 96EUs
2669 MB/s +7%
Minisforum Neptune Series NAD9
Intel Core i9-12900H, Iris Xe G7 96EUs
2558 MB/s +2%
Geekom XT12 Pro
Intel Core i9-12900H, Iris Xe G7 96EUs
2504 MB/s
Khadas Mind
Intel Core i7-1360P, Iris Xe G7 96EUs
2430 MB/s -3%
AIDA64 / CPU Queen
Geekom A7
AMD Ryzen 9 7940HS, Radeon 780M
118174 Points +44%
Minisforum EliteMini UM780 XTX
AMD Ryzen 7 7840HS, Radeon 780M
117103 Points +42%
Acemagic F2A
Intel Core Ultra 7 155H, Arc 8-Core
89748 Points +9%
Intel NUC 13 Pro Desk Edition Kit
Intel Core i7-1360P, Iris Xe G7 96EUs
86881 Points +6%
Minisforum Neptune Series NAD9
Intel Core i9-12900H, Iris Xe G7 96EUs
85240 Points +4%
Geekom XT12 Pro
Intel Core i9-12900H, Iris Xe G7 96EUs
82291 Points
Average of class Mini PC
  (8172 - 184747, n=119, last 2 years)
77998 Points -5%
Khadas Mind
Intel Core i7-1360P, Iris Xe G7 96EUs
65324 Points -21%
AIDA64 / FPU SinJulia
Minisforum EliteMini UM780 XTX
AMD Ryzen 7 7840HS, Radeon 780M
15145 Points +107%
Geekom A7
AMD Ryzen 9 7940HS, Radeon 780M
14663 Points +100%
Acemagic F2A
Intel Core Ultra 7 155H, Arc 8-Core
10247 Points +40%
Average of class Mini PC
  (408 - 29064, n=119, last 2 years)
8538 Points +17%
Minisforum Neptune Series NAD9
Intel Core i9-12900H, Iris Xe G7 96EUs
7548 Points +3%
Geekom XT12 Pro
Intel Core i9-12900H, Iris Xe G7 96EUs
7317 Points
Intel NUC 13 Pro Desk Edition Kit
Intel Core i7-1360P, Iris Xe G7 96EUs
7246 Points -1%
Khadas Mind
Intel Core i7-1360P, Iris Xe G7 96EUs
5734 Points -22%
AIDA64 / FPU Mandel
Minisforum EliteMini UM780 XTX
AMD Ryzen 7 7840HS, Radeon 780M
60809 Points +126%
Geekom A7
AMD Ryzen 9 7940HS, Radeon 780M
57402 Points +114%
Acemagic F2A
Intel Core Ultra 7 155H, Arc 8-Core
45718 Points +70%
Average of class Mini PC
  (1958 - 113499, n=119, last 2 years)
32689 Points +22%
Minisforum Neptune Series NAD9
Intel Core i9-12900H, Iris Xe G7 96EUs
28159 Points +5%
Intel NUC 13 Pro Desk Edition Kit
Intel Core i7-1360P, Iris Xe G7 96EUs
28019 Points +4%
Geekom XT12 Pro
Intel Core i9-12900H, Iris Xe G7 96EUs
26850 Points
Khadas Mind
Intel Core i7-1360P, Iris Xe G7 96EUs
22832 Points -15%
AIDA64 / CPU AES
Minisforum EliteMini UM780 XTX
AMD Ryzen 7 7840HS, Radeon 780M
170745 MB/s +79%
Geekom A7
AMD Ryzen 9 7940HS, Radeon 780M
164414 MB/s +72%
Acemagic F2A
Intel Core Ultra 7 155H, Arc 8-Core
144741 MB/s +52%
Minisforum Neptune Series NAD9
Intel Core i9-12900H, Iris Xe G7 96EUs
99521 MB/s +4%
Geekom XT12 Pro
Intel Core i9-12900H, Iris Xe G7 96EUs
95500 MB/s
Average of class Mini PC
  (3691 - 325960, n=119, last 2 years)
85358 MB/s -11%
Khadas Mind
Intel Core i7-1360P, Iris Xe G7 96EUs
80041 MB/s -16%
Intel NUC 13 Pro Desk Edition Kit
Intel Core i7-1360P, Iris Xe G7 96EUs
53328 MB/s -44%
AIDA64 / CPU ZLib
Acemagic F2A
Intel Core Ultra 7 155H, Arc 8-Core
1183 MB/s +59%
Minisforum EliteMini UM780 XTX
AMD Ryzen 7 7840HS, Radeon 780M
1075 MB/s +44%
Geekom A7
AMD Ryzen 9 7940HS, Radeon 780M
1020 MB/s +37%
Intel NUC 13 Pro Desk Edition Kit
Intel Core i7-1360P, Iris Xe G7 96EUs
775 MB/s +4%
Geekom XT12 Pro
Intel Core i9-12900H, Iris Xe G7 96EUs
745 MB/s
Minisforum Neptune Series NAD9
Intel Core i9-12900H, Iris Xe G7 96EUs
732 MB/s -2%
Average of class Mini PC
  (74.8 - 2039, n=119, last 2 years)
714 MB/s -4%
Khadas Mind
Intel Core i7-1360P, Iris Xe G7 96EUs
671 MB/s -10%
AIDA64 / FP64 Ray-Trace
Minisforum EliteMini UM780 XTX
AMD Ryzen 7 7840HS, Radeon 780M
14284 KRay/s +147%
Geekom A7
AMD Ryzen 9 7940HS, Radeon 780M
13517 KRay/s +134%
Acemagic F2A
Intel Core Ultra 7 155H, Arc 8-Core
9284 KRay/s +61%
Average of class Mini PC
  (308 - 26952, n=119, last 2 years)
6658 KRay/s +15%
Intel NUC 13 Pro Desk Edition Kit
Intel Core i7-1360P, Iris Xe G7 96EUs
5957 KRay/s +3%
Minisforum Neptune Series NAD9
Intel Core i9-12900H, Iris Xe G7 96EUs
5777 KRay/s 0%
Geekom XT12 Pro
Intel Core i9-12900H, Iris Xe G7 96EUs
5777 KRay/s
Khadas Mind
Intel Core i7-1360P, Iris Xe G7 96EUs
4975 KRay/s -14%
AIDA64 / CPU PhotoWorxx
Khadas Mind
Intel Core i7-1360P, Iris Xe G7 96EUs
43544 MPixel/s +75%
Geekom A7
AMD Ryzen 9 7940HS, Radeon 780M
40570 MPixel/s +63%
Minisforum EliteMini UM780 XTX
AMD Ryzen 7 7840HS, Radeon 780M
40460 MPixel/s +63%
Acemagic F2A
Intel Core Ultra 7 155H, Arc 8-Core
33092 MPixel/s +33%
Intel NUC 13 Pro Desk Edition Kit
Intel Core i7-1360P, Iris Xe G7 96EUs
29263 MPixel/s +18%
Average of class Mini PC
  (4408 - 50500, n=119, last 2 years)
27805 MPixel/s +12%
Geekom XT12 Pro
Intel Core i9-12900H, Iris Xe G7 96EUs
24858 MPixel/s
Minisforum Neptune Series NAD9
Intel Core i9-12900H, Iris Xe G7 96EUs
24323 MPixel/s -2%
Cinebench R10 Rendering Single 32Bit
7952
Cinebench R10 Shading 64Bit
18813 Points
Cinebench R10 Rendering Multiple CPUs 64Bit
69621 Points
Cinebench R10 Rendering Single CPUs 64Bit
13378 Points
Cinebench R10 Shading 32Bit
15567
Cinebench R10 Rendering Multiple CPUs 32Bit
35966
Cinebench R11.5 CPU Single 32Bit
2.63 Points
Cinebench R11.5 CPU Multi 32Bit
19.63 Points
Cinebench R11.5 OpenGL 32Bit
91.25 fps
Cinebench R11.5 CPU Single 64Bit
2.99 Points
Cinebench R11.5 CPU Multi 64Bit
21.11 Points
Cinebench R11.5 OpenGL 64Bit
93.7 fps
Cinebench R15 CPU Single 64Bit
251 Points
Cinebench R15 CPU Multi 64Bit
2121 Points
Cinebench R15 Ref. Match 64Bit
97.8 %
Cinebench R15 OpenGL 64Bit
104.99 fps
Cinebench R20 CPU (Single Core)
701 Points
Cinebench R20 CPU (Multi Core)
4294 Points
Cinebench R23 Multi Core
11036 Points
Cinebench R23 Single Core
1824 Points
Cinebench 2024 CPU Single Core
108 Points
Cinebench 2024 CPU Multi Core
578 Points
Ajuda

Geekom XT12 Pro no multi-loop Cinebench R15

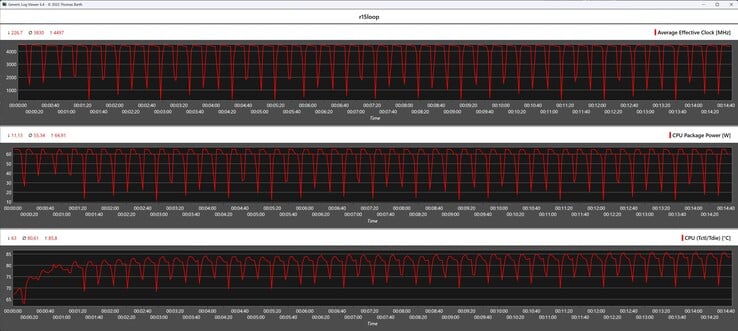
No loop contínuo do Cinebench R15, podemos ver que a Geekom instalou aqui uma unidade de resfriamento de desempenho relativamente baixo. Somente no início o Intel Core i9-12900H consegue apresentar um resultado significativamente melhor. A partir da segunda execução, o desempenho cai significativamente, o que significa que nossa amostra de teste está apenas no penúltimo lugar.

Métricas da CPU durante o loop do Cinebench R15
01452904355807258701015116013051450159517401885203021752320246526102755Tooltip
Geekom XT12 Pro Intel Core i9-12900H, Intel Core i9-12900H: Ø1545 (1395.97-2133.22)
Minisforum EliteMini UM780 XTX AMD Ryzen 7 7840HS, AMD Ryzen 7 7840HS: Ø2605 (2564.1-2649.53)
Minisforum Neptune Series NAD9 Intel Core i9-12900H, Intel Core i9-12900H: Ø1703 (1657.14-2261.04)
Acemagic F2A Intel Core Ultra 7 155H, Intel Core Ultra 7 155H: Ø2759 (2690.7-2800.92)
Geekom A7 AMD Ryzen 9 7940HS, AMD Ryzen 9 7940HS: Ø2410 (2285.58-2581.81)
Intel NUC 13 Pro Desk Edition Kit Intel Core i7-1360P, Intel Core i7-1360P: Ø1753 (1686.77-2083.33)
Khadas Mind Intel Core i7-1360P, Intel Core i7-1360P: Ø1443 (1386.82-1627.54)

Desempenho do sistema

O Geekom XT12 Pro domina muito bem os testes de desempenho do sistema e, em comparação com os testes de CPU pura, agora até vemos nossa amostra de teste no meio do campo. No entanto, isso mostra a desvantagem que a DDR4 tem agora em comparação com a DDR5: todos os sistemas baseados em DDR4 seguem os mini-PCs mais rápidos equipados com DDR5 por uma margem clara, dos quais o Geekom A7 foi o que apresentou o melhor desempenho.

PCMark 10 / Score
Minisforum EliteMini UM780 XTX, AMD Ryzen 7 7840HS
AMD Radeon 780M, Kingston OM8PGP41024Q-A0
7526 Points +20%
Geekom A7, AMD Ryzen 9 7940HS
AMD Radeon 780M, Acer N5000
7455 Points +18%
Acemagic F2A, Intel Core Ultra 7 155H
Intel Arc 8-Core iGPU, Kingston OM8SEP1024Q-A0
7120 Points +13%
Geekom XT12 Pro, Intel Core i9-12900H
Intel Iris Xe Graphics G7 96EUs, Lexar SSD NM7A1 1TB
6295 Points
Minisforum Neptune Series NAD9, Intel Core i9-12900H
Intel Iris Xe Graphics G7 96EUs, Kingston OM8PGP4512Q-A0
6187 Points -2%
Khadas Mind, Intel Core i7-1360P
Intel Iris Xe Graphics G7 96EUs, WD PC SN740 SDDPTQD-1T00
5937 Points -6%
Intel NUC 13 Pro Desk Edition Kit, Intel Core i7-1360P
Intel Iris Xe Graphics G7 96EUs, Samsung PM9A1 MZVL2512HCJQ
5882 Points -7%
PCMark 10 / Essentials
Geekom XT12 Pro, Intel Core i9-12900H
Intel Iris Xe Graphics G7 96EUs, Lexar SSD NM7A1 1TB
11273 Points
Minisforum Neptune Series NAD9, Intel Core i9-12900H
Intel Iris Xe Graphics G7 96EUs, Kingston OM8PGP4512Q-A0
11217 Points 0%
Acemagic F2A, Intel Core Ultra 7 155H
Intel Arc 8-Core iGPU, Kingston OM8SEP1024Q-A0
11125 Points -1%
Geekom A7, AMD Ryzen 9 7940HS
AMD Radeon 780M, Acer N5000
11114 Points -1%
Intel NUC 13 Pro Desk Edition Kit, Intel Core i7-1360P
Intel Iris Xe Graphics G7 96EUs, Samsung PM9A1 MZVL2512HCJQ
11035 Points -2%
Minisforum EliteMini UM780 XTX, AMD Ryzen 7 7840HS
AMD Radeon 780M, Kingston OM8PGP41024Q-A0
11011 Points -2%
Khadas Mind, Intel Core i7-1360P
Intel Iris Xe Graphics G7 96EUs, WD PC SN740 SDDPTQD-1T00
10761 Points -5%
PCMark 10 / Productivity
Minisforum EliteMini UM780 XTX, AMD Ryzen 7 7840HS
AMD Radeon 780M, Kingston OM8PGP41024Q-A0
10832 Points +33%
Geekom A7, AMD Ryzen 9 7940HS
AMD Radeon 780M, Acer N5000
10291 Points +27%
Acemagic F2A, Intel Core Ultra 7 155H
Intel Arc 8-Core iGPU, Kingston OM8SEP1024Q-A0
8901 Points +10%
Khadas Mind, Intel Core i7-1360P
Intel Iris Xe Graphics G7 96EUs, WD PC SN740 SDDPTQD-1T00
8161 Points +1%
Geekom XT12 Pro, Intel Core i9-12900H
Intel Iris Xe Graphics G7 96EUs, Lexar SSD NM7A1 1TB
8114 Points
Minisforum Neptune Series NAD9, Intel Core i9-12900H
Intel Iris Xe Graphics G7 96EUs, Kingston OM8PGP4512Q-A0
7673 Points -5%
Intel NUC 13 Pro Desk Edition Kit, Intel Core i7-1360P
Intel Iris Xe Graphics G7 96EUs, Samsung PM9A1 MZVL2512HCJQ
6576 Points -19%
CrossMark / Overall
Minisforum Neptune Series NAD9, Intel Core i9-12900H
Intel Iris Xe Graphics G7 96EUs, Kingston OM8PGP4512Q-A0
1894 Points +2%
Geekom A7, AMD Ryzen 9 7940HS
AMD Radeon 780M, Acer N5000
1861 Points 0%
Geekom XT12 Pro, Intel Core i9-12900H
Intel Iris Xe Graphics G7 96EUs, Lexar SSD NM7A1 1TB
1860 Points
Acemagic F2A, Intel Core Ultra 7 155H
Intel Arc 8-Core iGPU, Kingston OM8SEP1024Q-A0
1802 Points -3%
Minisforum EliteMini UM780 XTX, AMD Ryzen 7 7840HS
AMD Radeon 780M, Kingston OM8PGP41024Q-A0
1761 Points -5%
Intel NUC 13 Pro Desk Edition Kit, Intel Core i7-1360P
Intel Iris Xe Graphics G7 96EUs, Samsung PM9A1 MZVL2512HCJQ
1596 Points -14%
Khadas Mind, Intel Core i7-1360P
Intel Iris Xe Graphics G7 96EUs, WD PC SN740 SDDPTQD-1T00
1564 Points -16%
CrossMark / Responsiveness
Minisforum Neptune Series NAD9, Intel Core i9-12900H
Intel Iris Xe Graphics G7 96EUs, Kingston OM8PGP4512Q-A0
2116 Points +10%
Geekom XT12 Pro, Intel Core i9-12900H
Intel Iris Xe Graphics G7 96EUs, Lexar SSD NM7A1 1TB
1919 Points
Acemagic F2A, Intel Core Ultra 7 155H
Intel Arc 8-Core iGPU, Kingston OM8SEP1024Q-A0
1700 Points -11%
Geekom A7, AMD Ryzen 9 7940HS
AMD Radeon 780M, Acer N5000
1540 Points -20%
Khadas Mind, Intel Core i7-1360P
Intel Iris Xe Graphics G7 96EUs, WD PC SN740 SDDPTQD-1T00
1528 Points -20%
Minisforum EliteMini UM780 XTX, AMD Ryzen 7 7840HS
AMD Radeon 780M, Kingston OM8PGP41024Q-A0
1361 Points -29%
Intel NUC 13 Pro Desk Edition Kit, Intel Core i7-1360P
Intel Iris Xe Graphics G7 96EUs, Samsung PM9A1 MZVL2512HCJQ
1311 Points -32%
CrossMark / Creativity
Geekom A7, AMD Ryzen 9 7940HS
AMD Radeon 780M, Acer N5000
2072 Points +11%
Minisforum EliteMini UM780 XTX, AMD Ryzen 7 7840HS
AMD Radeon 780M, Kingston OM8PGP41024Q-A0
2040 Points +9%
Acemagic F2A, Intel Core Ultra 7 155H
Intel Arc 8-Core iGPU, Kingston OM8SEP1024Q-A0
1929 Points +3%
Geekom XT12 Pro, Intel Core i9-12900H
Intel Iris Xe Graphics G7 96EUs, Lexar SSD NM7A1 1TB
1870 Points
Minisforum Neptune Series NAD9, Intel Core i9-12900H
Intel Iris Xe Graphics G7 96EUs, Kingston OM8PGP4512Q-A0
1800 Points -4%
Intel NUC 13 Pro Desk Edition Kit, Intel Core i7-1360P
Intel Iris Xe Graphics G7 96EUs, Samsung PM9A1 MZVL2512HCJQ
1769 Points -5%
Khadas Mind, Intel Core i7-1360P
Intel Iris Xe Graphics G7 96EUs, WD PC SN740 SDDPTQD-1T00
1600 Points -14%
CrossMark / Productivity
Minisforum Neptune Series NAD9, Intel Core i9-12900H
Intel Iris Xe Graphics G7 96EUs, Kingston OM8PGP4512Q-A0
1921 Points +5%
Geekom XT12 Pro, Intel Core i9-12900H
Intel Iris Xe Graphics G7 96EUs, Lexar SSD NM7A1 1TB
1831 Points
Geekom A7, AMD Ryzen 9 7940HS
AMD Radeon 780M, Acer N5000
1781 Points -3%
Acemagic F2A, Intel Core Ultra 7 155H
Intel Arc 8-Core iGPU, Kingston OM8SEP1024Q-A0
1717 Points -6%
Minisforum EliteMini UM780 XTX, AMD Ryzen 7 7840HS
AMD Radeon 780M, Kingston OM8PGP41024Q-A0
1656 Points -10%
Khadas Mind, Intel Core i7-1360P
Intel Iris Xe Graphics G7 96EUs, WD PC SN740 SDDPTQD-1T00
1541 Points -16%
Intel NUC 13 Pro Desk Edition Kit, Intel Core i7-1360P
Intel Iris Xe Graphics G7 96EUs, Samsung PM9A1 MZVL2512HCJQ
1537 Points -16%
AIDA64 / Memory Copy
Geekom A7
AMD Ryzen 9 7940HS, Radeon 780M
67161 MB/s +47%
Minisforum EliteMini UM780 XTX
AMD Ryzen 7 7840HS, Radeon 780M
67039 MB/s +46%
Khadas Mind
Intel Core i7-1360P, Iris Xe G7 96EUs
65299 MB/s +43%
Acemagic F2A
Intel Core Ultra 7 155H, Arc 8-Core
62397 MB/s +36%
Average of class Mini PC
  (6481 - 89287, n=119, last 2 years)
47585 MB/s +4%
Minisforum Neptune Series NAD9
Intel Core i9-12900H, Iris Xe G7 96EUs
45941 MB/s 0%
Geekom XT12 Pro
Intel Core i9-12900H, Iris Xe G7 96EUs
45792 MB/s
Intel NUC 13 Pro Desk Edition Kit
Intel Core i7-1360P, Iris Xe G7 96EUs
44299 MB/s -3%
AIDA64 / Memory Read
Acemagic F2A
Intel Core Ultra 7 155H, Arc 8-Core
64323 MB/s +31%
Minisforum EliteMini UM780 XTX
AMD Ryzen 7 7840HS, Radeon 780M
61867 MB/s +26%
Geekom A7
AMD Ryzen 9 7940HS, Radeon 780M
61542 MB/s +26%
Khadas Mind
Intel Core i7-1360P, Iris Xe G7 96EUs
60668 MB/s +24%
Minisforum Neptune Series NAD9
Intel Core i9-12900H, Iris Xe G7 96EUs
49559 MB/s +1%
Geekom XT12 Pro
Intel Core i9-12900H, Iris Xe G7 96EUs
48963 MB/s
Average of class Mini PC
  (6914 - 99171, n=119, last 2 years)
48328 MB/s -1%
Intel NUC 13 Pro Desk Edition Kit
Intel Core i7-1360P, Iris Xe G7 96EUs
44751 MB/s -9%
AIDA64 / Memory Write
Geekom A7
AMD Ryzen 9 7940HS, Radeon 780M
86810 MB/s +84%
Minisforum EliteMini UM780 XTX
AMD Ryzen 7 7840HS, Radeon 780M
86693 MB/s +84%
Khadas Mind
Intel Core i7-1360P, Iris Xe G7 96EUs
74777 MB/s +58%
Acemagic F2A
Intel Core Ultra 7 155H, Arc 8-Core
65057 MB/s +38%
Average of class Mini PC
  (6862 - 98583, n=119, last 2 years)
52056 MB/s +10%
Geekom XT12 Pro
Intel Core i9-12900H, Iris Xe G7 96EUs
47201 MB/s
Minisforum Neptune Series NAD9
Intel Core i9-12900H, Iris Xe G7 96EUs
46815 MB/s -1%
Intel NUC 13 Pro Desk Edition Kit
Intel Core i7-1360P, Iris Xe G7 96EUs
45887 MB/s -3%
AIDA64 / Memory Latency
Acemagic F2A
Intel Core Ultra 7 155H, Arc 8-Core
149 ns * -99%
Minisforum Neptune Series NAD9
Intel Core i9-12900H, Iris Xe G7 96EUs
100 ns * -34%
Intel NUC 13 Pro Desk Edition Kit
Intel Core i7-1360P, Iris Xe G7 96EUs
96.2 ns * -29%
Minisforum EliteMini UM780 XTX
AMD Ryzen 7 7840HS, Radeon 780M
92 ns * -23%
Average of class Mini PC
  (44.9 - 184.8, n=119, last 2 years)
91.9 ns * -23%
Khadas Mind
Intel Core i7-1360P, Iris Xe G7 96EUs
90.5 ns * -21%
Geekom A7
AMD Ryzen 9 7940HS, Radeon 780M
89 ns * -19%
Geekom XT12 Pro
Intel Core i9-12900H, Iris Xe G7 96EUs
74.7 ns *

* ... smaller is better

Latências de DPC

Não foi possível documentar nenhum aumento de latência no Geekom XT12 Pro ao navegar na Internet. Somente ao reproduzir o vídeo de teste em 4K, as latências aumentaram. Entretanto, nossa amostra de teste só atingiu o valor máximo sob carga total com o Prime95. Mesmo assim, o XT12 Pro pode ser usado como cliente de streaming, pois não houve queda de quadros em nenhum momento.

Latência máxima ao abrir várias guias do navegador e reproduzir material de vídeo 4K
Latência máxima após dez segundos de Prime95
Drivers classificados pelo maior tempo de execução
DPC Latencies / LatencyMon - interrupt to process latency (max), Web, Youtube, Prime95
Acemagic F2A
Arc 8-Core, Ultra 7 155H, Kingston OM8SEP1024Q-A0
2724 μs * -27%
Geekom XT12 Pro
Iris Xe G7 96EUs, i9-12900H, Lexar SSD NM7A1 1TB
2151 μs *
Geekom A7
Radeon 780M, R9 7940HS, Acer N5000
1616.1 μs * +25%
Minisforum EliteMini UM780 XTX
Radeon 780M, R7 7840HS, Kingston OM8PGP41024Q-A0
1178.9 μs * +45%
Minisforum Neptune Series NAD9
Iris Xe G7 96EUs, i9-12900H, Kingston OM8PGP4512Q-A0
1113.9 μs * +48%
Intel NUC 13 Pro Desk Edition Kit
Iris Xe G7 96EUs, i7-1360P, Samsung PM9A1 MZVL2512HCJQ
1068.7 μs * +50%
Khadas Mind
Iris Xe G7 96EUs, i7-1360P, WD PC SN740 SDDPTQD-1T00
962 μs * +55%

* ... smaller is better

Armazenamento em massa

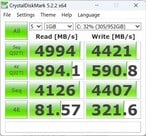
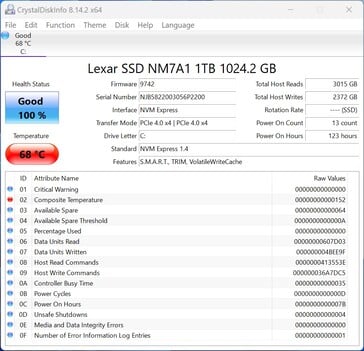
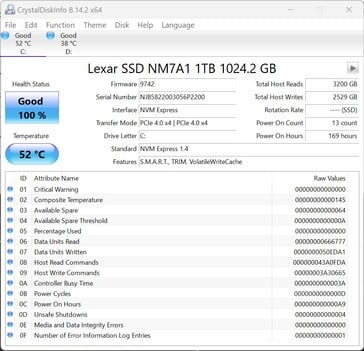
A Geekom instalou um SSD com espaço de armazenamento de 1 TB da Lexar em nossa amostra de teste. Em princípio, o SSD instalado tem um desempenho adequado, desde que não haja carga contínua. É nesse ponto que a SSD da Lexar tem problemas, o que faz com que o desempenho tenha que ser significativamente reduzido. O principal problema aqui são as almofadas térmicas fixadas incorretamente, pois ambas não estão onde deveriam estar. Instalamos uma almofada térmica da mesma espessura na área que faltava, o que resolveu o problema. Informamos o fabricante para que ele possa corrigir o problema. De acordo com a Geekom, esse problema está sendo resolvido e os lotes futuros deverão ser equipados com almofadas térmicas instaladas corretamente. De acordo com nossa pesquisa, esse problema não parece afetar apenas o nosso dispositivo.

Dois SSDs podem ser instalados no Geekom XT12 Pro. No entanto, é preciso prestar atenção ao fator de forma, pois o segundo slot M.2 suporta apenas SSDs SATA com 42 milímetros de comprimento.

Para mais comparações e benchmarks, consulte nossa Tabela de comparação.

sSD DE 1 TB
sSD DE 1 TB
Almofadas condutoras de calor conforme fornecidas
Temperaturas mais baixas graças a uma leve otimização
SSD AS
SSD AS
MDL 3
MDL 3
MDL 5
MDL 5
MDL 6
MDL 6
CDI - ex-works
CDI - ex-works
CDI - com almofada térmica adicional
Lexar SSD NM7A1 1TB
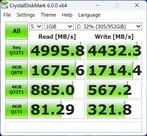
Sequential Read: 4081 MB/s
Sequential Write: 3463 MB/s
512K Read: 2265 MB/s
512K Write: 2966 MB/s
4K Read: 75.53 MB/s
4K Write: 338.3 MB/s
4K QD32 Read: 879.3 MB/s
4K QD32 Write: 606.4 MB/s
Drive Performance Rating - Percent
Minisforum Neptune Series NAD9
Kingston OM8PGP4512Q-A0
87.4 pt
Khadas Mind
WD PC SN740 SDDPTQD-1T00
85.8 pt
Geekom XT12 Pro
Lexar SSD NM7A1 1TB
73.3 pt
Intel NUC 13 Pro Desk Edition Kit
Samsung PM9A1 MZVL2512HCJQ
69.9 pt
Minisforum EliteMini UM780 XTX
Kingston OM8PGP41024Q-A0
68.3 pt
Geekom A7
Acer N5000
62.5 pt
Average of class Mini PC
 
52.8 pt
Acemagic F2A
Kingston OM8SEP1024Q-A0
52.4 pt
DiskSpd
seq read
Geekom A7
Acer N5000
3755 (3733.85min - 3754.99max) MB/s +72%
Khadas Mind
WD PC SN740 SDDPTQD-1T00
3628 (3596.13min - 3627.65max) MB/s +67%
Intel NUC 13 Pro Desk Edition Kit
Samsung PM9A1 MZVL2512HCJQ
3337 (3301.03min - 3337.16max) MB/s +53%
Minisforum EliteMini UM780 XTX
Kingston OM8PGP41024Q-A0
2896 (2845min - 2896.04max) MB/s +33%
Minisforum Neptune Series NAD9
Kingston OM8PGP4512Q-A0
2815 (2802.79min - 2814.97max) MB/s +29%
Average of class Mini PC
  (233 - 4357, n=119, last 2 years)
2288 MB/s +5%
Geekom XT12 Pro
Lexar SSD NM7A1 1TB
2178 (2158.39min - 2177.68max) MB/s
Acemagic F2A
Kingston OM8SEP1024Q-A0
1674 (1242.56min - 1673.54max) MB/s -23%
seq write
Khadas Mind
WD PC SN740 SDDPTQD-1T00
4121 (3696.6min - 4120.84max) MB/s +76%
Minisforum EliteMini UM780 XTX
Kingston OM8PGP41024Q-A0
3736 (3562.44min - 3735.53max) MB/s +60%
Geekom A7
Acer N5000
3492 (3398.43min - 3491.76max) MB/s +49%
Minisforum Neptune Series NAD9
Kingston OM8PGP4512Q-A0
3402 (3372.67min - 3402.21max) MB/s +45%
Intel NUC 13 Pro Desk Edition Kit
Samsung PM9A1 MZVL2512HCJQ
3356 (3181.73min - 3356.49max) MB/s +43%
Average of class Mini PC
  (222 - 5595, n=119, last 2 years)
2448 MB/s +5%
Geekom XT12 Pro
Lexar SSD NM7A1 1TB
2341 (2252.02min - 2341.4max) MB/s
Acemagic F2A
Kingston OM8SEP1024Q-A0
1348 (1117.85min - 1347.87max) MB/s -42%
seq q8 t1 read
Intel NUC 13 Pro Desk Edition Kit
Samsung PM9A1 MZVL2512HCJQ
5438 (4937.74min - 5438.31max) MB/s +14%
Khadas Mind
WD PC SN740 SDDPTQD-1T00
5168 (4831.21min - 5167.59max) MB/s +8%
Geekom A7
Acer N5000
4861 (4468.61min - 4860.57max) MB/s +2%
Minisforum EliteMini UM780 XTX
Kingston OM8PGP41024Q-A0
4821 (4521.88min - 4820.93max) MB/s +1%
Minisforum Neptune Series NAD9
Kingston OM8PGP4512Q-A0
4801 (4506.78min - 4800.59max) MB/s +1%
Geekom XT12 Pro
Lexar SSD NM7A1 1TB
4769 (3791.02min - 4769.24max) MB/s
Average of class Mini PC
  (236 - 8430, n=119, last 2 years)
3706 MB/s -22%
Acemagic F2A
Kingston OM8SEP1024Q-A0
3194 (2810.81min - 3194.17max) MB/s -33%
seq q8 t1 write
Intel NUC 13 Pro Desk Edition Kit
Samsung PM9A1 MZVL2512HCJQ
4955 (4929.56min - 4955.41max) MB/s +52%
Geekom A7
Acer N5000
4695 (4470.16min - 4694.73max) MB/s +44%
Khadas Mind
WD PC SN740 SDDPTQD-1T00
4212 (3767.95min - 4212.34max) MB/s +29%
Minisforum EliteMini UM780 XTX
Kingston OM8PGP41024Q-A0
3910 (3902.59min - 3909.87max) MB/s +20%
Minisforum Neptune Series NAD9
Kingston OM8PGP4512Q-A0
3402 (3374.28min - 3401.67max) MB/s +5%
Geekom XT12 Pro
Lexar SSD NM7A1 1TB
3255 (2485.13min - 3254.57max) MB/s
Average of class Mini PC
  (228 - 6669, n=119, last 2 years)
2743 MB/s -16%
Acemagic F2A
Kingston OM8SEP1024Q-A0
2212 (1222.43min - 2212.27max) MB/s -32%
4k q1 t1 read
Intel NUC 13 Pro Desk Edition Kit
Samsung PM9A1 MZVL2512HCJQ
84.5 (83.02min - 84.54max) MB/s +32%
Khadas Mind
WD PC SN740 SDDPTQD-1T00
83.7 (81.47min - 83.67max) MB/s +31%
Minisforum Neptune Series NAD9
Kingston OM8PGP4512Q-A0
82.1 (81.4min - 82.09max) MB/s +28%
Minisforum EliteMini UM780 XTX
Kingston OM8PGP41024Q-A0
64.9 (64.71min - 64.94max) MB/s +1%
Geekom XT12 Pro
Lexar SSD NM7A1 1TB
64.1 (56.32min - 64.06max) MB/s
Average of class Mini PC
  (5.67 - 86.6, n=119, last 2 years)
54.7 MB/s -15%
Geekom A7
Acer N5000
52.3 (51.85min - 52.27max) MB/s -18%
Acemagic F2A
Kingston OM8SEP1024Q-A0
47.3 (47.07min - 47.31max) MB/s -26%
4k q1 t1 write
Minisforum Neptune Series NAD9
Kingston OM8PGP4512Q-A0
425 (415.92min - 425.01max) MB/s +52%
Khadas Mind
WD PC SN740 SDDPTQD-1T00
301 (296.91min - 301.44max) MB/s +8%
Geekom XT12 Pro
Lexar SSD NM7A1 1TB
279 (237.61min - 279.08max) MB/s
Minisforum EliteMini UM780 XTX
Kingston OM8PGP41024Q-A0
196.1 (183.94min - 196.13max) MB/s -30%
Average of class Mini PC
  (30.4 - 435, n=119, last 2 years)
194.7 MB/s -30%
Acemagic F2A
Kingston OM8SEP1024Q-A0
187.2 (181.54min - 187.2max) MB/s -33%
Geekom A7
Acer N5000
165.9 (164.35min - 165.92max) MB/s -41%
Intel NUC 13 Pro Desk Edition Kit
Samsung PM9A1 MZVL2512HCJQ
144.6 (143.6min - 144.57max) MB/s -48%
4k q32 t16 read
Khadas Mind
WD PC SN740 SDDPTQD-1T00
2300 (2238.78min - 2299.5max) MB/s +58%
Minisforum Neptune Series NAD9
Kingston OM8PGP4512Q-A0
1944 (1936.89min - 1943.53max) MB/s +34%
Acemagic F2A
Kingston OM8SEP1024Q-A0
1824 (1239.47min - 1824.09max) MB/s +26%
Geekom A7
Acer N5000
1560 (1546.89min - 1559.94max) MB/s +7%
Minisforum EliteMini UM780 XTX
Kingston OM8PGP41024Q-A0
1557 (1529.87min - 1556.79max) MB/s +7%
Geekom XT12 Pro
Lexar SSD NM7A1 1TB
1452 (1402.67min - 1451.9max) MB/s
Average of class Mini PC
  (26.1 - 4158, n=119, last 2 years)
1360 MB/s -6%
Intel NUC 13 Pro Desk Edition Kit
Samsung PM9A1 MZVL2512HCJQ
808 (792.58min - 807.51max) MB/s -44%
4k q32 t16 write
Khadas Mind
WD PC SN740 SDDPTQD-1T00
2441 (2189.1min - 2441.28max) MB/s +63%
Minisforum Neptune Series NAD9
Kingston OM8PGP4512Q-A0
2396 (2376.28min - 2396.46max) MB/s +60%
Geekom XT12 Pro
Lexar SSD NM7A1 1TB
1499 (1114.25min - 1499.4max) MB/s
Acemagic F2A
Kingston OM8SEP1024Q-A0
1434 (1410.26min - 1433.71max) MB/s -4%
Average of class Mini PC
  (30.2 - 4288, n=119, last 2 years)
1287 MB/s -14%
Geekom A7
Acer N5000
595 (582.97min - 594.71max) MB/s -60%
Minisforum EliteMini UM780 XTX
Kingston OM8PGP41024Q-A0
565 (557.67min - 564.75max) MB/s -62%
Intel NUC 13 Pro Desk Edition Kit
Samsung PM9A1 MZVL2512HCJQ
454 (443.2min - 453.53max) MB/s -70%
AS SSD
Score Total
Minisforum Neptune Series NAD9
Kingston OM8PGP4512Q-A0
7134 Points +19%
Khadas Mind
WD PC SN740 SDDPTQD-1T00
6460 Points +8%
Geekom XT12 Pro
Lexar SSD NM7A1 1TB
5975 Points
Minisforum EliteMini UM780 XTX
Kingston OM8PGP41024Q-A0
5863 Points -2%
Intel NUC 13 Pro Desk Edition Kit
Samsung PM9A1 MZVL2512HCJQ
5249 Points -12%
Geekom A7
Acer N5000
5177 Points -13%
Acemagic F2A
Kingston OM8SEP1024Q-A0
4412 Points -26%
Average of class Mini PC
  (181.5 - 10021, n=117, last 2 years)
4121 Points -31%
Score Read
Khadas Mind
WD PC SN740 SDDPTQD-1T00
2658 Points +25%
Minisforum Neptune Series NAD9
Kingston OM8PGP4512Q-A0
2391 Points +13%
Geekom XT12 Pro
Lexar SSD NM7A1 1TB
2119 Points
Minisforum EliteMini UM780 XTX
Kingston OM8PGP41024Q-A0
1738 Points -18%
Geekom A7
Acer N5000
1685 Points -20%
Acemagic F2A
Kingston OM8SEP1024Q-A0
1561 Points -26%
Average of class Mini PC
  (61 - 3741, n=117, last 2 years)
1534 Points -28%
Intel NUC 13 Pro Desk Edition Kit
Samsung PM9A1 MZVL2512HCJQ
1320 Points -38%
Score Write
Minisforum Neptune Series NAD9
Kingston OM8PGP4512Q-A0
3538 Points +27%
Intel NUC 13 Pro Desk Edition Kit
Samsung PM9A1 MZVL2512HCJQ
3326 Points +20%
Minisforum EliteMini UM780 XTX
Kingston OM8PGP41024Q-A0
3294 Points +19%
Geekom XT12 Pro
Lexar SSD NM7A1 1TB
2777 Points
Geekom A7
Acer N5000
2676 Points -4%
Khadas Mind
WD PC SN740 SDDPTQD-1T00
2447 Points -12%
Acemagic F2A
Kingston OM8SEP1024Q-A0
2082 Points -25%
Average of class Mini PC
  (88 - 4371, n=117, last 2 years)
1851 Points -33%
Seq Read
Intel NUC 13 Pro Desk Edition Kit
Samsung PM9A1 MZVL2512HCJQ
4536 MB/s +4%
Khadas Mind
WD PC SN740 SDDPTQD-1T00
4496 MB/s +3%
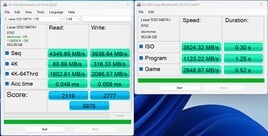
Geekom XT12 Pro
Lexar SSD NM7A1 1TB
4349.85 MB/s
Minisforum Neptune Series NAD9
Kingston OM8PGP4512Q-A0
4147 MB/s -5%
Minisforum EliteMini UM780 XTX
Kingston OM8PGP41024Q-A0
3822 MB/s -12%
Geekom A7
Acer N5000
3650 MB/s -16%
Average of class Mini PC
  (291 - 6620, n=117, last 2 years)
3161 MB/s -27%
Acemagic F2A
Kingston OM8SEP1024Q-A0
3010 MB/s -31%
Seq Write
Khadas Mind
WD PC SN740 SDDPTQD-1T00
4258 MB/s +8%
Geekom XT12 Pro
Lexar SSD NM7A1 1TB
3936.64 MB/s
Minisforum Neptune Series NAD9
Kingston OM8PGP4512Q-A0
3292 MB/s -16%
Intel NUC 13 Pro Desk Edition Kit
Samsung PM9A1 MZVL2512HCJQ
2698 MB/s -31%
Geekom A7
Acer N5000
2611 MB/s -34%
Minisforum EliteMini UM780 XTX
Kingston OM8PGP41024Q-A0
2463 MB/s -37%
Acemagic F2A
Kingston OM8SEP1024Q-A0
2369 MB/s -40%
Average of class Mini PC
  (240 - 5783, n=117, last 2 years)
2212 MB/s -44%
4K Read
Minisforum Neptune Series NAD9
Kingston OM8PGP4512Q-A0
103.66 MB/s +28%
Geekom XT12 Pro
Lexar SSD NM7A1 1TB
80.89 MB/s
Khadas Mind
WD PC SN740 SDDPTQD-1T00
76.3 MB/s -6%
Intel NUC 13 Pro Desk Edition Kit
Samsung PM9A1 MZVL2512HCJQ
72 MB/s -11%
Minisforum EliteMini UM780 XTX
Kingston OM8PGP41024Q-A0
61.9 MB/s -23%
Average of class Mini PC
  (6.08 - 104.3, n=117, last 2 years)
58.9 MB/s -27%
Geekom A7
Acer N5000
49.7 MB/s -39%
Acemagic F2A
Kingston OM8SEP1024Q-A0
41.8 MB/s -48%
4K Write
Minisforum Neptune Series NAD9
Kingston OM8PGP4512Q-A0
365.87 MB/s +16%
Geekom XT12 Pro
Lexar SSD NM7A1 1TB
316.33 MB/s
Khadas Mind
WD PC SN740 SDDPTQD-1T00
258 MB/s -18%
Minisforum EliteMini UM780 XTX
Kingston OM8PGP41024Q-A0
208 MB/s -34%
Acemagic F2A
Kingston OM8SEP1024Q-A0
196.9 MB/s -38%
Average of class Mini PC
  (30.9 - 366, n=117, last 2 years)
175.1 MB/s -45%
Intel NUC 13 Pro Desk Edition Kit
Samsung PM9A1 MZVL2512HCJQ
166.8 MB/s -47%
Geekom A7
Acer N5000
160 MB/s -49%
4K-64 Read
Khadas Mind
WD PC SN740 SDDPTQD-1T00
2132 MB/s +33%
Minisforum Neptune Series NAD9
Kingston OM8PGP4512Q-A0
1872.82 MB/s +17%
Geekom XT12 Pro
Lexar SSD NM7A1 1TB
1602.91 MB/s
Minisforum EliteMini UM780 XTX
Kingston OM8PGP41024Q-A0
1293 MB/s -19%
Geekom A7
Acer N5000
1270 MB/s -21%
Acemagic F2A
Kingston OM8SEP1024Q-A0
1218 MB/s -24%
Average of class Mini PC
  (23.4 - 3220, n=117, last 2 years)
1159 MB/s -28%
Intel NUC 13 Pro Desk Edition Kit
Samsung PM9A1 MZVL2512HCJQ
794 MB/s -50%
4K-64 Write
Intel NUC 13 Pro Desk Edition Kit
Samsung PM9A1 MZVL2512HCJQ
2889 MB/s +40%
Minisforum Neptune Series NAD9
Kingston OM8PGP4512Q-A0
2842.9 MB/s +38%
Minisforum EliteMini UM780 XTX
Kingston OM8PGP41024Q-A0
2840 MB/s +37%
Geekom A7
Acer N5000
2255 MB/s +9%
Geekom XT12 Pro
Lexar SSD NM7A1 1TB
2066.57 MB/s
Khadas Mind
WD PC SN740 SDDPTQD-1T00
1763 MB/s -15%
Acemagic F2A
Kingston OM8SEP1024Q-A0
1649 MB/s -20%
Average of class Mini PC
  (32.8 - 3731, n=117, last 2 years)
1455 MB/s -30%
Access Time Read
Geekom A7
Acer N5000
0.138 ms * -182%
Minisforum EliteMini UM780 XTX
Kingston OM8PGP41024Q-A0
0.127 ms * -159%
Average of class Mini PC
  (0.022 - 0.489, n=117, last 2 years)
0.09726 ms * -98%
Khadas Mind
WD PC SN740 SDDPTQD-1T00
0.094 ms * -92%
Minisforum Neptune Series NAD9
Kingston OM8PGP4512Q-A0
0.074 ms * -51%
Intel NUC 13 Pro Desk Edition Kit
Samsung PM9A1 MZVL2512HCJQ
0.06 ms * -22%
Geekom XT12 Pro
Lexar SSD NM7A1 1TB
0.049 ms *
Acemagic F2A
Kingston OM8SEP1024Q-A0
0.046 ms * +6%
Access Time Write
Acemagic F2A
Kingston OM8SEP1024Q-A0
0.126 ms * -114%
Average of class Mini PC
  (0.014 - 0.765, n=117, last 2 years)
0.1153 ms * -95%
Geekom A7
Acer N5000
0.072 ms * -22%
Geekom XT12 Pro
Lexar SSD NM7A1 1TB
0.059 ms *
Minisforum Neptune Series NAD9
Kingston OM8PGP4512Q-A0
0.031 ms * +47%
Intel NUC 13 Pro Desk Edition Kit
Samsung PM9A1 MZVL2512HCJQ
0.024 ms * +59%
Minisforum EliteMini UM780 XTX
Kingston OM8PGP41024Q-A0
0.022 ms * +63%
Khadas Mind
WD PC SN740 SDDPTQD-1T00
0.016 ms * +73%

* ... smaller is better

Continuous read: DiskSpd Read Loop, Queue Depth 8

02755508251100137516501925220024752750302533003575385041254400467549505225Tooltip
Geekom XT12 Pro Lexar SSD NM7A1 1TB; diskspd 2.0.17 f: Ø1764 (1425.22-4795.56)
Minisforum EliteMini UM780 XTX Kingston OM8PGP41024Q-A0; diskspd 2.0.17 f: Ø4795 (3366.33-4823.24)
Minisforum Neptune Series NAD9 Kingston OM8PGP4512Q-A0: Ø3302 (1830.49-4799.45)
Acemagic F2A Kingston OM8SEP1024Q-A0; diskspd 2.0.17 f: Ø1320 (771.89-3141.95)
Geekom A7 Acer N5000; diskspd 2.0.17 f: Ø4848 (4561.2-4857.36)
Intel NUC 13 Pro Desk Edition Kit Samsung PM9A1 MZVL2512HCJQ: Ø5462 (4797.39-5479.86)
Khadas Mind WD PC SN740 SDDPTQD-1T00: Ø5222 (4952.01-5235.75)

Gráficos

A Intel Iris Xe Graphics G7 é responsável pelos cálculos 3D e pela saída de imagens. Com 96 EUs, é o modelo mais rápido da série. No entanto, agora é um modelo antigo que é visivelmente inferior aos seus concorrentes. A Intel só atualizou a arquitetura de suas iGPUs com a geração Meteor Lake. Como exemplo, o senhor pode dar uma olhada nos resultados do Acemagic F2A. Mas mesmo isso era inferior às poderosas iGPUs da AMD. A própria Geekom apresentou o A7 - um dispositivo extremamente compacto em seu portfólio, que é equipado com uma AMD Radeon 780M e tem um desempenho significativamente superior ao do Geekom XT12 Pro.

Outras comparações e benchmarks podem ser encontrados em nossa Tabela de comparação de GPUs.

3DMark Performance Rating - Percent
Geekom A7
AMD Radeon 780M, AMD Ryzen 9 7940HS
97.5 pt
Minisforum EliteMini UM780 XTX
AMD Radeon 780M, AMD Ryzen 7 7840HS
94.6 pt
Acemagic F2A
Intel Arc 8-Core iGPU, Intel Core Ultra 7 155H
92.9 pt
Intel NUC 13 Pro Desk Edition Kit
Intel Iris Xe Graphics G7 96EUs, Intel Core i7-1360P
57.2 pt
Minisforum Neptune Series NAD9
Intel Iris Xe Graphics G7 96EUs, Intel Core i9-12900H
56.1 pt
Khadas Mind
Intel Iris Xe Graphics G7 96EUs, Intel Core i7-1360P
55.2 pt
Geekom XT12 Pro
Intel Iris Xe Graphics G7 96EUs, Intel Core i9-12900H
54.7 pt
Average Intel Iris Xe Graphics G7 96EUs
 
50.3 pt
3DMark 11 - 1280x720 Performance GPU
Geekom A7
AMD Radeon 780M, AMD Ryzen 9 7940HS
13932 Points +100%
Minisforum EliteMini UM780 XTX
AMD Radeon 780M, AMD Ryzen 7 7840HS
13347 Points +91%
Acemagic F2A
Intel Arc 8-Core iGPU, Intel Core Ultra 7 155H
12085 Points +73%
Intel NUC 13 Pro Desk Edition Kit
Intel Iris Xe Graphics G7 96EUs, Intel Core i7-1360P
7321 Points +5%
Minisforum Neptune Series NAD9
Intel Iris Xe Graphics G7 96EUs, Intel Core i9-12900H
7057 Points +1%
Geekom XT12 Pro
Intel Iris Xe Graphics G7 96EUs, Intel Core i9-12900H
6975 Points
Khadas Mind
Intel Iris Xe Graphics G7 96EUs, Intel Core i7-1360P
6722 Points -4%
Average Intel Iris Xe Graphics G7 96EUs
  (2867 - 7676, n=202)
6353 Points -9%
3DMark
2560x1440 Time Spy Graphics
Acemagic F2A
Intel Arc 8-Core iGPU, Intel Core Ultra 7 155H
3205 Points +103%
Geekom A7
AMD Radeon 780M, AMD Ryzen 9 7940HS
2968 Points +88%
Minisforum EliteMini UM780 XTX
AMD Radeon 780M, AMD Ryzen 7 7840HS
2832 Points +79%
Khadas Mind
Intel Iris Xe Graphics G7 96EUs, Intel Core i7-1360P
1680 Points +6%
Intel NUC 13 Pro Desk Edition Kit
Intel Iris Xe Graphics G7 96EUs, Intel Core i7-1360P
1672 Points +6%
Minisforum Neptune Series NAD9
Intel Iris Xe Graphics G7 96EUs, Intel Core i9-12900H
1658 Points +5%
Geekom XT12 Pro
Intel Iris Xe Graphics G7 96EUs, Intel Core i9-12900H
1581 Points
Average Intel Iris Xe Graphics G7 96EUs
  (707 - 1871, n=212)
1495 Points -5%
1920x1080 Fire Strike Graphics
Geekom A7
AMD Radeon 780M, AMD Ryzen 9 7940HS
8391 Points +55%
Minisforum EliteMini UM780 XTX
AMD Radeon 780M, AMD Ryzen 7 7840HS
8348 Points +54%
Acemagic F2A
Intel Arc 8-Core iGPU, Intel Core Ultra 7 155H
7710 Points +42%
Intel NUC 13 Pro Desk Edition Kit
Intel Iris Xe Graphics G7 96EUs, Intel Core i7-1360P
5616 Points +4%
Minisforum Neptune Series NAD9
Intel Iris Xe Graphics G7 96EUs, Intel Core i9-12900H
5526 Points +2%
Khadas Mind
Intel Iris Xe Graphics G7 96EUs, Intel Core i7-1360P
5461 Points +1%
Geekom XT12 Pro
Intel Iris Xe Graphics G7 96EUs, Intel Core i9-12900H
5421 Points
Average Intel Iris Xe Graphics G7 96EUs
  (2286 - 6482, n=215)
4920 Points -9%
Unigine Heaven 4.0
Extreme Preset OpenGL
Minisforum EliteMini UM780 XTX
AMD Radeon 780M, AMD Ryzen 7 7840HS
34.5 fps +58%
Acemagic F2A
Intel Arc 8-Core iGPU, Intel Core Ultra 7 155H
31.6 fps +45%
Geekom A7
AMD Radeon 780M, AMD Ryzen 9 7940HS
26 fps +19%
Khadas Mind
Intel Iris Xe Graphics G7 96EUs, Intel Core i7-1360P
25.2 fps +16%
Intel NUC 13 Pro Desk Edition Kit
Intel Iris Xe Graphics G7 96EUs, Intel Core i7-1360P
23.8 fps +9%
Minisforum Neptune Series NAD9
Intel Iris Xe Graphics G7 96EUs, Intel Core i9-12900H
23.3 fps +7%
Average Intel Iris Xe Graphics G7 96EUs
  (17.3 - 31.2, n=21)
23.3 fps +7%
Geekom XT12 Pro
Intel Iris Xe Graphics G7 96EUs, Intel Core i9-12900H
21.8 fps
Extreme Preset DX11
Minisforum EliteMini UM780 XTX
AMD Radeon 780M, AMD Ryzen 7 7840HS
35.5 fps +56%
Acemagic F2A
Intel Arc 8-Core iGPU, Intel Core Ultra 7 155H
32.7 fps +44%
Geekom A7
AMD Radeon 780M, AMD Ryzen 9 7940HS
32 fps +41%
Khadas Mind
Intel Iris Xe Graphics G7 96EUs, Intel Core i7-1360P
25.6 fps +13%
Intel NUC 13 Pro Desk Edition Kit
Intel Iris Xe Graphics G7 96EUs, Intel Core i7-1360P
24.5 fps +8%
Minisforum Neptune Series NAD9
Intel Iris Xe Graphics G7 96EUs, Intel Core i9-12900H
24 fps +6%
Average Intel Iris Xe Graphics G7 96EUs
  (17.7 - 31.9, n=21)
23.9 fps +5%
Geekom XT12 Pro
Intel Iris Xe Graphics G7 96EUs, Intel Core i9-12900H
22.7 fps
Unigine Valley 1.0
1920x1080 Extreme HD DirectX AA:x8
Minisforum EliteMini UM780 XTX
AMD Radeon 780M, AMD Ryzen 7 7840HS
24 fps +80%
Geekom A7
AMD Radeon 780M, AMD Ryzen 9 7940HS
17.7 fps +33%
Khadas Mind
Intel Iris Xe Graphics G7 96EUs, Intel Core i7-1360P
17.2 fps +29%
Acemagic F2A
Intel Arc 8-Core iGPU, Intel Core Ultra 7 155H
17.1 fps +29%
Intel NUC 13 Pro Desk Edition Kit
Intel Iris Xe Graphics G7 96EUs, Intel Core i7-1360P
15 fps +13%
Average Intel Iris Xe Graphics G7 96EUs
  (11.3 - 20, n=19)
15 fps +13%
Minisforum Neptune Series NAD9
Intel Iris Xe Graphics G7 96EUs, Intel Core i9-12900H
14.3 fps +8%
Geekom XT12 Pro
Intel Iris Xe Graphics G7 96EUs, Intel Core i9-12900H
13.3 fps
1920x1080 Extreme HD Preset OpenGL AA:x8
Minisforum EliteMini UM780 XTX
AMD Radeon 780M, AMD Ryzen 7 7840HS
20.8 fps +50%
Khadas Mind
Intel Iris Xe Graphics G7 96EUs, Intel Core i7-1360P
20.4 fps +47%
Acemagic F2A
Intel Arc 8-Core iGPU, Intel Core Ultra 7 155H
18.3 fps +32%
Average Intel Iris Xe Graphics G7 96EUs
  (11.7 - 21.7, n=19)
16.6 fps +19%
Intel NUC 13 Pro Desk Edition Kit
Intel Iris Xe Graphics G7 96EUs, Intel Core i7-1360P
15.5 fps +12%
Minisforum Neptune Series NAD9
Intel Iris Xe Graphics G7 96EUs, Intel Core i9-12900H
15.2 fps +9%
Geekom XT12 Pro
Intel Iris Xe Graphics G7 96EUs, Intel Core i9-12900H
13.9 fps
Geekom A7
AMD Radeon 780M, AMD Ryzen 9 7940HS
12.2 fps -12%
Unigine Superposition
1280x720 720p Low
Minisforum EliteMini UM780 XTX
AMD Radeon 780M, AMD Ryzen 7 7840HS
12023 Points +102%
Acemagic F2A
Intel Arc 8-Core iGPU, Intel Core Ultra 7 155H
10491 Points +76%
Geekom A7
AMD Radeon 780M, AMD Ryzen 9 7940HS
9725 Points +63%
Intel NUC 13 Pro Desk Edition Kit
Intel Iris Xe Graphics G7 96EUs, Intel Core i7-1360P
6384 Points +7%
Khadas Mind
Intel Iris Xe Graphics G7 96EUs, Intel Core i7-1360P
6265 Points +5%
Average Intel Iris Xe Graphics G7 96EUs
  (4088 - 8223, n=16)
5965 Points 0%
Geekom XT12 Pro
Intel Iris Xe Graphics G7 96EUs, Intel Core i9-12900H
5950 Points
Minisforum Neptune Series NAD9
Intel Iris Xe Graphics G7 96EUs, Intel Core i9-12900H
4088 Points -31%
1920x1080 1080p High
Minisforum EliteMini UM780 XTX
AMD Radeon 780M, AMD Ryzen 7 7840HS
3648 Points +79%
Acemagic F2A
Intel Arc 8-Core iGPU, Intel Core Ultra 7 155H
3391 Points +67%
Geekom A7
AMD Radeon 780M, AMD Ryzen 9 7940HS
3129 Points +54%
Khadas Mind
Intel Iris Xe Graphics G7 96EUs, Intel Core i7-1360P
2279 Points +12%
Intel NUC 13 Pro Desk Edition Kit
Intel Iris Xe Graphics G7 96EUs, Intel Core i7-1360P
2146 Points +5%
Average Intel Iris Xe Graphics G7 96EUs
  (1522 - 2744, n=16)
2103 Points +3%
Minisforum Neptune Series NAD9
Intel Iris Xe Graphics G7 96EUs, Intel Core i9-12900H
2095 Points +3%
Geekom XT12 Pro
Intel Iris Xe Graphics G7 96EUs, Intel Core i9-12900H
2035 Points
1920x1080 1080p Extreme
Acemagic F2A
Intel Arc 8-Core iGPU, Intel Core Ultra 7 155H
1920 Points +84%
Minisforum EliteMini UM780 XTX
AMD Radeon 780M, AMD Ryzen 7 7840HS
1800 Points +73%
Geekom A7
AMD Radeon 780M, AMD Ryzen 9 7940HS
1577 Points +51%
Intel NUC 13 Pro Desk Edition Kit
Intel Iris Xe Graphics G7 96EUs, Intel Core i7-1360P
1108 Points +6%
Khadas Mind
Intel Iris Xe Graphics G7 96EUs, Intel Core i7-1360P
1101 Points +6%
Minisforum Neptune Series NAD9
Intel Iris Xe Graphics G7 96EUs, Intel Core i9-12900H
1076 Points +3%
Geekom XT12 Pro
Intel Iris Xe Graphics G7 96EUs, Intel Core i9-12900H
1042 Points
Average Intel Iris Xe Graphics G7 96EUs
  (768 - 1251, n=16)
1027 Points -1%
ComputeMark v2.1
1024x600 Normal, Score
Minisforum EliteMini UM780 XTX
AMD Radeon 780M, AMD Ryzen 7 7840HS
10102 Points +198%
Geekom A7
AMD Radeon 780M, AMD Ryzen 9 7940HS
9796 Points +189%
Acemagic F2A
Intel Arc 8-Core iGPU, Intel Core Ultra 7 155H
7480 Points +121%
Khadas Mind
Intel Iris Xe Graphics G7 96EUs, Intel Core i7-1360P
3605 Points +6%
Intel NUC 13 Pro Desk Edition Kit
Intel Iris Xe Graphics G7 96EUs, Intel Core i7-1360P
3590 Points +6%
Average Intel Iris Xe Graphics G7 96EUs
  (2693 - 3877, n=25)
3403 Points 0%
Minisforum Neptune Series NAD9
Intel Iris Xe Graphics G7 96EUs, Intel Core i9-12900H
3390 Points 0%
Geekom XT12 Pro
Intel Iris Xe Graphics G7 96EUs, Intel Core i9-12900H
3390 Points
1024x600 Normal, Fluid 3DTex
Geekom A7
AMD Radeon 780M, AMD Ryzen 9 7940HS
479 Points +107%
Minisforum EliteMini UM780 XTX
AMD Radeon 780M, AMD Ryzen 7 7840HS
468 Points +103%
Acemagic F2A
Intel Arc 8-Core iGPU, Intel Core Ultra 7 155H
427 Points +85%
Khadas Mind
Intel Iris Xe Graphics G7 96EUs, Intel Core i7-1360P
385 Points +67%
Average Intel Iris Xe Graphics G7 96EUs
  (186 - 420, n=25)
308 Points +33%
Intel NUC 13 Pro Desk Edition Kit
Intel Iris Xe Graphics G7 96EUs, Intel Core i7-1360P
275 Points +19%
Minisforum Neptune Series NAD9
Intel Iris Xe Graphics G7 96EUs, Intel Core i9-12900H
234 Points +1%
Geekom XT12 Pro
Intel Iris Xe Graphics G7 96EUs, Intel Core i9-12900H
231 Points
1024x600 Normal, Fluid 2DTexArr
Minisforum EliteMini UM780 XTX
AMD Radeon 780M, AMD Ryzen 7 7840HS
488 Points +98%
Geekom A7
AMD Radeon 780M, AMD Ryzen 9 7940HS
484 Points +97%
Acemagic F2A
Intel Arc 8-Core iGPU, Intel Core Ultra 7 155H
422 Points +72%
Khadas Mind
Intel Iris Xe Graphics G7 96EUs, Intel Core i7-1360P
354 Points +44%
Average Intel Iris Xe Graphics G7 96EUs
  (204 - 398, n=25)
300 Points +22%
Intel NUC 13 Pro Desk Edition Kit
Intel Iris Xe Graphics G7 96EUs, Intel Core i7-1360P
279 Points +13%
Minisforum Neptune Series NAD9
Intel Iris Xe Graphics G7 96EUs, Intel Core i9-12900H
249 Points +1%
Geekom XT12 Pro
Intel Iris Xe Graphics G7 96EUs, Intel Core i9-12900H
246 Points
1024x600 Normal, Mandel Vector
Minisforum EliteMini UM780 XTX
AMD Radeon 780M, AMD Ryzen 7 7840HS
2637 Points +207%
Geekom A7
AMD Radeon 780M, AMD Ryzen 9 7940HS
2574 Points +199%
Acemagic F2A
Intel Arc 8-Core iGPU, Intel Core Ultra 7 155H
1961 Points +128%
Intel NUC 13 Pro Desk Edition Kit
Intel Iris Xe Graphics G7 96EUs, Intel Core i7-1360P
869 Points +1%
Geekom XT12 Pro
Intel Iris Xe Graphics G7 96EUs, Intel Core i9-12900H
860 Points
Minisforum Neptune Series NAD9
Intel Iris Xe Graphics G7 96EUs, Intel Core i9-12900H
851 Points -1%
Khadas Mind
Intel Iris Xe Graphics G7 96EUs, Intel Core i7-1360P
830 Points -3%
Average Intel Iris Xe Graphics G7 96EUs
  (558 - 918, n=25)
789 Points -8%
1024x600 Normal, Mandel Scalar
Minisforum EliteMini UM780 XTX
AMD Radeon 780M, AMD Ryzen 7 7840HS
2757 Points +216%
Geekom A7
AMD Radeon 780M, AMD Ryzen 9 7940HS
2608 Points +199%
Acemagic F2A
Intel Arc 8-Core iGPU, Intel Core Ultra 7 155H
1594 Points +83%
Intel NUC 13 Pro Desk Edition Kit
Intel Iris Xe Graphics G7 96EUs, Intel Core i7-1360P
888 Points +2%
Geekom XT12 Pro
Intel Iris Xe Graphics G7 96EUs, Intel Core i9-12900H
872 Points
Minisforum Neptune Series NAD9
Intel Iris Xe Graphics G7 96EUs, Intel Core i9-12900H
865 Points -1%
Khadas Mind
Intel Iris Xe Graphics G7 96EUs, Intel Core i7-1360P
864 Points -1%
Average Intel Iris Xe Graphics G7 96EUs
  (747 - 888, n=25)
836 Points -4%
1024x600 Normal, QJuliaRayTrace
Minisforum EliteMini UM780 XTX
AMD Radeon 780M, AMD Ryzen 7 7840HS
3752 Points +217%
Geekom A7
AMD Radeon 780M, AMD Ryzen 9 7940HS
3650 Points +209%
Acemagic F2A
Intel Arc 8-Core iGPU, Intel Core Ultra 7 155H
3076 Points +160%
Intel NUC 13 Pro Desk Edition Kit
Intel Iris Xe Graphics G7 96EUs, Intel Core i7-1360P
1253 Points +6%
Minisforum Neptune Series NAD9
Intel Iris Xe Graphics G7 96EUs, Intel Core i9-12900H
1191 Points +1%
Geekom XT12 Pro
Intel Iris Xe Graphics G7 96EUs, Intel Core i9-12900H
1182 Points
Khadas Mind
Intel Iris Xe Graphics G7 96EUs, Intel Core i7-1360P
1174 Points -1%
Average Intel Iris Xe Graphics G7 96EUs
  (936 - 1323, n=25)
1169 Points -1%
LuxMark v2.0 64Bit
Room GPUs-only
Average Intel Iris Xe Graphics G7 96EUs
  (415 - 2721, n=20)
832 Samples/s
Geekom A7
AMD Radeon 780M, AMD Ryzen 9 7940HS
817 Samples/s
Minisforum EliteMini UM780 XTX
AMD Radeon 780M, AMD Ryzen 7 7840HS
807 Samples/s
Minisforum Neptune Series NAD9
Intel Iris Xe Graphics G7 96EUs, Intel Core i9-12900H
603 Samples/s
Acemagic F2A
Intel Arc 8-Core iGPU, Intel Core Ultra 7 155H
549 Samples/s
Sala GPUs-only
Minisforum Neptune Series NAD9
Intel Iris Xe Graphics G7 96EUs, Intel Core i9-12900H
2470 Samples/s
Acemagic F2A
Intel Arc 8-Core iGPU, Intel Core Ultra 7 155H
2319 Samples/s
Average Intel Iris Xe Graphics G7 96EUs
  (942 - 3188, n=20)
2234 Samples/s
Minisforum EliteMini UM780 XTX
AMD Radeon 780M, AMD Ryzen 7 7840HS
1546 Samples/s
Geekom A7
AMD Radeon 780M, AMD Ryzen 9 7940HS
1522 Samples/s
Affinity Photo 2 - Combined (Single / Multi GPU)
Acemagic F2A
Intel Arc 8-Core iGPU, Intel Core Ultra 7 155H
4928 Points +29%
Intel NUC 13 Pro Desk Edition Kit
Intel Iris Xe Graphics G7 96EUs, Intel Core i7-1360P
4510 Points +18%
Minisforum Neptune Series NAD9
Intel Iris Xe Graphics G7 96EUs, Intel Core i9-12900H
4176 Points +9%
Average Intel Iris Xe Graphics G7 96EUs
  (1560 - 4958, n=11)
3909 Points +2%
Geekom XT12 Pro
Intel Iris Xe Graphics G7 96EUs, Intel Core i9-12900H
3830 Points
Khadas Mind
Intel Iris Xe Graphics G7 96EUs, Intel Core i7-1360P
3724 Points -3%
Minisforum EliteMini UM780 XTX
AMD Radeon 780M, AMD Ryzen 7 7840HS
1399 Points -63%
Geekom A7
AMD Radeon 780M, AMD Ryzen 9 7940HS
1396 Points -64%
Geekom XT12 Pro, Intel Iris Xe Graphics G7 96EUs
i9-12900H
Minisforum EliteMini UM780 XTX, AMD Radeon 780M
R7 7840HS
Minisforum Neptune Series NAD9, Intel Iris Xe Graphics G7 96EUs
i9-12900H
Acemagic F2A, Intel Arc 8-Core iGPU
Ultra 7 155H
Geekom A7, AMD Radeon 780M
R9 7940HS
Intel NUC 13 Pro Desk Edition Kit, Intel Iris Xe Graphics G7 96EUs
i7-1360P
Khadas Mind, Intel Iris Xe Graphics G7 96EUs
i7-1360P
Average of class Mini PC
 
SPECviewperf 12
752%
-4%
32%
771%
-2%
-4%
476%
1900x1060 3ds Max (3dsmax-05)
40.1
85
112%
40.9
2%
49.8
24%
84.7
111%
41
2%
37.8
-6%
1900x1060 Catia (catia-04)
37.1
89.8
142%
41.2
11%
48.2
30%
89
140%
35.4
-5%
39.4
6%
1900x1060 Creo (creo-01)
26.9
51.1
90%
9.64
-64%
23.1
-14%
55.4
106%
27.4
2%
7.37
-73%
1900x1060 Energy (energy-01)
0.4
20.1
4925%
0.41
3%
0.91
128%
20.7
5075%
0.32
-20%
0.46
15%
1900x1060 Maya (maya-04)
38.3
73.4
92%
39.9
4%
54.9
43%
69.7
82%
39.2
2%
41.3
8%
1900x1060 Medical (medical-01)
11.8
61.7
423%
12.3
4%
16.9
43%
60.5
413%
11.5
-3%
12
2%
1900x1060 Showcase (showcase-01)
16.6
30.1
81%
17.9
8%
18.2
10%
30.3
83%
17.7
7%
21.2
28%
1900x1060 Solidworks (sw-03)
45.3
113
149%
47.2
4%
42.7
-6%
116
156%
46
2%
41.6
-8%
SPECviewperf 13
202%
0%
21%
190%
-0%
3%
117%
3ds Max (3dsmax-06)
40.1
86.1
115%
40.5
1%
46.4
16%
83.9
109%
40.5
1%
39
-3%
Catia (catia-05)
51.3
132
157%
59.4
16%
71.6
40%
130
153%
49
-4%
57.1
11%
Creo (creo-02)
41.1
93.6
128%
38.8
-6%
29.6
-28%
93.4
127%
39.5
-4%
37.5
-9%
Energy (energy-02)
4.5
25.8
473%
4.27
-5%
5.69
26%
23.8
429%
4.32
-4%
4.34
-4%
Maya (maya-05)
47.5
108
127%
44.2
-7%
59.5
25%
107
125%
47.2
-1%
46.3
-3%
Medical (medical-02)
14.4
79.8
454%
14.5
1%
29.7
106%
77.6
439%
15.2
6%
16
11%
Showcase (showcase-02)
17.3
30
73%
17.9
3%
18.2
5%
25.4
47%
18.1
5%
21.4
24%
Solidworks (sw-04)
57.1
107
87%
55.8
-2%
44.8
-22%
109
91%
55.8
-2%
53.7
-6%
SPECviewperf 2020
295%
-2%
31%
286%
-3%
2%
196%
3840x2160 Medical (medical-03)
3.49
12
244%
2.57
-26%
5.05
45%
11.1
218%
2.66
-24%
2.67
-23%
3840x2160 Energy (energy-03)
3.05
15.4
405%
3.02
-1%
4.61
51%
14.1
362%
3.03
-1%
2.97
-3%
3840x2160 Creo (creo-03)
14.8
31.4
112%
15.3
3%
17.9
21%
31.4
112%
15.1
2%
16.9
14%
3840x2160 CATIA (catia-06)
7.78
24.4
214%
8.2
5%
10
29%
24.8
219%
7.87
1%
8.82
13%
3840x2160 3ds Max (3dsmax-07)
9.69
21
117%
9.67
0%
12.9
33%
20.9
116%
9.81
1%
10.1
4%
3840x2160 Siemens NX (snx-04)
6.29
61.5
878%
6.69
6%
5.7
-9%
61.4
876%
6.2
-1%
6.01
-4%
3840x2160 Maya (maya-06)
23.9
47.2
97%
24
0%
35.4
48%
47
97%
24.7
3%
27.8
16%
Total Average (Program / Settings)
416% / 422%
-2% / -2%
28% / 28%
416% / 421%
-2% / -2%
0% / 0%
263% / 266%
3DMark 05 Standard
39673 pontos
3DMark 06 Standard Score
30775 pontos
3DMark Vantage P Result
25978 pontos
3DMark 11 Performance
7503 pontos
3DMark Ice Storm Standard Score
136854 pontos
3DMark Cloud Gate Standard Score
24758 pontos
3DMark Fire Strike Score
5036 pontos
3DMark Fire Strike Extreme Score
2405 pontos
3DMark Time Spy Score
1797 pontos
Ajuda

Desempenho em jogos

A iGPU Intel Iris Xe é frequentemente sobrecarregada pela maioria dos jogos. O Geekom XT12 Pro normalmente só atinge taxas de quadros jogáveis em resoluções baixas e na predefinição mais baixa. Na comparação de desempenho com os concorrentes, também vemos que o desempenho da iGPU no Geekom XT12 Pro está no mesmo nível do Khadas Mind e o Minisforum NAD9. Entretanto, para obter um pouco mais de desempenho 3D, a única opção é usar uma placa gráfica externa, que pode ser conectada via USB4.

The Witcher 3
1024x768 Low Graphics & Postprocessing
Geekom A7
Radeon 780M, R9 7940HS, Acer N5000
154.6 (12.9min, 32P0.1, 98.7P1) fps +76%
Minisforum EliteMini UM780 XTX
Radeon 780M, R7 7840HS, Kingston OM8PGP41024Q-A0
153.5 (20.1min, 43.1P0.1, 107.8P1) fps +75%
Acemagic F2A
Arc 8-Core, Ultra 7 155H, Kingston OM8SEP1024Q-A0
126 (36.4min, 62.1P0.1, 99.1P1) fps +44%
Intel NUC 13 Pro Desk Edition Kit
Iris Xe G7 96EUs, i7-1360P, Samsung PM9A1 MZVL2512HCJQ
102 fps +16%
Minisforum Neptune Series NAD9
Iris Xe G7 96EUs, i9-12900H, Kingston OM8PGP4512Q-A0
97.2 fps +11%
Geekom XT12 Pro
Iris Xe G7 96EUs, i9-12900H, Lexar SSD NM7A1 1TB
87.7 (4.87min, 27.9P0.1, 53P1) fps
Khadas Mind
Iris Xe G7 96EUs, i7-1360P, WD PC SN740 SDDPTQD-1T00
85.9 fps -2%
1920x1080 High Graphics & Postprocessing (Nvidia HairWorks Off)
Geekom A7
Radeon 780M, R9 7940HS, Acer N5000
49.6 (13.7min, 22.8P0.1, 39.2P1) fps +58%
Minisforum EliteMini UM780 XTX
Radeon 780M, R7 7840HS, Kingston OM8PGP41024Q-A0
49.1 (23.1min, 38.4P0.1, 40.8P1) fps +56%
Acemagic F2A
Arc 8-Core, Ultra 7 155H, Kingston OM8SEP1024Q-A0
44.8 (26.8min, 32P0.1, 37.7P1) fps +43%
Intel NUC 13 Pro Desk Edition Kit
Iris Xe G7 96EUs, i7-1360P, Samsung PM9A1 MZVL2512HCJQ
33.5 fps +7%
Khadas Mind
Iris Xe G7 96EUs, i7-1360P, WD PC SN740 SDDPTQD-1T00
32.3 fps +3%
Minisforum Neptune Series NAD9
Iris Xe G7 96EUs, i9-12900H, Kingston OM8PGP4512Q-A0
32 fps +2%
Geekom XT12 Pro
Iris Xe G7 96EUs, i9-12900H, Lexar SSD NM7A1 1TB
31.4 (16min, 16.2P0.1, 17.4P1) fps
Borderlands 3
1280x720 Very Low Overall Quality (DX11)
Geekom A7
Radeon 780M, R9 7940HS, Acer N5000
100.5 fps +104%
Minisforum EliteMini UM780 XTX
Radeon 780M, R7 7840HS, Kingston OM8PGP41024Q-A0
97.3 fps +98%
Acemagic F2A
Arc 8-Core, Ultra 7 155H, Kingston OM8SEP1024Q-A0
68.5 fps +39%
Minisforum Neptune Series NAD9
Iris Xe G7 96EUs, i9-12900H, Kingston OM8PGP4512Q-A0
59.1 fps +20%
Intel NUC 13 Pro Desk Edition Kit
Iris Xe G7 96EUs, i7-1360P, Samsung PM9A1 MZVL2512HCJQ
54.5 fps +11%
Khadas Mind
Iris Xe G7 96EUs, i7-1360P, WD PC SN740 SDDPTQD-1T00
50.7 fps +3%
Geekom XT12 Pro
Iris Xe G7 96EUs, i9-12900H, Lexar SSD NM7A1 1TB
49.2 fps
1920x1080 High Overall Quality (DX11)
Minisforum EliteMini UM780 XTX
Radeon 780M, R7 7840HS, Kingston OM8PGP41024Q-A0
33.3 fps +123%
Acemagic F2A
Arc 8-Core, Ultra 7 155H, Kingston OM8SEP1024Q-A0
27.7 fps +86%
Geekom A7
Radeon 780M, R9 7940HS, Acer N5000
25.8 fps +73%
Minisforum Neptune Series NAD9
Iris Xe G7 96EUs, i9-12900H, Kingston OM8PGP4512Q-A0
16.2 fps +9%
Intel NUC 13 Pro Desk Edition Kit
Iris Xe G7 96EUs, i7-1360P, Samsung PM9A1 MZVL2512HCJQ
16.1 fps +8%
Khadas Mind
Iris Xe G7 96EUs, i7-1360P, WD PC SN740 SDDPTQD-1T00
15.3 fps +3%
Geekom XT12 Pro
Iris Xe G7 96EUs, i9-12900H, Lexar SSD NM7A1 1TB
14.9 fps
GTA V
1024x768 Lowest Settings possible
Geekom A7
Radeon 780M, R9 7940HS, Acer N5000
167.5 (5.17min, 125P1) fps
Minisforum EliteMini UM780 XTX
Radeon 780M, R7 7840HS, Kingston OM8PGP41024Q-A0
164.4 (4.9min, 111.1P1) fps
Acemagic F2A
Arc 8-Core, Ultra 7 155H, Kingston OM8SEP1024Q-A0
161 (4.76min, 100P1) fps
Minisforum Neptune Series NAD9
Iris Xe G7 96EUs, i9-12900H, Kingston OM8PGP4512Q-A0
135.3 (26.7min, 90.9P1) fps
Intel NUC 13 Pro Desk Edition Kit
Iris Xe G7 96EUs, i7-1360P, Samsung PM9A1 MZVL2512HCJQ
124.5 (12.7min, 76.9P1) fps
Khadas Mind
Iris Xe G7 96EUs, i7-1360P, WD PC SN740 SDDPTQD-1T00
112.7 (9.9min, 71.4P1) fps
1920x1080 High/On (Advanced Graphics Off) AA:2xMSAA + FX AF:8x
Minisforum EliteMini UM780 XTX
Radeon 780M, R7 7840HS, Kingston OM8PGP41024Q-A0
66.9 (3.09min, 45.5P1) fps
Geekom A7
Radeon 780M, R9 7940HS, Acer N5000
66.6 (4.46min, 37P1) fps
Acemagic F2A
Arc 8-Core, Ultra 7 155H, Kingston OM8SEP1024Q-A0
31.3 (2.94min, 22.7P1) fps
Khadas Mind
Iris Xe G7 96EUs, i7-1360P, WD PC SN740 SDDPTQD-1T00
23.6 (10.9min, 18.2P1) fps
Minisforum Neptune Series NAD9
Iris Xe G7 96EUs, i9-12900H, Kingston OM8PGP4512Q-A0
21 (8.15min, 16.1P1) fps
Intel NUC 13 Pro Desk Edition Kit
Iris Xe G7 96EUs, i7-1360P, Samsung PM9A1 MZVL2512HCJQ
20.9 (10.5min, 16.7P1) fps
Far Cry 5
1280x720 Low Preset AA:T
Minisforum EliteMini UM780 XTX
Radeon 780M, R7 7840HS, Kingston OM8PGP41024Q-A0
87 (75min) fps +74%
Geekom A7
Radeon 780M, R9 7940HS, Acer N5000
86 (76min) fps +72%
Acemagic F2A
Arc 8-Core, Ultra 7 155H, Kingston OM8SEP1024Q-A0
69 (25min) fps +38%
Minisforum Neptune Series NAD9
Iris Xe G7 96EUs, i9-12900H, Kingston OM8PGP4512Q-A0
57 (49min) fps +14%
Khadas Mind
Iris Xe G7 96EUs, i7-1360P, WD PC SN740 SDDPTQD-1T00
54 (44min) fps +8%
Geekom XT12 Pro
Iris Xe G7 96EUs, i9-12900H, Lexar SSD NM7A1 1TB
50 (45min) fps
Intel NUC 13 Pro Desk Edition Kit
Iris Xe G7 96EUs, i7-1360P, Samsung PM9A1 MZVL2512HCJQ
45 (40min) fps -10%
1920x1080 High Preset AA:T
Minisforum EliteMini UM780 XTX
Radeon 780M, R7 7840HS, Kingston OM8PGP41024Q-A0
47 (42min) fps +104%
Geekom A7
Radeon 780M, R9 7940HS, Acer N5000
43 (38min) fps +87%
Acemagic F2A
Arc 8-Core, Ultra 7 155H, Kingston OM8SEP1024Q-A0
37 (30min) fps +61%
Minisforum Neptune Series NAD9
Iris Xe G7 96EUs, i9-12900H, Kingston OM8PGP4512Q-A0
27 (24min) fps +17%
Intel NUC 13 Pro Desk Edition Kit
Iris Xe G7 96EUs, i7-1360P, Samsung PM9A1 MZVL2512HCJQ
27 (25min) fps +17%
Khadas Mind
Iris Xe G7 96EUs, i7-1360P, WD PC SN740 SDDPTQD-1T00
26 (23min) fps +13%
Geekom XT12 Pro
Iris Xe G7 96EUs, i9-12900H, Lexar SSD NM7A1 1TB
23 (21min) fps
Far Cry New Dawn
1280x720 Low Preset
Minisforum EliteMini UM780 XTX
Radeon 780M, R7 7840HS, Kingston OM8PGP41024Q-A0
75 (58min) fps +60%
Geekom A7
Radeon 780M, R9 7940HS, Acer N5000
75 (56min) fps +60%
Acemagic F2A
Arc 8-Core, Ultra 7 155H, Kingston OM8SEP1024Q-A0
65 (11min) fps +38%
Minisforum Neptune Series NAD9
Iris Xe G7 96EUs, i9-12900H, Kingston OM8PGP4512Q-A0
52 (31min) fps +11%
Intel NUC 13 Pro Desk Edition Kit
Iris Xe G7 96EUs, i7-1360P, Samsung PM9A1 MZVL2512HCJQ
52 (36min) fps +11%
Khadas Mind
Iris Xe G7 96EUs, i7-1360P, WD PC SN740 SDDPTQD-1T00
49 (32min) fps +4%
Geekom XT12 Pro
Iris Xe G7 96EUs, i9-12900H, Lexar SSD NM7A1 1TB
47 (31min) fps
1920x1080 High Preset
Minisforum EliteMini UM780 XTX
Radeon 780M, R7 7840HS, Kingston OM8PGP41024Q-A0
45 (37min) fps +88%
Geekom A7
Radeon 780M, R9 7940HS, Acer N5000
41 (27min) fps +71%
Acemagic F2A
Arc 8-Core, Ultra 7 155H, Kingston OM8SEP1024Q-A0
37 (25min) fps +54%
Minisforum Neptune Series NAD9
Iris Xe G7 96EUs, i9-12900H, Kingston OM8PGP4512Q-A0
28 (21min) fps +17%
Intel NUC 13 Pro Desk Edition Kit
Iris Xe G7 96EUs, i7-1360P, Samsung PM9A1 MZVL2512HCJQ
28 (21min) fps +17%
Khadas Mind
Iris Xe G7 96EUs, i7-1360P, WD PC SN740 SDDPTQD-1T00
27 (20min) fps +13%
Geekom XT12 Pro
Iris Xe G7 96EUs, i9-12900H, Lexar SSD NM7A1 1TB
24 (18min) fps
Dota 2 Reborn
1280x720 min (0/3) fastest
Minisforum EliteMini UM780 XTX
Radeon 780M, R7 7840HS, Kingston OM8PGP41024Q-A0
161.5 (141.6min) fps +52%
Geekom A7
Radeon 780M, R9 7940HS, Acer N5000
155.8 (135.9min) fps +47%
Minisforum Neptune Series NAD9
Iris Xe G7 96EUs, i9-12900H, Kingston OM8PGP4512Q-A0
136.9 (106.8min) fps +29%
Intel NUC 13 Pro Desk Edition Kit
Iris Xe G7 96EUs, i7-1360P, Samsung PM9A1 MZVL2512HCJQ
113.8 (8.3min) fps +7%
Geekom XT12 Pro
Iris Xe G7 96EUs, i9-12900H, Lexar SSD NM7A1 1TB
106.3 (81.7min) fps
Khadas Mind
Iris Xe G7 96EUs, i7-1360P, WD PC SN740 SDDPTQD-1T00
104.2 (79.7min) fps -2%
Acemagic F2A
Arc 8-Core, Ultra 7 155H, Kingston OM8SEP1024Q-A0
103.2 (59.8min) fps -3%
1920x1080 high (2/3)
Minisforum EliteMini UM780 XTX
Radeon 780M, R7 7840HS, Kingston OM8PGP41024Q-A0
97.45 (86.9min) fps +59%
Geekom A7
Radeon 780M, R9 7940HS, Acer N5000
87.6 (75min) fps +43%
Acemagic F2A
Arc 8-Core, Ultra 7 155H, Kingston OM8SEP1024Q-A0
77.3 (52.5min) fps +26%
Minisforum Neptune Series NAD9
Iris Xe G7 96EUs, i9-12900H, Kingston OM8PGP4512Q-A0
68 (62.7min) fps +11%
Intel NUC 13 Pro Desk Edition Kit
Iris Xe G7 96EUs, i7-1360P, Samsung PM9A1 MZVL2512HCJQ
67.6 (58.9min) fps +10%
Khadas Mind
Iris Xe G7 96EUs, i7-1360P, WD PC SN740 SDDPTQD-1T00
61.7 (51.7min) fps +1%
Geekom XT12 Pro
Iris Xe G7 96EUs, i9-12900H, Lexar SSD NM7A1 1TB
61.3 (54.1min) fps
GRID Legends
1280x720 Low Preset
Minisforum EliteMini UM780 XTX
Radeon 780M, R7 7840HS, Kingston OM8PGP41024Q-A0
150.6 (52.6min) fps
Geekom A7
Radeon 780M, R9 7940HS, Acer N5000
139.5 (50.7min) fps
Acemagic F2A
Arc 8-Core, Ultra 7 155H, Kingston OM8SEP1024Q-A0
80 (35min) fps
Khadas Mind
Iris Xe G7 96EUs, i7-1360P, WD PC SN740 SDDPTQD-1T00
53.5 (25.6min) fps
1920x1080 High Preset
Minisforum EliteMini UM780 XTX
Radeon 780M, R7 7840HS, Kingston OM8PGP41024Q-A0
68.8 (34.8min) fps
Geekom A7
Radeon 780M, R9 7940HS, Acer N5000
62.5 (27.3min) fps
Acemagic F2A
Arc 8-Core, Ultra 7 155H, Kingston OM8SEP1024Q-A0
41.7 (24min) fps
Khadas Mind
Iris Xe G7 96EUs, i7-1360P, WD PC SN740 SDDPTQD-1T00
27.1 (19.2min) fps
Shadow of the Tomb Raider
1280x720 Lowest Preset
Acemagic F2A
Arc 8-Core, Ultra 7 155H, Kingston OM8SEP1024Q-A0
131.4 fps +232%
Minisforum EliteMini UM780 XTX
Radeon 780M, R7 7840HS, Kingston OM8PGP41024Q-A0
109.2 fps +176%
Geekom A7
Radeon 780M, R9 7940HS, Acer N5000
96.7 fps +144%
Intel NUC 13 Pro Desk Edition Kit
Iris Xe G7 96EUs, i7-1360P, Samsung PM9A1 MZVL2512HCJQ
45.5 fps +15%
Khadas Mind
Iris Xe G7 96EUs, i7-1360P, WD PC SN740 SDDPTQD-1T00
43.7 fps +10%
Geekom XT12 Pro
Iris Xe G7 96EUs, i9-12900H, Lexar SSD NM7A1 1TB
39.6 fps
1920x1080 High Preset AA:SM
Acemagic F2A
Arc 8-Core, Ultra 7 155H, Kingston OM8SEP1024Q-A0
49.5 fps +163%
Minisforum EliteMini UM780 XTX
Radeon 780M, R7 7840HS, Kingston OM8PGP41024Q-A0
41.2 fps +119%
Geekom A7
Radeon 780M, R9 7940HS, Acer N5000
32.1 fps +71%
Intel NUC 13 Pro Desk Edition Kit
Iris Xe G7 96EUs, i7-1360P, Samsung PM9A1 MZVL2512HCJQ
23.4 fps +24%
Khadas Mind
Iris Xe G7 96EUs, i7-1360P, WD PC SN740 SDDPTQD-1T00
22.5 fps +20%
Geekom XT12 Pro
Iris Xe G7 96EUs, i9-12900H, Lexar SSD NM7A1 1TB
18.8 fps
F1 2021
1280x720 Ultra Low Preset
Geekom A7
Radeon 780M, R9 7940HS, Acer N5000
225 (178min, 175P1) fps +137%
Minisforum EliteMini UM780 XTX
Radeon 780M, R7 7840HS, Kingston OM8PGP41024Q-A0
219 (179min, 177P1) fps +131%
Acemagic F2A
Arc 8-Core, Ultra 7 155H, Kingston OM8SEP1024Q-A0
145.9 (119min, 118P1) fps +54%
Minisforum Neptune Series NAD9
Iris Xe G7 96EUs, i9-12900H, Kingston OM8PGP4512Q-A0
97.2 (76min, 74P1) fps +3%
Geekom XT12 Pro
Iris Xe G7 96EUs, i9-12900H, Lexar SSD NM7A1 1TB
94.8 (70min, 69P1) fps
1920x1080 High Preset AA:T AF:16x
Minisforum EliteMini UM780 XTX
Radeon 780M, R7 7840HS, Kingston OM8PGP41024Q-A0
84.5 (69min, 66P1) fps +132%
Geekom A7
Radeon 780M, R9 7940HS, Acer N5000
79.5 (50min, 42P1) fps +118%
Acemagic F2A
Arc 8-Core, Ultra 7 155H, Kingston OM8SEP1024Q-A0
63.2 (55min, 49P1) fps +74%
Minisforum Neptune Series NAD9
Iris Xe G7 96EUs, i9-12900H, Kingston OM8PGP4512Q-A0
40.4 (33min, 33P1) fps +11%
Geekom XT12 Pro
Iris Xe G7 96EUs, i9-12900H, Lexar SSD NM7A1 1TB
36.4 (28min, 28P1) fps
Tiny Tina's Wonderlands
1280x720 Lowest Preset (DX12)
Minisforum EliteMini UM780 XTX
Radeon 780M, R7 7840HS, Kingston OM8PGP41024Q-A0
151.2 fps +207%
Geekom A7
Radeon 780M, R9 7940HS, Acer N5000
98.6 fps +100%
Acemagic F2A
Arc 8-Core, Ultra 7 155H, Kingston OM8SEP1024Q-A0
83.8 fps +70%
Intel NUC 13 Pro Desk Edition Kit
Iris Xe G7 96EUs, i7-1360P, Samsung PM9A1 MZVL2512HCJQ
57.7 fps +17%
Minisforum Neptune Series NAD9
Iris Xe G7 96EUs, i9-12900H, Kingston OM8PGP4512Q-A0
56 fps +14%
Geekom XT12 Pro
Iris Xe G7 96EUs, i9-12900H, Lexar SSD NM7A1 1TB
49.3 fps
1920x1080 High Preset (DX12)
Minisforum EliteMini UM780 XTX
Radeon 780M, R7 7840HS, Kingston OM8PGP41024Q-A0
38.8 fps +169%
Geekom A7
Radeon 780M, R9 7940HS, Acer N5000
29.9 fps +108%
Acemagic F2A
Arc 8-Core, Ultra 7 155H, Kingston OM8SEP1024Q-A0
29.1 fps +102%
Intel NUC 13 Pro Desk Edition Kit
Iris Xe G7 96EUs, i7-1360P, Samsung PM9A1 MZVL2512HCJQ
15.9 fps +10%
Minisforum Neptune Series NAD9
Iris Xe G7 96EUs, i9-12900H, Kingston OM8PGP4512Q-A0
15.7 fps +9%
Geekom XT12 Pro
Iris Xe G7 96EUs, i9-12900H, Lexar SSD NM7A1 1TB
14.4 fps

Witcher 3 FPS chart

051015202530Tooltip
Geekom XT12 Pro i9-12900H, Iris Xe G7 96EUs: Ø15 (13-16)
Minisforum EliteMini UM780 XTX R7 7840HS, Radeon 780M: Ø29.7 (28-31)
Geekom A7 R9 7940HS, Radeon 780M: Ø25.7 (20-33)
baixomédiaaltoultra
The Witcher 3 (2015) 87.7 58.9 31.4 15.6
Dota 2 Reborn (2015) 106.3 76.3 61.3 54.2
Final Fantasy XV Benchmark (2018) 42.2 22.7 16.4
X-Plane 11.11 (2018) 55.5 42.2 36
Far Cry 5 (2018) 50 26 23 22
Strange Brigade (2018) 81.7 37.9 30.9 24.8
Shadow of the Tomb Raider (2018) 39.6 21.7 18.8 18
Far Cry New Dawn (2019) 47 25 24 22
Metro Exodus (2019) 35.2 17.7 10.9
Borderlands 3 (2019) 49.2 23.7 14.9 11.3
F1 2020 (2020) 84.5 43.7 34.2 22.5
F1 2021 (2021) 94.8 46.9 36.4 26.3
Tiny Tina's Wonderlands (2022) 28.8 22 14.4 11.2
F1 22 (2022) 42.5 38.4 28.7
F1 23 (2023) 38.7 35.1 25.2
Cyberpunk 2077 2.1 Phantom Liberty (2023) 16.4 13.1 11.5
Prince of Persia The Lost Crown (2024) 120 81.3 73.1

Teste de desempenho do Geekom XT12 Pro com duas eGPUs

Se o senhor equipar o Geekom XT12 Pro com uma eGPU, poderá esperar um aumento maciço no desempenho 3D. Demos uma olhada mais de perto no XT12 Pro em combinação com o GPD G1, bem como com o Razer Core X e um Nvidia GeForce RTX 3060 Ti. Em comparação com seus rivais, nossa amostra de teste mostra um desempenho muito bom aqui. A combinação das duas eGPUs e do processador Intel oferece consistentemente um desempenho melhor do que com os processadores AMD.

Esses testes são apenas uma representação do possível desempenho com as eGPUs. Esses resultados não influenciam a classificação geral desse teste.

Geekom XT12 Pro com GPD G1 e Razer Core X

Geekom XT12 Pro com GPD G1 (AMD Radeon RX 7600M XT)

Performance Rating - Percent
Geekom XT12 Pro (GPD G1 Radeon RX 7600M XT @USB4)
Intel Core i9-12900H
96.9 pt
Geekom A7 (GPD G1 Radeon RX 7600M XT @USB4)
AMD Ryzen 9 7940HS
93 pt
Acemagic AM18 (GPD G1 Radeon RX 7600M XT @USB4)
AMD Ryzen 7 7840HS
89.1 pt
Aoostar GOD77 (GPD G1 Radeon RX 7600M XT @USB4)
AMD Ryzen 7 7735HS
87.9 pt
3DMark 11 - 1280x720 Performance GPU
Acemagic AM18 (GPD G1 Radeon RX 7600M XT @USB4)
AMD Ryzen 7 7840HS
35004 Points +402%
Geekom A7 (GPD G1 Radeon RX 7600M XT @USB4)
AMD Ryzen 9 7940HS
34851 Points +400%
Geekom XT12 Pro (GPD G1 Radeon RX 7600M XT @USB4)
Intel Core i9-12900H
34018 Points +388%
Aoostar GOD77 (GPD G1 Radeon RX 7600M XT @USB4)
AMD Ryzen 7 7735HS
27060 Points +288%

6975 Points
3DMark
2560x1440 Time Spy Graphics
Geekom A7 (GPD G1 Radeon RX 7600M XT @USB4)
AMD Ryzen 9 7940HS
9703 Points +514%
Acemagic AM18 (GPD G1 Radeon RX 7600M XT @USB4)
AMD Ryzen 7 7840HS
9622 Points +509%
Geekom XT12 Pro (GPD G1 Radeon RX 7600M XT @USB4)
Intel Core i9-12900H
9617 Points +508%
Aoostar GOD77 (GPD G1 Radeon RX 7600M XT @USB4)
AMD Ryzen 7 7735HS
9555 Points +504%

1581 Points
1920x1080 Fire Strike Graphics
Aoostar GOD77 (GPD G1 Radeon RX 7600M XT @USB4)
AMD Ryzen 7 7735HS
29101 Points +437%
Geekom A7 (GPD G1 Radeon RX 7600M XT @USB4)
AMD Ryzen 9 7940HS
28983 Points +435%
Acemagic AM18 (GPD G1 Radeon RX 7600M XT @USB4)
AMD Ryzen 7 7840HS
28937 Points +434%
Geekom XT12 Pro (GPD G1 Radeon RX 7600M XT @USB4)
Intel Core i9-12900H
25367 Points +368%

5421 Points
3840x2160 Fire Strike Ultra Graphics
Acemagic AM18 (GPD G1 Radeon RX 7600M XT @USB4)
AMD Ryzen 7 7840HS
6764 Points +485%
Aoostar GOD77 (GPD G1 Radeon RX 7600M XT @USB4)
AMD Ryzen 7 7735HS
6738 Points +482%
Geekom A7 (GPD G1 Radeon RX 7600M XT @USB4)
AMD Ryzen 9 7940HS
6735 Points +482%
Geekom XT12 Pro (GPD G1 Radeon RX 7600M XT @USB4)
Intel Core i9-12900H
6533 Points +465%

1157 Points
Unigine Superposition
1280x720 720p Low
Geekom XT12 Pro (GPD G1 Radeon RX 7600M XT @USB4)
Intel Core i9-12900H
32000 Points +438%
Geekom A7 (GPD G1 Radeon RX 7600M XT @USB4)
AMD Ryzen 9 7940HS
6929 Points +16%

5950 Points
Acemagic AM18 (GPD G1 Radeon RX 7600M XT @USB4)
AMD Ryzen 7 7840HS
5073 Points -15%
Aoostar GOD77 (GPD G1 Radeon RX 7600M XT @USB4)
AMD Ryzen 7 7735HS
5014 Points -16%
1920x1080 1080p High
Geekom XT12 Pro (GPD G1 Radeon RX 7600M XT @USB4)
Intel Core i9-12900H
11575 Points +469%
Geekom A7 (GPD G1 Radeon RX 7600M XT @USB4)
AMD Ryzen 9 7940HS
7694 Points +278%
Acemagic AM18 (GPD G1 Radeon RX 7600M XT @USB4)
AMD Ryzen 7 7840HS
5740 Points +182%
Aoostar GOD77 (GPD G1 Radeon RX 7600M XT @USB4)
AMD Ryzen 7 7735HS
5621 Points +176%

2035 Points
1920x1080 1080p Extreme
Geekom XT12 Pro (GPD G1 Radeon RX 7600M XT @USB4)
Intel Core i9-12900H
5549 Points +433%
Geekom A7 (GPD G1 Radeon RX 7600M XT @USB4)
AMD Ryzen 9 7940HS
5388 Points +417%
Acemagic AM18 (GPD G1 Radeon RX 7600M XT @USB4)
AMD Ryzen 7 7840HS
4354 Points +318%
Aoostar GOD77 (GPD G1 Radeon RX 7600M XT @USB4)
AMD Ryzen 7 7735HS
4275 Points +310%

1042 Points
3840x2160 4k Optimized
Geekom XT12 Pro (GPD G1 Radeon RX 7600M XT @USB4)
Intel Core i9-12900H
6702 Points
Geekom A7 (GPD G1 Radeon RX 7600M XT @USB4)
AMD Ryzen 9 7940HS
6056 Points
Acemagic AM18 (GPD G1 Radeon RX 7600M XT @USB4)
AMD Ryzen 7 7840HS
4799 Points
Aoostar GOD77 (GPD G1 Radeon RX 7600M XT @USB4)
AMD Ryzen 7 7735HS
4765 Points
7680x4320 8k Optimized
Aoostar GOD77 (GPD G1 Radeon RX 7600M XT @USB4)
AMD Ryzen 7 7735HS
2770 Points
Geekom A7 (GPD G1 Radeon RX 7600M XT @USB4)
AMD Ryzen 9 7940HS
2764 Points
Acemagic AM18 (GPD G1 Radeon RX 7600M XT @USB4)
AMD Ryzen 7 7840HS
2743 Points
Geekom XT12 Pro (GPD G1 Radeon RX 7600M XT @USB4)
Intel Core i9-12900H
2723 Points
Unigine Valley 1.0
1920x1080 Extreme HD DirectX AA:x8
Geekom A7 (GPD G1 Radeon RX 7600M XT @USB4)
AMD Ryzen 9 7940HS
96.2 fps +623%
Acemagic AM18 (GPD G1 Radeon RX 7600M XT @USB4)
AMD Ryzen 7 7840HS
92.4 fps +595%
Aoostar GOD77 (GPD G1 Radeon RX 7600M XT @USB4)
AMD Ryzen 7 7735HS
91.6 fps +589%
Geekom XT12 Pro (GPD G1 Radeon RX 7600M XT @USB4)
Intel Core i9-12900H
89.9 fps +576%

13.3 fps
1920x1080 Extreme HD Preset OpenGL AA:x8
Geekom A7 (GPD G1 Radeon RX 7600M XT @USB4)
AMD Ryzen 9 7940HS
80.5 fps +479%
Geekom XT12 Pro (GPD G1 Radeon RX 7600M XT @USB4)
Intel Core i9-12900H
80.2 fps +477%
Acemagic AM18 (GPD G1 Radeon RX 7600M XT @USB4)
AMD Ryzen 7 7840HS
79.3 fps +471%
Aoostar GOD77 (GPD G1 Radeon RX 7600M XT @USB4)
AMD Ryzen 7 7735HS
79.1 fps +469%

13.9 fps
Unigine Heaven 4.0
Extreme Preset OpenGL
Geekom A7 (GPD G1 Radeon RX 7600M XT @USB4)
AMD Ryzen 9 7940HS
122.2 fps +461%
Geekom XT12 Pro (GPD G1 Radeon RX 7600M XT @USB4)
Intel Core i9-12900H
119.6 fps +449%
Aoostar GOD77 (GPD G1 Radeon RX 7600M XT @USB4)
AMD Ryzen 7 7735HS
118.1 fps +442%
Acemagic AM18 (GPD G1 Radeon RX 7600M XT @USB4)
AMD Ryzen 7 7840HS
117.1 fps +437%

21.8 fps
Extreme Preset DX11
Geekom A7 (GPD G1 Radeon RX 7600M XT @USB4)
AMD Ryzen 9 7940HS
129.9 fps +472%
Acemagic AM18 (GPD G1 Radeon RX 7600M XT @USB4)
AMD Ryzen 7 7840HS
125.5 fps +453%
Aoostar GOD77 (GPD G1 Radeon RX 7600M XT @USB4)
AMD Ryzen 7 7735HS
123.2 fps +443%
Geekom XT12 Pro (GPD G1 Radeon RX 7600M XT @USB4)
Intel Core i9-12900H
116 fps +411%

22.7 fps
ComputeMark v2.1
1024x600 Normal, Score
Aoostar GOD77 (GPD G1 Radeon RX 7600M XT @USB4)
AMD Ryzen 7 7735HS
20386 Points +501%
Geekom A7 (GPD G1 Radeon RX 7600M XT @USB4)
AMD Ryzen 9 7940HS
20154 Points +495%
Acemagic AM18 (GPD G1 Radeon RX 7600M XT @USB4)
AMD Ryzen 7 7840HS
20109 Points +493%
Geekom XT12 Pro (GPD G1 Radeon RX 7600M XT @USB4)
Intel Core i9-12900H
19681 Points +481%

3390 Points
1024x600 Normal, Fluid 3DTex
Acemagic AM18 (GPD G1 Radeon RX 7600M XT @USB4)
AMD Ryzen 7 7840HS
1715 Points +642%
Geekom XT12 Pro (GPD G1 Radeon RX 7600M XT @USB4)
Intel Core i9-12900H
1711 Points +641%
Geekom A7 (GPD G1 Radeon RX 7600M XT @USB4)
AMD Ryzen 9 7940HS
1708 Points +639%
Aoostar GOD77 (GPD G1 Radeon RX 7600M XT @USB4)
AMD Ryzen 7 7735HS
1701 Points +636%

231 Points
1024x600 Normal, Fluid 2DTexArr
Geekom XT12 Pro (GPD G1 Radeon RX 7600M XT @USB4)
Intel Core i9-12900H
1769 Points +619%
Geekom A7 (GPD G1 Radeon RX 7600M XT @USB4)
AMD Ryzen 9 7940HS
1760 Points +615%
Aoostar GOD77 (GPD G1 Radeon RX 7600M XT @USB4)
AMD Ryzen 7 7735HS
1748 Points +611%
Acemagic AM18 (GPD G1 Radeon RX 7600M XT @USB4)
AMD Ryzen 7 7840HS
1748 Points +611%

246 Points
1024x600 Normal, Mandel Vector
Geekom A7 (GPD G1 Radeon RX 7600M XT @USB4)
AMD Ryzen 9 7940HS
4457 Points +418%
Aoostar GOD77 (GPD G1 Radeon RX 7600M XT @USB4)
AMD Ryzen 7 7735HS
4450 Points +417%
Acemagic AM18 (GPD G1 Radeon RX 7600M XT @USB4)
AMD Ryzen 7 7840HS
4442 Points +417%
Geekom XT12 Pro (GPD G1 Radeon RX 7600M XT @USB4)
Intel Core i9-12900H
4246 Points +394%

860 Points
1024x600 Normal, Mandel Scalar
Geekom A7 (GPD G1 Radeon RX 7600M XT @USB4)
AMD Ryzen 9 7940HS
5418 Points +521%
Aoostar GOD77 (GPD G1 Radeon RX 7600M XT @USB4)
AMD Ryzen 7 7735HS
5373 Points +516%
Acemagic AM18 (GPD G1 Radeon RX 7600M XT @USB4)
AMD Ryzen 7 7840HS
5365 Points +515%
Geekom XT12 Pro (GPD G1 Radeon RX 7600M XT @USB4)
Intel Core i9-12900H
5069 Points +481%

872 Points
1024x600 Normal, QJuliaRayTrace
Aoostar GOD77 (GPD G1 Radeon RX 7600M XT @USB4)
AMD Ryzen 7 7735HS
7114 Points +502%
Geekom XT12 Pro (GPD G1 Radeon RX 7600M XT @USB4)
Intel Core i9-12900H
6886 Points +483%
Acemagic AM18 (GPD G1 Radeon RX 7600M XT @USB4)
AMD Ryzen 7 7840HS
6839 Points +479%
Geekom A7 (GPD G1 Radeon RX 7600M XT @USB4)
AMD Ryzen 9 7940HS
6811 Points +476%

1182 Points
baixomédiaaltoultraQHD4K
GTA V (2015) 159.3 148.4 118.5 74 60.7 69.4
The Witcher 3 (2015) 254 184.3 125.4 70.5 55.6 47.3
Dota 2 Reborn (2015) 102.2 89.1 78.3 76.9 65
Final Fantasy XV Benchmark (2018) 162.9 106.4 71.2 55.4 32.9
X-Plane 11.11 (2018) 65.1 46 33.6 25.3
Far Cry 5 (2018) 142 123 115 107 82 45
Strange Brigade (2018) 204 154.6 149.6 138.5 108.1 62.1
Shadow of the Tomb Raider (2018) 125.4 89.9 86.4 79.8 61.7 34.5
Far Cry New Dawn (2019) 126 110 106 93 84 49
Metro Exodus (2019) 77.1 62.6 55.2 45.4 38.4 26.1
Borderlands 3 (2019) 138.5 98.6 73.8 60.5 46 27.1
F1 2020 (2020) 255 184.1 156.8 108.3 86.7 54.9
F1 2021 (2021) 239 203 131.8 81.5 63.3 31.4
God of War (2022) 93.9 84.4 70 52.1 43.3 30.2
GRID Legends (2022) 96.5 82.3 67.3 60.2 55.7 44
Tiny Tina's Wonderlands (2022) 164.8 127.1 85.2 68.5 51.1 22.1
F1 22 (2022) 101.6 96.9 76.4 39.9 27.8 13.5
F1 23 (2023) 120.1 126.7 106.1 32.7 13.1 6.6
Cyberpunk 2077 2.1 Phantom Liberty (2023) 87.3 74.5 64.9 59.1 39.9 18.5
Assassin's Creed Mirage (2023) 75 68 63 46 37 23
Total War Pharaoh (2023) 280.6 158 93.4 46.7 45.9 32.1
Avatar Frontiers of Pandora (2023) 46 44 36 30 20 9.5

Geekom XT12 Pro com Razer Core X e Nvidia GeForce RTX 3060 Ti

Performance Rating - Percent
Geekom A7 (Nvidia GeForce RTX 3060 Ti FE)
AMD Ryzen 9 7940HS
99.6 pt
Intel NUC 13 Pro Kit NUC13ANK (Nvidia GeForce RTX 3060 Ti FE TB3)
Intel Core i7-1360P
98.3 pt
Acemagic AM18 (Nvidia GeForce RTX 3060 Ti FE)
AMD Ryzen 7 7840HS
97.8 pt
Geekom XT12 Pro (Nvidia GeForce RTX 3060 Ti FE)
Intel Core i9-12900H
96.4 pt
Minisforum Venus Series UM790 Pro (Nvidia GeForce RTX 3060 Ti FE TB3)
AMD Ryzen 9 7940HS
95.8 pt
Ace Magician AM08Pro (Nvidia GeForce RTX 3060 Ti FE TB3)
AMD Ryzen 9 6900HX
95.2 pt
3DMark 11 - 1280x720 Performance GPU
Geekom A7 (Nvidia GeForce RTX 3060 Ti FE)
AMD Ryzen 9 7940HS
34990 Points +402%
Intel NUC 13 Pro Kit NUC13ANK (Nvidia GeForce RTX 3060 Ti FE TB3)
Intel Core i7-1360P
33577 Points +381%
Minisforum Venus Series UM790 Pro (Nvidia GeForce RTX 3060 Ti FE TB3)
AMD Ryzen 9 7940HS
33147 Points +375%
Acemagic AM18 (Nvidia GeForce RTX 3060 Ti FE)
AMD Ryzen 7 7840HS
32887 Points +371%
Ace Magician AM08Pro (Nvidia GeForce RTX 3060 Ti FE TB3)
AMD Ryzen 9 6900HX
32835 Points +371%
Geekom XT12 Pro (Nvidia GeForce RTX 3060 Ti FE)
Intel Core i9-12900H
32654 Points +368%

6975 Points
3DMark
2560x1440 Time Spy Graphics
Geekom A7 (Nvidia GeForce RTX 3060 Ti FE)
AMD Ryzen 9 7940HS
11210 Points +609%
Geekom XT12 Pro (Nvidia GeForce RTX 3060 Ti FE)
Intel Core i9-12900H
11062 Points +600%
Intel NUC 13 Pro Kit NUC13ANK (Nvidia GeForce RTX 3060 Ti FE TB3)
Intel Core i7-1360P
11031 Points +598%
Acemagic AM18 (Nvidia GeForce RTX 3060 Ti FE)
AMD Ryzen 7 7840HS
10822 Points +585%
Minisforum Venus Series UM790 Pro (Nvidia GeForce RTX 3060 Ti FE TB3)
AMD Ryzen 9 7940HS
10764 Points +581%
Ace Magician AM08Pro (Nvidia GeForce RTX 3060 Ti FE TB3)
AMD Ryzen 9 6900HX
10743 Points +580%

1581 Points
1920x1080 Fire Strike Graphics
Geekom A7 (Nvidia GeForce RTX 3060 Ti FE)
AMD Ryzen 9 7940HS
25894 Points +378%
Intel NUC 13 Pro Kit NUC13ANK (Nvidia GeForce RTX 3060 Ti FE TB3)
Intel Core i7-1360P
25669 Points +374%
Acemagic AM18 (Nvidia GeForce RTX 3060 Ti FE)
AMD Ryzen 7 7840HS
24892 Points +359%
Geekom XT12 Pro (Nvidia GeForce RTX 3060 Ti FE)
Intel Core i9-12900H
24796 Points +357%
Ace Magician AM08Pro (Nvidia GeForce RTX 3060 Ti FE TB3)
AMD Ryzen 9 6900HX
24657 Points +355%
Minisforum Venus Series UM790 Pro (Nvidia GeForce RTX 3060 Ti FE TB3)
AMD Ryzen 9 7940HS
24452 Points +351%

5421 Points
3840x2160 Fire Strike Ultra Graphics
Acemagic AM18 (Nvidia GeForce RTX 3060 Ti FE)
AMD Ryzen 7 7840HS
7063 Points +510%
Geekom A7 (Nvidia GeForce RTX 3060 Ti FE)
AMD Ryzen 9 7940HS
7061 Points +510%
Geekom XT12 Pro (Nvidia GeForce RTX 3060 Ti FE)
Intel Core i9-12900H
7047 Points +509%
Intel NUC 13 Pro Kit NUC13ANK (Nvidia GeForce RTX 3060 Ti FE TB3)
Intel Core i7-1360P
7036 Points +508%
Minisforum Venus Series UM790 Pro (Nvidia GeForce RTX 3060 Ti FE TB3)
AMD Ryzen 9 7940HS
6996 Points +505%
Ace Magician AM08Pro (Nvidia GeForce RTX 3060 Ti FE TB3)
AMD Ryzen 9 6900HX
6977 Points +503%

1157 Points
Unigine Superposition
1280x720 720p Low
Geekom A7 (Nvidia GeForce RTX 3060 Ti FE)
AMD Ryzen 9 7940HS
34424 Points +479%
Minisforum Venus Series UM790 Pro (Nvidia GeForce RTX 3060 Ti FE TB3)
AMD Ryzen 9 7940HS
33051 Points +455%
Acemagic AM18 (Nvidia GeForce RTX 3060 Ti FE)
AMD Ryzen 7 7840HS
32781 Points +451%
Geekom XT12 Pro (Nvidia GeForce RTX 3060 Ti FE)
Intel Core i9-12900H
31903 Points +436%
Intel NUC 13 Pro Kit NUC13ANK (Nvidia GeForce RTX 3060 Ti FE TB3)
Intel Core i7-1360P
31403 Points +428%
Ace Magician AM08Pro (Nvidia GeForce RTX 3060 Ti FE TB3)
AMD Ryzen 9 6900HX
27744 Points +366%

5950 Points
1920x1080 1080p High
Intel NUC 13 Pro Kit NUC13ANK (Nvidia GeForce RTX 3060 Ti FE TB3)
Intel Core i7-1360P
15114 Points +643%
Geekom A7 (Nvidia GeForce RTX 3060 Ti FE)
AMD Ryzen 9 7940HS
14964 Points +635%
Acemagic AM18 (Nvidia GeForce RTX 3060 Ti FE)
AMD Ryzen 7 7840HS
14870 Points +631%
Geekom XT12 Pro (Nvidia GeForce RTX 3060 Ti FE)
Intel Core i9-12900H
14853 Points +630%
Ace Magician AM08Pro (Nvidia GeForce RTX 3060 Ti FE TB3)
AMD Ryzen 9 6900HX
14660 Points +620%
Minisforum Venus Series UM790 Pro (Nvidia GeForce RTX 3060 Ti FE TB3)
AMD Ryzen 9 7940HS
14362 Points +606%

2035 Points
1920x1080 1080p Extreme
Intel NUC 13 Pro Kit NUC13ANK (Nvidia GeForce RTX 3060 Ti FE TB3)
Intel Core i7-1360P
7129 Points +584%
Geekom XT12 Pro (Nvidia GeForce RTX 3060 Ti FE)
Intel Core i9-12900H
7089 Points +580%
Acemagic AM18 (Nvidia GeForce RTX 3060 Ti FE)
AMD Ryzen 7 7840HS
7037 Points +575%
Geekom A7 (Nvidia GeForce RTX 3060 Ti FE)
AMD Ryzen 9 7940HS
7024 Points +574%
Ace Magician AM08Pro (Nvidia GeForce RTX 3060 Ti FE TB3)
AMD Ryzen 9 6900HX
6971 Points +569%
Minisforum Venus Series UM790 Pro (Nvidia GeForce RTX 3060 Ti FE TB3)
AMD Ryzen 9 7940HS
6894 Points +562%

1042 Points
3840x2160 4k Optimized
Intel NUC 13 Pro Kit NUC13ANK (Nvidia GeForce RTX 3060 Ti FE TB3)
Intel Core i7-1360P
9308 Points
Geekom XT12 Pro (Nvidia GeForce RTX 3060 Ti FE)
Intel Core i9-12900H
9240 Points
Geekom A7 (Nvidia GeForce RTX 3060 Ti FE)
AMD Ryzen 9 7940HS
9173 Points
Acemagic AM18 (Nvidia GeForce RTX 3060 Ti FE)
AMD Ryzen 7 7840HS
9112 Points
Ace Magician AM08Pro (Nvidia GeForce RTX 3060 Ti FE TB3)
AMD Ryzen 9 6900HX
9039 Points
Minisforum Venus Series UM790 Pro (Nvidia GeForce RTX 3060 Ti FE TB3)
AMD Ryzen 9 7940HS
8782 Points
7680x4320 8k Optimized
Geekom XT12 Pro (Nvidia GeForce RTX 3060 Ti FE)
Intel Core i9-12900H
4042 Points
Intel NUC 13 Pro Kit NUC13ANK (Nvidia GeForce RTX 3060 Ti FE TB3)
Intel Core i7-1360P
4036 Points
Acemagic AM18 (Nvidia GeForce RTX 3060 Ti FE)
AMD Ryzen 7 7840HS
4023 Points
Geekom A7 (Nvidia GeForce RTX 3060 Ti FE)
AMD Ryzen 9 7940HS
3995 Points
Ace Magician AM08Pro (Nvidia GeForce RTX 3060 Ti FE TB3)
AMD Ryzen 9 6900HX
3966 Points
Minisforum Venus Series UM790 Pro (Nvidia GeForce RTX 3060 Ti FE TB3)
AMD Ryzen 9 7940HS
3910 Points
Unigine Valley 1.0
1920x1080 Extreme HD DirectX AA:x8
Geekom XT12 Pro (Nvidia GeForce RTX 3060 Ti FE)
Intel Core i9-12900H
144.5 fps +986%
Intel NUC 13 Pro Kit NUC13ANK (Nvidia GeForce RTX 3060 Ti FE TB3)
Intel Core i7-1360P
143.1 fps +976%
Geekom A7 (Nvidia GeForce RTX 3060 Ti FE)
AMD Ryzen 9 7940HS
141.5 fps +964%
Acemagic AM18 (Nvidia GeForce RTX 3060 Ti FE)
AMD Ryzen 7 7840HS
135.5 fps +919%
Minisforum Venus Series UM790 Pro (Nvidia GeForce RTX 3060 Ti FE TB3)
AMD Ryzen 9 7940HS
133 fps +900%
Ace Magician AM08Pro (Nvidia GeForce RTX 3060 Ti FE TB3)
AMD Ryzen 9 6900HX
131.4 fps +888%

13.3 fps
1920x1080 Extreme HD Preset OpenGL AA:x8
Geekom XT12 Pro (Nvidia GeForce RTX 3060 Ti FE)
Intel Core i9-12900H
138.2 fps +894%
Geekom A7 (Nvidia GeForce RTX 3060 Ti FE)
AMD Ryzen 9 7940HS
137 fps +886%
Acemagic AM18 (Nvidia GeForce RTX 3060 Ti FE)
AMD Ryzen 7 7840HS
136.3 fps +881%
Intel NUC 13 Pro Kit NUC13ANK (Nvidia GeForce RTX 3060 Ti FE TB3)
Intel Core i7-1360P
125.8 fps +805%
Ace Magician AM08Pro (Nvidia GeForce RTX 3060 Ti FE TB3)
AMD Ryzen 9 6900HX
121.1 fps +771%
Minisforum Venus Series UM790 Pro (Nvidia GeForce RTX 3060 Ti FE TB3)
AMD Ryzen 9 7940HS
119.2 fps +758%

13.9 fps
Unigine Heaven 4.0
Extreme Preset OpenGL
Geekom A7 (Nvidia GeForce RTX 3060 Ti FE)
AMD Ryzen 9 7940HS
174.4 fps +700%
Acemagic AM18 (Nvidia GeForce RTX 3060 Ti FE)
AMD Ryzen 7 7840HS
172.6 fps +692%
Geekom XT12 Pro (Nvidia GeForce RTX 3060 Ti FE)
Intel Core i9-12900H
172.1 fps +689%
Intel NUC 13 Pro Kit NUC13ANK (Nvidia GeForce RTX 3060 Ti FE TB3)
Intel Core i7-1360P
169.6 fps +678%
Ace Magician AM08Pro (Nvidia GeForce RTX 3060 Ti FE TB3)
AMD Ryzen 9 6900HX
163.2 fps +649%
Minisforum Venus Series UM790 Pro (Nvidia GeForce RTX 3060 Ti FE TB3)
AMD Ryzen 9 7940HS
160.7 fps +637%

21.8 fps
Extreme Preset DX11
Geekom A7 (Nvidia GeForce RTX 3060 Ti FE)
AMD Ryzen 9 7940HS
164.9 fps +626%
Intel NUC 13 Pro Kit NUC13ANK (Nvidia GeForce RTX 3060 Ti FE TB3)
Intel Core i7-1360P
164.8 fps +626%
Geekom XT12 Pro (Nvidia GeForce RTX 3060 Ti FE)
Intel Core i9-12900H
162.5 fps +616%
Acemagic AM18 (Nvidia GeForce RTX 3060 Ti FE)
AMD Ryzen 7 7840HS
153.4 fps +576%
Ace Magician AM08Pro (Nvidia GeForce RTX 3060 Ti FE TB3)
AMD Ryzen 9 6900HX
152.4 fps +571%
Minisforum Venus Series UM790 Pro (Nvidia GeForce RTX 3060 Ti FE TB3)
AMD Ryzen 9 7940HS
147.7 fps +551%

22.7 fps
ComputeMark v2.1
1024x600 Normal, Score
Geekom A7 (Nvidia GeForce RTX 3060 Ti FE)
AMD Ryzen 9 7940HS
27998 Points +726%
Acemagic AM18 (Nvidia GeForce RTX 3060 Ti FE)
AMD Ryzen 7 7840HS
27910 Points +723%
Minisforum Venus Series UM790 Pro (Nvidia GeForce RTX 3060 Ti FE TB3)
AMD Ryzen 9 7940HS
27842 Points +721%
Intel NUC 13 Pro Kit NUC13ANK (Nvidia GeForce RTX 3060 Ti FE TB3)
Intel Core i7-1360P
27811 Points +720%
Ace Magician AM08Pro (Nvidia GeForce RTX 3060 Ti FE TB3)
AMD Ryzen 9 6900HX
27460 Points +710%
Geekom XT12 Pro (Nvidia GeForce RTX 3060 Ti FE)
Intel Core i9-12900H
25975 Points +666%

3390 Points
1024x600 Normal, Fluid 3DTex
Geekom A7 (Nvidia GeForce RTX 3060 Ti FE)
AMD Ryzen 9 7940HS
2697 Points +1068%
Intel NUC 13 Pro Kit NUC13ANK (Nvidia GeForce RTX 3060 Ti FE TB3)
Intel Core i7-1360P
2689 Points +1064%
Minisforum Venus Series UM790 Pro (Nvidia GeForce RTX 3060 Ti FE TB3)
AMD Ryzen 9 7940HS
2681 Points +1061%
Acemagic AM18 (Nvidia GeForce RTX 3060 Ti FE)
AMD Ryzen 7 7840HS
2678 Points +1059%
Ace Magician AM08Pro (Nvidia GeForce RTX 3060 Ti FE TB3)
AMD Ryzen 9 6900HX
2667 Points +1055%
Geekom XT12 Pro (Nvidia GeForce RTX 3060 Ti FE)
Intel Core i9-12900H
2527 Points +994%

231 Points
1024x600 Normal, Fluid 2DTexArr
Geekom A7 (Nvidia GeForce RTX 3060 Ti FE)
AMD Ryzen 9 7940HS
2622 Points +966%
Intel NUC 13 Pro Kit NUC13ANK (Nvidia GeForce RTX 3060 Ti FE TB3)
Intel Core i7-1360P
2619 Points +965%
Minisforum Venus Series UM790 Pro (Nvidia GeForce RTX 3060 Ti FE TB3)
AMD Ryzen 9 7940HS
2614 Points +963%
Acemagic AM18 (Nvidia GeForce RTX 3060 Ti FE)
AMD Ryzen 7 7840HS
2610 Points +961%
Ace Magician AM08Pro (Nvidia GeForce RTX 3060 Ti FE TB3)
AMD Ryzen 9 6900HX
2598 Points +956%
Geekom XT12 Pro (Nvidia GeForce RTX 3060 Ti FE)
Intel Core i9-12900H
2463 Points +901%

246 Points
1024x600 Normal, Mandel Vector
Geekom A7 (Nvidia GeForce RTX 3060 Ti FE)
AMD Ryzen 9 7940HS
5776 Points +572%
Acemagic AM18 (Nvidia GeForce RTX 3060 Ti FE)
AMD Ryzen 7 7840HS
5743 Points +568%
Minisforum Venus Series UM790 Pro (Nvidia GeForce RTX 3060 Ti FE TB3)
AMD Ryzen 9 7940HS
5726 Points +566%
Intel NUC 13 Pro Kit NUC13ANK (Nvidia GeForce RTX 3060 Ti FE TB3)
Intel Core i7-1360P
5694 Points +562%
Ace Magician AM08Pro (Nvidia GeForce RTX 3060 Ti FE TB3)
AMD Ryzen 9 6900HX
5606 Points +552%
Geekom XT12 Pro (Nvidia GeForce RTX 3060 Ti FE)
Intel Core i9-12900H
5342 Points +521%

860 Points
1024x600 Normal, Mandel Scalar
Geekom A7 (Nvidia GeForce RTX 3060 Ti FE)
AMD Ryzen 9 7940HS
6325 Points +625%
Acemagic AM18 (Nvidia GeForce RTX 3060 Ti FE)
AMD Ryzen 7 7840HS
6287 Points +621%
Minisforum Venus Series UM790 Pro (Nvidia GeForce RTX 3060 Ti FE TB3)
AMD Ryzen 9 7940HS
6275 Points +620%
Intel NUC 13 Pro Kit NUC13ANK (Nvidia GeForce RTX 3060 Ti FE TB3)
Intel Core i7-1360P
6253 Points +617%
Ace Magician AM08Pro (Nvidia GeForce RTX 3060 Ti FE TB3)
AMD Ryzen 9 6900HX
6202 Points +611%
Geekom XT12 Pro (Nvidia GeForce RTX 3060 Ti FE)
Intel Core i9-12900H
5881 Points +574%

872 Points
1024x600 Normal, QJuliaRayTrace
Acemagic AM18 (Nvidia GeForce RTX 3060 Ti FE)
AMD Ryzen 7 7840HS
10592 Points +796%
Geekom A7 (Nvidia GeForce RTX 3060 Ti FE)
AMD Ryzen 9 7940HS
10578 Points +795%
Intel NUC 13 Pro Kit NUC13ANK (Nvidia GeForce RTX 3060 Ti FE TB3)
Intel Core i7-1360P
10555 Points +793%
Minisforum Venus Series UM790 Pro (Nvidia GeForce RTX 3060 Ti FE TB3)
AMD Ryzen 9 7940HS
10548 Points +792%
Ace Magician AM08Pro (Nvidia GeForce RTX 3060 Ti FE TB3)
AMD Ryzen 9 6900HX
10388 Points +779%
Geekom XT12 Pro (Nvidia GeForce RTX 3060 Ti FE)
Intel Core i9-12900H
9762 Points +726%

1182 Points
baixomédiaaltoultraQHD4K
GTA V (2015) 177.3 173.2 164.2 98.5 89.8 103.3
The Witcher 3 (2015) 304 208 150.6 72.9 62.5 71.8
Dota 2 Reborn (2015) 153.2 134.5 121.1 109.9 70.4
Final Fantasy XV Benchmark (2018) 159.7 116.9 80.2 49.3 31.6
X-Plane 11.11 (2018) 126.2 107.4 84.1 71.3
Far Cry 5 (2018) 154 131 125 119 99 58
Strange Brigade (2018) 205 155.9 153 149.1 128.3 84.1
Shadow of the Tomb Raider (2018) 150.3 103.1 99.4 94 77.2 47.8
Far Cry New Dawn (2019) 130 114 111 99 91 59
Metro Exodus (2019) 142.2 90.4 68.4 51.7 45.4 33.5
Borderlands 3 (2019) 149.6 127 101.8 83.3 64.7 38.5
F1 2020 (2020) 209 122.3 123.5 101.8 88.5 59.9
F1 2021 (2021) 141.2 108.3 68.7 51.5 48.5 40.4
God of War (2022) 109.9 96.4 81.2 62 55.8 39.7
GRID Legends (2022) 115.6 98.6 82.3 70.4 63.7 50.7
Tiny Tina's Wonderlands (2022) 171.2 136.3 101 79.7 60.9 34
F1 22 (2022) 60 55.2 42.8 27.2 26.6 19.5
F1 23 (2023) 66 64.2 53 33.5 31.2 13.4
Baldur's Gate 3 (2023) 113.3 90.1 78.5 78.2 61.2 36.7
Cyberpunk 2077 2.1 Phantom Liberty (2023) 83.8 78.9 70.1 63.3 44.5 22
Assassin's Creed Mirage (2023) 86 82 77 62 52 37
Total War Pharaoh (2023) 303.7 170.9 101.8 76.5 62.2 38.9
Avatar Frontiers of Pandora (2023) 63 62 62 50 43 31
F1 24 (2024) 75 74.1 60.4 41.8 36 18.6

Emissões - Não é muito silencioso, mas é bastante econômico

Emissões de ruído

Infelizmente, o Geekom XT12 Pro não é um dos dispositivos mais silenciosos. O dispositivo funciona com pouco ruído quando está em marcha lenta, e apenas um ruído baixo da ventoinha é audível. Isso muda sob carga, pois o mini-PC é claramente audível em até 44,2 dB(A). Chegamos a medir até 47,2 dB(A) durante os jogos. No entanto, não foi possível detectar um nível de pressão sonora permanentemente alto durante os jogos. Aqui, o resultado oscilou entre 39 e 47,2 dB(A).

Barulho

Ocioso
28 / 28.1 / 28.5 dB
Carga
39.6 / 44.2 dB
  red to green bar
 
 
30 dB
silencioso
40 dB(A)
audível
50 dB(A)
ruidosamente alto
 
min: dark, med: mid, max: light   Earthworks M23R (15 cm de distância)   environment noise: 25.4 dB(A)
dB(A) 0102030405060708090Deep BassMiddle BassHigh BassLower RangeMidsHigher MidsLower HighsMid HighsUpper HighsSuper Highs2033.33234.232.939.932.833.32529.527.430.433.930.633.129.53131.232.827.330.129.327.831.24022.22319.32727.620.222.25028.325.622.938.23431.528.36322.719.620.521.51917.922.78019.916.814.215.916.414.919.910020.720.118.220.218.119.320.71252222.31516.52011.52216025.323.418.419.522.210.925.320029.223.720.120.122.112.329.225027.324.415.215.615.110.227.331526.424.114.314.714.41026.440026.723.314.314.714.310.226.750027.324.815.615.815.811.427.363029.527.715.314.914.210.929.580034.529.915.815.214.811.134.5100035.831.816.5161611.635.8125034.430.215.915.515.111.934.4160031.526.914.714.31411.231.520003529.819.218.818.711.935250033.929.219.319.117.812.833.9315029.725.814.414.214.113.529.7400034.728.114.614.514.714.234.7500028.822.514.914.614.914.928.8630024.118.816.415.115.815.424.1800019.516.61615.315.715.219.51000017.116.616.115.61615.817.11250015.816.316.315.716.315.915.81600015.416.816.715.516.115.415.4SPL44.239.628.528.12825.444.2N4.431110.64.4median 27.3median 24.1median 15.9median 15.5median 15.8median 11.9median 27.3Delta6.34.11.11.31.62.16.3hearing rangehide median Fan NoiseGeekom XT12 Pro
Geekom XT12 Pro
i9-12900H, Iris Xe G7 96EUs
Minisforum EliteMini UM780 XTX
R7 7840HS, Radeon 780M
Minisforum Neptune Series NAD9
i9-12900H, Iris Xe G7 96EUs
Acemagic F2A
Ultra 7 155H, Arc 8-Core
Geekom A7
R9 7940HS, Radeon 780M
Intel NUC 13 Pro Desk Edition Kit
i7-1360P, Iris Xe G7 96EUs
Khadas Mind
i7-1360P, Iris Xe G7 96EUs
Noise
8%
2%
0%
-8%
0%
-14%
off / environment *
25.4
24.8
2%
30.2
-19%
24.9
2%
25.4
-0%
25.2
1%
25.2
1%
Idle Minimum *
28
28.5
-2%
30.5
-9%
25.4
9%
33.3
-19%
28.1
-0%
34.4
-23%
Idle Average *
28.1
28.5
-1%
30.5
-9%
25.7
9%
33.6
-20%
28.2
-0%
34.4
-22%
Idle Maximum *
28.5
28.7
-1%
30.5
-7%
25.7
10%
33.7
-18%
28.3
1%
34.5
-21%
Load Average *
39.6
32.4
18%
30.5
23%
47.8
-21%
43.3
-9%
42
-6%
44.7
-13%
Witcher 3 ultra *
47.2
32.7
31%
45.23
4%
43.2
8%
49
-4%
Load Maximum *
44.2
39.6
10%
30.5
31%
49
-11%
43.3
2%
42.1
5%
50.4
-14%

* ... smaller is better

Temperatura

O Geekom XT12 Pro aquece visivelmente sob carga. A parte superior aquece significativamente mais do que a parte inferior do minicomputador. As temperaturas documentadas estão todas dentro de uma faixa razoável e não são motivo de preocupação. O Intel Core i9-12900H em si é um pouco diferente. Entretanto, o XT12 Pro só atinge esses valores altos por um curto período de tempo. Sob carga contínua, o consumo de energia do SoC cai para 35 watts, fazendo com que a temperatura do processador se estabilize em pouco mais de 80 °C, em média. Isso significa que o SoC opera dentro das especificações da Intel, embora a utilização do Turbo seja muito baixa devido à pequena unidade de resfriamento.

Para descobrir a causa da alta temperatura, desmontamos o cooler uma vez após os testes para descartar um problema com a pasta térmica. Na verdade, não foi possível encontrar um problema aqui, e mesmo a nova pasta térmica não conseguiu garantir temperaturas mais baixas do ponto quente sob carga.

Teste de estresse Prime95, solo
Teste de estresse FurMark, solo
Teste de estresse Prime95 e FurMark
Teste de estresse do Geekom XT12 Pro (lado superior)
Teste de estresse do Geekom XT12 Pro (parte inferior)
Unidade de fonte de alimentação durante o teste de estresse
Carga Máxima
 44.2 °C47.5 °C45.2 °C 
 41 °C44.9 °C39.7 °C 
 36.7 °C39.8 °C33.4 °C 
Máximo: 47.5 °C
Médio: 41.4 °C
39.5 °C39.9 °C39.7 °C
35.1 °C38.3 °C36.1 °C
35.5 °C36.6 °C35 °C
Máximo: 39.9 °C
Médio: 37.3 °C
alimentação elétrica  41.6 °C | Temperatura do quarto 21.9 °C | Fluke t3000FC (calibrated)
(-) The average temperature for the upper side under maximal load is 41.4 °C / 107 F, compared to the average of 32.2 °C / 90 F for the devices in the class Mini PC.
(-) The maximum temperature on the upper side is 47.5 °C / 118 F, compared to the average of 35.7 °C / 96 F, ranging from 24 to 69.5 °C for the class Mini PC.
(+) The bottom heats up to a maximum of 39.9 °C / 104 F, compared to the average of 36.2 °C / 97 F
(+) In idle usage, the average temperature for the upper side is 30.7 °C / 87 F, compared to the device average of 32.2 °C / 90 F.

Consumo de energia

A própria Geekom descreve o XT12 Pro como um mini-PC muito eficiente e econômico. Em sua maior parte, podemos concordar com isso, embora o consumo de energia no modo inativo não corresponda exatamente à tese. Valores quase idênticos também foram alcançados pelo Intel NUC 13 em nosso teste. Por outro lado, a Geekom mostra que as coisas podem ser diferentes quando olhamos para a comparação com o A7 aqui. No pico, no entanto, vemos apenas 87,8 watts, o que torna nossa amostra de teste bastante econômica. Sob carga média, a necessidade de energia cai para cerca de 53 watts, o que também é um bom resultado. A fonte de alimentação é fornecida por uma pequena unidade de fonte de alimentação com 120 watts. A potência da unidade de fonte de alimentação é um pouco exagerada; uma unidade de fonte de alimentação de 90 watts teria sido suficiente aqui.

Geekom XT12 Pro e a fonte de alimentação (19 V; 6,32 A)
Unidade de fonte de alimentação (19 V; 6,32 A)
Consumo de energia
desligadodarklight 0.9 / 1.4 Watt
Ociosodarkmidlight 5.7 / 9.5 / 16.5 Watt
Carga midlight 53.3 / 87.8 Watt
 color bar
Key: min: dark, med: mid, max: light        Metrahit Energy
Geekom XT12 Pro
i9-12900H, Iris Xe G7 96EUs
Minisforum EliteMini UM780 XTX
R7 7840HS, Radeon 780M
Minisforum Neptune Series NAD9
i9-12900H, Iris Xe G7 96EUs
Acemagic F2A
Ultra 7 155H, Arc 8-Core
Geekom A7
R9 7940HS, Radeon 780M
Intel NUC 13 Pro Desk Edition Kit
i7-1360P, Iris Xe G7 96EUs
Khadas Mind
i7-1360P, Iris Xe G7 96EUs
Average Intel Iris Xe Graphics G7 96EUs
 
Average of class Mini PC
 
Power Consumption
-15%
-44%
-17%
20%
3%
3%
18%
-19%
Idle Minimum *
5.7
8.5
-49%
12.1
-112%
9.1
-60%
3.8
33%
7
-23%
7.8
-37%
Idle Average *
9.5
10.5
-11%
13
-37%
10.3
-8%
4.8
49%
9.2
3%
10.9
-15%
8.55 ?(3.8 - 63, n=193)
10%
Idle Maximum *
16.5
12.9
22%
18.2
-10%
14.4
13%
6.5
61%
11.8
28%
11.8
28%
Load Average *
53.3
67.2
-26%
70.6
-32%
54.9
-3%
71.9
-35%
45
16%
39.2
26%
Load Maximum *
87.8
97.2
-11%
113
-29%
110.4
-26%
94.7
-8%
97.2
-11%
76.4
13%

* ... smaller is better

Power consumtion with the external monitor

0102030405060708090100110Tooltip
Geekom XT12 Pro i9-12900H, Iris Xe G7 96EUs; Idle 1min (external Monitor): Ø11.9 (10.5-16.5)
Acemagic F2A Ultra 7 155H, Arc 8-Core; Idle 1min (external Monitor): Ø10.4 (9.08-14.4)
Geekom A7 R9 7940HS, Radeon 780M; Idle 1min (external Monitor): Ø4.81 (3.82-6.48)
Geekom XT12 Pro i9-12900H, Iris Xe G7 96EUs; 1920x1080 The Witcher 3 ultra (external Monitor): Ø55.4 (53.9-60.9)
Acemagic F2A Ultra 7 155H, Arc 8-Core; 1920x1080 The Witcher 3 ultra (external Monitor): Ø48.4 (45.6-52.4)
Geekom A7 R9 7940HS, Radeon 780M; 1920x1080 The Witcher 3 ultra (external Monitor): Ø73.1 (66.4-82.2)
Geekom XT12 Pro i9-12900H, Iris Xe G7 96EUs; 1280x720 Prime95 28.10 and Furmark 1.25: Ø58.7 (55.2-76)
Acemagic F2A Ultra 7 155H, Arc 8-Core; 1280x720 Prime95 28.10 and Furmark 1.25: Ø92.2 (78.7-114)
Geekom A7 R9 7940HS, Radeon 780M; 1280x720 Prime95 28.10 and Furmark 1.25: Ø64.2 (55.6-95.8)

Power consumtion with the external monitor

0102030405060708090100110Tooltip
Geekom XT12 Pro i9-12900H, Iris Xe G7 96EUs; Prime95 V2810 Stress (external Monitor): Ø58.7 (55-77.6)
Acemagic F2A Ultra 7 155H, Arc 8-Core; Prime95 V2810 Stress (external Monitor): Ø99.6 (92-110.4)
Geekom A7 R9 7940HS, Radeon 780M; Prime95 V2810 Stress (external Monitor): Ø70 (57.2-94.7)
Geekom XT12 Pro i9-12900H, Iris Xe G7 96EUs; Cinebench R15 Multi (external Monitor): Ø85.9 (84-87.8)
Acemagic F2A Ultra 7 155H, Arc 8-Core; Cinebench R15 Multi (external Monitor): Ø103 (99.2-107)
Geekom A7 R9 7940HS, Radeon 780M; Cinebench R15 Multi (external Monitor): Ø73 (64.8-85.1)
Geekom XT12 Pro i9-12900H, Iris Xe G7 96EUs; Cinebench R23 Single (external Monitor): Ø49.1 (41.1-62.2)
Acemagic F2A Ultra 7 155H, Arc 8-Core; Cinebench R23 Single (external Monitor): Ø32.7 (19.4-55.3)
Geekom A7 R9 7940HS, Radeon 780M; Cinebench R23 Single (external Monitor): Ø28.7 (24.1-75.1)
Geekom XT12 Pro i9-12900H, Iris Xe G7 96EUs; Cinebench R23 Multi (external Monitor): Ø60.4 (48.6-81.3)
Acemagic F2A Ultra 7 155H, Arc 8-Core; Cinebench R23 Multi (external Monitor): Ø100.7 (97.2-108.6)
Geekom A7 R9 7940HS, Radeon 780M; Cinebench R23 Multi (external Monitor): Ø66.2 (63.5-84.2)
Geekom XT12 Pro i9-12900H, Iris Xe G7 96EUs; 1280x720 FurMark 1.19 GPU Stress Test (external Monitor): Ø55.4 (51.6-69.7)
Acemagic F2A Ultra 7 155H, Arc 8-Core; 1280x720 FurMark 1.19 GPU Stress Test (external Monitor): Ø49.7 (47.3-60.6)
Geekom A7 R9 7940HS, Radeon 780M; 1280x720 FurMark 1.19 GPU Stress Test (external Monitor): Ø72.8 (57.4-85.5)

Pro

+ carcaça robusta e compacta
+ design moderno e superfícies metálicas de alta qualidade
+ soC rápido com núcleos P e E
+ bom desempenho do sistema
+ fácil de abrir
+ 2x USB4
+ sSD rápido
+ 36 meses de garantia

Contra

- audível sob carga
- Almofadas térmicas do SSD na posição errada
- altas latências de DPC
- relativamente caro

Veredicto - Preço premium, mas apenas um desempenho sólido

Geekom XT12 Pro em análise - Fornecido por Geekom

O Geekom XT12 Pro é, sem dúvida, um mini-PC potente. O Intel Core i9-12900H não é mais uma das CPUs mais recentes, mas ainda pode acompanhar seus concorrentes mais modernos em termos de desempenho da CPU. A maior desvantagem do Geekom XT12 Pro atualmente é seu desempenho 3D. Os modelos mais novos baseados na série Meteor Lake podem oferecer um desempenho significativamente melhor graças à iGPU revisada. O mesmo também se aplica à Radeon 780M da AMD. Aqueles que não dependem disso podem facilmente ignorar esse fato. A Geekom faz um excelente trabalho com o acabamento. Também não há nada a reclamar quando se trata da escolha dos materiais.

O Geekom XT12 Pro é um minicomputador potente e impressiona com seus excelentes recursos. Entretanto, a relação preço-desempenho não é um dos pontos fortes do Geekom XT12 Pro.

O Geekom XT12 Pro é particularmente impressionante com sua boa seleção de interfaces externas. Dois soquetes USB4 são mais do que a maioria dos concorrentes oferece. Afinal de contas, o baixo desempenho 3D pode ser visivelmente aumentado com os acessórios certos. Os demais recursos, que incluem 32 GB de RAM DDR4 e um SSD de 1 TB, são bons e completam muito bem o pacote geral. As opiniões podem ser divididas quando se trata de eficiência, pois observamos valores comparativamente altos no modo inativo em nossa amostra de teste, o que prejudica um pouco o quadro geral. Afinal de contas, o fabricante está anunciando um dispositivo particularmente eficiente. Não queremos negar isso completamente com o Geekom XT12 Pro, pois sob carga o mini-PC mostra que pode ser econômico. Se isso é intencional ou resultado da pequena unidade de resfriamento, vamos deixar isso de lado por enquanto.

Por fim, vamos dar outra olhada no preço de compra: A Geekom cita um RRP de 899 euros para o XT12 Pro, mas isso quase nunca acontece, pois sempre há ofertas especiais. Isso significa que, atualmente, o senhor terá que desembolsar 749 euros pelo Geekom XT12 Pro em nossa configuração de teste. Em relação a outros mini-PCs, o preço de compra atual é bastante alto. Pelo mesmo preço, o senhor também pode adquirir o Geekom A7 com AMD Ryzen 7 7840HS, que certamente oferece melhor desempenho do que o XT12 Pro desta análise. É aqui que a Geekom se atrapalha um pouco e torna o XT12 Pro pouco atraente. Comparado com o Geekom A7, o Geekom XT12 Pro deveria ser significativamente mais barato para despertar o interesse do senhor.

Preços e disponibilidade

No momento, o Geekom XT12 Pro está disponível apenas em nossa configuração de teste e pode ser encomendado na Geekom ou na Amazon. O preço aqui é de 749 euros. Atualmente, há um desconto de cinco por cento ao usar os códigos - Geekom-Shop: ntcpr5, Amazon: ntcpr5XT12

Geekom XT12 Pro - 07/30/2024 v8
Sebastian Bade

Acabamento
88 / 98 → 89%
Conectividade
62 / 81 → 76%
Peso
82%
Desempenho do jogos
67 / 80 → 84%
Desempenho da aplicação
94 / 92 → 100%
Workstation
60%
Temperatura
87%
Ruído
84%
Médio
78%
84%
Mini PC - Médio equilibrado

Transparency

The selection of devices to be reviewed is made by our editorial team. The test sample was given to the author by the manufacturer free of charge for the purposes of review. There was no third-party influence on this review, nor did the manufacturer receive a copy of this review before publication. There was no obligation to publish this review. We never accept compensation or payment in return for our reviews. As an independent media company, Notebookcheck is not subjected to the authority of manufacturers, retailers or publishers.

This is how Notebookcheck is testing

Every year, Notebookcheck independently reviews hundreds of laptops and smartphones using standardized procedures to ensure that all results are comparable. We have continuously developed our test methods for around 20 years and set industry standards in the process. In our test labs, high-quality measuring equipment is utilized by experienced technicians and editors. These tests involve a multi-stage validation process. Our complex rating system is based on hundreds of well-founded measurements and benchmarks, which maintains objectivity. Further information on our test methods can be found here.

Please share our article, every link counts!
Mail Logo
> Análises e revisões de portáteis e celulares > Análises > Análises > Análise do Geekom XT12 Pro: Alternativa elegante ao mini-PC NUC com Intel Core i9-12900H, 32 GB de RAM DDR4 e SSD de 1 TB
Sebastian Bade, 2024-04-30 (Update: 2024-04-30)