Notebookcheck Logo
Teaser

Análise do Acer Nitro V 16 ANV16-41: Um laptop para jogos acessível com um problema

O senhor precisa de Nitro?

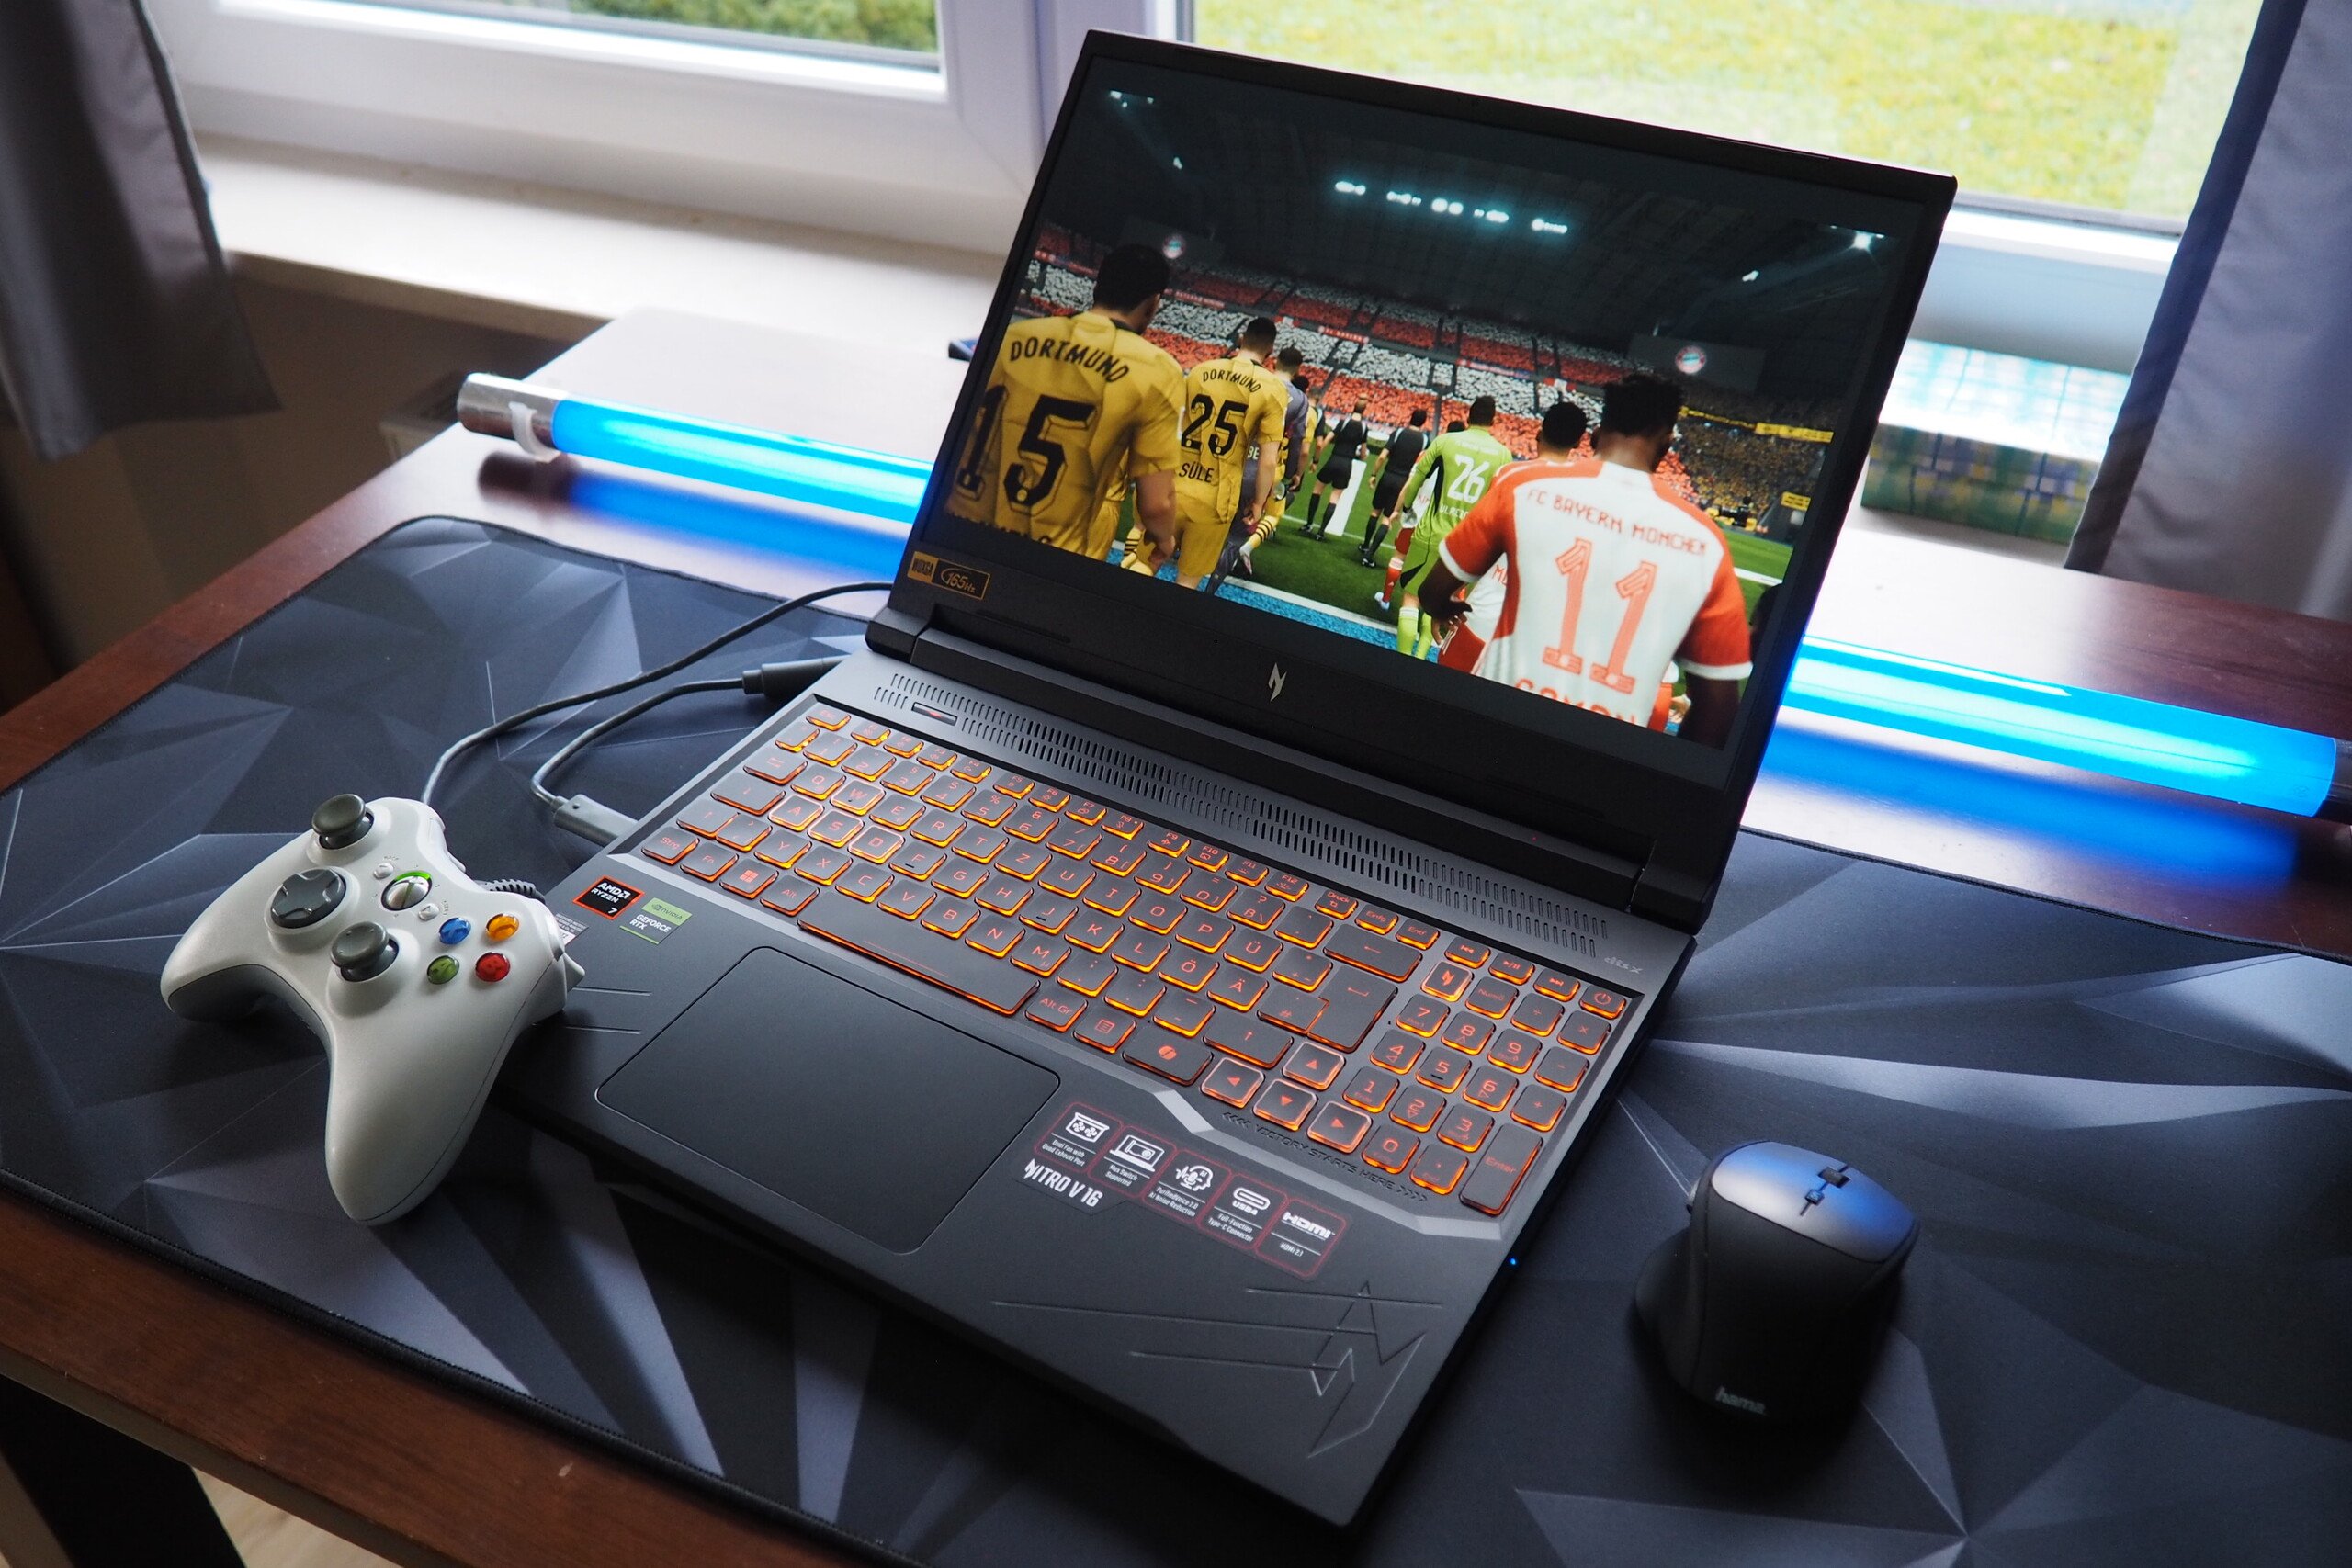
O Nitro V16 é um laptop para jogos em torno da marca de 1.000 dólares que oferece um desempenho mais do que decente para seu preço (Ryzen 8000 e RTX 4060). Descubra aqui se o dispositivo de 16 polegadas também se saiu bem em todas as outras categorias. Primeiro, as primeiras coisas: Infelizmente, a Acer falhou em um aspecto importante.
Florian Glaser, 👁 Florian Glaser (traduzido por DeepL / Ninh Duy) Published 🇺🇸 🇩🇪 ...
Ryzen (Zen) AMD Radeon Nvidia Geforce Gaming Laptop / Notebook

Veredicto - A Acer negligenciou a qualidade da imagem

Para que um laptop seja digno de nossa recomendação, muitas vezes depende de um único ponto. No papel, o Nitro V 16 ANV16-41 causou uma impressão totalmente bem-sucedida. Os processadores Ryzen da geração 8000 da AMD são conhecidos por sua boa relação entre potência e velocidade. A situação é semelhante com o GeForce RTX 4060 da Nvidia, que está instalado em nossa configuração de teste. 16 GB de RAM DDR5 e um SSD de 1 TB também são (ainda) apropriados no segmento de preço de pouco mais de 1.000 dólares.

Sua tela IPS apresenta a proporção 16:10, que é popular no momento, e tem uma taxa de atualização de 165 Hz e uma resolução de 1.920 x 1.200 pixels. O que o senhor não percebe à primeira vista, no entanto, é que a Acer optou por uma tela bastante inferior, como explicaremos em mais detalhes em breve. Em resumo, a cobertura do espaço de cores, em particular, é insuficiente, fazendo com que o conteúdo pareça bastante pálido e sem brilho. Em outras disciplinas, ele também foi suficiente para alcançar resultados médios - seja em seus dispositivos de entrada, alto-falantes, webcam ou capacidade da bateria. Entretanto, ele ganhou pontos positivos por suas opções de atualização e manutenção: Tanto a RAM (dois bancos de RAM) quanto o armazenamento em massa (dois slots M.2) podem ser facilmente substituídos ou expandidos, se necessário.

De modo geral, ainda é difícil recomendar o Nitro V 16 quando se olha para alguns de seus concorrentes. Por um preço semelhante ou um pouco mais alto, há notebooks para jogos com telas significativamente melhores, como o Lenovo Legion 5 16IRX G9, que tem um Core i7-14650HX e um RTX 4060. Também listamos o HP Victus 16, o Nubia RedMagic Titan 16 e o Asus ROG Zephyrus G16 - todos modelos de 16 polegadas - como outros adversários em nosso teste.

Pro

+ sólida relação preço/desempenho
+ consumo moderado de energia
+ A RAM pode ser trocada
+ dois slots M.2
+ USB 4

Contra

- o gabinete é um pouco frágil e não parece ser de alta qualidade
- controle deficiente do ventilador, muito alto sob carga
- tela decepcionante (especialmente em termos de cobertura do espaço de cores)
- pouca capacidade da bateria
- sem leitor de cartão
- webcam ruim

Preço e disponibilidade

No momento em que este artigo foi escrito, o senhor pode comprar o Acer Nitro V 16 ANV16-41-R5AT em lojas on-line como a Amazon, onde ele custa atualmente US$ 959.

Possíveis concorrentes em comparação

Image
Model / Review
Price
Weight
Height
Display
1.
76.3%
Acer Nitro V 16 ANV16-41-R5AT
AMD Ryzen 7 8845HS ⎘
NVIDIA GeForce RTX 4060 Laptop GPU ⎘
16 GB Memória, 1024 GB SSD
List Price: 1100 EUR2.5 kg25.5 mm16.00"
1920x1200
142 PPI
IPS
2.
89.1% v7 (old)
Lenovo Legion 5 16IRX G9
Intel Core i7-14650HX ⎘
NVIDIA GeForce RTX 4060 Laptop GPU ⎘
16 GB Memória, 1024 GB SSD
List Price: 1599€2.4 kg25.2 mm16.00"
2560x1600
189 PPI
IPS
3.
84.3% v7 (old)
HP Victus 16 (2024)
HP Victus 16 (2024)
Intel Core i7-14700HX ⎘
NVIDIA GeForce RTX 4060 Laptop GPU ⎘
16 GB Memória, 512 GB SSD
Amazon: $1,549.00
List Price: 1499 Euro
2.4 kg23.9 mm16.10"
1920x1080
137 PPI
IPS
4.
81.2%
Nubia RedMagic Titan 16 Pro
Intel Core i9-14900HX ⎘
NVIDIA GeForce RTX 4060 Laptop GPU ⎘
16 GB Memória, 1024 GB SSD
Amazon:
1. $62.99
atFoliX Screen Protector com...
2. $62.19
atFoliX Screen Protection Fi...
3. $59.69
atFoliX Plastic Glass Protec...
List Price: 1759 Euro
2.4 kg23.9 mm16.00"
2560x1600
189 PPI
IPS
5.
85.9%
Asus ROG Zephyrus G16 GA605WV
AMD Ryzen AI 9 HX 370 ⎘
NVIDIA GeForce RTX 4060 Laptop GPU ⎘
32 GB Memória, 1024 GB SSD
Amazon: $2,199.00
List Price: 2599€
1.8 kg17.2 mm16.00"
2560x1600
189 PPI
OLED

O Nitro V 16 está disponível em diversas variantes. Dependendo da configuração, ele apresenta um Ryzen 5 8645HS ou um Ryzen 7 8845HS no interior. Sua RAM varia de 16 a 32 GB e seu SSD NVMe tem uma capacidade de 1 TB em todos os casos. Ou uma GeForce RTX 4050 ou RTX 4060 cuida do processamento de imagens. Os modelos têm preços entre US$ 1.000 e US$ 1.400.

Especificações

Acer Nitro V 16 ANV16-41-R5AT
Processador
AMD Ryzen 7 8845HS 8 x 3.8 - 5.1 GHz, 65 W PL2 / Short Burst, 54 W PL1 / Sustained, Hawk Point-HS (Zen 4)
Placa gráfica
NVIDIA GeForce RTX 4060 Laptop GPU - 8 GB VRAM, Análises do: 1890 MHz, Memoría: 2000 MHz, 85 W TDP, GDDR6, ForceWare 566.14, Optimus
Memória
16 GB 
, 2x 8 GB SO-DIMM DDR5-5600, two slots (both in use)
Pantalha
16.00 polegadas 16:10, 1920 x 1200 pixel 142 PPI, AUO B160UAN05.B (AUOD8B1), IPS, Brilhante: não, 165 Hz
placa mãe
AMD Promontory/Bixby FCH
Disco rígido
Micron 2550 1TB, 1024 GB 
, NVMe-SSD, two M.2-slots (one empty)
Placa de Som
Realtek ALC245 @ AMD K19.7 - Audio Processor - High Definition Audio Controller
Conexões
2 USB 3.1 Gen2, 1 USB 4.0 40 Gbps, 1 Thunderbolt, USB-C Power Delivery (PD), 1 HDMI, 1 DisplayPort, 1 Kensington Lock, Conexões Audio: Combined (Headset/Mic)
Funcionamento em rede
Realtek PCIe GBE Family Controller (10/100/1000MBit/s), MediaTek RZ616 (a/b/g/n = Wi-Fi 4/ac = Wi-Fi 5/ax = Wi-Fi 6/ Wi-Fi 6E 6 GHz), Bluetooth 5.3
Tamanho
altura x largura x profundidade (em mm): 25.5 x 362 x 278
Bateria
57 Wh Lítio-Ion
Sistema Operativo
Microsoft Windows 11 Home
Camera
Webcam: 0.9 MP
Características adicionais
Alto falantes: 2.0, Teclado: Chiclet, Iluminação do Teclado: sim, 135 W Power Supply, NitroSense, 24 Meses Garantia
peso
2.5 kg, Suprimento de energia: 476 g
Preço
1100 EUR
Note: The manufacturer may use components from different suppliers including display panels, drives or memory sticks with similar specifications.


Caso

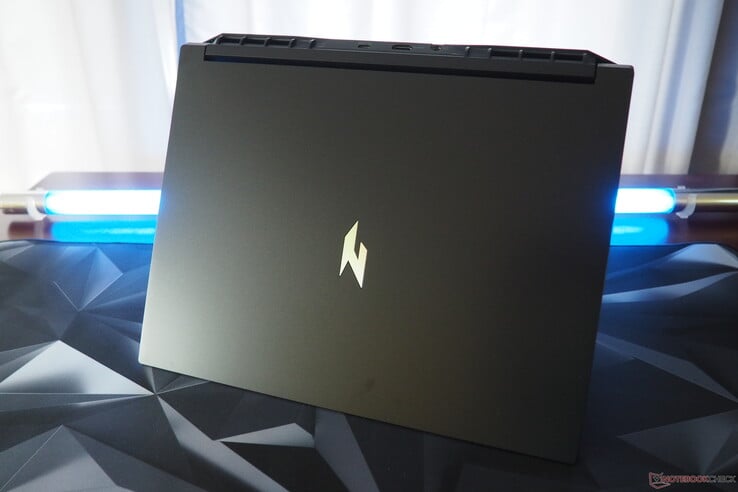
O gabinete do Acer Nitro V 16 é feito totalmente de plástico, o que parece bonito à primeira vista, mas não parece ser de alta qualidade quando examinado mais de perto e tende a chacoalhar aqui e ali. Entretanto, não temos nada a reclamar em termos de qualidade de construção, que é irrepreensível. As dobradiças fazem um trabalho aceitável e a tela pode ser aberta facilmente com uma mão (ângulo máximo de aproximadamente 145°). Infelizmente, as superfícies do laptop são propensas a acumular impressões digitais visíveis, principalmente devido à sua cor escura.

Acer Nitro V 16
Acer Nitro V 16
Acer Nitro V 16
Acer Nitro V 16
Acer Nitro V 16
Acer Nitro V 16

Com um peso de 2,5 kg, o Nitro V 16 é o modelo de 16 polegadas mais pesado no campo de comparação, embora a maioria de seus concorrentes seja apenas um pouco mais leve. Somente o Zephyrus G16 se destaca com seu peso de 1,8 kg. O quadro é quase o mesmo quando se trata da altura de construção. Com 2,55 cm, o dispositivo da Acer está novamente alinhado com a concorrência, sendo que apenas o laptop da Asus está abaixo da marca de 2 cm.

Comparação de tamanho

369 mm 259.4 mm 23.9 mm 2.4 kg362 mm 278 mm 25.5 mm 2.5 kg359.7 mm 262.3 mm 25.2 mm 2.4 kg358 mm 262 mm 23.9 mm 2.4 kg354 mm 246 mm 17.2 mm 1.8 kg297 mm 210 mm 1 mm 5.7 g

Conectividade

Portas

Se o senhor excluir a falta do leitor de cartão, a seleção de portas do notebook é bastante impressionante. Embora tivéssemos gostado de outra porta USB-C, a porta USB existente é um modelo de versão 4 (incluindo DisplayPort). As duas portas USB-A, por outro lado, usam o padrão 3.2 Gen 2. Há também uma porta HDMI 2.1, uma porta Gigabit LAN, um conector de áudio e uma abertura para travas Kensington. A Acer colocou algumas das portas na parte traseira do dispositivo, o que é benéfico quando se usa um mouse externo (palavra-chave: espaço).

Lado esquerdo: Trava Kensington, RJ45 Gigabit LAN, USB-A 3.2 Gen 2, combinação de áudio
Parte traseira: fonte de alimentação, HDMI 2.1, USB-C 4 (incluindo DisplayPort)
Lado direito: USB-A 3.2 Gen 2

Comunicação

O chip MediaTek instalado (RZ616) apresentou desempenho sólido (transmissão) a muito bom (recepção) durante nosso teste de alcance a uma distância de um metro do roteador de referência.

Networking
iperf3 transmit AXE11000
Asus ROG Zephyrus G16 GA605WV
Mediatek Wi-Fi 7 MT7925 Wireless LAN Card
1843 (1712min - 1964max) MBit/s +119%
Lenovo Legion 5 16IRX G9
Intel Wi-Fi 6E AX211
1489 (1329min, 1338.28P1 - 1686max) MBit/s +77%
Average of class Gaming
  (469 - 1843, n=148, last 2 years)
1235 MBit/s +47%
Average MediaTek RZ616
  (593 - 1793, n=15)
1171 MBit/s +39%
Nubia RedMagic Titan 16 Pro
Intel Wi-Fi 6E AX211
1058 (543min - 1423max) MBit/s +26%
Acer Nitro V 16 ANV16-41-R5AT
MediaTek RZ616
843 (470min - 976max) MBit/s
HP Victus 16 (2024)
Realtek RTL8852BE
776 (487min - 929max) MBit/s -8%
iperf3 receive AXE11000
Acer Nitro V 16 ANV16-41-R5AT
MediaTek RZ616
1735 (1720min - 1751max) MBit/s
Asus ROG Zephyrus G16 GA605WV
Mediatek Wi-Fi 7 MT7925 Wireless LAN Card
1712 (1678min - 1737max) MBit/s -1%
Nubia RedMagic Titan 16 Pro
Intel Wi-Fi 6E AX211
1658 (1631min - 1690max) MBit/s -4%
Average MediaTek RZ616
  (750 - 1752, n=15)
1514 MBit/s -13%
Lenovo Legion 5 16IRX G9
Intel Wi-Fi 6E AX211
1398 (1327min, 1333.09P1 - 1464max) MBit/s -19%
Average of class Gaming
  (680 - 1890, n=148, last 2 years)
1392 MBit/s -20%
HP Victus 16 (2024)
Realtek RTL8852BE
978 (960min - 990max) MBit/s -44%
05010015020025030035040045050055060065070075080085090095010001050110011501200125013001350140014501500155016001650170017501800185019001950Tooltip
Acer Nitro V 16 ANV16-41-R5AT MediaTek RZ616; iperf3 transmit AXE11000; iperf 3.1.3: Ø843 (470-976)
Lenovo Legion 5 16IRX G9 Intel Wi-Fi 6E AX211; iperf3 transmit AXE11000: Ø1489 (1329-1686)
HP Victus 16 (2024) Realtek RTL8852BE; iperf3 transmit AXE11000; iperf 3.1.3: Ø776 (487-929)
Nubia RedMagic Titan 16 Pro Intel Wi-Fi 6E AX211; iperf3 transmit AXE11000; iperf 3.1.3: Ø1040 (543-1423)
Asus ROG Zephyrus G16 GA605WV Mediatek Wi-Fi 7 MT7925 Wireless LAN Card; iperf3 transmit AXE11000; iperf 3.1.3: Ø1844 (1712-1964)
Acer Nitro V 16 ANV16-41-R5AT MediaTek RZ616; iperf3 receive AXE11000; iperf 3.1.3: Ø1734 (1720-1751)
Lenovo Legion 5 16IRX G9 Intel Wi-Fi 6E AX211; iperf3 receive AXE11000: Ø1398 (1327-1464)
HP Victus 16 (2024) Realtek RTL8852BE; iperf3 receive AXE11000; iperf 3.1.3: Ø978 (960-990)
Nubia RedMagic Titan 16 Pro Intel Wi-Fi 6E AX211; iperf3 receive AXE11000; iperf 3.1.3: Ø1658 (1631-1690)
Asus ROG Zephyrus G16 GA605WV Mediatek Wi-Fi 7 MT7925 Wireless LAN Card; iperf3 receive AXE11000; iperf 3.1.3: Ø1711 (1678-1737)

Webcam

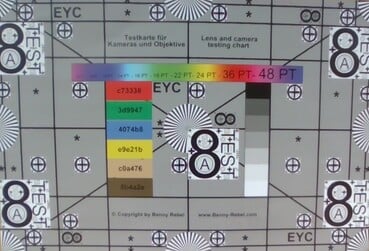
Os compradores só podem esperar uma webcam de baixa qualidade. O modelo de 0,9 MP não é nítido nem particularmente fiel às cores (veja as fotos).

ColorChecker
15.6 ∆E
15 ∆E
19.5 ∆E
17.3 ∆E
17.9 ∆E
15.9 ∆E
12.5 ∆E
23.9 ∆E
15.4 ∆E
16.2 ∆E
15 ∆E
12 ∆E
18.3 ∆E
17.6 ∆E
15.6 ∆E
9.2 ∆E
18.2 ∆E
22 ∆E
2.3 ∆E
11.8 ∆E
18.2 ∆E
19 ∆E
18 ∆E
6.3 ∆E
ColorChecker Acer Nitro V 16 ANV16-41-R5AT: 15.52 ∆E min: 2.33 - max: 23.87 ∆E

Acessórios

A Acer fornece o laptop com alguns folhetos informativos e uma fonte de alimentação semicompacta de 135 watts.

Manutenção

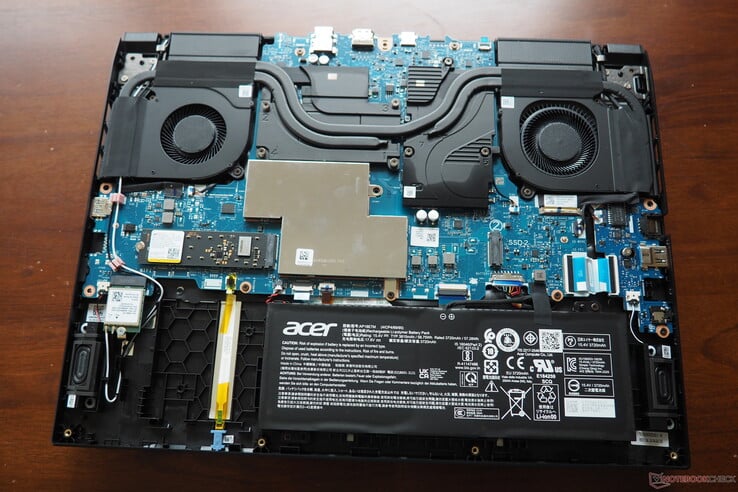
A placa de base é fixada com um total de 11 parafusos Phillips. Como mencionado no início, há dois slots M.2 (um dos quais está vazio) e dois bancos de RAM sob o capô do laptop, embora eles estejam ocultos atrás de uma tampa. A bateria, o módulo WLAN e o sistema de resfriamento também estão acessíveis.

Acer Nitro V 16
Acer Nitro V 16
Acer Nitro V 16
Acer Nitro V 16
Acer Nitro V 16
Acer Nitro V 16

Sustentabilidade

O fabricante usa principalmente papelão na embalagem do dispositivo. Somente a unidade de fonte de alimentação e o próprio laptop são envolvidos em um filme ou capa de plástico.

Garantia

O laptop é coberto por uma garantia padrão de 12 meses nos Estados Unidos.

Dispositivos de entrada

Teclado

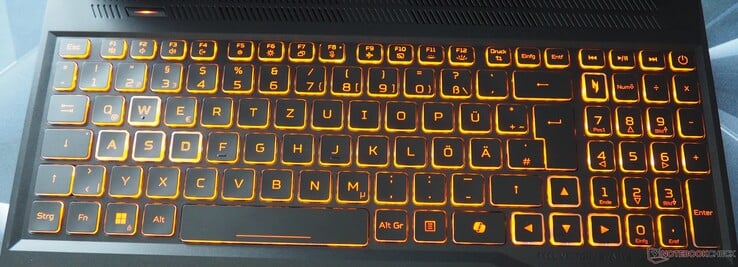
Semelhante ao Nitro V 15descreveríamos o teclado desse modelo como medíocre. Sua sensação de digitação um pouco esponjosa provavelmente só satisfará os digitadores frequentes até certo ponto. A Acer optou pela iluminação laranja e pelas letras como cor de destaque. A última não é particularmente fácil de ver de alguns ângulos. Seu layout tem alguns aspectos positivos e negativos. No lado positivo, temos que mencionar as setas direcionais de tamanho generoso. Por outro lado, não ficamos muito satisfeitos com o botão liga/desliga, que não está separado do restante das teclas.
Acer Nitro V 16

Touchpad

O touchpad está mais ou menos no mesmo nível do teclado em termos de qualidade, o que significa que pode ser usado, mas não é um verdadeiro destaque. A Acer poderia trabalhar em sua precisão e propriedades de deslizamento. As áreas de clique também soam bastante frágeis, ou seja, baratas. No entanto, seu tamanho de 12,6 x 8,2 cm não é motivo para críticas.

Tela

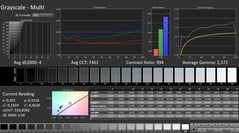
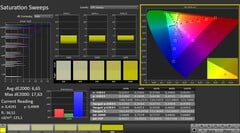
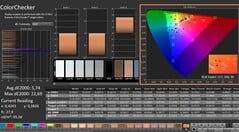
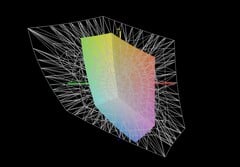
Isso nos leva ao maior ponto fraco do Nitro V 16, ou seja, sua tela pálida. 57% de cobertura sRGB, 40% de cobertura AdobeRGB e 38% de cobertura DCI-P3 é um resultado muito ruim e deve realmente ser coisa do passado em 2024. Entre os dispositivos de comparação, uma tela tão ruim só pode ser encontrada no HP Victus 16.

307
cd/m²
307
cd/m²
309
cd/m²
307
cd/m²
303
cd/m²
289
cd/m²
303
cd/m²
310
cd/m²
310
cd/m²
Distribuição do brilho
AUO B160UAN05.B (AUOD8B1) tested with X-Rite i1Pro 2
Máximo: 310 cd/m² (Nits) Médio: 305 cd/m² Minimum: 19 cd/m²
iluminação: 93 %
iluminação com acumulador: 303 cd/m²
Contraste: 947:1 (Preto: 0.32 cd/m²)
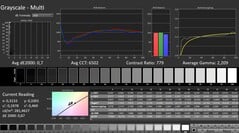
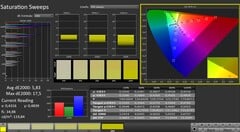
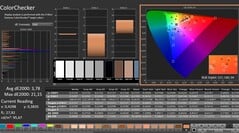
ΔE Color 5.74 | 0.5-29.43 Ø4.91, calibrated: 3.78
ΔE Greyscale 4 | 0.5-98 Ø5.2
39.6% AdobeRGB 1998 (Argyll 2.2.0 3D)
57.4% sRGB (Argyll 2.2.0 3D)
38.3% Display P3 (Argyll 2.2.0 3D)
Gamma: 2.372
Acer Nitro V 16 ANV16-41-R5AT
AUO B160UAN05.B (AUOD8B1), IPS, 1920x1200, 16", 165 Hz
Lenovo Legion 5 16IRX G9
NE160QDM-NZ3, IPS, 2560x1600, 16", 240 Hz
HP Victus 16 (2024)
Chi Mei CMN163E, IPS, 1920x1080, 16.1", 144 Hz
Nubia RedMagic Titan 16 Pro
BOE CQ NE160QDM-NZ2, IPS, 2560x1600, 16", 240 Hz
Asus ROG Zephyrus G16 GA605WV
ATNA60DL04-0, OLED, 2560x1600, 16", 240 Hz
Display
83%
8%
112%
127%
Display P3 Coverage
38.3
72.4
89%
41.3
8%
96.3
151%
99.9
161%
sRGB Coverage
57.4
100
74%
61.7
7%
100
74%
100
74%
AdobeRGB 1998 Coverage
39.6
74.1
87%
42.7
8%
84.1
112%
96.9
145%
Response Times
55%
-2%
80%
99%
Response Time Grey 50% / Grey 80% *
26.5 ?(13.1, 13.4)
12.5 ?(6.1, 6.4)
53%
28.6 ?(13.3, 15.3)
-8%
3.9 ?(1.7, 2.2)
85%
0.22 ?(0.11, 0.11)
99%
Response Time Black / White *
19.6 ?(11.6, 8)
8.7 ?(4.6, 4.1)
56%
18.7 ?(9.6, 9.1)
5%
5 ?(1.2, 3.8)
74%
0.25 ?(0.13, 0.12)
99%
PWM Frequency
960
Screen
56%
9%
31%
45%
Brightness middle
303
526
74%
287
-5%
543
79%
416
37%
Brightness
305
500
64%
288
-6%
516
69%
418
37%
Brightness Distribution
93
87
-6%
86
-8%
86
-8%
96
3%
Black Level *
0.32
0.33
-3%
0.19
41%
0.51
-59%
Contrast
947
1594
68%
1511
60%
1065
12%
Colorchecker dE 2000 *
5.74
1.2
79%
5.46
5%
3.19
44%
1.6
72%
Colorchecker dE 2000 max. *
22.69
2.1
91%
20.36
10%
7.09
69%
2.1
91%
Colorchecker dE 2000 calibrated *
3.78
1
74%
3.52
7%
0.69
82%
Greyscale dE 2000 *
4
1.3
67%
4.8
-20%
4.2
-5%
2.7
32%
Gamma
2.372 93%
2.23 99%
2.108 104%
1.999 110%
2.16 102%
CCT
7461 87%
6391 102%
6442 101%
7431 87%
6331 103%
Total Average (Program / Settings)
65% / 62%
5% / 7%
74% / 56%
90% / 77%

* ... smaller is better

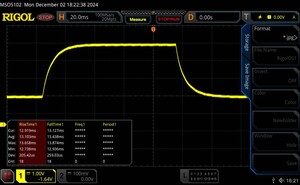
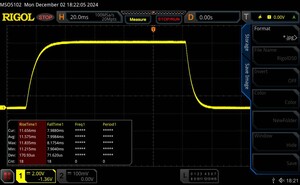
Seus tempos de resposta também atendem apenas aos requisitos de multimídia e jogos de forma limitada, com aproximadamente 20 ms para preto para branco e 27 ms para cinza para cinza. A maioria dos concorrentes tem um desempenho melhor nesse aspecto.

CalMAN: escala de cinza
CalMAN: saturação de cor
CalMAN: ColorChecker
CalMAN: escala de cinza (calibrada)
CalMAN: saturação de cor (calibrada)
CalMAN: ColorChecker (calibrado)

Os fãs de ambientes externos também dificilmente receberão seu dinheiro. Uma média de 303 cd/m² tende a ser algo apenas para uso em ambientes internos.

Acer Nitro V 16 vs sRGB
Acer Nitro V 16 vs AdobeRGB
Acer Nitro V 16 vs DCI-P3

Pelos padrões IPS, o nível de preto (0,32 cd/m²) e o contraste (947:1) são razoáveis, mas o Nitro V 16 não tem chance contra os painéis OLED. A estabilidade do ângulo de visão da tela é semelhante. Por outro lado, o painel de 16 polegadas não apresenta cintilação da imagem em todos os níveis de brilho.

Luz do dia
Luz do dia
Subpixels
Subpixels
Ângulos de visão
Ângulos de visão

Display Response Times

Display response times show how fast the screen is able to change from one color to the next. Slow response times can lead to afterimages and can cause moving objects to appear blurry (ghosting). Gamers of fast-paced 3D titles should pay special attention to fast response times.
       Response Time Black to White
19.6 ms ... rise ↗ and fall ↘ combined↗ 11.6 ms rise
↘ 8 ms fall
The screen shows good response rates in our tests, but may be too slow for competitive gamers.
In comparison, all tested devices range from 0.1 (minimum) to 240 (maximum) ms. » 39 % of all devices are better.
This means that the measured response time is similar to the average of all tested devices (20.9 ms).
       Response Time 50% Grey to 80% Grey
26.5 ms ... rise ↗ and fall ↘ combined↗ 13.1 ms rise
↘ 13.4 ms fall
The screen shows relatively slow response rates in our tests and may be too slow for gamers.
In comparison, all tested devices range from 0.165 (minimum) to 636 (maximum) ms. » 33 % of all devices are better.
This means that the measured response time is better than the average of all tested devices (32.8 ms).

Screen Flickering / PWM (Pulse-Width Modulation)

To dim the screen, some notebooks will simply cycle the backlight on and off in rapid succession - a method called Pulse Width Modulation (PWM) . This cycling frequency should ideally be undetectable to the human eye. If said frequency is too low, users with sensitive eyes may experience strain or headaches or even notice the flickering altogether.
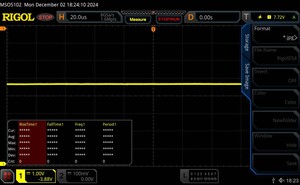
Screen flickering / PWM not detected

In comparison: 53 % of all tested devices do not use PWM to dim the display. If PWM was detected, an average of 8705 (minimum: 5 - maximum: 343500) Hz was measured.

100 % de brilho
100 % de brilho
75 % de brilho
75 % de brilho
50 % de brilho
50 % de brilho
25 % de brilho
25 % de brilho
0 % de brilho
0 % de brilho

Desempenho

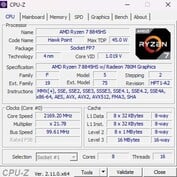
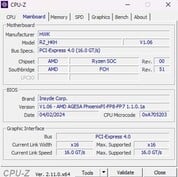
Independentemente da GPU instalada (RTX 4050 ou RTX 4060), o Nitro V 16 está em algum lugar na faixa intermediária dos notebooks para jogos. O processador Ryzen (8645HS ou 8845HS) deve ter reservas suficientes para os próximos anos.

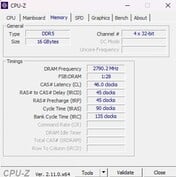
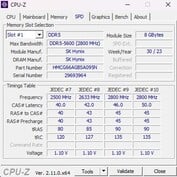
CPU-Z
CPU-Z
CPU-Z
CPU-Z
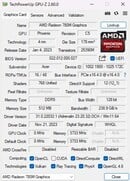
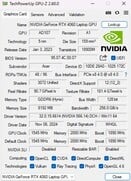
GPU-Z
GPU-Z
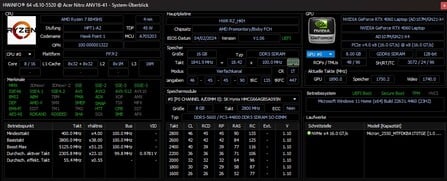
HWiNFO
 

Condições de teste

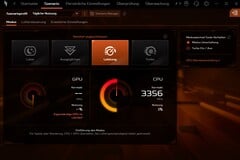
O senhor pode alternar entre diferentes perfis usando um botão especial (ou no software NitroSense). Esses perfis variam de Eco a Turbo, mas, de acordo com nossas medições, eles diferem muito pouco quando se trata de desempenho e emissões de ruído. Usamos o modo Performance em nosso teste. Apenas a duração da bateria do laptop foi medida usando o perfil Balanced.

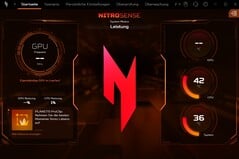
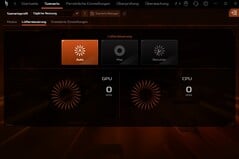
NitroSense
NitroSense
NitroSense
Cyberpunk 2077 Sequência de loop (FHD/Ultra) Silencioso Balanceado Desempenho Turbo
Ruído 52 dB(A) 53 dB(A) 54 dB(A) 55 dB(A)
Desempenho 59 fps 63 fps 64 fps 68 fps
CPU PL1 (HWiNFO) 45 watts 45 watts 54 watts 54 watts
CPU PL2 (HWiNFO) 65 watts 65 watts 65 watts 65 watts

Processador

O Ryzen 7 8845HS é um modelo de oito núcleos da geração Zen 4, que pode processar até 16 threads em paralelo via SMT e abriga uma iGPU bastante rápida na forma da Radeon 780M. Durante os benchmarks e o loop do Cinebench, o chip de 4 nm estava praticamente no mesmo nível do Intel Core i7-14700HX. No entanto, o 8845HS não teve chance contra o mais novo Ryzen AI 9 HX 370.

Cinebench R15 Multi continuous test

019539058578097511701365156017551950214523402535273029253120331535103705Tooltip
Acer Nitro V 16 ANV16-41-R5AT AMD Ryzen 7 8845HS: Ø2572 (2557.38-2602.64)
Lenovo Legion 5 16IRX G9 Intel Core i7-14650HX: Ø3471 (3409.19-3799.39)
HP Victus 16 (2024) Intel Core i7-14700HX: Ø2658 (2509.88-3812.18)
Nubia RedMagic Titan 16 Pro Intel Core i9-14900HX: Ø2240 (2071.36-3453.93)
Asus ROG Zephyrus G16 GA605WV AMD Ryzen AI 9 HX 370: Ø3338 (3327.79-3370.98)
CPU Performance Rating - Percent
Lenovo Legion 5 16IRX G9
Intel Core i7-14650HX
81.9 pt
Asus ROG Zephyrus G16 GA605WV
AMD Ryzen AI 9 HX 370
78.4 pt
Nubia RedMagic Titan 16 Pro
Intel Core i9-14900HX
74.7 pt
Average of class Gaming
 
74.6 pt
HP Victus 16 (2024)
Intel Core i7-14700HX
71.7 pt
Acer Nitro V 16 ANV16-41-R5AT
AMD Ryzen 7 8845HS
65.3 pt
Average AMD Ryzen 7 8845HS
 
64.4 pt
Cinebench R23
Multi Core
Lenovo Legion 5 16IRX G9
Intel Core i7-14650HX
24455 Points +48%
HP Victus 16 (2024)
Intel Core i7-14700HX
23887 Points +45%
Asus ROG Zephyrus G16 GA605WV
AMD Ryzen AI 9 HX 370
22724 Points +38%
Average of class Gaming
  (5668 - 36249, n=189, last 2 years)
21812 Points +32%
Nubia RedMagic Titan 16 Pro
Intel Core i9-14900HX
17078 Points +3%
Acer Nitro V 16 ANV16-41-R5AT
AMD Ryzen 7 8845HS
16501 Points
Average AMD Ryzen 7 8845HS
  (14895 - 18037, n=11)
16146 Points -2%
Single Core
Nubia RedMagic Titan 16 Pro
Intel Core i9-14900HX
2165 Points +23%
Asus ROG Zephyrus G16 GA605WV
AMD Ryzen AI 9 HX 370
1973 Points +12%
Lenovo Legion 5 16IRX G9
Intel Core i7-14650HX
1963 Points +11%
Average of class Gaming
  (1136 - 2235, n=187, last 2 years)
1887 Points +7%
Acer Nitro V 16 ANV16-41-R5AT
AMD Ryzen 7 8845HS
1762 Points
Average AMD Ryzen 7 8845HS
  (1623 - 1783, n=11)
1747 Points -1%
HP Victus 16 (2024)
Intel Core i7-14700HX
1702 Points -3%
Cinebench R20
CPU (Multi Core)
Lenovo Legion 5 16IRX G9
Intel Core i7-14650HX
9349 Points +47%
HP Victus 16 (2024)
Intel Core i7-14700HX
9244 Points +45%
Asus ROG Zephyrus G16 GA605WV
AMD Ryzen AI 9 HX 370
8843 Points +39%
Average of class Gaming
  (2179 - 13832, n=187, last 2 years)
8300 Points +30%
Nubia RedMagic Titan 16 Pro
Intel Core i9-14900HX
6579 Points +3%
Acer Nitro V 16 ANV16-41-R5AT
AMD Ryzen 7 8845HS
6362 Points
Average AMD Ryzen 7 8845HS
  (5808 - 7026, n=11)
6309 Points -1%
CPU (Single Core)
Nubia RedMagic Titan 16 Pro
Intel Core i9-14900HX
826 Points +21%
Asus ROG Zephyrus G16 GA605WV
AMD Ryzen AI 9 HX 370
777 Points +13%
Lenovo Legion 5 16IRX G9
Intel Core i7-14650HX
754 Points +10%
Average of class Gaming
  (439 - 856, n=187, last 2 years)
725 Points +6%
Acer Nitro V 16 ANV16-41-R5AT
AMD Ryzen 7 8845HS
685 Points
Average AMD Ryzen 7 8845HS
  (673 - 698, n=11)
685 Points 0%
HP Victus 16 (2024)
Intel Core i7-14700HX
651 Points -5%
Cinebench R15
CPU Multi 64Bit
HP Victus 16 (2024)
Intel Core i7-14700HX
3812 Points +46%
Lenovo Legion 5 16IRX G9
Intel Core i7-14650HX
3799 (3409.19min - 3799.39max) Points +46%
Nubia RedMagic Titan 16 Pro
Intel Core i9-14900HX
3454 Points +33%
Average of class Gaming
  (905 - 5663, n=194, last 2 years)
3417 Points +31%
Asus ROG Zephyrus G16 GA605WV
AMD Ryzen AI 9 HX 370
3371 (3327.79min - 3370.98max) Points +30%
Acer Nitro V 16 ANV16-41-R5AT
AMD Ryzen 7 8845HS
2603 (2557.38min - 2602.64max) Points
Average AMD Ryzen 7 8845HS
  (2342 - 2908, n=11)
2556 Points -2%
CPU Single 64Bit
Nubia RedMagic Titan 16 Pro
Intel Core i9-14900HX
314 Points +14%
Asus ROG Zephyrus G16 GA605WV
AMD Ryzen AI 9 HX 370
303 Points +10%
Lenovo Legion 5 16IRX G9
Intel Core i7-14650HX
287 Points +4%
Average of class Gaming
  (191.9 - 318, n=191, last 2 years)
278 Points +1%
Average AMD Ryzen 7 8845HS
  (269 - 283, n=11)
276 Points 0%
Acer Nitro V 16 ANV16-41-R5AT
AMD Ryzen 7 8845HS
275 Points
HP Victus 16 (2024)
Intel Core i7-14700HX
238 Points -13%
Blender - v2.79 BMW27 CPU
Nubia RedMagic Titan 16 Pro
Intel Core i9-14900HX
206 Seconds * -7%
Average AMD Ryzen 7 8845HS
  (179 - 216, n=11)
202 Seconds * -5%
Acer Nitro V 16 ANV16-41-R5AT
AMD Ryzen 7 8845HS
193 Seconds *
HP Victus 16 (2024)
Intel Core i7-14700HX
173 Seconds * +10%
Average of class Gaming
  (87 - 555, n=182, last 2 years)
170.8 Seconds * +12%
Asus ROG Zephyrus G16 GA605WV
AMD Ryzen AI 9 HX 370
145 Seconds * +25%
Lenovo Legion 5 16IRX G9
Intel Core i7-14650HX
141 Seconds * +27%
7-Zip 18.03
7z b 4
Lenovo Legion 5 16IRX G9
Intel Core i7-14650HX
93686 MIPS +33%
Average of class Gaming
  (23795 - 140932, n=186, last 2 years)
85207 MIPS +21%
HP Victus 16 (2024)
Intel Core i7-14700HX
84799 MIPS +21%
Asus ROG Zephyrus G16 GA605WV
AMD Ryzen AI 9 HX 370
82463 MIPS +17%
Acer Nitro V 16 ANV16-41-R5AT
AMD Ryzen 7 8845HS
70193 MIPS
Average AMD Ryzen 7 8845HS
  (62669 - 74664, n=11)
67906 MIPS -3%
Nubia RedMagic Titan 16 Pro
Intel Core i9-14900HX
66769 MIPS -5%
7z b 4 -mmt1
Nubia RedMagic Titan 16 Pro
Intel Core i9-14900HX
7161 MIPS +8%
Lenovo Legion 5 16IRX G9
Intel Core i7-14650HX
6695 MIPS +1%
Acer Nitro V 16 ANV16-41-R5AT
AMD Ryzen 7 8845HS
6608 MIPS
Average of class Gaming
  (4199 - 7581, n=186, last 2 years)
6305 MIPS -5%
Average AMD Ryzen 7 8845HS
  (5197 - 6714, n=11)
6288 MIPS -5%
Asus ROG Zephyrus G16 GA605WV
AMD Ryzen AI 9 HX 370
6127 MIPS -7%
HP Victus 16 (2024)
Intel Core i7-14700HX
5641 MIPS -15%
Geekbench 6.3
Multi-Core
Lenovo Legion 5 16IRX G9
Intel Core i7-14650HX
16010 Points +30%
Asus ROG Zephyrus G16 GA605WV
AMD Ryzen AI 9 HX 370
15230 Points +24%
HP Victus 16 (2024)
Intel Core i7-14700HX
14807 Points +21%
Average of class Gaming
  (5340 - 19665, n=110, last 2 years)
14195 Points +16%
Nubia RedMagic Titan 16 Pro
Intel Core i9-14900HX
13158 Points +7%
Average AMD Ryzen 7 8845HS
  (11073 - 14014, n=15)
12791 Points +4%
Acer Nitro V 16 ANV16-41-R5AT
AMD Ryzen 7 8845HS
12277 Points
Single-Core
Nubia RedMagic Titan 16 Pro
Intel Core i9-14900HX
3036 Points +14%
Asus ROG Zephyrus G16 GA605WV
AMD Ryzen AI 9 HX 370
2875 Points +8%
Lenovo Legion 5 16IRX G9
Intel Core i7-14650HX
2761 Points +4%
Acer Nitro V 16 ANV16-41-R5AT
AMD Ryzen 7 8845HS
2654 Points
Average of class Gaming
  (1490 - 3129, n=110, last 2 years)
2650 Points 0%
Average AMD Ryzen 7 8845HS
  (2510 - 2698, n=13)
2617 Points -1%
HP Victus 16 (2024)
Intel Core i7-14700HX
2378 Points -10%
Geekbench 5.5
Multi-Core
Lenovo Legion 5 16IRX G9
Intel Core i7-14650HX
16810 Points +46%
HP Victus 16 (2024)
Intel Core i7-14700HX
16732 Points +45%
Average of class Gaming
  (4557 - 23194, n=187, last 2 years)
14993 Points +30%
Asus ROG Zephyrus G16 GA605WV
AMD Ryzen AI 9 HX 370
14774 Points +28%
Nubia RedMagic Titan 16 Pro
Intel Core i9-14900HX
14270 Points +24%
Average AMD Ryzen 7 8845HS
  (11256 - 12726, n=12)
11855 Points +3%
Acer Nitro V 16 ANV16-41-R5AT
AMD Ryzen 7 8845HS
11536 Points
Single-Core
Nubia RedMagic Titan 16 Pro
Intel Core i9-14900HX
2160 Points +9%
Asus ROG Zephyrus G16 GA605WV
AMD Ryzen AI 9 HX 370
2104 Points +6%
Acer Nitro V 16 ANV16-41-R5AT
AMD Ryzen 7 8845HS
1977 Points
Lenovo Legion 5 16IRX G9
Intel Core i7-14650HX
1933 Points -2%
Average AMD Ryzen 7 8845HS
  (1765 - 2004, n=12)
1924 Points -3%
Average of class Gaming
  (986 - 2210, n=187, last 2 years)
1892 Points -4%
HP Victus 16 (2024)
Intel Core i7-14700HX
1700 Points -14%
HWBOT x265 Benchmark v2.2 - 4k Preset
Asus ROG Zephyrus G16 GA605WV
AMD Ryzen AI 9 HX 370
26.5 fps +30%
Lenovo Legion 5 16IRX G9
Intel Core i7-14650HX
25.6 fps +25%
Average of class Gaming
  (6.72 - 38.9, n=186, last 2 years)
23.5 fps +15%
HP Victus 16 (2024)
Intel Core i7-14700HX
22 fps +8%
Acer Nitro V 16 ANV16-41-R5AT
AMD Ryzen 7 8845HS
20.4 fps
Average AMD Ryzen 7 8845HS
  (18.6 - 22.7, n=11)
20 fps -2%
Nubia RedMagic Titan 16 Pro
Intel Core i9-14900HX
16.8 fps -18%
LibreOffice - 20 Documents To PDF
HP Victus 16 (2024)
Intel Core i7-14700HX
55.3 s * -2%
Acer Nitro V 16 ANV16-41-R5AT
AMD Ryzen 7 8845HS
54.1 s *
Asus ROG Zephyrus G16 GA605WV
AMD Ryzen AI 9 HX 370
53.8 s * +1%
Average AMD Ryzen 7 8845HS
  (44.4 - 77, n=11)
51 s * +6%
Average of class Gaming
  (31.4 - 96.6, n=183, last 2 years)
47.3 s * +13%
Lenovo Legion 5 16IRX G9
Intel Core i7-14650HX
43.8 s * +19%
Nubia RedMagic Titan 16 Pro
Intel Core i9-14900HX
34 s * +37%
R Benchmark 2.5 - Overall mean
HP Victus 16 (2024)
Intel Core i7-14700HX
0.4896 sec * -14%
Average AMD Ryzen 7 8845HS
  (0.4304 - 0.4935, n=11)
0.4528 sec * -5%
Average of class Gaming
  (0.3609 - 0.759, n=187, last 2 years)
0.438 sec * -2%
Acer Nitro V 16 ANV16-41-R5AT
AMD Ryzen 7 8845HS
0.4304 sec *
Lenovo Legion 5 16IRX G9
Intel Core i7-14650HX
0.4195 sec * +3%
Asus ROG Zephyrus G16 GA605WV
AMD Ryzen AI 9 HX 370
0.4111 sec * +4%
Nubia RedMagic Titan 16 Pro
Intel Core i9-14900HX
0.3699 sec * +14%

* ... smaller is better

Cinebench R15 CPU Multi 64Bit
2603 Points
Cinebench R15 OpenGL 64Bit
140.6 fps
Cinebench R15 Ref. Match 64Bit
99.6 %
Cinebench R15 CPU Single 64Bit
275 Points
Cinebench R20 CPU (Multi Core)
6362 Points
Cinebench R20 CPU (Single Core)
685 Points
Cinebench R23 Single Core
1762 Points
Cinebench R23 Multi Core
16501 Points
Ajuda
Performance Rating - Percent
Asus ROG Zephyrus G16 GA605WV
AMD Ryzen AI 9 HX 370, NVIDIA GeForce RTX 4060 Laptop GPU
93.1 pt
Average of class Gaming
 
76.7 pt
Average AMD Ryzen 7 8845HS
 
76.4 pt
Acer Nitro V 16 ANV16-41-R5AT
AMD Ryzen 7 8845HS, NVIDIA GeForce RTX 4060 Laptop GPU
75.1 pt
Lenovo Legion 5 16IRX G9
Intel Core i7-14650HX, NVIDIA GeForce RTX 4060 Laptop GPU
67.1 pt
HP Victus 16 (2024)
Intel Core i7-14700HX, NVIDIA GeForce RTX 4060 Laptop GPU
66.3 pt
Nubia RedMagic Titan 16 Pro
Intel Core i9-14900HX, NVIDIA GeForce RTX 4060 Laptop GPU
59.7 pt
AIDA64
FP32 Ray-Trace
Asus ROG Zephyrus G16 GA605WV
AMD Ryzen AI 9 HX 370, NVIDIA GeForce RTX 4060 Laptop GPU
36304 KRay/s +37%
Acer Nitro V 16 ANV16-41-R5AT
AMD Ryzen 7 8845HS, NVIDIA GeForce RTX 4060 Laptop GPU
26479 KRay/s
Average AMD Ryzen 7 8845HS
  (23708 - 29544, n=11)
25839 KRay/s -2%
Average of class Gaming
  (4986 - 60169, n=183, last 2 years)
21786 KRay/s -18%
Lenovo Legion 5 16IRX G9
Intel Core i7-14650HX, NVIDIA GeForce RTX 4060 Laptop GPU
19044 KRay/s -28%
HP Victus 16 (2024)
Intel Core i7-14700HX, NVIDIA GeForce RTX 4060 Laptop GPU
16932 KRay/s -36%
Nubia RedMagic Titan 16 Pro
Intel Core i9-14900HX, NVIDIA GeForce RTX 4060 Laptop GPU
13098 KRay/s -51%
FPU Julia
Asus ROG Zephyrus G16 GA605WV
AMD Ryzen AI 9 HX 370, NVIDIA GeForce RTX 4060 Laptop GPU
138436 Points +23%
Acer Nitro V 16 ANV16-41-R5AT
AMD Ryzen 7 8845HS, NVIDIA GeForce RTX 4060 Laptop GPU
112213 Points
Average AMD Ryzen 7 8845HS
  (99659 - 125873, n=11)
109203 Points -3%
Average of class Gaming
  (25360 - 252486, n=183, last 2 years)
106398 Points -5%
Lenovo Legion 5 16IRX G9
Intel Core i7-14650HX, NVIDIA GeForce RTX 4060 Laptop GPU
95271 Points -15%
HP Victus 16 (2024)
Intel Core i7-14700HX, NVIDIA GeForce RTX 4060 Laptop GPU
86338 Points -23%
Nubia RedMagic Titan 16 Pro
Intel Core i9-14900HX, NVIDIA GeForce RTX 4060 Laptop GPU
67573 Points -40%
CPU SHA3
Asus ROG Zephyrus G16 GA605WV
AMD Ryzen AI 9 HX 370, NVIDIA GeForce RTX 4060 Laptop GPU
5696 MB/s +21%
Average of class Gaming
  (1339 - 10389, n=183, last 2 years)
4884 MB/s +4%
Average AMD Ryzen 7 8845HS
  (4332 - 5180, n=11)
4708 MB/s 0%
Acer Nitro V 16 ANV16-41-R5AT
AMD Ryzen 7 8845HS, NVIDIA GeForce RTX 4060 Laptop GPU
4701 MB/s
Lenovo Legion 5 16IRX G9
Intel Core i7-14650HX, NVIDIA GeForce RTX 4060 Laptop GPU
4214 MB/s -10%
HP Victus 16 (2024)
Intel Core i7-14700HX, NVIDIA GeForce RTX 4060 Laptop GPU
4008 MB/s -15%
Nubia RedMagic Titan 16 Pro
Intel Core i9-14900HX, NVIDIA GeForce RTX 4060 Laptop GPU
3589 MB/s -24%
CPU Queen
HP Victus 16 (2024)
Intel Core i7-14700HX, NVIDIA GeForce RTX 4060 Laptop GPU
129836 Points +9%
Nubia RedMagic Titan 16 Pro
Intel Core i9-14900HX, NVIDIA GeForce RTX 4060 Laptop GPU
123488 Points +4%
Acer Nitro V 16 ANV16-41-R5AT
AMD Ryzen 7 8845HS, NVIDIA GeForce RTX 4060 Laptop GPU
118943 Points
Average of class Gaming
  (50699 - 200651, n=183, last 2 years)
116767 Points -2%
Average AMD Ryzen 7 8845HS
  (109458 - 124695, n=11)
116188 Points -2%
Lenovo Legion 5 16IRX G9
Intel Core i7-14650HX, NVIDIA GeForce RTX 4060 Laptop GPU
101500 Points -15%
Asus ROG Zephyrus G16 GA605WV
AMD Ryzen AI 9 HX 370, NVIDIA GeForce RTX 4060 Laptop GPU
94289 Points -21%
FPU SinJulia
Asus ROG Zephyrus G16 GA605WV
AMD Ryzen AI 9 HX 370, NVIDIA GeForce RTX 4060 Laptop GPU
18867 Points +25%
Acer Nitro V 16 ANV16-41-R5AT
AMD Ryzen 7 8845HS, NVIDIA GeForce RTX 4060 Laptop GPU
15106 Points
Average AMD Ryzen 7 8845HS
  (14062 - 15519, n=11)
14859 Points -2%
Average of class Gaming
  (4800 - 32988, n=183, last 2 years)
13223 Points -12%
Lenovo Legion 5 16IRX G9
Intel Core i7-14650HX, NVIDIA GeForce RTX 4060 Laptop GPU
11913 Points -21%
HP Victus 16 (2024)
Intel Core i7-14700HX, NVIDIA GeForce RTX 4060 Laptop GPU
11704 Points -23%
Nubia RedMagic Titan 16 Pro
Intel Core i9-14900HX, NVIDIA GeForce RTX 4060 Laptop GPU
10475 Points -31%
FPU Mandel
Asus ROG Zephyrus G16 GA605WV
AMD Ryzen AI 9 HX 370, NVIDIA GeForce RTX 4060 Laptop GPU
74066 Points +23%
Acer Nitro V 16 ANV16-41-R5AT
AMD Ryzen 7 8845HS, NVIDIA GeForce RTX 4060 Laptop GPU
60105 Points
Average AMD Ryzen 7 8845HS
  (53436 - 67367, n=11)
58328 Points -3%
Average of class Gaming
  (12321 - 134044, n=183, last 2 years)
53561 Points -11%
Lenovo Legion 5 16IRX G9
Intel Core i7-14650HX, NVIDIA GeForce RTX 4060 Laptop GPU
47097 Points -22%
HP Victus 16 (2024)
Intel Core i7-14700HX, NVIDIA GeForce RTX 4060 Laptop GPU
42125 Points -30%
Nubia RedMagic Titan 16 Pro
Intel Core i9-14900HX, NVIDIA GeForce RTX 4060 Laptop GPU
32543 Points -46%
CPU AES
Nubia RedMagic Titan 16 Pro
Intel Core i9-14900HX, NVIDIA GeForce RTX 4060 Laptop GPU
136951 MB/s +101%
Average of class Gaming
  (19065 - 328679, n=183, last 2 years)
109083 MB/s +60%
Average AMD Ryzen 7 8845HS
  (64515 - 172642, n=11)
95038 MB/s +40%
Lenovo Legion 5 16IRX G9
Intel Core i7-14650HX, NVIDIA GeForce RTX 4060 Laptop GPU
86485 MB/s +27%
HP Victus 16 (2024)
Intel Core i7-14700HX, NVIDIA GeForce RTX 4060 Laptop GPU
82161 MB/s +21%
Asus ROG Zephyrus G16 GA605WV
AMD Ryzen AI 9 HX 370, NVIDIA GeForce RTX 4060 Laptop GPU
80186 MB/s +18%
Acer Nitro V 16 ANV16-41-R5AT
AMD Ryzen 7 8845HS, NVIDIA GeForce RTX 4060 Laptop GPU
68109 MB/s
CPU ZLib
Asus ROG Zephyrus G16 GA605WV
AMD Ryzen AI 9 HX 370, NVIDIA GeForce RTX 4060 Laptop GPU
1489 MB/s +39%
Average of class Gaming
  (373 - 2409, n=183, last 2 years)
1359 MB/s +26%
Lenovo Legion 5 16IRX G9
Intel Core i7-14650HX, NVIDIA GeForce RTX 4060 Laptop GPU
1289 MB/s +20%
HP Victus 16 (2024)
Intel Core i7-14700HX, NVIDIA GeForce RTX 4060 Laptop GPU
1177 MB/s +9%
Acer Nitro V 16 ANV16-41-R5AT
AMD Ryzen 7 8845HS, NVIDIA GeForce RTX 4060 Laptop GPU
1075 MB/s
Nubia RedMagic Titan 16 Pro
Intel Core i9-14900HX, NVIDIA GeForce RTX 4060 Laptop GPU
1054 MB/s -2%
Average AMD Ryzen 7 8845HS
  (627 - 1080, n=11)
979 MB/s -9%
FP64 Ray-Trace
Asus ROG Zephyrus G16 GA605WV
AMD Ryzen AI 9 HX 370, NVIDIA GeForce RTX 4060 Laptop GPU
19629 KRay/s +39%
Acer Nitro V 16 ANV16-41-R5AT
AMD Ryzen 7 8845HS, NVIDIA GeForce RTX 4060 Laptop GPU
14146 KRay/s
Average AMD Ryzen 7 8845HS
  (12361 - 15911, n=11)
13740 KRay/s -3%
Average of class Gaming
  (2540 - 31796, n=183, last 2 years)
11734 KRay/s -17%
Lenovo Legion 5 16IRX G9
Intel Core i7-14650HX, NVIDIA GeForce RTX 4060 Laptop GPU
10316 KRay/s -27%
HP Victus 16 (2024)
Intel Core i7-14700HX, NVIDIA GeForce RTX 4060 Laptop GPU
9029 KRay/s -36%
Nubia RedMagic Titan 16 Pro
Intel Core i9-14900HX, NVIDIA GeForce RTX 4060 Laptop GPU
6809 KRay/s -52%
CPU PhotoWorxx
Asus ROG Zephyrus G16 GA605WV
AMD Ryzen AI 9 HX 370, NVIDIA GeForce RTX 4060 Laptop GPU
49354 MPixel/s +49%
Average of class Gaming
  (10805 - 60161, n=184, last 2 years)
40082 MPixel/s +21%
HP Victus 16 (2024)
Intel Core i7-14700HX, NVIDIA GeForce RTX 4060 Laptop GPU
39448 MPixel/s +19%
Average AMD Ryzen 7 8845HS
  (33192 - 41668, n=11)
38987 MPixel/s +17%
Lenovo Legion 5 16IRX G9
Intel Core i7-14650HX, NVIDIA GeForce RTX 4060 Laptop GPU
33763 MPixel/s +2%
Acer Nitro V 16 ANV16-41-R5AT
AMD Ryzen 7 8845HS, NVIDIA GeForce RTX 4060 Laptop GPU
33192 MPixel/s
Nubia RedMagic Titan 16 Pro
Intel Core i9-14900HX, NVIDIA GeForce RTX 4060 Laptop GPU
23970 MPixel/s -28%

Desempenho do sistema

Em termos de desempenho do sistema, o Nitro V 16 ficou em penúltimo lugar, logo à frente do HP Victus 16, embora as diferenças em relação aos outros dispositivos de comparação não tenham sido muito grandes. Subjetivamente, o laptop funciona e reage de forma agradável e rápida.

PCMark 10 / Score
Average AMD Ryzen 7 8845HS, NVIDIA GeForce RTX 4060 Laptop GPU
  (7538 - 8822, n=2)
8180 Points +9%
Asus ROG Zephyrus G16 GA605WV
NVIDIA GeForce RTX 4060 Laptop GPU, Ryzen AI 9 HX 370, Micron 2400 MTFDKBA1T0QFM
7915 Points +5%
Nubia RedMagic Titan 16 Pro
NVIDIA GeForce RTX 4060 Laptop GPU, i9-14900HX, Samsung PM9A1 MZVL21T0HCLR
7830 Points +4%
Average of class Gaming
  (5776 - 9852, n=165, last 2 years)
7791 Points +3%
Lenovo Legion 5 16IRX G9
NVIDIA GeForce RTX 4060 Laptop GPU, i7-14650HX, Samsung PM9A1 MZVL21T0HCLR
7645 Points +1%
Acer Nitro V 16 ANV16-41-R5AT
NVIDIA GeForce RTX 4060 Laptop GPU, R7 8845HS, Micron 2550 1TB
7538 Points
HP Victus 16 (2024)
NVIDIA GeForce RTX 4060 Laptop GPU, i7-14700HX, Kioxia XG8 KXG80ZNV512G
7528 Points 0%
PCMark 10 / Essentials
Nubia RedMagic Titan 16 Pro
NVIDIA GeForce RTX 4060 Laptop GPU, i9-14900HX, Samsung PM9A1 MZVL21T0HCLR
11022 Points +11%
Average of class Gaming
  (9057 - 12334, n=164, last 2 years)
10835 Points +9%
Lenovo Legion 5 16IRX G9
NVIDIA GeForce RTX 4060 Laptop GPU, i7-14650HX, Samsung PM9A1 MZVL21T0HCLR
10804 Points +9%
HP Victus 16 (2024)
NVIDIA GeForce RTX 4060 Laptop GPU, i7-14700HX, Kioxia XG8 KXG80ZNV512G
10778 Points +8%
Asus ROG Zephyrus G16 GA605WV
NVIDIA GeForce RTX 4060 Laptop GPU, Ryzen AI 9 HX 370, Micron 2400 MTFDKBA1T0QFM
10140 Points +2%
Average AMD Ryzen 7 8845HS, NVIDIA GeForce RTX 4060 Laptop GPU
  (9936 - 10061, n=2)
9999 Points +1%
Acer Nitro V 16 ANV16-41-R5AT
NVIDIA GeForce RTX 4060 Laptop GPU, R7 8845HS, Micron 2550 1TB
9936 Points
PCMark 10 / Productivity
Average AMD Ryzen 7 8845HS, NVIDIA GeForce RTX 4060 Laptop GPU
  (9789 - 14612, n=2)
12201 Points +25%
Asus ROG Zephyrus G16 GA605WV
NVIDIA GeForce RTX 4060 Laptop GPU, Ryzen AI 9 HX 370, Micron 2400 MTFDKBA1T0QFM
9971 Points +2%
HP Victus 16 (2024)
NVIDIA GeForce RTX 4060 Laptop GPU, i7-14700HX, Kioxia XG8 KXG80ZNV512G
9910 Points +1%
Average of class Gaming
  (6662 - 14612, n=164, last 2 years)
9899 Points +1%
Acer Nitro V 16 ANV16-41-R5AT
NVIDIA GeForce RTX 4060 Laptop GPU, R7 8845HS, Micron 2550 1TB
9789 Points
Nubia RedMagic Titan 16 Pro
NVIDIA GeForce RTX 4060 Laptop GPU, i9-14900HX, Samsung PM9A1 MZVL21T0HCLR
9776 Points 0%
Lenovo Legion 5 16IRX G9
NVIDIA GeForce RTX 4060 Laptop GPU, i7-14650HX, Samsung PM9A1 MZVL21T0HCLR
9241 Points -6%
PCMark 10 / Digital Content Creation
Asus ROG Zephyrus G16 GA605WV
NVIDIA GeForce RTX 4060 Laptop GPU, Ryzen AI 9 HX 370, Micron 2400 MTFDKBA1T0QFM
13309 Points +11%
Average AMD Ryzen 7 8845HS, NVIDIA GeForce RTX 4060 Laptop GPU
  (11953 - 12674, n=2)
12314 Points +3%
Lenovo Legion 5 16IRX G9
NVIDIA GeForce RTX 4060 Laptop GPU, i7-14650HX, Samsung PM9A1 MZVL21T0HCLR
12144 Points +2%
Nubia RedMagic Titan 16 Pro
NVIDIA GeForce RTX 4060 Laptop GPU, i9-14900HX, Samsung PM9A1 MZVL21T0HCLR
12091 Points +1%
Average of class Gaming
  (6703 - 18475, n=164, last 2 years)
12084 Points +1%
Acer Nitro V 16 ANV16-41-R5AT
NVIDIA GeForce RTX 4060 Laptop GPU, R7 8845HS, Micron 2550 1TB
11953 Points
HP Victus 16 (2024)
NVIDIA GeForce RTX 4060 Laptop GPU, i7-14700HX, Kioxia XG8 KXG80ZNV512G
10841 Points -9%
CrossMark / Overall
Nubia RedMagic Titan 16 Pro
NVIDIA GeForce RTX 4060 Laptop GPU, i9-14900HX, Samsung PM9A1 MZVL21T0HCLR
2103 Points
Lenovo Legion 5 16IRX G9
NVIDIA GeForce RTX 4060 Laptop GPU, i7-14650HX, Samsung PM9A1 MZVL21T0HCLR
2092 Points
HP Victus 16 (2024)
NVIDIA GeForce RTX 4060 Laptop GPU, i7-14700HX, Kioxia XG8 KXG80ZNV512G
1923 Points
Average of class Gaming
  (1247 - 2344, n=147, last 2 years)
1905 Points
Average AMD Ryzen 7 8845HS, NVIDIA GeForce RTX 4060 Laptop GPU
  ()
1889 Points
Asus ROG Zephyrus G16 GA605WV
NVIDIA GeForce RTX 4060 Laptop GPU, Ryzen AI 9 HX 370, Micron 2400 MTFDKBA1T0QFM
1819 Points
CrossMark / Productivity
Nubia RedMagic Titan 16 Pro
NVIDIA GeForce RTX 4060 Laptop GPU, i9-14900HX, Samsung PM9A1 MZVL21T0HCLR
2042 Points
Lenovo Legion 5 16IRX G9
NVIDIA GeForce RTX 4060 Laptop GPU, i7-14650HX, Samsung PM9A1 MZVL21T0HCLR
1938 Points
Average of class Gaming
  (1299 - 2204, n=147, last 2 years)
1805 Points
Average AMD Ryzen 7 8845HS, NVIDIA GeForce RTX 4060 Laptop GPU
  ()
1789 Points
HP Victus 16 (2024)
NVIDIA GeForce RTX 4060 Laptop GPU, i7-14700HX, Kioxia XG8 KXG80ZNV512G
1782 Points
Asus ROG Zephyrus G16 GA605WV
NVIDIA GeForce RTX 4060 Laptop GPU, Ryzen AI 9 HX 370, Micron 2400 MTFDKBA1T0QFM
1637 Points
CrossMark / Creativity
Lenovo Legion 5 16IRX G9
NVIDIA GeForce RTX 4060 Laptop GPU, i7-14650HX, Samsung PM9A1 MZVL21T0HCLR
2336 Points
Asus ROG Zephyrus G16 GA605WV
NVIDIA GeForce RTX 4060 Laptop GPU, Ryzen AI 9 HX 370, Micron 2400 MTFDKBA1T0QFM
2264 Points
Nubia RedMagic Titan 16 Pro
NVIDIA GeForce RTX 4060 Laptop GPU, i9-14900HX, Samsung PM9A1 MZVL21T0HCLR
2240 Points
HP Victus 16 (2024)
NVIDIA GeForce RTX 4060 Laptop GPU, i7-14700HX, Kioxia XG8 KXG80ZNV512G
2107 Points
Average AMD Ryzen 7 8845HS, NVIDIA GeForce RTX 4060 Laptop GPU
  ()
2102 Points
Average of class Gaming
  (1275 - 2660, n=147, last 2 years)
2090 Points
CrossMark / Responsiveness
Nubia RedMagic Titan 16 Pro
NVIDIA GeForce RTX 4060 Laptop GPU, i9-14900HX, Samsung PM9A1 MZVL21T0HCLR
1899 Points
Lenovo Legion 5 16IRX G9
NVIDIA GeForce RTX 4060 Laptop GPU, i7-14650HX, Samsung PM9A1 MZVL21T0HCLR
1889 Points
HP Victus 16 (2024)
NVIDIA GeForce RTX 4060 Laptop GPU, i7-14700HX, Kioxia XG8 KXG80ZNV512G
1835 Points
Average of class Gaming
  (1030 - 2330, n=147, last 2 years)
1704 Points
Average AMD Ryzen 7 8845HS, NVIDIA GeForce RTX 4060 Laptop GPU
  ()
1613 Points
Asus ROG Zephyrus G16 GA605WV
NVIDIA GeForce RTX 4060 Laptop GPU, Ryzen AI 9 HX 370, Micron 2400 MTFDKBA1T0QFM
1293 Points
WebXPRT 3 / Overall
Nubia RedMagic Titan 16 Pro
NVIDIA GeForce RTX 4060 Laptop GPU, i9-14900HX, Samsung PM9A1 MZVL21T0HCLR
329 Points +8%
Lenovo Legion 5 16IRX G9
NVIDIA GeForce RTX 4060 Laptop GPU, i7-14650HX, Samsung PM9A1 MZVL21T0HCLR
311 Points +2%
Acer Nitro V 16 ANV16-41-R5AT
NVIDIA GeForce RTX 4060 Laptop GPU, R7 8845HS, Micron 2550 1TB
305 Points
Average AMD Ryzen 7 8845HS, NVIDIA GeForce RTX 4060 Laptop GPU
  (305 - 305, n=2)
305 Points 0%
Average of class Gaming
  (215 - 480, n=161, last 2 years)
304 Points 0%
HP Victus 16 (2024)
NVIDIA GeForce RTX 4060 Laptop GPU, i7-14700HX, Kioxia XG8 KXG80ZNV512G
276 Points -10%
WebXPRT 4 / Overall
Nubia RedMagic Titan 16 Pro
NVIDIA GeForce RTX 4060 Laptop GPU, i9-14900HX, Samsung PM9A1 MZVL21T0HCLR
309 Points +75%
Lenovo Legion 5 16IRX G9
NVIDIA GeForce RTX 4060 Laptop GPU, i7-14650HX, Samsung PM9A1 MZVL21T0HCLR
283 Points +60%
Average of class Gaming
  (157.9 - 328, n=149, last 2 years)
267 Points +51%
Asus ROG Zephyrus G16 GA605WV
NVIDIA GeForce RTX 4060 Laptop GPU, Ryzen AI 9 HX 370, Micron 2400 MTFDKBA1T0QFM
259 Points +47%
HP Victus 16 (2024)
NVIDIA GeForce RTX 4060 Laptop GPU, i7-14700HX, Kioxia XG8 KXG80ZNV512G
251 Points +42%
Average AMD Ryzen 7 8845HS, NVIDIA GeForce RTX 4060 Laptop GPU
  (176.4 - 264, n=2)
220 Points +25%
Acer Nitro V 16 ANV16-41-R5AT
NVIDIA GeForce RTX 4060 Laptop GPU, R7 8845HS, Micron 2550 1TB
176.4 Points
Mozilla Kraken 1.1 / Total
HP Victus 16 (2024)
NVIDIA GeForce RTX 4060 Laptop GPU, i7-14700HX, Kioxia XG8 KXG80ZNV512G
542 ms * -4%
Acer Nitro V 16 ANV16-41-R5AT
NVIDIA GeForce RTX 4060 Laptop GPU, R7 8845HS, Micron 2550 1TB
523 ms *
Average AMD Ryzen 7 8845HS, NVIDIA GeForce RTX 4060 Laptop GPU
  (496 - 523, n=2)
510 ms * +2%
Average of class Gaming
  (421 - 674, n=175, last 2 years)
503 ms * +4%
Lenovo Legion 5 16IRX G9
NVIDIA GeForce RTX 4060 Laptop GPU, i7-14650HX, Samsung PM9A1 MZVL21T0HCLR
486 ms * +7%
Nubia RedMagic Titan 16 Pro
NVIDIA GeForce RTX 4060 Laptop GPU, i9-14900HX, Samsung PM9A1 MZVL21T0HCLR
439 ms * +16%
Asus ROG Zephyrus G16 GA605WV
NVIDIA GeForce RTX 4060 Laptop GPU, Ryzen AI 9 HX 370, Micron 2400 MTFDKBA1T0QFM
434 ms * +17%

* ... smaller is better

PCMark 10 Score
7538 pontos
Ajuda
AIDA64 / Memory Copy
Asus ROG Zephyrus G16 GA605WV
AMD Ryzen AI 9 HX 370, NVIDIA GeForce RTX 4060 Laptop GPU
89564 MB/s +44%
Average AMD Ryzen 7 8845HS
  (61459 - 71873, n=11)
67394 MB/s +8%
HP Victus 16 (2024)
Intel Core i7-14700HX, NVIDIA GeForce RTX 4060 Laptop GPU
66599 MB/s +7%
Average of class Gaming
  (21842 - 94222, n=183, last 2 years)
65188 MB/s +5%
Acer Nitro V 16 ANV16-41-R5AT
AMD Ryzen 7 8845HS, NVIDIA GeForce RTX 4060 Laptop GPU
62270 MB/s
Lenovo Legion 5 16IRX G9
Intel Core i7-14650HX, NVIDIA GeForce RTX 4060 Laptop GPU
59727 MB/s -4%
Nubia RedMagic Titan 16 Pro
Intel Core i9-14900HX, NVIDIA GeForce RTX 4060 Laptop GPU
43236 MB/s -31%
AIDA64 / Memory Read
Asus ROG Zephyrus G16 GA605WV
AMD Ryzen AI 9 HX 370, NVIDIA GeForce RTX 4060 Laptop GPU
99713 MB/s +64%
HP Victus 16 (2024)
Intel Core i7-14700HX, NVIDIA GeForce RTX 4060 Laptop GPU
81049 MB/s +33%
Lenovo Legion 5 16IRX G9
Intel Core i7-14650HX, NVIDIA GeForce RTX 4060 Laptop GPU
71455 MB/s +18%
Average of class Gaming
  (23681 - 99713, n=183, last 2 years)
69056 MB/s +14%
Acer Nitro V 16 ANV16-41-R5AT
AMD Ryzen 7 8845HS, NVIDIA GeForce RTX 4060 Laptop GPU
60784 MB/s
Average AMD Ryzen 7 8845HS
  (49866 - 61976, n=11)
58208 MB/s -4%
Nubia RedMagic Titan 16 Pro
Intel Core i9-14900HX, NVIDIA GeForce RTX 4060 Laptop GPU
47588 MB/s -22%
AIDA64 / Memory Write
Asus ROG Zephyrus G16 GA605WV
AMD Ryzen AI 9 HX 370, NVIDIA GeForce RTX 4060 Laptop GPU
98802 MB/s +27%
Average AMD Ryzen 7 8845HS
  (68425 - 93239, n=11)
85626 MB/s +10%
Acer Nitro V 16 ANV16-41-R5AT
AMD Ryzen 7 8845HS, NVIDIA GeForce RTX 4060 Laptop GPU
78054 MB/s
Average of class Gaming
  (22986 - 108954, n=183, last 2 years)
66928 MB/s -14%
HP Victus 16 (2024)
Intel Core i7-14700HX, NVIDIA GeForce RTX 4060 Laptop GPU
65204 MB/s -16%
Lenovo Legion 5 16IRX G9
Intel Core i7-14650HX, NVIDIA GeForce RTX 4060 Laptop GPU
51138 MB/s -34%
Nubia RedMagic Titan 16 Pro
Intel Core i9-14900HX, NVIDIA GeForce RTX 4060 Laptop GPU
39011 MB/s -50%
AIDA64 / Memory Latency
Asus ROG Zephyrus G16 GA605WV
AMD Ryzen AI 9 HX 370, NVIDIA GeForce RTX 4060 Laptop GPU
114.2 ns * -31%
Average AMD Ryzen 7 8845HS
  (82.5 - 117, n=11)
96.9 ns * -11%
HP Victus 16 (2024)
Intel Core i7-14700HX, NVIDIA GeForce RTX 4060 Laptop GPU
96.4 ns * -10%
Average of class Gaming
  (59.5 - 259, n=183, last 2 years)
94 ns * -7%
Lenovo Legion 5 16IRX G9
Intel Core i7-14650HX, NVIDIA GeForce RTX 4060 Laptop GPU
89.8 ns * -3%
Acer Nitro V 16 ANV16-41-R5AT
AMD Ryzen 7 8845HS, NVIDIA GeForce RTX 4060 Laptop GPU
87.5 ns *
Nubia RedMagic Titan 16 Pro
Intel Core i9-14900HX, NVIDIA GeForce RTX 4060 Laptop GPU
79.7 ns * +9%

* ... smaller is better

Latências de DPC

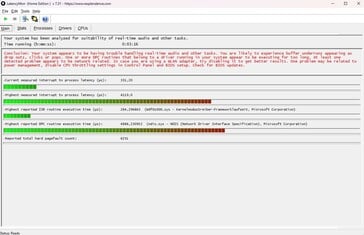
A latência não é um ponto forte do dispositivo de 16 polegadas. A ferramenta LatencyMon confirmou que o V 16 pode ter problemas com o processamento de áudio em tempo real e em outras áreas. Apenas o Zephyrus G16 se saiu bem no campo de comparação.

LatencyMon
LatencyMon
DPC Latencies / LatencyMon - interrupt to process latency (max), Web, Youtube, Prime95
Acer Nitro V 16 ANV16-41-R5AT
NVIDIA GeForce RTX 4060 Laptop GPU, R7 8845HS, Micron 2550 1TB
4119 μs *
Nubia RedMagic Titan 16 Pro
NVIDIA GeForce RTX 4060 Laptop GPU, i9-14900HX, Samsung PM9A1 MZVL21T0HCLR
2500.7 μs * +39%
Lenovo Legion 5 16IRX G9
NVIDIA GeForce RTX 4060 Laptop GPU, i7-14650HX, Samsung PM9A1 MZVL21T0HCLR
2024.9 μs * +51%
HP Victus 16 (2024)
NVIDIA GeForce RTX 4060 Laptop GPU, i7-14700HX, Kioxia XG8 KXG80ZNV512G
853.9 μs * +79%
Asus ROG Zephyrus G16 GA605WV
NVIDIA GeForce RTX 4060 Laptop GPU, Ryzen AI 9 HX 370, Micron 2400 MTFDKBA1T0QFM
566.1 μs * +86%

* ... smaller is better

Dispositivo de armazenamento

A Acer optou por um SSD NVMe sólido, ou seja, o Micron 2550. Ele não é nem lento nem particularmente rápido na leitura ou gravação. No teste de longo prazo usando o DiskSpd, observamos algumas pequenas quedas no longo prazo, mas o desempenho da SSD flutuou significativamente mais ou caiu consideravelmente mais em outros dispositivos (por exemplo, o Lenovo Legion 5 e o HP Victus 16).

Micron 2550 1TB
CDM 5/6 Read Seq Q32T1: 4809 MB/s
CDM 5/6 Write Seq Q32T1: 2218 MB/s
CDM 5/6 Read 4K Q32T1: 581.6 MB/s
CDM 5/6 Write 4K Q32T1: 339.6 MB/s
CDM 5 Read Seq: 2116 MB/s
CDM 5 Write Seq: 2312 MB/s
CDM 5/6 Read 4K: 51.26 MB/s
CDM 5/6 Write 4K: 270.2 MB/s
Drive Performance Rating - Percent
Lenovo Legion 5 16IRX G9
Samsung PM9A1 MZVL21T0HCLR
95 pt
Nubia RedMagic Titan 16 Pro
Samsung PM9A1 MZVL21T0HCLR
90 pt
HP Victus 16 (2024)
Kioxia XG8 KXG80ZNV512G
80.4 pt
Average of class Gaming
 
79.4 pt
Acer Nitro V 16 ANV16-41-R5AT
Micron 2550 1TB
64.1 pt
Average Micron 2550 1TB
 
58.7 pt
Asus ROG Zephyrus G16 GA605WV
Micron 2400 MTFDKBA1T0QFM
46.8 pt
DiskSpd
seq read
Lenovo Legion 5 16IRX G9
Samsung PM9A1 MZVL21T0HCLR
4182 (4112.68min - 4181.96max) MB/s +93%
Nubia RedMagic Titan 16 Pro
Samsung PM9A1 MZVL21T0HCLR
3795 (3728.41min - 3794.55max) MB/s +75%
Average of class Gaming
  (1319 - 7045, n=164, last 2 years)
3470 MB/s +60%
HP Victus 16 (2024)
Kioxia XG8 KXG80ZNV512G
3469 (3344.35min - 3469.11max) MB/s +60%
Average Micron 2550 1TB
  (2165 - 2799, n=4)
2631 MB/s +22%
Asus ROG Zephyrus G16 GA605WV
Micron 2400 MTFDKBA1T0QFM
2267 (2202.85min - 2267.15max) MB/s +5%
Acer Nitro V 16 ANV16-41-R5AT
Micron 2550 1TB
2165 (2154.82min - 2165.1max) MB/s
seq write
Lenovo Legion 5 16IRX G9
Samsung PM9A1 MZVL21T0HCLR
4064 (3527.07min - 4064.49max) MB/s +26%
HP Victus 16 (2024)
Kioxia XG8 KXG80ZNV512G
3895 (3747.67min - 3894.8max) MB/s +21%
Average of class Gaming
  (535 - 9307, n=164, last 2 years)
3807 MB/s +18%
Nubia RedMagic Titan 16 Pro
Samsung PM9A1 MZVL21T0HCLR
3625 (3598.44min - 3624.51max) MB/s +13%
Average Micron 2550 1TB
  (3150 - 3470, n=4)
3302 MB/s +3%
Acer Nitro V 16 ANV16-41-R5AT
Micron 2550 1TB
3219 (533.93min - 3218.71max) MB/s
Asus ROG Zephyrus G16 GA605WV
Micron 2400 MTFDKBA1T0QFM
2542 (2385.77min - 2541.75max) MB/s -21%
seq q8 t1 read
HP Victus 16 (2024)
Kioxia XG8 KXG80ZNV512G
6933 (6552.34min - 6933.16max) MB/s +41%
Nubia RedMagic Titan 16 Pro
Samsung PM9A1 MZVL21T0HCLR
6654 (5651.22min - 6654.47max) MB/s +35%
Lenovo Legion 5 16IRX G9
Samsung PM9A1 MZVL21T0HCLR
6651 (5971.64min - 6651.33max) MB/s +35%
Average of class Gaming
  (2594 - 16089, n=164, last 2 years)
6313 MB/s +29%
Average Micron 2550 1TB
  (4912 - 5200, n=4)
5122 MB/s +4%
Asus ROG Zephyrus G16 GA605WV
Micron 2400 MTFDKBA1T0QFM
4946 (3626.31min - 4945.75max) MB/s +1%
Acer Nitro V 16 ANV16-41-R5AT
Micron 2550 1TB
4912 (3899.82min - 4911.74max) MB/s
seq q8 t1 write
Nubia RedMagic Titan 16 Pro
Samsung PM9A1 MZVL21T0HCLR
4990 (4969.33min - 4989.54max) MB/s +124%
Lenovo Legion 5 16IRX G9
Samsung PM9A1 MZVL21T0HCLR
4952 (4919.08min - 4952.42max) MB/s +123%
Average of class Gaming
  (539 - 14571, n=164, last 2 years)
4851 MB/s +118%
HP Victus 16 (2024)
Kioxia XG8 KXG80ZNV512G
4392 (3922.93min - 4391.65max) MB/s +97%
Average Micron 2550 1TB
  (2225 - 4612, n=4)
3983 MB/s +79%
Asus ROG Zephyrus G16 GA605WV
Micron 2400 MTFDKBA1T0QFM
3387 (3154.75min - 3386.9max) MB/s +52%
Acer Nitro V 16 ANV16-41-R5AT
Micron 2550 1TB
2225 (711.19min - 2225.08max) MB/s
4k q1 t1 read
Lenovo Legion 5 16IRX G9
Samsung PM9A1 MZVL21T0HCLR
83.9 (83.66min - 83.86max) MB/s +64%
Nubia RedMagic Titan 16 Pro
Samsung PM9A1 MZVL21T0HCLR
66.2 (61.1min - 66.24max) MB/s +29%
Average of class Gaming
  (30.6 - 95.9, n=164, last 2 years)
65.9 MB/s +29%
Average Micron 2550 1TB
  (51.2 - 78.1, n=4)
63.5 MB/s +24%
Acer Nitro V 16 ANV16-41-R5AT
Micron 2550 1TB
51.2 (50.26min - 51.15max) MB/s
HP Victus 16 (2024)
Kioxia XG8 KXG80ZNV512G
46.2 (45.32min - 46.24max) MB/s -10%
Asus ROG Zephyrus G16 GA605WV
Micron 2400 MTFDKBA1T0QFM
40.3 (40.03min - 40.33max) MB/s -21%
4k q1 t1 write
Acer Nitro V 16 ANV16-41-R5AT
Micron 2550 1TB
273 (270.95min - 273.28max) MB/s
HP Victus 16 (2024)
Kioxia XG8 KXG80ZNV512G
251 (249.24min - 250.87max) MB/s -8%
Lenovo Legion 5 16IRX G9
Samsung PM9A1 MZVL21T0HCLR
246 (236.18min - 245.56max) MB/s -10%
Nubia RedMagic Titan 16 Pro
Samsung PM9A1 MZVL21T0HCLR
241 (231.88min - 240.59max) MB/s -12%
Average of class Gaming
  (66.6 - 397, n=164, last 2 years)
223 MB/s -18%
Average Micron 2550 1TB
  (141.2 - 273, n=4)
178.7 MB/s -35%
Asus ROG Zephyrus G16 GA605WV
Micron 2400 MTFDKBA1T0QFM
93.9 (77.46min - 93.94max) MB/s -66%
4k q32 t16 read
Lenovo Legion 5 16IRX G9
Samsung PM9A1 MZVL21T0HCLR
4010 (4002.81min - 4009.85max) MB/s +466%
Nubia RedMagic Titan 16 Pro
Samsung PM9A1 MZVL21T0HCLR
3822 (3797.23min - 3821.59max) MB/s +439%
HP Victus 16 (2024)
Kioxia XG8 KXG80ZNV512G
3330 (3310.23min - 3329.64max) MB/s +370%
Average of class Gaming
  (417 - 6172, n=164, last 2 years)
2568 MB/s +262%
Acer Nitro V 16 ANV16-41-R5AT
Micron 2550 1TB
709 (708.4min - 709.45max) MB/s
Asus ROG Zephyrus G16 GA605WV
Micron 2400 MTFDKBA1T0QFM
550 (536.5min - 549.61max) MB/s -22%
Average Micron 2550 1TB
  (416 - 709, n=4)
532 MB/s -25%
4k q32 t16 write
Nubia RedMagic Titan 16 Pro
Samsung PM9A1 MZVL21T0HCLR
3539 (3004.21min - 3539.13max) MB/s +94%
Lenovo Legion 5 16IRX G9
Samsung PM9A1 MZVL21T0HCLR
2646 (2422.02min - 2645.88max) MB/s +45%
HP Victus 16 (2024)
Kioxia XG8 KXG80ZNV512G
2405 (937.07min - 2405.2max) MB/s +32%
Average of class Gaming
  (162.3 - 4869, n=164, last 2 years)
2130 MB/s +17%
Acer Nitro V 16 ANV16-41-R5AT
Micron 2550 1TB
1824 (254.66min - 1823.53max) MB/s
Average Micron 2550 1TB
  (350 - 1824, n=4)
727 MB/s -60%
Asus ROG Zephyrus G16 GA605WV
Micron 2400 MTFDKBA1T0QFM
313 (297.37min - 312.94max) MB/s -83%
AS SSD
Score Total
Lenovo Legion 5 16IRX G9
Samsung PM9A1 MZVL21T0HCLR
8677 Points +95%
Nubia RedMagic Titan 16 Pro
Samsung PM9A1 MZVL21T0HCLR
8192 Points +84%
HP Victus 16 (2024)
Kioxia XG8 KXG80ZNV512G
7423 Points +67%
Average of class Gaming
  (2271 - 13854, n=156, last 2 years)
6745 Points +52%
Acer Nitro V 16 ANV16-41-R5AT
Micron 2550 1TB
4451 Points
Average Micron 2550 1TB
  (3379 - 4613, n=4)
3979 Points -11%
Asus ROG Zephyrus G16 GA605WV
Micron 2400 MTFDKBA1T0QFM
3564 Points -20%
Score Read
Lenovo Legion 5 16IRX G9
Samsung PM9A1 MZVL21T0HCLR
3242 Points +116%
Nubia RedMagic Titan 16 Pro
Samsung PM9A1 MZVL21T0HCLR
3136 Points +109%
HP Victus 16 (2024)
Kioxia XG8 KXG80ZNV512G
3007 Points +100%
Average of class Gaming
  (776 - 4721, n=156, last 2 years)
2446 Points +63%
Acer Nitro V 16 ANV16-41-R5AT
Micron 2550 1TB
1500 Points
Average Micron 2550 1TB
  (1001 - 1500, n=4)
1207 Points -20%
Asus ROG Zephyrus G16 GA605WV
Micron 2400 MTFDKBA1T0QFM
954 Points -36%
Score Write
Lenovo Legion 5 16IRX G9
Samsung PM9A1 MZVL21T0HCLR
3846 Points +77%
Nubia RedMagic Titan 16 Pro
Samsung PM9A1 MZVL21T0HCLR
3524 Points +62%
Average of class Gaming
  (515 - 7208, n=156, last 2 years)
3112 Points +43%
HP Victus 16 (2024)
Kioxia XG8 KXG80ZNV512G
2919 Points +34%
Average Micron 2550 1TB
  (1912 - 2763, n=4)
2194 Points +1%
Asus ROG Zephyrus G16 GA605WV
Micron 2400 MTFDKBA1T0QFM
2185 Points +1%
Acer Nitro V 16 ANV16-41-R5AT
Micron 2550 1TB
2171 Points
Seq Read
Lenovo Legion 5 16IRX G9
Samsung PM9A1 MZVL21T0HCLR
5413 MB/s +26%
HP Victus 16 (2024)
Kioxia XG8 KXG80ZNV512G
5247.63 MB/s +22%
Nubia RedMagic Titan 16 Pro
Samsung PM9A1 MZVL21T0HCLR
5097.01 MB/s +19%
Average of class Gaming
  (2260 - 12763, n=156, last 2 years)
4938 MB/s +15%
Acer Nitro V 16 ANV16-41-R5AT
Micron 2550 1TB
4290.67 MB/s
Average Micron 2550 1TB
  (4005 - 4291, n=4)
4095 MB/s -5%
Asus ROG Zephyrus G16 GA605WV
Micron 2400 MTFDKBA1T0QFM
3863 MB/s -10%
Seq Write
HP Victus 16 (2024)
Kioxia XG8 KXG80ZNV512G
4617.83 MB/s +12%
Acer Nitro V 16 ANV16-41-R5AT
Micron 2550 1TB
4126 MB/s
Lenovo Legion 5 16IRX G9
Samsung PM9A1 MZVL21T0HCLR
3979 MB/s -4%
Average of class Gaming
  (495 - 11316, n=156, last 2 years)
3759 MB/s -9%
Nubia RedMagic Titan 16 Pro
Samsung PM9A1 MZVL21T0HCLR
3690.18 MB/s -11%
Average Micron 2550 1TB
  (2090 - 4126, n=4)
2931 MB/s -29%
Asus ROG Zephyrus G16 GA605WV
Micron 2400 MTFDKBA1T0QFM
2555 MB/s -38%
4K Read
Lenovo Legion 5 16IRX G9
Samsung PM9A1 MZVL21T0HCLR
81.2 MB/s +7%
Acer Nitro V 16 ANV16-41-R5AT
Micron 2550 1TB
75.62 MB/s
Nubia RedMagic Titan 16 Pro
Samsung PM9A1 MZVL21T0HCLR
69.73 MB/s -8%
Average Micron 2550 1TB
  (59.3 - 75.6, n=4)
65.9 MB/s -13%
Average of class Gaming
  (27.8 - 112.1, n=156, last 2 years)
65.3 MB/s -14%
HP Victus 16 (2024)
Kioxia XG8 KXG80ZNV512G
51.41 MB/s -32%
Asus ROG Zephyrus G16 GA605WV
Micron 2400 MTFDKBA1T0QFM
27.8 MB/s -63%
4K Write
HP Victus 16 (2024)
Kioxia XG8 KXG80ZNV512G
218.1 MB/s +1%
Acer Nitro V 16 ANV16-41-R5AT
Micron 2550 1TB
216.65 MB/s
Average of class Gaming
  (108.8 - 512, n=156, last 2 years)
212 MB/s -2%
Average Micron 2550 1TB
  (176.9 - 218, n=4)
207 MB/s -4%
Nubia RedMagic Titan 16 Pro
Samsung PM9A1 MZVL21T0HCLR
204.43 MB/s -6%
Lenovo Legion 5 16IRX G9
Samsung PM9A1 MZVL21T0HCLR
194.6 MB/s -10%
Asus ROG Zephyrus G16 GA605WV
Micron 2400 MTFDKBA1T0QFM
185.4 MB/s -14%
4K-64 Read
Lenovo Legion 5 16IRX G9
Samsung PM9A1 MZVL21T0HCLR
2619 MB/s +163%
Nubia RedMagic Titan 16 Pro
Samsung PM9A1 MZVL21T0HCLR
2556.31 MB/s +157%
HP Victus 16 (2024)
Kioxia XG8 KXG80ZNV512G
2430.71 MB/s +144%
Average of class Gaming
  (451 - 3475, n=156, last 2 years)
1881 MB/s +89%
Acer Nitro V 16 ANV16-41-R5AT
Micron 2550 1TB
995.45 MB/s
Average Micron 2550 1TB
  (537 - 995, n=4)
731 MB/s -27%
Asus ROG Zephyrus G16 GA605WV
Micron 2400 MTFDKBA1T0QFM
539 MB/s -46%
4K-64 Write
Lenovo Legion 5 16IRX G9
Samsung PM9A1 MZVL21T0HCLR
3253 MB/s +111%
Nubia RedMagic Titan 16 Pro
Samsung PM9A1 MZVL21T0HCLR
2950.72 MB/s +91%
Average of class Gaming
  (277 - 5909, n=156, last 2 years)
2526 MB/s +64%
HP Victus 16 (2024)
Kioxia XG8 KXG80ZNV512G
2238.92 MB/s +45%
Asus ROG Zephyrus G16 GA605WV
Micron 2400 MTFDKBA1T0QFM
1744 MB/s +13%
Average Micron 2550 1TB
  (1424 - 2305, n=4)
1694 MB/s +10%
Acer Nitro V 16 ANV16-41-R5AT
Micron 2550 1TB
1542.24 MB/s
Access Time Read
HP Victus 16 (2024)
Kioxia XG8 KXG80ZNV512G
0.137 ms * -174%
Average Micron 2550 1TB
  (0.05 - 0.092, n=4)
0.0795 ms * -59%
Average of class Gaming
  (0.016 - 0.379, n=155, last 2 years)
0.05538 ms * -11%
Nubia RedMagic Titan 16 Pro
Samsung PM9A1 MZVL21T0HCLR
0.052 ms * -4%
Acer Nitro V 16 ANV16-41-R5AT
Micron 2550 1TB
0.05 ms *
Asus ROG Zephyrus G16 GA605WV
Micron 2400 MTFDKBA1T0QFM
0.027 ms * +46%
Lenovo Legion 5 16IRX G9
Samsung PM9A1 MZVL21T0HCLR
0.021 ms * +58%
Access Time Write
Asus ROG Zephyrus G16 GA605WV
Micron 2400 MTFDKBA1T0QFM
0.139 ms * -348%
Average Micron 2550 1TB
  (0.031 - 0.063, n=4)
0.0495 ms * -60%
Average of class Gaming
  (0.011 - 1.028, n=156, last 2 years)
0.04826 ms * -56%
Acer Nitro V 16 ANV16-41-R5AT
Micron 2550 1TB
0.031 ms *
Nubia RedMagic Titan 16 Pro
Samsung PM9A1 MZVL21T0HCLR
0.021 ms * +32%
Lenovo Legion 5 16IRX G9
Samsung PM9A1 MZVL21T0HCLR
0.02 ms * +35%
HP Victus 16 (2024)
Kioxia XG8 KXG80ZNV512G
0.019 ms * +39%

* ... smaller is better

Reading continuous performance: DiskSpd Read Loop, Queue Depth 8

035070010501400175021002450280031503500385042004550490052505600595063006650Tooltip
Acer Nitro V 16 ANV16-41-R5AT Micron 2550 1TB; diskspd 2.0.17 f: Ø4582 (3749.76-4895.8)
Lenovo Legion 5 16IRX G9 Samsung PM9A1 MZVL21T0HCLR; diskspd 2.0.17 f: Ø4118 (3284.7-6662.02)
HP Victus 16 (2024) Kioxia XG8 KXG80ZNV512G; diskspd 2.0.17 f: Ø5625 (4912.19-6954.3)
Nubia RedMagic Titan 16 Pro Samsung PM9A1 MZVL21T0HCLR; diskspd 2.0.17 f: Ø6623 (5874.12-6660.14)
Asus ROG Zephyrus G16 GA605WV Micron 2400 MTFDKBA1T0QFM; diskspd 2.0.17 f: Ø4865 (4284.24-4950.91)

Placa de vídeo

A GeForce RTX 4060 é, de longe, uma das placas de vídeo para jogos em laptops mais bem-sucedidas dos últimos anos. O modelo de médio porte da geração Ada Lovelace da Nvidia é equipado com 3.072 unidades de shader e 8 GB GDDR6 VRAM. Assim como a RTX 4070sua VRAM já atingiu seus limites ao executar alguns jogos, e é por isso que os jogadores apaixonados provavelmente devem optar por um laptop com um RTX 4080 (12 GB). Apesar de seu TGP moderado de 85 watts dentro do Nitro V 16, o modelo de 16 polegadas teve um desempenho muito bom nos testes de gráficos sintéticos contra a concorrência, alguns dos quais funcionam com um TGP de mais de 100 watts.

3DMark Performance Rating - Percent
Average of class Gaming
 
100 pt
Lenovo Legion 5 16IRX G9
NVIDIA GeForce RTX 4060 Laptop GPU, Intel Core i7-14650HX
86.2 pt
Nubia RedMagic Titan 16 Pro
NVIDIA GeForce RTX 4060 Laptop GPU, Intel Core i9-14900HX
82.8 pt
HP Victus 16 (2024)
NVIDIA GeForce RTX 4060 Laptop GPU, Intel Core i7-14700HX
80.3 pt
Average NVIDIA GeForce RTX 4060 Laptop GPU
 
79 pt
Acer Nitro V 16 ANV16-41-R5AT
NVIDIA GeForce RTX 4060 Laptop GPU, AMD Ryzen 7 8845HS
76 pt
Asus ROG Zephyrus G16 GA605WV
NVIDIA GeForce RTX 4060 Laptop GPU, AMD Ryzen AI 9 HX 370
73.5 pt
3DMark 11 - 1280x720 Performance GPU
Average of class Gaming
  (1029 - 72178, n=182, last 2 years)
43857 Points +31%
Lenovo Legion 5 16IRX G9
NVIDIA GeForce RTX 4060 Laptop GPU, Intel Core i7-14650HX
37410 Points +12%
Nubia RedMagic Titan 16 Pro
NVIDIA GeForce RTX 4060 Laptop GPU, Intel Core i9-14900HX
36548 Points +9%
HP Victus 16 (2024)
NVIDIA GeForce RTX 4060 Laptop GPU, Intel Core i7-14700HX
35045 Points +5%
Average NVIDIA GeForce RTX 4060 Laptop GPU
  (28136 - 38912, n=56)
34832 Points +4%
Acer Nitro V 16 ANV16-41-R5AT
NVIDIA GeForce RTX 4060 Laptop GPU, AMD Ryzen 7 8845HS
33404 Points
Asus ROG Zephyrus G16 GA605WV
NVIDIA GeForce RTX 4060 Laptop GPU, AMD Ryzen AI 9 HX 370
32517 Points -3%
3DMark
1920x1080 Fire Strike Graphics
Average of class Gaming
  (781 - 53059, n=193, last 2 years)
31437 Points +23%
Lenovo Legion 5 16IRX G9
NVIDIA GeForce RTX 4060 Laptop GPU, Intel Core i7-14650HX
27474 Points +7%
HP Victus 16 (2024)
NVIDIA GeForce RTX 4060 Laptop GPU, Intel Core i7-14700HX
26844 Points +5%
Nubia RedMagic Titan 16 Pro
NVIDIA GeForce RTX 4060 Laptop GPU, Intel Core i9-14900HX
26573 Points +4%
Average NVIDIA GeForce RTX 4060 Laptop GPU
  (20533 - 29656, n=53)
25748 Points +1%
Acer Nitro V 16 ANV16-41-R5AT
NVIDIA GeForce RTX 4060 Laptop GPU, AMD Ryzen 7 8845HS
25565 Points
Asus ROG Zephyrus G16 GA605WV
NVIDIA GeForce RTX 4060 Laptop GPU, AMD Ryzen AI 9 HX 370
23753 Points -7%
2560x1440 Time Spy Graphics
Average of class Gaming
  (224 - 22717, n=188, last 2 years)
13135 Points +42%
Lenovo Legion 5 16IRX G9
NVIDIA GeForce RTX 4060 Laptop GPU, Intel Core i7-14650HX
11267 Points +22%
Nubia RedMagic Titan 16 Pro
NVIDIA GeForce RTX 4060 Laptop GPU, Intel Core i9-14900HX
10575 Points +14%
HP Victus 16 (2024)
NVIDIA GeForce RTX 4060 Laptop GPU, Intel Core i7-14700HX
9937 Points +7%
Average NVIDIA GeForce RTX 4060 Laptop GPU
  (7484 - 11451, n=55)
9936 Points +7%
Asus ROG Zephyrus G16 GA605WV
NVIDIA GeForce RTX 4060 Laptop GPU, AMD Ryzen AI 9 HX 370
9286 Points 0%
Acer Nitro V 16 ANV16-41-R5AT
NVIDIA GeForce RTX 4060 Laptop GPU, AMD Ryzen 7 8845HS
9254 Points
3DMark 11 Performance
29566 pontos
3DMark Ice Storm Standard Score
166948 pontos
3DMark Cloud Gate Standard Score
64085 pontos
3DMark Fire Strike Score
23112 pontos
3DMark Time Spy Score
9511 pontos
Ajuda
Blender
v3.3 Classroom OPTIX/RTX
Acer Nitro V 16 ANV16-41-R5AT
NVIDIA GeForce RTX 4060 Laptop GPU, AMD Ryzen 7 8845HS
25 Seconds *
Lenovo Legion 5 16IRX G9
NVIDIA GeForce RTX 4060 Laptop GPU, Intel Core i7-14650HX
23 Seconds * +8%
Asus ROG Zephyrus G16 GA605WV
NVIDIA GeForce RTX 4060 Laptop GPU, AMD Ryzen AI 9 HX 370
23 Seconds * +8%
Average NVIDIA GeForce RTX 4060 Laptop GPU
  (19 - 28, n=52)
23 Seconds * +8%
HP Victus 16 (2024)
NVIDIA GeForce RTX 4060 Laptop GPU, Intel Core i7-14700HX
22 Seconds * +12%
Nubia RedMagic Titan 16 Pro
NVIDIA GeForce RTX 4060 Laptop GPU, Intel Core i9-14900HX
22 Seconds * +12%
Average of class Gaming
  (9 - 95, n=177, last 2 years)
20.9 Seconds * +16%
v3.3 Classroom CUDA
Asus ROG Zephyrus G16 GA605WV
NVIDIA GeForce RTX 4060 Laptop GPU, AMD Ryzen AI 9 HX 370
44 Seconds * -5%
Nubia RedMagic Titan 16 Pro
NVIDIA GeForce RTX 4060 Laptop GPU, Intel Core i9-14900HX
44 Seconds * -5%
Average NVIDIA GeForce RTX 4060 Laptop GPU
  (39 - 53, n=53)
43.2 Seconds * -3%
Acer Nitro V 16 ANV16-41-R5AT
NVIDIA GeForce RTX 4060 Laptop GPU, AMD Ryzen 7 8845HS
42 Seconds *
Lenovo Legion 5 16IRX G9
NVIDIA GeForce RTX 4060 Laptop GPU, Intel Core i7-14650HX
41 Seconds * +2%
HP Victus 16 (2024)
NVIDIA GeForce RTX 4060 Laptop GPU, Intel Core i7-14700HX
41 Seconds * +2%
Average of class Gaming
  (16 - 175, n=182, last 2 years)
36.5 Seconds * +13%
v3.3 Classroom CPU
Nubia RedMagic Titan 16 Pro
NVIDIA GeForce RTX 4060 Laptop GPU, Intel Core i9-14900HX
394 Seconds * -26%
HP Victus 16 (2024)
NVIDIA GeForce RTX 4060 Laptop GPU, Intel Core i7-14700HX
312 Seconds * -0%
Acer Nitro V 16 ANV16-41-R5AT
NVIDIA GeForce RTX 4060 Laptop GPU, AMD Ryzen 7 8845HS
312 Seconds *
Average NVIDIA GeForce RTX 4060 Laptop GPU
  (189 - 452, n=52)
311 Seconds * -0%
Average of class Gaming
  (138 - 962, n=187, last 2 years)
295 Seconds * +5%
Lenovo Legion 5 16IRX G9
NVIDIA GeForce RTX 4060 Laptop GPU, Intel Core i7-14650HX
247 Seconds * +21%
Asus ROG Zephyrus G16 GA605WV
NVIDIA GeForce RTX 4060 Laptop GPU, AMD Ryzen AI 9 HX 370
221 Seconds * +29%

* ... smaller is better

Desempenho em jogos

Durante os jogos cotidianos, o Nitro tende a vacilar, pelo menos em comparação com o campo de comparação. Medimos que outros notebooks com RTX 4060 às vezes são mais de 20% mais rápidos. Em princípio, a RTX 4060 é potente o suficiente para executar quase todos os jogos modernos sem problemas com as configurações máximas na resolução nativa da tela. Somente ao jogar jogos extremamente exigentes e/ou mal otimizados, como Star Wars Outlaws o senhor terá que se contentar com detalhes reduzidos ou usar o DLSS.

Performance Rating - Percent
Lenovo Legion 5 16IRX G9 -1!
Intel Core i7-14650HX, NVIDIA GeForce RTX 4060 Laptop GPU
95.8 pt
Average of class Gaming
 
95.2 pt
Nubia RedMagic Titan 16 Pro
Intel Core i9-14900HX, NVIDIA GeForce RTX 4060 Laptop GPU
89.3 pt
Average NVIDIA GeForce RTX 4060 Laptop GPU
 
82.6 pt
HP Victus 16 (2024) -1!
Intel Core i7-14700HX, NVIDIA GeForce RTX 4060 Laptop GPU
82.4 pt
Asus ROG Zephyrus G16 GA605WV
AMD Ryzen AI 9 HX 370, NVIDIA GeForce RTX 4060 Laptop GPU
75.1 pt
Acer Nitro V 16 ANV16-41-R5AT
AMD Ryzen 7 8845HS, NVIDIA GeForce RTX 4060 Laptop GPU
74.3 pt
Cyberpunk 2077 2.1 Phantom Liberty - 1920x1080 Ultra Preset (FSR off)
Average of class Gaming
  (6.76 - 144.7, n=79, last 2 years)
86.5 fps +30%
Lenovo Legion 5 16IRX G9
Intel Core i7-14650HX, NVIDIA GeForce RTX 4060 Laptop GPU
81.8 (19.5min) fps +23%
Nubia RedMagic Titan 16 Pro
Intel Core i9-14900HX, NVIDIA GeForce RTX 4060 Laptop GPU
74.7 (62min) fps +13%
Average NVIDIA GeForce RTX 4060 Laptop GPU
  (56.4 - 93.1, n=30)
71.5 fps +8%
HP Victus 16 (2024)
Intel Core i7-14700HX, NVIDIA GeForce RTX 4060 Laptop GPU
67.1 (20.8min) fps +1%
Asus ROG Zephyrus G16 GA605WV
AMD Ryzen AI 9 HX 370, NVIDIA GeForce RTX 4060 Laptop GPU
66.4 (55.7min) fps 0%
Acer Nitro V 16 ANV16-41-R5AT
AMD Ryzen 7 8845HS, NVIDIA GeForce RTX 4060 Laptop GPU
66.4 (56min) fps
Baldur's Gate 3 - 1920x1080 Ultra Preset
Average of class Gaming
  (34.5 - 208, n=44, last 2 years)
103.5 fps +28%
Nubia RedMagic Titan 16 Pro
Intel Core i9-14900HX, NVIDIA GeForce RTX 4060 Laptop GPU
96.5 (62.4min, 71.2P0.1, 81.3P1) fps +19%
Average NVIDIA GeForce RTX 4060 Laptop GPU
  (66.5 - 105.5, n=18)
84.6 fps +5%
Asus ROG Zephyrus G16 GA605WV
AMD Ryzen AI 9 HX 370, NVIDIA GeForce RTX 4060 Laptop GPU
82.9 fps +2%
Acer Nitro V 16 ANV16-41-R5AT
AMD Ryzen 7 8845HS, NVIDIA GeForce RTX 4060 Laptop GPU
80.9 (25.2min, 31.9P0.1, 55.1P1) fps
GTA V - 1920x1080 Highest Settings possible AA:4xMSAA + FX AF:16x
Lenovo Legion 5 16IRX G9
Intel Core i7-14650HX, NVIDIA GeForce RTX 4060 Laptop GPU
120.2 (4.33min, 76.9P1) fps +15%
Nubia RedMagic Titan 16 Pro
Intel Core i9-14900HX, NVIDIA GeForce RTX 4060 Laptop GPU
118.4 (4.07min, 83.3P1) fps +13%
Average of class Gaming
  (12.1 - 167.7, n=168, last 2 years)
113.7 fps +9%
HP Victus 16 (2024)
Intel Core i7-14700HX, NVIDIA GeForce RTX 4060 Laptop GPU
110.2 (8.03min, 76.9P1) fps +5%
Average NVIDIA GeForce RTX 4060 Laptop GPU
  (76.9 - 126.3, n=47)
107.6 fps +3%
Acer Nitro V 16 ANV16-41-R5AT
AMD Ryzen 7 8845HS, NVIDIA GeForce RTX 4060 Laptop GPU
104.6 (17.5min, 71.4P1) fps
Asus ROG Zephyrus G16 GA605WV
AMD Ryzen AI 9 HX 370, NVIDIA GeForce RTX 4060 Laptop GPU
100.1 (4.02min, 66.7P1) fps -4%
Final Fantasy XV Benchmark - 1920x1080 High Quality
Average of class Gaming
  (19.2 - 201, n=180, last 2 years)
119.9 fps +25%
Lenovo Legion 5 16IRX G9
Intel Core i7-14650HX, NVIDIA GeForce RTX 4060 Laptop GPU
106.3 fps +11%
Nubia RedMagic Titan 16 Pro
Intel Core i9-14900HX, NVIDIA GeForce RTX 4060 Laptop GPU
105.4 fps +10%
HP Victus 16 (2024)
Intel Core i7-14700HX, NVIDIA GeForce RTX 4060 Laptop GPU
98.1 fps +2%
Average NVIDIA GeForce RTX 4060 Laptop GPU
  (75.1 - 109.8, n=50)
97.3 fps +1%
Acer Nitro V 16 ANV16-41-R5AT
AMD Ryzen 7 8845HS, NVIDIA GeForce RTX 4060 Laptop GPU
96.1 fps
Asus ROG Zephyrus G16 GA605WV
AMD Ryzen AI 9 HX 370, NVIDIA GeForce RTX 4060 Laptop GPU
90.7 fps -6%
Strange Brigade - 1920x1080 ultra AA:ultra AF:16
Average of class Gaming
  (38.9 - 421, n=178, last 2 years)
229 fps +35%
Lenovo Legion 5 16IRX G9
Intel Core i7-14650HX, NVIDIA GeForce RTX 4060 Laptop GPU
210 fps +24%
Nubia RedMagic Titan 16 Pro
Intel Core i9-14900HX, NVIDIA GeForce RTX 4060 Laptop GPU
189.2 (10.3min, 139.1P1) fps +11%
Average NVIDIA GeForce RTX 4060 Laptop GPU
  (135.3 - 210, n=49)
181.3 fps +7%
HP Victus 16 (2024)
Intel Core i7-14700HX, NVIDIA GeForce RTX 4060 Laptop GPU
179 (76.4min, 130.3P1) fps +5%
Asus ROG Zephyrus G16 GA605WV
AMD Ryzen AI 9 HX 370, NVIDIA GeForce RTX 4060 Laptop GPU
174.9 (77.7min, 128P1) fps +3%
Acer Nitro V 16 ANV16-41-R5AT
AMD Ryzen 7 8845HS, NVIDIA GeForce RTX 4060 Laptop GPU
169.7 (30.6min, 122.4P1) fps
Dota 2 Reborn - 1920x1080 ultra (3/3) best looking
Lenovo Legion 5 16IRX G9
Intel Core i7-14650HX, NVIDIA GeForce RTX 4060 Laptop GPU
168.7 (146.8min) fps +29%
Average of class Gaming
  (33.2 - 220, n=186, last 2 years)
150.5 fps +15%
HP Victus 16 (2024)
Intel Core i7-14700HX, NVIDIA GeForce RTX 4060 Laptop GPU
149.7 (130.4min) fps +15%
Nubia RedMagic Titan 16 Pro
Intel Core i9-14900HX, NVIDIA GeForce RTX 4060 Laptop GPU
146.9 (123.2min) fps +13%
Average NVIDIA GeForce RTX 4060 Laptop GPU
  (115 - 183.8, n=52)
145 fps +11%
Asus ROG Zephyrus G16 GA605WV
AMD Ryzen AI 9 HX 370, NVIDIA GeForce RTX 4060 Laptop GPU
139.2 (118.4min) fps +7%
Acer Nitro V 16 ANV16-41-R5AT
AMD Ryzen 7 8845HS, NVIDIA GeForce RTX 4060 Laptop GPU
130.5 (112.8min) fps
X-Plane 11.11 - 1920x1080 high (fps_test=3)
Lenovo Legion 5 16IRX G9
Intel Core i7-14650HX, NVIDIA GeForce RTX 4060 Laptop GPU
130.9 fps +116%
Nubia RedMagic Titan 16 Pro
Intel Core i9-14900HX, NVIDIA GeForce RTX 4060 Laptop GPU
117.2 fps +93%
Average of class Gaming
  (31.5 - 166.2, n=192, last 2 years)
108.1 fps +78%
Average NVIDIA GeForce RTX 4060 Laptop GPU
  (60.7 - 141.1, n=53)
102.1 fps +68%
HP Victus 16 (2024)
Intel Core i7-14700HX, NVIDIA GeForce RTX 4060 Laptop GPU
100.3 fps +65%
Asus ROG Zephyrus G16 GA605WV
AMD Ryzen AI 9 HX 370, NVIDIA GeForce RTX 4060 Laptop GPU
66.5 fps +10%
Acer Nitro V 16 ANV16-41-R5AT
AMD Ryzen 7 8845HS, NVIDIA GeForce RTX 4060 Laptop GPU
60.7 fps
baixomédiaaltoultra
GTA V (2015) 175.8 167.8 104.6
Dota 2 Reborn (2015) 161.6 156 138.3 130.5
Final Fantasy XV Benchmark (2018) 205 130.8 96.1
X-Plane 11.11 (2018) 87.1 87.7 60.7
Strange Brigade (2018) 251 200 169.7
Baldur's Gate 3 (2023) 98.3 83.1 80.9
Cyberpunk 2077 2.1 Phantom Liberty (2023) 90.6 77.2 66.4
Prince of Persia The Lost Crown (2024) 345 340 337
Star Wars Outlaws (2024) 42.6 35.6 29.1
Space Marine 2 (2024) 76.9 76 67.8
Final Fantasy XVI (2024) 64 54.8 50.4
God of War Ragnarök (2024) 102.8 88 80.2
Until Dawn (2024) 80.1 56.8 43.2
Call of Duty Black Ops 6 (2024) 116 80 76
Stalker 2 (2024) 54.1 48.1 40.2
Cyberpunk 2077 2.1 Phantom Liberty
1920x1080 Medium Preset (FSR off)
Lenovo Legion 5 16IRX G9
Intel Core i7-14650HX, NVIDIA GeForce RTX 4060 Laptop GPU
110.4 (18.7min) fps +22%
Nubia RedMagic Titan 16 Pro
Intel Core i9-14900HX, NVIDIA GeForce RTX 4060 Laptop GPU
101.1 (86.5min) fps +12%
Average of class Gaming
  (7.27 - 185.2, n=57, last 2 years)
101 fps +11%
Average NVIDIA GeForce RTX 4060 Laptop GPU
  (77.7 - 110.4, n=22)
93.8 fps +4%
Acer Nitro V 16 ANV16-41-R5AT
AMD Ryzen 7 8845HS, NVIDIA GeForce RTX 4060 Laptop GPU
90.6 (78min) fps
HP Victus 16 (2024)
Intel Core i7-14700HX, NVIDIA GeForce RTX 4060 Laptop GPU
90 (47.2min) fps -1%
Asus ROG Zephyrus G16 GA605WV
AMD Ryzen AI 9 HX 370, NVIDIA GeForce RTX 4060 Laptop GPU
90 (77.6min) fps -1%
1920x1080 High Preset (FSR off)
Lenovo Legion 5 16IRX G9
Intel Core i7-14650HX, NVIDIA GeForce RTX 4060 Laptop GPU
95.3 (18.5min) fps +23%
Average of class Gaming
  (7.4 - 164.5, n=59, last 2 years)
92.2 fps +19%
Nubia RedMagic Titan 16 Pro
Intel Core i9-14900HX, NVIDIA GeForce RTX 4060 Laptop GPU
86.2 (73min) fps +12%
Average NVIDIA GeForce RTX 4060 Laptop GPU
  (65.2 - 102, n=25)
80.6 fps +4%
Acer Nitro V 16 ANV16-41-R5AT
AMD Ryzen 7 8845HS, NVIDIA GeForce RTX 4060 Laptop GPU
77.2 (66min) fps
HP Victus 16 (2024)
Intel Core i7-14700HX, NVIDIA GeForce RTX 4060 Laptop GPU
76.9 (24min) fps 0%
Asus ROG Zephyrus G16 GA605WV
AMD Ryzen AI 9 HX 370, NVIDIA GeForce RTX 4060 Laptop GPU
75.2 (64min) fps -3%
1920x1080 Ultra Preset (FSR off)
Average of class Gaming
  (6.76 - 144.7, n=79, last 2 years)
86.5 fps +30%
Lenovo Legion 5 16IRX G9
Intel Core i7-14650HX, NVIDIA GeForce RTX 4060 Laptop GPU
81.8 (19.5min) fps +23%
Nubia RedMagic Titan 16 Pro
Intel Core i9-14900HX, NVIDIA GeForce RTX 4060 Laptop GPU
74.7 (62min) fps +13%
Average NVIDIA GeForce RTX 4060 Laptop GPU
  (56.4 - 93.1, n=30)
71.5 fps +8%
HP Victus 16 (2024)
Intel Core i7-14700HX, NVIDIA GeForce RTX 4060 Laptop GPU
67.1 (20.8min) fps +1%
Asus ROG Zephyrus G16 GA605WV
AMD Ryzen AI 9 HX 370, NVIDIA GeForce RTX 4060 Laptop GPU
66.4 (55.7min) fps 0%
Acer Nitro V 16 ANV16-41-R5AT
AMD Ryzen 7 8845HS, NVIDIA GeForce RTX 4060 Laptop GPU
66.4 (56min) fps

Testamos se o desempenho da GPU permanece constante por períodos mais longos usando o Cyberpunk 2077. Não observamos nenhuma anormalidade a esse respeito.

Cyberpunk 2077 ultra FPS diagram

05101520253035404550556065Tooltip
Acer Nitro V 16 ANV16-41-R5AT R7 8845HS, NVIDIA GeForce RTX 4060 Laptop GPU: Ø64.2 (61.7-64.8)
Nubia RedMagic Titan 16 Pro i9-14900HX, NVIDIA GeForce RTX 4060 Laptop GPU: Ø67.6 (60.1-69.2)
Asus ROG Zephyrus G16 GA605WV Ryzen AI 9 HX 370, NVIDIA GeForce RTX 4060 Laptop GPU: Ø62.3 (54.5-62.9)

Emissões

Emissões de ruído

Juntamente com a tela, o controle confuso da ventoinha do Nitro V 16 acabou sendo um de seus maiores pontos fracos. Mesmo no modo Equilibrado, as ventoinhas tendem a acelerar desnecessariamente quando ocorrem pequenas coisas, como abrir o navegador. Os saltos de velocidade para frente e para trás podem se tornar bastante irritantes na prática, e é por isso que a Acer deve definitivamente fazer melhorias nesse sentido. Em geral, o dispositivo de 16 polegadas é bastante barulhento sob carga. Acima de 50 dB(A), definitivamente requer o uso de um fone de ouvido.

Barulho

Ocioso
25 / 28 / 37 dB
Carga
51 / 52 dB
  red to green bar
 
 
30 dB
silencioso
40 dB(A)
audível
50 dB(A)
ruidosamente alto
 
min: dark, med: mid, max: light   Earthworks M23R, Arta (15 cm de distância)   environment noise: 25 dB(A)
dB(A) 0102030405060708090Deep BassMiddle BassHigh BassLower RangeMidsHigher MidsLower HighsMid HighsUpper HighsSuper Highs2048.447.94346.140.241.12542.243.540.942.840.837.63148.84751.747.847.246.14034.830.232.132.231.228.55043.526.628.233.232.132.56331.330.52524.324.730.58025.119.217.316.815.522.910024.517.315.314.113.82312528.620.12014.214.826.816027.220.717.816.615.326.920030.124.220.620.819.230.725028.821.318.118.416.529.331529.320.918.814.513.630.340032.62416.713.213.733.950033.325.822.511.81234.763036.326.418.51111.537.580037.526.816.410.31338.8100039.327.616.711.111.640.1125041.429.21711.311.442.5160042.829.416.911.411.343.5200041.328.815.212.31241.9250039.924.213.812.812.240.8315039.220.213.713.812.739.2400038.220.61514.613.239.150003718.81413.913.837.3630034.116.213.914.414.634.7800029.814.91414.214.431.51000027.416.313.913.814.628.61250021.414.513.113.114.523.11600019.216.313.213.212.619.1SPL50.837.528.325.425.351.6N7.12.410.70.77.5median 33.3median 20.9median 16.4median 13.8median 13.6median 34.7Delta5.64.72.11.21.36.2hearing rangehide median Fan NoiseAcer Nitro V 16 ANV16-41-R5AT
Acer Nitro V 16 ANV16-41-R5AT
R7 8845HS, NVIDIA GeForce RTX 4060 Laptop GPU
Lenovo Legion 5 16IRX G9
i7-14650HX, NVIDIA GeForce RTX 4060 Laptop GPU
HP Victus 16 (2024)
i7-14700HX, NVIDIA GeForce RTX 4060 Laptop GPU
Nubia RedMagic Titan 16 Pro
i9-14900HX, NVIDIA GeForce RTX 4060 Laptop GPU
Asus ROG Zephyrus G16 GA605WV
Ryzen AI 9 HX 370, NVIDIA GeForce RTX 4060 Laptop GPU
Noise
4%
3%
-10%
6%
off / environment *
25
24
4%
25
-0%
26
-4%
24.6
2%
Idle Minimum *
25
24
4%
28
-12%
35
-40%
28.6
-14%
Idle Average *
28
28.8
-3%
29
-4%
36
-29%
28.6
-2%
Idle Maximum *
37
32
14%
33
11%
40
-8%
28.6
23%
Load Average *
51
45.5
11%
45
12%
49
4%
42.8
16%
Cyberpunk 2077 ultra *
54
50
7%
48.3
11%
Load Maximum *
52
55.7
-7%
48
8%
52
-0%
48.3
7%
Witcher 3 ultra *
53.1
43

* ... smaller is better

Temperatura

Suas temperaturas, por outro lado, permaneceram dentro de uma faixa aceitável durante nosso teste. Embora a parte inferior do gabinete às vezes esquentasse até quase 50 °C em locais sob carga, a parte superior não esquentava muito, com um máximo de 42 °C. No modo inativo, a situação - ou seja, a proporção entre a parte superior e inferior - foi semelhante.

 39 °C41 °C38 °C 
 35 °C37 °C34 °C 
 28 °C30 °C29 °C 
Máximo: 41 °C
Médio: 34.6 °C
49 °C47 °C44 °C
41 °C43 °C44 °C
29 °C29 °C28 °C
Máximo: 49 °C
Médio: 39.3 °C
alimentação elétrica  46 °C | Temperatura do quarto 21 °C | Fluke t3000FC (calibrated), Voltcraft IR-900
(±) The average temperature for the upper side under maximal load is 34.6 °C / 94 F, compared to the average of 33.9 °C / 93 F for the devices in the class Gaming.
(±) The maximum temperature on the upper side is 41 °C / 106 F, compared to the average of 40.5 °C / 105 F, ranging from 21.2 to 68.8 °C for the class Gaming.
(-) The bottom heats up to a maximum of 49 °C / 120 F, compared to the average of 43.2 °C / 110 F
(+) In idle usage, the average temperature for the upper side is 30.1 °C / 86 F, compared to the device average of 33.9 °C / 93 F.
(±) 3: The average temperature for the upper side is 34.9 °C / 95 F, compared to the average of 33.9 °C / 93 F for the class Gaming.
(+) The palmrests and touchpad are cooler than skin temperature with a maximum of 30 °C / 86 F and are therefore cool to the touch.
(±) The average temperature of the palmrest area of similar devices was 28.9 °C / 84 F (-1.1 °C / -2 F).
Acer Nitro V 16 ANV16-41-R5AT
R7 8845HS, NVIDIA GeForce RTX 4060 Laptop GPU
Lenovo Legion 5 16IRX G9
i7-14650HX, NVIDIA GeForce RTX 4060 Laptop GPU
HP Victus 16 (2024)
i7-14700HX, NVIDIA GeForce RTX 4060 Laptop GPU
Nubia RedMagic Titan 16 Pro
i9-14900HX, NVIDIA GeForce RTX 4060 Laptop GPU
Asus ROG Zephyrus G16 GA605WV
Ryzen AI 9 HX 370, NVIDIA GeForce RTX 4060 Laptop GPU
Heat
6%
7%
-6%
3%
Maximum Upper Side *
41
40.4
1%
50
-22%
50
-22%
48.2
-18%
Maximum Bottom *
49
43.8
11%
50
-2%
58
-18%
51.3
-5%
Idle Upper Side *
32
30.3
5%
25
22%
31
3%
28
12%
Idle Bottom *
37
35.3
5%
26
30%
32
14%
28.8
22%

* ... smaller is better

Teste de estresse

Também não há necessidade de se preocupar com os componentes do laptop. Tanto ao executar o Cyberpunk 2077 quanto durante o teste de estresse usando as ferramentas Furmark e Prime95, a CPU e a GPU se estabilizaram em pouco menos de 70 °C, o que é completamente inofensivo.

Furmark e Prime95
Furmark e Prime95
Furmark e Prime95
Furmark e Prime95
Furmark e Prime95
Furmark e Prime95
Cyberpunk 2077
Cyberpunk 2077
Cyberpunk 2077
Cyberpunk 2077
Cyberpunk 2077
Cyberpunk 2077

Alto-falantes

O sistema 2.0 oferece um bom nível máximo de 82 dB(A), mas, como sabemos da maioria dos laptops, apresenta pontos fracos quando se trata de graves. A qualidade do som é suficiente para vídeos ocasionais do YouTube, etc., mas para um uso mais intenso de mídia (filmes, música, jogos, etc.), o senhor deve conectar alto-falantes externos ou um fone de ouvido, se possível.

dB(A) 0102030405060708090Deep BassMiddle BassHigh BassLower RangeMidsHigher MidsLower HighsMid HighsUpper HighsSuper Highs2040.242.62540.8383147.244.54031.233.15032.128.26324.729.98015.520.810013.818.912514.827.216015.336.120019.247.325016.560.531513.663.940013.769.65001270.563011.574.38001374.2100011.672.2125011.469.9160011.370.720001269.6250012.267315012.769.4400013.268.4500013.867.2630014.666.1800014.470.51000014.674.11250014.572.31600012.667.6SPL25.382.5N0.757.5median 13.6median 69.4Delta1.36.526.325.821.422.12624.925.127.622.532.523.448.72655.818.860.922.167.2267019.372.317.674.217.774.319.575.31571.711.871.311.27410.574.21072.710.17210.67210.97511.374.811.671.71269.71269.612.371.112.669.61270.111.269.824.784.70.666.6median 12median 71.73.42.2hearing rangehide median Pink NoiseAcer Nitro V 16 ANV16-41-R5ATApple MacBook Pro 16 2021 M1 Pro
Frequency diagram (checkboxes can be checked and unchecked to compare devices)
Acer Nitro V 16 ANV16-41-R5AT audio analysis

(+) | speakers can play relatively loud (82 dB)
Bass 100 - 315 Hz
(-) | nearly no bass - on average 27.1% lower than median
(±) | linearity of bass is average (14% delta to prev. frequency)
Mids 400 - 2000 Hz
(+) | balanced mids - only 2% away from median
(+) | mids are linear (3.8% delta to prev. frequency)
Highs 2 - 16 kHz
(+) | balanced highs - only 2.1% away from median
(+) | highs are linear (4.2% delta to prev. frequency)
Overall 100 - 16.000 Hz
(±) | linearity of overall sound is average (16% difference to median)
Compared to same class
» 37% of all tested devices in this class were better, 6% similar, 57% worse
» The best had a delta of 6%, average was 18%, worst was 132%
Compared to all devices tested
» 22% of all tested devices were better, 5% similar, 73% worse
» The best had a delta of 4%, average was 25%, worst was 134%

Apple MacBook Pro 16 2021 M1 Pro audio analysis

(+) | speakers can play relatively loud (84.7 dB)
Bass 100 - 315 Hz
(+) | good bass - only 3.8% away from median
(+) | bass is linear (5.2% delta to prev. frequency)
Mids 400 - 2000 Hz
(+) | balanced mids - only 1.3% away from median
(+) | mids are linear (2.1% delta to prev. frequency)
Highs 2 - 16 kHz
(+) | balanced highs - only 1.9% away from median
(+) | highs are linear (2.7% delta to prev. frequency)
Overall 100 - 16.000 Hz
(+) | overall sound is linear (4.6% difference to median)
Compared to same class
» 0% of all tested devices in this class were better, 0% similar, 100% worse
» The best had a delta of 5%, average was 18%, worst was 45%
Compared to all devices tested
» 0% of all tested devices were better, 0% similar, 100% worse
» The best had a delta of 4%, average was 25%, worst was 134%

Gerenciamento de energia

Consumo de energia

Graças à sua CPU Ryzen, o Nitro V 16 é o representante mais econômico em nosso campo de teste. 9 a 13 watts no modo inativo e 61 a 134 watts sob carga foram, em alguns casos, claramente superados pela concorrência da Intel.

Consumo de energia
desligadodarklight 0.1 / 0.8 Watt
Ociosodarkmidlight 9 / 10 / 13 Watt
Carga midlight 61 / 134 Watt
 color bar
Key: min: dark, med: mid, max: light        Metrahit Energy
Acer Nitro V 16 ANV16-41-R5AT
R7 8845HS, NVIDIA GeForce RTX 4060 Laptop GPU
Lenovo Legion 5 16IRX G9
i7-14650HX, NVIDIA GeForce RTX 4060 Laptop GPU
HP Victus 16 (2024)
i7-14700HX, NVIDIA GeForce RTX 4060 Laptop GPU
Nubia RedMagic Titan 16 Pro
i9-14900HX, NVIDIA GeForce RTX 4060 Laptop GPU
Asus ROG Zephyrus G16 GA605WV
Ryzen AI 9 HX 370, NVIDIA GeForce RTX 4060 Laptop GPU
Average of class Gaming
 
Power Consumption
-76%
-62%
-80%
-13%
-81%
Idle Minimum *
9
15.4
-71%
9
-0%
16
-78%
6.9
23%
Idle Average *
10
19.7
-97%
15
-50%
19
-90%
12.6
-26%
Idle Maximum *
13
20.7
-59%
23
-77%
27
-108%
13
-0%
Load Average *
61
102.6
-68%
123
-102%
123
-102%
84.1
-38%
Cyberpunk 2077 ultra *
118.9
184.3
-55%
127.2
-7%
Cyberpunk 2077 ultra external monitor *
116.3
174.2
-50%
124.5
-7%
Load Maximum *
134
246.6
-84%
241
-80%
240
-79%
177.6
-33%
Witcher 3 ultra *
191.3
143.7

* ... smaller is better

Power consumption Cyberpunk / stress test

0102030405060708090100110120130Tooltip
Acer Nitro V 16 ANV16-41-R5AT; 1280x720 Prime95 28.10 and Furmark 1.25: Ø121.9 (115.9-134)
Acer Nitro V 16 ANV16-41-R5AT; Idle 150cd/m2: Ø10 (9-13.3)
Acer Nitro V 16 ANV16-41-R5AT; Cyberpunk 2077 FHD ultra no FSR 150cd: Ø118.9 (115.6-122.8)

Power consumption with external monitor

0102030405060708090100110120Tooltip
Acer Nitro V 16 ANV16-41-R5AT; Prime95 V2810 Stress (external Monitor): Ø85.6 (84.8-99.4)
Acer Nitro V 16 ANV16-41-R5AT; Cinebench R23 Multi (external Monitor): Ø86.4 (84.1-99.1)
Acer Nitro V 16 ANV16-41-R5AT; 1280x720 FurMark 1.19 GPU Stress Test (external Monitor): Ø111.1 (103-119.7)
Acer Nitro V 16 ANV16-41-R5AT; Idle 1min (external Monitor): Ø16.5 (14.1-23.4)
Acer Nitro V 16 ANV16-41-R5AT; Cyberpunk 2077 FHD ultra no FSR (external Monitor): Ø116.3 (114-121.6)

Tempos de execução

O fato de a duração da bateria não ser totalmente a melhor se deve principalmente à sua capacidade reduzida. Embora houvesse mais espaço na caixa do laptop, a Acer só deu ao V 16 uma capacidade de 57 Wh. A concorrência, por outro lado, pode contar com 80 a 90 Wh. Como resultado, pouco menos de 6 horas em nosso teste WLAN com o brilho reduzido a 150 cd/m² é, portanto, apenas medíocre. Em outras palavras: Ainda há muito espaço para melhorias aqui.

Tempo de Execução da Bateria
WiFi Websurfing
5h 56min
Acer Nitro V 16 ANV16-41-R5AT
R7 8845HS, NVIDIA GeForce RTX 4060 Laptop GPU, 57 Wh
Lenovo Legion 5 16IRX G9
i7-14650HX, NVIDIA GeForce RTX 4060 Laptop GPU, 80 Wh
HP Victus 16 (2024)
i7-14700HX, NVIDIA GeForce RTX 4060 Laptop GPU, 83 Wh
Nubia RedMagic Titan 16 Pro
i9-14900HX, NVIDIA GeForce RTX 4060 Laptop GPU, 80.1 Wh
Asus ROG Zephyrus G16 GA605WV
Ryzen AI 9 HX 370, NVIDIA GeForce RTX 4060 Laptop GPU, 90 Wh
Average of class Gaming
 
Battery Runtime
25%
44%
-21%
34%
6%
WiFi v1.3
356
444
25%
511
44%
280
-21%
478
34%
H.264
576
316
824
Load
46
76
103
Reader / Idle
481

Classificação total do Notebookcheck

Com uma tela mais potente e melhor controle da ventoinha, o Acer Nitro V 16 poderia ser um laptop para jogos totalmente impressionante pelo preço. No entanto, em sua forma atual, muitos concorrentes levam vantagem.

Acer Nitro V 16 ANV16-41-R5AT - 12/04/2024 v8
Florian Glaser

Acabamento
73 / 98 → 74%
Teclado
74%
Mouse
72%
Conectividade
64 / 80 → 81%
Peso
60 / 10-68 → 86%
Bateria
68 / 95 → 72%
Pantalha
74%
Desempenho do jogos
78%
Desempenho da aplicação
85%
AI Performance
88%
Temperatura
87 / 95 → 91%
Ruído
60 / 90 → 67%
Audio
76%
Camera
32 / 75 → 43%
Médio
59%
76%
Gaming - Médio equilibrado
CO2 Emissions
No Data
Materials
0%
Packaging
50%
Power Use
83.1%
Repairability
50%
Software Updates
22.3%
Recycle Logo Total Sustainability Score: 34.2%

Transparency

The selection of devices to be reviewed is made by our editorial team. The test sample was provided to the author as a loan by the manufacturer or retailer for the purpose of this review. The lender had no influence on this review, nor did the manufacturer receive a copy of this review before publication. There was no obligation to publish this review. We never accept compensation or payment in return for our reviews. As an independent media company, Notebookcheck is not subjected to the authority of manufacturers, retailers or publishers.

This is how Notebookcheck is testing

Every year, Notebookcheck independently reviews hundreds of laptops and smartphones using standardized procedures to ensure that all results are comparable. We have continuously developed our test methods for around 20 years and set industry standards in the process. In our test labs, high-quality measuring equipment is utilized by experienced technicians and editors. These tests involve a multi-stage validation process. Our complex rating system is based on hundreds of well-founded measurements and benchmarks, which maintains objectivity. Further information on our test methods can be found here.

Please share our article, every link counts!
Mail Logo
> Análises e revisões de portáteis e celulares > Análises > Análises > Análise do Acer Nitro V 16 ANV16-41: Um laptop para jogos acessível com um problema
Florian Glaser, 2024-12- 7 (Update: 2024-12- 7)