

Análise do Minisforum BD795i SE: A placa-mãe Mini-ITX para desktop com CPU AMD Ryzen 9 como solução DIY para mini PCs para jogos
Muito desempenho, pouca conectividade.
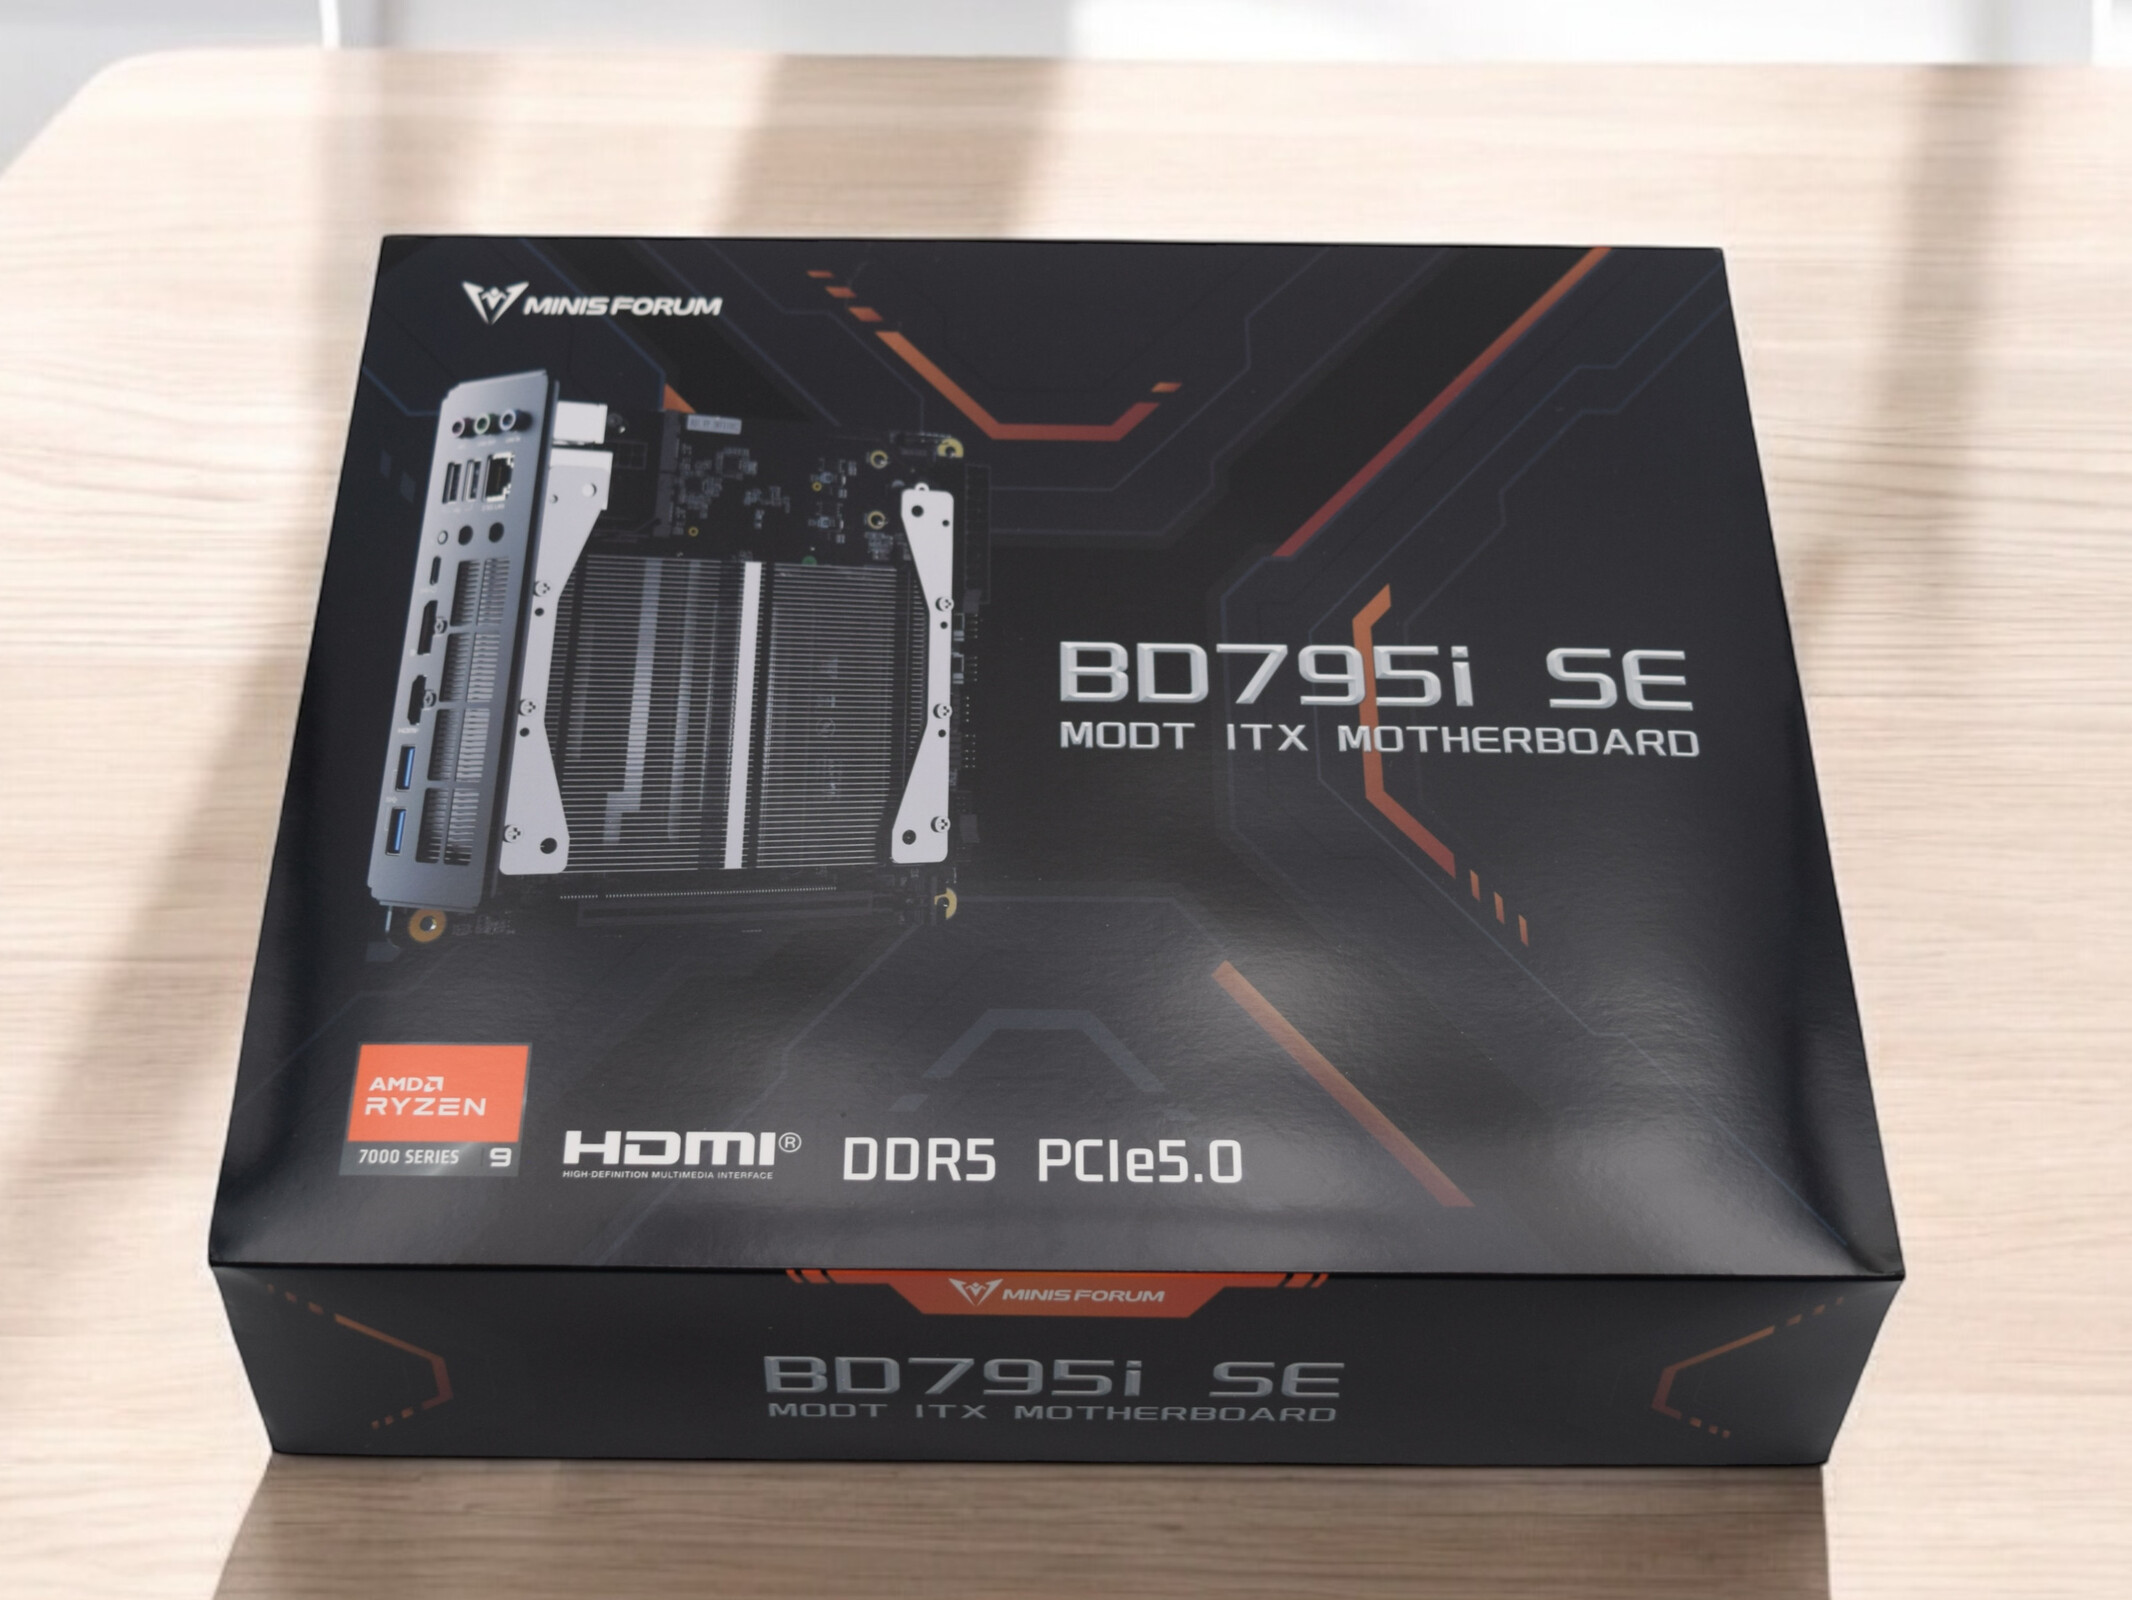
O Minisforum BD795i SE promete alto desempenho e é ideal para a criação de PCs Mini-ITX compactos. Com seu AMD Ryzen 9 7945HX instalado de fábrica, ele é destinado a usuários exigentes. Testamos seu desempenho durante tarefas intensas e analisamos seu desempenho em jogos com uma Nvidia GeForce RTX 4090.Sebastian Bade, 👁 Sebastian Bade (traduzido por DeepL / Ninh Duy) Publicado 🇺🇸 🇩🇪 ...
Veredicto - Uma base poderosa para sistemas de alto desempenho
A Minisforum BD795i SE é uma poderosa placa-mãe Mini-ITX com um AMD Ryzen 9 7945HX instalado permanentemente. Tecnicamente, ela é semelhante à Minisforum BD790i, mas não possui WLAN e um cooler ativo para SSD. Em termos de preço, o Minisforum BD795i SE é muito atraente, custando US$ 399,92 (Amazon) e oferece muito desempenho por relativamente pouco dinheiro. Nessa faixa de preço, outras configurações de desktop convencionais não conseguem se equiparar ao potente AMD Ryzen 9 7945HX.
Há algumas limitações no que diz respeito ao resfriamento, pois o dissipador de calor instalado de fábrica não pode ser substituído. A CPU também é instalada permanentemente, mas, com seus 16 núcleos e 32 threads, ela certamente oferecerá desempenho suficiente por um longo período. No que diz respeito à conexão, a BD795i SE não consegue acompanhar as placas-mãe Mini-ITX clássicas, pois apresenta apenas as portas mais essenciais. Entretanto, tudo o que é necessário para sistemas compactos e de alto desempenho está disponível - acima de tudo, o suporte total a PCIe 5.0 para SSDs e placas gráficas é um ponto positivo evidente.
Pro
Contra
Preço e disponibilidade
Atualmente, o senhor pode comprar o Minisforum BD795i SE na Amazon por US$ 399,92.
Índice
- Veredicto - Uma base poderosa para sistemas de alto desempenho
- O Minisforum BD795i SE em detalhes
- Escopo de entrega e conectividade
- Benchmarks de processador
- Resultados do Cinebench AMD Ryzen 9 7945HX
- Desempenho do sistema
- Latências de DPC
- Dispositivo de armazenamento
- Placa de vídeo - A AMD Radeon 610M como uma iGPU
- O Minisforum BD795i SE com a Nvidia GeForce RTX 4090
- Requisitos de energia e temperaturas
- Classificação total do Notebookcheck
A Minisforum é conhecida principalmente pelos mini PCs em várias classes de desempenho. Há algum tempo, o fabricante também vem se aventurando no setor de desktops na forma de várias placas-mãe. Ela utiliza processadores potentes do setor de laptops, o que torna esse conceito fundamentalmente diferente das grandes massas do segmento de desktops. A BD770i com seu Ryzen 7 7745HX e a BD790I já se saíram bem em nossos testes.
A Minisforum BD795i SE é uma poderosa placa-mãe Mini-ITX e é ideal para sistemas compactos. Em comparação com a BD790i, ela oferece recursos um pouco reduzidos, mas é mais barata e ainda assim continua potente. O AMD Ryzen 9 7945HX é um SoC extremamente potente com 16 núcleos Zen4 e é um dos processadores móveis mais rápidos da AMD. Para avaliar seu desempenho em jogos, testamos o sistema com uma placa Nvidia GeForce RTX 4090, que pode ser conectada sem restrições graças a um slot PCIe x16 completo.
Comparação das placas-mãe do Minisforum
| Nome | BD795i SE | BD790i X3D | BD790i SE | BD770i | AR900i |
| CPU | AMD Ryzen 9 7945HX | AMD Ryzen 9 7945HX3D | AMD Ryzen 9 7940HX | AMD Ryzen 7 7745HX | Processador Intel Core i9-13900HX |
| Núcleos / threads | 16 / 32 | 16 / 32 | 16/32 | 8/16 | 24/32 |
| GPU | AMD Radeon 610M | AMD Radeon 610M | AMD Radeon 610M | AMD Radeon 610M | Intel UHD Graphics |
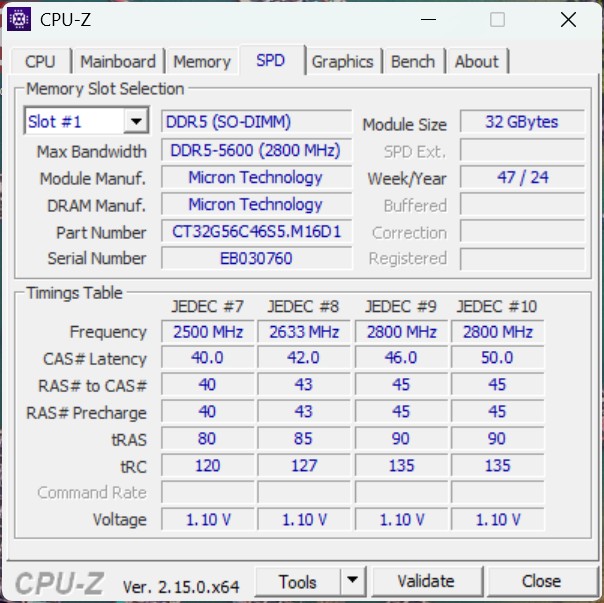
| Tipos de memória | DDR5-5200SODIMM | DDR5-5200 SODIMM | DDR5-5200 SODIMM | DDR5-5200 SODIMM | DDR5-5600 SODIMM |
| Tamanho máximo da memória | 96 GB | 96 GB | 64 GB | 64 GB | 64 GB |
O Minisforum BD795i SE em detalhes

Escopo de entrega e conectividade
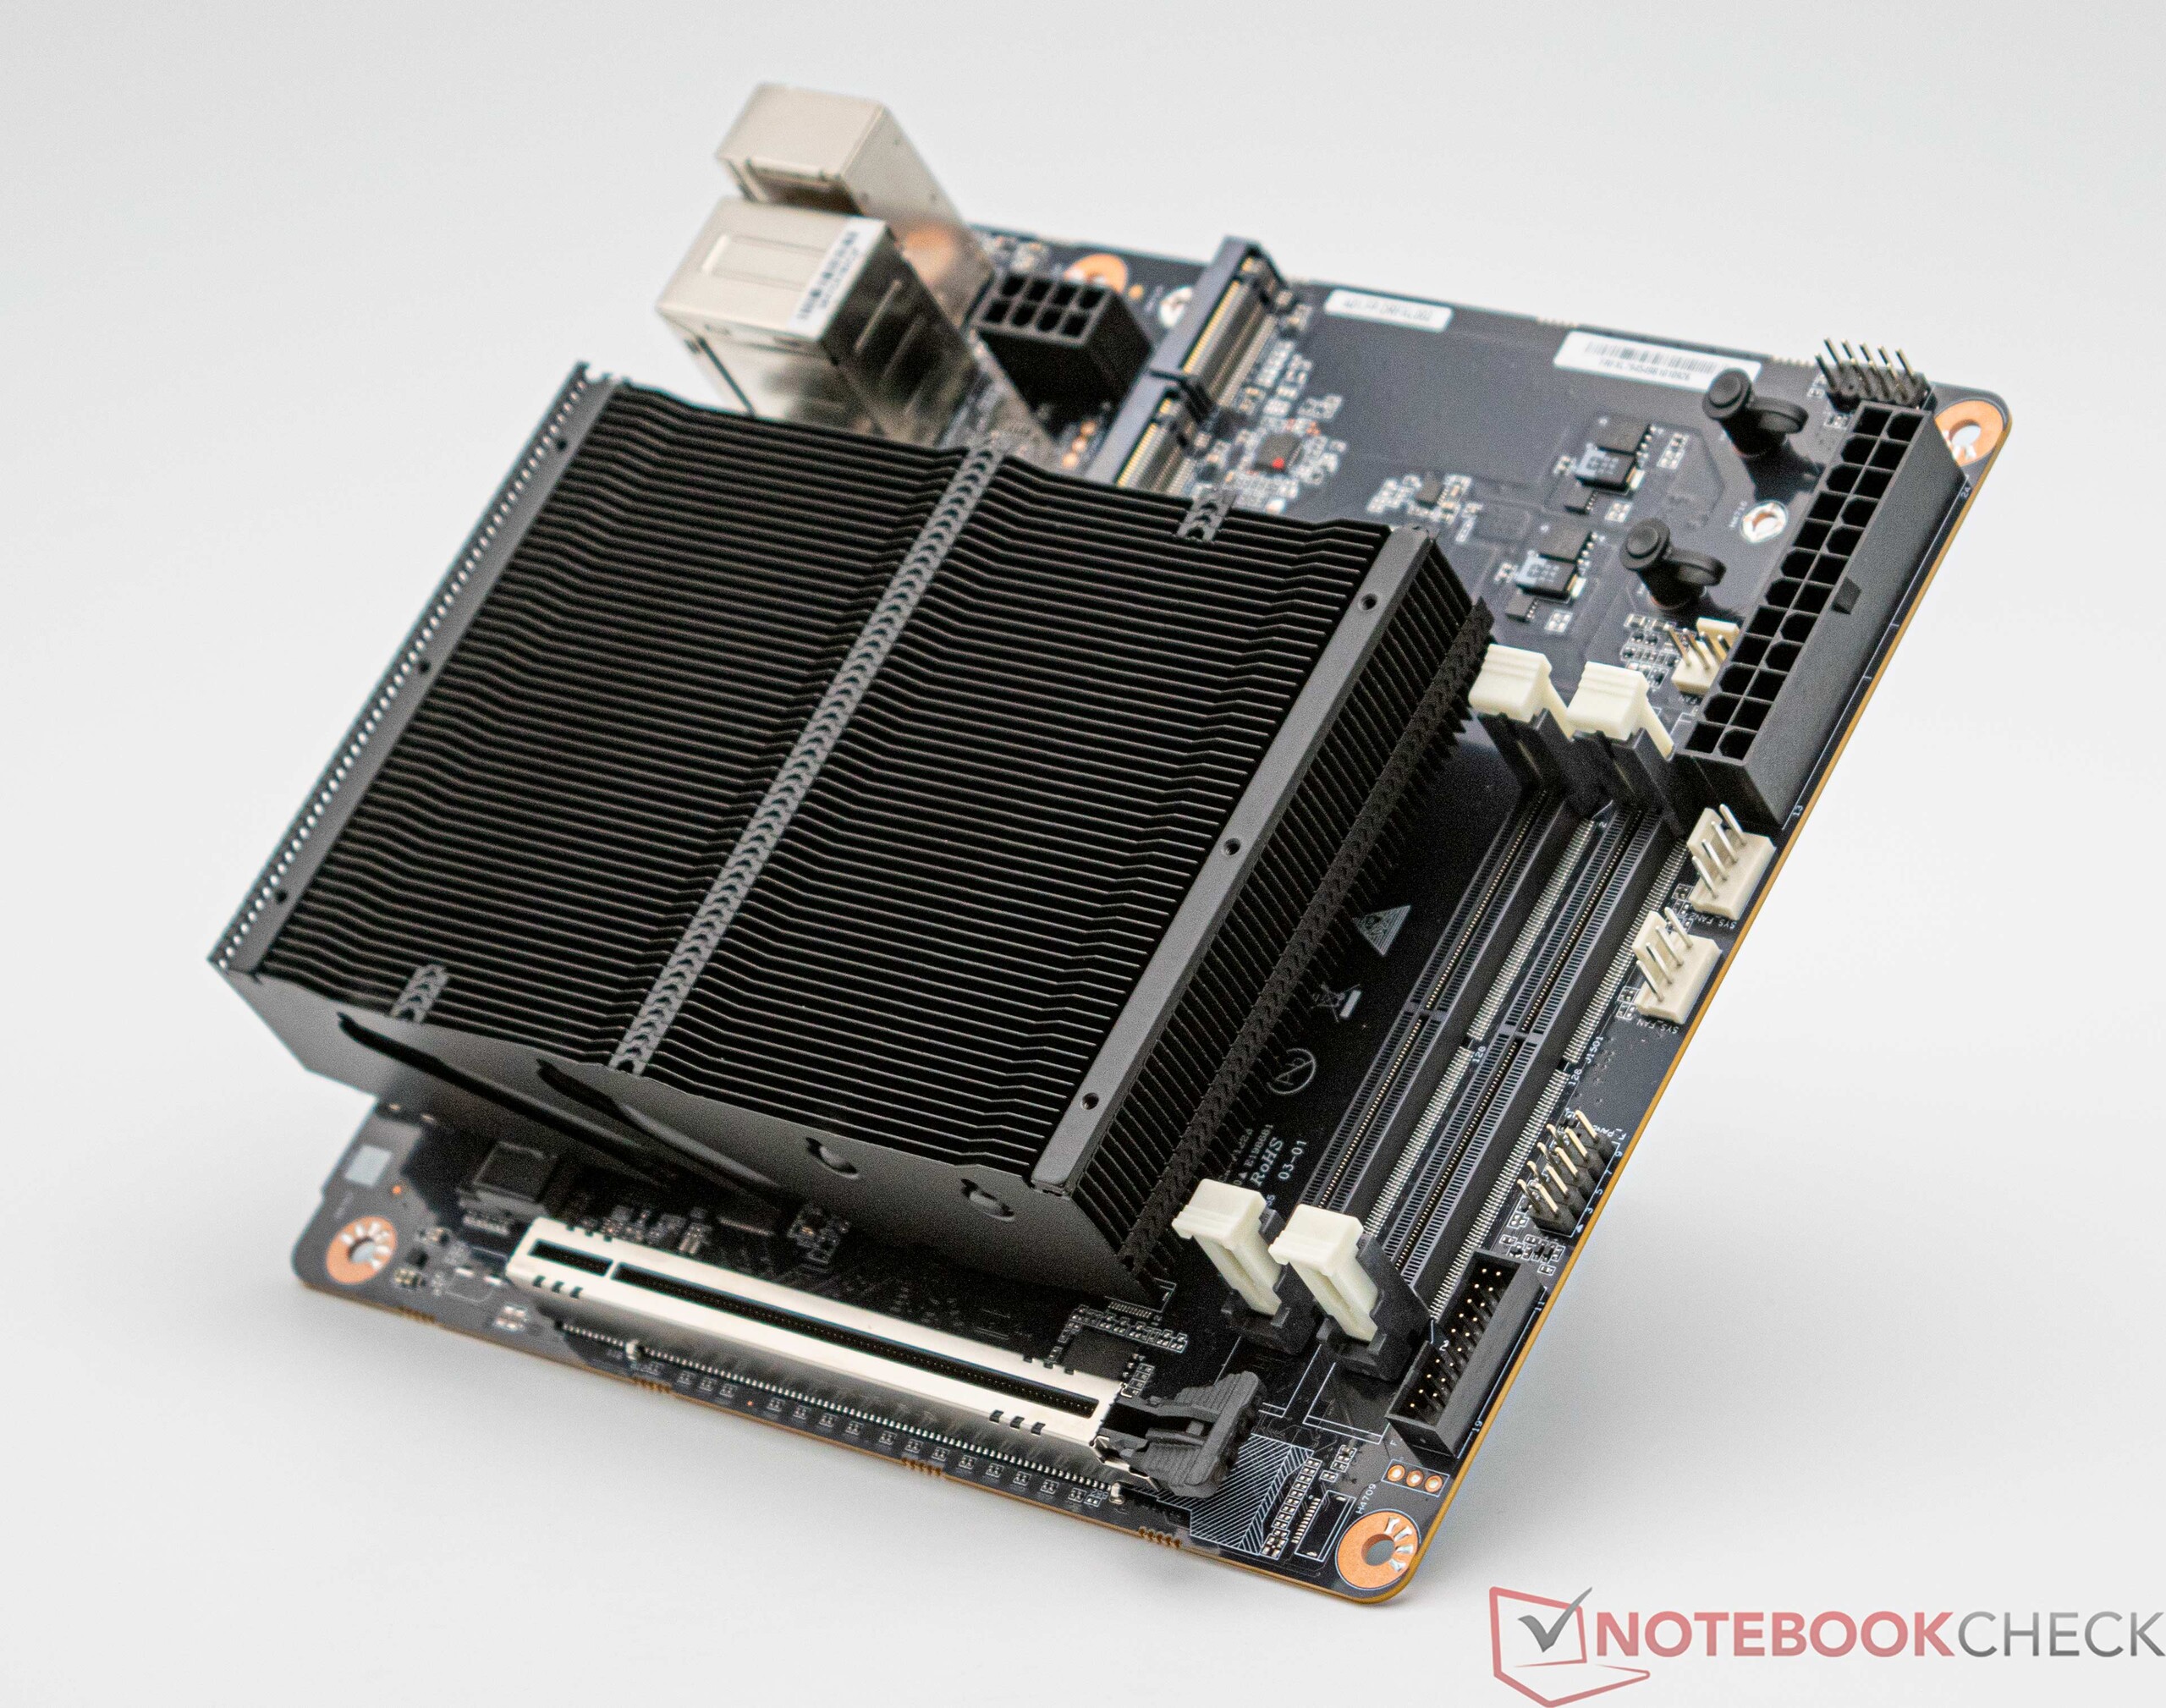
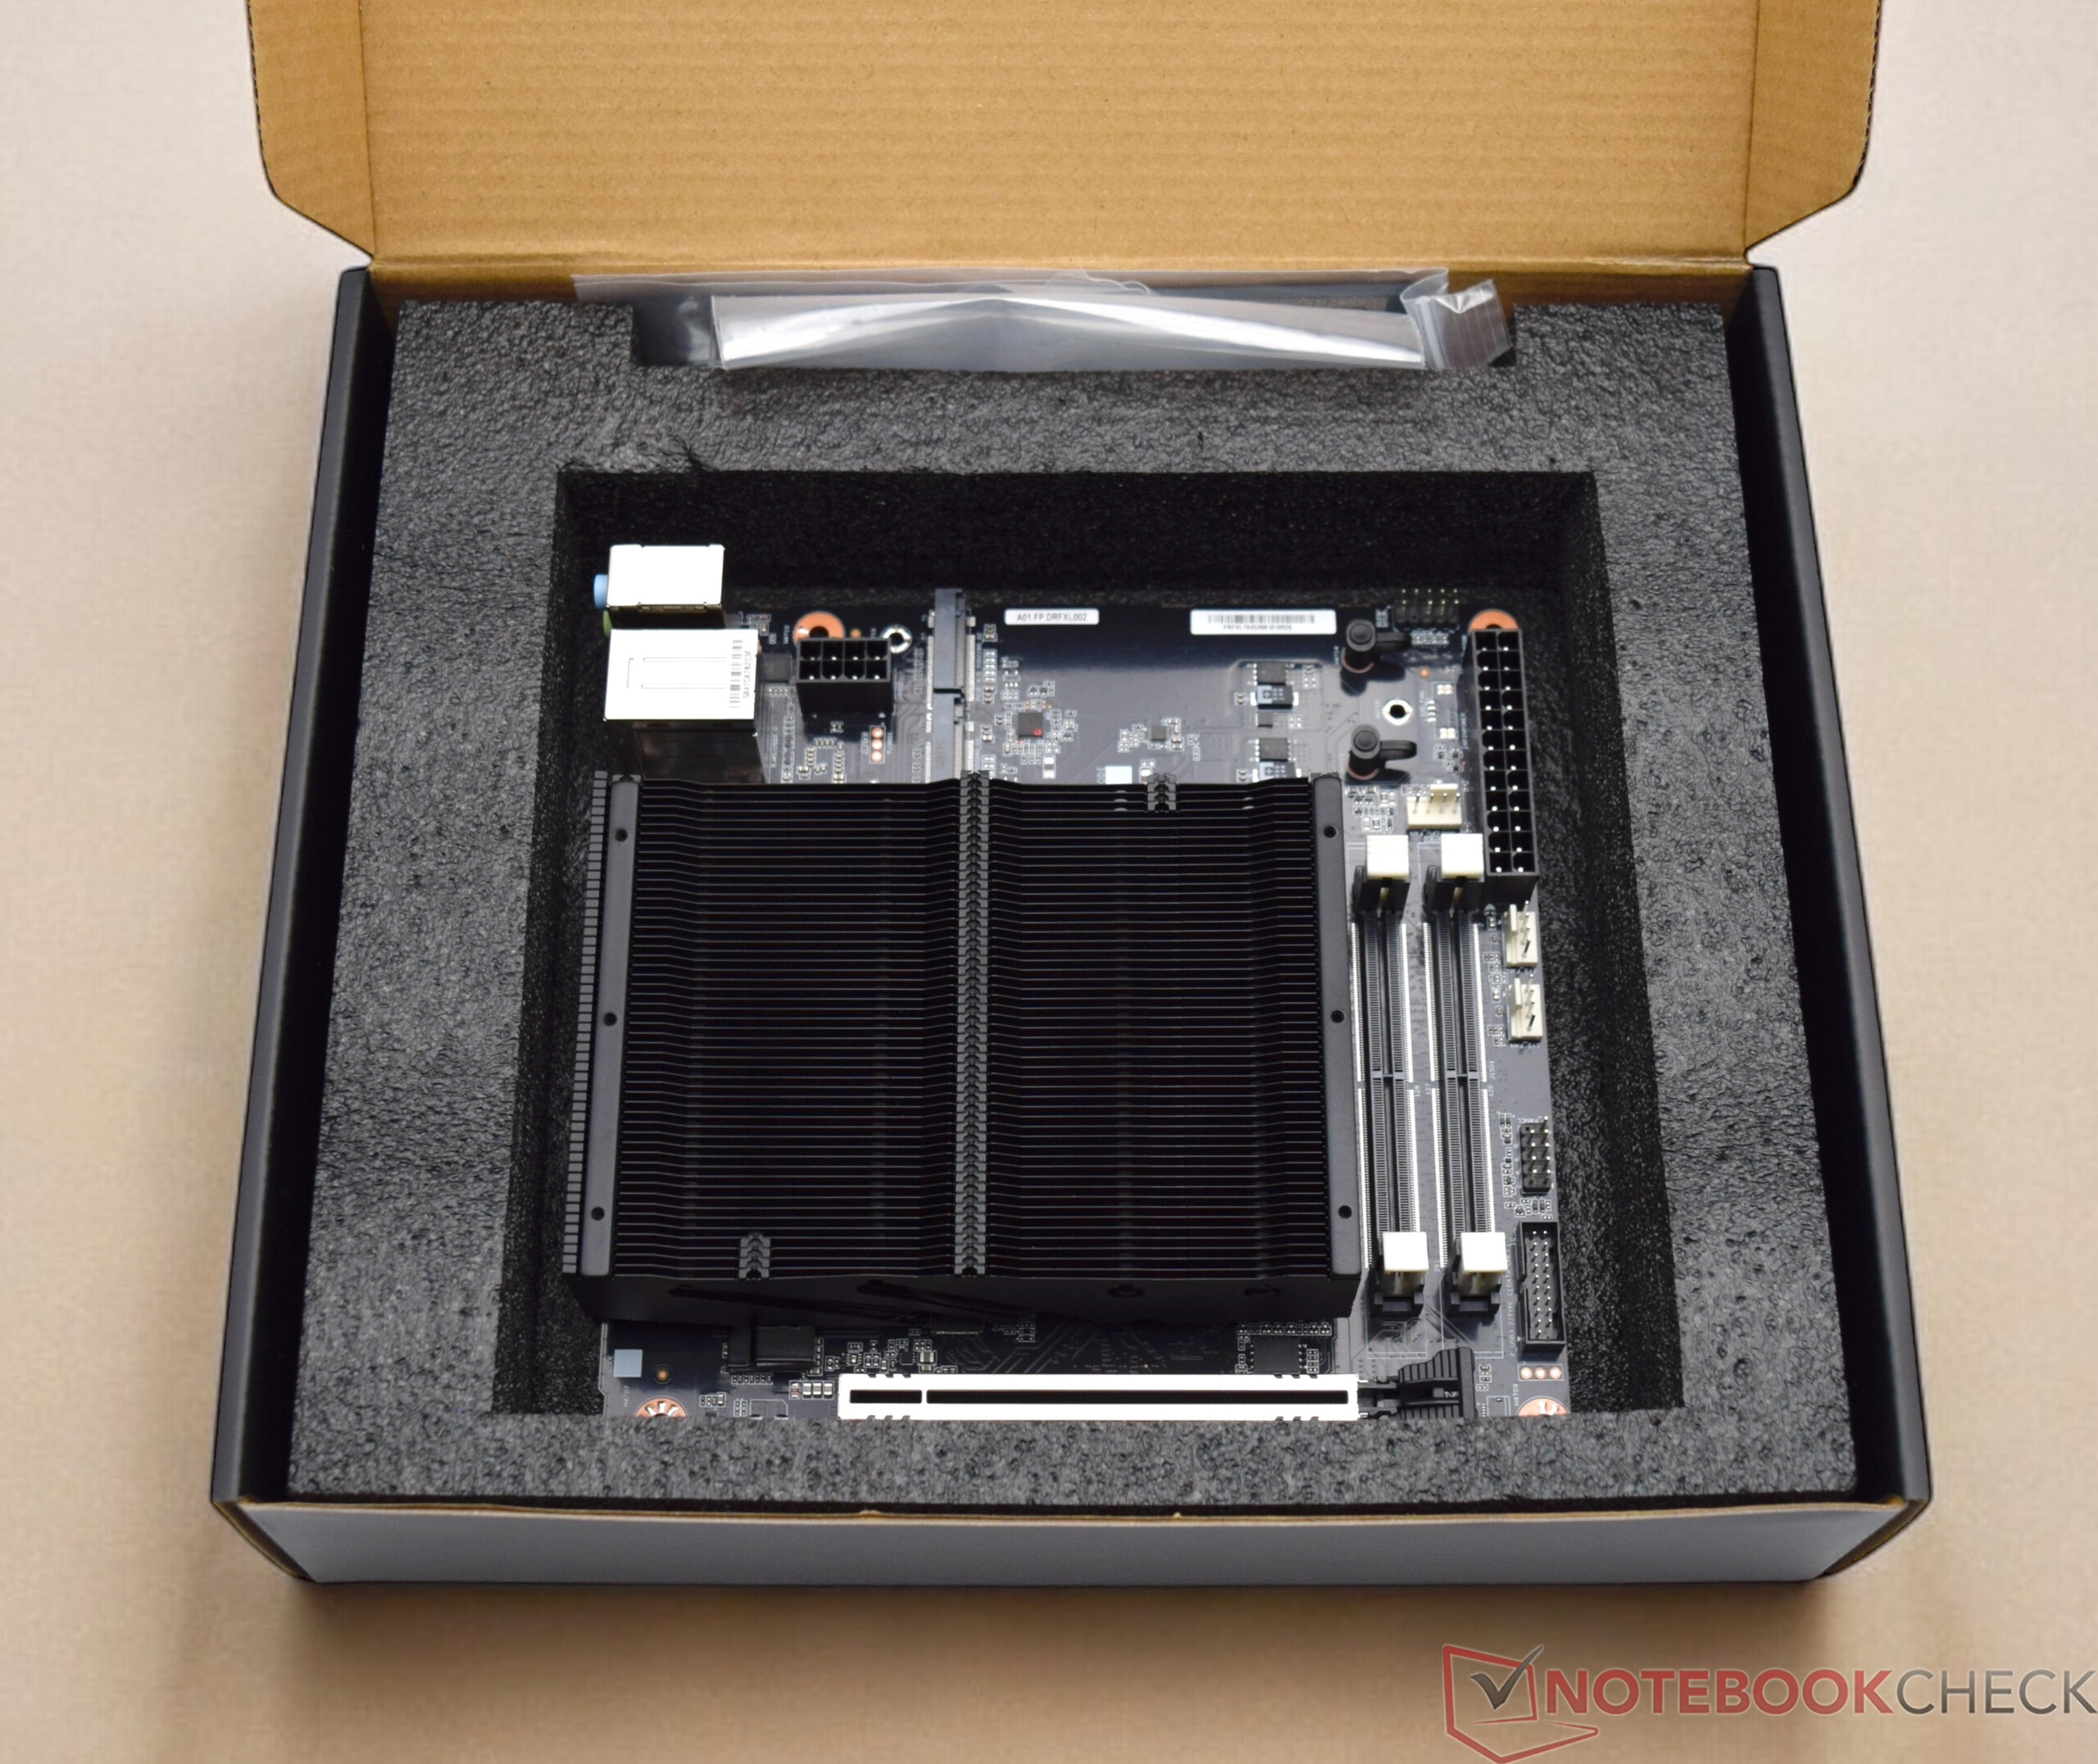
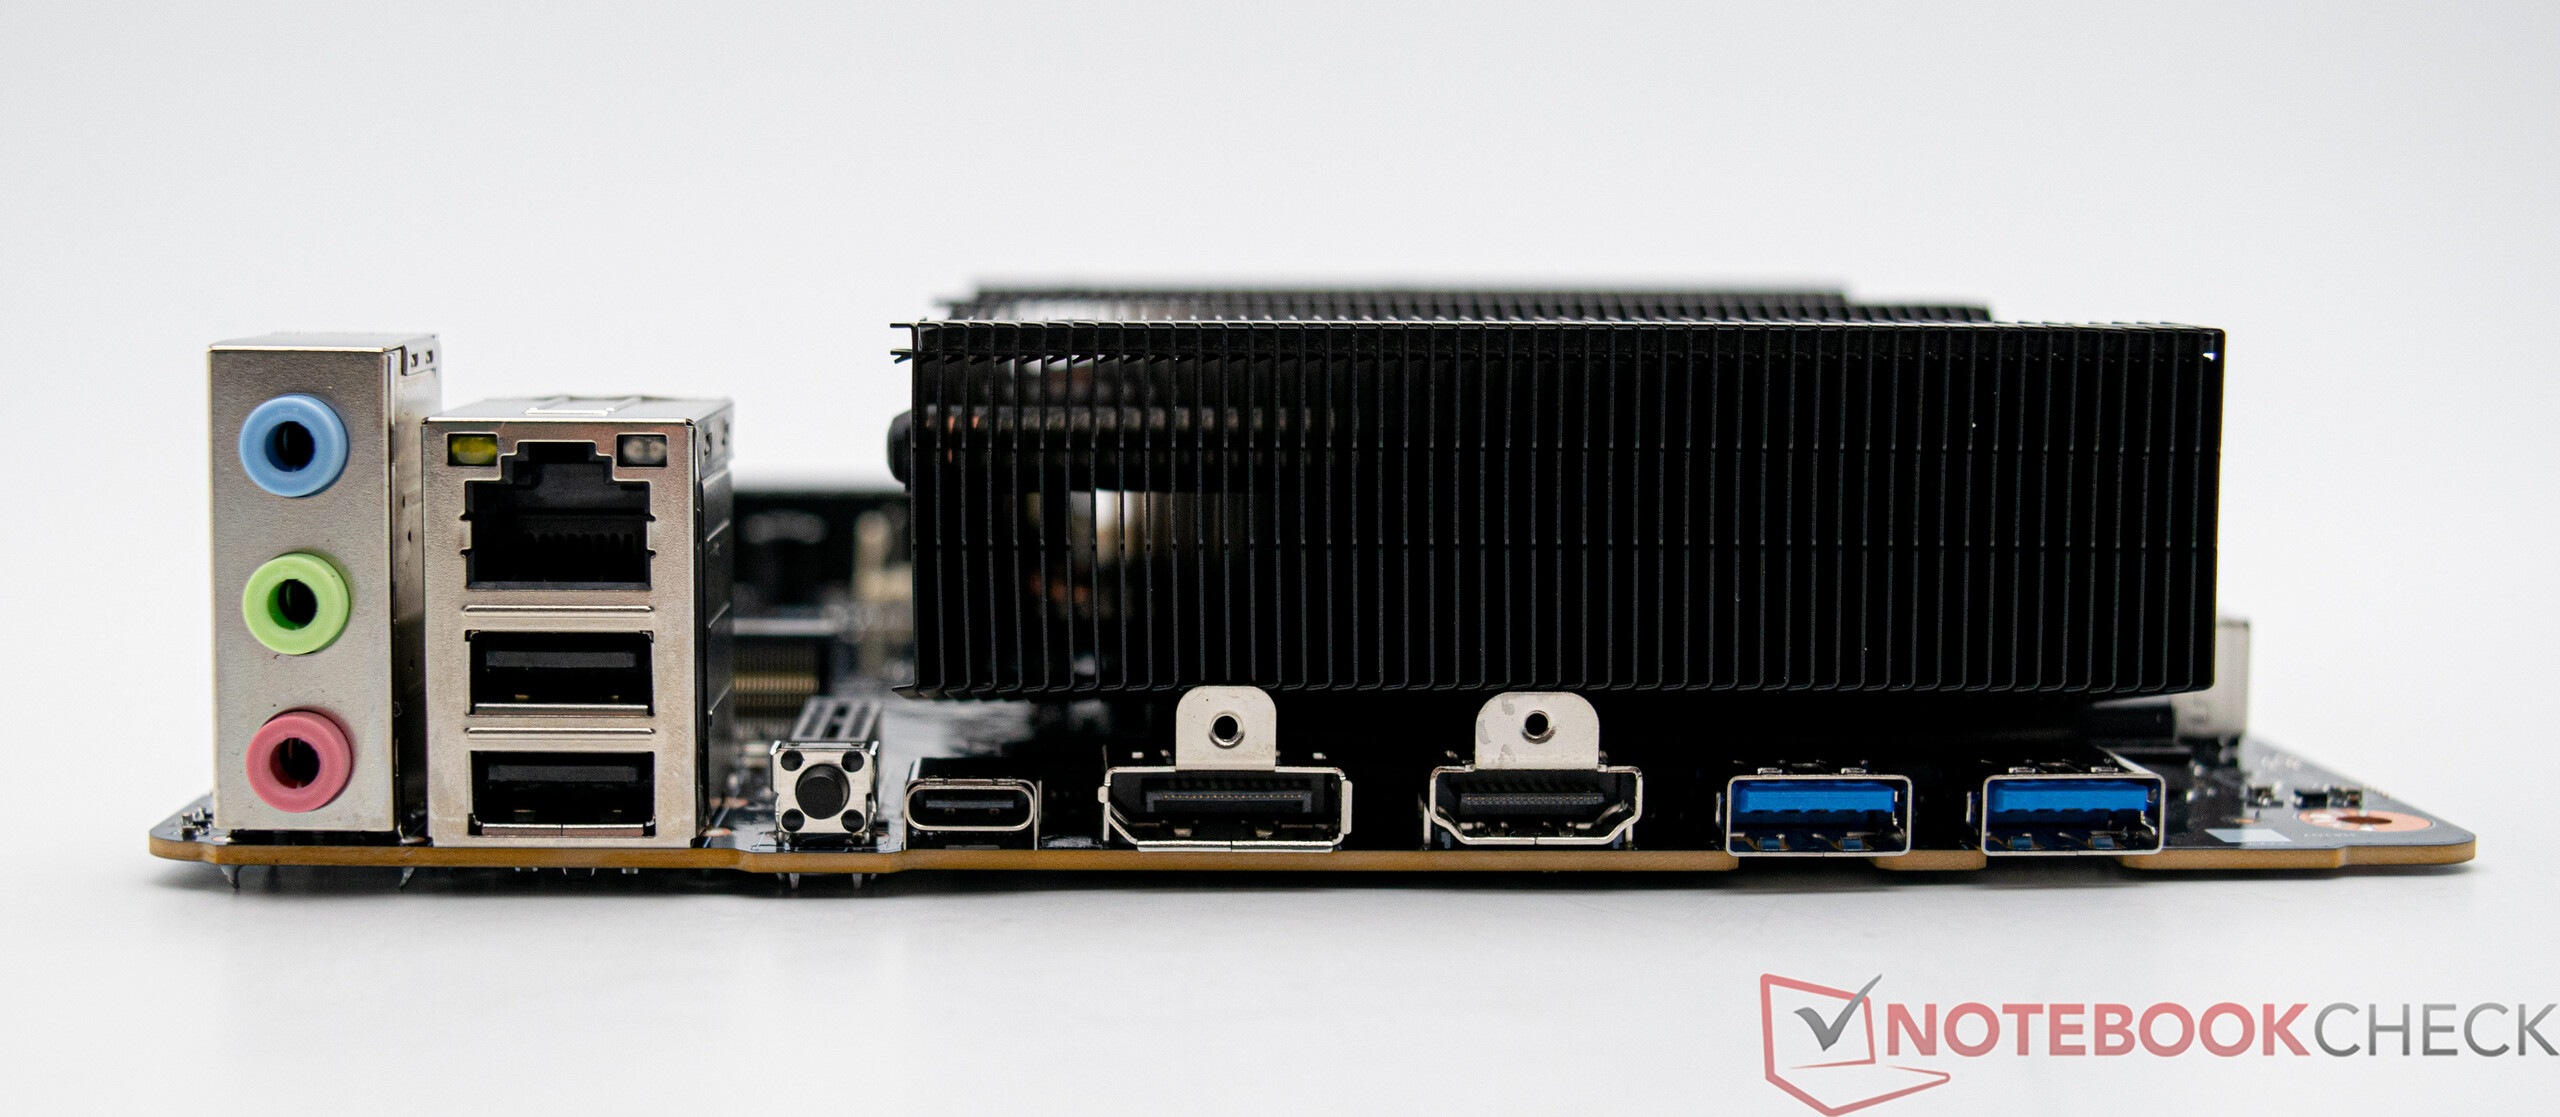
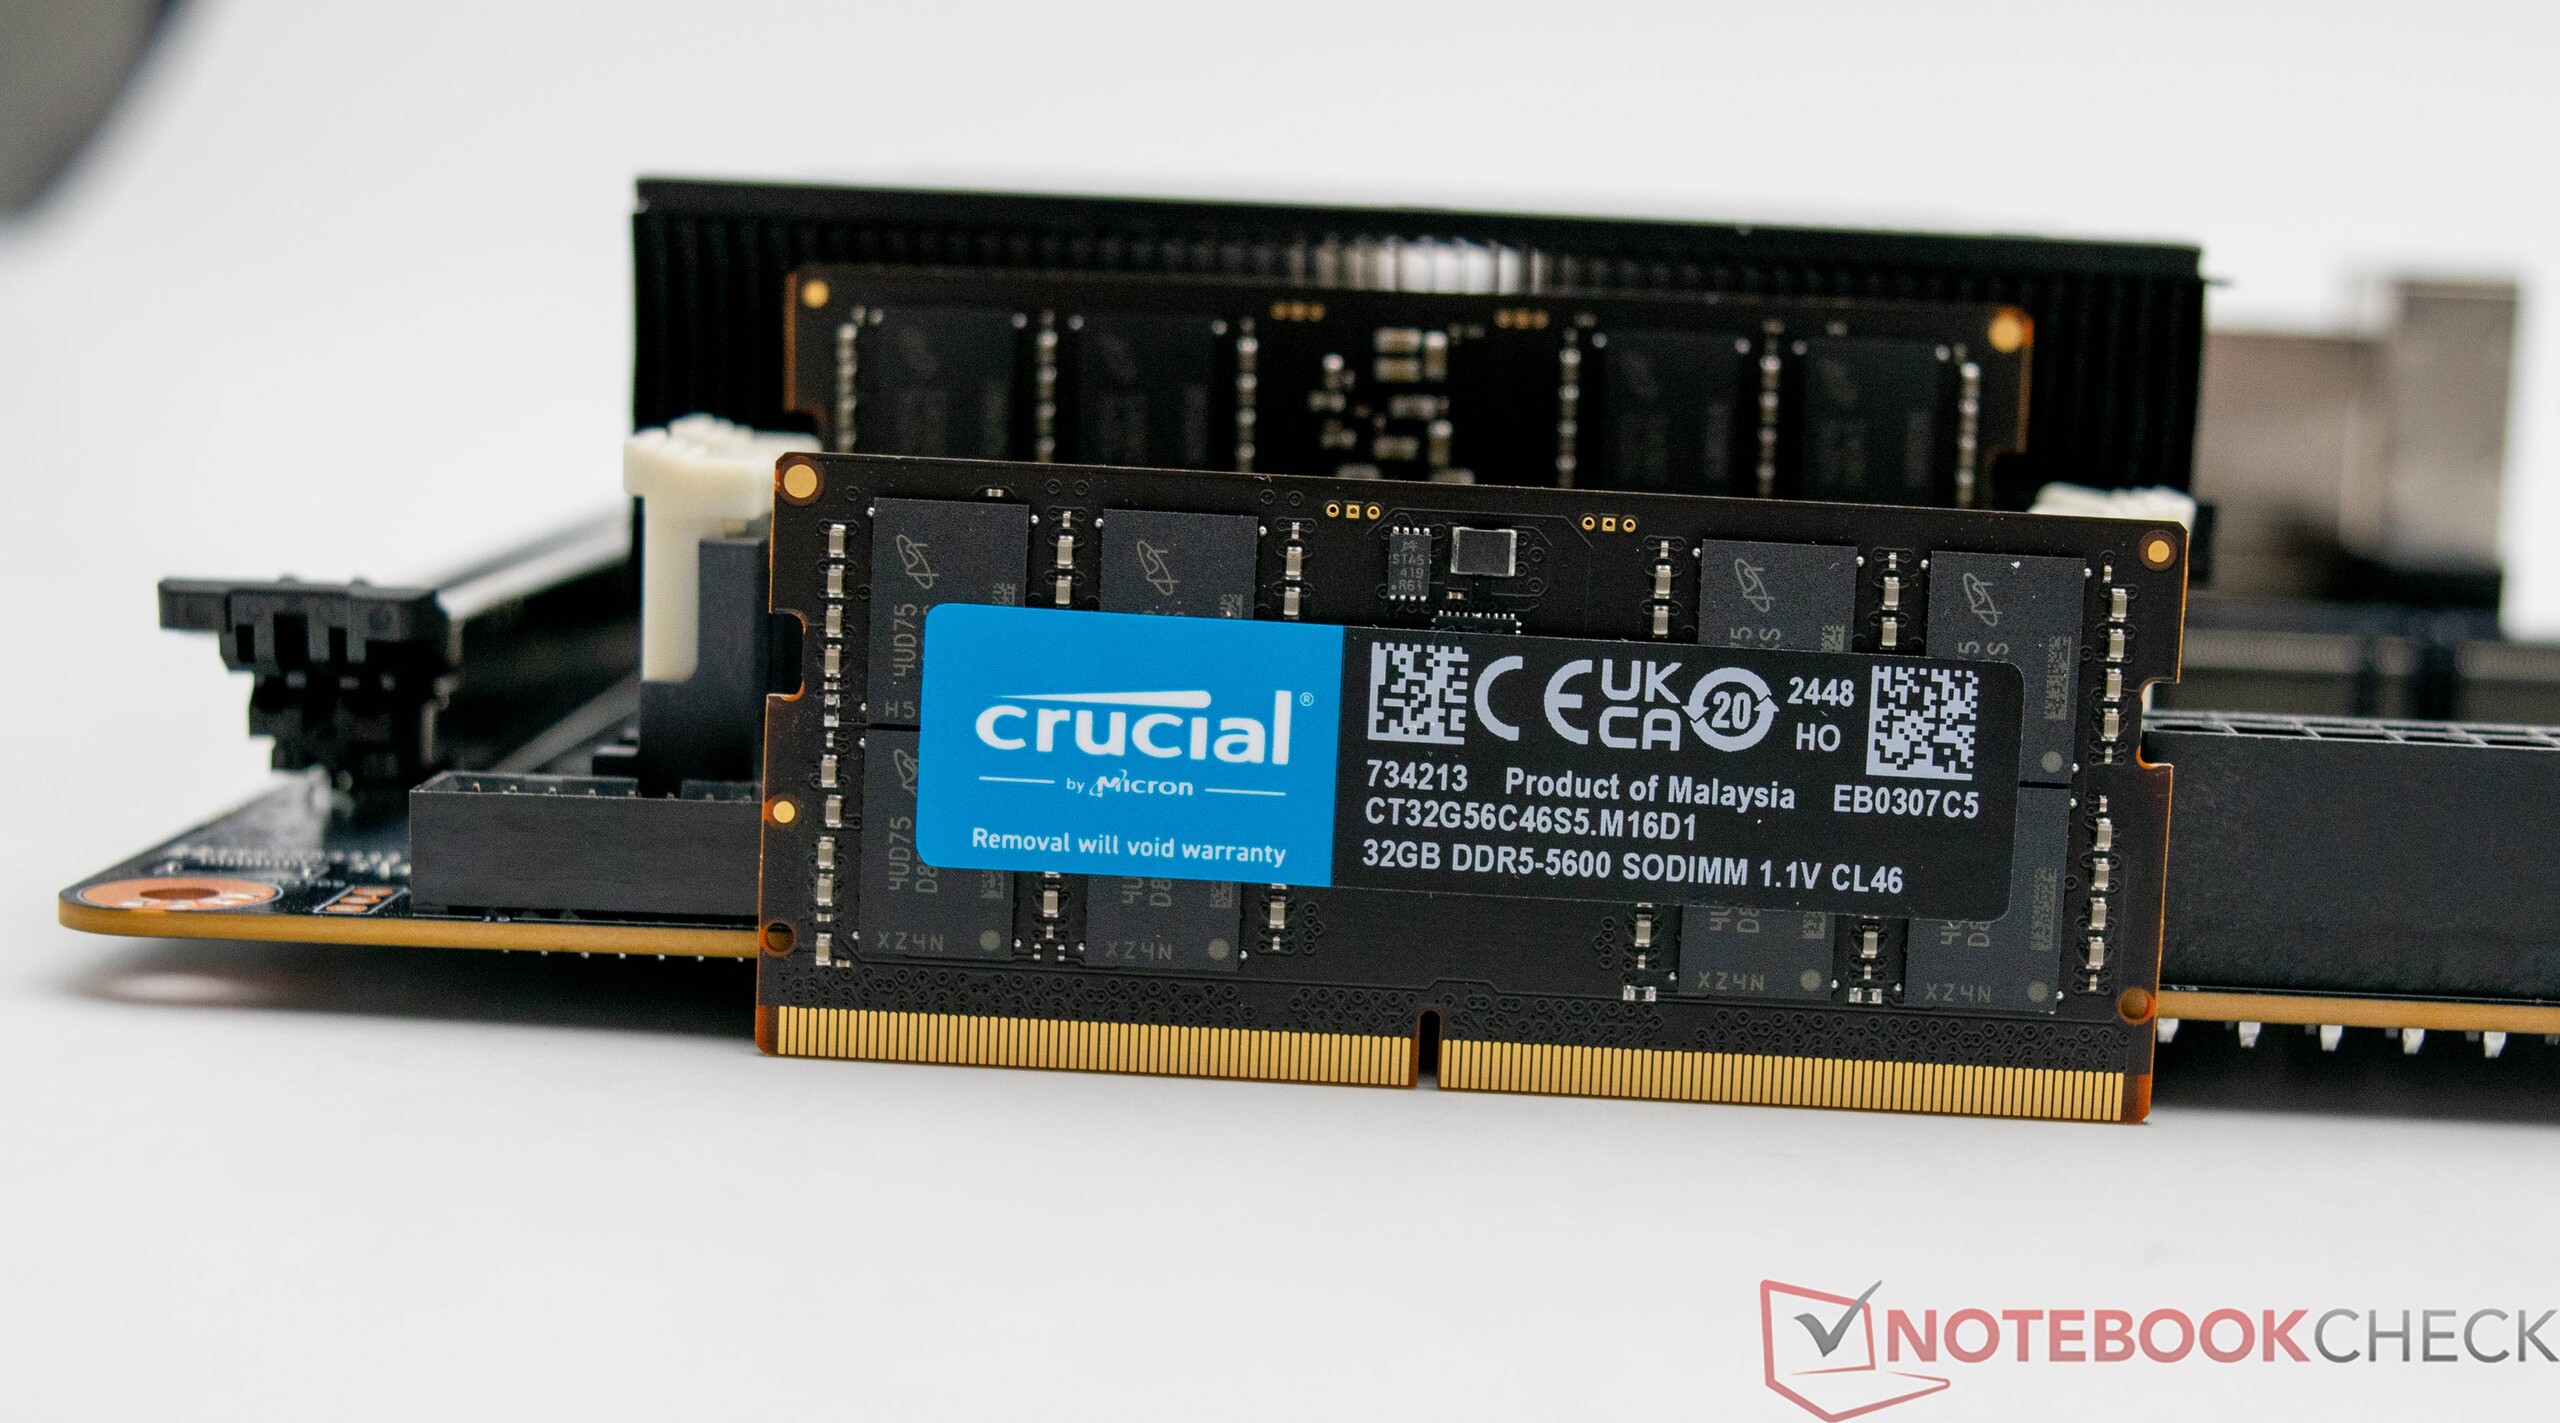
O escopo de fornecimento do Minisforum BD795i SE é quase idêntico ao do BD790i. Ele vem com um cooler pré-instalado que cobre a CPU e os conversores de voltagem. A placa-mãe também inclui uma proteção IO (não pré-instalada). O Minisforum dispensou a antena WLAN relativamente grande incluída no BD790itornando sua caixa um pouco menor. No entanto, está incluído um suporte para instalação posterior de um módulo WLAN. Semelhante aos sistemas barebone, ao adquirir o Minisforum BD795i SE, o senhor ainda terá que cuidar do SSD, da RAM, da fonte de alimentação, do gabinete e de uma ventoinha de 120 mm.
Sua conectividade é bastante básica. Há apenas algumas conexões na parte traseira, mas todas as portas importantes estão lá. A placa também possui um conector USB 3.2 interno, o que significa que um total de seis portas USB A pode ser usado. Faltam outras conexões, como os conectores ARGB ou um conector USB-C adicional. Não há alternativa para o cooler pré-instalado, pois não há opção de montagem para coolers mais potentes - o resfriamento separado dos conversores de voltagem seria benéfico nesse caso.
Condições de teste
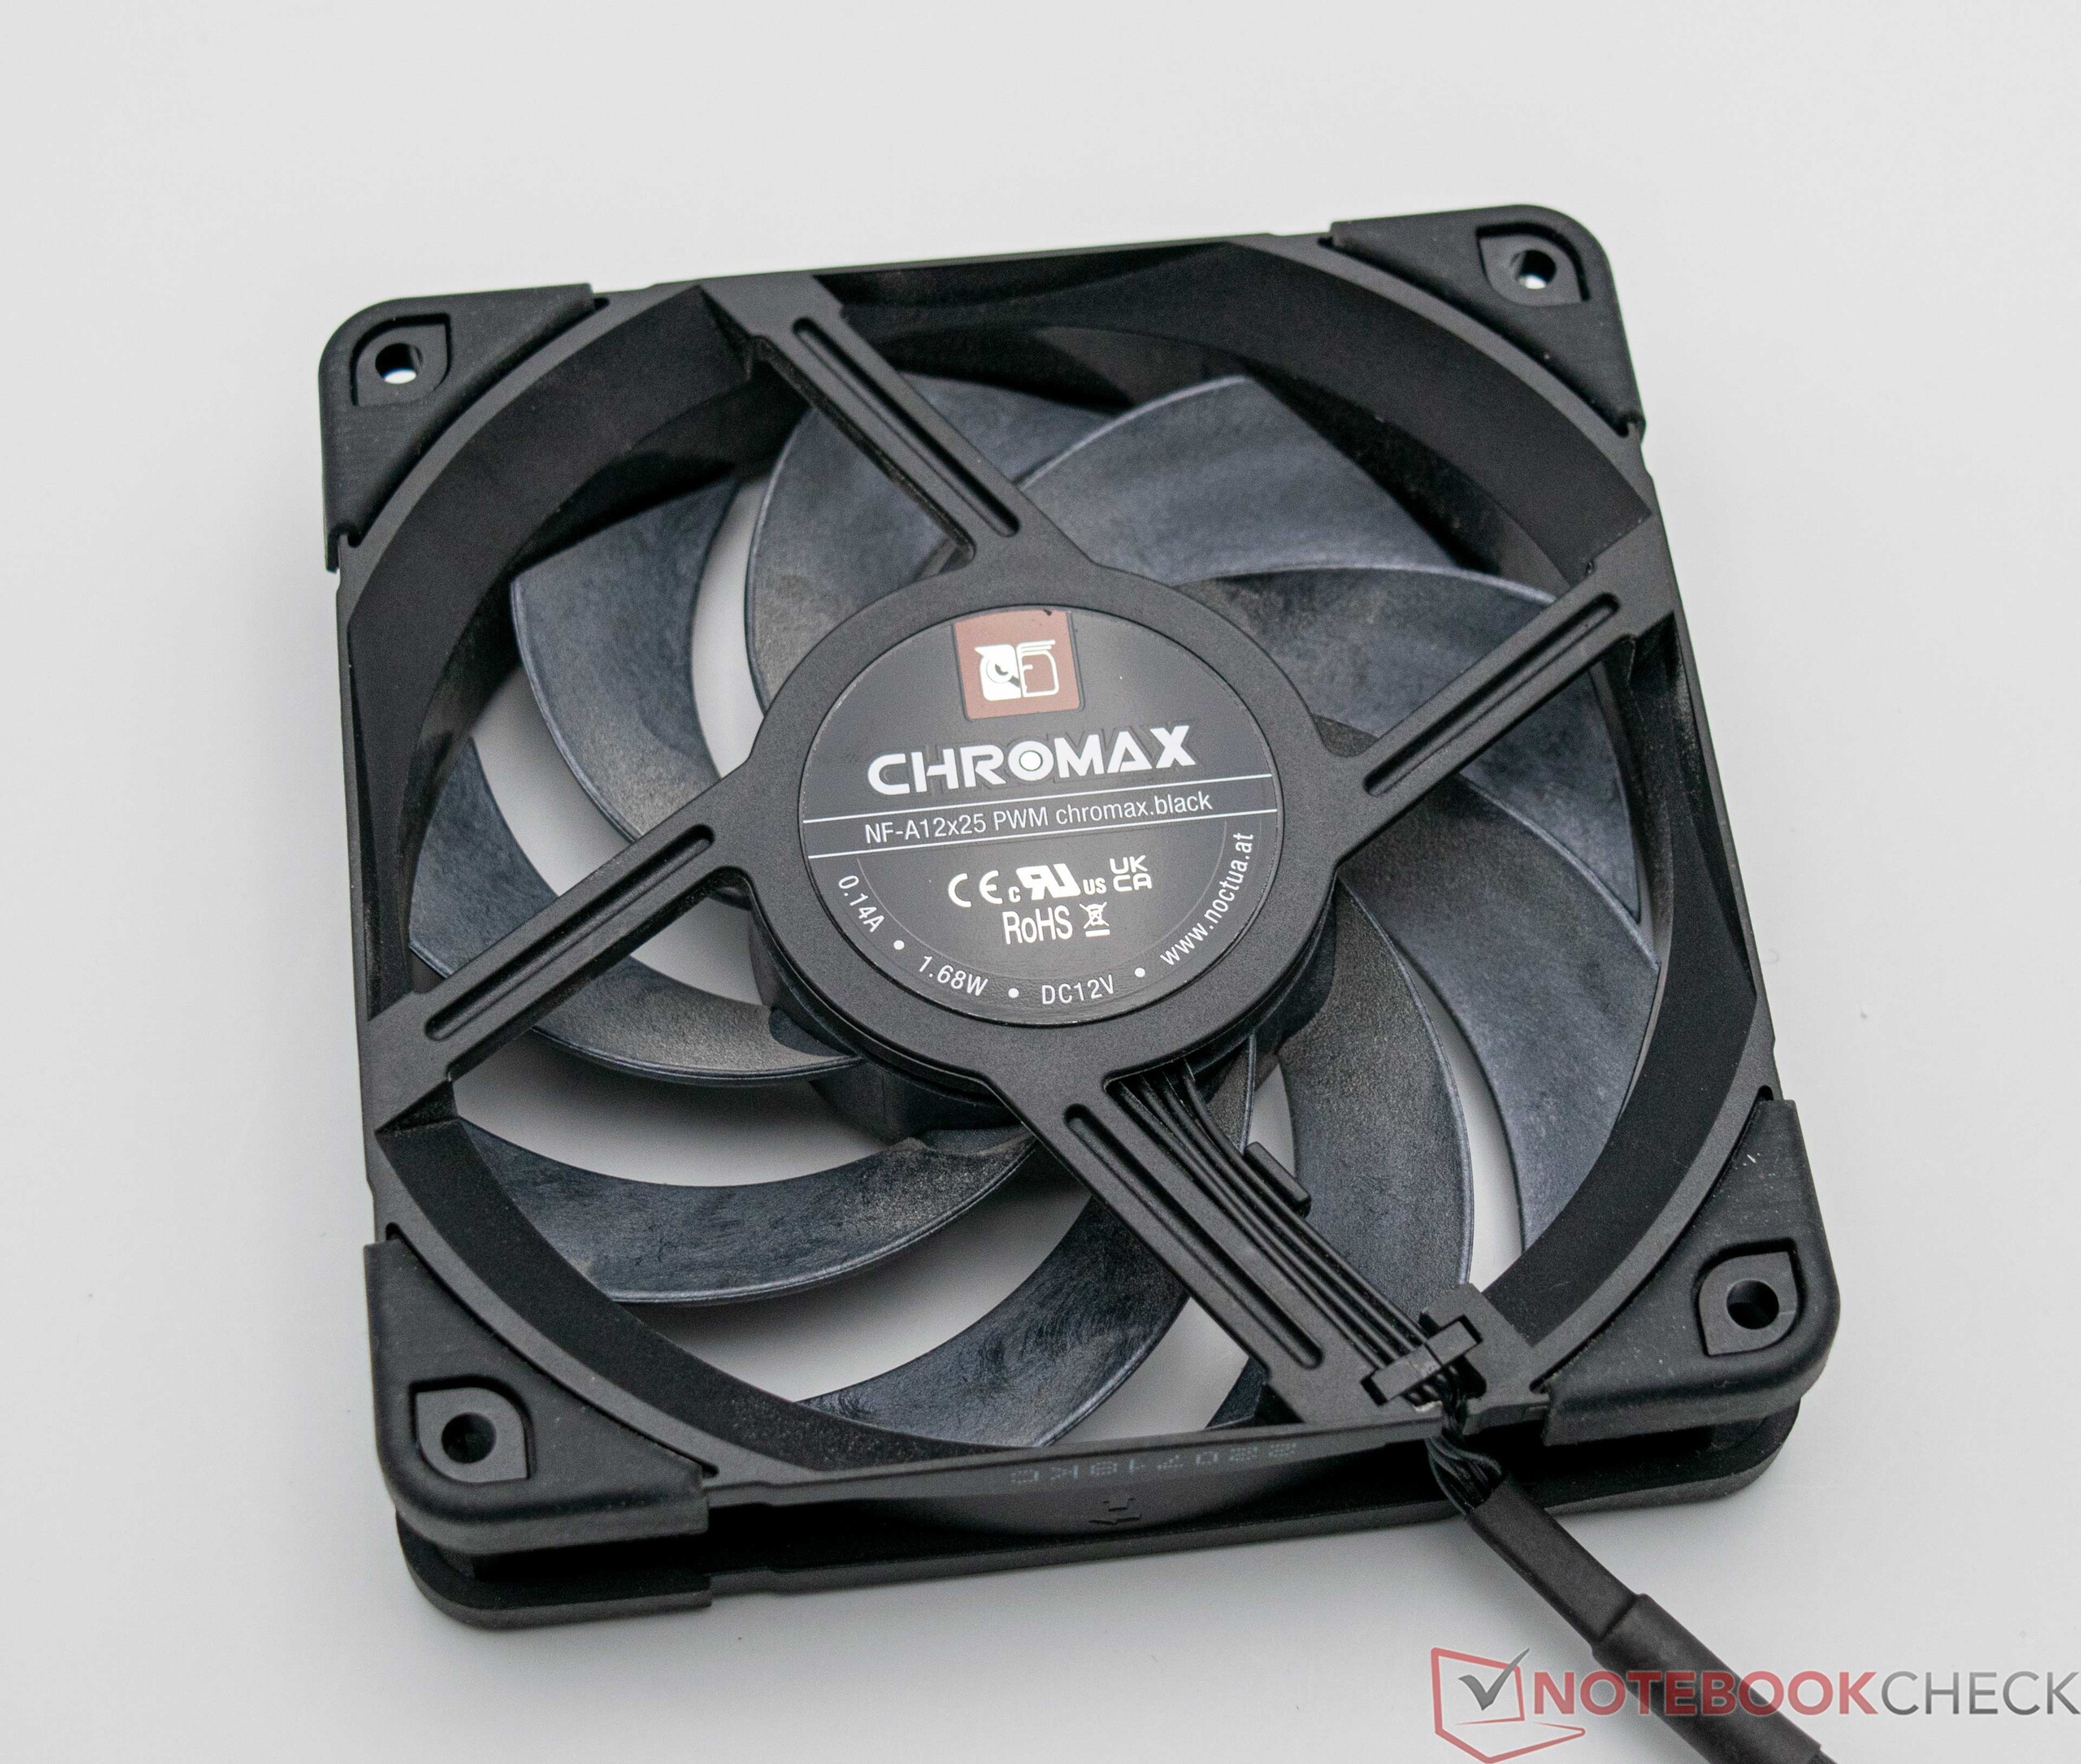
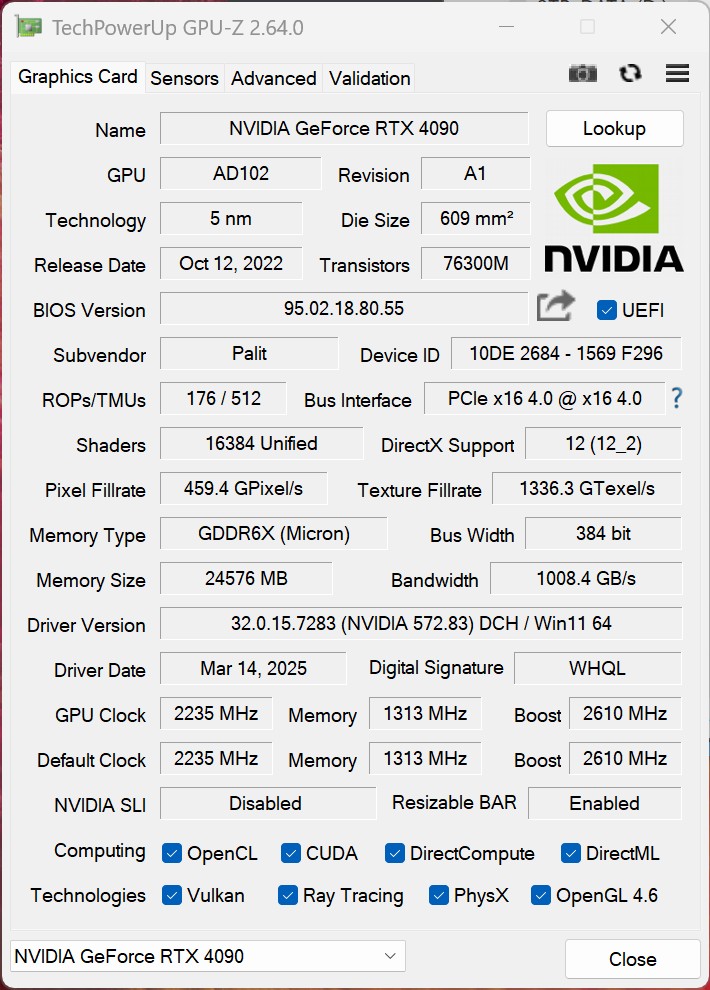
Realizamos todos os testes de desempenho em uma configuração aberta em uma mesa de bancada Streacom BC1 V2. Usamos um Noctua NF-A12x25 como ventoinha e usamos nosso Palit GeForce RTX 4090 Gamerock OC para os testes de jogos em combinação com uma placa de vídeo dedicada.
Benchmarks de processador
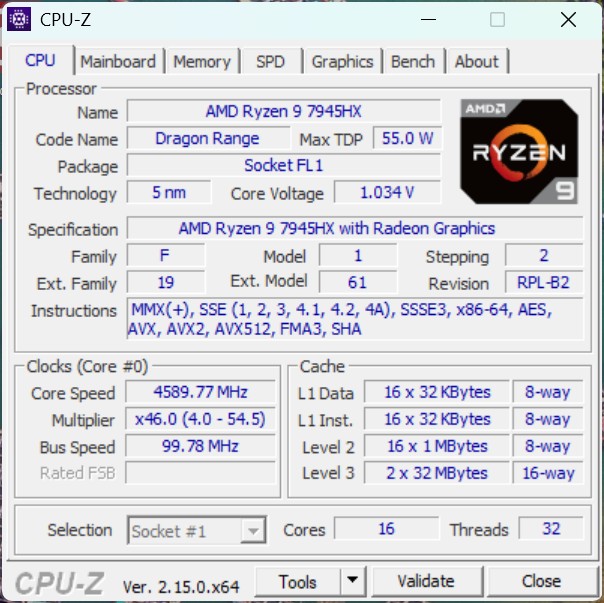
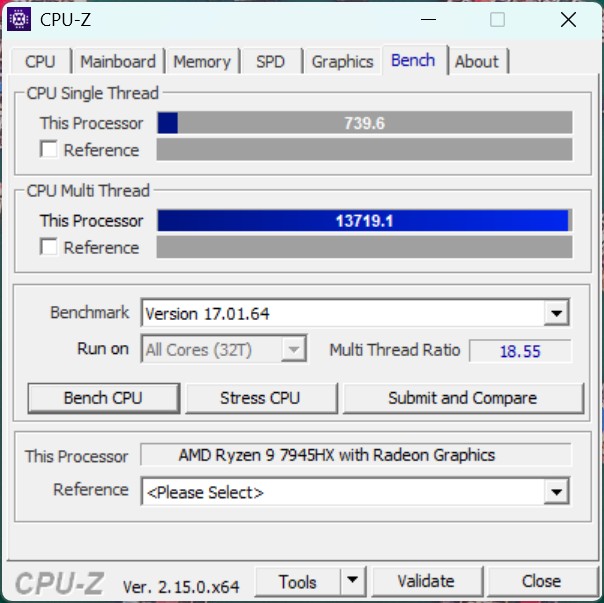
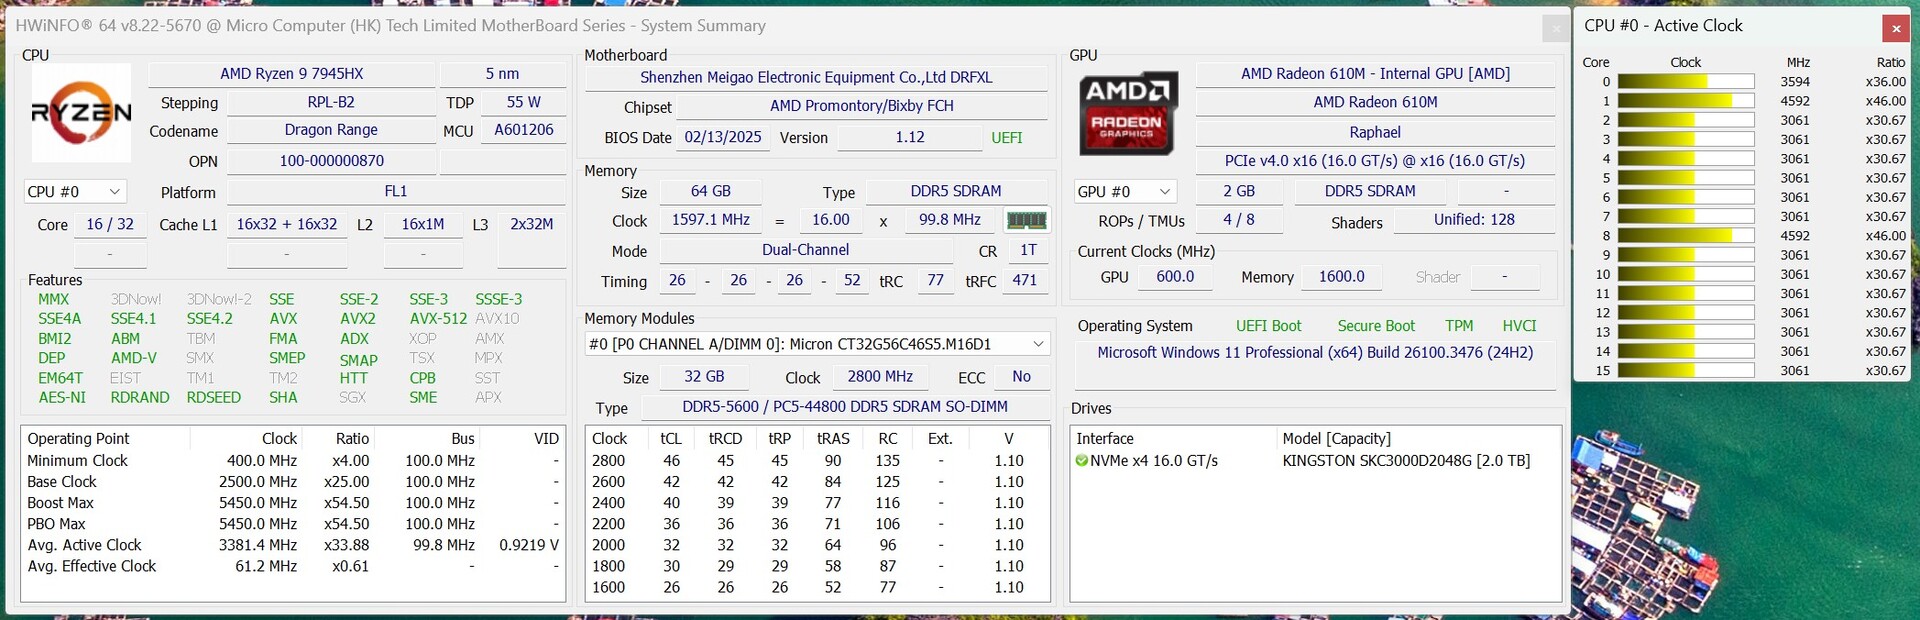
O Minisforum BD795i SE está equipado com o poderoso AMD Ryzen 9 7945HXum processador para laptop com 16 núcleos Zen4 e 32 threads. Durante nossos testes, seu desempenho ficou entre o AMD Ryzen 9 7900X e o AMD Ryzen 9 7950X e foi comparável ao Intel Core i7-14700K. Uma grande vantagem em relação às CPUs de desktop é sua eficiência: com apenas 100 watts, ela é mais econômica e é significativamente mais fácil de resfriar.
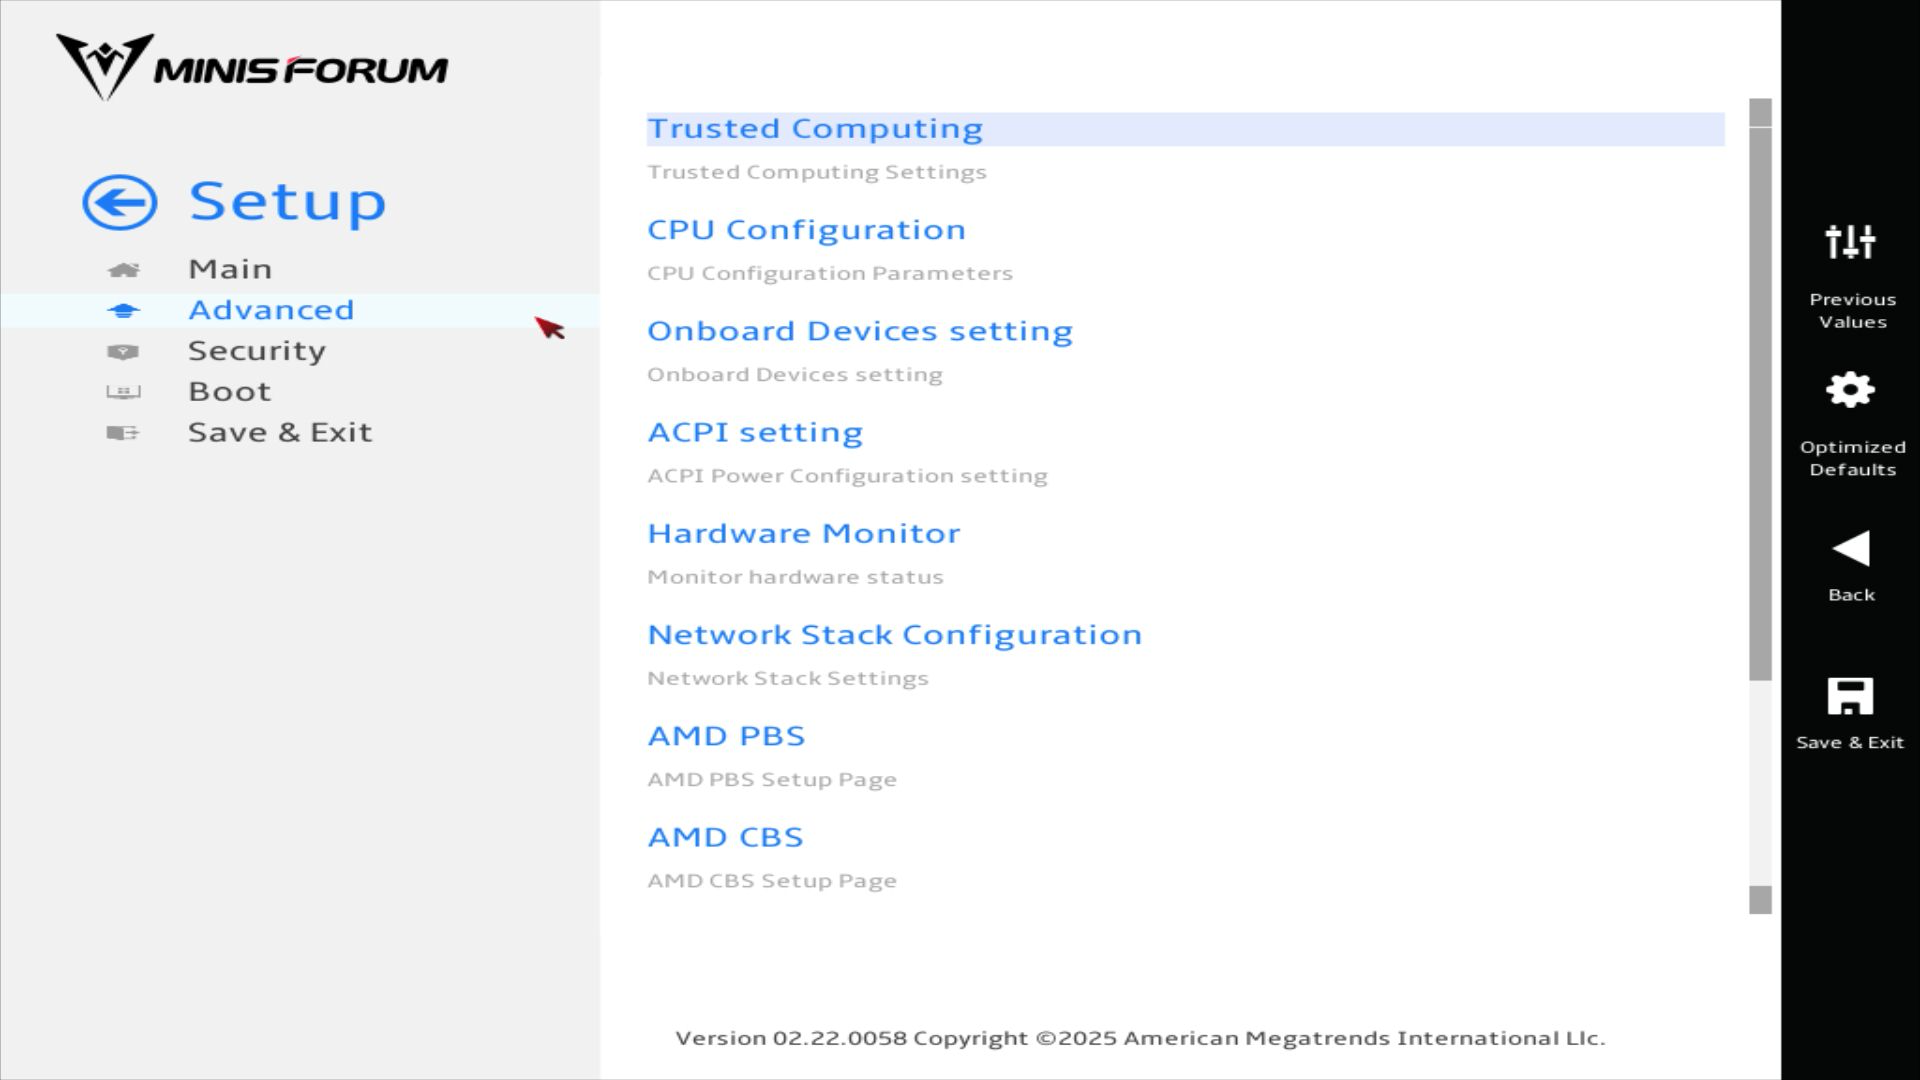
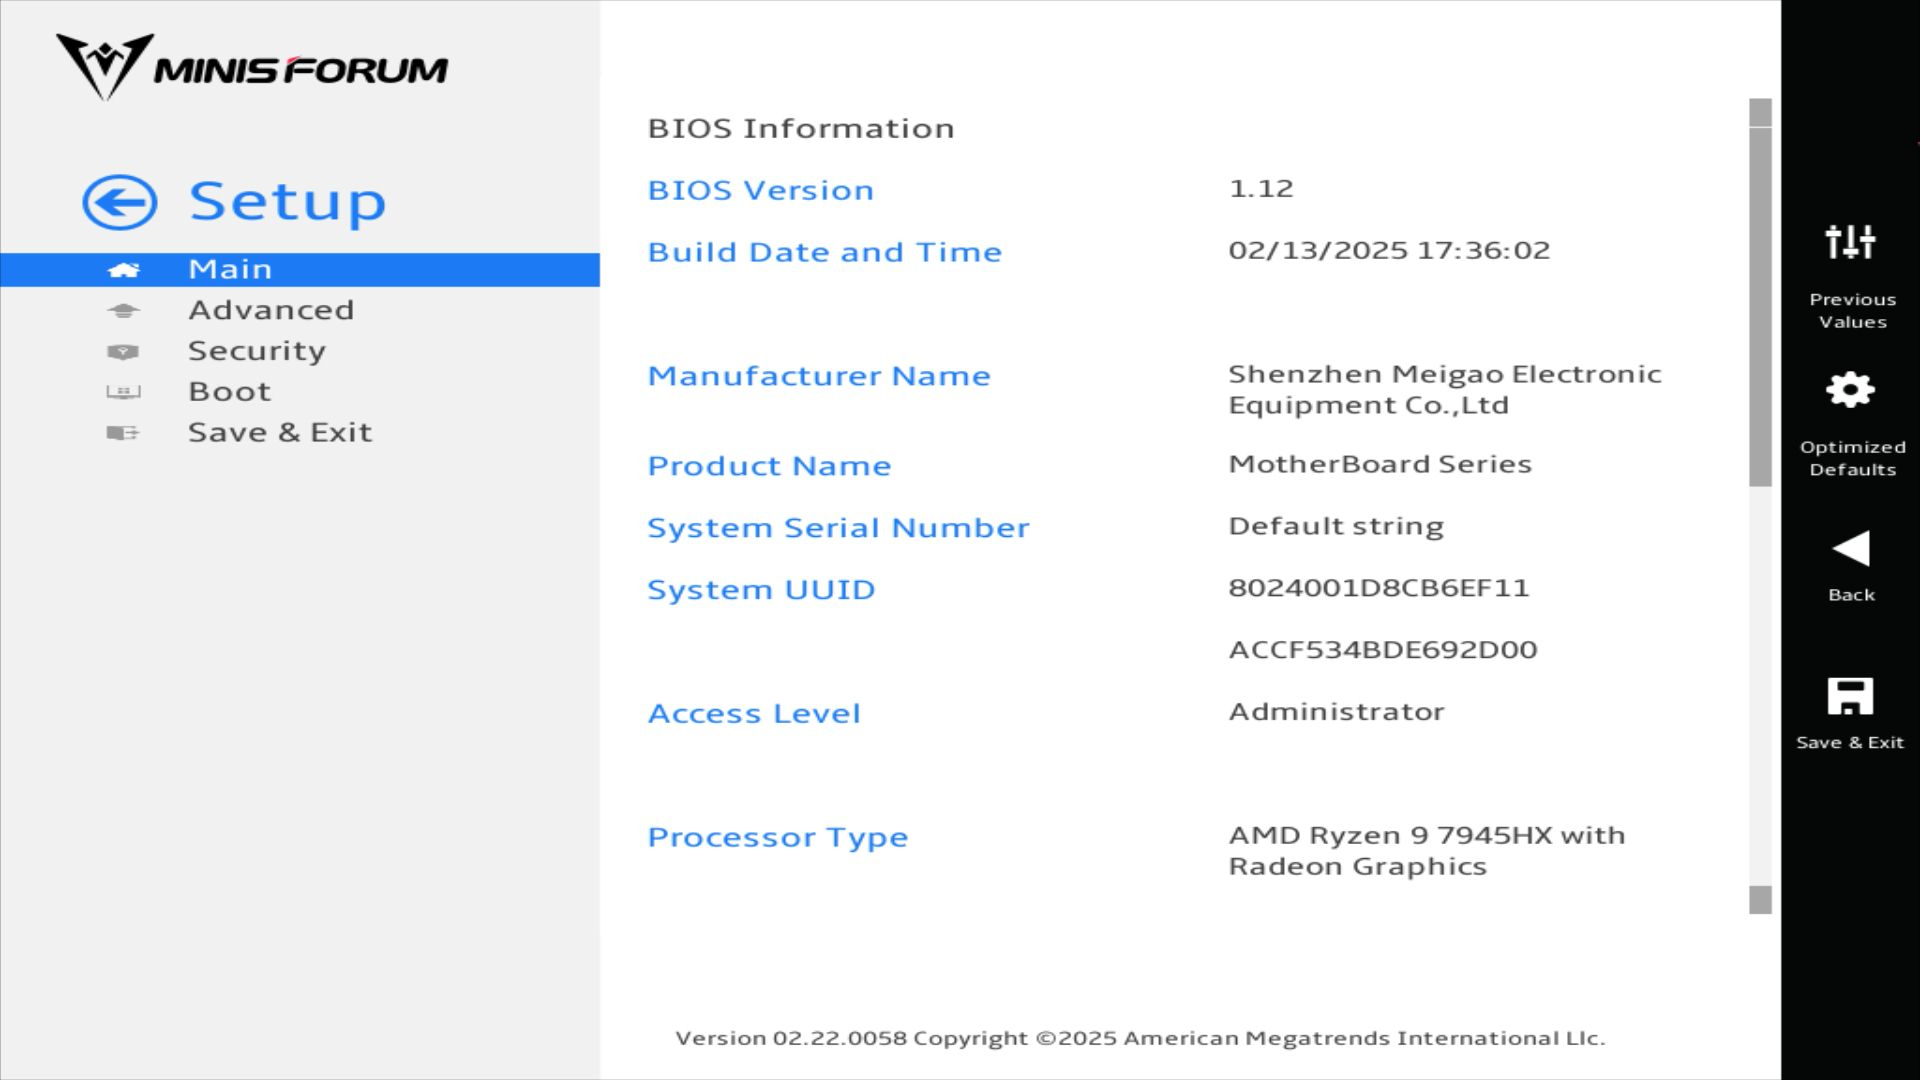
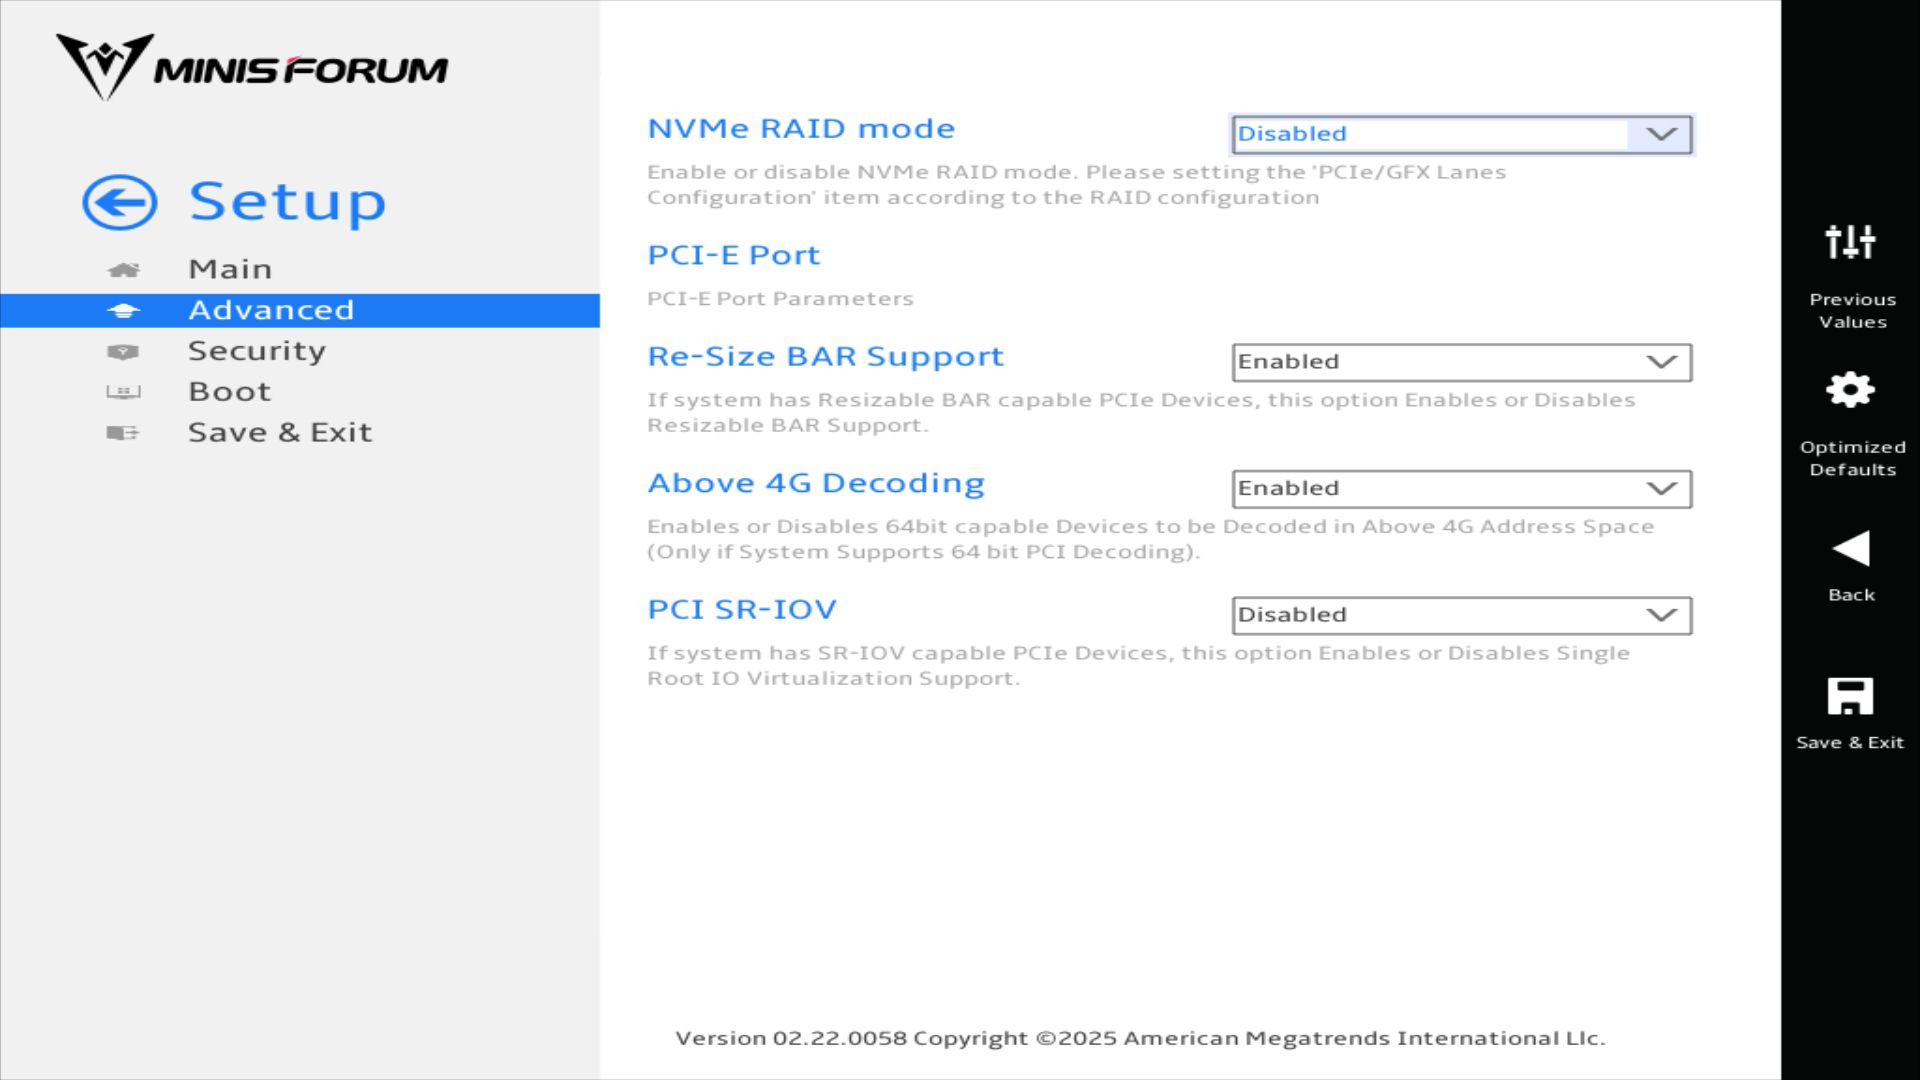
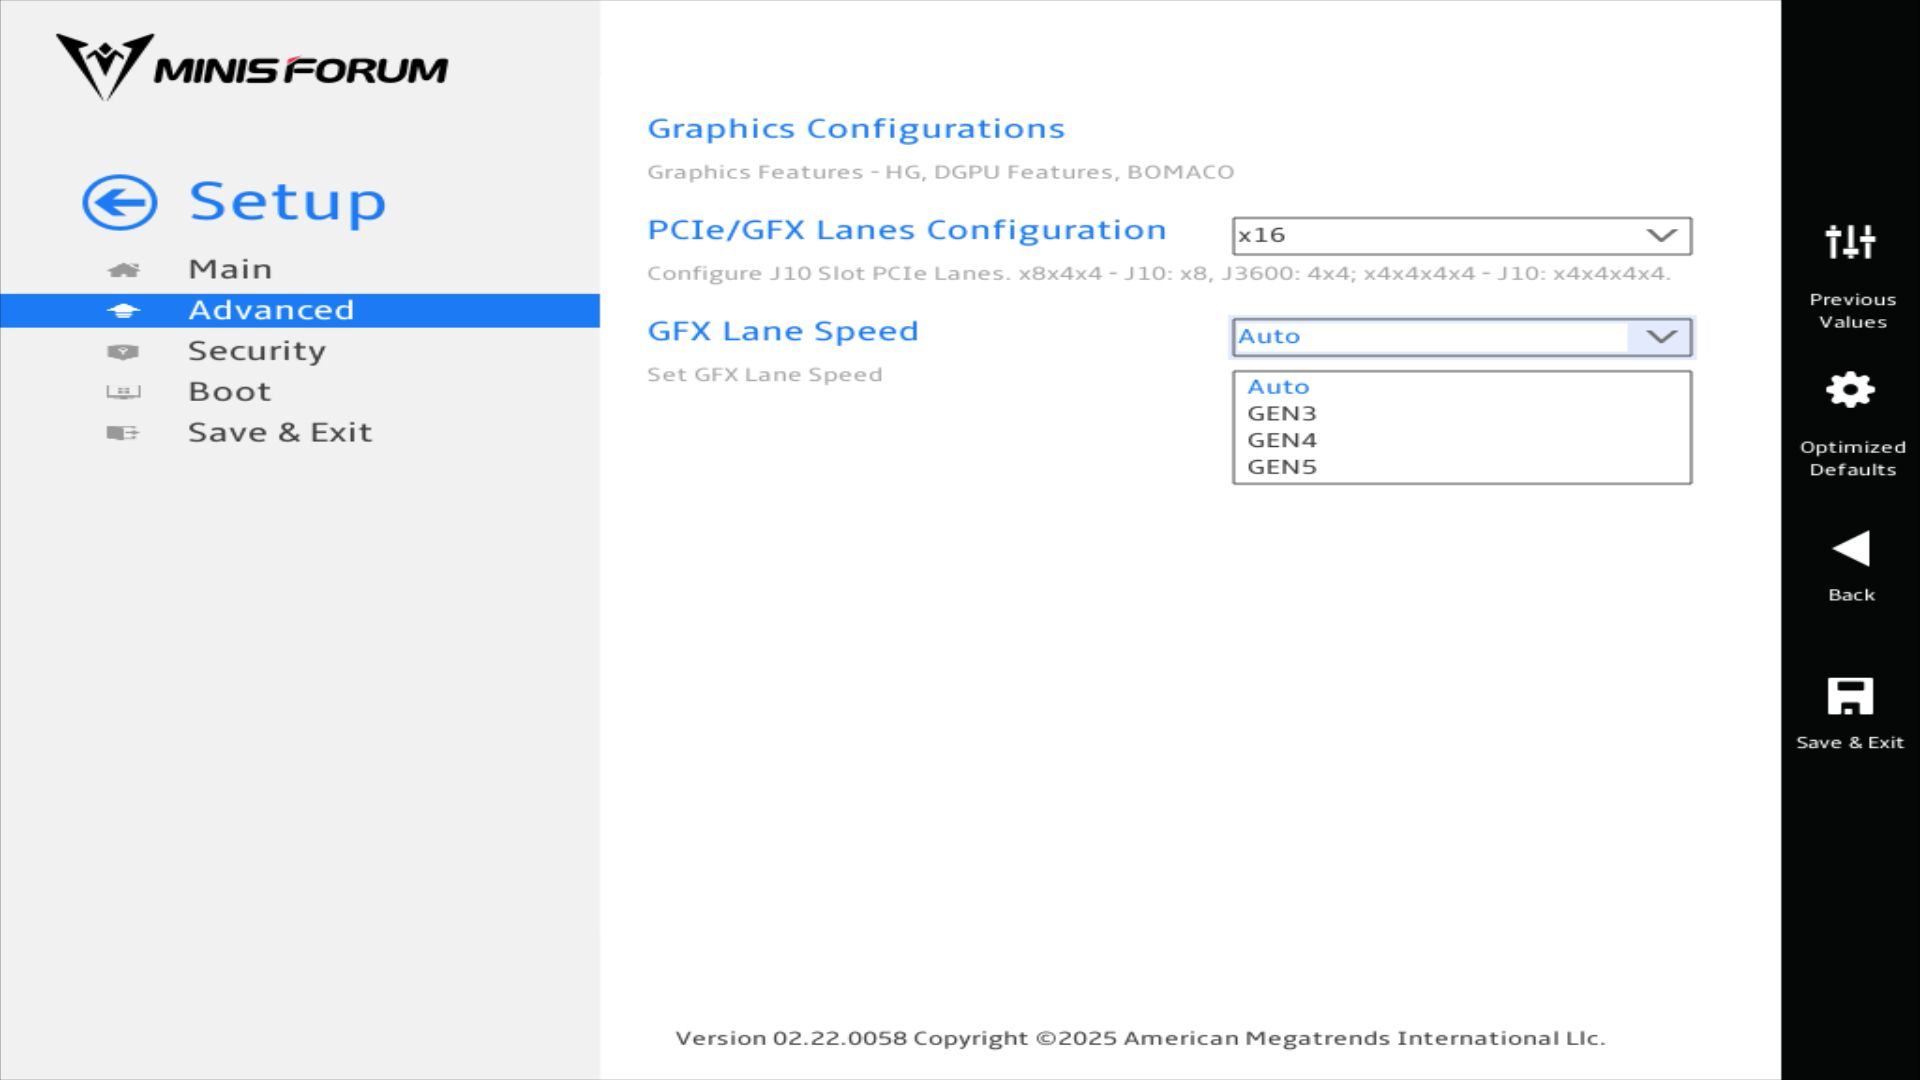
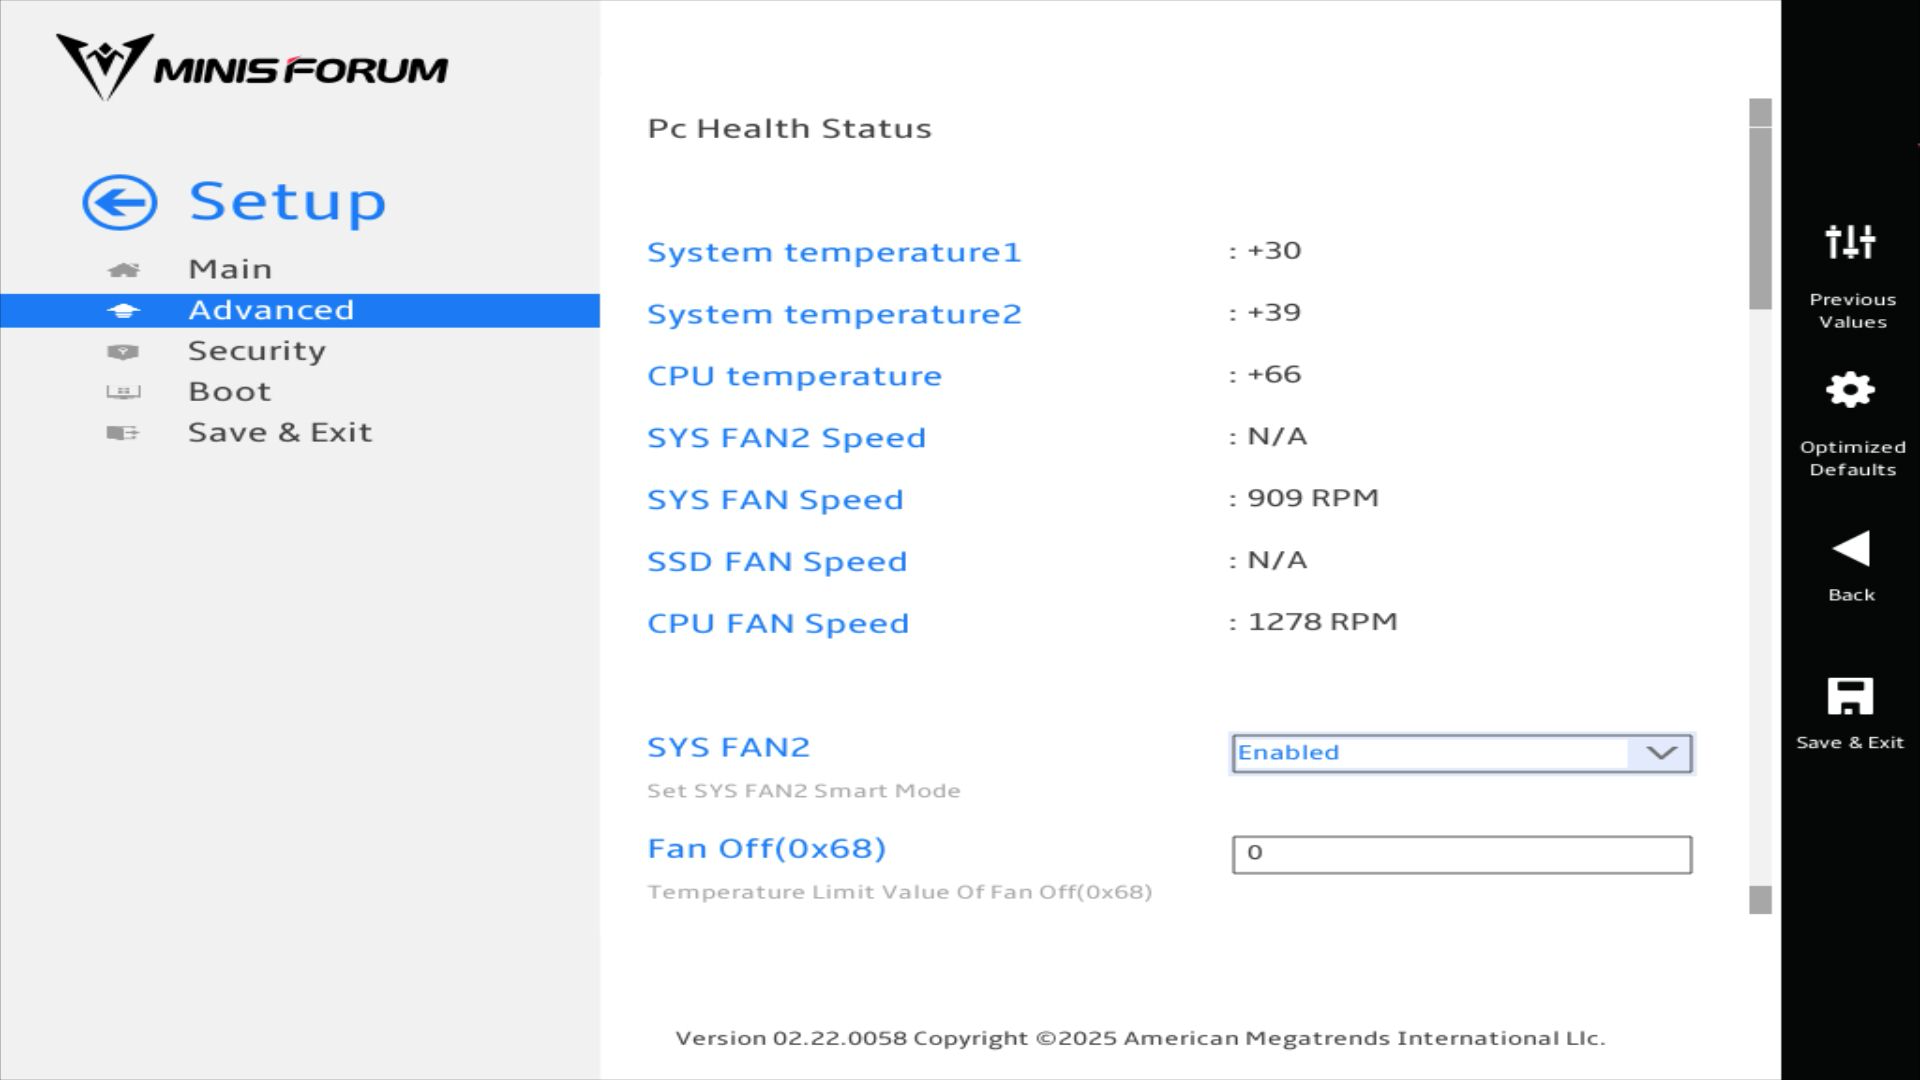
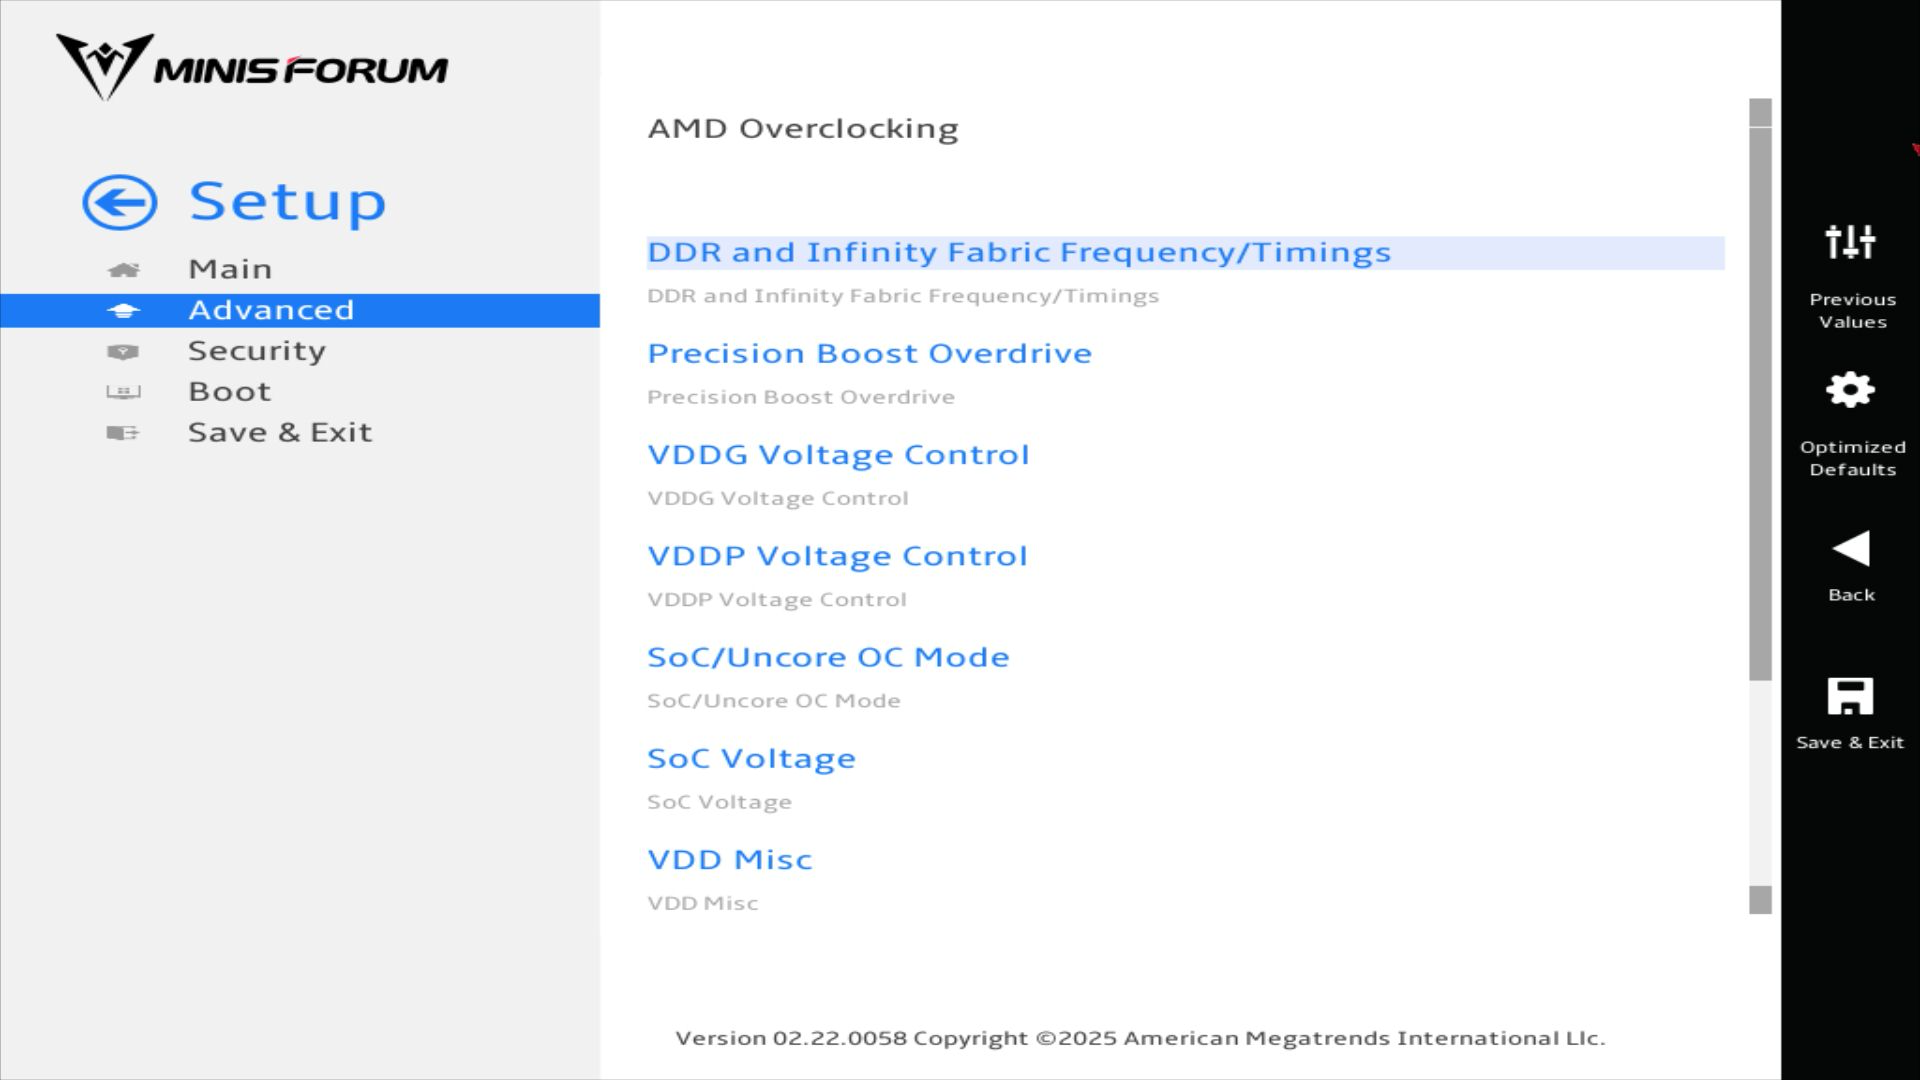
Opções UEFI
* ... menor é melhor
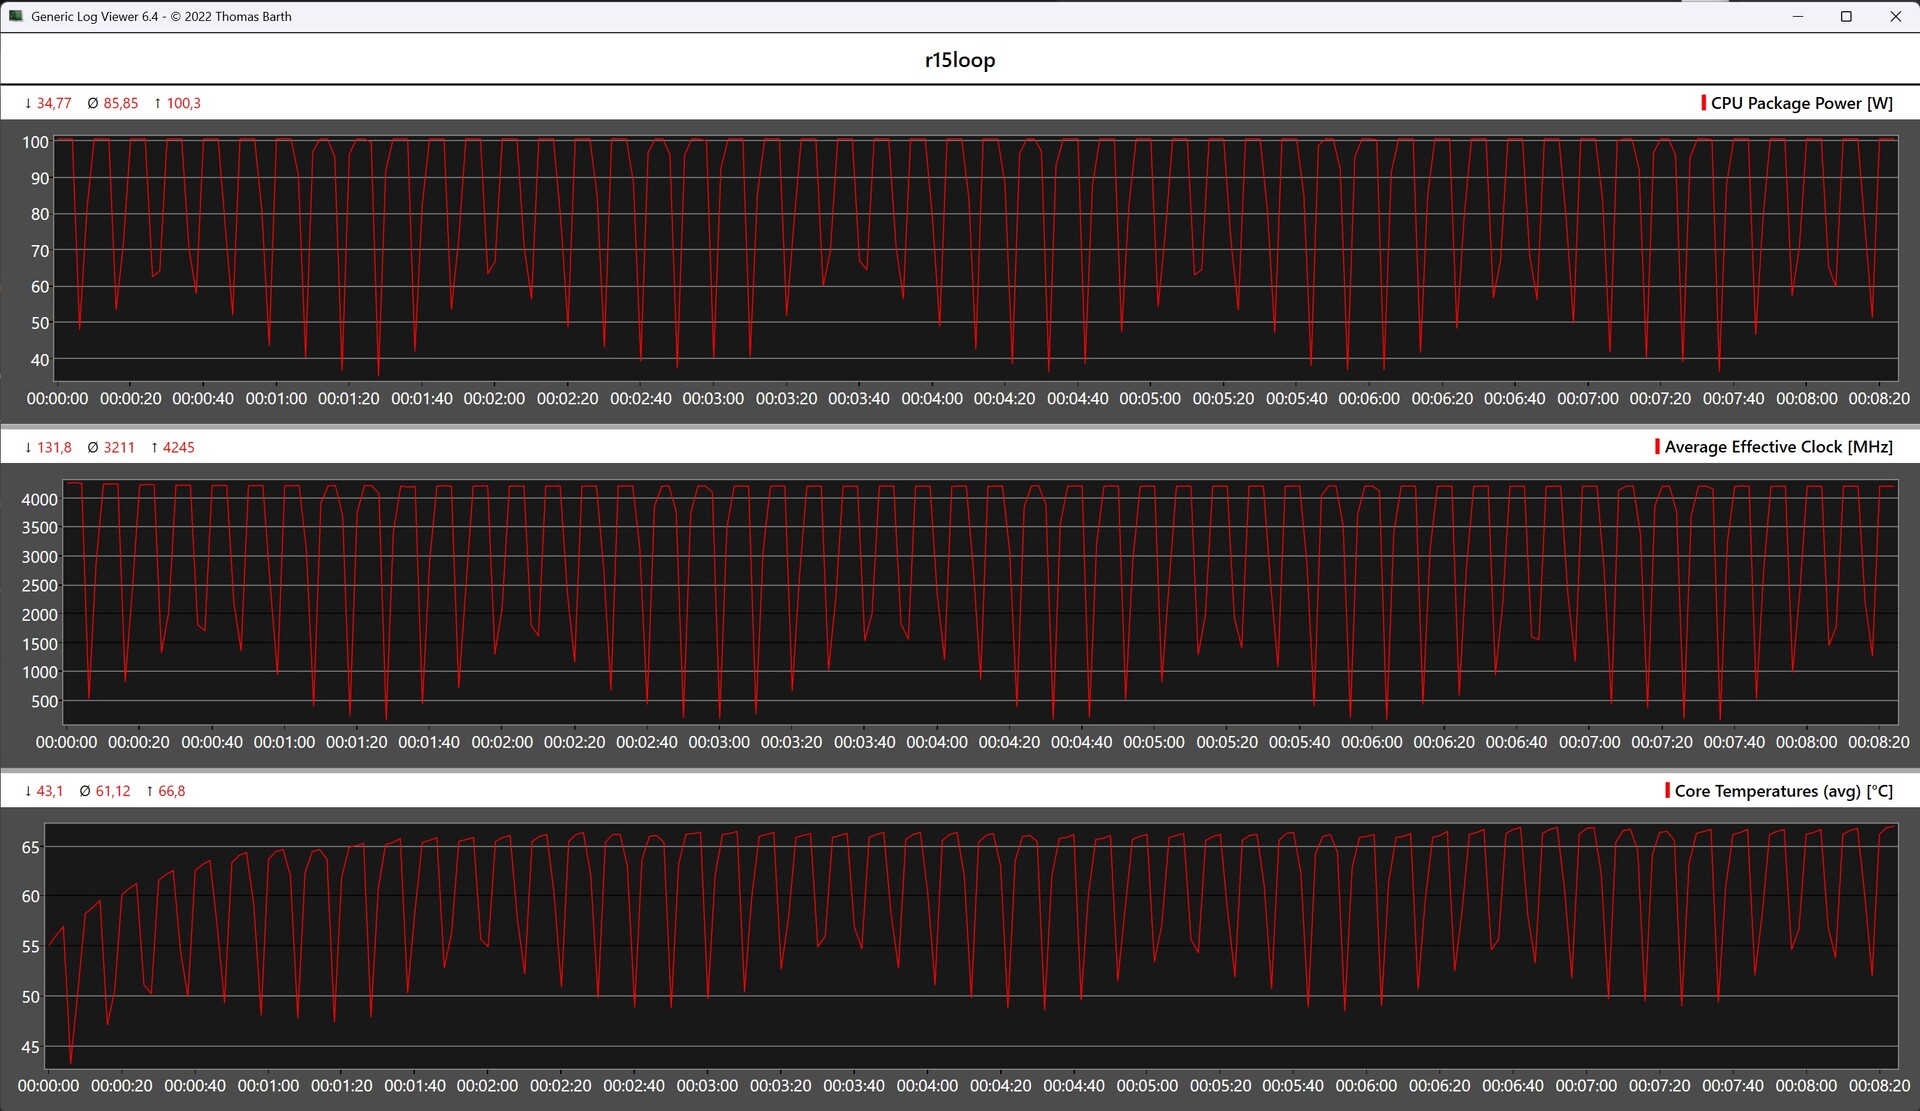
Resultados do Cinebench AMD Ryzen 9 7945HX
Em combinação com seu AMD Ryzen 9 7945HX, o Minisforum BD795i SE dominou o loop contínuo do Cinebench R15 sem problemas. O desempenho do processador de 16 núcleos permaneceu estável ao longo de 50 execuções sem nenhuma queda sob carga contínua. O cooler instalado de fábrica em combinação com a ventoinha de 120 milímetros da Noctua garantiu um resfriamento eficaz.
Desempenho do sistema
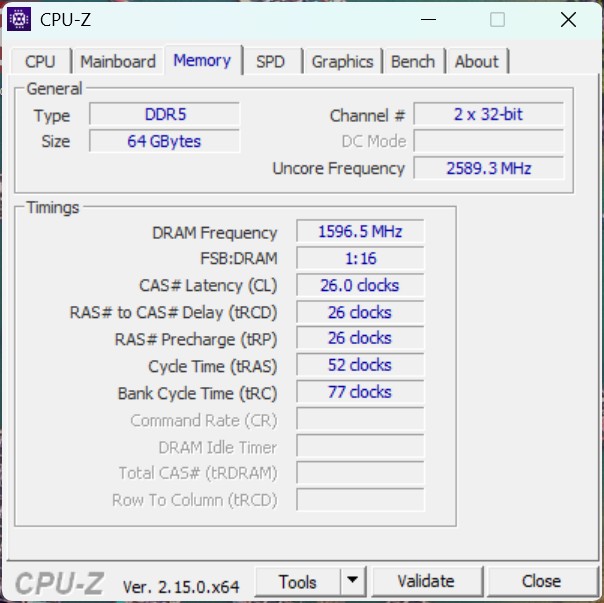
Durante os benchmarks de desempenho do sistema, nosso sistema de teste com o Minisforum BD795i SE não conseguiu acompanhar a concorrência o tempo todo, mas permaneceu em um nível alto no geral. O eficiente AMD Ryzen 9 7945HX não mostra fraquezas durante o uso diário e, graças ao seu rápido SSD NVMe e à RAM DDR5, ele pode até mesmo realizar tarefas exigentes sem problemas.
* ... menor é melhor
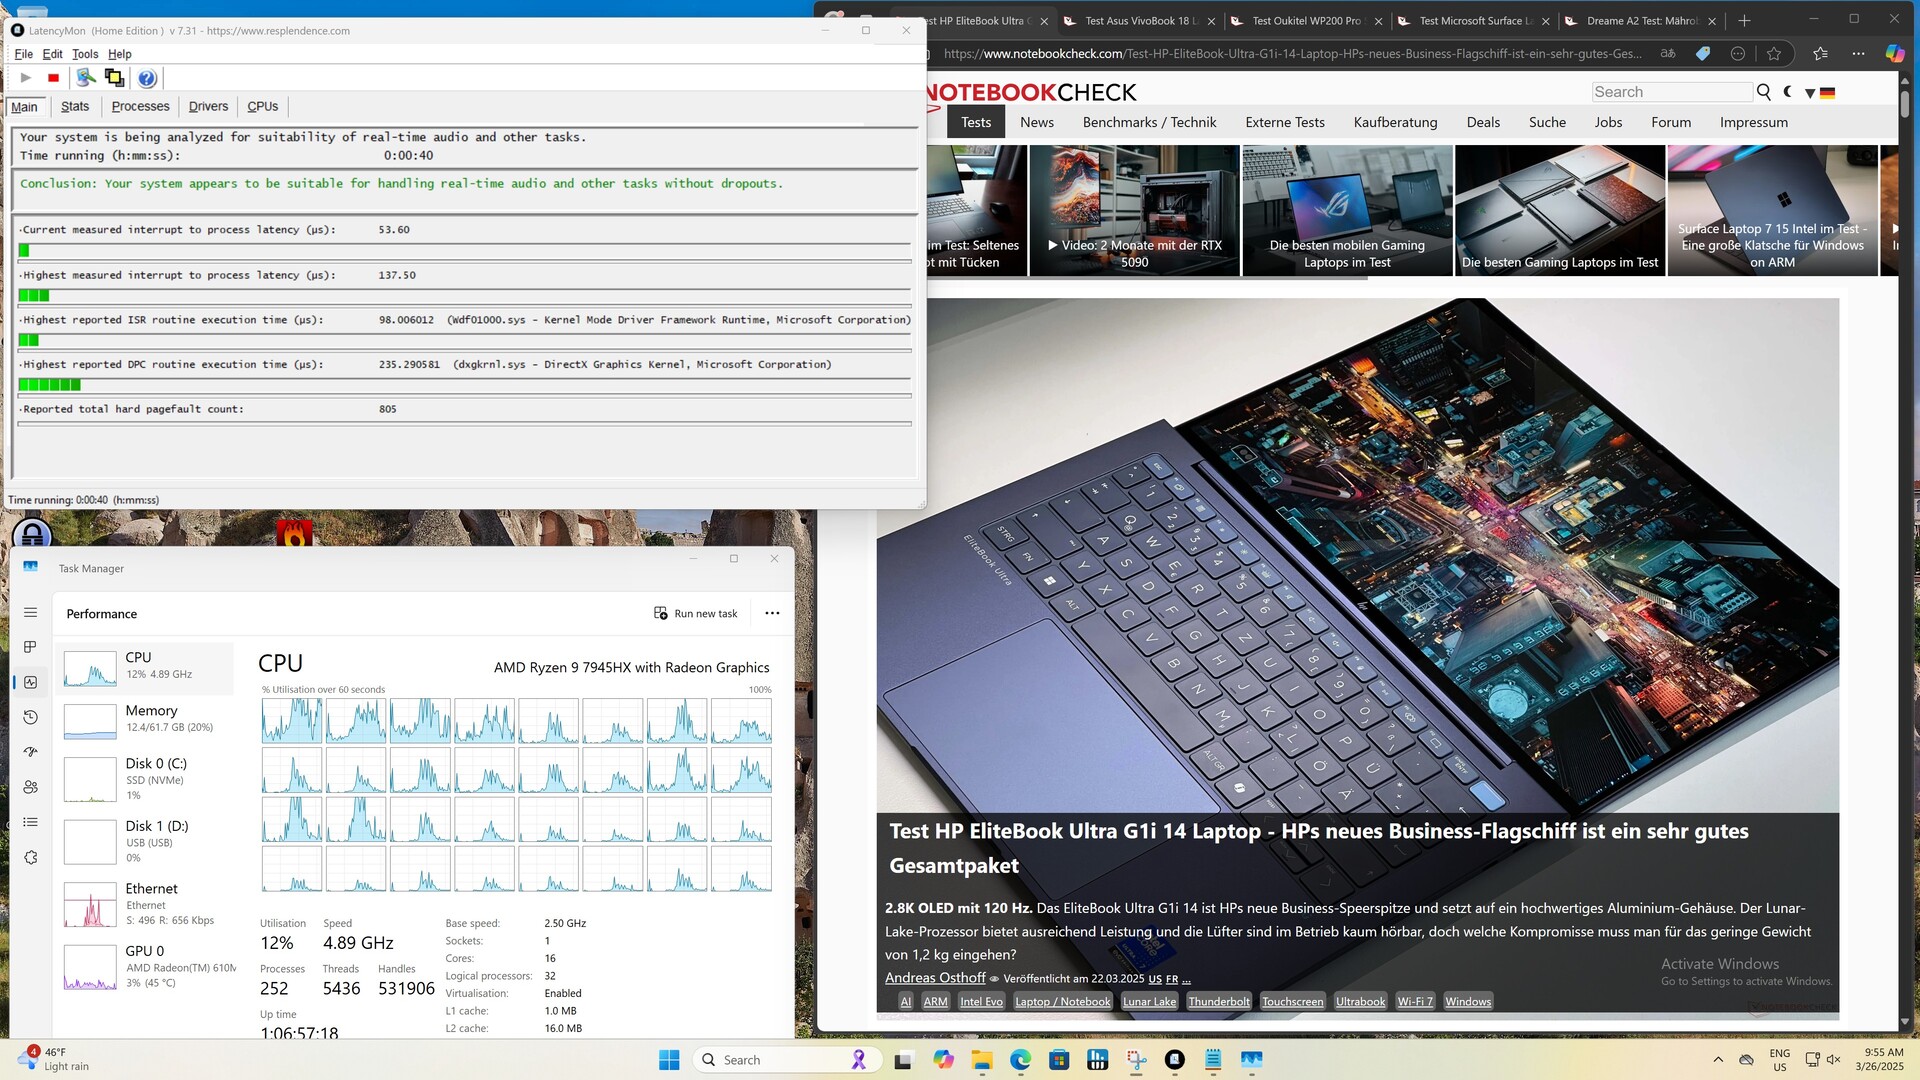
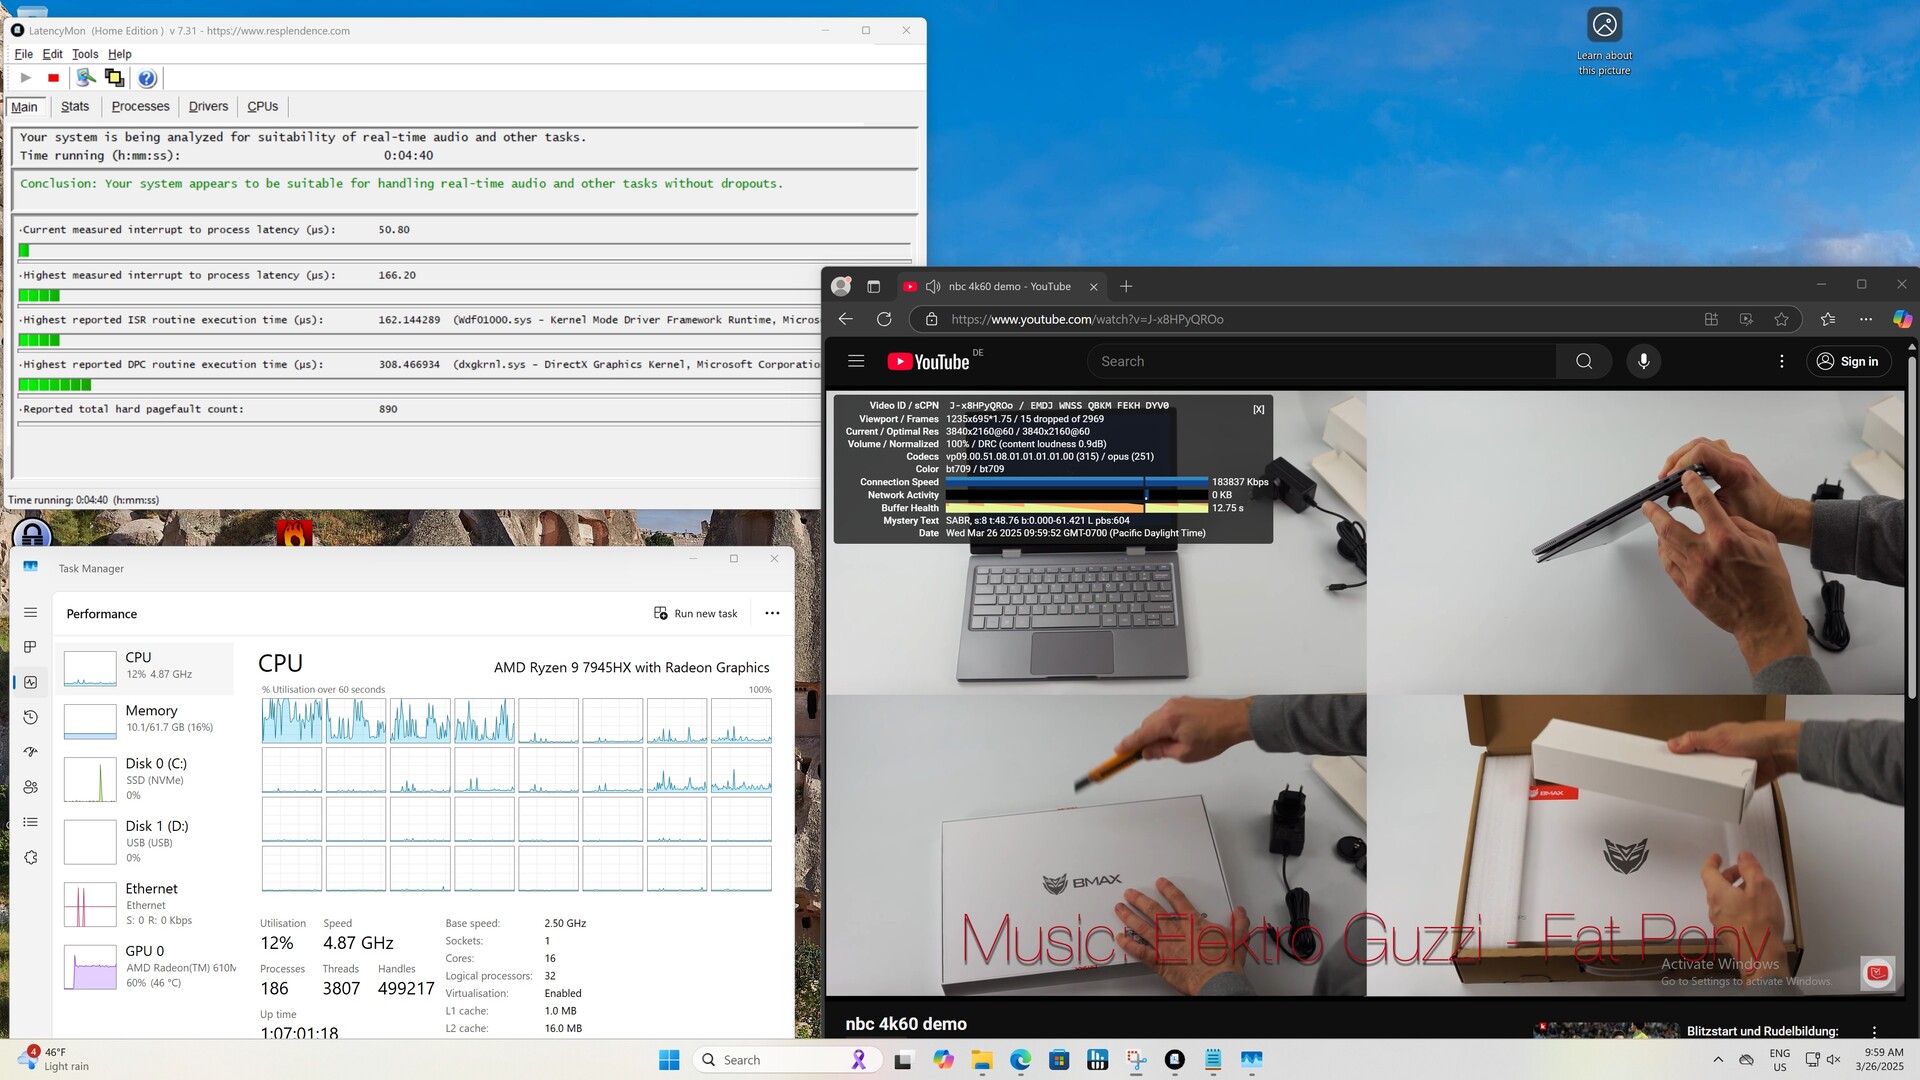
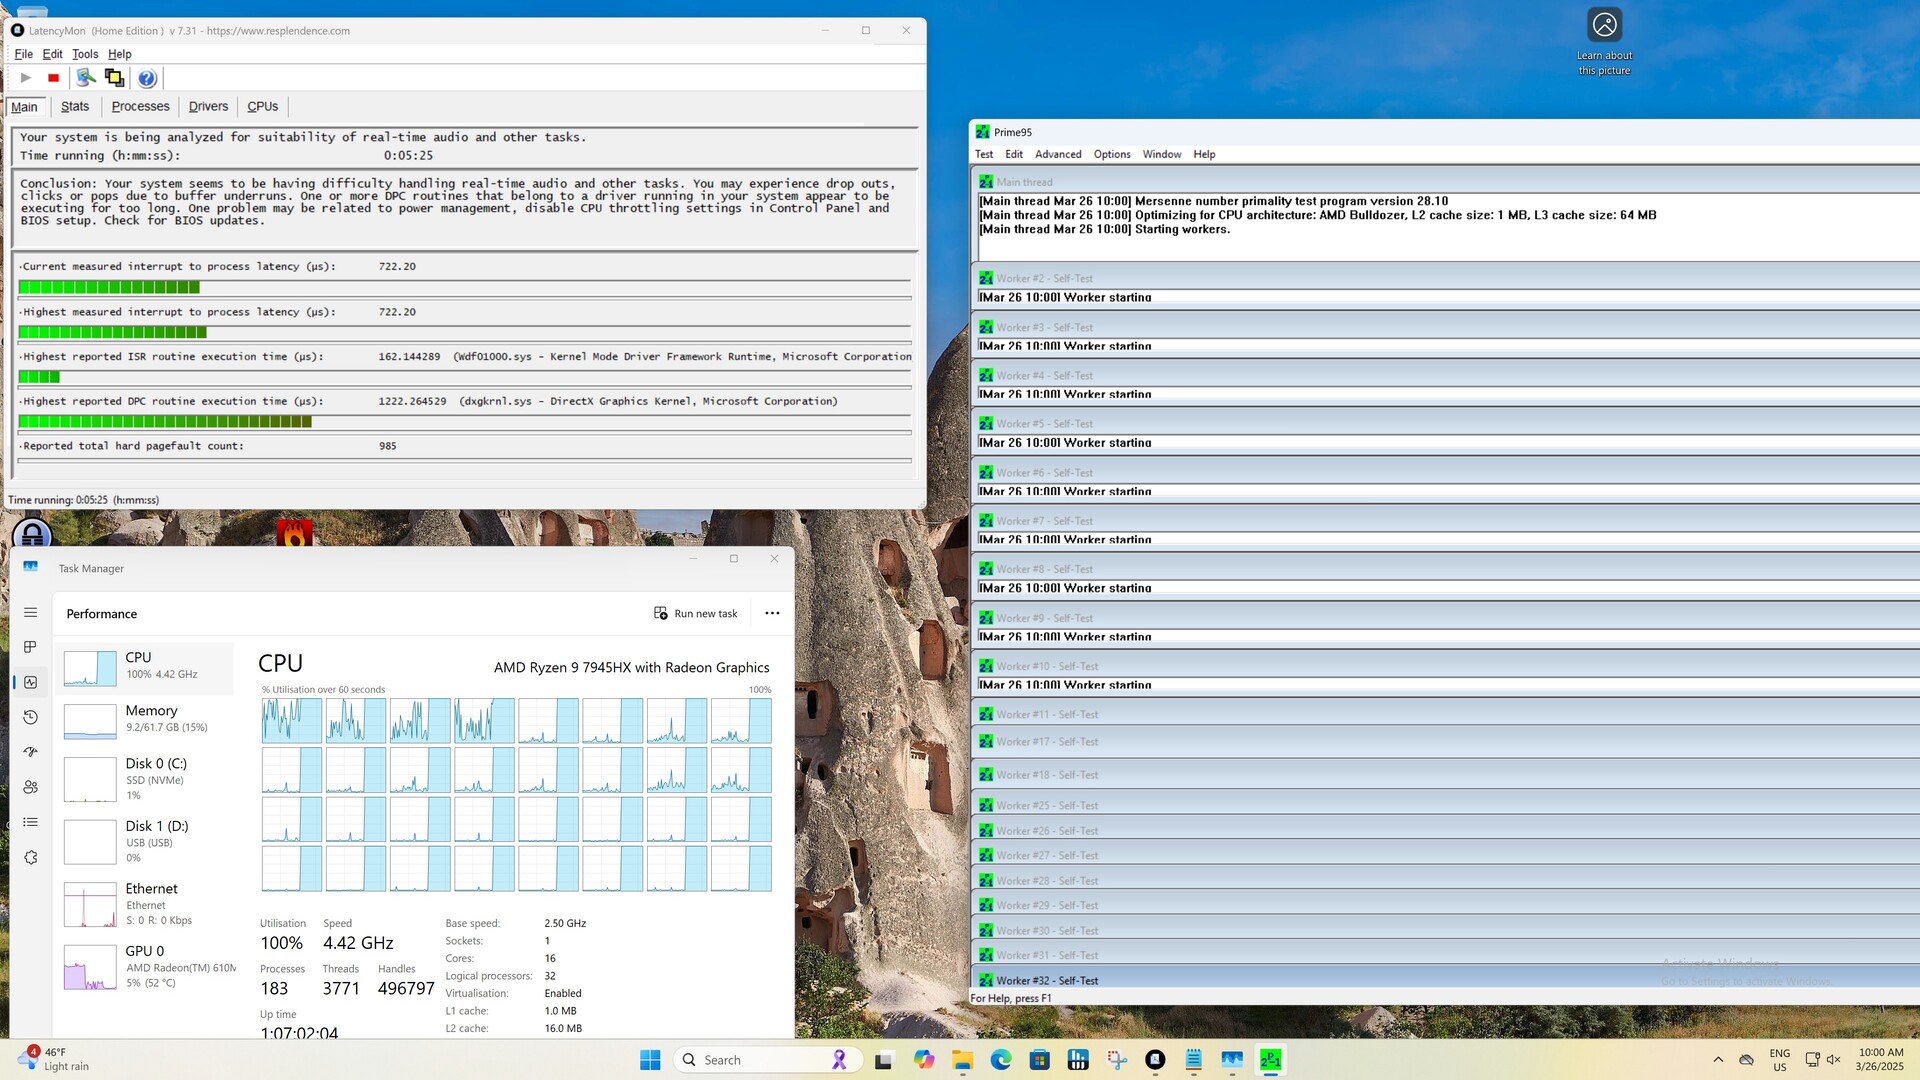
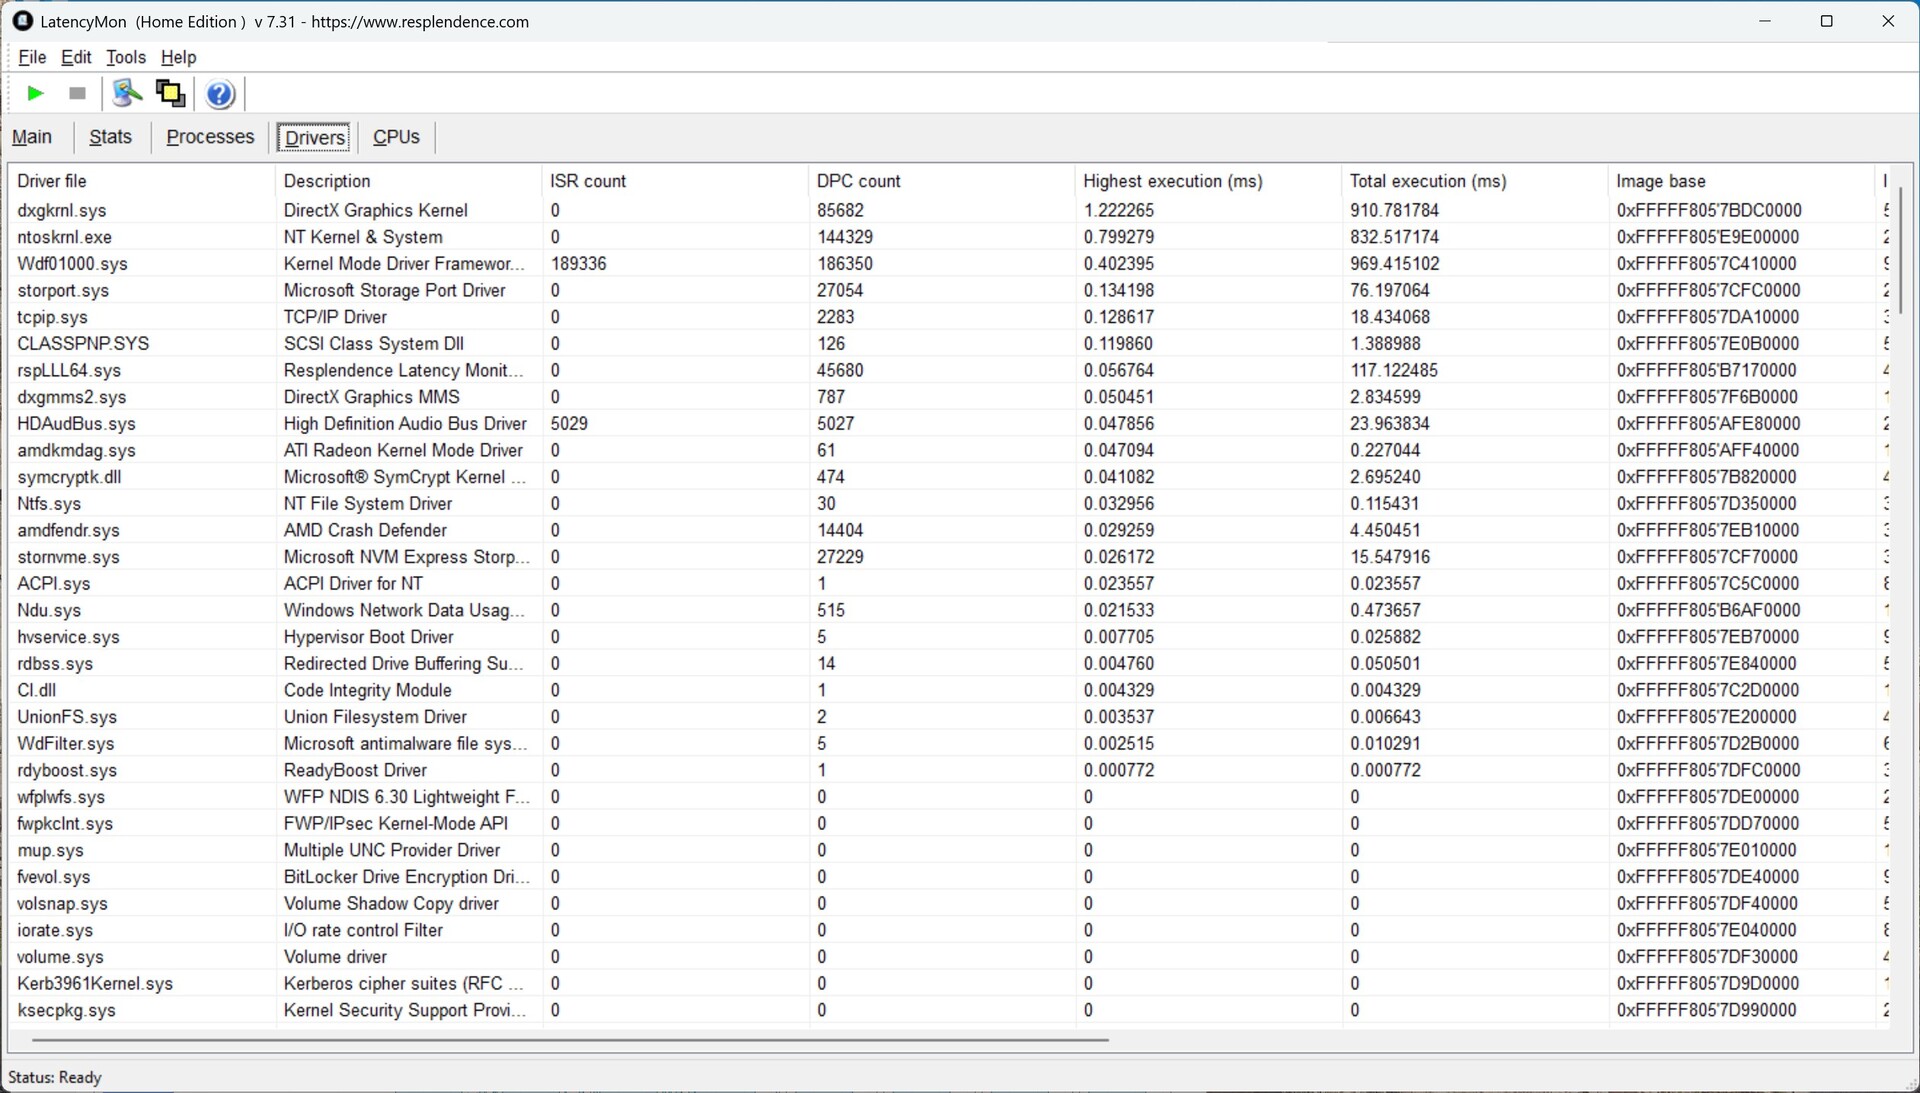
Latências de DPC
Nosso sistema de teste com o Minisforum BD795i SE revelou latências moderadas. Tudo funcionou sem problemas ao navegar na Web e reproduzir um vídeo de teste em 4K, enquanto as latências só aumentaram ao executar o Prime95.
| DPC Latencies / LatencyMon - interrupt to process latency (max), Web, Youtube, Prime95 | |
| Minisforum BD790i | |
| Minisforum BD795i SE | |
| Minisforum EliteMini UM780 XTX | |
| Minisforum Venus Series UM790 Pro | |
| Minisforum BD770i | |
* ... menor é melhor
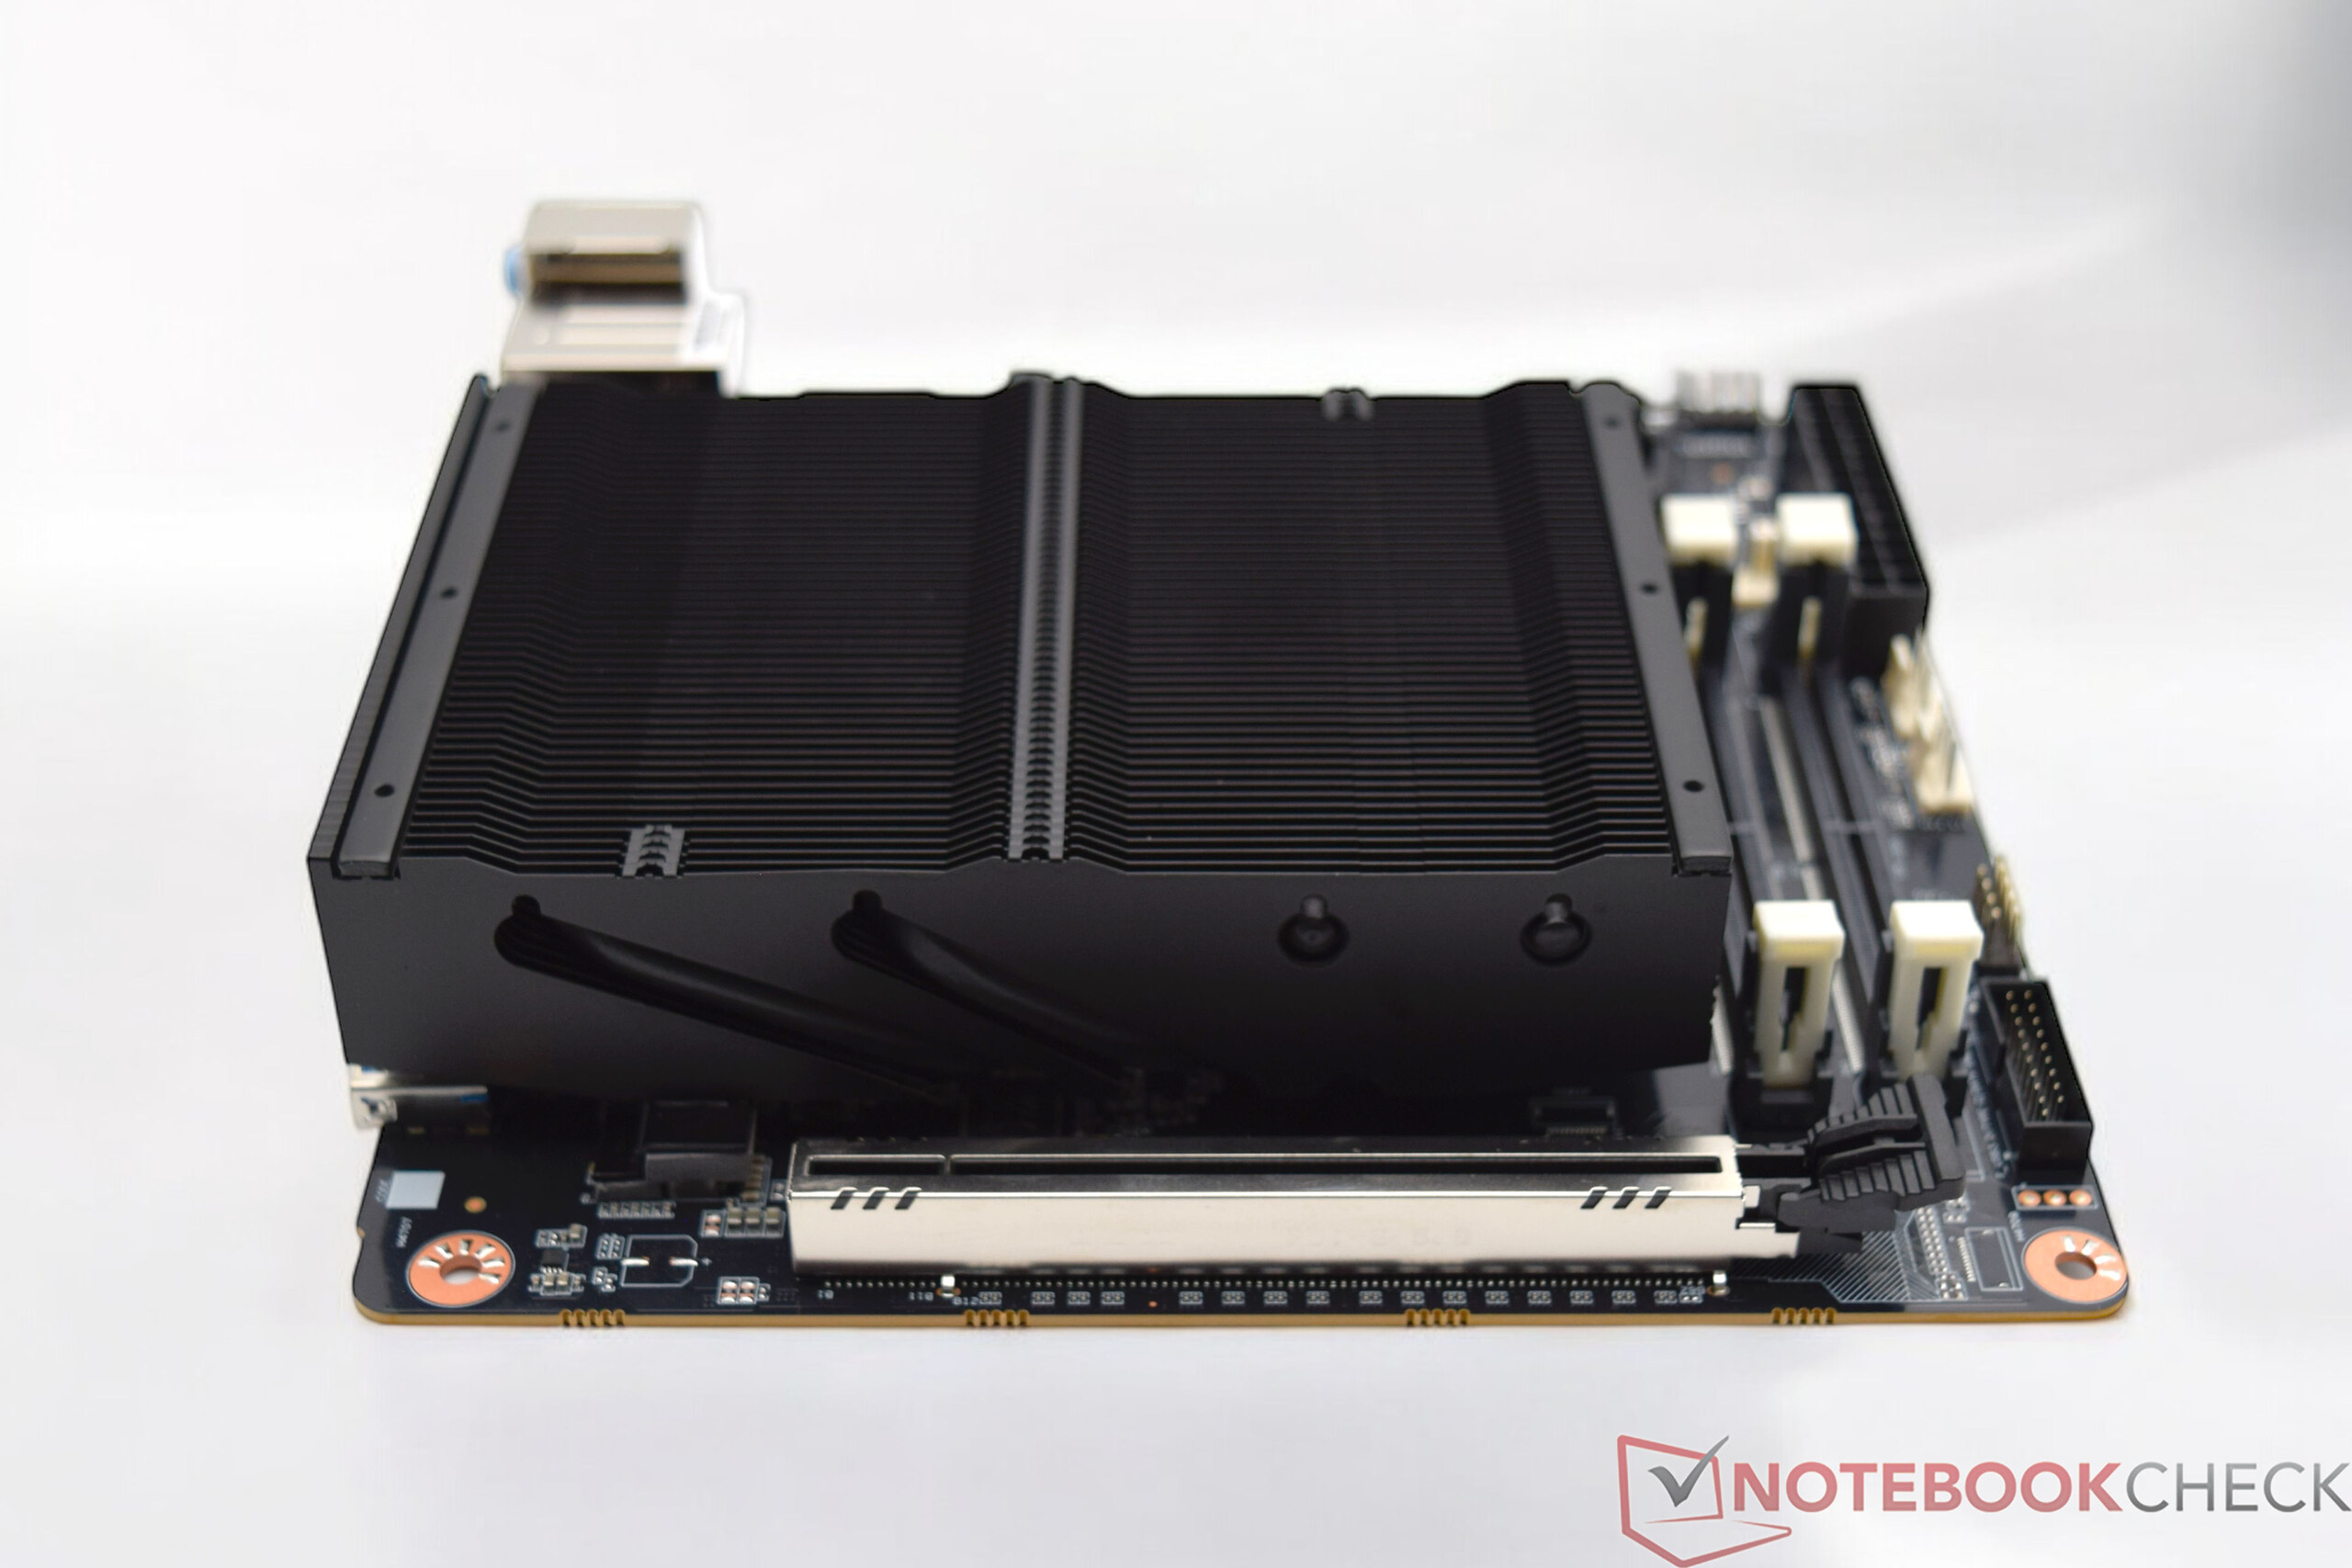
Dispositivo de armazenamento
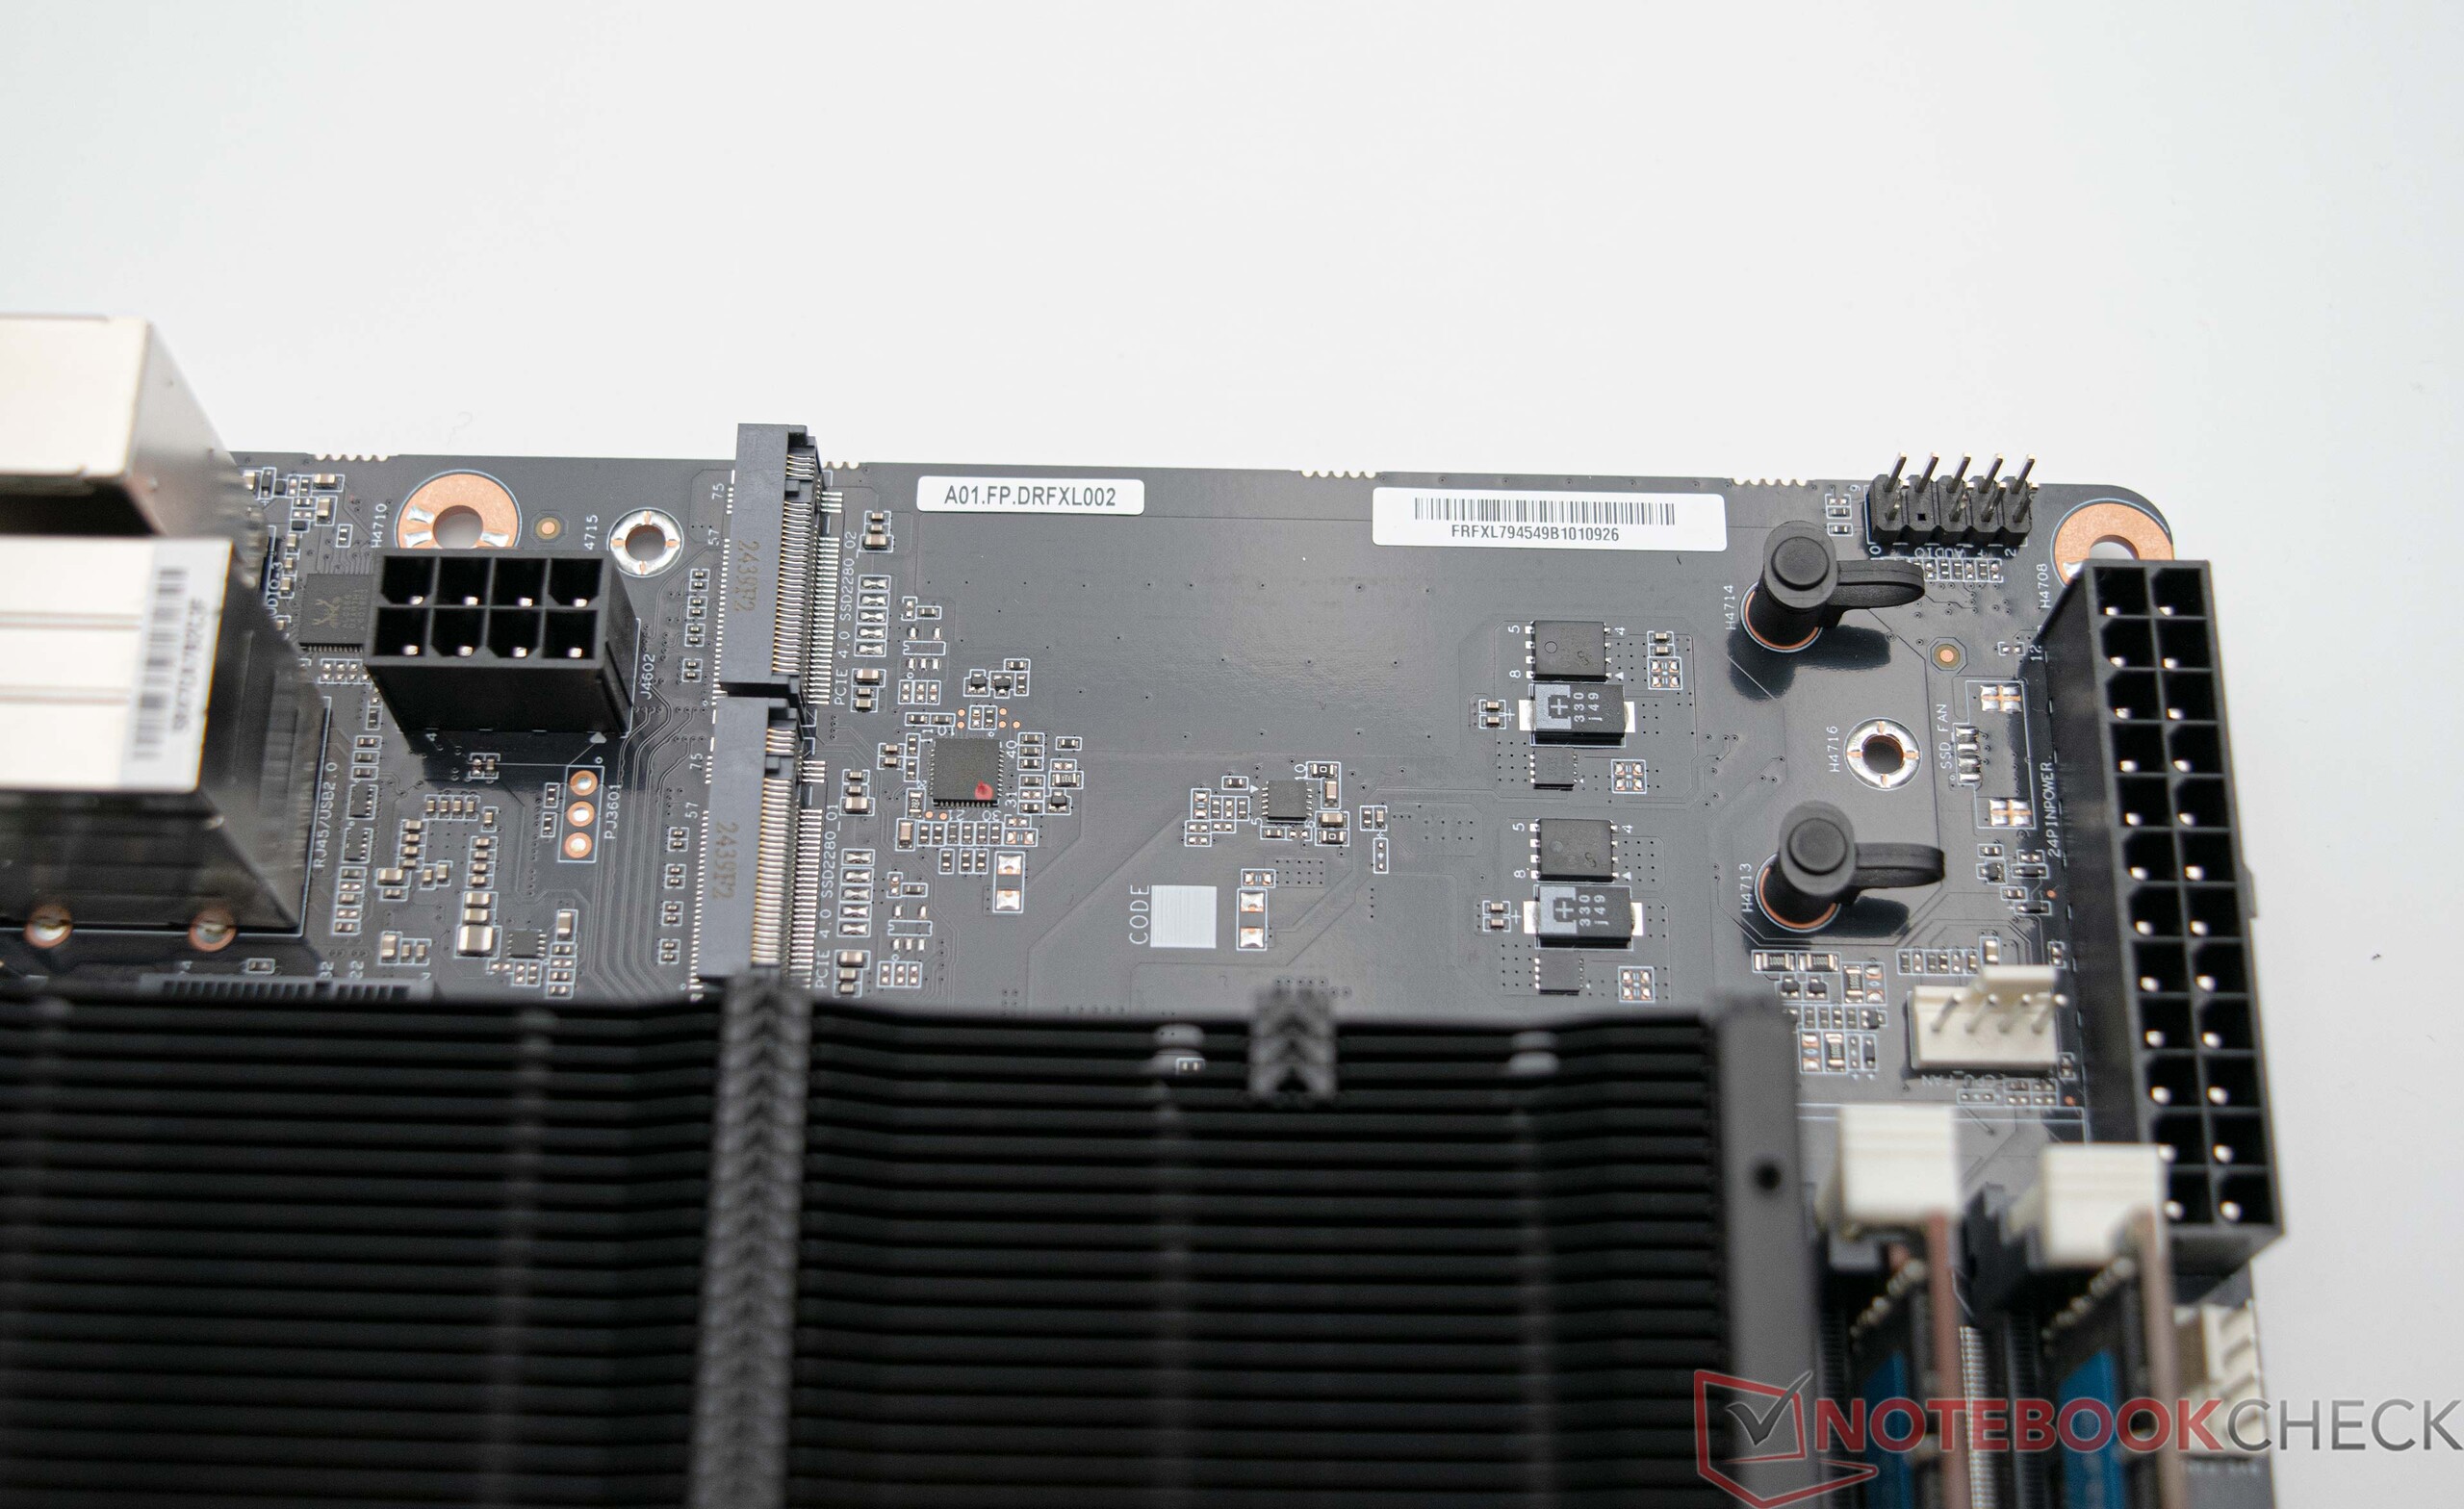
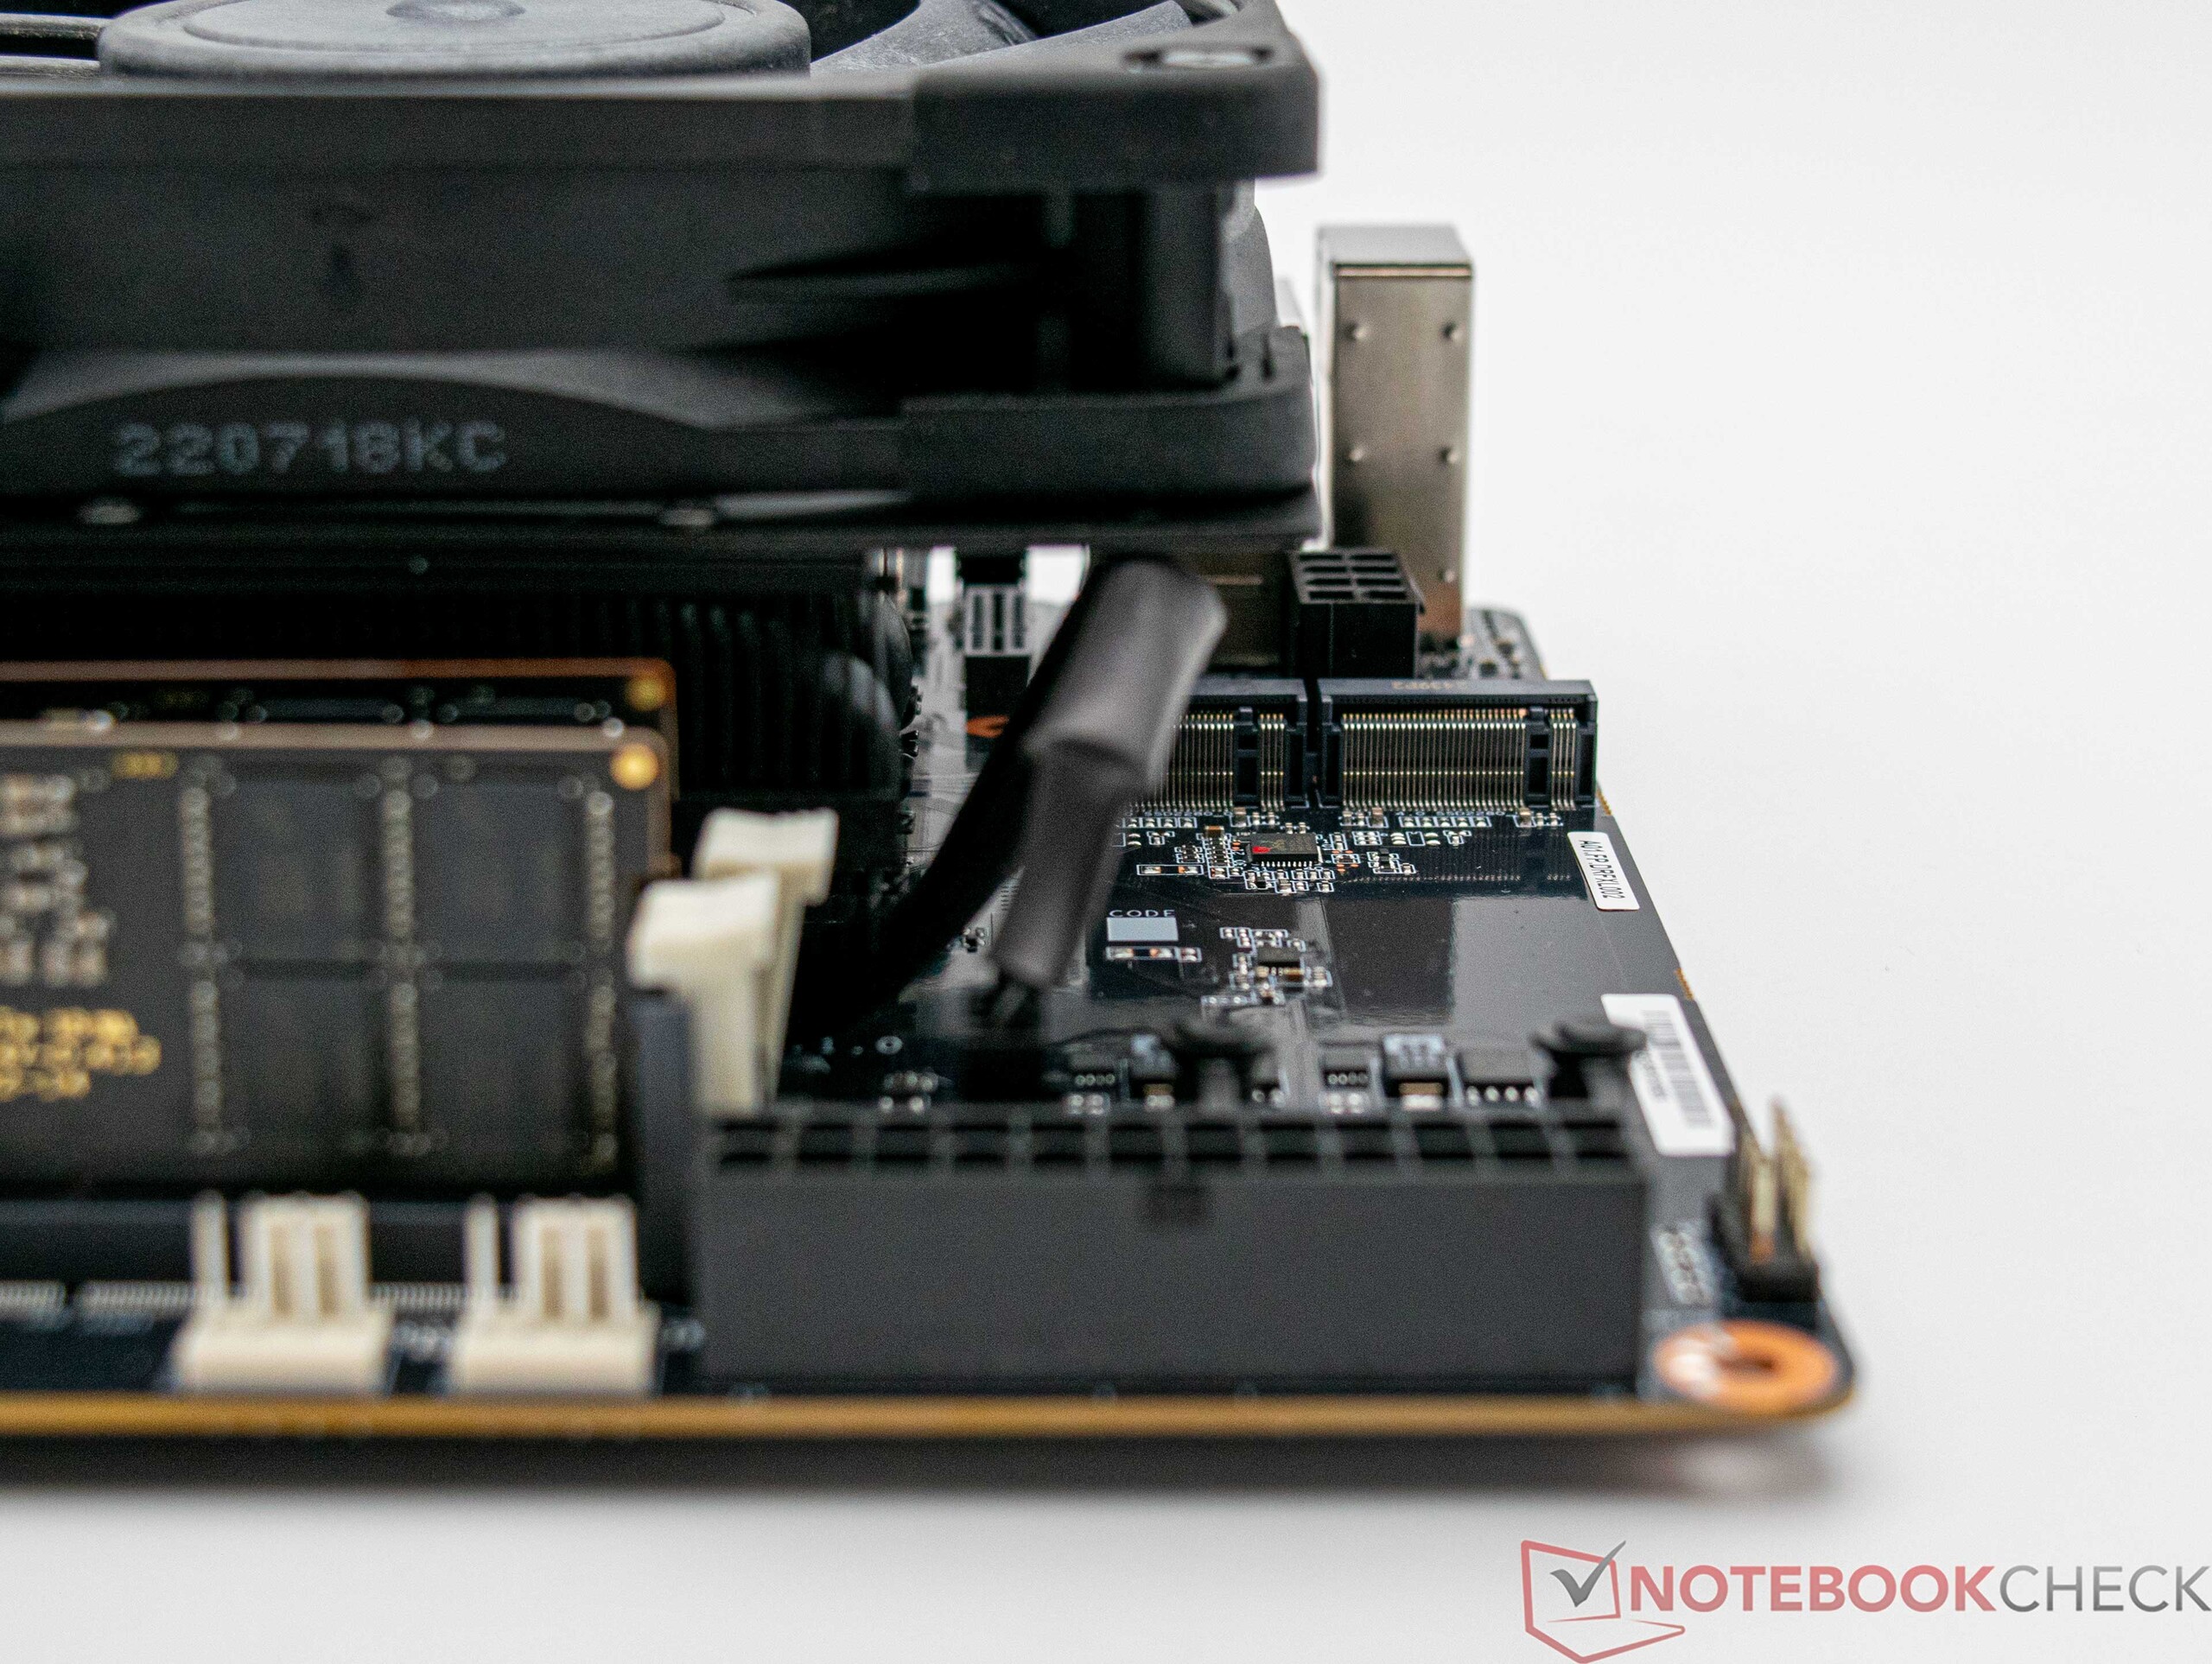
A Minisforum fornece apenas a placa-mãe BD795 SE, portanto, os componentes que faltam, como RAM, SSD, fonte de alimentação e ventoinha da CPU, devem ser adicionados pelo senhor. Escolhemos o Kingston KC3000 (2 TB, PCIe 4.0 x4), que não pode utilizar totalmente o potencial da placa com seus dois slots PCIe 5.0. Os dois slots M.2 estão localizados na parte superior e recebem ar fresco por meio da ventoinha da CPU. Os SSDs com um cooler pré-instalado de fábrica (altura máxima de aproximadamente 27 milímetros) também podem ser instalados.

Reading continuous performance: DiskSpd Read Loop, Queue Depth 8
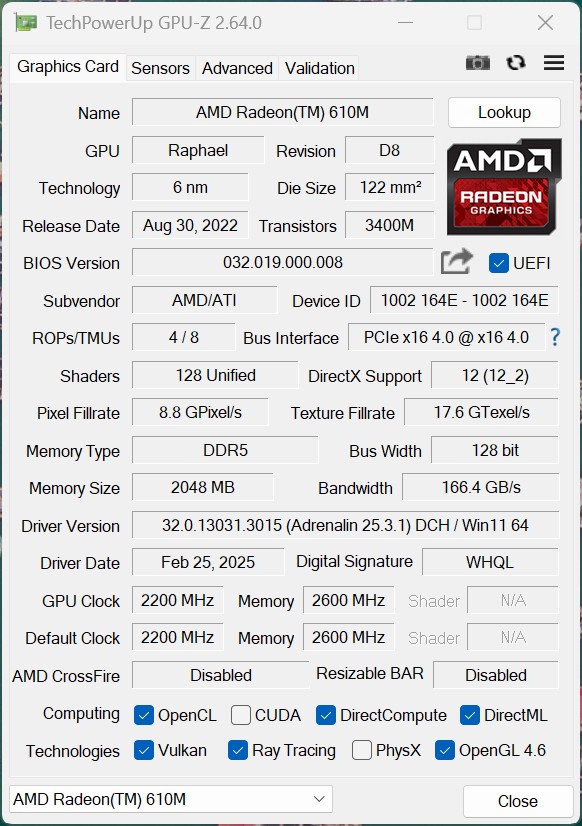
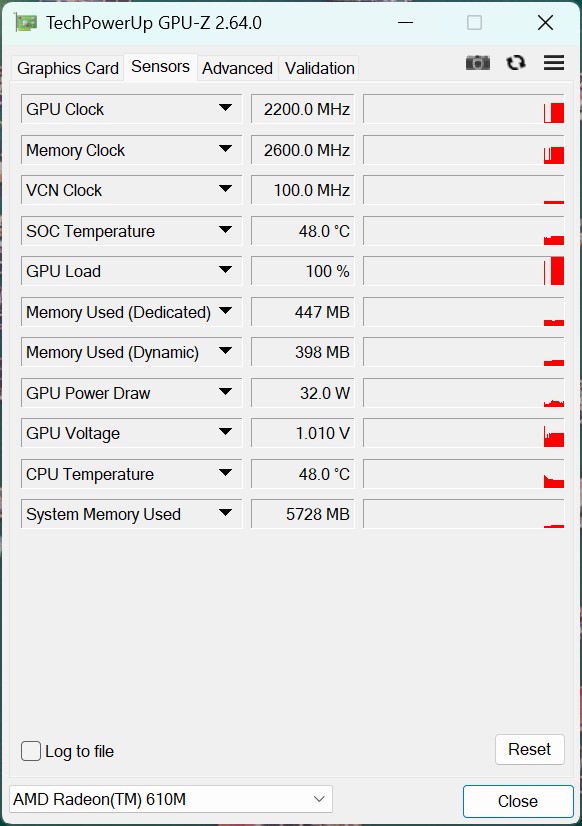
Placa de vídeo - A AMD Radeon 610M como uma iGPU
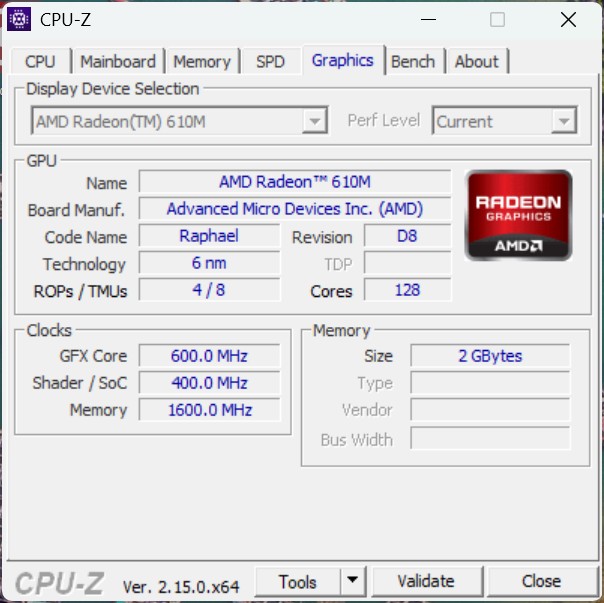
O AMD Ryzen 9 7945HX apresenta uma iGPU RDNA2 simples com 2 CUs e 128 unidades shader, ou seja, a AMD Radeon 610M. Ela não oferece um desempenho 3D superior ao da iGPU do Ryzen 7 7745HX, o que significa que os resultados foram quase idênticos. Ela provou ser claramente inferior à AMD Radeon 780M e é adequada apenas para a produção de imagens simples.
| Unigine Valley 1.0 | |
| 1920x1080 Extreme HD DirectX AA:x8 | |
| Minisforum EliteMini UM780 XTX | |
| Minisforum Venus Series UM790 Pro | |
| Minisforum Mars Series MC560 | |
| NiPoGi AD08 | |
| Minisforum BD770i | |
| Média AMD Radeon 610M (9.8 - 10, n=3) | |
| Minisforum BD795i SE | |
| Acemagic AD15 | |
| 1920x1080 Extreme HD Preset OpenGL AA:x8 | |
| Minisforum EliteMini UM780 XTX | |
| Minisforum Venus Series UM790 Pro | |
| NiPoGi AD08 | |
| Minisforum Mars Series MC560 | |
| Acemagic AD15 | |
| Minisforum BD770i | |
| Média AMD Radeon 610M (9.1 - 9.6, n=3) | |
| Minisforum BD795i SE | |
| Affinity Photo 2 - Combined (Single / Multi GPU) | |
| NiPoGi AD08 | |
| Média AMD Radeon 610M (889 - 5750, n=3) | |
| Acemagic AD15 | |
| Minisforum EliteMini UM780 XTX | |
| Minisforum Mars Series MC560 | |
| Minisforum Venus Series UM790 Pro | |
| Minisforum BD795i SE | |
| Minisforum BD770i | |
| 3DMark 06 Standard Score | 20555 pontos | |
| 3DMark Vantage P Result | 12092 pontos | |
| 3DMark 11 Performance | 3873 pontos | |
| 3DMark Ice Storm Standard Score | 41556 pontos | |
| 3DMark Cloud Gate Standard Score | 14629 pontos | |
| 3DMark Fire Strike Score | 2156 pontos | |
| 3DMark Fire Strike Extreme Score | 530 pontos | |
| 3DMark Time Spy Score | 740 pontos | |
Ajuda | ||
| baixo | média | alto | ultra | |
|---|---|---|---|---|
| The Witcher 3 (2015) | 39.3 | 23.6 | 12.8 | |
| Dota 2 Reborn (2015) | 195.8 | 76.9 | 34.9 | 31.3 |
| Final Fantasy XV Benchmark (2018) | 23.4 | 10.9 | 7.05 | |
| X-Plane 11.11 (2018) | 37.1 | 23.7 | 19.5 | |
| Baldur's Gate 3 (2023) | 9.31 | 7.03 |
O Minisforum BD795i SE com a Nvidia GeForce RTX 4090
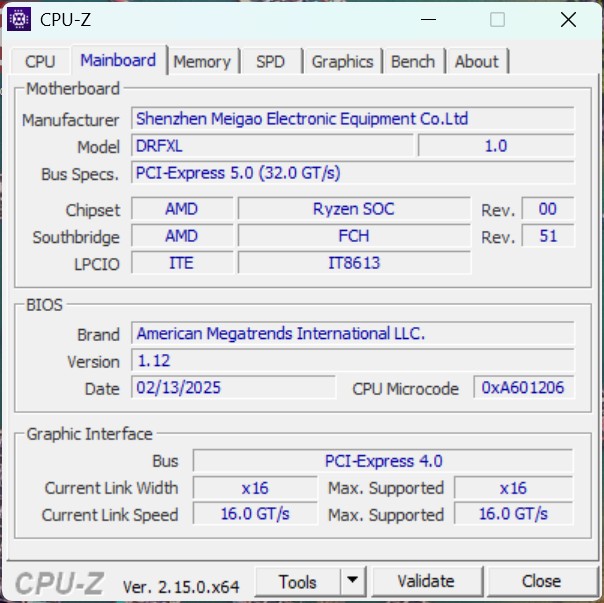
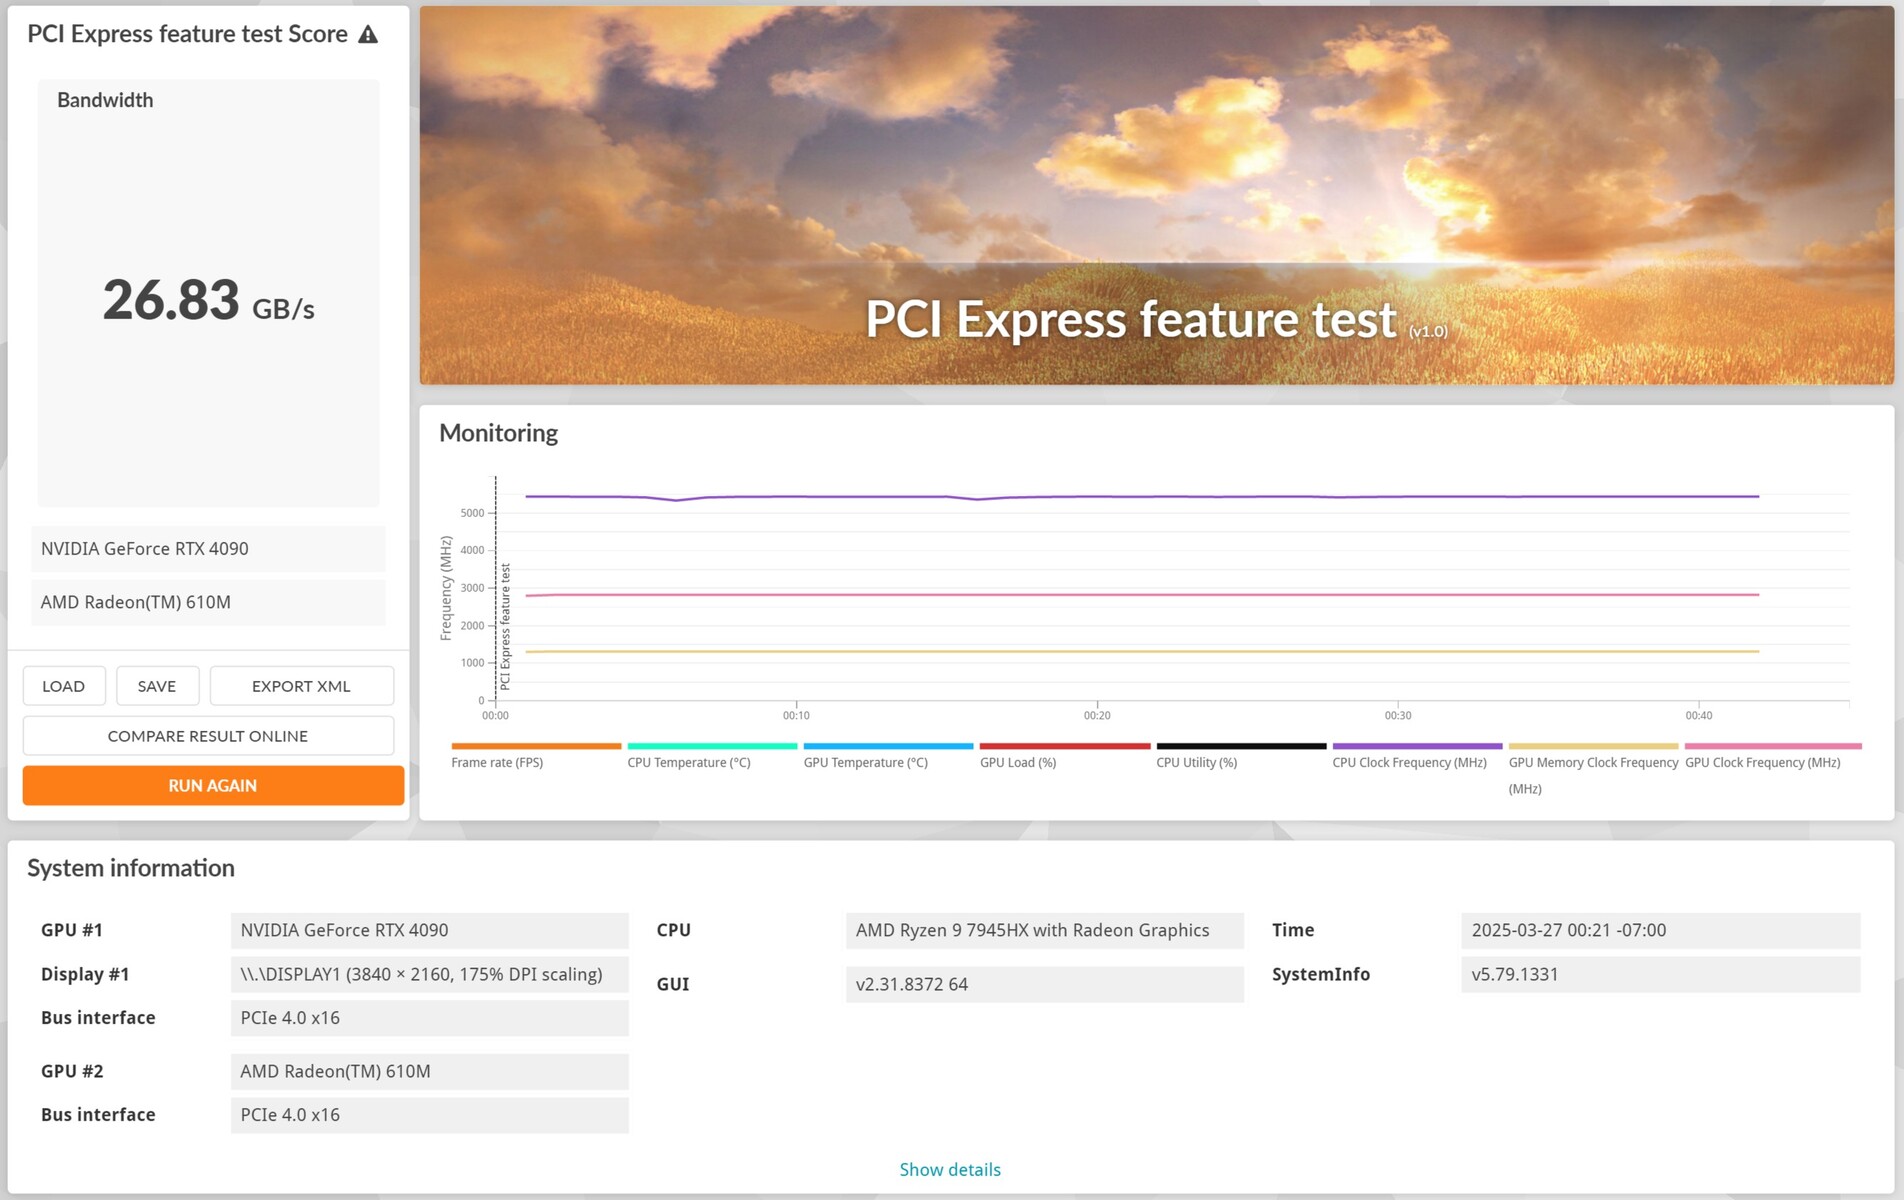
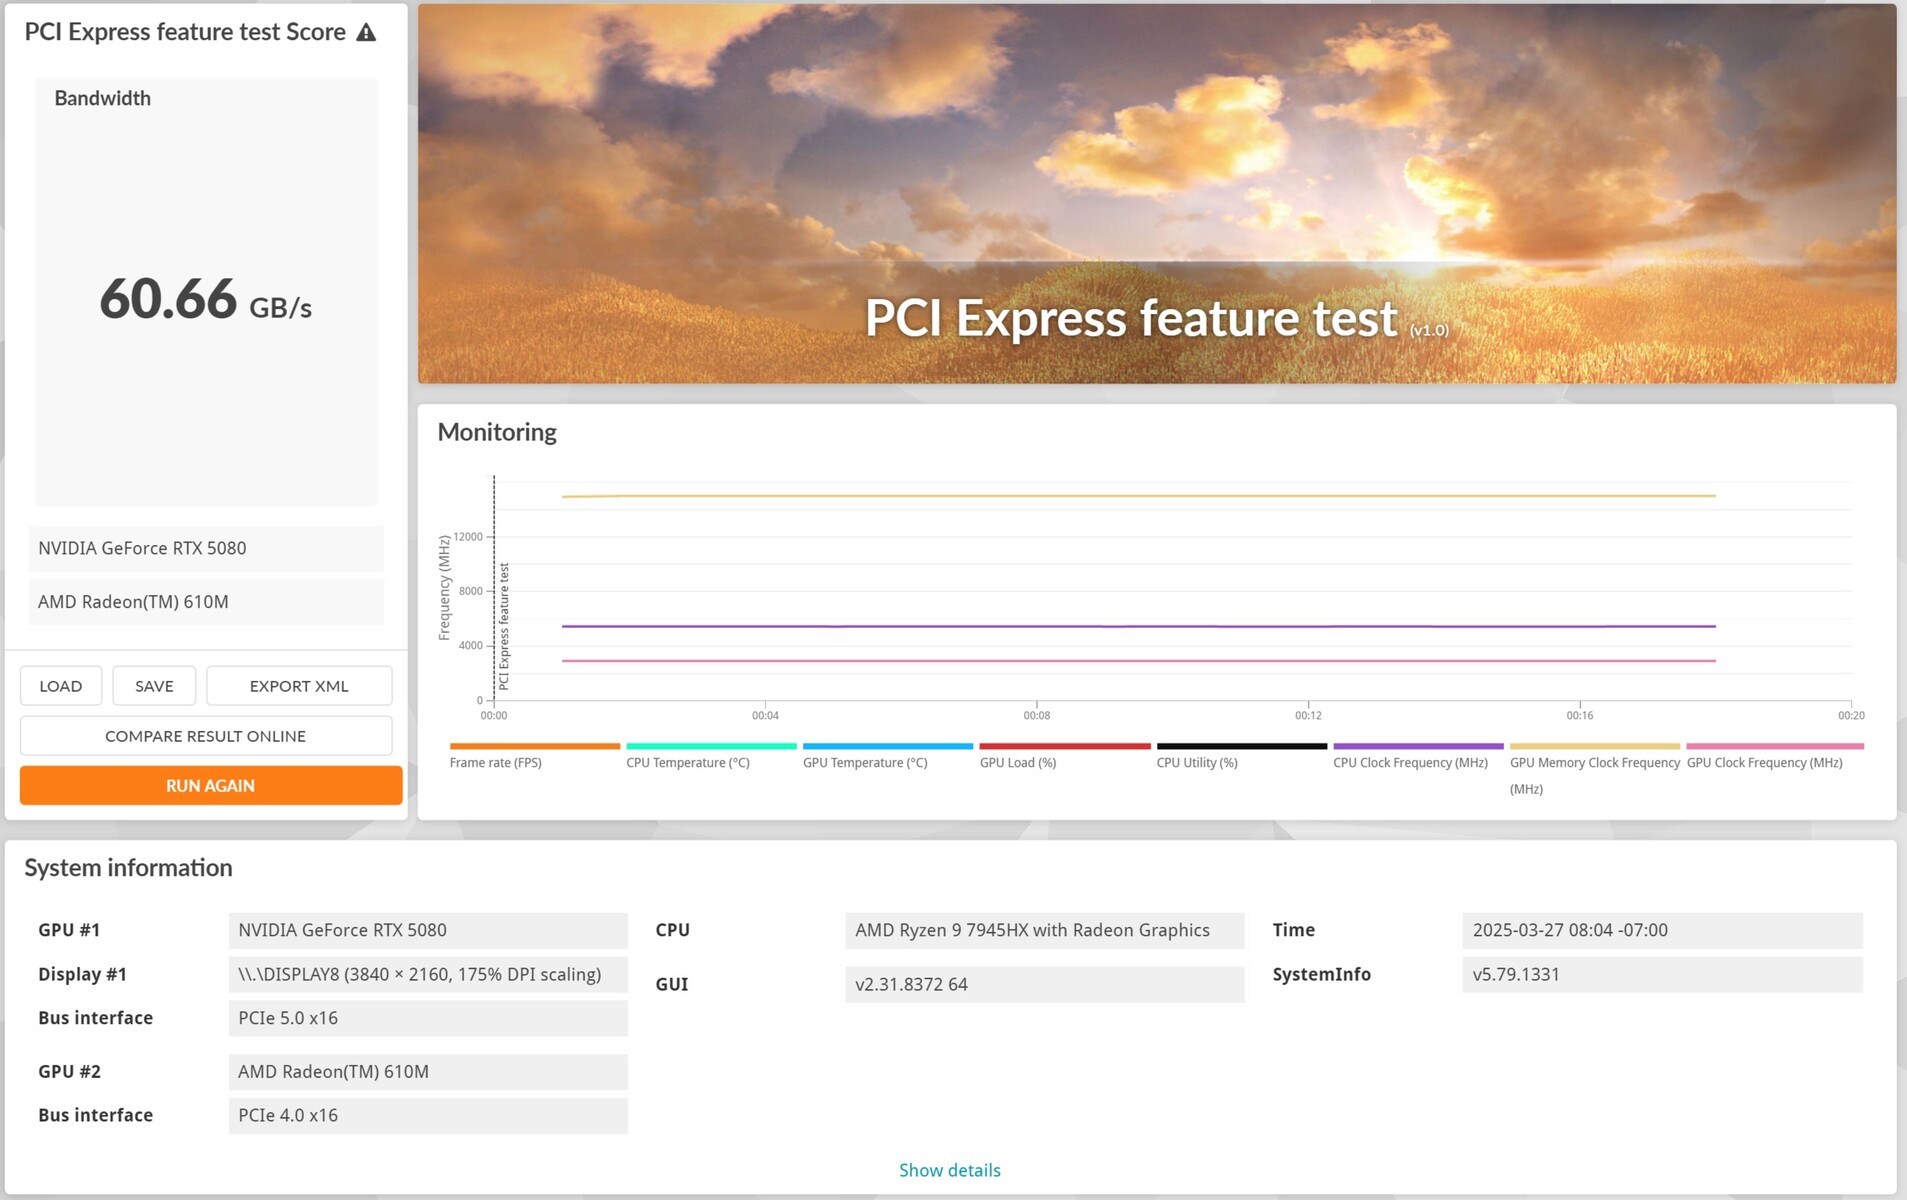
Durante nosso teste, o Minisforum BD795i SE apresentou um desempenho impressionante em combinação com a Nvidia GeForce RTX 4090. Graças ao slot PCIe 5.0 x16 completo, a placa de vídeo foi capaz de liberar todo o seu potencial. Ao executar os jogos atuais, o sistema gerenciou altas taxas de fps e exibiu sem problemas em 4K com o máximo de detalhes. O teste de largura de banda em conjunto com uma placa de vídeo Nvidia GeForce RTX 5080 confirmou a utilização total da interface PCIe 5.0 x16.
Performance comparison at CPU limit at 720p / 1,080p
| Performance Rating - Percent | |
| AMD Ryzen 7 9800X3D | |
| Intel Core Ultra 9 285K | |
| Intel Core Ultra 5 245K | |
| Minisforum BD795i SE, RTX 4090 | |
| Minisforum UM890 Pro (Nvidia GeForce RTX 4090 @OCuLink) | |
| 3DMark 11 - 1280x720 Performance GPU | |
| AMD Ryzen 7 9800X3D | |
| Intel Core Ultra 5 245K | |
| Minisforum UM890 Pro (Nvidia GeForce RTX 4090 @OCuLink) | |
| Intel Core Ultra 9 285K | |
| Minisforum BD795i SE, RTX 4090 | |
| 3DMark | |
| 2560x1440 Time Spy Graphics | |
| AMD Ryzen 7 9800X3D | |
| Intel Core Ultra 5 245K | |
| Intel Core Ultra 9 285K | |
| Minisforum UM890 Pro (Nvidia GeForce RTX 4090 @OCuLink) | |
| Minisforum BD795i SE, RTX 4090 | |
| 1920x1080 Fire Strike Graphics | |
| AMD Ryzen 7 9800X3D | |
| Intel Core Ultra 5 245K | |
| Minisforum UM890 Pro (Nvidia GeForce RTX 4090 @OCuLink) | |
| Minisforum BD795i SE, RTX 4090 | |
| Intel Core Ultra 9 285K | |
| 3840x2160 Fire Strike Ultra Graphics | |
| Minisforum BD795i SE, RTX 4090 | |
| Intel Core Ultra 5 245K | |
| AMD Ryzen 7 9800X3D | |
| Intel Core Ultra 9 285K | |
| Minisforum UM890 Pro (Nvidia GeForce RTX 4090 @OCuLink) | |
| Unigine Superposition | |
| 1280x720 720p Low | |
| AMD Ryzen 7 9800X3D | |
| Intel Core Ultra 9 285K | |
| Minisforum BD795i SE, RTX 4090 | |
| Intel Core Ultra 5 245K | |
| Minisforum UM890 Pro (Nvidia GeForce RTX 4090 @OCuLink) | |
| 1920x1080 1080p High | |
| AMD Ryzen 7 9800X3D | |
| Minisforum BD795i SE, RTX 4090 | |
| Intel Core Ultra 9 285K | |
| Intel Core Ultra 5 245K | |
| Minisforum UM890 Pro (Nvidia GeForce RTX 4090 @OCuLink) | |
| 1920x1080 1080p Extreme | |
| Intel Core Ultra 9 285K | |
| Minisforum BD795i SE, RTX 4090 | |
| AMD Ryzen 7 9800X3D | |
| Intel Core Ultra 5 245K | |
| Minisforum UM890 Pro (Nvidia GeForce RTX 4090 @OCuLink) | |
| 3840x2160 4k Optimized | |
| AMD Ryzen 7 9800X3D | |
| Intel Core Ultra 9 285K | |
| Minisforum BD795i SE, RTX 4090 | |
| Intel Core Ultra 5 245K | |
| Minisforum UM890 Pro (Nvidia GeForce RTX 4090 @OCuLink) | |
| 7680x4320 8k Optimized | |
| AMD Ryzen 7 9800X3D | |
| Intel Core Ultra 5 245K | |
| Intel Core Ultra 9 285K | |
| Minisforum BD795i SE, RTX 4090 | |
| Minisforum UM890 Pro (Nvidia GeForce RTX 4090 @OCuLink) | |
| Unigine Valley 1.0 | |
| 1920x1080 Extreme HD DirectX AA:x8 | |
| AMD Ryzen 7 9800X3D | |
| Intel Core Ultra 9 285K | |
| Minisforum BD795i SE, RTX 4090 | |
| Intel Core Ultra 5 245K | |
| Minisforum UM890 Pro (Nvidia GeForce RTX 4090 @OCuLink) | |
| 1920x1080 Extreme HD Preset OpenGL AA:x8 | |
| AMD Ryzen 7 9800X3D | |
| Intel Core Ultra 9 285K | |
| Intel Core Ultra 5 245K | |
| Minisforum BD795i SE, RTX 4090 | |
| Minisforum UM890 Pro (Nvidia GeForce RTX 4090 @OCuLink) | |
| Unigine Heaven 4.0 | |
| Extreme Preset OpenGL | |
| AMD Ryzen 7 9800X3D | |
| Intel Core Ultra 9 285K | |
| Minisforum BD795i SE, RTX 4090 | |
| Intel Core Ultra 5 245K | |
| Minisforum UM890 Pro (Nvidia GeForce RTX 4090 @OCuLink) | |
| Extreme Preset DX11 | |
| AMD Ryzen 7 9800X3D | |
| Intel Core Ultra 9 285K | |
| Minisforum BD795i SE, RTX 4090 | |
| Intel Core Ultra 5 245K | |
| Minisforum UM890 Pro (Nvidia GeForce RTX 4090 @OCuLink) | |
| ComputeMark v2.1 | |
| 1024x600 Normal, Score | |
| AMD Ryzen 7 9800X3D | |
| Minisforum BD795i SE, RTX 4090 | |
| Intel Core Ultra 9 285K | |
| Intel Core Ultra 5 245K | |
| Minisforum UM890 Pro (Nvidia GeForce RTX 4090 @OCuLink) | |
| 1024x600 Normal, Fluid 3DTex | |
| Minisforum BD795i SE, RTX 4090 | |
| AMD Ryzen 7 9800X3D | |
| Intel Core Ultra 9 285K | |
| Minisforum UM890 Pro (Nvidia GeForce RTX 4090 @OCuLink) | |
| Intel Core Ultra 5 245K | |
| 1024x600 Normal, Fluid 2DTexArr | |
| AMD Ryzen 7 9800X3D | |
| Minisforum BD795i SE, RTX 4090 | |
| Intel Core Ultra 9 285K | |
| Intel Core Ultra 5 245K | |
| Minisforum UM890 Pro (Nvidia GeForce RTX 4090 @OCuLink) | |
| 1024x600 Normal, Mandel Vector | |
| AMD Ryzen 7 9800X3D | |
| Intel Core Ultra 9 285K | |
| Minisforum BD795i SE, RTX 4090 | |
| Intel Core Ultra 5 245K | |
| Minisforum UM890 Pro (Nvidia GeForce RTX 4090 @OCuLink) | |
| 1024x600 Normal, Mandel Scalar | |
| AMD Ryzen 7 9800X3D | |
| Minisforum BD795i SE, RTX 4090 | |
| Intel Core Ultra 5 245K | |
| Intel Core Ultra 9 285K | |
| Minisforum UM890 Pro (Nvidia GeForce RTX 4090 @OCuLink) | |
| 1024x600 Normal, QJuliaRayTrace | |
| AMD Ryzen 7 9800X3D | |
| Minisforum BD795i SE, RTX 4090 | |
| Intel Core Ultra 5 245K | |
| Intel Core Ultra 9 285K | |
| Minisforum UM890 Pro (Nvidia GeForce RTX 4090 @OCuLink) | |
Performance comparison at CPU limit at 720p / 1,080p
| Performance Rating - Percent | |
| AMD Ryzen 7 9800X3D | |
| Minisforum BD795i SE, RTX 4090 | |
| F1 24 - 1920x1080 Low Preset AA:T AF:16x | |
| AMD Ryzen 7 9800X3D | |
| Minisforum BD795i SE, RTX 4090 | |
| Indiana Jones and the Great Circle - 1920x1080 Low Preset | |
| AMD Ryzen 7 9800X3D | |
| Minisforum BD795i SE, RTX 4090 | |
| Black Myth: Wukong - 1280x720 low TSR 100 | |
| AMD Ryzen 7 9800X3D | |
| Minisforum BD795i SE, RTX 4090 | |
| Baldur's Gate 3 - 1280x720 Low Preset | |
| AMD Ryzen 7 9800X3D | |
| Minisforum BD795i SE, RTX 4090 | |
| The Witcher 3 - 1024x768 Low Graphics & Postprocessing | |
| AMD Ryzen 7 9800X3D | |
| Minisforum BD795i SE, RTX 4090 | |
| Final Fantasy XV Benchmark - 1280x720 Lite Quality | |
| AMD Ryzen 7 9800X3D | |
| Minisforum BD795i SE, RTX 4090 | |
Performance comparison at GPU limit at 2,160p
| Performance Rating - Percent | |
| AMD Ryzen 7 9800X3D | |
| Minisforum BD795i SE, RTX 4090 | |
| F1 24 - 3840x2160 Ultra High Preset AA:T AF:16x | |
| Minisforum BD795i SE, RTX 4090 | |
| AMD Ryzen 7 9800X3D | |
| Indiana Jones and the Great Circle - 3840x2160 Very Ultra Preset | |
| AMD Ryzen 7 9800X3D | |
| Minisforum BD795i SE, RTX 4090 | |
| Black Myth: Wukong - 3840x2160 cinematic TSR 100 | |
| AMD Ryzen 7 9800X3D | |
| Minisforum BD795i SE, RTX 4090 | |
| Baldur's Gate 3 - 3840x2160 Ultra Preset | |
| AMD Ryzen 7 9800X3D | |
| Minisforum BD795i SE, RTX 4090 | |
| The Witcher 3 - 3840x2160 Ultra Graphics & Postprocessing (HBAO+) | |
| AMD Ryzen 7 9800X3D | |
| Minisforum BD795i SE, RTX 4090 | |
| Final Fantasy XV Benchmark - 3840x2160 High Quality | |
| AMD Ryzen 7 9800X3D | |
| Minisforum BD795i SE, RTX 4090 | |
| baixo | média | alto | ultra | QHD | 4K | |
|---|---|---|---|---|---|---|
| The Witcher 3 (2015) | 670 | 579 | 531 | 288 | 251 | 273 |
| Dota 2 Reborn (2015) | 252 | 219 | 204 | 197.2 | 192.1 | |
| Final Fantasy XV Benchmark (2018) | 233 | 231 | 210 | 204 | 160.1 | |
| X-Plane 11.11 (2018) | 128 | 121 | 97.4 | 90.8 | ||
| Strange Brigade (2018) | 593 | 472 | 465 | 478 | 467 | 290 |
| Baldur's Gate 3 (2023) | 282 | 252 | 232 | 228 | 204 | 128.1 |
| Cyberpunk 2077 2.2 Phantom Liberty (2023) | 185.3 | 184.3 | 175.3 | 166.2 | 155.7 | 78.1 |
| F1 24 (2024) | 351 | 370 | 357 | 184.5 | 168.4 | 93.4 |
| Black Myth: Wukong (2024) | 201 | 172 | 137 | 88 | 69 | 44 |
| Indiana Jones and the Great Circle (2024) | 246 | 210 | 194 | 163.8 | 107.5 | |
| Monster Hunter Wilds (2025) | 104.2 | 101.1 | 93.7 | 92.7 | 70.6 |
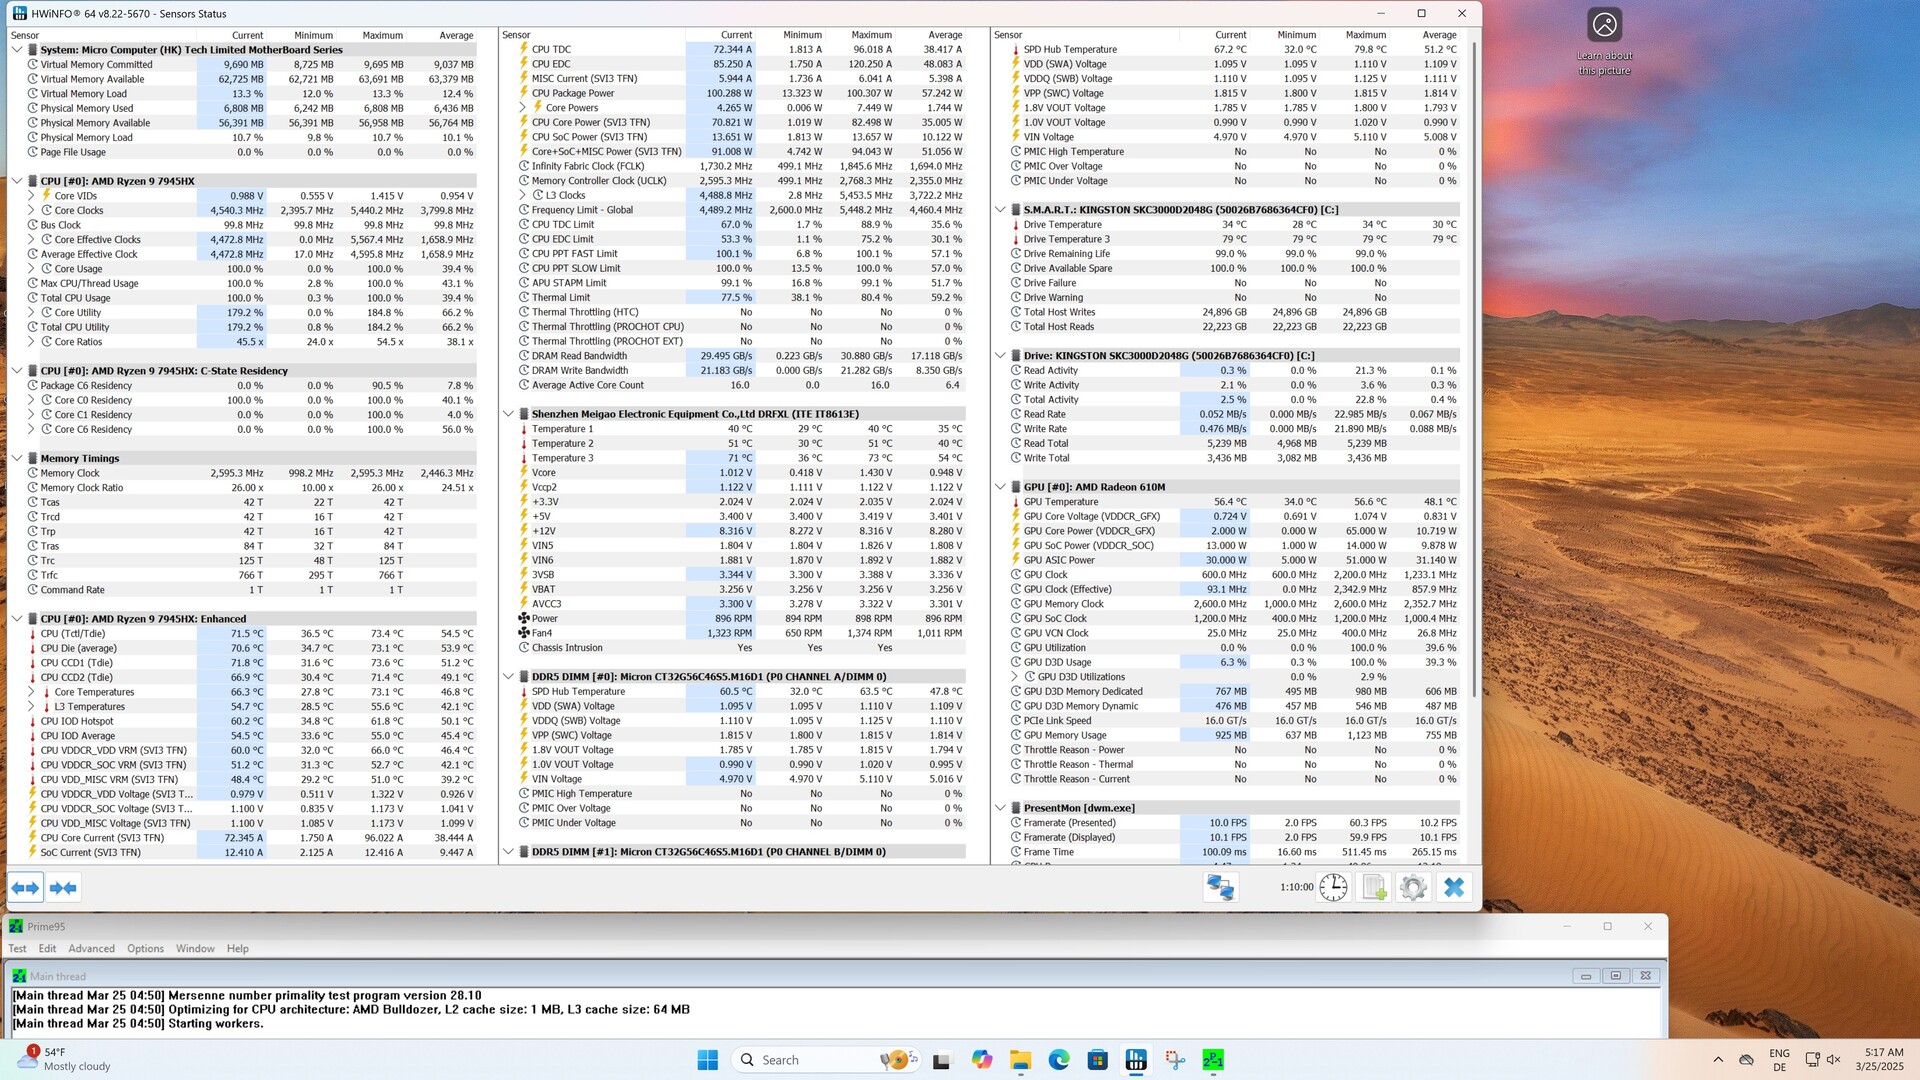
Requisitos de energia e temperaturas
A Minisforum fornece o BD795i SE com resfriamento por heatpipe pré-instalado para a CPU e o conversor de tensão. O usuário precisa instalar uma ventoinha de 120 mm, mas o material de montagem necessário já está incluído. Usamos a Noctua NF-A12x25, que já se mostrou eficaz em nossa análise do BD770i e do BD790i. Uma das principais vantagens do BD795i SE é sua alta eficiência: Durante o multiteste Cinebench R15, medimos apenas cerca de 140 watts, o que é impressionante para o desempenho oferecido.
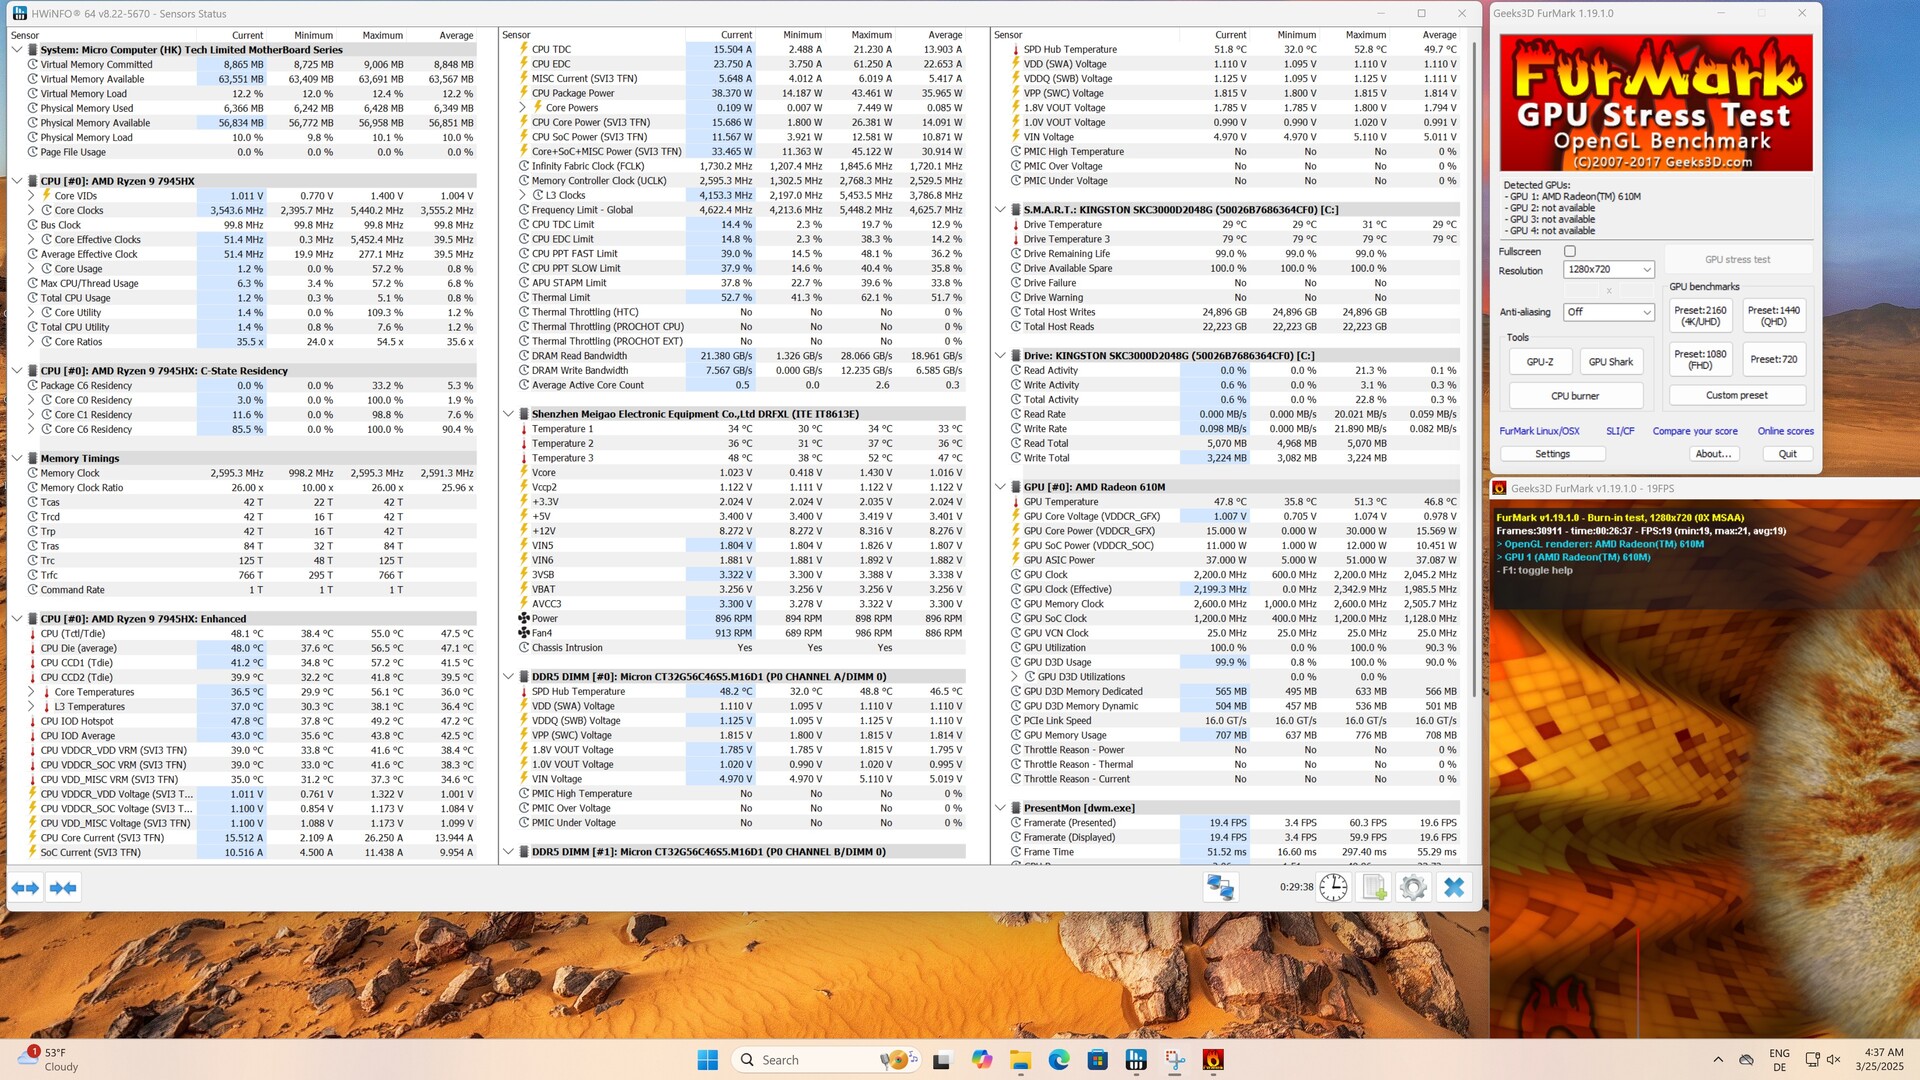
Com relação às emissões de ruído: A placa-mãe em si não produziu nenhum ruído durante nosso teste, pois não há elementos de resfriamento ativos. O resfriamento funcionou de forma eficaz e não ocorreram temperaturas críticas. No entanto, um resfriamento separado para a CPU e os VRMs faria sentido, especialmente ao usar o resfriamento a água AiO. A BD795M da Minisforum, por exemplo, é uma placa-mãe mATX do mesmo fabricante que permite o uso de suas próprias soluções de resfriamento. Por que não também para os modelos Mini-ITX?
Em comparação com os fabricantes de placas-mãe estabelecidos, o BIOS oferece apenas algumas opções. Embora o senhor possa ajustar o consumo de energia da CPU, não é possível ajustar a curva da ventoinha. Caso o Minisforum continue a atender ao mercado, seria desejável uma otimização do BIOS mais fácil de usar. Uma ferramenta de monitoramento baseada no Windows certamente seria uma adição útil.
Efficiency overview
| Performance Rating - Percent | |
| Minisforum BD790i | |
| Minisforum BD795i SE | |
| Minisforum BD770i | |
| Intel Core Ultra 9 285K | |
| Intel Core Ultra 5 245K | |
| AMD Ryzen 7 9800X3D | |
| Power Consumption | |
| Cinebench R23 Multi Power Efficiency - external Monitor | |
| Minisforum BD790i | |
| Minisforum BD795i SE | |
| Minisforum BD770i | |
| Intel Core Ultra 9 285K | |
| Intel Core Ultra 5 245K | |
| AMD Ryzen 7 9800X3D | |
| Cinebench R23 Single Power Efficiency - external Monitor | |
| Minisforum BD770i | |
| Minisforum BD790i | |
| Minisforum BD795i SE | |
| Intel Core Ultra 9 285K | |
| Intel Core Ultra 5 245K | |
| AMD Ryzen 7 9800X3D | |
| Cinebench R15 Multi Efficiency (external Monitor) | |
| Minisforum BD790i | |
| Minisforum BD795i SE | |
| Minisforum BD770i | |
| Intel Core Ultra 9 285K | |
| Intel Core Ultra 5 245K | |
| AMD Ryzen 7 9800X3D | |
Power consumption without dedicated graphics card
Power consumption with Nvidia GeForce RTX 4090
Classificação total do Notebookcheck
A Minisforum BD795i SE é uma poderosa placa-mãe mini-ITX equipada com o AMD Ryzen 9 7945HX. Graças ao seu design compacto e resfriamento eficiente, ela é ideal para pequenos PCs de alto desempenho. No entanto, seu BIOS oferece apenas opções limitadas e seu resfriamento poderia ser mais flexível.
Transparência
A seleção dos dispositivos a serem analisados é feita pela nossa equipe editorial. A amostra de teste foi fornecida gratuitamente ao autor pelo fabricante para fins de revisão. Não houve influência de terceiros nesta revisão, nem o fabricante recebeu uma cópia desta revisão antes da publicação. Não houve obrigação de publicar esta revisão. Nunca aceitamos compensação ou pagamento em troca de nossas avaliações. Como empresa de mídia independente, a Notebookcheck não está sujeita à autoridade de fabricantes, varejistas ou editores.
É assim que o Notebookcheck está testando
Todos os anos, o Notebookcheck analisa de forma independente centenas de laptops e smartphones usando procedimentos padronizados para garantir que todos os resultados sejam comparáveis. Desenvolvemos continuamente nossos métodos de teste há cerca de 20 anos e definimos padrões da indústria no processo. Em nossos laboratórios de teste, equipamentos de medição de alta qualidade são utilizados por técnicos e editores experientes. Esses testes envolvem um processo de validação em vários estágios. Nosso complexo sistema de classificação é baseado em centenas de medições e benchmarks bem fundamentados, o que mantém a objetividade.
