

Análise do laptop robusto Durabook S15: Surpreendentemente fino e leve para a categoria

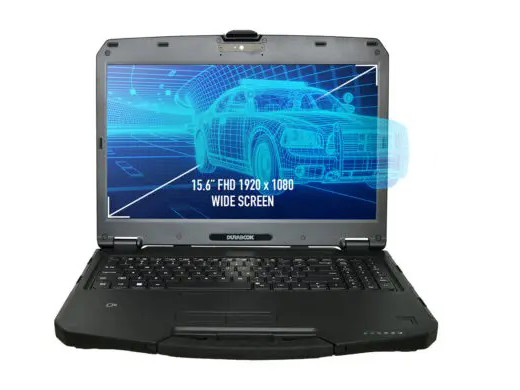
O 2024 S15 é o mais recente laptop robusto de 15,6 polegadas da Durabook, sucedendo o design antigo do 2020 S15. Ele apresenta algumas mudanças externas, além de CPUs Alder Lake mais novas, prontas para vPro, que substituem as opções Whiskey Lake-U do 2020 mais antigo.
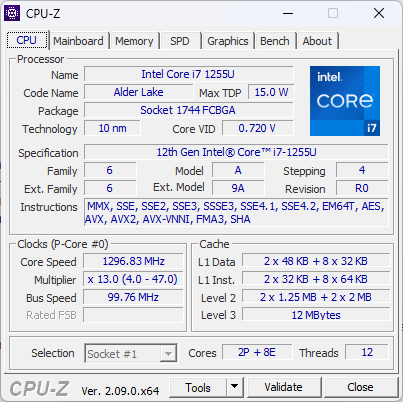
Nossa unidade em análise vem com a CPU Core i7-1255U de 12ª geração, gráficos Iris Xe integrados e tela IPS 1080p de 1000 nits, enquanto outras SKUs podem oferecer o Core i5-1235U mais lento, gráficos Quadro T1000 discretos mais rápidos ou uma tela mais fraca. A folha de especificações completa pode ser encontrada em aqui.
Mais análises do Durabook:
Possíveis concorrentes em comparação
Avaliação | Data | Modelo | Peso | Altura | Size | Resolução | Preço |
|---|---|---|---|---|---|---|---|
| 80.5 % | 06/2024 | Durabook S15 i7-1255U, Iris Xe G7 96EUs | 2.7 kg | 29.5 mm | 15.60" | 1920x1080 | |
| 78.3 % v7 (old) | Durabook S15ABG2 i5-8265U, UHD Graphics 620 | 2.6 kg | 30 mm | 15.60" | 1920x1080 | ||
v (old) | 07/2022 | Panasonic Toughbook 40 i7-1185G7, Iris Xe G7 96EUs | 3.9 kg | 53.4 mm | 14.00" | 1920x1080 | |
| 82.9 % v7 (old) | 06/2024 | Getac S410 G5 i5-1350P, Iris Xe G7 80EUs | 2.9 kg | 34.9 mm | 14.00" | 1920x1080 | |
| 89.2 % v6 (old) | Dell Latitude 5420 Rugged-P85G i7-8650U, Radeon RX 540 | 2.8 kg | 32.9 mm | 14.00" | 1920x1080 | ||
| 82.4 % v7 (old) | 12/2021 | Acer Enduro Urban N3 EUN314 i7-1165G7, Iris Xe G7 96EUs | 1.8 kg | 21.95 mm | 14.00" | 1920x1080 |
Estojo - Certificado MIL-STD-810H
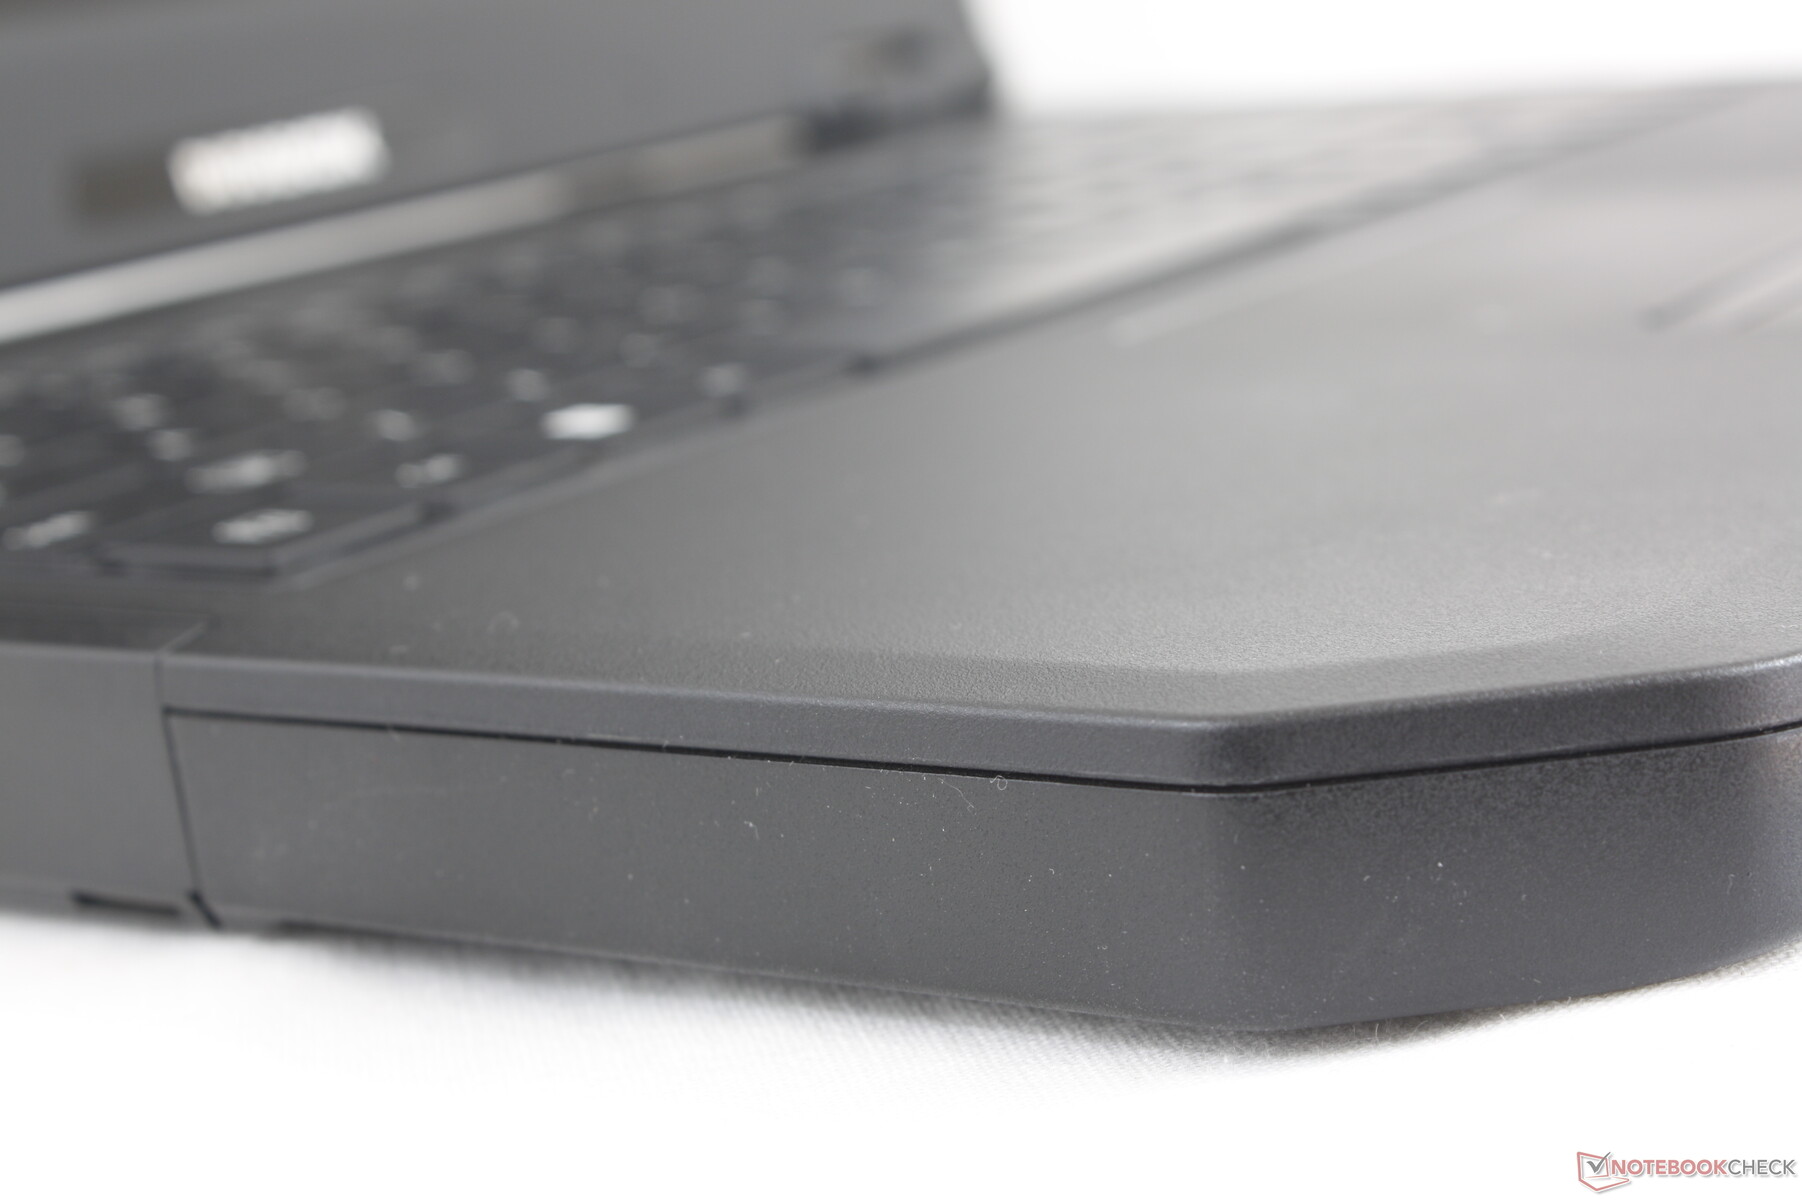
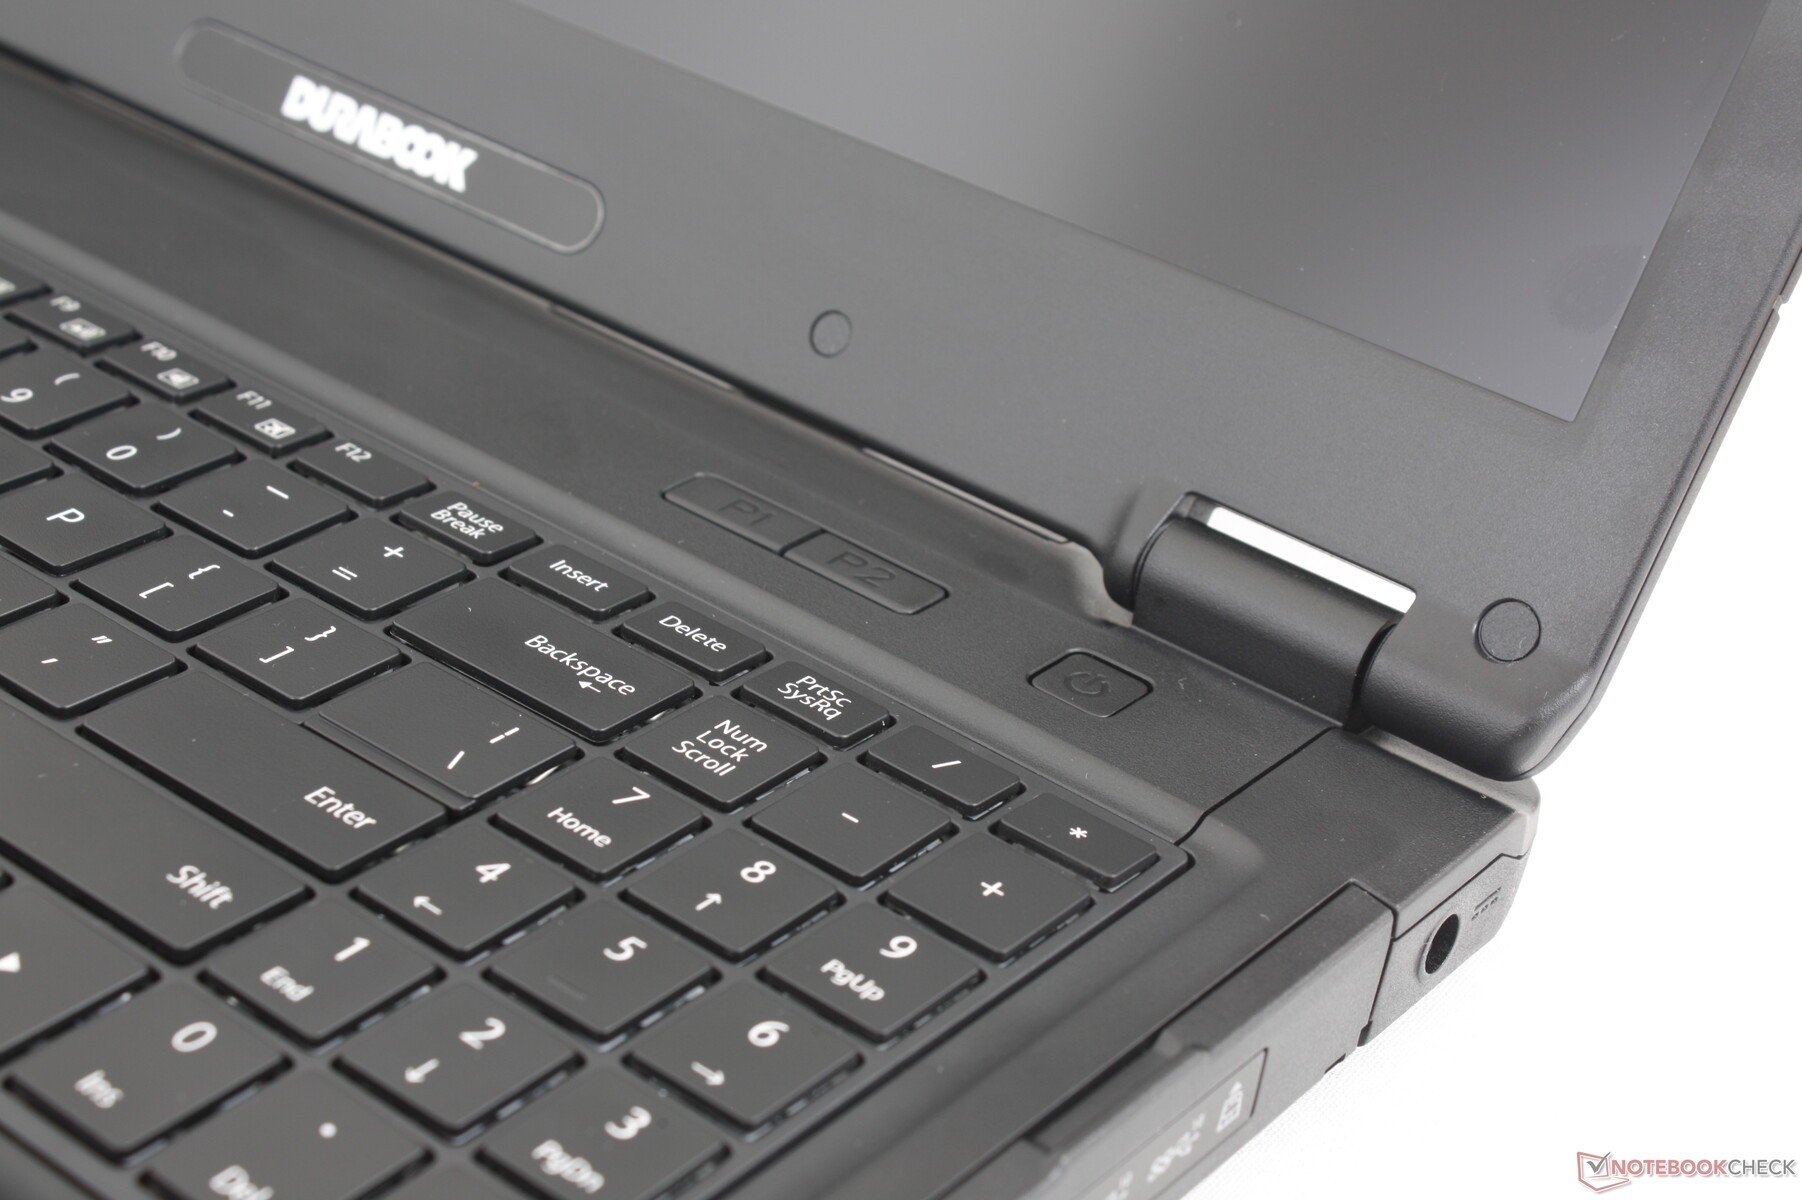
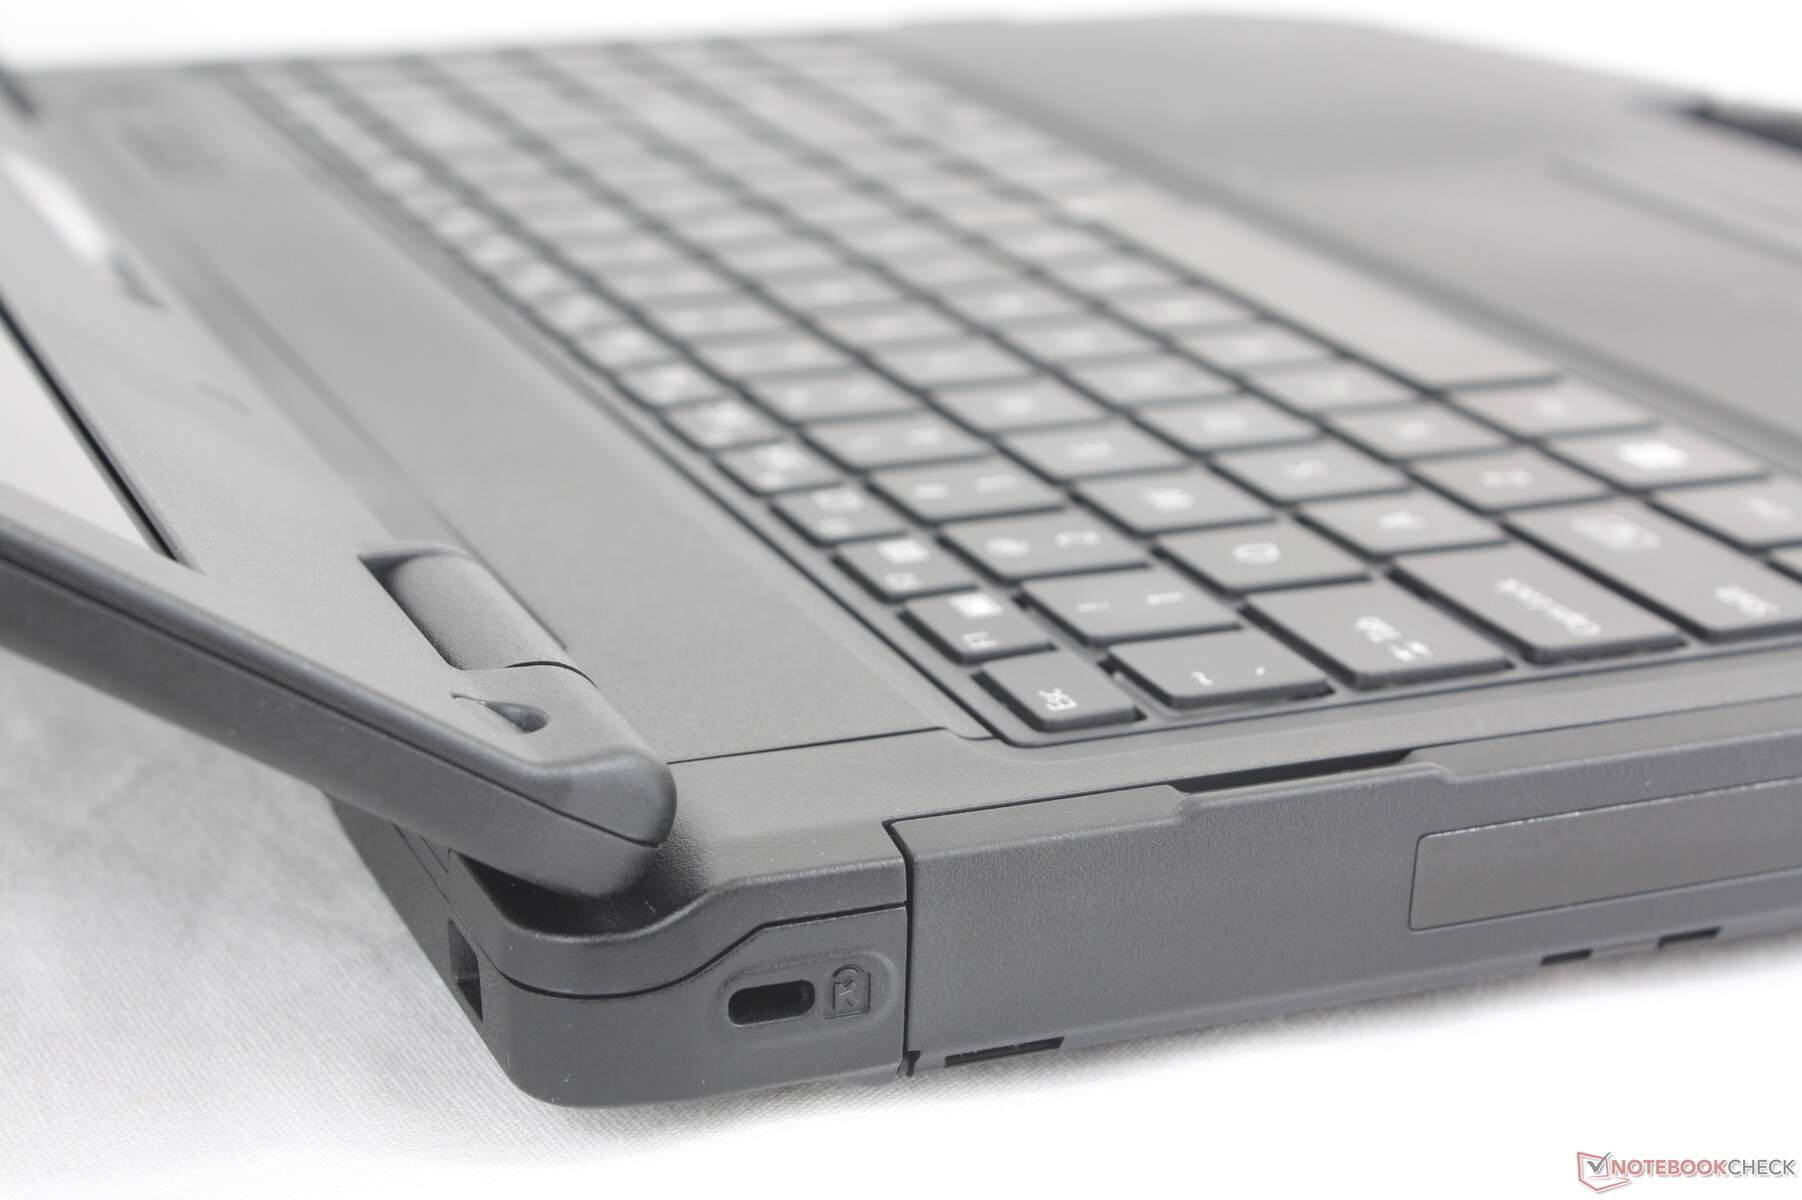
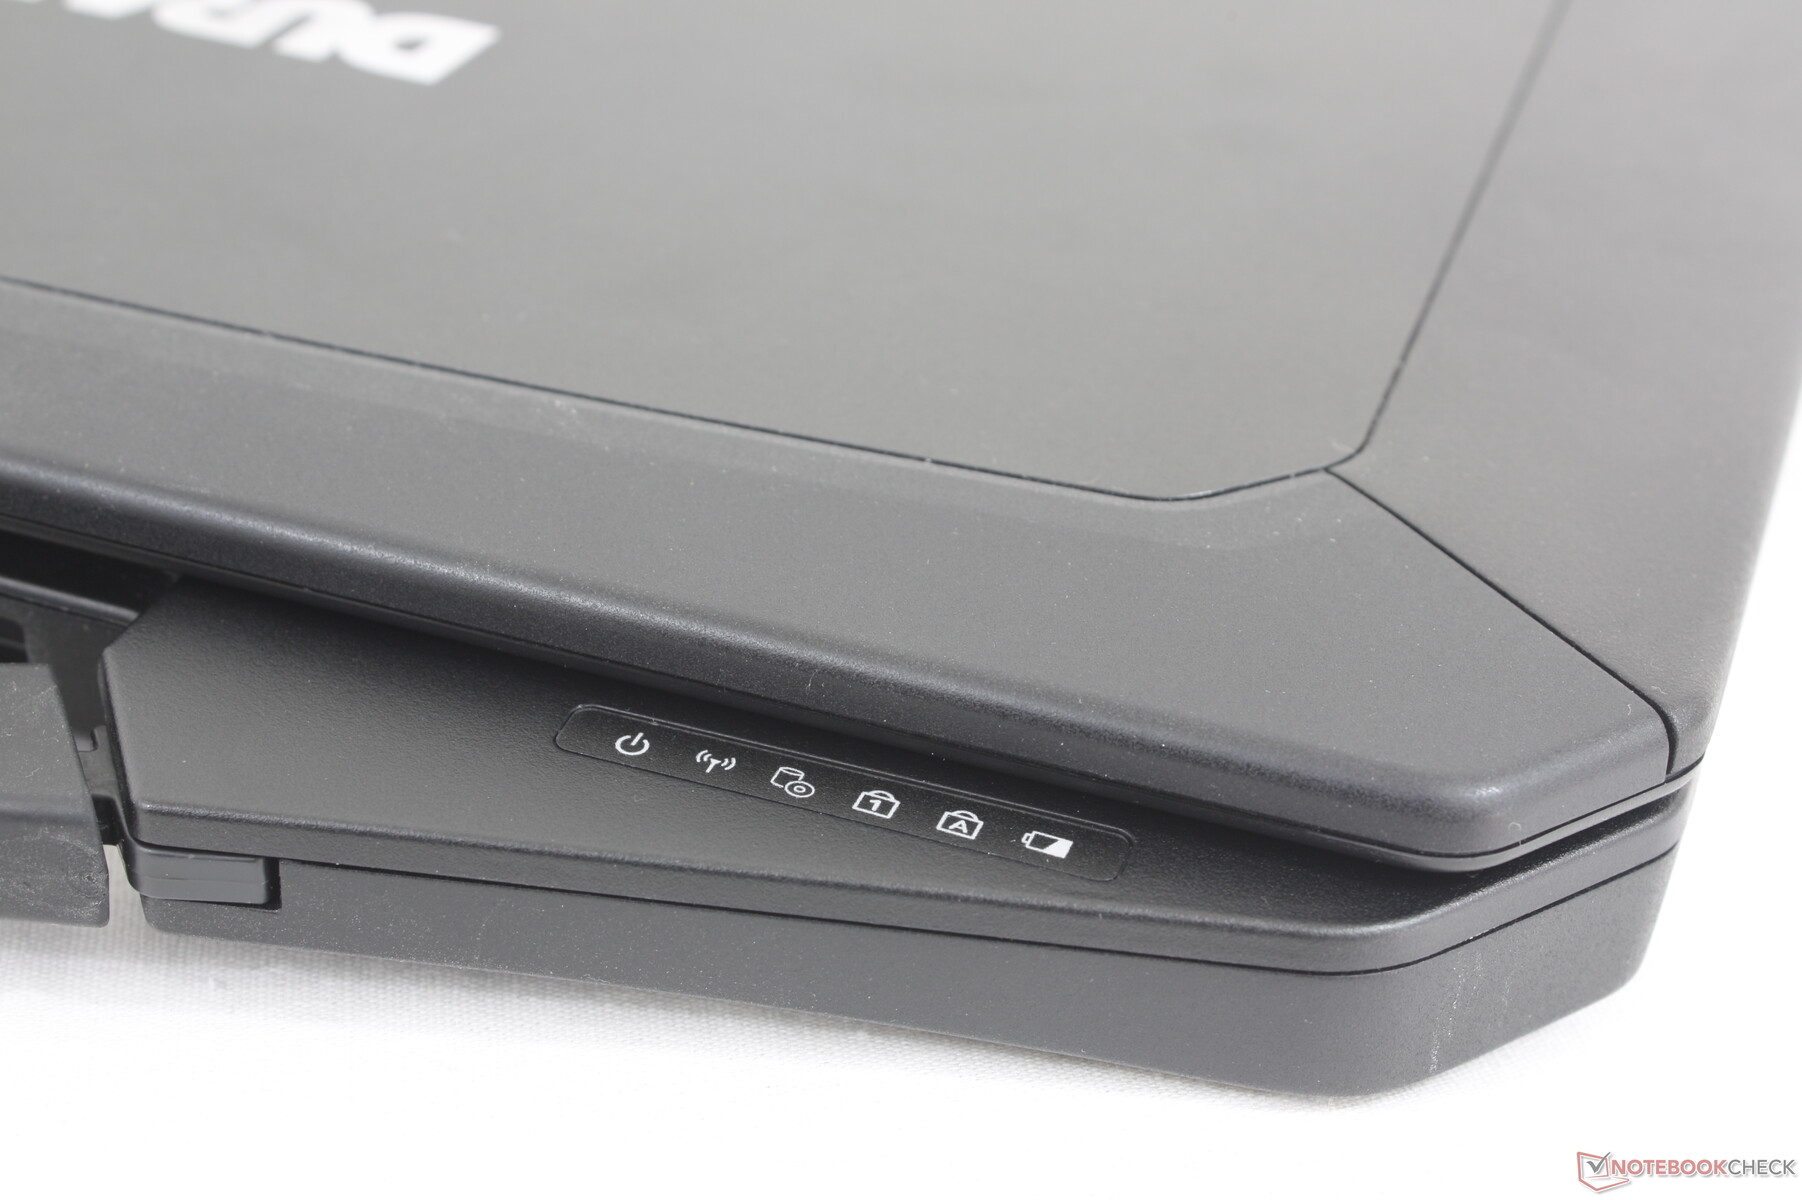
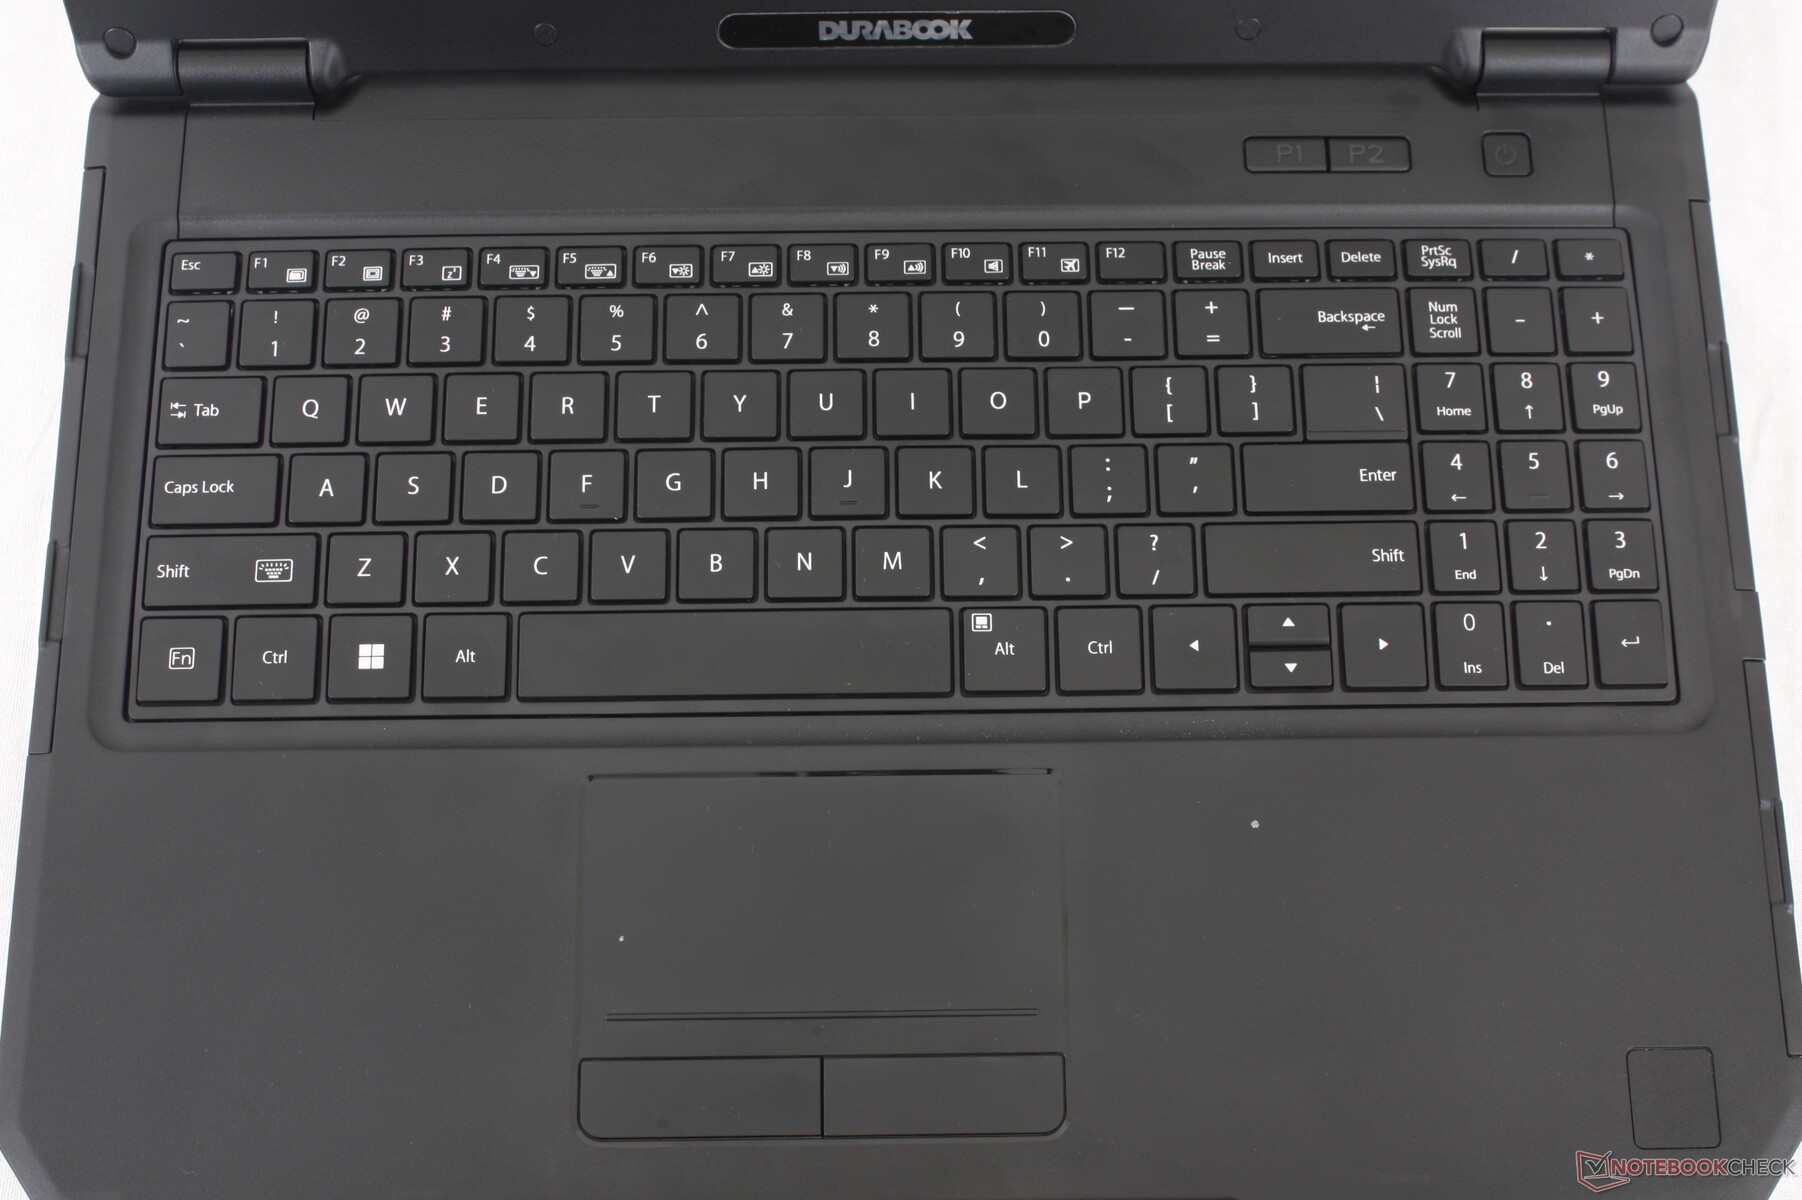
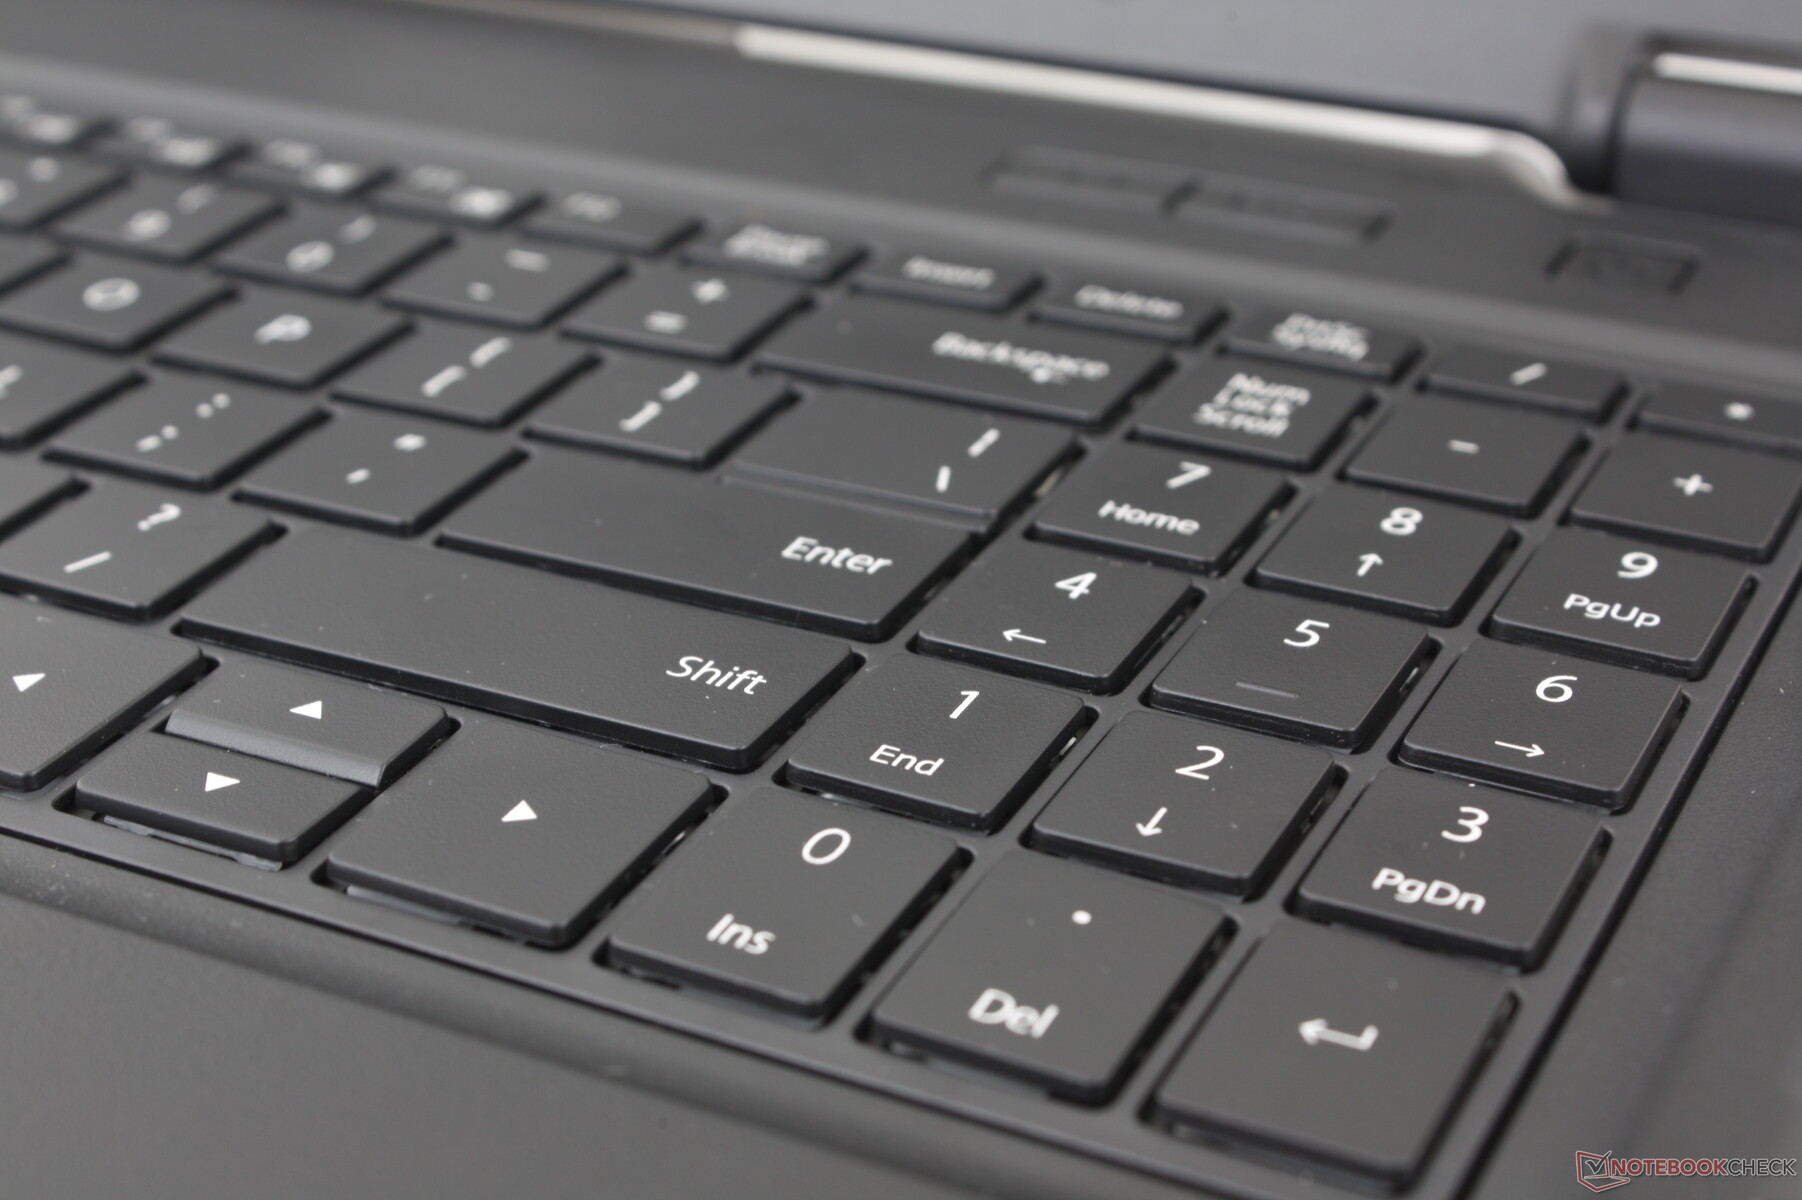
Visualmente, foram feitos alguns ajustes no chassi, incluindo a nova cor preta uniforme, teclado maior com teclado numérico, transição de superfície mais suave entre o deck do teclado e a alça de transporte e posicionamento revisado das portas devido a todas as alterações internas na placa-mãe. A qualidade do chassi continua excelente, como antes, exceto pela parte do teclado numérico, em que a superfície tende a se deformar com muito mais facilidade quando se aplica pressão. Achamos que o Getac S410 mais espesso é mais resistente, especialmente nos cantos, pois o Durabook não é emborrachado para melhor proteção contra quedas.
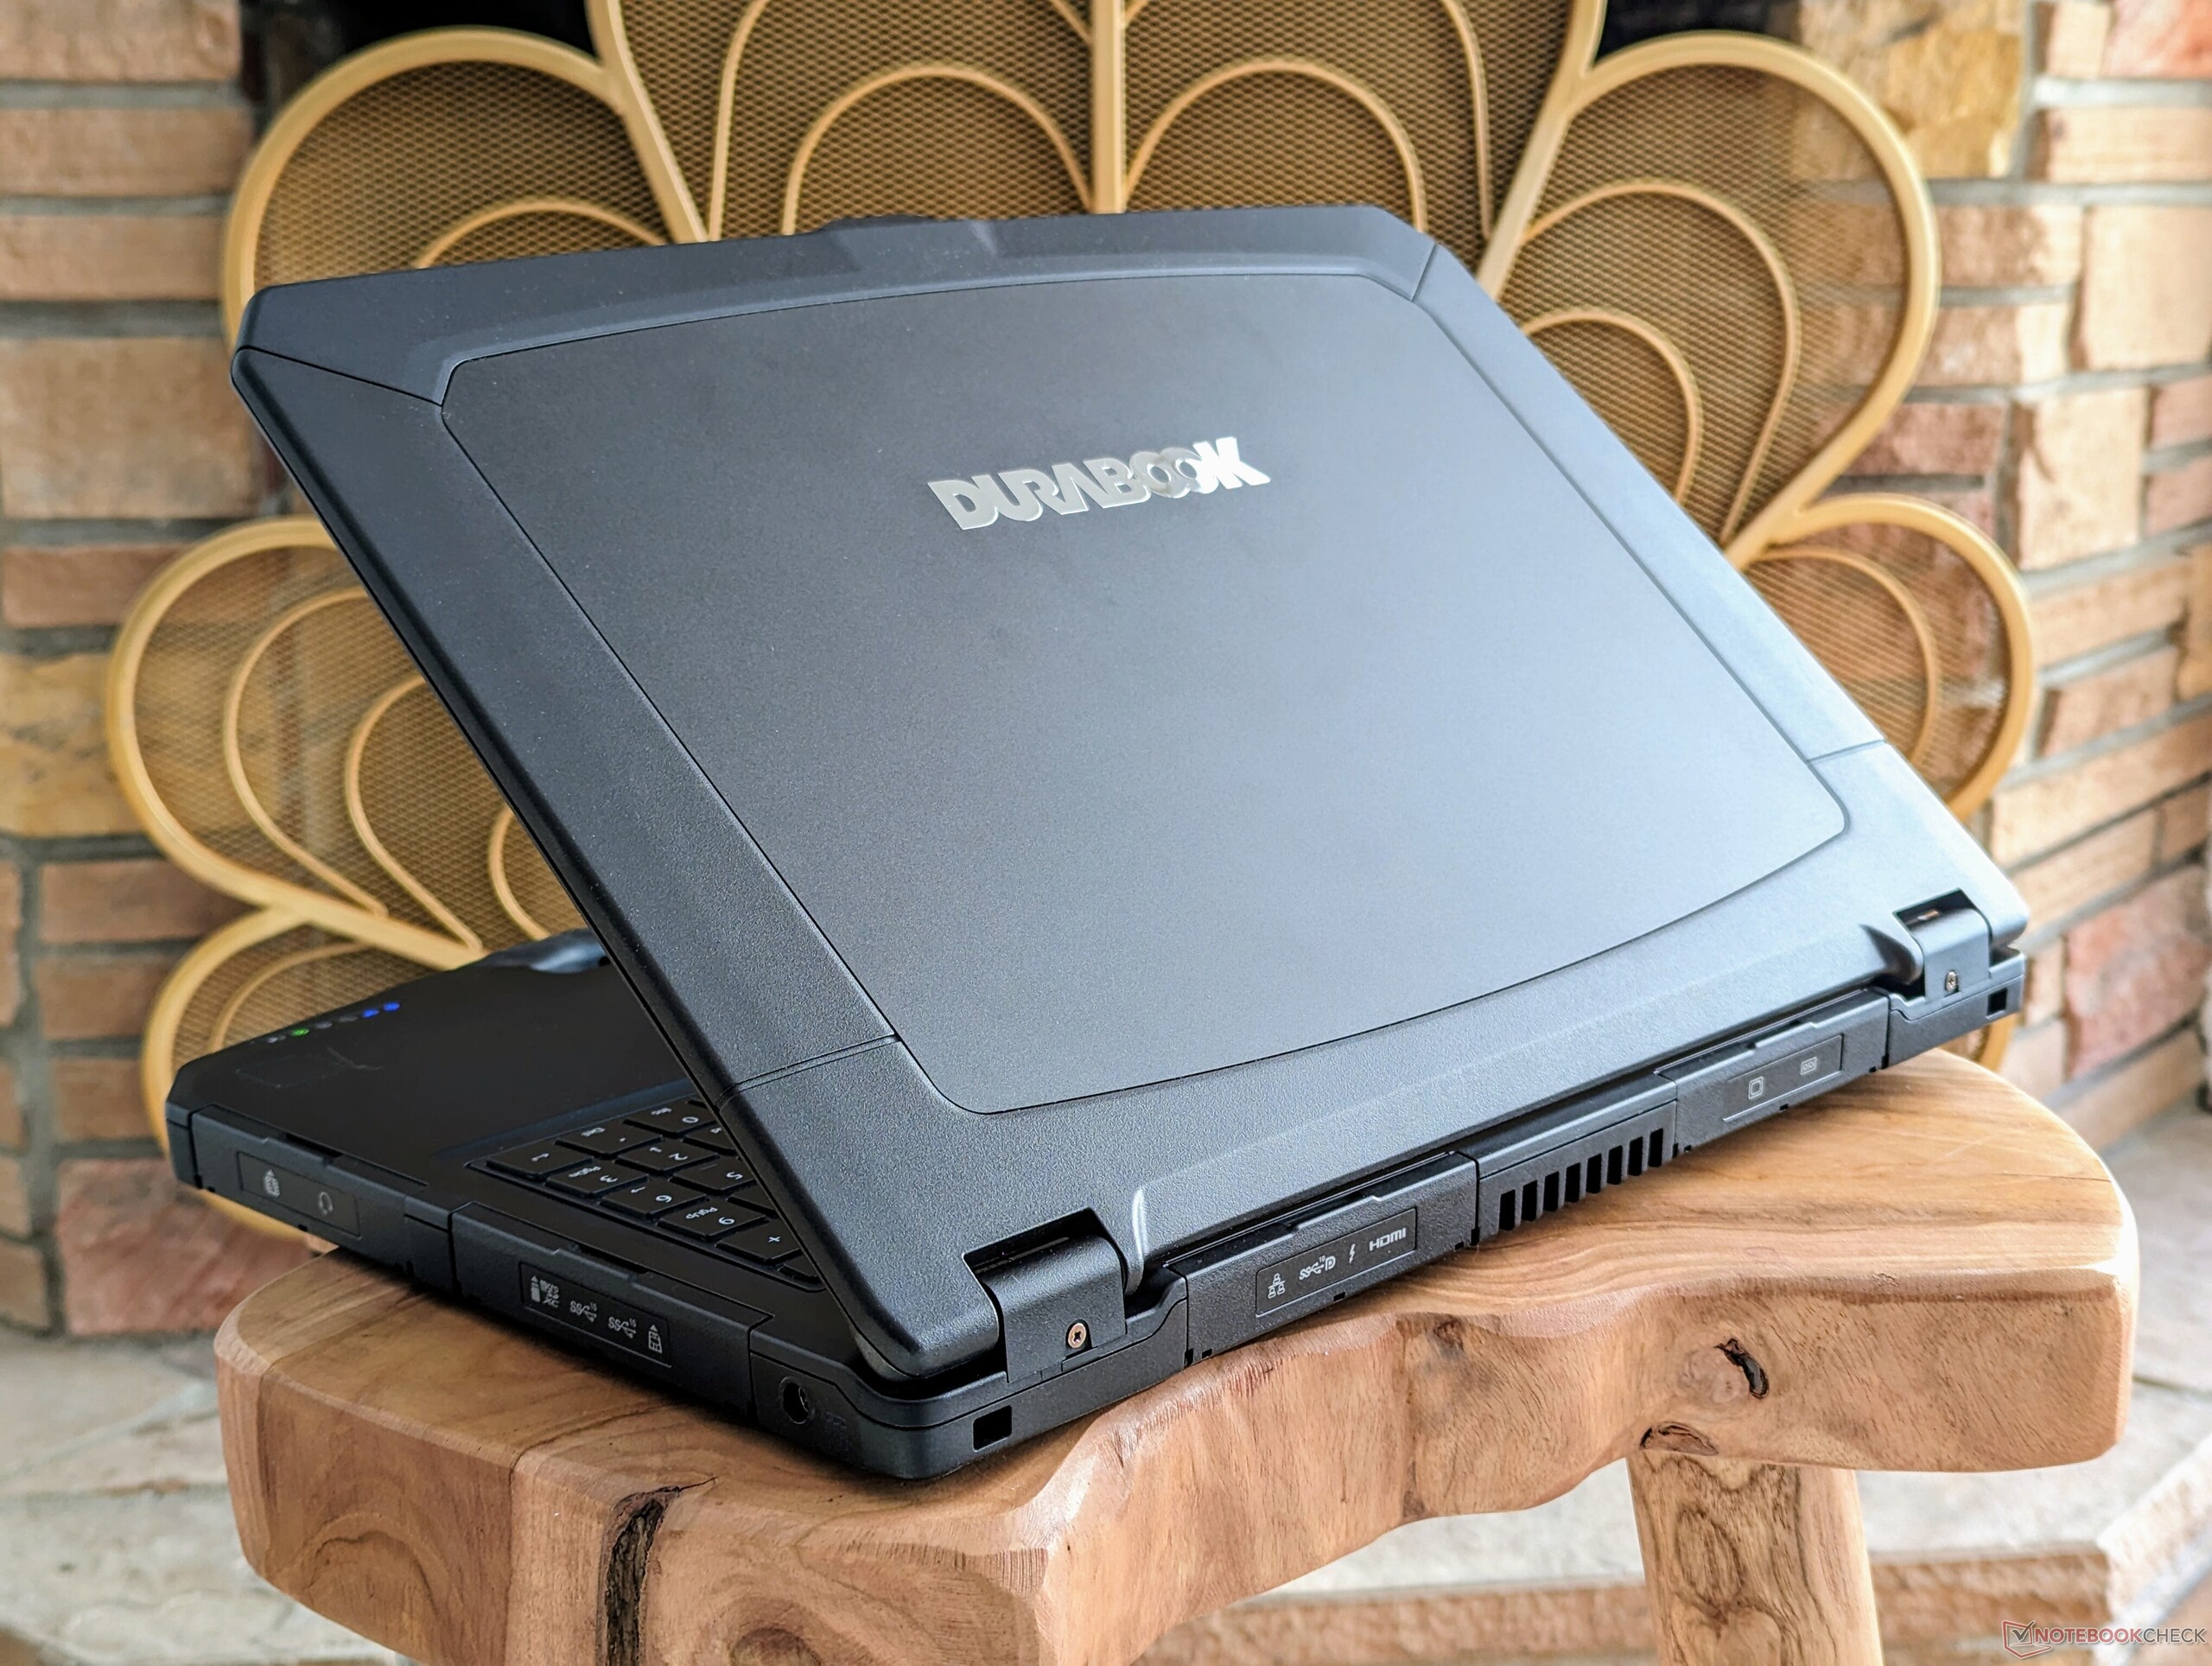
O peso e as dimensões são essencialmente idênticos aos do design de 2020 para preservar a compatibilidade com o maior número possível de acessórios. O design mais antigo já era muito portátil para a categoria e isso ainda permanece verdadeiro para o S15 2024, no qual o fabricante está ostentando o título de "mais fino e mais leve". O modelo de 14 polegadas Getac S410 G5de 14 polegadas, por exemplo, é mais pesado e mais grosso que o S15, embora o Durabook ofereça uma tela maior de 15,6 polegadas.
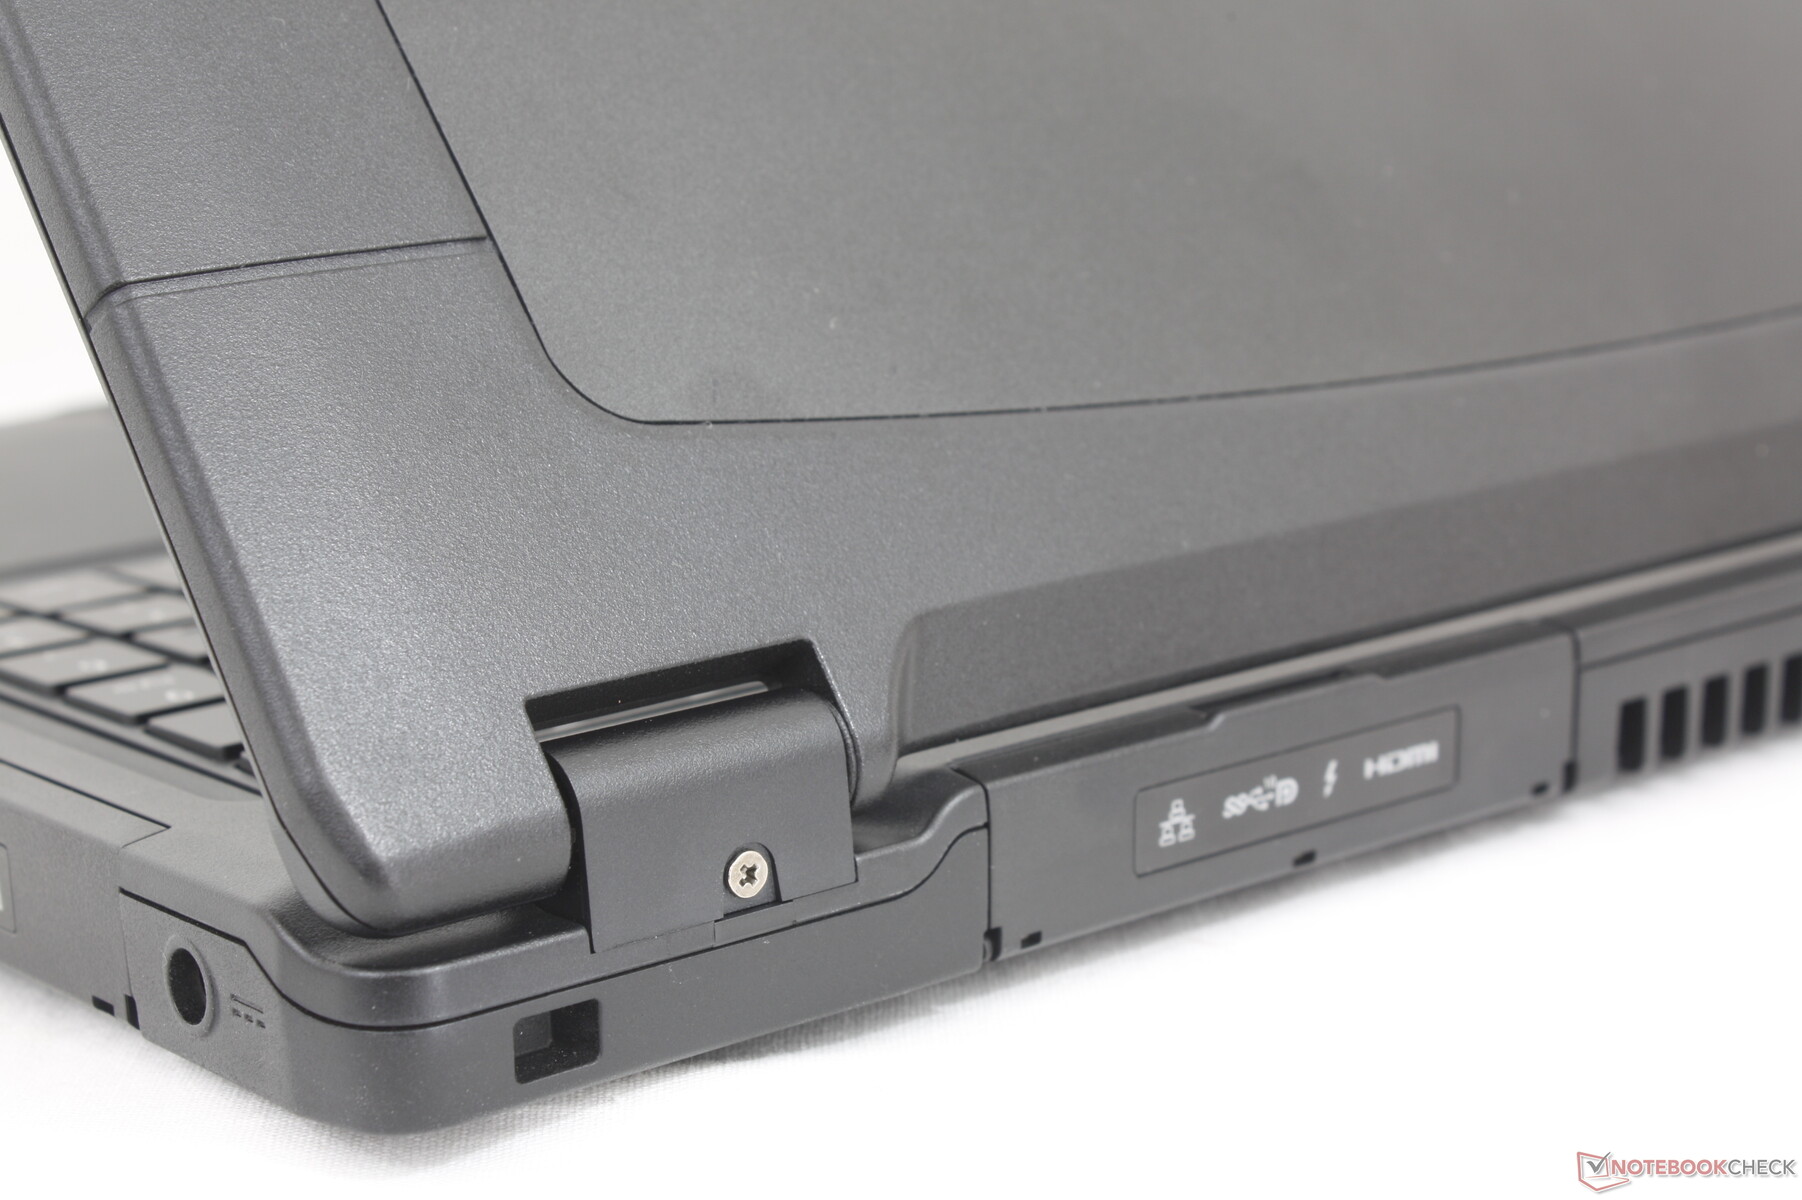
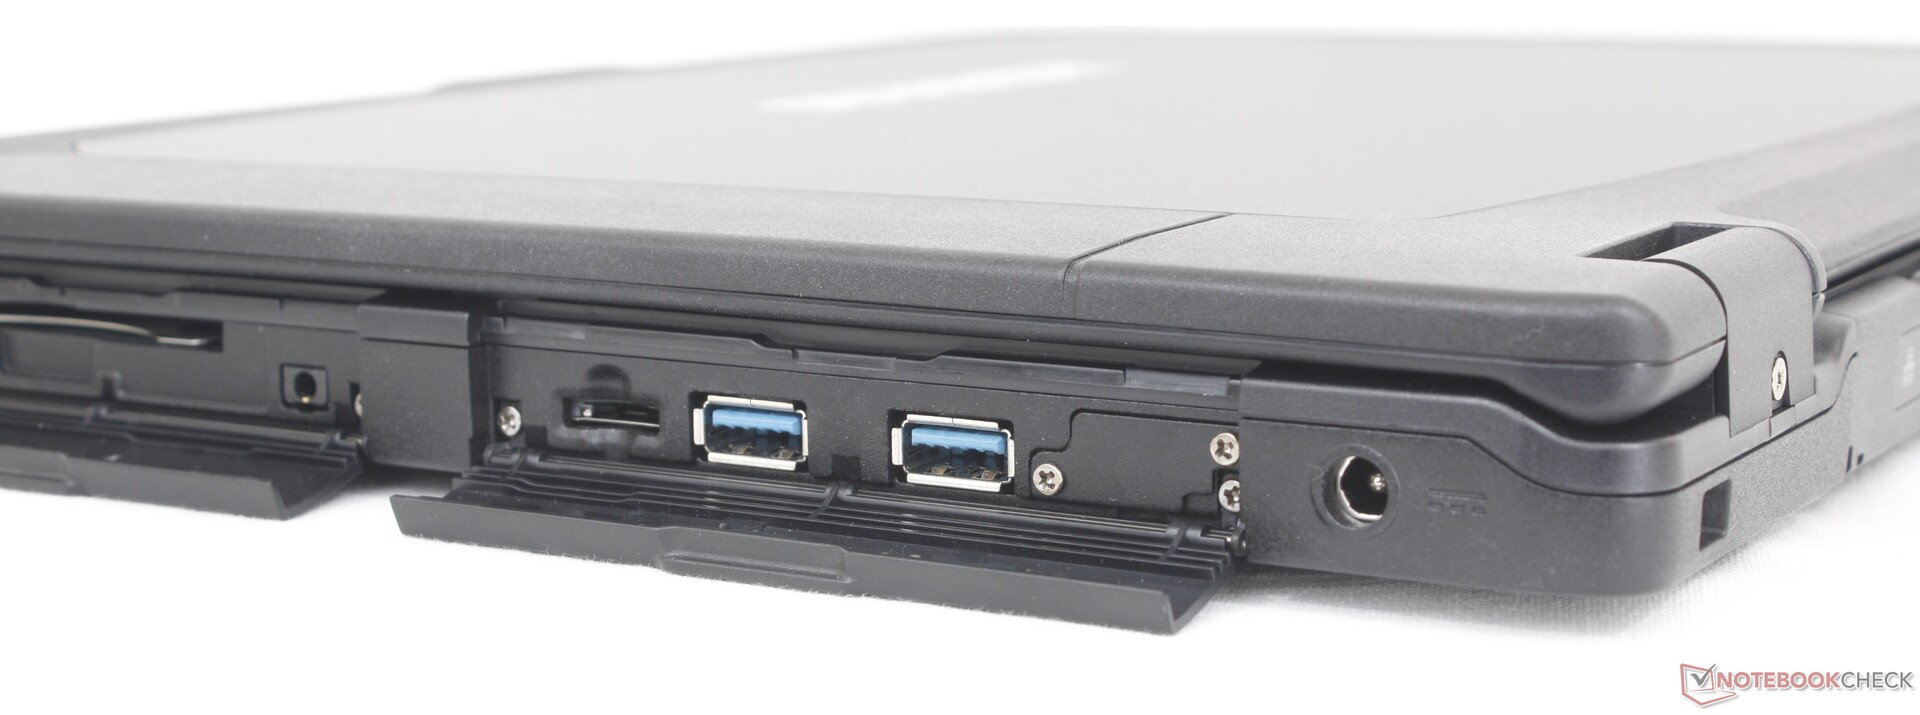
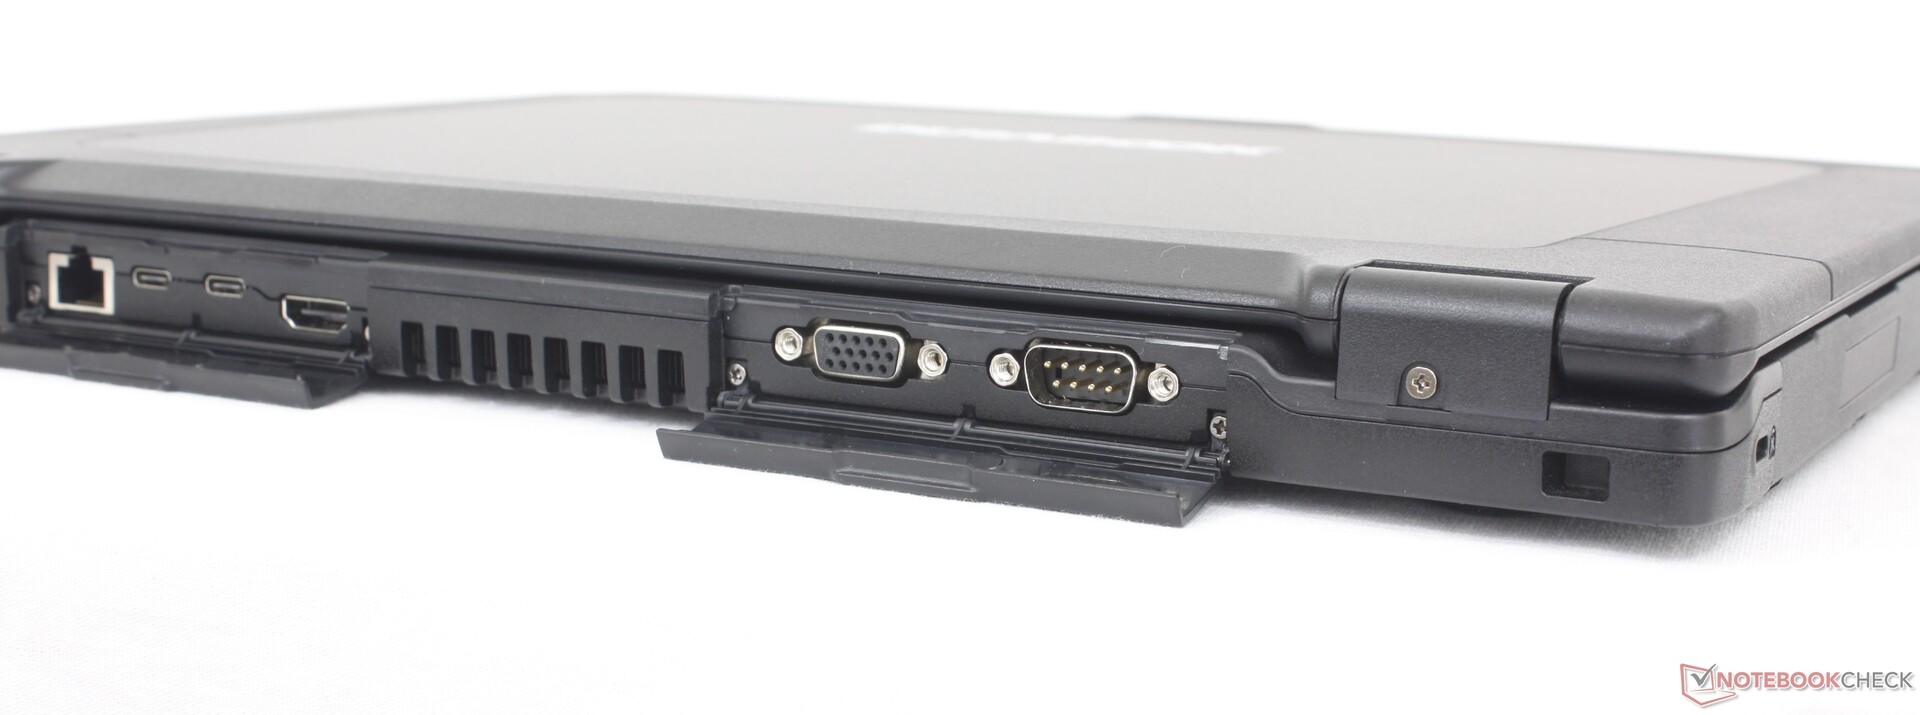
Conectividade - Agora com mais portas USB-C
A variedade de portas é excelente, com todas as mesmas opções que retornaram do S15AB mais espesso. O mais notável é a adição de uma segunda porta USB-C para suporte a Thunderbolt e o prático slot ODD para troca a quente de armazenamento adicional ou acessórios especializados. Observe que, embora ambas as portas USB-C suportem DisplayPort, apenas a porta compatível com Thunderbolt suporta Power Delivery para carregar a unidade.
As abas de proteção que cobrem as portas são notavelmente mais fáceis de abrir e fechar do que as abas do Getac S410. É um pequeno detalhe que torna o Durabook um pouco mais fácil de usar quando o senhor está em campo.


Leitor de cartão SD
As taxas de transferência do cartão SD não melhoraram. Recomendamos que o senhor confira a Dell Latitude Rugged series que tende a integrar leitores de cartão SD muito mais rápidos se as taxas de transferência forem uma prioridade.
| SD Card Reader | |
| average JPG Copy Test (av. of 3 runs) | |
| Dell Latitude 5420 Rugged-P85G (Toshiba Exceria Pro SDXC 64 GB UHS-II) | |
| Getac S410 G5 (AV Pro V60) | |
| Panasonic Toughbook 40 (AV Pro V60) | |
| Durabook S15ABG2 (Toshiba Exceria Pro SDXC 64 GB UHS-II) | |
| Durabook S15 (AV Pro V60) | |
| Acer Enduro Urban N3 EUN314 (AV Pro V60) | |
| maximum AS SSD Seq Read Test (1GB) | |
| Dell Latitude 5420 Rugged-P85G (Toshiba Exceria Pro SDXC 64 GB UHS-II) | |
| Getac S410 G5 (AV Pro V60) | |
| Durabook S15 (AV Pro V60) | |
| Durabook S15ABG2 (Toshiba Exceria Pro SDXC 64 GB UHS-II) | |
| Panasonic Toughbook 40 (AV Pro V60) | |
| Acer Enduro Urban N3 EUN314 (AV Pro V60) | |
Comunicação
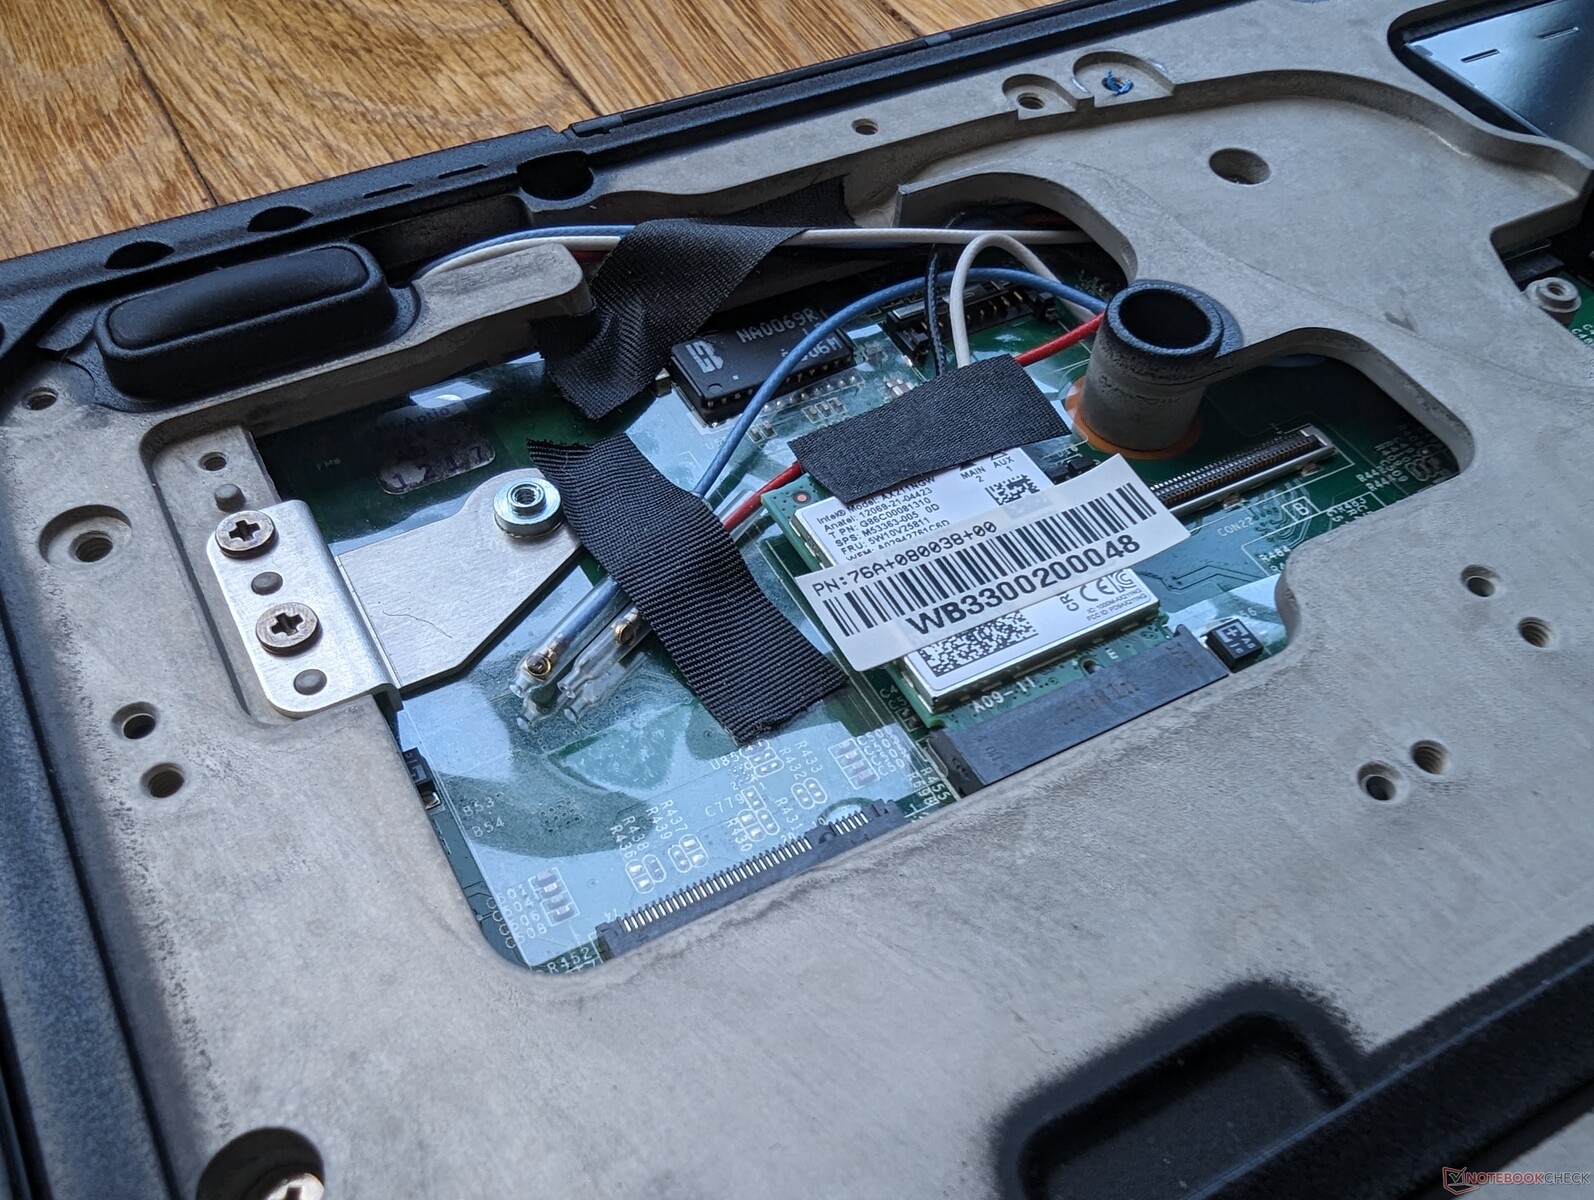
Nossa unidade é fornecida com um Intel AX211 para conectividade Wi-Fi 6E e Bluetooth 5.3. As taxas de transferência são excelentes e surpreendentemente estáveis quando emparelhadas com nosso roteador de teste Asus AXE11000.
| Networking | |
| iperf3 transmit AX12 | |
| Acer Enduro Urban N3 EUN314 | |
| Durabook S15ABG2 | |
| Dell Latitude 5420 Rugged-P85G | |
| iperf3 receive AX12 | |
| Acer Enduro Urban N3 EUN314 | |
| Durabook S15ABG2 | |
| Dell Latitude 5420 Rugged-P85G | |
| iperf3 transmit AXE11000 | |
| Durabook S15 | |
| Panasonic Toughbook 40 | |
| Getac S410 G5 | |
| iperf3 receive AXE11000 | |
| Panasonic Toughbook 40 | |
| Durabook S15 | |
| Getac S410 G5 | |
| iperf3 transmit AXE11000 6GHz | |
| Durabook S15 | |
| Getac S410 G5 | |
| iperf3 receive AXE11000 6GHz | |
| Durabook S15 | |
| Getac S410 G5 | |
Webcam
A webcam pode ser configurada para 2 MP, 5 MP ou nenhuma, dependendo do aplicativo do usuário. Nossa unidade inclui um sensor de 5 MP com IR integrado para suporte ao Hello. Um obturador deslizante físico é padrão para questões de privacidade.


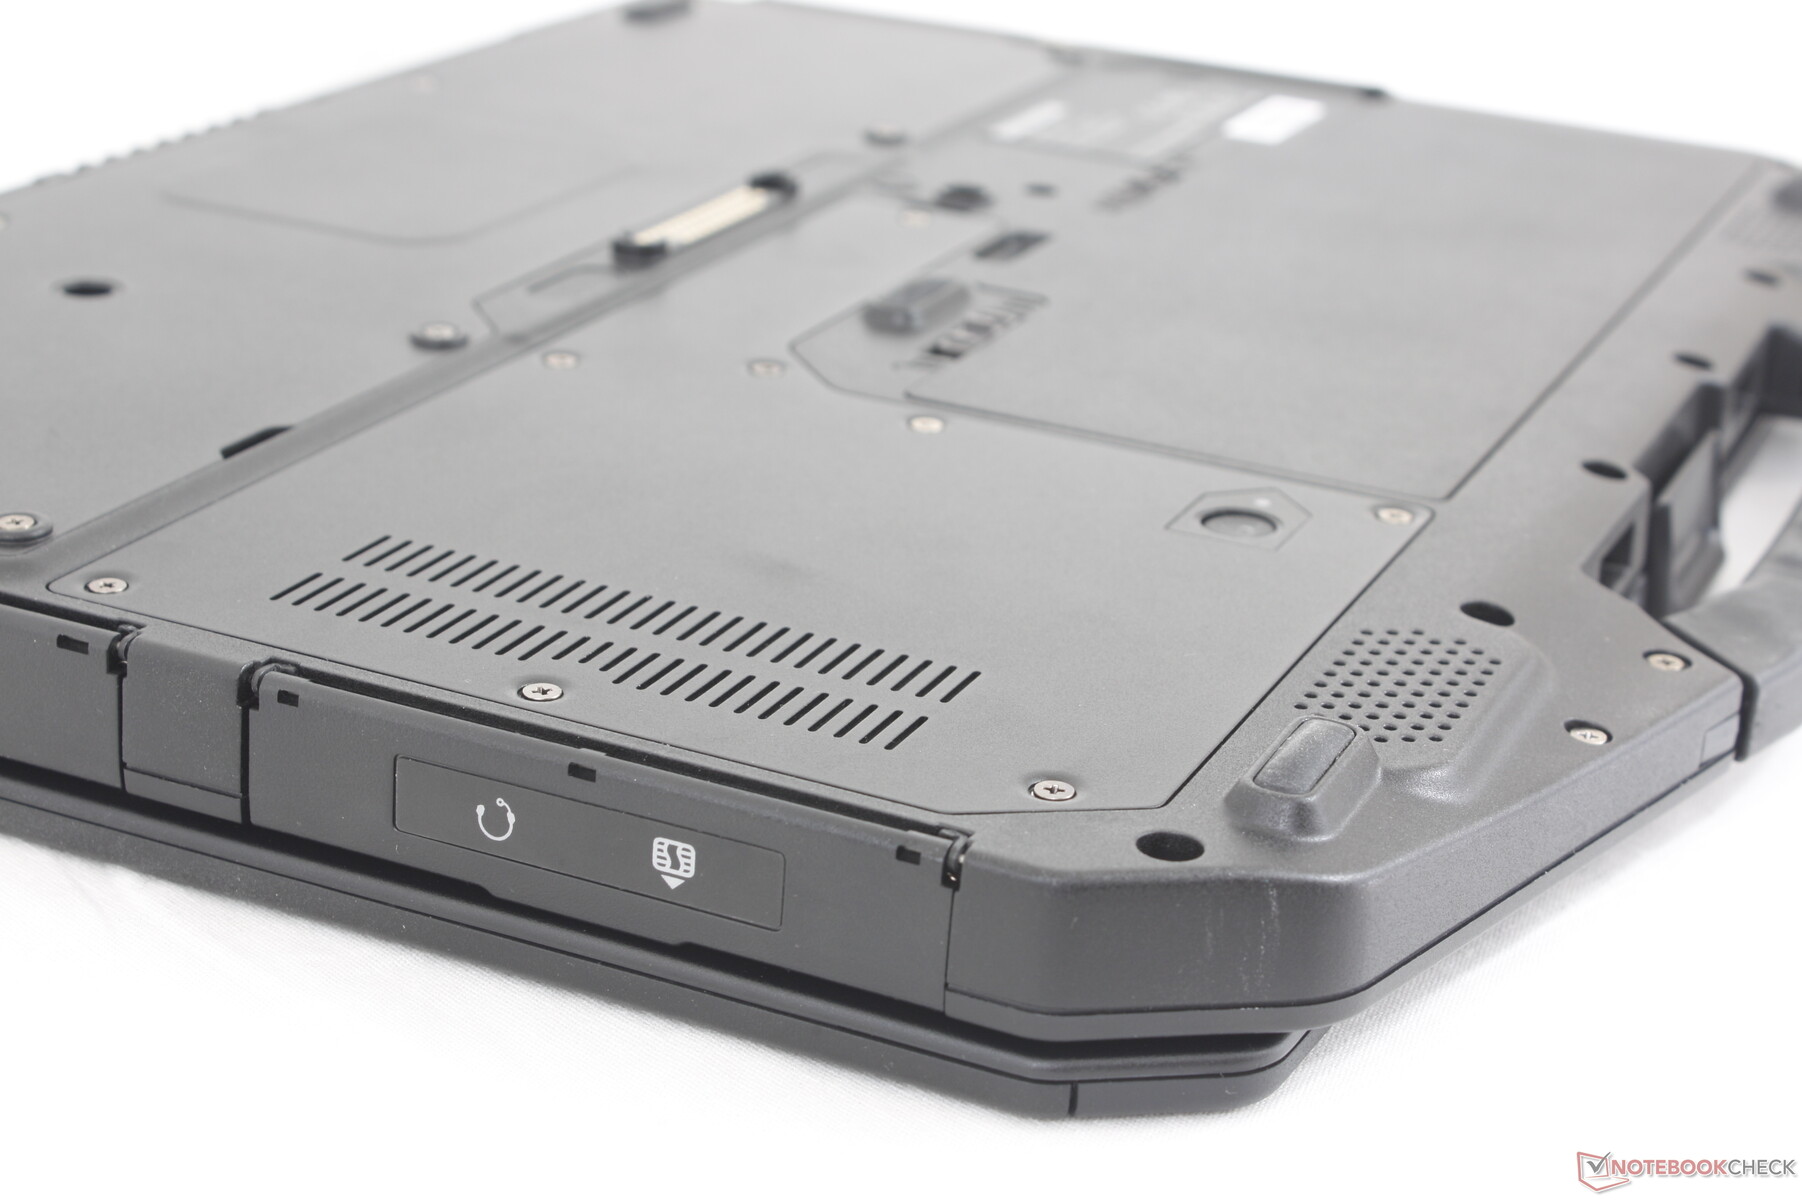
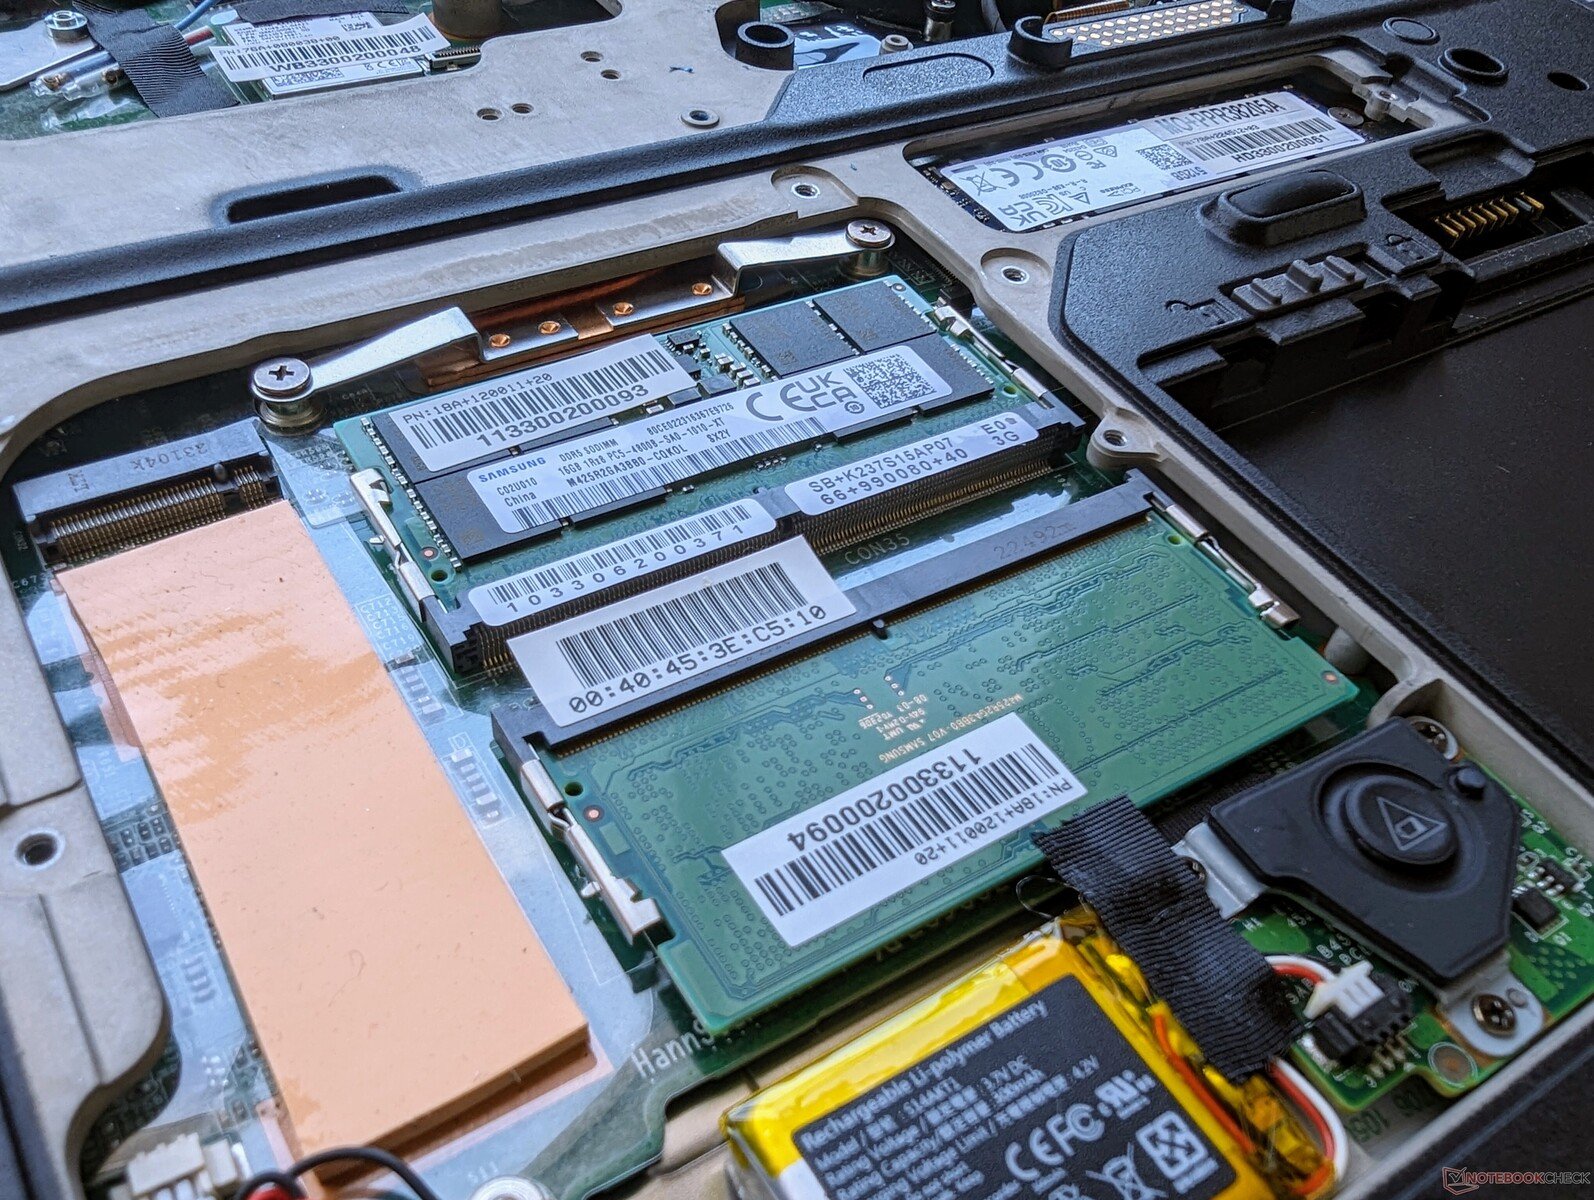
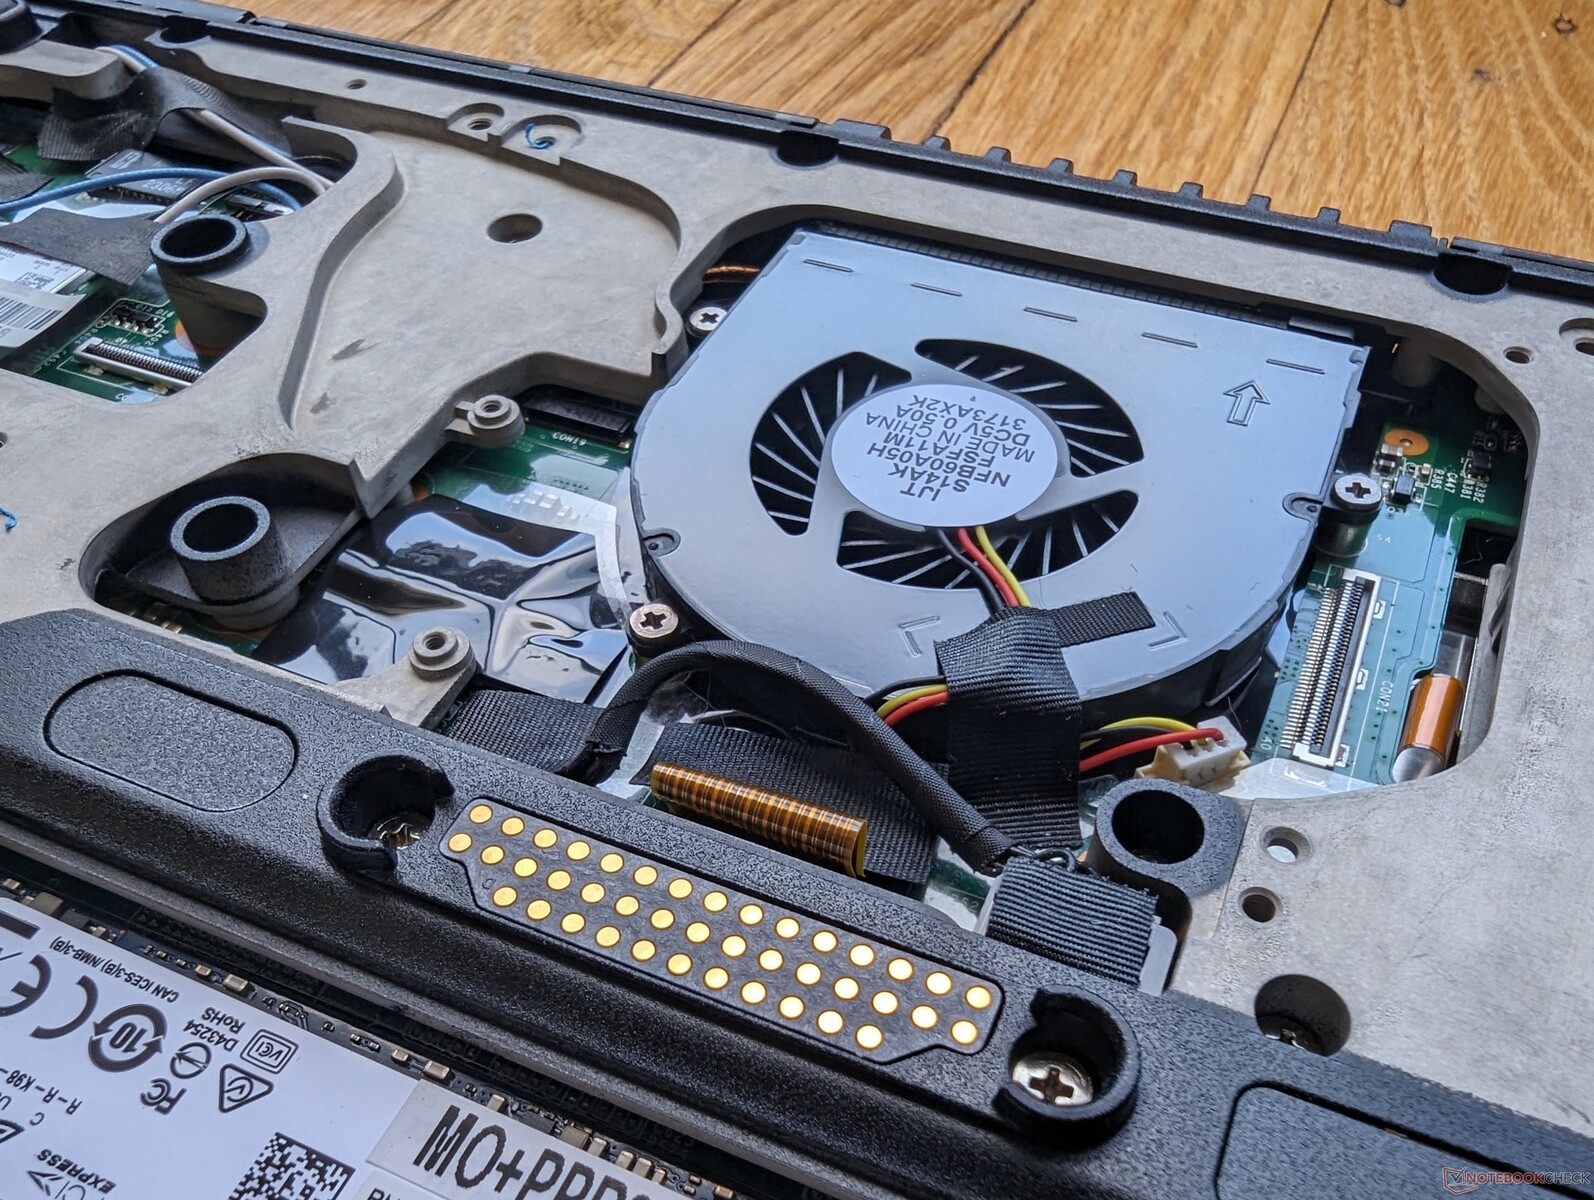
Manutenção
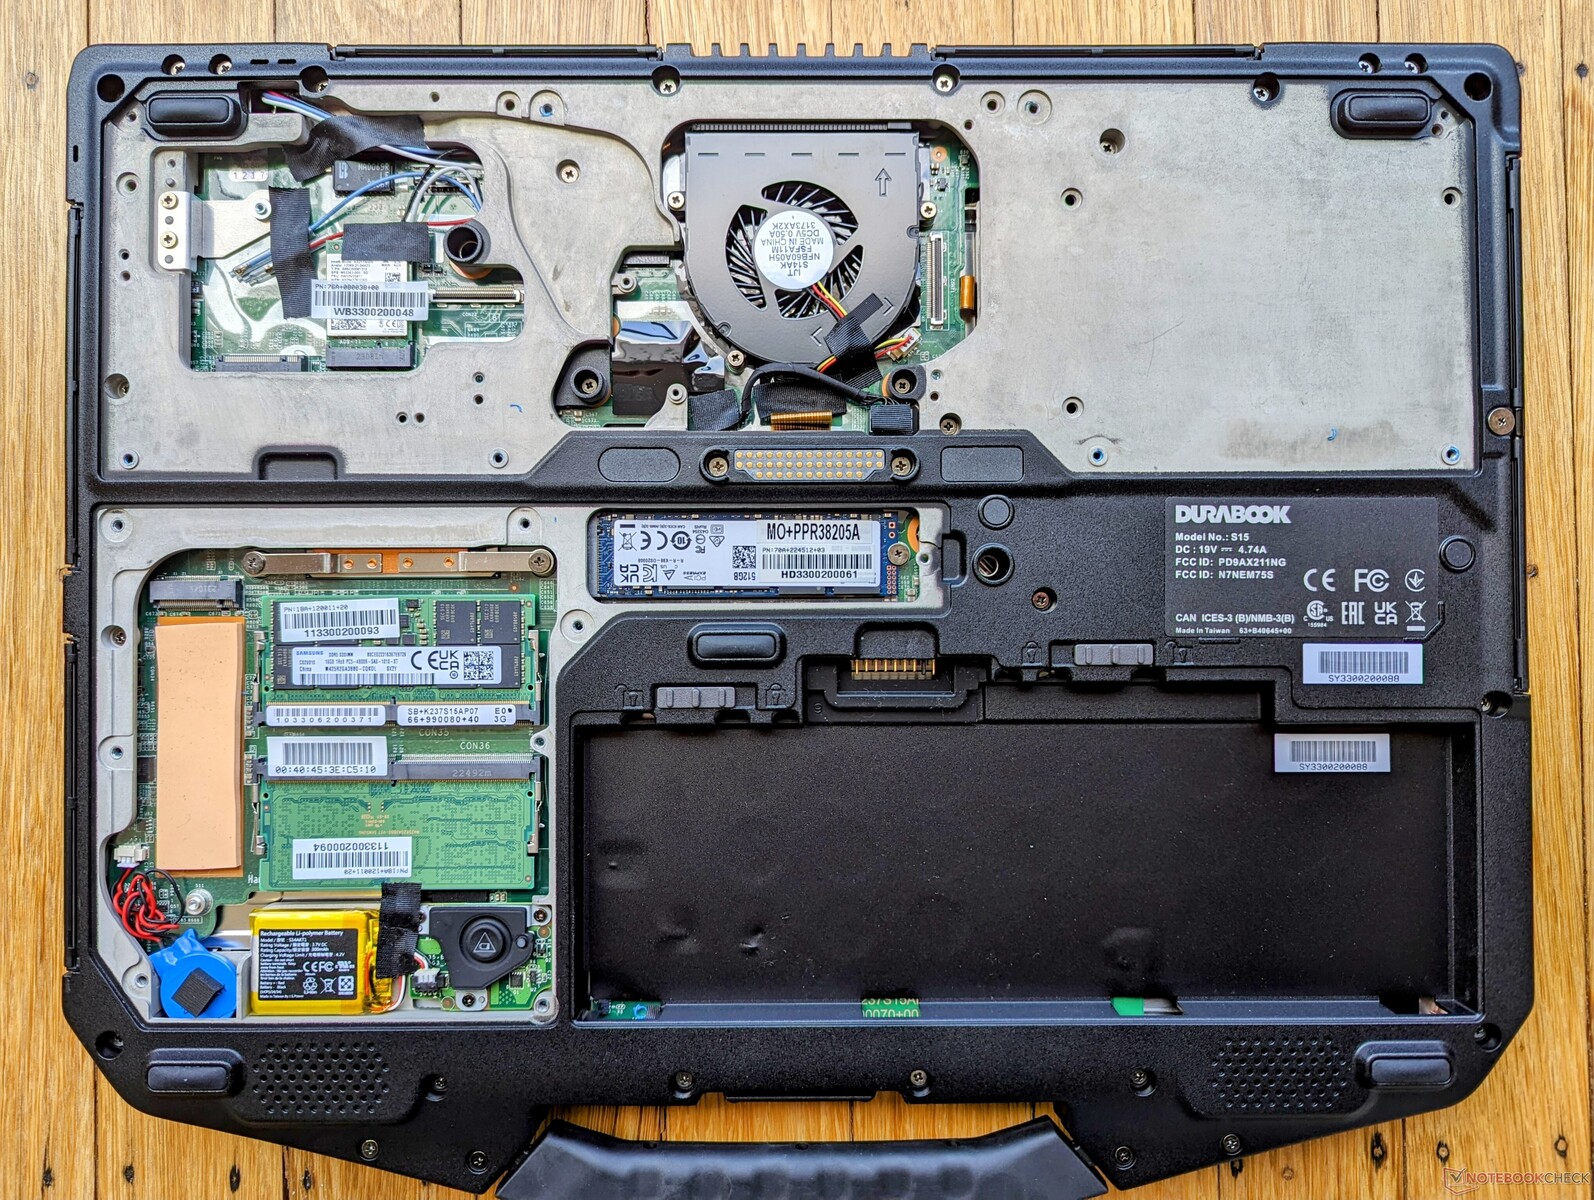
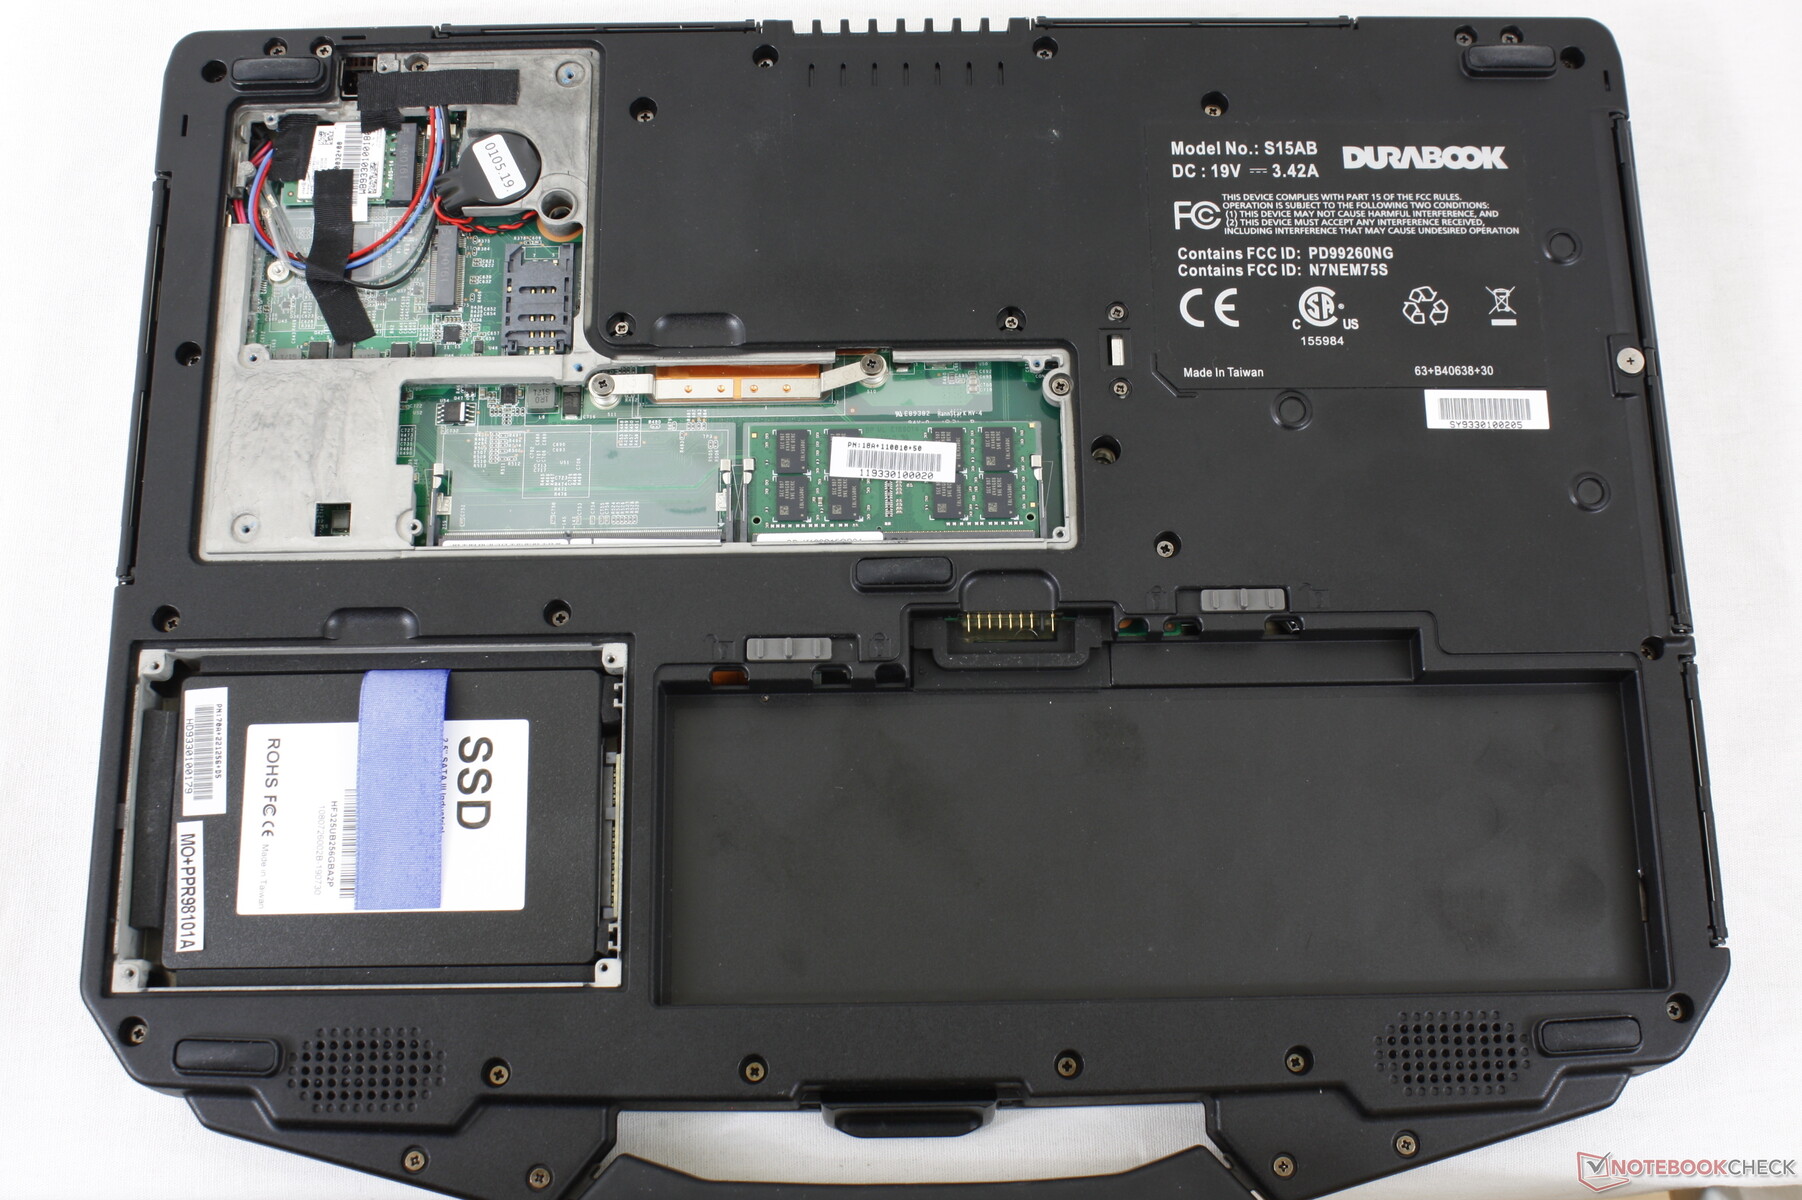
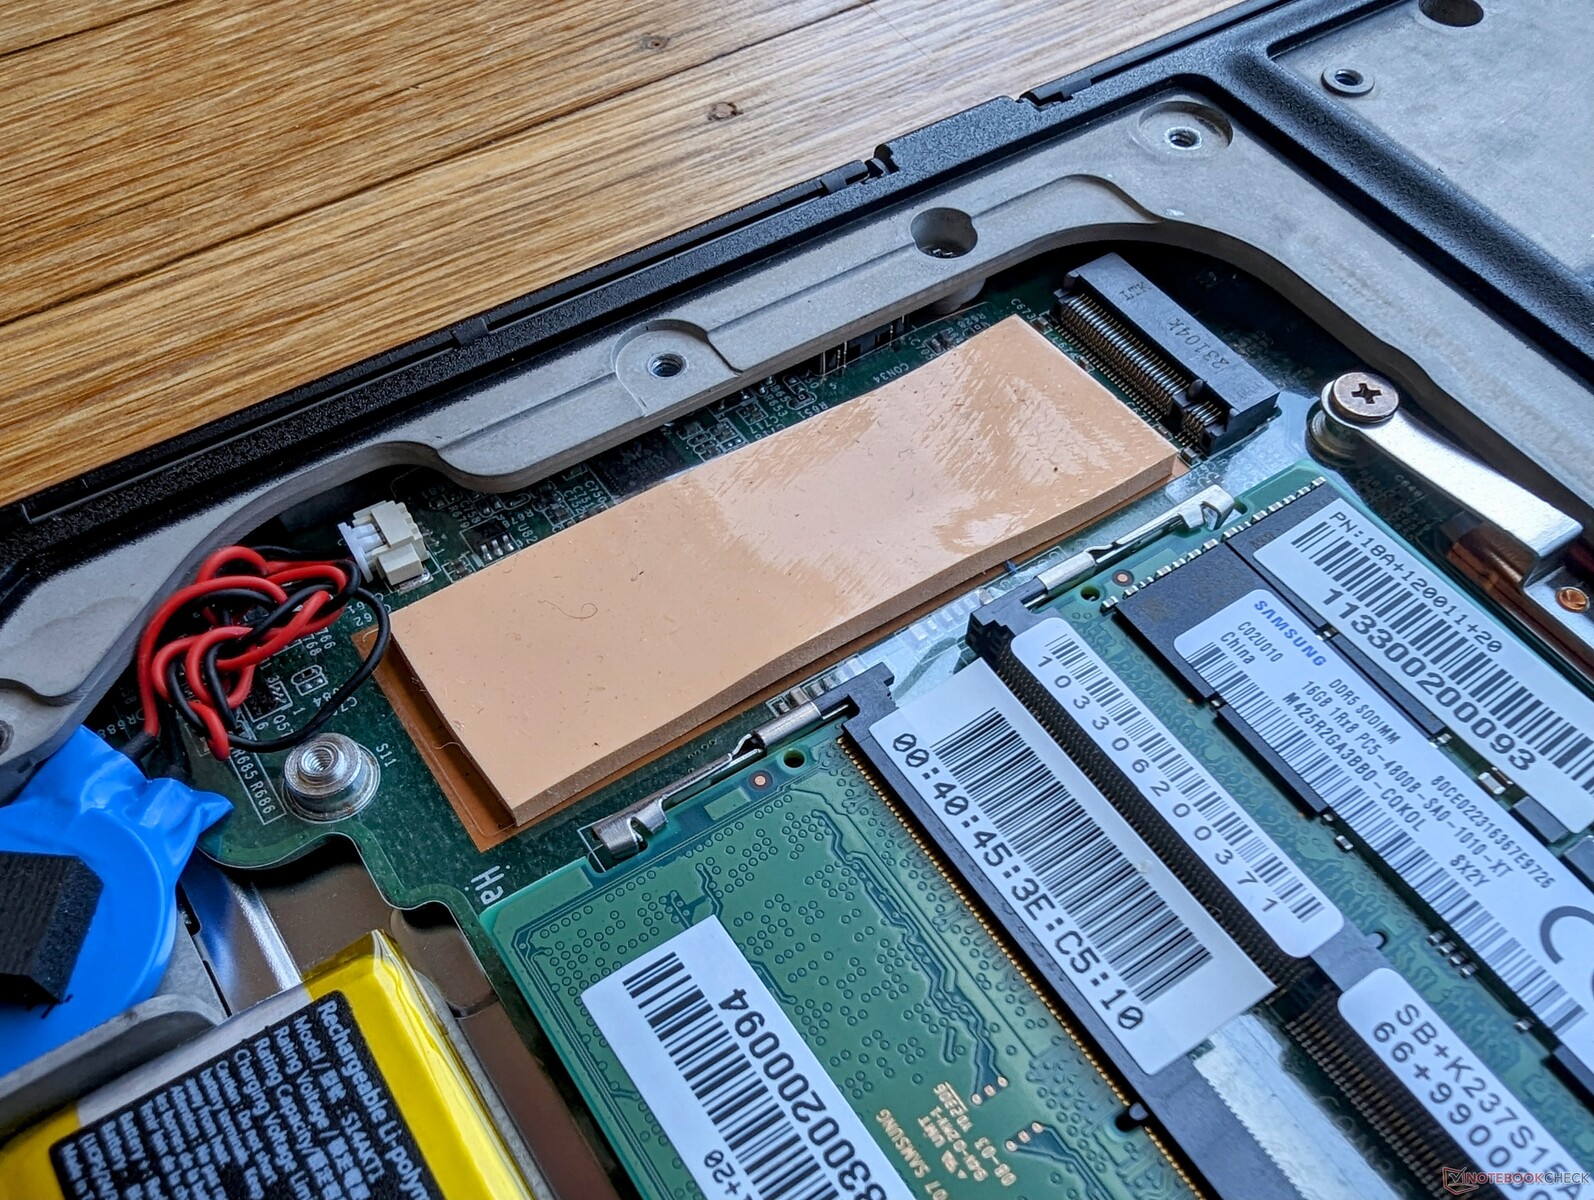
A parte inferior (painel D) foi quase totalmente redesenhada. O antigo slot SATA III de 2,5 polegadas foi substituído por um slot secundário M.2 2280, enquanto a ventoinha interna agora é muito mais fácil de acessar para fins de limpeza ou manutenção.
Acessórios e garantia
O Durabook oferece vários acessórios opcionais, incluindo compartimentos de mídia de expansão, adaptadores de cigarro para carro, estações de acoplamento e baterias sobressalentes. Observe que não há caneta ou caneta stylus, pois a tela sensível ao toque não é uma opção.
A garantia limitada de três anos do fabricante é padrão.
Dispositivos de entrada - Teclado ruim emparelhado com um ótimo touchpad
Teclado
O teclado, infelizmente, é um misto. Embora seja espaçoso e tenha um teclado numérico integrado, o feedback das teclas é fraco e o deslocamento é muito superficial, mesmo quando comparado a laptops mais finos para o consumidor, como o HP Pavilion ou o Lenovo IdeaPad. A tecla de espaço, em particular, parece esponjosa quando pressionada, embora seja tradicionalmente mais firme e mais sensível do que as teclas QWERTY principais. A deformação mencionada anteriormente ao pressionar o teclado numérico também não ajuda no feedback das teclas. Portanto, a digitação pode parecer insatisfatória no S15.
Touchpad
A área útil do touchpad é idêntica à do touchpad do 2020 S15AB, com 10 x 5 cm. Temos que dizer "utilizável" porque a área real da superfície do trackpad parece um pouco maior, mas a seção estreita entre a barra em relevo e os botões dedicados do mouse é apenas um espaço morto. A área da superfície é ligeiramente texturizada com excelente capacidade de resposta, enquanto os trackpads de outros laptops robustos, como o Getac S410 ou o Panasonic Toughbook 40 podem frequentemente pular ou registrar incorretamente as entradas. Esse é um dos melhores trackpads que já vimos na categoria.
Enquanto isso, os botões dedicados do mouse são firmes e altos quando pressionados, proporcionando uma sensação satisfatória. No entanto, o deslocamento poderia ter sido um pouco mais profundo.


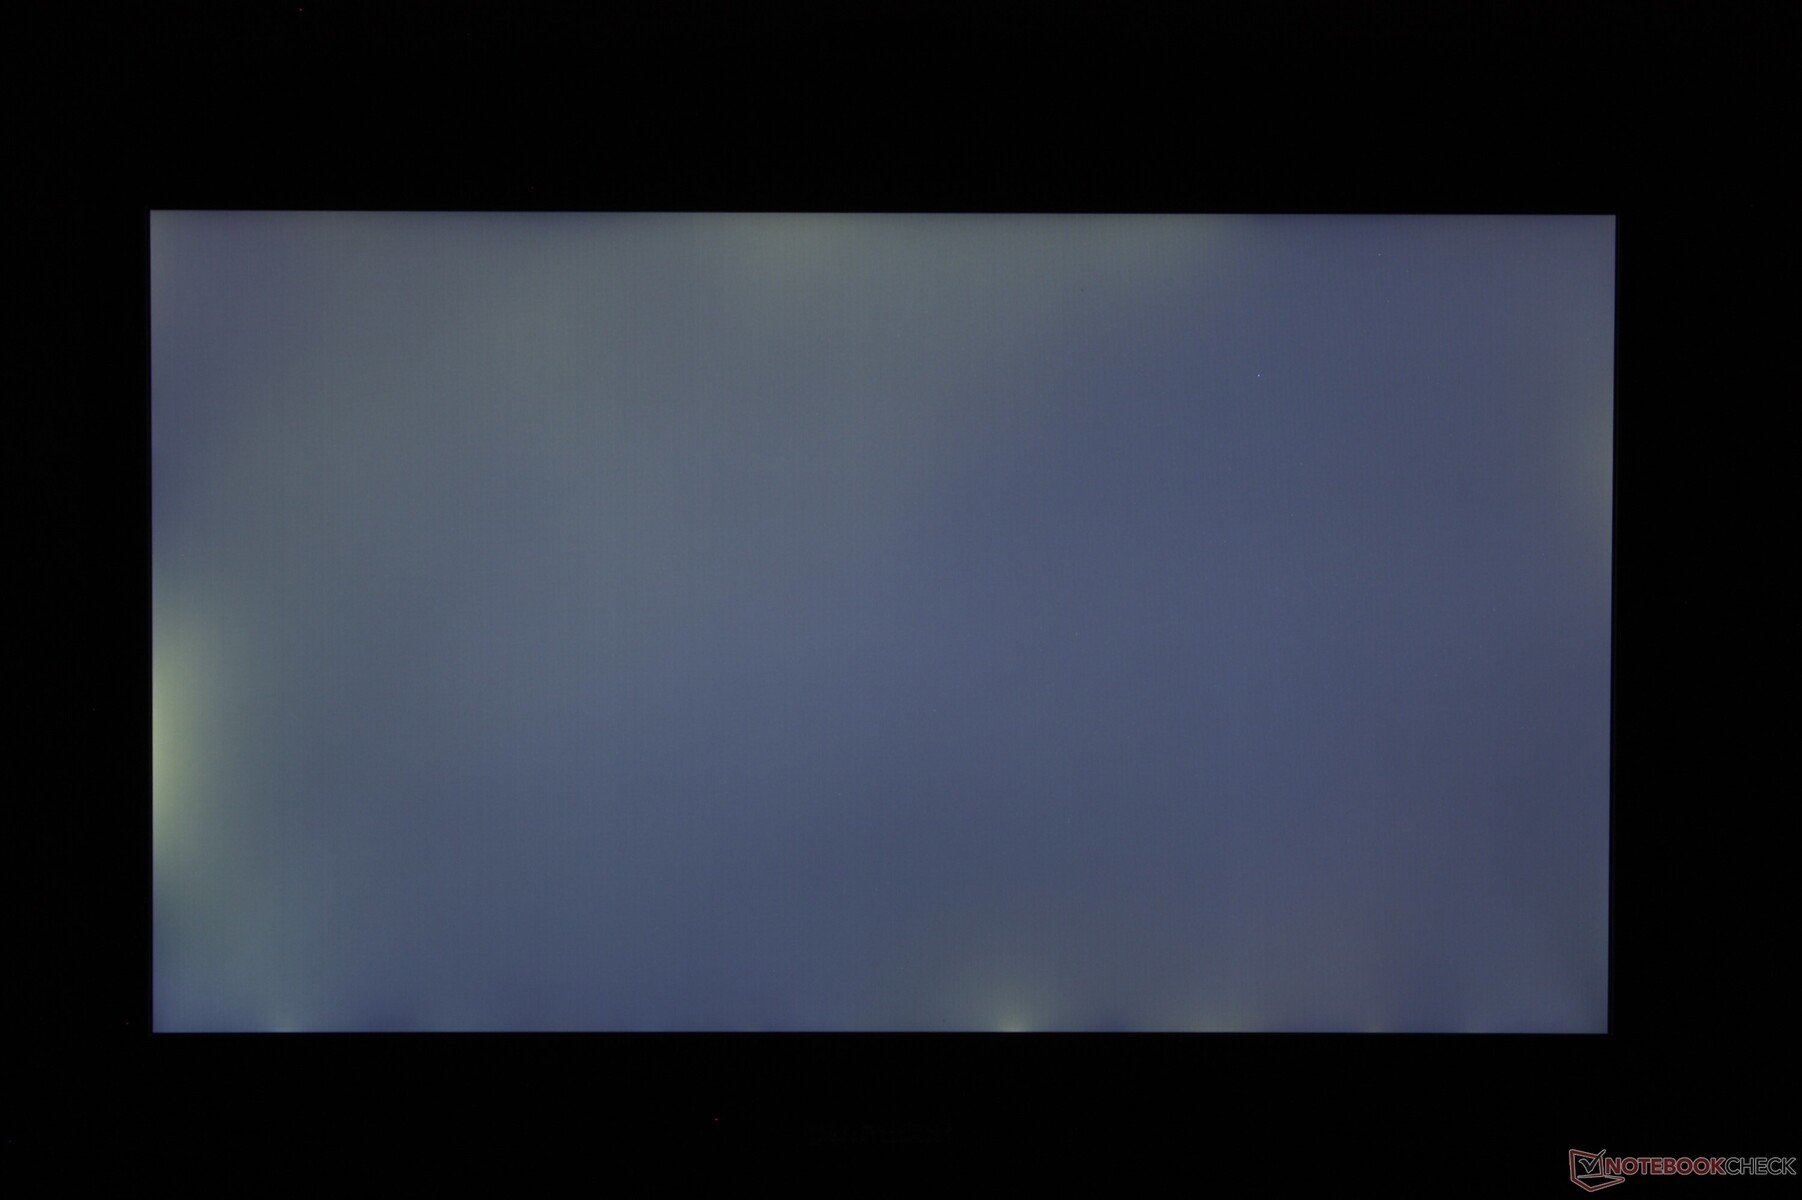
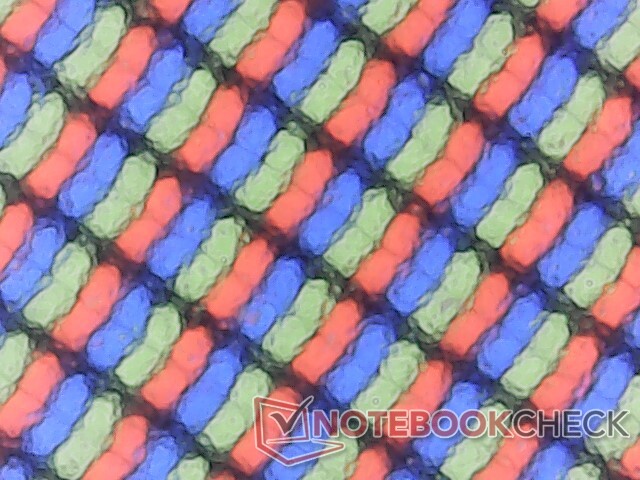
Tela - IPS brilhante de 1000 nits
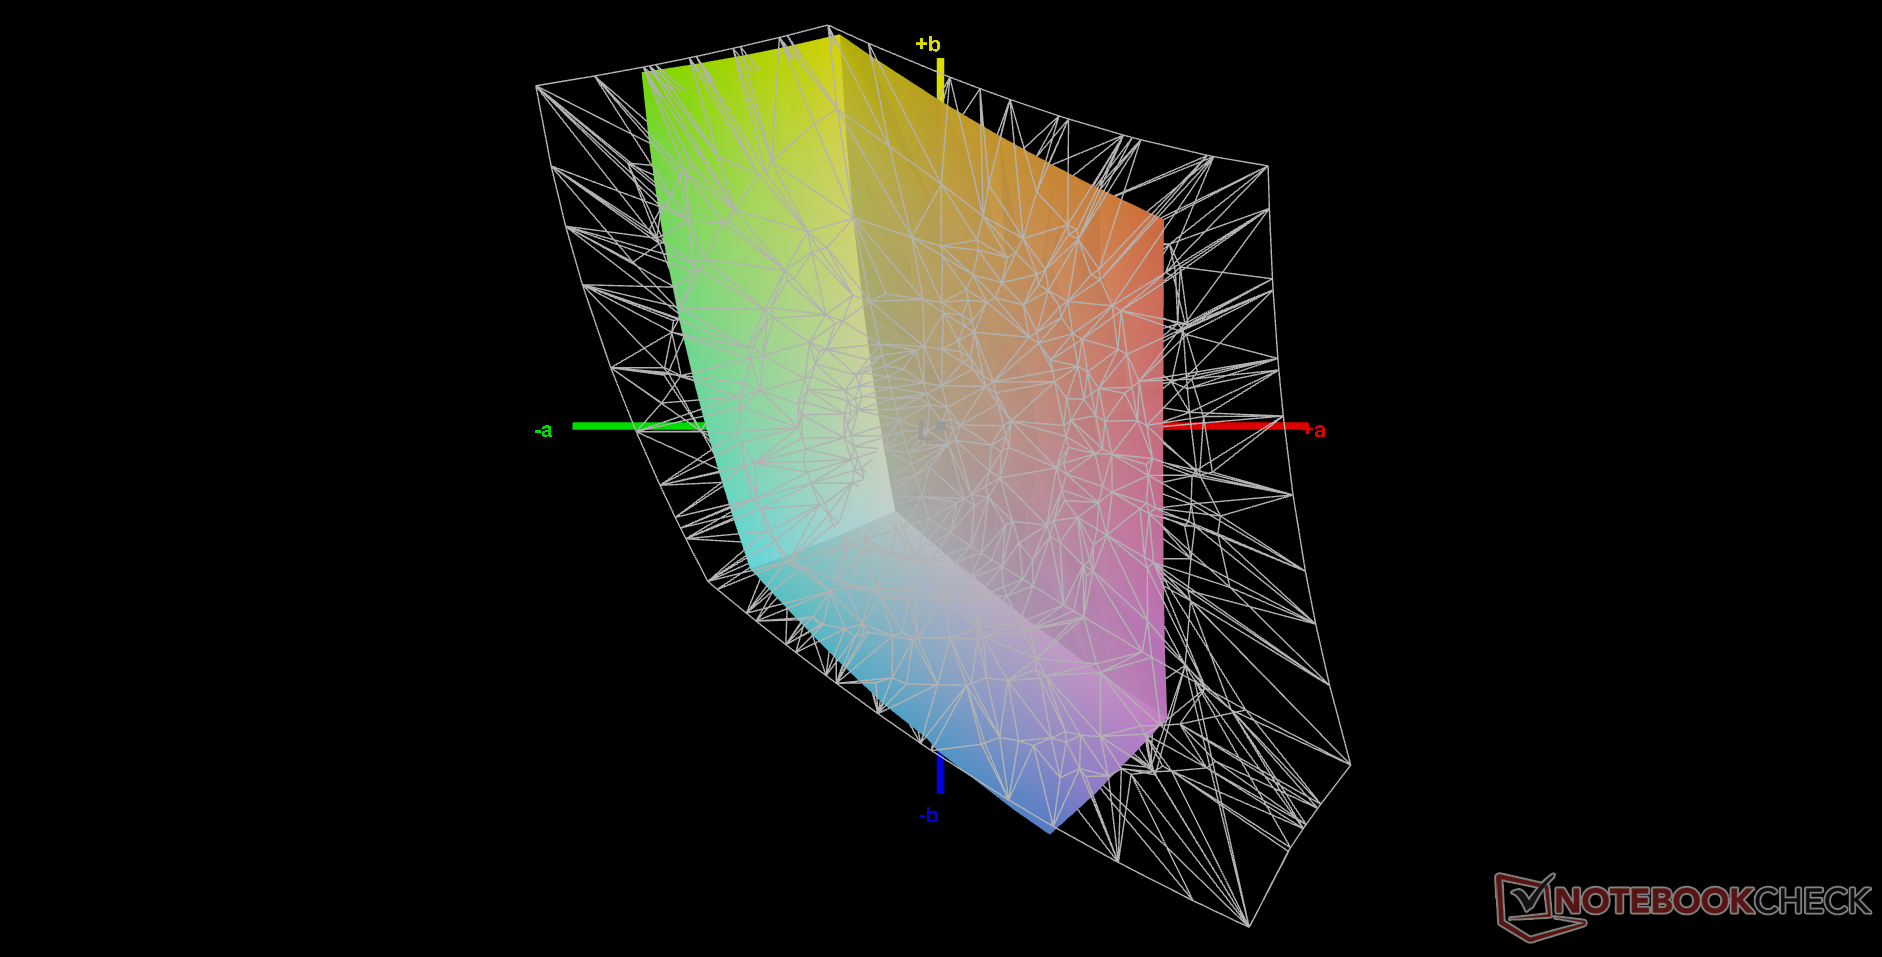
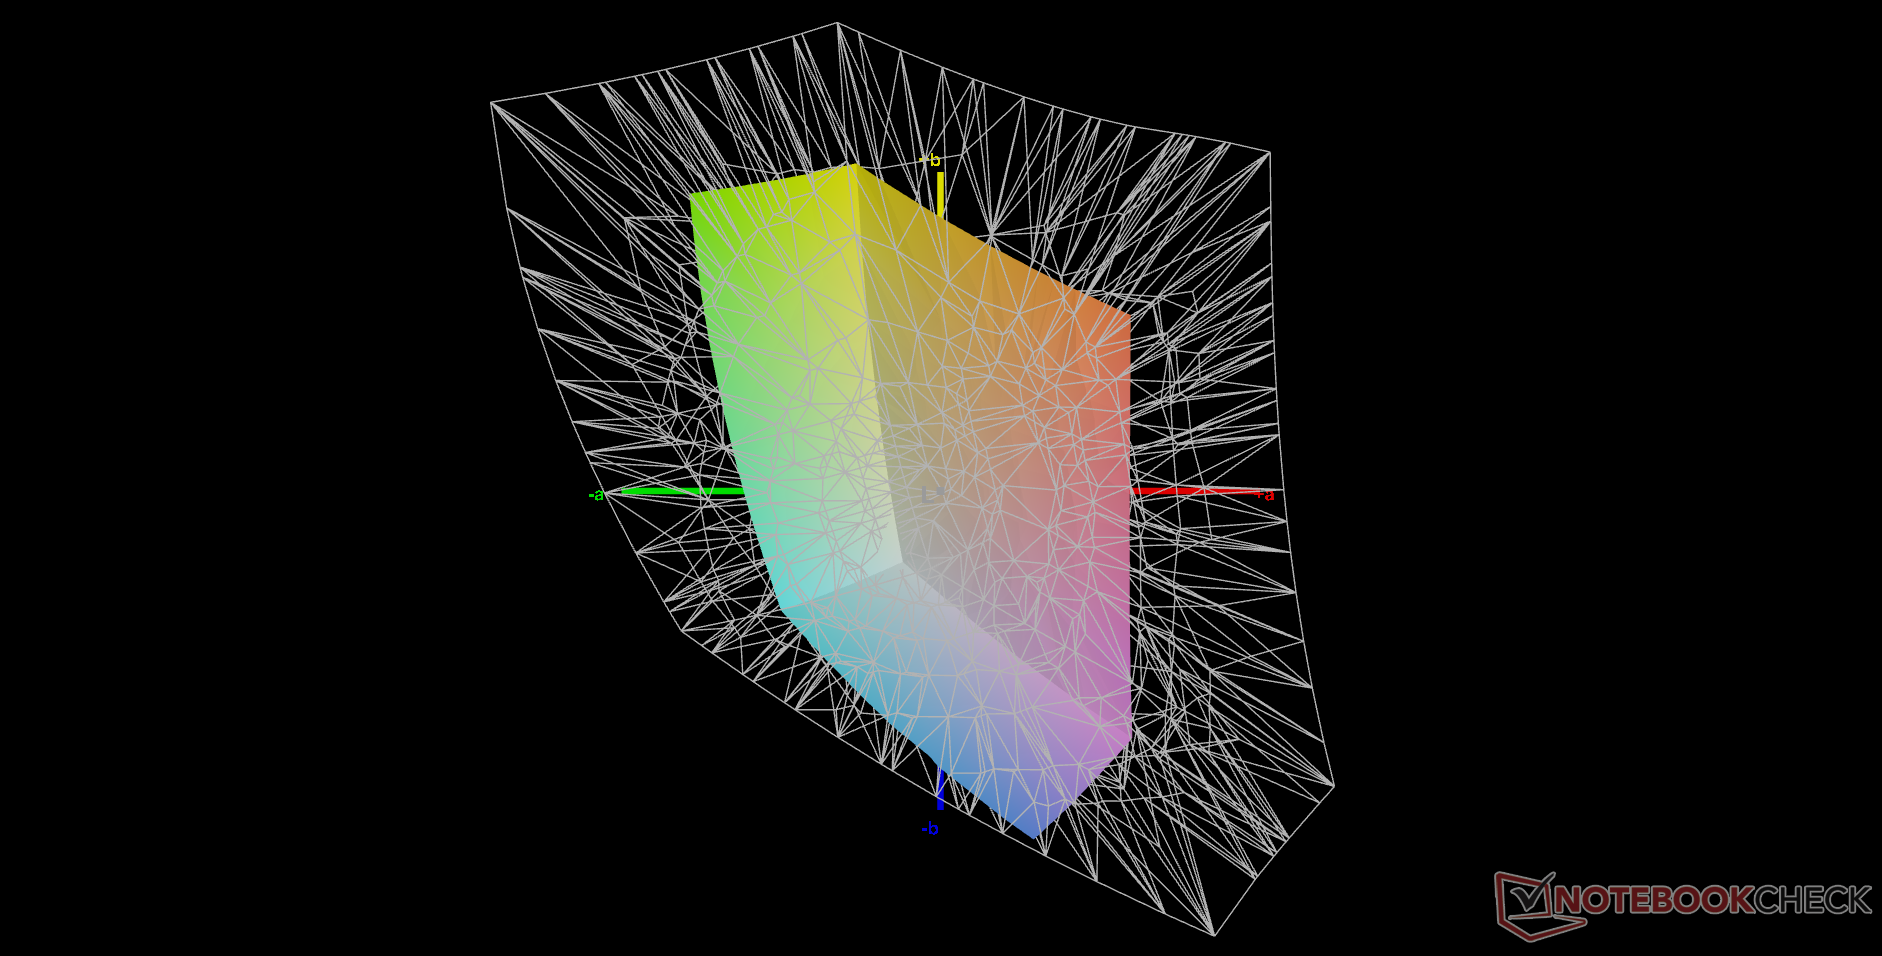
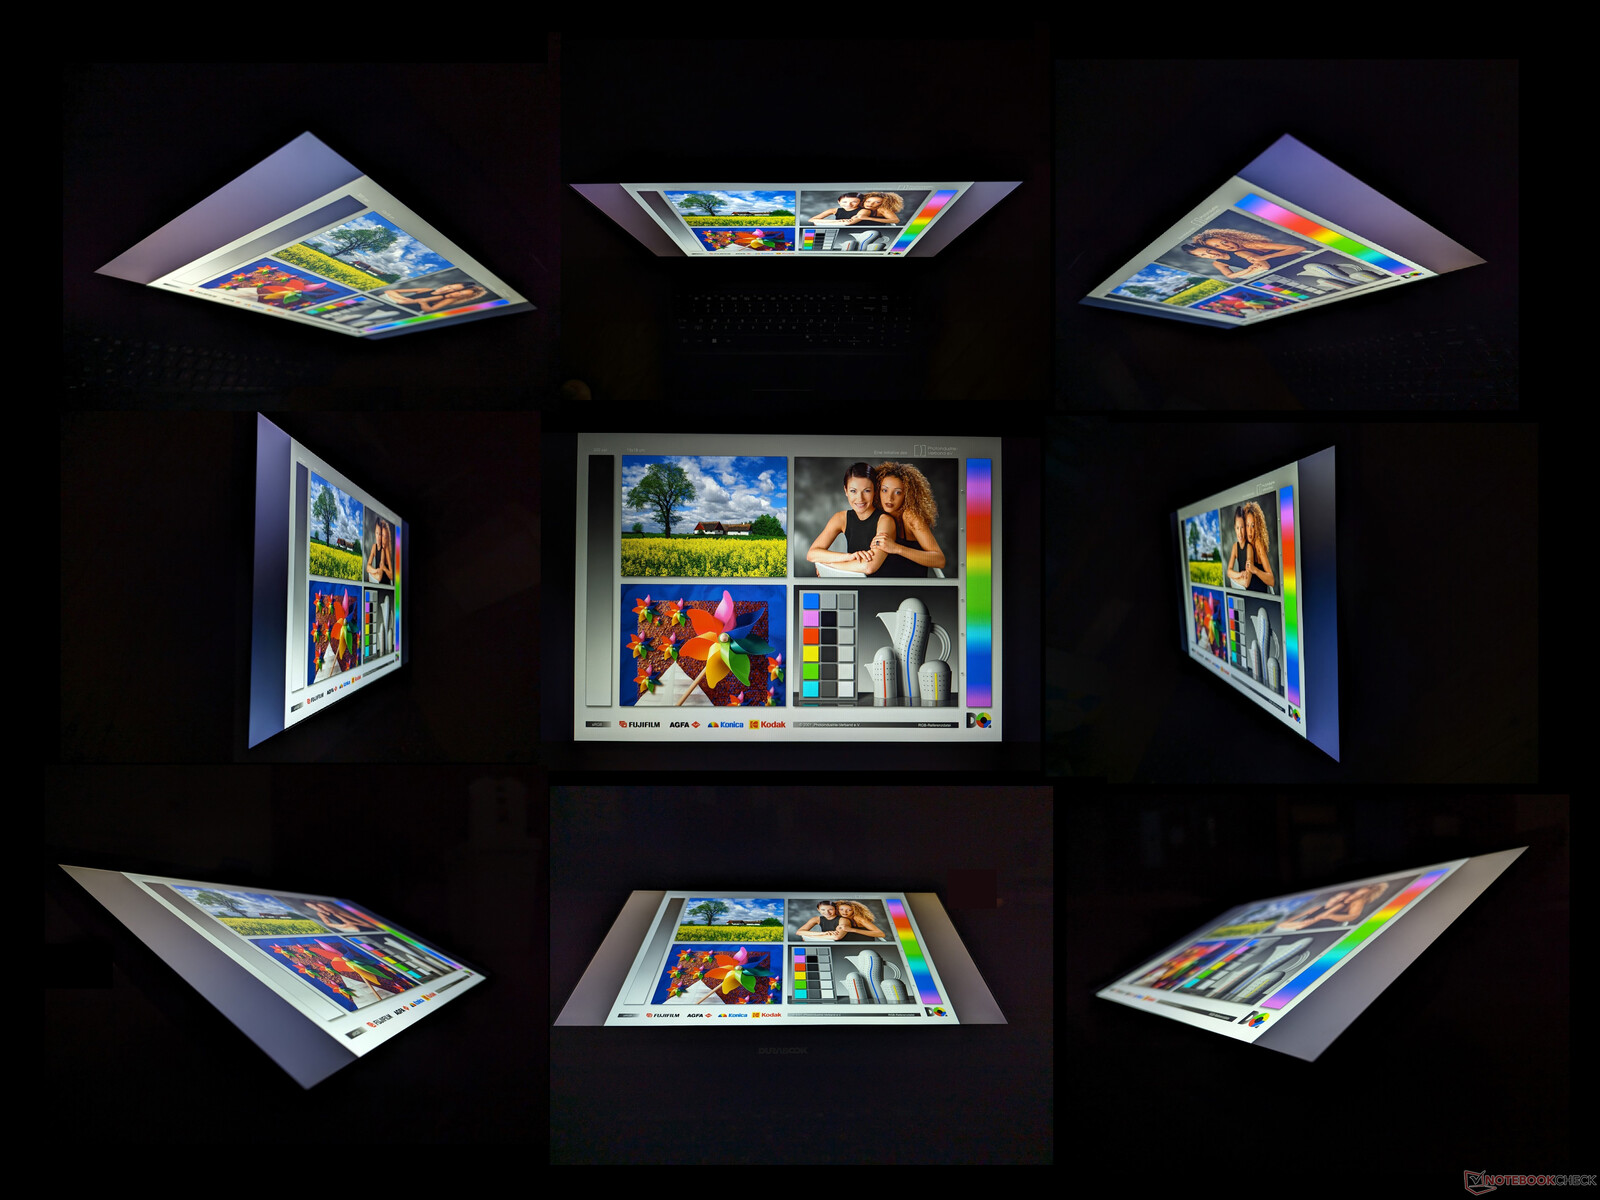
O S15 é o primeiro modelo em nosso banco de dados a ter o painel IPS HKC MB156CS01'2. É uma melhoria significativa em relação ao painel Chi Mei TN do antigo S15ABG2 em termos de ângulos de visão, contraste e brilho, enquanto outros aspectos, como tempos de resposta e cores, são praticamente os mesmos. Outros modelos robustos, como o Dell Latitude 5420 Rugged ou o Acer Enduro Urban oferecem painéis com mais cobertura sRGB para cores mais vibrantes.


| |||||||||||||||||||||||||
iluminação: 84 %
iluminação com acumulador: 1087.3 cd/m²
Contraste: 1066:1 (Preto: 1.02 cd/m²)
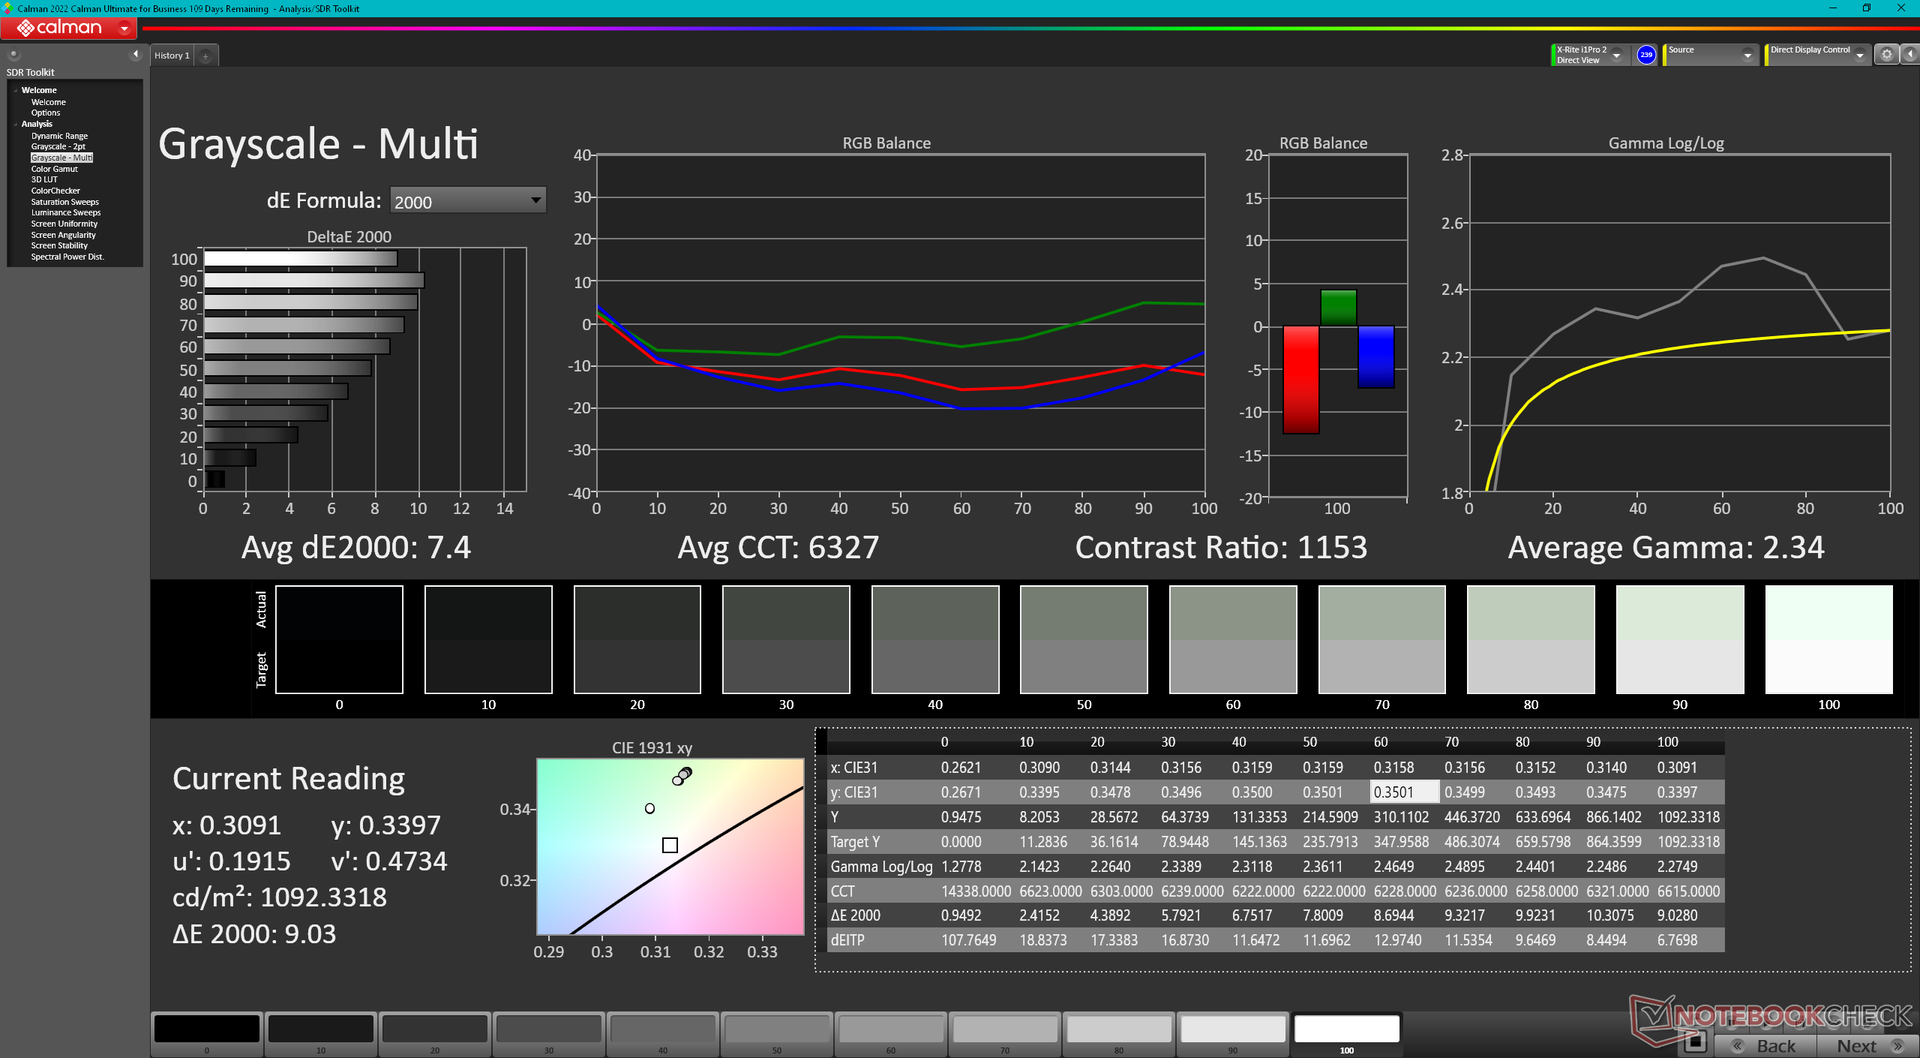
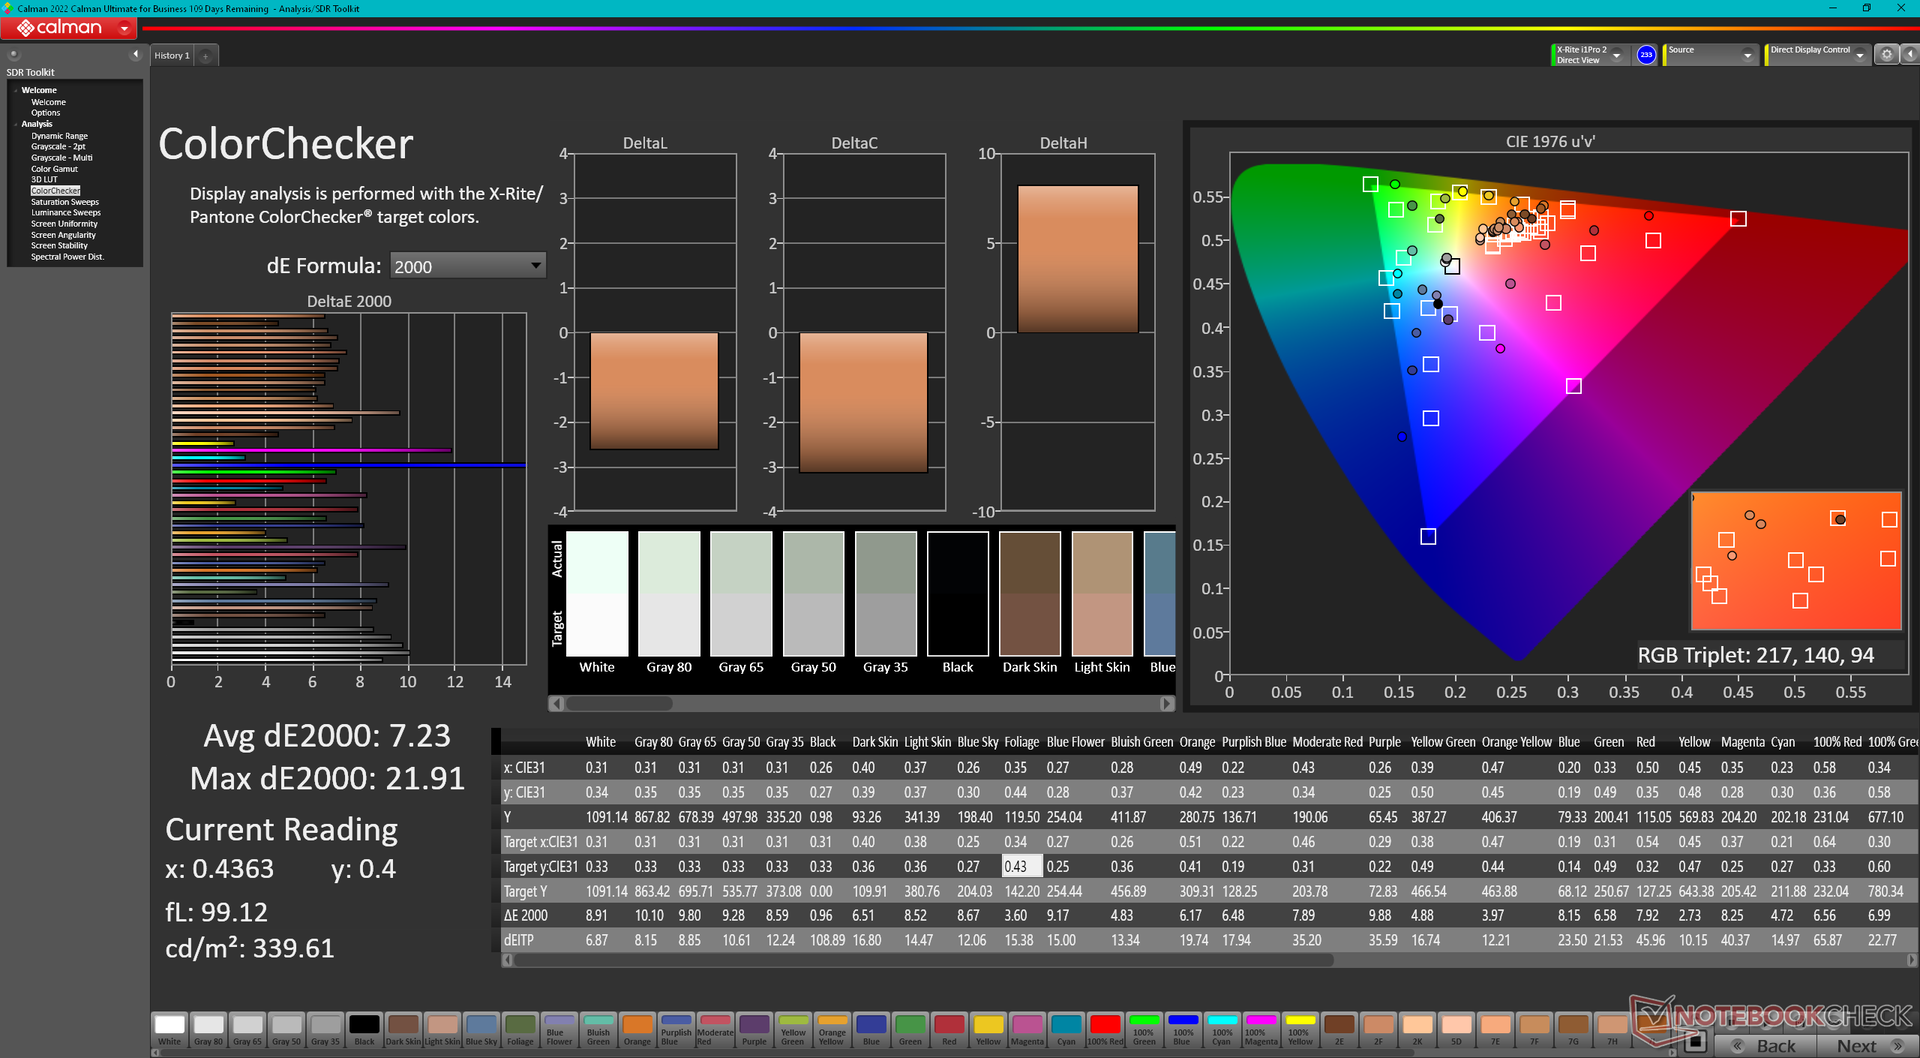
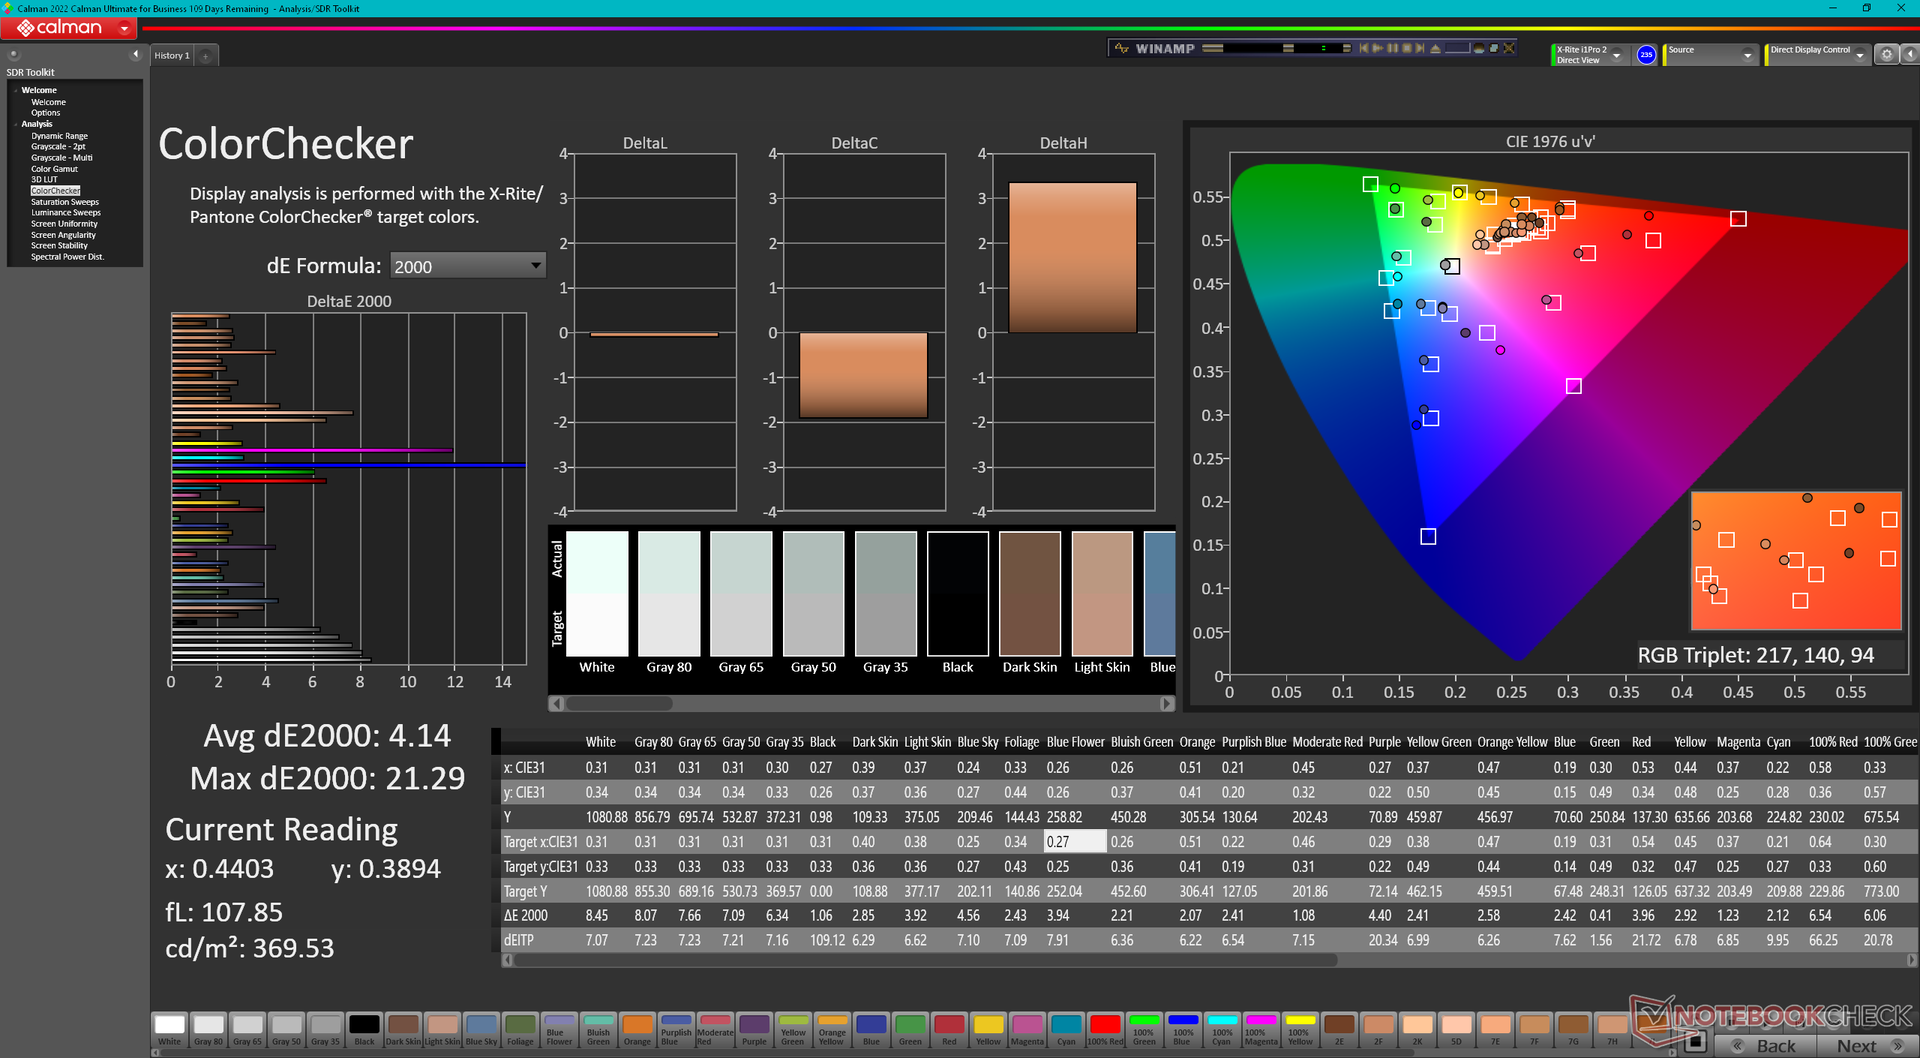
ΔE Color 7.23 | 0.5-29.43 Ø4.87, calibrated: 4.14
ΔE Greyscale 7.4 | 0.5-98 Ø5.1
41.2% AdobeRGB 1998 (Argyll 2.2.0 3D)
59% sRGB (Argyll 2.2.0 3D)
39.9% Display P3 (Argyll 2.2.0 3D)
Gamma: 2.34
| Durabook S15 HKC MY MB156CS01'2, IPS, 1920x1080, 15.6" | Durabook S15ABG2 Chi Mei N156HGE-EA2, TN LED, 1920x1080, 15.6" | Panasonic Toughbook 40 InfoVision M140NWF5 R3, IPS, 1920x1080, 14" | Getac S410 G5 CSOT T9 SNE001BS1-1, IPS, 1920x1080, 14" | Dell Latitude 5420 Rugged-P85G AU Optronics AUO523D, IPS, 1920x1080, 14" | Acer Enduro Urban N3 EUN314 XR140EA6T, IPS, 1920x1080, 14" | |
|---|---|---|---|---|---|---|
| Display | 29% | -10% | -3% | 57% | 58% | |
| Display P3 Coverage | 39.9 | 51.4 29% | 35.8 -10% | 38.5 -4% | 62.5 57% | 63.5 59% |
| sRGB Coverage | 59 | 77.1 31% | 53.8 -9% | 57.9 -2% | 92.4 57% | 91.9 56% |
| AdobeRGB 1998 Coverage | 41.2 | 52.9 28% | 37 -10% | 39.8 -3% | 64.2 56% | 65.5 59% |
| Response Times | -15% | -28% | 45% | -64% | -20% | |
| Response Time Grey 50% / Grey 80% * | 22.4 ? | 24.4 ? -9% | 50.4 ? -125% | 29 ? -29% | 68 ? -204% | 56 ? -150% |
| Response Time Black / White * | 14.5 ? | 19.6 ? -35% | 27.6 ? -90% | 18.6 ? -28% | 33.6 ? -132% | 35.2 ? -143% |
| PWM Frequency | 300 ? | 301.2 ? 0% | 694.4 ? 131% | 876 ? 192% | 735 ? 145% | 1000 ? 233% |
| Screen | -31% | 28% | 16% | 24% | 6% | |
| Brightness middle | 1087.3 | 284.8 -74% | 1284.3 18% | 958.4 -12% | 1111.7 2% | 487.8 -55% |
| Brightness | 997 | 267 -73% | 1289 29% | 978 -2% | 1026 3% | 464 -53% |
| Brightness Distribution | 84 | 86 2% | 82 -2% | 86 2% | 80 -5% | 89 6% |
| Black Level * | 1.02 | 0.7 31% | 0.89 13% | 0.96 6% | 0.81 21% | 0.48 53% |
| Contrast | 1066 | 407 -62% | 1443 35% | 998 -6% | 1372 29% | 1016 -5% |
| Colorchecker dE 2000 * | 7.23 | 11.48 -59% | 4.67 35% | 4.95 32% | 3.83 47% | 6.51 10% |
| Colorchecker dE 2000 max. * | 21.91 | 19.71 10% | 19.85 9% | 16.88 23% | 7.85 64% | 11.36 48% |
| Colorchecker dE 2000 calibrated * | 4.14 | 3.06 26% | 2.21 47% | 1.96 53% | 2.98 28% | 1.77 57% |
| Greyscale dE 2000 * | 7.4 | 13.2 -78% | 2.7 64% | 3.9 47% | 5.6 24% | 7.8 -5% |
| Gamma | 2.34 94% | 2.09 105% | 1.97 112% | 2.14 103% | 2.306 95% | 2.28 96% |
| CCT | 6327 103% | 14566 45% | 6222 104% | 7174 91% | 7676 85% | 8102 80% |
| Color Space (Percent of AdobeRGB 1998) | 48.8 | 59 | ||||
| Color Space (Percent of sRGB) | 76.8 | 93 | ||||
| Média Total (Programa/Configurações) | -6% /
-16% | -3% /
9% | 19% /
18% | 6% /
13% | 15% /
11% |
* ... menor é melhor
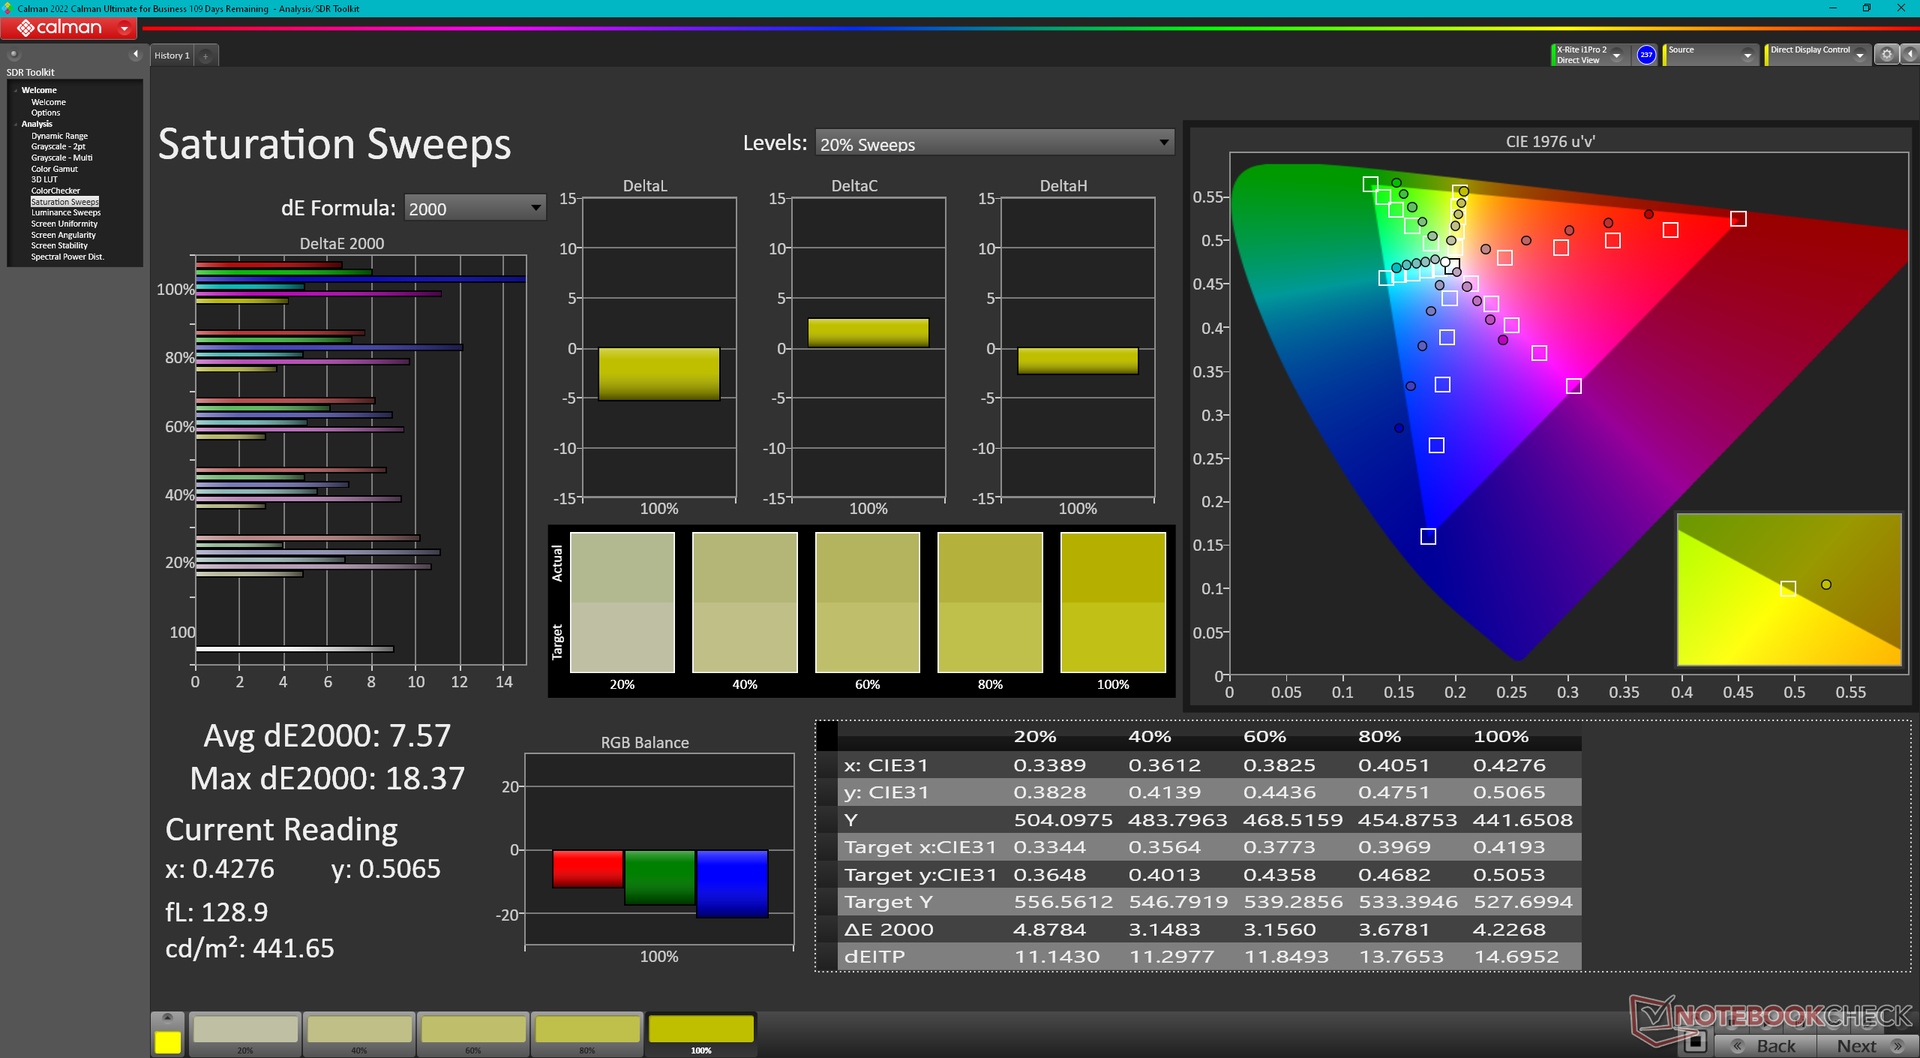
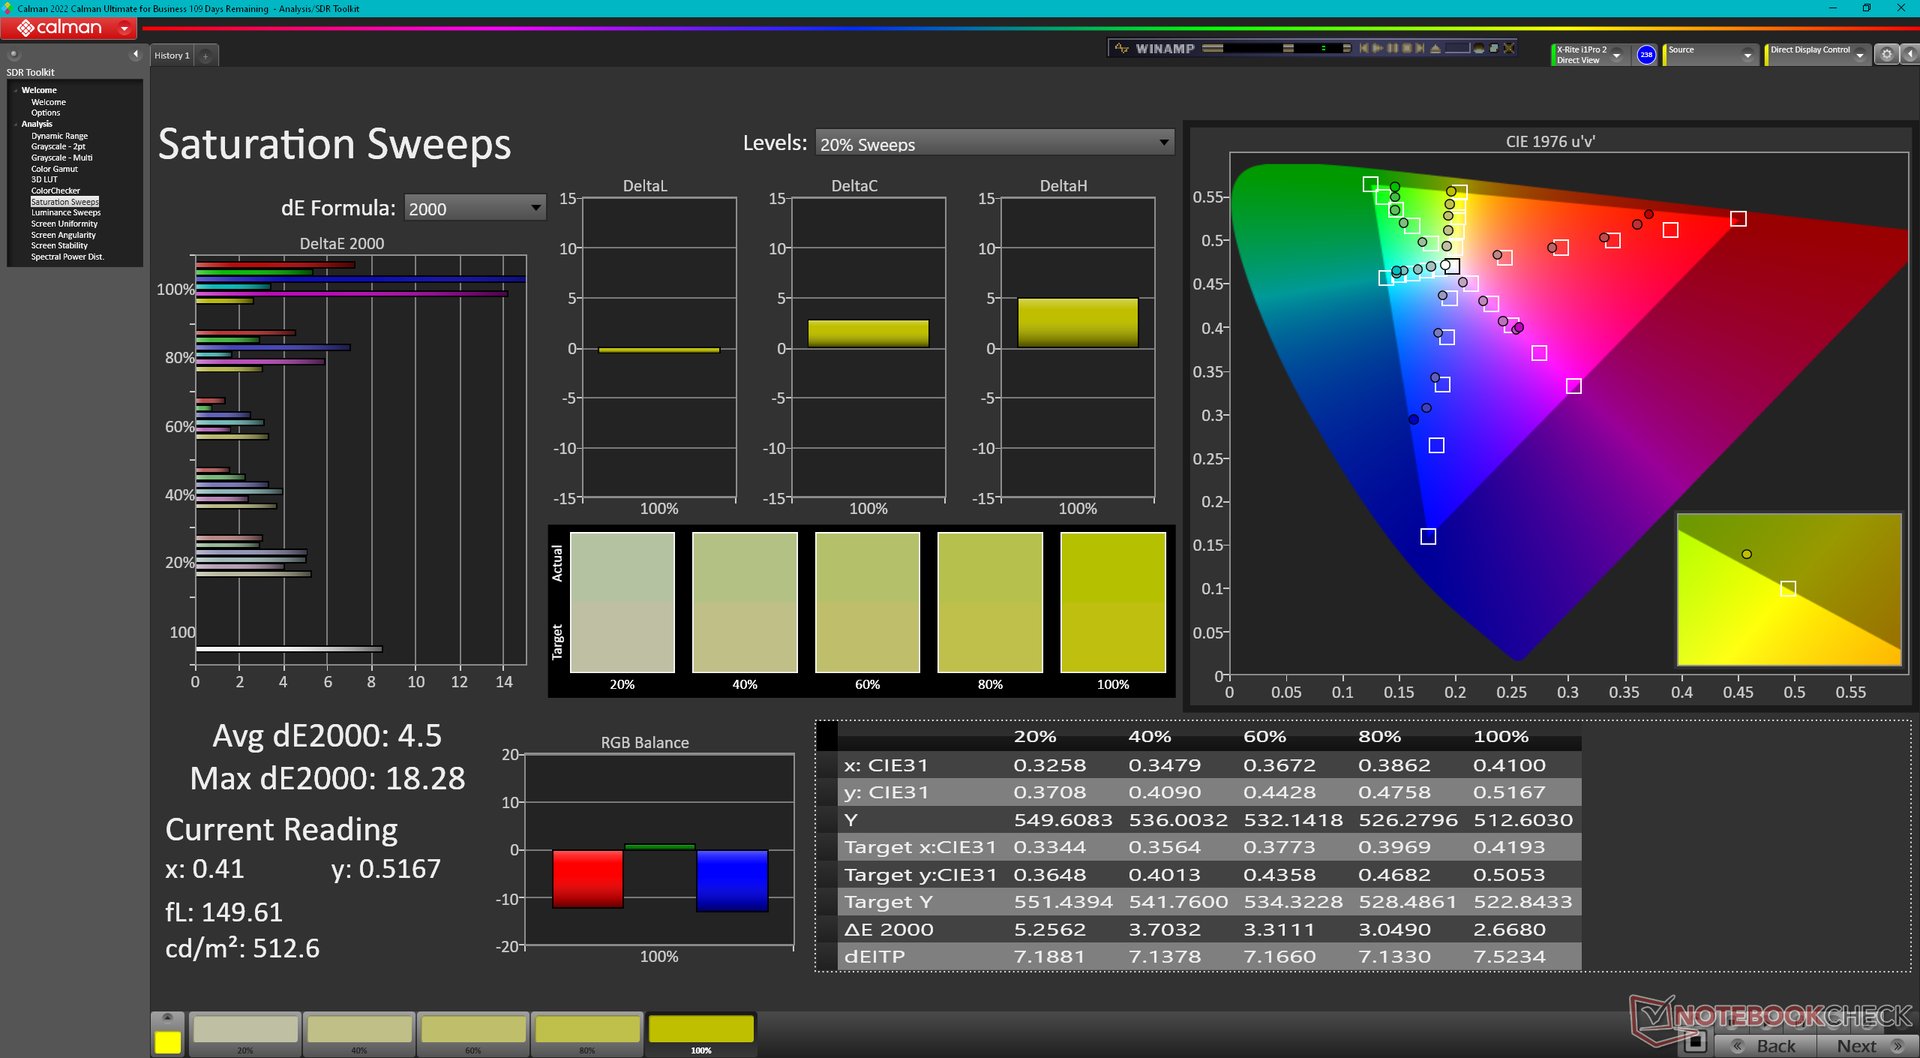
A tela vem mal calibrada, com valores médios relativamente altos de escala de cinza e deltaE de cores de 7,4 e 7,23, respectivamente. Calibrar a tela por conta própria melhoraria um pouco as coisas, mas as cores ainda se tornam cada vez mais imprecisas quanto maior o nível de saturação, devido à cobertura sRGB limitada mencionada anteriormente. De qualquer forma, cores precisas geralmente não são prioridade nesses tipos de laptops.

Exibir tempos de resposta
| ↔ Tempo de resposta preto para branco | ||
|---|---|---|
| 14.5 ms ... ascensão ↗ e queda ↘ combinadas | ↗ 7 ms ascensão | 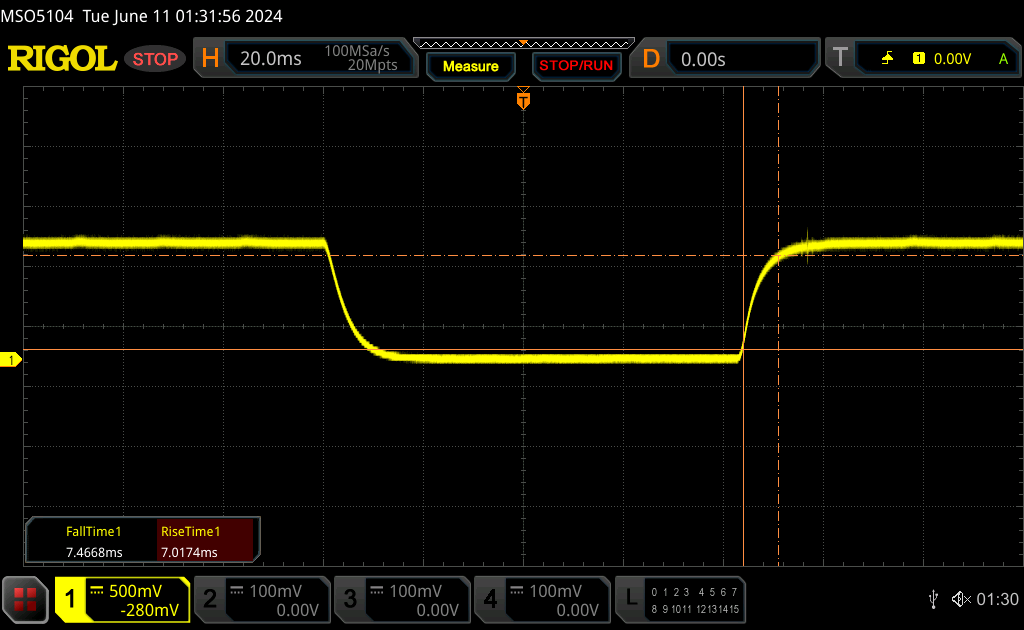 |
| ↘ 7.5 ms queda | ||
| A tela mostra boas taxas de resposta em nossos testes, mas pode ser muito lenta para jogadores competitivos. Em comparação, todos os dispositivos testados variam de 0.1 (mínimo) a 240 (máximo) ms. » 33 % de todos os dispositivos são melhores. Isso significa que o tempo de resposta medido é melhor que a média de todos os dispositivos testados (20.8 ms). | ||
| ↔ Tempo de resposta 50% cinza a 80% cinza | ||
| 22.4 ms ... ascensão ↗ e queda ↘ combinadas | ↗ 10 ms ascensão | 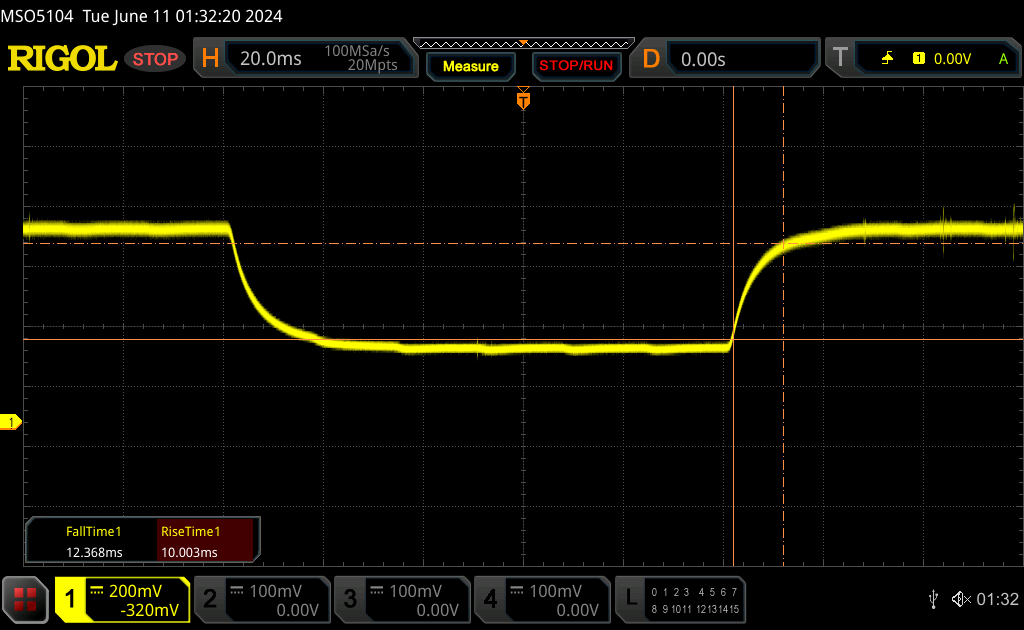 |
| ↘ 12.4 ms queda | ||
| A tela mostra boas taxas de resposta em nossos testes, mas pode ser muito lenta para jogadores competitivos. Em comparação, todos os dispositivos testados variam de 0.165 (mínimo) a 636 (máximo) ms. » 31 % de todos os dispositivos são melhores. Isso significa que o tempo de resposta medido é melhor que a média de todos os dispositivos testados (32.5 ms). | ||
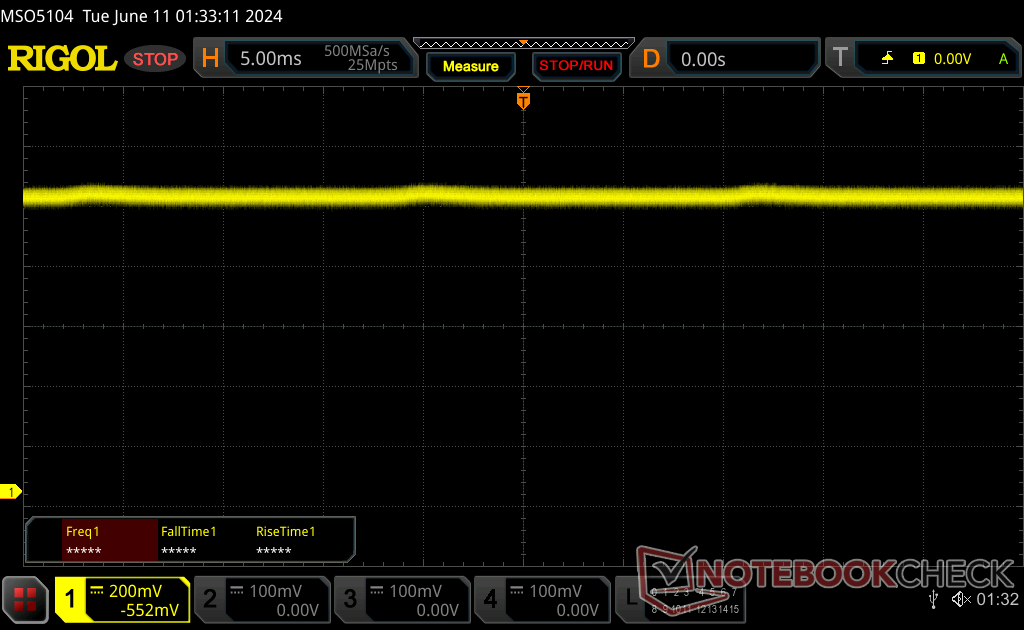
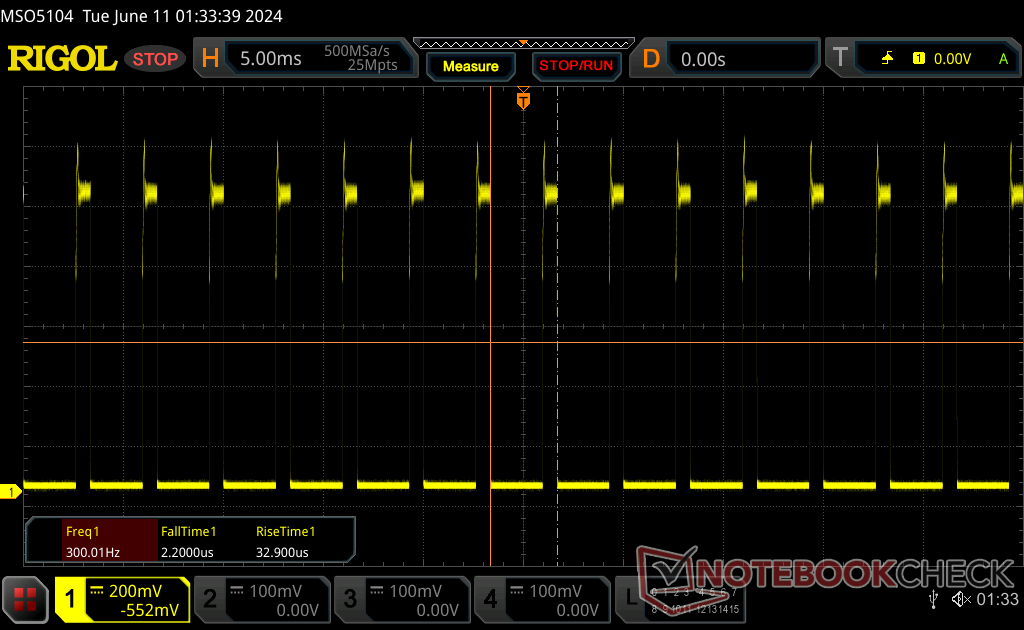
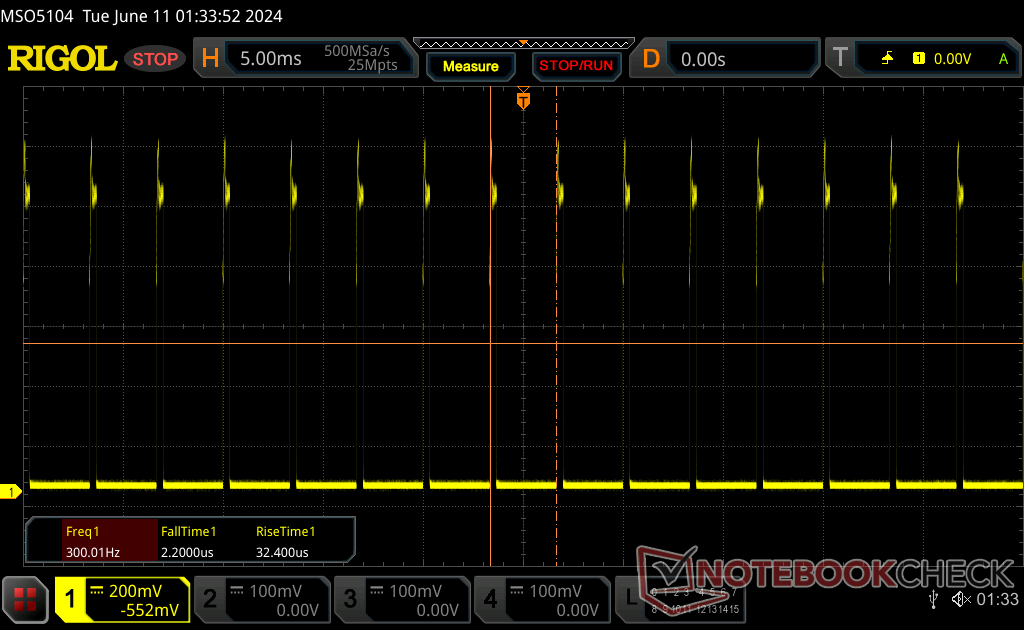
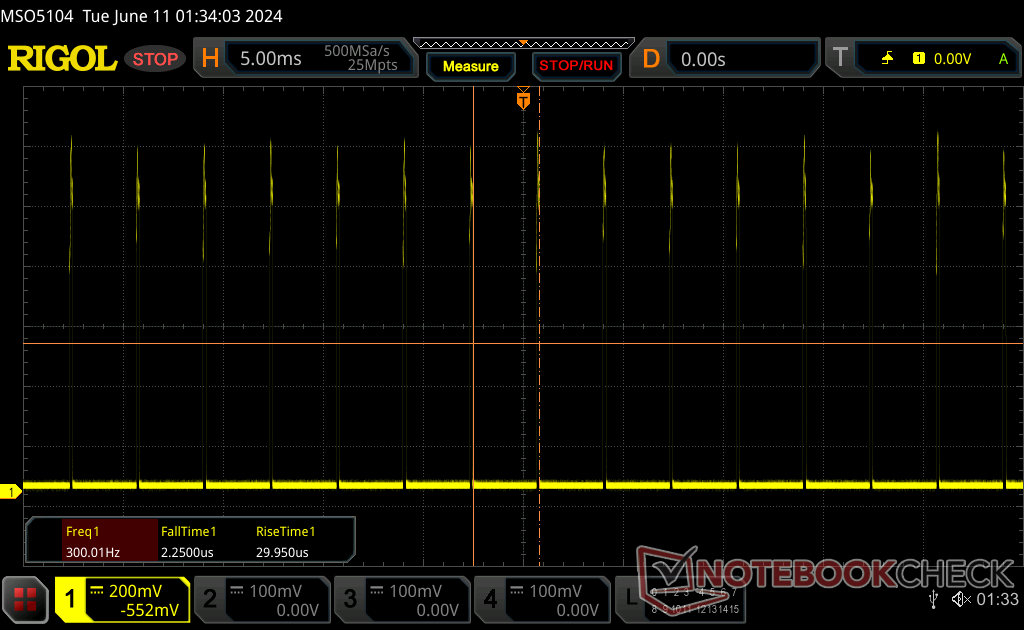
Cintilação da tela / PWM (modulação por largura de pulso)
| Tela tremeluzindo/PWM detectado | 300 Hz | ≤ 99 % configuração de brilho | 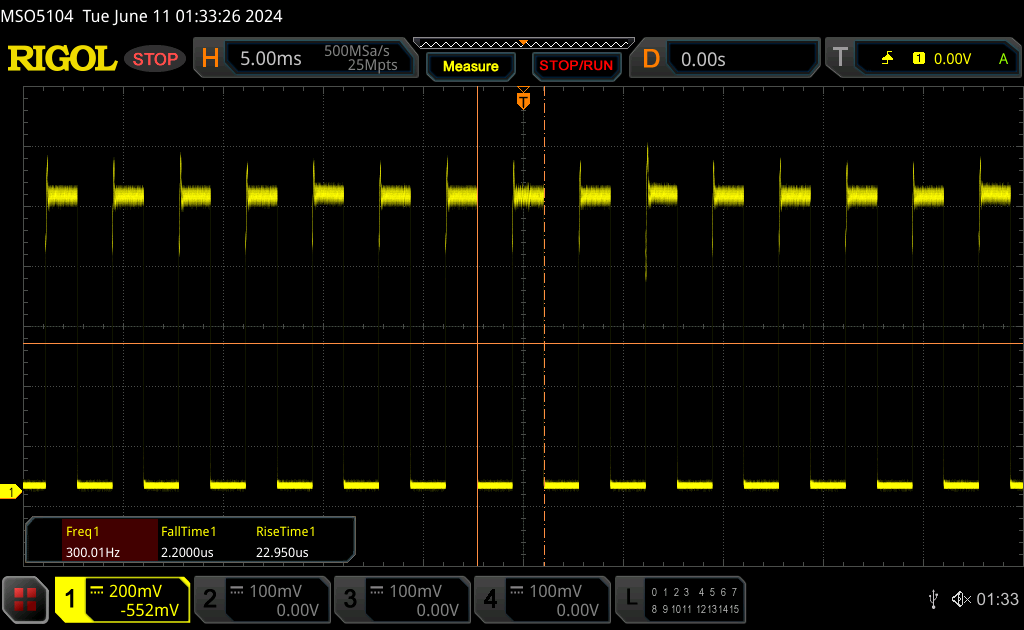 |
A luz de fundo da tela pisca em 300 Hz (pior caso, por exemplo, utilizando PWM) Cintilação detectada em uma configuração de brilho de 99 % e abaixo. Não deve haver cintilação ou PWM acima desta configuração de brilho. A frequência de 300 Hz é relativamente alta, portanto, a maioria dos usuários sensíveis ao PWM não deve notar nenhuma oscilação. No entanto, há relatos de que alguns usuários ainda são sensíveis ao PWM em 500 Hz e acima, portanto, esteja atento. [pwm_comparison] Em comparação: 53 % de todos os dispositivos testados não usam PWM para escurecer a tela. Se PWM foi detectado, uma média de 8516 (mínimo: 5 - máximo: 343500) Hz foi medida. | |||
A modulação de largura de pulso está presente em todos os níveis de brilho, exceto no máximo. Sua frequência é constante em 300 Hz de 0 a 99% de brilho, o que significa que os usuários sensíveis à oscilação da tela podem querer evitar o uso do Durabook por longos períodos de tempo.
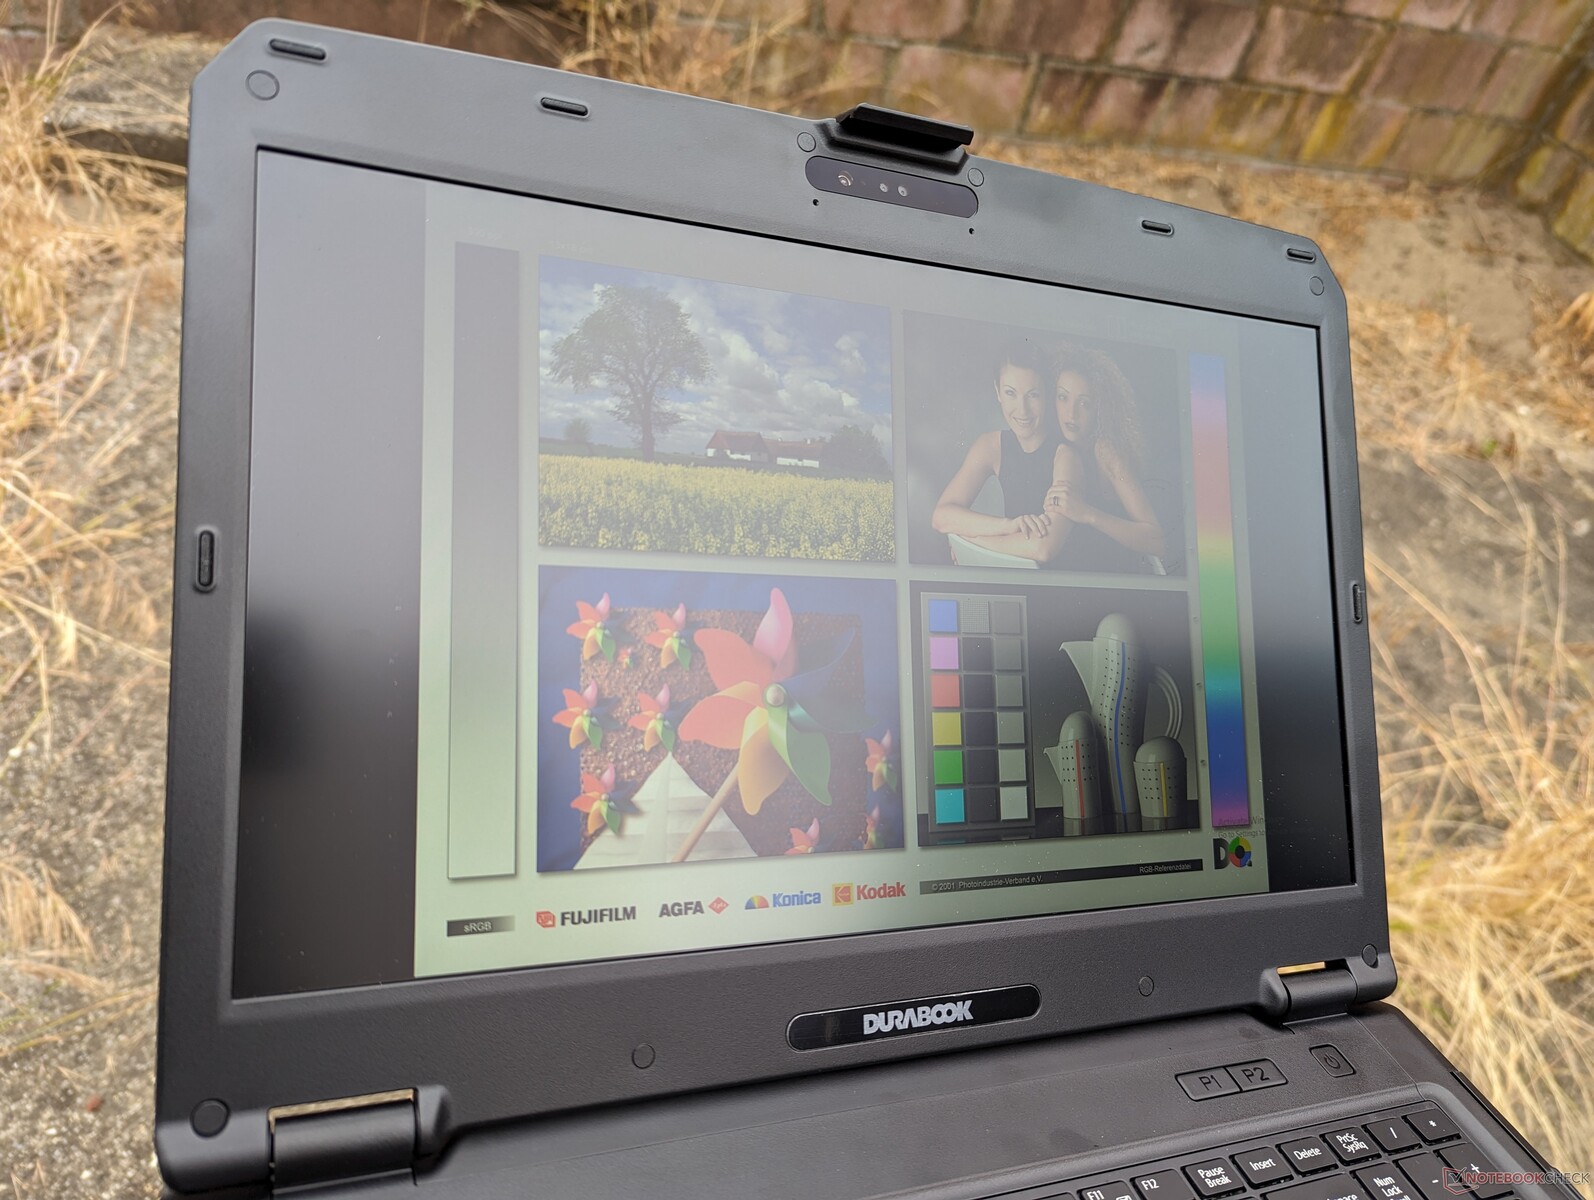
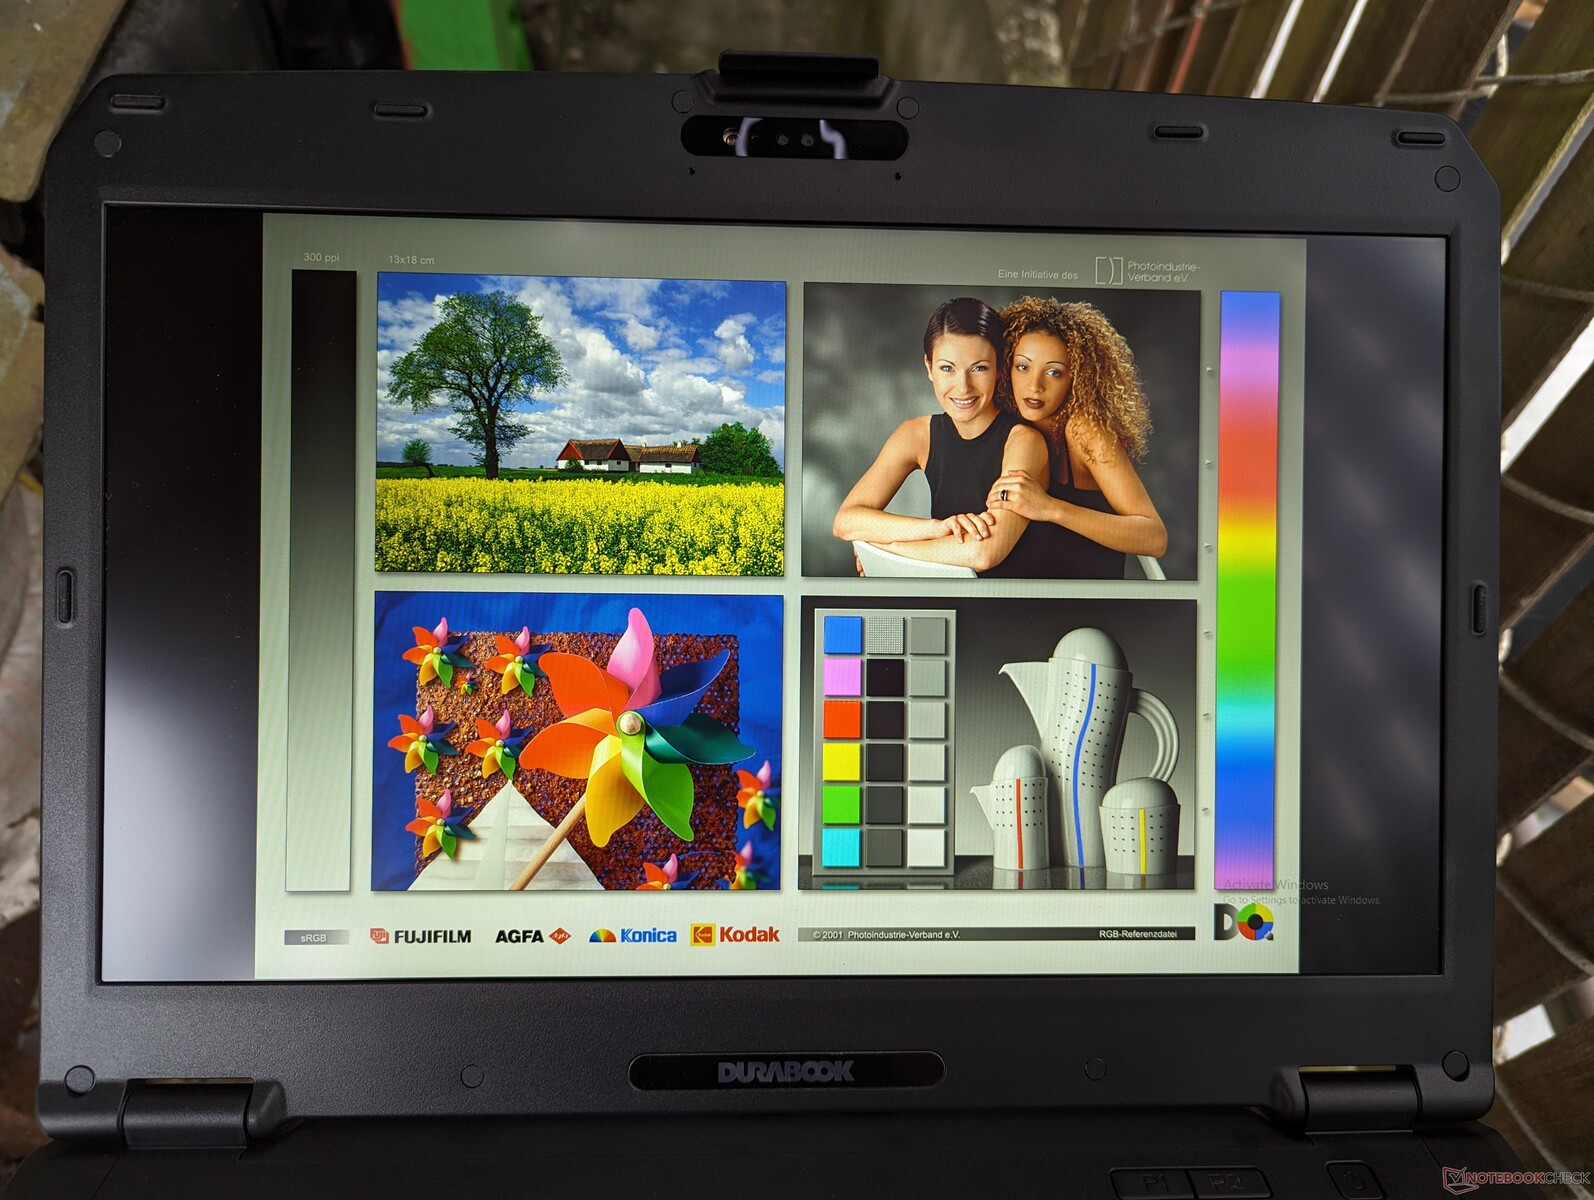
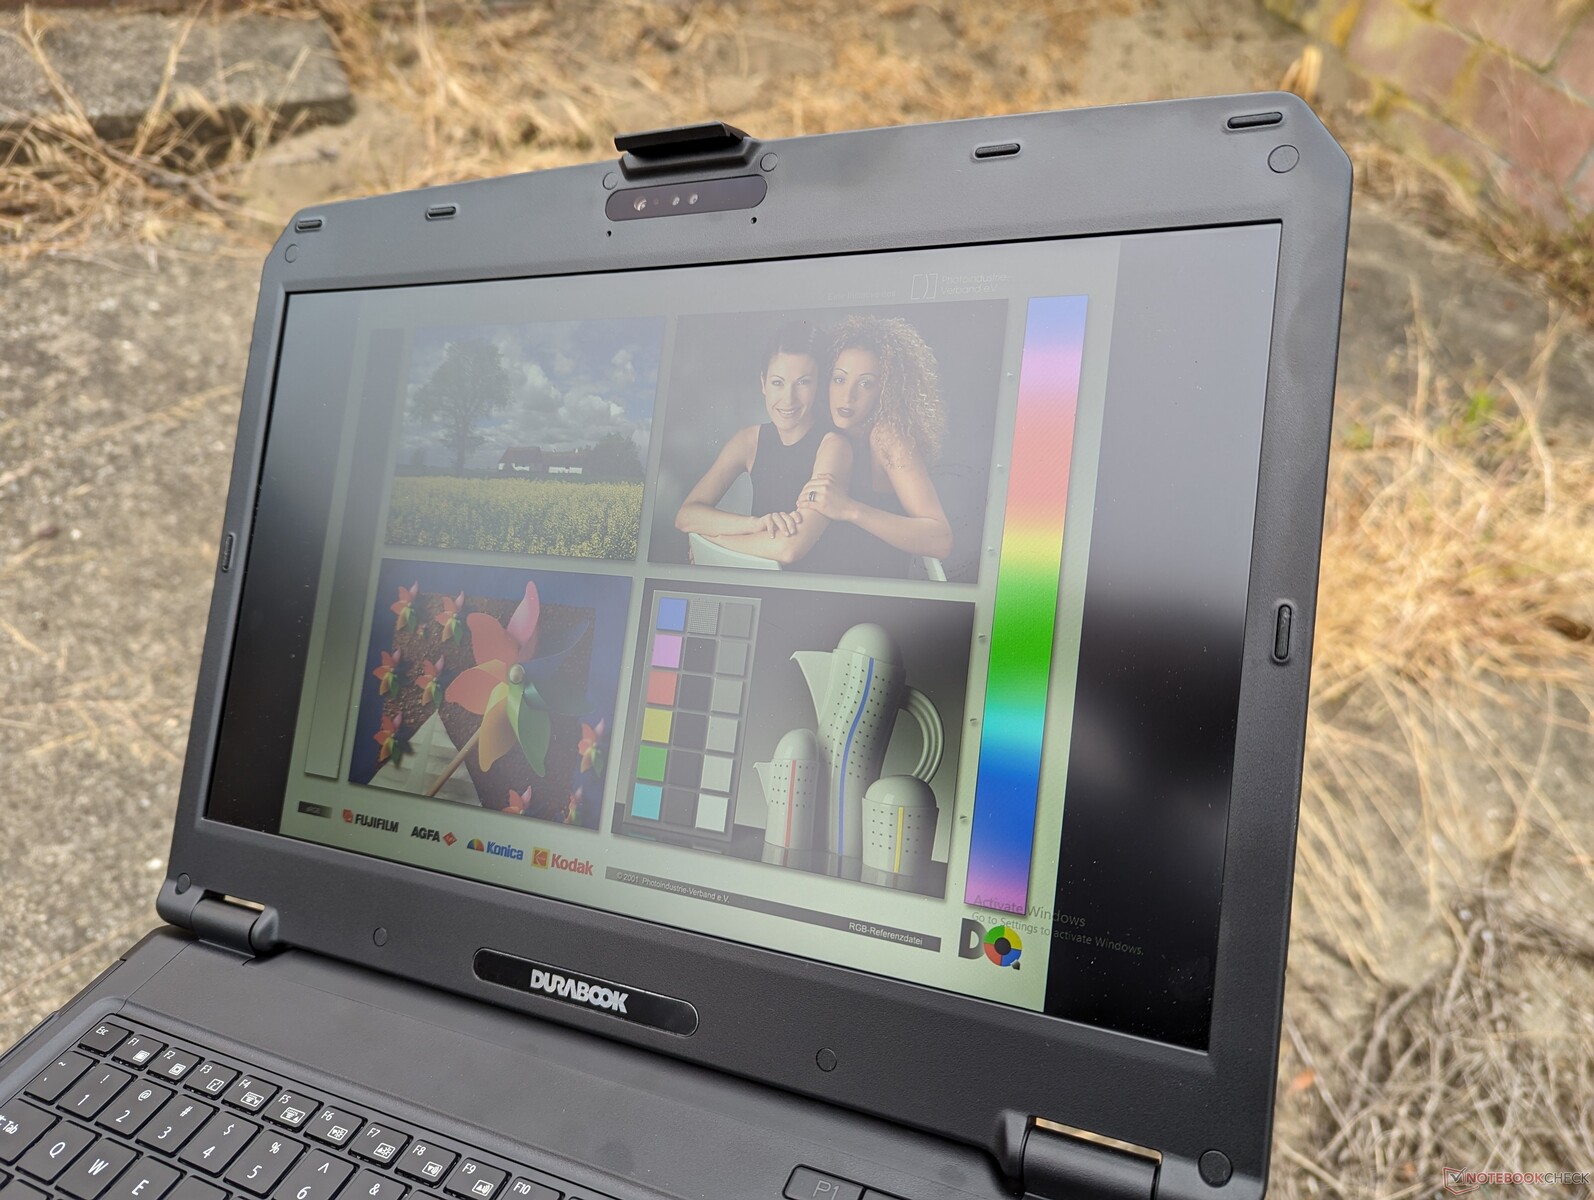
A visibilidade em ambientes externos é excelente quando à sombra e utilizável quando sob a luz do sol ou nublado. Haverá um pouco de brilho, mas a luz de fundo de 1.000 nits ajuda a atenuar a iluminação ambiente intensa para tornar os textos mais facilmente legíveis.
Desempenho - Intel 12ª geração com vPro
Condições de teste
Colocamos o Windows no modo Desempenho antes de executar os benchmarks abaixo.
Processador
O desempenho da CPU é bem superior ao do Core i5-8265U no antigo S15ABG2, como era de se esperar, e também um pouco mais rápido do que os processadores Core i7 Tiger Lake encontrados no Panasonic Toughbook FZ ou no Acer Enduro Urban. Por outro lado, no entanto, ele também é visivelmente mais lento do que o laptop médio em nosso banco de dados equipado com o mesmo processador Core i7-1255U Em cerca de 20 a 25 por cento. Isso sugere que o S15 está usando o processador de forma conservadora para melhorar a consistência e a confiabilidade do desempenho.
Para um aumento mais significativo no desempenho, recomendamos dar uma olhada no Getac S410 G5 que vem com opções de CPU Raptor Lake-P de 13ª geração para um desempenho multi-thread até 60 a 70% mais rápido do que o nosso Core i7-1255U.
Cinebench R15 Multi Loop
Cinebench R23: Multi Core | Single Core
Cinebench R20: CPU (Multi Core) | CPU (Single Core)
Cinebench R15: CPU Multi 64Bit | CPU Single 64Bit
Blender: v2.79 BMW27 CPU
7-Zip 18.03: 7z b 4 | 7z b 4 -mmt1
Geekbench 6.4: Multi-Core | Single-Core
Geekbench 5.5: Multi-Core | Single-Core
HWBOT x265 Benchmark v2.2: 4k Preset
LibreOffice : 20 Documents To PDF
R Benchmark 2.5: Overall mean
| CPU Performance Rating | |
| Getac S410 G5 | |
| Média Intel Core i7-1255U | |
| Durabook S15 | |
| Dell Latitude 7330 Rugged Extreme -2! | |
| Acer Enduro Urban N3 EUN314 -2! | |
| Panasonic Toughbook FZ-55 MK2 -4! | |
| Getac S410 Gen 4 -2! | |
| Panasonic Toughbook 40 -2! | |
| Durabook S14I -2! | |
| Getac B360 -3! | |
| Getac S410 -14! | |
| Dell Latitude 5420 Rugged-P85G -14! | |
| Durabook S15ABG2 -4! | |
| Cinebench R23 / Multi Core | |
| Getac S410 G5 | |
| Média Intel Core i7-1255U (5269 - 9628, n=11) | |
| Durabook S15 | |
| Dell Latitude 7330 Rugged Extreme | |
| Panasonic Toughbook FZ-55 MK2 | |
| Acer Enduro Urban N3 EUN314 | |
| Getac S410 Gen 4 | |
| Panasonic Toughbook 40 | |
| Getac B360 | |
| Durabook S14I | |
| Cinebench R23 / Single Core | |
| Getac S410 G5 | |
| Média Intel Core i7-1255U (1408 - 1775, n=11) | |
| Dell Latitude 7330 Rugged Extreme | |
| Panasonic Toughbook FZ-55 MK2 | |
| Acer Enduro Urban N3 EUN314 | |
| Getac S410 Gen 4 | |
| Durabook S15 | |
| Panasonic Toughbook 40 | |
| Durabook S14I | |
| Getac B360 | |
| Cinebench R20 / CPU (Multi Core) | |
| Getac S410 G5 | |
| Média Intel Core i7-1255U (2095 - 3702, n=11) | |
| Durabook S15 | |
| Dell Latitude 7330 Rugged Extreme | |
| Panasonic Toughbook FZ-55 MK2 | |
| Acer Enduro Urban N3 EUN314 | |
| Getac S410 Gen 4 | |
| Panasonic Toughbook 40 | |
| Getac B360 | |
| Durabook S14I | |
| Durabook S15ABG2 | |
| Cinebench R20 / CPU (Single Core) | |
| Getac S410 G5 | |
| Média Intel Core i7-1255U (550 - 682, n=11) | |
| Durabook S15 | |
| Dell Latitude 7330 Rugged Extreme | |
| Acer Enduro Urban N3 EUN314 | |
| Panasonic Toughbook FZ-55 MK2 | |
| Getac S410 Gen 4 | |
| Durabook S14I | |
| Panasonic Toughbook 40 | |
| Getac B360 | |
| Durabook S15ABG2 | |
| Cinebench R15 / CPU Multi 64Bit | |
| Getac S410 G5 | |
| Média Intel Core i7-1255U (919 - 1577, n=11) | |
| Durabook S15 | |
| Acer Enduro Urban N3 EUN314 | |
| Dell Latitude 7330 Rugged Extreme | |
| Panasonic Toughbook FZ-55 MK2 | |
| Getac S410 Gen 4 | |
| Panasonic Toughbook 40 | |
| Getac B360 | |
| Durabook S14I | |
| Getac S410 | |
| Durabook S15ABG2 | |
| Dell Latitude 5420 Rugged-P85G | |
| Cinebench R15 / CPU Single 64Bit | |
| Getac S410 G5 | |
| Média Intel Core i7-1255U (161 - 251, n=12) | |
| Durabook S15 | |
| Dell Latitude 7330 Rugged Extreme | |
| Panasonic Toughbook FZ-55 MK2 | |
| Acer Enduro Urban N3 EUN314 | |
| Getac S410 Gen 4 | |
| Durabook S14I | |
| Panasonic Toughbook 40 | |
| Getac B360 | |
| Getac S410 | |
| Durabook S15ABG2 | |
| Dell Latitude 5420 Rugged-P85G | |
| Blender / v2.79 BMW27 CPU | |
| Durabook S15ABG2 | |
| Durabook S14I | |
| Getac B360 | |
| Panasonic Toughbook 40 | |
| Getac S410 Gen 4 | |
| Panasonic Toughbook FZ-55 MK2 | |
| Acer Enduro Urban N3 EUN314 | |
| Dell Latitude 7330 Rugged Extreme | |
| Durabook S15 | |
| Média Intel Core i7-1255U (372 - 601, n=11) | |
| Getac S410 G5 | |
| 7-Zip 18.03 / 7z b 4 | |
| Getac S410 G5 | |
| Média Intel Core i7-1255U (24126 - 37365, n=11) | |
| Durabook S15 | |
| Acer Enduro Urban N3 EUN314 | |
| Dell Latitude 7330 Rugged Extreme | |
| Panasonic Toughbook FZ-55 MK2 | |
| Getac S410 Gen 4 | |
| Getac B360 | |
| Panasonic Toughbook 40 | |
| Durabook S14I | |
| Durabook S15ABG2 | |
| 7-Zip 18.03 / 7z b 4 -mmt1 | |
| Dell Latitude 7330 Rugged Extreme | |
| Acer Enduro Urban N3 EUN314 | |
| Média Intel Core i7-1255U (5059 - 5529, n=11) | |
| Panasonic Toughbook FZ-55 MK2 | |
| Durabook S14I | |
| Getac S410 G5 | |
| Durabook S15 | |
| Panasonic Toughbook 40 | |
| Getac S410 Gen 4 | |
| Getac B360 | |
| Durabook S15ABG2 | |
| Geekbench 6.4 / Multi-Core | |
| Getac S410 G5 | |
| Média Intel Core i7-1255U (7914 - 8632, n=2) | |
| Durabook S15 | |
| Geekbench 6.4 / Single-Core | |
| Getac S410 G5 | |
| Média Intel Core i7-1255U (2313 - 2325, n=2) | |
| Durabook S15 | |
| Geekbench 5.5 / Multi-Core | |
| Getac S410 G5 | |
| Média Intel Core i7-1255U (4463 - 8821, n=12) | |
| Durabook S15 | |
| Dell Latitude 7330 Rugged Extreme | |
| Acer Enduro Urban N3 EUN314 | |
| Getac S410 Gen 4 | |
| Panasonic Toughbook 40 | |
| Getac B360 | |
| Durabook S14I | |
| Durabook S15ABG2 | |
| Geekbench 5.5 / Single-Core | |
| Getac S410 G5 | |
| Durabook S15 | |
| Média Intel Core i7-1255U (1560 - 1712, n=12) | |
| Dell Latitude 7330 Rugged Extreme | |
| Acer Enduro Urban N3 EUN314 | |
| Durabook S14I | |
| Getac S410 Gen 4 | |
| Panasonic Toughbook 40 | |
| Getac B360 | |
| Durabook S15ABG2 | |
| HWBOT x265 Benchmark v2.2 / 4k Preset | |
| Getac S410 G5 | |
| Média Intel Core i7-1255U (6.31 - 10.1, n=11) | |
| Dell Latitude 7330 Rugged Extreme | |
| Durabook S15 | |
| Panasonic Toughbook FZ-55 MK2 | |
| Acer Enduro Urban N3 EUN314 | |
| Getac S410 Gen 4 | |
| Panasonic Toughbook 40 | |
| Getac B360 | |
| Durabook S14I | |
| Durabook S15ABG2 | |
| LibreOffice / 20 Documents To PDF | |
| Durabook S15ABG2 | |
| Acer Enduro Urban N3 EUN314 | |
| Panasonic Toughbook 40 | |
| Durabook S15 | |
| Getac S410 Gen 4 | |
| Dell Latitude 7330 Rugged Extreme | |
| Panasonic Toughbook FZ-55 MK2 | |
| Média Intel Core i7-1255U (35.6 - 52.5, n=11) | |
| Durabook S14I | |
| Getac S410 G5 | |
| R Benchmark 2.5 / Overall mean | |
| Durabook S15ABG2 | |
| Getac B360 | |
| Panasonic Toughbook 40 | |
| Getac S410 Gen 4 | |
| Durabook S14I | |
| Acer Enduro Urban N3 EUN314 | |
| Panasonic Toughbook FZ-55 MK2 | |
| Dell Latitude 7330 Rugged Extreme | |
| Média Intel Core i7-1255U (0.4688 - 0.558, n=11) | |
| Getac S410 G5 | |
| Durabook S15 | |
Cinebench R23: Multi Core | Single Core
Cinebench R20: CPU (Multi Core) | CPU (Single Core)
Cinebench R15: CPU Multi 64Bit | CPU Single 64Bit
Blender: v2.79 BMW27 CPU
7-Zip 18.03: 7z b 4 | 7z b 4 -mmt1
Geekbench 6.4: Multi-Core | Single-Core
Geekbench 5.5: Multi-Core | Single-Core
HWBOT x265 Benchmark v2.2: 4k Preset
LibreOffice : 20 Documents To PDF
R Benchmark 2.5: Overall mean
* ... menor é melhor
AIDA64: FP32 Ray-Trace | FPU Julia | CPU SHA3 | CPU Queen | FPU SinJulia | FPU Mandel | CPU AES | CPU ZLib | FP64 Ray-Trace | CPU PhotoWorxx
| Performance Rating | |
| Getac S410 G5 | |
| Média Intel Core i7-1255U | |
| Acer Enduro Urban N3 EUN314 | |
| Durabook S15 | |
| Panasonic Toughbook 40 | |
| Durabook S15ABG2 | |
| AIDA64 / FP32 Ray-Trace | |
| Getac S410 G5 | |
| Acer Enduro Urban N3 EUN314 | |
| Média Intel Core i7-1255U (4313 - 8127, n=11) | |
| Panasonic Toughbook 40 | |
| Durabook S15 | |
| Durabook S15ABG2 | |
| AIDA64 / FPU Julia | |
| Getac S410 G5 | |
| Média Intel Core i7-1255U (19813 - 41353, n=11) | |
| Acer Enduro Urban N3 EUN314 | |
| Durabook S15 | |
| Panasonic Toughbook 40 | |
| Durabook S15ABG2 | |
| AIDA64 / CPU SHA3 | |
| Getac S410 G5 | |
| Acer Enduro Urban N3 EUN314 | |
| Média Intel Core i7-1255U (1325 - 2135, n=11) | |
| Panasonic Toughbook 40 | |
| Durabook S15 | |
| Durabook S15ABG2 | |
| AIDA64 / CPU Queen | |
| Getac S410 G5 | |
| Média Intel Core i7-1255U (61375 - 65892, n=11) | |
| Durabook S15 | |
| Acer Enduro Urban N3 EUN314 | |
| Panasonic Toughbook 40 | |
| Durabook S15ABG2 | |
| AIDA64 / FPU SinJulia | |
| Getac S410 G5 | |
| Acer Enduro Urban N3 EUN314 | |
| Média Intel Core i7-1255U (3577 - 5095, n=11) | |
| Panasonic Toughbook 40 | |
| Durabook S15ABG2 | |
| Durabook S15 | |
| AIDA64 / FPU Mandel | |
| Getac S410 G5 | |
| Acer Enduro Urban N3 EUN314 | |
| Média Intel Core i7-1255U (11759 - 20187, n=11) | |
| Panasonic Toughbook 40 | |
| Durabook S15 | |
| Durabook S15ABG2 | |
| AIDA64 / CPU AES | |
| Acer Enduro Urban N3 EUN314 | |
| Getac S410 G5 | |
| Média Intel Core i7-1255U (27900 - 67458, n=11) | |
| Panasonic Toughbook 40 | |
| Durabook S15 | |
| Durabook S15ABG2 | |
| AIDA64 / CPU ZLib | |
| Getac S410 G5 | |
| Média Intel Core i7-1255U (393 - 640, n=11) | |
| Durabook S15 | |
| Acer Enduro Urban N3 EUN314 | |
| Panasonic Toughbook 40 | |
| Durabook S15ABG2 | |
| AIDA64 / FP64 Ray-Trace | |
| Getac S410 G5 | |
| Acer Enduro Urban N3 EUN314 | |
| Média Intel Core i7-1255U (2474 - 4400, n=11) | |
| Panasonic Toughbook 40 | |
| Durabook S15 | |
| Durabook S15ABG2 | |
| AIDA64 / CPU PhotoWorxx | |
| Getac S410 G5 | |
| Durabook S15 | |
| Média Intel Core i7-1255U (13899 - 44054, n=11) | |
| Acer Enduro Urban N3 EUN314 | |
| Panasonic Toughbook 40 | |
| Durabook S15ABG2 | |
Teste de estresse
A CPU aumentava para 2,4 GHz e 34 W ao iniciar o estresse do Prime95. No entanto, após atingir uma temperatura central de 85 °C alguns segundos depois, o processador caía para 1,3 GHz e 15 W para manter uma temperatura ligeiramente mais baixa de 80 °C. Essa faixa de temperatura é semelhante à que registramos no 2020 S15ABG2.
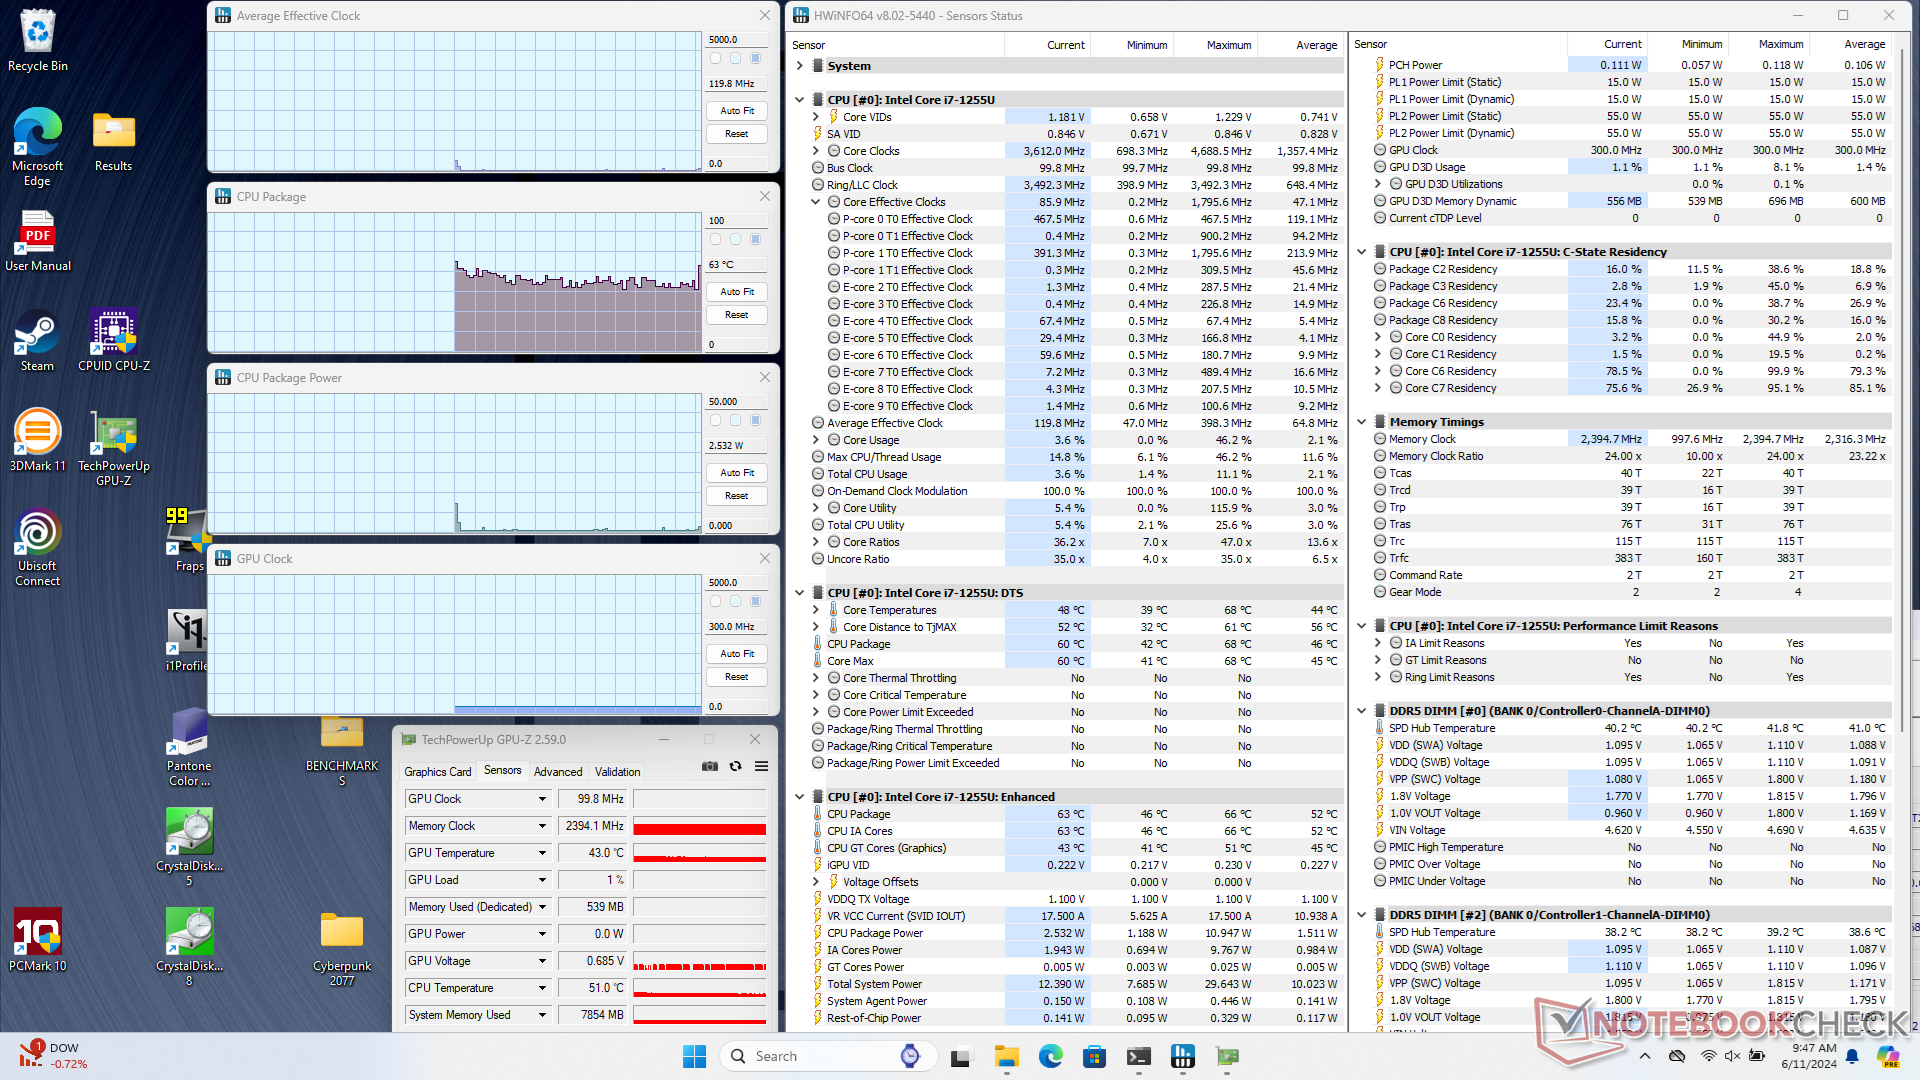
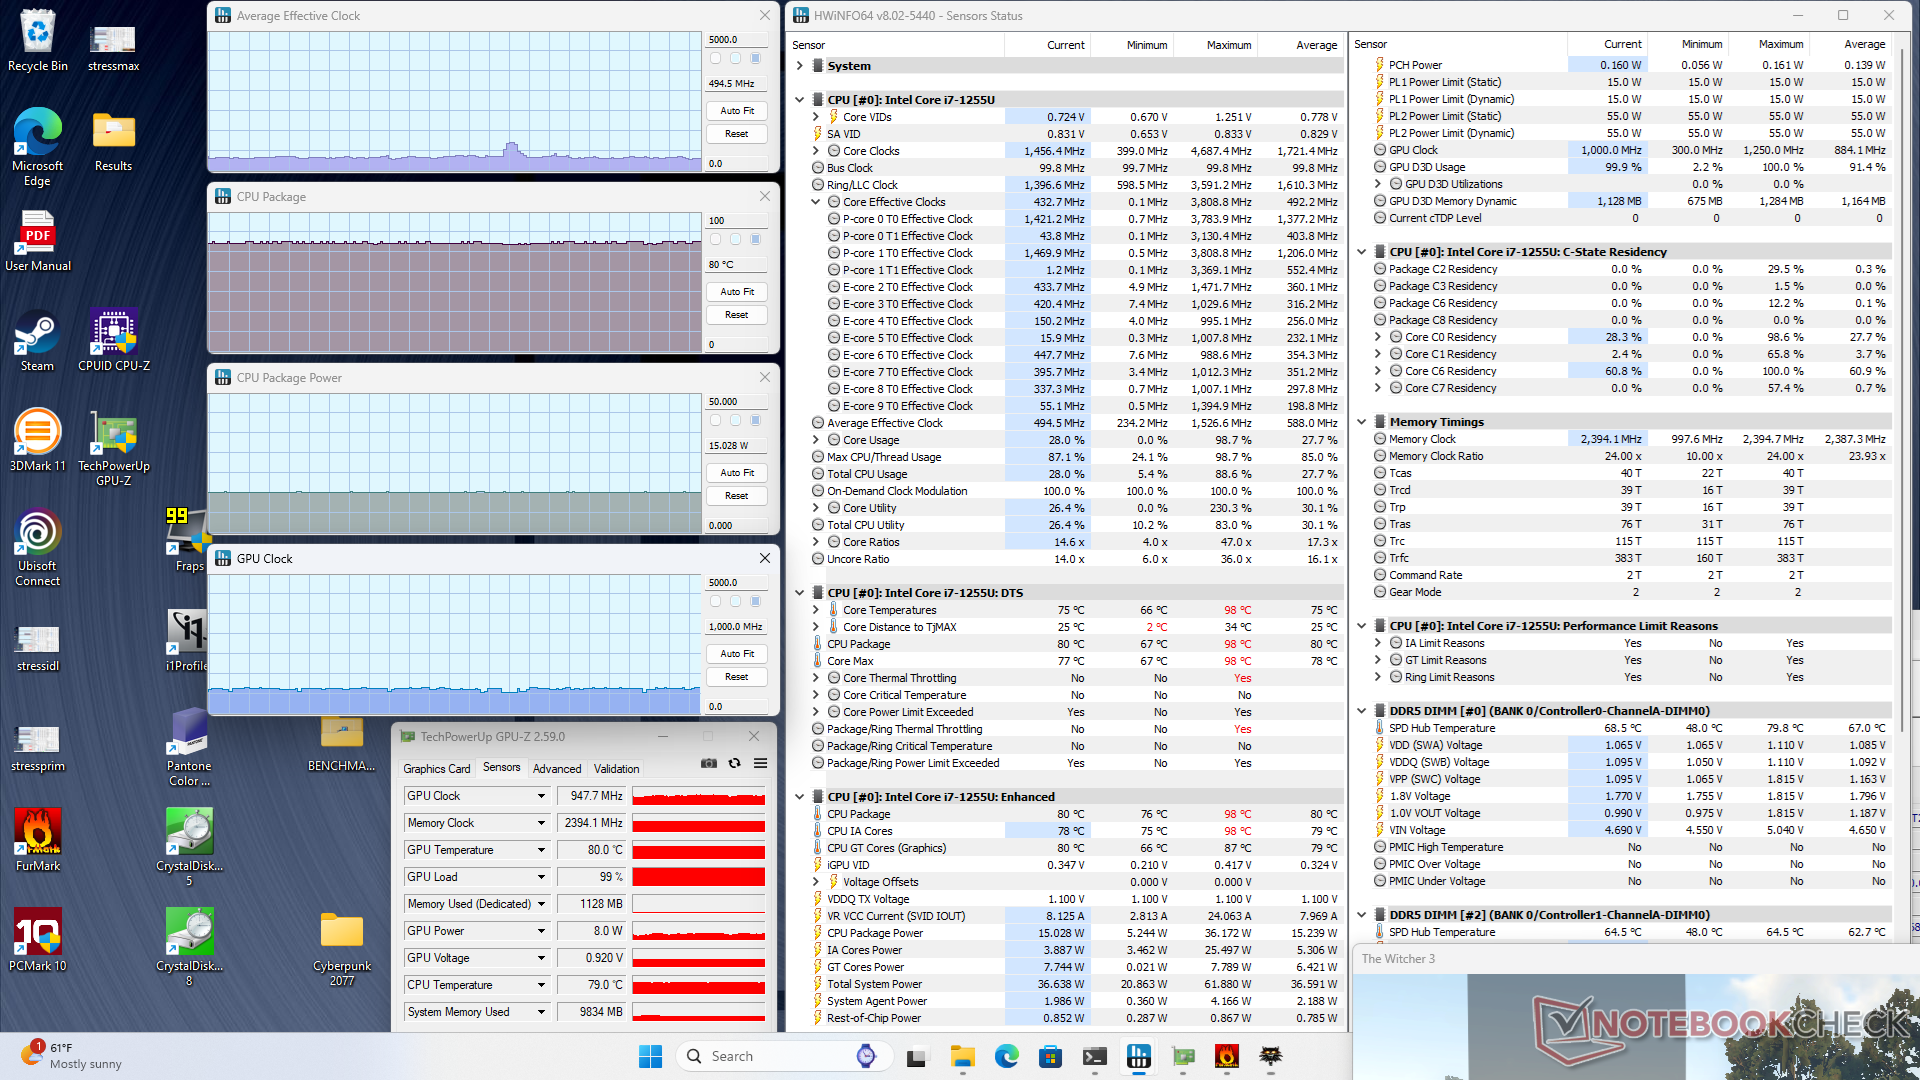
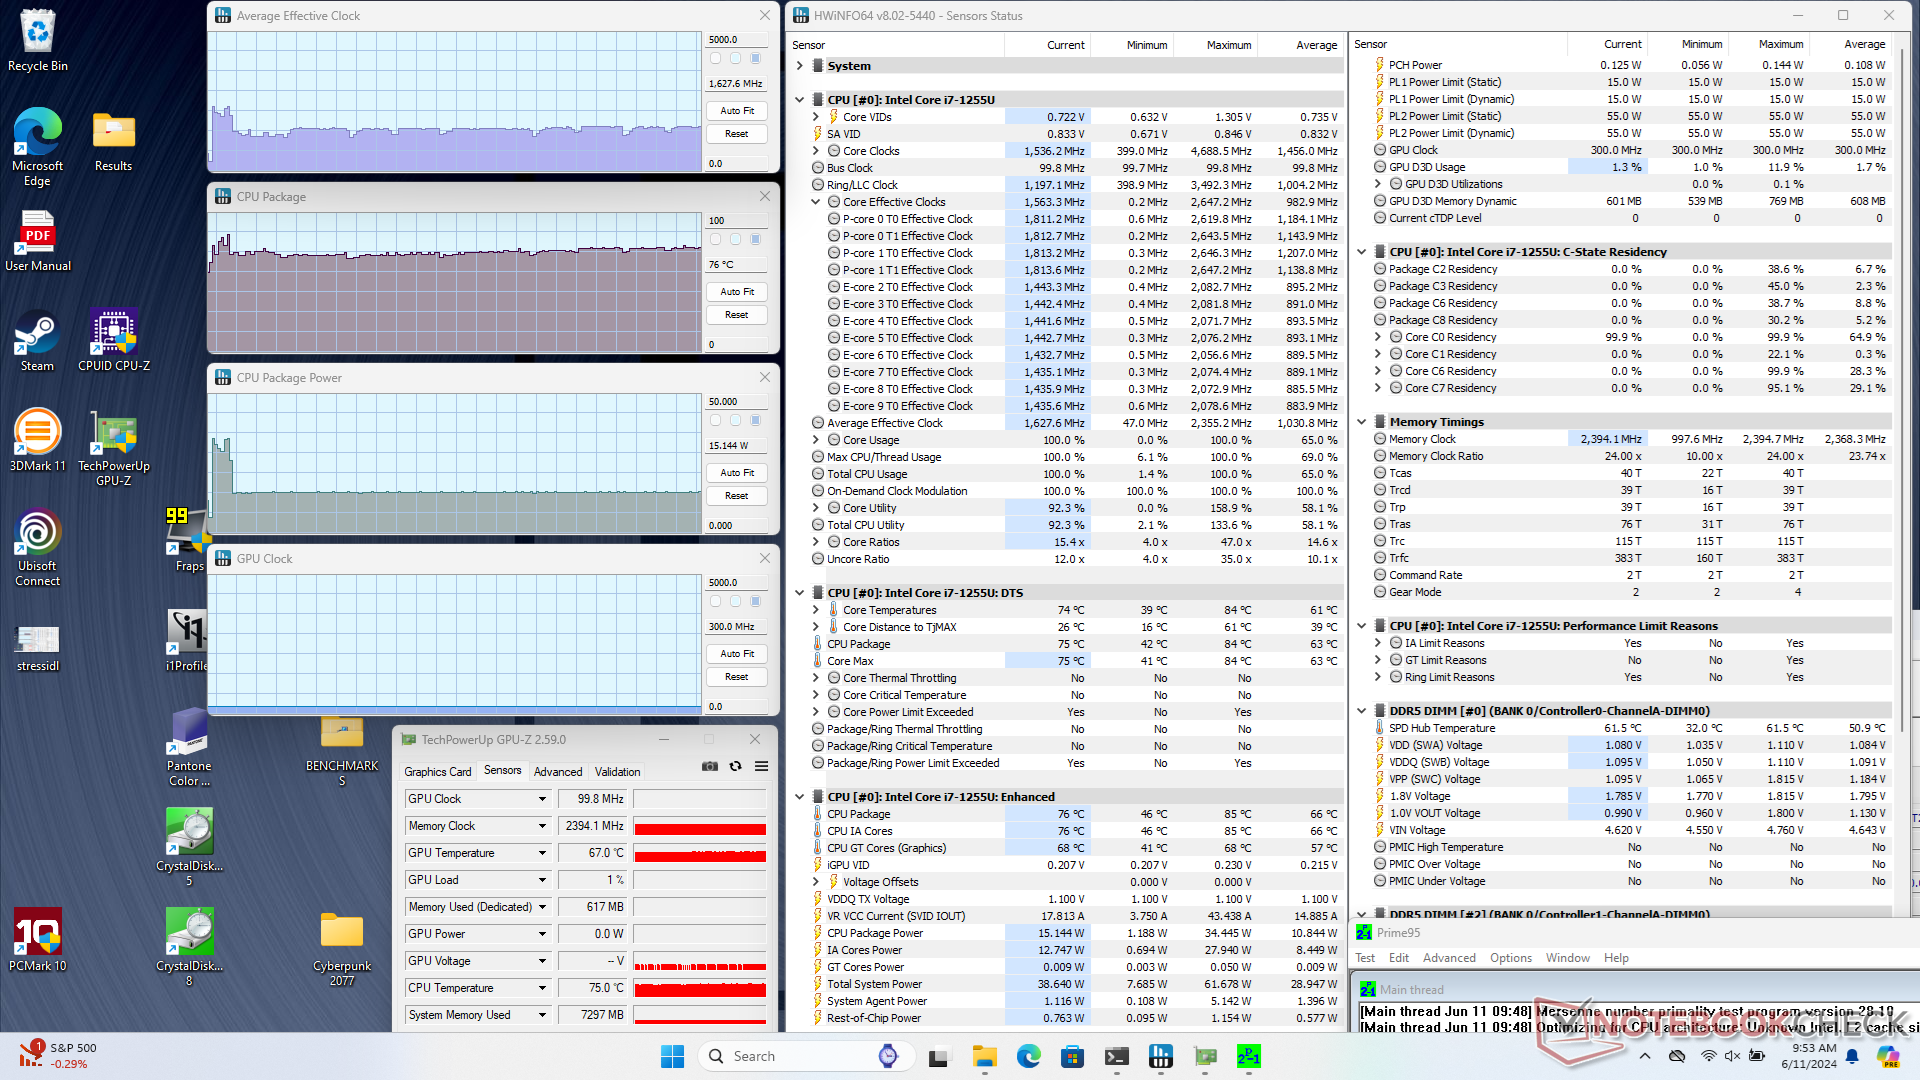
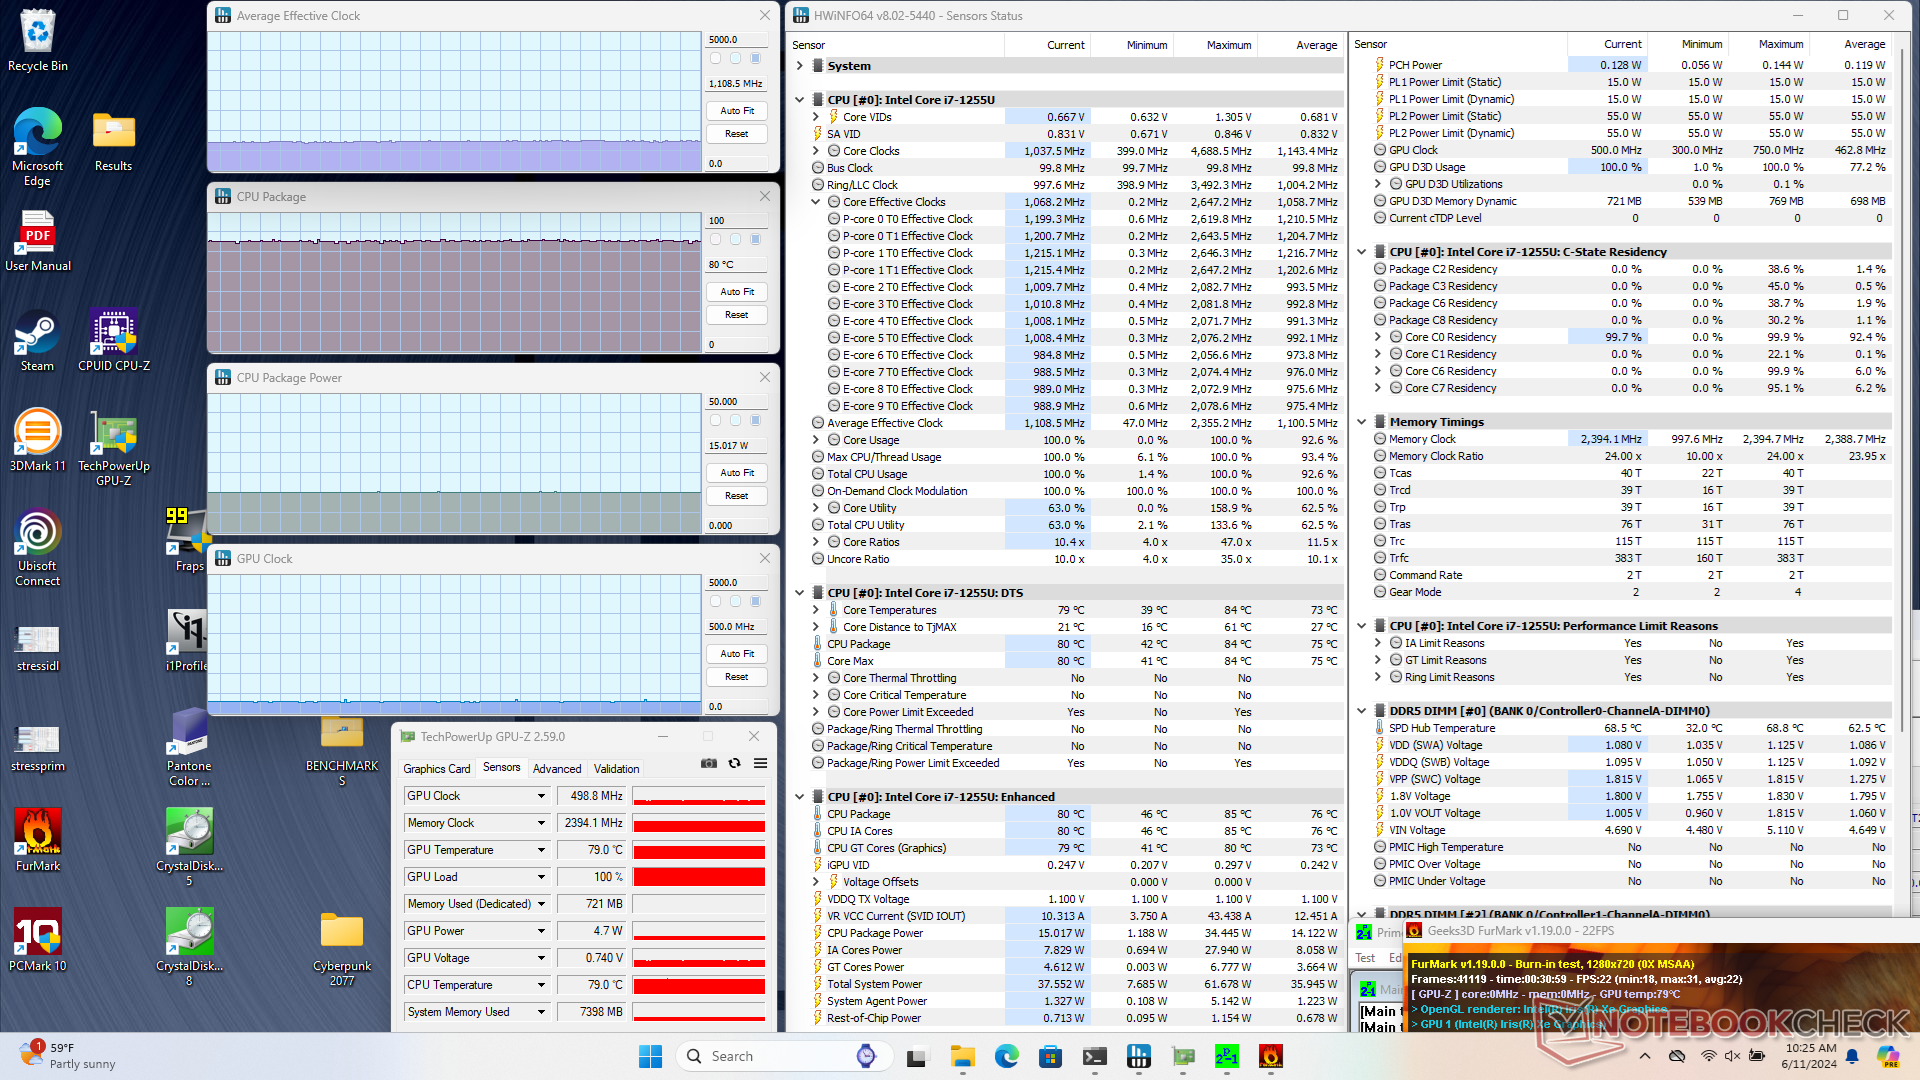
| Clock médio da CPU (GHz) | Clock da GPU (MHz) | Temperatura média da CPU (°C) | |
| Sistema ocioso | -- | -- | 60 |
| Estresse doPrime95 | 1.6 | -- | 76 |
| Prime95 + FurMark Stress | 1.1 | 499 | 80 |
| Witcher 3 Estresse | 0,5 | 948 | 80 |
Desempenho do sistema
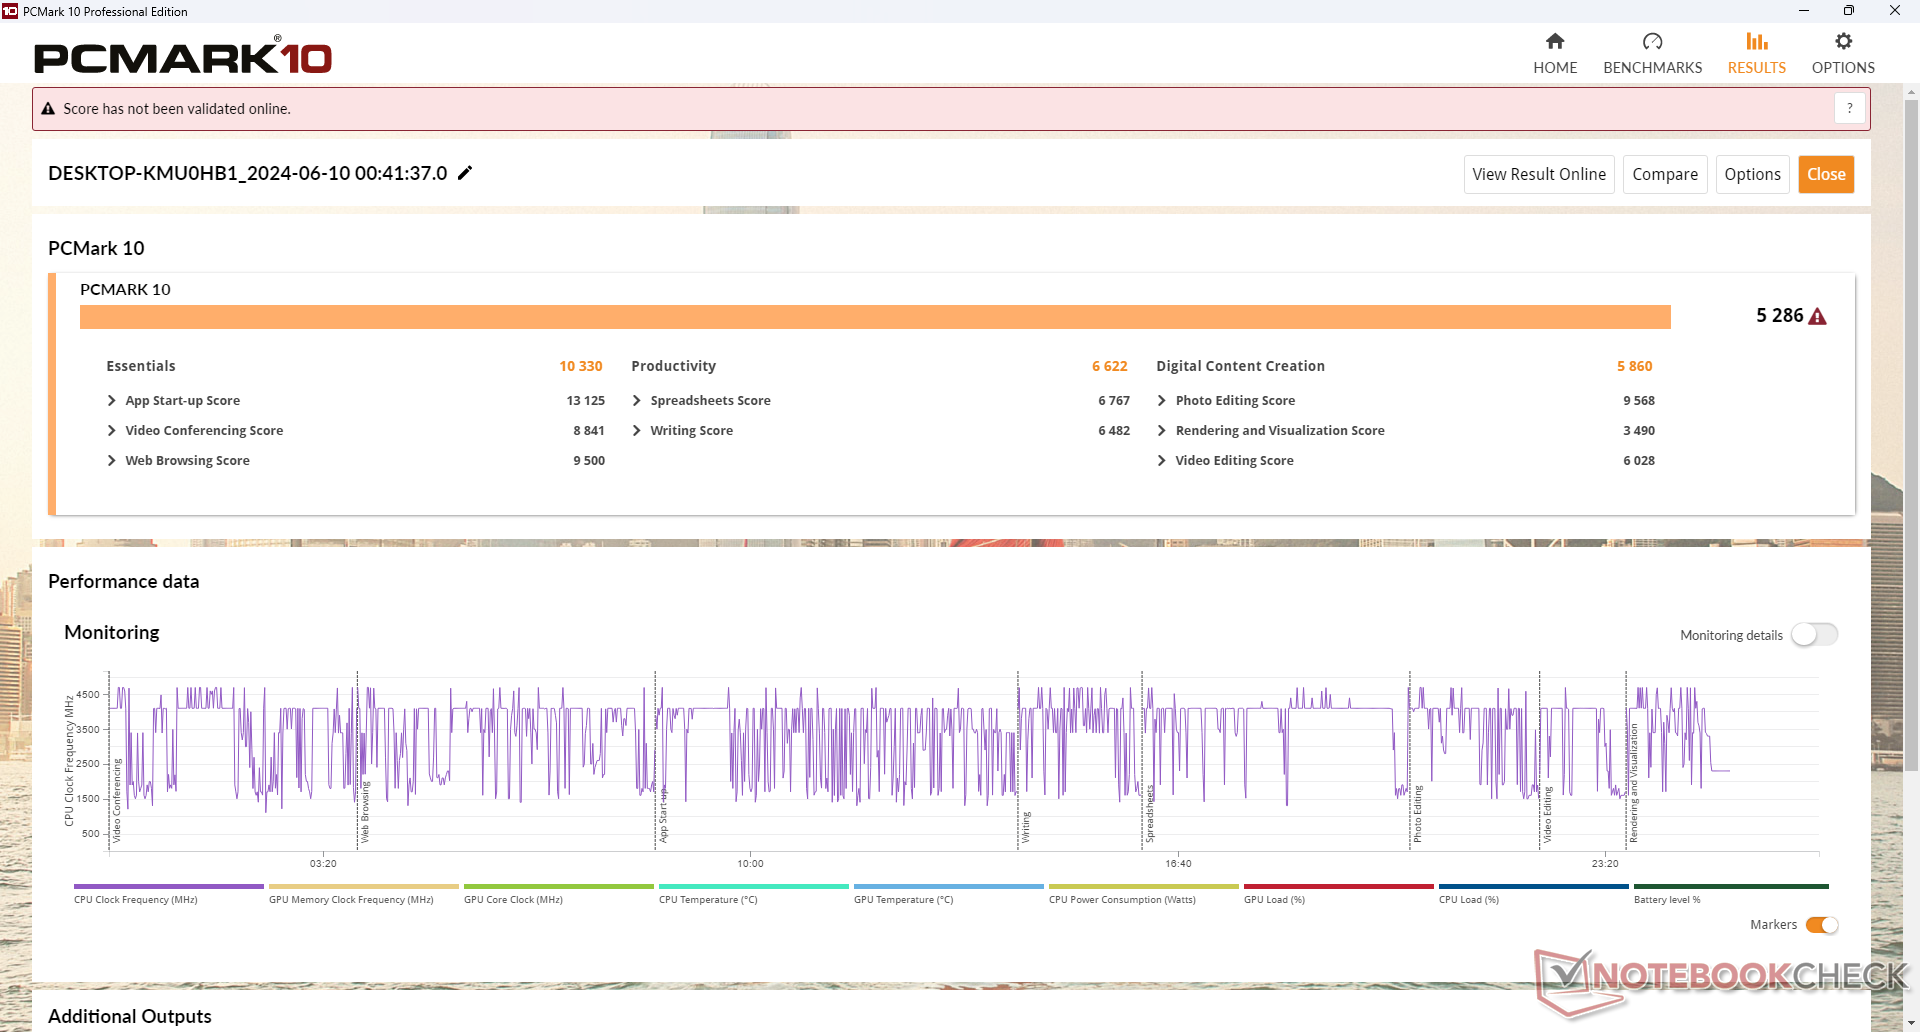
As pontuações do PCMark estão à frente da maioria dos outros laptops robustos executados em plataformas Intel mais antigas de 11ª ou 10ª geração. Talvez o mais notável seja que ele está bem à frente do antigo 2020 S15ABG2 no subteste Criação de conteúdo digital, em que o desempenho da GPU é mais importante.
CrossMark: Overall | Productivity | Creativity | Responsiveness
WebXPRT 3: Overall
WebXPRT 4: Overall
Mozilla Kraken 1.1: Total
| PCMark 10 / Score | |
| Getac S410 G5 | |
| Média Intel Core i7-1255U, Intel Iris Xe Graphics G7 96EUs (4676 - 5523, n=9) | |
| Durabook S15 | |
| Panasonic Toughbook 40 | |
| Durabook S14I | |
| Acer Enduro Urban N3 EUN314 | |
| Dell Latitude 5420 Rugged-P85G | |
| Durabook S15ABG2 | |
| PCMark 10 / Essentials | |
| Média Intel Core i7-1255U, Intel Iris Xe Graphics G7 96EUs (9381 - 11654, n=9) | |
| Durabook S15 | |
| Durabook S14I | |
| Getac S410 G5 | |
| Panasonic Toughbook 40 | |
| Acer Enduro Urban N3 EUN314 | |
| Dell Latitude 5420 Rugged-P85G | |
| Durabook S15ABG2 | |
| PCMark 10 / Productivity | |
| Dell Latitude 5420 Rugged-P85G | |
| Getac S410 G5 | |
| Durabook S14I | |
| Média Intel Core i7-1255U, Intel Iris Xe Graphics G7 96EUs (6530 - 7418, n=9) | |
| Durabook S15 | |
| Panasonic Toughbook 40 | |
| Durabook S15ABG2 | |
| Acer Enduro Urban N3 EUN314 | |
| PCMark 10 / Digital Content Creation | |
| Getac S410 G5 | |
| Durabook S15 | |
| Média Intel Core i7-1255U, Intel Iris Xe Graphics G7 96EUs (4498 - 6203, n=9) | |
| Panasonic Toughbook 40 | |
| Acer Enduro Urban N3 EUN314 | |
| Durabook S14I | |
| Dell Latitude 5420 Rugged-P85G | |
| Durabook S15ABG2 | |
| CrossMark / Overall | |
| Média Intel Core i7-1255U, Intel Iris Xe Graphics G7 96EUs (1329 - 1573, n=9) | |
| Getac S410 G5 | |
| Durabook S15 | |
| Panasonic Toughbook 40 | |
| CrossMark / Productivity | |
| Média Intel Core i7-1255U, Intel Iris Xe Graphics G7 96EUs (1364 - 1554, n=9) | |
| Getac S410 G5 | |
| Durabook S15 | |
| Panasonic Toughbook 40 | |
| CrossMark / Creativity | |
| Getac S410 G5 | |
| Média Intel Core i7-1255U, Intel Iris Xe Graphics G7 96EUs (1372 - 1660, n=9) | |
| Durabook S15 | |
| Panasonic Toughbook 40 | |
| CrossMark / Responsiveness | |
| Durabook S15 | |
| Média Intel Core i7-1255U, Intel Iris Xe Graphics G7 96EUs (1117 - 1434, n=9) | |
| Getac S410 G5 | |
| Panasonic Toughbook 40 | |
| WebXPRT 3 / Overall | |
| Média Intel Core i7-1255U, Intel Iris Xe Graphics G7 96EUs (200 - 366, n=9) | |
| Getac S410 G5 | |
| Durabook S14I | |
| Panasonic Toughbook 40 | |
| Acer Enduro Urban N3 EUN314 | |
| Durabook S15ABG2 | |
| WebXPRT 4 / Overall | |
| Getac S410 G5 | |
| Durabook S15 | |
| Média Intel Core i7-1255U, Intel Iris Xe Graphics G7 96EUs (183.4 - 249, n=9) | |
| Mozilla Kraken 1.1 / Total | |
| Dell Latitude 5420 Rugged-P85G | |
| Durabook S15ABG2 | |
| Acer Enduro Urban N3 EUN314 | |
| Panasonic Toughbook 40 | |
| Durabook S14I | |
| Média Intel Core i7-1255U, Intel Iris Xe Graphics G7 96EUs (476 - 727, n=10) | |
| Durabook S15 | |
| Getac S410 G5 | |
* ... menor é melhor
| PCMark 10 Score | 5286 pontos | |
Ajuda | ||
| AIDA64 / Memory Copy | |
| Durabook S15 | |
| Getac S410 G5 | |
| Média Intel Core i7-1255U (22846 - 67017, n=11) | |
| Acer Enduro Urban N3 EUN314 | |
| Panasonic Toughbook 40 | |
| Durabook S15ABG2 | |
| AIDA64 / Memory Read | |
| Durabook S15 | |
| Getac S410 G5 | |
| Média Intel Core i7-1255U (22877 - 67398, n=11) | |
| Acer Enduro Urban N3 EUN314 | |
| Panasonic Toughbook 40 | |
| Durabook S15ABG2 | |
| AIDA64 / Memory Write | |
| Durabook S15 | |
| Getac S410 G5 | |
| Média Intel Core i7-1255U (22883 - 65839, n=11) | |
| Acer Enduro Urban N3 EUN314 | |
| Panasonic Toughbook 40 | |
| Durabook S15ABG2 | |
| AIDA64 / Memory Latency | |
| Getac S410 G5 | |
| Panasonic Toughbook 40 | |
| Durabook S15 | |
| Média Intel Core i7-1255U (76 - 163.2, n=11) | |
| Acer Enduro Urban N3 EUN314 | |
| Durabook S15ABG2 | |
* ... menor é melhor
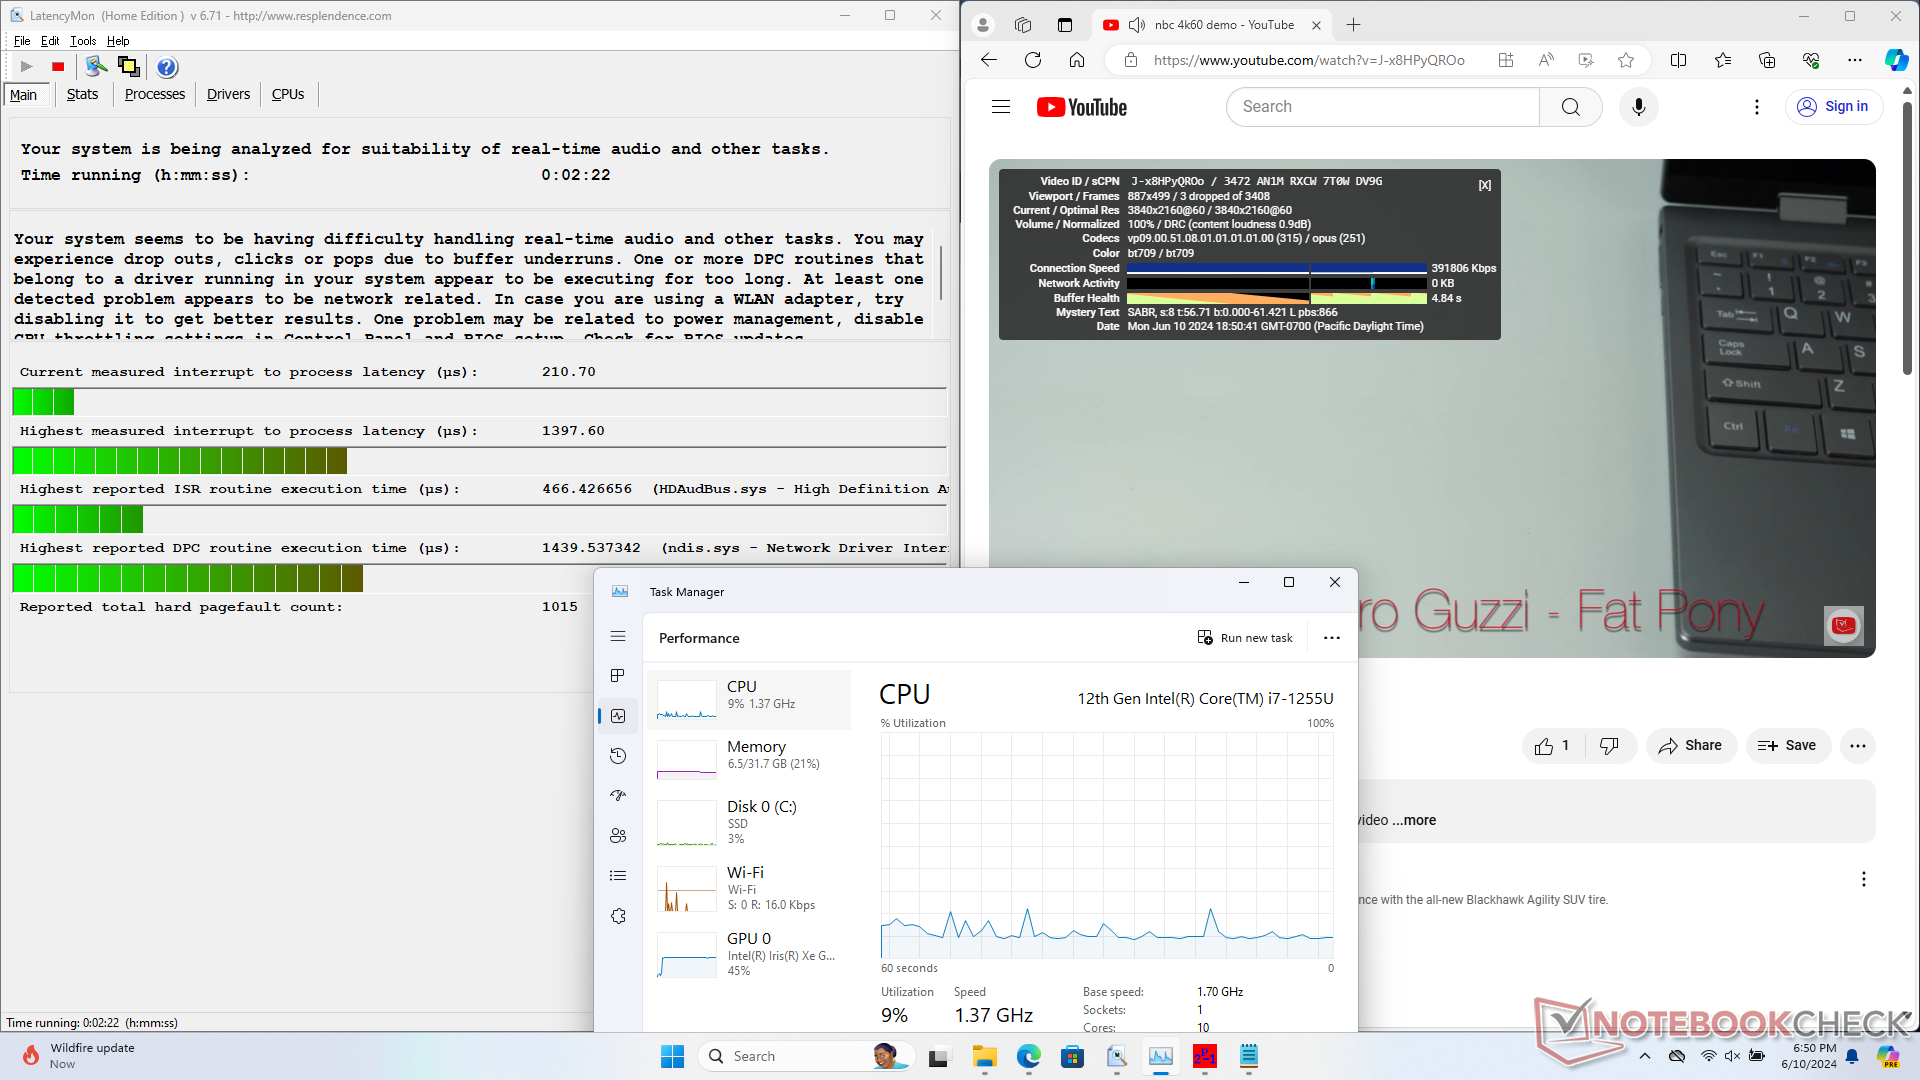
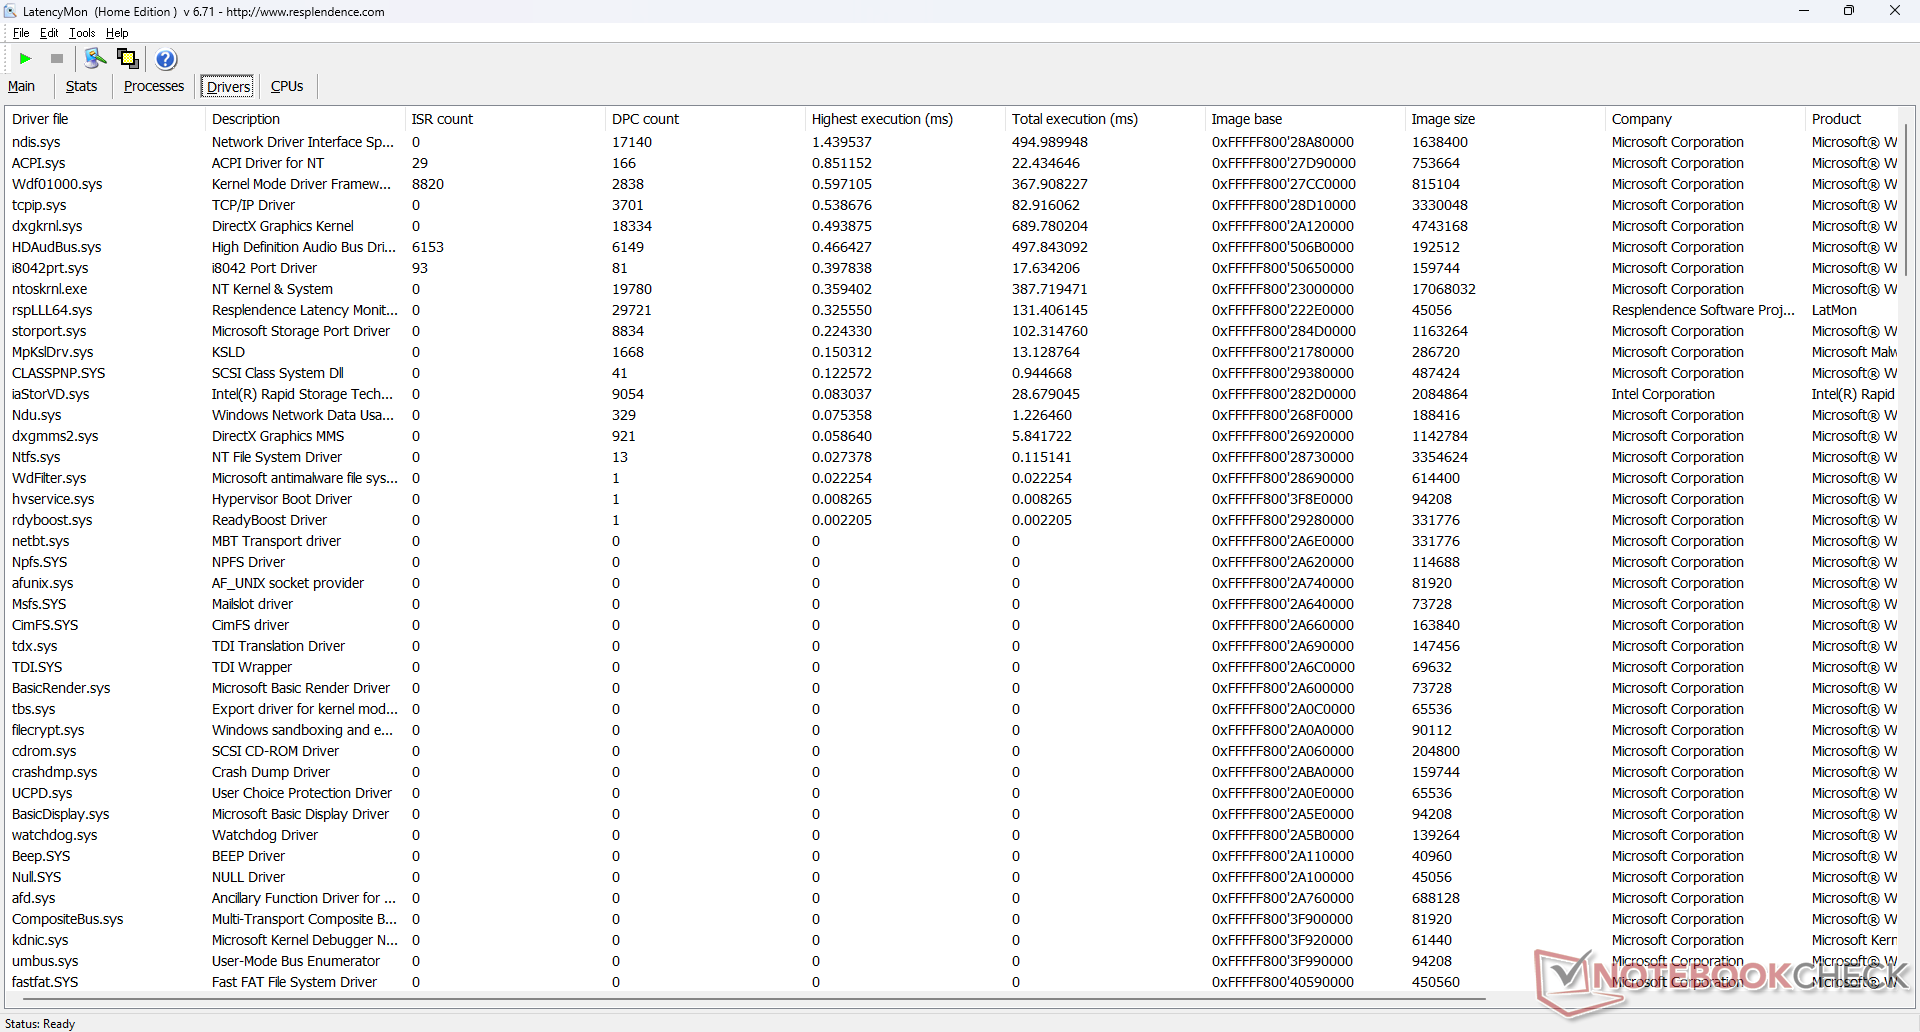
Latência DPC
O LatencyMon revela pequenos problemas de DPC ao abrir várias guias do navegador em nossa página inicial. a reprodução de vídeo 4K a 60 FPS também é imperfeita, com pelo menos alguns quadros pulados durante uma janela de 60 segundos, mesmo após várias tentativas.
| DPC Latencies / LatencyMon - interrupt to process latency (max), Web, Youtube, Prime95 | |
| Acer Enduro Urban N3 EUN314 | |
| Getac S410 G5 | |
| Durabook S15 | |
| Panasonic Toughbook 40 | |
| Durabook S15ABG2 | |
* ... menor é melhor
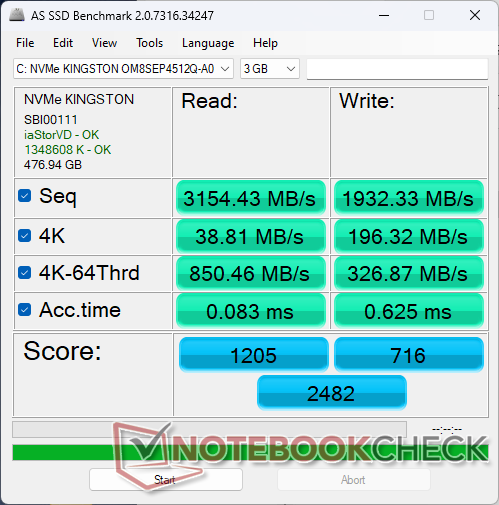
Dispositivos de armazenamento
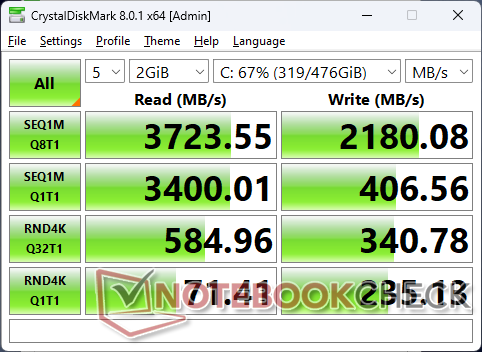
Nossa unidade é fornecida com o Kingston OM8SEP4512Q-AA PCIe4 NVMe da Kingston para taxas sequenciais de leitura e gravação de cerca de 3300 MB/s e 2200 MB/s, respectivamente. A unidade não apresentaria problemas para manter essas velocidades máximas sob estresse.


| Drive Performance Rating - Percent | |
| Acer Enduro Urban N3 EUN314 | |
| Getac S410 G5 | |
| Panasonic Toughbook 40 | |
| Durabook S15 | |
| Dell Latitude 5420 Rugged-P85G -8! | |
| Durabook S15ABG2 | |
| DiskSpd | |
| seq read | |
| Durabook S15 | |
| Getac S410 G5 | |
| Panasonic Toughbook 40 | |
| Acer Enduro Urban N3 EUN314 | |
| Durabook S15ABG2 | |
| seq write | |
| Panasonic Toughbook 40 | |
| Acer Enduro Urban N3 EUN314 | |
| Getac S410 G5 | |
| Durabook S15 | |
| Durabook S15ABG2 | |
| seq q8 t1 read | |
| Getac S410 G5 | |
| Durabook S15 | |
| Panasonic Toughbook 40 | |
| Acer Enduro Urban N3 EUN314 | |
| Durabook S15ABG2 | |
| seq q8 t1 write | |
| Durabook S15 | |
| Getac S410 G5 | |
| Panasonic Toughbook 40 | |
| Acer Enduro Urban N3 EUN314 | |
| Durabook S15ABG2 | |
| 4k q1 t1 read | |
| Panasonic Toughbook 40 | |
| Acer Enduro Urban N3 EUN314 | |
| Getac S410 G5 | |
| Durabook S15 | |
| Durabook S15ABG2 | |
| 4k q1 t1 write | |
| Durabook S15 | |
| Acer Enduro Urban N3 EUN314 | |
| Getac S410 G5 | |
| Panasonic Toughbook 40 | |
| Durabook S15ABG2 | |
| 4k q32 t16 read | |
| Acer Enduro Urban N3 EUN314 | |
| Durabook S15 | |
| Panasonic Toughbook 40 | |
| Getac S410 G5 | |
| Durabook S15ABG2 | |
| 4k q32 t16 write | |
| Acer Enduro Urban N3 EUN314 | |
| Durabook S15 | |
| Getac S410 G5 | |
| Panasonic Toughbook 40 | |
| Durabook S15ABG2 | |
* ... menor é melhor
Disk Throttling: DiskSpd Read Loop, Queue Depth 8
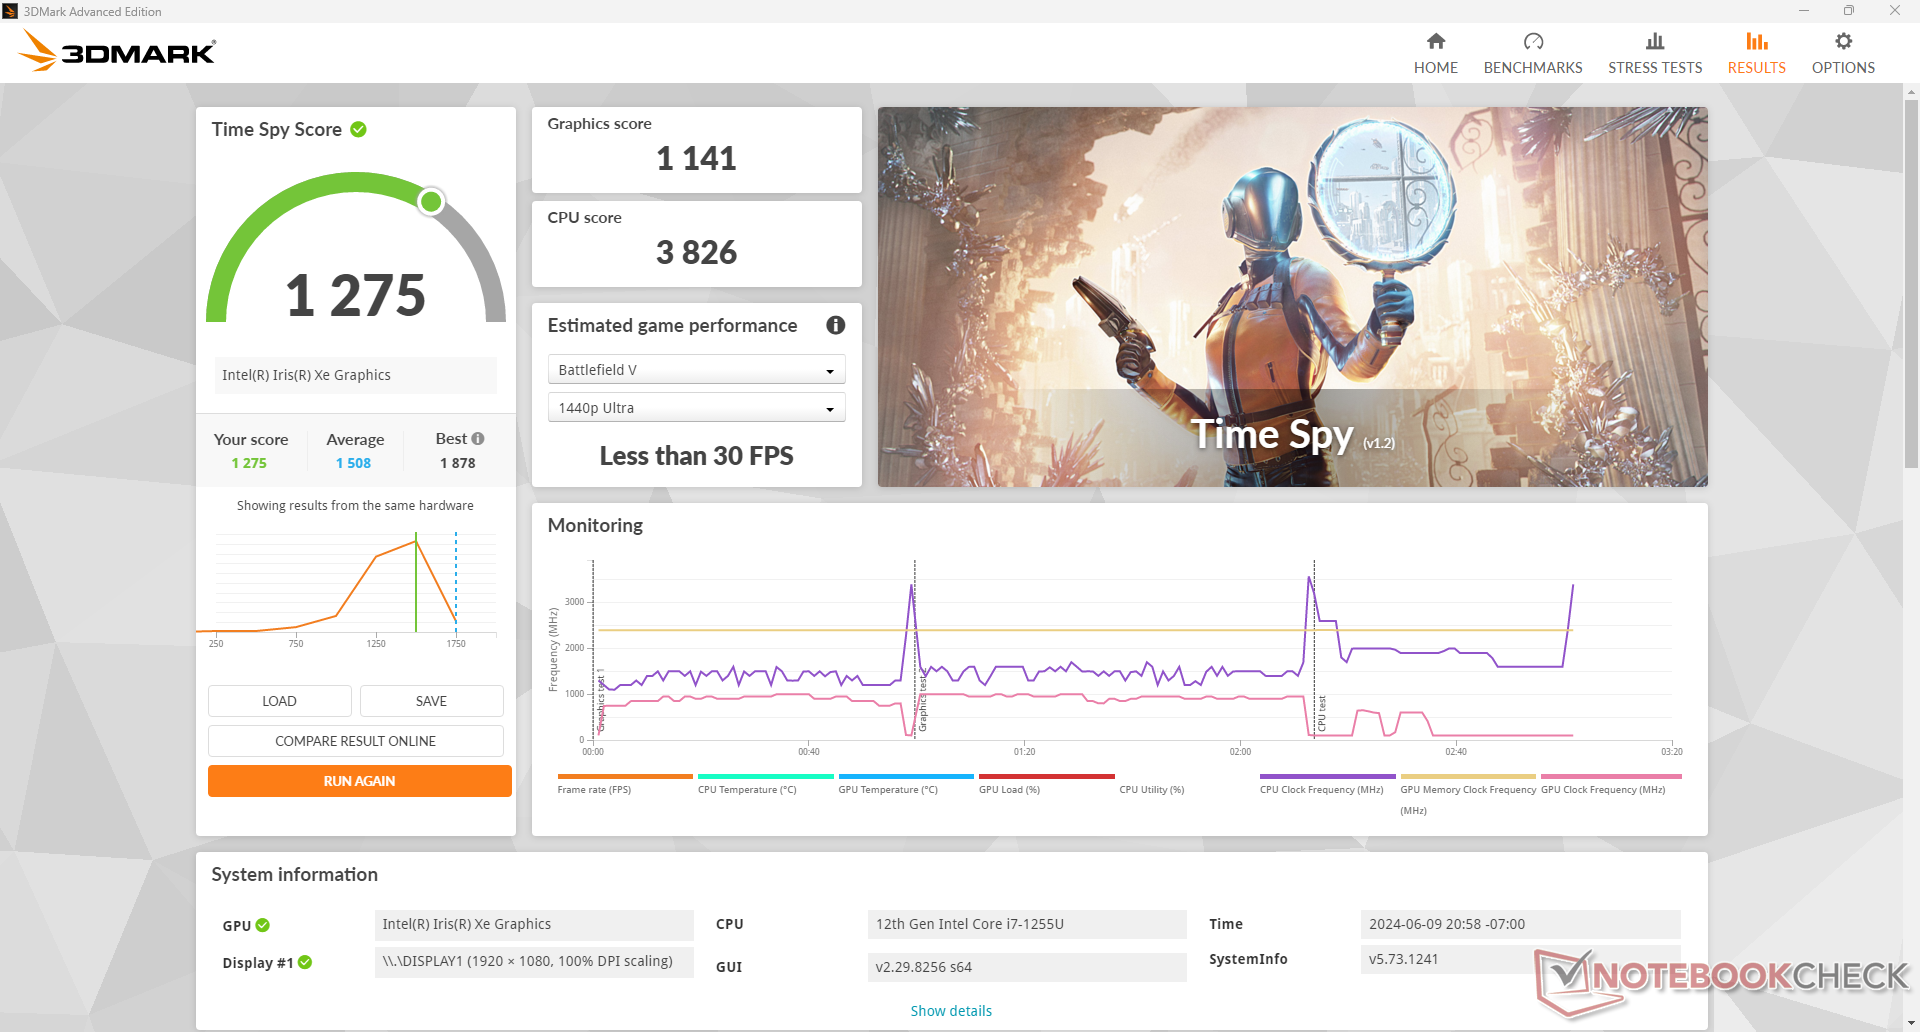
Desempenho da GPU - A Iris Xe está começando a mostrar sua idade
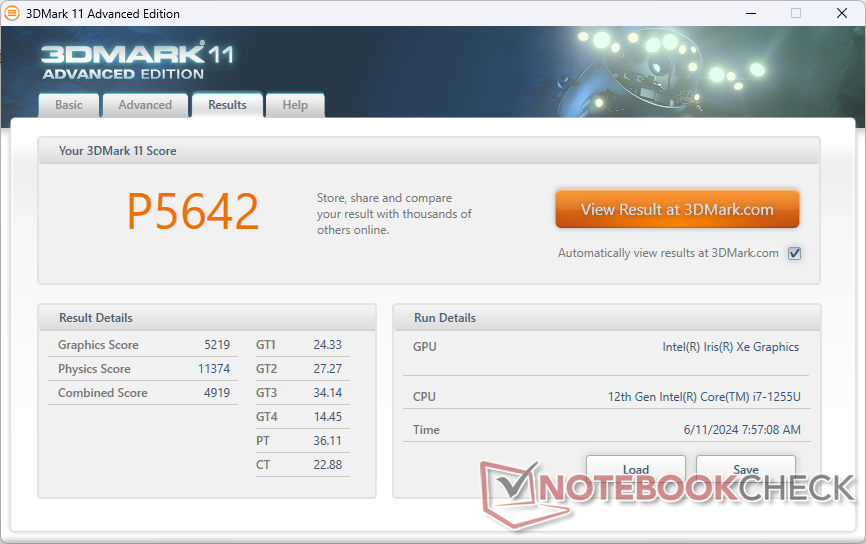
O modelo utiliza o mesmo sistema integrado Iris Xe Integrada Iris Xe do antigo S14I para um ligeiro aumento no desempenho gráfico geral. A maioria dos laptops robustos ainda não fez a transição para o Meteor Lake para a série Arc integrada muito melhorada, mas o 2024 S15 está, no entanto, significativamente à frente do agora antigo UHD Graphics 620 em 2x a 4x.
A Nvidia Quadro T1000 é opcional para aqueles que exigem gráficos discretos.
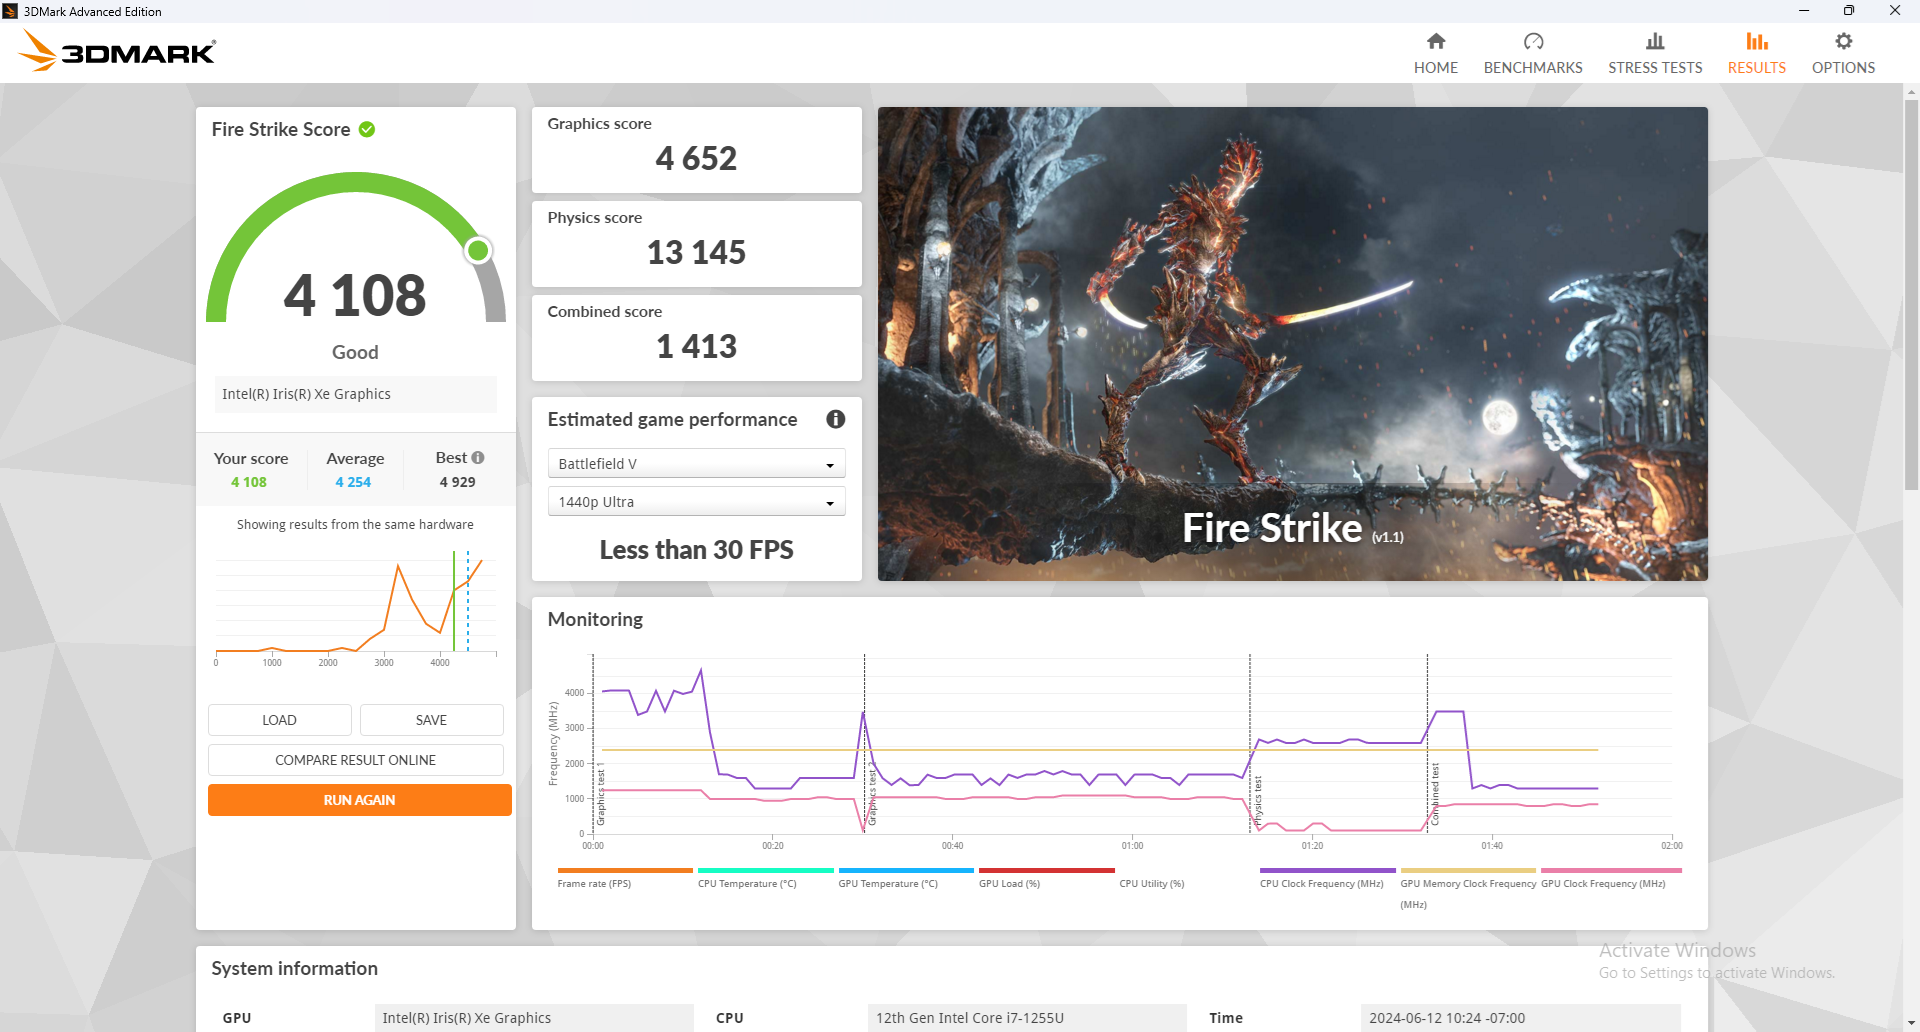
| Perfil de potência | Pontuação de gráficos | Pontuação de física | Pontuação combinada |
| Modo de desempenho | 4652 | 13145 | 1413 |
| Modo equilibrado | 4119 (-15%) | 11865 (-10%) | 1312 (-7%) |
| Energia da bateria | 3958 (-15%) | 12722 (-3%) | 1314 (-7%) |
A execução no modo balanceado ou com a energia da bateria pode afetar o desempenho em até 10 a 15%, conforme mostrado na tabela de resultados do site Fire Strike acima.
| 3DMark Performance Rating - Percent | |
| Lenovo ThinkPad P1 2019-20QT000RGE | |
| Dell Latitude 7330 Rugged Extreme | |
| Getac S410 G5 | |
| Acer Enduro Urban N3 EUN314 | |
| Média Intel Iris Xe Graphics G7 96EUs | |
| Panasonic Toughbook FZ-55 MK2 | |
| Getac S410 Gen 4 | |
| Panasonic Toughbook 40 | |
| Durabook S15 | |
| Durabook S14I | |
| Dell Latitude 5420 Rugged-P85G | |
| Getac B360 | |
| Getac S410 -4! | |
| Durabook S15ABG2 | |
| 3DMark 11 - 1280x720 Performance GPU | |
| Lenovo ThinkPad P1 2019-20QT000RGE | |
| Acer Enduro Urban N3 EUN314 | |
| Dell Latitude 7330 Rugged Extreme | |
| Panasonic Toughbook FZ-55 MK2 | |
| Getac S410 Gen 4 | |
| Getac S410 G5 | |
| Panasonic Toughbook 40 | |
| Média Intel Iris Xe Graphics G7 96EUs (2867 - 7676, n=205) | |
| Durabook S15 | |
| Durabook S14I | |
| Dell Latitude 5420 Rugged-P85G | |
| Getac B360 | |
| Getac S410 | |
| Durabook S15ABG2 | |
| 3DMark 11 Performance | 5642 pontos | |
| 3DMark Cloud Gate Standard Score | 14383 pontos | |
| 3DMark Fire Strike Score | 4108 pontos | |
| 3DMark Time Spy Score | 1275 pontos | |
Ajuda | ||
| Blender - v3.3 Classroom CPU | |
| Durabook S15 | |
| Média Intel Iris Xe Graphics G7 96EUs (336 - 1259, n=104) | |
| Getac S410 G5 | |
* ... menor é melhor
| Performance Rating - Percent | |
| Getac S410 G5 | |
| Acer Enduro Urban N3 EUN314 | |
| Panasonic Toughbook 40 -2! | |
| Durabook S15 -1! | |
| Durabook S15ABG2 -4! | |
| Dell Latitude 5420 Rugged-P85G -4! | |
| The Witcher 3 - 1920x1080 Ultra Graphics & Postprocessing (HBAO+) | |
| Getac S410 G5 | |
| Panasonic Toughbook 40 | |
| Acer Enduro Urban N3 EUN314 | |
| Durabook S15 | |
| Dell Latitude 5420 Rugged-P85G | |
| GTA V - 1920x1080 Highest Settings possible AA:4xMSAA + FX AF:16x | |
| Getac S410 G5 | |
| Acer Enduro Urban N3 EUN314 | |
| Final Fantasy XV Benchmark - 1920x1080 High Quality | |
| Acer Enduro Urban N3 EUN314 | |
| Getac S410 G5 | |
| Panasonic Toughbook 40 | |
| Durabook S15 | |
| Dell Latitude 5420 Rugged-P85G | |
| Strange Brigade - 1920x1080 ultra AA:ultra AF:16 | |
| Getac S410 G5 | |
| Acer Enduro Urban N3 EUN314 | |
| Durabook S15 | |
| Dota 2 Reborn - 1920x1080 ultra (3/3) best looking | |
| Panasonic Toughbook 40 | |
| Getac S410 G5 | |
| Durabook S15 | |
| Acer Enduro Urban N3 EUN314 | |
| Durabook S15ABG2 | |
| X-Plane 11.11 - 1920x1080 high (fps_test=3) | |
| Acer Enduro Urban N3 EUN314 | |
| Getac S410 G5 | |
| Durabook S15 | |
| Panasonic Toughbook 40 | |
| Durabook S15ABG2 | |
| Far Cry 5 | |
| 1280x720 Low Preset AA:T | |
| Acer Enduro Urban N3 EUN314 | |
| Média Intel Iris Xe Graphics G7 96EUs (23 - 75, n=93) | |
| Dell Latitude 5420 Rugged-P85G | |
| Durabook S15 | |
| 1920x1080 Medium Preset AA:T | |
| Média Intel Iris Xe Graphics G7 96EUs (14 - 39, n=91) | |
| Dell Latitude 5420 Rugged-P85G | |
| Acer Enduro Urban N3 EUN314 | |
| Durabook S15 | |
| 1920x1080 High Preset AA:T | |
| Média Intel Iris Xe Graphics G7 96EUs (10 - 35, n=89) | |
| Dell Latitude 5420 Rugged-P85G | |
| Acer Enduro Urban N3 EUN314 | |
| Durabook S15 | |
| 1920x1080 Ultra Preset AA:T | |
| Média Intel Iris Xe Graphics G7 96EUs (11 - 33, n=75) | |
| Acer Enduro Urban N3 EUN314 | |
| Durabook S15 | |
| Dell Latitude 5420 Rugged-P85G | |
| Final Fantasy XV Benchmark | |
| 1280x720 Lite Quality | |
| Dell Latitude 7330 Rugged Extreme | |
| Panasonic Toughbook FZ-55 MK2 | |
| Getac S410 G5 | |
| Panasonic Toughbook 40 | |
| Acer Enduro Urban N3 EUN314 | |
| Média Intel Iris Xe Graphics G7 96EUs (14.9 - 56.5, n=186) | |
| Getac S410 Gen 4 | |
| Durabook S15 | |
| Durabook S14I | |
| Getac B360 | |
| Dell Latitude 5420 Rugged-P85G | |
| 1920x1080 Standard Quality | |
| Dell Latitude 7330 Rugged Extreme | |
| Acer Enduro Urban N3 EUN314 | |
| Panasonic Toughbook FZ-55 MK2 | |
| Getac S410 G5 | |
| Média Intel Iris Xe Graphics G7 96EUs (10.5 - 31.2, n=182) | |
| Panasonic Toughbook 40 | |
| Getac S410 Gen 4 | |
| Durabook S15 | |
| Durabook S14I | |
| Getac B360 | |
| Dell Latitude 5420 Rugged-P85G | |
| 1920x1080 High Quality | |
| Dell Latitude 7330 Rugged Extreme | |
| Média Intel Iris Xe Graphics G7 96EUs (8.15 - 27.8, n=175) | |
| Acer Enduro Urban N3 EUN314 | |
| Getac S410 G5 | |
| Panasonic Toughbook FZ-55 MK2 | |
| Panasonic Toughbook 40 | |
| Getac S410 Gen 4 | |
| Durabook S15 | |
| Durabook S14I | |
| Getac B360 | |
| Dell Latitude 5420 Rugged-P85G | |
| Strange Brigade | |
| 1280x720 lowest AF:1 | |
| Getac S410 G5 | |
| Média Intel Iris Xe Graphics G7 96EUs (48.5 - 115.1, n=170) | |
| Acer Enduro Urban N3 EUN314 | |
| Getac S410 Gen 4 | |
| Durabook S15 | |
| 1920x1080 medium AA:medium AF:4 | |
| Getac S410 G5 | |
| Média Intel Iris Xe Graphics G7 96EUs (18.2 - 51.4, n=168) | |
| Acer Enduro Urban N3 EUN314 | |
| Durabook S15 | |
| Getac S410 Gen 4 | |
| 1920x1080 high AA:high AF:8 | |
| Getac S410 G5 | |
| Média Intel Iris Xe Graphics G7 96EUs (15.4 - 39.8, n=167) | |
| Acer Enduro Urban N3 EUN314 | |
| Getac S410 Gen 4 | |
| Durabook S15 | |
| 1920x1080 ultra AA:ultra AF:16 | |
| Getac S410 G5 | |
| Média Intel Iris Xe Graphics G7 96EUs (13.2 - 31.7, n=165) | |
| Acer Enduro Urban N3 EUN314 | |
| Getac S410 Gen 4 | |
| Durabook S15 | |
| Tiny Tina's Wonderlands | |
| 1280x720 Lowest Preset (DX12) | |
| Média Intel Iris Xe Graphics G7 96EUs (25.9 - 67.3, n=32) | |
| Durabook S15 | |
| 1920x1080 Low Preset (DX12) | |
| Média Intel Iris Xe Graphics G7 96EUs (22.3 - 53, n=32) | |
| Durabook S15 | |
| F1 22 | |
| 1280x720 Ultra Low Preset AA:T AF:16x | |
| Média Intel Iris Xe Graphics G7 96EUs (57.4 - 94.9, n=53) | |
| Durabook S15 | |
| 1920x1080 Low Preset AA:T AF:16x | |
| Média Intel Iris Xe Graphics G7 96EUs (33.3 - 57.2, n=58) | |
| Durabook S15 | |
| 1920x1080 Medium Preset AA:T AF:16x | |
| Média Intel Iris Xe Graphics G7 96EUs (28 - 52.3, n=58) | |
| Durabook S15 | |
| Baldur's Gate 3 | |
| 1280x720 Low Preset | |
| Média Intel Iris Xe Graphics G7 96EUs (14.5 - 66.1, n=11) | |
| Durabook S15 | |
| 1920x1080 Low Preset | |
| Média Intel Iris Xe Graphics G7 96EUs (9.4 - 29.3, n=11) | |
| Durabook S15 | |
| Cyberpunk 2077 2.2 Phantom Liberty | |
| 1280x720 Low Preset (FSR off) | |
| Média Intel Iris Xe Graphics G7 96EUs (21.4 - 37.3, n=16) | |
| Durabook S15 | |
| 1920x1080 Low Preset (FSR off) | |
| Média Intel Iris Xe Graphics G7 96EUs (13.1 - 22.5, n=16) | |
| Durabook S15 | |
Witcher 3 FPS Chart
| baixo | média | alto | ultra | |
|---|---|---|---|---|
| The Witcher 3 (2015) | 60.2 | 46 | 24.9 | 12.5 |
| Dota 2 Reborn (2015) | 93.7 | 65.7 | 51.8 | 46.8 |
| Final Fantasy XV Benchmark (2018) | 35.2 | 20.1 | 14.7 | |
| X-Plane 11.11 (2018) | 44.8 | 33.3 | 30.2 | |
| Far Cry 5 (2018) | 23 | 22 | 19 | 19 |
| Strange Brigade (2018) | 73 | 32.4 | 26.7 | 21.9 |
| Tiny Tina's Wonderlands (2022) | 23.4 | |||
| F1 22 (2022) | 34.7 | 29.1 | 22.1 | |
| Baldur's Gate 3 (2023) | 9.4 | |||
| Cyberpunk 2077 2.2 Phantom Liberty (2023) | 14.4 |
Emissões
Ruído do sistema
O ruído da ventoinha é um dos mais silenciosos para qualquer laptop da categoria robusto. Ao executar cargas muito exigentes, como jogos ou Prime95, o ruído da ventoinha pode atingir um máximo de 37 dB(A) antes de cair rapidamente para a faixa quase silenciosa de 28 dB(A). Essa abordagem muito conservadora complementa o desempenho da CPU abaixo da média mencionado acima. Ao considerar o público de aplicativos governamentais ou científicos, o ruído mais silencioso da ventoinha é provavelmente preferível, mesmo que isso signifique um desempenho reduzido.
Barulho
| Ocioso |
| 26.3 / 26.3 / 26.8 dB |
| Carga |
| 27.7 / 37.4 dB |
 | ||
30 dB silencioso 40 dB(A) audível 50 dB(A) ruidosamente alto |
||
min: | ||
| Durabook S15 Iris Xe G7 96EUs, i7-1255U, Kingston OM8SEP4512Q-AA | Durabook S15ABG2 UHD Graphics 620, i5-8265U, UDinfo HF3-25UB HF325UB256GBA2P | Panasonic Toughbook 40 Iris Xe G7 96EUs, i7-1185G7, Samsung PM991 MZVLQ1T0HALB | Getac S410 G5 Iris Xe G7 80EUs, i5-1350P, SSSTC CL4-8D512 | Dell Latitude 5420 Rugged-P85G Radeon RX 540, i7-8650U, SK hynix PC401 NVMe 500 GB | Acer Enduro Urban N3 EUN314 Iris Xe G7 96EUs, i7-1165G7, Samsung PM991 MZVLQ1T0HALB | |
|---|---|---|---|---|---|---|
| Noise | -13% | -10% | -12% | -8% | -1% | |
| desligado / ambiente * | 24.6 | 29.3 -19% | 22.8 7% | 23.4 5% | 28.3 -15% | 23.8 3% |
| Idle Minimum * | 26.3 | 29.3 -11% | 26 1% | 23.4 11% | 28.3 -8% | 24.1 8% |
| Idle Average * | 26.3 | 29.3 -11% | 26 1% | 25.9 2% | 28.3 -8% | 24.1 8% |
| Idle Maximum * | 26.8 | 29.3 -9% | 26 3% | 26 3% | 28.3 -6% | 24.1 10% |
| Load Average * | 27.7 | 35.5 -28% | 37.6 -36% | 38.7 -40% | 29.9 -8% | 27.9 -1% |
| Witcher 3 ultra * | 27.4 | 37.8 -38% | 42.1 -54% | 35.7 -30% | ||
| Load Maximum * | 37.4 | 38 -2% | 40.3 -8% | 42.1 -13% | 38 -2% | 38.6 -3% |
* ... menor é melhor
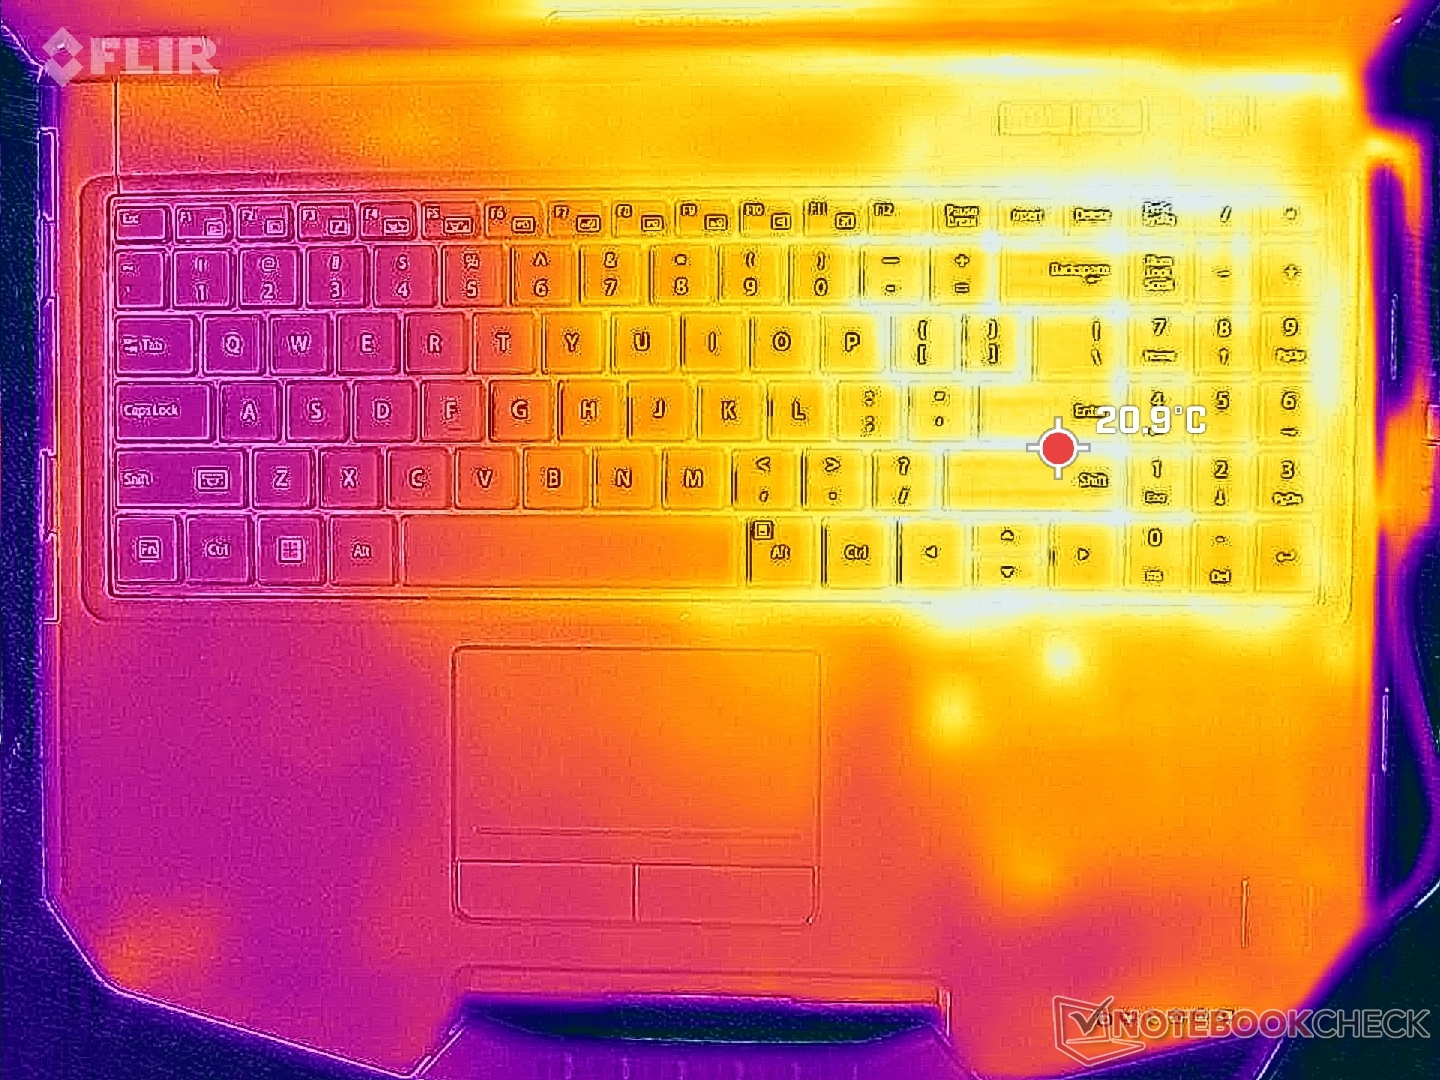
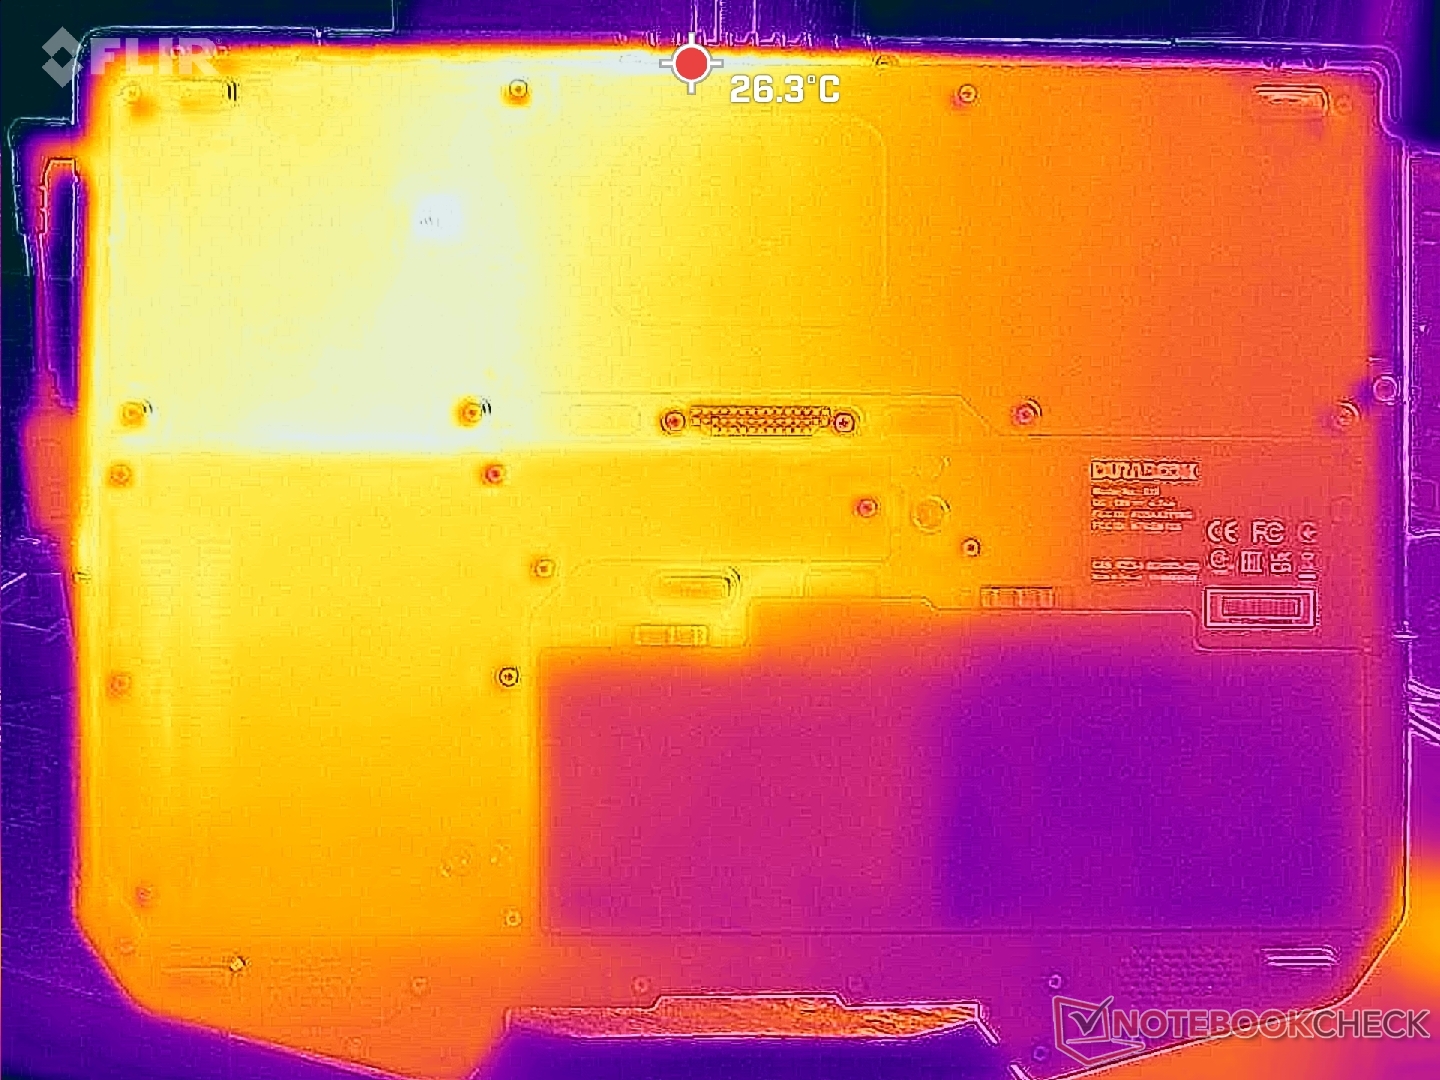
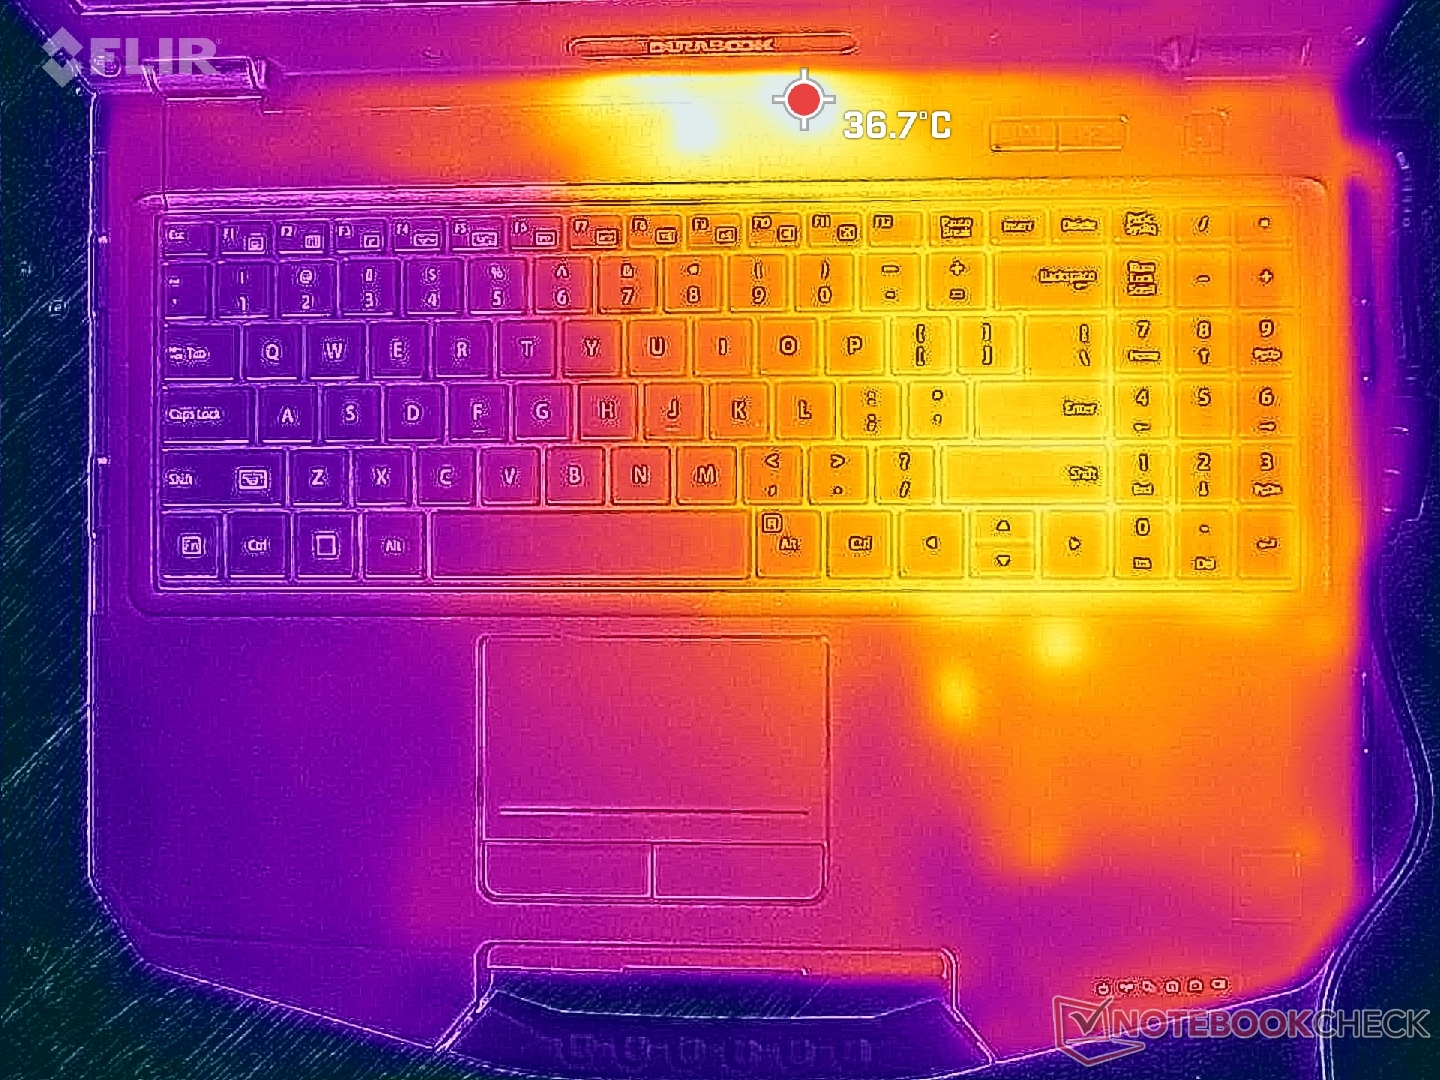
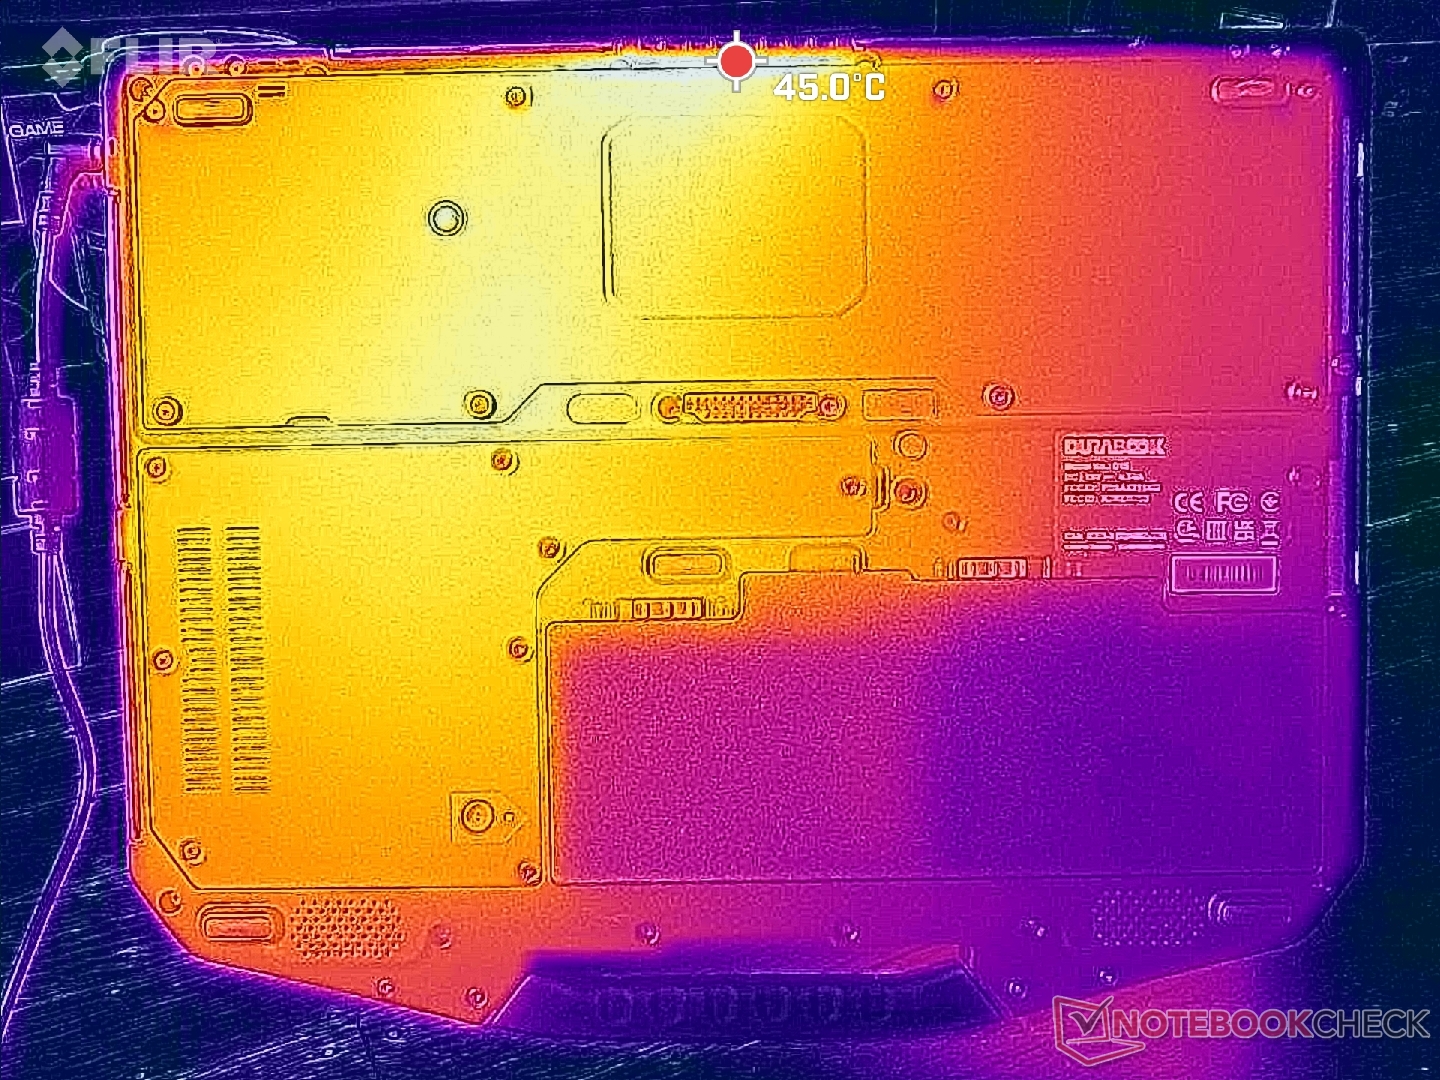
Temperatura
A metade direita do sistema sempre será mais quente do que a esquerda devido ao posicionamento da bateria e da solução de resfriamento. Os pontos quentes na parte inferior podem chegar a pouco mais de 40 °C, semelhante ao mais grosso e mais pesado Panasonic Toughbook 40 ou do antigo Durabook S15ABG2.
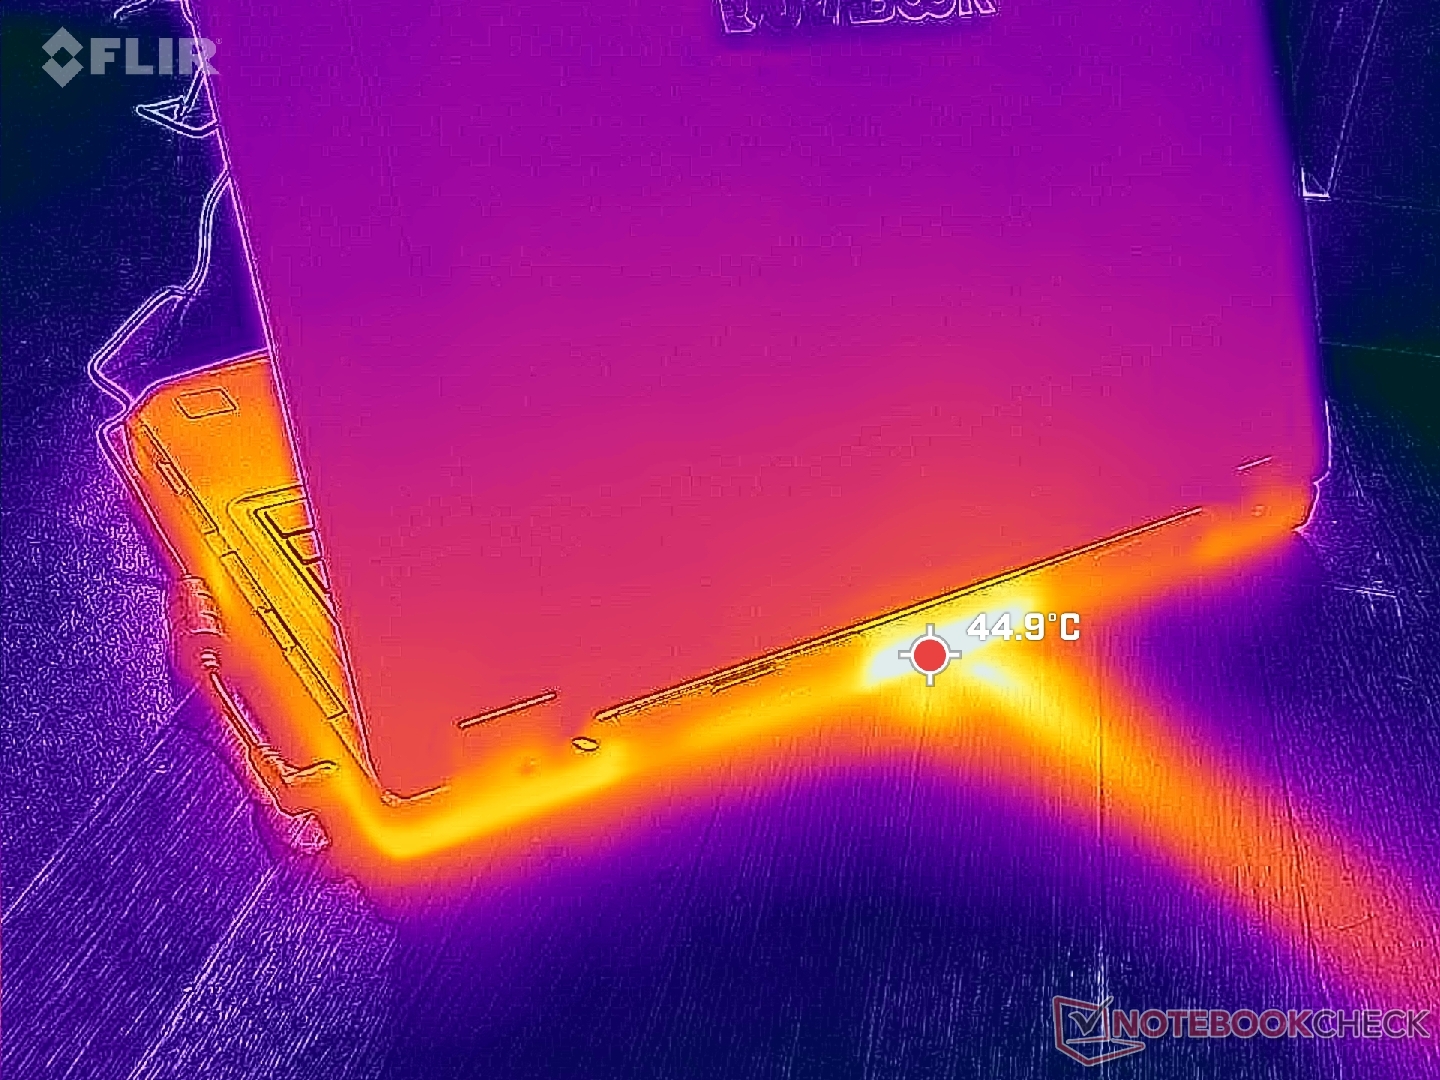
(+) A temperatura máxima no lado superior é 38.6 °C / 101 F, em comparação com a média de 34.3 °C / 94 F , variando de 21.2 a 62.5 °C para a classe Office.
(±) A parte inferior aquece até um máximo de 41 °C / 106 F, em comparação com a média de 36.8 °C / 98 F
(+) Em uso inativo, a temperatura média para o lado superior é 26.6 °C / 80 F, em comparação com a média do dispositivo de 29.5 °C / ### class_avg_f### F.
(+) Os apoios para as mãos e o touchpad estão atingindo a temperatura máxima da pele (32.6 °C / 90.7 F) e, portanto, não estão quentes.
(-) A temperatura média da área do apoio para as mãos de dispositivos semelhantes foi 27.6 °C / 81.7 F (-5 °C / -9 F).
| Durabook S15 Intel Core i7-1255U, Intel Iris Xe Graphics G7 96EUs | Durabook S15ABG2 Intel Core i5-8265U, Intel UHD Graphics 620 | Panasonic Toughbook 40 Intel Core i7-1185G7, Intel Iris Xe Graphics G7 96EUs | Getac S410 G5 Intel Core i5-1350P, Intel Iris Xe Graphics G7 80EUs | Dell Latitude 5420 Rugged-P85G Intel Core i7-8650U, AMD Radeon RX 540 | Acer Enduro Urban N3 EUN314 Intel Core i7-1165G7, Intel Iris Xe Graphics G7 96EUs | |
|---|---|---|---|---|---|---|
| Heat | -3% | 4% | -1% | -6% | 1% | |
| Maximum Upper Side * | 38.6 | 44 -14% | 35.6 8% | 37 4% | 42.2 -9% | 37.8 2% |
| Maximum Bottom * | 41 | 42 -2% | 40 2% | 42.2 -3% | 42 -2% | 45.8 -12% |
| Idle Upper Side * | 28.8 | 28 3% | 28.6 1% | 28.8 -0% | 31.6 -10% | 26.4 8% |
| Idle Bottom * | 31.4 | 30.6 3% | 29.4 6% | 33 -5% | 31.8 -1% | 30.2 4% |
* ... menor é melhor
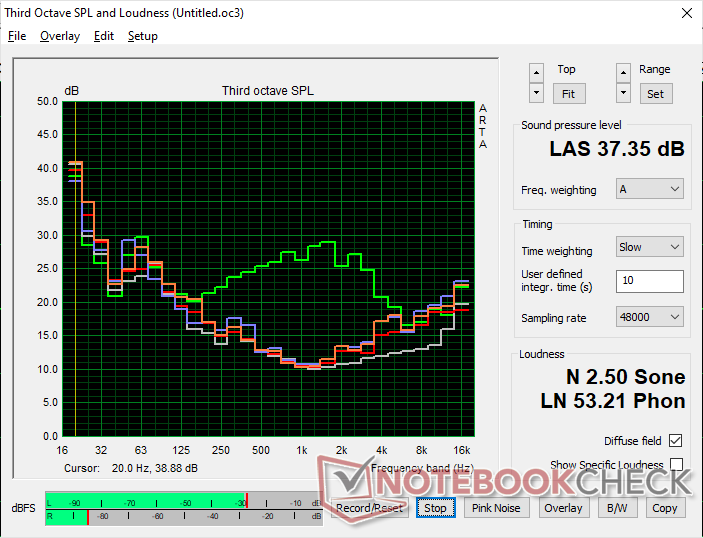
Alto-falantes
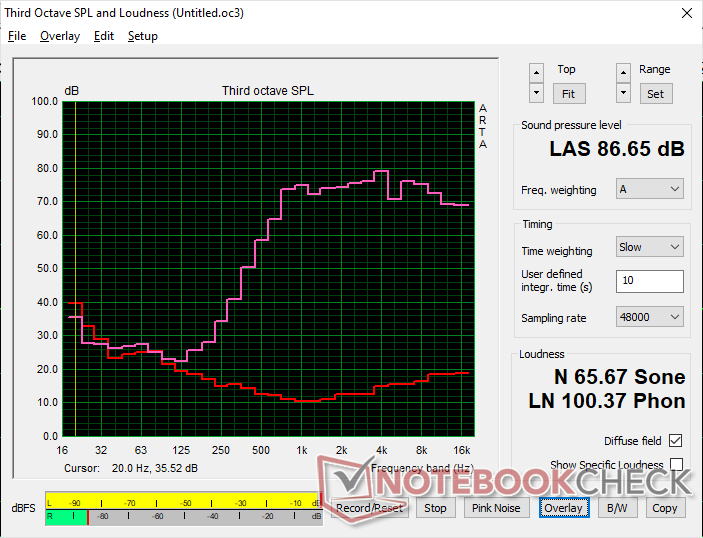
Durabook S15 análise de áudio
(+) | os alto-falantes podem tocar relativamente alto (###valor### dB)
Graves 100 - 315Hz
(-) | quase nenhum baixo - em média 41.6% menor que a mediana
(+) | o baixo é linear (6.3% delta para a frequência anterior)
Médios 400 - 2.000 Hz
(±) | médios reduzidos - em média 6.7% menor que a mediana
(±) | a linearidade dos médios é média (8.8% delta para frequência anterior)
Altos 2 - 16 kHz
(+) | agudos equilibrados - apenas 4.4% longe da mediana
(+) | os máximos são lineares (5.7% delta da frequência anterior)
Geral 100 - 16.000 Hz
(±) | a linearidade do som geral é média (25.8% diferença em relação à mediana)
Comparado com a mesma classe
» 78% de todos os dispositivos testados nesta classe foram melhores, 7% semelhantes, 15% piores
» O melhor teve um delta de 7%, a média foi 21%, o pior foi 53%
Comparado com todos os dispositivos testados
» 77% de todos os dispositivos testados foram melhores, 5% semelhantes, 18% piores
» O melhor teve um delta de 4%, a média foi 24%, o pior foi 134%
Apple MacBook Pro 16 2021 M1 Pro análise de áudio
(+) | os alto-falantes podem tocar relativamente alto (###valor### dB)
Graves 100 - 315Hz
(+) | bons graves - apenas 3.8% longe da mediana
(+) | o baixo é linear (5.2% delta para a frequência anterior)
Médios 400 - 2.000 Hz
(+) | médios equilibrados - apenas 1.3% longe da mediana
(+) | médios são lineares (2.1% delta para frequência anterior)
Altos 2 - 16 kHz
(+) | agudos equilibrados - apenas 1.9% longe da mediana
(+) | os máximos são lineares (2.7% delta da frequência anterior)
Geral 100 - 16.000 Hz
(+) | o som geral é linear (4.6% diferença em relação à mediana)
Comparado com a mesma classe
» 0% de todos os dispositivos testados nesta classe foram melhores, 0% semelhantes, 100% piores
» O melhor teve um delta de 5%, a média foi 18%, o pior foi 45%
Comparado com todos os dispositivos testados
» 0% de todos os dispositivos testados foram melhores, 0% semelhantes, 100% piores
» O melhor teve um delta de 4%, a média foi 24%, o pior foi 134%
Gerenciamento de energia
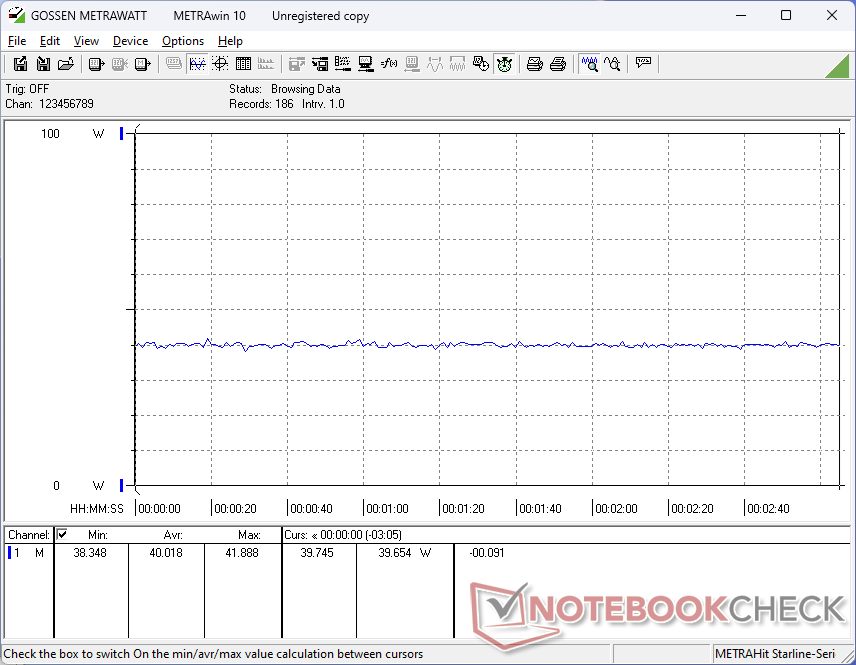
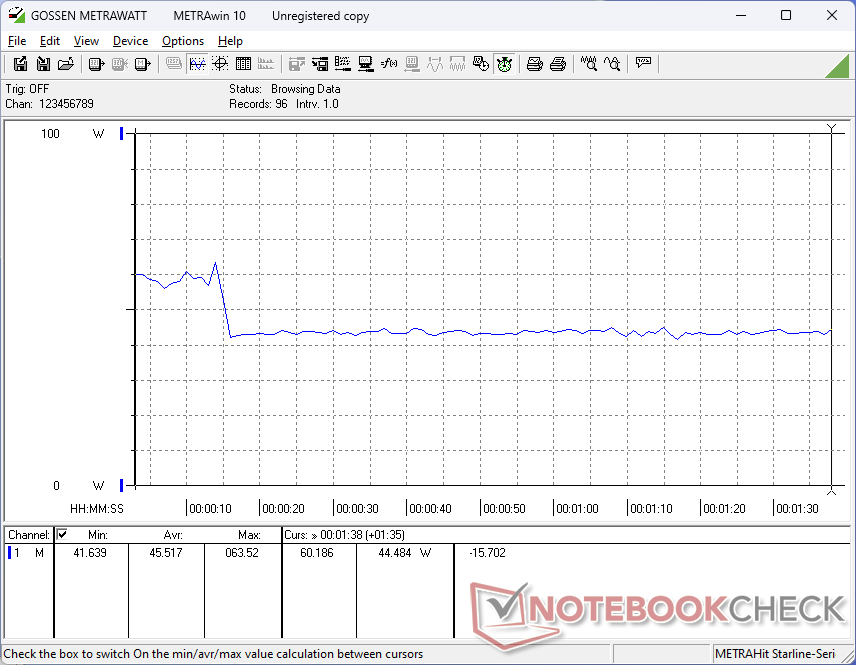
Consumo de energia
Ocioso no desktop, o consumo entre 4 W e 16 W é visivelmente maior do que o do S15ABG2 2020. No entanto, o aumento do consumo pode ser atribuído à tela muito mais brilhante do nosso S15, em que a diferença entre o brilho mínimo e o brilho máximo é de cerca de 10 W.
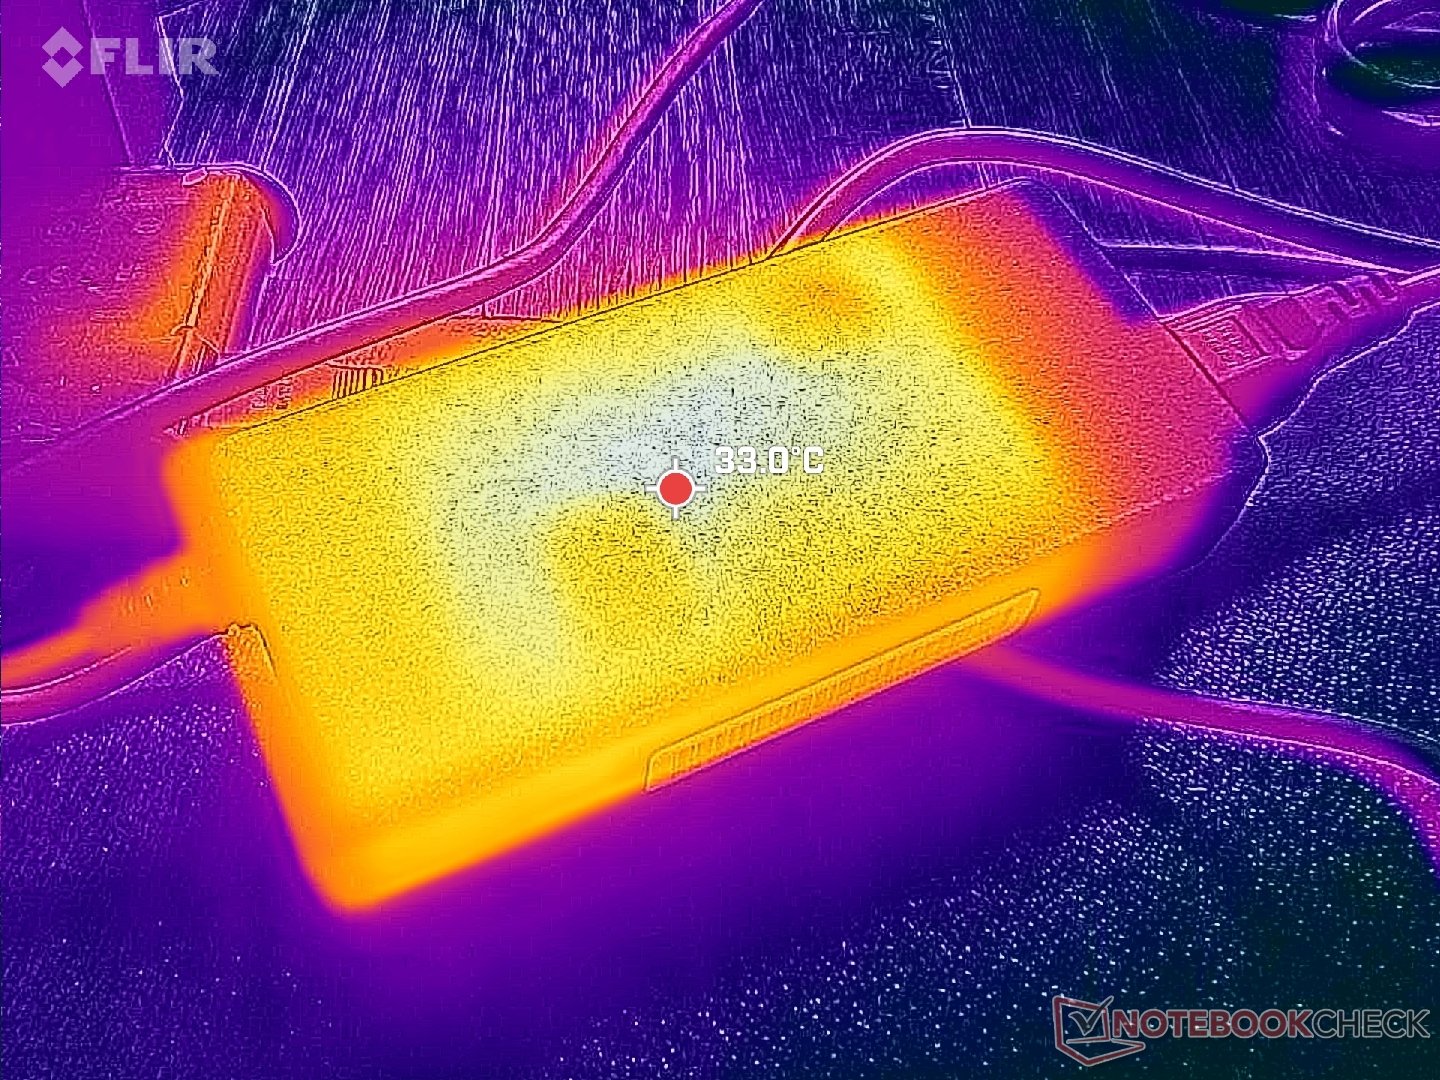
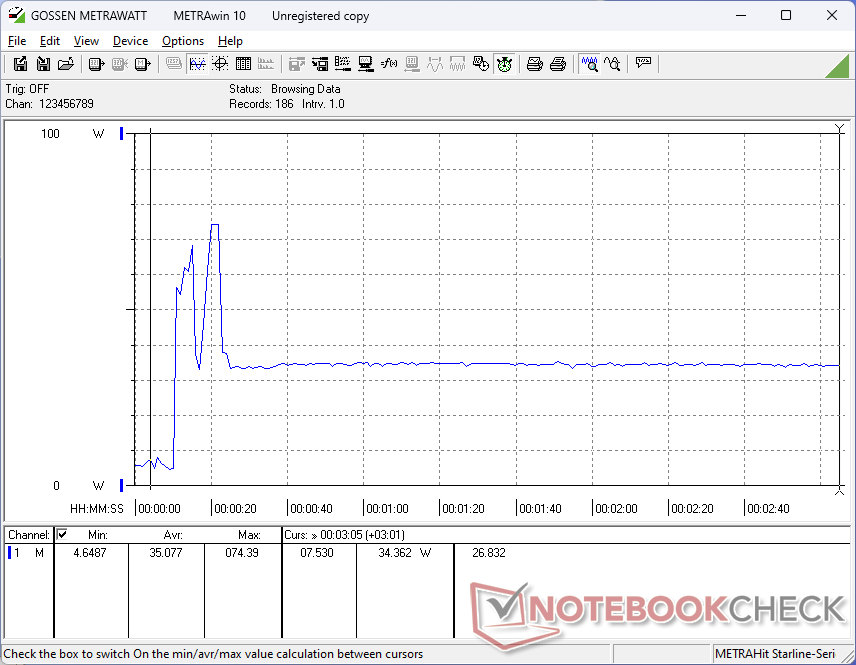
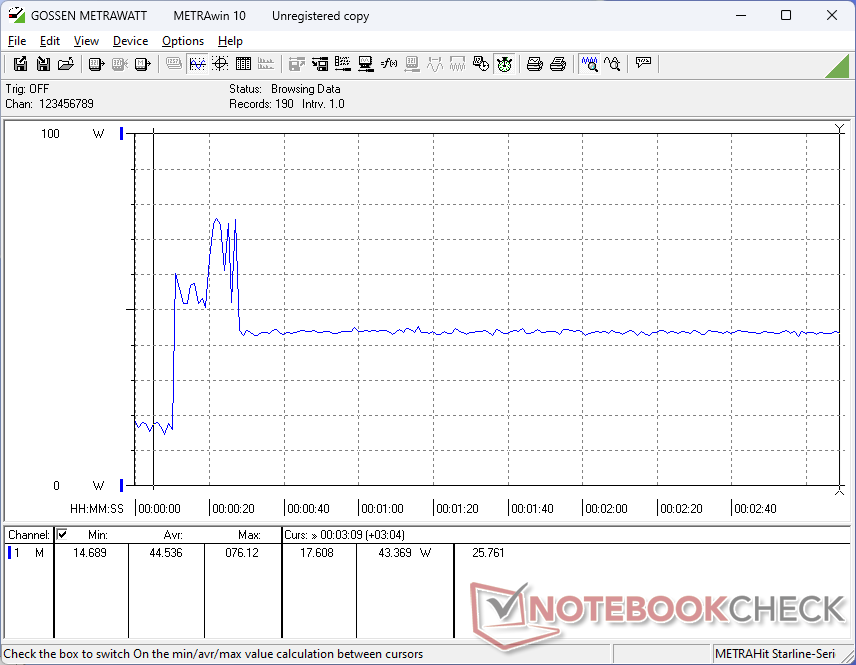
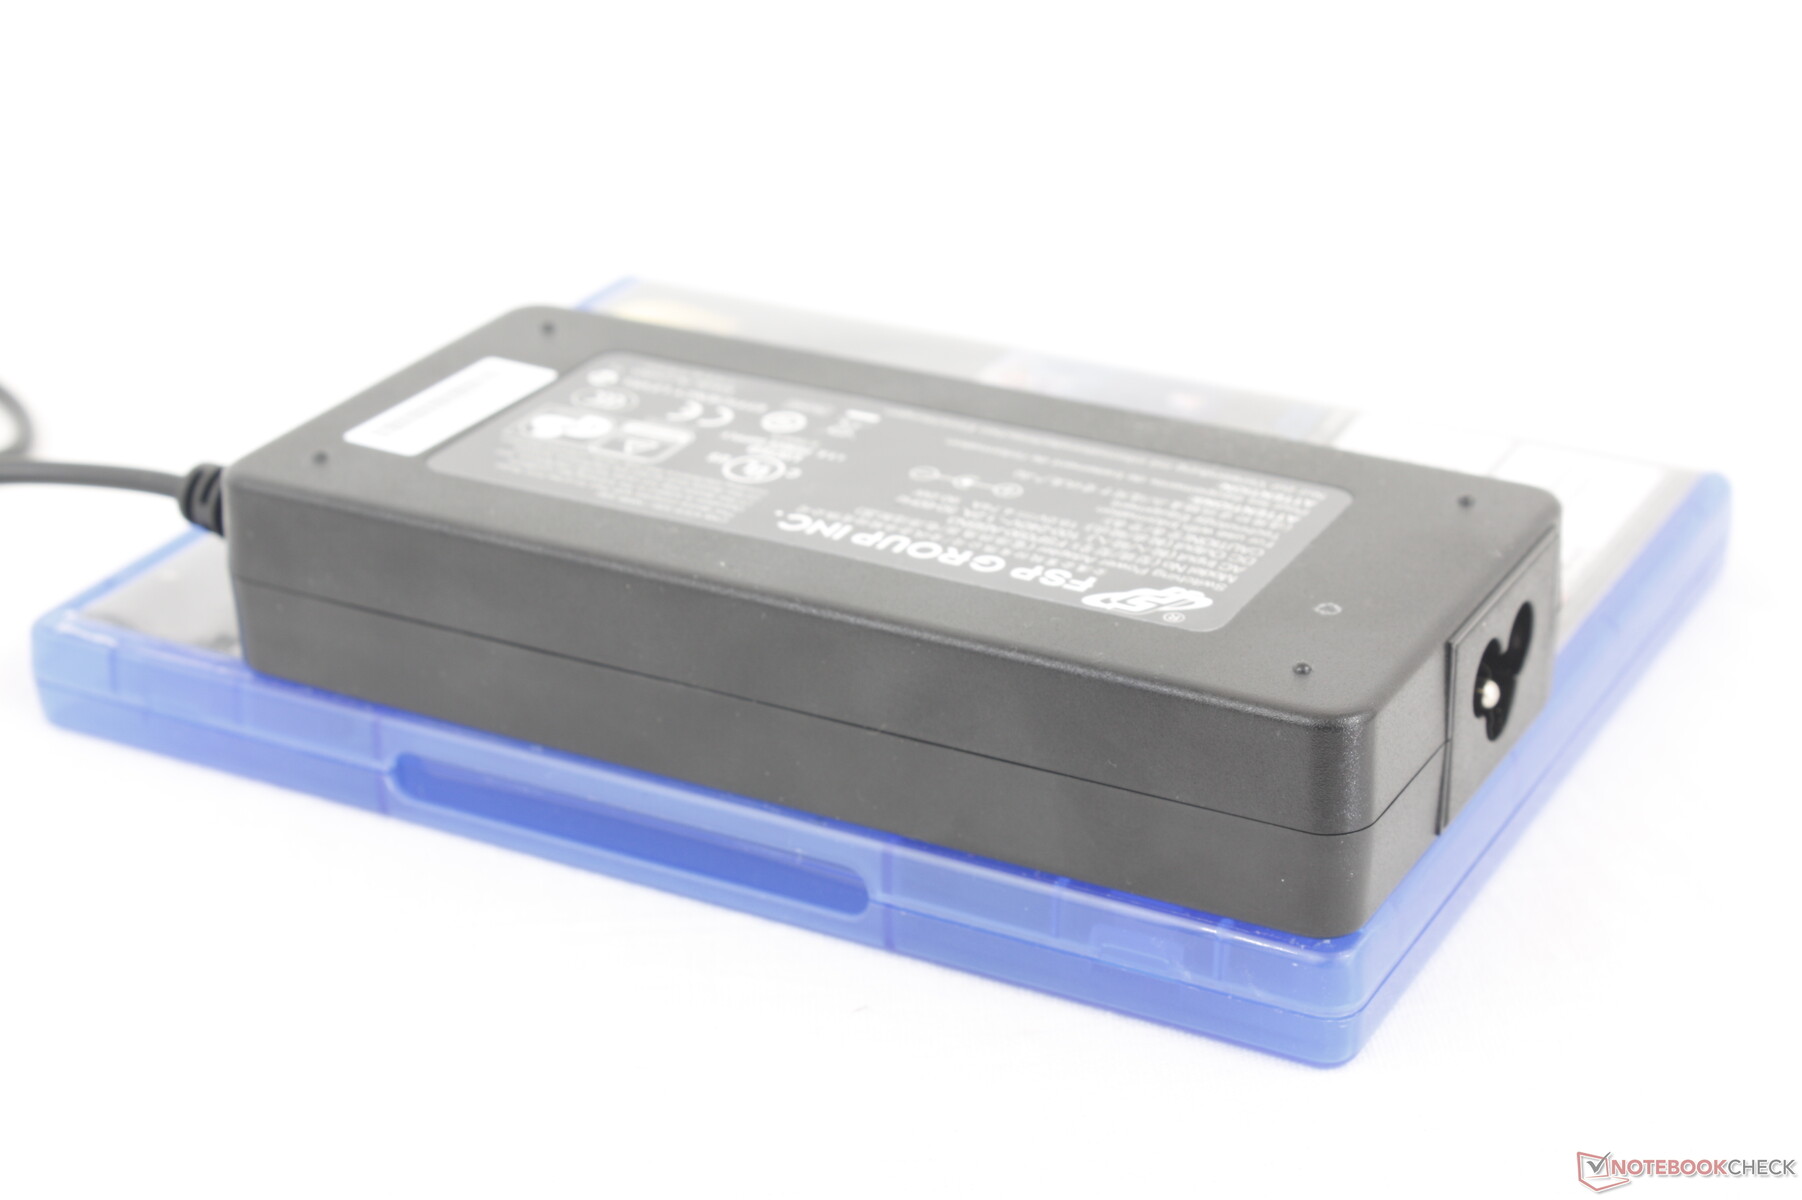
O consumo geral ao executar cargas mais altas é um pouco menor do que o do Getac S410 G5 que possui uma CPU da série Core-P mais rápida. O consumo máximo pode chegar temporariamente a 77 W quando a CPU está sob tensão, antes que as limitações térmicas entrem em ação, conforme mostram os gráficos abaixo. O sistema é compatível com a maioria dos adaptadores CA USB-C genéricos e, portanto, o adaptador de barril CA de 90 W proprietário (~15 x 6,4 x 2,6 cm) que vem na caixa não é absolutamente necessário.
| desligado | |
| Ocioso | |
| Carga |
|
Key:
min: | |
| Durabook S15 i7-1255U, Iris Xe G7 96EUs, Kingston OM8SEP4512Q-AA, IPS, 1920x1080, 15.6" | Durabook S15ABG2 i5-8265U, UHD Graphics 620, UDinfo HF3-25UB HF325UB256GBA2P, TN LED, 1920x1080, 15.6" | Panasonic Toughbook 40 i7-1185G7, Iris Xe G7 96EUs, Samsung PM991 MZVLQ1T0HALB, IPS, 1920x1080, 14" | Getac S410 G5 i5-1350P, Iris Xe G7 80EUs, SSSTC CL4-8D512, IPS, 1920x1080, 14" | Dell Latitude 5420 Rugged-P85G i7-8650U, Radeon RX 540, SK hynix PC401 NVMe 500 GB, IPS, 1920x1080, 14" | Acer Enduro Urban N3 EUN314 i7-1165G7, Iris Xe G7 96EUs, Samsung PM991 MZVLQ1T0HALB, IPS, 1920x1080, 14" | |
|---|---|---|---|---|---|---|
| Power Consumption | 29% | -5% | -29% | -22% | 30% | |
| Idle Minimum * | 4.4 | 3.5 20% | 4.9 -11% | 7.9 -80% | 4.8 -9% | 3.8 14% |
| Idle Average * | 14.9 | 7.9 47% | 12.3 17% | 14.4 3% | 13.6 9% | 8 46% |
| Idle Maximum * | 15.6 | 9 42% | 14 10% | 15.2 3% | 13.8 12% | 8.7 44% |
| Load Average * | 45.5 | 39.8 13% | 54 -19% | 58.4 -28% | 67.8 -49% | 34.6 24% |
| Witcher 3 ultra * | 40 | 46.3 -16% | 53.7 -34% | 69.1 -73% | 35.4 11% | |
| Load Maximum * | 76.2 | 59.8 22% | 83.6 -10% | 106.5 -40% | 93.5 -23% | 45.4 40% |
* ... menor é melhor
Power Consumption Witcher 3 / Stresstest
Power Consumption external Monitor
Duração da bateria
A bateria interna é relativamente pequena, com 54 Wh, para um tempo de execução de WLAN no mundo real de cerca de 8 horas, semelhante ao modelo 2020 mais antigo, quando ambos estão configurados com brilho de 150 nit. Há opções de bateria secundária disponíveis para aumentar a vida útil da bateria.
O carregamento da bateria vazia até a capacidade total é relativamente lento, com pouco mais de 2 horas, em comparação com 1,5 hora na maioria dos laptops de consumo.
| Durabook S15 i7-1255U, Iris Xe G7 96EUs, 56 Wh | Durabook S15ABG2 i5-8265U, UHD Graphics 620, 56 Wh | Panasonic Toughbook 40 i7-1185G7, Iris Xe G7 96EUs, 136 Wh | Getac S410 G5 i5-1350P, Iris Xe G7 80EUs, 150 Wh | Dell Latitude 5420 Rugged-P85G i7-8650U, Radeon RX 540, 102 Wh | Acer Enduro Urban N3 EUN314 i7-1165G7, Iris Xe G7 96EUs, 50.3 Wh | |
|---|---|---|---|---|---|---|
| Duração da bateria | -14% | 137% | 119% | 93% | -20% | |
| Reader / Idle | 1030 | 1882 83% | ||||
| WiFi v1.3 | 480 | 411 -14% | 1137 137% | 1052 119% | 972 103% | 382 -20% |
| Load | 190 |
Pro
Contra
Veredicto - Os componentes internos atualizados fazem toda a diferença
O Durabook S15 2024 se baseia no design que analisamos em 2020 para atualizar a série e, ao mesmo tempo, manter todas as qualidades essenciais do original. Os recursos externos conhecidos são sólidos, mas com novas especificações de hardware, como Wi-Fi 6E, opções de tela de 1000 nits, teclado maior, Thunderbolt 4 e, é claro, desempenho mais rápido do processador. Alguns usuários, no entanto, podem ficar chateados com a falta de um slot SATA III de 2,5 polegadas e de uma tela sensível ao toque. Alguns modelos concorrentes, como o Getac S410 Gen 5 têm tela sensível ao toque, caneta stylus e opções Core-P mais rápidas em comparação.
O Durabook S15 2024 pode parecer o mesmo por fora, mas o interior foi quase totalmente revisado para trazer recursos e opções modernos, mantendo a compatibilidade com a maioria dos acessórios.
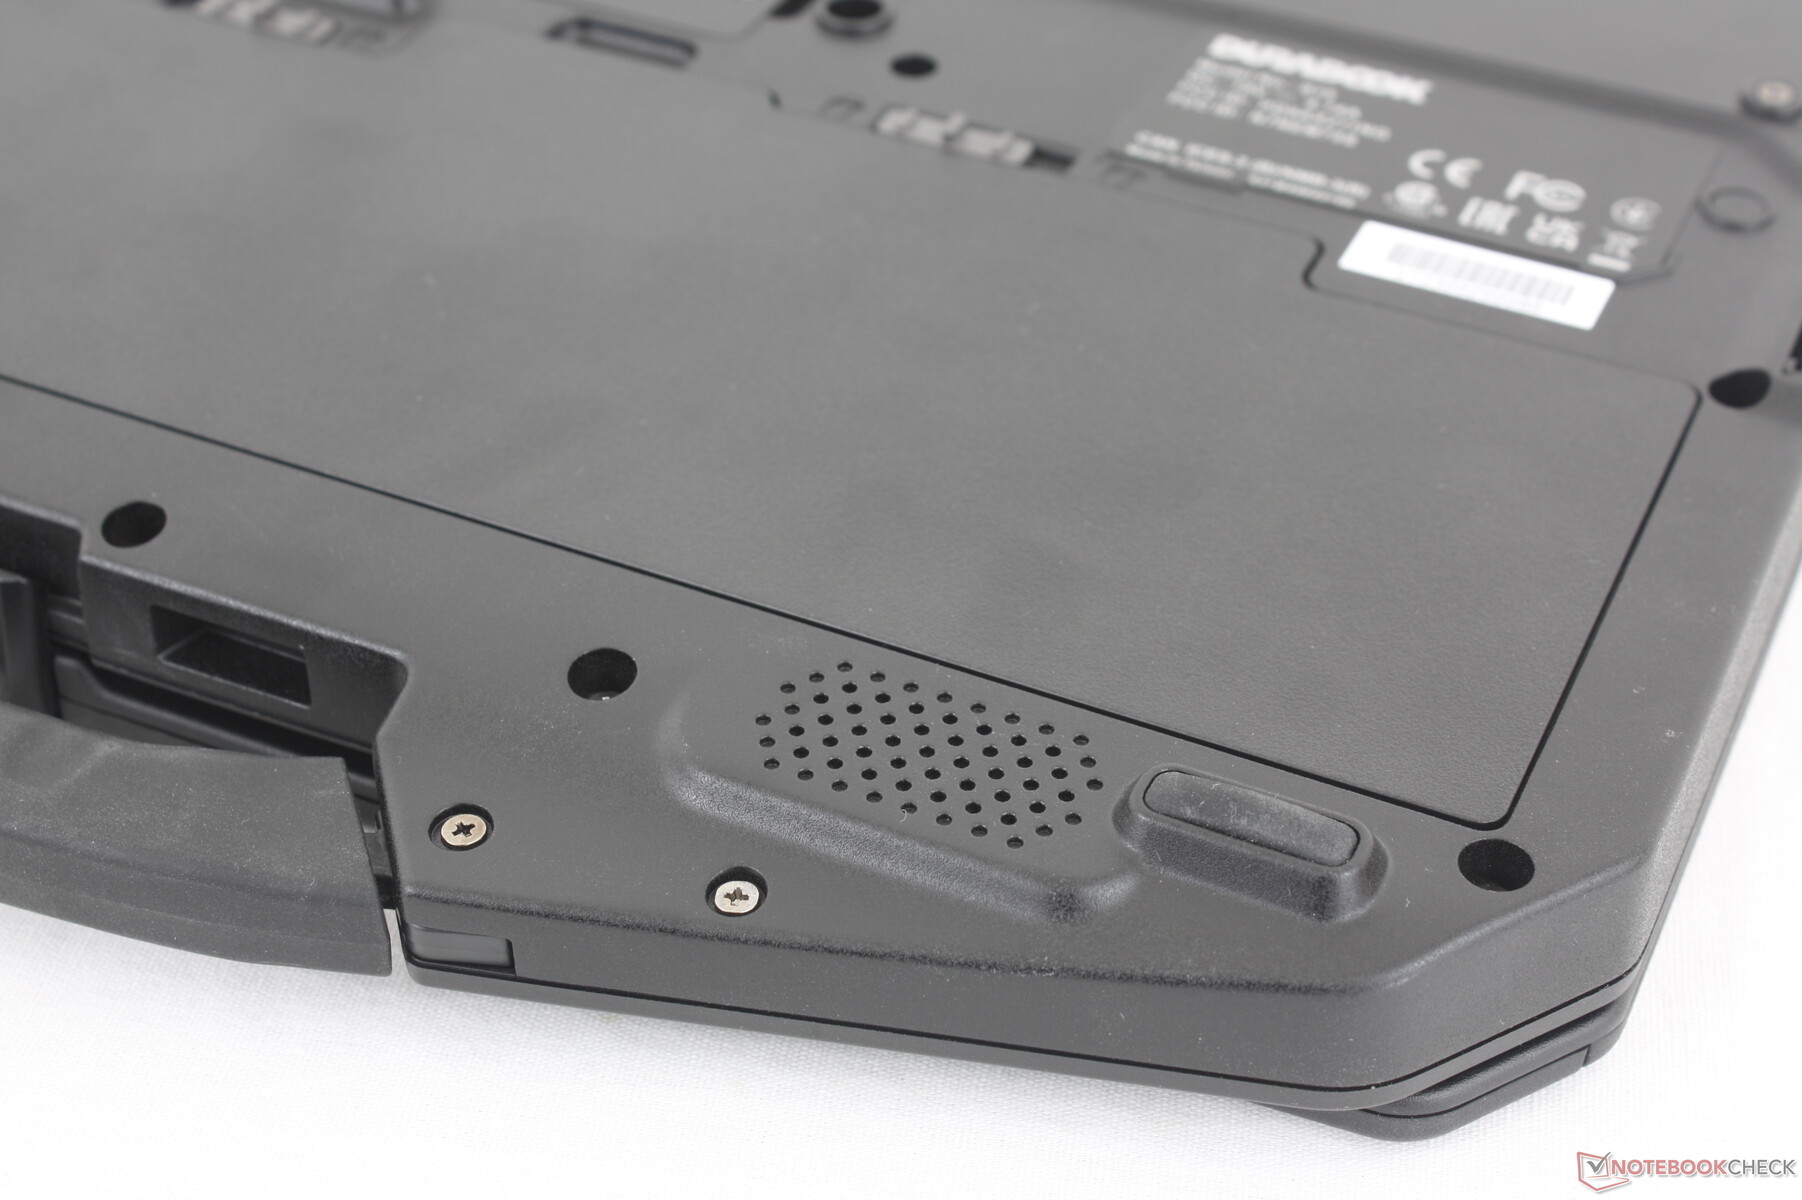
A presença de PWM para controle de brilho e o feedback desigual das teclas entre os lados esquerdo e direito do teclado devem ser melhorados em futuras revisões. Os alto-falantes poderiam ser mais altos e o compartimento de encaixe lateral ainda requer uma chave de fenda para ser acessado, o que pode ser inconveniente quando se está em campo. A grande maioria dos notebooks mais recentes também fez a transição para telas de 16:10 ou 16 polegadas, enquanto o S15 está começando a parecer ultrapassado com seu formato 16:9 de 15,6 polegadas. Apesar dessas desvantagens, é impressionante que o modelo continue sendo um dos mais portáteis da categoria, mesmo depois de todos esses anos.
Preço e disponibilidade
As cotações estão disponíveis se configurados e comprados diretamente do fabricante.
Durabook S15
- 06/17/2024 v8
Allen Ngo
Transparência
A seleção dos dispositivos a serem analisados é feita pela nossa equipe editorial. A amostra de teste foi fornecida ao autor como empréstimo pelo fabricante ou varejista para fins desta revisão. O credor não teve influência nesta revisão, nem o fabricante recebeu uma cópia desta revisão antes da publicação. Não houve obrigação de publicar esta revisão. Nunca aceitamos compensação ou pagamento em troca de nossas avaliações. Como empresa de mídia independente, a Notebookcheck não está sujeita à autoridade de fabricantes, varejistas ou editores.
É assim que o Notebookcheck está testando
Todos os anos, o Notebookcheck analisa de forma independente centenas de laptops e smartphones usando procedimentos padronizados para garantir que todos os resultados sejam comparáveis. Desenvolvemos continuamente nossos métodos de teste há cerca de 20 anos e definimos padrões da indústria no processo. Em nossos laboratórios de teste, equipamentos de medição de alta qualidade são utilizados por técnicos e editores experientes. Esses testes envolvem um processo de validação em vários estágios. Nosso complexo sistema de classificação é baseado em centenas de medições e benchmarks bem fundamentados, o que mantém a objetividade.Price comparison

