

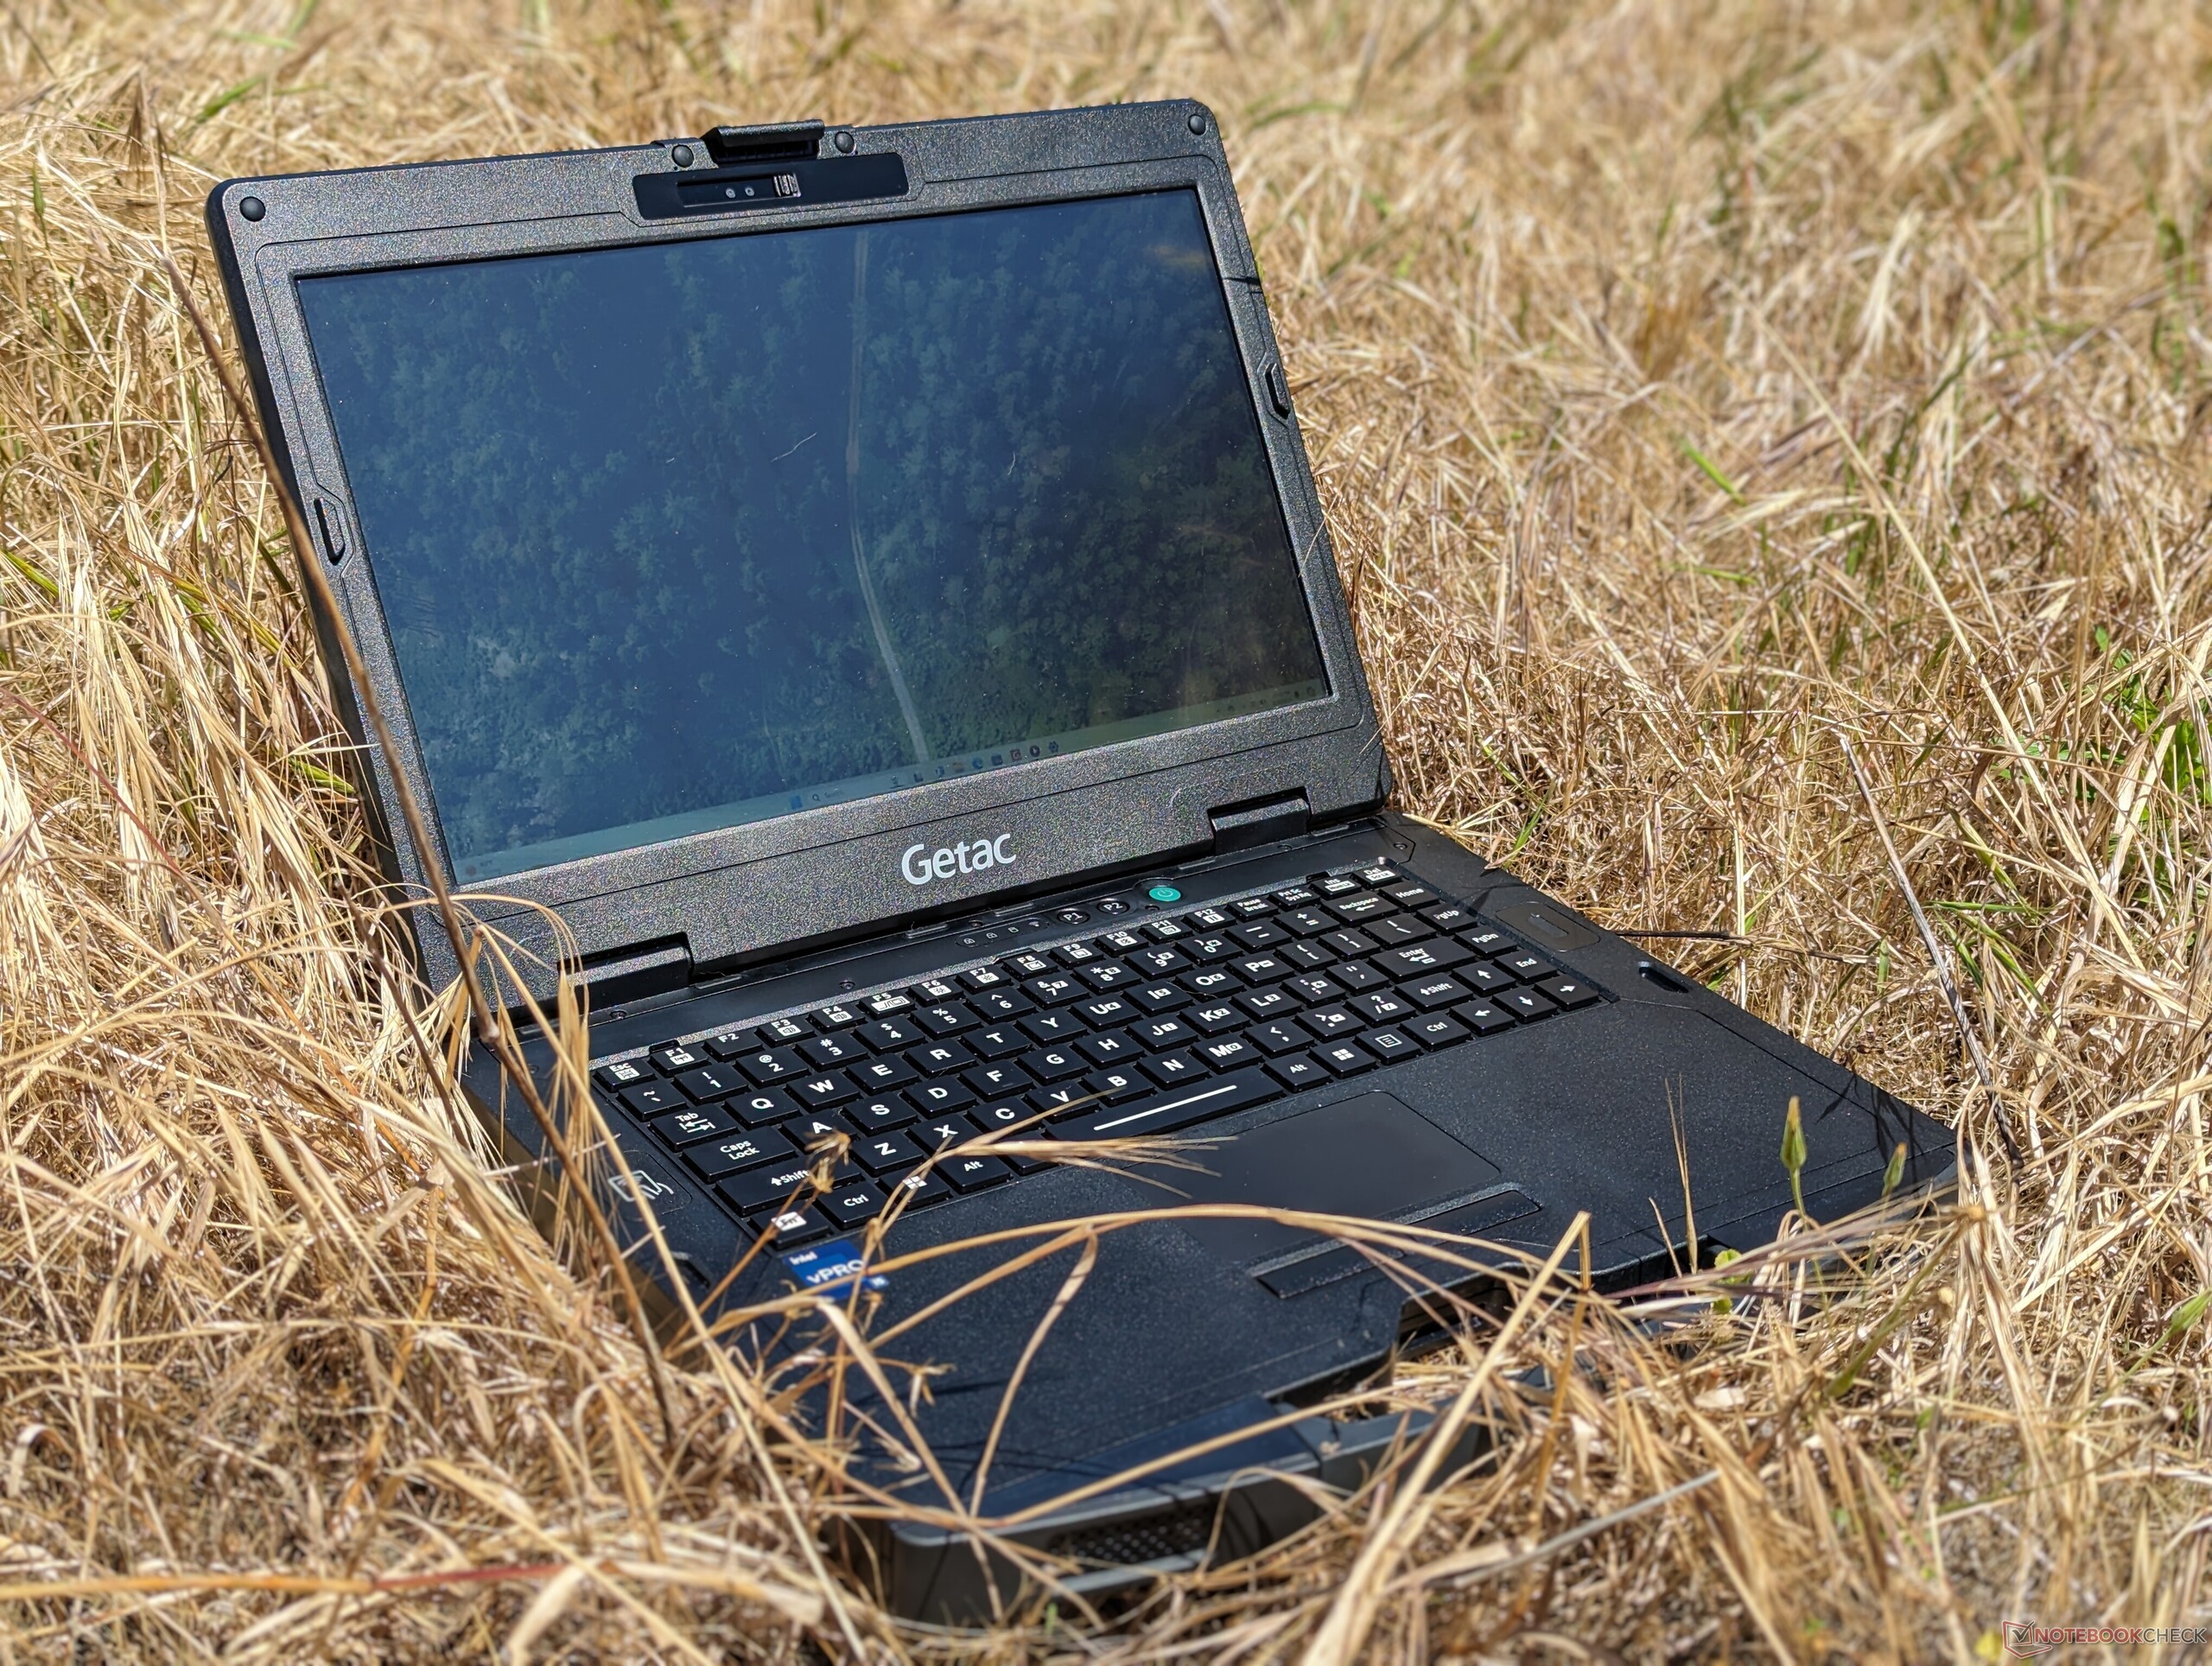
Análise do laptop robusto Getac S410 Gen 5: Raptor Lake-P para desempenho extra

O S410 está de volta este ano como um modelo de 5ª geração com os mesmos recursos físicos das quatro iterações anteriores. Seus componentes internos foram atualizados para incluir os processadores Raptor Lake-P vPro, que sucedem as opções mais antigas Tiger Lake-U. Recomendamos que confira nossas análises sobre o S410 G4 e o original 2018 S410 para saber mais sobre o chassi e os recursos do S410 G5, pois muito pouco mudou para manter a compatibilidade com peças e acessórios. Em vez disso, esta análise se concentrará em todas as diferenças de desempenho entre o S410 G5 e suas alternativas e antecessores.
Mais informações sobre o S410 G5 e sua longa lista de recursos personalizáveis podem ser encontradas na página oficial do produto em PDF aqui.
Mais análises da Getac:
Posibles contendientes en la comparación
Avaliação | Data | Modelo | Peso | Altura | Size | Resolução | Preço |
|---|---|---|---|---|---|---|---|
| 82.9 % v7 (old) | 06/2024 | Getac S410 G5 i5-1350P, Iris Xe G7 80EUs | 2.9 kg | 34.9 mm | 14.00" | 1920x1080 | |
| 81.7 % v7 (old) | 05/2022 | Getac S410 Gen 4 i7-1185G7, Iris Xe G7 96EUs | 3.2 kg | 34.9 mm | 14.00" | 1920x1080 | |
v (old) | 04/2021 | Durabook S14I i7-1165G7, Iris Xe G7 96EUs | 3 kg | 38.1 mm | 14.00" | 1920x1080 | |
| 84.8 % v7 (old) | 01/2022 | Dell Latitude 14 5420-D2G5W i5-1135G7, Iris Xe G7 80EUs | 1.5 kg | 20.9 mm | 14.00" | 1920x1080 | |
v (old) | 05/2022 | Dell Latitude 7330 Rugged Extreme i7-1185G7, Iris Xe G7 96EUs | 2.7 kg | 36.5 mm | 13.30" | 1920x1080 | |
v (old) | 07/2022 | Panasonic Toughbook 40 i7-1185G7, Iris Xe G7 96EUs | 3.9 kg | 53.4 mm | 14.00" | 1920x1080 |
Case - robusto com certificação MIL-STD-810H e IP53
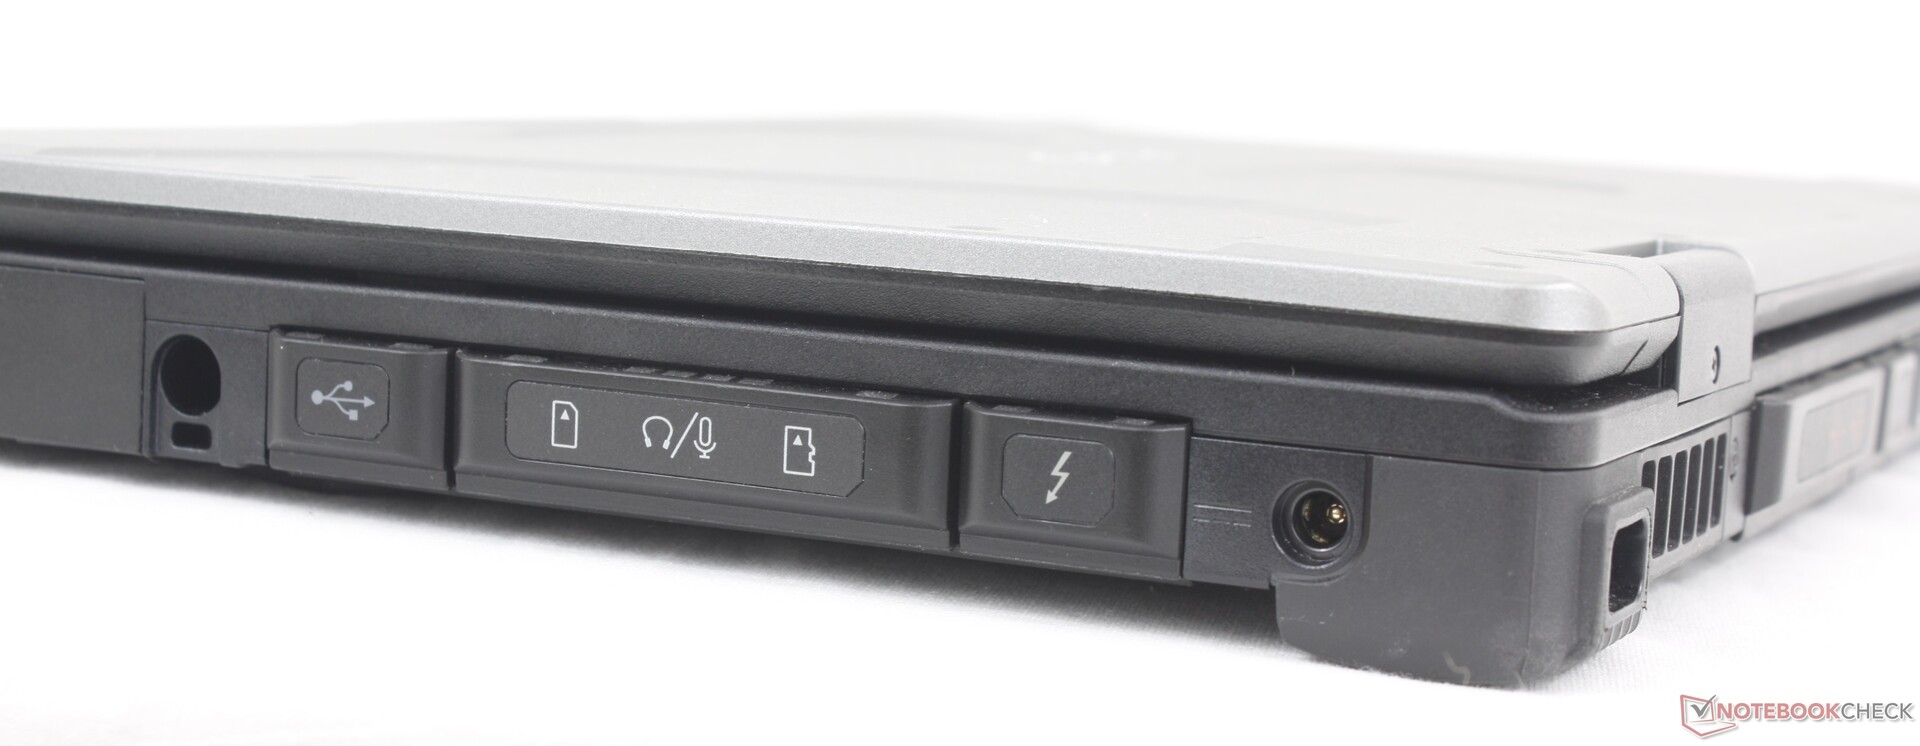
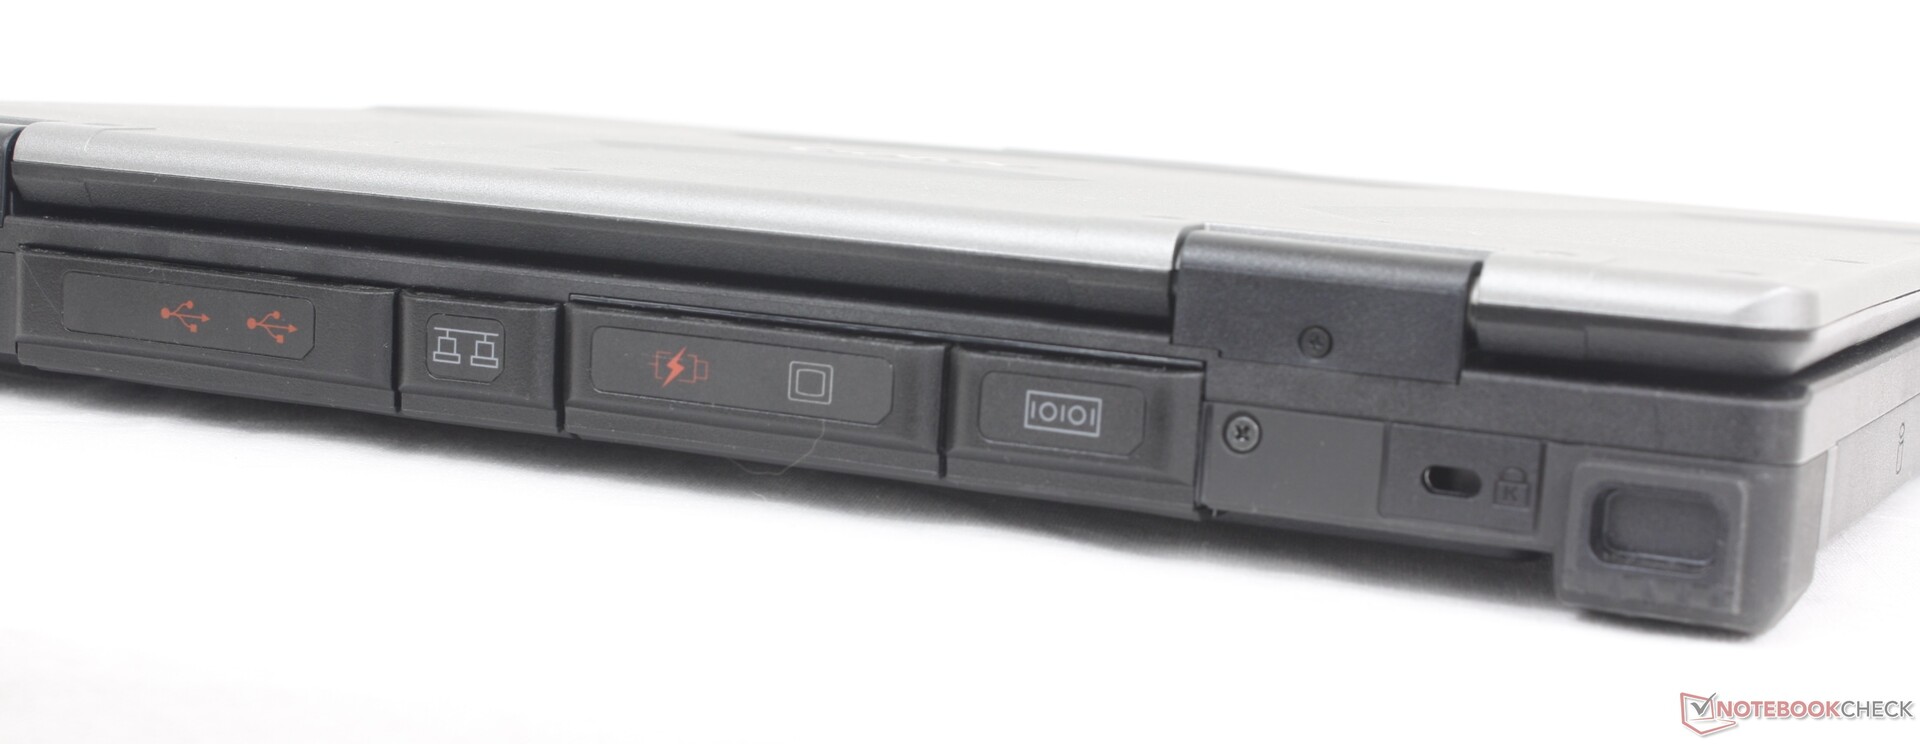
Conectividade

Leitor de cartão SD
| SD Card Reader | |
| average JPG Copy Test (av. of 3 runs) | |
| Dell Latitude 14 5420-D2G5W (AV Pro SD microSD 128 GB V60) | |
| Dell Latitude 7330 Rugged Extreme (AV Pro V60) | |
| Getac S410 G5 (AV Pro V60) | |
| Panasonic Toughbook 40 (AV Pro V60) | |
| Durabook S14I (Angelbird 128GB AV Pro UHS-II) | |
| maximum AS SSD Seq Read Test (1GB) | |
| Dell Latitude 7330 Rugged Extreme (AV Pro V60) | |
| Dell Latitude 14 5420-D2G5W (AV Pro SD microSD 128 GB V60) | |
| Getac S410 G5 (AV Pro V60) | |
| Panasonic Toughbook 40 (AV Pro V60) | |
| Durabook S14I (Angelbird 128GB AV Pro UHS-II) | |
Comunicação
A WLAN foi atualizada do Intel AX201 para o AX211 para suportar velocidades Wi-Fi 6E.
| Networking | |
| iperf3 transmit AX12 | |
| Durabook S14I | |
| Dell Latitude 7330 Rugged Extreme | |
| Getac S410 Gen 4 | |
| Dell Latitude 14 5420-D2G5W | |
| iperf3 receive AX12 | |
| Durabook S14I | |
| Getac S410 Gen 4 | |
| Dell Latitude 7330 Rugged Extreme | |
| Dell Latitude 14 5420-D2G5W | |
| iperf3 transmit AXE11000 | |
| Panasonic Toughbook 40 | |
| Getac S410 G5 | |
| iperf3 receive AXE11000 | |
| Panasonic Toughbook 40 | |
| Getac S410 G5 | |
| iperf3 transmit AXE11000 6GHz | |
| Getac S410 G5 | |
| iperf3 receive AXE11000 6GHz | |
| Getac S410 G5 | |
Webcam
Nossa unidade de teste foi configurada com uma webcam de 5 MP, o que representa um grande avanço em relação à webcam de 1 MP do S410 G4. O reconhecimento facial Windows Hello é compatível.


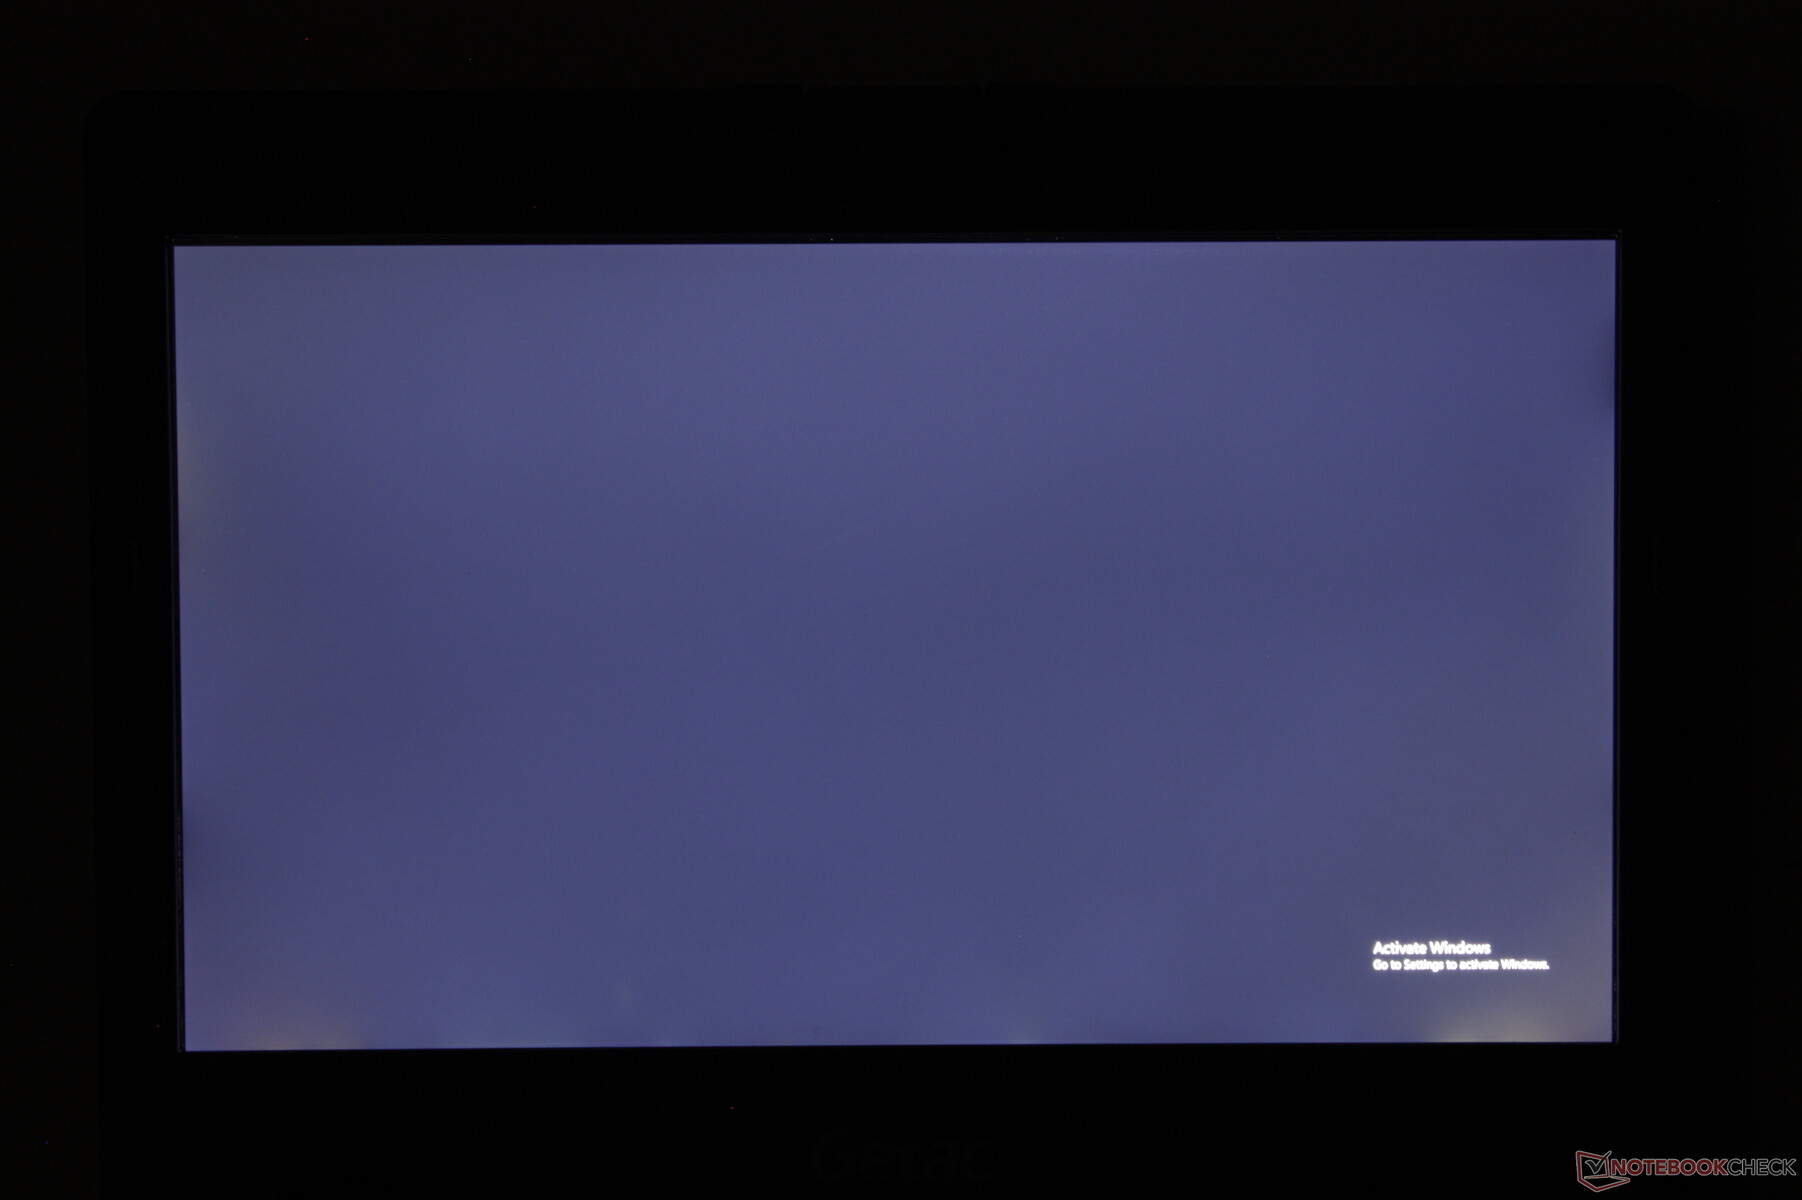
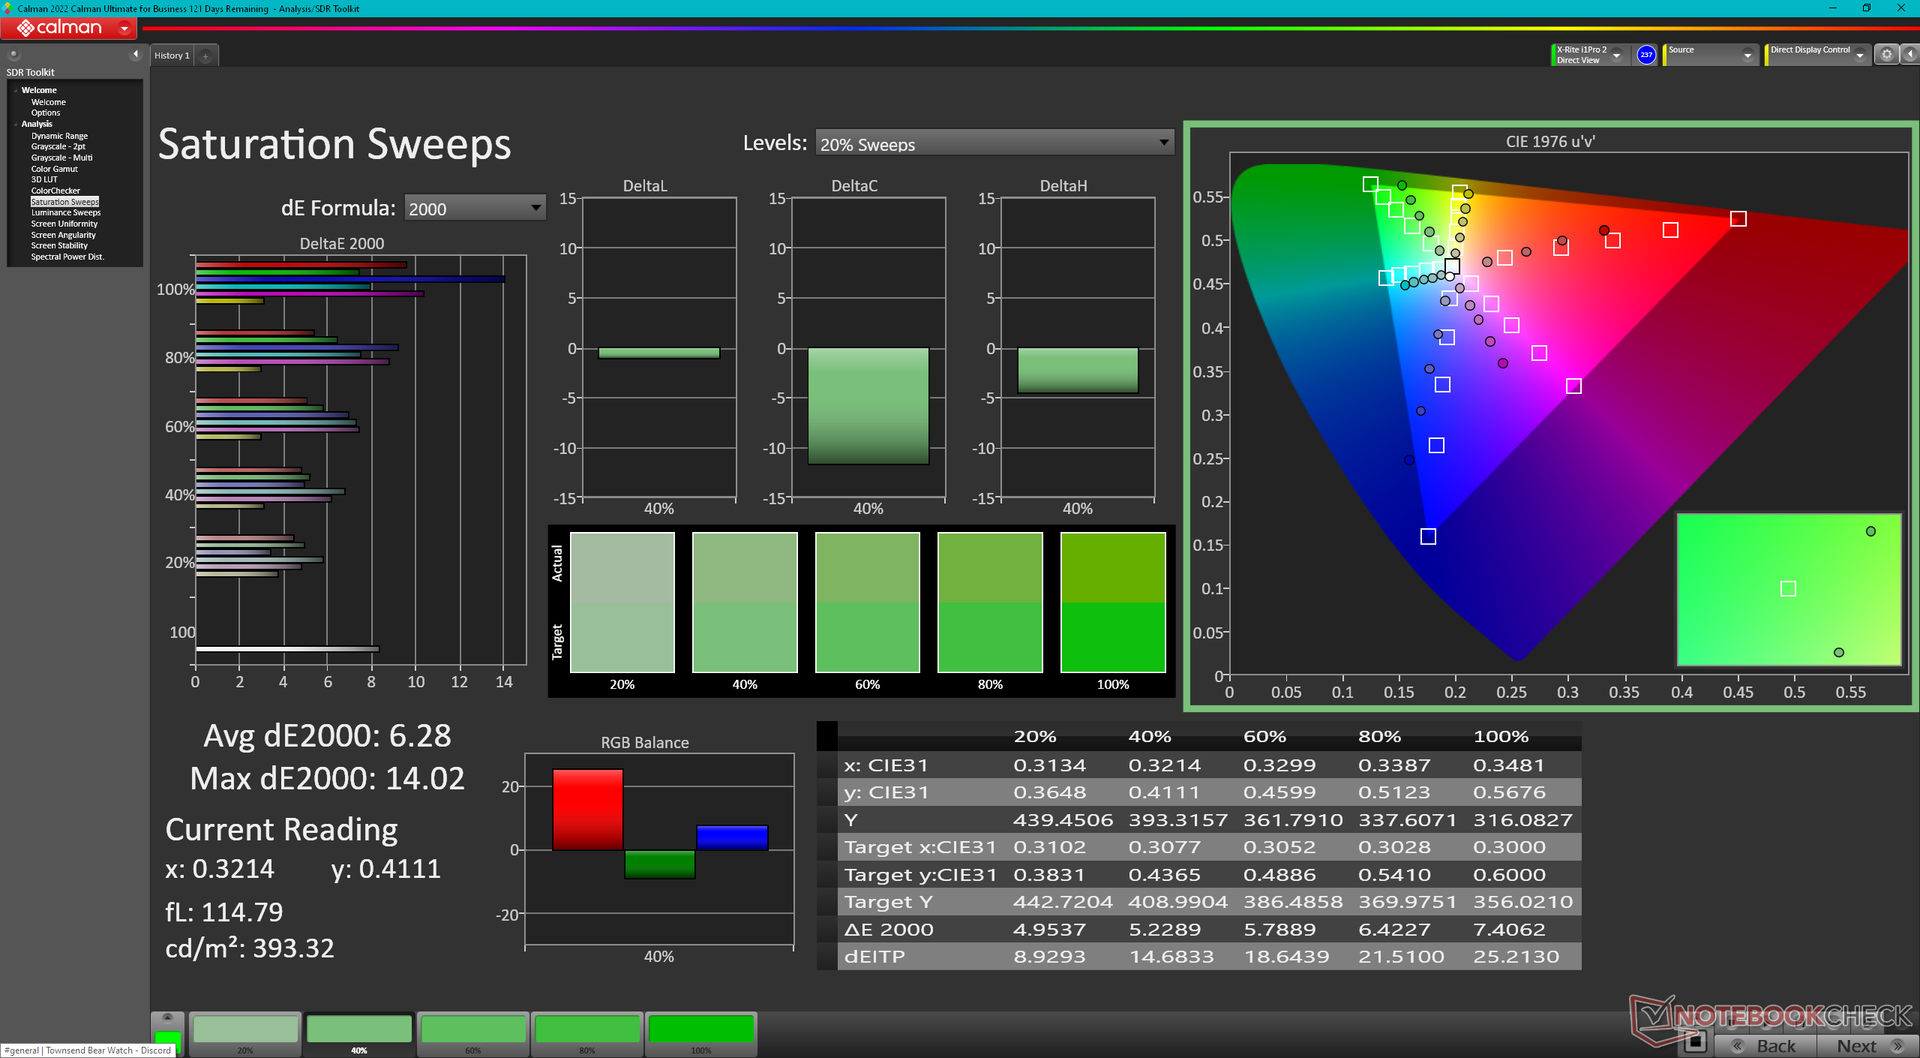
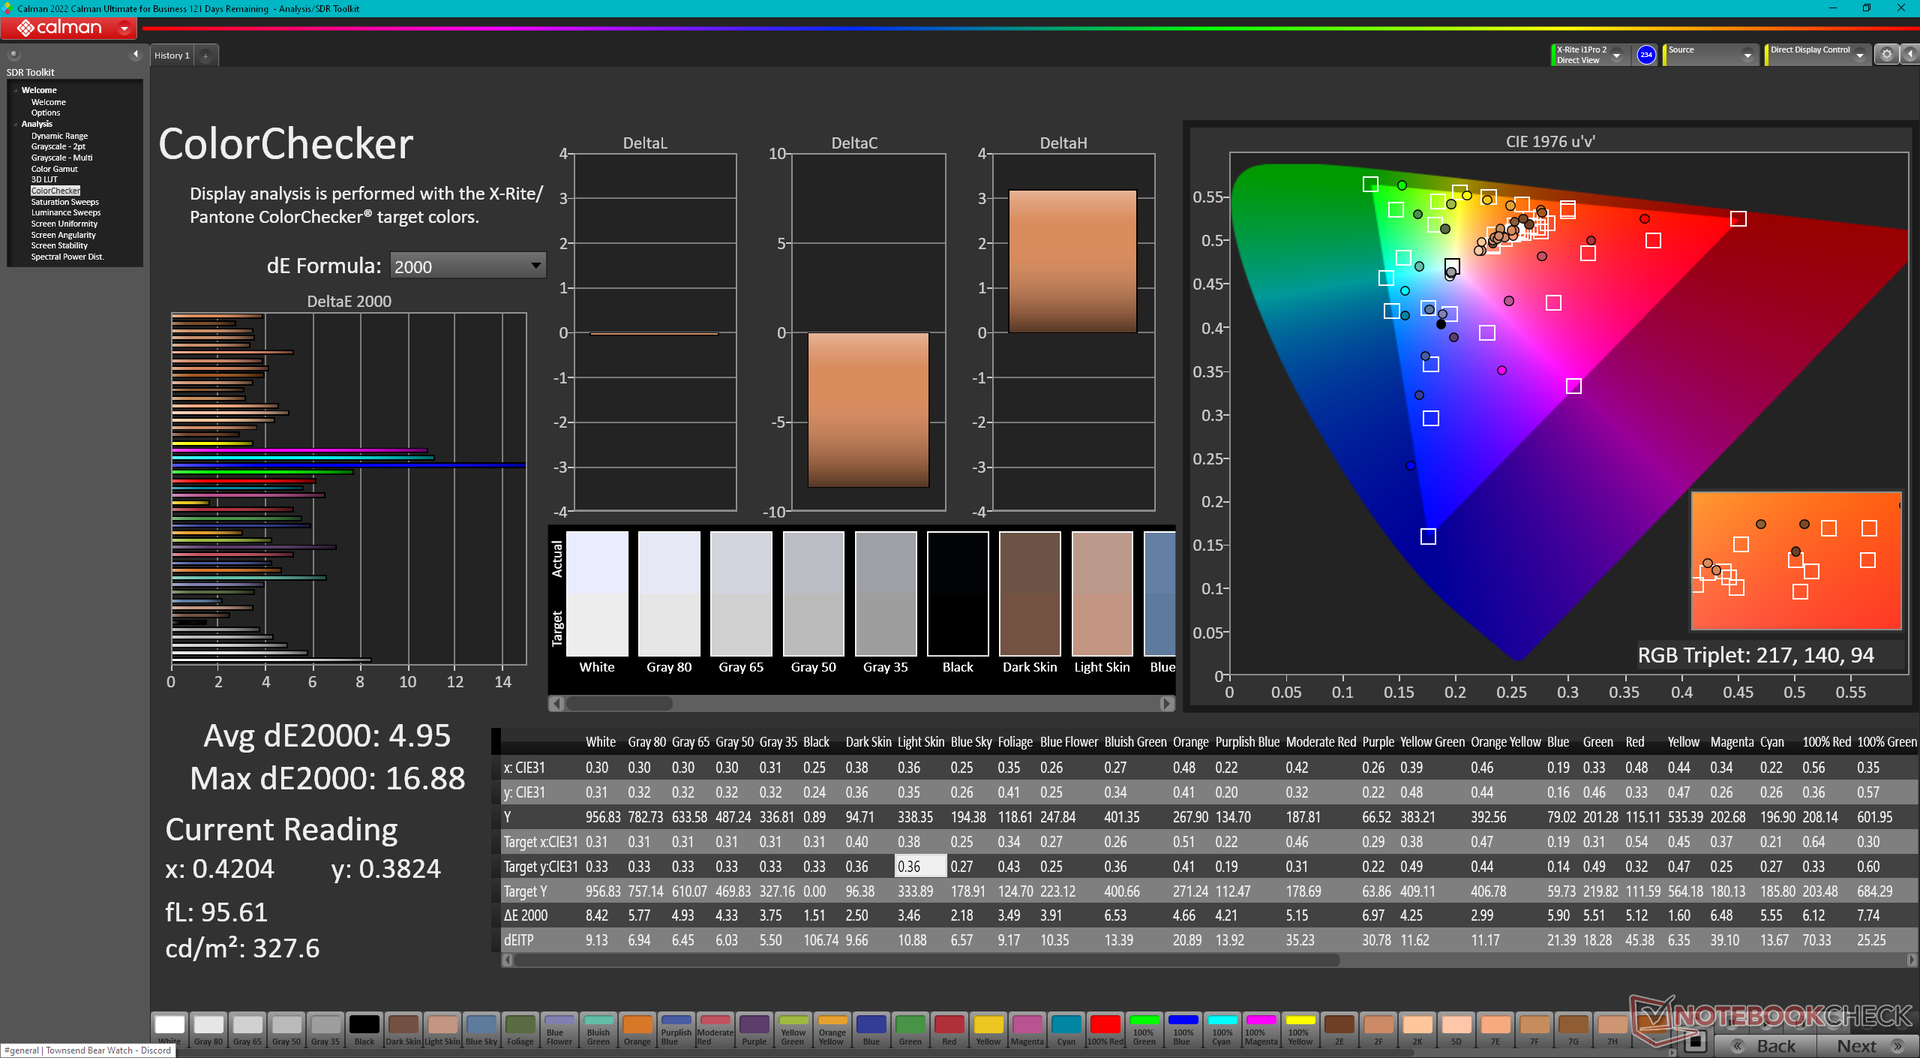
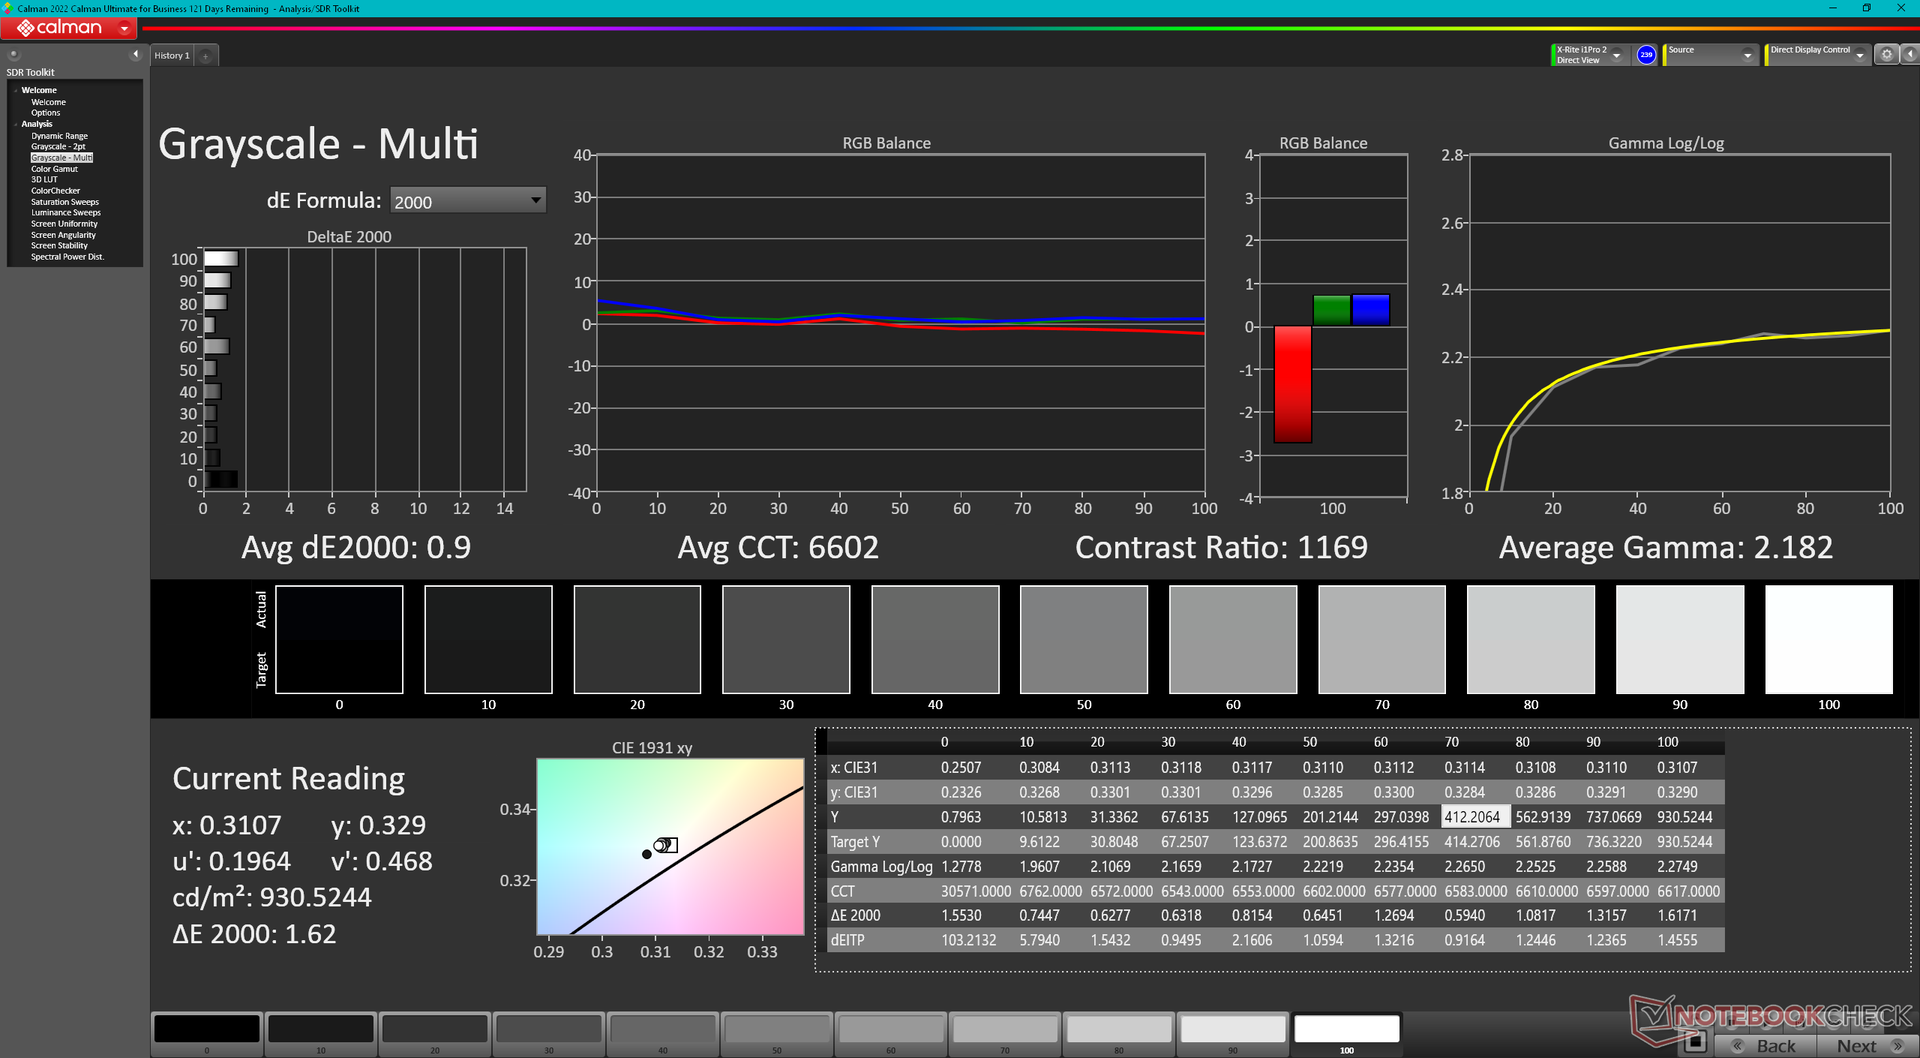
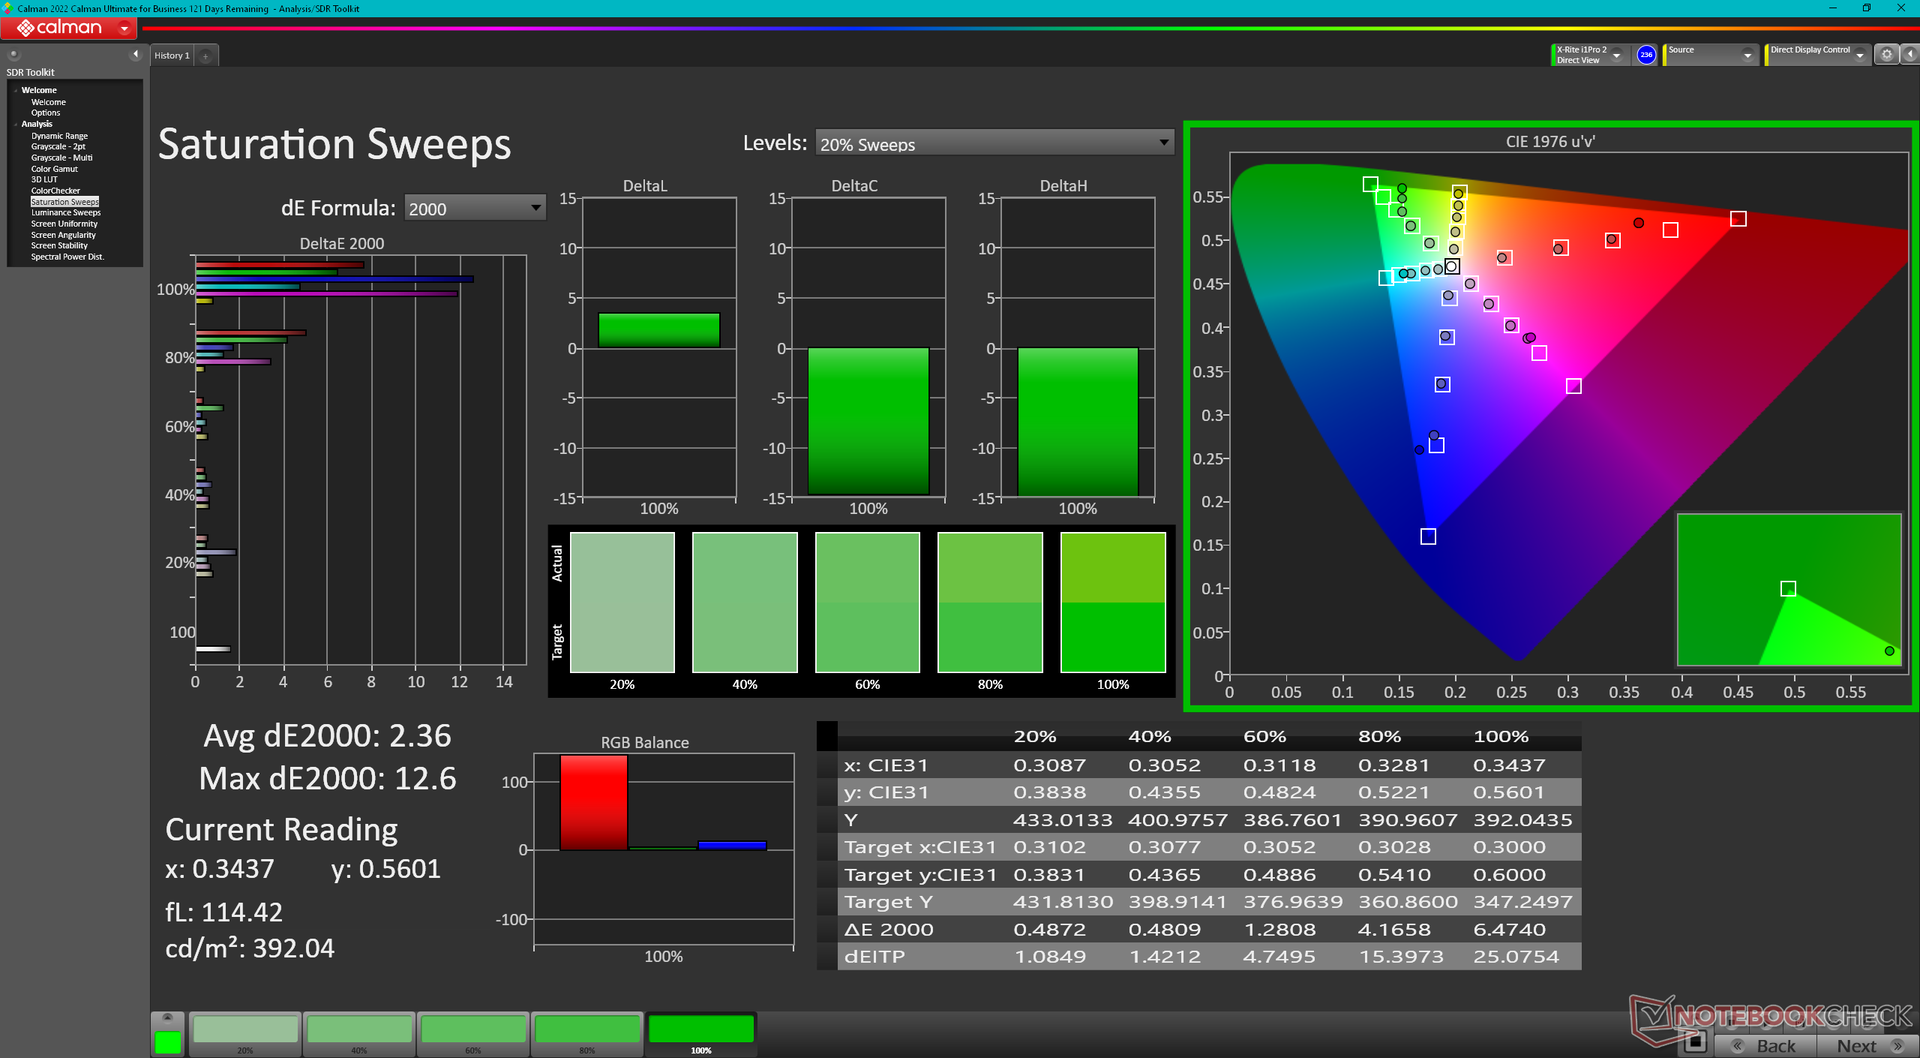
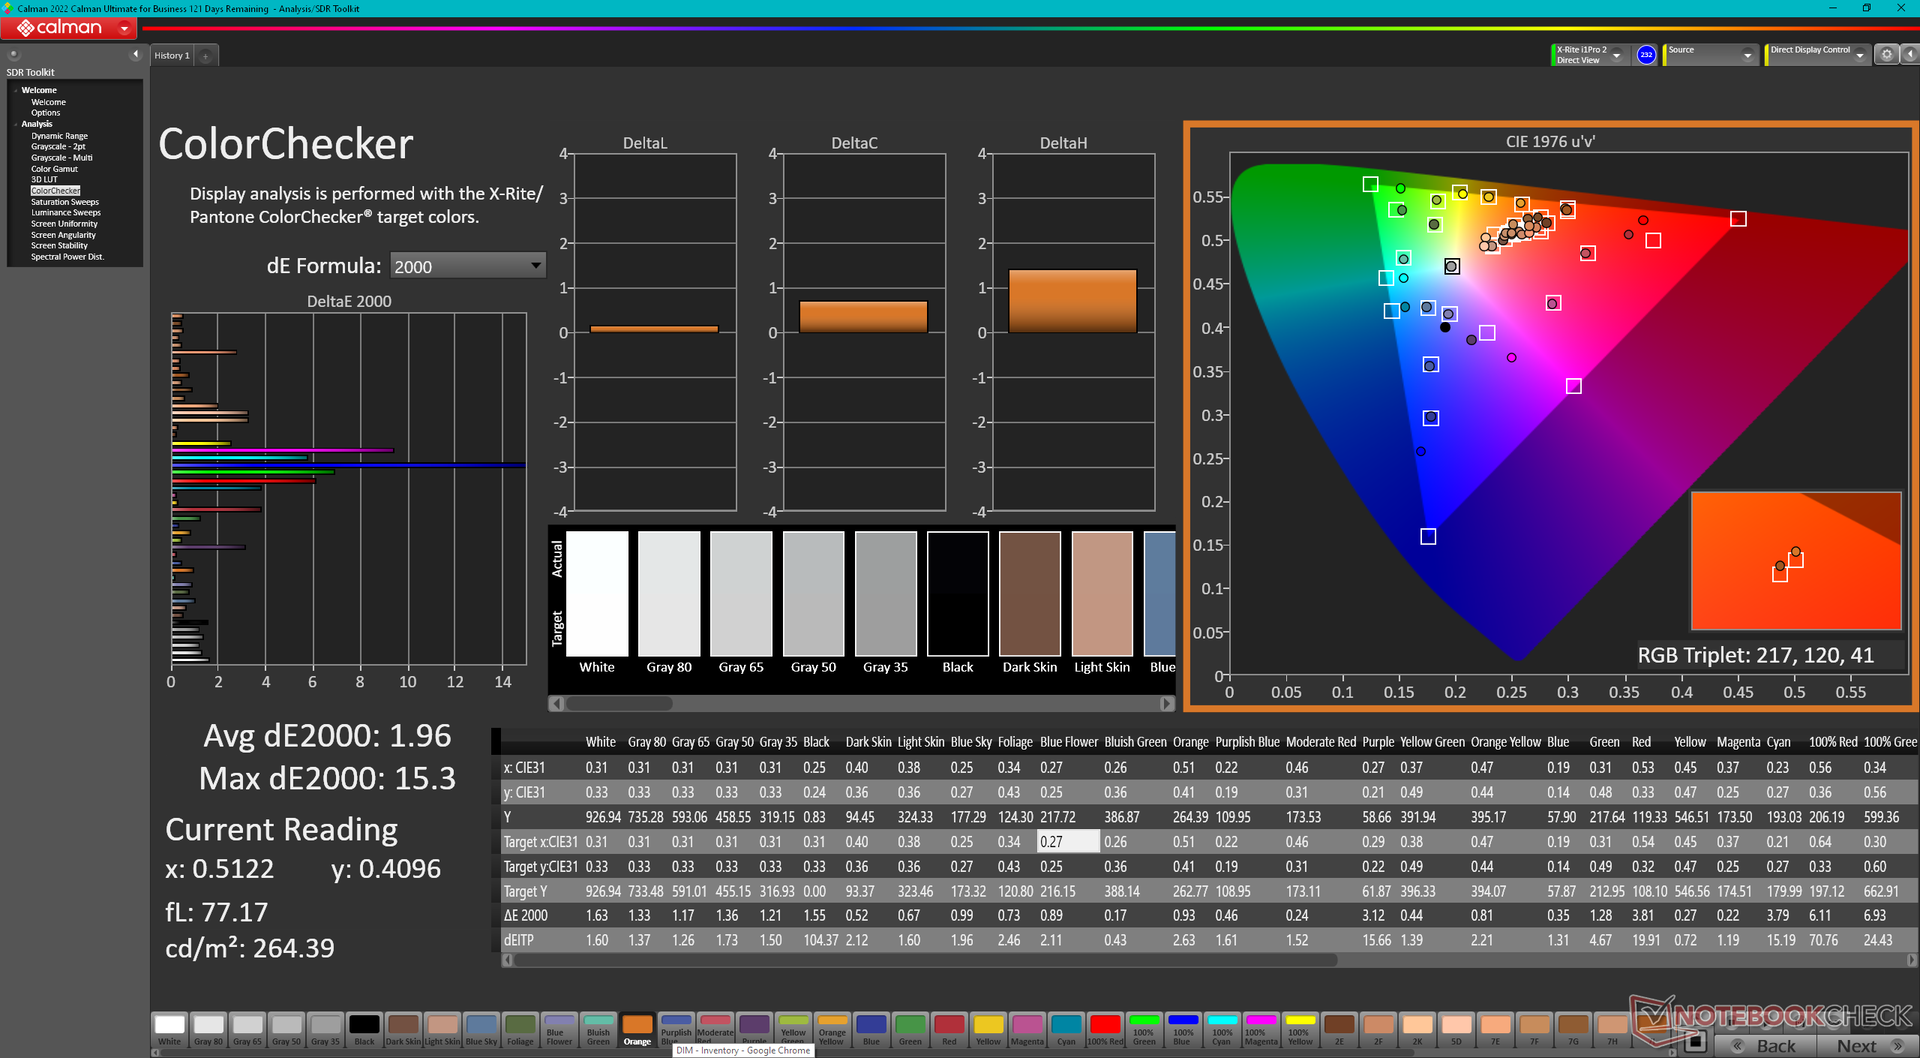
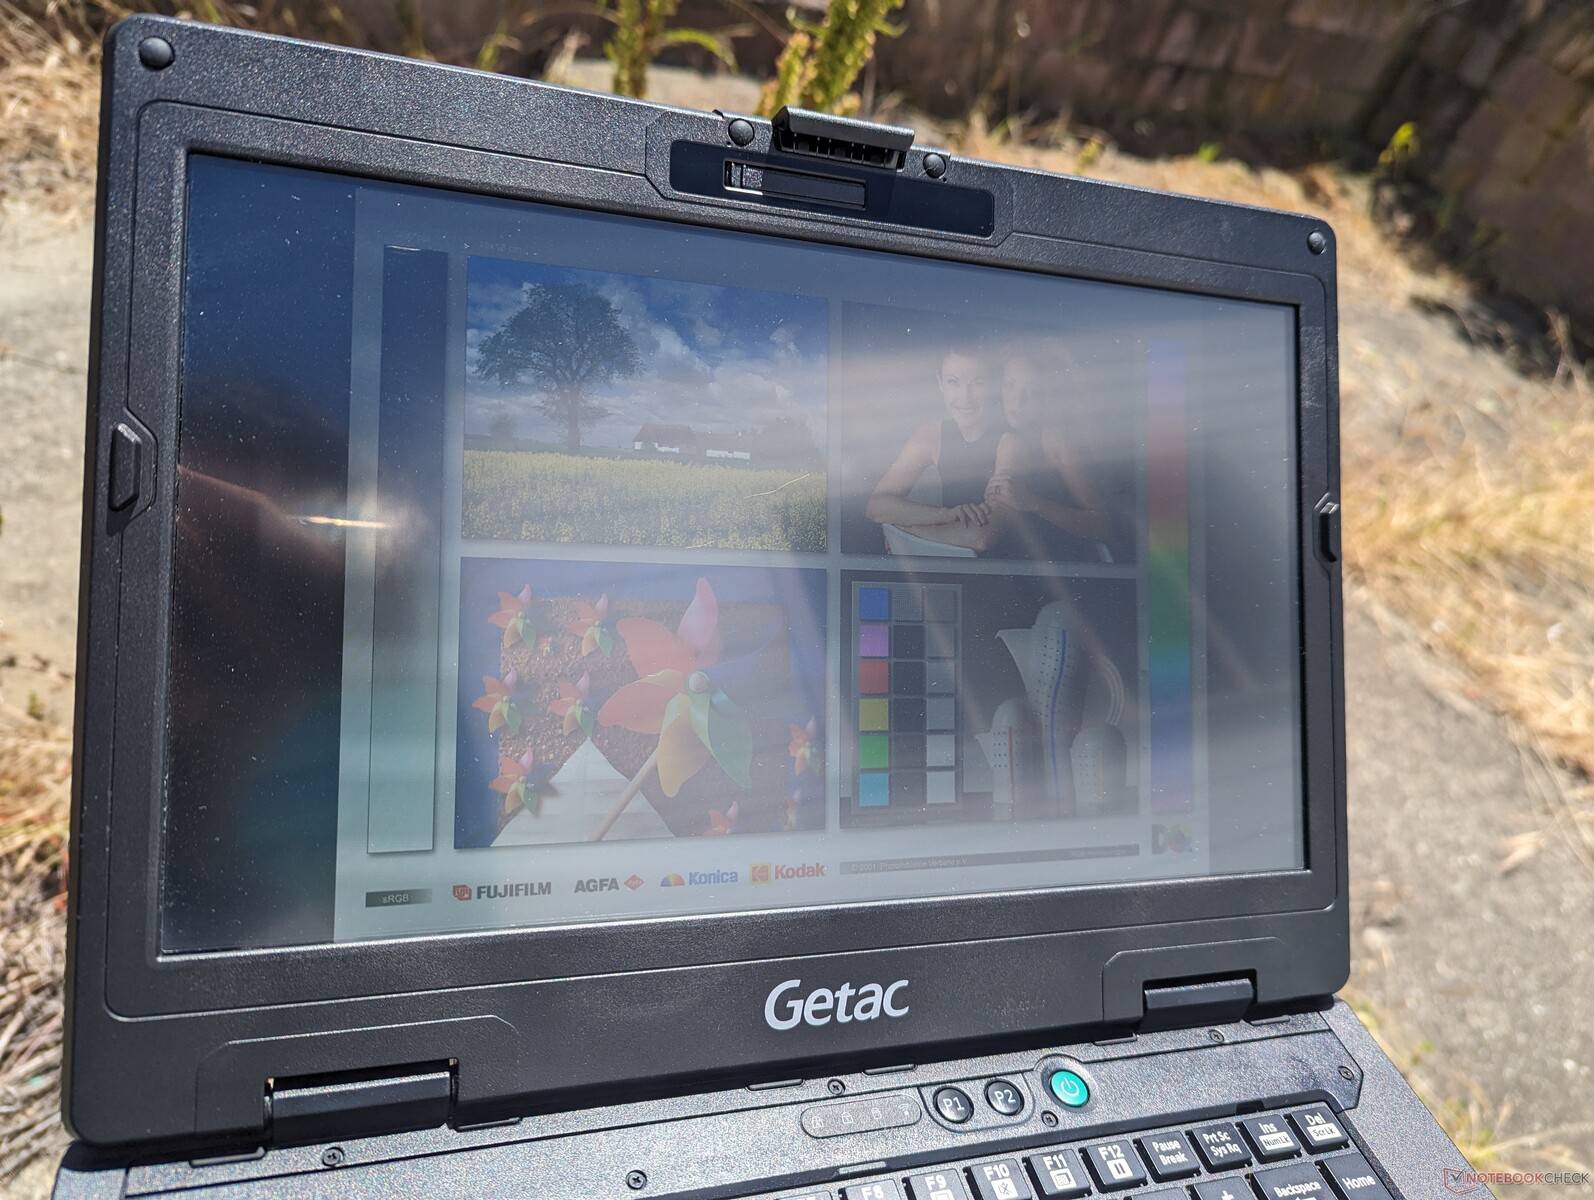
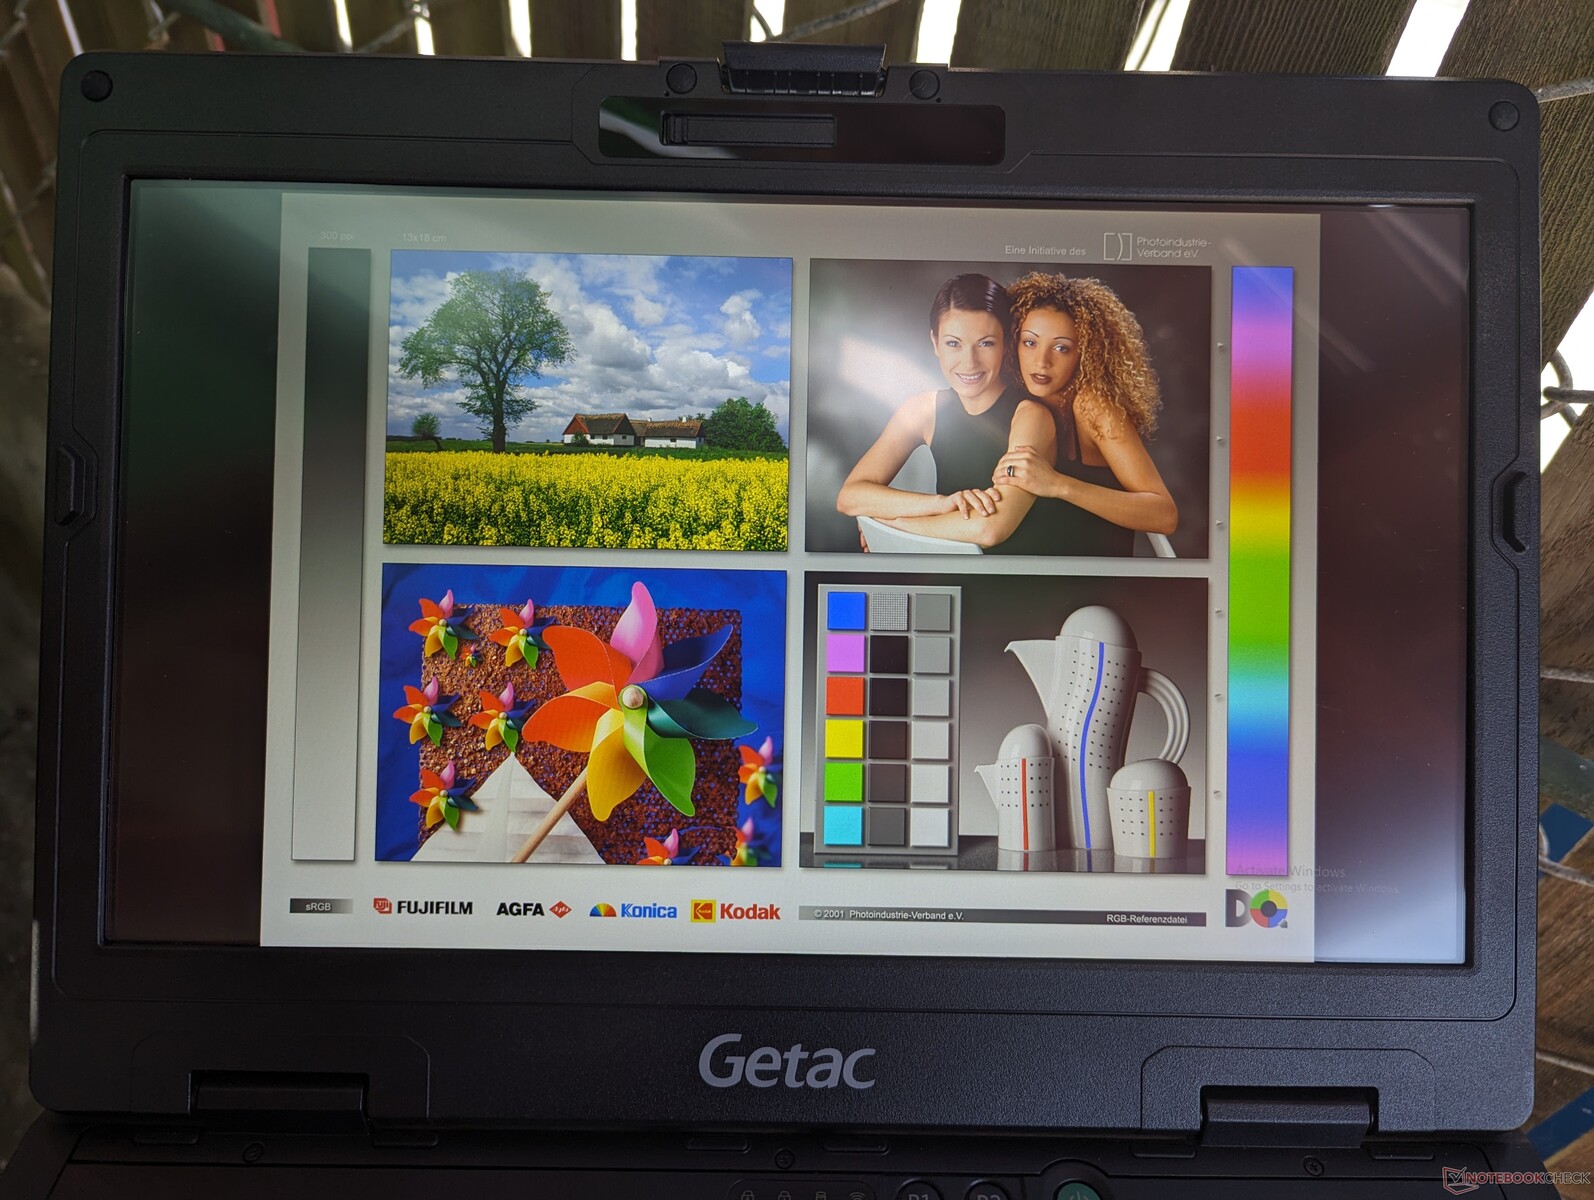
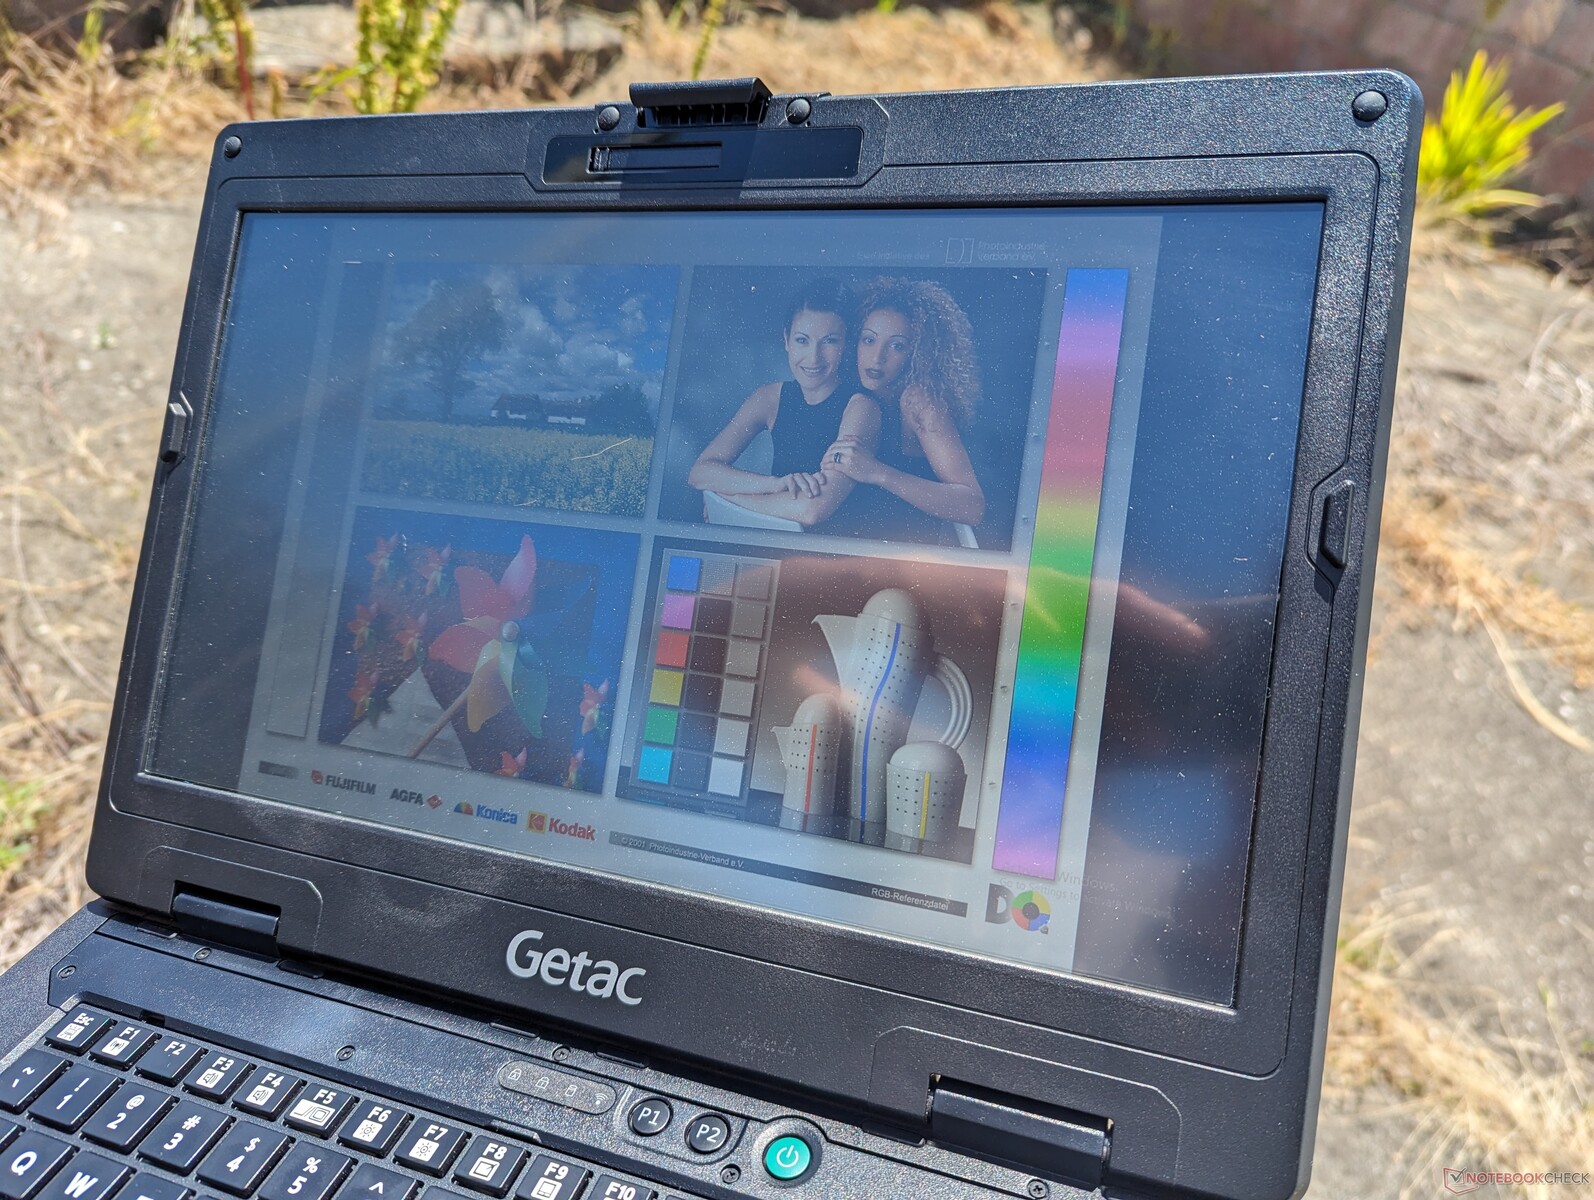
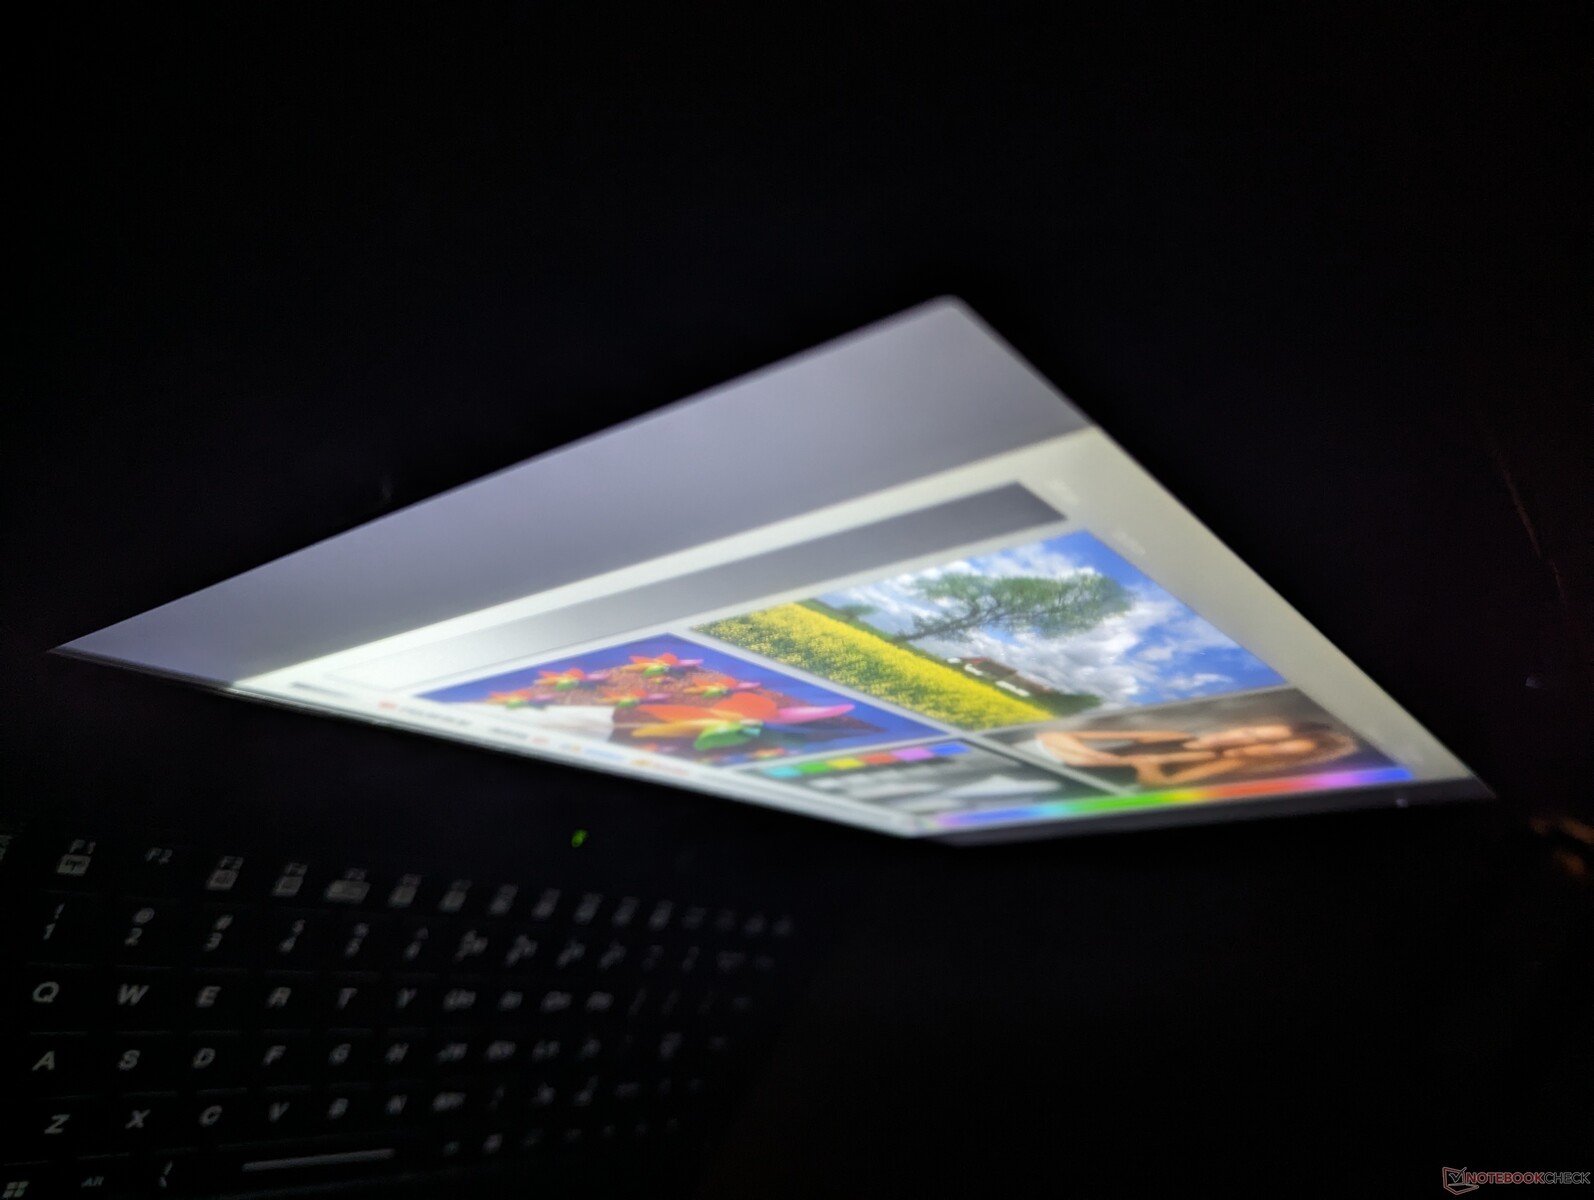
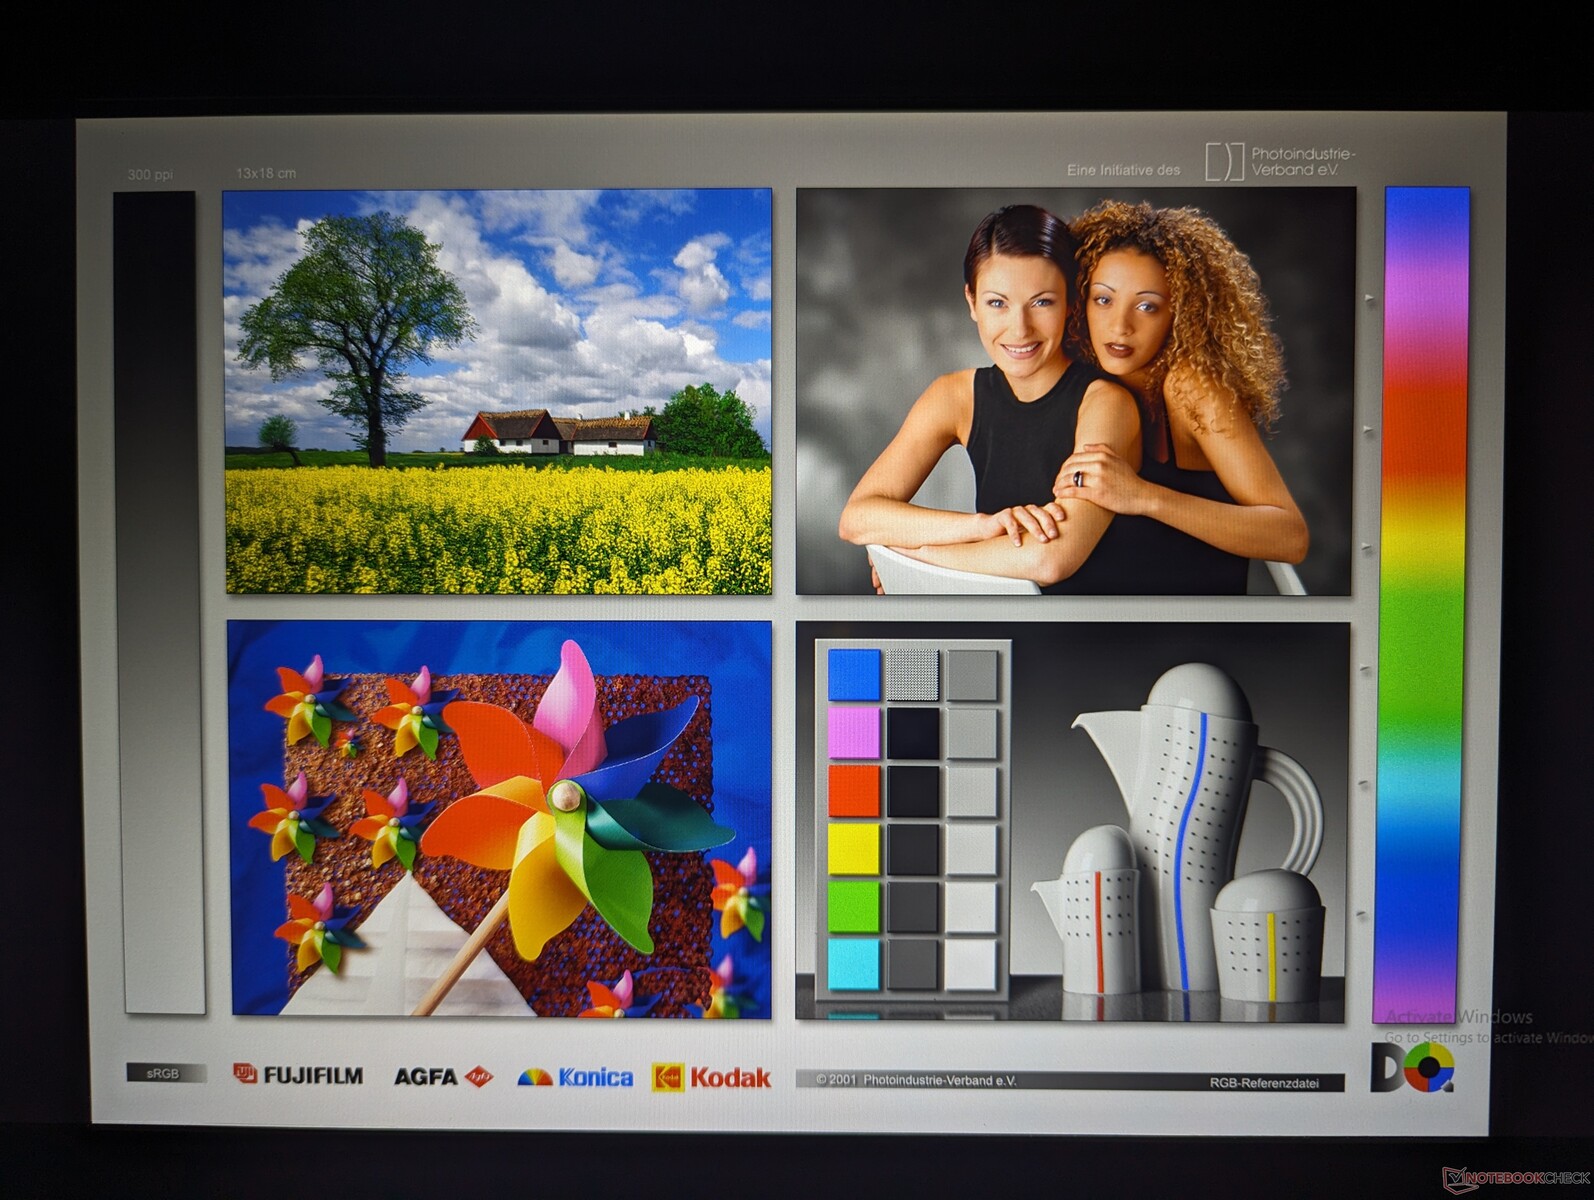
Tela - Tempos de resposta mais rápidos em preto e branco
Nosso S410 G5 é fornecido com um painel da TCL CSOT (SNE001BS1-1), enquanto o S410 G4 seria fornecido com um painel da AU Optronics. O painel da TCL oferece tempos de resposta mais rápidos em preto e branco e cinza para reduzir o efeito fantasma, que era um problema perceptível no S410 G4. Por outro lado, todas as outras características permanecem praticamente as mesmas, inclusive o brilho de 1000 nits, a relação de contraste decente de 1000:1 e as cores sRGB limitadas a <60%.

| |||||||||||||||||||||||||
iluminação: 86 %
iluminação com acumulador: 958.4 cd/m²
Contraste: 998:1 (Preto: 0.96 cd/m²)
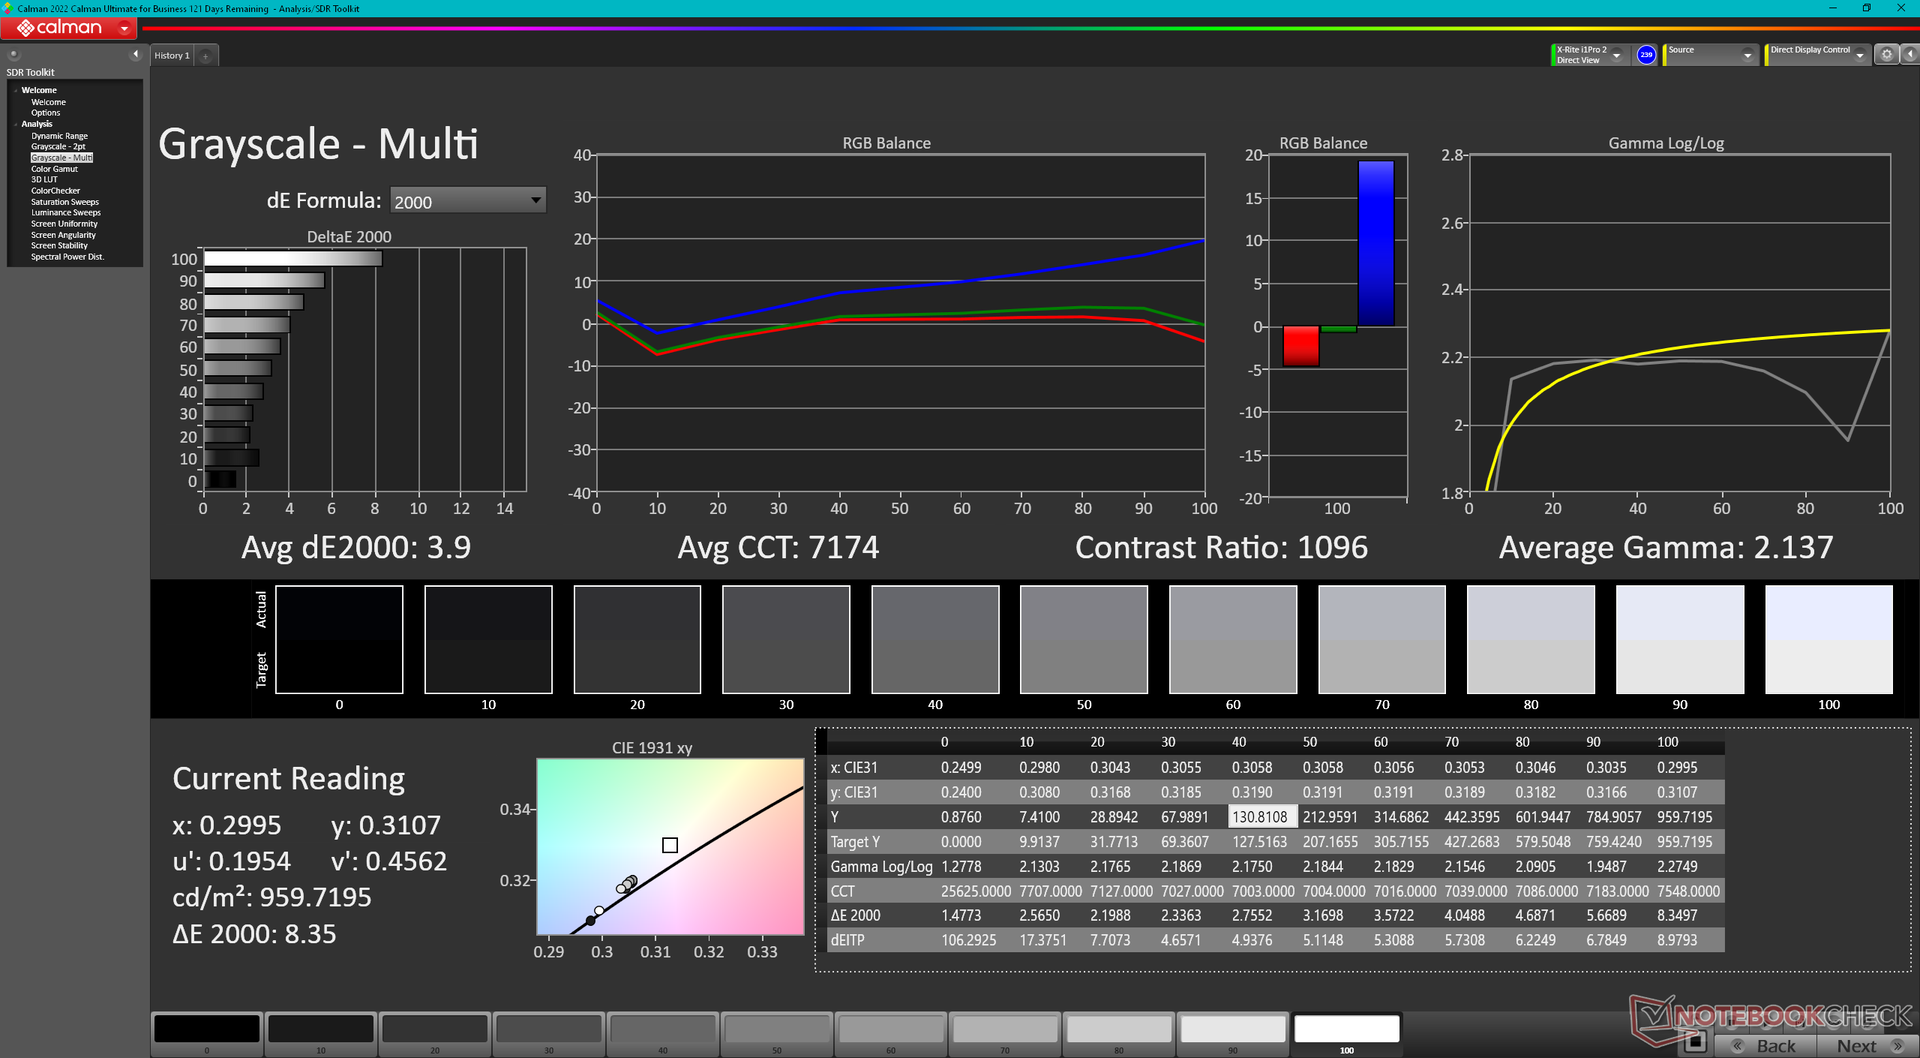
ΔE Color 4.95 | 0.5-29.43 Ø4.87, calibrated: 1.96
ΔE Greyscale 3.9 | 0.5-98 Ø5.1
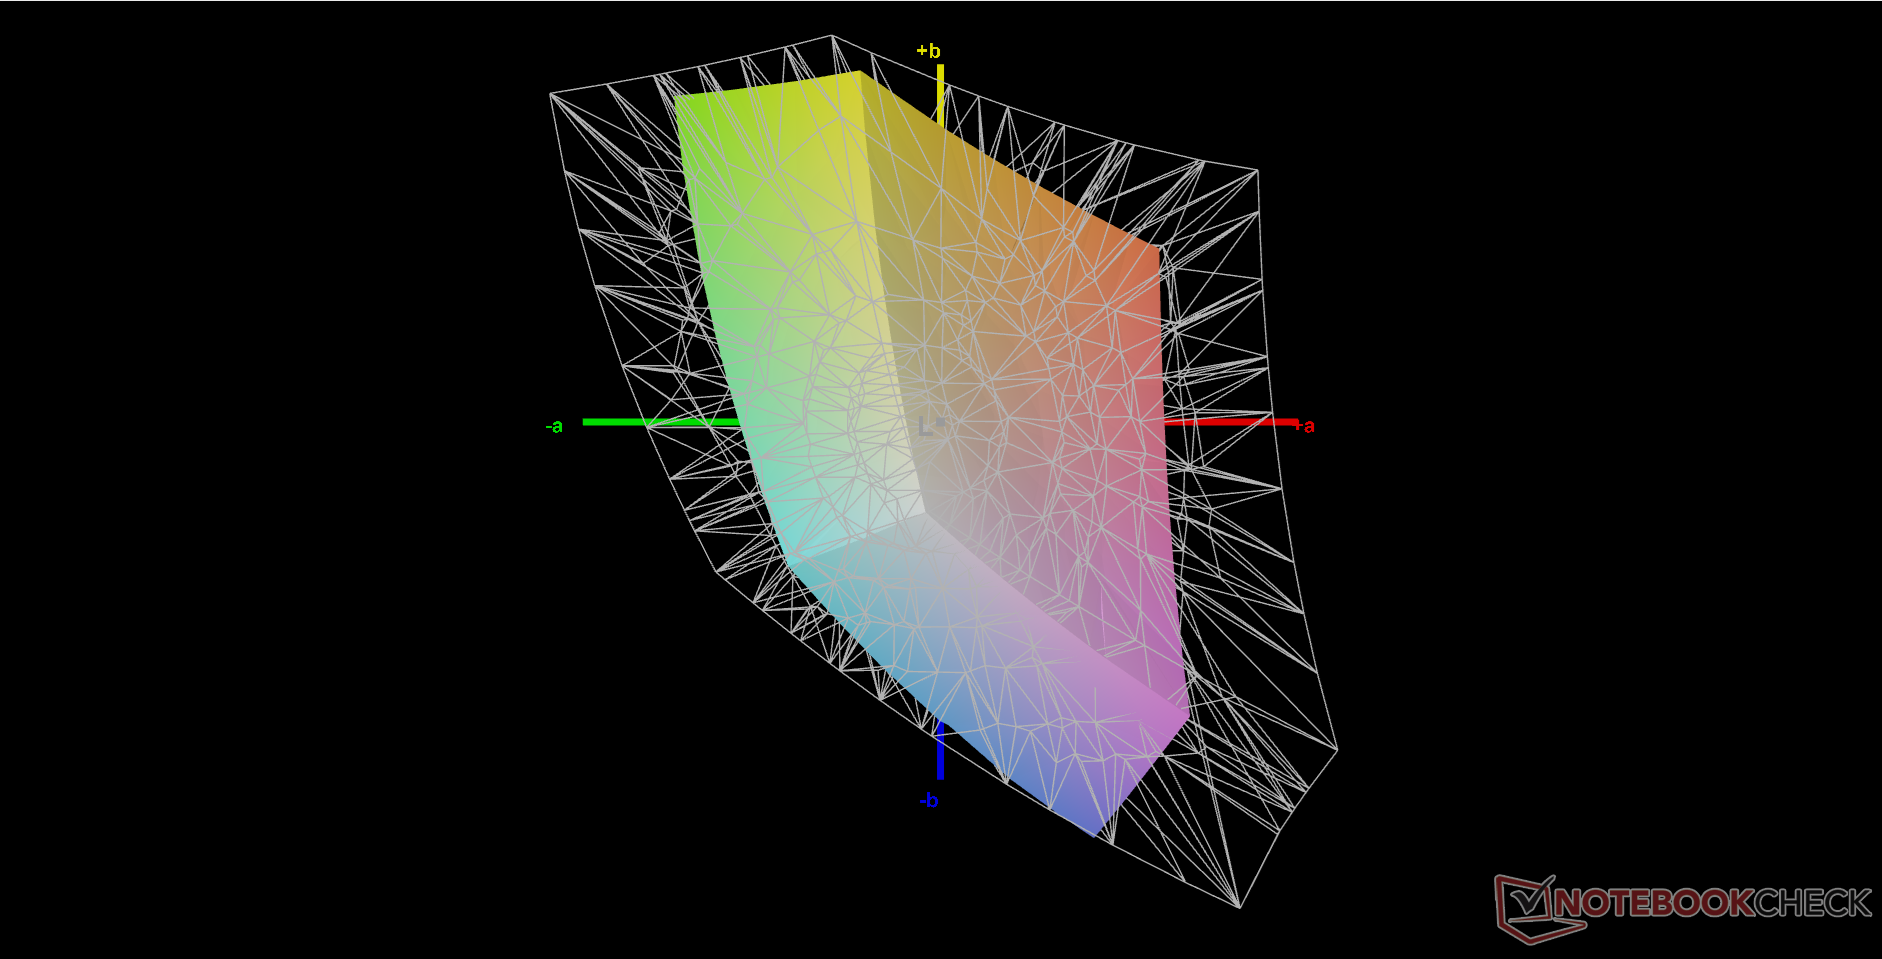
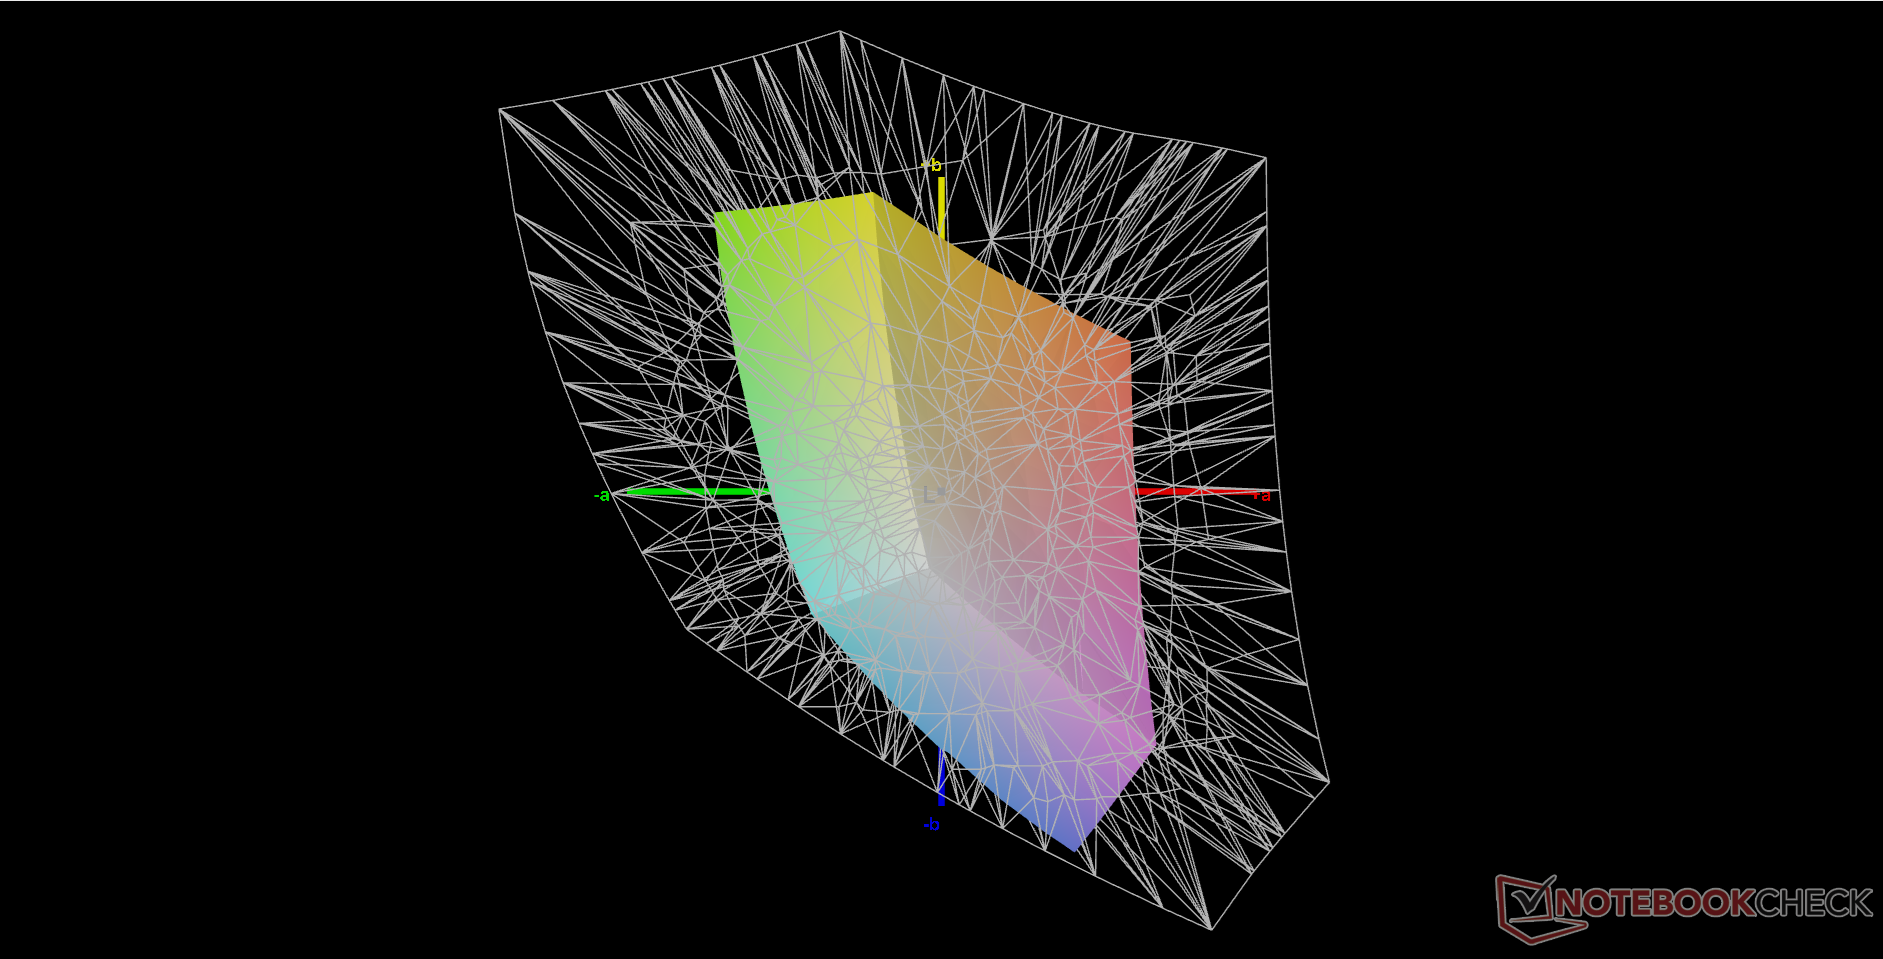
39.8% AdobeRGB 1998 (Argyll 2.2.0 3D)
57.9% sRGB (Argyll 2.2.0 3D)
38.5% Display P3 (Argyll 2.2.0 3D)
Gamma: 2.14
| Getac S410 G5 CSOT T9 SNE001BS1-1, IPS, 1920x1080, 14" | Getac S410 Gen 4 AU Optronics AUO413D, IPS, 1920x1080, 14" | Durabook S14I KD140N0730A01, TN, 1920x1080, 14" | Dell Latitude 14 5420-D2G5W AUO5491 / B140HAN, IPS, 1920x1080, 14" | Dell Latitude 7330 Rugged Extreme Sharp LQ133M1, IPS, 1920x1080, 13.3" | Panasonic Toughbook 40 InfoVision M140NWF5 R3, IPS, 1920x1080, 14" | |
|---|---|---|---|---|---|---|
| Display | -1% | 13% | -7% | 72% | -7% | |
| Display P3 Coverage | 38.5 | 38.3 -1% | 43.55 13% | 36 -6% | 67.1 74% | 35.8 -7% |
| sRGB Coverage | 57.9 | 57.2 -1% | 65.4 13% | 54 -7% | 98.2 70% | 53.8 -7% |
| AdobeRGB 1998 Coverage | 39.8 | 39.5 -1% | 45 13% | 37 -7% | 69 73% | 37 -7% |
| Response Times | -30% | -11% | -41% | -143% | -48% | |
| Response Time Grey 50% / Grey 80% * | 29 ? | 35.2 ? -21% | 30.4 ? -5% | 41 ? -41% | 74.4 ? -157% | 50.4 ? -74% |
| Response Time Black / White * | 18.6 ? | 31.2 ? -68% | 11.8 ? 37% | 26 ? -40% | 42.4 ? -128% | 27.6 ? -48% |
| PWM Frequency | 876 ? | 870 ? -1% | 304.9 ? -65% | 694.4 ? -21% | ||
| Screen | -22% | -73% | -10% | 43% | 13% | |
| Brightness middle | 958.4 | 956.9 0% | 1180.7 23% | 290 -70% | 1414.1 48% | 1284.3 34% |
| Brightness | 978 | 984 1% | 1102 13% | 282 -71% | 1282 31% | 1289 32% |
| Brightness Distribution | 86 | 84 -2% | 89 3% | 81 -6% | 84 -2% | 82 -5% |
| Black Level * | 0.96 | 0.81 16% | 1.91 -99% | 0.26 73% | 0.83 14% | 0.89 7% |
| Contrast | 998 | 1181 18% | 618 -38% | 1115 12% | 1704 71% | 1443 45% |
| Colorchecker dE 2000 * | 4.95 | 6.6 -33% | 13.45 -172% | 4.65 6% | 1.99 60% | 4.67 6% |
| Colorchecker dE 2000 max. * | 16.88 | 22.94 -36% | 22.52 -33% | 7.5 56% | 3.75 78% | 19.85 -18% |
| Colorchecker dE 2000 calibrated * | 1.96 | 4.05 -107% | 3.19 -63% | 3.98 -103% | 0.72 63% | 2.21 -13% |
| Greyscale dE 2000 * | 3.9 | 6 -54% | 15.4 -295% | 3.22 17% | 2.8 28% | 2.7 31% |
| Gamma | 2.14 103% | 2.19 100% | 1.97 112% | 2.54 87% | 2.06 107% | 1.97 112% |
| CCT | 7174 91% | 7276 89% | 21134 31% | 6169 105% | 6775 96% | 6222 104% |
| Color Space (Percent of AdobeRGB 1998) | 41.6 | |||||
| Color Space (Percent of sRGB) | 65.5 | |||||
| Média Total (Programa/Configurações) | -18% /
-19% | -24% /
-44% | -19% /
-13% | -9% /
23% | -14% /
-3% |
* ... menor é melhor
O monitor vem mal calibrado, com valores médios de deltaE superiores a 4 e uma temperatura de cor excessivamente fria. Uma calibração adequada com o nosso colorímetro X-Rite resolve essas preocupações, mas as cores ainda se tornam mais imprecisas em níveis de saturação mais altos, não importa o que aconteça, devido ao espaço de cores limitado mencionado acima. Recomendamos que o senhor aplique nosso perfil ICM calibrado para obter o máximo do monitor.
Exibir tempos de resposta
| ↔ Tempo de resposta preto para branco | ||
|---|---|---|
| 18.6 ms ... ascensão ↗ e queda ↘ combinadas | ↗ 9.4 ms ascensão | 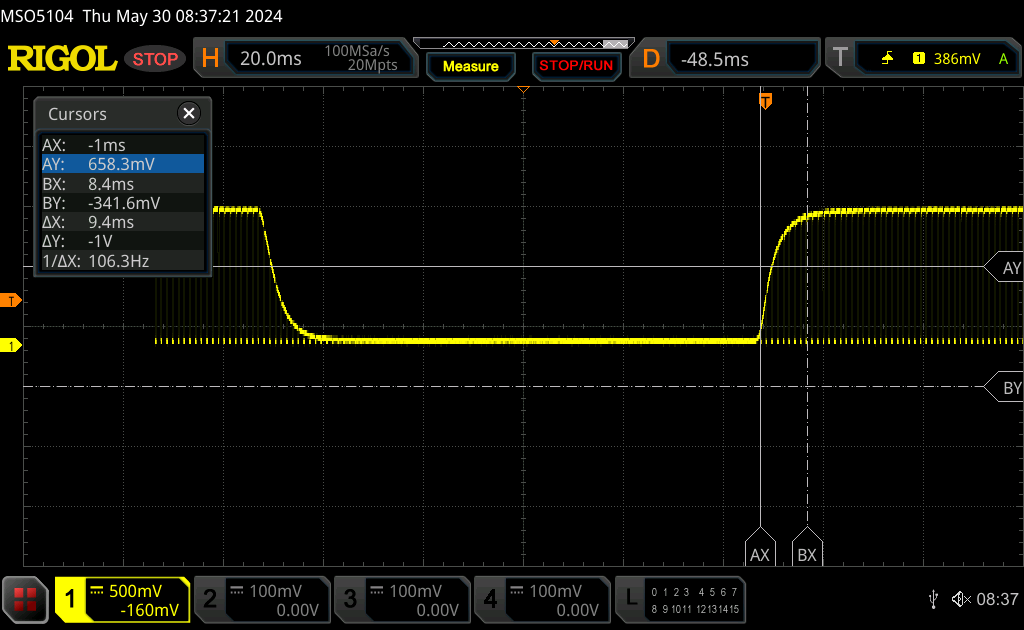 |
| ↘ 9.2 ms queda | ||
| A tela mostra boas taxas de resposta em nossos testes, mas pode ser muito lenta para jogadores competitivos. Em comparação, todos os dispositivos testados variam de 0.1 (mínimo) a 240 (máximo) ms. » 38 % de todos os dispositivos são melhores. Isso significa que o tempo de resposta medido é melhor que a média de todos os dispositivos testados (20.8 ms). | ||
| ↔ Tempo de resposta 50% cinza a 80% cinza | ||
| 29 ms ... ascensão ↗ e queda ↘ combinadas | ↗ 14.6 ms ascensão | 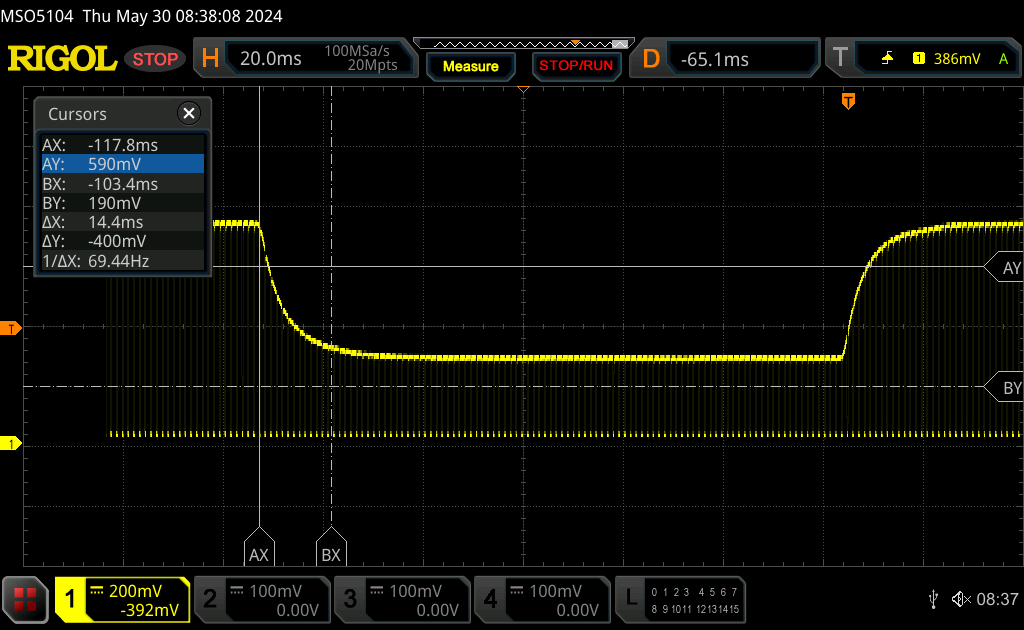 |
| ↘ 14.4 ms queda | ||
| A tela mostra taxas de resposta relativamente lentas em nossos testes e pode ser muito lenta para os jogadores. Em comparação, todos os dispositivos testados variam de 0.165 (mínimo) a 636 (máximo) ms. » 36 % de todos os dispositivos são melhores. Isso significa que o tempo de resposta medido é melhor que a média de todos os dispositivos testados (32.5 ms). | ||
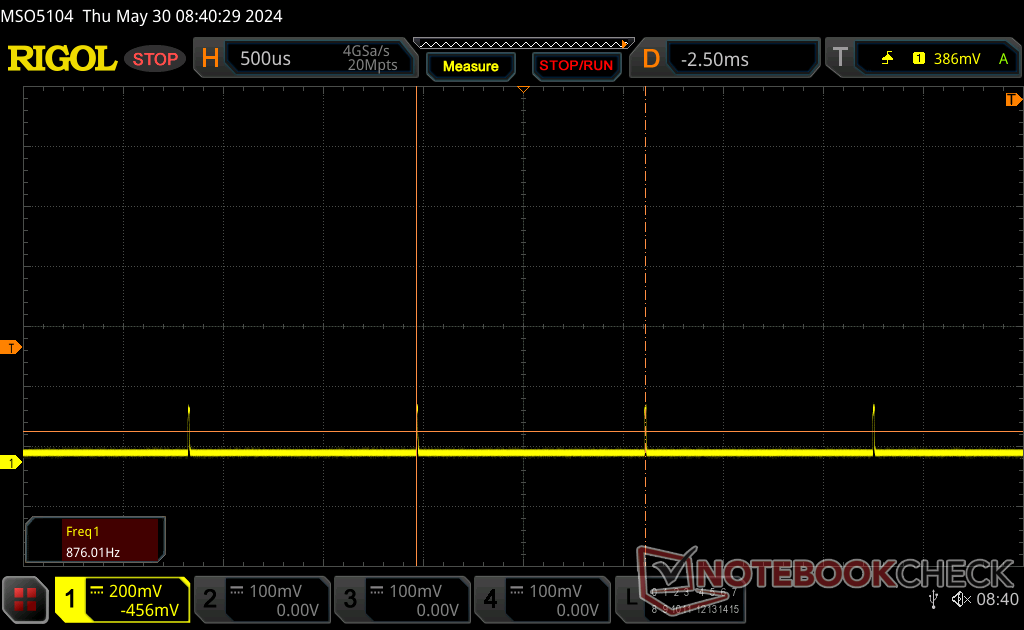
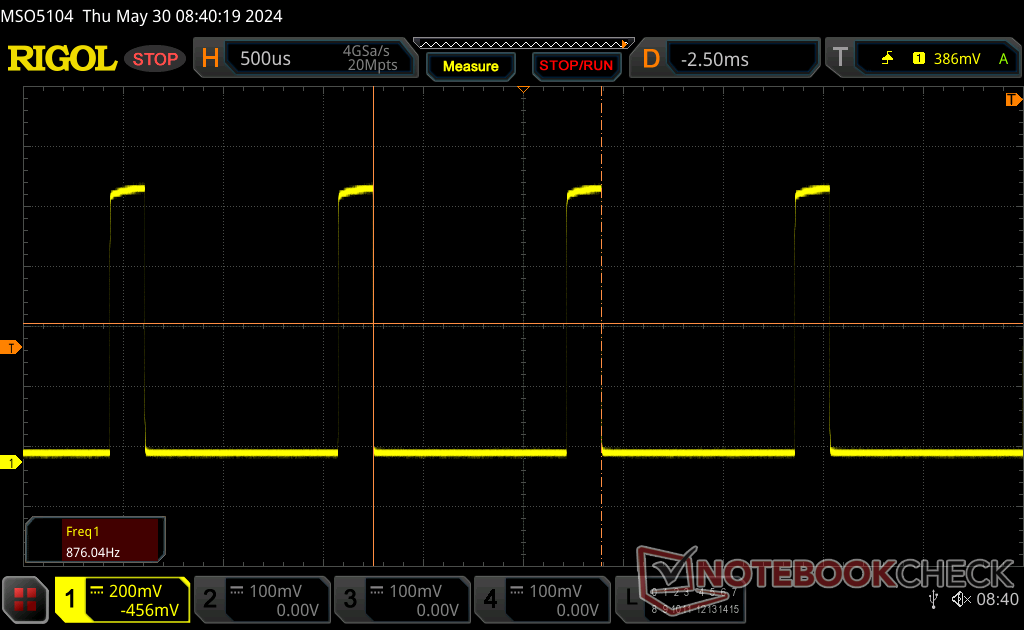
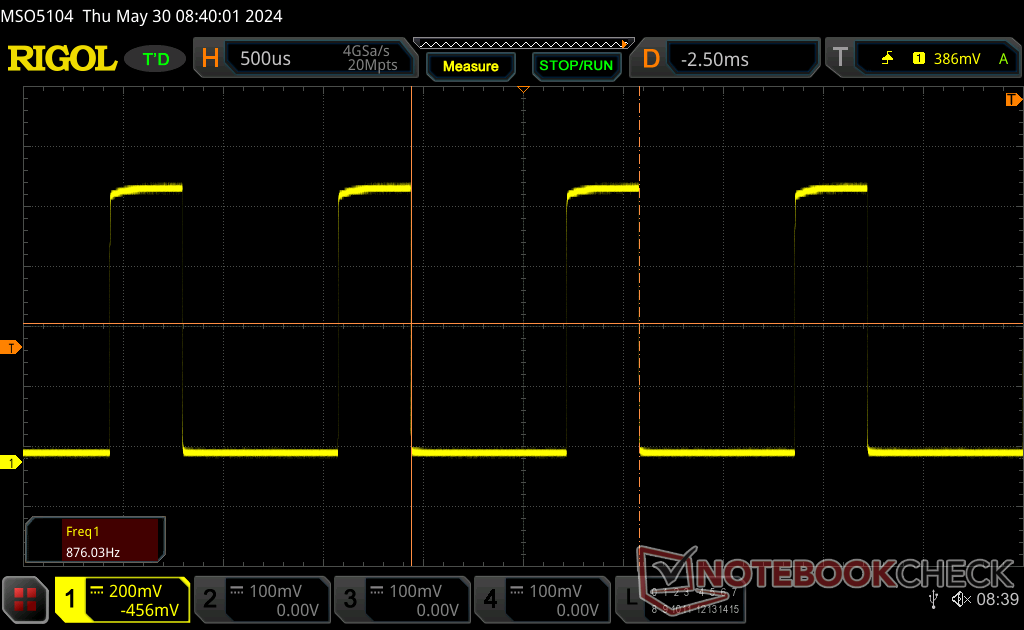
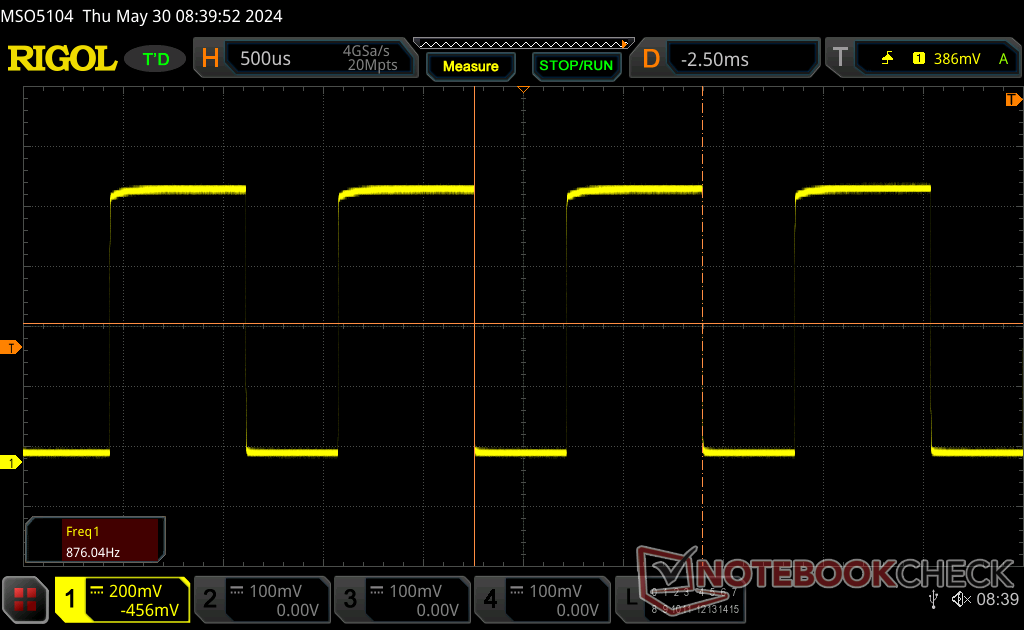
Cintilação da tela / PWM (modulação por largura de pulso)
| Tela tremeluzindo/PWM detectado | 876 Hz | ≤ 100 % configuração de brilho | 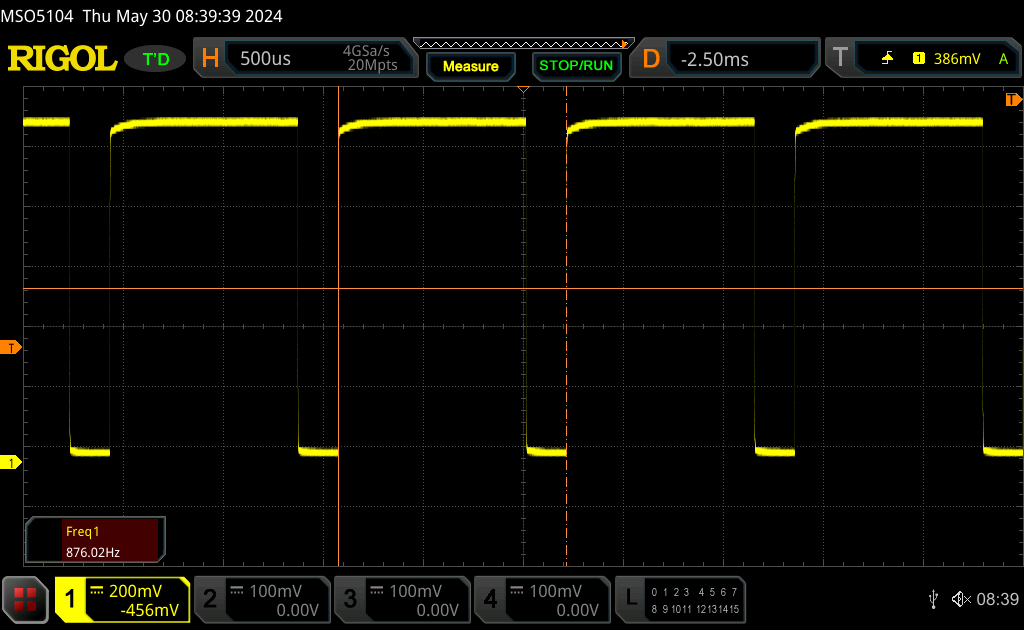 |
A luz de fundo da tela pisca em 876 Hz (pior caso, por exemplo, utilizando PWM) Cintilação detectada em uma configuração de brilho de 100 % e abaixo. Não deve haver cintilação ou PWM acima desta configuração de brilho. A frequência de 876 Hz é bastante alta, então a maioria dos usuários sensíveis ao PWM não deve notar nenhuma oscilação. [pwm_comparison] Em comparação: 53 % de todos os dispositivos testados não usam PWM para escurecer a tela. Se PWM foi detectado, uma média de 8516 (mínimo: 5 - máximo: 343500) Hz foi medida. | |||
A modulação de largura de pulso ou cintilação está presente em todos os níveis de brilho a uma frequência de 876 Hz. Os usuários que são sensíveis à oscilação podem evitar usar a tela por longos períodos ou, pelo menos, reduzir o nível de brilho.
Desempenho - Upgrade do Raptor Lake-P
Condições de teste
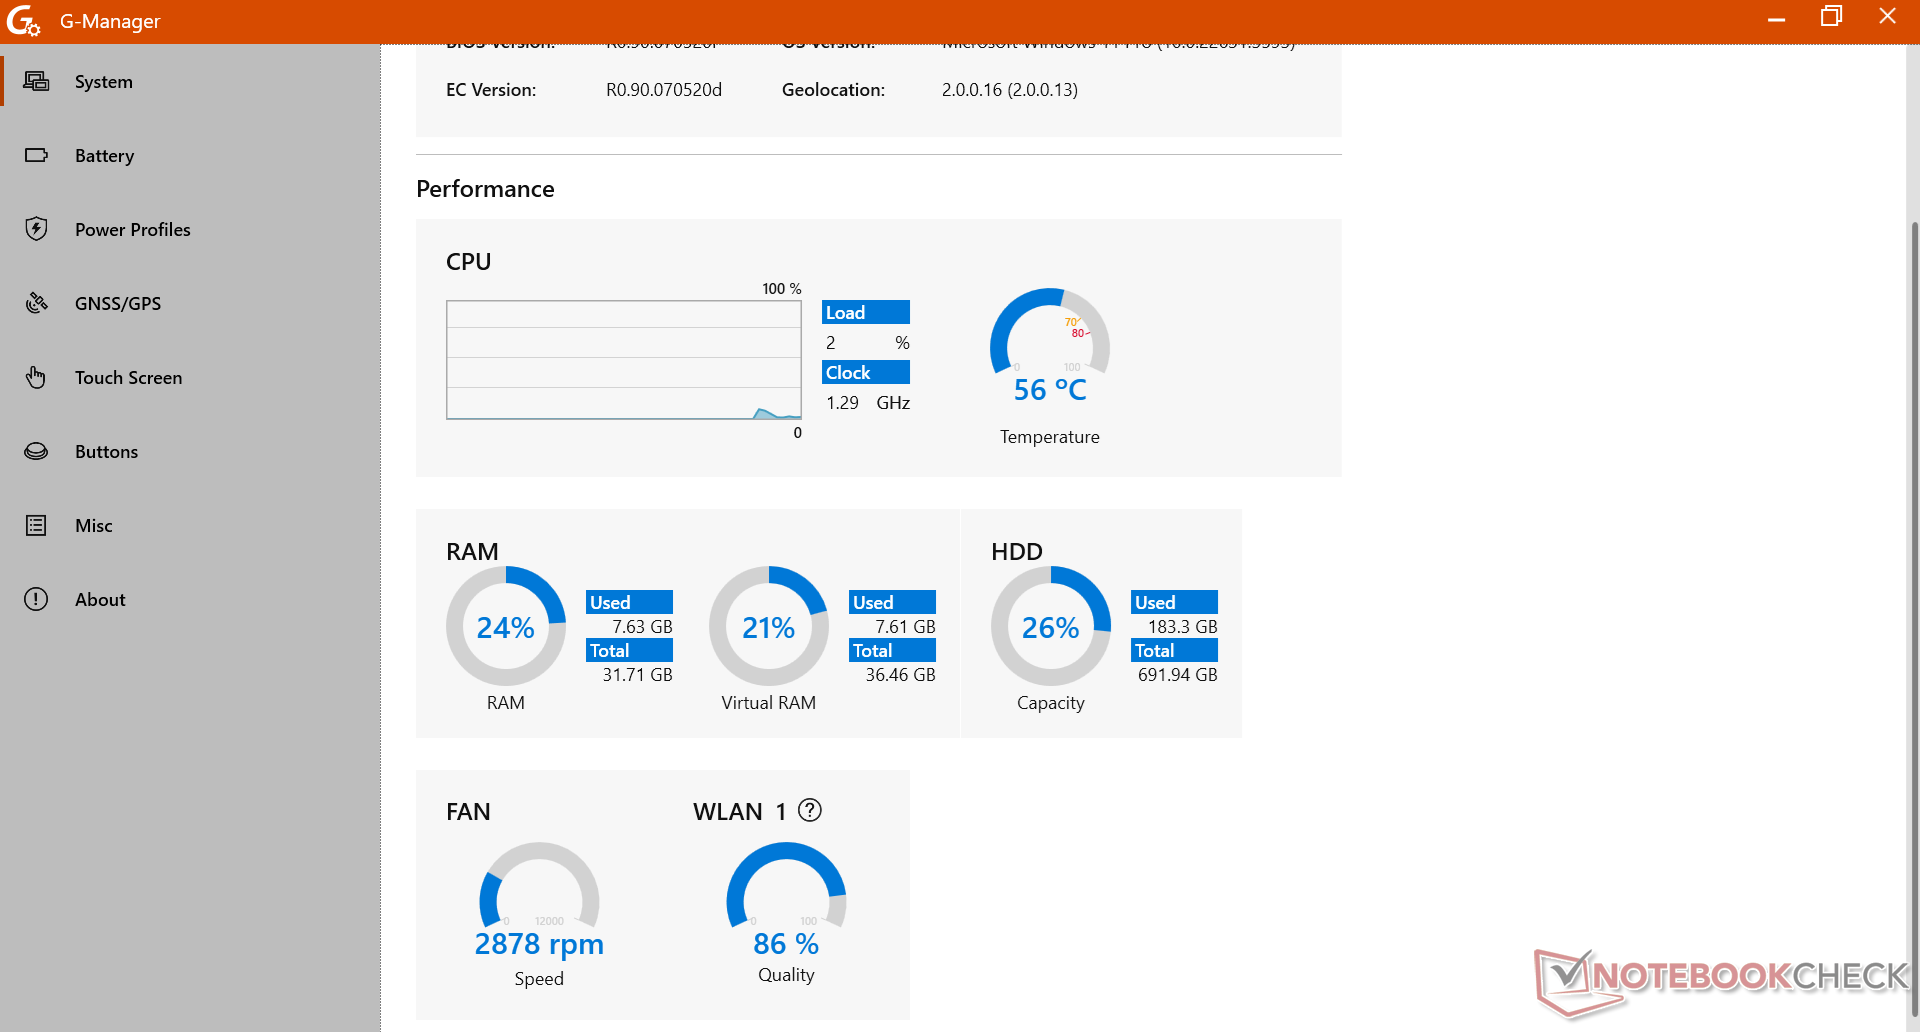
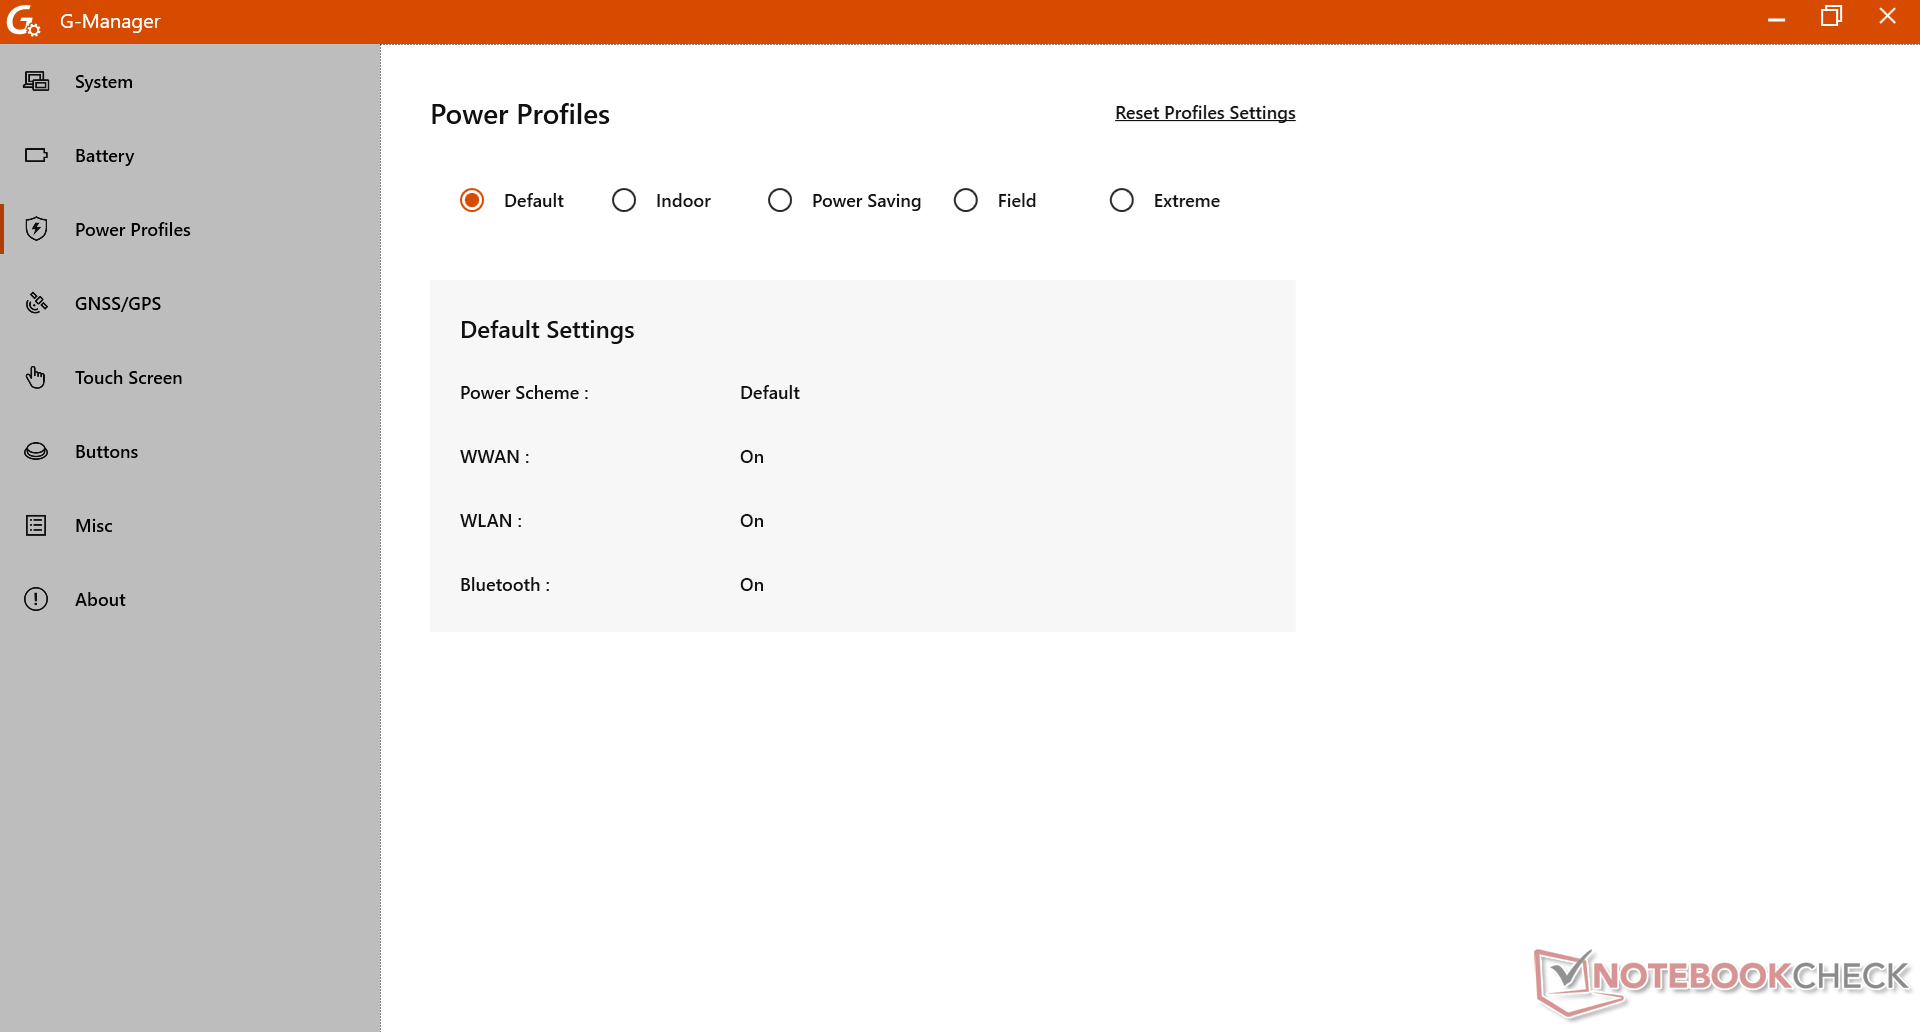
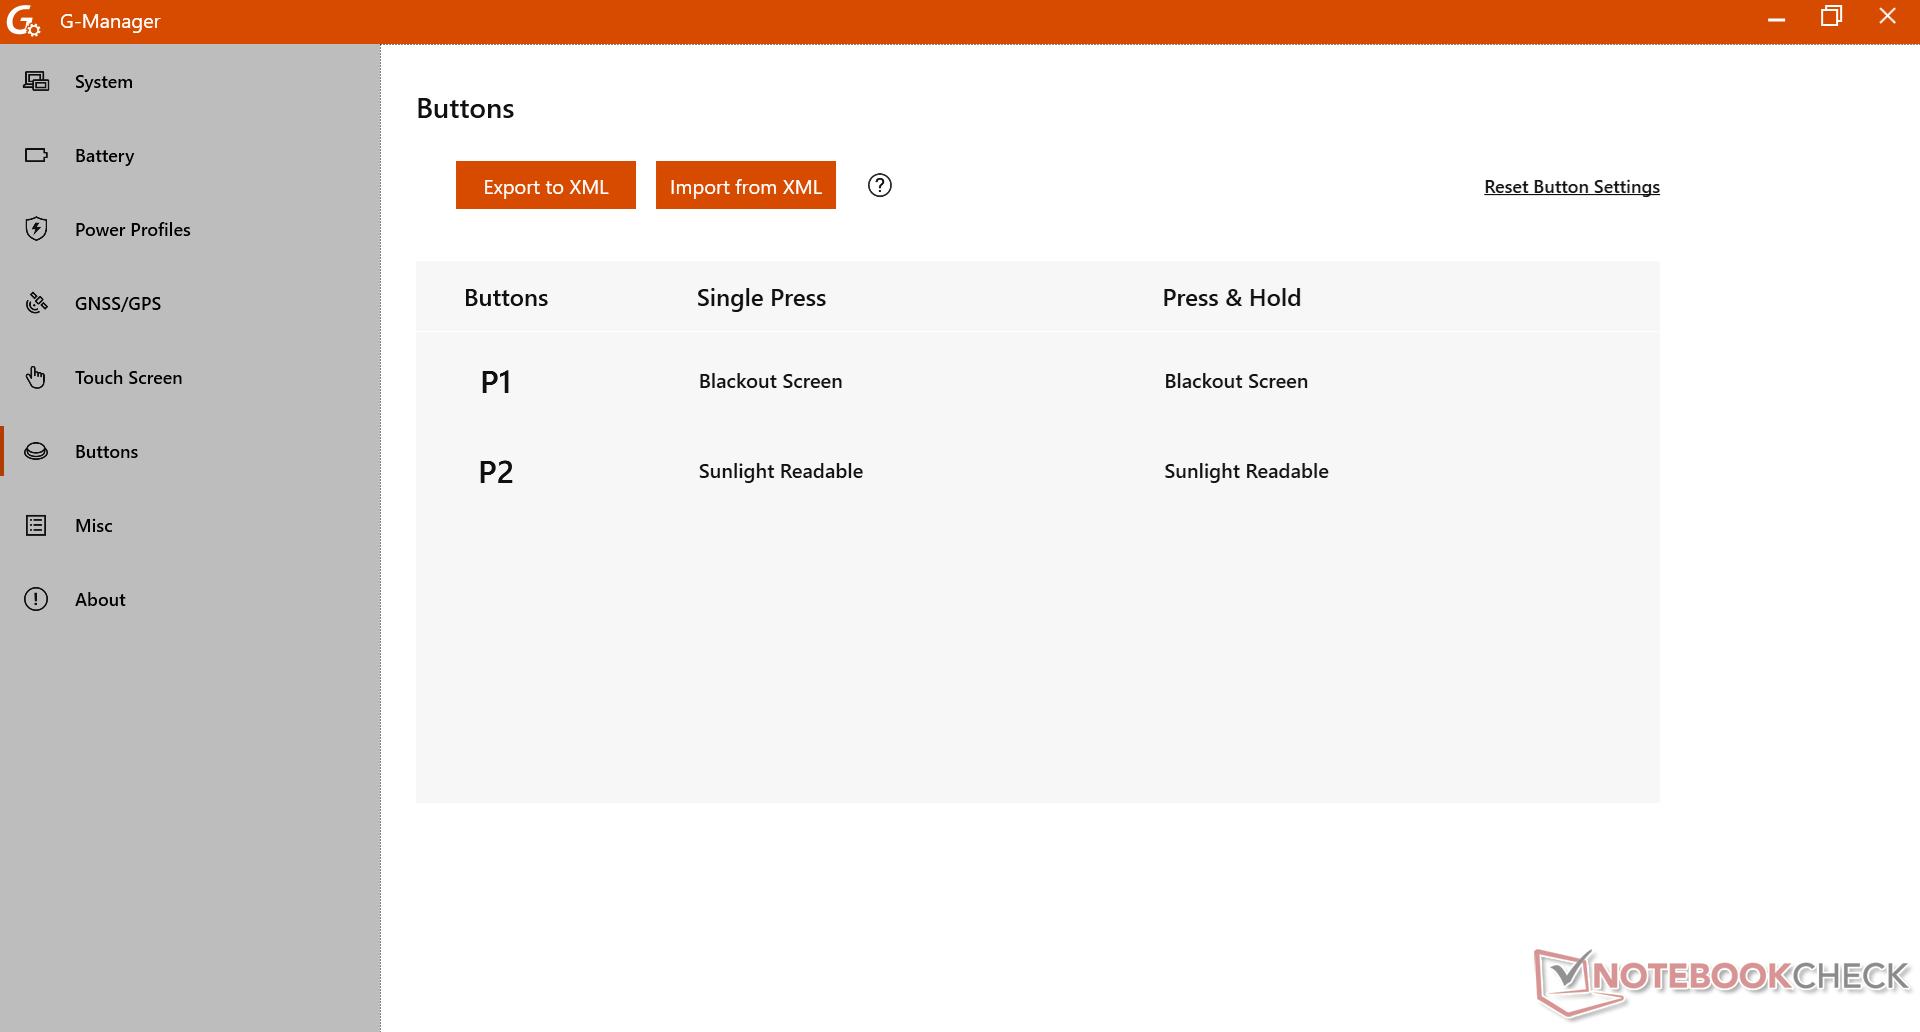
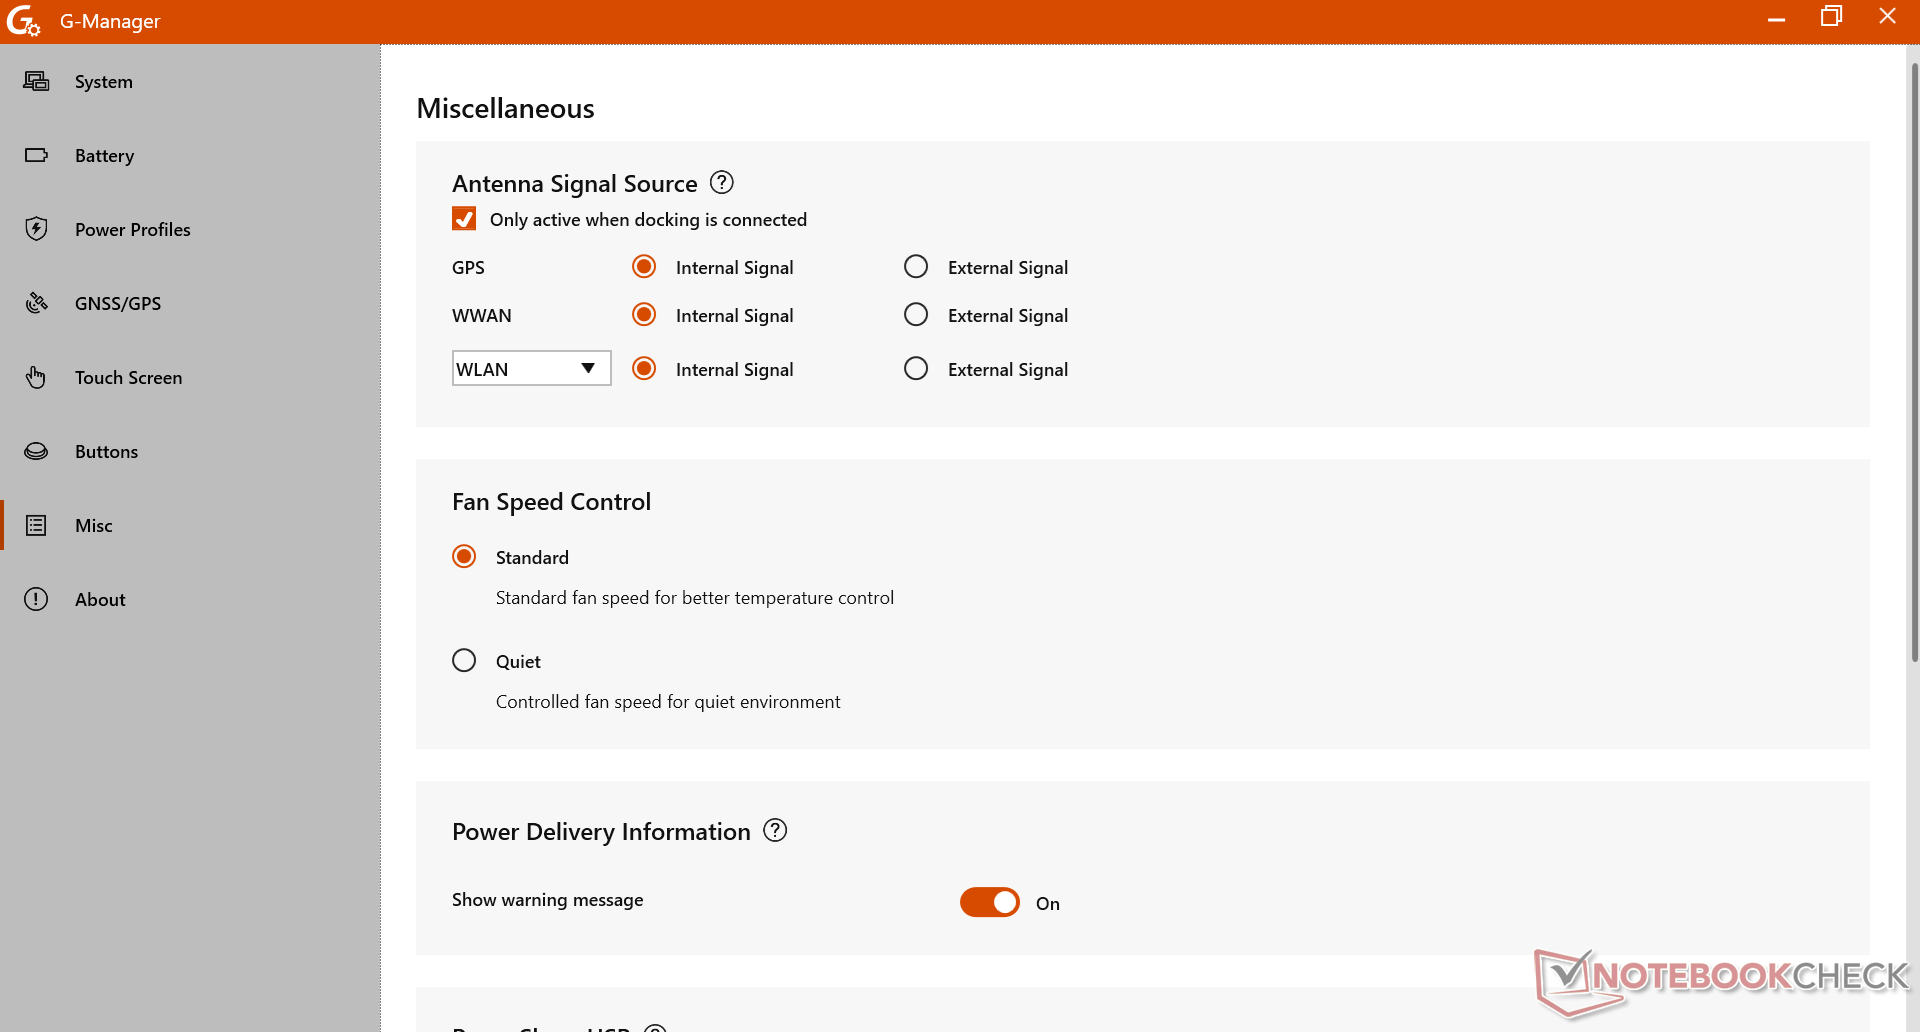
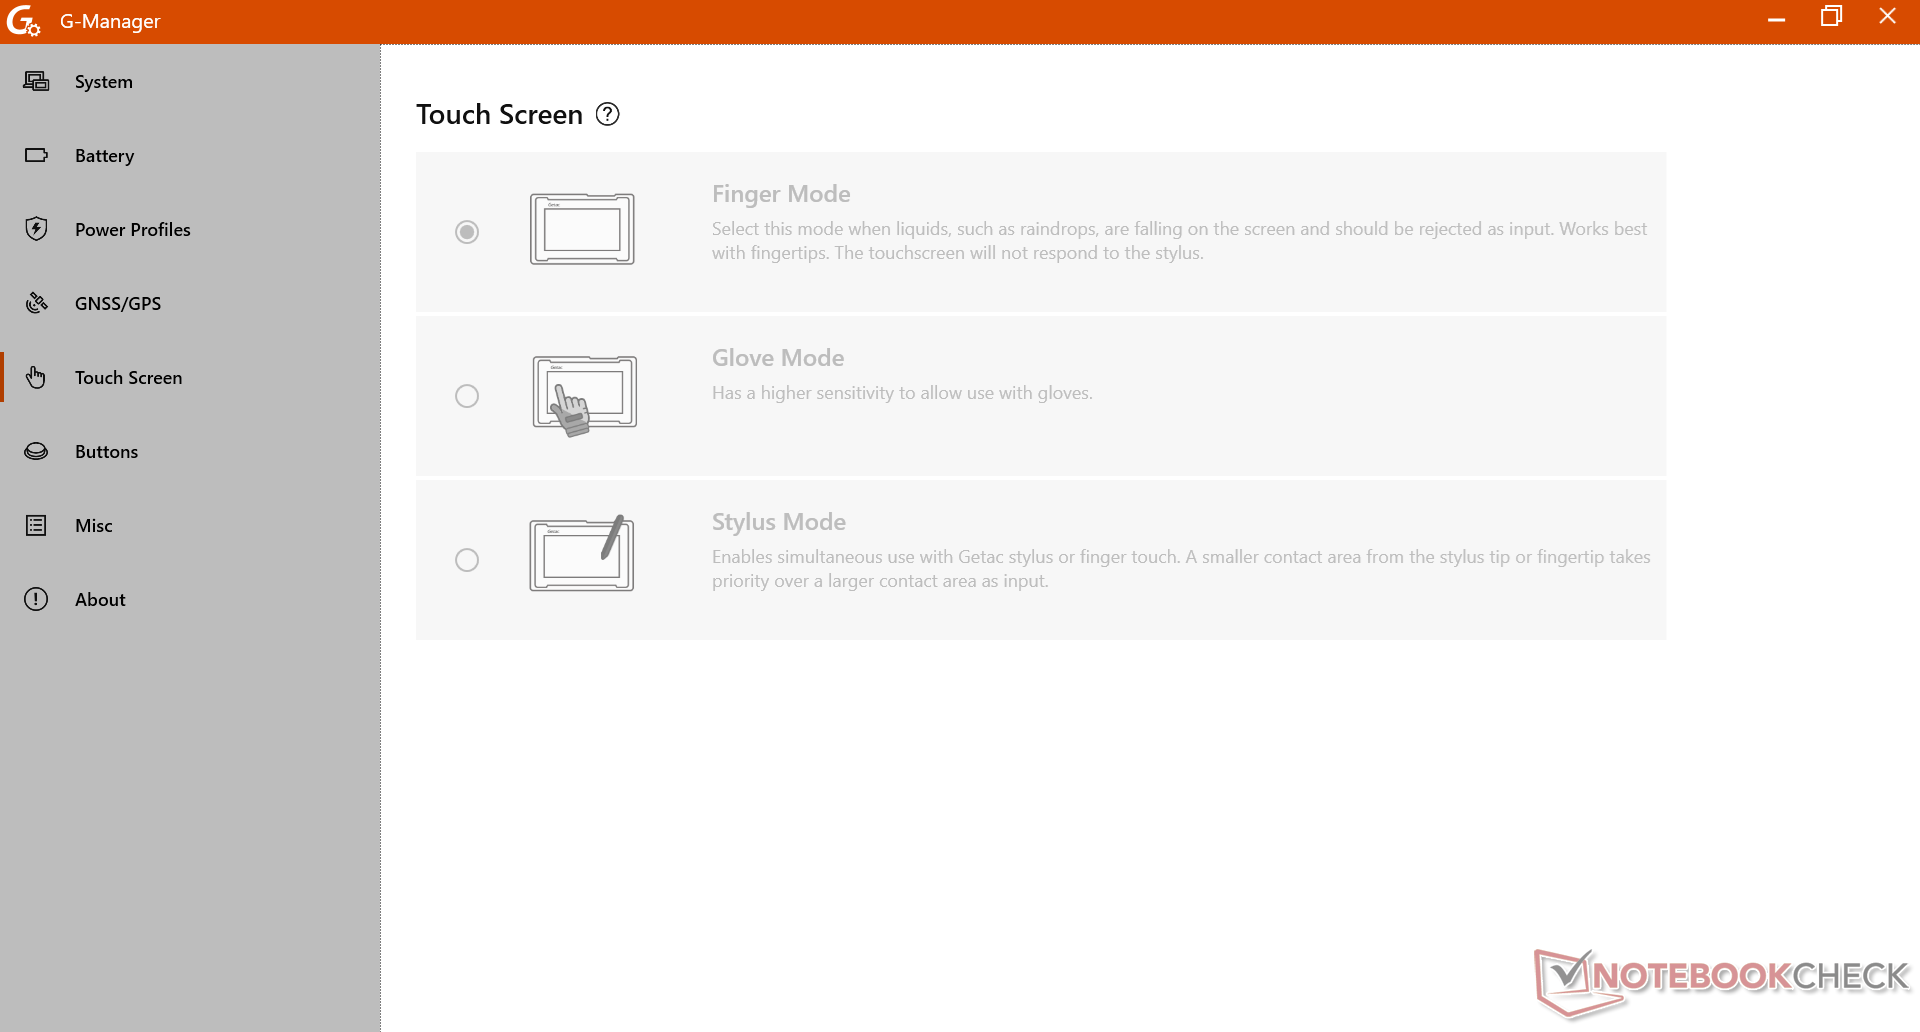
Definimos o Windows para o modo Desempenho e o G-Manager para o modo Desempenho extremo antes de executar os benchmarks abaixo. É recomendável que os usuários se familiarizem com o G-Manager, pois ele é o centro de ajuste de vários recursos exclusivos do S410, inclusive o GPS/GNSS integrado, os botões personalizáveis e a sensibilidade da tela sensível ao toque.
Processador
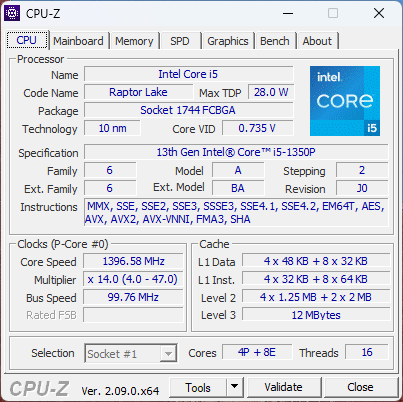
O salto de desempenho do Core i7-1185G7 no antigo S410 G4 para o nosso mais novo Core i5-1350P é significativo, pois a CPU Raptor Lake-P pode ser duas vezes mais rápida do que a Tiger Lake-U quando se trata de cargas de trabalho multithread. No entanto, o Turbo Boost é limitado, conforme demonstrado em nosso gráfico de teste de loop CineBench R15 xT abaixo. Apesar disso, o sistema ainda é muito mais rápido do que antes, mesmo depois de levar em conta a aceleração acentuada.
Cinebench R15 Multi Loop
Cinebench R23: Multi Core | Single Core
Cinebench R20: CPU (Multi Core) | CPU (Single Core)
Cinebench R15: CPU Multi 64Bit | CPU Single 64Bit
Blender: v2.79 BMW27 CPU
7-Zip 18.03: 7z b 4 | 7z b 4 -mmt1
Geekbench 6.4: Multi-Core | Single-Core
Geekbench 5.5: Multi-Core | Single-Core
HWBOT x265 Benchmark v2.2: 4k Preset
LibreOffice : 20 Documents To PDF
R Benchmark 2.5: Overall mean
| CPU Performance Rating | |
| Getac S410 G5 | |
| Média Intel Core i5-1350P | |
| Dell Latitude 7330 Rugged Extreme -2! | |
| Panasonic Toughbook FZ-55 MK2 -4! | |
| Getac S410 Gen 4 -2! | |
| Dell Latitude 14 5420-D2G5W -2! | |
| Panasonic Toughbook 40 -2! | |
| Durabook S14I -2! | |
| Panasonic Toughbook FZ-55 -14! | |
| Getac B360 -3! | |
| Getac S410 -14! | |
| Cinebench R23 / Multi Core | |
| Getac S410 G5 | |
| Média Intel Core i5-1350P (n=1) | |
| Dell Latitude 7330 Rugged Extreme | |
| Dell Latitude 14 5420-D2G5W | |
| Panasonic Toughbook FZ-55 MK2 | |
| Getac S410 Gen 4 | |
| Panasonic Toughbook 40 | |
| Getac B360 | |
| Durabook S14I | |
| Cinebench R23 / Single Core | |
| Getac S410 G5 | |
| Média Intel Core i5-1350P (n=1) | |
| Dell Latitude 7330 Rugged Extreme | |
| Panasonic Toughbook FZ-55 MK2 | |
| Getac S410 Gen 4 | |
| Panasonic Toughbook 40 | |
| Durabook S14I | |
| Dell Latitude 14 5420-D2G5W | |
| Getac B360 | |
| Cinebench R20 / CPU (Multi Core) | |
| Getac S410 G5 | |
| Média Intel Core i5-1350P (n=1) | |
| Dell Latitude 14 5420-D2G5W | |
| Dell Latitude 7330 Rugged Extreme | |
| Panasonic Toughbook FZ-55 MK2 | |
| Getac S410 Gen 4 | |
| Panasonic Toughbook 40 | |
| Getac B360 | |
| Durabook S14I | |
| Cinebench R20 / CPU (Single Core) | |
| Getac S410 G5 | |
| Média Intel Core i5-1350P (n=1) | |
| Dell Latitude 7330 Rugged Extreme | |
| Panasonic Toughbook FZ-55 MK2 | |
| Getac S410 Gen 4 | |
| Durabook S14I | |
| Panasonic Toughbook 40 | |
| Dell Latitude 14 5420-D2G5W | |
| Getac B360 | |
| Cinebench R15 / CPU Multi 64Bit | |
| Getac S410 G5 | |
| Média Intel Core i5-1350P (n=1) | |
| Dell Latitude 14 5420-D2G5W | |
| Dell Latitude 7330 Rugged Extreme | |
| Panasonic Toughbook FZ-55 MK2 | |
| Getac S410 Gen 4 | |
| Panasonic Toughbook 40 | |
| Getac B360 | |
| Durabook S14I | |
| Panasonic Toughbook FZ-55 | |
| Getac S410 | |
| Cinebench R15 / CPU Single 64Bit | |
| Getac S410 G5 | |
| Média Intel Core i5-1350P (n=1) | |
| Dell Latitude 7330 Rugged Extreme | |
| Panasonic Toughbook FZ-55 MK2 | |
| Getac S410 Gen 4 | |
| Durabook S14I | |
| Panasonic Toughbook 40 | |
| Dell Latitude 14 5420-D2G5W | |
| Getac B360 | |
| Panasonic Toughbook FZ-55 | |
| Getac S410 | |
| Blender / v2.79 BMW27 CPU | |
| Durabook S14I | |
| Getac B360 | |
| Panasonic Toughbook 40 | |
| Getac S410 Gen 4 | |
| Panasonic Toughbook FZ-55 MK2 | |
| Dell Latitude 7330 Rugged Extreme | |
| Dell Latitude 14 5420-D2G5W | |
| Getac S410 G5 | |
| Média Intel Core i5-1350P (n=1) | |
| 7-Zip 18.03 / 7z b 4 | |
| Getac S410 G5 | |
| Média Intel Core i5-1350P (n=1) | |
| Dell Latitude 7330 Rugged Extreme | |
| Panasonic Toughbook FZ-55 MK2 | |
| Dell Latitude 14 5420-D2G5W | |
| Getac S410 Gen 4 | |
| Getac B360 | |
| Panasonic Toughbook 40 | |
| Durabook S14I | |
| 7-Zip 18.03 / 7z b 4 -mmt1 | |
| Dell Latitude 7330 Rugged Extreme | |
| Panasonic Toughbook FZ-55 MK2 | |
| Durabook S14I | |
| Getac S410 G5 | |
| Média Intel Core i5-1350P (n=1) | |
| Panasonic Toughbook 40 | |
| Getac S410 Gen 4 | |
| Dell Latitude 14 5420-D2G5W | |
| Getac B360 | |
| Geekbench 6.4 / Multi-Core | |
| Getac S410 G5 | |
| Média Intel Core i5-1350P (n=1) | |
| Geekbench 6.4 / Single-Core | |
| Getac S410 G5 | |
| Média Intel Core i5-1350P (n=1) | |
| Geekbench 5.5 / Multi-Core | |
| Getac S410 G5 | |
| Média Intel Core i5-1350P (n=1) | |
| Dell Latitude 7330 Rugged Extreme | |
| Getac S410 Gen 4 | |
| Panasonic Toughbook 40 | |
| Getac B360 | |
| Durabook S14I | |
| Dell Latitude 14 5420-D2G5W | |
| Geekbench 5.5 / Single-Core | |
| Getac S410 G5 | |
| Média Intel Core i5-1350P (n=1) | |
| Dell Latitude 7330 Rugged Extreme | |
| Durabook S14I | |
| Getac S410 Gen 4 | |
| Panasonic Toughbook 40 | |
| Getac B360 | |
| Dell Latitude 14 5420-D2G5W | |
| HWBOT x265 Benchmark v2.2 / 4k Preset | |
| Getac S410 G5 | |
| Média Intel Core i5-1350P (n=1) | |
| Dell Latitude 7330 Rugged Extreme | |
| Panasonic Toughbook FZ-55 MK2 | |
| Getac S410 Gen 4 | |
| Dell Latitude 14 5420-D2G5W | |
| Panasonic Toughbook 40 | |
| Getac B360 | |
| Durabook S14I | |
| LibreOffice / 20 Documents To PDF | |
| Dell Latitude 14 5420-D2G5W | |
| Panasonic Toughbook 40 | |
| Getac S410 Gen 4 | |
| Dell Latitude 7330 Rugged Extreme | |
| Panasonic Toughbook FZ-55 MK2 | |
| Durabook S14I | |
| Getac S410 G5 | |
| Média Intel Core i5-1350P (n=1) | |
| R Benchmark 2.5 / Overall mean | |
| Getac B360 | |
| Dell Latitude 14 5420-D2G5W | |
| Panasonic Toughbook 40 | |
| Getac S410 Gen 4 | |
| Durabook S14I | |
| Panasonic Toughbook FZ-55 MK2 | |
| Dell Latitude 7330 Rugged Extreme | |
| Getac S410 G5 | |
| Média Intel Core i5-1350P (n=1) | |
* ... menor é melhor
AIDA64: FP32 Ray-Trace | FPU Julia | CPU SHA3 | CPU Queen | FPU SinJulia | FPU Mandel | CPU AES | CPU ZLib | FP64 Ray-Trace | CPU PhotoWorxx
| Performance Rating | |
| Getac S410 G5 | |
| Média Intel Core i5-1350P | |
| Dell Latitude 7330 Rugged Extreme | |
| Dell Latitude 14 5420-D2G5W | |
| Getac S410 Gen 4 | |
| Panasonic Toughbook 40 | |
| Durabook S14I | |
| AIDA64 / FP32 Ray-Trace | |
| Getac S410 G5 | |
| Média Intel Core i5-1350P (n=1) | |
| Dell Latitude 14 5420-D2G5W | |
| Dell Latitude 7330 Rugged Extreme | |
| Getac S410 Gen 4 | |
| Panasonic Toughbook 40 | |
| Durabook S14I | |
| AIDA64 / FPU Julia | |
| Getac S410 G5 | |
| Média Intel Core i5-1350P (n=1) | |
| Dell Latitude 7330 Rugged Extreme | |
| Dell Latitude 14 5420-D2G5W | |
| Getac S410 Gen 4 | |
| Panasonic Toughbook 40 | |
| Durabook S14I | |
| AIDA64 / CPU SHA3 | |
| Dell Latitude 7330 Rugged Extreme | |
| Dell Latitude 14 5420-D2G5W | |
| Getac S410 G5 | |
| Média Intel Core i5-1350P (n=1) | |
| Getac S410 Gen 4 | |
| Panasonic Toughbook 40 | |
| Durabook S14I | |
| AIDA64 / CPU Queen | |
| Getac S410 G5 | |
| Média Intel Core i5-1350P (n=1) | |
| Dell Latitude 7330 Rugged Extreme | |
| Durabook S14I | |
| Getac S410 Gen 4 | |
| Dell Latitude 14 5420-D2G5W | |
| Panasonic Toughbook 40 | |
| AIDA64 / FPU SinJulia | |
| Getac S410 G5 | |
| Média Intel Core i5-1350P (n=1) | |
| Dell Latitude 7330 Rugged Extreme | |
| Dell Latitude 14 5420-D2G5W | |
| Getac S410 Gen 4 | |
| Panasonic Toughbook 40 | |
| Durabook S14I | |
| AIDA64 / FPU Mandel | |
| Getac S410 G5 | |
| Média Intel Core i5-1350P (n=1) | |
| Dell Latitude 7330 Rugged Extreme | |
| Dell Latitude 14 5420-D2G5W | |
| Getac S410 Gen 4 | |
| Panasonic Toughbook 40 | |
| Durabook S14I | |
| AIDA64 / CPU AES | |
| Dell Latitude 7330 Rugged Extreme | |
| Dell Latitude 14 5420-D2G5W | |
| Durabook S14I | |
| Getac S410 G5 | |
| Média Intel Core i5-1350P (n=1) | |
| Getac S410 Gen 4 | |
| Panasonic Toughbook 40 | |
| AIDA64 / CPU ZLib | |
| Getac S410 G5 | |
| Média Intel Core i5-1350P (n=1) | |
| Dell Latitude 7330 Rugged Extreme | |
| Dell Latitude 14 5420-D2G5W | |
| Panasonic Toughbook 40 | |
| Getac S410 Gen 4 | |
| Durabook S14I | |
| AIDA64 / FP64 Ray-Trace | |
| Getac S410 G5 | |
| Média Intel Core i5-1350P (n=1) | |
| Dell Latitude 7330 Rugged Extreme | |
| Dell Latitude 14 5420-D2G5W | |
| Getac S410 Gen 4 | |
| Panasonic Toughbook 40 | |
| Durabook S14I | |
| AIDA64 / CPU PhotoWorxx | |
| Dell Latitude 7330 Rugged Extreme | |
| Getac S410 G5 | |
| Média Intel Core i5-1350P (n=1) | |
| Getac S410 Gen 4 | |
| Panasonic Toughbook 40 | |
| Durabook S14I | |
| Dell Latitude 14 5420-D2G5W | |
Desempenho do sistema
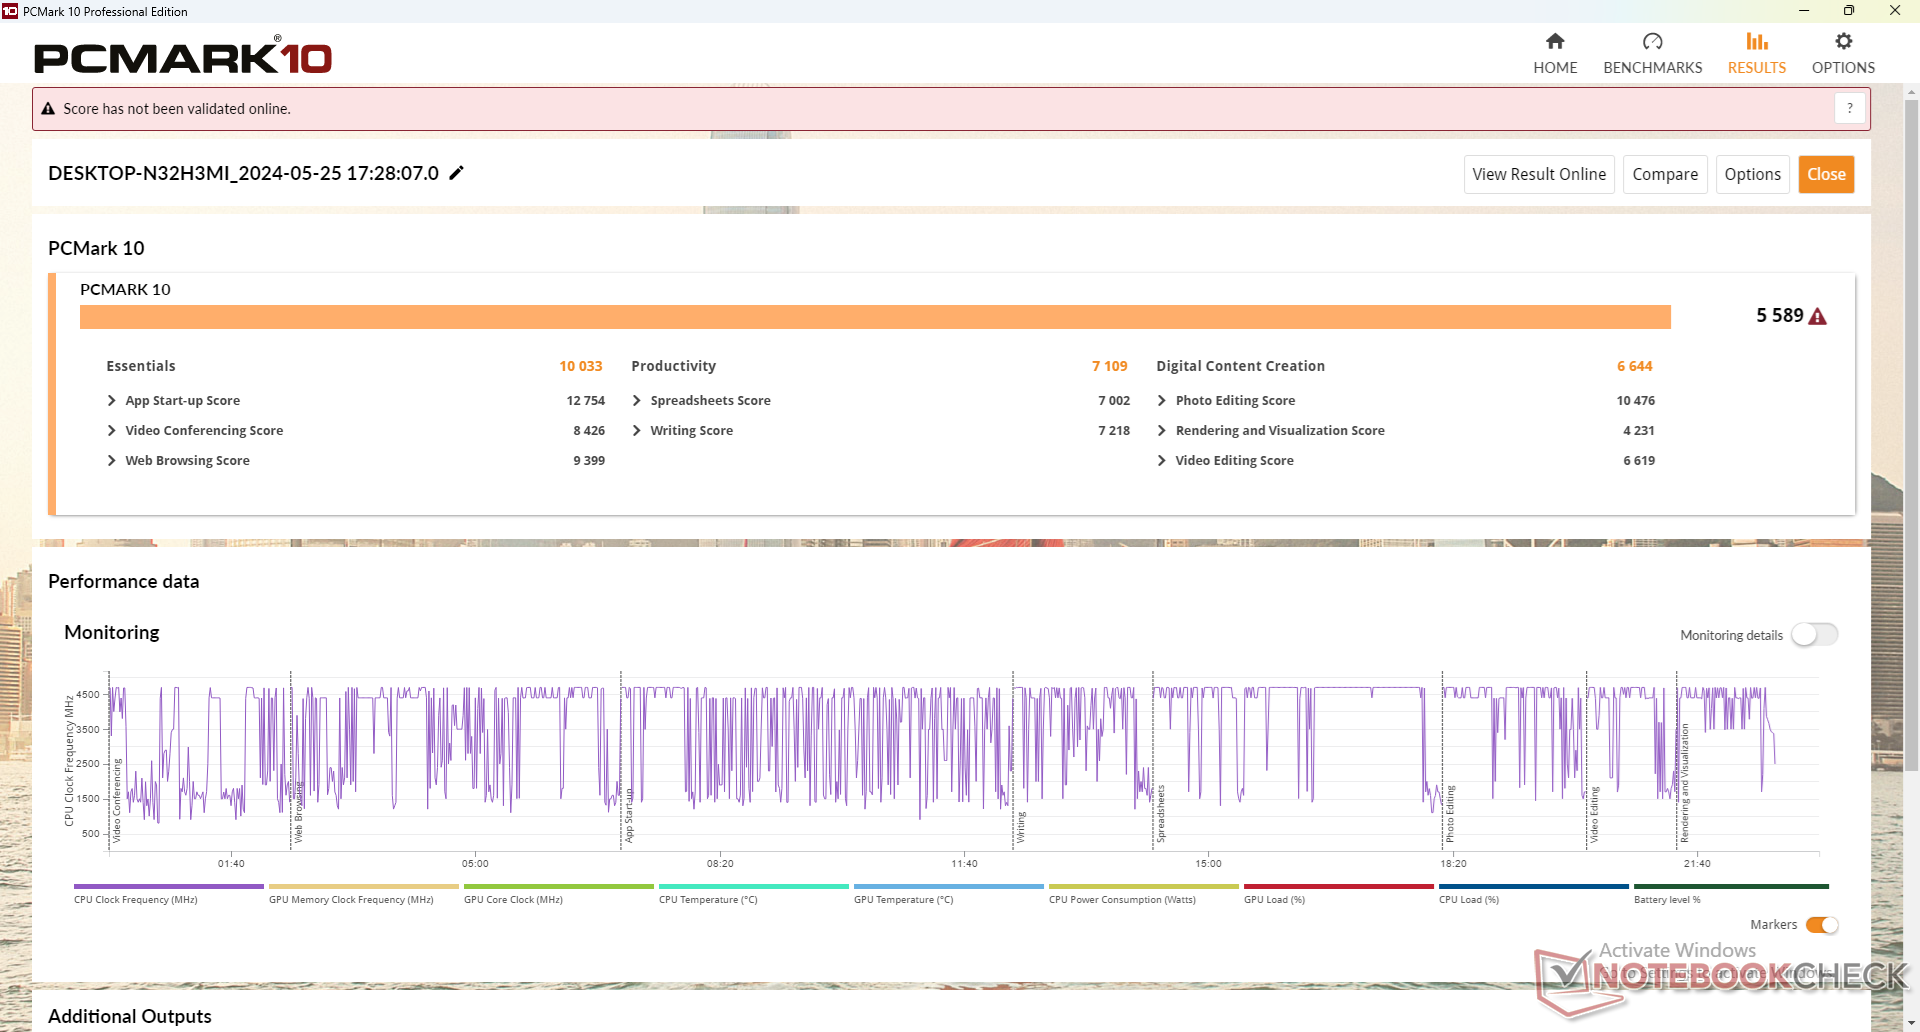
Os resultados do PCMark são consistentemente mais altos do que os do modelo do ano passado para refletir o desempenho geral mais rápido com o processador mais novo.
CrossMark: Overall | Productivity | Creativity | Responsiveness
WebXPRT 3: Overall
WebXPRT 4: Overall
Mozilla Kraken 1.1: Total
| PCMark 10 / Score | |
| Getac S410 G5 | |
| Média Intel Core i5-1350P, Intel Iris Xe Graphics G7 80EUs (n=1) | |
| Dell Latitude 7330 Rugged Extreme | |
| Panasonic Toughbook 40 | |
| Durabook S14I | |
| Getac S410 Gen 4 | |
| Dell Latitude 14 5420-D2G5W | |
| PCMark 10 / Essentials | |
| Dell Latitude 7330 Rugged Extreme | |
| Durabook S14I | |
| Getac S410 G5 | |
| Média Intel Core i5-1350P, Intel Iris Xe Graphics G7 80EUs (n=1) | |
| Getac S410 Gen 4 | |
| Panasonic Toughbook 40 | |
| Dell Latitude 14 5420-D2G5W | |
| PCMark 10 / Productivity | |
| Getac S410 G5 | |
| Média Intel Core i5-1350P, Intel Iris Xe Graphics G7 80EUs (n=1) | |
| Durabook S14I | |
| Dell Latitude 7330 Rugged Extreme | |
| Panasonic Toughbook 40 | |
| Dell Latitude 14 5420-D2G5W | |
| Getac S410 Gen 4 | |
| PCMark 10 / Digital Content Creation | |
| Getac S410 G5 | |
| Média Intel Core i5-1350P, Intel Iris Xe Graphics G7 80EUs (n=1) | |
| Dell Latitude 7330 Rugged Extreme | |
| Panasonic Toughbook 40 | |
| Getac S410 Gen 4 | |
| Dell Latitude 14 5420-D2G5W | |
| Durabook S14I | |
| CrossMark / Overall | |
| Getac S410 G5 | |
| Média Intel Core i5-1350P, Intel Iris Xe Graphics G7 80EUs (n=1) | |
| Panasonic Toughbook 40 | |
| Getac S410 Gen 4 | |
| Dell Latitude 14 5420-D2G5W | |
| CrossMark / Productivity | |
| Getac S410 G5 | |
| Média Intel Core i5-1350P, Intel Iris Xe Graphics G7 80EUs (n=1) | |
| Panasonic Toughbook 40 | |
| Getac S410 Gen 4 | |
| Dell Latitude 14 5420-D2G5W | |
| CrossMark / Creativity | |
| Getac S410 G5 | |
| Média Intel Core i5-1350P, Intel Iris Xe Graphics G7 80EUs (n=1) | |
| Panasonic Toughbook 40 | |
| Getac S410 Gen 4 | |
| Dell Latitude 14 5420-D2G5W | |
| CrossMark / Responsiveness | |
| Getac S410 G5 | |
| Média Intel Core i5-1350P, Intel Iris Xe Graphics G7 80EUs (n=1) | |
| Panasonic Toughbook 40 | |
| Dell Latitude 14 5420-D2G5W | |
| Getac S410 Gen 4 | |
| WebXPRT 3 / Overall | |
| Getac S410 G5 | |
| Média Intel Core i5-1350P, Intel Iris Xe Graphics G7 80EUs (n=1) | |
| Dell Latitude 7330 Rugged Extreme | |
| Durabook S14I | |
| Getac S410 Gen 4 | |
| Panasonic Toughbook 40 | |
| Dell Latitude 14 5420-D2G5W | |
| WebXPRT 4 / Overall | |
| Getac S410 G5 | |
| Média Intel Core i5-1350P, Intel Iris Xe Graphics G7 80EUs (n=1) | |
| Mozilla Kraken 1.1 / Total | |
| Dell Latitude 14 5420-D2G5W | |
| Dell Latitude 7330 Rugged Extreme | |
| Panasonic Toughbook 40 | |
| Durabook S14I | |
| Getac S410 G5 | |
| Média Intel Core i5-1350P, Intel Iris Xe Graphics G7 80EUs (n=1) | |
* ... menor é melhor
| PCMark 10 Score | 5589 pontos | |
Ajuda | ||
| AIDA64 / Memory Copy | |
| Dell Latitude 7330 Rugged Extreme | |
| Getac S410 G5 | |
| Média Intel Core i5-1350P (n=1) | |
| Getac S410 Gen 4 | |
| Panasonic Toughbook 40 | |
| Durabook S14I | |
| Dell Latitude 14 5420-D2G5W | |
| AIDA64 / Memory Read | |
| Dell Latitude 7330 Rugged Extreme | |
| Getac S410 G5 | |
| Média Intel Core i5-1350P (n=1) | |
| Getac S410 Gen 4 | |
| Panasonic Toughbook 40 | |
| Durabook S14I | |
| Dell Latitude 14 5420-D2G5W | |
| AIDA64 / Memory Write | |
| Dell Latitude 7330 Rugged Extreme | |
| Getac S410 G5 | |
| Média Intel Core i5-1350P (n=1) | |
| Getac S410 Gen 4 | |
| Panasonic Toughbook 40 | |
| Durabook S14I | |
| Dell Latitude 14 5420-D2G5W | |
| AIDA64 / Memory Latency | |
| Getac S410 G5 | |
| Média Intel Core i5-1350P (n=1) | |
| Panasonic Toughbook 40 | |
| Dell Latitude 7330 Rugged Extreme | |
| Getac S410 Gen 4 | |
| Durabook S14I | |
| Dell Latitude 14 5420-D2G5W | |
* ... menor é melhor
Latência DPC
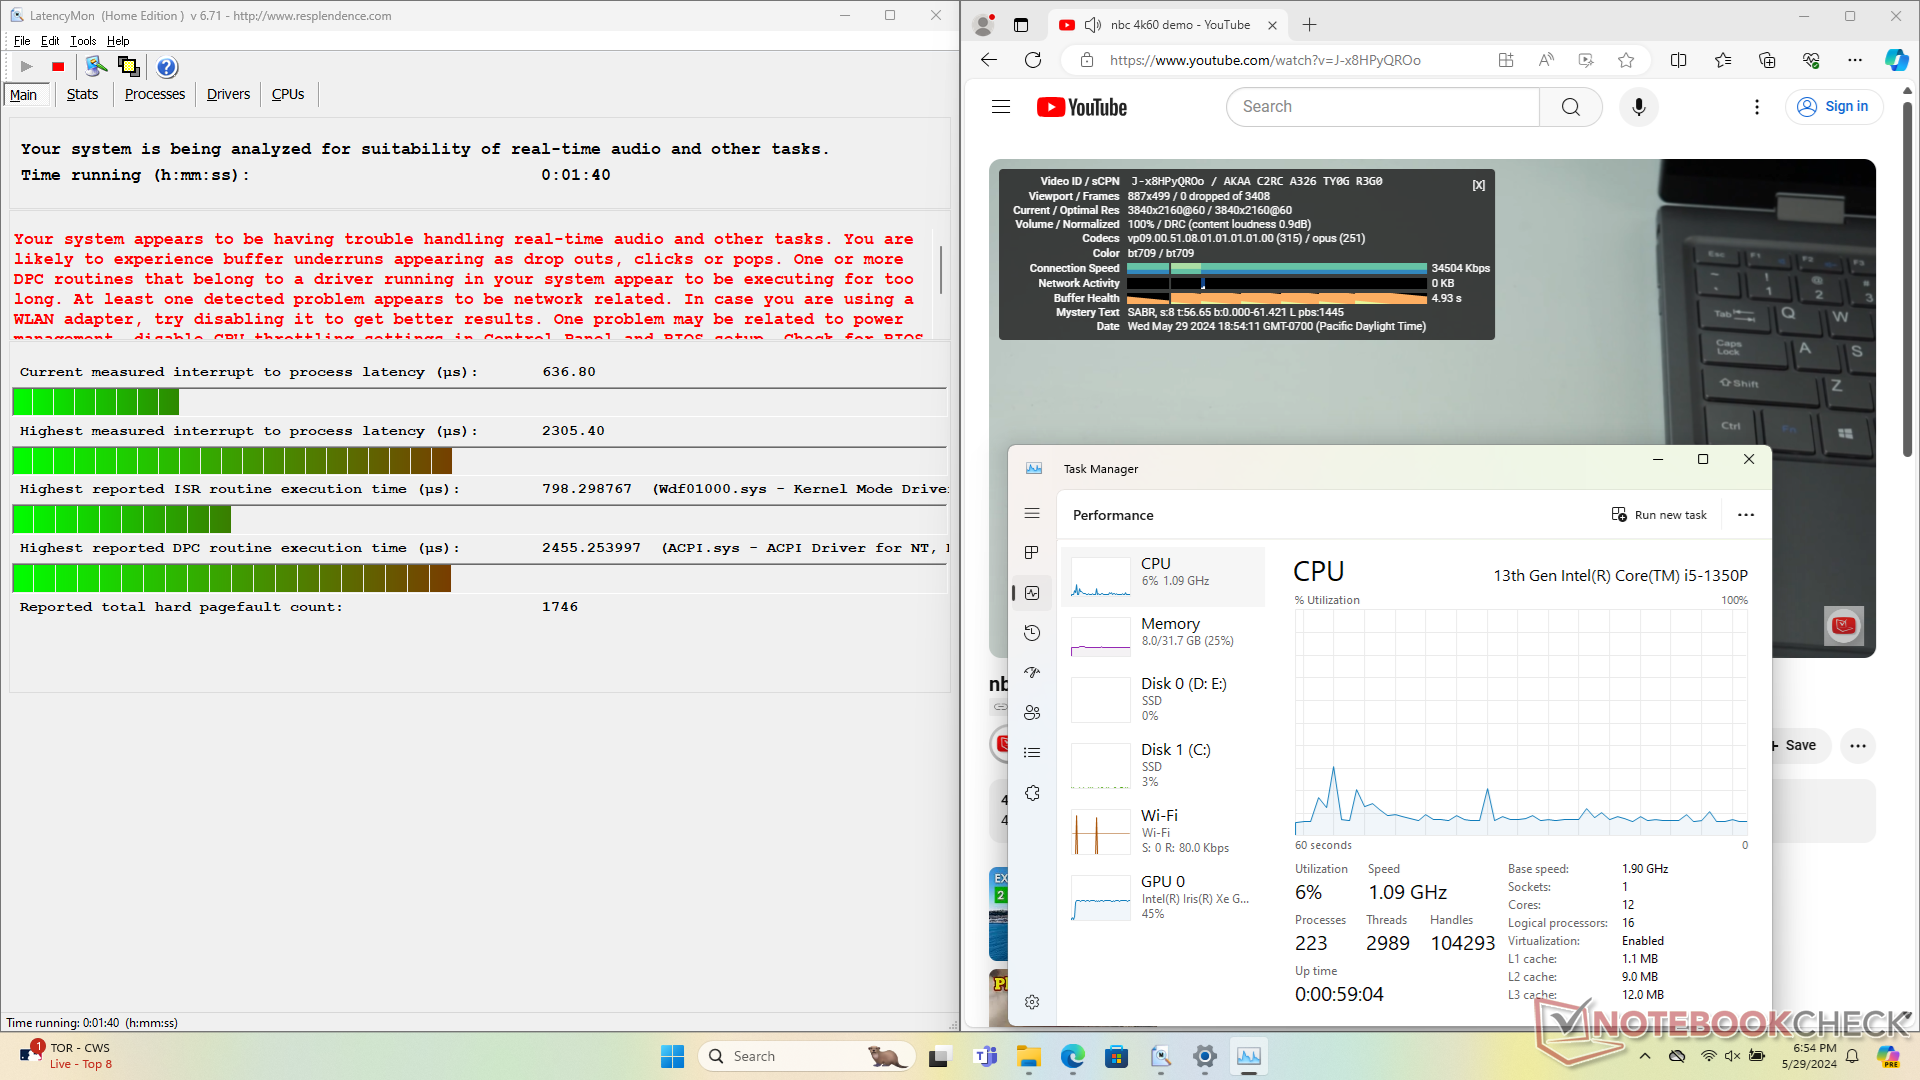
Há pequenos problemas de DPC ao abrir várias guias do navegador em nossa página inicial. a reprodução de vídeo 4K a 60 FPS é perfeita, sem registro de quadros pulados.
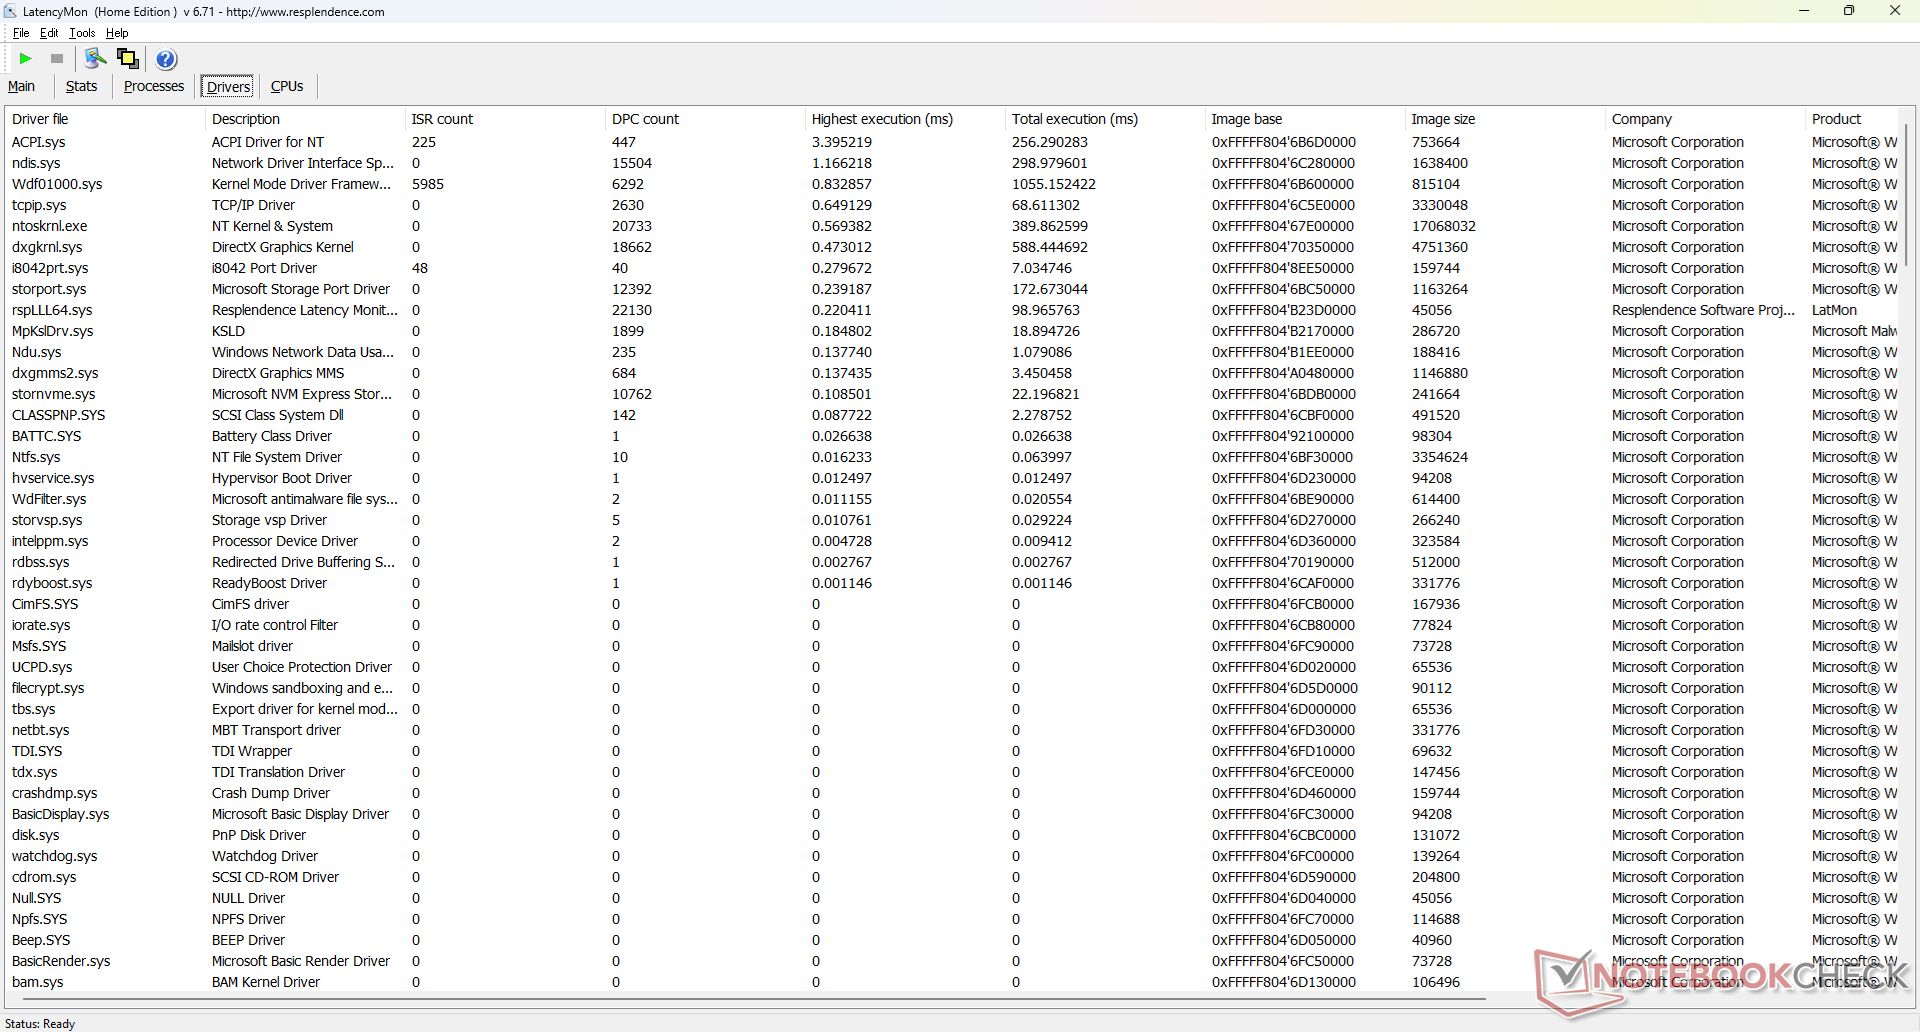
| DPC Latencies / LatencyMon - interrupt to process latency (max), Web, Youtube, Prime95 | |
| Dell Latitude 14 5420-D2G5W | |
| Getac S410 G5 | |
| Durabook S14I | |
| Getac S410 Gen 4 | |
| Panasonic Toughbook 40 | |
| Dell Latitude 7330 Rugged Extreme | |
* ... menor é melhor
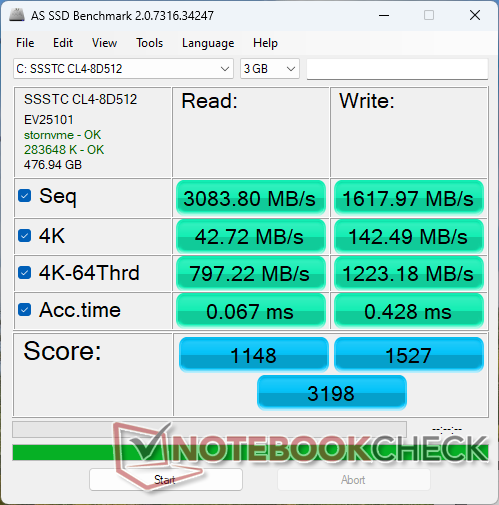
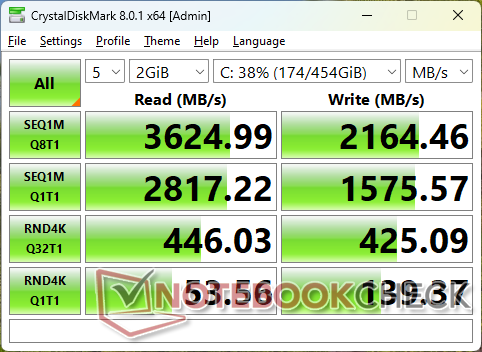
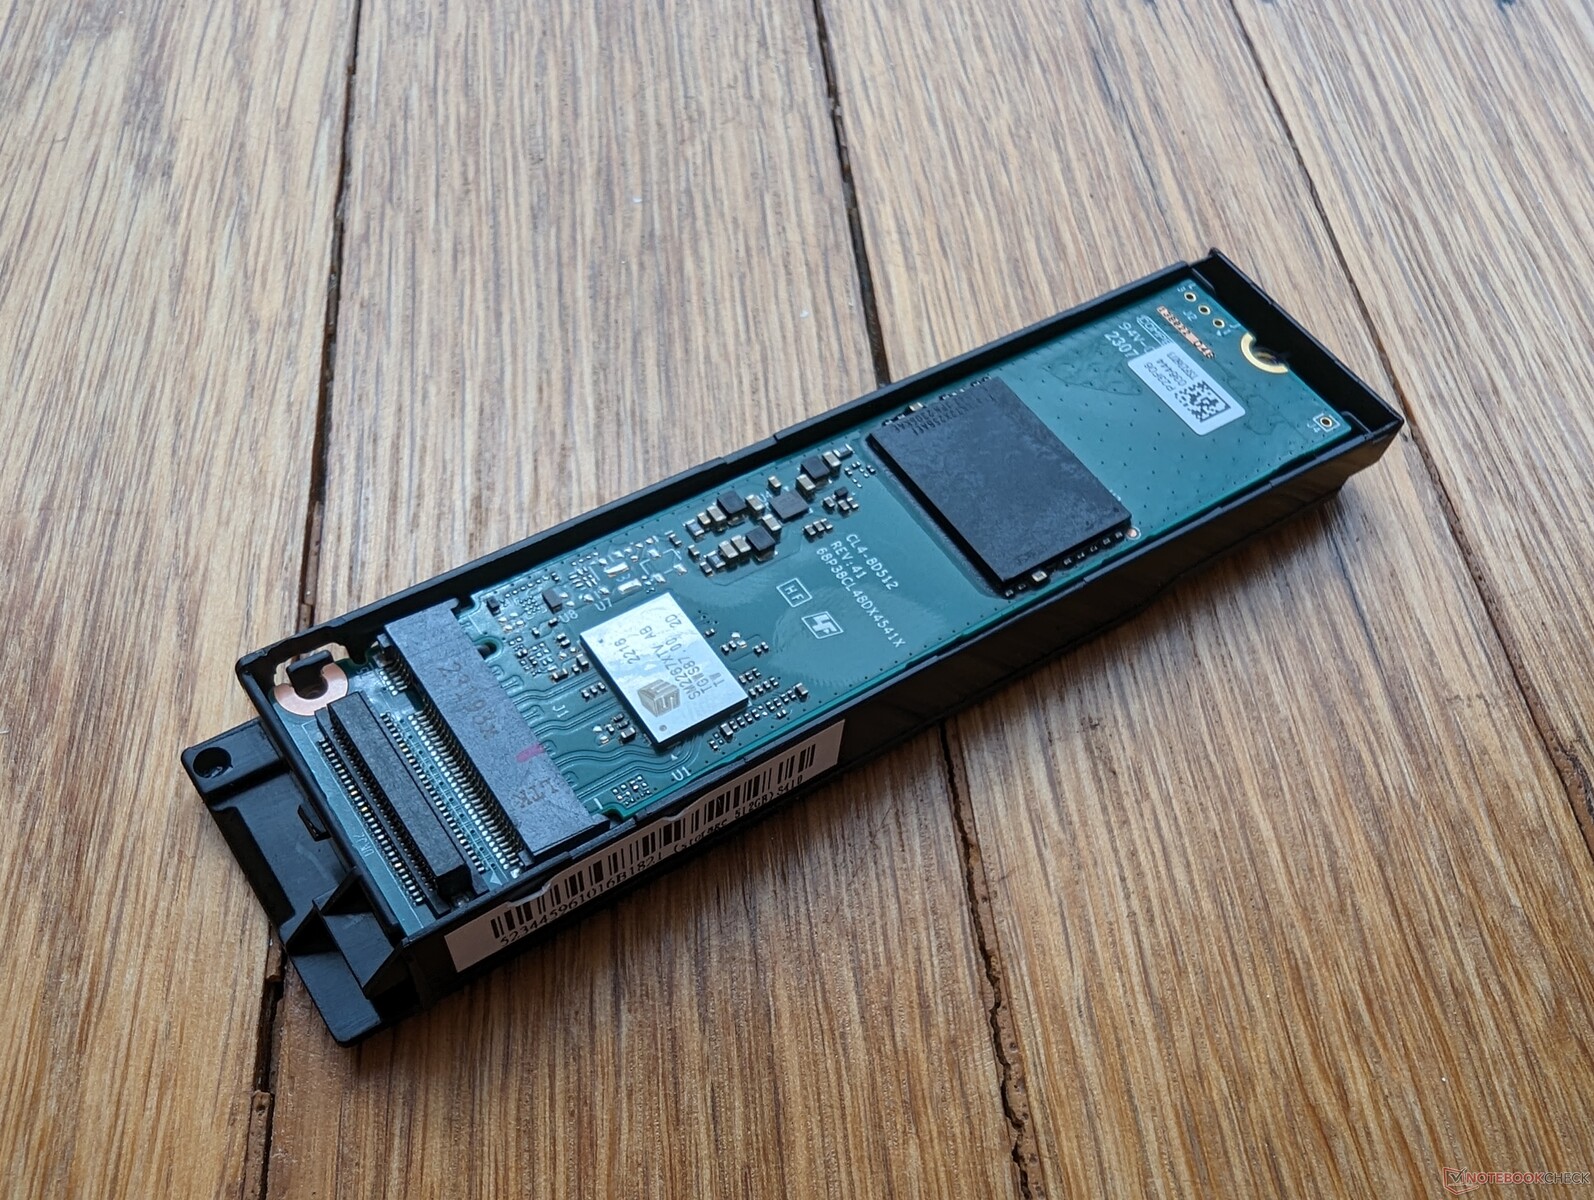
Dispositivos de armazenamento
Nossa unidade de teste é fornecida com o SSSTC CL4-8D512 enquanto o S410 G4 mais antigo seria fornecido com o SSSTC CA5-8D256. A unidade mais nova é um pouco mais rápida em todos os aspectos, mas ainda sofre com tempos de acesso um pouco mais longos do que a maioria das outras unidades.

| Drive Performance Rating - Percent | |
| Dell Latitude 7330 Rugged Extreme | |
| Getac S410 G5 | |
| Durabook S14I | |
| Panasonic Toughbook 40 | |
| Dell Latitude 14 5420-D2G5W | |
| Getac S410 Gen 4 | |
* ... menor é melhor
Disk Throttling: DiskSpd Read Loop, Queue Depth 8
Desempenho da GPU - Iris Xe mais uma vez
Tiger Lake-U e Raptor Lake-P compartilham a mesma arquitetura Iris Xe subjacente e, portanto, qualquer aumento de desempenho entre o S410 G4 e o S410 G5 é mínimo. A Iris Xe Graphics G7 80 EUs em nossa unidade é apenas cerca de 10% mais rápida do que a Iris Xe Graphics G7 96 EUs do modelo do ano passado. Essa pequena vantagem não será perceptível na grande maioria dos aplicativos.
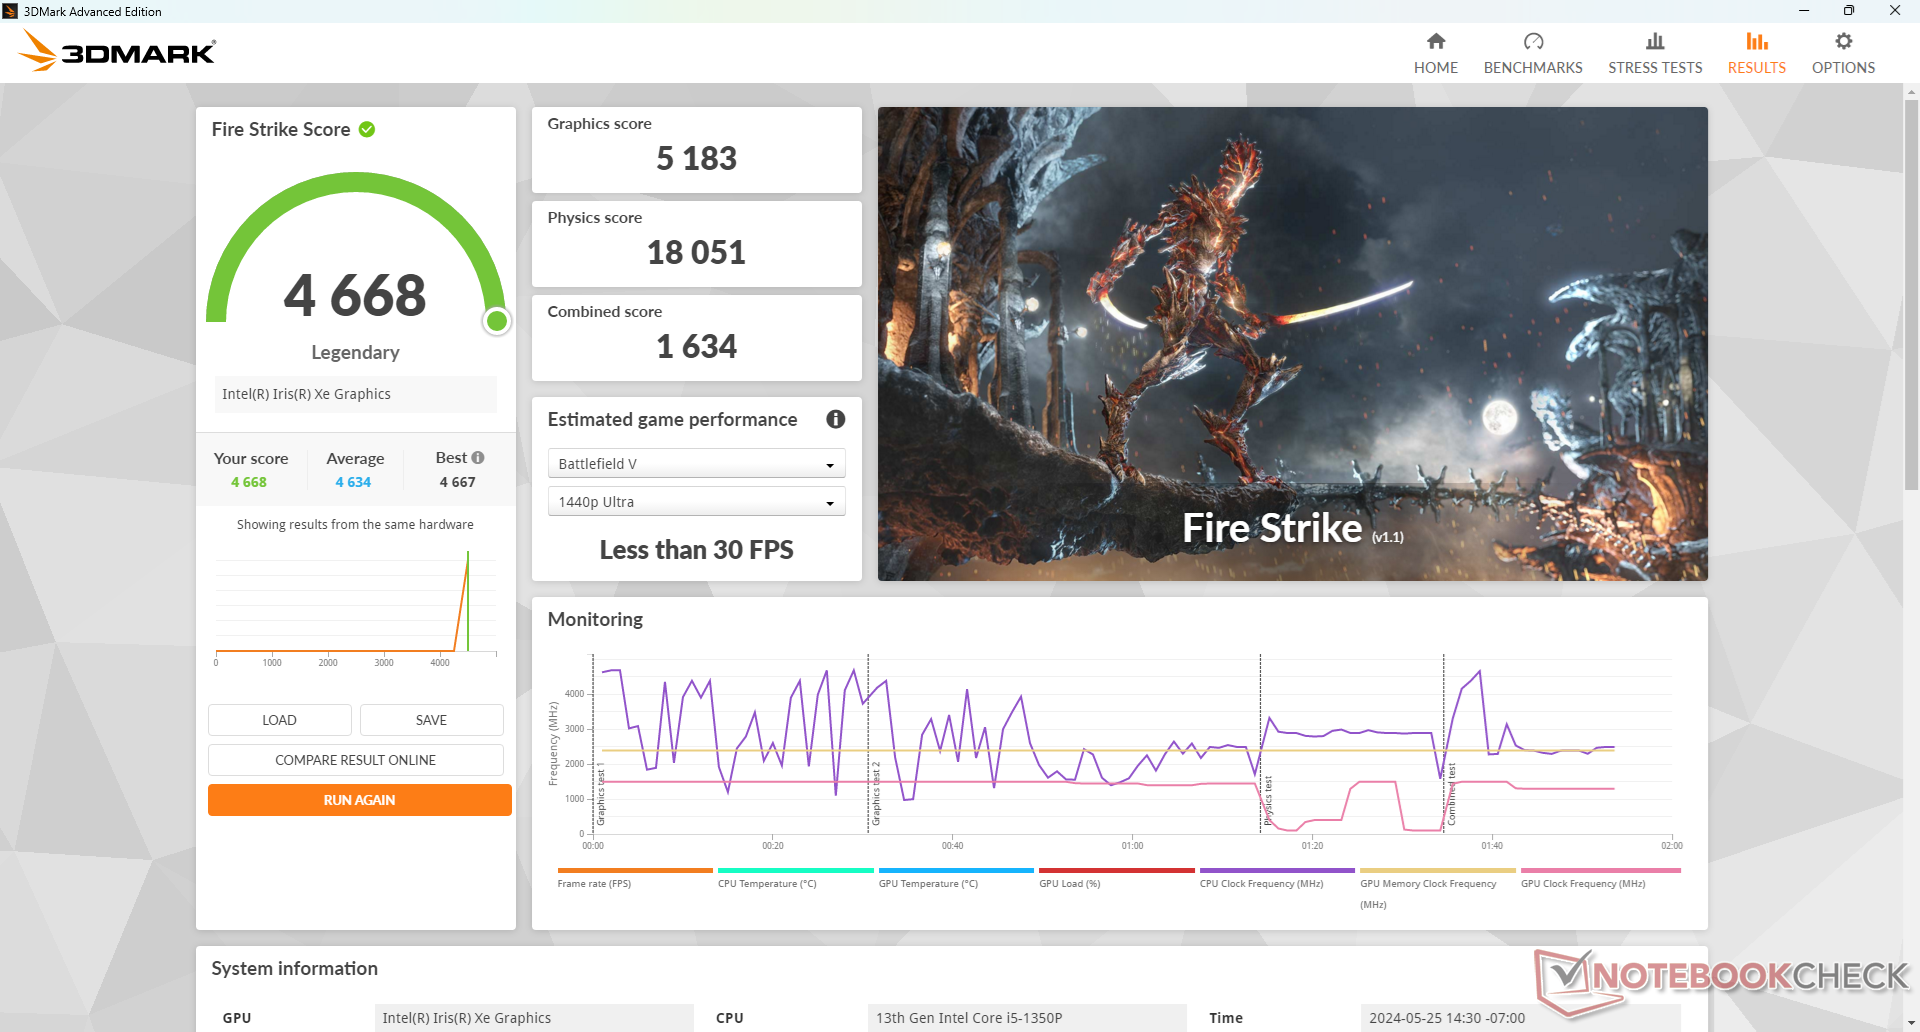
| Perfil de potência | Pontuação de gráficos | Pontuação de física | Pontuação combinada |
| Perfil extremo | 5183 | 18051 | 1634 |
| Perfil padrão | 5169 (-0%) | 17729 (-2%) | 1648 (-0%) |
| Energia da bateria | 5186 (-0%) | 11113 (-38%) | 1725 (-0%) |
A execução no modo de desempenho Extremo não resulta em desempenho mais rápido do que no modo de desempenho Padrão regular, conforme mostrado na tabela de resultados do site Fire Strike acima. No entanto, o desempenho da CPU é bastante reduzido se estiver funcionando com a energia da bateria, o que pode ser decepcionante se o senhor estiver em campo.
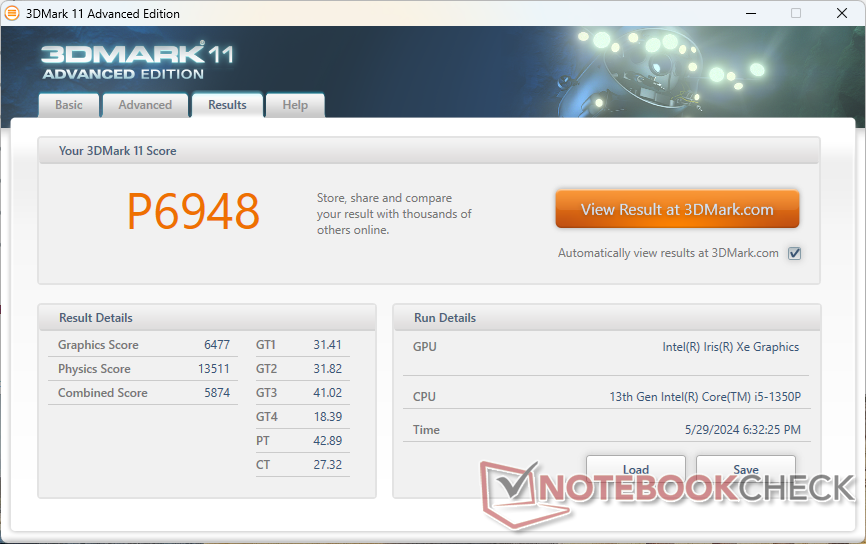
| 3DMark 11 Performance | 6948 pontos | |
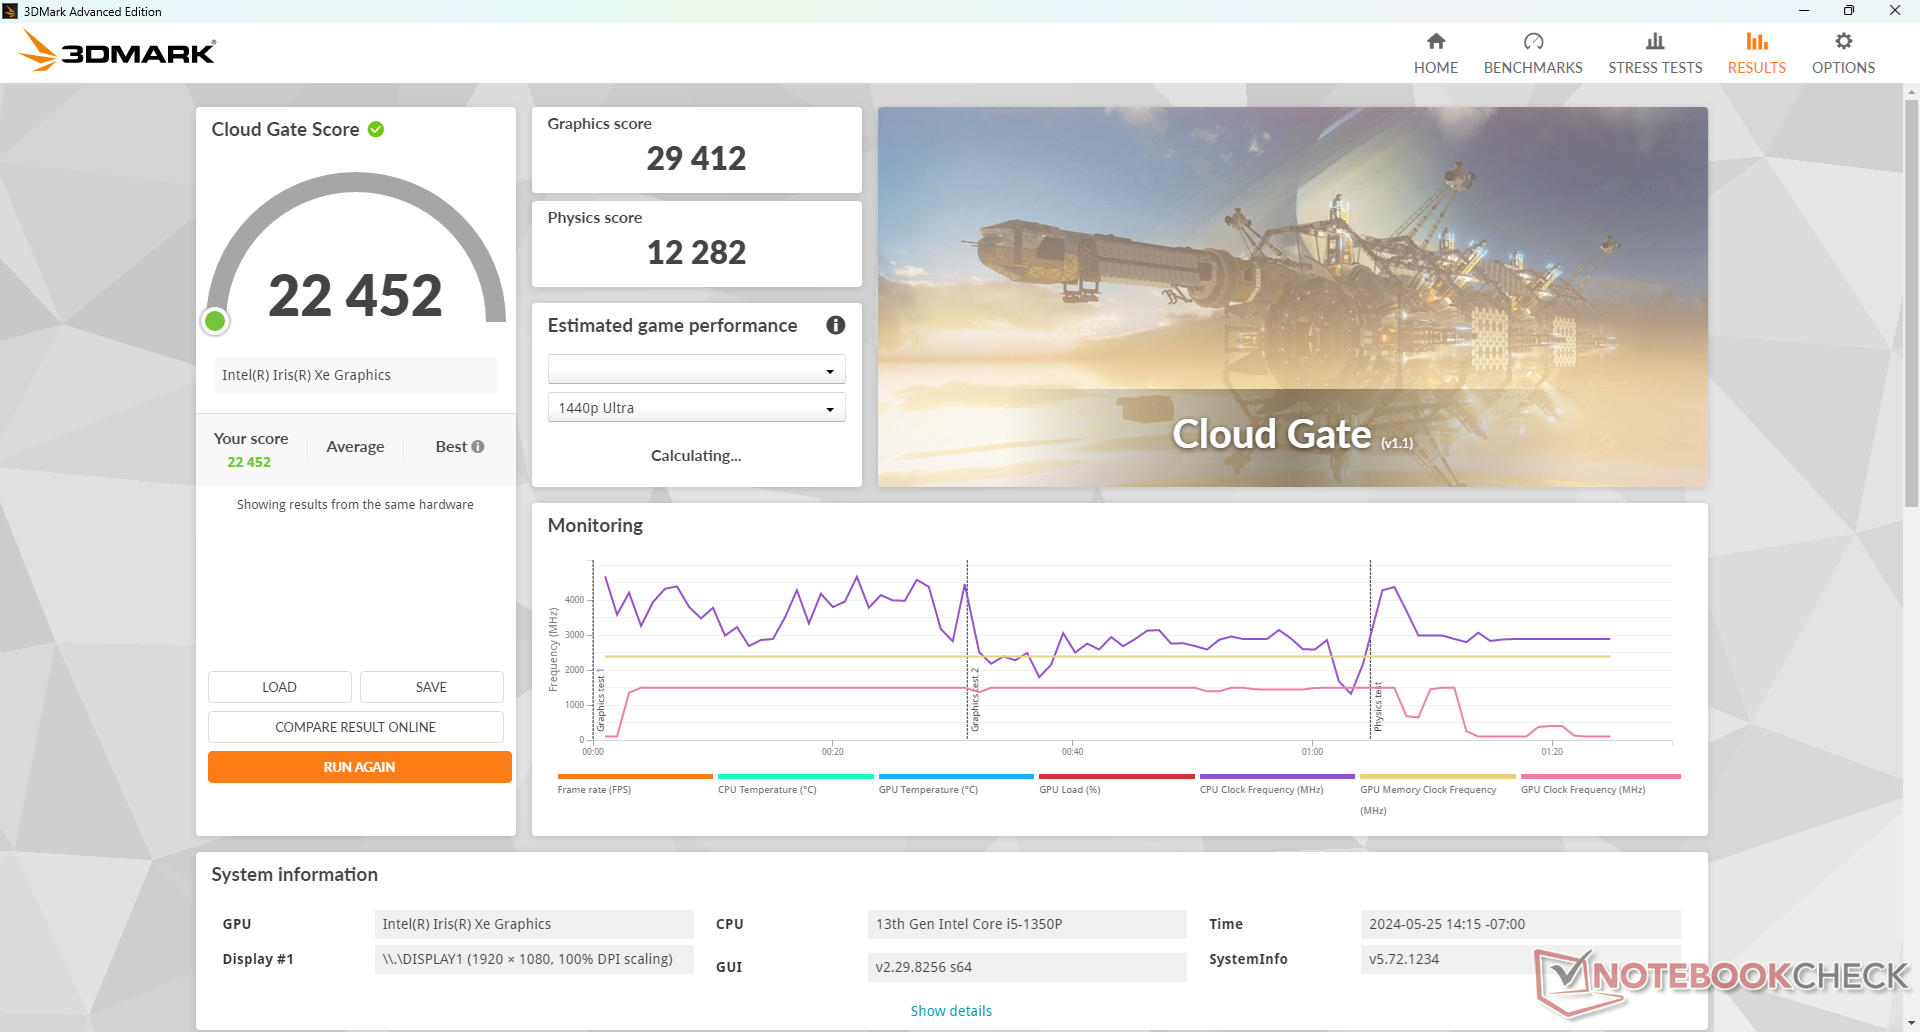
| 3DMark Cloud Gate Standard Score | 22452 pontos | |
| 3DMark Fire Strike Score | 4668 pontos | |
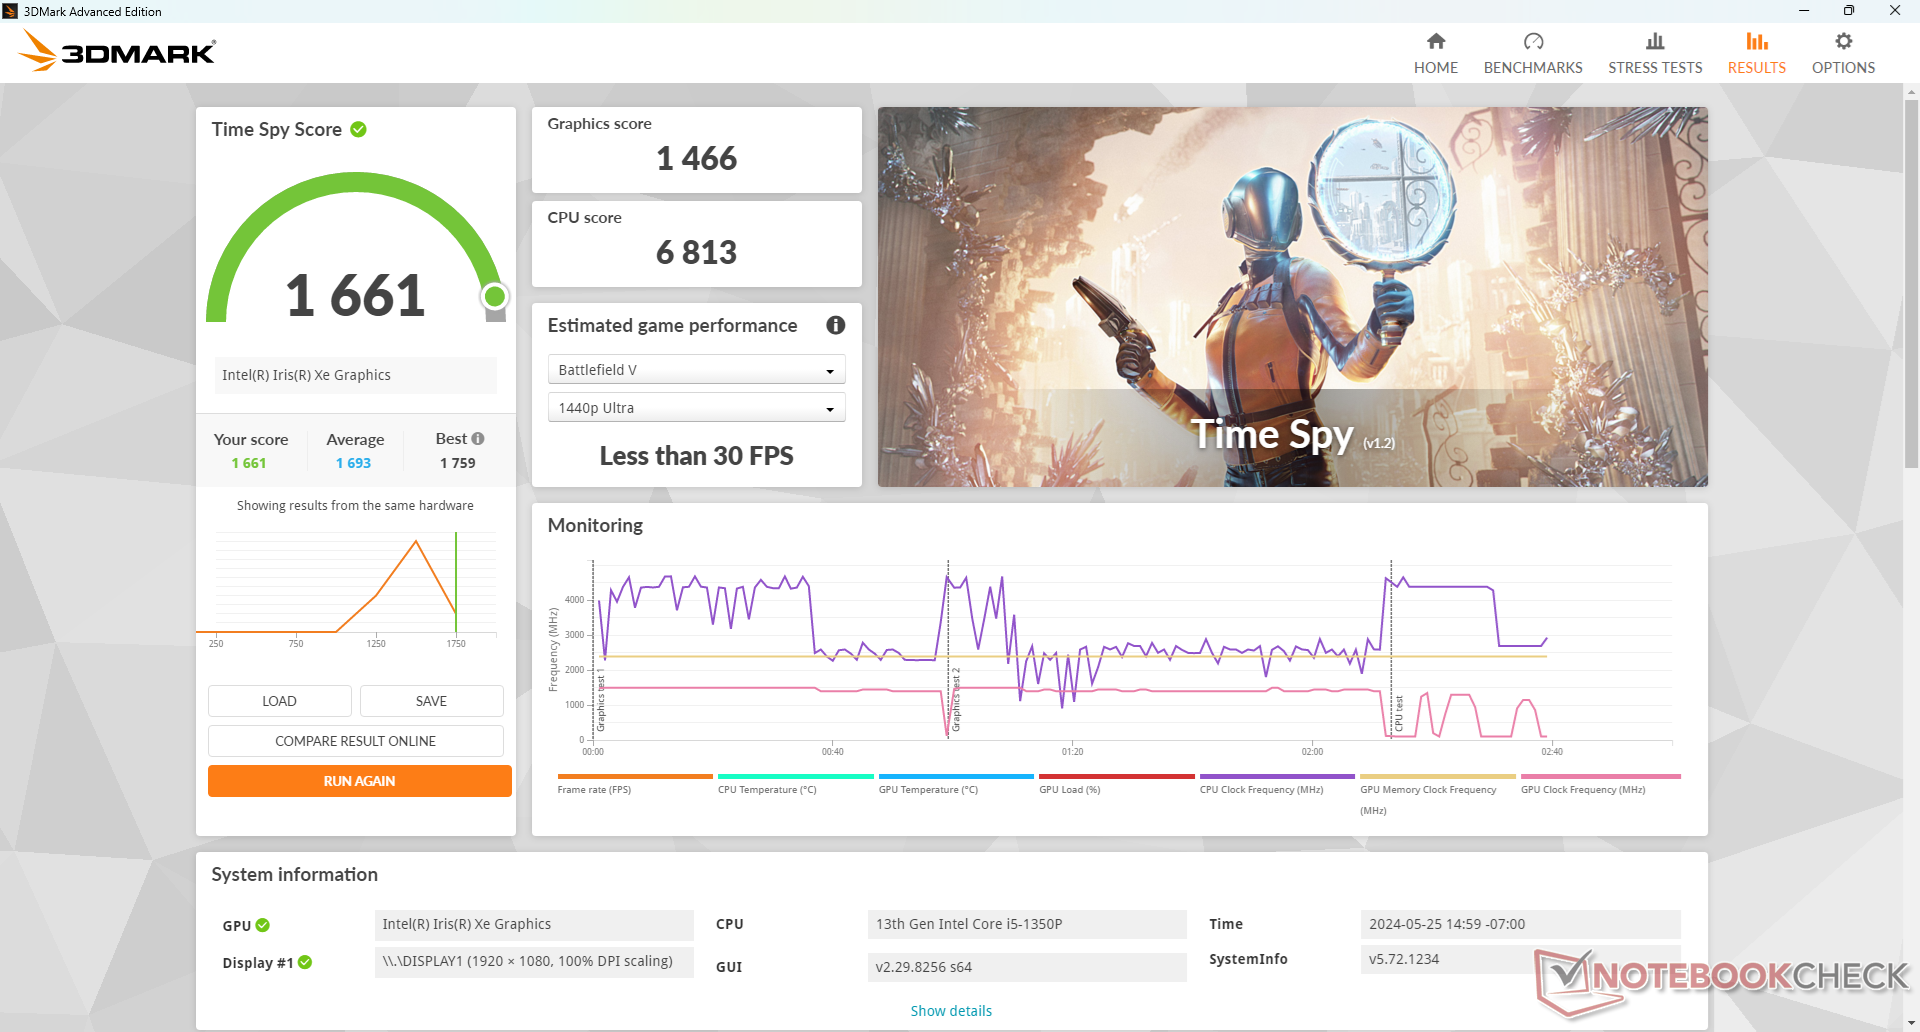
| 3DMark Time Spy Score | 1661 pontos | |
Ajuda | ||
| Blender - v3.3 Classroom CPU | |
| Getac S410 G5 | |
* ... menor é melhor
| Performance Rating - Percent | |
| Getac S410 G5 | |
| Dell Latitude 7330 Rugged Extreme -2! | |
| Getac S410 Gen 4 | |
| Panasonic Toughbook 40 -2! | |
| Durabook S14I -3! | |
| Dell Latitude 14 5420-D2G5W -3! | |
| The Witcher 3 - 1920x1080 Ultra Graphics & Postprocessing (HBAO+) | |
| Getac S410 G5 | |
| Dell Latitude 7330 Rugged Extreme | |
| Panasonic Toughbook 40 | |
| Getac S410 Gen 4 | |
| Dell Latitude 14 5420-D2G5W | |
| GTA V - 1920x1080 Highest Settings possible AA:4xMSAA + FX AF:16x | |
| Getac S410 G5 | |
| Getac S410 Gen 4 | |
| Final Fantasy XV Benchmark - 1920x1080 High Quality | |
| Dell Latitude 7330 Rugged Extreme | |
| Getac S410 G5 | |
| Panasonic Toughbook 40 | |
| Getac S410 Gen 4 | |
| Durabook S14I | |
| Dell Latitude 14 5420-D2G5W | |
| Strange Brigade - 1920x1080 ultra AA:ultra AF:16 | |
| Getac S410 G5 | |
| Getac S410 Gen 4 | |
| Dota 2 Reborn - 1920x1080 ultra (3/3) best looking | |
| Dell Latitude 7330 Rugged Extreme | |
| Panasonic Toughbook 40 | |
| Getac S410 G5 | |
| Getac S410 Gen 4 | |
| Durabook S14I | |
| X-Plane 11.11 - 1920x1080 high (fps_test=3) | |
| Getac S410 G5 | |
| Getac S410 Gen 4 | |
| Durabook S14I | |
| Panasonic Toughbook 40 | |
| Dell Latitude 14 5420-D2G5W | |
| Dell Latitude 7330 Rugged Extreme | |
| GTA V | |
| 1024x768 Lowest Settings possible | |
| Getac S410 G5 | |
| Média Intel Iris Xe Graphics G7 80EUs (36.5 - 144.6, n=82) | |
| Getac S410 Gen 4 | |
| Dell Latitude 14 5420-D2G5W | |
| 1920x1080 Lowest Settings possible | |
| Getac S410 G5 | |
| Média Intel Iris Xe Graphics G7 80EUs (21.5 - 98.1, n=66) | |
| Getac S410 Gen 4 | |
| 1366x768 Normal/Off AF:4x | |
| Getac S410 G5 | |
| Média Intel Iris Xe Graphics G7 80EUs (28.9 - 133.8, n=85) | |
| Getac S410 Gen 4 | |
| Dell Latitude 14 5420-D2G5W | |
| 1920x1080 Normal/Off AF:4x | |
| Getac S410 G5 | |
| Média Intel Iris Xe Graphics G7 80EUs (18.8 - 97.2, n=66) | |
| Getac S410 Gen 4 | |
| 1920x1080 High/On (Advanced Graphics Off) AA:2xMSAA + FX AF:8x | |
| Getac S410 G5 | |
| Getac S410 Gen 4 | |
| Média Intel Iris Xe Graphics G7 80EUs (7.81 - 32, n=84) | |
| Dell Latitude 14 5420-D2G5W | |
| 1920x1080 Highest Settings possible AA:4xMSAA + FX AF:16x | |
| Getac S410 G5 | |
| Getac S410 Gen 4 | |
| Média Intel Iris Xe Graphics G7 80EUs (3.07 - 11.6, n=71) | |
| Strange Brigade | |
| 1280x720 lowest AF:1 | |
| Getac S410 G5 | |
| Getac S410 Gen 4 | |
| Média Intel Iris Xe Graphics G7 80EUs (22.7 - 98.7, n=82) | |
| Dell Latitude 14 5420-D2G5W | |
| 1920x1080 medium AA:medium AF:4 | |
| Getac S410 G5 | |
| Getac S410 Gen 4 | |
| Média Intel Iris Xe Graphics G7 80EUs (6 - 48.8, n=84) | |
| Dell Latitude 14 5420-D2G5W | |
| 1920x1080 high AA:high AF:8 | |
| Getac S410 G5 | |
| Getac S410 Gen 4 | |
| Média Intel Iris Xe Graphics G7 80EUs (11.4 - 34, n=81) | |
| Dell Latitude 14 5420-D2G5W | |
| 1920x1080 ultra AA:ultra AF:16 | |
| Getac S410 G5 | |
| Getac S410 Gen 4 | |
| Média Intel Iris Xe Graphics G7 80EUs (13.6 - 27, n=57) | |
As taxas de quadros quando ociosas no site Witcher 3 são estáveis, exceto por um caso em que, após 40 minutos de teste, caíram para apenas 10 FPS, sugerindo a interrupção da atividade em segundo plano. É decepcionante ver isso em um sistema industrial ou robusto, em que a estabilidade é de extrema importância e os aplicativos em segundo plano não devem ter prioridade.
Witcher 3 FPS Chart
| baixo | média | alto | ultra | |
|---|---|---|---|---|
| GTA V (2015) | 101.8 | 94.6 | 22.5 | 9.58 |
| The Witcher 3 (2015) | 79.9 | 56.3 | 31.5 | 28 |
| Dota 2 Reborn (2015) | 94.8 | 71.3 | 55.8 | 49.5 |
| Final Fantasy XV Benchmark (2018) | 40.4 | 22 | 15.8 | |
| X-Plane 11.11 (2018) | 47.6 | 36.1 | 32.7 | |
| Strange Brigade (2018) | 86.2 | 38.9 | 31 | 25.1 |
Emissões
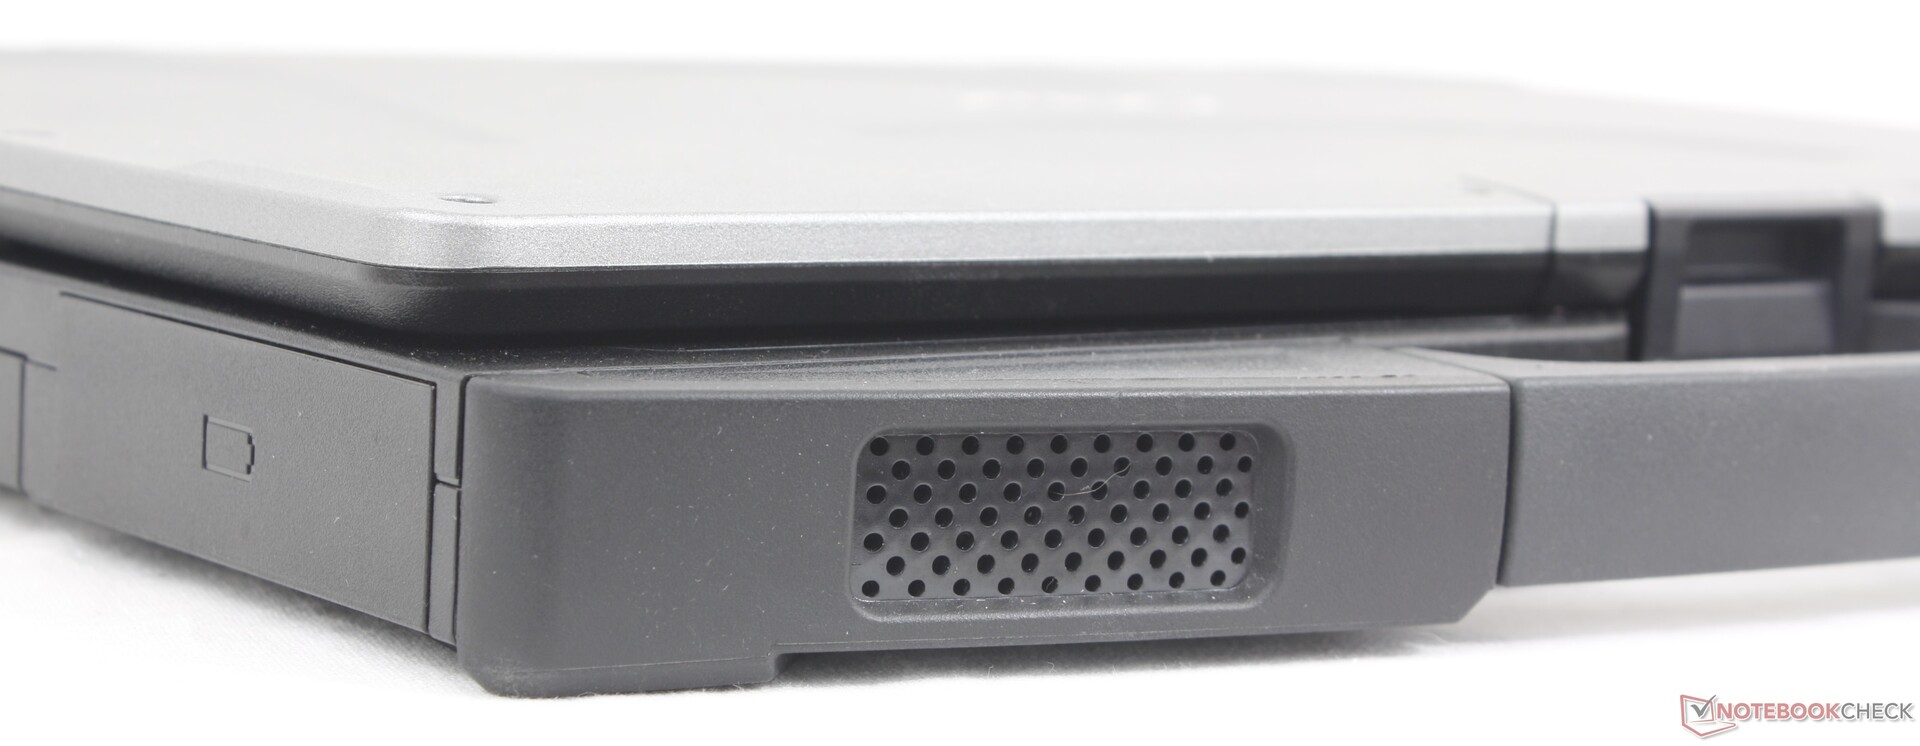
Ruído do sistema - Ventilador de alta frequência
O comportamento do ruído do ventilador é praticamente o mesmo de antes, com piso e teto semelhantes. O mais decepcionante é que o ruído relativamente agudo do ventilador permanece, o que torna o ventilador mais perceptível do que o necessário durante o uso.
Barulho
| Ocioso |
| 23.4 / 25.9 / 26 dB |
| Carga |
| 38.7 / 42.1 dB |
 | ||
30 dB silencioso 40 dB(A) audível 50 dB(A) ruidosamente alto |
||
min: | ||
| Getac S410 G5 Iris Xe G7 80EUs, i5-1350P, SSSTC CL4-8D512 | Getac S410 Gen 4 Iris Xe G7 96EUs, i7-1185G7, SSSTC CA5-8D256 | Durabook S14I Iris Xe G7 96EUs, i7-1165G7, UDinfo M2P M2P80DE512GBAEP | Dell Latitude 14 5420-D2G5W Iris Xe G7 80EUs, i5-1135G7, WDC PC SN530 SDBPTPZ-256G | Dell Latitude 7330 Rugged Extreme Iris Xe G7 96EUs, i7-1185G7 | Panasonic Toughbook 40 Iris Xe G7 96EUs, i7-1185G7, Samsung PM991 MZVLQ1T0HALB | |
|---|---|---|---|---|---|---|
| Noise | -2% | -4% | -4% | 13% | 1% | |
| desligado / ambiente * | 23.4 | 23.3 -0% | 25.2 -8% | 25 -7% | 22.9 2% | 22.8 3% |
| Idle Minimum * | 23.4 | 23.5 -0% | 25.2 -8% | 25 -7% | 23.1 1% | 26 -11% |
| Idle Average * | 25.9 | 23.5 9% | 25.2 3% | 25 3% | 23.1 11% | 26 -0% |
| Idle Maximum * | 26 | 28 -8% | 34.5 -33% | 25 4% | 23.1 11% | 26 -0% |
| Load Average * | 38.7 | 42.8 -11% | 34.5 11% | 36.5 6% | 28 28% | 37.6 3% |
| Witcher 3 ultra * | 42.1 | 42.3 -0% | 31.2 26% | 37.8 10% | ||
| Load Maximum * | 42.1 | 42.6 -1% | 36.2 14% | 52.4 -24% | 36.2 14% | 40.3 4% |
* ... menor é melhor
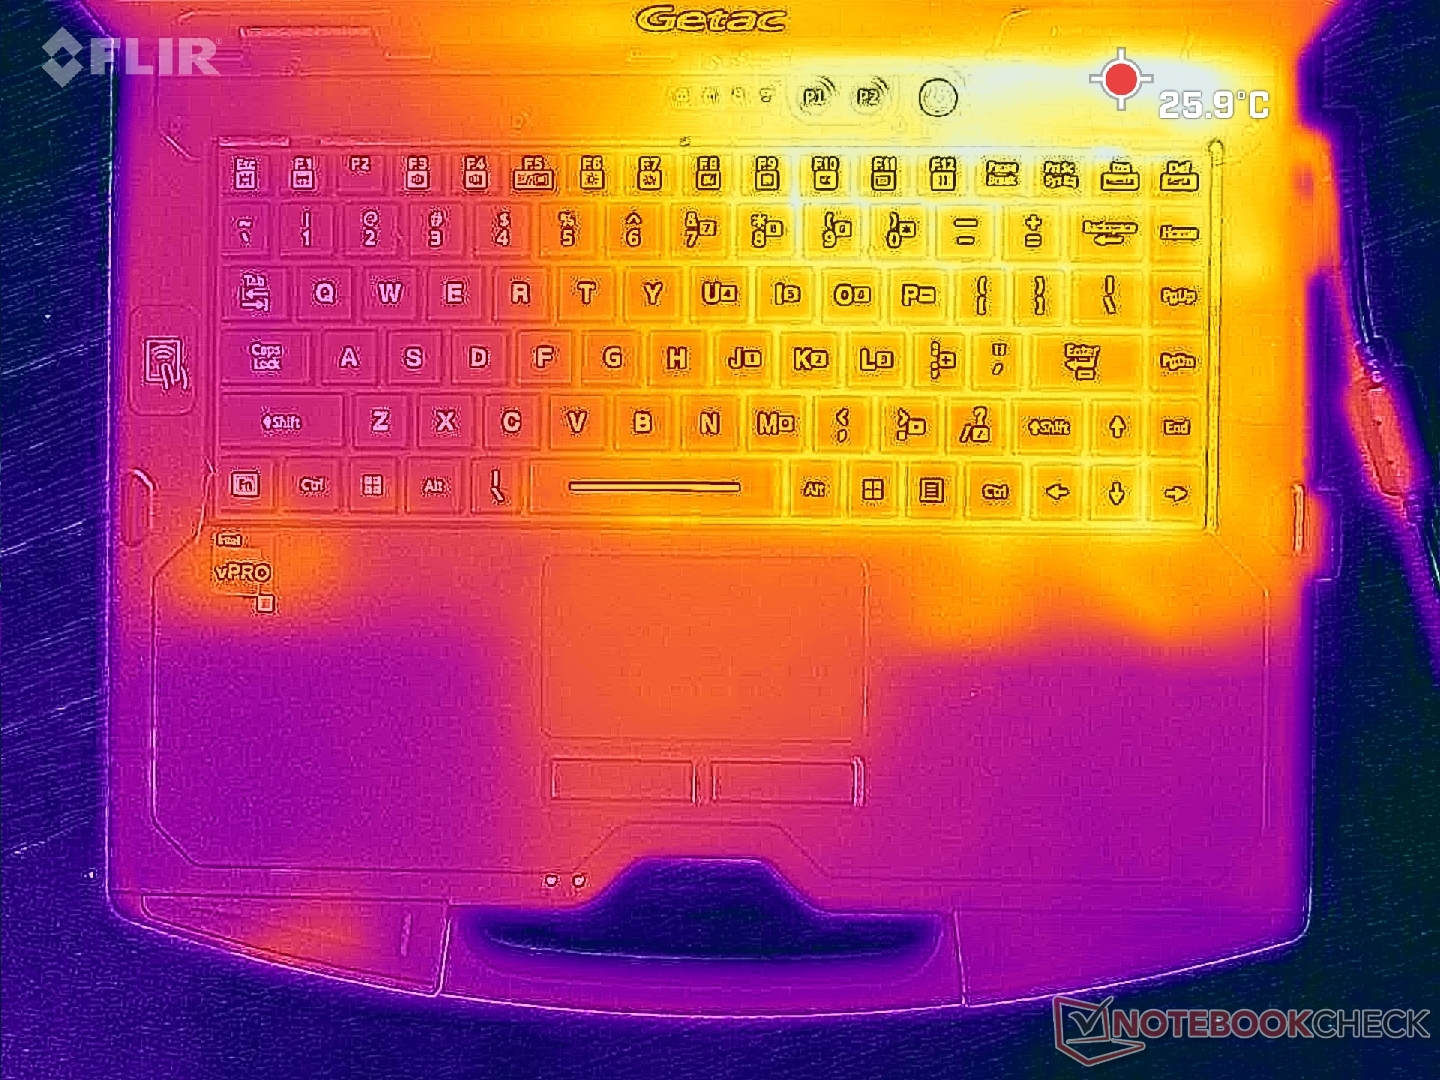
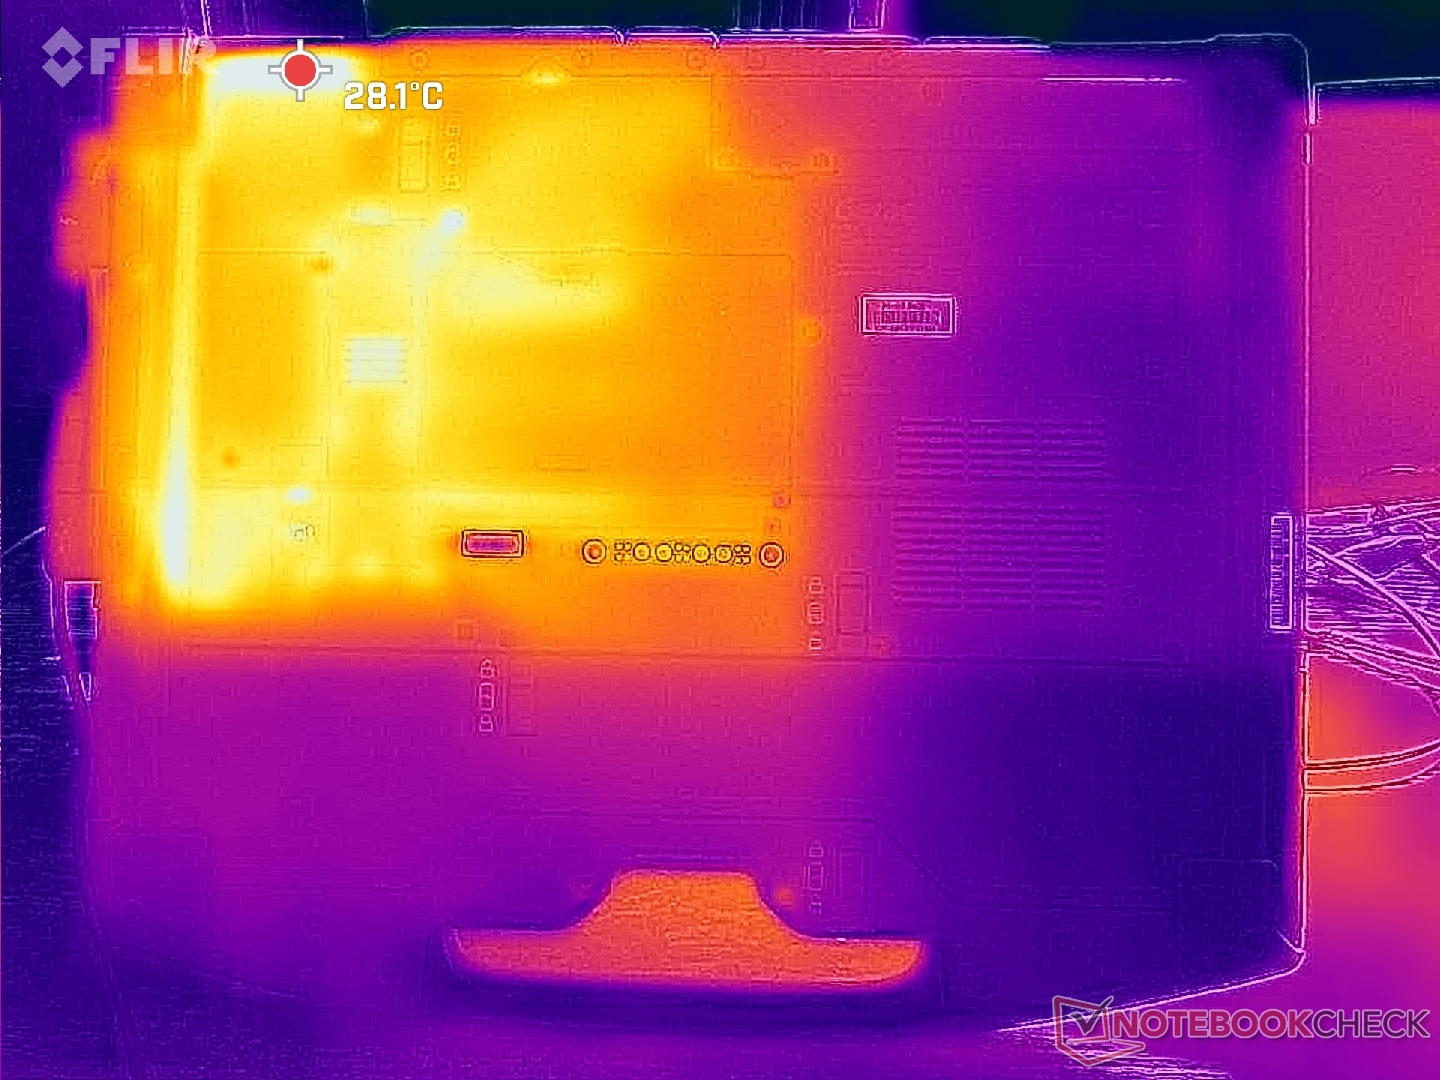
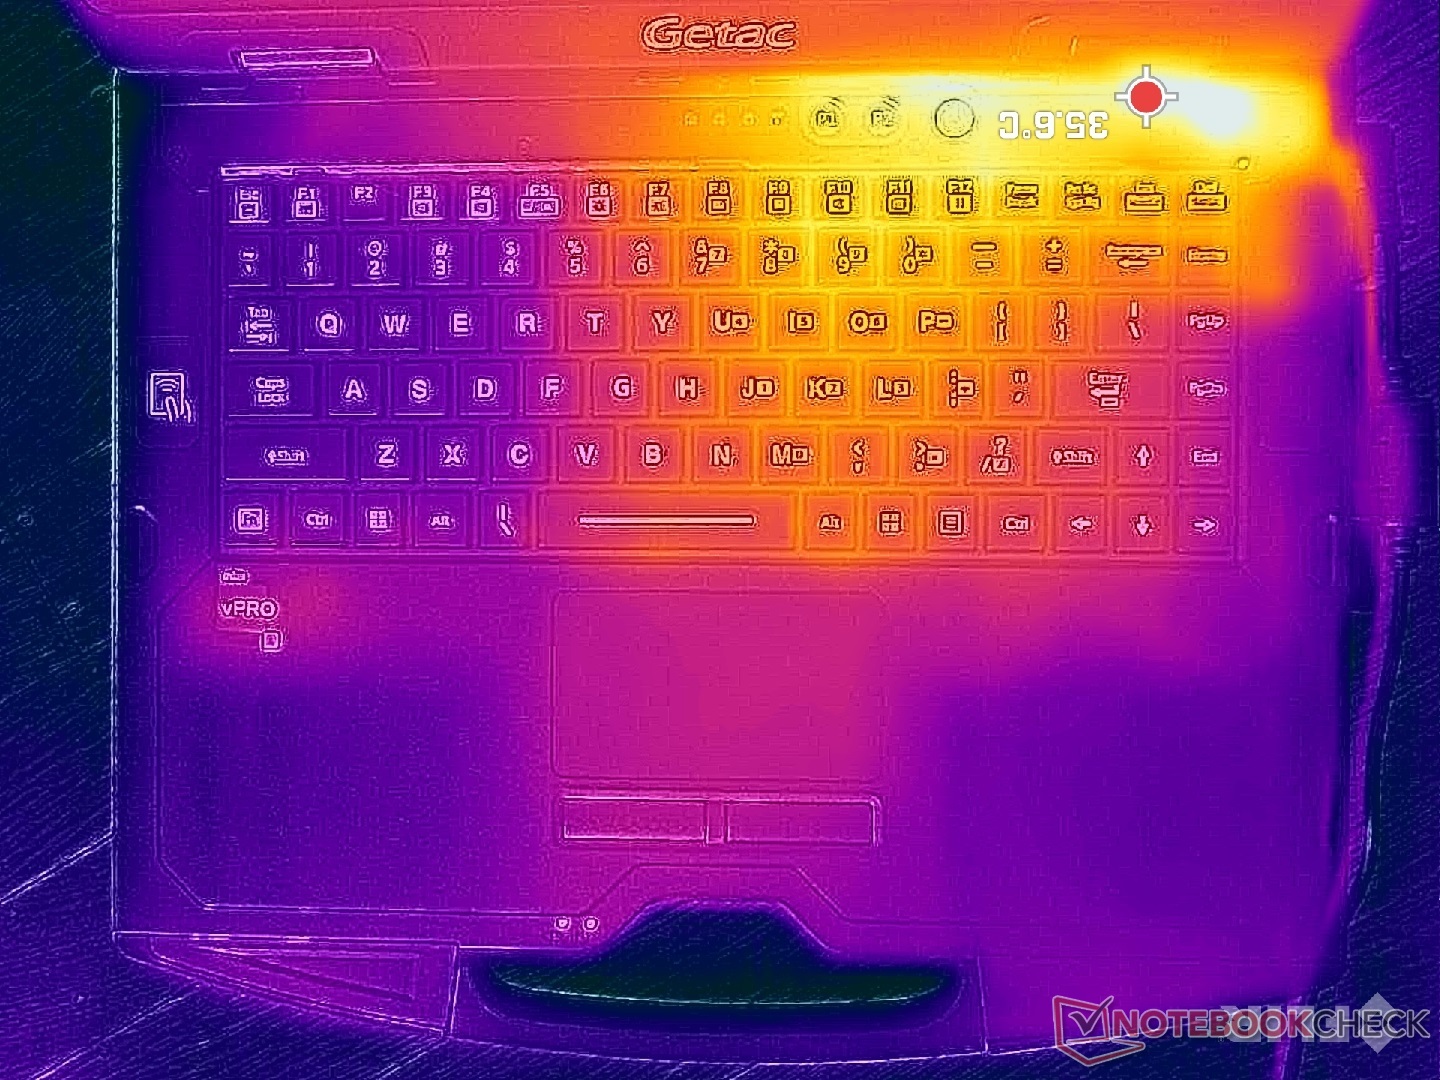
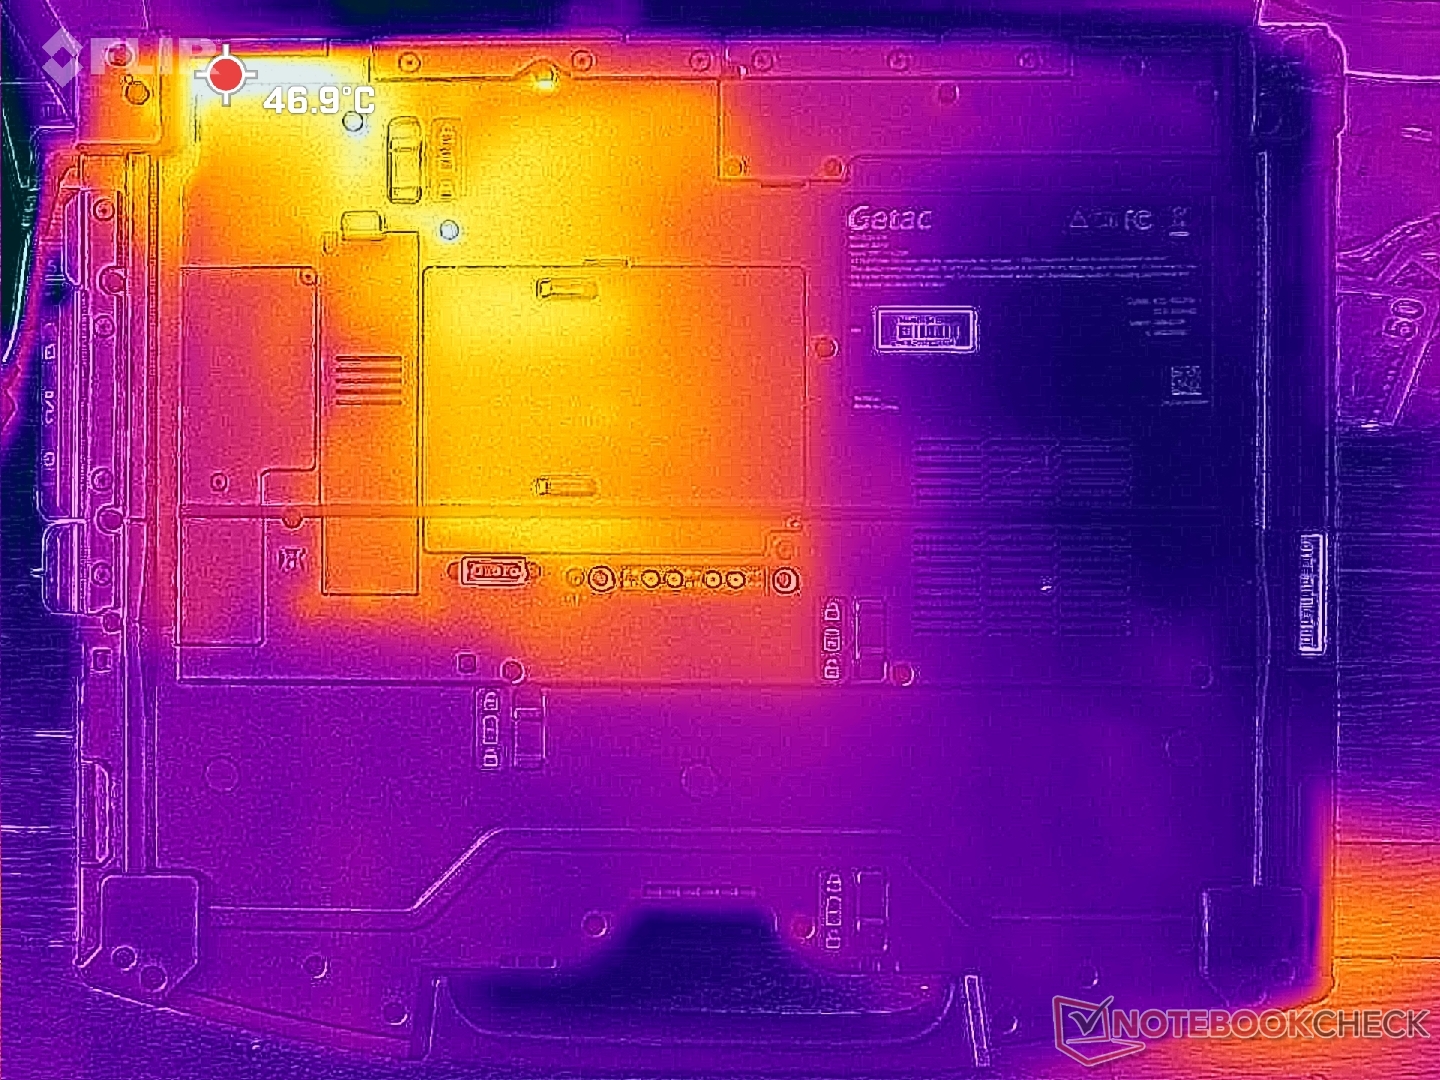
Temperatura
As temperaturas da superfície são mais quentes na metade direita do chassi do que na esquerda. Os pontos quentes podem atingir mais de 36 C e 47 C nas tampas C e D do laptop, respectivamente, mas essas áreas estão concentradas na parte traseira, onde é improvável que os dedos ou a pele toquem.
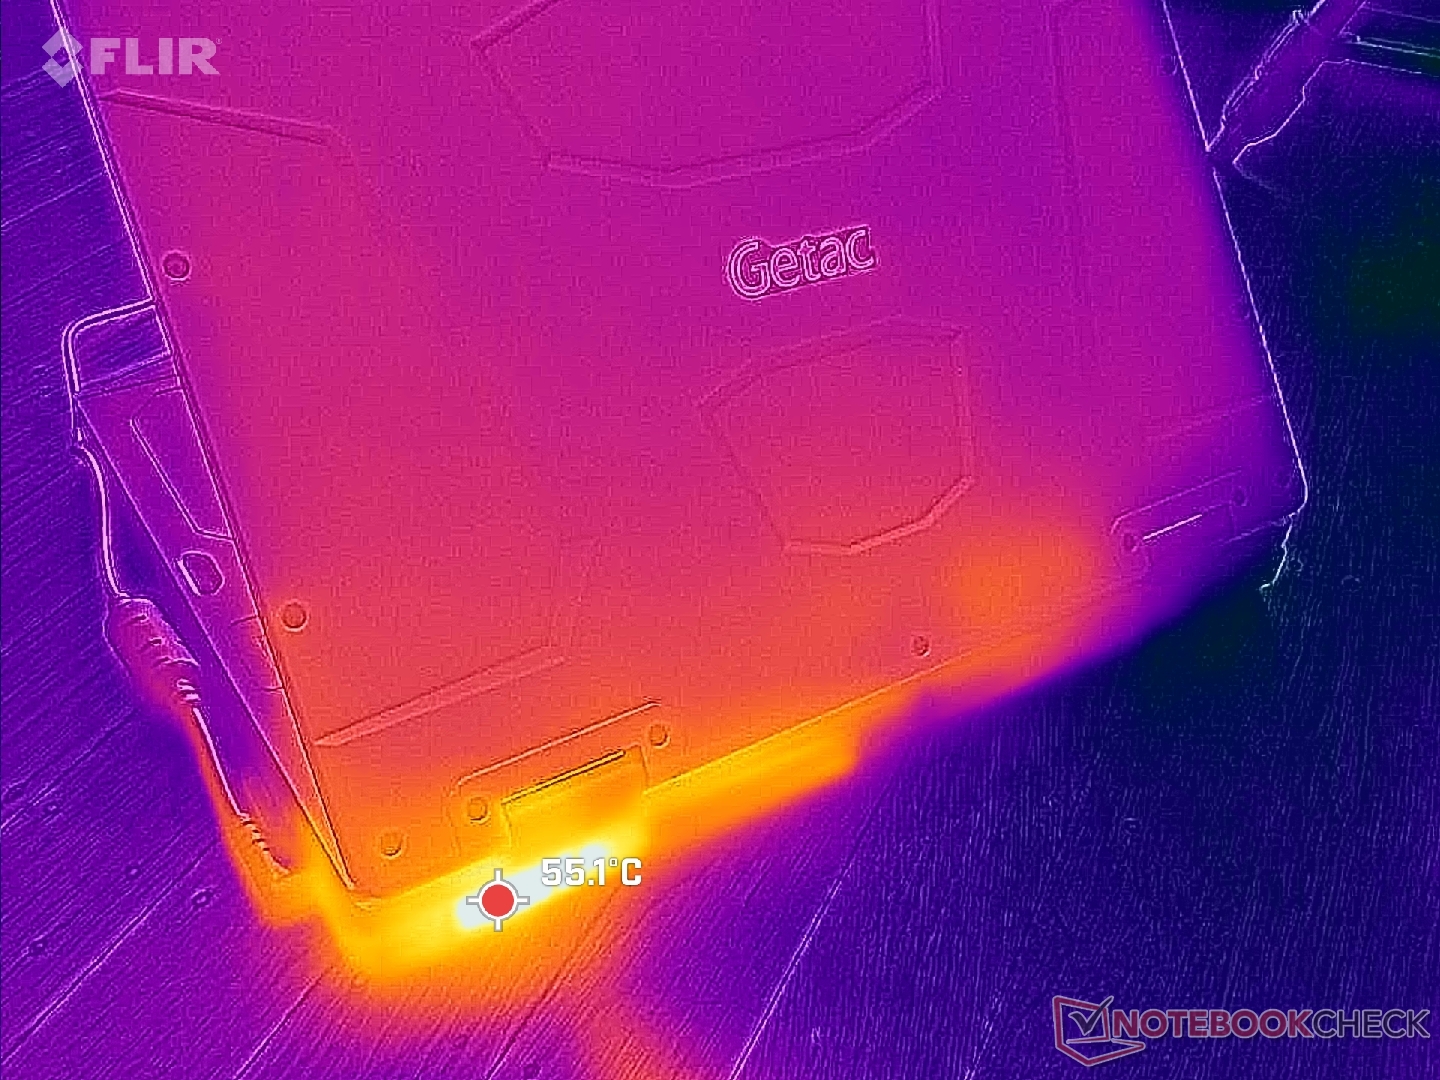
(+) A temperatura máxima no lado superior é 37 °C / 99 F, em comparação com a média de 34.3 °C / 94 F , variando de 21.2 a 62.5 °C para a classe Office.
(±) A parte inferior aquece até um máximo de 42.2 °C / 108 F, em comparação com a média de 36.8 °C / 98 F
(+) Em uso inativo, a temperatura média para o lado superior é 25.6 °C / 78 F, em comparação com a média do dispositivo de 29.5 °C / ### class_avg_f### F.
(+) Os apoios para as mãos e o touchpad são mais frios que a temperatura da pele, com um máximo de 26.8 °C / 80.2 F e, portanto, são frios ao toque.
(±) A temperatura média da área do apoio para as mãos de dispositivos semelhantes foi 27.6 °C / 81.7 F (+0.8 °C / 1.5 F).
| Getac S410 G5 Intel Core i5-1350P, Intel Iris Xe Graphics G7 80EUs | Getac S410 Gen 4 Intel Core i7-1185G7, Intel Iris Xe Graphics G7 96EUs | Durabook S14I Intel Core i7-1165G7, Intel Iris Xe Graphics G7 96EUs | Dell Latitude 14 5420-D2G5W Intel Core i5-1135G7, Intel Iris Xe Graphics G7 80EUs | Dell Latitude 7330 Rugged Extreme Intel Core i7-1185G7, Intel Iris Xe Graphics G7 96EUs | Panasonic Toughbook 40 Intel Core i7-1185G7, Intel Iris Xe Graphics G7 96EUs | |
|---|---|---|---|---|---|---|
| Heat | -7% | -1% | 2% | 14% | 5% | |
| Maximum Upper Side * | 37 | 36 3% | 36.4 2% | 41.7 -13% | 34.6 6% | 35.6 4% |
| Maximum Bottom * | 42.2 | 46.8 -11% | 38.6 9% | 35.6 16% | 36.6 13% | 40 5% |
| Idle Upper Side * | 28.8 | 30 -4% | 32.6 -13% | 29.9 -4% | 24.8 14% | 28.6 1% |
| Idle Bottom * | 33 | 38.2 -16% | 33.8 -2% | 29.7 10% | 25.2 24% | 29.4 11% |
* ... menor é melhor
Teste de estresse
A temperatura do núcleo sob carga é ligeiramente mais fria em alguns graus C do que no S410 G4 do ano passado. Ao executar o estresse do Prime95, a CPU aumentaria para 3,1 GHz, 53 W e 97 C até cair para 1,9 GHz, 88 C e 29 W após um minuto de teste devido à sustentabilidade limitada do Turbo Boost. A temperatura do núcleo também seria semelhante durante a execução Witcher 3 enquanto a CPU do S410 G4 se estabilizaria bem acima de 90 °C.
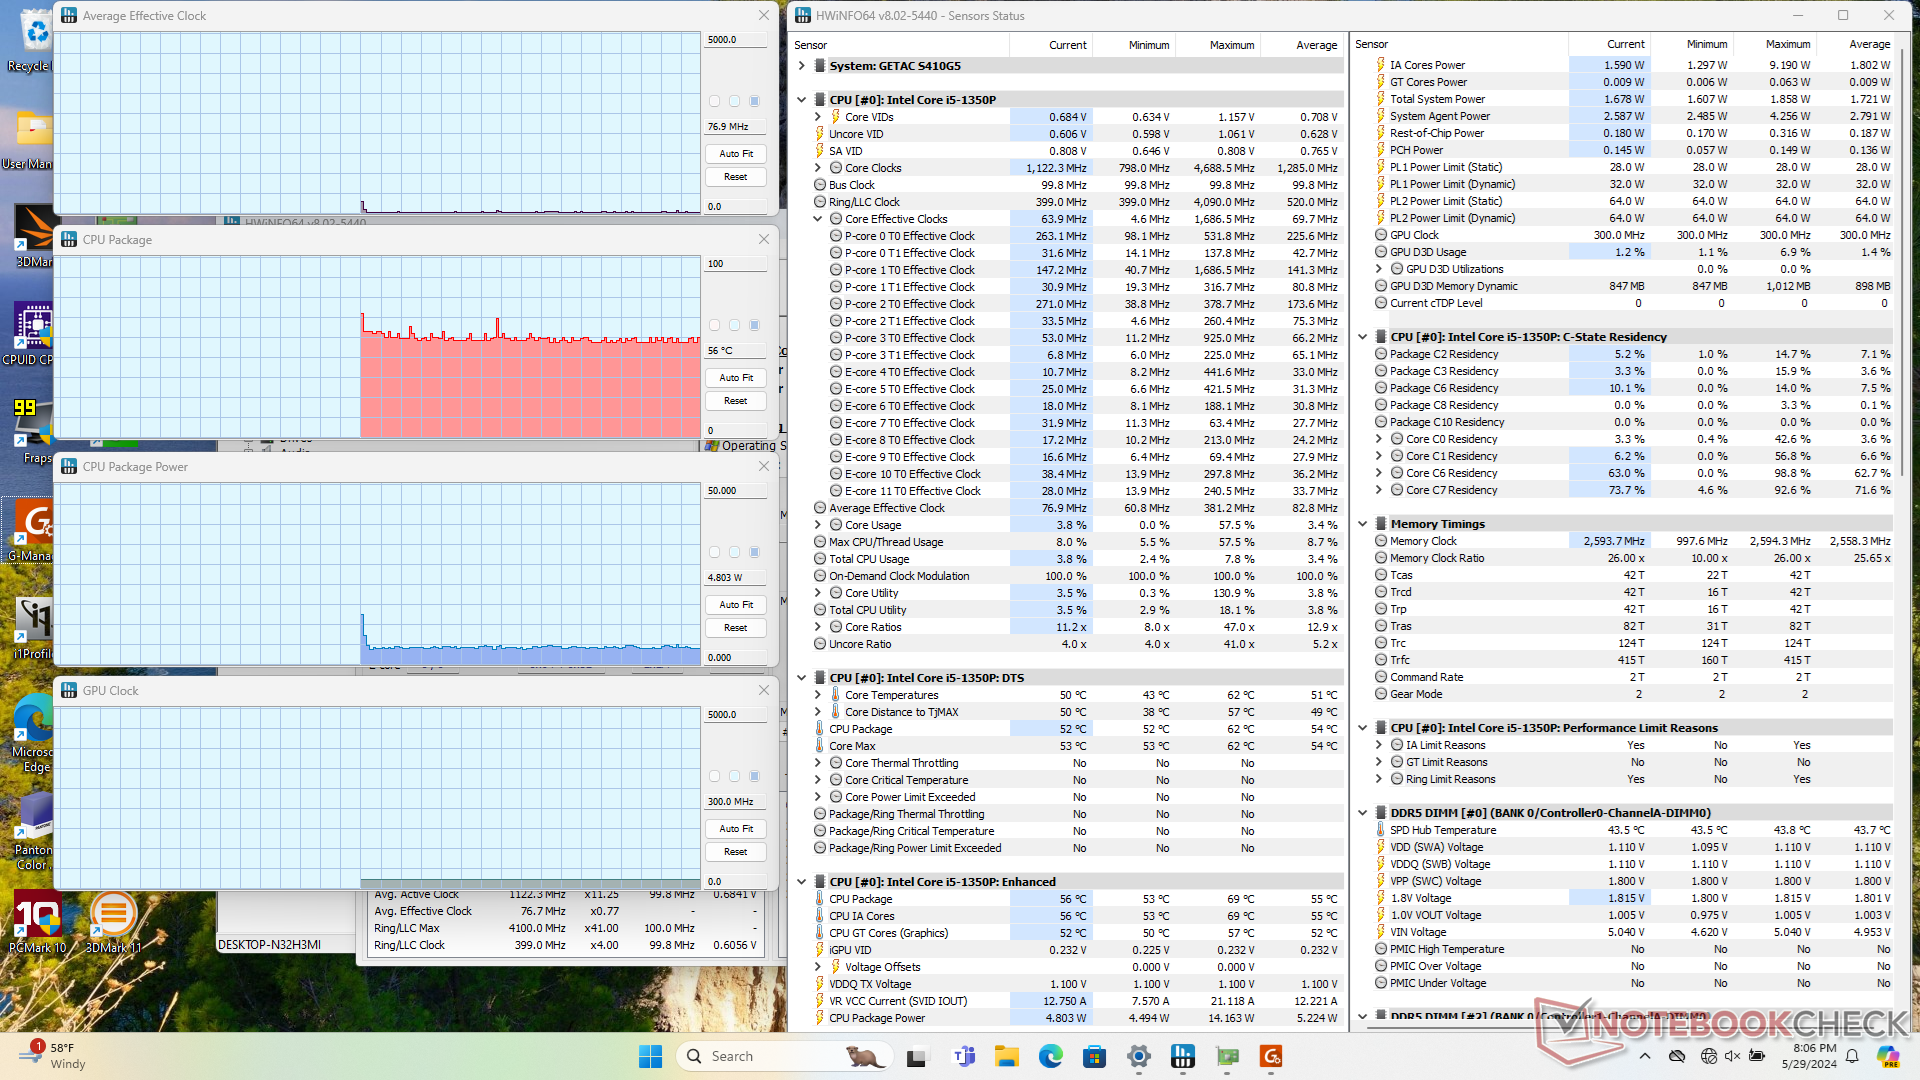
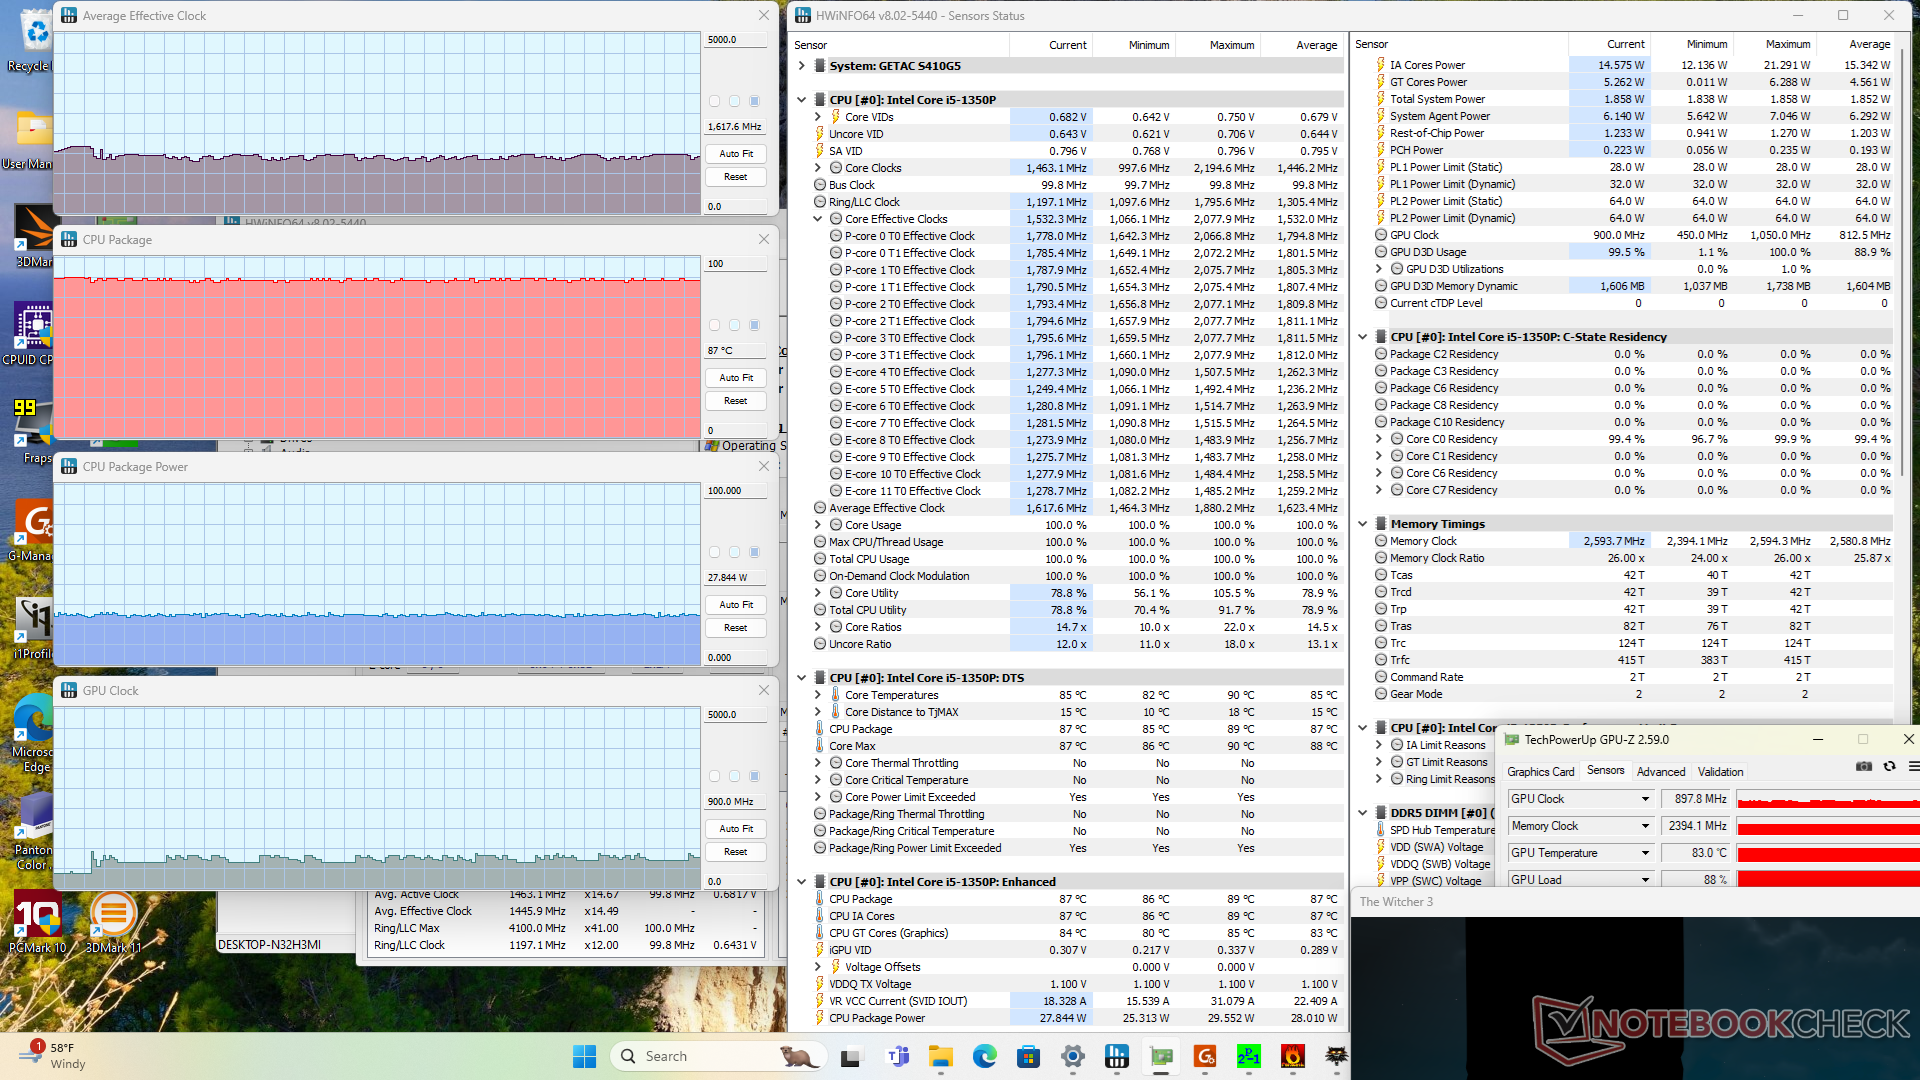
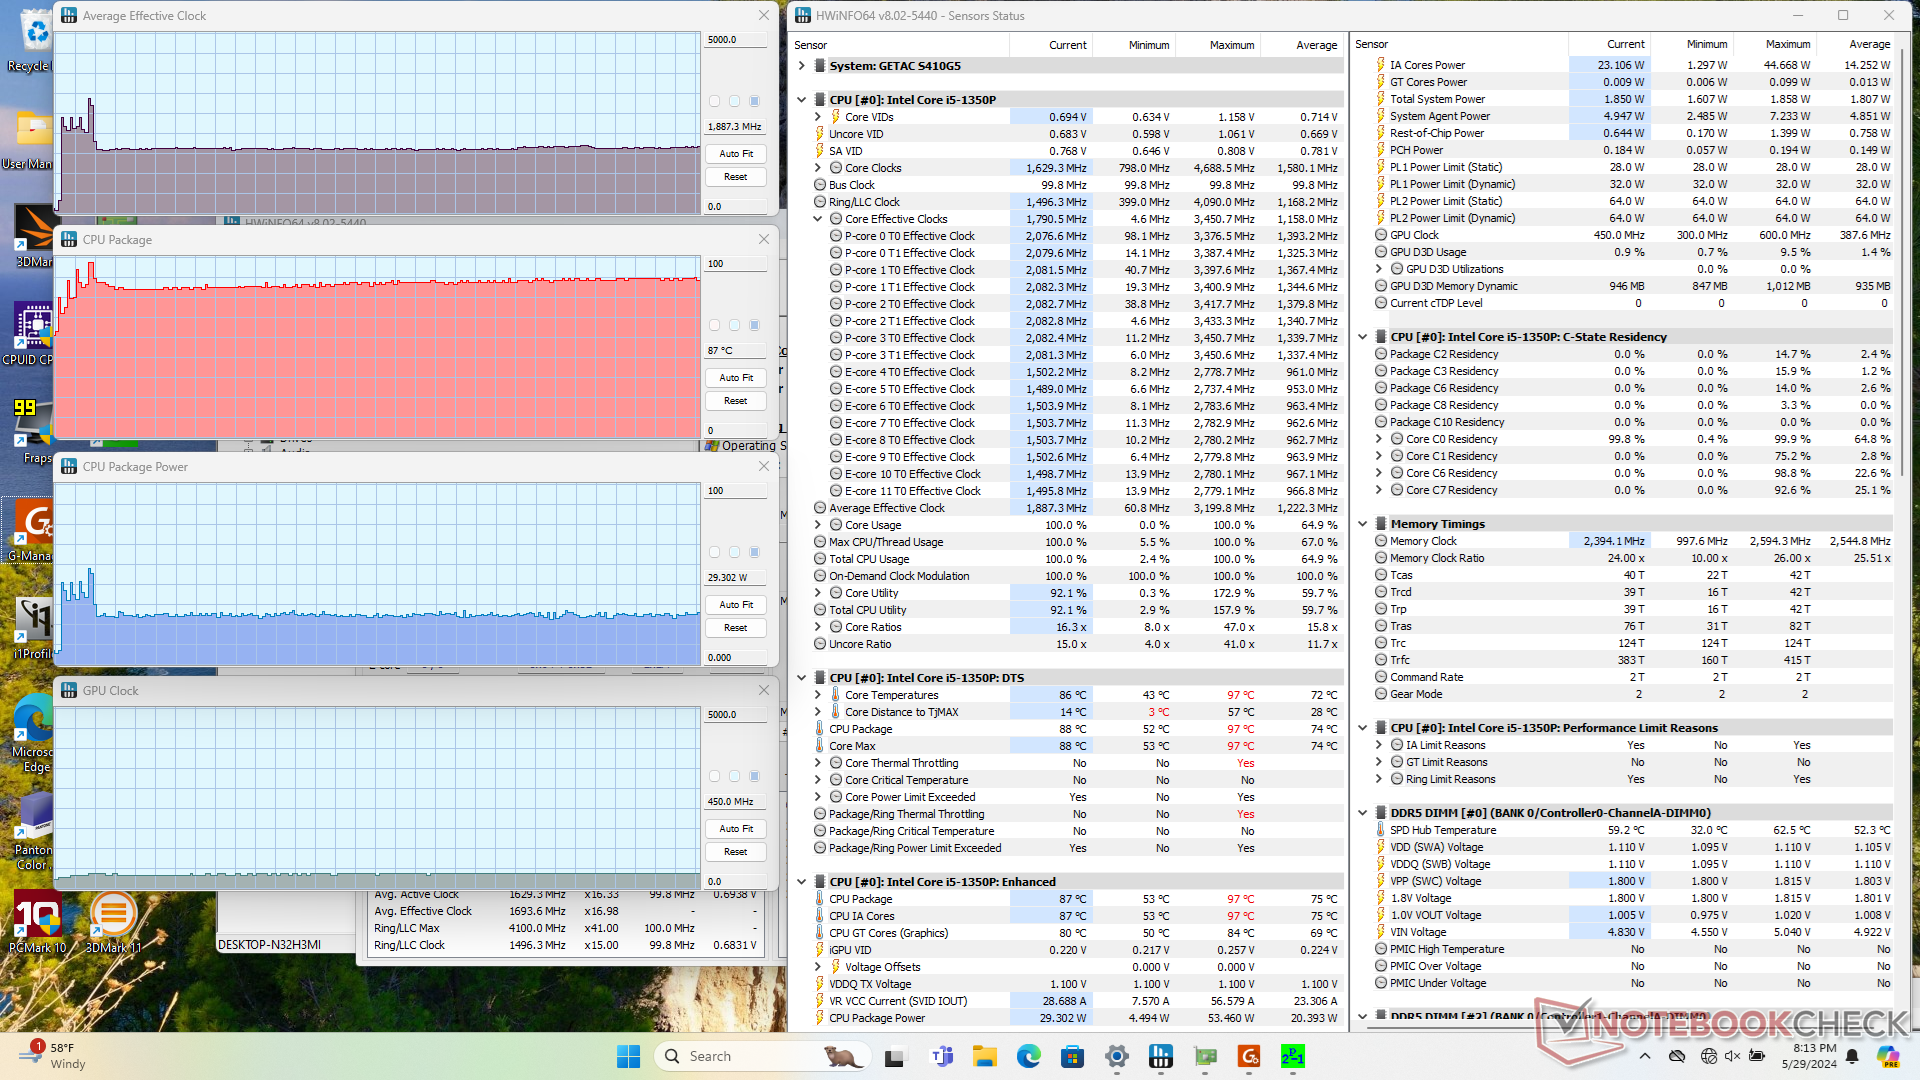
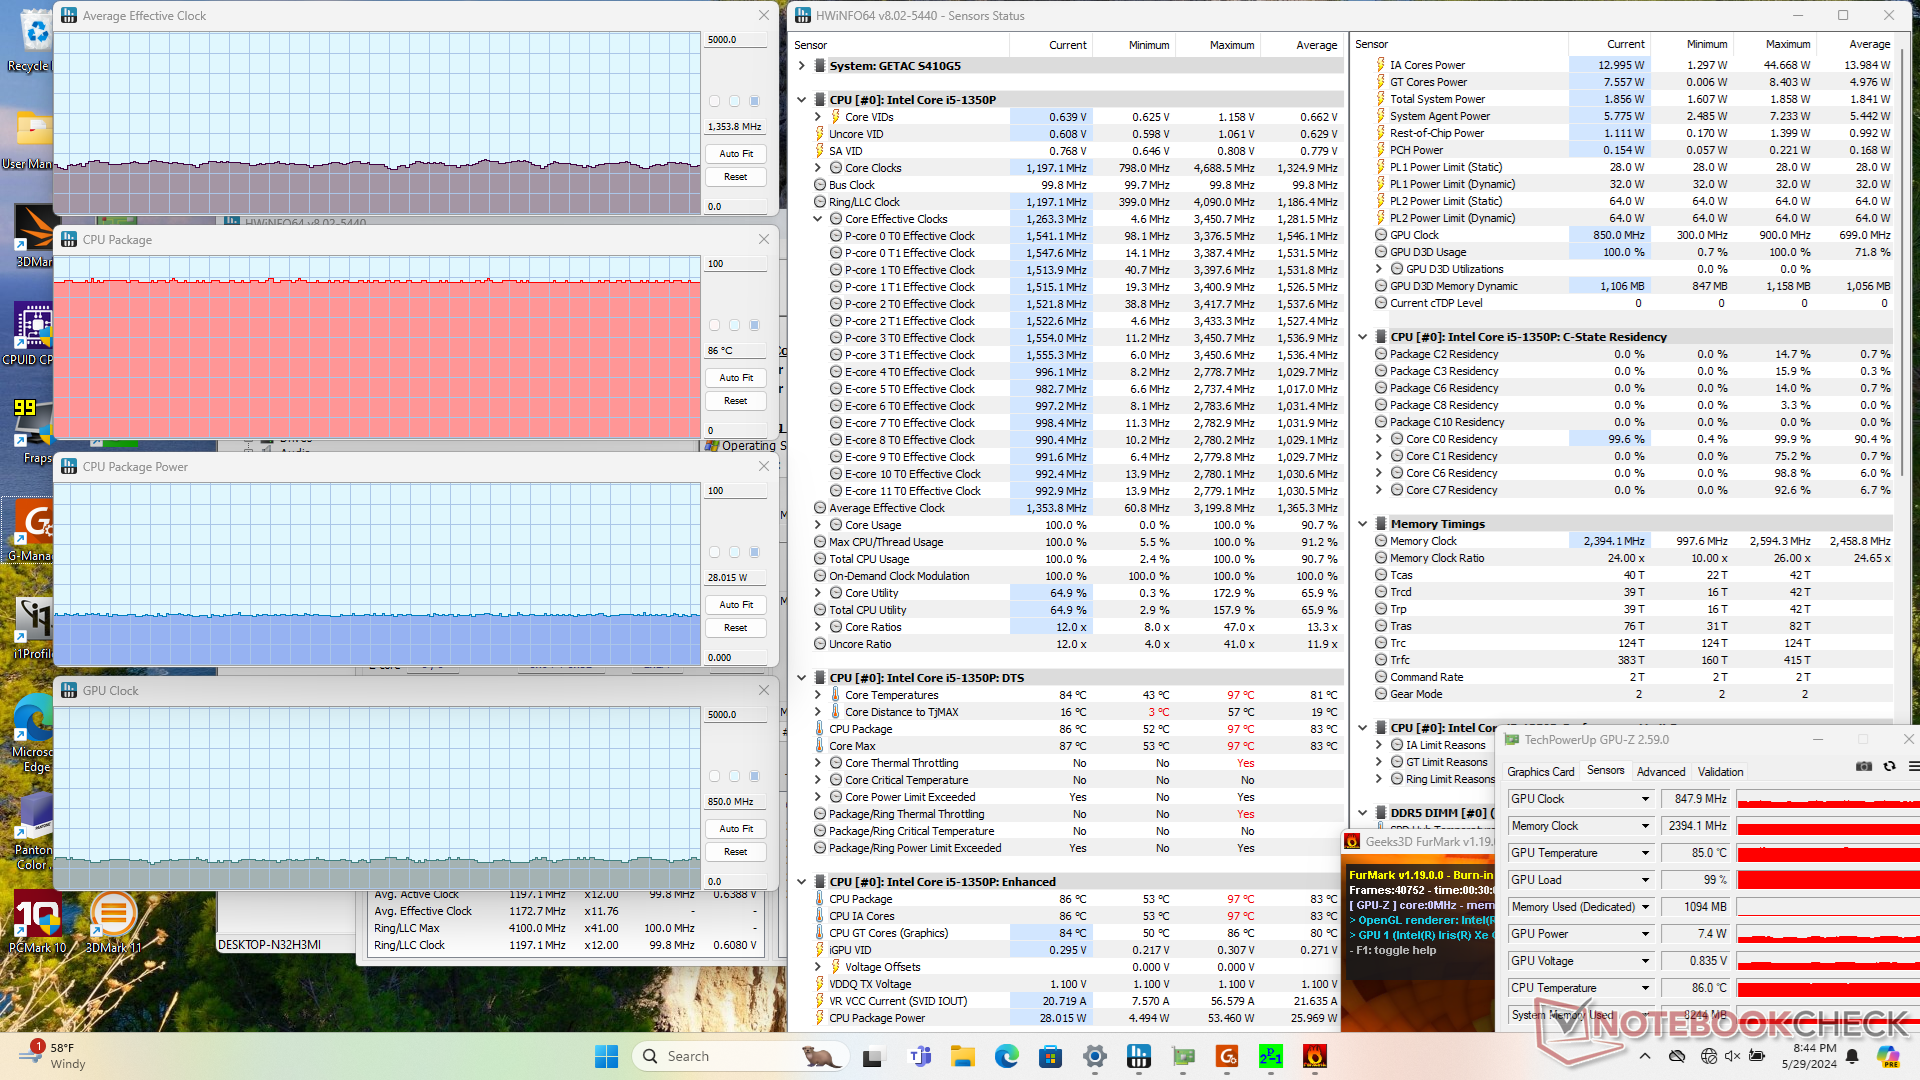
| Clock médio da CPU (GHz) | Clock da GPU (MHz) | Temperatura média da CPU (°C) | |
| Sistema ocioso | -- | -- | 56 |
| Estresse doPrime95 | 1.9 | -- | 88 |
| Prime95 + FurMark Stress | 1.2 - 1.5 | 850 | 86 |
| Witcher 3 Estresse | 1.6 | 900 | 87 |
Alto-falantes
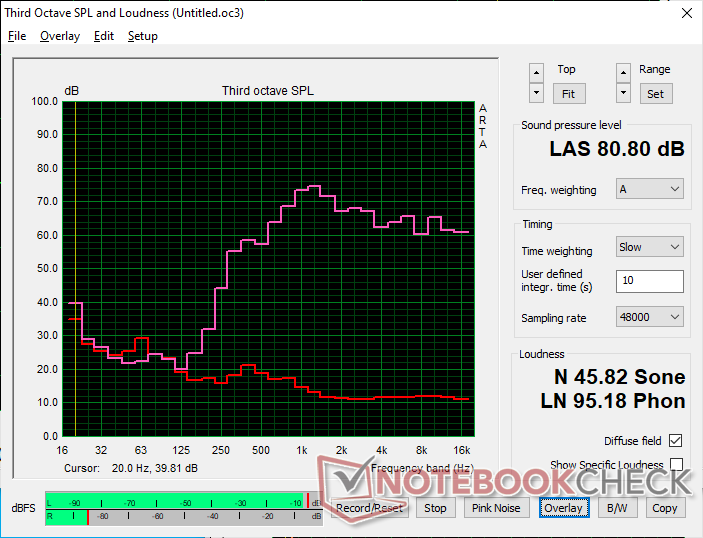
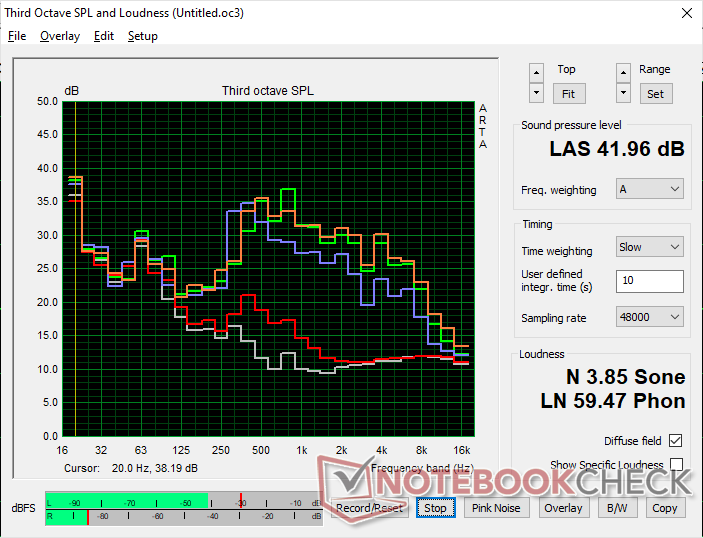
Getac S410 G5 análise de áudio
(±) | o volume do alto-falante é médio, mas bom (###valor### dB)
Graves 100 - 315Hz
(-) | quase nenhum baixo - em média 29.2% menor que a mediana
(±) | a linearidade dos graves é média (13.4% delta para a frequência anterior)
Médios 400 - 2.000 Hz
(±) | médios mais altos - em média 6.7% maior que a mediana
(±) | a linearidade dos médios é média (7.5% delta para frequência anterior)
Altos 2 - 16 kHz
(+) | agudos equilibrados - apenas 2.9% longe da mediana
(+) | os máximos são lineares (6% delta da frequência anterior)
Geral 100 - 16.000 Hz
(±) | a linearidade do som geral é média (23.3% diferença em relação à mediana)
Comparado com a mesma classe
» 64% de todos os dispositivos testados nesta classe foram melhores, 8% semelhantes, 28% piores
» O melhor teve um delta de 7%, a média foi 21%, o pior foi 53%
Comparado com todos os dispositivos testados
» 68% de todos os dispositivos testados foram melhores, 6% semelhantes, 27% piores
» O melhor teve um delta de 4%, a média foi 24%, o pior foi 134%
Apple MacBook Pro 16 2021 M1 Pro análise de áudio
(+) | os alto-falantes podem tocar relativamente alto (###valor### dB)
Graves 100 - 315Hz
(+) | bons graves - apenas 3.8% longe da mediana
(+) | o baixo é linear (5.2% delta para a frequência anterior)
Médios 400 - 2.000 Hz
(+) | médios equilibrados - apenas 1.3% longe da mediana
(+) | médios são lineares (2.1% delta para frequência anterior)
Altos 2 - 16 kHz
(+) | agudos equilibrados - apenas 1.9% longe da mediana
(+) | os máximos são lineares (2.7% delta da frequência anterior)
Geral 100 - 16.000 Hz
(+) | o som geral é linear (4.6% diferença em relação à mediana)
Comparado com a mesma classe
» 0% de todos os dispositivos testados nesta classe foram melhores, 0% semelhantes, 100% piores
» O melhor teve um delta de 5%, a média foi 18%, o pior foi 45%
Comparado com todos os dispositivos testados
» 0% de todos os dispositivos testados foram melhores, 0% semelhantes, 100% piores
» O melhor teve um delta de 4%, a média foi 24%, o pior foi 134%
Gerenciamento de energia
Consumo de energia
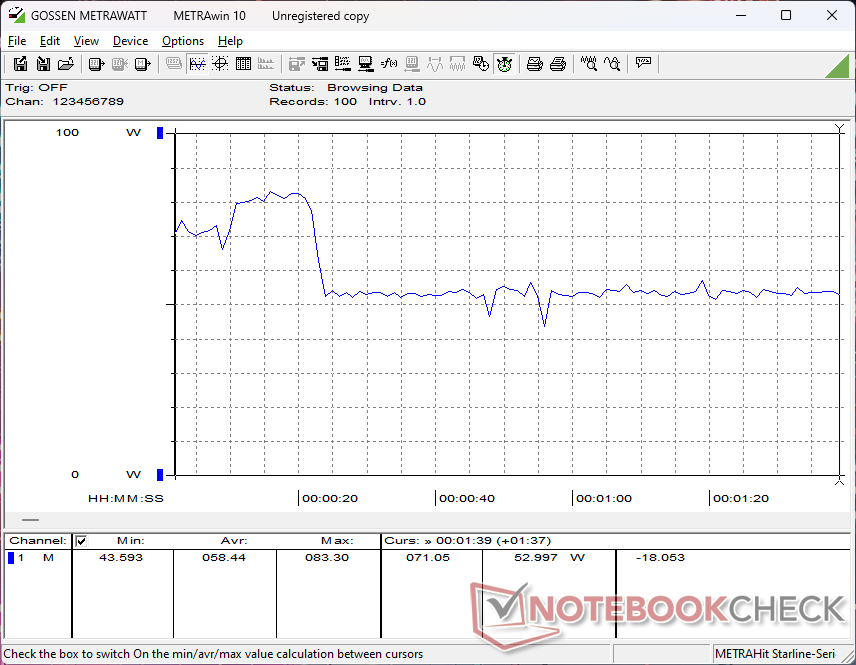
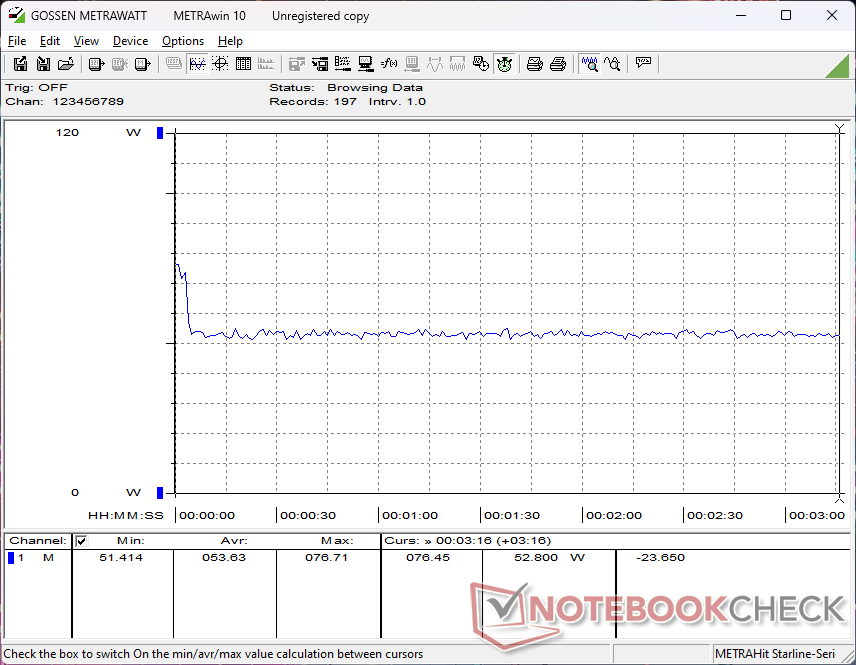
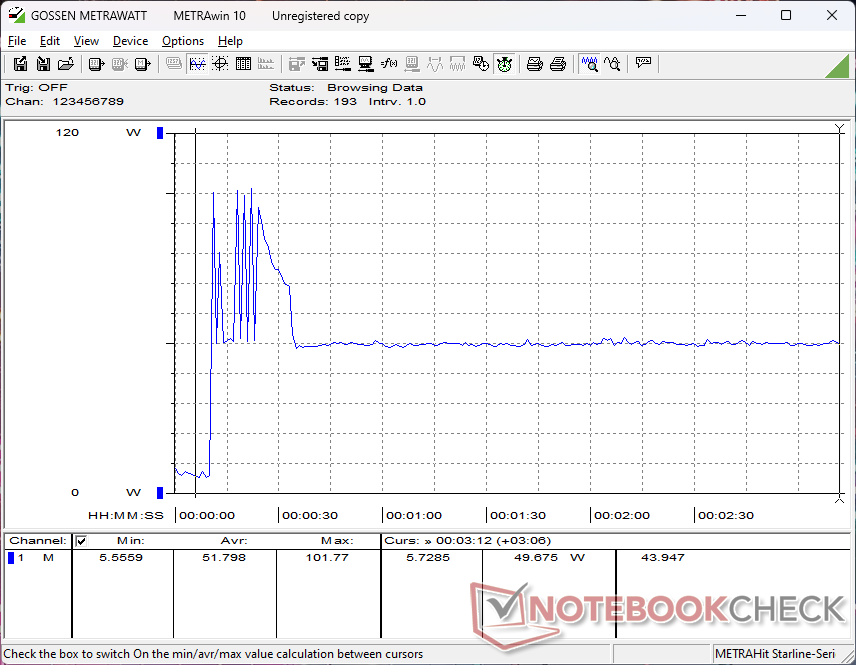
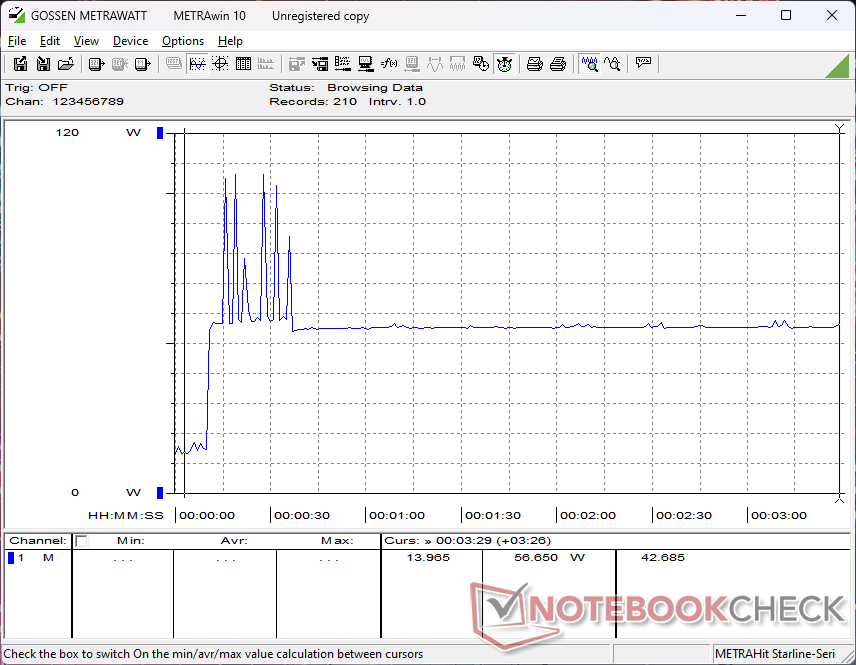
O consumo de energia é comparável ao do S410 G4, mas com uma exceção notável relacionada à CPU. O novo Core i5-1350P é significativamente mais rápido do que o Core i7-1185G7, conforme mencionado acima, mas isso tem o preço de um maior consumo de energia, especialmente quando o Turbo Boost está ativo. Por exemplo, o consumo pode chegar a 102 W durante os primeiros segundos de estresse do Prime95, quando o Turbo Boost está mais rápido, em comparação com apenas 73 W no S410 G4. Mesmo assim, o desempenho por watt ainda é superior com a CPU mais nova, antes e depois de qualquer limitação.
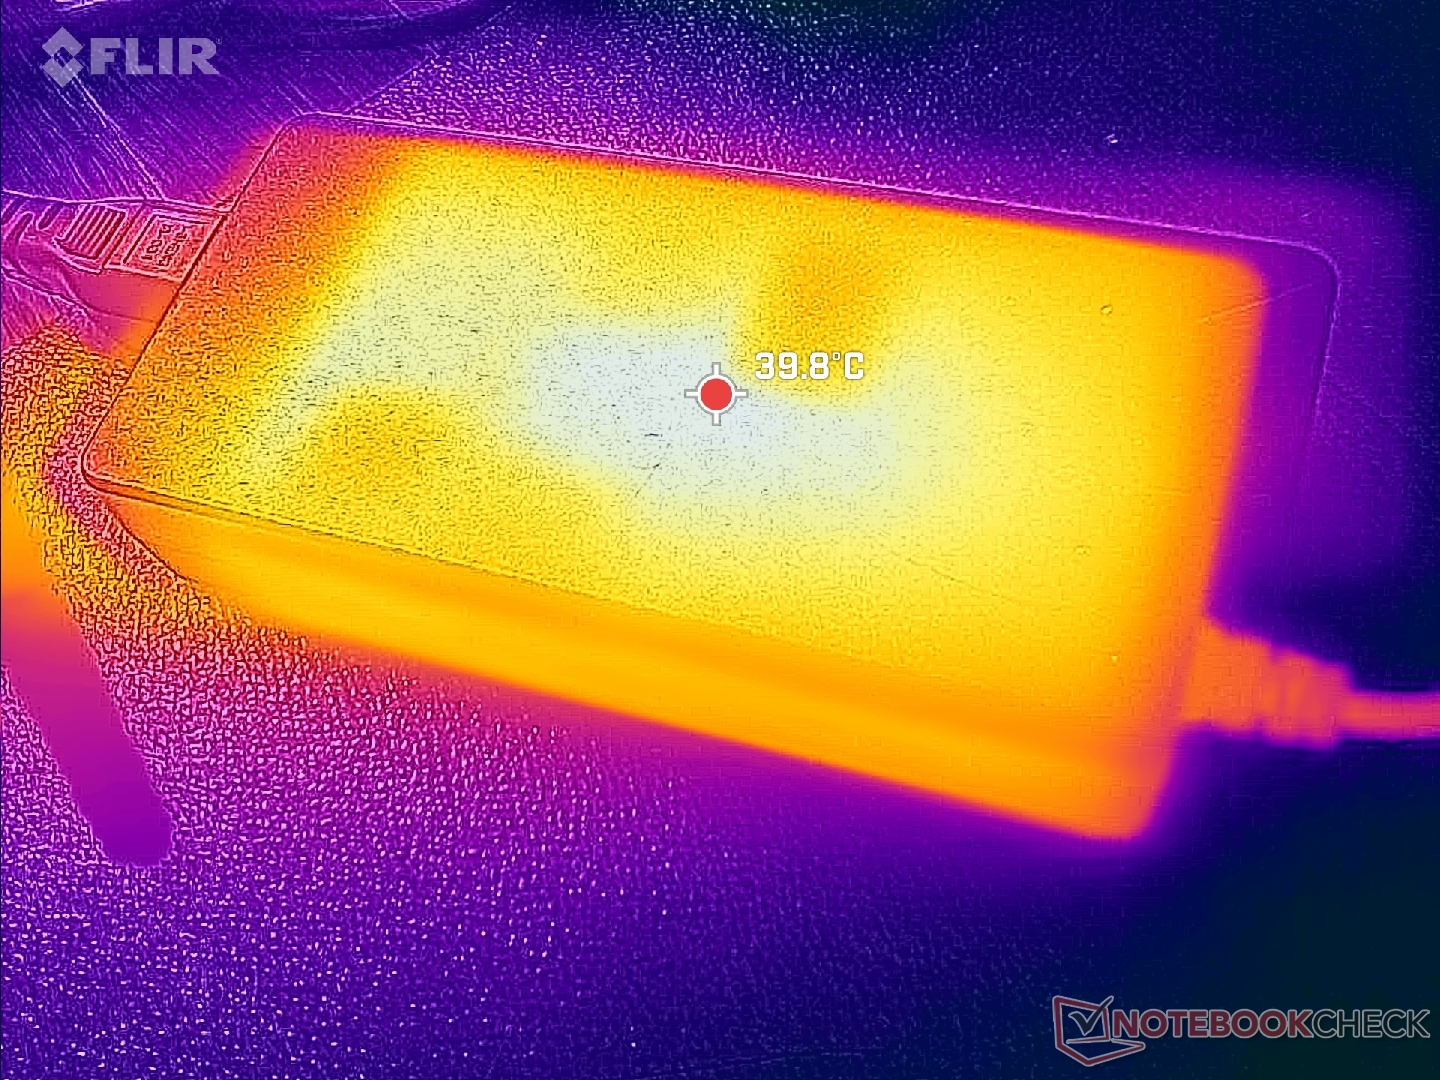
O modelo é fornecido com o mesmo adaptador CA de 90 W de antes.
| desligado | |
| Ocioso | |
| Carga |
|
Key:
min: | |
| Getac S410 G5 i5-1350P, Iris Xe G7 80EUs, SSSTC CL4-8D512, IPS, 1920x1080, 14" | Getac S410 Gen 4 i7-1185G7, Iris Xe G7 96EUs, SSSTC CA5-8D256, IPS, 1920x1080, 14" | Durabook S14I i7-1165G7, Iris Xe G7 96EUs, UDinfo M2P M2P80DE512GBAEP, TN, 1920x1080, 14" | Dell Latitude 14 5420-D2G5W i5-1135G7, Iris Xe G7 80EUs, WDC PC SN530 SDBPTPZ-256G, IPS, 1920x1080, 14" | Dell Latitude 7330 Rugged Extreme i7-1185G7, Iris Xe G7 96EUs, , IPS, 1920x1080, 13.3" | Panasonic Toughbook 40 i7-1185G7, Iris Xe G7 96EUs, Samsung PM991 MZVLQ1T0HALB, IPS, 1920x1080, 14" | |
|---|---|---|---|---|---|---|
| Power Consumption | 10% | 11% | 44% | 23% | 18% | |
| Idle Minimum * | 7.9 | 8.3 -5% | 6.8 14% | 3.4 57% | 4.1 48% | 4.9 38% |
| Idle Average * | 14.4 | 10.5 27% | 16.4 -14% | 7.1 51% | 11.7 19% | 12.3 15% |
| Idle Maximum * | 15.2 | 14.9 2% | 16.9 -11% | 8.4 45% | 11.8 22% | 14 8% |
| Load Average * | 58.4 | 48.6 17% | 39.2 33% | 35.3 40% | 48.5 17% | 54 8% |
| Witcher 3 ultra * | 53.7 | 50.9 5% | 35.4 34% | 44.3 18% | 46.3 14% | |
| Load Maximum * | 106.5 | 90.1 15% | 73.1 31% | 67 37% | 91 15% | 83.6 22% |
* ... menor é melhor
Power Consumption Witcher 3 / Stresstest
Power Consumption external Monitor
Duração da bateria
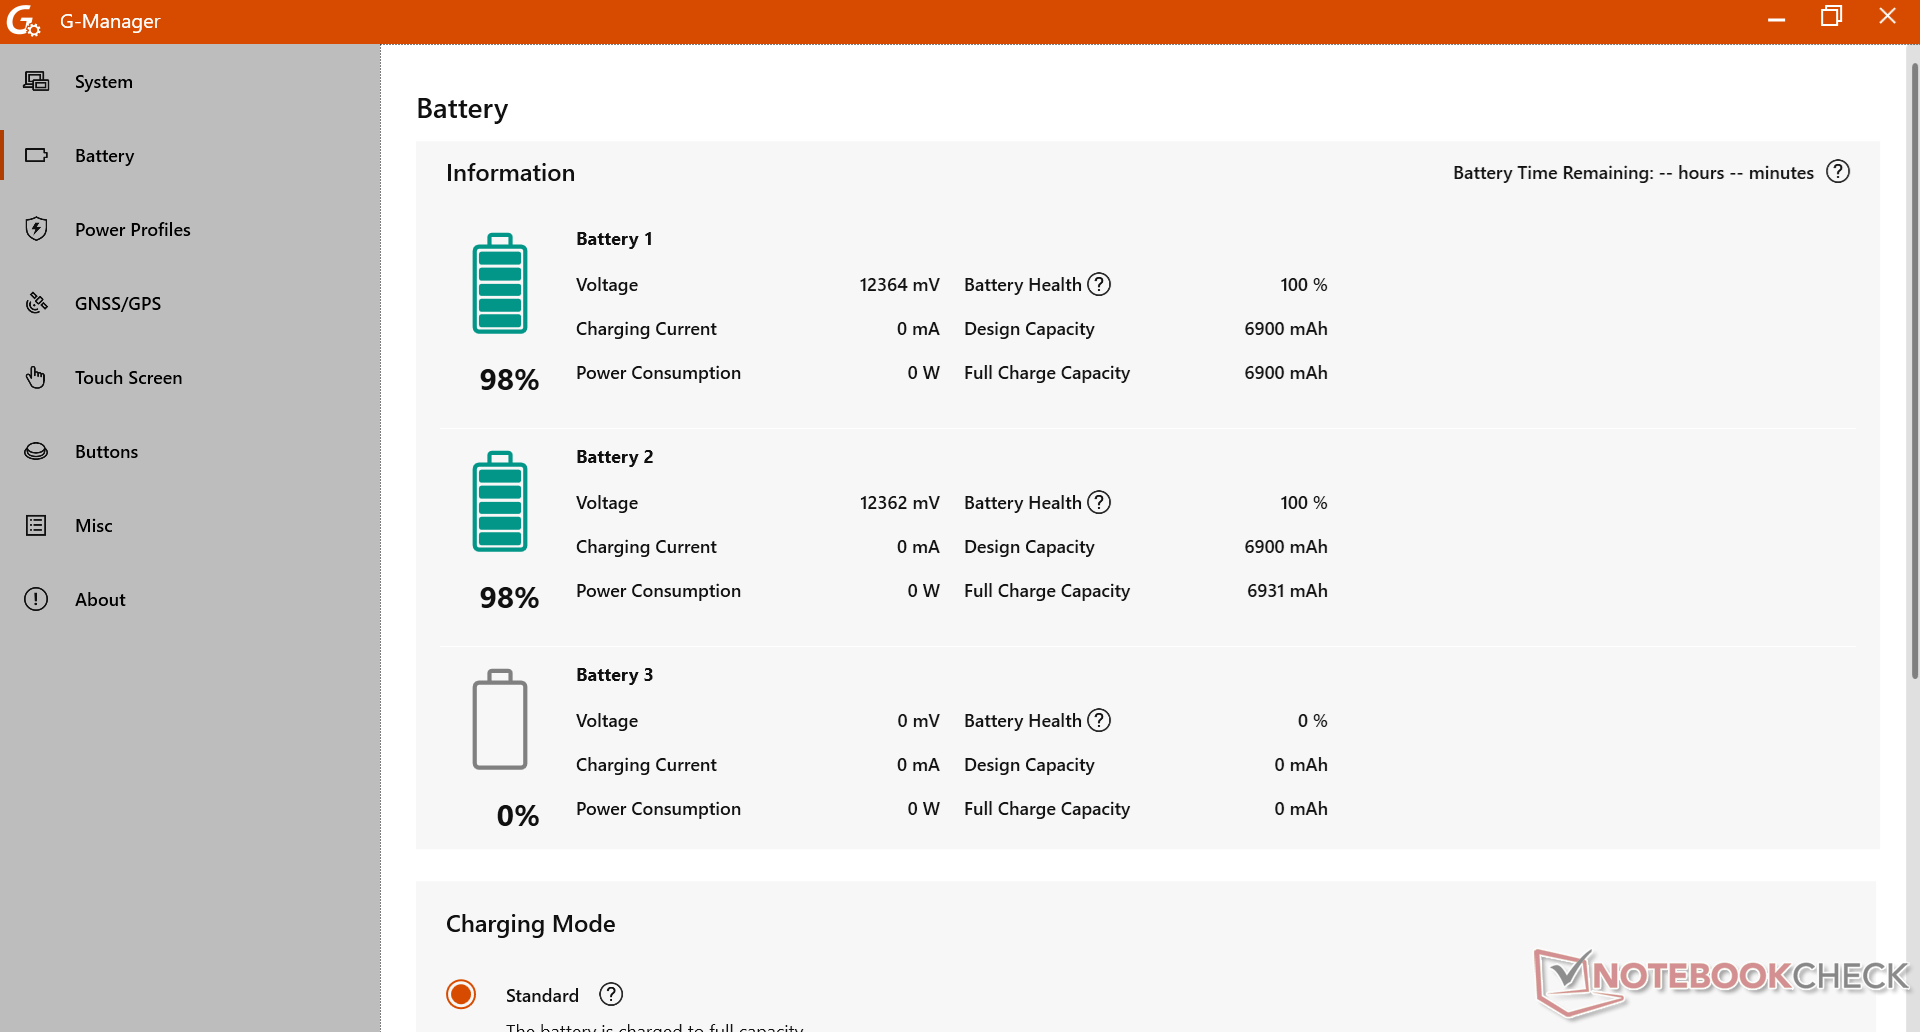
Nossa unidade de teste S410 G5 não inclui uma bateria interna, ao contrário da nossa unidade S410 G4, e, portanto, conta com duas baterias removíveis de 75 Wh para uma capacidade total de 150 Wh. Mesmo assim, o tempo de execução da WLAN é muito menor do que o do modelo do ano passado (17,5 horas contra 28,5 horas), mesmo depois de levar em conta a menor capacidade total. A discrepância na duração da bateria pode ser atribuída em grande parte à CPU Raptor Lake-P mais exigente, conforme mencionado na seção Consumo de energia acima.
| Getac S410 G5 i5-1350P, Iris Xe G7 80EUs, 150 Wh | Getac S410 Gen 4 i7-1185G7, Iris Xe G7 96EUs, 194 Wh | Durabook S14I i7-1165G7, Iris Xe G7 96EUs, 50 Wh | Dell Latitude 14 5420-D2G5W i5-1135G7, Iris Xe G7 80EUs, 63 Wh | Dell Latitude 7330 Rugged Extreme i7-1185G7, Iris Xe G7 96EUs, 107 Wh | Panasonic Toughbook 40 i7-1185G7, Iris Xe G7 96EUs, 136 Wh | |
|---|---|---|---|---|---|---|
| Duração da bateria | 63% | -69% | -27% | 2% | 8% | |
| WiFi v1.3 | 1052 | 1715 63% | 329 -69% | 769 -27% | 1077 2% | 1137 8% |
| Reader / Idle | 1371 | |||||
| Load | 146 |
Pro
Contra
Veredicto

O S410 G5 mantém a compatibilidade com os modelos da geração anterior, o que é importante para aplicações industriais e governamentais. A redução do efeito fantasma na tela e o aumento do desempenho da CPU são, sem dúvida, os destaques do modelo mais recente e os principais motivos para comprar o S410 G5 em vez do antigo S410 G4. A duração da bateria é afetada pela CPU mais rápida, mas ainda é muito longa, especialmente porque o sistema pode suportar vários pacotes de bateria. Enquanto isso, a webcam de resolução mais alta e o suporte adequado ao Wi-Fi 6E são ótimos extras.
O robusto Getac S410 G5 é mais rápido do que antes por margens significativas devido à nova CPU de 13ª geração. Entretanto, alguns recursos internos e externos precisam de atualizações para melhorar a experiência do usuário.
Gostaríamos muito que alguns aspectos incômodos do design fossem abordados em versões futuras. Uma ventoinha maior, por exemplo, ajudaria a reduzir o ruído da ventoinha. Os alto-falantes poderiam ser mais altos e as tampas das portas poderiam ser mais fáceis de abrir. As teclas do teclado também não são muito confiáveis, pois é possível tocar uma tecla sem registrar uma entrada. Essas desvantagens têm sido persistentes na série S410 e estão se tornando mais difíceis de ignorar a cada ano.
Preço e disponibilidade
As cotações estão disponíveis mediante solicitação no site oficial da Getac.
Getac S410 G5
- 06/05/2024 v7 (old)
Allen Ngo
Transparência
A seleção dos dispositivos a serem analisados é feita pela nossa equipe editorial. A amostra de teste foi fornecida ao autor como empréstimo pelo fabricante ou varejista para fins desta revisão. O credor não teve influência nesta revisão, nem o fabricante recebeu uma cópia desta revisão antes da publicação. Não houve obrigação de publicar esta revisão. Nunca aceitamos compensação ou pagamento em troca de nossas avaliações. Como empresa de mídia independente, a Notebookcheck não está sujeita à autoridade de fabricantes, varejistas ou editores.
É assim que o Notebookcheck está testando
Todos os anos, o Notebookcheck analisa de forma independente centenas de laptops e smartphones usando procedimentos padronizados para garantir que todos os resultados sejam comparáveis. Desenvolvemos continuamente nossos métodos de teste há cerca de 20 anos e definimos padrões da indústria no processo. Em nossos laboratórios de teste, equipamentos de medição de alta qualidade são utilizados por técnicos e editores experientes. Esses testes envolvem um processo de validação em vários estágios. Nosso complexo sistema de classificação é baseado em centenas de medições e benchmarks bem fundamentados, o que mantém a objetividade.Price comparison

