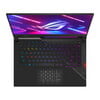
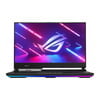
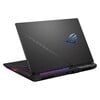
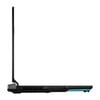
Análise do Asus ROG Strix Scar 15 G533zm: Laptop moderno para jogos RTX 3060 com muitos pontos fortes

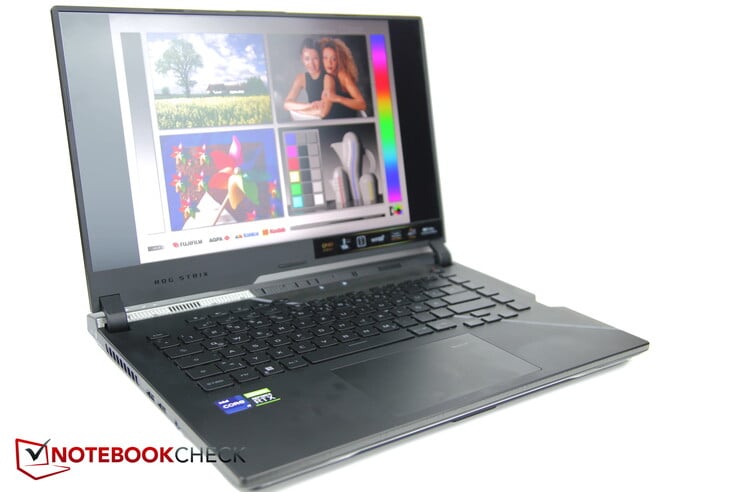
Atualmente, temos dois modelos do Asus ROG Strix Scar 15 disponíveis para teste. Este artigo se concentrará no modelo RTX 3060 enquanto uma análise da versão RTX 3070 Ti será publicada em paralelo. Além da RTX 3060, nossa SKU está equipada com um potente processador Alder Lake i9-12900H Alder Lake, 16 GB de RAM e uma tela QHD de 240 Hz.
No ano passado, analisamos o modelo anterior Scar 15 anterior com uma RTX 3080por isso, faz mais sentido comparar nossa unidade de análise com sua irmã RTX 3070 Ti. Além disso, optamos por incluir outros notebooks para jogos de 15 polegadas com a mesma GPU em nossa comparação, como o Asus TUF Gaming F15e o MSI Pulse GL66 e o Alienware m15 R5. Embora a comparação também apresente o Lenovo Legion 5 com uma Radeon RX6600Messe notebook não está na mesma faixa de preço do Strix Scar, já que nossa configuração de análise custa cerca de 2.000 euros (US$ 2.170), enquanto o Legion custa pouco mais de 1.000 euros (US$ 1.085).
Para ver as seções sobre o chassi, a manutenção, os dispositivos de entrada e muito mais, consulte nossa análise principal do Asus ROG Strix Scar com RTX 3070 Ti.
Possíveis concorrentes em comparação
Avaliação | Data | Modelo | Peso | Altura | Size | Resolução | Preço |
|---|---|---|---|---|---|---|---|
| 89.2 % v7 (old) | 11/2024 | Asus ROG Strix Scar 15 G533zm i9-12900H, GeForce RTX 3060 Laptop GPU | 2.3 kg | 27.2 mm | 15.60" | 2560x1440 | |
| 86.3 % v7 (old) | 06/2022 | Asus ROG Strix Scar 15 G533ZW-LN106WS i9-12900H, GeForce RTX 3070 Ti Laptop GPU | 2.3 kg | 27.2 mm | 15.60" | 2560x1440 | |
| 87.2 % v7 (old) | 03/2022 | Asus TUF Gaming F15 FX507ZM i7-12700H, GeForce RTX 3060 Laptop GPU | 2.1 kg | 24.95 mm | 15.60" | 1920x1080 | |
| 80.7 % v7 (old) | 04/2022 | MSI Pulse GL66 12UEK i9-12900H, GeForce RTX 3060 Laptop GPU | 2.3 kg | 25 mm | 15.60" | 1920x1080 | |
| 84.7 % v7 (old) | 06/2021 | Alienware m15 R5 Ryzen Edition R7 5800H, GeForce RTX 3060 Laptop GPU | 2.5 kg | 22.85 mm | 15.60" | 1920x1080 | |
| 82.6 % v7 (old) | 05/2022 | Lenovo Legion 5 15ACH6A-82NW0010GE R5 5600H, Radeon RX 6600M | 2.5 kg | 25.75 mm | 15.60" | 1920x1080 |
Os Top 10
» Os Top 10 Portáteis Multimídia
» Os Top 10 Portáteis de Jogos
» Os Top 10 Portáteis Leves para Jogos
» Os Top 10 Portáteis Acessíveis de Escritório/Empresariais
» Os Top 10 Portáteis Premium de Escritório/Empresariais
» Os Top 10 dos Portáteis Workstation
» Os Top 10 Subportáteis
» Os Top 10 Ultrabooks
» Os Top 10 Conversíveis
» Os Top 10 Tablets
» Os Top 10 Smartphones
» A melhores Telas de Portáteis Analisadas Pela Notebookcheck
» Top 10 dos portáteis abaixo dos 500 Euros da Notebookcheck
» Top 10 dos Portáteis abaixo dos 300 Euros
Case - Design atraente de laptop para jogos
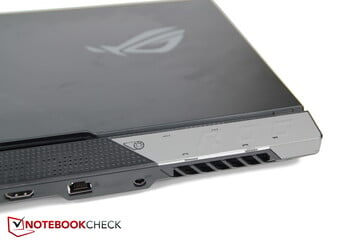
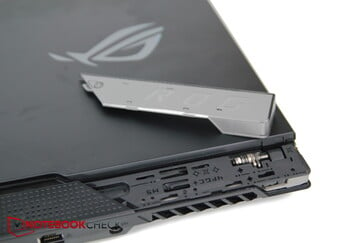
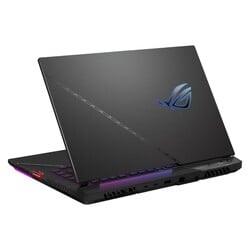
Uma filosofia de design bastante exclusiva permeia todo o ROG Scar, tornando-o um laptop atraente para os gamers. Com linhas diagonais, uma placa substituível na tampa traseira, detalhes de cores sutis e elementos RGB, o fabricante criou um estilo de jogo distinto sem uma iluminação excessivamente berrante que pisca e brilha.
Por exemplo, há uma faixa de luz que atravessa toda a parte frontal, mas ela é ligeiramente recuada, o que a torna menos proeminente. Essa faixa de luz também pode ser sincronizada com o teclado e o logotipo da ROG na parte superior.
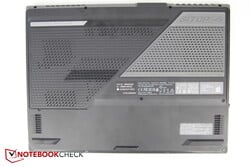
Na parte inferior, há pés de borracha largos e de cores vivas, que contrastam com o chassi predominantemente preto.
Apesar de sua construção quase totalmente em plástico, o Strix Scar 15 parece bastante robusto. A tela não faz nenhum ruído quando é girada, enquanto a seção da base apenas range levemente.
A tela é mantida firmemente no lugar por duas dobradiças e quase não oscila quando é movida.
Comparação de tamanhos
No geral, o Scar 15 é um pouco mais grosso, mas uma fração menor do que alguns de seus concorrentes. Ele também é relativamente leve; por exemplo, os modelos Alienware e Legion são mais pesados, e apenas o TUF Gaming F15 é um pouco mais leve.
Especificações - Thunderbolt 4, Keystone, mas sem Webcam
O Strix está equipado com duas portas USB-C, uma das quais suporta Thunderbolt 4 e a outra é capaz de atingir velocidades de USB 3.2 Gen 2; ambas oferecem a funcionalidade DisplayPort. Isso mostra que o laptop tem recursos bastante modernos. As E/Ss estão bem distribuídas no lado esquerdo e na parte traseira do dispositivo.
O lado direito apresenta apenas um slot Keystone. O Keystone é como um pequeno dispositivo de armazenamento e um switch em um só. Por exemplo, ele pode ser usado para armazenar configurações e transferi-las para laptops que suportam esse recurso (uma lista de modelos compatíveis é fornecida pela Asus). Ele também pode funcionar como uma chave de segurança no Strix Scar: uma vez configurado, o laptop só será ligado com o Keystone inserido. Outra aplicação é permitir o acesso rápido a programas. Os usuários podem instruir o laptop a abrir automaticamente um determinado programa, como um jogo, quando o Keystone estiver conectado. O laptop também pode ser programado para executar uma combinação de ações, como alternar para o modo de ventilador de alto desempenho e iniciar o Cyberpunk simultaneamente. A escolha está nas mãos do usuário.
No entanto, falta uma coisa no dispositivo da Asus: uma webcam. Isso torna o Scar Strix um dos poucos laptops (para jogos) sem webcam.
Conectividade
Dispositivos de entrada - O botão do touchpad pode ficar ligeiramente preso
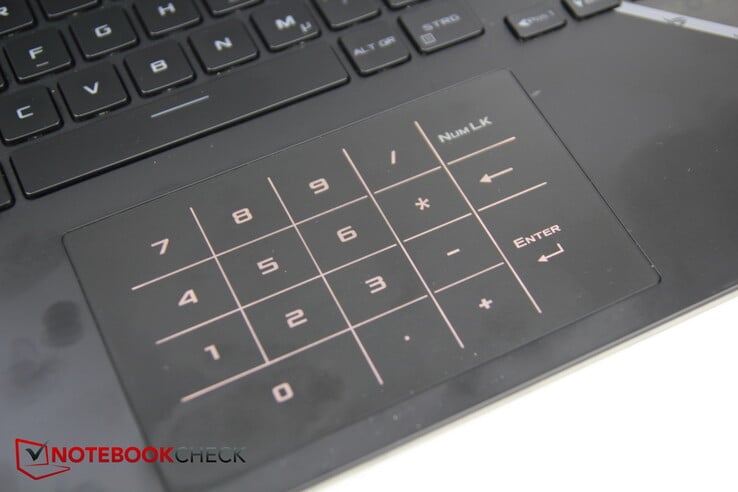
Touchpad
Tela - QHD com 240 Hz e Dolby Vision Atmos
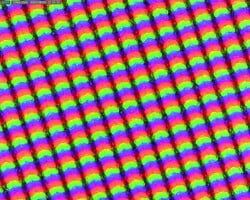
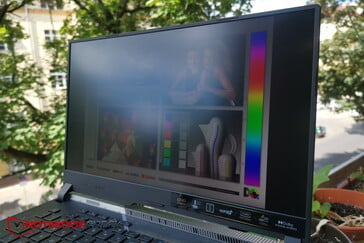
A tela QHD IPS (2.560 x 1.440 pixels) fabricada pela BOE apresenta tempos de resposta bastante rápidos, uma alta taxa de atualização de 240 Hz e excelente cobertura de cores, capaz de reproduzir quase toda a gama sRGB e AdobeRGB.
O painel tem um brilho de pico médio de 300 nits e uma distribuição de brilho muito boa de 89%. No entanto, o nível de preto e o contraste são bastante medianos.
O laptop não usa PWM para ajustar o brilho e há apenas uma quantidade minúscula de sangramento na tela.
| |||||||||||||||||||||||||
iluminação: 89 %
iluminação com acumulador: 357 cd/m²
Contraste: 1026:1 (Preto: 0.34 cd/m²)
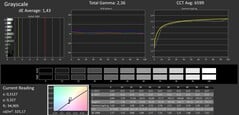
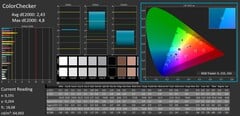
ΔE Color 3.44 | 0.5-29.43 Ø4.87, calibrated: 2.43
ΔE Greyscale 3.34 | 0.5-98 Ø5.1
84.1% AdobeRGB 1998 (Argyll 2.2.0 3D)
99.6% sRGB (Argyll 2.2.0 3D)
95% Display P3 (Argyll 2.2.0 3D)
Gamma: 2.5
| Asus ROG Strix Scar 15 G533zm BOE CQ NE156QHM-NZ2 (BOE0A55), IPS, 2560x1440, 15.6" | Asus ROG Strix Scar 15 G533ZW-LN106WS BOE CQ NE156QHM-NZ2, IPS-level, 2560x1440, 15.6" | Asus TUF Gaming F15 FX507ZM TL156VDXP0101, IPS, 1920x1080, 15.6" | MSI Pulse GL66 12UEK AU Optronics B156HAN08.4 (AUOAF90), IPS, 1920x1080, 15.6" | Alienware m15 R5 Ryzen Edition B156HAN, IPS, 1920x1080, 15.6" | Lenovo Legion 5 15ACH6A-82NW0010GE LGD06A5, IPS, 1920x1080, 15.6" | |
|---|---|---|---|---|---|---|
| Display | 0% | -17% | -51% | -13% | ||
| Display P3 Coverage | 95 | 96.2 1% | 66.4 -30% | 39 -59% | 71.1 -25% | |
| sRGB Coverage | 99.6 | 99.9 0% | 97 -3% | 58.4 -41% | 99.1 -1% | |
| AdobeRGB 1998 Coverage | 84.1 | 84.5 0% | 68.5 -19% | 40.3 -52% | 72.3 -14% | |
| Response Times | 14% | -4% | -333% | 30% | -45% | |
| Response Time Grey 50% / Grey 80% * | 6.4 ? | 7.86 ? -23% 4.21 ? 34% | 5.6 ? 12% | 38.8 ? -506% | 4 ? 37% | 15 ? -134% |
| Response Time Black / White * | 10.8 ? | 7.5 ? 31% | 12.8 ? -19% | 28 ? -159% | 8.4 ? 22% | 6 ? 44% |
| PWM Frequency | ||||||
| Screen | -14% | 23% | 15% | 14% | 2% | |
| Brightness middle | 349 | 346 -1% | 353.7 1% | 248 -29% | 329 -6% | 371 6% |
| Brightness | 333 | 329 -1% | 340 2% | 245 -26% | 321 -4% | 328 -2% |
| Brightness Distribution | 89 | 91 2% | 89 0% | 86 -3% | 92 3% | 85 -4% |
| Black Level * | 0.34 | 0.59 -74% | 0.34 -0% | 0.13 62% | 0.27 21% | 0.32 6% |
| Contrast | 1026 | 586 -43% | 1040 1% | 1908 86% | 1219 19% | 1159 13% |
| Colorchecker dE 2000 * | 3.44 | 3.06 11% | 1.74 49% | 3.14 9% | 2.78 19% | 3.25 6% |
| Colorchecker dE 2000 max. * | 5.78 | 5.81 -1% | 3.63 37% | 5.82 -1% | 4.88 16% | 6.33 -10% |
| Colorchecker dE 2000 calibrated * | 2.43 | 2.57 -6% | 0.5 79% | 3.14 -29% | 1.63 33% | 1.11 54% |
| Greyscale dE 2000 * | 3.34 | 2.1 37% | 1.2 64% | 2.5 25% | 4.94 -48% | |
| Gamma | 2.5 88% | 2.12 104% | 2.3 96% | 2.49 88% | 2.106 104% | 2.45 90% |
| CCT | 6641 98% | 7021 93% | 6257 104% | 6468 100% | 6201 105% | 6064 107% |
| Color Space (Percent of AdobeRGB 1998) | 76 | |||||
| Color Space (Percent of sRGB) | 99 | |||||
| Média Total (Programa/Configurações) | 0% /
-5% | 1% /
11% | -123% /
-49% | 22% /
17% | -19% /
-8% |
* ... menor é melhor
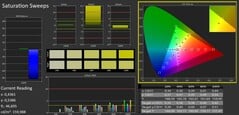
Usando a ferramenta de calibração de cores Calman da Portrait Displays, medimos diferenças de cores normais a moderadas logo que o produto saiu da caixa, com a tela tendo uma tonalidade mais alaranjada. Com nossa calibração, conseguimos reduzir substancialmente as diferenças de cores.
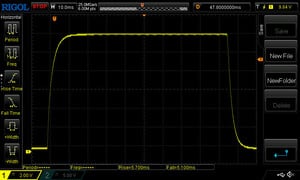
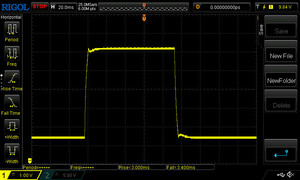
Exibir tempos de resposta
| ↔ Tempo de resposta preto para branco | ||
|---|---|---|
| 10.8 ms ... ascensão ↗ e queda ↘ combinadas | ↗ 5.7 ms ascensão | |
| ↘ 5.1 ms queda | ||
| A tela mostra boas taxas de resposta em nossos testes, mas pode ser muito lenta para jogadores competitivos. Em comparação, todos os dispositivos testados variam de 0.1 (mínimo) a 240 (máximo) ms. » 26 % de todos os dispositivos são melhores. Isso significa que o tempo de resposta medido é melhor que a média de todos os dispositivos testados (20.8 ms). | ||
| ↔ Tempo de resposta 50% cinza a 80% cinza | ||
| 6.4 ms ... ascensão ↗ e queda ↘ combinadas | ↗ 3 ms ascensão | |
| ↘ 3.4 ms queda | ||
| A tela mostra taxas de resposta muito rápidas em nossos testes e deve ser muito adequada para jogos em ritmo acelerado. Em comparação, todos os dispositivos testados variam de 0.165 (mínimo) a 636 (máximo) ms. » 16 % de todos os dispositivos são melhores. Isso significa que o tempo de resposta medido é melhor que a média de todos os dispositivos testados (32.5 ms). | ||
Cintilação da tela / PWM (modulação por largura de pulso)
| Tela tremeluzindo / PWM não detectado | |||
[pwm_comparison] Em comparação: 53 % de todos os dispositivos testados não usam PWM para escurecer a tela. Se PWM foi detectado, uma média de 8516 (mínimo: 5 - máximo: 343500) Hz foi medida. | |||
Desempenho - Bom desempenho em jogos com uma RTX 3060 de 140 W
O Core i9-12900H está entre os melhores em sua classe de hardware. Embora o RTX 3060 seja capaz de lidar com todos os jogos em FHD, ela pode ter dificuldades com jogos altamente exigentes na resolução QHD nativa da tela. A Asus também incluiu uma memória RAM DDR5 de alta velocidade. No geral, o Strix Scar é um laptop para jogos de médio porte que alguns editores de foto e vídeo também podem achar atraente.
Condições de teste
Em nossa opinião, a Asus exagerou em seu software. Os notebooks para jogos da Asus são fornecidos com o software Armoury Crate, além do programa MyASUS, que também vem pré-instalado em seus notebooks comuns. O Armoury Crate permite ajustar os perfis de ventoinha e desempenho, e usamos o modo Turbo para obter os melhores resultados de benchmark possíveis em nossos testes. Por outro lado, o MyASUS inclui configurações para o comportamento de carregamento da bateria, opções de Wi-Fi e formas de entrar em contato com o suporte ao cliente. Talvez a Asus considere a possibilidade de combinar os dois programas para evitar o inchaço desnecessário de software para seus clientes.
Processador
A Asus optou por equipar a maioria dos modelos com o processador de ponta Intel Core i9-12900Hque apresenta 6 núcleos de desempenho (P) e 8 núcleos de eficiência (E), capazes de lidar com 20 threads simultaneamente. Cada núcleo P pode funcionar a até 5 GHz. Tanto o Strix G533zm quanto o G533zw estão disponíveis com o processador um pouco menos potente i7-12700H.
Em nosso teste de loop Cinebench R15, a CPU apresentou excelente desempenho, como esperado, superando o i7-12700H no Asus TUF Gaming F15 e os chips Ryzen da geração anterior. Ela só ficou para trás de forma reprodutível no Cinebench R20.
A mudança para a energia da bateria fez com que a pontuação do Cinebench R15 caísse para 1.752.
Cinebench R15 Multi sustained load
Cinebench R23: Multi Core | Single Core
Cinebench R20: CPU (Multi Core) | CPU (Single Core)
Cinebench R15: CPU Multi 64Bit | CPU Single 64Bit
Blender: v2.79 BMW27 CPU
7-Zip 18.03: 7z b 4 | 7z b 4 -mmt1
Geekbench 5.5: Multi-Core | Single-Core
HWBOT x265 Benchmark v2.2: 4k Preset
LibreOffice : 20 Documents To PDF
R Benchmark 2.5: Overall mean
| CPU Performance Rating | |
| Média da turma Gaming | |
| Asus ROG Strix Scar 15 G533ZW-LN106WS | |
| Asus ROG Strix Scar 15 G533zm | |
| MSI Pulse GL66 12UEK | |
| Asus TUF Gaming F15 FX507ZM | |
| Média Intel Core i9-12900H | |
| Alienware m15 R5 Ryzen Edition | |
| Lenovo Legion 5 15ACH6A-82NW0010GE | |
| Cinebench R23 / Multi Core | |
| Média da turma Gaming (5668 - 39652, n=151, últimos 2 anos) | |
| Asus ROG Strix Scar 15 G533ZW-LN106WS | |
| Asus TUF Gaming F15 FX507ZM | |
| MSI Pulse GL66 12UEK | |
| Asus ROG Strix Scar 15 G533zm | |
| Média Intel Core i9-12900H (7359 - 19648, n=28) | |
| Alienware m15 R5 Ryzen Edition | |
| Lenovo Legion 5 15ACH6A-82NW0010GE | |
| Cinebench R23 / Single Core | |
| Asus ROG Strix Scar 15 G533ZW-LN106WS | |
| MSI Pulse GL66 12UEK | |
| Média da turma Gaming (1136 - 2252, n=151, últimos 2 anos) | |
| Média Intel Core i9-12900H (1634 - 1930, n=28) | |
| Asus ROG Strix Scar 15 G533zm | |
| Asus TUF Gaming F15 FX507ZM | |
| Alienware m15 R5 Ryzen Edition | |
| Lenovo Legion 5 15ACH6A-82NW0010GE | |
| Cinebench R20 / CPU (Multi Core) | |
| Média da turma Gaming (2179 - 15517, n=151, últimos 2 anos) | |
| Asus ROG Strix Scar 15 G533ZW-LN106WS | |
| Asus TUF Gaming F15 FX507ZM | |
| MSI Pulse GL66 12UEK | |
| Média Intel Core i9-12900H (2681 - 7471, n=28) | |
| Asus ROG Strix Scar 15 G533zm | |
| Alienware m15 R5 Ryzen Edition | |
| Lenovo Legion 5 15ACH6A-82NW0010GE | |
| Cinebench R20 / CPU (Single Core) | |
| MSI Pulse GL66 12UEK | |
| Asus ROG Strix Scar 15 G533zm | |
| Asus ROG Strix Scar 15 G533ZW-LN106WS | |
| Média da turma Gaming (439 - 866, n=151, últimos 2 anos) | |
| Média Intel Core i9-12900H (624 - 738, n=28) | |
| Asus TUF Gaming F15 FX507ZM | |
| Alienware m15 R5 Ryzen Edition | |
| Lenovo Legion 5 15ACH6A-82NW0010GE | |
| Cinebench R15 / CPU Multi 64Bit | |
| Média da turma Gaming (905 - 6074, n=154, últimos 2 anos) | |
| Asus ROG Strix Scar 15 G533zm | |
| Asus ROG Strix Scar 15 G533ZW-LN106WS | |
| Asus TUF Gaming F15 FX507ZM | |
| MSI Pulse GL66 12UEK | |
| Média Intel Core i9-12900H (1395 - 3077, n=28) | |
| Alienware m15 R5 Ryzen Edition | |
| Lenovo Legion 5 15ACH6A-82NW0010GE | |
| Cinebench R15 / CPU Single 64Bit | |
| MSI Pulse GL66 12UEK | |
| Média da turma Gaming (191.9 - 343, n=151, últimos 2 anos) | |
| Asus ROG Strix Scar 15 G533zm | |
| Asus ROG Strix Scar 15 G533ZW-LN106WS | |
| Média Intel Core i9-12900H (235 - 277, n=29) | |
| Asus TUF Gaming F15 FX507ZM | |
| Alienware m15 R5 Ryzen Edition | |
| Lenovo Legion 5 15ACH6A-82NW0010GE | |
| Blender / v2.79 BMW27 CPU | |
| Lenovo Legion 5 15ACH6A-82NW0010GE | |
| Alienware m15 R5 Ryzen Edition | |
| Média Intel Core i9-12900H (160 - 451, n=28) | |
| MSI Pulse GL66 12UEK | |
| Asus TUF Gaming F15 FX507ZM | |
| Média da turma Gaming (81 - 555, n=144, últimos 2 anos) | |
| Asus ROG Strix Scar 15 G533ZW-LN106WS | |
| Asus ROG Strix Scar 15 G533zm | |
| 7-Zip 18.03 / 7z b 4 | |
| Média da turma Gaming (23795 - 144064, n=149, últimos 2 anos) | |
| Asus ROG Strix Scar 15 G533zm | |
| Asus ROG Strix Scar 15 G533ZW-LN106WS | |
| Asus TUF Gaming F15 FX507ZM | |
| MSI Pulse GL66 12UEK | |
| Média Intel Core i9-12900H (34684 - 76677, n=28) | |
| Alienware m15 R5 Ryzen Edition | |
| Lenovo Legion 5 15ACH6A-82NW0010GE | |
| 7-Zip 18.03 / 7z b 4 -mmt1 | |
| Média da turma Gaming (4199 - 7573, n=149, últimos 2 anos) | |
| MSI Pulse GL66 12UEK | |
| Asus ROG Strix Scar 15 G533zm | |
| Asus ROG Strix Scar 15 G533ZW-LN106WS | |
| Média Intel Core i9-12900H (5302 - 6289, n=28) | |
| Alienware m15 R5 Ryzen Edition | |
| Asus TUF Gaming F15 FX507ZM | |
| Lenovo Legion 5 15ACH6A-82NW0010GE | |
| Geekbench 5.5 / Multi-Core | |
| Média da turma Gaming (4557 - 25855, n=148, últimos 2 anos) | |
| Asus ROG Strix Scar 15 G533ZW-LN106WS | |
| Asus ROG Strix Scar 15 G533zm | |
| Asus TUF Gaming F15 FX507ZM | |
| Média Intel Core i9-12900H (8519 - 14376, n=31) | |
| MSI Pulse GL66 12UEK | |
| Alienware m15 R5 Ryzen Edition | |
| Lenovo Legion 5 15ACH6A-82NW0010GE | |
| Geekbench 5.5 / Single-Core | |
| Média da turma Gaming (986 - 2423, n=148, últimos 2 anos) | |
| Asus ROG Strix Scar 15 G533ZW-LN106WS | |
| MSI Pulse GL66 12UEK | |
| Asus ROG Strix Scar 15 G533zm | |
| Média Intel Core i9-12900H (1631 - 1897, n=31) | |
| Asus TUF Gaming F15 FX507ZM | |
| Alienware m15 R5 Ryzen Edition | |
| Lenovo Legion 5 15ACH6A-82NW0010GE | |
| HWBOT x265 Benchmark v2.2 / 4k Preset | |
| Média da turma Gaming (6.72 - 42.9, n=148, últimos 2 anos) | |
| Asus ROG Strix Scar 15 G533zm | |
| Asus ROG Strix Scar 15 G533ZW-LN106WS | |
| Asus TUF Gaming F15 FX507ZM | |
| MSI Pulse GL66 12UEK | |
| Média Intel Core i9-12900H (8.05 - 22.5, n=28) | |
| Alienware m15 R5 Ryzen Edition | |
| Lenovo Legion 5 15ACH6A-82NW0010GE | |
| LibreOffice / 20 Documents To PDF | |
| Alienware m15 R5 Ryzen Edition | |
| Lenovo Legion 5 15ACH6A-82NW0010GE | |
| Asus TUF Gaming F15 FX507ZM | |
| Média da turma Gaming (19 - 96.6, n=147, últimos 2 anos) | |
| Média Intel Core i9-12900H (36.8 - 59.8, n=28) | |
| MSI Pulse GL66 12UEK | |
| Asus ROG Strix Scar 15 G533zm | |
| Asus ROG Strix Scar 15 G533ZW-LN106WS | |
| R Benchmark 2.5 / Overall mean | |
| Lenovo Legion 5 15ACH6A-82NW0010GE | |
| Alienware m15 R5 Ryzen Edition | |
| Asus TUF Gaming F15 FX507ZM | |
| Média Intel Core i9-12900H (0.4218 - 0.506, n=28) | |
| Média da turma Gaming (0.3609 - 0.759, n=150, últimos 2 anos) | |
| Asus ROG Strix Scar 15 G533zm | |
| Asus ROG Strix Scar 15 G533ZW-LN106WS | |
| MSI Pulse GL66 12UEK | |
* ... menor é melhor
AIDA64: FP32 Ray-Trace | FPU Julia | CPU SHA3 | CPU Queen | FPU SinJulia | FPU Mandel | CPU AES | CPU ZLib | FP64 Ray-Trace | CPU PhotoWorxx
| Performance Rating | |
| Média da turma Gaming | |
| Alienware m15 R5 Ryzen Edition | |
| Asus ROG Strix Scar 15 G533zm | |
| Asus ROG Strix Scar 15 G533ZW-LN106WS | |
| Média Intel Core i9-12900H | |
| Asus TUF Gaming F15 FX507ZM | |
| MSI Pulse GL66 12UEK | |
| Lenovo Legion 5 15ACH6A-82NW0010GE | |
| AIDA64 / FP32 Ray-Trace | |
| Média da turma Gaming (4986 - 81639, n=147, últimos 2 anos) | |
| Alienware m15 R5 Ryzen Edition | |
| Lenovo Legion 5 15ACH6A-82NW0010GE | |
| Média Intel Core i9-12900H (4074 - 18289, n=28) | |
| Asus ROG Strix Scar 15 G533zm | |
| Asus ROG Strix Scar 15 G533ZW-LN106WS | |
| Asus TUF Gaming F15 FX507ZM | |
| MSI Pulse GL66 12UEK | |
| AIDA64 / FPU Julia | |
| Média da turma Gaming (25360 - 252486, n=147, últimos 2 anos) | |
| Alienware m15 R5 Ryzen Edition | |
| Lenovo Legion 5 15ACH6A-82NW0010GE | |
| Média Intel Core i9-12900H (22307 - 93236, n=28) | |
| Asus ROG Strix Scar 15 G533zm | |
| Asus ROG Strix Scar 15 G533ZW-LN106WS | |
| Asus TUF Gaming F15 FX507ZM | |
| MSI Pulse GL66 12UEK | |
| AIDA64 / CPU SHA3 | |
| Média da turma Gaming (1339 - 10389, n=147, últimos 2 anos) | |
| Asus ROG Strix Scar 15 G533zm | |
| Asus ROG Strix Scar 15 G533ZW-LN106WS | |
| Asus TUF Gaming F15 FX507ZM | |
| MSI Pulse GL66 12UEK | |
| Alienware m15 R5 Ryzen Edition | |
| Média Intel Core i9-12900H (1378 - 4215, n=28) | |
| Lenovo Legion 5 15ACH6A-82NW0010GE | |
| AIDA64 / CPU Queen | |
| Média da turma Gaming (50699 - 200651, n=147, últimos 2 anos) | |
| Asus ROG Strix Scar 15 G533zm | |
| MSI Pulse GL66 12UEK | |
| Asus ROG Strix Scar 15 G533ZW-LN106WS | |
| Média Intel Core i9-12900H (78172 - 111241, n=28) | |
| Asus TUF Gaming F15 FX507ZM | |
| Alienware m15 R5 Ryzen Edition | |
| Lenovo Legion 5 15ACH6A-82NW0010GE | |
| AIDA64 / FPU SinJulia | |
| Média da turma Gaming (4800 - 32988, n=147, últimos 2 anos) | |
| Alienware m15 R5 Ryzen Edition | |
| Asus ROG Strix Scar 15 G533zm | |
| Asus ROG Strix Scar 15 G533ZW-LN106WS | |
| MSI Pulse GL66 12UEK | |
| Asus TUF Gaming F15 FX507ZM | |
| Média Intel Core i9-12900H (5709 - 10410, n=28) | |
| Lenovo Legion 5 15ACH6A-82NW0010GE | |
| AIDA64 / FPU Mandel | |
| Média da turma Gaming (12321 - 134044, n=147, últimos 2 anos) | |
| Alienware m15 R5 Ryzen Edition | |
| Lenovo Legion 5 15ACH6A-82NW0010GE | |
| Média Intel Core i9-12900H (11257 - 45581, n=28) | |
| Asus ROG Strix Scar 15 G533zm | |
| Asus TUF Gaming F15 FX507ZM | |
| Asus ROG Strix Scar 15 G533ZW-LN106WS | |
| MSI Pulse GL66 12UEK | |
| AIDA64 / CPU AES | |
| Alienware m15 R5 Ryzen Edition | |
| Asus ROG Strix Scar 15 G533zm | |
| Asus ROG Strix Scar 15 G533ZW-LN106WS | |
| Média da turma Gaming (19065 - 328679, n=147, últimos 2 anos) | |
| MSI Pulse GL66 12UEK | |
| Lenovo Legion 5 15ACH6A-82NW0010GE | |
| Média Intel Core i9-12900H (31935 - 151546, n=28) | |
| Asus TUF Gaming F15 FX507ZM | |
| AIDA64 / CPU ZLib | |
| Média da turma Gaming (373 - 2531, n=147, últimos 2 anos) | |
| Asus ROG Strix Scar 15 G533ZW-LN106WS | |
| Asus ROG Strix Scar 15 G533zm | |
| Asus TUF Gaming F15 FX507ZM | |
| MSI Pulse GL66 12UEK | |
| Média Intel Core i9-12900H (449 - 1193, n=28) | |
| Alienware m15 R5 Ryzen Edition | |
| Lenovo Legion 5 15ACH6A-82NW0010GE | |
| AIDA64 / FP64 Ray-Trace | |
| Média da turma Gaming (2540 - 43430, n=147, últimos 2 anos) | |
| Alienware m15 R5 Ryzen Edition | |
| Lenovo Legion 5 15ACH6A-82NW0010GE | |
| Média Intel Core i9-12900H (2235 - 10511, n=28) | |
| Asus ROG Strix Scar 15 G533zm | |
| Asus ROG Strix Scar 15 G533ZW-LN106WS | |
| Asus TUF Gaming F15 FX507ZM | |
| MSI Pulse GL66 12UEK | |
| AIDA64 / CPU PhotoWorxx | |
| Média da turma Gaming (10805 - 60161, n=147, últimos 2 anos) | |
| Asus ROG Strix Scar 15 G533ZW-LN106WS | |
| Média Intel Core i9-12900H (20960 - 48269, n=29) | |
| Asus ROG Strix Scar 15 G533zm | |
| Asus TUF Gaming F15 FX507ZM | |
| MSI Pulse GL66 12UEK | |
| Lenovo Legion 5 15ACH6A-82NW0010GE | |
| Alienware m15 R5 Ryzen Edition | |
Desempenho do sistema
CrossMark: Overall | Productivity | Creativity | Responsiveness
| PCMark 10 / Score | |
| Asus ROG Strix Scar 15 G533ZW-LN106WS | |
| Asus ROG Strix Scar 15 G533zm | |
| Média da turma Gaming (5776 - 9852, n=133, últimos 2 anos) | |
| Média Intel Core i9-12900H, NVIDIA GeForce RTX 3060 Laptop GPU (7135 - 7861, n=4) | |
| Asus TUF Gaming F15 FX507ZM | |
| MSI Pulse GL66 12UEK | |
| Lenovo Legion 5 15ACH6A-82NW0010GE | |
| Alienware m15 R5 Ryzen Edition | |
| PCMark 10 / Essentials | |
| Asus ROG Strix Scar 15 G533zm | |
| Média Intel Core i9-12900H, NVIDIA GeForce RTX 3060 Laptop GPU (10380 - 11198, n=4) | |
| Média da turma Gaming (9057 - 12600, n=133, últimos 2 anos) | |
| Asus ROG Strix Scar 15 G533ZW-LN106WS | |
| Lenovo Legion 5 15ACH6A-82NW0010GE | |
| Asus TUF Gaming F15 FX507ZM | |
| MSI Pulse GL66 12UEK | |
| Alienware m15 R5 Ryzen Edition | |
| PCMark 10 / Productivity | |
| Asus ROG Strix Scar 15 G533zm | |
| Asus ROG Strix Scar 15 G533ZW-LN106WS | |
| Média Intel Core i9-12900H, NVIDIA GeForce RTX 3060 Laptop GPU (9751 - 10486, n=4) | |
| Média da turma Gaming (6662 - 14612, n=133, últimos 2 anos) | |
| MSI Pulse GL66 12UEK | |
| Lenovo Legion 5 15ACH6A-82NW0010GE | |
| Asus TUF Gaming F15 FX507ZM | |
| Alienware m15 R5 Ryzen Edition | |
| PCMark 10 / Digital Content Creation | |
| Média da turma Gaming (6807 - 18475, n=133, últimos 2 anos) | |
| Asus ROG Strix Scar 15 G533ZW-LN106WS | |
| Asus TUF Gaming F15 FX507ZM | |
| Asus ROG Strix Scar 15 G533zm | |
| Média Intel Core i9-12900H, NVIDIA GeForce RTX 3060 Laptop GPU (9741 - 11226, n=4) | |
| Lenovo Legion 5 15ACH6A-82NW0010GE | |
| MSI Pulse GL66 12UEK | |
| Alienware m15 R5 Ryzen Edition | |
| CrossMark / Overall | |
| MSI Pulse GL66 12UEK | |
| Asus ROG Strix Scar 15 G533ZW-LN106WS | |
| Asus ROG Strix Scar 15 G533zm | |
| Média Intel Core i9-12900H, NVIDIA GeForce RTX 3060 Laptop GPU (1789 - 2096, n=4) | |
| Média da turma Gaming (1247 - 2344, n=114, últimos 2 anos) | |
| CrossMark / Productivity | |
| MSI Pulse GL66 12UEK | |
| Asus ROG Strix Scar 15 G533ZW-LN106WS | |
| Asus ROG Strix Scar 15 G533zm | |
| Média Intel Core i9-12900H, NVIDIA GeForce RTX 3060 Laptop GPU (1677 - 2062, n=4) | |
| Média da turma Gaming (1299 - 2204, n=114, últimos 2 anos) | |
| CrossMark / Creativity | |
| Asus ROG Strix Scar 15 G533zm | |
| Asus ROG Strix Scar 15 G533ZW-LN106WS | |
| Média Intel Core i9-12900H, NVIDIA GeForce RTX 3060 Laptop GPU (2032 - 2125, n=4) | |
| MSI Pulse GL66 12UEK | |
| Média da turma Gaming (1275 - 2660, n=114, últimos 2 anos) | |
| CrossMark / Responsiveness | |
| MSI Pulse GL66 12UEK | |
| Asus ROG Strix Scar 15 G533ZW-LN106WS | |
| Asus ROG Strix Scar 15 G533zm | |
| Média Intel Core i9-12900H, NVIDIA GeForce RTX 3060 Laptop GPU (1486 - 2230, n=4) | |
| Média da turma Gaming (1030 - 2330, n=114, últimos 2 anos) | |
| PCMark 10 Score | 7861 pontos | |
Ajuda | ||
| AIDA64 / Memory Copy | |
| Média da turma Gaming (21750 - 97515, n=147, últimos 2 anos) | |
| Asus ROG Strix Scar 15 G533ZW-LN106WS | |
| Média Intel Core i9-12900H (34438 - 74264, n=28) | |
| Asus TUF Gaming F15 FX507ZM | |
| Asus ROG Strix Scar 15 G533zm | |
| MSI Pulse GL66 12UEK | |
| Alienware m15 R5 Ryzen Edition | |
| Lenovo Legion 5 15ACH6A-82NW0010GE | |
| AIDA64 / Memory Read | |
| Média da turma Gaming (22956 - 102937, n=147, últimos 2 anos) | |
| Asus ROG Strix Scar 15 G533ZW-LN106WS | |
| Média Intel Core i9-12900H (36365 - 74642, n=28) | |
| Asus TUF Gaming F15 FX507ZM | |
| Asus ROG Strix Scar 15 G533zm | |
| MSI Pulse GL66 12UEK | |
| Alienware m15 R5 Ryzen Edition | |
| Lenovo Legion 5 15ACH6A-82NW0010GE | |
| AIDA64 / Memory Write | |
| Média da turma Gaming (22297 - 108954, n=147, últimos 2 anos) | |
| Asus ROG Strix Scar 15 G533ZW-LN106WS | |
| Média Intel Core i9-12900H (32276 - 67858, n=28) | |
| Asus ROG Strix Scar 15 G533zm | |
| Asus TUF Gaming F15 FX507ZM | |
| MSI Pulse GL66 12UEK | |
| Alienware m15 R5 Ryzen Edition | |
| Lenovo Legion 5 15ACH6A-82NW0010GE | |
| AIDA64 / Memory Latency | |
| Asus ROG Strix Scar 15 G533zm | |
| Asus ROG Strix Scar 15 G533ZW-LN106WS | |
| Média da turma Gaming (59.5 - 259, n=147, últimos 2 anos) | |
| MSI Pulse GL66 12UEK | |
| Lenovo Legion 5 15ACH6A-82NW0010GE | |
| Média Intel Core i9-12900H (74.7 - 118.1, n=27) | |
| Alienware m15 R5 Ryzen Edition | |
| Asus TUF Gaming F15 FX507ZM | |
* ... menor é melhor
Latência DPC
O LatencyMon imediatamente relatou problemas quando um navegador foi iniciado. A abertura de várias guias piorou os problemas. Os valores de latência aumentaram ainda mais durante a reprodução de nosso vídeo de teste do YouTube em 4K e 60 fps. No entanto, o vídeo foi executado sem nenhuma queda de quadros.
| DPC Latencies / LatencyMon - interrupt to process latency (max), Web, Youtube, Prime95 | |
| Asus ROG Strix Scar 15 G533zm | |
| MSI Pulse GL66 12UEK | |
| Asus ROG Strix Scar 15 G533ZW-LN106WS | |
| Lenovo Legion 5 15ACH6A-82NW0010GE | |
| Asus TUF Gaming F15 FX507ZM | |
| Alienware m15 R5 Ryzen Edition | |
* ... menor é melhor
Armazenamento em massa
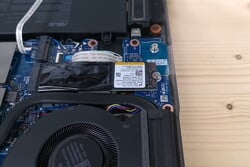
A Asus instalou um SSD NVMe PCIe 4.0 de 1 TB relativamente novo, fabricado pela Micron. Apesar de proporcionar excelentes taxas de transferência, a unidade não explorou totalmente as velocidades oferecidas pelo padrão relativamente novo. Dito isso, ele apresentou o melhor desempenho em comparação com as unidades de armazenamento dos laptops concorrentes. Seu desempenho também é excelente sob carga contínua.
* ... menor é melhor
Sustained load Read: DiskSpd Read Loop, Queue Depth 8
Placa de vídeo
A Nividia GeForce RTX 3060 ocupa o espaço entre o mid-range e o high-end. Seu TGP pode variar de 60 a 115 watts, e a configuração de energia tem um impacto duradouro no desempenho 3D da placa. A RTX 3060 na Strix Scar tem acesso a 115 watts completos e pode chegar a 140 watts com um Dynamic Boost de 25 watts.
Em benchmarks 3D sintéticos, a GPU teve um desempenho ligeiramente melhor do que uma RTX 3060 média de nosso banco de dados, mas o Lenovo Legion 5 e o Asus TUF Gaming F15 são marginalmente mais rápidos do que o Strix Scar. A RTX 3070 Ti no Scar 15 G533zw é cerca de 35% mais potente.
Com a energia da bateria, o desempenho 3D do notebook caiu cerca de 67% em um novo teste do Fire Strike, resultando em uma pontuação gráfica de apenas 7.168, em vez dos habituais 21.671.
| 3DMark 11 Performance | 27156 pontos | |
| 3DMark Fire Strike Score | 19296 pontos | |
| 3DMark Time Spy Score | 8606 pontos | |
Ajuda | ||
Desempenho em jogos
Infelizmente, o Optimus limita o Strix a executar jogos DirectX 11 a apenas 60 fps. Esse é um problema geral que afeta alguns notebooks com Optimus. Além de jogar esses jogos em um monitor externo, a única solução alternativa é ativar a chave MUX e usar a dGPU diretamente.
O Strix 15 oferece principalmente o melhor desempenho entre os dispositivos em nossa comparação. Apenas o TUF Gaming F15 é um pouco mais rápido em alguns jogos.
Desconectar o Strix fez com que as taxas de quadros se estabilizassem em 30 fps em Witcher 3 e as ventoinhas permaneceram agradavelmente silenciosas o tempo todo.
Witcher 3 funcionou de forma bastante estável durante o período de teste de uma hora, com apenas uma ligeira diminuição na taxa de quadros.
Witcher 3 FPS chart
| baixo | média | alto | ultra | QHD | |
|---|---|---|---|---|---|
| GTA V (2015) | 186.2 | 181.6 | 166.9 | 105 | 80.5 |
| The Witcher 3 (2015) | 400 | 290 | 165 | 88.7 | |
| Dota 2 Reborn (2015) | 182.6 | 167.7 | 159.1 | 151.4 | |
| Final Fantasy XV Benchmark (2018) | 178.9 | 117.2 | 87.5 | 65.1 | |
| X-Plane 11.11 (2018) | 145.8 | 123.9 | 99.8 | ||
| Far Cry 5 (2018) | 160 | 129 | 123 | 117 | 92 |
| Strange Brigade (2018) | 398 | 216 | 176.4 | 153 | |
| Cyberpunk 2077 1.6 (2022) | 120 | 118 | 63 | 63 |
Emissões - Legal, mas não necessariamente silencioso
Emissões de ruído
No modo Turbo, as ventoinhas internas giram regularmente bem alto por alguns segundos antes de voltar ao modo inativo. A Asus talvez queira considerar a possibilidade de tornar o sistema de resfriamento menos agressivo em uma atualização futura. Dito isso, as ventoinhas geralmente não estão girando no modo Silencioso.
O Asus Strix Scar não é necessariamente silencioso sob carga. Durante os jogos e o teste de estresse, o Asus TUF e o MSI Pulse foram igualmente barulhentos, enquanto o Lenovo Legion e o Alienware permaneceram mais silenciosos.
Ao iniciar determinadas cargas (por exemplo, o Witcher 3), também notamos ruídos suaves de bipes eletrônicos vindos do dispositivo, mas eles estavam presentes apenas temporariamente.
Barulho
| Ocioso |
| 23 / 23 / 37.75 dB |
| Carga |
| 45.35 / 56.22 dB |
 | ||
30 dB silencioso 40 dB(A) audível 50 dB(A) ruidosamente alto |
||
min: | ||
| Asus ROG Strix Scar 15 G533zm GeForce RTX 3060 Laptop GPU, i9-12900H | Asus ROG Strix Scar 15 G533ZW-LN106WS GeForce RTX 3070 Ti Laptop GPU, i9-12900H, Samsung PM9A1 MZVL22T0HBLB | Asus TUF Gaming F15 FX507ZM GeForce RTX 3060 Laptop GPU, i7-12700H, SK Hynix HFM001TD3JX013N | MSI Pulse GL66 12UEK GeForce RTX 3060 Laptop GPU, i9-12900H, Micron 2450 512GB MTFDKBA512TFK | Alienware m15 R5 Ryzen Edition GeForce RTX 3060 Laptop GPU, R7 5800H, Toshiba KBG40ZNS512G NVMe | Lenovo Legion 5 15ACH6A-82NW0010GE Radeon RX 6600M, R5 5600H, Micron 2210 MTFDHBA512QFD | |
|---|---|---|---|---|---|---|
| Noise | -26% | 6% | 0% | 2% | -4% | |
| desligado / ambiente * | 23 | 26.86 -17% | 23.2 -1% | 23 -0% | 24 -4% | 25 -9% |
| Idle Minimum * | 23 | 39.07 -70% | 23.6 -3% | 23 -0% | 24 -4% | 25 -9% |
| Idle Average * | 23 | 39.07 -70% | 23.6 -3% | 27 -17% | 25 -9% | 25 -9% |
| Idle Maximum * | 37.75 | 39.07 -3% | 25.4 33% | 27 28% | 35 7% | 34.5 9% |
| Load Average * | 45.35 | 53.34 -18% | 38 16% | 48.2 -6% | 44 3% | 51.1 -13% |
| Witcher 3 ultra * | 55.48 | 56.6 -2% | 54.1 2% | 56.9 -3% | 48 13% | |
| Load Maximum * | 56.22 | 56.6 -1% | 57.2 -2% | 56.94 -1% | 50 11% | 51.3 9% |
* ... menor é melhor
Temperatura
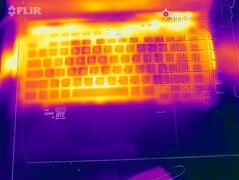
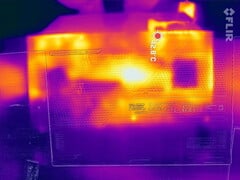
O notebook para jogos da Asus consegue se manter relativamente frio, tanto em modo inativo quanto sob carga. Por exemplo, o Alienware funciona muito mais quente, apesar de seu sistema de resfriamento saliente. O Strix Scar tem uma curva de ventoinha audivelmente mais agressiva, o que ajuda as temperaturas da superfície a permanecerem em um nível razoável.
(±) A temperatura máxima no lado superior é 43 °C / 109 F, em comparação com a média de 40.4 °C / 105 F , variando de 21.2 a 68.8 °C para a classe Gaming.
(-) A parte inferior aquece até um máximo de 47 °C / 117 F, em comparação com a média de 43.2 °C / 110 F
(+) Em uso inativo, a temperatura média para o lado superior é 29.2 °C / 85 F, em comparação com a média do dispositivo de 33.9 °C / ### class_avg_f### F.
(±) Jogando The Witcher 3, a temperatura média para o lado superior é 32.9 °C / 91 F, em comparação com a média do dispositivo de 33.9 °C / ## #class_avg_f### F.
(+) Os apoios para as mãos e o touchpad são mais frios que a temperatura da pele, com um máximo de 25 °C / 77 F e, portanto, são frios ao toque.
(+) A temperatura média da área do apoio para as mãos de dispositivos semelhantes foi 28.9 °C / 84 F (+3.9 °C / 7 F).
| Asus ROG Strix Scar 15 G533zm Intel Core i9-12900H, NVIDIA GeForce RTX 3060 Laptop GPU | Asus ROG Strix Scar 15 G533ZW-LN106WS Intel Core i9-12900H, NVIDIA GeForce RTX 3070 Ti Laptop GPU | Asus TUF Gaming F15 FX507ZM Intel Core i7-12700H, NVIDIA GeForce RTX 3060 Laptop GPU | MSI Pulse GL66 12UEK Intel Core i9-12900H, NVIDIA GeForce RTX 3060 Laptop GPU | Alienware m15 R5 Ryzen Edition AMD Ryzen 7 5800H, NVIDIA GeForce RTX 3060 Laptop GPU | Lenovo Legion 5 15ACH6A-82NW0010GE AMD Ryzen 5 5600H, AMD Radeon RX 6600M | |
|---|---|---|---|---|---|---|
| Heat | -10% | -11% | -11% | -22% | 3% | |
| Maximum Upper Side * | 43 | 42.6 1% | 44.4 -3% | 50 -16% | 62 -44% | 39.9 7% |
| Maximum Bottom * | 47 | 50.2 -7% | 48.8 -4% | 47 -0% | 61 -30% | 43.8 7% |
| Idle Upper Side * | 32 | 36.2 -13% | 37.8 -18% | 36 -13% | 36 -13% | 34.1 -7% |
| Idle Bottom * | 33 | 40.2 -22% | 39.6 -20% | 38 -15% | 33 -0% | 31.7 4% |
* ... menor é melhor
Teste de estresse
Durante o teste de estresse, o TDP atingiu cerca de 95 watts por alguns segundos antes de cair para os 45 watts nominais. Ao mesmo tempo, a velocidade do clock da CPU caiu para cerca de 2,3 GHz em média, com as temperaturas do núcleo oscilando em torno de 76°C (168,8°F).
O clock da GPU funcionou em torno de 1,6 GHz com apenas pequenas flutuações. O clock da memória funcionou a 1.750 MHz absolutamente constante. No entanto, as temperaturas da GPU foram relativamente altas, em torno de 81°C (177,8°F), o que, no entanto, ainda está dentro de uma faixa segura e indica que o espaço livre foi bem utilizado. A placa inteira consumiu uma média de 109 watts.
| CPU Clock (GHz) | GPU Clock (MHz) | Temperatura média da CPU (°C) | Temperatura média da GPU (°C) | |
| Prime95 + FurMark Stress | 2.3 | 1.600 | 76 | 81 |
Alto-falantes
Os alto-falantes não são suficientemente altos, mesmo no volume máximo. Dito isso, eles são pelo menos capazes de produzir graves decentes para alto-falantes de laptop. Por outro lado, os agudos não são tão impressionantes quanto nos dispositivos concorrentes.
Há um conector de áudio combinado para que os usuários possam conectar dispositivos de áudio analógicos externos.
Asus ROG Strix Scar 15 G533zm análise de áudio
(±) | o volume do alto-falante é médio, mas bom (###valor### dB)
Graves 100 - 315Hz
(+) | bons graves - apenas 3.5% longe da mediana
(+) | o baixo é linear (4.6% delta para a frequência anterior)
Médios 400 - 2.000 Hz
(±) | médios mais altos - em média 5.6% maior que a mediana
(+) | médios são lineares (4.8% delta para frequência anterior)
Altos 2 - 16 kHz
(±) | máximos reduzidos - em média 6.8% menor que a mediana
(±) | a linearidade dos máximos é média (8.2% delta para frequência anterior)
Geral 100 - 16.000 Hz
(+) | o som geral é linear (14.7% diferença em relação à mediana)
Comparado com a mesma classe
» 27% de todos os dispositivos testados nesta classe foram melhores, 7% semelhantes, 66% piores
» O melhor teve um delta de 6%, a média foi 18%, o pior foi 132%
Comparado com todos os dispositivos testados
» 17% de todos os dispositivos testados foram melhores, 4% semelhantes, 79% piores
» O melhor teve um delta de 4%, a média foi 24%, o pior foi 134%
Asus TUF Gaming F15 FX507ZM análise de áudio
(±) | o volume do alto-falante é médio, mas bom (###valor### dB)
Graves 100 - 315Hz
(±) | graves reduzidos - em média 13.7% menor que a mediana
(±) | a linearidade dos graves é média (10.1% delta para a frequência anterior)
Médios 400 - 2.000 Hz
(±) | médios mais altos - em média 5.2% maior que a mediana
(+) | médios são lineares (4.9% delta para frequência anterior)
Altos 2 - 16 kHz
(+) | agudos equilibrados - apenas 4.1% longe da mediana
(±) | a linearidade dos máximos é média (8.6% delta para frequência anterior)
Geral 100 - 16.000 Hz
(±) | a linearidade do som geral é média (15.9% diferença em relação à mediana)
Comparado com a mesma classe
» 36% de todos os dispositivos testados nesta classe foram melhores, 7% semelhantes, 58% piores
» O melhor teve um delta de 6%, a média foi 18%, o pior foi 132%
Comparado com todos os dispositivos testados
» 23% de todos os dispositivos testados foram melhores, 5% semelhantes, 72% piores
» O melhor teve um delta de 4%, a média foi 24%, o pior foi 134%
Gerenciamento de energia - Duração decente da bateria
Consumo de energia
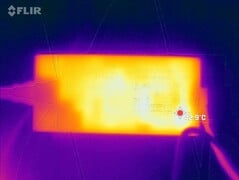
No geral, apesar de não ser particularmente eficiente em termos de energia, o Asus Strix Scar 15 também não é muito problemático nesse aspecto. Ele consome um pouco mais de energia do que seus concorrentes no modo ocioso de economia de energia, bem como durante os jogos. No entanto, seu pico de uso transitório de 221 watts não é maior do que o de seus rivais e está dentro dos limites do carregador de 240 watts.
| Ocioso | |
| Carga |
|
Key:
min: | |
| Asus ROG Strix Scar 15 G533zm i9-12900H, GeForce RTX 3060 Laptop GPU, , IPS, 2560x1440, 15.6" | Asus ROG Strix Scar 15 G533ZW-LN106WS i9-12900H, GeForce RTX 3070 Ti Laptop GPU, Samsung PM9A1 MZVL22T0HBLB, IPS-level, 2560x1440, 15.6" | Asus TUF Gaming F15 FX507ZM i7-12700H, GeForce RTX 3060 Laptop GPU, SK Hynix HFM001TD3JX013N, IPS, 1920x1080, 15.6" | MSI Pulse GL66 12UEK i9-12900H, GeForce RTX 3060 Laptop GPU, Micron 2450 512GB MTFDKBA512TFK, IPS, 1920x1080, 15.6" | Alienware m15 R5 Ryzen Edition R7 5800H, GeForce RTX 3060 Laptop GPU, Toshiba KBG40ZNS512G NVMe, IPS, 1920x1080, 15.6" | Lenovo Legion 5 15ACH6A-82NW0010GE R5 5600H, Radeon RX 6600M, Micron 2210 MTFDHBA512QFD, IPS, 1920x1080, 15.6" | Média NVIDIA GeForce RTX 3060 Laptop GPU | Média da turma Gaming | |
|---|---|---|---|---|---|---|---|---|
| Power Consumption | 7% | 9% | 28% | 1% | 8% | 7% | -11% | |
| Idle Minimum * | 13 | 7.56 42% | 6.3 52% | 7 46% | 11 15% | 10 23% | 10.4 ? 20% | 13.4 ? -3% |
| Idle Average * | 17 | 13.5 21% | 9.8 42% | 13 24% | 14 18% | 13.2 22% | 14.5 ? 15% | 18.9 ? -11% |
| Idle Maximum * | 17 | 16.87 1% | 26.5 -56% | 13.7 19% | 25 -47% | 15.6 8% | 21.4 ? -26% | 26.3 ? -55% |
| Load Average * | 135 | 128.9 5% | 103.8 23% | 48.4 64% | 123 9% | 178 -32% | 109.3 ? 19% | 102.7 ? 24% |
| Witcher 3 ultra * | 195 | 196.2 -1% | 189 3% | 148 24% | 176 10% | 181 7% | ||
| Load Maximum * | 221 | 274.86 -24% | 241.9 -9% | 244 -10% | 226 -2% | 180 19% | 206 ? 7% | 244 ? -10% |
* ... menor é melhor
Power consumption Witcher 3 / stress test
Power consumption with external monitor
Duração da bateria
A Asus equipou o laptop com uma grande bateria de 90Wh capaz de oferecer 8,5 horas de reprodução de vídeo e 9 horas de navegação na Internet em nossos testes, que foram realizados com brilho de tela reduzido.
| Asus ROG Strix Scar 15 G533zm i9-12900H, GeForce RTX 3060 Laptop GPU, 90 Wh | Asus ROG Strix Scar 15 G533ZW-LN106WS i9-12900H, GeForce RTX 3070 Ti Laptop GPU, 90 Wh | Asus TUF Gaming F15 FX507ZM i7-12700H, GeForce RTX 3060 Laptop GPU, 90 Wh | MSI Pulse GL66 12UEK i9-12900H, GeForce RTX 3060 Laptop GPU, 53.5 Wh | Alienware m15 R5 Ryzen Edition R7 5800H, GeForce RTX 3060 Laptop GPU, 86 Wh | Lenovo Legion 5 15ACH6A-82NW0010GE R5 5600H, Radeon RX 6600M, 80 Wh | Média da turma Gaming | |
|---|---|---|---|---|---|---|---|
| Duração da bateria | -17% | -40% | -16% | -16% | 12% | -16% | |
| H.264 | 518 | 510 -2% | 237 -54% | 525 1% | 447 ? -14% | ||
| WiFi v1.3 | 551 | 501.4 -9% | 285 -48% | 306 -44% | 552 0% | 387 ? -30% | |
| Witcher 3 ultra | 80 | 70 -12% | 96 20% | 74.7 ? -7% | |||
| Load | 95 | 52 -45% | 66 -31% | 116 22% | 55 -42% | 118 24% | 84.5 ? -11% |
| Reader / Idle | 947 | 881 | 770 | 585 ? |
Pro
Contra
Veredicto - Impressionante laptop para jogos por 1.999 euros
Apresentando uma RTX 3060, o modelo G533zm do Asus ROG Strix Scar 15 é também um laptop para jogos altamente competente e excelente, com uma qualidade de construção extraordinária. Ele oferece I/Os modernas, uma experiência de digitação fantástica, hardware potente e opções de personalização. Além disso, sua tela se destaca pelo ótimo tempo de resposta, excelente cobertura de cores, contraste e brilho sólidos. Em comparação com o modelo RTX 3070 Ti (G533zw) e os concorrentes diretos, o G533zm funciona relativamente bem.
Não temos nenhuma reclamação real sobre o laptop. O nível de ruído poderia ser otimizado, mas, fora isso, é bastante razoável. Nesse sentido, o senhor pode se perguntar se é necessário combinar uma RTX 3060 com o veloz, mas quente, i9-12900H, quando um i7-12700H provavelmente daria conta do recado. Em nossa unidade de análise, o botão esquerdo do touchpad ocasionalmente ficava um pouco preso, embora o outro modelo da Scar não tivesse esse problema.
Por cerca de 2.000 euros (US$ 2.170), os gamers estão adquirindo um excelente laptop com ótimo desempenho, muitos pontos fortes e poucas desvantagens.
Embora possa não ser um roubo para um laptop para jogos RTX 3060, o preço de € 2.000 (US$ 2.170) é bastante razoável, considerando os muitos aspectos positivos e as desvantagens quase inexistentes. Aqueles que querem investir menos dinheiro também podem considerar o Asus TUF Gaming F15. Esse laptop tem menos recursos, mas oferece excelente desempenho e custa cerca de € 400 (US$ 2.170)
Preço e disponibilidade
A configuração de análise está atualmente disponível no site Cyberport por €1.999 (US$2.166). Também é possível encontrar um modelo de especificação inferior com menos memória e uma tela FHD na Amazon por cerca de US$ 1.600.
Asus ROG Strix Scar 15 G533zm
- 04/30/2024 v7 (old)
Christian Hintze


