
Análise da Asus Prime GeForce RTX 5080 OC Edition: 13% de ganhos em relação à RX 7900 XTX por 30% de aumento no preço em relação à RTX 5080 FE
Prime sem Optimus.
A Asus Prime GeForce RTX 5080 Founders Edition é uma GPU SFF baseada na mais recente GPU Blackwell GB203 da Nvidia. A Prime RTX 5080 OC oferece clocks um pouco mais altos do que a RTX 5080 Founders Edition, mas os ganhos de desempenho no mundo real não acompanham necessariamente o preço mais alto.Vaidyanathan Subramaniam, 👁 Vaidyanathan Subramaniam (traduzido por DeepL / Ninh Duy) Publicado 🇺🇸 🇫🇷 ...
Veredicto: GPU RTX 5080 SFF com proposta de valor questionável
A Asus fez uma jogada interessante este ano ao expandir sua série Prime, tradicionalmente voltada para a faixa intermediária, para incluir o carro-chefe RTX 5080. A Prime GeForce RTX 5080 OC Edition busca ser uma alternativa capaz à RTX 5080 Founders Edition da própria Nvidia.
A Prime RTX 5080 OC apresenta um design minimalista, porém funcional, que ocupa apenas 2,5 slots, o que a torna ideal para montagens em formato pequeno (SFF).
Em termos de desempenho bruto, a Prime RTX 5080 OC Edition oferece uma modesta melhoria de 2 a 3% em relação à RTX 5080 FE, tanto em benchmarks sintéticos quanto em cenários de jogos reais.
O aumento em relação à Radeon RX 7900 XTX é mais tangível, na faixa de 10 a 13%, dependendo do benchmark ou do jogo.
A Prime RTX 5090 OC também se beneficia da muito elogiada pilha de software da Nvidia, e a placa suporta totalmente os mais recentes recursos de geração de vários quadros DLSS 4 da arquitetura Blackwell.

A Asus incorpora uma solução de resfriamento eficaz para a Prime RTX 5080 OC que mantém as emissões de calor e ruído da placa razoáveis, considerando o desempenho oferecido.
Embora o senhor não possa errar com a Prime RTX 5080 OC, há algumas ressalvas que devem ser observadas. O consumo de energia dessa placa durante os jogos pode ser um pouco maior em comparação com a RTX 5080 FE, sem ganhos perceptíveis em quadros.
A VRAM GDDR7 de 16 GB, embora muito mais rápida do que a implementação GDDR6X do ano passado, pode se tornar rapidamente um gargalo em determinados títulos exigentes, embora isso se aplique a todas as RTX 5080 em geral.
O aspecto mais controverso da Prime RTX 5080 OC, no entanto, é o preço. Supondo que o senhor consiga adquirir uma, espere pagar US$ 321 a mais do que o preço sugerido de US$ 999 da RTX 5080 FE por praticamente nenhum ganho de desempenho.
Com as placas RX 7900 XTX retornando aos seus preços originais de lançamento após os recentes cortes acentuados de preços e com a Radeon RX 9070 XT baseada em RDNA 4 surgindo no horizonte, talvez seja melhor esperar e observar como a dinâmica de preços mudará nas próximas semanas antes de gastar seu dinheiro.
Pro
Contra
Preço e disponibilidade
A Asus Prime GeForce RTX 5080 OC Edition pode ser adquirida na Amazon e na Best Buy US por US$ 1.319,99, mas a placa está esgotada no momento em que este artigo foi escrito.
Na Índia, a Prime GeForce RTX 5080 OC tem preço oficial de ₹1.59.999 e vem com garantia de três anos, mas atualmente é vendida por um preço mais alto em varejistas locais.
Índice
- Veredicto: GPU RTX 5080 SFF com proposta de valor questionável
- Uma rápida visita ao Asus Prime GeForce RTX 5080 OC Edition
- O banco de testes: A Prime RTX 5080 OC combina bem com o Core i9-14900K
- Benchmarks sintéticos: Está um pouco à frente da RTX 5080 FE
- Desempenho de IA e computação: Supera a Radeon RX 7900 XTX por uma margem significativa
- Desempenho em jogos: Vantagens tangíveis em relação à RX 7900 XTX
- Emissões: Saída tolerável de calor e ruído
- Gerenciamento de energia: Ganhos de eficiência bem-vindos em jogos em comparação com a RX 7900 XTX
- Impressões do Notebookcheck sobre o Asus Prime GeForce RTX 5080 OC Edition
Embora a RTX 5080 Founders Edition (FE) possa ser difícil de obter, não há escassez de placas parceiras add-in board (AiB) no mercado. A Asus oferece as GPUs da série RTX 50 nas categorias ROG, TUF Gaming e Prime.
A série Prime foi projetada para construções de PCs de fator de forma pequeno (SFF). Ela foi introduzida pela primeira vez com a linha da série RTX 40, mas estava limitada apenas às GPUs RTX 4060 e RTX 4070 e suas revisões. Este ano, a Asus expandiu a série Prime para incluir a RTX 5080.
Recentemente, analisamos a Asus TUF Gaming GeForce RTX 5080 OC. Nesta análise, daremos uma olhada na Asus Prime GeForce RTX 5080 OC Edition e veremos como ela se sai em comparação com a RTX 5080 FE.
Comparação da Prime GeForce RTX 5080 OC com outras GPUs da Nvidia
| Especificação | RTX 5090 FE | Prime RTX 5080 OC | RTX 5080 FE | RTX 4090 FE | RTX 4080 Super FE | RTX 4080 FE | Asus TUF RTX 4070 Ti Super | RTX 4070 Super FE | KFA2RTX 4060 Ti EX | RTX 3090 Ti FE | RTX 3090 FE | RTX 3080 Ti FE |
|---|---|---|---|---|---|---|---|---|---|---|---|---|
| Chip | GB202 | GB203 | GB203 | AD102 | AD103 | AD103 | AD103 | AD104 | AD106 | GA102 | GA102 | GA102 |
| Processo FinFET | 4N personalizado | 4N personalizado | 4N personalizado | 4N personalizado | 4N personalizado | 4N personalizado | 4N personalizado | 4N personalizado | 4N personalizado | 8 nm | 8 nm | 8 nm |
| Núcleos CUDA | 21.760 | 10.752 | 10.752 | 16.384 | 10.240 | 9.728 | 8.448 | 7.168 | 4.352 | 10.752 | 10.496 | 10.240 |
| Unidades de textura | 680 | 336 | 336 | 512 | 320 | 304 | 264 | 224 | 136 | 336 | 328 | 320 |
| Núcleos de Tensor | 680 5ª Geração | 336 5ª Geração | 336 5ª Geração | 512 4ª Geração | 320 4ª Geração | 304 4ª Geração | 264 4ª Geração | 224 4ª Geração | 136 4ª Geração | 336 3ª Geração | 328 3ª Geração | 320 3ª Geração 320 3ª Geração |
| RT Cores | 170 4ª Geração | 84 4ª Geração | 84 4ª Geração | 128 3ª Geração | 80 3ª Geração | 76 3ª Geração | 66 3ª Geração | 56 3ª Geração | 34 3ª Geração | 84 2ª Geração | 82 2ª Geração | 80 2ª Geração |
| Clock base da GPU | 2.017 MHz | 2.295 MHz | 2.295 MHz | 2.235 MHz | 2.295 MHz | 2.205 MHz | 2.340 MHz | 1.980 MHz | 2.310 MHz | 1.560 MHz | 1.395 MHz | 1.365 MHz |
| Relógio de aumento da GPU | 2.407 MHz | 2.655 MHz / 2.685 MHz (modo OC) | 2.617 MHz | 2.520 MHz | 2.550 MHz | 2.505 MHz | 2.610 MHz | 2.475 MHz | 2.535 MHz | 1.860 MHz | 1.695 MHz | 1.665 MHz |
| Barramento de memória | 512-bit | 256-bit | 256-bit | 384-bit | 256-bit | 256-bit | 256-bit | 192-bit | 128-bit | 384-bit | 384-bit | 384-bit |
| Largura de banda da memória | 1,79 TB/s | 960GB/s | 960 GB/s | 1.008 GB/s | 736,3 GB/s | 716,8 GB/s | 672 GB/s | 504 GB/s | 288 GB/s | 1.008 GB/s | 936 GB/s | 912 GB/s |
| Memória de vídeo | 32 GB GDDR7 | 16 GB GDDR7 | 16 GB GDDR7 | 24 GB GDDR6X | 16 GB GDDR6X | 16 GB GDDR6X | 16 GB GDDR6X | 12 GB GDDR6X | 8 GB GDDR6 | 24 GB GDDR6X | 24 GB GDDR6X | 12 GB GDDR6X |
| Consumo de energia | 575 W | 360 W | 360 W | 450 W | 320 W | 320 W | 285 W | 220 W | 160 W | 450 W | 350 W | 350 W |
Uma rápida visita ao Asus Prime GeForce RTX 5080 OC Edition
Medindo 304 x 126 x 50 mm, a Prime GeForce RTX 5080 OC é um pouco mais espessa que a RTX 5080 FE. No entanto, ela continua sendo uma placa SFF, ocupando apenas 2,5 slots.
O revestimento frontal é feito de plástico de alta qualidade, embora gostaríamos que fosse mais resistente, e é complementado por uma placa traseira de metal.
Os logotipos "GeForce RTX" e "PRIME" são exibidos com destaque no revestimento frontal, mas não há nenhum tipo de RGB ao redor deles.


A Prime RTX 5080 OC oferece um conjunto típico de conectores de monitor, como a grande maioria das GPUs existentes no mercado. Os três conectores DisplayPort agora finalmente suportam o padrão DisplayPort 2.1b.
Ao contrário da série TUF Gaming, que oferece duas saídas HDMI, a Prime RTX 5080 OC se contenta com apenas uma saída HDMI 2.1b.
Um conector 12VHPWR mantém a placa alimentada com a energia necessária. A Asus inclui um adaptador de 12VHPWR para 3x 8 pinos para uso com fontes de alimentação que não são compatíveis com ATX 3.x.
Semelhante a outras placas da Asus, um indicador LED próximo ao conector 12VHPWR acende em vermelho para indicar uma conexão incorreta do adaptador ou uma fonte de alimentação inadequada.
A Prime RTX 5080 OC apresenta um interruptor de modo dual-BIOS que alterna entre os modos Performance e Quiet. Usamos o modo Performance para todos os benchmarks e também comparamos os níveis de ruído da ventoinha entre os dois modos.


Na caixa, o senhor recebe vários acessórios que incluem o seguinte:
- Manual
- Gancho e argola de velcro
- Cartão de agradecimento
- Guia de início rápido
- cabo adaptador de 12VHPWR para 3x 8 pinos
Não há suporte para GPU com uma chave de fenda integrada, como vemos na série TUF Gaming, provavelmente devido ao formato compacto da placa.
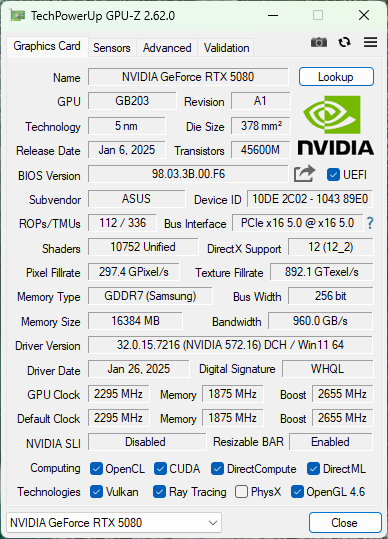
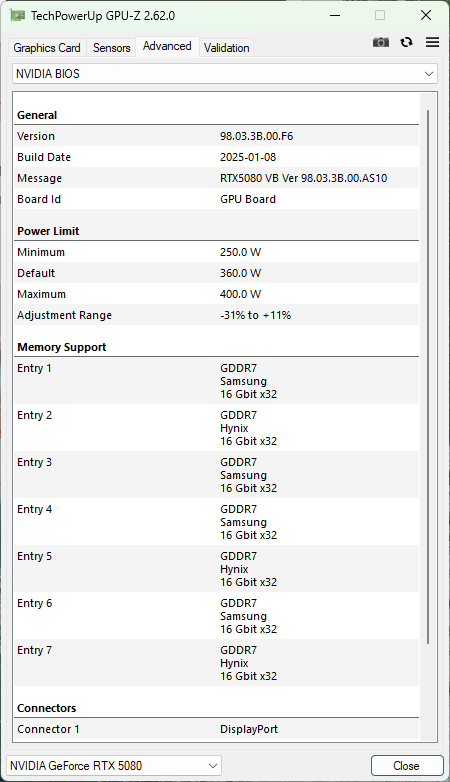
A Prime GeForce RTX 5080 OC é classificada para um boost clock padrão de 2.655 MHz, que é 38 MHz mais rápido do que a Founders Edition, mantendo a mesma potência gráfica total de 360 W (TGP). No modo Performance, essa placa pode aumentar ainda mais até um pico de 2.685 MHz.
É possível aumentar o limite de potência em mais 11% para um TGP máximo de 400 W.
O banco de testes: A Prime RTX 5080 OC combina bem com o Core i9-14900K
Usamos os seguintes componentes em nosso banco de testes atual:
- Banco de testes aberto Cooler Master MasterFrame 700
- Intel Core i9-14900K com o perfil Intel Extreme definido no BIOS
- Placa-mãe Gigabyte Z790 Aorus Master
- SSD Sabrent Rocket 4 Plus Gen4 2 TB NVMe e 2x SSDs Crucial MX500 1 TB SATA para sistema operacional, benchmarks e jogos
- 2x 16 GB de RAM Kingston Fury Renegade DDR5-6400 com temporizações 32-39-39-80 a 1,40 V
- Monitor Alienware AW3225QF 4K 240 Hz QD-OLED
- Cooler AiO Thermaltake TH420 V2 Ultra EX ARGB Cooler AiO
- Cooler Master MVE Gold V2 1250 ATX 3.0 PSU totalmente modular
Foi usado o Windows 11 24H2 com os patches mais recentes, juntamente com o Nvidia Game Ready Driver versão 572.16 emitido para a imprensa.
Gostaríamos de agradecer à Cooler Master pelo fornecimento da bancada de teste e da PSU, à Gigabyte pela placa-mãe, à Sabrent pelo SSD, à Dell pelo monitor Alienware, à Thermaltake pelo cooler AiO, à Kingston pelo kit de memória DDR5 e, finalmente, à Asus pela GPU Prime RTX 5080 Gaming OC Edition.
Benchmarks sintéticos: Está um pouco à frente da RTX 5080 FE
A Asus Prime GeForce RTX 5080 OC Edition tem um desempenho mais ou menos semelhante ao da RTX 5080 FE em benchmarks sintéticos. Os aumentos marginalmente mais altos se traduzem em uma vantagem de apenas 2% nos testes cumulativos 3DMark e Unigine.
Enquanto isso, a Sapphire Pulse Radeon RX 7900 XTX consegue um ganho de 4% em relação à Prime RTX 5080 OC no 3DMark Fire Strike Graphics, mas é prejudicada nos testes Port Royal e Speed Way, que envolvem traçado de raios.
| Performance rating - Percent | |
| NVIDIA GeForce RTX 5090 Founders Edition | |
| NVIDIA GeForce RTX 4090 | |
| Asus Prime GeForce RTX 5080 OC Edition | |
| NVIDIA GeForce RTX 5080 Founders Edition | |
| Sapphire Pulse AMD Radeon RX 7900 XTX | |
| NVIDIA GeForce RTX 4080 Founders Edition | |
| Sapphire Pulse AMD Radeon RX 7900 XT | |
| 3DMark | |
| 1920x1080 Fire Strike Graphics | |
| NVIDIA GeForce RTX 5090 Founders Edition | |
| NVIDIA GeForce RTX 4090 | |
| Sapphire Pulse AMD Radeon RX 7900 XTX | |
| Asus Prime GeForce RTX 5080 OC Edition | |
| Sapphire Pulse AMD Radeon RX 7900 XT | |
| NVIDIA GeForce RTX 5080 Founders Edition | |
| NVIDIA GeForce RTX 4080 Founders Edition | |
| Fire Strike Extreme Graphics | |
| NVIDIA GeForce RTX 5090 Founders Edition | |
| NVIDIA GeForce RTX 4090 | |
| Asus Prime GeForce RTX 5080 OC Edition | |
| NVIDIA GeForce RTX 5080 Founders Edition | |
| Sapphire Pulse AMD Radeon RX 7900 XTX | |
| Sapphire Pulse AMD Radeon RX 7900 XT | |
| NVIDIA GeForce RTX 4080 Founders Edition | |
| 3840x2160 Fire Strike Ultra Graphics | |
| NVIDIA GeForce RTX 5090 Founders Edition | |
| NVIDIA GeForce RTX 4090 | |
| Asus Prime GeForce RTX 5080 OC Edition | |
| NVIDIA GeForce RTX 5080 Founders Edition | |
| Sapphire Pulse AMD Radeon RX 7900 XTX | |
| Sapphire Pulse AMD Radeon RX 7900 XT | |
| NVIDIA GeForce RTX 4080 Founders Edition | |
| 2560x1440 Port Royal Graphics | |
| NVIDIA GeForce RTX 5090 Founders Edition | |
| NVIDIA GeForce RTX 4090 | |
| Asus Prime GeForce RTX 5080 OC Edition | |
| NVIDIA GeForce RTX 5080 Founders Edition | |
| NVIDIA GeForce RTX 4080 Founders Edition | |
| Sapphire Pulse AMD Radeon RX 7900 XTX | |
| Sapphire Pulse AMD Radeon RX 7900 XT | |
| 2560x1440 Speed Way Score | |
| NVIDIA GeForce RTX 5090 Founders Edition | |
| NVIDIA GeForce RTX 4090 | |
| Asus Prime GeForce RTX 5080 OC Edition | |
| NVIDIA GeForce RTX 5080 Founders Edition | |
| NVIDIA GeForce RTX 4080 Founders Edition | |
| Sapphire Pulse AMD Radeon RX 7900 XTX | |
| Sapphire Pulse AMD Radeon RX 7900 XT | |
| Steel Nomad Score | |
| NVIDIA GeForce RTX 5090 Founders Edition | |
| NVIDIA GeForce RTX 4090 | |
| NVIDIA GeForce RTX 5080 Founders Edition | |
| Asus Prime GeForce RTX 5080 OC Edition | |
| Sapphire Pulse AMD Radeon RX 7900 XTX | |
| NVIDIA GeForce RTX 4080 Founders Edition | |
| Sapphire Pulse AMD Radeon RX 7900 XT | |
| 2560x1440 Time Spy Graphics | |
| NVIDIA GeForce RTX 5090 Founders Edition | |
| NVIDIA GeForce RTX 4090 | |
| Asus Prime GeForce RTX 5080 OC Edition | |
| NVIDIA GeForce RTX 5080 Founders Edition | |
| Sapphire Pulse AMD Radeon RX 7900 XTX | |
| Sapphire Pulse AMD Radeon RX 7900 XT | |
| NVIDIA GeForce RTX 4080 Founders Edition | |
| Unigine Heaven 4.0 - Extreme Preset DX11 | |
| NVIDIA GeForce RTX 5090 Founders Edition | |
| NVIDIA GeForce RTX 4090 | |
| Asus Prime GeForce RTX 5080 OC Edition | |
| NVIDIA GeForce RTX 5080 Founders Edition | |
| Sapphire Pulse AMD Radeon RX 7900 XTX | |
| NVIDIA GeForce RTX 4080 Founders Edition | |
| Sapphire Pulse AMD Radeon RX 7900 XT | |
| Unigine Valley 1.0 - 1920x1080 Extreme HD DirectX AA:x8 | |
| Sapphire Pulse AMD Radeon RX 7900 XTX | |
| Sapphire Pulse AMD Radeon RX 7900 XT | |
| Asus Prime GeForce RTX 5080 OC Edition | |
| NVIDIA GeForce RTX 4090 | |
| NVIDIA GeForce RTX 5090 Founders Edition | |
| NVIDIA GeForce RTX 4080 Founders Edition | |
| NVIDIA GeForce RTX 5080 Founders Edition | |
| Unigine Superposition | |
| 3840x2160 4k Optimized | |
| NVIDIA GeForce RTX 5090 Founders Edition | |
| NVIDIA GeForce RTX 4090 | |
| Asus Prime GeForce RTX 5080 OC Edition | |
| NVIDIA GeForce RTX 5080 Founders Edition | |
| Sapphire Pulse AMD Radeon RX 7900 XTX | |
| NVIDIA GeForce RTX 4080 Founders Edition | |
| Sapphire Pulse AMD Radeon RX 7900 XT | |
| 7680x4320 8k Optimized | |
| NVIDIA GeForce RTX 5090 Founders Edition | |
| NVIDIA GeForce RTX 4090 | |
| Asus Prime GeForce RTX 5080 OC Edition | |
| NVIDIA GeForce RTX 5080 Founders Edition | |
| Sapphire Pulse AMD Radeon RX 7900 XTX | |
| NVIDIA GeForce RTX 4080 Founders Edition | |
| Sapphire Pulse AMD Radeon RX 7900 XT | |
| 3DMark Fire Strike Score | 48491 pontos | |
| 3DMark Fire Strike Extreme Score | 36605 pontos | |
| 3DMark Time Spy Score | 30376 pontos | |
| 3DMark Steel Nomad Score | 7979 pontos | |
Ajuda | ||
Desempenho de IA e computação: Supera a Radeon RX 7900 XTX por uma margem significativa
Mais uma vez, a Prime GeForce RTX 5080 OC consegue uma vantagem de um fio de cabelo sobre a RTX 5080 FE no benchmark MLPerf AI.
Tanto a Prime RTX 5080 OC quanto a RTX 5080 FE levam o mesmo tempo para concluir as renderizações do Blender 3.3 Classroom CUDA e Classroom Optix, sem mostrar nenhuma diferença prática nos testes do V-Ray.
As placas AMD estão em desvantagem óbvia nos benchmarks CUDA e RTX, mas a Radeon RX 7900 XTX consegue superar os dois modelos RTX 5080 em alguns subtestes do ComputeMark.
| MLPerf Client 0.5 - overall generation rate | |
| NVIDIA GeForce RTX 5090 Founders Edition | |
| NVIDIA GeForce RTX 4090 | |
| Asus Prime GeForce RTX 5080 OC Edition | |
| NVIDIA GeForce RTX 5080 Founders Edition | |
| Sapphire Pulse AMD Radeon RX 7900 XTX | |
| NVIDIA GeForce RTX 4080 Founders Edition | |
| Sapphire Pulse AMD Radeon RX 7900 XT | |
| Blender | |
| v3.3 Classroom CUDA | |
| NVIDIA GeForce RTX 4080 Founders Edition | |
| NVIDIA GeForce RTX 5080 Founders Edition | |
| Asus Prime GeForce RTX 5080 OC Edition | |
| NVIDIA GeForce RTX 4090 | |
| NVIDIA GeForce RTX 5090 Founders Edition | |
| v3.3 Classroom OPTIX/RTX | |
| NVIDIA GeForce RTX 4080 Founders Edition | |
| NVIDIA GeForce RTX 5080 Founders Edition | |
| Asus Prime GeForce RTX 5080 OC Edition | |
| NVIDIA GeForce RTX 4090 | |
| NVIDIA GeForce RTX 5090 Founders Edition | |
| V-Ray Benchmark Next 4.10 - GPU | |
| NVIDIA GeForce RTX 5090 Founders Edition | |
| NVIDIA GeForce RTX 4090 | |
| NVIDIA GeForce RTX 5080 Founders Edition | |
| Asus Prime GeForce RTX 5080 OC Edition | |
| NVIDIA GeForce RTX 4080 Founders Edition | |
| Sapphire Pulse AMD Radeon RX 7900 XTX | |
| Sapphire Pulse AMD Radeon RX 7900 XT | |
| V-Ray 5 Benchmark | |
| GPU CUDA | |
| NVIDIA GeForce RTX 5090 Founders Edition | |
| NVIDIA GeForce RTX 4090 | |
| Asus Prime GeForce RTX 5080 OC Edition | |
| NVIDIA GeForce RTX 5080 Founders Edition | |
| NVIDIA GeForce RTX 4080 Founders Edition | |
| Sapphire Pulse AMD Radeon RX 7900 XTX | |
| Sapphire Pulse AMD Radeon RX 7900 XT | |
| GPU RTX | |
| NVIDIA GeForce RTX 5090 Founders Edition | |
| NVIDIA GeForce RTX 4090 | |
| NVIDIA GeForce RTX 5080 Founders Edition | |
| Asus Prime GeForce RTX 5080 OC Edition | |
| NVIDIA GeForce RTX 4080 Founders Edition | |
| ComputeMark v2.1 | |
| 1024x600 Normal, Score | |
| NVIDIA GeForce RTX 5090 Founders Edition | |
| NVIDIA GeForce RTX 4090 | |
| Asus Prime GeForce RTX 5080 OC Edition | |
| NVIDIA GeForce RTX 5080 Founders Edition | |
| Sapphire Pulse AMD Radeon RX 7900 XTX | |
| Sapphire Pulse AMD Radeon RX 7900 XT | |
| NVIDIA GeForce RTX 4080 Founders Edition | |
| 1024x600 Normal, Fluid 3DTex | |
| NVIDIA GeForce RTX 5090 Founders Edition | |
| Asus Prime GeForce RTX 5080 OC Edition | |
| NVIDIA GeForce RTX 5080 Founders Edition | |
| NVIDIA GeForce RTX 4090 | |
| Sapphire Pulse AMD Radeon RX 7900 XTX | |
| Sapphire Pulse AMD Radeon RX 7900 XT | |
| NVIDIA GeForce RTX 4080 Founders Edition | |
| 1024x600 Normal, Fluid 2DTexArr | |
| NVIDIA GeForce RTX 5090 Founders Edition | |
| Sapphire Pulse AMD Radeon RX 7900 XTX | |
| Sapphire Pulse AMD Radeon RX 7900 XT | |
| Asus Prime GeForce RTX 5080 OC Edition | |
| NVIDIA GeForce RTX 5080 Founders Edition | |
| NVIDIA GeForce RTX 4090 | |
| NVIDIA GeForce RTX 4080 Founders Edition | |
| 1024x600 Normal, Mandel Vector | |
| NVIDIA GeForce RTX 5090 Founders Edition | |
| Sapphire Pulse AMD Radeon RX 7900 XTX | |
| NVIDIA GeForce RTX 4090 | |
| Asus Prime GeForce RTX 5080 OC Edition | |
| NVIDIA GeForce RTX 5080 Founders Edition | |
| Sapphire Pulse AMD Radeon RX 7900 XT | |
| NVIDIA GeForce RTX 4080 Founders Edition | |
| 1024x600 Normal, Mandel Scalar | |
| NVIDIA GeForce RTX 5090 Founders Edition | |
| NVIDIA GeForce RTX 4090 | |
| Sapphire Pulse AMD Radeon RX 7900 XTX | |
| Asus Prime GeForce RTX 5080 OC Edition | |
| NVIDIA GeForce RTX 5080 Founders Edition | |
| Sapphire Pulse AMD Radeon RX 7900 XT | |
| NVIDIA GeForce RTX 4080 Founders Edition | |
| 1024x600 Normal, QJuliaRayTrace | |
| NVIDIA GeForce RTX 5090 Founders Edition | |
| NVIDIA GeForce RTX 4090 | |
| Asus Prime GeForce RTX 5080 OC Edition | |
| NVIDIA GeForce RTX 5080 Founders Edition | |
| NVIDIA GeForce RTX 4080 Founders Edition | |
| Sapphire Pulse AMD Radeon RX 7900 XTX | |
| Sapphire Pulse AMD Radeon RX 7900 XT | |
| LuxMark v2.0 64Bit | |
| Room GPUs-only | |
| NVIDIA GeForce RTX 5090 Founders Edition | |
| NVIDIA GeForce RTX 4090 | |
| Asus Prime GeForce RTX 5080 OC Edition | |
| NVIDIA GeForce RTX 5080 Founders Edition | |
| NVIDIA GeForce RTX 4080 Founders Edition | |
| Sapphire Pulse AMD Radeon RX 7900 XTX | |
| Sapphire Pulse AMD Radeon RX 7900 XT | |
| Sala GPUs-only | |
| NVIDIA GeForce RTX 5090 Founders Edition | |
| NVIDIA GeForce RTX 4090 | |
| Asus Prime GeForce RTX 5080 OC Edition | |
| NVIDIA GeForce RTX 5080 Founders Edition | |
| NVIDIA GeForce RTX 4080 Founders Edition | |
| Sapphire Pulse AMD Radeon RX 7900 XTX | |
| Sapphire Pulse AMD Radeon RX 7900 XT | |
* ... menor é melhor
Desempenho em jogos: Vantagens tangíveis em relação à RX 7900 XTX
A Prime GeForce RTX 5080 OC Edition está à frente da RTX 5080 FE apenas por uma pequena margem nos testes cumulativos de jogos em 1080p, 1440p e 4K Ultra, enquanto supera a Radeon RX 7900 XTX em 13% no geral.
A maior vantagem da RX 7900 XTX vem do site F1 24 em 4K Ultra, onde a Prime RTX 5080 OC é 47% mais rápida.
Curiosamente, Alan Wake 2 vê a principal GPU RDNA 3 mostrando ganhos de até 12% em relação à Prime RTX 5080 OC e até 18% de vantagem em relação à RTX 5080 FE.
De modo geral, a Prime RTX 5080 OC não tem dificuldades para atingir e até mesmo ultrapassar a marca de 4K 60 fps sem ajuda de upscaling nas configurações Ultra em um bom número de títulos AAA modernos.
| Performance rating - Percent | |
| NVIDIA GeForce RTX 5090 Founders Edition | |
| NVIDIA GeForce RTX 4090 | |
| Asus Prime GeForce RTX 5080 OC Edition | |
| NVIDIA GeForce RTX 5080 Founders Edition | |
| Sapphire Pulse AMD Radeon RX 7900 XTX | |
| NVIDIA GeForce RTX 4080 Founders Edition | |
| Sapphire Pulse AMD Radeon RX 7900 XT | |
| Indiana Jones and the Great Circle | |
| 3840x2160 Very Ultra Preset | |
| NVIDIA GeForce RTX 5090 Founders Edition | |
| NVIDIA GeForce RTX 4090 | |
| Asus Prime GeForce RTX 5080 OC Edition | |
| NVIDIA GeForce RTX 5080 Founders Edition | |
| Sapphire Pulse AMD Radeon RX 7900 XTX | |
| NVIDIA GeForce RTX 4080 Founders Edition | |
| Sapphire Pulse AMD Radeon RX 7900 XT | |
| 2560x1440 Very Ultra Preset | |
| NVIDIA GeForce RTX 5090 Founders Edition | |
| NVIDIA GeForce RTX 4090 | |
| Asus Prime GeForce RTX 5080 OC Edition | |
| NVIDIA GeForce RTX 5080 Founders Edition | |
| Sapphire Pulse AMD Radeon RX 7900 XTX | |
| Sapphire Pulse AMD Radeon RX 7900 XT | |
| NVIDIA GeForce RTX 4080 Founders Edition | |
| 1920x1080 Very Ultra Preset | |
| NVIDIA GeForce RTX 5090 Founders Edition | |
| NVIDIA GeForce RTX 4090 | |
| Asus Prime GeForce RTX 5080 OC Edition | |
| NVIDIA GeForce RTX 5080 Founders Edition | |
| Sapphire Pulse AMD Radeon RX 7900 XTX | |
| Sapphire Pulse AMD Radeon RX 7900 XT | |
| NVIDIA GeForce RTX 4080 Founders Edition | |
| Black Myth: Wukong | |
| 3840x2160 cinematic TSR 100 | |
| NVIDIA GeForce RTX 5090 Founders Edition | |
| NVIDIA GeForce RTX 4090 | |
| NVIDIA GeForce RTX 5080 Founders Edition | |
| Asus Prime GeForce RTX 5080 OC Edition | |
| NVIDIA GeForce RTX 4080 Founders Edition | |
| Sapphire Pulse AMD Radeon RX 7900 XTX | |
| Sapphire Pulse AMD Radeon RX 7900 XT | |
| 2560x1440 cinematic TSR 100 | |
| NVIDIA GeForce RTX 5090 Founders Edition | |
| NVIDIA GeForce RTX 4090 | |
| Asus Prime GeForce RTX 5080 OC Edition | |
| NVIDIA GeForce RTX 5080 Founders Edition | |
| Sapphire Pulse AMD Radeon RX 7900 XTX | |
| NVIDIA GeForce RTX 4080 Founders Edition | |
| Sapphire Pulse AMD Radeon RX 7900 XT | |
| 1920x1080 cinematic TSR 100 | |
| NVIDIA GeForce RTX 5090 Founders Edition | |
| NVIDIA GeForce RTX 4090 | |
| Asus Prime GeForce RTX 5080 OC Edition | |
| NVIDIA GeForce RTX 5080 Founders Edition | |
| NVIDIA GeForce RTX 4080 Founders Edition | |
| Sapphire Pulse AMD Radeon RX 7900 XTX | |
| Sapphire Pulse AMD Radeon RX 7900 XT | |
| Alan Wake 2 | |
| 3840x2160 High Preset | |
| NVIDIA GeForce RTX 5090 Founders Edition | |
| NVIDIA GeForce RTX 4090 | |
| Sapphire Pulse AMD Radeon RX 7900 XTX | |
| Asus Prime GeForce RTX 5080 OC Edition | |
| NVIDIA GeForce RTX 5080 Founders Edition | |
| Sapphire Pulse AMD Radeon RX 7900 XT | |
| NVIDIA GeForce RTX 4080 Founders Edition | |
| 2560x1440 High Preset | |
| NVIDIA GeForce RTX 5090 Founders Edition | |
| Sapphire Pulse AMD Radeon RX 7900 XTX | |
| NVIDIA GeForce RTX 4090 | |
| Asus Prime GeForce RTX 5080 OC Edition | |
| NVIDIA GeForce RTX 5080 Founders Edition | |
| Sapphire Pulse AMD Radeon RX 7900 XT | |
| NVIDIA GeForce RTX 4080 Founders Edition | |
| 1920x1080 High Preset | |
| NVIDIA GeForce RTX 5090 Founders Edition | |
| NVIDIA GeForce RTX 4090 | |
| Sapphire Pulse AMD Radeon RX 7900 XTX | |
| Asus Prime GeForce RTX 5080 OC Edition | |
| NVIDIA GeForce RTX 5080 Founders Edition | |
| Sapphire Pulse AMD Radeon RX 7900 XT | |
| NVIDIA GeForce RTX 4080 Founders Edition | |
| F1 24 | |
| 3840x2160 Ultra High Preset AA:T AF:16x | |
| NVIDIA GeForce RTX 5090 Founders Edition | |
| NVIDIA GeForce RTX 4090 | |
| Asus Prime GeForce RTX 5080 OC Edition | |
| NVIDIA GeForce RTX 5080 Founders Edition | |
| NVIDIA GeForce RTX 4080 Founders Edition | |
| Sapphire Pulse AMD Radeon RX 7900 XTX | |
| Sapphire Pulse AMD Radeon RX 7900 XT | |
| 2560x1440 Ultra High Preset AA:T AF:16x | |
| NVIDIA GeForce RTX 5090 Founders Edition | |
| NVIDIA GeForce RTX 4090 | |
| Asus Prime GeForce RTX 5080 OC Edition | |
| NVIDIA GeForce RTX 5080 Founders Edition | |
| NVIDIA GeForce RTX 4080 Founders Edition | |
| Sapphire Pulse AMD Radeon RX 7900 XTX | |
| Sapphire Pulse AMD Radeon RX 7900 XT | |
| 1920x1080 Ultra High Preset AA:T AF:16x | |
| NVIDIA GeForce RTX 5090 Founders Edition | |
| NVIDIA GeForce RTX 4090 | |
| Asus Prime GeForce RTX 5080 OC Edition | |
| NVIDIA GeForce RTX 5080 Founders Edition | |
| NVIDIA GeForce RTX 4080 Founders Edition | |
| Sapphire Pulse AMD Radeon RX 7900 XTX | |
| Sapphire Pulse AMD Radeon RX 7900 XT | |
| Assassin's Creed Mirage | |
| 3840x2160 Ultra High Preset (Adaptive Quality Off) | |
| NVIDIA GeForce RTX 5090 Founders Edition | |
| NVIDIA GeForce RTX 4090 | |
| NVIDIA GeForce RTX 5080 Founders Edition | |
| Asus Prime GeForce RTX 5080 OC Edition | |
| Sapphire Pulse AMD Radeon RX 7900 XTX | |
| NVIDIA GeForce RTX 4080 Founders Edition | |
| Sapphire Pulse AMD Radeon RX 7900 XT | |
| 2560x1440 Ultra High Preset (Adaptive Quality Off) | |
| NVIDIA GeForce RTX 5090 Founders Edition | |
| Asus Prime GeForce RTX 5080 OC Edition | |
| NVIDIA GeForce RTX 5080 Founders Edition | |
| Sapphire Pulse AMD Radeon RX 7900 XTX | |
| Sapphire Pulse AMD Radeon RX 7900 XT | |
| NVIDIA GeForce RTX 4080 Founders Edition | |
| NVIDIA GeForce RTX 4090 | |
| 1920x1080 Ultra High Preset (Adaptive Quality Off) | |
| NVIDIA GeForce RTX 4090 | |
| NVIDIA GeForce RTX 5090 Founders Edition | |
| NVIDIA GeForce RTX 5080 Founders Edition | |
| Asus Prime GeForce RTX 5080 OC Edition | |
| Sapphire Pulse AMD Radeon RX 7900 XTX | |
| Sapphire Pulse AMD Radeon RX 7900 XT | |
| NVIDIA GeForce RTX 4080 Founders Edition | |
| Avatar Frontiers of Pandora | |
| 3840x2160 Ultra Preset AA:T | |
| NVIDIA GeForce RTX 5090 Founders Edition | |
| NVIDIA GeForce RTX 4090 | |
| NVIDIA GeForce RTX 5080 Founders Edition | |
| Asus Prime GeForce RTX 5080 OC Edition | |
| Sapphire Pulse AMD Radeon RX 7900 XTX | |
| NVIDIA GeForce RTX 4080 Founders Edition | |
| Sapphire Pulse AMD Radeon RX 7900 XT | |
| 2560x1440 Ultra Preset AA:T | |
| NVIDIA GeForce RTX 5090 Founders Edition | |
| NVIDIA GeForce RTX 4090 | |
| NVIDIA GeForce RTX 5080 Founders Edition | |
| Asus Prime GeForce RTX 5080 OC Edition | |
| Sapphire Pulse AMD Radeon RX 7900 XTX | |
| NVIDIA GeForce RTX 4080 Founders Edition | |
| Sapphire Pulse AMD Radeon RX 7900 XT | |
| 1920x1080 Ultra Preset AA:T | |
| NVIDIA GeForce RTX 5090 Founders Edition | |
| NVIDIA GeForce RTX 4090 | |
| NVIDIA GeForce RTX 5080 Founders Edition | |
| Asus Prime GeForce RTX 5080 OC Edition | |
| Sapphire Pulse AMD Radeon RX 7900 XTX | |
| NVIDIA GeForce RTX 4080 Founders Edition | |
| Sapphire Pulse AMD Radeon RX 7900 XT | |
| Cyberpunk 2077 | |
| 2560x1440 Ultra Preset (FSR off) | |
| NVIDIA GeForce RTX 5090 Founders Edition | |
| Asus Prime GeForce RTX 5080 OC Edition | |
| NVIDIA GeForce RTX 5080 Founders Edition | |
| NVIDIA GeForce RTX 4090 | |
| Sapphire Pulse AMD Radeon RX 7900 XTX | |
| Sapphire Pulse AMD Radeon RX 7900 XT | |
| NVIDIA GeForce RTX 4080 Founders Edition | |
| 1920x1080 Ultra Preset (FSR off) | |
| NVIDIA GeForce RTX 5090 Founders Edition | |
| Sapphire Pulse AMD Radeon RX 7900 XTX | |
| NVIDIA GeForce RTX 4090 | |
| Asus Prime GeForce RTX 5080 OC Edition | |
| Sapphire Pulse AMD Radeon RX 7900 XT | |
| NVIDIA GeForce RTX 5080 Founders Edition | |
| NVIDIA GeForce RTX 4080 Founders Edition | |
| X-Plane 11.11 | |
| 3840x2160 high (fps_test=3) | |
| NVIDIA GeForce RTX 5090 Founders Edition | |
| NVIDIA GeForce RTX 4090 | |
| Asus Prime GeForce RTX 5080 OC Edition | |
| NVIDIA GeForce RTX 5080 Founders Edition | |
| NVIDIA GeForce RTX 4080 Founders Edition | |
| Sapphire Pulse AMD Radeon RX 7900 XTX | |
| Sapphire Pulse AMD Radeon RX 7900 XT | |
| 1920x1080 high (fps_test=3) | |
| NVIDIA GeForce RTX 5090 Founders Edition | |
| NVIDIA GeForce RTX 5080 Founders Edition | |
| NVIDIA GeForce RTX 4090 | |
| Asus Prime GeForce RTX 5080 OC Edition | |
| NVIDIA GeForce RTX 4080 Founders Edition | |
| Sapphire Pulse AMD Radeon RX 7900 XTX | |
| Sapphire Pulse AMD Radeon RX 7900 XT | |
Desempenho do Ray Tracing
A liderança da RX 7900 XTX em Alan Wake 2 raster não pode ser transportada para as configurações de ray tracing, onde ela fica atrás da Prime RTX 5080 OC em 47% em 4K.
Em Cyberpunk 2077 Phantom Liberty, a Prime RTX 5080 OC tem uma vantagem impressionante de 58% sobre a RX 7900 XTX. No entanto, os ganhos provenientes da RTX 5080 FE são bastante minúsculos.
A VRAM GDDR7 de 16 GB da RTX 5080 é 30% mais rápida do que a equivalente GDDR6X da RTX 4080 Super. No entanto, isso pode se revelar uma grande limitação em determinadas configurações dos títulos AAA modernos.
Por exemplo, é impossível até mesmo navegar pelos menus, quanto mais jogar, em Indiana Jones and the Great Circle quando o rastreamento de caminho completo está ativado em 4K. A ativação do DLSS e da geração de quadros também não ajuda.
| Indiana Jones and the Great Circle - 2560x1440 Very Ultra Preset + Full Path Tracing + Quality DLSS + Frame Generation | |
| NVIDIA GeForce RTX 5090 Founders Edition | |
| NVIDIA GeForce RTX 4090 | |
| Asus Prime GeForce RTX 5080 OC Edition | |
| NVIDIA GeForce RTX 5080 Founders Edition | |
| NVIDIA GeForce RTX 4080 Founders Edition | |
| Black Myth: Wukong | |
| 3840x2160 cinematic RT: Very High DLSS 68 FG | |
| NVIDIA GeForce RTX 4090 | |
| NVIDIA GeForce RTX 5090 Founders Edition | |
| Asus Prime GeForce RTX 5080 OC Edition | |
| NVIDIA GeForce RTX 5080 Founders Edition | |
| NVIDIA GeForce RTX 4080 Founders Edition | |
| 2560x1440 cinematic RT: Very High DLSS 68 FG | |
| NVIDIA GeForce RTX 5090 Founders Edition | |
| NVIDIA GeForce RTX 4090 | |
| Asus Prime GeForce RTX 5080 OC Edition | |
| NVIDIA GeForce RTX 5080 Founders Edition | |
| NVIDIA GeForce RTX 4080 Founders Edition | |
| Alan Wake 2 | |
| 3840x2160 High Preset + High Ray Tracing | |
| NVIDIA GeForce RTX 5090 Founders Edition | |
| NVIDIA GeForce RTX 4090 | |
| Asus Prime GeForce RTX 5080 OC Edition | |
| NVIDIA GeForce RTX 5080 Founders Edition | |
| NVIDIA GeForce RTX 4080 Founders Edition | |
| Sapphire Pulse AMD Radeon RX 7900 XTX | |
| Sapphire Pulse AMD Radeon RX 7900 XT | |
| 1920x1080 High Preset + High Ray Tracing | |
| NVIDIA GeForce RTX 5090 Founders Edition | |
| NVIDIA GeForce RTX 4090 | |
| Asus Prime GeForce RTX 5080 OC Edition | |
| NVIDIA GeForce RTX 5080 Founders Edition | |
| NVIDIA GeForce RTX 4080 Founders Edition | |
| Sapphire Pulse AMD Radeon RX 7900 XTX | |
| Sapphire Pulse AMD Radeon RX 7900 XT | |
| 3840x2160 High Preset + High Ray Tracing + Quality DLSS + FG | |
| NVIDIA GeForce RTX 5090 Founders Edition | |
| NVIDIA GeForce RTX 4090 | |
| Asus Prime GeForce RTX 5080 OC Edition | |
| NVIDIA GeForce RTX 5080 Founders Edition | |
| NVIDIA GeForce RTX 4080 Founders Edition | |
| Cyberpunk 2077 | |
| 3840x2160 Ray Tracing Ultra Preset (DLSS off, no Path Tracing) | |
| NVIDIA GeForce RTX 5090 Founders Edition | |
| NVIDIA GeForce RTX 4090 | |
| NVIDIA GeForce RTX 5080 Founders Edition | |
| Asus Prime GeForce RTX 5080 OC Edition | |
| NVIDIA GeForce RTX 4080 Founders Edition | |
| Sapphire Pulse AMD Radeon RX 7900 XTX | |
| Sapphire Pulse AMD Radeon RX 7900 XT | |
| 1920x1080 Ray Tracing Ultra Preset (DLSS off) | |
| NVIDIA GeForce RTX 5090 Founders Edition | |
| NVIDIA GeForce RTX 4090 | |
| Asus Prime GeForce RTX 5080 OC Edition | |
| NVIDIA GeForce RTX 5080 Founders Edition | |
| NVIDIA GeForce RTX 4080 Founders Edition | |
| Sapphire Pulse AMD Radeon RX 7900 XTX | |
| Sapphire Pulse AMD Radeon RX 7900 XT | |
Geração de vários quadros DLSS 4
Atualmente, apenas alguns títulos são compatíveis com a geração de vários quadros (MFG) DLSS 4 imediatamente. No entanto, muitos outros jogos compatíveis podem utilizar DLSS 4 (para todas as GPUs RTX) e MFG (somente para GPUs Blackwell) por meio de substituições no aplicativo Nvidia
Em comparação com Alan Wake 2 ou Cyberpunk 2077 Phantom Liberty, Star Wars Outlaws mostra ganhos de 5 a 7% na Prime RTX 5080 OC em relação à RTX 5080 FE com DLSS e geração de quadros ativados.
Curiosamente, notamos um resultado anômalo no Cyberpunk 2077 Phantom Liberty com MFG 2x ativado na predefinição 4K Ray Tracing Overdrive, em que a Prime RTX 5080 OC teve um desempenho 31% mais lento do que a RTX 5080 FE.
Apesar de verificar novamente se as configurações, o driver e a versão do sistema operacional eram idênticos para os dois testes, a placa da Asus ficou inesperadamente para trás.
| Alan Wake 2 | |
| 3840x2160 High Preset + Ultra Ray Tracing + Quality DLSS + FG 4x | |
| NVIDIA GeForce RTX 5090 Founders Edition | |
| Asus Prime GeForce RTX 5080 OC Edition | |
| NVIDIA GeForce RTX 5080 Founders Edition | |
| 3840x2160 High Preset + Ultra Ray Tracing + Quality DLSS + FG 2x | |
| NVIDIA GeForce RTX 5090 Founders Edition | |
| Asus Prime GeForce RTX 5080 OC Edition | |
| NVIDIA GeForce RTX 5080 Founders Edition | |
| 3840x2160 High Preset + High Ray Tracing + Quality DLSS + FG | |
| NVIDIA GeForce RTX 5090 Founders Edition | |
| NVIDIA GeForce RTX 4090 | |
| Asus Prime GeForce RTX 5080 OC Edition | |
| NVIDIA GeForce RTX 5080 Founders Edition | |
| Cyberpunk 2077 | |
| 3840x2160 Ray Tracing Overdrive Preset + DLSS 4 Transformer Quality + Frame Generation MFG 4x | |
| NVIDIA GeForce RTX 5090 Founders Edition | |
| NVIDIA GeForce RTX 5080 Founders Edition | |
| Asus Prime GeForce RTX 5080 OC Edition | |
| 3840x2160 Ray Tracing Overdrive Preset + DLSS 4 Transformer Quality + Frame Generation (M)FG 2x | |
| NVIDIA GeForce RTX 5090 Founders Edition | |
| NVIDIA GeForce RTX 5080 Founders Edition | |
| Asus Prime GeForce RTX 5080 OC Edition | |
| 2560x1440 Ultra Preset DLSS4 quality no FG | |
| NVIDIA GeForce RTX 5090 Founders Edition | |
| Asus Prime GeForce RTX 5080 OC Edition | |
| Star Wars Outlaws | |
| 2560x1440 cinem. ultra, RT ultra, DLSS, FG RR | |
| NVIDIA GeForce RTX 5090 Founders Edition | |
| NVIDIA GeForce RTX 4090 | |
| Asus Prime GeForce RTX 5080 OC Edition | |
| NVIDIA GeForce RTX 5080 Founders Edition | |
| 3840x2160 cinem. ultra, RT ultra, DLSS, FG RR | |
| NVIDIA GeForce RTX 5090 Founders Edition | |
| NVIDIA GeForce RTX 4090 | |
| Asus Prime GeForce RTX 5080 OC Edition | |
| NVIDIA GeForce RTX 5080 Founders Edition | |
| 3840x2160 cinem. ultra, RT ultra, DLSS, FG 4x, RR | |
| NVIDIA GeForce RTX 5090 Founders Edition | |
| Asus Prime GeForce RTX 5080 OC Edition | |
| NVIDIA GeForce RTX 5080 Founders Edition | |
| baixo | média | alto | ultra | QHD DLSS | QHD | 4K DLSS | 4K | |
|---|---|---|---|---|---|---|---|---|
| The Witcher 3 (2015) | 278 | 232 | 225 | |||||
| X-Plane 11.11 (2018) | 154.2 | 128.1 | ||||||
| Baldur's Gate 3 (2023) | 240 | 193.7 | 169.8 | 109.4 | ||||
| Cyberpunk 2077 (2023) | 180.2 | 163.3 | 152.5 | |||||
| Assassin's Creed Mirage (2023) | 194 | 163 | 140 | 109 | ||||
| Alan Wake 2 (2023) | 146.9 | 108.6 | 95.2 | 57.6 | ||||
| Avatar Frontiers of Pandora (2023) | 132.6 | 94.5 | 85.9 | 51.1 | ||||
| F1 24 (2024) | 204 | 204 | 141.9 | 122 | 73.2 | |||
| Black Myth: Wukong (2024) | 80 | 88 | 63 | 65 | 38 | |||
| Star Wars Outlaws (2024) | 108.7 | 104.3 | 80.6 | 71.4 | 50 | |||
| Stalker 2 (2024) | 102.4 | 171.6 | 87.4 | 113.7 | 55 | |||
| Indiana Jones and the Great Circle (2024) | 168.5 | 139.4 | 93 |
Emissões: Saída tolerável de calor e ruído
A Asus Prime GeForce RTX 5080 OC Edition tem alguns truques na manga para gerenciar a temperatura. Não há material de interface térmica de metal líquido, mas a Asus diz que a placa usa uma almofada térmica de mudança de fase para melhor condutividade, juntamente com uma combinação de câmara de vapor e dissipador de calor.
Além disso, a placa traseira de metal ventilada foi projetada para ajudar a melhorar a dissipação de calor.
Teste de estresse
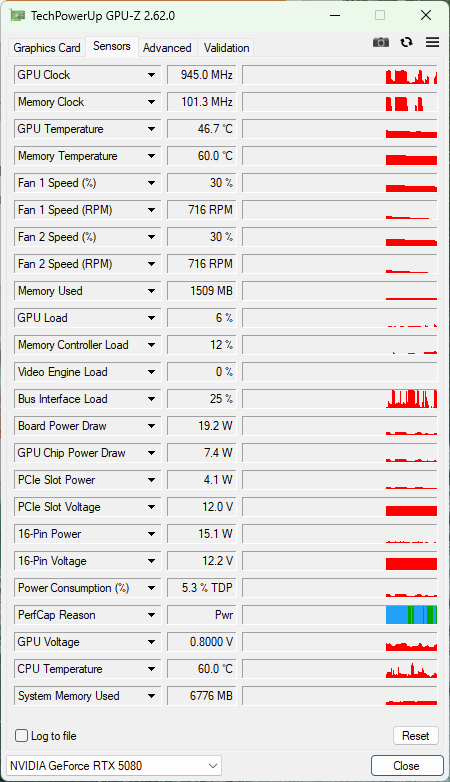
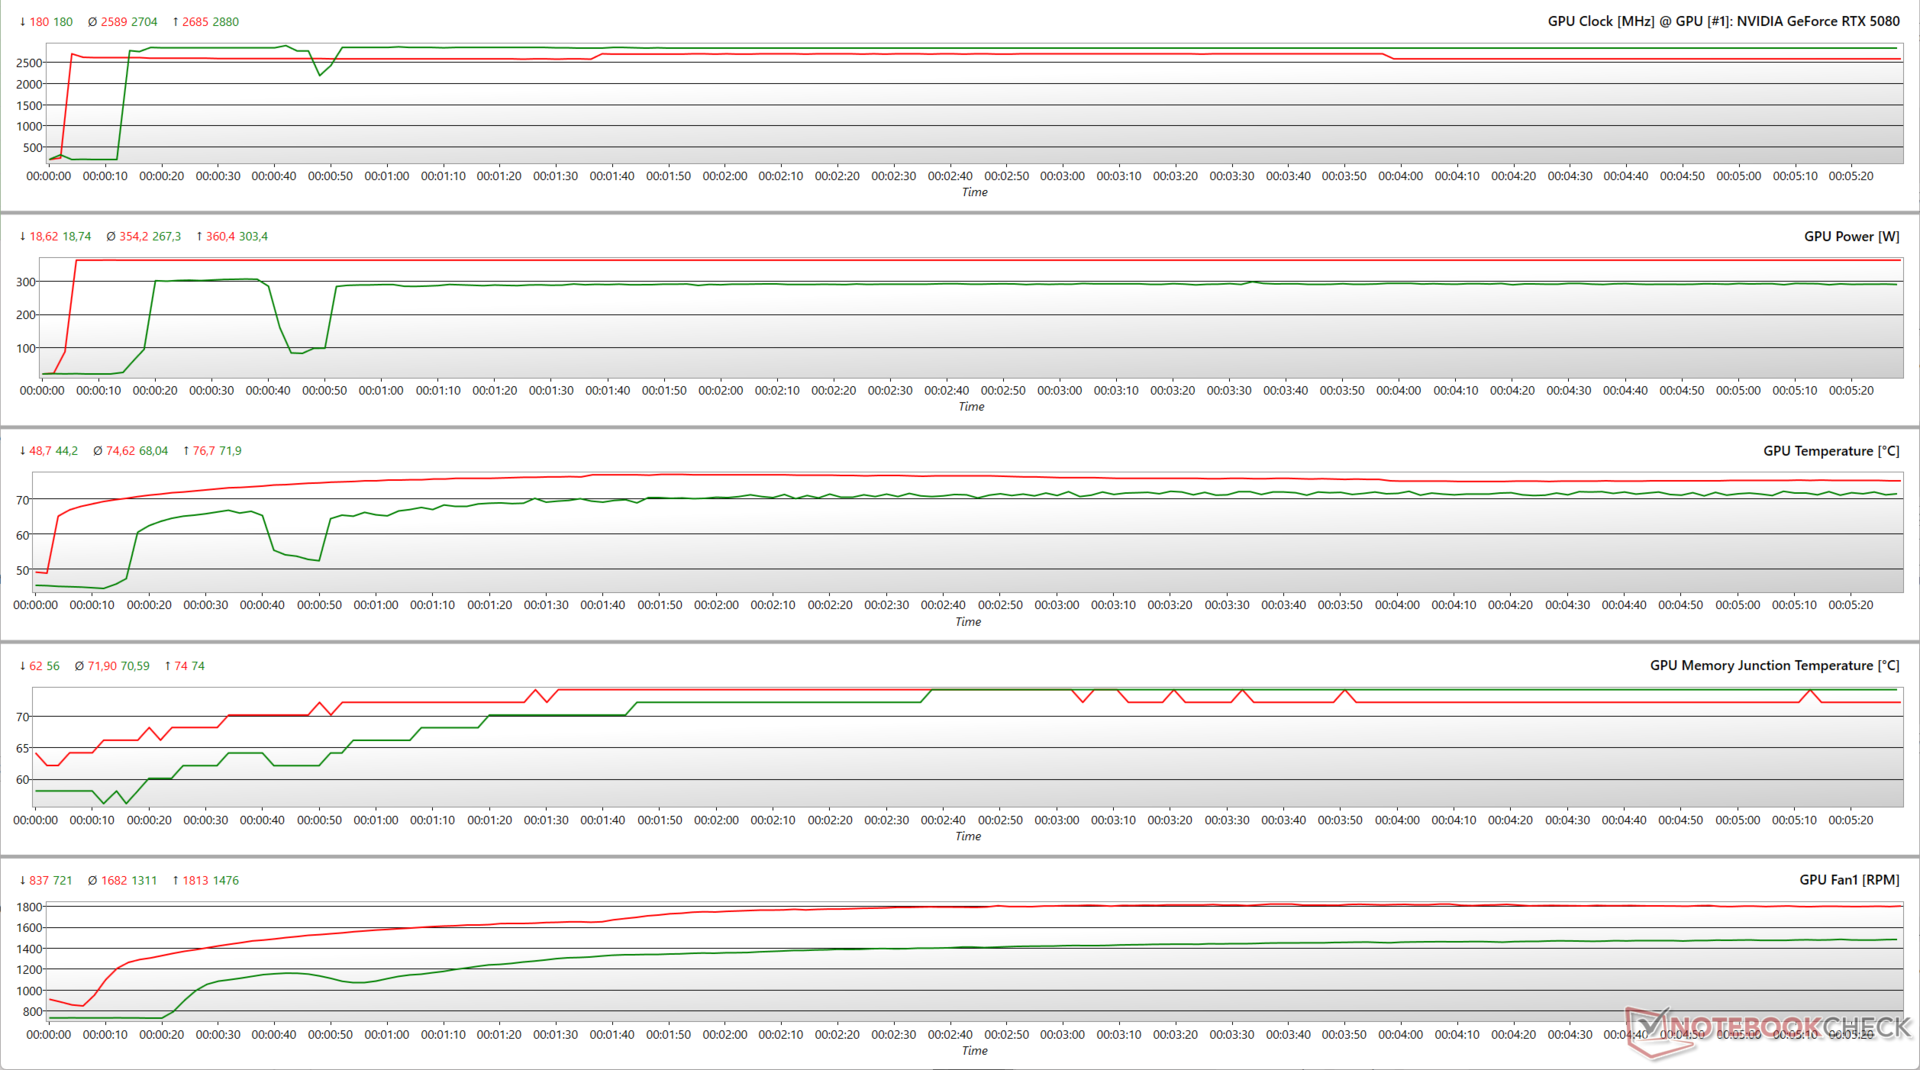
A realização de um breve teste de estresse com o FurMark (1.280x720, sem AA) mostra que a Prime RTX 5080 OC pode atingir seu aumento nominal de 2.685 MHz enquanto consome 360 W com temperaturas médias do núcleo em torno da marca de 74,6 °C.
Ao testar o Cyberpunk 2077 Phantom Liberty em configurações Ultra de 1080p, a Prime RTX 5080 OC aumenta ainda mais para até 2.880 MHz com apenas 303 W e temperaturas médias de 68 °C.
Isso mostra que a Blackwell é bastante semelhante à Ada quando se trata de aumentar oportunamente os clocks com base no espaço térmico e de energia disponível.
Temperaturas da superfície
O revestimento frontal da Prime RTX 5080 OC permanece bastante frio mesmo sob carga pesada, embora a placa traseira chegue a 62 °C e a área da GPU possa atingir 78 °C quando a temperatura ambiente é de 23 °C
Registramos temperaturas em torno da marca de 46 °C perto da região do conector 12VHPWR, o que não é preocupante.


Níveis de ruído

As ventoinhas Axial-tech triplas da Prime RTX 5080 OC apresentam rolamentos de esferas duplas e lâminas mais longas para maior confiabilidade e resfriamento.
Na curva padrão da ventoinha, as ventoinhas param em marcha lenta quando a temperatura do núcleo está abaixo de 50 °C.
Registramos um nível máximo de pressão sonora (SPL) de 47,6 dB(A) durante uma execução do FurMark com uma meta de energia de 111%.
Os usuários podem selecionar entre os modos VBIOS Performance e Quiet, sendo que o modo Quiet é bastante eficaz na limitação dos níveis de ruído em torno da marca de 40 db(A).
| Teste de estresse | Modo VBIOS/ Alvo de energia | Ruído do ventilador dB(A) |
| FurMark 1280 x 720, sem AA | Desempenho / 100% | 45.26 |
| FurMark 1280 x 720, sem AA | Silencioso / 100% | 40.01 |
| FurMark 1280 x 720, sem AA | Desempenho / 111% | 47,60 |
| FurMark 1280 x 720, sem AA | Silencioso / 111% | 43,35 |
| Cyberpunk 2077 1080p Ultra | Desempenho / 100% | 40,75 |
| Cyberpunk 2077 1080p Ultra | Silencioso / 100% | 38,80 |
| Cyberpunk 2077 1080p Ultra | Desempenho / 111% | 41.58 |
| Cyberpunk 2077 1080p Ultra | Silencioso / 111% | 38,58 |
Gerenciamento de energia: Ganhos de eficiência bem-vindos em jogos em comparação com a RX 7900 XTX
A Prime GeForce RTX 5080 OC Edition apresenta consumo de energia um pouco menor do que a RTX 5080 FE no FurMark (1.280x720, sem AA), apesar de ter um clock mais alto.
Por outro lado, embora o consumo de energia para Cyberpunk 2077 1080p Ultra seja praticamente idêntico entre a GPU Prime RTX 5080 OC e a RTX 5080 FE, a placa da Asus mostra um consumo de energia 13% maior em comparação com a FE em The Witcher 3 a 1080p Ultra.
Consequentemente, a GPU Prime é 4% mais eficiente em termos de consumo de energia do que a placa FE no Cyberpunk 2077, enquanto a última mostra uma eficiência 13% maior no The Witcher 3.
Dito isso, a Prime RTX 5080 OC é 20% mais eficiente em termos de energia no Witcher 3 do que a Radeon RX 7900 XTX.
Power consumption: External monitor
:
| Power Consumption / FurMark 1.19 GPU Stress Test (external Monitor) | |
| NVIDIA GeForce RTX 5090 Founders Edition (Idle: 90 W) | |
| NVIDIA GeForce RTX 4090 (Idle: 82 W) | |
| Sapphire Pulse AMD Radeon RX 7900 XTX (Idle: 74 W) | |
| NVIDIA GeForce RTX 5080 Founders Edition (Idle: 70 W) | |
| Sapphire Pulse AMD Radeon RX 7900 XT (Idle: 94 W) | |
| Asus Prime GeForce RTX 5080 OC Edition (Idle: 78 W) | |
| NVIDIA GeForce RTX 4080 Founders Edition (Idle: 72 W) | |
| Power Consumption / Cyberpunk 2077 FHD ultra no FSR (external Monitor) | |
| Sapphire Pulse AMD Radeon RX 7900 XTX (Idle: 74 W) | |
| Sapphire Pulse AMD Radeon RX 7900 XT (Idle: 94 W) | |
| NVIDIA GeForce RTX 5090 Founders Edition (Idle: 90 ) | |
| NVIDIA GeForce RTX 4090 (Idle: 82 W) | |
| Asus Prime GeForce RTX 5080 OC Edition (Idle: 78 W) | |
| NVIDIA GeForce RTX 5080 Founders Edition (Idle: 70 W) | |
| NVIDIA GeForce RTX 4080 Founders Edition (Idle: 72 W) | |
| Power Consumption / Cyberpunk 2077 ultra Efficiency | |
| Asus Prime GeForce RTX 5080 OC Edition | |
| NVIDIA GeForce RTX 5080 Founders Edition | |
| NVIDIA GeForce RTX 4090 | |
| NVIDIA GeForce RTX 4080 Founders Edition | |
| NVIDIA GeForce RTX 5090 Founders Edition | |
| Sapphire Pulse AMD Radeon RX 7900 XT | |
| Sapphire Pulse AMD Radeon RX 7900 XTX | |
| Power Consumption / The Witcher 3 ultra (external Monitor) | |
| NVIDIA GeForce RTX 5090 Founders Edition (Idle: 90 W) | |
| Sapphire Pulse AMD Radeon RX 7900 XTX (Idle: 74 W) | |
| NVIDIA GeForce RTX 4090 (Idle: 82 W) | |
| Sapphire Pulse AMD Radeon RX 7900 XT (Idle: 94 W) | |
| Asus Prime GeForce RTX 5080 OC Edition (Idle: 78 W) | |
| NVIDIA GeForce RTX 5080 Founders Edition (Idle: 70 W) | |
| NVIDIA GeForce RTX 4080 Founders Edition (Idle: 72 W) | |
| Power Consumption / Witcher 3 ultra Efficiency (external Monitor) | |
| NVIDIA GeForce RTX 5080 Founders Edition | |
| NVIDIA GeForce RTX 4080 Founders Edition | |
| NVIDIA GeForce RTX 4090 | |
| Asus Prime GeForce RTX 5080 OC Edition | |
| NVIDIA GeForce RTX 5090 Founders Edition | |
| Sapphire Pulse AMD Radeon RX 7900 XT | |
| Sapphire Pulse AMD Radeon RX 7900 XTX | |
| 1280x720 FurMark 1.19 GPU Stress Test (external Monitor) | |
| 1920x1080 The Witcher 3 ultra (external Monitor) | |
* ... menor é melhor
Impressões do Notebookcheck sobre o Asus Prime GeForce RTX 5080 OC Edition
Com a Prime GeForce RTX 5080 OC Edition, a Asus oferece uma opção viável de AiB para a GeForce RTX 5080 Founders Edition da própria Nvidia. No entanto, o aumento de US$ 320 em relação à RTX 5080 FE pode dissuadir possíveis compradores.
Transparência
A seleção dos dispositivos a serem analisados é feita pela nossa equipe editorial. A amostra de teste foi fornecida ao autor como empréstimo pelo fabricante ou varejista para fins desta revisão. O credor não teve influência nesta revisão, nem o fabricante recebeu uma cópia desta revisão antes da publicação. Não houve obrigação de publicar esta revisão. Como empresa de mídia independente, a Notebookcheck não está sujeita à autoridade de fabricantes, varejistas ou editores.
É assim que o Notebookcheck está testando
Todos os anos, o Notebookcheck analisa de forma independente centenas de laptops e smartphones usando procedimentos padronizados para garantir que todos os resultados sejam comparáveis. Desenvolvemos continuamente nossos métodos de teste há cerca de 20 anos e definimos padrões da indústria no processo. Em nossos laboratórios de teste, equipamentos de medição de alta qualidade são utilizados por técnicos e editores experientes. Esses testes envolvem um processo de validação em vários estágios. Nosso complexo sistema de classificação é baseado em centenas de medições e benchmarks bem fundamentados, o que mantém a objetividade.
