Notebookcheck Logo

Revisão Gigabyte Aero 16 YE5: Caderno multimídia compacto 4K

Criador do OLED.

Uma CPU Core i9-12900HK combinada com uma GPU portátil GeForce RTX 3080 Ti com acesso a 16 GB de VRAM são mais do que poderosos o suficiente para rodar todos os jogos atuais suavemente no display 16:10 4K OLED da Aero 16. O dispositivo também vem com duas portas Thunderbolt 4.

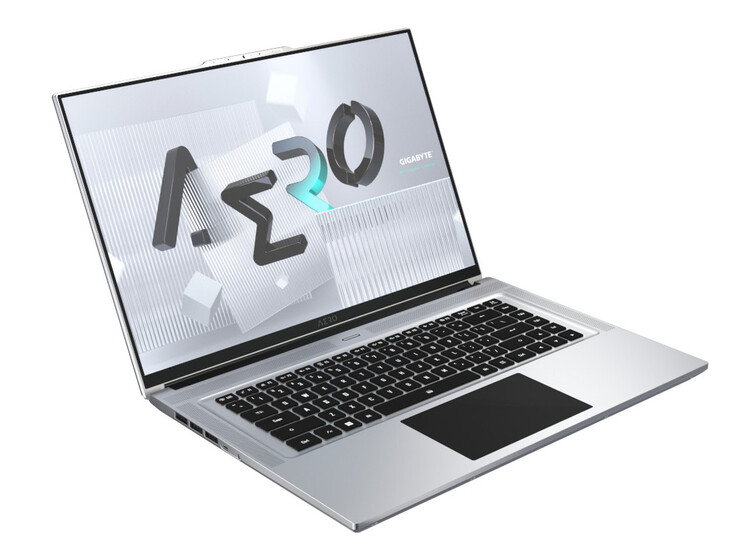
O Aero 16 da Gigabyte é uma mistura entre um notebook compacto para jogos, uma estação de trabalho portátil e um laptop para os criativos. Ele é alimentado por um Core i9-12900HK (Alder Lake) e um GeForce RTX 3080 Ti. Seus principais concorrentes são dispositivos como o Lenovo ThinkPad X1 Extreme G4, o Schenker XMG Pro 15 (Final de 2021), o HP ZBook Studio 15 G8, o Apple MacBook Pro 16 2021 M1 Max Laptop Review: Desempenho total sem engarrafamento Apple MacBook Pro 16 2021 M1 Max, e o Razer Blade 15 2022

Gigabyte Aero 16 YE5 (Aero 16 Serie)
Processador
Intel Core i9-12900HK 14 x 1.8 - 5 GHz, 115 W PL2 / Short Burst, 86 W PL1 / Sustained, Alder Lake-H
Placa gráfica
NVIDIA GeForce RTX 3080 Ti Laptop GPU - 16 GB VRAM, Análises do: 1125 MHz, Memoría: 1750 MHz, 105 W TDP ( including 15 W Dynamic Boost), GDDR6, 30.0.15.1165, Optimus
Memória
32 GB 
, DDR5-4800, Dual-Channel-Mode, two memory slots (both populated)
Pantalha
16.00 polegadas 16:10, 3840 x 2400 pixel 283 PPI, Samsung SDC416B, AMOLED, Brilhante: sim, 60 Hz
placa mãe
Intel Alder Lake-P PCH
Disco rígido
Phison ESR01TBMFCT, 1024 GB 
, + Samsung MZVL22T0HBLB (2 TB, NVMe), 2872 GB livre
Placa de Som
Realtek ALC897
Conexões
3 USB 3.1 Gen2, 0 USB 4.0 40 Gbps, 2 Thunderbolt, USB-C Power Delivery (PD), 3 DisplayPort, Conexões Audio: Headset combined port, TPM 2.0
Funcionamento em rede
Intel Wi-Fi 6E AX210 (a/b/g/h/n = Wi-Fi 4/ac = Wi-Fi 5/ax = Wi-Fi 6/), Bluetooth 5.2
Tamanho
altura x largura x profundidade (em mm): 22.4 x 356 x 248.5
Bateria
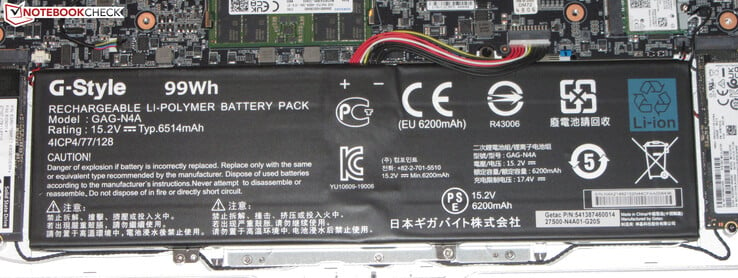
99 Wh, 6514 mAh Lítio-Polímero
Sistema Operativo
Microsoft Windows 11 Pro
Camera
Webcam: HD
Primary Camera: 0.9 MPix
Características adicionais
Alto falantes: Stereo, Teclado: Chiclet, Iluminação do Teclado: sim, USC-C-Hub (Aero Hub), 24 Meses Garantia
peso
2.29 kg, Suprimento de energia: 726 g
Note: The manufacturer may use components from different suppliers including display panels, drives or memory sticks with similar specifications.


Possíveis concorrentes em comparação

Rating
Date
Model
Weight
Height
Size
Resolution
Price
84.7 %
v7 (old)
03/2022
Gigabyte Aero 16 YE5
i9-12900HK, GeForce RTX 3080 Ti Laptop GPU
2.3 kg22.4 mm16.00"3840x2400
88.3 %
v7 (old)
12/2021
Lenovo ThinkPad X1 Extreme G4-20Y50040GE
i9-11950H, GeForce RTX 3080 Laptop GPU
1.9 kg18.2 mm16.00"3840x2400
92.5 %
v7 (old)
11/2021
Apple MacBook Pro 16 2021 M1 Max
M1 Max, M1 Max 32-Core GPU
2.2 kg16.8 mm16.20"3456x2234
87.8 %
v7 (old)
08/2021
HP ZBook Studio 15 G8
i9-11950H, GeForce RTX 3070 Laptop GPU
1.9 kg18 mm15.60"3840x2160
84.6 %
v7 (old)
01/2022
SCHENKER XMG Pro 15 (Late 2021)
i7-11800H, GeForce RTX 3080 Laptop GPU
2 kg19.8 mm15.60"3840x2160
89.1 %
v7 (old)
03/2022
Razer Blade 15 2022
i7-12800H, GeForce RTX 3080 Ti Laptop GPU
2.1 kg16.99 mm15.60"2560x1440

Caixa - Aero com caixa metálica robusta

O Aero 16 apresenta uma caixa de metal prateado compacta de boa aparência com uma superfície fosca e lisa. Vários elementos pretos, como o teclado, o trackpad, as luneta do display e a tampa da dobradiça, servem como ornamentos de design, assim como o logotipo Aero iluminado na parte de trás da tampa do display. O interior é facilmente acessível através da remoção da tampa inferior. A bateria não pode ser substituída.

A qualidade geral de construção é boa. As fendas do painel são consistentes, e também não encontramos fendas protuberantes. A rigidez é decente com uma base que mal empena e uma tampa que empena e dobra apenas ligeiramente. A dobradiça é firme e consegue manter o visor firmemente no lugar, sem muito tetos. Seu ângulo máximo de abertura é de cerca de 125-130° e pode ser aberto e ajustado com uma só mão.

Entre nosso grupo de teste o Aero é um dos dispositivos maiores, e o mais pesado por uma pequena margem. Com seus 2,3 kg (5,07 lbs), é um bom 400 g (0,88 lbs) mais pesado que o Lenovo ThinkPad X1 Extreme G4

Comparação de tamanho

356 mm 248.5 mm 22.4 mm 2.3 kg359.5 mm 253.8 mm 18.2 mm 1.9 kg357.5 mm 238 mm 19.8 mm 2 kg355.7 mm 248.1 mm 16.8 mm 2.2 kg354 mm 235 mm 18 mm 1.9 kg355 mm 235 mm 16.99 mm 2.1 kg297 mm 210 mm 1 mm 5.7 g

Conectividade - Gigabyte Notebook com USB-C

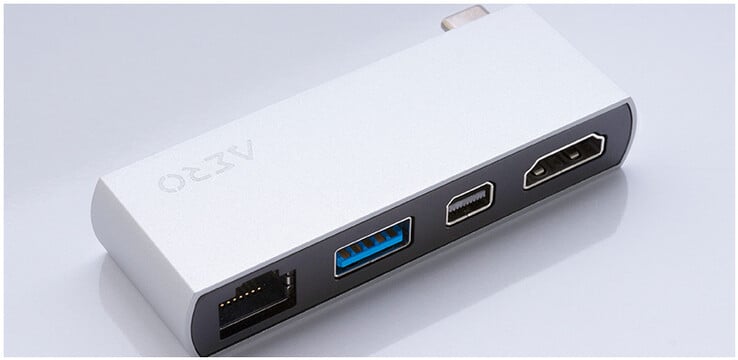
Além de uma porta de carga e uma tomada para fones de ouvido, encontramos um total de três portas USB-C no dispositivo, duas das quais suportam o Thunderbolt 4 e uma que se limita a apenas USB 3.2 Gen 2. Todas as portas levam um sinal DisplayPort, e a porta traseira Thunderbolt 4 também suporta o fornecimento de energia para carregar a bateria com uma fonte de alimentação USB-C, que tem que ser classificada em 45 W ou mais. O hub Aero incluído acrescenta portas adicionais mais comuns, como HDMI, Mini DisplayPort, USB-A, e Ethernet.

Certo: Thunderbolt 4 (USB-C, DisplayPort), Thunderbolt 4 (USB-C, DisplayPort, Power Delivery), fonte de alimentação
Esquerda: USB 3.2 Gen 2 (USB-C, DisplayPort), conector de áudio

Comunicação

O modem Wi-Fi AX210 incorporado é feito pela Intel e suporta 802.11a/b/g/n/ac/ax. Suas taxas de transferência de dados foram muito boas em condições ideais (nenhum outro dispositivo Wi-Fi nas proximidades, distância próxima entre o notebook e o servidor).

Networking
iperf3 receive AXE11000
Average of class Multimedia
  (709 - 1789, n=77, last 2 years)
1447 MBit/s +40%
Gigabyte Aero 16 YE5
Intel Wi-Fi 6E AX210
1030 (752min - 1313max) MBit/s
iperf3 transmit AXE11000
Average of class Multimedia
  (358 - 1921, n=78, last 2 years)
1359 MBit/s +2%
Gigabyte Aero 16 YE5
Intel Wi-Fi 6E AX210
1333 (1044min - 1390max) MBit/s
05010015020025030035040045050055060065070075080085090095010001050110011501200125013001350140014501500155016001650Tooltip
Gigabyte Aero 16 YE5 Intel Wi-Fi 6E AX210; iperf3 receive AXE11000; iperf 3.1.3: Ø1029 (752-1313)
HP ZBook Studio 15 G8 Intel Wi-Fi 6 AX201; iperf3 receive AX12; iperf 3.1.3: Ø1363 (1311-1453)
SCHENKER XMG Pro 15 (Late 2021) Intel Wi-Fi 6 AX201; iperf3 receive AX12; iperf 3.1.3: Ø1263 (800-1659)
Razer Blade 15 2022  ; iperf3 receive AX12; iperf 3.1.3: Ø1470 (1448-1522)
Gigabyte Aero 16 YE5 Intel Wi-Fi 6E AX210; iperf3 transmit AXE11000; iperf 3.1.3: Ø1333 (1044-1390)
HP ZBook Studio 15 G8 Intel Wi-Fi 6 AX201; iperf3 transmit AX12; iperf 3.1.3: Ø1419 (1169-1609)
SCHENKER XMG Pro 15 (Late 2021) Intel Wi-Fi 6 AX201; iperf3 transmit AX12; iperf 3.1.3: Ø1459 (1142-1595)
Razer Blade 15 2022  ; iperf3 transmit AX12; iperf 3.1.3: Ø1529 (1341-1654)

Webcam

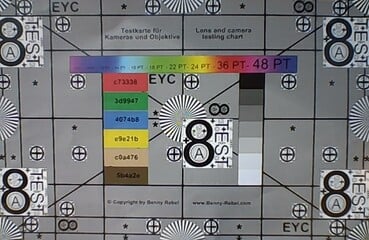
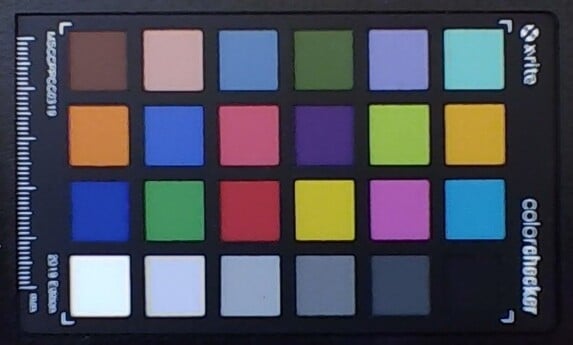
A webcam de 0,9 MP funciona com uma resolução de 1280 x 720 e não é particularmente precisa em cores com um desvio DeltaE de 9. O ideal seria ver menos de 3.
ColorChecker
8.7 ∆E
10.9 ∆E
4.8 ∆E
3.9 ∆E
6.7 ∆E
11.8 ∆E
4.5 ∆E
6.6 ∆E
8.6 ∆E
8.4 ∆E
3.3 ∆E
6.4 ∆E
3.9 ∆E
5.6 ∆E
5.8 ∆E
9.7 ∆E
8.5 ∆E
10 ∆E
9.1 ∆E
14.8 ∆E
13.3 ∆E
14.5 ∆E
14 ∆E
11.7 ∆E
ColorChecker Gigabyte Aero 16 YE5: 8.56 ∆E min: 3.35 - max: 14.82 ∆E

Acessórios

Além da papelada usual (guia de início rápido, folheto informativo de garantia) o dispositivo também vem com um hub USB-C.

Centro Aeroespacial
Centro Aeroespacial

Manutenção

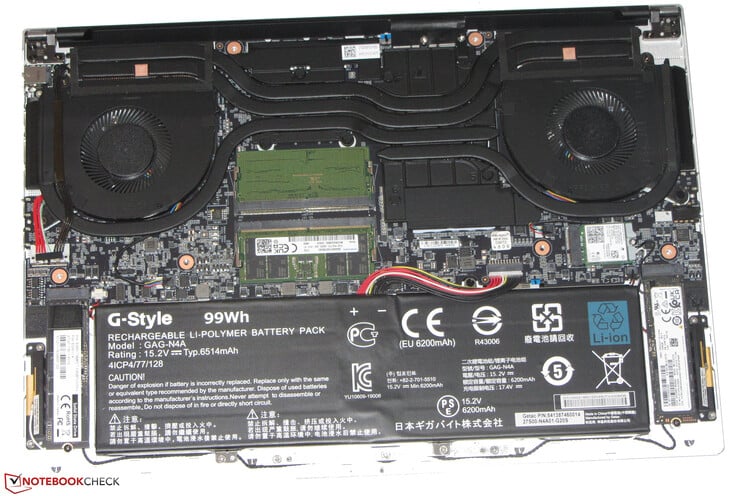
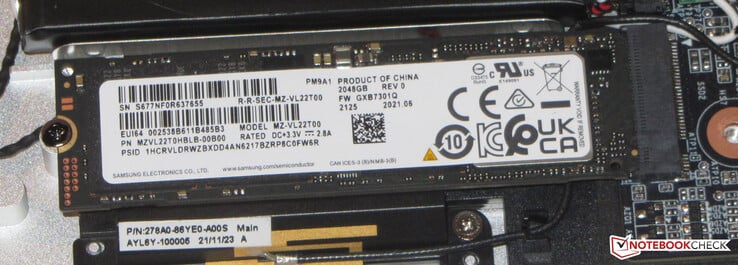
A manutenção e as atualizações são comparativamente fáceis de realizar. Depois de desapertar cada parafuso no fundo, a tampa pode ser facilmente removida com um pequeno spudger. Uma vez removida, você tem acesso aos dois SSDs, ao modem Wi-Fi, à RAM e aos ventiladores.

Hardware Aero 16
Hardware Aero 16

Garantia

Como de costume, os clientes europeus recebem dois anos de garantia limitada, enquanto os clientes americanos são novamente limitados a apenas 12 meses. A Gigabyte não oferece nenhuma extensão de garantia.

Dispositivos de entrada - Gigabyte Laptop com teclado retroiluminado

Teclado

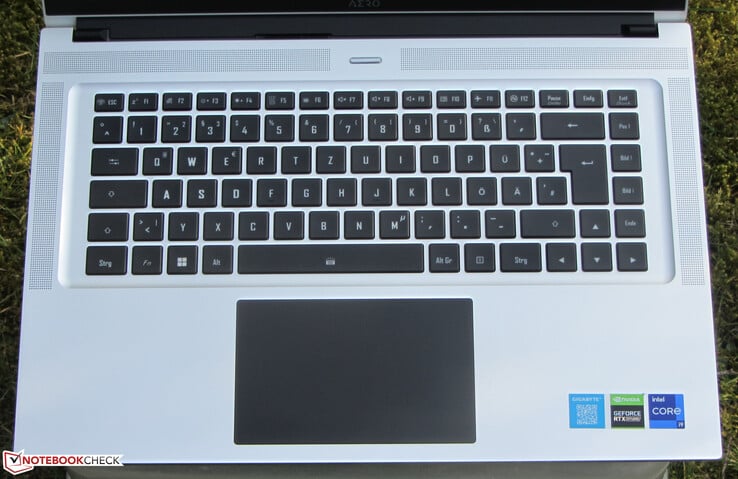
O teclado em chiclet iluminado é bastante suave com deslocamento moderado das teclas e pontos de acentuação claros com feedback e resistência decentes. O teclado não flexiona durante a digitação. A retroiluminação de dois estágios é controlada por uma tecla de função. Tudo considerado que este teclado Gigabyte é decente para uso diário.

Touchpad

O touchpad multi-touch (12,1 x 7,6 cm/4,8 x 3 polegadas) é muito suave para uma grande usabilidade. Ele detecta a entrada do usuário até suas próprias extremidades, e seus botões integrados apresentam um percurso bastante raso com um ponto de acentuação claro.

Dispositivos de entrada Aero 16

Mostrador - Negros profundos graças ao OLED

Matriz subpixel
Matriz subpixel

O Aero 16 vem com um visor refletivo 16:10 de 16 polegadas 4K OLED (3840 x 2400) com uma excelente relação de contraste de 36.000:1, um nível de preto de 0,01, e tempos de resposta curtos. Seu brilho máximo de 367,6 lêndeas é bom, mas não está nem perto de alguns de seus concorrentes, como o Macbook Pro 16.

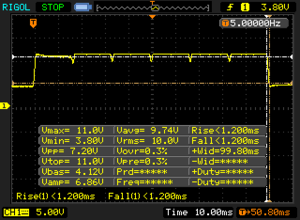
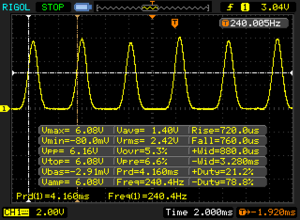
Em níveis de brilho de 58% e abaixo encontramos PWM cintilando a 60 Hz, que aumentou para 240 Hz em níveis de brilho de menos de 26%. Os usuários sensíveis podem sofrer de dores de cabeça e fadiga ocular devido a esta baixa freqüência.

360
cd/m²
366
cd/m²
376
cd/m²
360
cd/m²
368
cd/m²
377
cd/m²
355
cd/m²
366
cd/m²
380
cd/m²
Distribuição do brilho
Samsung SDC416B tested with X-Rite i1Pro 2
Máximo: 380 cd/m² (Nits) Médio: 367.6 cd/m² Minimum: 28 cd/m²
iluminação: 93 %
iluminação com acumulador: 368 cd/m²
Contraste: 36800:1 (Preto: 0.01 cd/m²)
ΔE Color 2.33 | 0.5-29.43 Ø4.92
ΔE Greyscale 0.8 | 0.5-98 Ø5.2
Gamma: 2.119
Gigabyte Aero 16 YE5
Samsung SDC416B, AMOLED, 3840x2400, 16"
Apple MacBook Pro 16 2021 M1 Max
Mini-LED, 3456x2234, 16.2"
HP ZBook Studio 15 G8
SDC4145, OLED, 3840x2160, 15.6"
SCHENKER XMG Pro 15 (Late 2021)
Samsung ATNA56WR14-0, OLED, 3840x2160, 15.6"
Razer Blade 15 2022
Sharp LQ156T1JW03, IPS, 2560x1440, 15.6"
Lenovo ThinkPad X1 Extreme G4-20Y5CTO1WW (3050 Ti)
LP160UQ1-SPB1, IPS LED, 3840x2400, 16"
Display
Display P3 Coverage
99.9
81.2
99.1
84.3
sRGB Coverage
100
97.7
99.9
98.3
AdobeRGB 1998 Coverage
95.3
89.1
86.8
97.8
Response Times
94%
-4%
-490%
-2200%
Response Time Grey 50% / Grey 80% *
2.4 ?(1.2, 1.2)
2.4 ?(1, 1.4)
-0%
3.2 ?(1.2, 2)
-33%
14.4 ?(6.8, 7.6)
-500%
60 ?(29, 31)
-2400%
Response Time Black / White *
2 ?(1, 1)
2.4 ?(1.1, 1.3)
-20%
1.6 ?(1, 0.6)
20%
11.6 ?(5.6, 6)
-480%
42 ?(23, 19)
-2000%
PWM Frequency
60 ?(58)
240.4 ?(52)
301%
60 ?(81)
0%
Screen
-21%
-70%
-58%
-328%
-587%
Brightness middle
368
507
38%
379.6
3%
443
20%
286
-22%
639
74%
Brightness
368
494
34%
380
3%
434
18%
271
-26%
612
66%
Brightness Distribution
93
96
3%
95
2%
94
1%
89
-4%
84
-10%
Black Level *
0.01
0.02
-100%
0.02
-100%
0.25
-2400%
0.47
-4600%
Contrast
36800
25350
-31%
22150
-40%
1144
-97%
1360
-96%
Colorchecker dE 2000 *
2.33
1.4
40%
5.15
-121%
3.73
-60%
2.74
-18%
2.2
6%
Colorchecker dE 2000 max. *
4.34
2.8
35%
7.79
-79%
8.12
-87%
5.21
-20%
5.3
-22%
Greyscale dE 2000 *
0.8
2.3
-188%
2.6
-225%
2.5
-213%
1.1
-38%
1.7
-113%
Gamma
2.119 104%
2.27 97%
1.99 111%
2.001 110%
2.2 100%
2.31 95%
CCT
6569 99%
6792 96%
6166 105%
6522 100%
6408 101%
6390 102%
Colorchecker dE 2000 calibrated *
3.1
2.52
1.4
Total Average (Program / Settings)
-21% / -21%
12% / -15%
-31% / -43%
-409% / -361%
-1394% / -910%

* ... smaller is better

A tela é certificada com X-Rite Pantone para garantir a representação natural das cores, e como esperado, os desvios de cor foram muito pequenos e imperceptíveis fora da caixa. Também não encontramos nenhuma evidência de uma coloração azul. Neste ponto, durante a revisão, normalmente o apresentaríamos e comentaríamos nossas leituras de cobertura do espaço de cores. No entanto, decidimos segurá-las por enquanto, pois diferem imensamente das especificações oficiais da Gigabyte e não podemos descartar problemas com nosso equipamento de teste neste momento.

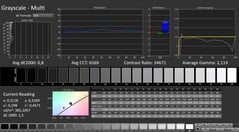
CalMAN: escala de tons de cinza
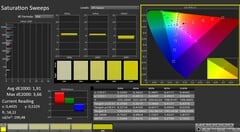
CalMAN: saturação
CalMAN: saturação
CalMAN: ColorChecker

Display Response Times

Display response times show how fast the screen is able to change from one color to the next. Slow response times can lead to afterimages and can cause moving objects to appear blurry (ghosting). Gamers of fast-paced 3D titles should pay special attention to fast response times.
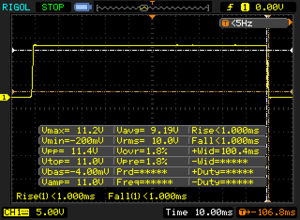
       Response Time Black to White
2 ms ... rise ↗ and fall ↘ combined↗ 1 ms rise
↘ 1 ms fall
The screen shows very fast response rates in our tests and should be very well suited for fast-paced gaming.
In comparison, all tested devices range from 0.1 (minimum) to 240 (maximum) ms. » 7 % of all devices are better.
This means that the measured response time is better than the average of all tested devices (21 ms).
       Response Time 50% Grey to 80% Grey
2.4 ms ... rise ↗ and fall ↘ combined↗ 1.2 ms rise
↘ 1.2 ms fall
The screen shows very fast response rates in our tests and should be very well suited for fast-paced gaming.
In comparison, all tested devices range from 0.165 (minimum) to 636 (maximum) ms. » 8 % of all devices are better.
This means that the measured response time is better than the average of all tested devices (32.9 ms).

Screen Flickering / PWM (Pulse-Width Modulation)

To dim the screen, some notebooks will simply cycle the backlight on and off in rapid succession - a method called Pulse Width Modulation (PWM) . This cycling frequency should ideally be undetectable to the human eye. If said frequency is too low, users with sensitive eyes may experience strain or headaches or even notice the flickering altogether.
Screen flickering / PWM detected 60 Hz ≤ 58 % brightness setting

The display backlight flickers at 60 Hz (worst case, e.g., utilizing PWM) Flickering detected at a brightness setting of 58 % and below. There should be no flickering or PWM above this brightness setting.

The frequency of 60 Hz is very low, so the flickering may cause eyestrain and headaches after extended use.

In comparison: 53 % of all tested devices do not use PWM to dim the display. If PWM was detected, an average of 8743 (minimum: 5 - maximum: 343500) Hz was measured.

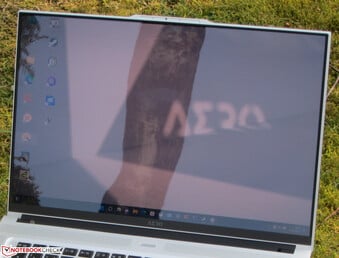
O painel oferece ângulos de visão muito amplos e é facilmente legível a partir de qualquer posição. Ao ar livre, encontramos o revestimento refletivo para impedir drasticamente a usabilidade.

Aero 16 ao ar livre
Aero 16 ao ar livre
Ângulos de visualização

Desempenho - Um Gigabyte Laptop com desempenho de ponta

O Gigabyte Aero 16 é um poderoso notebook compacto de 16 polegadas com alta versatilidade de uso em todas as áreas. Sua certificação GeForce RTX Studio garante alto desempenho, drivers otimizados, boa compatibilidade de software e uma alta cobertura de espaço de cores.

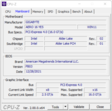
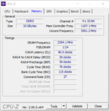
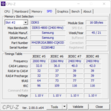
CPU-Z
CPU-Z
CPU-Z
CPU-Z
CPU-Z
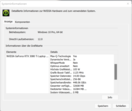
Nvidia Systeminfo
GPU-Z
GPU-Z
HWInfo
HWInfo


Condições de teste

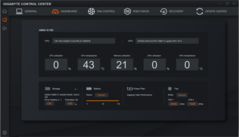
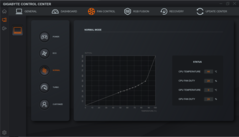
O dispositivo vem com o Centro de Controle Gigabyte pré-carregado, que oferece vários perfis de desempenho. Estes não só afetam o desempenho da CPU e da GPU, mas também o brilho e a temperatura da cor da tela. Decidimos confiar nosso destino ao modo AI incluído, permitindo ao Centro de Controle tomar essa decisão e escolher o melhor perfil para nós.

Além disso, executamos alguns benchmarks com "Modo Silencioso de Economia de Energia" e "Modo Turbo" ativado manualmente. Este último não é particularmente adequado por longos períodos de tempo, pois eleva os ventiladores à sua velocidade máxima instantânea e permanentemente.

Modo Criador Modo Turbo Modo Jogo Modo Reunião Modo Silêncio Economia de Energia
Limite de potência 1 86 Watt 86 Watt 62 Watt 15 Watt 15 Watt
Limite de potência 2 115 Watt 115 Watt 115 Watt 30 Watt 30 Watt

Processador

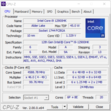
Intel Alder LakeCore i9-12900HK apresenta seis núcleos de desempenho com Hyperthreading rodando entre 2,5 e 5 GHz, bem como oito núcleos de eficiência sem Hyperthreading rodando entre 1,8 e 3,8 GHz. Combinados, isto perfaz um total de 20 núcleos de CPU disponíveis. Graças a um multiplicador desbloqueado, a CPU também pode ser facilmente overclockada.

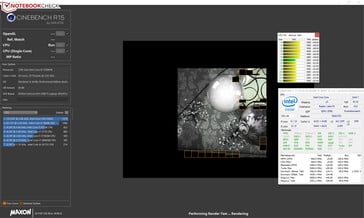
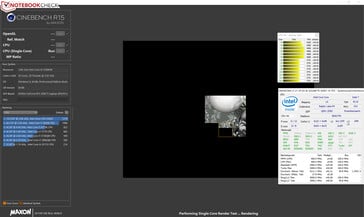
Ao rodar nosso benchmark CineBench R15, a CPU funcionava em velocidades de relógio muito altas (multi-tarefa: P-cores 4-4,1 GHz, E-cores: 3-3,1 GHz) ou mesmo máximas (rosca única: P-cores 4,3-5 GHz, E-cores: 3,8 GHz). Na bateria, estas foram reduzidas significativamente.

Multifios (na rede elétrica)
Rosca única (na rede elétrica)

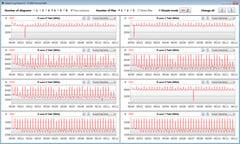
Executamos o teste multi-tarefa CineBench R15 por pelo menos 30 minutos em um loop para determinar se um processador é capaz de utilizar ou não altas velocidades de relógio turbo-boost sob carga sustentada. O Aero 16 conseguiu manter seu alto nível inicial de desempenho tanto em núcleos de desempenho quanto em núcleos de eficiência. A ativação manual do "Modo Turbo" não teve qualquer efeito positivo.

Cinebench R15 Multi Loop

0140280420560700840980112012601400154016801820196021002240238025202660Tooltip
Gigabyte Aero 16 YE5 Intel Core i9-12900HK: Ø2616 (2562.79-2779.9)
Gigabyte Aero 16 YE5 Intel Core i9-12900HK; Silence Mode: Ø730 (712.31-1010.15)
Gigabyte Aero 16 YE5 Intel Core i9-12900HK; Turbo Mode: Ø2627 (2586.15-2785.9)
Lenovo ThinkPad X1 Extreme G4-20Y50040GE Intel Core i9-11950H; BIOS 1.13: Ø1875 (1823.99-2089.32)
Lenovo ThinkPad X1 Extreme G4-20Y50040GE Intel Core i9-11950H; BIOS 1.10: Ø1849 (1818.43-1953.6)
Apple MacBook Pro 16 2021 M1 Max Apple M1 Max; Rosetta 2: Ø1687 (1667.29-1693.05)
HP ZBook Studio 15 G8 Intel Core i9-11950H: Ø1806 (1765.46-1841.11)
SCHENKER XMG Pro 15 (Late 2021) Intel Core i7-11800H: Ø1929 (1910.86-2050.14)
Razer Blade 15 2022 Intel Core i7-12800H: Ø2081 (2061.43-2178.41)
Velocidades do relógio da CPU durante a execução do loop CB15
Velocidades do relógio da CPU durante a execução do loop CB15 (Modo Turbo)
Velocidades do relógio da CPU durante a execução do loop CB15 (Modo Silêncio)
Cinebench R15 CPU Multi 64Bit
2780 Points
Cinebench R15 OpenGL 64Bit
233 fps
Cinebench R15 Ref. Match 64Bit
99.6 %
Cinebench R15 CPU Single 64Bit
279 Points
Cinebench R20 CPU (Multi Core)
6941 Points
Cinebench R20 CPU (Single Core)
685 Points
Cinebench R23 Multi Core
18106 Points
Cinebench R23 Single Core
1940 Points
Ajuda
Cinebench R23
Multi Core
Gigabyte Aero 16 YE5
Intel Core i9-12900HK (Turbo Mode)
18373 Points +1%
Gigabyte Aero 16 YE5
Intel Core i9-12900HK
18106 Points
Average Intel Core i9-12900HK
  (4796 - 19282, n=12)
15973 Points -12%
Average of class Multimedia
  (6936 - 30789, n=100, last 2 years)
15387 Points -15%
Razer Blade 15 2022
Intel Core i7-12800H
14893 (13078min - 14893.1max) Points -18%
SCHENKER XMG Pro 15 (Late 2021)
Intel Core i7-11800H
12721 Points -30%
Apple MacBook Pro 16 2021 M1 Max
Apple M1 Max
12385 Points -32%
HP ZBook Studio 15 G8
Intel Core i9-11950H
12166 (11410min - 12166.4max) Points -33%
Lenovo ThinkPad X1 Extreme G4-20Y50040GE
Intel Core i9-11950H
12048 Points -33%
Gigabyte Aero 16 YE5
Intel Core i9-12900HK (Silence Mode)
4796 Points -74%
Single Core
Gigabyte Aero 16 YE5
Intel Core i9-12900HK
1940 Points
Gigabyte Aero 16 YE5
Intel Core i9-12900HK (Turbo Mode)
1938 Points 0%
Razer Blade 15 2022
Intel Core i7-12800H
1796 Points -7%
Average of class Multimedia
  (878 - 2290, n=91, last 2 years)
1757 Points -9%
Average Intel Core i9-12900HK
  (819 - 1940, n=13)
1660 Points -14%
Lenovo ThinkPad X1 Extreme G4-20Y50040GE
Intel Core i9-11950H
1586 Points -18%
HP ZBook Studio 15 G8
Intel Core i9-11950H
1569 Points -19%
Apple MacBook Pro 16 2021 M1 Max
Apple M1 Max
1530 Points -21%
SCHENKER XMG Pro 15 (Late 2021)
Intel Core i7-11800H
1513 Points -22%
Gigabyte Aero 16 YE5
Intel Core i9-12900HK (Silence Mode)
819 Points -58%
Cinebench R20
CPU (Multi Core)
Gigabyte Aero 16 YE5
Intel Core i9-12900HK (Turbo Mode)
7040 Points +1%
Gigabyte Aero 16 YE5
Intel Core i9-12900HK
6941 Points
Average Intel Core i9-12900HK
  (1828 - 7366, n=12)
6097 Points -12%
Razer Blade 15 2022
Intel Core i7-12800H
5731 Points -17%
Average of class Multimedia
  (2681 - 11768, n=86, last 2 years)
5683 Points -18%
SCHENKER XMG Pro 15 (Late 2021)
Intel Core i7-11800H
4756 Points -31%
HP ZBook Studio 15 G8
Intel Core i9-11950H
4660 Points -33%
Lenovo ThinkPad X1 Extreme G4-20Y50040GE
Intel Core i9-11950H
4471 Points -36%
Apple MacBook Pro 16 2021 M1 Max
Apple M1 Max
2735 Points -61%
Gigabyte Aero 16 YE5
Intel Core i9-12900HK (Silence Mode)
1828 Points -74%
CPU (Single Core)
Gigabyte Aero 16 YE5
Intel Core i9-12900HK (Turbo Mode)
739 Points +8%
Razer Blade 15 2022
Intel Core i7-12800H
690 Points +1%
Gigabyte Aero 16 YE5
Intel Core i9-12900HK
685 Points
Average of class Multimedia
  (341 - 853, n=86, last 2 years)
652 Points -5%
Average Intel Core i9-12900HK
  (316 - 739, n=12)
649 Points -5%
Lenovo ThinkPad X1 Extreme G4-20Y50040GE
Intel Core i9-11950H
621 Points -9%
HP ZBook Studio 15 G8
Intel Core i9-11950H
610 Points -11%
SCHENKER XMG Pro 15 (Late 2021)
Intel Core i7-11800H
585 Points -15%
Apple MacBook Pro 16 2021 M1 Max
Apple M1 Max
390 Points -43%
Gigabyte Aero 16 YE5
Intel Core i9-12900HK (Silence Mode)
316 Points -54%
Cinebench R15
CPU Multi 64Bit
Gigabyte Aero 16 YE5
Intel Core i9-12900HK (Turbo Mode)
2786 Points 0%
Gigabyte Aero 16 YE5
Intel Core i9-12900HK
2780 Points
Average of class Multimedia
  (1252 - 4774, n=90, last 2 years)
2435 Points -12%
Average Intel Core i9-12900HK
  (965 - 2944, n=12)
2408 Points -13%
Razer Blade 15 2022
Intel Core i7-12800H
2178 (2061.43min - 2178.41max) Points -22%
Lenovo ThinkPad X1 Extreme G4-20Y50040GE
Intel Core i9-11950H (BIOS 1.13)
2089 (1823.99min - 2089.32max) Points -25%
Lenovo ThinkPad X1 Extreme G4-20Y50040GE
Intel Core i9-11950H (BIOS 1.10)
1954 (1818.43min - 1953.6max) Points -30%
SCHENKER XMG Pro 15 (Late 2021)
Intel Core i7-11800H
2050 Points -26%
HP ZBook Studio 15 G8
Intel Core i9-11950H
1841 (1765.46min - 1841.11max) Points -34%
Apple MacBook Pro 16 2021 M1 Max
Apple M1 Max (Rosetta 2)
1693 (1667min - 1693max) Points -39%
Gigabyte Aero 16 YE5
Intel Core i9-12900HK (Silence Mode)
1010 Points -64%
CPU Single 64Bit
Gigabyte Aero 16 YE5
Intel Core i9-12900HK
279 Points
Gigabyte Aero 16 YE5
Intel Core i9-12900HK (Turbo Mode)
278 Points 0%
Razer Blade 15 2022
Intel Core i7-12800H
258 Points -8%
Average of class Multimedia
  (99.6 - 323, n=86, last 2 years)
257 Points -8%
Average Intel Core i9-12900HK
  (119 - 279, n=12)
245 Points -12%
Lenovo ThinkPad X1 Extreme G4-20Y50040GE
Intel Core i9-11950H
244 Points -13%
HP ZBook Studio 15 G8
Intel Core i9-11950H
236 Points -15%
SCHENKER XMG Pro 15 (Late 2021)
Intel Core i7-11800H
225 Points -19%
Apple MacBook Pro 16 2021 M1 Max
Apple M1 Max (Rosetta 2)
197 Points -29%
Gigabyte Aero 16 YE5
Intel Core i9-12900HK (Silence Mode)
119 Points -57%
Blender - v2.79 BMW27 CPU
HP ZBook Studio 15 G8
Intel Core i9-11950H
254 Seconds * -27%
Average of class Multimedia
  (107 - 502, n=84, last 2 years)
253 Seconds * -27%
SCHENKER XMG Pro 15 (Late 2021)
Intel Core i7-11800H
243 Seconds * -22%
Razer Blade 15 2022
Intel Core i7-12800H
226 Seconds * -13%
Average Intel Core i9-12900HK
  (172.5 - 483, n=11)
219 Seconds * -10%
Gigabyte Aero 16 YE5
Intel Core i9-12900HK
200 Seconds *
Apple MacBook Pro 16 2021 M1 Max
Apple M1 Max (Blender 3.0 beta for mac)
189 Seconds * +5%
Gigabyte Aero 16 YE5
Intel Core i9-12900HK (Turbo Mode)
185 Seconds * +7%
7-Zip 18.03
7z b 4
Gigabyte Aero 16 YE5
Intel Core i9-12900HK (Turbo Mode)
72912 MIPS +6%
Gigabyte Aero 16 YE5
Intel Core i9-12900HK
68520 MIPS
Average Intel Core i9-12900HK
  (25736 - 75564, n=12)
63736 MIPS -7%
Razer Blade 15 2022
Intel Core i7-12800H
61936 MIPS -10%
Average of class Multimedia
  (30592 - 121228, n=79, last 2 years)
60265 MIPS -12%
SCHENKER XMG Pro 15 (Late 2021)
Intel Core i7-11800H
55743 MIPS -19%
HP ZBook Studio 15 G8
Intel Core i9-11950H
50050 MIPS -27%
Gigabyte Aero 16 YE5
Intel Core i9-12900HK (Silence Mode)
25736 MIPS -62%
7z b 4 -mmt1
Gigabyte Aero 16 YE5
Intel Core i9-12900HK
6186 MIPS
Gigabyte Aero 16 YE5
Intel Core i9-12900HK (Turbo Mode)
6171 MIPS 0%
HP ZBook Studio 15 G8
Intel Core i9-11950H
5773 MIPS -7%
Razer Blade 15 2022
Intel Core i7-12800H
5726 MIPS -7%
Average of class Multimedia
  (3398 - 7545, n=79, last 2 years)
5722 MIPS -8%
SCHENKER XMG Pro 15 (Late 2021)
Intel Core i7-11800H
5521 MIPS -11%
Average Intel Core i9-12900HK
  (2898 - 6186, n=12)
5516 MIPS -11%
Gigabyte Aero 16 YE5
Intel Core i9-12900HK (Silence Mode)
2898 MIPS -53%
Geekbench 5.5
Multi-Core
Gigabyte Aero 16 YE5
Intel Core i9-12900HK (Turbo Mode)
13925 Points 0%
Gigabyte Aero 16 YE5
Intel Core i9-12900HK
13865 Points
Apple MacBook Pro 16 2021 M1 Max
Apple M1 Max
12708 Points -8%
Razer Blade 15 2022
Intel Core i7-12800H
12434 Points -10%
Average of class Multimedia
  (4990 - 23059, n=86, last 2 years)
11967 Points -14%
Average Intel Core i9-12900HK
  (5869 - 14294, n=11)
11901 Points -14%
SCHENKER XMG Pro 15 (Late 2021)
Intel Core i7-11800H
9408 Points -32%
Lenovo ThinkPad X1 Extreme G4-20Y50040GE
Intel Core i9-11950H
7969 Points -43%
HP ZBook Studio 15 G8
Intel Core i9-11950H
7286 Points -47%
Gigabyte Aero 16 YE5
Intel Core i9-12900HK (Silence Mode)
5916 Points -57%
Single-Core
Gigabyte Aero 16 YE5
Intel Core i9-12900HK (Turbo Mode)
1887 Points +1%
Gigabyte Aero 16 YE5
Intel Core i9-12900HK
1870 Points
Average of class Multimedia
  (891 - 2342, n=86, last 2 years)
1818 Points -3%
Apple MacBook Pro 16 2021 M1 Max
Apple M1 Max
1782 Points -5%
Razer Blade 15 2022
Intel Core i7-12800H
1758 Points -6%
HP ZBook Studio 15 G8
Intel Core i9-11950H
1702 Points -9%
Average Intel Core i9-12900HK
  (843 - 1918, n=11)
1696 Points -9%
Lenovo ThinkPad X1 Extreme G4-20Y50040GE
Intel Core i9-11950H
1631 Points -13%
SCHENKER XMG Pro 15 (Late 2021)
Intel Core i7-11800H
1571 Points -16%
Gigabyte Aero 16 YE5
Intel Core i9-12900HK (Silence Mode)
843 Points -55%
HWBOT x265 Benchmark v2.2 - 4k Preset
Gigabyte Aero 16 YE5
Intel Core i9-12900HK (Turbo Mode)
21 fps +16%
Gigabyte Aero 16 YE5
Intel Core i9-12900HK
18.1 fps
Average Intel Core i9-12900HK
  (5.33 - 21.6, n=12)
17.7 fps -2%
Razer Blade 15 2022
Intel Core i7-12800H
17.2 fps -5%
Average of class Multimedia
  (5.26 - 30.5, n=78, last 2 years)
16.4 fps -9%
SCHENKER XMG Pro 15 (Late 2021)
Intel Core i7-11800H
15.7 fps -13%
HP ZBook Studio 15 G8
Intel Core i9-11950H
14.5 fps -20%
Lenovo ThinkPad X1 Extreme G4-20Y50040GE
Intel Core i9-11950H
13.8 fps -24%
Gigabyte Aero 16 YE5
Intel Core i9-12900HK (Silence Mode)
5.33 fps -71%
LibreOffice - 20 Documents To PDF
Gigabyte Aero 16 YE5
Intel Core i9-12900HK (Silence Mode)
89.1 s * -128%
Razer Blade 15 2022
Intel Core i7-12800H
51.5 s * -32%
Average of class Multimedia
  (6.7 - 146.7, n=80, last 2 years)
49.6 s * -27%
SCHENKER XMG Pro 15 (Late 2021)
Intel Core i7-11800H
48.8 s * -25%
HP ZBook Studio 15 G8
Intel Core i9-11950H
48.6 s * -25%
Average Intel Core i9-12900HK
  (34.8 - 89.1, n=12)
45 s * -15%
Gigabyte Aero 16 YE5
Intel Core i9-12900HK
39 s *
Lenovo ThinkPad X1 Extreme G4-20Y50040GE
Intel Core i9-11950H
38.6 s * +1%
Gigabyte Aero 16 YE5
Intel Core i9-12900HK (Turbo Mode)
34.8 s * +11%
R Benchmark 2.5 - Overall mean
Gigabyte Aero 16 YE5
Intel Core i9-12900HK (Silence Mode)
0.994 sec * -139%
HP ZBook Studio 15 G8
Intel Core i9-11950H
0.551 sec * -33%
SCHENKER XMG Pro 15 (Late 2021)
Intel Core i7-11800H
0.549 sec * -32%
Lenovo ThinkPad X1 Extreme G4-20Y50040GE
Intel Core i9-11950H
0.545 sec * -31%
Average Intel Core i9-12900HK
  (0.4155 - 0.994, n=12)
0.502 sec * -21%
Average of class Multimedia
  (0.3604 - 0.947, n=79, last 2 years)
0.484 sec * -16%
Razer Blade 15 2022
Intel Core i7-12800H
0.4715 sec * -13%
Gigabyte Aero 16 YE5
Intel Core i9-12900HK (Turbo Mode)
0.4293 sec * -3%
Gigabyte Aero 16 YE5
Intel Core i9-12900HK
0.4155 sec *

* ... smaller is better

Performance Rating
SCHENKER XMG Pro 15 (Late 2021)
Intel Core i7-11800H, GeForce RTX 3080 Laptop GPU
90.4 pt
Lenovo ThinkPad X1 Extreme G4-20Y50040GE
Intel Core i9-11950H, GeForce RTX 3080 Laptop GPU
87.8 pt
Average of class Multimedia
 
86.6 pt
HP ZBook Studio 15 G8
Intel Core i9-11950H, GeForce RTX 3070 Laptop GPU
82.2 pt
Gigabyte Aero 16 YE5
Intel Core i9-12900HK, GeForce RTX 3080 Ti Laptop GPU
77.6 pt
Gigabyte Aero 16 YE5
Intel Core i9-12900HK, GeForce RTX 3080 Ti Laptop GPU
72.7 pt
Average Intel Core i9-12900HK
 
72.3 pt
Razer Blade 15 2022
Intel Core i7-12800H, GeForce RTX 3080 Ti Laptop GPU
66.3 pt
Gigabyte Aero 16 YE5
Intel Core i9-12900HK, GeForce RTX 3080 Ti Laptop GPU
28.9 pt
AIDA64 / FP32 Ray-Trace
SCHENKER XMG Pro 15 (Late 2021)
Intel Core i7-11800H, GeForce RTX 3080 Laptop GPU (v6.50.5800)
15493 KRay/s +87%
Lenovo ThinkPad X1 Extreme G4-20Y50040GE
Intel Core i9-11950H, GeForce RTX 3080 Laptop GPU (v6.50.5800)
15282 KRay/s +85%
Average of class Multimedia
  (4906 - 36957, n=76, last 2 years)
14429 KRay/s +75%
HP ZBook Studio 15 G8
Intel Core i9-11950H, GeForce RTX 3070 Laptop GPU (v6.33.5700)
14407 KRay/s +74%
Average Intel Core i9-12900HK
  (2677 - 13948, n=13)
9248 KRay/s +12%
Gigabyte Aero 16 YE5
Intel Core i9-12900HK, GeForce RTX 3080 Ti Laptop GPU (v6.50.5800, Turbo Mode)
9048 KRay/s +9%
Gigabyte Aero 16 YE5
Intel Core i9-12900HK, GeForce RTX 3080 Ti Laptop GPU (v6.50.5800)
8265 KRay/s
Razer Blade 15 2022
Intel Core i7-12800H, GeForce RTX 3080 Ti Laptop GPU (v6.50.5800)
7671 KRay/s -7%
Gigabyte Aero 16 YE5
Intel Core i9-12900HK, GeForce RTX 3080 Ti Laptop GPU (v6.50.5800, Silence Mode)
2677 KRay/s -68%
AIDA64 / FPU Julia
Average of class Multimedia
  (14528 - 147248, n=77, last 2 years)
72714 Points +90%
SCHENKER XMG Pro 15 (Late 2021)
Intel Core i7-11800H, GeForce RTX 3080 Laptop GPU (v6.50.5800)
64283 Points +68%
Lenovo ThinkPad X1 Extreme G4-20Y50040GE
Intel Core i9-11950H, GeForce RTX 3080 Laptop GPU (v6.50.5800)
63303 Points +65%
HP ZBook Studio 15 G8
Intel Core i9-11950H, GeForce RTX 3070 Laptop GPU (v6.33.5700)
60286 Points +57%
Average Intel Core i9-12900HK
  (12762 - 70764, n=13)
43854 Points +15%
Gigabyte Aero 16 YE5
Intel Core i9-12900HK, GeForce RTX 3080 Ti Laptop GPU (v6.50.5800, Turbo Mode)
41548 Points +9%
Gigabyte Aero 16 YE5
Intel Core i9-12900HK, GeForce RTX 3080 Ti Laptop GPU (v6.50.5800)
38277 Points
Razer Blade 15 2022
Intel Core i7-12800H, GeForce RTX 3080 Ti Laptop GPU (v6.50.5800)
36695 Points -4%
Gigabyte Aero 16 YE5
Intel Core i9-12900HK, GeForce RTX 3080 Ti Laptop GPU (v6.50.5800, Silence Mode)
12762 Points -67%
AIDA64 / CPU SHA3
SCHENKER XMG Pro 15 (Late 2021)
Intel Core i7-11800H, GeForce RTX 3080 Laptop GPU (v6.50.5800)
4332 MB/s +48%
Lenovo ThinkPad X1 Extreme G4-20Y50040GE
Intel Core i9-11950H, GeForce RTX 3080 Laptop GPU (v6.50.5800)
4254 MB/s +45%
HP ZBook Studio 15 G8
Intel Core i9-11950H, GeForce RTX 3070 Laptop GPU (v6.33.5700)
4003 MB/s +37%
Average of class Multimedia
  (1529 - 6698, n=77, last 2 years)
3389 MB/s +16%
Gigabyte Aero 16 YE5
Intel Core i9-12900HK, GeForce RTX 3080 Ti Laptop GPU (v6.50.5800, Turbo Mode)
3169 MB/s +8%
Gigabyte Aero 16 YE5
Intel Core i9-12900HK, GeForce RTX 3080 Ti Laptop GPU (v6.50.5800)
2931 MB/s
Average Intel Core i9-12900HK
  (841 - 3504, n=13)
2923 MB/s 0%
Razer Blade 15 2022
Intel Core i7-12800H, GeForce RTX 3080 Ti Laptop GPU (v6.50.5800)
2681 MB/s -9%
Gigabyte Aero 16 YE5
Intel Core i9-12900HK, GeForce RTX 3080 Ti Laptop GPU (v6.50.5800, Silence Mode)
841 MB/s -71%
AIDA64 / CPU Queen
Gigabyte Aero 16 YE5
Intel Core i9-12900HK, GeForce RTX 3080 Ti Laptop GPU (v6.50.5800, Turbo Mode)
107161 Points 0%
Gigabyte Aero 16 YE5
Intel Core i9-12900HK, GeForce RTX 3080 Ti Laptop GPU (v6.50.5800)
107042 Points
Average Intel Core i9-12900HK
  (60202 - 107161, n=13)
99332 Points -7%
HP ZBook Studio 15 G8
Intel Core i9-11950H, GeForce RTX 3070 Laptop GPU (v6.33.5700)
98772 Points -8%
Lenovo ThinkPad X1 Extreme G4-20Y50040GE
Intel Core i9-11950H, GeForce RTX 3080 Laptop GPU (v6.50.5800)
98176 Points -8%
Razer Blade 15 2022
Intel Core i7-12800H, GeForce RTX 3080 Ti Laptop GPU (v6.50.5800)
93492 Points -13%
SCHENKER XMG Pro 15 (Late 2021)
Intel Core i7-11800H, GeForce RTX 3080 Laptop GPU (v6.50.5800)
91924 Points -14%
Average of class Multimedia
  (21547 - 141074, n=77, last 2 years)
90849 Points -15%
Gigabyte Aero 16 YE5
Intel Core i9-12900HK, GeForce RTX 3080 Ti Laptop GPU (v6.50.5800, Silence Mode)
60202 Points -44%
AIDA64 / FPU SinJulia
Lenovo ThinkPad X1 Extreme G4-20Y50040GE
Intel Core i9-11950H, GeForce RTX 3080 Laptop GPU (v6.50.5800)
10451 Points +8%
Gigabyte Aero 16 YE5
Intel Core i9-12900HK, GeForce RTX 3080 Ti Laptop GPU (v6.50.5800, Turbo Mode)
10259 Points +6%
HP ZBook Studio 15 G8
Intel Core i9-11950H, GeForce RTX 3070 Laptop GPU (v6.33.5700)
9828 Points +2%
SCHENKER XMG Pro 15 (Late 2021)
Intel Core i7-11800H, GeForce RTX 3080 Laptop GPU (v6.50.5800)
9787 Points +1%
Gigabyte Aero 16 YE5
Intel Core i9-12900HK, GeForce RTX 3080 Ti Laptop GPU (v6.50.5800)
9655 Points
Average of class Multimedia
  (1240 - 19021, n=77, last 2 years)
9329 Points -3%
Razer Blade 15 2022
Intel Core i7-12800H, GeForce RTX 3080 Ti Laptop GPU (v6.50.5800)
9205 Points -5%
Average Intel Core i9-12900HK
  (3225 - 10402, n=13)
9025 Points -7%
Gigabyte Aero 16 YE5
Intel Core i9-12900HK, GeForce RTX 3080 Ti Laptop GPU (v6.50.5800, Silence Mode)
3225 Points -67%
AIDA64 / FPU Mandel
SCHENKER XMG Pro 15 (Late 2021)
Intel Core i7-11800H, GeForce RTX 3080 Laptop GPU (v6.50.5800)
38524 Points +68%
Lenovo ThinkPad X1 Extreme G4-20Y50040GE
Intel Core i9-11950H, GeForce RTX 3080 Laptop GPU (v6.50.5800)
38046 Points +66%
Average of class Multimedia
  (9903 - 75780, n=76, last 2 years)
36169 Points +58%
HP ZBook Studio 15 G8
Intel Core i9-11950H, GeForce RTX 3070 Laptop GPU (v6.33.5700)
35735 Points +56%
Gigabyte Aero 16 YE5
Intel Core i9-12900HK, GeForce RTX 3080 Ti Laptop GPU (v6.50.5800, Turbo Mode)
25019 Points +9%
Average Intel Core i9-12900HK
  (7417 - 34233, n=13)
24963 Points +9%
Gigabyte Aero 16 YE5
Intel Core i9-12900HK, GeForce RTX 3080 Ti Laptop GPU (v6.50.5800)
22873 Points
Razer Blade 15 2022
Intel Core i7-12800H, GeForce RTX 3080 Ti Laptop GPU (v6.50.5800)
21312 Points -7%
Gigabyte Aero 16 YE5
Intel Core i9-12900HK, GeForce RTX 3080 Ti Laptop GPU (v6.50.5800, Silence Mode)
7417 Points -68%
AIDA64 / CPU AES
Lenovo ThinkPad X1 Extreme G4-20Y50040GE
Intel Core i9-11950H, GeForce RTX 3080 Laptop GPU (v6.50.5800)
147249 MB/s +62%
SCHENKER XMG Pro 15 (Late 2021)
Intel Core i7-11800H, GeForce RTX 3080 Laptop GPU (v6.50.5800)
145983 MB/s +60%
Gigabyte Aero 16 YE5
Intel Core i9-12900HK, GeForce RTX 3080 Ti Laptop GPU (v6.50.5800, Turbo Mode)
98817 MB/s +9%
Gigabyte Aero 16 YE5
Intel Core i9-12900HK, GeForce RTX 3080 Ti Laptop GPU (v6.50.5800)
91041 MB/s
HP ZBook Studio 15 G8
Intel Core i9-11950H, GeForce RTX 3070 Laptop GPU (v6.33.5700)
84048 MB/s -8%
Average Intel Core i9-12900HK
  (32382 - 112254, n=13)
77919 MB/s -14%
Average of class Multimedia
  (31432 - 169946, n=77, last 2 years)
75995 MB/s -17%
Razer Blade 15 2022
Intel Core i7-12800H, GeForce RTX 3080 Ti Laptop GPU (v6.50.5800)
55775 MB/s -39%
Gigabyte Aero 16 YE5
Intel Core i9-12900HK, GeForce RTX 3080 Ti Laptop GPU (v6.50.5800, Silence Mode)
32382 MB/s -64%
AIDA64 / CPU ZLib
Gigabyte Aero 16 YE5
Intel Core i9-12900HK, GeForce RTX 3080 Ti Laptop GPU (v6.50.5800, Turbo Mode)
1121 MB/s +13%
Gigabyte Aero 16 YE5
Intel Core i9-12900HK, GeForce RTX 3080 Ti Laptop GPU (v6.50.5800)
988 MB/s
Average Intel Core i9-12900HK
  (314 - 1209, n=13)
979 MB/s -1%
Average of class Multimedia
  (454 - 1973, n=77, last 2 years)
935 MB/s -5%
Razer Blade 15 2022
Intel Core i7-12800H, GeForce RTX 3080 Ti Laptop GPU (v6.50.5800)
928 MB/s -6%
Lenovo ThinkPad X1 Extreme G4-20Y50040GE
Intel Core i9-11950H, GeForce RTX 3080 Laptop GPU (v6.50.5800)
820 MB/s -17%
SCHENKER XMG Pro 15 (Late 2021)
Intel Core i7-11800H, GeForce RTX 3080 Laptop GPU (v6.50.5800)
807 MB/s -18%
HP ZBook Studio 15 G8
Intel Core i9-11950H, GeForce RTX 3070 Laptop GPU (v6.33.5700)
767 MB/s -22%
Gigabyte Aero 16 YE5
Intel Core i9-12900HK, GeForce RTX 3080 Ti Laptop GPU (v6.50.5800, Silence Mode)
314 MB/s -68%
AIDA64 / FP64 Ray-Trace
SCHENKER XMG Pro 15 (Late 2021)
Intel Core i7-11800H, GeForce RTX 3080 Laptop GPU (v6.50.5800)
8393 KRay/s +76%
Lenovo ThinkPad X1 Extreme G4-20Y50040GE
Intel Core i9-11950H, GeForce RTX 3080 Laptop GPU (v6.50.5800)
8306 KRay/s +74%
HP ZBook Studio 15 G8
Intel Core i9-11950H, GeForce RTX 3070 Laptop GPU (v6.33.5700)
7871 KRay/s +65%
Average of class Multimedia
  (2738 - 20608, n=77, last 2 years)
7836 KRay/s +64%
Average Intel Core i9-12900HK
  (1501 - 7616, n=13)
5248 KRay/s +10%
Gigabyte Aero 16 YE5
Intel Core i9-12900HK, GeForce RTX 3080 Ti Laptop GPU (v6.50.5800, Turbo Mode)
5189 KRay/s +9%
Gigabyte Aero 16 YE5
Intel Core i9-12900HK, GeForce RTX 3080 Ti Laptop GPU (v6.50.5800)
4776 KRay/s
Razer Blade 15 2022
Intel Core i7-12800H, GeForce RTX 3080 Ti Laptop GPU (v6.50.5800)
4173 KRay/s -13%
Gigabyte Aero 16 YE5
Intel Core i9-12900HK, GeForce RTX 3080 Ti Laptop GPU (v6.50.5800, Silence Mode)
1501 KRay/s -69%
AIDA64 / CPU PhotoWorxx
Razer Blade 15 2022
Intel Core i7-12800H, GeForce RTX 3080 Ti Laptop GPU (v6.50.5800)
40992 MPixel/s +5%
Average of class Multimedia
  (7419 - 53918, n=77, last 2 years)
40459 MPixel/s +4%
Gigabyte Aero 16 YE5
Intel Core i9-12900HK, GeForce RTX 3080 Ti Laptop GPU (v6.50.5800)
38990 MPixel/s
Gigabyte Aero 16 YE5
Intel Core i9-12900HK, GeForce RTX 3080 Ti Laptop GPU (v6.50.5800, Turbo Mode)
38885 MPixel/s 0%
Average Intel Core i9-12900HK
  (24903 - 42462, n=13)
36542 MPixel/s -6%
SCHENKER XMG Pro 15 (Late 2021)
Intel Core i7-11800H, GeForce RTX 3080 Laptop GPU (v6.50.5800)
26732 MPixel/s -31%
Gigabyte Aero 16 YE5
Intel Core i9-12900HK, GeForce RTX 3080 Ti Laptop GPU (v6.50.5800, Silence Mode)
24991 MPixel/s -36%
HP ZBook Studio 15 G8
Intel Core i9-11950H, GeForce RTX 3070 Laptop GPU (v6.33.5700)
22621 MPixel/s -42%
Lenovo ThinkPad X1 Extreme G4-20Y50040GE
Intel Core i9-11950H, GeForce RTX 3080 Laptop GPU (v6.50.5800)
12933 MPixel/s -67%

Desempenho do sistema

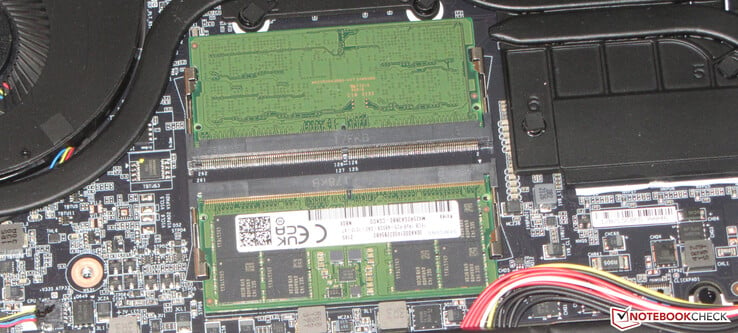
Sem surpresas, o desempenho geral do sistema foi muito rápido e suave graças a seu poderoso hardware interno. O computador fez um trabalho fantástico em todos os testes de aplicação. O desempenho geral aumentou ainda mais com a interface de memória DDR5 de canal duplo, como testemunham os excelentes resultados do benchmark PCMark.

Um total de dois slots de RAM estão disponíveis
PCMark 8 Home Score Accelerated v2
4775 pontos
PCMark 8 Creative Score Accelerated v2
6920 pontos
PCMark 8 Work Score Accelerated v2
5343 pontos
PCMark 10 Score
7816 pontos
Ajuda
PCMark 10 / Score
Average Intel Core i9-12900HK, NVIDIA GeForce RTX 3080 Ti Laptop GPU
  (7149 - 8186, n=5)
7867 Points +1%
Gigabyte Aero 16 YE5
GeForce RTX 3080 Ti Laptop GPU, i9-12900HK, Phison ESR01TBMFCT
7816 Points
Razer Blade 15 2022
GeForce RTX 3080 Ti Laptop GPU, i7-12800H, SSSTC CA6-8D1024
7706 Points -1%
Lenovo ThinkPad X1 Extreme G4-20Y50040GE
GeForce RTX 3080 Laptop GPU, i9-11950H, Kioxia XG7 KXG7AZNV1T02
6919 Points -11%
Average of class Multimedia
  (4542 - 8670, n=72, last 2 years)
6795 Points -13%
PCMark 10 / Essentials
Gigabyte Aero 16 YE5
GeForce RTX 3080 Ti Laptop GPU, i9-12900HK, Phison ESR01TBMFCT
10945 Points
Average Intel Core i9-12900HK, NVIDIA GeForce RTX 3080 Ti Laptop GPU
  (9870 - 11205, n=5)
10757 Points -2%
Razer Blade 15 2022
GeForce RTX 3080 Ti Laptop GPU, i7-12800H, SSSTC CA6-8D1024
10708 Points -2%
Average of class Multimedia
  (8480 - 12420, n=72, last 2 years)
10521 Points -4%
Lenovo ThinkPad X1 Extreme G4-20Y50040GE
GeForce RTX 3080 Laptop GPU, i9-11950H, Kioxia XG7 KXG7AZNV1T02
10508 Points -4%
PCMark 10 / Productivity
Gigabyte Aero 16 YE5
GeForce RTX 3080 Ti Laptop GPU, i9-12900HK, Phison ESR01TBMFCT
10050 Points
Average Intel Core i9-12900HK, NVIDIA GeForce RTX 3080 Ti Laptop GPU
  (9173 - 10422, n=5)
9978 Points -1%
Razer Blade 15 2022
GeForce RTX 3080 Ti Laptop GPU, i7-12800H, SSSTC CA6-8D1024
9581 Points -5%
Average of class Multimedia
  (6089 - 10742, n=72, last 2 years)
8932 Points -11%
Lenovo ThinkPad X1 Extreme G4-20Y50040GE
GeForce RTX 3080 Laptop GPU, i9-11950H, Kioxia XG7 KXG7AZNV1T02
8790 Points -13%
PCMark 10 / Digital Content Creation
Average Intel Core i9-12900HK, NVIDIA GeForce RTX 3080 Ti Laptop GPU
  (10951 - 13098, n=5)
12318 Points +5%
Razer Blade 15 2022
GeForce RTX 3080 Ti Laptop GPU, i7-12800H, SSSTC CA6-8D1024
12104 Points +3%
Gigabyte Aero 16 YE5
GeForce RTX 3080 Ti Laptop GPU, i9-12900HK, Phison ESR01TBMFCT
11777 Points
Lenovo ThinkPad X1 Extreme G4-20Y50040GE
GeForce RTX 3080 Laptop GPU, i9-11950H, Kioxia XG7 KXG7AZNV1T02
9735 Points -17%
Average of class Multimedia
  (3651 - 13548, n=72, last 2 years)
9202 Points -22%
CrossMark / Overall
Gigabyte Aero 16 YE5
GeForce RTX 3080 Ti Laptop GPU, i9-12900HK, Phison ESR01TBMFCT
2113 Points
Average Intel Core i9-12900HK, NVIDIA GeForce RTX 3080 Ti Laptop GPU
  (970 - 2138, n=5)
1770 Points -16%
Average of class Multimedia
  (978 - 2184, n=87, last 2 years)
1703 Points -19%
Lenovo ThinkPad X1 Extreme G4-20Y50040GE
GeForce RTX 3080 Laptop GPU, i9-11950H, Kioxia XG7 KXG7AZNV1T02
1649 Points -22%
Apple MacBook Pro 16 2021 M1 Max
M1 Max 32-Core GPU, M1 Max, Apple SSD AP2048R
1586 Points -25%
CrossMark / Productivity
Gigabyte Aero 16 YE5
GeForce RTX 3080 Ti Laptop GPU, i9-12900HK, Phison ESR01TBMFCT
2031 Points
Average Intel Core i9-12900HK, NVIDIA GeForce RTX 3080 Ti Laptop GPU
  (921 - 2038, n=5)
1677 Points -17%
Lenovo ThinkPad X1 Extreme G4-20Y50040GE
GeForce RTX 3080 Laptop GPU, i9-11950H, Kioxia XG7 KXG7AZNV1T02
1655 Points -19%
Average of class Multimedia
  (913 - 2064, n=87, last 2 years)
1616 Points -20%
Apple MacBook Pro 16 2021 M1 Max
M1 Max 32-Core GPU, M1 Max, Apple SSD AP2048R
1361 Points -33%
CrossMark / Creativity
Gigabyte Aero 16 YE5
GeForce RTX 3080 Ti Laptop GPU, i9-12900HK, Phison ESR01TBMFCT
2161 Points
Apple MacBook Pro 16 2021 M1 Max
M1 Max 32-Core GPU, M1 Max, Apple SSD AP2048R
2102 Points -3%
Average of class Multimedia
  (1054 - 2594, n=87, last 2 years)
1909 Points -12%
Average Intel Core i9-12900HK, NVIDIA GeForce RTX 3080 Ti Laptop GPU
  (1007 - 2210, n=5)
1892 Points -12%
Lenovo ThinkPad X1 Extreme G4-20Y50040GE
GeForce RTX 3080 Laptop GPU, i9-11950H, Kioxia XG7 KXG7AZNV1T02
1678 Points -22%
CrossMark / Responsiveness
Gigabyte Aero 16 YE5
GeForce RTX 3080 Ti Laptop GPU, i9-12900HK, Phison ESR01TBMFCT
2228 Points
Average Intel Core i9-12900HK, NVIDIA GeForce RTX 3080 Ti Laptop GPU
  (1012 - 2234, n=5)
1722 Points -23%
Lenovo ThinkPad X1 Extreme G4-20Y50040GE
GeForce RTX 3080 Laptop GPU, i9-11950H, Kioxia XG7 KXG7AZNV1T02
1547 Points -31%
Average of class Multimedia
  (869 - 2171, n=87, last 2 years)
1435 Points -36%
Apple MacBook Pro 16 2021 M1 Max
M1 Max 32-Core GPU, M1 Max, Apple SSD AP2048R
1080 Points -52%
AIDA64 / Memory Copy
Average of class Multimedia
  (20549 - 104459, n=77, last 2 years)
68580 MB/s +10%
Razer Blade 15 2022
Intel Core i7-12800H, GeForce RTX 3080 Ti Laptop GPU
62522 MB/s 0%
Gigabyte Aero 16 YE5
Intel Core i9-12900HK, GeForce RTX 3080 Ti Laptop GPU
62419 MB/s
Average Intel Core i9-12900HK
  (44442 - 62959, n=13)
58702 MB/s -6%
Lenovo ThinkPad X1 Extreme G4-20Y50040GE
Intel Core i9-11950H, GeForce RTX 3080 Laptop GPU
27947 MB/s -55%
AIDA64 / Memory Read
Average of class Multimedia
  (22917 - 125604, n=77, last 2 years)
69599 MB/s +6%
Razer Blade 15 2022
Intel Core i7-12800H, GeForce RTX 3080 Ti Laptop GPU
65933 MB/s 0%
Gigabyte Aero 16 YE5
Intel Core i9-12900HK, GeForce RTX 3080 Ti Laptop GPU
65835 MB/s
Average Intel Core i9-12900HK
  (44775 - 66989, n=13)
61950 MB/s -6%
Lenovo ThinkPad X1 Extreme G4-20Y50040GE
Intel Core i9-11950H, GeForce RTX 3080 Laptop GPU
26064 MB/s -60%
AIDA64 / Memory Write
Average of class Multimedia
  (20226 - 117933, n=77, last 2 years)
69752 MB/s +13%
Razer Blade 15 2022
Intel Core i7-12800H, GeForce RTX 3080 Ti Laptop GPU
66074 MB/s +7%
Gigabyte Aero 16 YE5
Intel Core i9-12900HK, GeForce RTX 3080 Ti Laptop GPU
61981 MB/s
Average Intel Core i9-12900HK
  (45952 - 65268, n=13)
60328 MB/s -3%
Lenovo ThinkPad X1 Extreme G4-20Y50040GE
Intel Core i9-11950H, GeForce RTX 3080 Laptop GPU
22302 MB/s -64%
AIDA64 / Memory Latency
Average of class Multimedia
  (7 - 346, n=77, last 2 years)
106.6 ns * -19%
Gigabyte Aero 16 YE5
Intel Core i9-12900HK, GeForce RTX 3080 Ti Laptop GPU
89.7 ns *
Lenovo ThinkPad X1 Extreme G4-20Y50040GE
Intel Core i9-11950H, GeForce RTX 3080 Laptop GPU
87.8 ns * +2%
Average Intel Core i9-12900HK
  (79.9 - 109, n=13)
65.1 (79.9min - 109max) ns * +27%
Razer Blade 15 2022
Intel Core i7-12800H, GeForce RTX 3080 Ti Laptop GPU
0 ns * +100%

* ... smaller is better

Latências DPC

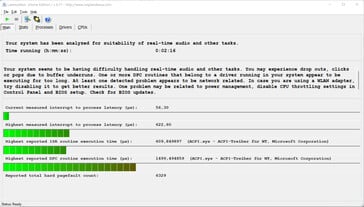
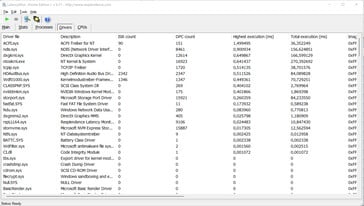
Em nosso teste de monitor de latência padronizado (navegando na web, reprodução de vídeo 4K, Prime95 de alta carga) fomos capazes de detectar algumas inconsistências de latências DPC. O Aero 16 não parece ser particularmente adequado para edição de vídeo e áudio. Tendo dito que alguns de seus concorrentes sofrem de latências DPC ainda mais altas. No passado, descobrimos que as latências de DPC podem ser melhoradas por atualizações de software ao longo do tempo. Infelizmente, o oposto também é possível.

Monitor de latência
Monitor de latência
Monitor de latência
Monitor de latência
DPC Latencies / LatencyMon - interrupt to process latency (max), Web, Youtube, Prime95
Lenovo ThinkPad X1 Extreme G4-20Y50040GE
GeForce RTX 3080 Laptop GPU, i9-11950H, Kioxia XG7 KXG7AZNV1T02
1604 μs * -157%
HP ZBook Studio 15 G8
GeForce RTX 3070 Laptop GPU, i9-11950H, Samsung PM981a MZVLB2T0HALB
1508 μs * -142%
Razer Blade 15 2022
GeForce RTX 3080 Ti Laptop GPU, i7-12800H, SSSTC CA6-8D1024
1364 μs * -119%
SCHENKER XMG Pro 15 (Late 2021)
GeForce RTX 3080 Laptop GPU, i7-11800H, Samsung SSD 980 Pro 1TB MZ-V8P1T0BW
1056 μs * -70%
Gigabyte Aero 16 YE5
GeForce RTX 3080 Ti Laptop GPU, i9-12900HK, Phison ESR01TBMFCT
623 μs *

* ... smaller is better

Dispositivos de armazenamento

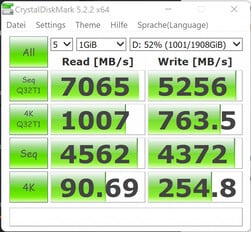
Nossa unidade de revisão veio com dois SSDs instalados, um Samsung M.2-2280 de 2 TB e um Phison M.2-2280 de 1 TB, o último dos quais foi usado para o sistema operacional. Graças a sua interface PCIe 4.0, ambos SSDs tiveram um desempenho admirável e muito rápido.

SSD NVMe primário de 1 TB para o sistema operacional
SSD NVMe secundário de 2 TB para um total de 3 TB de armazenamento
CrystalDiskMark (Samsung SSD)
AS SSD (Samsung SSD)
Phison ESR01TBMFCT
CDM 5/6 Read Seq Q32T1: 7076 MB/s
CDM 5/6 Write Seq Q32T1: 5000 MB/s
CDM 5/6 Read 4K Q32T1: 1134 MB/s
CDM 5/6 Write 4K Q32T1: 809 MB/s
CDM 5 Read Seq: 4217 MB/s
CDM 5 Write Seq: 4454 MB/s
CDM 5/6 Read 4K: 88.4 MB/s
CDM 5/6 Write 4K: 332.6 MB/s
Drive Performance Rating - Percent
Gigabyte Aero 16 YE5
Phison ESR01TBMFCT
92.5 pt
Average Phison ESR01TBMFCT
 
92.5 pt
Razer Blade 15 2022
SSSTC CA6-8D1024
79.5 pt
Lenovo ThinkPad X1 Extreme G4-20Y50040GE
Kioxia XG7 KXG7AZNV1T02
75.1 pt
SCHENKER XMG Pro 15 (Late 2021)
Samsung SSD 980 Pro 1TB MZ-V8P1T0BW
67.5 pt
Average of class Multimedia
 
56 pt
HP ZBook Studio 15 G8
Samsung PM981a MZVLB2T0HALB
39.9 pt
DiskSpd
seq read
Razer Blade 15 2022
SSSTC CA6-8D1024
4119 (4098.66min - 4118.81max) MB/s +8%
SCHENKER XMG Pro 15 (Late 2021)
Samsung SSD 980 Pro 1TB MZ-V8P1T0BW
3829 (3821.85min - 3829.08max) MB/s 0%
Gigabyte Aero 16 YE5
Phison ESR01TBMFCT
3819 (3405.77min - 3819.33max) MB/s
Average Phison ESR01TBMFCT
  ()
3819 MB/s 0%
Lenovo ThinkPad X1 Extreme G4-20Y50040GE
Kioxia XG7 KXG7AZNV1T02
3675 (3650.76min - 3674.84max) MB/s -4%
Average of class Multimedia
  (1629 - 4861, n=76, last 2 years)
2970 MB/s -22%
HP ZBook Studio 15 G8
Samsung PM981a MZVLB2T0HALB
2222 (2190.89min - 2222.39max) MB/s -42%
seq write
Gigabyte Aero 16 YE5
Phison ESR01TBMFCT
4457 MB/s
Average Phison ESR01TBMFCT
  ()
4457 MB/s 0%
SCHENKER XMG Pro 15 (Late 2021)
Samsung SSD 980 Pro 1TB MZ-V8P1T0BW
4318 (3897.94min - 4317.86max) MB/s -3%
Razer Blade 15 2022
SSSTC CA6-8D1024
4167 (4120.63min - 4166.62max) MB/s -7%
Lenovo ThinkPad X1 Extreme G4-20Y50040GE
Kioxia XG7 KXG7AZNV1T02
4042 (4002.62min - 4041.84max) MB/s -9%
Average of class Multimedia
  (463 - 5711, n=76, last 2 years)
3092 MB/s -31%
HP ZBook Studio 15 G8
Samsung PM981a MZVLB2T0HALB
1994 (1956.99min - 1994.39max) MB/s -55%
seq q8 t1 read
Gigabyte Aero 16 YE5
Phison ESR01TBMFCT
7028 (6634.28min - 7027.76max) MB/s
Average Phison ESR01TBMFCT
  ()
7028 MB/s 0%
Razer Blade 15 2022
SSSTC CA6-8D1024
6921 (6631.14min - 6921.02max) MB/s -2%
SCHENKER XMG Pro 15 (Late 2021)
Samsung SSD 980 Pro 1TB MZ-V8P1T0BW
6672 (6155.41min - 6672.09max) MB/s -5%
Lenovo ThinkPad X1 Extreme G4-20Y50040GE
Kioxia XG7 KXG7AZNV1T02
5903 (5502.82min - 5903.42max) MB/s -16%
Average of class Multimedia
  (2132 - 7126, n=76, last 2 years)
5486 MB/s -22%
HP ZBook Studio 15 G8
Samsung PM981a MZVLB2T0HALB
3546 (2637.17min - 3546.07max) MB/s -50%
seq q8 t1 write
Gigabyte Aero 16 YE5
Phison ESR01TBMFCT
5004 (4980.32min - 5004.43max) MB/s
Average Phison ESR01TBMFCT
  ()
5004 MB/s 0%
Razer Blade 15 2022
SSSTC CA6-8D1024
4740 (4542.15min - 4740.19max) MB/s -5%
Average of class Multimedia
  (555 - 6898, n=76, last 2 years)
4169 MB/s -17%
Lenovo ThinkPad X1 Extreme G4-20Y50040GE
Kioxia XG7 KXG7AZNV1T02
4155 (4004.26min - 4155.09max) MB/s -17%
SCHENKER XMG Pro 15 (Late 2021)
Samsung SSD 980 Pro 1TB MZ-V8P1T0BW
4124 (2287.86min - 4123.91max) MB/s -18%
HP ZBook Studio 15 G8
Samsung PM981a MZVLB2T0HALB
3056 (2938.74min - 3056.18max) MB/s -39%
4k q1 t1 read
Gigabyte Aero 16 YE5
Phison ESR01TBMFCT
88.7 MB/s
Average Phison ESR01TBMFCT
  ()
88.7 MB/s 0%
Razer Blade 15 2022
SSSTC CA6-8D1024
79.6 (78.85min - 79.63max) MB/s -10%
Lenovo ThinkPad X1 Extreme G4-20Y50040GE
Kioxia XG7 KXG7AZNV1T02
65 (63.72min - 64.96max) MB/s -27%
Average of class Multimedia
  (14.6 - 97.7, n=76, last 2 years)
62.9 MB/s -29%
SCHENKER XMG Pro 15 (Late 2021)
Samsung SSD 980 Pro 1TB MZ-V8P1T0BW
62.7 (62.59min - 62.69max) MB/s -29%
HP ZBook Studio 15 G8
Samsung PM981a MZVLB2T0HALB
39.7 (39.25min - 39.67max) MB/s -55%
4k q1 t1 write
Gigabyte Aero 16 YE5
Phison ESR01TBMFCT
373 (371.9min - 373.21max) MB/s
Average Phison ESR01TBMFCT
  ()
373 MB/s 0%
Razer Blade 15 2022
SSSTC CA6-8D1024
256 (23.49min - 256.28max) MB/s -31%
Lenovo ThinkPad X1 Extreme G4-20Y50040GE
Kioxia XG7 KXG7AZNV1T02
246 (244.97min - 246.27max) MB/s -34%
SCHENKER XMG Pro 15 (Late 2021)
Samsung SSD 980 Pro 1TB MZ-V8P1T0BW
246 (245.08min - 246.35max) MB/s -34%
Average of class Multimedia
  (69.4 - 378, n=76, last 2 years)
170.9 MB/s -54%
HP ZBook Studio 15 G8
Samsung PM981a MZVLB2T0HALB
111 (110.67min - 111.48max) MB/s -70%
4k q32 t16 read
SCHENKER XMG Pro 15 (Late 2021)
Samsung SSD 980 Pro 1TB MZ-V8P1T0BW
4192 (4183.34min - 4192.34max) MB/s +18%
Gigabyte Aero 16 YE5
Phison ESR01TBMFCT
3555 (3552.55min - 3555.1max) MB/s
Average Phison ESR01TBMFCT
  ()
3555 MB/s 0%
Lenovo ThinkPad X1 Extreme G4-20Y50040GE
Kioxia XG7 KXG7AZNV1T02
3453 (3437.37min - 3452.91max) MB/s -3%
Razer Blade 15 2022
SSSTC CA6-8D1024
3184 (3180.75min - 3183.86max) MB/s -10%
Average of class Multimedia
  (295 - 4881, n=76, last 2 years)
1357 MB/s -62%
HP ZBook Studio 15 G8
Samsung PM981a MZVLB2T0HALB
955 (945.81min - 954.64max) MB/s -73%
4k q32 t16 write
Gigabyte Aero 16 YE5
Phison ESR01TBMFCT
3612 (3585.78min - 3612.01max) MB/s
Average Phison ESR01TBMFCT
  ()
3612 MB/s 0%
Razer Blade 15 2022
SSSTC CA6-8D1024
2141 (2137.08min - 2141.26max) MB/s -41%
Lenovo ThinkPad X1 Extreme G4-20Y50040GE
Kioxia XG7 KXG7AZNV1T02
1831 (1773.55min - 1830.98max) MB/s -49%
SCHENKER XMG Pro 15 (Late 2021)
Samsung SSD 980 Pro 1TB MZ-V8P1T0BW
1184 (1165.59min - 1184.31max) MB/s -67%
Average of class Multimedia
  (192.1 - 4074, n=76, last 2 years)
1025 MB/s -72%
HP ZBook Studio 15 G8
Samsung PM981a MZVLB2T0HALB
388 (383.05min - 388.19max) MB/s -89%
AS SSD
Score Total
Gigabyte Aero 16 YE5
Phison ESR01TBMFCT
9380 Points
Average Phison ESR01TBMFCT
  ()
9380 Points 0%
Razer Blade 15 2022
SSSTC CA6-8D1024
7659 Points -18%
Lenovo ThinkPad X1 Extreme G4-20Y50040GE
Kioxia XG7 KXG7AZNV1T02
7397 Points -21%
SCHENKER XMG Pro 15 (Late 2021)
Samsung SSD 980 Pro 1TB MZ-V8P1T0BW
6065 Points -35%
Average of class Multimedia
  (2033 - 9972, n=73, last 2 years)
5061 Points -46%
HP ZBook Studio 15 G8
Samsung PM981a MZVLB2T0HALB
4297 Points -54%
Score Read
Gigabyte Aero 16 YE5
Phison ESR01TBMFCT
3634 Points
Average Phison ESR01TBMFCT
  ()
3634 Points 0%
Razer Blade 15 2022
SSSTC CA6-8D1024
3431 Points -6%
Lenovo ThinkPad X1 Extreme G4-20Y50040GE
Kioxia XG7 KXG7AZNV1T02
3361 Points -8%
SCHENKER XMG Pro 15 (Late 2021)
Samsung SSD 980 Pro 1TB MZ-V8P1T0BW
2673 Points -26%
Average of class Multimedia
  (669 - 3501, n=73, last 2 years)
1630 Points -55%
HP ZBook Studio 15 G8
Samsung PM981a MZVLB2T0HALB
1404 Points -61%
Score Write
Gigabyte Aero 16 YE5
Phison ESR01TBMFCT
3991 Points
Average Phison ESR01TBMFCT
  ()
3991 Points 0%
Average of class Multimedia
  (656 - 4813, n=73, last 2 years)
2660 Points -33%
Razer Blade 15 2022
SSSTC CA6-8D1024
2563 Points -36%
Lenovo ThinkPad X1 Extreme G4-20Y50040GE
Kioxia XG7 KXG7AZNV1T02
2381 Points -40%
HP ZBook Studio 15 G8
Samsung PM981a MZVLB2T0HALB
2232 Points -44%
SCHENKER XMG Pro 15 (Late 2021)
Samsung SSD 980 Pro 1TB MZ-V8P1T0BW
2211 Points -45%
Seq Read
Razer Blade 15 2022
SSSTC CA6-8D1024
5750 MB/s +3%
Gigabyte Aero 16 YE5
Phison ESR01TBMFCT
5588 MB/s
Average Phison ESR01TBMFCT
  ()
5588 MB/s 0%
Lenovo ThinkPad X1 Extreme G4-20Y50040GE
Kioxia XG7 KXG7AZNV1T02
5386 MB/s -4%
SCHENKER XMG Pro 15 (Late 2021)
Samsung SSD 980 Pro 1TB MZ-V8P1T0BW
5274 MB/s -6%
Average of class Multimedia
  (1718 - 5730, n=73, last 2 years)
4248 MB/s -24%
HP ZBook Studio 15 G8
Samsung PM981a MZVLB2T0HALB
2953 MB/s -47%
Seq Write
Lenovo ThinkPad X1 Extreme G4-20Y50040GE
Kioxia XG7 KXG7AZNV1T02
4218 MB/s +29%
Razer Blade 15 2022
SSSTC CA6-8D1024
4073 MB/s +25%
Gigabyte Aero 16 YE5
Phison ESR01TBMFCT
3267 MB/s
Average Phison ESR01TBMFCT
  ()
3267 MB/s 0%
Average of class Multimedia
  (414 - 5651, n=73, last 2 years)
2749 MB/s -16%
HP ZBook Studio 15 G8
Samsung PM981a MZVLB2T0HALB
1691 MB/s -48%
SCHENKER XMG Pro 15 (Late 2021)
Samsung SSD 980 Pro 1TB MZ-V8P1T0BW
1613 MB/s -51%
4K Read
Gigabyte Aero 16 YE5
Phison ESR01TBMFCT
109.4 MB/s
Average Phison ESR01TBMFCT
  ()
109.4 MB/s 0%
Razer Blade 15 2022
SSSTC CA6-8D1024
67.2 MB/s -39%
Lenovo ThinkPad X1 Extreme G4-20Y50040GE
Kioxia XG7 KXG7AZNV1T02
65.9 MB/s -40%
Average of class Multimedia
  (28.7 - 98.5, n=73, last 2 years)
61.6 MB/s -44%
SCHENKER XMG Pro 15 (Late 2021)
Samsung SSD 980 Pro 1TB MZ-V8P1T0BW
55 MB/s -50%
HP ZBook Studio 15 G8
Samsung PM981a MZVLB2T0HALB
43.98 MB/s -60%
4K Write
Average Phison ESR01TBMFCT
  ()
322 MB/s 0%
Gigabyte Aero 16 YE5
Phison ESR01TBMFCT
321.6 MB/s
Lenovo ThinkPad X1 Extreme G4-20Y50040GE
Kioxia XG7 KXG7AZNV1T02
223.2 MB/s -31%
Razer Blade 15 2022
SSSTC CA6-8D1024
221.3 MB/s -31%
SCHENKER XMG Pro 15 (Late 2021)
Samsung SSD 980 Pro 1TB MZ-V8P1T0BW
208.7 MB/s -35%
Average of class Multimedia
  (66.5 - 328, n=73, last 2 years)
190.3 MB/s -41%
HP ZBook Studio 15 G8
Samsung PM981a MZVLB2T0HALB
105.4 MB/s -67%
4K-64 Read
Gigabyte Aero 16 YE5
Phison ESR01TBMFCT
2966 MB/s
Average Phison ESR01TBMFCT
  ()
2966 MB/s 0%
Razer Blade 15 2022
SSSTC CA6-8D1024
2789 MB/s -6%
Lenovo ThinkPad X1 Extreme G4-20Y50040GE
Kioxia XG7 KXG7AZNV1T02
2757 MB/s -7%
SCHENKER XMG Pro 15 (Late 2021)
Samsung SSD 980 Pro 1TB MZ-V8P1T0BW
2091 MB/s -30%
Average of class Multimedia
  (350 - 2989, n=73, last 2 years)
1144 MB/s -61%
HP ZBook Studio 15 G8
Samsung PM981a MZVLB2T0HALB
1065 MB/s -64%
4K-64 Write
Gigabyte Aero 16 YE5
Phison ESR01TBMFCT
3342 MB/s
Average Phison ESR01TBMFCT
  ()
3342 MB/s 0%
Average of class Multimedia
  (411 - 4265, n=73, last 2 years)
2195 MB/s -34%
HP ZBook Studio 15 G8
Samsung PM981a MZVLB2T0HALB
1957 MB/s -41%
Razer Blade 15 2022
SSSTC CA6-8D1024
1934 MB/s -42%
SCHENKER XMG Pro 15 (Late 2021)
Samsung SSD 980 Pro 1TB MZ-V8P1T0BW
1841 MB/s -45%
Lenovo ThinkPad X1 Extreme G4-20Y50040GE
Kioxia XG7 KXG7AZNV1T02
1736 MB/s -48%
Access Time Read
SCHENKER XMG Pro 15 (Late 2021)
Samsung SSD 980 Pro 1TB MZ-V8P1T0BW
0.067 ms * -20%
Gigabyte Aero 16 YE5
Phison ESR01TBMFCT
0.056 ms *
Average Phison ESR01TBMFCT
  ()
0.056 ms * -0%
Average of class Multimedia
  (0.018 - 0.15, n=73, last 2 years)
0.0551 ms * +2%
Lenovo ThinkPad X1 Extreme G4-20Y50040GE
Kioxia XG7 KXG7AZNV1T02
0.049 ms * +12%
HP ZBook Studio 15 G8
Samsung PM981a MZVLB2T0HALB
0.04 ms * +29%
Razer Blade 15 2022
SSSTC CA6-8D1024
0.023 ms * +59%
Access Time Write
HP ZBook Studio 15 G8
Samsung PM981a MZVLB2T0HALB
0.105 ms * -775%
Average of class Multimedia
  (0.013 - 0.414, n=73, last 2 years)
0.06104 ms * -409%
Razer Blade 15 2022
SSSTC CA6-8D1024
0.058 ms * -383%
Lenovo ThinkPad X1 Extreme G4-20Y50040GE
Kioxia XG7 KXG7AZNV1T02
0.02 ms * -67%
SCHENKER XMG Pro 15 (Late 2021)
Samsung SSD 980 Pro 1TB MZ-V8P1T0BW
0.02 ms * -67%
Gigabyte Aero 16 YE5
Phison ESR01TBMFCT
0.012 ms *
Average Phison ESR01TBMFCT
  ()
0.012 ms * -0%

* ... smaller is better

Sustained Read: DiskSpd Read Loop, Queue Depth 8

035571010651420177521302485284031953550390542604615497053255680603563906745Tooltip
Gigabyte Aero 16 YE5 Phison ESR01TBMFCT: Ø7004 (6456.5-7039.72)
Lenovo ThinkPad X1 Extreme G4-20Y50040GE Kioxia XG7 KXG7AZNV1T02: Ø4767 (4234.91-5952.56)
SCHENKER XMG Pro 15 (Late 2021) Samsung SSD 980 Pro 1TB MZ-V8P1T0BW: Ø6365 (4085.25-6768.35)
Razer Blade 15 2022 SSSTC CA6-8D1024: Ø6887 (6595.77-6910.33)

Desempenho gráfico

Como sabemos, o verdadeiro desempenho de um RTX 3000 depende de uma série de fatores, tais como refrigeração, configuração de memória e TGP máximo conforme definido pelo OEM dentro dos limites pré-definidos pela Nvidia. No Aero 16, a Gigabyte optou por umGeForce RTX 3080 Ti Laptop GPU com TGP máximo de 105 W (90 W + 15 W Dynamic Boost).

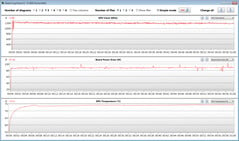
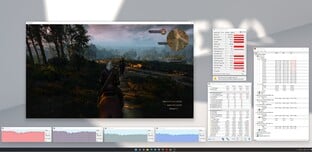
Em nossos benchmarks, a unidade teve um desempenho mais lento do que a média de todos os dispositivos RTX 3080 Ti-equipados testados anteriormente, cortesia de seu TGP comparativamente baixo. Além disso, nosso teste Witcher 3 revelou que este TGP máximo não pode ser mantido por longos períodos de tempo. O Razer Blade 15, que é equipado exatamente com o mesmo GPU, teve um desempenho notavelmente melhor, entre outros, graças a sua altura de 5 W adicional de TGP.

A GPU tem acesso a um total de 16 GB de GDDR6 VRAM, e o notebook suporta a comutação dinâmica da GPU on-demand entre a GPU dedicada e a integradaIris Xe Graphics G7 (Nvidia Optimus).

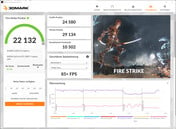
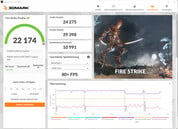
Fire Strike (na rede elétrica)
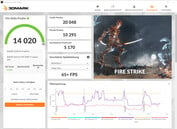
Fire Strike (em bateria)
Fire Strike (na rede elétrica, modo Turbo)
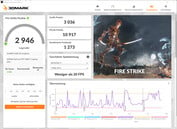
Fire Strike (em rede, Modo Silêncio)
3DMark 06 Standard Score
55891 pontos
3DMark 11 Performance
30249 pontos
3DMark Ice Storm Standard Score
77183 pontos
3DMark Cloud Gate Standard Score
45491 pontos
3DMark Fire Strike Score
22132 pontos
3DMark Time Spy Score
9875 pontos
Ajuda
3DMark 11 - 1280x720 Performance GPU
Average NVIDIA GeForce RTX 3080 Ti Laptop GPU
  (13920 - 45841, n=45)
39402 Points +19%
Razer Blade 15 2022
NVIDIA GeForce RTX 3080 Ti Laptop GPU, Intel Core i7-12800H
37438 Points +13%
SCHENKER XMG Pro 15 (Late 2021)
NVIDIA GeForce RTX 3080 Laptop GPU, Intel Core i7-11800H
36134 Points +9%
Gigabyte Aero 16 YE5
NVIDIA GeForce RTX 3080 Ti Laptop GPU, Intel Core i9-12900HK (Turbo Mode)
33856 Points +2%
Lenovo ThinkPad X1 Extreme G4-20Y50040GE
NVIDIA GeForce RTX 3080 Laptop GPU, Intel Core i9-11950H
33732 Points +1%
Gigabyte Aero 16 YE5
NVIDIA GeForce RTX 3080 Ti Laptop GPU, Intel Core i9-12900HK
33249 Points
Gigabyte Aero 16 YE5
NVIDIA GeForce RTX 3080 Ti Laptop GPU, Intel Core i9-12900HK (Silence Mode)
29839 Points -10%
HP ZBook Studio 15 G8
NVIDIA GeForce RTX 3070 Laptop GPU, Intel Core i9-11950H
28908 Points -13%
Average of class Multimedia
  (3505 - 60250, n=77, last 2 years)
20075 Points -40%
3DMark
Wild Life Extreme Unlimited
Average NVIDIA GeForce RTX 3080 Ti Laptop GPU
  (20846 - 28879, n=9)
26251 Points +26%
SCHENKER XMG Pro 15 (Late 2021)
NVIDIA GeForce RTX 3080 Laptop GPU, Intel Core i7-11800H
20971 Points +1%
Gigabyte Aero 16 YE5
NVIDIA GeForce RTX 3080 Ti Laptop GPU, Intel Core i9-12900HK
20846 Points
Apple MacBook Pro 16 2021 M1 Max
Apple M1 Max 32-Core GPU, Apple M1 Max
20228 Points -3%
Average of class Multimedia
  (1867 - 31403, n=43, last 2 years)
13229 Points -37%
Wild Life Extreme
Average NVIDIA GeForce RTX 3080 Ti Laptop GPU
  (18567 - 28432, n=8)
24882 Points +34%
SCHENKER XMG Pro 15 (Late 2021)
NVIDIA GeForce RTX 3080 Laptop GPU, Intel Core i7-11800H
18895 Points +2%
Apple MacBook Pro 16 2021 M1 Max
Apple M1 Max 32-Core GPU, Apple M1 Max
18779 Points +1%
Gigabyte Aero 16 YE5
NVIDIA GeForce RTX 3080 Ti Laptop GPU, Intel Core i9-12900HK
18567 Points
Average of class Multimedia
  (1854 - 22084, n=17, last 2 years)
11601 Points -38%
1920x1080 Fire Strike Graphics
Average NVIDIA GeForce RTX 3080 Ti Laptop GPU
  (6928 - 34439, n=43)
29496 Points +20%
Razer Blade 15 2022
NVIDIA GeForce RTX 3080 Ti Laptop GPU, Intel Core i7-12800H
28601 Points +16%
SCHENKER XMG Pro 15 (Late 2021)
NVIDIA GeForce RTX 3080 Laptop GPU, Intel Core i7-11800H
26868 Points +9%
Lenovo ThinkPad X1 Extreme G4-20Y50040GE
NVIDIA GeForce RTX 3080 Laptop GPU, Intel Core i9-11950H
25285 Points +3%
Gigabyte Aero 16 YE5
NVIDIA GeForce RTX 3080 Ti Laptop GPU, Intel Core i9-12900HK
24580 Points
Gigabyte Aero 16 YE5
NVIDIA GeForce RTX 3080 Ti Laptop GPU, Intel Core i9-12900HK (Turbo Mode)
24275 Points -1%
HP ZBook Studio 15 G8
NVIDIA GeForce RTX 3070 Laptop GPU, Intel Core i9-11950H
21399 Points -13%
Gigabyte Aero 16 YE5
NVIDIA GeForce RTX 3080 Ti Laptop GPU, Intel Core i9-12900HK (Silence Mode)
20048 Points -18%
Average of class Multimedia
  (1835 - 46022, n=80, last 2 years)
14437 Points -41%
2560x1440 Time Spy Graphics
Average NVIDIA GeForce RTX 3080 Ti Laptop GPU
  (4921 - 13835, n=43)
11850 Points +25%
Razer Blade 15 2022
NVIDIA GeForce RTX 3080 Ti Laptop GPU, Intel Core i7-12800H
11071 Points +17%
SCHENKER XMG Pro 15 (Late 2021)
NVIDIA GeForce RTX 3080 Laptop GPU, Intel Core i7-11800H
9981 Points +5%
Gigabyte Aero 16 YE5
NVIDIA GeForce RTX 3080 Ti Laptop GPU, Intel Core i9-12900HK (Turbo Mode)
9746 Points +3%
Gigabyte Aero 16 YE5
NVIDIA GeForce RTX 3080 Ti Laptop GPU, Intel Core i9-12900HK
9488 Points
Lenovo ThinkPad X1 Extreme G4-20Y50040GE
NVIDIA GeForce RTX 3080 Laptop GPU, Intel Core i9-11950H
8774 Points -8%
Gigabyte Aero 16 YE5
NVIDIA GeForce RTX 3080 Ti Laptop GPU, Intel Core i9-12900HK (Silence Mode)
8278 Points -13%
HP ZBook Studio 15 G8
NVIDIA GeForce RTX 3070 Laptop GPU, Intel Core i9-11950H
7909 Points -17%
Average of class Multimedia
  (622 - 17620, n=81, last 2 years)
5446 Points -43%
SPECviewperf 2020
3840x2160 3ds Max (3dsmax-07)
Average NVIDIA GeForce RTX 3080 Ti Laptop GPU
  (69.5 - 144, n=7)
95.7 fps +13%
Gigabyte Aero 16 YE5
NVIDIA GeForce RTX 3080 Ti Laptop GPU, Intel Core i9-12900HK
84.4 fps
Gigabyte Aero 16 YE5
NVIDIA GeForce RTX 3080 Ti Laptop GPU, Intel Core i9-12900HK (Turbo Mode)
82.7 fps -2%
Gigabyte Aero 16 YE5
NVIDIA GeForce RTX 3080 Ti Laptop GPU, Intel Core i9-12900HK (Silence Mode)
69.5 fps -18%
3840x2160 CATIA (catia-06)
Average NVIDIA GeForce RTX 3080 Ti Laptop GPU
  (30.3 - 69.6, n=7)
43.7 fps +16%
Gigabyte Aero 16 YE5
NVIDIA GeForce RTX 3080 Ti Laptop GPU, Intel Core i9-12900HK
37.6 fps
Gigabyte Aero 16 YE5
NVIDIA GeForce RTX 3080 Ti Laptop GPU, Intel Core i9-12900HK (Turbo Mode)
37.3 fps -1%
Gigabyte Aero 16 YE5
NVIDIA GeForce RTX 3080 Ti Laptop GPU, Intel Core i9-12900HK (Silence Mode)
30.3 fps -19%
3840x2160 Creo (creo-03)
Gigabyte Aero 16 YE5
NVIDIA GeForce RTX 3080 Ti Laptop GPU, Intel Core i9-12900HK (Turbo Mode)
78.6 fps +12%
Average NVIDIA GeForce RTX 3080 Ti Laptop GPU
  (49 - 93.3, n=7)
77.4 fps +10%
Gigabyte Aero 16 YE5
NVIDIA GeForce RTX 3080 Ti Laptop GPU, Intel Core i9-12900HK
70.4 fps
Gigabyte Aero 16 YE5
NVIDIA GeForce RTX 3080 Ti Laptop GPU, Intel Core i9-12900HK (Silence Mode)
49 fps -30%
3840x2160 Energy (energy-03)
Average NVIDIA GeForce RTX 3080 Ti Laptop GPU
  (27.7 - 118.7, n=7)
65.1 fps +1%
Gigabyte Aero 16 YE5
NVIDIA GeForce RTX 3080 Ti Laptop GPU, Intel Core i9-12900HK
64.6 fps
Gigabyte Aero 16 YE5
NVIDIA GeForce RTX 3080 Ti Laptop GPU, Intel Core i9-12900HK (Turbo Mode)
63.2 fps -2%
Gigabyte Aero 16 YE5
NVIDIA GeForce RTX 3080 Ti Laptop GPU, Intel Core i9-12900HK (Silence Mode)
56.6 fps -12%
3840x2160 Maya (maya-06)
Average NVIDIA GeForce RTX 3080 Ti Laptop GPU
  (137.4 - 345, n=7)
208 fps +37%
Gigabyte Aero 16 YE5
NVIDIA GeForce RTX 3080 Ti Laptop GPU, Intel Core i9-12900HK (Turbo Mode)
154 fps +1%
Gigabyte Aero 16 YE5
NVIDIA GeForce RTX 3080 Ti Laptop GPU, Intel Core i9-12900HK
152.1 fps
Gigabyte Aero 16 YE5
NVIDIA GeForce RTX 3080 Ti Laptop GPU, Intel Core i9-12900HK (Silence Mode)
137.4 fps -10%
3840x2160 Medical (medical-03)
Average NVIDIA GeForce RTX 3080 Ti Laptop GPU
  (13.2 - 34.3, n=7)
17.9 fps +23%
Gigabyte Aero 16 YE5
NVIDIA GeForce RTX 3080 Ti Laptop GPU, Intel Core i9-12900HK
14.5 fps
Gigabyte Aero 16 YE5
NVIDIA GeForce RTX 3080 Ti Laptop GPU, Intel Core i9-12900HK (Turbo Mode)
14.4 fps -1%
Gigabyte Aero 16 YE5
NVIDIA GeForce RTX 3080 Ti Laptop GPU, Intel Core i9-12900HK (Silence Mode)
13.2 fps -9%
3840x2160 Siemens NX (snx-04)
Average NVIDIA GeForce RTX 3080 Ti Laptop GPU
  (15.5 - 21.1, n=7)
18.9 fps +4%
Gigabyte Aero 16 YE5
NVIDIA GeForce RTX 3080 Ti Laptop GPU, Intel Core i9-12900HK (Turbo Mode)
18.7 fps +3%
Gigabyte Aero 16 YE5
NVIDIA GeForce RTX 3080 Ti Laptop GPU, Intel Core i9-12900HK
18.1 fps
Gigabyte Aero 16 YE5
NVIDIA GeForce RTX 3080 Ti Laptop GPU, Intel Core i9-12900HK (Silence Mode)
15.5 fps -14%
3840x2160 Solidworks (solidworks-05)
Average NVIDIA GeForce RTX 3080 Ti Laptop GPU
  (87.9 - 255, n=4)
137.6 fps +32%
Gigabyte Aero 16 YE5
NVIDIA GeForce RTX 3080 Ti Laptop GPU, Intel Core i9-12900HK
104.1 fps
Gigabyte Aero 16 YE5
NVIDIA GeForce RTX 3080 Ti Laptop GPU, Intel Core i9-12900HK (Turbo Mode)
103.5 fps -1%
Gigabyte Aero 16 YE5
NVIDIA GeForce RTX 3080 Ti Laptop GPU, Intel Core i9-12900HK (Silence Mode)
87.9 fps -16%
1920x1080 3ds Max (3dsmax-07)
Average NVIDIA GeForce RTX 3080 Ti Laptop GPU
  (99.2 - 153, n=6)
128.4 fps +6%
Gigabyte Aero 16 YE5
NVIDIA GeForce RTX 3080 Ti Laptop GPU, Intel Core i9-12900HK
121.5 fps
Gigabyte Aero 16 YE5
NVIDIA GeForce RTX 3080 Ti Laptop GPU, Intel Core i9-12900HK (Turbo Mode)
120.6 fps -1%
Gigabyte Aero 16 YE5
NVIDIA GeForce RTX 3080 Ti Laptop GPU, Intel Core i9-12900HK (Silence Mode)
99.2 fps -18%
Average of class Multimedia
  (47.5 - 96.9, n=2, last 2 years)
72.2 fps -41%
1920x1080 CATIA (catia-06)
Average NVIDIA GeForce RTX 3080 Ti Laptop GPU
  (51.8 - 78.7, n=6)
67.4 fps +4%
Gigabyte Aero 16 YE5
NVIDIA GeForce RTX 3080 Ti Laptop GPU, Intel Core i9-12900HK (Turbo Mode)
65.3 fps 0%
Gigabyte Aero 16 YE5
NVIDIA GeForce RTX 3080 Ti Laptop GPU, Intel Core i9-12900HK
65.1 fps
Gigabyte Aero 16 YE5
NVIDIA GeForce RTX 3080 Ti Laptop GPU, Intel Core i9-12900HK (Silence Mode)
51.8 fps -20%
Average of class Multimedia
  (20.7 - 63.5, n=2, last 2 years)
42.1 fps -35%
1920x1080 Creo (creo-03)
Gigabyte Aero 16 YE5
NVIDIA GeForce RTX 3080 Ti Laptop GPU, Intel Core i9-12900HK (Turbo Mode)
102.1 fps +14%
Average NVIDIA GeForce RTX 3080 Ti Laptop GPU
  (55.3 - 114.7, n=6)
92.3 fps +3%
Gigabyte Aero 16 YE5
NVIDIA GeForce RTX 3080 Ti Laptop GPU, Intel Core i9-12900HK
89.6 fps
Average of class Multimedia
  (57 - 113, n=2, last 2 years)
85 fps -5%
Gigabyte Aero 16 YE5
NVIDIA GeForce RTX 3080 Ti Laptop GPU, Intel Core i9-12900HK (Silence Mode)
55.3 fps -38%
1920x1080 Energy (energy-03)
Average of class Multimedia
  (14.1 - 42, n=2, last 2 years)
28 fps +30%
Average NVIDIA GeForce RTX 3080 Ti Laptop GPU
  (19.6 - 27, n=6)
23.7 fps +10%
Gigabyte Aero 16 YE5
NVIDIA GeForce RTX 3080 Ti Laptop GPU, Intel Core i9-12900HK
21.6 fps
Gigabyte Aero 16 YE5
NVIDIA GeForce RTX 3080 Ti Laptop GPU, Intel Core i9-12900HK (Turbo Mode)
20.9 fps -3%
Gigabyte Aero 16 YE5
NVIDIA GeForce RTX 3080 Ti Laptop GPU, Intel Core i9-12900HK (Silence Mode)
19.6 fps -9%
1920x1080 Maya (maya-06)
Average NVIDIA GeForce RTX 3080 Ti Laptop GPU
  (248 - 456, n=6)
351 fps +14%
Gigabyte Aero 16 YE5
NVIDIA GeForce RTX 3080 Ti Laptop GPU, Intel Core i9-12900HK (Turbo Mode)
326.5 fps +6%
Gigabyte Aero 16 YE5
NVIDIA GeForce RTX 3080 Ti Laptop GPU, Intel Core i9-12900HK
308.7 fps
Average of class Multimedia
  (223 - 364, n=2, last 2 years)
293 fps -5%
Gigabyte Aero 16 YE5
NVIDIA GeForce RTX 3080 Ti Laptop GPU, Intel Core i9-12900HK (Silence Mode)
247.9 fps -20%
1920x1080 Medical (medical-03)
Average NVIDIA GeForce RTX 3080 Ti Laptop GPU
  (33 - 40.2, n=6)
37.4 fps +3%
Gigabyte Aero 16 YE5
NVIDIA GeForce RTX 3080 Ti Laptop GPU, Intel Core i9-12900HK
36.2 fps
Gigabyte Aero 16 YE5
NVIDIA GeForce RTX 3080 Ti Laptop GPU, Intel Core i9-12900HK (Turbo Mode)
36.2 fps 0%
Gigabyte Aero 16 YE5
NVIDIA GeForce RTX 3080 Ti Laptop GPU, Intel Core i9-12900HK (Silence Mode)
33 fps -9%
Average of class Multimedia
  (24.6 - 34.7, n=2, last 2 years)
29.6 fps -18%
1920x1080 Siemens NX (snx-04)
Gigabyte Aero 16 YE5
NVIDIA GeForce RTX 3080 Ti Laptop GPU, Intel Core i9-12900HK (Turbo Mode)
22.1 fps +3%
Average NVIDIA GeForce RTX 3080 Ti Laptop GPU
  (18.1 - 25, n=6)
21.8 fps +2%
Gigabyte Aero 16 YE5
NVIDIA GeForce RTX 3080 Ti Laptop GPU, Intel Core i9-12900HK
21.4 fps
Gigabyte Aero 16 YE5
NVIDIA GeForce RTX 3080 Ti Laptop GPU, Intel Core i9-12900HK (Silence Mode)
18.1 fps -15%
Average of class Multimedia
  (2.54 - 22.5, n=2, last 2 years)
12.5 fps -42%
1920x1080 Solidworks (solidworks-05)
Gigabyte Aero 16 YE5
NVIDIA GeForce RTX 3080 Ti Laptop GPU, Intel Core i9-12900HK
210.7 fps
Gigabyte Aero 16 YE5
NVIDIA GeForce RTX 3080 Ti Laptop GPU, Intel Core i9-12900HK (Turbo Mode)
210.4 fps 0%
Average NVIDIA GeForce RTX 3080 Ti Laptop GPU
  (174.7 - 211, n=3)
198.6 fps -6%
Gigabyte Aero 16 YE5
NVIDIA GeForce RTX 3080 Ti Laptop GPU, Intel Core i9-12900HK (Silence Mode)
174.7 fps -17%
Average of class Multimedia
  (93.1 - 250, n=2, last 2 years)
171.4 fps -19%
SPECviewperf 13
3ds Max (3dsmax-06)
Average NVIDIA GeForce RTX 3080 Ti Laptop GPU
  (161 - 260, n=8)
223 fps +6%
Average of class Multimedia
  (last 2 years)
216 fps +3%
Gigabyte Aero 16 YE5
NVIDIA GeForce RTX 3080 Ti Laptop GPU, Intel Core i9-12900HK (Turbo Mode)
214 fps +2%
Gigabyte Aero 16 YE5
NVIDIA GeForce RTX 3080 Ti Laptop GPU, Intel Core i9-12900HK
210.2 fps
HP ZBook Studio 15 G8
NVIDIA GeForce RTX 3070 Laptop GPU, Intel Core i9-11950H
177.3 fps -16%
Gigabyte Aero 16 YE5
NVIDIA GeForce RTX 3080 Ti Laptop GPU, Intel Core i9-12900HK (Silence Mode)
161 fps -23%
Catia (catia-05)
Average NVIDIA GeForce RTX 3080 Ti Laptop GPU
  (130.4 - 190.3, n=8)
170 fps +5%
Gigabyte Aero 16 YE5
NVIDIA GeForce RTX 3080 Ti Laptop GPU, Intel Core i9-12900HK (Turbo Mode)
162.7 fps +1%
Gigabyte Aero 16 YE5
NVIDIA GeForce RTX 3080 Ti Laptop GPU, Intel Core i9-12900HK
161.6 fps
Average of class Multimedia
  (last 2 years)
150.2 fps -7%
Gigabyte Aero 16 YE5
NVIDIA GeForce RTX 3080 Ti Laptop GPU, Intel Core i9-12900HK (Silence Mode)
130.4 fps -19%
HP ZBook Studio 15 G8
NVIDIA GeForce RTX 3070 Laptop GPU, Intel Core i9-11950H
127.9 fps -21%
Creo (creo-02)
Average NVIDIA GeForce RTX 3080 Ti Laptop GPU
  (177.4 - 311, n=8)
249 fps +15%
Average of class Multimedia
  (last 2 years)
241 fps +12%
Gigabyte Aero 16 YE5
NVIDIA GeForce RTX 3080 Ti Laptop GPU, Intel Core i9-12900HK (Turbo Mode)
224.7 fps +4%
Gigabyte Aero 16 YE5
NVIDIA GeForce RTX 3080 Ti Laptop GPU, Intel Core i9-12900HK
215.7 fps
Gigabyte Aero 16 YE5
NVIDIA GeForce RTX 3080 Ti Laptop GPU, Intel Core i9-12900HK (Silence Mode)
177.4 fps -18%
HP ZBook Studio 15 G8
NVIDIA GeForce RTX 3070 Laptop GPU, Intel Core i9-11950H
156.8 fps -27%
Energy (energy-02)
Average of class Multimedia
  (last 2 years)
42.1 fps +94%
Average NVIDIA GeForce RTX 3080 Ti Laptop GPU
  (19.3 - 27.3, n=8)
24.5 fps +13%
Gigabyte Aero 16 YE5
NVIDIA GeForce RTX 3080 Ti Laptop GPU, Intel Core i9-12900HK
21.7 fps
HP ZBook Studio 15 G8
NVIDIA GeForce RTX 3070 Laptop GPU, Intel Core i9-11950H
21.17 fps -2%
Gigabyte Aero 16 YE5
NVIDIA GeForce RTX 3080 Ti Laptop GPU, Intel Core i9-12900HK (Turbo Mode)
21 fps -3%
Gigabyte Aero 16 YE5
NVIDIA GeForce RTX 3080 Ti Laptop GPU, Intel Core i9-12900HK (Silence Mode)
19.3 fps -11%
Maya (maya-05)
Average NVIDIA GeForce RTX 3080 Ti Laptop GPU
  (212 - 430, n=8)
321 fps +16%
Average of class Multimedia
  (last 2 years)
319 fps +16%
Gigabyte Aero 16 YE5
NVIDIA GeForce RTX 3080 Ti Laptop GPU, Intel Core i9-12900HK (Turbo Mode)
281.9 fps +2%
Gigabyte Aero 16 YE5
NVIDIA GeForce RTX 3080 Ti Laptop GPU, Intel Core i9-12900HK
275.8 fps
Gigabyte Aero 16 YE5
NVIDIA GeForce RTX 3080 Ti Laptop GPU, Intel Core i9-12900HK (Silence Mode)
211.5 fps -23%
HP ZBook Studio 15 G8
NVIDIA GeForce RTX 3070 Laptop GPU, Intel Core i9-11950H
200.8 fps -27%
Medical (medical-02)
Average NVIDIA GeForce RTX 3080 Ti Laptop GPU
  (65.3 - 79.1, n=8)
74.5 fps +4%
Average of class Multimedia
  (last 2 years)
74.4 fps +3%
Gigabyte Aero 16 YE5
NVIDIA GeForce RTX 3080 Ti Laptop GPU, Intel Core i9-12900HK
71.9 fps
Gigabyte Aero 16 YE5
NVIDIA GeForce RTX 3080 Ti Laptop GPU, Intel Core i9-12900HK (Turbo Mode)
71.6 fps 0%
Gigabyte Aero 16 YE5
NVIDIA GeForce RTX 3080 Ti Laptop GPU, Intel Core i9-12900HK (Silence Mode)
65.3 fps -9%
HP ZBook Studio 15 G8
NVIDIA GeForce RTX 3070 Laptop GPU, Intel Core i9-11950H
56.8 fps -21%
Showcase (showcase-02)
Average NVIDIA GeForce RTX 3080 Ti Laptop GPU
  (110 - 175, n=8)
146.6 fps +15%
Gigabyte Aero 16 YE5
NVIDIA GeForce RTX 3080 Ti Laptop GPU, Intel Core i9-12900HK
127.2 fps
Gigabyte Aero 16 YE5
NVIDIA GeForce RTX 3080 Ti Laptop GPU, Intel Core i9-12900HK (Turbo Mode)
123 fps -3%
Average of class Multimedia
  (last 2 years)
111.2 fps -13%
Gigabyte Aero 16 YE5
NVIDIA GeForce RTX 3080 Ti Laptop GPU, Intel Core i9-12900HK (Silence Mode)
110 fps -14%
HP ZBook Studio 15 G8
NVIDIA GeForce RTX 3070 Laptop GPU, Intel Core i9-11950H
100.3 fps -21%
Siemens NX (snx-03)
Average of class Multimedia
  (last 2 years)
22.8 fps +5%
Gigabyte Aero 16 YE5
NVIDIA GeForce RTX 3080 Ti Laptop GPU, Intel Core i9-12900HK (Turbo Mode)
22.5 fps +4%
Average NVIDIA GeForce RTX 3080 Ti Laptop GPU
  (18.3 - 25.3, n=8)
22.3 fps +3%
Gigabyte Aero 16 YE5
NVIDIA GeForce RTX 3080 Ti Laptop GPU, Intel Core i9-12900HK
21.7 fps
HP ZBook Studio 15 G8
NVIDIA GeForce RTX 3070 Laptop GPU, Intel Core i9-11950H
18.89 fps -13%
Gigabyte Aero 16 YE5
NVIDIA GeForce RTX 3080 Ti Laptop GPU, Intel Core i9-12900HK (Silence Mode)
18.3 fps -16%
Solidworks (sw-04)
Average of class Multimedia
  (last 2 years)
109.6 fps +7%
Average NVIDIA GeForce RTX 3080 Ti Laptop GPU
  (62.9 - 133.4, n=8)
108.8 fps +6%
Gigabyte Aero 16 YE5
NVIDIA GeForce RTX 3080 Ti Laptop GPU, Intel Core i9-12900HK (Turbo Mode)
102.8 fps 0%
Gigabyte Aero 16 YE5
NVIDIA GeForce RTX 3080 Ti Laptop GPU, Intel Core i9-12900HK
102.3 fps
HP ZBook Studio 15 G8
NVIDIA GeForce RTX 3070 Laptop GPU, Intel Core i9-11950H
92.3 fps -10%
Gigabyte Aero 16 YE5
NVIDIA GeForce RTX 3080 Ti Laptop GPU, Intel Core i9-12900HK (Silence Mode)
62.9 fps -39%
SPECviewperf 12
1900x1060 3ds Max (3dsmax-05)
Average NVIDIA GeForce RTX 3080 Ti Laptop GPU
  ()
212 fps 0%
Gigabyte Aero 16 YE5
NVIDIA GeForce RTX 3080 Ti Laptop GPU, Intel Core i9-12900HK
211.7 fps
1900x1060 Catia (catia-04)
Gigabyte Aero 16 YE5
NVIDIA GeForce RTX 3080 Ti Laptop GPU, Intel Core i9-12900HK
113.5 fps
Average NVIDIA GeForce RTX 3080 Ti Laptop GPU
  ()
113.5 fps 0%
HP ZBook Studio 15 G8
NVIDIA GeForce RTX 3070 Laptop GPU, Intel Core i9-11950H
93.4 fps -18%
1900x1060 Creo (creo-01)
Gigabyte Aero 16 YE5
NVIDIA GeForce RTX 3080 Ti Laptop GPU, Intel Core i9-12900HK
69.1 fps
Average NVIDIA GeForce RTX 3080 Ti Laptop GPU
  ()
69.1 fps 0%
HP ZBook Studio 15 G8
NVIDIA GeForce RTX 3070 Laptop GPU, Intel Core i9-11950H
54 fps -22%
1900x1060 Energy (energy-01)
Gigabyte Aero 16 YE5
NVIDIA GeForce RTX 3080 Ti Laptop GPU, Intel Core i9-12900HK
11.3 fps
Average NVIDIA GeForce RTX 3080 Ti Laptop GPU
  ()
11.3 fps 0%
HP ZBook Studio 15 G8
NVIDIA GeForce RTX 3070 Laptop GPU, Intel Core i9-11950H
10.01 fps -11%
1900x1060 Maya (maya-04)
Gigabyte Aero 16 YE5
NVIDIA GeForce RTX 3080 Ti Laptop GPU, Intel Core i9-12900HK
137.5 fps
Average NVIDIA GeForce RTX 3080 Ti Laptop GPU
  ()
137.5 fps 0%
HP ZBook Studio 15 G8
NVIDIA GeForce RTX 3070 Laptop GPU, Intel Core i9-11950H
108 fps -21%
1900x1060 Medical (medical-01)
Gigabyte Aero 16 YE5
NVIDIA GeForce RTX 3080 Ti Laptop GPU, Intel Core i9-12900HK
59.1 fps
Average NVIDIA GeForce RTX 3080 Ti Laptop GPU
  ()
59.1 fps 0%
HP ZBook Studio 15 G8
NVIDIA GeForce RTX 3070 Laptop GPU, Intel Core i9-11950H
40.43 fps -32%
1900x1060 Showcase (showcase-01)
Gigabyte Aero 16 YE5
NVIDIA GeForce RTX 3080 Ti Laptop GPU, Intel Core i9-12900HK
126.5 fps
Average NVIDIA GeForce RTX 3080 Ti Laptop GPU
  ()
126.5 fps 0%
HP ZBook Studio 15 G8
NVIDIA GeForce RTX 3070 Laptop GPU, Intel Core i9-11950H
102 fps -19%
1900x1060 Siemens NX (snx-02)
Gigabyte Aero 16 YE5
NVIDIA GeForce RTX 3080 Ti Laptop GPU, Intel Core i9-12900HK
12 fps
Average NVIDIA GeForce RTX 3080 Ti Laptop GPU
  ()
12 fps 0%
HP ZBook Studio 15 G8
NVIDIA GeForce RTX 3070 Laptop GPU, Intel Core i9-11950H
10.48 fps -13%
1900x1060 Solidworks (sw-03)
Gigabyte Aero 16 YE5
NVIDIA GeForce RTX 3080 Ti Laptop GPU, Intel Core i9-12900HK
75.1 fps
Average NVIDIA GeForce RTX 3080 Ti Laptop GPU
  ()
75.1 fps 0%
HP ZBook Studio 15 G8
NVIDIA GeForce RTX 3070 Laptop GPU, Intel Core i9-11950H
69.1 fps -8%
Geekbench 5.5 - OpenCL Score
Average NVIDIA GeForce RTX 3080 Ti Laptop GPU
  (88580 - 151633, n=41)
136691 Points +5%
Gigabyte Aero 16 YE5
NVIDIA GeForce RTX 3080 Ti Laptop GPU, Intel Core i9-12900HK (Turbo Mode)
130419 Points 0%
Gigabyte Aero 16 YE5
NVIDIA GeForce RTX 3080 Ti Laptop GPU, Intel Core i9-12900HK
130282 Points
Razer Blade 15 2022
NVIDIA GeForce RTX 3080 Ti Laptop GPU, Intel Core i7-12800H
128448 Points -1%
Lenovo ThinkPad X1 Extreme G4-20Y50040GE
NVIDIA GeForce RTX 3080 Laptop GPU, Intel Core i9-11950H
115266 Points -12%
Gigabyte Aero 16 YE5
NVIDIA GeForce RTX 3080 Ti Laptop GPU, Intel Core i9-12900HK (Silence Mode)
111428 Points -14%
SCHENKER XMG Pro 15 (Late 2021)
NVIDIA GeForce RTX 3080 Laptop GPU, Intel Core i7-11800H
97037 Points -26%
Apple MacBook Pro 16 2021 M1 Max
Apple M1 Max 32-Core GPU, Apple M1 Max
60482 Points -54%
Average of class Multimedia
  (10769 - 122560, n=85, last 2 years)
60173 Points -54%
GFXBench
on screen Aztec Ruins High Tier Onscreen
Apple MacBook Pro 16 2021 M1 Max
Apple M1 Max 32-Core GPU, Apple M1 Max
119.9 fps +11%
Gigabyte Aero 16 YE5
NVIDIA GeForce RTX 3080 Ti Laptop GPU, Intel Core i9-12900HK (DX11)
108.4 fps
Average NVIDIA GeForce RTX 3080 Ti Laptop GPU
  ()
108.4 fps 0%
Average of class Multimedia
  (36.8 - 133.5, n=15, last 2 years)
101.2 fps -7%
2560x1440 Aztec Ruins High Tier Offscreen
Apple MacBook Pro 16 2021 M1 Max
Apple M1 Max 32-Core GPU, Apple M1 Max
310.3 fps +19%
Average NVIDIA GeForce RTX 3080 Ti Laptop GPU
  ()
262 fps 0%
Gigabyte Aero 16 YE5
NVIDIA GeForce RTX 3080 Ti Laptop GPU, Intel Core i9-12900HK (DX11)
261.5 fps
Average of class Multimedia
  (73.3 - 446, n=15, last 2 years)
233 fps -11%
on screen Aztec Ruins Normal Tier Onscreen
Gigabyte Aero 16 YE5
NVIDIA GeForce RTX 3080 Ti Laptop GPU, Intel Core i9-12900HK (DX11)
149.5 fps
Average NVIDIA GeForce RTX 3080 Ti Laptop GPU
  ()
149.5 fps 0%
Apple MacBook Pro 16 2021 M1 Max
Apple M1 Max 32-Core GPU, Apple M1 Max
120 fps -20%
Average of class Multimedia
  (52 - 177.1, n=14, last 2 years)
118.2 fps -21%
1920x1080 Aztec Ruins Normal Tier Offscreen
Apple MacBook Pro 16 2021 M1 Max
Apple M1 Max 32-Core GPU, Apple M1 Max
752 fps +16%
Gigabyte Aero 16 YE5
NVIDIA GeForce RTX 3080 Ti Laptop GPU, Intel Core i9-12900HK (DX11)
646 fps
Average NVIDIA GeForce RTX 3080 Ti Laptop GPU
  ()
646 fps 0%
Average of class Multimedia
  (178.3 - 950, n=15, last 2 years)
569 fps -12%
V-Ray 5 Benchmark
GPU RTX
Average NVIDIA GeForce RTX 3080 Ti Laptop GPU
  (1225 - 1915, n=19)
1745 mpaths +11%
Lenovo ThinkPad X1 Extreme G4-20Y50040GE
NVIDIA GeForce RTX 3080 Laptop GPU, Intel Core i9-11950H (5.0.1)
1585 mpaths +1%
Gigabyte Aero 16 YE5
NVIDIA GeForce RTX 3080 Ti Laptop GPU, Intel Core i9-12900HK (5.0.1)
1566 mpaths
SCHENKER XMG Pro 15 (Late 2021)
NVIDIA GeForce RTX 3080 Laptop GPU, Intel Core i7-11800H (5.0.1)
1533 mpaths -2%
Average of class Multimedia
  (391 - 1751, n=23, last 2 years)
1338 mpaths -15%
Gigabyte Aero 16 YE5
NVIDIA GeForce RTX 3080 Ti Laptop GPU, Intel Core i9-12900HK (5.0.1, Silence Mode)
1225 mpaths -22%
GPU CUDA
Average NVIDIA GeForce RTX 3080 Ti Laptop GPU
  (846 - 1384, n=20)
1273 mpaths +1%
Gigabyte Aero 16 YE5
NVIDIA GeForce RTX 3080 Ti Laptop GPU, Intel Core i9-12900HK (5.0.1, Turbo Mode)
1266 mpaths +1%
Gigabyte Aero 16 YE5
NVIDIA GeForce RTX 3080 Ti Laptop GPU, Intel Core i9-12900HK (5.0.1)
1255 mpaths
SCHENKER XMG Pro 15 (Late 2021)
NVIDIA GeForce RTX 3080 Laptop GPU, Intel Core i7-11800H (5.0.1)
1221 mpaths -3%
Lenovo ThinkPad X1 Extreme G4-20Y50040GE
NVIDIA GeForce RTX 3080 Laptop GPU, Intel Core i9-11950H (5.0.1)
993 mpaths -21%
Average of class Multimedia
  (274 - 1259, n=23, last 2 years)
883 mpaths -30%
Gigabyte Aero 16 YE5
NVIDIA GeForce RTX 3080 Ti Laptop GPU, Intel Core i9-12900HK (5.0.1, Silence Mode)
846 mpaths -33%
CPU
Gigabyte Aero 16 YE5
NVIDIA GeForce RTX 3080 Ti Laptop GPU, Intel Core i9-12900HK (5.0.1, Turbo Mode)
12400 mpaths +15%
Average NVIDIA GeForce RTX 3080 Ti Laptop GPU
  (3692 - 15811, n=25)
11154 mpaths +3%
Gigabyte Aero 16 YE5
NVIDIA GeForce RTX 3080 Ti Laptop GPU, Intel Core i9-12900HK (5.0.1)
10780 mpaths
Razer Blade 15 2022
NVIDIA GeForce RTX 3080 Ti Laptop GPU, Intel Core i7-12800H (5.0.1)
10193 mpaths -5%
Average of class Multimedia
  (5027 - 19998, n=39, last 2 years)
10018 mpaths -7%
SCHENKER XMG Pro 15 (Late 2021)
NVIDIA GeForce RTX 3080 Laptop GPU, Intel Core i7-11800H
9113 mpaths -15%
Lenovo ThinkPad X1 Extreme G4-20Y50040GE
NVIDIA GeForce RTX 3080 Laptop GPU, Intel Core i9-11950H (5.0.1)
8963 mpaths -17%
Gigabyte Aero 16 YE5
NVIDIA GeForce RTX 3080 Ti Laptop GPU, Intel Core i9-12900HK (5.0.1, Silence Mode)
3692 mpaths -66%
V-Ray Benchmark Next 4.10
GPU
Average NVIDIA GeForce RTX 3080 Ti Laptop GPU
  (311 - 552, n=35)
500 mpaths +2%
Gigabyte Aero 16 YE5
NVIDIA GeForce RTX 3080 Ti Laptop GPU, Intel Core i9-12900HK (v4.10.07 )
489 mpaths
Gigabyte Aero 16 YE5
NVIDIA GeForce RTX 3080 Ti Laptop GPU, Intel Core i9-12900HK (v4.10.07, Turbo Mode)
488 mpaths 0%
SCHENKER XMG Pro 15 (Late 2021)
NVIDIA GeForce RTX 3080 Laptop GPU, Intel Core i7-11800H (v4.10.07 )
439 mpaths -10%
Gigabyte Aero 16 YE5
NVIDIA GeForce RTX 3080 Ti Laptop GPU, Intel Core i9-12900HK (v4.10.07, Silence Mode)
321 mpaths -34%
Average of class Multimedia
  (45 - 684, n=64, last 2 years)
270 mpaths -45%
CPU
Gigabyte Aero 16 YE5
NVIDIA GeForce RTX 3080 Ti Laptop GPU, Intel Core i9-12900HK (v4.10.07, Turbo Mode)
18739 ksamples +16%
Average NVIDIA GeForce RTX 3080 Ti Laptop GPU
  (5564 - 23947, n=35)
17294 ksamples +7%
Gigabyte Aero 16 YE5
NVIDIA GeForce RTX 3080 Ti Laptop GPU, Intel Core i9-12900HK (v4.10.07 )
16216 ksamples
Average of class Multimedia
  (7035 - 30140, n=64, last 2 years)
15553 ksamples -4%
SCHENKER XMG Pro 15 (Late 2021)
NVIDIA GeForce RTX 3080 Laptop GPU, Intel Core i7-11800H (v4.10.07 )
14385 ksamples -11%
Gigabyte Aero 16 YE5
NVIDIA GeForce RTX 3080 Ti Laptop GPU, Intel Core i9-12900HK (v4.10.07, Silence Mode)
5564 ksamples -66%

Desempenho nos jogos

Graças a seu poderoso hardware, o Aero 16 executa todos os jogos atuais suavemente em resolução FHD e com o máximo de detalhes. Isto também é verdade para resoluções mais altas, embora às vezes com detalhes reduzidos. De modo geral, o notebook teve um desempenho ligeiramente mais lento do que a média do RTX 3080 Ti-equipado.

The Witcher 3
1920x1080 Ultra Graphics & Postprocessing (HBAO+)
Average NVIDIA GeForce RTX 3080 Ti Laptop GPU
  (30 - 130.6, n=43)
112.1 fps +22%
Razer Blade 15 2022
Intel Core i7-12800H, NVIDIA GeForce RTX 3080 Ti Laptop GPU
107.2 (99min) fps +16%
SCHENKER XMG Pro 15 (Late 2021)
Intel Core i7-11800H, NVIDIA GeForce RTX 3080 Laptop GPU
100 (34.2min, 39.9P0.1, 63.9P1) fps +8%
Gigabyte Aero 16 YE5
Intel Core i9-12900HK, NVIDIA GeForce RTX 3080 Ti Laptop GPU (Turbo Mode)
98.2 (36.5min, 43P0.1, 74.9P1) fps +7%
Gigabyte Aero 16 YE5
Intel Core i9-12900HK, NVIDIA GeForce RTX 3080 Ti Laptop GPU
92.2 (19.1min, 45.8P0.1, 67.7P1) fps
Lenovo ThinkPad X1 Extreme G4-20Y50040GE
Intel Core i9-11950H, NVIDIA GeForce RTX 3080 Laptop GPU
85.1 (82min, 82P1) fps -8%
HP ZBook Studio 15 G8
Intel Core i9-11950H, NVIDIA GeForce RTX 3070 Laptop GPU
81.5 (72min) fps -12%
Gigabyte Aero 16 YE5
Intel Core i9-12900HK, NVIDIA GeForce RTX 3080 Ti Laptop GPU (SIlence Mode)
79.4 (13.7min, 18.1P0.1, 35.9P1) fps -14%
Average of class Multimedia
  (8 - 143.2, n=80, last 2 years)
54 fps -41%
3840x2160 High Graphics & Postprocessing (Nvidia HairWorks Off)
Average NVIDIA GeForce RTX 3080 Ti Laptop GPU
  (62.1 - 94.3, n=8)
81.3 fps +27%
SCHENKER XMG Pro 15 (Late 2021)
Intel Core i7-11800H, NVIDIA GeForce RTX 3080 Laptop GPU
69.6 (25.8min, 36.3P0.1, 52.6P1) fps +9%
Gigabyte Aero 16 YE5
Intel Core i9-12900HK, NVIDIA GeForce RTX 3080 Ti Laptop GPU
64 (20.4min, 29.2P0.1, 51.9P1) fps
Average of class Multimedia
  (24.4 - 117, n=9, last 2 years)
53.9 fps -16%
HP ZBook Studio 15 G8
Intel Core i9-11950H, NVIDIA GeForce RTX 3070 Laptop GPU
40.3 (37min) fps -37%
Dota 2 Reborn
1920x1080 ultra (3/3) best looking
Gigabyte Aero 16 YE5
Intel Core i9-12900HK, NVIDIA GeForce RTX 3080 Ti Laptop GPU
160 (139.4min) fps
Gigabyte Aero 16 YE5
Intel Core i9-12900HK, NVIDIA GeForce RTX 3080 Ti Laptop GPU (Turbo Mode)
160 (139.3min) fps 0%
Razer Blade 15 2022
Intel Core i7-12800H, NVIDIA GeForce RTX 3080 Ti Laptop GPU
156 (135.1min) fps -2%
Average NVIDIA GeForce RTX 3080 Ti Laptop GPU
  (29.9 - 170.5, n=45)
141.1 fps -12%
SCHENKER XMG Pro 15 (Late 2021)
Intel Core i7-11800H, NVIDIA GeForce RTX 3080 Laptop GPU
132 (109.4min) fps -17%
HP ZBook Studio 15 G8
Intel Core i9-11950H, NVIDIA GeForce RTX 3070 Laptop GPU
116.3 (90.8min) fps -27%
Lenovo ThinkPad X1 Extreme G4-20Y50040GE
Intel Core i9-11950H, NVIDIA GeForce RTX 3080 Laptop GPU
98 (81.5min) fps -39%
Average of class Multimedia
  (26.3 - 179.9, n=82, last 2 years)
96.4 fps -40%
Gigabyte Aero 16 YE5
Intel Core i9-12900HK, NVIDIA GeForce RTX 3080 Ti Laptop GPU (Silence Mode)
82.5 (70.7min) fps -48%
3840x2160 ultra (3/3) best looking
Average NVIDIA GeForce RTX 3080 Ti Laptop GPU
  (70.8 - 155.6, n=19)
124.8 fps +11%
Gigabyte Aero 16 YE5
Intel Core i9-12900HK, NVIDIA GeForce RTX 3080 Ti Laptop GPU (Turbo Mode)
119 (100.8min) fps +6%
SCHENKER XMG Pro 15 (Late 2021)
Intel Core i7-11800H, NVIDIA GeForce RTX 3080 Laptop GPU
116 (95.6min) fps +4%
Gigabyte Aero 16 YE5
Intel Core i9-12900HK, NVIDIA GeForce RTX 3080 Ti Laptop GPU
112 (98.7min) fps
HP ZBook Studio 15 G8
Intel Core i9-11950H, NVIDIA GeForce RTX 3070 Laptop GPU
93.1 (67.6min) fps -17%
Average of class Multimedia
  (30 - 139.3, n=16, last 2 years)
84.3 fps -25%
Gigabyte Aero 16 YE5
Intel Core i9-12900HK, NVIDIA GeForce RTX 3080 Ti Laptop GPU (Silence Mode)
70.8 (59.4min) fps -37%
Lenovo ThinkPad X1 Extreme G4-20Y50040GE
Intel Core i9-11950H, NVIDIA GeForce RTX 3080 Laptop GPU
55.2 (41.3min) fps -51%
X-Plane 11.11
1920x1080 high (fps_test=3)
Razer Blade 15 2022
Intel Core i7-12800H, NVIDIA GeForce RTX 3080 Ti Laptop GPU
110 fps +2%
Gigabyte Aero 16 YE5
Intel Core i9-12900HK, NVIDIA GeForce RTX 3080 Ti Laptop GPU
108 fps
Gigabyte Aero 16 YE5
Intel Core i9-12900HK, NVIDIA GeForce RTX 3080 Ti Laptop GPU (Turbo Mode)
108 fps 0%
Average NVIDIA GeForce RTX 3080 Ti Laptop GPU
  (32.6 - 127, n=45)
101.1 fps -6%
SCHENKER XMG Pro 15 (Late 2021)
Intel Core i7-11800H, NVIDIA GeForce RTX 3080 Laptop GPU
88.5 fps -18%
HP ZBook Studio 15 G8
Intel Core i9-11950H, NVIDIA GeForce RTX 3070 Laptop GPU
83.5 fps -23%
Lenovo ThinkPad X1 Extreme G4-20Y50040GE
Intel Core i9-11950H, NVIDIA GeForce RTX 3080 Laptop GPU
74 fps -31%
Average of class Multimedia
  (23 - 141.1, n=82, last 2 years)
66.8 fps -38%
Gigabyte Aero 16 YE5
Intel Core i9-12900HK, NVIDIA GeForce RTX 3080 Ti Laptop GPU (Silence Mode)
60.2 fps -44%
3840x2160 high (fps_test=3)
Average NVIDIA GeForce RTX 3080 Ti Laptop GPU
  (32.9 - 109.5, n=20)
82.7 fps +5%
Gigabyte Aero 16 YE5
Intel Core i9-12900HK, NVIDIA GeForce RTX 3080 Ti Laptop GPU (Turbo Mode)
80.9 fps +3%
Gigabyte Aero 16 YE5
Intel Core i9-12900HK, NVIDIA GeForce RTX 3080 Ti Laptop GPU
78.6 fps
SCHENKER XMG Pro 15 (Late 2021)
Intel Core i7-11800H, NVIDIA GeForce RTX 3080 Laptop GPU
67.9 fps -14%
Average of class Multimedia
  (19.3 - 114.7, n=16, last 2 years)
66.8 fps -15%
HP ZBook Studio 15 G8
Intel Core i9-11950H, NVIDIA GeForce RTX 3070 Laptop GPU
54.4 fps -31%
Gigabyte Aero 16 YE5
Intel Core i9-12900HK, NVIDIA GeForce RTX 3080 Ti Laptop GPU (Silence Mode)
47.2 fps -40%
Lenovo ThinkPad X1 Extreme G4-20Y50040GE
Intel Core i9-11950H, NVIDIA GeForce RTX 3080 Laptop GPU
39.9 fps -49%
Final Fantasy XV Benchmark
1920x1080 High Quality
Average NVIDIA GeForce RTX 3080 Ti Laptop GPU
  (30.7 - 140.6, n=42)
113.8 fps +33%
Razer Blade 15 2022
Intel Core i7-12800H, NVIDIA GeForce RTX 3080 Ti Laptop GPU (1.3)
106 fps +24%
SCHENKER XMG Pro 15 (Late 2021)
Intel Core i7-11800H, NVIDIA GeForce RTX 3080 Laptop GPU (1.3)
97.5 fps +14%
Gigabyte Aero 16 YE5
Intel Core i9-12900HK, NVIDIA GeForce RTX 3080 Ti Laptop GPU (1.3, Turbo Mode)
90.9 fps +6%
Gigabyte Aero 16 YE5
Intel Core i9-12900HK, NVIDIA GeForce RTX 3080 Ti Laptop GPU (1.3)
85.8 fps
HP ZBook Studio 15 G8
Intel Core i9-11950H, NVIDIA GeForce RTX 3070 Laptop GPU (1.3)
78.5 fps -9%
Lenovo ThinkPad X1 Extreme G4-20Y50040GE
Intel Core i9-11950H, NVIDIA GeForce RTX 3080 Laptop GPU (1.3)
78.2 fps -9%
Average of class Multimedia
  (6.53 - 141.8, n=81, last 2 years)
50.9 fps -41%
3840x2160 High Quality
Average NVIDIA GeForce RTX 3080 Ti Laptop GPU
  (35.1 - 61.2, n=18)
52.7 fps +31%
SCHENKER XMG Pro 15 (Late 2021)
Intel Core i7-11800H, NVIDIA GeForce RTX 3080 Laptop GPU (1.3)
44.1 fps +10%
Gigabyte Aero 16 YE5
Intel Core i9-12900HK, NVIDIA GeForce RTX 3080 Ti Laptop GPU (1.3, Turbo Mode)
41.8 fps +4%
Gigabyte Aero 16 YE5
Intel Core i9-12900HK, NVIDIA GeForce RTX 3080 Ti Laptop GPU (1.3)
40.1 fps
Lenovo ThinkPad X1 Extreme G4-20Y50040GE
Intel Core i9-11950H, NVIDIA GeForce RTX 3080 Laptop GPU (1.3)
37.5 fps -6%
HP ZBook Studio 15 G8
Intel Core i9-11950H, NVIDIA GeForce RTX 3070 Laptop GPU (1.3)
36.2 fps -10%
Gigabyte Aero 16 YE5
Intel Core i9-12900HK, NVIDIA GeForce RTX 3080 Ti Laptop GPU (1.3, Silence Mode)
35.1 fps -12%
Average of class Multimedia
  (8.98 - 81.9, n=13, last 2 years)
32.9 fps -18%
GTA V
1920x1080 Highest Settings possible AA:4xMSAA + FX AF:16x
Razer Blade 15 2022
Intel Core i7-12800H, NVIDIA GeForce RTX 3080 Ti Laptop GPU
118 (4.44min, 76.9P1) fps +4%
Gigabyte Aero 16 YE5
Intel Core i9-12900HK, NVIDIA GeForce RTX 3080 Ti Laptop GPU (Turbo Mode)
118 (21min, 76.9P1) fps +4%
Gigabyte Aero 16 YE5
Intel Core i9-12900HK, NVIDIA GeForce RTX 3080 Ti Laptop GPU
113 (20.6min, 76.9P1) fps
Average NVIDIA GeForce RTX 3080 Ti Laptop GPU
  (30 - 139.2, n=42)
111 fps -2%
SCHENKER XMG Pro 15 (Late 2021)
Intel Core i7-11800H, NVIDIA GeForce RTX 3080 Laptop GPU
102 (19.1min, 71.4P1) fps -10%
Average of class Multimedia
  (5.09 - 126.3, n=80, last 2 years)
53.5 fps -53%
Gigabyte Aero 16 YE5
Intel Core i9-12900HK, NVIDIA GeForce RTX 3080 Ti Laptop GPU (Silence Mode)
47.4 (9.59min, 27.8P1) fps -58%
3840x2160 Highest Settings possible AA:4xMSAA + FX AF:16x
Average NVIDIA GeForce RTX 3080 Ti Laptop GPU
  (37.7 - 67.2, n=14)
58.6 fps +40%
SCHENKER XMG Pro 15 (Late 2021)
Intel Core i7-11800H, NVIDIA GeForce RTX 3080 Laptop GPU
48.6 (7.94min, 33.3P1) fps +16%
Gigabyte Aero 16 YE5
Intel Core i9-12900HK, NVIDIA GeForce RTX 3080 Ti Laptop GPU (Turbo Mode)
44.7 (12.4min, 34.5P1) fps +7%
Gigabyte Aero 16 YE5
Intel Core i9-12900HK, NVIDIA GeForce RTX 3080 Ti Laptop GPU
41.8 (13min, 32.3P1) fps
Gigabyte Aero 16 YE5
Intel Core i9-12900HK, NVIDIA GeForce RTX 3080 Ti Laptop GPU (Silence Mode)
37.7 (8.69min, 22.7P1) fps -10%
Average of class Multimedia
  (5.03 - 71.6, n=8, last 2 years)
34.2 fps -18%
Strange Brigade
1920x1080 ultra AA:ultra AF:16
Average NVIDIA GeForce RTX 3080 Ti Laptop GPU
  (42.3 - 224, n=41)
187.3 fps +24%
Razer Blade 15 2022
Intel Core i7-12800H, NVIDIA GeForce RTX 3080 Ti Laptop GPU (1.47.22.14 D3D12)
184 (33.3min, 131P1) fps +22%
SCHENKER XMG Pro 15 (Late 2021)
Intel Core i7-11800H, NVIDIA GeForce RTX 3080 Laptop GPU (1.47.22.14 D3D12)
176 (116min, 133P1) fps +17%
Gigabyte Aero 16 YE5
Intel Core i9-12900HK, NVIDIA GeForce RTX 3080 Ti Laptop GPU (1.47.22.14 D3D12, Turbo Mode)
159 (33.5min, 116P1) fps +5%
Gigabyte Aero 16 YE5
Intel Core i9-12900HK, NVIDIA GeForce RTX 3080 Ti Laptop GPU (1.47.22.14 D3D12)
151 (35.4min, 116P1) fps
Gigabyte Aero 16 YE5
Intel Core i9-12900HK, NVIDIA GeForce RTX 3080 Ti Laptop GPU (1.47.22.14 D3D12, Silence Mode)
130 (64.4min, 92.8P1) fps -14%
Average of class Multimedia
  (11 - 233, n=80, last 2 years)
87.4 fps -42%
3840x2160 ultra AA:ultra AF:16
Average NVIDIA GeForce RTX 3080 Ti Laptop GPU
  (61.7 - 100.7, n=15)
87.6 fps +28%
SCHENKER XMG Pro 15 (Late 2021)
Intel Core i7-11800H, NVIDIA GeForce RTX 3080 Laptop GPU (1.47.22.14 D3D12)
76 (61.3min, 63.9P1) fps +11%
Gigabyte Aero 16 YE5
Intel Core i9-12900HK, NVIDIA GeForce RTX 3080 Ti Laptop GPU (1.47.22.14 D3D12, Turbo Mode)
70.6 (38.3min, 59P1) fps +3%
Gigabyte Aero 16 YE5
Intel Core i9-12900HK, NVIDIA GeForce RTX 3080 Ti Laptop GPU (1.47.22.14 D3D12)
68.4 (41.3min, 58.5P1) fps
Gigabyte Aero 16 YE5
Intel Core i9-12900HK, NVIDIA GeForce RTX 3080 Ti Laptop GPU (1.47.22.14 D3D12, Silence Mode)
61.7 (44.4min, 52.1P1) fps -10%
Average of class Multimedia
  (14.2 - 127.8, n=9, last 2 years)
55.6 fps -19%
F1 2021
1920x1080 Ultra High Preset + Raytracing AA:T AF:16x
Average NVIDIA GeForce RTX 3080 Ti Laptop GPU
  (30.2 - 160.6, n=30)
126.1 fps +22%
SCHENKER XMG Pro 15 (Late 2021)
Intel Core i7-11800H, NVIDIA GeForce RTX 3080 Laptop GPU (831795)
117 (101min, 91P1) fps +14%
Gigabyte Aero 16 YE5
Intel Core i9-12900HK, NVIDIA GeForce RTX 3080 Ti Laptop GPU (852849, Turbo Mode)
107 (91min, 84P1) fps +4%
Gigabyte Aero 16 YE5
Intel Core i9-12900HK, NVIDIA GeForce RTX 3080 Ti Laptop GPU (852849)
103 (76min, 83P1) fps
Average of class Multimedia
  (31.5 - 149.8, n=15, last 2 years)
90.1 fps -13%
Gigabyte Aero 16 YE5
Intel Core i9-12900HK, NVIDIA GeForce RTX 3080 Ti Laptop GPU (852849, Silence Mode)
68 (48min, 42P1) fps -34%
3840x2160 Ultra High Preset + Raytracing AA:T AF:16x
Average NVIDIA GeForce RTX 3080 Ti Laptop GPU
  (41.1 - 70.2, n=18)
60.9 fps +29%
Gigabyte Aero 16 YE5
Intel Core i9-12900HK, NVIDIA GeForce RTX 3080 Ti Laptop GPU (852849, Turbo Mode)
50.3 (43min, 42P1) fps +6%
SCHENKER XMG Pro 15 (Late 2021)
Intel Core i7-11800H, NVIDIA GeForce RTX 3080 Laptop GPU (831795)
49.6 (43min, 42P1) fps +5%
Gigabyte Aero 16 YE5
Intel Core i9-12900HK, NVIDIA GeForce RTX 3080 Ti Laptop GPU (852849)
47.3 (39min, 38P1) fps
Gigabyte Aero 16 YE5
Intel Core i9-12900HK, NVIDIA GeForce RTX 3080 Ti Laptop GPU (852849, Silence Mode)
41.1 (35min, 31P1) fps -13%
Average of class Multimedia
  (11 - 53.5, n=4, last 2 years)
25.8 fps -45%
Riders Republic
1920x1080 Ultra Preset
Average NVIDIA GeForce RTX 3080 Ti Laptop GPU
  (92 - 129, n=3)
114.3 fps +24%
SCHENKER XMG Pro 15 (Late 2021)
Intel Core i7-11800H, NVIDIA GeForce RTX 3080 Laptop GPU
104 (87min) fps +13%
Gigabyte Aero 16 YE5
Intel Core i9-12900HK, NVIDIA GeForce RTX 3080 Ti Laptop GPU
92 (76min) fps
Average of class Multimedia
  (last 2 years)
63 fps -32%
3840x2160 Ultra Preset
Average NVIDIA GeForce RTX 3080 Ti Laptop GPU
  (39 - 56, n=2)
47.5 fps +22%
SCHENKER XMG Pro 15 (Late 2021)
Intel Core i7-11800H, NVIDIA GeForce RTX 3080 Laptop GPU
41 (36min) fps +5%
Gigabyte Aero 16 YE5
Intel Core i9-12900HK, NVIDIA GeForce RTX 3080 Ti Laptop GPU
39 (33min) fps
Forza Horizon 5
1920x1080 Extreme Preset
SCHENKER XMG Pro 15 (Late 2021)
Intel Core i7-11800H, NVIDIA GeForce RTX 3080 Laptop GPU
81 fps +13%
Average NVIDIA GeForce RTX 3080 Ti Laptop GPU
  (48 - 95, n=5)
77.6 fps +8%
Gigabyte Aero 16 YE5
Intel Core i9-12900HK, NVIDIA GeForce RTX 3080 Ti Laptop GPU
72 fps
Average of class Multimedia
  (last 2 years)
42 fps -42%
3840x2160 Extreme Preset
Average NVIDIA GeForce RTX 3080 Ti Laptop GPU
  (38 - 61, n=2)
49.5 fps +30%
SCHENKER XMG Pro 15 (Late 2021)
Intel Core i7-11800H, NVIDIA GeForce RTX 3080 Laptop GPU
48 fps +26%
Gigabyte Aero 16 YE5
Intel Core i9-12900HK, NVIDIA GeForce RTX 3080 Ti Laptop GPU
38 fps
Rainbow Six Extraction
1920x1080 Ultra Preset (with Fixed Resolution Quality)
Average NVIDIA GeForce RTX 3080 Ti Laptop GPU
  (128 - 169, n=3)
152 fps +19%
Gigabyte Aero 16 YE5
Intel Core i9-12900HK, NVIDIA GeForce RTX 3080 Ti Laptop GPU
128 fps
Average of class Multimedia
  (last 2 years)
89 fps -30%
3840x2160 Ultra Preset (with Fixed Resolution Quality)
Average NVIDIA GeForce RTX 3080 Ti Laptop GPU
  (44 - 57, n=2)
50.5 fps +15%
Gigabyte Aero 16 YE5
Intel Core i9-12900HK, NVIDIA GeForce RTX 3080 Ti Laptop GPU
44 (19min) fps
GRID Legends
1920x1080 Ultra Preset
Average NVIDIA GeForce RTX 3080 Ti Laptop GPU
  (100.4 - 102.6, n=2)
101.5 fps +1%
Gigabyte Aero 16 YE5
Intel Core i9-12900HK, NVIDIA GeForce RTX 3080 Ti Laptop GPU
100.4 (70.7min) fps
Average of class Multimedia
  (last 2 years)
49.5 fps -51%
3840x2160 Ultra Preset
Gigabyte Aero 16 YE5
Intel Core i9-12900HK, NVIDIA GeForce RTX 3080 Ti Laptop GPU
54.4 (46min) fps
Average NVIDIA GeForce RTX 3080 Ti Laptop GPU
  ()
54.4 fps 0%
Average of class Multimedia
  (last 2 years)
23.3 fps -57%
Cyberpunk 2077 1.6
1920x1080 Ultra Preset
Average NVIDIA GeForce RTX 3080 Ti Laptop GPU
  (54 - 144.1, n=16)
93.6 fps +28%
Gigabyte Aero 16 YE5
Intel Core i9-12900HK, NVIDIA GeForce RTX 3080 Ti Laptop GPU
73.2 (55.1min) fps
Average of class Multimedia
  (9.2 - 103, n=28, last 2 years)
51 fps -30%
3840x2160 Ultra Preset
Average NVIDIA GeForce RTX 3080 Ti Laptop GPU
  (19.6 - 32.4, n=6)
27.1 fps +38%
Average of class Multimedia
  (5.57 - 45, n=6, last 2 years)
20.2 fps +3%
Gigabyte Aero 16 YE5
Intel Core i9-12900HK, NVIDIA GeForce RTX 3080 Ti Laptop GPU
19.6 (13min) fps
1920x1080 Ray Tracing Ultra Preset (DLSS off)
Gigabyte Aero 16 YE5
Intel Core i9-12900HK, NVIDIA GeForce RTX 3080 Ti Laptop GPU
49.9 (28.1min) fps
Average NVIDIA GeForce RTX 3080 Ti Laptop GPU
  (39.2 - 49.9, n=7)
43.3 fps -13%
Average of class Multimedia
  (8.37 - 40, n=4, last 2 years)
25 fps -50%
3840x2160 Ray Tracing Ultra Preset (DLSS off)
Average NVIDIA GeForce RTX 3080 Ti Laptop GPU
  (9.22 - 12.3, n=3)
10.9 fps +18%
Gigabyte Aero 16 YE5
Intel Core i9-12900HK, NVIDIA GeForce RTX 3080 Ti Laptop GPU
9.22 (6.5min) fps
Elex 2
1920x1080 Ultra / On AA:SM AF:16x
Gigabyte Aero 16 YE5
Intel Core i9-12900HK, NVIDIA GeForce RTX 3080 Ti Laptop GPU
70.3 (26.5min, 44.5P0.1, 56.8P1) fps
Average NVIDIA GeForce RTX 3080 Ti Laptop GPU
  (31 - 91, n=3)
64.1 fps -9%
Average of class Multimedia
  (last 2 years)
15.2 fps -78%
3840x2160 Ultra / On AA:SM AF:16x
Gigabyte Aero 16 YE5
Intel Core i9-12900HK, NVIDIA GeForce RTX 3080 Ti Laptop GPU
28.2 (16.7min, 17.1P0.1, 21.7P1) fps
Average NVIDIA GeForce RTX 3080 Ti Laptop GPU
  ()
28.2 fps 0%

Rodamos Witcher 3 por 60 minutos em FHD e detalhes máximos para determinar se um dispositivo é ou não capaz de manter altos níveis consistentes de desempenho durante longos períodos de tempo. O avatar é estacionário durante todo o teste para garantir a comparabilidade. Neste caso, não encontramos nenhuma evidência de diminuição das taxas de quadros durante todo o teste.

Witcher 3 FPS Graph

0102030405060708090100110Tooltip
SCHENKER XMG Pro 15 (Late 2021) i7-11800H, GeForce RTX 3080 Laptop GPU: Ø92 (74-98)
Gigabyte Aero 16 YE5 i9-12900HK, GeForce RTX 3080 Ti Laptop GPU: Ø91.2 (87-96)
Lenovo ThinkPad X1 Extreme G4-20Y50040GE i9-11950H, GeForce RTX 3080 Laptop GPU: Ø85.1 (80-91)
HP ZBook Studio 15 G8 i9-11950H, GeForce RTX 3070 Laptop GPU: Ø73.7 (63-79)
Razer Blade 15 2022 i7-12800H, GeForce RTX 3080 Ti Laptop GPU: Ø102.3 (87-111)
Gigabyte Aero 16 YE5 i9-12900HK, GeForce RTX 3080 Ti Laptop GPU; SIlence Mode: Ø82.9 (51-92)
Gigabyte Aero 16 YE5 i9-12900HK, GeForce RTX 3080 Ti Laptop GPU; Turbo Mode: Ø93.9 (86-100)
Dados da GPU durante nosso teste Witcher 3
Dados da GPU durante nosso teste Witcher 3 (Modo Turbo)
Dados da GPU durante nosso teste Witcher 3 (Modo Silencioso)
baixomédiaaltoultraQHD4K
GTA V (2015) 187 185 179 113 82.7 78.2
The Witcher 3 (2015) 408 278 144 92.2 64
Dota 2 Reborn (2015) 191 176 168 160 112
Final Fantasy XV Benchmark (2018) 195 110 85.8 64.8 40.1
X-Plane 11.11 (2018) 154 134 108 78.6
Far Cry 5 (2018) 189 141 130 122 86 45
Strange Brigade (2018) 424 200 168 151 113 68.4
F1 2021 (2021) 383 236 196 103 84 47.3
Riders Republic (2021) 202 126 101 92 65 39
Forza Horizon 5 (2021) 221 131 116 72 61 38
Rainbow Six Extraction (2022) 185 160 157 128 87 44
Dying Light 2 (2022) 97.1 79 69.2 49.6 27.3
GRID Legends (2022) 206.6 159.5 139.2 100.4 81 54.4
Cyberpunk 2077 1.6 (2022) 121.7 96.4 72.4 73.2 39.7 19.6
Elex 2 (2022) 93.5 89.5 76.5 70.3 48.1 28.2

Emissões - O Aero Faz Muito Barulho

Emissões sonoras

No uso diário (escritório, internet) ambos os ventiladores permanecem discretos e comparativamente silenciosos em geral. Sob carga, no entanto, eles sobem e se tornam muito audíveis muito rapidamente. Infelizmente, eles também produzem um choro perceptível em altas rotações. As emissões de ruído podem ser reduzidas significativamente selecionando o perfil "Power Saving Silence Mode", embora às custas do desempenho.

Barulho

Ocioso
30 / 32 / 33 dB
Carga
45 / 52 dB
  red to green bar
 
 
30 dB
silencioso
40 dB(A)
audível
50 dB(A)
ruidosamente alto
 
min: dark, med: mid, max: light   Earthworks M23R, Arta (15 cm de distância)   environment noise: 25 dB(A)
dB(A) 0102030405060708090Deep BassMiddle BassHigh BassLower RangeMidsHigher MidsLower HighsMid HighsUpper HighsSuper Highs2043.443.845.143.538.641.82538.537.941.937.835.140.83144.345.244.947.544.6484030.933.732.832.429.837.65038.239.137.337.323.430.46333.429.430.530.127.337.98027.223.524.925.217.937.310027.823.825.22618.826.812530.22929.130.418.42816031.727.627.225.918.230.120029.222.523.823.721.631.425029.824.72423.119.43331529.121.421.22014.232.740026.818.117.915.912.130.750028.819.718.717.111.332.963029.724.227.220.410.834.58003223.321.921.311.336.510003322.420.918.611.139125034.623.321.219.511.540160035.823.521.319.611.541.7200035.123.121.519.711.540.9250034.620.817.114.912.140.6315035.816.514.513.612.540.44000331615.215.11344500029.214.913.813.412.938.4630028.91413.413.313.137.280002613.613.413.213.136.51000022.413.213.1131332.51250018.913.413.213.112.628.71600017.413.112.91312.822.1SPL45333229.924.751.6N4.91.71.51.30.67.8median 29.7median 21.4median 20.9median 18.6median 12.8median 34.5Delta3454.62.55hearing rangehide median Fan NoiseGigabyte Aero 16 YE5
Gigabyte Aero 16 YE5
GeForce RTX 3080 Ti Laptop GPU, i9-12900HK
Lenovo ThinkPad X1 Extreme G4-20Y50040GE
GeForce RTX 3080 Laptop GPU, i9-11950H
Apple MacBook Pro 16 2021 M1 Max
M1 Max 32-Core GPU, M1 Max
HP ZBook Studio 15 G8
GeForce RTX 3070 Laptop GPU, i9-11950H
SCHENKER XMG Pro 15 (Late 2021)
GeForce RTX 3080 Laptop GPU, i7-11800H
Razer Blade 15 2022
GeForce RTX 3080 Ti Laptop GPU, i7-12800H
Noise
10%
17%
11%
-12%
8%
off / environment *
25
24.7
1%
24.2
3%
23.5
6%
24
4%
25.4
-2%
Idle Minimum *
30
24.7
18%
24.2
19%
25.3
16%
31
-3%
26.2
13%
Idle Average *
32
24.7
23%
24.2
24%
25.3
21%
37
-16%
26.2
18%
Idle Maximum *
33
28.1
15%
24.2
27%
25.3
23%
41
-24%
28.4
14%
Load Average *
45
42.5
6%
42.9
5%
41.2
8%
56
-24%
44.7
1%
Witcher 3 ultra *
50
46.4
7%
39.5
21%
49.4
1%
53
-6%
44.7
11%
Load Maximum *
52
52.1
-0%
42.9
17%
49.4
5%
58
-12%
51.9
-0%

* ... smaller is better

Temperatura

No uso diário (escritório, internet) as temperaturas dos casos permanecem bastante baixas. Sob carga (teste de estresse, Witcher 3) aquece drasticamente com pontos quentes de até 60 °C.

Witcher 3
Witcher 3
Witcher 3
Witcher 3
Witcher 3
Witcher 3
Teste de estresse
Teste de estresse
Teste de estresse
Teste de estresse
Teste de estresse
Teste de estresse
 47 °C49 °C47 °C 
 43 °C44 °C46 °C 
 41 °C40 °C41 °C 
Máximo: 49 °C
Médio: 44.2 °C
51 °C55 °C47 °C
49 °C52 °C47 °C
41 °C41 °C42 °C
Máximo: 55 °C
Médio: 47.2 °C
alimentação elétrica  42 °C | Temperatura do quarto 20 °C | Fluke t3000FC (calibrated), Voltcraft IR-900
(-) The average temperature for the upper side under maximal load is 44.2 °C / 112 F, compared to the average of 31.3 °C / 88 F for the devices in the class Multimedia.
(-) The maximum temperature on the upper side is 49 °C / 120 F, compared to the average of 36.9 °C / 98 F, ranging from 21.1 to 71 °C for the class Multimedia.
(-) The bottom heats up to a maximum of 55 °C / 131 F, compared to the average of 39.2 °C / 103 F
(+) In idle usage, the average temperature for the upper side is 31.1 °C / 88 F, compared to the device average of 31.3 °C / 88 F.
(-) Playing The Witcher 3, the average temperature for the upper side is 48.3 °C / 119 F, compared to the device average of 31.3 °C / 88 F.
(-) The palmrests and touchpad can get very hot to the touch with a maximum of 45 °C / 113 F.
(-) The average temperature of the palmrest area of similar devices was 28.8 °C / 83.8 F (-16.2 °C / -29.2 F).
Gigabyte Aero 16 YE5
Intel Core i9-12900HK, NVIDIA GeForce RTX 3080 Ti Laptop GPU
Lenovo ThinkPad X1 Extreme G4-20Y50040GE
Intel Core i9-11950H, NVIDIA GeForce RTX 3080 Laptop GPU
Apple MacBook Pro 16 2021 M1 Max
Apple M1 Max, Apple M1 Max 32-Core GPU
HP ZBook Studio 15 G8
Intel Core i9-11950H, NVIDIA GeForce RTX 3070 Laptop GPU
SCHENKER XMG Pro 15 (Late 2021)
Intel Core i7-11800H, NVIDIA GeForce RTX 3080 Laptop GPU
Razer Blade 15 2022
Intel Core i7-12800H, NVIDIA GeForce RTX 3080 Ti Laptop GPU
Heat
6%
24%
8%
2%
-4%
Maximum Upper Side *
49
51.4
-5%
42.3
14%
49
-0%
44
10%
50
-2%
Maximum Bottom *
55
55.9
-2%
41.7
24%
54.2
1%
60
-9%
47
15%
Idle Upper Side *
33
27.2
18%
23.9
28%
26.2
21%
30
9%
37.4
-13%
Idle Bottom *
33
28.8
13%
23.9
28%
30.2
8%
34
-3%
38.4
-16%

* ... smaller is better

Teste de estresse

Nosso teste de estresse é concluído com a CPU rodando a 2,7 GHz (P-cores) e 2,2-2,3 GHz (E-cores) e a GPU rodando entre 600 e 700 MHz. Tenha em mente que nosso teste de estresse é um cenário de carga extrema que não ocorre durante o uso diário. Utilizamos este teste para determinar possíveis problemas de estrangulamento e estabilidade.

Oradores

Os alto-falantes estéreo da unidade produzem um som decente com falta de graves e um volume máximo comparativamente alto. Sugerimos o uso de fones de ouvido ou alto-falantes externos para uma experiência de áudio muito melhor.

dB(A) 0102030405060708090Deep BassMiddle BassHigh BassLower RangeMidsHigher MidsLower HighsMid HighsUpper HighsSuper Highs2038.640.82535.138.53144.652.14029.834.65023.438.56327.342.58017.935.110018.824.412518.427.816018.236.520021.64425019.46031514.265.740012.16750011.373.363010.876.380011.380.1100011.176.3125011.573.6160011.569200011.568.6250012.168.8315012.57040001372500012.970.8630013.168.2800013.164.7100001366.21250012.667.61600012.871.6SPL24.784.7N0.662median 12.8median 68.6Delta2.56.838.735.538.728.629.428.627.626.427.628.424.728.430.321.130.33026.43031.623.831.635.62135.64418.74453.618.553.658.419.758.462.320.462.36524.96570.722.270.773.322.473.374.117.974.175.414.575.478.515.878.579.616.779.682.517.282.58217.48281.914.281.980.712.180.770.212.770.275.912.475.977.212.177.270.512.470.576.512.276.573.414.173.46611.46690.928.490.987.7187.7median 74.1median 16.7median 74.17.53.67.5hearing rangehide median Pink NoiseGigabyte Aero 16 YE5Razer Blade 15 2022
Frequency diagram (checkboxes can be checked and unchecked to compare devices)
Gigabyte Aero 16 YE5 audio analysis

(+) | speakers can play relatively loud (85 dB)
Bass 100 - 315 Hz
(-) | nearly no bass - on average 25.6% lower than median
(-) | bass is not linear (15.5% delta to prev. frequency)
Mids 400 - 2000 Hz
(+) | balanced mids - only 4.8% away from median
(+) | mids are linear (5.8% delta to prev. frequency)
Highs 2 - 16 kHz
(+) | balanced highs - only 2% away from median
(+) | highs are linear (3.1% delta to prev. frequency)
Overall 100 - 16.000 Hz
(±) | linearity of overall sound is average (16.6% difference to median)
Compared to same class
» 40% of all tested devices in this class were better, 7% similar, 53% worse
» The best had a delta of 5%, average was 18%, worst was 45%
Compared to all devices tested
» 26% of all tested devices were better, 5% similar, 69% worse
» The best had a delta of 4%, average was 25%, worst was 134%

Razer Blade 15 2022 audio analysis

(+) | speakers can play relatively loud (90.9 dB)
Bass 100 - 315 Hz
(-) | nearly no bass - on average 21% lower than median
(±) | linearity of bass is average (9.7% delta to prev. frequency)
Mids 400 - 2000 Hz
(+) | balanced mids - only 3.9% away from median
(+) | mids are linear (3.9% delta to prev. frequency)
Highs 2 - 16 kHz
(+) | balanced highs - only 4.2% away from median
(±) | linearity of highs is average (7.8% delta to prev. frequency)
Overall 100 - 16.000 Hz
(±) | linearity of overall sound is average (15.7% difference to median)
Compared to same class
» 34% of all tested devices in this class were better, 7% similar, 59% worse
» The best had a delta of 6%, average was 18%, worst was 132%
Compared to all devices tested
» 21% of all tested devices were better, 4% similar, 74% worse
» The best had a delta of 4%, average was 25%, worst was 134%

Gerenciamento de energia - Vida útil geral decente da bateria

Consumo de energia

Não encontramos inconsistências com o consumo de energia do Aero 16, que foi determinado a um nível esperado deste hardware em particular. No início de nosso teste de estresse, detectamos um pico curto de até 236 W, que rapidamente diminuiu para 180 W. Nosso teste Witcher 3 é concluído com um consumo médio de energia de 184 W. Consequentemente, o fornecimento de energia incluído de 230 W é mais do que adequadamente dimensionado.

Consumo de energia
desligadodarklight 1.4 / 2.2 Watt
Ociosodarkmidlight 26 / 30 / 37 Watt
Carga midlight 127 / 236 Watt
 color bar
Key: min: dark, med: mid, max: light        Metrahit Energy
Gigabyte Aero 16 YE5
i9-12900HK, GeForce RTX 3080 Ti Laptop GPU
Lenovo ThinkPad X1 Extreme G4-20Y50040GE
i9-11950H, GeForce RTX 3080 Laptop GPU
Apple MacBook Pro 16 2021 M1 Max
M1 Max, M1 Max 32-Core GPU
HP ZBook Studio 15 G8
i9-11950H, GeForce RTX 3070 Laptop GPU
SCHENKER XMG Pro 15 (Late 2021)
i7-11800H, GeForce RTX 3080 Laptop GPU
Razer Blade 15 2022
i7-12800H, GeForce RTX 3080 Ti Laptop GPU
Average of class Multimedia
 
Power Consumption
34%
48%
28%
17%
-6%
59%
Idle Minimum *
26
12.3
53%
5.4
79%
11
58%
20
23%
33.2
-28%
Idle Average *
30
22.8
24%
16.4
45%
18.8
37%
22
27%
36.4
-21%
Idle Maximum *
37
13.9
62%
16.7
55%
31.7
14%
26
30%
37.6
-2%
Load Average *
127
95.4
25%
94
26%
105.2
17%
103
19%
116.7
8%
Witcher 3 ultra *
176
154
12%
104
41%
148
16%
186
-6%
172
2%
Load Maximum *
236
170.7
28%
135
43%
171.8
27%
218
8%
228.6
3%

* ... smaller is better

Power Consumption Witcher 3 / stress test

0102030405060708090100110120130140150160170180190Tooltip
Gigabyte Aero 16 YE5; Witcher 3 ultra: Ø175.7 (168-184)
Gigabyte Aero 16 YE5; 1280x720 Prime95 28.10 and Furmark 1.25: Ø184 (181-199)

Power Consumption with External Monitor

0102030405060708090100110120130140150160170180Tooltip
Gigabyte Aero 16 YE5; Prime95 V2810 Stress (external Monitor): Ø126.2 (124-134)
Gigabyte Aero 16 YE5; Cinebench R15 Multi (external Monitor): Ø142.6 (139-150)
Gigabyte Aero 16 YE5; 1280x720 FurMark 1.19 GPU Stress Test (external Monitor): Ø170.4 (167-184)
Gigabyte Aero 16 YE5; 1920x1080 The Witcher 3 ultra (external Monitor): Ø170.4 (166-176)

Vida útil da bateria

Em nosso Wi-Fi (carregamento de sites via roteiro) e em nosso teste de reprodução de vídeo (reprodução em loop do curta-metragem Big Buck Bunny codificado em FHD), o Aero 16 gerenciou uma duração de bateria de 6:21 e 7:32 horas, respectivamente. Todos os recursos de economia de energia são desativados durante ambos os testes, e o brilho da tela é normalizado em 150 nits. Além disso, também desativamos todos os módulos de comunicação durante o teste de reprodução de vídeo.

Bateria com uma capacidade de 99 Wh
Tempo de Execução da Bateria
Ocioso (sem WLAN, min brilho)
8h 53min
WiFi Websurfing (Edge 99)
6h 21min
Big Buck Bunny H.264 1080p
7h 32min
Carga (máximo brilho)
1h 36min
Gigabyte Aero 16 YE5
i9-12900HK, GeForce RTX 3080 Ti Laptop GPU, 99 Wh
Lenovo ThinkPad X1 Extreme G4-20Y50040GE
i9-11950H, GeForce RTX 3080 Laptop GPU, 90 Wh
Apple MacBook Pro 16 2021 M1 Max
M1 Max, M1 Max 32-Core GPU, 99.6 Wh
HP ZBook Studio 15 G8
i9-11950H, GeForce RTX 3070 Laptop GPU, 83 Wh
SCHENKER XMG Pro 15 (Late 2021)
i7-11800H, GeForce RTX 3080 Laptop GPU, 73 Wh
Razer Blade 15 2022
i7-12800H, GeForce RTX 3080 Ti Laptop GPU, 80 Wh
Average of class Multimedia
 
Battery Runtime
-10%
76%
17%
-8%
-23%
67%
Reader / Idle
533
774
45%
636
19%
H.264
452
414
-8%
1021
126%
392
-13%
WiFi v1.3
381
406
7%
894
135%
369
-3%
314
-18%
292
-23%
Load
96
68
-29%
63
-34%
106
10%
78
-19%

Pro

+ visor OLED 4K de alto contraste
+ caixa robusta
+ alto desempenho do sistema
+ cPU com overclockable (multiplicador desbloqueado)
+ 2x ranhuras M.2 (PCIe 4)
+ armazenagem abundante (dois SSDs)
+ 16 GB VRAM
+ teclado retroiluminado
+ Thunderbolt 4
+ Fornecimento de energia

Contra

- visor brilhante
- quente e barulhento sob carga
- apito do ventilador
- sem leitor de cartões
- sem USB-A, HDMI somente via hub incluído

Veredicto Aero 16: Um Laptop Portátil para Jogadores e Criativos

Gigabyte Aero 16 YE5-94DE949HP. Unidade de revisão fornecida pela Gigabyte Alemanha

Edição de vídeo e foto, renderização e jogos são os principais casos de uso pretendido do Aero 16. Ele permite jogos FHD com o máximo de detalhes e jogos em resoluções mais altas com detalhes reduzidos. Sua CPU Core i9-12900HK eGeForce RTX 3080 Ti GPU com um TGP de 105 W garantem altos níveis de desempenho

O dispositivo aquece significativamente sob carga, e faz muito barulho que infelizmente inclui uma lamuriação perceptível do ventilador. As emissões de ruído podem ser reduzidas significativamente selecionando o perfil "Power Saving Silence Mode", embora às custas do desempenho.

Gigabyte's Aero 16 YE5 é um caderno bem feito para gamers e criativos. No entanto, não está totalmente livre de falhas.

A vida útil da bateria é decente para um laptop tão potente quanto este com um display de 4K. A bateria pode ser carregada com a fonte de alimentação incluída ou com um carregador USB-C universal, desde que seja classificado para pelo menos 45 W de potência de distribuição de energia. A parte traseira das duas portas Thunderbolt 4 suporta o fornecimento de energia. Além disso, suas duas portas Thunderbolt 4 permitem uma extensa conectividade de periféricos externos, como por exemplo docas ou mesmo GPUs externas.

O visor OLED 16:10 embutido rodando a uma alta resolução de 3840 x 2400 é sem dúvida a pièce de resistance do Aero 16. Ele oferece bom brilho, uma excelente relação de contraste, ângulos de visão amplos, tempos de resposta curtos e grande cobertura de espaço de cor. No lado oposto, é brilhante e sofre com a cintilação do PWM abaixo de um certo limite de brilho.

Uma boa alternativa ao Aero 16 é o

com mais performance GPU e sem a necessidade de carregar um hub ou dongles adicionais. Em troca, sua vida útil da bateria é mais curta. Se você estiver procurando uma boa mistura entre alto desempenho e excelente duração da bateria, o

Apple MacBook Pro 16 2021 M1 Max pode ser a melhor escolha. Com isso, você também precisa ter em mente que as maiores falhas do Apple laptop são a incapacidade de atualizar tanto o SSD quanto a RAM

.

Preço e Disponibilidade

No momento em que foi escrito, o Gigabyte Aero 16 já estava listado no site Gigabyte's homepage mas ainda não disponível para compra em qualquer lugar.

Gigabyte Aero 16 YE5 - 03/28/2022 v7 (old)
Sascha Mölck

Acabamento
87 / 98 → 88%
Teclado
84%
Mouse
87%
Conectividade
61 / 80 → 77%
Peso
61 / 20-72 → 79%
Bateria
71 / 95 → 75%
Pantalha
89%
Desempenho do jogos
97 / 90 → 100%
Desempenho da aplicação
96 / 90 → 100%
Temperatura
71%
Ruído
67 / 95 → 71%
Audio
80%
Camera
44 / 85 → 51%
Médio
77%
85%
Multimedia - Médio equilibrado

Price comparison

Please share our article, every link counts!
Mail Logo
> Análises e revisões de portáteis e celulares > Análises > Análises > Revisão Gigabyte Aero 16 YE5: Caderno multimídia compacto 4K
Sascha Mölck, 2022-03-26 (Update: 2022-03-26)