Notebookcheck Logo

GeForce RTX 4070, 4060, 4050 Análise de Laptop - As novas GPUs de Laptop Mainstream da Nvidia em Análise

Perfeito para QHD e 1080p. Duas semanas após o lançamento dos novos modelos high-end RTX 4090 e RTX 4080, a Nvidia lança as novas versões para laptop dos modelos RTX 4070, RTX 4060 e RTX 4050. Verificamos os três novos modelos e as versões menores também oferecem notavelmente mais desempenho.

Nvidia acaba de lançar seu novoGeForce Computador portátil RTX 4090eGeforce RTX 4080 LaptopgPUs no início de fevereiro. Nosso análises abrangentes mostraram que o desempenho era muito menor em comparação com seus equivalentes RTX 40 devido às restrições do TGP, mas ainda há uma grande melhoria de desempenho em relação ao antigo modelo de carro-chefeGeForce Laptop RTX 3080 Ti. Tanto oMSI Titan GT77(RTX 4090), bem como oLâmina Razer 16(RTX 4080) também mostrou que ambas as GPUs podem lidar facilmente com telas de alta resolução, incluindo 4K. Entretanto, estes laptops são muito caros e as novas GPUs convencionais serão mais interessantes para muitos clientes.

Hoje, a Nvidia lança os novos modelosGeForce Computador portátil RTX 4070,Computador portátil RTX 4060bem comoComputador portátil RTX 4050que estão disponíveis em muitos laptops de jogos e multimídia. Além dos benchmarks sintéticos, verificaremos o desempenho dos jogos, incluindo o Ray Tracing e o upscaling DLSS da Nvidia.

Visão geral - RTX 4070, 4060 & 4050 Laptop

Os novos modelos GeForce RTX 4070, 4060 e 4050 são todos baseados na arquitetura Ada Lovelace e todas as versões suportam o DLSS 3, bem como o raytracing. Existem obviamente diferenças em termos de contagem do núcleo, que está listado na tabela abaixo. O laptop RTX 4070 é baseado no chip AD106, enquanto ambos o laptop RTX 4060 e o laptop RTX 4050 são baseados no chip AD107. Todos os três GPUs podem cobrir uma ampla gama de sistemas com configurações TGP entre 35-115 Watts com um adicional de 25 Watts do processador através do Dynamic Boost. Isto significa que os três GPUs de laptops podem consumir até 140 Watts.

Visão geral do notebook RTX 40 (Fonte: Nvidia)

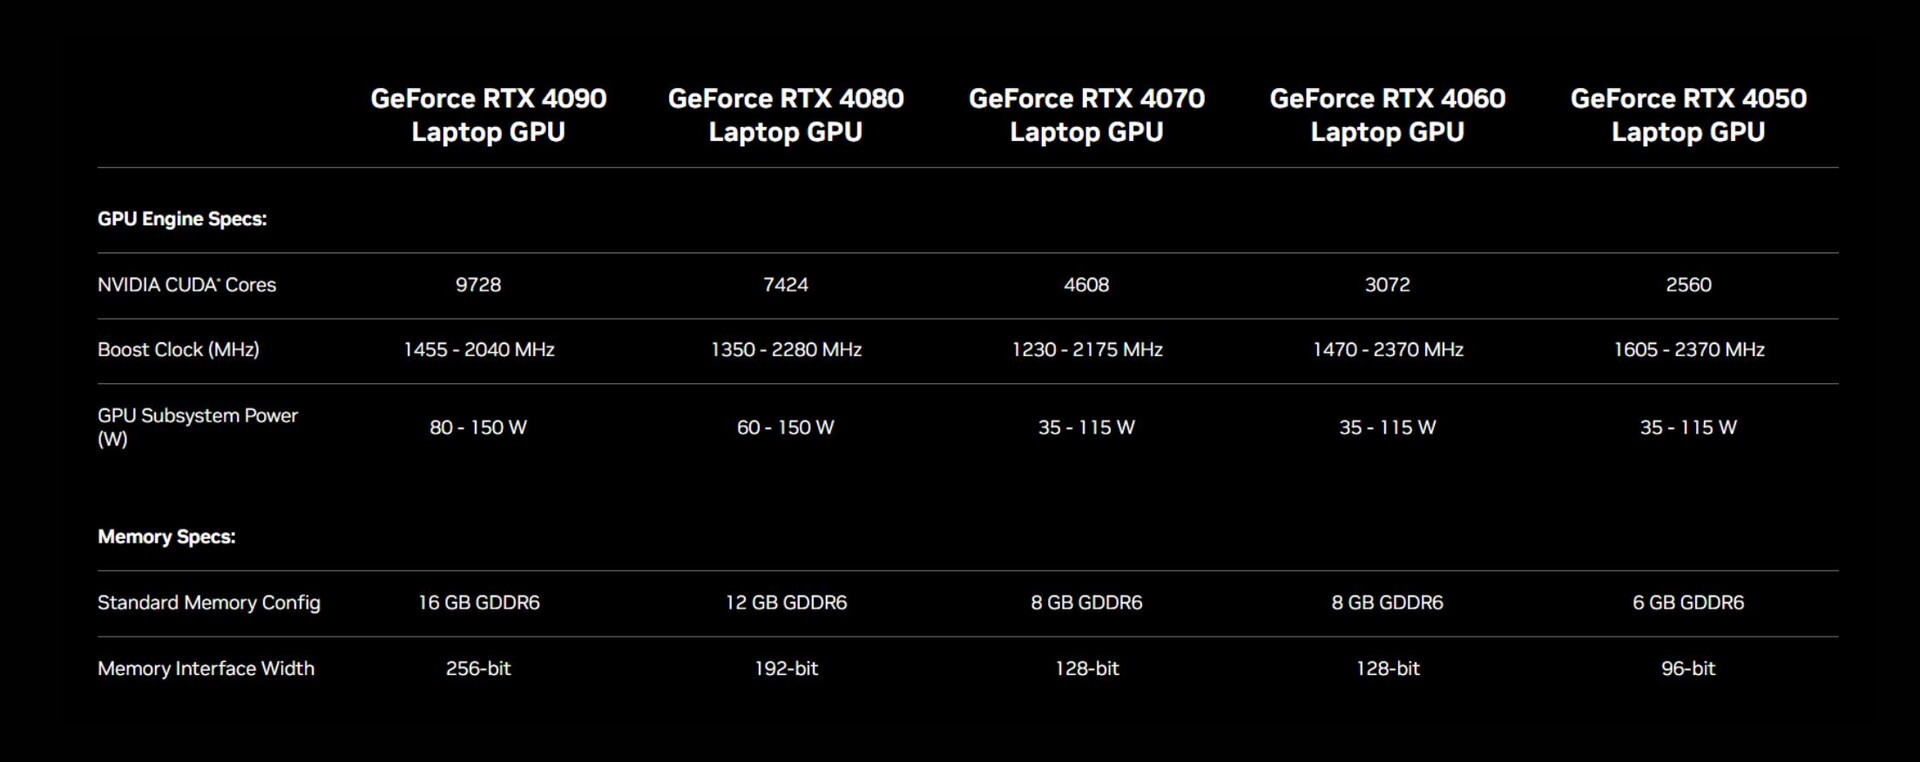
No entanto, você só verá este valor em cargas de trabalho sintéticas como a FurMark, por exemplo. O consumo de energia em cenários reais de jogos dependerá da carga real da GPU, portanto o consumo pode ser muito menor. Isto é importante quando você analisa os benchmarks de jogos e os dados do sensor, para que você não entre em pânico quando a GPU não atingir seu valor TGP máximo o tempo todo, já que tudo funciona como pretendido pela Nvidia. A ampla gama TGP também pode ser um problema para os clientes quando os fabricantes de laptops não divulgam números TGP exatos para seus produtos.

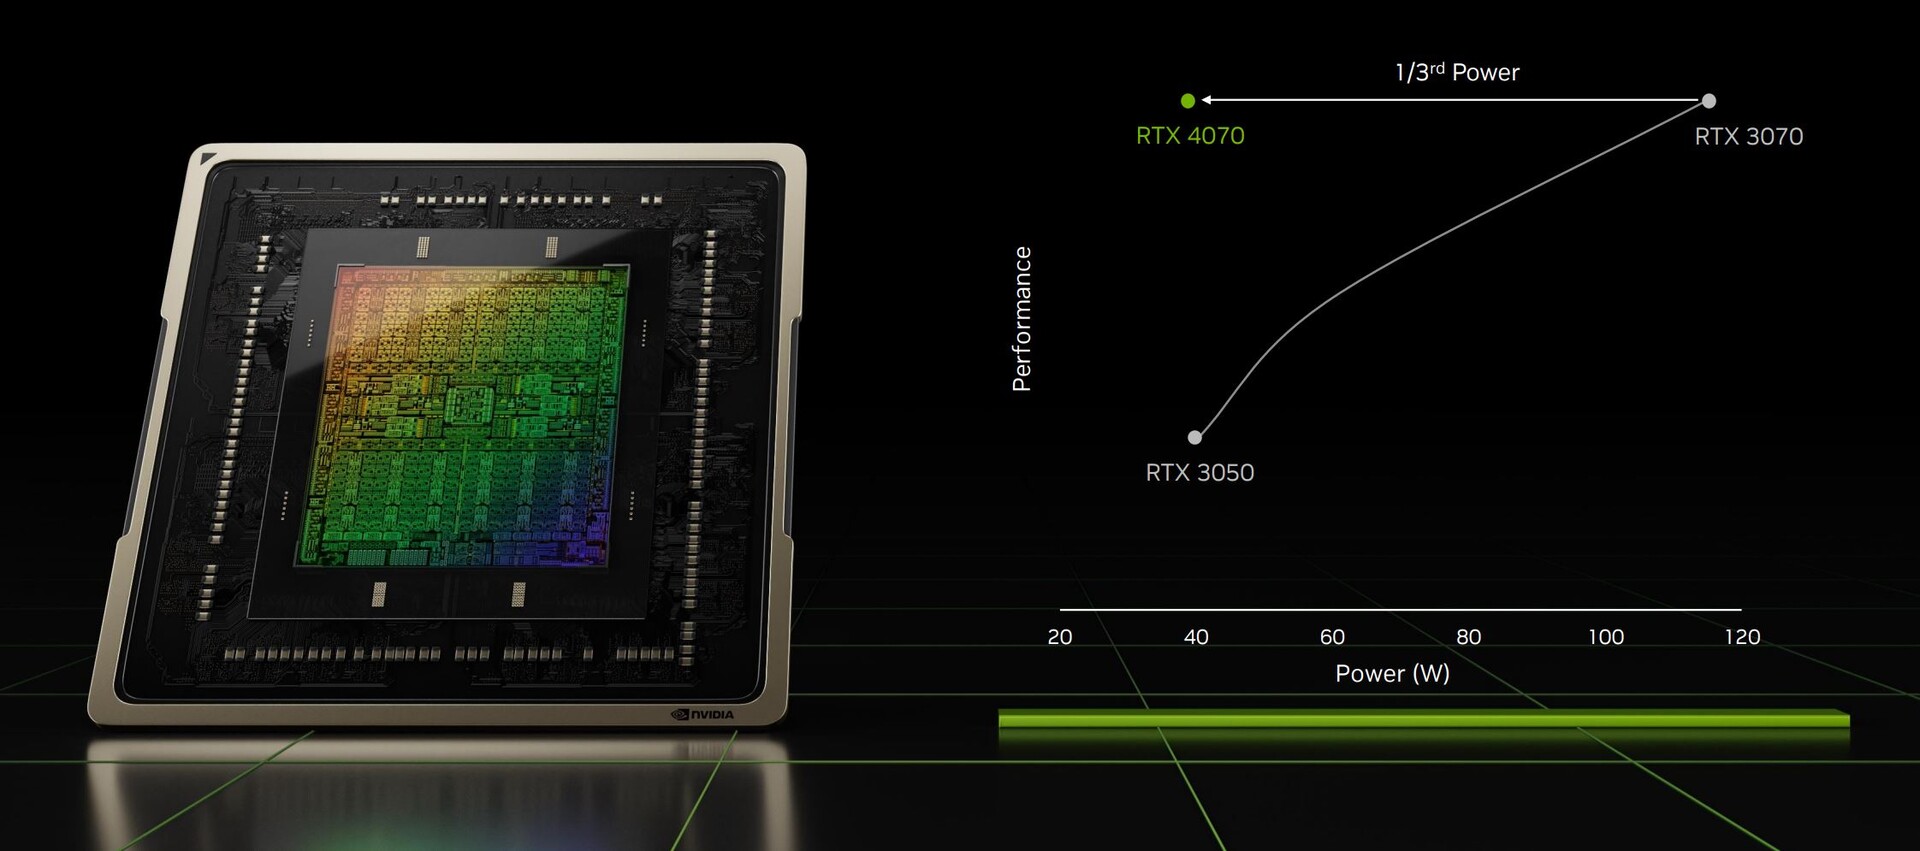
Nossa análise do laptop RTX 4090/480 mostrou melhorias de eficiência de mais de 50%, mas a Nvidia até mesmo anuncia maiores ganhos de eficiência (3x). As informações da imprensa agora mostram o cenário para esta afirmação, o que não é muito prático. A comparação inclui o novo notebook RTX 4070 rodando a 40W, que oferecerá o mesmo desempenho que o antigoComputador portátil RTX 3070. Entretanto, não há mais detalhes sobre esta comparação (como a aplicação, jogo, configurações, etc.).

A maior melhoria de eficiência sobre Ampere é possível a 40W (Fonte: Nvidia)

Já falamos sobre os detalhes técnicos da arquitetura Ada Lovelace em nosso análise do notebook RTX 4090/4080. Atualmente ainda estamos esperando para receber mais informações e fotos das novas GPUs AD106 e AD107 da Nvidia e atualizaremos o artigo assim que pudermos.

DLSS3 (Fonte: Nvidia)
5ª geração Max-Q (Fonte: Nvidia)

Sistemas de teste

Conseguimos usar vários sistemas para coletar os seguintes dados de referência. Além das unidades de varejo, também tivemos acesso a amostras de engenharia, que não serão vendidas aos clientes. Isto significa que não há nenhuma revisão sobre estes sistemas neste momento, mas testaremos seus equivalentes no varejo assim que pudermos.

Todos os laptops foram testados com as configurações de desempenho máximo e (se possível) iGPU desativado. Os dois modelos RTX 4070 Laptop e RTX 4050 Laptop nos sistemas XMG, assim como o Blade 18 são as versões mais rápidas das GPUs com o TGP máximo e os resultados representam o melhor desempenho que você pode alcançar. Gigaybte e MSI usam GPUs com um TGP máximo de 105W (80W TGP + 25W Dynamic Boost).

Benchmarks Sintéticos

Começamos com os benchmarks sintéticos 3DMark, onde o novoComputador portátil RTX 4070está bem à frente da GPU de ponta anteriorLaptop RTX 3080 Tie em igualdade com oDesktop RTX 3070. Isto também significa que há um enorme déficit de desempenho em comparação com aComputador portátil RTX 4080a versão mais potente é cerca de 40% mais rápida. O RTX 4070 com 105W no Gigabyte Aero 16, por outro lado, é apenas 4% mais lento.

O laptop RTX 4060 de 105W também é apenas 13% mais lento que o laptop RTX 4070 no XMG Neo 17 nos testes sintéticos, mas também é 33% mais rápido que o antigoGeForce Computador portátil RTX 3060por isso, é comparável ao portátil RTX 3070 Ti em geral.

O novo RTX 4050 mostra as maiores melhorias com uma vantagem de desempenho de 74% em relação ao antigoComputador portátil RTX 3050 Ti. Entretanto, temos que ser um pouco cuidadosos aqui, já que este é o portátil RTX 4050 mais rápido (140W), mas a maioria das unidades de varejo provavelmente terá especificações TGP muito mais baixas.

Performance Rating - Percent
NVIDIA GeForce RTX 4070 Ti
TUF Gaming GeForce RTX 4070 Ti, i9-13900K
99.6 pt
NVIDIA GeForce RTX 4090 Laptop GPU
Titan GT77 HX 13VI, i9-13950HX
93.2 pt
Average NVIDIA GeForce RTX 3090
 
83.7 pt
NVIDIA GeForce RTX 4080 Laptop GPU
Blade 16 Early 2023, i9-13950HX
76.7 pt
NVIDIA GeForce RTX 4070 Laptop GPU
XMG Neo 17 2023 Engineering Sample, i9-13900HX
55.4 pt
Average AMD Radeon RX 6800M
 
54.4 pt
Average NVIDIA GeForce RTX 3070
 
54.2 pt
NVIDIA GeForce RTX 4070 Laptop GPU
AERO 16 OLED BSF, i9-13900H
53.2 pt
Average NVIDIA GeForce RTX 3080 Ti Laptop GPU
 
52.8 pt
NVIDIA GeForce RTX 4070 Laptop GPU
Blade 18 RTX 4070, i9-13950HX
52.2 pt
Average NVIDIA GeForce RTX 3080 Laptop GPU
 
49.3 pt
Average NVIDIA GeForce RTX 3070 Ti Laptop GPU
 
48.1 pt
NVIDIA GeForce RTX 4060 Laptop GPU
Katana 17 B13VFK, i7-13620H
48 pt
Average AMD Radeon RX 6700M
 
45.1 pt
NVIDIA GeForce RTX 4050 Laptop GPU
XMG Focus 15 Engineering Sample, i5-13500HX
40.6 pt
Average AMD Radeon RX 6600M
 
39.7 pt
Average NVIDIA GeForce RTX 3060
 
37.4 pt
Average NVIDIA GeForce RTX 3060 Laptop GPU
 
36.1 pt
Average NVIDIA GeForce RTX 3050
 
28 pt
Average NVIDIA GeForce RTX 3050 Ti Laptop GPU
 
23.3 pt
Average NVIDIA GeForce RTX 3050 6GB Laptop GPU
 
21.8 pt
3DMark
2560x1440 Time Spy Graphics
NVIDIA GeForce RTX 4070 Ti
TUF Gaming GeForce RTX 4070 Ti, i9-13900K
22982 Points +83%
NVIDIA GeForce RTX 4070 Ti
TUF Gaming GeForce RTX 4070 Ti, i9-13900K
22949 Points +83%
NVIDIA GeForce RTX 4090 Laptop GPU
Titan GT77 HX 13VI, i9-13950HX
22254 Points +78%
Average NVIDIA GeForce RTX 3090
  (18685 - 20433, n=17)
19266 Points +54%
NVIDIA GeForce RTX 4080 Laptop GPU
Blade 16 Early 2023, i9-13950HX
18441 Points +47%
Average NVIDIA GeForce RTX 3070
  (11043 - 13579, n=7)
12616 Points +1%
NVIDIA GeForce RTX 4070 Laptop GPU
XMG Neo 17 2023 Engineering Sample, i9-13900HX
12529 Points
Average NVIDIA GeForce RTX 3080 Ti Laptop GPU
  (4921 - 13835, n=43)
11850 Points -5%
NVIDIA GeForce RTX 4070 Laptop GPU
AERO 16 OLED BSF, i9-13900H
11798 Points -6%
NVIDIA GeForce RTX 4070 Laptop GPU
Blade 18 RTX 4070, i9-13950HX
11683 Points -7%
Average AMD Radeon RX 6800M
  (10439 - 11316, n=4)
11067 Points -12%
Average NVIDIA GeForce RTX 3080 Laptop GPU
  (6407 - 13210, n=45)
10681 Points -15%
Average NVIDIA GeForce RTX 3070 Ti Laptop GPU
  (8142 - 12324, n=37)
10478 Points -16%
NVIDIA GeForce RTX 4060 Laptop GPU
Katana 17 B13VFK, i7-13620H
10299 Points -18%
Average AMD Radeon RX 6700M
  (8654 - 9323, n=2)
8989 Points -28%
NVIDIA GeForce RTX 4050 Laptop GPU
XMG Focus 15 Engineering Sample, i5-13500HX
8536 Points -32%
Average NVIDIA GeForce RTX 3060
  (7866 - 8600, n=5)
8426 Points -33%
Average NVIDIA GeForce RTX 3060 Laptop GPU
  (6285 - 9235, n=49)
8057 Points -36%
Average AMD Radeon RX 6600M
  (7200 - 8234, n=7)
7864 Points -37%
Average NVIDIA GeForce RTX 3050
  (6102 - 6198, n=2)
6150 Points -51%
Average NVIDIA GeForce RTX 3050 Ti Laptop GPU
  (3744 - 6122, n=27)
5177 Points -59%
Average NVIDIA GeForce RTX 3050 6GB Laptop GPU
  (4501 - 4820, n=2)
4661 Points -63%
1920x1080 Fire Strike Graphics
NVIDIA GeForce RTX 4070 Ti
TUF Gaming GeForce RTX 4070 Ti, i9-13900K
53729 Points +73%
NVIDIA GeForce RTX 4070 Ti
TUF Gaming GeForce RTX 4070 Ti, i9-13900K
52903 Points +70%
NVIDIA GeForce RTX 4090 Laptop GPU
Titan GT77 HX 13VI, i9-13950HX
49247 Points +59%
Average NVIDIA GeForce RTX 3090
  (41298 - 49282, n=17)
46856 Points +51%
NVIDIA GeForce RTX 4080 Laptop GPU
Blade 16 Early 2023, i9-13950HX
40570 Points +31%
Average AMD Radeon RX 6800M
  (30507 - 34993, n=3)
33233 Points +7%
NVIDIA GeForce RTX 4070 Laptop GPU
XMG Neo 17 2023 Engineering Sample, i9-13900HX
31054 Points
Average NVIDIA GeForce RTX 3080 Ti Laptop GPU
  (6928 - 34439, n=43)
29496 Points -5%
Average NVIDIA GeForce RTX 3070
  (20357 - 33270, n=7)
28949 Points -7%
NVIDIA GeForce RTX 4070 Laptop GPU
AERO 16 OLED BSF, i9-13900H
28885 Points -7%
NVIDIA GeForce RTX 4070 Laptop GPU
Blade 18 RTX 4070, i9-13950HX
28743 Points -7%
Average AMD Radeon RX 6700M
  (27449 - 28399, n=2)
27924 Points -10%
NVIDIA GeForce RTX 4060 Laptop GPU
Katana 17 B13VFK, i7-13620H
27681 Points -11%
Average NVIDIA GeForce RTX 3070 Ti Laptop GPU
  (22612 - 32550, n=37)
27554 Points -11%
Average NVIDIA GeForce RTX 3080 Laptop GPU
  (16455 - 32366, n=46)
27420 Points -12%
Average AMD Radeon RX 6600M
  (21876 - 24788, n=7)
23563 Points -24%
NVIDIA GeForce RTX 4050 Laptop GPU
XMG Focus 15 Engineering Sample, i5-13500HX
23362 Points -25%
Average NVIDIA GeForce RTX 3060
  (18711 - 21984, n=5)
20966 Points -32%
Average NVIDIA GeForce RTX 3060 Laptop GPU
  (16354 - 23109, n=49)
20436 Points -34%
Average NVIDIA GeForce RTX 3050
  (15545 - 15824, n=2)
15685 Points -49%
Average NVIDIA GeForce RTX 3050 Ti Laptop GPU
  (7917 - 15611, n=26)
13090 Points -58%
Average NVIDIA GeForce RTX 3050 6GB Laptop GPU
  (11887 - 12618, n=3)
12155 Points -61%
3DMark 11 - 1280x720 Performance GPU
NVIDIA GeForce RTX 4070 Ti
TUF Gaming GeForce RTX 4070 Ti, i9-13900K
75990 Points +85%
NVIDIA GeForce RTX 4070 Ti
TUF Gaming GeForce RTX 4070 Ti, i9-13900K
75612 Points +84%
NVIDIA GeForce RTX 4090 Laptop GPU
Titan GT77 HX 13VI, i9-13950HX
69211 Points +69%
Average NVIDIA GeForce RTX 3090
  (55144 - 66934, n=17)
60853 Points +48%
NVIDIA GeForce RTX 4080 Laptop GPU
Blade 16 Early 2023, i9-13950HX
56565 Points +38%
NVIDIA GeForce RTX 4070 Laptop GPU
AERO 16 OLED BSF, i9-13900H
41480 Points +1%
NVIDIA GeForce RTX 4070 Laptop GPU
XMG Neo 17 2023 Engineering Sample, i9-13900HX
41027 Points
Average NVIDIA GeForce RTX 3070
  (26812 - 46878, n=9)
40835 Points 0%
Average AMD Radeon RX 6800M
  (39075 - 41706, n=2)
40391 Points -2%
NVIDIA GeForce RTX 4070 Laptop GPU
Blade 18 RTX 4070, i9-13950HX
39733 Points -3%
Average NVIDIA GeForce RTX 3080 Ti Laptop GPU
  (13920 - 45841, n=45)
39402 Points -4%
Average NVIDIA GeForce RTX 3080 Laptop GPU
  (31288 - 43744, n=40)
38259 Points -7%
NVIDIA GeForce RTX 4060 Laptop GPU
Katana 17 B13VFK, i7-13620H
36323 Points -11%
Average NVIDIA GeForce RTX 3070 Ti Laptop GPU
  (13799 - 42569, n=36)
35944 Points -12%
Average AMD Radeon RX 6700M
  ()
33497 Points -18%
NVIDIA GeForce RTX 4050 Laptop GPU
XMG Focus 15 Engineering Sample, i5-13500HX
31377 Points -24%
Average AMD Radeon RX 6600M
  (27030 - 32340, n=6)
31142 Points -24%
Average NVIDIA GeForce RTX 3060
  (24369 - 29172, n=5)
27785 Points -32%
Average NVIDIA GeForce RTX 3060 Laptop GPU
  (13799 - 30772, n=43)
26816 Points -35%
Average NVIDIA GeForce RTX 3050
  (21288 - 21427, n=2)
21358 Points -48%
Average NVIDIA GeForce RTX 3050 Ti Laptop GPU
  (7952 - 20905, n=27)
17562 Points -57%
Average NVIDIA GeForce RTX 3050 6GB Laptop GPU
  (15860 - 18059, n=3)
17113 Points -58%

Benchmarks de jogos

Nossos benchmarks de jogos sem traçado de raio e escalonamento mostram uma situação muito semelhante em comparação com os testes sintéticos. De modo geral, osComputador portátil RTX 4070é mais uma vez muito parecido com oLaptop RTX 3080 Tiapenas 4K ajustes às vezes mostram a limitação da VRAM menor. o jogo 4K ainda é possível com o laptop RTX 4070 em quase todos os jogos modernos.

OComputador portátil RTX 4060é mais uma vez comparável com oComputador portátil RTX 3070 Tie é mais adequado para QHD e também 4K configurações em muitos títulos.

Nossa versão rápida do Portátil RTX 4050 está no mesmo nível do GeForce RTX 3060 em muitos benchmarks de jogos, o que significa que ele é ideal para jogos 1080p e também configurações de QHD em muitos títulos.

Nota: No final deste artigo, incluímos mesas com mais benchmarks de jogos.

The Witcher 3
1920x1080 Ultra Graphics & Postprocessing (HBAO+)
Asus TUF Gaming GeForce RTX 4070 Ti
NVIDIA GeForce RTX 4070 Ti, i9-13900K
230 (207min, 208.68P1 - 258max) fps +85%
MSI Titan GT77 HX 13VI
NVIDIA GeForce RTX 4090 Laptop GPU, i9-13950HX, Samsung PM9A1 MZVL22T0HBLB
198.9 (190min, 191P1 - 214max) fps +60%
Average NVIDIA GeForce RTX 3090
  (160 - 192.6, n=17)
180.3 fps +45%
Razer Blade 16 Early 2023
NVIDIA GeForce RTX 4080 Laptop GPU, i9-13950HX, SSSTC CA6-8D1024
176.8 (159min - 192max) fps +43%
SCHENKER XMG Neo 17 2023 Engineering Sample
NVIDIA GeForce RTX 4070 Laptop GPU, i9-13900HX
124 fps
Gigabyte AERO 16 OLED BSF
NVIDIA GeForce RTX 4070 Laptop GPU, i9-13900H, Gigabyte AG470S1TB-SI B10
116 (48.5P0.1, 82.5P1) fps -6%
Razer Blade 18 RTX 4070
NVIDIA GeForce RTX 4070 Laptop GPU, i9-13950HX, SSSTC CA6-8D1024
113.9 (110min - 119max) fps -8%
Average NVIDIA GeForce RTX 3080 Ti Laptop GPU
  (30 - 130.6, n=43)
112.1 fps -10%
Average AMD Radeon RX 6800M
  (108 - 110, n=2)
109 fps -12%
Average NVIDIA GeForce RTX 3070
  (52.8 - 132.2, n=7)
106.1 fps -14%
Average NVIDIA GeForce RTX 3080 Laptop GPU
  (85.1 - 123, n=40)
105.1 fps -15%
MSI Katana 17 B13VFK
NVIDIA GeForce RTX 4060 Laptop GPU, i7-13620H, Micron 2400 MTFDKBA1T0QFM
104.7 (88min - 119max) fps -16%
Average NVIDIA GeForce RTX 3070 Ti Laptop GPU
  (76.8 - 124.1, n=39)
102.4 fps -17%
Average AMD Radeon RX 6700M
  ()
95.4 fps -23%
SCHENKER XMG Focus 15 Engineering Sample
NVIDIA GeForce RTX 4050 Laptop GPU, i5-13500HX
89 fps -28%
Average AMD Radeon RX 6600M
  (75.4 - 88.2, n=6)
84 fps -32%
Average NVIDIA GeForce RTX 3060 Laptop GPU
  (58.2 - 91.5, n=48)
76.9 fps -38%
Average NVIDIA GeForce RTX 3060
  (52.4 - 91.3, n=4)
72.3 fps -42%
Average NVIDIA GeForce RTX 3050
  (62.8 - 67.2, n=2)
65 fps -48%
Average NVIDIA GeForce RTX 3050 6GB Laptop GPU
  (43.7 - 52.9, n=3)
48.9 fps -61%
Average NVIDIA GeForce RTX 3050 Ti Laptop GPU
  (19 - 58.5, n=29)
47.5 fps -62%
3840x2160 High Graphics & Postprocessing (Nvidia HairWorks Off)
MSI Titan GT77 HX 13VI
NVIDIA GeForce RTX 4090 Laptop GPU, i9-13950HX, Samsung PM9A1 MZVL22T0HBLB
160 fps +167%
Asus TUF Gaming GeForce RTX 4070 Ti
NVIDIA GeForce RTX 4070 Ti, i9-13900K
151.9 (137min, 138.12P1 - 167max) fps +153%
Average NVIDIA GeForce RTX 3090
  (128 - 160.2, n=13)
151.8 fps +153%
Razer Blade 16 Early 2023
NVIDIA GeForce RTX 4080 Laptop GPU, i9-13950HX, SSSTC CA6-8D1024
120.6 (99min - 146max) fps +101%
Average NVIDIA GeForce RTX 3070
  (84 - 93.9, n=5)
89.3 fps +49%
Average NVIDIA GeForce RTX 3080 Ti Laptop GPU
  (62.1 - 94.3, n=8)
81.3 fps +36%
Average NVIDIA GeForce RTX 3070 Ti Laptop GPU
  (73.2 - 78, n=2)
75.6 fps +26%
Razer Blade 18 RTX 4070
NVIDIA GeForce RTX 4070 Laptop GPU, i9-13950HX, SSSTC CA6-8D1024
72.5 (66min - 80max) fps +21%
Average NVIDIA GeForce RTX 3080 Laptop GPU
  (60 - 82.2, n=11)
71.7 fps +20%
Average NVIDIA GeForce RTX 3060
  (62.1 - 90.3, n=3)
71.6 fps +19%
MSI Katana 17 B13VFK
NVIDIA GeForce RTX 4060 Laptop GPU, i7-13620H, Micron 2400 MTFDKBA1T0QFM
62.6 (55min - 70max) fps +4%
SCHENKER XMG Neo 17 2023 Engineering Sample
NVIDIA GeForce RTX 4070 Laptop GPU, i9-13900HX
60 fps
Average AMD Radeon RX 6800M
  ()
59.5 fps -1%
SCHENKER XMG Focus 15 Engineering Sample
NVIDIA GeForce RTX 4050 Laptop GPU, i5-13500HX
50 fps -17%
Average NVIDIA GeForce RTX 3060 Laptop GPU
  (26 - 59.3, n=5)
45.4 fps -24%
Average NVIDIA GeForce RTX 3050
  (43.8 - 44.1, n=2)
44 fps -27%
Average AMD Radeon RX 6600M
  (43.6 - 44.1, n=3)
43.9 fps -27%
Average NVIDIA GeForce RTX 3050 Ti Laptop GPU
  (10 - 38.4, n=4)
26.7 fps -55%
Metro Exodus
1920x1080 Ultra Quality AF:16x
Asus TUF Gaming GeForce RTX 4070 Ti
NVIDIA GeForce RTX 4070 Ti, i9-13900K
161.4 (78.05min - 296.03max) fps +77%
Average NVIDIA GeForce RTX 3090
  (108 - 145, n=12)
135.3 fps +49%
MSI Titan GT77 HX 13VI
NVIDIA GeForce RTX 4090 Laptop GPU, i9-13950HX, Samsung PM9A1 MZVL22T0HBLB
132 fps +45%
Razer Blade 16 Early 2023
NVIDIA GeForce RTX 4080 Laptop GPU, i9-13950HX, SSSTC CA6-8D1024
121.7 (54.5min - 212.1max) fps +34%
Average NVIDIA GeForce RTX 3070
  (91.3 - 97.7, n=5)
93.9 fps +3%
SCHENKER XMG Neo 17 2023 Engineering Sample
NVIDIA GeForce RTX 4070 Laptop GPU, i9-13900HX
91 fps
Average NVIDIA GeForce RTX 3080 Ti Laptop GPU
  ()
88.1 fps -3%
Razer Blade 18 RTX 4070
NVIDIA GeForce RTX 4070 Laptop GPU, i9-13950HX, SSSTC CA6-8D1024
86.8 (45.8min - 150max) fps -5%
Average AMD Radeon RX 6800M
  (78.7 - 79.3, n=3)
79 fps -13%
Average NVIDIA GeForce RTX 3080 Laptop GPU
  (68.7 - 87.9, n=6)
78 fps -14%
MSI Katana 17 B13VFK
NVIDIA GeForce RTX 4060 Laptop GPU, i7-13620H, Micron 2400 MTFDKBA1T0QFM
74.3 (37.14min - 137.46max) fps -18%
Average NVIDIA GeForce RTX 3070 Ti Laptop GPU
  (71 - 77.2, n=2)
74.1 fps -19%
SCHENKER XMG Focus 15 Engineering Sample
NVIDIA GeForce RTX 4050 Laptop GPU, i5-13500HX
64 fps -30%
Average NVIDIA GeForce RTX 3060 Laptop GPU
  (59.4 - 63.2, n=3)
61.6 fps -32%
Average AMD Radeon RX 6600M
  (55.6 - 62.3, n=4)
59.8 fps -34%
Average NVIDIA GeForce RTX 3060
  (37.8 - 65.3, n=5)
56.1 fps -38%
Average NVIDIA GeForce RTX 3050
  (44.8 - 47.2, n=2)
46 fps -49%
Average NVIDIA GeForce RTX 3050 Ti Laptop GPU
  (43.2 - 43.5, n=2)
43.4 fps -52%
2560x1440 Ultra Quality AF:16x
Asus TUF Gaming GeForce RTX 4070 Ti
NVIDIA GeForce RTX 4070 Ti, i9-13900K
132.1 (72.92min - 245.28max) fps +83%
MSI Titan GT77 HX 13VI
NVIDIA GeForce RTX 4090 Laptop GPU, i9-13950HX, Samsung PM9A1 MZVL22T0HBLB
116 fps +61%
Average NVIDIA GeForce RTX 3090
  (102 - 118.2, n=12)
113.2 fps +57%
Razer Blade 16 Early 2023
NVIDIA GeForce RTX 4080 Laptop GPU, i9-13950HX, SSSTC CA6-8D1024
102 (50.6min - 175.9max) fps +42%
Average NVIDIA GeForce RTX 3070
  (74.4 - 78.3, n=5)
75.8 fps +5%
Average NVIDIA GeForce RTX 3080 Ti Laptop GPU
  ()
73.2 fps +2%
SCHENKER XMG Neo 17 2023 Engineering Sample
NVIDIA GeForce RTX 4070 Laptop GPU, i9-13900HX
72 fps
Razer Blade 18 RTX 4070
NVIDIA GeForce RTX 4070 Laptop GPU, i9-13950HX, SSSTC CA6-8D1024
69 (39.5min - 112.2max) fps -4%
MSI Katana 17 B13VFK
NVIDIA GeForce RTX 4060 Laptop GPU, i7-13620H, Micron 2400 MTFDKBA1T0QFM
59 (32.33min - 97.31max) fps -18%
Average AMD Radeon RX 6800M
  (55.9 - 61.4, n=2)
58.7 fps -18%
Average NVIDIA GeForce RTX 3080 Laptop GPU
  (45.1 - 59.4, n=5)
55.1 fps -23%
Average NVIDIA GeForce RTX 3070 Ti Laptop GPU
  ()
52.7 fps -27%
SCHENKER XMG Focus 15 Engineering Sample
NVIDIA GeForce RTX 4050 Laptop GPU, i5-13500HX
50 fps -31%
Average NVIDIA GeForce RTX 3060
  (48.6 - 51.7, n=4)
49.9 fps -31%
Average NVIDIA GeForce RTX 3060 Laptop GPU
  ()
49.6 fps -31%
Average AMD Radeon RX 6600M
  (45.1 - 47.6, n=3)
46.5 fps -35%
Average NVIDIA GeForce RTX 3050
  (35.7 - 36.9, n=2)
36.3 fps -50%
Average NVIDIA GeForce RTX 3050 Ti Laptop GPU
  ()
34.2 fps -52%
3840x2160 Ultra Quality AF:16x
Asus TUF Gaming GeForce RTX 4070 Ti
NVIDIA GeForce RTX 4070 Ti, i9-13900K
84.5 (55.02min - 124.04max) fps +84%
MSI Titan GT77 HX 13VI
NVIDIA GeForce RTX 4090 Laptop GPU, i9-13950HX, Samsung PM9A1 MZVL22T0HBLB
81 fps +76%
Average NVIDIA GeForce RTX 3090
  (70.6 - 77.3, n=12)
75 fps +63%
Razer Blade 16 Early 2023
NVIDIA GeForce RTX 4080 Laptop GPU, i9-13950HX, SSSTC CA6-8D1024
67 (34min - 118.9max) fps +46%
Average NVIDIA GeForce RTX 3070
  (48.3 - 49.7, n=5)
48.9 fps +6%
Average NVIDIA GeForce RTX 3080 Ti Laptop GPU
  ()
47.6 fps +3%
SCHENKER XMG Neo 17 2023 Engineering Sample
NVIDIA GeForce RTX 4070 Laptop GPU, i9-13900HX
46 fps
SCHENKER XMG Focus 15 Engineering Sample
NVIDIA GeForce RTX 4050 Laptop GPU, i5-13500HX
45 fps -2%
Razer Blade 18 RTX 4070
NVIDIA GeForce RTX 4070 Laptop GPU, i9-13950HX, SSSTC CA6-8D1024
44 (27.9min - 66.4max) fps -4%
Average NVIDIA GeForce RTX 3080 Laptop GPU
  (35.4 - 45.1, n=5)
38.4 fps -17%
Average AMD Radeon RX 6800M
  (37.1 - 39.6, n=2)
38.4 fps -17%
MSI Katana 17 B13VFK
NVIDIA GeForce RTX 4060 Laptop GPU, i7-13620H, Micron 2400 MTFDKBA1T0QFM
36.8 (22.74min - 56max) fps -20%
Average NVIDIA GeForce RTX 3060
  (31.3 - 32.2, n=4)
31.7 fps -31%
Average NVIDIA GeForce RTX 3060 Laptop GPU
  ()
31.4 fps -32%
Average AMD Radeon RX 6600M
  (27.3 - 28.7, n=3)
28.1 fps -39%
Average NVIDIA GeForce RTX 3050
  (22.4 - 22.7, n=2)
22.6 fps -51%
Average NVIDIA GeForce RTX 3050 Ti Laptop GPU
  ()
21.1 fps -54%
Borderlands 3
1920x1080 Badass Overall Quality (DX11)
Asus TUF Gaming GeForce RTX 4070 Ti
NVIDIA GeForce RTX 4070 Ti, i9-13900K
186.9 fps +71%
MSI Titan GT77 HX 13VI
NVIDIA GeForce RTX 4090 Laptop GPU, i9-13950HX, Samsung PM9A1 MZVL22T0HBLB
151 fps +39%
Average NVIDIA GeForce RTX 3090
  (117 - 170.1, n=13)
150.7 fps +38%
Razer Blade 16 Early 2023
NVIDIA GeForce RTX 4080 Laptop GPU, i9-13950HX, SSSTC CA6-8D1024
133.5 fps +22%
SCHENKER XMG Neo 17 2023 Engineering Sample
NVIDIA GeForce RTX 4070 Laptop GPU, i9-13900HX
109 fps
Average NVIDIA GeForce RTX 3070
  (95.3 - 108.9, n=5)
100.6 fps -8%
Razer Blade 18 RTX 4070
NVIDIA GeForce RTX 4070 Laptop GPU, i9-13950HX, SSSTC CA6-8D1024
100.3 fps -8%
Average NVIDIA GeForce RTX 3080 Ti Laptop GPU
  ()
90.7 fps -17%
Average NVIDIA GeForce RTX 3080 Laptop GPU
  (76.5 - 91.3, n=4)
85.8 fps -21%
MSI Katana 17 B13VFK
NVIDIA GeForce RTX 4060 Laptop GPU, i7-13620H, Micron 2400 MTFDKBA1T0QFM
83.9 fps -23%
Average NVIDIA GeForce RTX 3070 Ti Laptop GPU
  ()
80.9 fps -26%
Average AMD Radeon RX 6800M
  (77.6 - 83.9, n=3)
80.2 fps -26%
Average NVIDIA GeForce RTX 3060
  (58.5 - 100, n=5)
79.4 fps -27%
SCHENKER XMG Focus 15 Engineering Sample
NVIDIA GeForce RTX 4050 Laptop GPU, i5-13500HX
73 fps -33%
Average NVIDIA GeForce RTX 3060 Laptop GPU
  (69.3 - 74.3, n=4)
72.2 fps -34%
Average AMD Radeon RX 6700M
  ()
71.2 fps -35%
Average AMD Radeon RX 6600M
  (59.9 - 67.3, n=5)
64.8 fps -41%
Average NVIDIA GeForce RTX 3050
  (55.7 - 57.6, n=2)
56.7 fps -48%
Average NVIDIA GeForce RTX 3050 Ti Laptop GPU
  (36.8 - 50.2, n=3)
44 fps -60%
2560x1440 Badass Overall Quality (DX11)
Asus TUF Gaming GeForce RTX 4070 Ti
NVIDIA GeForce RTX 4070 Ti, i9-13900K
140.6 fps +87%
MSI Titan GT77 HX 13VI
NVIDIA GeForce RTX 4090 Laptop GPU, i9-13950HX, Samsung PM9A1 MZVL22T0HBLB
130 fps +73%
Average NVIDIA GeForce RTX 3090
  (105 - 131.6, n=13)
123.8 fps +65%
Razer Blade 16 Early 2023
NVIDIA GeForce RTX 4080 Laptop GPU, i9-13950HX, SSSTC CA6-8D1024
108.7 fps +45%
Average NVIDIA GeForce RTX 3080 Ti Laptop GPU
  ()
78.2 fps +4%
Average NVIDIA GeForce RTX 3070
  (75.1 - 82.9, n=5)
77.7 fps +4%
SCHENKER XMG Neo 17 2023 Engineering Sample
NVIDIA GeForce RTX 4070 Laptop GPU, i9-13900HX
75 fps
Razer Blade 18 RTX 4070
NVIDIA GeForce RTX 4070 Laptop GPU, i9-13950HX, SSSTC CA6-8D1024
68.7 fps -8%
Average AMD Radeon RX 6800M
  (57 - 67.2, n=2)
62.1 fps -17%
Average NVIDIA GeForce RTX 3080 Laptop GPU
  (55.7 - 65.2, n=4)
62 fps -17%
Average NVIDIA GeForce RTX 3060
  (54 - 70.2, n=4)
59.9 fps -20%
Average NVIDIA GeForce RTX 3070 Ti Laptop GPU
  ()
58.7 fps -22%
Average NVIDIA GeForce RTX 3060 Laptop GPU
  (51.3 - 52.4, n=2)
51.9 fps -31%
SCHENKER XMG Focus 15 Engineering Sample
NVIDIA GeForce RTX 4050 Laptop GPU, i5-13500HX
50 fps -33%
Average AMD Radeon RX 6600M
  (44.9 - 45.7, n=3)
45.2 fps -40%
Average NVIDIA GeForce RTX 3050
  (40.3 - 40.4, n=2)
40.4 fps -46%
Average NVIDIA GeForce RTX 3050 Ti Laptop GPU
  ()
35.6 fps -53%
3840x2160 Badass Overall Quality (DX11)
MSI Titan GT77 HX 13VI
NVIDIA GeForce RTX 4090 Laptop GPU, i9-13950HX, Samsung PM9A1 MZVL22T0HBLB
76 fps +90%
Asus TUF Gaming GeForce RTX 4070 Ti
NVIDIA GeForce RTX 4070 Ti, i9-13900K
74.1 fps +85%
Average NVIDIA GeForce RTX 3090
  (68 - 75.3, n=13)
72.8 fps +82%
Razer Blade 16 Early 2023
NVIDIA GeForce RTX 4080 Laptop GPU, i9-13950HX, SSSTC CA6-8D1024
59.8 fps +50%
Average NVIDIA GeForce RTX 3080 Ti Laptop GPU
  ()
46.1 fps +15%
Average NVIDIA GeForce RTX 3070
  (42.7 - 46.3, n=5)
44.3 fps +11%
SCHENKER XMG Neo 17 2023 Engineering Sample
NVIDIA GeForce RTX 4070 Laptop GPU, i9-13900HX
40 fps
Razer Blade 18 RTX 4070
NVIDIA GeForce RTX 4070 Laptop GPU, i9-13950HX, SSSTC CA6-8D1024
35.7 fps -11%
Average NVIDIA GeForce RTX 3080 Laptop GPU
  (32.3 - 36, n=4)
34.7 fps -13%
Average AMD Radeon RX 6800M
  (30.3 - 35.8, n=2)
33.1 fps -17%
Average NVIDIA GeForce RTX 3060
  (29.5 - 36.8, n=4)
32.4 fps -19%
Average NVIDIA GeForce RTX 3060 Laptop GPU
  ()
28.5 fps -29%
SCHENKER XMG Focus 15 Engineering Sample
NVIDIA GeForce RTX 4050 Laptop GPU, i5-13500HX
26 fps -35%
Average AMD Radeon RX 6600M
  (23.7 - 24.1, n=3)
23.9 fps -40%
Average NVIDIA GeForce RTX 3050
  (21.5 - 21.8, n=2)
21.7 fps -46%
Average NVIDIA GeForce RTX 3050 Ti Laptop GPU
  ()
16.3 fps -59%
GTA V
1920x1080 Highest Settings possible AA:4xMSAA + FX AF:16x
Asus TUF Gaming GeForce RTX 4070 Ti
NVIDIA GeForce RTX 4070 Ti, i9-13900K
172.3 (5.8min, 142.9P1 - 415max) fps +32%
Average NVIDIA GeForce RTX 3090
  (104 - 169.8, n=17)
147.5 fps +13%
MSI Titan GT77 HX 13VI
NVIDIA GeForce RTX 4090 Laptop GPU, i9-13950HX, Samsung PM9A1 MZVL22T0HBLB
140.9 (3.54min, 83.3P1 - 244max) fps +8%
Razer Blade 16 Early 2023
NVIDIA GeForce RTX 4080 Laptop GPU, i9-13950HX, SSSTC CA6-8D1024
140.7 (3.02min, 100P1 - 272max) fps +8%
SCHENKER XMG Neo 17 2023 Engineering Sample
NVIDIA GeForce RTX 4070 Laptop GPU, i9-13900HX
130.5 (3.9min, 83.3P1 - 227max) fps
Gigabyte AERO 16 OLED BSF
NVIDIA GeForce RTX 4070 Laptop GPU, i9-13900H, Gigabyte AG470S1TB-SI B10
123.2 (3.96min, 76.9P1 - 222max) fps -6%
Razer Blade 18 RTX 4070
NVIDIA GeForce RTX 4070 Laptop GPU, i9-13950HX, SSSTC CA6-8D1024
121.4 (3.6min, 76.9P1 - 236max) fps -7%
MSI Katana 17 B13VFK
NVIDIA GeForce RTX 4060 Laptop GPU, i7-13620H, Micron 2400 MTFDKBA1T0QFM
112.1 (8min, 62.5P1 - 277max) fps -14%
Average NVIDIA GeForce RTX 3080 Ti Laptop GPU
  (30 - 139.2, n=42)
111 fps -15%
Average NVIDIA GeForce RTX 3070 Ti Laptop GPU
  (44 - 123.9, n=36)
106.7 fps -18%
Average NVIDIA GeForce RTX 3070
  (91.1 - 122.4, n=4)
104.3 fps -20%
Average NVIDIA GeForce RTX 3080 Laptop GPU
  (68.6 - 114.6, n=34)
97.7 fps -25%
Average NVIDIA GeForce RTX 3060
  (77.1 - 111, n=5)
97.3 fps -25%
SCHENKER XMG Focus 15 Engineering Sample
NVIDIA GeForce RTX 4050 Laptop GPU, i5-13500HX
92.4 (4.29min, 58.8P1 - 168.7max) fps -29%
Average NVIDIA GeForce RTX 3060 Laptop GPU
  (69.2 - 109.8, n=46)
89.7 fps -31%
Average AMD Radeon RX 6700M
  ()
86.2 fps -34%
Average AMD Radeon RX 6800M
  (75.1 - 92.8, n=2)
84 fps -36%
Average NVIDIA GeForce RTX 3050
  (78.2 - 83.6, n=2)
80.9 fps -38%
Average AMD Radeon RX 6600M
  (65.9 - 88.7, n=6)
78.6 fps -40%
Average NVIDIA GeForce RTX 3050 Ti Laptop GPU
  (27.8 - 75.6, n=26)
63.3 fps -51%
Average NVIDIA GeForce RTX 3050 6GB Laptop GPU
  (53 - 63.8, n=3)
59.8 fps -54%
2560x1440 Highest Settings possible AA:4xMSAA + FX AF:16x
Asus TUF Gaming GeForce RTX 4070 Ti
NVIDIA GeForce RTX 4070 Ti, i9-13900K
158.4 (2.83min, 111.1P1 - 308max) fps +72%
Average NVIDIA GeForce RTX 3090
  (99.3 - 160, n=15)
141.6 fps +54%
MSI Titan GT77 HX 13VI
NVIDIA GeForce RTX 4090 Laptop GPU, i9-13950HX, Samsung PM9A1 MZVL22T0HBLB
138.5 (3.45min, 76.9P1 - 256max) fps +50%
Razer Blade 16 Early 2023
NVIDIA GeForce RTX 4080 Laptop GPU, i9-13950HX, SSSTC CA6-8D1024
125.2 (3.73min, 83.3P1 - 206max) fps +36%
Average NVIDIA GeForce RTX 3080 Ti Laptop GPU
  (30 - 121.2, n=28)
98.2 fps +7%
Average NVIDIA GeForce RTX 3070
  (86.5 - 113.1, n=4)
97.4 fps +6%
Average NVIDIA GeForce RTX 3070 Ti Laptop GPU
  (72.7 - 108.7, n=22)
92.9 fps +1%
SCHENKER XMG Neo 17 2023 Engineering Sample
NVIDIA GeForce RTX 4070 Laptop GPU, i9-13900HX
92.2 (5.62min, 58.8P1 - 182max) fps
Average NVIDIA GeForce RTX 3080 Laptop GPU
  (82.2 - 99.1, n=12)
91.6 fps -1%
Gigabyte AERO 16 OLED BSF
NVIDIA GeForce RTX 4070 Laptop GPU, i9-13900H, Gigabyte AG470S1TB-SI B10
90.6 (6.42min, 55.6P1 - 175.3max) fps -2%
Razer Blade 18 RTX 4070
NVIDIA GeForce RTX 4070 Laptop GPU, i9-13950HX, SSSTC CA6-8D1024
87.6 (4.62min, 55.6P1 - 218max) fps -5%
Average AMD Radeon RX 6800M
  ()
84 fps -9%
MSI Katana 17 B13VFK
NVIDIA GeForce RTX 4060 Laptop GPU, i7-13620H, Micron 2400 MTFDKBA1T0QFM
83 (5.89min, 45.5P1 - 161.1max) fps -10%
Average NVIDIA GeForce RTX 3060
  (77.5 - 82.9, n=4)
80.8 fps -12%
Average NVIDIA GeForce RTX 3060 Laptop GPU
  (52 - 86.5, n=23)
74.3 fps -19%
SCHENKER XMG Focus 15 Engineering Sample
NVIDIA GeForce RTX 4050 Laptop GPU, i5-13500HX
64.1 (3.43min, 41.7P1 - 136.8max) fps -30%
Average AMD Radeon RX 6600M
  (49.3 - 63.8, n=4)
58.8 fps -36%
Average NVIDIA GeForce RTX 3050
  (54.7 - 59.1, n=2)
56.9 fps -38%
Average NVIDIA GeForce RTX 3050 Ti Laptop GPU
  (22.8 - 53.4, n=9)
41.4 fps -55%
Average NVIDIA GeForce RTX 3050 6GB Laptop GPU
  (36.5 - 42.7, n=2)
39.6 fps -57%
3840x2160 High/On (Advanced Graphics Off) AA:FX AF:8x
Average NVIDIA GeForce RTX 3090
  (151 - 184.2, n=15)
176.5 fps +91%
MSI Titan GT77 HX 13VI
NVIDIA GeForce RTX 4090 Laptop GPU, i9-13950HX, Samsung PM9A1 MZVL22T0HBLB
175.7 (2.91min, 111.1P1 - 424max) fps +90%
Asus TUF Gaming GeForce RTX 4070 Ti
NVIDIA GeForce RTX 4070 Ti, i9-13900K
171.8 (4.03min, 111.1P1 - 586max) fps +86%
Razer Blade 16 Early 2023
NVIDIA GeForce RTX 4080 Laptop GPU, i9-13950HX, SSSTC CA6-8D1024
143.7 (4.72min, 62.5P1 - 291max) fps +55%
Average NVIDIA GeForce RTX 3070
  (110 - 125.9, n=4)
116.2 fps +26%
Average NVIDIA GeForce RTX 3080 Ti Laptop GPU
  (78.2 - 134.4, n=12)
115.4 fps +25%
Average NVIDIA GeForce RTX 3070 Ti Laptop GPU
  (92.1 - 98, n=2)
95.1 fps +3%
SCHENKER XMG Neo 17 2023 Engineering Sample
NVIDIA GeForce RTX 4070 Laptop GPU, i9-13900HX
92.5 (11min, 62.5P1 - 233max) fps
Average NVIDIA GeForce RTX 3080 Laptop GPU
  (64.8 - 112, n=11)
92.4 fps 0%
Razer Blade 18 RTX 4070
NVIDIA GeForce RTX 4070 Laptop GPU, i9-13950HX, SSSTC CA6-8D1024
88.5 (5.15min, 58.8P1 - 280max) fps -4%
Average AMD Radeon RX 6800M
  ()
85.4 fps -8%
Average NVIDIA GeForce RTX 3060
  (82 - 82.8, n=4)
82.4 fps -11%
MSI Katana 17 B13VFK
NVIDIA GeForce RTX 4060 Laptop GPU, i7-13620H, Micron 2400 MTFDKBA1T0QFM
82.1 (5.63min, 50P1 - 264max) fps -11%
Gigabyte AERO 16 OLED BSF
NVIDIA GeForce RTX 4070 Laptop GPU, i9-13900H, Gigabyte AG470S1TB-SI B10
75 (22.1min, 47.6P1 - 242max) fps -19%
Average NVIDIA GeForce RTX 3060 Laptop GPU
  (42.8 - 80.5, n=4)
67.4 fps -27%
SCHENKER XMG Focus 15 Engineering Sample
NVIDIA GeForce RTX 4050 Laptop GPU, i5-13500HX
63.5 (7.33min, 43.5P1 - 255max) fps -31%
Average AMD Radeon RX 6600M
  (57.6 - 58.7, n=3)
58.1 fps -37%
Average NVIDIA GeForce RTX 3050
  (55.8 - 58.3, n=2)
57.1 fps -38%
Average NVIDIA GeForce RTX 3050 Ti Laptop GPU
  ()
43.9 fps -53%
Cyberpunk 2077 1.6
1920x1080 Ultra Preset
Asus TUF Gaming GeForce RTX 4070 Ti
NVIDIA GeForce RTX 4070 Ti, i9-13900K
167.4 (70.9min - 228max) fps +84%
MSI Titan GT77 HX 13VI
NVIDIA GeForce RTX 4090 Laptop GPU, i9-13950HX, Samsung PM9A1 MZVL22T0HBLB
135 fps +48%
Average NVIDIA GeForce RTX 3090
  (78.6 - 173, n=10)
130.4 fps +43%
Razer Blade 16 Early 2023
NVIDIA GeForce RTX 4080 Laptop GPU, i9-13950HX, SSSTC CA6-8D1024
106.2 (47.5min - 153.9max) fps +17%
Average NVIDIA GeForce RTX 3070
  (90.3 - 114, n=2)
102.2 fps +12%
Average AMD Radeon RX 6800M
  (76.9 - 119, n=2)
98 fps +8%
Average NVIDIA GeForce RTX 3080 Ti Laptop GPU
  (54 - 144.1, n=16)
93.6 fps +3%
Razer Blade 18 RTX 4070
NVIDIA GeForce RTX 4070 Laptop GPU, i9-13950HX, SSSTC CA6-8D1024
92.1 (17.3min - 159max) fps +1%
SCHENKER XMG Neo 17 2023 Engineering Sample
NVIDIA GeForce RTX 4070 Laptop GPU, i9-13900HX
91 fps
Gigabyte AERO 16 OLED BSF
NVIDIA GeForce RTX 4070 Laptop GPU, i9-13900H, Gigabyte AG470S1TB-SI B10
84.75 (28.94min - 126.38max) fps -7%
Average NVIDIA GeForce RTX 3080 Laptop GPU
  (75 - 89.8, n=3)
80.1 fps -12%
Average NVIDIA GeForce RTX 3070 Ti Laptop GPU
  (48.5 - 104, n=13)
79.2 fps -13%
MSI Katana 17 B13VFK
NVIDIA GeForce RTX 4060 Laptop GPU, i7-13620H, Micron 2400 MTFDKBA1T0QFM
73.81 (36.7min - 103.1max) fps -19%
SCHENKER XMG Focus 15 Engineering Sample
NVIDIA GeForce RTX 4050 Laptop GPU, i5-13500HX
65 fps -29%
Average NVIDIA GeForce RTX 3060
  ()
64.2 fps -29%
Average NVIDIA GeForce RTX 3060 Laptop GPU
  (40 - 78.8, n=16)
61.1 fps -33%
Average NVIDIA GeForce RTX 3050
  ()
60.5 fps -34%
Average AMD Radeon RX 6600M
  (55 - 61.2, n=3)
59 fps -35%
Average NVIDIA GeForce RTX 3050 Ti Laptop GPU
  (31 - 50.5, n=9)
40.9 fps -55%
Average NVIDIA GeForce RTX 3050 6GB Laptop GPU
  ()
38.5 fps -58%
2560x1440 Ultra Preset
Asus TUF Gaming GeForce RTX 4070 Ti
NVIDIA GeForce RTX 4070 Ti, i9-13900K
122.9 (100.2min - 174.9max) fps +116%
MSI Titan GT77 HX 13VI
NVIDIA GeForce RTX 4090 Laptop GPU, i9-13950HX, Samsung PM9A1 MZVL22T0HBLB
98 fps +72%
Average NVIDIA GeForce RTX 3090
  (78 - 96, n=8)
90.6 fps +59%
Razer Blade 16 Early 2023
NVIDIA GeForce RTX 4080 Laptop GPU, i9-13950HX, SSSTC CA6-8D1024
81.2 (32.5min - 122.6max) fps +42%
Average NVIDIA GeForce RTX 3070
  (60.6 - 62.7, n=2)
61.7 fps +8%
SCHENKER XMG Neo 17 2023 Engineering Sample
NVIDIA GeForce RTX 4070 Laptop GPU, i9-13900HX
57 fps
Average NVIDIA GeForce RTX 3080 Ti Laptop GPU
  (36 - 69.6, n=13)
55.4 fps -3%
Razer Blade 18 RTX 4070
NVIDIA GeForce RTX 4070 Laptop GPU, i9-13950HX, SSSTC CA6-8D1024
54 (35.6min - 99.5max) fps -5%
Gigabyte AERO 16 OLED BSF
NVIDIA GeForce RTX 4070 Laptop GPU, i9-13900H, Gigabyte AG470S1TB-SI B10
53.28 (28.06min - 87.11max) fps -7%
Average AMD Radeon RX 6800M
  (48.1 - 53.3, n=2)
50.7 fps -11%
Average NVIDIA GeForce RTX 3070 Ti Laptop GPU
  (40 - 62, n=10)
50.1 fps -12%
Average NVIDIA GeForce RTX 3080 Laptop GPU
  (47.9 - 48.1, n=2)
48 fps -16%
MSI Katana 17 B13VFK
NVIDIA GeForce RTX 4060 Laptop GPU, i7-13620H, Micron 2400 MTFDKBA1T0QFM
45.9 (34.7min - 59.9max) fps -19%
Average NVIDIA GeForce RTX 3060
  ()
39.1 fps -31%
Average AMD Radeon RX 6600M
  (36 - 41.5, n=2)
38.8 fps -32%
Average NVIDIA GeForce RTX 3060 Laptop GPU
  (23 - 45.8, n=9)
36.5 fps -36%
SCHENKER XMG Focus 15 Engineering Sample
NVIDIA GeForce RTX 4050 Laptop GPU, i5-13500HX
32 fps -44%
Average NVIDIA GeForce RTX 3050
  ()
29.8 fps -48%
Average NVIDIA GeForce RTX 3050 Ti Laptop GPU
  (20 - 25, n=4)
22.2 fps -61%
3840x2160 Ultra Preset
MSI Titan GT77 HX 13VI
NVIDIA GeForce RTX 4090 Laptop GPU, i9-13950HX, Samsung PM9A1 MZVL22T0HBLB
56 fps +115%
Asus TUF Gaming GeForce RTX 4070 Ti
NVIDIA GeForce RTX 4070 Ti, i9-13900K
50.1 (42min - 64.5max) fps +93%
Average NVIDIA GeForce RTX 3090
  (43.9 - 48.6, n=8)
46.4 fps +78%
Razer Blade 16 Early 2023
NVIDIA GeForce RTX 4080 Laptop GPU, i9-13950HX, SSSTC CA6-8D1024
40 (20.8min - 74.9max) fps +54%
Average NVIDIA GeForce RTX 3070
  (29 - 30.2, n=2)
29.6 fps +14%
Average NVIDIA GeForce RTX 3080 Ti Laptop GPU
  (19.6 - 32.4, n=6)
27.1 fps +4%
Average NVIDIA GeForce RTX 3070 Ti Laptop GPU
  (24.6 - 28.1, n=2)
26.4 fps +2%
SCHENKER XMG Neo 17 2023 Engineering Sample
NVIDIA GeForce RTX 4070 Laptop GPU, i9-13900HX
26 fps
Razer Blade 18 RTX 4070
NVIDIA GeForce RTX 4070 Laptop GPU, i9-13950HX, SSSTC CA6-8D1024
23.3 (15.6min - 32.1max) fps -10%
Average AMD Radeon RX 6800M
  (22.1 - 23.4, n=2)
22.8 fps -12%
Average NVIDIA GeForce RTX 3080 Laptop GPU
  (22.4 - 23, n=2)
22.7 fps -13%
MSI Katana 17 B13VFK
NVIDIA GeForce RTX 4060 Laptop GPU, i7-13620H, Micron 2400 MTFDKBA1T0QFM
21.1 (17min - 28.5max) fps -19%
Gigabyte AERO 16 OLED BSF
NVIDIA GeForce RTX 4070 Laptop GPU, i9-13900H, Gigabyte AG470S1TB-SI B10
19.59 (5.98min - 27.64max) fps -25%
Average AMD Radeon RX 6600M
  (14.4 - 23.2, n=2)
18.8 fps -28%
SCHENKER XMG Focus 15 Engineering Sample
NVIDIA GeForce RTX 4050 Laptop GPU, i5-13500HX
18 fps -31%
Average NVIDIA GeForce RTX 3060
  ()
17.7 fps -32%
Average NVIDIA GeForce RTX 3060 Laptop GPU
  (11 - 17.9, n=4)
14.6 fps -44%
Average NVIDIA GeForce RTX 3050
  ()
12.2 fps -53%
Average NVIDIA GeForce RTX 3050 Ti Laptop GPU
  ()
10.4 fps -60%
Dota 2 Reborn
1920x1080 ultra (3/3) best looking
Asus TUF Gaming GeForce RTX 4070 Ti
NVIDIA GeForce RTX 4070 Ti, i9-13900K
245.5 (204.7min) fps +36%
Average NVIDIA GeForce RTX 3090
  (134.3 - 244, n=16)
203 fps +12%
Razer Blade 16 Early 2023
NVIDIA GeForce RTX 4080 Laptop GPU, i9-13950HX, SSSTC CA6-8D1024
194.7 (160min) fps +8%
MSI Titan GT77 HX 13VI
NVIDIA GeForce RTX 4090 Laptop GPU, i9-13950HX, Samsung PM9A1 MZVL22T0HBLB
185.9 (157.5min) fps +3%
Average NVIDIA GeForce RTX 3050
  (154.7 - 208, n=2)
181.3 fps 0%
SCHENKER XMG Neo 17 2023 Engineering Sample
NVIDIA GeForce RTX 4070 Laptop GPU, i9-13900HX
180.6 (157.3min) fps
Razer Blade 18 RTX 4070
NVIDIA GeForce RTX 4070 Laptop GPU, i9-13950HX, SSSTC CA6-8D1024
178.6 (153.9min) fps -1%
SCHENKER XMG Focus 15 Engineering Sample
NVIDIA GeForce RTX 4050 Laptop GPU, i5-13500HX
161.7 (139.6min) fps -10%
MSI Katana 17 B13VFK
NVIDIA GeForce RTX 4060 Laptop GPU, i7-13620H, Micron 2400 MTFDKBA1T0QFM
156.3 (132.3min) fps -13%
Gigabyte AERO 16 OLED BSF
NVIDIA GeForce RTX 4070 Laptop GPU, i9-13900H, Gigabyte AG470S1TB-SI B10
144.5 (123.6min) fps -20%
Average NVIDIA GeForce RTX 3080 Ti Laptop GPU
  (29.9 - 170.5, n=45)
141.1 fps -22%
Average NVIDIA GeForce RTX 3060
  (110.5 - 159.7, n=5)
135.7 fps -25%
Average NVIDIA GeForce RTX 3070 Ti Laptop GPU
  (68.7 - 160.5, n=38)
135.6 fps -25%
Average NVIDIA GeForce RTX 3080 Laptop GPU
  (98 - 156, n=45)
126.5 fps -30%
Average NVIDIA GeForce RTX 3060 Laptop GPU
  (90.7 - 154.8, n=49)
125.9 fps -30%
Average NVIDIA GeForce RTX 3070
  (92.1 - 136.3, n=6)
119.2 fps -34%
Average AMD Radeon RX 6800M
  ()
114.8 fps -36%
Average NVIDIA GeForce RTX 3050 Ti Laptop GPU
  (67.3 - 145, n=27)
113 fps -37%
Average AMD Radeon RX 6700M
  ()
112 fps -38%
Average NVIDIA GeForce RTX 3050 6GB Laptop GPU
  (98 - 116.9, n=3)
104.8 fps -42%
Average AMD Radeon RX 6600M
  (91.4 - 110.1, n=8)
100.9 fps -44%
3840x2160 ultra (3/3) best looking
Asus TUF Gaming GeForce RTX 4070 Ti
NVIDIA GeForce RTX 4070 Ti, i9-13900K
231.5 (185.5min) fps +54%
Average NVIDIA GeForce RTX 3090
  (138.6 - 222, n=16)
191.3 fps +27%
MSI Titan GT77 HX 13VI
NVIDIA GeForce RTX 4090 Laptop GPU, i9-13950HX, Samsung PM9A1 MZVL22T0HBLB
178.9 (144.9min) fps +19%
Razer Blade 16 Early 2023
NVIDIA GeForce RTX 4080 Laptop GPU, i9-13950HX, SSSTC CA6-8D1024
176.7 (125min) fps +17%
SCHENKER XMG Neo 17 2023 Engineering Sample
NVIDIA GeForce RTX 4070 Laptop GPU, i9-13900HX
150.7 (130.6min) fps
Razer Blade 18 RTX 4070
NVIDIA GeForce RTX 4070 Laptop GPU, i9-13950HX, SSSTC CA6-8D1024
145.5 (109.1min) fps -3%
Gigabyte AERO 16 OLED BSF
NVIDIA GeForce RTX 4070 Laptop GPU, i9-13900H, Gigabyte AG470S1TB-SI B10
128.3 (108.4min) fps -15%
MSI Katana 17 B13VFK
NVIDIA GeForce RTX 4060 Laptop GPU, i7-13620H, Micron 2400 MTFDKBA1T0QFM
126 (105.9min) fps -16%
Average NVIDIA GeForce RTX 3070
  (122.7 - 128.5, n=4)
125.5 fps -17%
Average NVIDIA GeForce RTX 3080 Ti Laptop GPU
  (70.8 - 155.6, n=19)
124.8 fps -17%
Average NVIDIA GeForce RTX 3070 Ti Laptop GPU
  (58.3 - 148.9, n=5)
117.6 fps -22%
SCHENKER XMG Focus 15 Engineering Sample
NVIDIA GeForce RTX 4050 Laptop GPU, i5-13500HX
115.2 (100.5min) fps -24%
Average NVIDIA GeForce RTX 3060
  (109.3 - 116.1, n=4)
113.7 fps -25%
Average NVIDIA GeForce RTX 3080 Laptop GPU
  (55.2 - 128, n=17)
106 fps -30%
Average AMD Radeon RX 6800M
  ()
95.2 fps -37%
Average NVIDIA GeForce RTX 3050
  (93.1 - 94.4, n=2)
93.8 fps -38%
Average NVIDIA GeForce RTX 3060 Laptop GPU
  (46.9 - 107, n=11)
89 fps -41%
Average AMD Radeon RX 6600M
  (79.2 - 81.7, n=3)
80.7 fps -46%
Average NVIDIA GeForce RTX 3050 Ti Laptop GPU
  (31.9 - 76.6, n=6)
55.9 fps -63%
F1 22
1920x1080 Ultra High Preset AA:T AF:16x
Asus TUF Gaming GeForce RTX 4070 Ti
NVIDIA GeForce RTX 4070 Ti, i9-13900K
143.5 (124min, 105P1 - 166max) fps +76%
MSI Titan GT77 HX 13VI
NVIDIA GeForce RTX 4090 Laptop GPU, i9-13950HX, Samsung PM9A1 MZVL22T0HBLB
138.2 (118min, 84P1 - 161max) fps +69%
Average NVIDIA GeForce RTX 3090
  (122.6 - 136.9, n=13)
128.9 fps +58%
Average NVIDIA GeForce RTX 3080 Ti Laptop GPU
  (78.9 - 91, n=4)
82.7 fps +1%
SCHENKER XMG Neo 17 2023 Engineering Sample
NVIDIA GeForce RTX 4070 Laptop GPU, i9-13900HX
81.7 (70min, 68P1 - 97max) fps
Average NVIDIA GeForce RTX 3070
  ()
81 fps -1%
Average NVIDIA GeForce RTX 3070 Ti Laptop GPU
  (58.1 - 80, n=8)
67.3 fps -18%
Gigabyte AERO 16 OLED BSF
NVIDIA GeForce RTX 4070 Laptop GPU, i9-13900H, Gigabyte AG470S1TB-SI B10
66.6 (58min, 47P1 - 76max) fps -18%
Average NVIDIA GeForce RTX 3080 Laptop GPU
  (64.1 - 70, n=3)
66.4 fps -19%
MSI Katana 17 B13VFK
NVIDIA GeForce RTX 4060 Laptop GPU, i7-13620H, Micron 2400 MTFDKBA1T0QFM
65.4 (52min, 44P1 - 76max) fps -20%
SCHENKER XMG Focus 15 Engineering Sample
NVIDIA GeForce RTX 4050 Laptop GPU, i5-13500HX
53.8 (46min, 44P1 - 63max) fps -34%
Average AMD Radeon RX 6800M
  (49.7 - 56, n=2)
52.9 fps -35%
Average NVIDIA GeForce RTX 3060 Laptop GPU
  (36.6 - 55.9, n=8)
51 fps -38%
Average AMD Radeon RX 6600M
  (39 - 43.4, n=4)
40.8 fps -50%
Average NVIDIA GeForce RTX 3050
  ()
39.9 fps -51%
Average NVIDIA GeForce RTX 3050 6GB Laptop GPU
  (30.7 - 34, n=3)
32.8 fps -60%
Average NVIDIA GeForce RTX 3050 Ti Laptop GPU
  (16 - 35, n=7)
27.5 fps -66%
2560x1440 Ultra High Preset AA:T AF:16x
Asus TUF Gaming GeForce RTX 4070 Ti
NVIDIA GeForce RTX 4070 Ti, i9-13900K
92.4 (80min, 78P1 - 108max) fps +78%
MSI Titan GT77 HX 13VI
NVIDIA GeForce RTX 4090 Laptop GPU, i9-13950HX, Samsung PM9A1 MZVL22T0HBLB
90.1 (78min, 71P1 - 104max) fps +74%
Average NVIDIA GeForce RTX 3090
  (82.5 - 89.9, n=12)
85.3 fps +64%
Average NVIDIA GeForce RTX 3080 Ti Laptop GPU
  (52.9 - 62, n=2)
57.5 fps +11%
Average NVIDIA GeForce RTX 3070
  ()
52 fps 0%
SCHENKER XMG Neo 17 2023 Engineering Sample
NVIDIA GeForce RTX 4070 Laptop GPU, i9-13900HX
51.9 (45min, 44P1 - 61max) fps
Gigabyte AERO 16 OLED BSF
NVIDIA GeForce RTX 4070 Laptop GPU, i9-13900H, Gigabyte AG470S1TB-SI B10
44.3 (38min, 31P1 - 50max) fps -15%
Average NVIDIA GeForce RTX 3070 Ti Laptop GPU
  (36.8 - 50.5, n=7)
42.9 fps -17%
Average NVIDIA GeForce RTX 3080 Laptop GPU
  (41.8 - 43, n=3)
42.3 fps -18%
MSI Katana 17 B13VFK
NVIDIA GeForce RTX 4060 Laptop GPU, i7-13620H, Micron 2400 MTFDKBA1T0QFM
41 (35min, 33P1 - 48max) fps -21%
SCHENKER XMG Focus 15 Engineering Sample
NVIDIA GeForce RTX 4050 Laptop GPU, i5-13500HX
33.2 (28min, 26P1 - 38max) fps -36%
Average AMD Radeon RX 6800M
  (29.9 - 34, n=2)
32 fps -38%
Average NVIDIA GeForce RTX 3060 Laptop GPU
  (14.4 - 34.8, n=5)
27.3 fps -47%
Average AMD Radeon RX 6600M
  (24.4 - 25.9, n=3)
25.2 fps -51%
Average NVIDIA GeForce RTX 3050
  ()
24.9 fps -52%
Average NVIDIA GeForce RTX 3050 6GB Laptop GPU
  (18.1 - 20.1, n=2)
19.1 fps -63%
Average NVIDIA GeForce RTX 3050 Ti Laptop GPU
  (10 - 17.4, n=4)
14.3 fps -72%
3840x2160 Ultra High Preset AA:T AF:16x
Asus TUF Gaming GeForce RTX 4070 Ti
NVIDIA GeForce RTX 4070 Ti, i9-13900K
47 (40min, 37P1 - 54max) fps +81%
MSI Titan GT77 HX 13VI
NVIDIA GeForce RTX 4090 Laptop GPU, i9-13950HX, Samsung PM9A1 MZVL22T0HBLB
44.9 (38min, 37P1 - 52max) fps +73%
Average NVIDIA GeForce RTX 3090
  (41.8 - 45.7, n=12)
43.1 fps +66%
Average NVIDIA GeForce RTX 3080 Ti Laptop GPU
  ()
32 fps +24%
SCHENKER XMG Neo 17 2023 Engineering Sample
NVIDIA GeForce RTX 4070 Laptop GPU, i9-13900HX
25.9 (21min, 21P1 - 31max) fps
Average NVIDIA GeForce RTX 3070
  ()
25 fps -3%
Gigabyte AERO 16 OLED BSF
NVIDIA GeForce RTX 4070 Laptop GPU, i9-13900H, Gigabyte AG470S1TB-SI B10
21.5 (18min, 15P1 - 24max) fps -17%
Average NVIDIA GeForce RTX 3080 Laptop GPU
  (20 - 22, n=3)
20.7 fps -20%
MSI Katana 17 B13VFK
NVIDIA GeForce RTX 4060 Laptop GPU, i7-13620H, Micron 2400 MTFDKBA1T0QFM
19.7 (17min, 16P1 - 23max) fps -24%
SCHENKER XMG Focus 15 Engineering Sample
NVIDIA GeForce RTX 4050 Laptop GPU, i5-13500HX
15.9 (14min, 13P1 - 18max) fps -39%
Average AMD Radeon RX 6800M
  (13.8 - 16, n=2)
14.9 fps -42%
Average NVIDIA GeForce RTX 3060 Laptop GPU
  (10.6 - 16, n=2)
13.3 fps -49%
Average NVIDIA GeForce RTX 3050
  ()
12 fps -54%
Average AMD Radeon RX 6600M
  (11.3 - 12.1, n=3)
11.7 fps -55%
Average NVIDIA GeForce RTX 3050 Ti Laptop GPU
  ()
4 fps -85%
F1 2021
1920x1080 Ultra High Preset + Raytracing AA:T AF:16x
Asus TUF Gaming GeForce RTX 4070 Ti
NVIDIA GeForce RTX 4070 Ti, i9-13900K
263 (218min, 204P1 - 293max) fps +67%
Average NVIDIA GeForce RTX 3090
  (154 - 244, n=13)
218 fps +38%
MSI Titan GT77 HX 13VI
NVIDIA GeForce RTX 4090 Laptop GPU, i9-13950HX, Samsung PM9A1 MZVL22T0HBLB
209 (170min, 105P1 - 225max) fps +33%
SCHENKER XMG Neo 17 2023 Engineering Sample
NVIDIA GeForce RTX 4070 Laptop GPU, i9-13900HX
157.5 (131min, 123P1 - 175max) fps
Average NVIDIA GeForce RTX 3070
  (148 - 158, n=2)
153 fps -3%
MSI Katana 17 B13VFK
NVIDIA GeForce RTX 4060 Laptop GPU, i7-13620H, Micron 2400 MTFDKBA1T0QFM
128.9 (106min, 81P1 - 145max) fps -18%
Average NVIDIA GeForce RTX 3080 Ti Laptop GPU
  (30.2 - 160.6, n=30)
126.1 fps -20%
Average AMD Radeon RX 6800M
  (114 - 124.1, n=2)
119.1 fps -24%
Average NVIDIA GeForce RTX 3070 Ti Laptop GPU
  (67.3 - 134.2, n=13)
110.2 fps -30%
SCHENKER XMG Focus 15 Engineering Sample
NVIDIA GeForce RTX 4050 Laptop GPU, i5-13500HX
109.7 (92min, 90P1 - 123max) fps -30%
Average NVIDIA GeForce RTX 3080 Laptop GPU
  (74.9 - 123.7, n=9)
108.6 fps -31%
Average AMD Radeon RX 6700M
  ()
100 fps -37%
Average NVIDIA GeForce RTX 3060
  (75.1 - 105.9, n=5)
95.8 fps -39%
Average NVIDIA GeForce RTX 3060 Laptop GPU
  (67 - 112.8, n=9)
92.4 fps -41%
Average AMD Radeon RX 6600M
  (80.9 - 95.9, n=5)
91.8 fps -42%
Average NVIDIA GeForce RTX 3050
  (81.6 - 82.2, n=2)
81.9 fps -48%
Average NVIDIA GeForce RTX 3050 6GB Laptop GPU
  ()
61.9 fps -61%
Average NVIDIA GeForce RTX 3050 Ti Laptop GPU
  (44.4 - 69, n=11)
54 fps -66%
2560x1440 Ultra High Preset + Raytracing AA:T AF:16x
Asus TUF Gaming GeForce RTX 4070 Ti
NVIDIA GeForce RTX 4070 Ti, i9-13900K
199.8 (168min, 154P1 - 221max) fps +74%
MSI Titan GT77 HX 13VI
NVIDIA GeForce RTX 4090 Laptop GPU, i9-13950HX, Samsung PM9A1 MZVL22T0HBLB
192.4 (146min, 114P1 - 209max) fps +68%
Average NVIDIA GeForce RTX 3090
  (153 - 186.2, n=13)
172.4 fps +50%
Average NVIDIA GeForce RTX 3070
  (113 - 118, n=2)
115.5 fps +1%
SCHENKER XMG Neo 17 2023 Engineering Sample
NVIDIA GeForce RTX 4070 Laptop GPU, i9-13900HX
114.7 (98min, 95P1 - 127max) fps
Average NVIDIA GeForce RTX 3080 Ti Laptop GPU
  (30 - 120.1, n=19)
94.1 fps -18%
MSI Katana 17 B13VFK
NVIDIA GeForce RTX 4060 Laptop GPU, i7-13620H, Micron 2400 MTFDKBA1T0QFM
93 (78min, 64P1 - 103max) fps -19%
Average AMD Radeon RX 6800M
  ()
88.2 fps -23%
Average NVIDIA GeForce RTX 3080 Laptop GPU
  (84 - 90.4, n=4)
88 fps -23%
Average NVIDIA GeForce RTX 3070 Ti Laptop GPU
  (47.5 - 99.2, n=11)
82.9 fps -28%
SCHENKER XMG Focus 15 Engineering Sample
NVIDIA GeForce RTX 4050 Laptop GPU, i5-13500HX
76.1 (64min, 63P1 - 87max) fps -34%
Average NVIDIA GeForce RTX 3060
  (72 - 78.8, n=4)
75.2 fps -34%
Average AMD Radeon RX 6600M
  (63 - 66.1, n=3)
64.9 fps -43%
Average NVIDIA GeForce RTX 3050
  (59 - 59.2, n=2)
59.1 fps -48%
Average NVIDIA GeForce RTX 3060 Laptop GPU
  (47.5 - 70.2, n=2)
58.9 fps -49%
Average NVIDIA GeForce RTX 3050 6GB Laptop GPU
  ()
40 fps -65%
Average NVIDIA GeForce RTX 3050 Ti Laptop GPU
  (30.9 - 43.1, n=5)
37.9 fps -67%
3840x2160 Ultra High Preset + Raytracing AA:T AF:16x
Asus TUF Gaming GeForce RTX 4070 Ti
NVIDIA GeForce RTX 4070 Ti, i9-13900K
114.4 (98min, 97P1 - 129max) fps +80%
MSI Titan GT77 HX 13VI
NVIDIA GeForce RTX 4090 Laptop GPU, i9-13950HX, Samsung PM9A1 MZVL22T0HBLB
114.4 (99min, 96P1 - 129max) fps +80%
Average NVIDIA GeForce RTX 3090
  (100.4 - 110, n=13)
103.5 fps +63%
Average NVIDIA GeForce RTX 3070
  (64 - 67.3, n=2)
65.7 fps +4%
SCHENKER XMG Neo 17 2023 Engineering Sample
NVIDIA GeForce RTX 4070 Laptop GPU, i9-13900HX
63.4 (46min, 53P1 - 73max) fps
Average NVIDIA GeForce RTX 3080 Ti Laptop GPU
  (41.1 - 70.2, n=18)
60.9 fps -4%
Average NVIDIA GeForce RTX 3070 Ti Laptop GPU
  (47 - 56.8, n=3)
52.4 fps -17%
MSI Katana 17 B13VFK
NVIDIA GeForce RTX 4060 Laptop GPU, i7-13620H, Micron 2400 MTFDKBA1T0QFM
50.2 (42min, 42P1 - 57max) fps -21%
Average AMD Radeon RX 6800M
  ()
47.6 fps -25%
Average NVIDIA GeForce RTX 3080 Laptop GPU
  (32.5 - 51.5, n=7)
45.9 fps -28%
Average NVIDIA GeForce RTX 3060
  (40.9 - 44.4, n=4)
42.6 fps -33%
SCHENKER XMG Focus 15 Engineering Sample
NVIDIA GeForce RTX 4050 Laptop GPU, i5-13500HX
38 (31min, 30P1 - 45max) fps -40%
Average AMD Radeon RX 6600M
  (31.6 - 35.4, n=3)
33.2 fps -48%
Average NVIDIA GeForce RTX 3050
  (32 - 32.4, n=2)
32.2 fps -49%
Average NVIDIA GeForce RTX 3060 Laptop GPU
  (25.9 - 38, n=2)
32 fps -50%
Average NVIDIA GeForce RTX 3050 Ti Laptop GPU
  ()
14.4 fps -77%
Final Fantasy XV Benchmark
1920x1080 High Quality
Asus TUF Gaming GeForce RTX 4070 Ti
NVIDIA GeForce RTX 4070 Ti, i9-13900K
209 fps +75%
MSI Titan GT77 HX 13VI
NVIDIA GeForce RTX 4090 Laptop GPU, i9-13950HX, Samsung PM9A1 MZVL22T0HBLB
187.4 fps +57%
Average NVIDIA GeForce RTX 3090
  (153 - 229, n=16)
184.1 fps +54%
Razer Blade 16 Early 2023
NVIDIA GeForce RTX 4080 Laptop GPU, i9-13950HX, SSSTC CA6-8D1024
157.8 fps +32%
SCHENKER XMG Focus 15 Engineering Sample
NVIDIA GeForce RTX 4050 Laptop GPU, i5-13500HX
122.3 fps +2%
Average NVIDIA GeForce RTX 3070
  (112 - 129.7, n=4)
119.7 fps 0%
SCHENKER XMG Neo 17 2023 Engineering Sample
NVIDIA GeForce RTX 4070 Laptop GPU, i9-13900HX
119.4 fps
Gigabyte AERO 16 OLED BSF
NVIDIA GeForce RTX 4070 Laptop GPU, i9-13900H, Gigabyte AG470S1TB-SI B10
116.2 fps -3%
Razer Blade 18 RTX 4070
NVIDIA GeForce RTX 4070 Laptop GPU, i9-13950HX, SSSTC CA6-8D1024
115.2 fps -4%
Average NVIDIA GeForce RTX 3080 Ti Laptop GPU
  (30.7 - 140.6, n=42)
113.8 fps -5%
Average NVIDIA GeForce RTX 3080 Laptop GPU
  (55.5 - 115, n=34)
99.2 fps -17%
Average AMD Radeon RX 6800M
  (97.5 - 99.7, n=2)
98.6 fps -17%
Average NVIDIA GeForce RTX 3070 Ti Laptop GPU
  (49.5 - 122.4, n=35)
98.5 fps -18%
MSI Katana 17 B13VFK
NVIDIA GeForce RTX 4060 Laptop GPU, i7-13620H, Micron 2400 MTFDKBA1T0QFM
96.1 fps -20%
Average NVIDIA GeForce RTX 3060
  (70.8 - 88.6, n=5)
84.3 fps -29%
Average AMD Radeon RX 6700M
  ()
83.8 fps -30%
Average NVIDIA GeForce RTX 3060 Laptop GPU
  (55 - 100.9, n=42)
79.4 fps -34%
Average AMD Radeon RX 6600M
  (72.1 - 82, n=6)
78.8 fps -34%
Average NVIDIA GeForce RTX 3050
  (66.5 - 67.3, n=2)
66.9 fps -44%
Average NVIDIA GeForce RTX 3050 Ti Laptop GPU
  (23.5 - 106, n=24)
51.2 fps -57%
Average NVIDIA GeForce RTX 3050 6GB Laptop GPU
  (44.2 - 52, n=3)
49.1 fps -59%
2560x1440 High Quality
Asus TUF Gaming GeForce RTX 4070 Ti
NVIDIA GeForce RTX 4070 Ti, i9-13900K
167 fps +94%
MSI Titan GT77 HX 13VI
NVIDIA GeForce RTX 4090 Laptop GPU, i9-13950HX, Samsung PM9A1 MZVL22T0HBLB
162.9 fps +89%
Average NVIDIA GeForce RTX 3090
  (128 - 153, n=15)
143.1 fps +66%
Razer Blade 16 Early 2023
NVIDIA GeForce RTX 4080 Laptop GPU, i9-13950HX, SSSTC CA6-8D1024
120.1 fps +39%
Average NVIDIA GeForce RTX 3070
  (89.2 - 99.3, n=4)
94.1 fps +9%
SCHENKER XMG Neo 17 2023 Engineering Sample
NVIDIA GeForce RTX 4070 Laptop GPU, i9-13900HX
86.1 fps
Average NVIDIA GeForce RTX 3080 Ti Laptop GPU
  (30.8 - 105.8, n=34)
85.9 fps 0%
Gigabyte AERO 16 OLED BSF
NVIDIA GeForce RTX 4070 Laptop GPU, i9-13900H, Gigabyte AG470S1TB-SI B10
84.7 fps -2%
Razer Blade 18 RTX 4070
NVIDIA GeForce RTX 4070 Laptop GPU, i9-13950HX, SSSTC CA6-8D1024
82 fps -5%
Average NVIDIA GeForce RTX 3080 Laptop GPU
  (61.6 - 90.3, n=18)
79.4 fps -8%
Average NVIDIA GeForce RTX 3070 Ti Laptop GPU
  (57.9 - 93, n=24)
76 fps -12%
Average AMD Radeon RX 6800M
  ()
71 fps -18%
MSI Katana 17 B13VFK
NVIDIA GeForce RTX 4060 Laptop GPU, i7-13620H, Micron 2400 MTFDKBA1T0QFM
70.1 fps -19%
Average NVIDIA GeForce RTX 3060
  (63.6 - 64.8, n=4)
64.3 fps -25%
SCHENKER XMG Focus 15 Engineering Sample
NVIDIA GeForce RTX 4050 Laptop GPU, i5-13500HX
60 fps -30%
Average NVIDIA GeForce RTX 3060 Laptop GPU
  (41.1 - 73.7, n=25)
59.5 fps -31%
Average AMD Radeon RX 6600M
  (54.8 - 58.2, n=4)
56.4 fps -34%
Average NVIDIA GeForce RTX 3050
  (48.6 - 48.9, n=2)
48.8 fps -43%
Average NVIDIA GeForce RTX 3050 6GB Laptop GPU
  (32 - 37.4, n=2)
34.7 fps -60%
Average NVIDIA GeForce RTX 3050 Ti Laptop GPU
  (18.4 - 53.1, n=11)
33.9 fps -61%
3840x2160 High Quality
MSI Titan GT77 HX 13VI
NVIDIA GeForce RTX 4090 Laptop GPU, i9-13950HX, Samsung PM9A1 MZVL22T0HBLB
94.7 fps +99%
Asus TUF Gaming GeForce RTX 4070 Ti
NVIDIA GeForce RTX 4070 Ti, i9-13900K
90.5 fps +91%
Average NVIDIA GeForce RTX 3090
  (81.5 - 92.4, n=15)
87.5 fps +84%
Razer Blade 16 Early 2023
NVIDIA GeForce RTX 4080 Laptop GPU, i9-13950HX, SSSTC CA6-8D1024
74.1 fps +56%
Average NVIDIA GeForce RTX 3070
  (54.8 - 58.2, n=4)
56.9 fps +20%
Average NVIDIA GeForce RTX 3080 Ti Laptop GPU
  (35.1 - 61.2, n=18)
52.7 fps +11%
SCHENKER XMG Neo 17 2023 Engineering Sample
NVIDIA GeForce RTX 4070 Laptop GPU, i9-13900HX
47.5 fps
Razer Blade 18 RTX 4070
NVIDIA GeForce RTX 4070 Laptop GPU, i9-13950HX, SSSTC CA6-8D1024
46.6 fps -2%
Gigabyte AERO 16 OLED BSF
NVIDIA GeForce RTX 4070 Laptop GPU, i9-13900H, Gigabyte AG470S1TB-SI B10
46.1 fps -3%
Average NVIDIA GeForce RTX 3070 Ti Laptop GPU
  (39.6 - 46.6, n=5)
43.9 fps -8%
Average NVIDIA GeForce RTX 3080 Laptop GPU
  (28.4 - 53.2, n=16)
43.5 fps -8%
Average AMD Radeon RX 6800M
  ()
41.3 fps -13%
MSI Katana 17 B13VFK
NVIDIA GeForce RTX 4060 Laptop GPU, i7-13620H, Micron 2400 MTFDKBA1T0QFM
40.2 fps -15%
Average NVIDIA GeForce RTX 3060
  (37 - 38.2, n=4)
37.8 fps -20%
SCHENKER XMG Focus 15 Engineering Sample
NVIDIA GeForce RTX 4050 Laptop GPU, i5-13500HX
33.3 fps -30%
Average NVIDIA GeForce RTX 3060 Laptop GPU
  (22.9 - 37.8, n=11)
33.2 fps -30%
Average AMD Radeon RX 6600M
  (30.2 - 30.6, n=3)
30.5 fps -36%
Average NVIDIA GeForce RTX 3050
  (28.2 - 28.2, n=2)
28.2 fps -41%
Average NVIDIA GeForce RTX 3050 Ti Laptop GPU
  (12.8 - 21.4, n=3)
16.9 fps -64%

Raytracing Benchmarks

Os resultados mudam um pouco quando você começa a usar o raytracing e o laptop RTX 4070 está um pouco atrás do laptop RTX 3080 Ti. Você está basicamente limitado à resolução de 1080p se quiser ativar o raytracing; as configurações de 4K geralmente sofrem com números baixos de fps.

As capacidades de raytracing do RTX 4050 são ainda mais limitadas e até mesmo as configurações de 1080p são, às vezes, muito desafiadoras, de modo que você tem que usar o upscaling para obter taxas de quadros suaves (cobriremos isso na próxima seção).

Nota: Em breve adicionaremos benchmarks de raytracing para o notebook RTX 4060.

Performance Rating - Percent
Asus TUF Gaming GeForce RTX 4070 Ti
NVIDIA GeForce RTX 4070 Ti, i9-13900K
99.4 pt
Average NVIDIA GeForce RTX 3090
 
86.1 pt
MSI Titan GT77 HX 13VI
NVIDIA GeForce RTX 4090 Laptop GPU, i9-13950HX, Samsung PM9A1 MZVL22T0HBLB
85.9 pt
Razer Blade 16 Early 2023
NVIDIA GeForce RTX 4080 Laptop GPU, i9-13950HX, SSSTC CA6-8D1024
81.9 pt
Average NVIDIA GeForce RTX 3080 Ti Laptop GPU
 
54.8 pt
Average NVIDIA GeForce RTX 3070
 
54.1 pt
SCHENKER XMG Neo 17 2023 Engineering Sample
NVIDIA GeForce RTX 4070 Laptop GPU, i9-13900HX
52.1 pt
Average NVIDIA GeForce RTX 3080 Laptop GPU
 
47.4 pt
Average NVIDIA GeForce RTX 3070 Ti Laptop GPU
 
43.8 pt
Average NVIDIA GeForce RTX 3060
 
41.7 pt
SCHENKER XMG Focus 15 Engineering Sample -1!
NVIDIA GeForce RTX 4050 Laptop GPU, i5-13500HX
32.6 pt
Average NVIDIA GeForce RTX 3060 Laptop GPU
 
31.7 pt
Average AMD Radeon RX 6800M -1!
 
31.2 pt
Average NVIDIA GeForce RTX 3050 -1!
 
31 pt
Average AMD Radeon RX 6600M -2!
 
29.4 pt
Average AMD Radeon RX 6700M -4!
 
27.6 pt
Average NVIDIA GeForce RTX 3050 Ti Laptop GPU
 
15.6 pt
Metro Exodus - 1920x1080 Ultra Quality DXR AF:16x
Asus TUF Gaming GeForce RTX 4070 Ti
NVIDIA GeForce RTX 4070 Ti, i9-13900K
128.8 (62.96min - 211.1max) fps +65%
Average NVIDIA GeForce RTX 3090
  (68.6 - 122.2, n=12)
111.4 fps +43%
MSI Titan GT77 HX 13VI
NVIDIA GeForce RTX 4090 Laptop GPU, i9-13950HX, Samsung PM9A1 MZVL22T0HBLB
108 fps +38%
Razer Blade 16 Early 2023
NVIDIA GeForce RTX 4080 Laptop GPU, i9-13950HX, SSSTC CA6-8D1024
104.4 (50.2min - 162.5max) fps +34%
Average NVIDIA GeForce RTX 3070
  (80.4 - 83, n=5)
81.6 fps +5%
SCHENKER XMG Neo 17 2023 Engineering Sample
NVIDIA GeForce RTX 4070 Laptop GPU, i9-13900HX
78 fps
Average NVIDIA GeForce RTX 3080 Ti Laptop GPU
  ()
77.9 fps 0%
Average NVIDIA GeForce RTX 3080 Laptop GPU
  (59.1 - 74.5, n=6)
68.1 fps -13%
Average NVIDIA GeForce RTX 3070 Ti Laptop GPU
  (61.3 - 65.1, n=2)
63.2 fps -19%
Average AMD Radeon RX 6800M
  (54.9 - 57.4, n=3)
56.1 fps -28%
SCHENKER XMG Focus 15 Engineering Sample
NVIDIA GeForce RTX 4050 Laptop GPU, i5-13500HX
54 fps -31%
Average NVIDIA GeForce RTX 3060
  (52.1 - 55.1, n=4)
53.4 fps -32%
Average NVIDIA GeForce RTX 3060 Laptop GPU
  (50.9 - 54.4, n=3)
52.9 fps -32%
Average AMD Radeon RX 6600M
  (43.8 - 54.4, n=3)
47.5 fps -39%
Average NVIDIA GeForce RTX 3050
  (37.9 - 39.2, n=2)
38.6 fps -51%
Average NVIDIA GeForce RTX 3050 Ti Laptop GPU
  ()
36.8 fps -53%
Watch Dogs Legion - 1920x1080 Ultra Preset + Ultra Ray Tracing (DX12)
Asus TUF Gaming GeForce RTX 4070 Ti
NVIDIA GeForce RTX 4070 Ti, i9-13900K
98.9 (72.06min, 82.17P1 - 137.41max) fps +120%
Average NVIDIA GeForce RTX 3090
  (75.7 - 110, n=3)
88 fps +96%
MSI Titan GT77 HX 13VI
NVIDIA GeForce RTX 4090 Laptop GPU, i9-13950HX, Samsung PM9A1 MZVL22T0HBLB
84 fps +87%
Razer Blade 16 Early 2023
NVIDIA GeForce RTX 4080 Laptop GPU, i9-13950HX, SSSTC CA6-8D1024
80 (58min - 115max) fps +78%
Average NVIDIA GeForce RTX 3080 Ti Laptop GPU
  (50 - 70, n=3)
58.6 fps +30%
Average NVIDIA GeForce RTX 3070
  (51.7 - 61, n=4)
55.1 fps +22%
Average NVIDIA GeForce RTX 3060
  ()
49.9 fps +11%
Average NVIDIA GeForce RTX 3080 Laptop GPU
  (41 - 61, n=6)
48.7 fps +8%
SCHENKER XMG Neo 17 2023 Engineering Sample
NVIDIA GeForce RTX 4070 Laptop GPU, i9-13900HX
45 fps
Average NVIDIA GeForce RTX 3050
  ()
44 fps -2%
Average NVIDIA GeForce RTX 3070 Ti Laptop GPU
  (36 - 41.2, n=2)
38.6 fps -14%
Average AMD Radeon RX 6800M
  ()
29 fps -36%
Average NVIDIA GeForce RTX 3060 Laptop GPU
  (15.4 - 27, n=2)
21.2 fps -53%
SCHENKER XMG Focus 15 Engineering Sample
NVIDIA GeForce RTX 4050 Laptop GPU, i5-13500HX
18 fps -60%
Average AMD Radeon RX 6700M
  ()
18 fps -60%
Average AMD Radeon RX 6600M
  ()
17.5 fps -61%
Average NVIDIA GeForce RTX 3050 Ti Laptop GPU
  ()
11 fps -76%
Far Cry 6 - 1920x1080 Ultra Graphics Quality + HD Textures + DXR AA:T
Asus TUF Gaming GeForce RTX 4070 Ti
NVIDIA GeForce RTX 4070 Ti, i9-13900K
146 (122min - 194max) fps +87%
Razer Blade 16 Early 2023
NVIDIA GeForce RTX 4080 Laptop GPU, i9-13950HX, SSSTC CA6-8D1024
119 (88min - 165max) fps +53%
MSI Titan GT77 HX 13VI
NVIDIA GeForce RTX 4090 Laptop GPU, i9-13950HX, Samsung PM9A1 MZVL22T0HBLB
116 fps +49%
Average NVIDIA GeForce RTX 3090
  (76 - 138.2, n=8)
112.6 fps +44%
Average NVIDIA GeForce RTX 3080 Ti Laptop GPU
  (91 - 92, n=3)
91.3 fps +17%
SCHENKER XMG Neo 17 2023 Engineering Sample
NVIDIA GeForce RTX 4070 Laptop GPU, i9-13900HX
78 fps
Average NVIDIA GeForce RTX 3080 Laptop GPU
  (59 - 84.7, n=4)
72.2 fps -7%
Average NVIDIA GeForce RTX 3070
  ()
71 fps -9%
Average NVIDIA GeForce RTX 3060
  ()
71 fps -9%
Average NVIDIA GeForce RTX 3070 Ti Laptop GPU
  (59 - 77.7, n=2)
68.4 fps -12%
Average AMD Radeon RX 6700M
  ()
54 fps -31%
Average AMD Radeon RX 6600M
  (45.6 - 66.8, n=4)
53.8 fps -31%
Average NVIDIA GeForce RTX 3060 Laptop GPU
  (34 - 66, n=2)
50 fps -36%
SCHENKER XMG Focus 15 Engineering Sample
NVIDIA GeForce RTX 4050 Laptop GPU, i5-13500HX
48 fps -38%
Average NVIDIA GeForce RTX 3050
  (25.8 - 53.1, n=2)
39.5 fps -49%
Average NVIDIA GeForce RTX 3050 Ti Laptop GPU
  ()
8 fps -90%
Dying Light 2 - 1920x1080 High Quality Raytracing
Average NVIDIA GeForce RTX 3090
  (67.9 - 109.9, n=3)
86 fps +105%
Razer Blade 16 Early 2023
NVIDIA GeForce RTX 4080 Laptop GPU, i9-13950HX, SSSTC CA6-8D1024
83.9 (66.4min - 121.8max) fps +100%
Asus TUF Gaming GeForce RTX 4070 Ti
NVIDIA GeForce RTX 4070 Ti, i9-13900K
82.9 (36.6min, 45.4P0.1, 69.2P1 - 247max) fps +97%
MSI Titan GT77 HX 13VI
NVIDIA GeForce RTX 4090 Laptop GPU, i9-13950HX, Samsung PM9A1 MZVL22T0HBLB
73 fps +74%
Average NVIDIA GeForce RTX 3070
  ()
42.2 fps 0%
SCHENKER XMG Neo 17 2023 Engineering Sample
NVIDIA GeForce RTX 4070 Laptop GPU, i9-13900HX
42 fps
Average NVIDIA GeForce RTX 3080 Ti Laptop GPU
  (33.4 - 42.3, n=5)
38.5 fps -8%
Average NVIDIA GeForce RTX 3070 Ti Laptop GPU
  (28.7 - 54.9, n=6)
36.6 fps -13%
Average NVIDIA GeForce RTX 3080 Laptop GPU
  ()
36 fps -14%
Average NVIDIA GeForce RTX 3060
  ()
34.2 fps -19%
Average NVIDIA GeForce RTX 3060 Laptop GPU
  ()
26.1 fps -38%
Average AMD Radeon RX 6800M
  ()
17.8 fps -58%
Average NVIDIA GeForce RTX 3050 Ti Laptop GPU
  ()
6.75 fps -84%
Cyberpunk 2077 1.6 - 1920x1080 Ray Tracing Ultra Preset (DLSS off)
Asus TUF Gaming GeForce RTX 4070 Ti
NVIDIA GeForce RTX 4070 Ti, i9-13900K
81 (62.6min - 103.6max) fps +93%
MSI Titan GT77 HX 13VI
NVIDIA GeForce RTX 4090 Laptop GPU, i9-13950HX, Samsung PM9A1 MZVL22T0HBLB
74 fps +76%
Average NVIDIA GeForce RTX 3090
  (61.3 - 70.4, n=6)
66.3 fps +58%
Razer Blade 16 Early 2023
NVIDIA GeForce RTX 4080 Laptop GPU, i9-13950HX, SSSTC CA6-8D1024
65.3 (31.7min - 96.9max) fps +55%
Average NVIDIA GeForce RTX 3080 Ti Laptop GPU
  (39.2 - 49.9, n=7)
43.3 fps +3%
Average NVIDIA GeForce RTX 3070
  (41.6 - 43.9, n=2)
42.8 fps +2%
SCHENKER XMG Neo 17 2023 Engineering Sample
NVIDIA GeForce RTX 4070 Laptop GPU, i9-13900HX
42 fps
Average NVIDIA GeForce RTX 3070 Ti Laptop GPU
  (27.9 - 63, n=7)
36.8 fps -12%
Average NVIDIA GeForce RTX 3080 Laptop GPU
  (34.6 - 37.8, n=3)
35.7 fps -15%
Average NVIDIA GeForce RTX 3060
  ()
28.3 fps -33%
SCHENKER XMG Focus 15 Engineering Sample
NVIDIA GeForce RTX 4050 Laptop GPU, i5-13500HX
27 fps -36%
Average NVIDIA GeForce RTX 3060 Laptop GPU
  (12.6 - 28.9, n=7)
23.9 fps -43%
Average AMD Radeon RX 6800M
  ()
23.5 fps -44%
Average NVIDIA GeForce RTX 3050
  ()
21.2 fps -50%
Average AMD Radeon RX 6600M
  (15.6 - 26.6, n=2)
21.1 fps -50%
Average NVIDIA GeForce RTX 3050 Ti Laptop GPU
  ()
14.1 fps -66%
Ghostwire Tokyo - 1920x1080 Highest Settings + Maximum Ray Tracing
Asus TUF Gaming GeForce RTX 4070 Ti
NVIDIA GeForce RTX 4070 Ti, i9-13900K
139.3 (31.3min, 53.2P0.1, 89.7P1 - 236max) fps +91%
MSI Titan GT77 HX 13VI
NVIDIA GeForce RTX 4090 Laptop GPU, i9-13950HX, Samsung PM9A1 MZVL22T0HBLB
127 fps +74%
Average NVIDIA GeForce RTX 3090
  (106 - 122, n=4)
114.1 fps +56%
Razer Blade 16 Early 2023
NVIDIA GeForce RTX 4080 Laptop GPU, i9-13950HX, SSSTC CA6-8D1024
97 fps +33%
Average NVIDIA GeForce RTX 3070
  ()
76.3 fps +5%
SCHENKER XMG Neo 17 2023 Engineering Sample
NVIDIA GeForce RTX 4070 Laptop GPU, i9-13900HX
73 fps
Average NVIDIA GeForce RTX 3080 Ti Laptop GPU
  (66.1 - 68.3, n=2)
67.2 fps -8%
Average NVIDIA GeForce RTX 3080 Laptop GPU
  (64.7 - 65.9, n=3)
65.3 fps -11%
Average NVIDIA GeForce RTX 3070 Ti Laptop GPU
  (48.9 - 59.9, n=3)
55.3 fps -24%
SCHENKER XMG Focus 15 Engineering Sample
NVIDIA GeForce RTX 4050 Laptop GPU, i5-13500HX
51 fps -30%
Average NVIDIA GeForce RTX 3060
  ()
48.5 fps -34%
Average NVIDIA GeForce RTX 3060 Laptop GPU
  ()
46.6 fps -36%
Average AMD Radeon RX 6800M
  ()
46.6 fps -36%
Average NVIDIA GeForce RTX 3050
  ()
38.1 fps -48%
Average NVIDIA GeForce RTX 3050 Ti Laptop GPU
  ()
32.2 fps -56%

Benchmarks DLSS

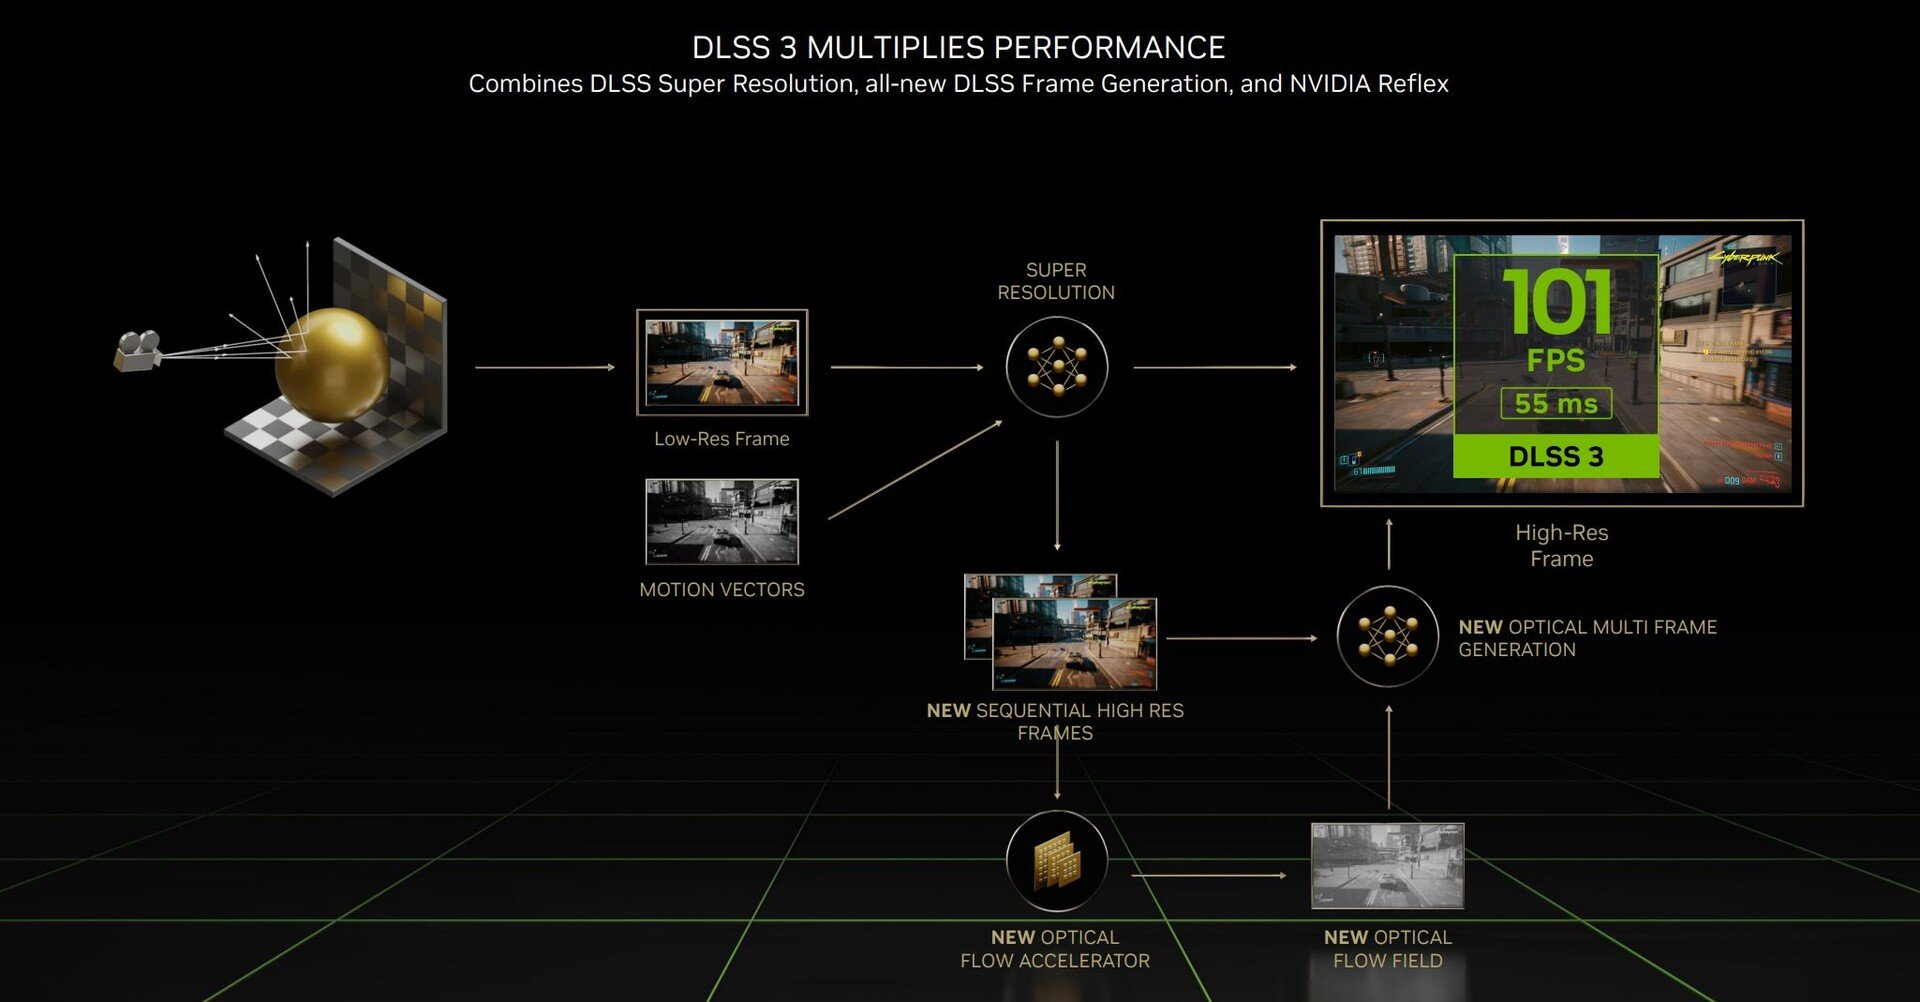
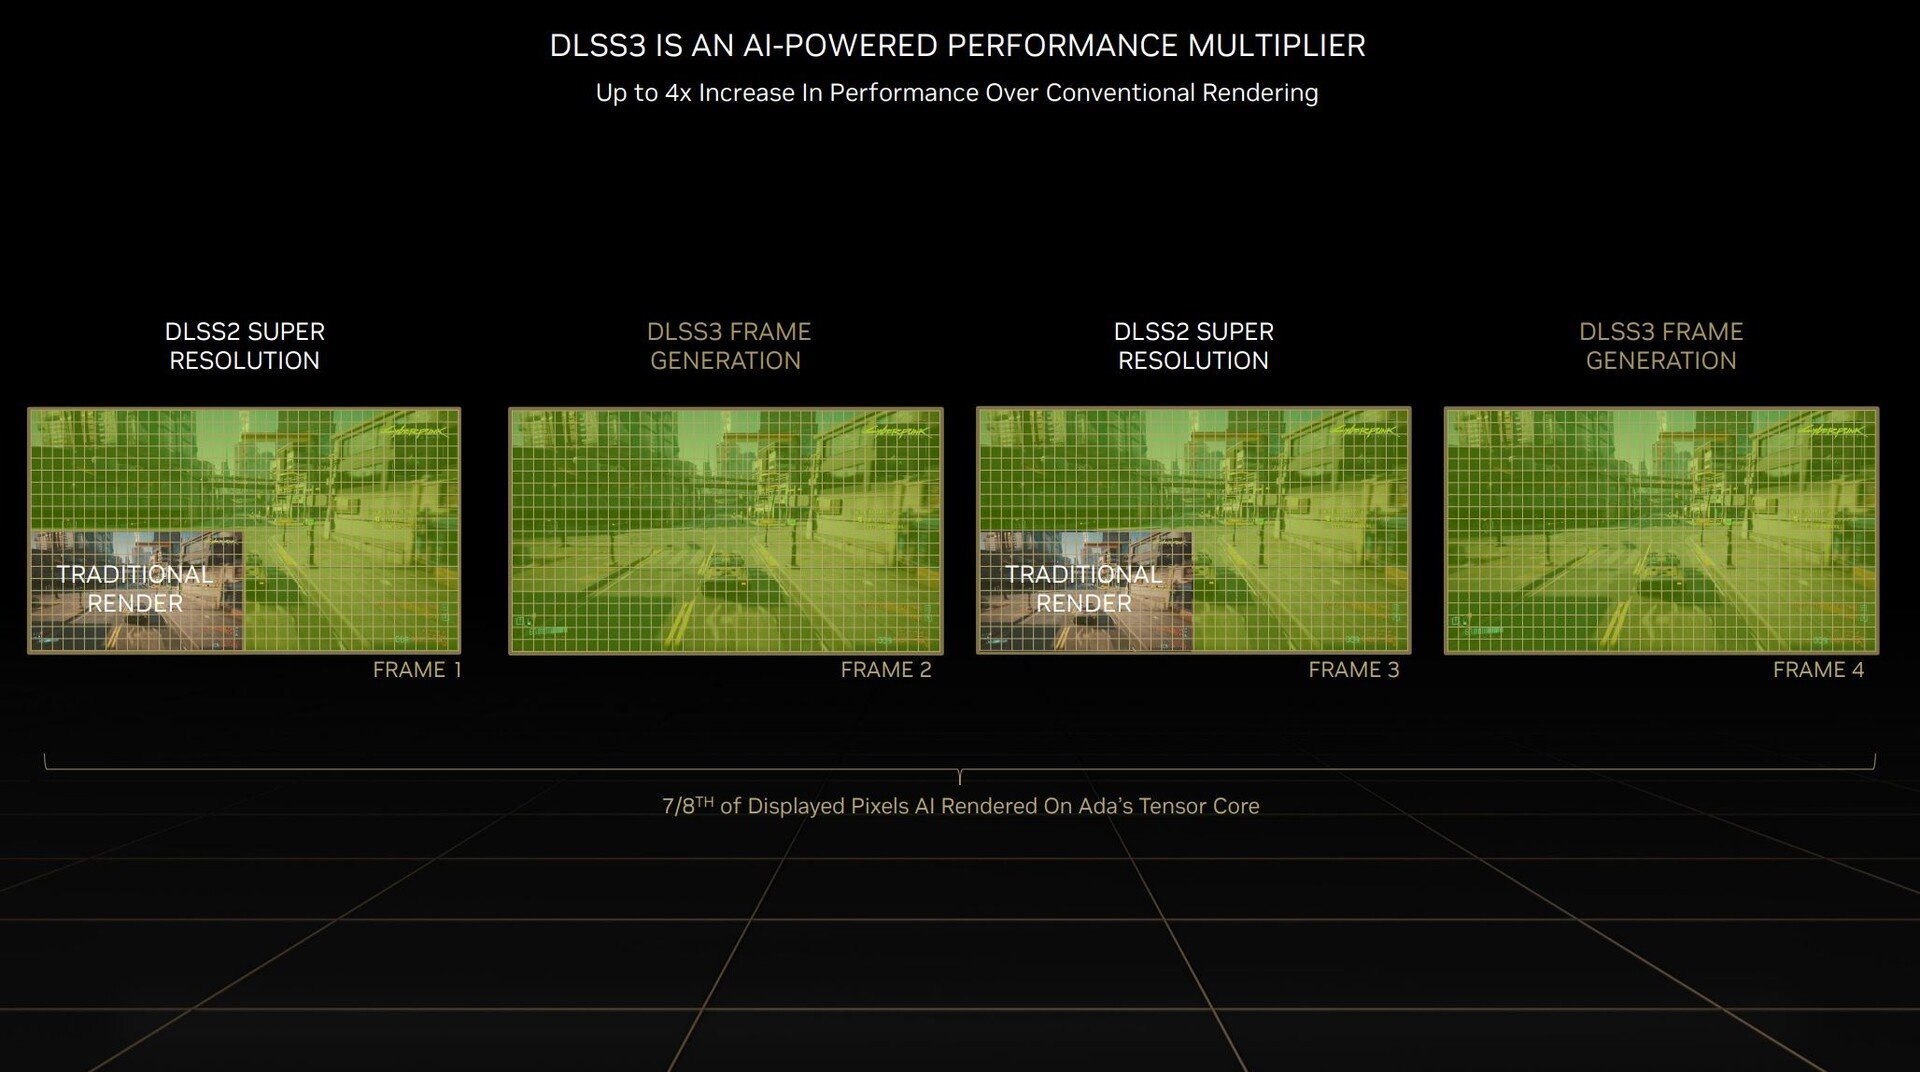
Normalmente realizamos nossos benchmarks de jogos sem tecnologias de upscaling como Nvidia DLSS ou AMD FSR. Entretanto, o desempenho pode se beneficiar muito quando o título o suporta e notamos algumas grandes melhorias com o DLSS 3.0 ativado sem nenhum déficit visual. Relacionamos os resultados para as três novas GPUs para laptops nas tabelas a seguir.

Benchmarks DLSS RTX 4070 Laptop

Título Configurações DLSS off DLSS on (Equilibrado) Diferença
Homem-Aranha Miles Morales 4K Ultra 44 FPS 57 FPS +30 %
O Witcher 3 4.00 1080p RT Ultra 36 FPS 45 FPS +25 %
Cyberpunk 2077 1.5 1080p RT Ultra 42 FPS 115 FPS +157 %
Deus da Guerra 4K Ultra 43 FPS 59 FPS +37 %
Horizon Zero Dawn 4K Ultra 52 FPS 83 FPS +60 %

Benchmarks DLSS RTX 4060 Laptop

Título Configurações DLSS off DLSS on (Equilibrado) Diferença
Spider-Man Miles Morales 4K Ultra 35 FPS 55 FPS +57 %
O Witcher 3 4.00 4K Ultra 21 FPS 32 FPS +52 %
Cyberpunk 2077 1.5 4K Ultra 21 FPS 43 FPS +104 %
Deus da Guerra 4K Ultra 35 FPS 51 FPS +46 %
Horizon Zero Dawn 4K Ultra 47 FPS 74 FPS +57 %

Benchmarks DLSS RTX 4050 Laptop

Título Configurações DLSS off DLSS on (Equilibrado) Diferença
Homem-Aranha Miles Morales 4K Ultra 26 FPS 36 FPS +38 %
Homem-Aranha Miles Morales 1080p RT Ultra 44 FPS 55 FPS +25 %
O Witcher 3 4.00 1080p RT Ultra 21 FPS 29 FPS +38 %
Cyberpunk 2077 1.5 1080p RT Ultra 27 FPS 85 FPS +214 %
Deus da Guerra 4K Ultra 28 FPS 41 FPS + 46%
Horizon Zero Dawn 4K Ultra 39 FPS 62 FPS +58 %
Call of Duty Modern Warfare 2 4K Ultra 31 FPS 50 FPS +61 %
Dying Light 2 1080p RT Ultra 52 FPS 77 FPS +48 %

OpenGL, OpenCL & Compute

Nossos benchmarks OpenGL, OpenCL e de computação não revelam nenhuma surpresa e a classificação é aproximadamente semelhante aos testes sintéticos e de jogos. Os modelos de consumo também têm um desempenho muito bom em alguns dos cenários profissionais da SPECviewperf e podem acompanhar os GPUs profissionais.

Unigine Valley 1.0
1920x1080 Extreme HD Preset OpenGL AA:x8
MSI Titan GT77 HX 13VI
NVIDIA GeForce RTX 4090 Laptop GPU, i9-13950HX, Samsung PM9A1 MZVL22T0HBLB
216.6 fps +93%
Asus TUF Gaming GeForce RTX 4070 Ti
NVIDIA GeForce RTX 4070 Ti, i9-13900K
206.8 (64.6min - 374.1max) fps +84%
Average NVIDIA GeForce RTX 3090
  (158.8 - 226, n=10)
203 fps +80%
Average NVIDIA GeForce RTX 3080 Laptop GPU
  (117.1 - 124.9, n=4)
119.3 fps +6%
SCHENKER XMG Neo 17 2023 Engineering Sample
NVIDIA GeForce RTX 4070 Laptop GPU, i9-13900HX
112.5 fps
Average AMD Radeon RX 6800M
  (92.4 - 93.7, n=2)
93.1 fps -17%
Average NVIDIA GeForce RTX 3060 Laptop GPU
  ()
92.6 fps -18%
Average AMD Radeon RX 6600M
  (64.8 - 93.8, n=4)
85.5 fps -24%
1920x1080 Extreme HD DirectX AA:x8
MSI Titan GT77 HX 13VI
NVIDIA GeForce RTX 4090 Laptop GPU, i9-13950HX, Samsung PM9A1 MZVL22T0HBLB
232 fps +91%
Asus TUF Gaming GeForce RTX 4070 Ti
NVIDIA GeForce RTX 4070 Ti, i9-13900K
230.3 (78.9min - 451.1max) fps +89%
Average NVIDIA GeForce RTX 3090
  (184.2 - 247, n=11)
225 fps +85%
Average NVIDIA GeForce RTX 3080 Laptop GPU
  (124.6 - 129.8, n=4)
128.3 fps +5%
SCHENKER XMG Neo 17 2023 Engineering Sample
NVIDIA GeForce RTX 4070 Laptop GPU, i9-13900HX
121.7 fps
Average AMD Radeon RX 6800M
  (117.2 - 117.7, n=2)
117.5 fps -3%
Average NVIDIA GeForce RTX 3060 Laptop GPU
  ()
97.4 fps -20%
Average AMD Radeon RX 6600M
  (83.6 - 94.5, n=4)
91.1 fps -25%
Unigine Heaven 4.0
Extreme Preset OpenGL
MSI Titan GT77 HX 13VI
NVIDIA GeForce RTX 4090 Laptop GPU, i9-13950HX, Samsung PM9A1 MZVL22T0HBLB
305.1 fps +91%
Asus TUF Gaming GeForce RTX 4070 Ti
NVIDIA GeForce RTX 4070 Ti, i9-13900K
292.6 (15.2min - 600.3max) fps +84%
Average NVIDIA GeForce RTX 3090
  (188.2 - 284, n=10)
270 fps +69%
SCHENKER XMG Neo 17 2023 Engineering Sample
NVIDIA GeForce RTX 4070 Laptop GPU, i9-13900HX
159.4 fps
Average NVIDIA GeForce RTX 3080 Laptop GPU
  (149.1 - 152.7, n=4)
150.4 fps -6%
MSI Katana 17 B13VFK
NVIDIA GeForce RTX 4060 Laptop GPU, i7-13620H, Micron 2400 MTFDKBA1T0QFM
142.6 fps -11%
Average AMD Radeon RX 6600M
  (92.2 - 140.4, n=4)
126.3 fps -21%
Average AMD Radeon RX 6800M
  (122.6 - 125.8, n=2)
124.2 fps -22%
Average NVIDIA GeForce RTX 3060 Laptop GPU
  ()
119.4 fps -25%
SCHENKER XMG Focus 15 Engineering Sample
NVIDIA GeForce RTX 4050 Laptop GPU, i5-13500HX
118.1 fps -26%
Extreme Preset DX11
MSI Titan GT77 HX 13VI
NVIDIA GeForce RTX 4090 Laptop GPU, i9-13950HX, Samsung PM9A1 MZVL22T0HBLB
324.1 fps +98%
Asus TUF Gaming GeForce RTX 4070 Ti
NVIDIA GeForce RTX 4070 Ti, i9-13900K
317.6 (57.8min - 692.1max) fps +94%
Average NVIDIA GeForce RTX 3090
  (272 - 315, n=11)
300 fps +83%
Lenovo Legion Pro 7 16IRX8H
NVIDIA GeForce RTX 4080 Laptop GPU, i9-13900HX, Samsung PM9A1 MZVL21T0HCLR
249.4 fps +52%
Average NVIDIA GeForce RTX 3080 Ti Laptop GPU
  ()
205 fps +25%
SCHENKER XMG Neo 17 2023 Engineering Sample
NVIDIA GeForce RTX 4070 Laptop GPU, i9-13900HX
164 fps
Average NVIDIA GeForce RTX 3080 Laptop GPU
  (158.2 - 160.5, n=4)
159.6 fps -3%
Average AMD Radeon RX 6800M
  (150.4 - 159.5, n=2)
155 fps -5%
Average NVIDIA GeForce RTX 3070 Ti Laptop GPU
  ()
148.8 fps -9%
MSI Katana 17 B13VFK
NVIDIA GeForce RTX 4060 Laptop GPU, i7-13620H, Micron 2400 MTFDKBA1T0QFM
137.6 fps -16%
Average AMD Radeon RX 6600M
  (114.8 - 130.2, n=4)
125.4 fps -24%
Average NVIDIA GeForce RTX 3060 Laptop GPU
  ()
121.6 fps -26%
Average AMD Radeon RX 6700M
  ()
118.9 fps -27%
SCHENKER XMG Focus 15 Engineering Sample
NVIDIA GeForce RTX 4050 Laptop GPU, i5-13500HX
114.6 fps -30%
Asus TUF Gaming A16 FA617
Radeon RX 7600S, R7 7735HS, Micron 2400 MTFDKBA1T0QFM
107.8 fps -34%
LuxMark v2.0 64Bit
Room GPUs-only
MSI Titan GT77 HX 13VI
NVIDIA GeForce RTX 4090 Laptop GPU, i9-13950HX, Samsung PM9A1 MZVL22T0HBLB
8614 Samples/s +82%
Asus TUF Gaming GeForce RTX 4070 Ti
NVIDIA GeForce RTX 4070 Ti, i9-13900K
8413 Samples/s +78%
Lenovo Legion Pro 7 16IRX8H
NVIDIA GeForce RTX 4080 Laptop GPU, i9-13900HX, Samsung PM9A1 MZVL21T0HCLR
7487 Samples/s +58%
Average NVIDIA GeForce RTX 3090
  (5727 - 5985, n=9)
5893 Samples/s +25%
Razer Blade 16 Early 2023
NVIDIA GeForce RTX 4080 Laptop GPU, i9-13950HX, SSSTC CA6-8D1024
5882 Samples/s +24%
Average NVIDIA GeForce RTX 3080 Laptop GPU
  (4895 - 5062, n=6)
4937 Samples/s +4%
SCHENKER XMG Neo 17 2023 Engineering Sample
NVIDIA GeForce RTX 4070 Laptop GPU, i9-13900HX
4727 Samples/s
Average NVIDIA GeForce RTX 3080 Ti Laptop GPU
  ()
4296 Samples/s -9%
Average NVIDIA GeForce RTX 3070 Ti Laptop GPU
  ()
3623 Samples/s -23%
Average AMD Radeon RX 6800M
  ()
3360 Samples/s -29%
SCHENKER XMG Focus 15 Engineering Sample
NVIDIA GeForce RTX 4050 Laptop GPU, i5-13500HX
2967 Samples/s -37%
Average AMD Radeon RX 6700M
  ()
2847 Samples/s -40%
Average AMD Radeon RX 6600M
  ()
2294 Samples/s -51%
MSI Katana 17 B13VFK
NVIDIA GeForce RTX 4060 Laptop GPU, i7-13620H, Micron 2400 MTFDKBA1T0QFM
Samples/s -100%
Sala GPUs-only
Asus TUF Gaming GeForce RTX 4070 Ti
NVIDIA GeForce RTX 4070 Ti, i9-13900K
20171 Samples/s +87%
MSI Titan GT77 HX 13VI
NVIDIA GeForce RTX 4090 Laptop GPU, i9-13950HX, Samsung PM9A1 MZVL22T0HBLB
20001 Samples/s +85%
Lenovo Legion Pro 7 16IRX8H
NVIDIA GeForce RTX 4080 Laptop GPU, i9-13900HX, Samsung PM9A1 MZVL21T0HCLR
17111 Samples/s +58%
Average NVIDIA GeForce RTX 3090
  (14590 - 15242, n=9)
14945 Samples/s +38%
Average AMD Radeon RX 6800M
  ()
14770 Samples/s +37%
Razer Blade 16 Early 2023
NVIDIA GeForce RTX 4080 Laptop GPU, i9-13950HX, SSSTC CA6-8D1024
12572 Samples/s +16%
Average AMD Radeon RX 6700M
  ()
12486 Samples/s +16%
Average NVIDIA GeForce RTX 3080 Laptop GPU
  (11081 - 11844, n=6)
11447 Samples/s +6%
SCHENKER XMG Neo 17 2023 Engineering Sample
NVIDIA GeForce RTX 4070 Laptop GPU, i9-13900HX
10800 Samples/s
Average NVIDIA GeForce RTX 3080 Ti Laptop GPU
  ()
10333 Samples/s -4%
SCHENKER XMG Focus 15 Engineering Sample
NVIDIA GeForce RTX 4050 Laptop GPU, i5-13500HX
8036 Samples/s -26%
Average NVIDIA GeForce RTX 3070 Ti Laptop GPU
  ()
8022 Samples/s -26%
Average AMD Radeon RX 6600M
  ()
5564 Samples/s -48%
MSI Katana 17 B13VFK
NVIDIA GeForce RTX 4060 Laptop GPU, i7-13620H, Micron 2400 MTFDKBA1T0QFM
Samples/s -100%
Blender
v3.3 Classroom OPTIX/RTX
Average NVIDIA GeForce RTX 3050 6GB Laptop GPU
  (68 - 72, n=3)
69.3 Seconds * -230%
Average NVIDIA GeForce RTX 3050 Ti Laptop GPU
  (48 - 60, n=7)
52.3 Seconds * -149%
Average NVIDIA GeForce RTX 3060 Laptop GPU
  (30 - 56, n=15)
34.2 Seconds * -63%
Asus ROG Zephyrus M16 GU603Z
GeForce RTX 3070 Ti Laptop GPU, i9-12900H, Micron 3400 1TB MTFDKBA1T0TFH
28 Seconds * -33%
SCHENKER XMG Focus 15 Engineering Sample
NVIDIA GeForce RTX 4050 Laptop GPU, i5-13500HX
27 Seconds * -29%
Average NVIDIA GeForce RTX 3070 Ti Laptop GPU
  (22 - 30, n=15)
25.3 Seconds * -20%
MSI Katana 17 B13VFK
NVIDIA GeForce RTX 4060 Laptop GPU, i7-13620H, Micron 2400 MTFDKBA1T0QFM
25 Seconds * -19%
Average NVIDIA GeForce RTX 3080 Laptop GPU
  (23 - 25, n=4)
23.8 Seconds * -13%
Average NVIDIA GeForce RTX 3080 Ti Laptop GPU
  (20 - 28, n=13)
23.1 Seconds * -10%
Lenovo ThinkPad P16 G1 RTX A5500
RTX A5500 Laptop GPU, i9-12950HX, WDC PC SN810 2TB
21 Seconds * -0%
Gigabyte AERO 16 OLED BSF
NVIDIA GeForce RTX 4070 Laptop GPU, i9-13900H, Gigabyte AG470S1TB-SI B10
21 Seconds * -0%
SCHENKER XMG Neo 17 2023 Engineering Sample
NVIDIA GeForce RTX 4070 Laptop GPU, i9-13900HX
21 Seconds *
Razer Blade 18 RTX 4070
NVIDIA GeForce RTX 4070 Laptop GPU, i9-13950HX, SSSTC CA6-8D1024
20 Seconds * +5%
Razer Blade 16 Early 2023
NVIDIA GeForce RTX 4080 Laptop GPU, i9-13950HX, SSSTC CA6-8D1024
15 Seconds * +29%
Lenovo Legion Pro 7 16IRX8H
NVIDIA GeForce RTX 4080 Laptop GPU, i9-13900HX, Samsung PM9A1 MZVL21T0HCLR
15 Seconds * +29%
Average NVIDIA GeForce RTX 3090
  (13 - 14, n=12)
13.3 Seconds * +37%
Asus TUF Gaming GeForce RTX 4070 Ti
NVIDIA GeForce RTX 4070 Ti, i9-13900K
12 Seconds * +43%
MSI Titan GT77 HX 13VI
NVIDIA GeForce RTX 4090 Laptop GPU, i9-13950HX, Samsung PM9A1 MZVL22T0HBLB
11 Seconds * +48%
v3.3 Classroom CUDA
Average NVIDIA GeForce RTX 3050 6GB Laptop GPU
  (107 - 115, n=3)
110.7 Seconds * -220%
Average NVIDIA GeForce RTX 3050 Ti Laptop GPU
  (83 - 104, n=7)
90 Seconds * -160%
Average NVIDIA GeForce RTX 3060 Laptop GPU
  (51 - 89, n=15)
57.6 Seconds * -66%
SCHENKER XMG Focus 15 Engineering Sample
NVIDIA GeForce RTX 4050 Laptop GPU, i5-13500HX
53.4 Seconds * -54%
Asus ROG Zephyrus M16 GU603Z
GeForce RTX 3070 Ti Laptop GPU, i9-12900H, Micron 3400 1TB MTFDKBA1T0TFH
45 Seconds * -30%
MSI Katana 17 B13VFK
NVIDIA GeForce RTX 4060 Laptop GPU, i7-13620H, Micron 2400 MTFDKBA1T0QFM
44 Seconds * -27%
Average NVIDIA GeForce RTX 3070 Ti Laptop GPU
  (36 - 46, n=16)
41.4 Seconds * -20%
Average NVIDIA GeForce RTX 3080 Laptop GPU
  (41 - 42, n=4)
41.3 Seconds * -19%
Razer Blade 18 RTX 4070
NVIDIA GeForce RTX 4070 Laptop GPU, i9-13950HX, SSSTC CA6-8D1024
36 Seconds * -4%
Lenovo ThinkPad P16 G1 RTX A5500
RTX A5500 Laptop GPU, i9-12950HX, WDC PC SN810 2TB
35 Seconds * -1%
Average NVIDIA GeForce RTX 3080 Ti Laptop GPU
  (32 - 41, n=13)
35 Seconds * -1%
SCHENKER XMG Neo 17 2023 Engineering Sample
NVIDIA GeForce RTX 4070 Laptop GPU, i9-13900HX
34.6 Seconds *
Gigabyte AERO 16 OLED BSF
NVIDIA GeForce RTX 4070 Laptop GPU, i9-13900H, Gigabyte AG470S1TB-SI B10
34 Seconds * +2%
Lenovo Legion Pro 7 16IRX8H
NVIDIA GeForce RTX 4080 Laptop GPU, i9-13900HX, Samsung PM9A1 MZVL21T0HCLR
23 Seconds * +34%
Razer Blade 16 Early 2023
NVIDIA GeForce RTX 4080 Laptop GPU, i9-13950HX, SSSTC CA6-8D1024
22 Seconds * +36%
Average NVIDIA GeForce RTX 3090
  (20 - 22, n=12)
21.4 Seconds * +38%
MSI Titan GT77 HX 13VI
NVIDIA GeForce RTX 4090 Laptop GPU, i9-13950HX, Samsung PM9A1 MZVL22T0HBLB
17 Seconds * +51%
v3.3 Classroom HIP/AMD
Average NVIDIA GeForce RTX 3060 Laptop GPU
  (393 - 481, n=2)
437 Seconds *
Average NVIDIA GeForce RTX 3070 Ti Laptop GPU
  ()
380 Seconds *
Asus TUF Gaming A16 FA617
Radeon RX 7600S, R7 7735HS, Micron 2400 MTFDKBA1T0QFM
74 Seconds *
Average AMD Radeon RX 6800M
  ()
63 Seconds *
Average AMD Radeon RX 6600M
  (4 - 87, n=3)
52 Seconds *
v3.3 Classroom METAL
Apple MacBook Pro 16 2023 M2 Max
M2 Max 38-Core GPU, M2 Max, Apple SSD AP2048Z
51.2 Seconds *
GFXBench
3840x2160 4K Aztec Ruins High Tier Offscreen
MSI Titan GT77 HX 13VI
NVIDIA GeForce RTX 4090 Laptop GPU, i9-13950HX, Samsung PM9A1 MZVL22T0HBLB
239.5 fps +88%
Razer Blade 16 Early 2023
NVIDIA GeForce RTX 4080 Laptop GPU, i9-13950HX, SSSTC CA6-8D1024
212 fps +66%
Lenovo Legion Pro 7 16IRX8H
NVIDIA GeForce RTX 4080 Laptop GPU, i9-13900HX, Samsung PM9A1 MZVL21T0HCLR
197.2 fps +55%
Apple MacBook Pro 16 2023 M2 Max
M2 Max 38-Core GPU, M2 Max, Apple SSD AP2048Z
179.9 fps +41%
SCHENKER XMG Neo 17 2023 Engineering Sample
NVIDIA GeForce RTX 4070 Laptop GPU, i9-13900HX
127.6 fps
MSI Katana 17 B13VFK
NVIDIA GeForce RTX 4060 Laptop GPU, i7-13620H, Micron 2400 MTFDKBA1T0QFM
107 fps -16%
SCHENKER XMG Focus 15 Engineering Sample
NVIDIA GeForce RTX 4050 Laptop GPU, i5-13500HX
90 fps -29%
Asus TUF Gaming A16 FA617
Radeon RX 7600S, R7 7735HS, Micron 2400 MTFDKBA1T0QFM
16.3 fps -87%
2560x1440 Aztec Ruins High Tier Offscreen
MSI Titan GT77 HX 13VI
NVIDIA GeForce RTX 4090 Laptop GPU, i9-13950HX, Samsung PM9A1 MZVL22T0HBLB
522 fps +81%
Razer Blade 16 Early 2023
NVIDIA GeForce RTX 4080 Laptop GPU, i9-13950HX, SSSTC CA6-8D1024
485 fps +68%
Lenovo Legion Pro 7 16IRX8H
NVIDIA GeForce RTX 4080 Laptop GPU, i9-13900HX, Samsung PM9A1 MZVL21T0HCLR
446.1 fps +55%
Apple MacBook Pro 16 2023 M2 Max
M2 Max 38-Core GPU, M2 Max, Apple SSD AP2048Z
397.6 fps +38%
SCHENKER XMG Neo 17 2023 Engineering Sample
NVIDIA GeForce RTX 4070 Laptop GPU, i9-13900HX
288.5 fps
Average NVIDIA GeForce RTX 3080 Ti Laptop GPU
  ()
262 fps -9%
MSI Katana 17 B13VFK
NVIDIA GeForce RTX 4060 Laptop GPU, i7-13620H, Micron 2400 MTFDKBA1T0QFM
248.5 fps -14%
SCHENKER XMG Focus 15 Engineering Sample
NVIDIA GeForce RTX 4050 Laptop GPU, i5-13500HX
208 fps -28%
Average NVIDIA GeForce RTX 3050 Ti Laptop GPU
  ()
108 fps -63%
Asus TUF Gaming A16 FA617
Radeon RX 7600S, R7 7735HS, Micron 2400 MTFDKBA1T0QFM
45 fps -84%
1920x1080 Car Chase Offscreen
MSI Titan GT77 HX 13VI
NVIDIA GeForce RTX 4090 Laptop GPU, i9-13950HX, Samsung PM9A1 MZVL22T0HBLB
888 fps +44%
SCHENKER XMG Neo 17 2023 Engineering Sample
NVIDIA GeForce RTX 4070 Laptop GPU, i9-13900HX
616.7 fps
Apple MacBook Pro 16 2023 M2 Max
M2 Max 38-Core GPU, M2 Max, Apple SSD AP2048Z
585.2 fps -5%
MSI Katana 17 B13VFK
NVIDIA GeForce RTX 4060 Laptop GPU, i7-13620H, Micron 2400 MTFDKBA1T0QFM
547.5 fps -11%
SCHENKER XMG Focus 15 Engineering Sample
NVIDIA GeForce RTX 4050 Laptop GPU, i5-13500HX
470 fps -24%
Average NVIDIA GeForce RTX 3050 Ti Laptop GPU
  ()
252 fps -59%
SPECviewperf 13
Solidworks (sw-04)
Lenovo ThinkPad P16 G1 RTX A5500
RTX A5500 Laptop GPU, i9-12950HX, WDC PC SN810 2TB
206.94 fps +79%
Average AMD Radeon RX 6600M
  (127 - 201, n=4)
170.8 fps +48%
Average AMD Radeon RX 6800M
  (143 - 179, n=2)
161 fps +39%
MSI Titan GT77 HX 13VI
NVIDIA GeForce RTX 4090 Laptop GPU, i9-13950HX, Samsung PM9A1 MZVL22T0HBLB
159.12 fps +38%
Average NVIDIA GeForce RTX 3090
  (82.9 - 160, n=11)
136.3 fps +18%
Razer Blade 16 Early 2023
NVIDIA GeForce RTX 4080 Laptop GPU, i9-13950HX, SSSTC CA6-8D1024
134.49 fps +17%
SCHENKER XMG Neo 17 2023 Engineering Sample
NVIDIA GeForce RTX 4070 Laptop GPU, i9-13900HX
115.44 fps
Average NVIDIA GeForce RTX 3080 Ti Laptop GPU
  (62.9 - 133.4, n=8)
108.8 fps -6%
MSI Katana 17 B13VFK
NVIDIA GeForce RTX 4060 Laptop GPU, i7-13620H, Micron 2400 MTFDKBA1T0QFM
108.18 fps -6%
Average NVIDIA GeForce RTX 3080 Laptop GPU
  (98.6 - 115, n=4)
104.2 fps -10%
Average NVIDIA GeForce RTX 3070 Ti Laptop GPU
  ()
103.4 fps -10%
SCHENKER XMG Focus 15 Engineering Sample
NVIDIA GeForce RTX 4050 Laptop GPU, i5-13500HX
93.4 fps -19%
Average NVIDIA GeForce RTX 3060 Laptop GPU
  (87.4 - 97.6, n=3)
92.7 fps -20%
Average NVIDIA GeForce RTX 3050 Ti Laptop GPU
  ()
79.5 fps -31%
Siemens NX (snx-03)
Lenovo ThinkPad P16 G1 RTX A5500
RTX A5500 Laptop GPU, i9-12950HX, WDC PC SN810 2TB
413.09 fps +1698%
Average AMD Radeon RX 6600M
  (64.2 - 344, n=4)
263 fps +1045%
Average AMD Radeon RX 6800M
  (65.6 - 79.4, n=2)
72.5 fps +216%
MSI Titan GT77 HX 13VI
NVIDIA GeForce RTX 4090 Laptop GPU, i9-13950HX, Samsung PM9A1 MZVL22T0HBLB
34.38 fps +50%
Razer Blade 16 Early 2023
NVIDIA GeForce RTX 4080 Laptop GPU, i9-13950HX, SSSTC CA6-8D1024
28.76 fps +25%
Average NVIDIA GeForce RTX 3090
  (15.6 - 33.3, n=11)
28.1 fps +22%
Average NVIDIA GeForce RTX 3080 Laptop GPU
  (23 - 23.2, n=4)
23.1 fps +1%
SCHENKER XMG Neo 17 2023 Engineering Sample
NVIDIA GeForce RTX 4070 Laptop GPU, i9-13900HX
22.97 fps
Average NVIDIA GeForce RTX 3080 Ti Laptop GPU
  (18.3 - 25.3, n=8)
22.3 fps -3%
MSI Katana 17 B13VFK
NVIDIA GeForce RTX 4060 Laptop GPU, i7-13620H, Micron 2400 MTFDKBA1T0QFM
21.83 fps -5%
SCHENKER XMG Focus 15 Engineering Sample
NVIDIA GeForce RTX 4050 Laptop GPU, i5-13500HX
21 fps -9%
Average NVIDIA GeForce RTX 3070 Ti Laptop GPU
  ()
19.2 fps -16%
Average NVIDIA GeForce RTX 3060 Laptop GPU
  (16.2 - 17.7, n=3)
16.9 fps -26%
Average NVIDIA GeForce RTX 3050 Ti Laptop GPU
  ()
13.3 fps -42%
Showcase (showcase-02)
MSI Titan GT77 HX 13VI
NVIDIA GeForce RTX 4090 Laptop GPU, i9-13950HX, Samsung PM9A1 MZVL22T0HBLB
281.1 fps +130%
Average NVIDIA GeForce RTX 3090
  (114 - 268, n=11)
246 fps +101%
Razer Blade 16 Early 2023
NVIDIA GeForce RTX 4080 Laptop GPU, i9-13950HX, SSSTC CA6-8D1024
203.33 fps +66%
Average NVIDIA GeForce RTX 3080 Ti Laptop GPU
  (110 - 175, n=8)
146.6 fps +20%
Lenovo ThinkPad P16 G1 RTX A5500
RTX A5500 Laptop GPU, i9-12950HX, WDC PC SN810 2TB
142.9 fps +17%
Average AMD Radeon RX 6800M
  (132 - 149, n=2)
140.5 fps +15%
Average NVIDIA GeForce RTX 3070 Ti Laptop GPU
  ()
130.4 fps +7%
Average NVIDIA GeForce RTX 3080 Laptop GPU
  (120 - 133, n=4)
123.3 fps +1%
SCHENKER XMG Neo 17 2023 Engineering Sample
NVIDIA GeForce RTX 4070 Laptop GPU, i9-13900HX
122.16 fps
Average AMD Radeon RX 6600M
  (98.5 - 129, n=4)
117.6 fps -4%
Average NVIDIA GeForce RTX 3060 Laptop GPU
  (98.1 - 110, n=3)
105.7 fps -13%
MSI Katana 17 B13VFK
NVIDIA GeForce RTX 4060 Laptop GPU, i7-13620H, Micron 2400 MTFDKBA1T0QFM
105.23 fps -14%
SCHENKER XMG Focus 15 Engineering Sample
NVIDIA GeForce RTX 4050 Laptop GPU, i5-13500HX
78.3 fps -36%
Average NVIDIA GeForce RTX 3050 Ti Laptop GPU
  ()
68.9 fps -44%
Medical (medical-02)
Lenovo ThinkPad P16 G1 RTX A5500
RTX A5500 Laptop GPU, i9-12950HX, WDC PC SN810 2TB
140.01 fps +75%
MSI Titan GT77 HX 13VI
NVIDIA GeForce RTX 4090 Laptop GPU, i9-13950HX, Samsung PM9A1 MZVL22T0HBLB
122.82 fps +53%
Razer Blade 16 Early 2023
NVIDIA GeForce RTX 4080 Laptop GPU, i9-13950HX, SSSTC CA6-8D1024
107.84 fps +35%
Average NVIDIA GeForce RTX 3090
  (49.3 - 109, n=11)
100.6 fps +26%
Average AMD Radeon RX 6600M
  (63 - 130, n=4)
85.4 fps +7%
SCHENKER XMG Neo 17 2023 Engineering Sample
NVIDIA GeForce RTX 4070 Laptop GPU, i9-13900HX
80.13 fps
Average NVIDIA GeForce RTX 3080 Ti Laptop GPU
  (65.3 - 79.1, n=8)
74.5 fps -7%
Average AMD Radeon RX 6800M
  (69.4 - 78.7, n=2)
74.1 fps -8%
MSI Katana 17 B13VFK
NVIDIA GeForce RTX 4060 Laptop GPU, i7-13620H, Micron 2400 MTFDKBA1T0QFM
67.75 fps -15%
Average NVIDIA GeForce RTX 3070 Ti Laptop GPU
  ()
67.4 fps -16%
SCHENKER XMG Focus 15 Engineering Sample
NVIDIA GeForce RTX 4050 Laptop GPU, i5-13500HX
59.9 fps -25%
Average NVIDIA GeForce RTX 3080 Laptop GPU
  (58.9 - 59.2, n=4)
59 fps -26%
Average NVIDIA GeForce RTX 3060 Laptop GPU
  (57.2 - 58.6, n=3)
57.8 fps -28%
Average NVIDIA GeForce RTX 3050 Ti Laptop GPU
  ()
42.2 fps -47%
Maya (maya-05)
MSI Titan GT77 HX 13VI
NVIDIA GeForce RTX 4090 Laptop GPU, i9-13950HX, Samsung PM9A1 MZVL22T0HBLB
600.78 fps +69%
Average NVIDIA GeForce RTX 3090
  (253 - 595, n=11)
522 fps +46%
Razer Blade 16 Early 2023
NVIDIA GeForce RTX 4080 Laptop GPU, i9-13950HX, SSSTC CA6-8D1024
494.88 fps +39%
Lenovo ThinkPad P16 G1 RTX A5500
RTX A5500 Laptop GPU, i9-12950HX, WDC PC SN810 2TB
362.87 fps +2%
SCHENKER XMG Neo 17 2023 Engineering Sample
NVIDIA GeForce RTX 4070 Laptop GPU, i9-13900HX
356.37 fps
Average NVIDIA GeForce RTX 3080 Ti Laptop GPU
  (212 - 430, n=8)
321 fps -10%
Average NVIDIA GeForce RTX 3080 Laptop GPU
  (304 - 311, n=4)
308 fps -14%
MSI Katana 17 B13VFK
NVIDIA GeForce RTX 4060 Laptop GPU, i7-13620H, Micron 2400 MTFDKBA1T0QFM
299.64 fps -16%
Average AMD Radeon RX 6600M
  (187 - 340, n=4)
283 fps -21%
Average NVIDIA GeForce RTX 3070 Ti Laptop GPU
  ()
270 fps -24%
Average AMD Radeon RX 6800M
  (228 - 279, n=2)
254 fps -29%
SCHENKER XMG Focus 15 Engineering Sample
NVIDIA GeForce RTX 4050 Laptop GPU, i5-13500HX
253.7 fps -29%
Average NVIDIA GeForce RTX 3060 Laptop GPU
  (198 - 264, n=3)
234 fps -34%
Average NVIDIA GeForce RTX 3050 Ti Laptop GPU
  ()
157 fps -56%
Energy (energy-02)
MSI Titan GT77 HX 13VI
NVIDIA GeForce RTX 4090 Laptop GPU, i9-13950HX, Samsung PM9A1 MZVL22T0HBLB
74.73 fps +78%
Lenovo ThinkPad P16 G1 RTX A5500
RTX A5500 Laptop GPU, i9-12950HX, WDC PC SN810 2TB
69.02 fps +65%
Razer Blade 16 Early 2023
NVIDIA GeForce RTX 4080 Laptop GPU, i9-13950HX, SSSTC CA6-8D1024
61.32 fps +46%
Average NVIDIA GeForce RTX 3090
  (26.6 - 45.2, n=11)
42.8 fps +2%
SCHENKER XMG Neo 17 2023 Engineering Sample
NVIDIA GeForce RTX 4070 Laptop GPU, i9-13900HX
41.89 fps
MSI Katana 17 B13VFK
NVIDIA GeForce RTX 4060 Laptop GPU, i7-13620H, Micron 2400 MTFDKBA1T0QFM
35.21 fps -16%
Average AMD Radeon RX 6600M
  (2.05 - 43.5, n=4)
32.2 fps -23%
SCHENKER XMG Focus 15 Engineering Sample
NVIDIA GeForce RTX 4050 Laptop GPU, i5-13500HX
31.8 fps -24%
Average NVIDIA GeForce RTX 3080 Laptop GPU
  (24.6 - 24.8, n=4)
24.7 fps -41%
Average NVIDIA GeForce RTX 3080 Ti Laptop GPU
  (19.3 - 27.3, n=8)
24.5 fps -42%
Average NVIDIA GeForce RTX 3070 Ti Laptop GPU
  ()
23 fps -45%
Average NVIDIA GeForce RTX 3060 Laptop GPU
  (20.3 - 20.7, n=3)
20.6 fps -51%
Average AMD Radeon RX 6800M
  (2.98 - 35.1, n=2)
19 fps -55%
Average NVIDIA GeForce RTX 3050 Ti Laptop GPU
  ()
12.8 fps -69%
Creo (creo-02)
MSI Titan GT77 HX 13VI
NVIDIA GeForce RTX 4090 Laptop GPU, i9-13950HX, Samsung PM9A1 MZVL22T0HBLB
461.26 fps +75%
Razer Blade 16 Early 2023
NVIDIA GeForce RTX 4080 Laptop GPU, i9-13950HX, SSSTC CA6-8D1024
377.58 fps +43%
Average NVIDIA GeForce RTX 3090
  (176 - 417, n=11)
366 fps +39%
Lenovo ThinkPad P16 G1 RTX A5500
RTX A5500 Laptop GPU, i9-12950HX, WDC PC SN810 2TB
330.97 fps +26%
SCHENKER XMG Neo 17 2023 Engineering Sample
NVIDIA GeForce RTX 4070 Laptop GPU, i9-13900HX
263.41 fps
Average NVIDIA GeForce RTX 3080 Ti Laptop GPU
  (177.4 - 311, n=8)
249 fps -5%
Average AMD Radeon RX 6600M
  (166 - 273, n=4)
228 fps -13%
Average NVIDIA GeForce RTX 3080 Laptop GPU
  (215 - 218, n=4)
216 fps -18%
Average AMD Radeon RX 6800M
  (179 - 247, n=2)
213 fps -19%
Average NVIDIA GeForce RTX 3070 Ti Laptop GPU
  ()
205 fps -22%
MSI Katana 17 B13VFK
NVIDIA GeForce RTX 4060 Laptop GPU, i7-13620H, Micron 2400 MTFDKBA1T0QFM
199.33 fps -24%
Average NVIDIA GeForce RTX 3060 Laptop GPU
  (156.6 - 192, n=3)
175.9 fps -33%
SCHENKER XMG Focus 15 Engineering Sample
NVIDIA GeForce RTX 4050 Laptop GPU, i5-13500HX
173 fps -34%
Average NVIDIA GeForce RTX 3050 Ti Laptop GPU
  ()
120 fps -54%
Catia (catia-05)
Lenovo ThinkPad P16 G1 RTX A5500
RTX A5500 Laptop GPU, i9-12950HX, WDC PC SN810 2TB
369.46 fps +133%
Average AMD Radeon RX 6600M
  (211 - 381, n=4)
318 fps +100%
Average AMD Radeon RX 6800M
  (260 - 344, n=2)
302 fps +90%
MSI Titan GT77 HX 13VI
NVIDIA GeForce RTX 4090 Laptop GPU, i9-13950HX, Samsung PM9A1 MZVL22T0HBLB
281.44 fps +77%
Razer Blade 16 Early 2023
NVIDIA GeForce RTX 4080 Laptop GPU, i9-13950HX, SSSTC CA6-8D1024
233.27 fps +47%
Average NVIDIA GeForce RTX 3090
  (111 - 260, n=11)
232 fps +46%
Average NVIDIA GeForce RTX 3080 Ti Laptop GPU
  (130.4 - 190.3, n=8)
170 fps +7%
SCHENKER XMG Neo 17 2023 Engineering Sample
NVIDIA GeForce RTX 4070 Laptop GPU, i9-13900HX
158.82 fps
Average NVIDIA GeForce RTX 3080 Laptop GPU
  (158 - 159, n=4)
158.8 fps 0%
Average NVIDIA GeForce RTX 3070 Ti Laptop GPU
  ()
150.6 fps -5%
MSI Katana 17 B13VFK
NVIDIA GeForce RTX 4060 Laptop GPU, i7-13620H, Micron 2400 MTFDKBA1T0QFM
145.49 fps -8%
SCHENKER XMG Focus 15 Engineering Sample
NVIDIA GeForce RTX 4050 Laptop GPU, i5-13500HX
124.6 fps -22%
Average NVIDIA GeForce RTX 3060 Laptop GPU
  (47.7 - 118.1, n=3)
94.3 fps -41%
Average NVIDIA GeForce RTX 3050 Ti Laptop GPU
  ()
82.8 fps -48%
3ds Max (3dsmax-06)
MSI Titan GT77 HX 13VI
NVIDIA GeForce RTX 4090 Laptop GPU, i9-13950HX, Samsung PM9A1 MZVL22T0HBLB
372.51 fps +53%
Average NVIDIA GeForce RTX 3090
  (180 - 387, n=11)
348 fps +43%
Razer Blade 16 Early 2023
NVIDIA GeForce RTX 4080 Laptop GPU, i9-13950HX, SSSTC CA6-8D1024
346.23 fps +42%
SCHENKER XMG Neo 17 2023 Engineering Sample
NVIDIA GeForce RTX 4070 Laptop GPU, i9-13900HX
243.42 fps
Lenovo ThinkPad P16 G1 RTX A5500
RTX A5500 Laptop GPU, i9-12950HX, WDC PC SN810 2TB
241.24 fps -1%
Average AMD Radeon RX 6800M
  (226 - 231, n=2)
229 fps -6%
Average NVIDIA GeForce RTX 3080 Ti Laptop GPU
  (161 - 260, n=8)
223 fps -8%
Average NVIDIA GeForce RTX 3080 Laptop GPU
  (215 - 217, n=4)
216 fps -11%
MSI Katana 17 B13VFK
NVIDIA GeForce RTX 4060 Laptop GPU, i7-13620H, Micron 2400 MTFDKBA1T0QFM
206.17 fps -15%
Average NVIDIA GeForce RTX 3070 Ti Laptop GPU
  ()
195.1 fps -20%
Average AMD Radeon RX 6600M
  (156 - 246, n=4)
194.5 fps -20%
SCHENKER XMG Focus 15 Engineering Sample
NVIDIA GeForce RTX 4050 Laptop GPU, i5-13500HX
164.7 fps -32%
Average NVIDIA GeForce RTX 3060 Laptop GPU
  (49.1 - 193.9, n=3)
141 fps -42%
Average NVIDIA GeForce RTX 3050 Ti Laptop GPU
  ()
133 fps -45%
SPECviewperf 2020
1920x1080 Solidworks (solidworks-05)
MSI Titan GT77 HX 13VI
NVIDIA GeForce RTX 4090 Laptop GPU, i9-13950HX, Samsung PM9A1 MZVL22T0HBLB
499.25 fps +90%
Razer Blade 16 Early 2023
NVIDIA GeForce RTX 4080 Laptop GPU, i9-13950HX, SSSTC CA6-8D1024
420.83 fps +60%
SCHENKER XMG Neo 17 2023 Engineering Sample
NVIDIA GeForce RTX 4070 Laptop GPU, i9-13900HX
262.82 fps
Lenovo ThinkPad P16 G1 RTX A5500
RTX A5500 Laptop GPU, i9-12950HX, WDC PC SN810 2TB
258.01 fps -2%
MSI Katana 17 B13VFK
NVIDIA GeForce RTX 4060 Laptop GPU, i7-13620H, Micron 2400 MTFDKBA1T0QFM
235 fps -11%
Average NVIDIA GeForce RTX 3070 Ti Laptop GPU
  ()
226 fps -14%
Average NVIDIA GeForce RTX 3080 Ti Laptop GPU
  (174.7 - 211, n=3)
198.6 fps -24%
Average NVIDIA GeForce RTX 3060 Laptop GPU
  ()
196 fps -25%
SCHENKER XMG Focus 15 Engineering Sample
NVIDIA GeForce RTX 4050 Laptop GPU, i5-13500HX
188.3 fps -28%
1920x1080 Siemens NX (snx-04)
Lenovo ThinkPad P16 G1 RTX A5500
RTX A5500 Laptop GPU, i9-12950HX, WDC PC SN810 2TB
410.78 fps +1718%
MSI Titan GT77 HX 13VI
NVIDIA GeForce RTX 4090 Laptop GPU, i9-13950HX, Samsung PM9A1 MZVL22T0HBLB
34.28 fps +52%
Razer Blade 16 Early 2023
NVIDIA GeForce RTX 4080 Laptop GPU, i9-13950HX, SSSTC CA6-8D1024
30 fps +33%
Average NVIDIA GeForce RTX 3080 Laptop GPU
  ()
23.1 fps +2%
SCHENKER XMG Neo 17 2023 Engineering Sample
NVIDIA GeForce RTX 4070 Laptop GPU, i9-13900HX
22.59 fps
Average NVIDIA GeForce RTX 3080 Ti Laptop GPU
  (18.1 - 25, n=6)
21.8 fps -3%
MSI Katana 17 B13VFK
NVIDIA GeForce RTX 4060 Laptop GPU, i7-13620H, Micron 2400 MTFDKBA1T0QFM
21.7 fps -4%
SCHENKER XMG Focus 15 Engineering Sample
NVIDIA GeForce RTX 4050 Laptop GPU, i5-13500HX
21.4 fps -5%
Average NVIDIA GeForce RTX 3070 Ti Laptop GPU
  (19.9 - 20.4, n=2)
20.2 fps -11%
Average NVIDIA GeForce RTX 3060 Laptop GPU
  (16.2 - 17.5, n=2)
16.9 fps -25%
1920x1080 Medical (medical-03)
Lenovo ThinkPad P16 G1 RTX A5500
RTX A5500 Laptop GPU, i9-12950HX, WDC PC SN810 2TB
68.3 fps +85%
MSI Titan GT77 HX 13VI
NVIDIA GeForce RTX 4090 Laptop GPU, i9-13950HX, Samsung PM9A1 MZVL22T0HBLB
56.7 fps +54%
Razer Blade 16 Early 2023
NVIDIA GeForce RTX 4080 Laptop GPU, i9-13950HX, SSSTC CA6-8D1024
49.97 fps +35%
Average NVIDIA GeForce RTX 3080 Ti Laptop GPU
  (33 - 40.2, n=6)
37.4 fps +1%
SCHENKER XMG Neo 17 2023 Engineering Sample
NVIDIA GeForce RTX 4070 Laptop GPU, i9-13900HX
36.9 fps
Average NVIDIA GeForce RTX 3070 Ti Laptop GPU
  (32.1 - 33.1, n=2)
32.6 fps -12%
MSI Katana 17 B13VFK
NVIDIA GeForce RTX 4060 Laptop GPU, i7-13620H, Micron 2400 MTFDKBA1T0QFM
32.2 fps -13%
Average NVIDIA GeForce RTX 3080 Laptop GPU
  ()
29.6 fps -20%
Average NVIDIA GeForce RTX 3060 Laptop GPU
  (27.6 - 30, n=2)
28.8 fps -22%
SCHENKER XMG Focus 15 Engineering Sample
NVIDIA GeForce RTX 4050 Laptop GPU, i5-13500HX
28.7 fps -22%
1920x1080 Maya (maya-06)
MSI Titan GT77 HX 13VI
NVIDIA GeForce RTX 4090 Laptop GPU, i9-13950HX, Samsung PM9A1 MZVL22T0HBLB
610.71 fps +50%
Razer Blade 16 Early 2023
NVIDIA GeForce RTX 4080 Laptop GPU, i9-13950HX, SSSTC CA6-8D1024
555.93 fps +36%
SCHENKER XMG Neo 17 2023 Engineering Sample
NVIDIA GeForce RTX 4070 Laptop GPU, i9-13900HX
407.77 fps
Lenovo ThinkPad P16 G1 RTX A5500
RTX A5500 Laptop GPU, i9-12950HX, WDC PC SN810 2TB
403.83 fps -1%
MSI Katana 17 B13VFK
NVIDIA GeForce RTX 4060 Laptop GPU, i7-13620H, Micron 2400 MTFDKBA1T0QFM
371 fps -9%
Average NVIDIA GeForce RTX 3080 Laptop GPU
  ()
360 fps -12%
Average NVIDIA GeForce RTX 3080 Ti Laptop GPU
  (248 - 456, n=6)
351 fps -14%
Average NVIDIA GeForce RTX 3070 Ti Laptop GPU
  ()
334 fps -18%
SCHENKER XMG Focus 15 Engineering Sample
NVIDIA GeForce RTX 4050 Laptop GPU, i5-13500HX
333.9 fps -18%
Average NVIDIA GeForce RTX 3060 Laptop GPU
  (202 - 299, n=2)
250 fps -39%
1920x1080 Energy (energy-03)
MSI Titan GT77 HX 13VI
NVIDIA GeForce RTX 4090 Laptop GPU, i9-13950HX, Samsung PM9A1 MZVL22T0HBLB
74.95 fps +80%
Lenovo ThinkPad P16 G1 RTX A5500
RTX A5500 Laptop GPU, i9-12950HX, WDC PC SN810 2TB
69.15 fps +66%
Razer Blade 16 Early 2023
NVIDIA GeForce RTX 4080 Laptop GPU, i9-13950HX, SSSTC CA6-8D1024
62.41 fps +50%
SCHENKER XMG Neo 17 2023 Engineering Sample
NVIDIA GeForce RTX 4070 Laptop GPU, i9-13900HX
41.73 fps
MSI Katana 17 B13VFK
NVIDIA GeForce RTX 4060 Laptop GPU, i7-13620H, Micron 2400 MTFDKBA1T0QFM
34.1 fps -18%
SCHENKER XMG Focus 15 Engineering Sample
NVIDIA GeForce RTX 4050 Laptop GPU, i5-13500HX
28.7 fps -31%
Average NVIDIA GeForce RTX 3080 Laptop GPU
  ()
24.7 fps -41%
Average NVIDIA GeForce RTX 3080 Ti Laptop GPU
  (19.6 - 27, n=6)
23.7 fps -43%
Average NVIDIA GeForce RTX 3070 Ti Laptop GPU
  (23.6 - 23.8, n=2)
23.7 fps -43%
Average NVIDIA GeForce RTX 3060 Laptop GPU
  (20.6 - 20.7, n=2)
20.7 fps -50%
1920x1080 Creo (creo-03)
Lenovo ThinkPad P16 G1 RTX A5500
RTX A5500 Laptop GPU, i9-12950HX, WDC PC SN810 2TB
165.08 fps +41%
MSI Titan GT77 HX 13VI
NVIDIA GeForce RTX 4090 Laptop GPU, i9-13950HX, Samsung PM9A1 MZVL22T0HBLB
138.99 fps +18%
Razer Blade 16 Early 2023
NVIDIA GeForce RTX 4080 Laptop GPU, i9-13950HX, SSSTC CA6-8D1024
130.27 fps +11%
SCHENKER XMG Neo 17 2023 Engineering Sample
NVIDIA GeForce RTX 4070 Laptop GPU, i9-13900HX
117.49 fps
MSI Katana 17 B13VFK
NVIDIA GeForce RTX 4060 Laptop GPU, i7-13620H, Micron 2400 MTFDKBA1T0QFM
100 fps -15%
Average NVIDIA GeForce RTX 3080 Laptop GPU
  ()
98.9 fps -16%
Average NVIDIA GeForce RTX 3070 Ti Laptop GPU
  ()
95 fps -19%
SCHENKER XMG Focus 15 Engineering Sample
NVIDIA GeForce RTX 4050 Laptop GPU, i5-13500HX
94.5 fps -20%
Average NVIDIA GeForce RTX 3080 Ti Laptop GPU
  (55.3 - 114.7, n=6)
92.3 fps -21%
Average NVIDIA GeForce RTX 3060 Laptop GPU
  (81.5 - 86.5, n=2)
84 fps -29%
1920x1080 CATIA (catia-06)
MSI Titan GT77 HX 13VI
NVIDIA GeForce RTX 4090 Laptop GPU, i9-13950HX, Samsung PM9A1 MZVL22T0HBLB
116.64 fps +70%
Lenovo ThinkPad P16 G1 RTX A5500
RTX A5500 Laptop GPU, i9-12950HX, WDC PC SN810 2TB
109.77 fps +60%
Razer Blade 16 Early 2023
NVIDIA GeForce RTX 4080 Laptop GPU, i9-13950HX, SSSTC CA6-8D1024
98.79 fps +44%
SCHENKER XMG Neo 17 2023 Engineering Sample
NVIDIA GeForce RTX 4070 Laptop GPU, i9-13900HX
68.6 fps
Average NVIDIA GeForce RTX 3080 Ti Laptop GPU
  (51.8 - 78.7, n=6)
67.4 fps -2%
Average NVIDIA GeForce RTX 3080 Laptop GPU
  ()
64.8 fps -6%
Average NVIDIA GeForce RTX 3070 Ti Laptop GPU
  (63.6 - 65.5, n=2)
64.5 fps -6%
MSI Katana 17 B13VFK
NVIDIA GeForce RTX 4060 Laptop GPU, i7-13620H, Micron 2400 MTFDKBA1T0QFM
61 fps -11%
Average NVIDIA GeForce RTX 3060 Laptop GPU
  (51.7 - 53.9, n=2)
52.8 fps -23%
SCHENKER XMG Focus 15 Engineering Sample
NVIDIA GeForce RTX 4050 Laptop GPU, i5-13500HX
50.7 fps -26%
1920x1080 3ds Max (3dsmax-07)
MSI Titan GT77 HX 13VI
NVIDIA GeForce RTX 4090 Laptop GPU, i9-13950HX, Samsung PM9A1 MZVL22T0HBLB
212.6 fps +113%
Razer Blade 16 Early 2023
NVIDIA GeForce RTX 4080 Laptop GPU, i9-13950HX, SSSTC CA6-8D1024
177.9 fps +78%
Lenovo ThinkPad P16 G1 RTX A5500
RTX A5500 Laptop GPU, i9-12950HX, WDC PC SN810 2TB
144.56 fps +45%
Average NVIDIA GeForce RTX 3080 Ti Laptop GPU
  (99.2 - 153, n=6)
128.4 fps +29%
Average NVIDIA GeForce RTX 3080 Laptop GPU
  ()
126 fps +26%
SCHENKER XMG Neo 17 2023 Engineering Sample
NVIDIA GeForce RTX 4070 Laptop GPU, i9-13900HX
99.85 fps
Average NVIDIA GeForce RTX 3070 Ti Laptop GPU
  (95.6 - 98.5, n=2)
97 fps -3%
MSI Katana 17 B13VFK
NVIDIA GeForce RTX 4060 Laptop GPU, i7-13620H, Micron 2400 MTFDKBA1T0QFM
89.6 fps -10%
Average NVIDIA GeForce RTX 3060 Laptop GPU
  (85.3 - 89.4, n=2)
87.4 fps -12%
SCHENKER XMG Focus 15 Engineering Sample
NVIDIA GeForce RTX 4050 Laptop GPU, i5-13500HX
79.7 fps -20%
3840x2160 Solidworks (solidworks-05)
MSI Titan GT77 HX 13VI
NVIDIA GeForce RTX 4090 Laptop GPU, i9-13950HX, Samsung PM9A1 MZVL22T0HBLB
207.55 fps +80%
Average NVIDIA GeForce RTX 3060 Laptop GPU
  ()
182 fps +58%
Average NVIDIA GeForce RTX 3090
  (93.1 - 194, n=8)
178 fps +55%
Razer Blade 16 Early 2023
NVIDIA GeForce RTX 4080 Laptop GPU, i9-13950HX, SSSTC CA6-8D1024
164.32 fps +43%
Average AMD Radeon RX 6800M
  ()
146 fps +27%
Average NVIDIA GeForce RTX 3080 Ti Laptop GPU
  (87.9 - 255, n=4)
137.6 fps +20%
SCHENKER XMG Neo 17 2023 Engineering Sample
NVIDIA GeForce RTX 4070 Laptop GPU, i9-13900HX
115.11 fps
Average NVIDIA GeForce RTX 3050 Ti Laptop GPU
  (113 - 113, n=2)
113 fps -2%
Lenovo ThinkPad P16 G1 RTX A5500
RTX A5500 Laptop GPU, i9-12950HX, WDC PC SN810 2TB
109.04 fps -5%
Average NVIDIA GeForce RTX 3080 Laptop GPU
  (102 - 105, n=4)
104 fps -10%
Average AMD Radeon RX 6600M
  (71 - 129, n=5)
101 fps -12%
MSI Katana 17 B13VFK
NVIDIA GeForce RTX 4060 Laptop GPU, i7-13620H, Micron 2400 MTFDKBA1T0QFM
97.2 fps -16%
SCHENKER XMG Focus 15 Engineering Sample
NVIDIA GeForce RTX 4050 Laptop GPU, i5-13500HX
73.4 fps -36%
3840x2160 Siemens NX (snx-04)
Lenovo ThinkPad P16 G1 RTX A5500
RTX A5500 Laptop GPU, i9-12950HX, WDC PC SN810 2TB
301.3 fps +1578%
Average AMD Radeon RX 6600M
  (62.5 - 226, n=6)
143.3 fps +698%
Average AMD Radeon RX 6800M
  (64.4 - 67.8, n=2)
66.1 fps +268%
MSI Titan GT77 HX 13VI
NVIDIA GeForce RTX 4090 Laptop GPU, i9-13950HX, Samsung PM9A1 MZVL22T0HBLB
28.23 fps +57%
Razer Blade 16 Early 2023
NVIDIA GeForce RTX 4080 Laptop GPU, i9-13950HX, SSSTC CA6-8D1024
23.93 fps +33%
Average NVIDIA GeForce RTX 3090
  (13.2 - 27, n=10)
23.7 fps +32%
Average NVIDIA GeForce RTX 3080 Ti Laptop GPU
  (15.5 - 21.1, n=7)
18.9 fps +5%
Average NVIDIA GeForce RTX 3080 Laptop GPU
  (18.5 - 18.8, n=4)
18.7 fps +4%
SCHENKER XMG Neo 17 2023 Engineering Sample
NVIDIA GeForce RTX 4070 Laptop GPU, i9-13900HX
17.96 fps
MSI Katana 17 B13VFK
NVIDIA GeForce RTX 4060 Laptop GPU, i7-13620H, Micron 2400 MTFDKBA1T0QFM
17.5 fps -3%
Average NVIDIA GeForce RTX 3060 Laptop GPU
  ()
16.8 fps -6%
SCHENKER XMG Focus 15 Engineering Sample
NVIDIA GeForce RTX 4050 Laptop GPU, i5-13500HX
16.2 fps -10%
Average NVIDIA GeForce RTX 3050 Ti Laptop GPU
  (13.2 - 13.2, n=2)
13.2 fps -27%
3840x2160 Medical (medical-03)
Average AMD Radeon RX 6800M
  (16.9 - 42.6, n=2)
29.8 fps +115%
Average NVIDIA GeForce RTX 3060 Laptop GPU
  ()
26.5 fps +91%
Lenovo ThinkPad P16 G1 RTX A5500
RTX A5500 Laptop GPU, i9-12950HX, WDC PC SN810 2TB
25.78 fps +86%
Average AMD Radeon RX 6600M
  (18.1 - 34, n=6)
25 fps +80%
MSI Titan GT77 HX 13VI
NVIDIA GeForce RTX 4090 Laptop GPU, i9-13950HX, Samsung PM9A1 MZVL22T0HBLB
24.42 fps +76%
Average NVIDIA GeForce RTX 3050 Ti Laptop GPU
  (20.2 - 20.2, n=2)
20.2 fps +46%
Average NVIDIA GeForce RTX 3090
  (9.95 - 23, n=10)
19.8 fps +43%
Razer Blade 16 Early 2023
NVIDIA GeForce RTX 4080 Laptop GPU, i9-13950HX, SSSTC CA6-8D1024
19.3 fps +39%
Average NVIDIA GeForce RTX 3080 Ti Laptop GPU
  (13.2 - 34.3, n=7)
17.9 fps +29%
SCHENKER XMG Neo 17 2023 Engineering Sample
NVIDIA GeForce RTX 4070 Laptop GPU, i9-13900HX
13.87 fps
MSI Katana 17 B13VFK
NVIDIA GeForce RTX 4060 Laptop GPU, i7-13620H, Micron 2400 MTFDKBA1T0QFM
10.9 fps -21%
Average NVIDIA GeForce RTX 3080 Laptop GPU
  (9.84 - 10.5, n=4)
10.3 fps -26%
SCHENKER XMG Focus 15 Engineering Sample
NVIDIA GeForce RTX 4050 Laptop GPU, i5-13500HX
9.2 fps -34%
3840x2160 Maya (maya-06)
MSI Titan GT77 HX 13VI
NVIDIA GeForce RTX 4090 Laptop GPU, i9-13950HX, Samsung PM9A1 MZVL22T0HBLB
371.75 fps +74%
Average NVIDIA GeForce RTX 3090
  (181 - 369, n=10)
339 fps +59%
Razer Blade 16 Early 2023
NVIDIA GeForce RTX 4080 Laptop GPU, i9-13950HX, SSSTC CA6-8D1024
302.82 fps +42%
Average NVIDIA GeForce RTX 3060 Laptop GPU
  ()
264 fps +23%
Lenovo ThinkPad P16 G1 RTX A5500
RTX A5500 Laptop GPU, i9-12950HX, WDC PC SN810 2TB
218.16 fps +2%
SCHENKER XMG Neo 17 2023 Engineering Sample
NVIDIA GeForce RTX 4070 Laptop GPU, i9-13900HX
213.77 fps
Average NVIDIA GeForce RTX 3080 Ti Laptop GPU
  (137.4 - 345, n=7)
208 fps -3%
MSI Katana 17 B13VFK
NVIDIA GeForce RTX 4060 Laptop GPU, i7-13620H, Micron 2400 MTFDKBA1T0QFM
188 fps -12%
Average NVIDIA GeForce RTX 3080 Laptop GPU
  (186 - 190, n=4)
187.8 fps -12%
Average AMD Radeon RX 6600M
  (143 - 266, n=6)
186.5 fps -13%
Average AMD Radeon RX 6800M
  (137 - 229, n=2)
183 fps -14%
Average NVIDIA GeForce RTX 3050 Ti Laptop GPU
  (180 - 180, n=2)
180 fps -16%
SCHENKER XMG Focus 15 Engineering Sample
NVIDIA GeForce RTX 4050 Laptop GPU, i5-13500HX
154.4 fps -28%
3840x2160 Energy (energy-03)
MSI Titan GT77 HX 13VI
NVIDIA GeForce RTX 4090 Laptop GPU, i9-13950HX, Samsung PM9A1 MZVL22T0HBLB
112.25 fps +297%
Average NVIDIA GeForce RTX 3080 Ti Laptop GPU
  (27.7 - 118.7, n=7)
65.1 fps +130%
Average NVIDIA GeForce RTX 3090
  (22.3 - 101, n=10)
63.1 fps +123%
Razer Blade 16 Early 2023
NVIDIA GeForce RTX 4080 Laptop GPU, i9-13950HX, SSSTC CA6-8D1024
30.03 fps +6%
Average NVIDIA GeForce RTX 3080 Laptop GPU
  (29.1 - 29.6, n=4)
29.5 fps +4%
SCHENKER XMG Neo 17 2023 Engineering Sample
NVIDIA GeForce RTX 4070 Laptop GPU, i9-13900HX
28.25 fps
Lenovo ThinkPad P16 G1 RTX A5500
RTX A5500 Laptop GPU, i9-12950HX, WDC PC SN810 2TB
24.11 fps -15%
Average NVIDIA GeForce RTX 3060 Laptop GPU
  ()
20.4 fps -28%
Average AMD Radeon RX 6600M
  (2.05 - 47.9, n=6)
20.4 fps -28%
MSI Katana 17 B13VFK
NVIDIA GeForce RTX 4060 Laptop GPU, i7-13620H, Micron 2400 MTFDKBA1T0QFM
20 fps -29%
SCHENKER XMG Focus 15 Engineering Sample
NVIDIA GeForce RTX 4050 Laptop GPU, i5-13500HX
17.2 fps -39%
Average NVIDIA GeForce RTX 3050 Ti Laptop GPU
  (12.8 - 12.8, n=2)
12.8 fps -55%
Average AMD Radeon RX 6800M
  (1.83 - 2.77, n=2)
2.3 fps -92%
3840x2160 Creo (creo-03)
MSI Titan GT77 HX 13VI
NVIDIA GeForce RTX 4090 Laptop GPU, i9-13950HX, Samsung PM9A1 MZVL22T0HBLB
117.51 fps +29%
Lenovo ThinkPad P16 G1 RTX A5500
RTX A5500 Laptop GPU, i9-12950HX, WDC PC SN810 2TB
117.5 fps +29%
Average NVIDIA GeForce RTX 3090
  (68.1 - 122, n=10)
107.1 fps +18%
Razer Blade 16 Early 2023
NVIDIA GeForce RTX 4080 Laptop GPU, i9-13950HX, SSSTC CA6-8D1024
105.26 fps +16%
SCHENKER XMG Neo 17 2023 Engineering Sample
NVIDIA GeForce RTX 4070 Laptop GPU, i9-13900HX
90.79 fps
Average NVIDIA GeForce RTX 3060 Laptop GPU
  ()
84.5 fps -7%
MSI Katana 17 B13VFK
NVIDIA GeForce RTX 4060 Laptop GPU, i7-13620H, Micron 2400 MTFDKBA1T0QFM
78 fps -14%
Average NVIDIA GeForce RTX 3080 Laptop GPU
  (75.7 - 79.7, n=4)
77.7 fps -14%
Average NVIDIA GeForce RTX 3080 Ti Laptop GPU
  (49 - 93.3, n=7)
77.4 fps -15%
Average AMD Radeon RX 6600M
  (65 - 88.4, n=6)
72.9 fps -20%
SCHENKER XMG Focus 15 Engineering Sample
NVIDIA GeForce RTX 4050 Laptop GPU, i5-13500HX
70 fps -23%
Average NVIDIA GeForce RTX 3050 Ti Laptop GPU
  (69.2 - 69.2, n=2)
69.2 fps -24%
Average AMD Radeon RX 6800M
  (60.8 - 64.3, n=2)
62.6 fps -31%
3840x2160 CATIA (catia-06)
Lenovo ThinkPad P16 G1 RTX A5500
RTX A5500 Laptop GPU, i9-12950HX, WDC PC SN810 2TB
68.64 fps +82%
MSI Titan GT77 HX 13VI
NVIDIA GeForce RTX 4090 Laptop GPU, i9-13950HX, Samsung PM9A1 MZVL22T0HBLB
65.16 fps +73%
Average NVIDIA GeForce RTX 3090
  (32.3 - 61.3, n=10)
56.8 fps +51%
Razer Blade 16 Early 2023
NVIDIA GeForce RTX 4080 Laptop GPU, i9-13950HX, SSSTC CA6-8D1024
52.5 fps +39%
Average NVIDIA GeForce RTX 3060 Laptop GPU
  ()
52.3 fps +39%
Average NVIDIA GeForce RTX 3080 Ti Laptop GPU
  (30.3 - 69.6, n=7)
43.7 fps +16%
Average NVIDIA GeForce RTX 3080 Laptop GPU
  (37.6 - 38.1, n=4)
37.9 fps 0%
SCHENKER XMG Neo 17 2023 Engineering Sample
NVIDIA GeForce RTX 4070 Laptop GPU, i9-13900HX
37.72 fps
Average AMD Radeon RX 6600M
  (16.8 - 57.9, n=6)
37.7 fps 0%
Average NVIDIA GeForce RTX 3050 Ti Laptop GPU
  (37.6 - 37.6, n=2)
37.6 fps 0%
MSI Katana 17 B13VFK
NVIDIA GeForce RTX 4060 Laptop GPU, i7-13620H, Micron 2400 MTFDKBA1T0QFM
33.8 fps -10%
SCHENKER XMG Focus 15 Engineering Sample
NVIDIA GeForce RTX 4050 Laptop GPU, i5-13500HX
27.9 fps -26%
Average AMD Radeon RX 6800M
  (13.5 - 15.6, n=2)
14.6 fps -61%
3840x2160 3ds Max (3dsmax-07)
MSI Titan GT77 HX 13VI
NVIDIA GeForce RTX 4090 Laptop GPU, i9-13950HX, Samsung PM9A1 MZVL22T0HBLB
147.71 fps +111%
Average NVIDIA GeForce RTX 3090
  (70.2 - 143, n=10)
134.3 fps +92%
Razer Blade 16 Early 2023
NVIDIA GeForce RTX 4080 Laptop GPU, i9-13950HX, SSSTC CA6-8D1024
117.66 fps +68%
Average AMD Radeon RX 6800M
  (69.2 - 127, n=2)
98.1 fps +40%
Average NVIDIA GeForce RTX 3080 Ti Laptop GPU
  (69.5 - 144, n=7)
95.7 fps +37%
Average NVIDIA GeForce RTX 3080 Laptop GPU
  (84.5 - 87.5, n=4)
86.5 fps +24%
Average NVIDIA GeForce RTX 3060 Laptop GPU
  ()
82.5 fps +18%
Lenovo ThinkPad P16 G1 RTX A5500
RTX A5500 Laptop GPU, i9-12950HX, WDC PC SN810 2TB
79.63 fps +14%
SCHENKER XMG Neo 17 2023 Engineering Sample
NVIDIA GeForce RTX 4070 Laptop GPU, i9-13900HX
69.84 fps
MSI Katana 17 B13VFK
NVIDIA GeForce RTX 4060 Laptop GPU, i7-13620H, Micron 2400 MTFDKBA1T0QFM
61.6 fps -12%
Average NVIDIA GeForce RTX 3050 Ti Laptop GPU
  (58.9 - 58.9, n=2)
58.9 fps -16%
Average AMD Radeon RX 6600M
  (37.5 - 66.5, n=6)
53.7 fps -23%
SCHENKER XMG Focus 15 Engineering Sample
NVIDIA GeForce RTX 4050 Laptop GPU, i5-13500HX
52.2 fps -25%

* ... smaller is better

Eficiência da GPU

Usamos o teste Witcher 3 rodando com uma tela externa para nosso teste de eficiência, assim podemos eliminar a influência do painel integrado. Witcher 3 também não é muito exigente para o processador, então o impacto da CPU também é muito pequeno, Vemos os novos modelos RTX 40 liderando o gráfico com o laptop RTX 4090 no topo, seguido pelo novo laptop RTX 4060. Esperamos que as versões dos novos GPUs com configurações TGP mais baixas sejam ainda melhores a este respeito. O único outlier é o laptop GeForce RTX 4050, que está bem entre as GPUs Ampere anteriores. Isto mostra claramente que altos valores TGP não fazem muito sentido para o RTX 4050.

Há uma melhora notável na eficiência em geral para os novos chips Ada em comparação com as GPUs Ampere anteriores. A comparação entre o Laptop RTX 4070/RTX 3080 Ti Laptop e o RTX 4060 Laptop/RTX 3070 Ti Laptop mostra uma melhoria de eficiência de 23-24 %, o que significa que a vantagem das GPUs Ada mais lentas é menor em comparação com os modelos high-end, onde notamos melhorias de eficiência de até 53 %.

Power Consumption - Witcher 3 ultra Efficiency (external Monitor)
MSI Titan GT77 HX 13VI
NVIDIA GeForce RTX 4090 Laptop GPU, i9-13950HX, Samsung PM9A1 MZVL22T0HBLB
0.796 fps per Watt +17%
Gigabyte AERO 16 OLED BSF
NVIDIA GeForce RTX 4070 Laptop GPU, i9-13900H, Gigabyte AG470S1TB-SI B10
0.73 fps per Watt +7%
MSI Katana 17 B13VFK
NVIDIA GeForce RTX 4060 Laptop GPU, i7-13620H, Micron 2400 MTFDKBA1T0QFM
0.717 fps per Watt +5%
Razer Blade 16 Early 2023
NVIDIA GeForce RTX 4080 Laptop GPU, i9-13950HX, SSSTC CA6-8D1024
0.71 fps per Watt +4%
SCHENKER XMG Neo 17 2023 Engineering Sample
NVIDIA GeForce RTX 4070 Laptop GPU, i9-13900HX
0.68 fps per Watt
Razer Blade 18 RTX 4070
NVIDIA GeForce RTX 4070 Laptop GPU, i9-13950HX, SSSTC CA6-8D1024
0.587 fps per Watt -14%
Average NVIDIA GeForce RTX 3080 Laptop GPU
  (0.4696 - 0.736, n=24)
0.58 fps per Watt -15%
Average NVIDIA GeForce RTX 3070 Ti Laptop GPU
  (0.4399 - 0.97, n=24)
0.579 fps per Watt -15%
Average NVIDIA GeForce RTX 3080 Ti Laptop GPU
  (0.4432 - 0.69, n=26)
0.555 fps per Watt -18%
SCHENKER XMG Focus 15 Engineering Sample
NVIDIA GeForce RTX 4050 Laptop GPU, i5-13500HX
0.548 fps per Watt -19%
Asus TUF Gaming GeForce RTX 4070 Ti
NVIDIA GeForce RTX 4070 Ti, i9-13900K
0.545 fps per Watt -20%
Average NVIDIA GeForce RTX 3060 Laptop GPU
  (0.4181 - 0.651, n=33)
0.538 fps per Watt -21%
Average AMD Radeon RX 6700M
  ()
0.524 fps per Watt -23%
Average AMD Radeon RX 6600M
  (0.4398 - 0.608, n=6)
0.519 fps per Watt -24%
Average NVIDIA GeForce RTX 3090
  (0.268 - 0.3954, n=14)
0.3429 fps per Watt -50%

Visão geral dos Benchmarks de Jogo

Schenker XMG Neo 17 Engineering Sample RTX 4070 Laptop

baixo média alto ultraQHD4K DLSS4K
GTA V (2015) 187.1 184.1 182.9 130.5 92.2 92.5
The Witcher 3 (2015) 258 124 60
Dota 2 Reborn (2015) 233 206 195.4 180.6 150.7
Final Fantasy XV Benchmark (2018) 227 173.7 119.4 86.1 47.5
X-Plane 11.11 (2018) 212 187.1 144.4 122.7
Far Cry 5 (2018) 179 169 158 118 60
Strange Brigade (2018) 476 326 252 214 139.8 74.7
Shadow of the Tomb Raider (2018) 172 158 107 53
Metro Exodus (2019) 117 91 72 46
Borderlands 3 (2019) 139 109 75 40
Horizon Zero Dawn (2020) 143 126 98 52
Watch Dogs Legion (2020) 130 89 64 33
F1 2021 (2021) 520 407 306 157.5 114.7 63.4
Far Cry 6 (2021) 144 126 91
God of War (2022) 109 80 65 43
Rainbow Six Extraction (2022) 253 240 188 125 64
Dying Light 2 (2022) 95 64 32
Cyberpunk 2077 1.6 (2022) 98 91 57 26
Ghostwire Tokyo (2022)
F1 22 (2022) 275 275 222 81.7 51.9 25.9
Call of Duty Modern Warfare 2 2022 (2022) 111 105 76 71 47
Spider-Man Miles Morales (2022) 115 110 86 44
The Witcher 3 v4.00 (2023) 101 85 54 28
Dead Space Remake (2023) 97 94 81 80 51 26

Razer Blade 18 RTX 4070 Laptop

baixo média alto ultraQHD4K
GTA V (2015) 186.1 184.7 181.6 121.4 87.6 88.5
The Witcher 3 (2015) 617 405.9 240.9 113.9 72.5
Dota 2 Reborn (2015) 225 200 191 178.6 145.5
Final Fantasy XV Benchmark (2018) 231 166.9 115.2 82 46.6
X-Plane 11.11 (2018) 203 178.9 137.9 117.7
Strange Brigade (2018) 464 315 243 208 136.7 71.9
Metro Exodus (2019) 208.9 139.8 109.7 86.8 69 44
Borderlands 3 (2019) 258.5 200.1 131.8 100.3 68.7 35.7
Hitman 3 (2021) 294.3 234 208.4 197.4 129.9 68.5
Cyberpunk 2077 1.6 (2022) 147.8 125.7 111.5 92.1 54 23.3

Gigabyte Aero 16 RTX 4070 Laptop

baixo média alto ultraQHD4K
GTA V (2015) 185.3 186.4 183.1 123.2 90.6 75
The Witcher 3 (2015) 236 116
Dota 2 Reborn (2015) 164.7 157 150.9 144.5 128.3
Final Fantasy XV Benchmark (2018) 132.3 116.2 84.7 46.1
X-Plane 11.11 (2018) 169.3 148 115.3 98.5
Far Cry 5 (2018) 202 168 159 149 115 55
Strange Brigade (2018) 481 300 237 204 138.8 67.6
Shadow of the Tomb Raider (2018) 158 129 70
Assassin´s Creed Valhalla (2020) 106 78 41
Cyberpunk 2077 1.6 (2022) 84.75 53.28 19.59
F1 22 (2022) 220 214 173.8 66.6 44.3 21.5
Call of Duty Modern Warfare 2 2022 (2022) 101 72 39
Spider-Man Miles Morales (2022) 90.5 68.9 40.5
The Callisto Protocol (2022) 78.86 59.07 32.96

MSI Katana 17 RTX 4060 Laptop

baixo média alto ultraQHD4K DLSS4K
GTA V (2015) 186.1 184.7 180.2 112.1 83 82.1
The Witcher 3 (2015) 435 322 206 104.7 62.6
Dota 2 Reborn (2015) 184.6 171 164.1 156.3 126
Final Fantasy XV Benchmark (2018) 204 135.1 96.1 70.1 40.2
X-Plane 11.11 (2018) 178.6 154.9 118.9 98.9
Far Cry 5 (2018) 134 99 51
Strange Brigade (2018) 508 270 216 185.1 126.4 67.2
Shadow of the Tomb Raider (2018) 155.6 120.7 67.2
Metro Exodus (2019) 74.3 59 36.8
Control (2019) 238 119 89
Borderlands 3 (2019) 171.3 144.6 106.5 83.9
Death Stranding (2020) 200 158.9 150.3 146.7
Horizon Zero Dawn (2020) 108.3 85.9 46.5
Flight Simulator 2020 (2020) 96.9 69.4 52.5
Crysis Remastered (2020) 312 224 85.9 72.5
Watch Dogs Legion (2020) 65 44 25
Dirt 5 (2020) 218 147.2 116.1 89.5
Assassin´s Creed Valhalla (2020) 135 111 96
Yakuza Like a Dragon (2020) 131.7 123.2 117.4 109.6
Hitman 3 (2021) 267.5 197.7 172.7 163.5
Days Gone (2021) 148 131.4 100.2
F1 2021 (2021) 389 312 244 128.9 93 50.2
Alan Wake Remastered (2021) 149.8 144.9
Far Cry 6 (2021) 97.2 32.6 3.38
Back 4 Blood (2021) 245 197.5 188.2
Guardians of the Galaxy (2021) 134 135 133
Riders Republic (2021) 177 145 122 112
Forza Horizon 5 (2021) 137 125 84
Battlefield 2042 (2021) 145.6 123 106.1
Halo Infinite (2021) 144.9 123.6 114.2
God of War (2022) 67.5 55.6 34.7
Rainbow Six Extraction (2022) 149.1 106 52.4
Dying Light 2 (2022) 64.7 43.8 23
GRID Legends (2022) 126.4 102.2 63.9
Elden Ring (2022) 59.5
Cyberpunk 2077 1.6 (2022) 73.81 45.9 21.1
Elex 2 (2022) 115.4 115.4 113.5 96
Ghostwire Tokyo (2022) 68.6 65.9 36.8 29.6
Tiny Tina's Wonderlands (2022) 198.6 164.9 110 85.2
Vampire Bloodhunt (2022) 220 201 185.7
F1 22 (2022) 247 240 179.2 65.4 41 19.7
The Quarry (2022) 154.8 121.3 100.5 77.9
A Plague Tale Requiem (2022) 100.7 84.9 73 63.3
Uncharted Legacy of Thieves Collection (2022) 87.9 85.1 79.1 76.9
Call of Duty Modern Warfare 2 2022 (2022) 87 59 55 34
Spider-Man Miles Morales (2022) 77.3 59.7 35.3
The Callisto Protocol (2022) 68.9 48.6 27
Need for Speed Unbound (2022) 127.4 117.2 98.9 98.6
High On Life (2023) 220 165.8 125.6 99.9
The Witcher 3 v4.00 (2023) 66.3 40.5 21.4
Dead Space Remake (2023) 67 43.4 20.6
Hogwarts Legacy (2023) 150 126.7 107.7 91.6
Returnal (2023)
Atomic Heart (2023) 167.3 129.2 81.6 66.8
Company of Heroes 3 (2023) 202.7 182.1 133.3 131.3
Sons of the Forest (2023) 82 79.1 73.3 71.8

Schenker XMG Focus 15 Engineering Sample RTX 4050 Laptop

baixo média alto ultraQHD4K DLSS4K
GTA V (2015) 186.6 184.2 177.3 92.4 64.1 63.5
The Witcher 3 (2015) 465 319 175 89 50
Dota 2 Reborn (2015) 192.6 176.1 169.1 161.7 115.2
Final Fantasy XV Benchmark (2018) 214 122.3 122.3 60 33.3
X-Plane 11.11 (2018) 161 142.3 113.1 97.9
Far Cry 5 (2018) 197 146 135 127 87 43
Strange Brigade (2018) 481 221 178 153 100 53
Shadow of the Tomb Raider (2018) 215 150 134 116 73 33
Metro Exodus (2019) 199 109 82 64 50 45
Control (2019) 100 74 48 24
Borderlands 3 (2019) 171 139 96 73 50 26
Horizon Zero Dawn (2020) 170 131 114 98 72 39
Watch Dogs Legion (2020) 138 120 105 49 37 26
F1 2021 (2021) 377 292 219 109.7 76.1 38
Far Cry 6 (2021) 166 133 114 82 58
God of War (2022) 121 102 81 55 44 28
Dying Light 2 (2022) 88 74 62 41 21
Cyberpunk 2077 1.6 (2022) 108 83 72 65 32 18
Ghostwire Tokyo (2022)
F1 22 (2022) 232 223 167.3 53.8 33.2 15.9
Call of Duty Modern Warfare 2 2022 (2022) 128 109 81 77 53 50 31
Spider-Man Miles Morales (2022) 112 101 96 85 53 26
The Callisto Protocol (2022) 137 97 60 59 42 21
The Witcher 3 v4.00 (2023) 106 76 68 59 37 17
Dead Space Remake (2023) 67 64 55 54 35 17

Veredicto - GPUs Ada Mainstream com ganhos significativos de desempenho

Nvidia RTX 40 Laptop em revisão.

Nosso veredicto sobre as novas GPUs (superiores) baseadas na arquitetura Ada Lovelace não é tão bom quanto era na versão high-end. Nvidia foi capaz de melhorar o desempenho e a nova GPU RTX 4070 Laptop com altos valores TGP está aproximadamente no mesmo nível que a antiga RTX 3080 Ti Laptop. Há algumas exceções em títulos 4K onde a VRAM menor do Laptop RTX 4070 tem um impacto. O laptop RTX 4060 é comparável ao antigo laptop RTX 3070 Ti e o laptop mais testado RTX 4050 é semelhante a um laptop RTX 3060 ou até mesmo um pouco mais rápido.

Mais desempenho para as principais GPUs: Os novos notebooks RTX 4070 e RTX 4060 da Nvidia substituem o antigo GeForce RTX 3080 Ti Laptop e RTX 3070 Ti Laptop, respectivamente. Eles oferecem bastante desempenho para painéis QHD e até mesmo 4K em alguns jogos, mas o desempenho do raytracing ainda é limitado e muitas vezes é preciso reduzir as configurações ou usar o upscaling DLSS para obter taxas de quadros suaves.

Estas são boas notícias, mas as melhorias de eficiência são menores em comparação com os modelos high-end RTX 4090 Laptop/RTX 4080 Laptop. Vemos uma melhoria de 23-24 % para o Laptop RTX 4070Laptop/RTX 4060, mas também podemos ver claramente que a versão TGP alta do Laptop RTX 4050 não faz muito sentido e a eficiência cai para níveis Ampere. Simplesmente não temos dados suficientes para uma versão mais lenta da GPU para avaliar a eficiência. O anúncio da Nvidia com uma eficiência 3x mais alta é limitado a um cenário muito específico de acordo com as informações da imprensa, por isso não podemos confirmar esta afirmação.

O novo GeForce RTX 4050 portátil oferece o desempenho do antigo GeForce RTX 3060 e é mais adequado para displays de 1080p. As capacidades de raytracing, no entanto, são limitadas.

O maior problema com a nova GPU para laptop é a ampla gama TGP e os fabricantes podem configurar as três GPUs (RTX 4070, RTX 4060 e RTX 4050) entre 35-115 Watts ou 140W considerando até 25W de Dynamic Boost, respectivamente. Será extremamente importante que o fabricante divulgue os números exatos do TGP para seus produtos, caso contrário, poderá haver heróis da folha de especificações que serão decepcionantes na prática, especialmente em laptops finos com capacidades limitadas de refrigeração.

Esperamos que o laptop RTX 4070 e o laptop RTX 4060 ofereçam números de desempenho muito semelhantes e você geralmente pode economizar o dinheiro adicional para o laptop RTX 4070, especialmente em dispositivos com telas de 1080p ou QHD.

Please share our article, every link counts!
> Análises e revisões de portáteis e celulares > Análises > Análises > GeForce RTX 4070, 4060, 4050 Análise de Laptop - As novas GPUs de Laptop Mainstream da Nvidia em Análise
Andreas Osthoff, 2023-02-22 (Update: 2023-02-22)