

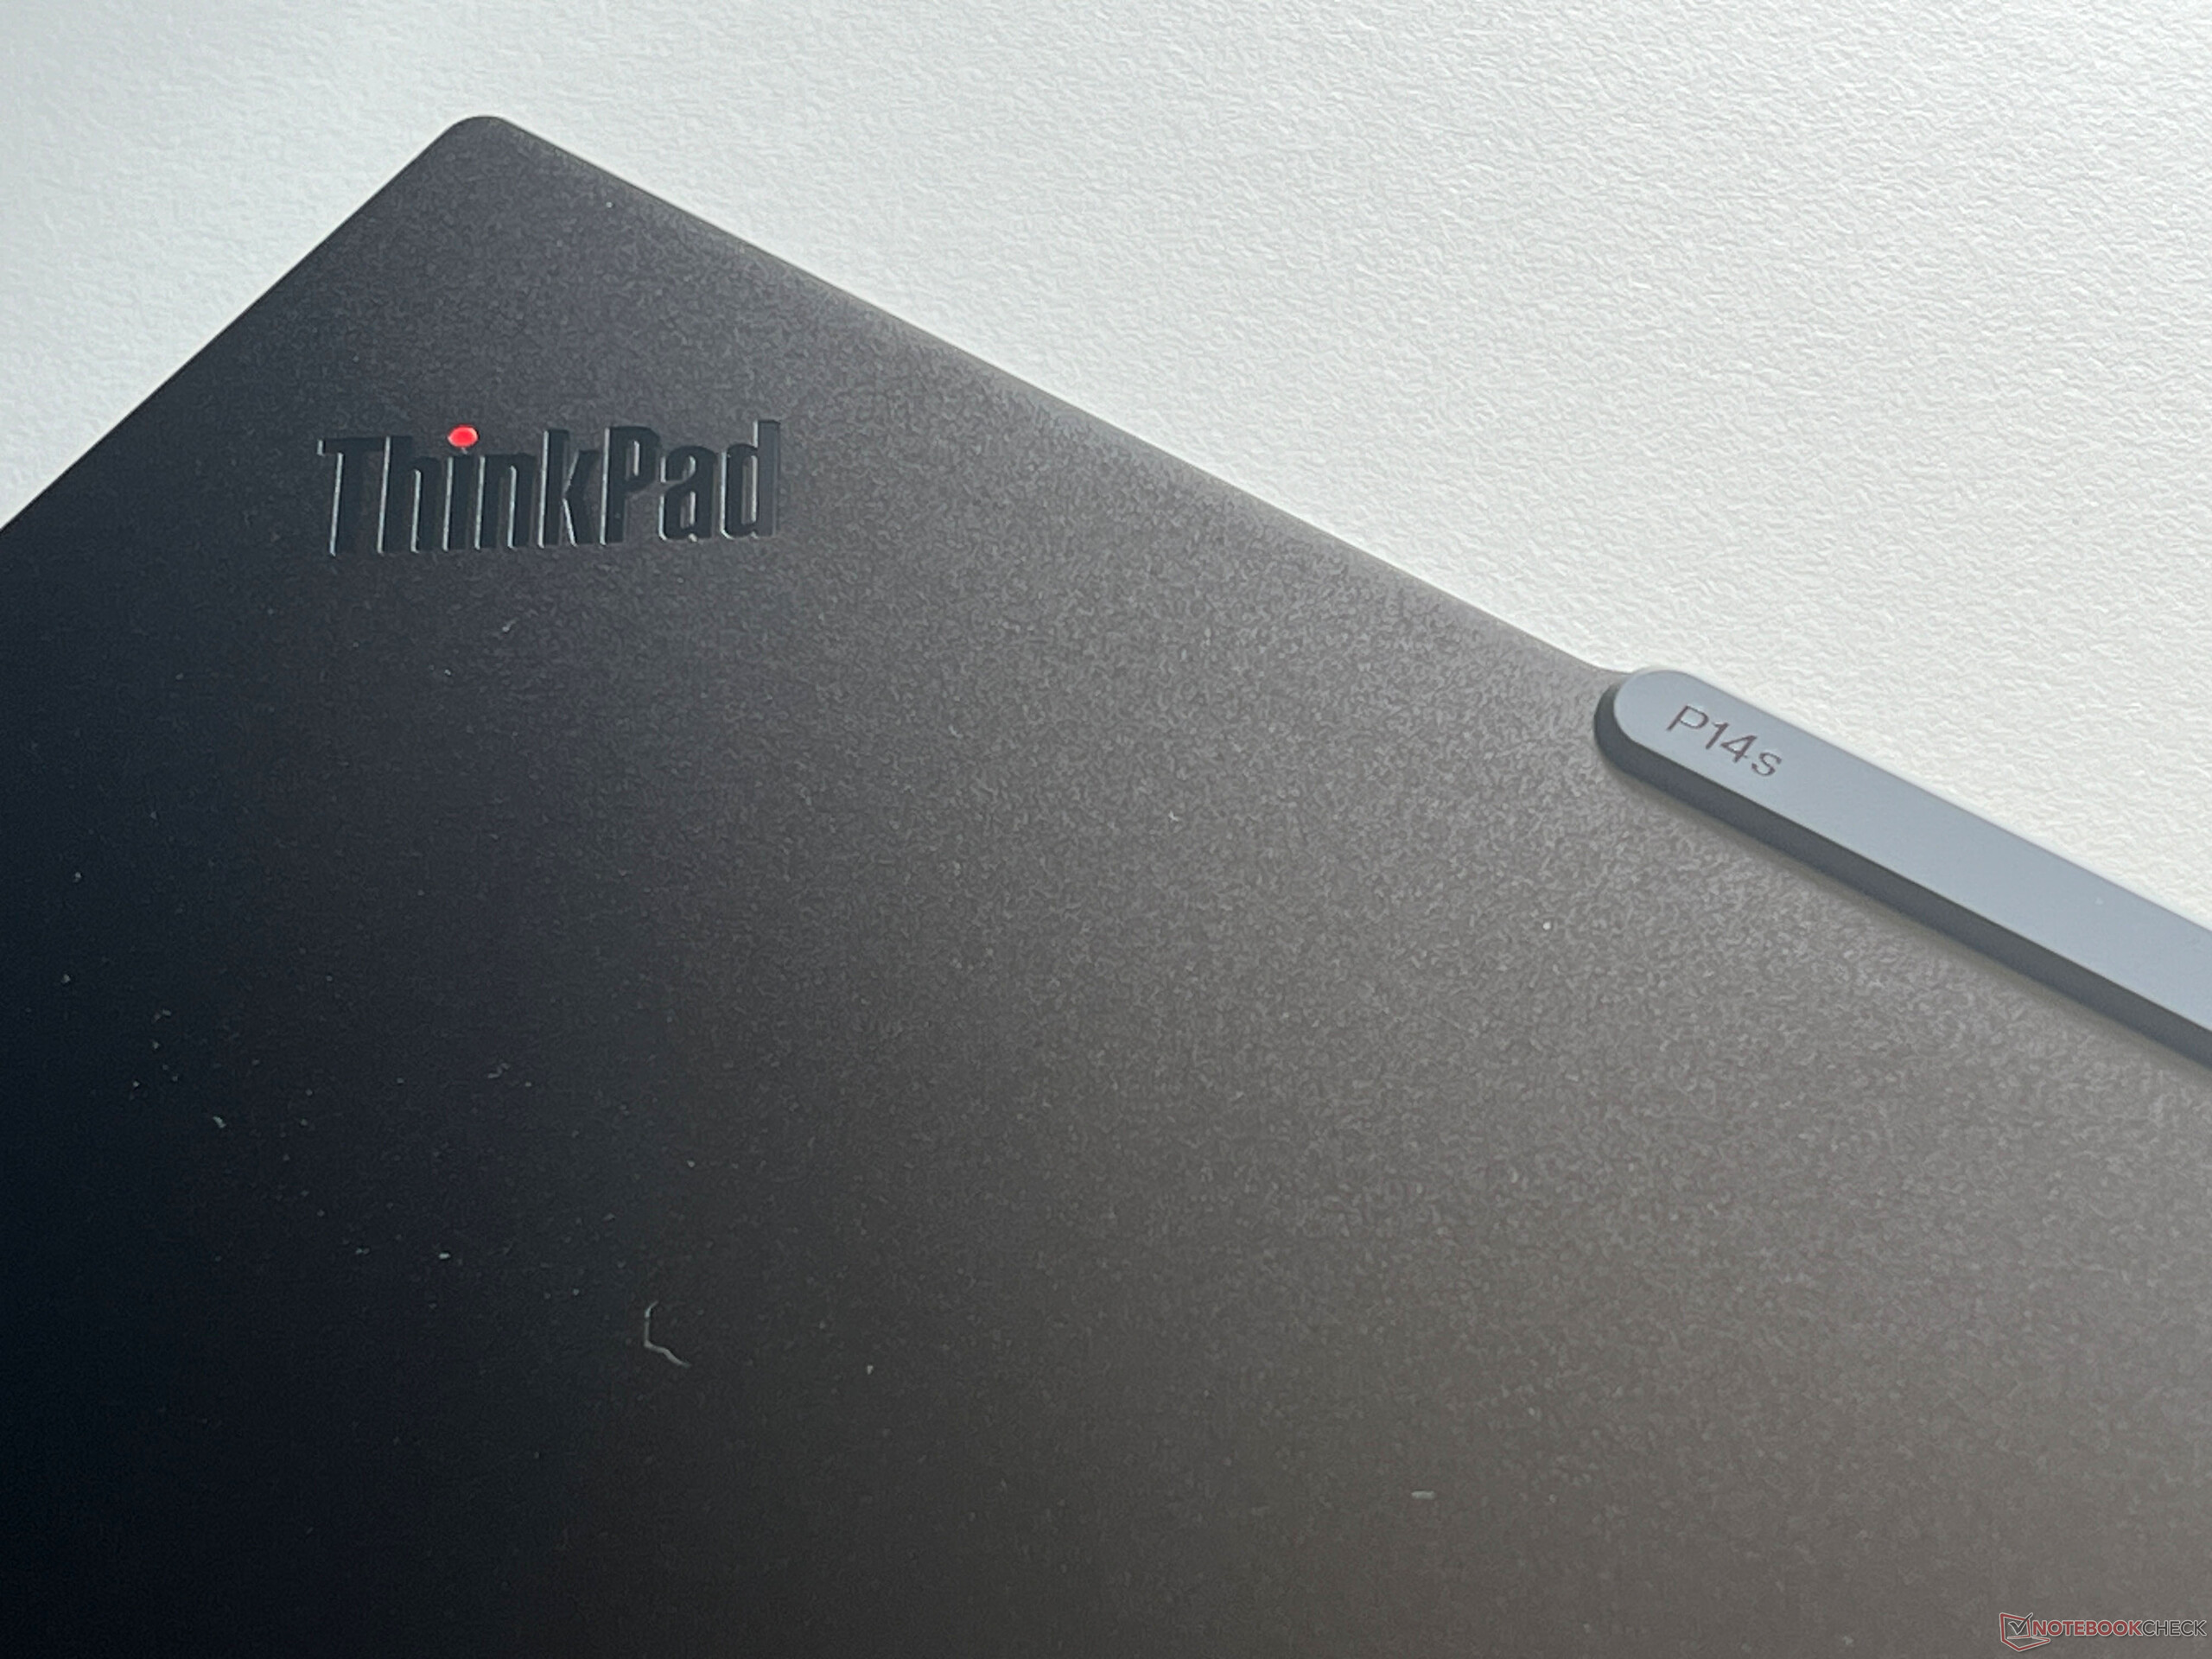
Análise do laptop Lenovo ThinkPad P14s G5 - A estação de trabalho móvel agora com uma RTX 500 Ada e um painel IPS 3K
A Lenovo tomou um novo rumo com sua estação de trabalho móvel ThinkPad P14s G5, pois enquanto os modelos predecessores sempre foram baseados nos respectivos modelos da série T, o novo P14s G5 com CPUs Intel recebeu seu próprio design, incluindo uma nova tela de 14,5 polegadas (anteriormente 14 polegadas). O P14s G5 com os processadores AMD, por outro lado, ainda usa o gabinete antigo junto com seu painel de 14 polegadas.
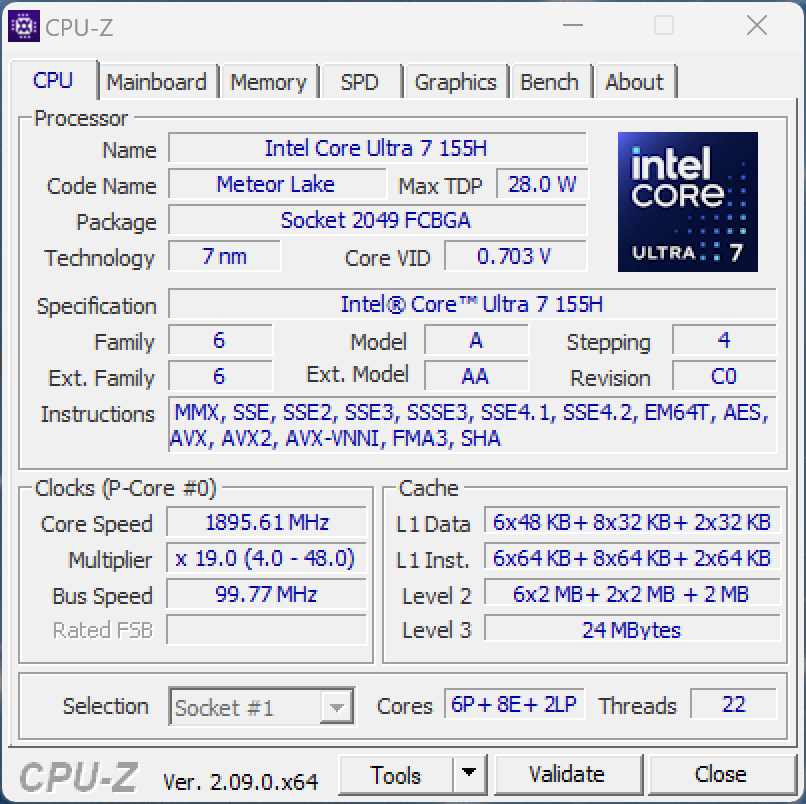
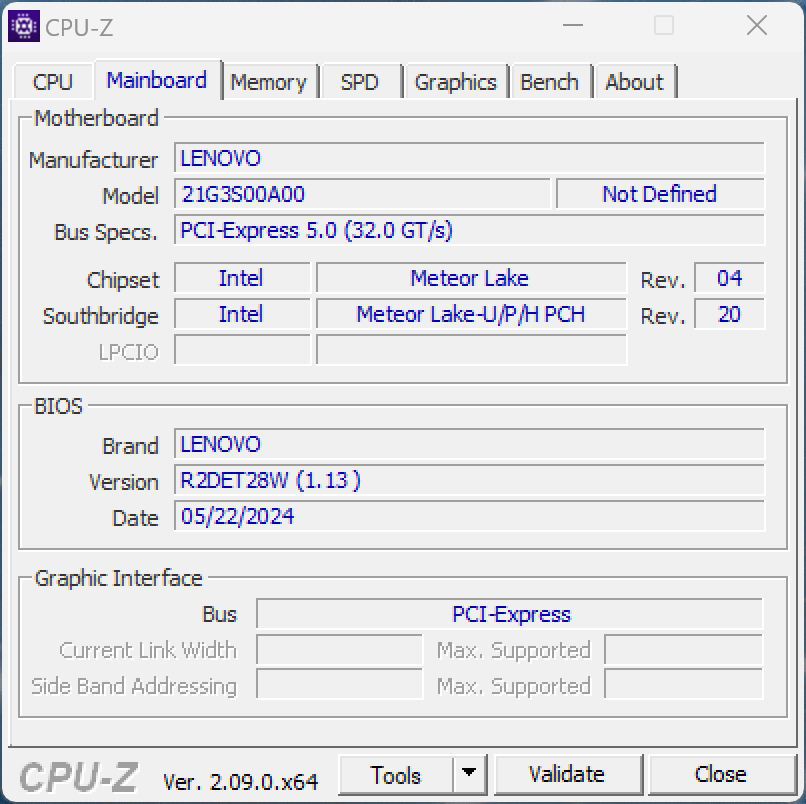
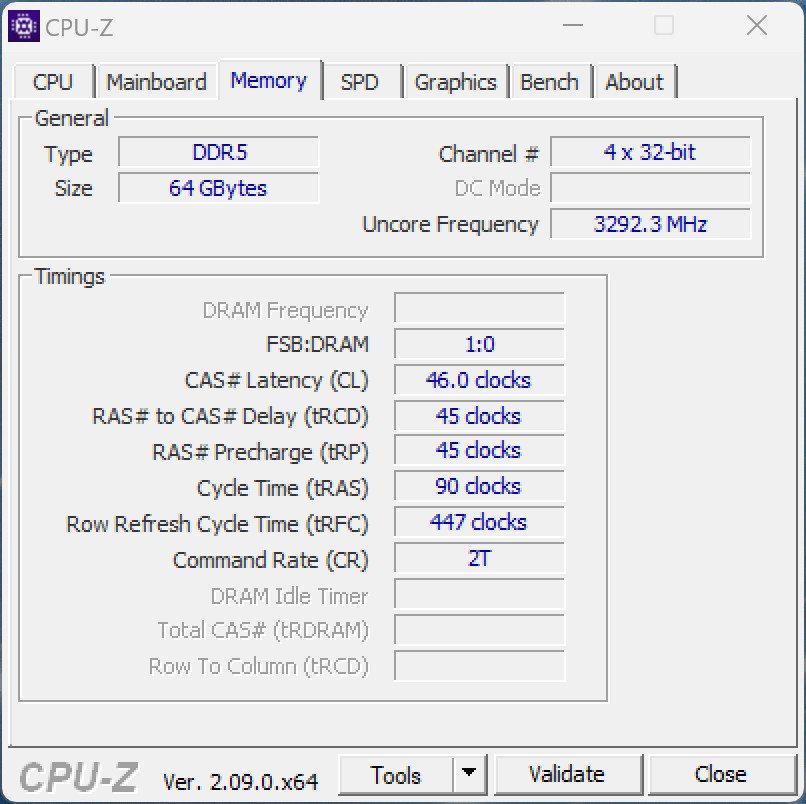
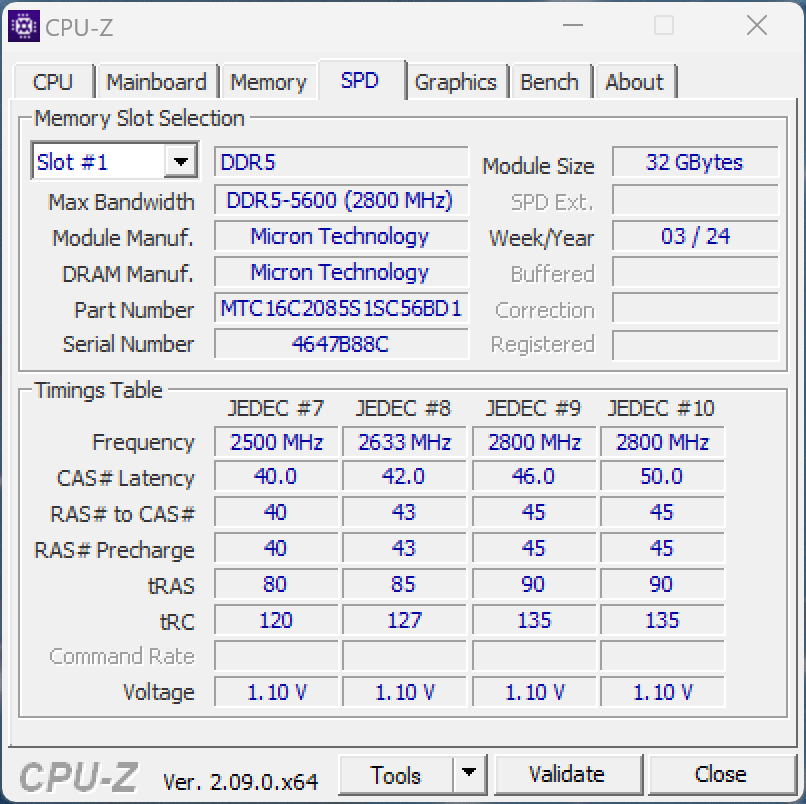
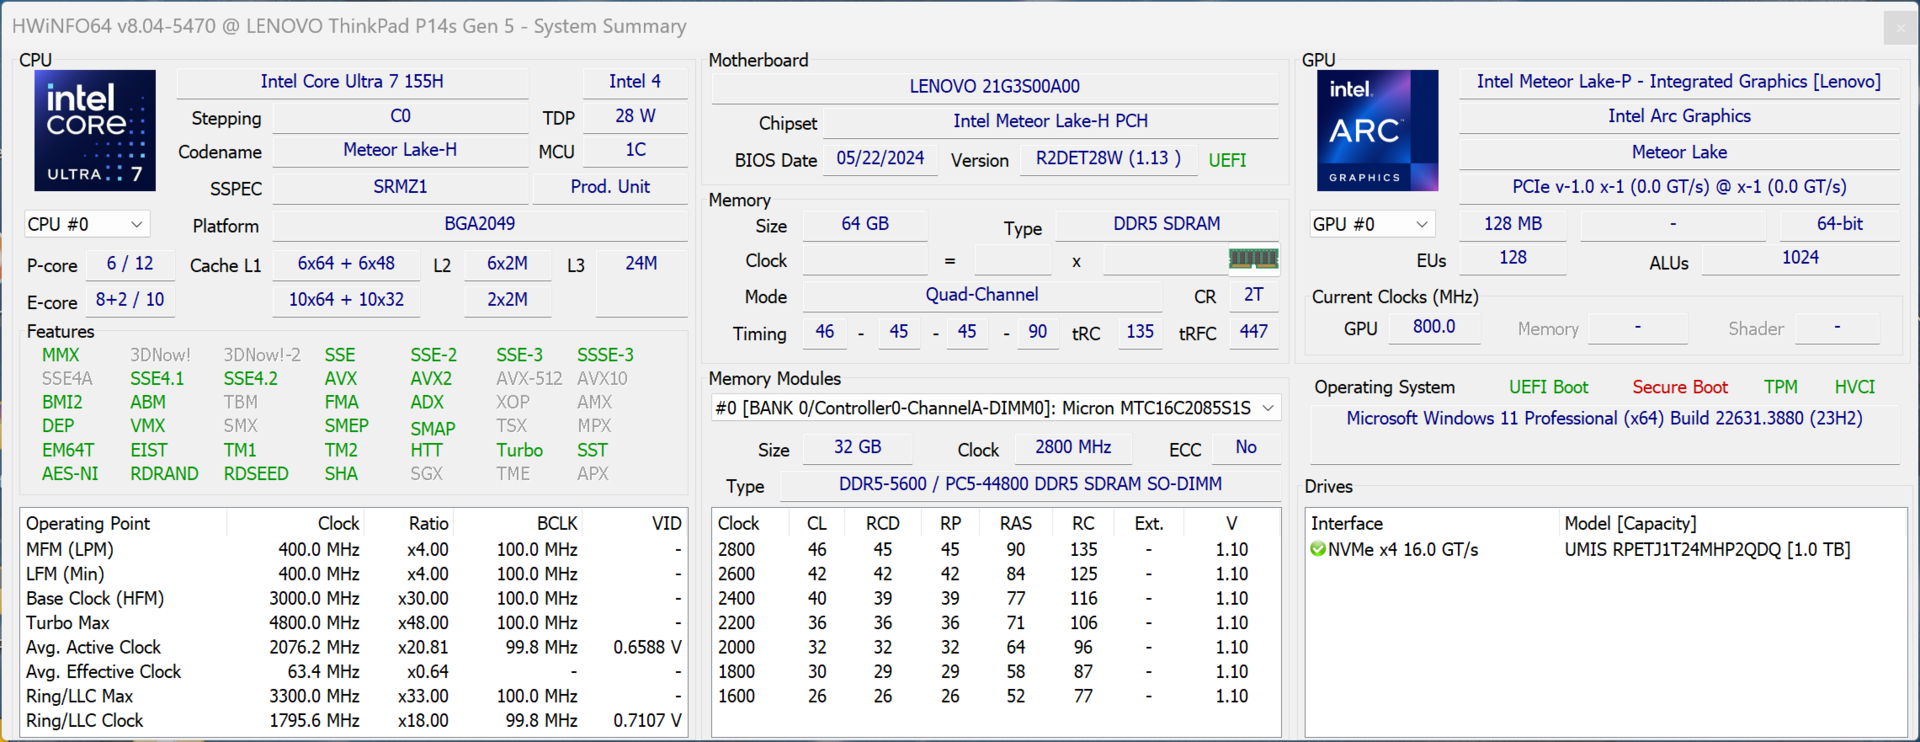
Nosso dispositivo de teste é a versão Campus 21G3S00A00 por cerca de US$ 2.100 sem um sistema operacional, mas com uma configuração muito boa. Além de sua nova tela 3K, ele foi equipado com o Core Ultra 7 155H em combinação com 64 GB de RAM, um SSD de 1 TB, bem como o processador dedicado Nvidia RTX 500 Ada. No momento, não há um modelo top de vendas correspondente para clientes particulares; se o senhor configurar o dispositivo por meio do site da Lenovo, o preço final será de pouco mais de US$ 2.700, incluindo o Windows 11 Home.
Possíveis concorrentes em comparação
Avaliação | Versão | Data | Modelo | Peso | Altura | Size | Resolução | Preço |
|---|---|---|---|---|---|---|---|---|
| 82.5 % | v8 | 07/2024 | Lenovo ThinkPad P14s G5 21G3S00A00 Ultra 7 155H, Nvidia RTX 500 Ada Generation Laptop GPU | 1.7 kg | 22 mm | 14.50" | 3072x1920 | |
| 80.3 % | v8 | 07/2024 | HP ZBook Firefly 14 G11 Ultra 7 165H, RTX A500 Laptop GPU | 1.5 kg | 19.2 mm | 14.00" | 2560x1600 | |
| 81 % | v8 | 07/2024 | Lenovo ThinkPad P14s G4 21HF0017GE i7-1370P, RTX A500 Laptop GPU | 1.5 kg | 22.7 mm | 14.00" | 2880x1800 | |
| 89.3 % v7 (old) | v7 (old) | 04/2024 | Dell Precision 5000 5490 Ultra 9 185H, NVIDIA RTX 3000 Ada Generation Laptop GPU | 1.6 kg | 18.95 mm | 14.00" | 2560x1600 | |
| 85.5 % v7 (old) | v7 (old) | 10/2023 | Microsoft Surface Laptop Studio 2 RTX 4060 i7-13700H, NVIDIA GeForce RTX 4060 Laptop GPU | 2 kg | 22 mm | 14.40" | 2400x1600 | |
| 89.8 % v7 (old) | v7 (old) | 07/2023 | Lenovo Yoga Pro 9-14IRP G8 i7-13705H, NVIDIA GeForce RTX 4050 Laptop GPU | 1.7 kg | 17.6 mm | 14.50" | 3072x1920 |
Observação: Atualizamos recentemente nosso sistema de classificação e os resultados da versão 8 não são comparáveis aos resultados da versão 7. Mais informações estão disponíveis aqui .
Case - A Lenovo enganou com suas dimensões
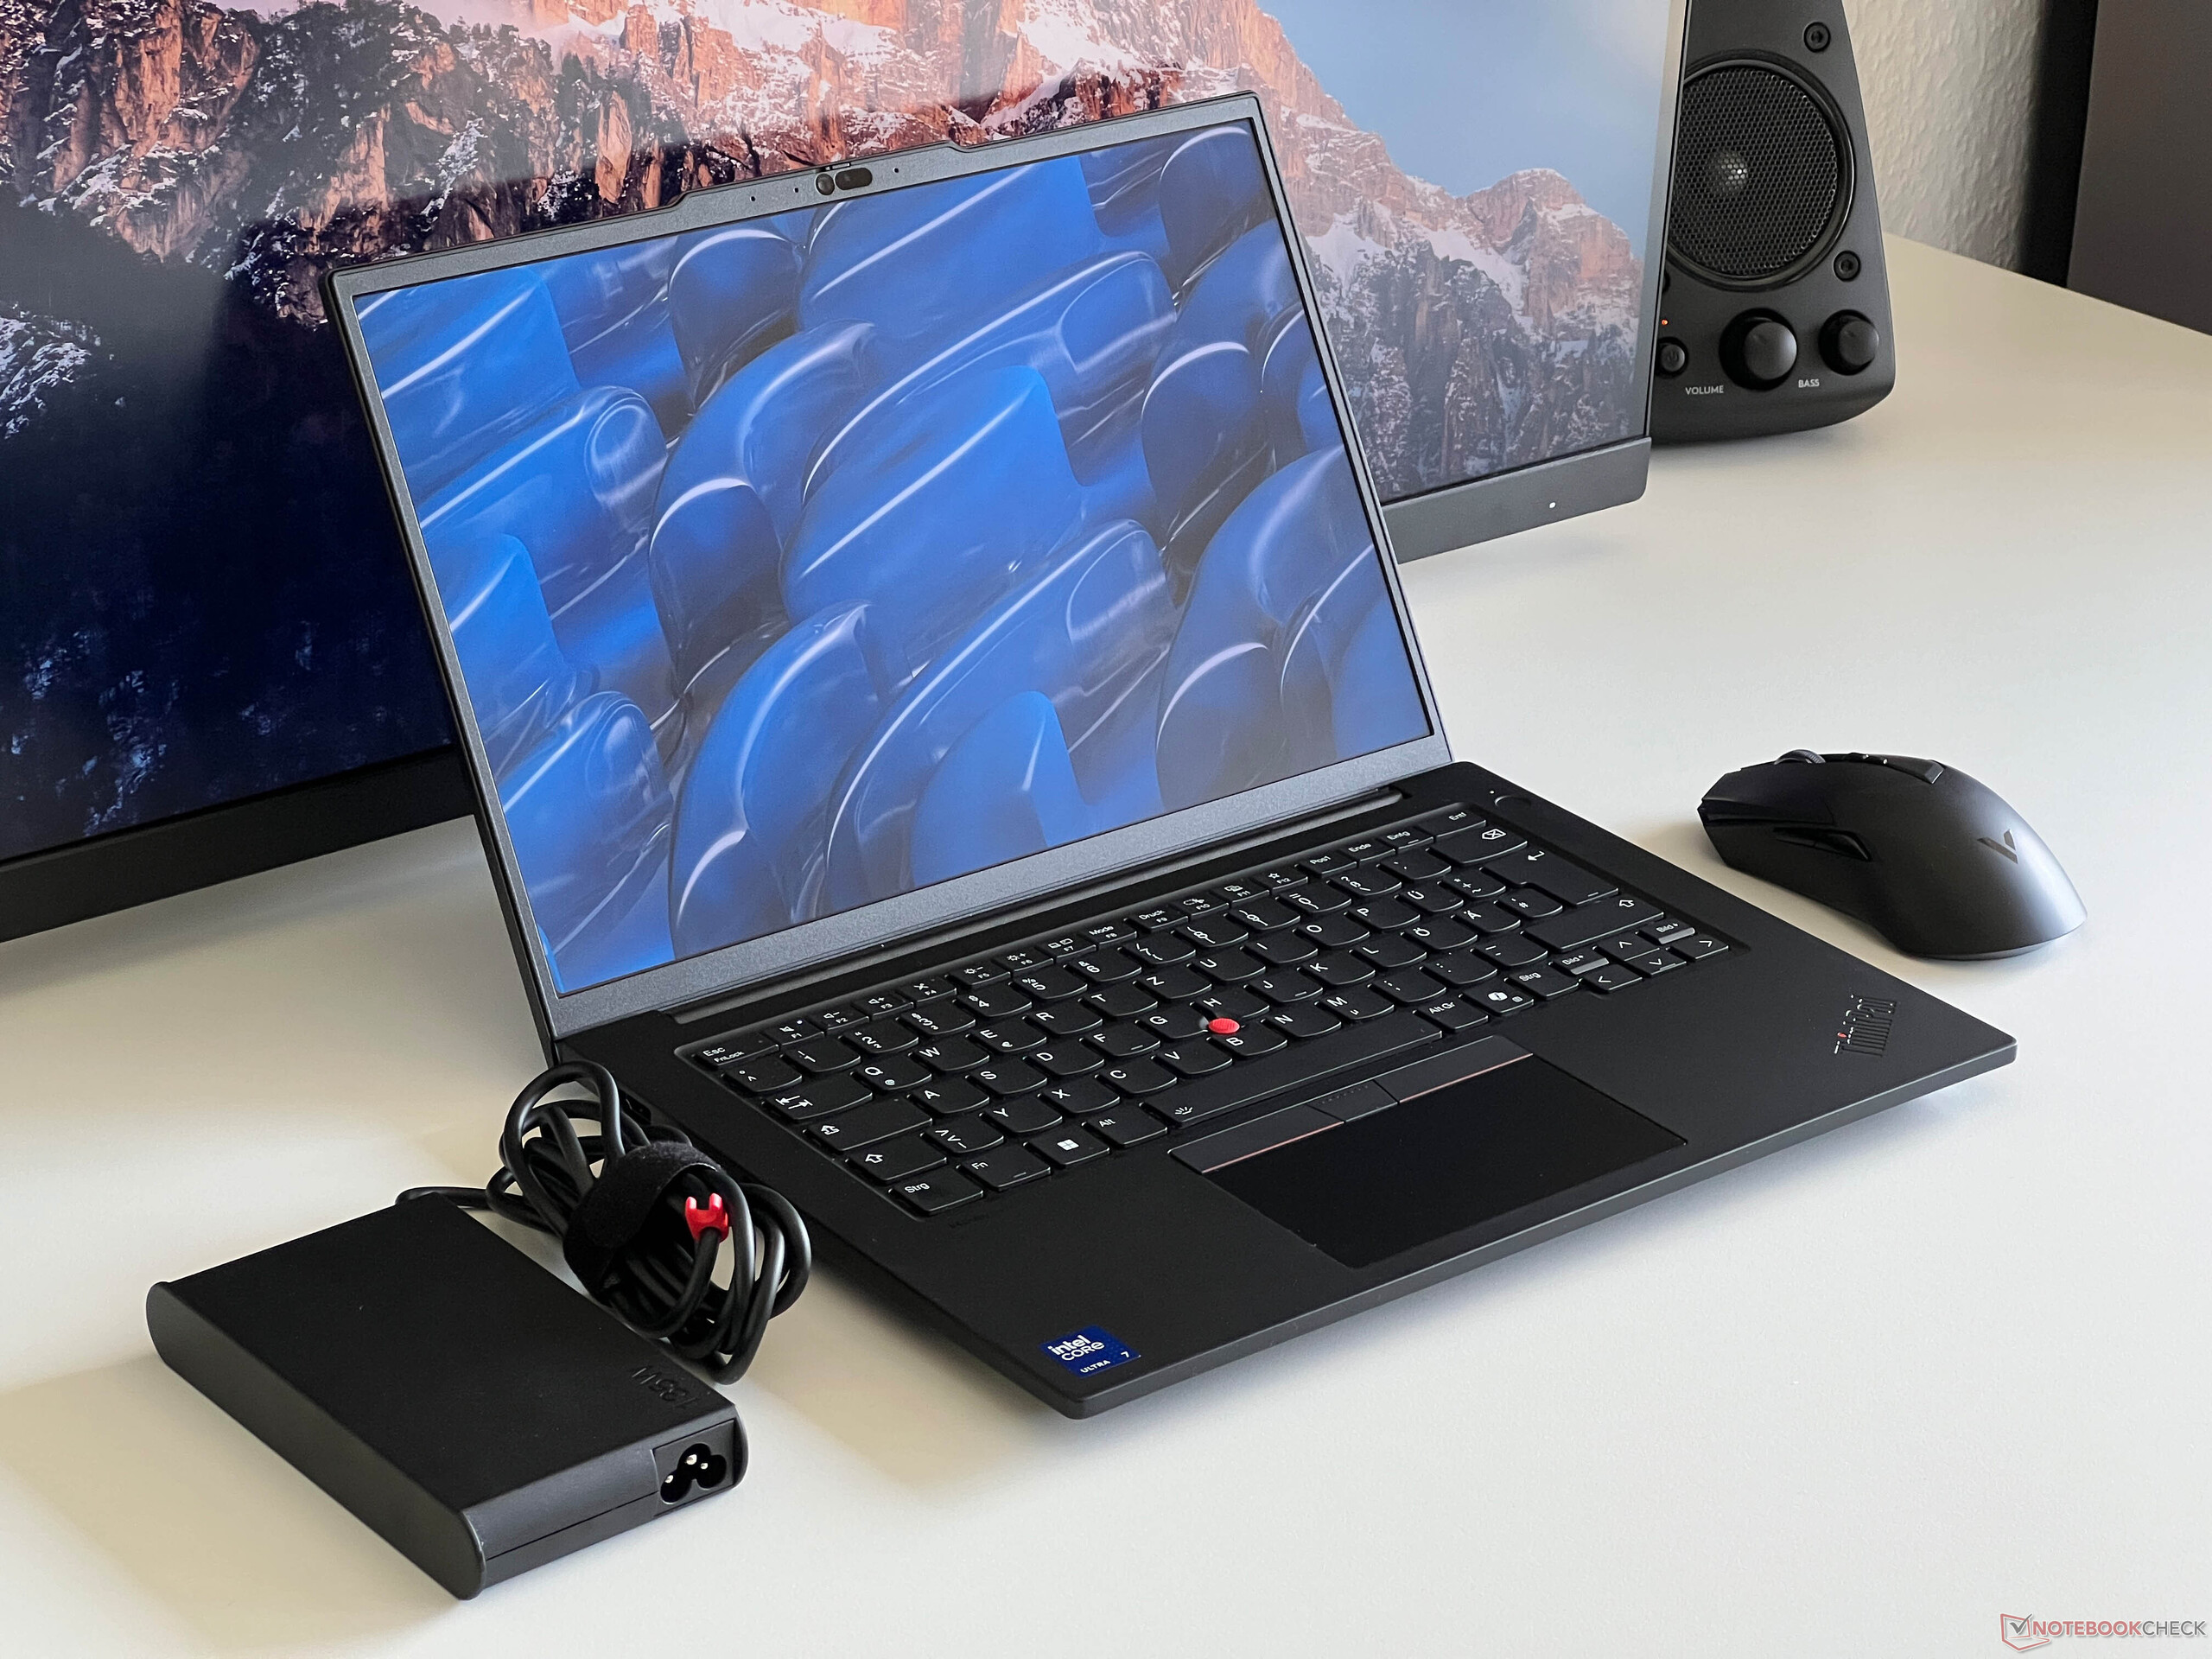
O ThinkPad P14s é uma estação de trabalho móvel e, quando o senhor o pega pela primeira vez, percebe imediatamente que ele definitivamente não é um dispositivo particularmente fino ou leve. No entanto, quando olhamos a folha de dados, ficamos surpresos porque a Lenovo afirma uma altura de 18,5 mm, o que simplesmente não está correto. Medimos cerca de 22 mm sem os pés, o que faz outra diferença significativa.
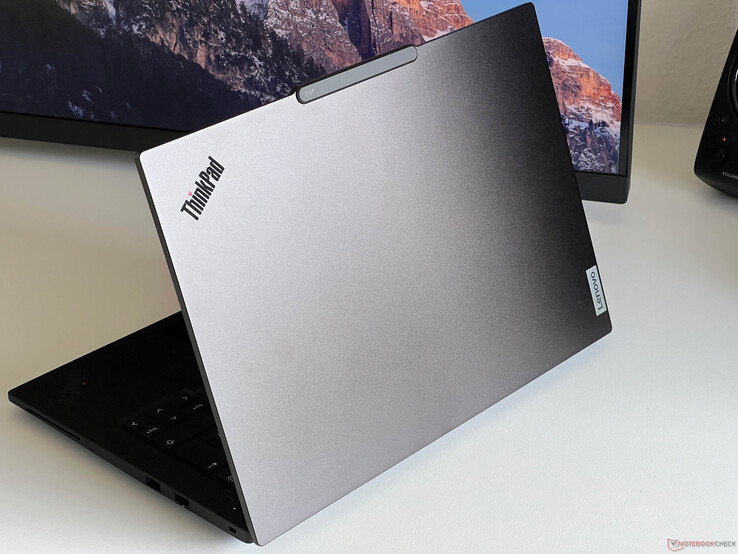
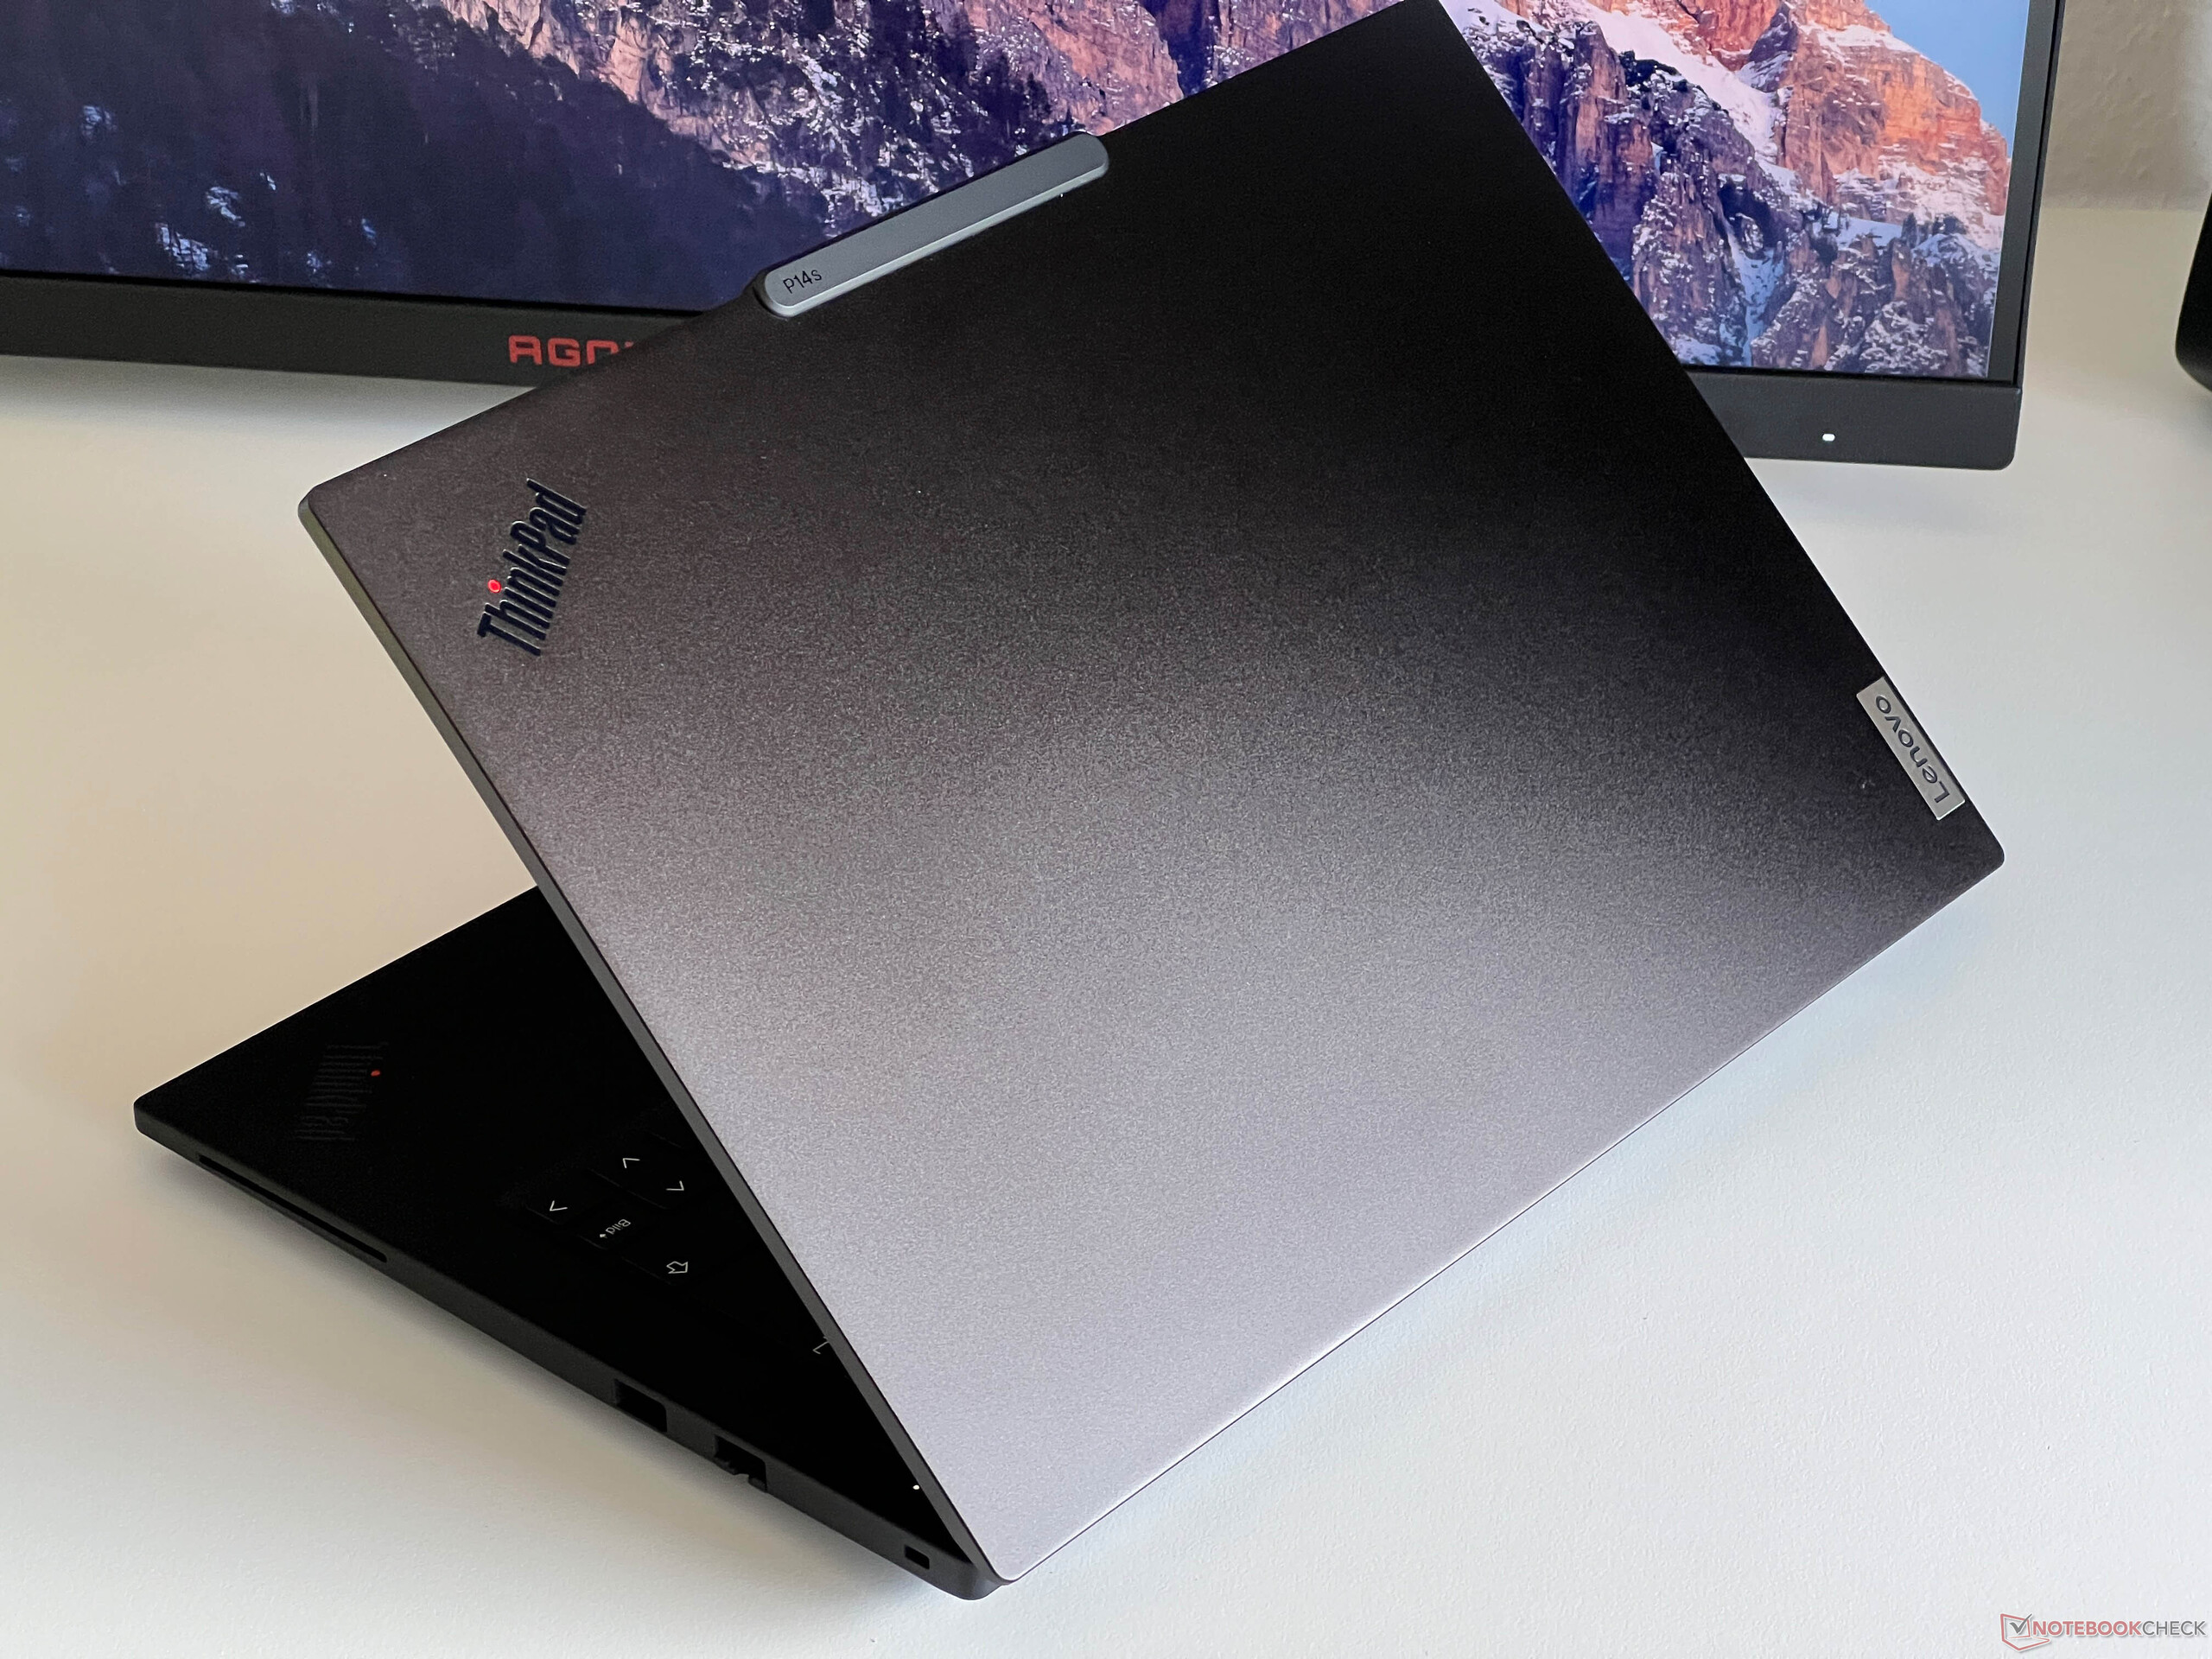
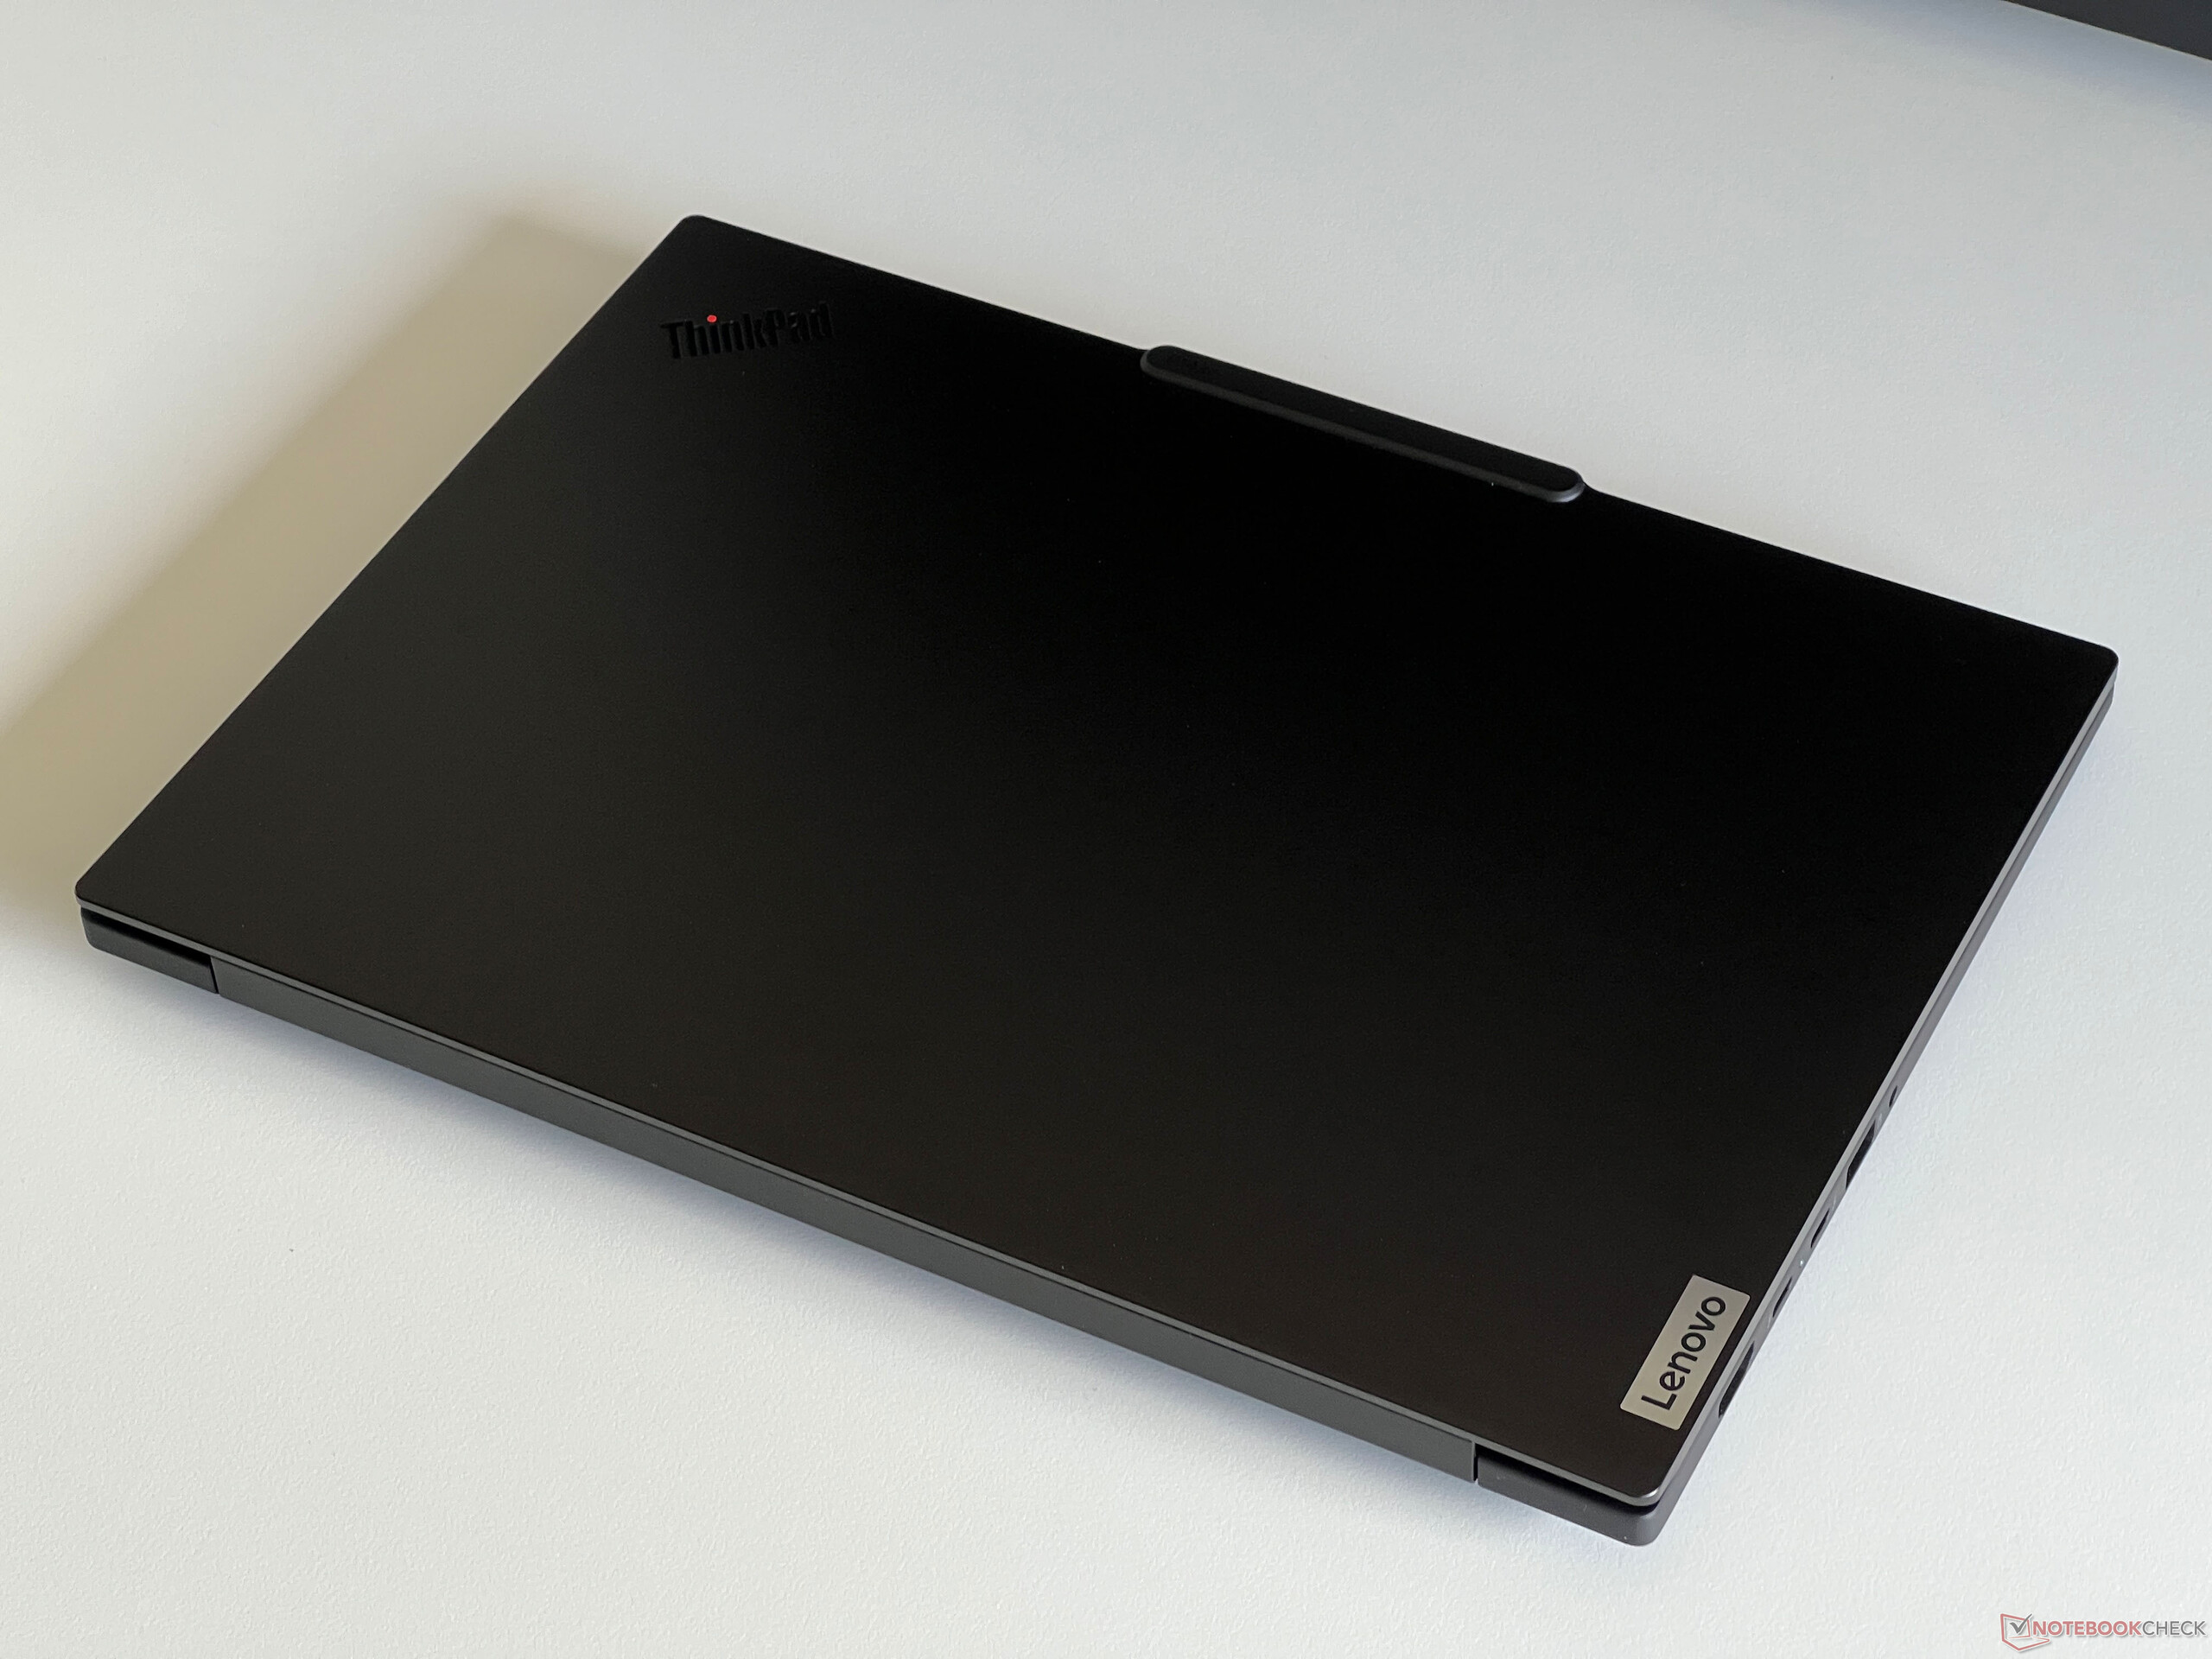
Do lado de fora, o ThinkPad P14s G5 apresenta o mesmo design dos modelos atuais do fabricante, o que infelizmente inclui a protuberância da câmera, que é pouco atraente e saliente. Além disso, seu design foi mantido simples e, para algumas pessoas, talvez um pouco entediante. As superfícies lisas da tampa e da parte inferior (ambas de alumínio) são muito suscetíveis a acumular marcas de impressões digitais, enquanto a parte superior da unidade básica (liga de magnésio/alumínio) tem um toque levemente emborrachado e não tem tanto problema com isso. As bordas da tela são um pouco mais estreitas do que no modelo anterior, e é por isso que há espaço para o painel maior de 14,5 polegadas.
A estabilidade da unidade básica é excelente e nada pode ser pressionado ou torcido, mas a aplicação de pressão na área à direita do teclado produz um leve ruído de rangido em nosso dispositivo de teste. A tampa da tela também é muito estável e não conseguimos provocar nenhum erro de imagem durante nosso teste. Em geral, as dobradiças estão bem apertadas, mas o senhor ainda pode abrir o dispositivo com uma mão. No entanto, não é possível evitar completamente que ele balance ao mudar o ângulo de abertura (máximo de 180 graus).
Já falamos sobre sua altura, mas o novo P14s G5 também é um dos maiores modelos em nosso grupo de comparação quando se trata de sua pegada. Seu peso é de 1,72 kg e a fonte de alimentação de 135 watts pesa mais 527 gramas.
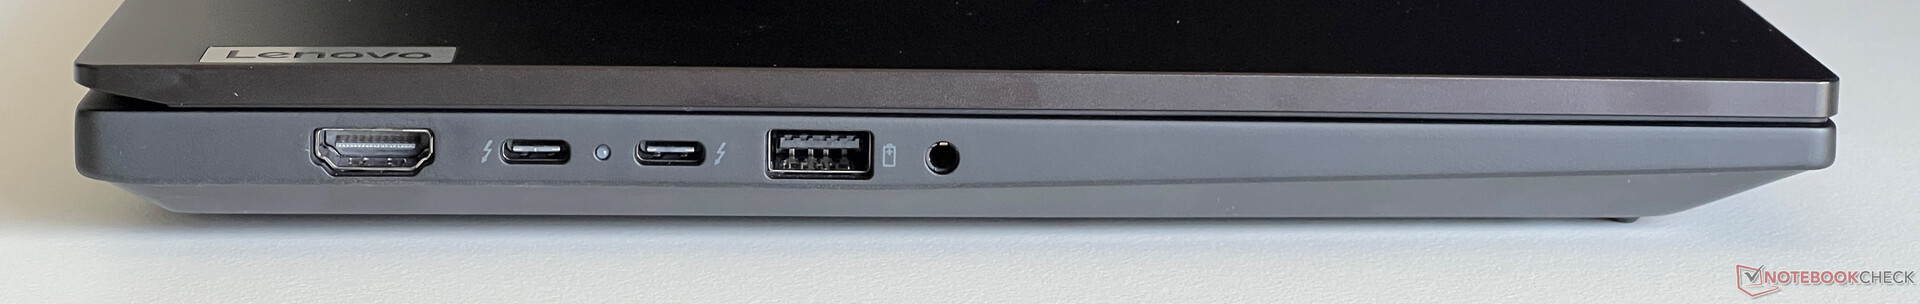
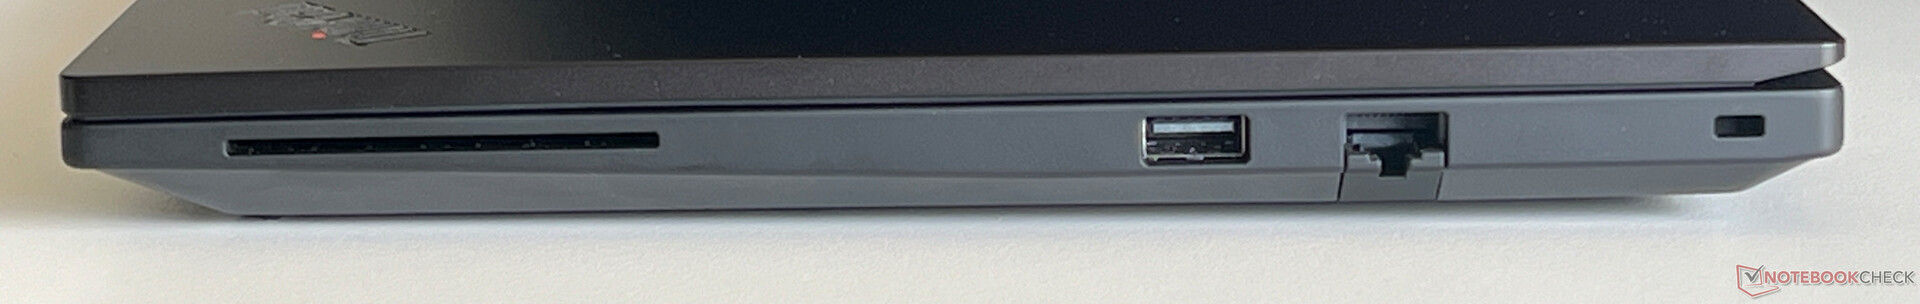
Conectividade - Thunderbolt 4 e um leitor de SmartCard
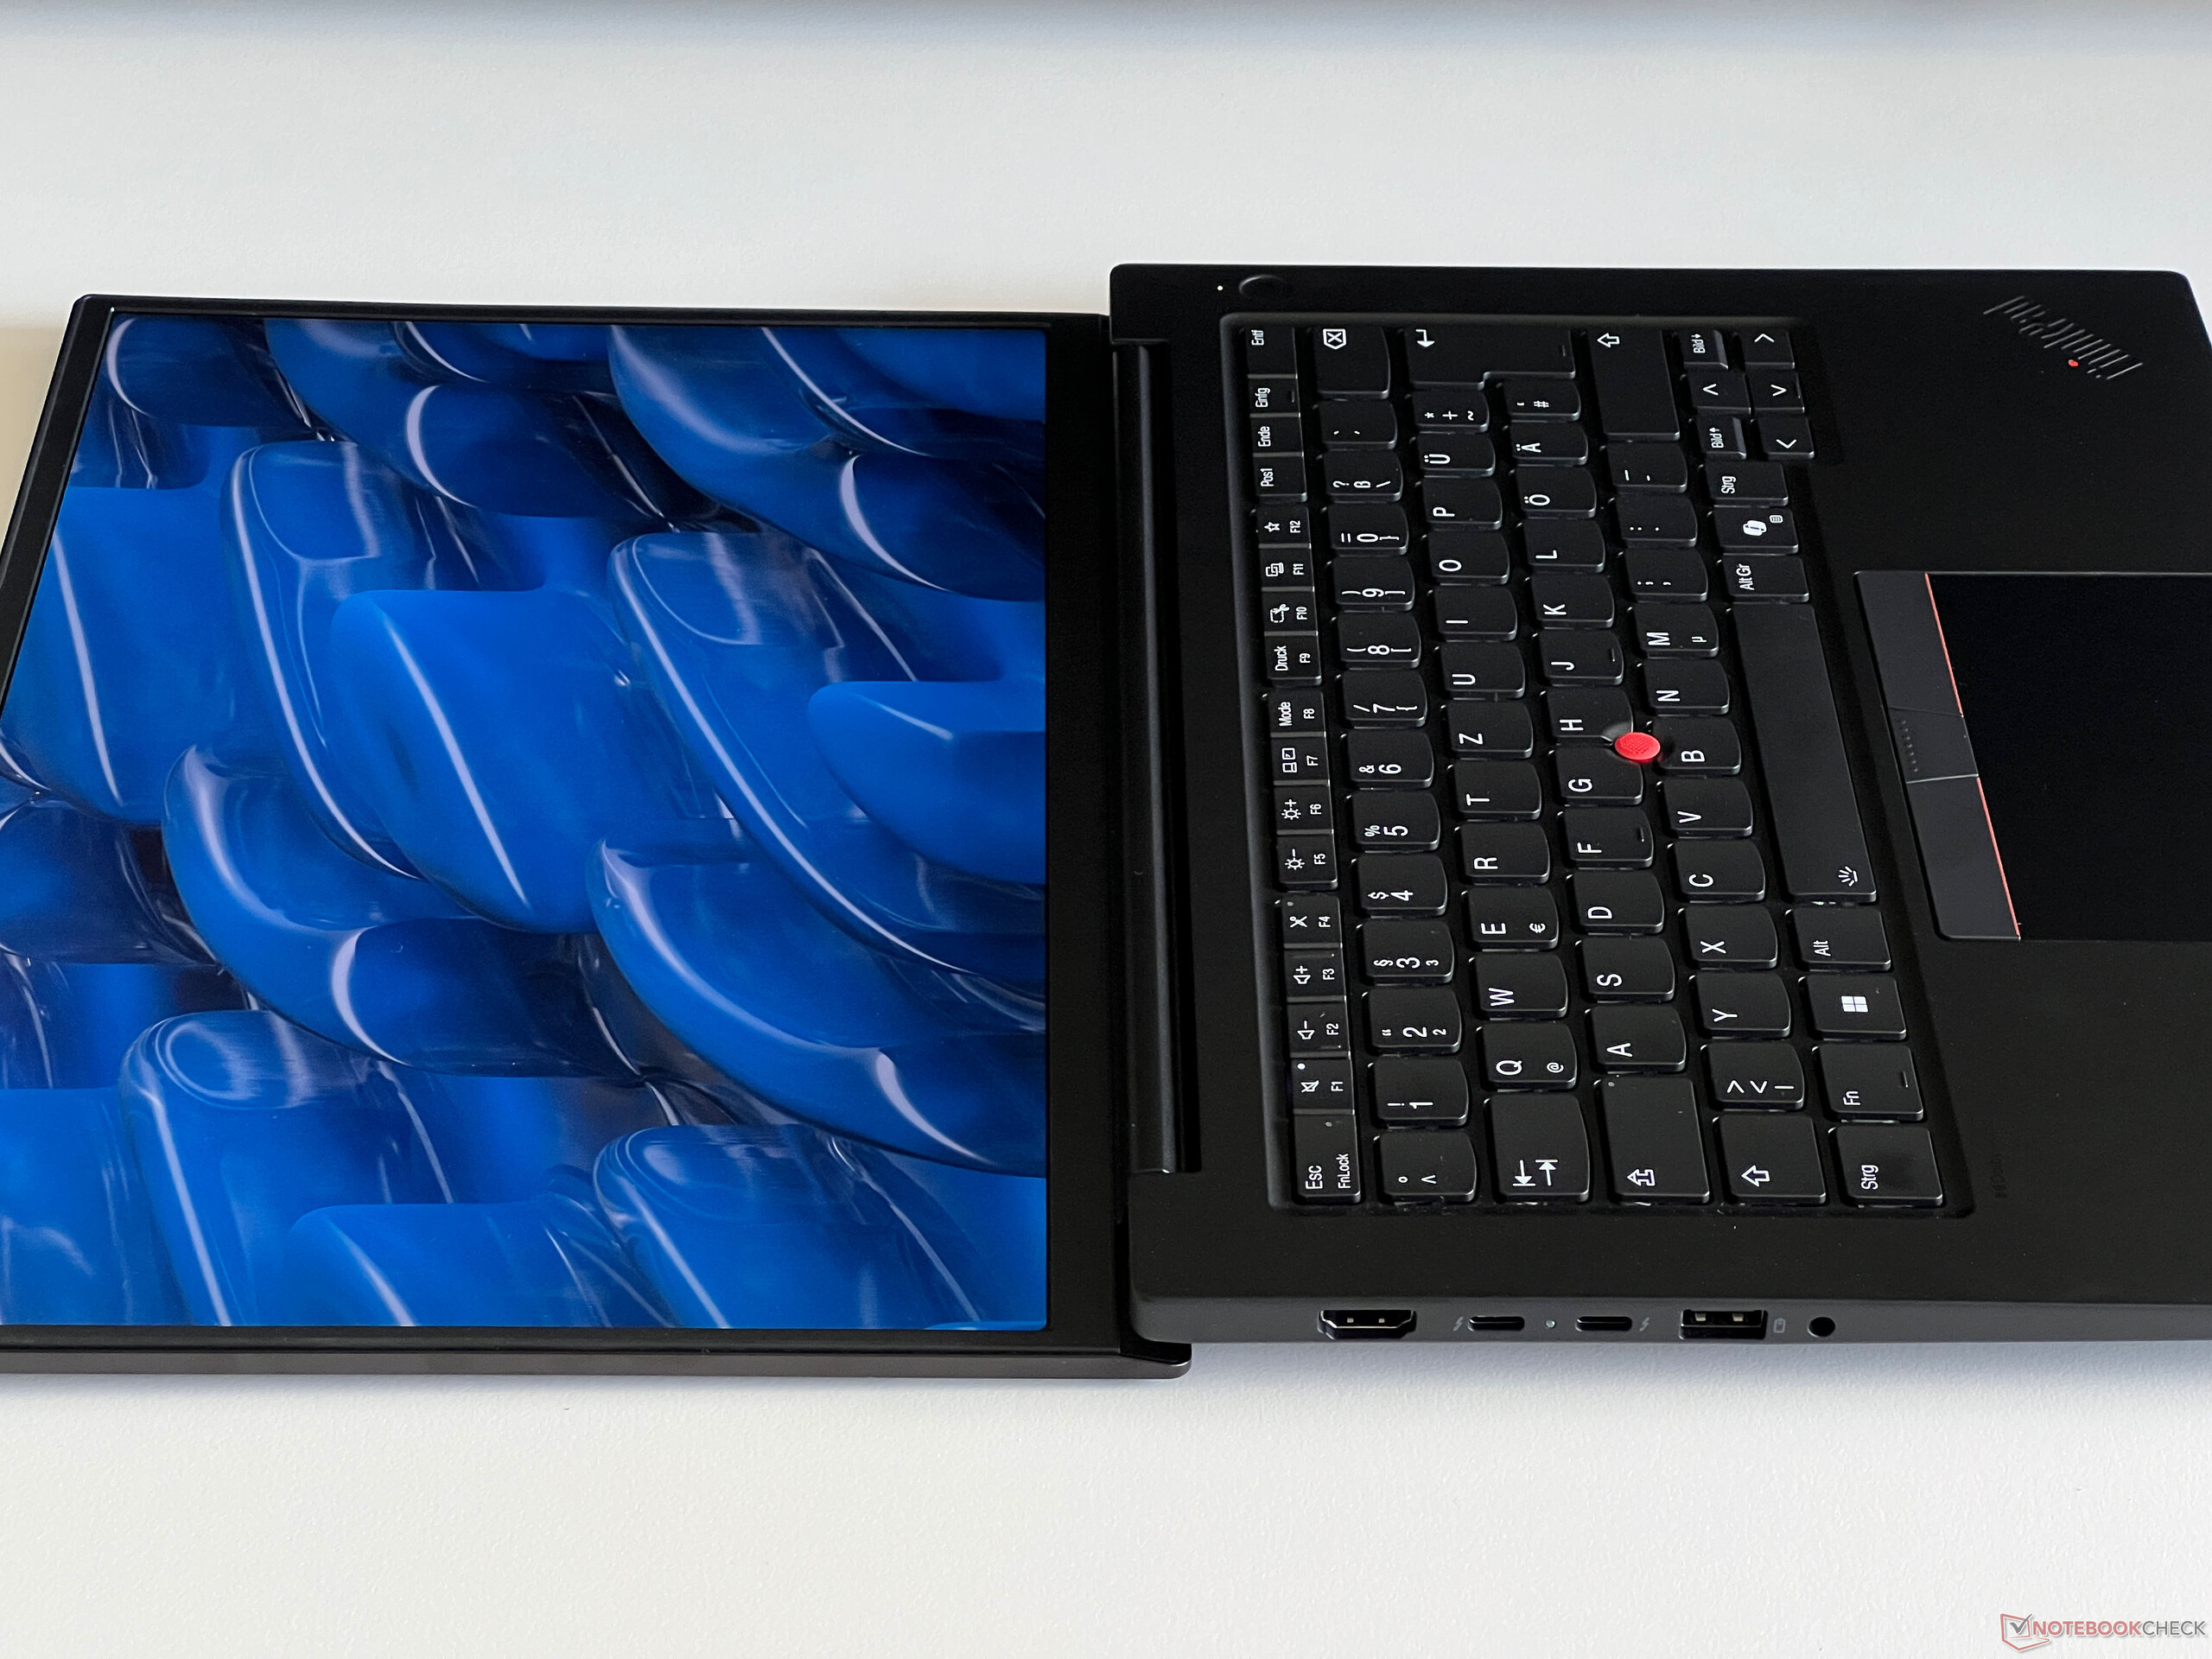
Não há surpresas para os usuários quando se trata de conexões e, além das modernas portas Thunderbolt 4, há também duas portas USB-A comuns instaladas. Isso significa que o senhor não precisará usar adaptadores durante o uso diário. Nosso dispositivo de teste também está equipado com um leitor de SmartCard opcional, mas não tem um leitor de cartão SD.
Comunicação
A Lenovo instalou o módulo WLAN Intel AX211 que também suporta redes modernas de 6 GHz e Bluetooth 5.3. No entanto, não há um módulo Wi-Fi 7 integrado. Em nosso teste usando nosso roteador de referência da Asus, suas taxas de transferência foram excelentes e também muito estáveis, portanto, não deve haver problemas durante o uso nesse aspecto. Uma porta Gigabit Ethernet (Intel i219-V) também está disponível para redes com fio.
Além disso, o P14s G5 apresenta um slot M.2-2242 para um módulo WWAN, mas nenhuma configuração correspondente está disponível no momento na Alemanha (onde esse teste foi realizado) devido a uma disputa legal. As antenas necessárias também estão ausentes (não estão prontas para WWAN), portanto, um módulo não pode ser adaptado pelos usuários sem que sejam tomadas medidas adicionais.
| Networking | |
| Lenovo ThinkPad P14s G5 21G3S00A00 | |
| iperf3 transmit AXE11000 | |
| iperf3 receive AXE11000 | |
| HP ZBook Firefly 14 G11 | |
| iperf3 transmit AXE11000 | |
| iperf3 receive AXE11000 | |
| iperf3 transmit AXE11000 6GHz | |
| iperf3 receive AXE11000 6GHz | |
| Dell Precision 5000 5490 | |
| iperf3 transmit AXE11000 | |
| iperf3 receive AXE11000 | |
| iperf3 transmit AXE11000 6GHz | |
| iperf3 receive AXE11000 6GHz | |
| Lenovo ThinkPad P14s G4 21HF0017GE | |
| iperf3 transmit AXE11000 | |
| iperf3 receive AXE11000 | |
| iperf3 transmit AXE11000 6GHz | |
| iperf3 receive AXE11000 6GHz | |
| Microsoft Surface Laptop Studio 2 RTX 4060 | |
| iperf3 transmit AXE11000 | |
| iperf3 receive AXE11000 | |
| Lenovo Yoga Pro 9-14IRP G8 | |
| iperf3 transmit AXE11000 | |
| iperf3 receive AXE11000 | |
Webcam
A webcam pode capturar imagens de até 5 MP em 4:3 (2.592 x 1.944 pixels) ou 3,7 MP em 16:9 (2.560 x 1.440 pixels). A nitidez da imagem é melhor do que a dos sensores usuais de 2 MP e os efeitos adicionais do Windows Studio também são suportados.


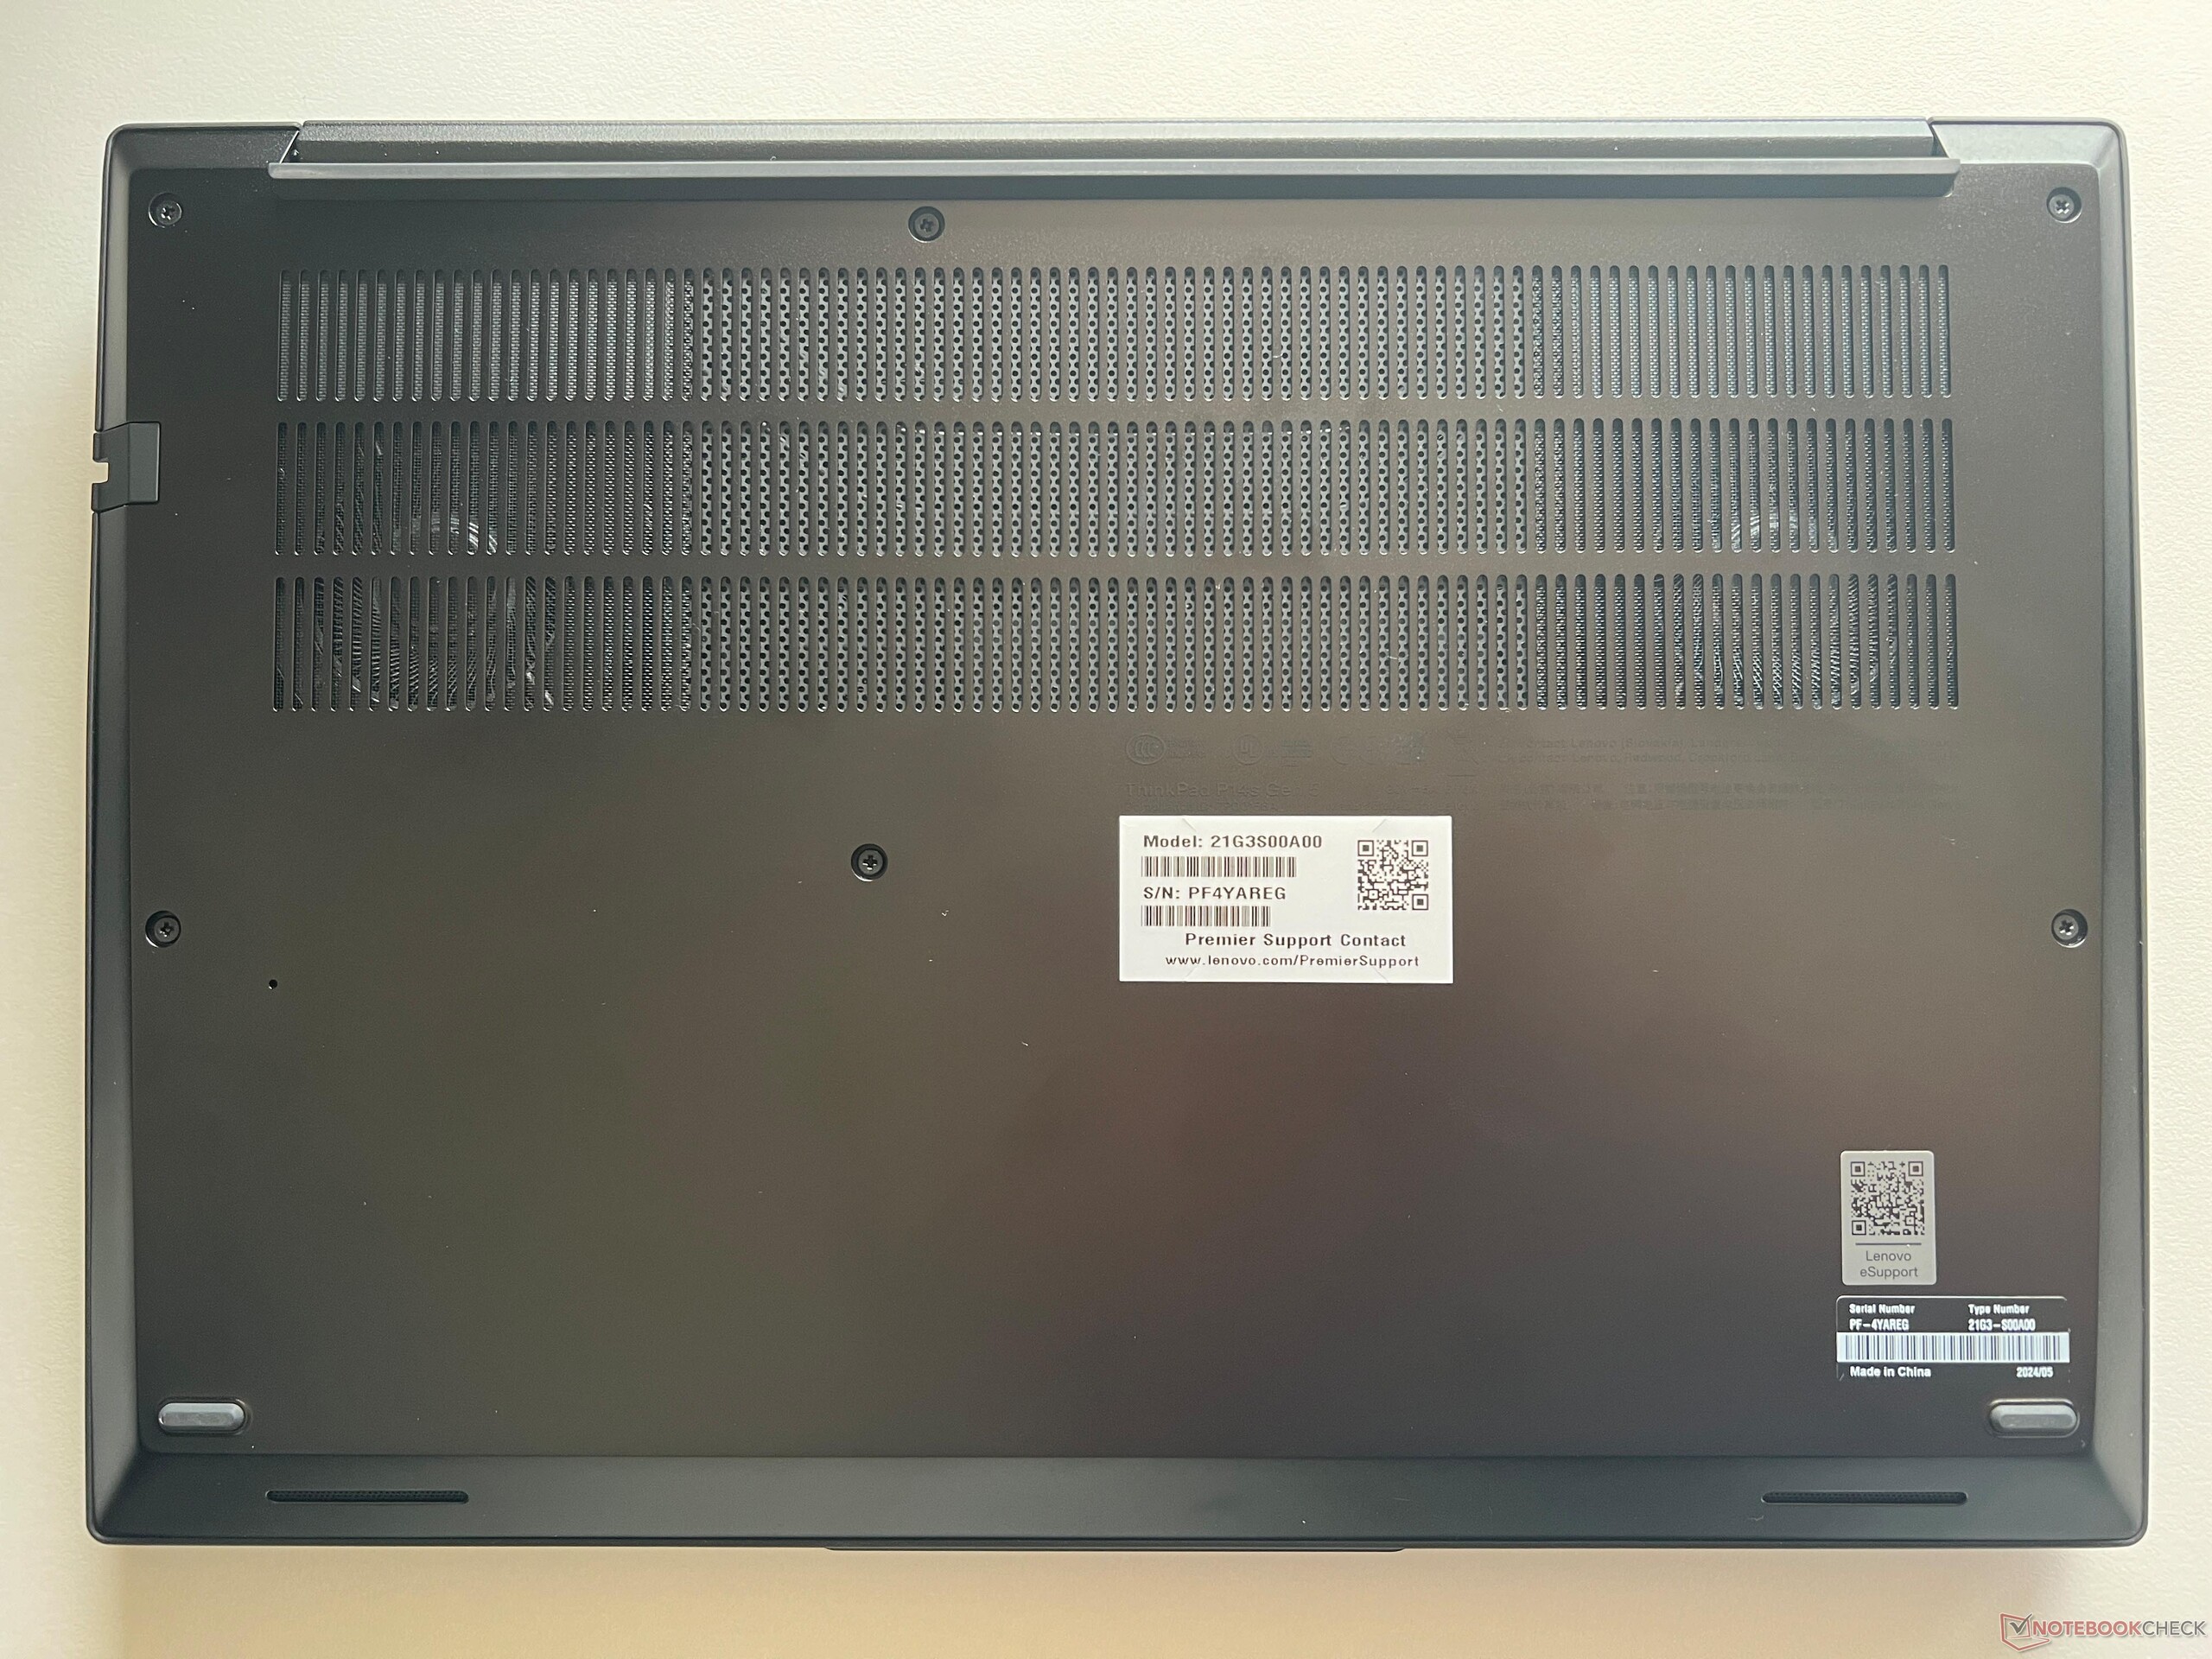
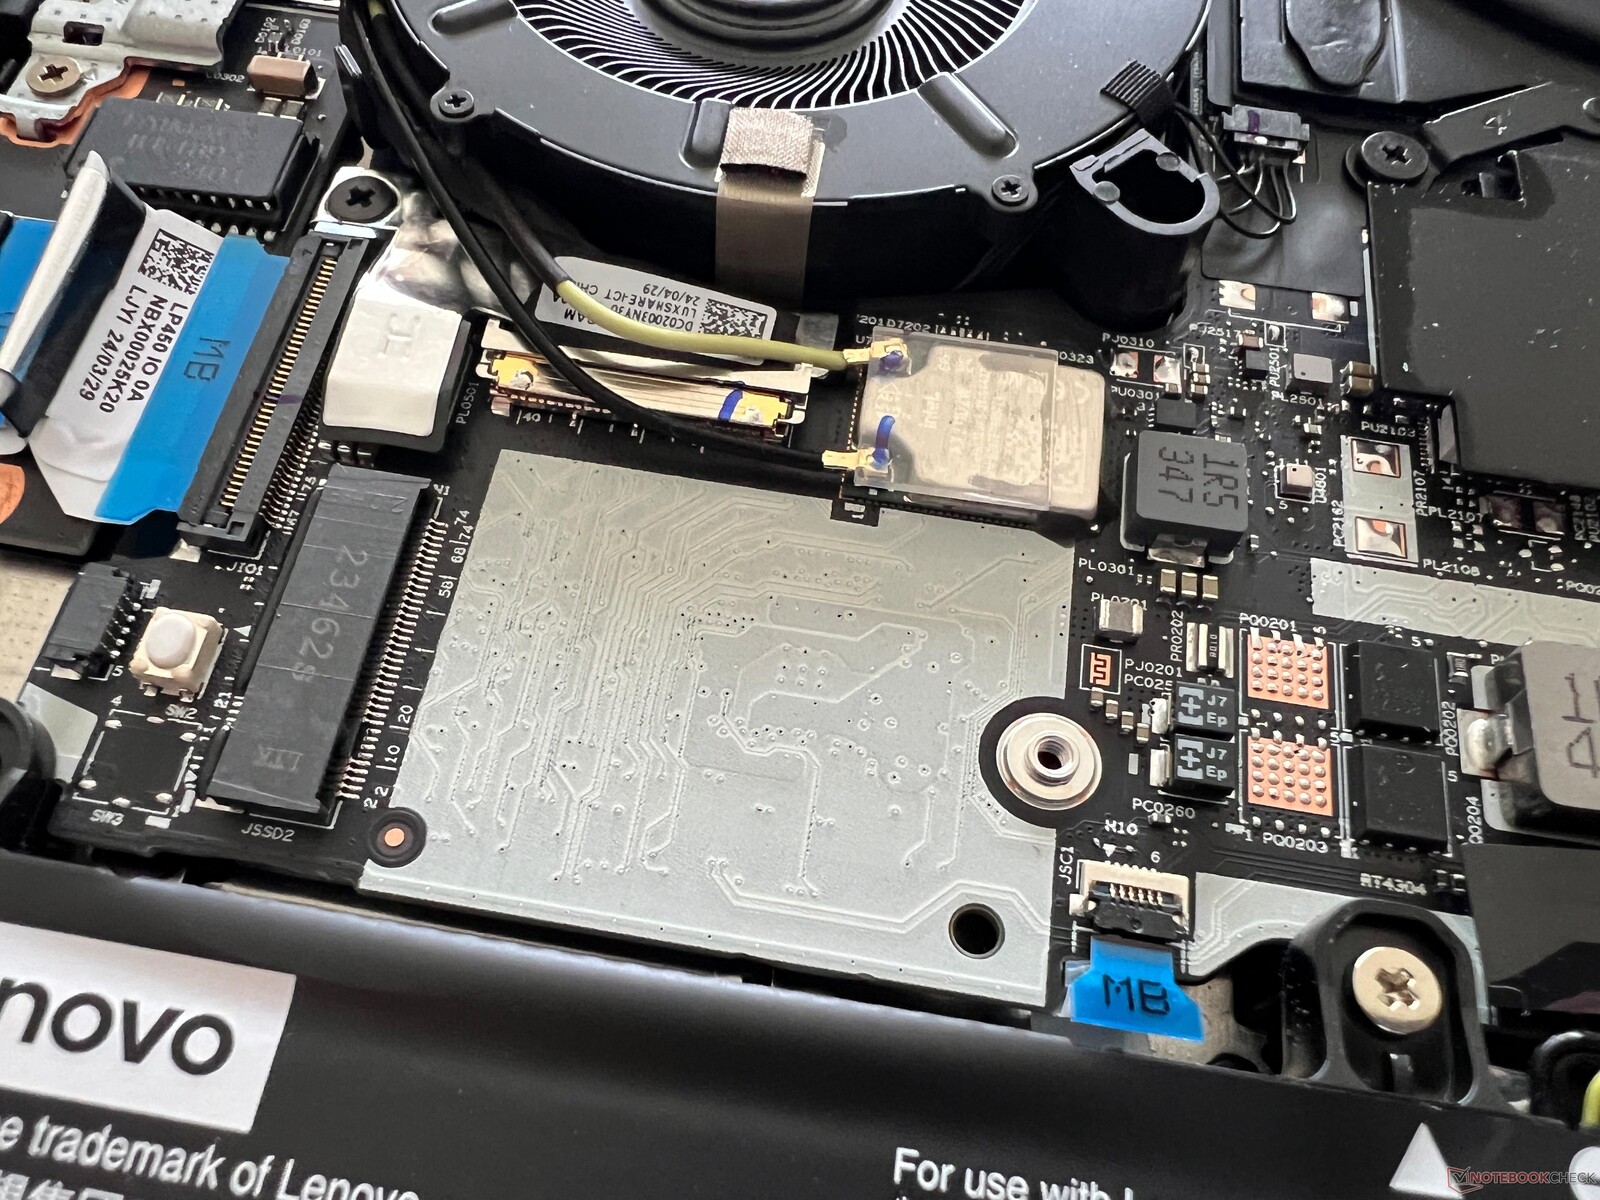
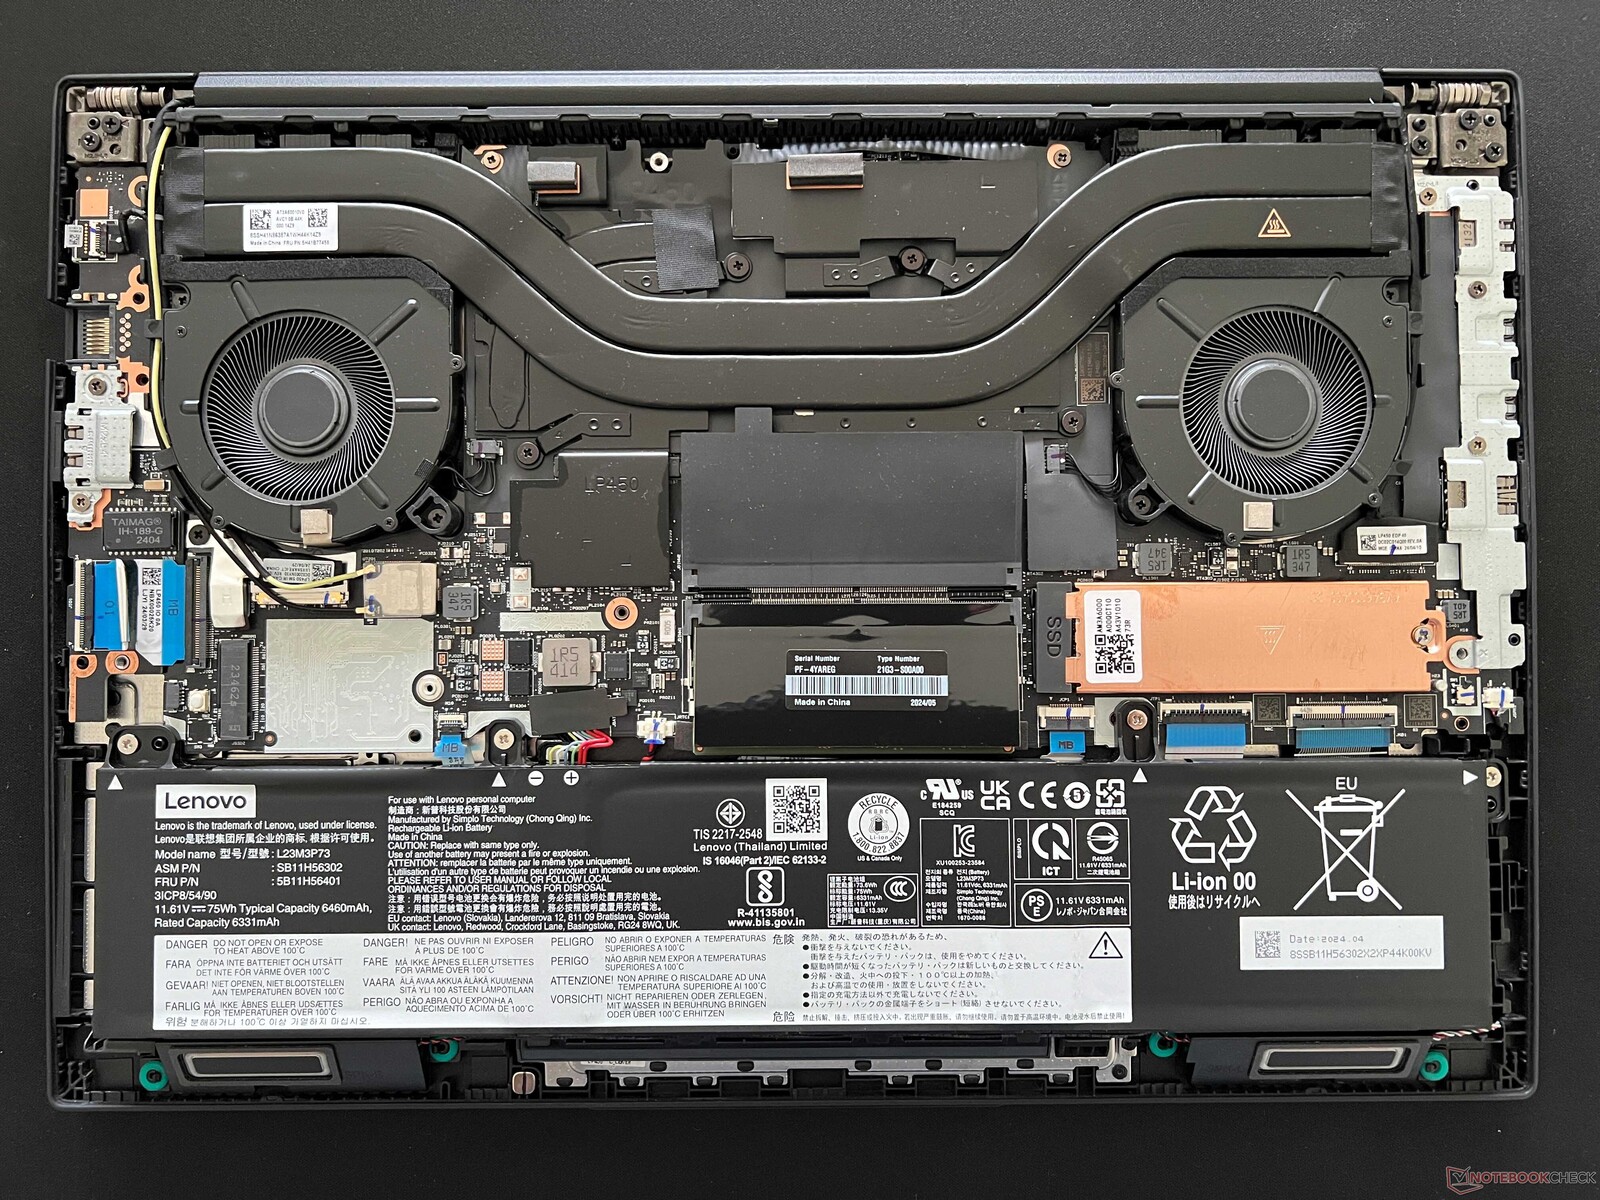
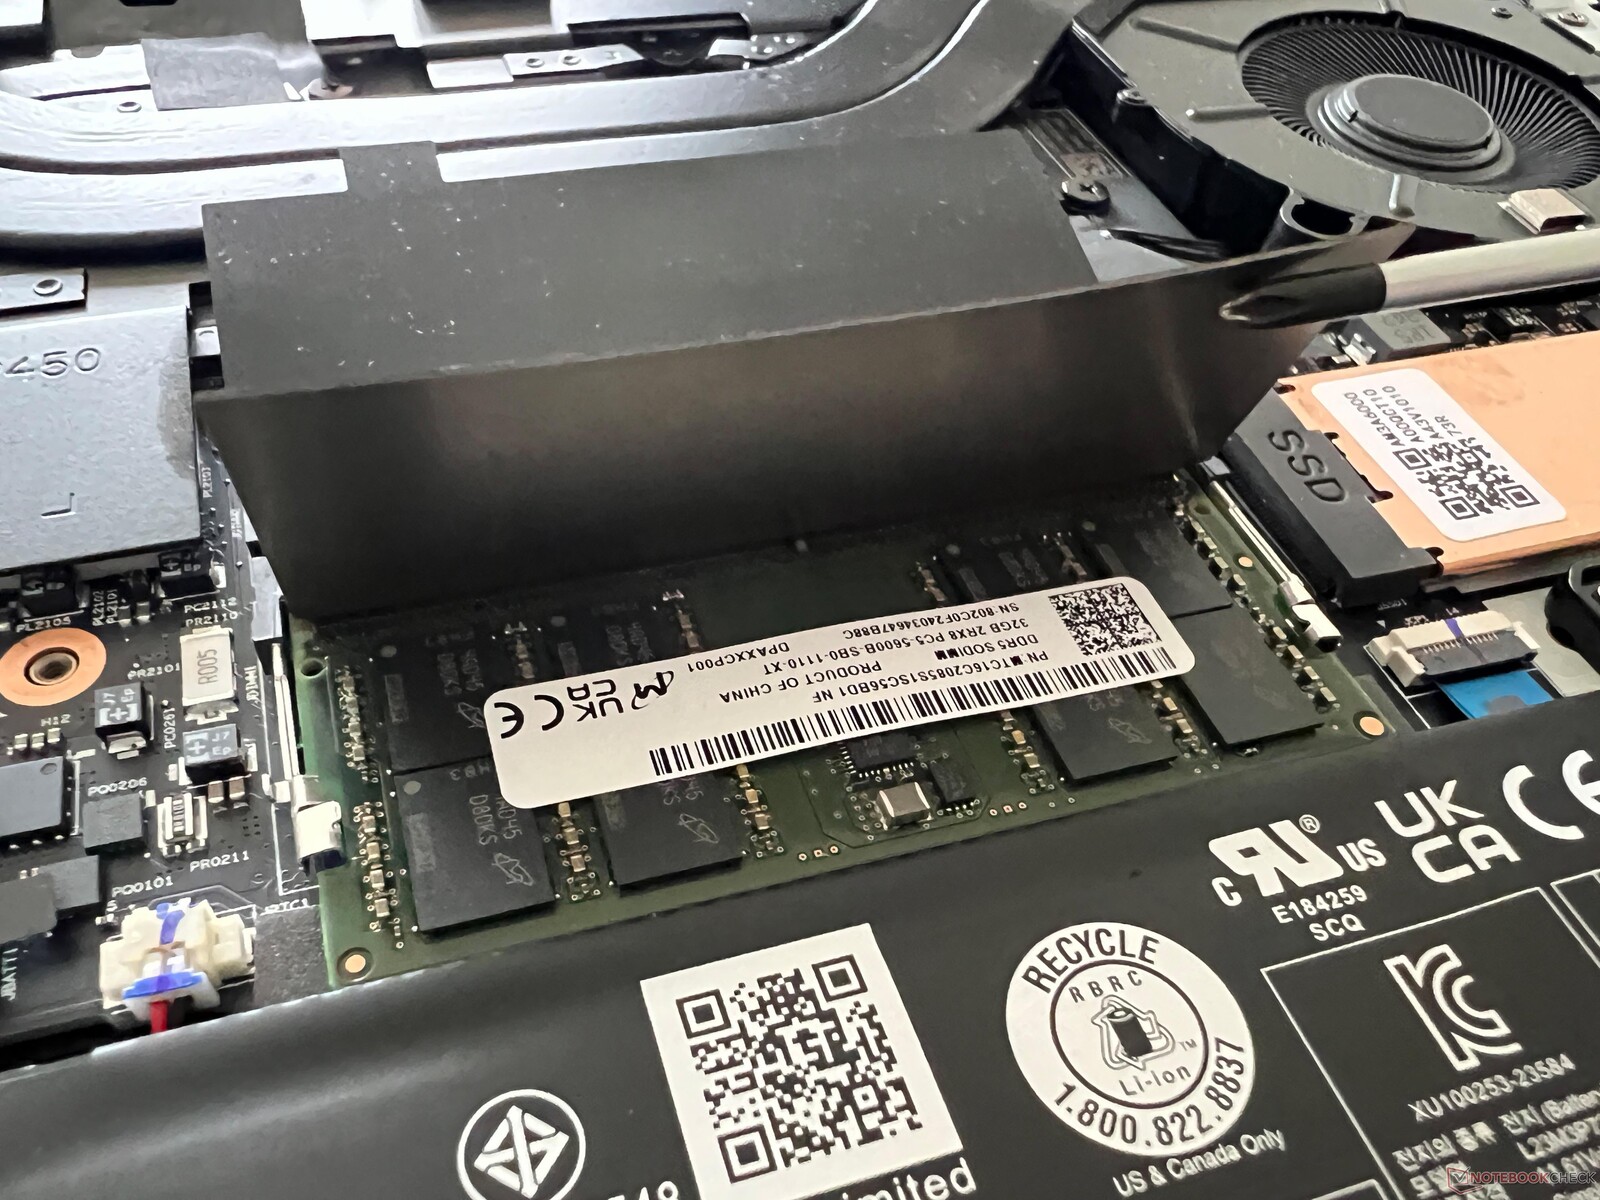
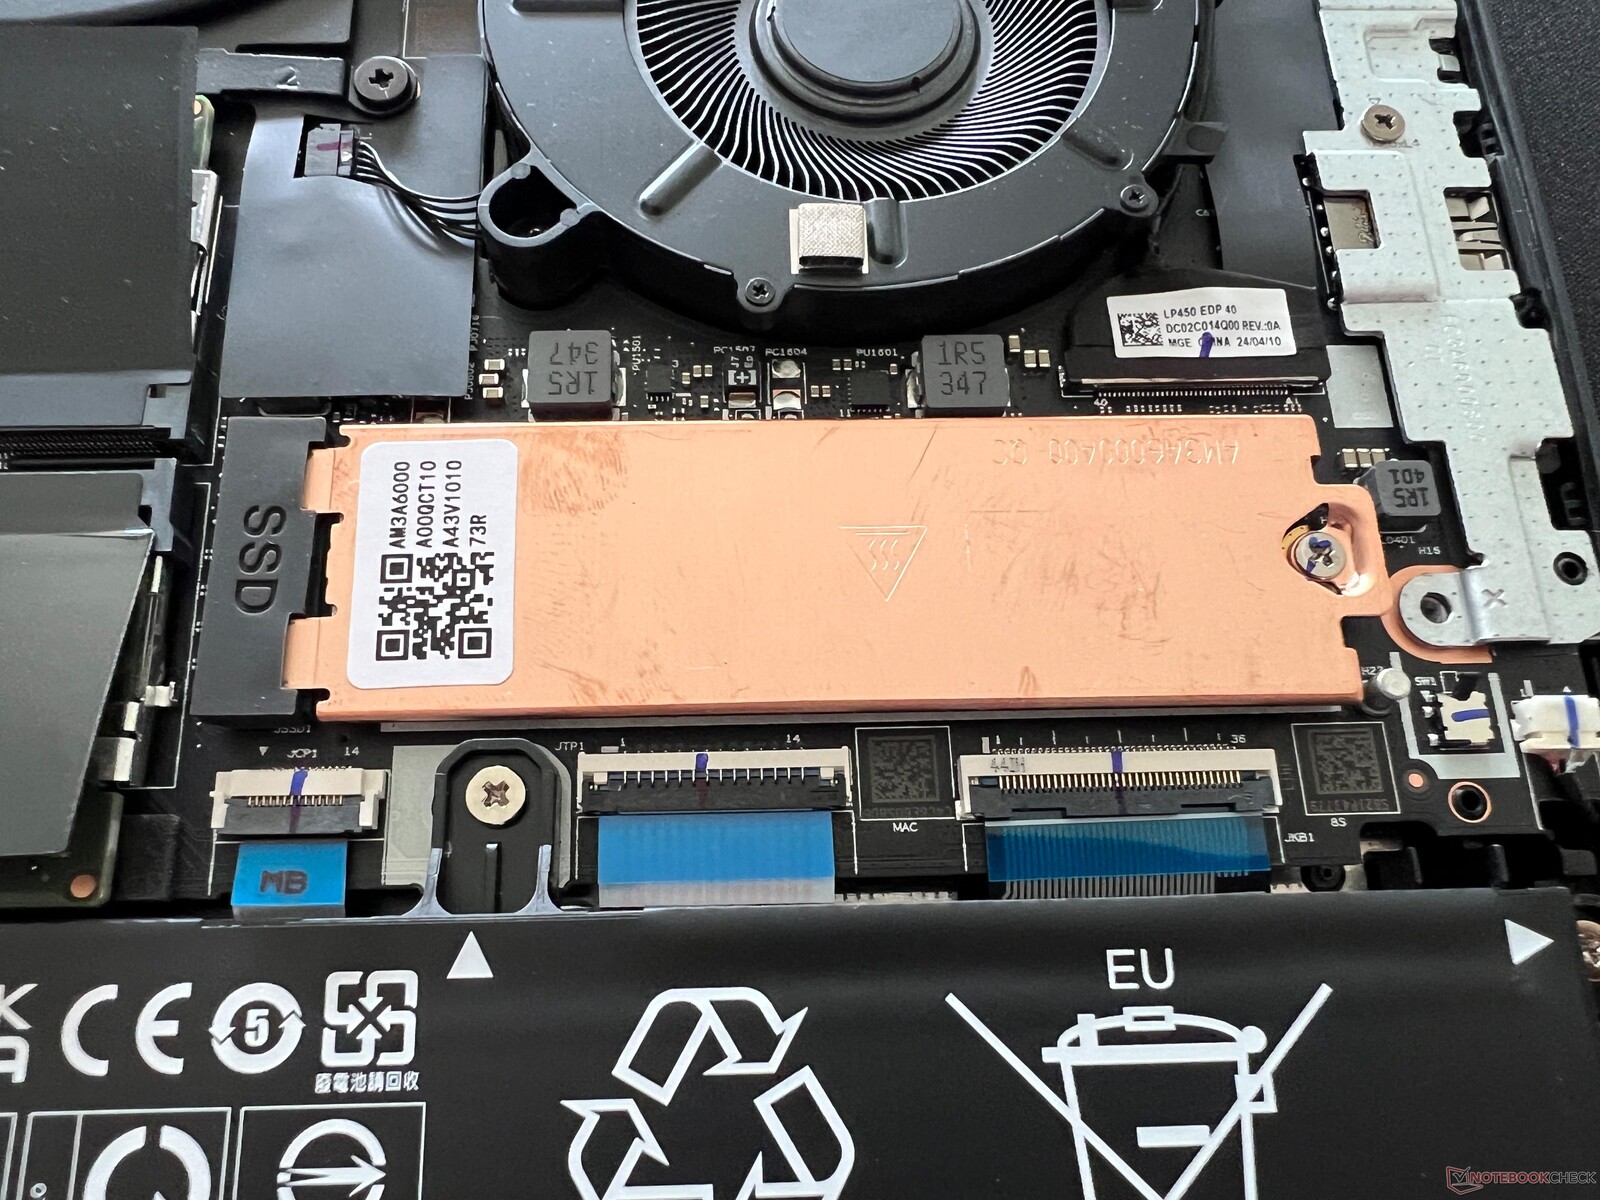
Manutenção
A tampa inferior do gabinete é fixada com seis parafusos Phillips e pode ser removida facilmente. O processador, a placa de vídeo e o módulo WLAN são todos soldados, mas tanto o SSD M.2 2280 quanto a RAM podem ser atualizados. Os dois slots DIMM podem acomodar módulos com um máximo de 48 GB, o que significa que um total de 96 GB de RAM pode ser instalado no laptop.
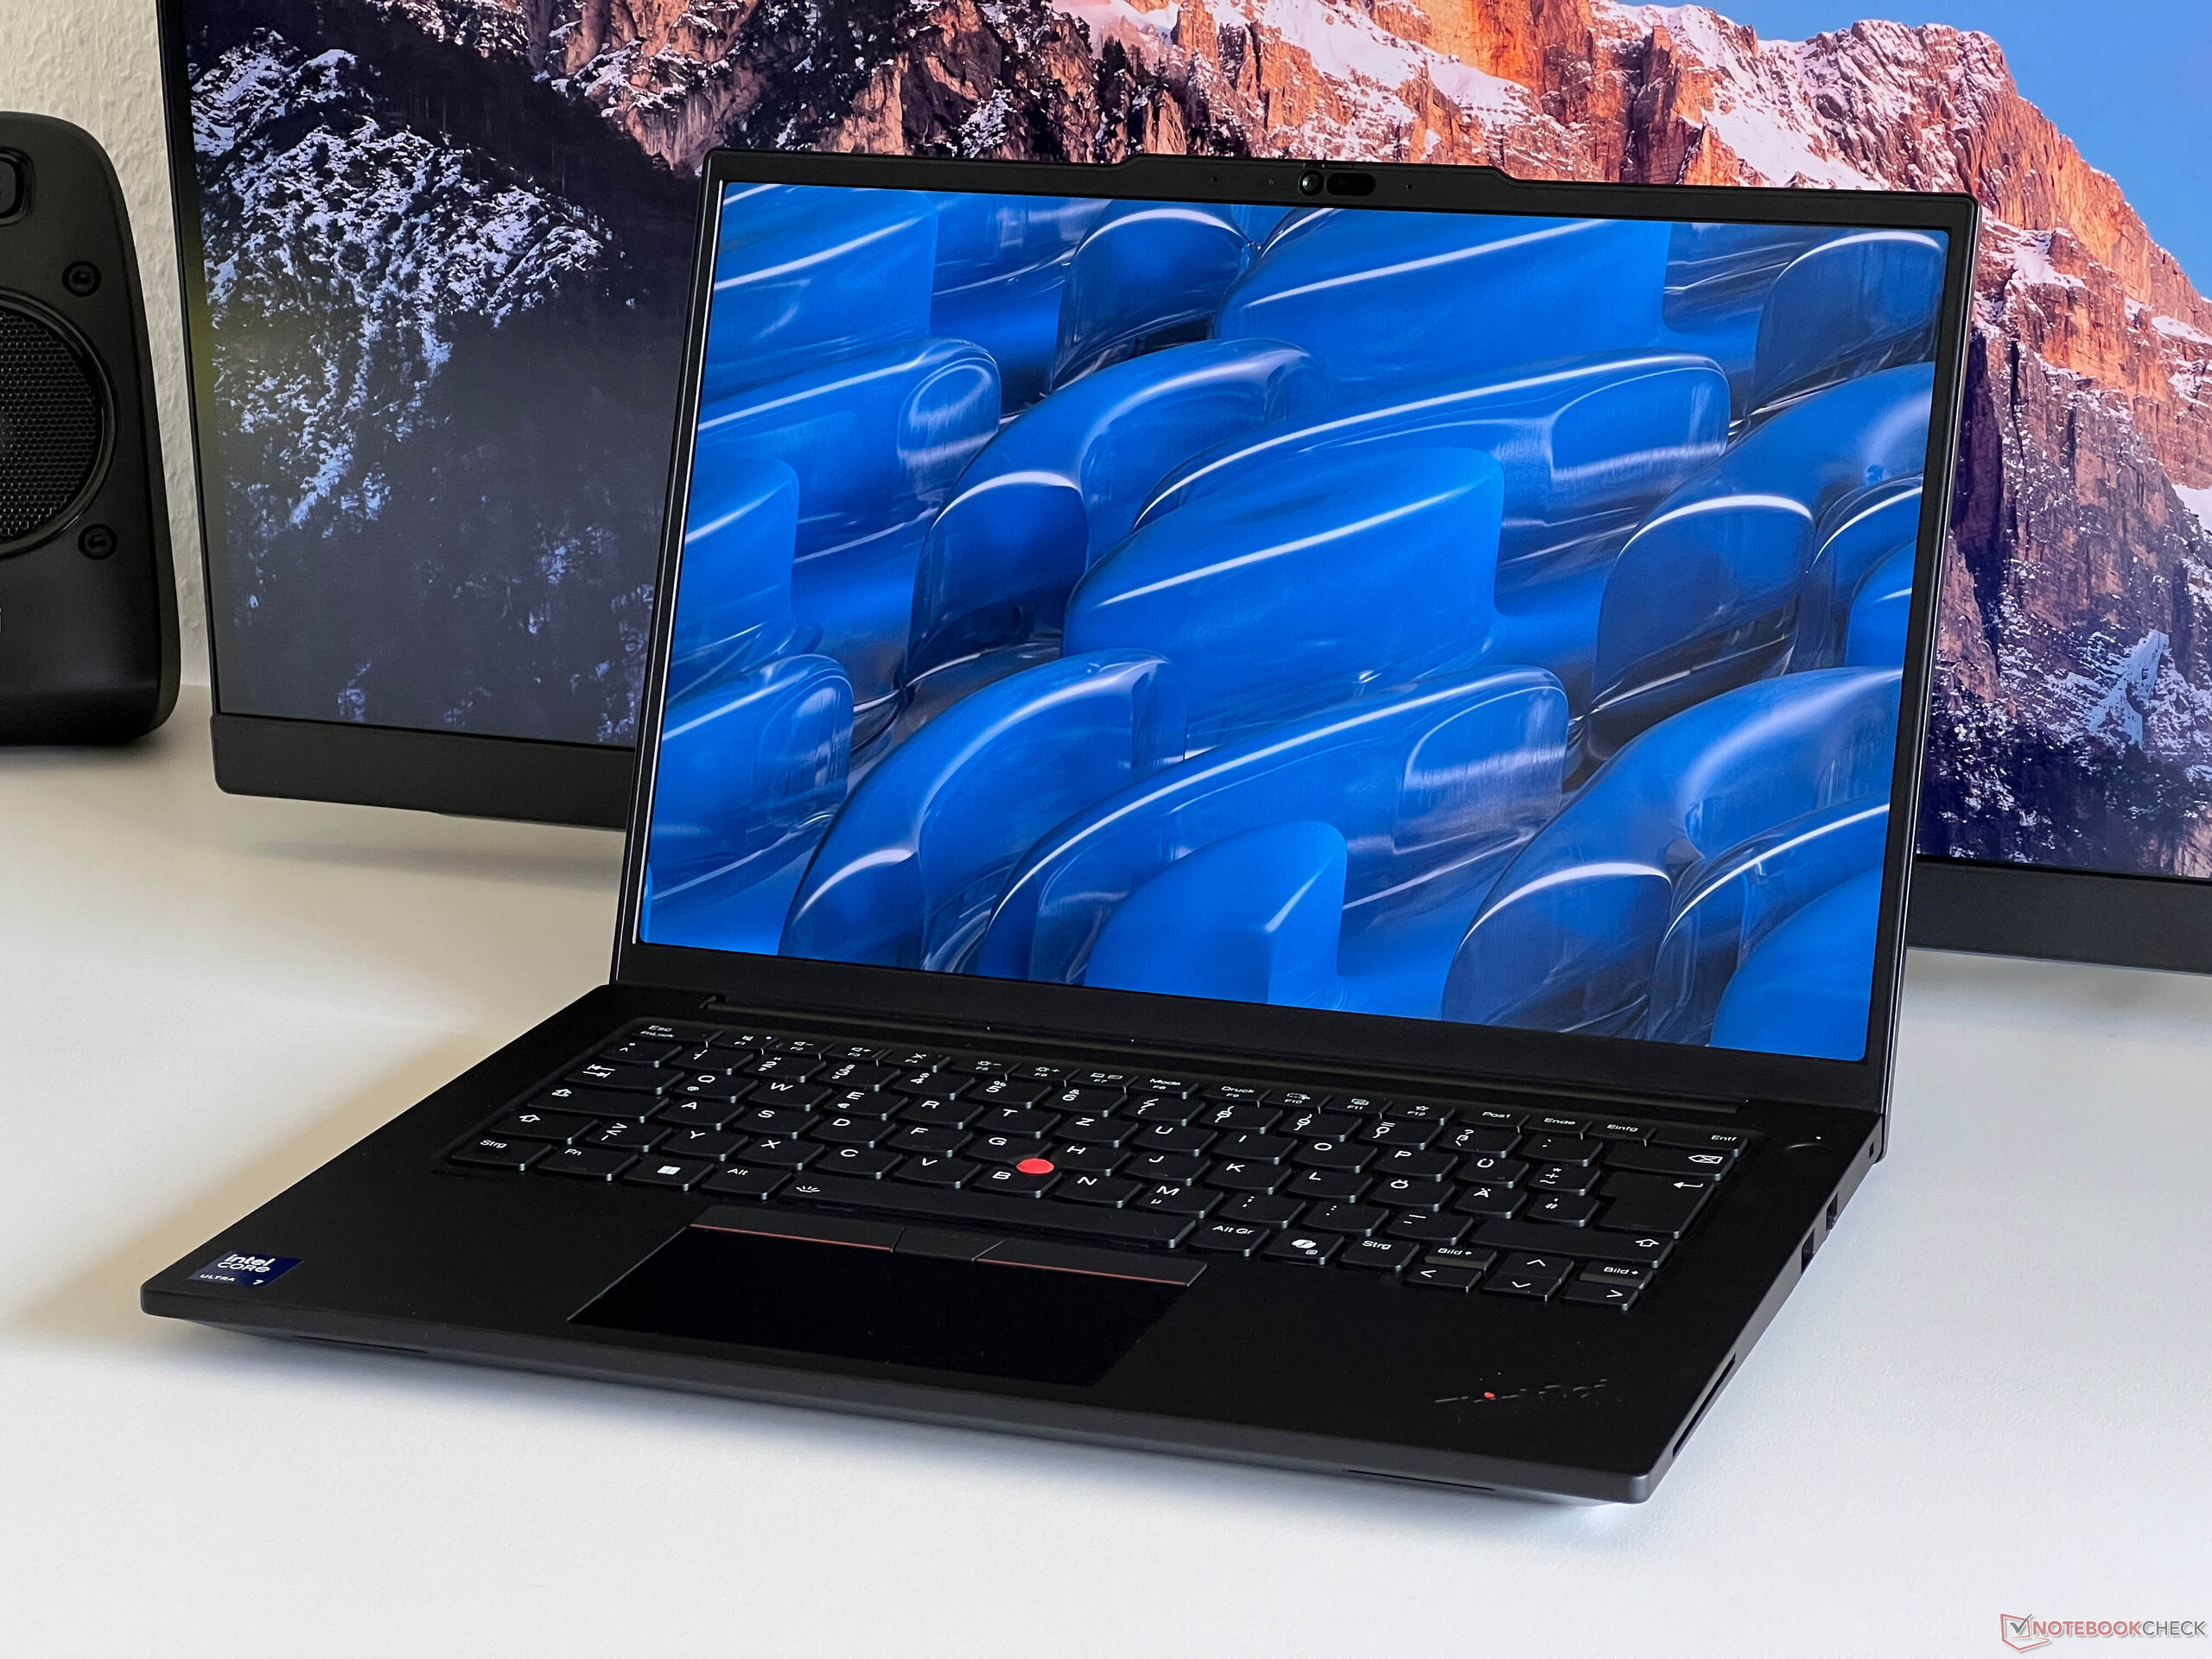
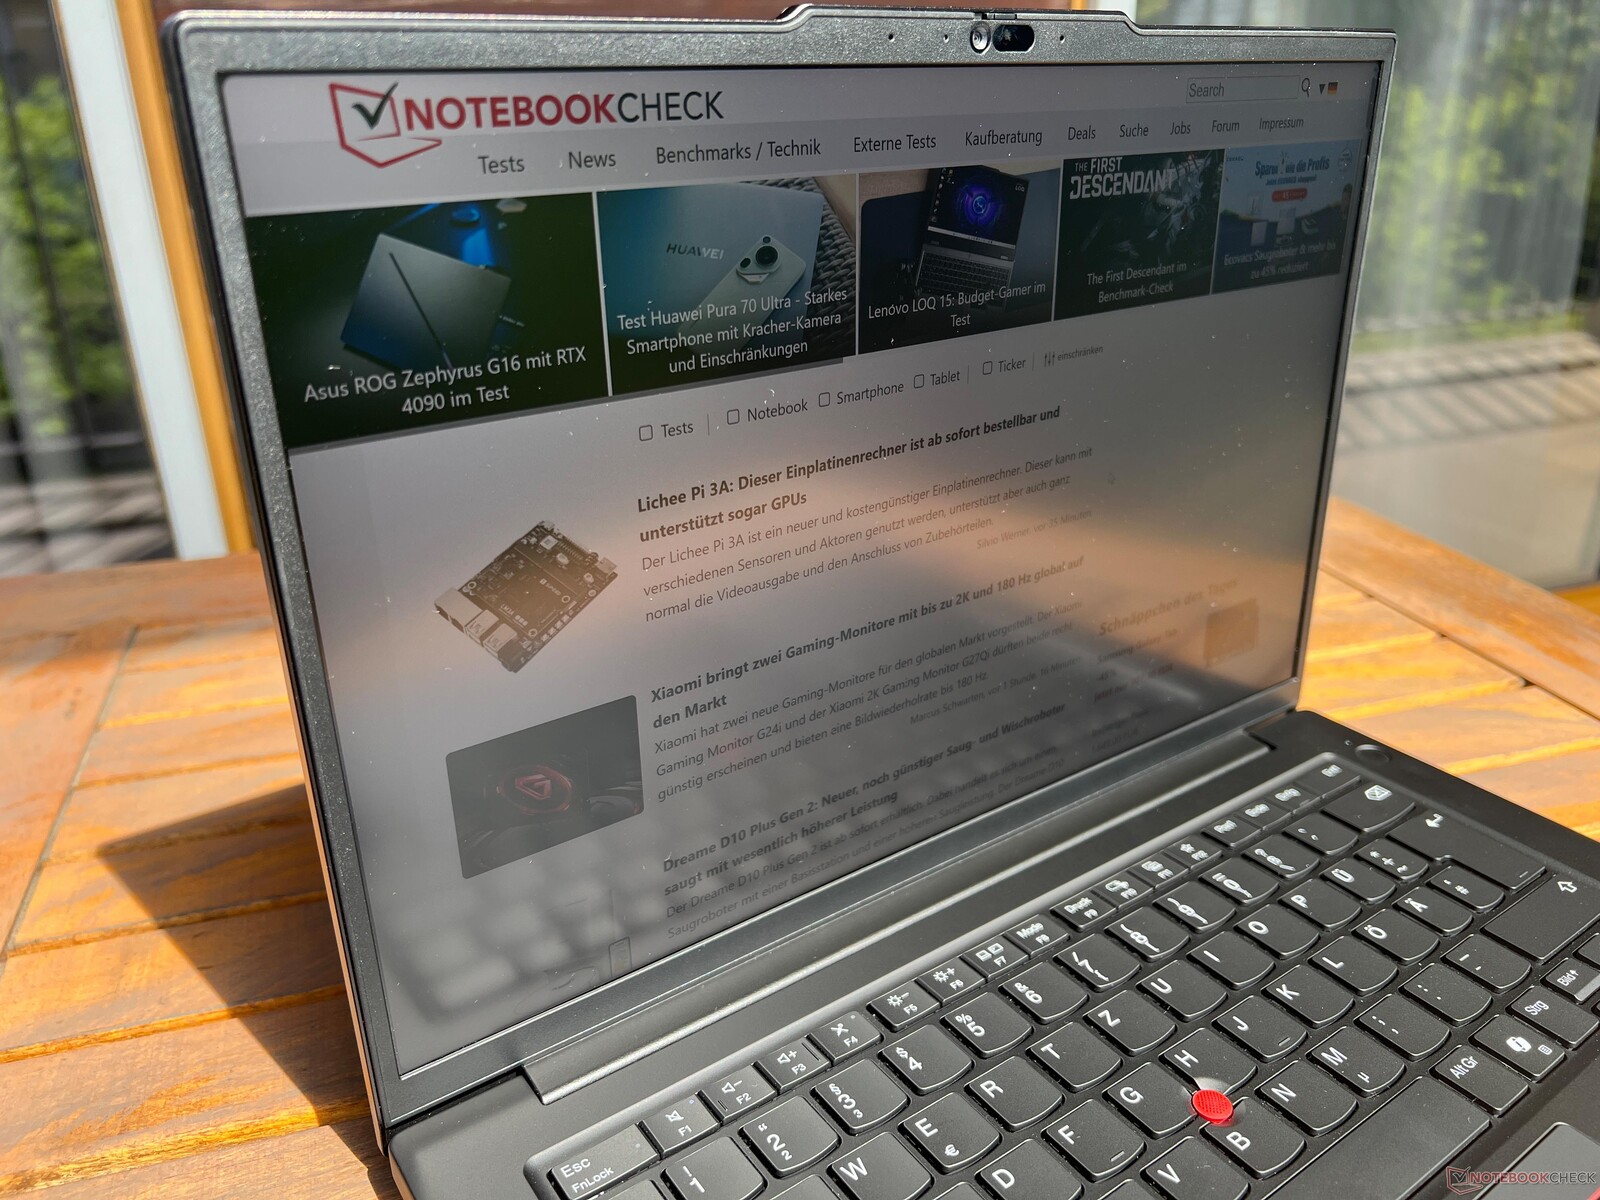
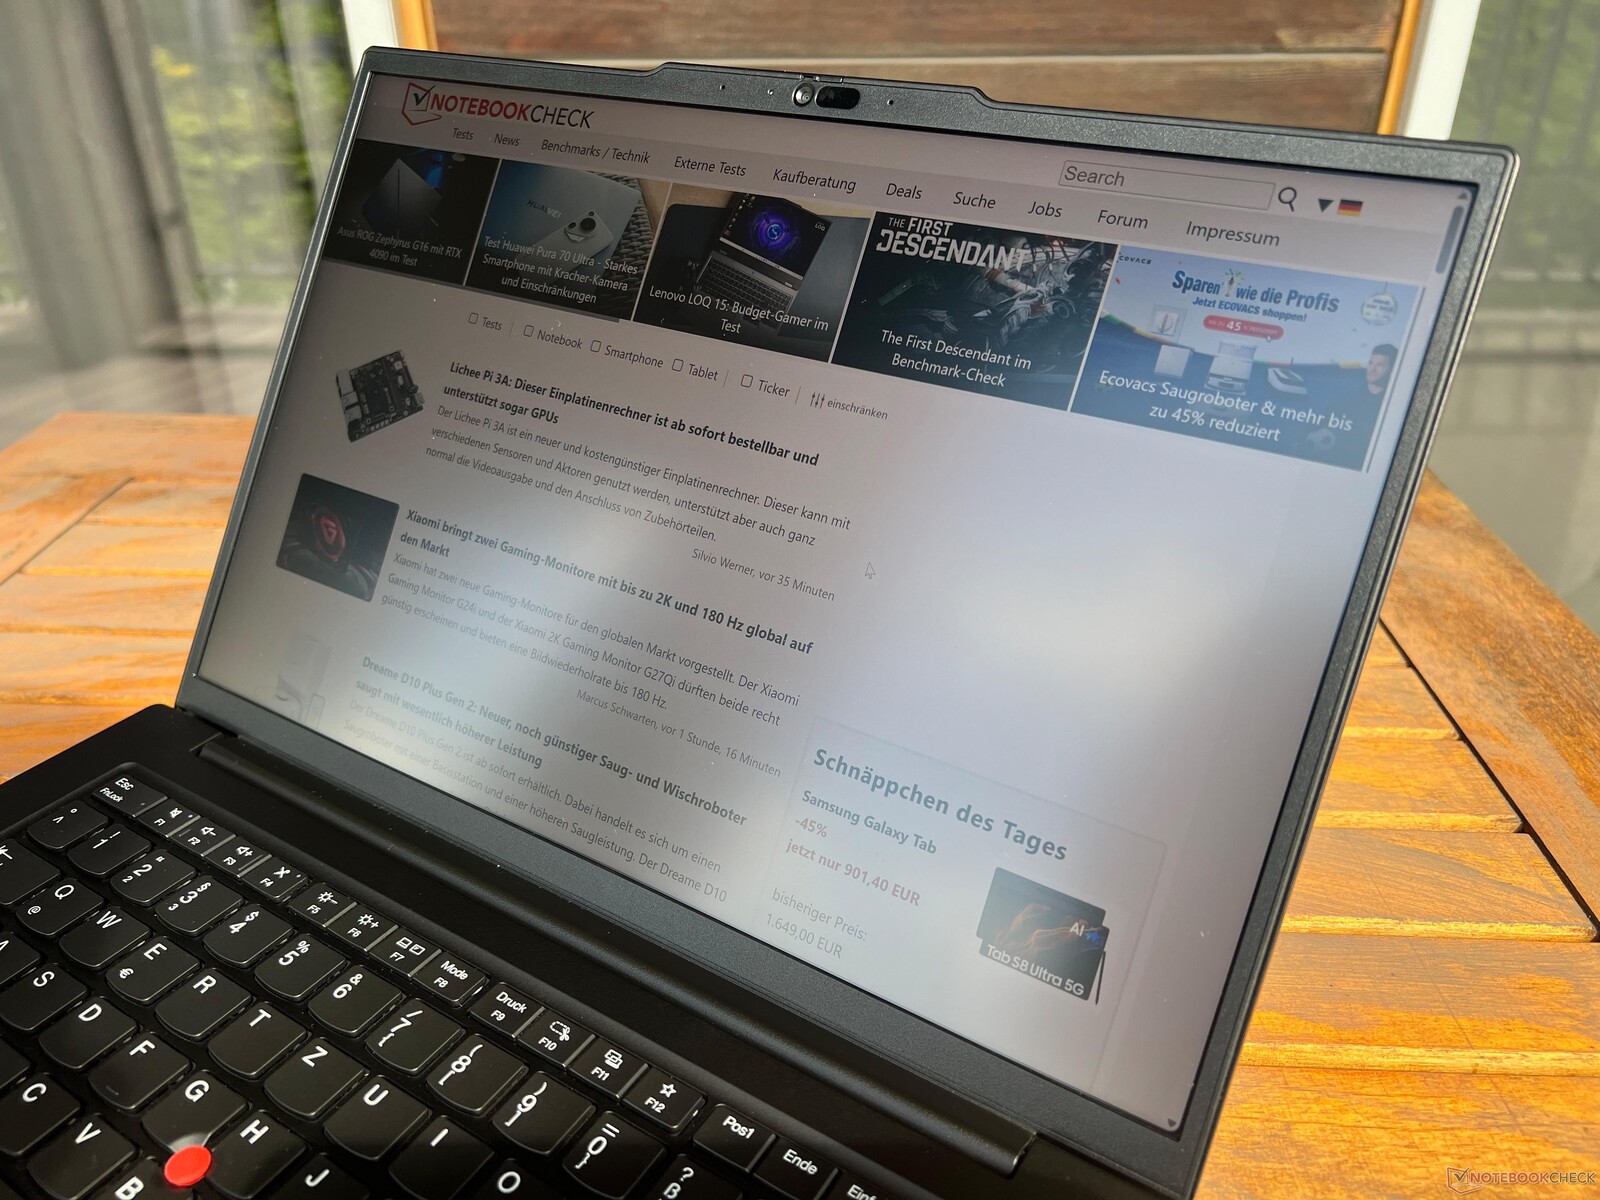
Dispositivos de entrada - elevação de 1,5 mm e novo posicionamento da tecla Fn
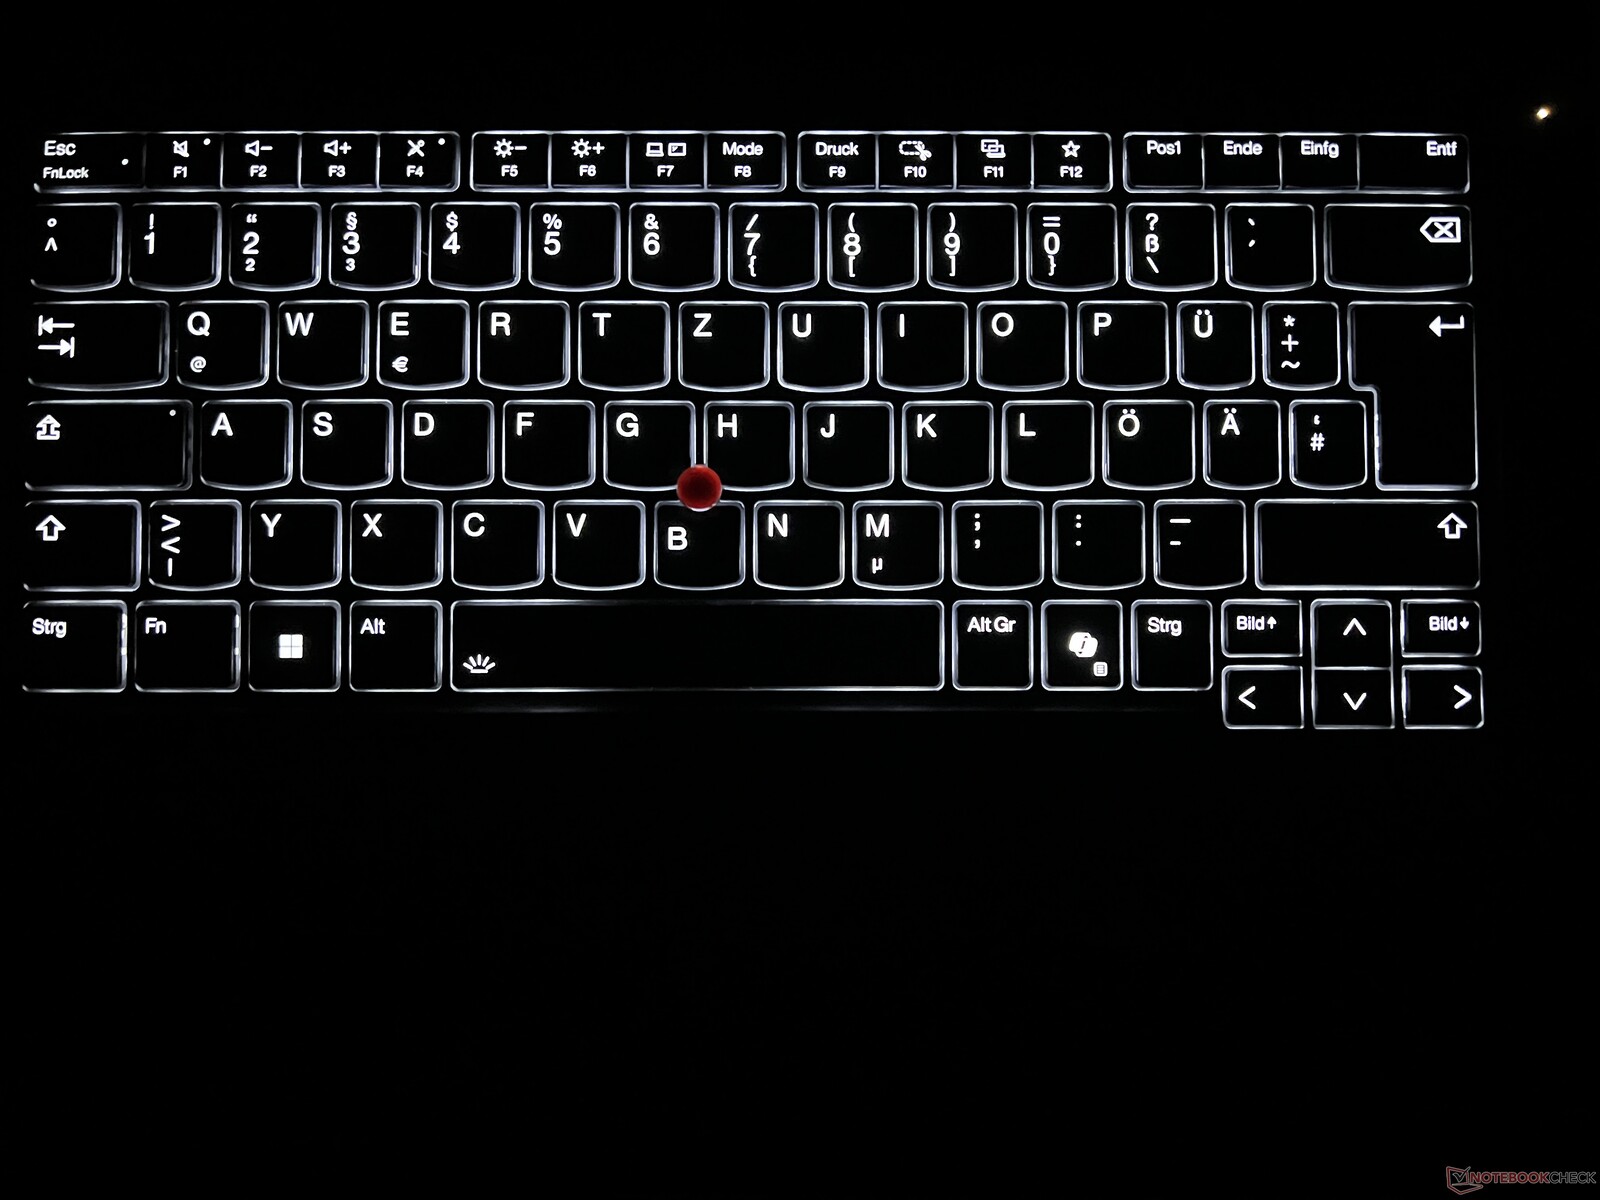
O teclado é um modelo familiar com uma elevação de 1,5 mm. É agradável para digitar, mas este ThinkPad não pode mais se destacar de outros concorrentes nesse aspecto. Também ainda temos um ThinkPad X1 Carbon com uma elevação de tecla de 1,8 mm em uso e o senhor pode definitivamente sentir a diferença. A novidade desde o ano de 2024 é a substituição das teclas Fn e Ctrl, o que certamente causará alguns problemas para os veteranos do ThinkPad no início. Uma tecla Co-Pilot também foi instalada. A luz de fundo branca de dois níveis do teclado não pode ser ativada por meio de um sensor. O botão liga/desliga está localizado na parte superior direita, ao lado do teclado, e também funciona como um scanner de impressões digitais.
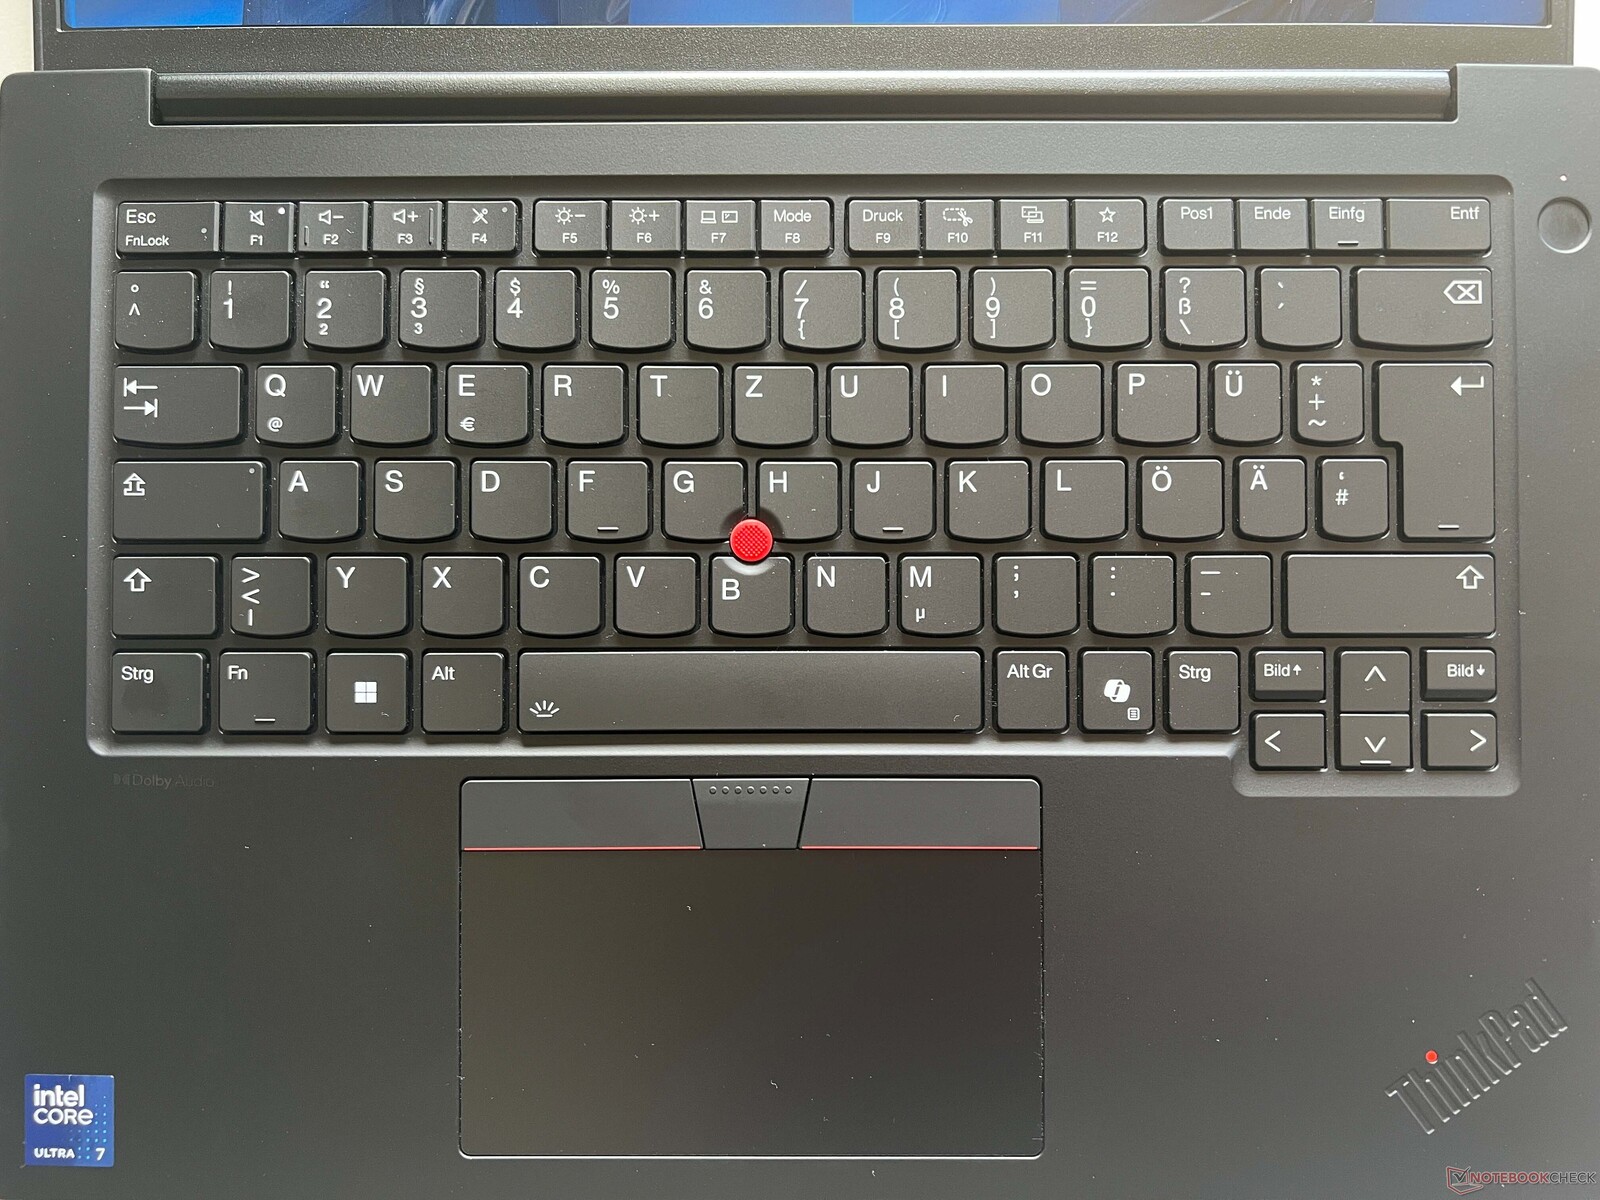
Pelos padrões atuais, o clickpad de 11,5 x 6 cm do laptop não é particularmente grande, pois também precisa abrir espaço para os botões adicionais do TrackPoint. No entanto, ele é agradável e suave - apenas o ruído do clique é um pouco alto demais. É claro que o TrackPoint também pode ser usado como alternativa, o que funciona muito bem (depois que o senhor se acostuma). As teclas dedicadas causaram uma impressão muito boa em nosso dispositivo de teste graças aos cliques abafados de alta qualidade, e não notamos nenhuma folga.
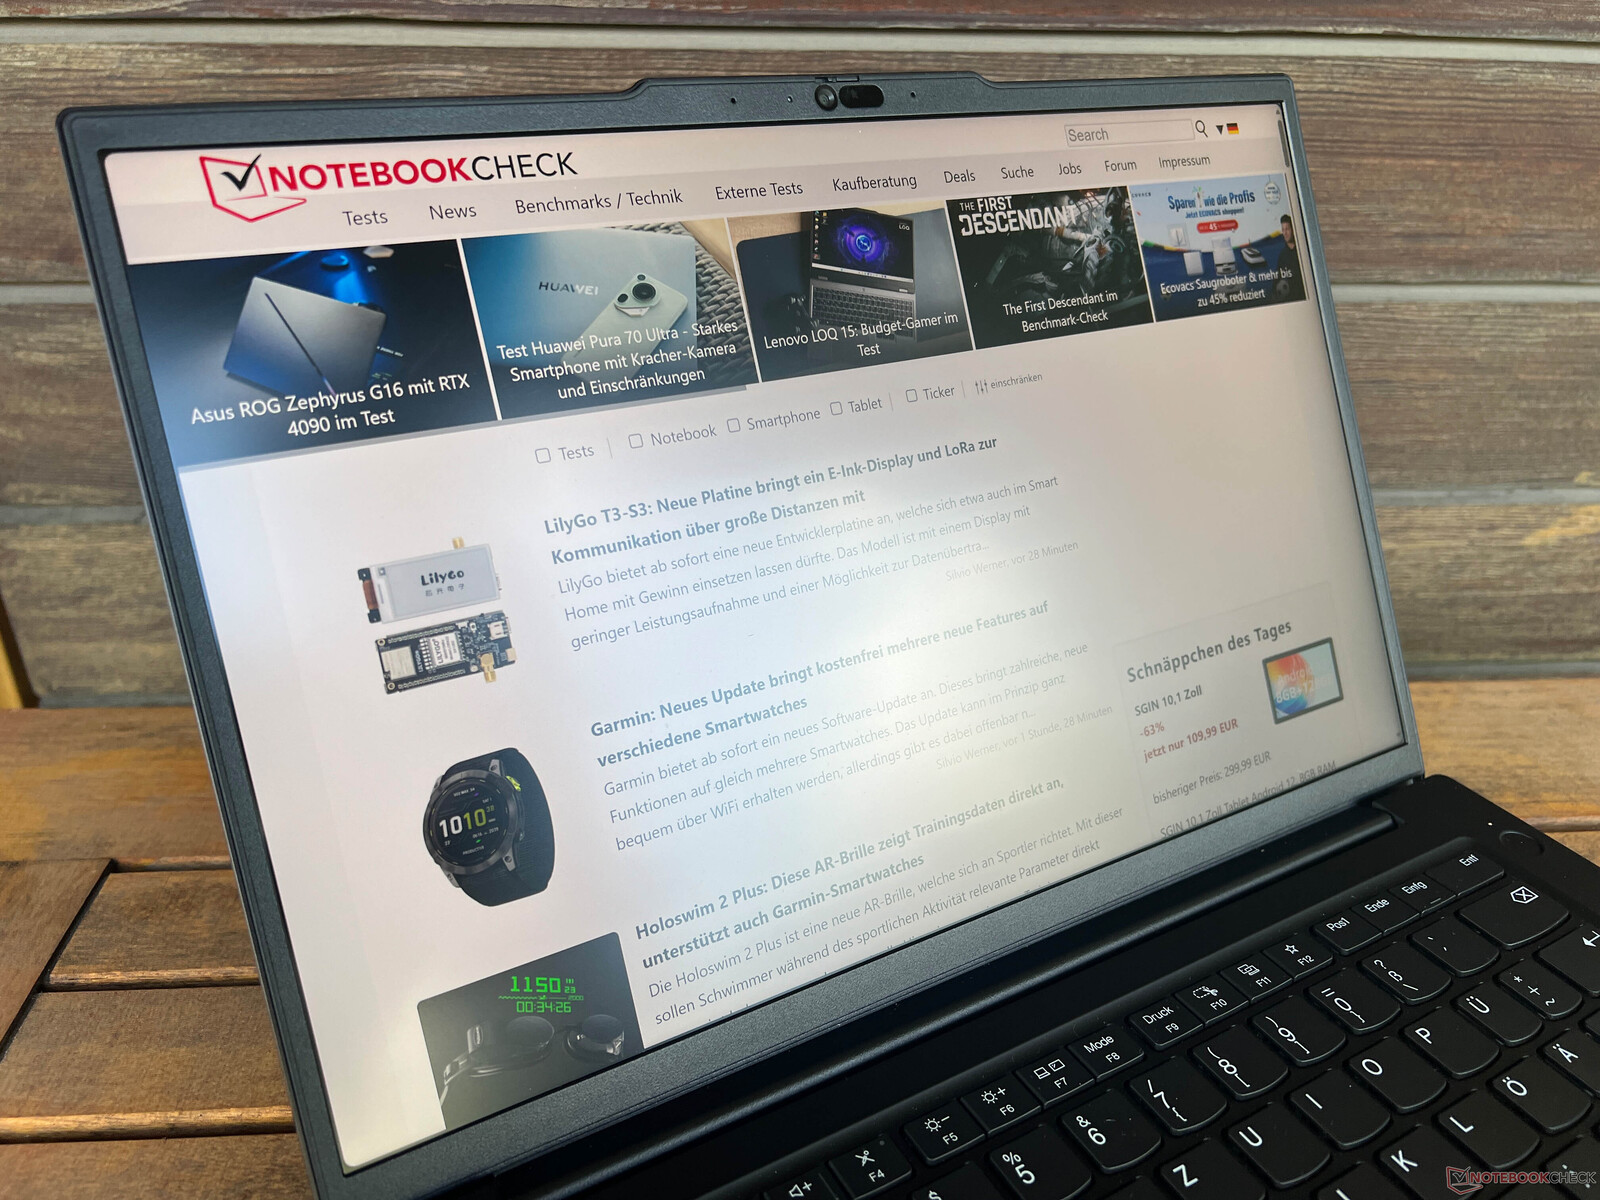
Tela - 3K IPS a 120 Hz
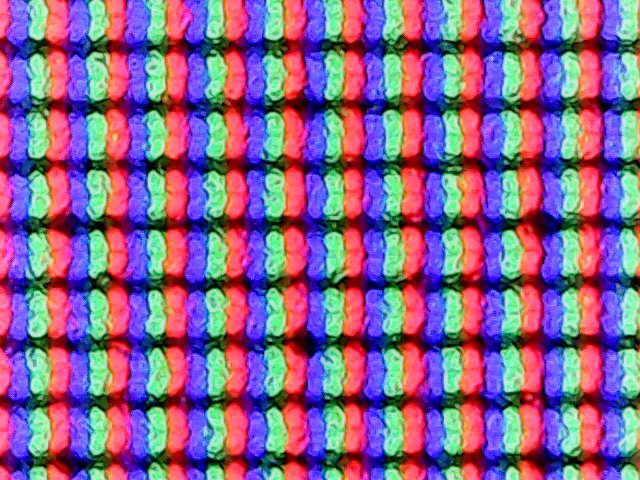
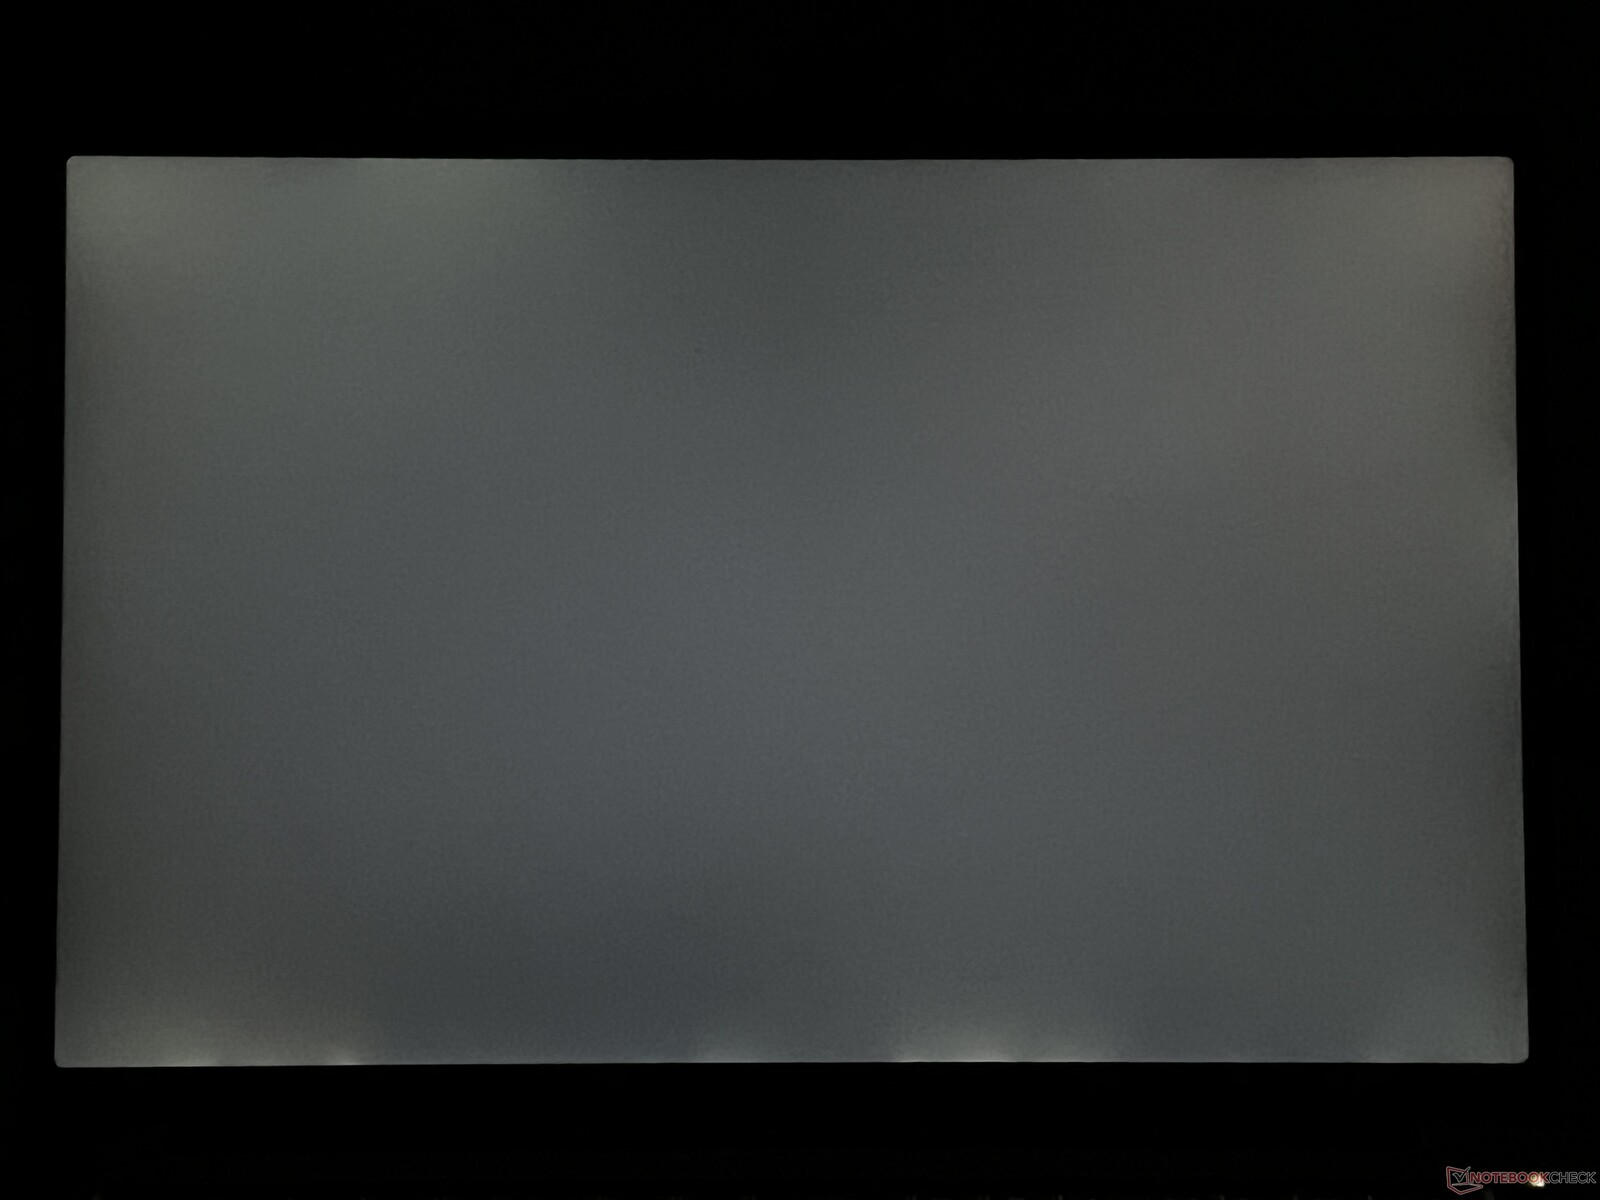
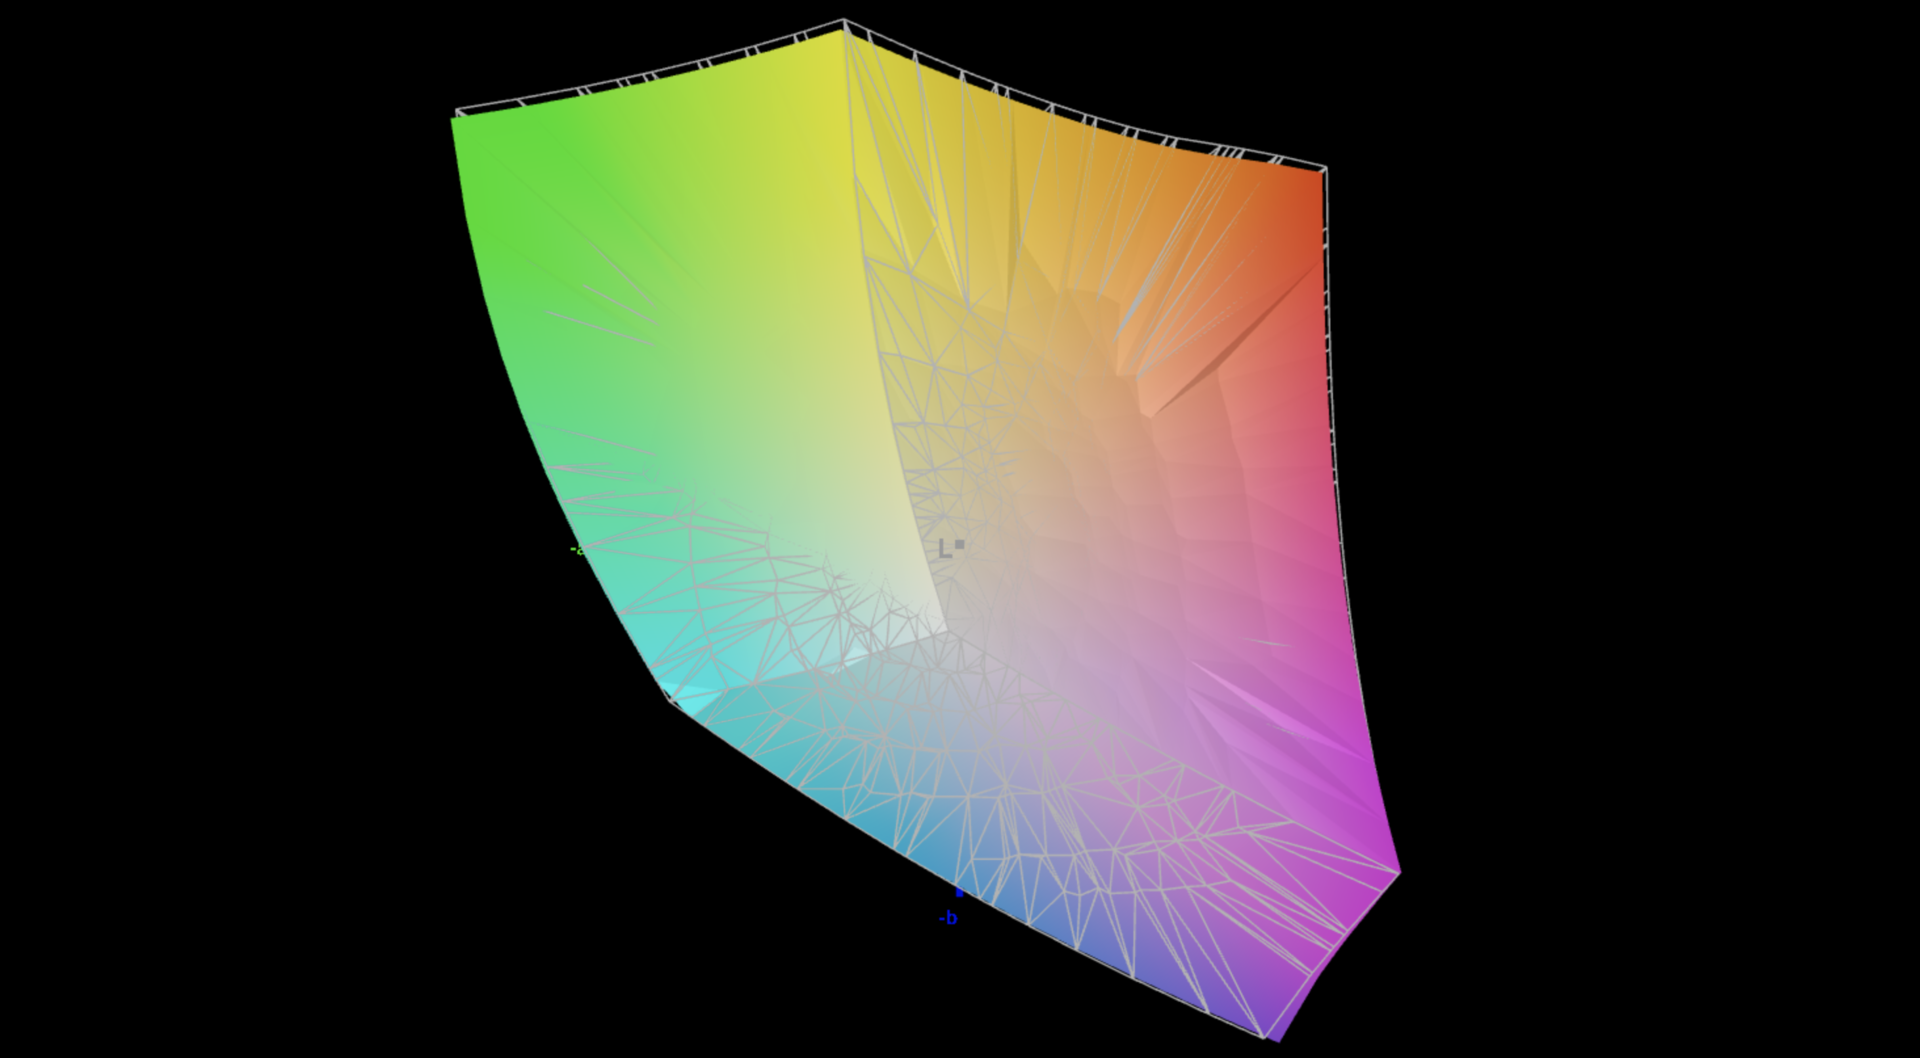
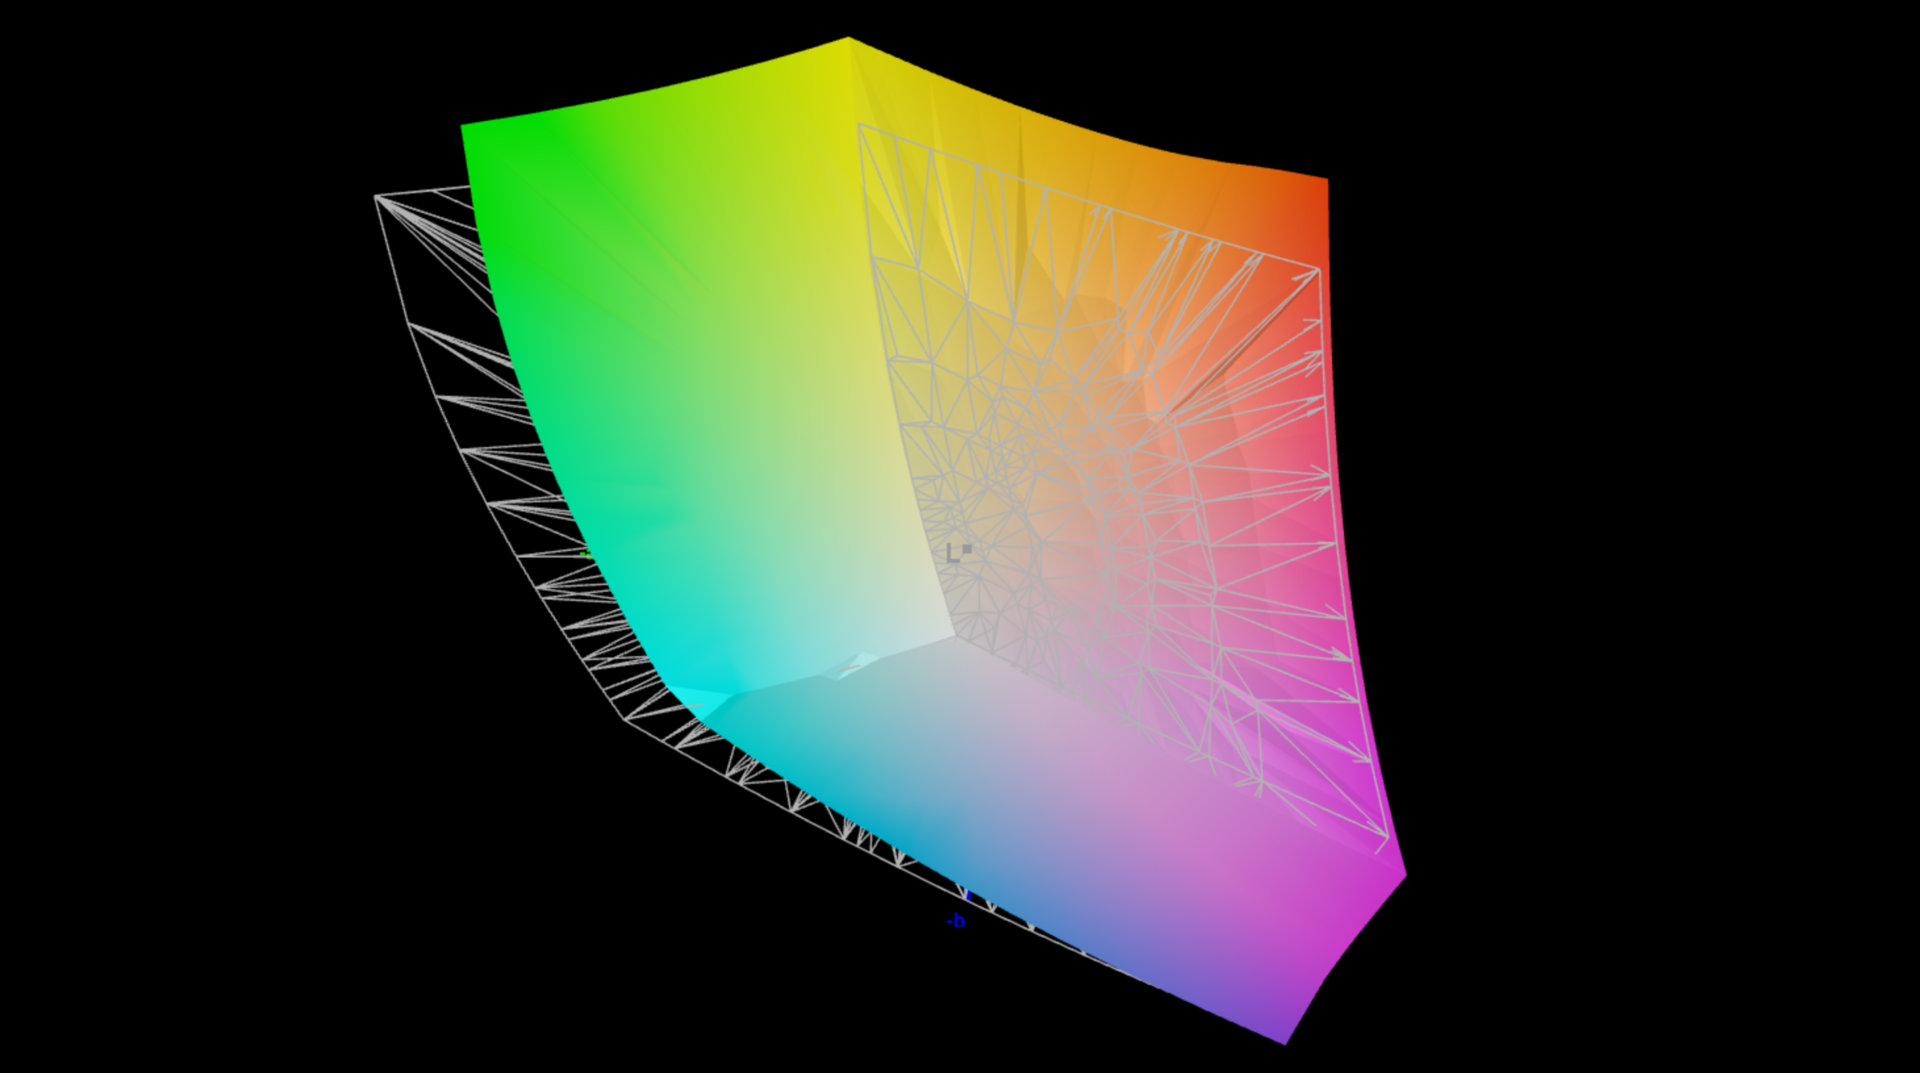
A Lenovo não oferece mais a tela OLED opcional vista no P14s G4 neste modelo Intel atualizado; em vez disso, o senhor só pode escolher painéis IPS foscos de 14,5 polegadas. O novo modelo 3K com uma resolução de 3.072 x 1.920 pixels, uma taxa de atualização de 120 Hz e cobertura de espaço de cores P3 está instalado em nosso dispositivo de teste. Subjetivamente, a qualidade da imagem é excelente, já que, mesmo com uma inspeção mais detalhada, só é possível ver uma granulação mínima ao representar conteúdo leve. Felizmente, isso não é perceptível ao visualizar a tela de uma distância normal. Todo o conteúdo é retratado com muita nitidez e as cores parecem super vibrantes. É claro que as cores dessa tela não são tão vibrantes quanto as dos painéis OLED, mas a tela é pelo menos fosca e não usa PWM. Os movimentos parecem suaves graças ao aumento da taxa de atualização e os tempos de resposta são bons (sem fantasmas). Com o brilho ajustado para níveis altos e ao visualizar uma imagem escura, é possível observar um leve sangramento da luz de fundo ao longo das bordas da tela. Nem o brilho nem a temperatura da cor podem ser ajustados automaticamente, e o conteúdo HDR não é compatível.
A Lenovo anuncia um brilho de 430 cd/m², mas só pudemos confirmar isso no centro da tela. Em média, seu brilho é apenas um pouco acima de 400 cd/m². O valor de preto da tela é de 0,32 cd/m², resultando em uma taxa de contraste máxima de pouco menos de 1.400,1. Em geral, esses valores são razoáveis, mas também não podem ser considerados bons. Isso também pode ser visto em comparação com a concorrência, pois o novo HP ZBook Firefly G11por exemplo, consegue um brilho de cerca de 550 cd/m² com sua tela de 120 Hz (mesmo que sua resolução seja um pouco menor). A Lenovo também oferece outros painéis, como o mini painel LED superior de 165 Hz do Yoga Pro 9i 14 (também de 14,5 polegadas, 3.072 x 1.920 pixels).
| |||||||||||||||||||||||||
iluminação: 87 %
iluminação com acumulador: 439 cd/m²
Contraste: 1372:1 (Preto: 0.32 cd/m²)
ΔE Color 2.1 | 0.5-29.43 Ø4.87, calibrated: 0.8
ΔE Greyscale 3.9 | 0.5-98 Ø5.1
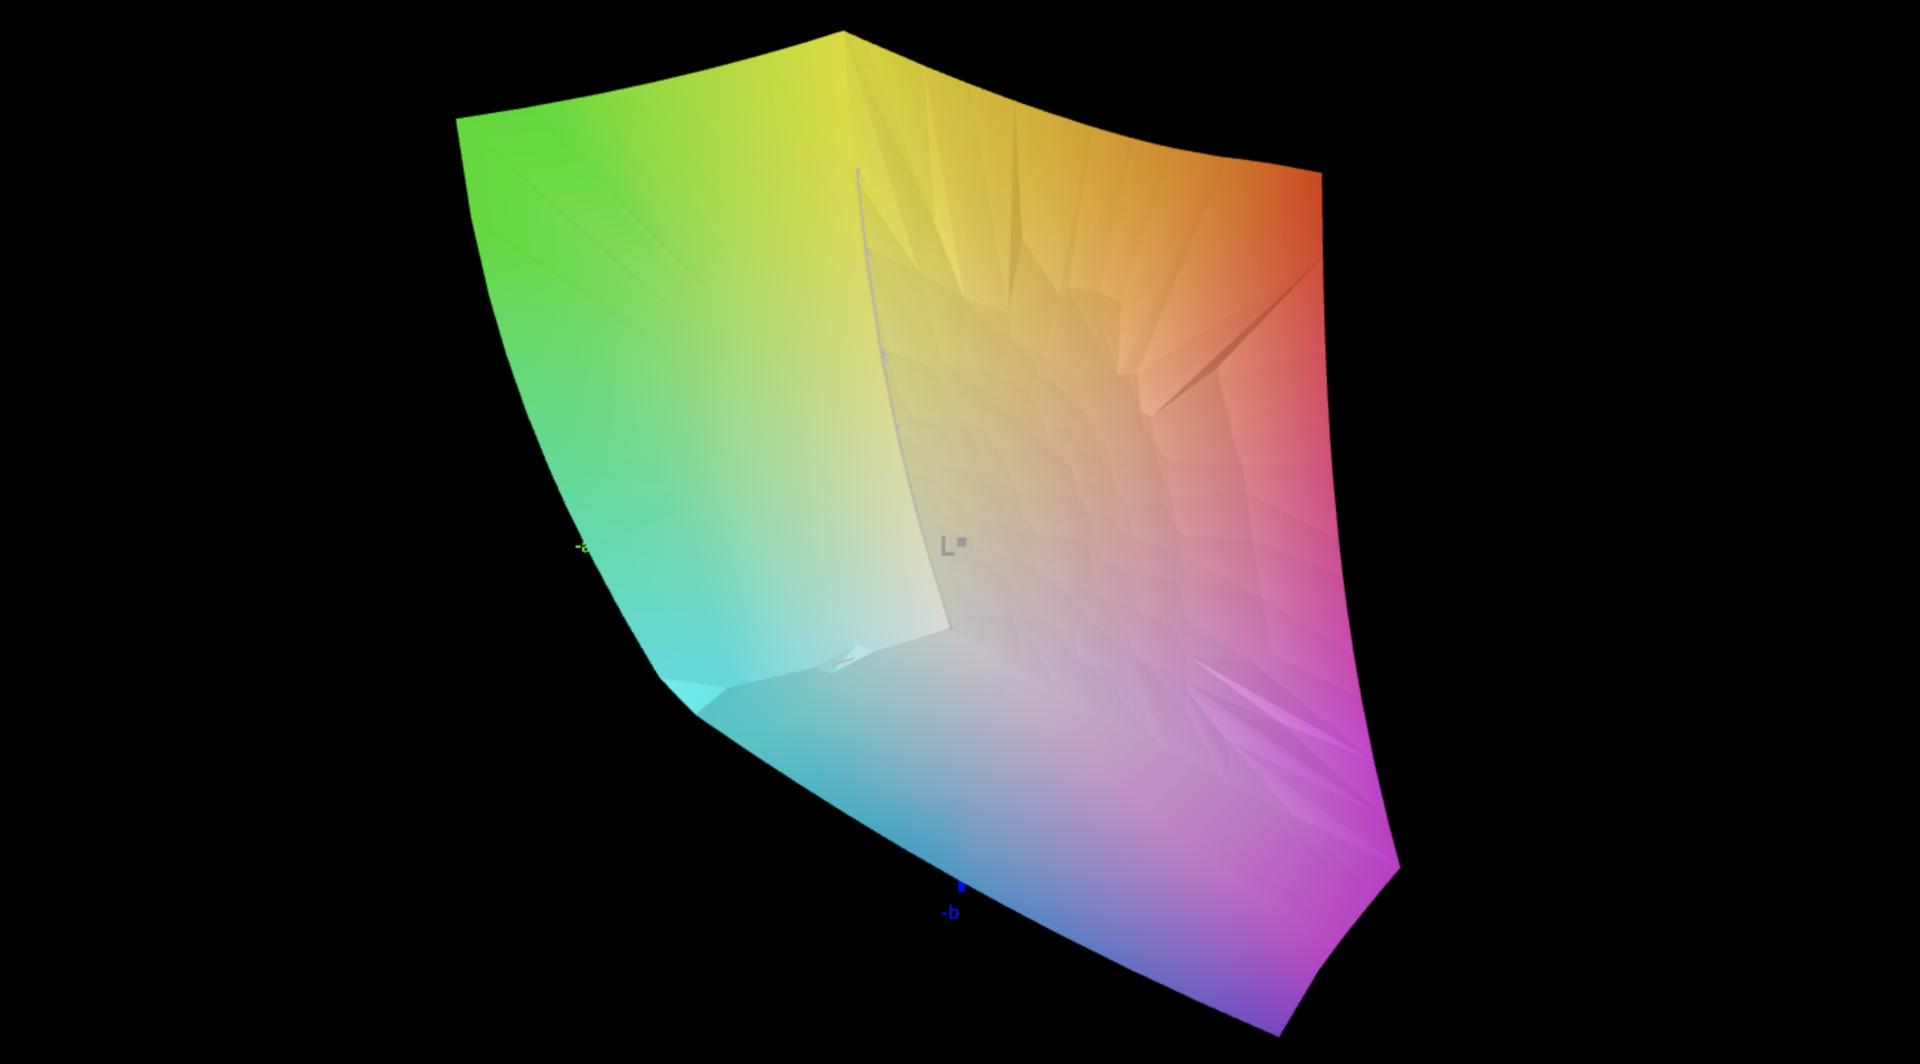
87.4% AdobeRGB 1998 (Argyll 2.2.0 3D)
100% sRGB (Argyll 2.2.0 3D)
98.4% Display P3 (Argyll 2.2.0 3D)
Gamma: 2.2
| Lenovo ThinkPad P14s G5 21G3S00A00 LEN145-3K, IPS, 3072x1920, 14.5", 120 Hz | HP ZBook Firefly 14 G11 AUO6DA8, IPS, 2560x1600, 14", 120 Hz | Dell Precision 5000 5490 AU Optronics B140QAN, IPS, 2560x1600, 14", 60 Hz | Lenovo ThinkPad P14s G4 21HF0017GE ATNA40YK15-0, OLED, 2880x1800, 14", 60 Hz | Microsoft Surface Laptop Studio 2 RTX 4060 LQ144P1JX01, IPS, 2400x1600, 14.4", 120 Hz | Lenovo Yoga Pro 9-14IRP G8 CSOT T3 MNE507HZ2-1, Mini-LED, 3072x1920, 14.5", 165 Hz | |
|---|---|---|---|---|---|---|
| Display | 0% | -9% | 4% | -18% | 1% | |
| Display P3 Coverage | 98.4 | 98.9 1% | 79.7 -19% | 99.9 2% | 66.7 -32% | 92 -7% |
| sRGB Coverage | 100 | 99.9 0% | 100 0% | 100 0% | 99 -1% | 99.7 0% |
| AdobeRGB 1998 Coverage | 87.4 | 86.6 -1% | 79.5 -9% | 97 11% | 68.9 -21% | 96.9 11% |
| Response Times | 52% | -98% | 88% | -143% | 41% | |
| Response Time Grey 50% / Grey 80% * | 30.2 ? | 12.3 ? 59% | 52.3 ? -73% | 3 ? 90% | 77.6 ? -157% | 12.7 ? 58% |
| Response Time Black / White * | 15 ? | 8.3 ? 45% | 33.3 ? -122% | 2.2 ? 85% | 34.3 ? -129% | 11.4 ? 24% |
| PWM Frequency | 360 ? | 17600 ? | 6000 ? | |||
| Screen | 6% | 9% | -90% | 43% | 19% | |
| Brightness middle | 439 | 554.1 26% | 485.1 11% | 432 -2% | 511 16% | 670 53% |
| Brightness | 406 | 540 33% | 471 16% | 432 6% | 503 24% | 680 67% |
| Brightness Distribution | 87 | 93 7% | 90 3% | 98 13% | 89 2% | 89 2% |
| Black Level * | 0.32 | 0.58 -81% | 0.38 -19% | 0.26 19% | 0.19 41% | |
| Contrast | 1372 | 955 -30% | 1277 -7% | 1965 43% | 3526 157% | |
| Colorchecker dE 2000 * | 2.1 | 2.54 -21% | 2.15 -2% | 4.8 -129% | 0.5 76% | 4 -90% |
| Colorchecker dE 2000 max. * | 6.2 | 4.99 20% | 5.39 13% | 9.2 -48% | 1.1 82% | 4.5 27% |
| Colorchecker dE 2000 calibrated * | 0.8 | 0.56 30% | 0.67 16% | 4.9 -513% | 1.3 -63% | |
| Greyscale dE 2000 * | 3.9 | 1 74% | 2 49% | 2.3 41% | 0.8 79% | 4.9 -26% |
| Gamma | 2.2 100% | 2.3 96% | 2.3 96% | 2.23 99% | 2.19 100% | 2.22 99% |
| CCT | 7013 93% | 6556 99% | 6826 95% | 6391 102% | 6650 98% | 5735 113% |
| Média Total (Programa/Configurações) | 19% /
12% | -33% /
-10% | 1% /
-37% | -39% /
0% | 20% /
18% |
* ... menor é melhor
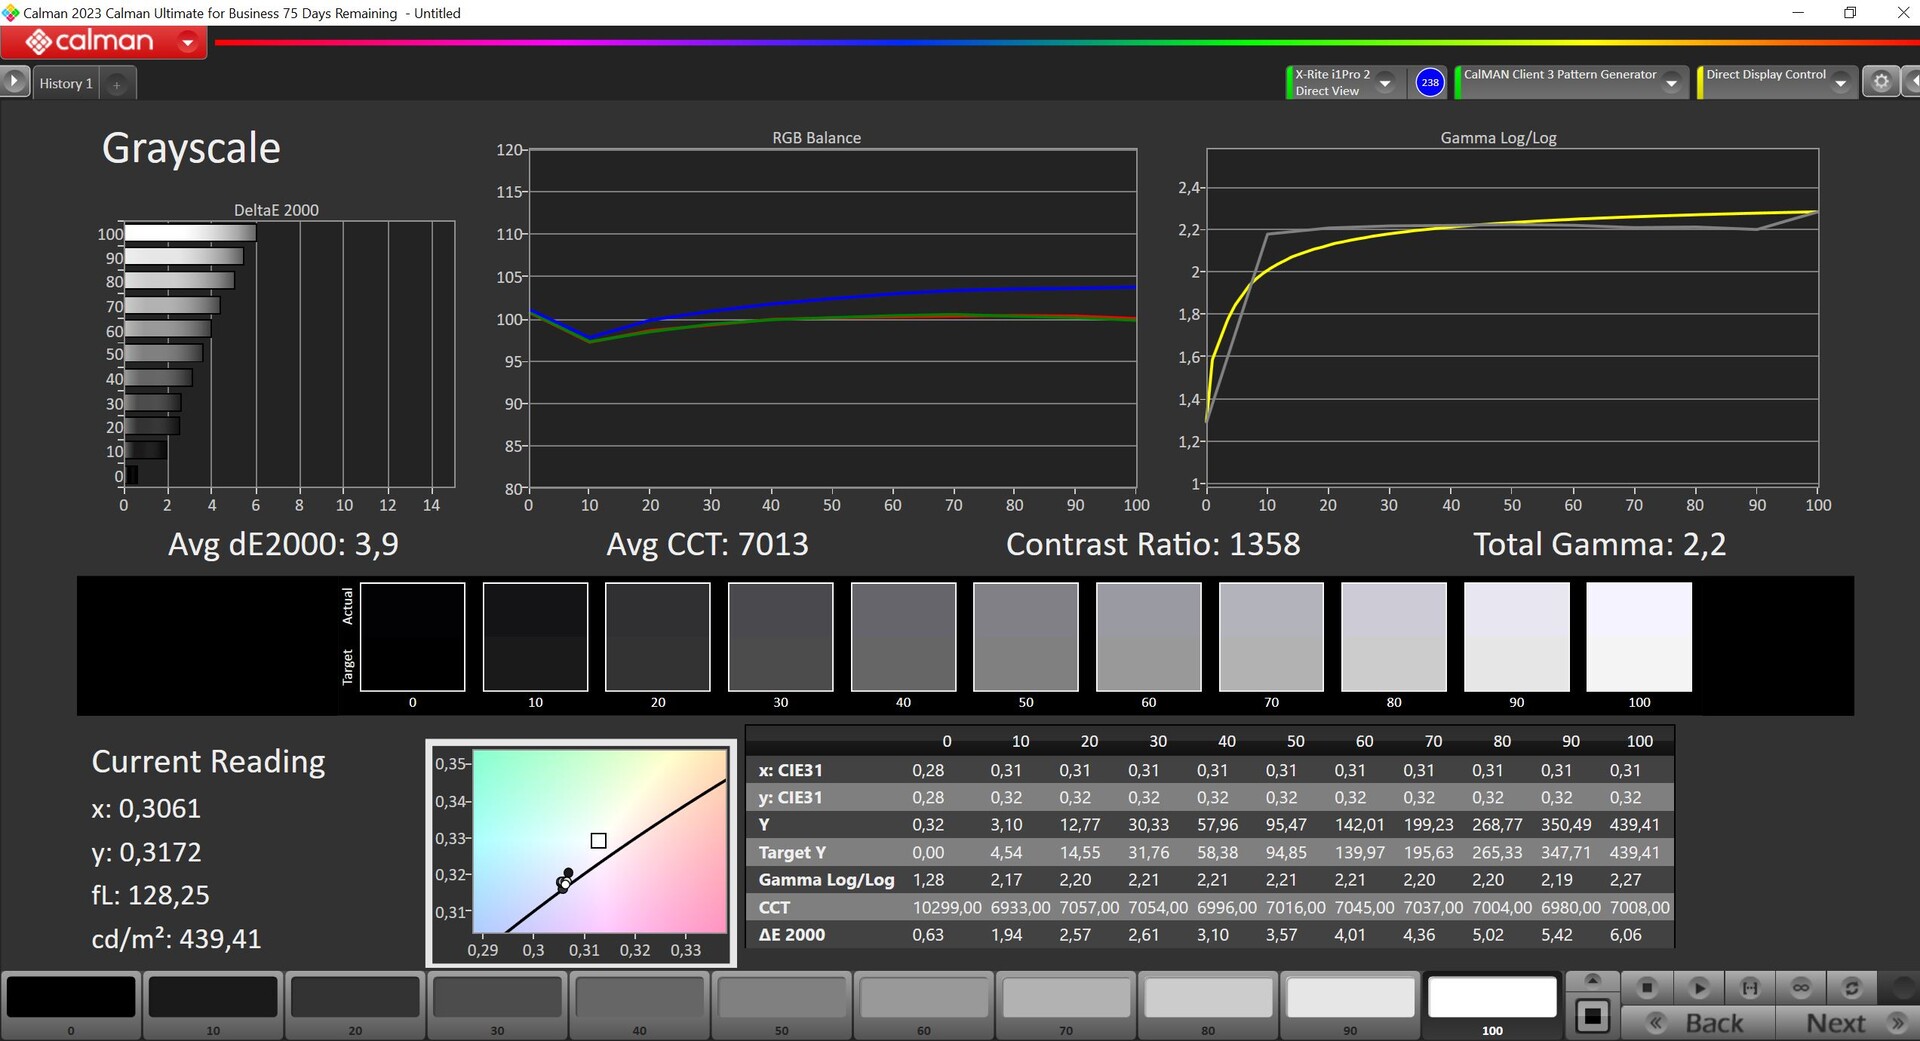
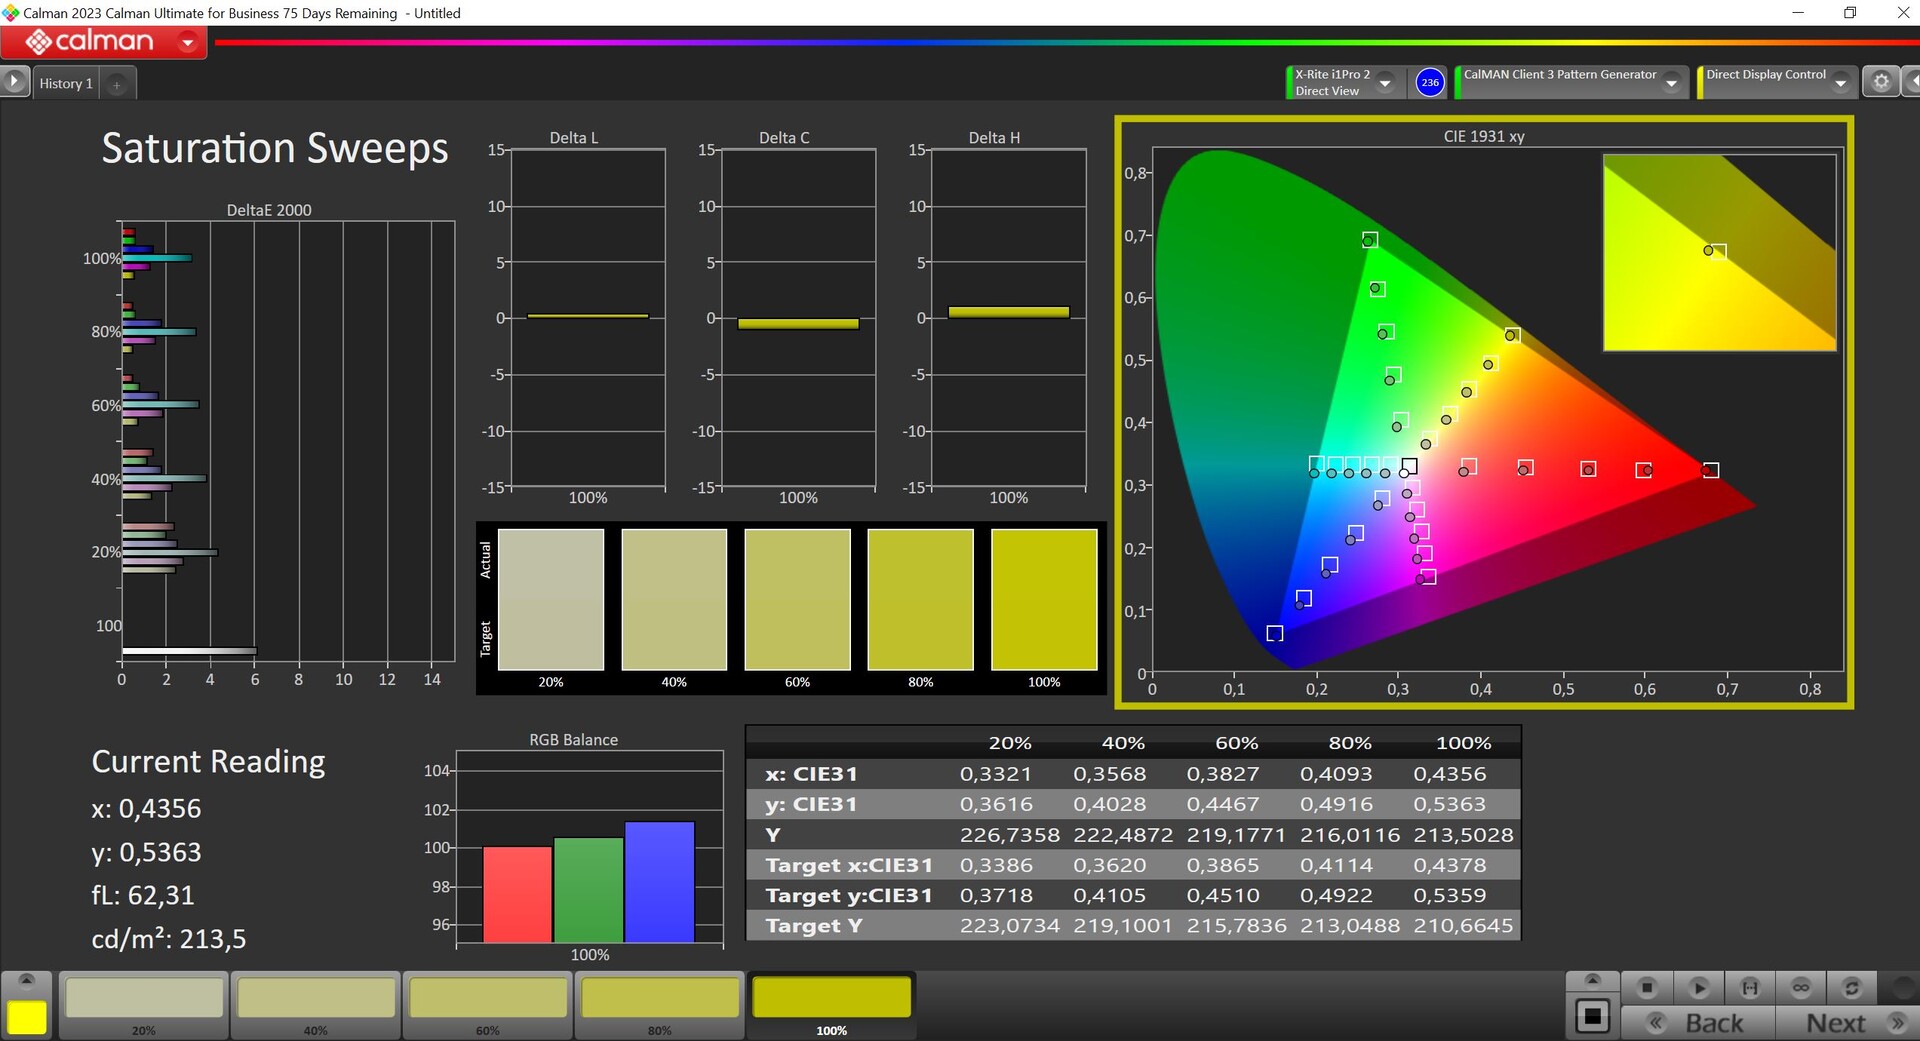
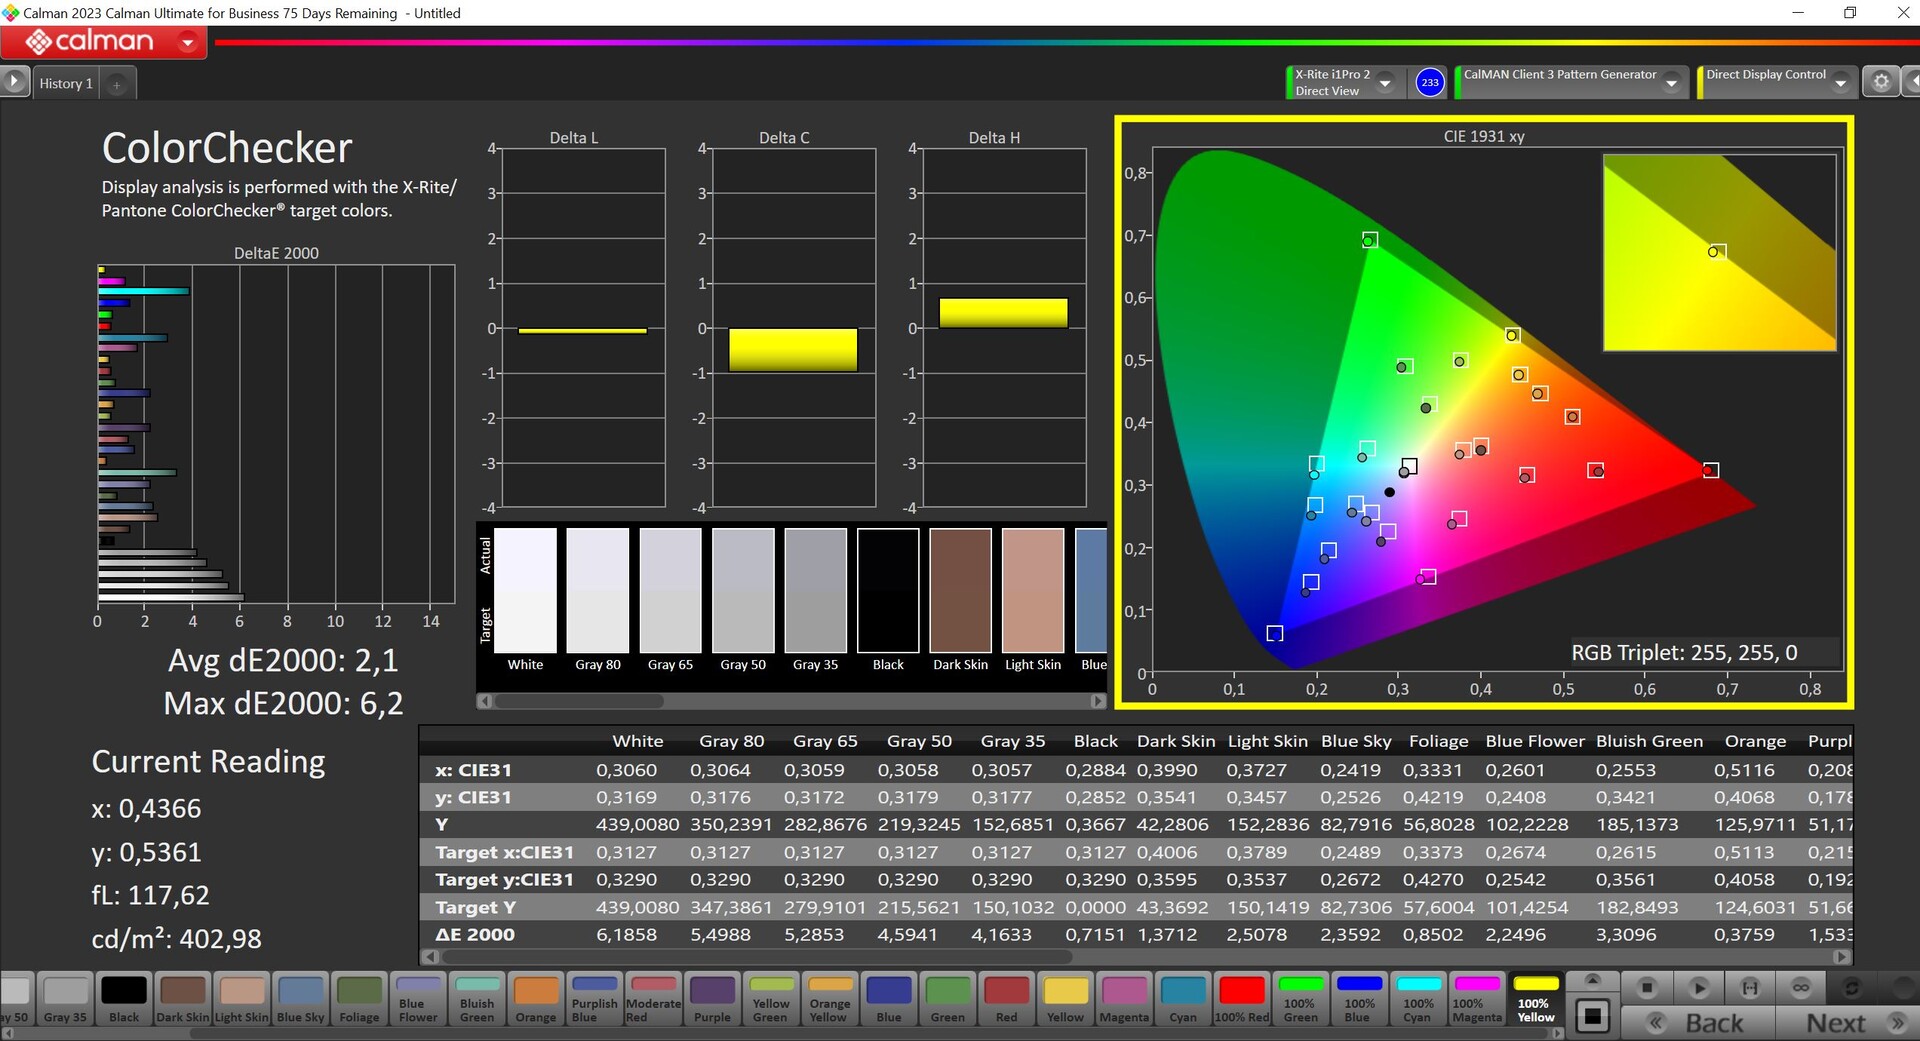
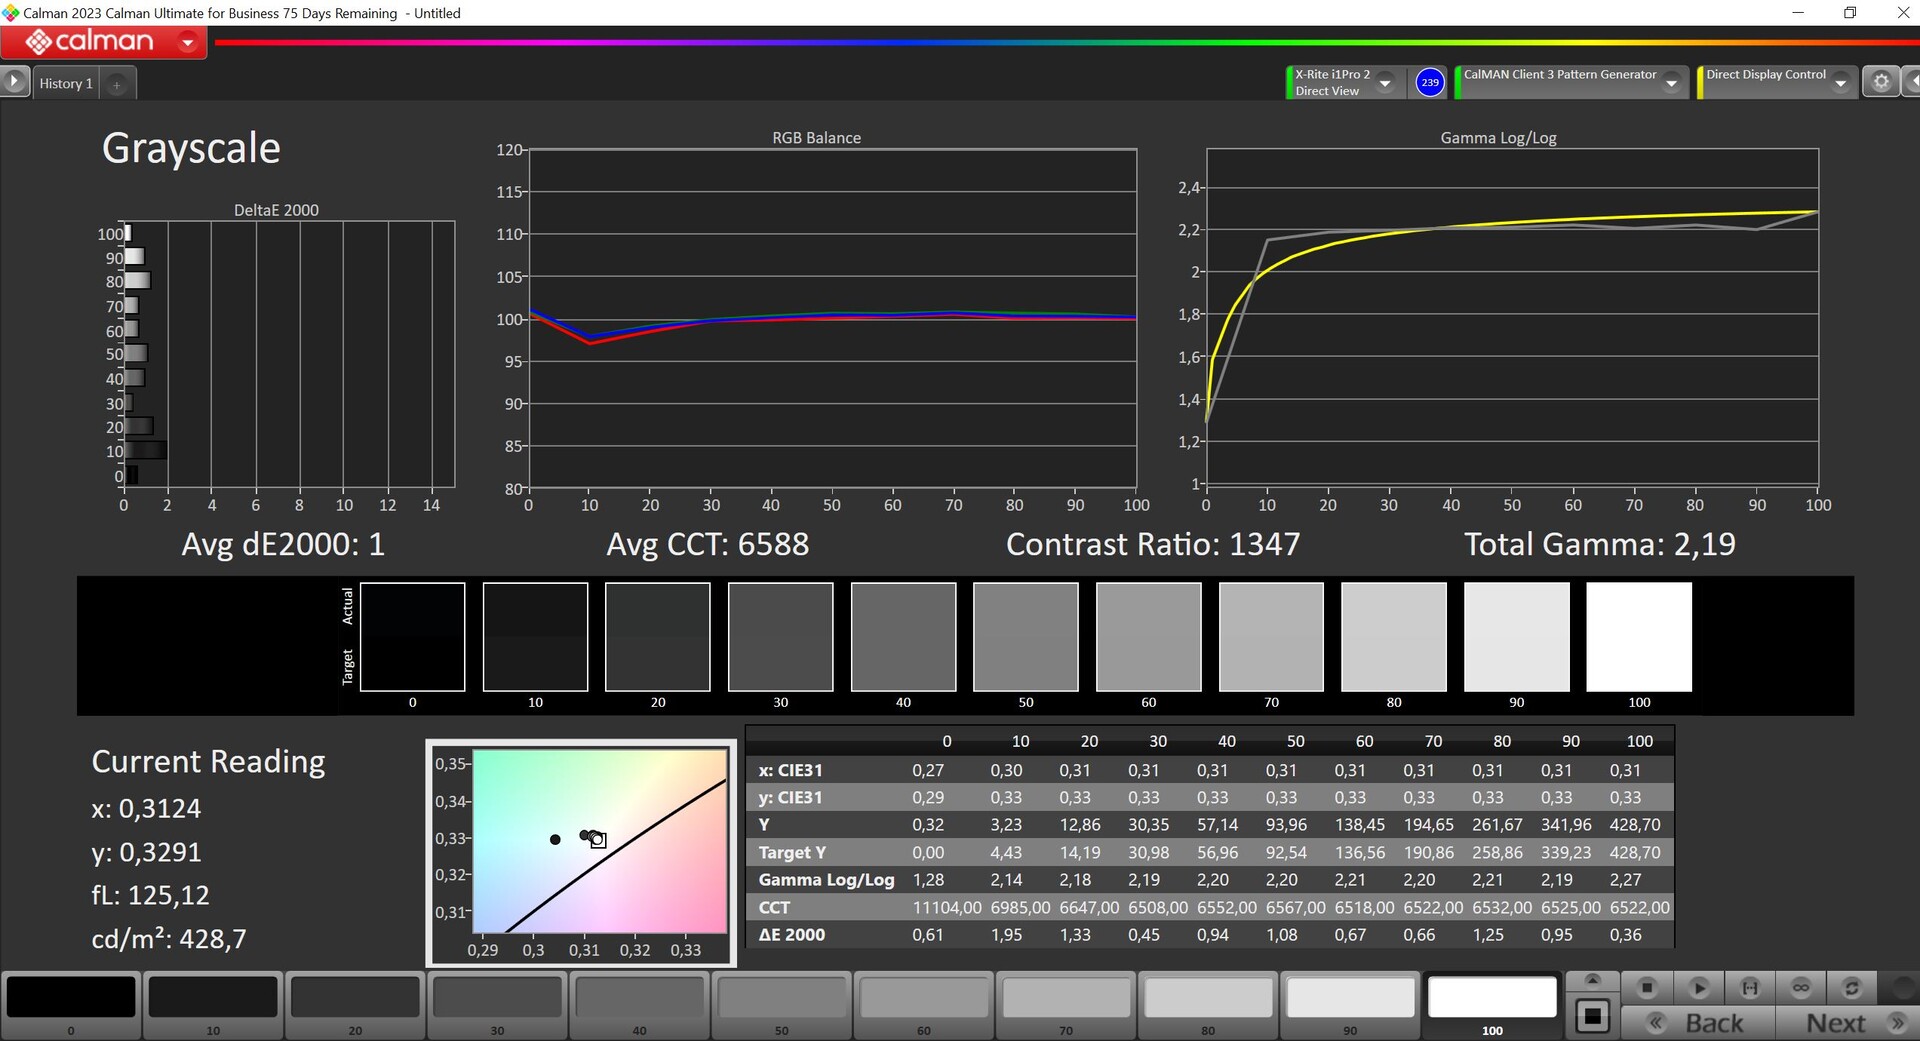
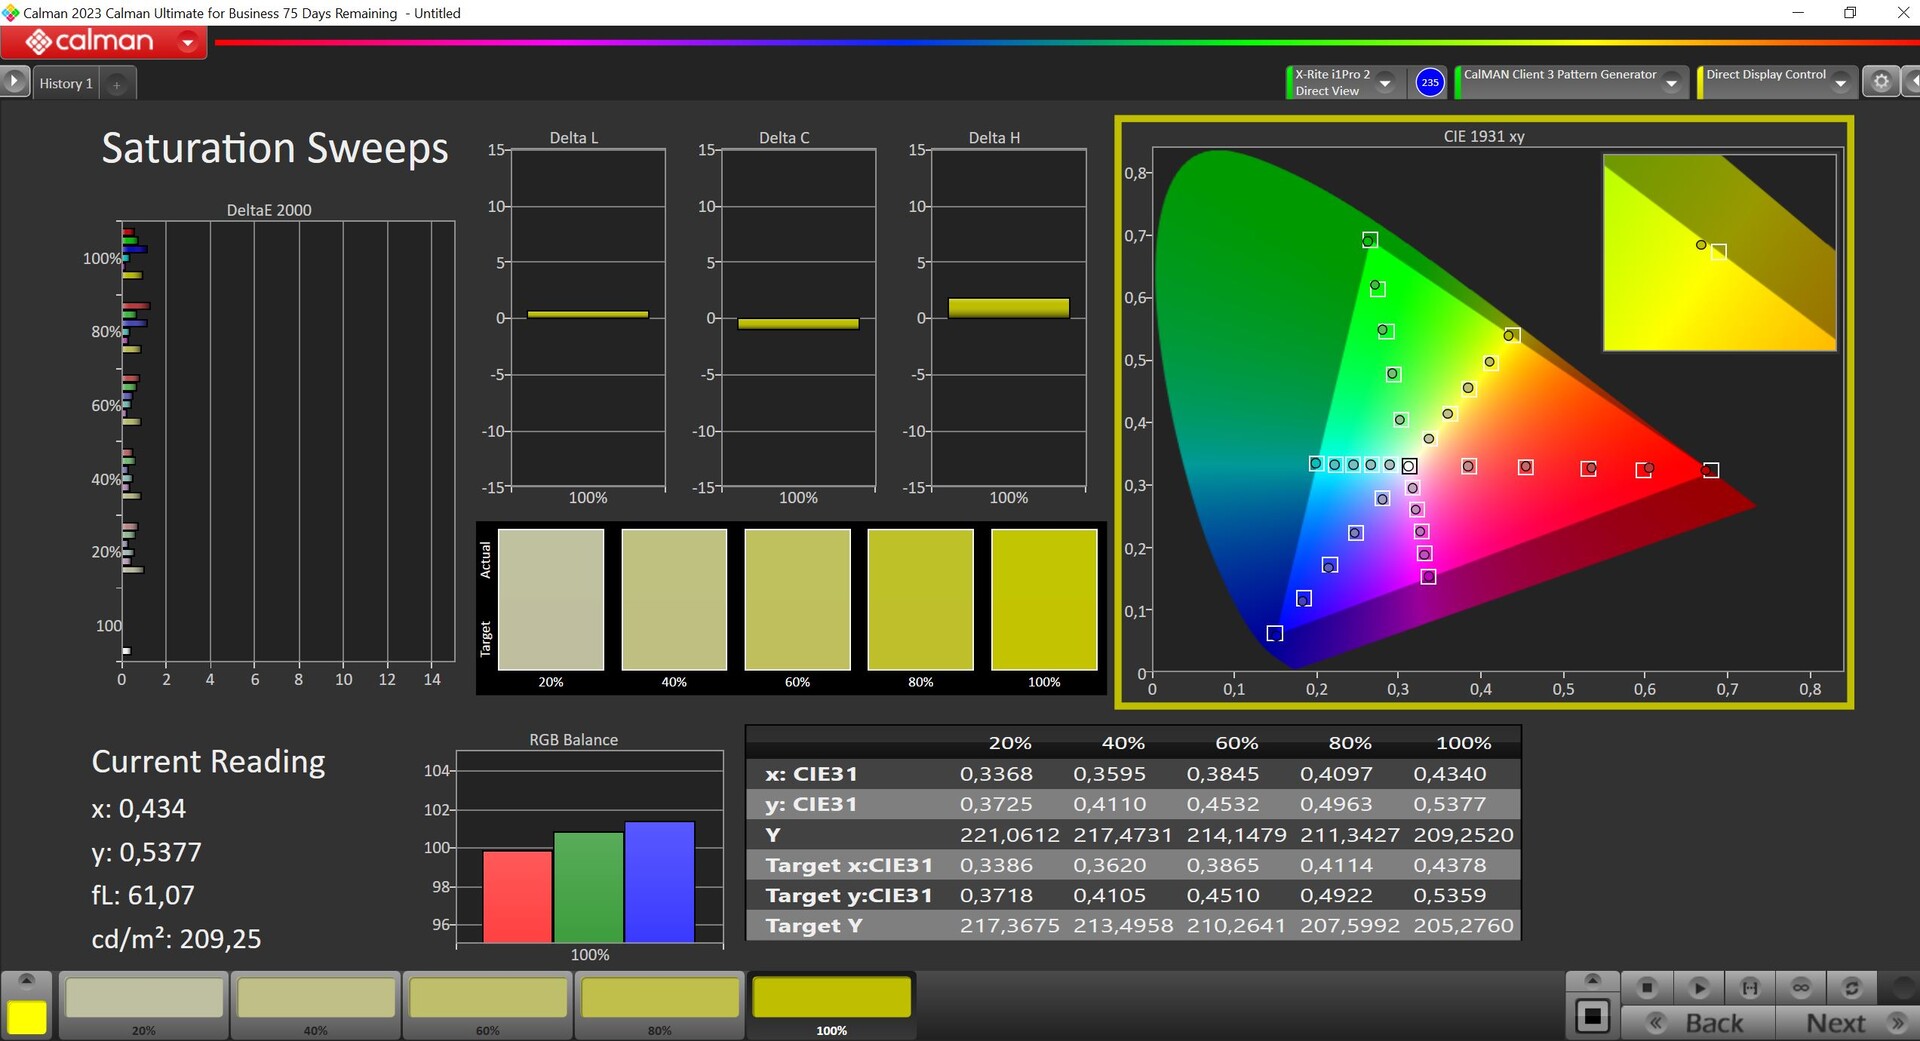
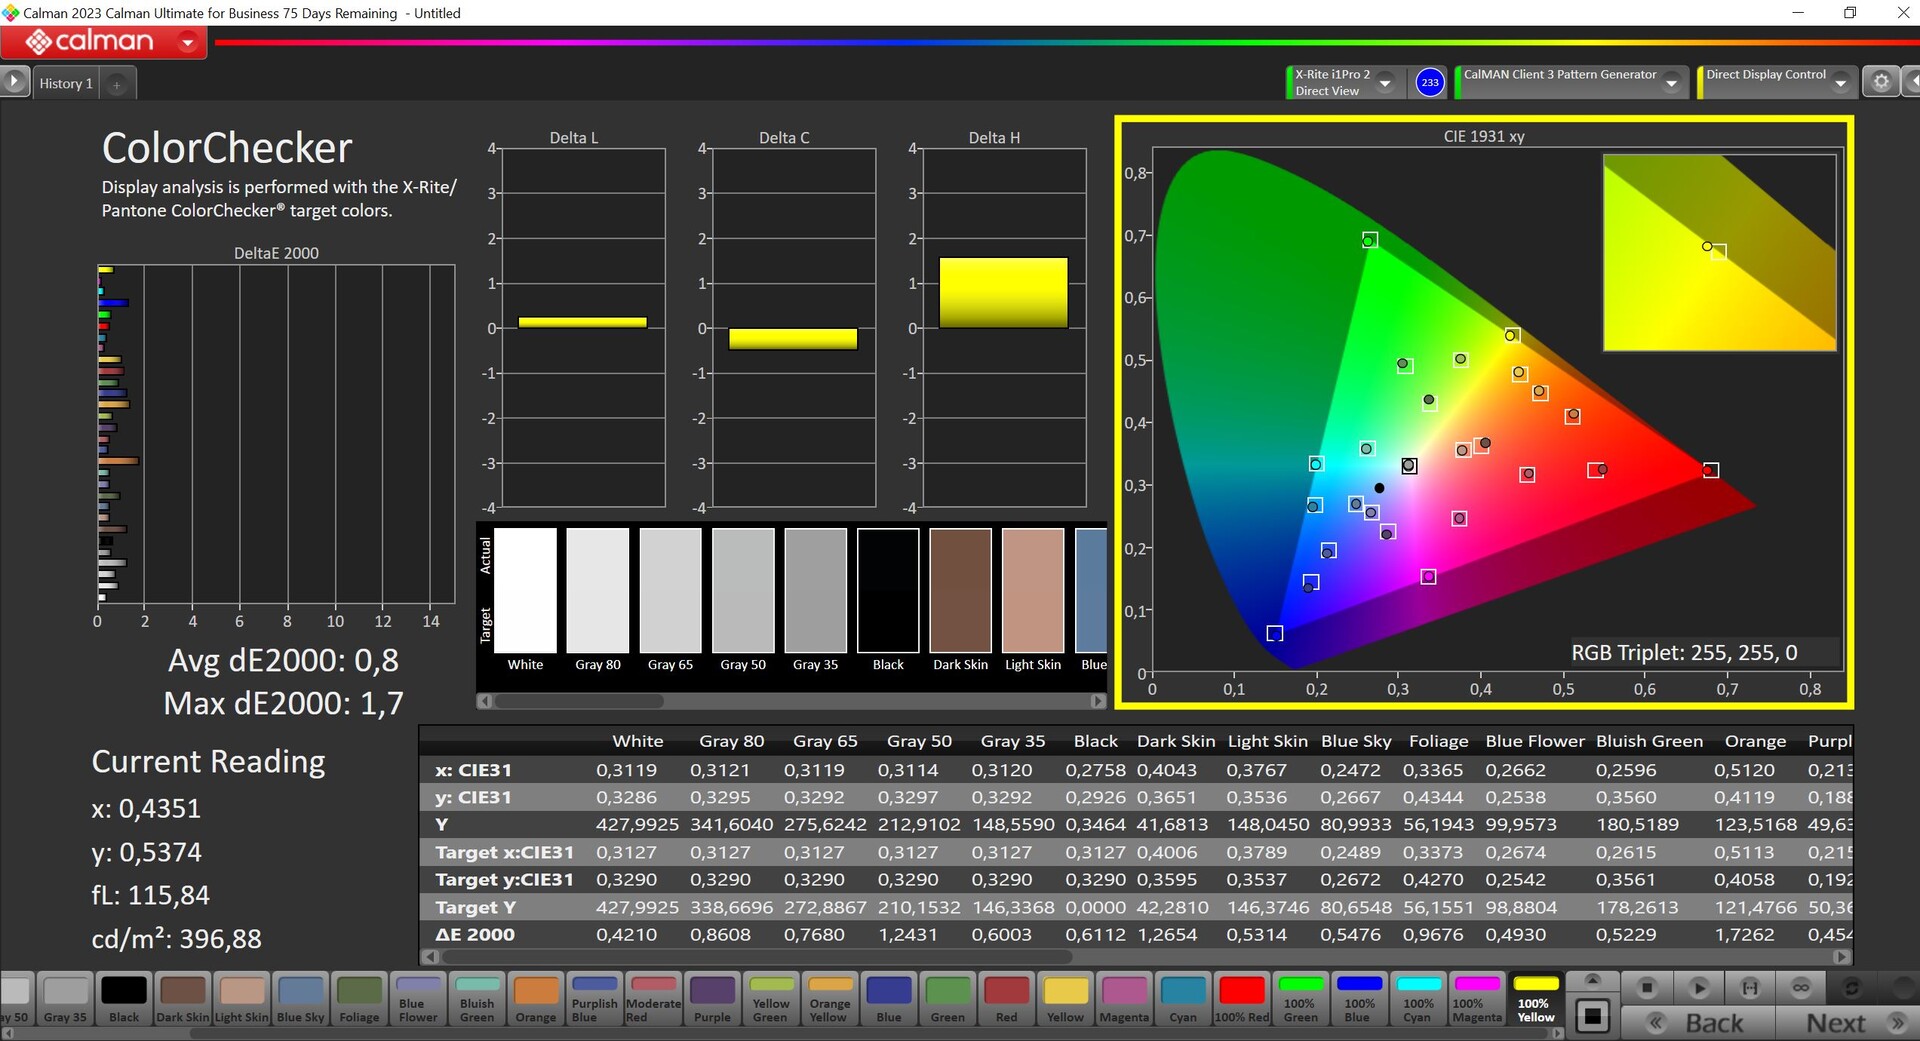
Analisamos o painel usando o software profissional CalMAN (X-Rite i1 Pro 2), mas a Lenovo não fornece um perfil sRGB. Logo que sai da caixa, a tela tem uma projeção azul combinada com uma temperatura de cor muito fria, e alguns desvios de cor estão acima do valor-alvo de 3. Ao realizar nossa própria calibração, melhoramos significativamente a representação e corrigimos a escala de cinza e os desvios de cor. O perfil correspondente está disponível para download gratuito acima. O painel cobre totalmente os espaços de cores P3 e sRGB.
Exibir tempos de resposta
| ↔ Tempo de resposta preto para branco | ||
|---|---|---|
| 15 ms ... ascensão ↗ e queda ↘ combinadas | ↗ 5.8 ms ascensão | 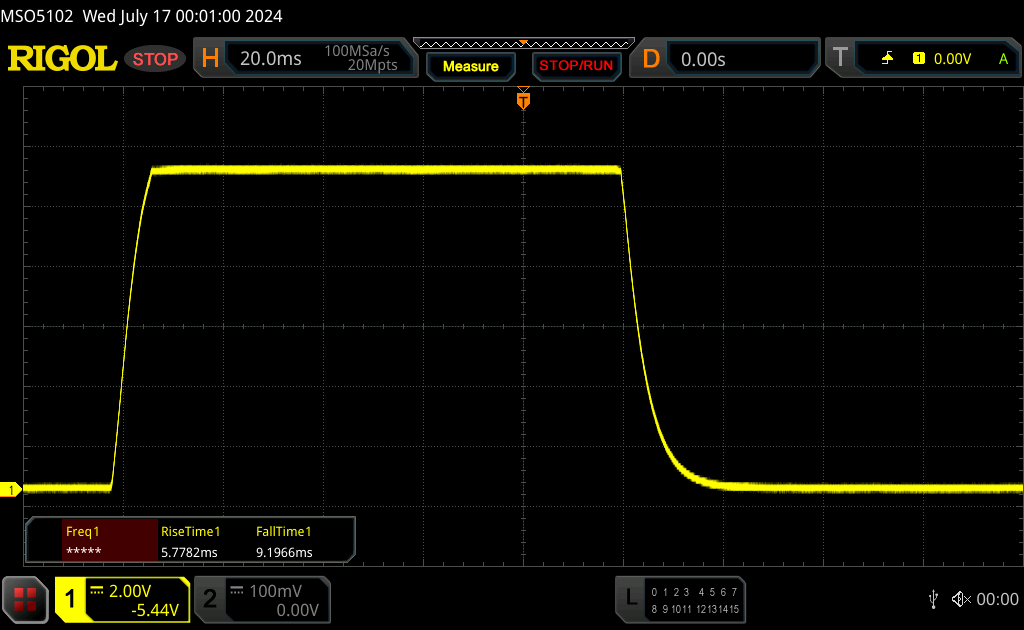 |
| ↘ 9.2 ms queda | ||
| A tela mostra boas taxas de resposta em nossos testes, mas pode ser muito lenta para jogadores competitivos. Em comparação, todos os dispositivos testados variam de 0.1 (mínimo) a 240 (máximo) ms. » 33 % de todos os dispositivos são melhores. Isso significa que o tempo de resposta medido é melhor que a média de todos os dispositivos testados (20.8 ms). | ||
| ↔ Tempo de resposta 50% cinza a 80% cinza | ||
| 30.2 ms ... ascensão ↗ e queda ↘ combinadas | ↗ 14 ms ascensão | 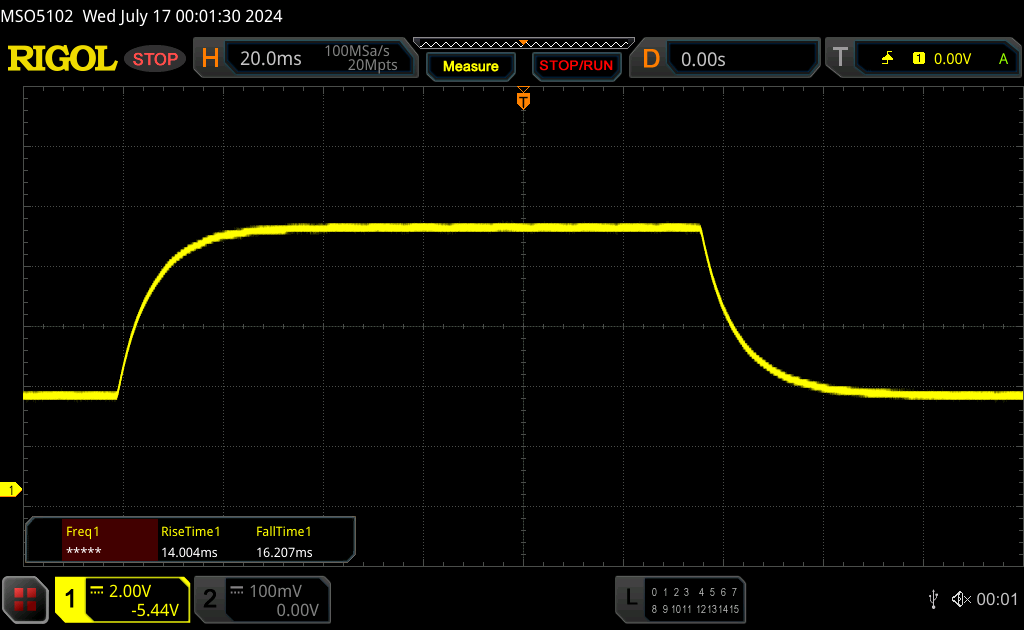 |
| ↘ 16.2 ms queda | ||
| A tela mostra taxas de resposta lentas em nossos testes e será insatisfatória para os jogadores. Em comparação, todos os dispositivos testados variam de 0.165 (mínimo) a 636 (máximo) ms. » 37 % de todos os dispositivos são melhores. Isso significa que o tempo de resposta medido é semelhante à média de todos os dispositivos testados (32.5 ms). | ||
Cintilação da tela / PWM (modulação por largura de pulso)
| Tela tremeluzindo / PWM não detectado |  | ||
[pwm_comparison] Em comparação: 53 % de todos os dispositivos testados não usam PWM para escurecer a tela. Se PWM foi detectado, uma média de 8519 (mínimo: 5 - máximo: 343500) Hz foi medida. | |||
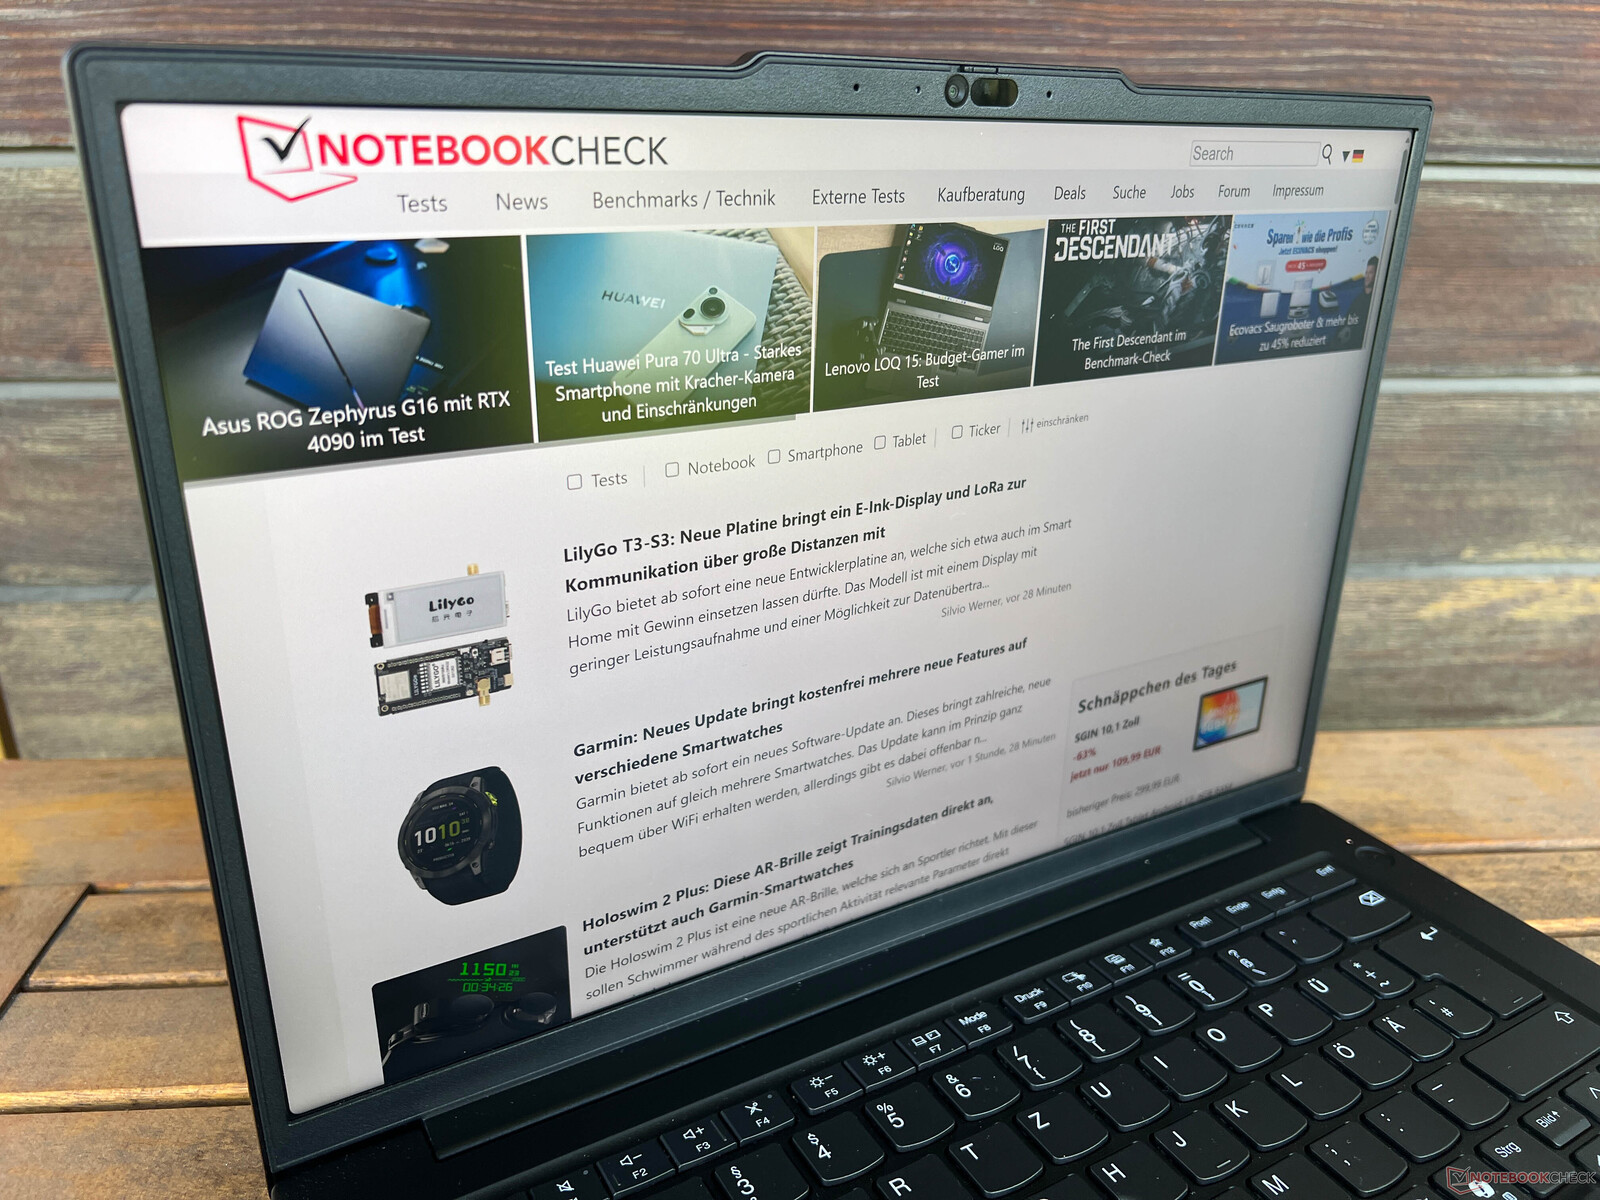
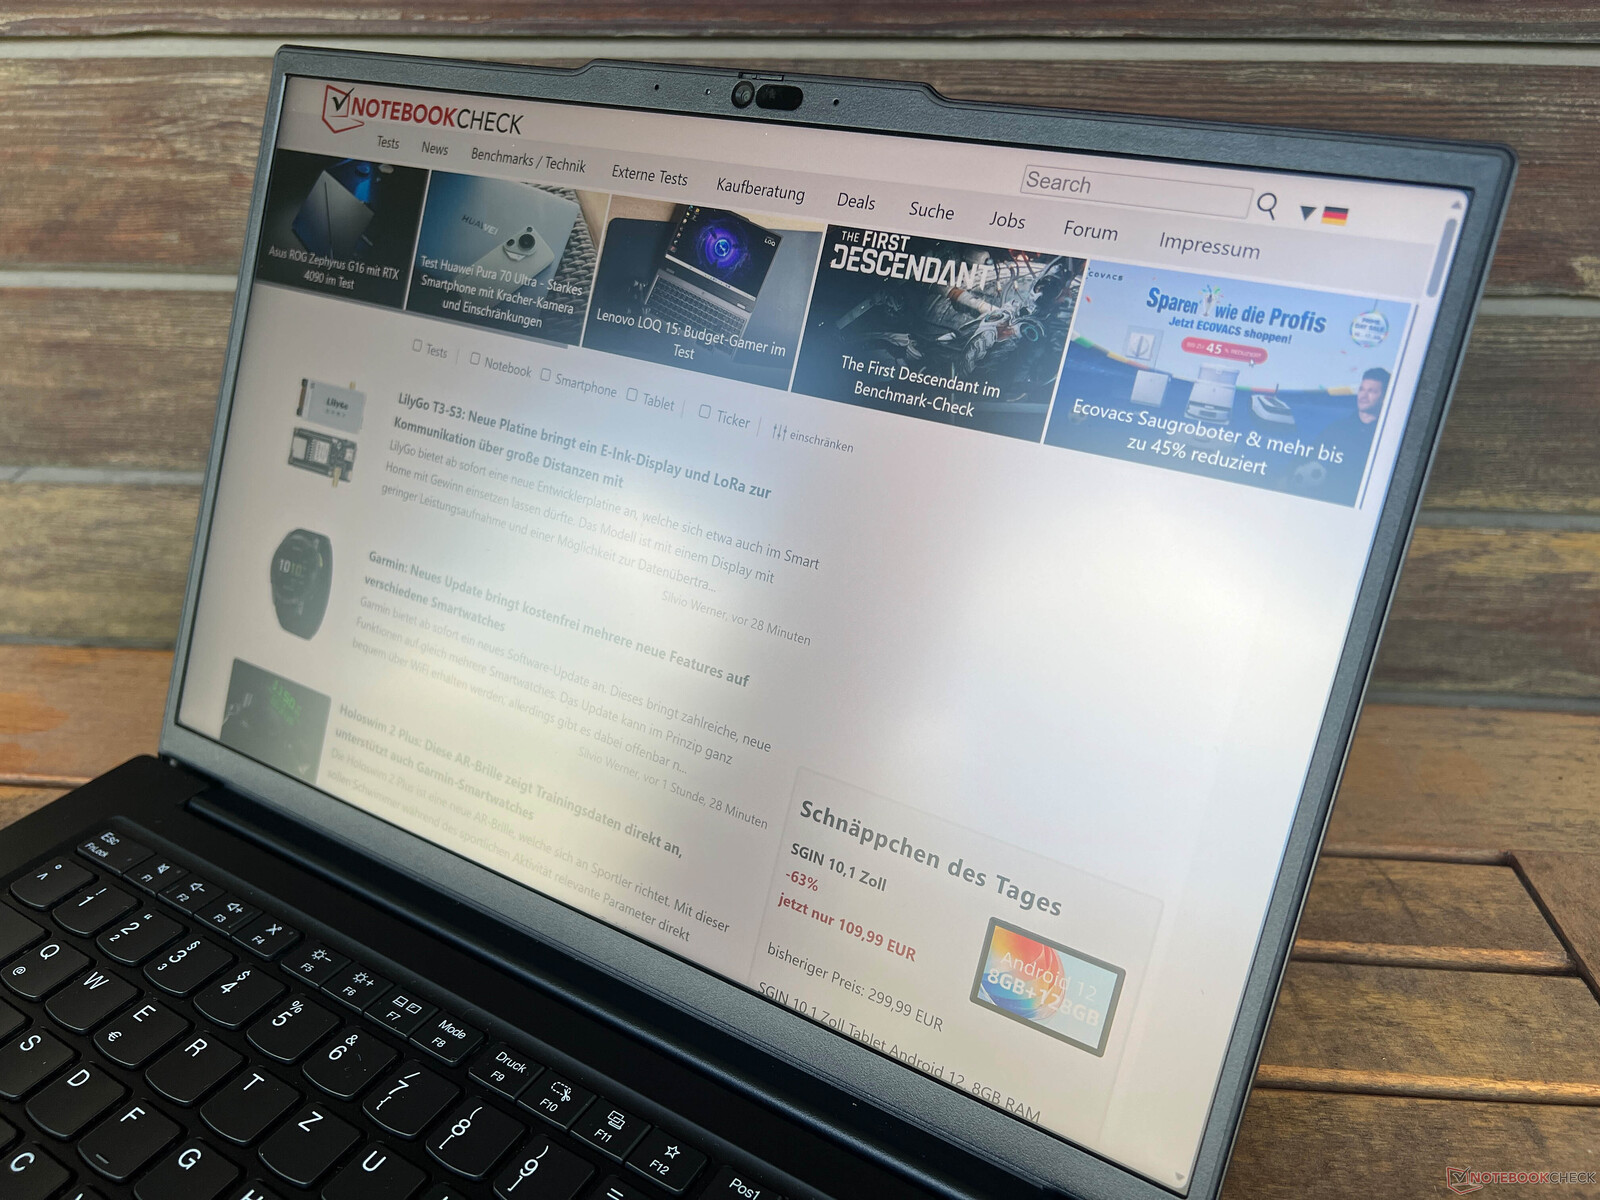
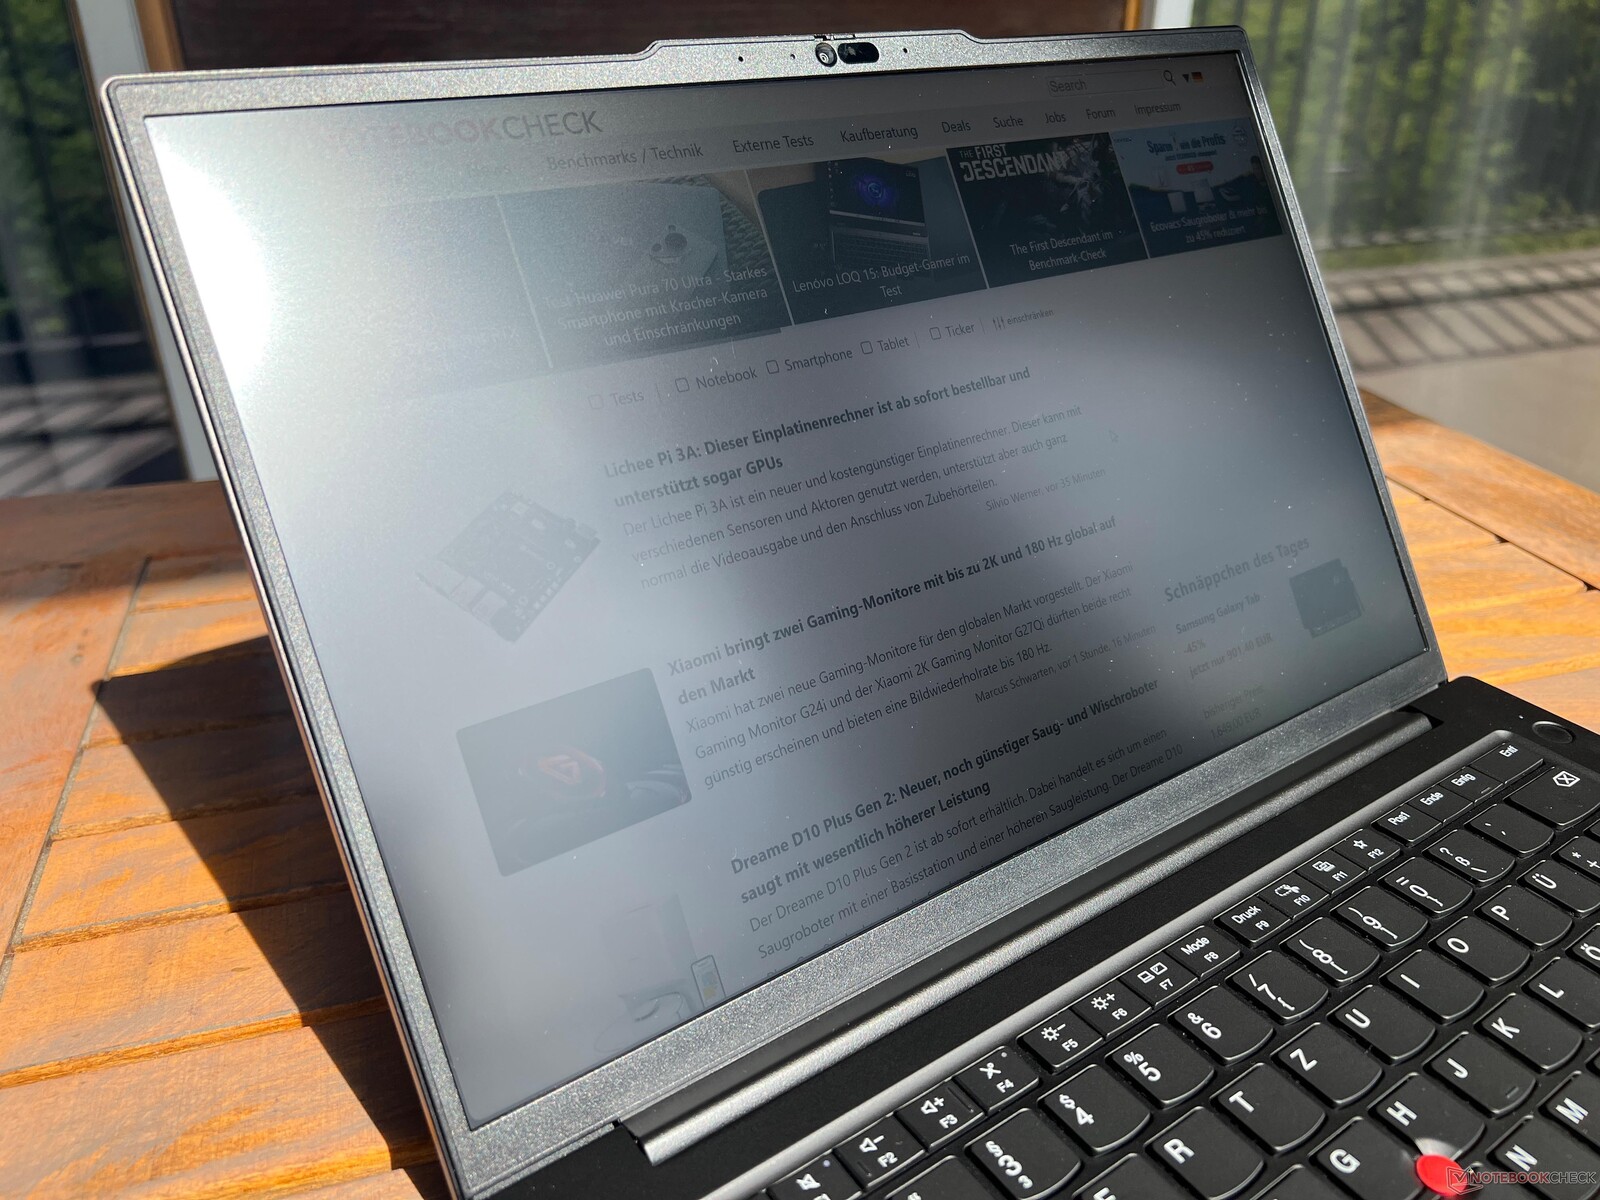
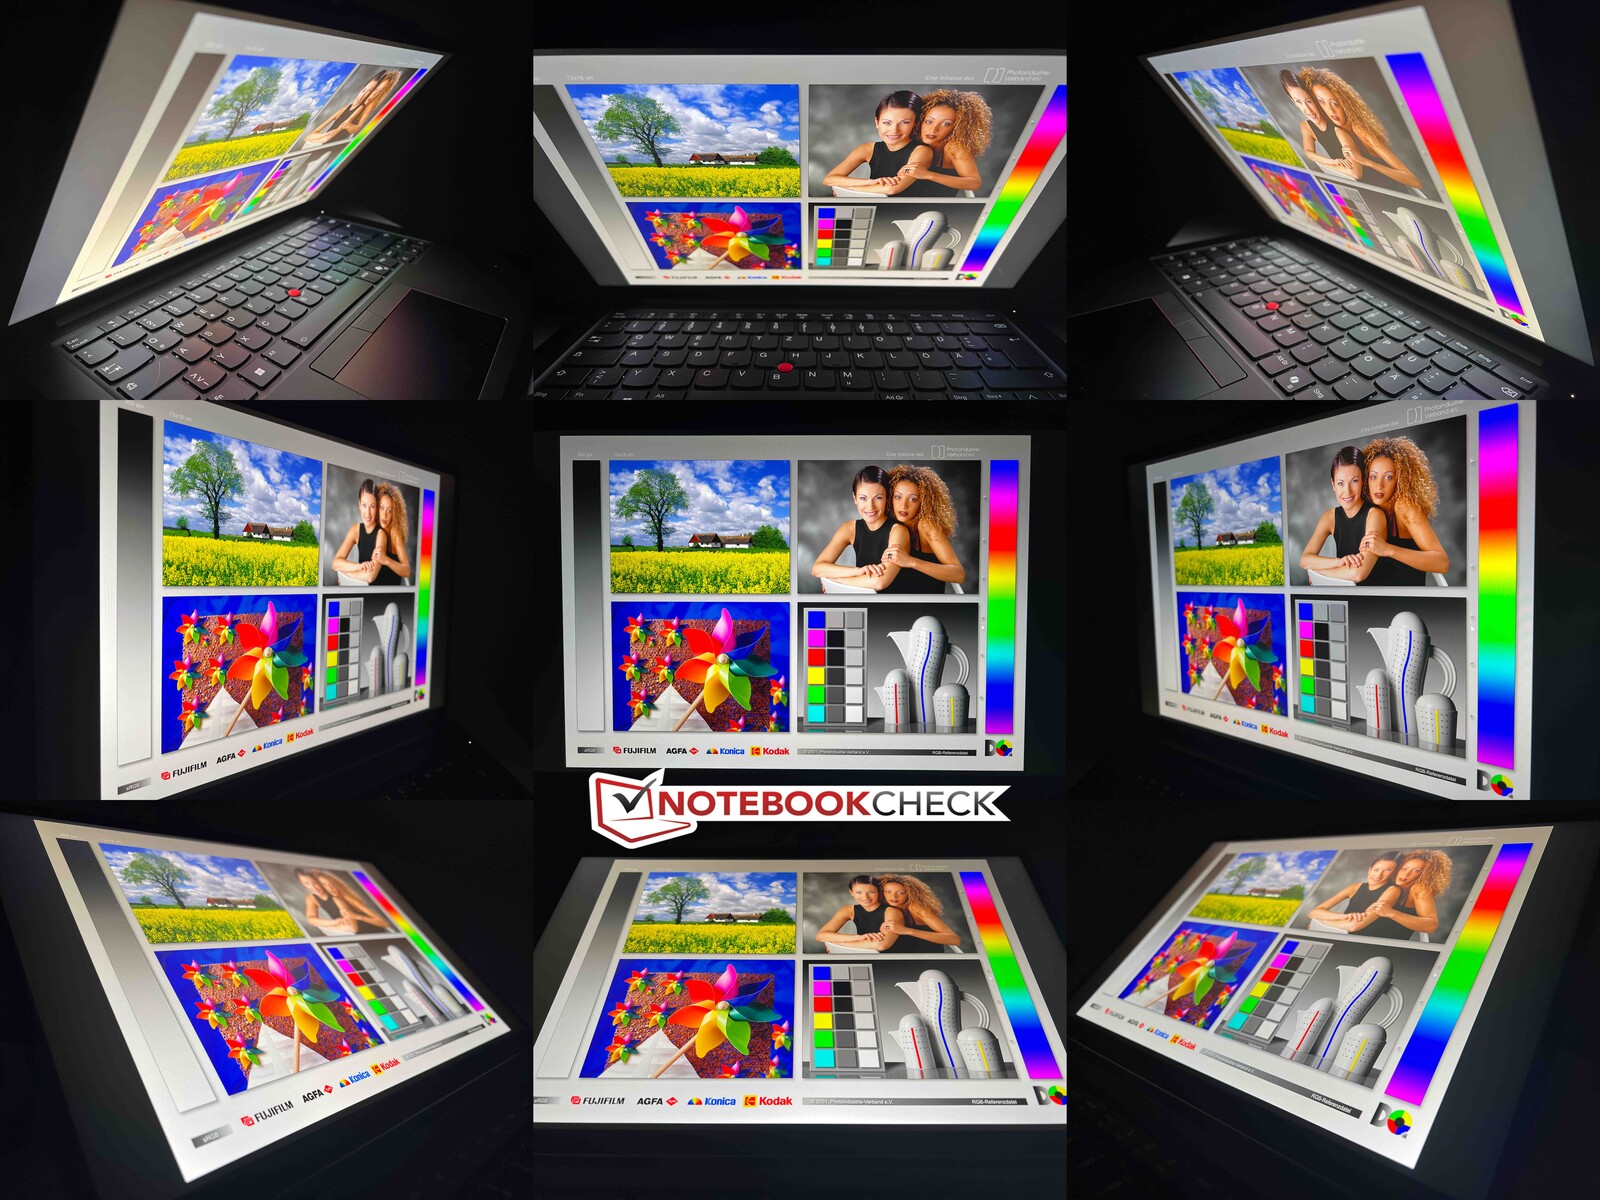
O painel fosco se sai bem em ambientes externos, mas seu brilho, em particular, poderia ser um pouco melhor em dias muito claros. A estabilidade do ângulo de visão do painel IPS é boa.
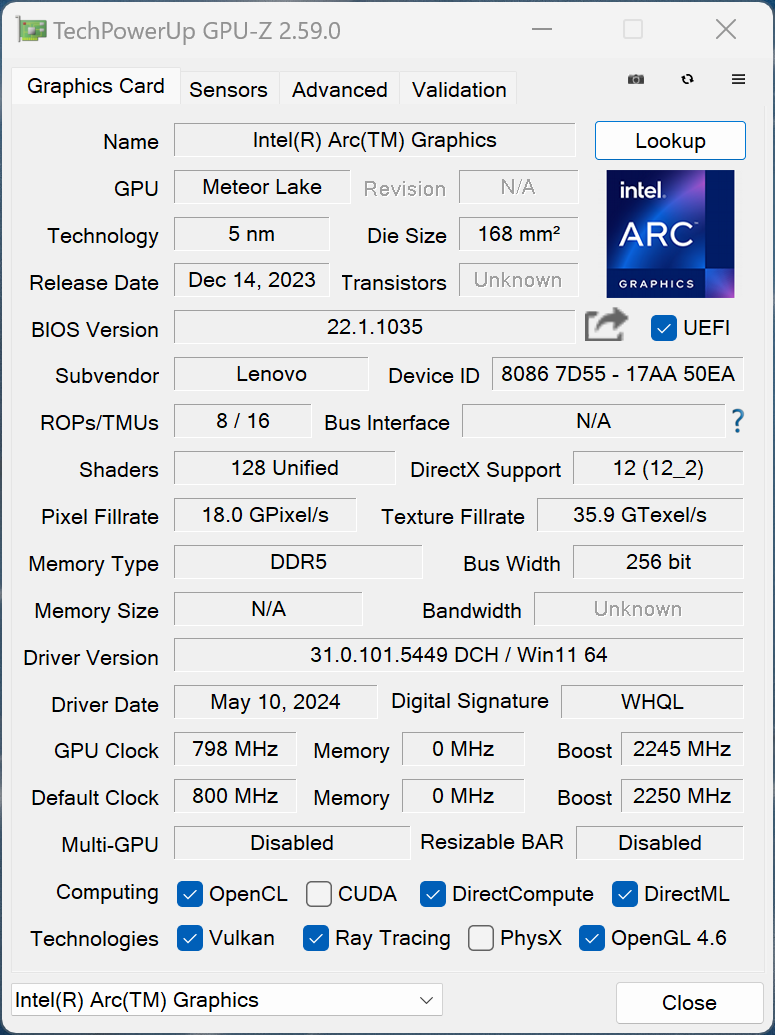
Desempenho - Meteor Lake e RTX 500 Ada
A versão Intel do ThinkPad P14s G5 está disponível apenas com CPUs Meteor Lake. Quando se trata da GPU, o senhor pode escolher entre a placa de vídeo integrada Intel Arc Graphics e a placa de vídeo dedicada Nvidia RTX 500 Ada. A versão AMD do P14s G5 com o design antigo, por outro lado, só está disponível com uma iGPU.
Condições de teste
A Lenovo há muito tempo vincula seus próprios perfis de energia do ThinkPad diretamente às configurações de energia do Windows. A tabela a seguir resume as configurações de TDP/TGP correspondentes. Realizamos os benchmarks e as medições usando o melhor desempenho, que é definido por padrão.
| Modo de desempenho | CPU TDP | CB R23 Multi | GPU TGP | Time Spy gráficos | Teste de estresse | emissões máximas de ruído do ventilador |
|---|---|---|---|---|---|---|
| Melhor economia de energia | 80/30 watts | 12,089 pontos | 35 watts | 4,848 pontos | CPU: 15 watts GPU: 35 watts |
38,3 dB(A) |
| Equilibrado | 80/40 watts | 17.620 pontos | 40 watts | 4.981 pontos | CPU: 17 watts GPU: 35 watts |
44,8 dB(A) |
| Melhor desempenho | 80/50 watts | 17.612 pontos | 50 watts | 5.278 pontos | CPU: 25 watts GPU: 35 watts |
46,8 dB(A) |
Processador - Intel Core Ultra 7 155H
O Core Ultra 7 155H faz parte da atual geração Meteor Lake da Intel e é usado em muitos laptops. Graças aos seus altos limites de energia, os resultados de benchmark do processador foram muito bons e ele superou tanto o Core i7-1370P quanto o AMD Ryzen 7 PRO 7840U nos modelos P14s-G4. Até mesmo o processador nominalmente mais rápido Core Ultra 7 165H no interior do ZBook Firefly 14 G11 foi significativamente mais lento. No entanto, também deve ser mencionado que os antigos chips Raptor Lake da Intel (por exemplo, o Core i7-13700H) ofereciam maior desempenho de núcleo único. No modo de bateria, o processador pode consumir no máximo 55 watts, razão pela qual seu desempenho de vários núcleos é 8% menor. Outros benchmarks de CPU podem ser encontrados em nossa seção de tecnologia.
Cinebench R15 Multi continuous test
Cinebench R23: Multi Core | Single Core
Cinebench R20: CPU (Multi Core) | CPU (Single Core)
Cinebench R15: CPU Multi 64Bit | CPU Single 64Bit
Blender: v2.79 BMW27 CPU
7-Zip 18.03: 7z b 4 | 7z b 4 -mmt1
Geekbench 6.4: Multi-Core | Single-Core
Geekbench 5.5: Multi-Core | Single-Core
HWBOT x265 Benchmark v2.2: 4k Preset
LibreOffice : 20 Documents To PDF
R Benchmark 2.5: Overall mean
| CPU Performance Rating | |
| Média da turma Workstation | |
| Lenovo Yoga Pro 9-14IRP G8 | |
| Microsoft Surface Laptop Studio 2 RTX 4060 | |
| Lenovo ThinkPad P14s G5 21G3S00A00 | |
| Dell Precision 5000 5490 | |
| Lenovo ThinkPad P14s G4 21HF0017GE | |
| Média Intel Core Ultra 7 155H | |
| HP ZBook Firefly 14 G11 | |
| Lenovo ThinkPad P14s G4 21K5000LGE | |
| Cinebench R23 / Multi Core | |
| Média da turma Workstation (11507 - 30706, n=25, últimos 2 anos) | |
| Lenovo Yoga Pro 9-14IRP G8 | |
| Lenovo ThinkPad P14s G5 21G3S00A00 | |
| Dell Precision 5000 5490 | |
| Microsoft Surface Laptop Studio 2 RTX 4060 | |
| Média Intel Core Ultra 7 155H (9769 - 19007, n=52) | |
| Lenovo ThinkPad P14s G4 21HF0017GE | |
| HP ZBook Firefly 14 G11 | |
| Lenovo ThinkPad P14s G4 21K5000LGE | |
| Cinebench R23 / Single Core | |
| Lenovo ThinkPad P14s G4 21HF0017GE | |
| Microsoft Surface Laptop Studio 2 RTX 4060 | |
| Média da turma Workstation (1581 - 2178, n=25, últimos 2 anos) | |
| Lenovo Yoga Pro 9-14IRP G8 | |
| Lenovo ThinkPad P14s G5 21G3S00A00 | |
| Dell Precision 5000 5490 | |
| HP ZBook Firefly 14 G11 | |
| Média Intel Core Ultra 7 155H (1496 - 1815, n=52) | |
| Lenovo ThinkPad P14s G4 21K5000LGE | |
| Cinebench R20 / CPU (Multi Core) | |
| Média da turma Workstation (4530 - 11816, n=25, últimos 2 anos) | |
| Lenovo Yoga Pro 9-14IRP G8 | |
| Lenovo ThinkPad P14s G5 21G3S00A00 | |
| Dell Precision 5000 5490 | |
| Microsoft Surface Laptop Studio 2 RTX 4060 | |
| Média Intel Core Ultra 7 155H (3798 - 7409, n=50) | |
| Lenovo ThinkPad P14s G4 21HF0017GE | |
| Lenovo ThinkPad P14s G4 21K5000LGE | |
| HP ZBook Firefly 14 G11 | |
| Cinebench R20 / CPU (Single Core) | |
| Microsoft Surface Laptop Studio 2 RTX 4060 | |
| Lenovo ThinkPad P14s G4 21HF0017GE | |
| Lenovo Yoga Pro 9-14IRP G8 | |
| Média da turma Workstation (612 - 827, n=25, últimos 2 anos) | |
| Lenovo ThinkPad P14s G5 21G3S00A00 | |
| Dell Precision 5000 5490 | |
| HP ZBook Firefly 14 G11 | |
| Média Intel Core Ultra 7 155H (601 - 696, n=50) | |
| Lenovo ThinkPad P14s G4 21K5000LGE | |
| Cinebench R15 / CPU Multi 64Bit | |
| Média da turma Workstation (1863 - 4784, n=25, últimos 2 anos) | |
| Dell Precision 5000 5490 | |
| Lenovo Yoga Pro 9-14IRP G8 | |
| Lenovo ThinkPad P14s G5 21G3S00A00 | |
| Microsoft Surface Laptop Studio 2 RTX 4060 | |
| HP ZBook Firefly 14 G11 | |
| Média Intel Core Ultra 7 155H (1932 - 2880, n=56) | |
| Lenovo ThinkPad P14s G4 21HF0017GE | |
| Lenovo ThinkPad P14s G4 21K5000LGE | |
| Cinebench R15 / CPU Single 64Bit | |
| Microsoft Surface Laptop Studio 2 RTX 4060 | |
| Lenovo Yoga Pro 9-14IRP G8 | |
| Média da turma Workstation (167 - 307, n=25, últimos 2 anos) | |
| Lenovo ThinkPad P14s G4 21K5000LGE | |
| Lenovo ThinkPad P14s G5 21G3S00A00 | |
| Lenovo ThinkPad P14s G4 21HF0017GE | |
| HP ZBook Firefly 14 G11 | |
| Dell Precision 5000 5490 | |
| Média Intel Core Ultra 7 155H (99.6 - 268, n=52) | |
| Blender / v2.79 BMW27 CPU | |
| HP ZBook Firefly 14 G11 | |
| Lenovo ThinkPad P14s G4 21HF0017GE | |
| Microsoft Surface Laptop Studio 2 RTX 4060 | |
| Lenovo ThinkPad P14s G4 21K5000LGE | |
| Média Intel Core Ultra 7 155H (175 - 381, n=47) | |
| Dell Precision 5000 5490 | |
| Lenovo ThinkPad P14s G5 21G3S00A00 | |
| Média da turma Workstation (102 - 270, n=25, últimos 2 anos) | |
| Lenovo Yoga Pro 9-14IRP G8 | |
| 7-Zip 18.03 / 7z b 4 | |
| Média da turma Workstation (51096 - 109760, n=25, últimos 2 anos) | |
| Lenovo Yoga Pro 9-14IRP G8 | |
| Lenovo ThinkPad P14s G5 21G3S00A00 | |
| Dell Precision 5000 5490 | |
| Microsoft Surface Laptop Studio 2 RTX 4060 | |
| Média Intel Core Ultra 7 155H (41739 - 70254, n=50) | |
| Lenovo ThinkPad P14s G4 21K5000LGE | |
| HP ZBook Firefly 14 G11 | |
| Lenovo ThinkPad P14s G4 21HF0017GE | |
| 7-Zip 18.03 / 7z b 4 -mmt1 | |
| Microsoft Surface Laptop Studio 2 RTX 4060 | |
| Lenovo ThinkPad P14s G4 21HF0017GE | |
| Média da turma Workstation (4981 - 6960, n=25, últimos 2 anos) | |
| Lenovo Yoga Pro 9-14IRP G8 | |
| Lenovo ThinkPad P14s G4 21K5000LGE | |
| Lenovo ThinkPad P14s G5 21G3S00A00 | |
| Dell Precision 5000 5490 | |
| HP ZBook Firefly 14 G11 | |
| Média Intel Core Ultra 7 155H (4594 - 5621, n=50) | |
| Geekbench 6.4 / Multi-Core | |
| Lenovo Yoga Pro 9-14IRP G8 | |
| Lenovo Yoga Pro 9-14IRP G8 | |
| Dell Precision 5000 5490 | |
| Microsoft Surface Laptop Studio 2 RTX 4060 | |
| Média da turma Workstation (10200 - 16855, n=23, últimos 2 anos) | |
| Lenovo ThinkPad P14s G5 21G3S00A00 | |
| Lenovo ThinkPad P14s G4 21HF0017GE | |
| Média Intel Core Ultra 7 155H (7732 - 13656, n=55) | |
| HP ZBook Firefly 14 G11 | |
| Lenovo ThinkPad P14s G4 21K5000LGE | |
| Geekbench 6.4 / Single-Core | |
| Lenovo ThinkPad P14s G4 21HF0017GE | |
| Microsoft Surface Laptop Studio 2 RTX 4060 | |
| Lenovo Yoga Pro 9-14IRP G8 | |
| Lenovo Yoga Pro 9-14IRP G8 | |
| Média da turma Workstation (2352 - 2949, n=23, últimos 2 anos) | |
| Lenovo ThinkPad P14s G4 21K5000LGE | |
| Lenovo ThinkPad P14s G5 21G3S00A00 | |
| HP ZBook Firefly 14 G11 | |
| Dell Precision 5000 5490 | |
| Média Intel Core Ultra 7 155H (1901 - 2473, n=52) | |
| Geekbench 5.5 / Multi-Core | |
| Lenovo Yoga Pro 9-14IRP G8 | |
| Média da turma Workstation (8863 - 19316, n=25, últimos 2 anos) | |
| Lenovo ThinkPad P14s G5 21G3S00A00 | |
| Microsoft Surface Laptop Studio 2 RTX 4060 | |
| Dell Precision 5000 5490 | |
| HP ZBook Firefly 14 G11 | |
| Média Intel Core Ultra 7 155H (10017 - 13556, n=52) | |
| Lenovo ThinkPad P14s G4 21HF0017GE | |
| Lenovo ThinkPad P14s G4 21K5000LGE | |
| Geekbench 5.5 / Single-Core | |
| Média da turma Workstation (1740 - 2095, n=25, últimos 2 anos) | |
| Lenovo Yoga Pro 9-14IRP G8 | |
| Microsoft Surface Laptop Studio 2 RTX 4060 | |
| Lenovo ThinkPad P14s G4 21HF0017GE | |
| Lenovo ThinkPad P14s G5 21G3S00A00 | |
| HP ZBook Firefly 14 G11 | |
| Dell Precision 5000 5490 | |
| Média Intel Core Ultra 7 155H (1462 - 1824, n=52) | |
| Lenovo ThinkPad P14s G4 21K5000LGE | |
| HWBOT x265 Benchmark v2.2 / 4k Preset | |
| Média da turma Workstation (14.4 - 33, n=25, últimos 2 anos) | |
| Lenovo ThinkPad P14s G5 21G3S00A00 | |
| Lenovo Yoga Pro 9-14IRP G8 | |
| Microsoft Surface Laptop Studio 2 RTX 4060 | |
| Dell Precision 5000 5490 | |
| Lenovo ThinkPad P14s G4 21K5000LGE | |
| Média Intel Core Ultra 7 155H (9.93 - 21.2, n=50) | |
| Lenovo ThinkPad P14s G4 21HF0017GE | |
| HP ZBook Firefly 14 G11 | |
| LibreOffice / 20 Documents To PDF | |
| Lenovo ThinkPad P14s G4 21K5000LGE | |
| HP ZBook Firefly 14 G11 | |
| Lenovo ThinkPad P14s G5 21G3S00A00 | |
| Média Intel Core Ultra 7 155H (37.5 - 79.2, n=49) | |
| Lenovo Yoga Pro 9-14IRP G8 | |
| Média da turma Workstation (36.5 - 56.9, n=25, últimos 2 anos) | |
| Microsoft Surface Laptop Studio 2 RTX 4060 | |
| Lenovo ThinkPad P14s G4 21HF0017GE | |
| Dell Precision 5000 5490 | |
| R Benchmark 2.5 / Overall mean | |
| Média Intel Core Ultra 7 155H (0.4457 - 0.53, n=49) | |
| Lenovo ThinkPad P14s G4 21K5000LGE | |
| Dell Precision 5000 5490 | |
| Lenovo ThinkPad P14s G5 21G3S00A00 | |
| HP ZBook Firefly 14 G11 | |
| Média da turma Workstation (0.3825 - 0.4888, n=25, últimos 2 anos) | |
| Microsoft Surface Laptop Studio 2 RTX 4060 | |
| Lenovo ThinkPad P14s G4 21HF0017GE | |
| Lenovo Yoga Pro 9-14IRP G8 | |
* ... menor é melhor
AIDA64: FP32 Ray-Trace | FPU Julia | CPU SHA3 | CPU Queen | FPU SinJulia | FPU Mandel | CPU AES | CPU ZLib | FP64 Ray-Trace | CPU PhotoWorxx
| Performance Rating | |
| Média da turma Workstation | |
| Lenovo Yoga Pro 9-14IRP G8 | |
| Lenovo ThinkPad P14s G5 21G3S00A00 | |
| Dell Precision 5000 5490 | |
| Média Intel Core Ultra 7 155H | |
| Microsoft Surface Laptop Studio 2 RTX 4060 | |
| Lenovo ThinkPad P14s G4 21HF0017GE | |
| HP ZBook Firefly 14 G11 | |
| AIDA64 / FP32 Ray-Trace | |
| Média da turma Workstation (10658 - 61611, n=25, últimos 2 anos) | |
| Lenovo Yoga Pro 9-14IRP G8 | |
| Lenovo ThinkPad P14s G5 21G3S00A00 | |
| Dell Precision 5000 5490 | |
| Média Intel Core Ultra 7 155H (6670 - 18470, n=50) | |
| Microsoft Surface Laptop Studio 2 RTX 4060 | |
| Lenovo ThinkPad P14s G4 21HF0017GE | |
| HP ZBook Firefly 14 G11 | |
| AIDA64 / FPU Julia | |
| Média da turma Workstation (56664 - 183843, n=25, últimos 2 anos) | |
| Lenovo ThinkPad P14s G5 21G3S00A00 | |
| Lenovo Yoga Pro 9-14IRP G8 | |
| Dell Precision 5000 5490 | |
| Microsoft Surface Laptop Studio 2 RTX 4060 | |
| Média Intel Core Ultra 7 155H (40905 - 93181, n=50) | |
| Lenovo ThinkPad P14s G4 21HF0017GE | |
| HP ZBook Firefly 14 G11 | |
| AIDA64 / CPU SHA3 | |
| Média da turma Workstation (2608 - 8341, n=25, últimos 2 anos) | |
| Dell Precision 5000 5490 | |
| Lenovo ThinkPad P14s G5 21G3S00A00 | |
| Lenovo Yoga Pro 9-14IRP G8 | |
| Média Intel Core Ultra 7 155H (1940 - 4436, n=50) | |
| Microsoft Surface Laptop Studio 2 RTX 4060 | |
| Lenovo ThinkPad P14s G4 21HF0017GE | |
| HP ZBook Firefly 14 G11 | |
| AIDA64 / CPU Queen | |
| Média da turma Workstation (84022 - 144411, n=25, últimos 2 anos) | |
| Lenovo Yoga Pro 9-14IRP G8 | |
| Microsoft Surface Laptop Studio 2 RTX 4060 | |
| Lenovo ThinkPad P14s G4 21HF0017GE | |
| Dell Precision 5000 5490 | |
| HP ZBook Firefly 14 G11 | |
| Lenovo ThinkPad P14s G5 21G3S00A00 | |
| Média Intel Core Ultra 7 155H (64698 - 94181, n=50) | |
| AIDA64 / FPU SinJulia | |
| Média da turma Workstation (7906 - 29343, n=25, últimos 2 anos) | |
| Lenovo Yoga Pro 9-14IRP G8 | |
| Lenovo ThinkPad P14s G5 21G3S00A00 | |
| Dell Precision 5000 5490 | |
| Média Intel Core Ultra 7 155H (5639 - 10647, n=50) | |
| Microsoft Surface Laptop Studio 2 RTX 4060 | |
| HP ZBook Firefly 14 G11 | |
| Lenovo ThinkPad P14s G4 21HF0017GE | |
| AIDA64 / FPU Mandel | |
| Média da turma Workstation (27301 - 97385, n=25, últimos 2 anos) | |
| Lenovo Yoga Pro 9-14IRP G8 | |
| Lenovo ThinkPad P14s G5 21G3S00A00 | |
| Dell Precision 5000 5490 | |
| Média Intel Core Ultra 7 155H (18236 - 47685, n=50) | |
| Microsoft Surface Laptop Studio 2 RTX 4060 | |
| Lenovo ThinkPad P14s G4 21HF0017GE | |
| HP ZBook Firefly 14 G11 | |
| AIDA64 / CPU AES | |
| Média da turma Workstation (56077 - 187841, n=25, últimos 2 anos) | |
| Lenovo ThinkPad P14s G5 21G3S00A00 | |
| Média Intel Core Ultra 7 155H (45713 - 152179, n=50) | |
| Dell Precision 5000 5490 | |
| Lenovo Yoga Pro 9-14IRP G8 | |
| Microsoft Surface Laptop Studio 2 RTX 4060 | |
| Lenovo ThinkPad P14s G4 21HF0017GE | |
| HP ZBook Firefly 14 G11 | |
| AIDA64 / CPU ZLib | |
| Média da turma Workstation (742 - 2057, n=25, últimos 2 anos) | |
| Lenovo ThinkPad P14s G5 21G3S00A00 | |
| Lenovo Yoga Pro 9-14IRP G8 | |
| Dell Precision 5000 5490 | |
| Média Intel Core Ultra 7 155H (557 - 1250, n=50) | |
| Microsoft Surface Laptop Studio 2 RTX 4060 | |
| Lenovo ThinkPad P14s G4 21HF0017GE | |
| HP ZBook Firefly 14 G11 | |
| AIDA64 / FP64 Ray-Trace | |
| Média da turma Workstation (5580 - 32891, n=25, últimos 2 anos) | |
| Lenovo Yoga Pro 9-14IRP G8 | |
| Lenovo ThinkPad P14s G5 21G3S00A00 | |
| Dell Precision 5000 5490 | |
| Microsoft Surface Laptop Studio 2 RTX 4060 | |
| Média Intel Core Ultra 7 155H (3569 - 9802, n=50) | |
| Lenovo ThinkPad P14s G4 21HF0017GE | |
| HP ZBook Firefly 14 G11 | |
| AIDA64 / CPU PhotoWorxx | |
| Lenovo Yoga Pro 9-14IRP G8 | |
| Dell Precision 5000 5490 | |
| Lenovo ThinkPad P14s G5 21G3S00A00 | |
| Média Intel Core Ultra 7 155H (32719 - 54223, n=50) | |
| HP ZBook Firefly 14 G11 | |
| Média da turma Workstation (24325 - 93684, n=25, últimos 2 anos) | |
| Microsoft Surface Laptop Studio 2 RTX 4060 | |
| Lenovo ThinkPad P14s G4 21HF0017GE | |
Desempenho do sistema
O ThinkPad P14s G5 é um laptop super rápido, o que também foi confirmado durante os benchmarks sintéticos. Embora outros dispositivos tenham sido, às vezes, ainda mais rápidos durante esse teste, as diferenças gerais são pequenas e todas as entradas são processadas rapidamente pelo sistema. Além disso, não tivemos problemas com a estabilidade do sistema durante o teste.
CrossMark: Overall | Productivity | Creativity | Responsiveness
WebXPRT 3: Overall
WebXPRT 4: Overall
Mozilla Kraken 1.1: Total
| PCMark 10 / Score | |
| Média da turma Workstation (6336 - 8587, n=25, últimos 2 anos) | |
| Lenovo Yoga Pro 9-14IRP G8 | |
| Dell Precision 5000 5490 | |
| Microsoft Surface Laptop Studio 2 RTX 4060 | |
| Lenovo ThinkPad P14s G4 21HF0017GE | |
| Lenovo ThinkPad P14s G5 21G3S00A00 | |
| Média Intel Core Ultra 7 155H, Nvidia RTX 500 Ada Generation Laptop GPU (n=1) | |
| HP ZBook Firefly 14 G11 | |
| PCMark 10 / Essentials | |
| Lenovo Yoga Pro 9-14IRP G8 | |
| Dell Precision 5000 5490 | |
| Lenovo ThinkPad P14s G5 21G3S00A00 | |
| Média Intel Core Ultra 7 155H, Nvidia RTX 500 Ada Generation Laptop GPU (n=1) | |
| Média da turma Workstation (9647 - 12197, n=25, últimos 2 anos) | |
| Microsoft Surface Laptop Studio 2 RTX 4060 | |
| Lenovo ThinkPad P14s G4 21HF0017GE | |
| HP ZBook Firefly 14 G11 | |
| PCMark 10 / Productivity | |
| Lenovo ThinkPad P14s G4 21HF0017GE | |
| Média da turma Workstation (8829 - 10820, n=25, últimos 2 anos) | |
| HP ZBook Firefly 14 G11 | |
| Lenovo ThinkPad P14s G5 21G3S00A00 | |
| Média Intel Core Ultra 7 155H, Nvidia RTX 500 Ada Generation Laptop GPU (n=1) | |
| Microsoft Surface Laptop Studio 2 RTX 4060 | |
| Dell Precision 5000 5490 | |
| Lenovo Yoga Pro 9-14IRP G8 | |
| PCMark 10 / Digital Content Creation | |
| Média da turma Workstation (7589 - 15093, n=25, últimos 2 anos) | |
| Lenovo Yoga Pro 9-14IRP G8 | |
| Microsoft Surface Laptop Studio 2 RTX 4060 | |
| Dell Precision 5000 5490 | |
| Lenovo ThinkPad P14s G5 21G3S00A00 | |
| Média Intel Core Ultra 7 155H, Nvidia RTX 500 Ada Generation Laptop GPU (n=1) | |
| Lenovo ThinkPad P14s G4 21HF0017GE | |
| HP ZBook Firefly 14 G11 | |
| CrossMark / Overall | |
| Lenovo Yoga Pro 9-14IRP G8 | |
| Lenovo ThinkPad P14s G4 21HF0017GE | |
| Média da turma Workstation (1574 - 2037, n=23, últimos 2 anos) | |
| Dell Precision 5000 5490 | |
| Microsoft Surface Laptop Studio 2 RTX 4060 | |
| Lenovo ThinkPad P14s G5 21G3S00A00 | |
| Média Intel Core Ultra 7 155H, Nvidia RTX 500 Ada Generation Laptop GPU (n=1) | |
| HP ZBook Firefly 14 G11 | |
| CrossMark / Productivity | |
| Lenovo Yoga Pro 9-14IRP G8 | |
| Lenovo ThinkPad P14s G4 21HF0017GE | |
| Média da turma Workstation (1546 - 1902, n=23, últimos 2 anos) | |
| Dell Precision 5000 5490 | |
| Microsoft Surface Laptop Studio 2 RTX 4060 | |
| HP ZBook Firefly 14 G11 | |
| Lenovo ThinkPad P14s G5 21G3S00A00 | |
| Média Intel Core Ultra 7 155H, Nvidia RTX 500 Ada Generation Laptop GPU (n=1) | |
| CrossMark / Creativity | |
| Lenovo Yoga Pro 9-14IRP G8 | |
| Lenovo ThinkPad P14s G4 21HF0017GE | |
| Média da turma Workstation (1655 - 2412, n=23, últimos 2 anos) | |
| Microsoft Surface Laptop Studio 2 RTX 4060 | |
| Dell Precision 5000 5490 | |
| HP ZBook Firefly 14 G11 | |
| Lenovo ThinkPad P14s G5 21G3S00A00 | |
| Média Intel Core Ultra 7 155H, Nvidia RTX 500 Ada Generation Laptop GPU (n=1) | |
| CrossMark / Responsiveness | |
| Lenovo ThinkPad P14s G4 21HF0017GE | |
| Lenovo Yoga Pro 9-14IRP G8 | |
| Média da turma Workstation (1304 - 1730, n=23, últimos 2 anos) | |
| Lenovo ThinkPad P14s G5 21G3S00A00 | |
| Média Intel Core Ultra 7 155H, Nvidia RTX 500 Ada Generation Laptop GPU (n=1) | |
| Dell Precision 5000 5490 | |
| Microsoft Surface Laptop Studio 2 RTX 4060 | |
| HP ZBook Firefly 14 G11 | |
| WebXPRT 3 / Overall | |
| Lenovo Yoga Pro 9-14IRP G8 | |
| Média da turma Workstation (259 - 415, n=26, últimos 2 anos) | |
| Microsoft Surface Laptop Studio 2 RTX 4060 | |
| Lenovo ThinkPad P14s G4 21HF0017GE | |
| HP ZBook Firefly 14 G11 | |
| Dell Precision 5000 5490 | |
| Lenovo ThinkPad P14s G5 21G3S00A00 | |
| Média Intel Core Ultra 7 155H, Nvidia RTX 500 Ada Generation Laptop GPU (n=1) | |
| WebXPRT 4 / Overall | |
| Microsoft Surface Laptop Studio 2 RTX 4060 | |
| Lenovo Yoga Pro 9-14IRP G8 | |
| Lenovo ThinkPad P14s G4 21HF0017GE | |
| Lenovo ThinkPad P14s G4 21HF0017GE | |
| Dell Precision 5000 5490 | |
| Média da turma Workstation (199.4 - 338, n=22, últimos 2 anos) | |
| HP ZBook Firefly 14 G11 | |
| Lenovo ThinkPad P14s G5 21G3S00A00 | |
| Média Intel Core Ultra 7 155H, Nvidia RTX 500 Ada Generation Laptop GPU (n=1) | |
| Mozilla Kraken 1.1 / Total | |
| Lenovo ThinkPad P14s G5 21G3S00A00 | |
| Média Intel Core Ultra 7 155H, Nvidia RTX 500 Ada Generation Laptop GPU (n=1) | |
| Dell Precision 5000 5490 | |
| HP ZBook Firefly 14 G11 | |
| Média da turma Workstation (433 - 591, n=26, últimos 2 anos) | |
| Lenovo Yoga Pro 9-14IRP G8 | |
| Microsoft Surface Laptop Studio 2 RTX 4060 | |
| Lenovo ThinkPad P14s G4 21HF0017GE | |
* ... menor é melhor
| PCMark 10 Score | 6974 pontos | |
Ajuda | ||
| AIDA64 / Memory Copy | |
| Dell Precision 5000 5490 | |
| Média Intel Core Ultra 7 155H (62397 - 96791, n=50) | |
| Lenovo Yoga Pro 9-14IRP G8 | |
| Lenovo ThinkPad P14s G5 21G3S00A00 | |
| HP ZBook Firefly 14 G11 | |
| Média da turma Workstation (34323 - 158632, n=25, últimos 2 anos) | |
| Microsoft Surface Laptop Studio 2 RTX 4060 | |
| Lenovo ThinkPad P14s G4 21HF0017GE | |
| AIDA64 / Memory Read | |
| Dell Precision 5000 5490 | |
| Média Intel Core Ultra 7 155H (60544 - 90647, n=50) | |
| Lenovo ThinkPad P14s G5 21G3S00A00 | |
| HP ZBook Firefly 14 G11 | |
| Lenovo Yoga Pro 9-14IRP G8 | |
| Média da turma Workstation (30787 - 121177, n=25, últimos 2 anos) | |
| Microsoft Surface Laptop Studio 2 RTX 4060 | |
| Lenovo ThinkPad P14s G4 21HF0017GE | |
| AIDA64 / Memory Write | |
| Dell Precision 5000 5490 | |
| Lenovo Yoga Pro 9-14IRP G8 | |
| Média da turma Workstation (39166 - 212172, n=25, últimos 2 anos) | |
| Microsoft Surface Laptop Studio 2 RTX 4060 | |
| Lenovo ThinkPad P14s G5 21G3S00A00 | |
| Média Intel Core Ultra 7 155H (58692 - 93451, n=50) | |
| HP ZBook Firefly 14 G11 | |
| Lenovo ThinkPad P14s G4 21HF0017GE | |
| AIDA64 / Memory Latency | |
| Média Intel Core Ultra 7 155H (116.2 - 233, n=50) | |
| Dell Precision 5000 5490 | |
| HP ZBook Firefly 14 G11 | |
| Lenovo ThinkPad P14s G5 21G3S00A00 | |
| Média da turma Workstation (83.4 - 165.2, n=25, últimos 2 anos) | |
| Lenovo ThinkPad P14s G4 21HF0017GE | |
| Lenovo Yoga Pro 9-14IRP G8 | |
| Microsoft Surface Laptop Studio 2 RTX 4060 | |
* ... menor é melhor
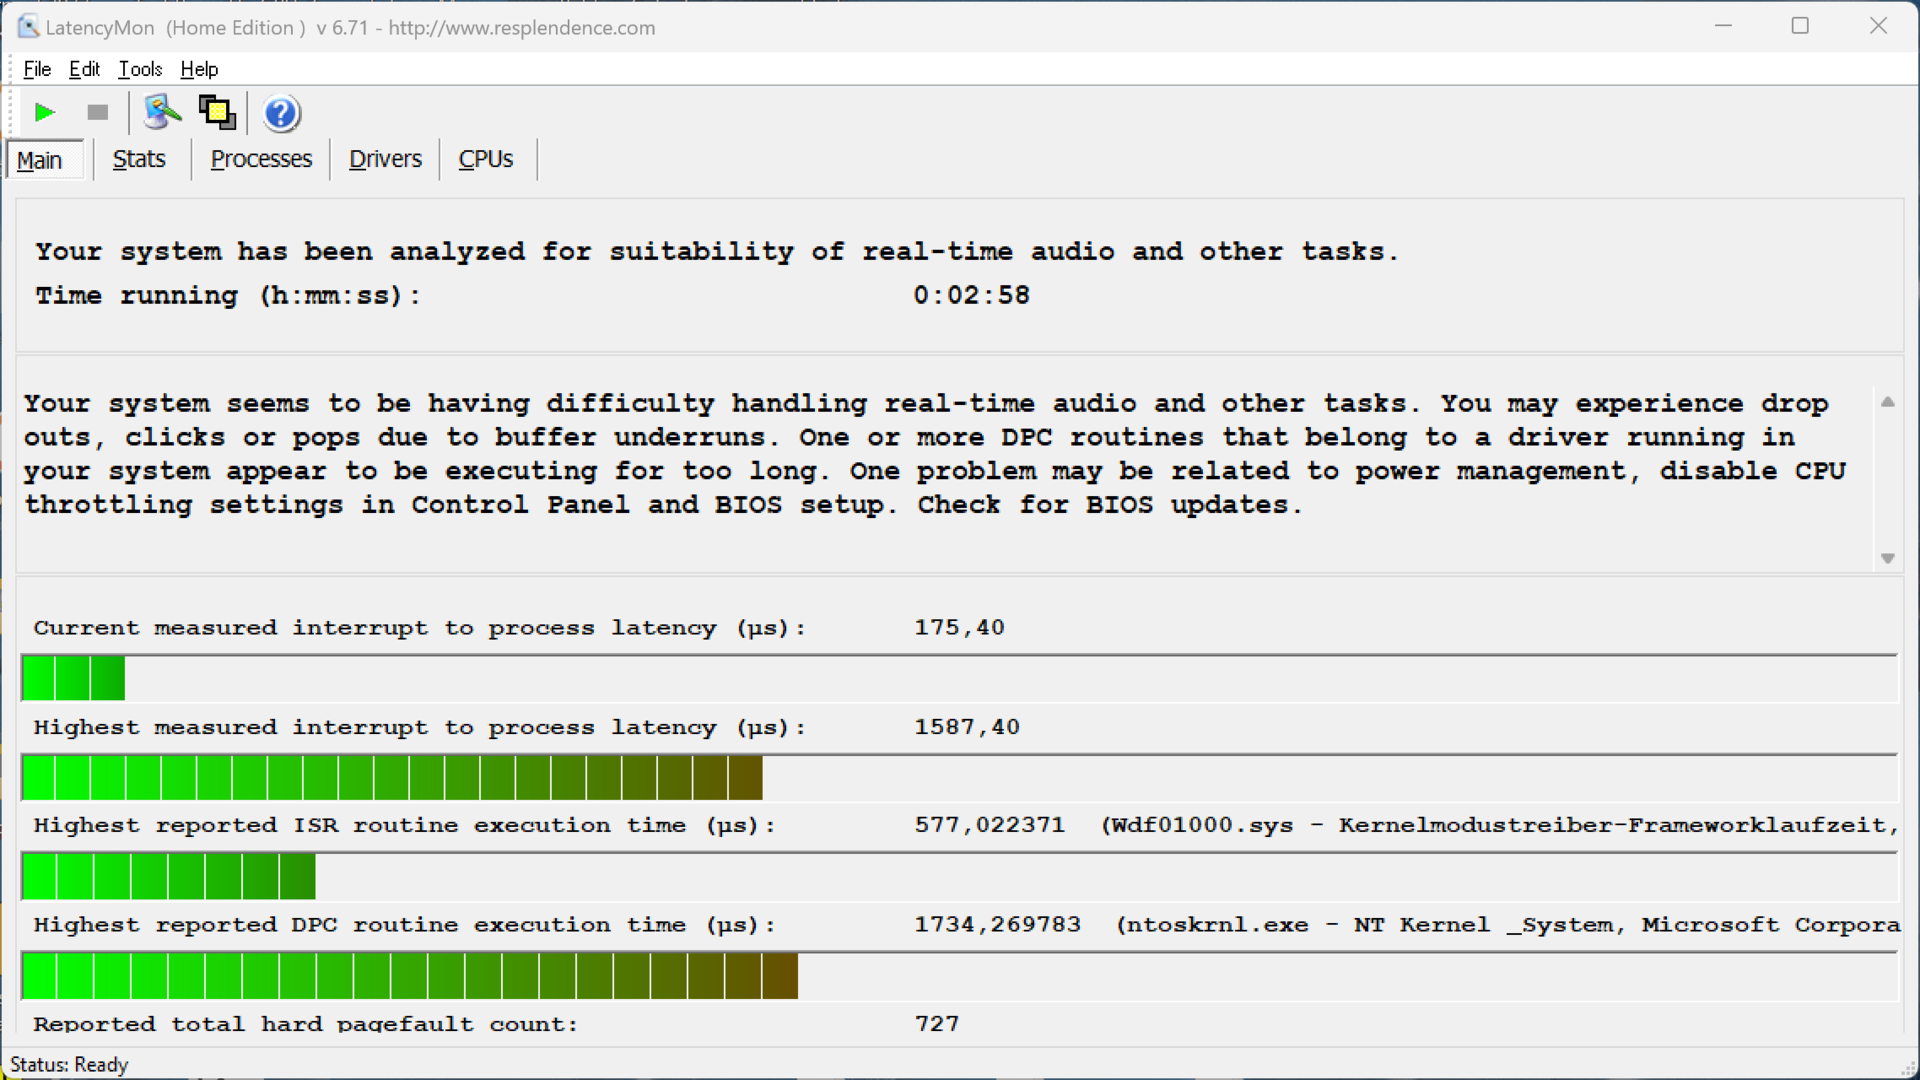
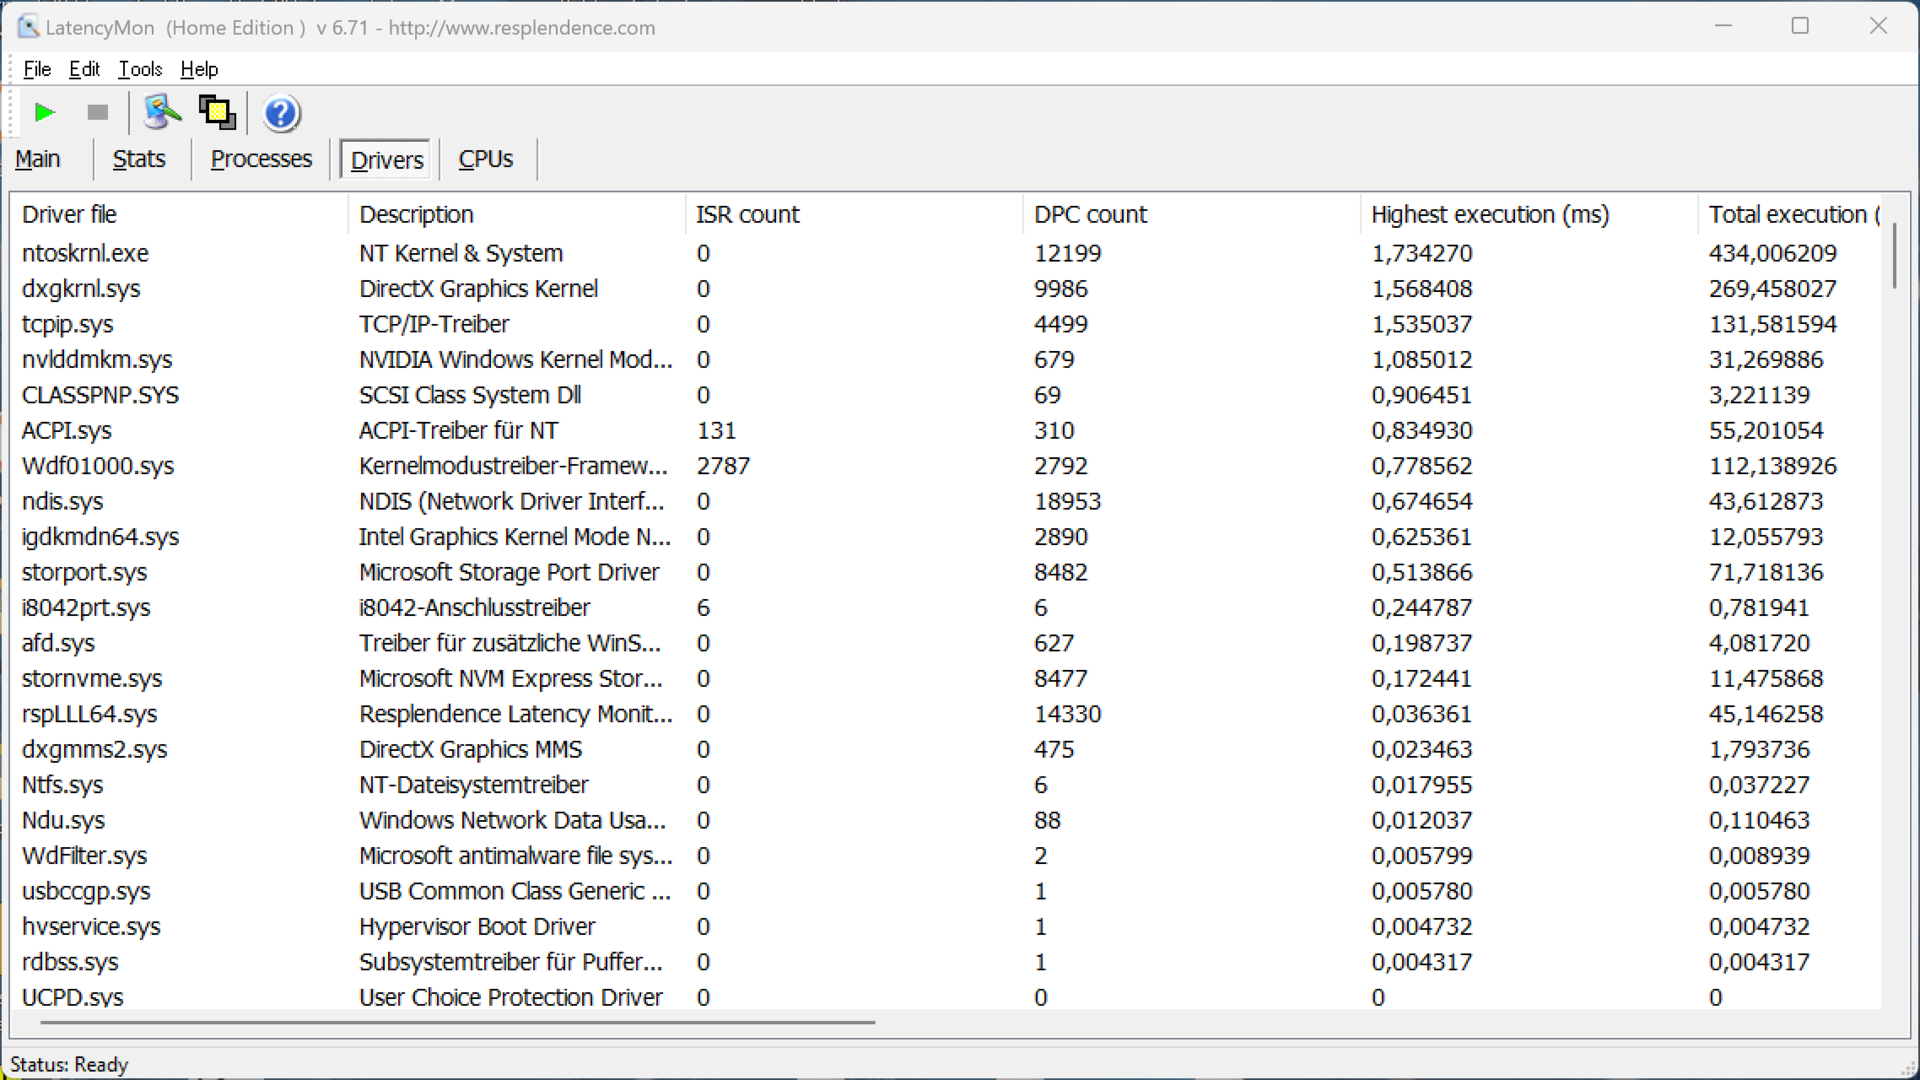
Latências de DPC
Em nosso teste de latência padronizado (navegação na Web, vídeo 4K do YouTube, carga da CPU), o dispositivo de teste com a versão atual do BIOS apresentou pequenas limitações ao usar aplicativos de áudio em tempo real.
| DPC Latencies / LatencyMon - interrupt to process latency (max), Web, Youtube, Prime95 | |
| Microsoft Surface Laptop Studio 2 RTX 4060 | |
| HP ZBook Firefly 14 G11 | |
| Dell Precision 5000 5490 | |
| Lenovo ThinkPad P14s G4 21HF0017GE | |
| Lenovo ThinkPad P14s G5 21G3S00A00 | |
| Lenovo Yoga Pro 9-14IRP G8 | |
* ... menor é melhor
Dispositivo de armazenamento
O P14s G5 apresenta um slot M.2 2280 que é conectado via PCIe 4.0. A versão de 1 TB do UMIS AM630 está instalada em nosso dispositivo de teste. Após a primeira inicialização do dispositivo, os usuários têm 871 GB à sua disposição. Com taxas de transferência de até 7 GB/s, seu desempenho é muito bom, embora não consiga manter esses valores completamente constantes sob carga contínua. Entretanto, como os valores ainda estão acima de 4 GB/s, os usuários não devem enfrentar limitações. Outros benchmarks de SSD estão disponíveis aqui.

* ... menor é melhor
Reading continuous performance: DiskSpd Read Loop, Queue Depth 8
Placa de vídeo - Nvidia RTX 500 Ada
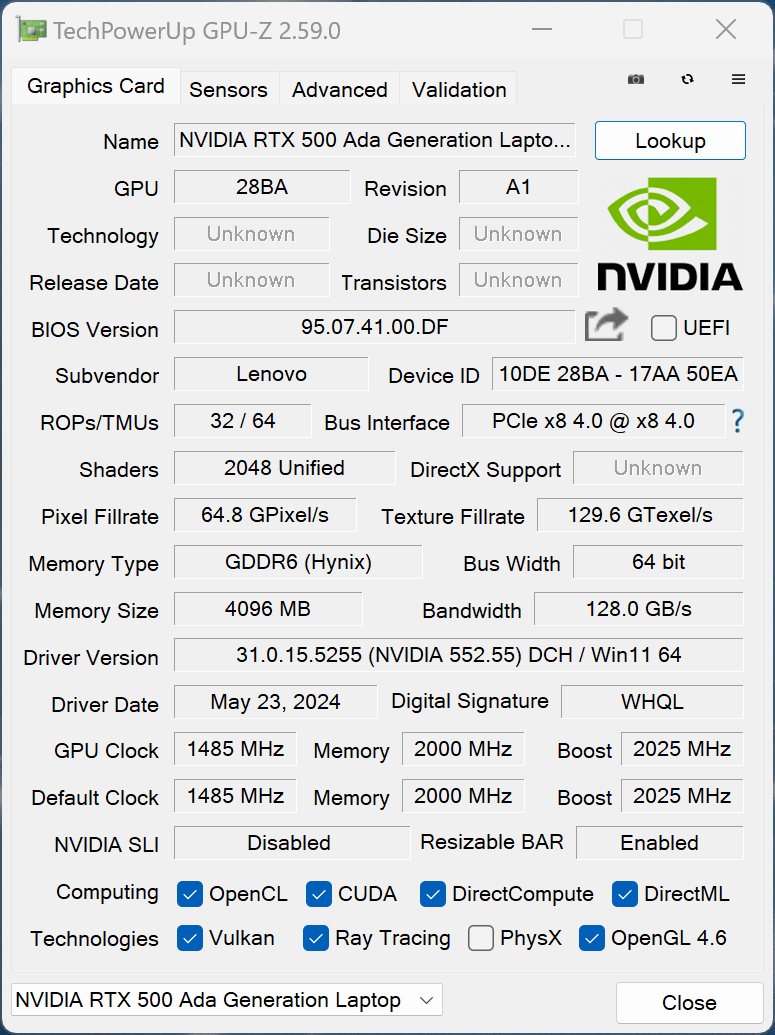
Opcionalmente, o senhor pode obter o P14s G5 com a Nvidia RTX 500 Adaque é atualmente a menor GPU móvel profissional da Nvidia. A RTX 500 Ada é baseada no chip AD107GLM com 2.048 núcleos CUDA e 4 GB GDDR6 VRAM. Trata-se, portanto, de uma versão reduzida da RTX 1000 Ada e, como resultado, também do GeForce RTX 4050 Laptop-ambos equipados com 2.560 núcleos CUDA e 6 GB de VRAM. No interior do ThinkPad P14s G5, o RTX 500 Ada pode consumir um máximo de 50 watts e o sistema suporta a comutação de gráficos através da tecnologia Optimus da Nvidia. Em comparação com os modelos GeForce, as GPUs profissionais oferecem certificações ISV que garantem compatibilidade máxima com aplicativos profissionais.
Em comparação com o antigo laptop RTX A500 (que é baseado no GeForce RTX 3050 e é usado no atual ZBook Firefly 14 G11por exemplo), seu desempenho nos testes 3DMark e SPECviewperf profissional foi significativamente melhor (50-80%), mas o laptop GeForce RTX 4050 para consumidores oferece ainda mais desempenho 3D. É uma pena que a Lenovo não ofereça também a RTX 1000 Ada dentro do P14s G5.
O desempenho da GPU permanece estável sob carga constante e no modo de bateria. Outros benchmarks de GPU estão disponíveis aqui.
| 3DMark 06 Standard Score | 50935 pontos | |
| 3DMark Vantage P Result | 66297 pontos | |
| 3DMark 11 Performance | 20426 pontos | |
| 3DMark Fire Strike Score | 12761 pontos | |
| 3DMark Time Spy Score | 5745 pontos | |
| 3DMark Steel Nomad Score | 981 pontos | |
| 3DMark Steel Nomad Light Score | 5441 pontos | |
Ajuda | ||
| Performance Rating - Percent | |
| Dell Precision 5000 5490 -1! | |
| Lenovo ThinkPad P14s G5 21G3S00A00 | |
| Lenovo ThinkPad P14s G4 21HF0017GE -1! | |
| HP ZBook Firefly 14 G11 -1! | |
| Blender / v3.3 Classroom OPTIX/RTX | |
| HP ZBook Firefly 14 G11 | |
| Lenovo ThinkPad P14s G4 21HF0017GE | |
| Lenovo ThinkPad P14s G5 21G3S00A00 | |
| Média Nvidia RTX 500 Ada Generation Laptop GPU (n=1) | |
| Média da turma Workstation (13 - 95, n=21, últimos 2 anos) | |
| Lenovo Yoga Pro 9-14IRP G8 | |
| Dell Precision 5000 5490 | |
| Microsoft Surface Laptop Studio 2 RTX 4060 | |
| Blender / v3.3 Classroom CUDA | |
| Lenovo ThinkPad P14s G4 21HF0017GE | |
| HP ZBook Firefly 14 G11 | |
| Lenovo ThinkPad P14s G5 21G3S00A00 | |
| Média Nvidia RTX 500 Ada Generation Laptop GPU (n=1) | |
| Média da turma Workstation (18 - 155, n=21, últimos 2 anos) | |
| Lenovo Yoga Pro 9-14IRP G8 | |
| Dell Precision 5000 5490 | |
| Microsoft Surface Laptop Studio 2 RTX 4060 | |
| Blender / v3.3 Classroom CPU | |
| Lenovo ThinkPad P14s G4 21HF0017GE | |
| HP ZBook Firefly 14 G11 | |
| Microsoft Surface Laptop Studio 2 RTX 4060 | |
| Dell Precision 5000 5490 | |
| Lenovo ThinkPad P14s G5 21G3S00A00 | |
| Média Nvidia RTX 500 Ada Generation Laptop GPU (n=1) | |
| Lenovo Yoga Pro 9-14IRP G8 | |
| Média da turma Workstation (159 - 472, n=26, últimos 2 anos) | |
* ... menor é melhor
Desempenho em jogos
Também é possível jogar no ThinkPad P14s G5 se o senhor quiser relaxar depois do trabalho, embora seu desempenho seja, mais uma vez, significativamente inferior ao do consumidor GeForce Laptop RTX 4050. Isso significa que o senhor geralmente está limitado à resolução de 1080p e detalhes altos ou máximos só são possíveis ao jogar jogos mais antigos ou menos exigentes. Por sua vez, os jogos atuais, como F1 24 ou Cyberpunk 2077 exigem uma redução adicional nos detalhes. O upsampling DLSS também pode ser usado para jogos compatíveis; por exemplo, conseguimos aumentar o desempenho do laptop ao executar o Cyberpunk 2077 (1080p, Ultra) de 25 fps para 45 fps (DLSS Balanced). Seu desempenho em jogos permanece completamente estável, mesmo durante sessões mais longas.
| Cyberpunk 2077 2.2 Phantom Liberty - 1920x1080 Ultra Preset (FSR off) | |
| Média da turma Workstation (19.6 - 113.5, n=16, últimos 2 anos) | |
| Microsoft Surface Laptop Studio 2 RTX 4060 | |
| Dell Precision 5000 5490 | |
| Lenovo ThinkPad P14s G5 21G3S00A00 | |
| Lenovo ThinkPad P14s G4 21HF0017GE | |
| HP ZBook Firefly 14 G11 | |
| GTA V - 1920x1080 Highest Settings possible AA:4xMSAA + FX AF:16x | |
| Microsoft Surface Laptop Studio 2 RTX 4060 | |
| Lenovo Yoga Pro 9-14IRP G8 | |
| Média da turma Workstation (18.3 - 126.7, n=22, últimos 2 anos) | |
| Lenovo ThinkPad P14s G5 21G3S00A00 | |
| Lenovo ThinkPad P14s G4 21HF0017GE | |
| F1 24 - 1920x1080 Ultra High Preset AA:T AF:16x | |
| Média da turma Workstation (11.7 - 47.5, n=4, últimos 2 anos) | |
| Lenovo ThinkPad P14s G5 21G3S00A00 | |
| Média Nvidia RTX 500 Ada Generation Laptop GPU (n=1) | |
| Lenovo ThinkPad P14s G4 21HF0017GE | |
Cyberpunk 2077 ultra FPS diagram
| baixo | média | alto | ultra | QHD | |
|---|---|---|---|---|---|
| GTA V (2015) | 182.7 | 177.4 | 138.2 | 64.6 | 45.1 |
| The Witcher 3 (2015) | 278 | 175 | 91 | 51 | 36 |
| Dota 2 Reborn (2015) | 176.2 | 156.1 | 148.1 | 137.4 | |
| Final Fantasy XV Benchmark (2018) | 130.5 | 71 | 50 | 36.1 | |
| X-Plane 11.11 (2018) | 128.3 | 103.5 | 81.5 | ||
| Far Cry 5 (2018) | 135 | 86 | 78 | 74 | 50 |
| Strange Brigade (2018) | 316 | 126 | 104 | 91 | 63 |
| Far Cry 6 (2021) | 126 | 80 | 68 | ||
| F1 22 (2022) | 150.4 | 134.4 | 99.6 | 32.9 | |
| F1 23 (2023) | 136.5 | 119.8 | 84.1 | 25 | 16 |
| Baldur's Gate 3 (2023) | 69.4 | 53.6 | 39 | 38.9 | 26.8 |
| Cyberpunk 2077 2.2 Phantom Liberty (2023) | 52.9 | 37.7 | 25.4 | 25 | 19.8 |
| Assassin's Creed Mirage (2023) | 78 | 69 | 55 | 40 | 32 |
| Total War Pharaoh (2023) | 199 | 129 | 73 | 56 | 39 |
| Call of Duty Modern Warfare 3 2023 (2023) | 88 | 78 | 58 | 49 | 33 |
| Avatar Frontiers of Pandora (2023) | 42 | 38 | 32 | 20 | |
| Ghost of Tsushima (2024) | 56.4 | 47.1 | 40.2 | 30.9 | 22 |
| F1 24 (2024) | 112.9 | 80.8 | 26.5 | 16 | 22 |
Emissões - Ventiladores barulhentos
Emissões de ruído
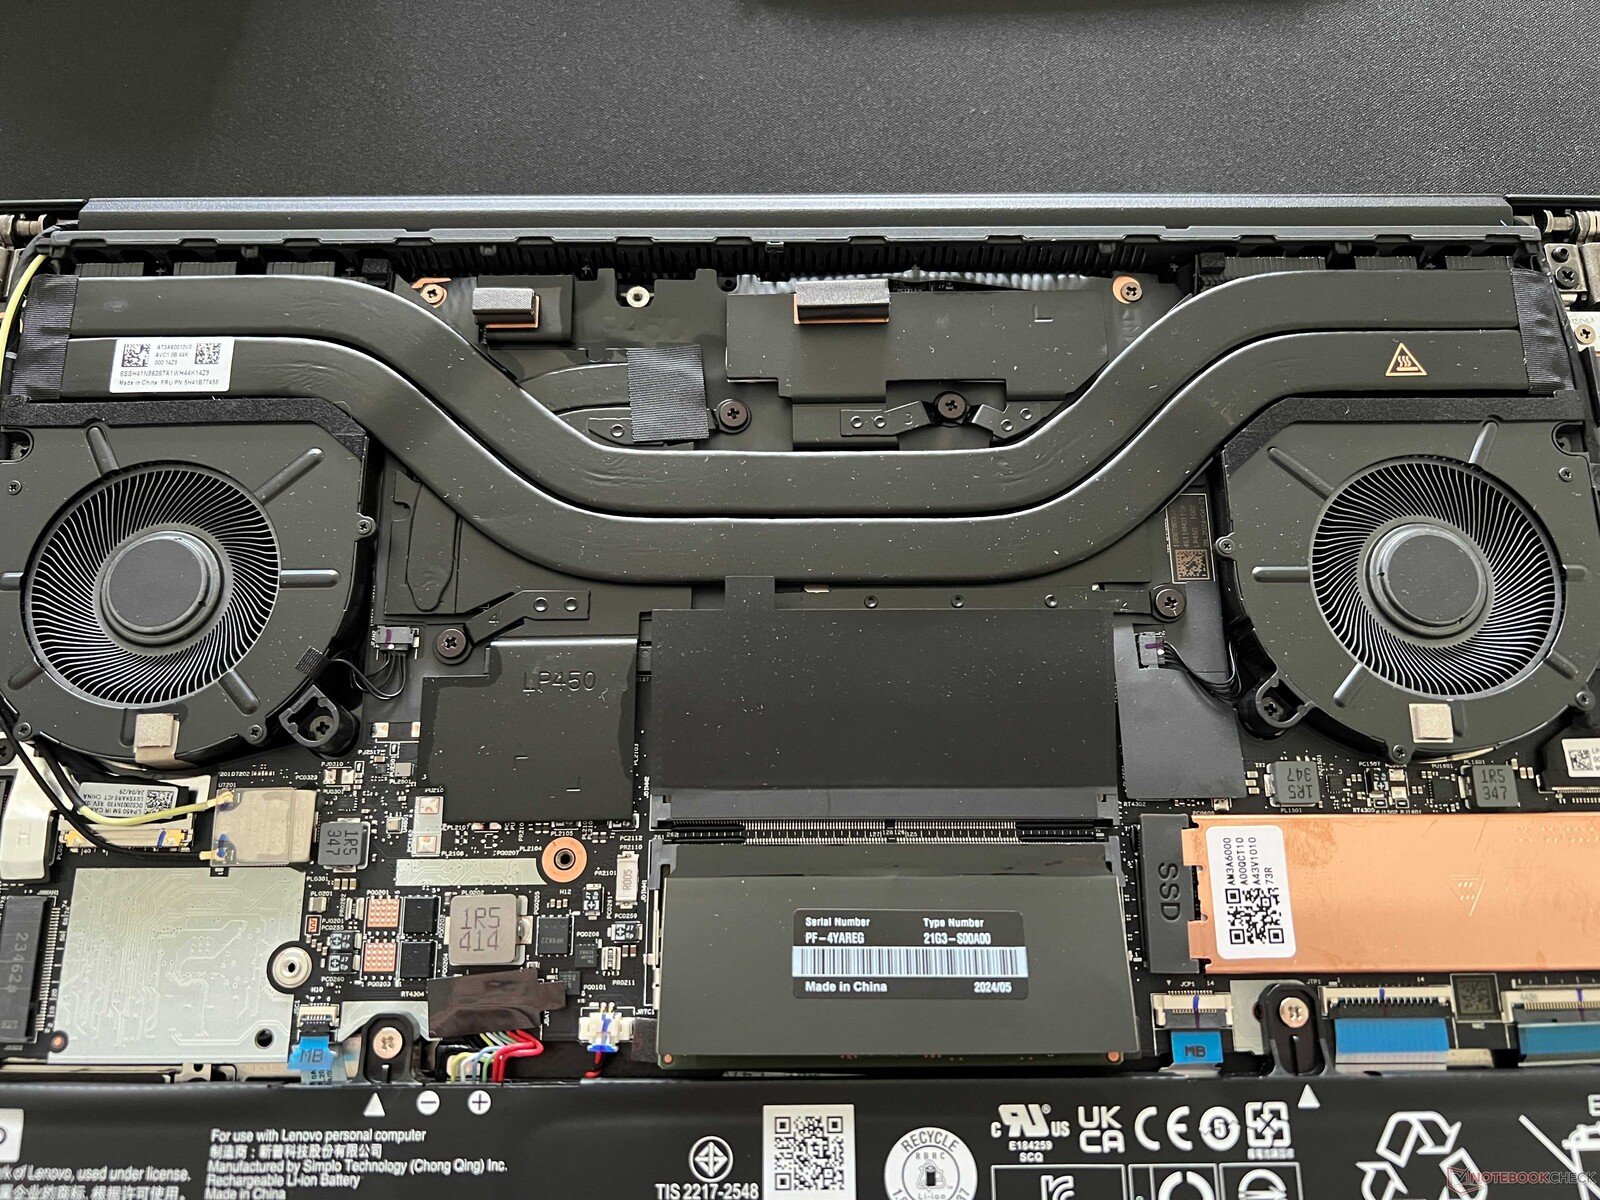
O sistema de resfriamento do laptop é composto por duas ventoinhas e inicia muito rapidamente, mesmo durante picos de carga curtos. Mesmo ao fazer coisas muito simples, como reproduzir vídeos do YouTube, as ventoinhas estavam sempre ativas em baixas velocidades durante nosso teste - isso só poderia ser reduzido um pouco com o uso de um perfil de energia mais fraco. O dispositivo também ficou rapidamente mais barulhento sob carga e medimos 46,8 dB(A) tanto em jogos quanto no teste de estresse. O modo balanceado não foi muito mais silencioso, com 44,8 dB(A), e mesmo ao usar o melhor modo de economia de energia, as ventoinhas ainda eram claramente audíveis, com até 38,3 dB(A). Nenhum outro ruído eletrônico foi emitido pelo nosso dispositivo de teste durante a fase de teste.
Barulho
| Ocioso |
| 24.6 / 24.6 / 27.5 dB |
| Carga |
| 41.2 / 46.8 dB |
 | ||
30 dB silencioso 40 dB(A) audível 50 dB(A) ruidosamente alto |
||
min: | ||
| Lenovo ThinkPad P14s G5 21G3S00A00 Nvidia RTX 500 Ada Generation Laptop GPU, Ultra 7 155H, Lenovo UMIS AM630 RPETJ1T24MGE2QDQ | HP ZBook Firefly 14 G11 RTX A500 Laptop GPU, Ultra 7 165H, Kioxia XG8 KXG80ZNV512G | Dell Precision 5000 5490 NVIDIA RTX 3000 Ada Generation Laptop GPU, Ultra 9 185H, Kioxia XG8 KXG80ZNV1T02 | Lenovo ThinkPad P14s G4 21HF0017GE RTX A500 Laptop GPU, i7-1370P, SK Hynix HFS002TEJ9X162N | Microsoft Surface Laptop Studio 2 RTX 4060 NVIDIA GeForce RTX 4060 Laptop GPU, i7-13700H, Kioxia XG8 KXG80ZNV1T02 | Lenovo Yoga Pro 9-14IRP G8 NVIDIA GeForce RTX 4050 Laptop GPU, i7-13705H, Samsung PM9A1 MZVL21T0HCLR | |
|---|---|---|---|---|---|---|
| Noise | 3% | 3% | 2% | -3% | -4% | |
| desligado / ambiente * | 24.6 | 24.3 1% | 22.8 7% | 24.6 -0% | 23.9 3% | 24.8 -1% |
| Idle Minimum * | 24.6 | 24.6 -0% | 23.8 3% | 24.6 -0% | 23.9 3% | 24.8 -1% |
| Idle Average * | 24.6 | 25.2 -2% | 23.8 3% | 24.6 -0% | 24.4 1% | 24.8 -1% |
| Idle Maximum * | 27.5 | 26.8 3% | 24.7 10% | 25.9 6% | 26.9 2% | 24.8 10% |
| Load Average * | 41.2 | 38.9 6% | 38.9 6% | 41.3 -0% | 48.5 -18% | 47.4 -15% |
| Cyberpunk 2077 ultra * | 46.8 | 41.8 11% | 44.2 6% | |||
| Load Maximum * | 46.8 | 45.8 2% | 51.4 -10% | 46.2 1% | 51.8 -11% | 52.9 -13% |
| Witcher 3 ultra * | 49.9 | 46 | 51.8 | 52.9 |
* ... menor é melhor
Temperatura
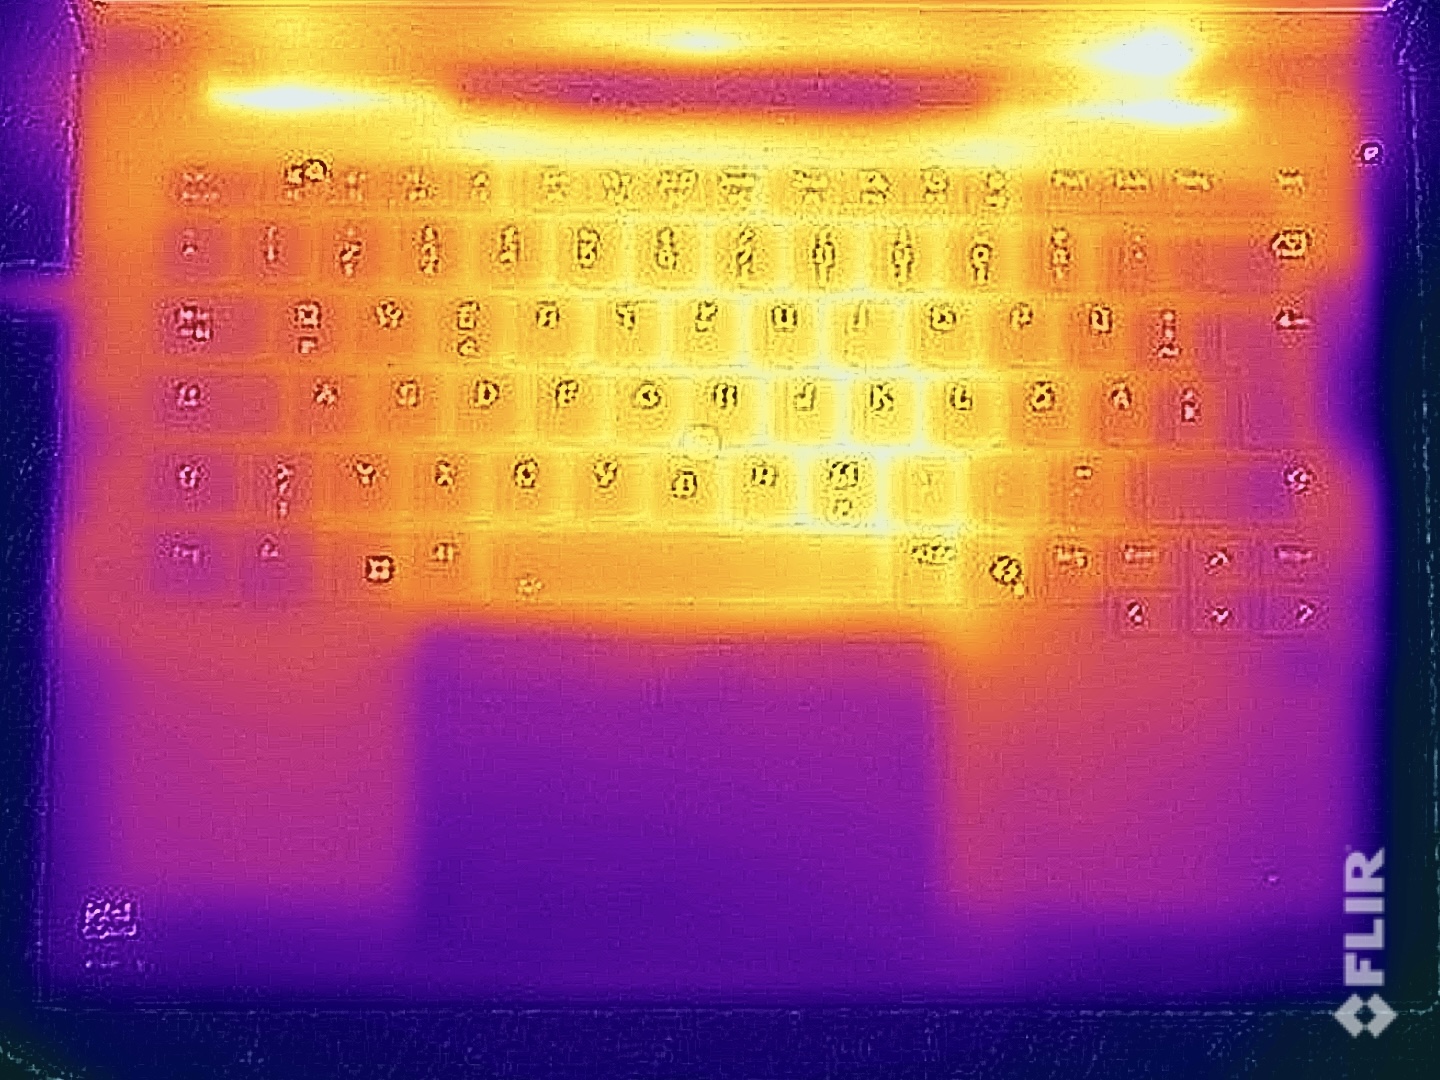
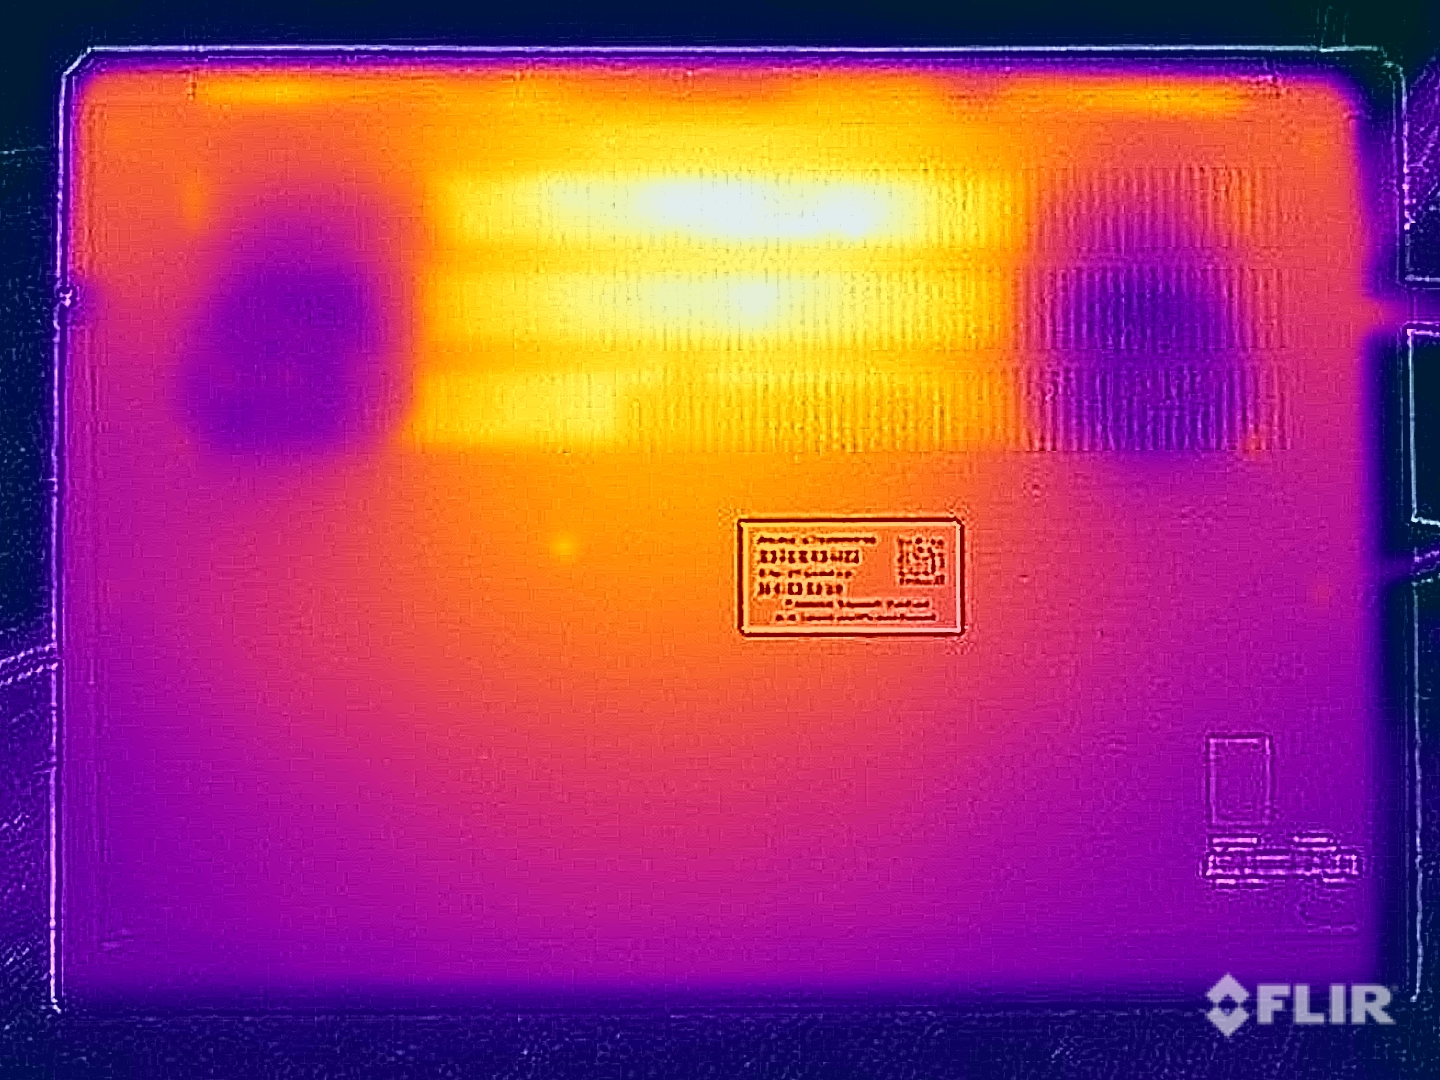
Algumas partes da superfície do ThinkPad P14s G5 já atingiram temperaturas de 30 °C quando em marcha lenta, de modo que as capacidades de resfriamento passivo do dispositivo não parecem ser as melhores. Sob carga, notamos um ponto de acesso de cerca de 47 °C na área central traseira da parte inferior, mas esse valor não é crítico. Mesmo assim, o senhor provavelmente não deveria colocar o laptop sobre as coxas. A área do teclado também fica visivelmente quente - medimos um pico de 41 °C, mas isso não deve representar nenhuma limitação durante o uso.
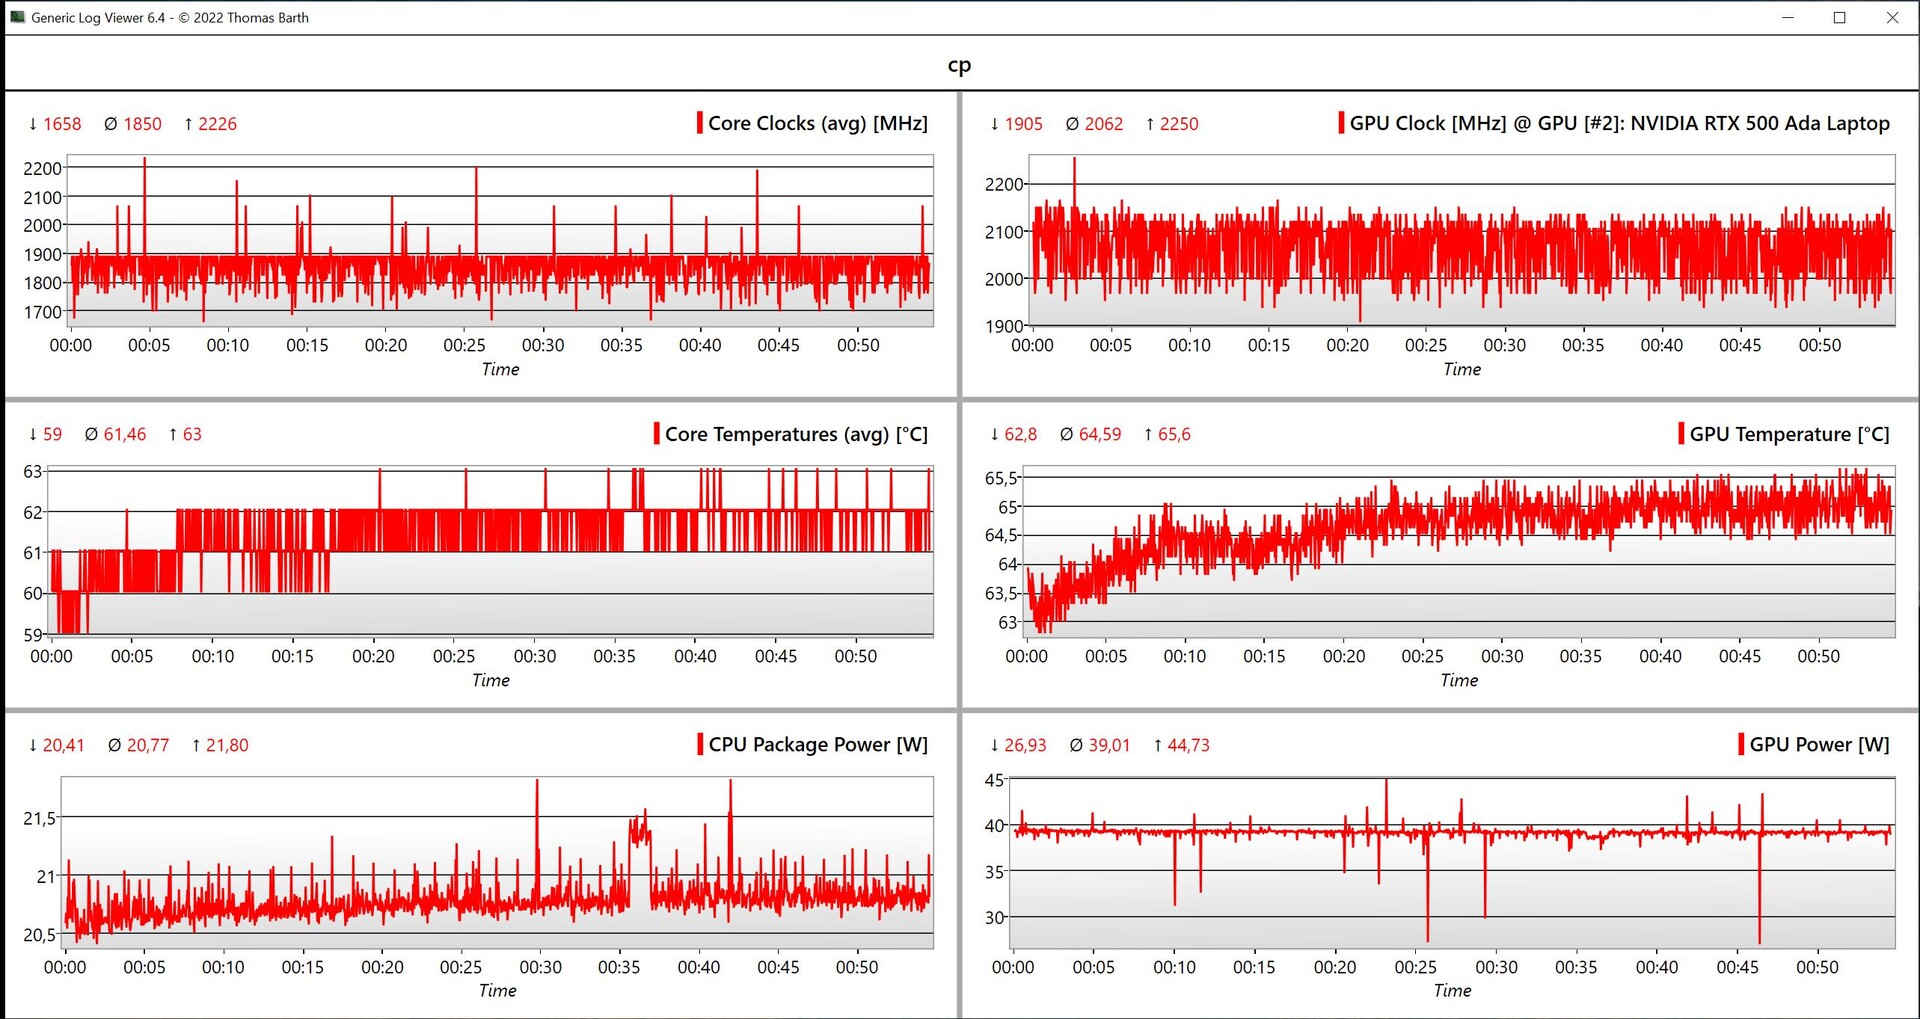
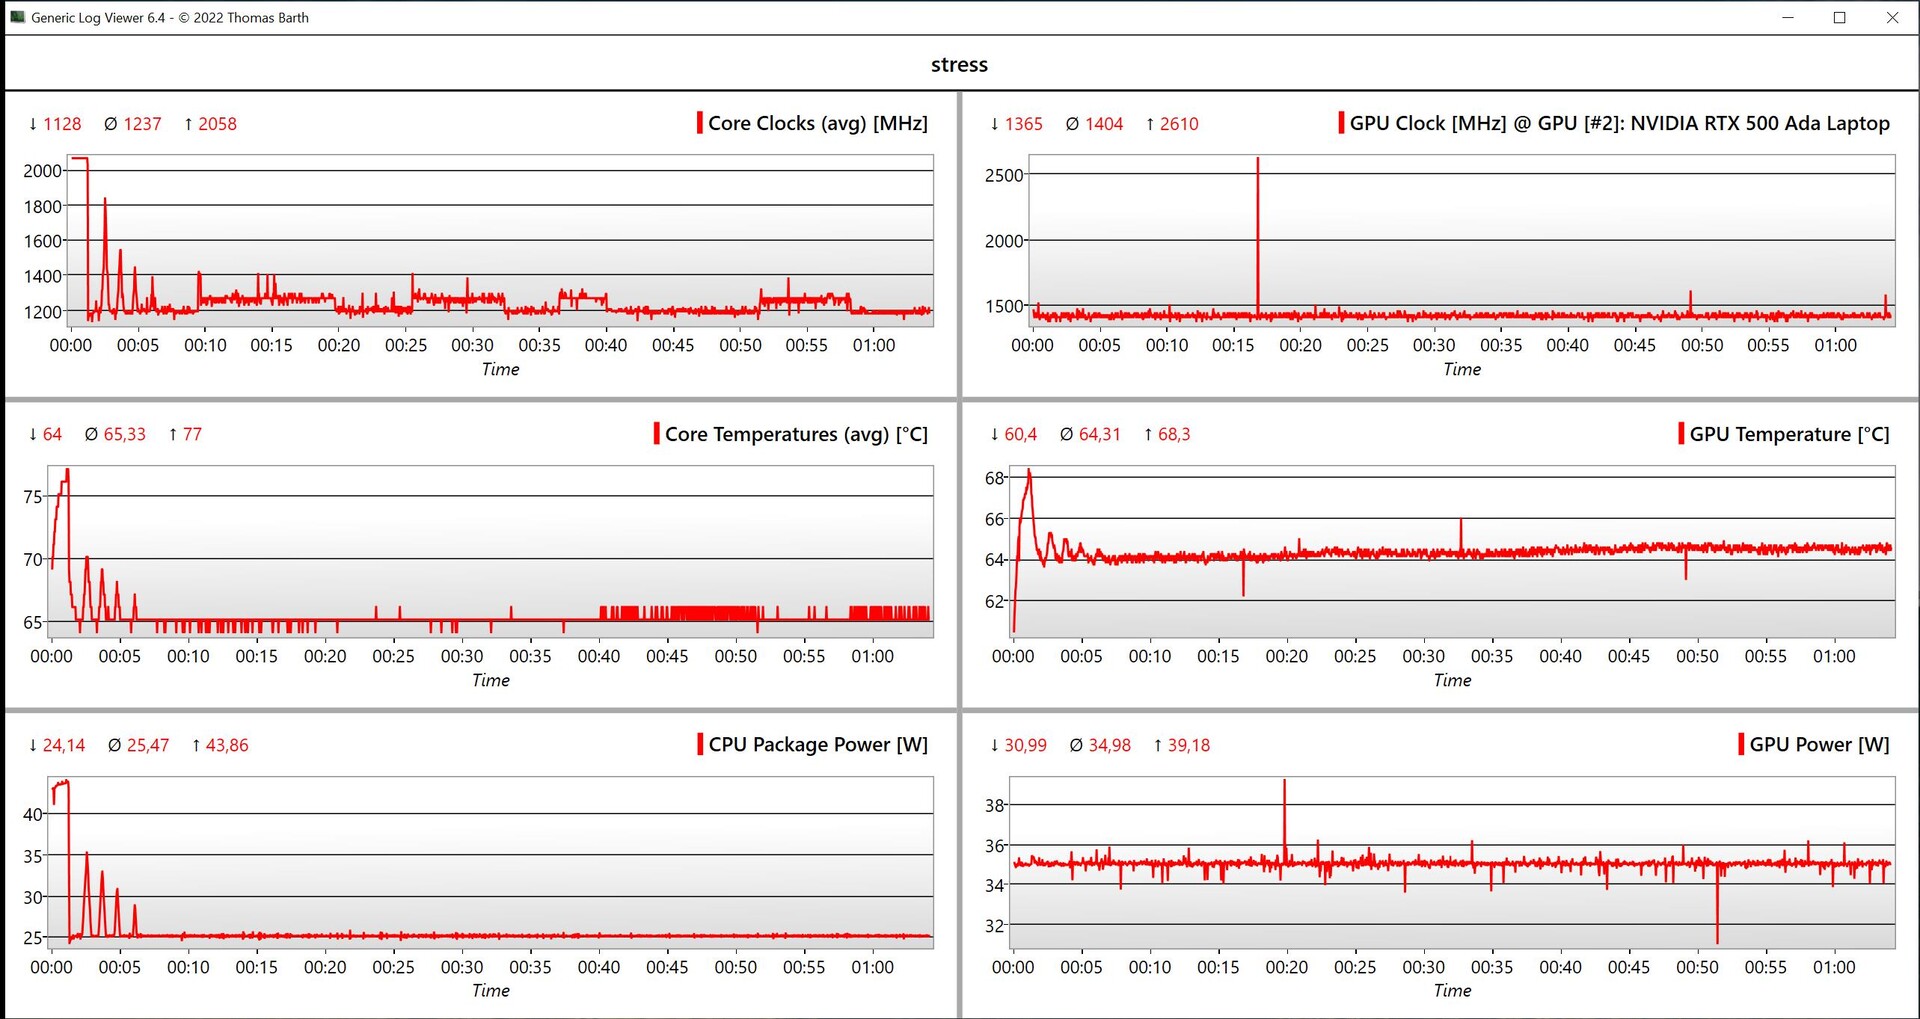
Durante o teste de estresse com carga combinada de CPU/GPU, a placa de vídeo foi a preferida pelo sistema e funcionou constantemente a 35 watts, enquanto o processador se estabilizou rapidamente em apenas 25 watts. No total, o sistema pode resfriar 60 watts permanentemente.
(±) A temperatura máxima no lado superior é 41.3 °C / 106 F, em comparação com a média de 38.2 °C / 101 F , variando de 22.2 a 69.8 °C para a classe Workstation.
(-) A parte inferior aquece até um máximo de 47 °C / 117 F, em comparação com a média de 41.2 °C / 106 F
(+) Em uso inativo, a temperatura média para o lado superior é 29.1 °C / 84 F, em comparação com a média do dispositivo de 32 °C / ### class_avg_f### F.
(±) 3: The average temperature for the upper side is 36.3 °C / 97 F, compared to the average of 32 °C / 90 F for the class Workstation.
(+) Os apoios para as mãos e o touchpad são mais frios que a temperatura da pele, com um máximo de 30.2 °C / 86.4 F e, portanto, são frios ao toque.
(-) A temperatura média da área do apoio para as mãos de dispositivos semelhantes foi 27.8 °C / 82 F (-2.4 °C / -4.4 F).
| Lenovo ThinkPad P14s G5 21G3S00A00 Intel Core Ultra 7 155H, Nvidia RTX 500 Ada Generation Laptop GPU | HP ZBook Firefly 14 G11 Intel Core Ultra 7 165H, NVIDIA RTX A500 Laptop GPU | Dell Precision 5000 5490 Intel Core Ultra 9 185H, NVIDIA RTX 3000 Ada Generation Laptop GPU | Lenovo ThinkPad P14s G4 21HF0017GE Intel Core i7-1370P, NVIDIA RTX A500 Laptop GPU | Microsoft Surface Laptop Studio 2 RTX 4060 Intel Core i7-13700H, NVIDIA GeForce RTX 4060 Laptop GPU | Lenovo Yoga Pro 9-14IRP G8 Intel Core i7-13705H, NVIDIA GeForce RTX 4050 Laptop GPU | |
|---|---|---|---|---|---|---|
| Heat | 2% | 4% | -8% | 11% | 0% | |
| Maximum Upper Side * | 41.3 | 42.8 -4% | 43.2 -5% | 55.3 -34% | 40.4 2% | 41 1% |
| Maximum Bottom * | 47 | 44 6% | 38.4 18% | 48.7 -4% | 42.2 10% | 56.7 -21% |
| Idle Upper Side * | 30.2 | 30.6 -1% | 31.6 -5% | 31 -3% | 26.6 12% | 27.4 9% |
| Idle Bottom * | 33.2 | 31.4 5% | 30.6 8% | 29.9 10% | 27 19% | 29.1 12% |
* ... menor é melhor
Alto-falantes
Os dois alto-falantes estéreo estão localizados sob a borda frontal da unidade base e emitem o som para baixo, onde ele é idealmente refletido de volta para o usuário a partir de uma superfície rígida. Durante nossa análise, os módulos tiveram um bom desempenho, não apenas por serem altos, mas também por causa do equilíbrio entre os sons agudos e médios. Isso também beneficia os vocais. Somente os graves soaram um pouco fracos, e é por isso que as músicas ou os filmes não soam tão potentes quanto poderiam.
Lenovo ThinkPad P14s G5 21G3S00A00 análise de áudio
(+) | os alto-falantes podem tocar relativamente alto (###valor### dB)
Graves 100 - 315Hz
(-) | quase nenhum baixo - em média 18.8% menor que a mediana
(±) | a linearidade dos graves é média (8.3% delta para a frequência anterior)
Médios 400 - 2.000 Hz
(+) | médios equilibrados - apenas 2.7% longe da mediana
(+) | médios são lineares (2.8% delta para frequência anterior)
Altos 2 - 16 kHz
(+) | agudos equilibrados - apenas 2.4% longe da mediana
(+) | os máximos são lineares (3.5% delta da frequência anterior)
Geral 100 - 16.000 Hz
(+) | o som geral é linear (12.2% diferença em relação à mediana)
Comparado com a mesma classe
» 14% de todos os dispositivos testados nesta classe foram melhores, 3% semelhantes, 83% piores
» O melhor teve um delta de 7%, a média foi 18%, o pior foi 35%
Comparado com todos os dispositivos testados
» 8% de todos os dispositivos testados foram melhores, 2% semelhantes, 89% piores
» O melhor teve um delta de 4%, a média foi 24%, o pior foi 134%
HP ZBook Firefly 14 G11 análise de áudio
(+) | os alto-falantes podem tocar relativamente alto (###valor### dB)
Graves 100 - 315Hz
(-) | quase nenhum baixo - em média 21.6% menor que a mediana
(±) | a linearidade dos graves é média (10% delta para a frequência anterior)
Médios 400 - 2.000 Hz
(+) | médios equilibrados - apenas 4.5% longe da mediana
(+) | médios são lineares (4.3% delta para frequência anterior)
Altos 2 - 16 kHz
(+) | agudos equilibrados - apenas 3.4% longe da mediana
(+) | os máximos são lineares (3.2% delta da frequência anterior)
Geral 100 - 16.000 Hz
(±) | a linearidade do som geral é média (16.2% diferença em relação à mediana)
Comparado com a mesma classe
» 38% de todos os dispositivos testados nesta classe foram melhores, 7% semelhantes, 55% piores
» O melhor teve um delta de 7%, a média foi 18%, o pior foi 35%
Comparado com todos os dispositivos testados
» 24% de todos os dispositivos testados foram melhores, 5% semelhantes, 71% piores
» O melhor teve um delta de 4%, a média foi 24%, o pior foi 134%
Lenovo Yoga Pro 9-14IRP G8 análise de áudio
(±) | o volume do alto-falante é médio, mas bom (###valor### dB)
Graves 100 - 315Hz
(±) | graves reduzidos - em média 5.9% menor que a mediana
(±) | a linearidade dos graves é média (7.8% delta para a frequência anterior)
Médios 400 - 2.000 Hz
(+) | médios equilibrados - apenas 2.3% longe da mediana
(+) | médios são lineares (3.2% delta para frequência anterior)
Altos 2 - 16 kHz
(+) | agudos equilibrados - apenas 2.5% longe da mediana
(+) | os máximos são lineares (3.4% delta da frequência anterior)
Geral 100 - 16.000 Hz
(+) | o som geral é linear (7.3% diferença em relação à mediana)
Comparado com a mesma classe
» 4% de todos os dispositivos testados nesta classe foram melhores, 1% semelhantes, 95% piores
» O melhor teve um delta de 5%, a média foi 18%, o pior foi 45%
Comparado com todos os dispositivos testados
» 1% de todos os dispositivos testados foram melhores, 0% semelhantes, 99% piores
» O melhor teve um delta de 4%, a média foi 24%, o pior foi 134%
Gerenciamento de energia - O painel de 3K precisa de muita energia
Consumo de energia
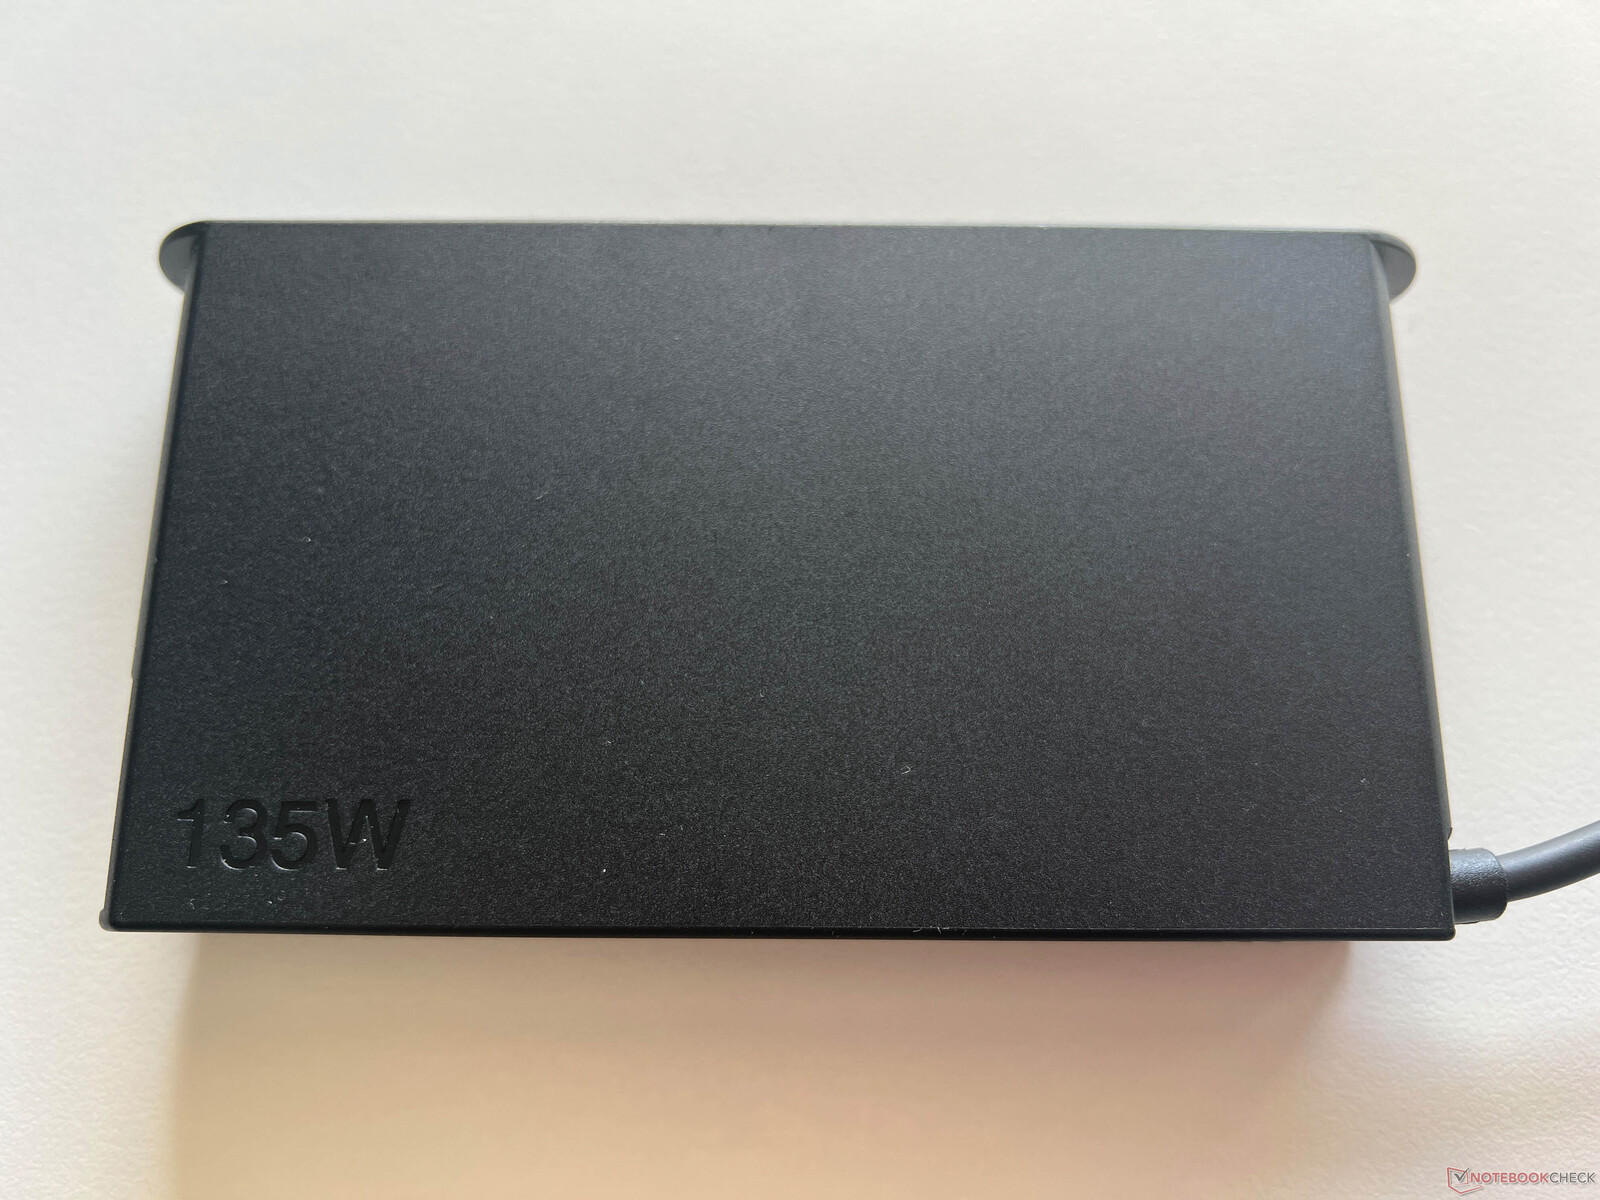
Nossas medições de consumo mostraram claramente que o novo painel 3K requer muita energia. Apesar de seu brilho máximo mais baixo, o consumo máximo do laptop em modo inativo é maior do que o do ZBook Firefly 14 G11por exemplo. Ao jogar, o dispositivo requer entre 80-90 watts, enquanto vimos 137 watts por alguns segundos durante o teste de estresse. No entanto, esse valor se estabilizou rapidamente em 90 watts e permaneceu nesse nível. A fonte de alimentação de 135 watts é, portanto, suficiente em tamanho. As configurações sem o RTX 500 Ada são fornecidas com uma fonte de alimentação mais fraca, de 100 watts.
| desligado | |
| Ocioso | |
| Carga |
|
Key:
min: | |
| Lenovo ThinkPad P14s G5 21G3S00A00 Ultra 7 155H, Nvidia RTX 500 Ada Generation Laptop GPU, Lenovo UMIS AM630 RPETJ1T24MGE2QDQ, IPS, 3072x1920, 14.5" | HP ZBook Firefly 14 G11 Ultra 7 165H, RTX A500 Laptop GPU, Kioxia XG8 KXG80ZNV512G, IPS, 2560x1600, 14" | Dell Precision 5000 5490 Ultra 9 185H, NVIDIA RTX 3000 Ada Generation Laptop GPU, Kioxia XG8 KXG80ZNV1T02, IPS, 2560x1600, 14" | Lenovo ThinkPad P14s G4 21HF0017GE i7-1370P, RTX A500 Laptop GPU, SK Hynix HFS002TEJ9X162N, OLED, 2880x1800, 14" | Microsoft Surface Laptop Studio 2 RTX 4060 i7-13700H, NVIDIA GeForce RTX 4060 Laptop GPU, Kioxia XG8 KXG80ZNV1T02, IPS, 2400x1600, 14.4" | Lenovo Yoga Pro 9-14IRP G8 i7-13705H, NVIDIA GeForce RTX 4050 Laptop GPU, Samsung PM9A1 MZVL21T0HCLR, Mini-LED, 3072x1920, 14.5" | Média Nvidia RTX 500 Ada Generation Laptop GPU | Média da turma Workstation | |
|---|---|---|---|---|---|---|---|---|
| Power Consumption | 21% | -9% | 30% | 37% | -23% | 0% | -6% | |
| Idle Minimum * | 7.5 | 6.6 12% | 11.1 -48% | 6.3 16% | 3 60% | 10.9 -45% | 7.5 ? -0% | 8.43 ? -12% |
| Idle Average * | 13.5 | 12.7 6% | 14.8 -10% | 7 48% | 7.1 47% | 17.7 -31% | 13.5 ? -0% | 12.4 ? 8% |
| Idle Maximum * | 14.2 | 13.3 6% | 16.5 -16% | 8.1 43% | 7.6 46% | 19.3 -36% | 14.2 ? -0% | 17.8 ? -25% |
| Load Average * | 100.2 | 67 33% | 70.1 30% | 84.6 16% | 73.1 27% | 93.3 7% | 100.2 ? -0% | 88.4 ? 12% |
| Cyberpunk 2077 ultra * | 86.7 | 63.4 27% | ||||||
| Cyberpunk 2077 ultra external monitor * | 84.6 | 58.1 31% | ||||||
| Load Maximum * | 137.4 | 94.9 31% | 137.5 -0% | 98.3 28% | 128.5 6% | 150.2 -9% | 137.4 ? -0% | 154.1 ? -12% |
| Witcher 3 ultra * | 93.1 | 56.5 | 113.9 | 129.5 |
* ... menor é melhor
Power consumption Cyberpunk / stress test
Power consumption with external monitor
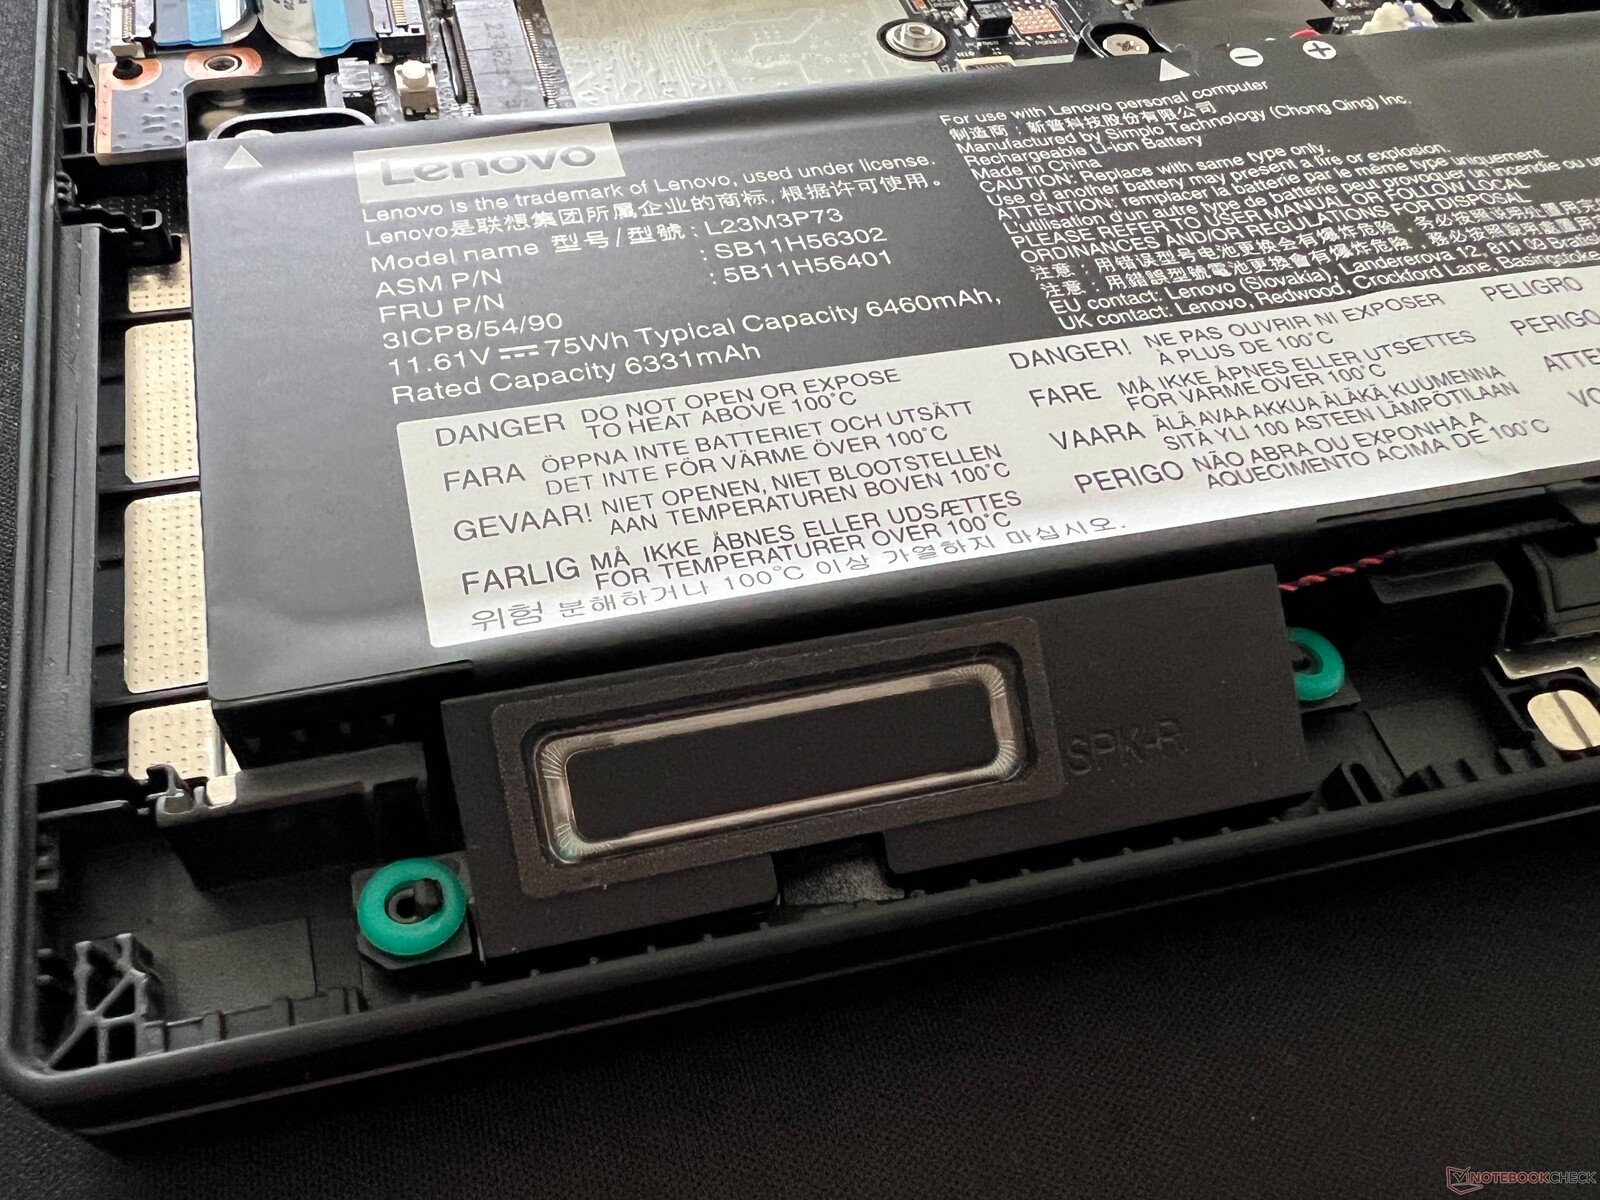
Tempos de execução
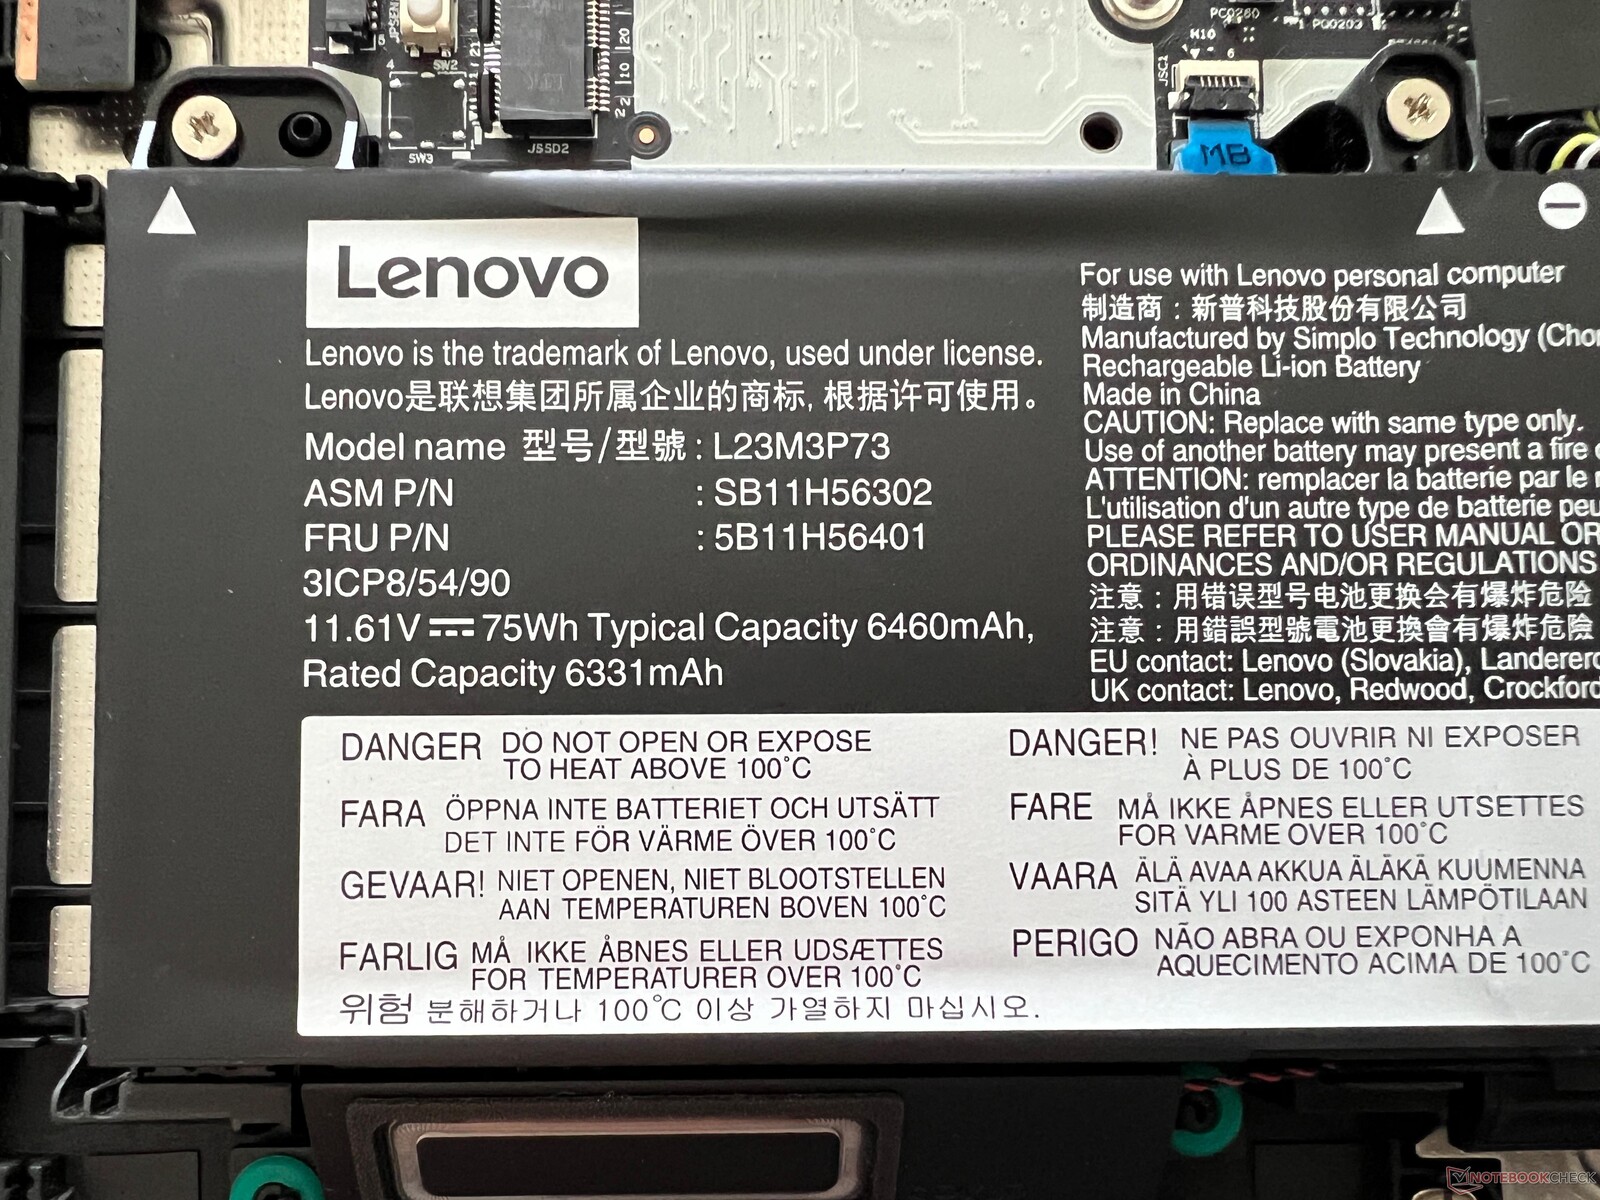
O novo ThinkPad P14s G5 Intel está disponível com dois tamanhos diferentes de bateria (57 ou 75 Wh). Nosso dispositivo de teste está equipado com a bateria maior de 75 Wh, que é necessária para alcançar tempos de execução decentes, já que apresenta um painel de 3K. A propósito, sua taxa de atualização não pode ser alterada no momento, pois o modo de sinal ativo sempre permanece em 120 Hz; a Lenovo poderia melhorar isso com uma atualização. A 120 Hz, seus resultados são apenas medianos. Durante o teste WLAN a 150 cd/m² (corresponde a 66% do brilho máximo de nosso dispositivo de teste), observamos um pouco menos de 8 horas, o que só foi superado pelo antigo P14s G4 com sua bateria de 52,5 Wh. Com brilho total, o teste WLAN durou apenas 5:43 horas. No teste de vídeo, ele durou pouco menos de 9 horas e, sob carga, a bateria foi descarregada em cerca de 80 minutos.
São necessários 128 minutos para carregar totalmente o dispositivo usando a fonte de alimentação de 135 watts quando ele é ligado, sendo que 80% de sua capacidade está disponível novamente após 75 minutos.
| Lenovo ThinkPad P14s G5 21G3S00A00 Ultra 7 155H, Nvidia RTX 500 Ada Generation Laptop GPU, 75 Wh | HP ZBook Firefly 14 G11 Ultra 7 165H, RTX A500 Laptop GPU, 56 Wh | Dell Precision 5000 5490 Ultra 9 185H, NVIDIA RTX 3000 Ada Generation Laptop GPU, 72 Wh | Lenovo ThinkPad P14s G4 21HF0017GE i7-1370P, RTX A500 Laptop GPU, 52.5 Wh | Microsoft Surface Laptop Studio 2 RTX 4060 i7-13700H, NVIDIA GeForce RTX 4060 Laptop GPU, 58 Wh | Lenovo Yoga Pro 9-14IRP G8 i7-13705H, NVIDIA GeForce RTX 4050 Laptop GPU, 75 Wh | Média da turma Workstation | |
|---|---|---|---|---|---|---|---|
| Duração da bateria | 9% | 39% | -23% | 33% | -2% | 14% | |
| H.264 | 534 | 675 26% | 547 2% | 733 ? 37% | |||
| WiFi v1.3 | 473 | 517 9% | 658 39% | 367 -22% | 498 5% | 477 1% | 502 ? 6% |
| Load | 78 | 59 -24% | 132 69% | 72 -8% | 77.4 ? -1% |
Pro
Contra
Veredicto - O ThinkPad P14s G5 agora com uma GPU mais rápida


No início deste teste, perguntamos se o desenvolvimento desse laptop está indo na direção certa novamente. O novo ThinkPad P14s G5 (Intel) mostra muito potencial - a decisão de não usar o gabinete mais fino possível, sua mudança do painel OLED opcional para uma tela IPS fosca sem PWM, bem como sua RAM atualizável, tudo isso beneficia muito uma estação de trabalho móvel. No entanto, em nossa opinião, essas medidas não são suficientes. Embora o desempenho dos componentes seja geralmente bom, o senhor simplesmente tem que questionar por que o fabricante não oferece a RTX 1000 Ada mais rápida, por exemplo, considerando o gabinete espesso do notebook - ou por que até mesmo o painel IPS opcional com sua resolução de 3K ainda fica atrás da concorrência em termos de brilho. No final das contas, a Lenovo conseguiu usar componentes mais potentes e um mini painel de LED muito mais brilhante no Yoga Pro 9 14-tudo isso em um gabinete mais fino.
A nova tela IPS em si, com sua resolução de 3K e cobertura P3, é um painel bastante decente, mas a Lenovo deveria dar aos usuários acesso a um perfil sRGB - além disso, atualmente não é possível reduzir sua taxa de atualização para 60 Hz, o que melhoraria um pouco mais a vida útil da bateria do dispositivo. O RTX 500 Adaé muito melhor do que o antigo laptop RTX A500 e seu processador Meteor Lake também não decepciona, enquanto o resfriamento do laptop atingiu seu limite durante o teste de estresse. Em vista de sua unidade de base espessa, uma capacidade máxima de resfriamento de 60 watts (CPU/GPU combinadas) não é muito impressionante, especialmente quando comparada com laptops multimídia potentes de 14 polegadas. Quanto ao seu teclado, a nova posição da tecla Fn certamente levará algum tempo para que os veteranos do ThinkPad se acostumem, mas a qualidade do teclado em si não mudou. Portanto, o teclado é bom, mas nada de especial. Novamente, temos que nos perguntar por que um teclado de 1,8 mm não poderia ter sido instalado em uma unidade de base tão espessa.
A versão Intel do ThinkPad P14s G5 oferece boas opções de manutenção, bem como uma nova tela de 14,5 polegadas. Seu desempenho também é um pouco melhor do que seu antecessor, mas apesar de sua unidade de base espessa, a estação de trabalho móvel só pode ser comprada com a GPU de nível básico da Nvidia, na melhor das hipóteses, ou seja, a RTX 500 Ada.
O ThinkPad P14s oferece outras vantagens, como boas opções de manutenção - incluindo dois slots de RAM para até 96 GB de RAM. Há portas suficientes e sua webcam de 5 MP faz um bom trabalho. Em termos de desempenho, ele também é claramente superior ao seu concorrente direto, o HP ZBook Firefly 14 G11. No entanto, se o senhor não depender de certificações ISV, poderá obter um desempenho significativamente maior dos dispositivos multimídia hoje em dia, especialmente em termos de placas de vídeo. A grande diferença entre os modelos Intel e AMD também não é uma boa situação para os clientes.
Preço e disponibilidade
O ThinkPad P14s G5 pode ser configurado por meio da loja on-line da Lenovo, com preços a partir de US$ 2.439.
Observação: Atualizamos recentemente nosso sistema de classificação e os resultados da versão 8 não são comparáveis aos resultados da versão 7. Mais informações estão disponíveis aqui.
Lenovo ThinkPad P14s G5 21G3S00A00
- 07/18/2024 v8
Andreas Osthoff
 Total Sustainability Score:
 Transparência
A seleção dos dispositivos a serem analisados é feita pela nossa equipe editorial. A amostra de teste foi fornecida ao autor como empréstimo pelo fabricante ou varejista para fins desta revisão. O credor não teve influência nesta revisão, nem o fabricante recebeu uma cópia desta revisão antes da publicação. Não houve obrigação de publicar esta revisão. Nunca aceitamos compensação ou pagamento em troca de nossas avaliações. Como empresa de mídia independente, a Notebookcheck não está sujeita à autoridade de fabricantes, varejistas ou editores.
É assim que o Notebookcheck está testando
Todos os anos, o Notebookcheck analisa de forma independente centenas de laptops e smartphones usando procedimentos padronizados para garantir que todos os resultados sejam comparáveis. Desenvolvemos continuamente nossos métodos de teste há cerca de 20 anos e definimos padrões da indústria no processo. Em nossos laboratórios de teste, equipamentos de medição de alta qualidade são utilizados por técnicos e editores experientes. Esses testes envolvem um processo de validação em vários estágios. Nosso complexo sistema de classificação é baseado em centenas de medições e benchmarks bem fundamentados, o que mantém a objetividade.Price comparison

