Notebookcheck Logo
Schenker Key 17 Pro M24

Análise do SCHENKER Key 17 Pro (M24) - conectores Thunderbolt 5 duplos ultrarrápidos e potência i9-14900HX

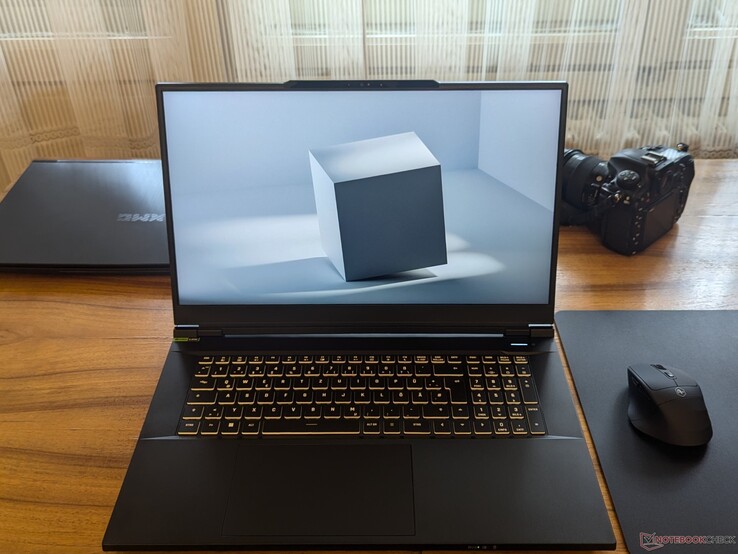
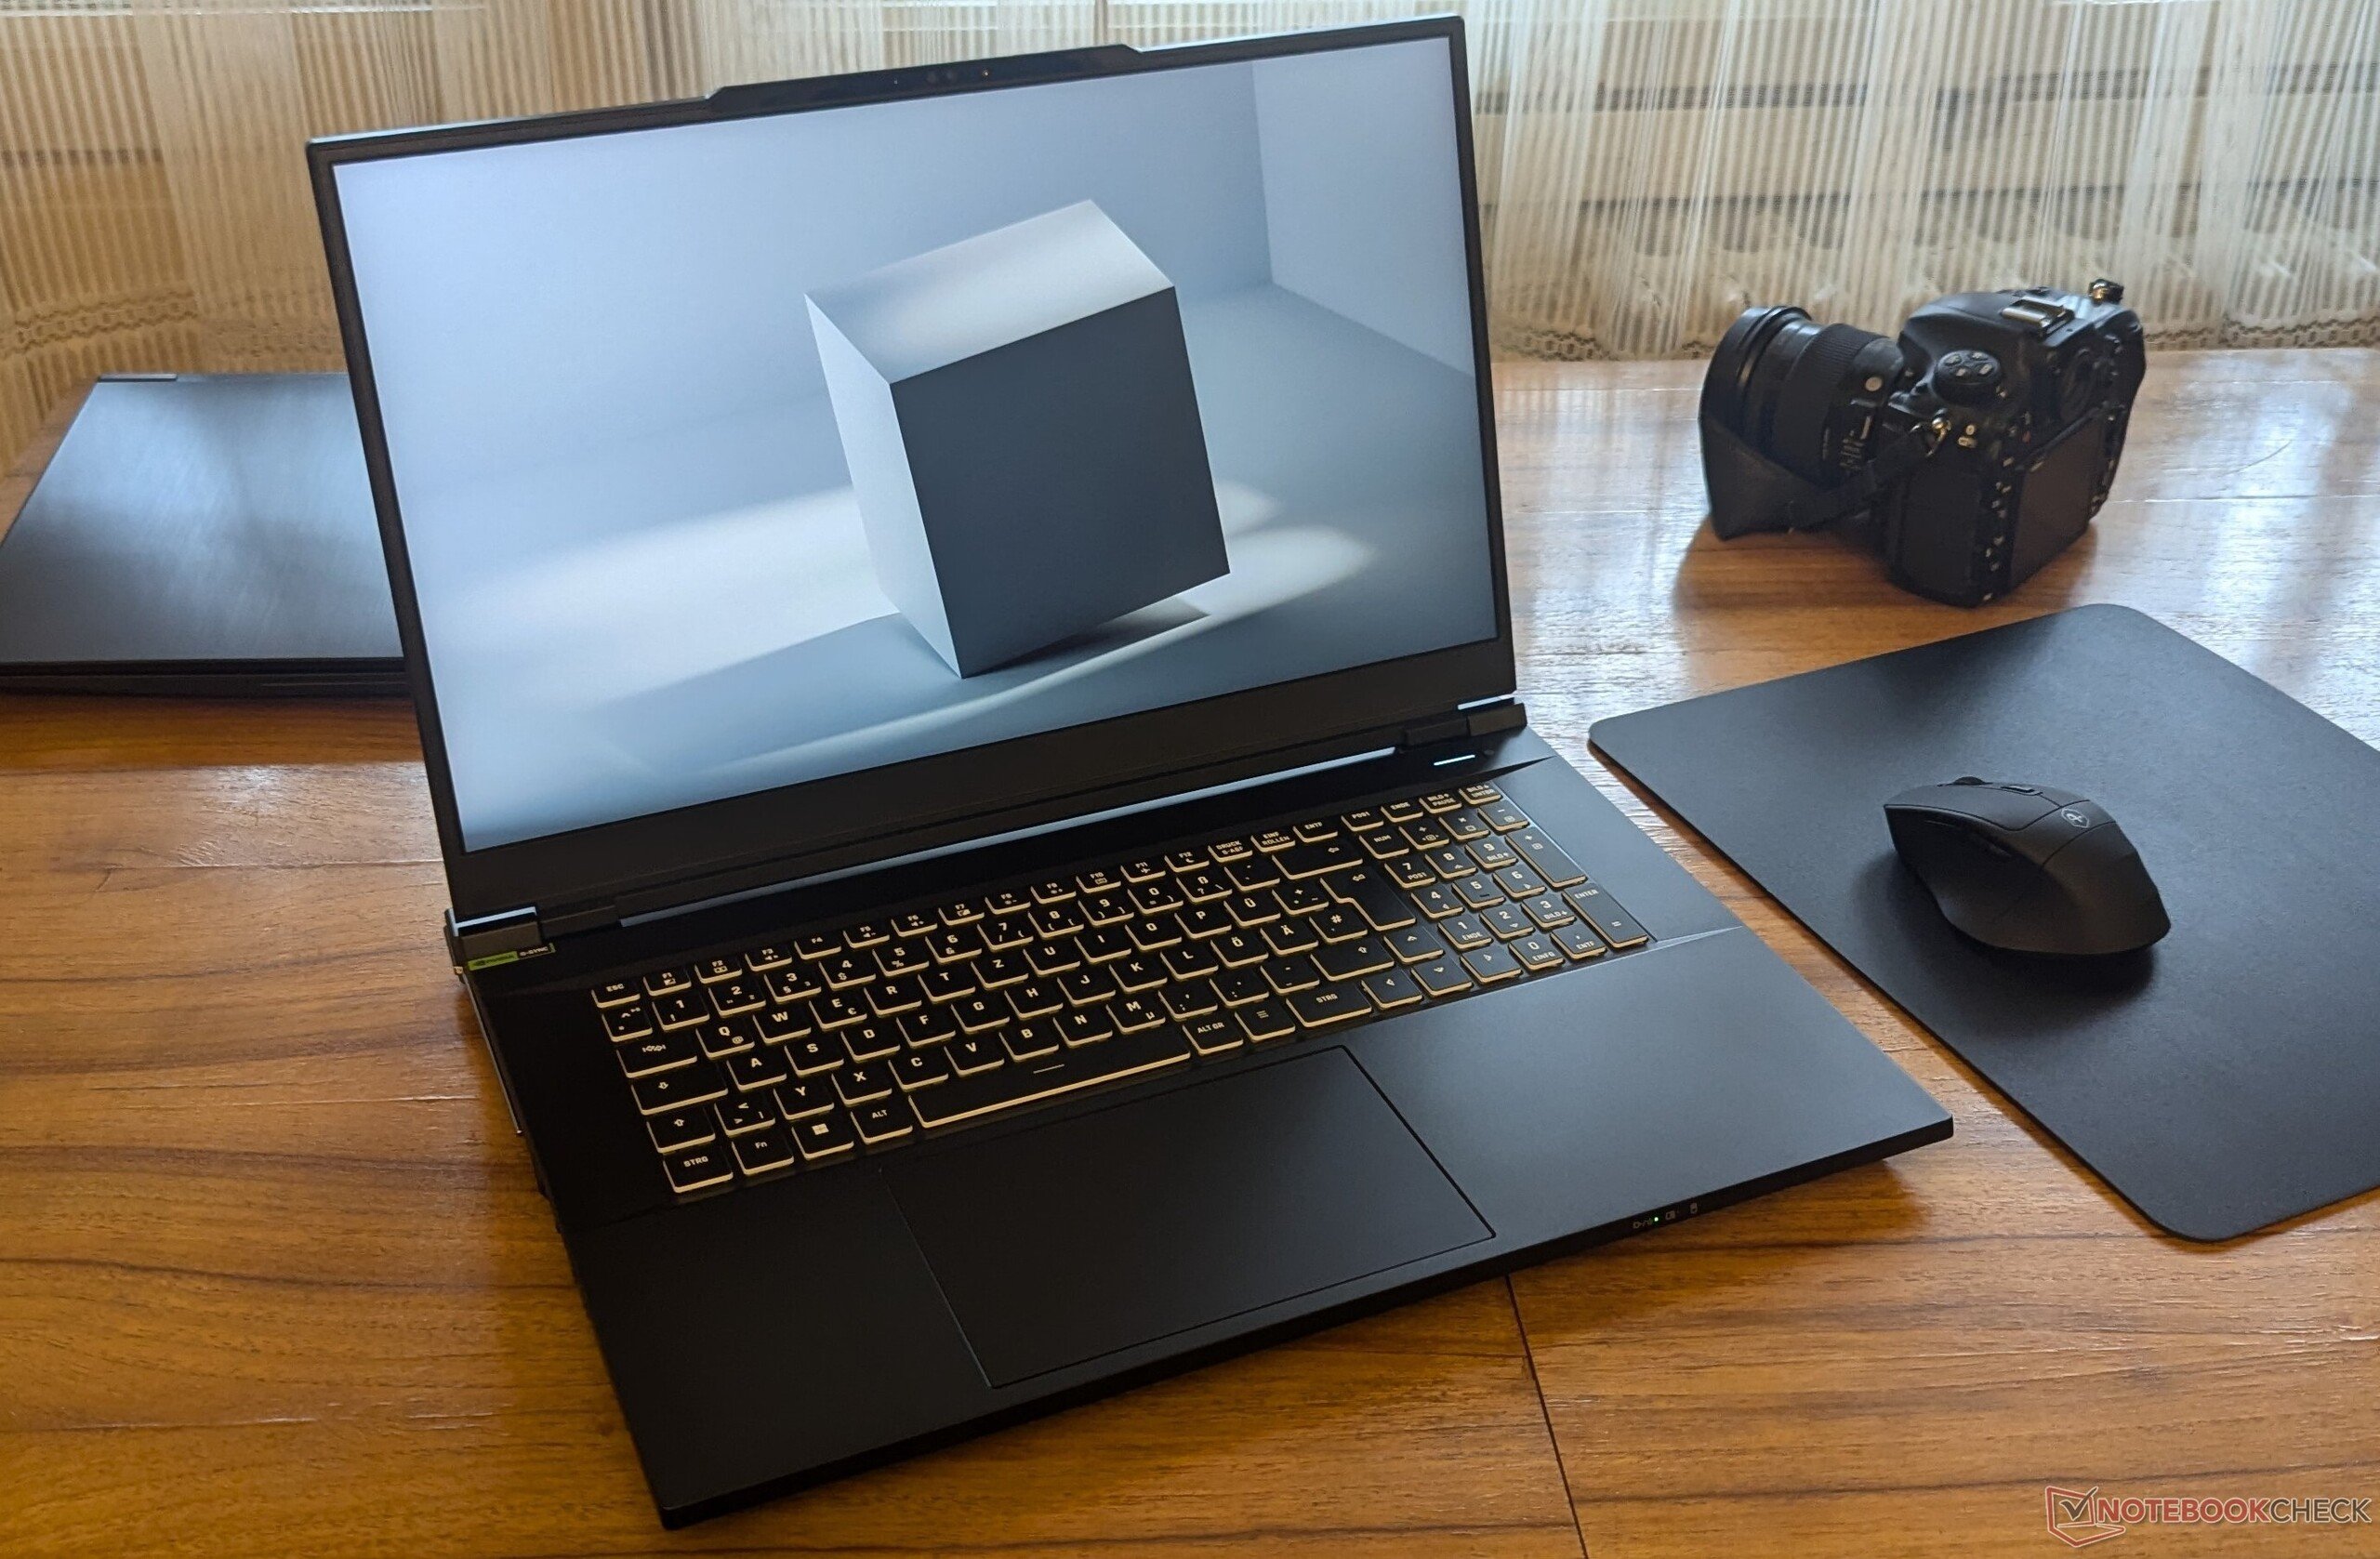
O Schenker KEY 17 Pro está entre as primeiras estações de trabalho móveis de substituição de desktops de ponta que apresentam portas Thunderbolt 5 duplas. Ela integra componentes de ponta, incluindo um processador Intel i9-14900HX atualizado, complementado pela RTX 4090 da Nvidia, bem como a conectividade Wi-Fi 7 mais rápida.
Bogdan Solca, 👁 Bogdan Solca (traduzido por DeepL / Ninh Duy) Published 🇺🇸 🇫🇷 ...
Gaming Geforce GPU Intel Laptop / Notebook Nvidia Raptor Lake Thunderbolt Workstation

Veredicto

A atualização 2024 da Schenker para os notebooks da classe de estação de trabalho Key 17 Pro vem com uma atualização da CPU e algumas adições impressionantes. A última iteração da estação de trabalho mantém o mesmo chassi Clevo do modelo do ano passado, mas substitui a CPU i9-13900HX pelo mais rápido i9-14900HXque atualmente continua sendo a solução móvel mais rápida da Intel. A Schenker também adicionou Wi-Fi 7 e dois Thunderbolt 5 cada uma com largura de banda de 80 Gbps, e esses recursos podem ser facilmente adicionados aos profissionais.

Embora a RAM e o armazenamento sejam os mesmos da variante anterior, eles ainda proporcionam um ótimo desempenho. A RTX 4090 para dispositivos móveis é sempre um ótimo complemento, mas nossos testes revelam que a implementação da Schenker não é a melhor do mercado. No geral, o desempenho é excelente.

Como desvantagem, a Schenker não melhorou o sistema de resfriamento, que ainda permanece barulhento, especialmente no perfil de desempenho, mesmo em carga média. O aplicativo da central de controle permite curvas personalizadas da ventoinha, mas isso precisa ser definido por aplicativo. Um ponto negativo em relação à versão do ano passado é a duração da bateria, que parece ter diminuído consideravelmente, embora tenha a mesma capacidade de 99 Wh. Por esse motivo, o Key 17 Pro M24 pode ser usado como um substituto do desktop ou, no máximo, em fluxos de trabalho híbridos. A tela IPS 4K tem brilho suficiente, mas o contraste e o nível de preto parecem baixos para essa faixa de preço, além disso, a webcam 1080p incluída é bastante medíocre.

Pro

+ Chassi de alumínio resistente
+ CPU i9-14900HX rápida e GPU Nvidia RTX 4090
+ RAM e armazenamento rápidos, com potencial para upgrades
+ Duas portas Thunderbolt 5
+ Conectividade Wi-Fi 7

Contra

- Sistema de resfriamento barulhento com temperaturas bastante altas em plena carga
- Baixo tempo de funcionamento da bateria
- O desempenho com a bateria foi reduzido em mais de 66%
- O contraste da tela poderia ser melhor
- Webcam 1080p medíocre

Preço e disponibilidade

A configuração testada pode ser encomendada diretamente da Bestware por 4.273 euros.

Possíveis concorrentes em comparação

Image
Model / Review
Geizhals
Weight
Height
Display
1.
85.1%
SCHENKER Key 17 Pro (M24)
Intel Core i9-14900HX ⎘
NVIDIA GeForce RTX 4090 Laptop GPU ⎘
32 GB Memória, 1024 GB SSD
Listenpreis 4273€3.4 kg24.9 mm17.30"
3840x2160
255 PPI
IPS
2.
87.2% v7 (old)
Asus ROG Strix Scar 17 G733PYV-LL053X
AMD Ryzen 9 7945HX3D ⎘
NVIDIA GeForce RTX 4090 Laptop GPU ⎘
32 GB Memória, 1024 GB SSD
Geizhals Suche2.9 kg28.3 mm17.30"
2560x1440
170 PPI
IPS
3.
85.2% v7 (old)
Eurocom Raptor X17 Core i9-14900HX
Intel Core i9-14900HX ⎘
NVIDIA GeForce RTX 4090 Laptop GPU ⎘
32 GB Memória, 2048 GB SSD
Listenpreis 4500 USD3.4 kg24.9 mm17.30"
3840x2160
255 PPI
IPS
4.
85.9%
HP ZBook Fury 16 G11
Intel Core i9-14900HX ⎘
NVIDIA RTX 3500 Ada Generation Laptop GPU ⎘
64 GB Memória, 1024 GB SSD
Bestpreis 3840.13€ Cyclotron
2. 3849€ Jacob Elektronik direkt
3. 3850€ HEINZSOFT
2.6 kg28.5 mm16.00"
3840x2400
283 PPI
IPS
5.
86% v7 (old)
Aorus 17X AZF
Aorus 17X AZF
Intel Core i9-13900HX ⎘
NVIDIA GeForce RTX 4090 Laptop GPU ⎘
32 GB Memória, 1024 GB SSD
Listenpreis 3800 EUR
Geizhals Suche
2.9 kg21.8 mm17.30"
2560x1440
170 PPI
IPS

A Schenker anuncia o Key 17 Pro (M24) como uma estação de trabalho de alto nível, portanto, nossos testes refletirão isso. Anteriormente, analisamos a versão Versão E23 como um notebook para jogos, mas, com a atualização para a CPU i9-14900HX, a variante M24 agora é recomendada como uma estação de trabalho. No entanto, não poderíamos colocá-lo apenas contra estações de trabalho, já que o Key 17 Pro é alimentado pela GPU RTX 4090 e não por uma GPU profissional. Assim, os concorrentes escolhidos incluem notebooks para jogos com uma RTX 4090 e CPUs semelhantes ou iguais.

O chassi parece não ter sofrido alterações em relação à iteração anterior, com o mesmo barebone Clevo. No entanto, além da CPU mais potente, o M24 apresenta algumas atualizações importantes, como Wi-Fi 7 e dois conectores Thunderbolt 5. Com a CPU atualizada e as novas adições, a bateria do M24, infelizmente, está sofrendo um golpe e não dura tanto quanto a do E23.

Especificações

SCHENKER Key 17 Pro (M24)
Processador
Intel Core i9-14900HX 24 x 1.6 - 5.8 GHz, Raptor Lake-HX Refresh
Placa gráfica
NVIDIA GeForce RTX 4090 Laptop GPU - 15.6 GB VRAM, 175 W TDP ( including 25 W Dynamic Boost), 566.03, MUX switch
Memória
32 GB 
, DDR5-5600
Pantalha
17.30 polegadas 16:9, 3840 x 2160 pixel 255 PPI, BOE, IPS, Brilhante: não, 144 Hz, Adaptive Sync
placa mãe
Intel HM770 (Raptor Lake-S PCH)
Disco rígido
Samsung 990 Pro 1 TB, 1024 GB 
Placa de Som
Creative Sound Blaster Recon3Di @ Intel Panther Point PCH - High Definition Audio Controller
Conexões
2 USB 3.1 Gen2, 2 USB 4.0 40 Gbps, 2 Thunderbolt, USB-C Power Delivery (PD), 1 HDMI, 3 DisplayPort, 1 Kensington Lock, Conexões Audio: 2-in-1 jack
Funcionamento em rede
Intel/Killer E3100X 2.5 Gigabit Ethernet Controller (10/100/1000/2500MBit/s), Intel Wi-Fi 7 BE200 320MHz (a/b/g/n = Wi-Fi 4/ac = Wi-Fi 5/ax = Wi-Fi 6/ Wi-Fi 6E 6 GHz be = Wi-Fi 7), Bluetooth 5.3
Tamanho
altura x largura x profundidade (em mm): 24.9 x 396 x 278
Bateria
99 Wh Lítio-Polímero
Sistema Operativo
Microsoft Windows 11 Home
Camera
Webcam: 1080p
Características adicionais
Alto falantes: stereo, Iluminação do Teclado: sim, 36 Meses Garantia, dual Thunderbolt 5 ports
peso
3.4 kg, Suprimento de energia: 1.178 kg
Preço
4273 Euro
Note: The manufacturer may use components from different suppliers including display panels, drives or memory sticks with similar specifications.


Estojo e conectividade

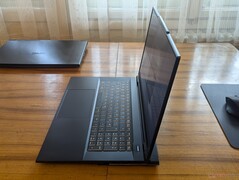
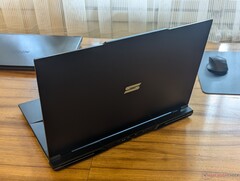
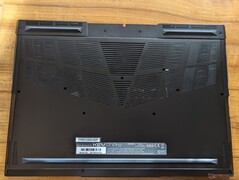
O sistema foi construído com base em um barebone fornecido pela Clevo, que também foi usado com o laptop Eurocom que incluímos na comparação de desempenho. Graças a uma placa traseira facilmente removível, a RAM e o armazenamento podem ser atualizados sempre que necessário.

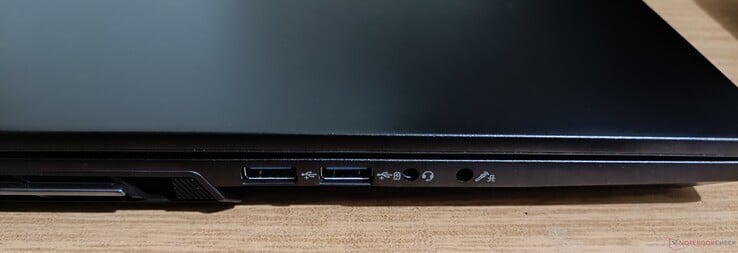
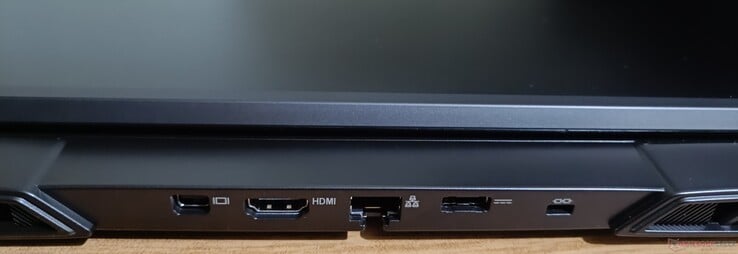
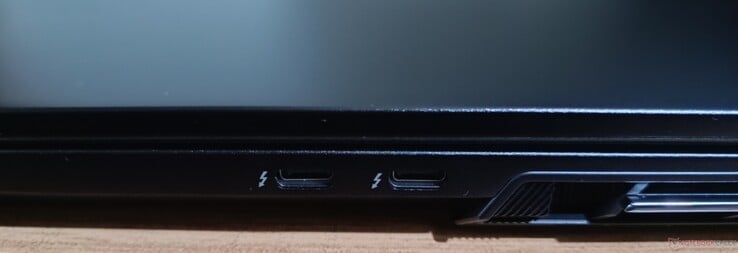
No que diz respeito à conectividade, o Key 17 Pro impressiona com uma sólida seleção de portas à prova de futuro e velocidades de Internet atualizadas. Esse é um dos poucos modelos selecionados que oferece dois conectores Thunderbolt 5 no lado direito, cada um com largura de banda total de 80 Gbps. Infelizmente, a opção de aumento de 120 Gbps não está disponível, pois a Nvidia RTX 4090 e a iGPU da Intel estão limitadas às velocidades DP 1.4 / HDMI 2.1. Ainda assim, a largura de banda dupla de 80 Gbps pode ser bem aproveitada com SSDs externos PCIe 5.0. No lado esquerdo, há duas portas USB-A 3.2 Gen 2 (apenas uma com fornecimento de energia), além de entradas de microfone ou S/PDIF óptico e saídas de fone de ouvido. A parte traseira inclui um conector de alimentação, uma tomada LAN e uma largura de banda total HDMI 2.1, além de saídas de vídeo mini DisplayPort 1.4a.

A conectividade com a Internet é rápida, com a conexão 5G atingindo mais de 900 Mb/s, enquanto as velocidades 6G estão entre as mais altas que testamos, com até 1,7 Gb/s no modo receptor.
Conectores laterais esquerdos: dois conectores USB-A 3.2 Gen 2 (um alimentado), saída de fone de ouvido + microfone em conectores de áudio S/PDIF
Conectores traseiros: mini DisplayPort 1.4a, HDMI 2.1, conector de 2,5 GbE, conector de energia, trava Kensington
Conectores do lado direito: duas portas Thunderbolt 5

Comparação de tamanho

395 mm 282.1 mm 28.3 mm 2.9 kg396 mm 278 mm 24.9 mm 3.4 kg396 mm 278 mm 24.9 mm 3.4 kg396 mm 293 mm 21.8 mm 2.9 kg363 mm 250 mm 28.5 mm 2.6 kg297 mm 210 mm 1 mm 5.7 g
Networking
iperf3 transmit AXE11000
Aorus 17X AZF
Intel Wi-Fi 6E AX210
1456 (1068min - 1561max) MBit/s +59%
Average Intel Wi-Fi 7 BE200 320MHz
  (469 - 1634, n=17)
1183 MBit/s +29%
Average of class Workstation
  (521 - 1838, n=27, last 2 years)
1127 MBit/s +23%
SCHENKER Key 17 Pro (M24)
Intel Wi-Fi 7 BE200 320MHz
916 (448min - 965max) MBit/s
HP ZBook Fury 16 G11
 
878 (829min - 937max) MBit/s -4%
Eurocom Raptor X17 Core i9-14900HX
Intel Wi-Fi 6E AX211
793 (386min - 871max) MBit/s -13%
iperf3 receive AXE11000
Aorus 17X AZF
Intel Wi-Fi 6E AX210
1619 (1579min - 1691max) MBit/s +70%
Average of class Workstation
  (845 - 1777, n=27, last 2 years)
1391 MBit/s +46%
Average Intel Wi-Fi 7 BE200 320MHz
  (838 - 1701, n=17)
1356 MBit/s +43%
Eurocom Raptor X17 Core i9-14900HX
Intel Wi-Fi 6E AX211
1214 (1011min - 1285max) MBit/s +28%
SCHENKER Key 17 Pro (M24)
Intel Wi-Fi 7 BE200 320MHz
951 (473min - 961max) MBit/s
HP ZBook Fury 16 G11
 
852 (750min - 875max) MBit/s -10%
iperf3 transmit AXE11000 6GHz
SCHENKER Key 17 Pro (M24)
Intel Wi-Fi 7 BE200 320MHz
1634 (812min - 1725max) MBit/s
HP ZBook Fury 16 G11
 
1505 (760min - 1591max) MBit/s -8%
Average Intel Wi-Fi 7 BE200 320MHz
  (943 - 1646, n=13)
1383 MBit/s -15%
Average of class Workstation
  (623 - 1634, n=23, last 2 years)
1211 MBit/s -26%
Eurocom Raptor X17 Core i9-14900HX
Intel Wi-Fi 6E AX211
691 (640min - 779max) MBit/s -58%
iperf3 receive AXE11000 6GHz
SCHENKER Key 17 Pro (M24)
Intel Wi-Fi 7 BE200 320MHz
1714 (853min - 1741max) MBit/s
HP ZBook Fury 16 G11
 
1599 (1565min - 1622max) MBit/s -7%
Average of class Workstation
  (1106 - 1774, n=23, last 2 years)
1535 MBit/s -10%
Average Intel Wi-Fi 7 BE200 320MHz
  (1149 - 1770, n=13)
1526 MBit/s -11%
Eurocom Raptor X17 Core i9-14900HX
Intel Wi-Fi 6E AX211
1227 (1158min - 1258max) MBit/s -28%
050100150200250300350400450500550600650700750800850900950100010501100115012001250130013501400145015001550160016501700Tooltip
SCHENKER Key 17 Pro (M24) Intel Wi-Fi 7 BE200 320MHz; iperf3 transmit AXE11000 6GHz; iperf 3.1.3: Ø1607 (812-1725)
Eurocom Raptor X17 Core i9-14900HX Intel Wi-Fi 6E AX211; iperf3 transmit AXE11000 6GHz; iperf 3.1.3: Ø691 (640-779)
HP ZBook Fury 16 G11  ; iperf3 transmit AXE11000 6GHz; iperf 3.1.3: Ø1480 (760-1591)
SCHENKER Key 17 Pro (M24) Intel Wi-Fi 7 BE200 320MHz; iperf3 receive AXE11000 6GHz; iperf 3.1.3: Ø1685 (853-1741)
Eurocom Raptor X17 Core i9-14900HX Intel Wi-Fi 6E AX211; iperf3 receive AXE11000 6GHz; iperf 3.1.3: Ø1226 (1158-1258)
HP ZBook Fury 16 G11  ; iperf3 receive AXE11000 6GHz; iperf 3.1.3: Ø1598 (1565-1622)
SCHENKER Key 17 Pro (M24) Intel Wi-Fi 7 BE200 320MHz; iperf3 transmit AXE11000; iperf 3.1.3: Ø902 (448-965)
Eurocom Raptor X17 Core i9-14900HX Intel Wi-Fi 6E AX211; iperf3 transmit AXE11000; iperf 3.1.3: Ø780 (386-871)
HP ZBook Fury 16 G11  ; iperf3 transmit AXE11000; iperf 3.1.3: Ø878 (829-937)
Aorus 17X AZF Intel Wi-Fi 6E AX210; iperf3 transmit AXE11000; iperf 3.1.3: Ø1456 (1068-1561)
SCHENKER Key 17 Pro (M24) Intel Wi-Fi 7 BE200 320MHz; iperf3 receive AXE11000; iperf 3.1.3: Ø935 (473-961)
Eurocom Raptor X17 Core i9-14900HX Intel Wi-Fi 6E AX211; iperf3 receive AXE11000; iperf 3.1.3: Ø1213 (1011-1285)
HP ZBook Fury 16 G11  ; iperf3 receive AXE11000; iperf 3.1.3: Ø852 (750-875)
Aorus 17X AZF Intel Wi-Fi 6E AX210; iperf3 receive AXE11000; iperf 3.1.3: Ø1618 (1579-1691)
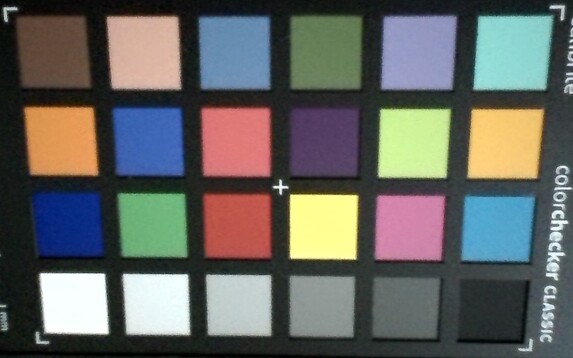
ColorChecker
5.5 ∆E
8 ∆E
7.8 ∆E
6.9 ∆E
8 ∆E
9.4 ∆E
7.5 ∆E
6 ∆E
11.3 ∆E
3.8 ∆E
14.8 ∆E
10.8 ∆E
7.3 ∆E
11.8 ∆E
9.3 ∆E
15.1 ∆E
12.9 ∆E
11.8 ∆E
3.4 ∆E
11.5 ∆E
13.6 ∆E
12.2 ∆E
9.6 ∆E
5.6 ∆E
ColorChecker SCHENKER Key 17 Pro (M24): 9.34 ∆E min: 3.43 - max: 15.07 ∆E

Dispositivos de entrada

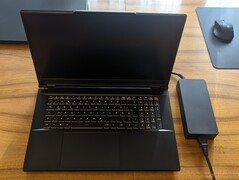
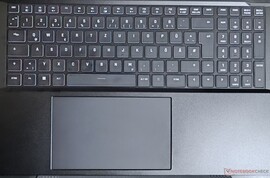
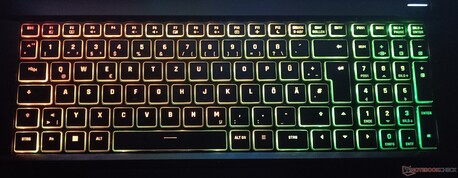
Como se trata de um laptop de 17 polegadas, ele inclui um teclado de tamanho normal com teclado numérico e teclas de seta. O mecanismo chiclet permite um deslocamento médio, o que proporciona uma experiência de digitação suficientemente confortável. O modelo testado veio com layout alemão, mas a Schenker oferece outros layouts europeus e o padrão US EN. As teclas têm iluminação RGB por pixel que pode ser personalizada no aplicativo especial do centro de controle.

O touchpad é grande o suficiente, com 150 x 90 mm, e é suave como seda graças a uma superfície inovadora que melhora o deslizamento. Ele também possui reconhecimento da palma da mão que ajuda a evitar entradas acidentais ao apoiar as palmas das mãos no touchpad.

Tela

A unidade testada vem equipada com a tela LCD IPS de 3840 X 2160 fabricada pela BOE. Ela tem uma atualização máxima de 144 Hz e suporta G-SYNC. Há também uma variante de 2560 X 1440 240 Hz 300 nit.

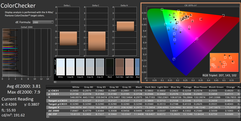
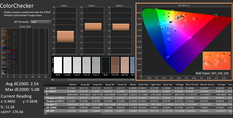
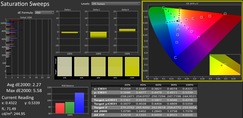
a reprodução de cores sRGB é de fato de 99%, conforme anunciado, mas a gama DCI-P3 é de 93% em vez dos 99% anunciados. Devido ao revestimento não brilhante, o contraste é um pouco prejudicado, com níveis de preto ligeiramente elevados de 0,54 cd/m². No entanto, a tela mais brilhante compensa o contraste mais baixo. A precisão das cores é um pouco baixa e conseguimos reduzir o dE de 3,81 para 2,54 na gama DCI-P3.

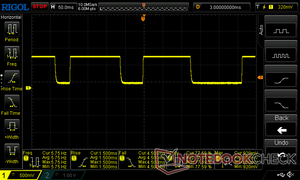
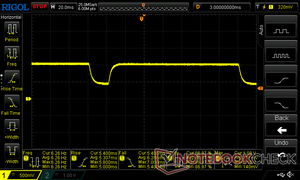
Os tempos de resposta são bons para uso geral e criação de conteúdo, mas podem ser um pouco lentos para jogos de tiro mais rápidos, com 11,6 ms. Não foi detectada oscilação de tela ou PWM.

503
cd/m²
499
cd/m²
519
cd/m²
496
cd/m²
548
cd/m²
500
cd/m²
491
cd/m²
517
cd/m²
472
cd/m²
Distribuição do brilho
BOE tested with X-Rite i1Pro 3
Máximo: 548 cd/m² (Nits) Médio: 505 cd/m² Minimum: 29 cd/m²
iluminação: 86 %
iluminação com acumulador: 555 cd/m²
Contraste: 1015:1 (Preto: 0.54 cd/m²)
ΔE Color 3.81 | 0.5-29.43 Ø4.92, calibrated: 2.54

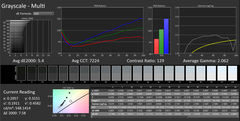
ΔE Greyscale 5.4 | 0.5-98 Ø5.2
84.33% AdobeRGB 1998 (Argyll 2.2.0 3D)
99.86% sRGB (Argyll 2.2.0 3D)
93.51% Display P3 (Argyll 2.2.0 3D)
Gamma: 2.062
SCHENKER Key 17 Pro (M24)
BOE, IPS, 3840x2160, 17.3", 144 Hz
Eurocom Raptor X17 Core i9-14900HX
BOE CQ NE173QUM-NY1, IPS, 3840x2160, 17.3", 144 Hz
HP ZBook Fury 16 G11
AUO87A8, IPS, 3840x2400, 16", 120 Hz
Aorus 17X AZF
BOE09F9, IPS, 2560x1440, 17.3", 240 Hz
Display
1%
2%
1%
Display P3 Coverage
93.51
95.9
3%
98.4
5%
96.7
3%
sRGB Coverage
99.86
99.8
0%
99.9
0%
99.9
0%
AdobeRGB 1998 Coverage
84.33
84.2
0%
86
2%
84.5
0%
Response Times
-59%
-19%
-45%
Response Time Grey 50% / Grey 80% *
11.593 ?(5.307, 6.286)
14.8 ?(7.2, 7.6)
-28%
11.4 ?(5.3, 6.1)
2%
14 ?(6.9, 7.1)
-21%
Response Time Black / White *
6 ?(1.5, 4.5)
11.4 ?(6.1, 5.3)
-90%
8.4 ?(4.7, 3.7)
-40%
10.1 ?(5.3, 4.8)
-68%
PWM Frequency
Screen
12%
18%
14%
Brightness middle
548
544.6
-1%
457.6
-16%
294
-46%
Brightness
505
507
0%
466
-8%
276
-45%
Brightness Distribution
86
77
-10%
83
-3%
90
5%
Black Level *
0.54
0.48
11%
0.43
20%
0.28
48%
Contrast
1015
1135
12%
1064
5%
1050
3%
Colorchecker dE 2000 *
3.81
3.38
11%
2.78
27%
2.81
26%
Colorchecker dE 2000 max. *
7.9
7.13
10%
5.53
30%
5.7
28%
Colorchecker dE 2000 calibrated *
2.54
1.03
59%
1.37
46%
0.86
66%
Greyscale dE 2000 *
5.4
4.3
20%
2
63%
3.4
37%
Gamma
2.062 107%
2.42 91%
2.28 96%
2.301 96%
CCT
7224 90%
7356 88%
6806 96%
7389 88%
Total Average (Program / Settings)
-15% / -0%
0% / 10%
-10% / 3%

* ... smaller is better

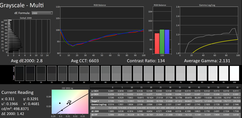
A escala de cinza padrão é deslocada para o azul, o que aumenta o deltaE médio para 5,4. A calibração para DCI-P3 com o colorímetro X-Rite i1Pro 3 reduziu o deltaE para 2,8, mas as tonalidades de azul, vermelho e, em menor grau, violeta permanecem um pouco apagadas, de modo que a tela pode não ser recomendada para a criação de conteúdo que exija cores mais precisas. O perfil ICM calibrado resultante está disponível para download gratuito acima.

Escala de cinza padrão
Verificador de cores padrão
Saturação padrão
Saturação padrão
Escala de cinza calibrada
Verificador de cores calibrado
Saturação calibrada
Saturação calibrada

Display Response Times

Display response times show how fast the screen is able to change from one color to the next. Slow response times can lead to afterimages and can cause moving objects to appear blurry (ghosting). Gamers of fast-paced 3D titles should pay special attention to fast response times.
       Response Time Black to White
6 ms ... rise ↗ and fall ↘ combined↗ 1.5 ms rise
↘ 4.5 ms fall
The screen shows very fast response rates in our tests and should be very well suited for fast-paced gaming.
In comparison, all tested devices range from 0.1 (minimum) to 240 (maximum) ms. » 15 % of all devices are better.
This means that the measured response time is better than the average of all tested devices (21 ms).
       Response Time 50% Grey to 80% Grey
11.593 ms ... rise ↗ and fall ↘ combined↗ 5.307 ms rise
↘ 6.286 ms fall
The screen shows good response rates in our tests, but may be too slow for competitive gamers.
In comparison, all tested devices range from 0.165 (minimum) to 636 (maximum) ms. » 21 % of all devices are better.
This means that the measured response time is better than the average of all tested devices (32.9 ms).

Screen Flickering / PWM (Pulse-Width Modulation)

To dim the screen, some notebooks will simply cycle the backlight on and off in rapid succession - a method called Pulse Width Modulation (PWM) . This cycling frequency should ideally be undetectable to the human eye. If said frequency is too low, users with sensitive eyes may experience strain or headaches or even notice the flickering altogether.
Screen flickering / PWM not detected

In comparison: 53 % of all tested devices do not use PWM to dim the display. If PWM was detected, an average of 8743 (minimum: 5 - maximum: 343500) Hz was measured.

0% de brilho
0% de brilho
50% de brilho
50% de brilho
100% de brilho
100% de brilho

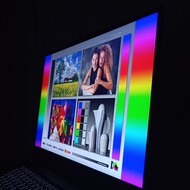
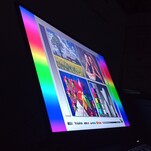
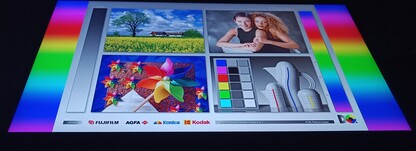
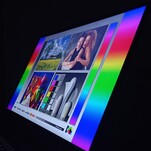
Os ângulos de visão estão em linha com outras telas IPS, o que significa que o contraste começa a mudar fora do eixo. No entanto, as telas IPS ainda são melhores nesse aspecto quando comparadas aos painéis TN e VA, que não são tão populares nos laptops atualmente.

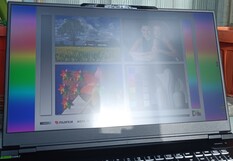
A uniformidade da luz de fundo mostra um sangramento moderado nos cantos superiores. Infelizmente, o acabamento fosco não ajuda muito no uso em ambientes externos, pois difunde significativamente a luz direta ou indireta. No entanto, o brilho máximo de mais de 500 nit ajuda na luz solar indireta.

Uniformidade da luz de fundo
Luz solar direta
Luz solar direta
Luz solar indireta
Luz solar indireta

Desempenho

Condições de teste

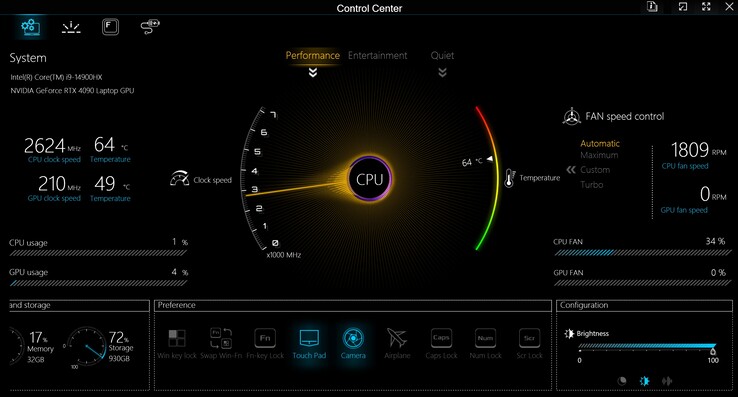
Os testes de desempenho foram feitos usando o perfil de "desempenho" ativado no aplicativo especial do centro de controle. Esse perfil usa TDP máximo, clocks de reforço e velocidades de ventoinha.

Processador

Nossa classificação combinada de desempenho da CPU revela que a implementação do i9-14900HX da Schenker é a segunda mais rápida entre os modelos Intel testados, ficando atrás do Eurocom em 4% e à frente do Aorus em 2%. Como esperado, o AMD Ryzen 9 7945HX3D está consideravelmente à frente do pacote Intel em pelo menos 10%, embora o desempenho de núcleo único seja, na maioria das vezes, inferior ao de todas as CPUs Intel. No loop de estrangulamento do Cinebench R15, o Schenker i9-14900HX começa mais ou menos no mesmo nível da implementação da Eurocom, mas cai 15% nas duas execuções seguintes e, em seguida, é o único modelo a apresentar variações crescentes e decrescentes no restante do loop, indicando que o modo turbo não está muito bem ajustado para a eficiência.

O desempenho da CPU na bateria é reduzido em pelo menos 66% no teste Cinebench R23, o que também se aplica ao desempenho da GPU.

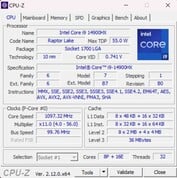
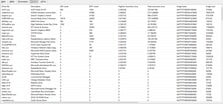
Informações sobre a CPU
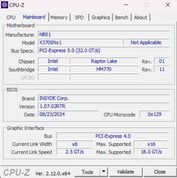
Informações sobre a placa-mãe
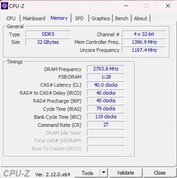
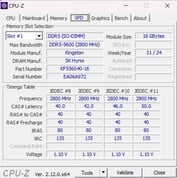
Informações sobre a RAM
Temporizações de RAM
Benchmark CPUZ vs i9-13900K
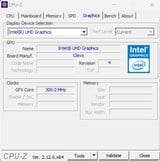
informações sobre a iGPU
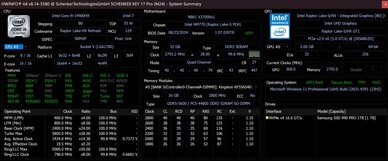
HWInfo
HWInfo
 

Cinebench R15 Multi Loop

02805608401120140016801960224025202800308033603640392042004480476050405320Tooltip
SCHENKER Key 17 Pro (M24) Intel Core i9-14900HX: Ø3786 (3488.57-4363)
Asus ROG Strix Scar 17 G733PYV-LL053X AMD Ryzen 9 7945HX3D: Ø5282 (5177.32-5599.89)
Eurocom Raptor X17 Core i9-14900HX Intel Core i9-14900HX: Ø4467 (4379.24-4648.46)
HP ZBook Fury 16 G11 Intel Core i9-14900HX: Ø3302 (2849.61-4173.19)
Aorus 17X AZF Intel Core i9-13900HX: Ø3258 (3190.05-4396.09)
CPU Performance Rating: Percent
Cinebench R23: Multi Core | Single Core
Cinebench R20: CPU (Multi Core) | CPU (Single Core)
Cinebench R15: CPU Multi 64Bit | CPU Single 64Bit
Blender: v2.79 BMW27 CPU
7-Zip 18.03: 7z b 4 | 7z b 4 -mmt1
Geekbench 6.3: Multi-Core | Single-Core
Geekbench 5.5: Multi-Core | Single-Core
HWBOT x265 Benchmark v2.2: 4k Preset
LibreOffice : 20 Documents To PDF
R Benchmark 2.5: Overall mean
CPU Performance Rating
Asus ROG Strix Scar 17 G733PYV-LL053X
AMD Ryzen 9 7945HX3D
84.4 pt
Average Intel Core i9-14900HX
 
79 pt
Eurocom Raptor X17 Core i9-14900HX
Intel Core i9-14900HX
76.8 pt
HP ZBook Fury 16 G11
Intel Core i9-14900HX
74.3 pt
SCHENKER Key 17 Pro (M24)
Intel Core i9-14900HX
73.8 pt
Aorus 17X AZF -2!
Intel Core i9-13900HX
72.1 pt
Average of class Workstation
 
56.8 pt
Cinebench R23 / Multi Core
Asus ROG Strix Scar 17 G733PYV-LL053X
AMD Ryzen 9 7945HX3D
32782 Points +20%
Eurocom Raptor X17 Core i9-14900HX
Intel Core i9-14900HX
31323 (28572.5min - 31322.6max) Points +15%
Average Intel Core i9-14900HX
  (17078 - 36249, n=34)
29130 Points +7%
Aorus 17X AZF
Intel Core i9-13900HX
27776 Points +2%
SCHENKER Key 17 Pro (M24)
Intel Core i9-14900HX
27338 Points
HP ZBook Fury 16 G11
Intel Core i9-14900HX
27130 (20747.4min - 27130max) Points -1%
Average of class Workstation
  (11026 - 27338, n=28, last 2 years)
17777 Points -35%
Cinebench R23 / Single Core
HP ZBook Fury 16 G11
Intel Core i9-14900HX
2178 Points +7%
Average Intel Core i9-14900HX
  (1720 - 2245, n=34)
2157 Points +6%
Eurocom Raptor X17 Core i9-14900HX
Intel Core i9-14900HX
2100 Points +4%
Aorus 17X AZF
Intel Core i9-13900HX
2097 Points +3%
SCHENKER Key 17 Pro (M24)
Intel Core i9-14900HX
2028 Points
Asus ROG Strix Scar 17 G733PYV-LL053X
AMD Ryzen 9 7945HX3D
1935 Points -5%
Average of class Workstation
  (1465 - 2178, n=28, last 2 years)
1835 Points -10%
Cinebench R20 / CPU (Multi Core)
Asus ROG Strix Scar 17 G733PYV-LL053X
AMD Ryzen 9 7945HX3D
13033 Points +27%
Eurocom Raptor X17 Core i9-14900HX
Intel Core i9-14900HX
11543 Points +12%
Average Intel Core i9-14900HX
  (6579 - 13832, n=34)
11084 Points +8%
Aorus 17X AZF
Intel Core i9-13900HX
10557 Points +3%
SCHENKER Key 17 Pro (M24)
Intel Core i9-14900HX
10276 Points
HP ZBook Fury 16 G11
Intel Core i9-14900HX
10069 Points -2%
Average of class Workstation
  (2990 - 10276, n=29, last 2 years)
6709 Points -35%
Cinebench R20 / CPU (Single Core)
HP ZBook Fury 16 G11
Intel Core i9-14900HX
827 Points +6%
Average Intel Core i9-14900HX
  (657 - 859, n=34)
826 Points +6%
Aorus 17X AZF
Intel Core i9-13900HX
810 Points +4%
Eurocom Raptor X17 Core i9-14900HX
Intel Core i9-14900HX
804 Points +3%
SCHENKER Key 17 Pro (M24)
Intel Core i9-14900HX
779 Points
Asus ROG Strix Scar 17 G733PYV-LL053X
AMD Ryzen 9 7945HX3D
755 Points -3%
Average of class Workstation
  (564 - 827, n=29, last 2 years)
706 Points -9%
Cinebench R15 / CPU Multi 64Bit
Asus ROG Strix Scar 17 G733PYV-LL053X
AMD Ryzen 9 7945HX3D
5600 (5177.32min - 5599.89max) Points +28%
Eurocom Raptor X17 Core i9-14900HX
Intel Core i9-14900HX
4648 (4379.24min - 4648.46max) Points +7%
Aorus 17X AZF
Intel Core i9-13900HX
4487 Points +3%
Average Intel Core i9-14900HX
  (3263 - 5589, n=35)
4462 Points +2%
SCHENKER Key 17 Pro (M24)
Intel Core i9-14900HX
4363 (3488.57min - 4363max) Points
HP ZBook Fury 16 G11
Intel Core i9-14900HX
4173 (2849.61min - 4173.19max) Points -4%
Average of class Workstation
  (1863 - 4363, n=28, last 2 years)
2780 Points -36%
Cinebench R15 / CPU Single 64Bit
Asus ROG Strix Scar 17 G733PYV-LL053X
AMD Ryzen 9 7945HX3D
311 Points +8%
Average Intel Core i9-14900HX
  (247 - 323, n=34)
306 Points +6%
Aorus 17X AZF
Intel Core i9-13900HX
304 Points +6%
Eurocom Raptor X17 Core i9-14900HX
Intel Core i9-14900HX
300 Points +4%
HP ZBook Fury 16 G11
Intel Core i9-14900HX
297 Points +3%
SCHENKER Key 17 Pro (M24)
Intel Core i9-14900HX
288 Points
Average of class Workstation
  (166.2 - 301, n=28, last 2 years)
265 Points -8%
Blender / v2.79 BMW27 CPU
Average of class Workstation
  (121 - 295, n=28, last 2 years)
200 Seconds * -65%
Aorus 17X AZF
Intel Core i9-13900HX
144 Seconds * -19%
HP ZBook Fury 16 G11
Intel Core i9-14900HX
134 Seconds * -11%
SCHENKER Key 17 Pro (M24)
Intel Core i9-14900HX
121 Seconds *
Average Intel Core i9-14900HX
  (91 - 206, n=34)
119.5 Seconds * +1%
Eurocom Raptor X17 Core i9-14900HX
Intel Core i9-14900HX
105 Seconds * +13%
Asus ROG Strix Scar 17 G733PYV-LL053X
AMD Ryzen 9 7945HX3D
95 Seconds * +21%
7-Zip 18.03 / 7z b 4
Asus ROG Strix Scar 17 G733PYV-LL053X
AMD Ryzen 9 7945HX3D
136201 MIPS +25%
Eurocom Raptor X17 Core i9-14900HX
Intel Core i9-14900HX
121036 MIPS +11%
Average Intel Core i9-14900HX
  (66769 - 136645, n=34)
112494 MIPS +3%
SCHENKER Key 17 Pro (M24)
Intel Core i9-14900HX
109204 MIPS
HP ZBook Fury 16 G11
Intel Core i9-14900HX
101027 MIPS -7%
Aorus 17X AZF
Intel Core i9-13900HX
93947 MIPS -14%
Average of class Workstation
  (47244 - 109204, n=28, last 2 years)
70695 MIPS -35%
7-Zip 18.03 / 7z b 4 -mmt1
Asus ROG Strix Scar 17 G733PYV-LL053X
AMD Ryzen 9 7945HX3D
7573 MIPS +10%
Aorus 17X AZF
Intel Core i9-13900HX
7177 MIPS +5%
Average Intel Core i9-14900HX
  (5452 - 7545, n=34)
7017 MIPS +2%
HP ZBook Fury 16 G11
Intel Core i9-14900HX
6960 MIPS +1%
SCHENKER Key 17 Pro (M24)
Intel Core i9-14900HX
6858 MIPS
Eurocom Raptor X17 Core i9-14900HX
Intel Core i9-14900HX
6658 MIPS -3%
Average of class Workstation
  (4981 - 6960, n=28, last 2 years)
6068 MIPS -12%
Geekbench 6.3 / Multi-Core
Eurocom Raptor X17 Core i9-14900HX
Intel Core i9-14900HX
18291 Points +11%
Average Intel Core i9-14900HX
  (13158 - 19665, n=34)
17369 Points +5%
Asus ROG Strix Scar 17 G733PYV-LL053X
AMD Ryzen 9 7945HX3D
16957 Points +3%
SCHENKER Key 17 Pro (M24)
Intel Core i9-14900HX
16482 Points
HP ZBook Fury 16 G11
Intel Core i9-14900HX
15279 Points -7%
Average of class Workstation
  (10200 - 16482, n=20, last 2 years)
13325 Points -19%
Geekbench 6.3 / Single-Core
Average Intel Core i9-14900HX
  (2419 - 3129, n=34)
2973 Points +14%
HP ZBook Fury 16 G11
Intel Core i9-14900HX
2924 Points +12%
Asus ROG Strix Scar 17 G733PYV-LL053X
AMD Ryzen 9 7945HX3D
2916 Points +12%
Eurocom Raptor X17 Core i9-14900HX
Intel Core i9-14900HX
2874 Points +10%
SCHENKER Key 17 Pro (M24)
Intel Core i9-14900HX
2611 Points
Average of class Workstation
  (2352 - 2949, n=20, last 2 years)
2603 Points 0%
Geekbench 5.5 / Multi-Core
Asus ROG Strix Scar 17 G733PYV-LL053X
AMD Ryzen 9 7945HX3D
19875 Points +3%
Average Intel Core i9-14900HX
  (8618 - 23194, n=34)
19540 Points +1%
SCHENKER Key 17 Pro (M24)
Intel Core i9-14900HX
19316 Points
Aorus 17X AZF
Intel Core i9-13900HX
19272 Points 0%
HP ZBook Fury 16 G11
Intel Core i9-14900HX
18407 Points -5%
Average of class Workstation
  (8050 - 19316, n=28, last 2 years)
13122 Points -32%
Eurocom Raptor X17 Core i9-14900HX
Intel Core i9-14900HX
8618 Points -55%
Geekbench 5.5 / Single-Core
Asus ROG Strix Scar 17 G733PYV-LL053X
AMD Ryzen 9 7945HX3D
2133 Points +11%
Average Intel Core i9-14900HX
  (1669 - 2210, n=34)
2092 Points +9%
Aorus 17X AZF
Intel Core i9-13900HX
2063 Points +7%
HP ZBook Fury 16 G11
Intel Core i9-14900HX
2030 Points +6%
SCHENKER Key 17 Pro (M24)
Intel Core i9-14900HX
1924 Points
Average of class Workstation
  (1474 - 2095, n=28, last 2 years)
1857 Points -3%
Eurocom Raptor X17 Core i9-14900HX
Intel Core i9-14900HX
1669 Points -13%
HWBOT x265 Benchmark v2.2 / 4k Preset
Asus ROG Strix Scar 17 G733PYV-LL053X
AMD Ryzen 9 7945HX3D
36.4 fps +34%
Eurocom Raptor X17 Core i9-14900HX
Intel Core i9-14900HX
33.8 fps +25%
Average Intel Core i9-14900HX
  (16.8 - 38.9, n=34)
29.7 fps +10%
SCHENKER Key 17 Pro (M24)
Intel Core i9-14900HX
27.1 fps
HP ZBook Fury 16 G11
Intel Core i9-14900HX
27 fps 0%
Aorus 17X AZF
Intel Core i9-13900HX
24.2 fps -11%
Average of class Workstation
  (12.7 - 27.1, n=28, last 2 years)
19.5 fps -28%
LibreOffice / 20 Documents To PDF
Average of class Workstation
  (36.5 - 95.2, n=28, last 2 years)
48.4 s * -4%
HP ZBook Fury 16 G11
Intel Core i9-14900HX
48 s * -3%
SCHENKER Key 17 Pro (M24)
Intel Core i9-14900HX
46.6 s *
Aorus 17X AZF
Intel Core i9-13900HX
44.7 s * +4%
Average Intel Core i9-14900HX
  (31.4 - 85.1, n=34)
43.4 s * +7%
Asus ROG Strix Scar 17 G733PYV-LL053X
AMD Ryzen 9 7945HX3D
39 s * +16%
Eurocom Raptor X17 Core i9-14900HX
Intel Core i9-14900HX
37.6 s * +19%
R Benchmark 2.5 / Overall mean
Average of class Workstation
  (0.3825 - 0.54, n=28, last 2 years)
0.4482 sec * -8%
SCHENKER Key 17 Pro (M24)
Intel Core i9-14900HX
0.4143 sec *
Asus ROG Strix Scar 17 G733PYV-LL053X
AMD Ryzen 9 7945HX3D
0.4127 sec * -0%
Aorus 17X AZF
Intel Core i9-13900HX
0.3935 sec * +5%
Eurocom Raptor X17 Core i9-14900HX
Intel Core i9-14900HX
0.3845 sec * +7%
Average Intel Core i9-14900HX
  (0.3604 - 0.4859, n=34)
0.3845 sec * +7%
HP ZBook Fury 16 G11
Intel Core i9-14900HX
0.3825 sec * +8%

* ... smaller is better

Cinebench R15 CPU Multi 64Bit
4363 Points
Cinebench R15 OpenGL 64Bit
279 fps
Cinebench R15 Ref. Match 64Bit
99.6 %
Cinebench R15 CPU Single 64Bit
288 Points
Cinebench R20 CPU (Multi Core)
10276 Points
Cinebench R20 CPU (Single Core)
779 Points
Cinebench R23 Single Core
2028 Points
Cinebench R23 Multi Core
27338 Points
Ajuda
Performance Rating
Asus ROG Strix Scar 17 G733PYV-LL053X
AMD Ryzen 9 7945HX3D, NVIDIA GeForce RTX 4090 Laptop GPU
97.1 pt
Eurocom Raptor X17 Core i9-14900HX
Intel Core i9-14900HX, NVIDIA GeForce RTX 4090 Laptop GPU
70.1 pt
Average Intel Core i9-14900HX
 
61.7 pt
SCHENKER Key 17 Pro (M24)
Intel Core i9-14900HX, NVIDIA GeForce RTX 4090 Laptop GPU
57.4 pt
Aorus 17X AZF
Intel Core i9-13900HX, NVIDIA GeForce RTX 4090 Laptop GPU
53.8 pt
HP ZBook Fury 16 G11
Intel Core i9-14900HX, NVIDIA RTX 3500 Ada Generation Laptop GPU
51 pt
Average of class Workstation
 
43.8 pt
AIDA64 / FP32 Ray-Trace
Asus ROG Strix Scar 17 G733PYV-LL053X
AMD Ryzen 9 7945HX3D, NVIDIA GeForce RTX 4090 Laptop GPU
53908 KRay/s +147%
Eurocom Raptor X17 Core i9-14900HX
Intel Core i9-14900HX, NVIDIA GeForce RTX 4090 Laptop GPU
26984 KRay/s +23%
Average Intel Core i9-14900HX
  (13098 - 33474, n=33)
25096 KRay/s +15%
SCHENKER Key 17 Pro (M24)
Intel Core i9-14900HX, NVIDIA GeForce RTX 4090 Laptop GPU
21858 KRay/s
HP ZBook Fury 16 G11
Intel Core i9-14900HX, NVIDIA RTX 3500 Ada Generation Laptop GPU
20058 KRay/s -8%
Aorus 17X AZF
Intel Core i9-13900HX, NVIDIA GeForce RTX 4090 Laptop GPU
19255 KRay/s -12%
Average of class Workstation
  (10658 - 25776, n=28, last 2 years)
17880 KRay/s -18%
AIDA64 / FPU Julia
Asus ROG Strix Scar 17 G733PYV-LL053X
AMD Ryzen 9 7945HX3D, NVIDIA GeForce RTX 4090 Laptop GPU
222115 Points +96%
Eurocom Raptor X17 Core i9-14900HX
Intel Core i9-14900HX, NVIDIA GeForce RTX 4090 Laptop GPU
138436 Points +22%
Average Intel Core i9-14900HX
  (67573 - 166040, n=33)
125765 Points +11%
SCHENKER Key 17 Pro (M24)
Intel Core i9-14900HX, NVIDIA GeForce RTX 4090 Laptop GPU
113270 Points
HP ZBook Fury 16 G11
Intel Core i9-14900HX, NVIDIA RTX 3500 Ada Generation Laptop GPU
101926 Points -10%
Aorus 17X AZF
Intel Core i9-13900HX, NVIDIA GeForce RTX 4090 Laptop GPU
95343 Points -16%
Average of class Workstation
  (56664 - 113270, n=28, last 2 years)
88964 Points -21%
AIDA64 / CPU SHA3
Asus ROG Strix Scar 17 G733PYV-LL053X
AMD Ryzen 9 7945HX3D, NVIDIA GeForce RTX 4090 Laptop GPU
9582 MB/s +71%
Eurocom Raptor X17 Core i9-14900HX
Intel Core i9-14900HX, NVIDIA GeForce RTX 4090 Laptop GPU
7026 MB/s +26%
Average Intel Core i9-14900HX
  (3589 - 7979, n=33)
6212 MB/s +11%
SCHENKER Key 17 Pro (M24)
Intel Core i9-14900HX, NVIDIA GeForce RTX 4090 Laptop GPU
5598 MB/s
HP ZBook Fury 16 G11
Intel Core i9-14900HX, NVIDIA RTX 3500 Ada Generation Laptop GPU
4972 MB/s -11%
Aorus 17X AZF
Intel Core i9-13900HX, NVIDIA GeForce RTX 4090 Laptop GPU
4880 MB/s -13%
Average of class Workstation
  (2598 - 5598, n=28, last 2 years)
3968 MB/s -29%
AIDA64 / CPU Queen
Asus ROG Strix Scar 17 G733PYV-LL053X
AMD Ryzen 9 7945HX3D, NVIDIA GeForce RTX 4090 Laptop GPU
181270 Points +31%
Eurocom Raptor X17 Core i9-14900HX
Intel Core i9-14900HX, NVIDIA GeForce RTX 4090 Laptop GPU
144137 Points +4%
Average Intel Core i9-14900HX
  (118405 - 148966, n=33)
138709 Points 0%
SCHENKER Key 17 Pro (M24)
Intel Core i9-14900HX, NVIDIA GeForce RTX 4090 Laptop GPU
138708 Points
HP ZBook Fury 16 G11
Intel Core i9-14900HX, NVIDIA RTX 3500 Ada Generation Laptop GPU
136844 Points -1%
Aorus 17X AZF
Intel Core i9-13900HX, NVIDIA GeForce RTX 4090 Laptop GPU
128728 Points -7%
Average of class Workstation
  (84022 - 144411, n=28, last 2 years)
107100 Points -23%
AIDA64 / FPU SinJulia
Asus ROG Strix Scar 17 G733PYV-LL053X
AMD Ryzen 9 7945HX3D, NVIDIA GeForce RTX 4090 Laptop GPU
29487 Points +112%
Eurocom Raptor X17 Core i9-14900HX
Intel Core i9-14900HX, NVIDIA GeForce RTX 4090 Laptop GPU
16403 Points +18%
Average Intel Core i9-14900HX
  (10475 - 18517, n=33)
15369 Points +11%
SCHENKER Key 17 Pro (M24)
Intel Core i9-14900HX, NVIDIA GeForce RTX 4090 Laptop GPU
13903 Points
HP ZBook Fury 16 G11
Intel Core i9-14900HX, NVIDIA RTX 3500 Ada Generation Laptop GPU
13331 Points -4%
Aorus 17X AZF
Intel Core i9-13900HX, NVIDIA GeForce RTX 4090 Laptop GPU
12939 Points -7%
Average of class Workstation
  (7906 - 14742, n=28, last 2 years)
11606 Points -17%
AIDA64 / FPU Mandel
Asus ROG Strix Scar 17 G733PYV-LL053X
AMD Ryzen 9 7945HX3D, NVIDIA GeForce RTX 4090 Laptop GPU
118813 Points +118%
Eurocom Raptor X17 Core i9-14900HX
Intel Core i9-14900HX, NVIDIA GeForce RTX 4090 Laptop GPU
67115 Points +23%
Average Intel Core i9-14900HX
  (32543 - 83662, n=33)
61872 Points +14%
SCHENKER Key 17 Pro (M24)
Intel Core i9-14900HX, NVIDIA GeForce RTX 4090 Laptop GPU
54428 Points
HP ZBook Fury 16 G11
Intel Core i9-14900HX, NVIDIA RTX 3500 Ada Generation Laptop GPU
50518 Points -7%
Aorus 17X AZF
Intel Core i9-13900HX, NVIDIA GeForce RTX 4090 Laptop GPU
47560 Points -13%
Average of class Workstation
  (27301 - 58181, n=28, last 2 years)
44611 Points -18%
AIDA64 / CPU AES
Asus ROG Strix Scar 17 G733PYV-LL053X
AMD Ryzen 9 7945HX3D, NVIDIA GeForce RTX 4090 Laptop GPU
328679 MB/s +209%
Eurocom Raptor X17 Core i9-14900HX
Intel Core i9-14900HX, NVIDIA GeForce RTX 4090 Laptop GPU
241777 MB/s +127%
Aorus 17X AZF
Intel Core i9-13900HX, NVIDIA GeForce RTX 4090 Laptop GPU
174819 MB/s +64%
Average Intel Core i9-14900HX
  (86964 - 241777, n=33)
137399 MB/s +29%
SCHENKER Key 17 Pro (M24)
Intel Core i9-14900HX, NVIDIA GeForce RTX 4090 Laptop GPU
106371 MB/s
HP ZBook Fury 16 G11
Intel Core i9-14900HX, NVIDIA RTX 3500 Ada Generation Laptop GPU
99014 MB/s -7%
Average of class Workstation
  (45568 - 128243, n=28, last 2 years)
81020 MB/s -24%
AIDA64 / CPU ZLib
Asus ROG Strix Scar 17 G733PYV-LL053X
AMD Ryzen 9 7945HX3D, NVIDIA GeForce RTX 4090 Laptop GPU
2043 MB/s +21%
Eurocom Raptor X17 Core i9-14900HX
Intel Core i9-14900HX, NVIDIA GeForce RTX 4090 Laptop GPU
2037 MB/s +20%
Average Intel Core i9-14900HX
  (1054 - 2292, n=33)
1815 MB/s +7%
SCHENKER Key 17 Pro (M24)
Intel Core i9-14900HX, NVIDIA GeForce RTX 4090 Laptop GPU
1691 MB/s
HP ZBook Fury 16 G11
Intel Core i9-14900HX, NVIDIA RTX 3500 Ada Generation Laptop GPU
1473 MB/s -13%
Aorus 17X AZF
Intel Core i9-13900HX, NVIDIA GeForce RTX 4090 Laptop GPU
1353 MB/s -20%
Average of class Workstation
  (713 - 1691, n=28, last 2 years)
1092 MB/s -35%
AIDA64 / FP64 Ray-Trace
Asus ROG Strix Scar 17 G733PYV-LL053X
AMD Ryzen 9 7945HX3D, NVIDIA GeForce RTX 4090 Laptop GPU
29140 KRay/s +146%
Eurocom Raptor X17 Core i9-14900HX
Intel Core i9-14900HX, NVIDIA GeForce RTX 4090 Laptop GPU
14781 KRay/s +25%
Average Intel Core i9-14900HX
  (6809 - 18349, n=33)
13525 KRay/s +14%
SCHENKER Key 17 Pro (M24)
Intel Core i9-14900HX, NVIDIA GeForce RTX 4090 Laptop GPU
11838 KRay/s
HP ZBook Fury 16 G11
Intel Core i9-14900HX, NVIDIA RTX 3500 Ada Generation Laptop GPU
10878 KRay/s -8%
Aorus 17X AZF
Intel Core i9-13900HX, NVIDIA GeForce RTX 4090 Laptop GPU
10268 KRay/s -13%
Average of class Workstation
  (5580 - 13800, n=28, last 2 years)
9530 KRay/s -19%
AIDA64 / CPU PhotoWorxx
Eurocom Raptor X17 Core i9-14900HX
Intel Core i9-14900HX, NVIDIA GeForce RTX 4090 Laptop GPU
51118 MPixel/s +1%
SCHENKER Key 17 Pro (M24)
Intel Core i9-14900HX, NVIDIA GeForce RTX 4090 Laptop GPU
50465 MPixel/s
Aorus 17X AZF
Intel Core i9-13900HX, NVIDIA GeForce RTX 4090 Laptop GPU
50348 MPixel/s 0%
Average Intel Core i9-14900HX
  (23903 - 54702, n=33)
46637 MPixel/s -8%
Average of class Workstation
  (18157 - 51647, n=28, last 2 years)
38975 MPixel/s -23%
HP ZBook Fury 16 G11
Intel Core i9-14900HX, NVIDIA RTX 3500 Ada Generation Laptop GPU
37151 MPixel/s -26%
Asus ROG Strix Scar 17 G733PYV-LL053X
AMD Ryzen 9 7945HX3D, NVIDIA GeForce RTX 4090 Laptop GPU
36406 MPixel/s -28%

Desempenho do sistema

Em comparação com os outros dois i9-14900HX, o Key 17 Pro parece ser o modelo Intel mais rápido no PCMark 10, mas o AMD Ryzen 9 7945HX3D no laptop Asus está à frente em no máximo 10%. O antigo i9-13900HX do modelo Aorus é surpreendentemente mais rápido por uma pequena margem em comparação com o Zbook Fury i9-14900HX.

No entanto, a RAM Kingston DDR5-5600 equipada no modelo Schenker provou ser a média mais rápida. Ela ocupa a primeira posição nos testes AIDA64 de cópia de memória e gravação de memória, enquanto fica em segundo lugar para leitura de memória e em terceiro para latência.

PCMark 10 / Score
Asus ROG Strix Scar 17 G733PYV-LL053X
NVIDIA GeForce RTX 4090 Laptop GPU, R9 7945HX3D, SK hynix PC801 HFS001TEJ9X101N
9117 Points +10%
Average Intel Core i9-14900HX, NVIDIA GeForce RTX 4090 Laptop GPU
  (8230 - 9234, n=13)
8674 Points +5%
SCHENKER Key 17 Pro (M24)
NVIDIA GeForce RTX 4090 Laptop GPU, i9-14900HX, Samsung 990 Pro 1 TB
8277 Points
Aorus 17X AZF
NVIDIA GeForce RTX 4090 Laptop GPU, i9-13900HX, Gigabyte AG470S1TB-SI B10
7690 Points -7%
HP ZBook Fury 16 G11
NVIDIA RTX 3500 Ada Generation Laptop GPU, i9-14900HX, SK hynix PC801 HFS001TEJ9X101N
7607 Points -8%
Average of class Workstation
  (5953 - 8587, n=28, last 2 years)
7259 Points -12%
PCMark 10 / Essentials
Asus ROG Strix Scar 17 G733PYV-LL053X
NVIDIA GeForce RTX 4090 Laptop GPU, R9 7945HX3D, SK hynix PC801 HFS001TEJ9X101N
11561 Points +7%
Aorus 17X AZF
NVIDIA GeForce RTX 4090 Laptop GPU, i9-13900HX, Gigabyte AG470S1TB-SI B10
11188 Points +4%
Average Intel Core i9-14900HX, NVIDIA GeForce RTX 4090 Laptop GPU
  (10778 - 11628, n=13)
11125 Points +3%
SCHENKER Key 17 Pro (M24)
NVIDIA GeForce RTX 4090 Laptop GPU, i9-14900HX, Samsung 990 Pro 1 TB
10778 Points
Average of class Workstation
  (9151 - 12197, n=28, last 2 years)
10648 Points -1%
HP ZBook Fury 16 G11
NVIDIA RTX 3500 Ada Generation Laptop GPU, i9-14900HX, SK hynix PC801 HFS001TEJ9X101N
9647 Points -10%
PCMark 10 / Productivity
Asus ROG Strix Scar 17 G733PYV-LL053X
NVIDIA GeForce RTX 4090 Laptop GPU, R9 7945HX3D, SK hynix PC801 HFS001TEJ9X101N
10881 Points +15%
Average Intel Core i9-14900HX, NVIDIA GeForce RTX 4090 Laptop GPU
  (9458 - 11759, n=13)
10610 Points +12%
Aorus 17X AZF
NVIDIA GeForce RTX 4090 Laptop GPU, i9-13900HX, Gigabyte AG470S1TB-SI B10
10403 Points +10%
HP ZBook Fury 16 G11
NVIDIA RTX 3500 Ada Generation Laptop GPU, i9-14900HX, SK hynix PC801 HFS001TEJ9X101N
9554 Points +1%
SCHENKER Key 17 Pro (M24)
NVIDIA GeForce RTX 4090 Laptop GPU, i9-14900HX, Samsung 990 Pro 1 TB
9458 Points
Average of class Workstation
  (7846 - 10820, n=28, last 2 years)
9393 Points -1%
PCMark 10 / Digital Content Creation
Asus ROG Strix Scar 17 G733PYV-LL053X
NVIDIA GeForce RTX 4090 Laptop GPU, R9 7945HX3D, SK hynix PC801 HFS001TEJ9X101N
16348 Points +8%
SCHENKER Key 17 Pro (M24)
NVIDIA GeForce RTX 4090 Laptop GPU, i9-14900HX, Samsung 990 Pro 1 TB
15093 Points
Average Intel Core i9-14900HX, NVIDIA GeForce RTX 4090 Laptop GPU
  (13219 - 16462, n=13)
15042 Points 0%
HP ZBook Fury 16 G11
NVIDIA RTX 3500 Ada Generation Laptop GPU, i9-14900HX, SK hynix PC801 HFS001TEJ9X101N
12961 Points -14%
Aorus 17X AZF
NVIDIA GeForce RTX 4090 Laptop GPU, i9-13900HX, Gigabyte AG470S1TB-SI B10
10605 Points -30%
Average of class Workstation
  (7417 - 15093, n=28, last 2 years)
10492 Points -30%
CrossMark / Overall
Eurocom Raptor X17 Core i9-14900HX
NVIDIA GeForce RTX 4090 Laptop GPU, i9-14900HX, Corsair MP700 Pro 2TB
2238 Points
Aorus 17X AZF
NVIDIA GeForce RTX 4090 Laptop GPU, i9-13900HX, Gigabyte AG470S1TB-SI B10
2163 Points
Average Intel Core i9-14900HX, NVIDIA GeForce RTX 4090 Laptop GPU
  (1877 - 2344, n=10)
2119 Points
Asus ROG Strix Scar 17 G733PYV-LL053X
NVIDIA GeForce RTX 4090 Laptop GPU, R9 7945HX3D, SK hynix PC801 HFS001TEJ9X101N
2086 Points
HP ZBook Fury 16 G11
NVIDIA RTX 3500 Ada Generation Laptop GPU, i9-14900HX, SK hynix PC801 HFS001TEJ9X101N
2037 Points
Average of class Workstation
  (1154 - 2037, n=26, last 2 years)
1761 Points
CrossMark / Productivity
Eurocom Raptor X17 Core i9-14900HX
NVIDIA GeForce RTX 4090 Laptop GPU, i9-14900HX, Corsair MP700 Pro 2TB
2113 Points
Aorus 17X AZF
NVIDIA GeForce RTX 4090 Laptop GPU, i9-13900HX, Gigabyte AG470S1TB-SI B10
2050 Points
Average Intel Core i9-14900HX, NVIDIA GeForce RTX 4090 Laptop GPU
  (1738 - 2162, n=10)
1968 Points
Asus ROG Strix Scar 17 G733PYV-LL053X
NVIDIA GeForce RTX 4090 Laptop GPU, R9 7945HX3D, SK hynix PC801 HFS001TEJ9X101N
1948 Points
HP ZBook Fury 16 G11
NVIDIA RTX 3500 Ada Generation Laptop GPU, i9-14900HX, SK hynix PC801 HFS001TEJ9X101N
1902 Points
Average of class Workstation
  (1188 - 1902, n=26, last 2 years)
1677 Points
CrossMark / Creativity
Asus ROG Strix Scar 17 G733PYV-LL053X
NVIDIA GeForce RTX 4090 Laptop GPU, R9 7945HX3D, SK hynix PC801 HFS001TEJ9X101N
2415 Points
Average Intel Core i9-14900HX, NVIDIA GeForce RTX 4090 Laptop GPU
  (2195 - 2660, n=10)
2387 Points
Eurocom Raptor X17 Core i9-14900HX
NVIDIA GeForce RTX 4090 Laptop GPU, i9-14900HX, Corsair MP700 Pro 2TB
2341 Points
Aorus 17X AZF
NVIDIA GeForce RTX 4090 Laptop GPU, i9-13900HX, Gigabyte AG470S1TB-SI B10
2319 Points
HP ZBook Fury 16 G11
NVIDIA RTX 3500 Ada Generation Laptop GPU, i9-14900HX, SK hynix PC801 HFS001TEJ9X101N
2304 Points
Average of class Workstation
  (1180 - 2311, n=26, last 2 years)
1963 Points
CrossMark / Responsiveness
Eurocom Raptor X17 Core i9-14900HX
NVIDIA GeForce RTX 4090 Laptop GPU, i9-14900HX, Corsair MP700 Pro 2TB
2327 Points
Aorus 17X AZF
NVIDIA GeForce RTX 4090 Laptop GPU, i9-13900HX, Gigabyte AG470S1TB-SI B10
2063 Points
Average Intel Core i9-14900HX, NVIDIA GeForce RTX 4090 Laptop GPU
  (1478 - 2327, n=10)
1862 Points
HP ZBook Fury 16 G11
NVIDIA RTX 3500 Ada Generation Laptop GPU, i9-14900HX, SK hynix PC801 HFS001TEJ9X101N
1730 Points
Asus ROG Strix Scar 17 G733PYV-LL053X
NVIDIA GeForce RTX 4090 Laptop GPU, R9 7945HX3D, SK hynix PC801 HFS001TEJ9X101N
1649 Points
Average of class Workstation
  (990 - 1805, n=26, last 2 years)
1478 Points
WebXPRT 3 / Overall
Asus ROG Strix Scar 17 G733PYV-LL053X
NVIDIA GeForce RTX 4090 Laptop GPU, R9 7945HX3D, SK hynix PC801 HFS001TEJ9X101N
480 Points +56%
Aorus 17X AZF
NVIDIA GeForce RTX 4090 Laptop GPU, i9-13900HX, Gigabyte AG470S1TB-SI B10
340 Points +10%
Eurocom Raptor X17 Core i9-14900HX
NVIDIA GeForce RTX 4090 Laptop GPU, i9-14900HX, Corsair MP700 Pro 2TB
332 Points +8%
Average Intel Core i9-14900HX, NVIDIA GeForce RTX 4090 Laptop GPU
  (279 - 339, n=10)
323 Points +5%
HP ZBook Fury 16 G11
NVIDIA RTX 3500 Ada Generation Laptop GPU, i9-14900HX, SK hynix PC801 HFS001TEJ9X101N
319 Points +4%
SCHENKER Key 17 Pro (M24)
NVIDIA GeForce RTX 4090 Laptop GPU, i9-14900HX, Samsung 990 Pro 1 TB
308 Points
Average of class Workstation
  (218 - 415, n=29, last 2 years)
301 Points -2%
WebXPRT 4 / Overall
Asus ROG Strix Scar 17 G733PYV-LL053X
NVIDIA GeForce RTX 4090 Laptop GPU, R9 7945HX3D, SK hynix PC801 HFS001TEJ9X101N
328 Points +19%
Eurocom Raptor X17 Core i9-14900HX
NVIDIA GeForce RTX 4090 Laptop GPU, i9-14900HX, Corsair MP700 Pro 2TB
308 Points +12%
HP ZBook Fury 16 G11
NVIDIA RTX 3500 Ada Generation Laptop GPU, i9-14900HX, SK hynix PC801 HFS001TEJ9X101N
302 Points +10%
Aorus 17X AZF
NVIDIA GeForce RTX 4090 Laptop GPU, i9-13900HX, Gigabyte AG470S1TB-SI B10
297 Points +8%
Average Intel Core i9-14900HX, NVIDIA GeForce RTX 4090 Laptop GPU
  (246 - 309, n=8)
291 Points +6%
SCHENKER Key 17 Pro (M24)
NVIDIA GeForce RTX 4090 Laptop GPU, i9-14900HX, Samsung 990 Pro 1 TB
275 Points
Average of class Workstation
  (166.7 - 338, n=25, last 2 years)
265 Points -4%
Mozilla Kraken 1.1 / Total
Average of class Workstation
  (447 - 612, n=29, last 2 years)
517 ms * -7%
SCHENKER Key 17 Pro (M24)
NVIDIA GeForce RTX 4090 Laptop GPU, i9-14900HX, Samsung 990 Pro 1 TB
481 ms *
Aorus 17X AZF
NVIDIA GeForce RTX 4090 Laptop GPU, i9-13900HX, Gigabyte AG470S1TB-SI B10
473 ms * +2%
Eurocom Raptor X17 Core i9-14900HX
NVIDIA GeForce RTX 4090 Laptop GPU, i9-14900HX, Corsair MP700 Pro 2TB
467 ms * +3%
Average Intel Core i9-14900HX, NVIDIA GeForce RTX 4090 Laptop GPU
  (428 - 535, n=11)
456 ms * +5%
HP ZBook Fury 16 G11
NVIDIA RTX 3500 Ada Generation Laptop GPU, i9-14900HX, SK hynix PC801 HFS001TEJ9X101N
447 ms * +7%
Asus ROG Strix Scar 17 G733PYV-LL053X
NVIDIA GeForce RTX 4090 Laptop GPU, R9 7945HX3D, SK hynix PC801 HFS001TEJ9X101N
421.3 ms * +12%

* ... smaller is better

PCMark 10 Score
8277 pontos
Ajuda
AIDA64 / Memory Copy
SCHENKER Key 17 Pro (M24)
Intel Core i9-14900HX, NVIDIA GeForce RTX 4090 Laptop GPU
78820 MB/s
Aorus 17X AZF
Intel Core i9-13900HX, NVIDIA GeForce RTX 4090 Laptop GPU
78171 MB/s -1%
Eurocom Raptor X17 Core i9-14900HX
Intel Core i9-14900HX, NVIDIA GeForce RTX 4090 Laptop GPU
76328 MB/s -3%
Average Intel Core i9-14900HX
  (38028 - 83392, n=33)
74739 MB/s -5%
Average of class Workstation
  (30324 - 95718, n=28, last 2 years)
63058 MB/s -20%
HP ZBook Fury 16 G11
Intel Core i9-14900HX, NVIDIA RTX 3500 Ada Generation Laptop GPU
60295 MB/s -24%
Asus ROG Strix Scar 17 G733PYV-LL053X
AMD Ryzen 9 7945HX3D, NVIDIA GeForce RTX 4090 Laptop GPU
50335 MB/s -36%
AIDA64 / Memory Read
Aorus 17X AZF
Intel Core i9-13900HX, NVIDIA GeForce RTX 4090 Laptop GPU
88462 MB/s +3%
SCHENKER Key 17 Pro (M24)
Intel Core i9-14900HX, NVIDIA GeForce RTX 4090 Laptop GPU
85763 MB/s
Average Intel Core i9-14900HX
  (43306 - 87568, n=33)
80919 MB/s -6%
Eurocom Raptor X17 Core i9-14900HX
Intel Core i9-14900HX, NVIDIA GeForce RTX 4090 Laptop GPU
80139 MB/s -7%
Average of class Workstation
  (30787 - 86584, n=28, last 2 years)
61266 MB/s -29%
Asus ROG Strix Scar 17 G733PYV-LL053X
AMD Ryzen 9 7945HX3D, NVIDIA GeForce RTX 4090 Laptop GPU
59921 MB/s -30%
HP ZBook Fury 16 G11
Intel Core i9-14900HX, NVIDIA RTX 3500 Ada Generation Laptop GPU
59863 MB/s -30%
AIDA64 / Memory Write
SCHENKER Key 17 Pro (M24)
Intel Core i9-14900HX, NVIDIA GeForce RTX 4090 Laptop GPU
77439 MB/s
Aorus 17X AZF
Intel Core i9-13900HX, NVIDIA GeForce RTX 4090 Laptop GPU
76529 MB/s -1%
Eurocom Raptor X17 Core i9-14900HX
Intel Core i9-14900HX, NVIDIA GeForce RTX 4090 Laptop GPU
76442 MB/s -1%
Average Intel Core i9-14900HX
  (37146 - 80589, n=33)
71949 MB/s -7%
Average of class Workstation
  (32728 - 93871, n=28, last 2 years)
66503 MB/s -14%
Asus ROG Strix Scar 17 G733PYV-LL053X
AMD Ryzen 9 7945HX3D, NVIDIA GeForce RTX 4090 Laptop GPU
58774 MB/s -24%
HP ZBook Fury 16 G11
Intel Core i9-14900HX, NVIDIA RTX 3500 Ada Generation Laptop GPU
56987 MB/s -26%
AIDA64 / Memory Latency
Average of class Workstation
  (83.4 - 140.8, n=28, last 2 years)
103.9 ns * -23%
HP ZBook Fury 16 G11
Intel Core i9-14900HX, NVIDIA RTX 3500 Ada Generation Laptop GPU
96.3 ns * -14%
Asus ROG Strix Scar 17 G733PYV-LL053X
AMD Ryzen 9 7945HX3D, NVIDIA GeForce RTX 4090 Laptop GPU
88.6 ns * -5%
Eurocom Raptor X17 Core i9-14900HX
Intel Core i9-14900HX, NVIDIA GeForce RTX 4090 Laptop GPU
85.5 ns * -1%
Average Intel Core i9-14900HX
  (76.1 - 105, n=33)
84.8 ns * -0%
SCHENKER Key 17 Pro (M24)
Intel Core i9-14900HX, NVIDIA GeForce RTX 4090 Laptop GPU
84.5 ns *
Aorus 17X AZF
Intel Core i9-13900HX, NVIDIA GeForce RTX 4090 Laptop GPU
80.4 ns * +5%

* ... smaller is better

Latência DPC

O Key 17 Pro M24 da Schenker tem a segunda maior latência entre todas as implementações do i9-14900HX nessa comparação, embora não seja significativamente maior, pois as melhores implementações estão apenas na faixa de 1000 microssegundos. O i9-13900HX da Gigabyte e o i9-14900HX do Zbook Fury parecem significativamente piores, com latência de 11000 - 12000+ microssegundos. A Latencymon sugere que a latência de 1,9K μs é muito alta para áudio em tempo real combinado com outras tarefas, portanto, isso poderia afetar negativamente a criação de conteúdo, como a edição de vídeo. Ainda assim, a reprodução de vídeo 4K@60 fps do YouTube não mostra queda de quadros e utilização relativamente baixa da CPU.

Guia principal do Latencymon
Guia do driver Latencymon
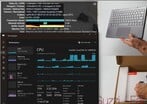
Estatísticas do YouTube e utilização da CPU em vídeo 4K
DPC Latencies / LatencyMon - interrupt to process latency (max), Web, Youtube, Prime95
Aorus 17X AZF
NVIDIA GeForce RTX 4090 Laptop GPU, i9-13900HX, Gigabyte AG470S1TB-SI B10
12614 μs * -545%
HP ZBook Fury 16 G11
NVIDIA RTX 3500 Ada Generation Laptop GPU, i9-14900HX, SK hynix PC801 HFS001TEJ9X101N
11167.3 μs * -471%
SCHENKER Key 17 Pro (M24)
NVIDIA GeForce RTX 4090 Laptop GPU, i9-14900HX, Samsung 990 Pro 1 TB
1955.8 μs *
Eurocom Raptor X17 Core i9-14900HX
NVIDIA GeForce RTX 4090 Laptop GPU, i9-14900HX, Corsair MP700 Pro 2TB
1123.4 μs * +43%
Asus ROG Strix Scar 17 G733PYV-LL053X
NVIDIA GeForce RTX 4090 Laptop GPU, R9 7945HX3D, SK hynix PC801 HFS001TEJ9X101N
1100.8 μs * +44%

* ... smaller is better

Dispositivos de armazenamento

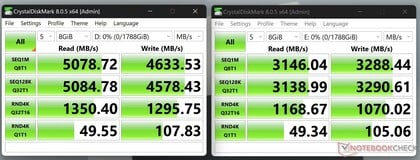
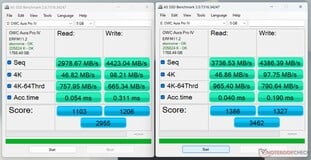
O SSD 990 Pro PCIe 4.0 de 1 TB da Samsung é mais rápido, em média, em comparação com todos os outros modelos de SSD, exceto o Corsair MP700da Corsair, que é um SSD PCIe 5.0 pCIe 5.0. A SSD da Samsung também é 14% mais rápida do que a média registrada entre os outros modelos de laptop equipados com ela. No loop de limitação, o Samsung 990 Pro não apresenta variações significativas, desconsiderando as primeiras execuções, embora a velocidade máxima pareça ser alguns % menor em comparação com os outros SSDs PCIe 4.0.

Samsung 990 Pro 1 TB
Sequential Read: 5346MB/s
Sequential Write: 5012MB/s
4K Read: 90.9MB/s
4K Write: 260MB/s
4K-64 Read: 3182MB/s
4K-64 Write: 4090MB/s
Access Time Read: 0.046ms
Access Time Write: 0.015ms
Score Read: 3807Points
Score Write: 4852Points
Score Total: 10591Points
Drive Performance Rating - Percent
Eurocom Raptor X17 Core i9-14900HX
Corsair MP700 Pro 2TB
90.9 pt
SCHENKER Key 17 Pro (M24)
Samsung 990 Pro 1 TB
73.2 pt
Average Samsung 990 Pro 1 TB
 
62.5 pt
Aorus 17X AZF
Gigabyte AG470S1TB-SI B10
59.6 pt
HP ZBook Fury 16 G11
SK hynix PC801 HFS001TEJ9X101N
53.2 pt
Average of class Workstation
 
46.9 pt
Asus ROG Strix Scar 17 G733PYV-LL053X
SK hynix PC801 HFS001TEJ9X101N
45.3 pt
DiskSpd
seq read
HP ZBook Fury 16 G11
SK hynix PC801 HFS001TEJ9X101N
4835 (4788.71min - 4834.56max) MB/s +54%
Average of class Workstation
  (1844 - 5715, n=28, last 2 years)
3594 MB/s +14%
Average Samsung 990 Pro 1 TB
  (2556 - 4234, n=18)
3249 MB/s +3%
Aorus 17X AZF
Gigabyte AG470S1TB-SI B10
3185 (2979.13min - 3184.87max) MB/s +1%
SCHENKER Key 17 Pro (M24)
Samsung 990 Pro 1 TB
3142 (3005.43min - 3141.53max) MB/s
Eurocom Raptor X17 Core i9-14900HX
Corsair MP700 Pro 2TB
2672 (2652.21min - 2671.88max) MB/s -15%
Asus ROG Strix Scar 17 G733PYV-LL053X
SK hynix PC801 HFS001TEJ9X101N
2570 (2552.37min - 2570.06max) MB/s -18%
seq write
Eurocom Raptor X17 Core i9-14900HX
Corsair MP700 Pro 2TB
9307 (5304.83min - 9307.21max) MB/s +90%
SCHENKER Key 17 Pro (M24)
Samsung 990 Pro 1 TB
4891 (4759.07min - 4890.56max) MB/s
Average Samsung 990 Pro 1 TB
  (3598 - 5842, n=18)
4777 MB/s -2%
Average of class Workstation
  (1309 - 7289, n=28, last 2 years)
3809 MB/s -22%
HP ZBook Fury 16 G11
SK hynix PC801 HFS001TEJ9X101N
3548 (3467.85min - 3547.93max) MB/s -27%
Aorus 17X AZF
Gigabyte AG470S1TB-SI B10
2988 (2534.41min - 2987.71max) MB/s -39%
Asus ROG Strix Scar 17 G733PYV-LL053X
SK hynix PC801 HFS001TEJ9X101N
1690 (1454.82min - 1690.3max) MB/s -65%
seq q8 t1 read
Eurocom Raptor X17 Core i9-14900HX
Corsair MP700 Pro 2TB
12029 (6621.31min - 12029.1max) MB/s +71%
Average Samsung 990 Pro 1 TB
  (7011 - 7148, n=18)
7091 MB/s +1%
SCHENKER Key 17 Pro (M24)
Samsung 990 Pro 1 TB
7033 (6025.44min - 7033.01max) MB/s
Asus ROG Strix Scar 17 G733PYV-LL053X
SK hynix PC801 HFS001TEJ9X101N
6971 (6127.67min - 6971.35max) MB/s -1%
HP ZBook Fury 16 G11
SK hynix PC801 HFS001TEJ9X101N
6961 (6365.34min - 6960.66max) MB/s -1%
Aorus 17X AZF
Gigabyte AG470S1TB-SI B10
6936 (6051.54min - 6936.09max) MB/s -1%
Average of class Workstation
  (3361 - 12631, n=28, last 2 years)
6593 MB/s -6%
seq q8 t1 write
Eurocom Raptor X17 Core i9-14900HX
Corsair MP700 Pro 2TB
11581 (11375.7min - 11581max) MB/s +75%
Average Samsung 990 Pro 1 TB
  (6531 - 6898, n=18)
6802 MB/s +3%
SCHENKER Key 17 Pro (M24)
Samsung 990 Pro 1 TB
6620 (6576.94min - 6620.29max) MB/s
HP ZBook Fury 16 G11
SK hynix PC801 HFS001TEJ9X101N
6159 (6120.41min - 6159.34max) MB/s -7%
Average of class Workstation
  (2526 - 9890, n=28, last 2 years)
5534 MB/s -16%
Aorus 17X AZF
Gigabyte AG470S1TB-SI B10
4348 (4155.37min - 4348.35max) MB/s -34%
Asus ROG Strix Scar 17 G733PYV-LL053X
SK hynix PC801 HFS001TEJ9X101N
2382 (920.86min - 2382.42max) MB/s -64%
4k q1 t1 read
SCHENKER Key 17 Pro (M24)
Samsung 990 Pro 1 TB
99 (97.84min - 99.01max) MB/s
Eurocom Raptor X17 Core i9-14900HX
Corsair MP700 Pro 2TB
95.9 (94.45min - 95.94max) MB/s -3%
Average Samsung 990 Pro 1 TB
  (55.3 - 99, n=18)
76.4 MB/s -23%
Average of class Workstation
  (45.4 - 99, n=28, last 2 years)
65.6 MB/s -34%
HP ZBook Fury 16 G11
SK hynix PC801 HFS001TEJ9X101N
64.3 (64.19min - 64.33max) MB/s -35%
Aorus 17X AZF
Gigabyte AG470S1TB-SI B10
55 (54.75min - 55.02max) MB/s -44%
Asus ROG Strix Scar 17 G733PYV-LL053X
SK hynix PC801 HFS001TEJ9X101N
54.3 (54.23min - 54.34max) MB/s -45%
4k q1 t1 write
Eurocom Raptor X17 Core i9-14900HX
Corsair MP700 Pro 2TB
397 (385.91min - 396.86max) MB/s +26%
Aorus 17X AZF
Gigabyte AG470S1TB-SI B10
324 (317.18min - 324.02max) MB/s +3%
SCHENKER Key 17 Pro (M24)
Samsung 990 Pro 1 TB
316 (303.92min - 316.48max) MB/s
Average Samsung 990 Pro 1 TB
  (133.9 - 343, n=18)
235 MB/s -26%
Asus ROG Strix Scar 17 G733PYV-LL053X
SK hynix PC801 HFS001TEJ9X101N
183.8 (182.06min - 183.78max) MB/s -42%
HP ZBook Fury 16 G11
SK hynix PC801 HFS001TEJ9X101N
162.1 (160.38min - 162.08max) MB/s -49%
Average of class Workstation
  (106.8 - 316, n=28, last 2 years)
157.2 MB/s -50%
4k q32 t16 read
Eurocom Raptor X17 Core i9-14900HX
Corsair MP700 Pro 2TB
6172 (6083.33min - 6171.85max) MB/s +25%
SCHENKER Key 17 Pro (M24)
Samsung 990 Pro 1 TB
4926 (4895.9min - 4926.27max) MB/s
Aorus 17X AZF
Gigabyte AG470S1TB-SI B10
3583 (3572.22min - 3582.76max) MB/s -27%
Average Samsung 990 Pro 1 TB
  (818 - 4926, n=18)
3327 MB/s -32%
Average of class Workstation
  (561 - 4926, n=28, last 2 years)
1535 MB/s -69%
Asus ROG Strix Scar 17 G733PYV-LL053X
SK hynix PC801 HFS001TEJ9X101N
1331 (1250.04min - 1330.81max) MB/s -73%
HP ZBook Fury 16 G11
SK hynix PC801 HFS001TEJ9X101N
905 (889.91min - 905max) MB/s -82%
4k q32 t16 write
Eurocom Raptor X17 Core i9-14900HX
Corsair MP700 Pro 2TB
4485 (4443.23min - 4484.95max) MB/s +25%
Aorus 17X AZF
Gigabyte AG470S1TB-SI B10
3622 (3512.08min - 3621.76max) MB/s +1%
SCHENKER Key 17 Pro (M24)
Samsung 990 Pro 1 TB
3579 (3433.86min - 3579.4max) MB/s
Average Samsung 990 Pro 1 TB
  (413 - 4683, n=18)
2563 MB/s -28%
Average of class Workstation
  (361 - 3579, n=28, last 2 years)
1014 MB/s -72%
Asus ROG Strix Scar 17 G733PYV-LL053X
SK hynix PC801 HFS001TEJ9X101N
730 (694.74min - 729.67max) MB/s -80%
HP ZBook Fury 16 G11
SK hynix PC801 HFS001TEJ9X101N
526 (510.99min - 525.65max) MB/s -85%
AS SSD
Score Total
Eurocom Raptor X17 Core i9-14900HX
Corsair MP700 Pro 2TB
13854 Points +31%
SCHENKER Key 17 Pro (M24)
Samsung 990 Pro 1 TB
10591 Points
Aorus 17X AZF
Gigabyte AG470S1TB-SI B10
8788 Points -17%
Average Samsung 990 Pro 1 TB
  (5405 - 10591, n=18)
8308 Points -22%
HP ZBook Fury 16 G11
SK hynix PC801 HFS001TEJ9X101N
6724 Points -37%
Asus ROG Strix Scar 17 G733PYV-LL053X
SK hynix PC801 HFS001TEJ9X101N
6546 Points -38%
Average of class Workstation
  (2512 - 10591, n=28, last 2 years)
5740 Points -46%
Score Read
Eurocom Raptor X17 Core i9-14900HX
Corsair MP700 Pro 2TB
4345 Points +14%
SCHENKER Key 17 Pro (M24)
Samsung 990 Pro 1 TB
3807 Points
Aorus 17X AZF
Gigabyte AG470S1TB-SI B10
3522 Points -7%
Average Samsung 990 Pro 1 TB
  (1349 - 4721, n=18)
2891 Points -24%
Average of class Workstation
  (1162 - 3807, n=28, last 2 years)
1779 Points -53%
Asus ROG Strix Scar 17 G733PYV-LL053X
SK hynix PC801 HFS001TEJ9X101N
1689 Points -56%
HP ZBook Fury 16 G11
SK hynix PC801 HFS001TEJ9X101N
1574 Points -59%
Score Write
Eurocom Raptor X17 Core i9-14900HX
Corsair MP700 Pro 2TB
7208 Points +49%
SCHENKER Key 17 Pro (M24)
Samsung 990 Pro 1 TB
4852 Points
HP ZBook Fury 16 G11
SK hynix PC801 HFS001TEJ9X101N
4428 Points -9%
Asus ROG Strix Scar 17 G733PYV-LL053X
SK hynix PC801 HFS001TEJ9X101N
4073 Points -16%
Average Samsung 990 Pro 1 TB
  (2308 - 4852, n=18)
4043 Points -17%
Aorus 17X AZF
Gigabyte AG470S1TB-SI B10
3618 Points -25%
Average of class Workstation
  (742 - 4852, n=28, last 2 years)
3138 Points -35%
Seq Read
Eurocom Raptor X17 Core i9-14900HX
Corsair MP700 Pro 2TB
7812.91 MB/s +46%
Asus ROG Strix Scar 17 G733PYV-LL053X
SK hynix PC801 HFS001TEJ9X101N
5739 MB/s +7%
HP ZBook Fury 16 G11
SK hynix PC801 HFS001TEJ9X101N
5639.52 MB/s +5%
SCHENKER Key 17 Pro (M24)
Samsung 990 Pro 1 TB
5346 MB/s
Average of class Workstation
  (2873 - 7437, n=28, last 2 years)
5291 MB/s -1%
Average Samsung 990 Pro 1 TB
  (4362 - 5760, n=18)
5211 MB/s -3%
Aorus 17X AZF
Gigabyte AG470S1TB-SI B10
4887 MB/s -9%
Seq Write
Eurocom Raptor X17 Core i9-14900HX
Corsair MP700 Pro 2TB
9485.67 MB/s +89%
SCHENKER Key 17 Pro (M24)
Samsung 990 Pro 1 TB
5012 MB/s
Average Samsung 990 Pro 1 TB
  (3376 - 5651, n=18)
4712 MB/s -6%
Asus ROG Strix Scar 17 G733PYV-LL053X
SK hynix PC801 HFS001TEJ9X101N
3972 MB/s -21%
HP ZBook Fury 16 G11
SK hynix PC801 HFS001TEJ9X101N
3610.72 MB/s -28%
Average of class Workstation
  (1785 - 6302, n=28, last 2 years)
3284 MB/s -34%
Aorus 17X AZF
Gigabyte AG470S1TB-SI B10
1891 MB/s -62%
4K Read
SCHENKER Key 17 Pro (M24)
Samsung 990 Pro 1 TB
90.9 MB/s
Eurocom Raptor X17 Core i9-14900HX
Corsair MP700 Pro 2TB
89.1 MB/s -2%
Aorus 17X AZF
Gigabyte AG470S1TB-SI B10
72.6 MB/s -20%
HP ZBook Fury 16 G11
SK hynix PC801 HFS001TEJ9X101N
71.74 MB/s -21%
Average Samsung 990 Pro 1 TB
  (52.7 - 90.9, n=18)
71.6 MB/s -21%
Average of class Workstation
  (46.6 - 90.9, n=28, last 2 years)
62.4 MB/s -31%
Asus ROG Strix Scar 17 G733PYV-LL053X
SK hynix PC801 HFS001TEJ9X101N
56 MB/s -38%
4K Write
Eurocom Raptor X17 Core i9-14900HX
Corsair MP700 Pro 2TB
350.79 MB/s +35%
Aorus 17X AZF
Gigabyte AG470S1TB-SI B10
284 MB/s +9%
HP ZBook Fury 16 G11
SK hynix PC801 HFS001TEJ9X101N
262.32 MB/s +1%
SCHENKER Key 17 Pro (M24)
Samsung 990 Pro 1 TB
260 MB/s
Average Samsung 990 Pro 1 TB
  (172.3 - 306, n=18)
223 MB/s -14%
Asus ROG Strix Scar 17 G733PYV-LL053X
SK hynix PC801 HFS001TEJ9X101N
192.1 MB/s -26%
Average of class Workstation
  (98.6 - 262, n=28, last 2 years)
176.2 MB/s -32%
4K-64 Read
Eurocom Raptor X17 Core i9-14900HX
Corsair MP700 Pro 2TB
3474.56 MB/s +9%
SCHENKER Key 17 Pro (M24)
Samsung 990 Pro 1 TB
3182 MB/s
Aorus 17X AZF
Gigabyte AG470S1TB-SI B10
2961 MB/s -7%
Average Samsung 990 Pro 1 TB
  (787 - 3182, n=18)
2252 MB/s -29%
Average of class Workstation
  (649 - 3182, n=28, last 2 years)
1191 MB/s -63%
Asus ROG Strix Scar 17 G733PYV-LL053X
SK hynix PC801 HFS001TEJ9X101N
1059 MB/s -67%
HP ZBook Fury 16 G11
SK hynix PC801 HFS001TEJ9X101N
938.68 MB/s -71%
4K-64 Write
Eurocom Raptor X17 Core i9-14900HX
Corsair MP700 Pro 2TB
5908.55 MB/s +44%
SCHENKER Key 17 Pro (M24)
Samsung 990 Pro 1 TB
4090 MB/s
HP ZBook Fury 16 G11
SK hynix PC801 HFS001TEJ9X101N
3804.93 MB/s -7%
Asus ROG Strix Scar 17 G733PYV-LL053X
SK hynix PC801 HFS001TEJ9X101N
3484 MB/s -15%
Average Samsung 990 Pro 1 TB
  (1592 - 4090, n=18)
3356 MB/s -18%
Aorus 17X AZF
Gigabyte AG470S1TB-SI B10
3145 MB/s -23%
Average of class Workstation
  (431 - 4090, n=28, last 2 years)
2633 MB/s -36%
Access Time Read
Aorus 17X AZF
Gigabyte AG470S1TB-SI B10
0.086 ms * -87%
Asus ROG Strix Scar 17 G733PYV-LL053X
SK hynix PC801 HFS001TEJ9X101N
0.062 ms * -35%
Average of class Workstation
  (0.017 - 0.105, n=28, last 2 years)
0.04943 ms * -7%
SCHENKER Key 17 Pro (M24)
Samsung 990 Pro 1 TB
0.046 ms *
Average Samsung 990 Pro 1 TB
  (0.018 - 0.074, n=18)
0.0345 ms * +25%
Eurocom Raptor X17 Core i9-14900HX
Corsair MP700 Pro 2TB
0.02 ms * +57%
HP ZBook Fury 16 G11
SK hynix PC801 HFS001TEJ9X101N
0.017 ms * +63%
Access Time Write
Eurocom Raptor X17 Core i9-14900HX
Corsair MP700 Pro 2TB
0.1 ms * -567%
HP ZBook Fury 16 G11
SK hynix PC801 HFS001TEJ9X101N
0.052 ms * -247%
Average of class Workstation
  (0.015 - 0.092, n=28, last 2 years)
0.04825 ms * -222%
Average Samsung 990 Pro 1 TB
  (0.012 - 0.053, n=18)
0.01978 ms * -32%
Asus ROG Strix Scar 17 G733PYV-LL053X
SK hynix PC801 HFS001TEJ9X101N
0.019 ms * -27%
SCHENKER Key 17 Pro (M24)
Samsung 990 Pro 1 TB
0.015 ms *
Aorus 17X AZF
Gigabyte AG470S1TB-SI B10
0.014 ms * +7%

* ... smaller is better

Disk Throttling: DiskSpd Read Loop, Queue Depth 8

0620124018602480310037204340496055806200682074408060868093009920105401116011780Tooltip
SCHENKER Key 17 Pro (M24) Samsung 990 Pro 1 TB; diskspd 2.0.17 f: Ø5981 (4453.3-6104.14)
Asus ROG Strix Scar 17 G733PYV-LL053X SK hynix PC801 HFS001TEJ9X101N: Ø6593 (4837.89-6648.18)
Eurocom Raptor X17 Core i9-14900HX Corsair MP700 Pro 2TB; diskspd 2.0.17 f: Ø12251 (10175.58-12345.09)
Eurocom Raptor X17 Core i9-14900HX Corsair MP700 Pro 2TB; diskspd 2.0.17 f: Ø6127 (3845.97-12312.59)
HP ZBook Fury 16 G11 SK hynix PC801 HFS001TEJ9X101N; diskspd 2.0.17 f: Ø5610 (3481.65-6919.34)
Aorus 17X AZF Gigabyte AG470S1TB-SI B10: Ø6890 (5212.74-6934.62)

Desempenho da GPU

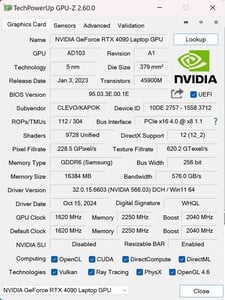
Informação GPUZ
Informação GPUZ

O desempenho geral em jogos coloca a implementação Schenker RTX 4090 em último lugar, mais uma vez não ficando muito atrás (no máximo 9%) em comparação com os concorrentes mais rápidos baseados em Intel. No entanto, o laptop Asus baseado em AMD é 16% mais rápido.

Um comportamento estranho foi registrado na execução de 30 minutos do Cyberpunk 2077 1080p ultra, em que o Schenker RTX 4090 cai para menos de 20 fps a cada 5 minutos, embora a média de fps permaneça acima de 100.

Além disso, o desempenho da GPU é drasticamente reduzido no modo de bateria. Por exemplo, o teste de estresse Furmark registra apenas 30 fps em média, enquanto que com o adaptador de energia conectado, ele registra 581 fps. Da mesma forma, o Cyberpunk 2077 1080p ultra e o Fire Strike funcionam a cerca de 30 fps com a bateria. O desempenho da GPU também cai bastante ao limitar a energia ao modo balanceado (entretenimento) ou ao modo de economia de energia (silencioso), conforme revelado pelo benchmark Fire Strike.

Perfil de energia
Pontuação de gráficos
Pontuação de física
Pontuação combinada
Modo de desempenho
456003061910857
Modo de entretenimento
34723 (-24%)
19943 (-35%)6499 (-41%)
Modo silencioso
30603 (-33%)
17142 (-44%)
4452 (-59%)
Energia da bateria
6899 (-85%)
9512 (-69%)
3095 (-72%)


3DMark Performance Rating - Percent
Asus ROG Strix Scar 17 G733PYV-LL053X -1!
NVIDIA GeForce RTX 4090 Laptop GPU, AMD Ryzen 9 7945HX3D
98.4 pt
Average NVIDIA GeForce RTX 4090 Laptop GPU
 
97.1 pt
Eurocom Raptor X17 Core i9-14900HX -1!
NVIDIA GeForce RTX 4090 Laptop GPU, Intel Core i9-14900HX
96.9 pt
Aorus 17X AZF
NVIDIA GeForce RTX 4090 Laptop GPU, Intel Core i9-13900HX
95.7 pt
SCHENKER Key 17 Pro (M24)
NVIDIA GeForce RTX 4090 Laptop GPU, Intel Core i9-14900HX
92.5 pt
HP ZBook Fury 16 G11 -1!
NVIDIA RTX 3500 Ada Generation Laptop GPU, Intel Core i9-14900HX
60.4 pt
Average of class Workstation
 
45.6 pt
3DMark 11 - 1280x720 Performance GPU
Average NVIDIA GeForce RTX 4090 Laptop GPU
  (54073 - 73027, n=42)
65041 Points +9%
Asus ROG Strix Scar 17 G733PYV-LL053X
NVIDIA GeForce RTX 4090 Laptop GPU, AMD Ryzen 9 7945HX3D
64166 Points +7%
Eurocom Raptor X17 Core i9-14900HX
NVIDIA GeForce RTX 4090 Laptop GPU, Intel Core i9-14900HX
63191 Points +6%
Aorus 17X AZF
NVIDIA GeForce RTX 4090 Laptop GPU, Intel Core i9-13900HX
62544 Points +5%
SCHENKER Key 17 Pro (M24)
NVIDIA GeForce RTX 4090 Laptop GPU, Intel Core i9-14900HX
59715 Points
HP ZBook Fury 16 G11
NVIDIA RTX 3500 Ada Generation Laptop GPU, Intel Core i9-14900HX
41630 Points -30%
Average of class Workstation
  (9356 - 59715, n=29, last 2 years)
29325 Points -51%
3DMark
1280x720 Cloud Gate Standard Graphics
Average NVIDIA GeForce RTX 4090 Laptop GPU
  (95671 - 164399, n=14)
142227 Points +3%
SCHENKER Key 17 Pro (M24)
NVIDIA GeForce RTX 4090 Laptop GPU, Intel Core i9-14900HX
137440 Points
Aorus 17X AZF
NVIDIA GeForce RTX 4090 Laptop GPU, Intel Core i9-13900HX
132812 Points -3%
Average of class Workstation
  (40615 - 152418, n=15, last 2 years)
81395 Points -41%
1920x1080 Fire Strike Graphics
Asus ROG Strix Scar 17 G733PYV-LL053X
NVIDIA GeForce RTX 4090 Laptop GPU, AMD Ryzen 9 7945HX3D
49422 Points +8%
Aorus 17X AZF
NVIDIA GeForce RTX 4090 Laptop GPU, Intel Core i9-13900HX
48251 Points +6%
Average NVIDIA GeForce RTX 4090 Laptop GPU
  (40259 - 53059, n=41)
46365 Points +2%
Eurocom Raptor X17 Core i9-14900HX
NVIDIA GeForce RTX 4090 Laptop GPU, Intel Core i9-14900HX
46191 Points +1%
SCHENKER Key 17 Pro (M24)
NVIDIA GeForce RTX 4090 Laptop GPU, Intel Core i9-14900HX
45600 Points
HP ZBook Fury 16 G11
NVIDIA RTX 3500 Ada Generation Laptop GPU, Intel Core i9-14900HX
29248 Points -36%
Average of class Workstation
  (6121 - 45600, n=29, last 2 years)
20806 Points -54%
2560x1440 Time Spy Graphics
Eurocom Raptor X17 Core i9-14900HX
NVIDIA GeForce RTX 4090 Laptop GPU, Intel Core i9-14900HX
22104 Points +12%
Asus ROG Strix Scar 17 G733PYV-LL053X
NVIDIA GeForce RTX 4090 Laptop GPU, AMD Ryzen 9 7945HX3D
21353 Points +8%
Aorus 17X AZF
NVIDIA GeForce RTX 4090 Laptop GPU, Intel Core i9-13900HX
21158 Points +7%
Average NVIDIA GeForce RTX 4090 Laptop GPU
  (16950 - 23292, n=43)
20950 Points +6%
SCHENKER Key 17 Pro (M24)
NVIDIA GeForce RTX 4090 Laptop GPU, Intel Core i9-14900HX
19741 Points
HP ZBook Fury 16 G11
NVIDIA RTX 3500 Ada Generation Laptop GPU, Intel Core i9-14900HX
12806 Points -35%
Average of class Workstation
  (1997 - 19741, n=29, last 2 years)
8356 Points -58%
3DMark 11 Performance
40366 pontos
3DMark Cloud Gate Standard Score
59382 pontos
3DMark Fire Strike Score
32725 pontos
3DMark Time Spy Score
18674 pontos
Ajuda
Blender
v3.3 Classroom OPTIX/RTX
Average of class Workstation
  (13 - 95, n=25, last 2 years)
34.2 Seconds * -163%
HP ZBook Fury 16 G11
NVIDIA RTX 3500 Ada Generation Laptop GPU, Intel Core i9-14900HX
21 Seconds * -62%
Aorus 17X AZF
NVIDIA GeForce RTX 4090 Laptop GPU, Intel Core i9-13900HX
14 Seconds * -8%
SCHENKER Key 17 Pro (M24)
NVIDIA GeForce RTX 4090 Laptop GPU, Intel Core i9-14900HX
13 Seconds *
Average NVIDIA GeForce RTX 4090 Laptop GPU
  (9 - 19, n=39)
12.1 Seconds * +7%
Eurocom Raptor X17 Core i9-14900HX
NVIDIA GeForce RTX 4090 Laptop GPU, Intel Core i9-14900HX
12 Seconds * +8%
Asus ROG Strix Scar 17 G733PYV-LL053X
NVIDIA GeForce RTX 4090 Laptop GPU, AMD Ryzen 9 7945HX3D
11 Seconds * +15%
v3.3 Classroom CUDA
Average of class Workstation
  (18 - 155, n=25, last 2 years)
61.8 Seconds * -243%
HP ZBook Fury 16 G11
NVIDIA RTX 3500 Ada Generation Laptop GPU, Intel Core i9-14900HX
33 Seconds * -83%
Aorus 17X AZF
NVIDIA GeForce RTX 4090 Laptop GPU, Intel Core i9-13900HX
21 Seconds * -17%
Eurocom Raptor X17 Core i9-14900HX
NVIDIA GeForce RTX 4090 Laptop GPU, Intel Core i9-14900HX
19 Seconds * -6%
Average NVIDIA GeForce RTX 4090 Laptop GPU
  (16 - 24, n=39)
18.3 Seconds * -2%
Asus ROG Strix Scar 17 G733PYV-LL053X
NVIDIA GeForce RTX 4090 Laptop GPU, AMD Ryzen 9 7945HX3D
18 Seconds * -0%
SCHENKER Key 17 Pro (M24)
NVIDIA GeForce RTX 4090 Laptop GPU, Intel Core i9-14900HX
18 Seconds *

* ... smaller is better

Performance Rating - Percent
Asus ROG Strix Scar 17 G733PYV-LL053X -3!
AMD Ryzen 9 7945HX3D, NVIDIA GeForce RTX 4090 Laptop GPU
100 pt
Eurocom Raptor X17 Core i9-14900HX -2!
Intel Core i9-14900HX, NVIDIA GeForce RTX 4090 Laptop GPU
94.3 pt
Aorus 17X AZF -3!
Intel Core i9-13900HX, NVIDIA GeForce RTX 4090 Laptop GPU
86.9 pt
SCHENKER Key 17 Pro (M24)
Intel Core i9-14900HX, NVIDIA GeForce RTX 4090 Laptop GPU
86.3 pt
HP ZBook Fury 16 G11 -1!
Intel Core i9-14900HX, NVIDIA RTX 3500 Ada Generation Laptop GPU
64.5 pt
Average of class Workstation
 
48.7 pt
Cyberpunk 2077 2.1 Phantom Liberty - 1920x1080 Ultra Preset (FSR off)
Eurocom Raptor X17 Core i9-14900HX
Intel Core i9-14900HX, NVIDIA GeForce RTX 4090 Laptop GPU
144.7 (63.1min) fps +27%
SCHENKER Key 17 Pro (M24)
Intel Core i9-14900HX, NVIDIA GeForce RTX 4090 Laptop GPU
113.5 (84.3min) fps
HP ZBook Fury 16 G11
Intel Core i9-14900HX, NVIDIA RTX 3500 Ada Generation Laptop GPU
90.3 (73.1min) fps -20%
Average of class Workstation
  (19.6 - 113.5, n=13, last 2 years)
62.4 fps -45%
The Witcher 3 v4.00 - 1920x1080 Ultra Preset / On AA:FX
SCHENKER Key 17 Pro (M24)
Intel Core i9-14900HX, NVIDIA GeForce RTX 4090 Laptop GPU
217 fps
Average of class Workstation
  (66.7 - 217, n=2, last 2 years)
141.9 fps -35%
Baldur's Gate 3 - 1920x1080 Ultra Preset
Eurocom Raptor X17 Core i9-14900HX
Intel Core i9-14900HX, NVIDIA GeForce RTX 4090 Laptop GPU
200.4 fps +13%
SCHENKER Key 17 Pro (M24)
Intel Core i9-14900HX, NVIDIA GeForce RTX 4090 Laptop GPU
177 fps
HP ZBook Fury 16 G11
Intel Core i9-14900HX, NVIDIA RTX 3500 Ada Generation Laptop GPU
117.3 fps -34%
Average of class Workstation
  (25.8 - 177, n=11, last 2 years)
89.8 fps -49%
GTA V - 1920x1080 Highest Settings possible AA:4xMSAA + FX AF:16x
Asus ROG Strix Scar 17 G733PYV-LL053X
AMD Ryzen 9 7945HX3D, NVIDIA GeForce RTX 4090 Laptop GPU
167.7 (1.87min, 111.1P1) fps +32%
Eurocom Raptor X17 Core i9-14900HX
Intel Core i9-14900HX, NVIDIA GeForce RTX 4090 Laptop GPU
152.2 (3.85min, 111.1P1) fps +20%
Aorus 17X AZF
Intel Core i9-13900HX, NVIDIA GeForce RTX 4090 Laptop GPU
135.3 (6.48min, 90.9P1) fps +7%
SCHENKER Key 17 Pro (M24)
Intel Core i9-14900HX, NVIDIA GeForce RTX 4090 Laptop GPU
126.7 (8.43min, 83.3P1) fps
HP ZBook Fury 16 G11
Intel Core i9-14900HX, NVIDIA RTX 3500 Ada Generation Laptop GPU
115.5 (4.64min, 76.9P1) fps -9%
Average of class Workstation
  (18.3 - 126.7, n=25, last 2 years)
82.8 fps -35%
Final Fantasy XV Benchmark - 1920x1080 High Quality
Asus ROG Strix Scar 17 G733PYV-LL053X
AMD Ryzen 9 7945HX3D, NVIDIA GeForce RTX 4090 Laptop GPU
180 fps +3%
Aorus 17X AZF
Intel Core i9-13900HX, NVIDIA GeForce RTX 4090 Laptop GPU
177.6 fps +2%
SCHENKER Key 17 Pro (M24)
Intel Core i9-14900HX, NVIDIA GeForce RTX 4090 Laptop GPU
174.6 fps
HP ZBook Fury 16 G11
Intel Core i9-14900HX, NVIDIA RTX 3500 Ada Generation Laptop GPU
128.9 fps -26%
Average of class Workstation
  (21.2 - 174.6, n=29, last 2 years)
80.9 fps -54%
Strange Brigade - 1920x1080 ultra AA:ultra AF:16
Asus ROG Strix Scar 17 G733PYV-LL053X
AMD Ryzen 9 7945HX3D, NVIDIA GeForce RTX 4090 Laptop GPU
420 (64.7min, 302P1) fps +17%
Eurocom Raptor X17 Core i9-14900HX
Intel Core i9-14900HX, NVIDIA GeForce RTX 4090 Laptop GPU
402 (69.8min, 280P1) fps +12%
Aorus 17X AZF
Intel Core i9-13900HX, NVIDIA GeForce RTX 4090 Laptop GPU
386 (35.7min, 279P1) fps +7%
SCHENKER Key 17 Pro (M24)
Intel Core i9-14900HX, NVIDIA GeForce RTX 4090 Laptop GPU
360 (22.5min, 268P1) fps
HP ZBook Fury 16 G11
Intel Core i9-14900HX, NVIDIA RTX 3500 Ada Generation Laptop GPU
223 (52.5min, 159.8P1) fps -38%
Average of class Workstation
  (34.1 - 360, n=26, last 2 years)
139.8 fps -61%
Dota 2 Reborn - 1920x1080 ultra (3/3) best looking
Asus ROG Strix Scar 17 G733PYV-LL053X
AMD Ryzen 9 7945HX3D, NVIDIA GeForce RTX 4090 Laptop GPU
220 (175min) fps +23%
Eurocom Raptor X17 Core i9-14900HX
Intel Core i9-14900HX, NVIDIA GeForce RTX 4090 Laptop GPU
195.2 (163.9min) fps +9%
SCHENKER Key 17 Pro (M24)
Intel Core i9-14900HX, NVIDIA GeForce RTX 4090 Laptop GPU
178.4 (149.2min) fps
Aorus 17X AZF
Intel Core i9-13900HX, NVIDIA GeForce RTX 4090 Laptop GPU
176.1 (149.8min) fps -1%
HP ZBook Fury 16 G11
Intel Core i9-14900HX, NVIDIA RTX 3500 Ada Generation Laptop GPU
153.9 (131.9min) fps -14%
Average of class Workstation
  (57.8 - 178.4, n=29, last 2 years)
128.3 fps -28%
X-Plane 11.11 - 1920x1080 high (fps_test=3)
Asus ROG Strix Scar 17 G733PYV-LL053X
AMD Ryzen 9 7945HX3D, NVIDIA GeForce RTX 4090 Laptop GPU
166.2 fps +19%
Eurocom Raptor X17 Core i9-14900HX
Intel Core i9-14900HX, NVIDIA GeForce RTX 4090 Laptop GPU
150.2 fps +8%
SCHENKER Key 17 Pro (M24)
Intel Core i9-14900HX, NVIDIA GeForce RTX 4090 Laptop GPU
139.7 fps
Aorus 17X AZF
Intel Core i9-13900HX, NVIDIA GeForce RTX 4090 Laptop GPU
138.5 fps -1%
HP ZBook Fury 16 G11
Intel Core i9-14900HX, NVIDIA RTX 3500 Ada Generation Laptop GPU
110.9 fps -21%
Average of class Workstation
  (27.7 - 139.7, n=30, last 2 years)
84.2 fps -40%

Cyberpunk 2077 ultra FPS Chart

0102030405060708090100110120Tooltip
SCHENKER Key 17 Pro (M24) i9-14900HX, NVIDIA GeForce RTX 4090 Laptop GPU: Ø105 (17.74-129.39)
HP ZBook Fury 16 G11 i9-14900HX, NVIDIA RTX 3500 Ada Generation Laptop GPU: Ø67.6 (57.7-73.7)
baixomédiaaltoultraQHD4K DLSS4K
GTA V (2015) 179.1 126.7 124.3 83.5
Dota 2 Reborn (2015) 240 209 199.8 178.4 170.9
Final Fantasy XV Benchmark (2018) 208 174.6 147.8 86.1
X-Plane 11.11 (2018) 201 178.2 139.7 114.8
Strange Brigade (2018) 480 389 379 360 281 145.5
The Witcher 3 v4.00 (2023) 241 217 165.7 84.4
Baldur's Gate 3 (2023) 183 177 124.7 107.9 66.5
Cyberpunk 2077 2.1 Phantom Liberty (2023) 134.1 129.8 127.7 113.5 89.7 40.4

Emissões e consumo de energia

Ruído do sistema

Em marcha lenta e carga média, a solução de resfriamento da Schenker é relativamente mais silenciosa em comparação com os outros sistemas de resfriamento. Um aspecto a ser observado em marcha lenta é um leve zumbido vindo das ventoinhas, aparentemente. O problema é que, assim que mudamos para o modo de desempenho com velocidades automáticas das ventoinhas, elas sempre funcionam no máximo, mesmo que a carga não seja tão alta. Nesse caso, o sistema de resfriamento prova ser o mais barulhento, com impressionantes 62,14 dBA. O modelo da Eurocom segue de perto, pois apresenta essencialmente o mesmo chassi Clevo usado pela Schenker. Os outros modelos são significativamente mais silenciosos, com no máximo 54 dBA nas velocidades máximas do ventilador.

Barulho

Ocioso
25.33 / 25.33 / 25.33 dB
Carga
33.57 / 62.14 dB
  red to green bar
 
 
30 dB
silencioso
40 dB(A)
audível
50 dB(A)
ruidosamente alto
 
min: dark, med: mid, max: light   Earthworks M23R, Arta (15 cm de distância)   environment noise: 23.41 dB(A)
dB(A) 0102030405060708090Deep BassMiddle BassHigh BassLower RangeMidsHigher MidsLower HighsMid HighsUpper HighsSuper Highs2024.522.120.721.623.324.52528.730.528.728.125.828.73129.229.727.927.523.529.24029.530.228.128.223.729.55043.64442.743.436.443.66328.831.124.126.728.928.8803033.620.118.824.63010031.432.120.817.224.431.412532.433.521.52020.732.416037.137.220.416.81437.120037.838.120.915.113.937.825042.14224.617.415.442.131544.445.226.118.21744.440046.747.329.418.614.146.750044.144.22614.612.144.163046.646.924.413.89.146.680047.848.523.412.48.647.8100048.848.623.311.38.748.8125049.850.122.711.58.949.8160048.248.320.910.39.648.2200049.149.323.611.69.949.1250051.351.52013.610.551.3315053.353.418.313.511.353.3400051.651.315.912.111.551.6500053.153.614.112.311.653.1630048.748.913.512.611.848.7800046.646.613.312.211.946.61000042.843.113.712.311.842.81250038.939.313.812.311.638.91600034.634.812.91210.934.6SPL6262.133.625.323.462N15.8161.80.70.515.8median 46.6median 46.9median 20.9median 12.6median 11.6median 46.6Delta5.15.34.42.12.45.1hearing rangehide median Fan NoiseSCHENKER Key 17 Pro (M24)
SCHENKER Key 17 Pro (M24)
NVIDIA GeForce RTX 4090 Laptop GPU, i9-14900HX, Samsung 990 Pro 1 TB
Asus ROG Strix Scar 17 G733PYV-LL053X
NVIDIA GeForce RTX 4090 Laptop GPU, R9 7945HX3D, SK hynix PC801 HFS001TEJ9X101N
Eurocom Raptor X17 Core i9-14900HX
NVIDIA GeForce RTX 4090 Laptop GPU, i9-14900HX, Corsair MP700 Pro 2TB
HP ZBook Fury 16 G11
NVIDIA RTX 3500 Ada Generation Laptop GPU, i9-14900HX, SK hynix PC801 HFS001TEJ9X101N
Aorus 17X AZF
NVIDIA GeForce RTX 4090 Laptop GPU, i9-13900HX, Gigabyte AG470S1TB-SI B10
Noise
-13%
-14%
2%
-18%
off / environment *
23.41
23
2%
23.7
-1%
23.2
1%
25
-7%
Idle Minimum *
25.33
23
9%
31.7
-25%
23.2
8%
28
-11%
Idle Average *
25.33
27.7
-9%
31.7
-25%
23.2
8%
29
-14%
Idle Maximum *
25.33
34.7
-37%
32.9
-30%
29.5
-16%
34
-34%
Load Average *
33.57
53.4
-59%
34
-1%
43
-28%
51
-52%
Cyberpunk 2077 ultra *
61.97
48.2
22%
Load Maximum *
62.14
53.4
14%
61.6
1%
48.2
22%
54
13%
Witcher 3 ultra *
53.4
61.6
57

* ... smaller is better

Temperatura

As temperaturas médias variam apenas ligeiramente entre o estado inativo e a carga no lado do teclado. A área do trackpad permanece abaixo da temperatura da pele, enquanto o teclado fica mais quente no meio superior e no canto esquerdo. Por outro lado, a parte inferior é ligeiramente mais quente em modo inativo, mas as temperaturas atingem mais de 60° C nas áreas superior e intermediária, portanto, não é realmente adequada para uso no colo. Em comparação com os outros modelos testados, as temperaturas de inatividade e de carga parecem significativamente mais altas. As imagens térmicas mostram que as saídas de ar traseiras e laterais têm os pontos mais quentes. As temperaturas na fonte de alimentação variam apenas ligeiramente entre carga e inatividade e não ultrapassam 40° C.

Carga Máxima
 49 °C51 °C29 °C 
 33.5 °C45 °C34.2 °C 
 30.3 °C29.3 °C32.2 °C 
Máximo: 51 °C
Médio: 37.1 °C
60 °C63.6 °C60 °C
44.3 °C64 °C40 °C
38.6 °C38.5 °C35.4 °C
Máximo: 64 °C
Médio: 49.4 °C
alimentação elétrica  43.6 °C | Temperatura do quarto 24.6 °C | Fluke t3000FC (calibrated), Fluke 62 MAX
(±) The average temperature for the upper side under maximal load is 37.1 °C / 99 F, compared to the average of 32 °C / 90 F for the devices in the class Workstation.
(-) The maximum temperature on the upper side is 51 °C / 124 F, compared to the average of 38.2 °C / 101 F, ranging from 22.2 to 69.8 °C for the class Workstation.
(-) The bottom heats up to a maximum of 64 °C / 147 F, compared to the average of 41.2 °C / 106 F
(±) In idle usage, the average temperature for the upper side is 35.4 °C / 96 F, compared to the device average of 32 °C / 90 F.
(+) The palmrests and touchpad are reaching skin temperature as a maximum (33.1 °C / 91.6 F) and are therefore not hot.
(-) The average temperature of the palmrest area of similar devices was 27.9 °C / 82.2 F (-5.2 °C / -9.4 F).
Temperaturas dianteiras (em marcha lenta)
Temperaturas de retorno (ocioso)
Temperaturas do adaptador de energia (ocioso)
Temperaturas frontais (teste de estresse)
Temperaturas das costas (teste de estresse)
Temperaturas do adaptador de energia (teste de estresse)
SCHENKER Key 17 Pro (M24)
Intel Core i9-14900HX, NVIDIA GeForce RTX 4090 Laptop GPU
Asus ROG Strix Scar 17 G733PYV-LL053X
AMD Ryzen 9 7945HX3D, NVIDIA GeForce RTX 4090 Laptop GPU
Eurocom Raptor X17 Core i9-14900HX
Intel Core i9-14900HX, NVIDIA GeForce RTX 4090 Laptop GPU
HP ZBook Fury 16 G11
Intel Core i9-14900HX, NVIDIA RTX 3500 Ada Generation Laptop GPU
Aorus 17X AZF
Intel Core i9-13900HX, NVIDIA GeForce RTX 4090 Laptop GPU
Heat
31%
21%
19%
23%
Maximum Upper Side *
51
40.1
21%
52.2
-2%
42.2
17%
47
8%
Maximum Bottom *
64
46.7
27%
53.2
17%
48
25%
51
20%
Idle Upper Side *
42.3
26.5
37%
28.6
32%
37
13%
30
29%
Idle Bottom *
46
27.7
40%
29.8
35%
36.8
20%
31
33%

* ... smaller is better

Alto-falantes

No volume máximo, algumas frequências médias e altas tendem a ressoar com o chassi. Os graves não são muito pronunciados, pois não há subwoofers incluídos no sistema de som.

dB(A) 0102030405060708090Deep BassMiddle BassHigh BassLower RangeMidsHigher MidsLower HighsMid HighsUpper HighsSuper Highs2023.622.623.62531.131.331.13125.42025.44027.919.927.95038.22838.26327.519.627.58031.421.231.410041.415.141.412551.116.751.116053.112.553.120059.312.859.325059.719.259.731561.519.761.540061.117.161.150068.713.668.763067.112.367.180067.410.467.4100069.79.769.7125073.31073.3160067.310.467.3200067.810.867.8250067.811.267.8315060.111.660.1400068.411.768.4500073.411.973.46300671267800069.41269.41000064.612.164.61250065.711.865.71600057.311.157.3SPL80.924.280.9N51.60.651.6median 67median 12median 67Delta4.41.94.426.325.821.422.12624.925.127.622.532.523.448.72655.818.860.922.167.2267019.372.317.674.217.774.319.575.31571.711.871.311.27410.574.21072.710.17210.67210.97511.374.811.671.71269.71269.612.371.112.669.61270.111.269.824.784.70.666.6median 12median 71.73.42.2hearing rangehide median Pink NoiseSCHENKER Key 17 Pro (M24)Apple MacBook Pro 16 2021 M1 Pro
Frequency diagram (checkboxes can be checked and unchecked to compare devices)
SCHENKER Key 17 Pro (M24) audio analysis

(±) | speaker loudness is average but good (80.9 dB)
Bass 100 - 315 Hz
(±) | reduced bass - on average 12.7% lower than median
(±) | linearity of bass is average (9.1% delta to prev. frequency)
Mids 400 - 2000 Hz
(+) | balanced mids - only 2.3% away from median
(+) | mids are linear (5.1% delta to prev. frequency)
Highs 2 - 16 kHz
(+) | balanced highs - only 2.9% away from median
(±) | linearity of highs is average (8.9% delta to prev. frequency)
Overall 100 - 16.000 Hz
(+) | overall sound is linear (11.2% difference to median)
Compared to same class
» 9% of all tested devices in this class were better, 3% similar, 88% worse
» The best had a delta of 7%, average was 18%, worst was 35%
Compared to all devices tested
» 6% of all tested devices were better, 2% similar, 93% worse
» The best had a delta of 4%, average was 25%, worst was 134%

Apple MacBook Pro 16 2021 M1 Pro audio analysis

(+) | speakers can play relatively loud (84.7 dB)
Bass 100 - 315 Hz
(+) | good bass - only 3.8% away from median
(+) | bass is linear (5.2% delta to prev. frequency)
Mids 400 - 2000 Hz
(+) | balanced mids - only 1.3% away from median
(+) | mids are linear (2.1% delta to prev. frequency)
Highs 2 - 16 kHz
(+) | balanced highs - only 1.9% away from median
(+) | highs are linear (2.7% delta to prev. frequency)
Overall 100 - 16.000 Hz
(+) | overall sound is linear (4.6% difference to median)
Compared to same class
» 0% of all tested devices in this class were better, 0% similar, 100% worse
» The best had a delta of 5%, average was 18%, worst was 45%
Compared to all devices tested
» 0% of all tested devices were better, 0% similar, 100% worse
» The best had a delta of 4%, average was 25%, worst was 134%

Consumo de energia

O consumo de energia em modo inativo é significativamente maior do que o de todos os modelos nesta comparação, com cerca de 40 W. Isso é quase o dobro em comparação com a geração anterior do i9-13900HX e do Ryzen 9 7945HX3D da AMD. No entanto, o consumo de carga total é o segundo menor em média. Ele começa em 300 W, mas cai para cerca de 200 W após alguns minutos. Em contraste, o i9-13900HX no modelo Aorus varia muito em carga total. No teste Cyberpunk 2077 1080p ultra 150 nit, o Key 17 Pro registra o consumo mais alto de 274 W em média.

Nos testes de monitor externo, o consumo ocioso é um pouco menor (29 W), como esperado, mas o Cyberpunk 2077 1080p Ultra consome um pouco mais (280 W).

Consumo de energia
desligadodarklight 0.62 / 2 Watt
Ociosodarkmidlight 33.79 / 41.67 / 49.66 Watt
Carga midlight 113.06 / 301 Watt
 color bar
Key: min: dark, med: mid, max: light        Metrahit Energy

Power Consumption Cyberpunk / Stress Test

020406080100120140160180200220240260280300320Tooltip
SCHENKER Key 17 Pro (M24) i9-14900HX, NVIDIA GeForce RTX 4090 Laptop GPU; 1280x720 Prime95 28.10 and Furmark 1.25: Ø248 (199.5-300)
Asus ROG Strix Scar 17 G733PYV-LL053X R9 7945HX3D, NVIDIA GeForce RTX 4090 Laptop GPU; 1280x720 Prime95 28.10 and Furmark 1.25: Ø287 (278-327)
HP ZBook Fury 16 G11 i9-14900HX, NVIDIA RTX 3500 Ada Generation Laptop GPU; 1280x720 Prime95 28.10 and Furmark 1.25: Ø177.3 (156.9-236)
Aorus 17X AZF i9-13900HX, NVIDIA GeForce RTX 4090 Laptop GPU; 1280x720 Prime95 28.10 and Furmark 1.25: Ø163.2 (123.4-275)
SCHENKER Key 17 Pro (M24) i9-14900HX, NVIDIA GeForce RTX 4090 Laptop GPU; Idle 150cd/m2: Ø42.7 (40.3-52)
Asus ROG Strix Scar 17 G733PYV-LL053X R9 7945HX3D, NVIDIA GeForce RTX 4090 Laptop GPU; Idle 150cd/m2: Ø17.2 (14.8-22.6)
HP ZBook Fury 16 G11 i9-14900HX, NVIDIA RTX 3500 Ada Generation Laptop GPU; Idle 150cd/m2: Ø9.03 (5.95-16.7)
Aorus 17X AZF i9-13900HX, NVIDIA GeForce RTX 4090 Laptop GPU; Idle 150cd/m2: Ø16.9 (11.9-21)
SCHENKER Key 17 Pro (M24) i9-14900HX, NVIDIA GeForce RTX 4090 Laptop GPU; Cyberpunk 2077 FHD ultra no FSR 150cd: Ø274 (178.4-310)
HP ZBook Fury 16 G11 i9-14900HX, NVIDIA RTX 3500 Ada Generation Laptop GPU; Cyberpunk 2077 FHD ultra no FSR 150cd: Ø199.4 (186.2-223)

Power Consumption external Monitor

020406080100120140160180200220240260280300Tooltip
SCHENKER Key 17 Pro (M24) i9-14900HX, NVIDIA GeForce RTX 4090 Laptop GPU; Prime95 V2810 Stress (external Monitor): Ø171.9 (158.8-211)
Asus ROG Strix Scar 17 G733PYV-LL053X R9 7945HX3D, NVIDIA GeForce RTX 4090 Laptop GPU; Prime95 V2810 Stress (external Monitor): Ø157.2 (155-164.7)
HP ZBook Fury 16 G11 i9-14900HX, NVIDIA RTX 3500 Ada Generation Laptop GPU; Prime95 V2810 Stress (external Monitor): Ø132.3 (110.2-196.2)
Aorus 17X AZF i9-13900HX, NVIDIA GeForce RTX 4090 Laptop GPU; Prime95 V2810 Stress (external Monitor): Ø126.3 (116.6-203)
Asus ROG Strix Scar 17 G733PYV-LL053X R9 7945HX3D, NVIDIA GeForce RTX 4090 Laptop GPU; Cinebench R15 Multi (external Monitor): Ø187.3 (172.4-195.5)
HP ZBook Fury 16 G11 i9-14900HX, NVIDIA RTX 3500 Ada Generation Laptop GPU; Cinebench R15 Multi (external Monitor): Ø209 (207-221)
SCHENKER Key 17 Pro (M24) i9-14900HX, NVIDIA GeForce RTX 4090 Laptop GPU; Cinebench R23 Single (external Monitor): Ø76.2 (67.2-92.4)
Asus ROG Strix Scar 17 G733PYV-LL053X R9 7945HX3D, NVIDIA GeForce RTX 4090 Laptop GPU; Cinebench R23 Single (external Monitor): Ø71.9 (70.8-86)
SCHENKER Key 17 Pro (M24) i9-14900HX, NVIDIA GeForce RTX 4090 Laptop GPU; Cinebench R23 Multi (external Monitor): Ø136.1 (84.2-156.1)
Asus ROG Strix Scar 17 G733PYV-LL053X R9 7945HX3D, NVIDIA GeForce RTX 4090 Laptop GPU; Cinebench R23 Multi (external Monitor): Ø158.5 (149.9-171.1)
Aorus 17X AZF i9-13900HX, NVIDIA GeForce RTX 4090 Laptop GPU; Cinebench R23 Multi (external Monitor): Ø160.8 (158.2-169.2)
SCHENKER Key 17 Pro (M24) i9-14900HX, NVIDIA GeForce RTX 4090 Laptop GPU; 1280x720 FurMark 1.19 GPU Stress Test (external Monitor): Ø235 (229-245)
Asus ROG Strix Scar 17 G733PYV-LL053X R9 7945HX3D, NVIDIA GeForce RTX 4090 Laptop GPU; 1280x720 FurMark 1.19 GPU Stress Test (external Monitor): Ø242 (225-263)
HP ZBook Fury 16 G11 i9-14900HX, NVIDIA RTX 3500 Ada Generation Laptop GPU; 1280x720 FurMark 1.19 GPU Stress Test (external Monitor): Ø175.5 (160.4-203)
Aorus 17X AZF i9-13900HX, NVIDIA GeForce RTX 4090 Laptop GPU; 1280x720 FurMark 1.19 GPU Stress Test (external Monitor): Ø239 (233-273)
SCHENKER Key 17 Pro (M24) i9-14900HX, NVIDIA GeForce RTX 4090 Laptop GPU; Idle 1min (external Monitor): Ø29 (22.5-36.9)
Asus ROG Strix Scar 17 G733PYV-LL053X R9 7945HX3D, NVIDIA GeForce RTX 4090 Laptop GPU; Idle 1min (external Monitor): Ø28.9 (22.6-43.7)
HP ZBook Fury 16 G11 i9-14900HX, NVIDIA RTX 3500 Ada Generation Laptop GPU; Idle 1min (external Monitor): Ø8.59 (4.29-17.9)
Aorus 17X AZF i9-13900HX, NVIDIA GeForce RTX 4090 Laptop GPU; Idle 1min (external Monitor): Ø22.5 (18.2-30.9)
SCHENKER Key 17 Pro (M24) i9-14900HX, NVIDIA GeForce RTX 4090 Laptop GPU; Cyberpunk 2077 FHD ultra no FSR - external Monitor: Ø280 (250-312)
HP ZBook Fury 16 G11 i9-14900HX, NVIDIA RTX 3500 Ada Generation Laptop GPU; Cyberpunk 2077 FHD ultra no FSR - external Monitor: Ø192.6 (181.9-209)

Duração da bateria

Apesar de ter uma generosa capacidade de 99 Wh, a bateria do Key 17 Pro não se sai bem em comparação com os outros modelos. Em condições de navegação na Web Wi-Fi a 150 nits, a bateria dura apenas 203 minutos, enquanto os outros modelos têm tempos de execução que variam entre 40% e 96% mais longos. Com carga total, o Key 17 Pro dura 64 minutos, o segundo menor tempo de execução, enquanto em condições de Cyberpunk 2077 1080p ultra 150 cd, a bateria dura apenas 3 minutos a mais. Esse modelo parece ter sido projetado para substituir o desktop, não como um dispositivo móvel.

Tempo de Execução da Bateria
Cyberpunk 2077 ultra 150cd
1h 07min
WiFi Websurfing
3h 23min
Carga (máximo brilho)
1h 04min
SCHENKER Key 17 Pro (M24)
i9-14900HX, NVIDIA GeForce RTX 4090 Laptop GPU, 99 Wh
Asus ROG Strix Scar 17 G733PYV-LL053X
R9 7945HX3D, NVIDIA GeForce RTX 4090 Laptop GPU, 90 Wh
Eurocom Raptor X17 Core i9-14900HX
i9-14900HX, NVIDIA GeForce RTX 4090 Laptop GPU, 99 Wh
HP ZBook Fury 16 G11
i9-14900HX, NVIDIA RTX 3500 Ada Generation Laptop GPU, 95 Wh
Aorus 17X AZF
i9-13900HX, NVIDIA GeForce RTX 4090 Laptop GPU, 99 Wh
Average of class Workstation
 
Battery Runtime
14%
40%
98%
96%
90%
WiFi v1.3
203
287
41%
284
40%
402
98%
389
92%
Cyberpunk 2077 ultra 150cd
67
Load
64
55
-14%
128
100%
H.264
302
403
Reader / Idle
541

Classificação do Notebookcheck

A estação de trabalho móvel Key 17 Pro da Schenker deste ano impressiona com excelentes adições de conectividade, como duas portas Thunderbolt 5 ultrarrápidas e velocidades de Wi-Fi 7. O Intel i9-14900HX e a RTX 4090 da Nvidia oferecem excelente desempenho, mas não exatamente no mesmo nível da concorrência. As desvantagens notáveis incluem o sistema de resfriamento barulhento e o tempo de duração da bateria bastante curto.

SCHENKER Key 17 Pro (M24) - 11/15/2024 v8
Bogdan Solca

Acabamento
84 / 98 → 86%
Teclado
96%
Mouse
94%
Conectividade
76 / 80 → 95%
Peso
54 / 10-66 → 78%
Bateria
51 / 95 → 53%
Pantalha
83%
Desempenho do jogos
90%
Desempenho da aplicação
88%
Workstation
80%
AI Performance
99%
Temperatura
82 / 95 → 86%
Ruído
56 / 90 → 63%
Audio
81%
Camera
50 / 75 → 67%
Médio
73%
85%
Workstation - Médio equilibrado

Transparency

The selection of devices to be reviewed is made by our editorial team. The test sample was provided to the author as a loan by the manufacturer or retailer for the purpose of this review. The lender had no influence on this review, nor did the manufacturer receive a copy of this review before publication. There was no obligation to publish this review. We never accept compensation or payment in return for our reviews. As an independent media company, Notebookcheck is not subjected to the authority of manufacturers, retailers or publishers.

This is how Notebookcheck is testing

Every year, Notebookcheck independently reviews hundreds of laptops and smartphones using standardized procedures to ensure that all results are comparable. We have continuously developed our test methods for around 20 years and set industry standards in the process. In our test labs, high-quality measuring equipment is utilized by experienced technicians and editors. These tests involve a multi-stage validation process. Our complex rating system is based on hundreds of well-founded measurements and benchmarks, which maintains objectivity. Further information on our test methods can be found here.

Please share our article, every link counts!
Mail Logo
> Análises e revisões de portáteis e celulares > Análises > Análises > Análise do SCHENKER Key 17 Pro (M24) - conectores Thunderbolt 5 duplos ultrarrápidos e potência i9-14900HX
Bogdan Solca, 2024-11-22 (Update: 2024-11-22)