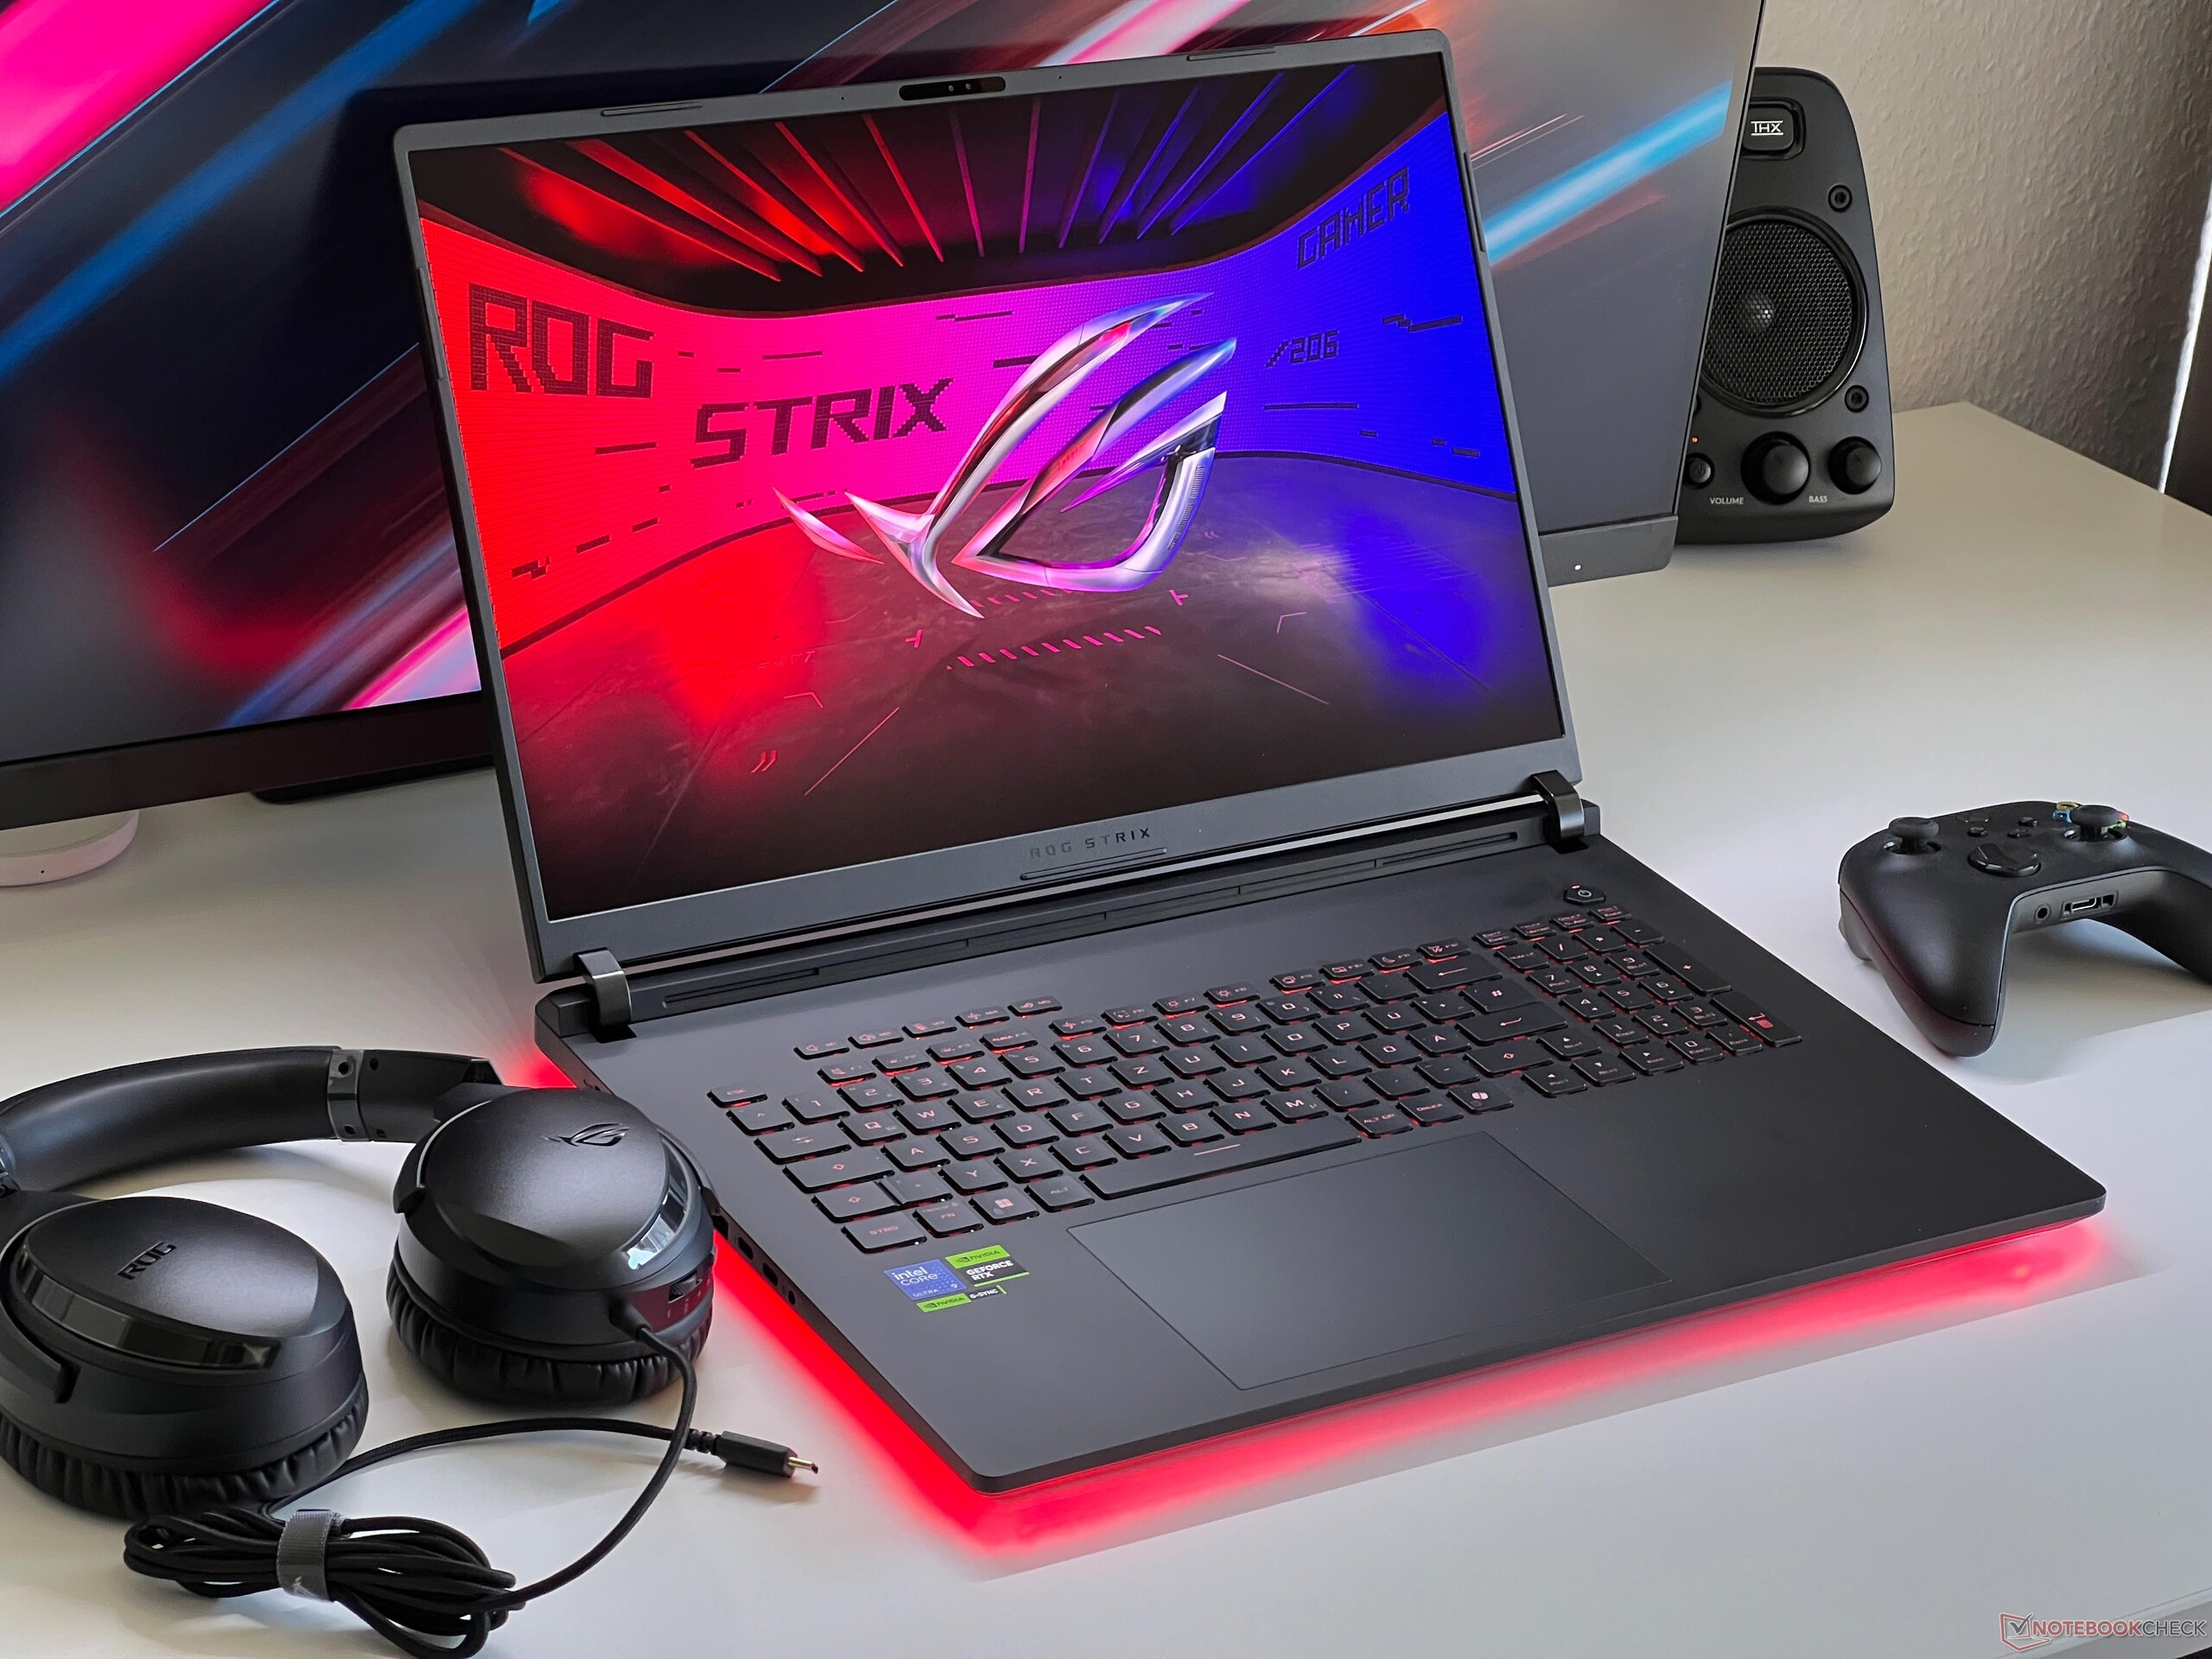
O gamer de 18 polegadas com excelente mini LED e um laptop RTX 5090 - Análise do Asus Strix SCAR 18 G835LX
Para jogadores e profissionais de criação.
A Asus atualizou seu carro-chefe para jogos, o Strix SCAR 18, com o Core Ultra 9 275HX, o laptop GeForce RTX 5090 e uma excelente tela mini LED a 240 Hz. Além disso, o acesso aos componentes do dispositivo ficou muito mais fácil e há muitos elementos de iluminação.Andreas Osthoff, 👁 Andreas Osthoff (traduzido por DeepL / Ninh Duy) Publicado 🇺🇸 🇩🇪 ...
Veredicto - Mais potência, um gabinete mais elegante e um excelente mini painel de LED
O ROG Strix SCAR 18 é o carro-chefe da Asus para jogos e isso fica claro assim que o senhor olha para seus dados técnicos. Ele apresenta os componentes mais rápidos, como o Core Ultra 9 275HX e o laptop GeForce RTX 5090, embora sua vantagem em relação ao antigo laptop RTX 4090 seja relativamente pequena em jogos, especialmente em sua resolução WQHD nativa. Somente ao usar métodos de upscaling, como o MFG4x, o novo laptop 5090 pode se destacar claramente. A atualização definitivamente faz mais sentido para os proprietários de notebooks para jogos com GPUs RTX 3000.
Foram feitas algumas alterações no gabinete e o design geral agora está um pouco mais organizado, enquanto as opções de iluminação também foram ampliadas com a faixa de LEDs em toda a volta e a tela AniME Vision na tampa. A unidade de base ainda é feita de plástico, mas, infelizmente, a superfície lisa da parte superior fica suja com extrema rapidez. O acesso aos componentes agora é possível sem a necessidade de uma chave de fenda e as opções de manutenção do laptop são excelentes, embora o nosso dispositivo de teste já estivesse muito bem equipado. Sua combinação RAID 0 de SSDs não é totalmente ideal - teríamos preferido o uso de um slot PCIe 5.0 rápido, pois isso significaria resultados ainda melhores com uma única unidade.
Sua tela mini LED de 240 Hz é impressionante em quase todos os aspectos e, além das especificações puras da tela, os modos adicionais da Asus também são bastante interessantes. Em primeiro lugar, isso inclui perfis de fábrica super precisos para P3 e sRGB, e o senhor pode desativar o escurecimento local para edição de imagens. No modo HDR, também é possível converter as cores sRGB claras (quando nenhum conteúdo HDR é exibido, por exemplo, a área de trabalho do Windows) no espaço de cores P3.
As desvantagens do laptop incluem o resfriamento ruidoso no modo Desempenho e Turbo e, é claro, o alto consumo de energia. Além disso, há o preço, que é extremamente alto, especialmente para nossa versão de ponta que custa aproximadamente US$ 6.200 - pelo menos há alguns acessórios incluídos. No entanto, faz mais sentido comprar um modelo mais barato com menos memória e depois expandi-la facilmente, se necessário.
O Strix SCAR 18 é o primeiro dos novos notebooks para jogos de 18 polegadas que testamos, mas os modelos da concorrência certamente virão em breve e só então poderemos dizer com certeza qual é o desempenho do novo SCAR 18.
Pro
Contra
Preço e disponibilidade
O novo Asus ROG Strix SCAR 18 provavelmente estará disponível a partir do final de abril/início de maio.
Índice
- Veredicto - Mais potência, um gabinete mais elegante e um excelente mini painel de LED
- Especificações
- Caso - Muita luz, pouca sombra
- Conectividade - O SCAR 18 com Thunderbolt 5
- Dispositivos de entrada
- Tela - Excelente mini painel de LED a 240 Hz
- Desempenho - Laptop Arrow Lake-HX e RTX 5000
- Emissões
- Gerenciamento de energia - Bateria de curta duração
- Classificação total do Notebookcheck
- Possible alternatives compared
O ROG Strix SCAR 18 G835LX é o primeiro novo laptop para jogos de 18 polegadas a apresentar o Intel Core Ultra 9 275HX e o laptop Nvidia GeForce RTX 5090 Laptope também é o carro-chefe da Asus para jogos em 2025. Além disso, o dispositivo tem um mini painel de LED a 240 Hz, 64 GB de RAM e uma capacidade SSD de 4 TB por um preço de cerca de US$ 6.200.
Os Top 10
» Os Top 10 Portáteis Multimídia
» Os Top 10 Portáteis de Jogos
» Os Top 10 Portáteis Leves para Jogos
» Os Top 10 Portáteis Acessíveis de Escritório/Empresariais
» Os Top 10 Portáteis Premium de Escritório/Empresariais
» Os Top 10 dos Portáteis Workstation
» Os Top 10 Subportáteis
» Os Top 10 Ultrabooks
» Os Top 10 Conversíveis
» Os Top 10 Tablets
» Os Top 10 Smartphones
» A melhores Telas de Portáteis Analisadas Pela Notebookcheck
» Top 10 dos portáteis abaixo dos 500 Euros da Notebookcheck
» Top 10 dos Portáteis abaixo dos 300 Euros
Especificações
Caso - Muita luz, pouca sombra
A Asus revisou todo o gabinete do laptop e seu design agora parece muito mais elegante. A faixa de LEDs na parte inferior e a nova tela AniME Vision dot-matrix na tampa são novas. Juntamente com a luz de fundo RGB do teclado e o logotipo da ROG, o senhor pode dar asas à sua criatividade. O visor AniME-Vision é um bom truque e, além de letras e animações prontas, o senhor também pode usar suas próprias imagens como animações.
O alumínio é novamente usado para a cobertura da tela e o plástico para a unidade básica. A estabilidade geral do gabinete é muito boa, mas a superfície lisa da unidade de base, em particular, é extremamente sensível a marcas de impressões digitais e precisa ser limpa regularmente com um pano úmido. As dobradiças mantêm a tampa firmemente na posição (ângulo máximo de abertura de 135 graus), mas um leve balanço não pode ser totalmente evitado quando o ângulo é ajustado. Em suma, o case é bom, mas para um produto de alta qualidade, teríamos preferido um feito inteiramente de metal.
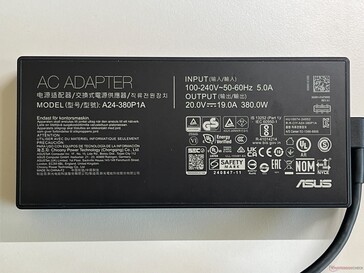
Entre os gamers de 18 polegadas, o novo Strix SCAR 18 é relativamente compacto e, com 3,3 kg, também está no meio do campo quando se trata de peso. A fonte de alimentação de 380 watts pesa mais 986 gramas.
Conectividade - O SCAR 18 com Thunderbolt 5
Sua distribuição de portas não mudou, mas as duas portas USB-C agora suportam Thunderbolt 5 de até 120 GB/s. O fato de não haver nenhuma porta na parte traseira (por exemplo, alimentação, tela, Ethernet) não é o ideal. Devido à fraca NPU Arrow Lake do laptop, ele não pode ter a designação Copilot+, mas funções como Studio Effects da webcam ou legendas ao vivo são suportadas.
Comunicação
Além de uma conexão Ethernet de 2,5 Gbit/s, o SCAR 18 apresenta um módulo Wi-Fi 7 moderno, incluindo Bluetooth 5.4. Suas taxas de transferência em conexão com nosso roteador de referência da Asus foram altas e estáveis. Não houve problemas com a qualidade do sinal durante nosso teste.
| Networking | |
| Asus Strix Scar 18 G835LX | |
| iperf3 transmit AXE11000 | |
| iperf3 receive AXE11000 | |
| Razer Blade 18 2024 RZ09-0509 | |
| iperf3 transmit AXE11000 | |
| iperf3 receive AXE11000 | |
| iperf3 transmit AXE11000 6GHz | |
| iperf3 receive AXE11000 6GHz | |
| Alienware m18 R2 | |
| iperf3 transmit AXE11000 | |
| iperf3 receive AXE11000 | |
| iperf3 transmit AXE11000 6GHz | |
| iperf3 receive AXE11000 6GHz | |
| Acer Predator Helios 18 PH18-72-98MW | |
| iperf3 transmit AXE11000 | |
| iperf3 receive AXE11000 | |
| MSI Titan 18 HX A14VIG | |
| iperf3 transmit AXE11000 | |
| iperf3 receive AXE11000 | |
| iperf3 transmit AXE11000 6GHz | |
| iperf3 receive AXE11000 6GHz | |
| SCHENKER Key 17 Pro (M24) | |
| iperf3 transmit AXE11000 | |
| iperf3 receive AXE11000 | |
| iperf3 transmit AXE11000 6GHz | |
| iperf3 receive AXE11000 6GHz | |
| Asus ROG Strix Scar 18 G834JYR (2024) | |
| iperf3 transmit AXE11000 | |
| iperf3 receive AXE11000 | |
Webcam
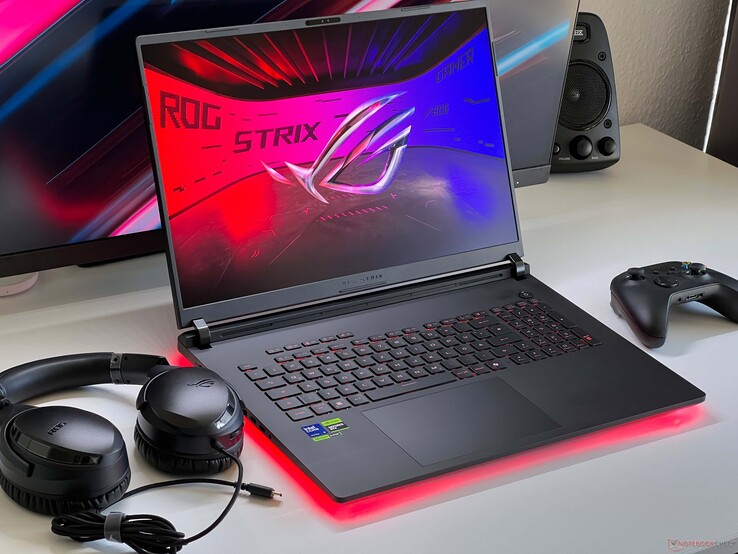
O laptop da Asus ainda tem uma webcam de 2 MP sem obturador, que faz seu trabalho, mas o senhor não deve esperar muito da qualidade da imagem. Também há uma câmera IR para reconhecimento facial via Windows Hello.

Acessórios
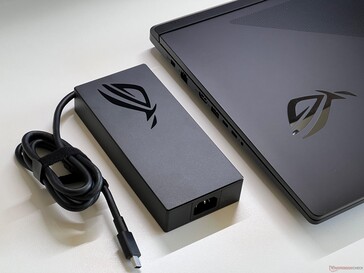
Além de uma mochila, nosso dispositivo de teste também veio com o headset com fio ROG Fusion II 300, o mouse para jogos Gladius III e uma fonte de alimentação USB-C adicional de 100 watts.
Manutenção
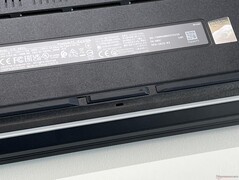
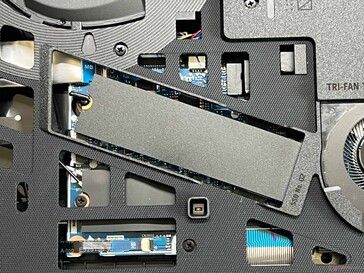
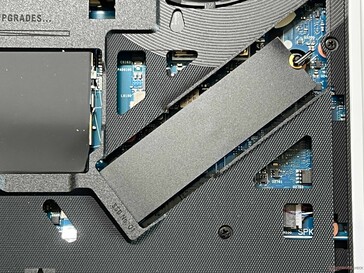
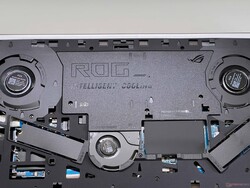
A Asus facilitou muito o acesso aos componentes do dispositivo. A placa de base inferior pode ser destravada por meio de um controle deslizante e simplesmente puxada para frente. Isso permite o acesso aos dois SSDs M.2 2280, aos dois slots SO-DIMM e às ventoinhas. Para substituir a bateria aparafusada, é necessário desmontá-la ainda mais.
Sustentabilidade
A Asus não comentou sobre a pegadade CO2 do laptop ou sobre o uso de materiais reciclados. Sua embalagem consiste quase inteiramente em papel e papelão.
Dispositivos de entrada
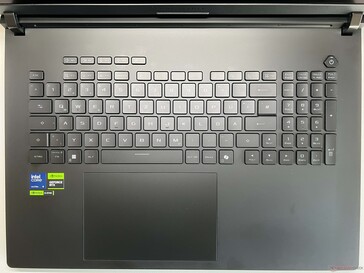
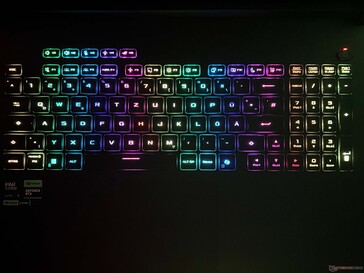
O teclado grande do dispositivo com um teclado numérico é confortável para digitar, com deslocamento suficiente e um toque preciso. Os teclados mecânicos são ainda melhores nesse aspecto, enquanto o teclado do Strix SCAR 18 é significativamente mais silencioso. Sua luz de fundo pode ser definida individualmente para cada tecla. O grande touchpad de vidro (13,5 x 8 cm) é agradável e suave, enquanto os cliques na área inferior são muito claros e abafados.
Tela - Excelente mini painel de LED a 240 Hz
O mini painel LED do Strix SCAR 18 com resolução de 2.560 x 1.600 pixels (16:10) oferece excelente qualidade de imagem e mesmo as superfícies brilhantes não parecem granuladas. Graças à sua taxa de atualização de 240 Hz, os movimentos parecem muito suaves. Não é possível determinar de forma confiável os tempos de resposta dos painéis mini LED usando nosso método de medição devido à cintilação da luz de fundo, portanto, os valores que fornecemos são apenas um guia. Entretanto, a própria Asus fala em 3 ms e não tivemos nenhum problema durante os jogos.
O painel oferece alguns recursos e modos de operação interessantes. Três modos de imagem estão disponíveis no modo SDR, cada um dos quais atinge diferentes níveis máximos de brilho. É possível escolher entre as configurações multiintensivo (escurecimento local ativo, máx. ~750 nits), multibalanceado (escurecimento local ativo, máx. ~490 nits) e controle de imagem única (escurecimento local desativado, máx. ~611 nits). O modo de imagem única é particularmente interessante para a edição de imagens para garantir um brilho uniforme em toda a superfície da tela. No modo HDR (brilho máximo de 1.450 nits com uma imagem quase totalmente branca), é possível selecionar um modo P3 além do modo normal, que converte automaticamente o conteúdo não HDR (como a área de trabalho) de sRGB para o espaço de cores P3 (embora isso possa reduzir a precisão das cores). Isso evita o problema de o conteúdo não HDR parecer muito pálido no modo HDR.
Outra característica surpreendente do painel é que seu nível de preto no modo SDR não é 0, mesmo quando o escurecimento local está ativo. Como resultado, há um leve sangramento da luz de fundo (embora menos com escurecimento local do que no modo de imagem única ). Somente no modo HDR a imagem é realmente totalmente preta (nível de preto 0).
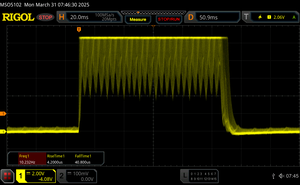
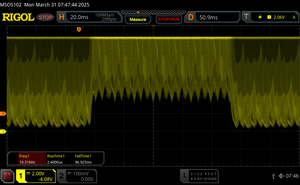
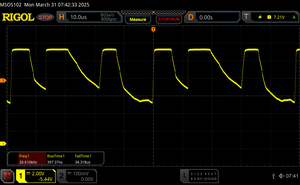
Com cerca de 750 cd/m², seu brilho é um pouco menor do que no ano passado, mas ainda assim é impressionante. Seu nível de preto é de 0,1 cd/m², o que resulta em uma excelente relação de contraste de mais de 7.000:1. O brilho da tela não é reduzido no modo de bateria. Entretanto, nem o brilho nem a temperatura da cor podem ser regulados automaticamente por um sensor. A tela pisca em todos os níveis de brilho, mas a frequência é muito alta, 20 kHz, e não deve causar nenhum problema.
| |||||||||||||||||||||||||
iluminação: 93 %
iluminação com acumulador: 764 cd/m²
Contraste: 7640:1 (Preto: 0.1 cd/m²)
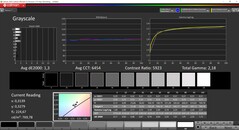
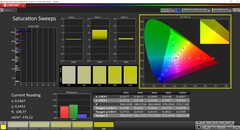
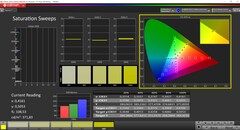
ΔE Color 1.2 | 0.5-29.43 Ø4.87
ΔE Greyscale 1.5 | 0.5-98 Ø5.1
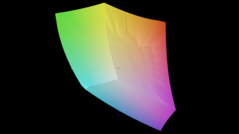
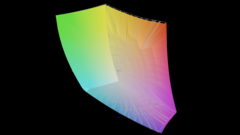
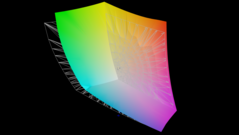
87.2% AdobeRGB 1998 (Argyll 2.2.0 3D)
100% sRGB (Argyll 2.2.0 3D)
99% Display P3 (Argyll 2.2.0 3D)
Gamma: 2.17
| Asus Strix Scar 18 G835LX N180QDM-NM2, Mini-LED, 2560x1600, 18", 240 Hz | Razer Blade 18 2024 RZ09-0509 BOE NE180QDM-NM1, Mini-LED, 2560x1600, 18", 300 Hz | Alienware m18 R2 BOE NE18NZ1, IPS, 2560x1600, 18", 165 Hz | Acer Predator Helios 18 PH18-72-98MW B180QAN01.2 (AUO45A8), Mini-LED, 2560x1600, 18", 250 Hz | MSI Titan 18 HX A14VIG AU Optronics B180ZAN01.0, Mini-LED, 3840x2400, 18", 120 Hz | SCHENKER Key 17 Pro (M24) BOE, IPS, 3840x2160, 17.3", 144 Hz | Asus ROG Strix Scar 18 G834JYR (2024) BOE NE180QDM-NM1, Mini LED, 2560x1600, 18", 240 Hz | |
|---|---|---|---|---|---|---|---|
| Display | 0% | 0% | 2% | -1% | -3% | 1% | |
| Display P3 Coverage | 99 | 99 0% | 97.8 -1% | 99.7 1% | 98.1 -1% | 93.51 -6% | 99.9 1% |
| sRGB Coverage | 100 | 100 0% | 99.5 0% | 100 0% | 99.8 0% | 99.86 0% | 100 0% |
| AdobeRGB 1998 Coverage | 87.2 | 86.9 0% | 88.9 2% | 91.6 5% | 86.2 -1% | 84.33 -3% | 90 3% |
| Response Times | -3% | 14% | -51% | -263% | -8% | -46% | |
| Response Time Grey 50% / Grey 80% * | 7.4 ? | 7.6 ? -3% | 5.3 ? 28% | 8 ? -8% | 8.6 ? -16% | 11.593 ? -57% | 12 ? -62% |
| Response Time Black / White * | 10.4 ? | 14 ? -35% | 10.4 ? -0% | 17.6 ? -69% | 81.8 ? -687% | 6 ? 42% | 10.7 ? -3% |
| PWM Frequency | 20610 ? | 26444 ? 28% | 4832 ? -77% | 2592 ? -87% | 5733 ? -72% | ||
| Screen | -99% | -94% | -30% | -88% | -157% | 15% | |
| Brightness middle | 764 | 605.4 -21% | 271.8 -64% | 722 -5% | 467.5 -39% | 548 -28% | 937 23% |
| Brightness | 747 | 600 -20% | 275 -63% | 724 -3% | 459 -39% | 505 -32% | 934 25% |
| Brightness Distribution | 93 | 97 4% | 78 -16% | 93 0% | 90 -3% | 86 -8% | 89 -4% |
| Black Level * | 0.1 | 0.62 -520% | 0.27 -170% | 0.04 60% | 0.54 -440% | 0.066 34% | |
| Contrast | 7640 | 976 -87% | 1007 -87% | 18050 136% | 1015 -87% | 14197 86% | |
| Colorchecker dE 2000 * | 1.2 | 1.53 -28% | 2.48 -107% | 3.4 -183% | 3.77 -214% | 3.81 -218% | 1.52 -27% |
| Colorchecker dE 2000 max. * | 2.8 | 4.15 -48% | 5.59 -100% | 5.32 -90% | 6.12 -119% | 7.9 -182% | 2.82 -1% |
| Greyscale dE 2000 * | 1.5 | 2.6 -73% | 3.7 -147% | 3.8 -153% | 3.2 -113% | 5.4 -260% | 1.7 -13% |
| Gamma | 2.17 101% | 2.22 99% | 2.2 100% | 2.383 92% | 2.43 91% | 2.062 107% | 2.042 108% |
| CCT | 6556 99% | 6843 95% | 6355 102% | 7051 92% | 6478 100% | 7224 90% | 6578 99% |
| Colorchecker dE 2000 calibrated * | 0.56 | 1.6 | 2.94 | 2.54 | 1.21 | ||
| Média Total (Programa/Configurações) | -34% /
-57% | -27% /
-56% | -26% /
-28% | -117% /
-110% | -56% /
-98% | -10% /
-1% |
* ... menor é melhor
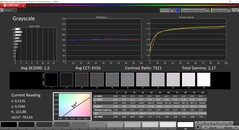
Como de costume, a Asus oferece vários perfis de cores para o modo SDR. O modo nativo é um pouco supersaturado, mas também estão disponíveis perfis muito precisos para P3 e sRGB. Não foi possível melhorar ainda mais a tela com nossa própria calibração.
Exibir tempos de resposta
| ↔ Tempo de resposta preto para branco | ||
|---|---|---|
| 10.4 ms ... ascensão ↗ e queda ↘ combinadas | ↗ 0.6 ms ascensão | |
| ↘ 9.8 ms queda | ||
| A tela mostra boas taxas de resposta em nossos testes, mas pode ser muito lenta para jogadores competitivos. Em comparação, todos os dispositivos testados variam de 0.1 (mínimo) a 240 (máximo) ms. » 25 % de todos os dispositivos são melhores. Isso significa que o tempo de resposta medido é melhor que a média de todos os dispositivos testados (20.7 ms). | ||
| ↔ Tempo de resposta 50% cinza a 80% cinza | ||
| 7.4 ms ... ascensão ↗ e queda ↘ combinadas | ↗ 2.4 ms ascensão | |
| ↘ 5 ms queda | ||
| A tela mostra taxas de resposta muito rápidas em nossos testes e deve ser muito adequada para jogos em ritmo acelerado. Em comparação, todos os dispositivos testados variam de 0.165 (mínimo) a 636 (máximo) ms. » 17 % de todos os dispositivos são melhores. Isso significa que o tempo de resposta medido é melhor que a média de todos os dispositivos testados (32.5 ms). | ||
Cintilação da tela / PWM (modulação por largura de pulso)
| Tela tremeluzindo/PWM detectado | 20610 Hz Amplitude: 100 % | ≤ 100 % configuração de brilho | |
A luz de fundo da tela pisca em 20610 Hz (pior caso, por exemplo, utilizando PWM) Cintilação detectada em uma configuração de brilho de 100 % e abaixo. Não deve haver cintilação ou PWM acima desta configuração de brilho. A frequência de 20610 Hz é bastante alta, então a maioria dos usuários sensíveis ao PWM não deve notar nenhuma oscilação. [pwm_comparison] Em comparação: 53 % de todos os dispositivos testados não usam PWM para escurecer a tela. Se PWM foi detectado, uma média de 8496 (mínimo: 5 - máximo: 343500) Hz foi medida. | |||
Desempenho - Laptop Arrow Lake-HX e RTX 5000
Condições de teste
A Asus oferece três perfis de energia chamados Quiet, Performance e Turbo, que usamos para os seguintes benchmarks e medições. Em geral, gostaríamos de ver uma diferença um pouco maior entre o Performance e o Turbo. Também está disponível um modo manual, no qual o senhor pode aumentar a taxa de clock da GPU e influenciar as curvas da ventoinha. O modo Turbo não está disponível no modo de bateria.
| Perfil de energia | CPU TDP | CB R24 Multi | GPU TGP | Time Spy Gráficos | CP 2077 QHD | emissões máximas de ruído do ventilador |
|---|---|---|---|---|---|---|
| Silencioso | 100/65 watts | 1.825 pontos | 55 watts | 9.029 pontos | 43,5 fps | 34,8 dB(A) |
| Desempenho | 120/105 watts | 2.039 pontos | 160 watts | 23.300 pontos | 102,7 fps | 49 dB(A) |
| Turbo | 175/150 watts | 2.223 pontos | 175 watts | 24.599 watts | 106,8fps | 53,7 dB(A) |
Processador - Core Ultra 9 275HX
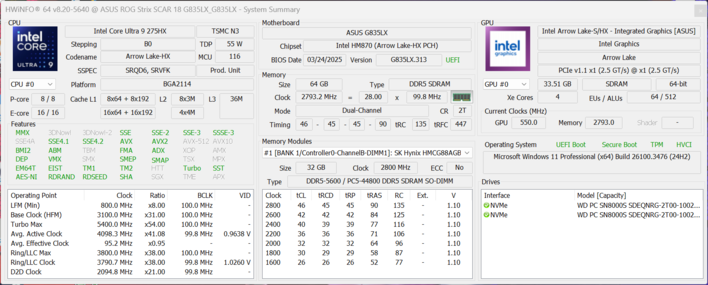
O novo Core Ultra 9 275HX da geração Arrow Lake é usado como processador do laptop. Ele tem 24 núcleos (desempenho 8x, eficiência 16x) sem hyperthreading e pode consumir até 175 watts por períodos curtos e 150 watts permanentemente. Como já vimos em nossa Análise da CPUseus resultados nos benchmarks sintéticos foram muito bons e sua vantagem média sobre os modelos de comparação foi de pelo menos 11%, enquanto que, em comparação com o modelo anterior, chegamos a notar 18%. No modo de bateria, o consumo de energia foi bastante reduzido (54/34 watts) e o desempenho de vários núcleos caiu 43%.
Cinebench R15 Multi continuous test
Cinebench R23: Multi Core | Single Core
Cinebench R20: CPU (Multi Core) | CPU (Single Core)
Cinebench R15: CPU Multi 64Bit | CPU Single 64Bit
Blender: v2.79 BMW27 CPU
7-Zip 18.03: 7z b 4 | 7z b 4 -mmt1
Geekbench 6.4: Multi-Core | Single-Core
Geekbench 5.5: Multi-Core | Single-Core
HWBOT x265 Benchmark v2.2: 4k Preset
LibreOffice : 20 Documents To PDF
R Benchmark 2.5: Overall mean
| CPU Performance Rating | |
| Asus Strix Scar 18 G835LX | |
| Média Intel Core Ultra 9 275HX | |
| Alienware m18 R2 | |
| MSI Titan 18 HX A14VIG | |
| Asus ROG Strix Scar 18 G834JYR (2024) | |
| Razer Blade 18 2024 RZ09-0509 | |
| SCHENKER Key 17 Pro (M24) | |
| Acer Predator Helios 18 PH18-72-98MW | |
| Média da turma Gaming | |
| Cinebench R23 / Multi Core | |
| Asus Strix Scar 18 G835LX | |
| Média Intel Core Ultra 9 275HX (33497 - 39001, n=4) | |
| MSI Titan 18 HX A14VIG | |
| Alienware m18 R2 | |
| Asus ROG Strix Scar 18 G834JYR (2024) | |
| Razer Blade 18 2024 RZ09-0509 | |
| SCHENKER Key 17 Pro (M24) | |
| Acer Predator Helios 18 PH18-72-98MW | |
| Média da turma Gaming (5668 - 39652, n=154, últimos 2 anos) | |
| Cinebench R23 / Single Core | |
| Asus Strix Scar 18 G835LX | |
| Alienware m18 R2 | |
| Média Intel Core Ultra 9 275HX (2126 - 2252, n=4) | |
| Asus ROG Strix Scar 18 G834JYR (2024) | |
| Acer Predator Helios 18 PH18-72-98MW | |
| MSI Titan 18 HX A14VIG | |
| Razer Blade 18 2024 RZ09-0509 | |
| SCHENKER Key 17 Pro (M24) | |
| Média da turma Gaming (1136 - 2252, n=154, últimos 2 anos) | |
| Cinebench R20 / CPU (Multi Core) | |
| Asus Strix Scar 18 G835LX | |
| Média Intel Core Ultra 9 275HX (13223 - 15517, n=4) | |
| MSI Titan 18 HX A14VIG | |
| Alienware m18 R2 | |
| Razer Blade 18 2024 RZ09-0509 | |
| Asus ROG Strix Scar 18 G834JYR (2024) | |
| SCHENKER Key 17 Pro (M24) | |
| Acer Predator Helios 18 PH18-72-98MW | |
| Média da turma Gaming (2179 - 15517, n=154, últimos 2 anos) | |
| Cinebench R20 / CPU (Single Core) | |
| Asus Strix Scar 18 G835LX | |
| Alienware m18 R2 | |
| Média Intel Core Ultra 9 275HX (821 - 866, n=4) | |
| Asus ROG Strix Scar 18 G834JYR (2024) | |
| Acer Predator Helios 18 PH18-72-98MW | |
| MSI Titan 18 HX A14VIG | |
| Razer Blade 18 2024 RZ09-0509 | |
| SCHENKER Key 17 Pro (M24) | |
| Média da turma Gaming (439 - 866, n=154, últimos 2 anos) | |
| Cinebench R15 / CPU Multi 64Bit | |
| Asus Strix Scar 18 G835LX | |
| Média Intel Core Ultra 9 275HX (5044 - 6060, n=4) | |
| Alienware m18 R2 | |
| MSI Titan 18 HX A14VIG | |
| Acer Predator Helios 18 PH18-72-98MW | |
| SCHENKER Key 17 Pro (M24) | |
| Razer Blade 18 2024 RZ09-0509 | |
| Asus ROG Strix Scar 18 G834JYR (2024) | |
| Média da turma Gaming (905 - 6074, n=157, últimos 2 anos) | |
| Cinebench R15 / CPU Single 64Bit | |
| Asus Strix Scar 18 G835LX | |
| Média Intel Core Ultra 9 275HX (327 - 343, n=4) | |
| Alienware m18 R2 | |
| Acer Predator Helios 18 PH18-72-98MW | |
| Razer Blade 18 2024 RZ09-0509 | |
| Asus ROG Strix Scar 18 G834JYR (2024) | |
| MSI Titan 18 HX A14VIG | |
| SCHENKER Key 17 Pro (M24) | |
| Média da turma Gaming (191.9 - 343, n=154, últimos 2 anos) | |
| Blender / v2.79 BMW27 CPU | |
| Média da turma Gaming (81 - 555, n=147, últimos 2 anos) | |
| Acer Predator Helios 18 PH18-72-98MW | |
| SCHENKER Key 17 Pro (M24) | |
| Asus ROG Strix Scar 18 G834JYR (2024) | |
| Razer Blade 18 2024 RZ09-0509 | |
| MSI Titan 18 HX A14VIG | |
| Alienware m18 R2 | |
| Média Intel Core Ultra 9 275HX (87 - 101, n=4) | |
| Asus Strix Scar 18 G835LX | |
| 7-Zip 18.03 / 7z b 4 | |
| Asus Strix Scar 18 G835LX | |
| Alienware m18 R2 | |
| MSI Titan 18 HX A14VIG | |
| Média Intel Core Ultra 9 275HX (109737 - 122818, n=4) | |
| Asus ROG Strix Scar 18 G834JYR (2024) | |
| SCHENKER Key 17 Pro (M24) | |
| Razer Blade 18 2024 RZ09-0509 | |
| Acer Predator Helios 18 PH18-72-98MW | |
| Média da turma Gaming (23795 - 144064, n=152, últimos 2 anos) | |
| 7-Zip 18.03 / 7z b 4 -mmt1 | |
| Asus ROG Strix Scar 18 G834JYR (2024) | |
| Alienware m18 R2 | |
| Asus Strix Scar 18 G835LX | |
| SCHENKER Key 17 Pro (M24) | |
| Média Intel Core Ultra 9 275HX (6654 - 7027, n=4) | |
| MSI Titan 18 HX A14VIG | |
| Razer Blade 18 2024 RZ09-0509 | |
| Média da turma Gaming (4199 - 7573, n=152, últimos 2 anos) | |
| Acer Predator Helios 18 PH18-72-98MW | |
| Geekbench 6.4 / Multi-Core | |
| Asus Strix Scar 18 G835LX | |
| Média Intel Core Ultra 9 275HX (16033 - 21668, n=5) | |
| Alienware m18 R2 | |
| Asus ROG Strix Scar 18 G834JYR (2024) | |
| Acer Predator Helios 18 PH18-72-98MW | |
| Razer Blade 18 2024 RZ09-0509 | |
| MSI Titan 18 HX A14VIG | |
| SCHENKER Key 17 Pro (M24) | |
| Média da turma Gaming (5340 - 21668, n=123, últimos 2 anos) | |
| Geekbench 6.4 / Single-Core | |
| Asus Strix Scar 18 G835LX | |
| Média Intel Core Ultra 9 275HX (3033 - 3158, n=5) | |
| Alienware m18 R2 | |
| Asus ROG Strix Scar 18 G834JYR (2024) | |
| Acer Predator Helios 18 PH18-72-98MW | |
| MSI Titan 18 HX A14VIG | |
| Razer Blade 18 2024 RZ09-0509 | |
| Média da turma Gaming (1490 - 3219, n=123, últimos 2 anos) | |
| SCHENKER Key 17 Pro (M24) | |
| Geekbench 5.5 / Multi-Core | |
| Asus Strix Scar 18 G835LX | |
| Média Intel Core Ultra 9 275HX (22218 - 25855, n=4) | |
| Alienware m18 R2 | |
| Acer Predator Helios 18 PH18-72-98MW | |
| Asus ROG Strix Scar 18 G834JYR (2024) | |
| SCHENKER Key 17 Pro (M24) | |
| Razer Blade 18 2024 RZ09-0509 | |
| MSI Titan 18 HX A14VIG | |
| Média da turma Gaming (4557 - 25855, n=151, últimos 2 anos) | |
| Geekbench 5.5 / Single-Core | |
| Asus Strix Scar 18 G835LX | |
| Média Intel Core Ultra 9 275HX (2186 - 2292, n=4) | |
| Alienware m18 R2 | |
| Asus ROG Strix Scar 18 G834JYR (2024) | |
| MSI Titan 18 HX A14VIG | |
| Razer Blade 18 2024 RZ09-0509 | |
| Acer Predator Helios 18 PH18-72-98MW | |
| SCHENKER Key 17 Pro (M24) | |
| Média da turma Gaming (986 - 2423, n=151, últimos 2 anos) | |
| HWBOT x265 Benchmark v2.2 / 4k Preset | |
| Asus Strix Scar 18 G835LX | |
| Média Intel Core Ultra 9 275HX (35.7 - 41.2, n=4) | |
| Alienware m18 R2 | |
| MSI Titan 18 HX A14VIG | |
| Acer Predator Helios 18 PH18-72-98MW | |
| Asus ROG Strix Scar 18 G834JYR (2024) | |
| Razer Blade 18 2024 RZ09-0509 | |
| SCHENKER Key 17 Pro (M24) | |
| Média da turma Gaming (6.72 - 42.9, n=151, últimos 2 anos) | |
| LibreOffice / 20 Documents To PDF | |
| Acer Predator Helios 18 PH18-72-98MW | |
| Média Intel Core Ultra 9 275HX (40.5 - 88, n=4) | |
| Razer Blade 18 2024 RZ09-0509 | |
| Média da turma Gaming (19 - 96.6, n=150, últimos 2 anos) | |
| SCHENKER Key 17 Pro (M24) | |
| MSI Titan 18 HX A14VIG | |
| Alienware m18 R2 | |
| Asus ROG Strix Scar 18 G834JYR (2024) | |
| Asus Strix Scar 18 G835LX | |
| R Benchmark 2.5 / Overall mean | |
| Média da turma Gaming (0.3609 - 0.759, n=153, últimos 2 anos) | |
| Acer Predator Helios 18 PH18-72-98MW | |
| SCHENKER Key 17 Pro (M24) | |
| Média Intel Core Ultra 9 275HX (0.3943 - 0.43, n=4) | |
| Asus ROG Strix Scar 18 G834JYR (2024) | |
| Asus Strix Scar 18 G835LX | |
| Razer Blade 18 2024 RZ09-0509 | |
| MSI Titan 18 HX A14VIG | |
| Alienware m18 R2 | |
* ... menor é melhor
AIDA64: FP32 Ray-Trace | FPU Julia | CPU SHA3 | CPU Queen | FPU SinJulia | FPU Mandel | CPU AES | CPU ZLib | FP64 Ray-Trace | CPU PhotoWorxx
| Performance Rating | |
| Asus Strix Scar 18 G835LX | |
| Média Intel Core Ultra 9 275HX | |
| MSI Titan 18 HX A14VIG | |
| Alienware m18 R2 | |
| Asus ROG Strix Scar 18 G834JYR (2024) | |
| Razer Blade 18 2024 RZ09-0509 | |
| Acer Predator Helios 18 PH18-72-98MW | |
| SCHENKER Key 17 Pro (M24) | |
| Média da turma Gaming | |
| AIDA64 / FP32 Ray-Trace | |
| Asus Strix Scar 18 G835LX | |
| Média Intel Core Ultra 9 275HX (32615 - 39551, n=4) | |
| MSI Titan 18 HX A14VIG | |
| Alienware m18 R2 | |
| Asus ROG Strix Scar 18 G834JYR (2024) | |
| Razer Blade 18 2024 RZ09-0509 | |
| Acer Predator Helios 18 PH18-72-98MW | |
| Média da turma Gaming (4986 - 81639, n=150, últimos 2 anos) | |
| SCHENKER Key 17 Pro (M24) | |
| AIDA64 / FPU Julia | |
| Asus Strix Scar 18 G835LX | |
| Média Intel Core Ultra 9 275HX (166245 - 194867, n=4) | |
| MSI Titan 18 HX A14VIG | |
| Alienware m18 R2 | |
| Asus ROG Strix Scar 18 G834JYR (2024) | |
| Razer Blade 18 2024 RZ09-0509 | |
| Acer Predator Helios 18 PH18-72-98MW | |
| SCHENKER Key 17 Pro (M24) | |
| Média da turma Gaming (25360 - 252486, n=150, últimos 2 anos) | |
| AIDA64 / CPU SHA3 | |
| Asus Strix Scar 18 G835LX | |
| Média Intel Core Ultra 9 275HX (7829 - 9482, n=4) | |
| MSI Titan 18 HX A14VIG | |
| Alienware m18 R2 | |
| Asus ROG Strix Scar 18 G834JYR (2024) | |
| Razer Blade 18 2024 RZ09-0509 | |
| Acer Predator Helios 18 PH18-72-98MW | |
| SCHENKER Key 17 Pro (M24) | |
| Média da turma Gaming (1339 - 10389, n=150, últimos 2 anos) | |
| AIDA64 / CPU Queen | |
| MSI Titan 18 HX A14VIG | |
| Asus ROG Strix Scar 18 G834JYR (2024) | |
| Asus Strix Scar 18 G835LX | |
| Alienware m18 R2 | |
| Acer Predator Helios 18 PH18-72-98MW | |
| SCHENKER Key 17 Pro (M24) | |
| Razer Blade 18 2024 RZ09-0509 | |
| Média Intel Core Ultra 9 275HX (125013 - 139608, n=4) | |
| Média da turma Gaming (50699 - 200651, n=150, últimos 2 anos) | |
| AIDA64 / FPU SinJulia | |
| MSI Titan 18 HX A14VIG | |
| Alienware m18 R2 | |
| Asus ROG Strix Scar 18 G834JYR (2024) | |
| Razer Blade 18 2024 RZ09-0509 | |
| Acer Predator Helios 18 PH18-72-98MW | |
| Asus Strix Scar 18 G835LX | |
| SCHENKER Key 17 Pro (M24) | |
| Média Intel Core Ultra 9 275HX (13238 - 14112, n=4) | |
| Média da turma Gaming (4800 - 32988, n=150, últimos 2 anos) | |
| AIDA64 / FPU Mandel | |
| Asus Strix Scar 18 G835LX | |
| Média Intel Core Ultra 9 275HX (87156 - 104057, n=4) | |
| Alienware m18 R2 | |
| MSI Titan 18 HX A14VIG | |
| Asus ROG Strix Scar 18 G834JYR (2024) | |
| Razer Blade 18 2024 RZ09-0509 | |
| Acer Predator Helios 18 PH18-72-98MW | |
| Média da turma Gaming (12321 - 134044, n=150, últimos 2 anos) | |
| SCHENKER Key 17 Pro (M24) | |
| AIDA64 / CPU AES | |
| MSI Titan 18 HX A14VIG | |
| Asus Strix Scar 18 G835LX | |
| Alienware m18 R2 | |
| Média Intel Core Ultra 9 275HX (119356 - 134920, n=4) | |
| Asus ROG Strix Scar 18 G834JYR (2024) | |
| Razer Blade 18 2024 RZ09-0509 | |
| Acer Predator Helios 18 PH18-72-98MW | |
| SCHENKER Key 17 Pro (M24) | |
| Média da turma Gaming (19065 - 328679, n=150, últimos 2 anos) | |
| AIDA64 / CPU ZLib | |
| Asus Strix Scar 18 G835LX | |
| MSI Titan 18 HX A14VIG | |
| Média Intel Core Ultra 9 275HX (1898 - 2220, n=4) | |
| Alienware m18 R2 | |
| Razer Blade 18 2024 RZ09-0509 | |
| Asus ROG Strix Scar 18 G834JYR (2024) | |
| Acer Predator Helios 18 PH18-72-98MW | |
| SCHENKER Key 17 Pro (M24) | |
| Média da turma Gaming (373 - 2531, n=150, últimos 2 anos) | |
| AIDA64 / FP64 Ray-Trace | |
| Asus Strix Scar 18 G835LX | |
| Média Intel Core Ultra 9 275HX (17631 - 21372, n=4) | |
| Alienware m18 R2 | |
| MSI Titan 18 HX A14VIG | |
| Razer Blade 18 2024 RZ09-0509 | |
| Asus ROG Strix Scar 18 G834JYR (2024) | |
| Acer Predator Helios 18 PH18-72-98MW | |
| Média da turma Gaming (2540 - 43430, n=150, últimos 2 anos) | |
| SCHENKER Key 17 Pro (M24) | |
| AIDA64 / CPU PhotoWorxx | |
| Asus Strix Scar 18 G835LX | |
| Média Intel Core Ultra 9 275HX (48187 - 56613, n=4) | |
| SCHENKER Key 17 Pro (M24) | |
| Alienware m18 R2 | |
| Asus ROG Strix Scar 18 G834JYR (2024) | |
| Razer Blade 18 2024 RZ09-0509 | |
| Acer Predator Helios 18 PH18-72-98MW | |
| Média da turma Gaming (10805 - 60161, n=150, últimos 2 anos) | |
| MSI Titan 18 HX A14VIG | |
Desempenho do sistema
O Strix SCAR 18 é um sistema super responsivo, mas seus resultados de benchmark foram apenas medianos. A troca de gráficos Advanced Optimus causa um breve travamento ao iniciar os jogos, mas isso é normal.
CrossMark: Overall | Productivity | Creativity | Responsiveness
WebXPRT 3: Overall
WebXPRT 4: Overall
Mozilla Kraken 1.1: Total
| PCMark 10 / Score | |
| Alienware m18 R2 | |
| MSI Titan 18 HX A14VIG | |
| Razer Blade 18 2024 RZ09-0509 | |
| Asus ROG Strix Scar 18 G834JYR (2024) | |
| Asus Strix Scar 18 G835LX | |
| Média Intel Core Ultra 9 275HX, Nvidia GeForce RTX 5090 Laptop (8608 - 8623, n=2) | |
| SCHENKER Key 17 Pro (M24) | |
| Acer Predator Helios 18 PH18-72-98MW | |
| Média da turma Gaming (5776 - 9852, n=133, últimos 2 anos) | |
| PCMark 10 / Essentials | |
| MSI Titan 18 HX A14VIG | |
| Alienware m18 R2 | |
| Asus ROG Strix Scar 18 G834JYR (2024) | |
| Razer Blade 18 2024 RZ09-0509 | |
| Acer Predator Helios 18 PH18-72-98MW | |
| Média Intel Core Ultra 9 275HX, Nvidia GeForce RTX 5090 Laptop (10966 - 11081, n=2) | |
| Asus Strix Scar 18 G835LX | |
| SCHENKER Key 17 Pro (M24) | |
| Média da turma Gaming (9057 - 12600, n=133, últimos 2 anos) | |
| PCMark 10 / Productivity | |
| Alienware m18 R2 | |
| Asus ROG Strix Scar 18 G834JYR (2024) | |
| MSI Titan 18 HX A14VIG | |
| Razer Blade 18 2024 RZ09-0509 | |
| Acer Predator Helios 18 PH18-72-98MW | |
| Média da turma Gaming (6662 - 14612, n=133, últimos 2 anos) | |
| SCHENKER Key 17 Pro (M24) | |
| Asus Strix Scar 18 G835LX | |
| Média Intel Core Ultra 9 275HX, Nvidia GeForce RTX 5090 Laptop (9304 - 9444, n=2) | |
| PCMark 10 / Digital Content Creation | |
| Asus Strix Scar 18 G835LX | |
| Média Intel Core Ultra 9 275HX, Nvidia GeForce RTX 5090 Laptop (16788 - 16802, n=2) | |
| MSI Titan 18 HX A14VIG | |
| Alienware m18 R2 | |
| Razer Blade 18 2024 RZ09-0509 | |
| Asus ROG Strix Scar 18 G834JYR (2024) | |
| SCHENKER Key 17 Pro (M24) | |
| Acer Predator Helios 18 PH18-72-98MW | |
| Média da turma Gaming (6807 - 18475, n=133, últimos 2 anos) | |
| CrossMark / Overall | |
| Asus Strix Scar 18 G835LX | |
| Média Intel Core Ultra 9 275HX, Nvidia GeForce RTX 5090 Laptop (n=1) | |
| Asus ROG Strix Scar 18 G834JYR (2024) | |
| Alienware m18 R2 | |
| Razer Blade 18 2024 RZ09-0509 | |
| Média da turma Gaming (1247 - 2344, n=113, últimos 2 anos) | |
| MSI Titan 18 HX A14VIG | |
| CrossMark / Productivity | |
| Asus ROG Strix Scar 18 G834JYR (2024) | |
| Asus Strix Scar 18 G835LX | |
| Média Intel Core Ultra 9 275HX, Nvidia GeForce RTX 5090 Laptop (n=1) | |
| Razer Blade 18 2024 RZ09-0509 | |
| Alienware m18 R2 | |
| Média da turma Gaming (1299 - 2204, n=113, últimos 2 anos) | |
| MSI Titan 18 HX A14VIG | |
| CrossMark / Creativity | |
| Asus Strix Scar 18 G835LX | |
| Média Intel Core Ultra 9 275HX, Nvidia GeForce RTX 5090 Laptop (n=1) | |
| Asus ROG Strix Scar 18 G834JYR (2024) | |
| Alienware m18 R2 | |
| Razer Blade 18 2024 RZ09-0509 | |
| MSI Titan 18 HX A14VIG | |
| Média da turma Gaming (1275 - 2660, n=113, últimos 2 anos) | |
| CrossMark / Responsiveness | |
| Asus ROG Strix Scar 18 G834JYR (2024) | |
| Asus Strix Scar 18 G835LX | |
| Média Intel Core Ultra 9 275HX, Nvidia GeForce RTX 5090 Laptop (n=1) | |
| Alienware m18 R2 | |
| Razer Blade 18 2024 RZ09-0509 | |
| Média da turma Gaming (1030 - 2330, n=113, últimos 2 anos) | |
| MSI Titan 18 HX A14VIG | |
| WebXPRT 3 / Overall | |
| Asus Strix Scar 18 G835LX | |
| Razer Blade 18 2024 RZ09-0509 | |
| Média Intel Core Ultra 9 275HX, Nvidia GeForce RTX 5090 Laptop (315 - 346, n=4) | |
| MSI Titan 18 HX A14VIG | |
| Alienware m18 R2 | |
| Asus ROG Strix Scar 18 G834JYR (2024) | |
| SCHENKER Key 17 Pro (M24) | |
| Média da turma Gaming (215 - 480, n=130, últimos 2 anos) | |
| WebXPRT 4 / Overall | |
| Asus Strix Scar 18 G835LX | |
| Média Intel Core Ultra 9 275HX, Nvidia GeForce RTX 5090 Laptop (317 - 335, n=2) | |
| Alienware m18 R2 | |
| Asus ROG Strix Scar 18 G834JYR (2024) | |
| MSI Titan 18 HX A14VIG | |
| SCHENKER Key 17 Pro (M24) | |
| Média da turma Gaming (176.4 - 335, n=116, últimos 2 anos) | |
| Mozilla Kraken 1.1 / Total | |
| Média da turma Gaming (408 - 674, n=143, últimos 2 anos) | |
| SCHENKER Key 17 Pro (M24) | |
| MSI Titan 18 HX A14VIG | |
| Asus ROG Strix Scar 18 G834JYR (2024) | |
| Razer Blade 18 2024 RZ09-0509 | |
| Acer Predator Helios 18 PH18-72-98MW | |
| Alienware m18 R2 | |
| Média Intel Core Ultra 9 275HX, Nvidia GeForce RTX 5090 Laptop (409 - 420, n=5) | |
| Asus Strix Scar 18 G835LX | |
* ... menor é melhor
| PCMark 10 Score | 8623 pontos | |
Ajuda | ||
| AIDA64 / Memory Copy | |
| Asus Strix Scar 18 G835LX | |
| Asus ROG Strix Scar 18 G834JYR (2024) | |
| Média Intel Core Ultra 9 275HX (74558 - 84432, n=4) | |
| Alienware m18 R2 | |
| SCHENKER Key 17 Pro (M24) | |
| Acer Predator Helios 18 PH18-72-98MW | |
| Razer Blade 18 2024 RZ09-0509 | |
| Média da turma Gaming (21750 - 97515, n=150, últimos 2 anos) | |
| MSI Titan 18 HX A14VIG | |
| AIDA64 / Memory Read | |
| Asus ROG Strix Scar 18 G834JYR (2024) | |
| Asus Strix Scar 18 G835LX | |
| Alienware m18 R2 | |
| SCHENKER Key 17 Pro (M24) | |
| Acer Predator Helios 18 PH18-72-98MW | |
| Razer Blade 18 2024 RZ09-0509 | |
| Média Intel Core Ultra 9 275HX (74094 - 87760, n=4) | |
| Média da turma Gaming (22956 - 102937, n=150, últimos 2 anos) | |
| MSI Titan 18 HX A14VIG | |
| AIDA64 / Memory Write | |
| Asus Strix Scar 18 G835LX | |
| Média Intel Core Ultra 9 275HX (72929 - 82198, n=4) | |
| Asus ROG Strix Scar 18 G834JYR (2024) | |
| SCHENKER Key 17 Pro (M24) | |
| Alienware m18 R2 | |
| Acer Predator Helios 18 PH18-72-98MW | |
| Média da turma Gaming (22297 - 108954, n=150, últimos 2 anos) | |
| Razer Blade 18 2024 RZ09-0509 | |
| MSI Titan 18 HX A14VIG | |
| AIDA64 / Memory Latency | |
| Média Intel Core Ultra 9 275HX (108.9 - 125.1, n=4) | |
| Asus Strix Scar 18 G835LX | |
| MSI Titan 18 HX A14VIG | |
| Média da turma Gaming (59.5 - 259, n=150, últimos 2 anos) | |
| Razer Blade 18 2024 RZ09-0509 | |
| Alienware m18 R2 | |
| SCHENKER Key 17 Pro (M24) | |
| Acer Predator Helios 18 PH18-72-98MW | |
| Asus ROG Strix Scar 18 G834JYR (2024) | |
* ... menor é melhor
Latências de DPC
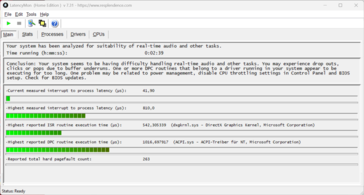
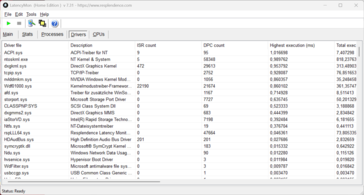
Em nosso teste de latência padronizado (navegação na Web, reprodução em 4K no YouTube, carga da CPU), o dispositivo de teste com a versão atual do BIOS não apresentou limitações. Embora um driver tenha falhado um pouco, o valor importante de latência de interrupção para processo foi baixo.
| DPC Latencies / LatencyMon - interrupt to process latency (max), Web, Youtube, Prime95 | |
| Acer Predator Helios 18 PH18-72-98MW | |
| Alienware m18 R2 | |
| MSI Titan 18 HX A14VIG | |
| SCHENKER Key 17 Pro (M24) | |
| Razer Blade 18 2024 RZ09-0509 | |
| Asus ROG Strix Scar 18 G834JYR (2024) | |
| Asus Strix Scar 18 G835LX | |
* ... menor é melhor
Dispositivo de armazenamento
Nossa configuração de teste está equipada com dois SSDs de 2 TB da WD, que funcionam em uma matriz RAID 0 (3,6 TB livres para o usuário). Embora isso tenha conseguido aumentar a taxa de transferência máxima, a equipe ficou claramente para trás em alguns valores durante os benchmarks. Uma matriz RAID 0 também não é ideal se um dos SSDs estiver com defeito. Teria sido melhor se a Asus já tivesse instalado um slot PCIe 5.0, pois isso teria resultado em melhor desempenho, mesmo com um único SSD ou sem RAID. Mesmo assim, o desempenho das duas SSDs permanece estável sob carga constante.
* ... menor é melhor
Reading continuous performance: DiskSpd Read Loop, Queue Depth 8
Placa de vídeo
O Strix SCAR 18 está equipado com a nova GeForce Laptop RTX 5090que possui 24 GB de VRAM e atinge uma velocidade de clock máxima de 2.340 MHz. É a variante mais rápida com um TGP de 175 watts (150 watts + 25 watts Dynamic Boost). Relatamos em detalhes os novos recursos da linha RTX 5000 em nossa Análise de GPU. Durante os benchmarks sintéticos, o novo SCAR 18 ficou cerca de 20% à frente do modelo antigo. No modo manual, o clock do núcleo e da memória pode ser aumentado em até 200 MHz, o que resultou em cerca de 25.200 pontos em Time Spy Graphics (+700 pontos vs. Turbo). O desempenho da GPU permaneceu constante mesmo sob carga permanente, mas a GPU pode consumir no máximo 55 watts no modo de bateria, razão pela qual seu desempenho foi significativamente menor nesse caso (-64%).
| 3DMark 11 Performance | 48486 pontos | |
| 3DMark Fire Strike Score | 38733 pontos | |
| 3DMark Time Spy Score | 23130 pontos | |
Ajuda | ||
| Blender / v3.3 Classroom OPTIX/RTX | |
| Média da turma Gaming (10 - 95, n=145, últimos 2 anos) | |
| Asus Strix Scar 18 G835LX | |
| Asus Strix Scar 18 G835LX | |
| Razer Blade 18 2024 RZ09-0509 | |
| Média Nvidia GeForce RTX 5090 Laptop (9.9 - 24, n=8) | |
| Acer Predator Helios 18 PH18-72-98MW | |
| SCHENKER Key 17 Pro (M24) | |
| Asus ROG Strix Scar 18 G834JYR (2024) | |
| Alienware m18 R2 | |
| MSI Titan 18 HX A14VIG | |
| Blender / v3.3 Classroom CUDA | |
| Média Nvidia GeForce RTX 5090 Laptop (16 - 156, n=7) | |
| Média da turma Gaming (16 - 156, n=147, últimos 2 anos) | |
| Razer Blade 18 2024 RZ09-0509 | |
| MSI Titan 18 HX A14VIG | |
| Acer Predator Helios 18 PH18-72-98MW | |
| Alienware m18 R2 | |
| SCHENKER Key 17 Pro (M24) | |
| Asus ROG Strix Scar 18 G834JYR (2024) | |
| Asus Strix Scar 18 G835LX | |
| Blender / v3.3 Classroom CPU | |
| Média da turma Gaming (123 - 962, n=153, últimos 2 anos) | |
| Acer Predator Helios 18 PH18-72-98MW | |
| SCHENKER Key 17 Pro (M24) | |
| Asus ROG Strix Scar 18 G834JYR (2024) | |
| Razer Blade 18 2024 RZ09-0509 | |
| Alienware m18 R2 | |
| MSI Titan 18 HX A14VIG | |
| Média Nvidia GeForce RTX 5090 Laptop (125 - 259, n=8) | |
| Asus Strix Scar 18 G835LX | |
* ... menor é melhor
Desempenho em jogos
No geral, seu desempenho em jogos é muito bom, mas a vantagem em seu desempenho nativo sem upscaling não é das maiores, especialmente em comparação com o antigo GeForce RTX 4090 Laptop-e uma atualização faz pouco sentido aqui. Isso muda se o senhor ainda estiver usando uma GPU da geração RTX-3000, como a RTX 3080 Ti. No entanto, se o senhor quiser jogar jogos exigentes com traçado de raio completo ou traçado de caminho, como Cyberpunk ou Alan Wake, não poderá evitar o upscaling via DLSS4, mesmo na resolução WQHD. Com a Frame Generation, o desempenho do notebook pode ser aumentado de forma ainda mais significativa, o que também mostramos em detalhes em nossa Análise da GPU.
| Cyberpunk 2077 2.2 Phantom Liberty - 1920x1080 Ultra Preset (FSR off) | |
| Asus Strix Scar 18 G835LX | |
| Alienware m18 R2 | |
| MSI Titan 18 HX A14VIG | |
| SCHENKER Key 17 Pro (M24) | |
| Asus ROG Strix Scar 18 G834JYR (2024) | |
| Razer Blade 18 2024 RZ09-0509 | |
| Média da turma Gaming (6.76 - 158, n=92, últimos 2 anos) | |
| Baldur's Gate 3 - 1920x1080 Ultra Preset | |
| MSI Titan 18 HX A14VIG | |
| Alienware m18 R2 | |
| Asus Strix Scar 18 G835LX | |
| SCHENKER Key 17 Pro (M24) | |
| Razer Blade 18 2024 RZ09-0509 | |
| Média da turma Gaming (34.5 - 208, n=59, últimos 2 anos) | |
| GTA V - 1920x1080 Highest Settings possible AA:4xMSAA + FX AF:16x | |
| Asus Strix Scar 18 G835LX | |
| MSI Titan 18 HX A14VIG | |
| Alienware m18 R2 | |
| Asus ROG Strix Scar 18 G834JYR (2024) | |
| Acer Predator Helios 18 PH18-72-98MW | |
| Razer Blade 18 2024 RZ09-0509 | |
| SCHENKER Key 17 Pro (M24) | |
| Média da turma Gaming (12.1 - 168.2, n=132, últimos 2 anos) | |
| Cyberpunk 2077 2.2 Phantom Liberty - 2560x1440 Ultra Preset (FSR off) | |
| Asus Strix Scar 18 G835LX | |
| Média Nvidia GeForce RTX 5090 Laptop (83.2 - 110.6, n=7) | |
| MSI Titan 18 HX A14VIG | |
| Alienware m18 R2 | |
| SCHENKER Key 17 Pro (M24) | |
| Asus ROG Strix Scar 18 G834JYR (2024) | |
| Razer Blade 18 2024 RZ09-0509 | |
| Média da turma Gaming (24.8 - 106.8, n=72, últimos 2 anos) | |
Cyberpunk 2077 ultra FPS diagram
| baixo | média | alto | ultra | QHD | 4K DLSS | 4K | |
|---|---|---|---|---|---|---|---|
| GTA V (2015) | 161.9 | 156.8 | 179.5 | ||||
| Dota 2 Reborn (2015) | 240 | 210 | 200 | 186.6 | 179.9 | ||
| Final Fantasy XV Benchmark (2018) | 233 | 231 | 199.3 | 162.4 | 101.3 | ||
| X-Plane 11.11 (2018) | 163.4 | 158.1 | 121.7 | 94.8 | |||
| Strange Brigade (2018) | 563 | 431 | 418 | 401 | 330 | 187.2 | |
| Baldur's Gate 3 (2023) | 193.7 | 145.6 | 125.4 | 82.8 | |||
| Cyberpunk 2077 2.2 Phantom Liberty (2023) | 154.9 | 106.8 | 52.1 | ||||
| Alan Wake 2 (2023) | 116.4 | 82.4 | 46 | ||||
| F1 24 (2024) | 148 | 100 | 52 | ||||
| Call of Duty Black Ops 6 (2024) | 147 | 117 | 79 | ||||
| Indiana Jones and the Great Circle (2024) | 127.9 | 102.2 | 65 | ||||
| Monster Hunter Wilds (2025) | 87.6 | 72 | 46.3 | ||||
| Assassin's Creed Shadows (2025) | 65 | 51 | 36 |
Emissões
Emissões de ruído
O ruído da ventoinha do dispositivo é determinado em grande parte pelo perfil de energia selecionado e recomendamos que o senhor use o modo silencioso durante o uso diário, pois as ventoinhas geralmente são silenciosas. Também é interessante usar esse modo para jogos se o senhor não quiser que as coisas fiquem barulhentas - medimos um máximo de 34,8 dB(A). Assim que o modo turbo é ativado, as ventoinhas sempre funcionam a pouco menos de 30 dB(A). Ao jogar e durante o teste de estresse, ele ficou muito alto, com 53,7 dB(A), e o senhor definitivamente deve usar fones de ouvido ou o headset incluído - mas isso também se aplica ao modo de desempenho (49 dB(A)). No entanto, também é preciso dizer que alguns concorrentes são ainda mais barulhentos. Notamos leves ruídos eletrônicos em alguns benchmarks sintéticos de GPU, mas isso não é um problema durante o uso diário e em jogos.
Barulho
| Ocioso |
| 29.8 / 29.8 / 29.8 dB |
| Carga |
| 42.9 / 53.7 dB |
 | ||
30 dB silencioso 40 dB(A) audível 50 dB(A) ruidosamente alto |
||
min: | ||
| Asus Strix Scar 18 G835LX GeForce RTX 5090 Laptop, Ultra 9 275HX, WD PC SN8000S 2TB | Razer Blade 18 2024 RZ09-0509 NVIDIA GeForce RTX 4090 Laptop GPU, i9-14900HX | Alienware m18 R2 NVIDIA GeForce RTX 4090 Laptop GPU, i9-14900HX, SK Hynix PC811 HFS002TEM9X152N | Acer Predator Helios 18 PH18-72-98MW NVIDIA GeForce RTX 4090 Laptop GPU, i9-14900HX, 2x SK Hynix HFS001TEJ9X115N (RAID 0) | MSI Titan 18 HX A14VIG NVIDIA GeForce RTX 4090 Laptop GPU, i9-14900HX, 2x Samsung PM9A1a MZVL22T0HDLB (RAID 0) | SCHENKER Key 17 Pro (M24) NVIDIA GeForce RTX 4090 Laptop GPU, i9-14900HX, Samsung 990 Pro 1 TB | Asus ROG Strix Scar 18 G834JYR (2024) NVIDIA GeForce RTX 4090 Laptop GPU, i9-14900HX, Samsung PM9A1a MZVL22T0HDLB | |
|---|---|---|---|---|---|---|---|
| Noise | 5% | 8% | -14% | 7% | 5% | -2% | |
| desligado / ambiente * | 23.3 | 23.4 -0% | 23.6 -1% | 25 -7% | 22.8 2% | 23.41 -0% | 24 -3% |
| Idle Minimum * | 29.8 | 23.9 20% | 23.8 20% | 30 -1% | 23.8 20% | 25.33 15% | 27 9% |
| Idle Average * | 29.8 | 28.2 5% | 26.1 12% | 36 -21% | 23.8 20% | 25.33 15% | 28 6% |
| Idle Maximum * | 29.8 | 29 3% | 31.5 -6% | 44 -48% | 28 6% | 25.33 15% | 32 -7% |
| Load Average * | 42.9 | 36.8 14% | 31.5 27% | 48 -12% | 38 11% | 33.57 22% | 50 -17% |
| Cyberpunk 2077 ultra * | 53.7 | 61.97 -15% | |||||
| Load Maximum * | 53.7 | 61.1 -14% | 56.6 -5% | 51 5% | 62.8 -17% | 62.14 -16% | 52 3% |
| Witcher 3 ultra * | 54.1 | 52.1 | 49 | 57.3 | 50 |
* ... menor é melhor
Temperatura
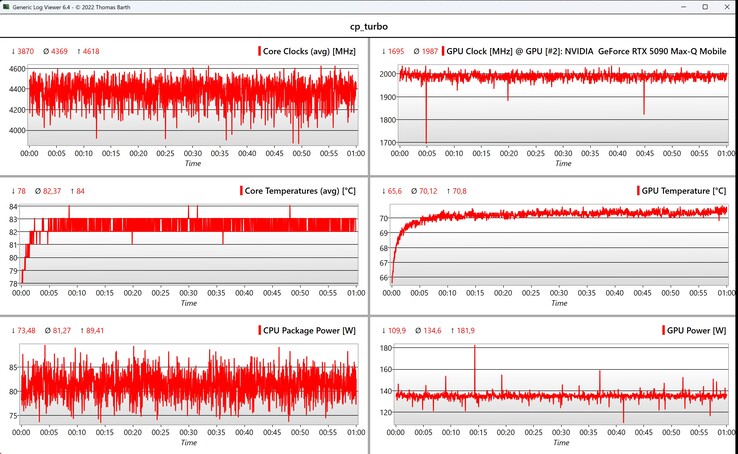
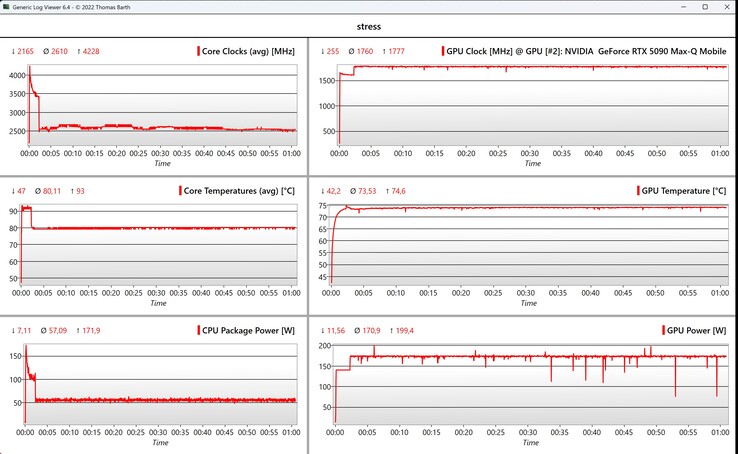
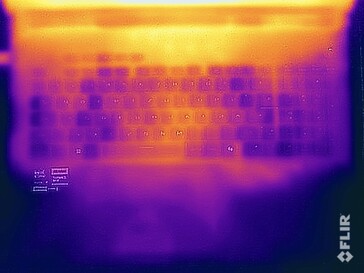
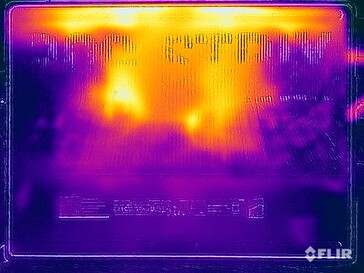
Não há problemas com relação às temperaturas da superfície do laptop e medimos apenas cerca de 45 °C em alguns lugares com carga total. Mesmo assim, o teclado (e especialmente a área WASD) aquece apenas um pouco e as mãos permanecem frias durante os jogos. A GPU foi favorecida durante o teste de estresse e ficou estável em 175 watts após alguns minutos (CPU ~57 watts), durante os quais as temperaturas também permaneceram inofensivas.
(-) A temperatura máxima no lado superior é 45.6 °C / 114 F, em comparação com a média de 40.4 °C / 105 F , variando de 21.2 a 68.8 °C para a classe Gaming.
(-) A parte inferior aquece até um máximo de 46 °C / 115 F, em comparação com a média de 43.2 °C / 110 F
(+) Em uso inativo, a temperatura média para o lado superior é 26.8 °C / 80 F, em comparação com a média do dispositivo de 33.9 °C / ### class_avg_f### F.
(±) 3: The average temperature for the upper side is 34.4 °C / 94 F, compared to the average of 33.9 °C / 93 F for the class Gaming.
(+) Os apoios para as mãos e o touchpad são mais frios que a temperatura da pele, com um máximo de 29.2 °C / 84.6 F e, portanto, são frios ao toque.
(±) A temperatura média da área do apoio para as mãos de dispositivos semelhantes foi 28.9 °C / 84 F (-0.3 °C / -0.6 F).
| Asus Strix Scar 18 G835LX Intel Core Ultra 9 275HX, Nvidia GeForce RTX 5090 Laptop | Razer Blade 18 2024 RZ09-0509 Intel Core i9-14900HX, NVIDIA GeForce RTX 4090 Laptop GPU | Alienware m18 R2 Intel Core i9-14900HX, NVIDIA GeForce RTX 4090 Laptop GPU | Acer Predator Helios 18 PH18-72-98MW Intel Core i9-14900HX, NVIDIA GeForce RTX 4090 Laptop GPU | MSI Titan 18 HX A14VIG Intel Core i9-14900HX, NVIDIA GeForce RTX 4090 Laptop GPU | SCHENKER Key 17 Pro (M24) Intel Core i9-14900HX, NVIDIA GeForce RTX 4090 Laptop GPU | Asus ROG Strix Scar 18 G834JYR (2024) Intel Core i9-14900HX, NVIDIA GeForce RTX 4090 Laptop GPU | |
|---|---|---|---|---|---|---|---|
| Heat | -10% | -16% | -12% | -2% | -39% | -4% | |
| Maximum Upper Side * | 45.6 | 43.2 5% | 41.2 10% | 43 6% | 37.8 17% | 51 -12% | 49 -7% |
| Maximum Bottom * | 46 | 42.6 7% | 34.6 25% | 59 -28% | 37.6 18% | 64 -39% | 47 -2% |
| Idle Upper Side * | 28.9 | 36 -25% | 42.8 -48% | 32 -11% | 34.8 -20% | 42.3 -46% | 29 -0% |
| Idle Bottom * | 29.2 | 36.4 -25% | 43.6 -49% | 34 -16% | 36 -23% | 46 -58% | 31 -6% |
* ... menor é melhor
Alto-falantes
O sistema de som do dispositivo consiste em quatro módulos e seu desempenho é decente, mas houve dispositivos de comparação melhores durante nosso teste nesse aspecto. Ainda assim, os alto-falantes não são muito úteis para jogos, pois as ventoinhas são muito altas.
Asus Strix Scar 18 G835LX análise de áudio
(+) | os alto-falantes podem tocar relativamente alto (###valor### dB)
Graves 100 - 315Hz
(±) | graves reduzidos - em média 7.5% menor que a mediana
(±) | a linearidade dos graves é média (7.7% delta para a frequência anterior)
Médios 400 - 2.000 Hz
(±) | médios mais altos - em média 9.9% maior que a mediana
(+) | médios são lineares (6.9% delta para frequência anterior)
Altos 2 - 16 kHz
(+) | agudos equilibrados - apenas 2.2% longe da mediana
(+) | os máximos são lineares (4.1% delta da frequência anterior)
Geral 100 - 16.000 Hz
(+) | o som geral é linear (13.7% diferença em relação à mediana)
Comparado com a mesma classe
» 20% de todos os dispositivos testados nesta classe foram melhores, 6% semelhantes, 74% piores
» O melhor teve um delta de 6%, a média foi 18%, o pior foi 132%
Comparado com todos os dispositivos testados
» 13% de todos os dispositivos testados foram melhores, 3% semelhantes, 83% piores
» O melhor teve um delta de 4%, a média foi 24%, o pior foi 134%
Razer Blade 18 2024 RZ09-0509 análise de áudio
(+) | os alto-falantes podem tocar relativamente alto (###valor### dB)
Graves 100 - 315Hz
(±) | graves reduzidos - em média 5.3% menor que a mediana
(+) | o baixo é linear (6.5% delta para a frequência anterior)
Médios 400 - 2.000 Hz
(+) | médios equilibrados - apenas 4.5% longe da mediana
(±) | a linearidade dos médios é média (7.1% delta para frequência anterior)
Altos 2 - 16 kHz
(+) | agudos equilibrados - apenas 2.9% longe da mediana
(+) | os máximos são lineares (4% delta da frequência anterior)
Geral 100 - 16.000 Hz
(+) | o som geral é linear (9.3% diferença em relação à mediana)
Comparado com a mesma classe
» 3% de todos os dispositivos testados nesta classe foram melhores, 2% semelhantes, 96% piores
» O melhor teve um delta de 6%, a média foi 18%, o pior foi 132%
Comparado com todos os dispositivos testados
» 3% de todos os dispositivos testados foram melhores, 1% semelhantes, 96% piores
» O melhor teve um delta de 4%, a média foi 24%, o pior foi 134%
Alienware m18 R2 análise de áudio
(+) | os alto-falantes podem tocar relativamente alto (###valor### dB)
Graves 100 - 315Hz
(-) | quase nenhum baixo - em média 22.1% menor que a mediana
(±) | a linearidade dos graves é média (14% delta para a frequência anterior)
Médios 400 - 2.000 Hz
(+) | médios equilibrados - apenas 4.1% longe da mediana
(+) | médios são lineares (3.3% delta para frequência anterior)
Altos 2 - 16 kHz
(+) | agudos equilibrados - apenas 4% longe da mediana
(+) | os máximos são lineares (6.1% delta da frequência anterior)
Geral 100 - 16.000 Hz
(±) | a linearidade do som geral é média (17% diferença em relação à mediana)
Comparado com a mesma classe
» 43% de todos os dispositivos testados nesta classe foram melhores, 12% semelhantes, 45% piores
» O melhor teve um delta de 6%, a média foi 18%, o pior foi 132%
Comparado com todos os dispositivos testados
» 28% de todos os dispositivos testados foram melhores, 8% semelhantes, 64% piores
» O melhor teve um delta de 4%, a média foi 24%, o pior foi 134%
Acer Predator Helios 18 PH18-72-98MW análise de áudio
(+) | os alto-falantes podem tocar relativamente alto (###valor### dB)
Graves 100 - 315Hz
(-) | quase nenhum baixo - em média 21.1% menor que a mediana
(±) | a linearidade dos graves é média (10.7% delta para a frequência anterior)
Médios 400 - 2.000 Hz
(+) | médios equilibrados - apenas 2.9% longe da mediana
(+) | médios são lineares (5.6% delta para frequência anterior)
Altos 2 - 16 kHz
(+) | agudos equilibrados - apenas 2.7% longe da mediana
(+) | os máximos são lineares (3.6% delta da frequência anterior)
Geral 100 - 16.000 Hz
(+) | o som geral é linear (13.6% diferença em relação à mediana)
Comparado com a mesma classe
» 19% de todos os dispositivos testados nesta classe foram melhores, 6% semelhantes, 74% piores
» O melhor teve um delta de 6%, a média foi 18%, o pior foi 132%
Comparado com todos os dispositivos testados
» 13% de todos os dispositivos testados foram melhores, 4% semelhantes, 83% piores
» O melhor teve um delta de 4%, a média foi 24%, o pior foi 134%
MSI Titan 18 HX A14VIG análise de áudio
(+) | os alto-falantes podem tocar relativamente alto (###valor### dB)
Graves 100 - 315Hz
(-) | quase nenhum baixo - em média 17.6% menor que a mediana
(±) | a linearidade dos graves é média (8% delta para a frequência anterior)
Médios 400 - 2.000 Hz
(+) | médios equilibrados - apenas 1.8% longe da mediana
(+) | médios são lineares (3.7% delta para frequência anterior)
Altos 2 - 16 kHz
(+) | agudos equilibrados - apenas 1.2% longe da mediana
(+) | os máximos são lineares (2% delta da frequência anterior)
Geral 100 - 16.000 Hz
(+) | o som geral é linear (9.9% diferença em relação à mediana)
Comparado com a mesma classe
» 4% de todos os dispositivos testados nesta classe foram melhores, 2% semelhantes, 94% piores
» O melhor teve um delta de 6%, a média foi 18%, o pior foi 132%
Comparado com todos os dispositivos testados
» 4% de todos os dispositivos testados foram melhores, 1% semelhantes, 95% piores
» O melhor teve um delta de 4%, a média foi 24%, o pior foi 134%
SCHENKER Key 17 Pro (M24) análise de áudio
(±) | o volume do alto-falante é médio, mas bom (###valor### dB)
Graves 100 - 315Hz
(±) | graves reduzidos - em média 12.7% menor que a mediana
(±) | a linearidade dos graves é média (9.1% delta para a frequência anterior)
Médios 400 - 2.000 Hz
(+) | médios equilibrados - apenas 2.3% longe da mediana
(+) | médios são lineares (5.1% delta para frequência anterior)
Altos 2 - 16 kHz
(+) | agudos equilibrados - apenas 2.9% longe da mediana
(±) | a linearidade dos máximos é média (8.9% delta para frequência anterior)
Geral 100 - 16.000 Hz
(+) | o som geral é linear (11.2% diferença em relação à mediana)
Comparado com a mesma classe
» 10% de todos os dispositivos testados nesta classe foram melhores, 3% semelhantes, 87% piores
» O melhor teve um delta de 7%, a média foi 18%, o pior foi 35%
Comparado com todos os dispositivos testados
» 6% de todos os dispositivos testados foram melhores, 2% semelhantes, 92% piores
» O melhor teve um delta de 4%, a média foi 24%, o pior foi 134%
Asus ROG Strix Scar 18 G834JYR (2024) análise de áudio
(+) | os alto-falantes podem tocar relativamente alto (###valor### dB)
Graves 100 - 315Hz
(±) | graves reduzidos - em média 5.6% menor que a mediana
(+) | o baixo é linear (6.8% delta para a frequência anterior)
Médios 400 - 2.000 Hz
(±) | médios mais altos - em média 5.7% maior que a mediana
(+) | médios são lineares (2.8% delta para frequência anterior)
Altos 2 - 16 kHz
(±) | máximos reduzidos - em média 7.2% menor que a mediana
(±) | a linearidade dos máximos é média (7.2% delta para frequência anterior)
Geral 100 - 16.000 Hz
(+) | o som geral é linear (13% diferença em relação à mediana)
Comparado com a mesma classe
» 17% de todos os dispositivos testados nesta classe foram melhores, 3% semelhantes, 80% piores
» O melhor teve um delta de 6%, a média foi 18%, o pior foi 132%
Comparado com todos os dispositivos testados
» 11% de todos os dispositivos testados foram melhores, 2% semelhantes, 86% piores
» O melhor teve um delta de 4%, a média foi 24%, o pior foi 134%
Gerenciamento de energia - Bateria de curta duração
Consumo de energia
O Strix SCAR 18 não é um notebook particularmente eficiente e seu painel mini LED brilhante requer muita energia logo de cara, e é por isso que seu consumo máximo em modo inativo já estava em torno de 40 watts durante nosso teste. Sob carga, ele consumiu brevemente 430 watts por um segundo, mas logo depois se estabilizou em 320 watts. A fonte de alimentação de 380 watts fornecida é, portanto, suficiente em tamanho. Seu consumo em modo de espera de 1,9 watts é muito alto, embora toda a iluminação já estivesse desativada.
| desligado | |
| Ocioso | |
| Carga |
|
Key:
min: | |
| Asus Strix Scar 18 G835LX Ultra 9 275HX, GeForce RTX 5090 Laptop, WD PC SN8000S 2TB, Mini-LED, 2560x1600, 18" | Razer Blade 18 2024 RZ09-0509 i9-14900HX, NVIDIA GeForce RTX 4090 Laptop GPU, , Mini-LED, 2560x1600, 18" | Alienware m18 R2 i9-14900HX, NVIDIA GeForce RTX 4090 Laptop GPU, SK Hynix PC811 HFS002TEM9X152N, IPS, 2560x1600, 18" | Acer Predator Helios 18 PH18-72-98MW i9-14900HX, NVIDIA GeForce RTX 4090 Laptop GPU, 2x SK Hynix HFS001TEJ9X115N (RAID 0), Mini-LED, 2560x1600, 18" | MSI Titan 18 HX A14VIG i9-14900HX, NVIDIA GeForce RTX 4090 Laptop GPU, 2x Samsung PM9A1a MZVL22T0HDLB (RAID 0), Mini-LED, 3840x2400, 18" | SCHENKER Key 17 Pro (M24) i9-14900HX, NVIDIA GeForce RTX 4090 Laptop GPU, Samsung 990 Pro 1 TB, IPS, 3840x2160, 17.3" | Asus ROG Strix Scar 18 G834JYR (2024) i9-14900HX, NVIDIA GeForce RTX 4090 Laptop GPU, Samsung PM9A1a MZVL22T0HDLB, Mini LED, 2560x1600, 18" | Média Nvidia GeForce RTX 5090 Laptop | Média da turma Gaming | |
|---|---|---|---|---|---|---|---|---|---|
| Power Consumption | -22% | 8% | -26% | 0% | 24% | 23% | 28% | 29% | |
| Idle Minimum * | 11.4 | 25.4 -123% | 10.6 7% | 31 -172% | 13.2 -16% | 12.16 -7% | 14 -23% | 10.6 ? 7% | 13.6 ? -19% |
| Idle Average * | 39.2 | 37.7 4% | 20.9 47% | 35 11% | 25.4 35% | 15.97 59% | 17 57% | 22.1 ? 44% | 19 ? 52% |
| Idle Maximum * | 40.2 | 57.9 -44% | 40 -0% | 43 -7% | 53.5 -33% | 23.71 41% | 24 40% | 23.2 ? 42% | 26.4 ? 34% |
| Load Average * | 161.2 | 128.4 20% | 201.1 -25% | 144 11% | 151.4 6% | 113.06 30% | 143 11% | 132.3 ? 18% | 103.2 ? 36% |
| Cyberpunk 2077 ultra * | 303 | 274 10% | |||||||
| Cyberpunk 2077 ultra external monitor * | 295 | 280 5% | |||||||
| Load Maximum * | 430.9 | 297.9 31% | 378.9 12% | 318 26% | 395.2 8% | 301 30% | 302 30% | 298 ? 31% | 247 ? 43% |
| Witcher 3 ultra * | 273.1 | 358 | 228 | 336 | 251 |
* ... menor é melhor
Power consumption Cyberpunk / stress test
Power consumption with external monitor
Tempos de execução
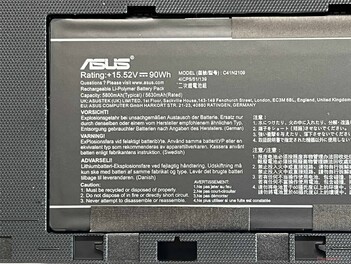
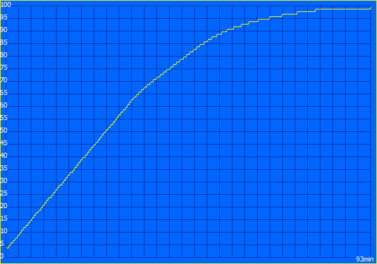
A bateria de 90 Wh do laptop também não ajuda muito com suas altas taxas de consumo. Durante o teste WLAN a 150 cd/m², medimos cerca de 5,5 horas e não mais do que três horas com brilho total (60 Hz em cada caso). Pelo menos esses resultados foram melhores do que os de muitos concorrentes diretos - apenas o modelo anterior durou mais. Os jogos terminaram após apenas 44 minutos.
| Asus Strix Scar 18 G835LX Ultra 9 275HX, GeForce RTX 5090 Laptop, 90 Wh | Razer Blade 18 2024 RZ09-0509 i9-14900HX, NVIDIA GeForce RTX 4090 Laptop GPU, 91.7 Wh | Alienware m18 R2 i9-14900HX, NVIDIA GeForce RTX 4090 Laptop GPU, 97 Wh | Acer Predator Helios 18 PH18-72-98MW i9-14900HX, NVIDIA GeForce RTX 4090 Laptop GPU, 90 Wh | MSI Titan 18 HX A14VIG i9-14900HX, NVIDIA GeForce RTX 4090 Laptop GPU, 99.9 Wh | SCHENKER Key 17 Pro (M24) i9-14900HX, NVIDIA GeForce RTX 4090 Laptop GPU, 99 Wh | Asus ROG Strix Scar 18 G834JYR (2024) i9-14900HX, NVIDIA GeForce RTX 4090 Laptop GPU, 90 Wh | Média da turma Gaming | |
|---|---|---|---|---|---|---|---|---|
| Duração da bateria | -19% | -13% | -26% | -11% | 1% | 26% | 23% | |
| H.264 | 347 | 447 29% | 452 ? 30% | |||||
| WiFi v1.3 | 332 | 263 -21% | 290 -13% | 192 -42% | 252 -24% | 203 -39% | 461 39% | 388 ? 17% |
| Cyberpunk 2077 ultra 150cd | 44 | 67 52% | ||||||
| Load | 70 | 58 -17% | 64 -9% | 72 3% | 64 -9% | 77 10% | 84.7 ? 21% |
Classificação total do Notebookcheck
Asus Strix Scar 18 G835LX
- 03/31/2025 v8
Andreas Osthoff
Possible alternatives compared
Imagem | Modelo / Análises | Preço | Peso | Altura | Tela |
|---|---|---|---|---|---|
| Asus Strix Scar 18 G835LX Intel Core Ultra 9 275HX ⎘ Nvidia GeForce RTX 5090 Laptop ⎘ 64 GB Memória, 2048 GB SSD | Amazon: 1. $2,899.00 ASUS ROG Strix Scar 16 (2024... 2. $6.99 Keyboard Cover for 2025 2024... 3. $6.90 Keyboard Cover for 2025-2023... Preço de tabela: 5799€ | 3.3 kg | 32 mm | 18.00" 2560x1600 168 PPI Mini-LED | |
| Razer Blade 18 2024 RZ09-0509 Intel Core i9-14900HX ⎘ NVIDIA GeForce RTX 4090 Laptop GPU ⎘ 32 GB Memória | Amazon: $4,899.99 Preço de tabela: 4500 USD | 3.1 kg | 21.9 mm | 18.00" 2560x1600 168 PPI Mini-LED | |
| Alienware m18 R2 Intel Core i9-14900HX ⎘ NVIDIA GeForce RTX 4090 Laptop GPU ⎘ 32 GB Memória, 2048 GB SSD | Amazon: 1. $2,799.99 Alienware M18 R2 Gaming Lapt... 2. $4,799.99 Alienware Dell M18 R2 Gaming... 3. $2,599.00 NewDell Alien.Ware M18 R2 Ga... Preço de tabela: 3300 USD | 4 kg | 26.7 mm | 18.00" 2560x1600 168 PPI IPS | |
| Acer Predator Helios 18 PH18-72-98MW Intel Core i9-14900HX ⎘ NVIDIA GeForce RTX 4090 Laptop GPU ⎘ 32 GB Memória, 2048 GB SSD | Amazon: 1. $99.99 330W Genuine Charger for Ace... 2. $99.99 330W Genuine Charger for Ace... 3. $179.99 PEHDPVS Replacement for Acer... | 3.3 kg | 29.5 mm | 18.00" 2560x1600 168 PPI Mini-LED | |
| MSI Titan 18 HX A14VIG Intel Core i9-14900HX ⎘ NVIDIA GeForce RTX 4090 Laptop GPU ⎘ 128 GB Memória, 4096 GB SSD | Amazon: 1. $189.00 400W ADP-400CB B laptop char... 2. $159.99 400W Charger for Msi Titan 1... 3. $408.98 Factory Original 64GB (2x32G... Preço de tabela: 5000 USD | 3.6 kg | 32.1 mm | 18.00" 3840x2400 252 PPI Mini-LED | |
| SCHENKER Key 17 Pro (M24) Intel Core i9-14900HX ⎘ NVIDIA GeForce RTX 4090 Laptop GPU ⎘ 32 GB Memória, 1024 GB SSD | Preço de tabela: 4273€ | 3.4 kg | 24.9 mm | 17.30" 3840x2160 255 PPI IPS |
Transparência
A seleção dos dispositivos a serem analisados é feita pela nossa equipe editorial. A amostra de teste foi fornecida ao autor como empréstimo pelo fabricante ou varejista para fins desta revisão. O credor não teve influência nesta revisão, nem o fabricante recebeu uma cópia desta revisão antes da publicação. Não houve obrigação de publicar esta revisão. Nunca aceitamos compensação ou pagamento em troca de nossas avaliações. Como empresa de mídia independente, a Notebookcheck não está sujeita à autoridade de fabricantes, varejistas ou editores.
É assim que o Notebookcheck está testando
Todos os anos, o Notebookcheck analisa de forma independente centenas de laptops e smartphones usando procedimentos padronizados para garantir que todos os resultados sejam comparáveis. Desenvolvemos continuamente nossos métodos de teste há cerca de 20 anos e definimos padrões da indústria no processo. Em nossos laboratórios de teste, equipamentos de medição de alta qualidade são utilizados por técnicos e editores experientes. Esses testes envolvem um processo de validação em vários estágios. Nosso complexo sistema de classificação é baseado em centenas de medições e benchmarks bem fundamentados, o que mantém a objetividade.


















 Total Sustainability Score:


