Notebookcheck Logo

Intel Core i9-13900K

Intel i9-13900K

O Intel Core i9-13900K é um processador de secretária rápido e topo de gama da série Raptor Lake. Apresenta uma arquitectura híbrida para núcleos de processador com 24 núcleos e 32 fios combinados. Oito núcleos rápidos de desempenho Raptor Cove (P-cores) com HyperThreading e uma velocidade de relógio de 3 - 5,8 GHz e dezasseis núcleos de eficiência Gracemont sem HyperThreading e uma velocidade de relógio de 2,2 - 4,3 GHz.

Graças aos núcleos P mais rápidos e mais núcleos E, o i9-13900K é significativamente mais rápido do que o anterior i9-12900K (especialmente em cargas de trabalho multithreaded). Em comparação com o Raphael AMD Ryzen 9 7950X (Zen 4), o 13900K oferece um desempenho ligeiramente melhor com multithreaded e um desempenho ligeiramente pior com um único núcleo. Nos jogos, o processador Intel é actualmente o vencedor claro (na altura do anúncio do 7950X).

O 13900K tem uma potência base de 125 watts TDP (PL1) e uma potência turbo de 253 watts (PL2), que é ligeiramente superior à do antigo i9-12900K.

CodinomeRaptor Lake
SérieIntel Raptor Lake-S

Serie: Raptor Lake-S Raptor Lake

Intel Core i9-13900K « 3 - 5.8 GHz24 / 32 cores36 MB L3
Intel Core i7-13700K3.4 - 5.4 GHz16 / 24 cores30 MB L3
Intel Core i5-13600K3.5 - 5.1 GHz14 / 20 cores24 MB L3
Intel Core i5-135002.5 - 4.8 GHz14 / 20 cores24 MB L3
Intel Core i5-13500T1.6 - 4.6 GHz14 / 20 cores24 MB L3
Frequência3000 - 5800 MHz
Cache de Nível 232 MB
Cache de Nível 336 MB
Número de Núcelos / Subprocessos24 / 32
8 x 5.8 GHz Intel Raptor Cove P-Core
16 x 4.3 GHz Intel Gracemont E-Core
Consumo de Energia (TDP = Thermal Design Power)125 Watt
Tecnologia de Produção10 nm
Tamanho da Matriz257 mm2
Tempratura Máx.100 °C
ConectorLGA 1700
CaracterísticasIntel UHD Graphics 770, DDR5 5600 MT/s, DDR4 3200 MT/s
GPUIntel UHD Graphics 770 (300 - 1650 MHz)
64 BitSuporte para 64 Bit
Architecturex86
Preço Inicial$589 U.S.
Data do Anúncio10/20/2022
Link do Produto (externo)www.intel.com

Benchmarks

Performance Rating - CB R15 + R20 + 7-Zip + X265 + Blender + 3DM11 CPU
49 pt (82%)
2.31 -95%
...
46.1 -6%
46.7 -5%
46.9 -4%
47.2 -4%
47.3 -3%
47.4 -3%
AMD Ryzen 7 9800X3D
47.5 -3%
47.6 -3%
48.1 -2%
Intel Core i9-13900K
49
49.2 0%
50 2%
50.4 3%
51.2 4%
51.6 5%
Intel Core Ultra 9 285K
52 6%
60.1 23%
0%
100%
Cinebench R23 - Cinebench R23 Multi Core
min: 32592     média: 37310     mediano: 38271.5 (36%)     max: 40103 Points
202 -99%
...
30428 -18%
30745 -18%
31070 -17%
32172 -14%
32782 -12%
33105 -11%
33441 -10%
34133 -9%
36291 -3%
Intel Core i9-13900K
37310
39400 6%
40924 10%
Intel Core Ultra 9 285K
42614 14%
AMD Ryzen Threadripper PRO 3975WX
42744 15%
AMD Ryzen Threadripper PRO 3995WX
61102 64%
107681 189%
0%
100%
Cinebench R23 - Cinebench R23 Single Core
min: 2203     média: 2238     mediano: 2238.5 (95%)     max: 2272 Points
74.4 -97%
...
2150 -4%
2160 -3%
2184 -2%
2202 -2%
2209 -1%
2211 -1%
2212 -1%
2213 -1%
2221 -1%
Intel Core i9-13900K
2238
2253 1%
2263 1%
2270 1%
Intel Core Ultra 9 285K
2348 5%
0%
100%
Cinebench R20 - Cinebench R20 CPU (Single Core)
min: 828     média: 849     mediano: 849.5 (94%)     max: 870 Points
Cinebench R20 - Cinebench R20 CPU (Multi Core)
min: 13415     média: 14459     mediano: 14620.5 (36%)     max: 15181 Points
Cinebench R15 - Cinebench R15 CPU Multi 64 Bit
min: 5321     média: 5798     mediano: 5805.5 (37%)     max: 6191 Points
31 -99%
...
4565 -21%
4724 -19%
4793 -17%
4818 -17%
5008 -14%
5035 -13%
5374 -7%
5563 -4%
5600 -3%
Intel Core i9-13900K
5798
5974 3%
6103 5%
6335 9%
Intel Core Ultra 9 285K
6492 12%
AMD Ryzen Threadripper PRO 3975WX
7053 22%
AMD Ryzen Threadripper PRO 3995WX
9706 67%
15842 173%
0%
100%
03156309451260157518902205252028353150346537804095441047255040535556705985Tooltip
Cinebench R15 - Cinebench R15 CPU Single 64 Bit
min: 299     média: 314.1     mediano: 318 (89%)     max: 328 Points
19 -94%
...
303.6 -3%
303.6 -3%
305.2 -3%
305.9 -3%
307 -2%
308 -2%
311 -1%
313.5 0%
313.7 0%
Intel Core i9-13900K
314.1
315 0%
315 0%
315 0%
316 1%
Intel Core Ultra 5 245K
322 3%
322.2 3%
324.5 3%
326 4%
AMD Ryzen 7 9800X3D
328 4%
...
Intel Core Ultra 9 285K
355.5 13%
0%
100%
Cinebench R11.5 - Cinebench R11.5 CPU Multi 64 Bit
min: 62.2     média: 67     mediano: 67.5 (87%)     max: 70.78 Points
Cinebench R11.5 - Cinebench R11.5 CPU Single 64 Bit
min: 3.8     média: 3.9     mediano: 3.9 (92%)     max: 3.93 Points
Cinebench R10 - Cinebench R10 Rend. Single (32bit)
min: 11661     média: 11989     mediano: 12017.5 (73%)     max: 12259 pontos
Cinebench R10 - Cinebench R10 Rend. Multi (32bit)
min: 85342     média: 88253     mediano: 87738 (64%)     max: 92192 pontos
Cinebench R10 - Cinebench R10 Rend. Multi (64bit)
min: 132000     média: 134526     mediano: 133567 (85%)     max: 138969 Points
Cinebench R10 - Cinebench R10 Rend. Single (64bit)
min: 17418     média: 17943     mediano: 17998.5 (22%)     max: 18355 Points
wPrime 2.10 - wPrime 2.0 1024m *
min: 79.738     média: 84.6     mediano: 84.2 (1%)     max: 90.13 s
wPrime 2.10 - wPrime 2.0 32m *
min: 1.818     média: 2.1     mediano: 2 (0%)     max: 2.305 s
WinRAR - WinRAR 4.0
min: 13210     média: 14265     mediano: 14271 (23%)     max: 15309 pontos
7-Zip 18.03 - 7-Zip 18.03 Multi Thread 4 runs
min: 127201     média: 142777     mediano: 146984 (84%)     max: 148053 MIPS
7-Zip 18.03 - 7-Zip 18.03 Single Thread 4 runs
min: 7176     média: 7343     mediano: 7272 (86%)     max: 7539 MIPS
X264 HD Benchmark 4.0 - x264 Pass 2
min: 247.5     média: 261.5     mediano: 264.8 (89%)     max: 269 fps
X264 HD Benchmark 4.0 - x264 Pass 1
min: 412     média: 419     mediano: 419.3 (97%)     max: 425.5 fps
HWBOT x265 Benchmark v2.2 - HWBOT x265 4k Preset
min: 34.5     média: 39.9     mediano: 40.7 (72%)     max: 42.6 fps
0510152025303540455055Tooltip
TrueCrypt - TrueCrypt Serpent
min: 2.6     média: 2.9     mediano: 2.9 (85%)     max: 3 GB/s
TrueCrypt - TrueCrypt Twofish
min: 5.2     média: 5.4     mediano: 5.4 (93%)     max: 5.4 GB/s
TrueCrypt - TrueCrypt AES
min: 20.5     média: 23.3     mediano: 22.9 (60%)     max: 27 GB/s
Blender - Blender 3.3 Classroom CPU *
min: 136     média: 145.2     mediano: 140.5 (2%)     max: 174 Seconds
Blender - Blender 2.79 BMW27 CPU *
min: 80     média: 85.7     mediano: 84 (1%)     max: 101 Seconds
R Benchmark 2.5 - R Benchmark 2.5 *
min: 0.3468     média: 0.4     mediano: 0.4 (8%)     max: 0.3911 sec
3DMark 06 - CPU - 3DMark 06 - CPU
min: 19989     média: 20578     mediano: 20192 (43%)     max: 21934 Points
Super Pi mod 1.5 XS 1M - Super Pi mod 1.5 XS 1M *
min: 5.655     média: 5.7     mediano: 5.7 (1%)     max: 5.86 s
Super Pi mod 1.5 XS 2M - Super Pi mod 1.5 XS 2M *
min: 12.287     média: 12.6     mediano: 12.5 (1%)     max: 13.193 s
Super Pi Mod 1.5 XS 32M - Super Pi mod 1.5 XS 32M *
min: 289.628     média: 296.6     mediano: 293.3 (1%)     max: 310.125 s
3DMark Vantage - 3DM Vant. Perf. CPU no Physx
min: 86915     média: 97290     mediano: 96473 (74%)     max: 112434 Points
3DMark 11 - 3DM11 Performance Physics
min: 29023     média: 31289     mediano: 31187.5 (79%)     max: 33181 Points
3DMark - 3DMark Ice Storm Physics
min: 79257     média: 97847     mediano: 97246.5 (79%)     max: 111988 Points
3DMark - 3DMark Ice Storm Extreme Physics
min: 80320     média: 96904     mediano: 97919.5 (79%)     max: 102987 Points
3DMark - 3DMark Ice Storm Unlimited Physics
min: 83056     média: 98634     mediano: 97311 (81%)     max: 105981 Points
3DMark - 3DMark Cloud Gate Physics
min: 26626     média: 29034     mediano: 29044.5 (73%)     max: 30955 Points
3DMark - 3DMark Fire Strike Standard Physics
min: 46013     média: 51456     mediano: 51140 (91%)     max: 54226 Points
3DMark - 3DMark Time Spy CPU
min: 16236     média: 20507     mediano: 20037 (84%)     max: 22794 Points
Geekbench 5.5 - Geekbench 5.1 - 5.5 64 Bit Single-Core
min: 2106     média: 2237     mediano: 2286 (89%)     max: 2290 pontos
58 -97%
...
2138 -4%
2140 -4%
2147 -4%
2161 -3%
2203 -2%
2212 -1%
2213 -1%
2218 -1%
Intel Core Ultra 5 245K
2224 -1%
Intel Core i9-13900K
2237
2290 2%
2311 3%
2316 4%
2325 4%
2327 4%
2327 4%
2331 4%
2347 5%
Intel Core Ultra 9 285K
2388 7%
...
2559 14%
0%
100%
Geekbench 5.5 - Geekbench 5.1 - 5.5 64 Bit Multi-Core
min: 22448     média: 23743     mediano: 24033 (43%)     max: 24157 pontos
Geekbench 5.0 - Geekbench 5.0 64 Bit Single-Core
min: 2148     média: 2191     mediano: 2197 (10%)     max: 2246 pontos
Geekbench 5.0 - Geekbench 5.0 64 Bit Multi-Core
min: 22024     média: 23446     mediano: 23664 (75%)     max: 24021 pontos
Geekbench 4.4 - Geekbench 4.1 - 4.4 64 Bit Single-Core
min: 9218     média: 9542     mediano: 9598 (96%)     max: 9683 pontos
Geekbench 4.4 - Geekbench 4.1 - 4.4 64 Bit Multi-Core
min: 77347     média: 84105     mediano: 85336 (85%)     max: 86695 pontos
Mozilla Kraken 1.1 - Kraken 1.1 Total Score *
min: 423     média: 430.6     mediano: 432 (1%)     max: 438 ms
WebXPRT 4 - WebXPRT 4 Score
min: 304     média: 317.6     mediano: 316 (87%)     max: 335 Points
WebXPRT 3 - WebXPRT 3 Score
min: 338     média: 364     mediano: 368 (66%)     max: 382 Points
CrossMark - CrossMark Overall
min: 2263     média: 2497     mediano: 2580 (96%)     max: 2589 Points
Power Consumption - Prime95 Power Consumption - external Monitor *
min: 228     média: 354.3     mediano: 359 (62%)     max: 471 Watt
0306090120150180210240270300330360390420450480510540Tooltip
Power Consumption - Cinebench R15 Multi Power Consumption - external Monitor *
min: 349     média: 392.5     mediano: 370.5 (68%)     max: 480 Watt
0306090120150180210240270300330360390420450480510540Tooltip
Power Consumption - Idle Power Consumption - external Monitor *
min: 41.8     média: 91.7     mediano: 94.4 (62%)     max: 138.2 Watt
0102030405060708090100110120130140150160Tooltip
Power Consumption - Cinebench R15 Multi Power Efficiency - external Monitor
min: 12.9     média: 15     mediano: 15.2 (11%)     max: 16.8 Points per Watt
- Gama de valores benchmark para essa solução gráfica
red legend - Média de valores benchmark para essa solução gráfica
* Números menores significam um desempenho maior

v1.28
log 15. 00:00:44

#0 ran 0s before starting gpusingle class +0s ... 0s

#1 no ids found in url (should be separated by "_") +0s ... 0s

#2 not redirecting to Ajax server +0s ... 0s

#3 did not recreate cache, as it is less than 5 days old! Created at Mon, 13 Jan 2025 05:33:32 +0100 +0.001s ... 0.001s

#4 no comparison url found in template nbc.compare_page_2 needed +0.006s ... 0.007s

#5 no comparison url found in template nbc.compare_page_2 needed +0s ... 0.008s

#6 no comparison url found in template nbc.compare_page_2 needed +0s ... 0.008s

#7 no comparison url found in template nbc.compare_page_2 needed +0s ... 0.008s

#8 composed specs +0.001s ... 0.009s

#9 did output specs +0s ... 0.009s

#10 getting avg benchmarks for device 14625 +0.019s ... 0.028s

#11 got single benchmarks 14625 +0.048s ... 0.076s

#12 got avg benchmarks for devices +0s ... 0.076s

#13 min, max, avg, median took s +1.117s ... 1.193s

#14 no comparison url found in template nbc.compare_page_2 needed +0s ... 1.193s

#15 return log +0s ... 1.193s

Análises para Intel Core i9-13900K processador

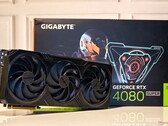
Gigabyte GeForce RTX 4080 Super Gaming OC em análise

Análise da Gigabyte GeForce RTX 4080 Super Gaming OC 16G: Troca de lugar com a RX 7900 XTX por US$ 200 a menos do que a RTX 4080 não-Super

A Gigabyte GeForce RTX 4080 Super Gaming OC substitui completamente a RTX 4080 não-Super e oferece algumas vantagens que possivelmente merecem o prêmio de US$ 5...
Intel Core i9-13900K | NVIDIA GeForce RTX 4080 Super
Asus TUF Gaming GeForce RTX 4070 Ti Super em análise

Análise do Asus TUF Gaming GeForce RTX 4070 Ti Super: AD103 mid-ranger que desafia a RX 7900 XT e substitui a RTX 3090 Ti por US$ 300 a menos

A Asus TUF Gaming GeForce RTX 4070 Ti Super agora recebe poderes AD103 que lhe conferem uma contagem de núcleos CUDA 10% maior e uma VRAM GDDR6X de 256 bits de ...
Intel Core i9-13900K | NVIDIA GeForce RTX 4070 Ti SUPER | 28.00"
Análise da Gigabyte GeForce RTX 4070 Super Gaming OC 12G

Análise da Gigabyte GeForce RTX 4070 Super Gaming OC 12G: Supera a RTX 3090 e a RX 7800 XT por um prêmio de US$ 50 em relação à Founders Edition

A Gigabyte GeForce RTX 4070 Super Gaming OC apresenta um die AD104 mais rápido e melhor resfriamento que a distingue totalmente da placa Founders Edition. A RTX...
Intel Core i9-13900K | NVIDIA GeForce RTX 4070 SUPER
Análise do cooler líquido Gigabyte Aorus Waterforce X II 360 AiO

Análise da Gigabyte Aorus Waterforce X II 360 AiO: Resfriamento de CPU para entusiastas sem a bagunça

A Gigabyte lançou recentemente o Waterforce X II 360 como sucessor do bem recebido Waterforce X. Embora o Waterforce X II 360 tenha feito um ótimo trabalho no r...
Intel Core i9-13900K | NVIDIA GeForce RTX 4070 Ti SUPER | 28.00"
Nvidia GeForce RTX 4070 Super Founders Edition em análise

Nvidia GeForce Análise da RTX 4070 Super Founders Edition: jogos de 1440p e 100 fps por US$ 100 a mais do que a Radeon RX 7800 XT

A Nvidia GeForce RTX 4070 Super é vendida pelo mesmo preço original de US$ 599 que a RTX 4070 e oferece contagens de shader quase 21% mais altas. Avaliamos como...
Intel Core i9-13900K | NVIDIA GeForce RTX 4070 SUPER | 28.00"

Zotac Gaming GeForce RTX 4070 AMP Airo: NVIDIA GeForce RTX 4070, 28.00"
  ánalise » Zotac Gaming GeForce RTX 4070 AMP Airo Review: RTX 3080-ish performance por US$ 200 de margem sobre RTX 3070

SCHENKER XMG SECTOR, i9 13900K, RTX 4090: NVIDIA GeForce RTX 4090
  ánalise » XMG SECTOR PC desktop de alta qualidade com Intel Core i9-13900K e Nvidia GeForce RTX 4090 revisado

Gigabyte Aorus GeForce RTX 4070 Ti Master: NVIDIA GeForce RTX 4070 Ti, 28.00"
  ánalise » Gigabyte Aorus GeForce RTX 4070 Ti Master 12G Revisão: RTX 3090 Ti challenger com bling adicional por US$1.000

Asus TUF Gaming GeForce RTX 4070 Ti: NVIDIA GeForce RTX 4070 Ti, 28.00"
  ánalise » Asus TUF Gaming GeForce RTX 4070 Ti Review: Ada mid-ranger com desempenho RTX 3090 Ti que reduz o AMD Radeon RX 7900 XT em US$50

Intel NUC13 Raptor Canyon: NVIDIA GeForce RTX 3080 Ti
  ánalise » Intel NUC 13 Extreme Raptor Canyon mini PC com Core i9-13900K e GeForce RTX 3080 Ti em revisão

NVIDIA GeForce RTX 4080 Founders Edition: NVIDIA GeForce RTX 4080, 28.00"
  ánalise » Nvidia GeForce RTX 4080 Revisão da Edição dos Fundadores: campeão de desempenho e eficiência 4K que merece um preço abaixo de US$ 1.000

NVIDIA GeForce RTX 4090 Founders Edition: NVIDIA GeForce RTX 4090, 28.00"
  ánalise » Nvidia GeForce RTX 4090 Revisão da Edição dos Fundadores: Inigualável behemoth de 4K 100 fps por US$400 a menos do que o RTX 3090 Ti

Intel Core i9-13900K: NVIDIA GeForce RTX 3090, 0.00"
  ánalise » Revisão do Intel Core i9-13900K e Intel Core i5-13600K: Mais núcleos e uma maior velocidade do relógio com Raptor Lake

  ánalise » Revisão do Intel Core i9-13900K e Intel Core i5-13600K: Mais núcleos e uma maior velocidade do relógio com Raptor Lake

NVIDIA GeForce RTX 4090 Founders Edition: NVIDIA GeForce RTX 4090, 28.00"
   » O gadget de US$ 76 da Thermal Grizzly promete evitar que sua GPU cara derreta

NVIDIA GeForce RTX 4080 Founders Edition: NVIDIA GeForce RTX 4080, 28.00"
   » Primeira Nvidia GeForce RTX 4080 Founders Edition benchmarks: Bordas fáceis de passar por RTX 3090 Ti e RX 6950 XT

Please share our article, every link counts!
Mail Logo

» Comparação de CPUs Móveis
Comparação de todas as séries de CPUs móveis

» Processadores Móveis - Benchmarklist
Benchmarklist de todos os CPUs conhecidos que são usados em portáteis (CPUs de desktop e laptop)

Outras CPUs da série Raptor Lake-S

» Intel Core i9-13900K
   24x 3 GHz - 5.8 GHz
» Intel Core i7-13700K
   16x 3.4 GHz - 5.4 GHz
» Intel Core i5-13600K
   14x 3.5 GHz - 5.1 GHz
» Intel Core i7-13700
   16x 2.1 GHz - 5.2 GHz
» Intel Core i5-13500
   14x 2.5 GHz - 4.8 GHz
» Intel Core i5-13400F
   10x 2.5 GHz - 4.6 GHz
» Intel Core i5-13400
   10x 2.5 GHz - 4.6 GHz
» Intel Core i5-13500T
   14x 1.6 GHz - 4.6 GHz

CPUs de ao redor

+ AMD Ryzen Threadripper PRO 3995WX
   64x 2.7 GHz - 4.2 GHz
+ AMD Ryzen 9 9950X
   16x 4.3 GHz - 5.7 GHz
+ Intel Core Ultra 9 285K
   24x 3.2 GHz - 5.7 GHz
+ Intel Core i9-14900K
   24x 3.2 GHz - 6 GHz
+ AMD Ryzen 9 7950X
   16x 4.5 GHz - 5.7 GHz
» Intel Core i9-13900K
   24x 3 GHz - 5.8 GHz
- AMD Ryzen 9 7950X3D
   16x 4.2 GHz - 5.7 GHz
- AMD Ryzen 9 9900X
   12x 4.4 GHz - 5.6 GHz
- Intel Core i7-14700K
   20x 2.5 GHz - 5.6 GHz
- AMD Ryzen 9 7900X
   12x 4.7 GHz - 5.6 GHz
- Intel Core i7-13700K
   16x 3.4 GHz - 5.4 GHz
> Análises e revisões de portáteis e celulares > FAQ/Técnica > Processadores de Notebook > Intel Raptor Lake-S i9-13900K Notebook Processor
Klaus Hinum (Update: 2023-01- 1)