Notebookcheck Logo

Breve Análise do tablet Samsung Galaxy Tab S7 - Sem dúvida, o melhor tablet Android de 11 polegadas

Ainda melhor do que o Galaxy Tab S7 Plus!

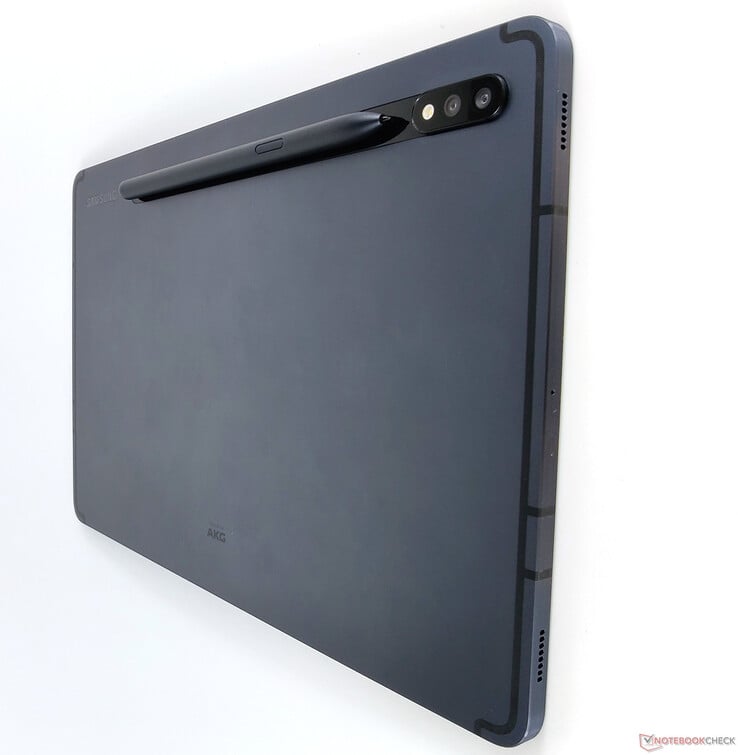
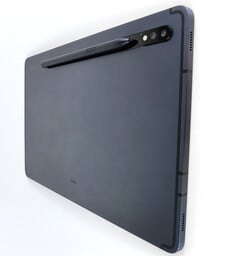
Quando comparado diretamente com seu irmão maior, o Galaxy Tab S7+, o Galaxy Tab S7 parece um tablet de segunda categoria. No entanto, na realidade, o Galaxy Tab S7 é realmente um tablet muito impressionante e é melhor do que seu irmão maior. Leia nossa análise para descobrir o porquê.
Samsung Galaxy Tab S7 (Galaxy Tab S9 Serie)
Processador
Qualcomm Snapdragon 865+ (Plus) 8 x 2.4 - 3.1 GHz, Cortex-A77 / A55 (Kryo 585)
Placa gráfica
Memória
6 GB 
Pantalha
11.00 polegadas 16:10, 2560 x 1600 pixel 274 PPI, Tela táctil capacitiva, native pen support, LTPS, Brilhante: sim, 120 Hz
Disco rígido
128 GB UFS 3.1 Flash, 128 GB 
, 103 GB livre
Conexões
1 USB 3.0, USB-C Power Delivery (PD), 1 HDMI, 1 DisplayPort, Conexões Audio: USB Type-C , Card Reader: microSD de até 1 TB, 1 Leitor de Impressões Digitais, Brightness Sensor, Sensores: Sensor de movimento, e-compass, giroscópio, sensor hall,, OTG, Miracast
Funcionamento em rede
802.11 a/b/g/n/ac/ax (a/b/g/n = Wi-Fi 4/ac = Wi-Fi 5/ax = Wi-Fi 6/), Bluetooth 5.0, GSM: 850, 900, 1.800, 1.900 MHz; UMTS: B1 (2.100), B2 (1.900), B4, B5 (850), B8 (900), LTE: B1 (2.100), B2 (1.900), B3 (1.800), B4, B5 (850), B7 (2.600), B8 (900), B12 (700), B13 (700), B20 (800), B25 (1.900), B26 (850), B28 (700), B66, LTE, GPS
Tamanho
altura x largura x profundidade (em mm): 6.3 x 253.8 x 165.3
Bateria
8000 mAh Lítio-Ion
Charging
fast charging / Quickcharge
Sistema Operativo
Android 10
Camera
Primary Camera: 13 MPix + 5 MPix (Ultra wide-angle), Camera2API: Level 3
Secondary Camera: 8 MPix
Características adicionais
Alto falantes: Configuração de alto-falante quádrupla afinada pela AKG, Dolby Atmos, Teclado: onscreen, teclado opcional, carregador modular, cabo USB, S Pen, OneUI 2.5, 24 Meses Garantia, SAR body : 1.381 W/Kg, Widevine L1, fanless
peso
500 g, Suprimento de energia: 51 g
Preço
681 Euro
Note: The manufacturer may use components from different suppliers including display panels, drives or memory sticks with similar specifications.


Rating
Date
Model
Weight
Height
Size
Resolution
Price
90.1 %
v7 (old)
10/2020
Samsung Galaxy Tab S7
SD 865+ (Plus), Adreno 650
500 g6.3 mm11.00"2560x1600
90.4 %
v7 (old)
04/2020
Apple iPad Pro 11 2020
A12Z Bionic, A12Z Bionic GPU
471 g5.9 mm11.00"2388x1668
88.4 %
v7 (old)
08/2020
Huawei MatePad Pro 10.8
Kirin 990, Mali-G76 MP16
460 g7.2 mm10.80"2560x1600
88.1 %
v7 (old)
10/2020
Samsung Galaxy Tab S7 Plus
SD 865+ (Plus), Adreno 650
575 g5.7 mm12.40"2800x1752

Size Comparison

285 mm 185 mm 5.7 mm 575 g253.8 mm 165.3 mm 6.3 mm 500 g247.6 mm 178.5 mm 5.9 mm 471 g246 mm 159 mm 7.2 mm 460 g297 mm 210 mm 1 mm 5.7 g
Networking
iperf3 transmit AX12
Huawei MatePad Pro 10.8
Mali-G76 MP16, Kirin 990, 256 GB UFS 3.0 Flash
873 (750min - 946max) MBit/s +29%
Apple iPad Pro 11 2020
A12Z Bionic GPU, A12Z Bionic, 128 GB NVMe
828 (752min - 864max) MBit/s +22%
Samsung Galaxy Tab S7
Adreno 650, SD 865+ (Plus), 128 GB UFS 3.1 Flash
679 (653min - 709max) MBit/s
Samsung Galaxy Tab S7 Plus
Adreno 650, SD 865+ (Plus), 256 GB UFS 3.1 Flash
612 (243min - 690max) MBit/s -10%
iperf3 receive AX12
Huawei MatePad Pro 10.8
Mali-G76 MP16, Kirin 990, 256 GB UFS 3.0 Flash
1065 (1022min - 1104max) MBit/s +27%
Samsung Galaxy Tab S7
Adreno 650, SD 865+ (Plus), 128 GB UFS 3.1 Flash
836 (624min - 890max) MBit/s
Samsung Galaxy Tab S7 Plus
Adreno 650, SD 865+ (Plus), 256 GB UFS 3.1 Flash
629 (284min - 753max) MBit/s -25%
Apple iPad Pro 11 2020
A12Z Bionic GPU, A12Z Bionic, 128 GB NVMe
609 (572min - 622max) MBit/s -27%
04590135180225270315360405450495540585630675720765810855Tooltip
Samsung Galaxy Tab S7; iperf3 receive AX12; iperf 3.1.3: Ø835 (624-890)
Samsung Galaxy Tab S7; iperf3 transmit AX12; iperf 3.1.3: Ø679 (653-709)
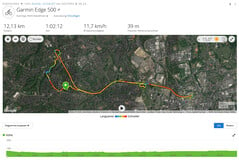
Navigation: Garmin Edge 500
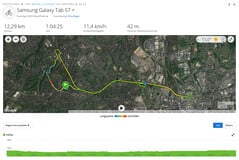
Navigation: Galaxy Tab S7

Image Comparison

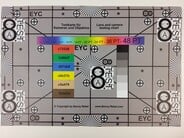
Choose a scene and navigate within the first image. One click changes the position on touchscreens. One click on the zoomed-in image opens the original in a new window. The first image shows the scaled photograph of the test device.

Wide-angle lensWide-angle lens5X zoomLow-light photographyUltra wide-angle lens
ColorChecker
13.2 ∆E
8.5 ∆E
12.2 ∆E
17.5 ∆E
8.8 ∆E
4.6 ∆E
12.1 ∆E
9.1 ∆E
10.4 ∆E
5.9 ∆E
7.3 ∆E
8.8 ∆E
7.1 ∆E
12.7 ∆E
10.5 ∆E
4.3 ∆E
5.5 ∆E
7.7 ∆E
5.9 ∆E
3.4 ∆E
7.6 ∆E
7.3 ∆E
5.2 ∆E
0 ∆E
ColorChecker Samsung Galaxy Tab S7: 8.16 ∆E min: 0 - max: 17.55 ∆E
ColorChecker
29.6 ∆E
55.1 ∆E
39.8 ∆E
34.8 ∆E
45.6 ∆E
62.4 ∆E
53.7 ∆E
36.1 ∆E
44.2 ∆E
29 ∆E
65.1 ∆E
64.1 ∆E
31.5 ∆E
47.7 ∆E
37.8 ∆E
76.8 ∆E
44.6 ∆E
42 ∆E
93.7 ∆E
71.4 ∆E
52.5 ∆E
36.9 ∆E
23.8 ∆E
13.3 ∆E
ColorChecker Samsung Galaxy Tab S7: 47.14 ∆E min: 13.35 - max: 93.69 ∆E
548
cd/m²
519
cd/m²
515
cd/m²
569
cd/m²
554
cd/m²
521
cd/m²
535
cd/m²
525
cd/m²
526
cd/m²
Distribuição do brilho
tested with X-Rite i1Pro 2
Máximo: 569 cd/m² (Nits) Médio: 534.7 cd/m² Minimum: 4.44 cd/m²
iluminação: 91 %
iluminação com acumulador: 554 cd/m²
Contraste: 1679:1 (Preto: 0.33 cd/m²)
ΔE Color 2.1 | 0.5-29.43 Ø4.91
ΔE Greyscale 1.6 | 0.5-98 Ø5.2
97% sRGB (Calman 2D)
Gamma: 2.32
Samsung Galaxy Tab S7
LTPS, 2560x1600, 11"
Apple iPad Pro 11 2020
IPS, 2388x1668, 11"
Huawei MatePad Pro 10.8
IPS, 2560x1600, 10.8"
Samsung Galaxy Tab S7 Plus
Super AMOLED, 2800x1752, 12.4"
Screen
18%
-20%
-14%
Brightness middle
554
617
11%
606
9%
441
-20%
Brightness
535
585
9%
579
8%
447
-16%
Brightness Distribution
91
84
-8%
89
-2%
98
8%
Black Level *
0.33
0.36
-9%
0.32
3%
Contrast
1679
1714
2%
1894
13%
Colorchecker dE 2000 *
2.1
0.94
55%
2.9
-38%
2.4
-14%
Colorchecker dE 2000 max. *
7.1
1.87
74%
6
15%
4.1
42%
Greyscale dE 2000 *
1.6
1.4
12%
4.3
-169%
2.9
-81%
Gamma
2.32 95%
2.156 102%
2.22 99%
2.01 109%
CCT
6623 98%
6733 97%
7272 89%
6469 100%

* ... smaller is better

Screen Flickering / PWM (Pulse-Width Modulation)

To dim the screen, some notebooks will simply cycle the backlight on and off in rapid succession - a method called Pulse Width Modulation (PWM) . This cycling frequency should ideally be undetectable to the human eye. If said frequency is too low, users with sensitive eyes may experience strain or headaches or even notice the flickering altogether.
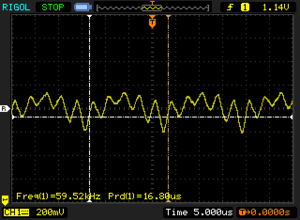
Screen flickering / PWM detected 59520 Hz ≤ 21 % brightness setting

The display backlight flickers at 59520 Hz (worst case, e.g., utilizing PWM) Flickering detected at a brightness setting of 21 % and below. There should be no flickering or PWM above this brightness setting.

The frequency of 59520 Hz is quite high, so most users sensitive to PWM should not notice any flickering.

In comparison: 53 % of all tested devices do not use PWM to dim the display. If PWM was detected, an average of 8715 (minimum: 5 - maximum: 343500) Hz was measured.

Display Response Times

Display response times show how fast the screen is able to change from one color to the next. Slow response times can lead to afterimages and can cause moving objects to appear blurry (ghosting). Gamers of fast-paced 3D titles should pay special attention to fast response times.
       Response Time Black to White
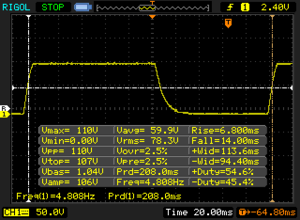
20.8 ms ... rise ↗ and fall ↘ combined↗ 6.8 ms rise
↘ 14 ms fall
The screen shows good response rates in our tests, but may be too slow for competitive gamers.
In comparison, all tested devices range from 0.1 (minimum) to 240 (maximum) ms. » 42 % of all devices are better.
This means that the measured response time is similar to the average of all tested devices (20.9 ms).
       Response Time 50% Grey to 80% Grey
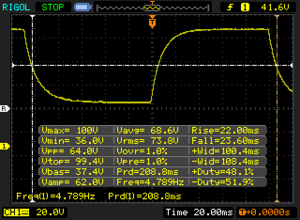
45.6 ms ... rise ↗ and fall ↘ combined↗ 22 ms rise
↘ 23.6 ms fall
The screen shows slow response rates in our tests and will be unsatisfactory for gamers.
In comparison, all tested devices range from 0.165 (minimum) to 636 (maximum) ms. » 76 % of all devices are better.
This means that the measured response time is worse than the average of all tested devices (32.8 ms).
Geekbench 5.5
Single-Core
Apple iPad Pro 11 2020
1127 Points +17%
Average Qualcomm Snapdragon 865+ (Plus) (950 - 1006, n=6)
979 Points +2%
Samsung Galaxy Tab S7
963 Points
Samsung Galaxy Tab S7 Plus
950 Points -1%
Xiaomi Mi 10 Pro
906 Points -6%
Huawei MatePad Pro 10.8
759 Points -21%
Average of class Tablet (140 - 1887, n=71, last 2 years)
707 Points -27%
Multi-Core
Apple iPad Pro 11 2020
4707 Points +47%
Xiaomi Mi 10 Pro
3338 Points +4%
Average Qualcomm Snapdragon 865+ (Plus) (3012 - 3458, n=6)
3243 Points +1%
Samsung Galaxy Tab S7
3201 Points
Samsung Galaxy Tab S7 Plus
3063 Points -4%
Huawei MatePad Pro 10.8
2893 Points -10%
Average of class Tablet (312 - 8624, n=71, last 2 years)
2494 Points -22%
OpenCL Score 5.1
Huawei MatePad Pro 10.8
3756 Points
Average of class Tablet (452 - 10879, n=19, last 2 years)
3153 Points
Xiaomi Mi 10 Pro
2932 Points
OpenCL Score
Average of class Tablet (516 - 11980, n=11, last 2 years)
6500 Points +81%
Samsung Galaxy Tab S7
3591 Points
Average Qualcomm Snapdragon 865+ (Plus) (3466 - 3671, n=6)
3556 Points -1%
Samsung Galaxy Tab S7 Plus
3466 Points -3%
Vulkan Score 5.5
Average of class Tablet (532 - 11502, n=13, last 2 years)
5336 Points +43%
Samsung Galaxy Tab S7
3732 Points
Average Qualcomm Snapdragon 865+ (Plus) (3119 - 4105, n=6)
3655 Points -2%
Samsung Galaxy Tab S7 Plus
3473 Points -7%
Geekbench 4.4
64 Bit Single-Core Score
Samsung Galaxy Tab S7
4493 Points
Average Qualcomm Snapdragon 865+ (Plus) ()
4493 Points 0%
Xiaomi Mi 10 Pro
4261 Points -5%
Huawei MatePad Pro 10.8
3865 Points -14%
Average of class Tablet (745 - 9443, n=15, last 2 years)
3721 Points -17%
64 Bit Multi-Core Score
Xiaomi Mi 10 Pro
13186 Points +1%
Samsung Galaxy Tab S7
13066 Points
Average Qualcomm Snapdragon 865+ (Plus) ()
13066 Points 0%
Huawei MatePad Pro 10.8
11885 Points -9%
Average of class Tablet (1418 - 30983, n=15, last 2 years)
10683 Points -18%
Compute RenderScript Score
Xiaomi Mi 10 Pro
9443 Points +2%
Samsung Galaxy Tab S7
9279 Points
Average Qualcomm Snapdragon 865+ (Plus) ()
9279 Points 0%
Huawei MatePad Pro 10.8
8892 Points -4%
Average of class Tablet (2128 - 10799, n=7, last 2 years)
7758 Points -16%
PCMark for Android
Work performance score
Average Qualcomm Snapdragon 865+ (Plus) (13629 - 19824, n=5)
15404 Points +3%
Samsung Galaxy Tab S7
14982 Points
Samsung Galaxy Tab S7 Plus
13629 Points -9%
Xiaomi Mi 10 Pro
13142 Points -12%
Huawei MatePad Pro 10.8
10918 Points -27%
Work 2.0 performance score
Average Qualcomm Snapdragon 865+ (Plus) (12355 - 14979, n=6)
13143 Points +4%
Samsung Galaxy Tab S7
12603 Points
Samsung Galaxy Tab S7 Plus
12466 Points -1%
Xiaomi Mi 10 Pro
10952 Points -13%
Huawei MatePad Pro 10.8
8636 Points -31%
3DMark
1280x720 offscreen Ice Storm Unlimited Score
Apple iPad Pro 11 2020
110846 Points +9%
Samsung Galaxy Tab S7 Plus
109154 Points +8%
Average Qualcomm Snapdragon 865+ (Plus) (91762 - 117606, n=5)
102336 Points +1%
Samsung Galaxy Tab S7
101385 Points
Xiaomi Mi 10 Pro
82937 Points -18%
Huawei MatePad Pro 10.8
42861 Points -58%
1280x720 offscreen Ice Storm Unlimited Graphics Score
Apple iPad Pro 11 2020
221941 Points +35%
Samsung Galaxy Tab S7
164853 Points
Samsung Galaxy Tab S7 Plus
160665 Points -3%
Average Qualcomm Snapdragon 865+ (Plus) (128372 - 169103, n=5)
158068 Points -4%
Xiaomi Mi 10 Pro
150281 Points -9%
Huawei MatePad Pro 10.8
64715 Points -61%
1280x720 offscreen Ice Storm Unlimited Physics
Samsung Galaxy Tab S7 Plus
51436 Points +20%
Average Qualcomm Snapdragon 865+ (Plus) (35563 - 56928, n=5)
46532 Points +9%
Samsung Galaxy Tab S7
42810 Points
Apple iPad Pro 11 2020
40279 Points -6%
Xiaomi Mi 10 Pro
32384 Points -24%
Huawei MatePad Pro 10.8
19565 Points -54%
2560x1440 Sling Shot OpenGL ES 3.0
Samsung Galaxy Tab S7
9238 Points
Xiaomi Mi 10 Pro
9123 Points -1%
Average Qualcomm Snapdragon 865+ (Plus) (8272 - 10046, n=6)
8977 Points -3%
Samsung Galaxy Tab S7 Plus
8675 Points -6%
Huawei MatePad Pro 10.8
4215 Points -54%
Average of class Tablet (507 - 5864, n=18, last 2 years)
2615 Points -72%
2560x1440 Sling Shot OpenGL ES 3.0 Graphics
Samsung Galaxy Tab S7
14283 Points
Samsung Galaxy Tab S7 Plus
12725 Points -11%
Average Qualcomm Snapdragon 865+ (Plus) (11107 - 14283, n=6)
12559 Points -12%
Xiaomi Mi 10 Pro
12394 Points -13%
Huawei MatePad Pro 10.8
4256 Points -70%
Average of class Tablet (454 - 6698, n=18, last 2 years)
2648 Points -81%
2560x1440 Sling Shot OpenGL ES 3.0 Physics
Xiaomi Mi 10 Pro
4729 Points +6%
Average Qualcomm Snapdragon 865+ (Plus) (4104 - 5301, n=6)
4589 Points +2%
Samsung Galaxy Tab S7
4482 Points
Samsung Galaxy Tab S7 Plus
4104 Points -8%
Huawei MatePad Pro 10.8
4056 Points -10%
Average of class Tablet (863 - 4085, n=18, last 2 years)
2806 Points -37%
2560x1440 Sling Shot OpenGL ES 3.0 Unlimited
Average Qualcomm Snapdragon 865+ (Plus) (8709 - 10467, n=6)
9355 Points +1%
Samsung Galaxy Tab S7
9283 Points
Samsung Galaxy Tab S7 Plus
8902 Points -4%
Xiaomi Mi 10 Pro
8823 Points -5%
Average of class Tablet (539 - 17675, n=29, last 2 years)
5834 Points -37%
Huawei MatePad Pro 10.8
4472 Points -52%
2560x1440 Sling Shot OpenGL ES 3.0 Unlimited Graphics
Samsung Galaxy Tab S7
13779 Points
Samsung Galaxy Tab S7 Plus
13149 Points -5%
Average Qualcomm Snapdragon 865+ (Plus) (11617 - 13779, n=6)
12893 Points -6%
Xiaomi Mi 10 Pro
12694 Points -8%
Average of class Tablet (485 - 35165, n=29, last 2 years)
8711 Points -37%
Huawei MatePad Pro 10.8
4405 Points -68%
2560x1440 Sling Shot OpenGL ES 3.0 Unlimited Physics
Average Qualcomm Snapdragon 865+ (Plus) (4178 - 5686, n=6)
4805 Points +11%
Huawei MatePad Pro 10.8
4702 Points +9%
Samsung Galaxy Tab S7
4319 Points
Xiaomi Mi 10 Pro
4283 Points -1%
Samsung Galaxy Tab S7 Plus
4178 Points -3%
Average of class Tablet (463 - 6449, n=29, last 2 years)
3648 Points -16%
2560x1440 Sling Shot Extreme (ES 3.1)
Average Qualcomm Snapdragon 865+ (Plus) (6850 - 7881, n=5)
7346 Points +3%
Xiaomi Mi 10 Pro
7157 Points +1%
Samsung Galaxy Tab S7
7098 Points
Samsung Galaxy Tab S7 Plus
6850 Points -3%
Huawei MatePad Pro 10.8
4334 Points -39%
Average of class Tablet (361 - 14235, n=46, last 2 years)
2067 Points -71%
2560x1440 Sling Shot Extreme (ES 3.1) Graphics
Average Qualcomm Snapdragon 865+ (Plus) (8548 - 9140, n=5)
8924 Points 0%
Samsung Galaxy Tab S7
8894 Points
Samsung Galaxy Tab S7 Plus
8548 Points -4%
Xiaomi Mi 10 Pro
8299 Points -7%
Huawei MatePad Pro 10.8
4425 Points -50%
Average of class Tablet (290 - 24605, n=46, last 2 years)
2198 Points -75%
2560x1440 Sling Shot Extreme (ES 3.1) Physics
Xiaomi Mi 10 Pro
4895 Points +17%
Average Qualcomm Snapdragon 865+ (Plus) (4041 - 5318, n=5)
4572 Points +9%
Samsung Galaxy Tab S7
4201 Points
Huawei MatePad Pro 10.8
4096 Points -2%
Samsung Galaxy Tab S7 Plus
4041 Points -4%
Average of class Tablet (858 - 5751, n=46, last 2 years)
2797 Points -33%
2560x1440 Sling Shot Extreme (ES 3.1) Unlimited
Average Qualcomm Snapdragon 865+ (Plus) (7369 - 8780, n=6)
8154 Points +6%
Xiaomi Mi 10 Pro
7986 Points +4%
Samsung Galaxy Tab S7
7701 Points
Samsung Galaxy Tab S7 Plus
7369 Points -4%
Average of class Tablet (267 - 17674, n=66, last 2 years)
4499 Points -42%
Huawei MatePad Pro 10.8
4467 Points -42%
2560x1440 Sling Shot Extreme (ES 3.1) Unlimited Graphics
Average Qualcomm Snapdragon 865+ (Plus) (9453 - 10442, n=6)
10019 Points +1%
Samsung Galaxy Tab S7
9893 Points
Samsung Galaxy Tab S7 Plus
9453 Points -4%
Xiaomi Mi 10 Pro
9356 Points -5%
Average of class Tablet (240 - 29325, n=66, last 2 years)
5876 Points -41%
Huawei MatePad Pro 10.8
4356 Points -56%
2560x1440 Sling Shot Extreme (ES 3.1) Unlimited Physics
Xiaomi Mi 10 Pro
5277 Points +23%
Average Qualcomm Snapdragon 865+ (Plus) (4159 - 5751, n=6)
4965 Points +16%
Huawei MatePad Pro 10.8
4756 Points +11%
Samsung Galaxy Tab S7
4298 Points
Samsung Galaxy Tab S7 Plus
4159 Points -3%
Average of class Tablet (441 - 7451, n=66, last 2 years)
3632 Points -15%
2560x1440 Sling Shot Extreme (Vulkan) Unlimited
Xiaomi Mi 10 Pro
6578 Points +5%
Samsung Galaxy Tab S7
6292 Points
Samsung Galaxy Tab S7 Plus
6226 Points -1%
Average Qualcomm Snapdragon 865+ (Plus) (4846 - 6977, n=5)
6060 Points -4%
Huawei MatePad Pro 10.8
4036 Points -36%
Average of class Tablet (615 - 7863, n=49, last 2 years)
1973 Points -69%
2560x1440 Sling Shot Extreme (Vulkan) Unlimited Graphics
Samsung Galaxy Tab S7
8768 Points
Samsung Galaxy Tab S7 Plus
8745 Points 0%
Average Qualcomm Snapdragon 865+ (Plus) (7613 - 9054, n=5)
8645 Points -1%
Xiaomi Mi 10 Pro
8173 Points -7%
Huawei MatePad Pro 10.8
4156 Points -53%
Average of class Tablet (521 - 10276, n=49, last 2 years)
2063 Points -76%
2560x1440 Sling Shot Extreme (Vulkan) Unlimited Physics
Xiaomi Mi 10 Pro
3830 Points +17%
Huawei MatePad Pro 10.8
3658 Points +11%
Samsung Galaxy Tab S7
3285 Points
Samsung Galaxy Tab S7 Plus
3100 Points -6%
Average Qualcomm Snapdragon 865+ (Plus) (1845 - 3875, n=5)
3098 Points -6%
Average of class Tablet (1370 - 4352, n=49, last 2 years)
2521 Points -23%
GFXBench (DX / GLBenchmark) 2.7
T-Rex Onscreen
Samsung Galaxy Tab S7
119 fps
Samsung Galaxy Tab S7 Plus
116 fps -3%
Average Qualcomm Snapdragon 865+ (Plus) (60 - 142, n=5)
110.2 fps -7%
Xiaomi Mi 10 Pro
90 fps -24%
Average of class Tablet (14 - 144, n=68, last 2 years)
64 fps -46%
Huawei MatePad Pro 10.8
60 fps -50%
1920x1080 T-Rex Offscreen
Samsung Galaxy Tab S7
225 fps
Samsung Galaxy Tab S7 Plus
215 fps -4%
Average Qualcomm Snapdragon 865+ (Plus) (171 - 225, n=5)
211 fps -6%
Xiaomi Mi 10 Pro
203 fps -10%
Average of class Tablet (15 - 809, n=68, last 2 years)
191.4 fps -15%
Huawei MatePad Pro 10.8
135 fps -40%
GFXBench 3.0
on screen Manhattan Onscreen OGL
Xiaomi Mi 10 Pro
88 fps +7%
Samsung Galaxy Tab S7
82 fps
Average Qualcomm Snapdragon 865+ (Plus) (60 - 117, n=5)
80.2 fps -2%
Samsung Galaxy Tab S7 Plus
67 fps -18%
Average of class Tablet (8.1 - 122, n=68, last 2 years)
52.5 fps -36%
Huawei MatePad Pro 10.8
44 fps -46%
1920x1080 1080p Manhattan Offscreen
Samsung Galaxy Tab S7
134 fps
Average Qualcomm Snapdragon 865+ (Plus) (110 - 134, n=5)
126.4 fps -6%
Samsung Galaxy Tab S7 Plus
125 fps -7%
Xiaomi Mi 10 Pro
122 fps -9%
Average of class Tablet (7.3 - 530, n=68, last 2 years)
111 fps -17%
Huawei MatePad Pro 10.8
64 fps -52%
GFXBench 3.1
on screen Manhattan ES 3.1 Onscreen
Xiaomi Mi 10 Pro
77 fps +51%
Average Qualcomm Snapdragon 865+ (Plus) (41 - 82, n=5)
56 fps +10%
Samsung Galaxy Tab S7
51 fps
Samsung Galaxy Tab S7 Plus
41 fps -20%
Average of class Tablet (4.8 - 120, n=68, last 2 years)
39.9 fps -22%
Huawei MatePad Pro 10.8
34 fps -33%
1920x1080 Manhattan ES 3.1 Offscreen
Samsung Galaxy Tab S7
93 fps
Average Qualcomm Snapdragon 865+ (Plus) (75 - 93, n=5)
88.2 fps -5%
Samsung Galaxy Tab S7 Plus
88 fps -5%
Xiaomi Mi 10 Pro
86 fps -8%
Average of class Tablet (5 - 400, n=68, last 2 years)
79.4 fps -15%
Huawei MatePad Pro 10.8
41 fps -56%
GFXBench
on screen Car Chase Onscreen
Xiaomi Mi 10 Pro
45 fps +41%
Average Qualcomm Snapdragon 865+ (Plus) (24 - 52, n=5)
36.8 fps +15%
Samsung Galaxy Tab S7
32 fps
Average of class Tablet (3.1 - 117.9, n=67, last 2 years)
25.3 fps -21%
Samsung Galaxy Tab S7 Plus
24 fps -25%
Huawei MatePad Pro 10.8
21 fps -34%
1920x1080 Car Chase Offscreen
Samsung Galaxy Tab S7
57 fps
Average Qualcomm Snapdragon 865+ (Plus) (46 - 57, n=5)
53.2 fps -7%
Samsung Galaxy Tab S7 Plus
53 fps -7%
Xiaomi Mi 10 Pro
50 fps -12%
Average of class Tablet (2.2 - 284, n=67, last 2 years)
47.3 fps -17%
Huawei MatePad Pro 10.8
38 fps -33%
on screen Aztec Ruins High Tier Onscreen
Xiaomi Mi 10 Pro
30 fps +43%
Average Qualcomm Snapdragon 865+ (Plus) (18 - 35, n=6)
27.2 fps +30%
Samsung Galaxy Tab S7
21 fps
Average of class Tablet (1.9 - 106.4, n=79, last 2 years)
19 fps -10%
Samsung Galaxy Tab S7 Plus
18 fps -14%
Huawei MatePad Pro 10.8
13 fps -38%
2560x1440 Aztec Ruins High Tier Offscreen
Samsung Galaxy Tab S7
22 fps
Samsung Galaxy Tab S7 Plus
22 fps 0%
Average Qualcomm Snapdragon 865+ (Plus) (22 - 22, n=6)
22 fps 0%
Average of class Tablet (0.9 - 114.5, n=79, last 2 years)
21.3 fps -3%
Xiaomi Mi 10 Pro
20 fps -9%
Huawei MatePad Pro 10.8
17 fps -23%
on screen Aztec Ruins Normal Tier Onscreen
Xiaomi Mi 10 Pro
47 fps +42%
Average Qualcomm Snapdragon 865+ (Plus) (27 - 54, n=6)
41.5 fps +26%
Samsung Galaxy Tab S7
33 fps
Average of class Tablet (3 - 120, n=79, last 2 years)
27.4 fps -17%
Samsung Galaxy Tab S7 Plus
27 fps -18%
Huawei MatePad Pro 10.8
17 fps -48%
1920x1080 Aztec Ruins Normal Tier Offscreen
Samsung Galaxy Tab S7
58 fps
Samsung Galaxy Tab S7 Plus
57 fps -2%
Average Qualcomm Snapdragon 865+ (Plus) (46 - 59, n=6)
56 fps -3%
Average of class Tablet (2.5 - 340, n=79, last 2 years)
55.9 fps -4%
Xiaomi Mi 10 Pro
54 (20min) fps -7%
Huawei MatePad Pro 10.8
41 fps -29%
AnTuTu v8 - Total Score
Apple iPad Pro 11 2020
712218 Points +22%
Xiaomi Mi 10 Pro
595466 Points +2%
Samsung Galaxy Tab S7
584052 Points
Average Qualcomm Snapdragon 865+ (Plus) (490260 - 622888, n=4)
571612 Points -2%
Samsung Galaxy Tab S7 Plus
490260 Points -16%
Huawei MatePad Pro 10.8
409039 Points -30%
BaseMark OS II
Overall
Xiaomi Mi 10 Pro
6072 Points +9%
Average Qualcomm Snapdragon 865+ (Plus) (5305 - 6247, n=4)
5656 Points +1%
Samsung Galaxy Tab S7
5592 Points
Samsung Galaxy Tab S7 Plus
5305 Points -5%
Huawei MatePad Pro 10.8
4738 Points -15%
Average of class Tablet (444 - 11721, n=59, last 2 years)
4205 Points -25%
System
Xiaomi Mi 10 Pro
10002 Points +11%
Average Qualcomm Snapdragon 865+ (Plus) (8965 - 9901, n=4)
9264 Points +3%
Samsung Galaxy Tab S7
8994 Points
Samsung Galaxy Tab S7 Plus
8965 Points 0%
Huawei MatePad Pro 10.8
8215 Points -9%
Average of class Tablet (1103 - 16435, n=59, last 2 years)
7265 Points -19%
Memory
Xiaomi Mi 10 Pro
7945 Points +22%
Huawei MatePad Pro 10.8
6751 Points +4%
Average Qualcomm Snapdragon 865+ (Plus) (5918 - 8056, n=4)
6654 Points +2%
Samsung Galaxy Tab S7
6501 Points
Samsung Galaxy Tab S7 Plus
5918 Points -9%
Average of class Tablet (916 - 10977, n=59, last 2 years)
4862 Points -25%
Graphics
Samsung Galaxy Tab S7
12048 Points
Average Qualcomm Snapdragon 865+ (Plus) (11773 - 12048, n=4)
11899 Points -1%
Samsung Galaxy Tab S7 Plus
11773 Points -2%
Xiaomi Mi 10 Pro
11567 Points -4%
Average of class Tablet (580 - 57192, n=59, last 2 years)
9168 Points -24%
Huawei MatePad Pro 10.8
8775 Points -27%
Web
Xiaomi Mi 10 Pro
1514 Points +7%
Samsung Galaxy Tab S7
1409 Points
Average Qualcomm Snapdragon 865+ (Plus) (1268 - 1621, n=4)
1407 Points 0%
Average of class Tablet (10 - 2051, n=59, last 2 years)
1269 Points -10%
Samsung Galaxy Tab S7 Plus
1268 Points -10%
Huawei MatePad Pro 10.8
1032 Points -27%

Legend

 
Samsung Galaxy Tab S7 Qualcomm Snapdragon 865+ (Plus), Qualcomm Adreno 650, 128 GB UFS 3.1 Flash
 
Apple iPad Pro 11 2020 Apple A12Z Bionic, Apple A12Z Bionic GPU, 128 GB NVMe
 
Huawei MatePad Pro 10.8 HiSilicon Kirin 990, ARM Mali-G76 MP16, 256 GB UFS 3.0 Flash
 
Samsung Galaxy Tab S7 Plus Qualcomm Snapdragon 865+ (Plus), Qualcomm Adreno 650, 256 GB UFS 3.1 Flash
 
Xiaomi Mi 10 Pro Qualcomm Snapdragon 865, Qualcomm Adreno 650, 256 GB UFS 3.0 Flash
Jetstream 2 - Total Score
Apple iPad Pro 11 2020 (Safari 14.1)
127.4 Points +77%
Apple iPad Pro 11 2020 (Chrome 80)
124.5 Points +73%
Average of class Tablet (19.9 - 334, n=70, last 2 years)
111.2 Points +55%
Samsung Galaxy Tab S7 Plus (Samsung Browser 12.1)
72.5 Points +1%
Average Qualcomm Snapdragon 865+ (Plus) (69.8 - 75.5, n=4)
72.4 Points +1%
Samsung Galaxy Tab S7 (Chrome86)
71.8 Points
Huawei MatePad Pro 10.8 (Huawei Browser V10.1.2)
55.1 Points -23%
JetStream 1.1 - Total Score
Apple iPad Pro 11 2020 (Chrome 80)
274.4 Points +116%
Samsung Galaxy Tab S7 Plus (Samsung Browser 12.1)
127.6 Points 0%
Samsung Galaxy Tab S7 (Chrome86)
127 Points
Average Qualcomm Snapdragon 865+ (Plus) (121.7 - 131.5, n=4)
127 Points 0%
Huawei MatePad Pro 10.8 (Huawei Browser V10.1.2)
101.2 Points -20%
WebXPRT 3 - Overall
Apple iPad Pro 11 2020 (Safari 14.1)
194 Points +67%
Apple iPad Pro 11 2020 (Chrome 80)
141 Points +22%
Average of class Tablet (34 - 435, n=45, last 2 years)
155.2 Points +34%
Samsung Galaxy Tab S7 Plus (Samsung Browser 12.1)
126 Points +9%
Average Qualcomm Snapdragon 865+ (Plus) (114 - 126, n=4)
119.8 Points +3%
Samsung Galaxy Tab S7 (Chrome86)
116 Points
Huawei MatePad Pro 10.8 (Huawei Browser V10.1.2)
97 Points -16%
Speedometer 2.0 - Result
Apple iPad Pro 11 2020 (Safari 14.1)
154 runs/min +117%
Average of class Tablet (2.59 - 572, n=64, last 2 years)
121.9 runs/min +72%
Samsung Galaxy Tab S7 Plus (Samsung Browser 12.1)
71.3 runs/min +1%
Samsung Galaxy Tab S7 (Chrome86)
70.9 runs/min
Average Qualcomm Snapdragon 865+ (Plus) (41.2 - 73.3, n=4)
64.2 runs/min -9%
Huawei MatePad Pro 10.8 (Huawei Browser V10.1.2)
63.9 runs/min -10%
Octane V2 - Total Score
Apple iPad Pro 11 2020 (Safari 14.1)
42425 Points +60%
Apple iPad Pro 11 2020 (Chrome 80)
42372 Points +60%
Average of class Tablet (763 - 105178, n=87, last 2 years)
29371 Points +11%
Samsung Galaxy Tab S7 Plus (Samsung Browser 12.1)
27360 Points +3%
Average Qualcomm Snapdragon 865+ (Plus) (25953 - 27360, n=4)
26679 Points +1%
Samsung Galaxy Tab S7 (Chrome86)
26495 Points
Huawei MatePad Pro 10.8 (Huawei Browser V10.1.2)
19885 Points -25%
Mozilla Kraken 1.1 - Total
Average of class Tablet (319 - 34733, n=75, last 2 years)
3734 ms * -97%
Huawei MatePad Pro 10.8 (Huawei Browser V10.1.2)
2345 ms * -23%
Samsung Galaxy Tab S7 Plus (Samsung Browser 12.1)
1947 ms * -2%
Average Qualcomm Snapdragon 865+ (Plus) (1854 - 1947, n=4)
1908 ms * -0%
Samsung Galaxy Tab S7 (Chrome86)
1900 ms *
Apple iPad Pro 11 2020 (Chrome 80)
646 ms * +66%

* ... smaller is better

Samsung Galaxy Tab S7Huawei MatePad Pro 10.8Samsung Galaxy Tab S7 PlusAverage 128 GB UFS 3.1 FlashAverage of class Tablet
AndroBench 3-5
1%
4%
7%
-14%
Sequential Read 256KB
1512
1789
18%
1675
11%
Sequential Write 256KB
680
399
-41%
732
8%
Random Read 4KB
219
224.6
3%
230.1
5%
Random Write 4KB
211.5
262.4
24%
205
-3%
Sequential Read 256KB SDCard
86 ?(Toshiba Exceria Pro M501)
82.4 ?(NM Card)
-4%
85.8 ?(Toshiba Exceria Pro M501)
0%
85.9 ?(85.8 - 86, n=2)
0%
Sequential Write 256KB SDCard
69 ?(Toshiba Exceria Pro M501)
71.7 ?(NM Card)
4%
69.3 ?(Toshiba Exceria Pro M501)
0%
68.8 ?(68.6 - 69, n=2)
0%
PUBG
051015202530354045505560Tooltip
Samsung Galaxy Tab S7; Balanced: Ø59.9 (58-60)
Samsung Galaxy Tab S7; HD: Ø59.7 (52-61)
Samsung Galaxy Tab S7; Ultra HD: Ø40 (39-41)
Asphalt 9 Legends
051015202530354045505560Tooltip
Samsung Galaxy Tab S7: Ø57.3 (44-60)
Carga Máxima
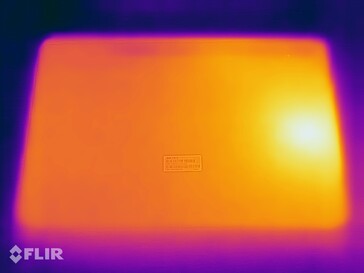
 28.1 °C27.4 °C33.4 °C 
 28.8 °C26.5 °C33.5 °C 
 27.8 °C25.4 °C32.2 °C 
Máximo: 33.5 °C
Médio: 29.2 °C
25.6 °C27.1 °C28.5 °C
25.3 °C27.3 °C29.8 °C
25 °C26.3 °C28.1 °C
Máximo: 29.8 °C
Médio: 27 °C
alimentação elétrica  24.8 °C | Temperatura do quarto 20 °C | Fluke t3000FC (calibrated) & Voltcraft IR-260
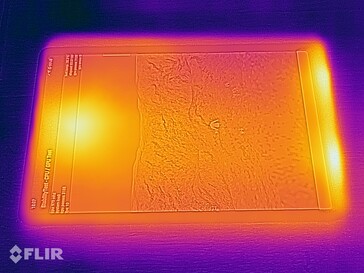
(+) The average temperature for the upper side under maximal load is 29.2 °C / 85 F, compared to the average of 30 °C / 86 F for the devices in the class Tablet.
(+) The maximum temperature on the upper side is 33.5 °C / 92 F, compared to the average of 33.7 °C / 93 F, ranging from 20.7 to 53.2 °C for the class Tablet.
(+) The bottom heats up to a maximum of 29.8 °C / 86 F, compared to the average of 33.2 °C / 92 F
(+) In idle usage, the average temperature for the upper side is 25.8 °C / 78 F, compared to the device average of 30 °C / 86 F.
dB(A) 0102030405060708090Deep BassMiddle BassHigh BassLower RangeMidsHigher MidsLower HighsMid HighsUpper HighsSuper Highs2030.523.22521.326.73118.426.44022.5275020.333.56315.828.48015.735.710016.746.912515.153.51601561.920010.662.125014.167.331510.872.140010.973.650010.577.46308.877.28001075.7100010.179125011.177160011.97720001174.6250012.171.6315012.574.4400012.778.5500013.476630013.879.180001576100001475.61250014.1651600014.157.3SPL24.488.4N0.584median 12.5median 75.6Delta25.242.340.440.741.131.138.634.34334.751.928.946.423.840.926.249.42253.720.757.32157.218.657.117.762.517.268.31970.51771.515.27217.369.715.468.618.564.615.958.715.165.614.464.314.860.115.161.215.363.815.664.915.961.416.161.216.65760.869.667.428.378.515.224.219.31.145.8median 16.6median 62.5median 43.3median 14.7median 62.13.13.92413.616.4hearing rangehide median Pink NoiseSamsung Galaxy Tab S7Apple iPad Pro 11 2020
Frequency diagram (checkboxes can be checked and unchecked to compare devices)
Samsung Galaxy Tab S7 audio analysis

(+) | speakers can play relatively loud (88.4 dB)
Bass 100 - 315 Hz
(-) | nearly no bass - on average 15% lower than median
(±) | linearity of bass is average (9.6% delta to prev. frequency)
Mids 400 - 2000 Hz
(+) | balanced mids - only 1.6% away from median
(+) | mids are linear (2.9% delta to prev. frequency)
Highs 2 - 16 kHz
(+) | balanced highs - only 1.7% away from median
(+) | highs are linear (4.3% delta to prev. frequency)
Overall 100 - 16.000 Hz
(+) | overall sound is linear (10.4% difference to median)
Compared to same class
» 6% of all tested devices in this class were better, 3% similar, 91% worse
» The best had a delta of 7%, average was 22%, worst was 129%
Compared to all devices tested
» 4% of all tested devices were better, 1% similar, 95% worse
» The best had a delta of 4%, average was 25%, worst was 134%

Apple iPad Pro 11 2020 audio analysis

(±) | speaker loudness is average but good (78.5 dB)
Bass 100 - 315 Hz
(±) | reduced bass - on average 6.3% lower than median
(±) | linearity of bass is average (7.6% delta to prev. frequency)
Mids 400 - 2000 Hz
(±) | higher mids - on average 6.4% higher than median
(+) | mids are linear (6% delta to prev. frequency)
Highs 2 - 16 kHz
(+) | balanced highs - only 1.9% away from median
(+) | highs are linear (6.2% delta to prev. frequency)
Overall 100 - 16.000 Hz
(+) | overall sound is linear (13% difference to median)
Compared to same class
» 19% of all tested devices in this class were better, 3% similar, 77% worse
» The best had a delta of 7%, average was 22%, worst was 129%
Compared to all devices tested
» 11% of all tested devices were better, 2% similar, 87% worse
» The best had a delta of 4%, average was 25%, worst was 134%

Consumo de energia
desligadodarklight 0.01 / 0.11 Watt
Ociosodarkmidlight 1.16 / 4.42 / 4.43 Watt
Carga midlight 8.86 / 11.6 Watt
 color bar
Key: min: dark, med: mid, max: light        Metrahit Energy
Samsung Galaxy Tab S7
8000 mAh
Apple iPad Pro 11 2020
7538 mAh
Huawei MatePad Pro 10.8
7250 mAh
Samsung Galaxy Tab S7 Plus
10090 mAh
Power Consumption
-25%
-13%
-5%
Idle Minimum *
1.16
1.3
-12%
1.98
-71%
2.41
-108%
Idle Average *
4.42
3.5
21%
5.66
-28%
3.4
23%
Idle Maximum *
4.43
5.6
-26%
5.69
-28%
3.43
23%
Load Average *
8.86
12.5
-41%
6.96
21%
6.63
25%
Load Maximum *
11.6
19.2
-66%
6.98
40%
10.29
11%

* ... smaller is better

Tempo de Execução da Bateria
Ocioso (sem WLAN, min brilho)
32h 43min
WiFi Websurfing
13h 31min
Big Buck Bunny H.264 1080p
14h 45min
Carga (máximo brilho)
3h 41min
Samsung Galaxy Tab S7
8000 mAh
Apple iPad Pro 11 2020
7538 mAh
Huawei MatePad Pro 10.8
7250 mAh
Samsung Galaxy Tab S7 Plus
10090 mAh
Battery Runtime
2%
4%
-18%
Reader / Idle
1963
2001
2%
1877
-4%
898
-54%
H.264
885
936
6%
909
3%
620
-30%
WiFi v1.3
811
902
11%
891
10%
425
-48%
Load
221
197
-11%
233
5%
355
61%

Pro

+ Tela de 120 Hz rica em contraste
+ Alto nível de desempenho
+ Armazenamento veloz
+ Qualidade de construção
+ Excelentes alto-falantes
+ S Pen

Contra

- O botão liga/desliga está colocado muito fundo na carcaça
- "apenas" 6 GB de RAM
- Sem modem 5G
- PWM
- Sem certificação IP
- Carregador rápido de 45 W não incluído na caixa

Veredicto do Galaxy Tab S7: A Samsung acertou muito, mas nem em tudo

Samsung Galaxy Tab S7 review. Device provided courtesy of: notebooksbilliger.de

O Samsung Galaxy Tab S7 é um tablet Android atraente que é capaz de dar ao resto da concorrência de ponta, mas ainda um tanto econômica, uma corrida pelo seu dinheiro. Na verdade, o único concorrente real no espaço do Android é o Huawei MatePad Pro, que tem alguns pontos fracos que o Tab S7 não tem. O dispositivo da Samsung tem um sensor de digitais, um painel de 120 Hz e nenhum orifício para câmera, o que escurece a parte da tela ao redor. Além disso, o Tab S7 é compatível com o Google Play Services e o Huawei não. 

Além dos ótimos alto-falantes, armazenamento UFS rápido e o poderoso SoC da Qualcomm, também gostamos da S Pen incluída e da funcionalidade que ela oferece. A qualidade de construção está em um nível muito bom. No entanto, as superfícies mate não oferecem muita aderência. 

O Galaxy Tab S7 é um excelente tablet Android, que não foi tratado tão bem como merece. 

Em suma, o tablet premium se abre para mais críticas do que os smartphones Galaxy S20. Por exemplo, ele não possui recursos premium como certificação IP, chip NFC ou carregamento sem fio. O fato de a carcaça não incluir o carregador rápido de 45 W é difícil de entender por causa do alto preço recomendado do dispositivo. Também é difícil entender por que o Tab S7 tem apenas 6 GB de RAM quando havia uma versão de 8 GB do Tab S6 e o Note 20 Ultra inclusive vem com até 16 GB de RAM. O fato de a versão celular do Tab S7 vir apenas com um modem 4G também é um tanto intrigante.      

Download your licensed rating image as SVG / PNG

Samsung Galaxy Tab S7 - 10/15/2020 v7 (old)
Marcus Herbrich

Acabamento
88 / 98 → 89%
Teclado
72 / 80 → 89%
Mouse
94%
Conectividade
66 / 70 → 94%
Peso
83 / 40-88 → 90%
Bateria
90%
Pantalha
88%
Desempenho do jogos
63 / 78 → 80%
Desempenho da aplicação
83 / 92 → 90%
Temperatura
94%
Ruído
100%
Audio
89 / 91 → 98%
Camera
57 / 85 → 68%
Médio
82%
90%
Tablet - Médio equilibrado

Price comparison

Please share our article, every link counts!
Mail Logo
> Análises e revisões de portáteis e celulares > Análises > Análises > Breve Análise do tablet Samsung Galaxy Tab S7 - Sem dúvida, o melhor tablet Android de 11 polegadas
Marcus Herbrich, 2020-10-20 (Update: 2020-10-26)