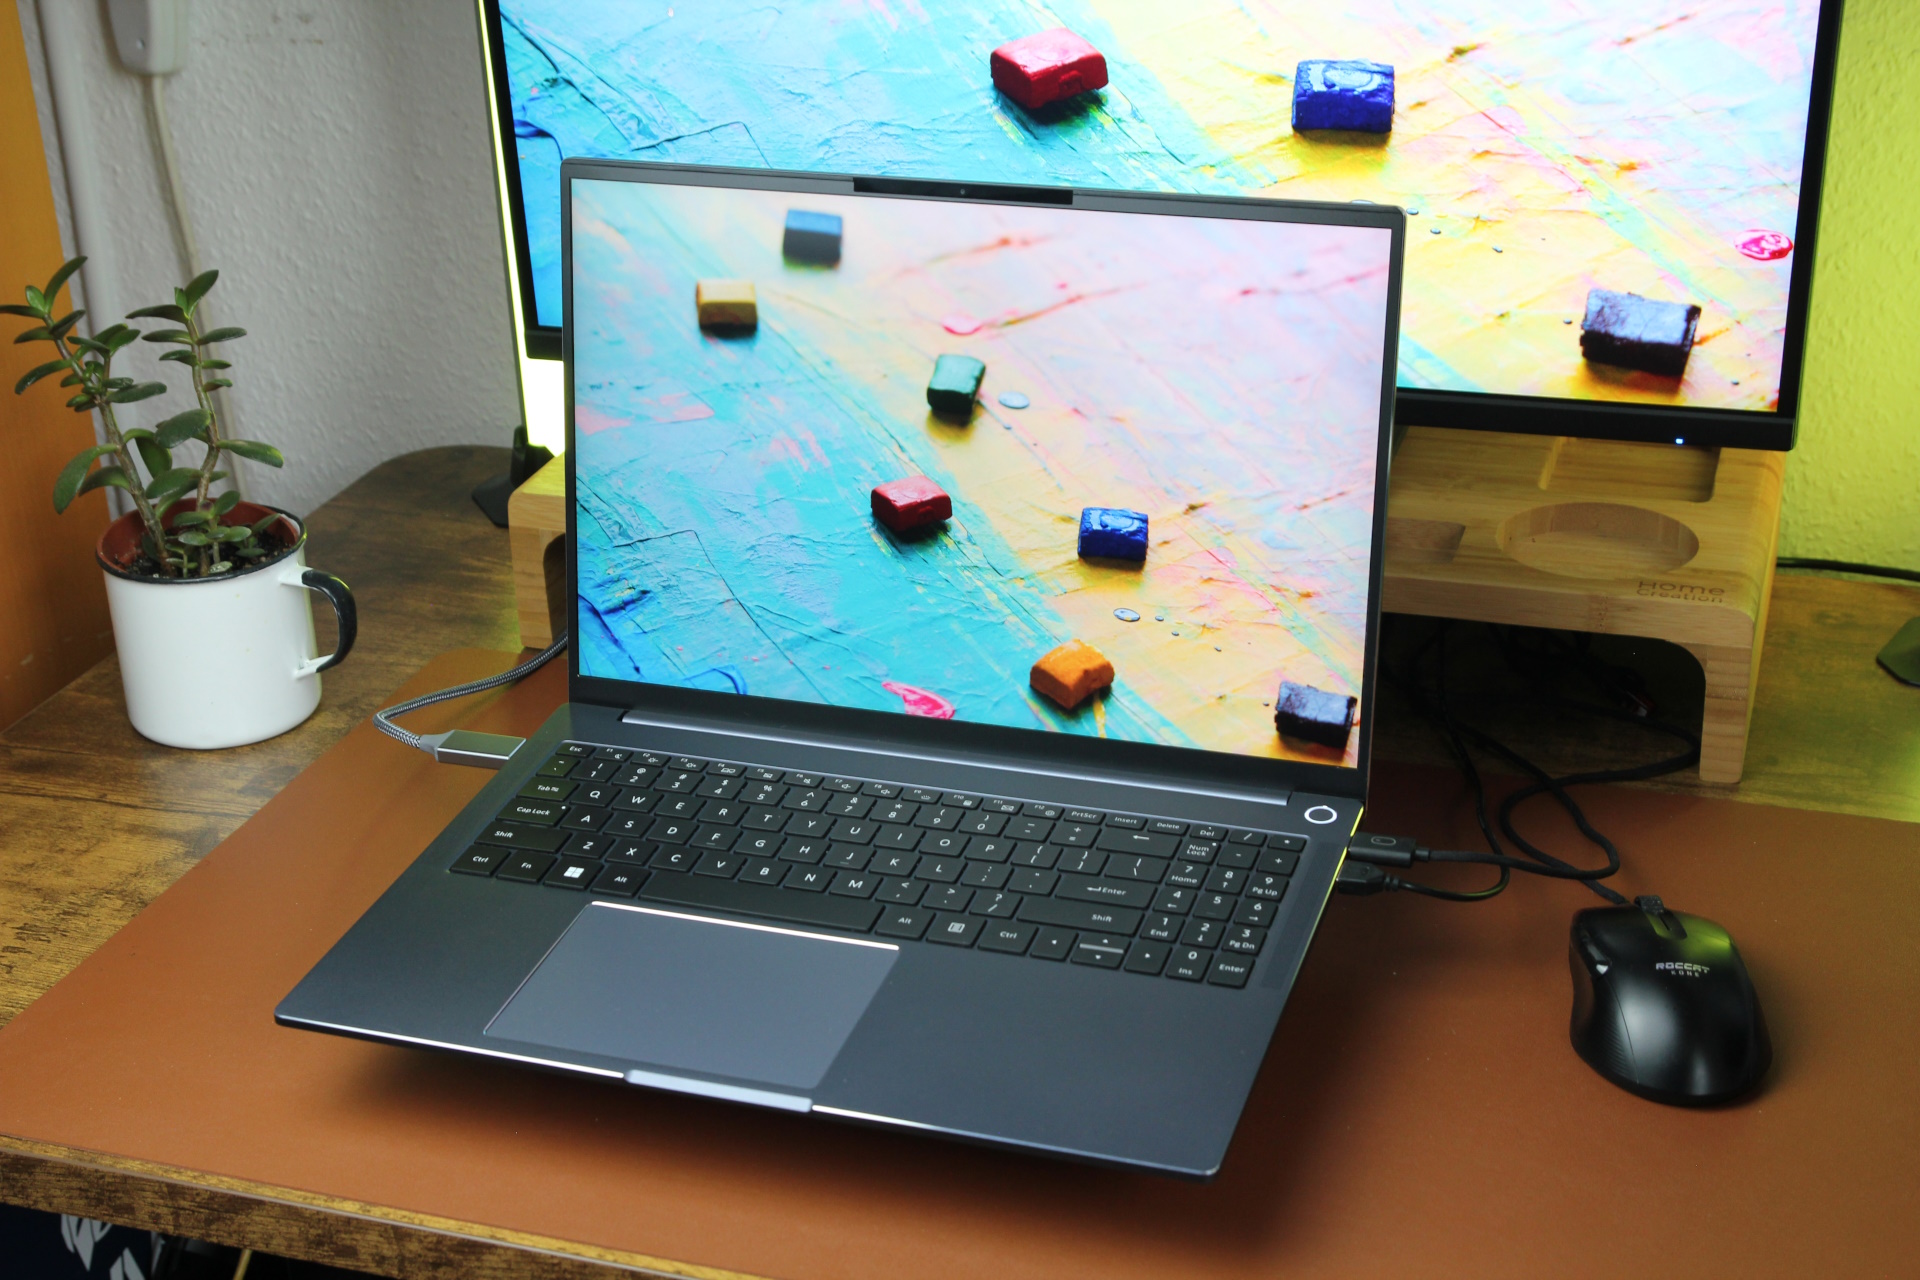
Análise do laptop Ninkear A16 Pro: Acessível, potente e silencioso durante o uso
Melhor ainda com a AMD.
O Ninkear A16 Pro é um laptop surpreendentemente bom da China, equipado com o AMD Ryzen 7 8845HS, 32 GB de RAM e um SSD de 1 TB por cerca de US$ 840. Com seus bons recursos, ele supera o desempenho de seu modelo irmão, o N16 Pro, e até mesmo se aproxima do Xiaomi RedmiBook Pro 16. Descobrimos exatamente o quão próximo durante nosso teste.Christian Hintze, 👁 Christian Hintze (traduzido por DeepL / Ninh Duy) Publicado 🇺🇸 🇩🇪 ...
Veredicto - Muito bom, quase nada ruim
Com o lançamento do A16 Pro, a Ninkear provou mais uma vez que pode oferecer uma alternativa acessível e de alta qualidade aos modelos de marcas estabelecidas. Embora não possamos dizer nada sobre seu funcionamento a longo prazo, o A16 Pro nos impressionou durante o teste com sua caixa de metal, tela bonita, desempenho bom e, acima de tudo, constante (mesmo quando funciona com bateria) e operação silenciosa por um preço relativamente baixo. Ele definitivamente está à frente de seu modelo irmão, o N16 Pro, em termos de desempenho.
Os pontos são deduzidos por sua fraca webcam de 720p, e seu clickpad muito barulhento e de aparência um tanto barata prejudica a boa experiência de usuário de seus dispositivos de entrada. Mas esses são pontos fracos que podem ser perdoados. Apesar da bateria grande, ficamos surpresos com a fraca duração da bateria do notebook, embora o fabricante tenha declarado um tempo de execução de pelo menos 10 horas. Além disso, certamente ainda há espaço para melhorias com relação à otimização do software. Suas portas USB também poderiam ser um pouco mais modernas.
Pro
Contra
Preço e disponibilidade
No momento em que este artigo foi escrito, o Ninkear A16 não estava disponível para compra nos Estados Unidos, mas se o senhor estiver na Europa, poderá comprá-lo de nosso credor Geekmaxi. Atualmente, ele custa 779 euros (aproximadamente US$ 842).
Possíveis concorrentes em comparação
Imagem | Modelo / Análises | Geizhals | Peso | Altura | Tela |
|---|---|---|---|---|---|
| Ninkear A16 Pro AMD Ryzen 7 8845HS ⎘ AMD Radeon 780M ⎘ 32 GB Memória, 1000 GB SSD | Listenpreis 799 Euro Geizhals Suche | 1.8 kg | 24 mm | 16.00" 2560x1600 189 PPI IPS | |
| Ninkear N16-Pro-32+1TB Intel Core i7-13620H ⎘ Intel UHD Graphics 64EUs (Alder Lake 12th Gen) ⎘ 32 GB Memória, 1024 GB SSD | Listenpreis 800 Euro Geizhals Suche | 1.8 kg | 22 mm | 16.00" 2560x1600 189 PPI IPS | |
| Xiaomi RedmiBook Pro 16 2024 Intel Core Ultra 7 155H ⎘ Intel Arc 8-Core iGPU ⎘ 32 GB Memória, 1024 GB SSD | Listenpreis 957€ | 1.9 kg | 15.9 mm | 16.00" 3072x1920 226 PPI IPS | |
| Acer Aspire 16 A16-51GM-77G2 Intel Core 7 150U ⎘ NVIDIA GeForce RTX 2050 Mobile ⎘ 16 GB Memória, 1024 GB SSD | 1.9 kg | 21 mm | 16.00" 1920x1200 142 PPI IPS | ||
| Lenovo IdeaPad Slim 5 16IRU9 Intel Core 7 150U ⎘ Intel Iris Xe Graphics G7 96EUs ⎘ 16 GB Memória | Listenpreis 800 USD Geizhals Suche | 1.8 kg | 16.9 mm | 16.00" 1920x1200 142 PPI IPS | |
| Medion S10 OLED Intel Core Ultra 7 155H ⎘ Intel Arc 8-Core iGPU ⎘ 16 GB Memória, 1024 GB SSD | 1.6 kg | 17.8 mm | 16.00" 3840x2400 283 PPI OLED |
Os Top 10
» Os Top 10 Portáteis Multimídia
» Os Top 10 Portáteis de Jogos
» Os Top 10 Portáteis Leves para Jogos
» Os Top 10 Portáteis Acessíveis de Escritório/Empresariais
» Os Top 10 Portáteis Premium de Escritório/Empresariais
» Os Top 10 dos Portáteis Workstation
» Os Top 10 Subportáteis
» Os Top 10 Ultrabooks
» Os Top 10 Conversíveis
» Os Top 10 Tablets
» Os Top 10 Smartphones
» A melhores Telas de Portáteis Analisadas Pela Notebookcheck
» Top 10 dos portáteis abaixo dos 500 Euros da Notebookcheck
» Top 10 dos Portáteis abaixo dos 300 Euros
Índice
- Veredicto - Muito bom, quase nada ruim
- Especificações
- Case e conectividade - Muitas incógnitas no A16 Pro
- Dispositivos de entrada - Bom teclado, teclas do touchpad com ruído
- Tela - Ninkear com 1.600p, 400 nits e 120 Hz
- Desempenho - O A16 Pro com AMD Hawk Point
- Emissões e potência - O silencioso e frio Ninkear
- Classificação total do Notebookcheck
Nos últimos tempos, os laptops da Ninkear nos surpreenderam. O A15 Plus e o N16 Pro do Extremo Oriente se saíram muito bem em nossos testes, então agora é hora de testar o A16 Pro. Os destaques são a caixa de metal e, acima de tudo, a tela de 16 polegadas com resolução de 2.560 x 1.600 pixels. Ao contrário do N16 Pro com uma CPU Intel, esse modelo é alimentado por um processador AMD Hawk Point e uma GPU Radeon integrada. Ele custa pouco mais de US$ 800. Analisamos a qualidade de sua tela multimídia e o quão completo é seu pacote de escritório.
Especificações
Case e conectividade - Muitas incógnitas no A16 Pro
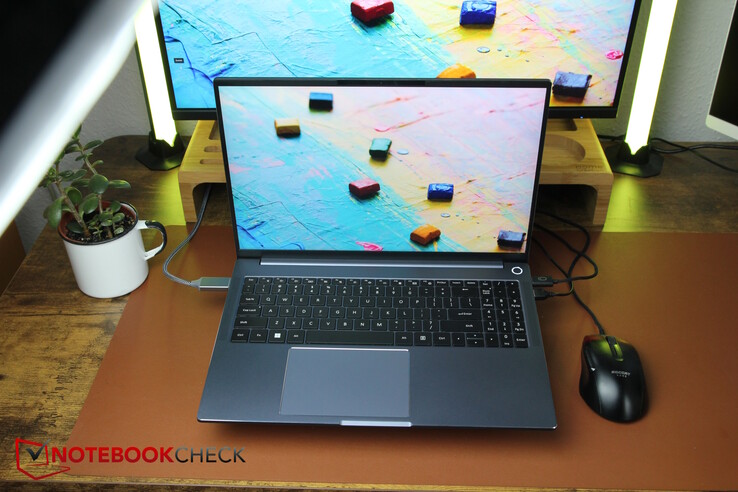
Apesar de haver algumas semelhanças, nosso A16 Pro também parece bem diferente do N16 Pro por fora. A Ninkear optou por ainda mais metal e menos plástico em seu A16 Pro. Como tudo é azul metálico, o A16 Pro parece ter sido fundido a partir de um único molde. Infelizmente, a tampa da tela estala e racha consideravelmente quando é torcida. A base, por outro lado, é muito estável.
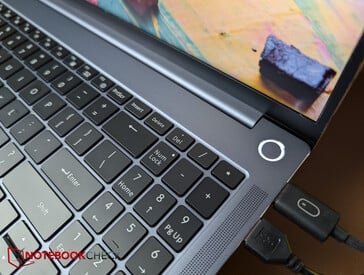
No geral, seu design é excelente, com "Ninkear" em letras pretas em um dos cantos superiores da tampa. Fora isso, o laptop brilha com a elegância e a simplicidade do azul. A tela pode ser aberta em 180 graus, mas a dobradiça, infelizmente, não é suficientemente firme. As saídas de ar estão ocultas atrás da longa dobradiça e um sensor de impressão digital está integrado ao botão liga/desliga.
Os acessórios são dignos de elogios: Além dos adesivos de teclado em diferentes idiomas, os usuários também recebem um mouse USB e um mouse pad.
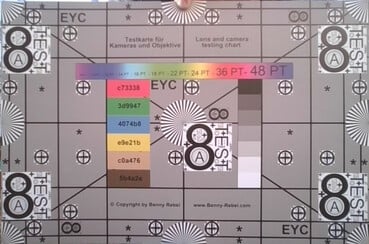
Infelizmente, a webcam tem uma resolução de apenas 720p e sofre com altos desvios de cor e baixa nitidez. Ele suporta apenas Wi-Fi 6 sem o sufixo E, portanto, a rede rápida de 6 GHz está ausente, e suas taxas de transferência na rede de 5 GHz são bastante medianas.
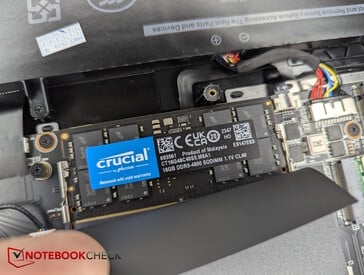
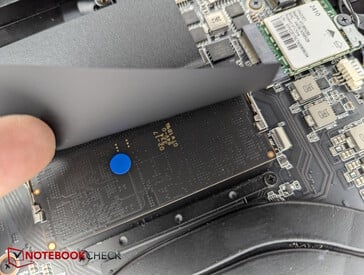
Para abrir o dispositivo, o senhor só precisa remover 13 parafusos Phillips. Parece que não há quase nenhum grampo na placa de base, portanto ela se solta imediatamente. No interior, é possível acessar todos os componentes importantes, como SSD, RAM, bateria, módulo Wi-Fi e sistema de resfriamento. Há um segundo slot M.2 para SSDs.
Conectividade
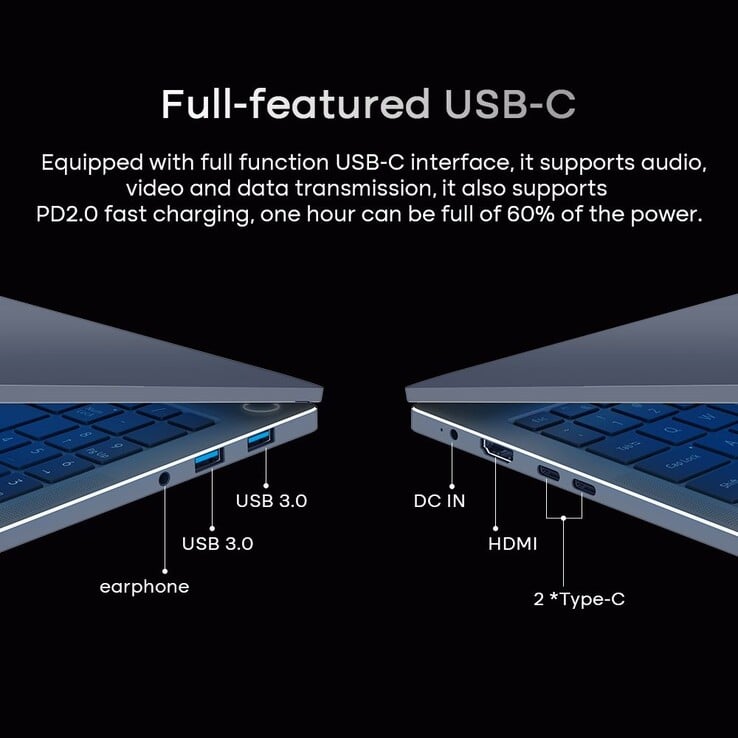
Infelizmente, o laptop não é compatível com Thunderbolt e o fabricante não parece querer dar mais detalhes sobre as duas portas USB-C - ou o que exatamente significa USB-C completo?
| Networking | |
| iperf3 transmit AXE11000 | |
| Ninkear N16-Pro-32+1TB | |
| Medion S10 OLED | |
| Média da turma Office (47.8 - 1793, n=87, últimos 2 anos) | |
| Acer Aspire 16 A16-51GM-77G2 | |
| Lenovo IdeaPad Slim 5 16IRU9 | |
| Ninkear A16 Pro | |
| Média Realtek RTL8852BE (536 - 926, n=52) | |
| Xiaomi RedmiBook Pro 16 2024 | |
| iperf3 receive AXE11000 | |
| Ninkear N16-Pro-32+1TB | |
| Medion S10 OLED | |
| Média da turma Office (104.2 - 1775, n=87, últimos 2 anos) | |
| Xiaomi RedmiBook Pro 16 2024 | |
| Ninkear A16 Pro | |
| Acer Aspire 16 A16-51GM-77G2 | |
| Média Realtek RTL8852BE (455 - 985, n=53) | |
| Lenovo IdeaPad Slim 5 16IRU9 | |
| iperf3 transmit AXE11000 6GHz | |
| Acer Aspire 16 A16-51GM-77G2 | |
| Média da turma Office (385 - 1961, n=51, últimos 2 anos) | |
| iperf3 receive AXE11000 6GHz | |
| Média da turma Office (1065 - 1790, n=51, últimos 2 anos) | |
| Acer Aspire 16 A16-51GM-77G2 | |
Sustentabilidade
O laptop é entregue em duas caixas de papelão, uma dentro da outra. No entanto, por dentro, a embalagem e os materiais de proteção consistem em muito plástico. O fabricante não forneceu nenhuma informação sobre as emissõesde CO2 durante a produção.
Dispositivos de entrada - Bom teclado, teclas do touchpad com ruído
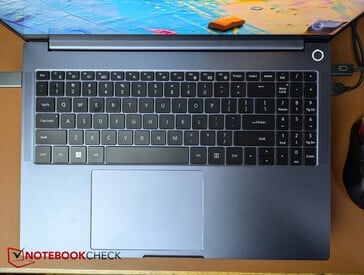
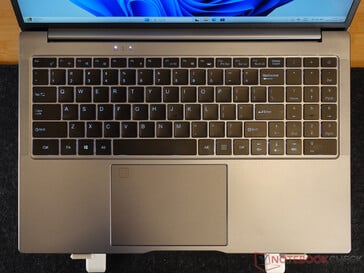
O layout do teclado é muito organizado e diferente do N16 Pro. No lado direito, um teclado numérico com teclas pequenas está espremido ao lado de outras teclas bem grandes. Infelizmente, as teclas de seta verticais têm a altura reduzida pela metade. O laptop vem com um layout de teclado americano como padrão; no entanto, os falantes de outros idiomas não precisam se preocupar, pois o fabricante inclui adesivos de identificação para vários outros idiomas.
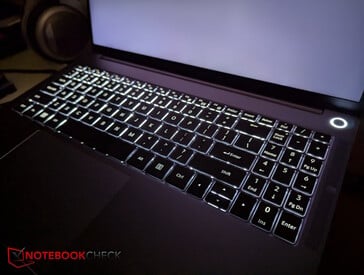
É surpreendentemente bom digitar no teclado - embora seu curso seja baixo, o feedback que ele fornece é perceptível e os ruídos de clique são bastante silenciosos, sendo que apenas a barra de espaço é visivelmente mais alta. Uma luz de fundo branca de dois níveis oferece suporte no escuro.
O touchpad muito grande (aprox. 12,8 x 9 cm) é fácil de deslizar o dedo sobre ele e executar gestos. Apenas os botões integrados do mouse parecem um pouco baratos com seus cliques altos e, portanto, são menos agradáveis de usar, embora o feedback seja bom e acionado de forma confiável.
Tela - Ninkear com 1.600p, 400 nits e 120 Hz
Quando se trata da tela IPS fosca instalada, até mesmo o Hwinfo tem que passar ("unknown") - uma pesquisa através da ID do hardware (CSO1623) indica que é um painel Lenovo, mas isso também não produziu nenhum resultado definitivo. Ele tem uma resolução de 2.560 x 1.600 pixels e deve cobrir totalmente o sRGB, ter um alto contraste e funcionar a 120 Hz.
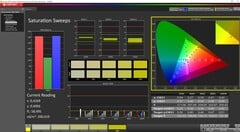
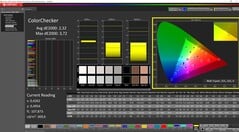
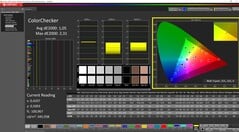
Medimos um brilho médio de pouco menos de 400 nits, e sua iluminação é de 91%. Seu nível de preto é muito alto nas configurações de fábrica e, como resultado, o contraste é prejudicado. Quando calibrada, o nível de preto da tela diminui e o contraste aumenta para mais de 1.200:1.
| |||||||||||||||||||||||||
iluminação: 91 %
iluminação com acumulador: 393.5 cd/m²
Contraste: 895:1 (Preto: 0.44 cd/m²)
ΔE Color 2.32 | 0.5-29.43 Ø4.87, calibrated: 1.05
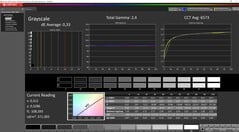
ΔE Greyscale 2.69 | 0.5-98 Ø5.1
71.1% AdobeRGB 1998 (Argyll 2.2.0 3D)
97.6% sRGB (Argyll 2.2.0 3D)
68.7% Display P3 (Argyll 2.2.0 3D)
Gamma: 2.38
| Ninkear A16 Pro cso1623, IPS, 2560x1600, 16", 120 Hz | Ninkear N16-Pro-32+1TB BOE0A40 (NE160QDM-NY1), IPS, 2560x1600, 16", 165 Hz | Xiaomi RedmiBook Pro 16 2024 TL160MDMP03_0, IPS, 3072x1920, 16", 165 Hz | Acer Aspire 16 A16-51GM-77G2 N160JCA-EEK (Chi Mei CMN163D), IPS, 1920x1200, 16", 60 Hz | Lenovo IdeaPad Slim 5 16IRU9 LEN160WUXGA, IPS, 1920x1200, 16", 60 Hz | Medion S10 OLED Samsung SDC4174, OLED, 3840x2400, 16", 60 Hz | |
|---|---|---|---|---|---|---|
| Display | 2% | 24% | -37% | -39% | 29% | |
| Display P3 Coverage | 68.7 | 70.2 2% | 98.8 44% | 42.3 -38% | 41.5 -40% | 99.9 45% |
| sRGB Coverage | 97.6 | 99.5 2% | 100 2% | 63.6 -35% | 61.2 -37% | 100 2% |
| AdobeRGB 1998 Coverage | 71.1 | 72.5 2% | 89.9 26% | 43.7 -39% | 42.9 -40% | 98.6 39% |
| Response Times | 18% | -85% | -94% | -31% | 89% | |
| Response Time Grey 50% / Grey 80% * | 16.4 ? | 14 ? 15% | 39.2 ? -139% | 31.4 ? -91% | 20.7 ? -26% | 1.7 ? 90% |
| Response Time Black / White * | 11.2 ? | 9 ? 20% | 14.6 ? -30% | 22 ? -96% | 15.1 ? -35% | 1.4 ? 87% |
| PWM Frequency | 60 ? | |||||
| Screen | 23% | -1% | -67% | -114% | 371% | |
| Brightness middle | 393.6 | 397 1% | 520 32% | 352 -11% | 313.3 -20% | 307 -22% |
| Brightness | 398 | 396 -1% | 510 28% | 324 -19% | 308 -23% | 307 -23% |
| Brightness Distribution | 91 | 89 -2% | 93 2% | 86 -5% | 91 0% | 96 5% |
| Black Level * | 0.44 | 0.35 20% | 0.35 20% | 0.27 39% | 0.37 16% | 0.01 98% |
| Contrast | 895 | 1134 27% | 1486 66% | 1304 46% | 847 -5% | 30700 3330% |
| Colorchecker dE 2000 * | 2.32 | 1.15 50% | 2.9 -25% | 4.41 -90% | 8.42 -263% | 2.1 9% |
| Colorchecker dE 2000 max. * | 3.72 | 2.08 44% | 6.2 -67% | 15.04 -304% | 19.09 -413% | 4.87 -31% |
| Colorchecker dE 2000 calibrated * | 1.05 | 0.81 23% | 1.1 -5% | 3.52 -235% | 2.16 -106% | 2.08 -98% |
| Greyscale dE 2000 * | 2.69 | 1.4 48% | 4.3 -60% | 3.32 -23% | 8.3 -209% | 0.9 67% |
| Gamma | 2.38 92% | 2.142 103% | 2.19 100% | 2.44 90% | 2.83 78% | 2.197 100% |
| CCT | 6086 107% | 7422 88% | 7122 91% | 6296 103% | 6513 100% | |
| Média Total (Programa/Configurações) | 14% /
18% | -21% /
-8% | -66% /
-64% | -61% /
-86% | 163% /
257% |
* ... menor é melhor
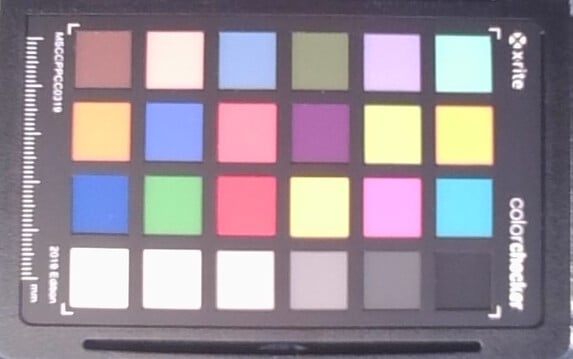
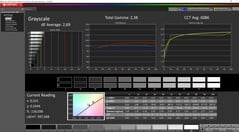
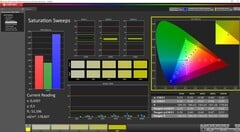
Logo que sai da caixa, os desvios de cor do painel e, acima de tudo, seu nível de preto são muito altos. A calibração manual usando nosso colorímetro Xrite e o software Calman é uma excelente maneira de reduzir os valores DeltaE, e o nível de preto também cai. Nosso perfil icc pode ser baixado gratuitamente acima. Infelizmente, o painel mais do que decente cobre apenas sRGB.
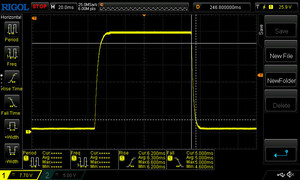
Exibir tempos de resposta
| ↔ Tempo de resposta preto para branco | ||
|---|---|---|
| 11.2 ms ... ascensão ↗ e queda ↘ combinadas | ↗ 6.2 ms ascensão | |
| ↘ 5 ms queda | ||
| A tela mostra boas taxas de resposta em nossos testes, mas pode ser muito lenta para jogadores competitivos. Em comparação, todos os dispositivos testados variam de 0.1 (mínimo) a 240 (máximo) ms. » 27 % de todos os dispositivos são melhores. Isso significa que o tempo de resposta medido é melhor que a média de todos os dispositivos testados (20.8 ms). | ||
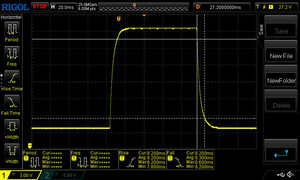
| ↔ Tempo de resposta 50% cinza a 80% cinza | ||
| 16.4 ms ... ascensão ↗ e queda ↘ combinadas | ↗ 8.2 ms ascensão | |
| ↘ 8.2 ms queda | ||
| A tela mostra boas taxas de resposta em nossos testes, mas pode ser muito lenta para jogadores competitivos. Em comparação, todos os dispositivos testados variam de 0.165 (mínimo) a 636 (máximo) ms. » 28 % de todos os dispositivos são melhores. Isso significa que o tempo de resposta medido é melhor que a média de todos os dispositivos testados (32.5 ms). | ||
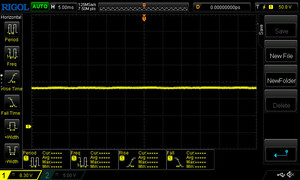
Cintilação da tela / PWM (modulação por largura de pulso)
| Tela tremeluzindo / PWM não detectado | |||
[pwm_comparison] Em comparação: 53 % de todos os dispositivos testados não usam PWM para escurecer a tela. Se PWM foi detectado, uma média de 8516 (mínimo: 5 - máximo: 343500) Hz foi medida. | |||
Desempenho - O A16 Pro com AMD Hawk Point
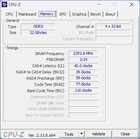
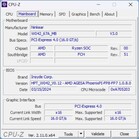
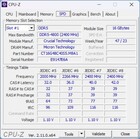
O Ninkear A16 Pro está disponível apenas em uma configuração, ou seja, com um AMD Ryzen 7 8845HS incluindo sua Radeon 780M integrada, generosos 32 GB de RAM e um SSD de 1 TB. Isso torna o laptop de 16 polegadas particularmente adequado para uso em escritório e algumas tarefas multimídia. Graças à NPU integrada, ele também pode lidar com aplicativos de IA, embora os modelos mais recentes sejam ainda mais potentes nesse aspecto.
Condições de teste
O A16 Pro não tem seus próprios perfis de desempenho predefinidos nem um aplicativo da Central de Controle. Portanto, definimos os perfis de energia do Windows como "desempenho" para nossos benchmarks de desempenho e como "economia de energia" durante os testes de bateria.
Processador
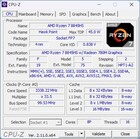
O AMD Ryzen 7 8845HS da série Hawk Point é classificado como um dos processadores de laptop mais avançados, tem 8 núcleos e pode processar 16 threads simultaneamente, com velocidades de clock que variam de 3,8 a 5,1 GHz. A NPU integrada para aplicativos locais de IA atinge até 16 TOPS, e a CPU inteira consegue até 38 TOPS.
Nosso teste de resistência Cinebench R15 confirmou que a CPU tem um desempenho muito consistente, sem nenhuma queda no desempenho. O Ryzen teve um desempenho exatamente no nível de um Intel Ultra 7 155H no Medion S10 - o mesmo processador no Xiaomi RedmiBook Pro 16 foi apenas um pouco mais rápido no início, mas isso foi igualado quando se tratou de desempenho contínuo.
Em todos os testes de CPU, o Ryzen 7 teve um desempenho ligeiramente abaixo de nossas expectativas, mas ainda assim ficou em segundo lugar em nossa comparação, atrás do RedmiBook, e até mesmo à frente do Medion e de todos os outros concorrentes.
Para nossa satisfação, o A16 Pro não perde nada de seu desempenho no modo de bateria, como demonstrou uma nova execução do Cinebench R15.
Cinebench R15 Multi continuous test
Cinebench R23: Multi Core | Single Core
Cinebench R20: CPU (Multi Core) | CPU (Single Core)
Cinebench R15: CPU Multi 64Bit | CPU Single 64Bit
Blender: v2.79 BMW27 CPU
7-Zip 18.03: 7z b 4 | 7z b 4 -mmt1
Geekbench 6.4: Multi-Core | Single-Core
Geekbench 5.5: Multi-Core | Single-Core
HWBOT x265 Benchmark v2.2: 4k Preset
LibreOffice : 20 Documents To PDF
R Benchmark 2.5: Overall mean
| CPU Performance Rating | |
| Xiaomi RedmiBook Pro 16 2024 | |
| Média AMD Ryzen 7 8845HS | |
| Ninkear A16 Pro | |
| Medion S10 OLED | |
| Ninkear N16-Pro-32+1TB | |
| Acer Aspire 16 A16-51GM-77G2 | |
| Lenovo IdeaPad Slim 5 16IRU9 | |
| Média da turma Office | |
| Cinebench R23 / Multi Core | |
| Xiaomi RedmiBook Pro 16 2024 | |
| Média AMD Ryzen 7 8845HS (14895 - 18037, n=12) | |
| Medion S10 OLED | |
| Ninkear A16 Pro | |
| Ninkear N16-Pro-32+1TB | |
| Média da turma Office (1577 - 20399, n=90, últimos 2 anos) | |
| Lenovo IdeaPad Slim 5 16IRU9 | |
| Acer Aspire 16 A16-51GM-77G2 | |
| Cinebench R23 / Single Core | |
| Acer Aspire 16 A16-51GM-77G2 | |
| Lenovo IdeaPad Slim 5 16IRU9 | |
| Ninkear N16-Pro-32+1TB | |
| Medion S10 OLED | |
| Xiaomi RedmiBook Pro 16 2024 | |
| Média AMD Ryzen 7 8845HS (1623 - 1783, n=12) | |
| Ninkear A16 Pro | |
| Média da turma Office (618 - 1995, n=90, últimos 2 anos) | |
| Cinebench R20 / CPU (Multi Core) | |
| Xiaomi RedmiBook Pro 16 2024 | |
| Média AMD Ryzen 7 8845HS (5808 - 7026, n=12) | |
| Medion S10 OLED | |
| Ninkear A16 Pro | |
| Ninkear N16-Pro-32+1TB | |
| Média da turma Office (590 - 8086, n=88, últimos 2 anos) | |
| Lenovo IdeaPad Slim 5 16IRU9 | |
| Acer Aspire 16 A16-51GM-77G2 | |
| Cinebench R20 / CPU (Single Core) | |
| Acer Aspire 16 A16-51GM-77G2 | |
| Ninkear N16-Pro-32+1TB | |
| Lenovo IdeaPad Slim 5 16IRU9 | |
| Medion S10 OLED | |
| Média AMD Ryzen 7 8845HS (673 - 698, n=12) | |
| Ninkear A16 Pro | |
| Xiaomi RedmiBook Pro 16 2024 | |
| Média da turma Office (229 - 766, n=88, últimos 2 anos) | |
| Cinebench R15 / CPU Multi 64Bit | |
| Xiaomi RedmiBook Pro 16 2024 | |
| Média AMD Ryzen 7 8845HS (2342 - 2908, n=12) | |
| Medion S10 OLED | |
| Ninkear A16 Pro | |
| Ninkear N16-Pro-32+1TB | |
| Média da turma Office (246 - 3132, n=92, últimos 2 anos) | |
| Acer Aspire 16 A16-51GM-77G2 | |
| Lenovo IdeaPad Slim 5 16IRU9 | |
| Cinebench R15 / CPU Single 64Bit | |
| Acer Aspire 16 A16-51GM-77G2 | |
| Média AMD Ryzen 7 8845HS (269 - 283, n=12) | |
| Ninkear A16 Pro | |
| Ninkear N16-Pro-32+1TB | |
| Medion S10 OLED | |
| Xiaomi RedmiBook Pro 16 2024 | |
| Lenovo IdeaPad Slim 5 16IRU9 | |
| Média da turma Office (98 - 294, n=90, últimos 2 anos) | |
| Blender / v2.79 BMW27 CPU | |
| Média da turma Office (163 - 1956, n=91, últimos 2 anos) | |
| Lenovo IdeaPad Slim 5 16IRU9 | |
| Acer Aspire 16 A16-51GM-77G2 | |
| Ninkear N16-Pro-32+1TB | |
| Ninkear A16 Pro | |
| Medion S10 OLED | |
| Média AMD Ryzen 7 8845HS (179 - 216, n=12) | |
| Xiaomi RedmiBook Pro 16 2024 | |
| 7-Zip 18.03 / 7z b 4 | |
| Xiaomi RedmiBook Pro 16 2024 | |
| Média AMD Ryzen 7 8845HS (62669 - 74664, n=12) | |
| Ninkear A16 Pro | |
| Medion S10 OLED | |
| Ninkear N16-Pro-32+1TB | |
| Média da turma Office (7532 - 76886, n=92, últimos 2 anos) | |
| Lenovo IdeaPad Slim 5 16IRU9 | |
| Acer Aspire 16 A16-51GM-77G2 | |
| 7-Zip 18.03 / 7z b 4 -mmt1 | |
| Ninkear N16-Pro-32+1TB | |
| Média AMD Ryzen 7 8845HS (5197 - 6714, n=12) | |
| Acer Aspire 16 A16-51GM-77G2 | |
| Lenovo IdeaPad Slim 5 16IRU9 | |
| Ninkear A16 Pro | |
| Medion S10 OLED | |
| Xiaomi RedmiBook Pro 16 2024 | |
| Média da turma Office (2972 - 6687, n=91, últimos 2 anos) | |
| Geekbench 6.4 / Multi-Core | |
| Xiaomi RedmiBook Pro 16 2024 | |
| Ninkear A16 Pro | |
| Média AMD Ryzen 7 8845HS (11073 - 14014, n=16) | |
| Medion S10 OLED | |
| Acer Aspire 16 A16-51GM-77G2 | |
| Lenovo IdeaPad Slim 5 16IRU9 | |
| Ninkear N16-Pro-32+1TB | |
| Média da turma Office (662 - 14767, n=85, últimos 2 anos) | |
| Geekbench 6.4 / Single-Core | |
| Acer Aspire 16 A16-51GM-77G2 | |
| Lenovo IdeaPad Slim 5 16IRU9 | |
| Média AMD Ryzen 7 8845HS (2510 - 2698, n=14) | |
| Ninkear A16 Pro | |
| Ninkear N16-Pro-32+1TB | |
| Medion S10 OLED | |
| Xiaomi RedmiBook Pro 16 2024 | |
| Média da turma Office (457 - 2871, n=84, últimos 2 anos) | |
| Geekbench 5.5 / Multi-Core | |
| Xiaomi RedmiBook Pro 16 2024 | |
| Média AMD Ryzen 7 8845HS (11256 - 12726, n=13) | |
| Ninkear A16 Pro | |
| Medion S10 OLED | |
| Ninkear N16-Pro-32+1TB | |
| Acer Aspire 16 A16-51GM-77G2 | |
| Lenovo IdeaPad Slim 5 16IRU9 | |
| Média da turma Office (1018 - 14192, n=91, últimos 2 anos) | |
| Geekbench 5.5 / Single-Core | |
| Acer Aspire 16 A16-51GM-77G2 | |
| Média AMD Ryzen 7 8845HS (1765 - 2004, n=13) | |
| Lenovo IdeaPad Slim 5 16IRU9 | |
| Ninkear N16-Pro-32+1TB | |
| Ninkear A16 Pro | |
| Xiaomi RedmiBook Pro 16 2024 | |
| Medion S10 OLED | |
| Média da turma Office (510 - 2096, n=92, últimos 2 anos) | |
| HWBOT x265 Benchmark v2.2 / 4k Preset | |
| Média AMD Ryzen 7 8845HS (18.6 - 22.7, n=12) | |
| Xiaomi RedmiBook Pro 16 2024 | |
| Ninkear A16 Pro | |
| Medion S10 OLED | |
| Ninkear N16-Pro-32+1TB | |
| Média da turma Office (1.72 - 22.4, n=89, últimos 2 anos) | |
| Lenovo IdeaPad Slim 5 16IRU9 | |
| Acer Aspire 16 A16-51GM-77G2 | |
| LibreOffice / 20 Documents To PDF | |
| Média da turma Office (31.3 - 129.6, n=89, últimos 2 anos) | |
| Ninkear A16 Pro | |
| Média AMD Ryzen 7 8845HS (44.4 - 77, n=12) | |
| Medion S10 OLED | |
| Xiaomi RedmiBook Pro 16 2024 | |
| Ninkear N16-Pro-32+1TB | |
| Lenovo IdeaPad Slim 5 16IRU9 | |
| Acer Aspire 16 A16-51GM-77G2 | |
| R Benchmark 2.5 / Overall mean | |
| Média da turma Office (0.4098 - 1.135, n=88, últimos 2 anos) | |
| Ninkear A16 Pro | |
| Xiaomi RedmiBook Pro 16 2024 | |
| Medion S10 OLED | |
| Média AMD Ryzen 7 8845HS (0.4304 - 0.4935, n=12) | |
| Ninkear N16-Pro-32+1TB | |
| Lenovo IdeaPad Slim 5 16IRU9 | |
| Acer Aspire 16 A16-51GM-77G2 | |
* ... menor é melhor
AIDA64: FP32 Ray-Trace | FPU Julia | CPU SHA3 | CPU Queen | FPU SinJulia | FPU Mandel | CPU AES | CPU ZLib | FP64 Ray-Trace | CPU PhotoWorxx
| Performance Rating | |
| Média AMD Ryzen 7 8845HS | |
| Ninkear A16 Pro | |
| Xiaomi RedmiBook Pro 16 2024 | |
| Medion S10 OLED | |
| Ninkear N16-Pro-32+1TB | |
| Média da turma Office | |
| Lenovo IdeaPad Slim 5 16IRU9 | |
| Acer Aspire 16 A16-51GM-77G2 | |
| AIDA64 / FP32 Ray-Trace | |
| Média AMD Ryzen 7 8845HS (23708 - 29544, n=12) | |
| Ninkear A16 Pro | |
| Medion S10 OLED | |
| Xiaomi RedmiBook Pro 16 2024 | |
| Ninkear N16-Pro-32+1TB | |
| Média da turma Office (763 - 31245, n=90, últimos 2 anos) | |
| Lenovo IdeaPad Slim 5 16IRU9 | |
| Acer Aspire 16 A16-51GM-77G2 | |
| AIDA64 / FPU Julia | |
| Média AMD Ryzen 7 8845HS (99659 - 125873, n=12) | |
| Ninkear A16 Pro | |
| Xiaomi RedmiBook Pro 16 2024 | |
| Medion S10 OLED | |
| Ninkear N16-Pro-32+1TB | |
| Média da turma Office (4113 - 125394, n=90, últimos 2 anos) | |
| Lenovo IdeaPad Slim 5 16IRU9 | |
| Acer Aspire 16 A16-51GM-77G2 | |
| AIDA64 / CPU SHA3 | |
| Média AMD Ryzen 7 8845HS (4332 - 5180, n=12) | |
| Ninkear A16 Pro | |
| Xiaomi RedmiBook Pro 16 2024 | |
| Medion S10 OLED | |
| Média da turma Office (287 - 5398, n=90, últimos 2 anos) | |
| Ninkear N16-Pro-32+1TB | |
| Lenovo IdeaPad Slim 5 16IRU9 | |
| Acer Aspire 16 A16-51GM-77G2 | |
| AIDA64 / CPU Queen | |
| Média AMD Ryzen 7 8845HS (109458 - 124695, n=12) | |
| Ninkear A16 Pro | |
| Xiaomi RedmiBook Pro 16 2024 | |
| Medion S10 OLED | |
| Média da turma Office (8185 - 115197, n=90, últimos 2 anos) | |
| Acer Aspire 16 A16-51GM-77G2 | |
| Lenovo IdeaPad Slim 5 16IRU9 | |
| Ninkear N16-Pro-32+1TB | |
| AIDA64 / FPU SinJulia | |
| Média AMD Ryzen 7 8845HS (14062 - 15519, n=12) | |
| Ninkear A16 Pro | |
| Xiaomi RedmiBook Pro 16 2024 | |
| Medion S10 OLED | |
| Média da turma Office (404 - 18321, n=90, últimos 2 anos) | |
| Ninkear N16-Pro-32+1TB | |
| Acer Aspire 16 A16-51GM-77G2 | |
| Lenovo IdeaPad Slim 5 16IRU9 | |
| AIDA64 / FPU Mandel | |
| Média AMD Ryzen 7 8845HS (53436 - 67367, n=12) | |
| Ninkear A16 Pro | |
| Medion S10 OLED | |
| Xiaomi RedmiBook Pro 16 2024 | |
| Média da turma Office (2075 - 66922, n=90, últimos 2 anos) | |
| Ninkear N16-Pro-32+1TB | |
| Lenovo IdeaPad Slim 5 16IRU9 | |
| Acer Aspire 16 A16-51GM-77G2 | |
| AIDA64 / CPU AES | |
| Ninkear A16 Pro | |
| Média AMD Ryzen 7 8845HS (64515 - 172642, n=12) | |
| Ninkear N16-Pro-32+1TB | |
| Xiaomi RedmiBook Pro 16 2024 | |
| Medion S10 OLED | |
| Média da turma Office (7254 - 155900, n=90, últimos 2 anos) | |
| Lenovo IdeaPad Slim 5 16IRU9 | |
| Acer Aspire 16 A16-51GM-77G2 | |
| AIDA64 / CPU ZLib | |
| Xiaomi RedmiBook Pro 16 2024 | |
| Medion S10 OLED | |
| Média AMD Ryzen 7 8845HS (627 - 1080, n=12) | |
| Ninkear A16 Pro | |
| Ninkear N16-Pro-32+1TB | |
| Média da turma Office (78 - 1366, n=90, últimos 2 anos) | |
| Lenovo IdeaPad Slim 5 16IRU9 | |
| Acer Aspire 16 A16-51GM-77G2 | |
| AIDA64 / FP64 Ray-Trace | |
| Média AMD Ryzen 7 8845HS (12361 - 15911, n=12) | |
| Ninkear A16 Pro | |
| Medion S10 OLED | |
| Xiaomi RedmiBook Pro 16 2024 | |
| Ninkear N16-Pro-32+1TB | |
| Média da turma Office (432 - 17834, n=90, últimos 2 anos) | |
| Acer Aspire 16 A16-51GM-77G2 | |
| Lenovo IdeaPad Slim 5 16IRU9 | |
| AIDA64 / CPU PhotoWorxx | |
| Xiaomi RedmiBook Pro 16 2024 | |
| Média AMD Ryzen 7 8845HS (33192 - 41668, n=12) | |
| Medion S10 OLED | |
| Lenovo IdeaPad Slim 5 16IRU9 | |
| Ninkear A16 Pro | |
| Acer Aspire 16 A16-51GM-77G2 | |
| Média da turma Office (4814 - 54971, n=90, últimos 2 anos) | |
| Ninkear N16-Pro-32+1TB | |
Desempenho do sistema
CrossMark: Overall | Productivity | Creativity | Responsiveness
WebXPRT 3: Overall
WebXPRT 4: Overall
Mozilla Kraken 1.1: Total
| PCMark 10 / Score | |
| Ninkear A16 Pro | |
| Média AMD Ryzen 7 8845HS, AMD Radeon 780M (7120 - 7641, n=7) | |
| Xiaomi RedmiBook Pro 16 2024 | |
| Acer Aspire 16 A16-51GM-77G2 | |
| Medion S10 OLED | |
| Lenovo IdeaPad Slim 5 16IRU9 | |
| Média da turma Office (2463 - 7578, n=82, últimos 2 anos) | |
| Ninkear N16-Pro-32+1TB | |
| PCMark 10 / Essentials | |
| Lenovo IdeaPad Slim 5 16IRU9 | |
| Acer Aspire 16 A16-51GM-77G2 | |
| Ninkear A16 Pro | |
| Média AMD Ryzen 7 8845HS, AMD Radeon 780M (10685 - 11570, n=7) | |
| Xiaomi RedmiBook Pro 16 2024 | |
| Média da turma Office (5575 - 20841, n=82, últimos 2 anos) | |
| Ninkear N16-Pro-32+1TB | |
| Medion S10 OLED | |
| PCMark 10 / Productivity | |
| Ninkear A16 Pro | |
| Média AMD Ryzen 7 8845HS, AMD Radeon 780M (9787 - 10482, n=7) | |
| Acer Aspire 16 A16-51GM-77G2 | |
| Xiaomi RedmiBook Pro 16 2024 | |
| Lenovo IdeaPad Slim 5 16IRU9 | |
| Medion S10 OLED | |
| Média da turma Office (3041 - 10415, n=82, últimos 2 anos) | |
| Ninkear N16-Pro-32+1TB | |
| PCMark 10 / Digital Content Creation | |
| Xiaomi RedmiBook Pro 16 2024 | |
| Média AMD Ryzen 7 8845HS, AMD Radeon 780M (9009 - 10009, n=7) | |
| Ninkear A16 Pro | |
| Medion S10 OLED | |
| Acer Aspire 16 A16-51GM-77G2 | |
| Média da turma Office (2049 - 11108, n=82, últimos 2 anos) | |
| Lenovo IdeaPad Slim 5 16IRU9 | |
| Ninkear N16-Pro-32+1TB | |
| CrossMark / Overall | |
| Acer Aspire 16 A16-51GM-77G2 | |
| Média AMD Ryzen 7 8845HS, AMD Radeon 780M (1633 - 1939, n=7) | |
| Xiaomi RedmiBook Pro 16 2024 | |
| Medion S10 OLED | |
| Lenovo IdeaPad Slim 5 16IRU9 | |
| Ninkear A16 Pro | |
| Ninkear N16-Pro-32+1TB | |
| Média da turma Office (348 - 1891, n=84, últimos 2 anos) | |
| CrossMark / Productivity | |
| Acer Aspire 16 A16-51GM-77G2 | |
| Média AMD Ryzen 7 8845HS, AMD Radeon 780M (1562 - 1872, n=7) | |
| Xiaomi RedmiBook Pro 16 2024 | |
| Medion S10 OLED | |
| Lenovo IdeaPad Slim 5 16IRU9 | |
| Ninkear A16 Pro | |
| Ninkear N16-Pro-32+1TB | |
| Média da turma Office (393 - 1870, n=84, últimos 2 anos) | |
| CrossMark / Creativity | |
| Xiaomi RedmiBook Pro 16 2024 | |
| Média AMD Ryzen 7 8845HS, AMD Radeon 780M (1734 - 2040, n=7) | |
| Ninkear A16 Pro | |
| Acer Aspire 16 A16-51GM-77G2 | |
| Medion S10 OLED | |
| Lenovo IdeaPad Slim 5 16IRU9 | |
| Ninkear N16-Pro-32+1TB | |
| Média da turma Office (340 - 2155, n=84, últimos 2 anos) | |
| CrossMark / Responsiveness | |
| Acer Aspire 16 A16-51GM-77G2 | |
| Média AMD Ryzen 7 8845HS, AMD Radeon 780M (1437 - 1849, n=7) | |
| Xiaomi RedmiBook Pro 16 2024 | |
| Medion S10 OLED | |
| Lenovo IdeaPad Slim 5 16IRU9 | |
| Ninkear A16 Pro | |
| Ninkear N16-Pro-32+1TB | |
| Média da turma Office (258 - 2017, n=84, últimos 2 anos) | |
| WebXPRT 3 / Overall | |
| Lenovo IdeaPad Slim 5 16IRU9 | |
| Média AMD Ryzen 7 8845HS, AMD Radeon 780M (295 - 334, n=7) | |
| Acer Aspire 16 A16-51GM-77G2 | |
| Ninkear A16 Pro | |
| Xiaomi RedmiBook Pro 16 2024 | |
| Ninkear N16-Pro-32+1TB | |
| Média da turma Office (121 - 455, n=84, últimos 2 anos) | |
| Medion S10 OLED | |
| WebXPRT 4 / Overall | |
| Acer Aspire 16 A16-51GM-77G2 | |
| Lenovo IdeaPad Slim 5 16IRU9 | |
| Média AMD Ryzen 7 8845HS, AMD Radeon 780M (245 - 314, n=7) | |
| Ninkear A16 Pro | |
| Xiaomi RedmiBook Pro 16 2024 | |
| Medion S10 OLED | |
| Média da turma Office (80 - 328, n=84, últimos 2 anos) | |
| Mozilla Kraken 1.1 / Total | |
| Média da turma Office (399 - 1966, n=92, últimos 2 anos) | |
| Medion S10 OLED | |
| Medion S10 OLED | |
| Média AMD Ryzen 7 8845HS, AMD Radeon 780M (501 - 664, n=7) | |
| Ninkear N16-Pro-32+1TB | |
| Ninkear A16 Pro | |
| Xiaomi RedmiBook Pro 16 2024 | |
| Lenovo IdeaPad Slim 5 16IRU9 | |
| Acer Aspire 16 A16-51GM-77G2 | |
* ... menor é melhor
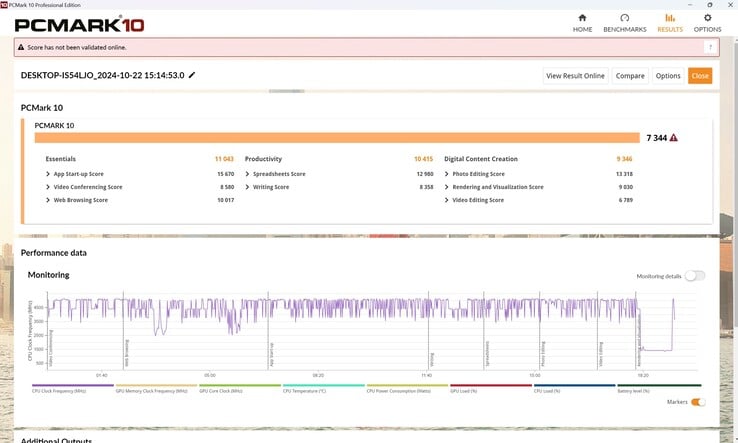
| PCMark 10 Score | 7344 pontos | |
Ajuda | ||
| AIDA64 / Memory Copy | |
| Xiaomi RedmiBook Pro 16 2024 | |
| Média AMD Ryzen 7 8845HS (61459 - 71873, n=12) | |
| Medion S10 OLED | |
| Ninkear A16 Pro | |
| Lenovo IdeaPad Slim 5 16IRU9 | |
| Acer Aspire 16 A16-51GM-77G2 | |
| Média da turma Office (7158 - 108783, n=91, últimos 2 anos) | |
| Ninkear N16-Pro-32+1TB | |
| AIDA64 / Memory Read | |
| Xiaomi RedmiBook Pro 16 2024 | |
| Medion S10 OLED | |
| Ninkear A16 Pro | |
| Acer Aspire 16 A16-51GM-77G2 | |
| Média AMD Ryzen 7 8845HS (49866 - 61976, n=12) | |
| Média da turma Office (7325 - 127282, n=91, últimos 2 anos) | |
| Lenovo IdeaPad Slim 5 16IRU9 | |
| Ninkear N16-Pro-32+1TB | |
| AIDA64 / Memory Write | |
| Média AMD Ryzen 7 8845HS (68425 - 93239, n=12) | |
| Lenovo IdeaPad Slim 5 16IRU9 | |
| Xiaomi RedmiBook Pro 16 2024 | |
| Ninkear A16 Pro | |
| Medion S10 OLED | |
| Acer Aspire 16 A16-51GM-77G2 | |
| Média da turma Office (7579 - 117935, n=91, últimos 2 anos) | |
| Ninkear N16-Pro-32+1TB | |
| AIDA64 / Memory Latency | |
| Medion S10 OLED | |
| Xiaomi RedmiBook Pro 16 2024 | |
| Ninkear A16 Pro | |
| Lenovo IdeaPad Slim 5 16IRU9 | |
| Média AMD Ryzen 7 8845HS (82.5 - 117, n=12) | |
| Média da turma Office (7.6 - 185.2, n=89, últimos 2 anos) | |
| Acer Aspire 16 A16-51GM-77G2 | |
| Ninkear N16-Pro-32+1TB | |
* ... menor é melhor
Latência DPC
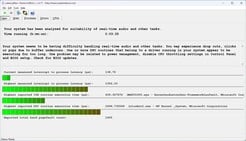
Ocorreram pequenos problemas assim que movemos o ponteiro do mouse após iniciar o LatencyMon. Esses problemas aumentaram minimamente ao abrir o navegador; a abertura de várias guias não teve mais nenhuma influência sobre o valor. A reprodução do nosso vídeo do YouTube em 4K/60 fps foi bem-sucedida sem nenhuma queda de quadros, mesmo que o valor da latência tenha aumentado um pouco novamente no teste Prime95 de 10 segundos. No geral, porém, o valor de latência não foi muito alto e foi até mesmo o segundo mais baixo na comparação.
| DPC Latencies / LatencyMon - interrupt to process latency (max), Web, Youtube, Prime95 | |
| Medion S10 OLED | |
| Acer Aspire 16 A16-51GM-77G2 | |
| Lenovo IdeaPad Slim 5 16IRU9 | |
| Ninkear N16-Pro-32+1TB | |
| Ninkear A16 Pro | |
| Xiaomi RedmiBook Pro 16 2024 | |
* ... menor é melhor
Dispositivo de armazenamento
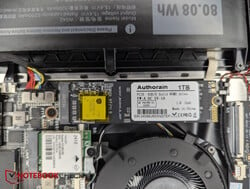
A HWinfo também encontrou o SSD - nossa olhada no interior do laptop revelou o nome da marca "Authorain" com capacidade de 1 TB. Uma pesquisa no Google também não encontrou nada sobre isso, mas, como sabemos, não é mais o que era antes. A placa de identificação diz algo em torno de 6 GB/s, mas medimos cerca de 2 GB/s. Os modelos da concorrência eram mais rápidos, mas o senhor não perceberá muito isso na prática.
Ele manteve seu desempenho por muito tempo sob estresse constante, mas depois teve dificuldades com pequenas quedas durante o último terço do teste.
| Drive Performance Rating - Percent | |
| Acer Aspire 16 A16-51GM-77G2 | |
| Medion S10 OLED | |
| Média da turma Office | |
| Xiaomi RedmiBook Pro 16 2024 | |
| Lenovo IdeaPad Slim 5 16IRU9 | |
| Ninkear N16-Pro-32+1TB | |
| Ninkear A16 Pro | |
| Média Authorain NV900-1T | |
* ... menor é melhor
Reading continuous performance: DiskSpd Read Loop, Queue Depth 8
Placa de vídeo
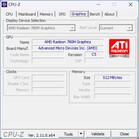
A Radeon 780M integrada à CPU pode ser usada para aplicativos 3D. O senhor não vai jogar nenhum jogo atual e exigente com ela, mas ela deve ser suficiente para aplicativos multimídia e, pelo menos, alguns jogos leves.
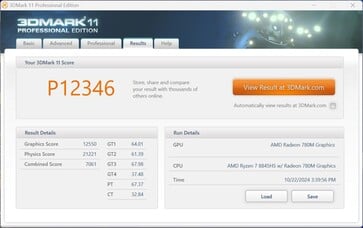
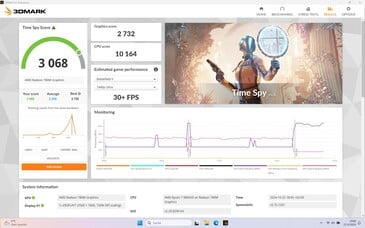
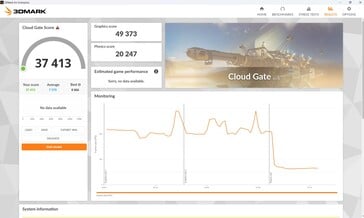
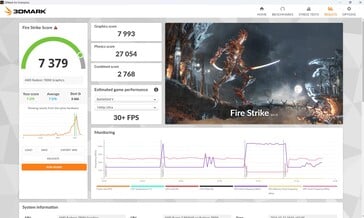
No teste 3DMark, ela teve um desempenho no nível desejado e superou o desempenho da antiga Intel UHD Graphics dentro do Ninkear N16 Pro. Em comparação com os gráficos Arc 8 do Core Ultra 7 155H, nosso A16 Pro ficou no meio do caminho entre o RedmiBook, que é muito rápido, e o Medion S10, que é bastante lento - ambos com a mesma iGPU da Intel.
Mesmo no teste 3D via Fire Strike, não houve perda de desempenho longe da tomada elétrica.
Nos jogos, ele até se saiu um pouco melhor do que o RedmiBook com a Intel Graphics, o que mostra que a Intel ainda está desperdiçando muito potencial com seus drivers. Jogos antigos e menos exigentes, como o GTA V, também podem ser jogados em Full HD com detalhes altos, enquanto títulos atuais, como o Cyberpunk, são executados sem problemas em Full HD, na melhor das hipóteses, com detalhes médios - mas é mais provável que o senhor tenha que selecionar detalhes mínimos. Seu desempenho durante o teste de resistência do Cyberpunk 2077 foi bom e consistente.
| 3DMark Performance Rating - Percent | |
| Acer Aspire 16 A16-51GM-77G2 | |
| Xiaomi RedmiBook Pro 16 2024 -1! | |
| Ninkear A16 Pro | |
| Média AMD Radeon 780M | |
| Medion S10 OLED -1! | |
| Média da turma Office | |
| Lenovo IdeaPad Slim 5 16IRU9 | |
| Ninkear N16-Pro-32+1TB | |
| 3DMark 11 - 1280x720 Performance GPU | |
| Acer Aspire 16 A16-51GM-77G2 | |
| Xiaomi RedmiBook Pro 16 2024 | |
| Ninkear A16 Pro | |
| Média AMD Radeon 780M (7868 - 14274, n=63) | |
| Medion S10 OLED | |
| Média da turma Office (1468 - 16418, n=87, últimos 2 anos) | |
| Lenovo IdeaPad Slim 5 16IRU9 | |
| Ninkear N16-Pro-32+1TB | |
| 3DMark | |
| 1280x720 Cloud Gate Standard Graphics | |
| Acer Aspire 16 A16-51GM-77G2 | |
| Ninkear A16 Pro | |
| Média AMD Radeon 780M (27771 - 53972, n=34) | |
| Lenovo IdeaPad Slim 5 16IRU9 | |
| Média da turma Office (7982 - 58068, n=55, últimos 2 anos) | |
| Ninkear N16-Pro-32+1TB | |
| 1920x1080 Fire Strike Graphics | |
| Acer Aspire 16 A16-51GM-77G2 | |
| Xiaomi RedmiBook Pro 16 2024 | |
| Ninkear A16 Pro | |
| Média AMD Radeon 780M (4550 - 8904, n=65) | |
| Medion S10 OLED | |
| Média da turma Office (736 - 10476, n=89, últimos 2 anos) | |
| Lenovo IdeaPad Slim 5 16IRU9 | |
| Ninkear N16-Pro-32+1TB | |
| 2560x1440 Time Spy Graphics | |
| Xiaomi RedmiBook Pro 16 2024 | |
| Acer Aspire 16 A16-51GM-77G2 | |
| Ninkear A16 Pro | |
| Média AMD Radeon 780M (1496 - 3196, n=65) | |
| Medion S10 OLED | |
| Média da turma Office (313 - 4415, n=86, últimos 2 anos) | |
| Lenovo IdeaPad Slim 5 16IRU9 | |
| Ninkear N16-Pro-32+1TB | |
| 3DMark 11 Performance | 12346 pontos | |
| 3DMark Cloud Gate Standard Score | 37413 pontos | |
| 3DMark Fire Strike Score | 7279 pontos | |
| 3DMark Time Spy Score | 3068 pontos | |
| 3DMark Steel Nomad Light Score | 2714 pontos | |
Ajuda | ||
| Blender - v3.3 Classroom CPU | |
| Média da turma Office (245 - 3964, n=87, últimos 2 anos) | |
| Lenovo IdeaPad Slim 5 16IRU9 | |
| Acer Aspire 16 A16-51GM-77G2 | |
| Ninkear N16-Pro-32+1TB | |
| Média AMD Radeon 780M (300 - 664, n=61) | |
| Ninkear A16 Pro | |
| Medion S10 OLED | |
| Xiaomi RedmiBook Pro 16 2024 | |
* ... menor é melhor
| Performance Rating - Percent | |
| Acer Aspire 16 A16-51GM-77G2 | |
| Ninkear A16 Pro | |
| Xiaomi RedmiBook Pro 16 2024 -1! | |
| Medion S10 OLED | |
| Média da turma Office | |
| Lenovo IdeaPad Slim 5 16IRU9 | |
| Ninkear N16-Pro-32+1TB -3! | |
| Baldur's Gate 3 - 1920x1080 Ultra Preset | |
| Acer Aspire 16 A16-51GM-77G2 | |
| Ninkear A16 Pro | |
| Média da turma Office (7.96 - 30, n=32, últimos 2 anos) | |
| Medion S10 OLED | |
| Lenovo IdeaPad Slim 5 16IRU9 | |
| GTA V - 1920x1080 Highest Settings possible AA:4xMSAA + FX AF:16x | |
| Acer Aspire 16 A16-51GM-77G2 | |
| Ninkear A16 Pro | |
| Xiaomi RedmiBook Pro 16 2024 | |
| Média da turma Office (3.98 - 47.8, n=78, últimos 2 anos) | |
| Medion S10 OLED | |
| Lenovo IdeaPad Slim 5 16IRU9 | |
| Ninkear N16-Pro-32+1TB | |
| Final Fantasy XV Benchmark - 1920x1080 High Quality | |
| Acer Aspire 16 A16-51GM-77G2 | |
| Xiaomi RedmiBook Pro 16 2024 | |
| Ninkear A16 Pro | |
| Medion S10 OLED | |
| Média da turma Office (4.18 - 36.4, n=86, últimos 2 anos) | |
| Lenovo IdeaPad Slim 5 16IRU9 | |
| Ninkear N16-Pro-32+1TB | |
| Strange Brigade - 1920x1080 ultra AA:ultra AF:16 | |
| Acer Aspire 16 A16-51GM-77G2 | |
| Xiaomi RedmiBook Pro 16 2024 | |
| Ninkear A16 Pro | |
| Medion S10 OLED | |
| Média da turma Office (12.8 - 61.7, n=69, últimos 2 anos) | |
| Lenovo IdeaPad Slim 5 16IRU9 | |
| Dota 2 Reborn - 1920x1080 ultra (3/3) best looking | |
| Acer Aspire 16 A16-51GM-77G2 | |
| Xiaomi RedmiBook Pro 16 2024 | |
| Ninkear A16 Pro | |
| Medion S10 OLED | |
| Lenovo IdeaPad Slim 5 16IRU9 | |
| Média da turma Office (13.4 - 121.2, n=92, últimos 2 anos) | |
| Ninkear N16-Pro-32+1TB | |
| X-Plane 11.11 - 1920x1080 high (fps_test=3) | |
| Acer Aspire 16 A16-51GM-77G2 | |
| Ninkear A16 Pro | |
| Lenovo IdeaPad Slim 5 16IRU9 | |
| Xiaomi RedmiBook Pro 16 2024 | |
| Média da turma Office (8.88 - 92.6, n=84, últimos 2 anos) | |
| Medion S10 OLED | |
Cyberpunk 2077 ultra FPS diagram
| baixo | média | alto | ultra | QHD | |
|---|---|---|---|---|---|
| GTA V (2015) | 162.2 | 149.8 | 62.2 | 25.1 | 17.4 |
| Dota 2 Reborn (2015) | 148.4 | 117.9 | 76.4 | 70.6 | |
| Final Fantasy XV Benchmark (2018) | 74.3 | 37.2 | 27 | 19.3 | |
| X-Plane 11.11 (2018) | 64.9 | 47.8 | 40.1 | ||
| Strange Brigade (2018) | 149.3 | 62.6 | 53 | 45.6 | |
| Baldur's Gate 3 (2023) | 42 | 33.3 | 27.5 | 27 | |
| Cyberpunk 2077 2.2 Phantom Liberty (2023) | 39.2 | 31 | 24.9 | 21.8 |
Emissões e potência - O silencioso e frio Ninkear
Emissões de ruído
A maioria das ventoinhas é desativada no modo inativo. Ele também não é particularmente barulhento sob carga; nosso A16 Pro permaneceu o mais silencioso na comparação.
Durante o teste 3DMark 06 - nosso cenário de carga média - as ventoinhas giraram no nível de um RedmiBook silencioso, e somente no final elas aumentaram ainda mais.
Barulho
| Ocioso |
| 23 / 23 / 23 dB |
| Carga |
| 37.68 / 37.41 dB |
 | ||
30 dB silencioso 40 dB(A) audível 50 dB(A) ruidosamente alto |
||
min: | ||
| Ninkear A16 Pro Radeon 780M, R7 8845HS, Authorain NV900-1T | Ninkear N16-Pro-32+1TB UHD Graphics 64EUs, i7-13620H, Derlar FP3 NVMe M.2 SSD PCIe Gen 3.0X4 1 TB | Xiaomi RedmiBook Pro 16 2024 Arc 8-Core, Ultra 7 155H, YMTC PC300-1TB | Acer Aspire 16 A16-51GM-77G2 GeForce RTX 2050 Mobile, Core 7 150U, WD PC SN740 SDDQNQD-1T00-1014 | Lenovo IdeaPad Slim 5 16IRU9 Iris Xe G7 96EUs, Core 7 150U | Medion S10 OLED Arc 8-Core, Ultra 7 155H, Phison PS5019-E19 SSO1TBITC4-E19-V7 | |
|---|---|---|---|---|---|---|
| Noise | -8% | -3% | -18% | -5% | -16% | |
| desligado / ambiente * | 23 | 25 -9% | 24.4 -6% | 23 -0% | 23 -0% | 25 -9% |
| Idle Minimum * | 23 | 25 -9% | 24.4 -6% | 23 -0% | 23 -0% | 26 -13% |
| Idle Average * | 23 | 25 -9% | 24.4 -6% | 23 -0% | 23 -0% | 27 -17% |
| Idle Maximum * | 23 | 25 -9% | 24.4 -6% | 31 -35% | 23 -0% | 28 -22% |
| Load Average * | 37.68 | 35.4 6% | 32 15% | 46.57 -24% | 43.3 -15% | 43 -14% |
| Cyberpunk 2077 ultra * | 37.68 | 43.5 -15% | 50 -33% | 40.8 -8% | 42 -11% | |
| Load Maximum * | 37.41 | 42.2 -13% | 39.7 -6% | 50 -34% | 40.9 -9% | 48 -28% |
| Witcher 3 ultra * | 30.6 |
* ... menor é melhor
Temperatura
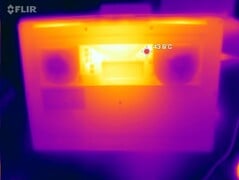
Ele só fica realmente quente na parte inferior do laptop, no centro da tela. Foi nesse ponto que localizamos um ponto quente de cerca de 50 °C. Em todos os outros lugares, o desenvolvimento da temperatura permaneceu moderado, com um máximo de 43 °C, e os apoios para as mãos permaneceram significativamente mais frios. No entanto, a pequena fonte de alimentação USB-C aqueceu até 56 °C.
(±) A temperatura máxima no lado superior é 43 °C / 109 F, em comparação com a média de 34.3 °C / 94 F , variando de 21.2 a 62.5 °C para a classe Office.
(-) A parte inferior aquece até um máximo de 50 °C / 122 F, em comparação com a média de 36.8 °C / 98 F
(±) 3: The average temperature for the upper side is 35.7 °C / 96 F, compared to the average of 29.5 °C / 85 F for the class Office.
(+) Os apoios para as mãos e o touchpad são mais frios que a temperatura da pele, com um máximo de 31 °C / 87.8 F e, portanto, são frios ao toque.
(-) A temperatura média da área do apoio para as mãos de dispositivos semelhantes foi 27.6 °C / 81.7 F (-3.4 °C / -6.1 F).
| Ninkear A16 Pro AMD Ryzen 7 8845HS, AMD Radeon 780M | Ninkear N16-Pro-32+1TB Intel Core i7-13620H, Intel UHD Graphics 64EUs (Alder Lake 12th Gen) | Xiaomi RedmiBook Pro 16 2024 Intel Core Ultra 7 155H, Intel Arc 8-Core iGPU | Acer Aspire 16 A16-51GM-77G2 Intel Core 7 150U, NVIDIA GeForce RTX 2050 Mobile | Lenovo IdeaPad Slim 5 16IRU9 Intel Core 7 150U, Intel Iris Xe Graphics G7 96EUs | Medion S10 OLED Intel Core Ultra 7 155H, Intel Arc 8-Core iGPU | |
|---|---|---|---|---|---|---|
| Heat | 8% | 7% | -5% | 26% | -19% | |
| Maximum Upper Side * | 43 | 35.1 18% | 40.3 6% | 47 -9% | 35.4 18% | 55 -28% |
| Maximum Bottom * | 50 | 51 -2% | 45.9 8% | 50 -0% | 33 34% | 55 -10% |
| Idle Upper Side * | 27.1 | 26.3 | 31 | 30.2 | 32 | |
| Idle Bottom * | 33.8 | 27.9 | 32 | 30.2 | 33 |
* ... menor é melhor
Alto-falantes
Os alto-falantes são medianos, na melhor das hipóteses, quase não reproduzem graves e só tocam em um volume decepcionante. Dispositivos de áudio analógicos podem ser conectados por meio da saída jack.
Ninkear A16 Pro análise de áudio
(±) | o volume do alto-falante é médio, mas bom (###valor### dB)
Graves 100 - 315Hz
(-) | quase nenhum baixo - em média 21.5% menor que a mediana
(±) | a linearidade dos graves é média (7.7% delta para a frequência anterior)
Médios 400 - 2.000 Hz
(±) | médios mais altos - em média 7.6% maior que a mediana
(±) | a linearidade dos médios é média (7% delta para frequência anterior)
Altos 2 - 16 kHz
(±) | máximos mais altos - em média 5.8% maior que a mediana
(+) | os máximos são lineares (6.7% delta da frequência anterior)
Geral 100 - 16.000 Hz
(±) | a linearidade do som geral é média (26.2% diferença em relação à mediana)
Comparado com a mesma classe
» 79% de todos os dispositivos testados nesta classe foram melhores, 7% semelhantes, 14% piores
» O melhor teve um delta de 7%, a média foi 21%, o pior foi 53%
Comparado com todos os dispositivos testados
» 79% de todos os dispositivos testados foram melhores, 4% semelhantes, 17% piores
» O melhor teve um delta de 4%, a média foi 24%, o pior foi 134%
Apple MacBook Pro 16 2021 M1 Pro análise de áudio
(+) | os alto-falantes podem tocar relativamente alto (###valor### dB)
Graves 100 - 315Hz
(+) | bons graves - apenas 3.8% longe da mediana
(+) | o baixo é linear (5.2% delta para a frequência anterior)
Médios 400 - 2.000 Hz
(+) | médios equilibrados - apenas 1.3% longe da mediana
(+) | médios são lineares (2.1% delta para frequência anterior)
Altos 2 - 16 kHz
(+) | agudos equilibrados - apenas 1.9% longe da mediana
(+) | os máximos são lineares (2.7% delta da frequência anterior)
Geral 100 - 16.000 Hz
(+) | o som geral é linear (4.6% diferença em relação à mediana)
Comparado com a mesma classe
» 0% de todos os dispositivos testados nesta classe foram melhores, 0% semelhantes, 100% piores
» O melhor teve um delta de 5%, a média foi 18%, o pior foi 45%
Comparado com todos os dispositivos testados
» 0% de todos os dispositivos testados foram melhores, 0% semelhantes, 100% piores
» O melhor teve um delta de 4%, a média foi 24%, o pior foi 134%
Consumo de energia
Seu consumo de energia é bastante baixo, especialmente quando ocioso. O consumo aumenta ligeiramente sob carga, mas ainda é adequado quando comparado ao seu desempenho. Infelizmente, não temos os valores comparativos do RedmiBook aqui, enquanto os outros concorrentes menos potentes consomem menos sob carga. O brilho da tela não foi insignificante ao medir o consumo em modo inativo, com cerca de 4 a 5 watts entre o brilho baixo e o brilho total.
| desligado | |
| Ocioso | |
| Carga |
|
Key:
min: | |
Power consumption Cyberpunk / stress test
Power consumption with external monitor
Tempos de execução
A Ninkear instalou uma grande bateria de 80 Wh, que é mais do que os recursos da concorrência (com exceção do RedmiBook). No entanto, o laptop não durou mais do que seus rivais, pelo menos em nossos testes. 7.em geral, o teste de WLAN durou 5 horas, mas alguns concorrentes pareciam durar mais com menos capacidade.
| Ninkear A16 Pro R7 8845HS, Radeon 780M, 80 Wh | Ninkear N16-Pro-32+1TB i7-13620H, UHD Graphics 64EUs, 57.75 Wh | Xiaomi RedmiBook Pro 16 2024 Ultra 7 155H, Arc 8-Core, 99 Wh | Acer Aspire 16 A16-51GM-77G2 Core 7 150U, GeForce RTX 2050 Mobile, 48.5 Wh | Lenovo IdeaPad Slim 5 16IRU9 Core 7 150U, Iris Xe G7 96EUs, 57 Wh | Medion S10 OLED Ultra 7 155H, Arc 8-Core, 70 Wh | Média da turma Office | |
|---|---|---|---|---|---|---|---|
| Duração da bateria | -28% | 79% | 41% | 38% | -3% | 36% | |
| WiFi v1.3 | 450 | 322 -28% | 983 118% | 607 35% | 761 69% | 436 -3% | 638 ? 42% |
| Load | 89 | 124 39% | 130 46% | 94 6% | 114.9 ? 29% | ||
| H.264 | 1308 | 498 | 750 ? | ||||
| Reader / Idle | 1568 | 1300 ? |
Classificação total do Notebookcheck
O Ninkear A16 Pro nos impressionou em muitos aspectos e, graças à sua combinação de componentes bons e baratos, dá a sensação de ser ainda melhor em áreas importantes do que alguns concorrentes mais caros.
Ninkear A16 Pro
- 10/24/2024 v8
Christian Hintze
Transparência
A seleção dos dispositivos a serem analisados é feita pela nossa equipe editorial. A amostra de teste foi fornecida ao autor como empréstimo pelo fabricante ou varejista para fins desta revisão. O credor não teve influência nesta revisão, nem o fabricante recebeu uma cópia desta revisão antes da publicação. Não houve obrigação de publicar esta revisão. Nunca aceitamos compensação ou pagamento em troca de nossas avaliações. Como empresa de mídia independente, a Notebookcheck não está sujeita à autoridade de fabricantes, varejistas ou editores.
É assim que o Notebookcheck está testando
Todos os anos, o Notebookcheck analisa de forma independente centenas de laptops e smartphones usando procedimentos padronizados para garantir que todos os resultados sejam comparáveis. Desenvolvemos continuamente nossos métodos de teste há cerca de 20 anos e definimos padrões da indústria no processo. Em nossos laboratórios de teste, equipamentos de medição de alta qualidade são utilizados por técnicos e editores experientes. Esses testes envolvem um processo de validação em vários estágios. Nosso complexo sistema de classificação é baseado em centenas de medições e benchmarks bem fundamentados, o que mantém a objetividade.
















 Total Sustainability Score:


