

Análise do Intel Core Ultra 5 245K: O equilíbrio perfeito entre potência e eficiência?
Uma maldição e uma bênção ao mesmo tempo!
A Intel está dando início a uma nova era com os processadores Arrow Lake para o setor de desktops. Um novo esquema de nomenclatura, uma nova arquitetura e menor consumo de energia são algumas das principais mudanças. Nesta análise, o senhor poderá descobrir em detalhes quais são as outras mudanças e qual é o desempenho do Intel Core Ultra 5 245K no uso diário e em jogos.Sebastian Bade (traduzido por DeepL / Ninh Duy) Publicado 🇺🇸 🇩🇪 ...
Veredicto: CPU eficiente para produtividade
O Intel Core Ultra 5 245K se apresenta em nosso teste como um processador versátil e potente que oferece um desempenho sólido tanto para jogos quanto para aplicativos criativos.
Com sua arquitetura híbrida, composta pelos poderosos núcleos Lion Cove Performance (núcleos P) e Skymont Efficiency (núcleos E), o chip oferece um excelente equilíbrio entre potência de computação e eficiência energética.
Essa última foi significativamente aprimorada em comparação com o modelo anterior, o que é um passo importante para não perder completamente o contato com as ofertas da AMD.
Em termos de desempenho, o Core Ultra 5 245K é particularmente impressionante nos testes de desempenho puro da CPU. Entretanto, seu desempenho em cenários de jogos é ligeiramente pior do que o do Intel Core i5-14600K mais antigo.
Mesmo assim, o desempenho oferecido é suficiente para executar todos os jogos modernos sem problemas. Em termos de conectividade, o Core Ultra 5 245K é compatível com os padrões atuais, como PCIe 5.0 e RAM DDR5, o que garante a transferência rápida de dados e a preparação para o futuro.
Isso possibilita equipar o sistema com os mais recentes SSDs e placas gráficas, o que é particularmente vantajoso para gamers e profissionais criativos.
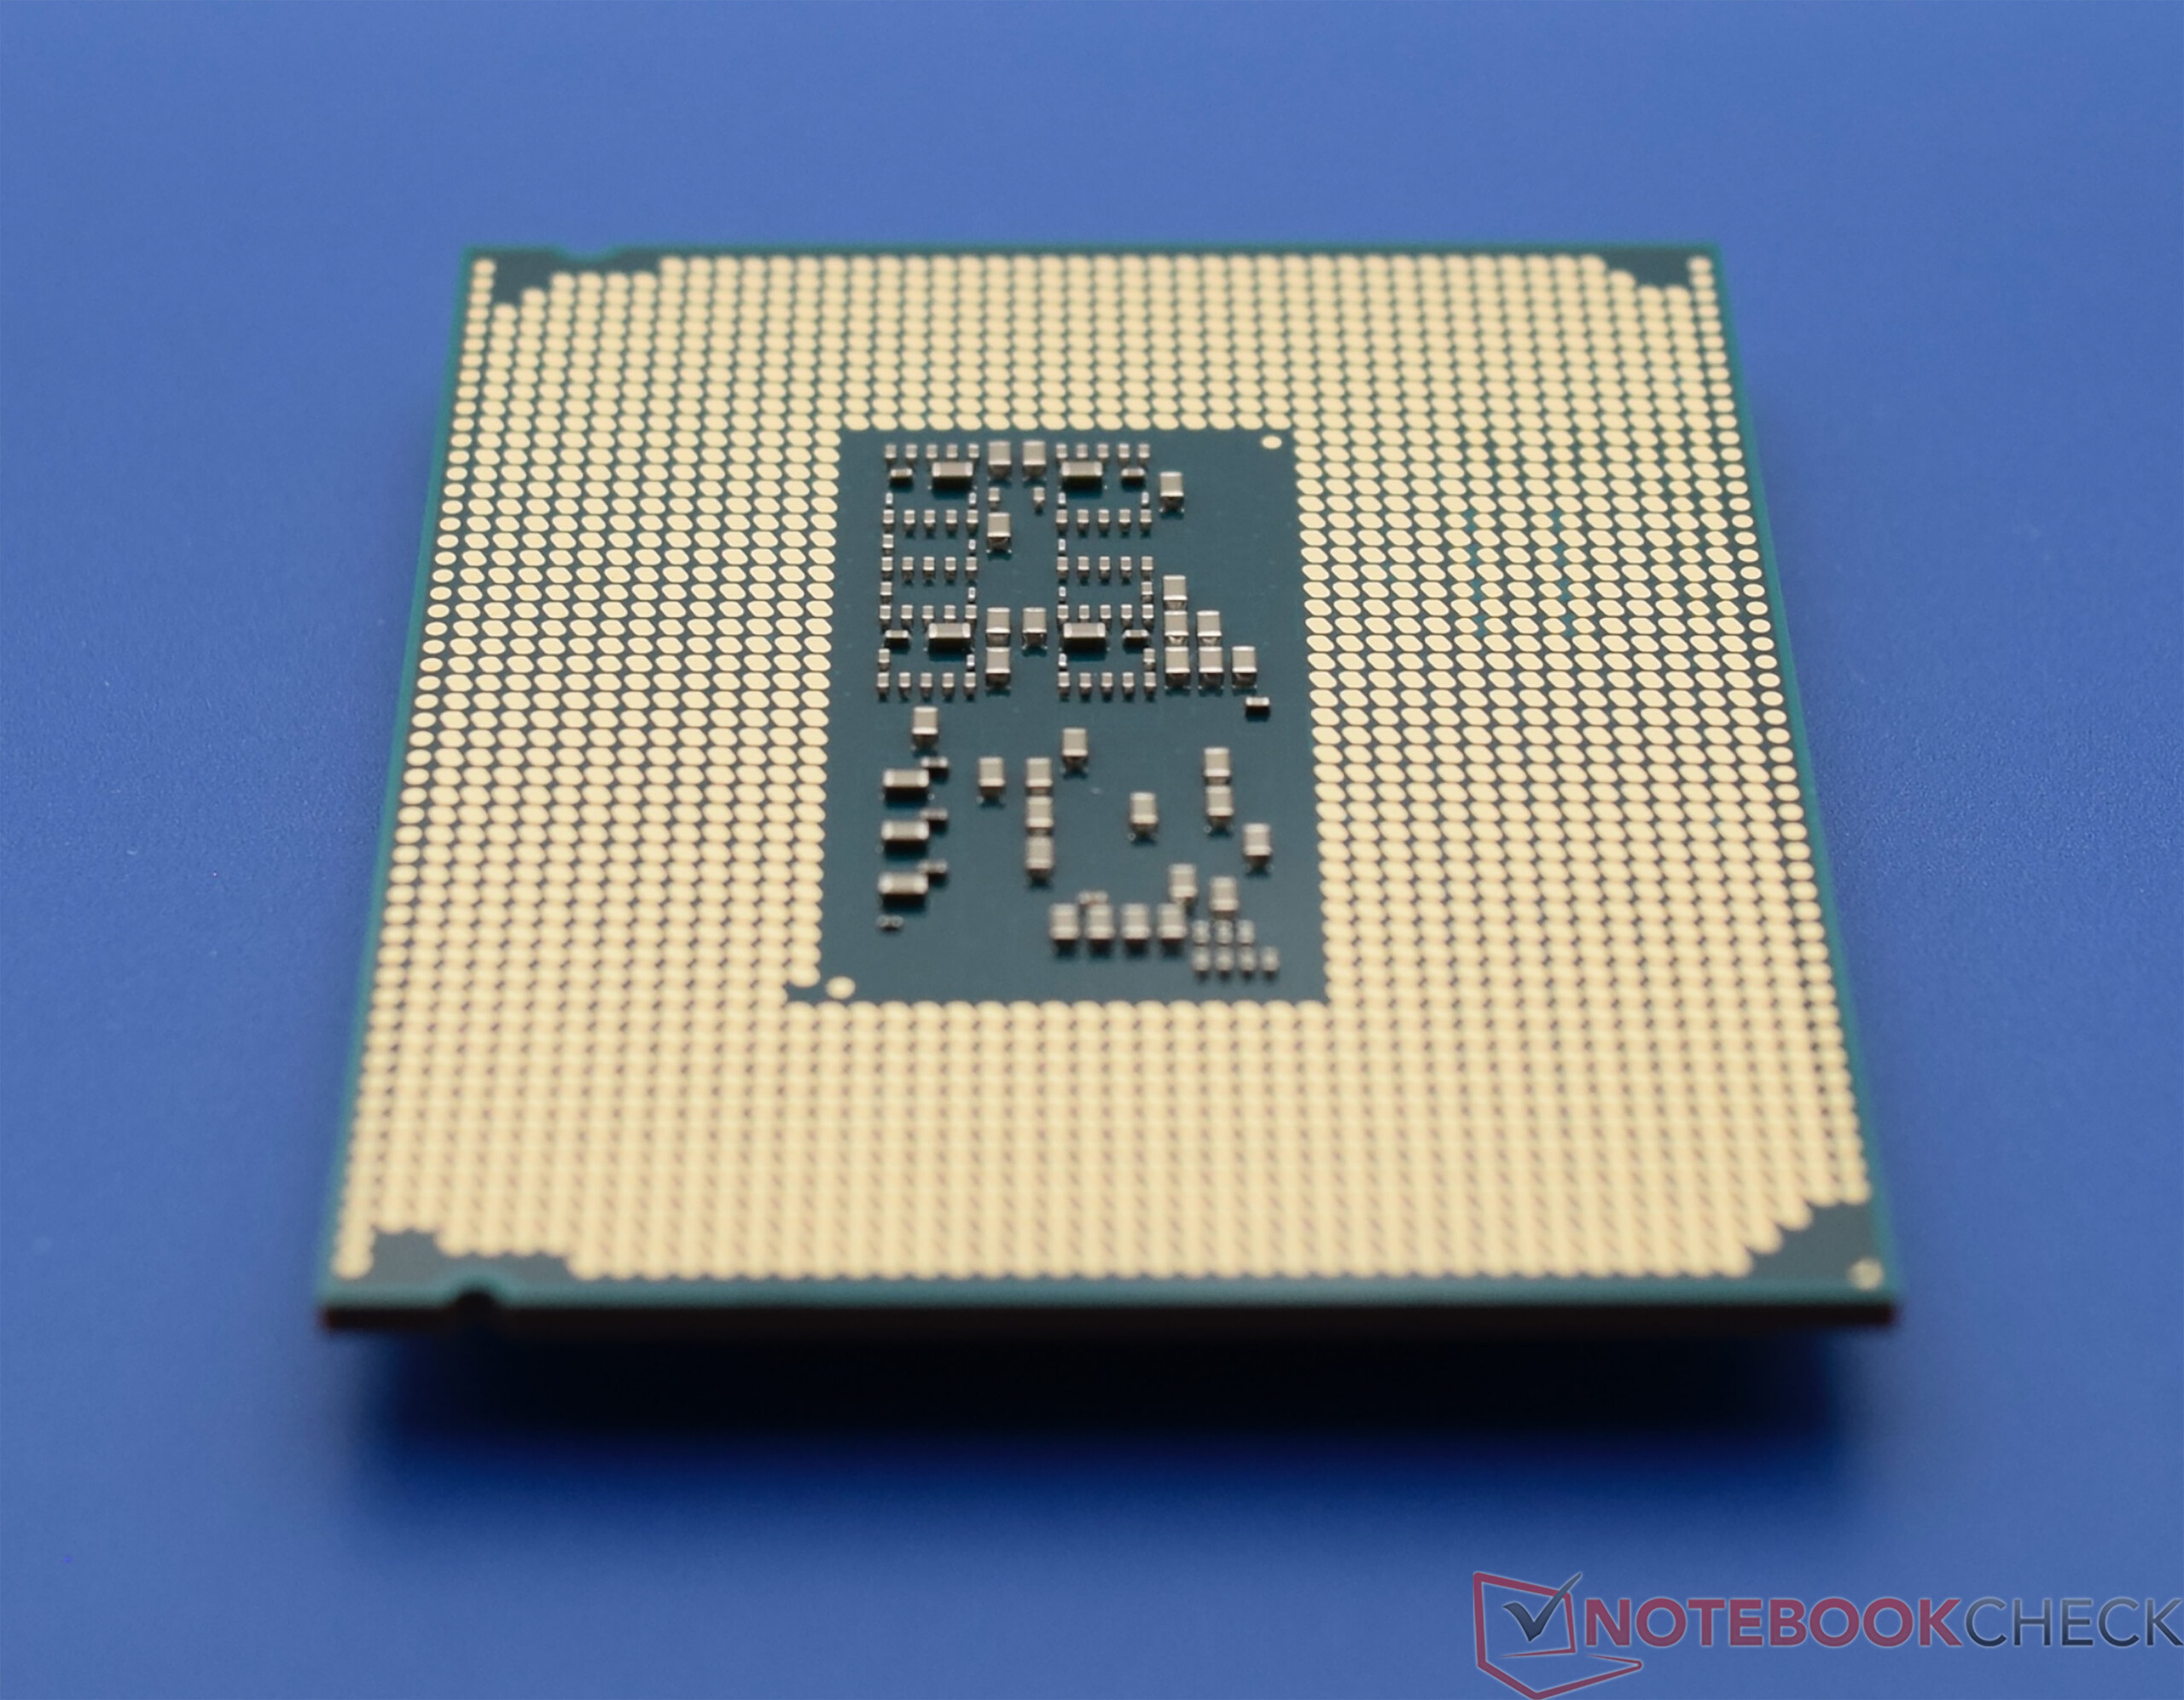
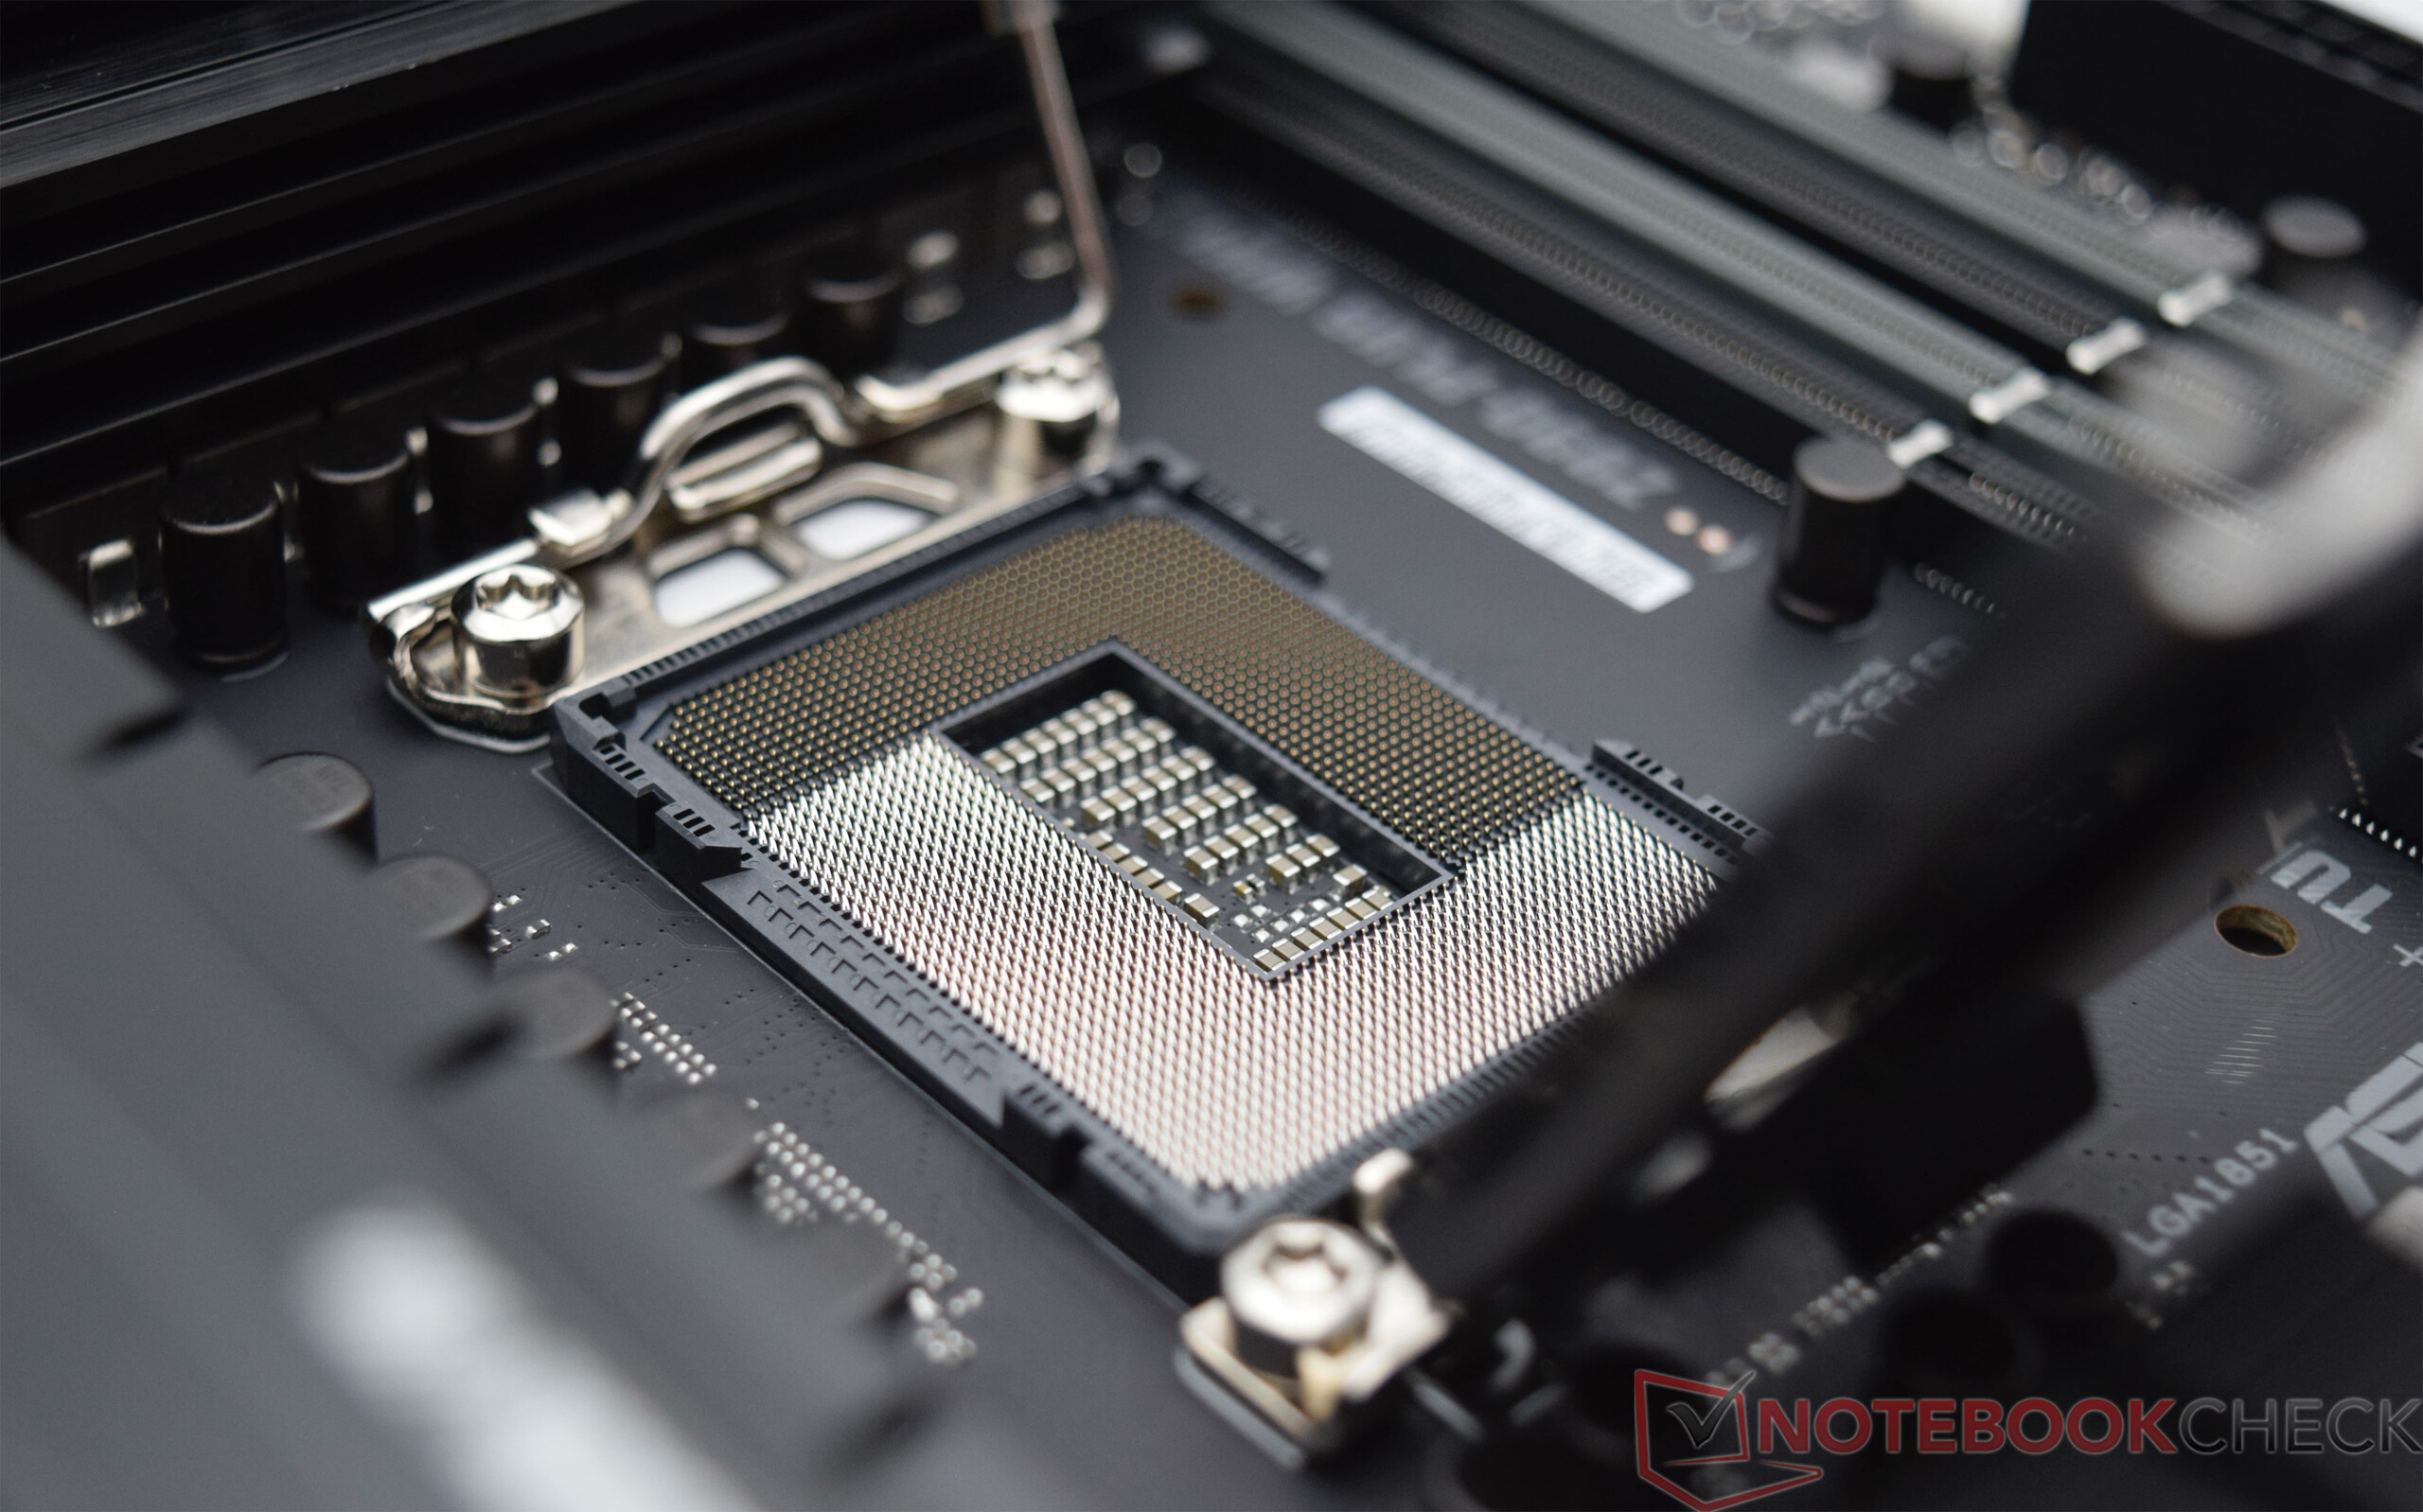
Como inovação, a Intel está introduzindo uma nova arquitetura baseada no soquete LGA 1851. Isso significa que não é possível fazer uma simples atualização da CPU da geração anterior.
O Intel Core Ultra 5 245K prova ser um all-rounder econômico no segmento de desempenho médio. Com seu sólido desempenho em jogos, bons recursos multitarefa e suporte a tecnologias modernas, como uma NPU, é uma excelente opção para usuários que buscam um bom equilíbrio entre preço e desempenho. A eficiência energética do processador é particularmente notável.
Pro
Contra
Preço e disponibilidade
O Intel Core Ultra 5 245K pode ser encomendado na Galaxus por 359 euros. Seu antecessor direto, o Intel Core i5-14600K, já está disponível na Amazon (DE) por 295 euros e na Amazon US por 254 dólares.
Índice
- Veredicto: CPU eficiente para produtividade
- Comparação entre os processadores Intel Arrow Lake S
- O Asus TUF Gaming Z890-PLUS Wi-Fi
- Benchmarks de processador
- Intel Core Ultra 5 245K no multi-loop do Cinebench R15
- Benchmarks sintéticos e desempenho de aplicativos
- Benchmarks de jogos
- Necessidade de energia
- Impressão geral do Notebookcheck sobre o Core Ultra 5 245K
A linha Arrow Lake-S representa a próxima geração de processadores Intel para desktops e é baseada no novo soquete LGA 1851. Isso significa que não apenas os modelos Raptor Lake, mas também o soquete LGA 1700 introduzido há três anos, estão sendo aposentados.
Os novos processadores Arrow Lake S são baseados em uma arquitetura híbrida com uma combinação de núcleos de desempenho (núcleos P) potentes e núcleos de eficiência (núcleos E) um pouco mais fracos. Essa arquitetura híbrida, que foi introduzida pela primeira vez no Alder Lake, foi otimizada ainda mais no Arrow Lake para permitir uma melhor eficiência energética.
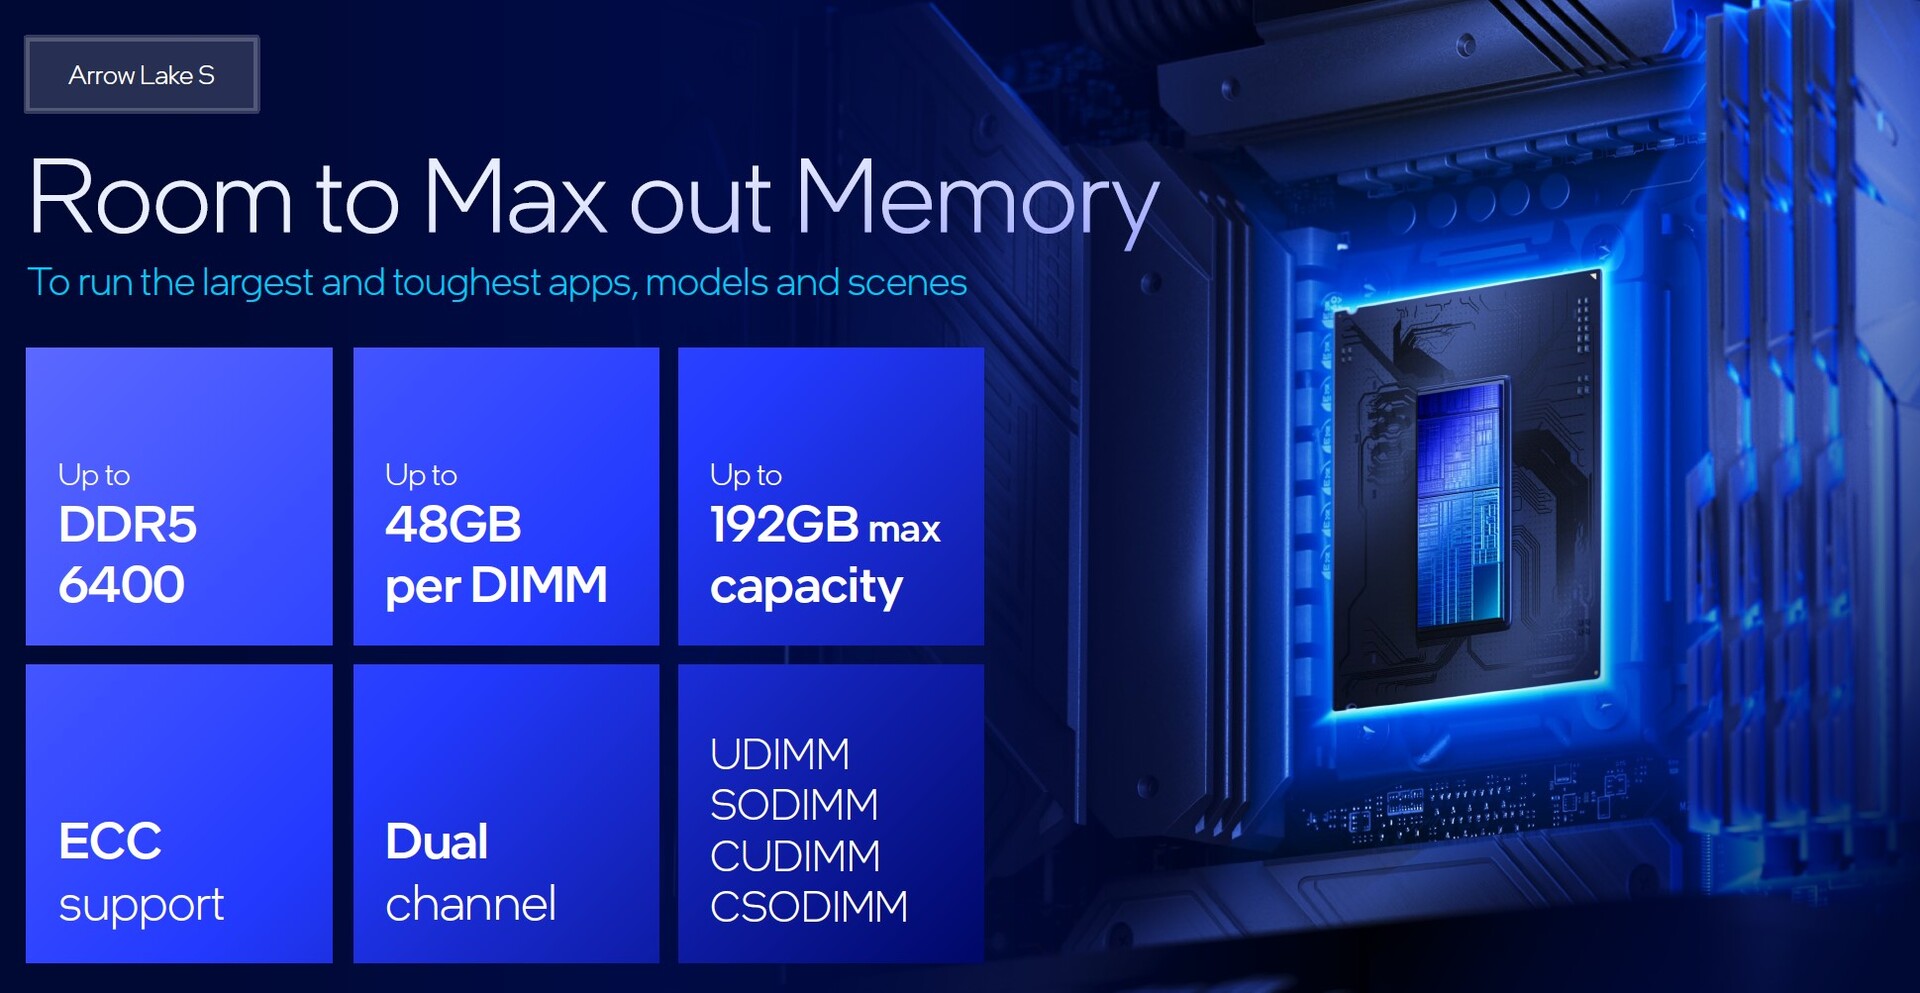
Com o Arrow Lake-S, a Intel está se concentrando em um aumento significativo do desempenho nas áreas de núcleo único e múltiplo. Nesta análise, analisaremos passo a passo o que isso significa exatamente, pois nem todos os aplicativos se beneficiarão da nova arquitetura. O suporte para RAM DDR4 foi completamente removido, o que significa que todas as placas-mãe LGA 1851 agora usam RAM DDR5.
Além disso, a unidade gráfica integrada foi aprimorada e agora é baseada na arquitetura Intel Xe. Isso pode proporcionar um notável aumento de desempenho, especialmente em sistemas pequenos que não têm espaço para uma placa de vídeo dedicada.
Usamos o seguinte sistema para os benchmarks e testes:
- Mesa de referência aberta Streacom BC1 V2
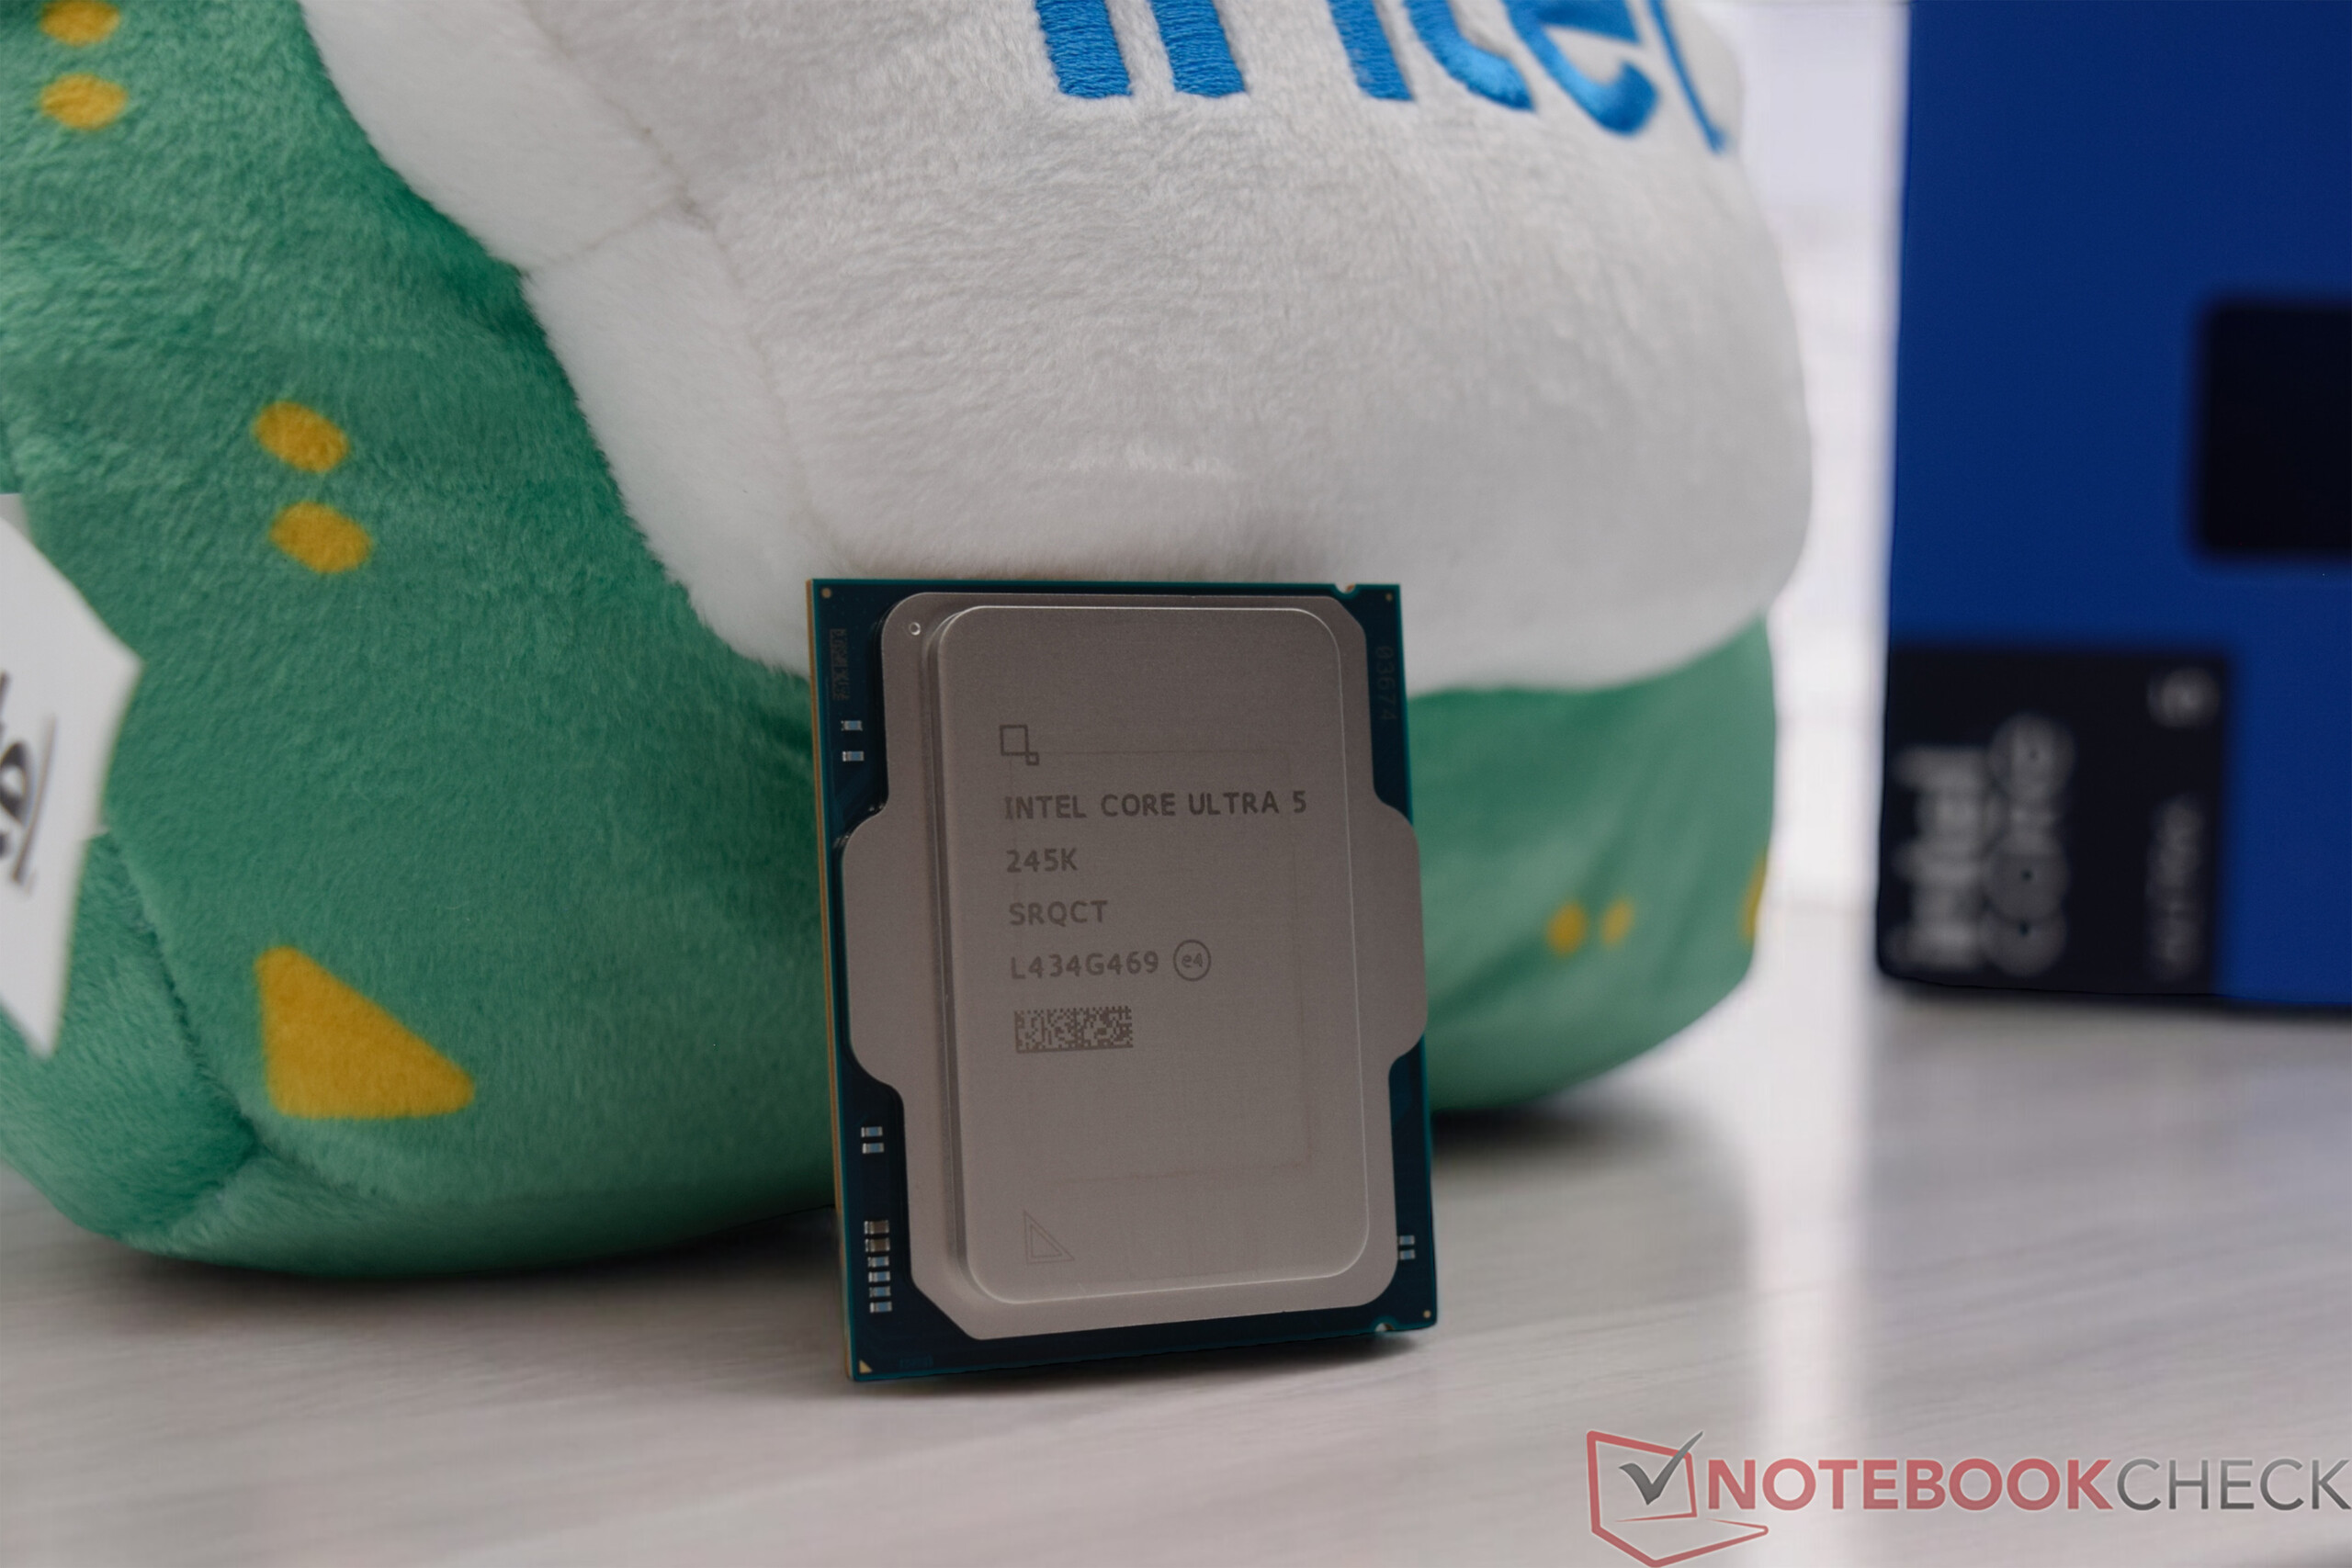
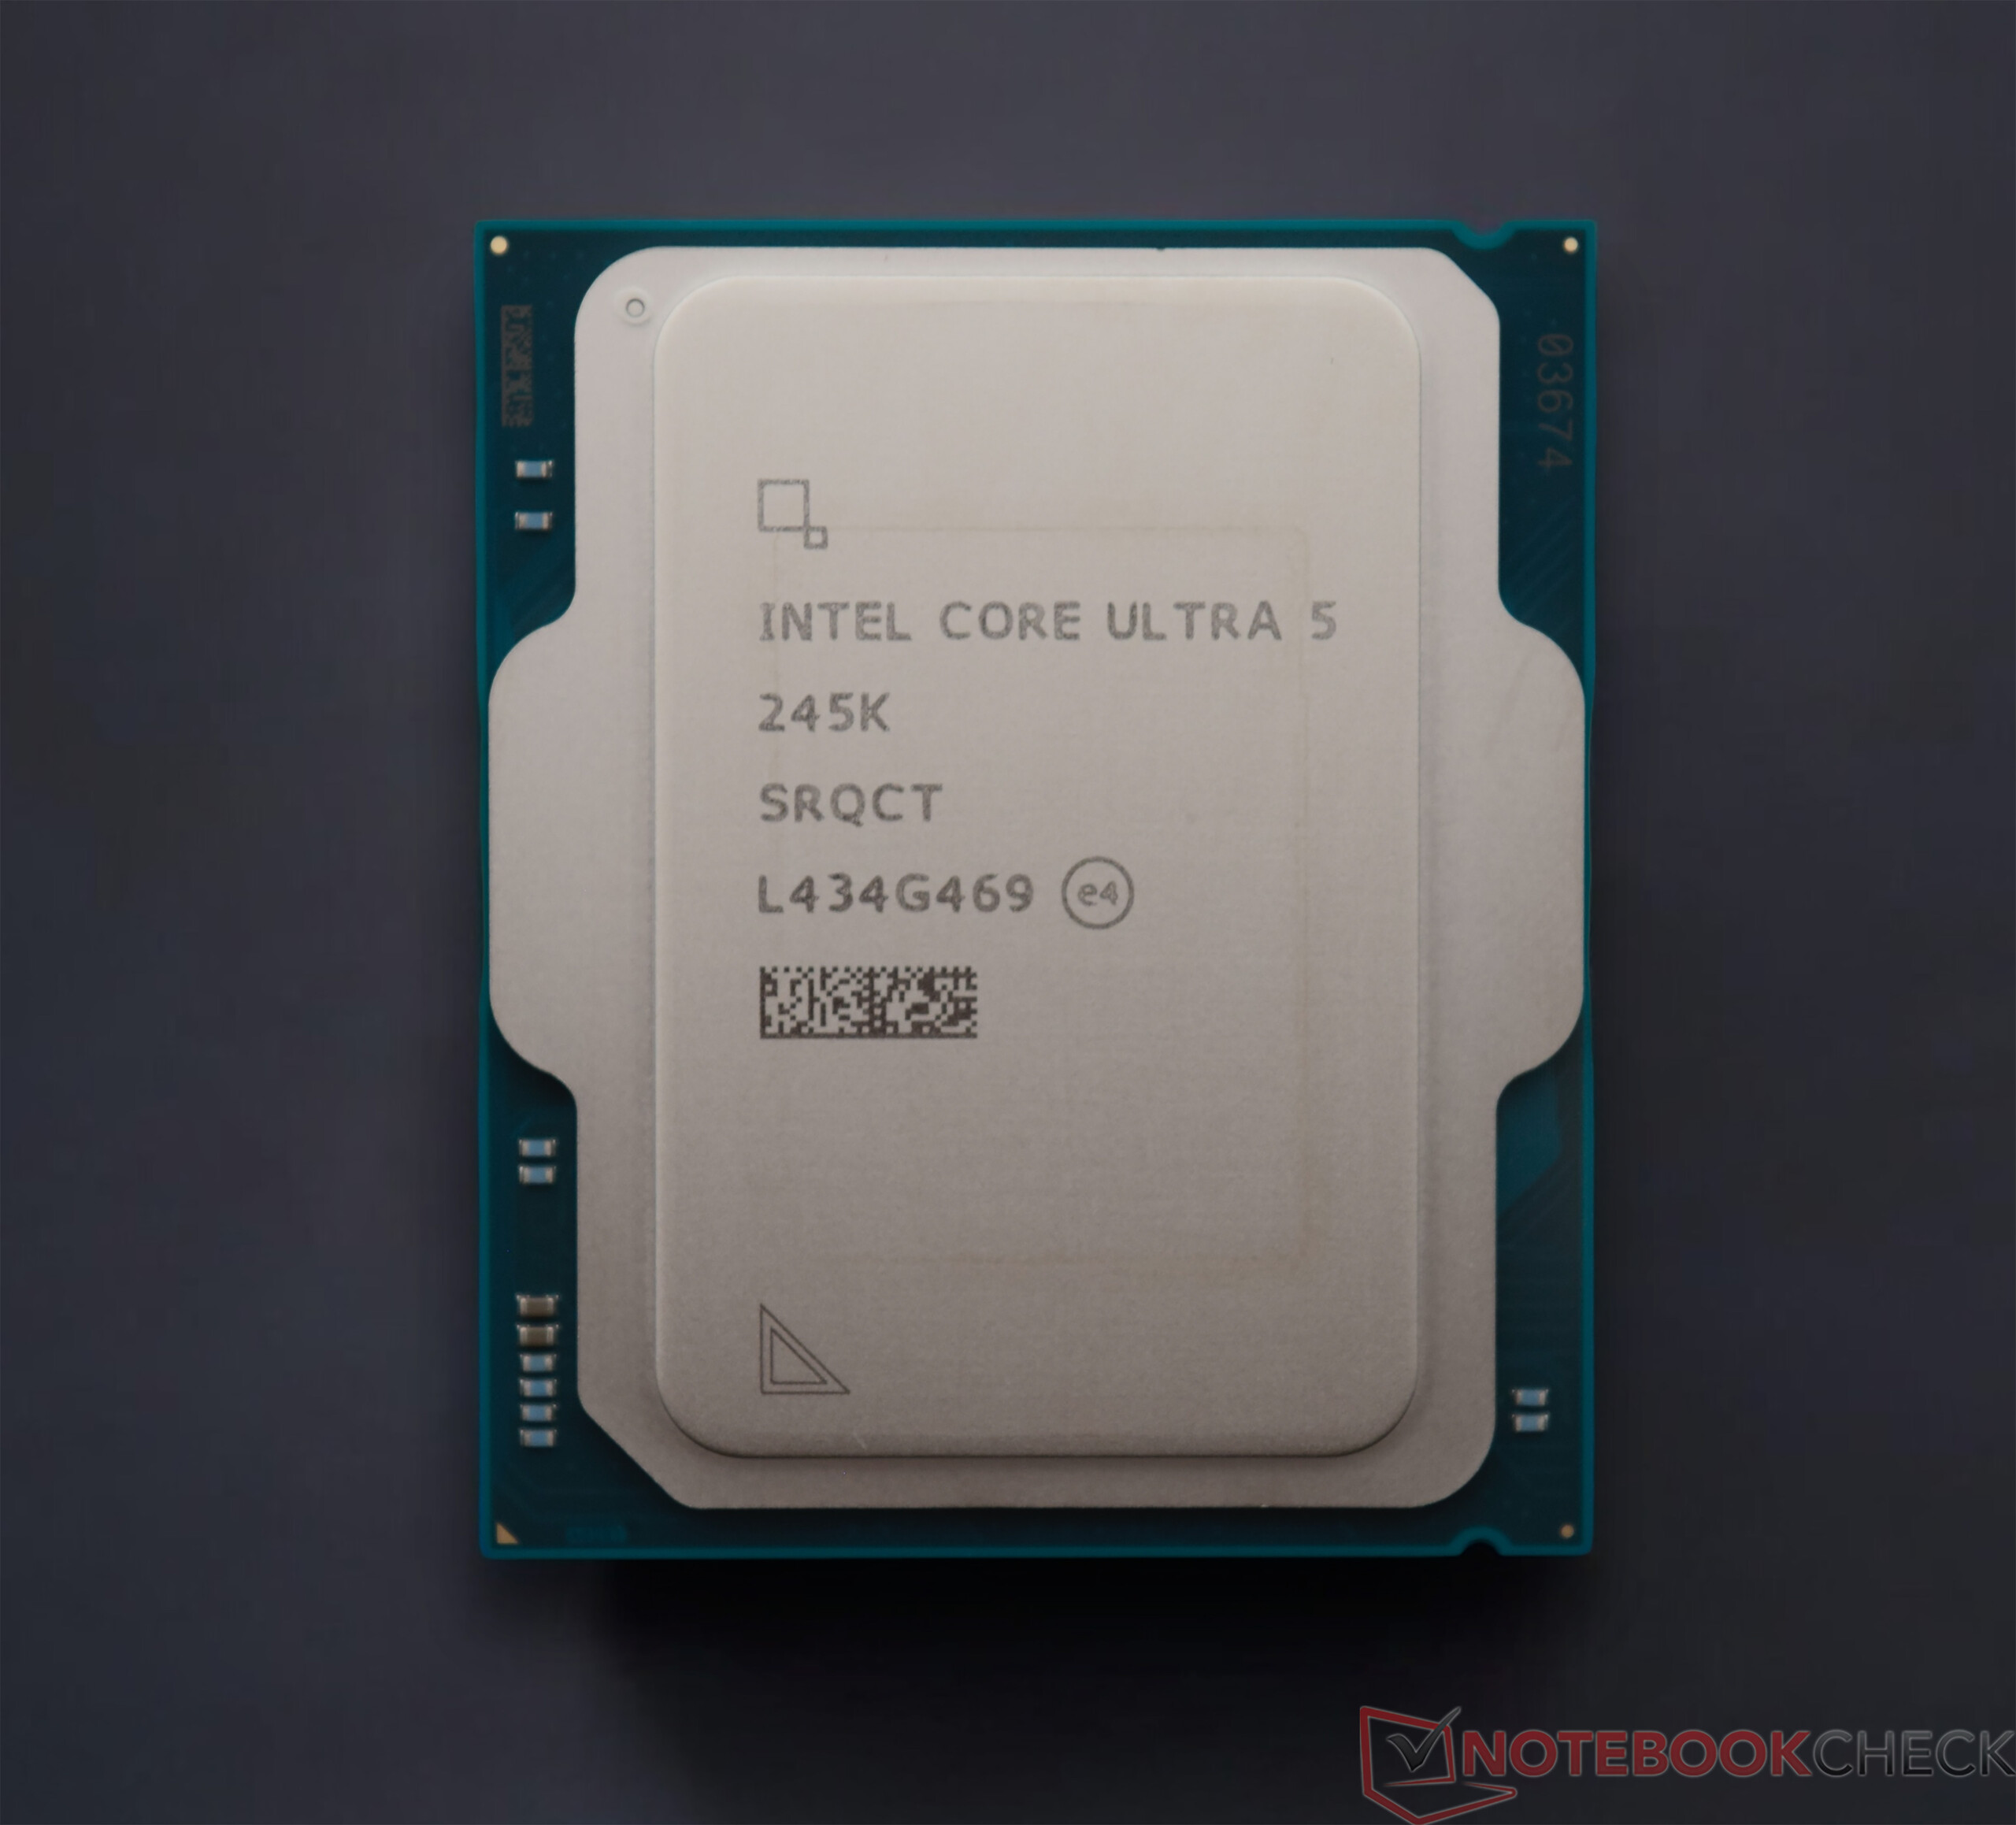
- Intel Core Ultra 5 245K
- Asus TUF Gaming Z890-PLUS Wi-Fi, BIOS: 0407
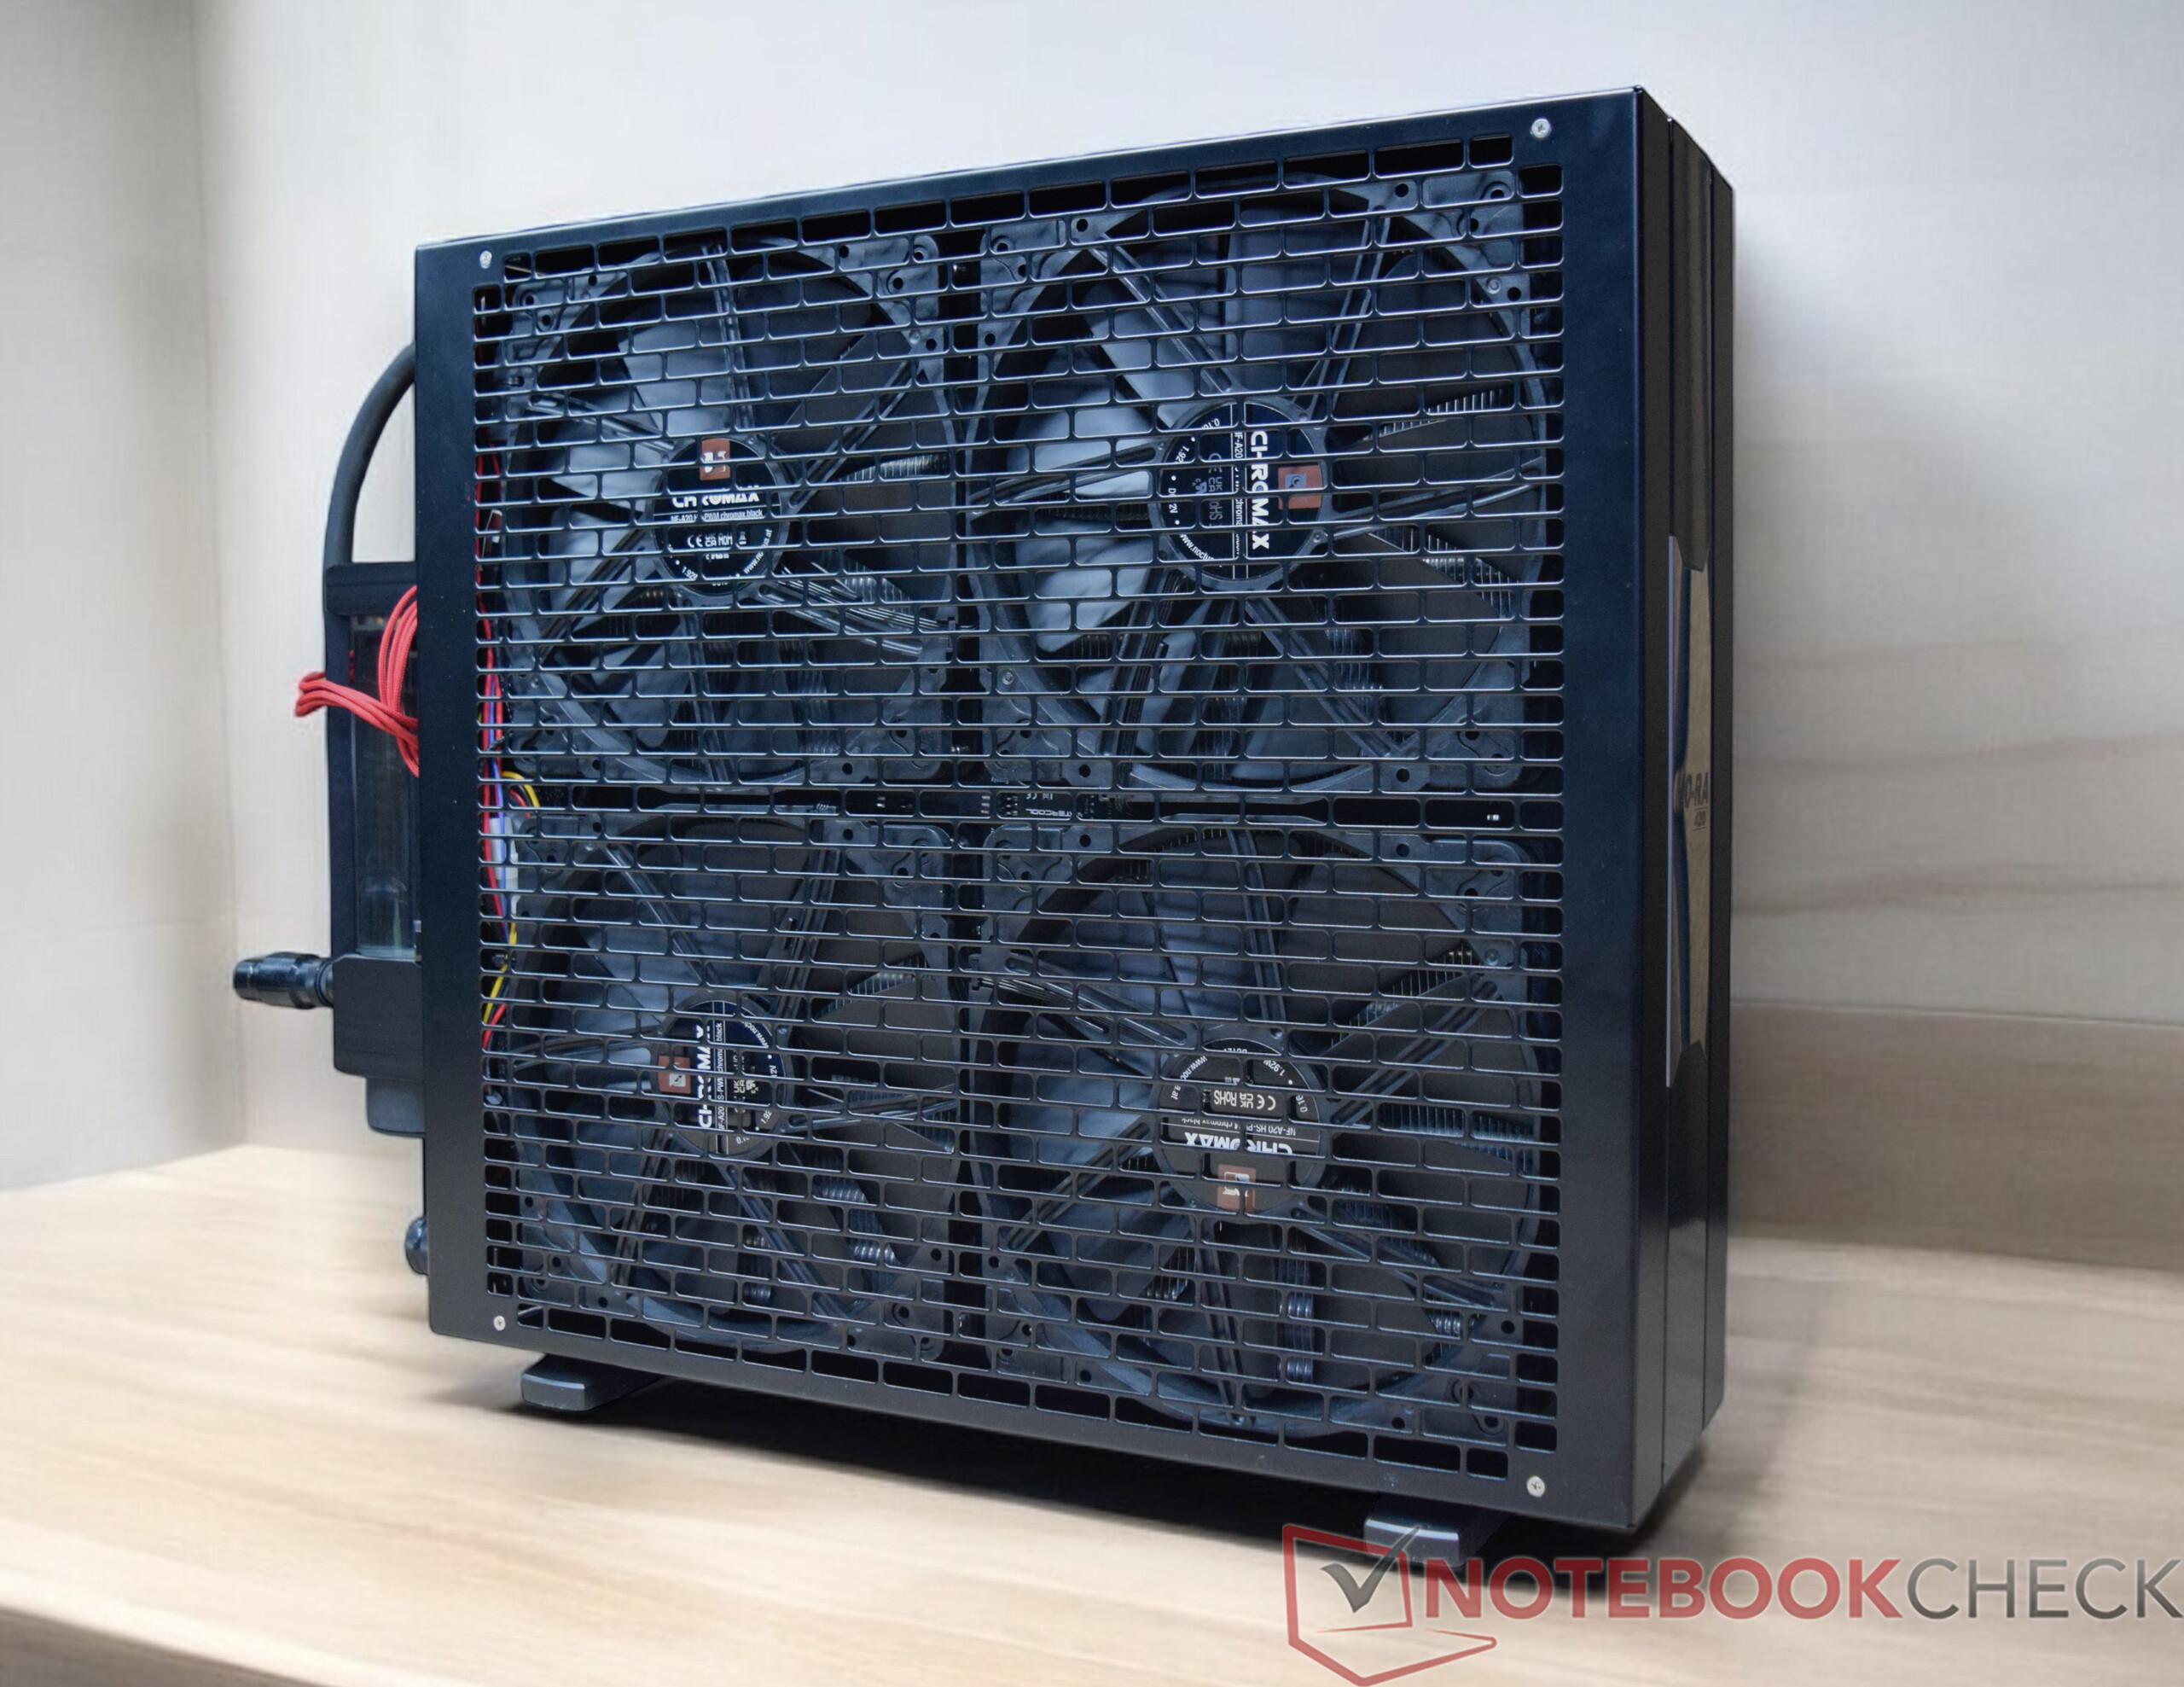
- Resfriamento a água em loop personalizado (bomba: Watercool WCP D5, radiador: EK MO-RA3 420 Pro)
- Palit GeForce RTX 4090 GameRock OC
- EVGA SuperNOVA P+ 1600W
- G.Skill Trident Z5 Neo DDR5-6000 2x 16 GB, EXPO (DDR5-6000 CL30-38-38-96)
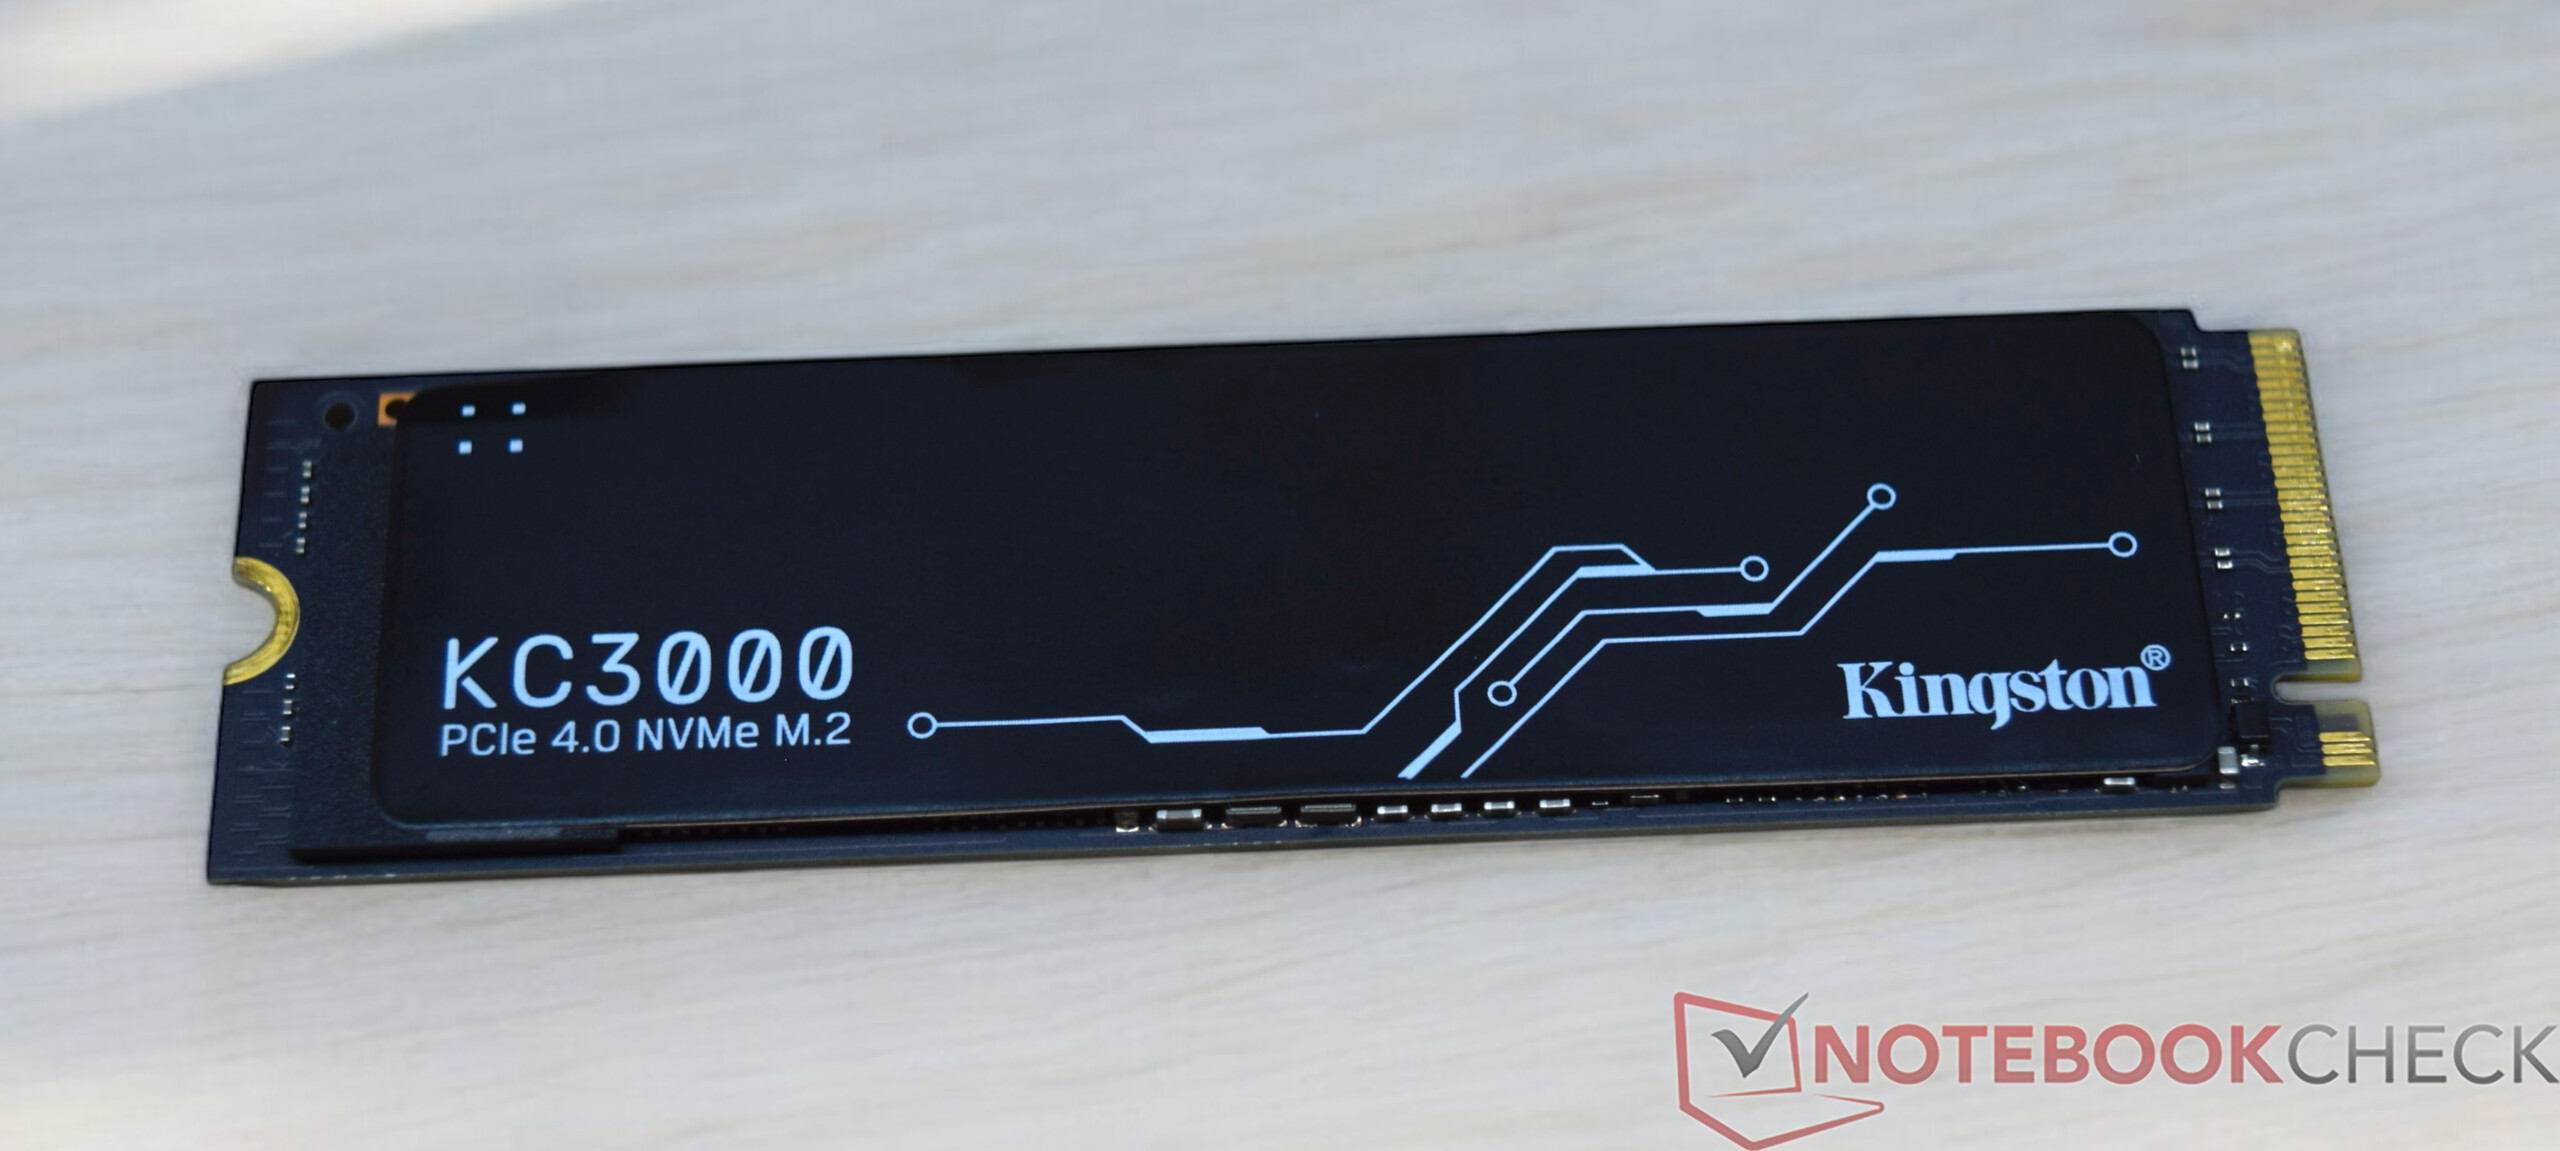
- Kingston KC3000 2 TB, M.2 2280 (SO + benchmarks sintéticos)
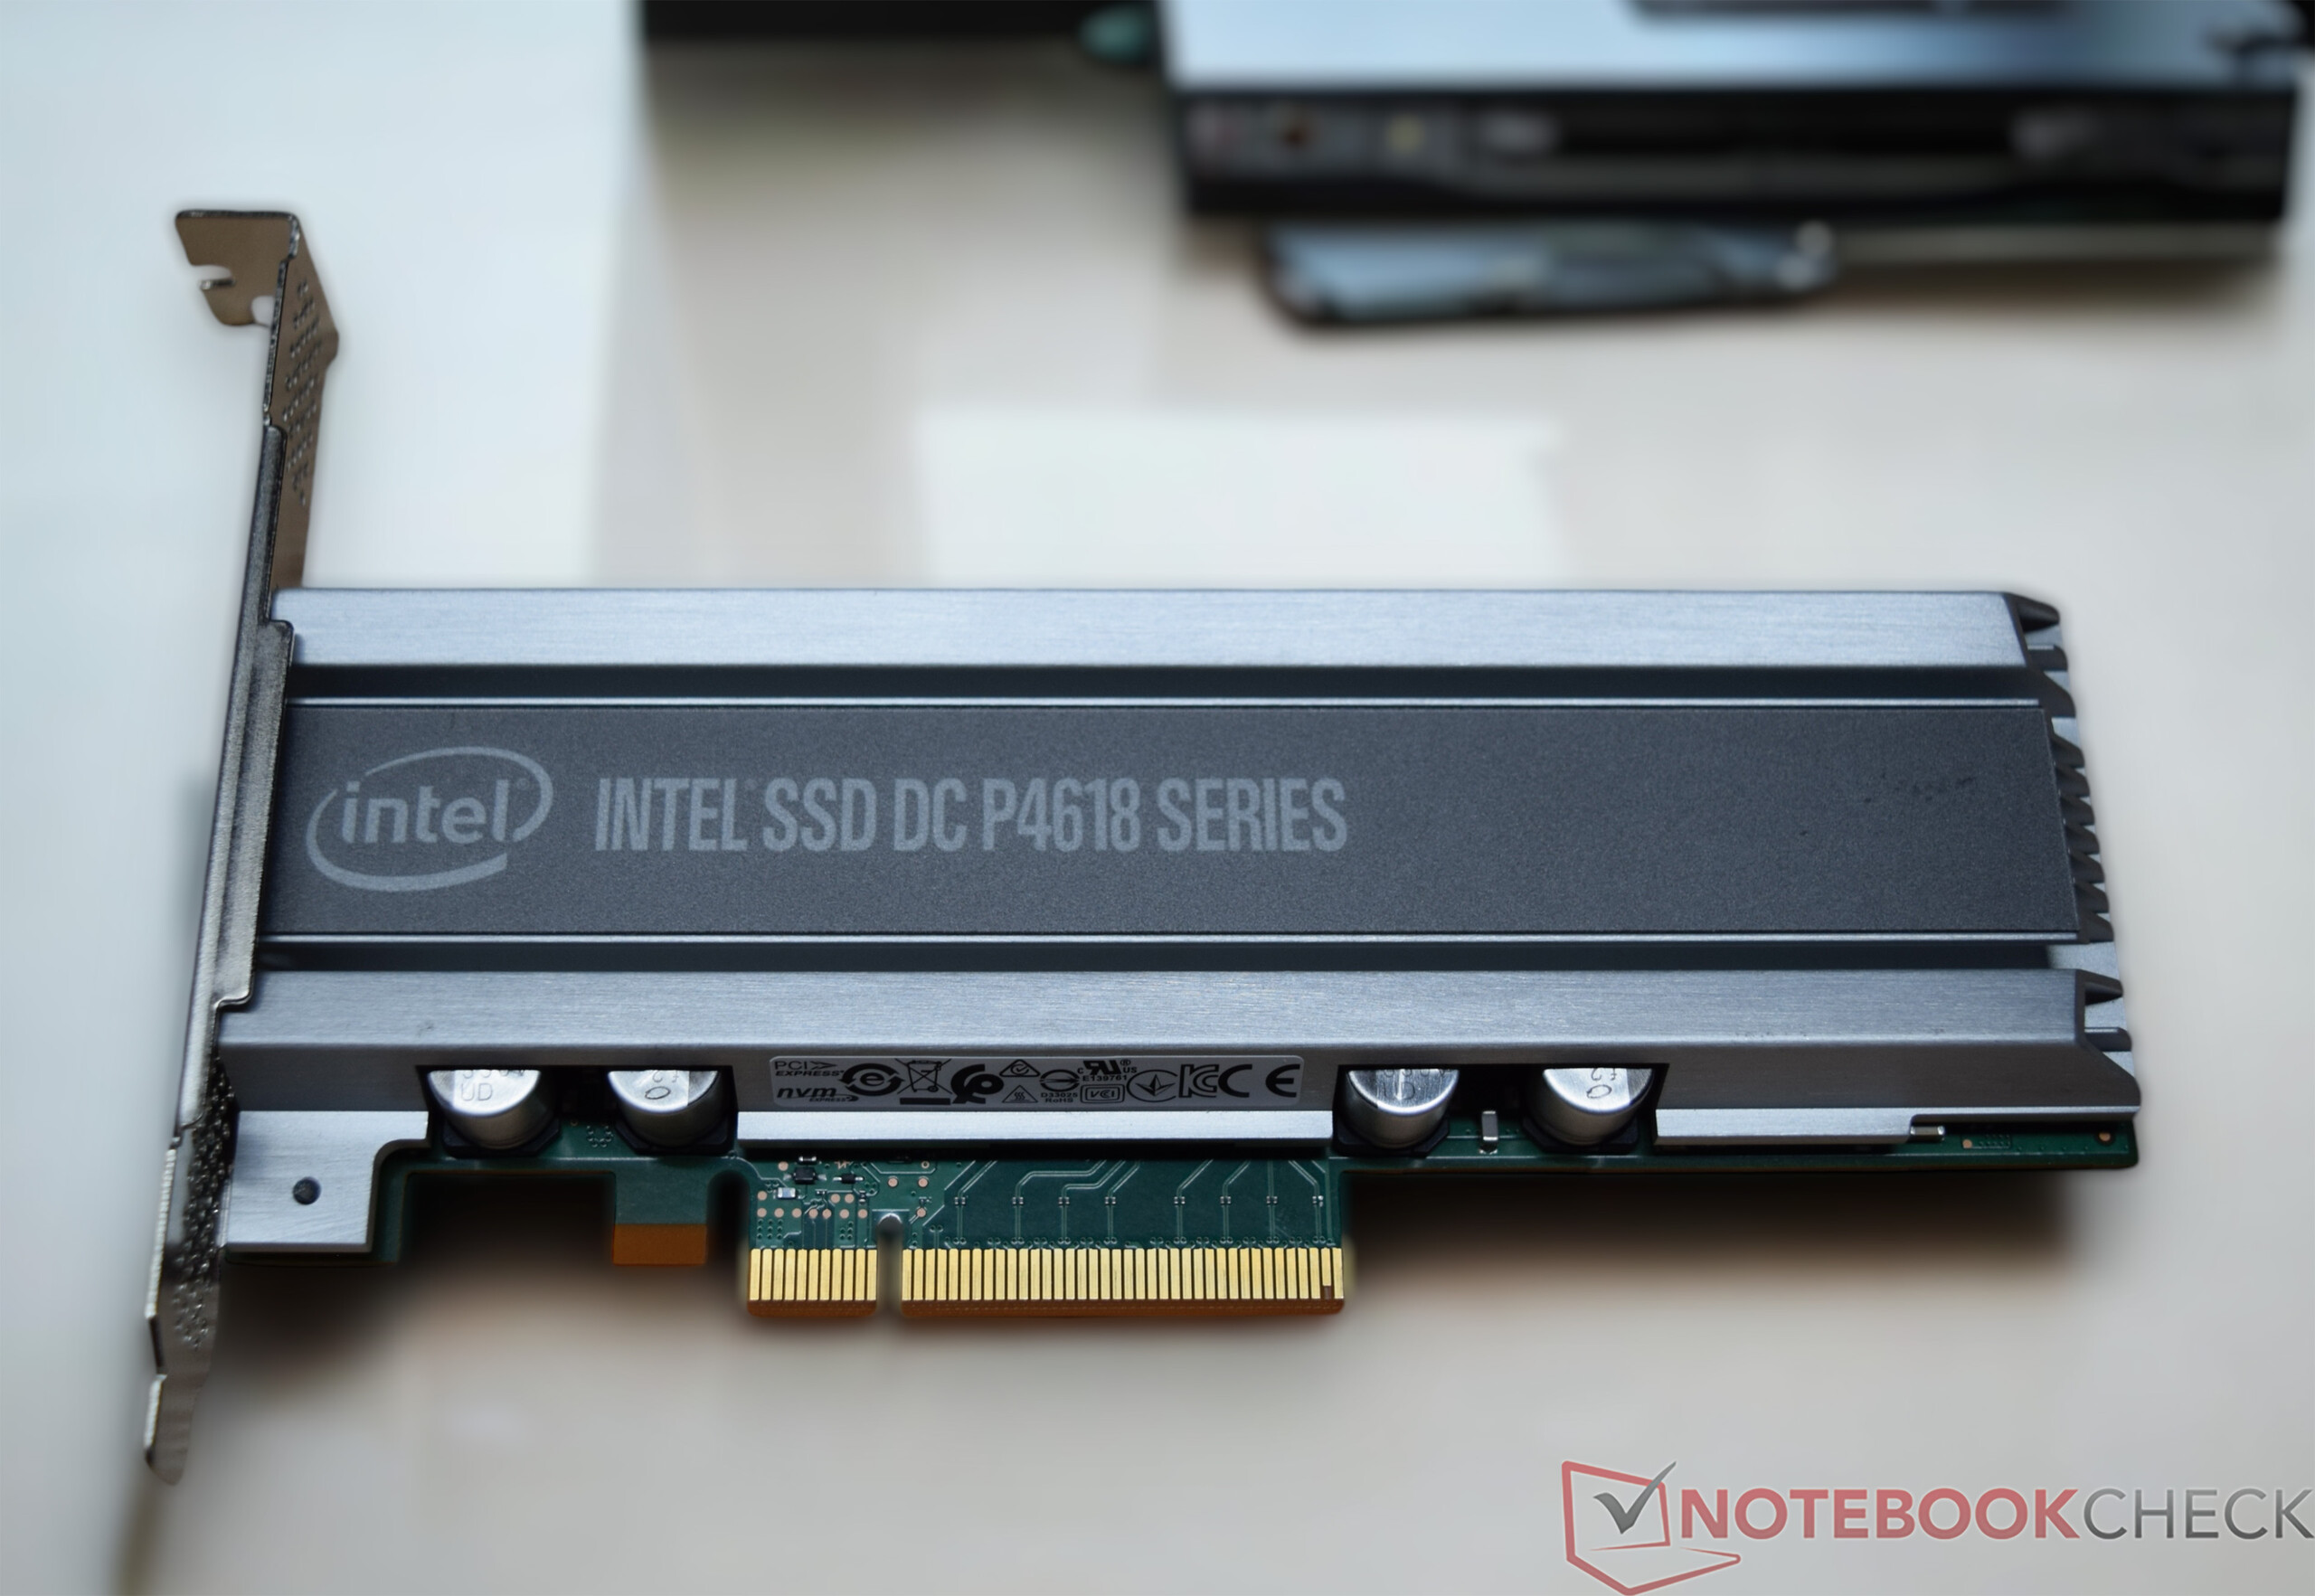
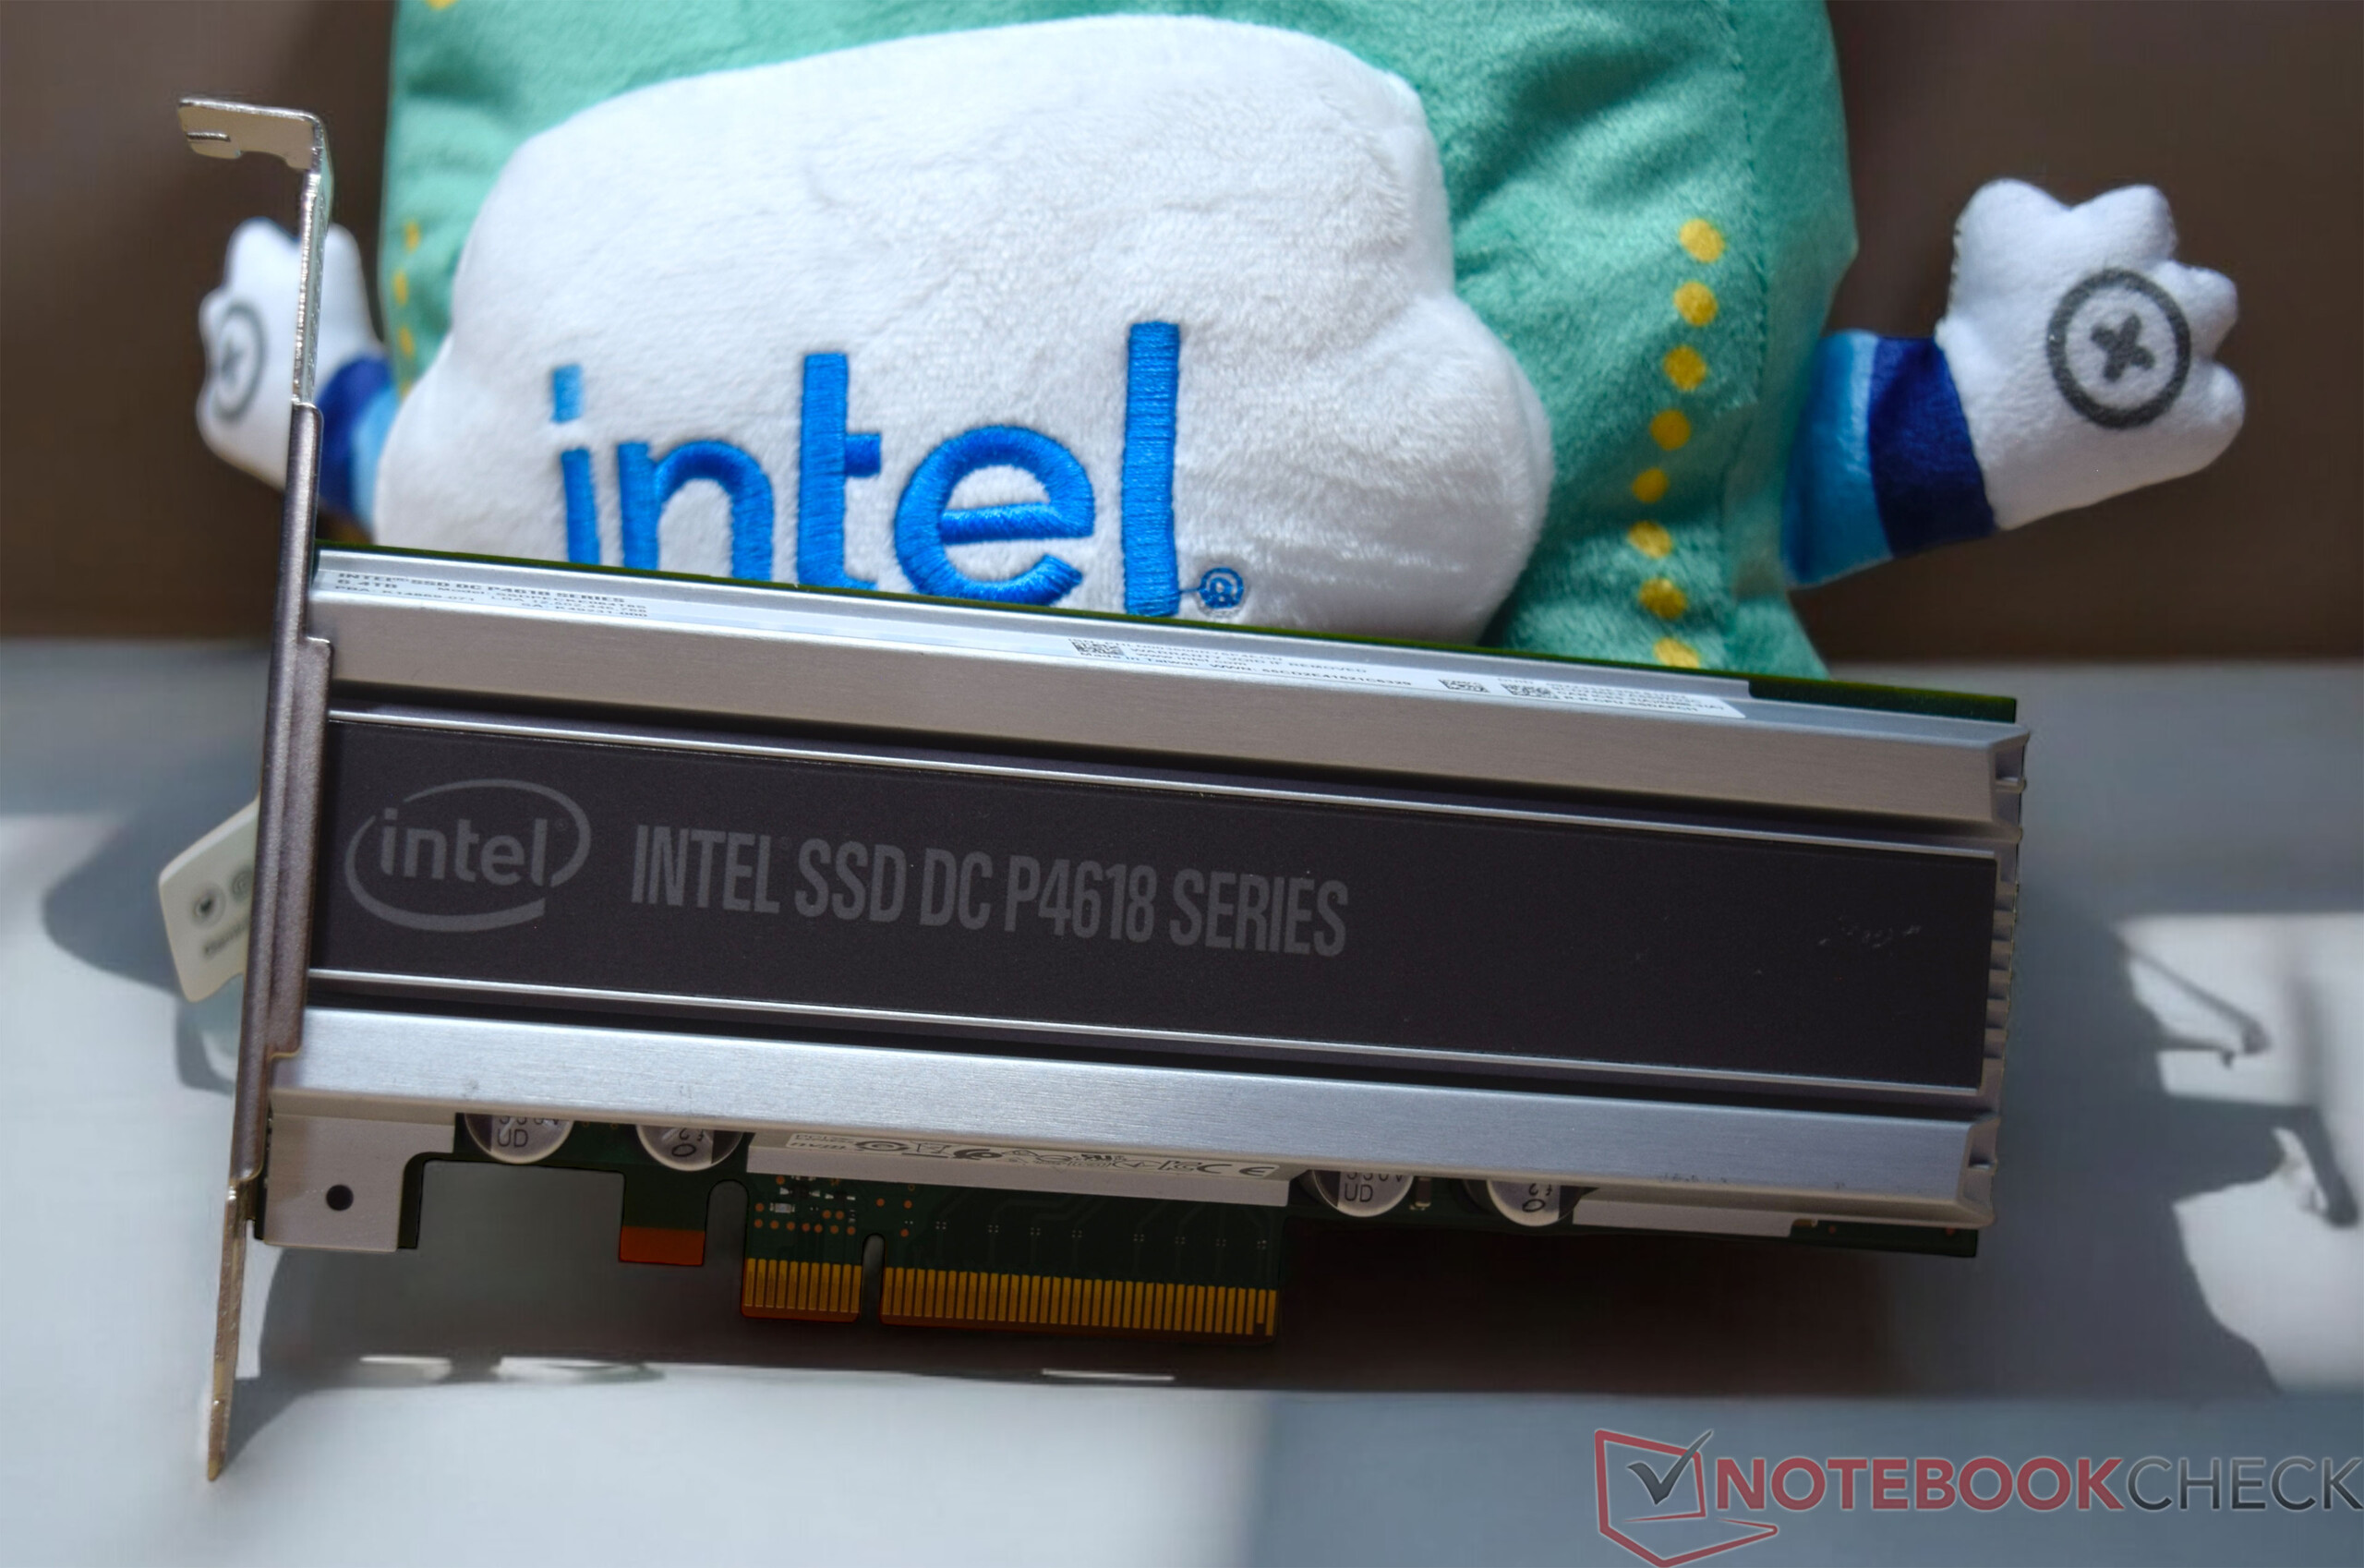
- Intel SSD DC P4618 - 6,4 TB (jogos)
- Microsoft Windows 11 Professional 64-bit (versão 24H2)
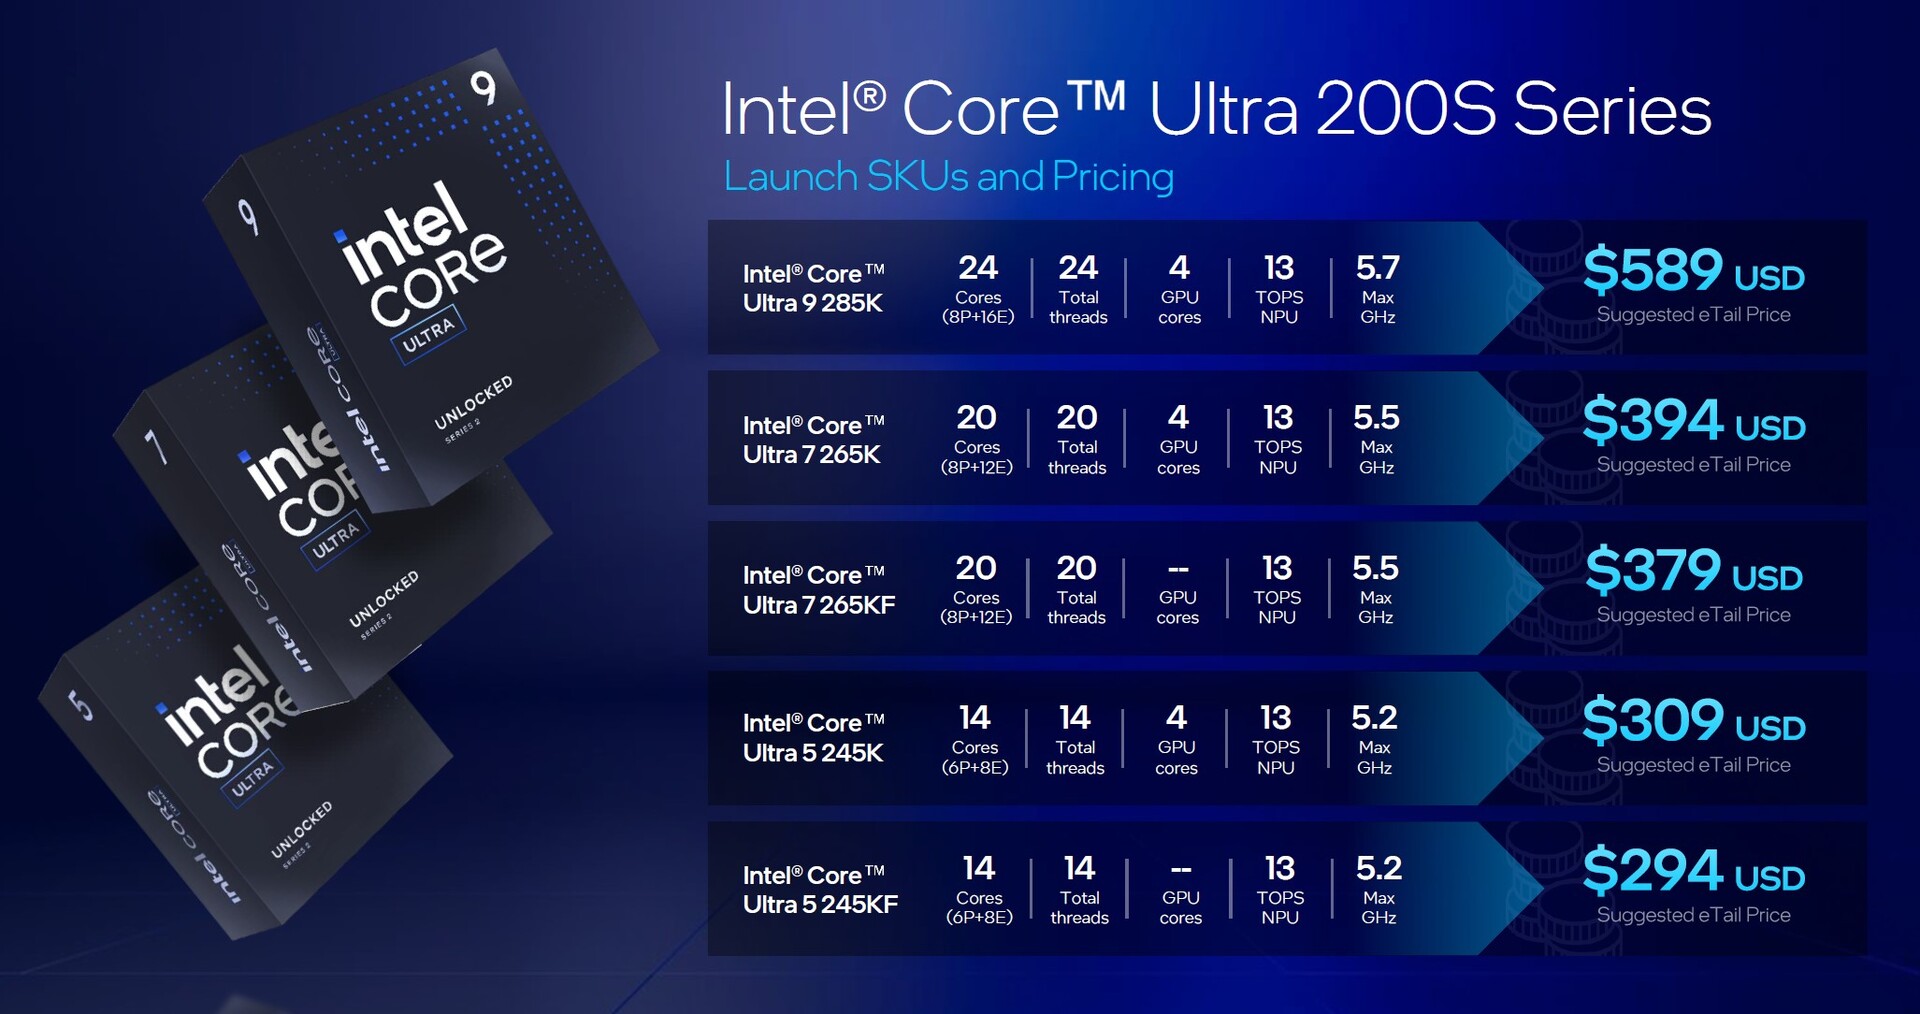
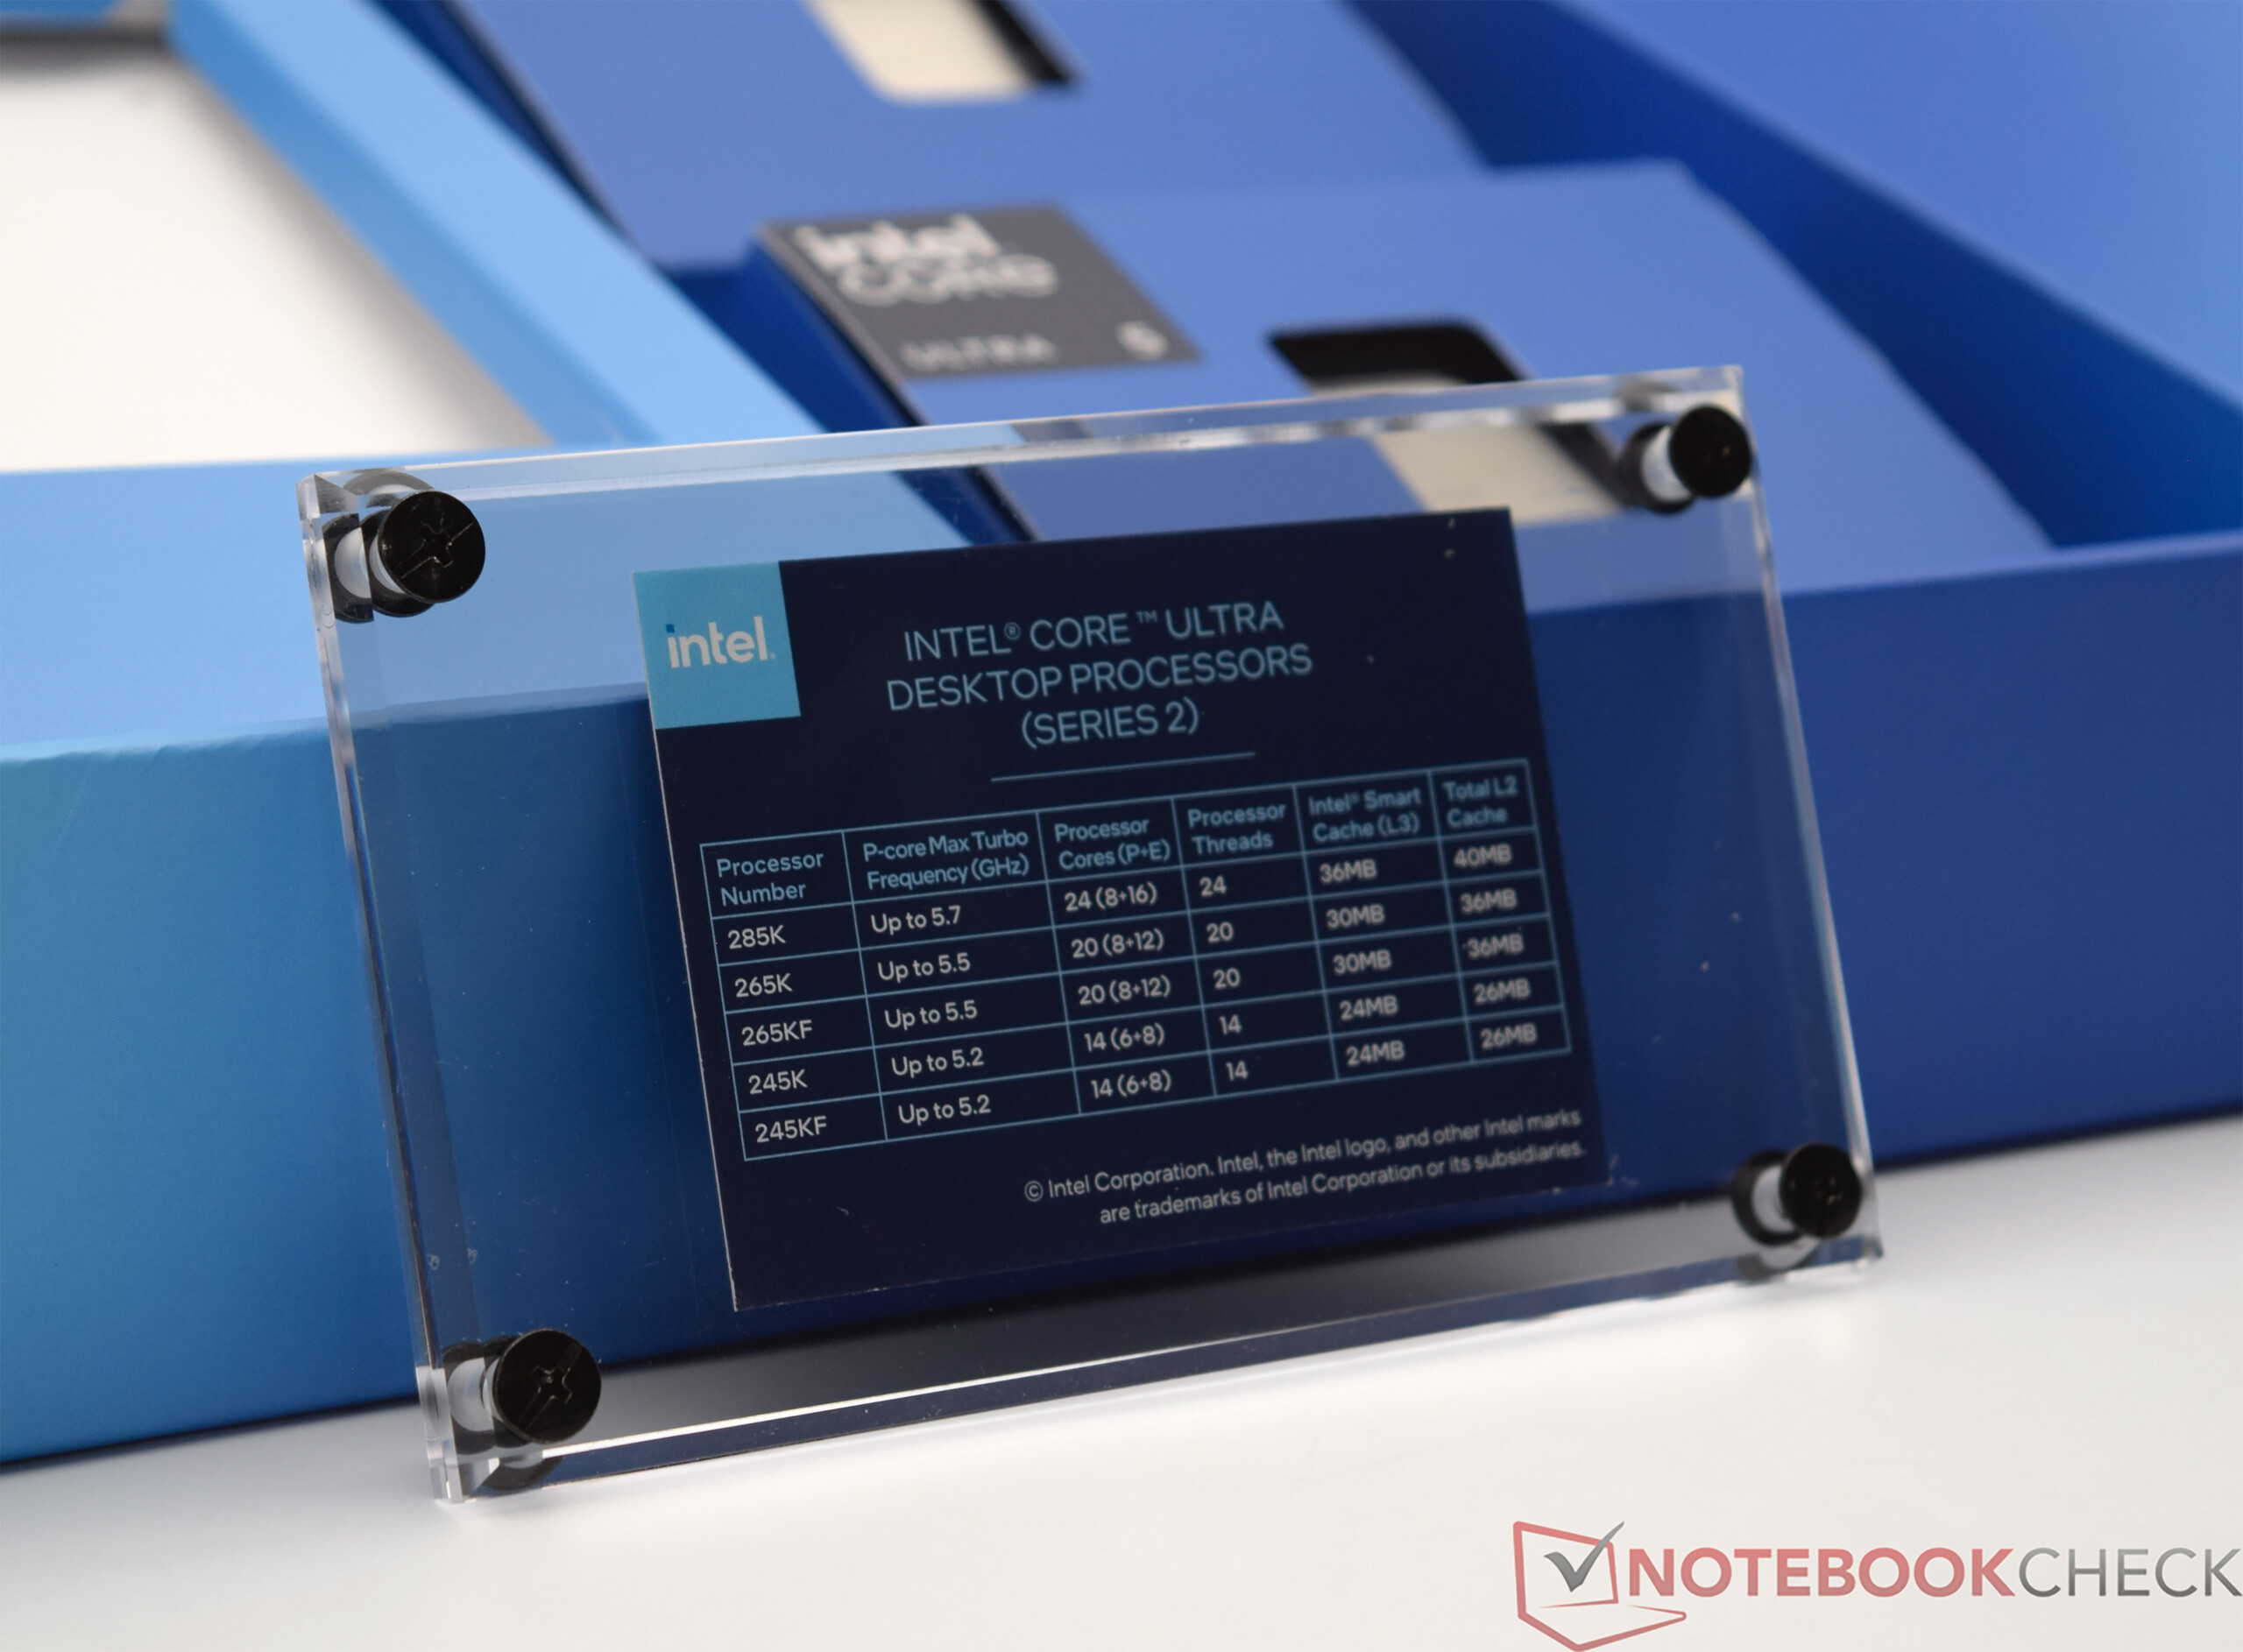
Comparação entre os processadores Intel Arrow Lake S
| Modelo | Cores / Threads |
Clock P-Core / Turbo | Clock E-Core / Turbo | TBMT 3.0 | Cache L2 | Intel Smart Cache | iGPU (4 Xe Cores) | NPU | PBP | MTP | Preço (RRP) |
| Intel Core Ultra 9 285K | 24 (8P + 16E) /24 | 3,7 GHz / 5,5 GHz | 3,2 GHz / 4,6 GHz | 5,6 GHz | 40 MB | 36 MB | 2,0 GHz | 13 TOPS | 125 watts | 250 watts | 589 dólares americanos |
| Intel Core Ultra 7 265K | 20 (8P + 12E) /20 | 3,9 GHz / 5,4 GHz | 3,3 GHz / 4,6 GHz | 5,6 GHz | 36 MB | 30 MB | ,.0 GHz | 13 TOPS | 125 watts | 250 watts | 394 dólares americanos |
| Intel Core Ultra 7 265KF | 20 (8P + 12E) /20 | 3,9 GHz / 5,4 GHz | 3,3 GHz / 4,6 GHz | 5,6 GHz | 36 MB | 30 MB | - | 13 TOPS | 125 watts | 250 watts | 379 dólares americanos |
| Intel Core Ultra 5 245K | 14 (6P + 8E) /14 | 3,9 GHz / 5,4 GHz | 4,2 GHz / 5,2 GHz | 5,2 GHz | 26 MB | 24 MB | 1,9 GHz | 13 TOPS | 125 watts | 159 watts | 309 dólares americanos |
| Intel Core Ultra 5 245KF | 14 (6P + 8E) /14 | 3,9 GHz / 5,4 GHz | 4,2 GHz / 5,2 GHz | 5,2 GHz | 26 MB | 24 MB | - | 13 TOPS | 125 watts | 159 watts | 294 dólares americanos |


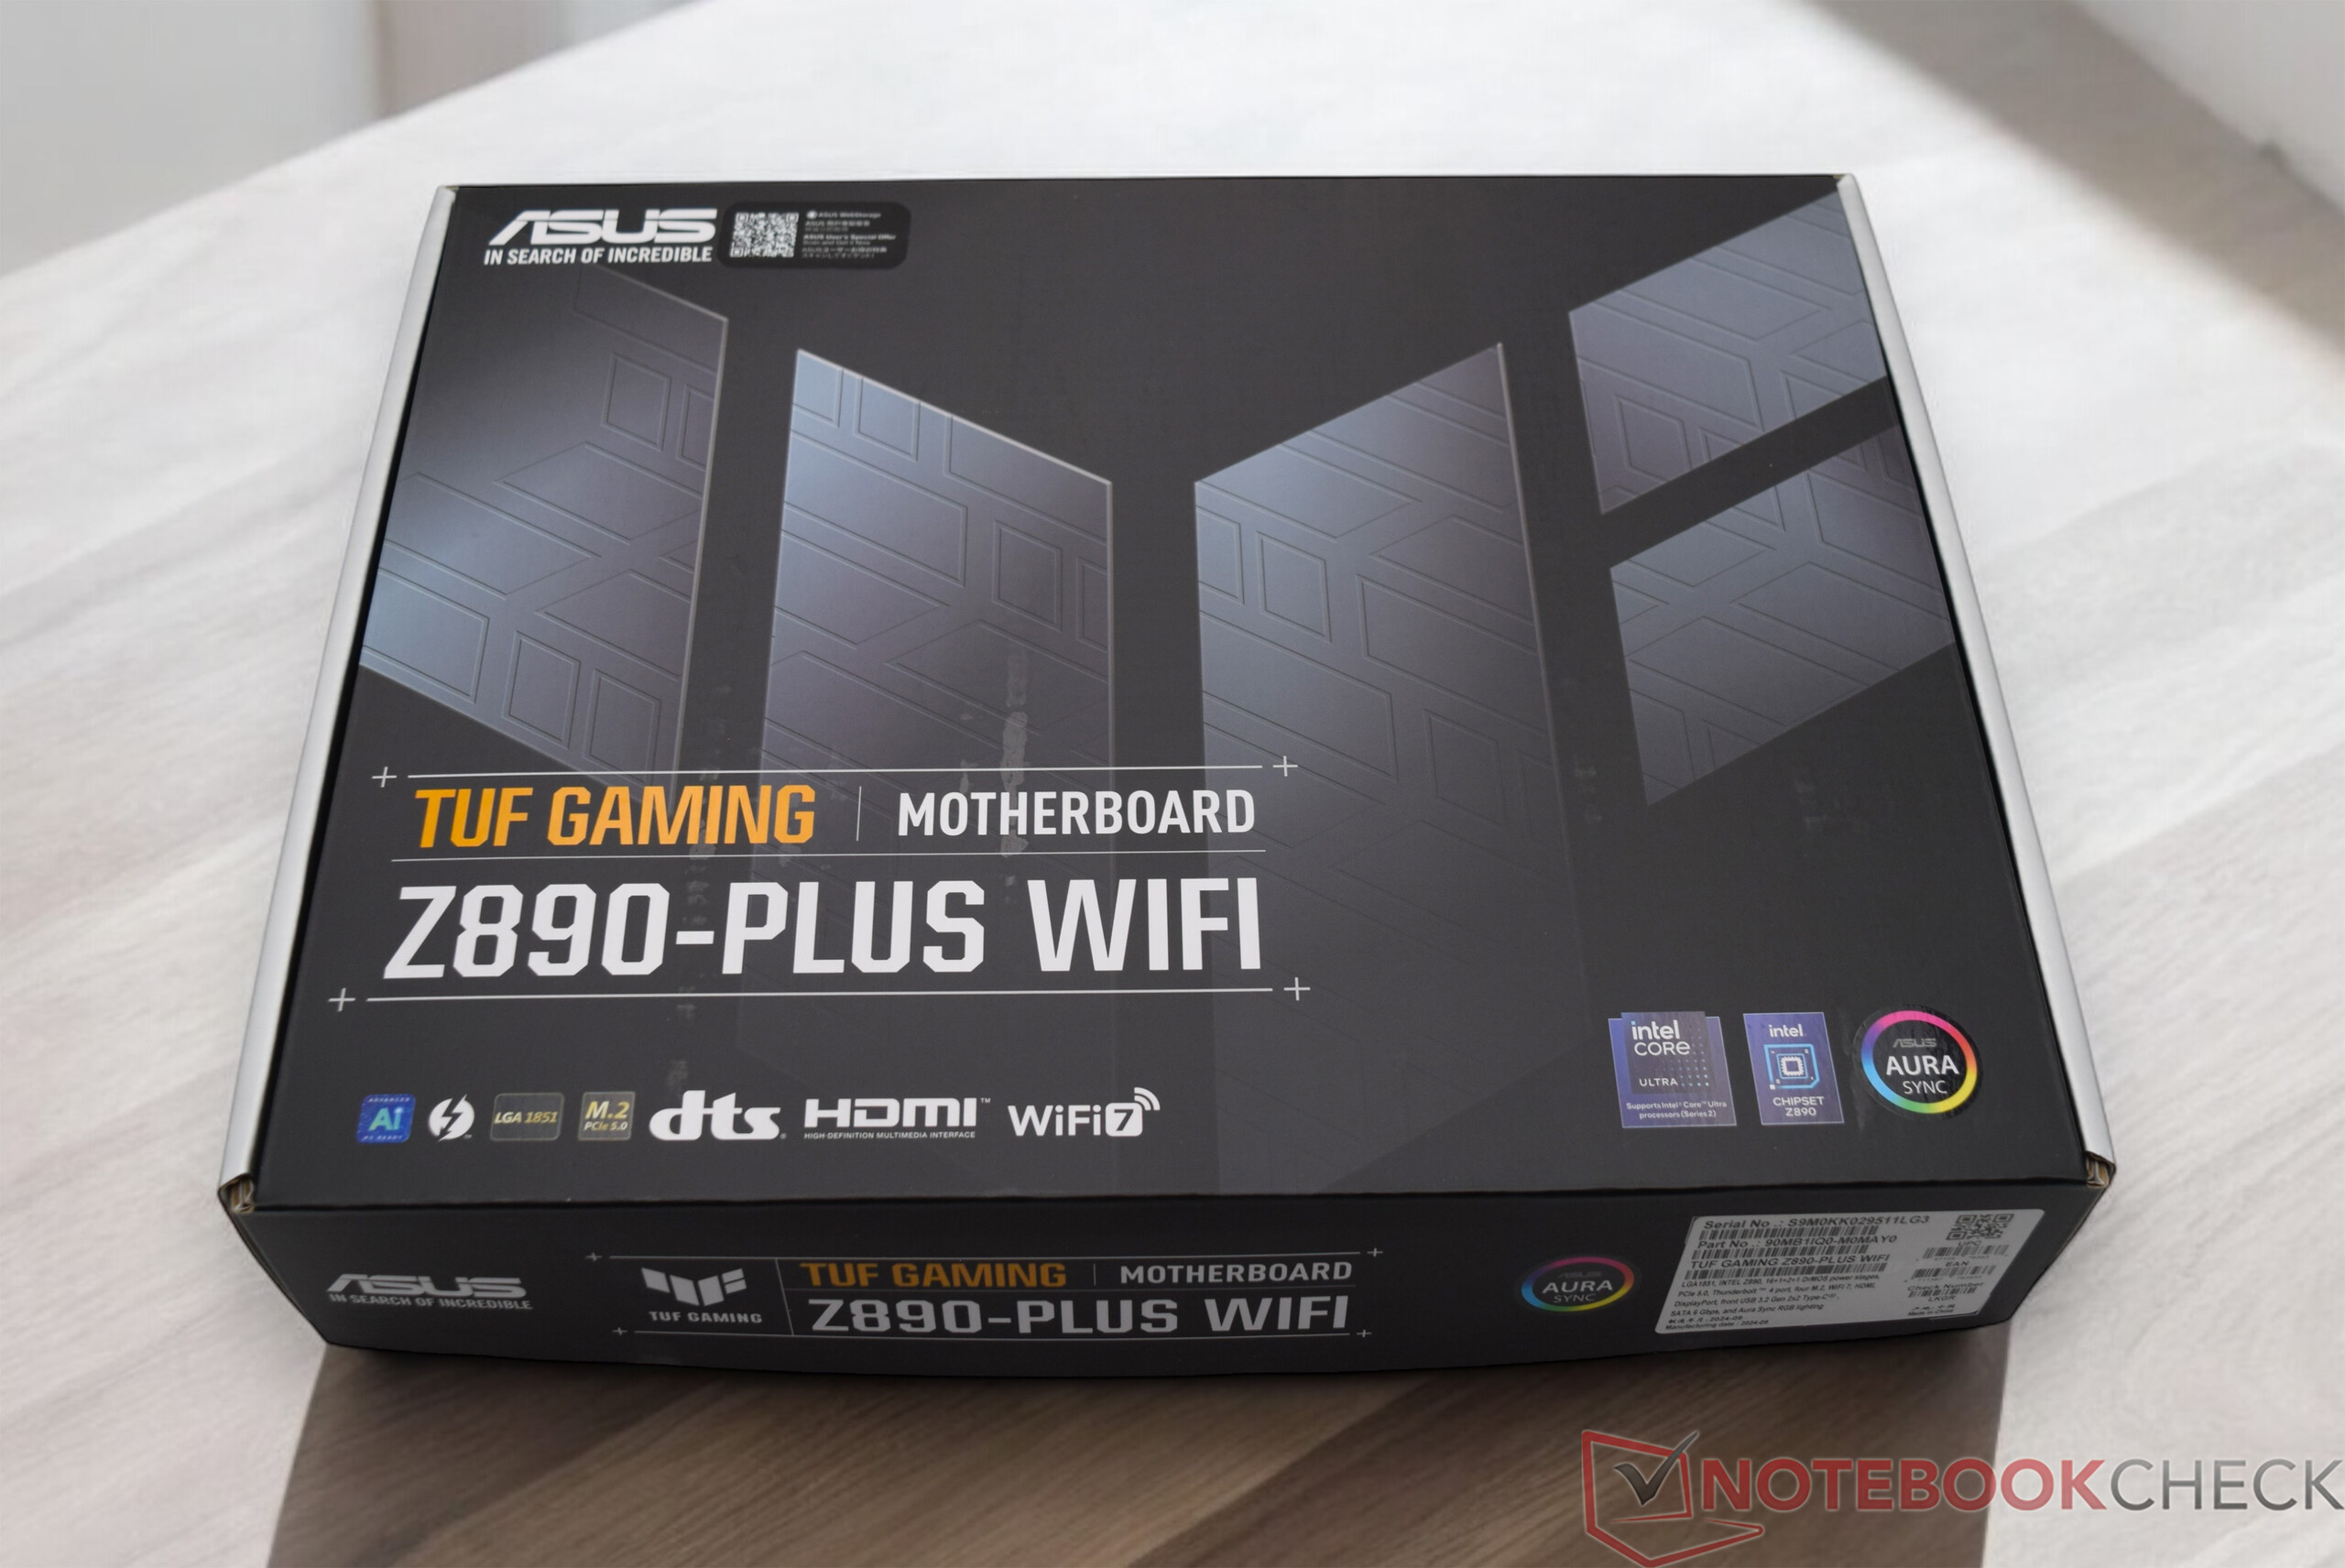
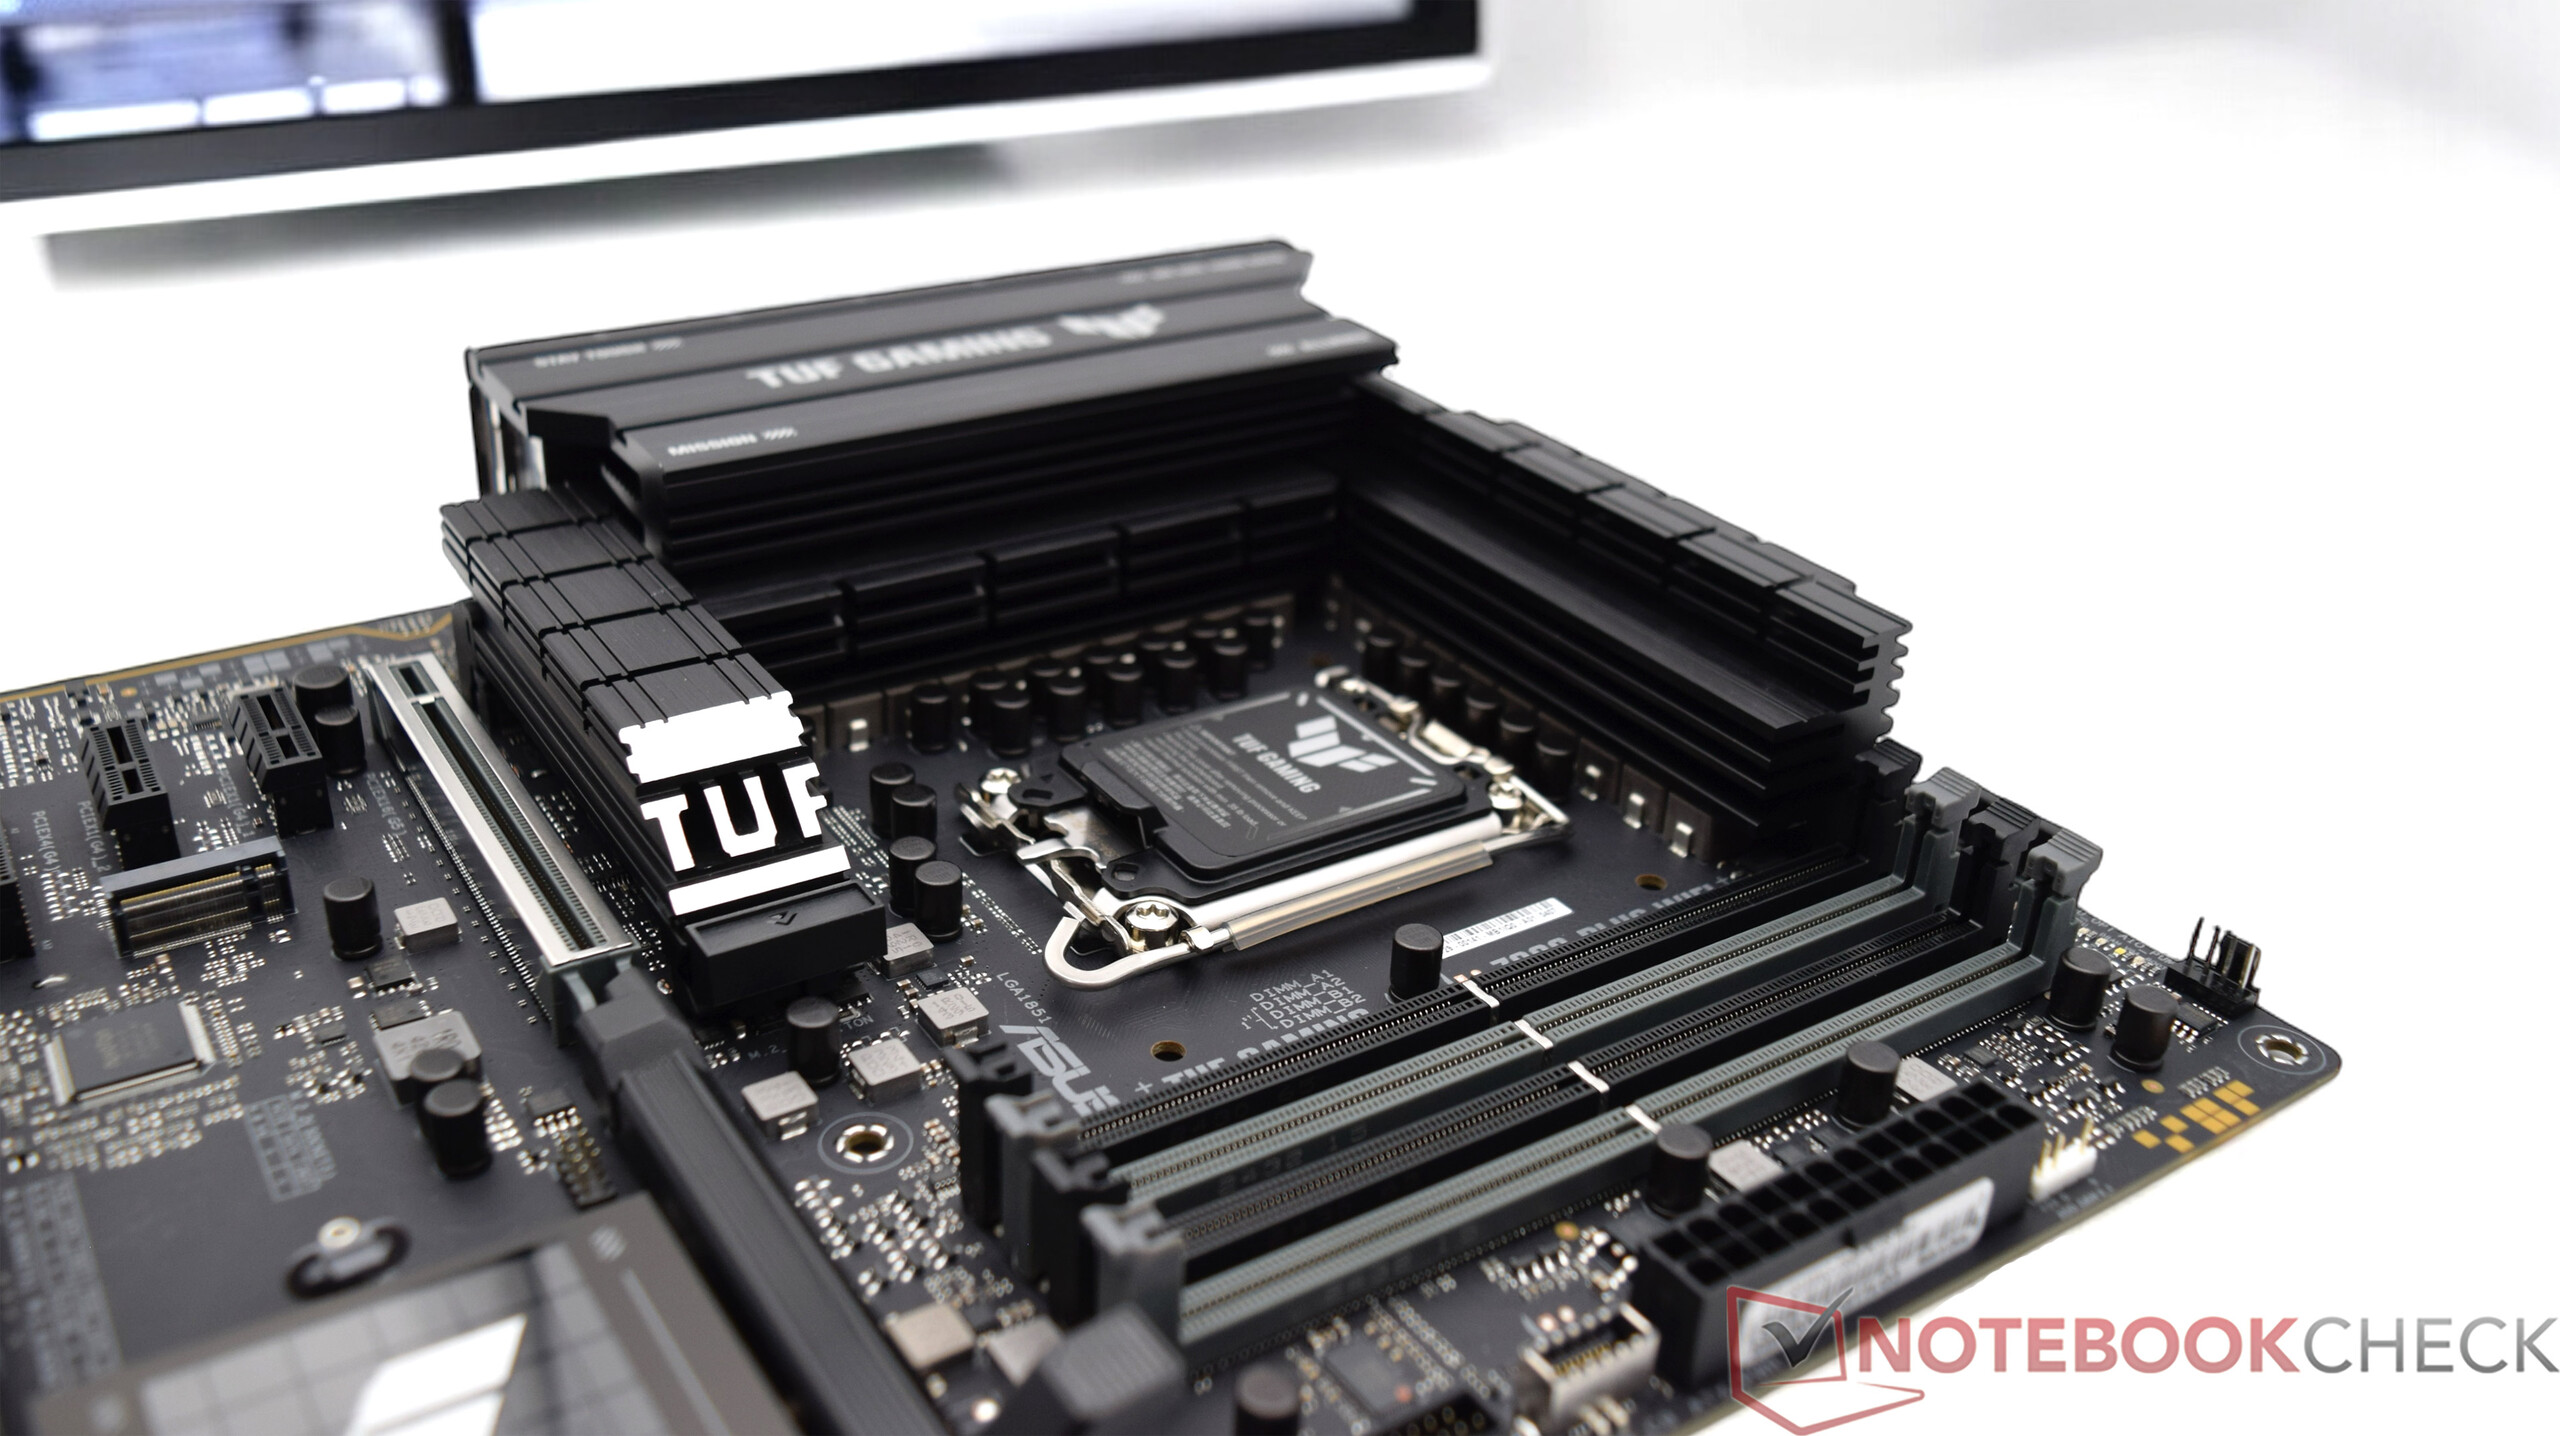
O Asus TUF Gaming Z890-PLUS Wi-Fi
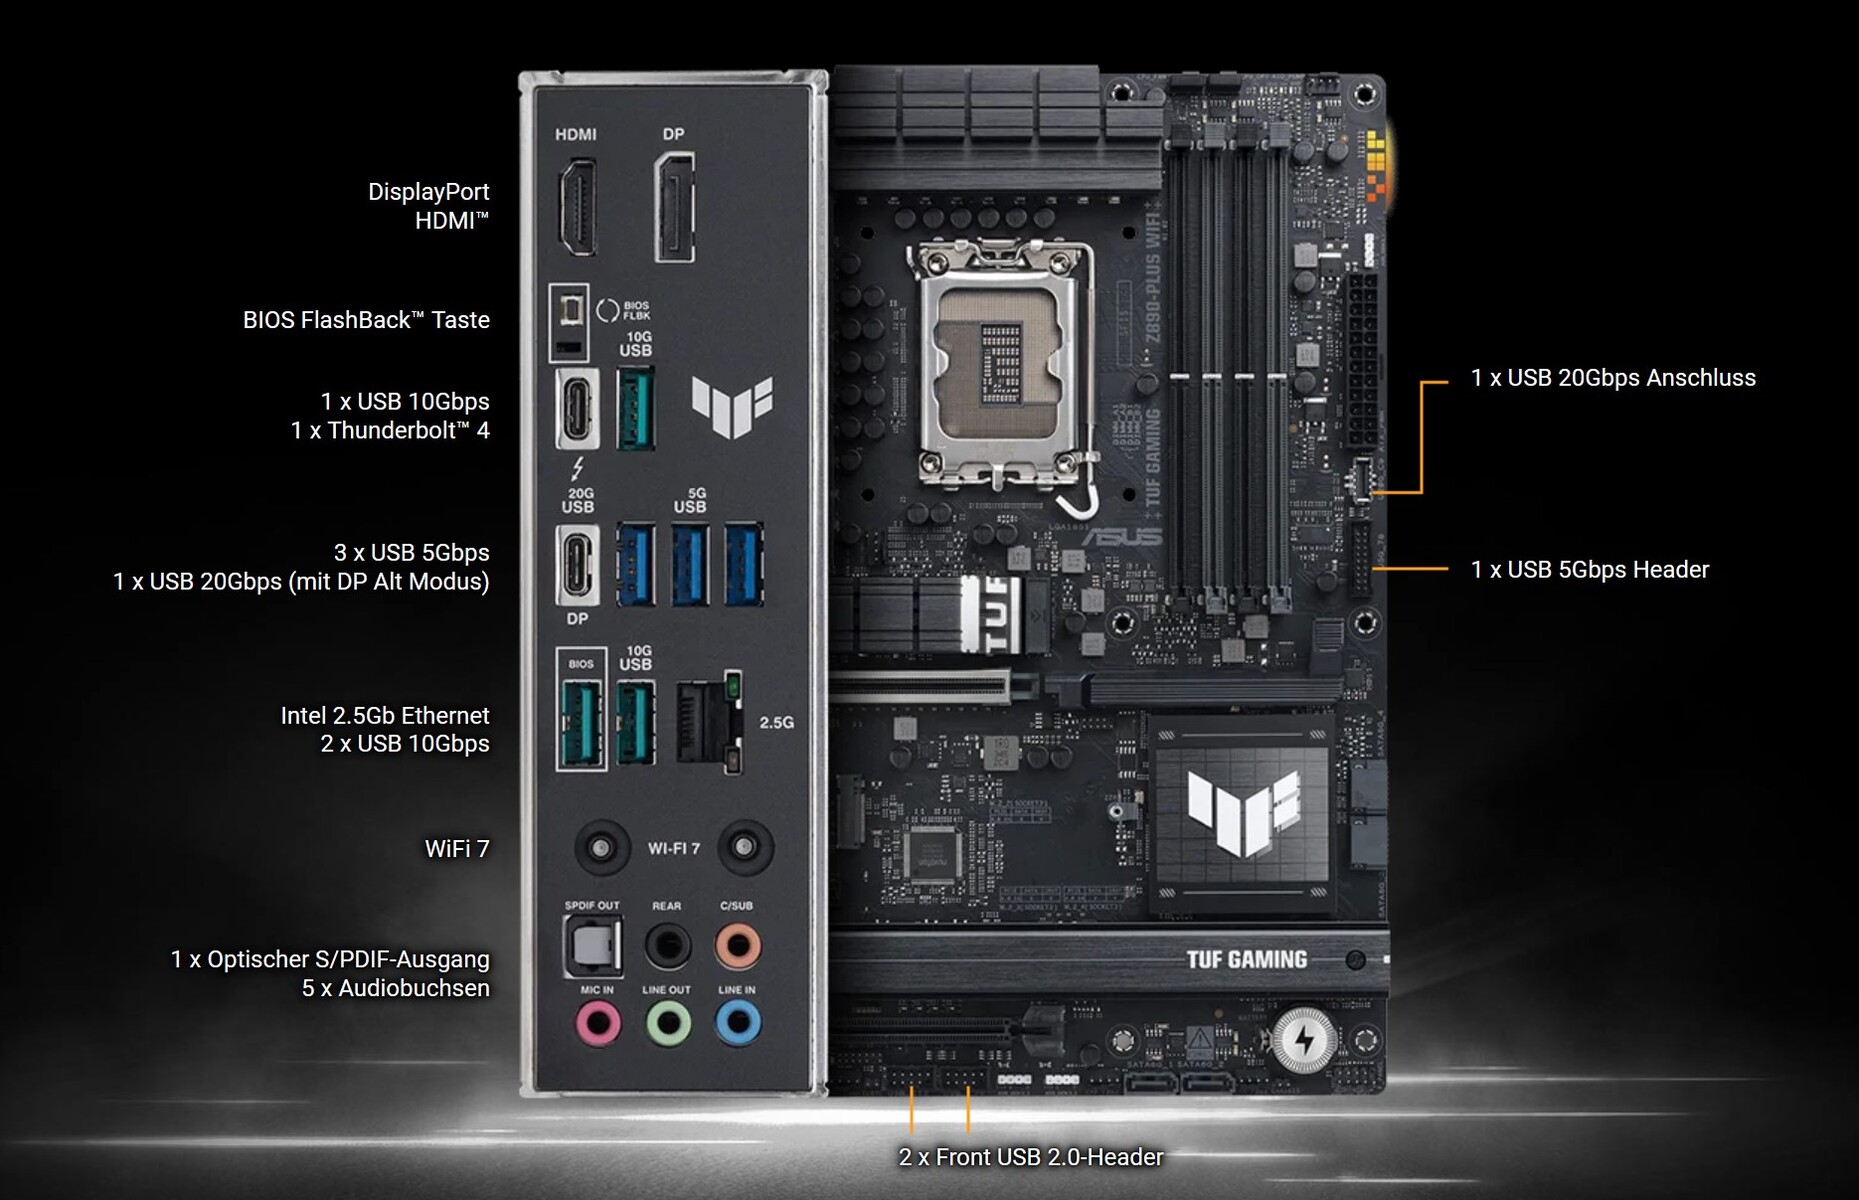
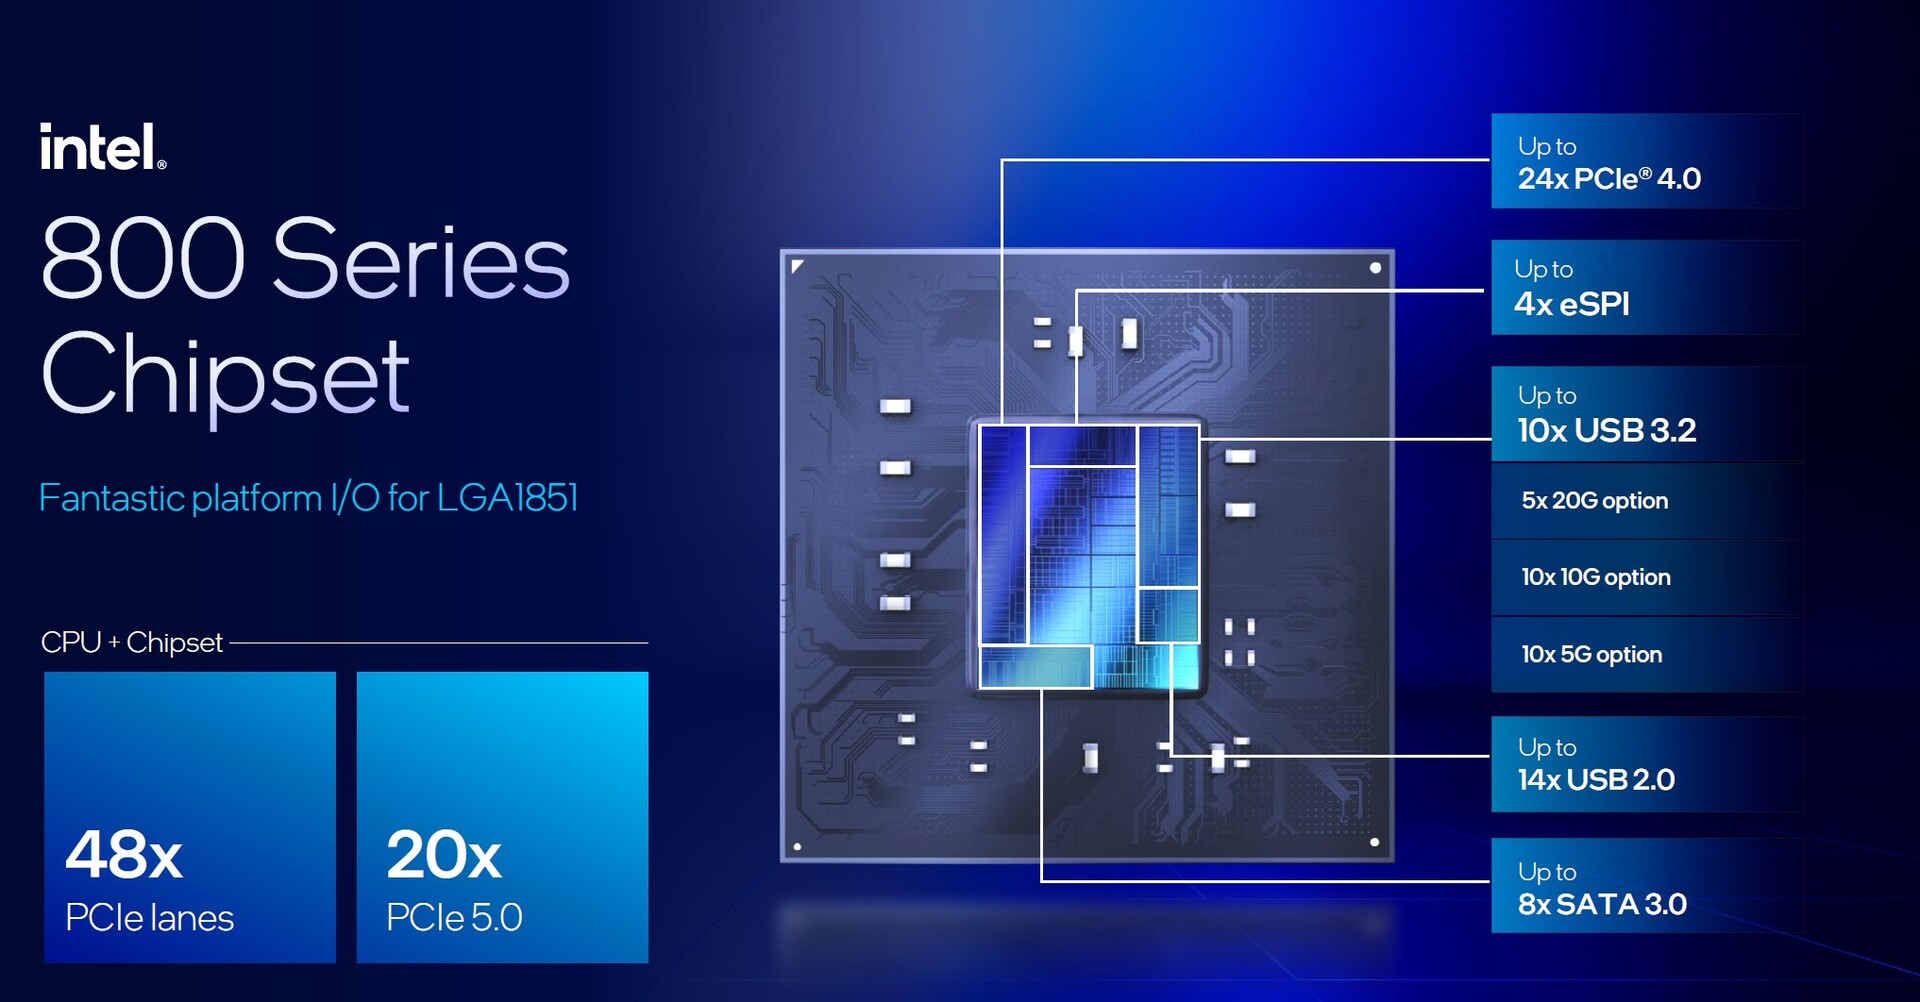
Como já mencionado, todos os processadores Arrow Lake-S usam um novo soquete, o que significa que um novo chipset também foi introduzido. A Asus nos forneceu a placa-mãe TUF Gaming Z890-PLUS Wi-Fi para este teste.
O chipset Z890 é soldado na placa-mãe, o que significa que um total de 48 pistas PCIe está disponível com o processador.
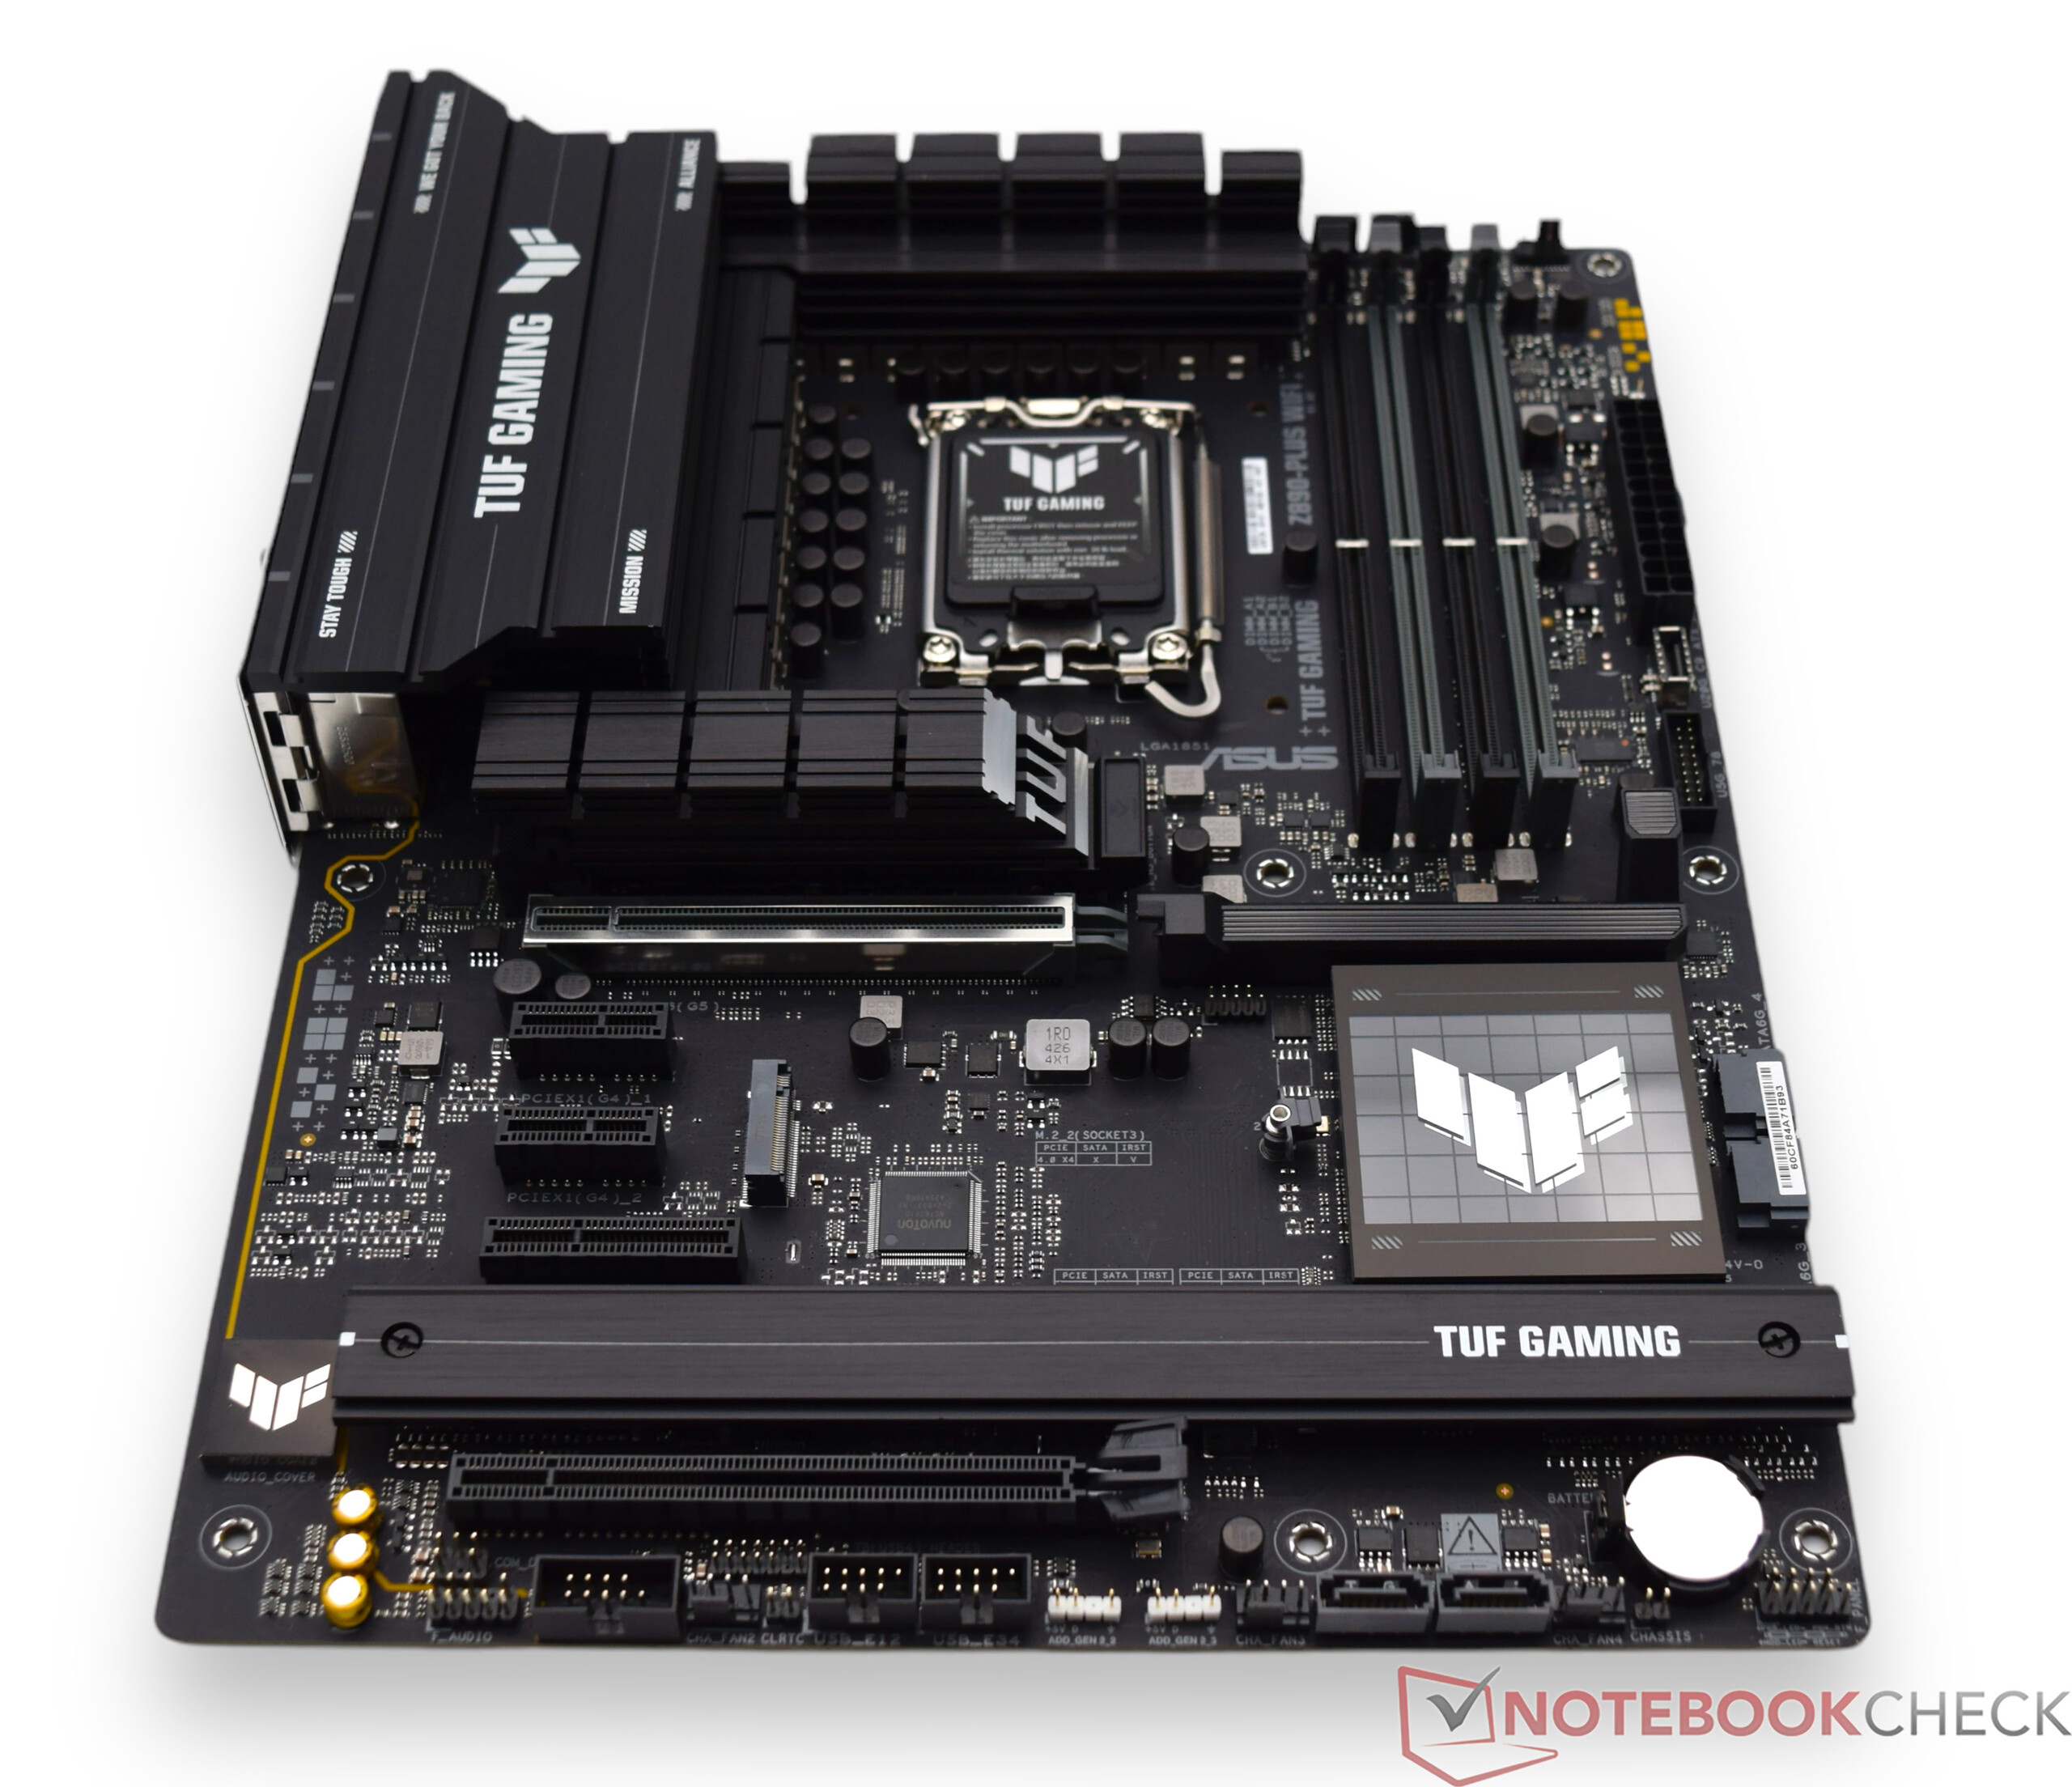
A Asus TUF Gaming Z890-PLUS Wi-Fi faz parte da série TUF da Asus. A placa-mãe predominantemente preta é aprimorada com alguns detalhes em prata, embora não haja elementos iluminados na parte frontal.
No entanto, a iluminação RGB não está completamente ausente, pois há alguns LEDs na parte traseira, que também se acendem quando o sistema não está ligado. No entanto, isso pode ser desativado no BIOS.
O Asus TUF Gaming Z890-PLUS Wi-Fi suporta RAM DDR5 com altas taxas de clock de até 8.600 MT/s e mais. Até 192 GB são possíveis quando todos os quatro slots de RAM estão totalmente carregados. No entanto, é preciso prestar atenção à compatibilidade, portanto, vale a pena verificar com antecedência a QVL (Qualified Vendor List) da placa-mãe correspondente.
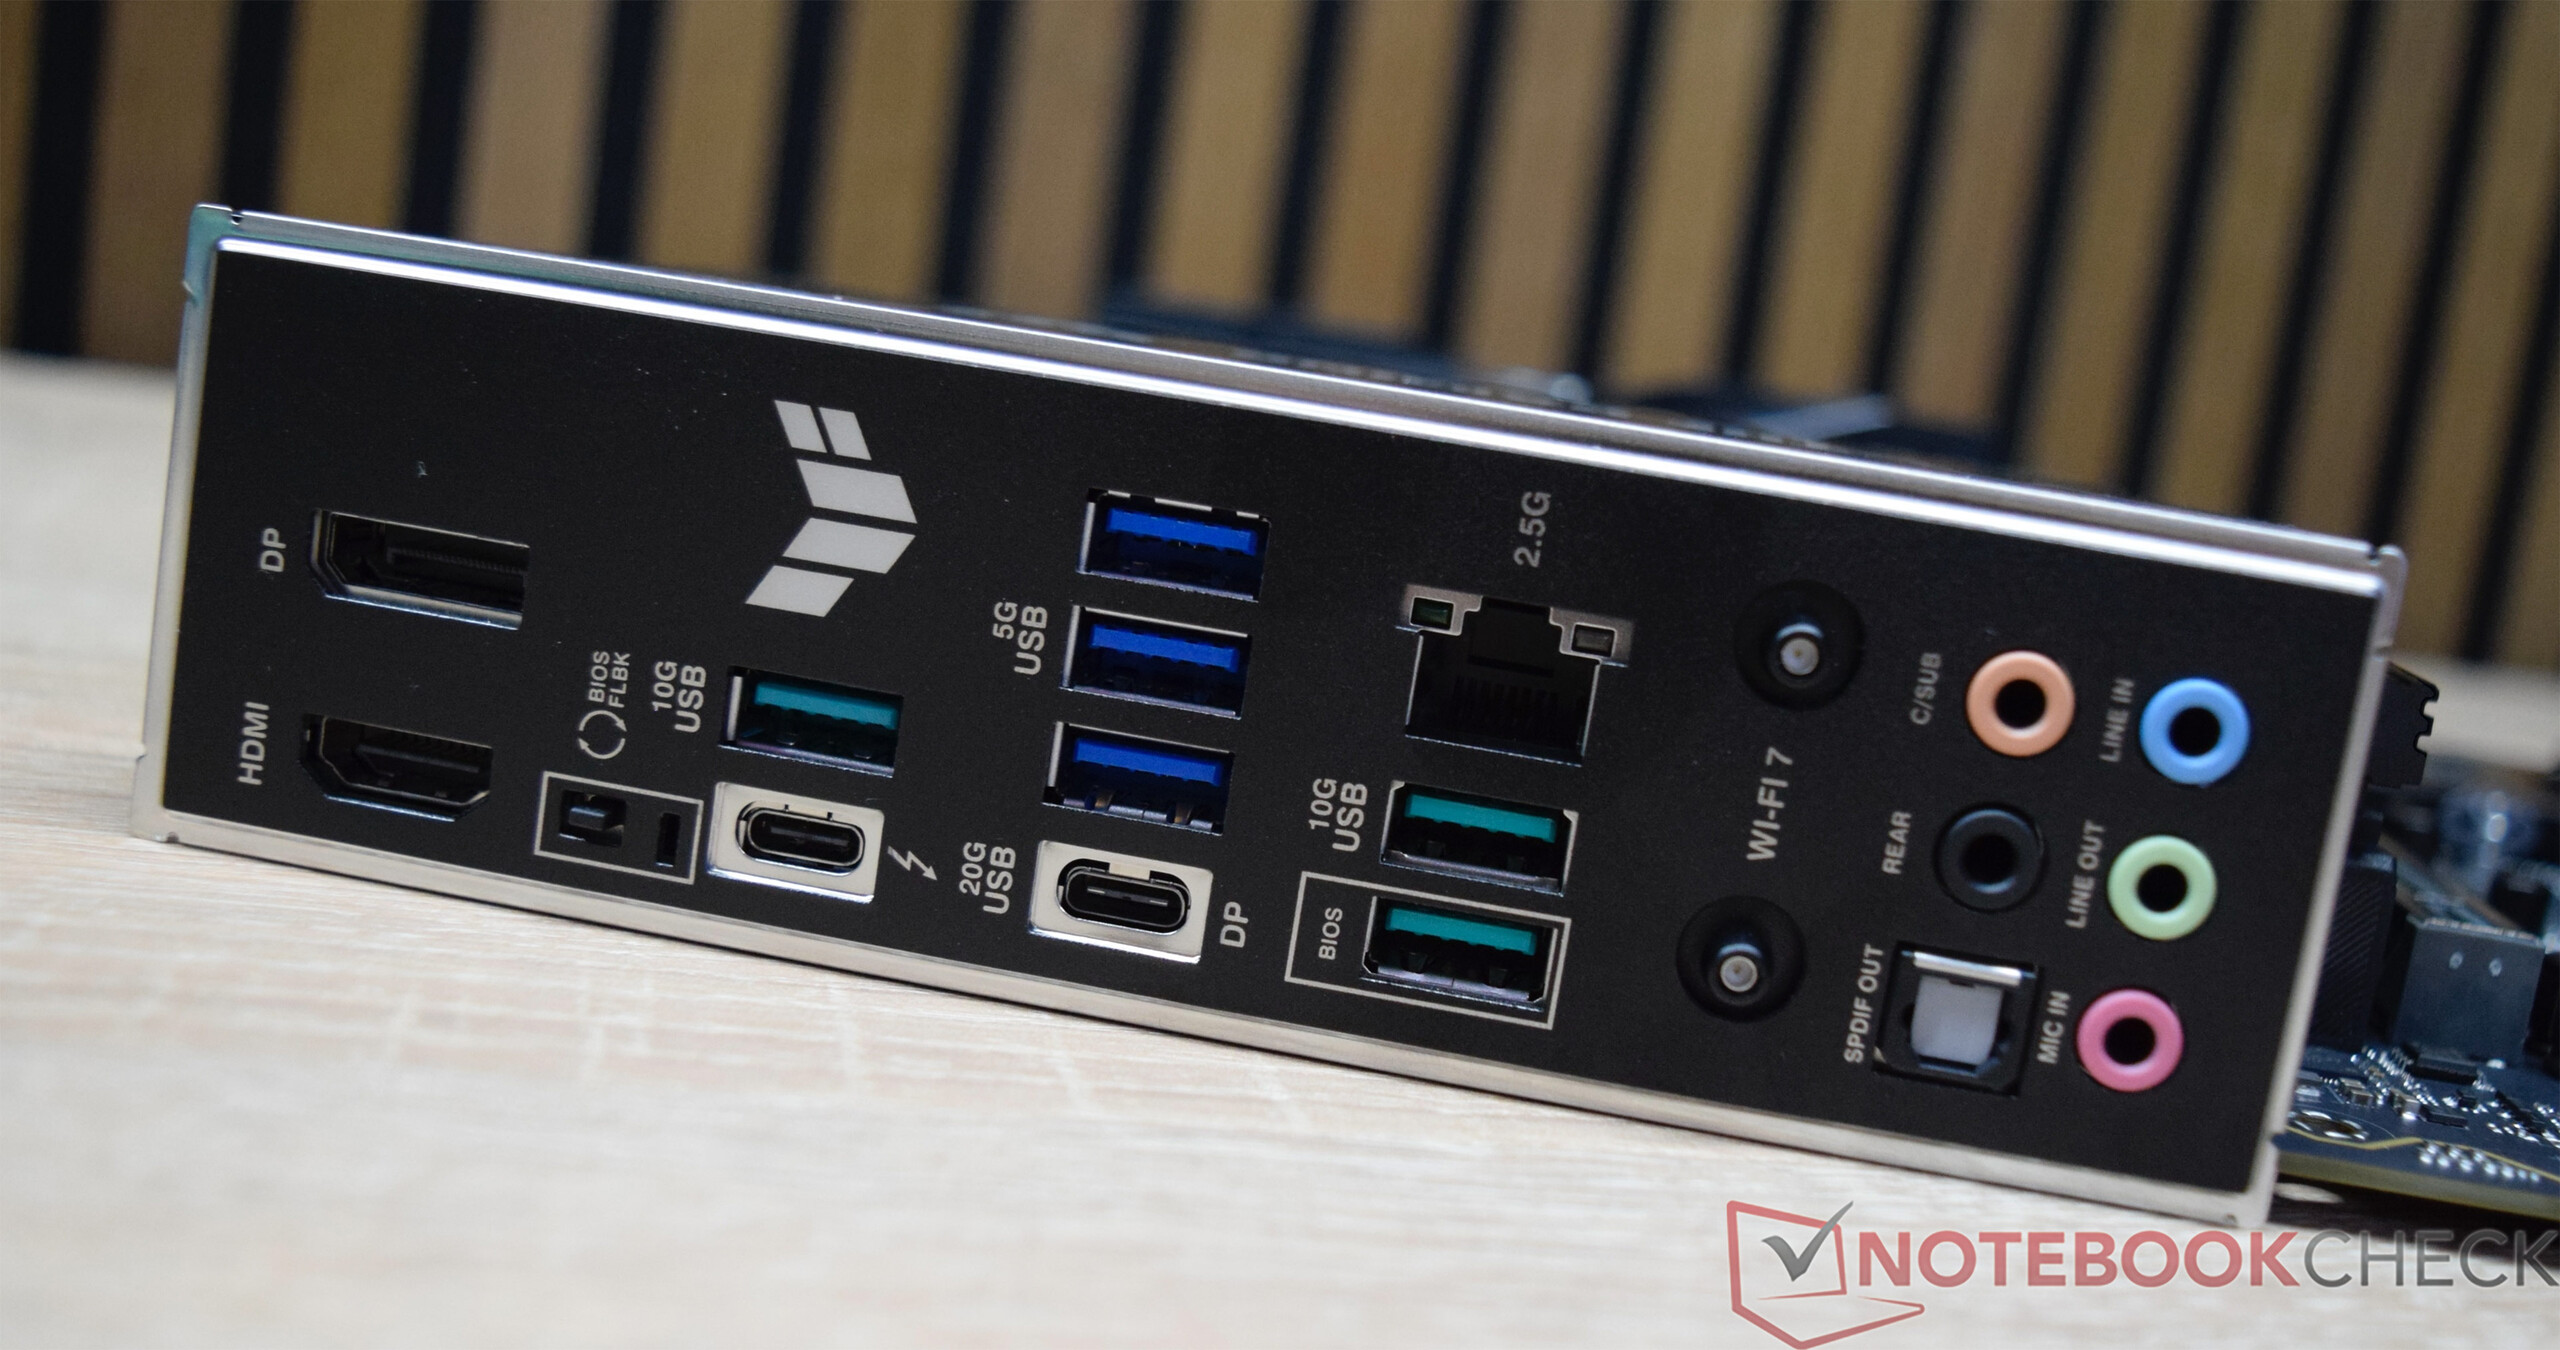
A placa-mãe oferece uma ampla variedade de conexões, incluindo várias portas USB 3 e uma porta USB 4.0. Há também uma LAN 2,5G para a conexão de rede com fio, embora o padrão Wi-Fi 7 mais recente seja oferecido para a rede sem fio.
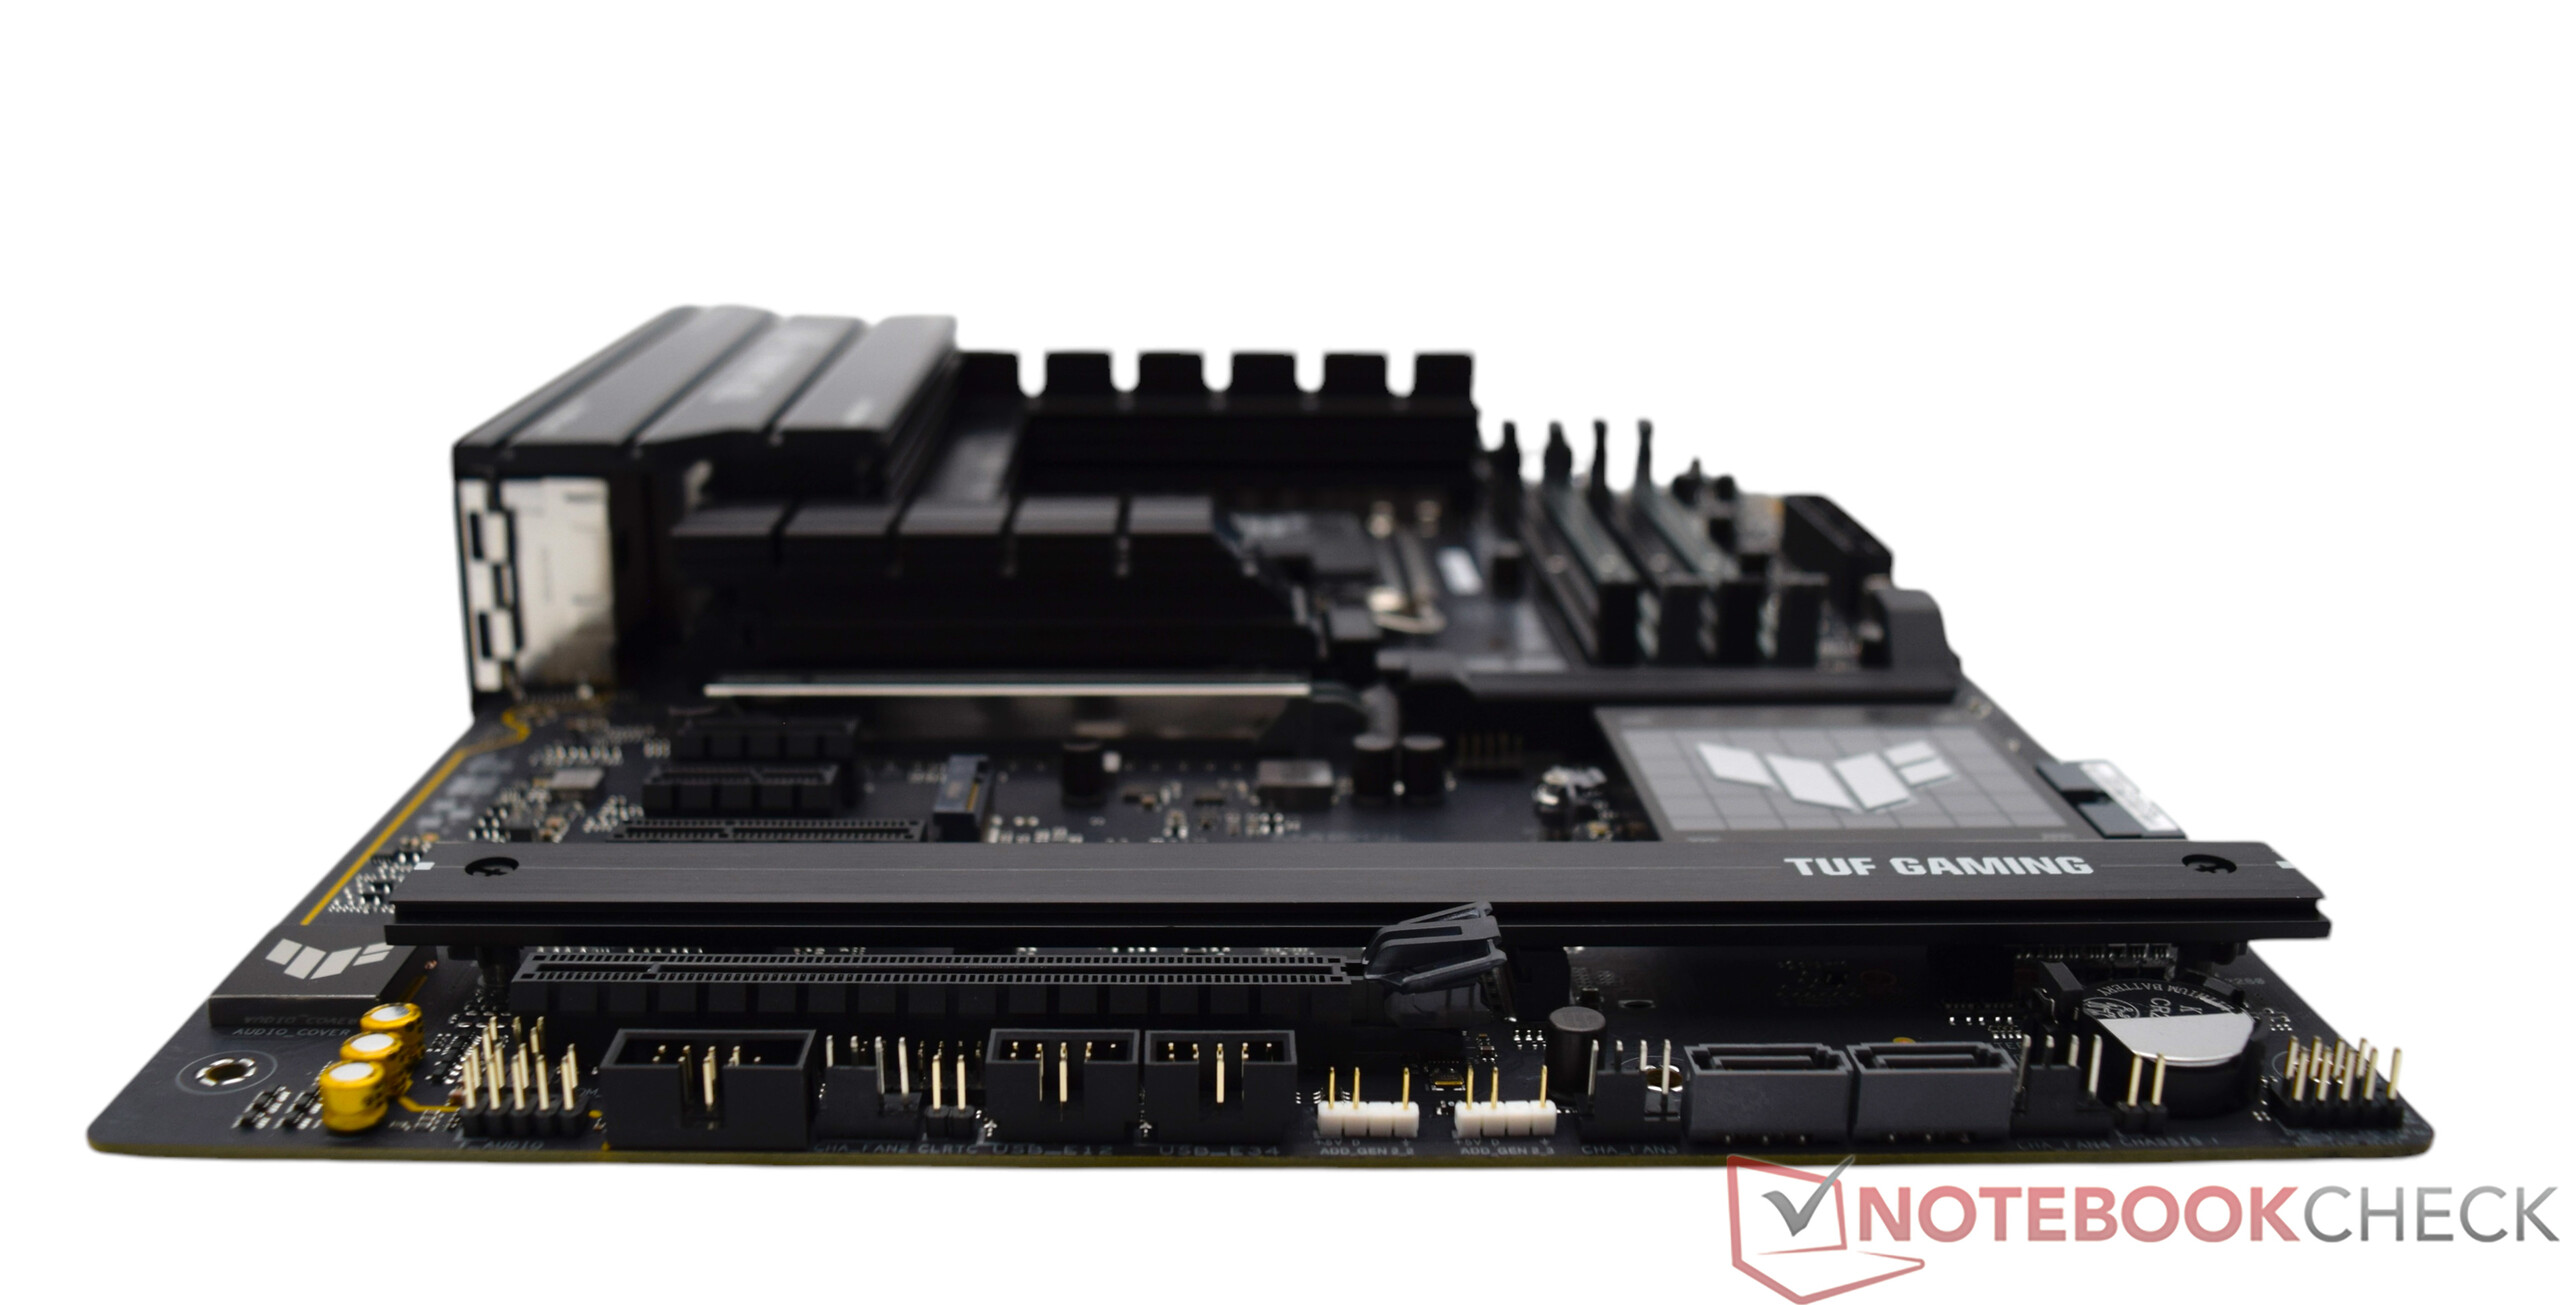
Há vários dissipadores de calor em toda a placa, o que, por um lado, caracteriza o visual, mas, por outro, destina-se principalmente a dissipar o calor. Um recurso especial que vale a pena mencionar é que pelo menos o dissipador de calor do SSD acima do slot da placa de vídeo pode ser removido rapidamente e sem ferramentas.
A placa de vídeo também pode ser destravada e removida do slot sem problemas usando o Q-release. Infelizmente, essa desmontagem sem ferramentas não é completa, pois o dissipador de calor na área inferior está parafusado.
O Asus TUF Gaming Z890-PLUS Wi-Fi está listado na Amazon por 378 euros e na Amazon US por 320 dólares. Isso significa que o fabricante está cobrando atualmente quase 140 euros a mais do que o senhor teria que pagar pelo Asus TUF Gaming Z790-Plus Wi-Fi.


Condições de teste
Realizamos todos os testes de desempenho com o perfil de energia Ultimate Performance
. Também selecionamos as configurações padrão da Intel
no BIOS.
Isso significa que o Intel Core Ultra 5 245K opera dentro das especificações fornecidas pelo fabricante. Usamos um sistema de resfriamento a água em loop personalizado como unidade de resfriamento, que já havia sido usado da mesma forma em testes anteriores de desempenho da CPU.
Benchmarks de processador
Vamos agora dar uma olhada no desempenho do Intel Core Ultra 5 245K nos benchmarks de CPU brutos. Fica imediatamente evidente que a nova CPU Arrow Lake-S não consegue se diferenciar de sua antecessora.
Na comparação de desempenho, o Intel Core Ultra 5 245K está em pé de igualdade com o Intel Core i5-14600K. Ambos os processadores têm 14 unidades físicas de computação, que são divididas em 6 núcleos P e 8 núcleos E. No entanto, a Intel dispensou completamente o hyperthreading em seus processadores mais recentes.
Mesmo assim, a Intel consegue obter um desempenho idêntico na comparação do desempenho médio da CPU em comparação com o Intel Core i5-14600K pode ser alcançado. Se voltarmos ainda mais na linha do tempo, o Intel Core Ultra 5 245K pode até competir com o antigo carro-chefe de 2021, o Intel Core i9-12900K.
No duelo com a AMD, o Intel Core Ultra 5 245K atinge o desempenho de um AMD Ryzen 7 9700Xque é uma CPU 8C/16T.
Basicamente, o Intel Core Ultra 5 245K oferece um desempenho impressionante, que, com um consumo de energia de 159 W, é menor do que os modelos Core i5 das gerações anteriores. Isso significa que o processador não só funciona com muito mais eficiência, mas também é mais fácil de resfriar.
O senhor pode encontrar mais benchmarks para os processadores aqui.
| Performance Rating - Percent | |
| AMD Ryzen 9 9950X | |
| Intel Core i9-14900K | |
| Intel Core i9-13900K | |
| Intel Core Ultra 9 285K | |
| AMD Ryzen 9 7950X | |
| AMD Ryzen 9 7950X3D | |
| AMD Ryzen 9 7900X | |
| Intel Core i5-14600K | |
| AMD Ryzen 7 9700X | |
| Intel Core i9-12900K | |
| Intel Core Ultra 5 245K | |
| AMD Ryzen 9 5950X | |
| Intel Core i5-13600K | |
| AMD Ryzen 5 9600X | |
| AMD Ryzen 7 7800X3D | |
| AMD Ryzen 5 7600X | |
| Intel Core i5-12600K | |
| Intel Core i5-13400 | |
| Intel Core i5-12400F | |
* ... menor é melhor
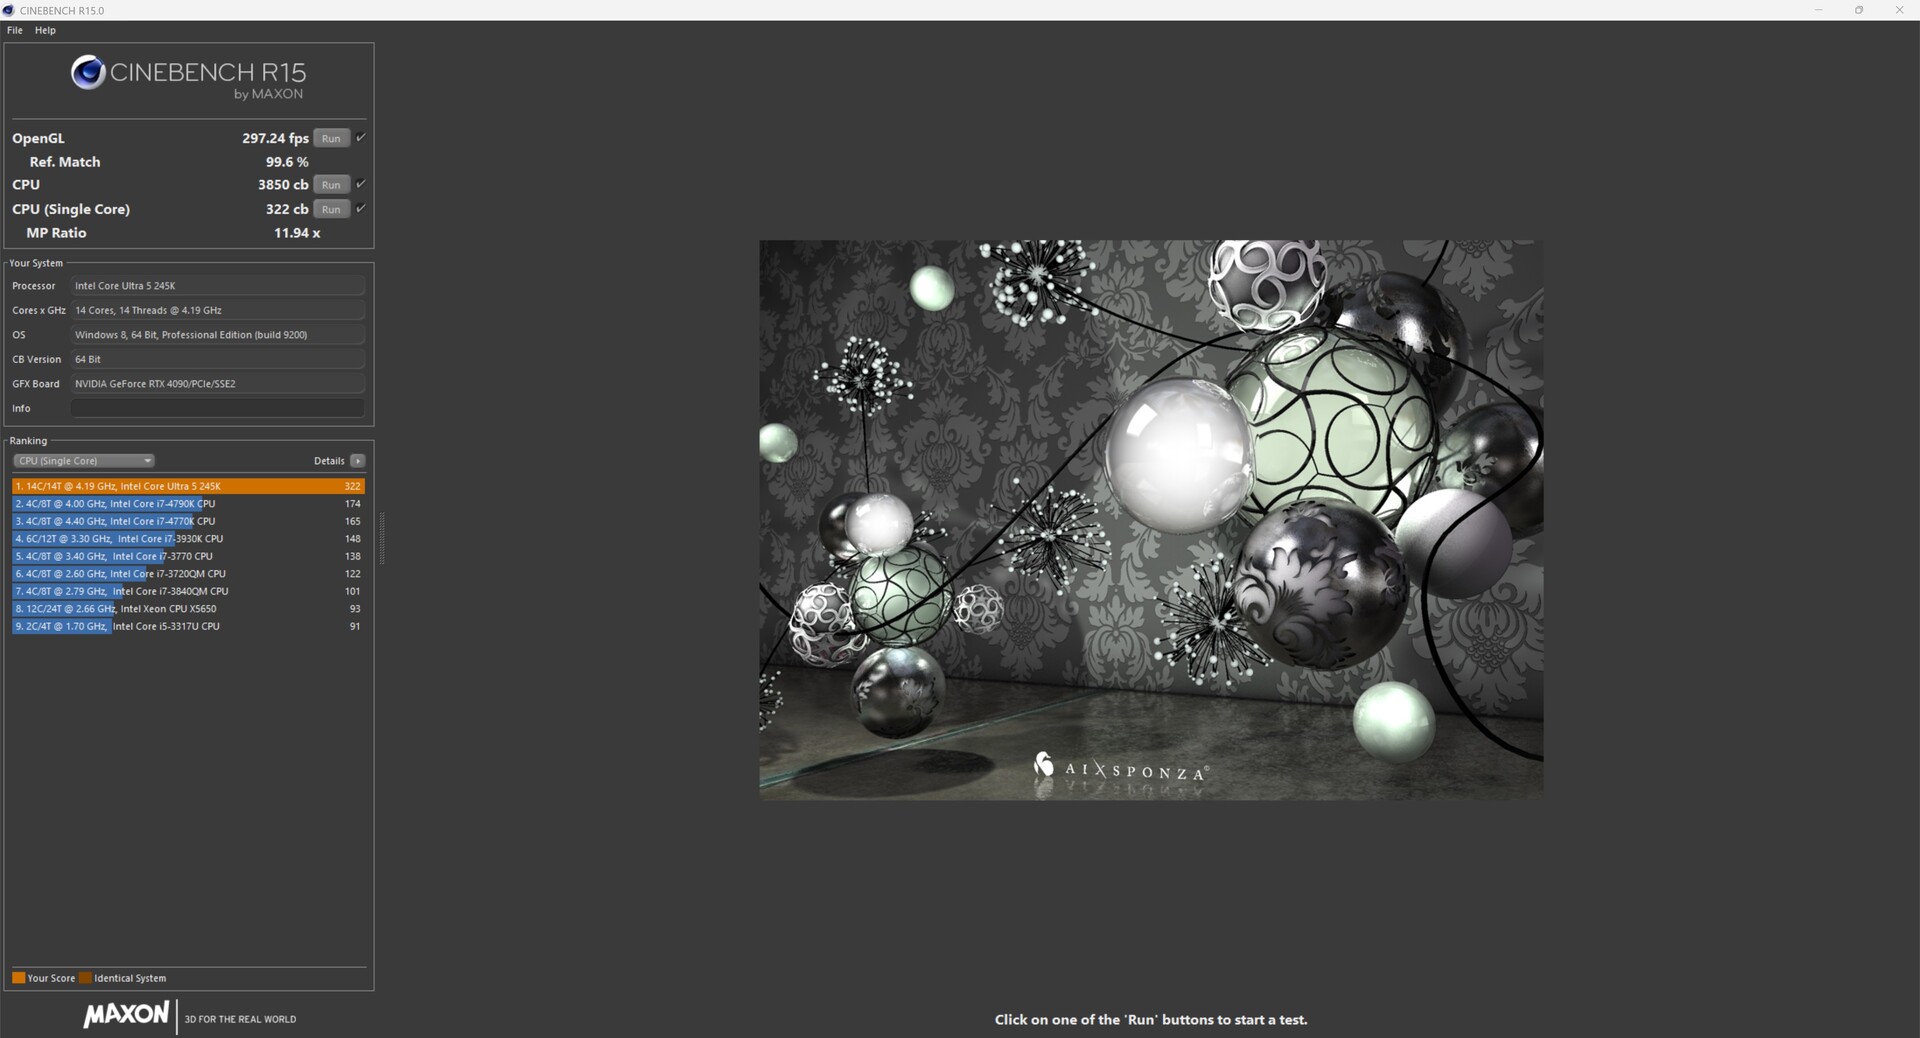


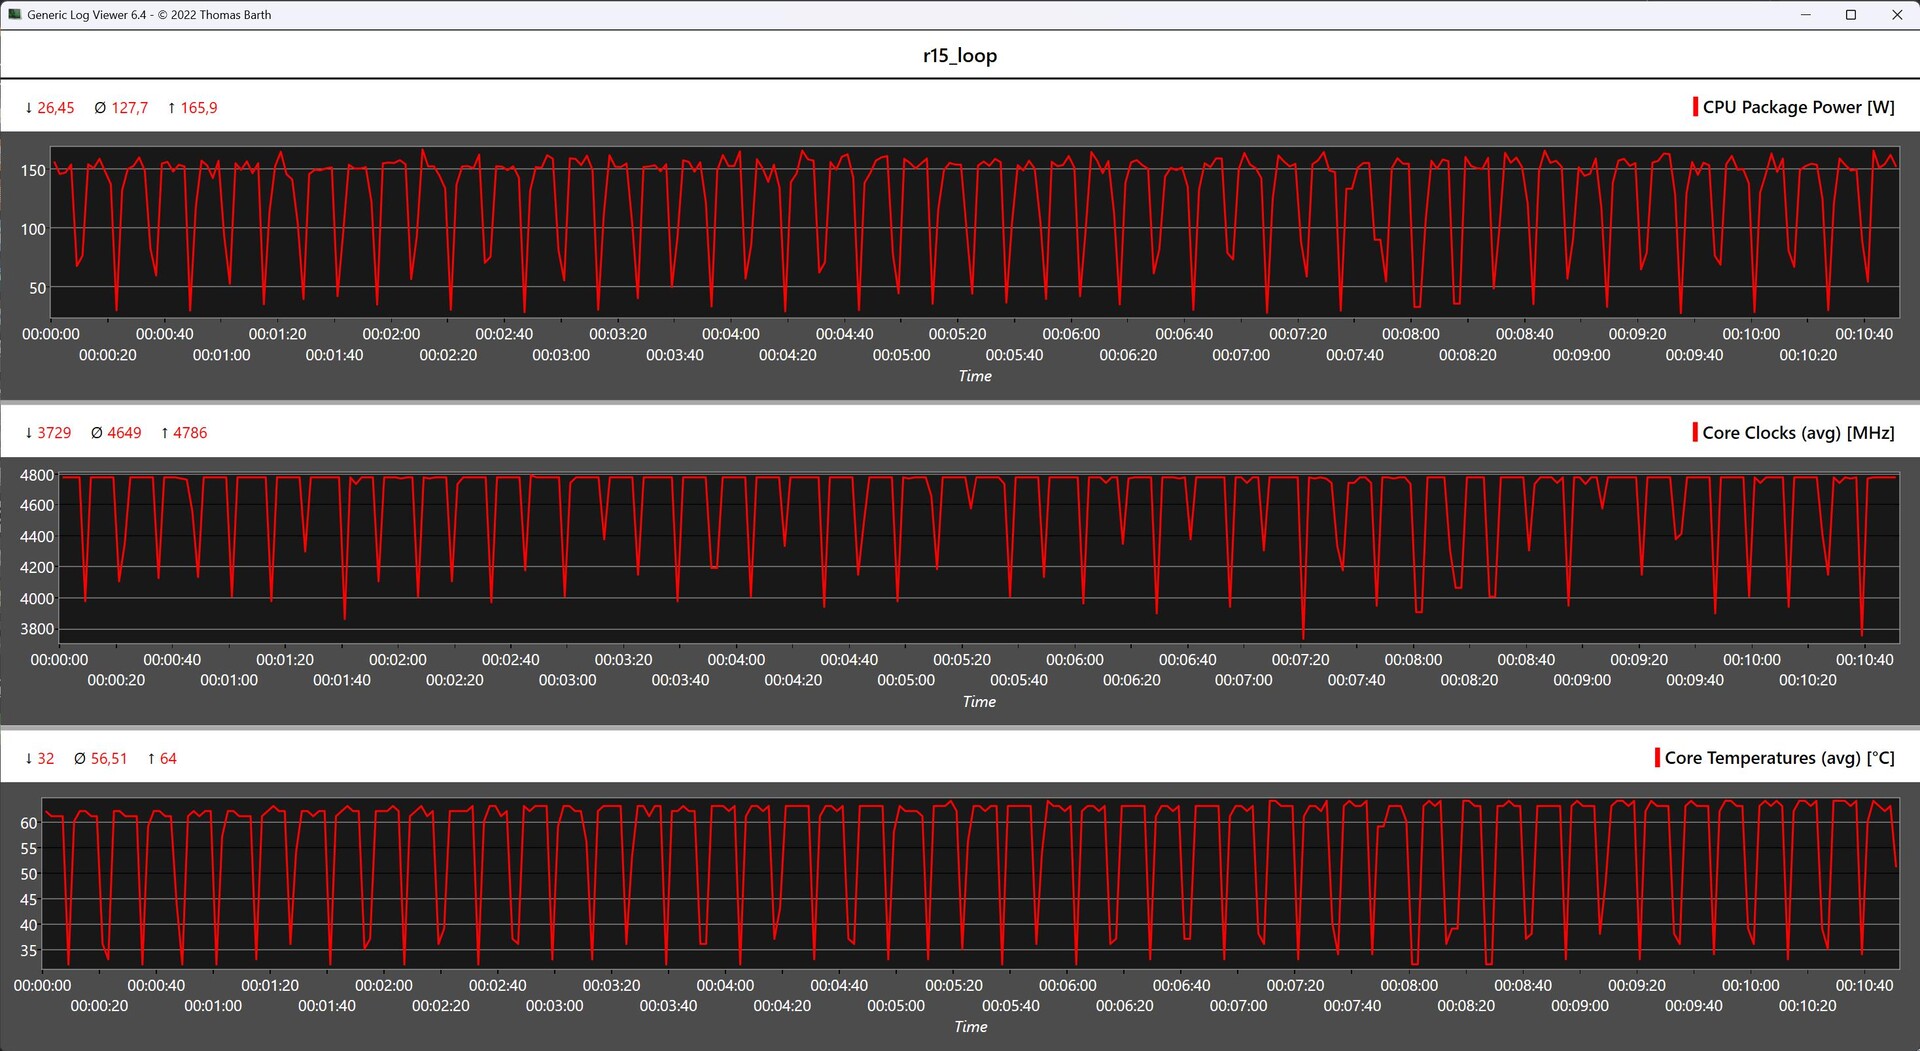
Intel Core Ultra 5 245K no multi-loop do Cinebench R15
O Intel Core Ultra 5 245K domina o loop contínuo do Cinebench R15 sem limitações. Cargas de pico de pouco menos de 166 W estão presentes apenas por um curto período, embora o consumo médio de energia do processador se estabilize em 128 W em 50 execuções.
Graças à nossa potente unidade de resfriamento, o Intel Core Ultra 5 245K não ficou mais quente do que 64 °C durante a execução.
Benchmarks sintéticos e desempenho de aplicativos
No uso diário, o Intel Core Ultra 5 245K tem um desempenho tão bom quanto o de todos os outros processadores na visão geral da comparação. Não há diferenças perceptíveis, embora os resultados do Core Ultra 5 245K revelem apenas um lugar no meio do campo.
O desempenho do Core i5-14600K não pode ser igualado, o que é um pouco decepcionante na avaliação.
| PCMark 10 - Score | |
| AMD Ryzen 9 9950X | |
| Intel Core i9-14900K | |
| AMD Ryzen 5 9600X | |
| AMD Ryzen 9 7900X | |
| AMD Ryzen 9 7950X | |
| Intel Core i9-13900K | |
| Intel Core i5-14600K | |
| AMD Ryzen 7 7800X3D | |
| AMD Ryzen 5 7600X | |
| Intel Core Ultra 5 245K | |
| Intel Core i5-13600K | |
| AMD Ryzen 9 5950X | |
| Intel Core i5-13400 | |
| Intel Core i9-12900K | |
| Intel Core i5-12600K | |
| Intel Core i5-12400F | |
* ... menor é melhor
| Performance Rating - Percent | |
| AMD Ryzen 5 9600X | |
| Intel Core i9-14900K | |
| Intel Core i5-14600K | |
| Intel Core i7-13700K | |
| AMD Ryzen 7 7800X3D | |
| AMD Ryzen 9 7950X3D | |
| AMD Ryzen 9 7950X | |
| Intel Core i7-13700 | |
| Intel Core Ultra 9 285K | |
| Intel Core i7-12700 | |
| Intel Core Ultra 5 245K | |
| Intel Core i5-13400 | |
Potência da NPU
O Intel Core Ultra 5 245K é equipado com uma Unidade de Processamento Neural (NPU), que pode calcular aplicativos de IA de forma particularmente eficiente como uma parte separada do processador.
O núcleo é a mesma NPU que já é usada nos processadores Meteor Lake de laptops e mini PCs com uma potência de computação especificada de 13 TOPS. No entanto, o Core Ultra 5 245K pode oferecer mais desempenho do que os processadores móveis da mesma empresa.
Ainda não se sabe até que ponto a integração das NPUs se tornará mais importante no futuro. Entretanto, em uma comparação de desempenho com placas gráficas modernas, as NPUs dos processadores não têm chance.
| UL Procyon for Windows / Overall Score Integer NPU | |
| Intel Core Ultra 5 245K | |
| Intel Core Ultra 9 285K | |
| Asus NUC 14 Pro | |
| Khadas Mind 2 | |
| Minisforum UH125 Pro | |
| Acemagic F2A | |
Benchmarks de jogos
Infelizmente, os ganhos de desempenho que vimos nos benchmarks de CPU não podem ser traduzidos em um melhor desempenho em jogos. Resumindo: o Intel Core Ultra 5 245K é significativamente mais lento do que um Intel Core i5-14600K.
Mas, antes de mais nada: Uma vez dividimos os benchmarks de jogos em duas seções. A placa de vídeo usada foi a Palit GeForce RTX 4090 GameRock OC para ambos.
Na primeira comparação, analisamos o desempenho no limite da CPU. Aqui, nossa amostra de teste está classificada apenas no terço inferior e duela com um Intel Core i7-12700. O Core Ultra 5 245K perde exatamente 20 por cento em comparação com o Intel Core i5-14600K. Esse é um resultado preocupante, que não esperávamos.
O atual modelo top da AMD no setor de jogos oferece quase 50% a mais de desempenho. Entretanto, essas configurações não são representativas e não refletem o uso diário.
Em segundo lugar, deixamos todos os processadores competirem na resolução de 2160p com o máximo de detalhes. Todos os representantes estão mais próximos uns dos outros, o que era de se esperar, já que a placa de vídeo é agora o fator decisivo, o que nos leva ao limite da GPU.
No entanto, o Intel Core Ultra 5 245K consegue se colocar à frente de seu oponente interno, o Intel Core i5-14600K. Permanece um déficit de desempenho de sete por cento, em média.
Performance comparison in CPU limit
| Performance Rating - Percent | |
| AMD Ryzen 7 7800X3D | |
| AMD Ryzen 9 7950X3D | |
| Intel Core i9-14900K | |
| AMD Ryzen 5 9600X | |
| AMD Ryzen 9 7950X | |
| AMD Ryzen 5 7600X | |
| Intel Core i9-13900K | |
| Intel Core i5-14600K | |
| Intel Core i7-13700K | |
| Intel Core i7-13700 | |
| Intel Core Ultra 9 285K | |
| Intel Core Ultra 5 245K | |
| Intel Core i7-12700 | |
| Intel Core i5-13400 | |
| Intel Core i5-12400F | |
Performance comparison in GPU limit
| Performance Rating - Percent | |
| AMD Ryzen 7 7800X3D | |
| AMD Ryzen 9 7950X3D | |
| Intel Core i9-14900K | |
| Intel Core i5-14600K | |
| AMD Ryzen 9 7950X | |
| AMD Ryzen 5 9600X | |
| AMD Ryzen 5 7600X | |
| Intel Core i9-13900K | |
| Intel Core i7-13700K | |
| Intel Core i7-13700 | |
| Intel Core Ultra 9 285K | |
| Intel Core Ultra 5 245K | |
| Intel Core i7-12700 | |
| Intel Core i5-13400 | |
| Intel Core i5-12400F | |
Intel Core Ultra 5 245K with Nvidia GeForce RTX 4090
| baixo | média | alto | ultra | QHD | 4K | |
|---|---|---|---|---|---|---|
| GTA V (2015) | 187.7 | 187.4 | 186 | 149.8 | 151.7 | 183.7 |
| The Witcher 3 (2015) | 536 | 485 | 461 | 308 | 273 | 284 |
| Dota 2 Reborn (2015) | 213.7 | 192.2 | 185.3 | 172.9 | 168 | |
| Final Fantasy XV Benchmark (2018) | 235 | 235 | 219 | 214 | 162.3 | |
| X-Plane 11.11 (2018) | 129.1 | 114.5 | 98.2 | 93.4 | ||
| Far Cry 5 (2018) | 204 | 177 | 169 | 156 | 155 | 153 |
| Strange Brigade (2018) | 661 | 503 | 498 | 491 | 479 | 285 |
| Shadow of the Tomb Raider (2018) | 246 | 235 | 232 | 233 | 229 | 186.6 |
| Far Cry New Dawn (2019) | 163 | 141 | 136 | 123 | 122 | 120 |
| Metro Exodus (2019) | 256 | 233 | 203 | 175.4 | 169 | 134.7 |
| Total War: Three Kingdoms (2019) | 471.8 | 317.1 | 263.6 | 232.3 | 199 | 104.7 |
| Borderlands 3 (2019) | 172.1 | 157.5 | 146.1 | 138.8 | 140.9 | 124 |
| F1 2020 (2020) | 384 | 333 | 333 | 314 | 311 | 270 |
| F1 2021 (2021) | 386 | 362 | 316 | 203 | 201 | 196.9 |
| Far Cry 6 (2021) | 181.7 | 156.3 | 139.9 | 143.5 | 137.3 | 126.5 |
| God of War (2022) | 227 | 227 | 223 | 206 | 181.6 | 127.2 |
| Tiny Tina's Wonderlands (2022) | 363 | 308 | 273 | 260 | 226 | 132.6 |
| F1 22 (2022) | 311 | 302 | 282 | 161 | 152.1 | 85.5 |
| The Witcher 3 v4.00 (2023) | 273 | 233 | 219 | 204 | 205 | 171.9 |
| Dead Space Remake (2023) | 215 | 213 | 207 | 203 | 176.4 | 97.2 |
| Returnal (2023) | 202 | 202 | 192 | 187 | 173 | 114 |
| F1 23 (2023) | 288 | 290 | 276 | 160.7 | 148 | 80 |
| Baldur's Gate 3 (2023) | 254 | 238 | 218 | 223 | 206 | 135.3 |
| Cyberpunk 2077 2.2 Phantom Liberty (2023) | 190.4 | 190.9 | 175.6 | 164.1 | 151 | 74.7 |
| Assassin's Creed Mirage (2023) | 267 | 259 | 253 | 183 | 179 | 128 |
| Total War Pharaoh (2023) | 399.7 | 235.8 | 197.1 | 159.4 | 157.2 | 147.4 |
| Avatar Frontiers of Pandora (2023) | 238 | 225 | 201 | 166 | 121 | 69 |
| F1 24 (2024) | 302 | 321 | 301 | 173.4 | 144.2 | 79.1 |
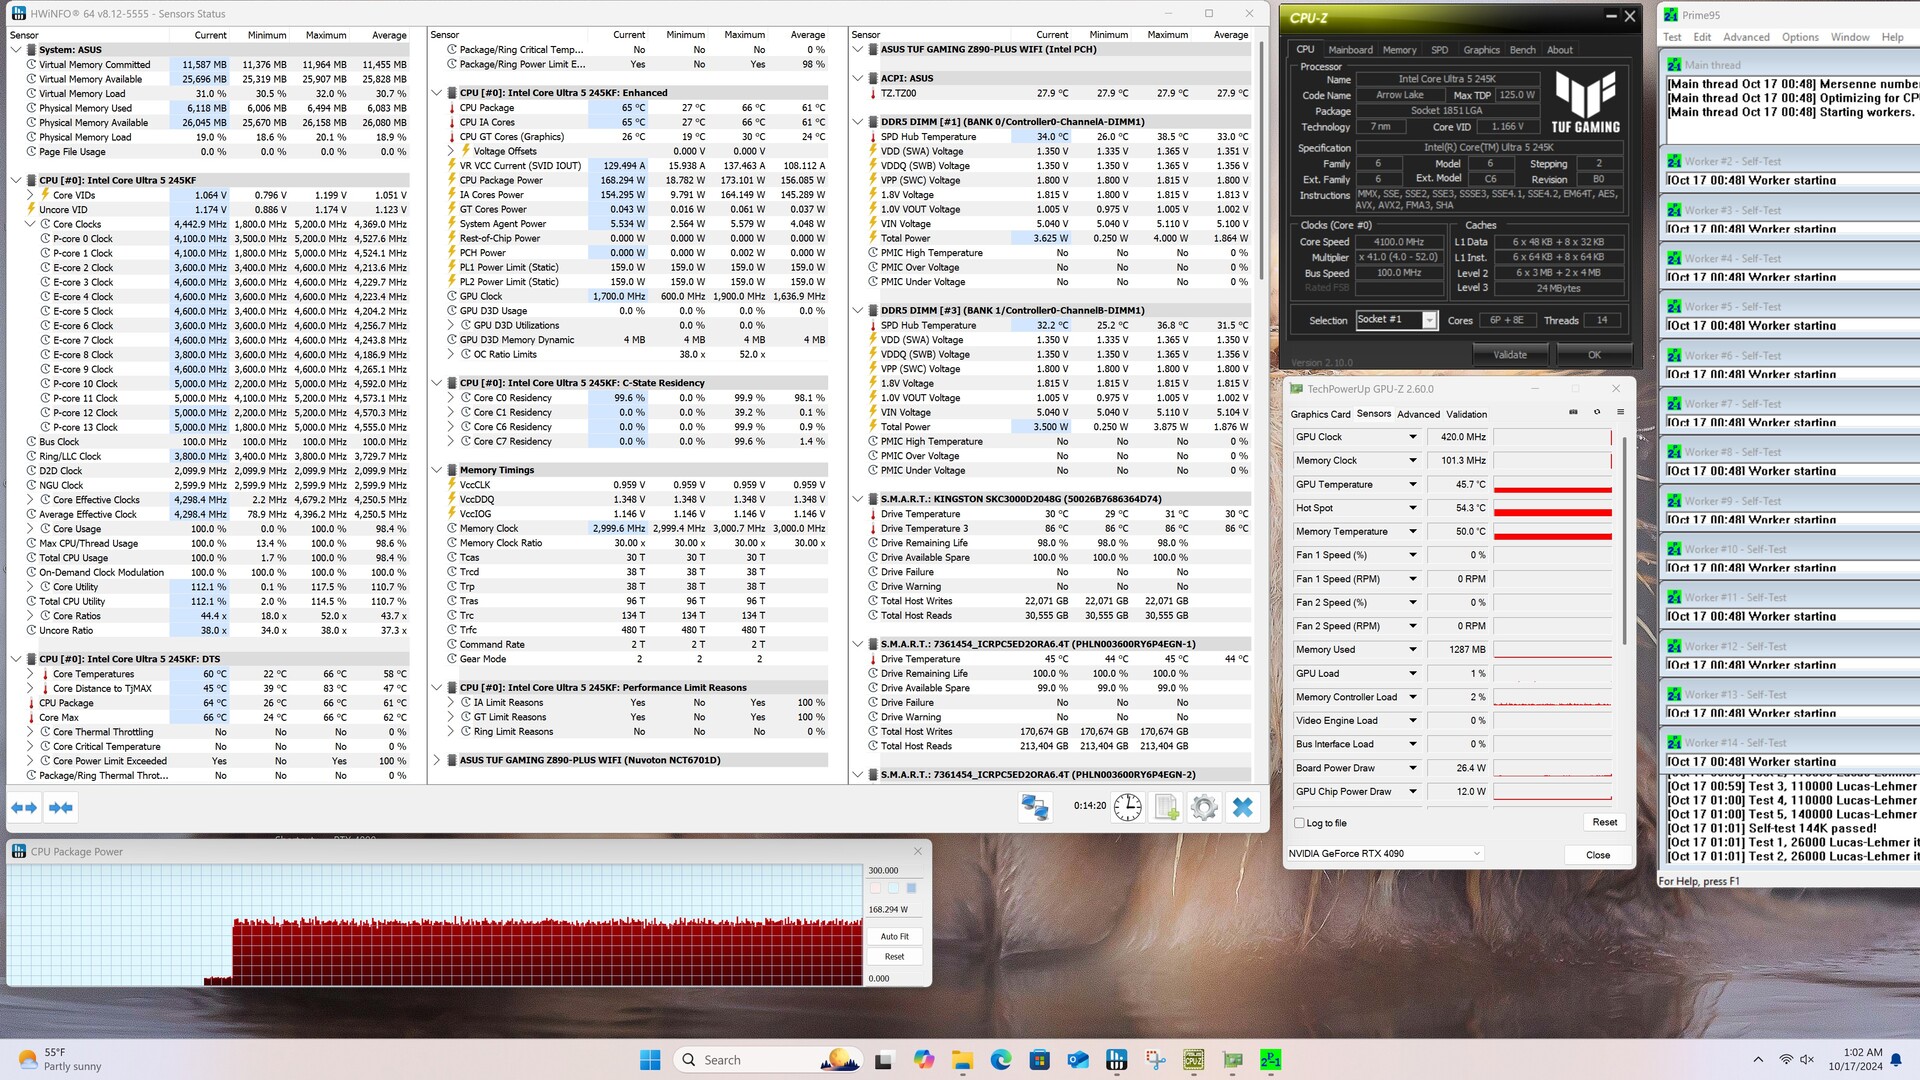
Necessidade de energia
A Intel deu um grande passo à frente em termos de consumo de energia. O Intel Core Ultra 5 245K foi capaz de impressionar na faixa intermediária com um melhor desempenho da CPU e, além disso, vemos que é necessária uma quantidade significativamente menor de energia.
Entretanto, a AMD mostra que pode fazer ainda melhor. Não vemos o consumo excessivo de energia das gerações anteriores de CPU no Core Ultra 5 245K. O limite de energia é de 159 W e está definido como PL1 e PL2, o que significa que a CPU pode obter o desempenho máximo mesmo sob carga sustentada.
O limite é ocasionalmente excedido, como pode ser visto no gráfico. No teste, vimos picos ocasionais de até 173 W. O consumo moderado de energia sob carga total significa que o Core Ultra 5 245K pode ser bem resfriado e não requer soluções de resfriamento extremas. Um cooler com uma especificação TDP de 200 W deve ser suficiente na maioria dos casos para manter o Intel Core Ultra 5 245K sob controle.
As temperaturas estão sempre dentro da faixa verde. Se todos os limites forem desativados no BIOS, o consumo de energia do processador não aumentará de forma perceptível.
As temperaturas também estão em um nível semelhante ao das configurações padrão ativadas da Intel, que servem de base para nossos testes de desempenho. Devido ao consumo de energia significativamente menor, o Intel Core Ultra 5 245K pode alcançar uma grande vantagem sobre o Intel Core i5-14600K na comparação de eficiência.
Efficiency
| Power Consumption / Cinebench R23 Single Power Efficiency - external Monitor | |
| Ultra 9 285K | |
| Ultra 5 245K | |
| Ryzen 5 9600X | |
| i5-14600K | |
| R7 7800X3D | |
| Performance Rating - Percent | |
| AMD Ryzen 5 9600X | |
| AMD Ryzen 7 7800X3D | |
| Intel Core i5-13400 | |
| Intel Core i5-12400F | |
| AMD Ryzen 5 7600X | |
| Intel Core Ultra 5 245K | |
| AMD Ryzen 9 7950X3D | |
| Intel Core i7-12700 | |
| Intel Core i5-14600K | |
| Intel Core i7-13700K | |
| Intel Core i7-13700 | |
| Intel Core Ultra 9 285K | |
| Intel Core i9-14900K | |
* ... menor é melhor
Power consumption with an external monitor
Power consumption with the external monitor
Impressão geral do Notebookcheck sobre o Core Ultra 5 245K
O Intel Core Ultra 5 245K oferece um excelente equilíbrio entre desempenho e eficiência, o que o torna ideal para jogos e multitarefa. Com uma arquitetura moderna, ele impressiona como um versátil e versátil.
Transparência
A seleção dos dispositivos a serem analisados é feita pela nossa equipe editorial. A amostra de teste foi fornecida ao autor como empréstimo pelo fabricante ou varejista para fins desta revisão. O credor não teve influência nesta revisão, nem o fabricante recebeu uma cópia desta revisão antes da publicação. Não houve obrigação de publicar esta revisão. Nunca aceitamos compensação ou pagamento em troca de nossas avaliações. Como empresa de mídia independente, a Notebookcheck não está sujeita à autoridade de fabricantes, varejistas ou editores.
É assim que o Notebookcheck está testando
Todos os anos, o Notebookcheck analisa de forma independente centenas de laptops e smartphones usando procedimentos padronizados para garantir que todos os resultados sejam comparáveis. Desenvolvemos continuamente nossos métodos de teste há cerca de 20 anos e definimos padrões da indústria no processo. Em nossos laboratórios de teste, equipamentos de medição de alta qualidade são utilizados por técnicos e editores experientes. Esses testes envolvem um processo de validação em vários estágios. Nosso complexo sistema de classificação é baseado em centenas de medições e benchmarks bem fundamentados, o que mantém a objetividade.